UNITED STATES
SECURITIES AND EXCHANGE COMMISSION
Washington, D.C. 20549
FORM N-CSR
CERTIFIED SHAREHOLDER REPORT OF REGISTERED MANAGEMENT
INVESTMENT COMPANIES
Investment Company Act file number 811-21977
PowerShares Exchange-Traded Fund Trust II
(Exact name of registrant as specified in charter)
3500 Lacey Road
Downers Grove, IL 60515
(Address of principal executive offices) (Zip code)
Daniel E. Draper
President
3500 Lacey Road
Downers Grove, IL 60515
(Name and address of agent for service)
Registrant’s telephone number, including area code: 800-983-0903
Date of fiscal year end: October 31
Date of reporting period: October 31, 2016
Form N-CSR is to be used by management investment companies to file reports with the Commission not later than 10 days after the transmission to stockholders of any report that is required to be transmitted to stockholders under Rule 30e-1 under the Investment Company Act of 1940 (17 CFR 270.30e-1). The Commission may use the information provided on Form N-CSR in its regulatory, disclosure review, inspection, and policymaking roles.
A registrant is required to disclose the information specified by Form N-CSR, and the Commission will make this information public. A registrant is not required to respond to the collection of information contained in Form N-CSR unless the Form displays a currently valid Office of Management and Budget (“OMB”) control number. Please direct comments concerning the accuracy of the information collection burden estimate and any suggestions for reducing the burden to Secretary, Securities and Exchange Commission, 100 F Street, NE, Washington, DC 20549. The OMB has reviewed this collection of information under the clearance requirements of 44 U.S.C. § 3507.
Item 1. Reports to Stockholders.
The Registrant’s annual report transmitted to shareholders pursuant to Rule 30e-1 under the Investment Company Act of 1940 is as follows:

2016 Annual Report to Shareholders
| | |
| |
| FXEP | | PowerShares Developed EuroPacific Currency Hedged Low Volatility Portfolio |
| |
| PIZ | | PowerShares DWA Developed Markets Momentum Portfolio |
| |
| PIE | | PowerShares DWA Emerging Markets Momentum Portfolio |
| |
| PXR | | PowerShares Emerging Markets Infrastructure Portfolio |
| |
| FXEU | | PowerShares Europe Currency Hedged Low Volatility Portfolio |
| |
| PAF | | PowerShares FTSE RAFI Asia Pacific ex-Japan Portfolio |
| |
| PXF | | PowerShares FTSE RAFI Developed Markets ex-U.S. Portfolio |
| |
| PDN | | PowerShares FTSE RAFI Developed Markets ex-U.S. Small-Mid Portfolio |
| |
| PXH | | PowerShares FTSE RAFI Emerging Markets Portfolio |
| |
| PAGG | | PowerShares Global Agriculture Portfolio |
| |
| PBD | | PowerShares Global Clean Energy Portfolio |
| |
| PSAU | | PowerShares Global Gold and Precious Metals Portfolio |
| |
| PIO | | PowerShares Global Water Portfolio |
| |
| IPKW | | PowerShares International BuyBack AchieversTM Portfolio |
| |
| FXJP | | PowerShares Japan Currency Hedged Low Volatility Portfolio |
| |
| IDHQ | | PowerShares S&P International Developed Quality Portfolio |
Table of Contents
The Market Environment
US Equity
During the fiscal year ended October 31, 2016, the US economy continued to expand. The initial estimate of US gross domestic product (GDP) showed the US economy grew by 2.9% in the third calendar quarter of 2016, beating consensus estimates.1 However, annualized GDP is expected to be lower. Employment data were mixed, though the unemployment rate had a surprise uptick from 4.9% in August to 5.0% in September before ending the fiscal year at 4.9%.2 Oil prices traded in a range from the high $20s to the low $50s during the reporting period.3
The US Federal Reserve (the Fed) raised interest rates in December 2015—its first increase since 2006—but that was its only increase during the reporting period. Major US stock market indexes posted gains for the reporting period, but they were fairly volatile. Stocks began calendar year 2016 on a negative note, driven by investor concerns about economic weakness in China, falling oil prices and uncertainty over Fed policy, including rumors of possible negative interest rates in the US. Markets recovered in late February and posted gains until June when UK voters opted to leave the European Union, sending markets sharply lower once again. Markets again recovered, and major US equity indexes hit record highs during the summer.4 In this environment, investors generally favored the perceived safety of government bonds and more defensive, dividend-paying equities often found in the telecommunication services, utilities and consumer staples sectors.
Global Equity
The global economy continued to expand, albeit slowly, for the fiscal year ended October 31, 2016. However, that growth became increasingly uneven across developed and emerging economies, amid continued volatility in oil prices and as the policies of central banks globally began to diverge.
Equity market rallies in October and November 2015 were offset by negative performance in December, as a late-year crash in oil prices rattled the markets. Also in December, the US Federal Reserve (the Fed) followed through on its commitment to normalize monetary policy by raising interest rates—its first increase since 2006—even as the European Central Bank extended its asset purchase program and Japan introduced additional quantitative easing and negative interest rates.5
Stocks began calendar year 2016 on a negative note, driven by investor concerns about economic weakness in China and falling oil prices. Markets recovered in late February and posted gains amid concerted central bank commitments to very loose monetary policy. As a result, the US dollar fell sharply against the euro and Japanese yen, a development that was largely supportive of oil and stock prices.
All major global stock indexes experienced steep declines again in June after UK voters opted to leave the European Union—resulting
in a sharp stock-market sell-off. Stocks in economically sensitive sectors, including energy and financials, were hardest hit, and investors flocked to the perceived safety of US Treasuries and more defensive, dividend-paying equities often found in the telecommunication services, utilities and consumer staples sectors.
After the initial shock of the UK vote, stocks made a strong recovery, regaining most of their losses as fears of a shock to consumer confidence never materialized. For the remainder of the reporting period, emerging markets outperformed as the Fed left interest rates unchanged and expectations for an interest rate increase were delayed again.
| 1 | Source: Bureau of Economic Analysis |
| 2 | Source: Bureau of Labor Statistics |
| 3 | Source: Thompson-Reuters |
| 5 | Source: Bureau of Economic Analysis |
| | |
| FXEP | | Manager’s Analysis |
| | PowerShares Developed EuroPacific Currency Hedged Low Volatility Portfolio (FXEP) |
As an index fund, the PowerShares Developed EuroPacific Currency Hedged Low Volatility Portfolio (the “Fund”) is passively managed and attempts to track the returns of an underlying index. The Fund seeks investment results that generally correspond (before fees and expenses) to the price and yield of the S&P EPAC Ex Korea Low Volatility USD Hedged Index (Net) (the “Index”). The Fund generally will invest at least 90% of its total assets in common stocks that comprise the Index.
S&P Dow Jones Indices LLC (“S&P DJI” or the “Index Provider”) compiles, maintains and calculates the Index strictly in accordance with its existing guidelines and mandated procedures. The Index measures the performance of the 200 least volatile stocks in the S&P EPAC Ex-Korea LargeMidCap Index, while also employing a currency-hedged strategy to mitigate exposure to fluctuations between the value of the U.S. dollar and the currencies of the countries in which the component securities of the Index are domiciled. From the constituents of the S&P EPAC Ex-Korea LargeMidCap Index, the Index Provider selects securities with the least volatility over the past 12 months for inclusion in the Index, with the least volatile stocks receiving the greatest weights. To hedge against exchange rate fluctuations, the Fund also will invest in foreign currency forward contracts to “lock in” the contract’s agreed-upon exchange rates. Through this process, the Fund attempts to use the profits (or losses) from the forward contracts to offset the losses (or profits) from changes in currency values. The Fund generally invests in all of the securities comprising the Index in proportion to their weightings in the Index.
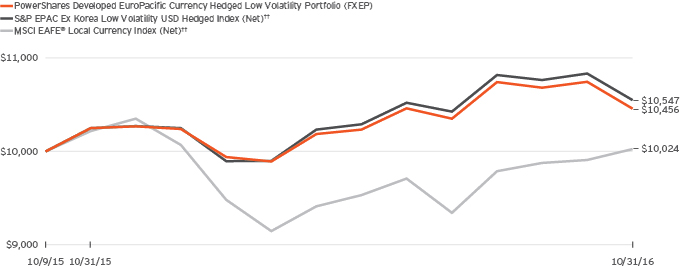
For the fiscal year ended October 31, 2016, on a market price basis, the Fund returned 2.06%. On a net asset value (“NAV”) basis, the Fund returned 2.04%. During the same time period, the Index returned 2.91%. During the fiscal year, the Fund fully replicated the components of the Index; therefore, the Fund’s performance (NAV basis) differed from the return of the Index primarily due to slippage around rebalances and the fees and operating expenses that the Fund incurred during the period.
During this same time period, the MSCI EAFE® Local Currency Index (Net) (the “Benchmark Index”) returned (1.90)%. The Benchmark Index is an unmanaged index weighted by market capitalization based on the average performance of approximately 930 securities.
The Benchmark Index was selected for its recognition in the marketplace, and its performance comparison is a useful measure for investors as a broad representation of stock of Europe, Australasia and the Far East.
Relative to the Benchmark Index, the Fund was most overweight in the real estate sector and most underweight in the health care sector during the fiscal year ended October 31, 2016. The majority of the Fund’s outperformance relative to the Benchmark Index during the period can be attributed to a larger allocation in the real estate sector and stock selection in the real estate and financial sectors.
For the fiscal year ended October 31, 2016, the real estate sector contributed most significantly to the Fund’s return, followed by the consumer staples and industrials sectors. The consumer discretionary sector detracted most significantly from the Fund’s return, followed by the telecommunication services and financials sectors.
Positions that contributed most significantly to the Fund’s return included Kagome Co. Ltd., a consumer staples company (portfolio average weight of 0.60%), and HK Electric Investments & HK Electric Investments Ltd., a utilities company (portfolio average weight of 0.79%). Positions that detracted most significantly from the Fund’s return included Next PLC, a consumer discretionary company (no longer held at fiscal year-end), and Derwent London PLC REIT, a financials company (no longer held at fiscal year-end).
| | | | |
Sector Breakdown
(% of the Fund’s Net Assets)
as of October 31, 2016 | |
| Industrials | | | 20.6 | |
| Real Estate | | | 17.5 | |
| Consumer Staples | | | 12.1 | |
| Utilities | | | 11.7 | |
| Financials | | | 11.2 | |
| Consumer Discretionary | | | 7.4 | |
| Health Care | | | 5.6 | |
| Telecommunication Services | | | 4.9 | |
| Information Technology | | | 3.6 | |
| Materials | | | 2.7 | |
| Other Assets Less Liabilities | | | 2.7 | |
|
Top Ten Fund Holdings
(% of the Fund’s Net Assets)
as of October 31, 2016 | |
| Security | | | | |
| MAN SE | | | 1.3 | |
| Sofina SA | | | 0.7 | |
| Hong Kong & China Gas Co. Ltd. | | | 0.7 | |
| MTR Corp. Ltd. | | | 0.7 | |
| Venture Corp. Ltd. | | | 0.7 | |
| HK Electric Investments & HK Electric Investments Ltd. | | | 0.6 | |
| United Overseas Bank Ltd. | | | 0.6 | |
| AGL Energy Ltd. | | | 0.6 | |
| SGS SA | | | 0.6 | |
| Jardine Strategic Holdings Ltd. | | | 0.6 | |
| Total | | | 7.1 | |
PowerShares Developed EuroPacific Currency Hedged Low Volatility Portfolio (FXEP) (continued)
Growth of a $10,000 Investment Since Inception†
Fund Performance History as of October 31, 2016
| | | | | | | | | | | | | | | | |
| | | 1 Year | | | | | | Fund Inception† | |
| Index | | | | | | Average
Annualized | | | Cumulative | |
| S&P EPAC Ex Korea Low Volatility USD Hedged Index (Net)†† | | | 2.91 | % | | | | | | | 5.15 | % | | | 5.47 | % |
| MSCI EAFE® Local Currency Index (Net)†† | | | (1.90 | ) | | | | | | | 0.23 | | | | 0.24 | |
| Fund | | | | | | | | | | | | | | | | |
| NAV Return | | | 2.04 | | | | | | | | 4.30 | | | | 4.56 | |
| Market Price Return | | | 2.06 | | | | | | | | 4.06 | | | | 4.31 | |
Fund Inception: October 9, 2015
Performance quoted above represents past performance. Past performance is not a guarantee of future results and current performance may be higher or lower than performance quoted. Investment returns and principal value will fluctuate, and shares of the Fund (“Fund Shares”), when redeemed or sold, may be worth more or less than their original cost. Fund performance reflects any applicable fee waivers and/or expense reimbursements. Had the adviser not waived fees and/or reimbursed expenses currently or in the past, returns would have been lower. See current prospectus for more information. According to the Fund’s current prospectus, the Fund’s expense ratio of 0.25% is expressed as a unitary management fee to cover operating expenses and expenses incurred in connection with managing the portfolio. NAV and Market Price returns assume that dividends and capital gain distributions have been reinvested in the Fund at NAV and
Market Price, respectively. See invescopowershares.com to find the most recent month-end performance numbers.
Index and Benchmark Index performance results are based upon a hypothetical investment in their respective constituent securities. Index and Benchmark Index returns do not represent Fund returns. An investor cannot invest directly in an index. The Index and Benchmark Index do not charge management fees or brokerage expenses, and no such fees or expenses were deducted from the hypothetical performance shown. In addition, the results actual investors might have achieved would have differed from those shown because of differences in the timing, amounts of their investments, and fees and expenses associated with an investment in the Fund.
| † | Fund, Index and Benchmark Index returns are based on the inception date of the Fund. |
| †† | Reflects invested dividends net of withholding taxes. |
| | |
| PIZ | | Manager’s Analysis |
| | PowerShares DWA Developed Markets Momentum Portfolio (PIZ) |
As an index fund, the PowerShares DWA Developed Markets Momentum Portfolio (the “Fund”) is passively managed and attempts to track the returns of an underlying index. The Fund seeks investment results that generally correspond (before fees and expenses) to the price and yield of the Dorsey Wright® Developed Markets Technical Leaders Index (Net) (the “Index”). The Fund will invest at least 90% of its total assets in equity securities that comprise the Index, which is comprised of equity securities of large capitalization companies based in countries with developed economies excluding the United States.
Dorsey Wright & Associates, LLC (“Dorsey Wright” or the “Index Provider”) selects securities pursuant to its proprietary selection methodology, which is designed to identify securities that demonstrate powerful relative strength characteristics. “Relative strength” is an investing technique that seeks to determine the strongest performing securities by measuring certain factors such as market performance. Dorsey Wright selects securities from a universe of approximately 1,000 constituents by market capitalization within the NASDAQ Developed Market Ex-United States Index. The Index provider then ranks the eligible securities by their relative strength score, selects approximately 100 securities with the greatest score for inclusion in the Index and weights each component security based on its relative strength score. The Fund generally invests in all of the securities comprising its Index in proportion to their weightings in the Index.
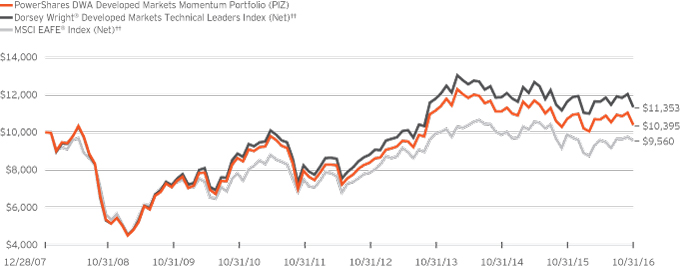
For the fiscal year ended October 31, 2016, on a market price basis, the Fund returned (2.43)%. On a net asset value (“NAV”) basis, the Fund returned (2.97)%. During the same time period, the Index returned (2.43)%. During the fiscal year, the Fund fully replicated the components of the Index; therefore, the Fund’s performance (NAV basis) differed from the return of the Index primarily due to fees and expenses that the Fund incurred during the period which were offset by a gain around rebalances due to starting trading early for liquidity purposes.
During this same time period, the MSCI EAFE® Index (Net) (the “Benchmark Index”) returned (3.23)%. The Benchmark Index is an unmanaged index weighted by market capitalization and based on the average performance of approximately 930 securities. The Benchmark Index was selected for its recognition in the marketplace, and its performance comparison is a useful measure for investors as a broad representation of the equities market in developed countries outside the U.S.
Relative to the Benchmark Index, the Fund was most overweight in the industrials sector and most underweight in the financials sector during the fiscal year ended October 31, 2016. The majority of the Fund’s outperformance relative to the Benchmark Index during the period can be attributed to stock selection and overweight positions in the materials and information technology sectors.
For the fiscal year ended October 31, 2016, the health care sector contributed most significantly to the Fund’s return, followed
by the industrials and energy sectors, respectively. The consumer discretionary sector detracted most significantly from the Fund’s return, followed by the financials and information technology sectors, respectively.
Positions that contributed most significantly to the Fund’s return included Genmab A/S, a health care company (no longer held at fiscal year-end), and Ramsay Health Care Ltd., a health care company (portfolio average weight of 3.16%). Positions that detracted most significantly from the Fund’s return included Goldin Financial Holdings Limited, a financials company (no longer held at fiscal year-end), and Howden Joinery Group PLC, an industrials company (portfolio average weight of 1.70%).
| | | | |
Sector Breakdown
(% of the Fund’s Net Assets)
as of October 31, 2016 | |
| Industrials | | | 31.4 | |
| Health Care | | | 14.6 | |
| Information Technology | | | 10.4 | |
| Consumer Staples | | | 9.8 | |
| Materials | | | 9.0 | |
| Financials | | | 7.0 | |
| Utilities | | | 5.4 | |
| Consumer Discretionary | | | 5.4 | |
| Real Estate | | | 3.5 | |
| Energy | | | 2.3 | |
| Telecommunication Services | | | 1.2 | |
| Money Market Fund Plus Other Assets Less Liabilities | | | 0.0 | |
|
Top Ten Fund Holdings*
(% of the Fund’s Net Assets)
as of October 31, 2016 | |
| Security | | | | |
| Ramsay Health Care Ltd. | | | 3.0 | |
| Ryman Healthcare Ltd. | | | 2.8 | |
| Kone Oyj, Class B | | | 2.7 | |
| Jardine Matheson Holdings Ltd. | | | 2.7 | |
| Experian PLC | | | 2.6 | |
| Recordati SpA | | | 2.5 | |
| Wartsila Oyj Abp | | | 2.4 | |
| Flughafen Zuerich AG | | | 2.3 | |
| Constellation Software, Inc. | | | 2.3 | |
| Auckland International Airport Ltd. | | | 2.1 | |
| Total | | | 25.4 | |
| * | Excluding money market fund holdings. |
PowerShares DWA Developed Markets Momentum Portfolio (PIZ) (continued)
Growth of a $10,000 Investment Since Inception†
Fund Performance History as of October 31, 2016
| | | | | | | | | | | | | | | | | | | | | | | | | | | | | | | | |
| | | 1 Year | | | 3 Years
Average
Annualized | | | 3 Years
Cumulative | | | 5 Years
Average
Annualized | | | 5 Years
Cumulative | | | | | | Fund Inception† | |
| Index | | | | | | | | | | Average
Annualized | | | Cumulative | |
| Dorsey Wright® Developed Markets Technical Leaders Index (Net)†† | | | (2.43 | )% | | | (1.27 | )% | | | (3.76 | )% | | | 6.62 | % | | | 37.78 | % | | | | | | | 1.45 | % | | | 13.53 | % |
| MSCI EAFE® Index (Net)†† | | | (3.23 | ) | | | (1.31 | ) | | | (3.87 | ) | | | 4.99 | | | | 27.59 | | | | | | | | (0.51 | ) | | | (4.40 | ) |
| Fund | | | | | | | | | | | | | | | | | | | | | | | | | | | | | | | | |
| NAV Return | | | (2.97 | ) | | | (2.33 | ) | | | (6.82 | ) | | | 5.51 | | | | 30.75 | | | | | | | | 0.44 | | | | 3.95 | |
| Market Price Return | | | (2.43 | ) | | | (2.46 | ) | | | (7.20 | ) | | | 5.68 | | | | 31.80 | | | | | | | | 0.36 | | | | 3.25 | |
Fund Inception: December 28, 2007
Performance quoted above represents past performance. Past performance is not a guarantee of future results and current performance may be higher or lower than performance quoted. Investment returns and principal value will fluctuate, and shares of the Fund (“Fund Shares”), when redeemed or sold, may be worth more or less than their original cost. Fund performance reflects any applicable fee waivers and/or expense reimbursements. Had the adviser not waived fees and/or reimbursed expenses currently or in the past, returns would have been lower. See current prospectus for more information. According to the Fund’s current prospectus, the Fund’s expense ratio of 0.81% includes the unitary management fee of 0.80% and other expenses of 0.01%. NAV and Market Price returns assume that dividends and capital gain distributions have been reinvested in the Fund at NAV and Market Price, respectively. The returns shown in the table above do not reflect the deduction of taxes that a shareholder would pay
on Fund distributions or the redemption or sale of Fund Shares. See invescopowershares.com to find the most recent month-end performance numbers.
Index and Benchmark Index performance results are based upon a hypothetical investment in their respective constituent securities. Index and Benchmark Index returns do not represent Fund returns. An investor cannot invest directly in an index. The Index and Benchmark Index do not charge management fees or brokerage expenses, and no such fees or expenses were deducted from the hypothetical performance shown. In addition, the results actual investors might have achieved would have differed from those shown because of differences in the timing, amounts of their investments, and fees and expenses associated with an investment in the Fund.
| † | Fund, Index and Benchmark Index returns are based on the inception date of the Fund. |
| †† | Reflects reinvested dividends net of withholding taxes. |
| | |
| PIE | | Manager’s Analysis |
| | PowerShares DWA Emerging Markets Momentum Portfolio (PIE) |
As an index fund, the PowerShares DWA Emerging Markets Momentum Portfolio (the “Fund”) is passively managed and attempts to track the returns of an underlying index. The Fund seeks investment results that generally correspond (before fees and expenses) to the price and yield of the Dorsey Wright® Emerging Markets Technical Leaders Index (Net) (the “Index”). The Fund will invest at least 90% of its total assets in equity securities that comprise the Index.
Dorsey Wright & Associates, LLC (“Dorsey Wright” or the “Index Provider”) selects such securities pursuant to its proprietary selection methodology, which is designed to identify securities that demonstrate powerful relative strength characteristics. “Relative strength” is an investing technique that seeks to determine the strongest performing securities by measuring certain factors such as performance security’s relative performance against the overall market. Dorsey Wright selects securities for inclusion in the Index from an eligible universe of the largest 1,000 constituents by market capitalization within the NASDAQ Emerging Markets Index (except for U.S. –listed American Depository Receipts or foreign listings). The Index Provider assigns a relative strength score to each eligible security and selects approximately 100 securities with the greatest scores for inclusion in the Index and weights each security on its relative strength score. The Fund generally invests in all of the securities comprising its Index in proportion to their weightings in the Index.
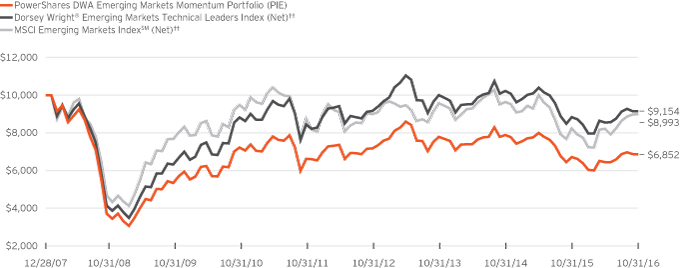
For the fiscal year ended October 31, 2016, on a market price basis, the Fund returned 2.25%. On a net asset value (“NAV”) basis, the Fund returned 2.00%. During the same time period, the Index returned 3.63%. During the fiscal year, the Fund fully replicated the components of the Index; therefore, the Fund’s performance (NAV basis) differed from the return of the Index primarily due to trading costs and slippage around quarterly rebalances, and fees and operating expenses that the Fund incurred during the period.
During this same time period, the MSCI Emerging Markets IndexSM (Net) (the “Benchmark Index”) returned 9.27%. The Benchmark Index is an unmanaged index weighted by market capitalization and based on the average performance of approximately 830 securities. The Benchmark Index was selected for its recognition in the marketplace, and its performance comparison is a useful measure for investors as a broad representation of emerging market equities.
Relative to the Benchmark Index, the Fund was most overweight in the industrials sector and most underweight in the financials sector during the fiscal year ended October 31, 2016. The majority of the Fund’s underperformance relative to the Benchmark Index during the period can be attributed to stock selection and having overweight positions within the consumer discretionary and materials sector.
For the fiscal year ended October 31, 2016, the information technology sector contributed most significantly to the Fund’s return, followed by the consumer staples and utilities sectors, respectively. The consumer discretionary sector detracted most significantly from the Fund’s return, followed by the materials and telecommunication services sectors, respectively.
Positions that contributed most significantly to the Fund’s return included Grape King Bio Ltd., a consumer staples company (portfolio average weight of 2.18%), and KCE Electronics PCL NVDR, an information technology company (portfolio average weight of 1.96%). Positions that detracted most significantly from the Fund’s return included Tipco Asphalt PCL NVDR, a materials company (no longer held at fiscal year-end), and EOH Holdings Ltd., an information technology company (portfolio average weight of 0.46%).
| | | | |
Sector Breakdown
(% of the Fund’s Net Assets)
as of October 31, 2016 | |
| Information Technology | | | 31.1 | |
| Consumer Discretionary | | | 18.5 | |
| Consumer Staples | | | 11.1 | |
| Financials | | | 10.3 | |
| Utilities | | | 7.4 | |
| Real Estate | | | 7.4 | |
| Materials | | | 6.4 | |
| Industrials | | | 4.5 | |
| Health Care | | | 2.6 | |
| Energy | | | 0.7 | |
| Money Market Fund Plus Other Assets Less Liabilities | | | 0.0 | |
|
Top Ten Fund Holdings*
(% of the Fund’s Net Assets)
as of October 31, 2016 | |
| Security | | | | |
| Sahamitr Pressure Container PCL NVDR | | | 4.1 | |
| KCE Electronics PCL NVDR | | | 3.1 | |
| Grape King Bio Ltd. | | | 2.9 | |
| Tencent Holdings Ltd. | | | 2.5 | |
| CP ALL PCL NVDR | | | 2.5 | |
| My E.G. Services Bhd | | | 2.4 | |
| AAC Technologies Holdings, Inc. | | | 2.2 | |
| EOH Holdings Ltd. | | | 2.2 | |
| Magazine Luiza SA | | | 2.1 | |
| Supalai PCL NVDR | | | 2.1 | |
| Total | | | 26.1 | |
| * | Excluding money market fund holdings. |
PowerShares DWA Emerging Markets Momentum Portfolio (PIE) (continued)
Growth of a $10,000 Investment Since Inception†
Fund Performance History as of October 31, 2016
| | | | | | | | | | | | | | | | | | | | | | | | | | | | | | | | |
| | | 1 Year | | | 3 Years
Average
Annualized | | | 3 Years
Cumulative | | | 5 Years
Average
Annualized | | | 5 Years
Cumulative | | | | | | Fund Inception† | |
| Index | | | | | | | | | | Average
Annualized | | | Cumulative | |
| Dorsey Wright® Emerging Markets Technical Leaders Index (Net)†† | | | 3.63 | % | | | (2.93 | )% | | | (8.53 | )% | | | 1.65 | % | | | 8.53 | % | | | | | | | (0.99 | )% | | | (8.46 | )% |
| MSCI Emerging Markets IndexSM (Net)†† | | | 9.27 | | | | (2.05 | ) | | | (6.01 | ) | | | 0.55 | | | | 2.76 | | | | | | | | (1.19 | ) | | | (10.07 | ) |
| Fund | | | | | | | | | | | | | | | | | | | | | | | | | | | | | | | | |
| NAV Return | | | 2.00 | | | | (4.16 | ) | | | (11.98 | ) | | | 0.67 | | | | 3.41 | | | | | | | | (4.19 | ) | | | (31.48 | ) |
| Market Price Return | | | 2.25 | | | | (4.15 | ) | | | (11.93 | ) | | | 0.75 | | | | 3.80 | | | | | | | | (4.27 | ) | | | (32.00 | ) |
Fund Inception: December 28, 2007
Performance quoted above represents past performance. Past performance is not a guarantee of future results and current performance may be higher or lower than performance quoted. Investment returns and principal value will fluctuate, and shares of the Fund (“Fund Shares”), when redeemed or sold, may be worth more or less than their original cost. Fund performance reflects any applicable fee waivers and/or expense reimbursements. Had the adviser not waived fees and/or reimbursed expenses currently or in the past, returns would have been lower. See current prospectus for more information. According to the Fund’s current prospectus, the Fund’s expense ratio of 0.90% is expressed as a unitary management fee to cover operating expenses and expenses incurred in connection with managing the portfolio. NAV and Market Price returns assume that dividends and capital gain distributions have been reinvested in the Fund at NAV and Market Price, respectively. The returns shown in the table above do not reflect the deduction of taxes that a shareholder would pay on Fund
distributions or the redemption or sale of Fund Shares. See invescopowershares.com to find the most recent month-end performance numbers.
Index and Benchmark Index performance results are based upon a hypothetical investment in their respective constituent securities. Index and Benchmark Index returns do not represent Fund returns. An investor cannot invest directly in an index. The Index and Benchmark Index do not charge management fees or brokerage expenses, and no such fees or expenses were deducted from the hypothetical performance shown. In addition, the results actual investors might have achieved would have differed from those shown because of differences in the timing, amounts of their investments, and fees and expenses associated with an investment in the Fund.
| † | Fund, Index and Benchmark Index returns are based on the inception date of the Fund. |
| †† | Reflects reinvested dividends net of withholding taxes. |
| | |
| PXR | | Manager’s Analysis |
| | PowerShares Emerging Markets Infrastructure Portfolio (PXR) |
As an index fund, the PowerShares Emerging Markets Infrastructure Portfolio (the “Fund”) is passively managed and attempts to track the returns of an underlying index. The Fund seeks investment results that generally correspond (before fees and expenses) to the price and yield of the S-Network Emerging Infrastructure Builders IndexSM (the “Index”). The Fund will invest at least 90% of its total assets in the equity securities of companies involved in the following sectors related to infrastructure construction and development in emerging market countries: 1) construction and engineering; 2) construction machinery; 3) construction materials; 4) diversified metals and mining; 5) heavy electrical equipment; 6) industrial machinery; and 7) steel, and that comprise the Index, and American depositary receipts (“ADRs”) and global depositary receipts (“GDRs”) that are based on the securities in the Index. Historically, the Index has consisted of securities of companies listed on exchanges in Australia, Bermuda, Brazil, Canada, Chile, China, Egypt, France, Hong Kong, India, Indonesia, Israel, Luxembourg, Malaysia, Mexico, Poland, Russia, Singapore, South Africa, Spain, Sweden, Switzerland, Taiwan and the United States.
The Index is calculated and maintained by Standard & Poor’s Custom Indices on behalf of S-Network Global Indexes Inc. (the “Index Provider”). Emerging market countries are determined according to the Index Provider’s definition, which currently includes those countries identified in the World Bank Country Classification system as “Middle Income” countries. The Index Provider will include stocks only with a minimum market capitalization of $500 million, and it will remove such stocks if their market capitalization falls below $300 million. The Fund generally invests in all of the securities comprising the Index in proportion to their weightings in the Index.
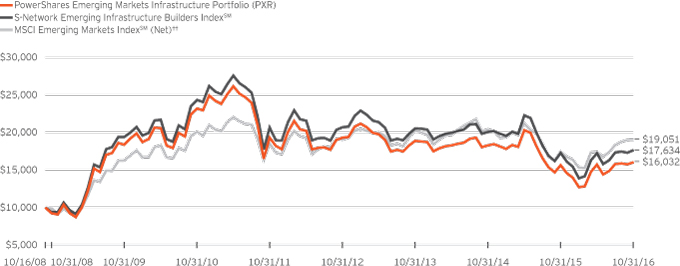
For the fiscal year ended October 31, 2016, on a market price basis, the Fund returned 3.21%. On a net asset value (“NAV”) basis, the Fund returned 2.44%. During the same time period, the Index returned 2.19%. During the fiscal year, the Fund fully replicated the components of the Index; therefore, the Fund’s performance (NAV basis) differed from the return of the Index primarily due to fees and operating expenses that the Fund incurred partially offset by the income received from the security lending program in which the Fund participates.
During this same time period, the MSCI Emerging Markets IndexSM (Net) (the “Benchmark Index”) returned 9.27%. The Benchmark Index is an unmanaged index weighted by market capitalization and based on the average performance of approximately 830 securities. The Benchmark Index was selected for its recognition in the marketplace, and its performance comparison is a useful measure for investors as a broad representation of emerging market equities.
Relative to the Benchmark Index, the Fund was most overweight in the industrials sector and most underweight in the financials
sector during the fiscal year ended October 31, 2016. The majority of the Fund’s underperformance relative to the Benchmark Index during the period can be attributed to stock selection and a significant overweight in the industrials sector and underweight in the information technology sector.
For the fiscal year ended October 31, 2016, the materials sector contributed most significantly to the Fund’s return, followed by the financials and energy sectors, respectively. The industrials sector detracted most significantly from the Fund’s return, followed by the telecommunication services sector.
Positions that contributed most significantly to the Fund’s return included African Rainbow Minerals Ltd., a materials company (portfolio average weight of 1.28%), and Cia Siderurgica Nacional SA ADR, a materials company (portfolio average weight of 1.18%). Positions that detracted most significantly from the Fund’s return included PPC Ltd., a materials company (portfolio average weight of 1.08%), and Xinjiang Goldwind Science & Technology Co. Ltd., H-Shares, an industrials company (portfolio average weight of 1.93%).
| | | | |
Sector Breakdown
(% of the Fund’s Net Assets)
as of October 31, 2016 | |
| Industrials | | | 52.1 | |
| Materials | | | 42.0 | |
| Energy | | | 1.6 | |
| Consumer Discretionary | | | 1.5 | |
| Utilities | | | 1.3 | |
| Financials | | | 1.0 | |
| Telecommunication Services | | | 0.6 | |
| Other Assets Less Liabilities | | | (0.1) | |
|
Top Ten Fund Holdings
(% of the Fund’s Net Assets)
as of October 31, 2016 | |
| Security | | | | |
| China Communications Construction Co. Ltd., H-Shares | | | 3.1 | |
| China National Building Material Co. Ltd., H-Shares | | | 2.8 | |
| Shanghai Electric Group Co. Ltd., H-Shares | | | 2.7 | |
| Alstom SA | | | 2.7 | |
| Taiwan Cement Corp. | | | 2.5 | |
| Anhui Conch Cement Co. Ltd., H-Shares | | | 2.1 | |
| Caterpillar, Inc. | | | 2.1 | |
| Cemex SAB de CV ADR | | | 2.0 | |
| Atlas Copco AB, Class A | | | 2.0 | |
| Metallurgical Corp. of China Ltd., H-Shares | | | 2.0 | |
| Total | | | 24.0 | |
PowerShares Emerging Markets Infrastructure Portfolio (PXR) (continued)
Growth of a $10,000 Investment Since Inception†
Fund Performance History as of October 31, 2016
| | | | | | | | | | | | | | | | | | | | | | | | | | | | | | | | |
| | | 1 Year | | | 3 Years
Average
Annualized | | | 3 Years
Cumulative | | | 5 Years
Average
Annualized | | | 5 Years
Cumulative | | | | | | Fund Inception† | |
| Index | | | | | | | | | | Average
Annualized | | | Cumulative | |
| S-Network Emerging Infrastructure Builders IndexSM | | | 2.19 | % | | | (4.94 | )% | | | (14.10 | )% | | | (3.11 | )% | | | (14.62 | )% | | | | | | | 7.31 | % | | | 76.34 | % |
| MSCI Emerging Markets IndexSM (Net)†† | | | 9.27 | | | | (2.05 | ) | | | (6.01 | ) | | | 0.55 | | | | 2.76 | | | | | | | | 8.35 | | | | 90.51 | |
| Fund | | | | | | | | | | | | | | | | | | | | | | | | | | | | | | | | |
| NAV Return | | | 2.44 | | | | (5.29 | ) | | | (15.04 | ) | | | (3.64 | ) | | | (16.93 | ) | | | | | | | 6.05 | | | | 60.32 | |
| Market Price Return | | | 3.21 | | | | (5.03 | ) | | | (14.34 | ) | | | (3.56 | ) | | | (16.57 | ) | | | | | | | 4.53 | | | | 42.78 | |
Fund Inception: October 16, 2008
Performance quoted above represents past performance. Past performance is not a guarantee of future results and current performance may be higher or lower than performance quoted. Investment returns and principal value will fluctuate, and shares of the Fund (“Fund Shares”), when redeemed or sold, may be worth more or less than their original cost. Fund performance reflects any applicable fee waivers and/or expense reimbursements. Had the adviser not waived fees and/or reimbursed expenses currently or in the past, returns would have been lower. See current prospectus for more information. According to the Fund’s current prospectus, the Fund’s expense ratio of 0.77% includes the unitary management fee of 0.75% and other expenses of 0.02%. NAV and Market Price returns assume that dividends and capital gain distributions have been reinvested in the Fund at NAV and Market Price, respectively. The returns shown in the table above do not reflect the deduction of taxes that a shareholder would pay
on Fund distributions or the redemption or sale of Fund Shares. See invescopowershares.com to find the most recent month-end performance numbers.
Index and Benchmark Index performance results are based upon a hypothetical investment in their respective constituent securities. Index and Benchmark Index returns do not represent Fund returns. An investor cannot invest directly in an index. The Index and Benchmark Index do not charge management fees or brokerage expenses, and no such fees or expenses were deducted from the hypothetical performance shown. In addition, the results actual investors might have achieved would have differed from those shown because of differences in the timing, amounts of their investments, and fees and expenses associated with an investment in the Fund.
| † | Fund, Index and Benchmark Index returns are based on the inception date of the Fund. |
| †† | Reflects reinvested dividends net of withholding taxes. |
| | |
| FXEU | | Manager’s Analysis |
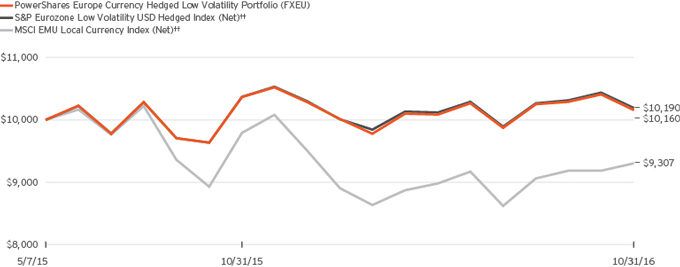
| | PowerShares Europe Currency Hedged Low Volatility Portfolio (FXEU) |
As an index fund, the PowerShares Europe Currency Hedged Low Volatility Portfolio (the “Fund”) is passively managed and attempts to track the returns of an underlying index. The Fund seeks investment results that generally correspond (before fees and expenses) to the price and yield of the S&P Eurozone Low Volatility USD Hedged Index (Net) (the “Index”). The Fund generally will invest at least 90% of its total assets in common stocks that comprise the Index.
S&P Dow Jones Indices LLC (“S&P DJI” or the “Index Provider”) compiles, maintains and calculates the Index strictly in accordance with its guidelines and mandated procedures. The Index measures the performance of the 80 least volatile stocks in the S&P Eurozone BMI Index, while also employing a currency-hedged strategy to mitigate exposure to fluctuations between the value of the U.S. dollar and the currencies of the countries in which the component securities of the Index are domiciled. From the constituents of the S&P Eurozone BMI Index, the Index Provider selects securities with the least volatility over the past 12 months for inclusion in the Index, with the least volatile stocks receiving the greatest weights. To hedge against exchange rate fluctuations, the Fund also will invest in foreign currency forward contracts to “lock in” the contract’s agreed-upon exchange rates. The Fund generally invests in all of the securities comprising the Index in proportion to their weightings in the Index.
For the fiscal year ended October 31, 2016, on a market price basis, the Fund returned (2.02)%. On a net asset value (“NAV”) basis, the Fund returned (2.00)%. During the same time period, the Index returned (1.76)%. During the fiscal year, the Fund fully replicated the components of the Index; therefore, the Fund’s performance (NAV basis) differed from the return of the Index primarily due to fees and operating expenses that the Fund incurred during the period.
During this same time period, the MSCI EMU Local Currency Index (Net) (the “Benchmark Index”) returned (4.99)%. The Benchmark Index is an unmanaged index weighted by market capitalization based on the average performance of approximately 80 securities. The Benchmark Index was selected for its recognition in the marketplace, and its performance comparison is a useful measure for investors as a broad representation of the overall U.S. stock market. The majority of the Fund’s outperformance relative to the Benchmark Index during the period can be attributed to the Fund being overweight the information technology sector relative to the Benchmark Index.
For the fiscal year ended October 31, 2016, the information technology sector contributed most significantly to the Fund’s return, followed by the health care and utilities sectors. The financials sector detracted most significantly from the Fund’s return, followed by the real estate and consumer discretionary sectors.
Positions that contributed most significantly to the Fund’s return included Sodexo SA, a consumer discretionary company (portfolio average weight of 1.26%), and DiaSorin SpA, a health care company (no longer held at fiscal year-end). Positions that detracted most significantly from the Fund’s return included Eutelsat Communications SA, a consumer discretionary company (no longer held at fiscal year-end), and Vienna Insurance Group AG Wiener Versicherung Gruppe, a financials company (no longer held at fiscal year-end).
| | | | |
Sector Breakdown
(% of the Fund’s Net Assets)
as of October 31, 2016 | |
| Industrials | | | 24.3 | |
| Real Estate | | | 16.8 | |
| Consumer Staples | | | 15.6 | |
| Consumer Discretionary | | | 10.7 | |
| Utilities | | | 10.7 | |
| Financials | | | 8.7 | |
| Health Care | | | 5.0 | |
| Information Technology | | | 3.6 | |
| Materials | | | 2.3 | |
| Telecommunication Services | | | 2.3 | |
| Other Assets Less Liabilities | | | (0.0) | |
|
Top Ten Fund Holdings
(% of the Fund’s Net Assets)
as of October 31, 2016 | |
| Security | | | | |
| MAN SE | | | 3.4 | |
| DMG Mori AG | | | 1.7 | |
| Cofinimmo SA REIT | | | 1.6 | |
| RHOEN KLINIKUM AG | | | 1.6 | |
| Red Electrica Corp. SA | | | 1.6 | |
| Ebro Foods SA | | | 1.5 | |
| Enagas SA | | | 1.5 | |
| Groupe Bruxelles Lambert SA | | | 1.4 | |
| Telenet Group Holding NV | | | 1.4 | |
| Aeroports de Paris | | | 1.4 | |
| Total | | | 17.1 | |
PowerShares Europe Currency Hedged Low Volatility Portfolio (FXEU) (continued)
Growth of a $10,000 Investment Since Inception†
Fund Performance History as of October 31, 2016
| | | | | | | | | | | | | | | | |
| | | 1 Year | | | | | | Fund Inception† | |
| Index | | | | | | Average
Annualized | | | Cumulative | |
| S&P Eurozone Low Volatility USD Hedged Index (Net)†† | | | (1.76 | )% | | | | | | | 1.28 | % | | | 1.90 | % |
| MSCI EMU Local Currency Index (Net)†† | | | (4.99 | ) | | | | | | | (4.74 | ) | | | (6.93 | ) |
| Fund | | | | | | | | | | | | | | | | |
| NAV Return | | | (2.00 | ) | | | | | | | 1.07 | | | | 1.60 | |
| Market Price Return | | | (2.02 | ) | | | | | | | 0.79 | | | | 1.17 | |
Fund Inception: May 7, 2015
Performance quoted above represents past performance. Past performance is not a guarantee of future results and current performance may be higher or lower than performance quoted. Investment returns and principal value will fluctuate, and shares of the Fund (“Fund Shares”), when redeemed or sold, may be worth more or less than their original cost. Fund performance reflects any applicable fee waivers and/or expense reimbursements. Had the adviser not waived fees and/or reimbursed expenses currently or in the past, returns would have been lower. See current prospectus for more information. According to the Fund’s current prospectus, the Fund’s expense ratio of 0.25% is expressed as a unitary management fee to cover operating expenses and expenses incurred in connection with managing the portfolio. NAV and Market Price returns assume that dividends and capital gain distributions have been reinvested in the Fund at NAV and Market Price, respectively. The returns shown in the table above do not reflect the deduction of taxes that a shareholder would pay on Fund
distributions or the redemption or sale of Fund Shares. See invescopowershares.com to find the most recent month-end performance numbers.
Index and Benchmark Index performance results are based upon a hypothetical investment in their respective constituent securities. Index and Benchmark Index returns do not represent Fund returns. An investor cannot invest directly in an index. The Index and Benchmark Index do not charge management fees or brokerage expenses, and no such fees or expenses were deducted from the hypothetical performance shown. In addition, the results actual investors might have achieved would have differed from those shown because of differences in the timing, amounts of their investments, and fees and expenses associated with an investment in the Fund.
| † | Fund, Index and Benchmark Index returns are based on the inception date of the Fund. |
| †† | Reflects reinvested dividends net of withholding taxes. |
| | |
| PAF | | Manager’s Analysis |
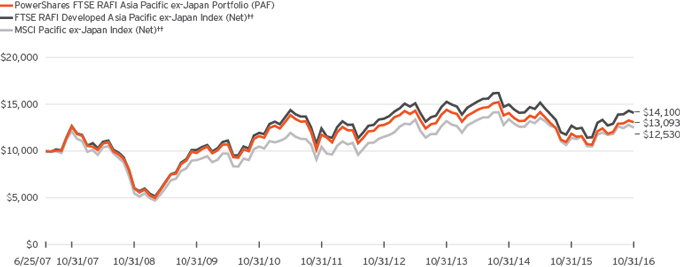
| | PowerShares FTSE RAFI Asia Pacific ex-Japan Portfolio (PAF) |
As an index fund, the PowerShares FTSE RAFI Asia Pacific ex-Japan Portfolio (the “Fund”) is passively managed and attempts to track the returns of an underlying index. The Fund seeks investment results that generally correspond (before fees and expenses) to the price and yield of the FTSE RAFI Developed Asia Pacific ex-Japan Index (Net) (the “Index”). The Fund will invest at least 90% of its total assets in equity securities that are classified as “Asia Pacific” within the country classification definition of FTSE International Limited (“FTSE” or the “Index Provider”), excluding Japanese companies, and that comprise the Index, and American depositary receipts and global depositary receipts that are based on the securities in the Index. The Index is designed to track the performance of the Asia Pacific companies with the largest cumulative scores (“Fundamental Value”), selected from the constituents of the FTSE All Cap Developed Index, as determined by FTSE. The Index Provider selects and weights the companies based on their Fundamental Values, which are derived from the following four fundamental measures of firm size: book value, cash flow, sales and dividends.
Historically, the Index has consisted of securities of companies that were domiciled in Australia, Hong Kong, New Zealand, Singapore and South Korea or primarily listed on an exchange in such countries. The Fund generally invests in all of the securities comprising its Index in proportion to their weightings in the Index.
For the fiscal year ended October 31, 2016, on a market price basis, the Fund returned 10.21%. On a net asset value (“NAV”) basis, the Fund returned 10.52%. During the same time period, the Index returned 10.78%. During the fiscal year, the Fund fully replicated the components of the Index; therefore, the Fund’s performance, on a NAV basis, differed from the return of the Index primarily due to fees and operating expenses the Fund incurred during the period.
During this same time period, the MSCI Pacific ex-Japan Index (Net) (the “Benchmark Index”) returned 9.70%. The Benchmark Index is an unmanaged index weighted by market capitalization and based on the average performance of approximately 150 securities. The adviser provided this additional comparative benchmark to help investors better understand how the investment results of the Fund compare to the performance of a broad Asia Pacific equities benchmark.
The Benchmark Index was selected for its recognition in the marketplace, and its performance comparison is a useful measure for investors as a broad representation of the Asia Pacific equity markets (excluding Japan). The Fund outperformed the Benchmark Index in part because the Fund employs a fundamental weighting and selection methodology, whereas the Benchmark Index selects and weights stocks based on market capitalization.
Relative to the Benchmark Index, the Fund was most overweight in the information technology sector and most underweight in the
financials sector during the fiscal year ended October 31, 2016. The majority of the Fund’s outperformance relative to the Benchmark Index during the period can be attributed to its allocation to the materials sector.
For the fiscal year ended October 31, 2016, the materials sector contributed most significantly to the Fund’s return, followed by the information technology and financials sectors, respectively. The consumer discretionary sector was the only detracting sector.
Positions that contributed most significantly to the Fund’s return included Samsung Electronics Co. Ltd., an information technology company (portfolio average weight of 7.02%), and BHP Billiton Ltd., a materials company (portfolio average weight of 4.70%). Positions that detracted most significantly from the Fund’s return included Kia Motors Corp., a consumer discretionary company (portfolio average weight of 0.96%), and QBE Insurance Group Ltd., a financials company (portfolio average weight of 0.99%).
| | | | |
Sector Breakdown
(% of the Fund’s Net Assets)
as of October 31, 2016 | |
| Financials | | | 31.7 | |
| Materials | | | 15.4 | |
| Information Technology | | | 11.1 | |
| Real Estate | | | 9.6 | |
| Industrials | | | 7.9 | |
| Consumer Discretionary | | | 6.5 | |
| Consumer Staples | | | 5.8 | |
| Energy | | | 4.8 | |
| Utilities | | | 3.2 | |
| Telecommunication Services | | | 3.2 | |
| Health Care | | | 0.8 | |
| Other Assets Less Liabilities | | | (0.0) | |
|
Top Ten Fund Holdings
(% of the Fund’s Net Assets)
as of October 31, 2016 | |
| Security | | | | |
| Samsung Electronics Co. Ltd. | | | 7.6 | |
| BHP Billiton Ltd. | | | 6.3 | |
| Australia & New Zealand Banking Group Ltd. | | | 4.3 | |
| Commonwealth Bank of Australia | | | 4.1 | |
| Westpac Banking Corp. | | | 4.0 | |
| National Australia Bank Ltd. | | | 3.1 | |
| POSCO | | | 2.0 | |
| AIA Group Ltd. | | | 1.7 | |
| Woolworths Ltd. | | | 1.7 | |
| Wesfarmers Ltd. | | | 1.7 | |
| Total | | | 36.5 | |
PowerShares FTSE RAFI Asia Pacific ex-Japan Portfolio (PAF) (continued)
Growth of a $10,000 Investment Since Inception†
Fund Performance History as of October 31, 2016
| | | | | | | | | | | | | | | | | | | | | | | | | | | | | | | | |
| | | 1 Year | | | 3 Years
Average
Annualized | | | 3 Years
Cumulative | | | 5 Years
Average
Annualized | | | 5 Years
Cumulative | | | | | | Fund Inception† | |
| Index | | | | | | | | | | Average
Annualized | | | Cumulative | |
| FTSE RAFI Developed Asia Pacific ex-Japan Index (Net)†† | | | 10.78 | % | | | (2.62 | )% | | | (7.64 | )% | | | 2.58 | % | | | 13.61 | % | | | | | | | 3.74 | % | | | 41.00 | % |
| MSCI Pacific ex-Japan Index (Net)†† | | | 9.70 | | | | (1.73 | ) | | | (5.09 | ) | | | 3.66 | | | | 19.69 | | | | | | | | 2.44 | | | | 25.30 | |
| Fund | | | | | | | | | | | | | | | | | | | | | | | | | | | | | | | | |
| NAV Return | | | 10.52 | | | | (3.14 | ) | | | (9.13 | ) | | | 2.18 | | | | 11.36 | | | | | | | | 2.92 | | | | 30.93 | |
| Market Price Return | | | 10.21 | | | | (3.14 | ) | | | (9.12 | ) | | | 2.23 | | | | 11.67 | | | | | | | | 2.91 | | | | 30.79 | |
Fund Inception: June 25, 2007
Performance quoted above represents past performance. Past performance is not a guarantee of future results and current performance may be higher or lower than performance quoted. Investment returns and principal value will fluctuate, and shares of the Fund (“Fund Shares”), when redeemed or sold, may be worth more or less than their original cost. Fund performance reflects any applicable fee waivers and/or expense reimbursements. Had the adviser not waived fees and/or reimbursed expenses currently or in the past, returns would have been lower. See current prospectus for more information. According to the Fund’s current prospectus, the Fund’s expense ratio of 0.49% is expressed as a unitary management fee to cover operating expenses and expenses incurred in connection with managing the portfolio. NAV and Market Price returns assume that dividends and capital gain distributions have been reinvested in the Fund at NAV and Market Price, respectively. The returns shown in the table above do not reflect the deduction of taxes that a shareholder would pay on Fund
distributions or the redemption or sale of Fund Shares. See invescopowershares.com to find the most recent month-end performance numbers.
Index and Benchmark Index performance results are based upon a hypothetical investment in their respective constituent securities. Index and Benchmark Index returns do not represent Fund returns. An investor cannot invest directly in an index. The Index and Benchmark Index do not charge management fees or brokerage expenses, and no such fees or expenses were deducted from the hypothetical performance shown. In addition, the results actual investors might have achieved would have differed from those shown because of differences in the timing, amounts of their investments, and fees and expenses associated with an investment in the Fund.
| † | Fund, Index and Benchmark Index returns are based on the inception date of the Fund. |
| †† | Reflects reinvested dividends net of withholding taxes. |
| | |
| PXF | | Manager’s Analysis |
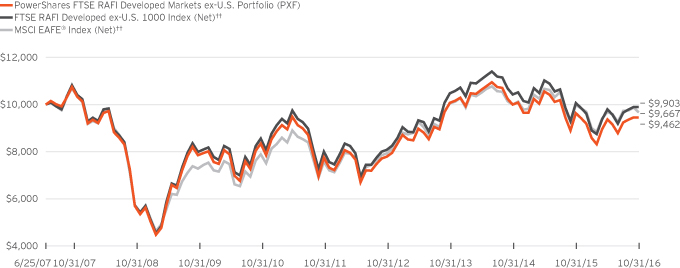
| | PowerShares FTSE RAFI Developed Markets ex-U.S. Portfolio (PXF) |
As an index fund, the PowerShares FTSE RAFI Developed Markets ex-U.S. Portfolio (the “Fund”) is passively managed and attempts to track the returns of an underlying index. The Fund seeks investment results that generally correspond (before fees and expenses) to the price and yield of the FTSE RAFI Developed ex-U.S. 1000 Index (Net) (the “Index”). The Fund will invest at least 90% of its total assets in the securities of companies originating in countries that are classified as “developed” within the country classification definition of FTSE International Limited (“FTSE” or the “Index Provider”), excluding the United States, and that comprise the Index, and American depositary receipts and global depositary receipts that are based on the securities in the Index. The Index is designed to track the performance of the companies domiciled in developed markets with the largest cumulative scores (“Fundamental Value”), selected from the constituents of the FTSE RAFI Developed ex U.S. Large/Mid-Cap Index as determined by FTSE. The Index Provider selects and weights companies based on their Fundamental Values, which are derived from the following four fundamental measures of firm size: book value, cash flow, sales and dividends.
Historically, the Index has consisted of securities of companies that were domiciled in Australia, Austria, Belgium, Canada, Denmark, Finland, France, Germany, Greece, Hong Kong, Ireland, Israel, Italy, Japan, Luxembourg, the Netherlands, New Zealand, Norway, Portugal, Singapore, South Korea, Spain, Sweden, Switzerland and the United Kingdom or primarily listed on an exchange in such countries. The Fund generally invests in all of the securities comprising its Index in proportion to their weightings in the Index.
For the fiscal year ended October 31, 2016, on a market price basis, the Fund returned (1.24)%. On a net asset value (“NAV”) basis, the Fund returned (1.73)%. During the same time period, the Index returned (1.65)%. During the fiscal year, the Fund fully replicated the components of the Index; therefore, the Fund’s performance (NAV basis) differed from the return of the Index primarily due to fees and operating expenses the Fund incurred during the period partially offset by revenue generated from lending portfolio securities.
During this same time period, the MSCI EAFE® Index (Net) (the “Benchmark Index”) returned (3.23)%. The Benchmark Index is an unmanaged index weighted by market capitalization and based on the average performance of approximately 930 securities.
The Benchmark Index was selected for its recognition in the marketplace, and its performance comparison is a useful measure for investors as a broad representation of the markets of economically developed countries outside the U.S. The performance of the Fund differed from the Benchmark Index in part because the Fund employs a fundamental weighting and selection methodology, whereas the Benchmark Index selects and weights stocks based on market capitalization.
Relative to the Benchmark Index, the Fund was most overweight in the financials sector and most underweight in the health care sector during the fiscal year ended October 31, 2016. The
majority of the Fund’s outperformance relative to the Benchmark Index (on NAV basis) during that period can be attributed to security selection within the materials sector.
For the fiscal year ended October 31, 2016, the materials sector contributed most significantly to the Fund’s return, followed by the industrials and energy sectors, respectively. The financials sector detracted most significantly from the Fund’s return, followed by the consumer discretionary and health care sectors, respectively.
Positions that contributed most significantly to the Fund’s return included Glencore PLC, a materials company (portfolio average weight of 0.45%), and Teck Resources Ltd., Class B, a materials company (portfolio average weight of 0.14%). Positions that detracted most significantly from the Fund’s return included UniCredit SpA, a financials company (portfolio average weight of 0.33%), and Deutsche Bank AG, a financials company (portfolio average weight of 0.42%).
| | | | |
Sector Breakdown
(% of the Fund’s Net Assets)
as of October 31, 2016 | |
| Financials | | | 26.7 | |
| Industrials | | | 12.5 | |
| Energy | | | 11.0 | |
| Consumer Discretionary | | | 10.8 | |
| Materials | | | 10.7 | |
| Consumer Staples | | | 6.9 | |
| Utilities | | | 5.0 | |
| Health Care | | | 4.8 | |
| Telecommunication Services | | | 4.7 | |
| Information Technology | | | 4.3 | |
| Real Estate | | | 2.3 | |
| Money Market Fund Plus Other Assets Less Liabilities | | | 0.3 | |
|
Top Ten Fund Holdings*
(% of the Fund’s Net Assets)
as of October 31, 2016 | |
| Security | | | | |
| BP PLC | | | 1.8 | |
| HSBC Holdings PLC | | | 1.7 | |
| Royal Dutch Shell PLC, Class A | | | 1.5 | |
| Banco Santander SA | | | 1.5 | |
| Total SA | | | 1.3 | |
| Toyota Motor Corp. | | | 1.1 | |
| Royal Dutch Shell PLC, Class B | | | 1.0 | |
| Samsung Electronics Co. Ltd. | | | 1.0 | |
| Nestle SA | | | 0.9 | |
| Mitsubishi UFJ Financial Group, Inc. | | | 0.9 | |
| Total | | | 12.7 | |
| * | Excluding money market fund holdings. |
PowerShares FTSE RAFI Developed Markets ex-U.S. Portfolio (PXF) (continued)
Growth of a $10,000 Investment Since Inception†
Fund Performance History as of October 31, 2016
| | | | | | | | | | | | | | | | | | | | | | | | | | | | | | | | |
| | | 1 Year | | | 3 Years
Average
Annualized | | | 3 Years
Cumulative | | | 5 Years
Average
Annualized | | | 5 Years
Cumulative | | | | | | Fund Inception† | |
| Index | | | | | | | | | | Average
Annualized | | | Cumulative | |
| FTSE RAFI Developed ex-U.S. 1000 Index (Net)†† | | | (1.65 | )% | | | (1.88 | )% | | | (5.54 | )% | | | 4.35 | % | | | 23.70 | % | | | | | | | (0.10 | )% | | | (0.97 | )% |
| MSCI EAFE® Index (Net)†† | | | (3.23 | ) | | | (1.31 | ) | | | (3.87 | ) | | | 4.99 | | | | 27.59 | | | | | | | | (0.36 | ) | | | (3.33 | ) |
| Fund | | | | | | | | | | | | | | | | | | | | | | | | | | | | | | | | |
| NAV Return | | | (1.73 | ) | | | (2.07 | ) | | | (6.07 | ) | | | 4.06 | | | | 22.00 | | | | | | | | (0.59 | ) | | | (5.38 | ) |
| Market Price Return | | | (1.24 | ) | | | (2.31 | ) | | | (6.77 | ) | | | 4.32 | | | | 23.55 | | | | | | | | (0.62 | ) | | | (5.65 | ) |
Fund Inception: June 25, 2007
Performance quoted above represents past performance. Past performance is not a guarantee of future results and current performance may be higher or lower than performance quoted. Investment returns and principal value will fluctuate, and shares of the Fund (“Fund Shares”), when redeemed or sold, may be worth more or less than their original cost. Fund performance reflects any applicable fee waivers and/or expense reimbursements. Had the adviser not waived fees and/or reimbursed expenses currently or in the past, returns would have been lower. See current prospectus for more information. According to the Fund’s current prospectus, the Fund’s expense ratio of 0.46% includes the unitary management fee of 0.45% and other expenses of 0.01%. NAV and Market Price returns assume that dividends and capital gain distributions have been reinvested in the Fund at NAV and Market Price, respectively. The returns shown in the table above do not reflect the deduction of taxes that a shareholder would pay
on Fund distributions or the redemption or sale of Fund Shares. See invescopowershares.com to find the most recent month-end performance numbers.
Index and Benchmark Index performance results are based upon a hypothetical investment in their respective constituent securities. Index and Benchmark Index returns do not represent Fund returns. An investor cannot invest directly in an index. The Index and Benchmark Index do not charge management fees or brokerage expenses, and no such fees or expenses were deducted from the hypothetical performance shown. In addition, the results actual investors might have achieved would have differed from those shown because of differences in the timing, amounts of their investments, and fees and expenses associated with an investment in the Fund.
| † | Fund, Index and Benchmark Index returns are based on the inception date of the Fund. |
| †† | Reflects reinvested dividends net of withholding taxes. |
| | |
| PDN | | Manager’s Analysis |
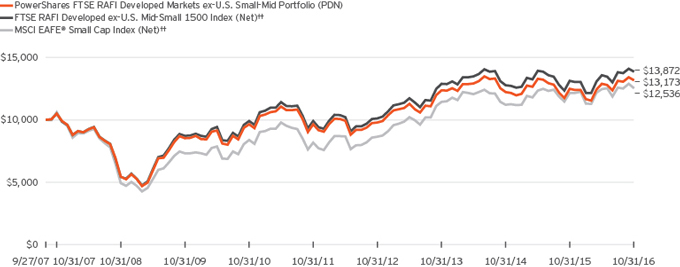
| | PowerShares FTSE RAFI Developed Markets ex-U.S. Small-Mid Portfolio (PDN) |
As an index fund, the PowerShares FTSE RAFI Developed Markets ex-U.S. Small-Mid Portfolio (the “Fund”) is passively managed and attempts to track the returns of an underlying index. The Fund seeks investment results that generally correspond (before fees and expenses) to the price and yield of the FTSE RAFI Developed ex-U.S. Mid-Small 1500 Index (Net) (the “Index”). The Fund will invest at least 90% of its total assets in securities of small- and mid-capitalization companies that are classified as “developed” within the country classification definition of FTSE International Limited (“FTSE” or the “Index Provider”), excluding the United States, and that comprise the Index, as well as American depositary receipts (“ADRs”) and global depositary receipts (“GDRs”) that are based on the securities in the Index. The Fund anticipates that the majority of its investments will be in the securities that comprise the Index rather than ADRs or GDRs. The Index is designed to track the performance of the small- and mid-capitalization companies domiciled in developed markets with the highest ranking cumulative score (“Fundamental Value”), selected from the constituents of the FTSE Developed All Cap ex U.S. Index, as determined by FTSE. The Index Provider selects and weights companies based on their Fundamental Values, which are derived from the following four fundamental measures of firm size: book value, cash flow, sales and dividends. The Fund generally invests in all of the securities comprising its Index in proportion to their weightings in the Index.
For the fiscal year ended October 31, 2016, on a market price basis, the Fund returned 4.87%. On a net asset value (“NAV”) basis, the Fund returned 5.37%. During the same time period, the Index returned 5.66%. During the fiscal year, the Fund fully replicated the components of the Index; therefore, the Fund’s performance, on a NAV basis, differed from the return of the Index primarily due to the fees and operating expenses that the Fund incurred during the period.
During this same time period, the MSCI EAFE® Small Cap Index (the “Benchmark Index”) returned 2.98%. The Benchmark Index is an unmanaged index weighted by market capitalization and based on the average performance of approximately 2,220 securities. The Benchmark Index was selected for its recognition in the marketplace, and its performance comparison is a useful measure for investors as a broad representation of small capitalization equities markets in developed countries around the world, excluding the U.S.
Relative to the Benchmark Index, the Fund was most overweight in the materials sector and most underweight in the real estate sector during the fiscal year ended October 31, 2016. The majority of the Fund’s outperformance relative to the Benchmark Index during the period can be attributed to sector allocation differences and stock selection within the materials and consumer discretionary sectors.
For the fiscal year ended October 31, 2016, the materials sector contributed most significantly to the Fund’s return, followed by the consumer staples and industrials sectors. The financials sector detracted most significantly from the Fund’s return, followed by the telecommunication services sector.
Positions that contributed most significantly to the Fund’s return included Tokuyama Corp., a materials company (portfolio average weight of 0.18%), and Whitehaven Coal Ltd., an energy company (portfolio average weight of 0.08%). Positions that detracted most significantly from the Fund’s return included Banca Carige SpA, a financials company (portfolio average weight of 0.09%), and Credito Valtellinese SC, a financials company (portfolio average weight of 0.09%).
| | | | |
Sector Breakdown
(% of the Fund’s Net Assets)
as of October 31, 2016 | |
| Industrials | | | 23.6 | |
| Consumer Discretionary | | | 17.9 | |
| Materials | | | 12.5 | |
| Financials | | | 10.0 | |
| Information Technology | | | 9.5 | |
| Consumer Staples | | | 7.5 | |
| Real Estate | | | 6.3 | |
| Health Care | | | 5.0 | |
| Energy | | | 4.7 | |
| Utilities | | | 1.6 | |
| Telecommunication Services | | | 1.2 | |
| Money Market Fund Plus Other Assets Less Liabilities | | | 0.2 | |
|
Top Ten Fund Holdings*
(% of the Fund’s Net Assets)
as of October 31, 2016 | |
| Security | | | | |
| Tokuyama Corp. | | | 0.4 | |
| Vedanta Resources PLC | | | 0.3 | |
| ALS Ltd. | | | 0.3 | |
| Downer EDI Ltd. | | | 0.2 | |
| Whitehaven Coal Ltd. | | | 0.2 | |
| DeNA Co. Ltd. | | | 0.2 | |
| Calsonic Kansei Corp. | | | 0.2 | |
| Pengrowth Energy Corp. | | | 0.2 | |
| Sims Metal Management Ltd. | | | 0.2 | |
| Serco Group PLC | | | 0.2 | |
| Total | | | 2.4 | |
| * | Excluding money market fund holdings. |
PowerShares FTSE RAFI Developed Markets ex-U.S. Small-Mid Portfolio (PDN) (continued)
Growth of a $10,000 Investment Since Inception†
Fund Performance History as of October 31, 2016
| | | | | | | | | | | | | | | | | | | | | | | | | | | | | | | | |
| | | 1 Year | | | 3 Years
Average
Annualized | | | 3 Years
Cumulative | | | 5 Years
Average
Annualized | | | 5 Years
Cumulative | | | | | | Fund Inception† | |
| Index | | | | | | | | | | Average
Annualized | | | Cumulative | |
| FTSE RAFI Developed ex-U.S. Mid-Small 1500 Index (Net)†† | | | 5.66 | % | | | 2.45 | % | | | 7.52 | % | | | 6.95 | % | | | 39.90 | % | | | | | | | 3.67 | % | | | 38.72 | % |
| MSCI EAFE® Small Cap Index (Net)†† | | | 2.98 | | | | 3.05 | | | | 9.43 | | | | 8.91 | | | | 53.24 | | | | | | | | 2.52 | | | | 25.36 | |
| Fund | | | | | | | | | | | | | | | | | | | | | | | | | | | | | | | | |
| NAV Return | | | 5.37 | | | | 2.08 | | | | 6.36 | | | | 6.40 | | | | 36.38 | | | | | | | | 3.08 | | | | 31.73 | |
| Market Price Return | | | 4.87 | | | | 1.41 | | | | 4.28 | | | | 6.86 | | | | 39.36 | | | | | | | | 2.90 | | | | 29.70 | |
Fund Inception: September 27, 2007
Performance quoted above represents past performance. Past performance is not a guarantee of future results and current performance may be higher or lower than performance quoted. Investment returns and principal value will fluctuate, and shares of the Fund (“Fund Shares”), when redeemed or sold, may be worth more or less than their original cost. Fund performance reflects any applicable fee waivers and/or expense reimbursements. Had the adviser not waived fees and/or reimbursed expenses currently or in the past, returns would have been lower. See current prospectus for more information. According to the Fund’s current prospectus, the Fund’s expense ratio of 0.50% includes the unitary management fee of 0.49% and other expenses of 0.01%. NAV and Market Price returns assume that dividends and capital gain distributions have been reinvested in the Fund at NAV and Market Price, respectively. The returns shown in the table above do not reflect the deduction of taxes that a shareholder would pay
on Fund distributions or the redemption or sale of Fund Shares. See invescopowershares.com to find the most recent month-end performance numbers.
Index and Benchmark Index performance results are based upon a hypothetical investment in their respective constituent securities. Index and Benchmark Index returns do not represent Fund returns. An investor cannot invest directly in an index. The Index and Benchmark Index do not charge management fees or brokerage expenses, and no such fees or expenses were deducted from the hypothetical performance shown. In addition, the results actual investors might have achieved would have differed from those shown because of differences in the timing, amounts of their investments, and fees and expenses associated with an investment in the Fund.
| † | Fund, Index and Benchmark Index returns are based on the inception date of the Fund. |
| †† | Reflects reinvested dividends net of withholding taxes. |
| | |
| PXH | | Manager’s Analysis |
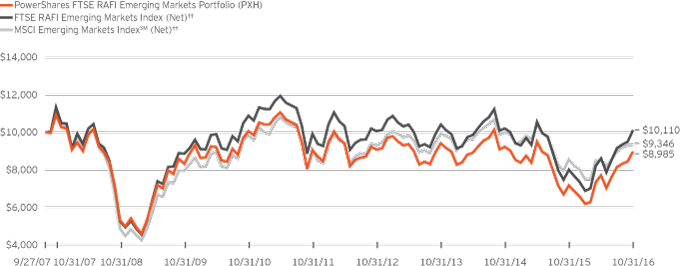
| | PowerShares FTSE RAFI Emerging Markets Portfolio (PXH) |
As an index fund, the PowerShares FTSE RAFI Emerging Markets Portfolio (the “Fund”) is passively managed and attempts to track the returns of an underlying index. The Fund seeks investment results that generally correspond (before fees and expenses) to the price and yield of the FTSE RAFI Emerging Markets Index (Net) (the “Index”). The Fund will invest at least 90% of its total assets in securities of companies domiciled in countries that are classified as emerging markets within the country classification definition of FTSE International Limited (“FTSE” or the “Index Provider”) and that comprise the Index, as well as American depositary receipts (“ADRs”) and global depositary receipts (“GDRs”) that are based on the securities in the Index. The Fund anticipates that a significant portion of its investments will be in ADRs and GDRs that are based on the securities included in the Index.
The Index is designed to track the performance of securities of companies domiciled in emerging market countries with the highest ranking cumulative score (“Fundamental Value”), selected from the constituents of the FTSE Emerging All Cap Index, as determined by FTSE. The Index Provider selects and weights the securities based on their Fundamental Values, which are derived from the following four fundamental measures of firm size: book value, cash flow, sales and dividends. Historically, the Index has consisted of securities of companies that were domiciled in Brazil, Chile, China, Colombia, the Czech Republic, Egypt, Hungary, India, Indonesia, Malaysia, Mexico, Morocco, Pakistan, Peru, the Philippines, Poland, Russia, South Africa, Taiwan, Thailand, Turkey and the United Arab Emirates. The Fund does not purchase all of the securities in the Index; instead, the Fund utilizes a “sampling” methodology to seek to achieve its investment objective.
For the fiscal year ended October 31, 2016, on a market price basis, the Fund returned 25.57%. On a net asset value (“NAV”) basis, the Fund returned 25.08%. During the same time period, the Index returned 26.12%. During the fiscal year, the Fund replicated the majority of the components of the Index and sampled a minority of the Index primarily for exposure to Indian and Russian securities; therefore, the Fund’s performance, on a NAV basis, trailed the return of the Index primarily due to sampling of these Indian and Russian securities, the Fund’s use of GDRs and ADRs, and the fees and expenses that the Fund incurred.
During this same time period, the MSCI Emerging Markets IndexSM (Net) (the “Benchmark Index”) returned 9.27%. The Benchmark Index is an unmanaged index weighted by market capitalization and based on the average performance of approximately 830 securities. The Benchmark Index was selected for its recognition in the marketplace, and its performance comparison is a useful measure for investors as a broad representation of the equities markets in emerging market countries.
Relative to the Benchmark Index, the Fund was most overweight in the energy sector and most underweight in the information technology sector during the fiscal year ended October 31, 2016. The majority of the Fund’s outperformance relative to the Benchmark Index during the period can be attributed to stock selection and a larger allocation to the energy, financials and materials sectors.
For the fiscal year ended October 31, 2016, the energy sector contributed most significantly to the Fund’s return, followed by the financials and materials sectors, respectively. The industrials sector detracted most significantly from the Fund’s return, followed by the telecommunication services sector.
Positions that contributed most significantly to the Fund’s return included Petroleo Brasileiro SA (Preference Shares), an energy company (portfolio average weight of 3.14%), and Petroleo Brasileiro SA, an energy company (portfolio average weight of 3.21%). Positions that detracted most significantly from the Fund’s return included America Movil SAB de CV, Series L, , a telecommunication services company (portfolio average weight of 0.93%), and China Life Insurance Co. Ltd.,
H-Shares, a financials company (portfolio average weight of 0.40%).
| | | | |
Sector Breakdown
(% of the Fund’s Net Assets)
as of October 31, 2016 | |
| Financials | | | 30.4 | |
| Energy | | | 25.6 | |
| Materials | | | 11.3 | |
| Information Technology | | | 8.4 | |
| Telecommunication Services | | | 7.3 | |
| Consumer Staples | | | 4.3 | |
| Consumer Discretionary | | | 3.6 | |
| Utilities | | | 3.4 | |
| Industrials | | | 2.5 | |
| Real Estate | | | 1.7 | |
| Investment Companies | | | 1.1 | |
| Health Care | | | 0.4 | |
| Other Assets Less Liabilities | | | 0.0 | |
|
Top Ten Fund Holdings
(% of the Fund’s Net Assets)
as of October 31, 2016 | |
| Security | | | | |
| Petroleo Brasileiro SA (Preference Shares) | | | 5.9 | |
| Petroleo Brasileiro SA | | | 5.2 | |
| Itau Unibanco Holding SA (Preference Shares) | | | 3.0 | |
| Vale SA (Preference Shares) | | | 2.8 | |
| China Construction Bank Corp., H-Shares | | | 2.8 | |
| LUKOIL PJSC ADR | | | 2.4 | |
| Taiwan Semiconductor Manufacturing Co. Ltd. | | | 2.2 | |
| Industrial & Commercial Bank of China Ltd., H-Shares | | | 2.1 | |
| Banco Bradesco SA (Preference Shares) | | | 2.1 | |
| Gazprom PJSC ADR | | | 2.1 | |
| Total | | | 30.6 | |
PowerShares FTSE RAFI Emerging Markets Portfolio (PXH) (continued)
Growth of a $10,000 Investment Since Inception†
Fund Performance History as of October 31, 2016
| | | | | | | | | | | | | | | | | | | | | | | | | | | | | | | | |
| | | 1 Year | | | 3 Years
Average
Annualized | | | 3 Years
Cumulative | | | 5 Years
Average
Annualized | | | 5 Years
Cumulative | | | | | | Fund Inception† | |
| Index | | | | | | | | | | Average
Annualized | | | Cumulative | |
| FTSE RAFI Emerging Markets Index (Net)†† | | | 26.12 | % | | | (1.00 | )% | | | (2.98 | )% | | | 0.36 | % | | | 1.83 | % | | | | | | | 0.12 | % | | | 1.10 | % |
MSCI Emerging Markets IndexSM
(Net)†† | | | 9.27 | | | | (2.05 | ) | | | (6.01 | ) | | | 0.55 | | | | 2.76 | | | | | | | | (0.74 | ) | | | (6.54 | ) |
| Fund | | | | | | | | | | | | | | | | | | | | | | | | | | | | | | | | |
| NAV Return | | | 25.08 | | | | (1.56 | ) | | | (4.61 | ) | | | (0.15 | ) | | | (0.74 | ) | | | | | | | (1.17 | ) | | | (10.15 | ) |
| Market Price Return | | | 25.57 | | | | (1.27 | ) | | | (3.75 | ) | | | (0.20 | ) | | | (1.02 | ) | | | | | | | (1.41 | ) | | | (12.15 | ) |
Fund Inception: September 27, 2007
Performance quoted above represents past performance. Past performance is not a guarantee of future results and current performance may be higher or lower than performance quoted. Investment returns and principal value will fluctuate, and shares of the Fund (“Fund Shares”), when redeemed or sold, may be worth more or less than their original cost. Fund performance reflects any applicable fee waivers and/or expense reimbursements. Had the adviser not waived fees and/or reimbursed expenses currently or in the past, returns would have been lower. See current prospectus for more information. According to the Fund’s current prospectus, the Fund’s expense ratio of 0.49% is expressed as a unitary management fee to cover operating expenses and expenses incurred in connection with managing the portfolio. NAV and Market Price returns assume that dividends and capital gain distributions have been reinvested in the Fund at NAV and Market Price, respectively. The returns shown in the table above do not reflect the deduction of taxes that a shareholder would pay on Fund
distributions or the redemption or sale of Fund Shares. See invescopowershares.com to find the most recent month-end performance numbers.
Index and Benchmark Index performance results are based upon a hypothetical investment in their respective constituent securities. Index and Benchmark Index returns do not represent Fund returns. An investor cannot invest directly in an index. The Index and Benchmark Index do not charge management fees or brokerage expenses, and no such fees or expenses were deducted from the hypothetical performance shown. In addition, the results actual investors might have achieved would have differed from those shown because of differences in the timing, amounts of their investments, and fees and expenses associated with an investment in the Fund.
| † | Fund, Index and Benchmark Index returns are based on the inception date of the Fund. |
| †† | Reflects reinvested dividends net of withholding taxes. |
| | |
| PAGG | | Manager’s Analysis |
| | PowerShares Global Agriculture Portfolio (PAGG) |
As an index fund, the PowerShares Global Agriculture Portfolio (the “Fund”) is passively managed and attempts to track the returns of an underlying index. The Fund seeks investment results that generally correspond (before fees and expenses) to the price and yield of the NASDAQ OMX Global Agriculture IndexSM (Net) (the “Index”). The Fund generally will invest at least 90% of its total assets in securities of companies engaged in agriculture and farming-related activities that comprise the Index, as well as American depositary receipts and global depositary receipts that are based on the securities in the Index.
Nasdaq, Inc., the Index provider, maintains and calculates the Index, which is designed to measure the overall performance of the most liquid, globally traded securities of companies engaged in agriculture and farming-related activities. The Index may include securities in emerging market countries. In addition, each security, according to a recognized market data vendor, must have a minimum worldwide market capitalization of $500 million, a minimum three-month average daily dollar trading volume of $1 million and a minimum free float of 20% prior to inclusion in the Index. The Fund generally invests in all of the securities comprising the Index in proportion to their weightings in the Index.
For the fiscal year ended October 31, 2016, on a market price basis, the Fund returned (4.11)%. On a net asset value (“NAV”) basis, the Fund returned (4.39)%. During the same time period, the Index returned (4.25)%. During the fiscal year, the Fund fully replicated the components of the Index; therefore, the Fund’s performance (NAV basis) differed from the return of the Index primarily due to fees and expenses that the Fund incurred during the period partially offset by income received from the security lending program in which the Fund participates.
During this same time period, the MSCI EAFE® Index (Net) (the “Benchmark Index”) returned (3.23)%. The Benchmark Index is an unmanaged index weighted by market capitalization based on the average performance of approximately 930 securities. The Benchmark Index was selected for its recognition in the marketplace, and its performance comparison is a useful measure for investors as a broad representation of the equities market in developed countries outside the U.S.
Relative to the Benchmark Index, the Fund was most overweight in the agricultural sub-industry during the fiscal year ended October 31, 2016. The majority of the Fund’s underperformance relative to the Benchmark Index during the period can be attributed to a larger allocation of securities to the fertilizers and agricultural chemicals sector as well as fees and operating expenses incurred by the Fund during the period.
For the fiscal year ended October 31, 2016, the agricultural products sub-industry was the only contributing sub-industry. The fertilizers & agricultural chemicals sub-industry was the only detracting sub-industry.
Positions that contributed most significantly to the Fund’s return included Ingredion, Inc., an agricultural products company (portfolio average weight of 4.40%), and Scotts Miracle-Gro Co. (The), Class A, a fertilizers & agricultural chemicals company (portfolio average weight of 3.08%). Positions that detracted most significantly from the Fund’s return included CF Industries Holdings, Inc., a fertilizers & agricultural chemicals company (no longer held at fiscal year-end), and Mosaic Co. (The), a fertilizers & agricultural chemicals company (portfolio average weight of 5.53%).
| | | | |
Sub-Industry Breakdown
(% of the Fund’s Net Assets)
as of October 31, 2016 | |
| Fertilizers & Agricultural Chemicals | | | 57.5 | |
| Agricultural Products | | | 42.5 | |
| Money Market Fund Plus Other Assets Less Liabilities | | | (0.0) | |
|
Top Ten Fund Holdings*
(% of the Fund’s Net Assets)
as of October 31, 2016 | |
| Security | | | | |
| Archer-Daniels-Midland Co. | | | 8.3 | |
| Agrium, Inc. | | | 7.9 | |
| Monsanto Co. | | | 7.9 | |
| Potash Corp. of Saskatchewan, Inc. | | | 7.5 | |
| Mosaic Co. (The) | | | 6.0 | |
| Wilmar International Ltd. | | | 4.4 | |
| FMC Corp. | | | 4.2 | |
| Yara International ASA | | | 4.2 | |
| Bunge Ltd. | | | 4.0 | |
| K+S AG | | | 4.0 | |
| Total | | | 58.4 | |
| * | Excluding money market fund holdings. |
PowerShares Global Agriculture Portfolio (PAGG) (continued)
Growth of a $10,000 Investment Since Inception†
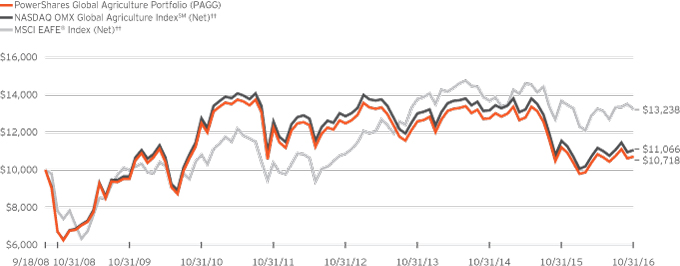
Fund Performance History as of October 31, 2016
| | | | | | | | | | | | | | | | | | | | | | | | | | | | | | | | |
| | | 1 Year | | | 3 Years
Average
Annualized | | | 3 Years
Cumulative | | | 5 Years
Average
Annualized | | | 5 Years
Cumulative | | | | | | Fund Inception† | |
| Index | | | | | | | | | | Average
Annualized | | | Cumulative | |
| NASDAQ OMX Global Agriculture IndexSM (Net)†† | | | (4.25 | )% | | | (5.27 | )% | | | (15.00 | )% | | | (2.54 | )% | | | (12.05 | )% | | | | | | | 1.26 | % | | | 10.66 | % |
| MSCI EAFE® Index (Net)†† | | | (3.23 | ) | | | (1.31 | ) | | | (3.87 | ) | | | 4.99 | | | | 27.59 | | | | | | | | 3.52 | | | | 32.38 | |
| Fund | | | | | | | | | | | | | | | | | | | | | | | | | | | | | | | | |
| NAV Return | | | (4.39 | ) | | | (5.22 | ) | | | (14.86 | ) | | | (2.64 | ) | | | (12.51 | ) | | | | | | | 0.86 | | | | 7.18 | |
| Market Price Return | | | (4.11 | ) | | | (5.06 | ) | | | (14.42 | ) | | | (2.45 | ) | | | (11.66 | ) | | | | | | | 0.65 | | | | 5.40 | |
Fund Inception: September 18, 2008
Performance quoted above represents past performance. Past performance is not a guarantee of future results and current performance may be higher or lower than performance quoted. Investment returns and principal value will fluctuate, and shares of the Fund (“Fund Shares”), when redeemed or sold, may be worth more or less than their original cost. Fund performance reflects any applicable fee waivers and/or expense reimbursements. Had the adviser not waived fees and/or reimbursed expenses currently or in the past, returns would have been lower. See current prospectus for more information. According to the Fund’s current prospectus, the Fund’s expense ratio of 0.76% includes the unitary management fee of 0.75% and other expenses of 0.01%. NAV and Market Price returns assume that dividends and capital gain distributions have been reinvested in the Fund at NAV and Market Price, respectively. The returns shown in the table above do not reflect the deduction of taxes that a shareholder would pay
on Fund distributions or the redemption or sale of Fund Shares. See invescopowershares.com to find the most recent month-end performance numbers.
Index and Benchmark Index performance results are based upon a hypothetical investment in their respective constituent securities. Index and Benchmark Index returns do not represent Fund returns. An investor cannot invest directly in an index. The Index and Benchmark Index do not charge management fees or brokerage expenses, and no such fees or expenses were deducted from the hypothetical performance shown. In addition, the results actual investors might have achieved would have differed from those shown because of differences in the timing, amounts of their investments, and fees and expenses associated with an investment in the Fund.
| † | Fund, Index and Benchmark Index returns are based on the inception date of the Fund. |
| †† | Reflects reinvested dividends net of withholding taxes. |
| | |
| PBD | | Manager’s Analysis |
| | PowerShares Global Clean Energy Portfolio (PBD) |
As an index fund, the PowerShares Global Clean Energy Portfolio (the “Fund”) is passively managed and attempts to track the returns of an underlying index. The Fund seeks investment results that generally correspond (before fees and expenses) to the price and yield of the WilderHill New Energy Global Innovation Index (the “Index”). The Fund generally will invest at least 90% of its total assets in the securities of companies engaged in the business of advancing cleaner energy and conservation that comprise the Index, as well as in American depositary receipts and global depositary receipts that are based on the securities in the Index.
The Index is comprised primarily of companies whose technologies focus on the generation and use of cleaner energy, conservation and efficiency, and the advancement of renewable energy in general, as determined by WilderHill New Energy Finance, LLC (the “Index Provider”). The Index is comprised mainly of companies in wind, solar, biofuels, hydro, wave and tidal, geothermal and other relevant renewable energy businesses and also includes companies involved in energy conversion, storage, conservation, efficiency, materials, pollution control, emerging hydrogen and fuel cells. The Index Provider selects securities principally on the basis of their capital appreciation potential as identified by the Index Provider pursuant to a proprietary Index methodology, with a bias placed on renewable energy companies. The Index may include companies in emerging market countries. The Fund generally invests in all of the securities comprising the Index in proportion to their weightings in the Index.
For the fiscal year ended October 31, 2016, on a market price basis, the Fund returned (5.56)%. On a net asset value (“NAV”) basis, the Fund returned (5.29)%. During the same time period, the Index returned (5.50)%. During the fiscal year, the Fund fully replicated the components of the Index; therefore, the Fund’s performance (NAV basis) differed from the return of the Index primarily due to fees and operating expenses that the Fund incurred during the period partially offset by the income received from the security lending program in which the Fund participates.
During this same time period, the MSCI EAFE® Index (Net) (the “Benchmark Index”) returned (3.23)%. The Benchmark Index is an unmanaged index weighted by market capitalization based on the average performance of approximately 930 securities. The Benchmark Index was selected for its recognition in the marketplace, and its performance comparison is a useful measure for investors as a broad representation of the equities market in developed countries outside the U.S.
Relative to the Benchmark Index, the Fund was most overweight in the semiconductor sub-industry and most underweight in the packaged foods & meats sub-industry during the fiscal year ended October 31, 2016. The majority of the Fund’s underperformance relative to the Benchmark Index during the period can be attributed to a larger allocation of securities to the semiconductor equipment and electrical components and equipment sectors.
For the fiscal year ended October 31, 2016, the heavy electrical equipment sub-industry contributed most significantly to the Fund’s return, followed by the electronic components and packaged foods & meats sub-industries, respectively. The semiconductors sub-industry detracted most significantly from the Fund’s return, followed by the semiconductor equipment and electrical components & equipment sub-industries, respectively.
Positions that contributed most significantly to the Fund’s return included Universal Display Corp., an electronic components company (portfolio average weight of 2.01%), and TransAlta Renewables, Inc., a renewable electricity company (portfolio average weight of 1.86%). Positions that detracted most significantly from the Fund’s return included SunPower Corp., a semiconductors company (portfolio average weight of 1.06%), and Vivint Solar, Inc., a renewable electricity company (portfolio average weight of 0.55%).
PowerShares Global Clean Energy Portfolio (PBD) (continued)
| | | | |
Sub-Industry Breakdown
(% of the Fund’s Net Assets)
as of October 31, 2016 | |
| Renewable Electricity | | | 24.0 | |
| Heavy Electrical Equipment | | | 10.9 | |
| Electrical Components & Equipment | | | 9.6 | |
| Semiconductors | | | 9.5 | |
| Semiconductor Equipment | | | 9.5 | |
Independent Power Producers &
Energy Traders | | | 4.6 | |
| Electric Utilities | | | 4.0 | |
| Building Products | | | 3.6 | |
| Oil & Gas Refining & Marketing | | | 3.0 | |
| Automobile Manufacturers | | | 3.0 | |
| Electronic Equipment & Instruments | | | 2.6 | |
| Industrial Machinery | | | 2.4 | |
| Diversified Support Services | | | 2.1 | |
| Mortgage REITs | | | 2.0 | |
| Electronic Components | | | 1.8 | |
| Packaged Foods & Meats | | | 1.3 | |
| Research & Consulting Services | | | 1.3 | |
| Application Software | | | 1.1 | |
| Environmental & Facilities Services | | | 1.0 | |
| Specialty Chemicals | | | 0.9 | |
| Construction & Engineering | | | 0.9 | |
| Auto Parts & Equipment | | | 0.5 | |
| Investment Companies | | | 0.3 | |
| Electronic Manufacturing Services | | | 0.3 | |
| Money Market Fund Plus Other Assets Less Liabilities | | | (0.2) | |
Top Ten Fund Holdings*
(% of the Fund’s Net Assets)
as of October 31, 2016 | |
| Security | | | | |
| Veeco Instruments, Inc. | | | 2.3 | |
| Caverion Corp. | | | 2.1 | |
| Meidensha Corp. | | | 2.1 | |
| Itron, Inc. | | | 2.0 | |
| Hannon Armstrong Sustainable Infrastructure Capital, Inc. REIT | | | 2.0 | |
| Tesla Motors, Inc. | | | 2.0 | |
| Kingspan Group PLC | | | 1.8 | |
| Cree, Inc. | | | 1.8 | |
| Universal Display Corp. | | | 1.8 | |
| Boralex, Inc., Class A | | | 1.8 | |
| Total | | | 19.7 | |
| * | Excluding money market fund holdings. |
PowerShares Global Clean Energy Portfolio (PBD) (continued)
Growth of a $10,000 Investment Since Inception†
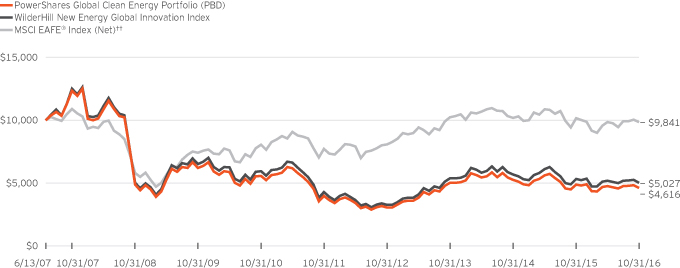
Fund Performance History as of October 31, 2016
| | | | | | | | | | | | | | | | | | | | | | | | | | | | | | | | |
| | | 1 Year | | | 3 Years
Average
Annualized | | | 3 Years
Cumulative | | | 5 Years
Average
Annualized | | | 5 Years
Cumulative | | | | | | Fund Inception† | |
| Index | | | | | | | | | | Average
Annualized | | | Cumulative | |
| WilderHill New Energy Global Innovation Index | | | (5.50 | )% | | | (2.20 | )% | | | (6.45 | )% | | | 3.27 | % | | | 17.45 | % | | | | | | | (7.07 | )% | | | (49.73 | )% |
| MSCI EAFE® Index (Net)†† | | | (3.23 | ) | | | (1.31 | ) | | | (3.87 | ) | | | 4.99 | | | | 27.59 | | | | | | | | (0.17 | ) | | | (1.59 | ) |
| Fund | | | | | | | | | | | | | | | | | | | | | | | | | | | | | | | | |
| NAV Return | | | (5.29 | ) | | | (2.82 | ) | | | (8.21 | ) | | | 2.99 | | | | 15.89 | | | | | | | | (7.91 | ) | | | (53.84 | ) |
| Market Price Return | | | (5.56 | ) | | | (2.88 | ) | | | (8.39 | ) | | | 3.19 | | | | 17.00 | | | | | | | | (8.01 | ) | | | (54.34 | ) |
Fund Inception: June 13, 2007
Performance quoted above represents past performance. Past performance is not a guarantee of future results and current performance may be higher or lower than performance quoted. Investment returns and principal value will fluctuate, and shares of the Fund (“Fund Shares”), when redeemed or sold, may be worth more or less than their original cost. Fund performance reflects any applicable fee waivers and/or expense reimbursements. Had the adviser not waived fees and/or reimbursed expenses currently or in the past, returns would have been lower. See current prospectus for more information. According to the Fund’s current prospectus, the Fund’s expense ratio of 0.77% includes the unitary management fee of 0.75% and other expenses of 0.02%. NAV and Market Price returns assume that dividends and capital gain distributions have been reinvested in the Fund at NAV and Market Price, respectively. The returns shown in the table above do not reflect the deduction of taxes that a shareholder would pay on Fund distributions or the redemption or sale of Fund Shares. See
invescopowershares.com to find the most recent month-end performance numbers.
Index and Benchmark Index performance results are based upon a hypothetical investment in their respective constituent securities. Index and Benchmark Index returns do not represent Fund returns. An investor cannot invest directly in an index. The Index and Benchmark Index do not charge management fees or brokerage expenses, and no such fees or expenses were deducted from the hypothetical performance shown. In addition, the results actual investors might have achieved would have differed from those shown because of differences in the timing, amounts of their investments, and fees and expenses associated with an investment in the Fund.
| † | Fund, Index and Benchmark Index returns are based on the inception date of the Fund. |
| †† | Reflects reinvested dividends net of withholding taxes. |
| | |
| PSAU | | Manager’s Analysis |
| | PowerShares Global Gold and Precious Metals Portfolio (PSAU) |
As an index fund, the PowerShares Global Gold and Precious Metals Portfolio (the “Fund”) is passively managed and attempts to track the returns of an underlying index. The Fund seeks investment results that generally correspond (before fees and expenses) to the price and yield of the NASDAQ OMX Global Gold and Precious Metals IndexSM (the “Index”). The Fund will invest at least 90% of its total assets in the securities of companies involved in the gold, silver and other precious metals mining industries that comprise the Index, as well as in American depositary receipts (“ADRs”) and global depositary receipts (“GDRs”) that are based on the securities in the Index. The Fund anticipates that the majority of its investments will be in the securities that comprise the Index rather than in ADRs and GDRs.
Nasdaq, Inc., the Index provider, calculates and maintains the Index, which is designed to measure the overall performance of the most liquid, globally traded securities of companies involved in gold, silver and other precious metals mining industry activities. In addition, each security, according to a recognized market data vendor, must have a minimum worldwide market capitalization of $500 million, a minimum three-month average daily dollar trading volume of $1 million and a minimum free float of 20% prior to inclusion in the Index. The Index may include securities in emerging market countries. The Fund generally invests in all of the securities comprising its Index in proportion to their weightings in the Index. The Index can be comprised of common stocks, ordinary shares, depositary receipts, shares of beneficial interest or limited partnership interests and tracking stocks.
For the fiscal year ended October 31, 2016, on a market price basis, the Fund returned 62.19%. On a net asset value (“NAV”) basis, the Fund returned 61.40%. During the same time period, the Index returned 62.77%. During the fiscal year, the Fund fully replicated the components of the Index; therefore, the Fund’s performance (NAV basis) differed from the return of the Index primarily due to fees and operating expenses that the Fund incurred.
During this same time period, the MSCI EAFE® Index (Net) (the “Benchmark Index”) returned (3.23)%. The Benchmark Index is an unmanaged index weighted by market capitalization and based on the average performance of approximately 930 securities. The Benchmark Index was selected for its recognition in the marketplace, and its performance comparison is a useful measure for investors as a broad representation of the equities market in developed countries outside the U.S. While the Benchmark Index has some exposure to gold, precious metals and mining operators, these represent a fairly small proportion. In contrast, the Fund focuses fully on these sub-industries. The Fund outperformed the Benchmark Index during the period due to its focus on these sub-industries and their strong performance compared to that of the broad equities market in developed countries outside the U.S.
For the fiscal year ended October 31, 2016, the gold sub-industry contributed most significantly to the Fund’s return, followed by the silver and precious metals & minerals sub-industries, respectively. The diversified metals & mining sub-industry was the only detracting sub-industry.
Positions that contributed most significantly to the Fund’s return included Barrick Gold Corp., a gold company (portfolio average weight of 8.45%), and Newmont Mining Corp., a gold company (portfolio average weight of 8.12%). Positions that detracted most significantly from the Fund’s return included Eldorado Gold Corp., a gold company (portfolio average weight of 1.90%), and First Majestic Silver Corp., a silver company (portfolio average weight of 0.11%).
| | | | |
Sub-Industry Breakdown
(% of the Fund’s Net Assets)
as of October 31, 2016 | |
| Gold | | | 81.9 | |
| Silver | | | 9.8 | |
| Precious Metals & Minerals | | | 8.0 | |
| Diversified Metals & Mining | | | 0.3 | |
| Other Assets Less Liabilities | | | (0.0) | |
|
Top Ten Fund Holdings
(% of the Fund’s Net Assets)
as of October 31, 2016 | |
| Security | | | | |
| Barrick Gold Corp. | | | 8.6 | |
| Newmont Mining Corp. | | | 8.1 | |
| Goldcorp, Inc. | | | 7.0 | |
| Newcrest Mining Ltd. | | | 6.7 | |
| Franco-Nevada Corp. | | | 5.8 | |
| Agnico Eagle Mines Ltd. | | | 4.2 | |
| Silver Wheaton Corp. | | | 4.0 | |
| Randgold Resources Ltd. | | | 3.8 | |
| AngloGold Ashanti Ltd. | | | 2.7 | |
| Kinross Gold Corp. | | | 2.6 | |
| Total | | | 53.5 | |
PowerShares Global Gold and Precious Metals Portfolio (PSAU) (continued)
Growth of a $10,000 Investment Since Inception†
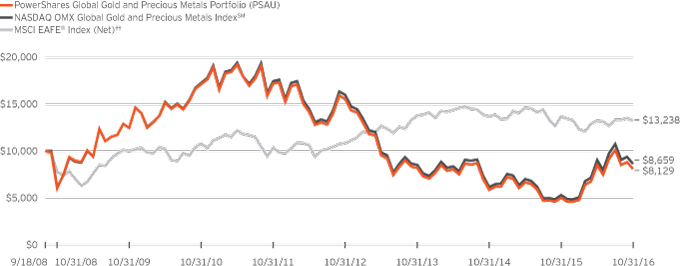
Fund Performance History as of October 31, 2016
| | | | | | | | | | | | | | | | | | | | | | | | | | | | | | | | |
| | | 1 Year | | | 3 Years
Average
Annualized | | | 3 Years
Cumulative | | | 5 Years
Average
Annualized | | | 5 Years
Cumulative | | | | | | Fund Inception† | |
| Index | | | | | | | | | | Average
Annualized | | | Cumulative | |
| NASDAQ OMX Global Gold and Precious Metals IndexSM | | | 62.77 | % | | | 0.45 | % | | | 1.35 | % | | | (13.06 | )% | | | (50.34 | )% | | | | | | | (1.76 | )% | | | (13.41 | )% |
| MSCI EAFE® Index (Net)†† | | | (3.23 | ) | | | (1.31 | ) | | | (3.87 | ) | | | 4.99 | | | | 27.59 | | | | | | | | 3.52 | | | | 32.38 | |
| Fund | | | | | | | | | | | | | | | | | | | | | | | | | | | | | | | | |
| NAV Return | | | 61.40 | | | | (0.41 | ) | | | (1.22 | ) | | | (13.90 | ) | | | (52.70 | ) | | | | | | | (2.52 | ) | | | (18.71 | ) |
| Market Price Return | | | 62.19 | | | | (0.17 | ) | | | (0.52 | ) | | | (13.76 | ) | | | (52.29 | ) | | | | | | | (2.54 | ) | | | (18.83 | ) |
Fund Inception: September 18, 2008
Performance quoted above represents past performance. Past performance is not a guarantee of future results and current performance may be higher or lower than performance quoted. Investment returns and principal value will fluctuate, and shares of the Fund (“Fund Shares”), when redeemed or sold, may be worth more or less than their original cost. Fund performance reflects any applicable fee waivers and/or expense reimbursements. Had the adviser not waived fees and/or reimbursed expenses currently or in the past, returns would have been lower. See current prospectus for more information. According to the Fund’s current prospectus, the Fund’s expense ratio of 0.75% is expressed as a unitary management fee to cover operating expenses and expenses incurred in connection with managing the portfolio. NAV and Market Price returns assume that dividends and capital gain distributions have been reinvested in the Fund at NAV and Market Price, respectively. The returns shown in the table above do not reflect the deduction of taxes that a shareholder would pay on Fund
distributions or the redemption or sale of Fund Shares. See invescopowershares.com to find the most recent month-end performance numbers.
Index and Benchmark Index performance results are based upon a hypothetical investment in their respective constituent securities. Index and Benchmark Index returns do not represent Fund returns. An investor cannot invest directly in an index. The Index and Benchmark Index do not charge management fees or brokerage expenses, and no such fees or expenses were deducted from the hypothetical performance shown. In addition, the results actual investors might have achieved would have differed from those shown because of differences in the timing, amounts of their investments, and fees and expenses associated with an investment in the Fund.
| † | Fund, Index and Benchmark Index returns are based on the inception date of the Fund. |
| †† | Reflects reinvested dividends net of withholding taxes. |
| | |
| PIO | | Manager’s Analysis |
| | PowerShares Global Water Portfolio (PIO) |
As an index fund, the PowerShares Global Water Portfolio (the “Fund”) is passively managed and attempts to track the returns of an underlying index. The Fund seeks investment results that generally correspond (before fees and expenses) to the price and yield of the NASDAQ OMX Global Water IndexSM (the “Index”). The Fund generally will invest at least 90% of its total assets in securities of companies listed on a global exchange that create products designed to conserve and purify water for homes, businesses and industries that comprise the Index, as well as in American depositary receipts and global depositary receipts that are based on the securities in the Index.
The Index was created by, and is a trademark of, the Nasdaq, Inc., the Index provider. A security must have a worldwide market capitalization of $50 million to be included in the Index. The Index may include companies in emerging market countries. The Fund generally invests in all of the securities comprising the Index in proportion to their weightings in the Index.
For the fiscal year ended October 31, 2016, on a market price basis, the Fund returned (0.78)%. On a net asset value (“NAV”) basis, the Fund returned (1.14)%. During the same time period, the Index returned (0.64)%. During the fiscal year, the Fund fully replicated the components of the Index; therefore, the Fund’s performance (NAV basis) differed from the return of the Index primarily due to fees and operating expenses that the Fund incurred during the period partially offset by income received from the security lending program in which the Fund participates.
During this same time period, the MSCI EAFE® Index (Net) (the “Benchmark Index”) returned (3.23)%. The Benchmark Index is an unmanaged index weighted by market capitalization based on the average performance of approximately 930 securities. The Benchmark Index was selected for its recognition in the marketplace, and its performance comparison is a useful measure for investors as a broad representation of the equities market in developed countries outside the U.S.
Relative to the Benchmark Index, the Fund was most overweight in the multi-utilities sector and most underweight in the diversified chemicals sector during the fiscal year ended October 31, 2016. The majority of the Fund’s outperformance relative to the Benchmark Index during the period can be attributed to security selection and a larger allocation of securities to the building products, industrial machinery and water utilities sectors.
For the fiscal year ended October 31, 2016, the industrials sector contributed most significantly to the Fund’s return, followed by the health care and information technology sectors, respectively. The utilities sector detracted most significantly from the Fund’s return, followed by the consumer discretionary and materials sectors, respectively.
Positions that contributed most significantly to the Fund’s return included Geberit AG, an industrials company (portfolio average
weight of 7.91%), and Cia de Saneamento Basico do Estado de Sao Paulo, a utilities company (portfolio average weight of 2.43%). Positions that detracted most significantly from the Fund’s return included TerraForm Power, Inc., Class A, a utilities company (no longer held at fiscal year-end), and United Utilities Group PLC, a utilities company (portfolio average weight of 3.62%).
| | | | |
Sector Breakdown
(% of the Fund’s Net Assets)
as of October 31, 2016 | |
| Industrials | | | 40.2 | |
| Utilities | | | 36.0 | |
| Health Care | | | 10.5 | |
| Materials | | | 7.7 | |
| Consumer Discretionary | | | 3.9 | |
| Information Technology | | | 1.5 | |
| Other Assets Less Liabilities | | | 0.2 | |
|
Top Ten Fund Holdings
(% of the Fund’s Net Assets)
as of October 31, 2016 | |
| Security | | | | |
| Geberit AG | | | 8.0 | |
| Danaher Corp. | | | 8.0 | |
| Ecolab, Inc. | | | 7.7 | |
| Veolia Environnement SA | | | 6.6 | |
| Wolseley PLC | | | 5.9 | |
| TOTO Ltd. | | | 4.3 | |
| American Water Works Co., Inc. | | | 4.1 | |
| Roper Technologies, Inc. | | | 4.0 | |
| Coway Co. Ltd. | | | 3.9 | |
| Cia de Saneamento Basico do Estado de Sao Paulo | | | 3.7 | |
| Total | | | 56.2 | |
PowerShares Global Water Portfolio (PIO) (continued)
Growth of a $10,000 Investment Since Inception†
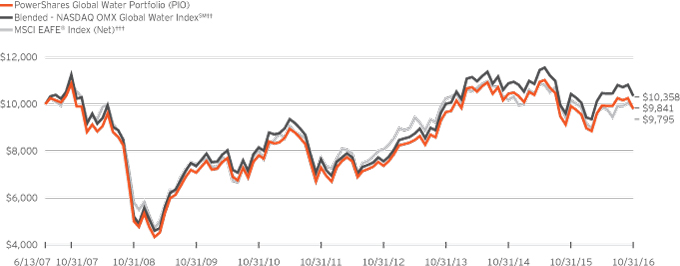
Fund Performance History as of October 31, 2016
| | | | | | | | | | | | | | | | | | | | | | | | | | | | | | | | |
| | | 1 Year | | | 3 Years
Average
Annualized | | | 3 Years
Cumulative | | | 5 Years
Average
Annualized | | | 5 Years
Cumulative | | | | | | Fund Inception† | |
| Index | | | | | | | | | | Average
Annualized | | | Cumulative | |
| Blended—NASDAQ OMX Global Water IndexSM†† | | | (0.64 | )% | | | 1.16 | % | | | 3.51 | % | | | 6.25 | % | | | 35.40 | % | | | | | | | 0.38 | % | | | 3.58 | % |
| MSCI EAFE® Index (Net)††† | | | (3.23 | ) | | | (1.31 | ) | | | (3.87 | ) | | | 4.99 | | | | 27.59 | | | | | | | | (0.17 | ) | | | (1.59 | ) |
| Fund | | | | | | | | | | | | | | | | | | | | | | | | | | | | | | | | |
| NAV Return | | | (1.14 | ) | | | 0.47 | | | | 1.43 | | | | 6.07 | | | | 34.25 | | | | | | | | (0.22 | ) | | | (2.05 | ) |
| Market Price Return | | | (0.78 | ) | | | 0.35 | | | | 1.05 | | | | 6.31 | | | | 35.82 | | | | | | | | (0.45 | ) | | | (4.14 | ) |
Fund Inception: June 13, 2007
Performance quoted above represents past performance. Past performance is not a guarantee of future results and current performance may be higher or lower than performance quoted. Investment returns and principal value will fluctuate, and shares of the Fund (“Fund Shares”), when redeemed or sold, may be worth more or less than their original cost. Fund performance reflects any applicable fee waivers and/or expense reimbursements. Had the adviser not waived fees and/or reimbursed expenses currently or in the past, returns would have been lower. See current prospectus for more information. According to the Fund’s current prospectus, the Fund’s expense ratio of 0.76% includes the unitary management fee of 0.75% and other expenses of 0.01%. NAV and Market Price returns assume that dividends and capital gain distributions have been reinvested in the Fund at NAV and Market Price, respectively. The returns shown in the table above do not reflect the deduction of taxes that a shareholder would pay on Fund distributions or the redemption or sale of Fund Shares. See invescopowershares.com to find the most recent month-end performance numbers.
Blended-Index and Benchmark Index performance results are based upon a hypothetical investment in their respective constituent securities. Blended-Index and Benchmark Index returns do not represent Fund returns. An investor cannot invest directly in an index. The Blended-Index and Benchmark Index do not charge management fees or brokerage expenses, and no such fees or expenses were deducted from the hypothetical performance shown. In addition, the results actual investors might have achieved would have differed from those shown because of differences in the timing, amounts of their investments, and fees and expenses associated with an investment in the Fund.
| † | Fund, Blended-Index and Benchmark Index returns are based on the inception date of the Fund. |
| †† | The Blended—NASDAQ OMX Global Water IndexSM performance is comprised of the performance of Palisades Global Water Index, the Fund’s previous underlying index, from Fund inception through date of the change to the Index, March 1, 2012, followed by the performance of the Index, starting from the conversion date through October 31, 2016. |
| ††† | Reflects reinvested dividends net of withholding taxes. |
| | |
| IPKW | | Manager’s Analysis |
| | PowerShares International BuyBack AchieversTM Portfolio (IPKW) |
As an index fund, the PowerShares International BuyBack AchieversTM Portfolio (the “Fund”) is passively managed and attempts to track the returns of an underlying index. The Fund seeks investment results that generally correspond (before fees and expenses) to the price and yield of the NASDAQ International BuyBack AchieversTM Index (the “Index”). The Fund generally will invest at least 90% of its total assets in common stocks that comprise the Index. Strictly in accordance with its guidelines and mandated procedures, the NASDAQ OMX Group, Inc. (“NASDAQ OMX” or the “Index Provider”) includes in the Index common stocks of foreign companies that are classified as “International BuyBack AchieversTM” pursuant to a proprietary selection methodology. To qualify as an “International BuyBack AchieversTM” and have its stock be eligible for inclusion in the Index, an issuer must: (i) have its common stock included in the NASDAQ Global Ex-US Index (a broad-based index designed to track the performance of the global equity market and whose component securities are issued by companies located throughout the world, excluding the United States); (ii) have a minimum market capitalization of $250 million; (iii) have effected a net reduction of 5% or more of its outstanding shares in its latest fiscal year; and (iv) have a minimum three-month average daily cash volume of $1 million. The Fund generally will invest in all of the securities comprising the Index in proportion to their weightings in the Index.
For the fiscal year ended October 31, 2016, on a market price basis, the Fund returned 6.78%. On a net asset value (“NAV”) basis, the Fund returned 6.25%. During the same time period, the Index returned 7.00%. During the fiscal period, the Fund fully replicated the components of the Index; therefore, the Fund’s performance (NAV basis) differed from the return of the Index primarily due to fees and operating expenses the fund incurred during the period.
During this same time period, the MSCI ACWI ex-USA® Index (Net) (the “Benchmark Index”) returned 0.22%. The Benchmark Index is an unmanaged index weighted by market capitalization and based on the average performance of approximately 1,850 securities.
The Benchmark Index was selected for its recognition in the marketplace, and its performance comparison is a useful measure for investors as a broad representation of the developed and emerging equity markets outside the U.S. The performance of the Fund differed from the Benchmark Index in part because the Fund employs a modified market capitalization weighting methodology and selects stocks based on constituent companies engaging in stock buybacks, whereas the Benchmark Index selects and weights stocks based on market capitalization.
Relative to the Benchmark Index, the Fund was most overweight in the consumer discretionary sector and most underweight in the financials sector during the fiscal year ended October 31, 2016. The majority of the Fund’s outperformance relative to the
Benchmark Index during the period can be attributed to security selection within the consumer discretionary sector.
For the fiscal year ended October 31, 2016, the consumer discretionary sector contributed most significantly to the Fund’s return, followed by the materials and telecommunication services sectors, respectively. The industrials sector detracted most significantly from the Fund’s return, followed by the financials and real estate sectors, respectively.
Positions that contributed most significantly to the Fund’s return included Cia Siderurgica Nacional SA, a materials company (no longer held at fiscal year-end), and NTT DoCoMo, Inc., a telecommunication services company (no longer held at fiscal year-end). Positions that detracted most significantly from the Fund’s return included Magna International, Inc., a consumer discretionary company (no longer held at fiscal year-end), and Nisshinbo Holdings, Inc., an industrials company (no longer held at fiscal year-end).
| | | | |
Sector Breakdown
(% of the Fund’s Net Assets)
as of October 31, 2016 | |
| Consumer Discretionary | | | 26.0 | |
| Information Technology | | | 14.7 | |
| Consumer Staples | | | 14.1 | |
| Health Care | | | 13.1 | |
| Financials | | | 11.0 | |
| Industrials | | | 6.2 | |
| Energy | | | 5.1 | |
| Telecommunication Services | | | 4.8 | |
| Real Estate | | | 2.5 | |
| Materials | | | 2.5 | |
| Other Assets Less Liabilities | | | 0.0 | |
|
Top Ten Fund Holdings
(% of the Fund’s Net Assets)
as of October 31, 2016 | |
| Security | | | | |
| Suzuki Motor Corp. | | | 5.5 | |
| Hoya Corp. | | | 5.3 | |
| Tokyo Electron Ltd. | | | 5.2 | |
| FUJIFILM Holdings Corp. | | | 5.2 | |
| LUKOIL PJSC ADR | | | 5.1 | |
| BRF SA | | | 5.0 | |
| Canadian Pacific Railway Ltd. | | | 4.8 | |
| Actelion Ltd. | | | 4.2 | |
| Isuzu Motors Ltd. | | | 2.7 | |
| Celestica, Inc. | | | 2.7 | |
| Total | | | 45.7 | |
PowerShares International BuyBack AchieversTM Portfolio (IPKW) (continued)
Growth of a $10,000 Investment Since Inception†
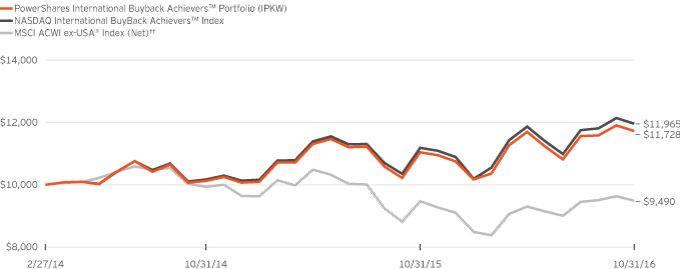
Fund Performance History as of October 31, 2016
| | | | | | | | | | | | | | | | |
| | | 1 Year | | | | | | Fund Inception† | |
| Index | | | | | | Average
Annualized | | | Cumulative | |
| NASDAQ International BuyBack AchieversTM Index | | | 7.00 | % | | | | | | | 6.95 | % | | | 19.65 | % |
| MSCI ACWI ex-USA® Index (Net)†† | | | 0.22 | | | | | | | | (1.94 | ) | | | (5.10 | ) |
| Fund | | | | | | | | | | | | | | | | |
| NAV Return | | | 6.25 | | | | | | | | 6.14 | | | | 17.28 | |
| Market Price Return | | | 6.78 | | | | | | | | 6.03 | | | | 16.94 | |
Fund Inception: February 27, 2014
Performance quoted above represents past performance. Past performance is not a guarantee of future results and current performance may be higher or lower than performance quoted. Investment returns and principal value will fluctuate, and shares of the Fund (“Fund Shares”), when redeemed or sold, may be worth more or less than their original cost. Fund performance reflects any applicable fee waivers and/or expense reimbursements. Had the adviser not waived fees and/or reimbursed expenses currently or in the past, returns would have been lower. See current prospectus for more information. According to the Fund’s current prospectus, the Fund’s expense ratio of 0.55% is expressed as a unitary management fee to cover operating expenses and expenses incurred in connection with managing the portfolio. NAV and Market Price returns assume that dividends and capital gain distributions have been reinvested in the Fund at NAV and Market Price, respectively. The returns shown in the table above do not reflect the deduction of taxes that a shareholder would pay on Fund
distributions or the redemption or sale of Fund Shares. See invescopowershares.com to find the most recent month-end performance numbers.
Index and Benchmark Index performance results are based upon a hypothetical investment in their respective constituent securities. Index and Benchmark Index returns do not represent Fund returns. An investor cannot invest directly in an index. The Index and Benchmark Index do not charge management fees or brokerage expenses, and no such fees or expenses were deducted from the hypothetical performance shown. In addition, the results actual investors might have achieved would have differed from those shown because of differences in the timing, amounts of their investments, and fees and expenses associated with an investment in the Fund.
| † | Fund, Index and Benchmark Index returns are based on the inception date of the Fund. |
| †† | Reflects reinvested dividends net of withholding taxes. |
| | |
| FXJP | | Manager’s Analysis |
| | PowerShares Japan Currency Hedged Low Volatility Portfolio (FXJP) |
As an index fund, the PowerShares Japan Currency Hedged Low Volatility Portfolio (the “Fund”) is passively managed and attempts to track the returns of an underlying index. The Fund seeks investment results that generally correspond (before fees and expenses) to the price and yield of the S&P Japan 500® Low Volatility USD Hedged Index (Net) (the “Index”). The Fund generally will invest at least 90% of its total assets in common stocks that comprise the Index.
S&P Dow Jones Indices LLC (“S&P DJI” or the “Index Provider”) compiles, maintains and calculates the Index strictly in accordance with its guidelines and mandated procedures. The Index is designed to measure the performance of the 100 least volatile stocks in the S&P Japan 500® Index, while also employing a currency-hedged strategy to mitigate exposure to fluctuations between the value of the U.S. dollar and the Japanese yen. From the constituents of the S&P Japan 500® Index, which are the 500 largest publicly listed companies in Japan, the Index Provider selects securities with the least volatility over the past 12 months for inclusion in the Index, with the least volatile stocks receiving the greatest weights. To hedge against exchange rate fluctuations, the Fund also will invest in foreign currency forward contracts to “lock in” the contract’s agreed-upon exchange rates. The Fund generally invests in all of the securities comprising the Index in proportion to their weightings in the Index.
For the fiscal year ended October 31, 2016, on a market price basis, the Fund returned (5.98)%. On a net asset value (“NAV”) basis, the Fund returned (6.17)%. During the same time period, the Index returned (5.33)%. During the fiscal year, the Fund fully replicated the components of the Index; therefore, the Fund’s performance (NAV basis) differed from the return of the Index primarily due to trading costs and slippage around rebalances as well as fees and expenses incurred by the Fund during this period.
During this same time period, the MSCI Japan Local Currency Index (Net) (the “Benchmark Index”) returned (10.14)%. The Benchmark Index is an unmanaged index weighted by market capitalization based on the average performance of approximately 320 securities. The Benchmark Index was selected for its recognition in the marketplace, and its performance comparison is a useful measure for investors as a broad representation of the overall Japanese stock market. The Fund outperformed the Benchmark Index primarily due to a larger allocation of securities in the consumer staples, industrials and the consumer discretionary sectors.
Relative to the Benchmark Index, the Fund was most overweight in the industrials sector and most underweight in the financials sector during the fiscal year ended October 31, 2016.
For the fiscal year ended October 31, 2016, the consumer staples sector contributed most significantly to the Fund’s return, followed by the industrials and consumer discretionary sectors. The
financials sector detracted most significantly from the Fund’s return, followed by the utilities and telecommunication services sectors.
Positions that contributed most significantly to the Fund’s return included Maruha Nichiro Corp., a consumer staples company (portfolio average weight of 1.09%), and Kagome Co. Ltd., a consumer staples company (portfolio average weight of 1.55%). Positions that detracted most significantly from the Fund’s return included Taiheiyo Cement Corp., a materials company (no longer held at fiscal year-end), and Mizuho Financial Group, Inc., a financials company (no longer held at fiscal year-end).
| | | | |
Sector Breakdown
(% of the Fund’s Net Assets)
as of October 31, 2016 | |
| Industrials | | | 28.4 | |
| Consumer Discretionary | | | 21.5 | |
| Consumer Staples | | | 19.7 | |
| Information Technology | | | 5.7 | |
| Materials | | | 5.5 | |
| Health Care | | | 4.6 | |
| Utilities | | | 4.1 | |
| Financials | | | 3.0 | |
| Real Estate | | | 2.2 | |
| Energy | | | 1.2 | |
| Telecommunication Services | | | 0.4 | |
| Other Assets Less Liabilities | | | 3.7 | |
|
Top Ten Fund Holdings
(% of the Fund’s Net Assets)
as of October 31, 2016 | |
| Security | | | | |
| Shochiku Co. Ltd. | | | 1.6 | |
| Kagome Co. Ltd. | | | 1.4 | |
| Daito Trust Construction Co. Ltd. | | | 1.3 | |
| Keikyu Corp. | | | 1.2 | |
| Yamaguchi Financial Group, Inc. | | | 1.2 | |
| Coca-Cola West Co. Ltd. | | | 1.2 | |
| TonenGeneral Sekiyu K.K. | | | 1.2 | |
| Maruha Nichiro Corp. | | | 1.2 | |
| Toppan Printing Co. Ltd. | | | 1.2 | |
| Nippo Corp. | | | 1.1 | |
| Total | | | 12.6 | |
PowerShares Japan Currency Hedged Low Volatility Portfolio (FXJP) (continued)
Growth of a $10,000 Investment Since Inception†
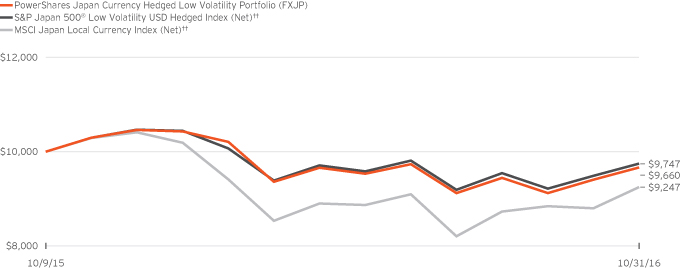
Fund Performance History as of October 31, 2016
| | | | | | | | | | | | | | | | |
| | | 1 Year | | | | | | Fund Inception† | |
| Index | | | | | | Average
Annualized | | | Cumulative | |
| S&P Japan 500® Low Volatility USD Hedged Index (Net)†† | | | (5.33 | )% | | | | | | | (2.39 | )% | | | (2.53 | )% |
| MSCI Japan Local Currency Index (Net)†† | | | (10.14 | ) | | | | | | | (7.13 | ) | | | (7.53 | ) |
| Fund | | | | | | | | | | | | | | | | |
| NAV Return | | | (6.17 | ) | | | | | | | (3.21 | ) | | | (3.40 | ) |
| Market Price Return | | | (5.98 | ) | | | | | | | (3.51 | ) | | | (3.72 | ) |
Fund Inception: October 9, 2015
Performance quoted above represents past performance. Past performance is not a guarantee of future results and current performance may be higher or lower than performance quoted. Investment returns and principal value will fluctuate, and shares of the Fund (“Fund Shares”), when redeemed or sold, may be worth more or less than their original cost. Fund performance reflects any applicable fee waivers and/or expense reimbursements. Had the adviser not waived fees and/or reimbursed expenses currently or in the past, returns would have been lower. See current prospectus for more information. According to the Fund’s current prospectus, the Fund’s expense ratio of 0.25% is expressed as a unitary management fee to cover operating expenses and expenses incurred in connection with managing the portfolio. NAV and Market Price returns assume that dividends and capital gain distributions have been reinvested in the Fund at NAV and
Market Price, respectively. See invescopowershares.com to find the most recent month-end performance numbers.
Index and Benchmark Index performance results are based upon a hypothetical investment in their respective constituent securities. Index and Benchmark Index returns do not represent Fund returns. An investor cannot invest directly in an index. The Index and Benchmark Index do not charge management fees or brokerage expenses, and no such fees or expenses were deducted from the hypothetical performance shown. In addition, the results actual investors might have achieved would have differed from those shown because of differences in the timing, amounts of their investments, and fees and expenses associated with an investment in the Fund.
| † | Fund, Index and Benchmark Index returns are based on the inception date of the Fund. |
| †† | Reflects reinvested dividends net of withholding taxes. |
| | |
| IDHQ | | Manager’s Analysis |
| | PowerShares S&P International Developed Quality Portfolio (IDHQ) |
Effective after the close of markets on March 18, 2016, the Fund’s name changed from PowerShares S&P International Developed High Quality Portfolio to PowerShares S&P International Developed Quality Portfolio and the underlying index changed from S&P International Developed High Quality Rankings Index (Net) (the “Previous Index”) to S&P Quality Developed ex-U.S. LargeMidCap Index (Net) (the “Index”).
As an index fund, PowerShares S&P International Developed Quality Portfolio (the “Fund”) is passively managed and attempts to track the returns of an underlying index. The Fund seeks investment results that generally correspond (before fees and expenses) to the price and yield of the Index and, through March 18, 2016, the Fund sought investment results that generally corresponded (before fees and expenses) to the price and yield of the Previous Index. The Fund generally will invest at least 90% of its total assets in the securities that comprise the Index and, through March 18, 2016, generally invested 90% of its total assets in the securities that comprised the Previous Index.
S&P Dow Jones Indices LLC (“S&P DJI” or the “Index Provider”) compiles, maintains and calculates the Index, which is constructed from constituents of the S&P Developed ex-U.S. LargeMidCap Index (the “Developed ex-U.S. Index”) that the Index Provider identifies as being of the highest quality that is, stocks of companies that seek to generate higher revenue and cash flow than their counterparts through prudent use of assets and finances. Strictly in accordance with its guidelines and mandated procedures, the Index Provider calculates the quality score of each security in the Developed ex-U.S. Index based on a composite of the following three factors: (i) return on equity, calculated as the company’s trailing 12-month earnings per share divided by the company’s latest book value per share; (ii) accruals ratio, computed using the change of the company’s net operating asset over the last year divided by the company’s average net operating asset over the last two years; and (iii) financial leverage, calculated as the company’s latest total debt divided by the company’s book value. The Index Provider then selects the 100 stocks with the highest quality score for inclusion in the Index. The Index is modified float-adjusted market-capitalization weighted, weighting securities by multiplying their float-adjusted market capitalization and their quality score. The Fund generally will invest in all of the securities comprising the Index in proportion to their weightings in the Index.
For the fiscal year ended October 31, 2016, on a market price basis, the Fund returned (0.59)%. On a net asset value (“NAV”) basis, the Fund returned (0.62)%. During the same time period, the Blended—S&P Quality Developed ex-U.S. LargeMidCap Index (Net) (a composite of the returns of the Previous Index through March 18, 2016, and of the Index for the remainder for the fiscal year, referred to herein as the “Blended-Index”) returned (0.94)%. During the fiscal year, the Fund fully replicated the components of the Blended-Index; therefore, the Fund’s
performance (NAV basis) differed from the return of the Blended-Index primarily due to fees and operating expenses incurred by the Fund partially offset by the proceeds received from a class action settlement.
During this same time period, the MSCI EAFE® Index (Net) (the “Benchmark Index”) returned (3.23)%. The Benchmark Index is an unmanaged index weighted by market capitalization and based on the average performance of approximately 930 securities. The adviser provided this additional comparative benchmark to help investors better understand how the investment results of the Fund compare to the performance of a broad international developed equity markets benchmark.
The Benchmark Index was selected for its recognition in the marketplace, and its performance comparison is a useful measure for investors as a broad representation of the international equity markets in developed countries outside the U.S. The performance of the Fund differed from the Benchmark Index in part because the Fund employs a quality ranking-driven weighting and stock selection methodology, as defined by the Index Provider, whereas the Benchmark Index selects and weights stocks based on market capitalization.
Relative to the Benchmark Index, the Fund was most overweight in the consumer discretionary sector and most underweight in the financials sector during the fiscal year ended October 31, 2016.
The majority of the Fund’s outperformance relative to the Benchmark Index during that period can be attributed to security selection within the consumer discretionary sector.
For the fiscal year ended October 31, 2016, the industrials sector contributed most significantly to the Fund’s return, followed by the information technology and telecommunication services sectors. The health care sector detracted most significantly from the Fund’s return, followed by the energy and financials sectors.
Positions that contributed most significantly to the Fund’s return included Novartis AG, a health care company (no longer held at fiscal year-end), and Daito Trust Construction Co. Ltd., a real estate company (portfolio average weight of 0.38%). Positions that detracted most significantly from the Fund’s return included Novo Nordisk A/S, Class B, a health care company (portfolio average weight of 2.34%), and Saipem SpA, an energy company (no longer held at fiscal year-end).
PowerShares S&P International Developed Quality Portfolio (IDHQ) (continued)
| | | | |
Sector Breakdown
(% of the Fund’s Net Assets)
as of October 31, 2016 | |
| Consumer Discretionary | | | 20.8 | |
| Consumer Staples | | | 19.0 | |
| Industrials | | | 15.8 | |
| Health Care | | | 14.5 | |
| Financials | | | 10.4 | |
| Information Technology | | | 6.1 | |
| Materials | | | 4.7 | |
| Telecommunication Services | | | 4.7 | |
| Utilities | | | 2.7 | |
| Real Estate | | | 0.8 | |
| Energy | | | 0.5 | |
| Other Assets Less Liabilities | | | 0.0 | |
| | | | |
Top Ten Fund Holdings
(% of the Fund’s Net Assets)
as of October 31, 2016 | |
| Security | | | | |
| Nestle SA | | | 5.1 | |
| Roche Holding AG | | | 4.6 | |
| Industria de Diseno Textil SA | | | 3.2 | |
| NTT DoCoMo, Inc. | | | 2.5 | |
| Novo Nordisk A/S, Class B | | | 2.5 | |
| Japan Tobacco, Inc. | | | 2.3 | |
| Reckitt Benckiser Group PLC | | | 1.9 | |
| Unilever NV CVA | | | 1.9 | |
| AIA Group Ltd. | | | 1.8 | |
| Diageo PLC | | | 1.8 | |
| Total | | | 27.6 | |
Growth of a $10,000 Investment Since Inception†
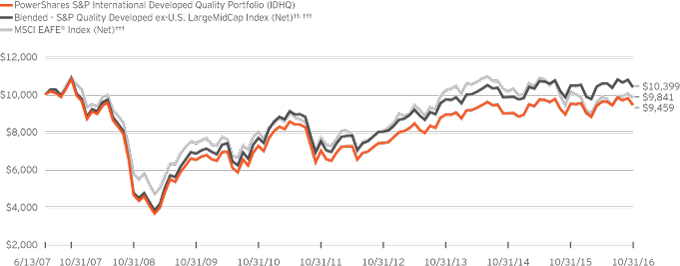
Fund Performance History as of October 31, 2016
| | | | | | | | | | | | | | | | | | | | | | | | | | | | | | | | |
| | | 1 Year | | | 3 Years
Average
Annualized | | | 3 Years
Cumulative | | | 5 Years
Average
Annualized | | | 5 Years
Cumulative | | | | | | Fund Inception† | |
| Index | | | | | | | | | | Average
Annualized | | | Cumulative | |
| Blended—S&P Quality Developed ex-U.S. LargeMidCap Index (Net)††,††† | | | (0.94 | )% | | | 2.14 | % | | | 6.56 | % | | | 6.73 | % | | | 38.48 | % | | | | | | | 0.42 | % | | | 3.99 | % |
| S&P Quality Developed ex-U.S. LargeMidCap Index (Net)††† | | | (2.75 | ) | | | N/A | | | | N/A | | | | N/A | | | | N/A | | | | | | | | N/A | | | | N/A | |
| MSCI EAFE® Index (Net)††† | | | (3.23 | ) | | | (1.31 | ) | | | (3.87 | ) | | | 4.99 | | | | 27.59 | | | | | | | | (0.17 | ) | | | (1.59 | ) |
| Fund | | | | | | | | | | | | | | | | | | | | | | | | | | | | | | | | |
| NAV Return | | | (0.62 | ) | | | 1.84 | | | | 5.63 | | | | 6.14 | | | | 34.70 | | | | | | | | (0.59 | ) | | | (5.41 | ) |
| Market Price Return | | | (0.59 | ) | | | 1.75 | | | | 5.35 | | | | 6.60 | | | | 37.67 | | | | | | | | (0.77 | ) | | | (7.03 | ) |
PowerShares S&P International Developed Quality Portfolio (IDHQ) (continued)
Fund Inception: June 13, 2007
Performance quoted above represents past performance. Past performance is not a guarantee of future results and current performance may be higher or lower than performance quoted. Investment returns and principal value will fluctuate, and shares of the Fund (“Fund Shares”), when redeemed or sold, may be worth more or less than their original cost. Fund performance reflects any applicable fee waivers and/or expense reimbursements. Had the adviser not waived fees and/or reimbursed expenses currently or in the past, returns would have been lower. See current prospectus for more information. According to the Fund’s current prospectus, the Fund’s expense ratio of 0.49% includes the unitary management fee of 0.45% and other expenses of 0.04%. NAV and Market Price returns assume that dividends and capital gain distributions have been reinvested in the Fund at NAV and Market Price, respectively. The returns shown in the table above do not reflect the deduction of taxes that a shareholder would pay on Fund distributions or the redemption or sale of Fund Shares. See invescopowershares.com to find the most recent month-end performance numbers.
Blended-Index, Index and Benchmark Index performance results are based upon a hypothetical investment in their respective constituent
securities. Blended-Index, Index and Benchmark Index returns do not represent Fund returns. An investor cannot invest directly in an index. The Blended-Index, Index and Benchmark Index do not charge management fees or brokerage expenses, and no such fees or expenses were deducted from the hypothetical performance shown. In addition, the results actual investors might have achieved would have differed from those shown because of differences in the timing, amounts of their investments, and fees and expenses associated with an investment in the Fund.
| † | Fund, Blended-Index, Index and Benchmark Index returns are based on the inception date of the Fund. |
| †† | The Blended—S&P Quality Developed ex-U.S. LargeMidCap Index is comprised of the performance of the QSG Developed International Opportunities Index, the Fund’s previous underlying index, from Fund inception through the conversion date, March 1, 2012, followed by the performance of the Previous Index, the Fund’s underlying index for the period March 1, 2012 through March 18, 2016, followed by the performance of the Index for the period March 18, 2016 through October 31, 2016. |
| ††† | Reflects reinvested dividends net of withholding taxes. |
Schedule of Investments
PowerShares Developed EuroPacific Currency Hedged Low Volatility Portfolio (FXEP)
October 31, 2016
| | | | | | | | |
Number
of Shares | | | | | Value | |
| | | | Common Stocks and Other Equity
Interests—97.3% | |
| | | | Australia—15.6% | |
| | 557 | | | AGL Energy Ltd. | | $ | 8,129 | |
| | 487 | | | Amcor Ltd. | | | 5,448 | |
| | 1,552 | | | AMP Ltd. | | | 5,397 | |
| | 1,017 | | | APA Group | | | 6,160 | |
| | 196 | | | ASX Ltd. | | | 7,029 | |
| | 5,705 | | | AusNet Services | | | 6,512 | |
| | 1,254 | | | Boral Ltd. | | | 6,012 | |
| | 725 | | | Brambles Ltd. | | | 6,361 | |
| | 858 | | | Coca-Cola Amatil Ltd. | | | 6,229 | |
| | 118 | | | Commonwealth Bank of Australia | | | 6,590 | |
| | 96 | | | CSL Ltd. | | | 7,342 | |
| | 966 | | | Dexus Property Group REIT | | | 6,572 | |
| | 4,308 | | | DUET Group | | | 7,802 | |
| | 1,266 | | | Goodman Group REIT | | | 6,541 | |
| | 1,993 | | | GPT Group (The) REIT | | | 7,067 | |
| | 1,487 | | | Insurance Australia Group Ltd. | | | 6,235 | |
| | 4,284 | | | Mirvac Group REIT | | | 6,813 | |
| | 279 | | | National Australia Bank Ltd. | | | 5,944 | |
| | 109 | | | Ramsay Health Care Ltd. | | | 6,085 | |
| | 140 | | | REA Group Ltd. | | | 5,448 | |
| | 2,287 | | | Scentre Group REIT | | | 7,327 | |
| | 2,206 | | | Stockland REIT | | | 7,420 | |
| | 644 | | | Suncorp Group Ltd. | | | 5,866 | |
| | 1,308 | | | Sydney Airport | | | 6,231 | |
| | 2,353 | | | Tatts Group Ltd. | | | 7,269 | |
| | 1,942 | | | Telstra Corp. Ltd. | | | 7,359 | |
| | 995 | | | Transurban Group | | | 7,867 | |
| | 2,912 | | | Vicinity Centres REIT | | | 6,360 | |
| | 222 | | | Wesfarmers Ltd. | | | 6,928 | |
| | 982 | | | Westfield Corp. REIT | | | 6,650 | |
| | 253 | | | Westpac Banking Corp. | | | 5,866 | |
| | | | | | | | |
| | | | | | | 204,859 | |
| | | | | | | | |
| | | | Austria—0.5% | | | | |
| | 242 | | | BUWOG AG | | | 5,840 | |
| | | | | | | | |
| | | | Belgium—4.6% | | | | |
| | 43 | | | Ackermans & van Haaren NV | | | 5,965 | |
| | 162 | | | Ageas | | | 5,909 | |
| | 47 | | | Anheuser-Busch InBev SA | | | 5,387 | |
| | 256 | | | bpost SA | | | 6,801 | |
| | 128 | | | Colruyt SA | | | 6,870 | |
| | 86 | | | Groupe Bruxelles Lambert SA | | | 7,387 | |
| | 210 | | | Proximus SADP | | | 6,004 | |
| | 64 | | | Sofina SA | | | 8,931 | |
| | 137 | | | Telenet Group Holding NV(a) | | | 7,324 | |
| | | | | | | | |
| | | | | | | 60,578 | |
| | | | | | | | |
| | | | Denmark—1.0% | | | | |
| | 63 | | | Carlsberg A/S, Class B | | | 5,673 | |
| | 184 | | | ISS A/S | | | 7,223 | |
| | | | | | | | |
| | | | | | | 12,896 | |
| | | | | | | | |
| | | | Finland—0.9% | | | | |
| | 130 | | | Huhtamaki Oyj | | | 5,241 | |
| | 129 | | | Sampo Oyj, Class A | | | 5,907 | |
| | | | | | | | |
| | | | | | | 11,148 | |
| | | | | | | | |
| | | | | | | | |
Number
of Shares | | | | | Value | |
| | | | Common Stocks and Other Equity Interests (continued) | |
| | | | France—8.0% | | | | |
| | 69 | | | Aeroports de Paris | | $ | 6,959 | |
| | 54 | | | Air Liquide SA | | | 5,486 | |
| | 314 | | | Bureau Veritas SA | | | 5,924 | |
| | 54 | | | Cie Generale des Etablissements Michelin | | | 5,838 | |
| | 84 | | | Danone SA | | | 5,808 | |
| | 74 | | | Dassault Systemes | | | 5,852 | |
| | 47 | | | Essilor International SA | | | 5,276 | |
| | 14 | | | Hermes International | | | 5,665 | |
| | 125 | | | Klepierre REIT | | | 5,106 | |
| | 32 | | | L’Oreal SA | | | 5,720 | |
| | 53 | | | Pernod Ricard SA | | | 6,295 | |
| | 51 | | | Sodexo SA | | | 5,915 | |
| | 364 | | | Suez | | | 5,756 | |
| | 69 | | | Thales SA | | | 6,488 | |
| | 23 | | | Unibail-Rodamco SE REIT | | | 5,471 | |
| | 268 | | | Veolia Environnement SA | | | 5,840 | |
| | 85 | | | Vinci SA | | | 6,148 | |
| | 282 | | | Vivendi SA | | | 5,694 | |
| | | | | | | | |
| | | | | | | 105,241 | |
| | | | | | | | |
| | | | Germany—4.1% | | | | |
| | 69 | | | Beiersdorf AG | | | 6,066 | |
| | 161 | | | Deutsche Wohnen AG-BR | | | 5,245 | |
| | 55 | | | Hannover Rueck SE | | | 6,123 | |
| | 56 | | | Henkel AG & Co. KGaA | | | 6,157 | |
| | 166 | | | MAN SE | | | 16,952 | |
| | 34 | | | Muenchener Rueckversicherungs-Gesellschaft AG | | | 6,582 | |
| | 72 | | | SAP SE | | | 6,333 | |
| | | | | | | | |
| | | | | | | 53,458 | |
| | | | | | | | |
| | | | Hong Kong—10.0% | | | | |
| | 786 | | | Cheung Kong Infrastructure Holdings Ltd. | | | 6,441 | |
| | 500 | | | CK Hutchison Holdings Ltd. | | | 6,186 | |
| | 695 | | | CLP Holdings Ltd. | | | 7,071 | |
| | 8,289 | | | HK Electric Investments & HK Electric Investments Ltd.(b) | | | 8,209 | |
| | 5,617 | | | HKT Trust & HKT Ltd. | | | 7,721 | |
| | 4,540 | | | Hong Kong & China Gas Co. Ltd. | | | 8,899 | |
| | 898 | | | Hongkong Land Holdings Ltd. | | | 6,017 | |
| | 854 | | | Hysan Development Co. Ltd. | | | 3,943 | |
| | 229 | | | Jardine Strategic Holdings Ltd. | | | 8,036 | |
| | 1,865 | | | Kerry Properties Ltd. | | | 5,904 | |
| | 810 | | | Link REIT | | | 5,776 | |
| | 1,573 | | | MTR Corp. Ltd. | | | 8,712 | |
| | 5,000 | | | New World Development Co. Ltd. | | | 6,235 | |
| | 10,000 | | | PCCW Ltd. | | | 5,958 | |
| | 748 | | | Power Assets Holdings Ltd. | | | 7,036 | |
| | 532 | | | Sun Hung Kai Properties Ltd. | | | 7,944 | |
| | 685 | | | Swire Pacific Ltd., Class A | | | 7,124 | |
| | 2,312 | | | Swire Properties Ltd. | | | 6,648 | |
| | 603 | | | VTech Holdings Ltd. | | | 7,403 | |
| | | | | | | | |
| | | | | | | 131,263 | |
| | | | | | | | |
| | | | Ireland—1.3% | | | | |
| | 305 | | | Experian PLC | | | 5,857 | |
| | 309 | | | Glanbia PLC | | | 5,027 | |
| | 82 | | | Kerry Group PLC, Class A | | | 5,945 | |
| | | | | | | | |
| | | | | | | 16,829 | |
| | | | | | | | |
See accompanying Notes to Financial Statements which are an integral part of the financial statements.
PowerShares Developed EuroPacific Currency Hedged Low Volatility Portfolio (FXEP) (continued)
October 31, 2016
| | | | | | | | |
Number
of Shares | | | | | Value | |
| | | | Common Stocks and Other Equity Interests (continued) | |
| | | | Israel—0.6% | | | | |
| | 90 | | | Check Point Software Technologies Ltd.(a) | | $ | 7,610 | |
| | | | | | | | |
| | | | Italy—1.0% | | | | |
| | 1,162 | | | Snam SpA | | | 6,117 | |
| | 1,310 | | | Terna-Rete Elettrica Nationale SpA | | | 6,407 | |
| | | | | | | | |
| | | | | | | 12,524 | |
| | | | | | | | |
| | | | Japan—4.1% | | | | |
| | 2 | | | Advance Residence Investment Corp. REIT | | | 5,584 | |
| | 5 | | | GLP J-REIT REIT | | | 6,257 | |
| | 2 | | | Japan Retail Fund Investment Corp. REIT | | | 4,528 | |
| | 257 | | | Kagome Co. Ltd. | | | 6,733 | |
| | 668 | | | Keikyu Corp. | | | 6,732 | |
| | 3 | | | Mori Trust Sogo REIT, Inc. REIT | | | 4,822 | |
| | 1,352 | | | Nagoya Railroad Co. Ltd. | | | 7,127 | |
| | 3 | | | ORIX JREIT Inc. REIT | | | 5,130 | |
| | 200 | | | Sankyo Co. Ltd. | | | 7,042 | |
| | | | | | | | |
| | | | | | | 53,955 | |
| | | | | | | | |
| | | | Netherlands—1.9% | | | | |
| | 76 | | | Heineken NV | | | 6,252 | |
| | 271 | | | Koninklijke Ahold Delhaize NV | | | 6,178 | |
| | 205 | | | Koninklijke Philips NV | | | 6,171 | |
| | 163 | | | Wolters Kluwer NV | | | 6,299 | |
| | | | | | | | |
| | | | | | | 24,900 | |
| | | | | | | | |
| | | | New Zealand—3.6% | | | | |
| | 1,163 | | | Auckland International Airport Ltd. | | | 5,483 | |
| | 2,276 | | | Contact Energy Ltd. | | | 7,734 | |
| | 935 | | | Fisher & Paykel Healthcare Corp. Ltd. | | | 5,927 | |
| | 791 | | | Fletcher Building Ltd. | | | 5,868 | |
| | 2,723 | | | Meridian Energy Ltd. | | | 5,006 | |
| | 1,186 | | | Ryman Healthcare Ltd. | | | 7,534 | |
| | 1,730 | | | SKYCITY Entertainment Group Ltd. | | | 4,827 | |
| | 1,338 | | | Trade Me Ltd. | | | 4,652 | |
| | | | | | | | |
| | | | | | | 47,031 | |
| | | | | | | | |
| | | | Norway—1.5% | | | | |
| | 334 | | | Gjensidige Forsikring ASA | | | 5,995 | |
| | 367 | | | Marine Harvest ASA | | | 6,667 | |
| | 790 | | | Orkla ASA | | | 7,472 | |
| | | | | | | | |
| | | | | | | 20,134 | |
| | | | | | | | |
| | | | Singapore—11.9% | | | | |
| | 3,536 | | | Ascendas Real Estate Investment Trust REIT | | | 6,021 | |
| | 6,378 | | | CapitaLand Commercial Trust Ltd. REIT | | | 7,217 | |
| | 2,795 | | | CapitaLand Ltd. | | | 6,205 | |
| | 4,726 | | | CapitaLand Mall Trust REIT | | | 7,028 | |
| | 874 | | | City Developments Ltd. | | | 5,331 | |
| | 3,272 | | | ComfortDelGro Corp. Ltd. | | | 5,971 | |
| | 608 | | | DBS Group Holdings Ltd. | | | 6,552 | |
| | 3,342 | | | M1 Ltd. | | | 4,898 | |
| | 8,338 | | | Mapletree Greater China Commercial Trust REIT(b) | | | 6,230 | |
| | 10,485 | | | Mapletree Logistics Trust REIT | | | 7,796 | |
| | 1,242 | | | Oversea-Chinese Banking Corp. Ltd. | | | 7,567 | |
| | 1,825 | | | SATS Ltd. | | | 6,346 | |
| | 1,019 | | | Singapore Airlines Ltd. | | | 7,416 | |
| | 1,343 | | | Singapore Exchange Ltd. | | | 6,841 | |
| | 6,140 | | | Singapore Post Ltd. | | | 7,058 | |
| | | | | | | | |
Number
of Shares | | | | | Value | |
| | | | Common Stocks and Other Equity Interests (continued) | |
| | | | Singapore (continued) | | | | |
| | 2,814 | | | Singapore Press Holdings Ltd. | | $ | 7,521 | |
| | 2,300 | | | Singapore Technologies Engineering Ltd. | | | 5,172 | |
| | 2,291 | | | Singapore Telecommunications Ltd. | | | 6,386 | |
| | 2,987 | | | StarHub Ltd. | | | 7,253 | |
| | 5,841 | | | Suntec Real Estate Investment Trust REIT | | | 7,050 | |
| | 607 | | | United Overseas Bank Ltd. | | | 8,190 | |
| | 1,748 | | | UOL Group Ltd. | | | 7,121 | |
| | 1,260 | | | Venture Corp. Ltd. | | | 8,600 | |
| | | | | | | | |
| | | | | | | 155,770 | |
| | | | | | | | |
| | | | Spain—3.9% | | | | |
| | 380 | | | Abertis Infraestructuras SA | | | 5,634 | |
| | 42 | | | Aena SA(b) | | | 6,158 | |
| | 127 | | | Amadeus IT Group SA | | | 5,987 | |
| | 325 | | | Endesa SA | | | 6,899 | |
| | 277 | | | Ferrovial SA | | | 5,382 | |
| | 295 | | | Grifols SA | | | 5,824 | |
| | 1,016 | | | Iberdrola SA | | | 6,915 | |
| | 378 | | | Red Electrica Corp. SA | | | 7,875 | |
| | | | | | | | |
| | | | | | | 50,674 | |
| | | | | | | | |
| | | | Sweden—3.4% | | | | |
| | 333 | | | Axfood AB | | | 5,212 | |
| | 448 | | | Castellum AB | | | 6,078 | |
| | 199 | | | Fastighets AB Balder, Class B(a) | | | 4,526 | |
| | 390 | | | Hufvudstaden AB, Class A | | | 6,044 | |
| | 322 | | | Industrivarden AB, Class C | | | 5,754 | |
| | 171 | | | Saab AB, Class B | | | 6,066 | |
| | 179 | | | Swedish Match AB | | | 6,236 | |
| | 1,243 | | | Telia Co. AB | | | 4,974 | |
| | | | | | | | |
| | | | | | | 44,890 | |
| | | | | | | | |
| | | | Switzerland—6.3% | | | | |
| | 298 | | | ABB Ltd. | | | 6,147 | |
| | 34 | | | Actelion Ltd. | | | 4,917 | |
| | 16 | | | Geberit AG | | | 6,774 | |
| | 4 | | | Givaudan SA | | | 7,746 | |
| | 56 | | | Kuehne + Nagel International AG | | | 7,600 | |
| | 105 | | | Nestle SA | | | 7,618 | |
| | 89 | | | Novartis AG | | | 6,336 | |
| | 29 | | | Roche Holding AG | | | 6,672 | |
| | 36 | | | Schindler Holding AG-PC | | | 6,695 | |
| | 4 | | | SGS SA | | | 8,114 | |
| | 77 | | | Swiss Re AG | | | 7,156 | |
| | 16 | | | Swisscom AG | | | 7,324 | |
| | | | | | | | |
| | | | | | | 83,099 | |
| | | | | | | | |
| | | | United Kingdom—13.1% | | | | |
| | 207 | | | Admiral Group PLC | | | 4,845 | |
| | 90 | | | AstraZeneca PLC | | | 5,041 | |
| | 412 | | | Babcock International Group PLC | | | 4,975 | |
| | 950 | | | BAE Systems PLC | | | 6,292 | |
| | 121 | | | British American Tobacco PLC | | | 6,931 | |
| | 250 | | | Bunzl PLC | | | 6,712 | |
| | 379 | | | Compass Group PLC | | | 6,853 | |
| | 67 | | | DCC PLC | | | 5,452 | |
| | 283 | | | Diageo PLC | | | 7,531 | |
| | 1,123 | | | Direct Line Insurance Group PLC | | | 4,745 | |
See accompanying Notes to Financial Statements which are an integral part of the financial statements.
PowerShares Developed EuroPacific Currency Hedged Low Volatility Portfolio (FXEP) (continued)
October 31, 2016
| | | | | | | | |
Number
of Shares | | | | | Value | |
| | | | Common Stocks and Other Equity Interests (continued) | |
| | | | United Kingdom (continued) | | | | |
| | 340 | | | GlaxoSmithKline PLC | | $ | 6,719 | |
| | 143 | | | Imperial Brands PLC | | | 6,906 | |
| | 832 | | | Informa PLC | | | 6,831 | |
| | 128 | | | Intertek Group PLC | | | 5,341 | |
| | 1,120 | | | Kingfisher PLC | | | 4,940 | |
| | 953 | | | Merlin Entertainments PLC(b) | | | 5,361 | |
| | 586 | | | National Grid PLC | | | 7,620 | |
| | 79 | | | Reckitt Benckiser Group PLC | | | 7,053 | |
| | 398 | | | RELX PLC | | | 7,099 | |
| | 879 | | | Royal Mail PLC | | | 5,269 | |
| | 605 | | | Sage Group PLC (The) | | | 5,329 | |
| | 263 | | | Severn Trent PLC | | | 7,475 | |
| | 406 | | | Smith & Nephew PLC | | | 5,864 | |
| | 301 | | | SSE PLC | | | 5,847 | |
| | 150 | | | Unilever PLC | | | 6,260 | |
| | 600 | | | United Utilities Group PLC | | | 6,886 | |
| | 2,113 | | | Vodafone Group PLC | | | 5,799 | |
| | 268 | | | WPP PLC | | | 5,818 | |
| | | | | | | | |
| | | | | | | 171,794 | |
| | | | | | | | |
| | | | Total Common Stocks and Other Equity Interests
(Cost $1,241,266) | | | 1,274,493 | |
| | | | | | | | |
| | |
| | | | | | | | |
| | | | Rights—0.0% | | | | |
| | | | Spain—0.0% | | | | |
| | 277 | | | Ferrovial SA, expiring 11/14/16(a)
(Cost $124) | | | 119 | |
| | | | | | | | |
| | | | Total Investments
(Cost $1,241,390)—97.3% | | | 1,274,612 | |
| | | | Other assets less
liabilities—2.7% | | | 34,967 | |
| | | | | | | | |
| | | | Net Assets—100.0% | | $ | 1,309,579 | |
| | | | | | | | |
Investment Abbreviations:
BR—Bearer Shares
PC—Participation Certificate
REIT—Real Estate Investment Trust
Notes to Schedule of Investments:
| (a) | Non-income producing security. |
| (b) | Security purchased or received in a transaction exempt from registration under the Securities Act of 1933, as amended (the “1933 Act”). The security may be resold pursuant to an exemption from registration under the 1933 Act, typically to qualified institutional buyers. The aggregate value of these securities at October 31, 2016 was $25,958, which represented 1.98% of the Fund’s Net Assets. |
See accompanying Notes to Financial Statements which are an integral part of the financial statements.
Schedule of Investments
PowerShares DWA Developed Markets Momentum Portfolio (PIZ)
October 31, 2016
| | | | | | | | |
Number
of Shares | | | | | Value | |
| | | | Common Stocks and Other Equity
Interests—100.0% | |
| | | | Australia—7.0% | |
| | 94,665 | | | Amcor Ltd. | | $ | 1,058,919 | |
| | 82,762 | | | Aristocrat Leisure Ltd. | | | 966,079 | |
| | 178,095 | | | Challenger Ltd. | | | 1,458,210 | |
| | 35,086 | | | CSL Ltd. | | | 2,683,485 | |
| | 92,530 | | | Ramsay Health Care Ltd. | | | 5,165,328 | |
| | 81,707 | | | Seek Ltd. | | | 910,241 | |
| | | | | | | | |
| | | | | | | 12,242,262 | |
| | | | | | | | |
| | | | Canada—16.2% | | | | |
| | 44,418 | | | Alimentation Couche-Tard, Inc., Class B | | | 2,233,079 | |
| | 21,326 | | | Bank of Nova Scotia | | | 1,146,934 | |
| | 37,565 | | | Canadian National Railway Co. | | | 2,363,351 | |
| | 36,000 | | | Canadian Utilities Ltd., Class A | | | 1,029,569 | |
| | 7,152 | | | CCL Industries, Inc., Class B | | | 1,272,925 | |
| | 22,349 | | | CGI Group, Inc., Class A(a) | | | 1,062,380 | |
| | 8,541 | | | Constellation Software, Inc. | | | 4,004,281 | |
| | 14,459 | | | Dollarama, Inc. | | | 1,081,310 | |
| | 28,506 | | | Emera, Inc.(b) | | | 994,972 | |
| | 46,893 | | | Inter Pipeline Ltd. | | | 973,023 | |
| | 29,000 | | | Metro, Inc. | | | 897,101 | |
| | 97,101 | | | Pembina Pipeline Corp. | | | 2,985,661 | |
| | 93,258 | | | RioCan Real Estate Investment Trust REIT | | | 1,814,713 | |
| | 20,342 | | | Royal Bank of Canada | | | 1,271,897 | |
| | 60,798 | | | Saputo, Inc. | | | 2,186,505 | |
| | 60,992 | | | Teck Resources Ltd., Class B | | | 1,317,910 | |
| | 35,081 | | | Toronto-Dominion Bank (The) | | | 1,593,008 | |
| | | | | | | | |
| | | | | | | 28,228,619 | |
| | | | | | | | |
| | | | Denmark—2.8% | | | | |
| | 13,460 | | | Coloplast A/S, Class B | | | 937,776 | |
| | 30,133 | | | Novozymes A/S, Class B | | | 1,117,640 | |
| | 34,319 | | | Vestas Wind Systems A/S | | | 2,748,595 | |
| | | | | | | | |
| | | | | | | 4,804,011 | |
| | | | | | | | |
| | | | Finland—8.9% | | | | |
| | 33,424 | | | Elisa Oyj | | | 1,124,829 | |
| | 24,059 | | | Huhtamaki Oyj | | | 970,017 | |
| | 102,679 | | | Kone Oyj, Class B | | | 4,719,505 | |
| | 33,758 | | | Metso Oyj | | | 884,432 | |
| | 85,567 | | | Orion Oyj, Class B | | | 3,638,447 | |
| | 94,769 | | | Wartsila Oyj Abp | | | 4,093,101 | |
| | | | | | | | |
| | | | | | | 15,430,331 | |
| | | | | | | | |
| | | | France—4.0% | | | | |
| | 11,108 | | | Essilor International SA | | | 1,246,883 | |
| | 18,275 | | | Rubis SCA | | | 1,664,347 | |
| | 9,044 | | | Teleperformance | | | 954,424 | |
| | 6,607 | | | Unibail-Rodamco SE REIT | | | 1,571,643 | |
| | 26,650 | | | Valeo SA | | | 1,533,722 | |
| | | | | | | | |
| | | | | | | 6,971,019 | |
| | | | | | | | |
| | | | Germany—3.2% | | | | |
| | 9,838 | | | Adidas AG | | | 1,611,192 | |
| | 36,159 | | | Freenet AG | | | 1,034,737 | |
| | 10,130 | | | Henkel AG & Co. KGaA | | | 1,113,782 | |
| | 13,293 | | | Symrise AG | | | 910,883 | |
| | 18,758 | | | Wirecard AG | | | 888,610 | |
| | | | | | | | |
| | | | | | | 5,559,204 | |
| | | | | | | | |
| | | | | | | | |
Number
of Shares | | | | | Value | |
| | | | Common Stocks and Other Equity Interests (continued) | |
| | | | Hong Kong—3.8% | |
| | 620,000 | | | China Gas Holdings Ltd. | | $ | 945,009 | |
| | 76,380 | | | Jardine Matheson Holdings Ltd. | | | 4,652,306 | |
| | 145,500 | | | Link REIT | | | 1,037,563 | |
| | | | | | | | |
| | | | | | | 6,634,878 | |
| | | | | | | | |
| | | | Ireland—2.6% | | | | |
| | 238,781 | | | Experian PLC | | | 4,585,731 | |
| | | | | | | | |
| | | | Israel—0.7% | | | | |
| | 17,691 | | | Nice Ltd. | | | 1,173,197 | |
| | | | | | | | |
| | | | Italy—3.1% | |
| | 153,466 | | | Recordati SpA | | | 4,336,956 | |
| | 181,157 | | | Snam SpA | | | 953,602 | |
| | | | | | | | |
| | | | | | | 5,290,558 | |
| | | | | | | | |
| | | | Japan—3.3% | |
| | 650 | | | Daiwa House REIT Investment Corp. REIT | | | 1,753,580 | |
| | 9,700 | | | Kose Corp. | | | 885,217 | |
| | 28,400 | | | Nippon Paint Holdings Co. Ltd. | | | 967,522 | |
| | 56,164 | | | Seiko Epson Corp. | | | 1,140,009 | |
| | 14,168 | | | Sysmex Corp. | | | 982,868 | |
| | | | | | | | |
| | | | | | | 5,729,196 | |
| | | | | | | | |
| | | | Luxembourg—0.9% | | | | |
| | 3,453 | | | Eurofins Scientific SE | | | 1,566,686 | |
| | | | | | | | |
| | | | Netherlands—1.2% | | | | |
| | 11,537 | | | ASML Holding NV | | | 1,220,422 | |
| | 41,045 | | | Koninklijke Ahold Delhaize NV | | | 935,641 | |
| | | | | | | | |
| | | | | | | 2,156,063 | |
| | | | | | | | |
| | | | New Zealand—4.9% | | | | |
| | 791,563 | | | Auckland International Airport Ltd. | | | 3,731,814 | |
| | 756,076 | | | Ryman Healthcare Ltd. | | | 4,803,164 | |
| | | | | | | | |
| | | | | | | 8,534,978 | |
| | | | | | | | |
| | | | Singapore—0.5% | | | | |
| | 482,800 | | | ComfortDelGro Corp. Ltd. | | | 881,035 | |
| | | | | | | | |
| | | | South Africa—0.6% | | | | |
| | 56,026 | | | Mondi PLC | | | 1,091,698 | |
| | | | | | | | |
| | | | Spain—2.5% | | | | |
| | 37,373 | | | Industria de Diseno Textil SA | | | 1,304,635 | |
| | 142,030 | | | Red Electrica Corp. SA | | | 2,958,952 | |
| | | | | | | | |
| | | | | | | 4,263,587 | |
| | | | | | | | |
| | | | Sweden—2.6% | |
| | 47,161 | | | ASSA ABLOY AB, Class B | | | 858,898 | |
| | 255,988 | | | Fingerprint Cards AB, Class B(a)(b) | | | 2,482,841 | |
| | 32,959 | | | Hexagon AB, Class B | | | 1,155,200 | |
| | | | | | | | |
| | | | | | | 4,496,939 | |
| | | | | | | | |
| | | | Switzerland—13.5% | |
| | 84,844 | | | ABB Ltd. | | | 1,750,245 | |
| | 38 | | | Chocoladefabriken Lindt & Sprungli AG | | | 2,359,389 | |
| | 2,048 | | | EMS-CHEMIE HOLDING AG | | | 1,028,763 | |
| | 22,009 | | | Flughafen Zuerich AG | | | 4,050,600 | |
| | 6,096 | | | Geberit AG | | | 2,581,045 | |
| | 601 | | | Givaudan SA | | | 1,163,834 | |
See accompanying Notes to Financial Statements which are an integral part of the financial statements.
PowerShares DWA Developed Markets Momentum Portfolio (PIZ) (continued)
October 31, 2016
| | | | | | | | |
Number
of Shares | | | | | Value | |
| | | | Common Stocks and Other Equity Interests (continued) | |
| | | | Switzerland (continued) | | | | |
| | 24,622 | | | Kuehne + Nagel International AG | | $ | 3,341,362 | |
| | 12,395 | | | Nestle SA | | | 899,324 | |
| | 2,199 | | | Partners Group Holding AG | | | 1,114,065 | |
| | 9,976 | | | Schindler Holding AG-PC | | | 1,855,179 | |
| | 901 | | | SGS SA | | | 1,827,693 | |
| | 15,700 | | | Swiss Re AG | | | 1,459,025 | |
| | | | | | | | |
| | | | | | | 23,430,524 | |
| | | | | | | | |
| | | | United Kingdom—17.7% | |
| | 58,552 | | | British American Tobacco PLC | | | 3,353,772 | |
| | 50,442 | | | Bunzl PLC | | | 1,354,246 | |
| | 52,646 | | | Compass Group PLC | | | 951,920 | |
| | 53,339 | | | Croda International PLC | | | 2,277,953 | |
| | 10,970 | | | DCC PLC | | | 892,661 | |
| | 252,463 | | | Dixons Carphone PLC | | | 970,006 | |
| | 217,913 | | | DS Smith PLC | | | 1,061,007 | |
| | 127,367 | | | Halma PLC | | | 1,629,665 | |
| | 70,141 | | | Hiscox Ltd. | | | 874,335 | |
| | 588,907 | | | Howden Joinery Group PLC | | | 2,695,518 | |
| | 82,998 | | | IG Group Holdings PLC | | | 836,498 | |
| | 23,688 | | | Intercontinental Hotels Group PLC | | | 918,231 | |
| | 348,586 | | | Legal & General Group PLC | | | 891,182 | |
| | 47,167 | | | Micro Focus International PLC | | | 1,232,920 | |
| | 41,496 | | | Provident Financial PLC | | | 1,494,543 | |
| | 24,336 | | | Reckitt Benckiser Group PLC | | | 2,172,825 | |
| | 46,381 | | | Rightmove PLC | | | 2,115,002 | |
| | 115,044 | | | Rolls-Royce Holdings PLC | | | 1,020,422 | |
| | 5,292,024 | | | Rolls-Royce Holdings PLC (Preference Shares), Class C(a) | | | 6,461 | |
| | 105,011 | | | RPC Group PLC | | | 1,215,411 | |
| | 35,712 | | | Spirax-Sarco Engineering PLC | | | 1,923,666 | |
| | 77,594 | | | United Utilities Group PLC | | | 890,504 | |
| | | | | | | | |
| | | | | | | 30,778,748 | |
| | | | | | | | |
| | | | Total Investments (excluding investments purchased with cash collateral from securities on loan)
(Cost $169,855,597)—100.0% | | | 173,849,264 | |
| | | | | | | | |
| | |
| | | | | | | | |
| | | | Investments Purchased with Cash Collateral from Securities on Loan | |
| | |
| | | | | | | | |
| | | | Money Market Fund—1.6% | |
| | 2,754,010 | | | Invesco Government & Agency Portfolio—Institutional Class,
0.29%(c)(d)
(Cost $2,754,010) | | | 2,754,010 | |
| | | | | | | | |
| | | | Total Investments
(Cost $172,609,607)—101.6% | | | 176,603,274 | |
| | | | Other assets less
liabilities—(1.6)% | | | (2,712,233 | ) |
| | | | | | | | |
| | | | Net Assets—100.0% | | $ | 173,891,041 | |
| | | | | | | | |
Investment Abbreviations:
PC—Participation Certificate
REIT—Real Estate Investment Trust
Notes to Schedule of Investments:
| (a) | Non-income producing security. |
| (b) | All or a portion of this security was out on loan at October 31, 2016. |
| (c) | The security and the Fund are advised by wholly-owned subsidiaries of Invesco Ltd. and are therefore considered to be affiliated. The rate shown is the 7-day SEC standardized yield as of October 31, 2016. |
| (d) | The security has been segregated to satisfy the commitment to return the cash collateral received in securities lending transactions upon the borrower’s return of the securities loaned. See Note 2J. |
See accompanying Notes to Financial Statements which are an integral part of the financial statements.
Schedule of Investments
PowerShares DWA Emerging Markets Momentum Portfolio (PIE)
October 31, 2016
| | | | | | | | |
Number
of Shares | | | | | Value | |
| | | | Common Stocks and Other Equity
Interests—100.0% | |
| | | | Brazil—7.6% | |
| | 241,600 | | | Ambev SA | | $ | 1,437,001 | |
| | 180,900 | | | Centrais Eletricas Brasileiras SA(a) | | | 1,354,243 | |
| | 106,600 | | | Cia de Saneamento de Minas Gerais-COPASA MG | | | 1,121,946 | |
| | 100,300 | | | Cielo SA | | | 1,026,492 | |
| | 85,500 | | | Engie Brasil Energia SA | | | 1,095,133 | |
| | 94,400 | | | Equatorial Energia SA | | | 1,697,849 | |
| | 133,800 | | | Magazine Luiza SA(a) | | | 3,907,686 | |
| | 219,700 | | | Petroleo Brasileiro SA (Preference Shares)(a) | | | 1,227,630 | |
| | 47,500 | | | Raia Drogasil SA | | | 1,063,174 | |
| | | | | | | | |
| | | | | | | 13,931,154 | |
| | | | | | | | |
| | | | China—14.7% | |
| | 420,869 | | | AAC Technologies Holdings, Inc. | | | 4,016,107 | |
| | 1,498,408 | | | Beijing Enterprises Water Group Ltd. | | | 1,087,840 | |
| | 939,357 | | | China Medical System Holdings Ltd. | | | 1,468,114 | |
| | 589,363 | | | China Resources Gas Group Ltd. | | | 1,850,582 | |
| | 735,855 | | | Guangdong Investment Ltd. | | | 1,112,107 | |
| | 295,988 | | | Minth Group Ltd. | | | 1,053,440 | |
| | 8,715 | | | NetEase, Inc. ADR | | | 2,239,668 | |
| | 1,003,064 | | | Shandong Chenming Paper Holdings Ltd., H-Shares | | | 866,623 | |
| | 932,801 | | | Shenzhen Expressway Co. Ltd., H-Shares | | | 937,029 | |
| | 352,386 | | | Shenzhou International Group Holdings Ltd. | | | 2,337,925 | |
| | 338,525 | | | Sunny Optical Technology Group Co. Ltd. | | | 1,654,461 | |
| | 175,582 | | | Tencent Holdings Ltd. | | | 4,659,636 | |
| | 580,344 | | | TravelSky Technology Ltd., H-Shares | | | 1,240,785 | |
| | 1,426,090 | | | Xinhua Winshare Publishing and Media Co. Ltd., H-Shares(a) | | | 1,458,300 | |
| | 2,672,877 | | | Yuzhou Properties Co. Ltd. | | | 992,654 | |
| | | | | | | | |
| | | | | | | 26,975,271 | |
| | | | | | | | |
| | | | Egypt—0.6% | | | | |
| | 178,341 | | | Commercial International Bank Egypt SAE | | | 1,038,119 | |
| | | | | | | | |
| | | | India—0.5% | | | | |
| | 13,667 | | | HDFC Bank Ltd. ADR | | | 967,350 | |
| | | | | | | | |
| | | | Indonesia—4.1% | | | | |
| | 1,033,083 | | | PT Bank Central Asia Tbk | | | 1,229,201 | |
| | 10,197,851 | | | PT Japfa Comfeed Indonesia Tbk | | | 1,473,248 | |
| | 24,968,389 | | | PT Kalbe Farma Tbk | | | 3,329,629 | |
| | 7,851,822 | | | PT Waskita Karya Persero Tbk | | | 1,576,623 | |
| | | | | | | | |
| | | | | | | 7,608,701 | |
| | | | | | | | |
| | | | Malaysia—2.9% | |
| | 7,442,600 | | | My E.G. Services Bhd | | | 4,328,950 | |
| | 199,700 | | | Public Bank Bhd | | | 945,421 | |
| | | | | | | | |
| | | | | | | 5,274,371 | |
| | | | | | | | |
| | | | Mexico—0.7% | | | | |
| | 207,259 | | | Grupo Aeroportuario del Centro Norte SAB de CV, Class B | | | 1,211,872 | |
| | | | | | | | |
| | | | Philippines—10.2% | | | | |
| | 3,704,199 | | | Aboitiz Power Corp. | | | 3,515,059 | |
| | 58,075 | | | Ayala Corp. | | | 1,001,448 | |
| | 1,344,151 | | | Ayala Land, Inc. | | | 1,006,257 | |
| | 442,388 | | | Bank of the Philippine Islands | | | 923,650 | |
| | | | | | | | |
Number
of Shares | | | | | Value | |
| | | | Common Stocks and Other Equity Interests (continued) | |
| | | | Philippines (continued) | | | | |
| | 419,117 | | | BDO Unibank, Inc. | | $ | 976,331 | |
| | 5,104,729 | | | D&L Industries, Inc. | | | 1,157,518 | |
| | 1,802,743 | | | First Gen Corp. | | | 854,416 | |
| | 665,448 | | | International Container Terminal Services, Inc. | | | 1,069,169 | |
| | 397,594 | | | Jollibee Foods Corp. | | | 1,954,202 | |
| | 555,964 | | | Metropolitan Bank & Trust Co. | | | 933,448 | |
| | 572,263 | | | Security Bank Corp. | | | 2,604,714 | |
| | 98,764 | | | SM Investments Corp. | | | 1,370,632 | |
| | 2,281,798 | | | SM Prime Holdings, Inc. | | | 1,267,600 | |
| | | | | | | | |
| | | | | | | 18,634,444 | |
| | | | | | | | |
| | | | South Africa—9.9% | |
| | 95,891 | | | Bidvest Group Ltd. (The) | | | 1,190,663 | |
| | 200,587 | | | Clicks Group Ltd. | | | 1,867,137 | |
| | 331,494 | | | EOH Holdings Ltd. | | | 3,931,459 | |
| | 212,608 | | | Famous Brands Ltd. | | | 2,480,177 | |
| | 109,161 | | | Hyprop Investments Ltd. REIT | | | 969,151 | |
| | 18,357 | | | Naspers Ltd., Class N | | | 3,076,950 | |
| | 95,320 | | | Pioneer Foods Group Ltd. | | | 1,150,769 | |
| | 229,259 | | | RMB Holdings Ltd. | | | 1,012,089 | |
| | 67,347 | | | SPAR Group Ltd. (The) | | | 954,072 | |
| | 545,643 | | | Super Group Ltd.(a) | | | 1,610,724 | |
| | | | | | | | |
| | | | | | | 18,243,191 | |
| | | | | | | | |
| | | | Taiwan—29.0% | |
| | 1,697,000 | | | Accton Technology Corp. | | | 2,710,253 | |
| | 240,000 | | | Advantech Co. Ltd. | | | 1,954,527 | |
| | 602,000 | | | Basso Industry Corp. | | | 1,623,392 | |
| | 490,000 | | | Cheng Shin Rubber Industry Co. Ltd. | | | 998,400 | |
| | 526,525 | | | Chicony Electronics Co. Ltd. | | | 1,348,118 | |
| | 1,194,752 | | | China Life Insurance Co. Ltd. | | | 1,103,605 | |
| | 465,000 | | | Elite Material Co. Ltd. | | | 1,298,154 | |
| | 199,000 | | | Ennoconn Corp. | | | 3,159,281 | |
| | 813,000 | | | Feng Tay Enterprise Co. Ltd. | | | 3,400,650 | |
| | 845,000 | | | Getac Technology Corp. | | | 1,097,837 | |
| | 643,000 | | | Grape King Bio Ltd. | | | 5,399,509 | |
| | 883,000 | | | Hota Industrial Manufacturing Co. Ltd. | | | 3,679,458 | |
| | 142,000 | | | Hotai Motor Co. Ltd. | | | 1,653,648 | |
| | 713,000 | | | IEI Integration Corp. | | | 1,061,903 | |
| | 1,178,000 | | | King’s Town Bank Co. Ltd. | | | 964,946 | |
| | 19,000 | | | Largan Precision Co. Ltd. | | | 2,248,752 | |
| | 994,000 | | | Micro-Star International Co. Ltd. | | | 2,863,174 | |
| | 367,000 | | | Pegatron Corp. | | | 988,513 | |
| | 128,000 | | | President Chain Store Corp. | | | 957,237 | |
| | 690,000 | | | Primax Electronics Ltd. | | | 1,093,242 | |
| | 1,238,000 | | | Sinbon Electronics Co. Ltd. | | | 2,785,328 | |
| | 516,000 | | | Taiwan Paiho Ltd. | | | 1,757,744 | |
| | 932,000 | | | Taiwan Pcb Techvest Co. Ltd. | | | 911,105 | |
| | 214,000 | | | Taiwan Semiconductor Manufacturing Co. Ltd. | | | 1,278,270 | |
| | 422,000 | | | Tong Yang Industry Co. Ltd. | | | 981,535 | |
| | 830,000 | | | Topco Scientific Co. Ltd. | | | 2,130,397 | |
| | 874,000 | | | TYC Brother Industrial Co. Ltd. | | | 900,103 | |
| | 768,000 | | | Uni-President Enterprises Corp. | | | 1,486,962 | |
| | 1,036,650 | | | WT Microelectronics Co. Ltd. | | | 1,470,018 | |
| | | | | | | | |
| | | | | | | 53,306,061 | |
| | | | | | | | |
See accompanying Notes to Financial Statements which are an integral part of the financial statements.
PowerShares DWA Emerging Markets Momentum Portfolio (PIE) (continued)
October 31, 2016
| | | | | | | | |
Number
of Shares | | | | | Value | |
| | | | Common Stocks and Other Equity Interests (continued) | |
| | | | Thailand—19.2% | | | | |
| | 13,129,903 | | | AP Thailand PCL NVDR | | $ | 2,663,685 | |
| | 20,480,967 | | | Bangkok Land PCL NVDR | | | 924,635 | |
| | 3,804,950 | | | BTS Group Holdings PCL NVDR | | | 929,561 | |
| | 1,125,343 | | | Central Pattana PCL NVDR | | | 1,792,639 | |
| | 2,616,333 | | | CP ALL PCL NVDR | | | 4,541,531 | |
| | 210,035 | | | Kasikornbank PCL NVDR | | | 1,032,246 | |
| | 1,755,661 | | | KCE Electronics PCL NVDR | | | 5,618,517 | |
| | 347,221 | | | Krungthai Card PCL NVDR | | | 1,488,196 | |
| | 2,576,330 | | | MCS Steel PCL NVDR | | | 1,118,943 | |
| | 15,044,514 | | | Sahamitr Pressure Container PCL NVDR | | | 7,565,782 | |
| | 70,428 | | | Siam Cement PCL (The) NVDR | | | 1,006,186 | |
| | 5,581,005 | | | Supalai PCL NVDR | | | 3,891,036 | |
| | 993,310 | | | Thanachart Capital PCL NVDR | | | 1,121,101 | |
| | 1,114,333 | | | Tisco Financial Group PCL NVDR | | | 1,647,739 | |
| | | | | | | | |
| | | | | | | 35,341,797 | |
| | | | | | | | |
| | | | United States—0.6% | | | | |
| | 822,924 | | | Nexteer Automotive Group Ltd. | | | 1,084,519 | |
| | | | | | | | |
| | | | Total Common Stocks and Other Equity Interests
(Cost $165,311,730) | | | 183,616,850 | |
| | | | | | | | |
| | | | Money Market Fund—0.6% | |
| | 1,098,965 | | | Invesco Premier U.S. Government Money Portfolio—Institutional Class, 0.25%(b)
(Cost $1,098,965) | | | 1,098,965 | |
| | | | | | | | |
| | | | Total Investments
(Cost $166,410,695)—100.6% | | | 184,715,815 | |
| | | | Other assets less
liabilities—(0.6)% | | | (1,047,844 | ) |
| | | | | | | | |
| | | | Net Assets—100.0% | | $ | 183,667,971 | |
| | | | | | | | |
Investment Abbreviations:
ADR—American Depositary Receipt
NVDR—Non-voting Depositary Receipt
REIT—Real Estate Investment Trust
Notes to Schedule of Investments:
| (a) | Non-income producing security. |
| (b) | The security and the Fund are advised by wholly-owned subsidiaries of Invesco Ltd. and are therefore considered to be affiliated. The rate shown is the 7-day SEC standardized yield as of October 31, 2016. |
See accompanying Notes to Financial Statements which are an integral part of the financial statements.
Schedule of Investments
PowerShares Emerging Markets Infrastructure Portfolio (PXR)
October 31, 2016
| | | | | | | | |
Number
of Shares | | | | | Value | |
| | | | Common Stocks and Other Equity Interests—100.1% | |
| | | | Australia—0.4% | | | | |
| | 3,345 | | | CIMIC Group Ltd. | | $ | 75,318 | |
| | | | | | | | |
| | | | Brazil—6.3% | | | | |
| | 87,335 | | | Cia Siderurgica Nacional SA ADR(a) | | | 294,319 | |
| | 115,051 | | | Gerdau SA (Preference Shares) ADR | | | 394,625 | |
| | 26,200 | | | Iochpe-Maxion SA | | | 134,068 | |
| | 44,045 | | | Vale SA ADR | | | 304,791 | |
| | 26,460 | | | WEG SA | | | 147,100 | |
| | | | | | | | |
| | | | | | | 1,274,903 | |
| | | | | | | | |
| | | | Chile—1.1% | | | | |
| | 31,673 | | | CAP SA | | | 221,050 | |
| | | | | | | | |
| | | | China—29.3% | | | | |
| | 470,250 | | | Angang Steel Co. Ltd., H-Shares(a) | | | 241,345 | |
| | 152,658 | | | Anhui Conch Cement Co. Ltd., H-Shares | | | 423,238 | |
| | 1,012,750 | | | BBMG Corp., H-Shares | | | 370,892 | |
| | 570,863 | | | China Communications Construction Co. Ltd., H-Shares | | | 628,661 | |
| | 357,575 | | | China Machinery Engineering Corp., H-Shares | | | 213,950 | |
| | 1,567,327 | | | China Molybdenum Co. Ltd., H-Shares | | | 347,628 | |
| | 1,248,091 | | | China National Building Material Co. Ltd., H-Shares | | | 571,349 | |
| | 243,572 | | | China Railway Construction Corp. Ltd., H-Shares | | | 305,295 | |
| | 498,976 | | | China Railway Group Ltd., H-Shares | | | 386,062 | |
| | 234,000 | | | Chongqing Iron & Steel Co. Ltd., H-Shares(a) | | | 74,833 | |
| | 330,279 | | | CSG Holding Co. Ltd., Class B | | | 275,557 | |
| | 107,947 | | | CSSC Offshore and Marine Engineering Group Company Ltd., H-Shares | | | 163,142 | |
| | 147,181 | | | Dongfang Electric Corp. Ltd., H-Shares | | | 114,065 | |
| | 174,925 | | | First Tractor Co. Ltd., H-Shares | | | 97,897 | |
| | 118,700 | | | Hangzhou Steam Turbine Co. Ltd., Class B(a) | | | 139,749 | |
| | 292,664 | | | Harbin Electric Co. Ltd., H-Shares | | | 143,033 | |
| | 153,676 | | | Jiangxi Copper Co. Ltd., H-Shares | | | 181,521 | |
| | 1,243,131 | | | Metallurgical Corp. of China Ltd., H-Shares | | | 405,568 | |
| | 1,198,712 | | | Shanghai Electric Group Co. Ltd., H-Shares(a) | | | 554,927 | |
| | 216,513 | | | Xinjiang Goldwind Science & Technology Co. Ltd., H-Shares | | | 299,299 | |
| | | | | | | | |
| | | | | | | 5,938,011 | |
| | | | | | | | |
| | | | France—2.7% | | | | |
| | 20,306 | | | Alstom SA(a) | | | 544,689 | |
| | | | | | | | |
| | | | Germany—0.4% | | | | |
| | 616 | | | HOCHTIEF AG | | | 83,968 | |
| | | | | | | | |
| | | | India—3.5% | | | | |
| | 18,116 | | | Larsen & Toubro Ltd. GDR(b) | | | 398,552 | |
| | 15,518 | | | Mahindra & Mahindra Ltd. GDR(b) | | | 303,377 | |
| | | | | | | | |
| | | | | | | 701,929 | |
| | | | | | | | |
| | | | Indonesia—9.8% | | | | |
| | 754,600 | | | PT Adhi Karya Persero Tbk | | | 131,280 | |
| | 3,637,800 | | | PT Aneka Tambang (Persero) Tbk(a) | | | 249,527 | |
| | 170,542 | | | PT Indocement Tunggal Prakarsa Tbk | | | 215,007 | |
| | 1,026,203 | | | PT Pembangunan Perumahan Persero Tbk | | | 324,031 | |
| | 374,014 | | | PT Semen Indonesia (Persero) Tbk | | | 282,345 | |
| | 253,053 | | | PT Tower Bersama Infrastructure Tbk | | | 115,879 | |
| | | | | | | | |
Number
of Shares | | | | | Value | |
| | | | Common Stocks and Other Equity Interests (continued) | |
| | | | Indonesia (continued) | | | | |
| | 192,031 | | | PT United Tractors Tbk | | $ | 318,261 | |
| | 268,543 | | | PT Vale Indonesia Tbk(a) | | | 55,981 | |
| | 593,939 | | | PT Waskita Karya Persero Tbk | | | 119,261 | |
| | 930,858 | | | PT Wijaya Karya Persero Tbk | | | 183,347 | |
| | | | | | | | |
| | | | | | | 1,994,919 | |
| | | | | | | | |
| | | | Israel—1.8% | | | | |
| | 10,350 | | | Caesarstone Sdot-Yam Ltd.(a) | | | 365,872 | |
| | | | | | | | |
| | | | Malaysia—3.8% | | | | |
| | 483,374 | | | Dialog Group Bhd | | | 178,601 | |
| | 199,584 | | | Gamuda Bhd | | | 233,601 | |
| | 338,914 | | | IJM Corp. Bhd | | | 266,607 | |
| | 42,724 | | | Lafarge Malaysia Bhd | | | 82,494 | |
| | | | | | | | |
| | | | | | | 761,303 | |
| | | | | | | | |
| | | | Mexico—3.6% | | | | |
| | 47,933 | | | Cemex SAB de CV ADR(a) | | | 416,059 | |
| | 12,400 | | | Grupo Carso SAB de CV, Series A1 | | | 54,393 | |
| | 23,034 | | | Promotora y Operadora de Infraestructura SAB de CV | | | 258,784 | |
| | | | | | | | |
| | | | | | | 729,236 | |
| | | | | | | | |
| | | | Netherlands—0.6% | | | | |
| | 8,135 | | | OCI NV(a) | | | 112,808 | |
| | | | | | | | |
| | | | Philippines—1.1% | | | | |
| | 1,437,617 | | | Metro Pacific Investments Corp. | | | 213,761 | |
| | | | | | | | |
| | | | Poland—1.6% | | | | |
| | 17,504 | | | KGHM Polska Miedz SA | | | 316,116 | |
| | | | | | | | |
| | | | Russia—3.3% | | | | |
| | 36,840 | | | Evraz PLC(a) | | | 92,250 | |
| | 14,377 | | | Magnitogorsk Iron & Steel OJSC GDR(b) | | | 94,457 | |
| | 23,289 | | | MMC Norilsk Nickel PJSC ADR | | | 351,198 | |
| | 2,871 | | | Novolipetsk Steel PJSC GDR(b) | | | 46,510 | |
| | 6,021 | | | Severstal PJSC GDR(b) | | | 84,896 | |
| | | | | | | | |
| | | | | | | 669,311 | |
| | | | | | | | |
| | | | Singapore—0.5% | | | | |
| | 104,841 | | | Sembcorp Marine Ltd. | | | 97,542 | |
| | | | | | | | |
| | | | South Africa—5.4% | | | | |
| | 43,218 | | | African Rainbow Minerals Ltd. | | | 312,535 | |
| | 4,492 | | | Assore Ltd. | | | 60,797 | |
| | 548,144 | | | PPC Ltd. | | | 223,608 | |
| | 60,945 | | | Reunert Ltd. | | | 278,903 | |
| | 19,678 | | | Wilson Bayly Holmes-Ovcon Ltd. | | | 221,847 | |
| | | | | | | | |
| | | | | | | 1,097,690 | |
| | | | | | | | |
| | | | Spain—1.0% | | | | |
| | 6,892 | | | ACS Actividades de Construccion y Servicios SA | | | 211,012 | |
| | | | | | | | |
| | | | Sweden—2.0% | | | | |
| | 13,993 | | | Atlas Copco AB, Class A | | | 411,034 | |
| | | | | | | | |
| | | | Switzerland—1.9% | | | | |
| | 18,424 | | | ABB Ltd. | | | 379,651 | |
| | | | | | | | |
See accompanying Notes to Financial Statements which are an integral part of the financial statements.
PowerShares Emerging Markets Infrastructure Portfolio (PXR) (continued)
October 31, 2016
| | | | | | | | |
Number
of Shares | | | | | Value | |
| | | | Common Stocks and Other Equity Interests (continued) | |
| | | | Taiwan—9.5% | | | | |
| | 307,234 | | | Asia Cement Corp. | | $ | 268,218 | |
| | 425,845 | | | China Steel Corp. | | | 307,669 | |
| | 251,000 | | | CTCI Corp. | | | 368,656 | |
| | 28,000 | | | King Slide Works Co. Ltd. | | | 343,373 | |
| | 414,573 | | | Taiwan Cement Corp. | | | 497,238 | |
| | 38,000 | | | Yeong Guan Energy Technology Group Co. Ltd. | | | 149,315 | |
| | | | | | | | |
| | | | | | | 1,934,469 | |
| | | | | | | | |
| | | | Thailand—6.8% | | | | |
| | 183,178 | | | CH Karnchang PCL NVDR | | | 154,404 | |
| | 990,343 | | | Gunkul Engineering PCL NVDR | | | 140,356 | |
| | 730,107 | | | Italian-Thai Development PCL NVDR(a) | | | 103,474 | |
| | 10,265 | | | Siam Cement PCL (The) NVDR | | | 146,653 | |
| | 8,546 | | | Siam City Cement PCL NVDR | | | 70,571 | |
| | 323,183 | | | Sino-Thai Engineering & Construction PCL NVDR | | | 235,479 | |
| | 5,798,006 | | | Superblock PCL NVDR(a) | | | 263,414 | |
| | 255,182 | | | Tipco Asphalt PCL NVDR | | | 131,975 | |
| | 2,095,242 | | | TPI Polene PCL NVDR | | | 131,710 | |
| | | | | | | | |
| | | | | | | 1,378,036 | |
| | | | | | | | |
| | | | Turkey—1.7% | | | | |
| | 21,033 | | | Cimsa Cimento Sanayi ve Ticaret AS | | | 104,399 | |
| | 96,021 | | | Tekfen Holding AS | | | 243,421 | |
| | | | | | | | |
| | | | | | | 347,820 | |
| | | | | | | | |
| | | | United States—2.0% | | | | |
| | 4,987 | | | Caterpillar, Inc. | | | 416,215 | |
| | | | | | | | |
| | | | Total Investments
(Cost $22,309,626)—100.1% | | | 20,276,663 | |
| | | | Other assets less
liabilities—(0.1)% | | | (19,024 | ) |
| | | | | | | | |
| | | | Net Assets—100.0% | | $ | 20,257,639 | |
| | | | | | | | |
Investment Abbreviations:
ADR—American Depositary Receipt
GDR—Global Depositary Receipt
NVDR—Non-voting Depositary Receipt
Notes to Schedule of Investments:
| (a) | Non-income producing security. |
| (b) | Security purchased or received in a transaction exempt from registration under the Securities Act of 1933, as amended (the “1933 Act”). The security may be resold pursuant to an exemption from registration under the 1933 Act, typically to qualified institutional buyers. The aggregate value of these securities at October 31, 2016 was $927,792, which represented 4.58% of the Fund’s Net Assets. |
See accompanying Notes to Financial Statements which are an integral part of the financial statements.
Schedule of Investments
PowerShares Europe Currency Hedged Low Volatility Portfolio (FXEU)
October 31, 2016
| | | | | | | | |
Number
of Shares | | | | | Value | |
| | | | Common Stocks and Other Equity Interests—100.0% | |
| | | | Austria—1.2% | |
| | 81,254 | | | BUWOG AG | | $ | 1,960,891 | |
| | | | | | | | |
| | | | Belgium—10.7% | |
| | 14,478 | | | Ackermans & van Haaren NV | | | 2,008,448 | |
| | 54,496 | | | Ageas | | | 1,987,800 | |
| | 86,126 | | | bpost SA | | | 2,288,059 | |
| | 23,535 | | | Cofinimmo SA REIT | | | 2,754,051 | |
| | 42,822 | | | Colruyt SA | | | 2,298,490 | |
| | 28,398 | | | Groupe Bruxelles Lambert SA | | | 2,439,339 | |
| | 70,358 | | | Proximus SADP | | | 2,011,458 | |
| | 45,391 | | | Telenet Group Holding NV(a) | | | 2,426,431 | |
| | | | | | | | |
| | | | | | | 18,214,076 | |
| | | | | | | | |
| | | | Finland—1.2% | |
| | 43,453 | | | Sampo Oyj, Class A | | | 1,989,638 | |
| | | | | | | | |
| | | | France—30.2% | | | | |
| | 23,213 | | | Aeroports de Paris | | | 2,341,296 | |
| | 102,587 | | | Bureau Veritas SA | | | 1,935,366 | |
| | 18,140 | | | Cie Generale des Etablissements Michelin | | | 1,961,265 | |
| | 28,326 | | | Danone SA | | | 1,958,695 | |
| | 24,784 | | | Dassault Systemes | | | 1,959,916 | |
| | 25,315 | | | Eiffage SA | | | 1,871,481 | |
| | 93,797 | | | Elior Group(b) | | | 2,103,189 | |
| | 15,697 | | | Essilor International SA | | | 1,762,003 | |
| | 22,894 | | | Fonciere des Regions REIT | | | 1,998,427 | |
| | 14,811 | | | Gecina SA REIT | | | 2,156,117 | |
| | 4,711 | | | Hermes International | | | 1,906,106 | |
| | 25,359 | | | ICADE REIT | | | 1,820,249 | |
| | 28,699 | | | Imerys SA | | | 1,993,296 | |
| | 31,653 | | | Legrand SA | | | 1,786,602 | |
| | 10,595 | | | L’Oreal SA | | | 1,893,702 | |
| | 39,220 | | | Nexity SA | | | 1,966,714 | |
| | 24,307 | | | Orpea | | | 2,020,783 | |
| | 17,876 | | | Pernod Ricard SA | | | 2,123,192 | |
| | 24,704 | | | Publicis Groupe SA | | | 1,692,533 | |
| | 13,945 | | | Societe BIC SA | | | 1,930,687 | |
| | 17,264 | | | Sodexo SA | | | 2,002,244 | |
| | 23,168 | | | Thales SA | | | 2,178,281 | |
| | 7,526 | | | Unibail-Rodamco SE REIT | | | 1,790,251 | |
| | 89,462 | | | Veolia Environnement SA | | | 1,949,597 | |
| | 28,979 | | | Vinci SA | | | 2,095,973 | |
| | 95,444 | | | Vivendi SA | | | 1,927,206 | |
| | | | | | | | |
| | | | | | | 51,125,171 | |
| | | | | | | | |
| | | | Germany—23.6% | | | | |
| | 168,225 | | | alstria office REIT-AG REIT | | | 2,167,720 | |
| | 38,763 | | | Axel Springer SE | | | 1,938,273 | |
| | 23,348 | | | Beiersdorf AG | | | 2,052,646 | |
| | 50,323 | | | Deutsche EuroShop AG | | | 2,170,707 | |
| | 53,872 | | | Deutsche Wohnen AG-BR | | | 1,755,100 | |
| | 62,348 | | | DMG Mori AG | | | 2,849,682 | |
| | 32,311 | | | Fielmann AG | | | 2,237,793 | |
| | 35,720 | | | Fraport AG Frankfurt Airport Services Worldwide | | | 2,117,180 | |
| | 18,342 | | | Hannover Rueck SE | | | 2,041,816 | |
| | 15,815 | | | Henkel AG & Co. KGaA (Preference Shares) | | | 2,026,626 | |
| | 56,121 | | | MAN SE | | | 5,731,190 | |
| | | | | | | | |
Number
of Shares | | | | | Value | |
| | | | Common Stocks and Other Equity Interests (continued) | |
| | | | Germany (continued) | | | | |
| | 11,603 | | | Muenchener Rueckversicherungs-Gesellschaft AG | | $ | 2,246,213 | |
| | 97,400 | | | RHOEN KLINIKUM AG | | | 2,707,151 | |
| | 23,953 | | | SAP SE | | | 2,106,885 | |
| | 27,835 | | | Symrise AG | | | 1,907,351 | |
| | 137,951 | | | TAG Immobilien AG | | | 1,838,859 | |
| | 66,840 | | | Talanx AG | | | 2,071,710 | |
| | | | | | | | |
| | | | | | | 39,966,902 | |
| | | | | | | | |
| | | | Ireland—3.4% | | | | |
| | 104,267 | | | Glanbia PLC | | | 1,696,175 | |
| | 1,437,837 | | | Hibernia REIT PLC REIT | | | 2,022,210 | |
| | 27,453 | | | Kerry Group PLC, Class A | | | 1,990,417 | |
| | | | | | | | |
| | | | | | | 5,708,802 | |
| | | | | | | | |
| | | | Italy—3.7% | | | | |
| | 827,721 | | | Hera SpA | | | 2,114,121 | |
| | 390,870 | | | Snam SpA | | | 2,057,522 | |
| | 439,895 | | | Terna-Rete Elettrica Nationale SpA | | | 2,151,634 | |
| | | | | | | | |
| | | | | | | 6,323,277 | |
| | | | | | | | |
| | | | Netherlands—8.4% | | | | |
| | 59,129 | | | Aalberts Industries NV | | | 1,865,116 | |
| | 47,997 | | | Eurocommercial Properties NV CVA | | | 2,040,384 | |
| | 25,207 | | | Heineken NV | | | 2,073,776 | |
| | 90,881 | | | Koninklijke Ahold Delhaize NV | | | 2,071,676 | |
| | 69,511 | | | Koninklijke Philips NV | | | 2,092,397 | |
| | 43,886 | | | Wereldhave NV REIT | | | 1,962,560 | |
| | 54,308 | | | Wolters Kluwer NV | | | 2,098,816 | |
| | | | | | | | |
| | | | | | | 14,204,725 | |
| | | | | | | | |
| | | | Spain—15.3% | | | | |
| | 128,665 | | | Abertis Infraestructuras SA | | | 1,907,602 | |
| | 14,206 | | | Aena SA(b) | | | 2,082,838 | |
| | 42,763 | | | Amadeus IT Group SA | | | 2,015,703 | |
| | 110,918 | | | Cellnex Telecom SA(b) | | | 1,818,962 | |
| | 119,596 | | | Ebro Foods SA | | | 2,577,449 | |
| | 85,511 | | | Enagas SA | | | 2,451,228 | |
| | 110,062 | | | Endesa SA | | | 2,336,387 | |
| | 94,100 | | | Ferrovial SA | | | 1,828,377 | |
| | 99,155 | | | Grifols SA | | | 1,957,574 | |
| | 343,308 | | | Iberdrola SA | | | 2,336,660 | |
| | 127,524 | | | Red Electrica Corp. SA | | | 2,656,744 | |
| | 39,844 | | | Viscofan SA | | | 1,875,272 | |
| | | | | | | | |
| | | | | | | 25,844,796 | |
| | | | | | | | |
| | | | United Kingdom—2.3% | | | | |
| | 124,267 | | | RELX NV | | | 2,094,406 | |
| | 44,383 | | | Unilever NV CVA | | | 1,857,559 | |
| | | | | | | | |
| | | | | | | 3,951,965 | |
| | | | | | | | |
| | | | Total Common Stocks and Other Equity Interests
(Cost $176,290,354) | | | 169,290,243 | |
| | | | | | | | |
| | |
| | | | | | | | |
See accompanying Notes to Financial Statements which are an integral part of the financial statements.
PowerShares Europe Currency Hedged Low Volatility Portfolio (FXEU) (continued)
October 31, 2016
| | | | | | | | |
Number
of Shares | | | | | Value | |
| | | | Rights—0.0% | | | | |
| | | | Spain—0.0% | | | | |
| | 91,541 | | | Ferrovial SA, expiring 11/14/16(a)
(Cost $40,942) | | $ | 39,135 | |
| | | | | | | | |
| | | | Total Investments
(Cost $176,331,296)—100.0% | | | 169,329,378 | |
| | | | Other assets less
liabilities—(0.0)% | | | (20,868 | ) |
| | | | | | | | |
| | | | Net Assets—100.0% | | $ | 169,308,510 | |
| | | | | | | | |
Investment Abbreviations:
BR—Bearer Shares
CVA—Dutch Certificates
REIT—Real Estate Investment Trust
Notes to Schedule of Investments:
| (a) | Non-income producing security. |
| (b) | Security purchased or received in a transaction exempt from registration under the Securities Act of 1933, as amended (the “1933 Act”). The security may be resold pursuant to an exemption from registration under the 1933 Act, typically to qualified institutional buyers. The aggregate value of these securities at October 31, 2016 was $6,004,989, which represented 3.55% of the Fund’s Net Assets. |
See accompanying Notes to Financial Statements which are an integral part of the financial statements.
Schedule of Investments
PowerShares FTSE RAFI Asia Pacific ex-Japan Portfolio (PAF)
October 31, 2016
| | | | | | | | |
Number
of Shares | | | | | Value | |
| | | | Common Stocks and Other Equity Interests—100.0% | |
| | | | Australia—46.0% | | | | |
| | 8,067 | | | AGL Energy Ltd. | | $ | 117,738 | |
| | 10,469 | | | Amcor Ltd. | | | 117,106 | |
| | 36,961 | | | AMP Ltd. | | | 128,533 | |
| | 8,099 | | | APA Group | | | 49,057 | |
| | 1,475 | | | ASX Ltd. | | | 52,899 | |
| | 26,151 | | | Aurizon Holdings Ltd. | | | 97,110 | |
| | 48,011 | | | Australia & New Zealand Banking Group Ltd. | | | 1,017,471 | |
| | 5,772 | | | Bank of Queensland Ltd. | | | 45,942 | |
| | 10,516 | | | Bendigo & Adelaide Bank Ltd. | | | 89,064 | |
| | 656,750 | | | BGP Holdings PLC(a) | | | 0 | |
| | 86,023 | | | BHP Billiton Ltd. | | | 1,510,144 | |
| | 11,328 | | | BlueScope Steel Ltd. | | | 67,236 | |
| | 10,642 | | | Boral Ltd. | | | 51,018 | |
| | 10,292 | | | Brambles Ltd. | | | 90,299 | |
| | 3,845 | | | Caltex Australia Ltd. | | | 89,911 | |
| | 5,662 | | | Challenger Ltd. | | | 46,359 | |
| | 1,728 | | | CIMIC Group Ltd. | | | 38,909 | |
| | 9,636 | | | Coca-Cola Amatil Ltd. | | | 69,952 | |
| | 17,781 | | | Commonwealth Bank of Australia | | | 993,000 | |
| | 5,146 | | | Computershare Ltd. | | | 41,312 | |
| | 4,027 | | | Crown Resorts Ltd. | | | 33,371 | |
| | 1,503 | | | CSL Ltd. | | | 114,954 | |
| | 10,607 | | | Dexus Property Group REIT | | | 72,158 | |
| | 25,409 | | | DUET Group | | | 46,017 | |
| | 50,708 | | | Fortescue Metals Group Ltd. | | | 212,224 | |
| | 12,527 | | | Goodman Group REIT | | | 64,725 | |
| | 15,210 | | | GPT Group (The) REIT | | | 53,935 | |
| | 6,622 | | | Iluka Resources Ltd. | | | 29,075 | |
| | 27,155 | | | Incitec Pivot Ltd. | | | 60,958 | |
| | 35,366 | | | Insurance Australia Group Ltd. | | | 148,284 | |
| | 8,979 | | | Lend Lease Group | | | 92,376 | |
| | 3,915 | | | Macquarie Group Ltd. | | | 237,734 | |
| | 22,386 | | | Medibank Private Ltd. | | | 43,949 | |
| | 34,341 | | | Metcash Ltd.(a) | | | 52,002 | |
| | 45,847 | | | Mirvac Group REIT | | | 72,914 | |
| | 35,084 | | | National Australia Bank Ltd. | | | 747,521 | |
| | 6,208 | | | Newcrest Mining Ltd. | | | 106,573 | |
| | 6,589 | | | Oil Search Ltd. | | | 33,393 | |
| | 9,575 | | | Orica Ltd. | | | 118,691 | |
| | 59,778 | | | Origin Energy Ltd. | | | 243,361 | |
| | 8,632 | | | OZ Minerals Ltd. | | | 44,009 | |
| | 16,958 | | | Qantas Airways Ltd. | | | 39,487 | |
| | 26,559 | | | QBE Insurance Group Ltd. | | | 201,899 | |
| | 39,294 | | | Santos Ltd. | | | 106,746 | |
| | 42,249 | | | Scentre Group REIT | | | 135,349 | |
| | 4,791 | | | Sonic Healthcare Ltd. | | | 74,701 | |
| | 39,831 | | | South32 Ltd. | | | 77,895 | |
| | 7,463 | | | Star Entertainment Group Ltd. (The) | | | 28,338 | |
| | 35,849 | | | Stockland REIT | | | 120,575 | |
| | 23,600 | | | Suncorp Group Ltd. | | | 214,962 | |
| | 13,018 | | | Tabcorp Holdings Ltd. | | | 47,945 | |
| | 19,956 | | | Tatts Group Ltd. | | | 61,653 | |
| | 66,057 | | | Telstra Corp. Ltd. | | | 250,325 | |
| | 9,396 | | | Transurban Group | | | 74,287 | |
| | 15,963 | | | Vicinity Centres REIT | | | 34,862 | |
| | 13,182 | | | Wesfarmers Ltd. | | | 411,365 | |
| | | | | | | | |
Number
of Shares | | | | | Value | |
| | | | Common Stocks and Other Equity Interests (continued) | |
| | | | Australia (continued) | | | | |
| | 13,886 | | | Westfield Corp. REIT | | $ | 94,042 | |
| | 41,098 | | | Westpac Banking Corp. | | | 952,904 | |
| | 13,313 | | | Woodside Petroleum Ltd. | | | 287,403 | |
| | 22,895 | | | Woolworths Ltd. | | | 412,029 | |
| | 12,030 | | | WorleyParsons Ltd.(a) | | | 77,811 | |
| | | | | | | | |
| | | | | | | 11,045,862 | |
| | | | | | | | |
| | | | China—0.6% | | | | |
| | 23,228 | | | China Mengniu Dairy Co. Ltd. | | | 44,031 | |
| | 32,666 | | | Global Logistic Properties Ltd. | | | 41,657 | |
| | 26,002 | | | Tingyi Cayman Islands Holding Corp. | | | 28,064 | |
| | 51,764 | | | Want Want China Holdings Ltd. | | | 31,573 | |
| | | | | | | | |
| | | | | | | 145,325 | |
| | | | | | | | |
| | | | Hong Kong—13.4% | | | | |
| | 65,530 | | | AIA Group Ltd. | | | 413,637 | |
| | 13,080 | | | Bank of East Asia Ltd. (The) | | | 52,709 | |
| | 48,735 | | | BOC Hong Kong (Holdings) Ltd. | | | 174,079 | |
| | 15,983 | | | Cheung Kong Property Holdings Ltd. | | | 118,406 | |
| | 12,983 | | | CK Hutchison Holdings Ltd. | | | 160,637 | |
| | 12,669 | | | CLP Holdings Ltd. | | | 128,898 | |
| | 11,867 | | | Galaxy Entertainment Group Ltd. | | | 48,739 | |
| | 26,635 | | | Hang Lung Properties Ltd. | | | 58,801 | |
| | 7,073 | | | Hang Seng Bank Ltd. | | | 127,782 | |
| | 12,729 | | | Henderson Land Development Co. Ltd. | | | 75,423 | |
| | 39,348 | | | Hong Kong & China Gas Co. Ltd. | | | 77,125 | |
| | 2,564 | | | Hong Kong Exchanges & Clearing Ltd. | | | 67,912 | |
| | 14,308 | | | Hongkong Land Holdings Ltd. | | | 95,864 | |
| | 80,616 | | | Hutchison Port Holdings Trust | | | 35,874 | |
| | 8,000 | | | Hysan Development Co. Ltd. | | | 36,932 | |
| | 1,775 | | | Jardine Matheson Holdings Ltd. | | | 108,115 | |
| | 1,100 | | | Jardine Strategic Holdings Ltd. | | | 38,599 | |
| | 104,938 | | | Li & Fung Ltd. | | | 51,692 | |
| | 20,252 | | | Link REIT | | | 144,417 | |
| | 11,213 | | | MTR Corp. Ltd. | | | 62,103 | |
| | 111,130 | | | New World Development Co. Ltd. | | | 138,575 | |
| | 299,540 | | | Noble Group Ltd.(a) | | | 35,723 | |
| | 8,459 | | | Power Assets Holdings Ltd. | | | 79,574 | |
| | 22,094 | | | Sands China Ltd. | | | 96,156 | |
| | 28,416 | | | Sino Land Co. Ltd. | | | 48,369 | |
| | 54,404 | | | SJM Holdings Ltd. | | | 37,673 | |
| | 23,727 | | | Sun Hung Kai Properties Ltd. | | | 354,306 | |
| | 7,888 | | | Swire Pacific Ltd., Class A | | | 82,035 | |
| | 59,504 | | | WH Group Ltd.(b) | | | 48,264 | |
| | 23,238 | | | Wharf Holdings Ltd. (The) | | | 174,700 | |
| | 8,500 | | | Yue Yuen Industrial Holdings Ltd. | | | 32,389 | |
| | | | | | | | |
| | | | | | | 3,205,508 | |
| | | | | | | | |
| | | | Indonesia—0.1% | | | | |
| | 111,936 | | | Golden Agri-Resources Ltd. | | | 30,961 | |
| | | | | | | | |
| | | | Ireland—0.2% | |
| | 2,325 | | | James Hardie Industries PLC | | | 34,730 | |
| | | | | | | | |
| | | | New Zealand—0.8% | |
| | 10,464 | | | Contact Energy Ltd. | | | 35,558 | |
| | 11,370 | | | Fletcher Building Ltd. | | | 84,351 | |
| | 27,969 | | | Spark New Zealand Ltd. | | | 73,233 | |
| | | | | | | | |
| | | | | | | 193,142 | |
| | | | | | | | |
See accompanying Notes to Financial Statements which are an integral part of the financial statements.
PowerShares FTSE RAFI Asia Pacific ex-Japan Portfolio (PAF) (continued)
October 31, 2016
| | | | | | | | |
Number
of Shares | | | | | Value | |
| | | | Common Stocks and Other Equity Interests (continued) | |
| | | | Singapore—7.0% | |
| | 18,743 | | | Ascendas Real Estate Investment Trust REIT | | $ | 31,914 | |
| | 34,182 | | | CapitaLand Ltd. | | | 75,883 | |
| | 22,672 | | | CapitaLand Mall Trust REIT | | | 33,717 | |
| | 8,514 | | | City Developments Ltd. | | | 51,932 | |
| | 18,377 | | | ComfortDelGro Corp. Ltd. | | | 33,535 | |
| | 25,883 | | | DBS Group Holdings Ltd. | | | 278,932 | |
| | 59,103 | | | Genting Singapore PLC | | | 31,634 | |
| | 1,385 | | | Jardine Cycle & Carriage Ltd. | | | 42,011 | |
| | 38,928 | | | Keppel Corp. Ltd. | | | 147,668 | |
| | 33,801 | | | Oversea-Chinese Banking Corp. Ltd. | | | 205,929 | |
| | 23,642 | | | Sembcorp Industries Ltd. | | | 42,973 | |
| | 7,131 | | | Singapore Airlines Ltd. | | | 51,898 | |
| | 19,913 | | | Singapore Press Holdings Ltd. | | | 53,220 | |
| | 14,760 | | | Singapore Technologies Engineering Ltd. | | | 33,191 | |
| | 87,327 | | | Singapore Telecommunications Ltd. | | | 243,429 | |
| | 16,961 | | | United Overseas Bank Ltd. | | | 228,844 | |
| | 37,800 | | | Wilmar International Ltd. | | | 89,890 | |
| | | | | | | | |
| | | | | | | 1,676,600 | |
| | | | | | | | |
| | | | South Korea—30.5% | |
| | 6,624 | | | BNK Financial Group, Inc. | | | 53,779 | |
| | 99 | | | CJ CheilJedang Corp. | | | 30,239 | |
| | 18 | | | CJ CheilJedang Corp. (Preference Shares) | | | 2,769 | |
| | 220 | | | CJ Corp. | | | 33,550 | |
| | 576 | | | Daelim Industrial Co. Ltd. | | | 41,127 | |
| | 810 | | | Dongbu Insurance Co. Ltd. | | | 50,331 | |
| | 702 | | | Doosan Corp. | | | 62,884 | |
| | 2,980 | | | Doosan Heavy Industries & Construction Co. Ltd. | | | 68,233 | |
| | 12,505 | | | Doosan Infracore Co. Ltd.(a) | | | 75,735 | |
| | 351 | | | E-Mart, Inc. | | | 49,847 | |
| | 1,395 | | | GS Engineering & Construction Corp.(a) | | | 32,673 | |
| | 1,021 | | | GS Holdings Corp. | | | 45,596 | |
| | 5,406 | | | Hana Financial Group, Inc. | | | 154,963 | |
| | 956 | | | Hankook Tire Co. Ltd. | | | 46,119 | |
| | 1,428 | | | Hanwha Corp. | | | 46,612 | |
| | 426 | | | Hyosung Corp. | | | 49,888 | |
| | 1,714 | | | Hyundai Engineering & Construction Co. Ltd. | | | 62,089 | |
| | 177 | | | Hyundai Glovis Co. Ltd. | | | 26,838 | |
| | 1,214 | | | Hyundai Heavy Industries Co. Ltd.(a) | | | 154,369 | |
| | 1,478 | | | Hyundai Marine & Fire Insurance Co. Ltd. | | | 45,661 | |
| | 854 | | | Hyundai Mobis Co. Ltd. | | | 204,497 | |
| | 2,282 | | | Hyundai Motor Co. | | | 279,205 | |
| | 366 | | | Hyundai Motor Co. (Preference Shares) | | | 30,579 | |
| | 585 | | | Hyundai Motor Co. (2nd Preference Shares) | | | 51,381 | |
| | 1,816 | | | Hyundai Steel Co. | | | 78,401 | |
| | 7,607 | | | Industrial Bank of Korea | | | 87,754 | |
| | 6,016 | | | KB Financial Group, Inc. | | | 222,396 | |
| | 1,191 | | | KB Insurance Co. Ltd. | | | 30,133 | |
| | 4,898 | | | Kia Motors Corp. | | | 174,218 | |
| | 4,711 | | | Korea Electric Power Corp. | | | 202,768 | |
| | 1,071 | | | Korea Gas Corp. | | | 43,383 | |
| | 83 | | | Korea Zinc Co. Ltd. | | | 33,004 | |
| | 1,598 | | | Korean Air Lines Co. Ltd.(a) | | | 44,690 | |
| | 2,866 | | | KT Corp. | | | 80,902 | |
| | 904 | | | KT&G Corp. | | | 89,274 | |
| | 483 | | | LG Chem Ltd. | | | 104,050 | |
| | | | | | | | |
Number
of Shares | | | | | Value | |
| | | | Common Stocks and Other Equity Interests (continued) | |
| | | | South Korea (continued) | |
| | 86 | | | LG Chem Ltd. (Preference Shares) | | $ | 13,529 | |
| | 1,107 | | | LG Corp. | | | 59,304 | |
| | 7,041 | | | LG Display Co. Ltd. | | | 167,987 | |
| | 3,198 | | | LG Electronics, Inc. | | | 133,594 | |
| | 495 | | | LG Electronics, Inc. (Preference Shares) | | | 10,274 | |
| | 5,065 | | | LG Uplus Corp. | | | 52,232 | |
| | 164 | | | Lotte Chemical Corp. | | | 41,349 | |
| | 283 | | | Lotte Shopping Co. Ltd. | | | 56,513 | |
| | 450 | | | OCI Co. Ltd.(a) | | | 35,591 | |
| | 2,323 | | | POSCO | | | 481,146 | |
| | 1,012 | | | Samsung Electro-Mechanics Co. Ltd. | | | 41,656 | |
| | 1,267 | | | Samsung Electronics Co. Ltd. | | | 1,814,825 | |
| | 241 | | | Samsung Electronics Co. Ltd. (Preference Shares) | | | 277,384 | |
| | 408 | | | Samsung Fire & Marine Insurance Co. Ltd. | | | 103,939 | |
| | 29 | | | Samsung Fire & Marine Insurance Co. Ltd. (Preference Shares) | | | 4,790 | |
| | 7,762 | | | Samsung Heavy Industries Co. Ltd.(a) | | | 66,139 | |
| | 1,116 | | | Samsung Life Insurance Co. Ltd. | | | 107,772 | |
| | 817 | | | Samsung SDI Co. Ltd. | | | 67,331 | |
| | 4,575 | | | Shinhan Financial Group Co. Ltd. | | | 175,323 | |
| | 6,811 | | | SK Hynix, Inc. | | | 244,047 | |
| | 1,569 | | | SK Innovation Co. Ltd. | | | 207,737 | |
| | 7,832 | | | SK Networks Co. Ltd. | | | 44,627 | |
| | 408 | | | SK Telecom Co. Ltd. | | | 79,692 | |
| | 850 | | | S-Oil Corp. | | | 58,313 | |
| | 8,295 | | | Woori Bank | | | 90,616 | |
| | | | | | | | |
| | | | | | | 7,325,647 | |
| | | | | | | | |
| | | | United Kingdom—1.4% | |
| | 8,283 | | | Rio Tinto Ltd. | | | 341,494 | |
| | | | | | | | |
| | | | Total Investments
(Cost $25,607,059)—100.0% | | | 23,999,269 | |
| | | | Other assets less liabilities—(0.0)% | | | (8,947 | ) |
| | | | | | | | |
| | | | Net Assets—100.0% | | $ | 23,990,322 | |
| | | | | | | | |
Investment Abbreviations:
REIT—Real Estate Investment Trust
Notes to Schedule of Investments:
| (a) | Non-income producing security. |
| (b) | Security purchased or received in a transaction exempt from registration under the Securities Act of 1933, as amended (the “1933 Act”). The security may be resold pursuant to an exemption from registration under the 1933 Act, typically to qualified institutional buyers. The value of this security at October 31, 2016 represented less than 1% of the Fund’s Net Assets. |
See accompanying Notes to Financial Statements which are an integral part of the financial statements.
Schedule of Investments
PowerShares FTSE RAFI Developed Markets ex-U.S. Portfolio (PXF)
October 31, 2016
| | | | | | | | |
Number
of Shares | | | | | Value | |
| | | | Common Stocks and Other Equity
Interests—99.7% | |
| | | | Australia—6.2% | |
| | 39,344 | | | AGL Energy Ltd. | | $ | 574,226 | |
| | 51,545 | | | Amcor Ltd. | | | 576,581 | |
| | 181,429 | | | AMP Ltd. | | | 630,927 | |
| | 39,843 | | | APA Group | | | 241,336 | |
| | 7,228 | | | ASX Ltd. | | | 259,222 | |
| | 128,891 | | | Aurizon Holdings Ltd. | | | 478,628 | |
| | 237,230 | | | Australia & New Zealand Banking Group Ltd. | | | 5,027,486 | |
| | 28,452 | | | Bank of Queensland Ltd. | | | 226,465 | |
| | 51,871 | | | Bendigo & Adelaide Bank Ltd. | | | 439,315 | |
| | 231,466 | | | BGP Holdings PLC(a) | | | 0 | |
| | 426,657 | | | BHP Billiton Ltd. | | | 7,490,012 | |
| | 273,268 | | | BHP Billiton PLC | | | 4,118,698 | |
| | 55,721 | | | BlueScope Steel Ltd. | | | 330,727 | |
| | 52,425 | | | Boral Ltd. | | | 251,325 | |
| | 50,132 | | | Brambles Ltd. | | | 439,846 | |
| | 18,781 | | | Caltex Australia Ltd. | | | 439,175 | |
| | 27,920 | | | Challenger Ltd. | | | 228,604 | |
| | 8,555 | | | CIMIC Group Ltd. | | | 192,629 | |
| | 47,428 | | | Coca-Cola Amatil Ltd. | | | 344,302 | |
| | 87,831 | | | Commonwealth Bank of Australia | | | 4,905,020 | |
| | 25,381 | | | Computershare Ltd. | | | 203,759 | |
| | 19,841 | | | Crown Resorts Ltd. | | | 164,417 | |
| | 7,310 | | | CSL Ltd. | | | 559,091 | |
| | 52,351 | | | Dexus Property Group REIT | | | 356,138 | |
| | 125,044 | | | DUET Group | | | 226,462 | |
| | 248,248 | | | Fortescue Metals Group Ltd. | | | 1,038,974 | |
| | 61,750 | | | Goodman Group REIT | | | 319,053 | |
| | 74,900 | | | GPT Group (The) REIT | | | 265,597 | |
| | 32,609 | | | Iluka Resources Ltd. | | | 143,176 | |
| | 133,667 | | | Incitec Pivot Ltd. | | | 300,056 | |
| | 173,624 | | | Insurance Australia Group Ltd. | | | 727,977 | |
| | 44,281 | | | Lend Lease Group | | | 455,565 | |
| | 19,238 | | | Macquarie Group Ltd. | | | 1,168,204 | |
| | 110,195 | | | Medibank Private Ltd. | | | 216,340 | |
| | 169,095 | | | Metcash Ltd.(a) | | | 256,059 | |
| | 225,830 | | | Mirvac Group REIT | | | 359,157 | |
| | 173,389 | | | National Australia Bank Ltd. | | | 3,694,330 | |
| | 30,237 | | | Newcrest Mining Ltd. | | | 519,079 | |
| | 32,492 | | | Oil Search Ltd. | | | 164,667 | |
| | 46,767 | | | Orica Ltd. | | | 579,718 | |
| | 294,110 | | | Origin Energy Ltd. | | | 1,197,346 | |
| | 42,457 | | | OZ Minerals Ltd. | | | 216,461 | |
| | 83,522 | | | Qantas Airways Ltd. | | | 194,482 | |
| | 130,373 | | | QBE Insurance Group Ltd. | | | 991,081 | |
| | 192,163 | | | Santos Ltd. | | | 522,028 | |
| | 207,365 | | | Scentre Group REIT | | | 664,314 | |
| | 23,353 | | | Sonic Healthcare Ltd. | | | 364,117 | |
| | 196,119 | | | South32 Ltd. | | | 383,538 | |
| | 36,735 | | | Star Entertainment Group Ltd. (The) | | | 139,488 | |
| | 175,197 | | | Stockland REIT | | | 589,257 | |
| | 116,139 | | | Suncorp Group Ltd. | | | 1,057,860 | |
| | 64,132 | | | Tabcorp Holdings Ltd. | | | 236,198 | |
| | 98,284 | | | Tatts Group Ltd. | | | 303,644 | |
| | 325,347 | | | Telstra Corp. Ltd. | | | 1,232,912 | |
| | 45,768 | | | Transurban Group | | | 361,854 | |
| | 78,571 | | | Vicinity Centres REIT | | | 171,593 | |
| | | | | | | | |
Number
of Shares | | | | | Value | |
| | | | Common Stocks and Other Equity
Interests (continued) | |
| | | | Australia (continued) | |
| | 64,930 | | | Wesfarmers Ltd. | | $ | 2,026,242 | |
| | 67,769 | | | Westfield Corp. REIT | | | 458,962 | |
| | 203,111 | | | Westpac Banking Corp. | | | 4,709,361 | |
| | 65,571 | | | Woodside Petroleum Ltd. | | | 1,415,556 | |
| | 112,774 | | | Woolworths Ltd. | | | 2,029,533 | |
| | 59,264 | | | WorleyParsons Ltd.(a) | | | 383,324 | |
| | | | | | | | |
| | | | | | | 58,561,494 | |
| | | | | | | | |
| | | | Austria—0.3% | |
| | 3,597 | | | Andritz AG | | | 187,886 | |
| | 25,447 | | | Erste Group Bank AG | | | 798,076 | |
| | 6,221 | | | Immoeast AG(a) | | | 0 | |
| | 85,462 | | | IMMOFINANZ AG | | | 183,901 | |
| | 26,971 | | | OMV AG | | | 841,881 | |
| | 24,382 | | | Raiffeisen Bank International AG(a) | | | 399,042 | |
| | 13,899 | | | voestalpine AG | | | 491,059 | |
| | | | | | | | |
| | | | | | | 2,901,845 | |
| | | | | | | | |
| | | | Belgium—0.6% | |
| | 22,857 | | | Ageas | | | 833,733 | |
| | 21,755 | | | Anheuser-Busch InBev SA | | | 2,493,292 | |
| | 3,405 | | | Colruyt SA | | | 182,765 | |
| | 15,953 | | | KBC Groep NV(a) | | | 970,741 | |
| | 11,778 | | | Proximus SADP | | | 336,720 | |
| | 5,634 | | | Solvay SA | | | 645,700 | |
| | 3,217 | | | UCB SA | | | 217,548 | |
| | 8,084 | | | Umicore SA | | | 490,849 | |
| | | | | | | | |
| | | | | | | 6,171,348 | |
| | | | | | | | |
| | | | Canada—7.9% | |
| | 6,538 | | | Agnico Eagle Mines Ltd. | | | 332,303 | |
| | 8,880 | | | Agrium, Inc. | | | 815,814 | |
| | 10,897 | | | Alimentation Couche-Tard, Inc., Class B | | | 547,838 | |
| | 7,752 | | | AltaGas Ltd.(b) | | | 191,971 | |
| | 25,611 | | | ARC Resources Ltd.(b) | | | 435,115 | |
| | 5,996 | | | ATCO Ltd., Class I | | | 210,358 | |
| | 46,807 | | | Bank of Montreal | | | 2,981,120 | |
| | 88,989 | | | Bank of Nova Scotia | | | 4,785,918 | |
| | 67,382 | | | Barrick Gold Corp. | | | 1,186,506 | |
| | 141,109 | | | Baytex Energy Corp.(a)(b) | | | 543,274 | |
| | 16,650 | | | BCE, Inc. | | | 757,061 | |
| | 57,417 | | | BlackBerry Ltd.(a) | | | 405,700 | |
| | 249,938 | | | Bombardier, Inc., Class B(a) | | | 331,945 | |
| | 41,775 | | | Brookfield Asset Management, Inc., Class A | | | 1,464,034 | |
| | 22,274 | | | Cameco Corp. | | | 171,677 | |
| | 29,493 | | | Canadian Imperial Bank of Commerce | | | 2,211,562 | |
| | 18,515 | | | Canadian National Railway Co. | | | 1,164,846 | |
| | 86,590 | | | Canadian Natural Resources Ltd. | | | 2,750,335 | |
| | 3,512 | | | Canadian Pacific Railway Ltd. | | | 502,437 | |
| | 4,687 | | | Canadian Real Estate Investment Trust REIT | | | 161,496 | |
| | 4,100 | | | Canadian Tire Corp. Ltd., Class A | | | 398,849 | |
| | 10,789 | | | Canadian Utilities Ltd., Class A | | | 308,556 | |
| | 10,732 | | | Capital Power Corp. | | | 165,354 | |
| | 16,655 | | | Celestica, Inc.(a) | | | 197,213 | |
| | 103,105 | | | Cenovus Energy, Inc. | | | 1,488,589 | |
| | 7,709 | | | CGI Group, Inc., Class A(a) | | | 366,454 | |
| | 10,727 | | | CI Financial Corp. | | | 197,532 | |
See accompanying Notes to Financial Statements which are an integral part of the financial statements.
PowerShares FTSE RAFI Developed Markets ex-U.S. Portfolio (PXF) (continued)
October 31, 2016
| | | | | | | | |
Number
of Shares | | | | | Value | |
| | | | Common Stocks and Other Equity
Interests (continued) | |
| | | | Canada (continued) | |
| | 16,180 | | | Cominar Real Estate Investment Trust REIT | | $ | 179,396 | |
| | 58,728 | | | Crescent Point Energy Corp. | | | 699,784 | |
| | 11,258 | | | Dream Office Real Estate Investment Trust REIT | | | 140,363 | |
| | 71,394 | | | Eldorado Gold Corp.(a) | | | 225,329 | |
| | 13,891 | | | Empire Co. Ltd., Class A | | | 200,242 | |
| | 44,257 | | | Enbridge, Inc. | | | 1,912,602 | |
| | 256,845 | | | Encana Corp. | | | 2,451,071 | |
| | 95,135 | | | Enerplus Corp. | | | 640,977 | |
| | 815 | | | Fairfax Financial Holdings Ltd. | | | 417,731 | |
| | 18,479 | | | Finning International, Inc. | | | 344,142 | |
| | 125,800 | | | First Quantum Minerals Ltd. | | | 1,195,816 | |
| | 16,222 | | | Fortis, Inc. | | | 534,379 | |
| | 2,543 | | | Franco-Nevada Corp. | | | 166,573 | |
| | 4,958 | | | George Weston Ltd. | | | 404,335 | |
| | 15,332 | | | Gibson Energy, Inc. | | | 192,529 | |
| | 49,622 | | | Goldcorp, Inc. | | | 754,188 | |
| | 20,229 | | | Great-West Lifeco, Inc. | | | 508,498 | |
| | 22,081 | | | H&R Real Estate Investment Trust REIT | | | 375,801 | |
| | 54,431 | | | Husky Energy, Inc.(a) | | | 586,039 | |
| | 61,859 | | | IAMGOLD Corp.(a) | | | 247,851 | |
| | 8,176 | | | IGM Financial, Inc. | | | 219,613 | |
| | 15,378 | | | Imperial Oil Ltd. | | | 499,118 | |
| | 6,975 | | | Industrial Alliance Insurance and Financial Services, Inc. | | | 270,309 | |
| | 6,033 | | | Intact Financial Corp. | | | 410,438 | |
| | 15,997 | | | Inter Pipeline Ltd. | | | 331,936 | |
| | 6,631 | | | Keyera Corp. | | | 199,190 | |
| | 74,351 | | | Kinross Gold Corp.(a) | | | 289,027 | |
| | 12,349 | | | Loblaw Cos. Ltd. | | | 609,779 | |
| | 58,156 | | | Lundin Mining Corp.(a) | | | 227,808 | |
| | 28,368 | | | Magna International, Inc. | | | 1,165,623 | |
| | 155,278 | | | Manulife Financial Corp. | | | 2,251,111 | |
| | 5,460 | | | Methanex Corp. | | | 198,601 | |
| | 11,312 | | | Metro, Inc. | | | 349,931 | |
| | 26,183 | | | National Bank of Canada | | | 935,379 | |
| | 5,150 | | | Onex Corp. | | | 333,381 | |
| | 17,722 | | | Pembina Pipeline Corp. | | | 544,916 | |
| | 142,845 | | | Penn West Petroleum Ltd.(a)(b) | | | 228,083 | |
| | 63,717 | | | Potash Corp. of Saskatchewan, Inc. | | | 1,036,872 | |
| | 31,479 | | | Power Corp. of Canada | | | 675,733 | |
| | 22,585 | | | Power Financial Corp. | | | 534,187 | |
| | 44,665 | | | Precision Drilling Corp. | | | 199,289 | |
| | 5,765 | | | Quebecor, Inc., Class B | | | 161,906 | |
| | 20,949 | | | RioCan Real Estate Investment Trust REIT | | | 407,648 | |
| | 22,820 | | | Rogers Communications, Inc., Class B | | | 918,759 | |
| | 89,077 | | | Royal Bank of Canada(b) | | | 5,569,597 | |
| | 8,162 | | | Saputo, Inc. | | | 293,534 | |
| | 28,207 | | | Shaw Communications, Inc., Class B | | | 559,405 | |
| | 11,266 | | | Silver Wheaton Corp. | | | 271,679 | |
| | 6,188 | | | Smart Real Estate Investment Trust REIT | | | 154,440 | |
| | 11,159 | | | SNC-Lavalin Group, Inc. | | | 453,770 | |
| | 43,387 | | | Sun Life Financial, Inc. | | | 1,453,193 | |
| | 118,293 | | | Suncor Energy, Inc. | | | 3,552,541 | |
| | 139,759 | | | Teck Resources Ltd., Class B | | | 3,019,900 | |
| | 12,703 | | | TELUS Corp. | | | 411,633 | |
| | | | | | | | |
Number
of Shares | | | | | Value | |
| | | | Common Stocks and Other Equity
Interests (continued) | |
| | | | Canada (continued) | |
| | 103,743 | | | Toronto-Dominion Bank (The) | | $ | 4,710,911 | |
| | 7,314 | | | Tourmaline Oil Corp.(a) | | | 191,820 | |
| | 62,166 | | | TransAlta Corp. | | | 274,129 | |
| | 41,200 | | | TransCanada Corp. | | | 1,866,565 | |
| | 7,583 | | | Vermilion Energy, Inc. | | | 297,606 | |
| | 122,889 | | | Yamana Gold, Inc. | | | 439,200 | |
| | | | | | | | |
| | | | | | | 73,770,063 | |
| | | | | | | | |
| | | | Chile—0.0% | |
| | 45,264 | | | Antofagasta PLC | | | 300,077 | |
| | | | | | | | |
| | | | China—0.1% | | | | |
| | 113,042 | | | China Mengniu Dairy Co. Ltd. | | | 214,281 | |
| | 157,815 | | | Global Logistic Properties Ltd. | | | 201,251 | |
| | 127,885 | | | Tingyi Cayman Islands Holding Corp. | | | 138,029 | |
| | 254,255 | | | Want Want China Holdings Ltd. | | | 155,081 | |
| | | | | | | | |
| | | | | | | 708,642 | |
| | | | | | | | |
| | | | Denmark—0.7% | |
| | 610 | | | AP Moller—Maersk A/S, Class A | | | 891,249 | |
| | 874 | | | AP Moller—Maersk A/S, Class B | | | 1,339,434 | |
| | 5,431 | | | Carlsberg A/S, Class B | | | 488,987 | |
| | 35,642 | | | Danske Bank A/S | | | 1,098,754 | |
| | 5,115 | | | DSV A/S | | | 247,529 | |
| | 4,479 | | | FLSmidth & Co. A/S | | | 162,497 | |
| | 9,276 | | | ISS A/S | | | 364,143 | |
| | 4,217 | | | Jyske Bank A/S | | | 191,084 | |
| | 25,612 | | | Novo Nordisk A/S, Class B | | | 914,856 | |
| | 3,230 | | | Novozymes A/S, Class B | | | 119,801 | |
| | 1,409 | | | Pandora A/S | | | 183,129 | |
| | 119,395 | | | TDC A/S(a) | | | 657,837 | |
| | 4,258 | | | Vestas Wind Systems A/S | | | 341,021 | |
| | | | | | | | |
| | | | | | | 7,000,321 | |
| | | | | | | | |
| | | | Finland—0.7% | |
| | 6,757 | | | Elisa Oyj | | | 227,396 | |
| | 55,049 | | | Fortum Oyj | | | 916,637 | |
| | 6,710 | | | Kesko Oyj, Class B | | | 333,057 | |
| | 9,789 | | | Kone Oyj, Class B | | | 449,939 | |
| | 11,639 | | | Metso Oyj | | | 304,932 | |
| | 8,792 | | | Neste Oyj | | | 379,054 | |
| | 222,113 | | | Nokia Oyj | | | 990,478 | |
| | 6,451 | | | Nokian Renkaat Oyj | | | 216,179 | |
| | 4,423 | | | Orion Oyj, Class B | | | 188,073 | |
| | 21,480 | | | Sampo Oyj, Class A | | | 983,532 | |
| | 56,469 | | | Stora Enso Oyj, Class R | | | 533,280 | |
| | 46,241 | | | UPM-Kymmene Oyj | | | 1,074,615 | |
| | 7,016 | | | Wartsila Oyj Abp | | | 303,023 | |
| | | | | | | | |
| | | | | | | 6,900,195 | |
| | | | | | | | |
| | | | France—9.2% | |
| | 10,239 | | | Accor SA | | | 388,182 | |
| | 53,877 | | | Air France-KLM(a)(b) | | | 328,255 | |
| | 16,171 | | | Air Liquide SA | | | 1,642,906 | |
| | 24,790 | | | Airbus Group SE | | | 1,471,516 | |
| | 19,252 | | | Alstom SA(a) | | | 516,416 | |
| | 6,473 | | | Arkema SA | | | 612,927 | |
| | 4,467 | | | Atos SE | | | 463,328 | |
See accompanying Notes to Financial Statements which are an integral part of the financial statements.
PowerShares FTSE RAFI Developed Markets ex-U.S. Portfolio (PXF) (continued)
October 31, 2016
| | | | | | | | |
Number
of Shares | | | | | Value | |
| | | | Common Stocks and Other Equity
Interests (continued) | |
| | | | France (continued) | |
| | 214,398 | | | AXA SA | | $ | 4,826,201 | |
| | 119,570 | | | BNP Paribas SA | | | 6,925,880 | |
| | 48,984 | | | Bollore SA | | | 161,089 | |
| | 24,071 | | | Bouygues SA | | | 783,815 | |
| | 9,216 | | | Bureau Veritas SA | | | 173,865 | |
| | 6,793 | | | Capgemini SA | | | 562,061 | |
| | 73,179 | | | Carrefour SA | | | 1,916,829 | |
| | 17,999 | | | Casino Guichard Perrachon SA | | | 894,384 | |
| | 8,418 | | | CGG SA(a)(b) | | | 222,298 | |
| | 2,762 | | | Christian Dior SE | | | 532,119 | |
| | 48,231 | | | Cie de Saint-Gobain | | | 2,138,361 | |
| | 14,587 | | | Cie Generale des Etablissements Michelin | | | 1,577,121 | |
| | 17,512 | | | CNP Assurances | | | 303,019 | |
| | 131,782 | | | Credit Agricole SA | | | 1,420,326 | |
| | 23,702 | | | Danone SA | | | 1,638,953 | |
| | 10,039 | | | Edenred | | | 232,255 | |
| | 6,757 | | | Eiffage SA | | | 499,530 | |
| | 73,864 | | | Electricite de France SA(b) | | | 826,701 | |
| | 8,157 | | | Elior Group(c) | | | 182,903 | |
| | 242,794 | | | Engie SA | | | 3,495,892 | |
| | 4,023 | | | Essilor International SA | | | 451,585 | |
| | 3,739 | | | Eurazeo SA | | | 214,895 | |
| | 7,609 | | | Eutelsat Communications SA | | | 159,313 | |
| | 6,810 | | | Faurecia | | | 250,156 | |
| | 2,130 | | | Fonciere des Regions REIT | | | 185,929 | |
| | 1,916 | | | Gecina SA REIT | | | 278,923 | |
| | 13,724 | | | Groupe Eurotunnel SE | | | 128,343 | |
| | 2,647 | | | ICADE REIT | | | 190,000 | |
| | 3,510 | | | Kering | | | 777,420 | |
| | 5,586 | | | Klepierre REIT | | | 228,188 | |
| | 11,842 | | | Lagardere SCA | | | 301,164 | |
| | 9,878 | | | Legrand SA | | | 557,547 | |
| | 6,338 | | | L’Oreal SA | | | 1,132,825 | |
| | 8,350 | | | LVMH Moet Hennessy Louis Vuitton SE | | | 1,515,324 | |
| | 82,461 | | | Natixis SA | | | 416,263 | |
| | 8,276 | | | Neopost SA | | | 250,210 | |
| | 4,199 | | | Nexans SA(a) | | | 238,341 | |
| | 3,427 | | | Nexity SA | | | 171,849 | |
| | 201,534 | | | Orange SA | | | 3,170,226 | |
| | 7,561 | | | Pernod Ricard SA | | | 898,045 | |
| | 53,999 | | | Peugeot SA(a) | | | 807,698 | |
| | 8,055 | | | Publicis Groupe SA | | | 551,868 | |
| | 15,088 | | | Renault SA | | | 1,308,438 | |
| | 52,992 | | | Rexel SA | | | 733,965 | |
| | 10,551 | | | Safran SA | | | 724,379 | |
| | 70,523 | | | Sanofi | | | 5,485,729 | |
| | 36,401 | | | Schneider Electric SE | | | 2,439,657 | |
| | 14,166 | | | SCOR SE | | | 457,944 | |
| | 123,682 | | | Societe Generale SA | | | 4,821,234 | |
| | 4,664 | | | Sodexo SA | | | 540,921 | |
| | 29,942 | | | Suez | | | 473,464 | |
| | 11,829 | | | Technip SA | | | 783,463 | |
| | 1,961 | | | Teleperformance | | | 206,947 | |
| | 4,465 | | | Thales SA | | | 419,804 | |
| | 246,767 | | | Total SA | | | 11,826,525 | |
| | 4,034 | | | Unibail-Rodamco SE REIT | | | 959,590 | |
| | | | | | | | |
Number
of Shares | | | | | Value | |
| | | | Common Stocks and Other Equity
Interests (continued) | |
| | | | France (continued) | |
| | 12,054 | | | Valeo SA | | $ | 693,714 | |
| | 118,721 | | | Vallourec SA(a) | | | 582,516 | |
| | 49,994 | | | Veolia Environnement SA | | | 1,089,492 | |
| | 30,339 | | | Vinci SA(b) | | | 2,194,338 | |
| | 116,147 | | | Vivendi SA | | | 2,345,241 | |
| | 2,494 | | | Wendel SA | | | 286,515 | |
| | 8,161 | | | Zodiac Aerospace | | | 198,335 | |
| | | | | | | | |
| | | | | | | 86,185,455 | |
| | | | | | | | |
| | | | Germany—9.0% | |
| | 5,192 | | | Aareal Bank AG | | | 187,050 | |
| | 7,364 | | | Adidas AG | | | 1,206,019 | |
| | 45,071 | | | Allianz SE | | | 7,015,772 | |
| | 8,305 | | | Aurubis AG | | | 431,436 | |
| | 80,124 | | | BASF SE | | | 7,052,906 | |
| | 31,708 | | | Bayer AG | | | 3,138,329 | |
| | 34,196 | | | Bayerische Motoren Werke AG | | | 2,975,237 | |
| | 5,608 | | | Bayerische Motoren Werke AG (Preference Shares) | | | 425,099 | |
| | 2,030 | | | Beiersdorf AG | | | 178,468 | |
| | 5,757 | | | Bilfinger SE(a)(b) | | | 202,546 | |
| | 8,573 | | | Brenntag AG | | | 457,622 | |
| | 238,711 | | | Commerzbank AG | | | 1,618,984 | |
| | 4,623 | | | Continental AG | | | 884,573 | |
| | 87,623 | | | Daimler AG | | | 6,234,759 | |
| | 260,714 | | | Deutsche Bank AG(a) | | | 3,759,630 | |
| | 6,888 | | | Deutsche Boerse AG(a) | | | 535,189 | |
| | 39,389 | | | Deutsche Lufthansa AG | | | 502,811 | |
| | 83,729 | | | Deutsche Post AG | | | 2,591,056 | |
| | 249,822 | | | Deutsche Telekom AG | | | 4,065,377 | |
| | 8,261 | | | Deutsche Wohnen AG-BR | | | 269,136 | |
| | 568,225 | | | E.ON SE | | | 4,155,912 | |
| | 9,530 | | | Evonik Industries AG | | | 297,316 | |
| | 7,199 | | | Freenet AG | | | 206,009 | |
| | 6,661 | | | Fresenius Medical Care AG & Co. KGaA | | | 541,866 | |
| | 14,102 | | | Fresenius SE & Co. KGaA | | | 1,039,437 | |
| | 6,165 | | | GEA Group AG | | | 238,053 | |
| | 4,733 | | | Hannover Rueck SE | | | 526,874 | |
| | 10,407 | | | HeidelbergCement AG | | | 982,927 | |
| | 3,521 | | | Henkel AG & Co. KGaA | | | 387,130 | |
| | 5,101 | | | Henkel AG & Co. KGaA (Preference Shares) | | | 653,672 | |
| | 2,386 | | | HOCHTIEF AG | | | 325,242 | |
| | 3,484 | | | HUGO BOSS AG | | | 218,494 | |
| | 33,479 | | | Infineon Technologies AG | | | 600,223 | |
| | 21,720 | | | K+S AG(b) | | | 438,809 | |
| | 3,072 | | | KION Group AG | | | 185,281 | |
| | 17,243 | | | Kloeckner & Co. SE(a) | | | 214,913 | |
| | 9,160 | | | LANXESS AG | | | 585,703 | |
| | 1,878 | | | LEG Immobilien AG | | | 158,188 | |
| | 5,650 | | | Leoni AG | | | 214,203 | |
| | 10,576 | | | Linde AG | | | 1,742,490 | |
| | 2,071 | | | MAN SE | | | 211,495 | |
| | 3,412 | | | Merck KGaA | | | 350,310 | |
| | 42,152 | | | METRO AG | | | 1,260,990 | |
| | 2,211 | | | MTU Aero Engines AG | | | 230,445 | |
| | 15,685 | | | Muenchener Rueckversicherungs-Gesellschaft AG | | | 3,036,443 | |
See accompanying Notes to Financial Statements which are an integral part of the financial statements.
PowerShares FTSE RAFI Developed Markets ex-U.S. Portfolio (PXF) (continued)
October 31, 2016
| | | | | | | | |
Number
of Shares | | | | | Value | |
| | | | Common Stocks and Other Equity
Interests (continued) | |
| | | | Germany (continued) | |
| | 4,559 | | | Osram Licht AG | | $ | 258,125 | |
| | 11,847 | | | Porsche Automobil Holding SE (Preference Shares) | | | 637,971 | |
| | 10,021 | | | ProSiebenSat.1 Media SE | | | 431,272 | |
| | 2,981 | | | Rheinmetall AG | | | 206,229 | |
| | 211,537 | | | RWE AG(a) | | | 3,353,085 | |
| | 13,937 | | | RWE AG (Preference Shares) | | | 160,493 | |
| | 8,732 | | | Salzgitter AG | | | 286,203 | |
| | 22,793 | | | SAP SE | | | 2,004,852 | |
| | 54,345 | | | Siemens AG | | | 6,162,828 | |
| | 11,252 | | | Suedzucker AG | | | 287,886 | |
| | 2,589 | | | Symrise AG | | | 177,407 | |
| | 5,505 | | | Talanx AG | | | 170,628 | |
| | 36,810 | | | Telefonica Deutschland Holding AG | | | 142,480 | |
| | 56,999 | | | thyssenkrupp AG | | | 1,317,752 | |
| | 30,188 | | | TUI AG | | | 382,202 | |
| | 56,755 | | | Uniper SE(a) | | | 754,355 | |
| | 4,677 | | | Volkswagen AG | | | 697,262 | |
| | 30,281 | | | Volkswagen AG (Preference Shares) | | | 4,155,894 | |
| | 10,814 | | | Vonovia SE | | | 380,346 | |
| | | | | | | | |
| | | | | | | 84,501,694 | |
| | | | | | | | |
| | | | Hong Kong—1.7% | | | | |
| | 325,757 | | | AIA Group Ltd. | | | 2,056,236 | |
| | 63,569 | | | Bank of East Asia Ltd. (The) | | | 256,166 | |
| | 238,022 | | | BOC Hong Kong (Holdings) Ltd. | | | 850,205 | |
| | 77,590 | | | Cheung Kong Property Holdings Ltd. | | | 574,807 | |
| | 63,294 | | | CK Hutchison Holdings Ltd. | | | 783,130 | |
| | 61,211 | | | CLP Holdings Ltd. | | | 622,778 | |
| | 57,932 | | | Galaxy Entertainment Group Ltd. | | | 237,933 | |
| | 133,706 | | | Hang Lung Properties Ltd. | | | 295,176 | |
| | 34,606 | | | Hang Seng Bank Ltd. | | | 625,196 | |
| | 61,542 | | | Henderson Land Development Co. Ltd. | | | 364,656 | |
| | 190,499 | | | Hong Kong & China Gas Co. Ltd. | | | 373,390 | |
| | 12,873 | | | Hong Kong Exchanges & Clearing Ltd. | | | 340,963 | |
| | 70,246 | | | Hongkong Land Holdings Ltd. | | | 470,648 | |
| | 396,900 | | | Hutchison Port Holdings Trust | | | 176,621 | |
| | 40,297 | | | Hysan Development Co. Ltd. | | | 186,030 | |
| | 8,717 | | | Jardine Matheson Holdings Ltd. | | | 530,953 | |
| | 5,773 | | | Jardine Strategic Holdings Ltd. | | | 202,575 | |
| | 510,166 | | | Li & Fung Ltd. | | | 251,305 | |
| | 99,288 | | | Link REIT | | | 708,025 | |
| | 55,939 | | | MTR Corp. Ltd. | | | 309,816 | |
| | 546,012 | | | New World Development Co. Ltd. | | | 680,856 | |
| | 1,462,376 | | | Noble Group Ltd.(a) | | | 174,405 | |
| | 40,940 | | | Power Assets Holdings Ltd. | | | 385,123 | |
| | 107,889 | | | Sands China Ltd. | | | 469,545 | |
| | 142,216 | | | Sino Land Co. Ltd. | | | 242,075 | |
| | 260,988 | | | SJM Holdings Ltd. | | | 180,726 | |
| | 116,053 | | | Sun Hung Kai Properties Ltd. | | | 1,732,972 | |
| | 38,575 | | | Swire Pacific Ltd., Class A | | | 401,178 | |
| | 293,219 | | | WH Group Ltd.(c) | | | 237,832 | |
| | 118,619 | | | Wharf Holdings Ltd. (The) | | | 891,763 | |
| | 40,948 | | | Yue Yuen Industrial Holdings Ltd. | | | 156,033 | |
| | | | | | | | |
| | | | | | | 15,769,117 | |
| | | | | | | | |
| | | | | | | | |
Number
of Shares | | | | | Value | |
| | | | Common Stocks and Other Equity
Interests (continued) | |
| | | | Indonesia—0.0% | |
| | 551,031 | | | Golden Agri-Resources Ltd. | | $ | 152,415 | |
| | | | | | | | |
| | | | Ireland—0.4% | | | | |
| | 2,032,599 | | | Bank of Ireland(a) | | | 434,486 | |
| | 46,090 | | | CRH PLC | | | 1,487,813 | |
| | 27,926 | | | Experian PLC | | | 536,312 | |
| | 11,382 | | | James Hardie Industries PLC | | | 170,018 | |
| | 3,082 | | | Kerry Group PLC, Class A | | | 223,453 | |
| | 2,107 | | | Ryanair Holdings PLC ADR(a) | | | 158,215 | |
| | 15,860 | | | Smurfit Kappa Group PLC | | | 347,574 | |
| | | | | | | | |
| | | | | | | 3,357,871 | |
| | | | | | | | |
| | | | Israel—0.3% | | | | |
| | 65,352 | | | Bank Hapoalim BM | | | 376,726 | |
| | 88,530 | | | Bank Leumi Le-Israel BM(a) | | | 333,771 | |
| | 153,897 | | | Bezeq The Israeli Telecommunication Corp. Ltd. | | | 279,288 | |
| | 72,764 | | | Israel Chemicals Ltd. | | | 258,796 | |
| | 35,047 | | | Teva Pharmaceutical Industries Ltd. | | | 1,466,413 | |
| | | | | | | | |
| | | | | | | 2,714,994 | |
| | | | | | | | |
| | | | Italy—2.8% | | | | |
| | 160,377 | | | A2A SpA | | | 218,174 | |
| | 196,751 | | | Assicurazioni Generali SpA | | | 2,538,536 | |
| | 21,563 | | | Atlantia SpA | | | 527,350 | |
| | 980,630 | | | Banca Monte dei Paschi di Siena SpA(a)(b) | | | 261,325 | |
| | 59,001 | | | Banca Popolare dell’Emilia Romagna SC | | | 276,429 | |
| | 362,918 | | | Banca Popolare di Milano Scarl | | | 166,134 | |
| | 74,937 | | | Banco Popolare SC | | | 215,551 | |
| | 1,048,140 | | | Enel SpA | | | 4,503,968 | |
| | 483,952 | | | Eni SpA | | | 7,008,015 | |
| | 4,630 | | | Ferrari NV | | | 243,518 | |
| | 52,085 | | | Hera SpA | | | 133,033 | |
| | 934,722 | | | Intesa Sanpaolo SpA | | | 2,161,996 | |
| | 70,709 | | | Intesa Sanpaolo SpA RSP | | | 152,542 | |
| | 32,299 | | | Leonardo-Finmeccanica SpA(a) | | | 393,009 | |
| | 4,250 | | | Luxottica Group SpA | | | 211,279 | |
| | 75,299 | | | Mediaset SpA | | | 214,941 | |
| | 47,352 | | | Mediobanca SpA | | | 346,481 | |
| | 12,857 | | | Prysmian SpA | | | 319,508 | |
| | 129,012 | | | Snam SpA | | | 679,113 | |
| | 1,481,332 | | | Telecom Italia SpA(a) | | | 1,283,643 | |
| | 930,474 | | | Telecom Italia SpA RSP | | | 658,911 | |
| | 71,820 | | | Terna-Rete Elettrica Nationale SpA | | | 351,289 | |
| | 942,411 | | | UniCredit SpA | | | 2,334,741 | |
| | 164,147 | | | Unione di Banche Italiane SpA(b) | | | 452,004 | |
| | 111,192 | | | Unipol Gruppo Finanziario SpA | | | 339,582 | |
| | 113,018 | | | UnipolSai SpA | | | 215,569 | |
| | | | | | | | |
| | | | | | | 26,206,641 | |
| | | | | | | | |
| | | | Japan—22.2% | | | | |
| | 102,968 | | | Aeon Co. Ltd. | | | 1,423,728 | |
| | 12,314 | | | Air Water, Inc. | | | 230,496 | |
| | 18,365 | | | Aisin Seiki Co. Ltd. | | | 806,533 | |
| | 18,005 | | | Ajinomoto Co., Inc. | | | 400,330 | |
| | 19,485 | | | Alfresa Holdings Corp. | | | 412,006 | |
| | 11,894 | | | Alps Electric Co. Ltd. | | | 285,225 | |
| | 17,772 | | | Amada Holdings Co. Ltd. | | | 202,606 | |
See accompanying Notes to Financial Statements which are an integral part of the financial statements.
PowerShares FTSE RAFI Developed Markets ex-U.S. Portfolio (PXF) (continued)
October 31, 2016
| | | | | | | | |
Number
of Shares | | | | | Value | |
| | | | Common Stocks and Other Equity
Interests (continued) | |
| | | | Japan (continued) | | | | |
| | 79,968 | | | ANA Holdings, Inc. | | $ | 224,643 | |
| | 69,352 | | | Aozora Bank Ltd. | | | 229,006 | |
| | 153,304 | | | Asahi Glass Co. Ltd. | | | 1,072,260 | |
| | 18,474 | | | Asahi Group Holdings Ltd. | | | 659,428 | |
| | 140,475 | | | Asahi Kasei Corp. | | | 1,266,995 | |
| | 72,385 | | | Astellas Pharma, Inc. | | | 1,074,220 | |
| | 10,741 | | | Bandai Namco Holdings, Inc. | | | 321,969 | |
| | 29,160 | | | Bank of Kyoto Ltd. (The) | | | 213,945 | |
| | 4,752 | | | Benesse Holdings, Inc. | | | 124,492 | |
| | 38,752 | | | Bridgestone Corp. | | | 1,443,727 | |
| | 21,940 | | | Brother Industries Ltd. | | | 402,952 | |
| | 76,062 | | | Canon, Inc. | | | 2,183,747 | |
| | 7,545 | | | Casio Computer Co. Ltd.(b) | | | 105,257 | |
| | 7,719 | | | Central Japan Railway Co. | | | 1,312,270 | |
| | 55,503 | | | Chiba Bank Ltd. (The) | | | 343,312 | |
| | 54,148 | | | Chubu Electric Power Co., Inc. | | | 795,847 | |
| | 5,562 | | | Chugai Pharmaceutical Co. Ltd. | | | 189,484 | |
| | 34,325 | | | Chugoku Electric Power Co., Inc. (The) | | | 401,114 | |
| | 25,450 | | | Citizen Watch Co. Ltd. | | | 143,131 | |
| | 89,117 | | | Concordia Financial Group Ltd. | | | 413,168 | |
| | 12,379 | | | Credit Saison Co. Ltd. | | | 213,925 | |
| | 46,363 | | | Dai Nippon Printing Co. Ltd. | | | 465,020 | |
| | 13,958 | | | Daicel Corp. | | | 183,831 | |
| | 42,878 | | | Daido Steel Co. Ltd. | | | 181,982 | |
| | 162,467 | | | DAI-Ichi Life Holdings, Inc. | | | 2,382,468 | |
| | 41,343 | | | Daiichi Sankyo Co. Ltd. | | | 993,790 | |
| | 9,401 | | | Daikin Industries Ltd. | | | 901,766 | |
| | 3,705 | | | Daito Trust Construction Co. Ltd. | | | 619,645 | |
| | 33,540 | | | Daiwa House Industry Co. Ltd. | | | 921,125 | |
| | 107,570 | | | Daiwa Securities Group, Inc. | | | 642,544 | |
| | 50,114 | | | Denka Co. Ltd. | | | 227,477 | |
| | 32,101 | | | Denso Corp. | | | 1,394,500 | |
| | 9,858 | | | Dentsu, Inc. | | | 491,563 | |
| | 11,176 | | | DIC Corp. | | | 338,731 | |
| | 4,244 | | | Don Quijote Holdings Co. Ltd. | | | 161,344 | |
| | 21,506 | | | East Japan Railway Co. | | | 1,894,476 | |
| | 9,100 | | | Ebara Corp. | | | 270,181 | |
| | 9,262 | | | Eisai Co. Ltd. | | | 590,350 | |
| | 15,453 | | | Electric Power Development Co. Ltd. | | | 359,837 | |
| | 5,905 | | | FANUC Corp. | | | 1,105,871 | |
| | 1,140 | | | Fast Retailing Co. Ltd. | | | 384,683 | |
| | 62,086 | | | Fuji Electric Co. Ltd. | | | 310,179 | |
| | 22,744 | | | Fuji Heavy Industries Ltd. | | | 886,082 | |
| | 26,615 | | | FUJIFILM Holdings Corp. | | | 1,006,753 | |
| | 36,838 | | | Fujikura Ltd. | | | 216,643 | |
| | 321,363 | | | Fujitsu Ltd. | | | 1,905,517 | |
| | 103,286 | | | Fukuoka Financial Group, Inc. | | | 447,211 | |
| | 11,200 | | | Furukawa Electric Co. Ltd. | | | 329,866 | |
| | 43,407 | | | Gunma Bank Ltd. (The) | | | 207,359 | |
| | 36,581 | | | Hachijuni Bank Ltd. (The) | | | 199,466 | |
| | 15,900 | | | Hakuhodo DY Holdings, Inc. | | | 191,100 | |
| | 13,440 | | | Hankyu Hanshin Holdings, Inc. | | | 445,080 | |
| | 17,262 | | | Haseko Corp. | | | 168,045 | |
| | 23,593 | | | Hino Motors Ltd. | | | 257,068 | |
| | 43,302 | | | Hiroshima Bank Ltd. (The) | | | 185,430 | |
| | 12,637 | | | Hitachi Construction Machinery Co. Ltd. | | | 264,200 | |
| | | | | | | | |
Number
of Shares | | | | | Value | |
| | | | Common Stocks and Other Equity
Interests (continued) | |
| | | | Japan (continued) | | | | |
| | 787,976 | | | Hitachi Ltd. | | $ | 4,193,141 | |
| | 14,104 | | | Hitachi Metals Ltd. | | | 176,090 | |
| | 23,582 | | | Hokkaido Electric Power Co., Inc. | | | 179,303 | |
| | 13,700 | | | Hokuhoku Financial Group, Inc. | | | 197,512 | |
| | 15,722 | | | Hokuriku Electric Power Co. | | | 178,487 | |
| | 192,745 | | | Honda Motor Co. Ltd. | | | 5,766,668 | |
| | 15,163 | | | Hoya Corp. | | | 632,724 | |
| | 13,659 | | | Ibiden Co. Ltd. | | | 198,220 | |
| | 19,523 | | | Idemitsu Kosan Co. Ltd. | | | 449,781 | |
| | 249,036 | | | IHI Corp.(a) | | | 656,449 | |
| | 10,300 | | | Iida Group Holdings Co. Ltd. | | | 198,874 | |
| | 134,986 | | | Inpex Corp. | | | 1,266,044 | |
| | 31,451 | | | Isetan Mitsukoshi Holdings Ltd. | | | 317,847 | |
| | 47,252 | | | Isuzu Motors Ltd. | | | 584,327 | |
| | 143,407 | | | ITOCHU Corp. | | | 1,812,972 | |
| | 26,558 | | | J Front Retailing Co. Ltd. | | | 365,699 | |
| | 4,554 | | | Japan Airlines Co. Ltd. | | | 134,169 | |
| | 100,555 | | | Japan Display, Inc.(a) | | | 198,077 | |
| | 34,832 | | | Japan Post Bank Co. Ltd. | | | 410,354 | |
| | 65,304 | | | Japan Post Holdings Co. Ltd. | | | 831,486 | |
| | 14,647 | | | Japan Post Insurance Co. Ltd. | | | 306,920 | |
| | 29,478 | | | Japan Tobacco, Inc. | | | 1,120,380 | |
| | 103,650 | | | JFE Holdings, Inc. | | | 1,485,928 | |
| | 17,487 | | | JGC Corp. | | | 309,353 | |
| | 14,617 | | | JSR Corp. | | | 222,277 | |
| | 20,293 | | | JTEKT Corp. | | | 300,287 | |
| | 310,298 | | | JX Holdings, Inc. | | | 1,228,081 | |
| | 64,202 | | | Kajima Corp. | | | 433,166 | |
| | 28,088 | | | Kaneka Corp. | | | 232,541 | |
| | 74,956 | | | Kansai Electric Power Co., Inc. (The)(a) | | | 716,499 | |
| | 14,180 | | | Kao Corp. | | | 729,342 | |
| | 153,763 | | | Kawasaki Heavy Industries Ltd. | | | 449,210 | |
| | 217,682 | | | Kawasaki Kisen Kaisha Ltd.(b) | | | 538,586 | |
| | 75,039 | | | KDDI Corp. | | | 2,279,340 | |
| | 17,213 | | | Keikyu Corp. | | | 173,465 | |
| | 20,314 | | | Keio Corp. | | | 168,180 | |
| | 497 | | | Keyence Corp. | | | 364,456 | |
| | 86,093 | | | Kintetsu Group Holdings Co. Ltd. | | | 347,371 | |
| | 74,681 | | | Kirin Holdings Co. Ltd. | | | 1,284,540 | |
| | 75,600 | | | Kobe Steel Ltd.(a) | | | 624,455 | |
| | 4,081 | | | Koito Manufacturing Co. Ltd. | | | 212,817 | |
| | 81,247 | | | Komatsu Ltd. | | | 1,811,502 | |
| | 44,913 | | | Konica Minolta, Inc. | | | 402,180 | |
| | 52,677 | | | Kubota Corp. | | | 849,419 | |
| | 26,461 | | | Kuraray Co. Ltd. | | | 401,378 | |
| | 6,228 | | | Kurita Water Industries Ltd. | | | 147,395 | |
| | 20,080 | | | Kyocera Corp. | | | 976,436 | |
| | 10,617 | | | Kyowa Hakko Kirin Co. Ltd. | | | 162,157 | |
| | 53,980 | | | Kyushu Electric Power Co., Inc. | | | 489,537 | |
| | 2,474 | | | Lawson, Inc. | | | 187,872 | |
| | 23,921 | | | Leopalace21 Corp. | | | 155,702 | |
| | 21,258 | | | LIXIL Group Corp. | | | 488,134 | |
| | 4,722 | | | Makita Corp. | | | 326,678 | |
| | 294,692 | | | Marubeni Corp. | | | 1,549,948 | |
| | 12,208 | | | Marui Group Co. Ltd. | | | 171,355 | |
| | 48,810 | | | Mazda Motor Corp. | | | 802,391 | |
See accompanying Notes to Financial Statements which are an integral part of the financial statements.
PowerShares FTSE RAFI Developed Markets ex-U.S. Portfolio (PXF) (continued)
October 31, 2016
| | | | | | | | |
Number
of Shares | | | | | Value | |
| | | | Common Stocks and Other Equity
Interests (continued) | |
| | | | Japan (continued) | | | | |
| | 20,573 | | | Medipal Holdings Corp. | | $ | 351,416 | |
| | 4,197 | | | MEIJI Holdings Co. Ltd. | | | 418,562 | |
| | 162,982 | | | Mitsubishi Chemical Holdings Corp. | | | 1,071,709 | |
| | 170,667 | | | Mitsubishi Corp. | | | 3,720,779 | |
| | 147,765 | | | Mitsubishi Electric Corp. | | | 2,000,245 | |
| | 40,005 | | | Mitsubishi Estate Co. Ltd. | | | 792,410 | |
| | 17,560 | | | Mitsubishi Gas Chemical Co., Inc. | | | 270,372 | |
| | 352,280 | | | Mitsubishi Heavy Industries Ltd. | | | 1,506,539 | |
| | 17,300 | | | Mitsubishi Materials Corp. | | | 496,355 | |
| | 56,745 | | | Mitsubishi Motors Corp. | | | 315,895 | |
| | 9,826 | | | Mitsubishi Tanabe Pharma Corp. | | | 191,312 | |
| | 1,589,814 | | | Mitsubishi UFJ Financial Group, Inc. | | | 8,239,166 | |
| | 229,488 | | | Mitsui & Co. Ltd. | | | 3,184,027 | |
| | 114,745 | | | Mitsui Chemicals, Inc. | | | 565,617 | |
| | 149,517 | | | Mitsui Engineering & Shipbuilding Co. Ltd. | | | 207,732 | |
| | 40,267 | | | Mitsui Fudosan Co. Ltd. | | | 916,004 | |
| | 121,154 | | | Mitsui Mining & Smelting Co. Ltd. | | | 269,782 | |
| | 291,171 | | | Mitsui OSK Lines Ltd. | | | 728,724 | |
| | 2,640,112 | | | Mizuho Financial Group, Inc. | | | 4,449,387 | |
| | 46,593 | | | MS&AD Insurance Group Holdings, Inc. | | | 1,384,245 | |
| | 4,770 | | | Murata Manufacturing Co. Ltd. | | | 665,898 | |
| | 49,984 | | | Nagoya Railroad Co. Ltd. | | | 263,512 | |
| | 376,622 | | | NEC Corp. | | | 1,007,097 | |
| | 10,043 | | | NGK Insulators Ltd. | | | 184,259 | |
| | 9,628 | | | NGK Spark Plug Co. Ltd. | | | 190,205 | |
| | 16,154 | | | NH Foods Ltd. | | | 386,460 | |
| | 18,283 | | | NHK Spring Co. Ltd. | | | 172,243 | |
| | 6,000 | | | Nidec Corp. | | | 580,673 | |
| | 26,084 | | | Nikon Corp. | | | 393,922 | |
| | 2,707 | | | Nintendo Co. Ltd. | | | 655,337 | |
| | 59,235 | | | Nippon Electric Glass Co. Ltd. | | | 321,865 | |
| | 89,654 | | | Nippon Express Co. Ltd. | | | 442,789 | |
| | 17,820 | | | Nippon Paper Industries Co. Ltd. | | | 333,728 | |
| | 30,000 | | | Nippon Sheet Glass Co. Ltd.(a) | | | 244,088 | |
| | 109,835 | | | Nippon Steel & Sumitomo Metal Corp. | | | 2,172,451 | |
| | 40,832 | | | Nippon Telegraph & Telephone Corp. | | | 1,810,697 | |
| | 361,233 | | | Nippon Yusen Kabushiki Kaisha | | | 739,069 | |
| | 265,094 | | | Nissan Motor Co. Ltd. | | | 2,695,465 | |
| | 11,629 | | | Nisshin Seifun Group, Inc. | | | 171,306 | |
| | 14,769 | | | Nisshin Steel Co. Ltd. | | | 196,058 | |
| | 3,049 | | | Nissin Foods Holdings Co. Ltd. | | | 176,409 | |
| | 1,991 | | | Nitori Holdings Co. Ltd. | | | 238,158 | |
| | 8,475 | | | Nitto Denko Corp. | | | 590,835 | �� |
| | 11,044 | | | NOK Corp. | | | 247,711 | |
| | 286,455 | | | Nomura Holdings, Inc. | | | 1,435,205 | |
| | 9,746 | | | Nomura Real Estate Holdings, Inc. | | | 164,806 | |
| | 34,119 | | | NSK Ltd. | | | 378,577 | |
| | 57,255 | | | NTN Corp. | | | 216,848 | |
| | 7,170 | | | NTT Data Corp. | | | 369,809 | |
| | 69,585 | | | NTT DoCoMo, Inc. | | | 1,748,482 | |
| | 45,440 | | | Obayashi Corp. | | | 438,033 | |
| | 11,600 | | | Odakyu Electric Railway Co. Ltd. | | | 236,780 | |
| | 116,650 | | | OJI Holdings Corp. | | | 493,974 | |
| | 8,169 | | | Olympus Corp. | | | 291,514 | |
| | 11,831 | | | OMRON Corp. | | | 453,718 | |
| | 5,952 | | | Ono Pharmaceutical Co. Ltd. | | | 151,059 | |
| | | | | | | | |
Number
of Shares | | | | | Value | |
| | | | Common Stocks and Other Equity
Interests (continued) | |
| | | | Japan (continued) | | | | |
| | 2,649 | | | Oriental Land Co. Ltd. | | $ | 154,703 | |
| | 73,059 | | | ORIX Corp. | | | 1,157,918 | |
| | 170,407 | | | Osaka Gas Co. Ltd. | | | 708,158 | |
| | 16,877 | | | Otsuka Holdings Co. Ltd. | | | 738,293 | |
| | 282,493 | | | Panasonic Corp. | | | 2,948,992 | |
| | 19,238 | | | Rakuten, Inc. | | | 221,973 | |
| | 11,861 | | | Recruit Holdings Co. Ltd. | | | 476,314 | |
| | 29,151 | | | Rengo Co. Ltd. | | | 182,809 | |
| | 269,197 | | | Resona Holdings, Inc. | | | 1,193,756 | |
| | 80,585 | | | Ricoh Co. Ltd. | | | 656,428 | |
| | 5,981 | | | Rohm Co. Ltd. | | | 314,745 | |
| | 9,333 | | | Santen Pharmaceutical Co. Ltd. | | | 136,240 | |
| | 6,096 | | | Sapporo Holdings Ltd. | | | 172,232 | |
| | 16,709 | | | SBI Holdings, Inc. | | | 198,756 | |
| | 6,624 | | | Secom Co. Ltd. | | | 477,992 | |
| | 16,363 | | | Sega Sammy Holdings, Inc. | | | 241,509 | |
| | 7,302 | | | Seibu Holdings, Inc. | | | 126,188 | |
| | 17,911 | | | Seiko Epson Corp. | | | 363,555 | |
| | 14,365 | | | Seino Holdings Co. Ltd. | | | 159,254 | |
| | 29,457 | | | Sekisui Chemical Co. Ltd. | | | 463,923 | |
| | 39,332 | | | Sekisui House Ltd. | | | 649,950 | |
| | 45,138 | | | Seven & i Holdings Co. Ltd. | | | 1,882,665 | |
| | 380,679 | | | Sharp Corp.(a)(b) | | | 655,687 | |
| | 13,775 | | | Shikoku Electric Power Co., Inc. | | | 129,511 | |
| | 1,046 | | | Shimano, Inc. | | | 178,771 | |
| | 37,707 | | | Shimizu Corp. | | | 335,141 | |
| | 21,591 | | | Shin-Etsu Chemical Co. Ltd. | | | 1,637,740 | |
| | 124,994 | | | Shinsei Bank Ltd. | | | 202,208 | |
| | 6,064 | | | Shionogi & Co. Ltd. | | | 298,800 | |
| | 16,906 | | | Shiseido Co. Ltd. | | | 435,661 | |
| | 39,192 | | | Shizuoka Bank Ltd. (The) | | | 330,811 | |
| | 31,088 | | | Showa Denko K.K. | | | 410,917 | |
| | 40,366 | | | Showa Shell Sekiyu K.K. | | | 376,829 | |
| | 1,520 | | | SMC Corp. | | | 441,022 | |
| | 53,322 | | | SoftBank Group Corp. | | | 3,349,972 | |
| | 299,520 | | | Sojitz Corp. | | | 786,673 | |
| | 37,051 | | | Sompo Holdings, Inc. | | | 1,200,187 | |
| | 103,049 | | | Sony Corp. | | | 3,295,881 | |
| | 13,812 | | | Sony Financial Holdings, Inc. | | | 194,000 | |
| | 7,087 | | | Stanley Electric Co. Ltd. | | | 195,106 | |
| | 167,829 | | | Sumitomo Chemical Co. Ltd. | | | 795,345 | |
| | 137,223 | | | Sumitomo Corp. | | | 1,579,400 | |
| | 80,503 | | | Sumitomo Electric Industries Ltd. | | | 1,190,864 | |
| | 16,719 | | | Sumitomo Forestry Co. Ltd. | | | 232,922 | |
| | 58,815 | | | Sumitomo Heavy Industries Ltd. | | | 310,068 | |
| | 47,958 | | | Sumitomo Metal Mining Co. Ltd. | | | 620,440 | |
| | 164,559 | | | Sumitomo Mitsui Financial Group, Inc. | | | 5,720,455 | |
| | 36,800 | | | Sumitomo Mitsui Trust Holdings, Inc. | | | 1,243,184 | |
| | 18,512 | | | Sumitomo Realty & Development Co. Ltd. | | | 486,736 | |
| | 16,927 | | | Sumitomo Rubber Industries Ltd. | | | 283,177 | |
| | 4,616 | | | Suntory Beverage & Food Ltd. | | | 201,842 | |
| | 11,273 | | | Suzuken Co. Ltd. | | | 362,053 | |
| | 31,994 | | | Suzuki Motor Corp. | | | 1,135,629 | |
| | 80,544 | | | T&D Holdings, Inc. | | | 974,177 | |
| | 149,394 | | | Taiheiyo Cement Corp. | | | 427,916 | |
| | 64,128 | | | Taisei Corp. | | | 480,876 | |
See accompanying Notes to Financial Statements which are an integral part of the financial statements.
PowerShares FTSE RAFI Developed Markets ex-U.S. Portfolio (PXF) (continued)
October 31, 2016
| | | | | | | | |
Number
of Shares | | | | | Value | |
| | | | Common Stocks and Other Equity
Interests (continued) | |
| | | | Japan (continued) | | | | |
| | 1,765 | | | Taisho Pharmaceutical Holdings Co. Ltd. | | $ | 172,158 | |
| | 29,195 | | | Takashimaya Co. Ltd. | | | 238,094 | |
| | 39,810 | | | Takeda Pharmaceutical Co. Ltd. | | | 1,780,530 | |
| | 8,523 | | | TDK Corp. | | | 588,828 | |
| | 17,700 | | | Teijin Ltd. | | | 342,429 | |
| | 8,299 | | | Terumo Corp. | | | 321,030 | |
| | 53,919 | | | Tobu Railway Co., Ltd. | | | 264,759 | |
| | 30,580 | | | Toho Gas Co. Ltd. | | | 283,145 | |
| | 8,831 | | | Toho Holdings Co. Ltd. | | | 185,301 | |
| | 48,739 | | | Tohoku Electric Power Co., Inc. | | | 595,990 | |
| | 53,527 | | | Tokio Marine Holdings, Inc. | | | 2,113,370 | |
| | 404,201 | | | Tokyo Electric Power Co. Holdings, Inc.(a) | | | 1,569,339 | |
| | 6,180 | | | Tokyo Electron Ltd. | | | 557,985 | |
| | 200,663 | | | Tokyo Gas Co. Ltd. | | | 909,318 | |
| | 52,312 | | | Tokyu Corp. | | | 391,774 | |
| | 34,217 | | | Tokyu Fudosan Holdings Corp. | | | 193,088 | |
| | 51,996 | | | TonenGeneral Sekiyu K.K. | | | 512,612 | |
| | 53,565 | | | Toppan Printing Co. Ltd. | | | 503,613 | |
| | 90,759 | | | Toray Industries, Inc. | | | 845,362 | |
| | 1,024,539 | | | Toshiba Corp.(a) | | | 3,714,606 | |
| | 73,991 | | | Tosoh Corp. | | | 483,721 | |
| | 6,048 | | | TOTO Ltd. | | | 241,724 | |
| | 13,957 | | | Toyo Seikan Group Holdings Ltd. | | | 257,664 | |
| | 3,722 | | | Toyo Suisan Kaisha Ltd. | | | 150,708 | |
| | 8,018 | | | Toyoda Gosei Co. Ltd. | | | 183,197 | |
| | 13,213 | | | Toyota Industries Corp. | | | 605,420 | |
| | 186,897 | | | Toyota Motor Corp. | | | 10,811,694 | |
| | 20,505 | | | Toyota Tsusho Corp. | | | 484,502 | |
| | 153,065 | | | Ube Industries Ltd. | | | 316,078 | |
| | 7,330 | | | Unicharm Corp. | | | 174,278 | |
| | 12,398 | | | West Japan Railway Co. | | | 763,571 | |
| | 86,215 | | | Yamada Denki Co. Ltd. | | | 445,494 | |
| | 19,240 | | | Yamaguchi Financial Group, Inc. | | | 212,018 | |
| | 5,667 | | | Yamaha Corp. | | | 202,499 | |
| | 22,546 | | | Yamaha Motor Co. Ltd. | | | 500,975 | |
| | 21,548 | | | Yamato Holdings Co. Ltd. | | | 491,102 | |
| | 10,342 | | | Yamazaki Baking Co. Ltd. | | | 231,867 | |
| | 9,372 | | | Yokohama Rubber Co. Ltd. (The) | | | 162,673 | |
| | | | | | | | |
| | | | | | | 208,892,689 | |
| | | | | | | | |
| | | | Jersey Island—0.0% | |
| | 1,659 | | | Randgold Resources Ltd. | | | 146,644 | |
| | | | | | | | |
| | | | Luxembourg—0.5% | | | | |
| | 595,492 | | | ArcelorMittal SA(a) | | | 4,006,755 | |
| | 3,067 | | | RTL Group SA | | | 240,050 | |
| | 12,152 | | | SES SA FDR, Class A | | | 279,075 | |
| | 35,586 | | | Tenaris SA | | | 502,441 | |
| | | | | | | | |
| | | | | | | 5,028,321 | |
| | | | | | | | |
| | | | Netherlands—4.4% | | | | |
| | 14,612 | | | ABN AMRO Group NV CVA(c) | | | 336,772 | |
| | 386,191 | | | Aegon NV | | | 1,662,890 | |
| | 14,621 | | | Akzo Nobel NV | | | 943,702 | |
| | 9,187 | | | Altice NV, Class A(a) | | | 169,189 | |
| | 2,964 | | | Altice NV, Class B(a) | | | 55,089 | |
| | 5,728 | | | ASML Holding NV | | | 605,927 | |
| | 5,990 | | | Boskalis Westminster NV | | | 193,015 | |
| | | | | | | | |
Number
of Shares | | | | | Value | |
| | | | Common Stocks and Other Equity
Interests (continued) | |
| | | | Netherlands (continued) | | | | |
| | 123,687 | | | Delta Lloyd NV | | $ | 747,077 | |
| | 13,105 | | | Fugro NV CVA(a) | | | 233,874 | |
| | 2,560 | | | Gemalto NV | | | 139,009 | |
| | 5,680 | | | Heineken Holding NV, Class A | | | 436,534 | |
| | 7,492 | | | Heineken NV | | | 616,366 | |
| | 321,495 | | | ING Groep NV | | | 4,227,313 | |
| | 58,223 | | | Koninklijke Ahold Delhaize NV | | | 1,327,222 | |
| | 30,979 | | | Koninklijke BAM Groep NV | | | 144,021 | |
| | 13,621 | | | Koninklijke DSM NV | | | 874,678 | |
| | 247,122 | | | Koninklijke KPN NV | | | 804,830 | |
| | 62,548 | | | Koninklijke Philips NV | | | 1,882,799 | |
| | 35,313 | | | NN Group NV | | | 1,062,593 | |
| | 44,237 | | | PostNL NV(a) | | | 208,130 | |
| | 7,276 | | | Randstad Holding NV | | | 374,192 | |
| | 582,805 | | | Royal Dutch Shell PLC, Class A | | | 14,504,876 | |
| | 360,859 | | | Royal Dutch Shell PLC, Class B | | | 9,318,112 | |
| | 12,711 | | | SBM Offshore NV | | | 182,324 | |
| | 11,180 | | | Wolters Kluwer NV | | | 432,068 | |
| | | | | | | | |
| | | | | | | 41,482,602 | |
| | | | | | | | |
| | | | New Zealand—0.1% | |
| | 51,514 | | | Contact Energy Ltd. | | | 175,053 | |
| | 55,248 | | | Fletcher Building Ltd. | | | 409,868 | |
| | 135,926 | | | Spark New Zealand Ltd. | | | 355,904 | |
| | | | | | | | |
| | | | | | | 940,825 | |
| | | | | | | | |
| | | | Norway—0.8% | |
| | 86,766 | | | DNB ASA | | | 1,256,571 | |
| | 12,426 | | | Gjensidige Forsikring ASA | | | 223,026 | |
| | 21,451 | | | Marine Harvest ASA | | | 389,690 | |
| | 117,365 | | | Norsk Hydro ASA | | | 525,561 | |
| | 46,240 | | | Orkla ASA | | | 437,381 | |
| | 178,431 | | | Statoil ASA(b) | | | 2,927,917 | |
| | 64,310 | | | Storebrand ASA(a) | | | 331,392 | |
| | 57,010 | | | Telenor ASA | | | 908,545 | |
| | 10,092 | | | TGS Nopec Geophysical Co. ASA | | | 204,862 | |
| | 14,244 | | | Yara International ASA | | | 504,063 | |
| | | | | | | | |
| | | | | | | 7,709,008 | |
| | | | | | | | |
| | | | Portugal—0.2% | |
| | 86,347 | | | Banco Comercial Portugues SA, Class R(a) | | | 114,815 | |
| | 243,478 | | | EDP-Energias de Portugal SA | | | 803,638 | |
| | 38,758 | | | Galp Energia SGPS SA | | | 524,709 | |
| | 12,236 | | | Jeronimo Martins SGPS SA | | | 210,183 | |
| | | | | | | | |
| | | | | | | 1,653,345 | |
| | | | | | | | |
| | | | Singapore—0.9% | |
| | 90,161 | | | Ascendas Real Estate Investment Trust REIT | | | 153,518 | |
| | 166,550 | | | CapitaLand Ltd. | | | 369,739 | |
| | 111,927 | | | CapitaLand Mall Trust REIT | | | 166,455 | |
| | 41,862 | | | City Developments Ltd. | | | 255,340 | |
| | 88,721 | | | ComfortDelGro Corp. Ltd. | | | 161,902 | |
| | 127,597 | | | DBS Group Holdings Ltd. | | | 1,375,066 | |
| | 291,369 | | | Genting Singapore PLC | | | 155,952 | |
| | 7,047 | | | Jardine Cycle & Carriage Ltd. | | | 213,754 | |
| | 190,294 | | | Keppel Corp. Ltd. | | | 721,857 | |
| | 166,529 | | | Oversea-Chinese Banking Corp. Ltd. | | | 1,014,560 | |
| | 114,661 | | | Sembcorp Industries Ltd. | | | 208,415 | |
See accompanying Notes to Financial Statements which are an integral part of the financial statements.
PowerShares FTSE RAFI Developed Markets ex-U.S. Portfolio (PXF) (continued)
October 31, 2016
| | | | | | | | |
Number
of Shares | | | | | Value | |
| | | | Common Stocks and Other Equity
Interests (continued) | |
| | | | Singapore (continued) | |
| | 35,093 | | | Singapore Airlines Ltd. | | $ | 255,401 | |
| | 96,737 | | | Singapore Press Holdings Ltd. | | | 258,540 | |
| | 72,700 | | | Singapore Technologies Engineering Ltd. | | | 163,482 | |
| | 425,670 | | | Singapore Telecommunications Ltd. | | | 1,186,579 | |
| | 82,958 | | | United Overseas Bank Ltd. | | | 1,119,298 | |
| | 185,535 | | | Wilmar International Ltd. | | | 441,211 | |
| | | | | | | | |
| | | | | | | 8,221,069 | |
| | | | | | | | |
| | | | South Africa—0.1% | |
| | 35,273 | | | Investec PLC | | | 218,769 | |
| | 17,015 | | | Mondi PLC | | | 331,547 | |
| | | | | | | | |
| | | | | | | 550,316 | |
| | | | | | | | |
| | | | South Korea—3.8% | |
| | 32,619 | | | BNK Financial Group, Inc. | | | 264,829 | |
| | 494 | | | CJ CheilJedang Corp. | | | 150,888 | |
| | 66 | | | CJ CheilJedang Corp. (Preference Shares) | | | 10,152 | |
| | 1,065 | | | CJ Corp. | | | 162,414 | |
| | 2,899 | | | Daelim Industrial Co. Ltd. | | | 206,990 | |
| | 4,016 | | | Dongbu Insurance Co. Ltd. | | | 249,541 | |
| | 3,456 | | | Doosan Corp. | | | 309,583 | |
| | 14,705 | | | Doosan Heavy Industries & Construction Co. Ltd. | | | 336,702 | |
| | 61,599 | | | Doosan Infracore Co. Ltd.(a) | | | 373,066 | |
| | 1,673 | | | E-Mart, Inc. | | | 237,590 | |
| | 6,802 | | | GS Engineering & Construction Corp.(a) | | | 159,313 | |
| | 5,047 | | | GS Holdings Corp. | | | 225,389 | |
| | 26,450 | | | Hana Financial Group, Inc. | | | 758,191 | |
| | 4,674 | | | Hankook Tire Co. Ltd. | | | 225,479 | |
| | 7,061 | | | Hanwha Corp. | | | 230,481 | |
| | 2,058 | | | Hyosung Corp. | | | 241,007 | |
| | 8,503 | | | Hyundai Engineering & Construction Co. Ltd. | | | 308,018 | |
| | 916 | | | Hyundai Glovis Co. Ltd. | | | 138,891 | |
| | 6,026 | | | Hyundai Heavy Industries Co. Ltd.(a) | | | 766,251 | |
| | 7,238 | | | Hyundai Marine & Fire Insurance Co. Ltd. | | | 223,608 | |
| | 4,248 | | | Hyundai Mobis Co. Ltd. | | | 1,017,218 | |
| | 11,221 | | | Hyundai Motor Co. | | | 1,372,899 | |
| | 1,872 | | | Hyundai Motor Co. (Preference Shares) | | | 156,402 | |
| | 2,932 | | | Hyundai Motor Co. (2nd Preference Shares) | | | 257,519 | |
| | 9,009 | | | Hyundai Steel Co. | | | 388,940 | |
| | 37,399 | | | Industrial Bank of Korea | | | 431,433 | |
| | 29,540 | | | KB Financial Group, Inc. | | | 1,092,018 | |
| | 5,792 | | | KB Insurance Co. Ltd. | | | 146,540 | |
| | 24,017 | | | Kia Motors Corp. | | | 854,264 | |
| | 23,208 | | | Korea Electric Power Corp. | | | 998,902 | |
| | 5,224 | | | Korea Gas Corp. | | | 211,608 | |
| | 430 | | | Korea Zinc Co. Ltd. | | | 170,985 | |
| | 7,808 | | | Korean Air Lines Co. Ltd.(a) | | | 218,358 | |
| | 9,413 | | | KT Corp. ADR | | | 150,514 | |
| | 9,296 | | | KT Corp. | | | 262,408 | |
| | 4,481 | | | KT&G Corp. | | | 442,520 | |
| | 2,421 | | | LG Chem Ltd. | | | 521,544 | |
| | 450 | | | LG Chem Ltd. (Preference Shares) | | | 70,789 | |
| | 5,494 | | | LG Corp. | | | 294,326 | |
| | 34,589 | | | LG Display Co. Ltd. | | | 825,239 | |
| | 15,727 | | | LG Electronics, Inc. | | | 656,981 | |
| | | | | | | | |
Number
of Shares | | | | | Value | |
| | | | Common Stocks and Other Equity
Interests (continued) | |
| | | | South Korea (continued) | |
| | 2,471 | | | LG Electronics, Inc. (Preference Shares) | | $ | 51,288 | |
| | 24,946 | | | LG Uplus Corp. | | | 257,254 | |
| | 867 | | | Lotte Chemical Corp. | | | 218,597 | |
| | 1,415 | | | Lotte Shopping Co. Ltd. | | | 282,567 | |
| | 2,169 | | | OCI Co. Ltd.(a) | | | 171,549 | |
| | 11,444 | | | POSCO | | | 2,370,311 | |
| | 5,016 | | | Samsung Electro-Mechanics Co. Ltd. | | | 206,470 | |
| | 6,279 | | | Samsung Electronics Co. Ltd. | | | 8,993,910 | |
| | 1,193 | | | Samsung Electronics Co. Ltd. (Preference Shares) | | | 1,373,110 | |
| | 2,005 | | | Samsung Fire & Marine Insurance Co. Ltd. | | | 510,778 | |
| | 104 | | | Samsung Fire & Marine Insurance Co. Ltd. (Preference Shares) | | | 17,178 | |
| | 38,601 | | | Samsung Heavy Industries Co. Ltd.(a) | | | 328,914 | |
| | 5,492 | | | Samsung Life Insurance Co. Ltd. | | | 530,361 | |
| | 4,007 | | | Samsung SDI Co. Ltd. | | | 330,225 | |
| | 22,449 | | | Shinhan Financial Group Co. Ltd. | | | 860,292 | |
| | 33,491 | | | SK Hynix, Inc. | | | 1,200,027 | |
| | 7,689 | | | SK Innovation Co. Ltd. | | | 1,018,032 | |
| | 38,615 | | | SK Networks Co. Ltd. | | | 220,030 | |
| | 2,092 | | | SK Telecom Co. Ltd. | | | 408,619 | |
| | 4,155 | | | S-Oil Corp. | | | 285,049 | |
| | 40,800 | | | Woori Bank | | | 445,707 | |
| | | | | | | | |
| | | | | | | 36,200,058 | |
| | | | | | | | |
| | | | Spain—4.4% | |
| | 29,564 | | | Abertis Infraestructuras SA | | | 438,319 | |
| | 3,087 | | | Acciona SA | | | 234,645 | |
| | 31,588 | | | ACS Actividades de Construccion y Servicios SA | | | 967,126 | |
| | 1,563 | | | Aena SA(c) | | | 229,162 | |
| | 7,787 | | | Amadeus IT Group SA | | | 367,053 | |
| | 607,497 | | | Banco Bilbao Vizcaya Argentaria SA | | | 4,380,543 | |
| | 477,534 | | | Banco de Sabadell SA | | | 638,114 | |
| | 342,114 | | | Banco Popular Espanol SA | | | 374,651 | |
| | 2,868,885 | | | Banco Santander SA | | | 14,079,595 | |
| | 425,239 | | | Bankia SA | | | 373,850 | |
| | 32,097 | | | Bankinter SA | | | 245,378 | |
| | 305,290 | | | CaixaBank SA | | | 922,655 | |
| | 78,517 | | | Distribuidora Internacional de Alimentacion SA | | | 419,765 | |
| | 11,069 | | | Enagas SA | | | 317,300 | |
| | 66,080 | | | Endesa SA | | | 1,402,741 | |
| | 28,686 | | | Ferrovial SA | | | 557,373 | |
| | 24,641 | | | Fomento de Construcciones y Contratas SA(a) | | | 212,851 | |
| | 33,543 | | | Gas Natural SDG SA | | | 660,938 | |
| | 5,697 | | | Grifols SA | | | 112,473 | |
| | 4,479 | | | Grifols SA (Preference Shares), Class B | | | 64,516 | |
| | 364,326 | | | Iberdrola SA | | | 2,479,715 | |
| | 21,756 | | | Industria de Diseno Textil SA | | | 759,469 | |
| | 199,617 | | | Mapfre SA | | | 592,346 | |
| | 27,711 | | | Obrascon Huarte Lain SA | | | 111,270 | |
| | 18,228 | | | Red Electrica Corp. SA | | | 379,749 | |
| | 254,436 | | | Repsol SA | | | 3,560,322 | |
| | 601,675 | | | Telefonica SA | | | 6,107,492 | |
| | | | | | | | |
| | | | | | | 40,989,411 | |
| | | | | | | | |
See accompanying Notes to Financial Statements which are an integral part of the financial statements.
PowerShares FTSE RAFI Developed Markets ex-U.S. Portfolio (PXF) (continued)
October 31, 2016
| | | | | | | | |
Number
of Shares | | | | | Value | |
| | | | Common Stocks and Other Equity
Interests (continued) | |
| | | | Sweden—2.0% | | | | |
| | 14,710 | | | Alfa Laval AB | | $ | 211,645 | |
| | 20,791 | | | ASSA ABLOY AB, Class B | | | 378,647 | |
| | 25,103 | | | Atlas Copco AB, Class A(b) | | | 737,382 | |
| | 16,291 | | | Atlas Copco AB, Class B(b) | | | 426,529 | |
| | 21,003 | | | Boliden AB | | | 487,272 | |
| | 389 | | | Bonava AB(a) | | | 4,722 | |
| | 6,519 | | | Bonava AB, Class B(a) | | | 80,643 | |
| | 16,765 | | | Electrolux AB, Series B | | | 397,499 | |
| | 9,002 | | | Getinge AB, Class B | | | 147,680 | |
| | 36,437 | | | Hennes & Mauritz AB, Class B | | | 1,026,286 | |
| | 7,084 | | | Hexagon AB, Class B | | | 248,291 | |
| | 22,570 | | | Husqvarna AB, Class B | | | 169,997 | |
| | 10,528 | | | Industrivarden AB, Class A | | | 200,139 | |
| | 9,002 | | | Industrivarden AB, Class C | | | 160,852 | |
| | 389 | | | NCC AB, Class A | | | 9,866 | |
| | 6,519 | | | NCC AB, Class B | | | 165,911 | |
| | 232,829 | | | Nordea Bank AB | | | 2,450,492 | |
| | 78,979 | | | Sandvik AB | | | 899,090 | |
| | 19,412 | | | Securitas AB, Class B | | | 300,384 | |
| | 92,130 | | | Skandinaviska Enskilda Banken AB, Class A | | | 930,848 | |
| | 28,594 | | | Skanska AB, Class B | | | 621,864 | |
| | 1,143 | | | SKF AB, Class A | | | 19,423 | |
| | 28,549 | | | SKF AB, Class B | | | 484,493 | |
| | 45,247 | | | SSAB AB, Class A(a)(b) | | | 143,593 | |
| | 50,810 | | | SSAB AB, Class B(a) | | | 135,058 | |
| | 23,001 | | | Svenska Cellulosa AB (SCA), Class B | | | 652,437 | |
| | 84,669 | | | Svenska Handelsbanken AB, Class A | | | 1,156,262 | |
| | 2,067 | | | Svenska Handelsbanken AB, Class B | | | 27,815 | |
| | 65,749 | | | Swedbank AB, Class A | | | 1,542,148 | |
| | 6,226 | | | Swedish Match AB | | | 216,908 | |
| | 55,061 | | | Tele2 AB, Class B | | | 455,612 | |
| | 203,204 | | | Telefonaktiebolaget LM Ericsson, Class B | | | 984,767 | |
| | 269,795 | | | Telia Co. AB | | | 1,079,599 | |
| | 10,724 | | | Trelleborg AB, Class B | | | 187,460 | |
| | 127,280 | | | Volvo AB, Class B | | | 1,368,526 | |
| | | | | | | | |
| | | | | | | 18,510,140 | |
| | | | | | | | |
| | | | Switzerland—5.8% | |
| | 119,024 | | | ABB Ltd. | | | 2,455,344 | |
| | 1,110 | | | Actelion Ltd. | | | 160,512 | |
| | 12,638 | | | Adecco Group AG | | | 752,095 | |
| | 5,084 | | | Aryzta AG | | | 223,534 | |
| | 3,573 | | | Baloise Holding AG | | | 440,076 | |
| | 1 | | | Chocoladefabriken Lindt & Sprungli AG | | | 62,089 | |
| | 16 | | | Chocoladefabriken Lindt & Sprungli AG-PC | | | 83,163 | |
| | 15,280 | | | Clariant AG | | | 253,250 | |
| | 9,740 | | | Coca-Cola HBC AG | | | 210,005 | |
| | 17,356 | | | Compagnie Financiere Richemont SA | | | 1,117,109 | |
| | 211,987 | | | Credit Suisse Group AG | | | 2,962,545 | |
| | 1,620 | | | Dufry AG(a) | | | 197,237 | |
| | 740 | | | Geberit AG | | | 313,316 | |
| | 248 | | | Georg Fischer AG | | | 220,063 | |
| | 232 | | | Givaudan SA | | | 449,267 | |
| | 2,411,614 | | | Glencore PLC(a) | | | 7,360,848 | |
| | 466 | | | Helvetia Holding AG | | | 242,684 | |
| | 7,601 | | | Julius Baer Group Ltd. | | | 308,298 | |
| | 2,395 | | | Kuehne + Nagel International AG | | | 325,017 | |
| | | | | | | | |
Number
of Shares | | | | | Value | |
| | | | Common Stocks and Other Equity
Interests (continued) | |
| | | | Switzerland (continued) | |
| | 23,309 | | | LafargeHolcim Ltd. | | $ | 1,245,708 | |
| | 1,519 | | | Lonza Group AG | | | 286,934 | |
| | 117,657 | | | Nestle SA | | | 8,536,647 | |
| | 79,608 | | | Novartis AG | | | 5,667,310 | |
| | 20,418 | | | Roche Holding AG | | | 4,697,234 | |
| | 852 | | | Roche Holding AG-BR | | | 198,246 | |
| | 526 | | | Schindler Holding AG | | | 97,338 | |
| | 1,083 | | | Schindler Holding AG-PC | | | 201,399 | |
| | 182 | | | SGS SA | | | 369,190 | |
| | 60 | | | Sika AG-BR | | | 288,563 | |
| | 59,051 | | | STMicroelectronics NV | | | 562,324 | |
| | 2,011 | | | Swatch Group AG (The) | | | 116,015 | |
| | 1,349 | | | Swatch Group AG (The)-BR | | | 406,105 | |
| | 3,266 | | | Swiss Life Holding AG | | | 865,297 | |
| | 2,578 | | | Swiss Prime Site AG | | | 213,899 | |
| | 28,269 | | | Swiss Re AG | | | 2,627,082 | |
| | 1,241 | | | Swisscom AG | | | 568,107 | |
| | 2,818 | | | Syngenta AG | | | 1,127,314 | |
| | 155,448 | | | UBS Group AG | | | 2,200,700 | |
| | 16,315 | | | Wolseley PLC | | | 846,756 | |
| | 18,369 | | | Zurich Insurance Group AG | | | 4,809,115 | |
| | | | | | | | |
| | | | | | | 54,067,735 | |
| | | | | | | | |
| | | | United Kingdom—14.4% | |
| | 49,058 | | | 3i Group PLC | | | 401,895 | |
| | 58,306 | | | Aberdeen Asset Management PLC | | | 227,937 | |
| | 8,675 | | | Admiral Group PLC | | | 203,035 | |
| | 16,343 | | | Aggreko PLC | | | 159,925 | |
| | 59,951 | | | Amec Foster Wheeler PLC | | | 327,324 | |
| | 307,697 | | | Anglo American PLC(a) | | | 4,248,796 | |
| | 15,659 | | | Ashtead Group PLC | | | 244,329 | |
| | 9,021 | | | Associated British Foods PLC | | | 271,158 | |
| | 67,499 | | | AstraZeneca PLC | | | 3,780,949 | |
| | 360,788 | | | Aviva PLC | | | 1,950,472 | |
| | 11,086 | | | Babcock International Group PLC | | | 133,860 | |
| | 197,717 | | | BAE Systems PLC | | | 1,309,555 | |
| | 55,419 | | | Balfour Beatty PLC | | | 183,361 | |
| | 2,239,036 | | | Barclays PLC | | | 5,202,115 | |
| | 31,282 | | | Barratt Developments PLC | | | 173,278 | |
| | 5,026 | | | Berkeley Group Holdings PLC (The) | | | 144,754 | |
| | 72,534 | | | Booker Group PLC | | | 158,871 | |
| | 2,870,429 | | | BP PLC | | | 16,951,297 | |
| | 68,414 | | | British American Tobacco PLC | | | 3,918,652 | |
| | 44,745 | | | British Land Co. PLC (The) REIT | | | 319,854 | |
| | 263,475 | | | BT Group PLC | | | 1,209,343 | |
| | 11,729 | | | Bunzl PLC | | | 314,895 | |
| | 15,451 | | | Burberry Group PLC | | | 278,246 | |
| | 21,041 | | | Capita PLC | | | 150,537 | |
| | 51,289 | | | Carillion PLC | | | 157,236 | |
| | 614,173 | | | Centrica PLC | | | 1,606,165 | |
| | 107,112 | | | CNH Industrial NV, Class A | | | 831,307 | |
| | 74,433 | | | Cobham PLC | | | 129,861 | |
| | 57,510 | | | Compass Group PLC | | | 1,039,869 | |
| | 3,598 | | | Croda International PLC | | | 153,660 | |
| | 4,523 | | | DCC PLC | | | 368,050 | |
| | 78,708 | | | Diageo PLC | | | 2,094,382 | |
| | 108,664 | | | Direct Line Insurance Group PLC | | | 459,163 | |
See accompanying Notes to Financial Statements which are an integral part of the financial statements.
PowerShares FTSE RAFI Developed Markets ex-U.S. Portfolio (PXF) (continued)
October 31, 2016
| | | | | | | | |
Number
of Shares | | | | | Value | |
| | | | Common Stocks and Other Equity
Interests (continued) | |
| | | | United Kingdom (continued) | |
| | 26,108 | | | Dixons Carphone PLC | | $ | 100,311 | |
| | 62,018 | | | Drax Group PLC | | | 239,950 | |
| | 39,884 | | | DS Smith PLC | | | 194,193 | |
| | 9,681 | | | easyJet PLC | | | 110,749 | |
| | 306,797 | | | Fiat Chrysler Automobiles NV(b) | | | 2,243,194 | |
| | 136,767 | | | G4S PLC | | | 367,353 | |
| | 101,756 | | | GKN PLC | | | 396,555 | |
| | 265,741 | | | GlaxoSmithKline PLC | | | 5,251,112 | |
| | 12,708 | | | Greene King PLC | | | 113,494 | |
| | 39,403 | | | Hammerson PLC REIT | | | 265,070 | |
| | 90,737 | | | Hays PLC | | | 151,327 | |
| | 9,814 | | | Hiscox Ltd. | | | 122,335 | |
| | 2,112,169 | | | HSBC Holdings PLC | | | 15,890,238 | |
| | 33,548 | | | ICAP PLC | | | 198,445 | |
| | 17,187 | | | IMI PLC | | | 208,577 | |
| | 37,211 | | | Imperial Brands PLC | | | 1,797,019 | |
| | 29,118 | | | Inchcape PLC | | | 231,254 | |
| | 23,798 | | | Informa PLC | | | 195,395 | |
| | 15,160 | | | Inmarsat PLC | | | 129,840 | |
| | 8,821 | | | Intercontinental Hotels Group PLC | | | 341,933 | |
| | 18,068 | | | Intermediate Capital Group PLC | | | 133,569 | |
| | 56,446 | | | International Consolidated Airlines Group SA | | | 299,366 | |
| | 4,500 | | | Intertek Group PLC | | | 187,787 | |
| | 58,006 | | | Intu Properties PLC REIT | | | 195,108 | |
| | 96,419 | | | ITV PLC | | | 200,709 | |
| | 245,737 | | | J Sainsbury PLC | | | 752,751 | |
| | 26,446 | | | John Wood Group PLC | | | 248,294 | |
| | 14,422 | | | Johnson Matthey PLC | | | 600,427 | |
| | 178,300 | | | Kingfisher PLC | | | 786,501 | |
| | 19,867 | | | Lancashire Holdings Ltd. | | | 169,062 | |
| | 43,890 | | | Land Securities Group PLC REIT | | | 535,317 | |
| | 538,719 | | | Legal & General Group PLC | | | 1,377,270 | |
| | 4,195,544 | | | Lloyds Banking Group PLC | | | 2,933,051 | |
| | 6,268 | | | London Stock Exchange Group PLC | | | 215,038 | |
| | 121,167 | | | Man Group PLC | | | 184,472 | |
| | 130,495 | | | Marks & Spencer Group PLC | | | 542,489 | |
| | 47,287 | | | Meggitt PLC | | | 251,310 | |
| | 207,143 | | | National Grid PLC | | | 2,693,394 | |
| | 4,186 | | | Next PLC | | | 246,131 | |
| | 455,542 | | | Old Mutual PLC | | | 1,120,685 | |
| | 69,398 | | | Pearson PLC | | | 641,815 | |
| | 18,953 | | | Pennon Group PLC | | | 193,101 | |
| | 6,733 | | | Persimmon PLC | | | 139,252 | |
| | 22,950 | | | Petrofac Ltd. | | | 225,979 | |
| | 16,482 | | | Phoenix Group Holdings | | | 146,998 | |
| | 4,059 | | | Provident Financial PLC | | | 146,191 | |
| | 151,496 | | | Prudential PLC | | | 2,468,310 | |
| | 15,711 | | | Reckitt Benckiser Group PLC | | | 1,402,747 | |
| | 19,862 | | | RELX NV | | | 334,756 | |
| | 22,369 | | | RELX PLC | | | 399,004 | |
| | 40,801 | | | Rio Tinto Ltd. | | | 1,682,154 | |
| | 112,901 | | | Rio Tinto PLC | | | 3,913,990 | |
| | 121,397 | | | Rolls-Royce Holdings PLC | | | 1,076,772 | |
| | 5,584,262 | | | Rolls-Royce Holdings PLC (Preference Shares), Class C(a) | | | 6,818 | |
| | 437,112 | | | Royal Bank of Scotland Group PLC(a) | | | 1,009,170 | |
| | | | | | | | |
Number
of Shares | | | | | Value | |
| | | | Common Stocks and Other Equity
Interests (continued) | |
| | | | United Kingdom (continued) | |
| | 75,585 | | | Royal Mail PLC | | $ | 453,103 | |
| | 98,287 | | | RSA Insurance Group PLC | | | 662,992 | |
| | 31,586 | | | Sage Group PLC (The) | | | 278,235 | |
| | 498,363 | | | Seadrill Ltd.(a)(b) | | | 1,070,839 | |
| | 33,112 | | | Segro PLC REIT | | | 176,744 | |
| | 11,280 | | | Severn Trent PLC | | | 320,606 | |
| | 34,781 | | | Sky PLC | | | 347,356 | |
| | 23,818 | | | Smith & Nephew PLC | | | 344,009 | |
| | 25,636 | | | Smiths Group PLC | | | 443,820 | |
| | 94,179 | | | SSE PLC | | | 1,829,382 | |
| | 17,216 | | | St. James’s Place PLC | | | 198,630 | |
| | 442,615 | | | Standard Chartered PLC(a) | | | 3,847,026 | |
| | 190,721 | | | Standard Life PLC | | | 786,572 | |
| | 52,582 | | | Subsea 7 SA(a) | | | 590,727 | |
| | 32,992 | | | Tate & Lyle PLC | | | 314,183 | |
| | 81,658 | | | Taylor Wimpey PLC | | | 141,270 | |
| | 1,184,675 | | | Tesco PLC(a) | | | 3,048,224 | |
| | 199,173 | | | Thomas Cook Group PLC(a) | | | 169,003 | |
| | 12,873 | | | Travis Perkins PLC | | | 209,503 | |
| | 104,919 | | | Tullow Oil PLC(a) | | | 339,069 | |
| | 53,435 | | | Unilever NV CVA | | | 2,236,411 | |
| | 41,190 | | | Unilever PLC | | | 1,718,873 | |
| | 33,693 | | | United Utilities Group PLC | | | 386,676 | |
| | 2,599,182 | | | Vodafone Group PLC | | | 7,133,670 | |
| | 18,691 | | | Weir Group PLC (The) | | | 387,937 | |
| | 5,449 | | | Whitbread PLC | | | 240,495 | |
| | 36,637 | | | William Hill PLC | | | 132,312 | |
| | 326,067 | | | WM Morrison Supermarkets PLC | | | 901,686 | |
| | 52,943 | | | WPP PLC | | | 1,149,265 | |
| | | | | | | | |
| | | | | | | 134,970,881 | |
| | | | | | | | |
| | | | United States—0.2% | | | | |
| | 7,035 | | | Carnival PLC | | | 338,064 | |
| | 6,753 | | | QIAGEN NV(a) | | | 165,116 | |
| | 8,745 | | | Shire PLC | | | 496,470 | |
| | 17,360 | | | Thomson Reuters Corp. | | | 684,686 | |
| | 4,539 | | | Valeant Pharmaceuticals International, Inc.(a) | | | 81,077 | |
| | | | | | | | |
| | | | | | | 1,765,413 | |
| | | | | | | | |
| | | | Total Common Stocks and Other Equity Interests
(Cost $1,010,246,157) | | | 936,330,629 | |
| | | | | | | | |
| | |
| | | | | | | | |
| | | | Rights—0.0% | |
| | | | Spain—0.0% | |
| | 28,686 | | | Ferrovial SA, expiring 11/14/16(a) | | | 12,264 | |
| | | | | | | | |
| | | | Sweden—0.0% | |
| | 55,061 | | | Tele2 AB, expiring 11/16/16(a) | | | 16,517 | |
| | | | | | | | |
| | | | Total Rights
(Cost $12,830) | | | 28,781 | |
| | | | | | | | |
| | | | Total Investments
(excluding investments purchased with cash collateral from securities on loan)
(Cost $1,010,258,987)—99.7% | | | 936,359,410 | |
| | | | | | | | |
| | |
| | | | | | | | |
See accompanying Notes to Financial Statements which are an integral part of the financial statements.
PowerShares FTSE RAFI Developed Markets ex-U.S. Portfolio (PXF) (continued)
October 31, 2016
| | | | | | | | |
Number
of Shares | | | | | Value | |
| | | | Investments Purchased with Cash Collateral from Securities on Loan | |
| | |
| | | | | | | | |
| | | | Money Market Fund—1.5% | |
| | 13,665,318 | | | Invesco Government & Agency Portfolio—Institutional Class, 0.29%(d)(e)
(Cost $13,665,318) | | $ | 13,665,318 | |
| | | | | | | | |
| | | | Total Investments
(Cost $1,023,924,305)—101.2% | | | 950,024,728 | |
| | | | Other assets less liabilities—(1.2)% | | | (11,375,160 | ) |
| | | | | | | | |
| | | | Net Assets—100.0% | | $ | 938,649,568 | |
| | | | | | | | |
Investment Abbreviations:
ADR—American Depositary Receipt
BR—Bearer Shares
CVA—Dutch Certificates
FDR—Fiduciary Depositary Receipt
PC—Participation Certificate
REIT—Real Estate Investment Trust
RSP—Registered Savings Plan Shares
Notes to Schedule of Investments:
| (a) | Non-income producing security. |
| (b) | All or a portion of this security was out on loan at October 31, 2016. |
| (c) | Security purchased or received in a transaction exempt from registration under the Securities Act of 1933, as amended (the “1933 Act”). The security may be resold pursuant to an exemption from registration under the 1933 Act, typically to qualified institutional buyers. The aggregate value of these securities at October 31, 2016 was $986,669, which represented less than 1% of the Fund’s Net Assets. |
| (d) | The security and the Fund are advised by wholly-owned subsidiaries of Invesco Ltd. and are therefore considered to be affiliated. The rate shown is the 7-day SEC standardized yield as of October 31, 2016. |
| (e) | The security has been segregated to satisfy the commitment to return the cash collateral received in securities lending transactions upon the borrower’s return of the securities loaned. See Note 2J. |
See accompanying Notes to Financial Statements which are an integral part of the financial statements.
Schedule of Investments
PowerShares FTSE RAFI Developed Markets ex-U.S. Small-Mid Portfolio (PDN)
October 31, 2016
| | | | | | | | |
Number
of Shares | | | | | Value | |
| | | | Common Stocks and Other Equity
Interests—99.8% | |
| | | | Australia—6.0% | |
| | 32,190 | | | Abacus Property Group REIT | | $ | 68,586 | |
| | 39,189 | | | Adelaide Brighton Ltd. | | | 159,542 | |
| | 82,200 | | | ALS Ltd. | | | 389,687 | |
| | 112,064 | | | Alumina Ltd. | | | 134,735 | |
| | 11,354 | | | Ansell Ltd. | | | 187,398 | |
| | 60,640 | | | Ardent Leisure Group | | | 93,211 | |
| | 16,365 | | | Aristocrat Leisure Ltd. | | | 191,028 | |
| | 161,545 | | | AusNet Services | | | 184,391 | |
| | 40,027 | | | Australian Agricultural Co. Ltd.(a) | | | 53,150 | |
| | 51,111 | | | Australian Pharmaceutical Industries Ltd. | | | 73,897 | |
| | 31,327 | | | Automotive Holdings Group Ltd. | | | 96,545 | |
| | 18,399 | | | Aveo Group, Class Miscellaneous | | | 45,082 | |
| | 149,778 | | | AWE Ltd.(a) | | | 62,116 | |
| | 9,299 | | | Bapcor Ltd. | | | 36,300 | |
| | 248,719 | | | Beach Energy Ltd. | | | 137,215 | |
| | 9,934 | | | Bega Cheese Ltd. | | | 37,267 | |
| | 8,289 | | | Breville Group Ltd. | | | 58,408 | |
| | 4,582 | | | Brickworks Ltd. | | | 47,000 | |
| | 7,161 | | | BT Investment Management Ltd. | | | 50,405 | |
| | 27,810 | | | BWP Trust REIT | | | 62,851 | |
| | 15,201 | | | Cabcharge Australia Ltd. | | | 41,642 | |
| | 7,184 | | | carsales.com Ltd. | | | 58,275 | |
| | 17,045 | | | Charter Hall Group REIT | | | 60,961 | |
| | 29,959 | | | Charter Hall Retail REIT | | | 94,609 | |
| | 134,373 | | | Cleanaway Waste Management Ltd. | | | 118,611 | |
| | 2,294 | | | Cochlear Ltd. | | | 223,369 | |
| | 128,405 | | | Cromwell Property Group REIT | | | 88,916 | |
| | 83,061 | | | CSR Ltd. | | | 231,331 | |
| | 84,699 | | | Downer EDI Ltd. | | | 375,753 | |
| | 20,972 | | | DSHE Holdings Ltd.(a) | | | 0 | |
| | 22,207 | | | DuluxGroup Ltd. | | | 108,826 | |
| | 320,834 | | | Fairfax Media Ltd. | | | 201,414 | |
| | 28,723 | | | FlexiGroup Ltd. | | | 49,178 | |
| | 4,184 | | | Flight Centre Travel Group Ltd. | | | 107,836 | |
| | 20,106 | | | G8 Education Ltd. | | | 48,347 | |
| | 68,778 | | | Genworth Mortgage Insurance Australia Ltd. | | | 160,150 | |
| | 28,257 | | | GrainCorp Ltd., Class A | | | 180,618 | |
| | 14,950 | | | GUD Holdings Ltd. | | | 108,074 | |
| | 35,970 | | | GWA Group Ltd. | | | 78,282 | |
| | 38,307 | | | Harvey Norman Holdings Ltd. | | | 147,206 | |
| | 62,759 | | | Healthscope Ltd. | | | 105,542 | |
| | 42,999 | | | Investa Office Fund REIT | | | 138,733 | |
| | 6,553 | | | InvoCare Ltd. | | | 65,174 | |
| | 26,082 | | | IOOF Holdings Ltd. | | | 162,746 | |
| | 8,780 | | | IRESS Ltd. | | | 75,831 | |
| | 17,718 | | | Japara Healthcare Ltd. | | | 25,347 | |
| | 11,523 | | | JB Hi-Fi Ltd. | | | 248,936 | |
| | 10,942 | | | Mantra Group Ltd. | | | 27,394 | |
| | 4,424 | | | McMillan Shakespeare Ltd. | | | 36,459 | |
| | 34,011 | | | Mineral Resources Ltd. | | | 299,439 | |
| | 16,802 | | | Monadelphous Group Ltd. | | | 119,161 | |
| | 185,885 | | | Myer Holdings Ltd. | | | 166,203 | |
| | 23,412 | | | Navitas Ltd. | | | 93,353 | |
| | 15,757 | | | NIB Holdings Ltd. | | | 57,793 | |
| | 96,209 | | | Nine Entertainment Co. Holdings Ltd. | | | 62,961 | |
| | 18,936 | | | Nufarm Ltd. | | | 127,667 | |
| | 32,584 | | | OceanaGold Corp. | | | 99,679 | |
| | | | | | | | |
Number
of Shares | | | | | Value | |
| | | | Common Stocks and Other Equity Interests (continued) | |
| | | | Australia (continued) | |
| | 88,709 | | | Orora Ltd. | | $ | 195,759 | |
| | 14,833 | | | Pact Group Holdings Ltd. | | | 74,157 | |
| | 3,186 | | | Perpetual Ltd. | | | 109,679 | |
| | 8,882 | | | Platinum Asset Management Ltd. | | | 33,726 | |
| | 7,169 | | | Premier Investments Ltd. | | | 77,410 | |
| | 99,260 | | | Primary Health Care Ltd. | | | 290,042 | |
| | 61,885 | | | Programmed Maintenance Services Ltd. | | | 67,576 | |
| | 46,429 | | | Qube Holdings Ltd. | | | 78,786 | |
| | 4,916 | | | Ramsay Health Care Ltd. | | | 274,427 | |
| | 10,550 | | | Retail Food Group Ltd. | | | 54,350 | |
| | 20,105 | | | SAI Global Ltd. | | | 71,599 | |
| | 12,429 | | | Seek Ltd. | | | 138,463 | |
| | 19,516 | | | Seven Group Holdings Ltd. | | | 134,993 | |
| | 138,745 | | | Seven West Media Ltd. | | | 71,793 | |
| | 46,650 | | | Shopping Centres Australasia Property Group REIT | | | 77,741 | |
| | 80,652 | | | Sigma Pharmaceuticals Ltd. | | | 81,625 | |
| | 63,100 | | | Slater & Gordon Ltd.(a) | | | 17,526 | |
| | 76,949 | | | Southern Cross Media Group Ltd. | | | 84,318 | |
| | 171,747 | | | Spotless Group Holdings Ltd. | | | 130,691 | |
| | 13,657 | | | Super Retail Group Ltd. | | | 101,844 | |
| | 43,774 | | | Sydney Airport | | | 208,519 | |
| | 12,236 | | | Tassal Group Ltd. | | | 35,847 | |
| | 6,431 | | | TPG Telecom Ltd. | | | 36,996 | |
| | 32,357 | | | Treasury Wine Estates Ltd. | | | 264,441 | |
| | 12,336 | | | Village Roadshow Ltd. | | | 47,780 | |
| | 112,977 | | | Virgin Australia Holdings Ltd.(a) | | | 0 | |
| | 7,677 | | | Virtus Health Ltd. | | | 40,717 | |
| | 31,556 | | | Western Areas Ltd.(a) | | | 59,311 | |
| | 159,806 | | | Whitehaven Coal Ltd.(a) | | | 368,461 | |
| | | | | | | | |
| | | | | | | 9,793,207 | |
| | | | | | | | |
| | | | Austria—1.0% | |
| | 1,910 | | | ams AG | | | 53,597 | |
| | 4,478 | | | BUWOG AG | | | 108,067 | |
| | 7,149 | | | CA Immobilien Anlagen AG | | | 129,620 | |
| | 4,812 | | | Conwert Immobilien Invest SE | | | 85,243 | |
| | 796 | | | Lenzing AG | | | 103,531 | |
| | 372 | | | Mayr-Melnhof Karton AG | | | 41,146 | |
| | 4,064 | | | Oesterreichische Post AG | | | 140,131 | |
| | 3,263 | | | RHI AG | | | 82,054 | |
| | 1,077 | | | Schoeller-Bleckmann Oilfield Equipment AG | | | 76,161 | |
| | 14,209 | | | Telekom Austria AG, Class A | | | 81,524 | |
| | 17,059 | | | UNIQA Insurance Group AG | | | 109,807 | |
| | 10,865 | | | Verbund AG | | | 181,095 | |
| | 8,122 | | | Vienna Insurance Group AG Wiener Versicherung Gruppe | | | 159,993 | |
| | 13,169 | | | Wienerberger AG | | | 210,258 | |
| | 3,049 | | | Zumtobel AG | | | 53,460 | |
| | | | | | | | |
| | | | | | | 1,615,687 | |
| | | | | | | | |
| | | | Belgium—1.6% | |
| | 1,438 | | | Ackermans & van Haaren NV | | | 199,485 | |
| | 47,301 | | | AGFA-Gevaert NV(a) | | | 196,517 | |
| | 680 | | | Barco NV | | | 53,372 | |
| | 1,866 | | | Befimmo SA REIT | | | 108,555 | |
| | 5,552 | | | Bekaert SA NV | | | 246,609 | |
See accompanying Notes to Financial Statements which are an integral part of the financial statements.
PowerShares FTSE RAFI Developed Markets ex-U.S. Small-Mid Portfolio (PDN) (continued)
October 31, 2016
| | | | | | | | |
Number
of Shares | | | | | Value | |
| | | | Common Stocks and Other Equity Interests (continued) | |
| | | | Belgium (continued) | |
| | 8,280 | | | bpost SA | | $ | 219,970 | |
| | 1,830 | | | Cofinimmo SA REIT | | | 214,145 | |
| | 601 | | | Compagnie d’Entreprises CFE SA | | | 66,112 | |
| | 3,784 | | | D’Ieteren SA/NV | | | 166,688 | |
| | 2,204 | | | Elia System Operator SA | | | 113,916 | |
| | 6,825 | | | Euronav SA | | | 53,411 | |
| | 1,135 | | | EVS Broadcast Equipment SA | | | 39,609 | |
| | 1,086 | | | Gimv NV | | | 58,333 | |
| | 10,721 | | | Nyrstar NV(a) | | | 55,001 | |
| | 3,770 | | | Ontex Group NV | | | 113,835 | |
| | 5,549 | | | Orange Belgium SA(a) | | | 124,789 | |
| | 1,266 | | | Sofina SA | | | 176,666 | |
| | 3,795 | | | Telenet Group Holding NV(a) | | | 202,866 | |
| | 2,293 | | | Tessenderlo Chemie NV(a) | | | 76,363 | |
| | 649 | | | Warehouses De Pauw SCA REIT | | | 59,675 | |
| | | | | | | | |
| | | | | | | 2,545,917 | |
| | | | | | | | |
| | | | Cambodia—0.0% | |
| | 97,405 | | | NagaCorp Ltd. | | | 60,165 | |
| | | | | | | | |
| | | | Canada—9.1% | |
| | 12,639 | | | Advantage Oil & Gas Ltd.(a) | | | 85,344 | |
| | 11,370 | | | Aecon Group, Inc. | | | 147,104 | |
| | 30,628 | | | Aimia, Inc. | | | 165,680 | |
| | 16,257 | | | Alamos Gold, Inc., Class A | | | 127,606 | |
| | 11,006 | | | Algonquin Power & Utilities Corp. | | | 97,311 | |
| | 7,401 | | | Allied Properties Real Estate Investment Trust REIT | | | 199,127 | |
| | 5,862 | | | Amaya, Inc.(a) | | | 78,554 | |
| | 23,171 | | | Artis Real Estate Investment Trust REIT | | | 202,622 | |
| | 147,468 | | | Athabasca Oil Corp.(a) | | | 138,638 | |
| | 7,491 | | | ATS Automation Tooling Systems,
Inc.(a) | | | 64,276 | |
| | 4,342 | | | AutoCanada, Inc. | | | 71,435 | |
| | 79,002 | | | B2Gold Corp.(a) | | | 228,709 | |
| | 15,250 | | | Birchcliff Energy Ltd.(a) | | | 97,172 | |
| | 4,963 | | | Boardwalk Real Estate Investment Trust REIT | | | 182,264 | |
| | 5,667 | | | Bonterra Energy Corp. | | | 106,723 | |
| | 18,359 | | | CAE, Inc. | | | 258,074 | |
| | 15,356 | | | Canaccord Genuity Group, Inc. | | | 48,007 | |
| | 10,474 | | | Canadian Apartment Properties REIT | | | 229,135 | |
| | 24,916 | | | Canadian Energy Services & Technology Corp. | | | 98,344 | |
| | 9,770 | | | Canadian Western Bank | | | 185,522 | |
| | 12,072 | | | Canfor Corp.(a) | | | 134,028 | |
| | 14,931 | | | Cascades, Inc. | | | 140,927 | |
| | 901 | | | CCL Industries, Inc., Class B | | | 160,362 | |
| | 19,772 | | | Centerra Gold, Inc. | | | 100,022 | |
| | 14,253 | | | Chartwell Retirement Residences | | | 158,881 | |
| | 4,113 | | | Cineplex, Inc. | | | 156,510 | |
| | 1,003 | | | Cogeco Communications, Inc. | | | 46,818 | |
| | 1,672 | | | Colliers International Group, Inc. | | | 58,260 | |
| | 226 | | | Constellation Software, Inc. | | | 105,956 | |
| | 21,227 | | | Corus Entertainment, Inc., Class B | | | 175,328 | |
| | 9,263 | | | Cott Corp. | | | 121,571 | |
| | 30,762 | | | Crew Energy, Inc.(a) | | | 151,257 | |
| | 6,119 | | | Detour Gold Corp.(a) | | | 116,742 | |
| | 6,850 | | | DH Corp. | | | 88,727 | |
| | | | | | | | |
Number
of Shares | | | | | Value | |
| | | | Common Stocks and Other Equity Interests (continued) | |
| | | | Canada (continued) | |
| | 2,046 | | | Dollarama, Inc. | | $ | 153,009 | |
| | 10,815 | | | Dominion Diamond Corp. | | | 91,991 | |
| | 3,721 | | | Dorel Industries, Inc., Class B | | | 94,535 | |
| | 6,587 | | | Dream Unlimited Corp., Class A(a) | | | 33,961 | |
| | 11,144 | | | ECN Capital Corp.(a) | | | 24,363 | |
| | 11,144 | | | Element Fleet Management Corp. | | | 108,675 | |
| | 2,804 | | | Emera, Inc. | | | 97,871 | |
| | 12,053 | | | Enerflex Ltd. | | | 128,152 | |
| | 27,316 | | | Ensign Energy Services, Inc. | | | 164,884 | |
| | 48,742 | | | Entertainment One Ltd. | | | 138,180 | |
| | 17,309 | | | Extendicare, Inc.(b) | | | 119,074 | |
| | 8,163 | | | First Capital Realty, Inc. | | | 130,279 | |
| | 11,054 | | | First Majestic Silver Corp.(a) | | | 88,828 | |
| | 6,679 | | | Genworth MI Canada, Inc.(b) | | | 145,166 | |
| | 8,131 | | | Gildan Activewear, Inc. | | | 209,000 | |
| | 4,195 | | | Granite Real Estate Investment Trust REIT | | | 132,087 | |
| | 3,094 | | | Great Canadian Gaming Corp.(a) | | | 51,434 | |
| | 6,091 | | | Home Capital Group, Inc. | | | 120,661 | |
| | 52,573 | | | HudBay Minerals, Inc. | | | 221,628 | |
| | 16,838 | | | Hudson’s Bay Co. | | | 207,044 | |
| | 7,941 | | | Innergex Renewable Energy, Inc. | | | 88,342 | |
| | 5,460 | | | Jean Coutu Group (PJC), Inc. (The), Class A | | | 82,292 | |
| | 34,078 | | | Just Energy Group, Inc. | | | 179,003 | |
| | 13,442 | | | Kelt Exploration Ltd.(a) | | | 59,475 | |
| | 4,150 | | | Laurentian Bank of Canada | | | 153,490 | |
| | 3,970 | | | Linamar Corp. | | | 161,584 | |
| | 1,669 | | | MacDonald Dettwiler & Associates Ltd. | | | 95,601 | |
| | 5,808 | | | Manitoba Telecom Services, Inc.(b) | | | 162,464 | |
| | 7,167 | | | Maple Leaf Foods, Inc. | | | 163,366 | |
| | 14,335 | | | Martinrea International, Inc. | | | 84,176 | |
| | 69,038 | | | MEG Energy Corp.(a)(b) | | | 281,767 | |
| | 3,662 | | | Morguard Real Estate Investment Trust REIT | | | 41,531 | |
| | 13,986 | | | Mullen Group Ltd. | | | 193,993 | |
| | 23,317 | | | Nevsun Resources Ltd. | | | 67,676 | |
| | 55,540 | | | New Gold, Inc.(a) | | | 219,218 | |
| | 3,117 | | | Norbord, Inc. | | | 73,375 | |
| | 4,516 | | | North West Co., Inc. (The) | | | 86,260 | |
| | 7,670 | | | Northland Power, Inc. | | | 137,347 | |
| | 6,446 | | | Northview Apartment Real Estate Investment Trust REIT | | | 95,854 | |
| | 13,606 | | | Nuvista Energy Ltd.(a) | | | 69,236 | |
| | 3,209 | | | Open Text Corp. | | | 199,400 | |
| | 11,971 | | | Pan American Silver Corp. | | | 191,322 | |
| | 9,336 | | | Paramount Resources Ltd., Class A(a) | | | 106,020 | |
| | 12,450 | | | Parkland Fuel Corp. | | | 291,034 | |
| | 5,264 | | | Pason Systems, Inc. | | | 59,896 | |
| | 222,190 | | | Pengrowth Energy Corp. | | | 343,170 | |
| | 8,343 | | | Peyto Exploration & Development Corp. | | | 214,512 | |
| | 5,219 | | | Raging River Exploration, Inc.(a) | | | 41,861 | |
| | 3,440 | | | Restaurant Brands International, Inc. | | | 153,051 | |
| | 3,703 | | | Ritchie Bros Auctioneers, Inc. | | | 128,144 | |
| | 14,671 | | | Russel Metals, Inc. | | | 233,707 | |
| | 12,057 | | | Secure Energy Services, Inc. | | | 73,948 | |
| | 16,121 | | | SEMAFO, Inc.(a) | | | 63,269 | |
| | 5,855 | | | Seven Generations Energy Ltd.,
Class A(a) | | | 124,942 | |
| | 6,659 | | | ShawCor Ltd. | | | 166,692 | |
See accompanying Notes to Financial Statements which are an integral part of the financial statements.
PowerShares FTSE RAFI Developed Markets ex-U.S. Small-Mid Portfolio (PDN) (continued)
October 31, 2016
| | | | | | | | |
Number
of Shares | | | | | Value | |
| | | | Common Stocks and Other Equity Interests (continued) | |
| | | | Canada (continued) | |
| | 2,756 | | | Sierra Wireless, Inc.(a) | | $ | 37,713 | |
| | 5,901 | | | Silver Standard Resources, Inc.(a) | | | 64,811 | |
| | 4,703 | | | Stantec, Inc. | | | 104,710 | |
| | 1,209 | | | Stella-Jones, Inc. | | | 42,939 | |
| | 26,340 | | | Superior Plus Corp. | | | 234,657 | |
| | 4,384 | | | TMX Group Ltd. | | | 202,444 | |
| | 10,640 | | | TORC Oil & Gas Ltd. | | | 60,256 | |
| | 4,435 | | | Toromont Industries Ltd. | | | 130,378 | |
| | 9,567 | | | Transcontinental, Inc., Class A | | | 128,060 | |
| | 12,215 | | | TransForce, Inc. | | | 277,338 | |
| | 75,648 | | | Turquoise Hill Resources Ltd.(a) | | | 234,804 | |
| | 33,458 | | | Veresen, Inc. | | | 303,313 | |
| | 3,485 | | | Waste Connections, Inc. | | | 261,742 | |
| | 5,275 | | | West Fraser Timber Co. Ltd. | | | 180,733 | |
| | 7,913 | | | Westshore Terminals Investment Corp. | | | 152,740 | |
| | 27,763 | | | Whitecap Resources, Inc. | | | 222,063 | |
| | 1,100 | | | Winpak Ltd. | | | 37,623 | |
| | 6,358 | | | WSP Global, Inc. | | | 206,122 | |
| | | | | | | | |
| | | | | | | 14,757,322 | |
| | | | | | | | |
| | | | China—0.7% | | | | |
| | 19,123 | | | AAC Technologies Holdings, Inc. | | | 182,480 | |
| | 207,008 | | | China Travel International Investment Hong Kong Ltd. | | | 59,794 | |
| | 293,380 | | | FIH Mobile Ltd. | | | 96,849 | |
| | 33,833 | | | Minth Group Ltd. | | | 120,414 | |
| | 2,230,814 | | | Semiconductor Manufacturing International Corp.(a) | | | 270,407 | |
| | 471,301 | | | Shui On Land Ltd. | | | 116,688 | |
| | 83,406 | | | SITC International Holdings Co. Ltd. | | | 49,367 | |
| | 16,784 | | | Stella International Holdings Ltd. | | | 29,132 | |
| | 78,257 | | | Uni-President China Holdings Ltd. | | | 52,980 | |
| | 294,508 | | | Yangzijiang Shipbuilding Holdings Ltd. | | | 157,632 | |
| | 133,818 | | | Yingde Gases Group Co. Ltd. | | | 54,011 | |
| | | | | | | | |
| | | | | | | 1,189,754 | |
| | | | | | | | |
| | | | Colombia—0.2% | | | | |
| | 58,504 | | | Gran Tierra Energy, Inc.(a) | | | 171,114 | |
| | 10,432 | | | Parex Resources, Inc.(a) | | | 120,101 | |
| | | | | | | | |
| | | | | | | 291,215 | |
| | | | | | | | |
| | | | Denmark—1.0% | | | | |
| | 5,329 | | | Alm. Brand A/S | | | 40,049 | |
| | 1,665 | | | Chr. Hansen Holding A/S | | | 99,564 | |
| | 2,249 | | | Coloplast A/S, Class B | | | 156,691 | |
| | 2,200 | | | DFDS A/S | | | 106,172 | |
| | 5,948 | | | GN Store Nord A/S | | | 120,430 | |
| | 2,402 | | | H. Lundbeck A/S(a) | | | 77,339 | |
| | 2,792 | | | Matas A/S | | | 54,103 | |
| | 2,433 | | | NKT Holding A/S | | | 163,630 | |
| | 398 | | | Rockwool International A/S, Class B | | | 66,508 | |
| | 1,455 | | | Royal Unibrew A/S | | | 67,967 | |
| | 860 | | | Schouw & Co. | | | 54,557 | |
| | 824 | | | SimCorp A/S | | | 45,473 | |
| | 6,495 | | | Spar Nord Bank A/S | | | 65,083 | |
| | 5,897 | | | Sydbank A/S | | | 184,136 | |
| | 5,541 | | | Topdanmark A/S(a) | | | 149,014 | |
| | | | | | | | |
Number
of Shares | | | | | Value | |
| | | | Common Stocks and Other Equity Interests (continued) | |
| | | | Denmark (continued) | | | | |
| | 8,282 | | | Tryg A/S | | $ | 161,584 | |
| | 4,040 | | | William Demant Holding A/S(a) | | | 75,131 | |
| | | | | | | | |
| | | | | | | 1,687,431 | |
| | | | | | | | |
| | | | Faroe Islands—0.0% | | | | |
| | 1,154 | | | Bakkafrost P/F | | | 48,473 | |
| | | | | | | | |
| | | | Finland—1.8% | | | | |
| | 6,710 | | | Amer Sports Oyj | | | 182,417 | |
| | 5,245 | | | Cargotec Oyj, Class B | | | 214,919 | |
| | 8,280 | | | Caverion Corp. | | | 59,542 | |
| | 21,084 | | | Citycon Oyj | | | 49,368 | |
| | 2,629 | | | Cramo Oyj | | | 69,022 | |
| | 7,351 | | | Finnair Oyj(a) | | | 32,555 | |
| | 6,358 | | | Huhtamaki Oyj | | | 256,343 | |
| | 11,463 | | | Kemira Oyj | | | 136,464 | |
| | 7,739 | | | Konecranes Oyj | | | 263,413 | |
| | 17,169 | | | Metsa Board Oyj, Class B | | | 98,526 | |
| | 42,069 | | | Outokumpu Oyj(a) | | | 292,837 | |
| | 47,097 | | | Outotec Oyj(a) | | | 204,859 | |
| | 7,298 | | | Ramirent Oyj | | | 53,761 | |
| | 10,780 | | | Sanoma Oyj | | | 100,858 | |
| | 25,352 | | | Sponda Oyj | | | 119,834 | |
| | 7,091 | | | Tieto Oyj | | | 194,251 | |
| | 4,800 | | | Uponor Oyj | | | 81,557 | |
| | 14,648 | | | Valmet Oyj | | | 217,253 | |
| | 29,596 | | | YIT Oyj | | | 246,243 | |
| | | | | | | | |
| | | | | | | 2,874,022 | |
| | | | | | | | |
| | | | France—3.4% | | | | |
| | 1,706 | | | Aeroports de Paris | | | 172,070 | |
| | 1,598 | | | Alten SA | | | 114,055 | |
| | 7,527 | | | Altran Technologies SA | | | 107,264 | |
| | 611 | | | bioMerieux | | | 88,947 | |
| | 3,830 | | | Bourbon Corp.(b) | | | 49,962 | |
| | 8,720 | | | Coface SA(a) | | | 56,388 | |
| | 2,720 | | | Dassault Systemes | | | 215,097 | |
| | 17,076 | | | Derichebourg SA | | | 53,423 | |
| | 4,509 | | | Elis SA | | | 74,834 | |
| | 6,289 | | | Eramet(a) | | | 294,788 | |
| | 35,467 | | | Etablissements Maurel et Prom(a)(b) | | | 155,905 | |
| | 1,036 | | | Euler Hermes Group | | | 89,774 | |
| | 7,464 | | | Europcar Groupe SA(a)(c) | | | 69,269 | |
| | 1,105 | | | Gaztransport Et Technigaz SA | | | 37,308 | |
| | 849 | | | Groupe Fnac SA(a) | | | 57,795 | |
| | 11,205 | | | Havas SA | | | 91,029 | |
| | 498 | | | Hermes International | | | 201,495 | |
| | 682 | | | Iliad SA | | | 142,868 | |
| | 3,474 | | | Imerys SA | | | 241,288 | |
| | 1,583 | | | Ingenico Group | | | 125,114 | |
| | 1,476 | | | Ipsen SA | | | 101,869 | |
| | 4,889 | | | Ipsos | | | 159,440 | |
| | 3,249 | | | JCDecaux SA | | | 99,207 | |
| | 3,413 | | | Korian SA | | | 104,402 | |
| | 3,980 | | | Mercialys SA REIT | | | 82,327 | |
| | 8,509 | | | Metropole Television SA | | | 148,075 | |
| | 1,739 | | | Orpea | | | 144,573 | |
See accompanying Notes to Financial Statements which are an integral part of the financial statements.
PowerShares FTSE RAFI Developed Markets ex-U.S. Small-Mid Portfolio (PDN) (continued)
October 31, 2016
| | | | | | | | |
Number
of Shares | | | | | Value | |
| | | | Common Stocks and Other Equity Interests (continued) | |
| | | | France (continued) | | | | |
| | 3,818 | | | Plastic Omnium SA | | $ | 124,219 | |
| | 12,957 | | | Rallye SA(b) | | | 234,215 | |
| | 1,439 | | | Remy Cointreau SA | | | 116,572 | |
| | 2,670 | | | Rubis SCA | | | 243,163 | |
| | 2,119 | | | SEB SA | | | 311,378 | |
| | 3,876 | | | SFR Group SA | | | 104,267 | |
| | 1,540 | | | Societe BIC SA | | | 213,213 | |
| | 939 | | | Sopra Steria Group | | | 95,378 | |
| | 3,271 | | | SPIE SA | | | 61,781 | |
| | 1,915 | | | Tarkett SA | | | 68,109 | |
| | 26,476 | | | Technicolor SA | | | 154,576 | |
| | 18,166 | | | Television Francaise 1(b) | | | 167,234 | |
| | 6,640 | | | Ubisoft Entertainment SA(a) | | | 225,642 | |
| | 1,334 | | | Vicat SA | | | 83,748 | |
| | 227 | | | Virbac SA(a) | | | 36,081 | |
| | 1,815 | | | Worldline SA(a)(c) | | | 49,820 | |
| | | | | | | | |
| | | | | | | 5,567,962 | |
| | | | | | | | |
| | | | Georgia—0.1% | | | | |
| | 2,943 | | | BGEO Group PLC | | | 106,212 | |
| | | | | | | | |
| | | | Germany—3.0% | | | | |
| | 12,024 | | | Aixtron SE(a) | | | 59,471 | |
| | 4,535 | | | alstria office REIT-AG REIT | | | 58,437 | |
| | 3,651 | | | Axel Springer SE | | | 182,562 | |
| | 2,491 | | | BayWa AG | | | 83,462 | |
| | 851 | | | Bechtle AG | | | 89,322 | |
| | 315 | | | Bertrandt AG | | | 33,512 | |
| | 589 | | | Biotest AG | | | 10,492 | |
| | 1,847 | | | Biotest AG (Preference Shares) | | | 25,632 | |
| | 2,394 | | | Deutsche EuroShop AG | | | 103,266 | |
| | 12,421 | | | Deutsche Pfandbriefbank AG(c) | | | 127,418 | |
| | 20,789 | | | Deutz AG | | | 102,550 | |
| | 4,801 | | | Dic Asset AG | | | 45,992 | |
| | 1,961 | | | DMG Mori AG | | | 89,630 | |
| | 556 | | | Draegerwerk AG & Co. KGaA | | | 35,411 | |
| | 1,182 | | | Draegerwerk AG & Co. KGaA (Preference Shares) | | | 84,195 | |
| | 1,940 | | | Drillisch AG | | | 88,468 | |
| | 1,020 | | | Duerr AG | | | 75,921 | |
| | 2,837 | | | ElringKlinger AG | | | 43,881 | |
| | 971 | | | Fielmann AG | | | 67,249 | |
| | 3,537 | | | Fraport AG Frankfurt Airport Services Worldwide | | | 209,643 | |
| | 1,865 | | | FUCHS PETROLUB SE | | | 73,619 | |
| | 3,611 | | | FUCHS PETROLUB SE (Preference Shares) | | | 161,205 | |
| | 1,805 | | | Gerresheimer AG | | | 135,952 | |
| | 3,649 | | | Gerry Weber International AG | | | 45,500 | |
| | 3,285 | | | Hamburger Hafen und Logistik AG, Class A | | | 52,251 | |
| | 59,636 | | | Heidelberger Druckmaschinen
AG(a)(b) | | | 158,203 | |
| | 3,306 | | | Hella KGAA Hueck & Co. | | | 125,863 | |
| | 1,987 | | | Indus Holding AG | | | 116,988 | |
| | 3,320 | | | Jenoptik AG | | | 56,847 | |
| | 3,780 | | | Jungheinrich AG (Preference Shares) | | | 119,109 | |
| | 856 | | | Krones AG | | | 87,126 | |
| | 124 | | | KWS Saat SE | | | 40,507 | |
| | 2,319 | | | Nordex SE(a) | | | 60,896 | |
| | | | | | | | |
Number
of Shares | | | | | Value | |
| | | | Common Stocks and Other Equity Interests (continued) | |
| | | | Germany (continued) | | | | |
| | 1,396 | | | Norma Group SE | | $ | 64,150 | |
| | 796 | | | Pfeiffer Vacuum Technology AG | | | 72,136 | |
| | 194 | | | Puma SE | | | 48,211 | |
| | 93 | | | Rational AG | | | 48,170 | |
| | 4,572 | | | RHOEN KLINIKUM AG | | | 127,075 | |
| | 592 | | | Sartorius AG (Preference Shares) | | | 46,445 | |
| | 5,714 | | | SGL Carbon SE(a)(b) | | | 71,156 | |
| | 1,527 | | | Sixt SE | | | 92,399 | |
| | 1,900 | | | Sixt SE (Preference Shares) | | | 84,561 | |
| | 799 | | | SMA Solar Technology AG(b) | | | 20,469 | |
| | 2,932 | | | Software AG | | | 106,385 | |
| | 5,536 | | | STADA Arzneimittel AG | | | 276,757 | |
| | 7,926 | | | TAG Immobilien AG | | | 105,652 | |
| | 2,470 | | | TLG Immobilien AG | | | 51,661 | |
| | 3,495 | | | United Internet AG | | | 143,249 | |
| | 1,231 | | | Vossloh AG(a) | | | 74,610 | |
| | 2,106 | | | Wacker Chemie AG | | | 187,320 | |
| | 3,187 | | | Wacker Neuson SE | | | 44,019 | |
| | 3,129 | | | Wincor Nixdorf AG(a) | | | 227,547 | |
| | 1,926 | | | Wirecard AG | | | 91,239 | |
| | 1,517 | | | Zalando SE(a)(c) | | | 66,501 | |
| | | | | | | | |
| | | | | | | 4,900,292 | |
| | | | | | | | |
| | | | Hong Kong—2.7% | | | | |
| | 16,247 | | | ASM Pacific Technology Ltd. | | | 156,817 | |
| | 233,328 | | | Brightoil Petroleum Holdings Ltd. | | | 67,397 | |
| | 13,573 | | | Cafe de Coral Holdings Ltd. | | | 47,957 | |
| | 131,144 | | | Cathay Pacific Airways Ltd. | | | 172,833 | |
| | 147,951 | | | Champion REIT | | | 84,136 | |
| | 15,395 | | | Cheung Kong Infrastructure Holdings Ltd. | | | 126,160 | |
| | 143,170 | | | Chow Tai Fook Jewellery Group Ltd. | | | 101,541 | |
| | 28,513 | | | Dah Sing Banking Group Ltd. | | | 51,622 | |
| | 9,446 | | | Dah Sing Financial Holdings Ltd. | | | 64,193 | |
| | 154,313 | | | Esprit Holdings Ltd.(a) | | | 127,353 | |
| | 195,071 | | | First Pacific Co. Ltd. | | | 147,910 | |
| | 97,901 | | | Fortune Real Estate Investment Trust REIT | | | 118,670 | |
| | 297,605 | | | Global Brands Group Holding Ltd.(a) | | | 33,771 | |
| | 63,064 | | | Haitong International Securities Group Ltd. | | | 40,498 | |
| | 46,754 | | | Hang Lung Group Ltd. | | | 179,363 | |
| | 11,807 | | | Hopewell Holdings Ltd. | | | 41,413 | |
| | 281,947 | | | Huabao International Holdings Ltd.(a) | | | 105,800 | |
| | 125,015 | | | Ju Teng International Holdings Ltd. | | | 39,657 | |
| | 30,685 | | | Kerry Logistics Network Ltd. | | | 40,756 | |
| | 74,744 | | | Kerry Properties Ltd. | | | 236,622 | |
| | 50,130 | | | Luk Fook Holdings International Ltd. | | | 147,064 | |
| | 87,068 | | | Man Wah Holdings Ltd. | | | 57,822 | |
| | 47,395 | | | NWS Holdings Ltd. | | | 83,974 | |
| | 21,061 | | | Orient Overseas International Ltd. | | | 78,895 | |
| | 369,060 | | | Pacific Basin Shipping Ltd.(a) | | | 55,205 | |
| | 42,094 | | | Pacific Textile Holdings Ltd. | | | 53,087 | |
| | 351,537 | | | PCCW Ltd. | | | 209,430 | |
| | 215,636 | | | Pou Sheng International Holdings Ltd. | | | 67,570 | |
| | 109,361 | | | Shangri-La Asia Ltd. | | | 120,292 | |
| | 139,079 | | | Shun Tak Holdings Ltd.(a) | | | 46,988 | |
| | 32,306 | | | SmarTone Telecommunications Holding Ltd. | | | 48,825 | |
| | 254,029 | | | Sun Art Retail Group Ltd. | | | 179,183 | |
See accompanying Notes to Financial Statements which are an integral part of the financial statements.
PowerShares FTSE RAFI Developed Markets ex-U.S. Small-Mid Portfolio (PDN) (continued)
October 31, 2016
| | | | | | | | |
Number
of Shares | | | | | Value | |
| | | | Common Stocks and Other Equity Interests (continued) | |
| | | | Hong Kong (continued) | | | | |
| | 69,950 | | | Swire Properties Ltd. | | $ | 201,150 | |
| | 50,548 | | | Techtronic Industries Co. Ltd. | | | 190,333 | |
| | 24,684 | | | Television Broadcasts Ltd. | | | 89,443 | |
| | 67,132 | | | Texwinca Holdings Ltd. | | | 47,093 | |
| | 170,946 | | | Truly International Holdings Ltd. | | | 67,013 | |
| | 13,225 | | | VTech Holdings Ltd. | | | 162,353 | |
| | 41,704 | | | Wheelock & Co. Ltd. | | | 257,596 | |
| | 222,253 | | | Xinyi Glass Holdings Co. Ltd. | | | 191,161 | |
| | 98,871 | | | Yuexiu Real Estate Investment Trust REIT | | | 56,736 | |
| | | | | | | | |
| | | | | | | 4,395,682 | |
| | | | | | | | |
| | | | India—0.3% | | | | |
| | 46,709 | | | Vedanta Resources PLC | | | 406,888 | |
| | | | | | | | |
| | | | Ireland—0.5% | | | | |
| | 26,580 | | | C&C Group PLC | | | 101,979 | |
| | 5,170 | | | Glanbia PLC | | | 84,104 | |
| | 31,638 | | | Green REIT PLC REIT | | | 47,167 | |
| | 19,173 | | | Greencore Group PLC | | | 77,247 | |
| | 24,076 | | | Hibernia REIT PLC REIT | | | 33,861 | |
| | 7,733 | | | Irish Continental Group PLC | | | 36,010 | |
| | 5,638 | | | Kingspan Group PLC | | | 137,822 | |
| | 11,789 | | | Origin Enterprises PLC | | | 73,016 | |
| | 350 | | | Paddy Power Betfair PLC | | | 36,194 | |
| | 15,976 | | | UDG Healthcare PLC | | | 127,466 | |
| | | | | | | | |
| | | | | | | 754,866 | |
| | | | | | | | |
| | | | Isle of Man—0.1% | | | | |
| | 9,435 | | | Gvc Holdings PLC | | | 80,231 | |
| | | | | | | | |
| | | | Israel—0.9% | | | | |
| | 6,890 | | | Alony Hetz Properties & Investments Ltd. REIT | | | 59,200 | |
| | 2,267 | | | Azrieli Group Ltd. | | | 96,448 | |
| | 1,462 | | | B Communications Ltd. | | | 32,333 | |
| | 9,989 | | | Cellcom Israel Ltd.(a) | | | 75,346 | |
| | 4,324 | | | Delek Automotive Systems Ltd. | | | 36,927 | |
| | 1,382 | | | Elbit Systems Ltd. | | | 136,736 | |
| | 3,719 | | | First International Bank of Israel Ltd. | | | 47,835 | |
| | 12,768 | | | Gazit-Globe Ltd. | | | 115,024 | |
| | 99,780 | | | Israel Discount Bank Ltd., Class A(a) | | | 183,131 | |
| | 11,453 | | | Mizrahi Tefahot Bank Ltd. | | | 149,100 | |
| | 1,631 | | | Nice Ltd. | | | 108,161 | |
| | 239,548 | | | Oil Refineries Ltd.(a) | | | 84,450 | |
| | 10,983 | | | Partner Communications Co. Ltd.(a) | | | 51,188 | |
| | 554 | | | Paz Oil Co. Ltd. | | | 86,460 | |
| | 32,184 | | | Shikun & Binui Ltd. | | | 55,809 | |
| | 2,780 | | | Strauss Group Ltd. | | | 43,719 | |
| | 4,512 | | | Tower Semiconductor Ltd.(a) | | | 69,771 | |
| | | | | | | | |
| | | | | | | 1,431,638 | |
| | | | | | | | |
| | | | Italy—2.3% | | | | |
| | 5,485 | | | ACEA SpA | | | 70,949 | |
| | 7,885 | | | Anima Holding SpA(c) | | | 38,360 | |
| | 6,843 | | | Ansaldo STS SpA | | | 78,539 | |
| | 16,255 | | | Astaldi SpA | | | 65,537 | |
| | 3,571 | | | ASTM SpA | | | 38,499 | |
| | 12,635 | | | Autogrill SpA | | | 105,195 | |
| | | | | | | | |
Number
of Shares | | | | | Value | |
| | | | Common Stocks and Other Equity Interests (continued) | |
| | | | Italy (continued) | | | | |
| | 4,838 | | | Azimut Holding SpA | | $ | 77,536 | |
| | 419,891 | | | Banca Carige SpA(a) | | | 142,964 | |
| | 3,782 | | | Banca Generali SpA | | | 83,870 | |
| | 51,337 | | | Banca Popolare DI Sondrio SCPA | | | 171,078 | |
| | 123,879 | | | Beni Stabili SpA REIT | | | 72,176 | |
| | 1,545 | | | Brembo SpA | | | 95,351 | |
| | 6,718 | | | Buzzi Unicem SpA | | | 130,495 | |
| | 3,852 | | | Buzzi Unicem SpA RSP | | | 39,270 | |
| | 7,465 | | | Cementir Holding SpA | | | 36,415 | |
| | 10,927 | | | Cerved Information Solutions SpA | | | 87,860 | |
| | 9,247 | | | Credito Emiliano SpA | | | 52,001 | |
| | 240,958 | | | Credito Valtellinese SC | | | 105,761 | |
| | 2,015 | | | Danieli & C. Officine Meccaniche SpA | | | 37,550 | |
| | 6,678 | | | Danieli & C. Officine Meccaniche SpA RSP | | | 89,309 | |
| | 13,501 | | | Davide Campari-Milano SpA | | | 135,788 | |
| | 3,367 | | | De’Longhi SpA | | | 78,690 | |
| | 810 | | | DiaSorin SpA | | | 49,724 | |
| | 656 | | | Ei Towers SpA(a) | | | 30,922 | |
| | 9,567 | | | ERG SpA | | | 106,132 | |
| | 4,878 | | | Esprinet SpA | | | 36,094 | |
| | 106,497 | | | Fincantieri SpA(a) | | | 48,179 | |
| | 4,858 | | | Finecobank Banca Fineco SpA | | | 28,331 | |
| | 662 | | | Industria Macchine Automatiche SpA | | | 40,892 | |
| | 3,980 | | | Interpump Group SpA | | | 63,785 | |
| | 74,121 | | | Iren SpA | | | 132,927 | |
| | 465 | | | Italmobiliare SpA | | | 22,026 | |
| | 2,828 | | | MARR SpA | | | 52,019 | |
| | 2,793 | | | Moncler SpA | | | 46,446 | |
| | 7,423 | | | OVS SpA(c) | | | 40,588 | |
| | 29,719 | | | Parmalat SpA | | | 78,383 | |
| | 26,819 | | | Piaggio & C. SpA | | | 46,744 | |
| | 40,765 | | | Prada SpA | | | 142,983 | |
| | 3,581 | | | Recordati SpA | | | 101,199 | |
| | 155,853 | | | Rizzoli Corriere Della Sera Mediagroup SpA(a) | | | 166,404 | |
| | 6,599 | | | Safilo Group SpA(a) | | | 68,975 | |
| | 68,056 | | | Saipem SpA(a) | | | 27,976 | |
| | 22,438 | | | Salini Impregilo SpA | | | 62,475 | |
| | 1,977 | | | Salvatore Ferragamo SpA | | | 48,307 | |
| | 115,549 | | | Saras SpA | | | 200,384 | |
| | 26,316 | | | Societa Cattolica di Assicurazioni SCRL | | | 158,950 | |
| | 7,821 | | | Societa Iniziative Autostradali e Servizi SpA | | | 73,131 | |
| | 1,083 | | | Tod’s SpA | | | 63,277 | |
| | | | | | | | |
| | | | | | | 3,770,446 | |
| | | | | | | | |
| | | | Japan—36.7% | | | | |
| | 45,561 | | | 77 Bank Ltd. (The) | | | 205,943 | |
| | 932 | | | ABC-Mart, Inc. | | | 56,673 | |
| | 8,440 | | | Accordia Golf Co. Ltd. | | | 85,135 | |
| | 15,299 | | | ACOM Co. Ltd.(a) | | | 70,464 | |
| | 2,272 | | | Adastria Co. Ltd. | | | 59,500 | |
| | 11,326 | | | ADEKA Corp. | | | 171,369 | |
| | 10,534 | | | Advantest Corp. | | | 150,665 | |
| | 1,386 | | | AEON DELIGHT Co. Ltd. | | | 40,953 | |
| | 7,827 | | | AEON Financial Service Co. Ltd. | | | 137,867 | |
| | 11,141 | | | AEON Mall Co. Ltd. | | | 165,390 | |
| | 4,641 | | | Aica Kogyo Co. Ltd. | | | 132,493 | |
| | 2,400 | | | Aichi Steel Corp. | | | 115,564 | |
See accompanying Notes to Financial Statements which are an integral part of the financial statements.
PowerShares FTSE RAFI Developed Markets ex-U.S. Small-Mid Portfolio (PDN) (continued)
October 31, 2016
| | | | | | | | |
Number
of Shares | | | | | Value | |
| | | | Common Stocks and Other Equity Interests (continued) | |
| | | | Japan (continued) | | | | |
| | 5,629 | | | Aida Engineering Ltd. | | $ | 48,424 | |
| | 26,608 | | | Aiful Corp.(a) | | | 81,025 | |
| | 1,524 | | | Ain Holdings, Inc. | | | 102,823 | |
| | 7,236 | | | Aisan Industry Co. Ltd.(b) | | | 58,805 | |
| | 21,855 | | | Akebono Brake Industry Co. Ltd.(a)(b) | | | 41,595 | |
| | 3,297 | | | Alpen Co. Ltd. | | | 60,020 | |
| | 7,375 | | | Alpine Electronics, Inc. | | | 98,254 | |
| | 5,881 | | | Amano Corp. | | | 109,410 | |
| | 16,943 | | | Anritsu Corp. | | | 89,806 | |
| | 5,630 | | | AOKI Holdings, Inc. | | | 68,095 | |
| | 5,112 | | | Aoyama Trading Co. Ltd. | | | 179,991 | |
| | 4,112 | | | Arcs Co. Ltd. | | | 103,265 | |
| | 6,673 | | | Asahi Diamond Industrial Co. Ltd. | | | 49,721 | |
| | 5,037 | | | Asahi Holdings, Inc. | | | 90,497 | |
| | 6,392 | | | Asatsu-DK, Inc. | | | 177,311 | |
| | 9,692 | | | ASICS Corp. | | | 206,780 | |
| | 1,385 | | | ASKUL Corp.(b) | | | 57,003 | |
| | 9,006 | | | Autobacs Seven Co. Ltd. | | | 128,039 | |
| | 5,561 | | | Avex Group Holdings, Inc. | | | 73,557 | |
| | 12,588 | | | Awa Bank Ltd. (The) | | | 82,774 | |
| | 1,322 | | | Axial Retailing, Inc. | | | 47,491 | |
| | 7,462 | | | Azbil Corp. | | | 221,549 | |
| | 1,100 | | | Bank of Nagoya Ltd. (The) | | | 38,731 | |
| | 5,789 | | | Bank of The Ryukyus Ltd. | | | 76,133 | |
| | 27,271 | | | Bic Camera, Inc. | | | 234,860 | |
| | 2,000 | | | BML, Inc. | | | 53,043 | |
| | 4,631 | | | Bunka Shutter Co. Ltd. | | | 38,384 | |
| | 1,876 | | | Calbee, Inc. | | | 68,017 | |
| | 29,169 | | | Calsonic Kansei Corp. | | | 365,012 | |
| | 3,352 | | | Canon Electronics, Inc. | | | 52,121 | |
| | 5,898 | | | Canon Marketing Japan, Inc. | | | 101,869 | |
| | 3,213 | | | Capcom Co. Ltd.(b) | | | 83,012 | |
| | 3,282 | | | Cawachi Ltd. | | | 84,420 | |
| | 27,684 | | | Central Glass Co. Ltd. | | | 113,281 | |
| | 8,748 | | | Chiba Kogyo Bank Ltd. (The) | | | 38,793 | |
| | 2,457 | | | Chiyoda Co. Ltd. | | | 58,383 | |
| | 21,747 | | | Chiyoda Corp. | | | 189,770 | |
| | 2,511 | | | Chudenko Corp. | | | 52,163 | |
| | 20,929 | | | Chugoku Bank Ltd. (The) | | | 280,819 | |
| | 9,461 | | | Chugoku Marine Paints Ltd. | | | 68,874 | |
| | 6,854 | | | CKD Corp. | | | 85,443 | |
| | 9,891 | | | CMK Corp.(a)(b) | | | 52,145 | |
| | 6,357 | | | Coca-Cola East Japan Co. Ltd. | | | 140,104 | |
| | 7,368 | | | Coca-Cola West Co. Ltd. | | | 217,706 | |
| | 2,732 | | | cocokara fine, Inc. | | | 105,682 | |
| | 2,902 | | | Colowide Co. Ltd.(b) | | | 56,364 | |
| | 11,319 | | | COMSYS Holdings Corp. | | | 199,376 | |
| | 396 | | | Cosmos Pharmaceutical Corp. | | | 86,183 | |
| | 3,810 | | | CyberAgent, Inc. | | | 110,763 | |
| | 5,543 | | | Daibiru Corp. | | | 48,106 | |
| | 6,602 | | | Daifuku Co. Ltd. | | | 119,494 | |
| | 12,963 | | | Daihen Corp. | | | 75,125 | |
| | 11,142 | | | Daiho Corp. | | | 61,284 | |
| | 37,050 | | | Daikyo, Inc. | | | 79,329 | |
| | 2,811 | | | Daikyonishikawa Corp. | | | 36,273 | |
| | 15,912 | | | Daio Paper Corp.(b) | | | 191,092 | |
| | | | | | | | |
Number
of Shares | | | | | Value | |
| | | | Common Stocks and Other Equity Interests (continued) | |
| | | | Japan (continued) | | | | |
| | 2,812 | | | Daiseki Co. Ltd. | | $ | 57,747 | |
| | 22,401 | | | Daishi Bank Ltd. (The) | | | 96,353 | |
| | 38,591 | | | Daiwabo Holdings Co. Ltd. | | | 93,278 | |
| | 20,914 | | | DCM Holdings Co. Ltd. | | | 183,098 | |
| | 11,358 | | | DeNA Co. Ltd. | | | 365,324 | |
| | 2,442 | | | Descente Ltd. | | | 33,881 | |
| | 5,290 | | | Dexerials Corp. | | | 42,487 | |
| | 1,023 | | | DISCO Corp. | | | 123,634 | |
| | 12,783 | | | DMG Mori Co. Ltd. | | | 135,633 | |
| | 2,152 | | | Doshisha Co. Ltd. | | | 44,480 | |
| | 2,992 | | | Doutor Nichires Holdings Co. Ltd. | | | 59,905 | |
| | 40,414 | | | Dowa Holdings Co. Ltd. | | | 300,360 | |
| | 1,827 | | | DTS Corp. | | | 40,474 | |
| | 5,704 | | | Duskin Co. Ltd. | | | 109,537 | |
| | 1,254 | | | DyDo Drinco, Inc. | | | 69,332 | |
| | 3,539 | | | Eagle Industry Co. Ltd. | | | 50,449 | |
| | 1,385 | | | Earth Chemical Co. Ltd. | | | 64,252 | |
| | 18,417 | | | EDION Corp.(b) | | | 163,165 | |
| | 1,635 | | | EIZO Corp. | | | 51,655 | |
| | 5,620 | | | EXEDY Corp. | | | 159,960 | |
| | 2,503 | | | Ezaki Glico Co. Ltd. | | | 142,198 | |
| | 4,814 | | | F.C.C. Co. Ltd. | | | 105,547 | |
| | 3,698 | | | Familymart UNY Holdings Co. Ltd. | | | 231,554 | |
| | 3,600 | | | Fancl Corp. | | | 54,367 | |
| | 39,568 | | | FIDEA Holdings Co. Ltd. | | | 71,165 | |
| | 4,249 | | | Foster Electric Co. Ltd. | | | 78,078 | |
| | 1,697 | | | FP Corp. | | | 91,402 | |
| | 7,824 | | | Fuji Machine Manufacturing Co. Ltd. | | | 99,619 | |
| | 5,095 | | | Fuji Oil Holdings, Inc. | | | 98,230 | |
| | 1,793 | | | Fuji Seal International, Inc. | | | 73,965 | |
| | 2,867 | | | Fuji Soft, Inc. | | | 76,173 | |
| | 7,023 | | | Fujitec Co. Ltd. | | | 80,332 | |
| | 5,260 | | | Fujitsu General Ltd. | | | 120,732 | |
| | 20,514 | | | Fukuyama Transporting Co. Ltd. | | | 116,738 | |
| | 5,693 | | | Funai Electric Co. Ltd.(b) | | | 46,428 | |
| | 47,471 | | | Furukawa Co. Ltd. | | | 75,892 | |
| | 4,444 | | | Futaba Corp. | | | 72,569 | |
| | 2,593 | | | Fuyo General Lease Co. Ltd. | | | 131,519 | |
| | 6,501 | | | Geo Holdings Corp.(b) | | | 82,465 | |
| | 4,730 | | | Glory Ltd. | | | 156,414 | |
| | 3,154 | | | GMO Internet, Inc. | | | 42,169 | |
| | 2,300 | | | Godo Steel Ltd. | | | 40,294 | |
| | 15,161 | | | Gree, Inc. | | | 84,112 | |
| | 49,641 | | | GS Yuasa Corp. | | | 214,465 | |
| | 4,476 | | | G-Tekt Corp. | | | 84,890 | |
| | 17,800 | | | GungHo Online Entertainment, Inc.(b) | | | 45,057 | |
| | 19,182 | | | Gunze Ltd. | | | 64,436 | |
| | 12,740 | | | H2O Retailing Corp. | | | 189,127 | |
| | 5,585 | | | Hamamatsu Photonics K.K. | | | 169,009 | |
| | 34,242 | | | Hanwa Co. Ltd. | | | 209,522 | |
| | 22,629 | | | Hazama Ando Corp. | | | 146,000 | |
| | 5,310 | | | Heiwa Corp. | | | 124,810 | |
| | 5,568 | | | Heiwa Real Estate Co. Ltd. | | | 79,161 | |
| | 4,720 | | | Heiwado Co. Ltd. | | | 98,276 | |
| | 1,922 | | | Hikari Tsushin, Inc. | | | 176,315 | |
| | 1,677 | | | Hirose Electric Co. Ltd. | | | 221,504 | |
See accompanying Notes to Financial Statements which are an integral part of the financial statements.
PowerShares FTSE RAFI Developed Markets ex-U.S. Small-Mid Portfolio (PDN) (continued)
October 31, 2016
| | | | | | | | |
Number
of Shares | | | | | Value | |
| | | | Common Stocks and Other Equity Interests (continued) | |
| | | | Japan (continued) | | | | |
| | 3,161 | | | HIS Co. Ltd. | | $ | 86,271 | |
| | 3,817 | | | Hisamitsu Pharmaceutical Co., Inc. | | | 203,772 | |
| | 4,436 | | | Hitachi Capital Corp. | | | 99,117 | |
| | 12,454 | | | Hitachi Chemical Co. Ltd. | | | 291,543 | |
| | 6,341 | | | Hitachi High-Technologies Corp. | | | 264,598 | |
| | 6,842 | | | Hitachi Koki Co. Ltd. | | | 57,882 | |
| | 4,701 | | | Hitachi Kokusai Electric, Inc. | | | 93,854 | |
| | 8,468 | | | Hitachi Maxell Ltd. | | | 154,315 | |
| | 7,402 | | | Hitachi Transport System Ltd. | | | 152,569 | |
| | 35,704 | | | Hitachi Zosen Corp. | | | 179,735 | |
| | 953 | | | Hogy Medical Co. Ltd. | | | 62,756 | |
| | 28,153 | | | Hokkoku Bank Ltd. (The) | | | 94,303 | |
| | 20,048 | | | Hokuetsu Kishu Paper Co. Ltd. | | | 125,342 | |
| | 2,303 | | | Hokuto Corp. | | | 44,795 | |
| | 3,500 | | | Horiba Ltd. | | | 167,198 | |
| | 1,185 | | | Hoshizaki Corp. | | | 106,902 | |
| | 8,562 | | | Hosiden Corp. | | | 63,470 | |
| | 6,775 | | | House Foods Group, Inc. | | | 151,186 | |
| | 8,860 | | | Hulic Co. Ltd. | | | 84,397 | |
| | 18,385 | | | Hyakugo Bank Ltd. (The) | | | 67,707 | |
| | 14,320 | | | Hyakujushi Bank Ltd. (The) | | | 48,785 | |
| | 4,175 | | | IBJ Leasing Co. Ltd. | | | 87,326 | |
| | 3,614 | | | Idom, Inc.(b) | | | 18,846 | |
| | 9,984 | | | Iino Kaiun Kaisha Ltd. | | | 37,148 | |
| | 2,185 | | | Inaba Denki Sangyo Co. Ltd. | | | 79,324 | |
| | 3,353 | | | Inabata & Co. Ltd. | | | 36,470 | |
| | 2,351 | | | Internet Initiative Japan, Inc. | | | 41,523 | |
| | 35,684 | | | Iseki & Co. Ltd. | | | 88,289 | |
| | 11,200 | | | Ishihara Sangyo Kaisha Ltd.(a) | | | 85,051 | |
| | 5,007 | | | Ito EN Ltd. | | | 182,489 | |
| | 7,522 | | | Itochu Enex Co. Ltd. | | | 57,837 | |
| | 5,038 | | | ITOCHU Techno-Solutions Corp. | | | 124,314 | |
| | 16,060 | | | Itoham Yonekyu Holdings, Inc.(a) | | | 153,134 | |
| | 5,707 | | | Itoki Corp. | | | 35,192 | |
| | 37,634 | | | Iwatani Corp. | | | 224,905 | |
| | 31,008 | | | Iyo Bank Ltd. (The) | | | 190,619 | |
| | 3,453 | | | Izumi Co. Ltd. | | | 159,695 | |
| | 9,022 | | | J Trust Co. Ltd. | | | 73,749 | |
| | 28,145 | | | Jaccs Co. Ltd. | | | 110,346 | |
| | 2,321 | | | JAFCO Co. Ltd. | | | 77,194 | |
| | 2,093 | | | Japan Airport Terminal Co. Ltd.(b) | | | 80,366 | |
| | 9,231 | | | Japan Aviation Electronics Industry Ltd. | | | 132,116 | |
| | 13,576 | | | Japan Exchange Group, Inc. | | | 201,925 | |
| | 7,125 | | | Japan Petroleum Exploration Co. Ltd. | | | 156,420 | |
| | 12,528 | | | Japan Securities Finance Co. Ltd. | | | 55,675 | |
| | 10,700 | | | Japan Steel Works Ltd. (The) | | | 229,813 | |
| | 6,408 | | | Japan Wool Textile Co. Ltd. (The) | | | 46,710 | |
| | 3,129 | | | Joyful Honda Co. Ltd. | | | 86,380 | |
| | 4,678 | | | Juki Corp. | | | 34,990 | |
| | 25,956 | | | Juroku Bank Ltd. (The) | | | 78,299 | |
| | 54,317 | | | JVC KENWOOD Corp. | | | 146,796 | |
| | 5,302 | | | Kagome Co. Ltd. | | | 138,901 | |
| | 1,932 | | | Kakaku.com, Inc. | | | 32,450 | |
| | 1,346 | | | Kaken Pharmaceutical Co. Ltd. | | | 84,793 | |
| | 19,713 | | | Kamigumi Co. Ltd. | | | 168,269 | |
| | 2,941 | | | Kanamoto Co. Ltd. | | | 70,667 | |
| | | | | | | | |
Number
of Shares | | | | | Value | |
| | | | Common Stocks and Other Equity Interests (continued) | |
| | | | Japan (continued) | | | | |
| | 15,684 | | | Kandenko Co. Ltd. | | $ | 154,474 | |
| | 95,388 | | | Kanematsu Corp. | | | 157,036 | |
| | 12,334 | | | Kansai Paint Co. Ltd. | | | 265,260 | |
| | 4,748 | | | Kasai Kogyo Co. Ltd. | | | 53,632 | |
| | 3,252 | | | Kato Sangyo Co. Ltd. | | | 78,387 | |
| | 2,400 | | | Kato Works Co. Ltd. | | | 60,203 | |
| | 29,251 | | | Keihan Holdings Co. Ltd. | | | 197,354 | |
| | 8,185 | | | Keihin Corp. | | | 133,113 | |
| | 6,700 | | | Keisei Electric Railway Co. Ltd. | | | 161,754 | |
| | 16,373 | | | Keiyo Bank Ltd. (The) | | | 68,867 | |
| | 8,355 | | | Kenedix, Inc. | | | 35,142 | |
| | 9,608 | | | Kewpie Corp. | | | 272,921 | |
| | 6,102 | | | Kikkoman Corp. | | | 194,235 | |
| | 15,307 | | | Kinden Corp. | | | 184,409 | |
| | 5,547 | | | Kintetsu World Express, Inc. | | | 75,484 | |
| | 2,638 | | | Kissei Pharmaceutical Co. Ltd. | | | 68,984 | |
| | 12,212 | | | Kitz Corp. | | | 70,191 | |
| | 6,589 | | | Kiyo Bank Ltd. (The) | | | 109,289 | |
| | 23,394 | | | KNT-CT Holdings Co. Ltd.(a) | | | 25,824 | |
| | 2,661 | | | Kobayashi Pharmaceutical Co. Ltd. | | | 139,020 | |
| | 2,443 | | | Koei Tecmo Holdings Co. Ltd. | | | 46,775 | |
| | 7,384 | | | Kohnan Shoji Co. Ltd. | | | 146,015 | |
| | 10,902 | | | Kokuyo Co. Ltd. | | | 144,412 | |
| | 5,152 | | | Komeri Co. Ltd. | | | 125,852 | |
| | 5,162 | | | Komori Corp. | | | 65,529 | |
| | 6,779 | | | Konami Holdings Corp. | | | 267,393 | |
| | 5,253 | | | Konoike Transport Co. Ltd. | | | 69,533 | |
| | 882 | | | Kose Corp. | | | 80,491 | |
| | 14,200 | | | K’s Holdings Corp. | | | 245,799 | |
| | 36,314 | | | Kumagai Gumi Co. Ltd. | | | 96,413 | |
| | 2,900 | | | Kureha Corp. | | | 110,939 | |
| | 7,368 | | | Kuroda Electric Co. Ltd. | | | 143,384 | |
| | 47,970 | | | KYB Corp. | | | 219,571 | |
| | 3,353 | | | Kyoei Steel Ltd. | | | 63,943 | |
| | 4,199 | | | Kyokuto Kaihatsu Kogyo Co. Ltd. | | | 49,588 | |
| | 4,549 | | | KYORIN Holdings, Inc. | | | 101,729 | |
| | 536 | | | Kyoritsu Maintenance Co. Ltd. | | | 32,185 | |
| | 12,786 | | | Kyowa Exeo Corp. | | | 192,243 | |
| | 3,647 | | | Kyudenko Corp. | | | 117,477 | |
| | 2,238 | | | Life Corp. | | | 72,623 | |
| | 6,008 | | | Lintec Corp. | | | 130,926 | |
| | 15,783 | | | Lion Corp. | | | 258,181 | |
| | 3,039 | | | Mabuchi Motor Co. Ltd. | | | 176,698 | |
| | 17,903 | | | Maeda Corp. | | | 165,937 | |
| | 7,143 | | | Maeda Road Construction Co. Ltd. | | | 132,141 | |
| | 11,750 | | | Makino Milling Machine Co. Ltd. | | | 74,692 | |
| | 1,176 | | | Mandom Corp. | | | 54,836 | |
| | 5,770 | | | Maruha Nichiro Corp. | | | 159,947 | |
| | 4,646 | | | Maruichi Steel Tube Ltd. | | | 149,657 | |
| | 3,662 | | | Marusan Securities Co. Ltd. | | | 30,422 | |
| | 5,941 | | | Matsui Securities Co. Ltd. | | | 47,546 | |
| | 3,771 | | | Matsumotokiyoshi Holdings Co. Ltd. | | | 194,139 | |
| | 27,585 | | | Mebuki Financial Group, Inc. | | | 98,176 | |
| | 7,769 | | | Megmilk Snow Brand Co. Ltd. | | | 270,216 | |
| | 22,841 | | | Meidensha Corp. | | | 76,510 | |
| | 1,542 | | | Meitec Corp. | | | 52,532 | |
See accompanying Notes to Financial Statements which are an integral part of the financial statements.
PowerShares FTSE RAFI Developed Markets ex-U.S. Small-Mid Portfolio (PDN) (continued)
October 31, 2016
| | | | | | | | |
Number
of Shares | | | | | Value | |
| | | | Common Stocks and Other Equity Interests (continued) | |
| | | | Japan (continued) | | | | |
| | 31,175 | | | Minebea Co. Ltd. | | $ | 318,618 | |
| | 1,909 | | | Ministop Co. Ltd.(b) | | | 32,881 | |
| | 4,996 | | | Miraca Holdings, Inc. | | | 241,516 | |
| | 11,920 | | | Mirait Holdings Corp. | | | 105,719 | |
| | 8,827 | | | Misawa Homes Co. Ltd. | | | 66,443 | |
| | 10,304 | | | MISUMI Group, Inc. | | | 187,969 | |
| | 7,441 | | | Mitsuba Corp. | | | 108,763 | |
| | 12,556 | | | Mitsubishi Logistics Corp. | | | 170,146 | |
| | 1,018 | | | Mitsubishi Pencil Co. Ltd. | | | 50,956 | |
| | 1,522 | | | Mitsubishi Shokuhin Co. Ltd. | | | 49,968 | |
| | 50,225 | | | Mitsubishi UFJ Lease & Finance Co. Ltd. | | | 243,275 | |
| | 5,086 | | | Mitsuboshi Belting Ltd. | | | 43,898 | |
| | 1,600 | | | Mitsui Sugar Co. Ltd. | | | 36,039 | |
| | 23,387 | | | Mitsui-Soko Holdings Co. Ltd. | | | 70,549 | |
| | 19,041 | | | Mitsumi Electric Co. Ltd.(a)(b) | | | 115,603 | |
| | 3,463 | | | Miura Co. Ltd. | | | 59,746 | |
| | 940 | | | Mochida Pharmaceutical Co. Ltd. | | | 73,618 | |
| | 2,873 | | | Modec, Inc. | | | 48,637 | |
| | 19,762 | | | Monex Group, Inc.(b) | | | 45,322 | |
| | 2,600 | | | Morinaga & Co. Ltd. | | | 120,864 | |
| | 40,743 | | | Morinaga Milk Industry Co. Ltd. | | | 328,007 | |
| | 1,350 | | | MOS Food Services, Inc. | | | 45,349 | |
| | 3,624 | | | Musashi Seimitsu Industry Co. Ltd. | | | 88,492 | |
| | 3,218 | | | Musashino Bank Ltd. (The) | | | 88,867 | |
| | 8,969 | | | Nabtesco Corp. | | | 267,999 | |
| | 27,643 | | | Nachi-Fujikoshi Corp.(b) | | | 104,958 | |
| | 11,759 | | | Nagase & Co. Ltd. | | | 150,505 | |
| | 13,465 | | | Namura Shipbuilding Co. Ltd. | | | 82,134 | |
| | 33,727 | | | Nankai Electric Railway Co. Ltd. | | | 153,093 | |
| | 1,300 | | | Nanto Bank Ltd. (The) | | | 49,422 | |
| | 3,927 | | | NEC Networks & System Integration Corp. | | | 69,807 | |
| | 19,062 | | | NET One Systems Co. Ltd. | | | 138,405 | |
| | 5,121 | | | Nexon Co. Ltd. | | | 87,230 | |
| | 15,168 | | | Nichias Corp. | | | 134,958 | |
| | 10,679 | | | Nichicon Corp. | | | 91,562 | |
| | 4,061 | | | Nichiha Corp. | | | 100,284 | |
| | 10,168 | | | Nichiigakkan Co. Ltd.(b) | | | 84,665 | |
| | 2,373 | | | Nichi-iko Pharmaceutical Co. Ltd. | | | 42,589 | |
| | 13,000 | | | Nichirei Corp. | | | 284,408 | |
| | 2,456 | | | Nifco, Inc. | | | 141,398 | |
| | 4,181 | | | Nihon Kohden Corp. | | | 101,974 | |
| | 8,540 | | | Nihon Parkerizing Co. Ltd. | | | 117,838 | |
| | 5,904 | | | Nihon Unisys Ltd. | | | 71,971 | |
| | 9,506 | | | Nikkiso Co. Ltd. | | | 84,037 | |
| | 4,970 | | | Nikkon Holdings Co. Ltd. | | | 106,792 | |
| | 7,528 | | | Nippo Corp. | | | 145,280 | |
| | 54,044 | | | Nippon Chemi-Con Corp. | | | 94,115 | |
| | 31,762 | | | Nippon Denko Co. Ltd. | | | 58,939 | |
| | 2,975 | | | Nippon Densetsu Kogyo Co. Ltd. | | | 54,243 | |
| | 6,300 | | | Nippon Flour Mills Co. Ltd. | | | 93,165 | |
| | 3,660 | | | Nippon Gas Co. Ltd. | | | 110,930 | |
| | 17,810 | | | Nippon Kayaku Co. Ltd. | | | 205,243 | |
| | 128,991 | | | Nippon Light Metal Holdings Co. Ltd. | | | 293,371 | |
| | 7,976 | | | Nippon Paint Holdings Co. Ltd. | | | 271,724 | |
| | 6,572 | | | Nippon Road Co. Ltd. (The) | | | 26,955 | |
| | 5,657 | | | Nippon Seiki Co. Ltd. | | | 108,903 | |
| | | | | | | | |
Number
of Shares | | | | | Value | |
| | | | Common Stocks and Other Equity Interests (continued) | |
| | | | Japan (continued) | | | | |
| | 1,800 | | | Nippon Shinyaku Co. Ltd. | | $ | 91,298 | |
| | 3,540 | | | Nippon Shokubai Co. Ltd. | | | 244,568 | |
| | 8,569 | | | Nippon Signal Co. Ltd. | | | 75,999 | |
| | 20,030 | | | Nippon Soda Co. Ltd. | | | 88,823 | |
| | 2,200 | | | Nippon Steel & Sumikin Bussan Corp. | | | 80,601 | |
| | 41,777 | | | Nippon Suisan Kaisha Ltd. | | | 200,765 | |
| | 58,225 | | | Nippon Yakin Kogyo Co. Ltd. | | | 85,328 | |
| | 16,933 | | | Nipro Corp. | | | 209,155 | |
| | 35,268 | | | Nishimatsu Construction Co. Ltd. | | | 164,786 | |
| | 24,600 | | | Nishi-Nippon Financial Holdings,
Inc.(a) | | | 244,396 | |
| | 27,865 | | | Nishi-Nippon Railroad Co. Ltd. | | | 132,053 | |
| | 2,083 | | | Nishio Rent All Co. Ltd. | | | 62,935 | |
| | 7,373 | | | Nissan Chemical Industries Ltd. | | | 250,128 | |
| | 5,734 | | | Nissan Shatai Co. Ltd. | | | 59,203 | |
| | 3,406 | | | Nissha Printing Co. Ltd.(b) | | | 82,423 | |
| | 13,332 | | | Nisshin Oillio Group Ltd. (The)(b) | | | 60,643 | |
| | 19,830 | | | Nisshinbo Holdings, Inc. | | | 197,573 | |
| | 6,509 | | | Nissin Kogyo Co. Ltd. | | | 96,255 | |
| | 1,314 | | | Nitta Corp. | | | 34,011 | |
| | 16,654 | | | Nitto Boseki Co. Ltd. | | | 54,201 | |
| | 2,970 | | | Nitto Kogyo Corp. | | | 43,581 | |
| | 14,920 | | | NOF Corp. | | | 162,283 | |
| | 5,482 | | | Nomura Research Institute Ltd. | | | 190,150 | |
| | 5,107 | | | Noritz Corp. | | | 105,848 | |
| | 57,761 | | | North Pacific Bank Ltd. | | | 215,467 | |
| | 2,059 | | | NS Solutions Corp. | | | 39,285 | |
| | 2,396 | | | NSD Co. Ltd. | | | 38,556 | |
| | 7,772 | | | NTT Urban Development Corp. | | | 71,297 | |
| | 1,803 | | | OBIC Co. Ltd. | | | 93,680 | |
| | 30,219 | | | Ogaki Kyoritsu Bank Ltd. (The) | | | 108,125 | |
| | 2,920 | | | Oiles Corp. | | | 52,934 | |
| | 6,152 | | | Okabe Co. Ltd. | | | 52,513 | |
| | 4,068 | | | Okamoto Industries, Inc. | | | 44,054 | |
| | 7,552 | | | Okamura Corp. | | | 74,093 | |
| | 24,160 | | | Okasan Securities Group, Inc. | | | 128,519 | |
| | 15,100 | | | Oki Electric Industry Co. Ltd. | | | 197,003 | |
| | 5,100 | | | Okinawa Electric Power Co., Inc. (The) | | | 117,982 | |
| | 13,439 | | | OKUMA Corp. | | | 112,541 | |
| | 19,427 | | | Okumura Corp. | | | 112,031 | |
| | 22,748 | | | Onward Holdings Co. Ltd. | | | 152,180 | |
| | 1,222 | | | Oracle Corp. Japan | | | 66,516 | |
| | 31,041 | | | Orient Corp.(a)(b) | | | 57,896 | |
| | 4,861 | | | OSG Corp.(b) | | | 103,571 | |
| | 3,425 | | | Otsuka Corp. | | | 162,963 | |
| | 6,096 | | | Pacific Industrial Co. Ltd. | | | 74,775 | |
| | 20,947 | | | Pacific Metals Co. Ltd.(a)(b) | | | 62,989 | |
| | 7,726 | | | Paltac Corp. | | | 189,538 | |
| | 9,742 | | | PanaHome Corp. | | | 72,403 | |
| | 1,441 | | | Paramount Bed Holdings Co. Ltd. | | | 54,851 | |
| | 4,485 | | | Park24 Co. Ltd.(b) | | | 138,496 | |
| | 35,344 | | | Penta-Ocean Construction Co. Ltd. | | | 210,547 | |
| | 2,810 | | | Pigeon Corp. | | | 79,151 | |
| | 1,260 | | | Pilot Corp. | | | 56,354 | |
| | 99,355 | | | Pioneer Corp.(a) | | | 243,932 | |
| | 2,890 | | | Plenus Co. Ltd. | | | 59,486 | |
| | 824 | | | Pola Orbis Holdings, Inc. | | | 68,533 | |
See accompanying Notes to Financial Statements which are an integral part of the financial statements.
PowerShares FTSE RAFI Developed Markets ex-U.S. Small-Mid Portfolio (PDN) (continued)
October 31, 2016
| | | | | | | | |
Number
of Shares | | | | | Value | |
| | | | Common Stocks and Other Equity Interests (continued) | |
| | | | Japan (continued) | | | | |
| | 15,317 | | | Press Kogyo Co. Ltd. | | $ | 74,482 | |
| | 27,887 | | | Prima Meat Packers Ltd. | | | 101,373 | |
| | 3,643 | | | Raito Kogyo Co. Ltd. | | | 43,889 | |
| | 5,181 | | | Relia, Inc. | | | 49,648 | |
| | 350 | | | Relo Group, Inc. | | | 57,787 | |
| | 3,300 | | | Resorttrust, Inc. | | | 65,978 | |
| | 1,415 | | | Ricoh Leasing Co. Ltd. | | | 40,867 | |
| | 2,009 | | | Rinnai Corp. | | | 193,090 | |
| | 5,491 | | | Rohto Pharmaceutical Co. Ltd. | | | 96,354 | |
| | 11,323 | | | Round One Corp. | | | 79,843 | |
| | 2,147 | | | Royal Holdings Co. Ltd. | | | 37,082 | |
| | 25,778 | | | Ryobi Ltd. | | | 103,765 | |
| | 659 | | | Ryohin Keikaku Co. Ltd. | | | 140,724 | |
| | 4,733 | | | Ryosan Co. Ltd. | | | 145,704 | |
| | 2,123 | | | Saizeriya Co. Ltd. | | | 55,941 | |
| | 5,281 | | | SAKATA INX Corp. | | | 69,251 | |
| | 1,460 | | | Sakata Seed Corp. | | | 42,028 | |
| | 1,257 | | | San-A Co. Ltd. | | | 68,421 | |
| | 7,120 | | | San-Ai Oil Co. Ltd. | | | 50,206 | |
| | 40,063 | | | Sanden Holdings Corp. | | | 123,904 | |
| | 6,295 | | | Sangetsu Corp. | | | 121,605 | |
| | 16,881 | | | San-in Godo Bank Ltd. (The) | | | 121,445 | |
| | 30,241 | | | Sanken Electric Co. Ltd.(a) | | | 107,053 | |
| | 4,170 | | | Sanki Engineering Co. Ltd. | | | 37,817 | |
| | 5,288 | | | Sankyo Co. Ltd. | | | 186,188 | |
| | 7,548 | | | Sankyo Tateyama, Inc.(b) | | | 118,803 | |
| | 37,931 | | | Sankyu, Inc. | | | 223,431 | |
| | 4,449 | | | Sanrio Co. Ltd.(b) | | | 83,362 | |
| | 5,188 | | | Sanshin Electronics Co. Ltd. | | | 45,914 | |
| | 23,984 | | | Sanwa Holdings Corp. | | | 239,190 | |
| | 1,500 | | | Sanyo Chemical Industries Ltd. | | | 67,874 | |
| | 8,418 | | | Sanyo Denki Co. Ltd. | | | 54,713 | |
| | 28,201 | | | Sanyo Shokai Ltd. | | | 45,353 | |
| | 19,297 | | | Sanyo Special Steel Co. Ltd. | | | 98,794 | |
| | 2,070 | | | Sato Holdings Corp. | | | 45,621 | |
| | 1,525 | | | Sawai Pharmaceutical Co. Ltd. | | | 98,537 | |
| | 2,967 | | | SCREEN Holdings Co. Ltd. | | | 203,005 | |
| | 1,815 | | | SCSK Corp. | | | 67,705 | |
| | 2,911 | | | Seikagaku Corp. | | | 46,705 | |
| | 28,120 | | | Seiko Holdings Corp.(b) | | | 92,052 | |
| | 5,104 | | | Seiren Co. Ltd. | | | 59,741 | |
| | 16,580 | | | Senko Co. Ltd. | | | 114,546 | |
| | 42,870 | | | Senshu Ikeda Holdings, Inc. | | | 195,003 | |
| | 29,158 | | | Seven Bank Ltd. | | | 89,623 | |
| | 26,346 | | | Shiga Bank Ltd. (The) | | | 136,638 | |
| | 3,212 | | | Shima Seiki Manufacturing Ltd. | | | 90,505 | |
| | 7,116 | | | Shimachu Co. Ltd. | | | 190,961 | |
| | 12,160 | | | Shimadzu Corp. | | | 176,930 | |
| | 2,032 | | | Shimamura Co. Ltd. | | | 260,079 | |
| | 14,712 | | | Shindengen Electric Manufacturing Co. Ltd. | | | 63,700 | |
| | 12,143 | | | Shinko Electric Industries Co. Ltd. | | | 78,230 | |
| | 12,050 | | | Shinmaywa Industries Ltd. | | | 93,226 | |
| | 4,213 | | | Ship Healthcare Holdings, Inc. | | | 123,281 | |
| | 1,391 | | | SHO-BOND Holdings Co. Ltd. | | | 67,111 | |
| | 6,100 | | | Shochiku Co. Ltd. | | | 68,323 | |
| | 11,105 | | | Showa Corp. | | | 72,388 | |
| | | | | | | | |
Number
of Shares | | | | | Value | |
| | | | Common Stocks and Other Equity Interests (continued) | |
| | | | Japan (continued) | | | | |
| | 2,440 | | | Siix Corp. | | $ | 97,521 | |
| | 12,648 | | | SKY Perfect JSAT Holdings, Inc. | | | 62,707 | |
| | 9,460 | | | Skylark Co. Ltd. | | | 132,963 | |
| | 5,780 | | | Sodick Co. Ltd. | | | 43,397 | |
| | 2,719 | | | Sohgo Security Services Co. Ltd. | | | 123,938 | |
| | 27,108 | | | Sotetsu Holdings, Inc. | | | 132,335 | |
| | 3,525 | | | Square Enix Holdings Co. Ltd. | | | 116,734 | |
| | 3,596 | | | Star Micronics Co. Ltd. | | | 51,193 | |
| | 2,446 | | | Starts Corp., Inc. | | | 45,412 | |
| | 2,135 | | | Sugi Holdings Co. Ltd. | | | 114,384 | |
| | 19,108 | | | Sumco Corp. | | | 200,381 | |
| | 24,070 | | | Sumitomo Bakelite Co. Ltd. | | | 130,789 | |
| | 14,933 | | | Sumitomo Dainippon Pharma Co. Ltd. | | | 258,771 | |
| | 130,718 | | | Sumitomo Mitsui Construction Co. Ltd. | | | 124,393 | |
| | 46,357 | | | Sumitomo Osaka Cement Co. Ltd. | | | 191,895 | |
| | 5,879 | | | Sumitomo Riko Co. Ltd. | | | 56,393 | |
| | 1,600 | | | Sumitomo Seika Chemicals Co. Ltd. | | | 59,837 | |
| | 16,168 | | | Sumitomo Warehouse Co. Ltd. (The) | | | 86,467 | |
| | 1,657 | | | Sundrug Co. Ltd. | | | 130,403 | |
| | 9,898 | | | Suruga Bank Ltd. | | | 241,598 | |
| | 77,605 | | | SWCC Showa Holdings Co. Ltd.(a)(b) | | | 54,649 | |
| | 2,371 | | | Sysmex Corp. | | | 164,482 | |
| | 6,054 | | | Tachi-S Co. Ltd. | | | 100,473 | |
| | 12,030 | | | Tadano Ltd. | | | 135,085 | |
| | 5,163 | | | Taihei Dengyo Kaisha Ltd. | | | 53,455 | |
| | 3,548 | | | Taikisha Ltd. | | | 89,641 | |
| | 1,069 | | | Taiyo Holdings Co. Ltd. | | | 40,131 | |
| | 14,602 | | | Taiyo Nippon Sanso Corp. | | | 153,544 | |
| | 14,976 | | | Taiyo Yuden Co. Ltd. | | | 159,900 | |
| | 14,963 | | | Takara Holdings, Inc. | | | 141,820 | |
| | 2,300 | | | Takara Standard Co. Ltd. | | | 42,702 | |
| | 7,065 | | | Takasago Thermal Engineering Co. Ltd. | | | 99,637 | |
| | 22,569 | | | Takata Corp.(a)(b) | | | 77,746 | |
| | 7,125 | | | Takuma Co. Ltd. | | | 65,429 | |
| | 2,542 | | | Tamron Co. Ltd. | | | 44,509 | |
| | 16,251 | | | Tamura Corp. | | | 66,807 | |
| | 1,420 | | | Technopro Holdings, Inc. | | | 48,714 | |
| | 18,411 | | | Tekken Corp.(b) | | | 59,919 | |
| | 7,094 | | | Temp Holdings Co. Ltd. | | | 120,298 | |
| | 7,211 | | | T-Gaia Corp. | | | 110,891 | |
| | 10,184 | | | THK Co. Ltd. | | | 215,145 | |
| | 9,305 | | | TIS, Inc. | | | 210,654 | |
| | 2,700 | | | Toa Corp. | | | 56,808 | |
| | 12,597 | | | Toagosei Co. Ltd. | | | 140,373 | |
| | 35,336 | | | Toda Corp. | | | 191,669 | |
| | 6,663 | | | Toei Co. Ltd. | | | 53,515 | |
| | 6,102 | | | Toenec Corp. | | | 29,208 | |
| | 14,240 | | | Toho Bank Ltd. (The) | | | 54,068 | |
| | 5,990 | | | Toho Co. Ltd. | | | 179,840 | |
| | 28,987 | | | Toho Zinc Co. Ltd. | | | 100,959 | |
| | 38,763 | | | Tokai Carbon Co. Ltd. | | | 118,039 | |
| | 12,918 | | | Tokai Holdings Corp.(b) | | | 82,854 | |
| | 6,906 | | | Tokai Rika Co. Ltd. | | | 129,268 | |
| | 24,637 | | | Tokai Tokyo Financial Holdings, Inc. | | | 125,195 | |
| | 738 | | | Token Corp. | | | 53,304 | |
| | 162,694 | | | Tokuyama Corp.(a)(b) | | | 696,696 | |
See accompanying Notes to Financial Statements which are an integral part of the financial statements.
PowerShares FTSE RAFI Developed Markets ex-U.S. Small-Mid Portfolio (PDN) (continued)
October 31, 2016
| | | | | | | | |
Number
of Shares | | | | | Value | |
| | | | Common Stocks and Other Equity Interests (continued) | |
| | | | Japan (continued) | | | | |
| | 3,447 | | | Tokyo Broadcasting System Holdings, Inc. | | $ | 54,222 | |
| | 3,399 | | | Tokyo Century Corp. | | | 119,839 | |
| | 8,300 | | | Tokyo Dome Corp. | | | 78,905 | |
| | 3,702 | | | Tokyo Ohka Kogyo Co. Ltd. | | | 131,403 | |
| | 3,095 | | | Tokyo Seimitsu Co. Ltd. | | | 84,440 | |
| | 7,956 | | | Tokyo Steel Manufacturing Co. Ltd. | | | 55,041 | |
| | 17,443 | | | Tokyo Tatemono Co. Ltd. | | | 221,762 | |
| | 2,234 | | | Tokyo Ty Financial Group, Inc. | | | 71,536 | |
| | 9,059 | | | Tokyu Construction Co. Ltd. | | | 91,637 | |
| | 8,503 | | | Tomy Co. Ltd. | | | 91,839 | |
| | 6,916 | | | Topcon Corp. | | | 103,393 | |
| | 5,252 | | | Toppan Forms Co. Ltd. | | | 52,228 | |
| | 3,709 | | | Topre Corp. | | | 85,697 | |
| | 1,600 | | | Topy Industries Ltd. | | | 37,120 | |
| | 16,064 | | | Toshiba Machine Co. Ltd. | | | 58,089 | |
| | 4,029 | | | Toshiba Plant Systems & Services Corp. | | | 64,987 | |
| | 34,348 | | | Toshiba TEC Corp.(a) | | | 152,970 | |
| | 1,966 | | | Totetsu Kogyo Co. Ltd. | | | 55,771 | |
| | 860 | | | Towa Pharmaceutical Co. Ltd.(b) | | | 32,081 | |
| | 11,981 | | | Toyo Construction Co. Ltd. | | | 49,937 | |
| | 28,449 | | | Toyo Engineering Corp. | | | 97,461 | |
| | 21,897 | | | Toyo Ink SC Holdings Co. Ltd. | | | 101,895 | |
| | 14,850 | | | Toyo Kohan Co. Ltd. | | | 44,514 | |
| | 12,155 | | | Toyo Tire & Rubber Co. Ltd. | | | 187,267 | |
| | 135,248 | | | Toyobo Co. Ltd. | | | 221,370 | |
| | 10,438 | | | Toyota Boshoku Corp. | | | 262,428 | |
| | 3,112 | | | TPR Co. Ltd. | | | 89,879 | |
| | 2,440 | | | transcosmos, Inc. | | | 61,763 | |
| | 5,577 | | | Trend Micro, Inc. | | | 196,364 | |
| | 1,604 | | | Trusco Nakayama Corp. | | | 82,883 | |
| | 7,801 | | | TS Tech Co. Ltd. | | | 208,972 | |
| | 14,323 | | | TSI Holdings Co. Ltd. | | | 80,553 | |
| | 22,623 | | | Tsubakimoto Chain Co. | | | 179,331 | |
| | 6,165 | | | Tsumura & Co. | | | 175,179 | |
| | 1,829 | | | Tsuruha Holdings, Inc. | | | 210,948 | |
| | 2,464 | | | TV Asahi Corp. | | | 46,262 | |
| | 2,402 | | | TV TOKYO Holdings Corp. | | | 54,950 | |
| | 55,868 | | | UACJ Corp. | | | 182,355 | |
| | 2,381 | | | UKC Holdings Corp. | | | 39,832 | |
| | 3,214 | | | Ulvac, Inc. | | | 101,541 | |
| | 8,348 | | | Unipres Corp. | | | 160,549 | |
| | 1,566 | | | United Arrows Ltd. | | | 42,710 | |
| | 187,263 | | | Unitika Ltd.(a) | | | 126,523 | |
| | 9,876 | | | Ushio, Inc. | | | 119,074 | |
| | 8,847 | | | USS Co. Ltd. | | | 149,688 | |
| | 6,839 | | | Valor Co. Ltd. | | | 193,875 | |
| | 7,730 | | | VT Holdings Co. Ltd. | | | 41,561 | |
| | 12,856 | | | Wacoal Holdings Corp. | | | 148,275 | |
| | 11,695 | | | Wacom Co. Ltd.(b) | | | 35,279 | |
| | 6,976 | | | Wakita & Co. Ltd. | | | 59,547 | |
| | 2,579 | | | Warabeya Nichiyo Holdings Co. Ltd. | | | 62,190 | |
| | 1,348 | | | Welcia Holdings Co. Ltd. | | | 91,975 | |
| | 3,806 | | | XEBIO Holdings Co. Ltd. | | | 59,072 | |
| | 52,152 | | | Yahoo! Japan Corp. | | | 200,002 | |
| | 3,542 | | | Yakult Honsha Co. Ltd. | | | 165,160 | |
| | 10,154 | | | Yamanashi Chuo Bank Ltd. (The) | | | 49,666 | |
| | | | | | | | |
Number
of Shares | | | | | Value | |
| | | | Common Stocks and Other Equity Interests (continued) | |
| | | | Japan (continued) | | | | |
| | 5,138 | | | Yamato Kogyo Co. Ltd. | | $ | 144,579 | |
| | 5,188 | | | Yamazen Corp. | | | 41,372 | |
| | 1,784 | | | Yaoko Co. Ltd. | | | 74,952 | |
| | 19,032 | | | Yaskawa Electric Corp.(b) | | | 303,722 | |
| | 1,930 | | | Yodogawa Steel Works Ltd. | | | 52,656 | |
| | 3,909 | | | Yokogawa Bridge Holdings Corp. | | | 42,964 | |
| | 21,556 | | | Yokogawa Electric Corp. | | | 302,976 | |
| | 4,374 | | | Yokohama Reito Co. Ltd. | | | 44,246 | |
| | 3,381 | | | Yorozu Corp. | | | 53,119 | |
| | 6,943 | | | Yoshinoya Holdings Co. Ltd.(b) | | | 104,523 | |
| | 2,111 | | | Yuasa Trading Co. Ltd. | | | 50,603 | |
| | 6,086 | | | Yurtec Corp. | | | 44,595 | |
| | 1,830 | | | Zenkoku Hosho Co. Ltd. | | | 78,713 | |
| | 10,174 | | | Zensho Holdings Co. Ltd. | | | 189,955 | |
| | 25,048 | | | Zeon Corp. | | | 229,063 | |
| | 4,007 | | | ZERIA Pharmaceutical Co. Ltd. | | | 67,187 | |
| | | | | | | | |
| | | | | | | 59,791,641 | |
| | | | | | | | |
| | | | Jersey Island—0.1% | | | | |
| | 69,618 | | | Centamin PLC | | | 134,125 | |
| | | | | | | | |
| | | | Jordan—0.1% | | | | |
| | 3,772 | | | Hikma Pharmaceuticals PLC | | | 80,776 | |
| | | | | | | | |
| | | | Luxembourg—0.2% | | | | |
| | 6,059 | | | APERAM SA | | | 274,941 | |
| | 154 | | | Eurofins Scientific SE | | | 69,872 | |
| | 22,517 | | | L’Occitane International SA | | | 46,516 | |
| | | | | | | | |
| | | | | | | 391,329 | |
| | | | | | | | |
| | | | Macau—0.3% | | | | |
| | 107,823 | | | MGM China Holdings Ltd. | | | 178,526 | |
| | 182,259 | | | Wynn Macau Ltd. | | | 279,681 | |
| | | | | | | | |
| | | | | | | 458,207 | |
| | | | | | | | |
| | | | Mexico—0.1% | | | | |
| | 10,593 | | | Fresnillo PLC | | | 212,101 | |
| | | | | | | | |
| | | | Netherlands—1.1% | | | | |
| | 6,015 | | | Aalberts Industries NV | | | 189,732 | |
| | 11,639 | | | Arcadis NV | | | 153,104 | |
| | 3,137 | | | ASM International NV | | | 133,631 | |
| | 8,354 | | | BinckBank NV | | | 49,506 | |
| | 2,294 | | | Brunel International NV | | | 37,381 | |
| | 5,994 | | | Corbion NV | | | 138,114 | |
| | 3,594 | | | Eurocommercial Properties NV CVA | | | 152,783 | |
| | 2,484 | | | Euronext NV(c) | | | 99,266 | |
| | 1,691 | | | GrandVision NV(c) | | | 38,677 | |
| | 2,278 | | | Imcd Group NV | | | 98,400 | |
| | 4,191 | | | Koninklijke Vopak NV | | | 211,355 | |
| | 11,666 | | | NSI NV REIT | | | 45,654 | |
| | 6,488 | | | OCI NV(a)(b) | | | 89,969 | |
| | 3,481 | | | Refresco Group NV(c) | | | 50,751 | |
| | 3,122 | | | TKH Group NV CVA | | | 120,056 | |
| | 7,617 | | | TomTom NV(a) | | | 61,504 | |
| | 1,598 | | | Vastned Retail NV REIT | | | 61,328 | |
| | 3,110 | | | Wereldhave NV REIT | | | 139,078 | |
| | | | | | | | |
| | | | | | | 1,870,289 | |
| | | | | | | | |
See accompanying Notes to Financial Statements which are an integral part of the financial statements.
PowerShares FTSE RAFI Developed Markets ex-U.S. Small-Mid Portfolio (PDN) (continued)
October 31, 2016
| | | | | | | | |
Number
of Shares | | | | | Value | |
| | | | Common Stocks and Other Equity Interests (continued) | |
| | | | New Zealand—0.8% | | | | |
| | 46,091 | | | Air New Zealand Ltd. | | $ | 63,639 | |
| | 32,013 | | | Auckland International Airport Ltd. | | | 150,925 | |
| | 34,123 | | | Chorus Ltd. | | | 89,224 | |
| | 13,712 | | | Fisher & Paykel Healthcare Corp. Ltd. | | | 86,913 | |
| | 34,882 | | | Genesis Energy Ltd. | | | 48,911 | |
| | 48,072 | | | Kiwi Property Group Ltd. | | | 50,382 | |
| | 41,670 | | | Mercury NZ Ltd. | | | 90,923 | |
| | 93,803 | | | Meridian Energy Ltd. | | | 172,464 | |
| | 11,903 | | | Ryman Healthcare Ltd. | | | 75,617 | |
| | 56,139 | | | Sky Network Television Ltd. | | | 185,548 | |
| | 49,797 | | | SKYCITY Entertainment Group Ltd. | | | 138,937 | |
| | 18,975 | | | Trade Me Ltd. | | | 65,973 | |
| | 25,269 | | | Z Energy Ltd. | | | 141,365 | |
| | | | | | | | |
| | | | | | | 1,360,821 | |
| | | | | | | | |
| | | | Norway—0.8% | | | | |
| | 62,499 | | | AKER Solutions ASA(a)(c) | | | 288,051 | |
| | 9,804 | | | Austevoll Seafood ASA | | | 88,518 | |
| | 59,793 | | | DNO ASA(a)(b) | | | 51,304 | |
| | 4,157 | | | Entra ASA(c) | | | 44,585 | |
| | 1,203 | | | Leroy Seafood Group ASA | | | 63,697 | |
| | 7,782 | | | Nordic Semiconductor ASA(a) | | | 31,123 | |
| | 84,807 | | | Petroleum Geo-Services ASA(a)(b) | | | 228,476 | |
| | 3,139 | | | Salmar ASA | | | 102,028 | |
| | 2,632 | | | Schibsted ASA, Class A | | | 63,189 | |
| | 3,132 | | | Schibsted ASA, Class B | | | 70,600 | |
| | 8,084 | | | Tomra Systems ASA | | | 87,929 | |
| | 5,087 | | | Veidekke ASA | | | 76,137 | |
| | 5,110 | | | XXL ASA(c) | | | 64,096 | |
| | | | | | | | |
| | | | | | | 1,259,733 | |
| | | | | | | | |
| | | | Portugal—0.4% | | | | |
| | 62,188 | | | Banco BPI SA(a) | | | 77,033 | |
| | 15,233 | | | CTT-Correios de Portugal SA | | | 100,675 | |
| | 24,846 | | | Mota-Engil SGPS SA | | | 48,480 | |
| | 38,467 | | | Navigator Co. SA (The) | | | 112,587 | |
| | 13,258 | | | NOS SGPS SA | | | 87,956 | |
| | 20,391 | | | REN—Redes Energeticas Nacionais SGPS SA | | | 59,503 | |
| | 3,477 | | | Semapa-Sociedade de Investimento e Gestao SGPS SA | | | 44,671 | |
| | 177,877 | | | Sonae SGPS SA | | | 141,367 | |
| | | | | | | | |
| | | | | | | 672,272 | |
| | | | | | | | |
| | | | Russia—0.2% | | | | |
| | 95,673 | | | Evraz PLC(a) | | | 239,572 | |
| | 13,276 | | | Polymetal International PLC | | | 144,419 | |
| | | | | | | | |
| | | | | | | 383,991 | |
| | | | | | | | |
| | | | Singapore—1.6% | | | | |
| | 97,342 | | | Ascendas Hospitality Trust REIT | | | 51,752 | |
| | 49,435 | | | Ascott Residence Trust REIT | | | 40,311 | |
| | 10,550 | | | BW LPG Ltd.(c) | | | 34,086 | |
| | 67,132 | | | Cache Logistics Trust REIT | | | 40,031 | |
| | 161,649 | | | CapitaLand Commercial Trust Ltd. REIT | | | 182,913 | |
| | 36,450 | | | CDL Hospitality Trusts REIT | | | 35,091 | |
| | 385,298 | | | COSCO Corp. Singapore Ltd.(a) | | | 70,588 | |
| | 177,346 | | | Ezion Holdings Ltd.(a) | | | 38,224 | |
| | 1,165,297 | | | Ezra Holdings Ltd.(a) | | | 36,000 | |
| | | | | | | | |
Number
of Shares | | | | | Value | |
| | | | Common Stocks and Other Equity Interests (continued) | |
| | | | Singapore (continued) | | | | |
| | 27,049 | | | First Resources Ltd. | | $ | 35,368 | |
| | 34,269 | | | Frasers Centrepoint Trust REIT | | | 51,210 | |
| | 141,271 | | | Keppel REIT | | | 110,630 | |
| | 30,797 | | | M1 Ltd. | | | 45,137 | |
| | 90,981 | | | Mapletree Commercial Trust REIT | | | 100,008 | |
| | 127,920 | | | Mapletree Greater China Commercial Trust REIT(c) | | | 95,579 | |
| | 83,352 | | | Mapletree Industrial Trust REIT | | | 103,000 | |
| | 126,271 | | | Mapletree Logistics Trust REIT | | | 93,894 | |
| | 47,985 | | | SATS Ltd. | | | 166,856 | |
| | 141,384 | | | Sembcorp Marine Ltd. | | | 131,541 | |
| | 32,799 | | | Singapore Exchange Ltd. | | | 167,070 | |
| | 97,418 | | | Singapore Post Ltd. | | | 111,983 | |
| | 50,529 | | | StarHub Ltd. | | | 122,701 | |
| | 185,833 | | | Suntec Real Estate Investment Trust REIT | | | 224,297 | |
| | 23,180 | | | United Engineers Ltd. | | | 43,133 | |
| | 46,012 | | | UOL Group Ltd. | | | 187,433 | |
| | 19,953 | | | Venture Corp. Ltd. | | | 136,183 | |
| | 31,362 | | | Wing Tai Holdings Ltd. | | | 38,191 | |
| | 57,978 | | | Yanlord Land Group Ltd. | | | 57,691 | |
| | | | | | | | |
| | | | | | | 2,550,901 | |
| | | | | | | | |
| | | | South Africa—0.1% | | | | |
| | 46,754 | | | Petra Diamonds Ltd. | | | 86,708 | |
| | | | | | | | |
| | | | South Korea—6.5% | | | | |
| | 424 | | | Amorepacific Corp. | | | 133,027 | |
| | 135 | | | Amorepacific Corp. (Preference Shares) | | | 23,596 | |
| | 797 | | | AMOREPACIFIC Group | | | 103,086 | |
| | 34,178 | | | Asiana Airlines, Inc.(a) | | | 137,996 | |
| | 403 | | | BGF Retail Co. Ltd. | | | 61,282 | |
| | 518 | | | Celltrion, Inc.(a) | | | 48,077 | |
| | 4,311 | | | Cheil Worldwide, Inc. | | | 63,860 | |
| | 1,196 | | | CJ E&M Corp. | | | 73,061 | |
| | 3,545 | | | CJ Hellovision Co. Ltd. | | | 25,342 | |
| | 438 | | | CJ Korea Express Co. Ltd.(a) | | | 76,939 | |
| | 454 | | | CJ O Shopping Co. Ltd. | | | 64,316 | |
| | 1,889 | | | Coway Co. Ltd. | | | 147,917 | |
| | 2,247 | | | Daesang Corp. | | | 52,923 | |
| | 25,339 | | | Daewoo Engineering & Construction Co. Ltd.(a) | | | 140,176 | |
| | 49,457 | | | Daewoo Shipbuilding & Marine Engineering Co. Ltd.(a) | | | 193,635 | |
| | 6,982 | | | Daishin Securities Co. Ltd. | | | 64,374 | |
| | 4,654 | | | Daishin Securities Co. Ltd. (Preference Shares) | | | 31,725 | |
| | 2,127 | | | Daou Technology, Inc. | | | 38,478 | |
| | 22,127 | | | DGB Financial Group, Inc. | | | 185,641 | |
| | 10,518 | | | Dongkuk Steel Mill Co. Ltd.(a) | | | 75,191 | |
| | 555 | | | Fila Korea Ltd. | | | 42,295 | |
| | 1,327 | | | Green Cross Holdings Corp. | | | 25,746 | |
| | 273 | | | GS Home Shopping, Inc. | | | 41,943 | |
| | 1,088 | | | GS Retail Co. Ltd. | | | 46,401 | |
| | 1,009 | | | Halla Holdings Corp. | | | 59,874 | |
| | 555 | | | Hanil Cement Co. Ltd. | | | 36,086 | |
| | 21,988 | | | Hanjin Heavy Industries & Construction Co. Ltd.(a) | | | 74,943 | |
See accompanying Notes to Financial Statements which are an integral part of the financial statements.
PowerShares FTSE RAFI Developed Markets ex-U.S. Small-Mid Portfolio (PDN) (continued)
October 31, 2016
| | | | | | | | |
Number
of Shares | | | | | Value | |
| | | | Common Stocks and Other Equity Interests (continued) | |
| | | | South Korea (continued) | | | | |
| | 2,809 | | | Hanjin Kal Corp. | | $ | 41,487 | |
| | 1,767 | | | Hanjin Transportation Co. Ltd. | | | 45,478 | |
| | 11,050 | | | Hanon Systems | | | 103,330 | |
| | 10,250 | | | Hanwha Chemical Corp. | | | 242,309 | |
| | 9,144 | | | Hanwha General Insurance Co. Ltd. | | | 60,654 | |
| | 22,151 | | | Hanwha Life Insurance Co. Ltd. | | | 120,991 | |
| | 3,820 | | | Hanwha Techwin Co. Ltd. | | | 212,992 | |
| | 2,704 | | | Hite Jinro Co. Ltd. | | | 51,989 | |
| | 1,554 | | | Hotel Shilla Co. Ltd. | | | 77,819 | |
| | 2,478 | | | Huchems Fine Chemical Corp. | | | 51,217 | |
| | 2,753 | | | Hyundai Corp. | | | 50,525 | |
| | 1,351 | | | Hyundai Department Store Co. Ltd. | | | 138,731 | |
| | 5,228 | | | Hyundai Development Co.-Engineering & Construction | | | 221,593 | |
| | 3,004 | | | Hyundai Greenfood Co. Ltd. | | | 43,974 | |
| | 444 | | | Hyundai Home Shopping Network Corp. | | | 44,041 | |
| | 1,704 | | | Hyundai Mipo Dockyard Co. Ltd.(a) | | | 104,690 | |
| | 4,750 | | | Hyundai Rotem Co. Ltd.(a) | | | 77,627 | |
| | 2,116 | | | Hyundai Wia Corp. | | | 145,536 | |
| | 3,454 | | | iMarketKorea, Inc. | | | 38,638 | |
| | 4,525 | | | Interpark Holdings Corp. | | | 19,753 | |
| | 12,566 | | | JB Financial Group Co. Ltd. | | | 65,232 | |
| | 908 | | | Kakao Corp. | | | 60,626 | |
| | 4,909 | | | Kangwon Land, Inc. | | | 162,811 | |
| | 599 | | | KCC Corp. | | | 211,750 | |
| | 826 | | | KEPCO Plant Service & Engineering Co. Ltd. | | | 39,631 | |
| | 725 | | | Kiwoom Securities Co. Ltd. | | | 42,135 | |
| | 850 | | | Kolon Corp. | | | 37,811 | |
| | 3,460 | | | Kolon Industries, Inc. | | | 224,972 | |
| | 1,097 | | | Korea Aerospace Industries Ltd. | | | 62,124 | |
| | 3,954 | | | Korea Investment Holdings Co. Ltd. | | | 142,023 | |
| | 205 | | | Korea Petrochemical Industries Co. Ltd. | | | 36,638 | |
| | 8,049 | | | Korean Reinsurance Co. | | | 83,005 | |
| | 6,991 | | | Kumho Industrial Co. Ltd.(a) | | | 58,531 | |
| | 3,560 | | | Kumho Petrochemical Co. Ltd. | | | 218,096 | |
| | 15,438 | | | Kumho Tire Co., Inc.(a) | | | 138,291 | |
| | 2,815 | | | LF Corp. | | | 53,385 | |
| | 723 | | | LG Hausys Ltd. | | | 59,837 | |
| | 191 | | | LG Household & Health Care Ltd. | | | 136,876 | |
| | 48 | | | LG Household & Health Care Ltd. (Preference Shares) | | | 19,968 | |
| | 2,112 | | | LG Innotek Co. Ltd. | | | 143,969 | |
| | 7,663 | | | LG International Corp. | | | 186,510 | |
| | 49 | | | Lotte Chilsung Beverage Co. Ltd. | | | 65,947 | |
| | 323 | | | Lotte Confectionery Co. Ltd. | | | 54,198 | |
| | 2,207 | | | Lotte Fine Chemical Co. Ltd. | | | 55,934 | |
| | 1,264 | | | Lotte Himart Co. Ltd. | | | 48,770 | |
| | 5,914 | | | LS Corp. | | | 283,748 | |
| | 2,232 | | | LS Industrial Systems Co. Ltd. | | | 76,367 | |
| | 4,705 | | | Meritz Financial Group, Inc. | | | 46,258 | |
| | 6,594 | | | Meritz Fire & Marine Insurance Co. Ltd. | | | 91,915 | |
| | 16,524 | | | Meritz Securities Co. Ltd. | | | 49,171 | |
| | 23,614 | | | Mirae Asset Daewoo Co. Ltd. | | | 159,937 | |
| | 13,772 | | | Mirae Asset Life Insurance Co. Ltd. | | | 56,328 | |
| | 4,821 | | | Mirae Asset Securities Co. Ltd. | | | 95,430 | |
| | 395 | | | Naver Corp. | | | 295,840 | |
| | | | | | | | |
Number
of Shares | | | | | Value | |
| | | | Common Stocks and Other Equity Interests (continued) | |
| | | | South Korea (continued) | | | | |
| | 459 | | | NCSOFT Corp. | | $ | 106,100 | |
| | 3,279 | | | Nexen Tire Corp. | | | 37,683 | |
| | 13,882 | | | NH Investment & Securities Co. Ltd. | | | 122,533 | |
| | 1,409 | | | NHN Entertainment Corp.(a) | | | 61,815 | |
| | 213 | | | Nongshim Co. Ltd. | | | 53,611 | |
| | 131 | | | Orion Corp. | | | 81,857 | |
| | 22,080 | | | Pan Ocean Co. Ltd.(a) | | | 69,564 | |
| | 3,132 | | | Paradise Co. Ltd. | | | 35,583 | |
| | 3,702 | | | Partron Co. Ltd. | | | 28,956 | |
| | 4,250 | | | Poongsan Corp. | | | 129,255 | |
| | 12,403 | | | POSCO Daewoo Corp. | | | 270,443 | |
| | 739 | | | S-1 Corp. | | | 59,740 | |
| | 1,166 | | | Samsung C&T Corp. | | | 164,570 | |
| | 4,825 | | | Samsung Card Co. Ltd. | | | 203,247 | |
| | 21,461 | | | Samsung Engineering Co. Ltd.(a) | | | 177,615 | |
| | 887 | | | Samsung SDS Co. Ltd. | | | 119,765 | |
| | 5,489 | | | Samsung Securities Co., Ltd. | | | 165,737 | |
| | 556 | | | Samyang Corp. | | | 60,738 | |
| | 2,289 | | | Seah Besteel Corp. | | | 46,410 | |
| | 1,112 | | | Sebang Global Battery Co. Ltd. | | | 36,054 | |
| | 3,493 | | | Seoul Semiconductor Co. Ltd. | | | 41,821 | |
| | 773 | | | Shinsegae, Inc. | | | 125,653 | |
| | 3,090 | | | SK Chemicals Co. Ltd. | | | 161,487 | |
| | 612 | | | SK Gas Co. Ltd. | | | 51,399 | |
| | 569 | | | SK Holdings Co. Ltd. | | | 111,140 | |
| | 3,166 | | | SKC Co. Ltd. | | | 74,844 | |
| | 4,013 | | | Ssangyong Cement Industrial Co. Ltd.(a) | | | 56,289 | |
| | 5,757 | | | Ssangyong Motor Co.(a) | | | 36,929 | |
| | 11,650 | | | Sungwoo Hitech Co. Ltd. | | | 78,193 | |
| | 5,095 | | | Tongyang Life Insurance Co. Ltd. | | | 53,432 | |
| | 25,466 | | | Tongyang, Inc. | | | 71,552 | |
| | 47 | | | Young Poong Corp. | | | 40,870 | |
| | 1,392 | | | Youngone Corp. | | | 39,111 | |
| | 12,717 | | | Yuanta Securities Korea Co. Ltd.(a) | | | 34,897 | |
| | 227 | | | Yuhan Corp. | | | 41,660 | |
| | | | | | | | |
| | | | | | | 10,575,921 | |
| | | | | | | | |
| | | | Spain—2.0% | | | | |
| | 19,268 | | | Acerinox SA | | | 236,984 | |
| | 3,124 | | | Almirall SA | | | 44,896 | |
| | 11,122 | | | Applus Services SA | | | 106,704 | |
| | 5,147 | | | Bolsas y Mercados Espanoles | | | 155,554 | |
| | 3,310 | | | Cellnex Telecom SA(c) | | | 54,281 | |
| | 1,741 | | | Cia de Distribucion Integral Logista Holdings SA | | | 38,609 | |
| | 3,697 | | | CIE Automotive SA | | | 76,149 | |
| | 266 | | | Construcciones y Auxiliar de Ferrocarriles SA | | | 100,103 | |
| | 8,295 | | | Ebro Foods SA | | | 178,768 | |
| | 16,753 | | | EDP Renovaveis SA | | | 126,422 | |
| | 15,193 | | | Ence Energia y Celulosa SA | | | 33,143 | |
| | 4,547 | | | Euskaltel SA(a)(c) | | | 45,757 | |
| | 14,599 | | | Faes Farma SA | | | 53,531 | |
| | 12,234 | | | Gamesa Corp. Tecnologica SA | | | 282,635 | |
| | 4,572 | | | Grupo Catalana Occidente SA | | | 143,890 | |
| | 17,892 | | | Indra Sistemas SA(a) | | | 221,335 | |
| | 12,493 | | | Inmobiliaria Colonial SA | | | 88,099 | |
| | 80,554 | | | Liberbank SA(a) | | | 79,914 | |
See accompanying Notes to Financial Statements which are an integral part of the financial statements.
PowerShares FTSE RAFI Developed Markets ex-U.S. Small-Mid Portfolio (PDN) (continued)
October 31, 2016
| | | | | | | | |
Number
of Shares | | | | | Value | |
| | | | Common Stocks and Other Equity Interests (continued) | |
| | | | Spain (continued) | | | | |
| | 10,610 | | | Mediaset Espana Comunicacion SA | | $ | 118,342 | |
| | 7,162 | | | Melia Hotels International SA | | | 88,441 | |
| | 8,520 | | | MERLIN Properties SOCIMI SA REIT | | | 95,638 | |
| | 20,229 | | | NH Hotel Group SA(a) | | | 89,255 | |
| | 14,279 | | | Promotora de Informaciones SA, Class A(a) | | | 98,925 | |
| | 22,138 | | | Prosegur Compania de Seguridad SA | | | 160,652 | |
| | 111,347 | | | Sacyr SA(a) | | | 254,248 | |
| | 4,524 | | | Tecnicas Reunidas SA | | | 169,431 | |
| | 2,220 | | | Viscofan SA | | | 104,485 | |
| | 5,920 | | | Zardoya Otis SA | | | 49,904 | |
| | | | | | | | |
| | | | | | | 3,296,095 | |
| | | | | | | | |
| | | | Sweden—2.4% | | | | |
| | 1,295 | | | AAK AB | | | 85,625 | |
| | 2,643 | | | AF AB, Class B | | | 48,486 | |
| | 999 | | | Avanza Bank Holding AB | | | 37,816 | |
| | 8,346 | | | Axfood AB | | | 130,627 | |
| | 5,295 | | | Betsson AB, Class B | | | 51,180 | |
| | 4,956 | | | Bilia AB, Class A | | | 118,386 | |
| | 8,927 | | | BillerudKorsnas AB | | | 146,846 | |
| | 14,917 | | | Castellum AB | | | 202,388 | |
| | 8,138 | | | Com Hem Holding AB | | | 73,428 | |
| | 20,507 | | | Elekta AB, Class B | | | 178,099 | |
| | 7,475 | | | Fabege AB | | | 126,441 | |
| | 2,949 | | | Fastighets AB Balder, Class B(a) | | | 67,077 | |
| | 203 | | | Fastighets AB Balder (Preference Shares) | | | 7,700 | |
| | 5,577 | | | Haldex AB | | | 72,019 | |
| | 5,661 | | | Hemfosa Fastigheter AB | | | 53,338 | |
| | 632 | | | Hemfosa Fastigheter AB (Preference Shares) | | | 11,244 | |
| | 7,791 | | | Hexpol AB, Class B | | | 64,123 | |
| | 6,501 | | | Holmen AB, Class B | | | 222,813 | |
| | 5,397 | | | Hufvudstaden AB, Class A | | | 83,634 | |
| | 4,858 | | | ICA Gruppen AB | | | 151,047 | |
| | 4,101 | | | Indutrade AB | | | 76,324 | |
| | 1,747 | | | Intrum Justitia AB | | | 53,931 | |
| | 1,135 | | | Investment AB Latour, Class B | | | 41,945 | |
| | 4,694 | | | JM AB | | | 135,333 | |
| | 23,985 | | | Klovern AB, Class B | | | 25,324 | |
| | 854 | | | Klovern AB (Preference Shares) | | | 29,194 | |
| | 13,542 | | | Kungsleden AB | | | 85,562 | |
| | 2,199 | | | L E Lundbergforetagen AB, Class B | | | 142,594 | |
| | 6,275 | | | Lindab International AB | | | 53,836 | |
| | 3,816 | | | Loomis AB, Class B | | | 108,708 | |
| | 6,693 | | | Lundin Petroleum AB(a) | | | 120,558 | |
| | 5,328 | | | Modern Times Group AB, Class B | | | 143,631 | |
| | 8,591 | | | Nibe Industrier AB, Class B | | | 63,993 | |
| | 4,196 | | | Nobia AB | | | 36,604 | |
| | 2,093 | | | Pandox AB, Class B | | | 33,223 | |
| | 20,329 | | | Peab AB, Class B | | | 172,723 | |
| | 32,486 | | | Ratos AB, Class B | | | 133,667 | |
| | 137 | | | Ratos AB (Preference Shares) | | | 28,443 | |
| | 3,222 | | | Saab AB, Class B | | | 114,287 | |
| | 32,329 | | | SAS AB(a)(b) | | | 54,828 | |
| | 1,520 | | | SAS AB (Preference Shares) | | | 93,173 | |
| | 2,395 | | | Sweco AB, Class B | | | 48,078 | |
| | 2,788 | | | Thule Group AB (The)(c) | | | 43,111 | |
| | 8,365 | | | Wallenstam AB, Class B | | | 64,489 | |
| | | | | | | | |
Number
of Shares | | | | | Value | |
| | | | Common Stocks and Other Equity Interests (continued) | |
| | | | Sweden (continued) | | | | |
| | 3,990 | | | Wihlborgs Fastigheter AB | | $ | 77,399 | |
| | | | | | | | |
| | | | | | | 3,913,275 | |
| | | | | | | | |
| | | | Switzerland—2.9% | | | | |
| | 4,936 | | | AFG Arbonia-Forster Holding AG(a) | | | 74,122 | |
| | 661 | | | Allreal Holding AG | | | 97,322 | |
| | 2,459 | | | Ascom Holding AG | | | 42,148 | |
| | 488 | | | Autoneum Holding AG | | | 129,291 | |
| | 208 | | | Banque Cantonale Vaudoise | | | 130,723 | |
| | 110 | | | Barry Callebaut AG | | | 137,041 | |
| | 21 | | | Belimo Holding AG | | | 64,238 | |
| | 571 | | | Bucher Industries AG | | | 126,972 | |
| | 186 | | | Burckhardt Compression Holding AG | | | 53,981 | |
| | 1,869 | | | Cembra Money Bank AG | | | 142,977 | |
| | 311 | | | Daetwyler Holding AG-BR | | | 42,582 | |
| | 2,758 | | | DKSH Holding AG | | | 191,323 | |
| | 126 | | | dormakaba Holding AG | | | 87,597 | |
| | 6,085 | | | EFG International AG | | | 32,797 | |
| | 148 | | | Emmi AG | | | 87,402 | |
| | 238 | | | EMS-CHEMIE HOLDING AG | | | 119,554 | |
| | 758 | | | Flughafen Zuerich AG | | | 139,505 | |
| | 68 | | | Forbo Holding AG | | | 86,779 | |
| | 149 | | | Galenica AG | | | 149,467 | |
| | 15,512 | | | GAM Holding AG | | | 150,430 | |
| | 2,364 | | | Implenia AG | | | 158,373 | |
| | 2,915 | | | Kudelski SA-BR | | | 50,259 | |
| | 7,082 | | | Logitech International SA | | | 171,518 | |
| | 10,374 | | | Meyer Burger Technology AG(a)(b) | | | 33,989 | |
| | 528 | | | Mobimo Holding AG | | | 127,128 | |
| | 14,987 | | | OC Oerlikon Corp. AG | | | 141,095 | |
| | 1,071 | | | Panalpina Welttransport Holding AG | | | 139,168 | |
| | 496 | | | Partners Group Holding AG | | | 251,285 | |
| | 2,345 | | | PSP Swiss Property AG | | | 209,862 | |
| | 401 | | | Rieter Holding AG | | | 76,315 | |
| | 66,899 | | | Schmolz + Bickenbach AG(a) | | | 43,972 | |
| | 67 | | | Schweiter Technologies AG | | | 72,224 | |
| | 1,064 | | | SFS Group AG | | | 80,212 | |
| | 1,804 | | | Sonova Holding AG | | | 242,078 | |
| | 92 | | | St. Galler Kantonalbank AG | | | 34,538 | |
| | 195 | | | Straumann Holding AG | | | 73,256 | |
| | 1,350 | | | Sulzer AG | | | 133,103 | |
| | 2,872 | | | Sunrise Communications Group AG(c) | | | 196,326 | |
| | 287 | | | Tecan Group AG | | | 47,306 | |
| | 1,454 | | | Valiant Holding AG | | | 137,990 | |
| | 486 | | | Valora Holding AG | | | 141,416 | |
| | 953 | | | Vontobel Holding AG | | | 46,691 | |
| | 2,467 | | | Wizz Air Holdings PLC(a)(c) | | | 45,511 | |
| | 986 | | | Zehnder Group AG(a) | | | 41,029 | |
| | | | | | | | |
| | | | | | | 4,780,895 | |
| | | | | | | | |
| | | | United Kingdom—8.3% | | | | |
| | 42,168 | | | AA PLC | | | 131,848 | |
| | 16,932 | | | Acacia Mining PLC | | | 107,186 | |
| | 37,927 | | | Ashmore Group PLC | | | 162,577 | |
| | 56,296 | | | Assura PLC REIT | | | 40,414 | |
| | 4,322 | | | Aveva Group PLC | | | 97,092 | |
| | 73,852 | | | BBA Aviation PLC | | | 233,169 | |
See accompanying Notes to Financial Statements which are an integral part of the financial statements.
PowerShares FTSE RAFI Developed Markets ex-U.S. Small-Mid Portfolio (PDN) (continued)
October 31, 2016
| | | | | | | | |
Number
of Shares | | | | | Value | |
| | | | Common Stocks and Other Equity Interests (continued) | |
| | | | United Kingdom (continued) | | | | |
| | 41,930 | | | Beazley PLC | | $ | 186,340 | |
| | 5,693 | | | Bellway PLC | | | 164,451 | |
| | 12,675 | | | Berendsen PLC | | | 149,488 | |
| | 6,721 | | | Big Yellow Group PLC REIT | | | 56,783 | |
| | 15,828 | | | Bodycote PLC | | | 114,497 | |
| | 8,813 | | | Bovis Homes Group PLC | | | 81,505 | |
| | 15,446 | | | Brewin Dolphin Holdings PLC | | | 49,031 | |
| | 15,176 | | | Britvic PLC | | | 102,832 | |
| | 9,634 | | | BTG PLC(a) | | | 77,395 | |
| | 56,526 | | | Cairn Energy PLC(a) | | | 140,372 | |
| | 30,390 | | | Capital & Counties Properties PLC | | | 106,968 | |
| | 10,678 | | | Card Factory PLC | | | 33,074 | |
| | 9,465 | | | Cineworld Group PLC | | | 62,459 | |
| | 12,011 | | | Close Brothers Group PLC | | | 194,594 | |
| | 4,267 | | | Computacenter PLC | | | 37,848 | |
| | 11,363 | | | Countrywide PLC | | | 24,999 | |
| | 10,834 | | | Crest Nicholson Holdings PLC | | | 53,822 | |
| | 20,572 | | | Daily Mail & General Trust PLC NV, Class A | | | 188,373 | |
| | 14,655 | | | Dairy Crest Group PLC | | | 109,143 | |
| | 7,400 | | | De La Rue PLC | | | 51,814 | |
| | 193,027 | | | Debenhams PLC | | | 126,553 | |
| | 2,562 | | | Dechra Pharmaceuticals PLC | | | 42,071 | |
| | 5,128 | | | Derwent London PLC REIT | | | 151,448 | |
| | 2,254 | | | Dialog Semiconductor PLC(a) | | | 88,332 | |
| | 1,121 | | | Dignity PLC | | | 36,310 | |
| | 5,592 | | | Diploma PLC | | | 64,006 | |
| | 9,372 | | | Domino’s Pizza Group PLC | | | 38,915 | |
| | 3,853 | | | Dunelm Group PLC | | | 35,587 | |
| | 38,082 | | | Electrocomponents PLC | | | 173,238 | |
| | 33,848 | | | Elementis PLC | | | 98,436 | |
| | 29,312 | | | Enterprise Inns PLC(a) | | | 33,014 | |
| | 10,983 | | | Essentra PLC | | | 68,387 | |
| | 13,090 | | | esure Group PLC | | | 43,454 | |
| | 34,729 | | | Fenner PLC | | | 92,857 | |
| | 1,211 | | | Fidessa Group PLC | | | 36,357 | |
| | 171,877 | | | FirstGroup PLC(a) | | | 229,990 | |
| | 7,035 | | | Galliford Try PLC | | | 105,302 | |
| | 69,835 | | | Genel Energy PLC(a) | | | 69,488 | |
| | 2,518 | | | Genus PLC | | | 57,672 | |
| | 4,120 | | | Go-Ahead Group PLC | | | 104,324 | |
| | 16,994 | | | Grafton Group PLC | | | 103,180 | |
| | 24,944 | | | Grainger PLC | | | 67,304 | |
| | 16,820 | | | Great Portland Estates PLC REIT | | | 121,981 | |
| | 5,978 | | | Greggs PLC | | | 69,738 | |
| | 24,814 | | | Halfords Group PLC | | | 102,762 | |
| | 11,704 | | | Halma PLC | | | 149,753 | |
| | 54,357 | | | Hansteen Holdings PLC REIT | | | 71,342 | |
| | 4,067 | | | Hargreaves Lansdown PLC | | | 57,599 | |
| | 63,120 | | | Henderson Group PLC | | | 178,555 | |
| | 9,511 | | | HomeServe PLC | | | 70,775 | |
| | 17,108 | | | Howden Joinery Group PLC | | | 78,306 | |
| | 30,028 | | | Hunting PLC | | | 184,589 | |
| | 20,594 | | | IG Group Holdings PLC | | | 207,557 | |
| | 65,397 | | | Indivior PLC | | | 251,027 | |
| | 29,480 | | | International Personal Finance PLC | | | 105,997 | |
| | 11,257 | | | Interserve PLC | | | 46,522 | |
| | | | | | | | |
Number
of Shares | | | | | Value | |
| | | | Common Stocks and Other Equity Interests (continued) | |
| | | | United Kingdom (continued) | | | | |
| | 6,393 | | | J D Wetherspoon PLC | | $ | 67,905 | |
| | 25,095 | | | Jupiter Fund Management PLC | | | 132,266 | |
| | 84,885 | | | KAZ Minerals PLC(a) | | | 296,399 | |
| | 41,504 | | | KCOM Group PLC | | | 59,667 | |
| | 4,816 | | | Keller Group PLC | | | 40,012 | |
| | 5,720 | | | Kennedy Wilson Europe Real Estate PLC | | | 70,883 | |
| | 8,253 | | | Kier Group PLC | | | 136,934 | |
| | 127,457 | | | Ladbrokes Coral Group PLC | | | 207,898 | |
| | 20,716 | | | Laird PLC | | | 36,674 | |
| | 34,053 | | | LondonMetric Property PLC REIT | | | 61,989 | |
| | 66,981 | | | Lonmin PLC(a) | | | 155,376 | |
| | 25,941 | | | Lookers PLC | | | 32,701 | |
| | 67,488 | | | Marston’s PLC | | | 110,164 | |
| | 21,827 | | | Merlin Entertainments PLC(c) | | | 122,797 | |
| | 5,233 | | | Micro Focus International PLC | | | 136,788 | |
| | 28,424 | | | Mitchells & Butlers PLC | | | 96,578 | |
| | 44,327 | | | Mitie Group PLC | | | 113,974 | |
| | 19,213 | | | Moneysupermarket.com Group PLC | | | 61,434 | |
| | 21,312 | | | Morgan Advanced Materials PLC | | | 70,904 | |
| | 16,238 | | | N Brown Group PLC | | | 37,806 | |
| | 32,526 | | | National Express Group PLC | | | 146,057 | |
| | 9,934 | | | Northgate PLC | | | 51,030 | |
| | 11,757 | | | Ocado Group PLC(a) | | | 39,474 | |
| | 72,958 | | | Ophir Energy PLC(a) | | | 61,684 | |
| | 4,071 | | | Oxford Instruments PLC | | | 33,599 | |
| | 20,025 | | | Pagegroup PLC | | | 88,773 | |
| | 27,995 | | | Paragon Group of Cos. PLC (The) | | | 113,304 | |
| | 19,025 | | | Pets at Home Group PLC | | | 49,568 | |
| | 9,929 | | | Playtech PLC | | | 112,495 | |
| | 8,060 | | | Polypipe Group PLC | | | 24,798 | |
| | 135,861 | | | Premier Oil PLC(a) | | | 109,476 | |
| | 24,271 | | | PZ Cussons PLC | | | 99,239 | |
| | 38,873 | | | QinetiQ Group PLC | | | 109,253 | |
| | 68,290 | | | Redefine International PLC REIT | | | 34,392 | |
| | 8,398 | | | Redrow PLC | | | 38,900 | |
| | 27,063 | | | Regus PLC | | | 82,240 | |
| | 1,848 | | | Renishaw PLC | | | 58,278 | |
| | 96,173 | | | Rentokil Initial PLC | | | 268,064 | |
| | 11,406 | | | Restaurant Group PLC (The) | | | 52,291 | |
| | 936 | | | Rightmove PLC | | | 42,682 | |
| | 57,233 | | | Rotork PLC | | | 142,547 | |
| | 12,935 | | | RPC Group PLC | | | 149,711 | |
| | 11,478 | | | Safestore Holdings PLC REIT | | | 50,210 | |
| | 8,786 | | | Savills PLC | | | 74,444 | |
| | 6,003 | | | Schroders PLC | | | 206,606 | |
| | 32,969 | | | Senior PLC | | | 70,159 | |
| | 196,455 | | | Serco Group PLC(a) | | | 329,077 | |
| | 13,154 | | | Shaftesbury PLC REIT | | | 147,268 | |
| | 71,146 | | | SIG PLC | | | 95,983 | |
| | 22,390 | | | Soco International PLC | | | 37,792 | |
| | 8,560 | | | Spectris PLC | | | 214,139 | |
| | 4,503 | | | Spirax-Sarco Engineering PLC | | | 242,559 | |
| | 18,315 | | | Spire Healthcare Group PLC(c) | | | 83,182 | |
| | 21,022 | | | Sports Direct International PLC(a) | | | 71,017 | |
| | 25,055 | | | SSP Group PLC | | | 103,913 | |
| | 13,124 | | | St. Modwen Properties PLC | | | 43,711 | |
See accompanying Notes to Financial Statements which are an integral part of the financial statements.
PowerShares FTSE RAFI Developed Markets ex-U.S. Small-Mid Portfolio (PDN) (continued)
October 31, 2016
| | | | | | | | |
Number
of Shares | | | | | Value | |
| | | | Common Stocks and Other Equity Interests (continued) | |
| | | | United Kingdom (continued) | | | | |
| | 49,305 | | | Stagecoach Group PLC | | $ | 119,069 | |
| | 12,112 | | | SVG Capital PLC(a) | | | 103,882 | |
| | 18,430 | | | Synthomer PLC | | | 80,419 | |
| | 50,192 | | | TalkTalk Telecom Group PLC | | | 124,765 | |
| | 4,332 | | | Telecom Plus PLC | | | 62,621 | |
| | 21,805 | | | Tritax Big Box REIT PLC REIT | | | 36,152 | |
| | 20,595 | | | Tullett Prebon PLC | | | 89,263 | |
| | 26,136 | | | UBM PLC | | | 229,269 | |
| | 4,079 | | | Ultra Electronics Holdings PLC | | | 92,529 | |
| | 8,909 | | | Unite Group PLC (The) | | | 60,204 | |
| | 11,194 | | | Vesuvius PLC | | | 49,815 | |
| | 5,216 | | | Victrex PLC | | | 111,507 | |
| | 15,900 | | | Virgin Money Holdings UK PLC | | | 63,866 | |
| | 4,990 | | | WH Smith PLC | | | 89,739 | |
| | 6,516 | | | Workspace Group PLC REIT | | | 50,079 | |
| | 8,488 | | | WS Atkins PLC | | | 156,689 | |
| | | | | | | | |
| | | | | | | 13,567,734 | |
| | | | | | | | |
| | | | United States—0.5% | | | | |
| | 21,474 | | | Alacer Gold Corp.(a) | | | 43,421 | |
| | 38,652 | | | Nexteer Automotive Group Ltd. | | | 50,939 | |
| | 1,529,947 | | | REC Silicon ASA(a)(b) | | | 191,905 | |
| | 56,021 | | | Samsonite International SA | | | 176,265 | |
| | 44,630 | | | Sims Metal Management Ltd. | | | 340,291 | |
| | 3,683 | | | Tahoe Resources, Inc. | | | 44,188 | |
| | | | | | | | |
| | | | | | | 847,009 | |
| | | | | | | | |
| | | | Total Common Stocks and Other Equity Interests
(Cost $148,315,801) | | | 162,511,233 | |
| | | | | | | | |
| | |
| | | | | | | | |
| | | | Rights—0.0% | |
| | | | Austria—0.0% | |
| | 24,553 | | | IMMOFINANZ AG, expiring 12/31/49(a)
(Cost $0) | | | 0 | |
| | | | | | | | |
| | |
| | | | | | | | |
| | | | Total Investments (excluding investments purchased with cash collateral from securities on loan)
(Cost $148,315,801)—99.8% | | | 162,511,233 | |
| | | | | | | | |
| | |
| | | | | | | | |
| | | | Investments Purchased with Cash Collateral from Securities on Loan | |
| | |
| | | | | | | | |
| | | | Money Market Fund—2.4% | |
| | 3,949,685 | | | Invesco Government & Agency Portfolio—Institutional Class, 0.29%(d)(e)
(Cost $3,949,685) | | | 3,949,685 | |
| | | | | | | | |
| | |
| | | | | | | | |
| | | | Total Investments
(Cost $152,265,486)—102.2% | | | 166,460,918 | |
| | | | Other assets less liabilities—(2.2)% | | | (3,606,630 | ) |
| | | | | | | | |
| | | | Net Assets—100.0% | | $ | 162,854,288 | |
| | | | | | | | |
Investment Abbreviations:
BR—Bearer Shares
CVA—Dutch Certificates
REIT—Real Estate Investment Trust
RSP—Registered Savings Plan Shares
Notes to Schedule of Investments:
| (a) | Non-income producing security. |
| (b) | All or a portion of this security was out on loan at October 31, 2016. |
| (c) | Security purchased or received in a transaction exempt from registration under the Securities Act of 1933, as amended (the “1933 Act”). The security may be resold pursuant to an exemption from registration under the 1933 Act, typically to qualified institutional buyers. The aggregate value of these securities at October 31, 2016 was $1,698,012, which represented 1.04% of the Fund’s Net Assets. |
| (d) | The security and the Fund are advised by wholly-owned subsidiaries of Invesco Ltd. and are therefore considered to be affiliated. The rate shown is the 7-day SEC standardized yield as of October 31, 2016. |
| (e) | The security has been segregated to satisfy the commitment to return the cash collateral received in securities lending transactions upon the borrower’s return of the securities loaned. See Note 2J. |
See accompanying Notes to Financial Statements which are an integral part of the financial statements.
Schedule of Investments
PowerShares FTSE RAFI Emerging Markets Portfolio (PXH)
October 31, 2016
| | | | | | | | |
Number
of Shares | | | | | Value | |
| | | | Common Stocks and Other Equity
Interests—100.0% | |
| | | | Brazil—30.2% | |
| | 91,200 | | | AES Tiete Energia SA | | $ | 476,475 | |
| | 688,050 | | | Ambev SA | | | 4,092,418 | |
| | 295,322 | | | Banco Bradesco SA | | | 2,959,890 | |
| | 1,245,676 | | | Banco Bradesco SA (Preference Shares) | | | 13,157,732 | |
| | 716,958 | | | Banco do Brasil SA | | | 6,633,195 | |
| | 193,300 | | | Banco Santander Brasil SA | | | 1,605,821 | |
| | 53,700 | | | BB Seguridade Participacoes SA | | | 545,167 | |
| | 434,685 | | | BM&FBOVESPA SA | | | 2,581,322 | |
| | 187,170 | | | BR Malls Participacoes SA(a) | | | 755,574 | |
| | 73,409 | | | Braskem SA (Preference Shares), Class A | | | 655,518 | |
| | 146,800 | | | BRF SA | | | 2,476,150 | |
| | 203,800 | | | CCR SA | | | 1,116,898 | |
| | 153,710 | | | Centrais Eletricas Brasileiras SA(a) | | | 1,150,695 | |
| | 126,700 | | | Centrais Eletricas Brasileiras SA (Preference Shares), Class B(a) | | | 1,094,570 | |
| | 108,579 | | | Cia Brasileira de Distribuicao (Preference Shares), Class A | | | 2,092,114 | |
| | 139,392 | | | Cia de Saneamento Basico do Estado de Sao Paulo | | | 1,483,807 | |
| | 423,282 | | | Cia Siderurgica Nacional SA(a) | | | 1,435,965 | |
| | 107,152 | | | Cielo SA | | | 1,096,617 | |
| | 72,980 | | | Companhia Energetica de Minas Gerais—CEMIG | | | 223,607 | |
| | 649,723 | | | Companhia Energetica de Minas Gerais (Preference Shares)—CEMIG | | | 2,000,979 | |
| | 16,200 | | | Copel—Companhia Paranaense de Energia | | | 121,020 | |
| | 81,408 | | | Copel—Companhia Paranaense de Energia (Preference Shares), Class B | | | 939,862 | |
| | 48,900 | | | Cosan SA Industria e Comercio | | | 662,946 | |
| | 149,568 | | | CPFL Energia SA | | | 1,144,254 | |
| | 147,500 | | | Cyrela Brazil Realty SA Empreendimentos e Participacoes | | | 500,853 | |
| | 127,841 | | | EDP—Energias do Brasil SA | | | 619,852 | |
| | 125,567 | | | Embraer SA | | | 680,220 | |
| | 63,154 | | | Engie Brasil Energia SA | | | 808,912 | |
| | 37,900 | | | Equatorial Energia SA | | | 681,658 | |
| | 50,855 | | | Fibria Celulose SA | | | 410,265 | |
| | 911,717 | | | Gerdau SA (Preference Shares) | | | 3,173,594 | |
| | 1,532,317 | | | Itau Unibanco Holding SA (Preference Shares) | | | 18,586,153 | |
| | 883,818 | | | Itausa—Investimentos Itau SA (Preference Shares) | | | 2,635,388 | |
| | 290,082 | | | JBS SA | | | 889,712 | |
| | 67,100 | | | Klabin SA | | | 348,657 | |
| | 195,200 | | | Kroton Educacional SA | | | 980,362 | |
| | 24,910 | | | Lojas Americanas SA | | | 123,218 | |
| | 79,520 | | | Lojas Americanas SA (Preference Shares) | | | 519,944 | |
| | 96,600 | | | Lojas Renner SA | | | 823,855 | |
| | 64,400 | | | Natura Cosmeticos SA | | | 623,688 | |
| | 5,529,162 | | | Petroleo Brasileiro SA(a) | | | 32,554,789 | |
| | 6,581,147 | | | Petroleo Brasileiro SA (Preference Shares)(a) | | | 36,773,849 | |
| | 52,700 | | | Porto Seguro SA | | | 503,886 | |
| | 99,300 | | | Sul America SA | | | 604,423 | |
| | 137,843 | | | Telefonica Brasil SA (Preference Shares) | | | 2,010,705 | |
| | 407,266 | | | Tim Participacoes SA | | | 1,139,781 | |
| | 98,896 | | | Ultrapar Participacoes SA | | | 2,259,471 | |
| | | | | | | | |
Number
of Shares | | | | | Value | |
| | | | Common Stocks and Other Equity
Interests (continued) | |
| | | | Brazil (continued) | |
| | 1,788,423 | | | Vale SA | | $ | 12,473,231 | |
| | 2,747,527 | | | Vale SA (Preference Shares) | | | 17,904,033 | |
| | | | | | | | |
| | | | | | | 189,133,095 | |
| | | | | | | | |
| | | | Chile—0.8% | |
| | 4,977,914 | | | Banco de Chile | | | 592,409 | |
| | 14,800,274 | | | Banco Santander Chile | | | 828,001 | |
| | 148,004 | | | Cencosud SA | | | 482,420 | |
| | 551,615 | | | Empresa Nacional de Electricidad SA | | | 380,462 | |
| | 551,619 | | | Endesa Americas SA | | | 256,635 | |
| | 5,027,576 | | | Enersis Americas SA | | | 851,422 | |
| | 5,027,645 | | | Enersis Chile SA | | | 503,288 | |
| | 54,646 | | | LATAM Airlines Group SA(a) | | | 523,324 | |
| | 58,560 | | | S.A.C.I. Falabella | | | 459,753 | |
| | | | | | | | |
| | | | | | | 4,877,714 | |
| | | | | | | | |
| | | | China—21.3% | |
| | 8,167,959 | | | Agricultural Bank of China Ltd., H-Shares | | | 3,444,196 | |
| | 255,526 | | | Anhui Conch Cement Co. Ltd., H-Shares | | | 708,435 | |
| | 24,192,222 | | | Bank of China Ltd., H-Shares | | | 10,856,294 | |
| | 2,550,626 | | | Bank of Communications Co. Ltd., H-Shares | | | 1,943,842 | |
| | 103,911 | | | Beijing Enterprises Holdings Ltd. | | | 519,900 | |
| | 1,266,658 | | | Belle International Holdings Ltd. | | | 767,686 | |
| | 1,863,099 | | | China Cinda Asset Management Co. Ltd., H-Shares | | | 670,296 | |
| | 1,827,029 | | | China CITIC Bank Corp. Ltd., H-Shares | | | 1,180,347 | |
| | 1,016,596 | | | China Communications Construction Co. Ltd., H-Shares | | | 1,119,523 | |
| | 24,326,977 | | | China Construction Bank Corp., H-Shares | | | 17,818,169 | |
| | 861,207 | | | China Everbright Bank Co. Ltd., H-Shares | | | 393,131 | |
| | 1,307,833 | | | China Evergrande Group | | | 865,160 | |
| | 950,914 | | | China Life Insurance Co. Ltd., H-Shares | | | 2,361,697 | |
| | 764,634 | | | China Longyuan Power Group Corp., H-Shares | | | 584,702 | |
| | 1,053,313 | | | China Merchants Bank Co. Ltd., H-Shares | | | 2,569,835 | |
| | 216,227 | | | China Merchants Port Holdings Co. Ltd. | | | 560,445 | |
| | 1,314,921 | | | China Minsheng Banking Corp. Ltd., H-Shares | | | 1,500,616 | |
| | 989,518 | | | China Mobile Ltd. | | | 11,337,250 | |
| | 1,568,489 | | | China National Building Material Co. Ltd., H-Shares | | | 718,020 | |
| | 417,042 | | | China Oilfield Services Ltd., H-Shares | | | 403,337 | |
| | 446,776 | | | China Overseas Land & Investment Ltd. | | | 1,379,819 | |
| | 364,318 | | | China Pacific Insurance (Group) Co. Ltd., H-Shares | | | 1,317,771 | |
| | 9,905,304 | | | China Petroleum & Chemical Corp. (Sinopec), H-Shares | | | 7,216,770 | |
| | 725,160 | | | China Power International Development Ltd. | | | 264,635 | |
| | 598,690 | | | China Railway Construction Corp. Ltd., H-Shares | | | 750,404 | |
| | 996,190 | | | China Railway Group Ltd., H-Shares | | | 770,762 | |
| | 502,215 | | | China Resources Beer Holdings Co. Ltd.(a) | | | 1,068,563 | |
| | 385,124 | | | China Resources Land Ltd. | | | 960,470 | |
| | 554,036 | | | China Resources Power Holdings Co. Ltd. | | | 941,629 | |
| | 1,274,921 | | | China Shenhua Energy Co. Ltd., H-Shares | | | 2,653,465 | |
| | 268,373 | | | China Taiping Insurance Holdings Co. Ltd.(a) | | | 518,415 | |
| | 4,774,604 | | | China Telecom Corp. Ltd., H-Shares | | | 2,468,928 | |
See accompanying Notes to Financial Statements which are an integral part of the financial statements.
PowerShares FTSE RAFI Emerging Markets Portfolio (PXH) (continued)
October 31, 2016
| | | | | | | | |
Number
of Shares | | | | | Value | |
| | | | Common Stocks and Other Equity
Interests (continued) | |
| | | | China (continued) | |
| | 1,899,727 | | | China Unicom (Hong Kong) Ltd. | | $ | 2,226,802 | |
| | 897,982 | | | Chongqing Rural Commercial Bank Co. Ltd., H-Shares | | | 538,452 | |
| | 1,275,687 | | | CITIC Ltd. | | | 1,832,550 | |
| | 249,695 | | | CITIC Securities Co. Ltd., H-Shares | | | 553,815 | |
| | 6,151,714 | | | CNOOC Ltd. | | | 7,829,606 | |
| | 420,741 | | | Cosco Shipping Ports Ltd. | | | 417,765 | |
| | 1,656,777 | | | Country Garden Holdings Co. Ltd. | | | 863,122 | |
| | 591,925 | | | Dongfeng Motor Group Co. Ltd., H-Shares | | | 615,980 | |
| | 85,321 | | | ENN Energy Holdings Ltd. | | | 401,583 | |
| | 302,448 | | | Fosun International Ltd. | | | 439,153 | |
| | 3,176,320 | | | GCL-Poly Energy Holdings Ltd. | | | 430,071 | |
| | 821,928 | | | Geely Automobile Holdings Ltd. | | | 847,911 | |
| | 3,989,112 | | | GOME Electrical Appliances Holding Ltd. | | | 504,114 | |
| | 487,533 | | | Great Wall Motor Co. Ltd., H-Shares | | | 475,912 | |
| | 401,520 | | | Greentown China Holdings Ltd.(a) | | | 328,264 | |
| | 281,425 | | | Guangdong Investment Ltd. | | | 425,321 | |
| | 396,830 | | | Guangzhou R&F Properties Co. Ltd., H-Shares | | | 560,843 | |
| | 278,309 | | | Haitong Securities Co. Ltd., H-Shares | | | 493,824 | |
| | 69,025 | | | Hengan International Group Co. Ltd. | | | 549,629 | |
| | 1,228,664 | | | Huaneng Power International, Inc., H-Shares | | | 755,750 | |
| | 22,075,456 | | | Industrial & Commercial Bank of China Ltd., H-Shares | | | 13,293,923 | |
| | 586,500 | | | Inner Mongolia Yitai Coal Co. Ltd., Class B | | | 579,462 | |
| | 497,640 | | | Jiangxi Copper Co. Ltd., H-Shares | | | 587,811 | |
| | 792,967 | | | Kunlun Energy Co. Ltd. | | | 600,233 | |
| | 1,831,638 | | | Lenovo Group Ltd. | | | 1,176,239 | |
| | 318,495 | | | Longfor Properties Co. Ltd. | | | 423,025 | |
| | 107,398 | | | New China Life Insurance Co. Ltd., H-Shares | | | 465,331 | |
| | 1,657,307 | | | People’s Insurance Co. Group of China Ltd. (The), H-Shares | | | 660,371 | |
| | 6,171,397 | | | PetroChina Co. Ltd., H-Shares | | | 4,249,632 | |
| | 538,296 | | | PICC Property & Casualty Co. Ltd., H-Shares | | | 871,841 | |
| | 626,242 | | | Ping An Insurance (Group) Co. of China Ltd., H-Shares | | | 3,306,912 | |
| | 13,819 | | | Qinqin Foodstuffs Group Cayman Co. Ltd.(a) | | | 4,776 | |
| | 154,568 | | | Shanghai Industrial Holdings Ltd. | | | 473,380 | |
| | 478,432 | | | Shimao Property Holdings Ltd. | | | 640,389 | |
| | 912,225 | | | Sino-Ocean Group Holding Ltd. | | | 379,954 | |
| | 186,377 | | | Sinopharm Group Co. Ltd., H-Shares | | | 907,269 | |
| | 817,903 | | | SOHO China Ltd. | | | 422,934 | |
| | 545,836 | | | Sunac China Holdings Ltd. | | | 373,752 | |
| | 84,321 | | | Tencent Holdings Ltd. | | | 2,237,730 | |
| | | | | | | | |
| | | | | | | 133,379,943 | |
| | | | | | | | |
| | | | Hong Kong—0.2% | |
| | 389,621 | | | Digital China Holdings Ltd. | | | 326,574 | |
| | 204,039 | | | Haier Electronics Group Co. Ltd. | | | 329,416 | |
| | 621,492 | | | Skyworth Digital Holdings Ltd. | | | 402,315 | |
| | | | | | | | |
| | | | | | | 1,058,305 | |
| | | | | | | | |
| | | | India—7.0% | |
| | 18,754 | | | Axis Bank Ltd. GDR(b) | | | 678,895 | |
| | 14,079 | | | GAIL India Ltd. GDR(b) | | | 542,042 | |
| | 12,319 | | | HDFC Bank Ltd. ADR | | | 871,939 | |
| | 288,065 | | | ICICI Bank Ltd. ADR | | | 2,388,059 | |
| | | | | | | | |
Number
of Shares | | | | | Value | |
| | | | Common Stocks and Other Equity
Interests (continued) | |
| | | | India (continued) | |
| | 145,670 | | | Infosys Ltd. ADR | | $ | 2,222,924 | |
| | 57,543 | | | Larsen & Toubro Ltd. GDR(b) | | | 1,265,946 | |
| | 42,039 | | | Mahindra & Mahindra Ltd. GDR(b) | | | 821,862 | |
| | 343,322 | | | PowerShares India Portfolio(c) | | | 7,130,798 | |
| | 357,492 | | | Reliance Industries Ltd. GDR(b) | | | 11,332,496 | |
| | 19,305 | | | Reliance Infrastructure Ltd. GDR(b) | | | 466,216 | |
| | 170,250 | | | State Bank of India GDR(b) | | | 6,486,525 | |
| | 69,661 | | | Tata Motors Ltd. ADR | | | 2,745,340 | |
| | 701,029 | | | Tata Steel Ltd. GDR(b) | | | 4,136,071 | |
| | 157,279 | | | Vedanta Ltd. ADR | | | 1,896,785 | |
| | 74,939 | | | Wipro Ltd. ADR | | | 724,660 | |
| | | | | | | | |
| | | | | | | 43,710,558 | |
| | | | | | | | |
| | | | Indonesia—1.7% | |
| | 3,461,464 | | | PT Astra International Tbk | | | 2,181,985 | |
| | 877,530 | | | PT Bank Central Asia Tbk | | | 1,044,118 | |
| | 1,380,909 | | | PT Bank Mandiri Persero Tbk | | | 1,214,434 | |
| | 1,359,044 | | | PT Bank Negara Indonesia (Persero) Tbk | | | 580,677 | |
| | 1,410,659 | | | PT Bank Rakyat Indonesia (Persero) Tbk | | | 1,318,979 | |
| | 628,071 | | | PT Indofood Sukses Makmur Tbk | | | 409,151 | |
| | 2,034,547 | | | PT Perusahaan Gas Negara Persero Tbk | | | 399,175 | |
| | 557,960 | | | PT Semen Indonesia (Persero) Tbk | | | 421,207 | |
| | 7,267,815 | | | PT Telekomunikasi Indonesia Persero Tbk | | | 2,350,566 | |
| | 372,913 | | | PT United Tractors Tbk | | | 618,044 | |
| | | | | | | | |
| | | | | | | 10,538,336 | |
| | | | | | | | |
| | | | Malaysia—2.1% | |
| | 291,700 | | | AMMB Holdings Bhd | | | 292,048 | |
| | 747,500 | | | Axiata Group Bhd | | | 876,686 | |
| | 910,500 | | | CIMB Group Holdings Bhd | | | 1,091,732 | |
| | 538,100 | | | DiGi.Com Bhd | | | 645,207 | |
| | 288,900 | | | Genting Bhd | | | 539,923 | |
| | 431,200 | | | IJM Corp. Bhd | | | 339,204 | |
| | 366,300 | | | IOI Corp. Bhd | | | 392,932 | |
| | 63,400 | | | Kuala Lumpur Kepong Bhd | | | 362,113 | |
| | 750,700 | | | Malayan Banking Bhd | | | 1,413,714 | |
| | 329,900 | | | Maxis Bhd | | | 468,702 | |
| | 216,000 | | | MISC Bhd | | | 387,204 | |
| | 399,700 | | | Petronas Chemicals Group Bhd | | | 666,960 | |
| | 80,500 | | | Petronas Gas Bhd | | | 422,169 | |
| | 429,300 | | | Public Bank Bhd | | | 2,032,395 | |
| | 735,800 | | | SapuraKencana Petroleum Bhd(a) | | | 284,147 | |
| | 340,400 | | | Sime Darby Bhd | | | 664,571 | |
| | 203,000 | | | Telekom Malaysia Bhd | | | 316,477 | |
| | 615,100 | | | Tenaga Nasional Bhd | | | 2,102,630 | |
| | | | | | | | |
| | | | | | | 13,298,814 | |
| | | | | | | | |
| | | | Mexico—3.4% | |
| | 491,917 | | | Alfa SAB de CV, Class A | | | 749,613 | |
| | 7,295,629 | | | America Movil SAB de CV, Series L | | | 4,856,641 | |
| | 5,411,554 | | | Cemex SAB de CV, Series CPO(a)(d) | | | 4,707,325 | |
| | 60,504 | | | Coca-Cola Femsa SAB de CV, Series L | | | 456,752 | |
| | 283,584 | | | Fibra Uno Administracion SA de CV REIT | | | 543,872 | |
| | 183,466 | | | Fomento Economico Mexicano SAB de CV | | | 1,768,570 | |
| | 141,097 | | | Grupo Bimbo SAB de CV, Series A | | | 381,935 | |
| | 258,578 | | | Grupo Financiero Banorte SAB de CV, Class O | | | 1,530,364 | |
| | 287,559 | | | Grupo Financiero Inbursa SAB de CV, Class O | | | 468,932 | |
See accompanying Notes to Financial Statements which are an integral part of the financial statements.
PowerShares FTSE RAFI Emerging Markets Portfolio (PXH) (continued)
October 31, 2016
| | | | | | | | |
Number
of Shares | | | | | Value | |
| | | | Common Stocks and Other Equity
Interests (continued) | |
| | | | Mexico (continued) | |
| | 432,177 | | | Grupo Financiero Santander Mexico SAB de CV, Series B | | $ | 786,111 | |
| | 700,876 | | | Grupo Mexico SAB de CV, Series B | | | 1,735,467 | |
| | 241,957 | | | Grupo Televisa SAB, Series CPO(e) | | | 1,196,438 | |
| | 195,986 | | | Mexichem SAB de CV | | | 471,012 | |
| | 666,173 | | | Wal-Mart de Mexico SAB de CV | | | 1,416,470 | |
| | | | | | | | |
| | | | | | | 21,069,502 | |
| | | | | | | | |
| | | | Netherlands—0.2% | |
| | 192,689 | | | Steinhoff International Holdings NV | | | 1,040,299 | |
| | | | | | | | |
| | | | Poland—1.3% | |
| | 28,284 | | | Bank Pekao SA | | | 869,895 | |
| | 4,212 | | | Bank Zachodni WBK SA | | | 339,242 | |
| | 68,620 | | | KGHM Polska Miedz SA | | | 1,239,252 | |
| | 208,838 | | | Orange Polska SA | | | 297,139 | |
| | 206,753 | | | PGE Polska Grupa Energetyczna SA | | | 539,490 | |
| | 93,276 | | | Polski Koncern Naftowy Orlen SA | | | 1,843,788 | |
| | 399,778 | | | Polskie Gornictwo Naftowe i Gazownictwo SA | | | 509,899 | |
| | 224,294 | | | Powszechna Kasa Oszczednosci Bank Polski SA | | | 1,566,015 | |
| | 157,937 | | | Powszechny Zaklad Ubezpieczen SA | | | 1,093,081 | |
| | | | | | | | |
| | | | | | | 8,297,801 | |
| | | | | | | | |
| | | | Russia—9.2% | |
| | 2,981,650 | | | Gazprom PJSC ADR | | | 12,880,728 | |
| | 302,897 | | | LUKOIL PJSC ADR | | | 14,766,229 | |
| | 30,442 | | | Magnit PJSC GDR(b) | | | 1,208,243 | |
| | 42,232 | | | MegaFon PJSC GDR(b) | | | 402,471 | |
| | 150,622 | | | MMC Norilsk Nickel PJSC ADR | | | 2,271,380 | |
| | 327,511 | | | Mobile TeleSystems PJSC ADR | | | 2,525,110 | |
| | 12,157 | | | Novatek OJSC GDR(b) | | | 1,299,583 | |
| | 623,648 | | | Rosneft PJSC GDR(b) | | | 3,398,882 | |
| | 334,084 | | | RusHydro PJSC ADR | | | 407,582 | |
| | 1,150,997 | | | Sberbank of Russia PJSC ADR | | | 10,922,961 | |
| | 46,932 | | | Severstal PJSC GDR(b) | | | 661,741 | |
| | 63,077 | | | Sistema Pjsc Fc GDR(b) | | | 471,185 | |
| | 469,425 | | | Surgutneftegas OJSC ADR | | | 2,017,589 | |
| | 62,874 | | | Tatneft PJSC ADR | | | 2,104,393 | |
| | 1,041,979 | | | VTB Bank PJSC GDR(b) | | | 2,181,904 | |
| | | | | | | | |
| | | | | | | 57,519,981 | |
| | | | | | | | |
| | | | South Africa—7.1% | |
| | 379,526 | | | African Bank Investments Ltd.(a) | | | 0 | |
| | 112,512 | | | AngloGold Ashanti Ltd.(a) | | | 1,507,531 | |
| | 21,099 | | | Aspen Pharmacare Holdings Ltd. | | | 459,663 | |
| | 115,144 | | | Barclays Africa Group Ltd. | | | 1,335,354 | |
| | 114,357 | | | Barloworld Ltd. | | | 740,808 | |
| | 71,883 | | | Bid Corp. Ltd. | | | 1,267,583 | |
| | 71,803 | | | Bidvest Group Ltd. (The) | | | 891,566 | |
| | 571,558 | | | FirstRand Ltd. | | | 2,048,410 | |
| | 48,800 | | | Foschini Group Ltd. (The) | | | 502,388 | |
| | 345,072 | | | Gold Fields Ltd. | | | 1,402,811 | |
| | 466,869 | | | Growthpoint Properties Ltd. REIT | | | 870,542 | |
| | 138,161 | | | Harmony Gold Mining Co. Ltd. | | | 421,272 | |
| | 315,998 | | | Impala Platinum Holdings Ltd.(a) | | | 1,270,320 | |
| | 98,225 | | | Imperial Holdings Ltd. | | | 1,240,844 | |
| | 59,182 | | | Investec Ltd. | | | 364,990 | |
| | | | | | | | |
Number
of Shares | | | | | Value | |
| | | | Common Stocks and Other Equity
Interests (continued) | |
| | | | South Africa (continued) | |
| | 171,523 | | | Life Healthcare Group Holdings Ltd. | | $ | 457,988 | |
| | 297,585 | | | MMI Holdings Ltd. | | | 499,047 | |
| | 17,485 | | | Mondi Ltd. | | | 341,724 | |
| | 33,515 | | | Mr Price Group Ltd. | | | 382,119 | |
| | 651,388 | | | MTN Group Ltd. | | | 5,622,253 | |
| | 314,277 | | | Nampak Ltd. | | | 438,228 | |
| | 10,533 | | | Naspers Ltd., Class N | | | 1,765,513 | |
| | 67,812 | | | Nedbank Group Ltd. | | | 1,109,034 | |
| | 252,650 | | | Netcare Ltd. | | | 648,935 | |
| | 693,643 | | | Redefine Properties Ltd. REIT | | | 595,764 | |
| | 51,876 | | | Remgro Ltd. | | | 861,875 | |
| | 402,204 | | | Sanlam Ltd. | | | 1,949,791 | |
| | 196,280 | | | Sappi Ltd.(a) | | | 1,091,860 | |
| | 166,891 | | | Sasol Ltd. | | | 4,634,699 | |
| | 94,223 | | | Shoprite Holdings Ltd. | | | 1,390,720 | |
| | 135,457 | | | Sibanye Gold Ltd. | | | 369,223 | |
| | 42,181 | | | SPAR Group Ltd. (The) | | | 597,558 | |
| | 389,986 | | | Standard Bank Group Ltd. | | | 4,138,060 | |
| | 116,176 | | | Telkom SA SOC Ltd. | | | 536,051 | |
| | 30,050 | | | Tiger Brands Ltd. | | | 855,820 | |
| | 80,998 | | | Truworths International Ltd. | | | 429,246 | |
| | 75,742 | | | Vodacom Group Ltd. | | | 817,109 | |
| | 120,517 | | | Woolworths Holdings Ltd. | | | 698,207 | |
| | | | | | | | |
| | | | | | | 44,554,906 | |
| | | | | | | | |
| | | | Taiwan—11.4% | |
| | 1,197,811 | | | Advanced Semiconductor Engineering, Inc. | | | 1,408,185 | |
| | 122,738 | | | Asustek Computer, Inc. | | | 1,075,404 | |
| | 5,598,000 | | | AU Optronics Corp. | | | 2,128,686 | |
| | 88,000 | | | Catcher Technology Co. Ltd. | | | 690,169 | |
| | 1,828,440 | | | Cathay Financial Holding Co. Ltd. | | | 2,372,641 | |
| | 306,894 | | | Cheng Shin Rubber Industry Co. Ltd. | | | 625,312 | |
| | 2,239,081 | | | China Development Financial Holding Corp. | | | 561,234 | |
| | 868,896 | | | China Life Insurance Co. Ltd. | | | 802,608 | |
| | 1,584,360 | | | China Steel Corp. | | | 1,144,685 | |
| | 721,000 | | | Chunghwa Telecom Co. Ltd. | | | 2,467,496 | |
| | 967,054 | | | Compal Electronics, Inc. | | | 576,111 | |
| | 3,267,838 | | | CTBC Financial Holding Co. Ltd. | | | 1,760,382 | |
| | 311,506 | | | Delta Electronics, Inc. | | | 1,643,532 | |
| | 1,044,057 | | | E.Sun Financial Holding Co. Ltd. | | | 593,863 | |
| | 468,562 | | | Far Eastern New Century Corp. | | | 363,031 | |
| | 279,000 | | | Far EasTone Telecommunications Co. Ltd. | | | 659,539 | |
| | 1,387,810 | | | First Financial Holding Co. Ltd. | | | 727,822 | |
| | 351,920 | | | Formosa Chemicals & Fibre Corp. | | | 1,047,145 | |
| | 281,000 | | | Formosa Petrochemical Corp. | | | 939,412 | |
| | 480,280 | | | Formosa Plastics Corp. | | | 1,299,720 | |
| | 249,102 | | | Foxconn Technology Co. Ltd. | | | 723,053 | |
| | 1,798,928 | | | Fubon Financial Holding Co. Ltd. | | | 2,553,814 | |
| | 337,900 | | | Highwealth Construction Corp. | | | 500,573 | |
| | 2,584,330 | | | Hon Hai Precision Industry Co. Ltd. | | | 6,985,450 | |
| | 654,233 | | | HTC Corp.(a) | | | 1,915,587 | |
| | 3,861,490 | | | Innolux Corp. | | | 1,303,172 | |
| | 357,000 | | | Inotera Memories, Inc.(a) | | | 334,290 | |
| | 1,252,000 | | | Inventec Corp. | | | 979,938 | |
| | 5,000 | | | Largan Precision Co. Ltd. | | | 591,777 | |
| | 355,313 | | | Lite-On Technology Corp. | | | 510,043 | |
| | 313,091 | | | MediaTek, Inc. | | | 2,381,109 | |
See accompanying Notes to Financial Statements which are an integral part of the financial statements.
PowerShares FTSE RAFI Emerging Markets Portfolio (PXH) (continued)
October 31, 2016
| | | | | | | | |
Number
of Shares | | | | | Value | |
| | | | Common Stocks and Other Equity
Interests (continued) | |
| | | | Taiwan (continued) | |
| | 1,641,080 | | | Mega Financial Holding Co. Ltd. | | $ | 1,123,261 | |
| | 476,940 | | | Nan Ya Plastics Corp. | | | 992,948 | |
| | 98,000 | | | Novatek Microelectronics Corp. | | | 367,995 | |
| | 670,106 | | | Pegatron Corp. | | | 1,804,928 | |
| | 583,740 | | | Pou Chen Corp. | | | 789,850 | |
| | 174,200 | | | Powertech Technology, Inc. | | | 497,359 | |
| | 69,000 | | | President Chain Store Corp. | | | 516,010 | |
| | 496,000 | | | Quanta Computer, Inc. | | | 1,005,910 | |
| | 179,000 | | | Radiant Opto-Electronics Corp. | | | 302,327 | |
| | 176,000 | | | Ruentex Industries Ltd. | | | 283,875 | |
| | 2,303,908 | | | Shin Kong Financial Holding Co. Ltd.(a) | | | 500,096 | |
| | 380,000 | | | Siliconware Precision Industries Co. Ltd. | | | 574,982 | |
| | 1,560,481 | | | SinoPac Financial Holdings Co. Ltd. | | | 450,479 | |
| | 1,815,337 | | | Taishin Financial Holding Co. Ltd. | | | 664,411 | |
| | 486,089 | | | Taiwan Cement Corp. | | | 583,014 | |
| | 232,400 | | | Taiwan Mobile Co. Ltd. | | | 813,759 | |
| | 2,308,000 | | | Taiwan Semiconductor Manufacturing Co. Ltd. | | | 13,786,200 | |
| | 243,000 | | | TPK Holding Co. Ltd.(a) | | | 388,862 | |
| | 649,941 | | | Uni-President Enterprises Corp. | | | 1,258,382 | |
| | 2,905,000 | | | United Microelectronics Corp. | | | 1,081,637 | |
| | 1,653,018 | | | Wistron Corp. | | | 1,246,671 | |
| | 1,909,671 | | | Yuanta Financial Holding Co. Ltd. | | | 714,065 | |
| | | | | | | | |
| | | | | | | 71,412,804 | |
| | | | | | | | |
| | | | Thailand—2.3% | |
| | 236,857 | | | Advanced Info Service PCL NVDR | | | 1,038,861 | |
| | 77,433 | | | Bangkok Bank PCL NVDR | | | 352,898 | |
| | 38,365 | | | Bangkok Bank PCL (Foreign Shares) | | | 174,299 | |
| | 844,729 | | | Banpu PCL NVDR | | | 441,704 | |
| | 996,279 | | | Charoen Pokphand Foods PCL NVDR | | | 896,715 | |
| | 397,459 | | | CP ALL PCL NVDR | | | 689,924 | |
| | 3,772,626 | | | IRPC PCL NVDR | | | 515,270 | |
| | 186,795 | | | Kasikornbank PCL NVDR | | | 918,030 | |
| | 886,536 | | | Krung Thai Bank PCL NVDR | | | 435,700 | |
| | 571,533 | | | PTT Exploration & Production PCL NVDR | | | 1,359,529 | |
| | 572,143 | | | PTT Global Chemical PCL NVDR | | | 980,887 | |
| | 401,096 | | | PTT PCL NVDR | | | 3,965,404 | |
| | 44,153 | | | Siam Cement PCL (The) NVDR | | | 630,802 | |
| | 284,644 | | | Siam Commercial Bank PCL (The) NVDR | | | 1,167,124 | |
| | 285,062 | | | Thai Oil PCL NVDR | | | 570,165 | |
| | 460,305 | | | Total Access Communication PCL NVDR | | | 411,016 | |
| | | | | | | | |
| | | | | | | 14,548,328 | |
| | | | | | | | |
| | | | Turkey—1.8% | |
| | 520,103 | | | Akbank TAS | | | 1,389,047 | |
| | 22,715 | | | BIM Birlesik Magazalar AS | | | 369,714 | |
| | 531,208 | | | Eregli Demir ve Celik Fabrikalari TAS | | | 720,503 | |
| | 296,223 | | | Haci Omer Sabanci Holding AS | | | 894,442 | |
| | 212,672 | | | KOC Holding AS | | | 885,976 | |
| | 44,169 | | | Tupras Turkiye Petrol Rafinerileri AS | | | 899,341 | |
| | 176,752 | | | Turk Hava Yollari AO(a) | | | 310,517 | |
| | 227,589 | | | Turk Telekomunikasyon AS | | | 420,406 | |
| | 220,153 | | | Turkcell Iletisim Hizmetleri AS(a) | | | 708,829 | |
| | 577,561 | | | Turkiye Garanti Bankasi AS | | | 1,568,613 | |
| | 259,282 | | | Turkiye Halk Bankasi AS | | | 787,086 | |
| | 613,436 | | | Turkiye Is Bankasi AS, Class C | | | 994,477 | |
| | | | | | | | |
Number
of Shares | | | | | Value | |
| | | | Common Stocks and Other Equity
Interests (continued) | |
| | | | Turkey (continued) | |
| | 413,128 | | | Turkiye Vakiflar Bankasi TAO, Class D | | $ | 611,043 | |
| | 281,162 | | | Yapi ve Kredi Bankasi AS(a) | | | 335,954 | |
| | | | | | | | |
| | | | | | | 10,895,948 | |
| | | | | | | | |
| | | | Total Investments
(Cost $574,448,227)—100.0% | | | 625,336,334 | |
| | | | Other assets less liabilities—0.0% | | | 62,063 | |
| | | | | | | | |
| | | | Net Assets—100.0% | | $ | 625,398,397 | |
| | | | | | | | |
Investment Abbreviations:
ADR—American Depositary Receipt
GDR—Global Depositary Receipt
NVDR—Non-voting Depositary Receipt
REIT—Real Estate Investment Trust
Notes to Schedule of Investments:
| (a) | Non-income producing security. |
| (b) | Security purchased or received in a transaction exempt from registration under the Securities Act of 1933, as amended (the “1933 Act”). The security may be resold pursuant to an exemption from registration under the 1933 Act, typically to qualified institutional buyers. The aggregate value of these securities at October 31, 2016 was $35,354,062, which represented 5.65% of the Fund’s Net Assets. |
| (c) | Affiliated company. The Fund’s Adviser also serves as the adviser for the PowerShares India Portfolio and therefore, PowerShares India Portfolio is considered to be affiliated with the Fund. See Note 4. |
| (d) | Each CPO for Cemex SAB de CV represents two Series A shares and one Series B share. |
| (e) | Each CPO for Grupo Televisa SAB represents twenty-five Series A shares, twenty-two Series B shares, thirty-five Series D shares and thirty-five Series L shares. |
See accompanying Notes to Financial Statements which are an integral part of the financial statements.
Schedule of Investments
PowerShares Global Agriculture Portfolio (PAGG)
October 31, 2016
| | | | | | | | |
Number
of Shares | | | | | Value | |
| | | | Common Stocks and Other Equity Interests—100.0% | |
| | | | Australia—2.9% | |
| | 42,976 | | | Costa Group Holdings Ltd. | | $ | 93,203 | |
| | 39,602 | | | GrainCorp Ltd., Class A | | | 253,135 | |
| | 45,382 | | | Nufarm Ltd. | | | 305,966 | |
| | | | | | | | |
| | | | | | | 652,304 | |
| | | | | | | | |
| | | | Canada—15.4% | |
| | 19,289 | | | Agrium, Inc. | | | 1,772,098 | |
| | 102,586 | | | Potash Corp. of Saskatchewan, Inc. | | | 1,669,391 | |
| | | | | | | | |
| | | | | | | 3,441,489 | |
| | | | | | | | |
| | | | China—1.7% | |
| | 521,974 | | | China Agri-Industries Holdings Ltd.(a) | | | 204,620 | |
| | 565,790 | | | China Modern Dairy Holdings Ltd.(a) | | | 123,302 | |
| | 413,616 | | | Sinofert Holdings Ltd. | | | 54,403 | |
| | | | | | | | |
| | | | | | | 382,325 | |
| | | | | | | | |
| | | | Germany—4.0% | |
| | 44,432 | | | K+S AG(b) | | | 897,658 | |
| | | | | | | | |
| | | | Hong Kong—0.9% | | | | |
| | 1,539,865 | | | C.P. Pokphand Co. Ltd. | | | 196,582 | |
| | | | | | | | |
| | | | Indonesia—5.2% | | | | |
| | 1,630,033 | | | Golden Agri-Resources Ltd. | | | 450,868 | |
| | 91,004 | | | PT Astra Agro Lestari Tbk | | | 106,362 | |
| | 1,710,281 | | | PT Charoen Pokphand Indonesia Tbk | | | 484,981 | |
| | 2,534,291 | | | PT Eagle High Plantations Tbk(a) | | | 37,098 | |
| | 661,412 | | | PT Perusahaan Perkebunan London Sumatra Indonesia Tbk | | | 77,303 | |
| | | | | | | | |
| | | | | | | 1,156,612 | |
| | | | | | | | |
| | | | Ireland—0.5% | |
| | 18,706 | | | Origin Enterprises PLC | | | 115,856 | |
| | | | | | | | |
| | | | Israel—2.6% | | | | |
| | 120,668 | | | Israel Chemicals Ltd. | | | 429,173 | |
| | 966 | | | Israel Corp. Ltd. (The)(a) | | | 143,868 | |
| | | | | | | | |
| | | | | | | 573,041 | |
| | | | | | | | |
| | | | Japan—2.0% | |
| | 6,424 | | | Hokuto Corp. | | | 124,953 | |
| | 14,340 | | | Kumiai Chemical Industry Co. Ltd.(b) | | | 81,194 | |
| | 8,368 | | | Sakata Seed Corp. | | | 240,883 | |
| | | | | | | | |
| | | | | | | 447,030 | |
| | | | | | | | |
| | | | Malaysia—6.7% | |
| | 303,000 | | | Felda Global Ventures Holdings Bhd | | | 145,180 | |
| | 58,100 | | | Genting Plantations Bhd | | | 152,348 | |
| | 597,990 | | | IOI Corp. Bhd | | | 641,467 | |
| | 83,474 | | | Kuala Lumpur Kepong Bhd | | | 476,767 | |
| | 12,800 | | | United Plantations Bhd | | | 85,130 | |
| | | | | | | | |
| | | | | | | 1,500,892 | |
| | | | | | | | |
| | | | Netherlands—1.0% | |
| | 16,595 | | | OCI NV(a)(b) | | | 230,122 | |
| | | | | | | | |
| | | | Norway—4.2% | | | | |
| | 26,192 | | | Yara International ASA | | | 926,875 | |
| | | | | | | | |
| | | | Russia—3.9% | | | | |
| | 69,318 | | | PhosAgro PJSC GDR(c) | | | 859,543 | |
| | | | | | | | |
| | | | | | | | |
Number
of Shares | | | | | Value | |
| | | | Common Stocks and Other Equity Interests (continued) | |
| | | | Singapore—5.0% | |
| | 112,682 | | | First Resources Ltd. | | $ | 147,339 | |
| | 410,919 | | | Wilmar International Ltd. | | | 977,184 | |
| | | | | | | | |
| | | | | | | 1,124,523 | |
| | | | | | | | |
| | | | Taiwan—1.1% | |
| | 176,099 | | | Taiwan Fertilizer Co. Ltd. | | | 236,045 | |
| | | | | | | | |
| | | | Turkey—0.6% | | | | |
| | 79,174 | | | Gubre Fabrikalari TAS | | | 130,399 | |
| | | | | | | | |
| | | | United Kingdom—1.0% | | | | |
| | 460,639 | | | Sirius Minerals PLC(a) | | | 216,522 | |
| | | | | | | | |
| | | | United States—41.3% | | | | |
| | 42,453 | | | Archer-Daniels-Midland Co. | | | 1,849,677 | |
| | 14,536 | | | Bunge Ltd. | | | 901,378 | |
| | 26,140 | | | Darling Ingredients, Inc.(a) | | | 355,504 | |
| | 19,788 | | | FMC Corp. | | | 927,859 | |
| | 5,589 | | | Fresh Del Monte Produce, Inc. | | | 337,296 | |
| | 6,782 | | | Ingredion, Inc. | | | 889,595 | |
| | 17,443 | | | Monsanto Co. | | | 1,757,731 | |
| | 56,729 | | | Mosaic Co. (The) | | | 1,334,834 | |
| | 9,769 | | | Scotts Miracle-Gro Co. (The), Class A | | | 860,551 | |
| | | | | | | | |
| | | | | | | 9,214,425 | |
| | | | | | | | |
| | | | Total Investments
(excluding investments purchased with cash collateral from securities on loan)
(Cost $28,567,687)—100.0% | | | 22,302,243 | |
| | | | | | | | |
| | |
| | | | | | | | |
| | | | Investments Purchased with Cash Collateral from Securities on Loan | |
| | |
| | | | | | | | |
| | | | Money Market Fund—4.3% | |
| | 960,398 | | | Invesco Government & Agency Portfolio—Institutional Class, 0.29%(d)(e)
(Cost $960,398) | | | 960,398 | |
| | | | | | | | |
| | | | Total Investments
(Cost $29,528,085)—104.3% | | | 23,262,641 | |
| | | | Other assets less liabilities—(4.3)% | | | (961,496 | ) |
| | | | | | | | |
| | | | Net Assets-100.0% | | $ | 22,301,145 | |
| | | | | | | | |
Investment Abbreviations:
GDR—Global Depositary Receipt
Notes to Schedule of Investments:
| (a) | Non-income producing security. |
| (b) | All or a portion of this security was out on loan at October 31, 2016. |
| (c) | Security purchased or received in a transaction exempt from registration under the Securities Act of 1933, as amended (the “1933 Act”). The security may be resold pursuant to an exemption from registration under the 1933 Act, typically to qualified institutional buyers. The value of this security at October 31, 2016 represented 3.85% of the Fund’s Net Assets. |
| (d) | The security and the Fund are advised by wholly-owned subsidiaries of Invesco Ltd. and are therefore considered to be affiliated. The rate shown is the 7-day SEC standardized yield as of October 31, 2016. |
| (e) | The security has been segregated to satisfy the commitment to return the cash collateral received in securities lending transactions upon the borrower’s return of the securities loaned. See Note 2J. |
See accompanying Notes to Financial Statements which are an integral part of the financial statements.
Schedule of Investments
PowerShares Global Clean Energy Portfolio (PBD)
October 31, 2016
| | | | | | | | |
Number
of Shares | | | | | Value | |
| | | | Common Stocks and Other Equity Interests—100.2% | |
| | | | Austria—0.3% | |
| | 9,963 | | | Verbund AG | | $ | 166,060 | |
| | | | | | | | |
| | | | Brazil—1.3% | | | | |
| | 35,400 | | | Sao Martinho SA | | | 710,829 | |
| | | | | | | | |
| | | | Canada—6.2% | | | | |
| | 70,400 | | | Ballard Power Systems, Inc.(a) | | | 138,147 | |
| | 70,560 | | | Boralex, Inc., Class A | | | 1,012,926 | |
| | 57,465 | | | Canadian Solar, Inc.(a)(b) | | | 829,795 | |
| | 47,990 | | | Innergex Renewable Energy, Inc. | | | 533,879 | |
| | 90,241 | | | TransAlta Renewables, Inc. | | | 997,179 | |
| | | | | | | | |
| | | | | | | 3,511,926 | |
| | | | | | | | |
| | | | China—13.5% | | | | |
| | 85,663 | | | BYD Co. Ltd., H-Shares(a) | | | 563,365 | |
| | 461,076 | | | China Everbright International Ltd. | | | 552,945 | |
| | 1,133,642 | | | China Longyuan Power Group Corp., H-Shares | | | 866,876 | |
| | 1,538,613 | | | China Power New Energy Development Co. Ltd. | | | 934,495 | |
| | 389,820 | | | China Singyes Solar Technologies Holdings Ltd. | | | 185,991 | |
| | 1,789,728 | | | China Titans Energy Technology Group Co. Ltd.(a) | | | 323,104 | |
| | 5,203,592 | | | GCL-Poly Energy Holdings Ltd. | | | 704,562 | |
| | 2,656,196 | | | Huaneng Renewables Corp. Ltd., H-Shares | | | 893,979 | |
| | 35,346 | | | JA Solar Holdings Co. Ltd. ADR(a)(b) | | | 205,714 | |
| | 58,514 | | | Kandi Technologies Group, Inc.(a)(b) | | | 292,570 | |
| | 1,633,409 | | | Shunfeng International Clean Energy Ltd.(a) | | | 139,016 | |
| | 594,493 | | | Wasion Group Holdings Ltd. | | | 350,340 | |
| | 643,672 | | | Xinjiang Goldwind Science & Technology Co. Ltd., H-Shares | | | 889,787 | |
| | 1,793,495 | | | Xinyi Solar Holdings Ltd. | | | 666,069 | |
| | | | | | | | |
| | | | | | | 7,568,813 | |
| | | | | | | | |
| | | | Denmark—4.5% | | | | |
| | 25,477 | | | Dong Energy A/S(a)(c) | | | 1,008,771 | |
| | 14,010 | | | Novozymes A/S, Class B | | | 519,634 | |
| | 12,380 | | | Vestas Wind Systems A/S | | | 991,509 | |
| | | | | | | | |
| | | | | | | 2,519,914 | |
| | | | | | | | |
| | | | Finland—2.1% | | | | |
| | 160,862 | | | Caverion Corp. | | | 1,156,771 | |
| | | | | | | | |
| | | | France—0.6% | | | | |
| | 10,157 | | | Albioma SA | | | 167,568 | |
| | 11,289 | | | Blue Solutions SA(a)(b) | | | 146,273 | |
| | | | | | | | |
| | | | | | | 313,841 | |
| | | | | | | | |
| | | | Germany—5.2% | | | | |
| | 29,587 | | | Capital Stage AG(b) | | | 210,816 | |
| | 35,410 | | | Nordex SE(a) | | | 929,848 | |
| | 56,275 | | | Senvion SA(a) | | | 988,561 | |
| | 23,707 | | | SMA Solar Technology AG(b) | | | 607,331 | |
| | 27,385 | | | VERBIO Vereinigte BioEnergie AG | | | 203,172 | |
| | | | | | | | |
| | | | | | | 2,939,728 | |
| | | | | | | | |
| | | | Guernsey—1.8% | | | | |
| | 768,301 | | | Renewables Infrastructure Group Ltd. (The) | | | 1,007,432 | |
| | | | | | | | |
| | | | | | | | |
Number
of Shares | | | | | Value | |
| | | | Common Stocks and Other Equity Interests (continued) | |
| | | | Hong Kong—4.2% | | | | |
| | 1,322,923 | | | Canvest Environmental Protection Group Co. Ltd.(c) | | $ | 597,075 | |
| | 973,133 | | | China High Speed Transmission Equipment Group Co. Ltd. | | | 1,010,171 | |
| | 10,967,817 | | | FDG Electric Vehicles Ltd.(a) | | | 572,798 | |
| | 2,115,464 | | | United Photovoltaics Group Ltd.(a) | | | 185,499 | |
| | | | | | | | |
| | | | | | | 2,365,543 | |
| | | | | | | | |
| | | | Ireland—1.8% | | | | |
| | 42,428 | | | Kingspan Group PLC | | | 1,037,164 | |
| | | | | | | | |
| | | | Japan—4.5% | | | | |
| | 142,354 | | | GS Yuasa Corp. | | | 615,014 | |
| | 343,774 | | | Meidensha Corp. | | | 1,151,529 | |
| | 8,810 | | | Odelic Co. Ltd. | | | 342,054 | |
| | 18,542 | | | Takuma Co. Ltd. | | | 170,272 | |
| | 30,902 | | | West Holdings Corp. | | | 245,252 | |
| | | | | | | | |
| | | | | | | 2,524,121 | |
| | | | | | | | |
| | | | Netherlands—1.8% | | | | |
| | 42,896 | | | Philips Lighting NV(a)(c) | | | 1,004,403 | |
| | | | | | | | |
| | | | New Zealand—1.9% | | | | |
| | 153,995 | | | Contact Energy Ltd. | | | 523,298 | |
| | 254,605 | | | Mercury NZ Ltd. | | | 555,541 | |
| | | | | | | | |
| | | | | | | 1,078,839 | |
| | | | | | | | |
| | | | Philippines—1.0% | | | | |
| | 4,445,329 | | | Energy Development Corp. | | | 541,637 | |
| | | | | | | | |
| | | | Spain—6.5% | | | | |
| | 39,197 | | | Atlantica Yield PLC | | | 704,762 | |
| | 128,275 | | | EDP Renovaveis SA | | | 967,995 | |
| | 42,412 | | | Gamesa Corp. Tecnologica SA | | | 979,820 | |
| | 103,960 | | | Saeta Yield SA | | | 1,003,996 | |
| | | | | | | | |
| | | | | | | 3,656,573 | |
| | | | | | | | |
| | | | Sweden—1.8% | | | | |
| | 134,383 | | | Nibe Industrier AB, Class B | | | 1,001,002 | |
| | | | | | | | |
| | | | Switzerland—0.3% | | | | |
| | 60,059 | | | Meyer Burger Technology AG(a) | | | 196,775 | |
| | | | | | | | |
| | | | Taiwan—4.8% | | | | |
| | 1,446,131 | | | Epistar Corp.(a) | | | 985,243 | |
| | 201,000 | | | Everlight Electronics Co. Ltd. | | | 303,498 | |
| | 62,000 | | | Gigasolar Materials Corp. | | | 782,920 | |
| | 214,000 | | | Motech Industries, Inc.(a) | | | 207,507 | |
| | 411,241 | | | Neo Solar Power Corp.(a) | | | 210,459 | |
| | 205,000 | | | Sino-American Silicon Products, Inc. | | | 220,867 | |
| | | | | | | | |
| | | | | | | 2,710,494 | |
| | | | | | | | |
| | | | Thailand—1.6% | | | | |
| | 830,859 | | | Energy Absolute PCL NVDR | | | 670,670 | |
| | 359,304 | | | SPCG PCL NVDR | | | 209,438 | |
| | | | | | | | |
| | | | | | | 880,108 | |
| | | | | | | | |
| | | | Turkey—0.3% | | | | |
| | 481,187 | | | Akenerji Elektrik Uretim AS(a) | | | 149,179 | |
| | | | | | | | |
See accompanying Notes to Financial Statements which are an integral part of the financial statements.
PowerShares Global Clean Energy Portfolio (PBD) (continued)
October 31, 2016
| | | | | | | | |
Number
of Shares | | | | | Value | |
| | | | Common Stocks and Other Equity Interests (continued) | |
| | | | United Kingdom—5.0% | | | | |
| | 36,905 | | | Dialight PLC(a) | | $ | 316,302 | |
| | 156,401 | | | Drax Group PLC | | | 605,120 | |
| | 125,142 | | | GCP Infrastructure Investments Ltd. | | | 196,483 | |
| | 706,043 | | | Greencoat UK Wind PLC | | | 986,999 | |
| | 27,118 | | | Ricardo PLC | | | 306,418 | |
| | 198,360 | | | Utilitywise PLC | | | 399,593 | |
| | | | | | | | |
| | | | | | | 2,810,915 | |
| | | | | | | | |
| | | | United States—29.2% | | | | |
| | 4,446 | | | Acuity Brands, Inc. | | | 993,992 | |
| | 62,503 | | | Ameresco, Inc., Class A(a) | | | 300,014 | |
| | 46,258 | | | Cree, Inc.(a) | | | 1,031,553 | |
| | 58,307 | | | EnerNOC, Inc.(a) | | | 303,196 | |
| | 20,095 | | | First Solar, Inc.(a) | | | 813,647 | |
| | 26,659 | | | FuelCell Energy, Inc.(a)(b) | | | 89,308 | |
| | 24,683 | | | Green Plains, Inc. | | | 641,758 | |
| | 49,026 | | | Hannon Armstrong Sustainable Infrastructure Capital, Inc. REIT | | | 1,120,734 | |
| | 20,936 | | | Itron, Inc.(a) | | | 1,128,450 | |
| | 31,580 | | | LSI Industries, Inc. | | | 271,588 | |
| | 32,701 | | | Maxwell Technologies, Inc.(a) | | | 158,273 | |
| | 58,786 | | | NRG Yield, Inc., Class C | | | 905,304 | |
| | 11,023 | | | Ormat Technologies, Inc. | | | 531,639 | |
| | 43,139 | | | Pattern Energy Group, Inc. | | | 964,157 | |
| | 86,519 | | | Plug Power, Inc.(a)(b) | | | 132,374 | |
| | 1,807,950 | | | REC Silicon ASA(a) | | | 226,776 | |
| | 21,344 | | | Renewable Energy Group, Inc.(a) | | | 186,760 | |
| | 23,623 | | | Silver Spring Networks, Inc.(a) | | | 332,139 | |
| | 38,708 | | | SolarCity Corp.(a)(b) | | | 758,677 | |
| | 45,578 | | | SolarEdge Technologies, Inc.(a)(b) | | | 624,419 | |
| | 87,412 | | | SunPower Corp.(a)(b) | | | 632,863 | |
| | 51,433 | | | TerraForm Power, Inc., Class A(a)(b) | | | 638,284 | |
| | 5,567 | | | Tesla Motors, Inc.(a)(b) | | | 1,100,763 | |
| | 19,637 | | | Universal Display Corp.(a) | | | 1,015,233 | |
| | 60,254 | | | Veeco Instruments, Inc.(a) | | | 1,307,512 | |
| | 70,459 | | | Vivint Solar, Inc.(a)(b) | | | 218,423 | |
| | | | | | | | |
| | | | | | | 16,427,836 | |
| | | | | | | | |
| | | | Total Investments
(excluding investments purchased with cash collateral from securities on loan)
(Cost $54,414,292)—100.2% | | | 56,279,903 | |
| | | | | | | | |
| | |
| | | | | | | | |
| | | | Investments Purchased with Cash Collateral from Securities on Loan | |
| | |
| | | | | | | | |
| | | | Money Market Fund—9.0% | |
| | 5,023,977 | | | Invesco Government & Agency Portfolio—Institutional Class, 0.29%(d)(e)
(Cost $5,023,977) | | | 5,023,977 | |
| | | | | | | | |
| | | | Total Investments
(Cost $59,438,269)—109.2% | | | 61,303,880 | |
| | | | Other assets less liabilities—(9.2)% | | | (5,151,420 | ) |
| | | | | | | | |
| | | | Net Assets—100.0% | | $ | 56,152,460 | |
| | | | | | | | |
Investment Abbreviations:
ADR—American Depositary Receipt
NVDR—Non-voting Depositary Receipt
REIT—Real Estate Investment Trust
Notes to Schedule of Investments:
| (a) | Non-income producing security. |
| (b) | All or a portion of this security was out on loan at October 31, 2016. |
| (c) | Security purchased or received in a transaction exempt from registration under the Securities Act of 1933, as amended (the “1933 Act”). The security may be resold pursuant to an exemption from registration under the 1933 Act, typically to qualified institutional buyers. The aggregate value of these securities at October 31, 2016 was $2,610,249, which represented 4.65% of the Fund’s Net Assets. |
| (d) | The security and the Fund are advised by wholly-owned subsidiaries of Invesco Ltd. and are therefore considered to be affiliated. The rate shown is the 7-day SEC standardized yield as of October 31, 2016. |
| (e) | The security has been segregated to satisfy the commitment to return the cash collateral received in securities lending transactions upon the borrower’s return of the securities loaned. See Note 2J. |
See accompanying Notes to Financial Statements which are an integral part of the financial statements.
Schedule of Investments
PowerShares Global Gold and Precious Metals Portfolio (PSAU)
October 31, 2016
| | | | | | | | |
Number
of Shares | | | | | Value | |
| | | | Common Stocks—100.0% | | | | |
| | | | Australia—12.4% | | | | |
| | 410,855 | | | Evolution Mining Ltd. | | $ | 706,567 | |
| | 167,268 | | | Newcrest Mining Ltd. | | | 2,871,495 | |
| | 147,256 | | | Northern Star Resources Ltd. | | | 466,146 | |
| | 149,261 | | | OceanaGold Corp. | | | 456,609 | |
| | 47,850 | | | Orocobre Ltd.(a) | | | 139,456 | |
| | 122,830 | | | Regis Resources Ltd. | | | 303,769 | |
| | 188,120 | | | Saracen Mineral Holdings Ltd.(a) | | | 159,612 | |
| | 95,281 | | | St. Barbara Ltd.(a) | | | 190,686 | |
| | | | | | | | |
| | | | | | | 5,294,340 | |
| | | | | | | | |
| | | | Canada—50.9% | | | | |
| | 35,194 | | | Agnico Eagle Mines Ltd. | | | 1,788,782 | |
| | 65,301 | | | Alamos Gold, Inc., Class A | | | 512,566 | |
| | 193,798 | | | B2Gold Corp.(a) | | | 561,042 | |
| | 209,900 | | | Barrick Gold Corp. | | | 3,696,057 | |
| | 40,421 | | | Centerra Gold, Inc. | | | 204,480 | |
| | 38,598 | | | Detour Gold Corp.(a) | | | 736,393 | |
| | 166,925 | | | Eldorado Gold Corp.(a) | | | 526,837 | |
| | 40,183 | | | First Majestic Silver Corp.(a) | | | 322,903 | |
| | 35,695 | | | Fortuna Silver Mines, Inc.(a) | | | 244,225 | |
| | 37,974 | | | Franco-Nevada Corp. | | | 2,487,400 | |
| | 196,030 | | | Goldcorp, Inc. | | | 2,979,393 | |
| | 41,556 | | | Guyana Goldfields, Inc.(a) | | | 244,639 | |
| | 110,494 | | | IAMGOLD Corp.(a) | | | 442,718 | |
| | 286,902 | | | Kinross Gold Corp.(a) | | | 1,115,284 | |
| | 24,791 | | | Kirkland Lake Gold, Inc.(a) | | | 172,025 | |
| | 17,374 | | | MAG Silver Corp.(a) | | | 255,117 | |
| | 125,753 | | | New Gold, Inc.(a) | | | 496,350 | |
| | 51,091 | | | NovaGold Resources, Inc.(a) | | | 255,788 | |
| | 26,167 | | | Osisko Gold Royalties Ltd. | | | 275,678 | |
| | 35,078 | | | Pan American Silver Corp. | | | 560,620 | |
| | 44,997 | | | Premier Gold Mines Ltd.(a) | | | 94,677 | |
| | 32,508 | | | Sandstorm Gold Ltd.(a) | | | 156,446 | |
| | 9,972 | | | Seabridge Gold, Inc.(a) | | | 108,927 | |
| | 79,656 | | | SEMAFO, Inc.(a) | | | 312,621 | |
| | 29,236 | | | Silver Standard Resources, Inc.(a) | | | 321,100 | |
| | 70,377 | | | Silver Wheaton Corp. | | | 1,697,135 | |
| | 19,446 | | | Torex Gold Resources, Inc.(a) | | | 362,005 | |
| | 232,336 | | | Yamana Gold, Inc. | | | 830,360 | |
| | | | | | | | |
| | | | | | | 21,761,568 | |
| | | | | | | | |
| | | | China—1.5% | | | | |
| | 190,843 | | | Zhaojin Mining Industry Co. Ltd., H-Shares | | | 192,938 | |
| | 1,405,512 | | | Zijin Mining Group Co. Ltd., H-Shares | | | 442,233 | |
| | | | | | | | |
| | | | | | | 635,171 | |
| | | | | | | | |
| | | | Japan—0.4% | | | | |
| | 8,811 | | | Asahi Holdings, Inc. | | | 158,302 | |
| | | | | | | | |
| | | | Jersey Island—5.0% | | | | |
| | 282,503 | | | Centamin PLC | | | 544,265 | |
| | 18,149 | | | Randgold Resources Ltd. | | | 1,604,247 | |
| | | | | | | | |
| | | | | | | 2,148,512 | |
| | | | | | | | |
| | | | Mexico—2.1% | | | | |
| | 45,172 | | | Fresnillo PLC | | | 904,468 | |
| | | | | | | | |
| | | | Monaco—0.7% | | | | |
| | 15,131 | | | Endeavour Mining Corp.(a) | | | 295,790 | |
| | | | | | | | |
| | | | | | | | |
Number
of Shares | | | | | Value | |
| | | | Common Stocks (continued) | | | | |
| | | | Peru—0.4% | | | | |
| | 57,122 | | | Hochschild Mining PLC | | $ | 185,858 | |
| | | | | | | | |
| | | | Russia—1.3% | | | | |
| | 49,226 | | | Polymetal International PLC | | | 535,491 | |
| | | | | | | | |
| | | | South Africa—9.0% | | | | |
| | 15,207 | | | Anglo American Platinum Ltd.(a) | | | 358,313 | |
| | 86,070 | | | AngloGold Ashanti Ltd.(a) | | | 1,153,239 | |
| | 149,069 | | | Gold Fields Ltd. | | | 606,006 | |
| | 91,298 | | | Harmony Gold Mining Co. Ltd. | | | 278,380 | |
| | 160,353 | | | Impala Platinum Holdings Ltd.(a) | | | 644,623 | |
| | 115,001 | | | Northam Platinum Ltd.(a) | | | 419,915 | |
| | 142,724 | | | Sibanye Gold Ltd. | | | 389,031 | |
| | | | | | | | |
| | | | | | | 3,849,507 | |
| | | | | | | | |
| | | | Turkey—0.1% | | | | |
| | 11,237 | | | Koza Altin Isletmeleri AS(a) | | | 63,796 | |
| | | | | | | | |
| | | | United Kingdom—0.7% | | | | |
| | 31,224 | | | Acacia Mining PLC | | | 197,659 | |
| | 49,195 | | | Lonmin PLC(a) | | | 114,118 | |
| | | | | | | | |
| | | | | | | 311,777 | |
| | | | | | | | |
| | | | United States—15.5% | | | | |
| | 71,706 | | | Alacer Gold Corp.(a) | | | 144,990 | |
| | 39,812 | | | Coeur Mining, Inc.(a) | | | 445,098 | |
| | 83,386 | | | Hecla Mining Co. | | | 499,482 | |
| | 93,251 | | | Newmont Mining Corp. | | | 3,454,017 | |
| | 13,763 | | | Royal Gold, Inc. | | | 947,170 | |
| | 21,412 | | | Stillwater Mining Co.(a) | | | 285,208 | |
| | 70,143 | | | Tahoe Resources, Inc. | | | 841,559 | |
| | | | | | | | |
| | | | | | | 6,617,524 | |
| | | | | | | | |
| | | | Total Investments
(Cost $44,193,842)—100.0% | | | 42,762,104 | |
| | | | Other assets less liabilities—(0.0)% | | | (20,697 | ) |
| | | | | | | | |
| | | | Net Assets—100.0% | | $ | 42,741,407 | |
| | | | | | | | |
Notes to Schedule of Investments:
| (a) | Non-income producing security. |
See accompanying Notes to Financial Statements which are an integral part of the financial statements.
Schedule of Investments
PowerShares Global Water Portfolio (PIO)
October 31, 2016
| | | | | | | | |
Number
of Shares | | | | | Value | |
| | | | Common Stocks—99.8% | |
| | | | Brazil—3.7% | |
| | 651,841 | | | Cia de Saneamento Basico do Estado de Sao Paulo | | $ | 6,938,750 | |
| | | | | | | | |
| | | | Canada—1.2% | |
| | 15,282 | | | Pure Technologies Ltd. | | | 55,415 | |
| | 99,702 | | | Stantec, Inc. | | | 2,219,816 | |
| | | | | | | | |
| | | | | | | 2,275,231 | |
| | | | | | | | |
| | | | Cayman Islands—0.0% | |
| | 5,542 | | | Consolidated Water Co. Ltd. | | | 62,070 | |
| | | | | | | | |
| | | | China—4.1% | |
| | 5,323,955 | | | Beijing Enterprises Water Group Ltd. | | | 3,865,177 | |
| | 639,316 | | | China Everbright Water Ltd. | | | 261,808 | |
| | 1,981,123 | | | CT Environmental Group Ltd. | | | 556,922 | |
| | 1,997,979 | | | Guangdong Investment Ltd. | | | 3,019,570 | |
| | | | | | | | |
| | | | | | | 7,703,477 | |
| | | | | | | | |
| | | | Finland—0.2% | |
| | 22,451 | | | Uponor Oyj | | | 381,467 | |
| | | | | | | | |
| | | | France—10.0% | |
| | 403,848 | | | Suez | | | 6,385,923 | |
| | 572,719 | | | Veolia Environnement SA | | | 12,480,958 | |
| | | | | | | | |
| | | | | | | 18,866,881 | |
| | | | | | | | |
| | | | Hong Kong—0.4% | |
| | 948,930 | | | China Water Affairs Group Ltd. | | | 690,144 | |
| | | | | | | | |
| | | | Italy—0.9% | |
| | 697,836 | | | Hera SpA | | | 1,782,376 | |
| | | | | | | | |
| | | | Japan—6.8% | |
| | 150,707 | | | Kurita Water Industries Ltd. | | | 3,566,716 | |
| | 31,184 | | | Metawater Co. Ltd. | | | 850,783 | |
| | 14,880 | | | Torishima Pump Manufacturing Co. Ltd. | | | 160,291 | |
| | 204,695 | | | TOTO Ltd. | | | 8,181,177 | |
| | | | | | | | |
| | | | | | | 12,758,967 | |
| | | | | | | | |
| | | | Netherlands—2.7% | |
| | 111,689 | | | Aalberts Industries NV | | | 3,523,025 | |
| | 118,036 | | | Arcadis NV | | | 1,552,693 | |
| | | | | | | | |
| | | | | | | 5,075,718 | |
| | | | | | | | |
| | | | Singapore—0.1% | |
| | 307,014 | | | SIIC Enviornment Holdings Ltd.(a) | | | 140,063 | |
| | | | | | | | |
| | | | South Korea—3.9% | |
| | 93,580 | | | Coway Co. Ltd. | | | 7,327,741 | |
| | | | | | | | |
| | | | Spain—2.7% | |
| | 66,746 | | | Acciona SA | | | 5,073,399 | |
| | | | | | | | |
| | | | Switzerland—13.9% | |
| | 35,635 | | | Geberit AG | | | 15,087,850 | |
| | 214,108 | | | Wolseley PLC | | | 11,112,302 | |
| | | | | | | | |
| | | | | | | 26,200,152 | |
| | | | | | | | |
| | | | United Kingdom—13.7% | |
| | 222,252 | | | Halma PLC | | | 2,843,721 | |
| | 347,305 | | | Pennon Group PLC | | | 3,538,485 | |
| | 111,840 | | | Pentair PLC | | | 6,165,739 | |
| | 228,624 | | | Severn Trent PLC | | | 6,498,077 | |
| | | | | | | | |
Number
of Shares | | | | | Value | |
| | | | Common Stocks (continued) | |
| | | | United Kingdom (continued) | |
| | 602,482 | | | United Utilities Group PLC | | $ | 6,914,360 | |
| | | | | | | | |
| | | | | | | 25,960,382 | |
| | | | | | | | |
| | | | United States—35.5% | | | | |
| | 100,746 | | | A.O. Smith Corp. | | | 4,550,697 | |
| | 105,143 | | | American Water Works Co., Inc. | | | 7,784,788 | |
| | 63,995 | | | Aqua America, Inc. | | | 1,964,646 | |
| | 191,122 | | | Danaher Corp. | | | 15,012,633 | |
| | 126,446 | | | Ecolab, Inc. | | | 14,436,340 | |
| | 137,585 | | | HD Supply Holdings, Inc.(a) | | | 4,540,305 | |
| | 25,270 | | | IDEX Corp. | | | 2,184,339 | |
| | 43,816 | | | Roper Technologies, Inc. | | | 7,593,751 | |
| | 34,536 | | | Waters Corp.(a) | | | 4,805,339 | |
| | 84,870 | | | Xylem, Inc. | | | 4,101,767 | |
| | | | | | | | |
| | | | | | | 66,974,605 | |
| | | | | | | | |
| | | | Total Investments
(Cost $160,322,078)—99.8% | | | 188,211,423 | |
| | | | Other assets less liabilities—0.2% | | | 453,486 | |
| | | | | | | | |
| | | | Net Assets—100.0% | | $ | 188,664,909 | |
| | | | | | | | |
Notes to Schedule of Investments:
| (a) | Non-income producing security. |
See accompanying Notes to Financial Statements which are an integral part of the financial statements.
Schedule of Investments
PowerShares International BuyBack AchieversTM Portfolio (IPKW)
October 31, 2016
| | | | | | | | |
Number
of Shares | | | | | Value | |
| | | | Common Stocks and Other Equity
Interests—100.0% | |
| | | | Australia—0.8% | |
| | 686,084 | | | Asaleo Care Ltd. | | $ | 762,230 | |
| | | | | | | | |
| | | | Brazil—5.0% | |
| | 274,800 | | | BRF SA | | | 4,635,191 | |
| | | | | | | | |
| | | | Canada—16.0% | |
| | 298,459 | | | Aimia, Inc. | | | 1,614,496 | |
| | 79,446 | | | Avigilon Corp.(a) | | | 503,855 | |
| | 30,724 | | | Canadian Pacific Railway Ltd. | | | 4,395,463 | |
| | 208,898 | | | Celestica, Inc.(a) | | | 2,473,577 | |
| | 30,024 | | | Dollarama, Inc. | | | 2,245,331 | |
| | 71,616 | | | Great Canadian Gaming Corp.(a) | | | 1,190,528 | |
| | 102,139 | | | Maple Leaf Foods, Inc. | | | 2,328,182 | |
| | | | | | | | |
| | | | | | | 14,751,432 | |
| | | | | | | | |
| | | | China—5.0% | |
| | 3,463,423 | | | China Evergrande Group | | | 2,291,129 | |
| | 6,257,602 | | | China Huishan Dairy Holdings Co. Ltd. | | | 2,323,951 | |
| | | | | | | | |
| | | | | | | 4,615,080 | |
| | | | | | | | |
| | | | Denmark—2.4% | |
| | 83,585 | | | Topdanmark A/S(a) | | | 2,247,852 | |
| | | | | | | | |
| | | | France—4.7% | |
| | 72,351 | | | JCDecaux SA | | | 2,209,213 | |
| | 79,445 | | | SFR Group SA | | | 2,137,131 | |
| | | | | | | | |
| | | | | | | 4,346,344 | |
| | | | | | | | |
| | | | Germany—2.2% | |
| | 74,562 | | | RHOEN KLINIKUM AG | | | 2,072,388 | |
| | | | | | | | |
| | | | Hong Kong—1.3% | |
| | 3,546,038 | | | SSY Group Ltd. | | | 1,198,040 | |
| | | | | | | | |
| | | | Ireland—2.2% | |
| | 520,569 | | | C&C Group PLC | | | 1,997,268 | |
| | | | | | | | |
| | | | Japan—31.8% | |
| | 9,588 | | | Ci:z Holdings Co. Ltd. | | | 274,634 | |
| | 61,336 | | | Credit Saison Co. Ltd. | | | 1,059,963 | |
| | 50,568 | | | DMG Mori Co. Ltd. | | | 536,550 | |
| | 21,860 | | | Duskin Co. Ltd. | | | 419,789 | |
| | 34,059 | | | EDION Corp. | | | 301,745 | |
| | 7,212 | | | Elecom Co. Ltd. | | | 147,486 | |
| | 5,836 | | | Enplas Corp. | | | 180,214 | |
| | 10,828 | | | Fujicco Co. Ltd. | | | 247,812 | |
| | 127,446 | | | FUJIFILM Holdings Corp. | | | 4,820,839 | |
| | 32,461 | | | Fujitec Co. Ltd. | | | 371,301 | |
| | 13,160 | | | Geo Holdings Corp. | | | 166,934 | |
| | 20,480 | | | Heiwado Co. Ltd. | | | 426,419 | |
| | 117,320 | | | Hoya Corp. | | | 4,895,544 | |
| | 10,328 | | | Ines Corp. | | | 114,892 | |
| | 200,850 | | | Isuzu Motors Ltd. | | | 2,483,747 | |
| | 25,204 | | | J Trust Co. Ltd. | | | 206,026 | |
| | 98,644 | | | Marui Group Co. Ltd. | | | 1,384,592 | |
| | 5,196 | | | Melco Holdings, Inc. | | | 140,722 | |
| | 11,992 | | | Ryosan Co. Ltd. | | | 369,169 | |
| | 23,156 | | | Sankyo Co. Ltd. | | | 815,313 | |
| | 140,970 | | | Suzuki Motor Corp. | | | 5,003,741 | |
| | 6,008 | | | Tamron Co. Ltd. | | | 105,198 | |
| | | | | | | | |
Number
of Shares | | | | | Value | |
| | | | Common Stocks and Other Equity
Interests (continued) | |
| | | | Japan (continued) | |
| | 53,404 | | | Tokyo Electron Ltd. | | $ | 4,821,784 | |
| | | | | | | | |
| | | | | | | 29,294,414 | |
| | | | | | | | |
| | | | Russia—5.1% | |
| | 96,120 | | | LUKOIL PJSC ADR | | | 4,685,850 | |
| | | | | | | | |
| | | | South Africa—2.5% | |
| | 620,131 | | | Northam Platinum Ltd.(a) | | | 2,264,346 | |
| | | | | | | | |
| | | | South Korea—4.9% | |
| | 138,345 | | | Cheil Worldwide, Inc. | | | 2,049,332 | |
| | 447,431 | | | Hanwha Life Insurance Co. Ltd. | | | 2,443,910 | |
| | | | | | | | |
| | | | | | | 4,493,242 | |
| | | | | | | | |
| | | | Spain—2.4% | |
| | 197,371 | | | Mediaset Espana Comunicacion SA | | | 2,201,444 | |
| | | | | | | | |
| | | | Sweden—2.5% | |
| | 252,812 | | | Com Hem Holding AB | | | 2,281,095 | |
| | | | | | | | |
| | | | Switzerland—9.1% | |
| | 26,973 | | | Actelion Ltd. | | | 3,900,434 | |
| | 29,769 | | | Cembra Money Bank AG | | | 2,277,303 | |
| | 1,736 | | | Forbo Holding AG | | | 2,215,423 | |
| | | | | | | | |
| | | | | | | 8,393,160 | |
| | | | | | | | |
| | | | United Kingdom—2.1% | |
| | 225,975 | | | SVG Capital PLC(a) | | | 1,938,147 | |
| | | | | | | | |
| | | | Total Investments
(Cost $90,626,698)—100.0% | | | 92,177,523 | |
| | | | Other assets less liabilities—0.0% | | | 24,669 | |
| | | | | | | | |
| | | | Net Assets—100.0% | | $ | 92,202,192 | |
| | | | | | | | |
Investment Abbreviations:
ADR—American Depositary Receipt
Notes to Schedule of Investments:
| (a) | Non-income producing security. |
See accompanying Notes to Financial Statements which are an integral part of the financial statements.
Schedule of Investments(a)
PowerShares Japan Currency Hedged Low Volatility Portfolio (FXJP)
October 31, 2016
| | | | | | | | |
Number
of Shares | | | | | Value | |
| | | | Common Stocks—96.3% | |
| | | | Consumer Discretionary—21.5% | |
| | 200 | | | ABC-Mart, Inc. | | $ | 12,162 | |
| | 300 | | | Aoyama Trading Co. Ltd. | | | 10,563 | |
| | 864 | | | Autobacs Seven Co. Ltd. | | | 12,283 | |
| | 471 | | | Benesse Holdings, Inc. | | | 12,339 | |
| | 300 | | | Daiichikosho Co. Ltd. | | | 13,032 | |
| | 893 | | | Fuji Media Holdings, Inc. | | | 12,322 | |
| | 100 | | | Hikari Tsushin, Inc. | | | 9,173 | |
| | 420 | | | McDonald’s Holdings Co. Japan Ltd. | | | 12,070 | |
| | 908 | | | Nikon Corp. | | | 13,713 | |
| | 1,972 | | | Onward Holdings Co. Ltd. | | | 13,192 | |
| | 200 | | | Oriental Land Co. Ltd. | | | 11,680 | |
| | 100 | | | Rinnai Corp. | | | 9,611 | |
| | 367 | | | Sankyo Co. Ltd. | | | 12,922 | |
| | 773 | | | Sekisui Chemical Co. Ltd. | | | 12,174 | |
| | 463 | | | Shimachu Co. Ltd. | | | 12,425 | |
| | 1,811 | | | Shochiku Co. Ltd. | | | 20,284 | |
| | 1,372 | | | Takashimaya Co. Ltd. | | | 11,189 | |
| | 379 | | | Toho Co. Ltd. | | | 11,379 | |
| | 1,200 | | | Tokyo Dome Corp. | | | 11,408 | |
| | 1,932 | | | TSI Holdings Co. Ltd. | | | 10,866 | |
| | 1,002 | | | Wacoal Holdings Corp. | | | 11,557 | |
| | 2,458 | | | Yamada Denki Co. Ltd. | | | 12,701 | |
| | | | | | | | |
| | | | | | | 269,045 | |
| | | | | | | | |
| | | | Consumer Staples—19.7% | |
| | 305 | | | Asahi Group Holdings Ltd. | | | 10,887 | |
| | 502 | | | Coca-Cola West Co. Ltd. | | | 14,833 | |
| | 131 | | | Familymart UNY Holdings Co. Ltd. | | | 8,203 | |
| | 580 | | | House Foods Group, Inc. | | | 12,943 | |
| | 386 | | | Ito EN Ltd. | | | 14,068 | |
| | 647 | | | Kagome Co. Ltd. | | | 16,950 | |
| | 200 | | | Kao Corp. | | | 10,287 | |
| | 715 | | | Kirin Holdings Co. Ltd. | | | 12,298 | |
| | 264 | | | Kobayashi Pharmaceutical Co. Ltd. | | | 13,792 | |
| | 158 | | | Lawson, Inc. | | | 11,998 | |
| | 522 | | | Maruha Nichiro Corp. | | | 14,470 | |
| | 497 | | | NH Foods Ltd. | | | 11,890 | |
| | 800 | | | Nisshin Seifun Group, Inc. | | | 11,785 | |
| | 148 | | | Nissin Foods Holdings Co. Ltd. | | | 8,563 | |
| | 400 | | | Sapporo Holdings Ltd. | | | 11,301 | |
| | 287 | | | Seven & i Holdings Co. Ltd. | | | 11,970 | |
| | 239 | | | Sugi Holdings Co. Ltd. | | | 12,805 | |
| | 286 | | | Suntory Beverage & Food Ltd. | | | 12,506 | |
| | 1,200 | | | Takara Holdings, Inc. | | | 11,374 | |
| | 321 | | | Toyo Suisan Kaisha Ltd. | | | 12,998 | |
| | | | | | | | |
| | | | | | | 245,921 | |
| | | | | | | | |
| | | | Energy—1.2% | |
| | 1,499 | | | TonenGeneral Sekiyu K.K. | | | 14,778 | |
| | | | | | | | |
| | | | Financials—3.0% | |
| | 3,604 | | | Aozora Bank Ltd. | | | 11,901 | |
| | 1,321 | | | Matsui Securities Co. Ltd. | | | 10,572 | |
| | 1,368 | | | Yamaguchi Financial Group, Inc. | | | 15,075 | |
| | | | | | | | |
| | | | | | | 37,548 | |
| | | | | | | | |
| | | | Health Care—4.6% | |
| | 725 | | | Astellas Pharma, Inc. | | | 10,759 | |
| | 672 | | | Mitsubishi Tanabe Pharma Corp. | | | 13,084 | |
| | | | | | | | |
Number
of Shares | | | | | Value | |
| | | | Common Stocks (continued) | |
| | | | Health Care (continued) | |
| | 188 | | | Sawai Pharmaceutical Co. Ltd. | | $ | 12,148 | |
| | 100 | | | Taisho Pharmaceutical Holdings Co. Ltd. | | | 9,754 | |
| | 270 | | | Takeda Pharmaceutical Co. Ltd. | | | 12,076 | |
| | | | | | | | |
| | | | | | | 57,821 | |
| | | | | | | | |
| | | | Industrials—28.4% | |
| | 478 | | | Aica Kogyo Co. Ltd. | | | 13,646 | |
| | 4,311 | | | ANA Holdings, Inc. | | | 12,110 | |
| | 543 | | | COMSYS Holdings Corp. | | | 9,565 | |
| | 1,393 | | | Dai Nippon Printing Co. Ltd. | | | 13,972 | |
| | 134 | | | East Japan Railway Co. | | | 11,804 | |
| | 400 | | | Hankyu Hanshin Holdings, Inc. | | | 13,246 | |
| | 2,208 | | | Iwatani Corp. | | | 13,195 | |
| | 400 | | | Japan Airlines Co. Ltd. | | | 11,785 | |
| | 1,251 | | | Kamigumi Co. Ltd. | | | 10,678 | |
| | 2,000 | | | Keihan Holdings Co. Ltd. | | | 13,494 | |
| | 1,537 | | | Keikyu Corp. | | | 15,489 | |
| | 1,411 | | | Keio Corp. | | | 11,682 | |
| | 3,084 | | | Kintetsu Group Holdings Co. Ltd. | | | 12,443 | |
| | 527 | | | Kurita Water Industries Ltd. | | | 12,472 | |
| | 600 | | | Miura Co. Ltd. | | | 10,352 | |
| | 2,144 | | | Nagoya Railroad Co. Ltd. | | | 11,303 | |
| | 2,293 | | | Nankai Electric Railway Co. Ltd. | | | 10,408 | |
| | 732 | | | Nippo Corp. | | | 14,127 | |
| | 2,857 | | | Nishimatsu Construction Co. Ltd. | | | 13,349 | |
| | 2,000 | | | Nishi-Nippon Railroad Co. Ltd. | | | 9,478 | |
| | 500 | | | Odakyu Electric Railway Co. Ltd. | | | 10,206 | |
| | 364 | | | Park24 Co. Ltd. | | | 11,240 | |
| | 301 | | | Recruit Holdings Co. Ltd. | | | 12,088 | |
| | 191 | | | Secom Co. Ltd. | | | 13,783 | |
| | 2,038 | | | Sotetsu Holdings, Inc. | | | 9,949 | |
| | 1,876 | | | Taisei Corp. | | | 14,068 | |
| | 2,715 | | | Tobu Railway Co., Ltd. | | | 13,331 | |
| | 1,504 | | | Tokyu Corp. | | | 11,264 | |
| | 1,531 | | | Toppan Printing Co. Ltd. | | | 14,394 | |
| | | | | | | | |
| | | | | | | 354,921 | |
| | | | | | | | |
| | | | Information Technology—5.7% | |
| | 443 | | | Azbil Corp. | | | 13,153 | |
| | 483 | | | Canon, Inc. | | | 13,867 | |
| | 303 | | | FUJIFILM Holdings Corp. | | | 11,461 | |
| | 340 | | | Nomura Research Institute Ltd. | | | 11,793 | |
| | 252 | | | NTT Data Corp. | | | 12,998 | |
| | 159 | | | Oracle Corp. Japan | | | 8,655 | |
| | | | | | | | |
| | | | | | | 71,927 | |
| | | | | | | | |
| | | | Materials—5.5% | |
| | 795 | | | ADEKA Corp. | | | 12,029 | |
| | 799 | | | Kuraray Co. Ltd. | | | 12,120 | |
| | 349 | | | Maruichi Steel Tube Ltd. | | | 11,242 | |
| | 600 | | | Nippon Paper Industries Co. Ltd. | | | 11,237 | |
| | 2,161 | | | Sumitomo Osaka Cement Co. Ltd. | | | 8,945 | |
| | 1,448 | | | Toray Industries, Inc. | | | 13,487 | |
| | | | | | | | |
| | | | | | | 69,060 | |
| | | | | | | | |
| | | | Real Estate—2.2% | |
| | 99 | | | Daito Trust Construction Co. Ltd. | | | 16,557 | |
| | 579 | | | Mitsubishi Estate Co. Ltd. | | | 11,469 | |
| | | | | | | | |
| | | | | | | 28,026 | |
| | | | | | | | |
See accompanying Notes to Financial Statements which are an integral part of the financial statements.
PowerShares Japan Currency Hedged Low Volatility Portfolio (FXJP) (continued)
October 31, 2016
| | | | | | | | |
Number
of Shares | | | | | Value | |
| | | | Common Stocks (continued) | |
| | | | Telecommunication Services—0.4% | |
| | 100 | | | Nippon Telegraph & Telephone Corp. | | $ | 4,434 | |
| | | | | | | | |
| | | | Utilities—4.1% | |
| | 952 | | | Chugoku Electric Power Co., Inc. (The) | | | 11,125 | |
| | 1,001 | | | Hokuriku Electric Power Co. | | | 11,364 | |
| | 2,746 | | | Osaka Gas Co. Ltd. | | | 11,412 | |
| | 957 | | | Toho Gas Co. Ltd. | | | 8,861 | |
| | 1,865 | | | Tokyo Gas Co. Ltd. | | | 8,451 | |
| | | | | | | | |
| | | | | | | 51,213 | |
| | | | | | | | |
| | | | Total Investments
(Cost $1,109,609)—96.3% | | | 1,204,694 | |
| | | | Other assets less liabilities—3.7% | | | 46,234 | |
| | | | | | | | |
| | | | Net Assets—100.0% | | $ | 1,250,928 | |
| | | | | | | | |
Notes to Schedule of Investments:
| (a) | Industry and/or sector classifications used in this report are generally according to the Global Industry Classification Standard, which was developed by and is the exclusive property and a service mark of MSCI Inc. and Standard & Poor’s. |
See accompanying Notes to Financial Statements which are an integral part of the financial statements.
Schedule of Investments
PowerShares S&P International Developed Quality Portfolio (IDHQ)
October 31, 2016
| | | | | | | | |
Number
of Shares | | | | | Value | |
| | | | Common Stocks and Other Equity Interests—100.0% | |
| | | | Australia—2.9% | |
| | 7,290 | | | Amcor Ltd. | | $ | 81,545 | |
| | 1,528 | | | Caltex Australia Ltd. | | | 35,731 | |
| | 2,537 | | | CIMIC Group Ltd. | | | 57,124 | |
| | 450 | | | Cochlear Ltd. | | | 43,817 | |
| | 3,283 | | | CSL Ltd. | | | 251,094 | |
| | 869 | | | Flight Centre Travel Group Ltd. | | | 22,397 | |
| | 13,321 | | | Qantas Airways Ltd. | | | 31,018 | |
| | 11,700 | | | Westfield Corp. REIT | | | 79,238 | |
| | | | | | | | |
| | | | | | | 601,964 | |
| | | | | | | | |
| | | | Belgium—0.5% | | | | |
| | 1,938 | | | bpost SA | | | 51,485 | |
| | 919 | | | Colruyt SA | | | 49,328 | |
| | | | | | | | |
| | | | | | | 100,813 | |
| | | | | | | | |
| | | | Canada—2.3% | | | | |
| | 2,351 | | | Alimentation Couche-Tard, Inc., Class B | | | 118,195 | |
| | 1,673 | | | CI Financial Corp. | | | 30,808 | |
| | 146 | | | Constellation Software, Inc. | | | 68,449 | |
| | 735 | | | Dollarama, Inc. | | | 54,967 | |
| | 505 | | | Genworth MI Canada, Inc. | | | 10,976 | |
| | 2,208 | | | Magna International, Inc. | | | 90,725 | |
| | 1,281 | | | Metro, Inc. | | | 39,627 | |
| | 3,824 | | | Potash Corp. of Saskatchewan, Inc. | | | 62,228 | |
| | | | | | | | |
| | | | | | | 475,975 | |
| | | | | | | | |
| | | | Denmark—5.0% | | | | |
| | 1,713 | | | Coloplast A/S, Class B | | | 119,347 | |
| | 1,001 | | | DSV A/S | | | 48,441 | |
| | 14,505 | | | Novo Nordisk A/S, Class B | | | 518,116 | |
| | 1,463 | | | Novozymes A/S, Class B | | | 54,263 | |
| | 721 | | | Pandora A/S | | | 93,709 | |
| | 1,737 | | | Tryg A/S | | | 33,889 | |
| | 1,960 | | | Vestas Wind Systems A/S | | | 156,976 | |
| | | | | | | | |
| | | | | | | 1,024,741 | |
| | | | | | | | |
| | | | Finland—2.8% | | | | |
| | 1,040 | | | Elisa Oyj | | | 34,999 | |
| | 5,317 | | | Fortum Oyj | | | 88,535 | |
| | 375 | | | Kesko Oyj, Class B | | | 18,614 | |
| | 3,208 | | | Kone Oyj, Class B | | | 147,452 | |
| | 1,118 | | | Metso Oyj | | | 29,291 | |
| | 1,320 | | | Neste Oyj | | | 56,910 | |
| | 32,738 | | | Nokia Oyj | | | 145,990 | |
| | 686 | | | Nokian Renkaat Oyj | | | 22,988 | |
| | 825 | | | Orion Oyj, Class B | | | 35,080 | |
| | | | | | | | |
| | | | | | | 579,859 | |
| | | | | | | | |
| | | | France—5.4% | | | | |
| | 4,235 | | | Airbus Group SE | | | 251,386 | |
| | 2,218 | | | Alstom SA(a) | | | 59,496 | |
| | 948 | | | Christian Dior SE | | | 182,639 | |
| | 621 | | | Hermes International | | | 251,261 | |
| | 5,121 | | | Peugeot SA(a) | | | 76,598 | |
| | 1,209 | | | Thales SA | | | 113,672 | |
| | 9,088 | | | Vivendi SA | | | 183,505 | |
| | | | | | | | |
| | | | | | | 1,118,557 | |
| | | | | | | | |
| | | | | | | | |
Number
of Shares | | | | | Value | |
| | | | Common Stocks and Other Equity Interests (continued) | |
| | | | Germany—0.7% | | | | |
| | 638 | | | Hannover Rueck SE | | $ | 71,022 | |
| | 2,086 | | | METRO AG | | | 62,403 | |
| | | | | | | | |
| | | | | | | 133,425 | |
| | | | | | | | |
| | | | Hong Kong—5.3% | | | | |
| | 60,200 | | | AIA Group Ltd. | | | 379,993 | |
| | 13,125 | | | CLP Holdings Ltd. | | | 133,537 | |
| | 7,450 | | | Hong Kong Exchanges & Clearing Ltd. | | | 197,326 | |
| | 13,192 | | | Power Assets Holdings Ltd. | | | 124,097 | |
| | 46,029 | | | Sands China Ltd. | | | 200,324 | |
| | 38,275 | | | SJM Holdings Ltd. | | | 26,504 | |
| | 2,398 | | | VTech Holdings Ltd. | | | 29,438 | |
| | | | | | | | |
| | | | | | | 1,091,219 | |
| | | | | | | | |
| | | | Ireland—1.7% | | | | |
| | 6,997 | | | Experian PLC | | | 134,375 | |
| | 688 | | | Paddy Power Betfair PLC | | | 71,120 | |
| | 2,019 | | | Ryanair Holdings PLC ADR(a) | | | 151,607 | |
| | | | | | | | |
| | | | | | | 357,102 | |
| | | | | | | | |
| | | | Israel—1.1% | | | | |
| | 8,273 | | | Bank Hapoalim BM | | | 47,690 | |
| | 9,358 | | | Bank Leumi Le-Israel BM(a) | | | 35,281 | |
| | 1,037 | | | Check Point Software Technologies Ltd.(a) | | | 87,689 | |
| | 243 | | | Elbit Systems Ltd. | | | 24,043 | |
| | 355 | | | Nice Ltd. | | | 23,542 | |
| | | | | | | | |
| | | | | | | 218,245 | |
| | | | | | | | |
| | | | Italy—0.5% | | | | |
| | 4,168 | | | Finecobank Banca Fineco SpA | | | 24,307 | |
| | 1,543 | | | Moncler SpA | | | 25,659 | |
| | 1,145 | | | Recordati SpA | | | 32,358 | |
| | 1,057 | | | Salvatore Ferragamo SpA | | | 25,827 | |
| | | | | | | | |
| | | | | | | 108,151 | |
| | | | | | | | |
| | | | Japan—31.4% | | | | |
| | 3,499 | | | 77 Bank Ltd. (The) | | | 15,816 | |
| | 1,487 | | | Aisin Seiki Co. Ltd. | | | 65,304 | |
| | 1,050 | | | Alps Electric Co. Ltd. | | | 25,180 | |
| | 11,859 | | | Astellas Pharma, Inc. | | | 175,992 | |
| | 1,226 | | | Bandai Namco Holdings, Inc. | | | 36,750 | |
| | 2,625 | | | Bank of Kyoto Ltd. (The) | | | 19,259 | |
| | 4,212 | | | Bridgestone Corp. | | | 156,920 | |
| | 1,751 | | | Chiyoda Corp. | | | 15,280 | |
| | 1,226 | | | Colopl, Inc. | | | 17,652 | |
| | 8,500 | | | DAI-Ichi Life Holdings, Inc. | | | 124,647 | |
| | 3,687 | | | Daiichi Sankyo Co. Ltd. | | | 88,627 | |
| | 1,475 | | | Daikin Industries Ltd. | | | 141,485 | |
| | 563 | | | Daito Trust Construction Co. Ltd. | | | 94,159 | |
| | 1,675 | | | Eisai Co. Ltd. | | | 106,763 | |
| | 349 | | | Ezaki Glico Co. Ltd. | | | 19,827 | |
| | 4,376 | | | Fuji Electric Co. Ltd. | | | 21,862 | |
| | 5,699 | | | Fuji Heavy Industries Ltd. | | | 222,027 | |
| | 3,150 | | | Gunma Bank Ltd. (The) | | | 15,048 | |
| | 3,150 | | | Hino Motors Ltd. | | | 34,322 | |
| | 264 | | | Hirose Electric Co. Ltd. | | | 34,870 | |
| | 4,376 | | | Hiroshima Bank Ltd. (The) | | | 18,739 | |
| | 1,243 | | | Hitachi Chemical Co. Ltd. | | | 29,098 | |
See accompanying Notes to Financial Statements which are an integral part of the financial statements.
PowerShares S&P International Developed Quality Portfolio (IDHQ) (continued)
October 31, 2016
| | | | | | | | |
Number
of Shares | | | | | Value | |
| | | | Common Stocks and Other Equity Interests (continued) | |
| | | | Japan (continued) | | | | |
| | 784 | | | Hitachi High-Technologies Corp. | | $ | 32,715 | |
| | 2,449 | | | Hitachi Metals Ltd. | | | 30,576 | |
| | 800 | | | Hokuhoku Financial Group, Inc. | | | 11,534 | |
| | 467 | | | Hoshizaki Corp. | | | 42,129 | |
| | 2,725 | | | Hoya Corp. | | | 113,709 | |
| | 3,250 | | | Japan Exchange Group, Inc. | | | 48,339 | |
| | 12,638 | | | Japan Tobacco, Inc. | | | 480,337 | |
| | 2,100 | | | JTEKT Corp. | | | 31,075 | |
| | 399 | | | Kaken Pharmaceutical Co. Ltd. | | | 25,136 | |
| | 1,575 | | | Kansai Paint Co. Ltd. | | | 33,873 | |
| | 2,630 | | | Kao Corp. | | | 135,273 | |
| | 962 | | | Koito Manufacturing Co. Ltd. | | | 50,167 | |
| | 4,637 | | | Komatsu Ltd. | | | 103,388 | |
| | 874 | | | Konami Holdings Corp. | | | 34,474 | |
| | 2,974 | | | Kyushu Financial Group, Inc. | | | 19,782 | |
| | 801 | | | Makita Corp. | | | 55,415 | |
| | 3,326 | | | Mazda Motor Corp. | | | 54,676 | |
| | 789 | | | MEIJI Holdings Co. Ltd. | | | 78,686 | |
| | 1,400 | | | Mitsubishi Gas Chemical Co., Inc. | | | 21,556 | |
| | 7,489 | | | Mitsubishi Motors Corp. | | | 41,691 | |
| | 701 | | | MonotaRO Co. Ltd. | | | 17,091 | |
| | 4,266 | | | MS&AD Insurance Group Holdings, Inc. | | | 126,740 | |
| | 1,088 | | | Murata Manufacturing Co. Ltd. | | | 151,886 | |
| | 701 | | | Nabtesco Corp. | | | 20,946 | |
| | 3,099 | | | Nexon Co. Ltd. | | | 52,788 | |
| | 1,663 | | | Nippon Paint Holdings Co. Ltd. | | | 56,655 | |
| | 264 | | | Nippon Shokubai Co. Ltd. | | | 18,239 | |
| | 1,000 | | | Nishi-Nippon Financial Holdings,
Inc.(a) | | | 9,935 | |
| | 874 | | | Nissan Chemical Industries Ltd. | | | 29,650 | |
| | 613 | | | Nitori Holdings Co. Ltd. | | | 73,325 | |
| | 1,062 | | | Nitto Denko Corp. | | | 74,037 | |
| | 962 | | | NOK Corp. | | | 21,577 | |
| | 1,314 | | | Nomura Research Institute Ltd. | | | 45,578 | |
| | 3,414 | | | NSK Ltd. | | | 37,881 | |
| | 20,626 | | | NTT DoCoMo, Inc. | | | 518,275 | |
| | 3,939 | | | Obayashi Corp. | | | 37,971 | |
| | 579 | | | OBIC Co. Ltd. | | | 30,084 | |
| | 1,226 | | | OMRON Corp. | | | 47,017 | |
| | 1,084 | | | Oracle Corp. Japan | | | 59,004 | |
| | 1,853 | | | Oriental Land Co. Ltd. | | | 108,216 | |
| | 11,500 | | | Osaka Gas Co. Ltd. | | | 47,790 | |
| | 527 | | | Otsuka Corp. | | | 25,075 | |
| | 13,031 | | | Panasonic Corp. | | | 136,033 | |
| | 650 | | | Pigeon Corp. | | | 18,309 | |
| | 349 | | | Pola Orbis Holdings, Inc. | | | 29,027 | |
| | 9,389 | | | Renesas Electronics Corp.(a) | | | 59,237 | |
| | 349 | | | Rinnai Corp. | | | 33,543 | |
| | 176 | | | Ryohin Keikaku Co. Ltd. | | | 37,583 | |
| | 596 | | | Sanrio Co. Ltd. | | | 11,167 | |
| | 2,713 | | | Santen Pharmaceutical Co. Ltd. | | | 39,604 | |
| | 579 | | | SCSK Corp. | | | 21,599 | |
| | 1,326 | | | Secom Co. Ltd. | | | 95,685 | |
| | 2,364 | | | Seiko Epson Corp. | | | 47,984 | |
| | 525 | | | Shimano, Inc. | | | 89,727 | |
| | 17,501 | | | Shinsei Bank Ltd. | | | 28,312 | |
| | 625 | | | Sohgo Security Services Co. Ltd. | | | 28,489 | |
| | | | | | | | |
Number
of Shares | | | | | Value | |
| | | | Common Stocks and Other Equity Interests (continued) | |
| | | | Japan (continued) | | | | |
| | 2,608 | | | Sompo Holdings, Inc. | | $ | 84,480 | |
| | 962 | | | Stanley Electric Co. Ltd. | | | 26,484 | |
| | 2,012 | | | Sumitomo Dainippon Pharma Co. Ltd. | | | 34,866 | |
| | 1,487 | | | Sumitomo Rubber Industries Ltd. | | | 24,876 | |
| | 349 | | | Sundrug Co. Ltd. | | | 27,466 | |
| | 3,426 | | | Suzuki Motor Corp. | | | 121,606 | |
| | 1,056 | | | Sysmex Corp. | | | 73,257 | |
| | 4,883 | | | T&D Holdings, Inc. | | | 59,060 | |
| | 6,124 | | | Taisei Corp. | | | 45,922 | |
| | 2,012 | | | Terumo Corp. | | | 77,830 | |
| | 3,499 | | | Toho Gas Co. Ltd. | | | 32,398 | |
| | 5,416 | | | Tokio Marine Holdings, Inc. | | | 213,836 | |
| | 1,016 | | | Tokyo Electron Ltd. | | | 91,733 | |
| | 1,751 | | | TonenGeneral Sekiyu K.K. | | | 17,263 | |
| | 4,150 | | | Tosoh Corp. | | | 27,131 | |
| | 962 | | | TOTO Ltd. | | | 38,449 | |
| | 1,050 | | | Toyota Boshoku Corp. | | | 26,399 | |
| | 1,763 | | | Toyota Industries Corp. | | | 80,781 | |
| | 874 | | | Trend Micro, Inc. | | | 30,773 | |
| | 1,706 | | | USS Co. Ltd. | | | 28,865 | |
| | 1,314 | | | Yamaha Corp. | | | 46,953 | |
| | 1,487 | | | Yaskawa Electric Corp. | | | 23,730 | |
| | 1,575 | | | Yokogawa Electric Corp. | | | 22,137 | |
| | | | | | | | |
| | | | | | | 6,466,512 | |
| | | | | | | | |
| | | | Jordan—0.1% | | | | |
| | 1,326 | | | Hikma Pharmaceuticals PLC | | | 28,396 | |
| | | | | | | | |
| | | | New Zealand—0.2% | | | | |
| | 3,313 | | | Fisher & Paykel Healthcare Corp. Ltd. | | | 20,999 | |
| | 10,393 | | | Spark New Zealand Ltd. | | | 27,213 | |
| | | | | | | | |
| | | | | | | 48,212 | |
| | | | | | | | |
| | | | Norway—0.1% | | | | |
| | 698 | | | Salmar ASA | | | 22,687 | |
| | | | | | | | |
| | | | Portugal—0.4% | | | | |
| | 4,165 | | | Jeronimo Martins SGPS SA | | | 71,544 | |
| | | | | | | | |
| | | | Singapore—1.6% | | | | |
| | 11,659 | | | ComfortDelGro Corp. Ltd. | | | 21,276 | |
| | 8,456 | | | SATS Ltd. | | | 29,404 | |
| | 7,920 | | | Singapore Exchange Ltd. | | | 40,342 | |
| | 8,360 | | | Singapore Press Holdings Ltd. | | | 22,343 | |
| | 75,741 | | | Singapore Telecommunications Ltd. | | | 211,132 | |
| | | | | | | | |
| | | | | | | 324,497 | |
| | | | | | | | |
| | | | South Africa—0.2% | | | | |
| | 2,071 | | | Mondi PLC | | | 40,355 | |
| | | | | | | | |
| | | | South Korea—2.7% | | | | |
| | 298 | | | Amorepacific Corp. | | | 93,495 | |
| | 390 | | | AMOREPACIFIC Group | | | 50,444 | |
| | 839 | | | Cheil Worldwide, Inc. | | | 12,428 | |
| | 441 | | | Coway Co. Ltd. | | | 34,532 | |
| | 465 | | | Grand Korea Leisure Co. Ltd. | | | 8,819 | |
| | 353 | | | Hanmi Science Co. Ltd. | | | 23,477 | |
| | 137 | | | Hanssem Co. Ltd. | | | 21,252 | |
See accompanying Notes to Financial Statements which are an integral part of the financial statements.
PowerShares S&P International Developed Quality Portfolio (IDHQ) (continued)
October 31, 2016
| | | | | | | | |
Number
of Shares | | | | | Value | |
| | | | Common Stocks and Other Equity Interests (continued) | |
| | | | South Korea (continued) | | | | |
| | 508 | | | Hyundai Development Co.-Engineering & Construction | | $ | 21,532 | |
| | 238 | | | KEPCO Plant Service & Engineering Co. Ltd. | | | 11,419 | |
| | 129 | | | Korea Kolmar Co. Ltd. | | | 9,188 | |
| | 2,608 | | | KT Corp. ADR | | | 41,702 | |
| | 667 | | | KT&G Corp. | | | 65,869 | |
| | 82 | | | LG Household & Health Care Ltd. | | | 58,764 | |
| | 193 | | | Loen Entertainment, Inc.(a) | | | 11,368 | |
| | 201 | | | Lotte Chemical Corp. | | | 50,678 | |
| | 35 | | | Medy-Tox, Inc. | | | 12,443 | |
| | 268 | | | S-1 Corp. | | | 21,665 | |
| | | | | | | | |
| | | | | | | 549,075 | |
| | | | | | | | |
| | | | Spain—4.3% | | | | |
| | 6,209 | | | Abertis Infraestructuras SA | | | 92,055 | |
| | 6,570 | | | Endesa SA | | | 139,468 | |
| | 18,690 | | | Industria de Diseno Textil SA | | | 652,440 | |
| | | | | | | | |
| | | | | | | 883,963 | |
| | | | | | | | |
| | | | Sweden—2.7% | | | | |
| | 2,399 | | | Alfa Laval AB | | | 34,516 | |
| | 5,287 | | | Atlas Copco AB, Class A | | | 155,302 | |
| | 1,916 | | | Axfood AB | | | 29,988 | |
| | 1,902 | | | Electrolux AB, Series B | | | 45,097 | |
| | 8,745 | | | Hennes & Mauritz AB, Class B | | | 246,312 | |
| | 2,295 | | | Skanska AB, Class B | | | 49,912 | |
| | | | | | | | |
| | | | | | | 561,127 | |
| | | | | | | | |
| | | | Switzerland—16.1% | | | | |
| | 11,819 | | | ABB Ltd. | | | 243,814 | |
| | 890 | | | Actelion Ltd. | | | 128,698 | |
| | 53 | | | Givaudan SA | | | 102,634 | |
| | 846 | | | Kuehne + Nagel International AG | | | 114,808 | |
| | 14,441 | | | Nestle SA | | | 1,047,772 | |
| | 4,116 | | | Roche Holding AG | | | 946,901 | |
| | 291 | | | Schindler Holding AG-PC | | | 54,116 | |
| | 45 | | | SGS SA | | | 91,283 | |
| | 2,070 | | | Swiss Re AG | | | 192,368 | |
| | 278 | | | Swisscom AG | | | 127,263 | |
| | 476 | | | Syngenta AG | | | 190,419 | |
| | 1,650 | | | Wolseley PLC | | | 85,636 | |
| | | | | | | | |
| | | | | | | 3,325,712 | |
| | | | | | | | |
| | | | United Kingdom—11.9% | | | | |
| | 2,065 | | | Admiral Group PLC | | | 48,331 | |
| | 1,277 | | | Aggreko PLC | | | 12,496 | |
| | 4,314 | | | Associated British Foods PLC | | | 129,673 | |
| | 2,454 | | | Burberry Group PLC | | | 44,192 | |
| | 2,538 | | | Coca-Cola European Partners PLC | | | 97,561 | |
| | 10,592 | | | Compass Group PLC | | | 191,519 | |
| | 14,079 | | | Diageo PLC | | | 374,635 | |
| | 9,932 | | | Direct Line Insurance Group PLC | | | 41,968 | |
| | 2,938 | | | easyJet PLC | | | 33,610 | |
| | 5,043 | | | Hargreaves Lansdown PLC | | | 71,421 | |
| | 1,587 | | | IMI PLC | | | 19,259 | |
| | 23,304 | | | ITV PLC | | | 48,510 | |
| | 1,386 | | | Johnson Matthey PLC | | | 57,703 | |
| | 4,540 | | | Pearson PLC | | | 41,987 | |
| | | | | | | | |
Number
of Shares | | | | | Value | |
| | | | Common Stocks and Other Equity Interests (continued) | |
| | | | United Kingdom (continued) | | | | |
| | 1,891 | | | Persimmon PLC | | $ | 39,110 | |
| | 4,467 | | | Reckitt Benckiser Group PLC | | | 398,833 | |
| | 7,791 | | | RELX PLC | | | 138,971 | |
| | 5,710 | | | Sage Group PLC (The) | | | 50,298 | |
| | 1,872 | | | Schroders PLC | | | 64,429 | |
| | 4,816 | | | Smith & Nephew PLC | | | 69,559 | |
| | 3,558 | | | Sports Direct International PLC(a) | | | 12,020 | |
| | 14,113 | | | Standard Life PLC | | | 58,205 | |
| | 20,043 | | | Taylor Wimpey PLC | | | 34,675 | |
| | 9,126 | | | Unilever NV CVA | | | 381,950 | |
| | | | | | | | |
| | | | | | | 2,460,915 | |
| | | | | | | | |
| | | | United States—0.1% | | | | |
| | 320 | | | ICON PLC(a) | | | 25,690 | |
| | | | | | | | |
| | | | Total Investments
(Cost $20,512,336)—100.0% | | | 20,618,736 | |
| | | | Other assets less liabilities—0.0% | | | 9,648 | |
| | | | | | | | |
| | | | Net Assets—100.0% | | $ | 20,628,384 | |
| | | | | | | | |
Investment Abbreviations:
ADR—American Depositary Receipt
CVA—Dutch Certificates
PC—Participation Certificate
REIT—Real Estate Investment Trust
Notes to Schedule of Investments:
| (a) | Non-income producing security. |
See accompanying Notes to Financial Statements which are an integral part of the financial statements.
Statements of Assets and Liabilities
October 31, 2016
| | | | | | | | | | | | | | | | |
| | |
PowerShares
Developed
EuroPacific
Currency Hedged
Low Volatility
Portfolio (FXEP) | | | PowerShares
DWA Developed
Markets
Momentum
Portfolio (PIZ) | | | PowerShares
DWA Emerging
Markets
Momentum
Portfolio (PIE) | | | PowerShares
Emerging
Markets
Infrastructure
Portfolio (PXR) | |
| Assets: | | | | | | | | | | | | | | | | |
Unaffiliated investments, at value(a) | | $ | 1,274,612 | | | $ | 173,849,264 | | | $ | 183,616,850 | | | $ | 20,276,663 | |
Affiliated investments, at value | | | — | | | | 2,754,010 | | | | 1,098,965 | | | | — | |
| | | | | | | | | | | | | | | | |
Total investments, at value | | | 1,274,612 | | | | 176,603,274 | | | | 184,715,815 | | | | 20,276,663 | |
Foreign currencies, at value | | | 10,048 | | | | 50,875 | | | | — | | | | 915 | |
Receivables: | | | | | | | | | | | | | | | | |
Dividends | | | 1,356 | | | | 162,675 | | | | 22,181 | | | | 14,042 | |
Foreign tax reclaims | | | 297 | | | | 902,647 | | | | 49,199 | | | | 270 | |
Securities lending | | | — | | | | 33,106 | | | | — | | | | — | |
Settlement proceeds | | | — | | | | 7,240 | | | | — | | | | — | |
Investments sold | | | — | | | | 17 | | | | — | | | | — | |
Unrealized appreciation on forward foreign currency contracts outstanding | | | 33,792 | | | | — | | | | — | | | | — | |
| | | | | | | | | | | | | | | | |
Total Assets | | | 1,320,105 | | | | 177,759,834 | | | | 184,787,195 | | | | 20,291,890 | |
| | | | | | | | | | | | | | | | |
| | | | |
| Liabilities: | | | | | | | | | | | | | | | | |
Due to custodian | | | 10,119 | | | | 983,244 | | | | — | | | | 21,455 | |
Due to foreign custodian | | | — | | | | — | | | | 980,804 | | | | — | |
Payables: | | | | | | | | | | | | | | | | |
Collateral upon return of securities loaned | | | — | | | | 2,754,010 | | | | — | | | | — | |
Investments purchased | | | — | | | | 84 | | | | — | | | | — | |
Unrealized depreciation on forward foreign currency contracts outstanding | | | 126 | | | | — | | | | — | | | | — | |
Accrued unitary management fees | | | 281 | | | | 121,037 | | | | 138,420 | | | | 12,796 | |
Accrued expenses | | | — | | | | 10,418 | | | | — | | | | — | |
| | | | | | | | | | | | | | | | |
Total Liabilities | | | 10,526 | | | | 3,868,793 | | | | 1,119,224 | | | | 34,251 | |
| | | | | | | | | | | | | | | | |
| Net Assets | | $ | 1,309,579 | | | $ | 173,891,041 | | | $ | 183,667,971 | | | $ | 20,257,639 | |
| | | | | | | | | | | | | | | | |
| | | | |
| Net Assets Consist of: | | | | | | | | | | | | | | | | |
Shares of beneficial interest | | $ | 1,285,262 | | | $ | 272,029,769 | | | $ | 296,569,203 | | | $ | 60,050,720 | |
Undistributed net investment income | | | 12,969 | | | | 228,635 | | | | — | | | | 24,233 | |
Undistributed net realized gain (loss) | | | (55,355 | ) | | | (102,276,950 | ) | | | (131,204,934 | ) | | | (37,784,396 | ) |
Net unrealized appreciation (depreciation) | | | 66,703 | | | | 3,909,587 | | | | 18,303,702 | | | | (2,032,918 | ) |
| | | | | | | | | | | | | | | | |
| Net Assets | | $ | 1,309,579 | | | $ | 173,891,041 | | | $ | 183,667,971 | | | $ | 20,257,639 | |
| | | | | | | | | | | | | | | | |
Shares outstanding (unlimited amount authorized, $0.01 par value) | | | 50,001 | | | | 7,800,000 | | | | 11,400,000 | | | | 650,000 | |
Net asset value | | $ | 26.19 | | | $ | 22.29 | | | $ | 16.11 | | | $ | 31.17 | |
| | | | | | | | | | | | | | | | |
Market price | | $ | 26.16 | | | $ | 22.27 | | | $ | 16.10 | | | $ | 31.10 | |
| | | | | | | | | | | | | | | | |
Unaffiliated investments, at cost | | $ | 1,241,390 | | | $ | 169,855,597 | | | $ | 165,311,730 | | | $ | 22,309,626 | |
| | | | | | | | | | | | | | | | |
Affiliated investments, at cost | | $ | — | | | $ | 2,754,010 | | | $ | 1,098,965 | | | $ | — | |
| | | | | | | | | | | | | | | | |
Total investments, at cost | | $ | 1,241,390 | | | $ | 172,609,607 | | | $ | 166,410,695 | | | $ | 22,309,626 | |
| | | | | | | | | | | | | | | | |
Foreign currencies, at cost | | $ | 10,183 | | | $ | 51,033 | | | $ | (980,804 | ) | | $ | 914 | |
| | | | | | | | | | | | | | | | |
(a) Includes securities on loan with an aggregate value of: | | $ | — | | | $ | 2,585,503 | | | $ | — | | | $ | — | |
| | | | | | | | | | | | | | | | |
See accompanying Notes to Financial Statements which are an integral part of the financial statements.
| | | | | | | | | | | | | | | | | | | | | | | | | | | | | | |
PowerShares
Europe Currency
Hedged Low
Volatility
Portfolio
(FXEU) | | | PowerShares
FTSE RAFI
Asia Pacific
ex-Japan
Portfolio
(PAF) | | | PowerShares
FTSE RAFI
Developed
Markets
ex-U.S.
Portfolio
(PXF) | | | PowerShares
FTSE RAFI
Developed
Markets
ex-U.S.
Small-Mid
Portfolio
(PDN) | | | PowerShares
FTSE RAFI
Emerging
Markets
Portfolio
(PXH) | | | PowerShares
Global
Agriculture
Portfolio
(PAGG) | | | PowerShares
Global Clean
Energy
Portfolio
(PBD) | | | PowerShares
Global Gold and
Precious Metals
Portfolio
(PSAU) | |
| | | | | | | | | | | | | | | | | | | | | | | | | | | | | | |
| $ | 169,329,378 | | | $ | 23,999,269 | | | $ | 936,359,410 | | | $ | 162,511,233 | | | $ | 618,205,536 | | | $ | 22,302,243 | | | $ | 56,279,903 | | | $ | 42,762,104 | |
| | — | | | | — | | | | 13,665,318 | | | | 3,949,685 | | | | 7,130,798 | | | | 960,398 | | | | 5,023,977 | | | | — | |
| | | | | | | | | | | | | | | | | | | | | | | | | | | | | | |
| | 169,329,378 | | | | 23,999,269 | | | | 950,024,728 | | | | 166,460,918 | | | | 625,336,334 | | | | 23,262,641 | | | | 61,303,880 | | | | 42,762,104 | |
| | — | | | | 689 | | | | — | | | | — | | | | 44,832 | | | | 9,345 | | | | 60,290 | | | | — | |
| | | | | | | | | | | | | | | | | | | | | | | | | | | | | | |
| | 57,826 | | | | 3,433 | | | | 2,296,134 | | | | 431,417 | | | | 604,839 | | | | 22,827 | | | | 46,220 | | | | 5,495 | |
| | 525,878 | | | | 303 | | | | 2,073,159 | | | | 161,842 | | | | 3,980 | | | | 198,035 | | | | 43,096 | | | | 2,642 | |
| | — | | | | — | | | | 51,601 | | | | 7,753 | | | | — | | | | 567 | | | | 16,060 | | | | 335 | |
| | — | | | | — | | | | 11 | | | | 139 | | | | 7,257 | | | | — | | | | 234,653 | | | | — | |
| | — | | | | — | | | | 82 | | | | — | | | | — | | | | — | | | | — | | | | — | |
| | 4,552,861 | | | | — | | | | — | | | | — | | | | — | | | | — | | | | — | | | | — | |
| | | | | | | | | | | | | | | | | | | | | | | | | | | | | | |
| | 174,465,943 | | | | 24,003,694 | | | | 954,445,715 | | | | 167,062,069 | | | | 625,997,242 | | | | 23,493,415 | | | | 61,704,199 | | | | 42,770,576 | |
| | | | | | | | | | | | | | | | | | | | | | | | | | | | | | |
| | | | | | | |
| | | | | | | | | | | | | | | | | | | | | | | | | | | | | | |
| | 410,741 | | | | 3,298 | | | | 1,305,569 | | | | 107,547 | | | | 353,642 | | | | 217,763 | | | | 491,161 | | | | 2,320 | |
| | 1,631 | | | | — | | | | 447,717 | | | | 82,275 | | | | — | | | | — | | | | — | | | | 54 | |
| | | | | | | | | | | | | | | | | | | | | | | | | | | | | | |
| | — | | | | — | | | | 13,665,318 | | | | 3,949,685 | | | | — | | | | 960,398 | | | | 5,023,977 | | | | — | |
| | 4,609,015 | | | | — | | | | 423 | | | | 51 | | | | 58 | | | | — | | | | — | | | | — | |
| | 99,812 | | | | — | | | | — | | | | — | | | | — | | | | — | | | | — | | | | — | |
| | 36,234 | | | | 10,074 | | | | 356,844 | | | | 68,223 | | | | 245,145 | | | | 14,109 | | | | 36,601 | | | | 26,795 | |
| | — | | | | — | | | | 20,276 | | | | — | | | | — | | | | — | | | | — | | | | — | |
| | | | | | | | | | | | | | | | | | | | | | | | | | | | | | |
| | 5,157,433 | | | | 13,372 | | | | 15,796,147 | | | | 4,207,781 | | | | 598,845 | | | | 1,192,270 | | | | 5,551,739 | | | | 29,169 | |
| | | | | | | | | | | | | | | | | | | | | | | | | | | | | | |
| $ | 169,308,510 | | | $ | 23,990,322 | | | $ | 938,649,568 | | | $ | 162,854,288 | | | $ | 625,398,397 | | | $ | 22,301,145 | | | $ | 56,152,460 | | | $ | 42,741,407 | |
| | | | | | | | | | | | | | | | | | | | | | | | | | | | | | |
| | | | | | | |
| | | | | | | | | | | | | | | | | | | | | | | | | | | | | | |
| $ | 182,457,642 | | | $ | 34,846,118 | | | $ | 1,068,897,289 | | | $ | 164,568,619 | | | $ | 706,695,873 | | | $ | 42,227,172 | | | $ | 243,477,379 | | | $ | 63,579,355 | |
| | 1,252,324 | | | | (49,496 | ) | | | 4,136,553 | | | | (182,450 | ) | | | 1,129,694 | | | | 82,513 | | | | 109,331 | | | | 94,182 | |
| | (11,839,186 | ) | | | (9,198,513 | ) | | | (60,354,042 | ) | | | (15,705,222 | ) | | | (133,330,067 | ) | | | (13,724,680 | ) | | | (189,290,322 | ) | | | (19,499,538 | ) |
| | (2,562,270 | ) | | | (1,607,787 | ) | | | (74,030,232 | ) | | | 14,173,341 | | | | 50,902,897 | | | | (6,283,860 | ) | | | 1,856,072 | | | | (1,432,592 | ) |
| | | | | | | | | | | | | | | | | | | | | | | | | | | | | | |
| $ | 169,308,510 | | | $ | 23,990,322 | | | $ | 938,649,568 | | | $ | 162,854,288 | | | $ | 625,398,397 | | | $ | 22,301,145 | | | $ | 56,152,460 | | | $ | 42,741,407 | |
| | | | | | | | | | | | | | | | | | | | | | | | | | | | | | |
| | 7,100,001 | | | | 500,000 | | | | 25,550,000 | | | | 5,950,000 | | | | 33,250,000 | | | | 950,000 | | | | 5,275,000 | | | | 2,050,000 | |
| $ | 23.85 | | | $ | 47.98 | | | $ | 36.74 | | | $ | 27.37 | | | $ | 18.81 | | | $ | 23.47 | | | $ | 10.65 | | | $ | 20.85 | |
| | | | | | | | | | | | | | | | | | | | | | | | | | | | | | |
| $ | 23.83 | | | $ | 47.75 | | | $ | 36.68 | | | $ | 27.30 | | | $ | 18.80 | | | $ | 23.50 | | | $ | 10.62 | | | $ | 20.87 | |
| | | | | | | | | | | | | | | | | | | | | | | | | | | | | | |
| $ | 176,331,296 | | | $ | 25,607,059 | | | $ | 1,010,258,987 | | | $ | 148,315,801 | | | $ | 567,405,091 | | | $ | 28,567,687 | | | $ | 54,414,292 | | | $ | 44,193,842 | |
| | | | | | | | | | | | | | | | | | | | | | | | | | | | | | |
| $ | — | | | $ | — | | | $ | 13,665,318 | | | $ | 3,949,685 | | | $ | 7,043,136 | | | $ | 960,398 | | | $ | 5,023,977 | | | $ | — | |
| | | | | | | | | | | | | | | | | | | | | | | | | | | | | | |
| $ | 176,331,296 | | | $ | 25,607,059 | | | $ | 1,023,924,305 | | | $ | 152,265,486 | | | $ | 574,448,227 | | | $ | 29,528,085 | | | $ | 59,438,269 | | | $ | 44,193,842 | |
| | | | | | | | | | | | | | | | | | | | | | | | | | | | | | |
| $ | (1,631 | ) | | $ | 689 | | | $ | (459,850 | ) | | $ | (84,452 | ) | | $ | 44,721 | | | $ | 9,330 | | | $ | 61,698 | | | $ | (55 | ) |
| | | | | | | | | | | | | | | | | | | | | | | | | | | | | | |
| $ | — | | | $ | — | | | $ | 12,806,065 | | | $ | 3,711,968 | | | $ | — | | | $ | 904,269 | | | $ | 4,660,685 | | | $ | — | |
| | | | | | | | | | | | | | | | | | | | | | | | | | | | | | |
Statements of Assets and Liabilities (continued)
October 31, 2016
| | | | | | | | | | | | | | | | |
| | | PowerShares
Global Water
Portfolio (PIO) | | | PowerShares
International
BuyBack
AchieversTM
Portfolio (IPKW) | | | PowerShares
Japan Currency
Hedged Low
Volatility
Portfolio (FXJP) | | | PowerShares
S&P
International
Developed Quality
Portfolio (IDHQ) | |
| Assets: | | | | | | | | | | | | | | | | |
Unaffiliated investments, at value | | $ | 188,211,423 | | | $ | 92,177,523 | | | $ | 1,204,694 | | | $ | 20,618,736 | |
| | | | | | | | | | | | | | | | |
Foreign currencies, at value | | | 485,678 | | | | — | | | | — | | | | 12,080 | |
Cash segregated as collateral | | | — | | | | 61,370 | | | | — | | | | — | |
Receivables: | | | | | | | | | | | | | | | | |
Dividends | | | 320,412 | | | | 204,110 | | | | 7,546 | | | | 56,475 | |
Foreign tax reclaims | | | 399,050 | | | | 80,893 | | | | — | | | | 60,824 | |
Settlement proceeds | | | 51,739 | | | | — | | | | — | | | | 631 | |
Investments sold | | | — | | | | 3,071,581 | | | | — | | | | — | |
Unrealized appreciation on forward foreign currency contracts outstanding | | | — | | | | — | | | | 46,176 | | | | — | |
| | | | | | | | | | | | | | | | |
Total Assets | | | 189,468,302 | | | | 95,595,477 | | | | 1,258,416 | | | | 20,748,746 | |
| | | | | | | | | | | | | | | | |
| | | | |
| Liabilities: | | | | | | | | | | | | | | | | |
Due to custodian | | | 673,677 | | | | 18,221 | | | | 7,047 | | | | 112,357 | |
Due to foreign custodian | | | — | | | | 201,031 | | | | — | | | | — | |
Payables: | | | | | | | | | | | | | | | | |
Investments purchased | | | — | | | | 3,071,118 | | | | — | | | | — | |
Collateral upon receipt of securities in-kind | | | — | | | | 61,370 | | | | — | | | | — | |
Unrealized depreciation on forward foreign currency contracts outstanding | | | — | | | | — | | | | 181 | | | | — | |
Accrued unitary management fees | | | 121,830 | | | | 41,545 | | | | 260 | | | | 8,005 | |
Accrued expenses | | | 7,886 | | | | — | | | | — | | | | — | |
| | | | | | | | | | | | | | | | |
Total Liabilities | | | 803,393 | | | | 3,393,285 | | | | 7,488 | | | | 120,362 | |
| | | | | | | | | | | | | | | | |
| Net Assets | | $ | 188,664,909 | | | $ | 92,202,192 | | | $ | 1,250,928 | | | $ | 20,628,384 | |
| | | | | | | | | | | | | | | | |
| | | | |
| Net Assets Consist of: | | | | | | | | | | | | | | | | |
Shares of beneficial interest | | $ | 264,386,029 | | | $ | 95,940,623 | | | $ | 1,283,761 | | | $ | 46,435,048 | |
Undistributed net investment income | | | 649,550 | | | | 383,421 | | | | 15,024 | | | | 124,877 | |
Undistributed net realized gain (loss) | | | (104,228,127 | ) | | | (5,709,269 | ) | | | (188,633 | ) | | | (26,030,015 | ) |
Net unrealized appreciation | | | 27,857,457 | | | | 1,587,417 | | | | 140,776 | | | | 98,474 | |
| | | | | | | | | | | | | | | | |
| Net Assets | | $ | 188,664,909 | | | $ | 92,202,192 | | | $ | 1,250,928 | | | $ | 20,628,384 | |
| | | | | | | | | | | | | | | | |
Shares outstanding (unlimited amount authorized, $0.01 par value) | | | 8,850,000 | | | | 3,300,000 | | | | 50,001 | | | | 1,050,000 | |
Net asset value | | $ | 21.32 | | | $ | 27.94 | | | $ | 25.02 | | | $ | 19.65 | |
| | | | | | | | | | | | | | | | |
Market price | | $ | 21.29 | | | $ | 28.02 | | | $ | 24.91 | | | $ | 19.61 | |
| | | | | | | | | | | | | | | | |
Unaffiliated investments, at cost | | $ | 160,322,078 | | | $ | 90,626,698 | | | $ | 1,109,609 | | | $ | 20,512,336 | |
| | | | | | | | | | | | | | | | |
Foreign currencies, at cost | | $ | 493,679 | | | $ | (248,885 | ) | | $ | — | | | $ | 12,342 | |
| | | | | | | | | | | | | | | | |
See accompanying Notes to Financial Statements which are an integral part of the financial statements.
(This Page Intentionally Left Blank)
Statements of Operations
For the year ended October 31, 2016
| | | | | | | | | | | | | | | | |
| | |
PowerShares
Developed
EuroPacific
Currency Hedged
Low Volatility
Portfolio (FXEP) | | | PowerShares
DWA Developed
Markets
Momentum
Portfolio (PIZ) | | | PowerShares
DWA Emerging
Markets
Momentum
Portfolio (PIE) | | | PowerShares
Emerging
Markets
Infrastructure
Portfolio (PXR) | |
| Investment Income: | | | | | | | | | | | | | | | | |
Unaffiliated dividend income | | $ | 55,387 | | | $ | 5,433,582 | | | $ | 3,855,333 | | | $ | 459,394 | |
Affiliated dividend income | | | 18 | | | | 280 | | | | 833 | | | | 34 | |
Securities lending income | | | — | | | | 33,106 | | | | — | | | | 54,603 | |
Foreign withholding tax | | | (4,724 | ) | | | (478,687 | ) | | | (574,585 | ) | | | (51,593 | ) |
| | | | | | | | | | | | | | | | |
Total Income | | | 50,681 | | | | 4,988,281 | | | | 3,281,581 | | | | 462,438 | |
| | | | | | | | | | | | | | | | |
| | | | |
| Expenses: | | | | | | | | | | | | | | | | |
Unitary management fees | | | 3,794 | | | | 1,729,777 | | | | 1,519,504 | | | | 151,378 | |
Professional fees | | | — | | | | 20,682 | | | | — | | | | 119 | |
| | | | | | | | | | | | | | | | |
Total Expenses | | | 3,794 | | | | 1,750,459 | | | | 1,519,504 | | | | 151,497 | |
| | | | | | | | | | | | | | | | |
Less: Waivers | | | (23 | ) | | | (122 | ) | | | (522 | ) | | | (17 | ) |
| | | | | | | | | | | | | | | | |
Net Expenses | | | 3,771 | | | | 1,750,337 | | | | 1,518,982 | | | | 151,480 | |
| | | | | | | | | | | | | | | | |
Net Investment Income | | | 46,910 | | | | 3,237,944 | | | | 1,762,599 | | | | 310,958 | |
| | | | | | | | | | | | | | | | |
| | | | |
| Realized and Unrealized Gain (Loss): | | | | | | | | | | | | | | | | |
Net realized gain (loss) from: | | | | | | | | | | | | | | | | |
Investment securities | | | (37,399 | ) | | | (4,417,566 | ) | | | (14,486,091 | ) | | | (4,695,902 | ) |
In-kind redemptions | | | 23,244 | | | | 3,717,757 | | | | (775,211 | ) | | | (1,015,569 | ) |
Foreign currencies | | | (1,932 | ) | | | (131,591 | ) | | | (184,573 | ) | | | (7,602 | ) |
Forward foreign currency contracts | | | 2,043 | | | | — | | | | — | | | | — | |
| | | | | | | | | | | | | | | | |
Net realized gain (loss) | | | (14,044 | ) | | | (831,400 | ) | | | (15,445,875 | ) | | | (5,719,073 | ) |
| | | | | | | | | | | | | | | | |
Change in net unrealized appreciation (depreciation) on: | | | | | | | | | | | | | | | | |
Investment securities | | | (54,259 | ) | | | (9,871,588 | ) | | | 13,676,204 | | | | 4,690,674 | |
Foreign currencies | | | (184 | ) | | | 9,116 | | | | 27,021 | | | | 34 | |
Forward foreign currency contracts | | | 35,241 | | | | — | | | | — | | | | — | |
| | | | | | | | | | | | | | | | |
Net change in unrealized appreciation (depreciation) | | | (19,202 | ) | | | (9,862,472 | ) | | | 13,703,225 | | | | 4,690,708 | |
| | | | | | | | | | | | | | | | |
Net realized and unrealized gain (loss) | | | (33,246 | ) | | | (10,693,872 | ) | | | (1,742,650 | ) | | | (1,028,365 | ) |
| | | | | | | | | | | | | | | | |
Net increase (decrease) in net assets resulting from operations | | $ | 13,664 | | | $ | (7,455,928 | ) | | $ | 19,949 | | | $ | (717,407 | ) |
| | | | | | | | | | | | | | | | |
See accompanying Notes to Financial Statements which are an integral part of the financial statements.
| | | | | | | | | | | | | | | | | | | | | | | | | | | | | | |
PowerShares
Europe Currency
Hedged Low
Volatility
Portfolio (FXEU) | | | PowerShares
FTSE RAFI
Asia Pacific
ex-Japan
Portfolio (PAF) | | | PowerShares
FTSE RAFI
Developed
Markets
ex-U.S.
Portfolio (PXF) | | | PowerShares
FTSE RAFI
Developed
Markets
ex-U.S.
Small-Mid
Portfolio (PDN) | | | PowerShares
FTSE RAFI
Emerging
Markets
Portfolio (PXH) | | | PowerShares
Global
Agriculture
Portfolio (PAGG) | | | PowerShares
Global Clean
Energy
Portfolio (PBD) | | | PowerShares
Global Gold and
Precious Metals
Portfolio (PSAU) | |
| | | | | | | | | | | | | | | | | | | | | | | | | | | | | | |
| $ | 8,686,515 | | | $ | 856,697 | | | $ | 28,932,147 | | | $ | 4,100,294 | | | $ | 14,085,564 | | | $ | 716,938 | | | $ | 1,182,899 | | | $ | 345,749 | |
| | 1,266 | | | | 63 | | | | 1,301 | | | | 354 | | | | 51,810 | | | | — | | | | 8 | | | | 30 | |
| | — | | | | — | | | | 664,866 | | | | 126,336 | | | | — | | | | 14,688 | | | | 451,034 | | | | 3,413 | |
| | (1,086,927 | ) | | | (40,007 | ) | | | (2,391,546 | ) | | | (415,362 | ) | | | (1,578,762 | ) | | | (61,551 | ) | | | (98,027 | ) | | | (30,123 | ) |
| | | | | | | | | | | | | | | | | | | | | | | | | | | | | | |
| | 7,600,854 | | | | 816,753 | | | | 27,206,768 | | | | 3,811,622 | | | | 12,558,612 | | | | 670,075 | | | | 1,535,914 | | | | 319,069 | |
| | | | | | | | | | | | | | | | | | | | | | | | | | | | | | |
| | | | | | | |
| | | | | | | | | | | | | | | | | | | | | | | | | | | | | | |
| | 494,257 | | | | 109,577 | | | | 3,493,542 | | | | 745,377 | | | | 1,958,364 | | | | 177,886 | | | | 446,407 | | | | 298,831 | |
| | — | | | | — | | | | 27,690 | | | | 2,282 | | | | — | | | | 1,945 | | | | 442 | | | | — | |
| | | | | | | | | | | | | | | | | | | | | | | | | | | | | | |
| | 494,257 | | | | 109,577 | | | | 3,521,232 | | | | 747,659 | | | | 1,958,364 | | | | 179,831 | | | | 446,849 | | | | 298,831 | |
| | | | | | | | | | | | | | | | | | | | | | | | | | | | | | |
| | (678 | ) | | | (38 | ) | | | (768 | ) | | | (204 | ) | | | (37,670 | ) | | | — | | | | (5 | ) | | | (23 | ) |
| | | | | | | | | | | | | | | | | | | | | | | | | | | | | | |
| | 493,579 | | | | 109,539 | | | | 3,520,464 | | | | 747,455 | | | | 1,920,694 | | | | 179,831 | | | | 446,844 | | | | 298,808 | |
| | | | | | | | | | | | | | | | | | | | | | | | | | | | | | |
| | 7,107,275 | | | | 707,214 | | | | 23,686,304 | | | | 3,064,167 | | | | 10,637,918 | | | | 490,244 | | | | 1,089,070 | | | | 20,261 | |
| | | | | | | | | | | | | | | | | | | | | | | | | | | | | | |
| | | | | | | |
| | | | | | | | | | | | | | | | | | | | | | | | | | | | | | |
| | | | | | | | | | | | | | | | | | | | | | | | | | | | | | |
| | (12,582,228 | ) | | | (743,731 | ) | | | (21,160,833 | ) | | | (5,307,856 | ) | | | (26,598,140 | ) | | | (4,746,603 | ) | | | (5,662,704 | ) | | | (6,762,512 | ) |
| | (814,540 | ) | | | 75,126 | | | | 1,804,625 | | | | 3,226,453 | | | | (922,987 | ) | | | (463,818 | ) | | | 1,095,985 | | | | 4,934,595 | |
| | (583,471 | ) | | | 6,382 | | | | 64,547 | | | | 47,635 | | | | (228,177 | ) | | | 2,367 | | | | (30,863 | ) | | | (30,110 | ) |
| | 4,808,848 | | | | — | | | | — | | | | — | | | | — | | | | — | | | | — | | | | — | |
| | | | | | | | | | | | | | | | | | | | | | | | | | | | | | |
| | (9,171,391 | ) | | | (662,223 | ) | | | (19,291,661 | ) | | | (2,033,768 | ) | | | (27,749,304 | ) | | | (5,208,054 | ) | | | (4,597,582 | ) | | | (1,858,027 | ) |
| | | | | | | | | | | | | | | | | | | | | | | | | | | | | | |
| | | | | | | | | | | | | | | | | | | | | | | | | | | | | | |
| | (10,792,140 | ) | | | 2,201,051 | | | | (16,800,921 | ) | | | 8,211,471 | | | | 125,535,603 | | | | 3,239,588 | | | | (255,122 | ) | | | 16,432,984 | |
| | (12,923 | ) | | | 20 | | | | (17,906 | ) | | | (11,745 | ) | | | 55,542 | | | | 1,843 | | | | 4,379 | | | | (153 | ) |
| | 2,748,558 | | | | — | | | | — | | | | — | | | | — | | | | — | | | | — | | | | — | |
| | | | | | | | | | | | | | | | | | | | | | | | | | | | | | |
| | (8,056,505 | ) | | | 2,201,071 | | | | (16,818,827 | ) | | | 8,199,726 | | | | 125,591,145 | | | | 3,241,431 | | | | (250,743 | ) | | | 16,432,831 | |
| | | | | | | | | | | | | | | | | | | | | | | | | | | | | | |
| | (17,227,896 | ) | | | 1,538,848 | | | | (36,110,488 | ) | | | 6,165,958 | | | | 97,841,841 | | | | (1,966,623 | ) | | | (4,848,325 | ) | | | 14,574,804 | |
| | | | | | | | | | | | | | | | | | | | | | | | | | | | | | |
| $ | (10,120,621 | ) | | $ | 2,246,062 | | | $ | (12,424,184 | ) | | $ | 9,230,125 | | | $ | 108,479,759 | | | $ | (1,476,379 | ) | | $ | (3,759,255 | ) | | $ | 14,595,065 | |
| | | | | | | | | | | | | | | | | | | | | | | | | | | | | | |
Statements of Operations (continued)
For the year ended October 31, 2016
| | | | | | | | | | | | | | | | |
| | | PowerShares
Global Water
Portfolio (PIO) | | | PowerShares
International
BuyBack
AchieversTM
Portfolio (IPKW) | | | PowerShares
Japan Currency
Hedged Low
Volatility
Portfolio (FXJP) | | | PowerShares
S&P
International
Developed Quality
Portfolio (IDHQ) | |
| Investment Income: | | | | | | | | | | | | | | | | |
Unaffiliated dividend income | | $ | 5,044,849 | | | $ | 2,612,914 | | | $ | 25,710 | | | $ | 611,021 | |
Affiliated dividend income | | | 105 | | | | 348 | | | | 3 | | | | 71 | |
Securities lending income | | | 75,365 | | | | — | | | | — | | | | — | |
Foreign withholding tax | | | (300,334 | ) | | | (170,973 | ) | | | (3,579 | ) | | | (64,935 | ) |
| | | | | | | | | | | | | | | | |
Total Income | | | 4,819,985 | | | | 2,442,289 | | | | 22,134 | | | | 546,157 | |
| | | | | | | | | | | | | | | | |
| | | | |
| Expenses: | | | | | | | | | | | | | | | | |
Unitary management fees | | | 1,529,364 | | | | 406,208 | | | | 3,661 | | | | 96,757 | |
Professional fees | | | (12,951 | ) | | | — | | | | — | | | | 974 | |
| | | | | | | | | | | | | | | | |
Total Expenses | | | 1,516,413 | | | | 406,208 | | | | 3,661 | | | | 97,731 | |
| | | | | | | | | | | | | | | | |
Less: Waivers | | | (71 | ) | | | (194 | ) | | | (3 | ) | | | (38 | ) |
| | | | | | | | | | | | | | | | |
Net Expenses | | | 1,516,342 | | | | 406,014 | | | | 3,658 | | | | 97,693 | |
| | | | | | | | | | | | | | | | |
Net Investment Income | | | 3,303,643 | | | | 2,036,275 | | | | 18,476 | | | | 448,464 | |
| | | | | | | | | | | | | | | | |
| | | | |
| Realized and Unrealized Gain (Loss): | | | | | | | | | | | | | | | | |
Net realized gain (loss) from: | | | | | | | | | | | | | | | | |
Investment securities | | | (7,055,570 | ) | | | (2,685,385 | ) | | | 40,061 | | | | (1,879,698 | ) |
In-kind redemptions | | | 10,486,008 | | | | 3,238,385 | | | | 62,569 | | | | 2,051,817 | |
Foreign currencies | | | (184,546 | ) | | | (57,768 | ) | | | (13,212 | ) | | | 53,276 | |
Forward foreign currency contracts | | | — | | | | — | | | | (200,631 | ) | | | — | |
| | | | | | | | | | | | | | | | |
Net realized gain (loss) | | | 3,245,892 | | | | 495,232 | | | | (111,213 | ) | | | 225,395 | |
| | | | | | | | | | | | | | | | |
Change in net unrealized appreciation (depreciation) on: | | | | | | | | | | | | | | | | |
Investment securities | | | (10,975,575 | ) | | | 2,059,610 | | | | (38,959 | ) | | | (646,337 | ) |
Foreign currencies | | | (6,806 | ) | | | 38,529 | | | | (303 | ) | | | (1,777 | ) |
Forward foreign currency contracts | | | — | | | | — | | | | 35,643 | | | | — | |
| | | | | | | | | | | | | | | | |
Net change in unrealized appreciation (depreciation) | | | (10,982,381 | ) | | | 2,098,139 | | | | (3,619 | ) | | | (648,114 | ) |
| | | | | | | | | | | | | | | | |
Net realized and unrealized gain (loss) | | | (7,736,489 | ) | | | 2,593,371 | | | | (114,832 | ) | | | (422,719 | ) |
| | | | | | | | | | | | | | | | |
Net increase (decrease) in net assets resulting from operations | | $ | (4,432,846 | ) | | $ | 4,629,646 | | | $ | (96,356 | ) | | $ | 25,745 | |
| | | | | | | | | | | | | | | | |
See accompanying Notes to Financial Statements which are an integral part of the financial statements.
(This Page Intentionally Left Blank)
Statements of Changes in Net Assets
For the years ended October 31, 2016 and 2015
| | | | | | | | | | | | | | | | |
| | | PowerShares Developed EuroPacific
Currency Hedged Low Volatility
Portfolio (FXEP) | | | PowerShares DWA Developed
Markets Momentum Portfolio (PIZ) | |
| | | 2016 | | | 2015(a) | | | 2016 | | | 2015 | |
| Operations: | | | | | | | | | | | | | | | | |
Net investment income | | $ | 46,910 | | | $ | 3,377 | | | $ | 3,237,944 | | | $ | 3,836,494 | |
Net realized gain (loss) | | | (14,044 | ) | | | (81 | ) | | | (831,400 | ) | | | (36,300,363 | ) |
Net change in unrealized appreciation (depreciation) | | | (19,202 | ) | | | 85,905 | | | | (9,862,472 | ) | | | 11,218,719 | |
| | | | | | | | | | | | | | | | |
Net increase (decrease) in net assets resulting from operations | | | 13,664 | | | | 89,201 | | | | (7,455,928 | ) | | | (21,245,150 | ) |
| | | | | | | | | | | | | | | | |
| | | | |
| Distributions to Shareholders from: | | | | | | | | | | | | | | | | |
Net investment income | | | (53,569 | ) | | | — | | | | (3,575,110 | ) | | | (4,075,936 | ) |
Net realized gains | | | (5,146 | ) | | | — | | | | — | | | | — | |
Return of capital | | | — | | | | — | | | | — | | | | — | |
| | | | | | | | | | | | | | | | |
Total distributions to shareholders | | | (58,715 | ) | | | — | | | | (3,575,110 | ) | | | (4,075,936 | ) |
| | | | | | | | | | | | | | | | |
| | | | |
| Shareholder Transactions: | | | | | | | | | | | | | | | | |
Proceeds from shares sold | | | 1,302,119 | | | | 2,566,867 | | | | — | | | | 135,238,189 | |
Value of shares repurchased | | | (2,603,557 | ) | | | — | | | | (79,074,299 | ) | | | (229,242,363 | ) |
Transaction fees | | | — | | | | — | | | | — | | | | — | |
| | | | | | | | | | | | | | | | |
Net increase (decrease) in net assets resulting from shares transactions | | | (1,301,438 | ) | | | 2,566,867 | | | | (79,074,299 | ) | | | (94,004,174 | ) |
| | | | | | | | | | | | | | | | |
Increase (Decrease) in Net Assets | | | (1,346,489 | ) | | | 2,656,068 | | | | (90,105,337 | ) | | | (119,325,260 | ) |
| | | | | | | | | | | | | | | | |
| | | | |
| Net Assets: | | | | | | | | | | | | | | | | |
Beginning of year | | | 2,656,068 | | | | — | | | | 263,996,378 | | | | 383,321,638 | |
| | | | | | | | | | | | | | | | |
End of year | | $ | 1,309,579 | | | $ | 2,656,068 | | | $ | 173,891,041 | | | $ | 263,996,378 | |
| | | | | | | | | | | | | | | | |
Undistributed net investment income at end of year | | $ | 12,969 | | | $ | 3,221 | | | $ | 228,635 | | | $ | 688,386 | |
| | | | | | | | | | | | | | | | |
| | | | |
| Changes in Shares Outstanding: | | | | | | | | | | | | | | | | |
Shares sold | | | 50,000 | | | | 100,001 | | | | — | | | | 5,300,000 | |
Shares repurchased | | | (100,000 | ) | | | — | | | | (3,500,000 | ) | | | (9,650,000 | ) |
Shares outstanding, beginning of year | | | 100,001 | | | | — | | | | 11,300,000 | | | | 15,650,000 | |
| | | | | | | | | | | | | | | | |
Shares outstanding, end of year | | | 50,001 | | | | 100,001 | | | | 7,800,000 | | | | 11,300,000 | |
| | | | | | | | | | | | | | | | |
| (a) | For the period October 6, 2015 (commencement of investment operations) through October 31, 2015. |
| (b) | For the period May 4, 2015 (commencement of investment operations) through October 31, 2015. |
See accompanying Notes to Financial Statements which are an integral part of the financial statements.
| | | | | | | | | | | | | | | | | | | | | | | | | | | | | | |
PowerShares DWA Emerging
Markets Momentum Portfolio (PIE) | | | PowerShares Emerging Markets
Infrastructure Portfolio (PXR) | | | PowerShares Europe
Currency Hedged
Low Volatility
Portfolio (FXEU) | | | PowerShares
FTSE RAFI Asia
Pacific ex-Japan
Portfolio (PAF) | |
| 2016 | | | 2015 | | | 2016 | | | 2015 | | | 2016 | | | 2015(b) | | | 2016 | | | 2015 | |
| | | | | | | | | | | | | | | | | | | | | | | | | | | | | | |
| $ | 1,762,599 | | | $ | 2,047,692 | | | $ | 310,958 | | | $ | 551,657 | | | $ | 7,107,275 | | | $ | 427,321 | | | $ | 707,214 | | | $ | 1,473,392 | |
| | (15,445,875 | ) | | | (33,620,140 | ) | | | (5,719,073 | ) | | | (3,450,751 | ) | | | (9,171,391 | ) | | | (2,835,148 | ) | | | (662,223 | ) | | | (2,149,850 | ) |
| | 13,703,225 | | | | (29,050,307 | ) | | | 4,690,708 | | | | (1,877,613 | ) | | | (8,056,505 | ) | | | 5,494,235 | | | | 2,201,071 | | | | (6,647,564 | ) |
| | | | | | | | | | | | | | | | | | | | | | | | | | | | | | |
| | 19,949 | | | | (60,622,755 | ) | | | (717,407 | ) | | | (4,776,707 | ) | | | (10,120,621 | ) | | | 3,086,408 | | | | 2,246,062 | | | | (7,324,022 | ) |
| | | | | | | | | | | | | | | | | | | | | | | | | | | | | | |
| | | | | | | |
| | | | | | | | | | | | | | | | | | | | | | | | | | | | | | |
| | (2,384,361 | ) | | | (1,862,258 | ) | | | (355,728 | ) | | | (562,003 | ) | | | (8,081,224 | ) | | | (19,178 | ) | | | (858,645 | ) | | | (1,354,446 | ) |
| | — | | | | — | | | | — | | | | — | | | | — | | | | — | | | | — | | | | — | |
| | (66,148 | ) | | | — | | | | — | | | | — | | | | — | | | | — | | | | — | | | | — | |
| | | | | | | | | | | | | | | | | | | | | | | | | | | | | | |
| | (2,450,509 | ) | | | (1,862,258 | ) | | | (355,728 | ) | | | (562,003 | ) | | | (8,081,224 | ) | | | (19,178 | ) | | | (858,645 | ) | | | (1,354,446 | ) |
| | | | | | | | | | | | | | | | | | | | | | | | | | | | | | |
| | | | | | | |
| | | | | | | | | | | | | | | | | | | | | | | | | | | | | | |
| | 17,607,844 | | | | 77,328,655 | | | | — | | | | — | | | | 190,264,696 | | | | 169,744,737 | | | | 2,210,526 | | | | — | |
| | (27,837,124 | ) | | | (221,746,185 | ) | | | (6,540,888 | ) | | | (3,600,407 | ) | | | (175,566,308 | ) | | | — | | | | (2,185,883 | ) | | | (13,112,366 | ) |
| | 59,744 | | | | 486,827 | | | | — | | | | — | | | | — | | | | — | | | | — | | | | — | |
| | | | | | | | | | | | | | | | | | | | | | | | | | | | | | |
| | (10,169,536 | ) | | | (143,930,703 | ) | | | (6,540,888 | ) | | | (3,600,407 | ) | | | 14,698,388 | | | | 169,744,737 | | | | 24,643 | | | | (13,112,366 | ) |
| | | | | | | | | | | | | | | | | | | | | | | | | | | | | | |
| | (12,600,096 | ) | | | (206,415,716 | ) | | | (7,614,023 | ) | | | (8,939,117 | ) | | | (3,503,457 | ) | | | 172,811,967 | | | | 1,412,060 | | | | (21,790,834 | ) |
| | | | | | | | | | | | | | | | | | | | | | | | | | | | | | |
| | | | | | | |
| | | | | | | | | | | | | | | | | | | | | | | | | | | | | | |
| | 196,268,067 | | | | 402,683,783 | | | | 27,871,662 | | | | 36,810,779 | | | | 172,811,967 | | | | — | | | | 22,578,262 | | | | 44,369,096 | |
| | | | | | | | | | | | | | | | | | | | | | | | | | | | | | |
| $ | 183,667,971 | | | $ | 196,268,067 | | | $ | 20,257,639 | | | $ | 27,871,662 | | | $ | 169,308,510 | | | $ | 172,811,967 | | | $ | 23,990,322 | | | $ | 22,578,262 | |
| | | | | | | | | | | | | | | | | | | | | | | | | | | | | | |
| $ | — | | | $ | 751,831 | | | $ | 24,233 | | | $ | 74,208 | | | $ | 1,252,324 | | | $ | 1,093,304 | | | $ | (49,496 | ) | | $ | 60,032 | |
| | | | | | | | | | | | | | | | | | | | | | | | | | | | | | |
| | | | | | | |
| | | | | | | | | | | | | | | | | | | | | | | | | | | | | | |
| | 1,100,000 | | | | 4,100,000 | | | | — | | | | — | | | | 7,850,000 | | | | 6,850,001 | | | | 50,000 | | | | — | |
| | (1,950,000 | ) | | | (13,150,000 | ) | | | (250,000 | ) | | | (100,000 | ) | | | (7,600,000 | ) | | | — | | | | (50,000 | ) | | | (300,000 | ) |
| | 12,250,000 | | | | 21,300,000 | | | | 900,000 | | | | 1,000,000 | | | | 6,850,001 | | | | — | | | | 500,000 | | | | 800,000 | |
| | | | | | | | | | | | | | | | | | | | | | | | | | | | | | |
| | 11,400,000 | | | | 12,250,000 | | | | 650,000 | | | | 900,000 | | | | 7,100,001 | | | | 6,850,001 | | | | 500,000 | | | | 500,000 | |
| | | | | | | | | | | | | | | | | �� | | | | | | | | | | | | | |
Statements of Changes in Net Assets (continued)
For the years ended October 31, 2016 and 2015
| | | | | | | | | | | | | | | | |
| | | PowerShares FTSE RAFI
Developed Markets ex-U.S.
Portfolio (PXF) | | | PowerShares FTSE RAFI
Developed Markets ex-U.S.
Small-Mid Portfolio (PDN) | |
| | | 2016 | | | 2015 | | | 2016 | | | 2015 | |
| Operations: | | | | | | | | | | | | | | | | |
Net investment income | | $ | 23,686,304 | | | $ | 23,816,453 | | | $ | 3,064,167 | | | $ | 2,021,602 | |
Net realized gain (loss) | | | (19,291,661 | ) | | | 34,388,849 | | | | (2,033,768 | ) | | | 804,550 | |
Net change in unrealized appreciation (depreciation) | | | (16,818,827 | ) | | | (91,805,638 | ) | | | 8,199,726 | | | | 1,293,636 | |
| | | | | | | | | | | | | | | | |
Net increase (decrease) in net assets resulting from operations | | | (12,424,184 | ) | | | (33,600,336 | ) | | | 9,230,125 | | | | 4,119,788 | |
| | | | | | | | | | | | | | | | |
| | | | |
| Distributions to Shareholders from: | | | | | | | | | | | | | | | | |
Net investment income | | | (23,487,004 | ) | | | (22,728,390 | ) | | | (3,521,834 | ) | | | (1,894,365 | ) |
| | | | | | | | | | | | | | | | |
| | | | |
| Shareholder Transactions: | | | | | | | | | | | | | | | | |
Proceeds from shares sold | | | 312,511,011 | | | | 293,870,441 | | | | 22,671,965 | | | | 42,312,799 | |
Value of shares repurchased | | | (125,486,253 | ) | | | (212,273,153 | ) | | | (9,146,629 | ) | | | (6,832,131 | ) |
| | | | | | | | | | | | | | | | |
Net increase (decrease) in net assets resulting from shares transactions | | | 187,024,758 | | | | 81,597,288 | | | | 13,525,336 | | | | 35,480,668 | |
| | | | | | | | | | | | | | | | |
Increase (Decrease) in Net Assets | | | 151,113,570 | | | | 25,268,562 | | | | 19,233,627 | | | | 37,706,091 | |
| | | | | | | | | | | | | | | | |
| | | | |
| Net Assets: | | | | | | | | | | | | | | | | |
Beginning of year | | | 787,535,998 | | | | 762,267,436 | | | | 143,620,661 | | | | 105,914,570 | |
| | | | | | | | | | | | | | | | |
End of year | | $ | 938,649,568 | | | $ | 787,535,998 | | | $ | 162,854,288 | | | $ | 143,620,661 | |
| | | | | | | | | | | | | | | | |
Undistributed net investment income at end of year | | $ | 4,136,553 | | | $ | 3,524,101 | | | $ | (182,450 | ) | | $ | (53,616 | ) |
| | | | | | | | | | | | | | | | |
| | | | |
| Changes in Shares Outstanding: | | | | | | | | | | | | | | | | |
Shares sold | | | 8,850,000 | | | | 7,200,000 | | | | 900,000 | | | | 1,650,000 | |
Shares repurchased | | | (3,700,000 | ) | | | (5,300,000 | ) | | | (350,000 | ) | | | (250,000 | ) |
Shares outstanding, beginning of year | | | 20,400,000 | | | | 18,500,000 | | | | 5,400,000 | | | | 4,000,000 | |
| | | | | | | | | | | | | | | | |
Shares outstanding, end of year | | | 25,550,000 | | | | 20,400,000 | | | | 5,950,000 | | | | 5,400,000 | |
| | | | | | | | | | | | | | | | |
See accompanying Notes to Financial Statements which are an integral part of the financial statements.
| | | | | | | | | | | | | | | | | | | | | | | | | | | | | | |
PowerShares FTSE RAFI
Emerging Markets Portfolio (PXH) | | | PowerShares Global Agriculture
Portfolio (PAGG) | | | PowerShares Global Clean
Energy Portfolio (PBD) | | | PowerShares Global Gold and
Precious Metals Portfolio (PSAU) | |
| 2016 | | | 2015 | | | 2016 | | | 2015 | | | 2016 | | | 2015 | | | 2016 | | | 2015 | |
| | | | | | | | | | | | | | | | | | | | | | | | | | | | | | |
| $ | 10,637,918 | | | $ | 10,907,508 | | | $ | 490,244 | | | $ | 1,067,505 | | | $ | 1,089,070 | | | $ | 747,926 | | | $ | 20,261 | | | $ | 121,891 | |
| | (27,749,304 | ) | | | (50,147,939 | ) | | | (5,208,054 | ) | | | (1,473,440 | ) | | | (4,597,582 | ) | | | 139,356 | | | | (1,858,027 | ) | | | (8,464,016 | ) |
| | 125,591,145 | | | | (54,090,317 | ) | | | 3,241,431 | | | | (4,361,616 | ) | | | (250,743 | ) | | | (6,858,965 | ) | | | 16,432,831 | | | | 871,806 | |
| | | | | | | | | | | | | | | | | | | | | | | | | | | | | | |
| | 108,479,759 | | | | (93,330,748 | ) | | | (1,476,379 | ) | | | (4,767,551 | ) | | | (3,759,255 | ) | | | (5,971,683 | ) | | | 14,595,065 | | | | (7,470,319 | ) |
| | | | | | | | | | | | | | | | | | | | | | | | | | | | | | |
| | | | | | | |
| | | | | | | | | | | | | | | | | | | | | | | | | | | | | | |
| | (11,147,902 | ) | | | (9,357,675 | ) | | | (520,195 | ) | | | (1,114,870 | ) | | | (1,139,789 | ) | | | (700,178 | ) | | | (25,870 | ) | | | (138,487 | ) |
| | | | | | | | | | | | | | | | | | | | | | | | | | | | | | |
| | | | | | | |
| | | | | | | | | | | | | | | | | | | | | | | | | | | | | | |
| | 259,038,350 | | | | 130,069,015 | | | | — | | | | — | | | | — | �� | | | 7,312,370 | | | | 27,894,011 | | | | 31,431,974 | |
| | (24,369,455 | ) | | | (121,183,360 | ) | | | (3,306,307 | ) | | | (22,211,750 | ) | | | (5,710,569 | ) | | | (11,166,396 | ) | | | (17,193,034 | ) | | | (24,650,928 | ) |
| | | | | | | | | | | | | | | | | | | | | | | | | | | | | | |
| | 234,668,895 | | | | 8,885,655 | | | | (3,306,307 | ) | | | (22,211,750 | ) | | | (5,710,569 | ) | | | (3,854,026 | ) | | | 10,700,977 | | | | 6,781,046 | |
| | | | | | | | | | | | | | | | | | | | | | | | | | | | | | |
| | 332,000,752 | | | | (93,802,768 | ) | | | (5,302,881 | ) | | | (28,094,171 | ) | | | (10,609,613 | ) | | | (10,525,887 | ) | | | 25,270,172 | | | | (827,760 | ) |
| | | | | | | | | | | | | | | | | | | | | | | | | | | | | | |
| | | | | | | |
| | | | | | | | | | | | | | | | | | | | | | | | | | | | | | |
| | 293,397,645 | | | | 387,200,413 | | | | 27,604,026 | | | | 55,698,197 | | | | 66,762,073 | | | | 77,287,960 | | | | 17,471,235 | | | | 18,298,995 | |
| | | | | | | | | | | | | | | | | | | | | | | | | | | | | | |
| $ | 625,398,397 | | | $ | 293,397,645 | | | $ | 22,301,145 | | | $ | 27,604,026 | | | $ | 56,152,460 | | | $ | 66,762,073 | | | $ | 42,741,407 | | | $ | 17,471,235 | |
| | | | | | | | | | | | | | | | | | | | | | | | | | | | | | |
| $ | 1,129,694 | | | $ | 1,841,046 | | | $ | 82,513 | | | $ | 104,045 | | | $ | 109,331 | | | $ | 177,490 | | | $ | 94,182 | | | $ | 22,670 | |
| | | | | | | | | | | | | | | | | | | | | | | | | | | | | | |
| | | | | | | |
| | | | | | | | | | | | | | | | | | | | | | | | | | | | | | |
| | 16,050,000 | | | | 6,950,000 | | | | — | | | | — | | | | — | | | | 600,000 | | | | 1,500,000 | | | | 1,700,000 | |
| | (1,800,000 | ) | | | (6,950,000 | ) | | | (150,000 | ) | | | (800,000 | ) | | | (550,000 | ) | | | (950,000 | ) | | | (800,000 | ) | | | (1,550,000 | ) |
| | 19,000,000 | | | | 19,000,000 | | | | 1,100,000 | | | | 1,900,000 | | | | 5,825,000 | | | | 6,175,000 | | | | 1,350,000 | | | | 1,200,000 | |
| | | | | | | | | | | | | | | | | | | | | | | | | | | | | | |
| | 33,250,000 | | | | 19,000,000 | | | | 950,000 | | | | 1,100,000 | | | | 5,275,000 | | | | 5,825,000 | | | | 2,050,000 | | | | 1,350,000 | |
| | | | | | | | | | | | | | | | | | | | | | | | | | | | | | |
Statements of Changes in Net Assets (continued)
For the years ended October 31, 2016 and 2015
| | | | | | | | | | | | | | | | |
| | | PowerShares Global Water
Portfolio (PIO) | | | PowerShares International BuyBack
AchieversTM Portfolio (IPKW) | |
| | | 2016 | | | 2015 | | | 2016 | | | 2015 | |
| Operations: | | | | | | | | | | | | | | | | |
Net investment income | | $ | 3,303,643 | | | $ | 3,408,468 | | | $ | 2,036,275 | | | $ | 569,472 | |
Net realized gain (loss) | | | 3,245,892 | | | | 2,198,876 | | | | 495,232 | | | | 336,383 | |
Net change in unrealized appreciation (depreciation) | | | (10,982,381 | ) | | | (20,237,082 | ) | | | 2,098,139 | | | | (74,980 | ) |
| | | | | | | | | | | | | | | | |
Net increase (decrease) in net assets resulting from operations | | | (4,432,846 | ) | | | (14,629,738 | ) | | | 4,629,646 | | | | 830,875 | |
| | | | | | | | | | | | | | | | |
| | | | |
| Distributions to Shareholders from: | | | | | | | | | | | | | | | | |
Net investment income | | | (2,943,188 | ) | | | (3,532,866 | ) | | | (2,039,215 | ) | | | (349,993 | ) |
Net realized gains | | | — | | | | — | | | | — | | | | — | |
| | | | | | | | | | | | | | | | |
Total distributions to shareholders | | | (2,943,188 | ) | | | (3,532,866 | ) | | | (2,039,215 | ) | | | (349,993 | ) |
| | | | | | | | | | | | | | | | |
| | | | |
| Shareholder Transactions: | | | | | | | | | | | | | | | | |
Proceeds from shares sold | | | — | | | | 6,128,370 | | | | 60,024,324 | | | | 63,225,930 | |
Value of shares repurchased | | | (45,790,737 | ) | | | (34,501,225 | ) | | | (28,511,244 | ) | | | (23,144,975 | ) |
| | | | | | | | | | | | | | | | |
Net increase (decrease) in net assets resulting from shares transactions | | | (45,790,737 | ) | | | (28,372,855 | ) | | | 31,513,080 | | | | 40,080,955 | |
| | | | | | | | | | | | | | | | |
Increase (Decrease) in Net Assets | | | (53,166,771 | ) | | | (46,535,459 | ) | | | 34,103,511 | | | | 40,561,837 | |
| | | | | | | | | | | | | | | | |
| | | | |
| Net Assets: | | | | | | | | | | | | | | | | |
Beginning of year | | | 241,831,680 | | | | 288,367,139 | | | | 58,098,681 | | | | 17,536,844 | |
| | | | | | | | | | | | | | | | |
End of year | | $ | 188,664,909 | | | $ | 241,831,680 | | | $ | 92,202,192 | | | $ | 58,098,681 | |
| | | | | | | | | | | | | | | | |
Undistributed net investment income at end of year | | $ | 649,550 | | | $ | 473,641 | | | $ | 383,421 | | | $ | 305,392 | |
| | | | | | | | | | | | | | | | |
| | | | |
| Changes in Shares Outstanding: | | | | | | | | | | | | | | | | |
Shares sold | | | — | | | | 250,000 | | | | 2,200,000 | | | | 2,300,000 | |
Shares repurchased | | | (2,200,000 | ) | | | (1,550,000 | ) | | | (1,050,000 | ) | | | (850,000 | ) |
Shares outstanding, beginning of year | | | 11,050,000 | | | | 12,350,000 | | | | 2,150,000 | | | | 700,000 | |
| | | | | | | | | | | | | | | | |
Shares outstanding, end of year | | | 8,850,000 | | | | 11,050,000 | | | | 3,300,000 | | | | 2,150,000 | |
| | | | | | | | | | | | | | | | |
| (a) | For the period October 6, 2015 (commencement of investment operations) through October 31, 2015. |
See accompanying Notes to Financial Statements which are an integral part of the financial statements.
| | | | | | | | | | | | | | |
PowerShares Japan Currency
Hedged Low Volatility Portfolio (FXJP) | | | PowerShares S&P International
Developed Quality Portfolio (IDHQ) | |
| 2016 | | | 2015(a) | | | 2016 | | | 2015 | |
| | | | | | | | | | | | | | |
| $ | 18,476 | | | $ | 243 | | | $ | 448,464 | | | $ | 291,587 | |
| | (111,213 | ) | | | — | | | | 225,395 | | | | 58,950 | |
| | (3,619 | ) | | | 144,395 | | | | (648,114 | ) | | | 527,727 | |
| | | | | | | | | | | | | | |
| | (96,356 | ) | | | 144,638 | | | | 25,745 | | | | 878,264 | |
| | | | | | | | | | | | | | |
| | | |
| | | | | | | | | | | | | | |
| | (10,051 | ) | | | — | | | | (448,611 | ) | | | (270,592 | ) |
| | (10,531 | ) | | | — | | | | — | | | | — | |
| | | | | | | | | | | | | | |
| | (20,582 | ) | | | — | | | | (448,611 | ) | | | (270,592 | ) |
| | | | | | | | | | | | | | |
| | | |
| | | | | | | | | | | | | | |
| | 1,241,552 | | | | 2,542,510 | | | | 16,658,112 | | | | 2,067,429 | |
| | (2,560,834 | ) | | | — | | | | (14,787,248 | ) | | | — | |
| | | | | | | | | | | | | | |
| | (1,319,282 | ) | | | 2,542,510 | | | | 1,870,864 | | | | 2,067,429 | |
| | | | | | | | | | | | | | |
| | (1,436,220 | ) | | | 2,687,148 | | | | 1,447,998 | | | | 2,675,101 | |
| | | | | | | | | | | | | | |
| | | |
| | | | | | | | | | | | | | |
| | 2,687,148 | | | | — | | | | 19,180,386 | | | | 16,505,285 | |
| | | | | | | | | | | | | | |
| $ | 1,250,928 | | | $ | 2,687,148 | | | $ | 20,628,384 | | | $ | 19,180,386 | |
| | | | | | | | | | | | | | |
| $ | 15,024 | | | $ | 243 | | | $ | 124,877 | | | $ | 63,450 | |
| | | | | | | | | | | | | | |
| | | |
| | | | | | | | | | | | | | |
| | 50,000 | | | | 100,001 | | | | 850,000 | | | | 100,000 | |
| | (100,000 | ) | | | — | | | | (750,000 | ) | | | — | |
| | 100,001 | | | | — | | | | 950,000 | | | | 850,000 | |
| | | | | | | | | | | | | | |
| | 50,001 | | | | 100,001 | | | | 1,050,000 | | | | 950,000 | |
| | | | | | | | | | | | | | |
Financial Highlights
PowerShares Developed EuroPacific Currency Hedged Low Volatility Portfolio (FXEP)
| | | | | | | | | | | | | | | | | | | | |
| | | Year Ended
October 31, 2016 | | | For the Period
October 6, 2015(a)
Through
October 31, 2015 | | | | | | | | | | |
| | | | | | | | | | | | |
| Per Share Operating Performance: | | | | | | | | | | | | | | | | | | | | |
Net asset value at beginning of period | | $ | 26.56 | | | $ | 25.66 | | | | | | | | | | | | | |
Net investment income(b) | | | 0.81 | | | | 0.03 | | | | | | | | | | | | | |
Net realized and unrealized gain (loss) on investments | | | (0.29 | ) | | | 0.87 | | | | | | | | | | | | | |
Total from investment operations | | | 0.52 | | | | 0.90 | | | | | | | | | | | | | |
Distributions to shareholders from: | | | | | | | | | | | | | | | | | | | | |
Net investment income | | | (0.79 | ) | | | — | | | | | | | | | | | | | |
Net realized gains | | | (0.10 | ) | | | — | | | | | | | | | | | | | |
Total distributions | | | (0.89 | ) | | | — | | | | | | | | | | | | | |
Net asset value at end of period | | $ | 26.19 | | | $ | 26.56 | | | | | | | | | | | | | |
Market price at end of period(c) | | $ | 26.16 | | | $ | 26.52 | | | | | | | | | | | | | |
| Net Asset Value Total Return(d) | | | 2.04 | % | | | 3.51 | %(e) | | | | | | | | | | | | |
| Market Price Total Return(d) | | | 2.06 | % | | | 3.35 | %(e) | | | | | | | | | | | | |
| Ratios/Supplemental Data: | | | | | | | | | | | | | | | | | | | | |
Net assets at end of period (000’s omitted) | | $ | 1,310 | | | $ | 2,656 | | | | | | | | | | | | | |
Ratio to average net assets of: | | | | | | | | | | | | | | | | | | | | |
Expenses | | | 0.25 | % | | | 0.25 | %(f) | | | | | | | | | | | | |
Net investment income | | | 3.09 | % | | | 2.05 | %(f) | | | | | | | | | | | | |
Portfolio turnover rate(g) | | | 75 | % | | | 0 | %(h) | | | | | | | | | | | | |
| (a) | Commencement of investment operations. |
| (b) | Based on average shares outstanding. |
| (c) | The mean between the last bid and ask prices. |
| (d) | Net asset value total return is calculated assuming an initial investment made at the net asset value at the beginning of the period, reinvestment of all dividends and distributions at net asset value during the period, and redemption on the last day of the period. Net asset value total return includes adjustments in accordance with accounting principles generally accepted in the United States of America and as such, the net asset value for financial reporting purposes and the returns based upon those net asset values may differ from the net asset value and returns for shareholder transactions. Market price total return is calculated assuming an initial investment made at the market price at the beginning of the period, reinvestment of all dividends and distributions at market price during the period, and sale at the market price on the last day of the period. Total investment returns calculated for a period of less than one year are not annualized. |
| (e) | The net asset value total return from Fund Inception (October 9, 2015, the first day of trading on the exchange) to October 31, 2015 was 2.47%. The market price total return from Fund Inception to October 31, 2015 was 2.20%. |
| (g) | Portfolio turnover rate is not annualized for periods less than one year, if applicable, and does not include securities received or delivered from processing creations or redemptions. |
| (h) | Amount represents less than 0.5%. |
PowerShares DWA Developed Markets Momentum Portfolio (PIZ)
| | | | | | | | | | | | | | | | | | | | |
| | | Year Ended October 31, | |
| | | 2016 | | | 2015 | | | 2014 | | | 2013 | | | 2012 | |
| Per Share Operating Performance: | | | | | | | | | | | | | | | | | | | | |
Net asset value at beginning of year | | $ | 23.36 | | | $ | 24.49 | | | $ | 25.39 | | | $ | 19.33 | | | $ | 18.85 | |
Net investment income(a) | | | 0.35 | | | | 0.27 | | | | 0.38 | | | | 0.35 | | | | 0.40 | |
Net realized and unrealized gain (loss) on investments | | | (1.04 | ) | | | (1.15 | ) | | | (0.43 | ) | | | 6.00 | | | | 0.56 | |
Total from investment operations | | | (0.69 | ) | | | (0.88 | ) | | | (0.05 | ) | | | 6.35 | | | | 0.96 | |
Distributions to shareholders from: | | | | | | | | | | | | | | | | | | | | |
Net investment income | | | (0.38 | ) | | | (0.25 | ) | | | (0.85 | ) | | | (0.29 | ) | | | (0.48 | ) |
Net asset value at end of year | | $ | 22.29 | | | $ | 23.36 | | | $ | 24.49 | | | $ | 25.39 | | | $ | 19.33 | |
Market price at end of year(b) | | $ | 22.27 | | | $ | 23.21 | | | $ | 24.55 | | | $ | 25.47 | | | $ | 19.44 | |
| Net Asset Value Total Return(c) | | | (2.97 | )% | | | (3.63 | )% | | | (0.35 | )% | | | 33.09 | % | | | 5.43 | % |
| Market Price Total Return(c) | | | (2.43 | )% | | | (4.48 | )% | | | (0.43 | )% | | | 32.75 | % | | | 6.99 | % |
| Ratios/Supplemental Data: | | | | | | | | | | | | | | | | | | | | |
Net assets at end of year (000’s omitted) | | $ | 173,891 | | | $ | 263,996 | | | $ | 383,322 | | | $ | 507,811 | | | $ | 65,735 | |
Ratio to average net assets of: | | | | | | | | | | | | | | | | | | | | |
Expenses | | | 0.81 | % | | | 0.81 | % | | | 0.80 | % | | | 0.81 | % | | | 0.80 | % |
Net investment income | | | 1.50 | % | | | 1.10 | % | | | 1.48 | % | | | 1.55 | % | | | 2.19 | % |
Portfolio turnover rate(d) | | | 124 | % | | | 120 | % | | | 99 | % | | | 96 | % | | | 133 | % |
| (a) | Based on average shares outstanding. |
| (b) | The mean between the last bid and ask prices. |
| (c) | Net asset value total return is calculated assuming an initial investment made at the net asset value at the beginning of the period, reinvestment of all dividends and distributions at net asset value during the period, and redemption on the last day of the period. Net asset value total return includes adjustments in accordance with accounting principles generally accepted in the United States of America and as such, the net asset value for financial reporting purposes and the returns based upon those net asset values may differ from the net asset value and returns for shareholder transactions. Market price total return is calculated assuming an initial investment made at the market price at the beginning of the period, reinvestment of all dividends and distributions at market price during the period, and sale at the market price on the last day of the period. Total investment returns calculated for a period of less than one year are not annualized. |
| (d) | Portfolio turnover rate is not annualized for periods less than one year, if applicable, and does not include securities received or delivered from processing creations or redemptions. |
See accompanying Notes to Financial Statements which are an integral part of the financial statements.
Financial Highlights (continued)
PowerShares DWA Emerging Markets Momentum Portfolio (PIE)
| | | | | | | | | | | | | | | | | | | | |
| | | Year Ended October 31, | |
| | | 2016 | | | 2015 | | | 2014 | | | 2013 | | | 2012 | |
| Per Share Operating Performance: | | | | | | | | | | | | | | | | | | | | |
Net asset value at beginning of year | | $ | 16.02 | | | $ | 18.91 | | | $ | 18.78 | | | $ | 17.44 | | | $ | 16.33 | |
Net investment income(a) | | | 0.16 | | | | 0.12 | | | | 0.13 | | | | 0.24 | | | | 0.19 | |
Net realized and unrealized gain (loss) on investments | | | 0.14 | (b) | | | (2.94 | ) | | | 0.08 | | | | 1.24 | | | | 1.12 | |
Total from investment operations | | | 0.30 | | | | (2.82 | ) | | | 0.21 | | | | 1.48 | | | | 1.31 | |
Distributions to shareholders from: | | | | | | | | | | | | | | | | | | | | |
Net investment income | | | (0.21 | ) | | | (0.10 | ) | | | (0.10 | ) | | | (0.16 | ) | | | (0.20 | ) |
Return of capital | | | (0.01 | ) | | | — | | | | — | | | | — | | | | — | |
Total distributions | | | (0.22 | ) | | | (0.10 | ) | | | (0.10 | ) | | | (0.16 | ) | | | (0.20 | ) |
Transaction fees(a) | | | 0.01 | | | | 0.03 | | | | 0.02 | | | | 0.02 | | | | — | |
Net asset value at end of year | | $ | 16.11 | | | $ | 16.02 | | | $ | 18.91 | | | $ | 18.78 | | | $ | 17.44 | |
Market price at end of year(c) | | $ | 16.10 | | | $ | 15.97 | | | $ | 18.79 | | | $ | 18.76 | | | $ | 17.48 | |
| Net Asset Value Total Return(d) | | | 2.00 | %(b) | | | (14.78 | )% | | | 1.27 | % | | | 8.66 | % | | | 8.12 | % |
| Market Price Total Return(d) | | | 2.25 | % | | | (14.50 | )% | | | 0.74 | % | | | 8.29 | % | | | 8.84 | % |
| Ratios/Supplemental Data: | | | | | | | | | | | | | | | | | | | | |
Net assets at end of year (000’s omitted) | | $ | 183,668 | | | $ | 196,268 | | | $ | 402,684 | | | $ | 373,792 | | | $ | 182,842 | |
Ratio to average net assets of: | | | | | | | | | | | | | | | | | | | | |
Expenses | | | 0.90 | % | | | 0.90 | % | | | 0.90 | % | | | 0.91 | % | | | 0.90 | % |
Net investment income | | | 1.04 | % | | | 0.68 | % | | | 0.69 | % | | | 1.26 | % | | | 1.12 | % |
Portfolio turnover rate(e) | | | 160 | % | | | 176 | % | | | 147 | % | | | 142 | % | | | 181 | % |
| (a) | Based on average shares outstanding. |
| (b) | Includes settlement proceeds recorded during the period. Had these settlement proceeds not been recorded Net realized and unrealized gain (loss) on investments per share would have been $0.10 and total return would have been lower. |
| (c) | The mean between the last bid and ask prices. |
| (d) | Net asset value total return is calculated assuming an initial investment made at the net asset value at the beginning of the period, reinvestment of all dividends and distributions at net asset value during the period, and redemption on the last day of the period. Net asset value total return includes adjustments in accordance with accounting principles generally accepted in the United States of America and as such, the net asset value for financial reporting purposes and the returns based upon those net asset values may differ from the net asset value and returns for shareholder transactions. Market price total return is calculated assuming an initial investment made at the market price at the beginning of the period, reinvestment of all dividends and distributions at market price during the period, and sale at the market price on the last day of the period. Total investment returns calculated for a period of less than one year are not annualized. |
| (e) | Portfolio turnover rate is not annualized for periods less than one year, if applicable, and does not include securities received or delivered from processing creations or redemptions. |
PowerShares Emerging Markets Infrastructure Portfolio (PXR)
| | | | | | | | | | | | | | | | | | | | |
| | | Year Ended October 31, | |
| | | 2016 | | | 2015 | | | 2014 | | | 2013 | | | 2012 | |
| Per Share Operating Performance: | | | | | | | | | | | | | | | | | | | | |
Net asset value at beginning of year | | $ | 30.97 | | | $ | 36.81 | | | $ | 38.71 | | | $ | 40.15 | | | $ | 40.96 | |
Net investment income(a) | | | 0.45 | | | | 0.60 | | | | 0.53 | | | | 0.54 | | | | 0.58 | |
Net realized and unrealized gain (loss) on investments | | | 0.26 | (b) | | | (5.83 | ) | | | (1.74 | ) | | | (1.48 | ) | | | (0.57 | ) |
Total from investment operations | | | 0.71 | | | | (5.23 | ) | | | (1.21 | ) | | | (0.94 | ) | | | 0.01 | |
Distributions to shareholders from: | | | | | | | | | | | | | | | | | | | | |
Net investment income | | | (0.51 | ) | | | (0.61 | ) | | | (0.69 | ) | | | (0.50 | ) | | | (0.82 | ) |
Net asset value at end of year | | $ | 31.17 | | | $ | 30.97 | | | $ | 36.81 | | | $ | 38.71 | | | $ | 40.15 | |
Market price at end of year(c) | | $ | 31.10 | | | $ | 30.67 | | | $ | 36.62 | | | $ | 38.31 | | | $ | 39.90 | |
| Net Asset Value Total Return(d) | | | 2.44 | %(b) | | | (14.36 | )% | | | (3.16 | )% | | | (2.35 | )% | | | 0.13 | % |
| Market Price Total Return(d) | | | 3.21 | % | | | (14.74 | )% | | | (2.65 | )% | | | (2.75 | )% | | | 0.15 | % |
| Ratios/Supplemental Data: | | | | | | | | | | | | | | | | | | | | |
Net assets at end of year (000’s omitted) | | $ | 20,258 | | | $ | 27,872 | | | $ | 36,811 | | | $ | 71,615 | | | $ | 94,351 | |
Ratio to average net assets of: | | | | | | | | | | | | | | | | | | | | |
Expenses | | | 0.75 | % | | | 0.77 | % | | | 0.76 | % | | | 0.76 | % | | | 0.75 | % |
Net investment income | | | 1.54 | % | | | 1.69 | % | | | 1.42 | % | | | 1.35 | % | | | 1.46 | % |
Portfolio turnover rate(e) | | | 28 | % | | | 34 | % | | | 20 | % | | | 30 | % | | | 20 | % |
| (a) | Based on average shares outstanding. |
| (b) | Includes settlement proceeds recorded during the period. Had these settlement proceeds not been recorded Net realized and unrealized gain (loss) on investments per share would have been $0.06 and total return would have been lower. |
| (c) | The mean between the last bid and ask prices. |
| (d) | Net asset value total return is calculated assuming an initial investment made at the net asset value at the beginning of the period, reinvestment of all dividends and distributions at net asset value during the period, and redemption on the last day of the period. Net asset value total return includes adjustments in accordance with accounting principles generally accepted in the United States of America and as such, the net asset value for financial reporting purposes and the returns based upon those net asset values may differ from the net asset value and returns for shareholder transactions. Market price total return is calculated assuming an initial investment made at the market price at the beginning of the period, reinvestment of all dividends and distributions at market price during the period, and sale at the market price on the last day of the period. Total investment returns calculated for a period of less than one year are not annualized. |
| (e) | Portfolio turnover rate is not annualized for periods less than one year, if applicable, and does not include securities received or delivered from processing creations or redemptions. |
See accompanying Notes to Financial Statements which are an integral part of the financial statements.
Financial Highlights (continued)
PowerShares Europe Currency Hedged Low Volatility Portfolio (FXEU)
| | | | | | | | | | | | | | | | | | | | |
| | | Year Ended
October 31, 2016 | | | For the Period
May 4, 2015(a)
Through
October 31, 2015 | | | | | | | | | | |
| | | | | | | | | | | | |
| Per Share Operating Performance: | | | | | | | | | | | | | | | | | | | | |
Net asset value at beginning of period | | $ | 25.23 | | | $ | 25.14 | | | | | | | | | | | | | |
Net investment income(b) | | | 0.86 | | | | 0.11 | | | | | | | | | | | | | |
Net realized and unrealized gain (loss) on investments | | | (1.38 | ) | | | 0.17 | | | | | | | | | | | | | |
Total from investment operations | | | (0.52 | ) | | | 0.28 | | | | | | | | | | | | | |
Distributions to shareholders from: | | | | | | | | | | | | | | | | | | | | |
Net investment income | | | (0.86 | ) | | | (0.19 | ) | | | | | | | | | | | | |
Net asset value at end of period | | $ | 23.85 | | | $ | 25.23 | | | | | | | | | | | | | |
Market price at end of period(c) | | $ | 23.83 | | | $ | 25.21 | | | | | | | | | | | | | |
| Net Asset Value Total Return(d) | | | (2.00 | )% | | | 1.16 | %(e) | | | | | | | | | | | | |
| Market Price Total Return(d) | | | (2.02 | )% | | | 1.08 | %(e) | | | | | | | | | | | | |
| Ratios/Supplemental Data: | | | | | | | | | | | | | | | | | | | | |
Net assets at end of period (000’s omitted) | | $ | 169,309 | | | $ | 172,812 | | | | | | | | | | | | | |
Ratio to average net assets of: | | | | | | | | | | | | | | | | | | | | |
Expenses | | | 0.25 | % | | | 0.25 | %(f) | | | | | | | | | | | | |
Net investment income | | | 3.59 | % | | | 0.95 | %(f) | | | | | | | | | | | | |
Portfolio turnover rate(g) | | | 77 | % | | | 26 | % | | | | | | | | | | | | |
| (a) | Commencement of investment operations. |
| (b) | Based on average shares outstanding. |
| (c) | The mean between the last bid and ask prices. |
| (d) | Net asset value total return is calculated assuming an initial investment made at the net asset value at the beginning of the period, reinvestment of all dividends and distributions at net asset value during the period, and redemption on the last day of the period. Net asset value total return includes adjustments in accordance with accounting principles generally accepted in the United States of America and as such, the net asset value for financial reporting purposes and the returns based upon those net asset values may differ from the net asset value and returns for shareholder transactions. Market price total return is calculated assuming an initial investment made at the market price at the beginning of the period, reinvestment of all dividends and distributions at market price during the period, and sale at the market price on the last day of the period. Total investment returns calculated for a period of less than one year are not annualized. |
| (e) | The net asset value total return from Fund Inception (May 7, 2015, the first day of trading on the exchange) to October 31, 2015 was 3.68%. The market price total return from Fund Inception to October 31, 2015 was 3.25%. |
| (g) | Portfolio turnover rate is not annualized for periods less than one year, if applicable, and does not include securities received or delivered from processing creations or redemptions. |
PowerShares FTSE RAFI Asia Pacific ex-Japan Portfolio (PAF)
| | | | | | | | | | | | | | | | | | | | |
| | | Year Ended October 31, | |
| | | 2016 | | | 2015 | | | 2014 | | | 2013 | | | 2012 | |
| Per Share Operating Performance: | | | | | | | | | | | | | | | | | | | | |
Net asset value at beginning of year | | $ | 45.16 | | | $ | 55.46 | | | $ | 58.66 | | | $ | 54.04 | | | $ | 51.15 | |
Net investment income(a) | | | 1.41 | | | | 1.98 | (b) | | | 1.77 | | | | 1.54 | | | | 1.37 | |
Net realized and unrealized gain (loss) on investments | | | 3.13 | | | | (10.57 | ) | | | (3.17 | ) | | | 5.07 | | | | 2.99 | |
Total from investment operations | | | 4.54 | | | | (8.59 | ) | | | (1.40 | ) | | | 6.61 | | | | 4.36 | |
Distributions to shareholders from: | | | | | | | | | | | | | | | | | | | | |
Net investment income | | | (1.72 | ) | | | (1.71 | ) | | | (1.80 | ) | | | (1.99 | ) | | | (1.47 | ) |
Net asset value at end of year | | $ | 47.98 | | | $ | 45.16 | | | $ | 55.46 | | | $ | 58.66 | | | $ | 54.04 | |
Market price at end of year(c) | | $ | 47.75 | | | $ | 45.08 | | | $ | 55.40 | | | $ | 58.38 | | | $ | 53.84 | |
| Net Asset Value Total Return(d) | | | 10.52 | % | | | (15.78 | )% | | | (2.38 | )% | | | 12.50 | % | | | 8.92 | % |
| Market Price Total Return(d) | | | 10.21 | % | | | (15.83 | )% | | | (2.02 | )% | | | 12.38 | % | | | 9.33 | % |
| Ratios/Supplemental Data: | | | | | | | | | | | | | | | | | | | | |
Net assets at end of year (000’s omitted) | | $ | 23,990 | | | $ | 22,578 | | | $ | 44,369 | | | $ | 49,861 | | | $ | 56,743 | |
Ratio to average net assets of: | | | | | | | | | | | | | | | | | | | | |
Expenses, after Waivers | | | 0.49 | % | | | 0.49 | % | | | 0.49 | % | | | 0.51 | % | | | 0.80 | % |
Expenses, prior to Waivers | | | 0.49 | % | | | 0.49 | % | | | 0.49 | % | | | 0.53 | % | | | 0.80 | % |
Net investment income, after Waivers | | | 3.16 | % | | | 3.93 | %(b) | | | 3.10 | % | | | 2.74 | % | | | 2.72 | % |
Portfolio turnover rate(e) | | | 20 | % | | | 19 | % | | | 16 | % | | | 32 | % | | | 14 | % |
| (a) | Based on average shares outstanding. |
| (b) | Net investment income per share and the ratio of net investment income to average net assets include a significant dividend received during the period. Net investment income per share and the ratio of net investment income to average net assets excluding the significant dividend are $1.75 and 3.46%, respectively. |
| (c) | The mean between the last bid and ask prices. |
| (d) | Net asset value total return is calculated assuming an initial investment made at the net asset value at the beginning of the period, reinvestment of all dividends and distributions at net asset value during the period, and redemption on the last day of the period. Net asset value total return includes adjustments in accordance with accounting principles generally accepted in the United States of America and as such, the net asset value for financial reporting purposes and the returns based upon those net asset values may differ from the net asset value and returns for shareholder transactions. Market price total return is calculated assuming an initial investment made at the market price at the beginning of the period, reinvestment of all dividends and distributions at market price during the period, and sale at the market price on the last day of the period. Total investment returns calculated for a period of less than one year are not annualized. |
| (e) | Portfolio turnover rate is not annualized for periods less than one year, if applicable, and does not include securities received or delivered from processing creations or redemptions. |
See accompanying Notes to Financial Statements which are an integral part of the financial statements.
Financial Highlights (continued)
PowerShares FTSE RAFI Developed Markets ex-U.S. Portfolio (PXF)
| | | | | | | | | | | | | | | | | | | | |
| | | Year Ended October 31, | |
| | | 2016 | | | 2015 | | | 2014 | | | 2013 | | | 2012 | |
| Per Share Operating Performance: | | | | | | | | | | | | | | | | | | | | |
Net asset value at beginning of year | | $ | 38.60 | | | $ | 41.20 | | | $ | 42.99 | | | $ | 34.18 | | | $ | 35.10 | |
Net investment income(a) | | | 1.09 | | | | 1.16 | | | | 1.55 | (b) | | | 1.08 | | | | 0.99 | |
Net realized and unrealized gain (loss) on investments | | | (1.82 | ) | | | (2.65 | ) | | | (1.79 | ) | | | 8.75 | | | | (0.90 | ) |
Total from investment operations | | | (0.73 | ) | | | (1.49 | ) | | | (0.24 | ) | | | 9.83 | | | | 0.09 | |
Distributions to shareholders from: | | | | | | | | | | | | | | | | | | | | |
Net investment income | | | (1.13 | ) | | | (1.11 | ) | | | (1.55 | ) | | | (1.02 | ) | | | (1.01 | ) |
Net asset value at end of year | | $ | 36.74 | | | $ | 38.60 | | | $ | 41.20 | | | $ | 42.99 | | | $ | 34.18 | |
Market price at end of year(c) | | $ | 36.68 | | | $ | 38.34 | | | $ | 41.71 | | | $ | 43.23 | | | $ | 34.29 | |
| Net Asset Value Total Return(d) | | | (1.73 | )% | | | (3.72 | )% | | | (0.72 | )% | | | 29.20 | % | | | 0.53 | % |
| Market Price Total Return(d) | | | (1.24 | )% | | | (5.55 | )% | | | (0.07 | )% | | | 29.49 | % | | | 2.35 | % |
| Ratios/Supplemental Data: | | | | | | | | | | | | | | | | | | | | |
Net assets at end of year (000’s omitted) | | $ | 938,650 | | | $ | 787,536 | | | $ | 762,267 | | | $ | 649,172 | | | $ | 283,715 | |
Ratio to average net assets of: | | | | | | | | | | | | | | | | | | | | |
Expenses, after Waivers | | | 0.45 | % | | | 0.46 | % | | | 0.45 | % | | | 0.48 | % | | | 0.75 | % |
Expenses, prior to Waivers | | | 0.45 | % | | | 0.46 | % | | | 0.45 | % | | | 0.49 | % | | | 0.75 | % |
Net investment income, after Waivers | | | 3.05 | % | | | 2.87 | % | | | 3.57 | %(b) | | | 2.82 | % | | | 2.99 | % |
Portfolio turnover rate(e) | | | 14 | % | | | 12 | % | | | 16 | % | | | 17 | % | | | 17 | % |
| (a) | Based on average shares outstanding. |
| (b) | Net investment income per share and the ratio of net investment income to average net assets include a significant dividend received during the period. Net investment income per share and the ratio of net investment income to average net assets excluding the significant dividend are $1.31 and 3.00%, respectively. |
| (c) | The mean between the last bid and ask prices. |
| (d) | Net asset value total return is calculated assuming an initial investment made at the net asset value at the beginning of the period, reinvestment of all dividends and distributions at net asset value during the period, and redemption on the last day of the period. Net asset value total return includes adjustments in accordance with accounting principles generally accepted in the United States of America and as such, the net asset value for financial reporting purposes and the returns based upon those net asset values may differ from the net asset value and returns for shareholder transactions. Market price total return is calculated assuming an initial investment made at the market price at the beginning of the period, reinvestment of all dividends and distributions at market price during the period, and sale at the market price on the last day of the period. Total investment returns calculated for a period of less than one year are not annualized. |
| (e) | Portfolio turnover rate is not annualized for periods less than one year, if applicable, and does not include securities received or delivered from processing creations or redemptions. |
PowerShares FTSE RAFI Developed Markets ex-U.S. Small-Mid Portfolio (PDN)
| | | | | | | | | | | | | | | | | | | | |
| | | Year Ended October 31, | |
| | | 2016 | | | 2015 | | | 2014 | | | 2013 | | | 2012 | |
| Per Share Operating Performance: | | | | | | | | | | | | | | | | | | | | |
Net asset value at beginning of year | | $ | 26.60 | | | $ | 26.48 | | | $ | 27.40 | | | $ | 22.18 | | | $ | 22.40 | |
Net investment income(a) | | | 0.53 | | | | 0.46 | | | | 0.48 | | | | 0.44 | | | | 0.40 | |
Net realized and unrealized gain (loss) on investments | | | 0.86 | | | | 0.12 | | | | (0.79 | ) | | | 5.36 | | | | (0.15 | ) |
Total from investment operations | | | 1.39 | | | | 0.58 | | | | (0.31 | ) | | | 5.80 | | | | 0.25 | |
Distributions to shareholders from: | | | | | | | | | | | | | | | | | | | | |
Net investment income | | | (0.62 | ) | | | (0.46 | ) | | | (0.61 | ) | | | (0.58 | ) | | | (0.47 | ) |
Net asset value at end of year | | $ | 27.37 | | | $ | 26.60 | | | $ | 26.48 | | | $ | 27.40 | | | $ | 22.18 | |
Market price at end of year(b) | | $ | 27.30 | | | $ | 26.66 | | | $ | 27.11 | | | $ | 27.87 | | | $ | 22.30 | |
| Net Asset Value Total Return(c) | | | 5.37 | % | | | 2.18 | % | | | (1.21 | )% | | | 26.56 | % | | | 1.32 | % |
| Market Price Total Return(c) | | | 4.87 | % | | | 0.01 | % | | | (0.58 | )% | | | 28.00 | % | | | 4.40 | % |
| Ratios/Supplemental Data: | | | | | | | | | | | | | | | | | | | | |
Net assets at end of year (000’s omitted) | | $ | 162,854 | | | $ | 143,621 | | | $ | 105,915 | | | $ | 98,656 | | | $ | 59,880 | |
Ratio to average net assets of: | | | | | | | | | | | | | | | | | | | | |
Expenses, after Waivers | | | 0.49 | % | | | 0.50 | % | | | 0.49 | % | | | 0.52 | % | | | 0.75 | % |
Expenses, prior to Waivers | | | 0.49 | % | | | 0.50 | % | | | 0.49 | % | | | 0.54 | % | | | 0.75 | % |
Net investment income, after Waivers | | | 2.01 | % | | | 1.73 | % | | | 1.73 | % | | | 1.78 | % | | | 1.84 | % |
Portfolio turnover rate(d) | | | 25 | % | | | 24 | % | | | 24 | % | | | 27 | % | | | 28 | % |
| (a) | Based on average shares outstanding. |
| (b) | The mean between the last bid and ask prices. |
| (c) | Net asset value total return is calculated assuming an initial investment made at the net asset value at the beginning of the period, reinvestment of all dividends and distributions at net asset value during the period, and redemption on the last day of the period. Net asset value total return includes adjustments in accordance with accounting principles generally accepted in the United States of America and as such, the net asset value for financial reporting purposes and the returns based upon those net asset values may differ from the net asset value and returns for shareholder transactions. Market price total return is calculated assuming an initial investment made at the market price at the beginning of the period, reinvestment of all dividends and distributions at market price during the period, and sale at the market price on the last day of the period. Total investment returns calculated for a period of less than one year are not annualized. |
| (d) | Portfolio turnover rate is not annualized for periods less than one year, if applicable, and does not include securities received or delivered from processing creations or redemptions. |
See accompanying Notes to Financial Statements which are an integral part of the financial statements.
Financial Highlights (continued)
PowerShares FTSE RAFI Emerging Markets Portfolio (PXH)
| | | | | | | | | | | | | | | | | | | | |
| | | Year Ended October 31, | |
| | | 2016 | | | 2015 | | | 2014 | | | 2013 | | | 2012 | |
| Per Share Operating Performance: | | | | | | | | | | | | | | | | | | | | |
Net asset value at beginning of year | | $ | 15.44 | | | $ | 20.38 | | | $ | 21.41 | | | $ | 21.20 | | | $ | 21.75 | |
Net investment income(a) | | | 0.42 | | | | 0.53 | | | | 0.60 | | | | 0.56 | | | | 0.50 | |
Net realized and unrealized gain (loss) on investments | | | 3.37 | | | | (5.02 | ) | | | (1.02 | ) | | | 0.19 | | | | (0.44 | ) |
Total from investment operations | | | 3.79 | | | | (4.49 | ) | | | (0.42 | ) | | | 0.75 | | | | 0.06 | |
Distributions to shareholders from: | | | | | | | | | | | | | | | | | | | | |
Net investment income | | | (0.42 | ) | | | (0.45 | ) | | | (0.61 | ) | | | (0.54 | ) | | | (0.61 | ) |
Net asset value at end of year | | $ | 18.81 | | | $ | 15.44 | | | $ | 20.38 | | | $ | 21.41 | | | $ | 21.20 | |
Market price at end of year(b) | | $ | 18.80 | | | $ | 15.37 | | | $ | 20.25 | | | $ | 21.21 | | | $ | 21.11 | |
| Net Asset Value Total Return(c) | | | 25.08 | % | | | (22.16 | )% | | | (2.03 | )% | | | 3.67 | % | | | 0.37 | % |
| Market Price Total Return(c) | | | 25.57 | % | | | (22.00 | )% | | | (1.73 | )% | | | 3.14 | % | | | (0.29 | )% |
| Ratios/Supplemental Data: | | | | | | | | | | | | | | | | | | | | |
Net assets at end of year (000’s omitted) | | $ | 625,398 | | | $ | 293,398 | | | $ | 387,200 | | | $ | 367,102 | | | $ | 375,161 | |
Ratio to average net assets of: | | | | | | | | | | | | | | | | | | | | |
Expenses, after Waivers | | | 0.48 | % | | | 0.49 | % | | | 0.49 | % | | | 0.52 | % | | | 0.85 | % |
Expenses, prior to Waivers | | | 0.49 | % | | | 0.49 | % | | | 0.49 | % | | | 0.54 | % | | | 0.85 | % |
Net investment income, after Waivers | | | 2.66 | % | | | 2.88 | % | | | 2.91 | % | | | 2.66 | % | | | 2.34 | % |
Portfolio turnover rate(d) | | | 16 | % | | | 34 | % | | | 22 | % | | | 24 | % | | | 33 | % |
| (a) | Based on average shares outstanding. |
| (b) | The mean between the last bid and ask prices. |
| (c) | Net asset value total return is calculated assuming an initial investment made at the net asset value at the beginning of the period, reinvestment of all dividends and distributions at net asset value during the period, and redemption on the last day of the period. Net asset value total return includes adjustments in accordance with accounting principles generally accepted in the United States of America and as such, the net asset value for financial reporting purposes and the returns based upon those net asset values may differ from the net asset value and returns for shareholder transactions. Market price total return is calculated assuming an initial investment made at the market price at the beginning of the period, reinvestment of all dividends and distributions at market price during the period, and sale at the market price on the last day of the period. Total investment returns calculated for a period of less than one year are not annualized. |
| (d) | Portfolio turnover rate is not annualized for periods less than one year, if applicable, and does not include securities received or delivered from processing creations or redemptions. |
PowerShares Global Agriculture Portfolio (PAGG)
| | | | | | | | | | | | | | | | | | | | |
| | | Year Ended October 31, | |
| | | 2016 | | | 2015 | | | 2014 | | | 2013 | | | 2012 | |
| Per Share Operating Performance: | | | | | | | | | | | | | | | | | | | | |
Net asset value at beginning of year | | $ | 25.09 | | | $ | 29.31 | | | $ | 29.60 | | | $ | 29.82 | | | $ | 29.71 | |
Net investment income(a) | | | 0.48 | | | | 0.68 | | | | 0.69 | (b) | | | 0.49 | | | | 0.35 | |
Net realized and unrealized gain (loss) on investments | | | (1.59 | ) | | | (4.17 | ) | | | (0.29 | ) | | | (0.22 | ) | | | 0.15 | (c) |
Total from investment operations | | | (1.11 | ) | | | (3.49 | ) | | | 0.40 | | | | 0.27 | | | | 0.50 | |
Distributions to shareholders from: | | | | | | | | | | | | | | | | | | | | |
Net investment income | | | (0.51 | ) | | | (0.73 | ) | | | (0.69 | ) | | | (0.49 | ) | | | (0.39 | ) |
Net asset value at end of year | | $ | 23.47 | | | $ | 25.09 | | | $ | 29.31 | | | $ | 29.60 | | | $ | 29.82 | |
Market price at end of year(d) | | $ | 23.50 | | | $ | 25.05 | | | $ | 29.25 | | | $ | 29.49 | | | $ | 29.66 | |
| Net Asset Value Total Return(e) | | | (4.39 | )% | | | (12.10 | )% | | | 1.31 | % | | | 0.91 | % | | | 1.85 | % |
| Market Price Total Return(e) | | | (4.11 | )% | | | (12.06 | )% | | | 1.49 | % | | | 1.07 | % | | | 2.13 | % |
| Ratios/Supplemental Data: | | | | | | | | | | | | | | | | | | | | |
Net assets at end of year (000’s omitted) | | $ | 22,301 | | | $ | 27,604 | | | $ | 55,698 | | | $ | 93,233 | | | $ | 108,832 | |
Ratio to average net assets of: | | | | | | | | | | | | | | | | | | | | |
Expenses | | | 0.76 | % | | | 0.76 | % | | | 0.75 | % | | | 0.76 | % | | | 0.75 | % |
Net investment income | | | 2.07 | % | | | 2.35 | % | | | 2.31 | %(b) | | | 1.63 | % | | | 1.22 | % |
Portfolio turnover rate(f) | | | 36 | % | | | 32 | % | | | 22 | % | | | 17 | % | | | 30 | % |
| (a) | Based on average shares outstanding. |
| (b) | Net investment income per share and the ratio of net investment income to average net assets include a significant dividend received during the period. Net investment income per share and the ratio of net investment income to average net assets excluding the significant dividend are $0.53 and 1.77%, respectively. |
| (c) | Due to the timing of creations and redemptions of capital shares, the net realized and unrealized gain (loss) per share is not in accord with the Fund’s change in net realized and unrealized gain (loss) on investment securities and in-kind transactions for the period. |
| (d) | The mean between the last bid and ask prices. |
| (e) | Net asset value total return is calculated assuming an initial investment made at the net asset value at the beginning of the period, reinvestment of all dividends and distributions at net asset value during the period, and redemption on the last day of the period. Net asset value total return includes adjustments in accordance with accounting principles generally accepted in the United States of America and as such, the net asset value for financial reporting purposes and the returns based upon those net asset values may differ from the net asset value and returns for shareholder transactions. Market price total return is calculated assuming an initial investment made at the market price at the beginning of the period, reinvestment of all dividends and distributions at market price during the period, and sale at the market price on the last day of the period. Total investment returns calculated for a period of less than one year are not annualized. |
| (f) | Portfolio turnover rate is not annualized for periods less than one year, if applicable, and does not include securities received or delivered from processing creations or redemptions. |
See accompanying Notes to Financial Statements which are an integral part of the financial statements.
Financial Highlights (continued)
PowerShares Global Clean Energy Portfolio (PBD)
| | | | | | | | | | | | | | | | | | | | |
| | | Year Ended October 31, | |
| | | 2016 | | | 2015 | | | 2014 | | | 2013 | | | 2012 | |
| Per Share Operating Performance: | | | | | | | | | | | | | | | | | | | | |
Net asset value at beginning of year | | $ | 11.46 | | | $ | 12.52 | | | $ | 12.04 | | | $ | 7.40 | | | $ | 9.89 | |
Net investment income(a) | | | 0.20 | | | | 0.13 | | | | 0.11 | | | | 0.10 | | | | 0.17 | |
Net realized and unrealized gain (loss) on investments | | | (0.80 | )(b) | | | (1.07 | ) | | | 0.47 | (b) | | | 4.65 | | | | (2.47 | ) |
Total from investment operations | | | (0.60 | ) | | | (0.94 | ) | | | 0.58 | | | | 4.75 | | | | (2.30 | ) |
Distributions to shareholders from: | | | | | | | | | | | | | | | | | | | | |
Net investment income | | | (0.21 | ) | | | (0.12 | ) | | | (0.10 | ) | | | (0.11 | ) | | | (0.19 | ) |
Net asset value at end of year | | $ | 10.65 | | | $ | 11.46 | | | $ | 12.52 | | | $ | 12.04 | | | $ | 7.40 | |
Market price at end of year(c) | | $ | 10.62 | | | $ | 11.46 | | | $ | 12.60 | | | $ | 12.03 | | | $ | 7.34 | |
| Net Asset Value Total Return(d) | | | (5.29 | )%(b) | | | (7.51 | )% | | | 4.79 | %(b) | | | 64.73 | % | | | (23.35 | )% |
| Market Price Total Return(d) | | | (5.56 | )% | | | (8.10 | )% | | | 5.55 | % | | | 65.94 | % | | | (23.03 | )% |
| Ratios/Supplemental Data: | | | | | | | | | | | | | | | | | | | | |
Net assets at end of year (000’s omitted) | | $ | 56,152 | | | $ | 66,762 | | | $ | 77,288 | | | $ | 81,000 | | | $ | 56,456 | |
Ratio to average net assets of: | | | | | | | | | | | | | | | | | | | | |
Expenses | | | 0.75 | % | | | 0.77 | % | | | 0.76 | % | | | 0.82 | % | | | 0.75 | % |
Net investment income | | | 1.83 | % | | | 1.11 | % | | | 0.83 | % | | | 1.10 | % | | | 2.05 | % |
Portfolio turnover rate(e) | | | 57 | % | | | 51 | % | | | 53 | % | | | 48 | % | | | 54 | % |
| (a) | Based on average shares outstanding. |
| (b) | Includes settlement proceeds recorded during the period. Had these settlement proceeds not been recorded Net realized and unrealized gain (loss) on investments per share would have been $(0.83) and $0.42 for the year ended October 31, 2016 and the year ended October 31, 2104, respectively, and total return would have been lower. |
| (c) | The mean between the last bid and ask prices. |
| (d) | Net asset value total return is calculated assuming an initial investment made at the net asset value at the beginning of the period, reinvestment of all dividends and distributions at net asset value during the period, and redemption on the last day of the period. Net asset value total return includes adjustments in accordance with accounting principles generally accepted in the United States of America and as such, the net asset value for financial reporting purposes and the returns based upon those net asset values may differ from the net asset value and returns for shareholder transactions. Market price total return is calculated assuming an initial investment made at the market price at the beginning of the period, reinvestment of all dividends and distributions at market price during the period, and sale at the market price on the last day of the period. Total investment returns calculated for a period of less than one year are not annualized. |
| (e) | Portfolio turnover rate is not annualized for periods less than one year, if applicable, and does not include securities received or delivered from processing creations or redemptions. |
PowerShares Global Gold and Precious Metals Portfolio (PSAU)
| | | | | | | | | | | | | | | | | | | | |
| | | Year Ended October 31, | |
| | | 2016 | | | 2015 | | | 2014 | | | 2013 | | | 2012 | |
| Per Share Operating Performance: | | | | | | | | | | | | | | | | | | | | |
Net asset value at beginning of year | | $ | 12.94 | | | $ | 15.25 | | | $ | 21.32 | | | $ | 40.49 | | | $ | 45.42 | |
Net investment income(a) | | | 0.01 | | | | 0.08 | | | | 0.05 | | | | 0.19 | | | | 0.22 | |
Net realized and unrealized gain (loss) on investments | | | 7.92 | | | | (2.29 | ) | | | (6.07 | ) | | | (19.26 | ) | | | (4.54 | ) |
Total from investment operations | | | 7.93 | | | | (2.21 | ) | | | (6.02 | ) | | | (19.07 | ) | | | (4.32 | ) |
Distributions to shareholders from: | | | | | | | | | | | | | | | | | | | | |
Net investment income | | | (0.02 | ) | | | (0.10 | ) | | | (0.05 | ) | | | (0.10 | ) | | | (0.61 | ) |
Net asset value at end of year | | $ | 20.85 | | | $ | 12.94 | | | $ | 15.25 | | | $ | 21.32 | | | $ | 40.49 | |
Market price at end of year(b) | | $ | 20.87 | | | $ | 12.89 | | | $ | 15.17 | | | $ | 21.19 | | | $ | 41.12 | |
| Net Asset Value Total Return(c) | | | 61.40 | % | | | (14.63 | )% | | | (28.31 | )% | | | (47.10 | )% | | | (9.48 | )% |
| Market Price Total Return(c) | | | 62.19 | % | | | (14.51 | )% | | | (28.25 | )% | | | (48.22 | )% | | | (7.37 | )% |
| Ratios/Supplemental Data: | | | | | | | | | | | | | | | | | | | | |
Net assets at end of year (000’s omitted) | | $ | 42,741 | | | $ | 17,471 | | | $ | 18,299 | | | $ | 29,848 | | | $ | 38,462 | |
Ratio to average net assets of: | | | | | | | | | | | | | | | | | | | | |
Expenses | | | 0.75 | % | | | 0.75 | % | | | 0.75 | % | | | 0.76 | % | | | 0.75 | % |
Net investment income | | | 0.05 | % | | | 0.49 | % | | | 0.24 | % | | | 0.70 | % | | | 0.57 | % |
Portfolio turnover rate(d) | | | 27 | % | | | 17 | % | | | 18 | % | | | 14 | % | | | 19 | % |
| (a) | Based on average shares outstanding. |
| (b) | The mean between the last bid and ask prices. |
| (c) | Net asset value total return is calculated assuming an initial investment made at the net asset value at the beginning of the period, reinvestment of all dividends and distributions at net asset value during the period, and redemption on the last day of the period. Net asset value total return includes adjustments in accordance with accounting principles generally accepted in the United States of America and as such, the net asset value for financial reporting purposes and the returns based upon those net asset values may differ from the net asset value and returns for shareholder transactions. Market price total return is calculated assuming an initial investment made at the market price at the beginning of the period, reinvestment of all dividends and distributions at market price during the period, and sale at the market price on the last day of the period. Total investment returns calculated for a period of less than one year are not annualized. |
| (d) | Portfolio turnover rate is not annualized for periods less than one year, if applicable, and does not include securities received or delivered from processing creations or redemptions. |
See accompanying Notes to Financial Statements which are an integral part of the financial statements.
Financial Highlights (continued)
PowerShares Global Water Portfolio (PIO)
| | | | | | | | | | | | | | | | | | | | |
| | | Year Ended October 31, | |
| | | 2016 | | | 2015 | | | 2014 | | | 2013 | | | 2012 | |
| Per Share Operating Performance: | | | | | | | | | | | | | | | | | | | | |
Net asset value at beginning of year | | $ | 21.89 | | | $ | 23.35 | | | $ | 21.91 | | | $ | 17.01 | | | $ | 17.17 | |
Net investment income(a) | | | 0.34 | | | | 0.29 | | | | 0.34 | | | | 0.36 | | | | 0.32 | |
Net realized and unrealized gain (loss) on investments | | | (0.60 | ) | | | (1.45 | ) | | | 1.44 | | | | 4.86 | | | | (0.15 | ) |
Total from investment operations | | | (0.26 | ) | | | (1.16 | ) | | | 1.78 | | | | 5.22 | | | | 0.17 | |
Distributions to shareholders from: | | | | | | | | | | | | | | | | | | | | |
Net investment income | | | (0.31 | ) | | | (0.30 | ) | | | (0.34 | ) | | | (0.32 | ) | | | (0.33 | ) |
Net asset value at end of year | | $ | 21.32 | | | $ | 21.89 | | | $ | 23.35 | | | $ | 21.91 | | | $ | 17.01 | |
Market price at end of year(b) | | $ | 21.29 | | | $ | 21.77 | | | $ | 23.30 | | | $ | 21.96 | | | $ | 16.93 | |
| Net Asset Value Total Return(c) | | | (1.14 | )% | | | (5.03 | )% | | | 8.08 | % | | | 30.91 | % | | | 1.11 | % |
| Market Price Total Return(c) | | | (0.78 | )% | | | (5.35 | )% | | | 7.59 | % | | | 31.84 | % | | | 1.95 | % |
| Ratios/Supplemental Data: | | | | | | | | | | | | | | | | | | | | |
Net assets at end of year (000’s omitted) | | $ | 188,665 | | | $ | 241,832 | | | $ | 288,367 | | | $ | 227,854 | | | $ | 206,712 | |
Ratio to average net assets of: | | | | | | | | | | | | | | | | | | | | |
Expenses | | | 0.74 | % | | | 0.76 | % | | | 0.76 | % | | | 0.83 | % | | | 0.75 | % |
Net investment income | | | 1.62 | % | | | 1.27 | % | | | 1.46 | % | | | 1.86 | % | | | 1.90 | % |
Portfolio turnover rate(d) | | | 67 | % | | | 78 | % | | | 28 | % | | | 52 | % | | | 104 | % |
| (a) | Based on average shares outstanding. |
| (b) | The mean between the last bid and ask prices. |
| (c) | Net asset value total return is calculated assuming an initial investment made at the net asset value at the beginning of the period, reinvestment of all dividends and distributions at net asset value during the period, and redemption on the last day of the period. Net asset value total return includes adjustments in accordance with accounting principles generally accepted in the United States of America and as such, the net asset value for financial reporting purposes and the returns based upon those net asset values may differ from the net asset value and returns for shareholder transactions. Market price total return is calculated assuming an initial investment made at the market price at the beginning of the period, reinvestment of all dividends and distributions at market price during the period, and sale at the market price on the last day of the period. Total investment returns calculated for a period of less than one year are not annualized. |
| (d) | Portfolio turnover rate is not annualized for periods less than one year, if applicable, and does not include securities received or delivered from processing creations or redemptions. |
PowerShares International BuyBack AchieversTM Portfolio (IPKW)
| | | | | | | | | | | | | | | | | | | | |
| | | Year Ended October 31, | | | For the Period
February 24, 2014(a)
Through
October 31, 2014 | | | | | | | |
| | 2016 | | | 2015 | | | | |
| Per Share Operating Performance: | | | | | | | | | | | | | | | | | | | | |
Net asset value at beginning of period | | $ | 27.02 | | | $ | 25.05 | | | $ | 25.03 | | | | | | | | | |
Net investment income(b) | | | 0.74 | (c) | | | 0.44 | | | | 0.33 | | | | | | | | | |
Net realized and unrealized gain (loss) on investments | | | 0.89 | | | | 1.82 | | | | (0.09 | ) | | | | | | | | |
Total from investment operations | | | 1.63 | | | | 2.26 | | | | 0.24 | | | | | | | | | |
Distributions to shareholders from: | | | | | | | | | | | | | | | | | | | | |
Net investment income | | | (0.71 | ) | | | (0.29 | ) | | | (0.22 | ) | | | | | | | | |
Net asset value at end of period | | $ | 27.94 | | | $ | 27.02 | | | $ | 25.05 | | | | | | | | | |
Market price at end of period(d) | | $ | 28.02 | | | $ | 26.96 | | | $ | 25.35 | | | | | | | | | |
| Net Asset Value Total Return(e) | | | 6.25 | % | | | 9.04 | % | | | 0.91 | %(f) | | | | | | | | |
| Market Price Total Return(e) | | | 6.78 | % | | | 7.51 | % | | | 2.11 | %(f) | | | | | | | | |
| Ratios/Supplemental Data: | | | | | | | | | | | | | | | | | | | | |
Net assets at end of period (000’s omitted) | | $ | 92,202 | | | $ | 58,099 | | | $ | 17,537 | | | | | | | | | |
Ratio to average net assets of: | | | | | | | | | | | | | | | | | | | | |
Expenses | | | 0.55 | % | | | 0.55 | % | | | 0.55 | %(g) | | | | | | | | |
Net investment income | | | 2.76 | %(c) | | | 1.68 | % | | | 1.88 | %(g) | | | | | | | | |
Portfolio turnover rate(h) | | | 106 | % | | | 162 | % | | | 130 | % | | | | | | | | |
| (a) | Commencement of investment operations. |
| (b) | Based on average shares outstanding. |
| (c) | Net investment income per share and the ratio of net investment income to average net assets include a significant dividend received during the period. Net investment income per share and the ratio of net investment income to average net assets excluding the significant dividend are $0.51 and 1.90%, respectively. |
| (d) | The mean between the last bid and ask prices. |
| (e) | Net asset value total return is calculated assuming an initial investment made at the net asset value at the beginning of the period, reinvestment of all dividends and distributions at net asset value during the period, and redemption on the last day of the period. Net asset value total return includes adjustments in accordance with accounting principles generally accepted in the United States of America and as such, the net asset value for financial reporting purposes and the returns based upon those net asset values may differ from the net asset value and returns for shareholder transactions. Market price total return is calculated assuming an initial investment made at the market price at the beginning of the period, reinvestment of all dividends and distributions at market price during the period, and sale at the market price on the last day of the period. Total investment returns calculated for a period of less than one year are not annualized. |
| (f) | The net asset value total return from Fund Inception (February 27, 2014, the first day of trading on the exchange) to October 31, 2014 was 1.23%. The market price total return from Fund Inception to October 31, 2014 was 1.87%. |
| (h) | Portfolio turnover rate is not annualized for periods less than one year, if applicable, and does not include securities received or delivered from processing creations or redemptions. |
See accompanying Notes to Financial Statements which are an integral part of the financial statements.
Financial Highlights (continued)
PowerShares Japan Currency Hedged Low Volatility Portfolio (FXJP)
| | | | | | | | | | | | | | | | | | | | |
| | | Year Ended
October 31, 2016 | | | For the Period
October 6, 2015(a)
Through
October 31, 2015 | | | | | | | | | | |
| | | | | | | | | | | | |
| Per Share Operating Performance: | | | | | | | | | | | | | | | | | | | | |
Net asset value at beginning of period | | $ | 26.87 | | | $ | 25.42 | | | | | | | | | | | | | |
Net investment income(b) | | | 0.32 | | | | 0.00 | (c) | | | | | | | | | | | | |
Net realized and unrealized gain (loss) on investments | | | (1.96 | ) | | | 1.45 | | | | | | | | | | | | | |
Total from investment operations | | | (1.64 | ) | | | 1.45 | | | | | | | | | | | | | |
Distributions to shareholders from: | | | | | | | | | | | | | | | | | | | | |
Net investment income | | | (0.10 | ) | | | — | | | | | | | | | | | | | |
Net realized gains | | | (0.11 | ) | | | — | | | | | | | | | | | | | |
Total distributions | | | (0.21 | ) | | | — | | | | | | | | | | | | | |
Net asset value at end of period | | $ | 25.02 | | | $ | 26.87 | | | | | | | | | | | | | |
Market price at end of period(d) | | $ | 24.91 | | | $ | 26.70 | | | | | | | | | | | | | |
| Net Asset Value Total Return(e) | | | (6.17 | )% | | | 5.70 | %(f) | | | | | | | | | | | | |
| Market Price Total Return(e) | | | (5.98 | )% | | | 5.04 | %(f) | | | | | | | | | | | | |
| Ratios/Supplemental Data: | | | | | | | | | | | | | | | | | | | | |
Net assets at end of period (000’s omitted) | | $ | 1,251 | | | $ | 2,687 | | | | | | | | | | | | | |
Ratio to average net assets of: | | | | | | | | | | | | | | | | | | | | |
Expenses | | | 0.25 | % | | | 0.25 | %(g) | | | | | | | | | | | | |
Net investment income | | | 1.26 | % | | | 0.15 | %(g) | | | | | | | | | | | | |
Portfolio turnover rate(h) | | | 80 | % | | | — | % | | | | | | | | | | | | |
| (a) | Commencement of investment operations. |
| (b) | Based on average shares outstanding. |
| (c) | Amount represents less than $0.005. |
| (d) | The mean between the last bid and ask prices. |
| (e) | Net asset value total return is calculated assuming an initial investment made at the net asset value at the beginning of the period, reinvestment of all dividends and distributions at net asset value during the period, and redemption on the last day of the period. Net asset value total return includes adjustments in accordance with accounting principles generally accepted in the United States of America and as such, the net asset value for financial reporting purposes and the returns based upon those net asset values may differ from the net asset value and returns for shareholder transactions. Market price total return is calculated assuming an initial investment made at the market price at the beginning of the period, reinvestment of all dividends and distributions at market price during the period, and sale at the market price on the last day of the period. Total investment returns calculated for a period of less than one year are not annualized. |
| (f) | The net asset value total return from Fund Inception (October 9, 2015, the first day of trading on the exchange) to October 31, 2015 was 2.95%. The market price total return from Fund Inception to October 31, 2015 was 2.42%. |
| (h) | Portfolio turnover rate is not annualized for periods less than one year, if applicable, and does not include securities received or delivered from processing creations or redemptions. |
PowerShares S&P International Developed Quality Portfolio (IDHQ)
| | | | | | | | | | | | | | | | | | | | |
| | | Year Ended October 31, | |
| | | 2016 | | | 2015 | | | 2014 | | | 2013 | | | 2012 | |
| Per Share Operating Performance: | | | | | | | | | | | | | | | | | | | | |
Net asset value at beginning of period | | $ | 20.19 | | | $ | 19.42 | | | $ | 19.67 | | | $ | 16.65 | | | $ | 16.03 | |
Net investment income(a) | | | 0.41 | | | | 0.33 | | | | 0.35 | | | | 0.32 | | | | 0.29 | |
Net realized and unrealized gain (loss) on investments | | | (0.54 | )(b) | | | 0.75 | | | | (0.21 | ) | | | 3.04 | | | | 0.62 | |
Total from investment operations | | | (0.13 | ) | | | 1.08 | | | | 0.14 | | | | 3.36 | | | | 0.91 | |
Distributions to shareholders from: | | | | | | | | | | | | | | | | | | | | |
Net investment income | | | (0.41 | ) | | | (0.31 | ) | | | (0.39 | ) | | | (0.34 | ) | | | (0.29 | ) |
Net asset value at end of period | | $ | 19.65 | | | $ | 20.19 | | | $ | 19.42 | | | $ | 19.67 | | | $ | 16.65 | |
Market price at end of period(c) | | $ | 19.61 | | | $ | 20.14 | | | $ | 19.59 | | | $ | 19.68 | | | $ | 16.81 | |
| Net Asset Value Total Return(d) | | | (0.62 | )%(b) | | | 5.60 | % | | | 0.66 | % | | | 20.44 | % | | | 5.87 | % |
| Market Price Total Return(d) | | | (0.59 | )% | | | 4.42 | % | | | 1.48 | % | | | 19.34 | % | | | 9.50 | % |
| Ratios/Supplemental Data: | | | | | | | | | | | | | | | | | | | | |
Net assets at end of period (000’s omitted) | | $ | 20,628 | | | $ | 19,180 | | | $ | 16,505 | | | $ | 21,641 | | | $ | 18,312 | |
Ratio to average net assets of: | | | | | | | | | | | | | | | | | | | | |
Expenses, after Waivers | | | 0.45 | % | | | 0.49 | % | | | 0.47 | % | | | 0.57 | % | | | 0.75 | % |
Expenses, prior to Waivers | | | 0.45 | % | | | 0.49 | % | | | 0.47 | % | | | 0.59 | % | | | 0.75 | % |
Net investment income, after Waivers | | | 2.09 | % | | | 1.66 | % | | | 1.73 | % | | | 1.79 | % | | | 1.82 | % |
Portfolio turnover rate(e) | | | 165 | % | | | 78 | % | | | 57 | % | | | 28 | % | | | 115 | % |
| (a) | Based on average shares outstanding. |
| (b) | Includes settlement proceeds recorded during the period. Had these settlement proceeds not been recorded Net realized and unrealized gain (loss) on investments per share would have been $(0.71) and total return would have been lower. |
| (c) | The mean between the last bid and ask prices. |
| (d) | Net asset value total return is calculated assuming an initial investment made at the net asset value at the beginning of the period, reinvestment of all dividends and distributions at net asset value during the period, and redemption on the last day of the period. Net asset value total return includes adjustments in accordance with accounting principles generally accepted in the United States of America and as such, the net asset value for financial reporting purposes and the returns based upon those net asset values may differ from the net asset value and returns for shareholder transactions. Market price total return is calculated assuming an initial investment made at the market price at the beginning of the period, reinvestment of all dividends and distributions at market price during the period, and sale at the market price on the last day of the period. Total investment returns calculated for a period of less than one year are not annualized. |
| (e) | Portfolio turnover rate is not annualized for periods less than one year, if applicable, and does not include securities received or delivered from processing creations or redemptions. For the year ended October 31, 2016, the portfolio turnover calculation includes the value of securities purchased and sold in the effort to realign the Fund’s portfolio holdings due to the underlying index change. |
See accompanying Notes to Financial Statements which are an integral part of the financial statements.
Notes to Financial Statements
PowerShares Exchange-Traded Fund Trust II
October 31, 2016
Note 1. Organization
PowerShares Exchange-Traded Fund Trust II (the “Trust”) was organized as a Massachusetts business trust on October 10, 2006 and is authorized to have multiple series of portfolios. The Trust is an open-end management investment company registered under the Investment Company Act of 1940, as amended (the “1940 Act”). As of October 31, 2016, the Trust offered sixty-seven portfolios. This report includes the following portfolios:
| | |
Full Name | | Short Name |
| PowerShares Developed EuroPacific Currency Hedged Low Volatility Portfolio (FXEP) | | “Developed EuroPacific Currency Hedged Low Volatility Portfolio” |
| PowerShares DWA Developed Markets Momentum Portfolio (PIZ) | | “DWA Developed Markets Momentum Portfolio” |
| PowerShares DWA Emerging Markets Momentum Portfolio (PIE) | | “DWA Emerging Markets Momentum Portfolio” |
| PowerShares Emerging Markets Infrastructure Portfolio (PXR) | | “Emerging Markets Infrastructure Portfolio” |
| PowerShares Europe Currency Hedged Low Volatility Portfolio (FXEU) | | “Europe Currency Hedged Low Volatility Portfolio” |
| PowerShares FTSE RAFI Asia Pacific ex-Japan Portfolio (PAF) | | “FTSE RAFI Asia Pacific ex-Japan Portfolio” |
| PowerShares FTSE RAFI Developed Markets ex-U.S. Portfolio (PXF) | | “FTSE RAFI Developed Markets ex-U.S. Portfolio” |
| PowerShares FTSE RAFI Developed Markets ex-U.S. Small-Mid Portfolio (PDN) | | “FTSE RAFI Developed Markets ex-U.S. Small-Mid Portfolio” |
| PowerShares FTSE RAFI Emerging Markets Portfolio (PXH) | | “FTSE RAFI Emerging Markets Portfolio” |
| PowerShares Global Agriculture Portfolio (PAGG) | | “Global Agriculture Portfolio” |
| PowerShares Global Clean Energy Portfolio (PBD) | | “Global Clean Energy Portfolio” |
| PowerShares Global Gold and Precious Metals Portfolio (PSAU) | | “Global Gold and Precious Metals Portfolio” |
| PowerShares Global Water Portfolio (PIO) | | “Global Water Portfolio” |
| PowerShares International BuyBack AchieversTM Portfolio (IPKW) | | “International BuyBack AchieversTM Portfolio” |
| PowerShares Japan Currency Hedged Low Volatility Portfolio (FXJP) | | “Japan Currency Hedged Low Volatility Portfolio” |
| PowerShares S&P International Developed Quality Portfolio (IDHQ) (formerly, PowerShares S&P International Developed High Quality Portfolio) | | “S&P International Developed Quality Portfolio” |
Each portfolio (each, a “Fund”, and collectively, the “Funds”) represents a separate series of the Trust. The shares of the Funds are referred to herein as “Shares” or “Fund’s Shares.” Each Fund’s Shares are listed and traded on the following exchanges:
| | |
Fund | | Exchange |
| Developed EuroPacific Currency Hedged Low Volatility Portfolio | | NYSE Arca, Inc. |
| DWA Developed Markets Momentum Portfolio | | NYSE Arca, Inc. |
| DWA Emerging Markets Momentum Portfolio | | NYSE Arca, Inc. |
| Emerging Markets Infrastructure Portfolio | | NYSE Arca, Inc. |
| Europe Currency Hedged Low Volatility Portfolio | | NYSE Arca, Inc. |
| FTSE RAFI Asia Pacific ex-Japan Portfolio | | NYSE Arca, Inc. |
| FTSE RAFI Developed Markets ex-U.S. Portfolio | | NYSE Arca, Inc. |
| FTSE RAFI Developed Markets ex-U.S. Small-Mid Portfolio | | NYSE Arca, Inc. |
| FTSE RAFI Emerging Markets Portfolio | | NYSE Arca, Inc. |
| Global Agriculture Portfolio | | The NASDAQ Stock Market LLC |
| Global Clean Energy Portfolio | | NYSE Arca, Inc. |
| Global Gold and Precious Metals Portfolio | | The NASDAQ Stock Market LLC |
| Global Water Portfolio | | NYSE Arca, Inc. |
| International BuyBack AchieversTM Portfolio | | The NASDAQ Stock Market LLC |
| Japan Currency Hedged Low Volatility Portfolio | | NYSE Arca, Inc. |
| S&P International Developed Quality Portfolio | | NYSE Arca, Inc. |
The market price of each Share may differ to some degree from the Fund’s net asset value (“NAV”). Unlike conventional mutual funds, each Fund issues and redeems Shares on a continuous basis, at NAV, only in a large specified number of Shares, each called a “Creation
Unit.” Creation Units are issued and redeemed principally in exchange for the deposit or delivery of a basket of securities (“Deposit Securities”). Except when aggregated in Creation Units by Authorized Participants, the Shares are not individually redeemable securities of the Funds.
The investment objective of each Fund is to seek investment results that generally correspond (before fees and expenses) to the price and yield of its respective index listed below (each, an “Underlying Index”):
| | |
Fund | | Underlying Index |
| Developed EuroPacific Currency Hedged Low Volatility Portfolio | | S&P EPAC Ex Korea Low Volatility USD Hedged Index |
| DWA Developed Markets Momentum Portfolio | | Dorsey Wright® Developed Markets Technical Leaders Index |
| DWA Emerging Markets Momentum Portfolio | | Dorsey Wright® Emerging Markets Technical Leaders Index |
| Emerging Markets Infrastructure Portfolio | | S-Network Emerging Infrastructure Builders IndexSM |
| Europe Currency Hedged Low Volatility Portfolio | | S&P Eurozone Low Volatility USD Hedged Index |
| FTSE RAFI Asia Pacific ex-Japan Portfolio | | FTSE RAFI Developed Asia Pacific ex-Japan Index |
| FTSE RAFI Developed Markets ex-U.S. Portfolio | | FTSE RAFI Developed ex-U.S. 1000 Index |
| FTSE RAFI Developed Markets ex-U.S. Small-Mid Portfolio | | FTSE RAFI Developed ex-U.S. Mid-Small 1500 Index |
| FTSE RAFI Emerging Markets Portfolio | | FTSE RAFI Emerging Markets Index |
| Global Agriculture Portfolio | | NASDAQ OMX Global Agriculture IndexSM |
| Global Clean Energy Portfolio | | WilderHill New Energy Global Innovation Index |
| Global Gold and Precious Metals Portfolio | | NASDAQ OMX Global Gold and Precious Metals IndexSM |
| Global Water Portfolio | | NASDAQ OMX Global Water IndexSM |
| International BuyBack AchieversTM Portfolio | | NASDAQ International BuyBack AchieversTM Index |
| Japan Currency Hedged Low Volatility Portfolio | | S&P Japan 500® Low Volatility USD Hedged Index |
| S&P International Developed Quality Portfolio | | S&P Quality Developed ex-U.S. LargeMidCap Index* |
| * | Effective after the close of markets on March 18, 2016, the underlying index changed from S&P International Developed High Quality Rankings Index to S&P Quality Developed ex-U.S. LargeMidCap Index. |
Note 2. Significant Accounting Policies
The preparation of the financial statements in accordance with accounting principles generally accepted in the United States of America (“GAAP”) requires management to make estimates and assumptions that affect the reported amounts and disclosures in the financial statements, including estimates and assumptions related to taxation. Actual results could differ from these estimates. In addition, the Funds monitor for material events or transactions that may occur or become known after the period-end date and before the date the financial statements are released to print. The following is a summary of the significant accounting policies followed by the Funds in preparation of the financial statements.
A. Security Valuation
Securities, including restricted securities, are valued according to the following policies:
A security listed or traded on an exchange (except convertible securities) is valued at its last sales price or official closing price as of the close of the customary trading session on the exchange where the security is principally traded, or lacking any sales or official closing price on a particular day, the security may be valued at the closing bid price on that day. Securities traded in the over-the-counter market are valued based on prices furnished by independent pricing services or market makers. When such securities are valued by an independent pricing service they may be considered fair valued. Futures contracts are valued at the final settlement price set by an exchange on which they are principally traded. Listed options are valued at the mean between the last bid and asked prices from the exchange on which they are principally traded. Options not listed on an exchange are valued by an independent source at the mean between the last bid and asked prices. For purposes of determining NAV per Share, futures and option contracts generally are valued 15 minutes after the close of the customary trading session of the New York Stock Exchange (“NYSE”).
Investments in open-end and closed-end registered investment companies that do not trade on an exchange are valued at the end of day NAV per share. Investments in open-end and closed-end registered investment companies that trade on an exchange are valued at the last sales price or official closing price as of the close of the customary trading session on the exchange where the security is principally traded.
Debt obligations (including convertible securities) and unlisted equities are fair valued using an evaluated quote provided by an independent pricing service. Evaluated quotes provided by the pricing service may be determined without exclusive reliance on quoted prices, and may reflect appropriate factors such as institution-size trading in similar groups of securities, developments related to specific securities, dividend rate (for unlisted equities), yield (for debt obligations), quality, type of issue, coupon rate (for debt obligations), maturity (for debt obligations), individual trading characteristics and other market data. Securities with a demand feature exercisable within one to seven days are valued at par. Debt obligations are subject to interest rate and credit risks. In addition, all debt obligations involve some risk of default with respect to interest and/or principal payments.
Foreign securities’ (including foreign exchange contracts’) prices are converted into U.S. dollar amounts using the applicable exchange rates as of the close of the London world markets. If market quotations are available and reliable for foreign exchange-traded equity securities, the securities will be valued at the market quotations. Because trading hours for certain foreign securities end before the close of the NYSE, closing market quotations may become unreliable. If between the time trading ends on a particular security and the close of the customary trading session on the NYSE, events occur that Invesco PowerShares Capital Management LLC (the “Adviser”) determines are significant and make the closing price unreliable, the Fund may fair value the security. If the event is likely to have affected the closing price of the security, the security will be valued at fair value in good faith using procedures approved by the Board of Trustees. Adjustments to closing prices to reflect fair value may also be based on a screening process of an independent pricing service to indicate the degree of certainty, based on historical data, that the closing price in the principal market where a foreign security trades is not the current value as of the close of the NYSE. Foreign securities’ prices meeting the approved degree of certainty that the price is not reflective of current value will be priced at the indication of fair value from the independent pricing service. Multiple factors may be considered by the independent pricing service in determining adjustments to reflect fair value and may include information relating to sector indices, American Depositary Receipts and domestic and foreign index futures. Foreign securities may have additional risks including exchange rate changes, potential for sharply devalued currencies and high inflation, political and economic upheaval, the relative lack of issuer information, relatively low market liquidity and the potential lack of strict financial and accounting controls and standards.
Securities for which market prices are not provided by any of the above methods may be valued based upon quotes furnished by independent sources. The last bid price may be used to value equity securities. The mean between the last bid and asked prices is used to value debt obligations, including corporate loans.
Securities for which market quotations are not readily available or became unreliable are valued at fair value as determined in good faith following procedures approved by the Board of Trustees. Issuer-specific events, market trends, bid/asked quotes of brokers and information providers and other market data may be reviewed in the course of making a good faith determination of a security’s fair value.
Each Fund may invest in securities that are subject to interest rate risk, meaning the risk that the prices will generally fall as interest rates rise and, conversely, the prices will generally rise as interest rates fall. Specific securities differ in their sensitivity to changes in interest rates depending on their individual characteristics. Changes in interest rates may result in increased market volatility, which may affect the value and/or liquidity of certain Fund investments.
Valuations change in response to many factors, including the historical and prospective earnings of the issuer, the value of the issuer’s assets, general economic conditions, interest rates, investor perceptions and market liquidity. Because of the inherent uncertainties of valuation, the values reflected in the financial statements may materially differ from the value received upon actual sale of those investments.
B. Other Risks
Index Risk. Unlike many investment companies, the Funds do not utilize investing strategies that seek returns in excess of their Underlying Indexes. Therefore, a Fund would not necessarily buy or sell a security unless that security is added or removed, respectively, from its respective Underlying Index, even if that security generally is underperforming.
Equity Risk. Equity risk is the risk that the value of the securities that each Fund holds will fall due to general market and economic conditions, perceptions regarding the industries in which the issuers of securities that a Fund holds participate or factors relating to specific companies in which the Fund invests. For example, an adverse event, such as an unfavorable earnings report, may depress the value of securities a Fund holds; the price of securities may be particularly sensitive to general movements in the stock market; or a drop in the stock market may depress the price of most or all of the securities a Fund holds. In addition, securities of an issuer in the Fund’s portfolio may decline in price if the issuer fails to make anticipated dividend payments because, among other reasons, the issuer of the security experiences a decline in its financial condition.
Industry or Geographic Concentration Risk. In following its methodology, each Fund’s Underlying Index from time to time may be concentrated to a significant degree in securities of issuers located in a single industry or a sector, or, in a specific country or geographic region. To the extent that an Underlying Index concentrates in the securities of issuers in a particular industry, sector, country or region, each Fund will also concentrate its investments to approximately the same extent. By so concentrating its investments, a Fund may face more risks than if it were diversified broadly over numerous industries, sectors, countries or geographic regions. In addition, at times, an industry or sector may be out of favor and underperform other industries or the market as a whole. Any factors detrimental to the performance of such industry or sector will disproportionately impact a Fund’s NAV. Also, a natural or other disaster could occur in a country or geographic region in which a Fund invests, which could affect the economy or particular business operations of companies in that specific country or geographic region and adversely impact such Fund’s investments in the affected country or region.
Non-Diversified Fund Risk. Developed EuroPacific Currency Hedged Low Volatility Portfolio, Europe Currency Hedged Low Volatility Portfolio, Global Agriculture Portfolio, Global Gold and Precious Metals Portfolio, Global Water Portfolio, International BuyBack AchieversTM Portfolio and Japan Currency Hedged Low Volatility Portfolio are non-diversified and can invest a greater portion of their assets in securities of individual issuers than diversified funds. As a result, changes in the market value of a single investment could cause greater fluctuations in Share price than would occur in a diversified fund. This may increase a Fund’s volatility and cause the performance of a relatively small number of issuers to have a greater impact on a Fund’s performance.
Non-Correlation Risk. Each Fund’s return may not match the return of its Underlying Index for a number of reasons. For example, each Fund incurs operating expenses not applicable to its Underlying Index, and incurs costs in buying and selling securities, especially when rebalancing the Fund’s securities holdings to reflect changes in the composition of its Underlying Index. In addition, the performance of each Fund and its Underlying Index may vary due to asset valuation differences and differences between each Fund’s portfolio and its Underlying Index resulting from legal restrictions, cost or liquidity constraints.
Sampling Risk. FTSE RAFI Emerging Markets Portfolio’s use of a representative sampling approach will result in the Fund holding a smaller number of securities than are in its Underlying Index. As a result, an adverse development to an issuer of securities held by the Fund could result in a greater decline in NAV than would be the case if the Fund held all of the securities in its Underlying Index. To the extent the assets in the Fund are smaller, these risks will be greater.
Foreign Investment Risk. Investments in the securities of non-U.S. issuers involve risks beyond those associated with investments in U.S. securities. Foreign securities may have relatively low market liquidity, greater market volatility, decreased publicly available information and less reliable financial information about issuers, and inconsistent and potentially less stringent accounting, auditing and financial reporting requirements and standards of practice comparable to those applicable to domestic issuers. Foreign securities also are subject to the risks of expropriation, nationalization, political instability or other adverse political or economic developments and the difficulty of enforcing obligations in other countries. As the Funds may invest in securities denominated in foreign currencies, fluctuations in the value of the U.S. dollar relative to the values of other currencies may adversely affect investments in foreign securities and may negatively impact the Funds’ returns. Such risks may be exacerbated in emerging markets, where securities laws are relatively new and unsettled.
Small- and Mid-Capitalization Company Risk. For each Fund (except DWA Developed Markets Momentum Portfolio, DWA Emerging Markets Momentum Portfolio, FTSE RAFI Asia Pacific ex-Japan Portfolio, FTSE RAFI Developed Markets ex-U.S. Portfolio, FTSE RAFI Emerging Markets Portfolio and Japan Currency Hedged Low Volatility Portfolio), investing in securities of small- and mid-capitalization companies involves greater risk than customarily is associated with investing in larger, more established companies. These companies’ securities may be more volatile and less liquid than those of more established companies. These securities may have returns that vary, sometimes significantly, from the overall securities market. Often small- and mid-capitalization companies and the industries in which they focus are still evolving and, as a result, they may be more sensitive to changing market conditions.
Portfolio Turnover Risk. DWA Developed Markets Momentum Portfolio, DWA Emerging Markets Momentum Portfolio and International BuyBack AchieversTM Portfolio may engage in frequent trading of its portfolio securities in connection with the rebalancing or adjustment of the Underlying Index. A portfolio turnover rate of 200%, for example, is equivalent to the Fund buying and selling all of its securities two times during the course of a year. A high portfolio turnover rate (such as 100% or more) could result in high brokerage costs for the Fund. While a high portfolio turnover rate can result in an increase in taxable capital gains distributions to the Fund’s shareholders, the Fund will seek to utilize the in-kind creation and redemption mechanism (described below) to minimize realization of capital gains to the extent possible.
Currency Risk. The Funds may invest in non-U.S. dollar denominated equity securities of foreign issuers. Because a Fund’s NAV is determined in U.S. dollars, the Fund’s NAV could decline if the currency of the non-U.S. market in which the Fund invests depreciates against the U.S. dollar, even if the value of the Fund’s holdings, measured in the foreign currency, increases.
Currency Hedging Risk. While currency hedging can reduce or eliminate losses, it can also reduce or eliminate gains. There can be no assurance that the hedging strategy of Developed EuroPacific Currency Hedged Low Volatility Portfolio, Europe Currency Hedged Low Volatility Portfolio or Japan Currency Hedged Low Volatility Portfolio will effectively reduce the currency risk included in either Fund’s portfolio. Hedges are sometimes subject to imperfect matching between the derivative and its reference asset. Some foreign currency forward contracts are less liquid, which could result in a Fund being unable to structure its hedging transactions as intended. Increased volatility in exchange rates will generally reduce the effectiveness of those Funds’ currency hedging strategy. The effectiveness of the Funds’ currency hedging strategy will also in general be affected by interest rates. Significant differences between U.S. dollar interest rates and foreign currency interest rates may impact the effectiveness of a Fund’s currency hedging strategy.
Commodity Pool Risk. Under amended regulations promulgated by the CFTC, investments by Developed EuroPacific Currency Hedged Low Volatility Portfolio, Europe Currency Hedged Low Volatility Portfolio and Japan Currency Hedged Low Volatility Portfolio will cause each Fund to be considered a commodity pool, thereby subjecting it to regulation under the Commodity Exchange Act and CFTC rules. The Adviser is registered as a commodity pool operator (“CPO”) and as a commodity trading advisor (“CTA”), and will manage the
Funds in accordance with CFTC rules, as well as the rules that apply to registered investment companies. Registration as a CPO or CTA imposes additional compliance obligations on the Adviser, which could increase costs and may affect the operations and financial performance of the Funds.
C. Federal Income Taxes
Each Fund intends to comply with the provisions of the Internal Revenue Code of 1986, as amended (the “Internal Revenue Code”), applicable to regulated investment companies and to distribute substantially all of the Fund’s taxable earnings to its shareholders. As such, the Funds will not be subject to federal income taxes on otherwise taxable income (including net realized gains) that is distributed to the shareholders. Therefore, no provision for federal income taxes is recorded in the financial statements.
Each Fund recognizes the tax benefits of uncertain tax positions only when the position is more likely than not to be sustained. Management has analyzed each Fund’s uncertain tax positions and concluded that no liability for unrecognized tax benefits should be recorded related to uncertain tax positions. Management is not aware of any tax positions for which it is reasonably possible that the total amounts of unrecognized tax benefits will change materially in the next 12 months.
Income and capital gain distributions are determined in accordance with federal income tax regulations, which may differ from GAAP. These differences are primarily due to differing book and tax treatments for in-kind transactions, losses deferred due to wash sales, and passive foreign investment company adjustments, if any.
The Funds file U.S. federal tax returns and tax returns in certain other jurisdictions. Generally, a Fund is subject to examinations by such taxing authorities for up to three years after the filing of the return for the tax period.
D. Investment Transactions and Investment Income
Investment transactions are accounted for on a trade date basis. Realized gains and losses from the sale or disposition of securities are computed on the specific identified cost basis. Interest income is recorded on the accrual basis. Dividend income (net of withholding tax, if any) is recorded on the ex-dividend date. Realized gains, dividends and interest received by a Fund may give rise to withholding and other taxes imposed by foreign countries. Tax conventions between certain countries and the United States may reduce or eliminate such taxes.
The Funds may periodically participate in litigation related to each Fund’s investments. As such, the Funds may receive proceeds from litigation settlements. Any proceeds received are included in the Statements of Operations as realized gain (loss) for investments no longer held and as unrealized gain (loss) for investments still held.
Corporate actions (including cash dividends) are recorded net of non-reclaimable foreign tax withholdings on the ex-date.
Brokerage commissions and mark ups are considered transaction costs and are recorded as an increase to the cost basis of securities purchased and/or a reduction of proceeds on a sale of securities. Such transaction costs are included in the determination of net realized and unrealized gain (loss) from investment securities reported in the Statements of Operations and the Statements of Changes in Net Assets and the net realized and unrealized gains (losses) on securities per share in the Financial Highlights. Transaction costs are included in the calculation of each Fund’s net asset value and, accordingly, they reduce each Fund’s total returns. These transaction costs are not considered operating expenses and are not reflected in net investment income reported in the Statements of Operations and the Statements of Changes in Net Assets, or the net investment income per share and the ratios of expenses and net investment income reported in the Financial Highlights, nor are they limited by any expense limitation arrangements between each Fund and the Adviser.
E. Country Determination
For the purposes of making investment selection decisions and presentation in the Schedule of Investments, the Adviser may determine the country in which an issuer is located and/or credit risk exposure based on various factors. These factors include the laws of the country under which the issuer is organized, where the issuer maintains a principal office, the country in which the issuer derives 50% or more of its total revenues and the country that has the primary market for the issuer’s securities, as well as other criteria. Among the other criteria that may be evaluated for making this determination are the country in which the issuer maintains 50% or more of its assets, the type of security, financial guarantees and enhancements, the nature of the collateral and the sponsor organization. Country of issuer and/or credit risk exposure has been determined to be the United States of America, unless otherwise noted.
F. Expenses
Each Fund has agreed to pay an annual unitary management fee to the Adviser. Out of the unitary management fee, the Adviser has agreed to pay for substantially all expenses of the Funds, including the cost of transfer agency, custody, fund administration, legal, audit and other services, except for advisory fees, distribution fees, if any, brokerage expenses, taxes, interest, acquired fund fees and expenses, if any, litigation expenses and other extraordinary expenses.
Expenses of the Trust that are excluded from a Fund’s unitary management fee and are directly identifiable to a specific Fund are applied to that Fund. Expenses of the Trust that are excluded from each Fund’s unitary management fee and that are not readily identifiable to a specific Fund are allocated in such a manner as deemed equitable, taking into consideration the nature and type of expense and the relative net assets of each Fund.
To the extent a Fund invests in other investment companies, the expenses shown in the accompanying financial statements reflect the expenses of the Fund and do not include any expenses of the investment companies in which it invests. The effects of such investment companies’ expenses are included in the realized and unrealized gain or loss on the investments in the investment companies.
G. Dividends and Distributions to Shareholders
Each Fund (except for Global Agriculture Portfolio and Global Gold and Precious Metals Portfolio) declares and pays dividends from net investment income, if any, to its shareholders quarterly and records such dividends on ex-dividend date. Global Agriculture Portfolio and Global Gold and Precious Metals Portfolio each declares and pays dividends from net investment income, if any, to its shareholders annually and records such dividends on ex-dividend date. Generally, each Fund distributes net realized taxable capital gains, if any, annually in cash and records them on ex-dividend date. Such distributions on a tax basis are determined in conformity with federal income tax regulations, which may differ from GAAP. Distributions in excess of tax basis earnings and profits, if any, are reported in such Fund’s financial statements as a tax return of capital at fiscal year-end.
H. Foreign Currency Translations
Foreign currency is valued at the close of the NYSE based on quotations posted by banks and major currency dealers. Portfolio securities and other assets and liabilities denominated in foreign currencies are translated into U.S. dollar amounts at date of valuation. Purchases and sales of portfolio securities (net of foreign taxes withheld on disposition) and income items denominated in foreign currencies are translated into U.S. dollar amounts on the respective dates of such transactions. The Funds do not separately account for the portion of the results of operations resulting from changes in foreign exchange rates on investments and the fluctuations arising from changes in market prices of securities held. The combined results of changes in foreign exchange rates and the fluctuation of market prices on investments (net of estimated foreign tax withholding) are included with the net realized and unrealized gain or loss from investments in the Statements of Operations. Reported net realized foreign currency gains or losses arise from (1) sales of foreign currencies, (2) currency gains or losses realized between the trade and settlement dates on securities transactions, and (3) the difference between the amounts of dividends, interest, and foreign withholding taxes recorded on each Fund’s books and the U.S. dollar equivalent of the amounts actually received or paid. Net unrealized foreign currency gains and losses arise from changes in the fair values of assets and liabilities, other than investments in securities at fiscal period-end, resulting from changes in exchange rates.
The Funds may invest in foreign securities, which may be subject to foreign taxes on income, gains on investments or currency repatriation, a portion of which may be recoverable. Foreign taxes, if any, are recorded based on the tax regulations and rates that exist in the foreign markets in which each Fund invests.
I. Forward Foreign Currency Contracts
Developed EuroPacific Currency Hedged Low Volatility Portfolio, Europe Currency Hedged Low Volatility Portfolio and Japan Currency Hedged Low Volatility Portfolio engage in foreign currency transactions either on a spot (i.e. for prompt delivery and settlement) basis at the rate prevailing in the currency exchange market at the time or through forward foreign currency contracts to manage or minimize currency or exchange rate risk.
The Funds also enter into forward foreign currency contracts for the purchase or sale of a security denominated in a foreign currency in order to “lock in” the U.S. dollar price of that security, or the Fund also enters into forward foreign currency contracts that do not provide for physical settlement of the two currencies, but instead are settled by a single cash payment calculated as the difference between the agreed upon exchange rate and the spot rate at settlement based upon an agreed upon notional amount (non-deliverable forwards). The Funds set aside liquid assets in an amount equal to the daily mark-to-market obligation for forward foreign currency contracts.
A forward foreign currency contract is an obligation between two parties (“Counterparties”) to purchase or sell a specific currency for an agreed-upon price at a future date. The use of forward foreign currency contracts does not eliminate fluctuations in the price of the underlying securities the Fund owns or intends to acquire but establishes a rate of exchange in advance. Fluctuations in the value of these contracts are measured by the difference in the contract date and reporting date exchange rates and are recorded as unrealized appreciation (depreciation) until the contracts are closed. When the contracts are closed, realized gains (losses) are recorded. Realized and unrealized gains (losses) on the contracts are included in the Statements of Operations. The primary risks associated with forward foreign currency contracts include failure of the Counterparty to meet the terms of the contract and the value of the foreign currency changing unfavorably. These risks may be in excess of the amounts reflected in the Statements of Assets and Liabilities.
J. Securities Lending
During the fiscal year ended October 31, 2016, DWA Developed Markets Momentum Portfolio, Emerging Markets Infrastructure Portfolio, FTSE RAFI Developed Markets ex-U.S. Portfolio, FTSE RAFI Developed Markets ex-U.S. Small-Mid Portfolio, Global Agriculture
Portfolio, Global Clean Energy Portfolio, Global Gold and Precious Metals Portfolio and Global Water Portfolio participated in securities lending. Each Fund loaned portfolio securities having a market value up to one-third of each Fund’s total assets. Such loans are secured by cash collateral equal to no less than 102% (105% for international securities) of the market value of the loaned securities determined daily by the securities lending provider. Cash collateral received in connection with these loans is invested in an affiliated money market fund and is shown as such on the Schedules of Investments. Each Fund bears the risk of loss with respect to the investment of collateral. It is the policy of these Funds to obtain additional collateral from or return excess collateral to the borrower by the end of the next business day, following the valuation date of the securities loaned. Therefore, the value of the collateral held may be temporarily less than the value of the securities on loan. When loaning securities, each Fund retains certain benefits of owning the securities, including the economic equivalent of dividends or interest generated by the security. Lending securities entails a risk of loss to each Fund if, and to the extent that, the market value of the securities loaned were to increase, and the borrower did not increase the collateral accordingly, and the borrower failed to return the securities. The securities loaned are subject to termination at the option of the borrower or each Fund. Upon termination, the borrower will return to each Fund the securities loaned and each Fund will return the collateral. Upon the failure of the borrower to return the securities, collateral may be liquidated and the securities may be purchased on the open market to replace the loaned securities. Each Fund could experience delays and costs in gaining access to the collateral and the securities may lose value during the delay which could result in potential losses to each Fund. Some of these losses may be indemnified by the lending agent. Each Fund bears the risk of any deficiency in the amount of the collateral available for return to the borrower due to any loss on the collateral invested. Dividends received on cash collateral investments for securities lending transactions, which are net of compensation to counterparties, are included in Securities lending income on the Statements of Operations. The aggregate value of securities out on loan, if any, is shown on the Statements of Assets and Liabilities.
Note 3. Investment Advisory Agreement and Other Agreements
The Trust has entered into an Investment Advisory Agreement with the Adviser on behalf of each Fund, pursuant to which the Adviser has overall responsibility for the selection and ongoing monitoring of the Funds’ investments, managing the Funds’ business affairs and providing certain clerical, bookkeeping and other administrative services.
As compensation for its services, each Fund has agreed to pay the Adviser an annual unitary management fee. Out of the unitary management fee, the Adviser has agreed to pay for substantially all expenses of the Funds, including the cost of transfer agency, custody, fund administration, legal, audit and other services, except for advisory fees, distribution fees, if any, brokerage expenses, taxes, interest, acquired fund fees and expenses, if any, litigation expenses and other extraordinary expenses. The unitary management fee is paid by each Fund to the Adviser at the following annual rates:
| | | | |
| | | % of Average
Daily Net Assets | |
| Developed EuroPacific Currency Hedged Low Volatility Portfolio | | | 0.25 | % |
| DWA Developed Markets Momentum Portfolio | | | 0.80 | % |
| DWA Emerging Markets Momentum Portfolio | | | 0.90 | % |
| Emerging Markets Infrastructure Portfolio | | | 0.75 | % |
| Europe Currency Hedged Low Volatility Portfolio | | | 0.25 | % |
| FTSE RAFI Asia Pacific ex-Japan Portfolio | | | 0.49 | % |
| FTSE RAFI Developed Markets ex-U.S. Portfolio | | | 0.45 | % |
| FTSE RAFI Developed Markets ex-U.S. Small-Mid Portfolio | | | 0.49 | % |
| FTSE RAFI Emerging Markets Portfolio | | | 0.49 | % |
| Global Agriculture Portfolio | | | 0.75 | % |
| Global Clean Energy Portfolio | | | 0.75 | % |
| Global Gold and Precious Metals Portfolio | | | 0.75 | % |
| Global Water Portfolio | | | 0.75 | % |
| International BuyBack AchieversTM Portfolio | | | 0.55 | % |
| Japan Currency Hedged Low Volatility Portfolio | | | 0.25 | % |
| S&P International Developed Quality Portfolio | | | 0.45 | % |
Further, through August 31, 2018, the Adviser has contractually agreed to waive a portion of each Fund’s management fee in an amount equal to 100% of the net advisory fees an affiliate of the Adviser receives that are attributable to certain of the Fund’s investments in money market funds managed by that affiliate (excluding investments of cash collateral from securities lending). The Adviser cannot discontinue this waiver prior to its expiration.
For the fiscal year ended October 31, 2016, the Adviser waived fees for each Fund in the following amounts:
| | | | |
| Developed EuroPacific Currency Hedged Low Volatility Portfolio | | $ | 23 | |
| DWA Developed Markets Momentum Portfolio | | | 122 | |
| DWA Emerging Markets Momentum Portfolio | | | 522 | |
| Emerging Markets Infrastructure Portfolio | | | 17 | |
| Europe Currency Hedged Low Volatility Portfolio | | | 678 | |
| FTSE RAFI Asia Pacific ex-Japan Portfolio | | | 38 | |
| FTSE RAFI Developed Markets ex-U.S. Portfolio | | | 768 | |
| FTSE RAFI Developed Markets ex-U.S. Small-Mid Portfolio | | | 204 | |
| FTSE RAFI Emerging Markets Portfolio | | | 37,670 | |
| Global Agriculture Portfolio | | | — | |
| Global Clean Energy Portfolio | | | 5 | |
| Global Gold and Precious Metals Portfolio | | | 23 | |
| Global Water Portfolio | | | 71 | |
| International BuyBack AchieversTM Portfolio | | | 194 | |
| Japan Currency Hedged Low Volatility Portfolio | | | 3 | |
| S&P International Developed Quality Portfolio | | | 38 | |
The Trust has entered into a Distribution Agreement with Invesco Distributors, Inc. (the “Distributor”), which serves as the distributor of Creation Units for each Fund. The Distributor does not maintain a secondary market in the Shares. The Funds are not charged any fees pursuant to the Distribution Agreement. The Distributor is an affiliate of the Adviser.
The Adviser has entered into a licensing agreement for each Fund with the following entities (each, a “Licensor”):
| | |
Fund | | Licensor |
| Developed EuroPacific Currency Hedged Low Volatility Portfolio | | S&P Dow Jones Indices LLC |
| DWA Developed Markets Momentum Portfolio | | Dorsey Wright & Associates, LLC |
| DWA Emerging Markets Momentum Portfolio | | Dorsey Wright & Associates, LLC |
| Emerging Markets Infrastructure Portfolio | | S-Network Global Indexes Inc.SM |
| Europe Currency Hedged Low Volatility Portfolio | | S&P Dow Jones Indices LLC |
| FTSE RAFI Asia Pacific ex-Japan Portfolio | | FTSE International Ltd. |
| FTSE RAFI Developed Markets ex-U.S. Portfolio | | FTSE International Ltd. |
| FTSE RAFI Developed Markets ex-U.S. Small-Mid Portfolio | | FTSE International Ltd. |
| FTSE RAFI Emerging Markets Portfolio | | FTSE International Ltd. |
| Global Agriculture Portfolio | | Nasdaq, Inc. |
| Global Clean Energy Portfolio | | WilderHill New Energy Finance, LLC |
| Global Gold and Precious Metals Portfolio | | Nasdaq, Inc. |
| Global Water Portfolio | | Nasdaq, Inc. |
| International BuyBack AchieversTM Portfolio | | Nasdaq, Inc. |
| Japan Currency Hedged Low Volatility Portfolio | | S&P Dow Jones Indices LLC |
| S&P International Developed Quality Portfolio | | S&P Dow Jones Indices LLC |
Each Underlying Index name trademark is owned by its respective Licensor. These trademarks have been licensed to the Adviser for use by the Funds. Each Fund is entitled to use its Underlying Index pursuant to the Trust’s sub-licensing agreement with the Adviser. The Funds are not sponsored, endorsed, sold or promoted by the Licensors, and the Licensors make no representation regarding the advisability of investing in any of the Funds.
The Trust has entered into service agreements whereby The Bank of New York Mellon, a wholly-owned subsidiary of The Bank of New York Mellon Corporation, serves as the administrator, custodian, fund accountant and transfer agent for each Fund.
Note 4. Investments in Affiliates
The Adviser also serves as the adviser for PowerShares India Portfolio, and therefore PowerShares India Portfolio is considered to be affiliated with the Funds. The table below shows FTSE RAFI Emerging Markets Portfolio’s transactions in, and earnings from, its investments in affiliates for the fiscal year ended October 31, 2016.
FTSE RAFI Emerging Markets Portfolio
| | | | | | | | | | | | | | | | | | | | | | | | | | | | |
| | | Value
October 31, 2015 | | | Purchases
at Cost | | | Proceeds
from Sales | | | Change in
Unrealized
Appreciation | | | Realized
Gain (Loss) | | | Value
October 31, 2016 | | | Dividend
Income | |
| PowerShares India Portfolio | | $ | 2,674,520 | | | $ | 4,671,711 | | | $ | (630,915 | ) | | $ | 460,597 | | | $ | (45,115 | ) | | $ | 7,130,798 | | | $ | 49,986 | |
Note 5. Additional Valuation Information
GAAP defines fair value as the price that would be received to sell an asset or paid to transfer a liability in an orderly transaction between market participants at the measurement date, under current market conditions. GAAP establishes a hierarchy that prioritizes the inputs to valuation methods, giving the highest priority to readily available unadjusted quoted prices in an active market for identical assets (Level 1) and the lowest priority to significant unobservable inputs (Level 3), generally when market prices are not readily available or are unreliable. Based on the valuation inputs, the securities or other investments are tiered into one of three levels. Changes in valuation methods may result in transfers in or out of an investment’s assigned level:
| | Level 1 — Prices | are determined using quoted prices in an active market for identical assets. |
| | Level 2 — Prices | are determined using other significant observable inputs. Observable inputs are inputs that other market participants may use in pricing a security. These may include quoted prices for similar securities, interest rates, prepayment speeds, credit risk, yield curves, loss severities, default rates, discount rates, volatilities and others. |
| | Level 3 — Prices | are determined using significant unobservable inputs. In situations where quoted prices or observable inputs are unavailable (for example, when there is little or no market activity for an investment at the end of the period), unobservable inputs may be used. Unobservable inputs reflect a Fund’s own assumptions about the factors market participants would use in determining fair value of the securities or instruments and would be based on the best available information. |
Except for the Funds listed below, as of October 31, 2016, all of the securities in each Fund were valued based on Level 1 inputs (see the Schedules of Investments for security categories). The level assigned to the securities valuations may not be an indication of the risk or liquidity associated with investing in those securities. Because of the inherent uncertainties of valuation, the values reflected in the financial statements may materially differ from the value received upon actual sale of those investments.
During the fiscal year ended October 31, 2016, there were transfers in Emerging Markets Infrastructure Portfolio from Level 3 to Level 1 of $960,495 due to the security resuming active trading.
| | | | | | | | | | | | | | | | |
| | | Investments in Securities | |
| | | Level 1 | | | Level 2 | | | Level 3 | | | Total | |
| Developed EuroPacific Currency Hedged Low Volatility Portfolio | | | | | | | | | | | | | | | | |
Equity Securities | | $ | 1,274,612 | | | $ | — | | | $ | — | | | $ | 1,274,612 | |
Forward Foreign Currency Contracts(a) | | | — | | | | 33,666 | | | | — | | | | 33,666 | |
| | | | | | | | | | | | | | | | |
Total Investments | | | 1,274,612 | | | | 33,666 | | | | — | | | | 1,308,278 | |
| | | | | | | | | | | | | | | | |
| DWA Developed Markets Momentum Portfolio | | | | | | | | | | | | | | | | |
Equity Securities | | | 176,596,813 | | | | 6,461 | | | | — | | | | 176,603,274 | |
| | | | | | | | | | | | | | | | |
| Europe Currency Hedged Low Volatility Portfolio | | | | | | | | | | | | | | | | |
Equity Securities | | | 169,329,378 | | | | — | | | | — | | | | 169,329,378 | |
Forward Foreign Currency Contracts(a) | | | — | | | | 4,453,049 | | | | — | | | | 4,453,049 | |
| | | | | | | | | | | | | | | | |
Total Investments | | | 169,329,378 | | | | 4,453,049 | | | | — | | | | 173,782,427 | |
| | | | | | | | | | | | | | | | |
| FTSE RAFI Asia Pacific ex-Japan Portfolio | | | | | | | | | | | | | | | | |
Equity Securities | | | 23,999,269 | | | | — | | | | 0 | | | | 23,999,269 | |
| | | | | | | | | | | | | | | | |
| FTSE RAFI Developed Markets ex-U.S. Portfolio | | | | | | | | | | | | | | | | |
Equity Securities | | | 950,001,393 | | | | 23,335 | | | | 0 | | | | 950,024,728 | |
| | | | | | | | | | | | | | | | |
| FTSE RAFI Developed Markets ex-U.S. Small-Mid Portfolio | | | | | | | | | | | | | | | | |
Equity Securities | | | 166,267,283 | | | | — | | | | 193,635 | | | | 166,460,918 | |
| | | | | | | | | | | | | | | | |
| FTSE RAFI Emerging Markets Portfolio | | | | | | | | | | | | | | | | |
Equity Securities | | | 625,336,334 | | | | — | | | | 0 | | | | 625,336,334 | |
| | | | | | | | | | | | | | | | |
| | | | | | | | | | | | | | | | |
| | | Investments in Securities | |
| | | Level 1 | | | Level 2 | | | Level 3 | | | Total | |
| Japan Currency Hedged Low Volatility Portfolio | | | | | | | | | | | | | | | | |
Equity Securities | | $ | 1,204,694 | | | $ | — | | | $ | — | | | $ | 1,204,694 | |
Forward Foreign Currency Contracts(a) | | | — | | | | 45,995 | | | | — | | | | 45,995 | |
| | | | | | | | | | | | | | | | |
Total Investments | | | 1,204,694 | | | | 45,995 | | | | — | | | | 1,250,689 | |
| | | | | | | | | | | | | | | | |
| (a) | Unrealized appreciation. |
A reconciliation of Level 3 investments is presented when a Fund had a significant amount of Level 3 investments at the beginning and/or end of the reporting period in relation to net assets.
The following is a reconciliation of the fair valuations using significant unobservable inputs (Level 3) for Emerging Markets Infrastructure Portfolio during the fiscal year ended October 31, 2016:
| | | | | | | | | | | | | | | | | | | | | | | | | | | | | | | | |
| | | Beginning
Balance, as of
October 31, 2015 | | | Purchases | | | Sales | | | Net
Realized
Gain | | | Net Change in
Unrealized
Appreciation
(Depreciation) | | | Transfers
into Level 3 | | | Transfers out
of Level 3 | | | Ending
Balance, as of
October 31, 2016 | |
| Equity Securities | | $ | 1,124,740 | | | $ | — | | | $ | — | | | $ | — | | | $ | (164,245 | ) | | $ | — | | | $ | (960,495 | ) | | $ | — | |
Note 6. Derivative Investments
The Funds may enter into an International Swaps and Derivatives Association Master Agreement (“ISDA Master Agreement”) under which a Fund may trade OTC derivatives. An OTC transaction entered into under an ISDA Master Agreement typically involves a collateral posting arrangement, payment netting provisions and close-out netting provisions. These netting provisions allow for reduction of credit risk through netting of contractual obligations. The enforceability of the netting provisions of the ISDA Master Agreement depends on the governing law of the ISDA Master Agreement, among other factors.
For financial reporting purposes, the Funds do not offset OTC derivative assets or liabilities that are subject to ISDA Master Agreements in the Statements of Assets and Liabilities.
Value of Derivative Investments at Fiscal Year-End
The table below summarizes the value of each Fund’s derivative investments, detailed by primary risk exposure, held as of October 31, 2016:
| | | | | | | | | | | | |
| | | Value | |
| | | Developed EuroPacific
Currency Hedged Low
Volatility Portfolio | | | Europe Currency Hedged
Low Volatility Portfolio | | | Japan Currency
Hedged Low
Volatility Portfolio | |
Derivative Assets | | Currency Risk | |
| Unrealized appreciation on forward foreign currency contracts outstanding | | $ | 33,792 | | | $ | 4,552,861 | | | $ | 46,176 | |
| Derivatives not subject to master netting agreements | | | — | | | | — | | | | — | |
| | | | | | | | | | | | |
| Total Derivative Assets subject to master netting agreements | | $ | 33,792 | | | $ | 4,552,861 | | | $ | 46,176 | |
| | | | | | | | | | | | |
Derivative Liabilities | | | |
| Unrealized depreciation forward foreign currency contracts outstanding | | $ | (126 | ) | | $ | (99,812 | ) | | $ | (181 | ) |
| Derivatives not subject to master netting agreements | | | — | | | | — | | | | — | |
| | | | | | | | | | | | |
| Total Derivative Liabilities subject to master netting agreements | | $ | (126 | ) | | $ | (99,812 | ) | | $ | (181 | ) |
| | | | | | | | | | | | |
Offsetting Assets and Liabilities
The tables below reflect the Funds’ exposure to Counterparties subject to either an ISDA Master Agreement or other agreement for OTC derivative transactions as of October 31, 2016:
Developed EuroPacific Currency Hedged Low Volatility Portfolio
| | | | | | | | | | | | | | | | | | | | | | | | |
| | | Financial Derivative
Assets | | | Financial Derivative
Liabilities | | | | | | Collateral
(Received)/Pledged | | | | |
Counterparty | | Forward foreign
currency contracts | | | Forward foreign
currency contracts | | | Net value of
derivatives | | | Non-Cash | | | Cash | | | Net amount | |
| CIBC World Markets Corp. | | $ | 33,792 | | | $ | (126 | ) | | $ | 33,666 | | | $ | — | | | $ | — | | | $ | 33,666 | |
Europe Currency Hedged Low Volatility Portfolio
| | | | | | | | | | | | | | | | | | | | | | | | |
| | | Financial Derivative
Assets | | | Financial Derivative
Liabilities | | | | | | Collateral
(Received)/Pledged | | | | |
Counterparty | | Forward foreign
currency contracts | | | Forward foreign
currency contracts | | | Net value of
derivatives | | | Non-Cash | | | Cash | | | Net amount | |
| CIBC World Markets Corp. | | $ | 1,519,189 | | | $ | (84,102 | ) | | $ | 1,435,087 | | | $ | — | | | $ | — | | | $ | 1,435,087 | |
| Goldman, Sachs & Co. | | | 1,517,816 | | | | (7,630 | ) | | | 1,510,186 | | | | — | | | | — | | | | 1,510,186 | |
| RBC Capital Markets LLC | | | 1,515,856 | | | | (8,080 | ) | | | 1,507,776 | | | | — | | | | — | | | | 1,507,776 | |
| | | | | | | | | | | | | | | | | | | | | | | | |
| Total | | $ | 4,552,861 | | | $ | (99,812 | ) | | $ | 4,453,049 | | | $ | — | | | $ | — | | | $ | 4,453,049 | |
| | | | | | | | | | | | | | | | | | | | | | | | |
Japan Currency Hedged Low Volatility Portfolio
| | | | | | | | | | | | | | | | | | | | | | | | |
| | | Financial Derivative
Assets | | | Financial Derivative
Liabilities | | | | | | Collateral
(Received)/Pledged | | | | |
Counterparty | | Forward foreign
currency contracts | | | Forward foreign
currency contracts | | | Net value of
derivatives | | | Non-Cash | | | Cash | | | Net amount | |
| CIBC World Markets Corp. | | $ | 46,176 | | | $ | (181 | ) | | $ | 45,995 | | | $ | — | | | $ | — | | | $ | 45,995 | |
Effect of Derivative Investments for the Fiscal Year Ended October 31, 2016
The table below summarizes the gains (losses) on derivative investments, detailed by primary risk exposure, recognized in earnings during the period:
| | | | | | | | | | | | |
| | | Location of Gain (Loss) on Statements of Operations | |
| | | Developed
EuroPacific
Currency Hedged
Low Volatility
Portfolio | | | Europe Currency
Hedged Low
Volatility Portfolio | | | Japan Currency
Hedged Low
Volatility
Portfolio | |
| | | Currency Risk | |
| Realized Gain (Loss): | | | | | | | | | | | | |
Forward foreign currency contracts | | $ | 2,043 | | | $ | 4,808,848 | | | $ | (200,631 | ) |
| Change in Net Unrealized Appreciation (Depreciation): | | | | | | | | | | | | |
Forward foreign currency contracts | | | 35,241 | | | | 2,748,558 | | | | 35,643 | |
| | | | | | | | | | | | |
Total | | $ | 37,284 | | | $ | 7,557,406 | | | $ | (164,988 | ) |
| | | | | | | | | | | | |
The table below summarizes the average notional value of forward foreign currency contracts outstanding during the year.
| | | | | | | | | | | | |
| | | Average Notional Value | |
| | | Developed
EuroPacific
Currency Hedged
Low Volatility
Portfolio | | | Europe Currency
Hedged Low
Volatility
Portfolio | | | Japan Currency
Hedged Low
Volatility
Portfolio | |
| Forward foreign currency contracts | | $ | 3,371,097 | | | $ | 451,959,707 | | | $ | 3,205,707 | |
Developed EuroPacific Currency Hedged Low Volatility Portfolio
| | | | | | | | | | | | | | | | | | | | | | |
| Open Forward Foreign Currency Contracts | |
| | | | | Contract to | | | | | | Unrealized
Appreciation
(Depreciation) | |
| Settlement Date | | Counterparty | | Deliver | | | Receive | | | Notional Value | | |
| 11/2/2016 | | CIBC World Markets Corp. | | AUD | | | 283,000 | | | USD | | | 216,436 | | | $ | 215,349 | | | $ | 1,087 | |
| 11/2/2016 | | CIBC World Markets Corp. | | CHF | | | 89,000 | | | USD | | | 91,963 | | | | 89,999 | | | | 1,964 | |
| 11/2/2016 | | CIBC World Markets Corp. | | DKK | | | 90,000 | | | USD | | | 13,600 | | | | 13,262 | | | | 338 | |
| 11/2/2016 | | CIBC World Markets Corp. | | EUR | | | 309,000 | | | USD | | | 347,715 | | | | 338,726 | | | | 8,989 | |
| 11/2/2016 | | CIBC World Markets Corp. | | GBP | | | 153,000 | | | USD | | | 198,863 | | | | 186,797 | | | | 12,066 | |
| 11/2/2016 | | CIBC World Markets Corp. | | HKD | | | 930,000 | | | USD | | | 119,940 | | | | 119,925 | | | | 15 | |
| 11/2/2016 | | CIBC World Markets Corp. | | JPY | | | 5,477,000 | | | USD | | | 54,148 | | | | 52,120 | | | | 2,028 | |
Developed EuroPacific Currency Hedged Low Volatility Portfolio (continued)
| | | | | | | | | | | | | | | | | | | | | | |
| Open Forward Foreign Currency Contracts | |
| | | | | Contract to | | | | | | Unrealized
Appreciation
(Depreciation) | |
| Settlement Date | | Counterparty | | Deliver | | | Receive | | | Notional Value | | |
| 11/2/2016 | | CIBC World Markets Corp. | | NOK | | | 165,000 | | | USD | | | 20,646 | | | $ | 19,996 | | | $ | 650 | |
| 11/2/2016 | | CIBC World Markets Corp. | | NZD | | | 71,000 | | | USD | | | 51,569 | | | | 50,794 | | | | 775 | |
| 11/2/2016 | | CIBC World Markets Corp. | | SEK | | | 415,000 | | | USD | | | 48,508 | | | | 46,001 | | | | 2,507 | |
| 11/2/2016 | | CIBC World Markets Corp. | | SGD | | | 223,000 | | | USD | | | 163,576 | | | | 160,213 | | | | 3,363 | |
| 11/2/2016 | | CIBC World Markets Corp. | | USD | | | 215,349 | | | AUD | | | 283,000 | | | | 215,349 | | | | 0 | |
| 11/2/2016 | | CIBC World Markets Corp. | | USD | | | 338,726 | | | EUR | | | 309,000 | | | | 338,726 | | | | 0 | |
| 11/2/2016 | | CIBC World Markets Corp. | | USD | | | 186,798 | | | GBP | | | 153,000 | | | | 186,798 | | | | 0 | |
| 11/2/2016 | | CIBC World Markets Corp. | | USD | | | 50,793 | | | NZD | | | 71,000 | | | | 50,793 | | | | 0 | |
| 12/2/2016 | | CIBC World Markets Corp. | | AUD | | | 272,000 | | | USD | | | 206,815 | | | | 206,807 | | | | 8 | |
| 12/2/2016 | | CIBC World Markets Corp. | | CHF | | | 88,000 | | | USD | | | 89,118 | | | | 89,134 | | | | (16 | ) |
| 12/2/2016 | | CIBC World Markets Corp. | | DKK | | | 89,000 | | | USD | | | 13,131 | | | | 13,133 | | | | (2 | ) |
| 12/2/2016 | | CIBC World Markets Corp. | | EUR | | | 313,000 | | | USD | | | 343,518 | | | | 343,564 | | | | (46 | ) |
| 12/2/2016 | | CIBC World Markets Corp. | | GBP | | | 153,000 | | | USD | | | 186,905 | | | | 186,917 | | | | (12 | ) |
| 12/2/2016 | | CIBC World Markets Corp. | | HKD | | | 935,000 | | | USD | | | 120,586 | | | | 120,591 | | | | (5 | ) |
| 12/2/2016 | | CIBC World Markets Corp. | | JPY | | | 5,630,000 | | | USD | | | 53,627 | | | | 53,635 | | | | (8 | ) |
| 12/2/2016 | | CIBC World Markets Corp. | | NOK | | | 170,000 | | | USD | | | 20,603 | | | | 20,604 | | | | (1 | ) |
| 12/2/2016 | | CIBC World Markets Corp. | | NZD | | | 67,000 | | | USD | | | 47,876 | | | | 47,874 | | | | 2 | |
| 12/2/2016 | | CIBC World Markets Corp. | | SEK | | | 414,000 | | | USD | | | 45,950 | | | | 45,957 | | | | (7 | ) |
| 12/2/2016 | | CIBC World Markets Corp. | | SGD | | | 223,000 | | | USD | | | 160,221 | | | | 160,250 | | | | (29 | ) |
| | | | | | | | | | | | | | | | | | | | | | |
| Total Forward Foreign Currency Contracts — Currency Risk | | | $ | 33,666 | |
| | | | | | | | | | | | | | | | | | | | | | |
Currency Abbreviations:
AUD—Australian Dollar
CHF—Swiss Franc
DKK—Danish Krone
EUR—Euro
GBP—British Pound
HKD—Hong Kong Dollar
JPY—Japanese Yen
NOK—Norwegian Krone
NZD—New Zealand Dollar
SEK—Swedish Krona
SGD—Singapore Dollar
Europe Currency Hedged Low Volatility Portfolio
| | | | | | | | | | | | | | | | | | | | | | |
| Open Forward Foreign Currency Contracts | |
| | | | | Contract to | | | | | | Unrealized
Appreciation
(Depreciation) | |
| Settlement Date | | Counterparty | | Deliver | | | Receive | | | Notional Value | | |
| 11/2/2016 | | CIBC World Markets Corp. | | EUR | | | 52,170,000 | | | USD | | | 58,707,944 | | | $ | 57,188,772 | | | $ | 1,519,172 | |
| 11/2/2016 | | CIBC World Markets Corp. | | USD | | | 54,141,318 | | | EUR | | | 49,390,000 | | | | 54,141,335 | | | | 17 | |
| 11/2/2016 | | CIBC World Markets Corp. | | USD | | | 3,122,885 | | | EUR | | | 2,780,000 | | | | 3,047,437 | | | | (75,448 | ) |
| 11/2/2016 | | Goldman, Sachs & Co. | | EUR | | | 52,170,000 | | | USD | | | 58,706,588 | | | | 57,188,772 | | | | 1,517,816 | |
| 11/2/2016 | | Goldman, Sachs & Co. | | USD | | | 57,191,571 | | | EUR | | | 52,170,000 | | | | 57,188,772 | | | | (2,799 | ) |
| 11/2/2016 | | RBC Capital Markets LLC | | EUR | | | 52,160,000 | | | USD | | | 58,693,666 | | | | 57,177,810 | | | | 1,515,856 | |
| 11/2/2016 | | RBC Capital Markets LLC | | USD | | | 57,179,200 | | | EUR | | | 52,160,000 | | | | 57,177,810 | | | | (1,390 | ) |
| 12/2/2016 | | CIBC World Markets Corp. | | EUR | | | 51,667,000 | | | USD | | | 56,703,499 | | | | 56,712,153 | | | | (8,654 | ) |
| 12/2/2016 | | Goldman, Sachs & Co. | | EUR | | | 51,667,000 | | | USD | | | 56,707,322 | | | | 56,712,153 | | | | (4,831 | ) |
| 12/2/2016 | | RBC Capital Markets LLC | | EUR | | | 51,666,000 | | | USD | | | 56,704,365 | | | | 56,711,055 | | | | (6,690 | ) |
| | | | | | | | | | | | | | | | | | | | | | |
| Total Forward Foreign Currency Contracts — Currency Risk | | | $ | 4,453,049 | |
| | | | | | | | | | | | | | | | | | | | | | |
Currency Abbreviations:
EUR—Euro
USD—U.S. Dollar
Japan Currency Hedged Low Volatility Portfolio
| | | | | | | | | | | | | | | | | | | | | | |
| Open Forward Foreign Currency Contracts | |
| | | | | Contract to | | | | | | Unrealized
Appreciation
(Depreciation) | |
| Settlement Date | | Counterparty | | Deliver | | | Receive | | | Notional Value | | |
| 11/2/2016 | | CIBC World Markets Corp. | | JPY | | | 124,700,000 | | | USD | | | 1,232,835 | | | $ | 1,186,659 | | | $ | 46,176 | |
| 12/2/2016 | | CIBC World Markets Corp. | �� | JPY | | | 131,900,000 | | | USD | | | 1,256,370 | | | | 1,256,551 | | | | (181 | ) |
| | | | | | | | | | | | | | | | | | | | | | |
| Total Forward Foreign Currency Contracts — Currency Risk | | | $ | 45,995 | |
| | | | | | | | | | | | | | | | | | | | | | |
Currency Abbreviations:
JPY—Japanese Yen
USD—U.S. Dollar
Note 7. Distributions to Shareholders and Tax Components of Net Assets
Tax Character of Distributions to Shareholders Paid During the Fiscal Years Ended October 31, 2016 and 2015:
| | | | | | | | | | | | | | | | | | | | | | | | |
| | | 2016 | | | 2015 | |
| | | Ordinary
Income | | | Long-Term
Capital Gains | | | Return of
Capital | | | Ordinary
Income | | | Long-Term
Capital Gains | | | Return of
Capital | |
| Developed EuroPacific Currency Hedged Low Volatility Portfolio | | $ | 55,672 | | | $ | 3,043 | | | $ | — | | | $ | — | | | $ | — | | | $ | — | |
| DWA Developed Markets Momentum Portfolio | | | 3,575,110 | | | | — | | | | — | | | | 4,075,936 | | | | — | | | | — | |
| DWA Emerging Markets Momentum Portfolio | | | 2,384,361 | | | | — | | | | 66,148 | | | | 1,862,258 | | | | — | | | | — | |
| Emerging Markets Infrastructure Portfolio | | | 355,728 | | | | — | | | | — | | | | 562,003 | | | | — | | | | — | |
| Europe Currency Hedged Low Volatility Portfolio | | | 8,081,224 | | | | — | | | | — | | | | 19,178 | | | | — | | | | — | |
| FTSE RAFI Asia Pacific ex-Japan Portfolio | | | 858,645 | | | | — | | | | — | | | | 1,354,446 | | | | — | | | | — | |
| FTSE RAFI Developed Markets ex-U.S. Portfolio | | | 23,487,004 | | | | — | | | | — | | | | 22,728,390 | | | | — | | | | — | |
| FTSE RAFI Developed Markets ex-U.S. Small-Mid Portfolio | | | 3,521,834 | | | | — | | | | — | | | | 1,894,365 | | | | — | | | | — | |
| FTSE RAFI Emerging Markets Portfolio | | | 11,147,902 | | | | — | | | | — | | | | 9,357,675 | | | | — | | | | — | |
| Global Agriculture Portfolio | | | 520,195 | | | | — | | | | — | | | | 1,114,870 | | | | — | | | | — | |
| Global Clean Energy Portfolio | | | 1,139,789 | | | | — | | | | — | | | | 700,178 | | | | — | | | | — | |
| Global Gold and Precious Metals Portfolio | | | 25,870 | | | | — | | | | — | | | | 138,487 | | | | — | | | | — | |
| Global Water Portfolio | | | 2,943,188 | | | | — | | | | — | | | | 3,532,866 | | | | — | | | | — | |
| International BuyBack AchieversTM Portfolio | | | 2,039,215 | | | | — | | | | — | | | | 349,993 | | | | — | | | | — | |
| Japan Currency Hedged Low Volatility Portfolio | | | 14,263 | | | | 6,319 | | | | — | | | | — | | | | — | | | | — | |
| S&P International Developed Quality Portfolio | | | 448,611 | | | | — | | | | — | | | | 270,592 | | | | — | | | | — | |
Tax Components of Net Assets at Fiscal Year-End:
| | | | | | | | | | | | | | | | | | | | | | | | |
| | | Undistributed
Ordinary
Income | | | Net
Unrealized
Appreciation
(Depreciation)—
Investment
Securities | | | Net Unrealized
Appreciation
(Depreciation)—
Other Investments | | | Capital Loss
Carryforwards | | | Shares of
Beneficial
Interest | | | Total Net
Assets | |
| Developed EuroPacific Currency Hedged Low Volatility Portfolio | | $ | 26,241 | | | $ | 9,830 | | | $ | 3,416 | | | $ | (15,170 | ) | | $ | 1,285,262 | | | $ | 1,309,579 | |
| DWA Developed Markets Momentum Portfolio | | | 228,635 | | | | 3,955,535 | | | | (84,080 | ) | | | (102,238,818 | ) | | | 272,029,769 | | | | 173,891,041 | |
| DWA Emerging Markets Momentum Portfolio | | | — | | | | 18,135,046 | | | | (1,418 | ) | | | (131,034,860 | ) | | | 296,569,203 | | | | 183,667,971 | |
| Emerging Markets Infrastructure Portfolio | | | 25,025 | | | | (2,277,967 | ) | | | 45 | | | | (37,540,184 | ) | | | 60,050,720 | | | | 20,257,639 | |
| Europe Currency Hedged Low Volatility Portfolio | | | 1,314,827 | | | | (7,961,461 | ) | | | (37,747 | ) | | | (6,464,751 | ) | | | 182,457,642 | | | | 169,308,510 | |
| FTSE RAFI Asia Pacific ex-Japan Portfolio | | | 94,624 | | | | (2,455,179 | ) | | | 3 | | | | (8,495,244 | ) | | | 34,846,118 | | | | 23,990,322 | |
| FTSE RAFI Developed Markets ex-U.S. Portfolio | | | 5,359,373 | | | | (97,239,053 | ) | | | (130,655 | ) | | | (38,237,386 | ) | | | 1,068,897,289 | | | | 938,649,568 | |
| FTSE RAFI Developed Markets ex-U.S. Small-Mid Portfolio | | | 816,203 | | | | 11,450,491 | | | | (22,091 | ) | | | (13,958,934 | ) | | | 164,568,619 | | | | 162,854,288 | |
| FTSE RAFI Emerging Markets Portfolio | | | 1,231,055 | | | | (3,852,908 | ) | | | 14,790 | | | | (78,690,413 | ) | | | 706,695,873 | | | | 625,398,397 | |
| Global Agriculture Portfolio | | | 174,068 | | | | (6,973,630 | ) | | | (18,416 | ) | | | (13,108,049 | ) | | | 42,227,172 | | | | 22,301,145 | |
| | | | | | | | | | | | | | | | | | | | | | | | |
| | | Undistributed
Ordinary
Income | | | Net
Unrealized
Appreciation
(Depreciation)—
Investment
Securities | | | Net Unrealized
Appreciation
(Depreciation)—
Other Investments | | | Capital Loss
Carryforwards | | | Shares of
Beneficial
Interest | | | Total Net
Assets | |
| Global Clean Energy Portfolio | | $ | 179,745 | | | $ | 385,516 | | | $ | (9,539 | ) | | $ | (187,880,641 | ) | | $ | 243,477,379 | | | $ | 56,152,460 | |
| Global Gold and Precious Metals Portfolio | | | 411,233 | | | | (4,002,888 | ) | | | (854 | ) | | | (17,245,439 | ) | | | 63,579,355 | | | | 42,741,407 | |
| Global Water Portfolio | | | 649,550 | | | | 20,471,746 | | | | (31,888 | ) | | | (96,810,528 | ) | | | 264,386,029 | | | | 188,664,909 | |
| International BuyBack AchieversTM Portfolio | | | 651,616 | | | | 839,372 | | | | 36,592 | | | | (5,266,011 | ) | | | 95,940,623 | | | | 92,202,192 | |
| Japan Currency Hedged Low Volatility Portfolio | | | 18,148 | | | | 75,563 | | | | (485 | ) | | | (126,059 | ) | | | 1,283,761 | | | | 1,250,928 | |
| S&P International Developed Quality Portfolio | | | 132,724 | | | | 79,948 | | | | (7,926 | ) | | | (26,011,410 | ) | | | 46,435,048 | | | | 20,628,384 | |
Capital loss carryforwards are calculated and reported as of a specific date. Results of transactions and other activity after that date may affect the amount of capital loss carryforwards actually available for the Funds to utilize. Capital losses generated in years beginning after December 22, 2010 can be carried forward for an unlimited period, whereas previous losses expire in eight tax years. Capital losses with an expiration period may not be used to offset capital gains until all net capital losses without an expiration date have been utilized. Capital loss carryforwards with no expiration date will retain their character as either short-term or long-term capital losses instead of as short-term capital losses as under prior law. The ability to utilize capital loss carryforwards in the future may be limited under the Internal Revenue Code and related regulations based on the results of future transactions.
The following table presents available capital loss carryforwards and expiration dates for each Fund as of October 31, 2016.
| | | | | | | | | | | | | | | | | | | | | | | | | | | | |
| | | | | | | | | | | | Post-effective/no expiration | | | | | | | |
| | | 2017 | | | 2018 | | | 2019 | | | Short-Term | | | Long-Term | | | Total* | | | Expired | |
| Developed EuroPacific Currency Hedged Low Volatility Portfolio | | $ | — | | | $ | — | | | $ | — | | | $ | 15,170 | | | $ | — | | | $ | 15,170 | | | $ | — | |
| DWA Developed Markets Momentum Portfolio | | | 6,761,697 | | | | 1,071,796 | | | | 11,083,378 | | | | 83,321,947 | | | | — | | | | 102,238,818 | | | | 17,174,329 | |
| DWA Emerging Markets Momentum Portfolio | | | 5,190,203 | | | | 602,137 | | | | 18,886,830 | | | | 106,355,690 | | | | — | | | | 131,034,860 | | | | 14,116,179 | |
| Emerging Markets Infrastructure Portfolio | | | — | | | | 5,545 | | | | 7,449,409 | | | | 6,000,527 | | | | 24,084,703 | | | | 37,540,184 | | | | — | |
| Europe Currency Hedged Low Volatility Portfolio | | | — | | | | — | | | | — | | | | 6,464,751 | | | | — | | | | 6,464,751 | | | | — | |
| FTSE RAFI Asia Pacific ex-Japan Portfolio | | | 4,187,699 | | | | 923,451 | | | | — | | | | 784,615 | | | | 2,599,479 | | | | 8,495,244 | | | | 317,335 | |
| FTSE RAFI Developed Markets ex-U.S. Portfolio | | | 8,801,477 | | | | 5,210,563 | | | | 1,248,239 | | | | 1,493,216 | | | | 21,483,891 | | | | 38,237,386 | | | | 2,040,934 | |
| FTSE RAFI Developed Markets ex-U.S. Small-Mid Portfolio | | | 2,633,165 | | | | 695,775 | | | | — | | | | 631,688 | | | | 9,998,306 | | | | 13,958,934 | | | | 192,155 | |
| FTSE RAFI Emerging Markets Portfolio | | | 11,700,199 | | | | 450,476 | | | | — | | | | 5,939,844 | | | | 60,599,894 | | | | 78,690,413 | | | | 5,378,903 | |
| Global Agriculture Portfolio | | | — | | | | — | | | | 365,885 | | | | 1,161,026 | | | | 11,581,138 | | | | 13,108,049 | | | | — | |
| Global Clean Energy Portfolio | | | 65,130,758 | | | | 22,796,787 | | | | 31,202,293 | | | | 12,081,613 | | | | 56,669,190 | | | | 187,880,641 | | | | 34,356,421 | |
| Global Gold and Precious Metals Portfolio | | | — | | | | — | | | | 374,482 | | | | 1,605,148 | | | | 15,265,809 | | | | 17,245,439 | | | | — | |
| Global Water Portfolio | | | 41,990,185 | | | | 1,909,380 | | | | 4,235,497 | | | | 37,503,483 | | | | 11,171,983 | | | | 96,810,528 | | | | 64,839,461 | |
| International BuyBack AchieversTM Portfolio | | | — | | | | — | | | | — | | | | 4,244,620 | | | | 1,021,391 | | | | 5,266,011 | | | | — | |
| Japan Currency Hedged Low Volatility Portfolio | | | — | | | | — | | | | — | | | | 19,051 | | | | 107,008 | | | | 126,059 | | | | — | |
| S&P International Developed Quality Portfolio | | | 19,713,557 | | | | 980,146 | | | | 2,056,117 | | | | 2,510,767 | | | | 750,823 | | | | 26,011,410 | | | | 23,676,544 | |
| * | Capital loss carryforwards as of the date listed above are reduced for limitations, if any, to the extent required by the Internal Revenue Code and may be further limited depending upon a variety of factors, including the realization of net unrealized gains or losses as of the date of any reorganization. |
Note 8. Investment Transactions
For the fiscal year ended October 31, 2016, the cost of securities purchased and proceeds from sales of securities (other than short-term securities, U.S. Treasury obligations, money market funds and in-kind transactions, if any) were as follows:
| | | | | | | | |
| | | Purchases | | | Sales | |
| Developed EuroPacific Currency Hedged Low Volatility Portfolio | | $ | 1,141,150 | | | $ | 2,295,635 | |
| DWA Developed Markets Momentum Portfolio | | | 269,615,172 | | | | 271,248,828 | |
| DWA Emerging Markets Momentum Portfolio | | | 273,187,369 | | | | 276,258,644 | |
| Emerging Markets Infrastructure Portfolio | | | 5,758,634 | | | | 7,041,001 | |
| Europe Currency Hedged Low Volatility Portfolio | | | 151,181,137 | | | | 145,172,106 | |
| FTSE RAFI Asia Pacific ex-Japan Portfolio | | | 4,407,854 | | | | 4,441,835 | |
| | | | | | | | |
| | | Purchases | | | Sales | |
| FTSE RAFI Developed Markets ex-U.S. Portfolio | | $ | 118,558,503 | | | $ | 111,476,999 | |
| FTSE RAFI Developed Markets ex-U.S. Small-Mid Portfolio | | | 40,290,401 | | | | 38,955,277 | |
| FTSE RAFI Emerging Markets Portfolio | | | 155,735,050 | | | | 64,737,492 | |
| Global Agriculture Portfolio | | | 8,596,668 | | | | 8,912,318 | |
| Global Clean Energy Portfolio | | | 34,316,343 | | | | 34,581,854 | |
| Global Gold and Precious Metals Portfolio | | | 10,376,059 | | | | 10,392,413 | |
| Global Water Portfolio | | | 138,074,175 | | | | 139,032,599 | |
| International BuyBack AchieversTM Portfolio | | | 83,958,643 | | | | 78,624,858 | |
| Japan Currency Hedged Low Volatility Portfolio | | | 1,180,349 | | | | 2,427,229 | |
| S&P International Developed Quality Portfolio | | | 36,485,290 | | | | 35,516,309 | |
For the fiscal year ended October 31, 2016, in-kind transactions associated with creations and redemptions were as follows:
| | | | | | | | |
| | | Cost of
Securities
Received | | | Value of
Securities
Delivered | |
| Developed EuroPacific Currency Hedged Low Volatility Portfolio | | $ | 1,227,630 | | | $ | 1,384,448 | |
| DWA Developed Markets Momentum Portfolio | | | — | | | | 77,473,960 | |
| DWA Emerging Markets Momentum Portfolio | | | 12,050,812 | | | | 19,221,748 | |
| Emerging Markets Infrastructure Portfolio | | | — | | | | 5,197,038 | |
| Europe Currency Hedged Low Volatility Portfolio | | | 189,484,589 | | | | 174,711,521 | |
| FTSE RAFI Asia Pacific ex-Japan Portfolio | | | 1,548,601 | | | | 1,549,593 | |
| FTSE RAFI Developed Markets ex-U.S. Portfolio | | | 300,382,584 | | | | 120,874,078 | |
| FTSE RAFI Developed Markets ex-U.S. Small-Mid Portfolio | | | 20,670,200 | | | | 8,981,415 | |
| FTSE RAFI Emerging Markets Portfolio | | | 159,104,514 | | | | 15,806,505 | |
| Global Agriculture Portfolio | | | — | | | | 2,965,171 | |
| Global Clean Energy Portfolio | | | — | | | | 5,128,391 | |
| Global Gold and Precious Metals Portfolio | | | 27,894,570 | | | | 17,193,100 | |
| Global Water Portfolio | | | — | | | | 44,617,207 | |
| International BuyBack AchieversTM Portfolio | | | 54,140,329 | | | | 28,006,583 | |
| Japan Currency Hedged Low Volatility Portfolio | | | 1,259,325 | | | | 1,547,921 | |
| S&P International Developed Quality Portfolio | | | 15,895,243 | | | | 14,734,897 | |
Gains (losses) on in-kind transactions are generally not considered taxable gains (losses) for federal income tax purposes.
During the period, DWA Emerging Markets Momentum Portfolio, Emerging Markets Infrastructure Portfolio, Global Clean Energy Portfolio and S&P International Developed Quality Portfolio received $488,463, $136,115, $168,260 and $188,800, respectively, in litigation settlement proceeds from foreign exchange investment transactions.
At October 31, 2016, the aggregate cost and net unrealized appreciation (depreciation) of investments for tax purposes were as follows:
| | | | | | | | | | | | | | | | |
| | | Gross
Unrealized
Appreciation | | | Gross
Unrealized
(Depreciation) | | | Net
Unrealized
Appreciation
(Depreciation) | | | Cost | |
| Developed EuroPacific Currency Hedged Low Volatility Portfolio | | $ | 63,669 | | | $ | (53,839 | ) | | $ | 9,830 | | | $ | 1,264,782 | |
| DWA Developed Markets Momentum Portfolio | | | 12,516,937 | | | | (8,561,402 | ) | | | 3,955,535 | | | | 172,647,739 | |
| DWA Emerging Markets Momentum Portfolio | | | 20,813,050 | | | | (2,678,004 | ) | | | 18,135,046 | | | | 166,580,769 | |
| Emerging Markets Infrastructure Portfolio | | | 2,453,233 | | | | (4,731,200 | ) | | | (2,277,967 | ) | | | 22,554,630 | |
| Europe Currency Hedged Low Volatility Portfolio | | | 2,548,000 | | | | (10,509,461 | ) | | | (7,961,461 | ) | | | 177,290,839 | |
| FTSE RAFI Asia Pacific ex-Japan Portfolio | | | 2,557,419 | | | | (5,012,598 | ) | | | (2,455,179 | ) | | | 26,454,448 | |
| FTSE RAFI Developed Markets ex-U.S. Portfolio | | | 38,626,353 | | | | (135,865,406 | ) | | | (97,239,053 | ) | | | 1,047,263,781 | |
| FTSE RAFI Developed Markets ex-U.S. Small-Mid Portfolio | | | 25,631,925 | | | | (14,181,434 | ) | | | 11,450,491 | | | | 155,010,427 | |
| FTSE RAFI Emerging Markets Portfolio | | | 56,451,736 | | | | (60,304,644 | ) | | | (3,852,908 | ) | | | 629,189,242 | |
| Global Agriculture Portfolio | | | 2,150,746 | | | | (9,124,376 | ) | | | (6,973,630 | ) | | | 30,236,271 | |
| | | | | | | | | | | | | | | | |
| | | Gross
Unrealized
Appreciation | | | Gross
Unrealized
(Depreciation) | | | Net
Unrealized
Appreciation
(Depreciation) | | | Cost | |
| Global Clean Energy Portfolio | | $ | 8,241,967 | | | $ | (7,856,451 | ) | | $ | 385,516 | | | $ | 60,918,364 | |
| Global Gold and Precious Metals Portfolio | | | 2,736,588 | | | | (6,739,476 | ) | | | (4,002,888 | ) | | | 46,764,992 | |
| Global Water Portfolio | | | 25,108,832 | | | | (4,637,086 | ) | | | 20,471,746 | | | | 167,739,677 | |
| International BuyBack AchieversTM Portfolio | | | 3,912,712 | | | | (3,073,340 | ) | | | 839,372 | | | | 91,338,151 | |
| Japan Currency Hedged Low Volatility Portfolio | | | 111,039 | | | | (35,476 | ) | | | 75,563 | | | | 1,129,131 | |
| S&P International Developed Quality Portfolio | | | 1,173,921 | | | | (1,093,973 | ) | | | 79,948 | | | | 20,538,788 | |
Note 9. Reclassification of Permanent Differences
Primarily as a result of differing book/tax treatment of in-kind transactions, foreign currency transactions, passive foreign investment company and expired capital loss carryforwards, amounts were reclassified between undistributed net investment income, undistributed net realized gain (loss) and Shares of beneficial interest. These reclassifications had no effect on the net assets of each Fund. For the fiscal year ended October 31, 2016, the reclassifications were as follows:
| | | | | | | | | | | | |
| | | Undistributed
Net Investment
Income | | | Undistributed
Net Realized
Gain (Loss) | | | Shares of
Beneficial
Interest | |
| Developed EuroPacific Currency Hedged Low Volatility Portfolio | | $ | 16,407 | | | $ | (36,240 | ) | | $ | 19,833 | |
| DWA Developed Markets Momentum Portfolio | | | (122,585 | ) | | | 13,631,556 | | | | (13,508,971 | ) |
| DWA Emerging Markets Momentum Portfolio | | | (130,069 | ) | | | 15,105,154 | | | | (14,975,085 | ) |
| Emerging Markets Infrastructure Portfolio | | | (5,205 | ) | | | 1,551,450 | | | | (1,546,245 | ) |
| Europe Currency Hedged Low Volatility Portfolio | | | 1,132,969 | | | | 852,514 | | | | (1,985,483 | ) |
| FTSE RAFI Asia Pacific ex-Japan Portfolio | | | 41,903 | | | | 245,857 | | | | (287,760 | ) |
| FTSE RAFI Developed Markets ex-U.S. Portfolio | | | 413,152 | | | | 4,138,338 | | | | (4,551,490 | ) |
| FTSE RAFI Developed Markets ex-U.S. Small-Mid Portfolio | | | 328,833 | | | | (3,150,072 | ) | | | 2,821,239 | |
| FTSE RAFI Emerging Markets Portfolio | | | (201,368 | ) | | | 7,638,355 | | | | (7,436,987 | ) |
| Global Agriculture Portfolio | | | 8,419 | | | | 578,260 | | | | (586,679 | ) |
| Global Clean Energy Portfolio | | | (17,440 | ) | | | 33,518,563 | | | | (33,501,123 | ) |
| Global Gold and Precious Metals Portfolio | | | 77,121 | | | | (4,237,740 | ) | | | 4,160,619 | |
| Global Water Portfolio | | | (184,546 | ) | | | 54,766,515 | | | | (54,581,969 | ) |
| International BuyBack AchieversTM Portfolio | | | 80,969 | | | | (3,066,878 | ) | | | 2,985,909 | |
| Japan Currency Hedged Low Volatility Portfolio | | | 6,356 | | | | (66,889 | ) | | | 60,533 | |
| S&P International Developed Quality Portfolio | | | 61,574 | | | | 21,686,302 | | | | (21,747,876 | ) |
Note 10. Trustees’ and Officer’s Fees
Trustees’ and Officer’s Fees include amounts accrued by the Funds to pay remuneration to each Trustee who is not an “interested person” as defined in the 1940 Act (an “Independent Trustee”), any Trustee who is not an affiliate of the Adviser or Distributor (or any of their affiliates) and who is otherwise an “interested person” of the Trust under the 1940 Act (an “Unaffiliated Trustee”) and an Officer of the Trust. The Adviser, as a result of each Fund’s unitary management fee, pays for such compensation. The Trustee who is an “interested person” of the Trust does not receive any Trustees’ fees.
The Trust has adopted a deferred compensation plan (the “Plan”). Under the Plan, each Independent Trustee or Unaffiliated Trustee who has executed a Deferred Fee Agreement (a “Participating Trustee”) may defer receipt of all or a portion of his compensation (“Deferral Fees”). Such Deferral Fees are deemed to be invested in select PowerShares Funds. The Deferral Fees payable to the Participating Trustee are valued as of the date such Deferral Fees would have been paid to the Participating Trustee. The value increases with contributions or with increases in the value of the Shares selected, and the value decreases with distributions or with declines in the value of the Shares selected. Obligations under the Plan represent unsecured claims against the general assets of the Funds.
Note 11. Capital
Shares are created and redeemed by each Fund only in Creation Units of 50,000 Shares. Only Authorized Participants are permitted to purchase or redeem Creation Units from the Funds. Such transactions are principally permitted in exchange for Deposit Securities, with a balancing cash component to equate the transaction to the NAV per Share of a Fund of the Trust on the transaction date. However, for all Funds, cash in an amount equivalent to the value of certain securities may be substituted, generally when the securities are not
available in sufficient quantity for delivery, not eligible for trading by the Authorized Participant or as a result of other market circumstances.
To the extent that the Funds permit transactions in exchange for Deposit Securities, each Fund may issue Shares in advance of receipt of Deposit Securities subject to various conditions, including a requirement to maintain on deposit with the Trust cash at least equal to 105% of the market value of the missing Deposit Securities. In accordance with the Trust’s Participant Agreement, Creation Units will be issued to an Authorized Participant, notwithstanding the fact that the corresponding Deposit Securities have not been received in part or in whole, in reliance on the undertaking of the Authorized Participant to deliver the missing Deposit Securities as soon as possible, which undertaking shall be secured by the Authorized Participant’s delivery and maintenance of collateral consisting of cash in the form of U.S. dollars in immediately available funds having a value (marked-to-market daily) at least equal to 105%, which the Adviser may change from time to time, of the value of the missing Deposit Securities.
Certain transaction fees may be charged by the Funds for creations and redemptions, which are treated as increases in capital.
Transactions in each Fund’s Shares are disclosed in detail in the Statements of Changes in Net Assets.
Note 12. Indemnifications
Under the Trust’s organizational documents, its officers and Trustees are indemnified against certain liabilities arising out of the performance of their duties to the Trust. Each Independent Trustee and Unaffiliated Trustee is also indemnified against certain liabilities arising out of the performance of his duties to the Trust pursuant to an Indemnification Agreement between such trustee and the Trust. Additionally, in the normal course of business, the Trust enters into contracts with service providers that contain general indemnification clauses. The Trust’s maximum exposure under these arrangements is unknown, as this would involve future claims that may be made against the Trust that have not yet occurred. However, based on experience, the Trust believes the risk of loss to be remote.
Note 13. Subsequent Events
Effective December 7, 2016 each of DWA Developed Markets Momentum Portfolio, DWA Emerging Markets Momentum Portfolio and Global Water Portfolio’s Shares were listed and began trading on The NASDAQ Stock Market LLC.
In addition, at a meeting held on December 15, 2016, the Board of Trustees approved a reduction in the annual unitary management fee of S&P International Developed Quality Portfolio to 0.29% of the Fund’s average daily net assets. The reduced fee will become effective on January 1, 2017.
Report of Independent Registered Public Accounting Firm
To the Board of Trustees and Shareholders of PowerShares Exchange-Traded Fund Trust II:
In our opinion, the accompanying statements of assets and liabilities, including the schedules of investments, and the related statements of operations and of changes in net assets and the financial highlights present fairly, in all material respects, the financial position of PowerShares Developed EuroPacific Currency Hedged Low Volatility Portfolio, PowerShares DWA Developed Markets Momentum Portfolio, PowerShares DWA Emerging Markets Momentum Portfolio, PowerShares Emerging Markets Infrastructure Portfolio, PowerShares Europe Currency Hedged Low Volatility Portfolio, PowerShares FTSE RAFI Asia Pacific ex-Japan Portfolio, PowerShares FTSE RAFI Developed Markets ex-U.S. Portfolio, PowerShares FTSE RAFI Developed Markets ex-U.S. Small-Mid Portfolio, PowerShares FTSE RAFI Emerging Markets Portfolio, PowerShares Global Agriculture Portfolio, PowerShares Global Clean Energy Portfolio, PowerShares Global Gold and Precious Metals Portfolio, PowerShares Global Water Portfolio, PowerShares International BuyBack AchieversTM Portfolio, PowerShares Japan Currency Hedged Low Volatility Portfolio, and PowerShares S&P International Developed Quality Portfolio (formerly PowerShares S&P International Developed High Quality Portfolio) (each an individual portfolio of PowerShares Exchange-Traded Fund Trust II, hereafter referred to as the “Funds”) as of October 31, 2016, the results of each of their operations for the year then ended, the changes in each of their net assets and the financial highlights for each of the periods presented, in conformity with accounting principles generally accepted in the United States of America. These financial statements and financial highlights (hereafter referred to as “financial statements”) are the responsibility of the Funds’ management. Our responsibility is to express an opinion on these financial statements based on our audits. We conducted our audits of these financial statements in accordance with the standards of the Public Company Accounting Oversight Board (United States). Those standards require that we plan and perform the audit to obtain reasonable assurance about whether the financial statements are free of material misstatement. An audit includes examining, on a test basis, evidence supporting the amounts and disclosures in the financial statements, assessing the accounting principles used and significant estimates made by management, and evaluating the overall financial statement presentation. We believe that our audits, which included confirmation of securities as of October 31, 2016 by correspondence with the custodian and brokers, and the application of alternative auditing procedures where confirmations of security purchases have not been received, provide a reasonable basis for our opinion.
PricewaterhouseCoopers LLP
Chicago, IL
December 22, 2016
Fees and Expenses
As a shareholder of a Fund of the PowerShares Exchange-Traded Fund Trust II, you incur a unitary management fee. In addition to the unitary management fee, a shareholder may pay distribution fees, if any, brokerage expenses, taxes, interest, acquired fund fees and expenses, if any, litigation expenses and other extraordinary expenses. The expense examples below are intended to help you understand your ongoing costs (in dollars) of investing in the Funds and to compare these costs with the ongoing costs of investing in other funds.
The example is based on an investment of $1,000 invested at the beginning of the period and held through the six-month period ended October 31, 2016.
Actual Expenses
The first line in the following table provides information about actual account values and actual expenses. You may use the information in this line, together with the amount you invested, to estimate the expenses that you paid over the period. Simply divide your account value by $1,000 (for example, an $8,600 account value divided by $1,000 = 8.6), then multiply the result by the number in the first line under the heading “Expenses Paid During the Six-Month Period” to estimate the expenses you paid on your account during this period.
Hypothetical Example for Comparison Purposes
The second line in the following table provides information about hypothetical account values and hypothetical expenses based on each Fund’s actual expense ratio and an assumed annualized rate of return of 5% per year before expenses, which is not the Fund’s actual return. The hypothetical account values and expenses may not be used to estimate the actual ending account balance or expenses you paid for the period. You may use this information to compare the ongoing costs of investing in the Funds and other funds. To do so, compare this 5% hypothetical example with the 5% hypothetical examples that appear in the shareholder reports of the other funds.
Please note that the expenses shown in the table are meant to highlight your ongoing costs only, and do not reflect any transactional costs such as sales charges and brokerage commissions. Therefore the second line in the table is useful in comparing ongoing costs only, and will not help you determine the relative total costs of owning different funds. In addition, if these transactional costs were included, your costs would have been higher.
| | | | | | | | | | | | | | | | |
| | | Beginning
Account Value
May 1, 2016 | | | Ending
Account Value
October 31, 2016 | | | Annualized
Expense Ratio
Based on the
Six-Month Period | | | Expenses Paid
During the
Six-Month Period(1) | |
| PowerShares Developed EuroPacific Currency Hedged Low Volatility Portfolio (FXEP) | | | | | | | | | | | | | | | | |
Actual | | $ | 1,000.00 | | | $ | 1,021.91 | | | | 0.25 | % | | $ | 1.27 | |
Hypothetical (5% return before expenses) | | | 1,000.00 | | | | 1,023.88 | | | | 0.25 | | | | 1.27 | |
| PowerShares DWA Developed Markets Momentum Portfolio (PIZ) | | | | | | | | | | | | | | | | |
Actual | | | 1,000.00 | | | | 972.91 | | | | 0.80 | | | | 3.97 | |
Hypothetical (5% return before expenses) | | | 1,000.00 | | | | 1,021.11 | | | | 0.80 | | | | 4.06 | |
| PowerShares DWA Emerging Markets Momentum Portfolio (PIE) | | | | | | | | | | | | | | | | |
Actual | | | 1,000.00 | | | | 1,063.28 | | | | 0.90 | | | | 4.67 | |
Hypothetical (5% return before expenses) | | | 1,000.00 | | | | 1,020.61 | | | | 0.90 | | | | 4.57 | |
| PowerShares Emerging Markets Infrastructure Portfolio (PXR) | | | | | | | | | | | | | | | | |
Actual | | | 1,000.00 | | | | 1,020.66 | | | | 0.75 | | | | 3.81 | |
Hypothetical (5% return before expenses) | | | 1,000.00 | | | | 1,021.37 | | | | 0.75 | | | | 3.81 | |
| PowerShares Europe Currency Hedged Low Volatility Portfolio (FXEU) | | | | | | | | | | | | | | | | |
Actual | | | 1,000.00 | | | | 1,007.38 | | | | 0.25 | | | | 1.26 | |
Hypothetical (5% return before expenses) | | | 1,000.00 | | | | 1,023.88 | | | | 0.25 | | | | 1.27 | |
| PowerShares FTSE RAFI Asia Pacific ex-Japan Portfolio (PAF) | | | | | | | | | | | | | | | | |
Actual | | | 1,000.00 | | | | 1,054.60 | | | | 0.49 | | | | 2.53 | |
Hypothetical (5% return before expenses) | | | 1,000.00 | | | | 1,022.67 | | | | 0.49 | | | | 2.49 | |
Fees and Expenses (continued)
| | | | | | | | | | | | | | | | |
| | | Beginning
Account Value
May 1, 2016 | | | Ending
Account Value
October 31, 2016 | | | Annualized
Expense Ratio
Based on the
Six-Month Period | | | Expenses Paid
During the
Six-Month Period(1) | |
| PowerShares FTSE RAFI Developed Markets ex-U.S. Portfolio (PXF) | | | | | | | | | | | | | | | | |
Actual | | $ | 1,000.00 | | | $ | 1,009.98 | | | | 0.45 | % | | $ | 2.27 | |
Hypothetical (5% return before expenses) | | | 1,000.00 | | | | 1,022.87 | | | | 0.45 | | | | 2.29 | |
| PowerShares FTSE RAFI Developed Markets ex-U.S. Small-Mid Portfolio (PDN) | | | | | | | | | | | | | | | | |
Actual | | | 1,000.00 | | | | 1,020.93 | | | | 0.49 | | | | 2.49 | |
Hypothetical (5% return before expenses) | | | 1,000.00 | | | | 1,022.67 | | | | 0.49 | | | | 2.49 | |
| PowerShares FTSE RAFI Emerging Markets Portfolio (PXH) | | | | | | | | | | | | | | | | |
Actual | | | 1,000.00 | | | | 1,165.07 | | | | 0.48 | | | | 2.61 | |
Hypothetical (5% return before expenses) | | | 1,000.00 | | | | 1,022.72 | | | | 0.48 | | | | 2.44 | |
| PowerShares Global Agriculture Portfolio (PAGG) | | | | | | | | | | | | | | | | |
Actual | | | 1,000.00 | | | | 989.47 | | | | 0.75 | | | | 3.75 | |
Hypothetical (5% return before expenses) | | | 1,000.00 | | | | 1,021.37 | | | | 0.75 | | | | 3.81 | |
| PowerShares Global Clean Energy Portfolio (PBD) | | | | | | | | | | | | | | | | |
Actual | | | 1,000.00 | | | | 972.28 | | | | 0.75 | | | | 3.72 | |
Hypothetical (5% return before expenses) | | | 1,000.00 | | | | 1,021.37 | | | | 0.75 | | | | 3.81 | |
| PowerShares Global Gold and Precious Metals Portfolio (PSAU) | | | | | | | | | | | | | | | | |
Actual | | | 1,000.00 | | | | 953.80 | | | | 0.75 | | | | 3.68 | |
Hypothetical (5% return before expenses) | | | 1,000.00 | | | | 1,021.37 | | | | 0.75 | | | | 3.81 | |
| PowerShares Global Water Portfolio (PIO) | | | | | | | | | | | | | | | | |
Actual | | | 1,000.00 | | | | 985.33 | | | | 0.75 | | | | 3.74 | |
Hypothetical (5% return before expenses) | | | 1,000.00 | | | | 1,021.37 | | | | 0.75 | | | | 3.81 | |
| PowerShares International BuyBack AchieversTM Portfolio (IPKW) | | | | | | | | | | | | | | | | |
Actual | | | 1,000.00 | | | | 1,003.02 | | | | 0.55 | | | | 2.77 | |
Hypothetical (5% return before expenses) | | | 1,000.00 | | | | 1,022.37 | | | | 0.55 | | | | 2.80 | |
| PowerShares Japan Currency Hedged Low Volatility Portfolio (FXJP) | | | | | | | | | | | | | | | | |
Actual | | | 1,000.00 | | | | 1,013.79 | | | | 0.25 | | | | 1.27 | |
Hypothetical (5% return before expenses) | | | 1,000.00 | | | | 1,023.88 | | | | 0.25 | | | | 1.27 | |
| PowerShares S&P International Developed Quality Portfolio (IDHQ) | | | | | | | | | | | | | | | | |
Actual | | | 1,000.00 | | | | 983.05 | | | | 0.45 | | | | 2.24 | |
Hypothetical (5% return before expenses) | | | 1,000.00 | | | | 1,022.87 | | | | 0.45 | | | | 2.29 | |
| (1) | Expenses are calculated using the annualized expense ratio, which represents the ongoing expenses as a percentage of net assets for the six-month period ended October 31, 2016. Expenses are calculated by multiplying the Fund’s annualized expense ratio by the average account value for the period, then multiplying the result by 184/366. Expense ratios for the most recent six-month period may differ from expense ratios based on annualized data in the Financial Highlights. |
Tax Information
Form 1099-DIV, Form 1042-S and other year-end tax information provide shareholders with actual calendar year amounts that should be included in their tax returns. Shareholders should consult their tax advisers.
The following distribution information is being provided as required by the Internal Revenue Code or to meet a specific state’s requirement.
Each Fund designates the following amounts or, if subsequently determined to be different, the maximum amount allowable for its fiscal year ended October 31, 2016:
| | | | | | | | | | | | | | | |
| | | Qualified Dividend
Income* | | Corporate
Dividends Received
Deduction* | | Long-Term
Capital Gains |
| PowerShares Developed EuroPacific Currency Hedged Low Volatility Portfolio | | | | 49 | % | | | | 0 | % | | | $ | 3,043 | |
| PowerShares DWA Developed Markets Momentum Portfolio | | | | 100 | % | | | | 0 | % | | | | — | |
| PowerShares DWA Emerging Markets Momentum Portfolio | | | | 100 | % | | | | 0 | % | | | | — | |
| PowerShares Emerging Markets Infrastructure Portfolio | | | | 100 | % | | | | 0 | % | | | | — | |
| PowerShares Europe Currency Hedged Low Volatility Portfolio | | | | 85 | % | | | | 0 | % | | | | — | |
| PowerShares FTSE RAFI Asia Pacific ex-Japan Portfolio | | | | 91 | % | | | | 0 | % | | | | — | |
| PowerShares FTSE RAFI Developed Markets ex-U.S. Portfolio | | | | 100 | % | | | | 0 | % | | | | — | |
| PowerShares FTSE RAFI Developed Markets ex-U.S. Small-Mid Portfolio | | | | 100 | % | | | | 0 | % | | | | — | |
| PowerShares FTSE RAFI Emerging Markets Portfolio | | | | 70 | % | | | | 0 | % | | | | — | |
| PowerShares Global Agriculture Portfolio | | | | 66 | % | | | | 18 | % | | | | — | |
| PowerShares Global Clean Energy Portfolio | | | | 75 | % | | | | 9 | % | | | | — | |
| PowerShares Global Gold and Precious Metals Portfolio | | | | 100 | % | | | | 16 | % | | | | — | |
| PowerShares Global Water Portfolio | | | | 83 | % | | | | 7 | % | | | | — | |
| PowerShares International BuyBack AchieversTM Portfolio | | | | 100 | % | | | | 0 | % | | | | — | |
| PowerShares Japan Currency Hedged Low Volatility Portfolio | | | | 42 | % | | | | 0 | % | | | | 6,319 | |
| PowerShares S&P International Developed Quality Portfolio | | | | 100 | % | | | | 0 | % | | | | — | |
| * | The above percentages are based on ordinary income dividends paid to shareholders during the fiscal year. |
The Funds intend to elect to pass through to shareholders the credit for taxes paid to foreign countries. The gross foreign source income and foreign taxes paid are as follows:
| | | | | | | | | | |
| | | Gross Foreign
Income | | Foreign Taxes
Paid |
| PowerShares Developed EuroPacific Currency Hedged Low Volatility Portfolio | | | $ | 55,386 | | | | $ | 3,817 | |
| PowerShares DWA Developed Markets Momentum Portfolio | | | | 5,433,582 | | | | | 423,039 | |
| PowerShares DWA Emerging Markets Momentum Portfolio | | | | 3,855,333 | | | | | 574,532 | |
| PowerShares Emerging Markets Infrastructure Portfolio | | | | 434,517 | | | | | 50,826 | |
| PowerShares Europe Currency Hedged Low Volatility Portfolio | | | | 8,686,736 | | | | | 1,071,500 | |
| PowerShares FTSE RAFI Asia Pacific ex-Japan Portfolio | | | | 856,697 | | | | | 33,940 | |
| PowerShares FTSE RAFI Developed Markets ex-U.S. Portfolio | | | | 24,013,977 | | | | | 1,488,753 | |
| PowerShares FTSE RAFI Developed Markets ex-U.S. Small-Mid Portfolio | | | | 4,100,340 | | | | | 380,443 | |
| PowerShares FTSE RAFI Emerging Markets Portfolio | | | | 14,085,564 | | | | | 1,578,697 | |
| PowerShares Global Agriculture Portfolio | | | | — | | | | | — | |
| PowerShares Global Clean Energy Portfolio | | | | — | | | | | — | |
| PowerShares Global Gold and Precious Metals Portfolio | | | | — | | | | | — | |
| PowerShares Global Water Portfolio | | | | — | | | | | — | |
| PowerShares International BuyBack AchieversTM Portfolio | | | | 2,609,755 | | | | | 169,826 | |
| PowerShares Japan Currency Hedged Low Volatility Portfolio | | | | 25,710 | | | | | 3,579 | |
| PowerShares S&P International Developed Quality Portfolio | | | | 611,020 | | | | | 41,503 | |
Trustees and Officers
The Independent Trustees, the Unaffiliated Trustees, the Non-Independent Trustees and the executive officers of the Trust, their term of office and length of time served, their principal business occupations during at least the past five years, the number of portfolios in the Fund Complex overseen by each Trustee and the other directorships, if any, held by a Trustee are shown below.
The Trustees and officers information is current as of October 31, 2016.
| | | | | | | | | | |
Name, Address and Year of Birth
of Independent Trustees | | Position(s)
Held with Trust | | Term of
Office and
Length of
Time
Served* | | Principal Occupation(s) During Past 5 Years | | Number of
Portfolios in Fund
Complex**
Overseen by
Independent
Trustees | | Other
Directorships
Held by
Independent
Trustees During
the Past 5 Years |
Ronn R. Bagge - 1958 c/o Invesco PowerShares Capital Management LLC 3500 Lacey Road, Suite 700 Downers Grove, IL 60515 | | Chairman of the Nominating and Governance Committee and Trustee | | Chairman of the Nominating and Governance Committee and Trustee since 2007 | | Founder and Principal, YQA Capital Management LLC (1998-Present); formerly Owner/CEO of Electronic Dynamic Balancing Co., Inc. (high-speed rotating equipment service provider). | | 126 | | None |
| | | | | |
Todd J. Barre - 1957 c/o Invesco PowerShares Capital Management LLC 3500 Lacey Road, Suite 700 Downers Grove, IL 60515 | | Trustee | | Since 2010 | | Assistant Professor of Business, Trinity Christian College (2010-2016); formerly Vice President and Senior Investment Strategist (2001-2008), Director of Open Architecture and Trading (2007-2008), Head of Fundamental Research (2004-2007) and Vice President and Senior Fixed Income Strategist (1994-2001), BMO Financial Group/Harris Private Bank. | | 126 | | None |
| | | | | |
Marc M. Kole - 1960 c/o Invesco PowerShares Capital Management LLC 3500 Lacey Road, Suite 700 Downers Grove, IL 60515 | | Chairman of the Audit Committee and Trustee | | Chairman of the Audit Committee since 2008; Trustee since 2007 | | Senior Director of Finance, By The Hand Club for Kids (2015-Present); Formerly: Chief Financial Officer, Hope Network (social services) (2008-2012); Assistant Vice President and Controller, Priority Health (health insurance) (2005-2008); Senior Vice President of Finance, United Healthcare (2004-2005); Chief Accounting Officer, Senior Vice President of Finance, Oxford Health Plans (2000-2004); Audit Partner, Arthur Andersen LLP (1996-2000). | | 126 | | None |
| | | | | |
Yung Bong Lim - 1964 c/o Invesco PowerShares Capital Management LLC 3500 Lacey Road, Suite 700 Downers Grove, IL 60515 | | Chairman of the Investment Oversight Committee and Trustee | | Chairman of the Investment Oversight Committee since 2014; Trustee since 2013 | | Managing Partner, Residential Dynamics Group LLC (2008-Present); formerly, Managing Director, Citadel Investment Group, L.L.C. (1999-2007). | | 126 | | None |
| * | This is the date the Independent Trustee began serving the Trust. He serves an indefinite term, until his successor is elected. |
| ** | Fund Complex includes all open-end funds (including all of their portfolios) advised by the Adviser. At October 31, 2016, the “Fund Family” consisted of the Trust’s 67 portfolios and four other exchange-traded fund trusts with 59 portfolios advised by the Adviser. |
Trustees and Officers (continued)
| | | | | | | | | | |
Name, Address and Year of Birth
of Independent Trustees | | Position(s)
Held with Trust | | Term of
Office and
Length of
Time
Served* | | Principal Occupation(s) During Past 5 Years | | Number of
Portfolios in Fund
Complex**
Overseen by
Independent
Trustees | | Other
Directorships
Held by
Independent
Trustees During
the Past 5 Years |
Gary R. Wicker - 1961 c/o Invesco PowerShares Capital Management LLC 3500 Lacey Road, Suite 700 Downers Grove, IL 60515 | | Trustee | | Since 2013 | | Senior Vice President of Global Finance and Chief Financial Officer at RBC Ministries (publishing company) (2013-Present); formerly, Executive Vice President and Chief Financial Officer, Zondervan Publishing (a division of Harper Collins/NewsCorp) (2007-2012); Senior Vice President and Group Controller (2005-2006), Senior Vice President and Chief Financial Officer (2003-2004), Chief Financial Officer (2001-2003), Vice President, Finance and Controller (1999-2001) and Assistant Controller (1997-1999), divisions of The Thomson Corporation (information services provider). | | 126 | | None |
| | | | | |
Donald H. Wilson - 1959 c/o Invesco PowerShares Capital Management LLC 3500 Lacey Road, Suite 700 Downers Grove, IL 60515 | | Chairman of the Board and Trustee | | Chairman since 2012; Trustee since 2007 | | Chairman and Chief Executive Officer, Stone Pillar Advisors, Ltd. (2010-Present); formerly, Chairman, President and Chief Executive Officer, Community Financial Shares, Inc. and Community Bank—Wheaton/Glen Ellyn (subsidiary) (2013-2015); Chief Operating Officer, AMCORE Financial, Inc. (bank holding company) (2007-2009); Executive Vice President and Chief Financial Officer, AMCORE Financial, Inc. (2006-2007); Senior Vice President and Treasurer, Marshall & Ilsley Corp. (bank holding company) (1995-2006). | | 126 | | None |
The Unaffiliated Trustees, their term of office and length of time served, their principal business occupations during the past five years, the number of portfolios in the Fund Complex overseen by the Unaffiliated Trustees and the other directorships, if any, held by such Trustees are shown below.
| | | | | | | | | | |
Philip M. Nussbaum - 1961 c/o Invesco PowerShares Capital Management LLC 3500 Lacey Road, Suite 700 Downers Grove, IL 60515 | | Trustee*** | | Since 2007 | | Chairman, Performance Trust Capital Partners (2004-Present). | | 126 | | None |
| * | This is the date the Independent Trustee began serving the Trust. He serves an indefinite term, until his successor is elected. |
| ** | Fund Complex includes all open-end funds (including all of their portfolios) advised by the Adviser. At October 31, 2016, the “Fund Family” consisted of the Trust’s 67 portfolios and four other exchange-traded fund trusts with 59 portfolios advised by the Adviser. |
| *** | Effective February 25, 2016, Mr. Nussbaum became an Unaffiliated Trustee. |
Trustees and Officers (continued)
The Non-Independent Trustees and the executive officers of the Trust, their term of office and length of time served, their principal business occupations during the past five years, the number of portfolios in the Fund Complex overseen by the Non-Independent Trustees and the other directorships, if any, held by the Trustees are shown below.
| | | | | | | | | | |
Name, Address and Year of Birth
of Non-Independent Trustees | | Position(s)
Held with Trust | | Term of
Office and
Length of
Time
Served* | | Principal Occupation(s) During Past 5 Years | | Number of
Portfolios in Fund
Complex**
Overseen by
Non-Independent
Trustees | | Other
Directorships
Held by Non-Independent
Trustees During
the Past 5 Years |
Kevin M. Carome - 1956 Invesco Ltd. Two Peachtree Pointe, 1555 Peachtree St., N.E., Suite 1800 Atlanta, GA 30309 | | Trustee | | Since 2010 | | Senior Managing Director, Secretary and General Counsel, Invesco Ltd. (2007-Present); Director, Invesco Advisers, Inc. (2009-Present); Director, Invesco Finance PLC, and Invesco Holding Company Limited; Director and Executive Vice President, Invesco Holding Company (US), Inc., Invesco Finance, Inc., Invesco Group Services, Inc., Invesco North American Holdings, Inc., and INVESCO Asset Management (Bermuda) Ltd.; Executive Vice President, Invesco Investments (Bermuda) Ltd., Manager, Horizon Flight Works LLC; Director and Secretary, Invesco Services (Bahamas) Private Limited; formerly, Director and Chairman, INVESCO Funds Group, Inc., Senior Vice President, Secretary and General Counsel, Invesco Advisers, Inc. (2003-2006); Director, Invesco Investments (Bermuda) Ltd. (2008-2016); Senior Vice President and General Counsel, Liberty Financial Companies, Inc. (2000-2001); General Counsel of certain investment management subsidiaries of Liberty Financial Companies, Inc. (1998-2000); Associate General Counsel, Liberty Financial Companies, Inc. (1993-1998); Associate, Ropes & Gray LLP. | | 126 | | None |
| * | This is the date the Non-Independent Trustee began serving the Trust. He serves an indefinite term, until his successor is elected. |
| ** | Fund Complex includes all open-end funds (including all of their portfolios) advised by the Adviser. At October 31, 2016, the “Fund Family” consisted of the Trust’s 67 portfolios and four other exchange-traded fund trusts with 59 portfolios advised by the Adviser. |
Trustees and Officers (continued)
| | | | | | |
Name, Address and Year of Birth
of Executive Officers | | Position(s)
Held with Trust | | Length of
Time
Served* | | Principal Occupation(s) During Past 5 Years |
Daniel E. Draper - 1968 Invesco PowerShares Capital Management LLC 3500 Lacey Road, Suite 700 Downers Grove, IL 60515 | | President and Principal Executive Officer | | Since 2015 | | President and Principal Executive Officer, PowerShares Exchange-Traded Fund Trust, PowerShares Exchange-Traded Fund Trust II, PowerShares India Exchange-Traded Fund Trust, PowerShares Actively Managed Exchange-Traded Fund Trust and PowerShares Actively Managed Exchange-Traded Commodity Fund Trust (2015-Present); Chief Executive Officer and Principal Executive Officer (2016-Present) and Managing Director (2013-Present), Invesco PowerShares Capital Management LLC; Senior Vice President, Invesco Distributors, Inc. (2014-Present); formerly, Vice President, PowerShares Exchange-Traded Fund Trust, PowerShares Exchange-Traded Fund Trust II, PowerShares India Exchange-Traded Fund Trust, PowerShares Actively Managed Exchange-Traded Fund Trust (2013-2015) and PowerShares Actively Managed Exchange-Traded Commodity Fund Trust (2014-2015); Managing Director, Credit Suisse Asset Management (2010-2013) and Lyxor Asset Management/Societe Generale (2007-2010). |
| | | |
Steven M. Hill - 1964 Invesco PowerShares Capital Management LLC 3500 Lacey Road, Suite 700 Downers Grove, IL 60515 | | Vice President and Treasurer | | Since 2013 | | Vice President and Treasurer, PowerShares Exchange-Traded Fund Trust, PowerShares Exchange-Traded Fund Trust II, PowerShares India Exchange-Traded Fund Trust, PowerShares Actively Managed Exchange-Traded Fund Trust (2013-Present) and PowerShares Actively Managed Exchange-Traded Commodity Fund Trust (2014-Present); Head of Global ETF Administration, Invesco PowerShares Capital Management LLC (2011-Present); Principal Financial and Accounting Officer—Investment Pools, Invesco PowerShares Capital Management LLC (2015-Present); formerly, Senior Managing Director and Chief Financial Officer, Destra Capital Management LLC and its subsidiaries (2010-2011); Chief Financial Officer, Destra Investment Trust and Destra Investment Trust II (2010-2011); Senior Managing Director, Claymore Securities, Inc. (2003-2010); and Chief Financial Officer, Claymore sponsored mutual funds (2003-2010). |
| | | |
Peter Hubbard - 1981 Invesco PowerShares Capital Management LLC 3500 Lacey Road, Suite 700 Downers Grove, IL 60515 | | Vice President | | Since 2009 | | Vice President, PowerShares Exchange-Traded Fund Trust, PowerShares Exchange-Traded Fund Trust II, PowerShares India Exchange-Traded Fund Trust, PowerShares Actively Managed Exchange-Traded Fund Trust (2009-Present) and PowerShares Actively Managed Exchange-Traded Commodity Fund Trust (2014-Present); Vice President and Director of Portfolio Management, Invesco PowerShares Capital Management LLC (2010-Present); formerly, Vice President of Portfolio Management, Invesco PowerShares Capital Management LLC (2008-2010); Portfolio Manager, Invesco PowerShares Capital Management LLC (2007-2008); Research Analyst, Invesco PowerShares Capital Management LLC (2005-2007); Research Analyst and Trader, Ritchie Capital, a hedge fund operator (2003-2005). |
| | | |
Christopher Joe - 1969 Invesco PowerShares Capital Management LLC 11 Greenway Plaza, Suite 1000 Houston, TX 77046-1173 | | Chief Compliance Officer | | Since 2012 | | Chief Compliance Officer of Invesco PowerShares Capital Management LLC (2015-Present); Chief Compliance Officer of PowerShares Exchange-Traded Fund Trust, PowerShares Exchange-Traded Fund Trust II, PowerShares India Exchange-Traded Fund Trust, PowerShares Actively Managed Exchange-Traded Fund Trust (2012-Present) and PowerShares Actively Managed Exchange-Traded Commodity Fund Trust (2014-Present); formerly, Chief Compliance Officer, Invesco Investment Advisers, LLC (registered investment adviser) (2010–2013), U.S. Compliance Director, Invesco, Ltd. (2006-2014) and Deputy Chief Compliance Officer of Invesco Advisers, Inc. (2014-2015). |
| * | This is the period for which the Officers began serving the Trust. Each Officer serves an indefinite term, until his or her successor is elected. |
Trustees and Officers (continued)
| | | | | | |
Name, Address and Year of Birth of Executive Officers | | Position(s)
Held with Trust | | Length of
Time
Served* | | Principal Occupation(s) During Past 5 Years |
Sheri Morris - 1964 Invesco Management Group, Inc. 11 Greenway Plaza, Suite 1000 Houston, TX 77046 | | Vice President | �� | Since 2012 | | President and Principal Executive Officer, The Invesco Funds (2016-Present); Treasurer, The Invesco Funds (2008-Present); Vice President, Invesco Advisers, Inc. (formerly known as Invesco Institutional (N.A.), Inc.) (registered investment adviser) (2009-Present) and Vice President, PowerShares Exchange-Traded Fund Trust, PowerShares Exchange-Traded Fund Trust II, PowerShares India Exchange-Traded Fund Trust, PowerShares Actively Managed Exchange-Traded Fund Trust (2012-Present) and PowerShares Actively Managed Exchange-Traded Commodity Fund Trust (2014-Present); formerly, Vice President and Principal Financial Officer, The Invesco Funds (2008-2016); Treasurer, PowerShares Exchange-Traded Fund Trust, PowerShares Exchange-Traded Fund Trust II, PowerShares India Exchange-Traded Fund Trust and PowerShares Actively Managed Exchange-Traded Fund Trust (2011-2013); Vice President, Invesco Aim Advisers, Inc., Invesco Aim Capital Management, Inc. and Invesco Aim Private Asset Management, Inc.; Assistant Vice President and Assistant Treasurer, The Invesco Funds and Assistant Vice President, Invesco Advisers, Inc., Invesco Aim Capital Management, Inc. and Invesco Aim Private Asset Management, Inc. |
| | | |
Anna Paglia - 1974 Invesco PowerShares Capital Management LLC 3500 Lacey Road, Suite 700 Downers Grove, IL 60515 | | Secretary | | Since 2011 | | Secretary, PowerShares Exchange-Traded Fund Trust, PowerShares Exchange-Traded Fund Trust II, PowerShares India Exchange-Traded Fund Trust, PowerShares Actively Managed Exchange-Traded Fund Trust (2011-Present) and PowerShares Actively Managed Exchange-Traded Commodity Fund Trust (2014-Present); Head of Legal (2010-Present) and Secretary (2015-Present), Invesco PowerShares Capital Management LLC (2010-Present); formerly, Partner, K&L Gates LLP (formerly, Bell Boyd & Lloyd LLP) (2007-2010); Associate Counsel at Barclays Global Investors Ltd. (2004-2006). |
| | | |
Rudolf E. Reitmann - 1971 Invesco PowerShares Capital Management LLC 3500 Lacey Road, Suite 700 Downers Grove, IL 60515 | | Vice President | | Since 2013 | | Vice President, PowerShares Exchange-Traded Fund Trust, PowerShares Exchange-Traded Fund Trust II, PowerShares India Exchange-Traded Fund Trust, PowerShares Actively Managed Exchange-Traded Fund Trust (2013-Present) and PowerShares Actively Managed Exchange-Traded Commodity Fund Trust (2014-Present); Head of Global Exchange Traded Funds Services, Invesco PowerShares Capital Management LLC (2013-Present). |
| | | |
David Warren - 1957 Invesco Canada Ltd. 5140 Yonge Street, Suite 800 Toronto, Ontario M2N 6X7 | | Vice President | | Since 2009 | | Vice President, PowerShares Exchange-Traded Fund Trust, PowerShares Exchange-Traded Fund Trust II, PowerShares India Exchange-Traded Fund Trust, and PowerShares Actively Managed Exchange-Traded Fund Trust (2009-Present) and PowerShares Actively Managed Exchange-Traded Commodity Fund Trust (2014-Present); Managing Director—Chief Administrative Officer, Americas, Invesco PowerShares Capital Management LLC; Senior Vice President, Invesco Advisers, Inc. (2009-Present); Director, Invesco Inc. (2009-Present); Senior Vice President, Invesco Management Group, Inc. (2007-Present); Director, Executive Vice President and Chief Financial Officer, Invesco Canada Ltd. (formerly, Invesco Trimark Ltd.); Chief Administrative Officer, North American Retail, Invesco Ltd. (2007-Present); Director, Invesco Corporate Class Inc. (2014-Present); Director, Invesco Global Direct Real Estate Feeder GP Ltd. (2015-Present); Director, Invesco Canada Holdings Inc. (2002-Present); Director, Invesco Financial Services Ltd./Services Financiers Invesco Ltée and Trimark Investments Ltd./Placements Trimark Ltée (2014-Present); Director, Invesco IP Holdings (Canada) Ltd. (2016-Present); Director, Invesco Global Direct Real Estate GP Ltd. (2015-Present); formerly, Executive Vice President and Chief Financial Officer, Invesco Inc. (2009-2015); Director, Executive Vice President and Chief Financial Officer, Invesco Canada Ltd. (formerly, Invesco Trimark Ltd.) (2000-2011). |
Availability of Additional Information About the Trustees
The Statement of Additional Information includes additional information about the Trustees and is available, without charge, upon request at (800) 983-0903.
| * | This is the period for which the Officers began serving the Trust. Each Officer serves an indefinite term, until his or her successor is elected. |
(This Page Intentionally Left Blank)
(This Page Intentionally Left Blank)
(This Page Intentionally Left Blank)
Proxy Voting Policies and Procedures
A description of the Trust’s proxy voting policies and procedures that the Funds use to determine how to vote proxies relating to portfolio securities is available, without charge and upon request, by calling (800) 983-0903. This information is also available on the Securities and Exchange Commission’s (“Commission”) website at www.sec.gov.
Information regarding how each Fund voted proxies for portfolio securities, if applicable, during the most recent 12-month period ended June 30, is also available, without charge and upon request, by (i) calling (800) 983-0903; or (ii) accessing the Trust’s Form N-PX on the Commission’s website at www.sec.gov.
Quarterly Portfolios
The Trust files its complete schedule of portfolio holdings for the Funds with the Commission for the first and third quarters of each fiscal year on Form N-Q. The Trust’s Forms N-Q are available on the Commission’s website at www.sec.gov. The Trust’s Forms N-Q may also be reviewed and copied at the Commission’s Public Reference Room in Washington, DC; information on the operation of the Public Reference Room may be obtained by calling (800) SEC-0330.
Frequency Distribution of Discounts and Premiums
A table showing the number of days the market price of each Fund’s shares was greater than the Fund’s net asset value, and the number of days it was less than the Fund’s net asset value (i.e., premium or discount) for the most recently completed calendar year, and the calendar quarters since that year end (or the life of the Fund, if shorter) may be found at the Fund’s website at www.invescopowershares.com.
| | | | | | |
| P-PS-AR-8 | |  |
©2016 Invesco PowerShares Capital Management LLC 3500 Lacey Road, Suite 700 Downers Grove, IL 60515 | |
| powershares.com 800 983 0903 | |  | | @PowerShares | |

2016 Annual Report to Shareholders
| | |
| |
| PLW | | PowerShares 1-30 Laddered Treasury Portfolio |
| |
| BAB | | PowerShares Build America Bond Portfolio |
| |
| PWZ | | PowerShares California AMT-Free Municipal Bond Portfolio |
| |
| PCEF | | PowerShares CEF Income Composite Portfolio |
| |
| DSUM | | PowerShares Chinese Yuan Dim Sum Bond Portfolio |
| |
| PCY | | PowerShares Emerging Markets Sovereign Debt Portfolio |
| |
| PHB | | PowerShares Fundamental High Yield® Corporate Bond Portfolio |
| |
| PFIG | | PowerShares Fundamental Investment Grade Corporate Bond Portfolio |
| |
| PGHY | | PowerShares Global Short Term High Yield Bond Portfolio |
| |
| PICB | | PowerShares International Corporate Bond Portfolio |
| |
| LDRI | | PowerShares LadderRite 0-5 Year Corporate Bond Portfolio |
| |
| PZA | | PowerShares National AMT-Free Municipal Bond Portfolio |
| |
| PZT | | PowerShares New York AMT-Free Municipal Bond Portfolio |
| |
| PGX | | PowerShares Preferred Portfolio |
| |
| VRP | | PowerShares Variable Rate Preferred Portfolio |
| |
| PVI | | PowerShares VRDO Tax-Free Weekly Portfolio |
Table of Contents
The Market Environment
Fixed Income
The fiscal year began amid heightened global financial market volatility triggered by a significant summer sell-off in Chinese equities caused by economic growth concerns and uncertainty over the country’s monetary and fiscal policy response. The 10-year US Treasury yield mirrored this volatility as lower oil prices began to threaten the solvency of several US energy companies. In January 2016, the confluence of these factors produced a “perfect storm” that roiled global financial markets. This caused Treasury prices to rise as Treasury bonds played their traditional role of buffering risk-asset volatility such as that of equities. Riskier asset classes posted significant losses.
The US Federal Reserve (the Fed) went ahead with its first interest rate hike in nearly a decade in December 2015, lifting the federal funds rate, the rate that banks lend to each other overnight, from a range of zero to 0.25% to a range of 0.25% to 0.50%.1 Realizing the systemic risks from the fallout of financial markets and the subsequent financial tightening which could significantly hamper economic growth and overall economic health, global central banks quickly acted to provide liquidity and more accommodative monetary policy measures to help spur growth. The Bank of Japan (BOJ) and the European Central Bank (ECB) adopted negative interest rates in an attempt to stimulate growth by forcing investors to spend rather than save. These actions along with the stabilization in oil prices, calmed markets and induced a significant rally across most risk assets. This rally more than offset the losses posted at the beginning of the year and carried through to the end of the reporting period.
Geopolitics, including the decision by UK voters to leave the European Union, did its part to reignite volatility. However, it was short-lived as central banks remained committed to keeping financial markets functioning and to promote economic growth. This had the effect of driving the 10-year US Treasury yield to an all-time low of 1.37%.1 The 10-year US Treasury yield ended the reporting period at 1.83%, 33 basis points lower than at the beginning of the fiscal year.1
For the reporting period, the broader bond market posted gains largely attributable to the decline in US Treasury yields and global government bond yields. All fixed income sectors (Treasuries, global government bonds, corporate, and securitized) posted positive returns for the fiscal year. Riskier fixed income sectors, such as high yield and emerging market (EM) debt, notched strong gains despite concerns over global growth, volatile commodity prices and the possibility of Fed interest rate hikes.
| 1 | Source: US Federal Reserve |
US Equity
During the fiscal year ended October 31, 2016, the US economy continued to expand. The initial estimate of US gross domestic product (GDP) showed the US economy grew by 2.9% in the third
calendar quarter of 2016, beating consensus estimates.1 However, annualized GDP is expected to be lower. Employment data were mixed, though the unemployment rate had a surprise uptick from 4.9% in August to 5.0% in September before ending the fiscal year at 4.9%.2 Oil prices traded in a range from the high $20s to the low $50s during the reporting period.3
The US Federal Reserve (the Fed) raised interest rates in December 2015—its first increase since 2006—but that was its only increase during the reporting period. Major US stock market indexes posted gains for the reporting period, but they were fairly volatile. Stocks began calendar year 2016 on a negative note, driven by investor concerns about economic weakness in China, falling oil prices and uncertainty over Fed policy, including rumors of possible negative interest rates in the US. Markets recovered in late February and posted gains until June when UK voters opted to leave the European Union, sending markets sharply lower once again. Markets again recovered, and major US equity indexes hit record highs during the summer.4 In this environment, investors generally favored the perceived safety of government bonds and more defensive, dividend-paying equities often found in the telecommunication services, utilities and consumer staples sectors.
| 1 | Source: Bureau of Economic Analysis |
| 2 | Source: Bureau of Labor Statistics |
| 3 | Source: Thompson-Reuters |
Global Equity
The global economy continued to expand, albeit slowly, for the fiscal year ended October 31, 2016. However, that growth became increasingly uneven across developed and emerging economies, amid continued volatility in oil prices and as the policies of central banks globally began to diverge.
Equity market rallies in October and November 2015 were offset by negative performance in December, as a late-year crash in oil prices rattled the markets. Also in December, the US Federal Reserve (the Fed) followed through on its commitment to normalize monetary policy by raising interest rates—its first increase since 2006—even as the European Central Bank extended its asset purchase program and Japan introduced additional quantitative easing and negative interest rates.1
Stocks began calendar year 2016 on a negative note, driven by investor concerns about economic weakness in China and falling oil prices. Markets recovered in late February and posted gains amid concerted central bank commitments to very loose monetary policy. As a result, the US dollar fell sharply against the euro and Japanese yen, a development that was largely supportive of oil and stock prices.
All major global stock indexes experienced steep declines again in June after UK voters opted to leave the European Union—resulting
The Market Environment (continued)
in a sharp stock-market sell-off. Stocks in economically sensitive sectors, including energy and financials, were hardest hit, and investors flocked to the perceived safety of US Treasuries and more defensive, dividend-paying equities often found in the telecommunication services, utilities and consumer staples sectors.
After the initial shock of the UK vote, stocks made a strong recovery, regaining most of their losses as fears of a shock to consumer confidence never materialized. For the remainder of the reporting period, emerging markets outperformed as the Fed left interest rates unchanged and expectations for an interest rate increase were delayed again.
| 1 | Source: Bureau of Economic Analysis |
| | |
| PLW | | Manager’s Analysis |
| | PowerShares 1-30 Laddered Treasury Portfolio (PLW) |
As an index fund, the PowerShares 1-30 Laddered Treasury Portfolio (the “Fund”) is passively managed and attempts to track the returns of an underlying index. The Fund seeks investment results that generally correspond (before fees and expenses) to the price and yield of the Ryan/NASDAQ U.S. 1-30 Year Treasury Laddered Index (the “Index”). The Fund generally will invest at least 80% of its total assets in U.S. Treasury securities that comprise the Index. The Index measures potential returns of a theoretical portfolio of U.S. Treasury securities with a yield curve based upon 30 distinct annual maturities. The Index seeks to maintain a continuous maturity laddered portfolio of securities, meaning that securities holdings are scheduled to mature in a proportional, annual sequential pattern. Nasdaq, Inc. (the “Index Provider”) allows a six-month maturity deviation if securities with a desired maturity date are not available.
Strictly in accordance with its guidelines and mandated procedures, the Index Provider selects securities for inclusion in the Index that are U.S. Treasury-auctioned issues with fixed coupon rates that are non-callable. The Index Provider does not include treasury inflation-protected securities, bills or zero-coupon securities in the Index. The Fund generally invests in all of the securities comprising its Index in proportion to their weightings in the Index.
For the fiscal year ended October 31, 2016, on a market price basis, the Fund returned 5.82%. On a net asset value (“NAV”) basis, the Fund returned 5.73%. During the same time period, the Index returned 6.03%. During the fiscal year, the Fund fully replicated the components of the Index; therefore, the Fund’s performance (NAV basis) differed from the return of the Index primarily due to fees and operating expenses that the Fund incurred during the period.
During this same time period, the Bloomberg Barclays U.S. Treasury Index (the “Benchmark Index”) returned 3.32%. The Benchmark Index is an unmanaged index weighted by market capitalization based on the average performance of approximately 250 securities. The Benchmark Index was selected for its recognition in the marketplace, and its performance comparison is a useful measure for investors as a broad representation of the roughly 5-year average duration U.S. Treasury market.
Relative to the Benchmark Index, the Fund was most overweight in the bonds with maturities less than 1 year duration and most underweight in the bonds with maturities between 10 and 20 years duration during the fiscal year ended October 31, 2016. The majority of the Fund’s outperformance relative to the Benchmark Index during the period can be attributed in part due to the Fund’s relative underweight position in bonds with maturities between 10 and 20 years.
For the fiscal year ended October 31, 2016, the bonds with maturities between 10 and 20 years duration contributed most significantly to the Fund’s return, followed by the bonds with maturities less than 1 year and bonds with maturities between 7 and 10 years durations. The bonds with maturities greater than
20 years duration detracted most significantly from the Fund’s return, followed by the bonds with maturities between 5 and 7 years duration.
Positions that contributed most significantly to the Fund’s return included United States Treasury Bonds, 4.40% coupon, due 2/15/2038 (portfolio average weight of 6.30%), and United States Treasury Bonds, 4.80% coupon, due 2/15/2037 (portfolio average weight of 6.30%). Positions that detracted most significantly from the Fund’s return included United States Treasury Bonds, 4.80% coupon, due 2/15/2041 (portfolio average weight of 6.20%), and United States Treasury Bonds, 6.30% coupon, due 8/15/2023 (portfolio average weight of 26.50%).
| | | | |
Duration Breakdown
(% of the Fund’s Net Assets) as of October 31, 2016 | |
| Maturing in 0-5 Years | | | 19.5 | |
| Maturing in 6-10 Years | | | 16.3 | |
| Maturing in 11-15 Years | | | 19.9 | |
| Maturing in 16-20 Years | | | 13.2 | |
| Maturing in 21-25 Years | | | 16.7 | |
| Maturing in 26-30 Years | | | 13.5 | |
| Money Market Fund Plus Other Assets Less Liabilities | | | 0.9 | |
|
Top Ten Fund Holdings*
(% of the Fund’s Net Assets) as of October 31, 2016 | |
| Security | | | | |
| United States Treasury Bonds, 5.375%, 02/15/2031 | | | 10.0 | |
| United States Treasury Bonds, 4.500%, 02/15/2036 | | | 9.9 | |
| United States Treasury Bonds, 2.500%, 02/15/2046 | | | 3.4 | |
| United States Treasury Bonds, 2.500%, 02/15/2045 | | | 3.4 | |
| United States Treasury Notes, 2.000%, 02/15/2022 | | | 3.4 | |
| United States Treasury Bonds, 3.125%, 02/15/2043 | | | 3.4 | |
| United States Treasury Bonds, 3.625%, 02/15/2044 | | | 3.4 | |
| United States Treasury Bonds, 3.125%, 02/15/2042 | | | 3.3 | |
| United States Treasury Bonds, 3.500%, 02/15/2039 | | | 3.3 | |
| United States Treasury Bonds, 6.250%, 05/15/2030 | | | 3.3 | |
| Total | | | 46.8 | |
| * | Excluding money market fund holdings. |
PowerShares 1-30 Laddered Treasury Portfolio (PLW) (continued)
Growth of a $10,000 Investment Since Inception†
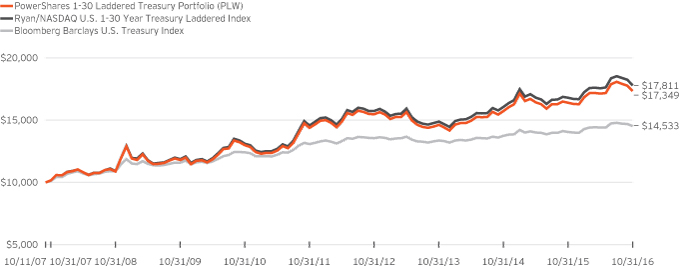
Fund Performance History as of October 31, 2016
| | | | | | | | | | | | | | | | | | | | | | | | | | | | | | | | |
| | | 1 Year | | | 3 Years
Average
Annualized | | | 3 Years
Cumulative | | | 5 Years
Average
Annualized | | | 5 Years
Cumulative | | | | | | Fund Inception† | |
| Index | | | | | | | | | | Average
Annualized | | | Cumulative | |
| Ryan/NASDAQ U.S. 1-30 Year Treasury Laddered Index | | | 6.03 | % | | | 6.14 | % | | | 19.57 | % | | | 4.07 | % | | | 22.09 | % | | | | | | | 6.58 | % | | | 78.11 | % |
| Bloomberg Barclays U.S. Treasury Index | | | 3.32 | | | | 2.83 | | | | 8.73 | | | | 2.12 | | | | 11.08 | | | | | | | | 4.22 | | | | 45.33 | |
| Fund | | | | | | | | | | | | | | | | | | | | | | | | | | | | | | | | |
| NAV Return | | | 5.73 | | | | 5.87 | | | | 18.66 | | | | 3.81 | | | | 20.54 | | | | | | | | 6.27 | | | | 73.49 | |
| Market Price Return | | | 5.82 | | | | 5.91 | | | | 18.80 | | | | 3.73 | | | | 20.10 | | | | | | | | 6.26 | | | | 73.23 | |
Fund Inception: October 11, 2007
Performance quoted above represents past performance. Past performance is not a guarantee of future results and current performance may be higher or lower than performance quoted. Investment returns and principal value will fluctuate, and shares of the Fund (“Fund Shares”), when redeemed or sold, may be worth more or less than their original cost. Fund performance reflects any applicable fee waivers and/or expense reimbursements. Had the adviser not waived fees and/or reimbursed expenses currently or in the past, returns would have been lower. See current prospectus for more information. According to the Fund’s current prospectus, the Fund’s expense ratio of 0.25% is expressed as a unitary management fee to cover operating expenses and expenses incurred in connection with managing the portfolio. NAV and Market Price returns assume that dividends and capital gain distributions have been reinvested in the Fund at NAV and Market Price, respectively. The returns shown in the table above do not
reflect the deduction of taxes that a shareholder would pay on Fund distributions or the redemption or sale of Fund Shares. See invescopowershares.com to find the most recent month-end performance numbers.
Index and Benchmark Index performance results are based upon a hypothetical investment in their respective constituent securities. Index and Benchmark Index returns do not represent Fund returns. An investor cannot invest directly in an index. The Index and Benchmark Index do not charge management fees or brokerage expenses, and no such fees or expenses were deducted from the hypothetical performance shown. In addition, the results actual investors might have achieved would have differed from those shown because of differences in the timing, amounts of their investments, and fees and expenses associated with an investment in the Fund.
| † | Fund, Index and Benchmark Index returns are based on the inception date of the Fund. |
| | |
| BAB | | Manager’s Analysis |
| | PowerShares Build America Bond Portfolio (BAB) |
As an index fund, the PowerShares Build America Bond Portfolio (the “Fund”) is passively managed and attempts to track the returns of an underlying index. The Fund seeks investment results that generally correspond (before fees and expenses) to the price and yield of The BofA Merrill Lynch Build America Bond Index (the “Index”). The Fund generally will invest at least 80% of its total assets in taxable municipal securities eligible to participate in the Build America Bond program (the “BAB program”) created under the American Recovery and Reinvestment Act of 2009 or other legislation providing for the issuance of taxable municipal securities on which the issuer receives federal support of the interest paid (“Build America Bonds”) and that comprise the Index.
The Index is designed to track the performance of U.S. dollar-denominated investment grade taxable municipal debt publicly issued under the BAB program by U.S. states and territories, and their political subdivisions, in the U.S. market. Qualifying securities must have a minimum amount outstanding of $1 million, at least 18 months remaining term to final maturity at the time of issuance and at least one year remaining term to final maturity, a fixed coupon schedule and an investment grade rating (based on an average of Moody’s Investors Service, Inc., Standard & Poor’s, a division of The McGraw-Hill Company, Inc., and Fitch Ratings, Inc.). Because Congress did not extend the BAB program, issuance of Build America Bonds ceased on December 31, 2010. Outstanding Build America Bonds remain eligible for the federal interest rate subsidy, which continues for the life of the Build America Bonds; however, no bonds issued following expiration of the BAB program are eligible for the federal tax subsidy. The Index does not include bonds that, under the BAB program, are eligible for tax credits. The Fund does not purchase all of the securities in the Index; instead, the Fund utilizes a “sampling” methodology to seek to achieve its investment objective.
For the fiscal year ended October 31, 2016, on a market price basis, the Fund returned 9.90%. On a net asset value (“NAV”) basis, the Fund returned 9.89%. During the same time period, the Index returned 9.36%. The Fund’s performance differed from that of the Index primarily as a result of the Fund’s sampling methodology, which resulted in the Fund being overweight in the State of California and in particular California General Obligation bonds. The State of California was the best performing state and California General Obligation bonds also were a top performer for the Fund.
During this same time period, The BofA Merrill Lynch U.S. Corporate Master Index returned 7.02% and Bloomberg Barclays U.S. Aggregate Index returned 4.37% (both are “Benchmark Indices”). The Benchmark Indices are unmanaged indices weighted by market capitalization and based on the average performance of approximately 8,225 securities and 9,980 securities, respectively. The adviser provided these Benchmark Indices to help investors better understand how the investment results of the Fund compare to the performance of a benchmark
of investment grade corporate debt with at least one year to maturity and a benchmark representative of the U.S investment-grade, fixed-rate bond market, respectively.
Relative to The BofA Merrill Lynch U.S. Corporate Master Index, the Fund’s outperformance during the period can primarily be attributed to the continuing low interest rate environment and limited supply of Build America Bonds, thus resulting in the Build America Bond market outperforming other markets within the fixed income universe.
Relative to the Bloomberg Barclays U.S. Aggregate Index, the Fund’s outperformance relative to the Benchmark Index during the period can be primarily attributed to the limited supply of Build America Bonds as well as the longer duration of Build America Bonds held by the Fund compared to the duration of this index. The Bloomberg Barclays U.S. Aggregate Index consists primarily of government bonds, corporate bonds and mortgage and asset-backed securities.
For the fiscal year ended October 31, 2016, the State of California contributed most significantly to the Fund’s return, followed by the State of New York and the State of Illinois. There were no detracting states.
Positions that contributed most significantly to the Fund’s return included California State Ser. 10, 7.60% coupon, due 11/1/2040 (portfolio average weight of 4.13%), and Municipal Electric Auth. of Georgia (Plant Vogtle Units 3&4 Project P) Ser. 10, 7.055%, due 4/1/2057 (portfolio average weight of 1.37%). Positions that detracted most significantly from the Fund’s return included Missouri State Health & Educational Facilities Auth. Educational Taxable Ref. (Washington University) Ser. 16B, 3.086%, due 9/15/2051 (portfolio average weight of 0.10%), and New York City New York Ser. 10, 6.246%, due 6/1/2035 (portfolio average weight of 0.09%).
| | | | |
State and Territory Breakdown (% of the Fund’s Net Assets) as of October 31, 2016 | |
| California | | | 30.6 | |
| Illinois | | | 6.5 | |
| New Jersey | | | 3.4 | |
| New York | | | 15.5 | |
| Ohio | | | 3.2 | |
| Texas | | | 6.9 | |
| Washington | | | 3.0 | |
| Other States, Territories and Security Types Less Than 3% Each | | | 25.5 | |
| Money Market Fund Plus Other Assets Less Liabilities | | | 5.4 | |
PowerShares Build America Bond Portfolio (BAB) (continued)
| | | | |
Top Ten Fund Holdings*
(% of the Fund’s Net Assets) as of October 31, 2016 | |
| Security | | | | |
| California State Ser. 10, 7.600%, 11/01/2040 | | | 4.3 | |
| California State Ser. 10, 7.950%, 03/01/2036 | | | 2.5 | |
| California State Ser. 09, 7.500%, 04/01/2034 | | | 2.4 | |
| California State Various Purpose Ser. 09, 7.550%, 04/01/2039 | | | 2.3 | |
| California State Highway Safety Air Quality Remarketed Ser. 09B, 6.509%, 04/01/2039 | | | 1.7 | |
| Metropolitan Transportation Auth. New York Rev. Ser. 10E, 6.814%, 11/15/2040 | | | 1.6 | |
| Utah State Ser. 10B, 3.539%, 07/01/2025 | | | 1.6 | |
| Illinois State Ser. 10-1, 5.563%, 02/01/2021 | | | 1.5 | |
| Texas State Transportation Commission Rev. (First Tier) Ser. 10B, 5.178%, 04/01/2030 | | | 1.4 | |
| University of California Rev. Ser. 10, 5.946%, 05/15/2045 | | | 1.3 | |
| Total | | | 20.6 | |
| * | Excluding money market fund holdings. |
Growth of a $10,000 Investment Since Inception†
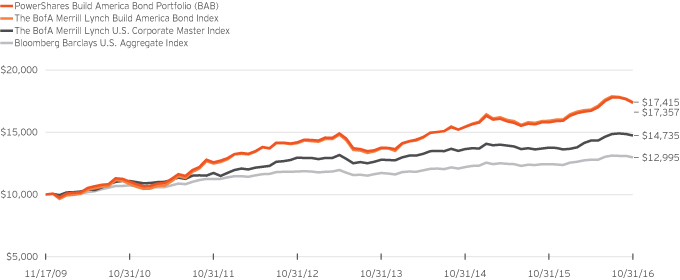
Fund Performance History as of October 31, 2016
| | | | | | | | | | | | | | | | | | | | | | | | | | | | | | | | |
| | | 1 Year | | | 3 Years
Average
Annualized | | | 3 Years
Cumulative | | | 5 Years
Average
Annualized | | | 5 Years
Cumulative | | | | | | Fund Inception† | |
| Index | | | | | | | | | | Average
Annualized | | | Cumulative | |
The BofA Merrill Lynch Build America Bond Index | | | 9.36 | % | | | 8.36 | % | | | 27.22 | % | | | 6.89 | % | | | 39.55 | % | | | | | | | 8.31 | % | | | 74.15 | % |
| The BofA Merrill Lynch U.S. Corporate Master Index | | | 7.02 | | | | 4.79 | | | | 15.06 | | | | 4.69 | | | | 25.76 | | | | | | | | 5.73 | | | | 47.35 | |
| Bloomberg Barclays U.S. Aggregate Index | | | 4.37 | | | | 3.48 | | | | 10.81 | | | | 2.90 | | | | 15.37 | | | | | | | | 3.84 | | | | 29.95 | |
| Fund | | | | | | | | | | | | | | | | | | | | | | | | | | | | | | | | |
NAV Return | | | 9.89 | | | | 8.04 | | | | 26.10 | | | | 6.64 | | | | 37.89 | | | | | | | | 8.25 | | | | 73.57 | |
| Market Price Return | | | 9.90 | | | | 8.25 | | | | 26.84 | | | | 6.67 | | | | 38.09 | | | | | | | | 8.23 | | | | 73.30 | |
PowerShares Build America Bond Portfolio (BAB) (continued)
Fund Inception: November 17, 2009
Performance quoted above represents past performance. Past performance is not a guarantee of future results and current performance may be higher or lower than performance quoted. Investment returns and principal value will fluctuate, and shares of the Fund (“Fund Shares”), when redeemed or sold, may be worth more or less than their original cost. Fund performance reflects any applicable fee waivers and/or expense reimbursements. Had the adviser not waived fees and/or reimbursed expenses currently or in the past, returns would have been lower. See current prospectus for more information. According to the Fund’s current prospectus, the Fund’s expense ratio of 0.28% is expressed as a unitary management fee to cover operating expenses and expenses incurred in connection with managing the portfolio. NAV and Market Price returns assume that dividends and capital gain distributions have been reinvested in the Fund at NAV and Market Price, respectively. The returns shown in the table above do not reflect the deduction of taxes that a shareholder would pay on Fund
distributions or the redemption or sale of Fund Shares. See invescopowershares.com to find the most recent month-end performance numbers.
Index and Benchmark Indices performance results are based upon a hypothetical investment in their respective constituent securities. Index and Benchmark Indices returns do not represent Fund returns. An investor cannot invest directly in an index. The Index and Benchmark Indices do not charge management fees or brokerage expenses, and no such fees or expenses were deducted from the hypothetical performance shown. In addition, the results actual investors might have achieved would have differed from those shown because of differences in the timing, amounts of their investments, and fees and expenses associated with an investment in the Fund.
| † | Fund, Index and Benchmark Indices returns are based on the inception date of the Fund. |
| | |
| PWZ | | Manager’s Analysis |
| | PowerShares California AMT-Free Municipal Bond Portfolio (PWZ) |
As an index fund, the PowerShares California AMT-Free Municipal Bond Portfolio (the “Fund”) is passively managed and attempts to track the returns of an underlying index. The Fund seeks investment results that generally correspond (before fees and expenses) to the price and yield of The BofA Merrill Lynch California Long-Term Core Plus Municipal Securities Index (the “Index”). The Fund generally will invest at least 80% of its total assets in municipal securities that comprise the Index and that are also exempt from the federal alternative minimum tax.
Merrill Lynch, Pierce, Fenner & Smith Incorporated is the Index provider (the “Index Provider”) for the Index. The Index is composed of U.S. dollar-denominated, investment grade, tax-exempt debt publicly issued in California or any U.S. territory, or their political subdivisions, in the U.S. domestic market with a term of at least 15 years remaining to final maturity. The Fund does not purchase all of the securities in the Index; instead, the Fund utilizes a “sampling” methodology to seek to achieve its investment objective.
For the fiscal year ended October 31, 2016, on a market price basis, the Fund returned 5.79%. On a net asset value (“NAV”) basis, the Fund returned 5.80%. During the same time period, the Index returned 5.67%. During the fiscal year, the Fund’s performance differed from the return of the Index primarily due to security selection as part of the Fund’s sampling methodology and the Fund’s slightly longer duration.
During this same time period, the Bloomberg Barclays Municipal Bond 20 Year Index (the “Benchmark Index”) returned 5.39%. The Benchmark Index is an unmanaged index weighted by market capitalization based on the average performance of approximately 5,280 securities. The Benchmark Index was selected for its recognition in the marketplace, and its performance comparison is a useful measure for investors as a broad representation of municipal securities with maturities of 17 to 22 years.
Relative to the Benchmark Index, the Fund was most overweight in the State of California and most underweight in the State of New York during the fiscal year ended October 31, 2016. The majority of the Fund’s outperformance relative to the Benchmark Index during the period can be attributed to the Fund’s heavy concentration in the State of California bonds and security selection.
For the fiscal year ended October 31, 2016, the State of California was the only contributor. The U.S. territory of Puerto Rico detracted most significantly from the Fund’s return, followed by the U.S. territory of Guam.
Positions that contributed most significantly to the Fund’s return included Puerto Rico Sales Tax Financing Corp. Sales Tax Rev. First Sub.-Ser. 10C, 5.125% coupon, due 8/1/2042 (portfolio average weight of 1.10%), and Chula Vista California Industrial Development Rev. (San Diego Gas-Remarketed 06/17/09)
Ser. 04A, 5.875%, due 2/15/2034 (portfolio average weight of 0.62%). Positions that detracted most significantly from the Fund’s return included Bay Area California Auth. Toll Bridge Rev. Ser. 14S-6, 5.00% coupon, due 10/1/2054 (portfolio average weight of 4.76%), and California State Educational Facilities Auth. Rev. (California Institute of Technology) Ser. 09, 5.00% coupon, due 11/1/2039 (no longer held at fiscal year-end).
| | | | |
Revenue Type Breakdown
(% of the Fund’s Net Assets) as of October 31, 2016 | |
| Ad Valorem Property Tax | | | 19.8 | |
| Health, Hospital, Nursing Home Revenue | | | 10.1 | |
| Electric Power Revenue | | | 9.7 | |
| Lease Revenue | | | 9.6 | |
| General Fund | | | 8.8 | |
| Water Revenue | | | 7.6 | |
| College Revenue | | | 7.5 | |
| Highway Tolls Revenue | | | 6.0 | |
| Port, Airport & Marina Revenue | | | 5.5 | |
| Miscellaneous Revenue | | | 3.5 | |
| Tax Increment Revenue | | | 2.2 | |
| Sewer Revenue | | | 1.7 | |
| Special Tax | | | 1.6 | |
| Natural Gas Revenue | | | 1.5 | |
| Transit Revenue | | | 0.9 | |
| Special Assessment | | | 0.9 | |
| Sales Tax Revenue | | | 0.8 | |
| Recreational Revenue | | | 0.6 | |
| Local or GTD Housing | | | 0.6 | |
| Other Assets Less Liabilities | | | 1.1 | |
PowerShares California AMT-Free Municipal Bond Portfolio (PWZ) (continued)
| | | | |
Top Ten Fund Holdings
(% of the Fund’s Net Assets) as of October 31, 2016 | |
| Security | | | | |
| Bay Area California Auth. Toll Bridge Rev. Ser. 14S-6, 5.000%, 10/01/2054 | | | 6.0 | |
| Los Angeles California Department of Water & Power Rev. (Power System) Ser. 12B, 5.000%, 07/01/2043 | | | 2.8 | |
| Santa Clara Valley California Water District Ref. Ser. 16A, 5.000%, 06/01/2046 | | | 2.6 | |
| California State Health Facilities Financing Auth. Rev. Ref. (Sutter Health) Ser. 11D, 5.000%, 08/15/2035 | | | 2.0 | |
| California State Ser. 15, 5.000%, 08/01/2045 | | | 1.9 | |
| San Francisco California City & County Airports Commission Rev. (San Francisco International Airport) Ser. 16C, 5.000%, 05/01/2046 | | | 1.9 | |
| California State University Rev. Systemwide Ser. 12A, 5.000%, 11/01/2037 | | | 1.8 | |
| San Jose California Financing Auth. Ref. (Civic Center Project) Ser. 13A, 5.000%, 06/01/2039 | | | 1.8 | |
| Contra Costa California Community College District (Election of 2006) Ser. 13, 5.000%, 08/01/2038 | | | 1.7 | |
| California State Ref. Various Purpose Ser.16, 5.000%, 09/01/2034 | | | 1.6 | |
| Total | | | 24.1 | |
Growth of a $10,000 Investment Since Inception†
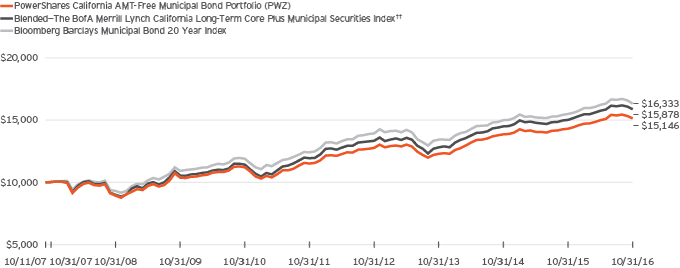
Fund Performance History as of October 31, 2016
| | | | | | | | | | | | | | | | | | | | | | | | | | | | | | | | |
| | | 1 Year | | | 3 Years
Average
Annualized | | | 3 Years
Cumulative | | | 5 Years
Average
Annualized | | | 5 Years
Cumulative | | | | | | Fund Inception† | |
| Index | | | | | | | | | | Average
Annualized | | | Cumulative | |
| Blended—The BofA Merrill Lynch California Long-Term Core Plus Municipal Securities Index†† | | | 5.67 | % | | | 7.38 | % | | | 23.82 | % | | | 5.87 | % | | | 33.02 | % | | | | | | | 5.24 | % | | | 58.78 | % |
| Bloomberg Barclays Municipal Bond 20 Year Index | | | 5.39 | | | | 6.71 | | | | 21.53 | | | | 5.64 | | | | 31.54 | | | | | | | | 5.57 | | | | 63.33 | |
| Fund | | | | | | | | | | | | | | | | | | | | | | | | | | | | | | | | |
| NAV Return | | | 5.80 | | | | 7.21 | | | | 23.21 | | | | 5.62 | | | | 31.43 | | | | | | | | 4.69 | | | | 51.46 | |
| Market Price Return | | | 5.79 | | | | 7.40 | | | | 23.89 | | | | 5.67 | | | | 31.73 | | | | | | | | 4.63 | | | | 50.72 | |
PowerShares California AMT-Free Municipal Bond Portfolio (PWZ) (continued)
Fund Inception: October 11, 2007
Performance quoted above represents past performance. Past performance is not a guarantee of future results and current performance may be higher or lower than performance quoted. Investment returns and principal value will fluctuate, and shares of the Fund (“Fund Shares”), when redeemed or sold, may be worth more or less than their original cost. Fund performance reflects any applicable fee waivers and/or expense reimbursements. Had the adviser not waived fees and/or reimbursed expenses currently or in the past, returns would have been lower. See current prospectus for more information. According to the Fund’s current prospectus, the Fund’s expense ratio of 0.28% is expressed as a unitary management fee to cover operating expenses and expenses incurred in connection with managing the portfolio. NAV and Market Price returns assume that dividends and capital gain distributions have been reinvested in the Fund at NAV and Market Price, respectively. The returns shown in the table above do not reflect the deduction of taxes that a shareholder would pay on Fund distributions or the redemption or sale of Fund Shares. See invescopowershares.com to find the most recent month-end performance numbers.
Blended-Index and Benchmark Index performance results are based upon a hypothetical investment in their respective constituent securities.
Blended-Index and Benchmark Index returns do not represent Fund returns. An investor cannot invest directly in an index. The Blended-Index and Benchmark Index do not charge management fees or brokerage expenses, and no such fees or expenses were deducted from the hypothetical performance shown. In addition, the results actual investors might have achieved would have differed from those shown because of differences in the timing, amounts of their investments, and fees and expenses associated with an investment in the Fund.
| † | Fund, Blended-Index and Benchmark Index returns are based on the inception date of the Fund. |
| †† | The Blended—BofA Merrill Lynch California Long-Term Core Plus Municipal Securities Index is comprised of the performance of the BofA Merrill Lynch California Insured Long-Term Core Municipal Securities Index the Fund’s underlying index, from Fund inception through the conversion date, May 29, 2009, followed by the performance of the BofA Merrill Lynch California Insured Long-Term Core Plus Municipal Securities Index, the Fund’s underlying index for the period May 29, 2009 through July 8, 2014, followed by the performance of the Index for the period July 8, 2014 through October 31, 2016. |
| | |
| PCEF | | Manager’s Analysis |
| | PowerShares CEF Income Composite Portfolio (PCEF) |
As an index fund, the PowerShares CEF Income Composite Portfolio (the “Fund”) is passively managed and attempts to track the returns of an underlying index. The Fund seeks investment results that generally correspond (before fees and expenses) to the price and yield of the S-Network Composite Closed-End Fund IndexSM (the “Index”). The Fund generally will invest at least 90% of its total assets in securities of U.S.-listed closed-end funds that comprise the Index. The Fund is a “fund of funds,” as it invests its assets in the common shares of funds included in the Index rather than in individual securities.
S-Network Global Indexes, LLC (the “Index Provider”), compiles, maintains and calculates the Index, which tracks the overall performance of a universe of U.S.-listed closed-end funds that are organized under the laws of the United States, which may be invested in taxable investment grade fixed-income securities, taxable high yield fixed-income securities and taxable equity options. The Index may include closed-end funds that are advised by an affiliate of Invesco PowerShares Capital Management LLC, the adviser. The number of constituents comprising the Index varies based on the number of closed-end funds that meet the Index’s eligibility criteria at each quarterly rebalancing. The Index Provider selects constituents of the Index from a universe of approximately 350 closed-end funds that: (i) are organized under the laws of the United States and are in compliance with all applicable laws and regulations applicable to closed-end funds; (ii) have a stated investment objective of concentrating in the taxable fixed-income, high yield fixed-income or option income sector; (iii) trade on a recognized North American stock exchange that provides a “last closing price;” (iv) have a minimum capitalization value greater than $100 million; and (v) have an average daily turnover of more than $500,000 per day for the three months prior to the snapshot date. The Index Provider weights Index constituents based on their net assets, adjusted for their average market price discount and modified to ensure compliance with the diversification requirements of Subchapter M of the Internal Revenue Code of 1986, as amended. The Fund generally invests in all of the securities in proportion to their weightings in the Index.
For the fiscal year ended October 31, 2016, on a market price basis, the Fund returned 10.41%. On a net asset value (“NAV”) basis, the Fund returned 10.11%. During the same time period, the Index returned 10.95%. During the fiscal year, the Fund fully replicated the components of the Index; therefore, the Fund’s performance (NAV basis) differed from the return of the Index primarily due to fees and operating expenses that the Fund incurred, as well as trading costs around quarterly rebalances during the period.
During this same time period, the S&P 500® Index (the “Benchmark Index”) returned 4.51%. The Benchmark Index is an unmanaged index weighted by market capitalization based on the average performance of approximately 500 equity securities. The
adviser provided this additional comparative benchmark to help investors better understand how the investment results of the Fund compare to the performance of a broad-based market benchmark.
The majority of the Fund’s holdings were focused in investment grade and high yield fixed income closed-end funds during the fiscal year ended October 31, 2016. The majority of the Fund’s outperformance relative to the Benchmark Index can be attributed to this exposure to fixed income, which generally outperformed the equity markets during the period. Additionally, many of the Fund’s underlying closed-end funds utilize financial leverage, which enhanced their returns during this period of positive performance.
Positions that contributed most significantly to the Fund’s return included DoubleLine Income Solutions Fund, a closed-end fixed income fund (portfolio average weight of 2.45%), and Aberdeen Asia-Pacific Income Fund, Inc., a closed-end equity fund (portfolio average weight of 2.23%). Positions that detracted most significantly from the Fund’s return included PIMCO Dynamic Credit and Mortgage Income Fund, a closed-end fixed income fund (no longer held at fiscal year-end), and BlackRock International Growth and Income Trust, a closed-end equity fund (portfolio average weight of 0.97%).
| | | | |
Asset Class Breakdown
(% of the Fund’s Net Assets) as of October 31, 2016 | |
| Bonds | | | 46.3 | |
| Bonds/High Yield | | | 26.4 | |
| Option Income | | | 25.8 | |
| Domestic Equity | | | 1.5 | |
| Other Assets Less Liabilities | | | (0.0) | |
|
Top Ten Fund Holdings
(% of the Fund’s Net Assets) as of October 31, 2016 | |
| Security | | | | |
| Eaton Vance Tax-Managed Global Diversified Equity Income Fund | | | 2.9 | |
| DoubleLine Income Solutions Fund | | | 2.8 | |
| Eaton Vance Limited Duration Income Fund | | | 2.5 | |
| BlackRock Enhanced Equity Dividend Trust | | | 2.4 | |
| BlackRock Credit Allocation Income Trust | | | 2.3 | |
| Eaton Vance Tax-Managed Diversified Equity Income Fund | | | 2.2 | |
| Aberdeen Asia-Pacific Income Fund, Inc. | | | 2.1 | |
| AllianzGI NFJ Dividend, Interest & Premium Strategy Fund | | | 2.1 | |
| BlackRock Corporate High Yield Fund, Inc. | | | 2.0 | |
| Nuveen Preferred Securities Income Fund | | | 1.9 | |
| Total | | | 23.2 | |
PowerShares CEF Income Composite Portfolio (PCEF) (continued)
Growth of a $10,000 Investment Since Inception†
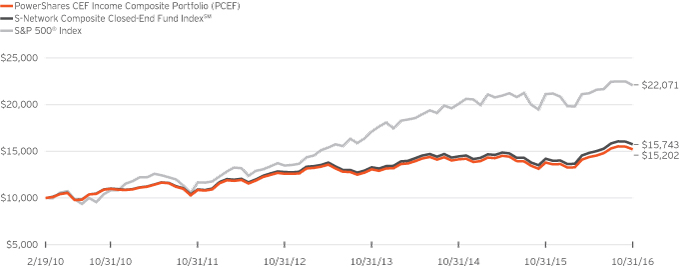
Fund Performance History as of October 31, 2016
| | | | | | | | | | | | | | | | | | | | | | | | | | | | | | | | |
| | | 1 Year | | | 3 Years
Average
Annualized | | | 3 Years
Cumulative | | | 5 Years
Average
Annualized | | | 5 Years
Cumulative | | | | | | Fund Inception† | |
| Index | | | | | | | | | | Average
Annualized | | | Cumulative | |
| S-Network Composite Closed-End Fund IndexSM | | | 10.95 | % | | | 5.78 | % | | | 18.35 | % | | | 7.57 | % | | | 44.06 | % | | | | | | | 7.02 | % | | | 57.43 | % |
| S&P 500® Index | | | 4.51 | | | | 8.84 | | | | 28.93 | | | | 13.57 | | | | 88.90 | | | | | | | | 12.56 | | | | 120.71 | |
| Fund | | | | | | | | | | | | | | | | | | | | | | | | | | | | | | | | |
| NAV Return | | | 10.11 | | | | 5.20 | | | | 16.41 | | | | 6.99 | | | | 40.19 | | | | | | | | 6.45 | | | | 52.02 | |
| Market Price Return | | | 10.41 | | | | 5.19 | | | | 16.39 | | | | 6.98 | | | | 40.13 | | | | | | | | 6.44 | | | | 51.87 | |
Fund Inception: February 19, 2010
Performance quoted above represents past performance. Past performance is not a guarantee of future results and current performance may be higher or lower than performance quoted. Investment returns and principal value will fluctuate, and shares of the Fund (“Fund Shares”), when redeemed or sold, may be worth more or less than their original cost. Fund performance reflects any applicable fee waivers and/or expense reimbursements. Had the adviser not waived fees and/or reimbursed expenses currently or in the past, returns would have been lower. See current prospectus for more information. According to the Fund’s current prospectus, the Fund’s expense ratio of 1.94% includes the unitary management fee of 0.50% and acquired fund fees and expenses of 1.44%. NAV and Market Price returns assume that dividends and capital gain distributions have been reinvested in the Fund at NAV and Market Price, respectively. The returns shown in the
table above do not reflect the deduction of taxes that a shareholder would pay on Fund distributions or the redemption or sale of Fund Shares. See invescopowershares.com to find the most recent month-end performance numbers.
Index and Benchmark Index performance results are based upon a hypothetical investment in their respective constituent securities. Index and Benchmark Index returns do not represent Fund returns. An investor cannot invest directly in an index. The Index and Benchmark Index do not charge management fees or brokerage expenses, and no such fees or expenses were deducted from the hypothetical performance shown. In addition, the results actual investors might have achieved would have differed from those shown because of differences in the timing, amounts of their investments, and fees and expenses associated with an investment in the Fund.
| † | Fund, Index and Benchmark Index returns are based on the inception date of the Fund. |
| | |
| DSUM | | Manager’s Analysis |
| | PowerShares Chinese Yuan Dim Sum Bond Portfolio (DSUM) |
As an index fund, the PowerShares Chinese Yuan Dim Sum Bond Portfolio (the “Fund”) is passively managed and attempts to track the returns of an underlying index. The Fund seeks investment results that generally correspond (before fees and expenses) to the price and yield of the Citi Custom Dim Sum (Offshore CNY) Bond Index (the “Index”). The Fund generally will invest at least 80% of its total assets in Chinese Renminbi (“RMB”) denominated bonds that comprise the Index.
The Index measures the performance of RMB-denominated “Dim Sum” bonds that are issued and settled outside of mainland China. Dim Sum bonds are RMB-denominated and generally are issued in Hong Kong by a variety of entities ranging from governments to corporations. The Index is designed to provide exposure to RMB-denominated bonds that are issued and settled outside of mainland China. Strictly in accordance with the Index’s guidelines and mandated procedures, securities must have a minimum maturity of one month and an outstanding amount of at least RMB 1 billion to be eligible for entry. There is no minimum rating requirement for inclusion in the Index. Securities with a maturity of less than one month are removed from the Index. The Index is composed of RMB-denominated bonds issued by governments, agencies, supranationals and corporations, excluding synthetics, convertible bonds, retail bonds and CDs. Citigroup Index LLC, the Index provider, rebalances the Index monthly. The Fund does not purchase all of the securities in the Index; instead, the Fund utilizes a “sampling” methodology to seek to achieve its investment objective.
For the fiscal year ended October 31, 2016, on a market price basis, the Fund returned (2.02)%. On a net asset value (“NAV”) basis, the Fund returned (2.28)%. During the same time period, the Index returned (1.72)%. The Fund’s performance differed from the return of the Index primarily due to fees and operating expenses that the Fund incurred during the period.
During this same time period, the Bloomberg Barclays China Aggregate Index (the “Benchmark Index”) returned (0.68)%. The Benchmark Index is an unmanaged index weighted by market capitalization based on the average performance of approximately 1,560 securities. The Benchmark Index was selected for its recognition in the marketplace, and its performance comparison is a useful measure for investors as a broad representation of the Dim Sum fixed income market.
Relative to the Benchmark Index, the Fund was most overweight in the banking industry and most underweight in the sovereign industry during the fiscal year ended October 31, 2016. The majority of the Fund’s underperformance relative to the Benchmark Index during the period can be attributed to frictional trading costs and fees and operating expenses that the Fund incurred during the period.
Positions that contributed most significantly to the Fund’s return included China Unicom Hong Kong Ltd., 4.00% coupon, due 4/16/2017 (portfolio average weight of 1.77%), and China City Construction, 5.35% coupon, due 7/3/2017 (no longer held at fiscal year-end). Positions that detracted most significantly from the Fund’s return included Banco BTG Pactual SA, 4.10% coupon, due 3/26/2016 (no longer held at fiscal year-end), and IT Ltd., 6.25% coupon, due 5/15/2018 (no longer held at fiscal year-end).
| | | | |
Industry Breakdown
(% of the Fund’s Net Assets) as of October 31, 2016 | |
| Sovereign | | | 28.9 | |
| Banks | | | 15.2 | |
| Real Estate | | | 8.2 | |
| Diversified Financial Services | | | 7.1 | |
| Transportation | | | 4.4 | |
| Multi-National | | | 4.3 | |
| Computers | | | 3.3 | |
| Chemicals | | | 2.9 | |
| Insurance | | | 2.7 | |
| Food | | | 2.7 | |
| Oil & Gas | | | 2.6 | |
| Investment Companies | | | 2.1 | |
| Electronics | | | 1.6 | |
| Holding Companies-Diversified | | | 1.5 | |
| Auto Manufacturers | | | 1.5 | |
| Telecommunications | | | 1.5 | |
| Airlines | | | 1.5 | |
| Electric | | | 1.5 | |
| Machinery-Construction & Mining | | | 1.5 | |
| Mining | | | 1.4 | |
| Engineering & Construction | | | 1.2 | |
| Other Assets Less Liabilities | | | 2.4 | |
PowerShares Chinese Yuan Dim Sum Bond Portfolio (DSUM) (continued)
| | | | |
Top Ten Fund Holdings
(% of the Fund’s Net Assets) as of October 31, 2016 | |
| Security | | | | |
| China Development Bank Corp., EMTN, 3.600%, 11/13/2018 | | | 3.0 | |
| Caisse d’Amortissement de la Dette Sociale, 3.800%, 02/06/2017 | | | 2.9 | |
| Export-Import Bank of Korea, EMTN, 3.600%, 06/10/2018 | | | 2.9 | |
| Export-Import Bank of China (The), Series B, 3.250%, 01/21/2017 | | | 2.9 | |
| Bank of Tokyo-Mitsubishi UFJ China Ltd., 3.050%, 05/26/2017 | | | 2.9 | |
| Gazprombank OJSC Via GPB Eurobond Finance PLC, EMTN, 4.250%, 01/30/2017 | | | 2.9 | |
| Asian Development Bank, EMTN, 2.850%, 10/21/2020 | | | 2.9 | |
| China Government Bond, 2.360%, 08/18/2021 | | | 2.9 | |
| China Government Bond, 3.160%, 06/27/2023 | | | 2.7 | |
| Bank of China Ltd./Abu Dhabi, EMTN, 3.600%, 06/30/2017 | | | 2.4 | |
| Total | | | 28.4 | |
Growth of a $10,000 Investment Since Inception†
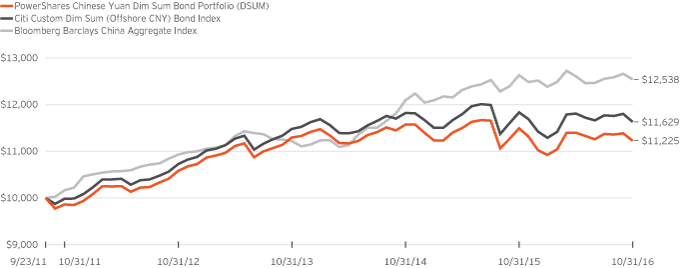
Fund Performance History as of October 31, 2016
| | | | | | | | | | | | | | | | | | | | | | | | | | | | | | | | |
| | | 1 Year | | | 3 Years
Average
Annualized | | | 3 Years
Cumulative | | | 5 Years
Average
Annualized | | | 5 Years
Cumulative | | | | | | Fund Inception† | |
| Index | | | | | | | | | | Average
Annualized | | | Cumulative | |
| Citi Custom Dim Sum (Offshore CNY) Bond Index | | | (1.72 | )% | | | 0.44 | % | | | 1.33 | % | | | 3.10 | % | | | 16.52 | % | | | | | | | 3.00 | % | | | 16.29 | % |
| Bloomberg Barclays China Aggregate Index | | | (0.68 | ) | | | 3.78 | | | | 11.76 | | | | 4.30 | | | | 23.40 | | | | | | | | 4.53 | | | | 25.38 | |
| Fund | | | | | | | | | | | | | | | | | | | | | | | | | | | | | | | | |
| NAV Return | | | (2.28 | ) | | | (0.20 | ) | | | (0.60 | ) | | | 2.62 | | | | 13.83 | | | | | | | | 2.29 | | | | 12.25 | |
| Market Price Return | | | (2.02 | ) | | | (0.49 | ) | | | (1.47 | ) | | | 2.45 | | | | 12.87 | | | | | | | | 1.48 | | | | 7.78 | |
PowerShares Chinese Yuan Dim Sum Bond Portfolio (DSUM) (continued)
Fund Inception: September 23, 2011
Performance quoted above represents past performance. Past performance is not a guarantee of future results and current performance may be higher or lower than performance quoted. Investment returns and principal value will fluctuate, and shares of the Fund (“Fund Shares”), when redeemed or sold, may be worth more or less than their original cost. Fund performance reflects any applicable fee waivers and/or expense reimbursements. Had the adviser not waived fees and/or reimbursed expenses currently or in the past, returns would have been lower. See current prospectus for more information. According to the Fund’s current prospectus, the Fund’s expense ratio of 0.45% is expressed as a unitary management fee to cover operating expenses and expenses incurred in connection with managing the portfolio. NAV and Market Price returns assume that dividends and capital gain distributions have been reinvested in the Fund at NAV and Market Price, respectively. The returns shown in the table above do not reflect the deduction of taxes that a shareholder would pay on Fund
distributions or the redemption or sale of Fund Shares. See invescopowershares.com to find the most recent month-end performance numbers.
Index and Benchmark Index performance results are based upon a hypothetical investment in its respective constituent securities. Index and Benchmark Index returns do not represent Fund returns. An investor cannot invest directly in an index. The Index and Benchmark Index do not charge management fees or brokerage expenses, and no such fees or expenses were deducted from the hypothetical performance shown. In addition, the results actual investors might have achieved would have differed from those shown because of differences in the timing, amounts of their investments, and fees and expenses associated with an investment in the Fund.
| † | Fund, Index and Benchmark Index returns are based on the inception date of the Fund. |
| | |
| PCY | | Manager’s Analysis |
| | PowerShares Emerging Markets Sovereign Debt Portfolio (PCY) |
As an index fund, the PowerShares Emerging Markets Sovereign Debt Portfolio (the “Fund”) is passively managed and attempts to track the returns of an underlying index. The Fund seeks investment results that generally correspond (before fees and expenses) to the price and yield of the DBIQ Emerging Market USD Liquid Balanced Index (the “Index”). The Index measures potential returns of a theoretical portfolio of liquid emerging market U.S. dollar-denominated government bonds. The Fund generally will invest 80% of its total assets in U.S. dollar-denominated government bonds from emerging market countries that comprise the Index.
Strictly in accordance with its guidelines and mandated procedures, Deutsche Bank Securities Inc. (“DB” or the “Index Provider”) selects one to three securities from each eligible emerging market country as determined by the Index Provider that (i) are denominated in U.S. dollars, (ii) are sovereign bonds, (iii) have at least three years to maturity, and (iv) have an outstanding float of at least $500 million. The Fund does not purchase all of the securities in the Index; instead, the Fund utilizes a “sampling” methodology to seek its investment objective.
For the fiscal year ended October 31, 2016, on a market price basis, the Fund returned 11.61%. On a net asset value (“NAV”) basis, the Fund returned 11.79%. During the same time period, the Index returned 12.74%. During the fiscal year, the Fund’s performance (NAV basis) differed from the return of the Index primarily due to a market moratorium on trading Ukraine bonds after the sovereign default that caused a debt restructuring, as well as fees incurred by the Fund during the period.
During this same time period, the JP Morgan Emerging Market Bond Global Index (the “Benchmark Index”) returned 11.59%. The Benchmark Index is an unmanaged index weighted by country, which limits weights of countries with higher debt outstanding, reallocating this excess to countries with lower debt outstanding, based on the average performance of approximately 300 securities.
The Benchmark Index was selected for its recognition in the marketplace, and its performance comparison is a useful measure for investors as a broad representation of the U.S. dollar- denominated bond market in emerging market countries. Relative to the Benchmark Index, the Fund was most overweight in the country of Slovenia and most underweight in the country of Mexico during the fiscal year ended October 31, 2016. The majority of the Fund’s outperformance relative to the Benchmark Index during the period can be attributed to country allocation differences.
For the fiscal year ended October 31, 2016, the country of Venezuela contributed most significantly to the Fund’s return, followed by the countries of Brazil and El Salvador. There were no detracting countries.
Positions that contributed most significantly to the Fund’s return included Venezuela Government International Bond, 7.75% coupon, due 10/13/2019 (portfolio average weight of 0.01%), and Venezuela Government International Bond, 9.00% coupon, due 5/7/2023 (portfolio average weight of 0.01%). Positions that detracted most significantly from the Fund’s return included Venezuela Government International Bond, 7.00% coupon, due 12/1/2018 (no longer held at fiscal year-end), and Ukraine Government International Bond, 0.00% coupon, due 5/31/2040 (no longer held at fiscal year-end).
| | | | |
Country Breakdown
(% of the Fund’s Net Assets) as of October 31, 2016 | |
| El Salvador | | | 3.7 | |
| Brazil | | | 3.7 | |
| Venezuela | | | 3.7 | |
| Colombia | | | 3.6 | |
| Indonesia | | | 3.5 | |
| Kazakhstan | | | 3.4 | |
| Sri Lanka | | | 3.4 | |
| Peru | | | 3.4 | |
| Russia | | | 3.4 | |
| South Africa | | | 3.4 | |
| Dominican Republic | | | 3.3 | |
| Uruguay | | | 3.3 | |
| Morocco | | | 3.3 | |
| Ukraine | | | 3.3 | |
| Mexico | | | 3.3 | |
| Pakistan | | | 3.2 | |
| Hungary | | | 3.2 | |
| Slovenia | | | 3.2 | |
| Panama | | | 3.2 | |
| Latvia | | | 3.1 | |
| Romania | | | 3.1 | |
| Croatia | | | 3.1 | |
| Qatar | | | 3.1 | |
| Serbia | | | 3.1 | |
| Poland | | | 3.1 | |
| Philippines | | | 3.1 | |
| South Korea | | | 3.1 | |
| Turkey | | | 3.0 | |
| Lithuania | | | 3.0 | |
| Lebanon | | | 3.0 | |
| Money Market Funds Plus Other Assets Less Liabilities | | | 1.7 | |
PowerShares Emerging Markets Sovereign Debt Portfolio (PCY) (continued)
| | | | |
Top Ten Fund Holdings*
(% of the Fund’s Net Assets) as of October 31, 2016 | |
| Security | | | | |
| Latvia Government International Bond, 2.750%, 01/12/2020 | | | 3.1 | |
| Morocco Government International Bond, 5.500%, 12/11/2042 | | | 1.7 | |
| Morocco Government International Bond, 4.250%, 12/11/2022 | | | 1.6 | |
| Serbia International Bond, 4.875%, 02/25/2020 | | | 1.6 | |
| Korea International Bond, 3.875%, 09/11/2023 | | | 1.6 | |
| Serbia International Bond, 7.250%, 09/28/2021 | | | 1.5 | |
| Korea International Bond, 4.125%, 06/10/2044 | | | 1.5 | |
| Venezuela Government International Bond, 7.750%, 10/13/2019 | | | 1.3 | |
| El Salvador Government International Bond, 7.625%, 02/01/2041 | | | 1.3 | |
| Brazil Government International Bond, 5.625%, 01/07/2041 | | | 1.3 | |
| Total | | | 16.5 | |
| * | Excluding money market fund holdings. |
Growth of a $10,000 Investment Since Inception†
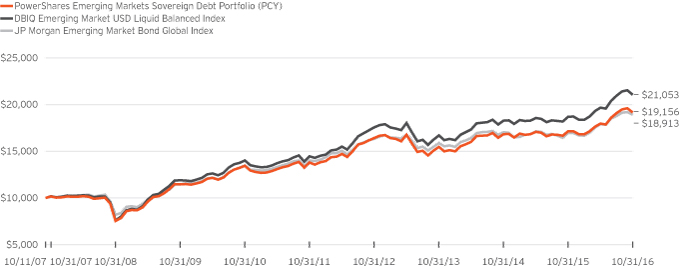
Fund Performance History as of October 31, 2016
| | | | | | | | | | | | | | | | | | | | | | | | | | | | | | | | |
| | | 1 Year | | | 3 Years
Average
Annualized | | | 3 Years
Cumulative | | | 5 Years
Average
Annualized | | | 5 Years
Cumulative | | | | | | Fund Inception† | |
| Index | | | | | | | | | | Average
Annualized | | | Cumulative | |
| DBIQ Emerging Market USD Liquid Balanced Index | | | 12.74 | % | | | 8.06 | % | | | 26.17 | % | | | 7.81 | % | | | 45.64 | % | | | | | | | 8.57 | % | | | 110.53 | % |
| JP Morgan Emerging Market Bond Global Index | | | 11.59 | | | | 5.98 | | | | 19.02 | | | | 6.17 | | | | 34.87 | | | | | | | | 7.29 | | | | 89.13 | |
| Fund | | | | | | | | | | | | | | | | | | | | | | | | | | | | | | | | |
| NAV Return | | | 11.79 | | | | 7.39 | | | | 23.86 | | | | 6.78 | | | | 38.80 | | | | | | | | 7.44 | | | | 91.56 | |
| Market Price Return | | | 11.61 | | | | 7.28 | | | | 23.46 | | | | 6.67 | | | | 38.13 | | | | | | | | 7.32 | | | | 89.54 | |
PowerShares Emerging Markets Sovereign Debt Portfolio (PCY) (continued)
Fund Inception: October 11, 2007
Performance quoted above represents past performance. Past performance is not a guarantee of future results and current performance may be higher or lower than performance quoted. Investment returns and principal value will fluctuate, and shares of the Fund (“Fund Shares”), when redeemed or sold, may be worth more or less than their original cost. Fund performance reflects any applicable fee waivers and/or expense reimbursements. Had the adviser not waived fees and/or reimbursed expenses currently or in the past, returns would have been lower. See current prospectus for more information. According to the Fund’s current prospectus, the Fund’s expense ratio of 0.50% is expressed as a unitary management fee to cover operating expenses and expenses incurred in connection with managing the portfolio. NAV and Market Price returns assume that dividends and capital gain distributions have been reinvested in the Fund at NAV and Market Price, respectively. The returns shown in the table above do not
reflect the deduction of taxes that a shareholder would pay on Fund distributions or the redemption or sale of Fund Shares. See invescopowershares.com to find the most recent month-end performance numbers.
Index and Benchmark Index performance results are based upon a hypothetical investment in their respective constituent securities. Index and Benchmark Index returns do not represent Fund returns. An investor cannot invest directly in an index. The Index and Benchmark Index do not charge management fees or brokerage expenses, and no such fees or expenses were deducted from the hypothetical performance shown. In addition, the results actual investors might have achieved would have differed from those shown because of differences in the timing, amounts of their investments, and fees and expenses associated with an investment in the Fund.
| † | Fund, Index and Benchmark Index returns are based on the inception date of the Fund. |
| | |
| PHB | | Manager’s Analysis |
| | PowerShares Fundamental High Yield® Corporate Bond Portfolio (PHB) |
As an index fund, the PowerShares Fundamental High Yield® Corporate Bond Portfolio (the “Fund”) is passively managed and attempts to track the returns of an underlying index. The Fund seeks investment results that generally correspond (before fees and expenses) to the price and yield of the RAFI® Bonds US High Yield 1-10 Index (the “Index”). The Fund generally will invest at least 80% of its total assets in high-yield corporate bonds that comprise the Index.
The Index is comprised of U.S. dollar-denominated bonds that are registered with the U.S. Securities and Exchange Commission or that are Rule 144A securities that provide for registration rights (issued after July 31, 2013) and whose issuers are public companies listed on a major U.S. stock exchange. Only investible, non-convertible, non-exchangeable, non-zero, fixed coupon high-yield corporate bonds qualify for inclusion in the Index. Bonds of foreign agencies, governments or supra-nationals, as well as those issuers that are not domiciled in the United States, are excluded from the Index. Ryan ALM, Inc. compiles and calculates the Index, which measures potential returns based on the Fundamental Index® methodology developed by Research Affiliates, LLC (the “Index Provider”). The Fund does not purchase all of the securities in the Index; instead, the Fund utilizes a “sampling” methodology to seek to achieve its investment objective.
For the fiscal year ended October 31, 2016, on a market price basis, the Fund returned 7.56%. On a net asset value (“NAV”) basis, the Fund returned 7.90%. During the same time period, the Index returned 9.30%. The Fund’s performance differed from the return of the Index primarily due to the Fund having a lower weighting to the energy industry as well as fees and trading costs the Fund incurred during the period.
During this same time period, the Bloomberg Barclays U.S. Corporate High Yield Index (the “Benchmark Index”) returned 10.14%. The Benchmark Index is an unmanaged index weighted by market capitalization and based on the average performance of approximately 2,190 securities. The adviser provided this additional comparative benchmark to help investors better understand how the investment results of the Fund compares to the performance of a broad-based U.S. high yield corporate bond benchmark.
Relative to the Benchmark Index, the Fund was most overweight in the consumer cyclicals industry and most underweight in the communications industry during the fiscal year ended October 31, 2016. The majority of the Fund’s underperformance relative to the Benchmark Index during the period can be attributed to the Fund having a lower weighting to the energy industry as well as fees and trading costs the Fund incurred.
For the fiscal year ended October 31, 2016, the energy industry contributed most significantly to the Fund’s return, followed by the communications and consumer non-cyclical industries. The
insurance industry detracted most significantly from the Fund’s return, followed by the basic industry and transportation industries.
Positions that contributed most significantly to the Fund’s return included Murphy Oil Corp., 4.70% coupon, due 12/1/2022, an energy company (portfolio average weight of 0.63%), and Freeport-McMoran Copper & Gold Inc., 3.55% coupon, 3/1/2022, a basic materials company (portfolio average weight of 0.62%). Positions that detracted most significantly from the Fund’s return included Denbury Resources Inc., 4.625% coupon, due 7/15/2023, an energy company (no longer held at fiscal year-end), and Chesapeake Energy Corp., 6.625% coupon, due 8/15/2020, an energy company (no longer held at fiscal year-end).
PowerShares Fundamental High Yield® Corporate Bond Portfolio (PHB) (continued)
| | | | |
Industry Breakdown
(% of the Fund’s Net Assets)
as of October 31, 2016 | |
| Oil & Gas | | | 14.9 | |
| Retail | | | 6.1 | |
| Healthcare-Services | | | 5.3 | |
| Media | | | 4.6 | |
| Telecommunications | | | 4.6 | |
| Electric | | | 3.9 | |
| Pipelines | | | 3.8 | |
| Diversified Financial Services | | | 3.6 | |
| Chemicals | | | 3.2 | |
| REITs | | | 3.1 | |
| Commercial Services | | | 2.6 | |
| Entertainment | | | 2.5 | |
| Home Builders | | | 2.2 | |
| Insurance | | | 2.2 | |
| Packaging & Containers | | | 2.2 | |
| Building Materials | | | 2.2 | |
| Food | | | 2.1 | |
| Mining | | | 2.1 | |
| Computers | | | 2.0 | |
| Auto Parts & Equipment | | | 1.9 | |
| Internet | | | 1.8 | |
| Auto Manufacturers | | | 1.7 | |
| Semiconductors | | | 1.6 | |
| Iron/Steel | | | 1.4 | |
| Lodging | | | 1.4 | |
| Engineering & Construction | | | 1.2 | |
| | | | |
Industry Breakdown
(% of the Fund’s Net Assets)
as of October 31, 2016 (continued) | |
| Aerospace/Defense | | | 1.2 | |
| Cosmetics/Personal Care | | | 1.1 | |
| Miscellaneous Manufacturing | | | 0.9 | |
| Electrical Components & Equipment | | | 0.9 | |
| Airlines | | | 0.8 | |
| Banks | | | 0.8 | |
| Leisure Time | | | 0.8 | |
| Distribution/Wholesale | | | 0.7 | |
| Advertising | | | 0.6 | |
| Holding Companies-Diversified | | | 0.6 | |
| Healthcare-Products | | | 0.6 | |
| Electronics | | | 0.6 | |
| Food Service | | | 0.5 | |
| Household Products/Wares | | | 0.5 | |
| Oil & Gas Services | | | 0.5 | |
| Beverages | | | 0.5 | |
| Office/Business Equipment | | | 0.5 | |
| Machinery-Construction & Mining | | | 0.4 | |
| Environmental Control | | | 0.4 | |
| Housewares | | | 0.3 | |
| Home Furnishings | | | 0.3 | |
| Apparel | | | 0.3 | |
| Machinery-Diversified | | | 0.2 | |
| Software | | | 0.2 | |
| Real Estate | | | 0.2 | |
| Money Market Fund Plus Other Assets Less Liabilities | | | 1.4 | |
| | | | |
Credit Quality Rating Breakdown*
(% of the Fund’s Net Assets)
as of October 31, 2016 | |
| BBB+ | | | 0.3 | |
| BBB | | | 4.8 | |
| BBB- | | | 11.9 | |
| BB+ | | | 21.0 | |
| BB | | | 17.6 | |
| BB- | | | 17.2 | |
| B+ | | | 14.1 | |
| B | | | 8.9 | |
| B- | | | 2.8 | |
| Money Market Fund Plus Other Assets Less Liabilities | | | 1.4 | |
| * | Source: Standard & Poor’s. A credit rating is an assessment provided by a nationally recognized statistical rating organization (NRSRO) of the creditworthiness of an issuer with respect to debt obligations, including specific securities, money market instruments or other debts. Ratings are measured on a scale that generally ranges from AAA (highest) to C (lowest); ratings are subject to change without notice. For more information on Standard & Poor’s rating methodology, please visit standardandpoors.com and select “Understanding Ratings” under Ratings Resources on the homepage. |
| | | | |
Top Ten Fund Holdings*
(% of the Fund’s Net Assets)
as of October 31, 2016 | |
| Security | | | | |
| Ally Financial, Inc., 8.000%, 03/15/2020 | | | 1.2 | |
| Micron Technology, Inc., 5.500%, 02/01/2025 | | | 0.9 | |
| Freeport-McMoRan, Inc., 3.550%, 03/01/2022 | | | 0.9 | |
| General Motors Financial Co., Inc., 3.200%, 07/06/2021 | | | 0.9 | |
| Murphy Oil Corp., 4.700%, 12/01/2022 | | | 0.9 | |
| General Motors Co., 4.875%, 10/02/2023 | | | 0.9 | |
| Yum! Brands, Inc., 3.750%, 11/01/2021 | | | 0.8 | |
| Western Digital Corp., 10.500%, 04/01/2024 | | | 0.8 | |
| American Airlines Group, Inc., 6.125%, 06/01/2018 | | | 0.8 | |
| Gap, Inc. (The), 5.950%, 04/12/2021 | | | 0.8 | |
| Total | | | 8.9 | |
| * | Excluding money market fund holdings. |
PowerShares Fundamental High Yield® Corporate Bond Portfolio (PHB) (continued)
Growth of a $10,000 Investment Since Inception†
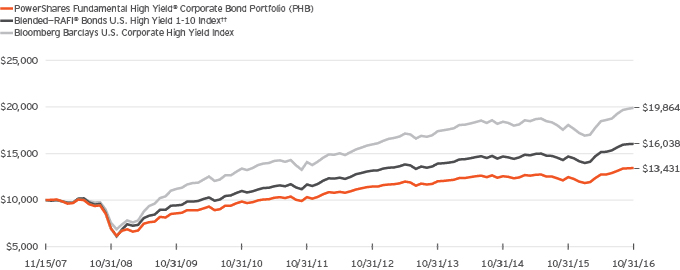
Fund Performance History as of October 31, 2016
| | | | | | | | | | | | | | | | | | | | | | | | | | | | | | | | |
| | | 1 Year | | | 3 Years
Average
Annualized | | | 3 Years
Cumulative | | | 5 Years
Average
Annualized | | | 5 Years
Cumulative | | | | | | Fund Inception† | |
| Index | | | | | | | | | | Average
Annualized | | | Cumulative | |
| Blended—RAFI® Bonds U.S. High Yield 1-10 Index†† | | | 9.30 | % | | | 4.87 | % | | | 15.33 | % | | | 6.56 | % | | | 37.42 | % | | | | | | | 5.41 | % | | | 60.38 | % |
| Bloomberg Barclays U.S. Corporate High Yield Index | | | 10.14 | | | | 4.55 | | | | 14.29 | | | | 7.17 | | | | 41.36 | | | | | | | | 7.96 | | | | 98.64 | |
| Fund | | | | | | | | | | | | | | | | | | | | | | | | | | | | | | | | |
| NAV Return | | | 7.90 | | | | 3.79 | | | | 11.80 | | | | 5.45 | | | | 30.39 | | | | | | | | 3.35 | | | | 34.31 | |
| Market Price Return | | | 7.56 | | | | 3.59 | | | | 11.15 | | | | 5.36 | | | | 29.85 | | | | | | | | 3.02 | | | | 30.60 | |
Fund Inception: November 15, 2007
Performance quoted above represents past performance. Past performance is not a guarantee of future results and current performance may be higher or lower than performance quoted. Investment returns and principal value will fluctuate, and shares of the Fund (“Fund Shares”), when redeemed or sold, may be worth more or less than their original cost. Fund performance reflects any applicable fee waivers and/or expense reimbursements. Had the adviser not waived fees and/or reimbursed expenses currently or in the past, returns would have been lower. See current prospectus for more information. According to the Fund’s current prospectus, the Fund’s expense ratio of 0.50% is expressed as a unitary management fee to cover operating expenses and expenses incurred in connection with managing the portfolio. NAV and Market Price returns assume that dividends and capital gain distributions have been reinvested in the Fund at NAV and Market Price, respectively. The returns shown in the table above do not reflect the deduction of taxes that a shareholder would pay on Fund distributions or the redemption or sale of Fund Shares. See invescopowershares.com to find the most recent month-end performance numbers.
Blended-Index and Benchmark Index performance results are based upon a hypothetical investment in their respective constituent securities. Blended-Index and Benchmark Index returns do not represent Fund returns. An investor cannot invest directly in an index. The Blended-Index and Benchmark Index do not charge management fees or brokerage expenses, and no such fees or expenses were deducted from the hypothetical performance shown. In addition, the results actual investors might have achieved would have differed from those shown because of differences in the timing, amounts of their investments, and fees and expenses associated with an investment in the Fund.
| † | Fund, Blended-Index and Benchmark Index returns are based on the inception date of the Fund. |
| †† | The Blended—RAFI® Bonds U.S. High Yield 1-10 Index is comprised of performance of the original underlying index from Fund inception through the conversion date, August 2, 2010, followed by the performance of the Index starting at the conversion date and through October 31, 2016. |
| | |
| PFIG | | Manager’s Analysis |
| | PowerShares Fundamental Investment Grade Corporate Bond Portfolio (PFIG) |
As an index fund, the PowerShares Fundamental Investment Grade Corporate Bond Portfolio (the “Fund”) is passively managed and attempts to track the returns of an underlying index. The Fund seeks investment results that generally correspond (before fees and expenses) to the price and yield of the RAFI® Bonds US Investment Grade 1-10 Index (the “Index”). The Fund generally will invest at least 80% of its total assets in component securities that comprise the Index.
The Index is comprised of U.S. dollar-denominated bonds that are registered with the U.S. Securities and Exchange Commission or that are Rule 144A securities that provide for registration rights (issued after July 31, 2013) and whose issuers are public companies listed on a major U.S. stock exchange. Only investible, non-convertible, non-exchangeable, non-zero, fixed coupon investment grade corporate bonds qualify for inclusion in the Index. Bonds of foreign agencies, governments or supra-nationals, as well as those issuers that are not domiciled in the United States are excluded from the Index. Ryan ALM, Inc. compiles and calculates the Index, which measures potential returns based on a methodology approach developed by Research Affiliates, LLC, the Index Provider, utilizing fundamental measures. The Fund does not purchase all of the securities in the Index; instead, the Fund utilizes a “sampling” methodology to seek to achieve its investment objective.
For the fiscal year ended October 31, 2016, on a market price basis, the Fund returned 5.03%. On a net asset value (“NAV”) basis, the Fund returned 5.08%. During the same time period, the Index returned 5.14%. During the fiscal year, the Fund employed a “sampling” methodology to attempt to track the Index, rather than a full replication methodology. The Fund’s performance differed from the return of the Index primarily due to fees that the Fund incurred during the period partially offset by a positive impact as a result of the sampling methodology employed by the Fund.
During this same time period, the Bloomberg Barclays U.S. Corporate Index (the “Benchmark Index”) returned 7.23%. The Benchmark Index is an unmanaged index weighted by market capitalization and based on the average performance of approximately 5,630 securities. The Benchmark Index was selected for its recognition in the marketplace, and its performance comparison is a useful measure for investors as a broad representation of the broad-based U.S. corporate bond market.
Relative to the Benchmark Index, the majority of the Fund’s underperformance during the period can be attributed to the Fund’s lower duration and pricing differences between the Benchmark Index and the Fund.
For the fiscal year ended October 31, 2016, the banking industry contributed most significantly to the Fund’s return, followed by the
energy and technology industries. The communications industry detracted most significantly from the Fund’s return, followed by the insurance and capital goods industries.
Positions that contributed most significantly to the Fund’s return included Halliburton Co., 6.15% coupon, due 9/15/2019, an energy company (no longer held at fiscal year-end), and Dow Chemical Co. (The), 4.25% coupon, due 11/15/2020, a basic industry company (no longer held at fiscal year-end). Positions that detracted most significantly from the Fund’s return included Joy Global Inc., 5.125% coupon, due 10/15/2021, a capital goods company (no longer held at fiscal year-end), and Exxon Mobil Corp., 3.043% coupon, due 03/01/2026, an energy company (portfolio average weight of 0.46%).
PowerShares Fundamental Investment Grade Corporate Bond Portfolio (PFIG) (continued)
| | | | |
Industry Breakdown
(% of the Fund’s Net Assets)
as of October 31, 2016 | |
| Banks | | | 10.7 | |
| Retail | | | 6.7 | |
| Insurance | | | 6.1 | |
| Pharmaceuticals | | | 5.6 | |
| Oil & Gas | | | 5.3 | |
| Electric | | | 4.7 | |
| REITs | | | 3.7 | |
| Diversified Financial Services | | | 3.5 | |
| Chemicals | | | 2.8 | |
| Aerospace/Defense | | | 2.8 | |
| Miscellaneous Manufacturing | | | 2.8 | |
| Telecommunications | | | 2.8 | |
| Food | | | 2.7 | |
| Computers | | | 2.6 | |
| Media | | | 2.5 | |
| Semiconductors | | | 2.3 | |
| Agriculture | | | 2.2 | |
| Software | | | 2.2 | |
| Healthcare-Products | | | 2.0 | |
| Healthcare-Services | | | 2.0 | |
| Oil & Gas Services | | | 1.6 | |
| Beverages | | | 1.6 | |
| Pipelines | | | 1.5 | |
| Transportation | | | 1.5 | |
| Auto Manufacturers | | | 1.4 | |
| Internet | | | 1.4 | |
| Commercial Services | | | 1.1 | |
| Biotechnology | | | 1.0 | |
| Electronics | | | 1.0 | |
| | | | |
Industry Breakdown
(% of the Fund’s Net Assets)
as of October 31, 2016 (continued) | |
| Cosmetics/Personal Care | | | 1.0 | |
| Machinery-Diversified | | | 0.9 | |
| Gas | | | 0.8 | |
| Apparel | | | 0.6 | |
| Environmental Control | | | 0.6 | |
| Machinery-Construction & Mining | | | 0.5 | |
| Mining | | | 0.5 | |
| Advertising | | | 0.5 | |
| Housewares | | | 0.4 | |
| Real Estate | | | 0.4 | |
| Auto Parts & Equipment | | | 0.4 | |
| Iron/Steel | | | 0.4 | |
| Office/Business Equipment | | | 0.4 | |
| Household Products/Wares | | | 0.4 | |
| Airlines | | | 0.3 | |
| Forest Products & Paper | | | 0.3 | |
| Engineering & Construction | | | 0.3 | |
| Electrical Components & Equipment | | | 0.2 | |
| Leisure Time | | | 0.2 | |
| Water | | | 0.2 | |
| Textiles | | | 0.2 | |
| Hand/Machine Tools | | | 0.2 | |
| Savings & Loans | | | 0.2 | |
| Lodging | | | 0.2 | |
| Toys/Games/Hobbies | | | 0.2 | |
| Distribution/Wholesale | | | 0.2 | |
| Money Market Fund Plus Other Assets Less Liabilities | | | 1.4 | |
PowerShares Fundamental Investment Grade Corporate Bond Portfolio (PFIG) (continued)
| | | | |
Credit Quality Rating Breakdown*
(% of the Fund’s Net Assets)
as of October 31, 2016 | |
| AAA | | | 1.1 | |
| AA+ | | | 2.0 | |
| AA | | | 3.6 | |
| AA- | | | 6.9 | |
| A+ | | | 5.3 | |
| A | | | 15.3 | |
| A- | | | 14.3 | |
| BBB+ | | | 21.3 | |
| BBB | | | 17.8 | |
| BBB- | | | 9.4 | |
| BB+ | | | 0.9 | |
| BB- | | | 0.7 | |
| Money Market Fund Plus Other Assets Less Liabilities | | | 1.4 | |
| * | Source: Standard & Poor’s. A credit rating is an assessment provided by a nationally recognized statistical rating organization (NRSRO) of the creditworthiness of an issuer with respect to debt obligations, including specific securities, money market instruments or other debts. Ratings are measured on a scale that generally ranges from AAA (highest) to C (lowest); ratings are subject to change without notice. For more information on Standard & Poor’s rating methodology, please visit standardandpoors.com and select “Understanding Ratings” under Ratings Resources on the homepage. |
| | | | |
Top Ten Fund Holdings*
(% of the Fund’s Net Assets)
as of October 31, 2016 | |
| Security | | | | |
| General Electric Co., 5.250%, 12/06/2017 | | | 0.7 | |
| Exxon Mobil Corp., 3.043%, 03/01/2026 | | | 0.7 | |
| Home Depot, Inc. (The), 2.625%, 06/01/2022 | | | 0.7 | |
| Wells Fargo & Co., 3.000%, 04/22/2026 | | | 0.6 | |
| Wal-Mart Stores, Inc., 3.250%, 10/25/2020 | | | 0.6 | |
| Verizon Communications, Inc., 5.150%, 09/15/2023 | | | 0.6 | |
| JPMorgan Chase & Co., 6.000%, 01/15/2018 | | | 0.6 | |
| Hartford Financial Services Group, Inc. (The), 5.500%, 03/30/2020 | | | 0.6 | |
| JPMorgan Chase & Co., 4.500%, 01/24/2022 | | | 0.6 | |
| L-3 Communications Corp., 5.200%, 10/15/2019 | | | 0.5 | |
| Total | | | 6.2 | |
| * | Excluding money market fund holdings. |
PowerShares Fundamental Investment Grade Corporate Bond Portfolio (PFIG) (continued)
Growth of a $10,000 Investment Since Inception†
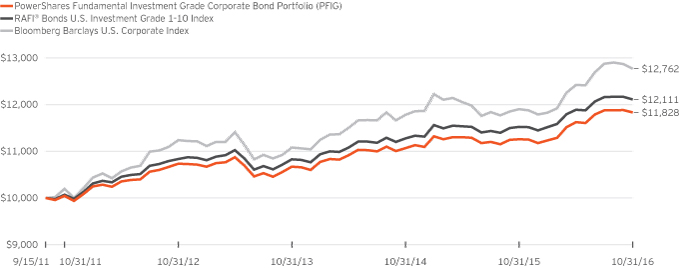
Fund Performance History as of October 31, 2016
| | | | | | | | | | | | | | | | | | | | | | | | | | | | | | | | |
| | | 1 Year | | | 3 Years
Average
Annualized | | | 3 Years
Cumulative | | | 5 Years
Average
Annualized | | | 5 Years
Cumulative | | | | | | Fund Inception† | |
| Index | | | | | | | | | | Average
Annualized | | | Cumulative | |
| RAFI® Bonds U.S. Investment Grade 1-10 Index | | | 5.14 | % | | | 3.80 | % | | | 11.85 | % | | | 3.76 | % | | | 20.26 | % | | | | | | | 3.81 | % | | | 21.11 | % |
| Bloomberg Barclays U.S. Corporate Index | | | 7.23 | | | | 4.82 | | | | 15.18 | | | | 4.59 | | | | 25.17 | | | | | | | | 4.87 | | | | 27.62 | |
| Fund | | | | | | | | | | | | | | | | | | | | | | | | | | | | | | | | |
| NAV Return | | | 5.08 | | | | 3.50 | | | | 10.86 | | | | 3.33 | | | | 17.78 | | | | | | | | 3.33 | | | | 18.28 | |
| Market Price Return | | | 5.03 | | | | 3.54 | | | | 11.01 | | | | 2.96 | | | | 15.72 | | | | | | | | 3.38 | | | | 18.55 | |
Fund Inception: September 15, 2011
Performance quoted above represents past performance. Past performance is not a guarantee of future results and current performance may be higher or lower than performance quoted. Investment returns and principal value will fluctuate, and shares of the Fund (“Fund Shares”), when redeemed or sold, may be worth more or less than their original cost. Fund performance reflects any applicable fee waivers and/or expense reimbursements. Had the adviser not waived fees and/or reimbursed expenses currently or in the past, returns would have been lower. See current prospectus for more information. According to the Fund’s current prospectus, the Fund’s expense ratio of 0.22% is expressed as a unitary management fee to cover operating expenses and expenses incurred in connection with managing the portfolio. NAV and Market Price returns assume that dividends and capital gain distributions have been reinvested in the Fund at NAV and Market Price, respectively. The returns shown in the table above do not
reflect the deduction of taxes that a shareholder would pay on Fund distributions or the redemption or sale of Fund Shares. See invescopowershares.com to find the most recent month-end performance numbers.
Index and Benchmark Index performance results are based upon a hypothetical investment in their respective constituent securities. Index Benchmark Index returns do not represent Fund returns. An investor cannot invest directly in an index. The Index and Benchmark Index do not charge management fees or brokerage expenses, and no such fees or expenses were deducted from the hypothetical performance shown. In addition, the results actual investors might have achieved would have differed from those shown because of differences in the timing, amounts of their investments, and fees and expenses associated with an investment in the Fund.
| † | Fund, Index and Benchmark Index returns are based on the inception date of the Fund. |
| | |
| PGHY | | Manager’s Analysis |
| | PowerShares Global Short Term High Yield Bond Portfolio (PGHY) |
As an index fund, the PowerShares Global Short Term High Yield Bond Portfolio (the “Fund”) is passively managed and attempts to track the returns of an underlying index. The Fund seeks investment results that generally correspond (before fees and expenses) to the price and yield of the DB Global Short Maturity High Yield Bond Index (the “Index”). The Fund generally invests at least 80% of its total assets in U.S. and foreign short-term, non- investment grade bonds included in the Index, all of which are denominated in U.S. dollars.
Strictly in accordance with its guidelines and mandated procedures, Deutsche Bank Securities Inc. (“DB” or the “Index Provider”) selects such bonds issued by corporations, as well as sovereign, sub-sovereign or quasi-government entities, from a universe of eligible securities for inclusion in the Index that (i) are denominated in U.S. dollars; (ii) are rated below “investment grade” (i.e., have a “composite rating” from DB of no greater than “BB+,” but no less than “C”); (iii) have three years or less to maturity; and (iv) have a fixed coupon.
Eligible bonds must be rated by at least one of Standard & Poor’s Ratings Group, a division of The McGraw-Hill Companies, Inc., Moody’s Investors Service, Inc., or Fitch Ratings Inc. DB converts all available ratings for each bond into a numerical score, and then calculates an average score for each bond from those available ratings that corresponds to DB’s “composite rating” system. Eligible bonds include either “short-term” bonds (i.e., bonds that have three years or less until maturity from the date they were issued) or “long-term seasoned” bonds (i.e., bonds that had a maturity longer than three years at the date they were issued, but currently have three years or less until maturity). To be eligible for inclusion in the Index, a “short-term” bond (excluding Eurodollar bonds) must have a minimum amount outstanding of at least $100 million, and a “long-term seasoned” bond (excluding Eurodollar bonds) must have a minimum amount outstanding of at least $250 million. Short-term Eurodollar bonds must have more than $200 million outstanding and long-term seasoned Eurodollar bonds must have more than $350 million outstanding. Effective with the close of markets on November 30, 2016, the Index Provider modified the eligibility requirements noted in this paragraph such that all bonds must now have a minimum amount outstanding of at least $250 million to be eligible for inclusion in the Index. The Fund does not purchase all of the securities in the Index; instead, the Fund utilizes a “sampling” methodology to seek to achieve its investment objective.
For the fiscal year ended October 31, 2016, on a market price basis, the Fund returned 10.17%. On a net asset value (“NAV”) basis, the Fund returned 9.23%. During the same time period, the Index returned 14.42%. Due to the relative lower liquidity of certain bonds in the Index, the Fund’s sampling methodology resulted in the Fund being underweight less liquid CCC rated bonds which outperformed the broad Index and overweight more liquid CCC rated bonds which underperformed the broad Index.
During this same time period, The BofA Merrill Lynch 0-5 Year US High Yield Constrained Index (the “Benchmark Index”) returned 9.27%. The Benchmark Index is an unmanaged index weighted by market capitalization and based on the average performance of approximately 880 securities. The Benchmark Index was selected for its recognition in the marketplace, and its performance comparison is a useful measure for investors as a broad representation of the U.S. Dollar-denominated short-term high yield corporate bond market.
The majority of the Fund’s underperformance (on a NAV basis) relative to the Benchmark Index during the period can be attributed to fees and operating expense incurred by the Fund during the period partially offset by performance differences as a result of varying country weights between the Fund and the Benchmark.
Positions that contributed most significantly to the Fund’s return included Energy XXI Gulf Coast, Inc., 9.25% coupon, due 12/15/2017, an energy company (portfolio average weight of 0.34%), and Thompson Creek Metals Co. Inc., 7.375% coupon, due 6/1/2018, a basic industry company (no longer held at fiscal year-end). Positions that detracted most significantly from the Fund’s return included Aspect Software Inc., 10.625% coupon, due 5/15/2017, a technology company (no longer held at fiscal year-end), and Chesapeake Energy Corp., 6.50% coupon, due 8/15/2017, an energy company (no longer held at fiscal year-end).
PowerShares Global Short Term High Yield Bond Portfolio (PGHY) (continued)
| | | | |
Industry Breakdown
(% of the Fund’s Net Assets)
as of October 31, 2016 | |
| Banks | | | 13.1 | |
| Oil & Gas | | | 9.6 | |
| Sovereign | | | 9.1 | |
| Diversified Financial Services | | | 6.9 | |
| Telecommunications | | | 6.3 | |
| Mining | | | 3.2 | |
| Chemicals | | | 3.1 | |
| Real Estate | | | 2.7 | |
| Home Builders | | | 2.7 | |
| Electric | | | 2.5 | |
| Healthcare-Services | | | 2.5 | |
| Pipelines | | | 2.5 | |
| Oil & Gas Services | | | 2.4 | |
| Transportation | | | 2.1 | |
| Commercial Services | | | 1.8 | |
| Media | | | 1.8 | |
| Iron/Steel | | | 1.7 | |
| Engineering & Construction | | | 1.7 | |
| Food | | | 1.3 | |
| Machinery-Diversified | | | 1.3 | |
| Retail | | | 1.2 | |
| Packaging & Containers | | | 1.2 | |
| Aerospace/Defense | | | 1.2 | |
| Healthcare-Products | | | 1.2 | |
| Miscellaneous Manufacturing | | | 1.0 | |
| Coal | | | 1.0 | |
| REITs | | | 0.9 | |
| | | | |
Industry Breakdown
(% of the Fund’s Net Assets)
as of October 31, 2016 (continued) | |
| Building Materials | | | 0.9 | |
| Auto Manufacturers | | | 0.7 | |
| Lodging | | | 0.7 | |
| Environmental Control | | | 0.6 | |
| Forest Products & Paper | | | 0.6 | |
| Machinery-Construction & Mining | | | 0.5 | |
| Auto Parts & Equipment | | | 0.5 | |
| Private Equity | | | 0.4 | |
| Electrical Components & Equipment | | | 0.4 | |
| Airlines | | | 0.4 | |
| Multi-National | | | 0.3 | |
| Semiconductors | | | 0.3 | |
| Investment Companies | | | 0.3 | |
| Insurance | | | 0.3 | |
| Storage/Warehousing | | | 0.3 | |
| Entertainment | | | 0.2 | |
| Computers | | | 0.2 | |
| Pharmaceuticals | | | 0.2 | |
| Internet | | | 0.2 | |
| Electronics | | | 0.2 | |
| Advertising | | | 0.2 | |
| Beverages | | | 0.2 | |
| Software | | | 0.1 | |
| Leisure Time | | | 0.1 | |
| Agriculture | | | 0.0 | |
| Money Market Fund Plus Other Assets Less Liabilities | | | 5.2 | |
| | | | |
Top Ten Fund Holdings*
(% of the Fund’s Net Assets)
as of October 31, 2016 | |
| Security | | | | |
| Trillion Chance Ltd., 8.500%, 01/10/2019 | | | 0.8 | |
| Ardagh Packaging Finance PLC/Ardagh Holdings USA, Inc., 6.250%, 01/31/2019 | | | 0.7 | |
| Mallinckrodt International Finance SA, 3.500%, 04/15/2018 | | | 0.7 | |
| Petroleos de Venezuela SA, 5.250%, 04/12/2017 | | | 0.7 | |
| Navios Maritime Holdings, Inc./Navios Maritime Finance II US, Inc., 8.125%, 02/15/2019 | | | 0.6 | |
| Novelis, Inc., 8.375%, 12/15/2017 | | | 0.6 | |
| VimpelCom Holdings BV, 5.200%, 02/13/2019 | | | 0.6 | |
| Jaguar Land Rover Automotive PLC, 4.125%, 12/15/2018 | | | 0.6 | |
| Phosagro OAO Via Phosagro Bond Funding Dac, 4.204%, 02/13/2018 | | | 0.6 | |
| VTB Bank OJSC Via VTB Capital SA, 6.000%, 04/12/2017 | | | 0.6 | |
| Total | | | 6.5 | |
| * | Excluding money market fund holdings. |
PowerShares Global Short Term High Yield Bond Portfolio (PGHY) (continued)
Growth of a $10,000 Investment Since Inception†
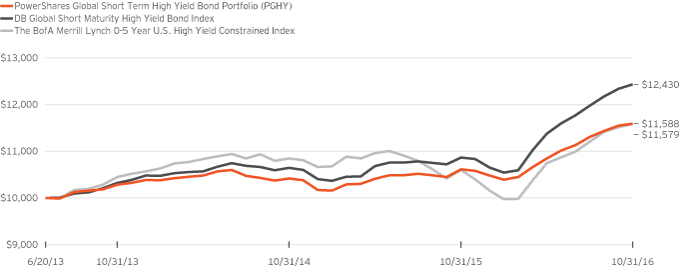
Fund Performance History as of October 31, 2016
| | | | | | | | | | | | | | | | | | | | | | | | |
| | | 1 Year | | | 3 Years
Average
Annualized | | | 3 Years
Cumulative | | | | | | Fund Inception† | |
| Index | | | | | | | | Average
Annualized | | | Cumulative | |
| DB Global Short Maturity High Yield Bond Index | | | 14.42 | % | | | 6.39 | % | | | 20.41 | % | | | | | | | 6.69 | % | | | 24.30 | % |
| The BofA Merrill Lynch 0-5 Year U.S. High Yield Constrained Index | | | 9.27 | | | | 3.49 | | | | 10.85 | | | | | | | | 4.46 | | | | 15.79 | |
| Fund | | | | | | | | | | | | | | | | | | | | | | | | |
| NAV Return | | | 9.23 | | | | 4.06 | | | | 12.69 | | | | | | | | 4.48 | | | | 15.88 | |
| Market Price Return | | | 10.17 | | | | 3.85 | | | | 12.00 | | | | | | | | 4.64 | | | | 16.50 | |
Fund Inception: June 20, 2013
Performance quoted above represents past performance. Past performance is not a guarantee of future results and current performance may be higher or lower than performance quoted. Investment returns and principal value will fluctuate, and shares of the Fund (“Fund Shares”), when redeemed or sold, may be worth more or less than their original cost. Fund performance reflects any applicable fee waivers and/or expense reimbursements. Had the adviser not waived fees and/or reimbursed expenses currently or in the past, returns would have been lower. See current prospectus for more information. According to the Fund’s current prospectus, the Fund’s expense ratio of 0.35% is expressed as a unitary management fee to cover operating expenses and expenses incurred in connection with managing the portfolio. NAV and Market Price returns assume that dividends and capital gain distributions have been reinvested in the Fund at NAV and Market Price, respectively. The returns shown in the table above do not reflect the deduction of taxes that a shareholder would pay on Fund
distributions or the redemption or sale of Fund Shares. See invescopowershares.com to find the most recent month-end performance numbers.
Index and Benchmark Index performance results are based upon a hypothetical investment in their respective constituent securities. Index and Benchmark Index returns do not represent Fund returns. An investor cannot invest directly in an index. The Index and Benchmark Index do not charge management fees or brokerage expenses, and no such fees or expenses were deducted from the hypothetical performance shown. In addition, the results actual investors might have achieved would have differed from those shown because of differences in the timing, amounts of their investments, and fees and expenses associated with an investment in the Fund.
| † | Fund, Index and Benchmark Index returns are based on the inception date of the Fund. |
| | |
| PICB | | Manager’s Analysis |
| | PowerShares International Corporate Bond Portfolio (PICB) |
As an index fund, the PowerShares International Corporate Bond Portfolio (the “Fund”) is passively managed and attempts to track the returns of an underlying index. The Fund seeks investment results that generally correspond (before fees and expenses) to the price and yield of the S&P International Corporate Bond Index® (Net) (the “Index”). The Fund generally will invest at least 80% of its total assets in investment grade corporate bonds that comprise the Index.
The Index measures the performance of investment grade corporate bonds issued in the following currencies of Group of Ten (“G10”) countries, excluding the U.S. Dollar (USD): Australian Dollar (AUD), British Pound (GBP), Canadian Dollar (CAD), Euro (EUR), Japanese Yen (JPY), New Zealand Dollar (NZD), Norwegian Krone (NOK), Swedish Krona (SEK) and Swiss Franc (CHF). S&P Dow Jones Indices LLC, the Index Provider, constructs the Index from investment grade corporate bonds denominated in the currencies noted above. The Fund does not purchase all of the securities in the Index; instead, the Fund utilizes a “sampling” methodology to seek to achieve its investment objective.
For the fiscal year ended October 31, 2016, on a market price basis, the Fund returned (1.26)%. On a net asset value (“NAV”) basis, the Fund returned (1.22)%. During the same time period, the Index returned (1.07)%. The Fund’s performance differed from the return of the Index primarily due to fees and operating expenses incurred by the Fund during the period partially offset by favorable allocations as a result of the Fund’s sampling methodology to the consumer cyclical and energy sectors.
During this same time period, the Bloomberg Barclays Pan-European Aggregate Index (the “Benchmark Index”) returned (0.13)%. The Benchmark Index is an unmanaged index weighted by market capitalization based on the average performance of approximately 2,710 securities. The adviser provided this additional comparative benchmark to help investors better understand how the investment results of the Fund compare to the performance of a broader non-U.S. dollar corporate bond benchmark. The majority of the Fund’s underperformance relative to the Benchmark Index during the period can be attributed to fees and operating expenses incurred by the Fund during the period as well as due to a different currency composition relative to the Benchmark index.
Positions that contributed most significantly to the Fund’s return included Electricite de France SA, 5.50% coupon, due 3/27/2037 (portfolio average weight of 0.70%), and GlaxoSmithKline Capital PLC, 6.375% coupon, due 3/9/2039 (portfolio average weight of 0.60%). Positions that detracted most significantly from the Fund’s return included Engie SA, 5.00% coupon, due 10/1/2060 (portfolio average weight of 0.35%), and BHP Billiton Finance Ltd., Series 12, 4.30% coupon, due 9/25/2042 (portfolio average weight of 0.05%).
| | | | |
Industry Breakdown
(% of the Fund’s Net Assets)
as of October 31, 2016 | |
| Banks | | | 43.7 | |
| Electric | | | 14.4 | |
| Telecommunications | | | 9.2 | |
| Oil & Gas | | | 6.2 | |
| Pharmaceuticals | | | 2.6 | |
| Beverages | | | 2.6 | |
| Auto Manufacturers | | | 2.3 | |
| Insurance | | | 2.1 | |
| Mining | | | 1.8 | |
| Water | | | 1.7 | |
| Commercial Services | | | 1.5 | |
| Agriculture | | | 1.4 | |
| Media | | | 1.1 | |
| Engineering & Construction | | | 1.0 | |
| Gas | | | 0.9 | |
| Savings & Loans | | | 0.9 | |
| Diversified Financial Services | | | 0.8 | |
| Sovereign | | | 0.6 | |
| Real Estate | | | 0.6 | |
| Home Furnishings | | | 0.6 | |
| Holding Companies-Diversified | | | 0.6 | |
| Miscellaneous Manufacturing | | | 0.5 | |
| Chemicals | | | 0.4 | |
| Computers | | | 0.3 | |
| Building Materials | | | 0.3 | |
| Healthcare-Services | | | 0.2 | |
| Food | | | 0.2 | |
| Transportation | | | 0.1 | |
| Semiconductors | | | 0.1 | |
| Money Market Fund Plus Other Assets Less Liabilities | | | 1.3 | |
PowerShares International Corporate Bond Portfolio (PICB) (continued)
| | | | |
Top Ten Fund Holdings*
(% of the Fund’s Net Assets)
as of October 31, 2016 | |
| Security | | | | |
| Electricite de France SA, EMTN, 5.500%, 10/17/2041 | | | 1.2 | |
| Lloyds Bank PLC, EMTN, 7.625%, 04/22/2025 | | | 1.0 | |
| Orange SA, EMTN, 5.625%, 01/23/2034 | | | 0.9 | |
| Anheuser-Busch InBev SA, EMTN, 2.000%, 03/17/2028 | | | 0.8 | |
| HSBC Holdings PLC, 2.625%, 08/16/2028 | | | 0.7 | |
| Cooperatieve Rabobank UA, GMTN, 1.375%, 02/03/2027 | | | 0.7 | |
| Barclays, EMTN, 6.000%, 01/14/2021 | | | 0.7 | |
| Electricite de France SA, EMTN, 5.500%, 03/27/2037 | | | 0.7 | |
| Cooperatieve Rabobank UA, EMTN, 5.250%, 09/14/2027 | | | 0.7 | |
| Electricite de France SA, EMTN, 5.125%, 09/22/2050 | | | 0.7 | |
| Total | | | 8.1 | |
| * | Excluding money market fund holdings. |
Growth of a $10,000 Investment Since Inception†
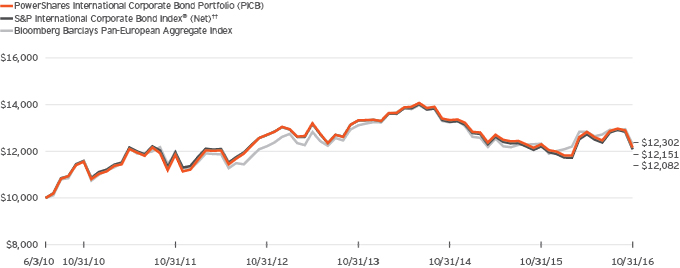
Fund Performance History as of October 31, 2016
| | | | | | | | | | | | | | | | | | | | | | | | | | | | | | | | |
| | | 1 Year | | | 3 Years
Average
Annualized | | | 3 Years
Cumulative | | | 5 Years
Average
Annualized | | | 5 Years
Cumulative | | | | | | Fund Inception† | |
| Index | | | | | | | | | | Average
Annualized | | | Cumulative | |
| S&P International Corporate Bond Index® (Net)†† | | | (1.07 | )% | | | (3.16 | )% | | | (9.18 | )% | | | 0.21 | % | | | 1.06 | % | | | | | | | 3.00 | % | | | 20.82 | % |
| Bloomberg Barclays Pan-European Aggregate Index | | | (0.13 | ) | | | (2.09 | ) | | | (6.14 | ) | | | 0.73 | | | | 3.70 | | | | | | | | 3.29 | | | | 23.02 | |
| Fund | | | | | | | | | | | | | | | | | | | | | | | | | | | | | | | | |
| NAV Return | | | (1.22 | ) | | | (3.01 | ) | | | (8.76 | ) | | | 0.53 | | | | 2.67 | | | | | | | | 3.09 | | | | 21.51 | |
| Market Price Return | | | (1.26 | ) | | | (3.16 | ) | | | (9.17 | ) | | | 0.65 | | | | 3.29 | | | | | | | | 2.92 | | | | 20.30 | |
PowerShares International Corporate Bond Portfolio (PICB) (continued)
Fund Inception: June 3, 2010
Performance quoted above represents past performance. Past performance is not a guarantee of future results and current performance may be higher or lower than performance quoted. Investment returns and principal value will fluctuate, and shares of the Fund (“Fund Shares”), when redeemed or sold, may be worth more or less than their original cost. Fund performance reflects any applicable fee waivers and/or expense reimbursements. Had the adviser not waived fees and/or reimbursed expenses currently or in the past, returns would have been lower. See current prospectus for more information. According to the Fund’s current prospectus, the Fund’s expense ratio of 0.50% is expressed as a unitary management fee to cover operating expenses and expenses incurred in connection with managing the portfolio. NAV and Market Price returns assume that dividends and capital gain distributions have been reinvested in the Fund at NAV and Market Price, respectively. The returns shown in the table above do not
reflect the deduction of taxes that a shareholder would pay on Fund distributions or the redemption or sale of Fund Shares. See invescopowershares.com to find the most recent month-end performance numbers.
Index performance results are based upon a hypothetical investment in their respective constituent securities. Index returns do not represent Fund returns. An investor cannot invest directly in an index. The Index does not charge management fees or brokerage expenses, and no such fees or expenses were deducted from the hypothetical performance shown. In addition, the results actual investors might have achieved would have differed from those shown because of differences in the timing, amounts of their investments, and fees and expenses associated with an investment in the Fund.
| † | Fund and Index returns are based on the inception date of the Fund. |
| †† | Reflects reinvested dividends net of withholding taxes. |
| | |
| LDRI | | Manager’s Analysis |
| | PowerShares LadderRite 0-5 Year Corporate Bond Portfolio (LDRI) |
As an index fund, the PowerShares LadderRite 0-5 Year Corporate Bond Portfolio (the “Fund”) is passively managed and attempts to track the returns of an underlying index. The Fund seeks investment results that generally correspond (before fees and expenses) to the price and yield of the NASDAQ LadderRite® 0-5 Year USD Corporate Bond Index (the “Index”). The Fund generally will invest at least 80% of its total assets in U.S. and foreign investment grade corporate bonds that comprise the Index. The Index measures potential returns of a theoretical portfolio of fixed income securities with a yield curve based upon remaining effective terms to maturity of five years or less.
Nasdaq, Inc. (the “Index Provider”) includes in the Index a portfolio of bonds with short- to intermediate-term maturities, meaning that it divides the components of the Index into five equally weighted groups of bonds with staggered terms to maturity in an annual, sequential (“laddered”) structure from zero to five years. Strictly in accordance with its guidelines and mandated procedures, the Index Provider selects such bonds issued by companies domiciled in the U.S. and other developed countries for inclusion in the Index that: (i) are denominated in U.S. dollars; (ii) pay fixed amounts of taxable interest; (iii) are rated as “investment grade” by at least one of Standard & Poor’s Ratings Group, a division of The McGraw-Hill Companies, Inc. (“S&P”), Moody’s Investors Service, Inc. (“Moody’s”) or Fitch Ratings Inc. (“Fitch”) (i.e., have a grade of BBB- or higher from Fitch or S&P or of Baa3 or higher from Moody’s); (iv) have an outstanding face value of at least $500 million; and (v) have five years or less to maturity. Bonds must have an initial term to maturity of at least one year to be eligible for inclusion in the Index. The Fund does not purchase all of the securities in the Index; instead, the Fund utilizes a “sampling” methodology to seek to achieve its investment objective.
For the fiscal year ended October 31, 2016, on a market price basis, the Fund returned 1.84%. On a net asset value (“NAV”) basis, the Fund returned 1.84%. During the same time period, the Index returned 2.73%. The Fund employed a “sampling” methodology to attempt to track the Index, rather than a full replication methodology; therefore, the Fund’s performance, on a NAV basis, differed from the return of the Index primarily due to this sampling as well as the fees the Fund incurred during the period.
During this same time period, The BofA Merrill Lynch 0-5 US Corporate Index (the “Benchmark Index”) returned 3.04%. The Benchmark Index is an unmanaged index weighted by capitalization and based on current amount outstanding times the market price plus accrued interest based on the average performance of approximately 3,440 securities.
The Benchmark Index was selected for its recognition in the marketplace, and its performance comparison is a useful measure for investors as a broad representation of the short-term
investment grade U.S. corporate bond market. The majority of the Fund’s underperformance relative to the Benchmark Index during the period can be attributed to the Fund’s relative overweight in the banking industry and relative underweight in the oil field equipment & services industry.
Positions that contributed most significantly to the Fund’s return included Freeport-McMoRan Oil & Gas LLC/FCX Oil & Gas, Inc., a basic industry company (portfolio average weight of 0.40%), and Enbridge Energy Partners LP, an energy company (portfolio average weight of 0.52%). Positions that detracted most significantly from the Fund’s return included Weatherford International Ltd., an energy company (no longer held at fiscal year-end), and SESI LLC, an energy company (no longer held at fiscal year-end).
PowerShares LadderRite 0-5 Year Corporate Bond Portfolio (LDRI) (continued)
| | | | |
Industry Breakdown
(% of the Fund’s Net Assets)
as of October 31, 2016 | |
| Banks | | | 31.4 | |
| Oil & Gas | | | 6.0 | |
| Telecommunications | | | 5.2 | |
| Pharmaceuticals | | | 4.6 | |
| Media | | | 4.5 | |
| Diversified Financial Services | | | 4.1 | |
| Auto Manufacturers | | | 3.5 | |
| Retail | | | 3.2 | |
| Beverages | | | 2.8 | |
| Miscellaneous Manufacturing | | | 2.4 | |
| REITs | | | 2.1 | |
| Electric | | | 2.0 | |
| Pipelines | | | 2.0 | |
| Food | | | 2.0 | |
| Insurance | | | 1.9 | |
| Software | | | 1.9 | |
| Healthcare-Products | | | 1.8 | |
| Healthcare-Services | | | 1.8 | |
| Chemicals | | | 1.4 | |
| | | | |
Industry Breakdown
(% of the Fund’s Net Assets)
as of October 31, 2016 (continued) | |
| Computers | | | 1.4 | |
| Agriculture | | | 1.1 | |
| Oil & Gas Services | | | 0.9 | |
| Transportation | | | 0.9 | |
| Biotechnology | | | 0.9 | |
| Mining | | | 0.9 | |
| Machinery-Diversified | | | 0.9 | |
| Internet | | | 0.9 | |
| Semiconductors | | | 0.9 | |
| Metal Fabricate/Hardware | | | 0.7 | |
| Household Products/Wares | | | 0.5 | |
| Electrical Components & Equipment | | | 0.5 | |
| Environmental Control | | | 0.5 | |
| Aerospace/Defense | | | 0.5 | |
| Cosmetics/Personal Care | | | 0.5 | |
| Machinery-Construction & Mining | | | 0.4 | |
| Gas | | | 0.4 | |
| Money Market Fund Plus Other Assets Less Liabilities | | | 2.6 | |
| | | | |
Credit Quality Rating Breakdown*
(% of the Fund’s Net Assets)
as of October 31, 2016 | |
| AAA | | | 1.8 | |
| AA+ | | | 1.1 | |
| AA | | | 1.9 | |
| AA- | | | 10.4 | |
| A+ | | | 9.0 | |
| A | | | 17.2 | |
| A- | | | 13.4 | |
| BBB+ | | | 24.0 | |
| BBB | | | 10.0 | |
| BBB- | | | 7.3 | |
| BB- | | | 0.9 | |
| NR | | | 0.4 | |
| Money Market Fund Plus Other Assets Less Liabilities | | | 2.6 | |
| * | Source: Standard & Poor’s. A credit rating is an assessment provided by a nationally recognized statistical rating organization (NRSRO) of the creditworthiness of an issuer with respect to debt obligations, including specific securities, money market instruments or other debts. Ratings are measured on a scale that generally ranges from AAA (highest) to C (lowest); ratings are subject to change without notice. For more information on Standard & Poor’s rating methodology, please visit standardandpoors.com and select “Understanding Ratings” under Ratings Resources on the homepage. |
| | | | |
Top Ten Fund Holdings*
(% of the Fund’s Net Assets)
as of October 31, 2016 | |
| Security | | | | |
| American Express Bank FSB, Series BKNT, 6.000%, 09/13/2017 | | | 0.9 | |
| Synchrony Financial, 3.000%, 08/15/2019 | | | 0.9 | |
| Lloyds Bank PLC, 2.000%, 08/17/2018 | | | 0.9 | |
| Bank of Montreal, MTN, 1.800%, 07/31/2018 | | | 0.9 | |
| Royal Bank of Canada, GMTN, 1.800%, 07/30/2018 | | | 0.9 | |
| Santander UK PLC, 1.650%, 09/29/2017 | | | 0.9 | |
| Bank of Nova Scotia (The), 1.700%, 06/11/2018 | | | 0.9 | |
| US Bancorp, MTN, 1.650%, 05/15/2017 | | | 0.9 | |
| Bank of Montreal, MTN, 1.450%, 04/09/2018 | | | 0.9 | |
| Bank of Nova Scotia (The), 1.450%, 04/25/2018 | | | 0.9 | |
| Total | | | 9.0 | |
| * | Excluding money market fund holdings. |
PowerShares LadderRite 0-5 Year Corporate Bond Portfolio (LDRI) (continued)
Growth of a $10,000 Investment Since Inception†
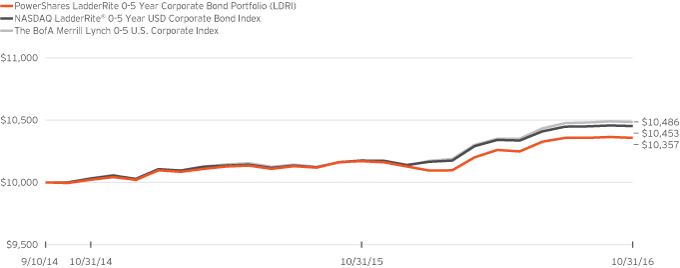
Fund Performance History as of October 31, 2016
| | | | | | | | | | | | | | | | |
| | | 1 Year | | | | | | Fund Inception† | |
| Index | | | | | | Average
Annualized | | | Cumulative | |
| NASDAQ LadderRite® 0-5 Year USD Corporate Bond Index | | | 2.73 | % | | | | | | | 2.10 | % | | | 4.53 | % |
| The BofA Merrill Lynch 0-5 U.S. Corporate Index | | | 3.04 | | | | | | | | 2.24 | | | | 4.86 | |
| Fund | | | | | | | | | | | | | | | | |
| NAV Return | | | 1.84 | | | | | | | | 1.65 | | | | 3.57 | |
| Market Price Return | | | 1.84 | | | | | | | | 1.80 | | | | 3.90 | |
Fund Inception: September 10, 2014
Performance quoted above represents past performance. Past performance is not a guarantee of future results and current performance may be higher or lower than performance quoted. Investment returns and principal value will fluctuate, and shares of the Fund (“Fund Shares”), when redeemed or sold, may be worth more or less than their original cost. Fund performance reflects any applicable fee waivers and/or expense reimbursements. Had the adviser not waived fees and/or reimbursed expenses currently or in the past, returns would have been lower. See current prospectus for more information. According to the Fund’s current prospectus, the Fund’s expense ratio of 0.22% is expressed as a unitary management fee to cover operating expenses and expenses incurred in connection with managing the portfolio. NAV and Market Price returns assume that dividends and capital gain distributions have been reinvested in the Fund at NAV and
Market Price, respectively. See invescopowershares.com to find the most recent month-end performance numbers.
Index and Benchmark Index performance results are based upon a hypothetical investment in their respective constituent securities. Index and Benchmark Index returns do not represent Fund returns. An investor cannot invest directly in an index. The Index and Benchmark Index do not charge management fees or brokerage expenses, and no such fees or expenses were deducted from the hypothetical performance shown. In addition, the results actual investors might have achieved would have differed from those shown because of differences in the timing, amounts of their investments, and fees and expenses associated with an investment in the Fund.
| † | Fund, Index and Benchmark Index returns are based on the inception date of the Fund. |
| | |
| PZA | | Manager’s Analysis |
| | PowerShares National AMT-Free Municipal Bond Portfolio (PZA) |
As an index fund, the PowerShares National AMT-Free Municipal Bond Portfolio (the “Fund”) is passively managed and attempts to track the returns of an underlying index. The Fund seeks investment results that generally correspond (before fees and expenses) to the price and yield of The BofA Merrill Lynch National Long-Term Core Plus Municipal Securities Index (the “Index”). The Fund generally will invest at least 80% of its total assets in municipal securities that comprise the Index and that are also exempt from the federal alternative minimum tax.
Merrill Lynch, Pierce, Fenner & Smith Incorporated is the Index provider for the Index. The Index is composed of U.S. dollar-denominated, investment grade, tax- exempt debt publicly issued by U.S. states and territories, or their political subdivisions, in the U.S. domestic market with a term of at least 15 years remaining to final maturity. The Fund does not purchase all of the securities in the Index; instead, the Fund utilizes a “sampling” methodology to seek to achieve its investment objective.
For the fiscal year ended October 31, 2016, on a market price basis, the Fund returned 5.82%. On a net asset value (“NAV”) basis, the Fund returned 5.71%. During the same time period, the Index returned 5.89%. The Fund’s performance differed from the return of the Index primarily due to fees and operating expenses that the Fund incurred during the period.
During this same time period, the Bloomberg Barclays Municipal Bond 20 Year Index (the “Benchmark Index”) returned 5.39%. The Benchmark Index is an unmanaged index weighted by market capitalization based on the average performance of approximately 5,280 securities. The adviser provided this comparative benchmark to help investors better understand how the investment results of the Fund compare to the performance of a municipal bond benchmark. The Benchmark Index was selected for its recognition in the marketplace, and its performance comparison is a useful measure for investors as a broad representation of insured municipal securities with maturities of 17 to 22 years.
Relative to the Benchmark Index, the Fund was most overweight in the State of New York and most underweight in the State of Texas during the fiscal year ended October 31, 2016. The majority of the Fund’s outperformance relative to the Benchmark Index during the period can be attributed to security selection within the States of California and Texas compared to the Benchmark Index.
For the fiscal year ended October 31, 2016, the U.S. territory of Puerto Rico contributed most significantly to the Fund’s return, followed by the State of Pennsylvania and the State of Illinois. The State of New York detracted most significantly from the Fund’s return, followed by the State of Massachusetts and the State of Texas.
Positions that contributed most significantly to the Fund’s return included Puerto Rico Commonwealth Public Improvement Ref. Ser. 12A, 5.00%, due 7/1/2035 (portfolio average weight of 0.79%), and Pennsylvania State Turnpike Commission Rev. Sub.-Ser. 12B, 5.00%, due 12/1/2042 (portfolio average weight of 0.85%). Positions that detracted most significantly from the Fund’s return included Sales Tax Asset Receivables Corp. Ref. (Fiscal 2015) Ser. 14A, 4.00% coupon, due 10/15/2032 (portfolio average weight of 2.52%), and New York City Municipal Water Finance Auth. Water & Sewer System Rev. (Second General Resolution Fiscal 2014) Ser. 14CC-1, 5.00% coupon, due 6/15/2047 (portfolio average weight of 1.10%).
| | | | |
State and Territory Breakdown
(% of the Fund’s Net Assets)
as of October 31, 2016 | |
| California | | | 17.5 | |
| Florida | | | 5.3 | |
| Illinois | | | 4.2 | |
| Massachusetts | | | 4.7 | |
| New York | | | 26.4 | |
| Pennsylvania | | | 4.7 | |
| Texas | | | 6.6 | |
| Other States and Territories Less Than 3% Each | | | 28.3 | |
| Other Assets Less Liabilities | | | 2.3 | |
PowerShares National AMT-Free Municipal Bond Portfolio (PZA) (continued)
| | | | |
Top Ten Fund Holdings
(% of the Fund’s Net Assets)
as of October 31, 2016 | |
| Security | | | | |
| Sales Tax Asset Receivables Corp. Ref. (Fiscal 2015) Ser. 14A, 4.000%, 10/15/2032 | | | 2.2 | |
| Chicago Illinois Wastewater Transmission Rev. (Second Lien) Ser. 12 AGM, 5.000%, 01/01/2037 | | | 1.9 | |
| City of Jasper Alabama Ser. 14 BAM, 5.000%, 03/01/2044 | | | 1.7 | |
| Miami-Dade County Florida Water & Sewer System Rev. Ser. 10 AGC, 5.000%, 10/01/2029 | | | 1.6 | |
| Massachusetts State School Building Auth. Dedicated Sales Tax Rev. Ref. Ser. 15C, 5.000%, 08/15/2037 | | | 1.6 | |
| California Statewide Communities Development Auth. Rev. (St. Joseph Health System-Remarketed) Insured Ser. 07C FGIC, 5.750%, 07/01/2018 | | | 1.6 | |
| Port Auth. of New York & New Jersey Ref. (194th Series) Ser. 15, 5.000%, 10/15/2041 | | | 1.5 | |
| Inland Valley California Development Successor Agency Tax Allocation Ref. Ser. 14A AGM, 5.000%, 09/01/2044 | | | 1.4 | |
| North Texas Tollway Auth. Rev. Ref. (First Tier) Ser. 08K-1 AGC, 5.750%, 01/01/2019 | | | 1.3 | |
| New York City Municipal Water Finance Auth. Water & Sewer System Rev. (Second General Resolution Fiscal 2013) Ser. 13CC, 5.000%, 06/15/2047 | | | 1.3 | |
| Total | | | 16.1 | |
Growth of a $10,000 Investment Since Inception†
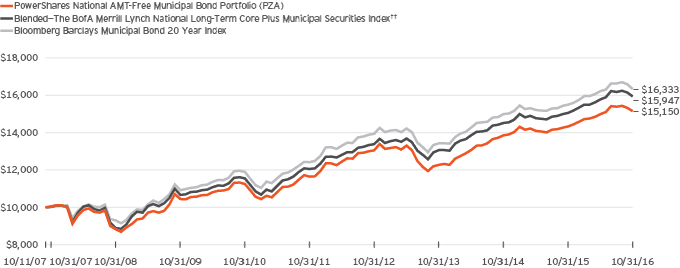
Fund Performance History as of October 31, 2016
| | | | | | | | | | | | | | | | | | | | | | | | | | | | | | | | |
| | | 1 Year | | | 3 Years
Average
Annualized | | | 3 Years
Cumulative | | | 5 Years
Average
Annualized | | | 5 Years
Cumulative | | | | | | Fund Inception† | |
| Index | | | | | | | | | | Average
Annualized | | | Cumulative | |
| Blended—The BofA Merrill Lynch National Long-Term Core Plus Municipal Securities Index†† | | | 5.89 | % | | | 6.90 | % | | | 22.17 | % | | | 5.76 | % | | | 32.33 | % | | | | | | | 5.29 | % | | | 59.47 | % |
| Bloomberg Barclays Municipal Bond 20 Year Index | | | 5.39 | | | | 6.71 | | | | 21.53 | | | | 5.64 | | | | 31.54 | | | | | | | | 5.57 | | | | 63.33 | |
| Fund | | | | | | | | | | | | | | | | | | | | | | | | | | | | | | | | |
| NAV Return | | | 5.71 | | | | 7.24 | | | | 23.32 | | | | 5.39 | | | | 29.99 | | | | | | | | 4.69 | | | | 51.50 | |
| Market Price Return | | | 5.82 | | | | 7.41 | | | | 23.93 | | | | 5.44 | | | | 30.31 | | | | | | | | 4.62 | | | | 50.58 | |
PowerShares National AMT-Free Municipal Bond Portfolio (PZA) (continued)
Fund Inception: October 11, 2007
Performance quoted above represents past performance. Past performance is not a guarantee of future results and current performance may be higher or lower than performance quoted. Investment returns and principal value will fluctuate, and shares of the Fund (“Fund Shares”), when redeemed or sold, may be worth more or less than their original cost. Fund performance reflects any applicable fee waivers and/or expense reimbursements. Had the adviser not waived fees and/or reimbursed expenses currently or in the past, returns would have been lower. See current prospectus for more information. According to the Fund’s current prospectus, the Fund’s expense ratio of 0.28% is expressed as a unitary management fee to cover operating expenses and expenses incurred in connection with managing the portfolio. NAV and Market Price returns assume that dividends and capital gain distributions have been reinvested in the Fund at NAV and Market Price, respectively. The returns shown in the table above do not reflect the deduction of taxes that a shareholder would pay on Fund distributions or the redemption or sale of Fund Shares. See invescopowershares.com to find the most recent month-end performance numbers.
Blended-Index and Benchmark Index performance results are based upon a hypothetical investment in their respective constituent securities.
Blended-Index and Benchmark Index returns do not represent Fund returns. An investor cannot invest directly in an index. The Blended-Index and Benchmark Index do not charge management fees or brokerage expenses, and no such fees or expenses were deducted from the hypothetical performance shown. In addition, the results actual investors might have achieved would have differed from those shown because of differences in the timing, amounts of their investments, and fees and expenses associated with an investment in the Fund.
| † | Fund, Blended-Index and Benchmark Index returns are based on the inception date of the Fund. |
| †† | The Blended—BofA Merrill Lynch National Long-Term Core Plus Municipal Securities Index is comprised of the performance of the BofA Merrill Lynch National Insured Long-Term Core Municipal Securities Index the Fund’s underlying index, from Fund inception through the conversion date, May 29, 2009, followed by the performance of the BofA Merrill Lynch National Insured Long-Term Core Plus Municipal Securities Index, the Fund’s underlying index for the period May 29, 2009 through July 8, 2014, followed by the performance of the Index for the period July 8, 2014 through October 31, 2016. |
| | |
| PZT | | Manager’s Analysis |
| | PowerShares New York AMT-Free Municipal Bond Portfolio (PZT) |
As an index fund, the PowerShares New York AMT-Free Municipal Bond Portfolio (the “Fund”) is passively managed and attempts to track the returns of an underlying index. The Fund seeks investment results that generally correspond (before fees and expenses) to the price and yield of The BofA Merrill Lynch New York Long-Term Core Plus Municipal Securities Index (the “Index”). The Fund generally will invest at least 80% of its total assets in municipal securities that comprise the Index and that are also exempt from federal alternative minimum tax.
Merrill Lynch, Pierce, Fenner & Smith Incorporated is the Index provider for the Index. The Index is composed of U.S. dollar-denominated, investment grade, tax-exempt debt publicly issued by New York or any U.S. territory, including Puerto Rico, or their political subdivisions in the U.S. domestic market with a term of at least 15 years remaining to final maturity. The Fund does not purchase all of the securities in the Index; instead, the Fund utilizes a “sampling” methodology to seek to achieve its investment objective.
For the fiscal year ended October 31, 2016, on a market price basis, the Fund returned 6.02%. On a net asset value (“NAV”) basis, the Fund returned 5.50%. During the same time period, the Index returned 6.15%. The Fund’s performance differed from the return of the Index primarily due to fees and operating expenses that the Fund incurred during the period, the Fund’s duration being shorter than that of the Index, and security selection as a result of the Fund’s “sampling” methodology.
During this same time period, the Bloomberg Barclays Municipal Bond 20 Year Index (the “Benchmark Index”) returned 5.39%. The Benchmark Index is an unmanaged index weighted by market capitalization based on the average performance of approximately 5,280 securities. The adviser provided this additional comparative benchmark to help investors better understand how the investment results of the Fund compares to the performance of a municipal bond benchmark. The Benchmark Index was selected for its recognition in the marketplace, and its performance comparison is a useful measure for investors as a broad representation of municipal securities with maturities of 17 to 22 years.
Relative to the Benchmark Index, the Fund was most overweight in the State of New York and most underweight in the U.S. territory of the Virgin Islands during the fiscal year ended October 31, 2016. The majority of the Fund’s outperformance relative to the Benchmark Index during the period can be attributed to New York bonds outperforming the municipal bond market in general.
For the fiscal year ended October 31, 2016, the U.S. territory of Puerto Rico contributed most significantly to the Fund’s return, followed by the U.S. territory of the Virgin Islands. The U.S. territory of Guam bonds detracted most significantly from the Fund’s return.
Positions that contributed most significantly to the Fund’s return included Puerto Rico Sales Tax Financing Corp. Sales Tax Rev. First Sub.-Ser. 10C, 5.125%, due 8/1/2042 (portfolio average weight of 2.71%), and Puerto Rico Commonwealth Public Improvement Ref. Ser. 07A-4, 5.00% coupon, due 7/1/2031 (no longer held at fiscal year-end). Positions that detracted most significantly from the Fund’s return included Long Island Power Auth. New York Electric Systems Rev. General Ser. 08A, 5.50% coupon, due 5/1/2019 (portfolio average weight of 9.08%), and New York State Dormitory Auth. Rev. (New York University) Ser. 01, 5.50% coupon, due 7/1/2040 (portfolio average weight of 3.86%).
| | | | |
Revenue Type Breakdown
(% of the Fund’s Net Assets)
as of October 31, 2016 | |
| Miscellaneous Revenue | | | 14.1 | |
| College Revenue | | | 13.9 | |
| Income Tax Revenue | | | 11.8 | |
| Electric Power Revenue | | | 9.2 | |
| Sales Tax Revenue | | | 7.8 | |
| Highway Tolls Revenue | | | 5.5 | |
| Health, Hospital, Nursing Home Revenue | | | 5.3 | |
| Ad Valorem Property Tax | | | 4.2 | |
| Lease Revenue | | | 3.9 | |
| Transit Revenue | | | 3.7 | |
| Water Revenue | | | 3.7 | |
| Recreational Revenue | | | 3.5 | |
| Port, Airport & Marina Revenue | | | 3.5 | |
| Hotel Occupancy Tax | | | 3.4 | |
| Sewer Revenue | | | 3.2 | |
| Other Assets Less Liabilities | | | 3.3 | |
PowerShares New York AMT-Free Municipal Bond Portfolio (PZT) (continued)
| | | | |
Top Ten Fund Holdings
(% of the Fund’s Net Assets)
as of October 31, 2016 | |
| Security | | | | |
| New York State Dormitory Auth. Rev. (The New School) Ser. 10 AGM, 5.500%, 07/01/2043 | | | 4.5 | |
| Long Island Power Auth. New York Electric Systems Rev. General Ser. 08A BHAC, 5.500%, 05/01/2019 | | | 4.3 | |
| New York City Industrial Development Agency Rev. (Queens Baseball Stadium-PILOT) Ser. 09 AGC, 6.500%, 01/01/2046 | | | 4.3 | |
| New York State Dormitory Auth. Personal Income Tax Rev. (General Purpose) Ser. 11C, 5.000%, 03/15/2041 | | | 3.9 | |
| New York State Dormitory Auth. Rev. Non State Supported Debt Ref. (Icahn School of Medicine at Mount Sinai) Ser. 15A, 5.000%, 07/01/2035 | | | 3.6 | |
| Brooklyn Arena New York Local Development Corp. PILOT Rev. Ref. (Barclays Center Project) Ser. 16A, 5.000%, 07/15/2042 | | | 3.6 | |
| New York City Industrial Development Agency Rev. Yankee Stadium (PILOT) Ser. 09 AGC, 7.000%, 03/01/2049 | | | 3.5 | |
| Sales Tax Asset Receivables Corp. Ref. (Fiscal 2015) Ser. 14A, 4.000%, 10/15/2032 | | | 3.5 | |
| New York State Convention Center Development Corp. Rev. Ref. (Hotel Unit Fee Secured) Ser. 15, 5.000%, 11/15/2040 | | | 3.5 | |
| New York State Ref. (Fiscal 2015) Ser. 14A, 5.000%, 08/01/2032 | | | 3.2 | |
| Total | | | 37.9 | |
Growth of a $10,000 Investment Since Inception†
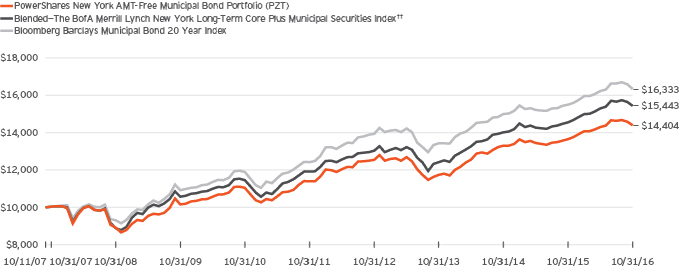
Fund Performance History as of October 31, 2016
| | | | | | | | | | | | | | | | | | | | | | | | | | | | | | | | |
| | | 1 Year | | | 3 Years
Average
Annualized | | | 3 Years
Cumulative | | | 5 Years
Average
Annualized | | | 5 Years
Cumulative | | | | | | Fund Inception† | |
| Index | | | | | | | | | | Average
Annualized | | | Cumulative | |
| Blended—The BofA Merrill Lynch New York Long-Term Core Plus Municipal Securities Index†† | | | 6.15 | % | | | 7.55 | % | | | 24.39 | % | | | 5.34 | % | | | 29.72 | % | | | | | | | 4.92 | % | | | 54.43 | % |
| Bloomberg Barclays Municipal Bond 20 Year Index | | | 5.39 | | | | 6.71 | | | | 21.53 | | | | 5.64 | | | | 31.54 | | | | | | | | 5.57 | | | | 63.33 | |
| Fund | | | | | | | | | | | | | | | | | | | | | | | | | | | | | | | | |
| NAV Return | | | 5.50 | | | | 7.03 | | | | 22.59 | | | | 4.79 | | | | 26.35 | | | | | | | | 4.11 | | | | 44.04 | |
| Market Price Return | | | 6.02 | | | | 7.21 | | | | 23.24 | | | | 4.85 | | | | 26.74 | | | | | | | | 4.02 | | | | 42.83 | |
PowerShares New York AMT-Free Municipal Bond Portfolio (PZT) (continued)
Fund Inception: October 11, 2007
Performance quoted above represents past performance. Past performance is not a guarantee of future results and current performance may be higher or lower than performance quoted. Investment returns and principal value will fluctuate, and shares of the Fund (“Fund Shares”), when redeemed or sold, may be worth more or less than their original cost. Fund performance reflects any applicable fee waivers and/or expense reimbursements. Had the adviser not waived fees and/or reimbursed expenses currently or in the past, returns would have been lower. See current prospectus for more information. According to the Fund’s current prospectus, the Fund’s expense ratio of 0.28% is expressed as a unitary management fee to cover operating expenses and expenses incurred in connection with managing the portfolio. NAV and Market Price returns assume that dividends and capital gain distributions have been reinvested in the Fund at NAV and Market Price, respectively. The returns shown in the table above do not reflect the deduction of taxes that a shareholder would pay on Fund distributions or the redemption or sale of Fund Shares. See invescopowershares.com to find the most recent month-end performance numbers.
Blended-Index and Benchmark Index performance results are based upon a hypothetical investment in their respective constituent securities.
Blended-Index and Benchmark Index returns do not represent Fund returns. An investor cannot invest directly in an index. The Blended-Index and Benchmark Index do not charge management fees or brokerage expenses, and no such fees or expenses were deducted from the hypothetical performance shown. In addition, the results actual investors might have achieved would have differed from those shown because of differences in the timing, amounts of their investments, and fees and expenses associated with an investment in the Fund.
| † | Fund, Blended-Index and Benchmark Index returns are based on the inception date of the Fund. |
| †† | The Blended—BofA Merrill Lynch New York Long-Term Core Plus Municipal Securities Index is comprised of the performance of the BofA Merrill Lynch New York Insured Long-Term Core Municipal Securities Index the Fund’s underlying index, from Fund inception through the conversion date, May 29, 2009, followed by the performance of the BofA Merrill Lynch New York Insured Long-Term Core Plus Municipal Securities Index, the Fund’s underlying index for the period May 29, 2009 through July 8, 2014, followed by the performance of the Index for the period July 8, 2014 through October 31, 2016. |
| | |
| PGX | | Manager’s Analysis |
| | PowerShares Preferred Portfolio (PGX) |
As an index fund, the PowerShares Preferred Portfolio (the “Fund”) is passively managed and attempts to track the returns of an underlying index. The Fund seeks investment results that generally correspond (before fees and expenses) to the price and yield of The BofA Merrill Lynch Core Plus Fixed Rate Preferred Securities Index (the “Index”). The Fund generally will invest at least 80% of its total assets in fixed-rate U.S. dollar-denominated preferred securities that comprise the Index.
The Index is a market capitalization-weighted index designed to reflect the total return performance of the fixed-rate U.S. dollar- denominated preferred securities market. The Index includes both traditional and other preferred securities, including preferred securities issued by foreign companies in the form of American depositary receipts, as well as senior and subordinated debt securities. Unlisted preferred securities are excluded from the Index, but unlisted senior or subordinated debt-like securities are eligible for inclusion. The Index may include Rule 144A securities. Strictly in accordance with its guidelines and mandated procedures, Merrill Lynch, Pierce, Fenner & Smith Incorporated (“BofA Merrill Lynch” or the “Index Provider”) selects securities for the Index using a rules-based methodology. Qualifying securities must be rated at least B3 (based on an average of Moody’s Investors Service, Inc. (“Moody’s”), Standard & Poor’s, a division of The McGraw-Hill Companies, Inc. (“S&P”), and Fitch Ratings, Inc. (“Fitch”)) and must have an investment grade country risk profile (based on an average of Moody’s, S&P and Fitch foreign currency long-term sovereign debt ratings). The Fund does not purchase all of the securities in the Index; instead, the Fund utilizes a “sampling” methodology to seek to achieve its investment objective.
For the fiscal year ended October 31, 2016, on a market price basis, the Fund returned 7.36%. On a net asset value (“NAV”) basis, the Fund returned 7.22%. During the same time period, the Index returned 7.02%. The Fund’s performance differed from that of the Index primarily due to a positive impact as a result of the Fund’s sampling methodology partially offset by fees that the Fund incurred during the period.
During this same time period, the S&P U.S. Preferred Stock Index (the “Benchmark Index”) returned 5.95%. The Benchmark Index is an unmanaged index weighted by modified market capitalization based on the average performance of approximately 290 securities. The Benchmark Index was selected for its recognition in the marketplace, and its performance comparison is a useful measure for investors as a broad representation of the preferred stock market, which includes convertible preferred stocks.
Relative to the Benchmark Index, the Fund was most overweight in the diversified financials industry and most underweight in the consumer non-cyclical industry during the fiscal year ended October 31, 2016. The majority of the Fund’s outperformance relative to the Benchmark Index during the period can be
attributed to the Benchmark Index’s allocation to convertible preferred stock that performed poorly over the period.
For the fiscal year ended October 31, 2016, the banks industry contributed most significantly to the Fund’s return, followed by the diversified financials and insurance industries. There were no detracting industries.
Positions that contributed most significantly to the Fund’s return included HSBC Holdings PLC, 8.13% (United Kingdom), a banks company (portfolio average weight of 2.65%), and Barclays Bank PLC, 8.13%, Series 5 (United Kingdom), a banks company (portfolio average weight of 3.67%). Positions that detracted most significantly from the Fund’s return included Deutsche Bank Contingent Capital Trust V, 8.05% (Germany), a banks company (portfolio average weight of 2.31%), and Deutsche Bank Contingent Capital Trust III, 7.60% (Germany), a banks company (portfolio average weight of 0.59%).
| | | | |
Industry Breakdown
(% of the Fund’s Net Assets)
as of October 31, 2016 | |
| Banks | | | 43.5 | |
| Capital Markets | | | 15.8 | |
| Insurance | | | 12.1 | |
| Equity Real Estate Investment Trusts | | | 8.8 | |
| Electric Utilities | | | 6.8 | |
| Diversified Telecommunication Services | | | 3.3 | |
| Consumer Finance | | | 2.9 | |
| Industrial Conglomerates | | | 1.6 | |
| Multi-Utilities | | | 1.5 | |
| Wireless Telecommunication Services | | | 1.3 | |
| Commercial Services & Supplies | | | 0.6 | |
| Internet Software & Services | | | 0.6 | |
| Machinery | | | 0.6 | |
| Mortgage Real Estate Investment Trusts | | | 0.2 | |
| Media | | | 0.2 | |
| Chemicals | | | 0.1 | |
| Trading Companies & Distributors | | | 0.1 | |
| Thrifts & Mortgage Finance | | | 0.1 | |
| Oil, Gas & Consumable Fuels | | | 0.1 | |
| Money Market Fund Plus Other Assets Less Liabilities | | | (0.2) | |
PowerShares Preferred Portfolio (PGX) (continued)
| | | | |
Top Ten Fund Holdings*
(% of the Fund’s Net Assets)
as of October 31, 2016 | |
| Security | | | | |
| Barclays Bank PLC, 8.13%, Series 5 | | | 3.1 | |
| HSBC Holdings PLC, 8.00%, Series 2 | | | 2.7 | |
| Wells Fargo & Co., 8.00%, Series J | | | 2.6 | |
| HSBC Holdings PLC, 8.13% | | | 2.6 | |
| Deutsche Bank Contingent Capital Trust V, 8.05% | | | 2.2 | |
| Citigroup, Inc., 6.88%, Series K | | | 1.6 | |
| BB&T Corp., 5.63%, Series E | | | 1.6 | |
| Bank of America Corp., 6.50%, Series Y | | | 1.5 | |
| JPMorgan Chase & Co., 6.13%, Series Y | | | 1.5 | |
| PNC Financial Services Group, Inc. (The), 6.13%, Series P | | | 1.5 | |
| Total | | | 20.9 | |
| * | Excluding money market fund holdings. |
Growth of a $10,000 Investment Since Inception†
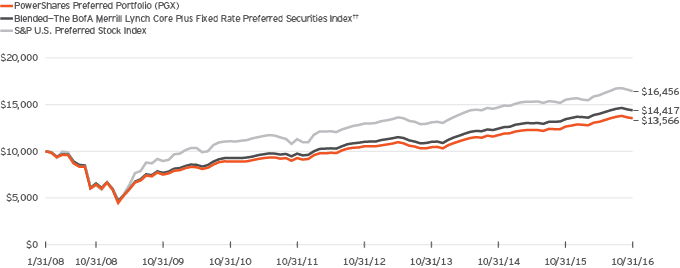
Fund Performance History as of October 31, 2016
| | | | | | | | | | | | | | | | | | | | | | | | | | | | | | | | |
| | | 1 Year | | | 3 Years
Average
Annualized | | | 3 Years
Cumulative | | | 5 Years
Average
Annualized | | | 5 Years
Cumulative | | | | | | Fund Inception† | |
| Index | | | | | | | | | | Average
Annualized | | | Cumulative | |
| Blended—The BofA Merrill Lynch Core Plus Fixed Rate Preferred Securities Index†† | | | 7.02 | % | | | 9.39 | % | | | 30.90 | % | | | 8.13 | % | | | 47.83 | % | | | | | | | 4.27 | % | | | 44.17 | % |
| S&P U.S. Preferred Stock Index | | | 5.95 | | | | 7.84 | | | | 25.40 | | | | 7.77 | | | | 45.38 | | | | | | | | 5.86 | | | | 64.56 | |
| Fund | | | | | | | | | | | | | | | | | | | | | | | | | | | | | | | | |
| NAV Return | | | 7.22 | | | | 9.10 | | | | 29.88 | | | | 7.85 | | | | 45.94 | | | | | | | | 3.55 | | | | 35.66 | |
| Market Price Return | | | 7.36 | | | | 9.17 | | | | 30.12 | | | | 7.84 | | | | 45.88 | | | | | | | | 3.38 | | | | 33.81 | |
PowerShares Preferred Portfolio (PGX) (continued)
Fund Inception: January 31, 2008
Performance quoted above represents past performance. Past performance is not a guarantee of future results and current performance may be higher or lower than performance quoted. Investment returns and principal value will fluctuate, and shares of the Fund (“Fund Shares”), when redeemed or sold, may be worth more or less than their original cost. Fund performance reflects any applicable fee waivers and/or expense reimbursements. Had the adviser not waived fees and/or reimbursed expenses currently or in the past, returns would have been lower. See current prospectus for more information. According to the Fund’s current prospectus, the Fund’s expense ratio of 0.50% is expressed as a unitary management fee to cover operating expenses and expenses incurred in connection with managing the portfolio. NAV and Market Price returns assume that dividends and capital gain distributions have been reinvested in the Fund at NAV and Market Price, respectively. The returns shown in the table above do not reflect the deduction of taxes that a shareholder would pay on Fund distributions or the redemption or sale of Fund Shares. See invescopowershares.com to find the most recent month-end performance numbers.
Blended-Index and Benchmark Index performance results are based upon a hypothetical investment in their respective constituent securities. Blended-Index and Benchmark Index returns do not represent Fund returns. An investor cannot invest directly in an index. The Blended-Index and Benchmark Index do not charge management fees or brokerage expenses, and no such fees or expenses were deducted from the hypothetical performance shown. In addition, the results actual investors might have achieved would have differed from those shown because of differences in the timing, amounts of their investments, and fees and expenses associated with an investment in the Fund.
| † | Fund, Blended-Index and Benchmark Index returns are based on the inception date of the Fund. |
| †† | The Blended—The BofA Merrill Lynch Core Plus Fixed Rate Preferred Securities Index performance is comprised of the performance of The BofA Merrill Lynch Core Fixed Rate Preferred Securities Index, the Fund’s previous underlying index, from Fund inception through the conversion date, April 1, 2012, followed by the performance of the Index, starting from the conversion date through October 31, 2016. |
| | |
| VRP | | Manager’s Analysis |
| | PowerShares Variable Rate Preferred Portfolio (VRP) |
As an index fund, the PowerShares Variable Rate Preferred Portfolio (the “Fund”) is passively managed and attempts to track the returns of an underlying index. The Fund seeks investment results that generally correspond (before fees and expenses) to the price and yield of the Wells Fargo® Hybrid and Preferred Securities Floating and Variable Rate Index (the “Index”). The Fund generally will invest at least 90% of its total assets in the securities that comprise the Index.
Strictly in accordance with its guidelines and mandated procedures, Wells Fargo Securities, LLC (together with Wells Fargo & Company, the “Index Provider”), employs a proprietary methodology to select for the Index issues of preferred stock and “hybrid securities” that, in the Index Provider’s judgment, are functionally equivalent to preferred stock, including certain convertible securities, depositary preferred stock, trust preferred securities, perpetual subordinated debt listed on the New York Stock Exchange, NYSE Arca or NASDAQ and other types of hybrid securities that receive preferred treatment within an issuer’s capital structure similar to that of traditional preferred stock. To be eligible for inclusion in the Index, the preferred stock or hybrid security must: (i) maintain a minimum par value of $100 million outstanding or a minimum of 10 million shares outstanding; (ii) have floating or variable dividends or coupons; and (iii) be U.S. dollar-denominated and U.S. registered (or otherwise exempt from registration in the United States). The Fund considers the traditional preferred stocks and functionally equivalent hybrid securities included in the Index, collectively, to be “Preferred Securities.” The Index is a market capitalization-weighted index designed to track the performance of Preferred Securities. The Fund does not purchase all of the Preferred Securities in the Index; instead, the Fund utilizes a “sampling” methodology to seek to achieve its investment objective.
For the fiscal year ended October 31, 2016, on a market price basis, the Fund returned 9.63%. On a net asset value (“NAV”) basis, the Fund returned 9.43%. During the same time period, the Index returned 9.44%. During the fiscal year, the Fund’s performance, on a NAV basis, differed from the return of the Index primarily due to beneficial trade execution during monthly rebalances offset by fees and operating expenses that the Fund incurred during the period.
During this same time period, the S&P U.S. Preferred Stock Index (the “Benchmark Index”) returned 5.95%. The Benchmark Index is an unmanaged index weighted by modified market capitalization and based on the average performance of approximately 290 securities. The Benchmark Index was selected for its recognition in the marketplace, and its performance comparison is a useful measure for investors as a broad representation of the primarily fixed-rate preferred stock market. The majority of the Fund’s outperformance relative to the Benchmark Index during the period can be attributed to the Fund’s inclusion of only variable rate Preferred Securities, rather than the Benchmark Index’s focus on
both fixed rate and variable rate securities. The variable rate segment of the preferred market (and hence the Fund) outpaced the fixed rate segment in 2016, benefitting from the potential for higher US short-term interest rates.
For the fiscal year ended October 31, 2016, the banks industry contributed most significantly to the Fund’s return, followed by the capital markets and insurance industries. There were no detracting industries.
Positions that contributed most significantly to the Fund’s return included Citigroup Capital XIII, 7.26% coupon (portfolio average weight of 3.72%), and Wachovia Capital Trust III, 5.57% coupon, due 3/29/2049 (portfolio average weight of 3.93%). Positions that detracted most significantly from the Fund’s return included Legacy Reserves LP, 8.00% coupon, due 12/31/2049 (no longer held at fiscal year-end), and Assured Guaranty US Holdings, 6.40% coupon, due 12/15/2066 (no longer held at fiscal year-end).
| | | | |
Industry Breakdown
(% of the Fund’s Net Assets)
as of October 31, 2016 | |
| Banks | | | 39.6 | |
| Insurance | | | 22.3 | |
| Capital Markets | | | 14.6 | |
| Pipelines | | | 6.4 | |
| Consumer Finance | | | 4.4 | |
| Electric | | | 4.4 | |
| Food Products | | | 1.8 | |
| Electric Utilities | | | 1.7 | |
| Diversified Financial Services | | | 1.5 | |
| Commercial Services & Supplies | | | 0.7 | |
| Hand/Machine Tools | | | 0.7 | |
| Multi-Utilities | | | 0.6 | |
| Miscellaneous Manufacturing | | | 0.5 | |
| Oil, Gas & Consumable Fuels | | | 0.2 | |
| Mortgage Real Estate Investment Trusts | | | 0.2 | |
| Other Assets Less Liabilities | | | 0.4 | |
PowerShares Variable Rate Preferred Portfolio (VRP) (continued)
| | | | |
Top Ten Fund Holdings
(% of the Fund’s Net Assets)
as of October 31, 2016 | |
| Security | | | | |
| GMAC Capital Trust I, 6.60%, Series 2 | | | 4.4 | |
| Wachovia Capital Trust III, 5.570%, 03/29/2049 | | | 3.9 | |
| Citigroup Capital XIII, 7.26% | | | 3.7 | |
| Wells Fargo & Co., 5.85% | | | 2.9 | |
| PNC Financial Services Group, Inc. (The), 6.13%, Series P | | | 2.7 | |
| Citigroup, Inc., 6.88%, Series K | | | 2.7 | |
| Prudential Financial, Inc., 5.625%, 06/15/2043 | | | 2.5 | |
| Emera, Inc., Series 16-A, 6.750%, 06/15/2076 | | | 2.1 | |
| TransCanada Trust, Series 16-A, 5.875%, 08/15/2076 | | | 2.0 | |
| U.S. Bancorp, 6.50%, Series F | | | 2.0 | |
| Total | | | 28.9 | |
Growth of a $10,000 Investment Since Inception†
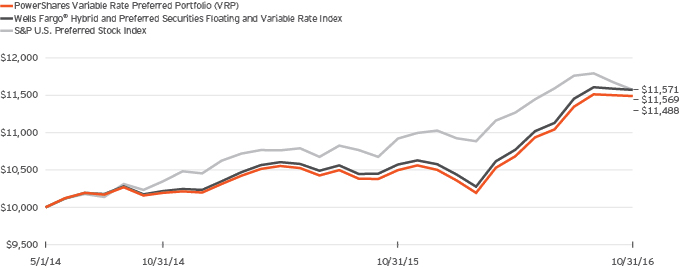
Fund Performance History as of October 31, 2016
| | | | | | | | | | | | | | | | |
| | | 1 Year | | | | | | Fund Inception† | |
| Index | | | | | | Average
Annualized | | | Cumulative | |
| Wells Fargo® Hybrid and Preferred Securities Floating and Variable Rate Index | | | 9.44 | % | | | | | | | 6.02 | % | | | 15.71 | % |
| S&P U.S. Preferred Stock Index | | | 5.95 | | | | | | | | 6.01 | | | | 15.69 | |
| Fund | | | | | | | | | | | | | | | | |
| NAV Return | | | 9.43 | | | | | | | | 5.70 | | | | 14.88 | |
| Market Price Return | | | 9.63 | | | | | | | | 5.76 | | | | 15.03 | |
PowerShares Variable Rate Preferred Portfolio (VRP) (continued)
Fund Inception: May 1, 2014
Performance quoted above represents past performance. Past performance is not a guarantee of future results and current performance may be higher or lower than performance quoted. Investment returns and principal value will fluctuate, and shares of the Fund (“Fund Shares”), when redeemed or sold, may be worth more or less than their original cost. Fund performance reflects any applicable fee waivers and/or expense reimbursements. Had the adviser not waived fees and/or reimbursed expenses currently or in the past, returns would have been lower. See current prospectus for more information. According to the Fund’s current prospectus, the Fund’s expense ratio of 0.50% is expressed as a unitary management fee to cover operating expenses and expenses incurred in connection with managing the portfolio. NAV and Market Price returns assume that dividends and capital gain distributions have been reinvested in the Fund at NAV and Market Price, respectively. The returns shown in the table above do not
reflect the deduction of taxes that a shareholder would pay on Fund distributions or the redemption or sale of Fund Shares. See invescopowershares.com to find the most recent month-end performance numbers.
Index and Benchmark Index performance results are based upon a hypothetical investment in their respective constituent securities. Index and Benchmark Index returns do not represent Fund returns. An investor cannot invest directly in an index. The Index and Benchmark Index do not charge management fees or brokerage expenses, and no such fees or expenses were deducted from the hypothetical performance shown. In addition, the results actual investors might have achieved would have differed from those shown because of differences in the timing, amounts of their investments, and fees and expenses associated with an investment in the Fund.
| † | Fund, Index and Benchmark Index returns are based on the inception date of the Fund. |
| | |
| PVI | | Manager’s Analysis |
| | PowerShares VRDO Tax-Free Weekly Portfolio (PVI) |
As an index fund, the PowerShares VRDO Tax-Free Weekly Portfolio (the “Fund”) is passively managed and attempts to track the returns of an underlying index. The Fund seeks investment results that generally correspond (before fees and expenses) to the price and yield of the Bloomberg U.S. Municipal AMT-Free Weekly VRDO Index (the “Index”). The Fund generally will invest at least 80% of its total assets in variable rate demand obligation (“VRDO”) bonds that are exempt from federal income tax with interest rates that reset weekly, which comprise the Index.
Bloomberg Finance L.P. (collectively with its affiliates, “Bloomberg” or the “Index Provider”) compiles and calculates the Index, which is comprised of municipal securities issued in the primary market as VRDOs. Bonds in the Index must be rated by at least one of the following statistical rating agencies: Moody’s Investors Service, Inc. as A-3 for long-term bonds or Prime-2 for short-term bonds; by Standard & Poor’s, a division of The McGraw-Hill Company, Inc., as A- for long-term bonds or A-2 for short-term bonds; and by Fitch Ratings, Inc. as A- for long- term bonds or F-2 for short-term bonds. The Fund does not purchase all of the securities in the Index; instead, the Fund utilizes a “sampling” methodology to seek to achieve its investment objective.
For the fiscal year ended October 31, 2016, on a market price basis, the Fund returned (0.01)%. On a net asset value (“NAV”) basis, the Fund returned 0.07%. During the same time period, the Index returned 0.32%. The Fund’s performance differed from the return of the Index primarily due to fees and operating expenses that the Fund incurred during the period.
During this same time period, the Bloomberg Barclays Municipal 1-Year Index (the “Benchmark Index”) returned 0.40%. The Benchmark Index is an unmanaged index weighted by market capitalization based on the average performance of approximately 4,490 securities. The adviser provided this additional comparative benchmark to help investors understand how investment results of the Fund compare to the performance of a 1-year duration municipal benchmark.
Relative to the Benchmark Index, the majority of the Fund’s underperformance during the period can be attributed to fees and operating expenses that the Fund incurred during the period as well as the Benchmark’s 1 year duration compared to the Fund’s focus on bonds with weekly resets.
For the fiscal year ended October 31, 2016, the State of New York contributed most significantly to the Fund’s return, followed by the State of Florida and the State of California. There were no detracting states.
Positions that contributed most significantly to the Fund’s return included Texas State Transportation Commission Rev. (First Tier) Ser. 06B, 0.80% coupon, due 4/1/2026 (portfolio average weight of 4.43%), and New York City Transitional Finance Auth. Rev. (Future Tax Secured) Sub.-Ser. 99-B3, 0.65% coupon, due 11/1/2028 (portfolio average weight of 5.63%). There were no detracting positions.
| | | | |
State Breakdown
(% of the Fund’s Net Assets) | |
| California | | | 13.6 | |
| Colorado | | | 4.2 | |
| Connecticut | | | 4.2 | |
| Florida | | | 13.7 | |
| Indiana | | | 4.2 | |
| Maryland | | | 4.8 | |
| Michigan | | | 4.2 | |
| Missouri | | | 4.7 | |
| New York | | | 11.1 | |
| North Carolina | | | 9.6 | |
| Ohio | | | 4.0 | |
| Tennessee | | | 7.4 | |
| Texas | | | 8.7 | |
| Other States Less Than 3% Each | | | 2.9 | |
| Other Assets Less Liabilities | | | 2.7 | |
|
Top Ten Fund Holdings
(% of the Fund’s Net Assets)
as of October 31, 2016 | |
| Security | | | | |
| Bay Area California Auth. Toll Bridge Rev. Ser. 07, 0.520%, 04/01/2047 | | | 6.4 | |
| Florida State Department of Environmental Protection Preservation Rev. (Everglades Restoration) Ser. 07A AGC, 0.670%, 07/01/2027 | | | 5.2 | |
| Texas State Transportation Commission Rev. (First Tier) Ser. 06B, 0.800%, 04/01/2026 | | | 5.0 | |
| North Carolina Medical Care Commission Health Care Facilities (Pennybyrn at Maryfield) Ser. 05A, 0.710%, 11/01/2034 | | | 5.0 | |
| Maryland State Health & Higher Educational Facilities Auth. Rev. (University of Maryland Medical Systems) Ser. 07A, 0.630%, 07/01/2034 | | | 4.8 | |
| Charlotte-Mecklenburg Hospital Auth. North Carolina Health Care System Rev. Ref. (Carolina-Remarketed) Ser. 07C, 0.630%, 01/15/2037 | | | 4.2 | |
| San Diego County California Regional Transportation Commission (Limited Tax) Ser. 08C, 0.580%, 04/01/2038 | | | 4.2 | |
| Connecticut State Health & Educational Facilities Auth. Rev. (Yale New Heaven Hospital) Ser. 13O, 0.590%, 07/01/2053 | | | 4.2 | |
| Colorado Springs Colorado Utilities Rev. (Sub.-Lien Improvement) Ser. 06B, 0.690%, 11/01/2036 | | | 4.2 | |
| Missouri State Health & Educational Facilities Auth. (BJC Health System) Ser. 08C, 0.600%, 05/15/2038 | | | 4.2 | |
| Total | | | 47.4 | |
PowerShares VRDO Tax-Free Weekly Portfolio (PVI) (continued)
Growth of a $10,000 Investment Since Inception†
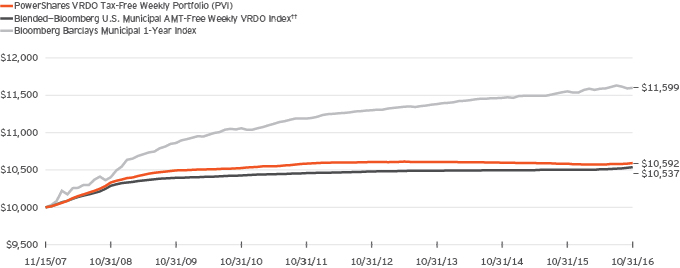
Fund Performance History as of October 31, 2016
| | | | | | | | | | | | | | | | | | | | | | | | | | | | | | | | |
| | | 1 Year | | | 3 Years
Average
Annualized | | | 3 Years
Cumulative | | | 5 Years
Average
Annualized | | | 5 Years
Cumulative | | | | | | Fund Inception† | |
| Index | | | | | | | | | | Average
Annualized | | | Cumulative | |
| Blended—Bloomberg U.S. Municipal AMT-Free Weekly VRDO Index†† | | | 0.32 | % | | | 0.14 | % | | | 0.42 | % | | | 0.15 | % | | | 0.75 | % | | | | | | | 0.59 | % | | | 5.37 | % |
| Bloomberg Barclays Municipal 1-Year Index | | | 0.40 | | | | 0.62 | | | | 1.88 | | | | 0.72 | | | | 3.67 | | | | | | | | 1.67 | | | | 15.99 | |
| Fund | | | | | | | | | | | | | | | | | | | | | | | | | | | | | | | | |
| NAV Return | | | 0.07 | | | | (0.06 | ) | | | (0.17 | ) | | | 0.01 | | | | 0.05 | | | | | | | | 0.64 | | | | 5.92 | |
| Market Price Return | | | (0.01 | ) | | | (0.08 | ) | | | (0.25 | ) | | | (0.01 | ) | | | (0.03 | ) | | | | | | | 0.63 | | | | 5.83 | |
Fund Inception: November 15, 2007
Performance quoted above represents past performance. Past performance is not a guarantee of future results and current performance may be higher or lower than performance quoted. Investment returns and principal value will fluctuate, and shares of the Fund (“Fund Shares”), when redeemed or sold, may be worth more or less than their original cost. Fund performance reflects any applicable fee waivers and/or expense reimbursements. Had the adviser not waived fees and/or reimbursed expenses currently or in the past, returns would have been lower. See current prospectus for more information. According to the Fund’s current prospectus, the Fund’s expense ratio of 0.25% is expressed as a unitary management fee to cover operating expenses and expenses incurred in connection with managing the portfolio. NAV and Market Price returns assume that dividends and capital gain distributions have been reinvested in the Fund at NAV and Market Price, respectively. The returns shown in the table above do not reflect the deduction of taxes that a shareholder would pay on Fund distributions or the redemption or sale of Fund Shares. See invescopowershares.com to find the most recent month-end performance numbers.
Blended-Index and Benchmark Index performance results are based upon a hypothetical investment in their respective constituent securities. Blended-Index and Benchmark Index returns do not represent Fund returns. An investor cannot invest directly in an index. The Blended-Index and Benchmark Index do not charge management fees or brokerage expenses, and no such fees or expenses were deducted from the hypothetical performance shown. In addition, the results actual investors might have achieved would have differed from those shown because of differences in the timing, amounts of their investments, and fees and expenses associated with an investment in the Fund.
| † | Fund, Blended-Index and Benchmark Index returns are based on the inception date of the Fund. |
| †† | The Blended—Bloomberg U.S. Municipal AMT-Free Weekly VRDO Index is comprised of the performance of the Thompson Municipal Market Data VRDO Index, the Fund’s original underlying index, from inception through the conversion date, August 5, 2010, followed by the performance of the Index starting at the conversion date through October 31, 2016. |
Schedule of Investments
PowerShares 1-30 Laddered Treasury Portfolio (PLW)
October 31, 2016
| | | | | | | | |
Principal
Amount | | | | | Value | |
| | | | Long-Term Investments—95.8% | |
| | | | United States Government Obligations—95.8% | |
| | | | United States Treasury Notes—6.7% | |
| $ | 7,064,000 | | | 3.500%, 02/15/2018 | | $ | 7,309,863 | |
| | 7,247,000 | | | 2.000%, 02/15/2022 | | | 7,467,099 | |
| | | | | | | | |
| | | | | | | 14,776,962 | |
| | | | | | | | |
| | | | United States Treasury Bonds—89.1% | |
| | 5,911,000 | | | 8.875%, 02/15/2019 | | | 6,988,717 | |
| | 5,681,000 | | | 8.500%, 02/15/2020 | | | 7,047,991 | |
| | 5,571,000 | | | 7.875%, 02/15/2021 | | | 7,111,621 | |
| | 5,362,000 | | | 7.125%, 02/15/2023 | | | 7,172,410 | |
| | 5,543,000 | | | 6.250%, 08/15/2023 | | | 7,217,052 | |
| | 4,934,000 | | | 7.625%, 02/15/2025 | | | 7,207,301 | |
| | 5,336,000 | | | 6.000%, 02/15/2026 | | | 7,261,335 | |
| | 5,011,000 | | | 6.625%, 02/15/2027 | | | 7,259,295 | |
| | 5,170,000 | | | 6.125%, 11/15/2027 | | | 7,346,249 | |
| | 5,388,000 | | | 5.250%, 02/15/2029 | | | 7,318,628 | |
| | 4,900,000 | | | 6.250%, 05/15/2030 | | | 7,376,891 | |
| | 15,528,000 | | | 5.375%, 02/15/2031 | | | 22,062,493 | |
| | 16,181,000 | | | 4.500%, 02/15/2036 | | | 22,005,529 | |
| | 5,213,000 | | | 4.750%, 02/15/2037 | | | 7,308,178 | |
| | 5,473,000 | | | 4.375%, 02/15/2038 | | | 7,361,825 | |
| | 6,219,000 | | | 3.500%, 02/15/2039 | | | 7,399,640 | |
| | 5,294,000 | | | 4.625%, 02/15/2040 | | | 7,340,459 | |
| | 5,191,000 | | | 4.750%, 02/15/2041 | | | 7,352,159 | |
| | 6,650,000 | | | 3.125%, 02/15/2042 | | | 7,403,319 | |
| | 6,692,000 | | | 3.125%, 02/15/2043 | | | 7,443,933 | |
| | 6,094,000 | | | 3.625%, 02/15/2044 | | | 7,407,897 | |
| | 7,638,000 | | | 2.500%, 02/15/2045 | | | 7,506,718 | |
| | 7,736,000 | | | 2.500%, 02/15/2046 | | | 7,592,157 | |
| | | | | | | | |
| | | | | | | 197,491,797 | |
| | | | | | | | |
| | | | Total Long-Term Investments
(Cost $208,625,667) | | | 212,268,759 | |
| | | | | | | | |
| | |
| | | | | | | | |
| | | | Short-Term Investments—3.3% | |
| | | | United States Government Obligations—3.3% | |
| | | | United States Treasury Notes—3.3% | |
| | 7,127,000 | | | 4.625%, 02/15/2017
(Cost $7,198,262) | | | 7,215,546 | |
| | | | | | | | |
| | |
| | | | | | | | |
Number
of Shares | | | | | | |
| | | | Money Market Fund—0.0% | |
| | 76,586 | | | Invesco Premier U.S. Government Money Portfolio—Institutional Class, 0.25%(a)
(Cost $76,586) | | | 76,586 | |
| | | | | | | | |
| | | | Total Short-Term Investments
(Cost $7,274,848) | | | 7,292,132 | |
| | | | | | | | |
| | | | Total Investments
(Cost $215,900,515)—99.1% | | | 219,560,891 | |
| | | | Other assets less liabilities—0.9% | | | 1,910,630 | |
| | | | | | | | |
| | | | Net Assets—100.0% | | $ | 221,471,521 | |
| | | | | | | | |
Notes to Schedule of Investments:
| (a) | The security and the Fund are advised by wholly-owned subsidiaries of Invesco Ltd. and are therefore considered to be affiliated. The rate shown is the 7-day SEC standardized yield as of October 31, 2016. |
See accompanying Notes to Financial Statements which are an integral part of the financial statements.
Schedule of Investments
PowerShares Build America Bond Portfolio (BAB)
October 31, 2016
| | | | | | | | | | | | | | | | |
Principal
Amount | | | | | Interest
Rate | | | Maturity
Date | | | Value | |
| | | | Municipal Bonds—93.8% | | | | | | | | | | | | |
| | | | Ad Valorem Property Tax—19.5% | | | | | | | | | | | | |
| $ | 3,000,000 | | | Anchorage Alaska Ser. 10A-2 | | | 5.910 | % | | | 04/01/2030 | | | $ | 3,356,280 | |
| | 1,500,000 | | | Bexar County Texas Ser. 10 | | | 5.755 | | | | 06/15/2040 | | | | 1,614,120 | |
| | 14,890,000 | | | California State Highway Safety Air Quality Remarketed Ser. 09B | | | 6.509 | | | | 04/01/2039 | | | | 17,930,389 | |
| | 8,505,000 | | | California State Ser. 09 | | | 7.350 | | | | 11/01/2039 | | | | 12,631,541 | |
| | 4,500,000 | | | California State Ser. 10 | | | 7.625 | | | | 03/01/2040 | | | | 6,936,570 | |
| | 1,010,000 | | | Carson City Nevada (Water Improvement) Ser. 10A | | | 6.662 | | | | 11/01/2039 | | | | 1,089,689 | |
| | 2,000,000 | | | Channelview Texas Independent School District Ser. 10 PSF-GTD | | | 5.926 | | | | 08/15/2035 | | | | 2,145,400 | |
| | 2,000,000 | | | Chicago Illinois (Recovery Zone Economic Development) Ser. 10D | | | 6.257 | | | | 01/01/2040 | | | | 1,904,560 | |
| | 2,000,000 | | | Chicago Illinois (Taxable Project) Ser. 10B | | | 7.517 | | | | 01/01/2040 | | | | 2,182,080 | |
| | 6,205,000 | | | Chicago Illinois Ser. 10C | | | 6.207 | | | | 01/01/2036 | | | | 5,913,613 | |
| | 1,500,000 | | | Clark County Nevada Las Vegas Convention and Visitors Auth. Ser. 10A | | | 6.554 | | | | 07/01/2030 | | | | 1,915,200 | |
| | 1,620,000 | | | Clark County Nevada Las Vegas Convention and Visitors Auth. Ser. 10A | | | 6.754 | | | | 07/01/2038 | | | | 2,173,149 | |
| | 4,560,000 | | | Clark County Nevada Ser. 10 | | | 7.000 | | | | 07/01/2038 | | | | 5,349,701 | |
| | 4,955,000 | | | Commonwealth of Pennsylvania First Ser. 10B | | | 4.650 | | | | 02/15/2026 | | | | 5,520,762 | |
| | 1,600,000 | | | Cook County Illinois Community Consolidated (School District No. 65) Ser. 09 | | | 4.400 | | | | 12/01/2020 | | | | 1,643,360 | |
| | 700,000 | | | Corpus Christi Texas Independent School District (School Building) Ser. 10B PSF-GTD | | | 6.124 | | | | 08/15/2032 | | | | 796,397 | |
| | 5,170,000 | | | Dallas Texas Independent School District Ser. 10C PSF-GTD | | | 6.450 | | | | 02/15/2035 | | | | 6,116,834 | |
| | 200,000 | | | Delaware State Ser. 09D | | | 5.200 | | | | 10/01/2026 | | | | 220,694 | |
| | 500,000 | | | Denver Colorado City & County School District No. 1 Ser. 09C | | | 5.664 | | | | 12/01/2033 | | | | 646,860 | |
| | 1,000,000 | | | Douglas County Nevada School District Ser. 10A PSF-GTD | | | 6.110 | | | | 04/01/2030 | | | | 1,081,140 | |
| | 605,000 | | | Hallettsville Texas Independent School Ser. 10 PSF-GTD | | | 6.265 | | | | 08/15/2030 | | | | 685,132 | |
| | 1,000,000 | | | Hallettsville Texas Independent School Ser. 10 PSF-GTD | | | 6.465 | | | | 08/15/2035 | | | | 1,102,340 | |
| | 1,000,000 | | | Hawaii State Ser. 10DX | | | 5.530 | | | | 02/01/2030 | | | | 1,274,240 | |
| | 2,000,000 | | | Hayward California Unified School District Ser. 10 AGM | | | 7.350 | | | | 08/01/2043 | | | | 2,358,940 | |
| | 1,000,000 | | | Hillsborough County Florida Ser. 09B | | | 6.350 | | | | 07/01/2039 | | | | 1,082,130 | |
| | 200,000 | | | Itasca Illinois Ser. 09A | | | 6.100 | | | | 02/01/2034 | | | | 221,902 | |
| | 320,000 | | | Itasca Illinois Ser. 09A | | | 6.200 | | | | 02/01/2039 | | | | 354,931 | |
| | 2,000,000 | | | Kiski Pennsylvania Area School District Ser. 10 AGM | | | 6.526 | | | | 09/01/2031 | | | | 2,274,700 | |
| | 1,000,000 | | | Lancaster Texas Ser. 10 | | | 6.528 | | | | 02/15/2040 | | | | 1,115,770 | |
| | 1,000,000 | | | Las Vegas Valley Nevada Water District Ser. 09A | | | 7.100 | | | | 06/01/2039 | | | | 1,121,440 | |
| | 5,140,000 | | | Los Angeles California Community College District Ser. 10 | | | 6.600 | | | | 08/01/2042 | | | | 7,657,366 | |
| | 5,000,000 | | | Los Angeles California Community College District Ser. 10 | | | 6.750 | | | | 08/01/2049 | | | | 7,656,700 | |
| | 500,000 | | | Los Angeles California Unified School District Qualified School Construction Bonds (Election of 2005) Ser. 10J-1 | | | 5.981 | | | | 05/01/2027 | | | | 649,125 | |
| | 1,000,000 | | | Los Angeles California Unified School District Taxable Ser. 09KRY | | | 5.755 | | | | 07/01/2029 | | | | 1,260,620 | |
| | 10,295,000 | | | Los Angeles California University School District Ser. 09KRY | | | 5.750 | | | | 07/01/2034 | | | | 13,417,062 | |
| | 200,000 | | | Louisville & Jefferson County Kentucky Metro Government (Recovery Zone Economic Development) Ser. 09E | | | 5.450 | | | | 11/15/2027 | | | | 244,800 | |
| | 4,300,000 | | | Massachusetts State Ser. 10 | | | 4.480 | | | | 05/01/2024 | | | | 4,896,926 | |
| | 1,595,000 | | | Massachusetts State Ser. 10E | | | 4.200 | | | | 12/01/2021 | | | | 1,760,561 | |
| | 1,500,000 | | �� | Massachusetts State Ser. 16F | | | 3.277 | | | | 06/01/2046 | | | | 1,496,880 | |
| | 1,000,000 | | | Montgomery County Pennsylvania Ser. 10 | | | 6.030 | | | | 09/01/2039 | | | | 1,128,250 | |
| | 3,000,000 | | | Napa Valley California University School District Ser. 10B | | | 6.507 | | | | 08/01/2043 | | | | 4,213,590 | |
| | 1,000,000 | | | New Orleans Louisiana Ser. 10A | | | 8.800 | | | | 12/01/2039 | | | | 1,157,670 | |
| | 1,500,000 | | | New York City New York Ser. 09 | | | 5.985 | | | | 12/01/2036 | | | | 1,963,665 | |
| | 1,000,000 | | | New York City New York Ser. 09D-1 | | | 6.385 | | | | 12/01/2029 | | | | 1,133,860 | |
| | 1,000,000 | | | New York City New York Ser. 10 | | | 5.646 | | | | 06/01/2027 | | | | 1,234,530 | |
| | 2,710,000 | | | New York City New York Ser. 10 | | | 5.817 | | | | 10/01/2031 | | | | 3,084,603 | |
| | 3,920,000 | | | New York City New York Ser. 10 | | | 6.246 | | | | 06/01/2035 | | | | 4,451,082 | |
| | 8,495,000 | | | New York City New York Ser. 10 | | | 5.968 | | | | 03/01/2036 | | | | 11,288,326 | |
| | 1,965,000 | | | New York City New York Taxable Ser. 10F-1 | | | 6.271 | | | | 12/01/2037 | | | | 2,716,554 | |
| | 960,000 | | | North Las Vegas Nevada Ser. 10 | | | 5.372 | | | | 06/01/2019 | | | | 952,166 | |
| | 1,000,000 | | | NYE County Nevada Ser. 10B AGM | | | 6.300 | | | | 08/01/2035 | | | | 1,104,540 | |
| | 1,000,000 | | | NYE County Nevada Ser. 10B AGM | | | 6.400 | | | | 08/01/2040 | | | | 1,091,120 | |
| | 1,450,000 | | | Peoria Illinois Community Unit (School District No. 323) Ser. 10 | | | 6.020 | | | | 04/01/2028 | | | | 1,581,993 | |
| | 1,000,000 | | | Philadelphia Pennsylvania School District Ser. 10 | | | 6.615 | | | | 06/01/2030 | | | | 1,164,610 | |
| | 1,000,000 | | | Quaker Valley Pennsylvania School District Ser. 10 AGM | | | 5.959 | | | | 10/01/2030 | | | | 1,100,520 | |
| | 2,000,000 | | | Round Rock Texas Independent School District Ser. 10 PSF-GTD | | | 5.774 | | | | 08/01/2030 | | | | 2,280,580 | |
See accompanying Notes to Financial Statements which are an integral part of the financial statements.
PowerShares Build America Bond Portfolio (BAB) (continued)
October 31, 2016
| | | | | | | | | | | | | | | | |
Principal
Amount | | | | | Interest
Rate | | | Maturity
Date | | | Value | |
| | | | Municipal Bonds (continued) | | | | | | | | | | | | |
| | | | Ad Valorem Property Tax (continued) | | | | | | | | | | | | |
| $ | 1,000,000 | | | Round Rock Texas Independent School District Ser. 10B | | | 6.054 | % | | | 08/01/2035 | | | $ | 1,080,190 | |
| | 2,000,000 | | | San Antonio Texas Independent School District Ser. 10 PSF-GTD | | | 6.397 | | | | 08/15/2040 | | | | 2,263,560 | |
| | 1,500,000 | | | San Francisco California City & County Ser. 10 | | | 6.260 | | | | 06/15/2030 | | | | 1,973,985 | |
| | 3,850,000 | | | San Francisco California City & County Ser. 10D | | | 6.260 | | | | 06/15/2030 | | | | 5,066,562 | |
| | 1,000,000 | | | San Mateo California Union High School District Ser. 10B | | | 6.733 | | | | 09/01/2034 | | | | 1,192,700 | |
| | 1,000,000 | | | Snohomish County Washington Public Hospital District No. 3 (Cascade Valley Hospital) Ser. 10B | | | 6.329 | | | | 12/01/2035 | | | | 1,037,260 | |
| | 200,000 | | | Southwestern Community College District California Ser. 09B | | | 7.130 | | | | 08/01/2031 | | | | 231,272 | |
| | 5,000,000 | | | Utah State Ser. 10B | | | 3.369 | | | | 07/01/2021 | | | | 5,402,850 | |
| | 15,255,000 | | | Utah State Ser. 10B | | | 3.539 | | | | 07/01/2025 | | | | 16,704,378 | |
| | 675,000 | | | Wilson County Tennessee Tenth Special School District Ser. 10 | | | 6.130 | | | | 04/01/2035 | | | | 735,122 | |
| | | | | | | | | | | | | | | | |
| | | | | | | | | | | | | | | 209,135,442 | |
| | | | | | | | | | | | | | | | |
| | | | College Revenue—7.2% | | | | | | | | | | | | |
| | 4,500,000 | | | California Infrastructure & Economic Development Bank Rev. (California Infrastructure Economic Development) Ser. 10 | | | 6.486 | | | | 05/15/2049 | | | | 6,155,190 | |
| | 900,000 | | | California State University Rev. Ser. 10 | | | 6.484 | | | | 11/01/2041 | | | | 1,201,032 | |
| | 1,000,000 | | | Colorado State Board Governors University Enterprise System Rev. Ser. 10 | | | 5.957 | | | | 03/01/2033 | | | | 1,210,900 | |
| | 2,000,000 | | | Indiana University Rev. Ser. 10 | | | 5.536 | | | | 06/01/2030 | | | | 2,185,820 | |
| | 1,500,000 | | | Indiana University Rev. Ser. 10 | | | 5.636 | | | | 06/01/2035 | | | | 1,620,945 | |
| | 5,000,000 | | | Massachusetts State College Building Auth. Ser. 09C | | | 5.832 | | | | 05/01/2030 | | | | 6,137,100 | |
| | 1,215,000 | | | Mesa State College Colorado (Auxiliary Facilities Enterprise) Rev. Ser. 09B | | | 5.800 | | | | 05/15/2040 | | | | 1,472,070 | |
| | 4,000,000 | | | Missouri State Health & Educational Facilities Auth. Taxable Ref. (Washington University) Ser. 16B | | | 3.086 | | | | 09/15/2051 | | | | 3,729,720 | |
| | 3,000,000 | | | New Jersey State Educational Facilities Auth. Rev. Ser. 10 | | | 6.190 | | | | 07/01/2040 | | | | 3,210,630 | |
| | 1,000,000 | | | New Mexico State University Regents Improvement Rev. Ser. 10B | | | 6.124 | | | | 04/01/2030 | | | | 1,080,250 | |
| | 1,000,000 | | | North Carolina State University at Raleigh Rev. Ser. 10B | | | 5.927 | | | | 10/01/2030 | | | | 1,134,770 | |
| | 3,000,000 | | | Northern Arizona University Rev. (Arizona Board of Regents) Ser. 10A | | | 6.593 | | | | 08/01/2030 | | | | 3,347,790 | |
| | 500,000 | | | Northern Arizona University Rev. Ser. 09A | | | 6.687 | | | | 06/01/2039 | | | | 552,860 | |
| | 1,000,000 | | | Pennsylvania State Higher Educational Facilities Auth. Rev. (Temple University) Ser. 10 | | | 6.141 | | | | 04/01/2030 | | | | 1,231,950 | |
| | 905,000 | | | Rutgers The State University of New Jersey Ser. 10 | | | 5.545 | | | | 05/01/2029 | | | | 1,054,778 | |
| | 1,500,000 | | | University of California Rev. Ref. Ser. 16AS | | | 3.552 | | | | 05/15/2039 | | | | 1,488,690 | |
| | 10,745,000 | | | University of California Rev. Ser. 10 | | | 5.946 | | | | 05/15/2045 | | | | 13,940,885 | |
| | 3,000,000 | | | University of Hawaii Rev. Ser. 10 | | | 5.834 | | | | 10/01/2030 | | | | 3,362,880 | |
| | 5,000,000 | | | University of Hawaii Rev. Ser. 10 | | | 6.034 | | | | 10/01/2040 | | | | 5,602,500 | |
| | 1,500,000 | | | University of Massachusetts Building Auth. Project Rev. Ser. 10 | | | 4.550 | | | | 11/01/2025 | | | | 1,724,925 | |
| | 250,000 | | | University of Michigan University Rev. Ser. 10A | | | 5.513 | | | | 04/01/2030 | | | | 301,195 | |
| | 500,000 | | | University of North Carolina University Ser. 09B | | | 5.757 | | | | 12/01/2039 | | | | 537,590 | |
| | 500,000 | | | University of Texas Ser. 09B | | | 6.276 | | | | 08/15/2041 | | | | 560,600 | |
| | 10,000,000 | | | University of Texas System Ser. 10C | | | 4.644 | | | | 08/15/2030 | | | | 11,742,400 | |
| | 1,435,000 | | | Washington State Biomedical Research Facilities No. 3 Ser. 10B | | | 6.416 | | | | 07/01/2030 | | | | 1,877,568 | |
| | 250,000 | | | Wayne State University Ser. 09B | | | 6.536 | | | | 11/15/2039 | | | | 278,200 | |
| | | | | | | | | | | | | | | | |
| | | | | | | | | | | | | | | 76,743,238 | |
| | | | | | | | | | | | | | | | |
| | | | Electric Power Revenue—11.5% | | | | | | | | | | | | |
| | 7,665,000 | | | American Municipal Power Ohio Inc. (Combined Hydroelectric Projects) Rev. Ser.10 | | | 8.084 | | | | 02/15/2050 | | | | 12,364,105 | |
| | 2,090,000 | | | American Municipal Power Ohio Inc. (Meldahl Hydroelectric-Remarketed) Rev. Ser. 10E | | | 6.270 | | | | 02/15/2050 | | | | 2,680,843 | |
| | 8,005,000 | | | American Municipal Power Ohio Inc. Rev. Ser. 09 | | | 6.053 | | | | 02/15/2043 | | | | 10,116,319 | |
| | 3,395,000 | | | American Municipal Power Ohio Inc. Rev. Ser. 10 | | | 7.499 | | | | 02/15/2050 | | | | 4,952,015 | |
| | 750,000 | | | Benton County Washington Public Utility District No. 1 Electric Rev. Ser. 10 | | | 6.546 | | | | 11/01/2030 | | | | 956,887 | |
| | 6,500,000 | | | Cowlitz County Washington Public Utility District No. 1 Electric Ser. 10 | | | 6.884 | | | | 09/01/2032 | | | | 8,329,685 | |
| | 2,000,000 | | | Douglas County Washington Public Utility District No. 1 Wells Hydroelectric Ser. 10B | | | 5.245 | | | | 09/01/2030 | | | | 2,321,500 | |
| | 2,500,000 | | | Grant County Washington Public Utility District No. 2 (Priest Rapids Hydroelectric) Ref. Ser. 10L | | | 5.730 | | | | 01/01/2030 | | | | 3,029,500 | |
| | 2,750,000 | | | Grant County Washington Public Utility District No. 2 (Priest Rapids Hydroelectric) Ref. Ser. 10L | | | 5.830 | | | | 01/01/2040 | | | | 3,391,245 | |
| | 500,000 | | | JEA Florida Electric Systems Rev. Ser. 09F | | | 6.406 | | | | 10/01/2034 | | | | 631,390 | |
| | 8,000,000 | | | Los Angeles California Department of Water & Power Rev. Ser. 10 | | | 6.166 | | | | 07/01/2040 | | | | 9,069,760 | |
| | 1,500,000 | | | Los Angeles California Department of Water & Power Rev. Ser. 10 | | | 7.000 | | | | 07/01/2041 | | | | 1,810,065 | |
| | 500,000 | | | Missouri Joint Municipal Electric Utility Commission Power Project Rev. Ser. 09A | | | 6.790 | | | | 01/01/2029 | | | | 529,250 | |
| | 10,000,000 | | | Missouri Joint Municipal Electric Utility Commission Power Project Rev. Ser. 09A | | | 6.890 | | | | 01/01/2042 | | | | 12,777,300 | |
| | 1,000,000 | | | Missouri Joint Municipal Electric Utility Commission Power Project Rev. Ser. 10 | | | 7.597 | | | | 01/01/2032 | | | | 1,259,880 | |
| | 9,909,000 | | | Municipal Electric Auth. of Georgia (Plant Vogtle Units 3&4 Project P) Ser. 10 | | | 7.055 | | | | 04/01/2057 | | | | 11,938,958 | |
See accompanying Notes to Financial Statements which are an integral part of the financial statements.
PowerShares Build America Bond Portfolio (BAB) (continued)
October 31, 2016
| | | | | | | | | | | | | | | | |
Principal
Amount | | | | | Interest
Rate | | | Maturity
Date | | | Value | |
| | | | Municipal Bonds (continued) | | | | | | | | | | | | |
| | | | Electric Power Revenue (continued) | | | | | | | | | | | | |
| $ | 6,690,000 | | | Municipal Electric Auth. of Georgia Ser. 10 | | | 6.655 | % | | | 04/01/2057 | | | $ | 8,688,771 | |
| | 1,000,000 | | | Northern California Power Agency (Lodi Energy Center) Rev. Ser. 10B | | | 7.311 | | | | 06/01/2040 | | | | 1,319,760 | |
| | 250,000 | | | Northern Illinois Municipal Power Agency Power Project Rev. Ser. 10 | | | 7.620 | | | | 01/01/2030 | | | | 308,635 | |
| | 9,050,000 | | | South Carolina State Public Service Auth. Rev. Obligation Ser. 10C | | | 6.454 | | | | 01/01/2050 | | | | 12,649,547 | |
| | 1,900,000 | | | Southern California Public Power Auth. (Power Project) Rev. Ser. 10 | | | 5.843 | | | | 07/01/2030 | | | | 2,319,748 | |
| | 2,000,000 | | | Southern California Public Power Auth. Rev. Ser. 10 | | | 5.921 | | | | 07/01/2035 | | | | 2,404,320 | |
| | 2,570,000 | | | Tacoma Washington Electric System Rev. Ser. 10 AGM | | | 5.791 | | | | 01/01/2032 | | | | 3,172,793 | |
| | 5,795,000 | | | Virgin Islands Water & Power Auth. (Electric System) Rev. Ser. 10C AGM | | | 6.850 | | | | 07/01/2035 | | | | 6,344,830 | |
| | | | | | | | | | | | | | | | |
| | | | | | | | | | | | | | | 123,367,106 | |
| | | | | | | | | | | | | | | | |
| | | | Fuel Sales Tax Revenue—1.9% | | | | | | | | | | | | |
| | 595,000 | | | Idaho Housing & Financing Association Ser. 10A-2 | | | 6.348 | | | | 07/15/2028 | | | | 709,579 | |
| | 2,250,000 | | | Missouri State Highways & Transportation Commission (State Road Rev.) Ser. 09 | | | 4.963 | | | | 05/01/2023 | | | | 2,615,850 | |
| | 6,000,000 | | | Missouri State Highways & Transportation Commission (Taxable Third Lien State Road) Ser. 09C | | | 5.063 | | | | 05/01/2024 | | | | 7,062,120 | |
| | 2,000,000 | | | Washington State Ser. 10 | | | 5.090 | | | | 08/01/2033 | | | | 2,468,740 | |
| | 1,400,000 | | | Washoe County Nevada Highway Rev. Ser. 10 | | | 7.063 | | | | 02/01/2030 | | | | 1,559,166 | |
| | 5,000,000 | | | Washoe County Nevada Highway Rev. Ser. 10 | | | 7.213 | | | | 02/01/2039 | | | | 5,553,950 | |
| | | | | | | | | | | | | | | | |
| | | | | | | | | | | | | | | 19,969,405 | |
| | | | | | | | | | | | | | | | |
| | | | General Fund—16.0% | | | | | | | | | | | | |
| | 17,590,000 | | | California State Ser. 09 | | | 7.500 | | | | 04/01/2034 | | | | 25,950,703 | |
| | 3,500,000 | | | California State Ser. 09 | | | 7.300 | | | | 10/01/2039 | | | | 5,162,220 | |
| | 22,850,000 | | | California State Ser. 10 | | | 7.950 | | | | 03/01/2036 | | | | 27,271,475 | |
| | 28,955,000 | | | California State Ser. 10 | | | 7.600 | | | | 11/01/2040 | | | | 45,523,340 | |
| | 15,860,000 | | | California State Various Purpose Ser. 09 | | | 7.550 | | | | 04/01/2039 | | | | 24,585,538 | |
| | 5,000,000 | | | California State Various Purpose Ser. 10 | | | 5.700 | | | | 11/01/2021 | | | | 5,842,900 | |
| | 9,300,000 | | | Illinois State Ser. 10 | | | 6.900 | | | | 03/01/2035 | | | | 9,901,152 | |
| | 5,000,000 | | | Illinois State Ser. 10-1 | | | 5.363 | | | | 02/01/2019 | | | | 5,264,950 | |
| | 14,795,000 | | | Illinois State Ser. 10-1 | | | 5.563 | | | | 02/01/2021 | | | | 16,156,732 | |
| | 2,500,000 | | | Illinois State Ser. 10-2 | | | 5.650 | | | | 03/01/2020 | | | | 2,638,050 | |
| | 2,000,000 | | | Kauai County Hawaii Ser. 10 | | | 5.763 | | | | 08/01/2033 | | | | 2,593,580 | |
| | | | | | | | | | | | | | | | |
| | | | | | | | | | | | | | | 170,890,640 | |
| | | | | | | | | | | | | | | | |
| | | | Government Fund/Grant Revenue—0.9% | | | | | | | | | | | | |
| | 10,700,000 | | | Chicago Board of Education Ser. 09E | | | 6.138 | | | | 12/01/2039 | | | | 9,070,069 | |
| | | | | | | | | | | | | | | | |
| | | | Health, Hospital, Nursing Home Revenue—1.0% | | | | | | | | | | | | |
| | 1,000,000 | | | Cuyahoga County Ohio Hospital Rev. Ser. 10 | | | 8.223 | | | | 02/15/2040 | | | | 1,265,860 | |
| | 2,000,000 | | | King County Washington Public Hospital District No. 1 Hospital Facilities Rev. Ser. 10 | | | 7.900 | | | | 06/15/2030 | | | | 2,311,080 | |
| | 2,500,000 | | | Lee Memorial Health System Florida Hospital Rev. Ser. 10A | | | 7.281 | | | | 04/01/2027 | | | | 3,148,575 | |
| | 1,000,000 | | | Metropolitan Government Nashville & Davidson County Health & Educational Facilities Board (Vanderbilt University Medical Center) Ser. 16B | | | 4.053 | | | | 07/01/2026 | | | | 1,075,700 | |
| | 1,000,000 | | | Oak Valley California Hospital District (Health Facility) Rev. Ser. 10B | | | 9.000 | | | | 11/01/2039 | | | | 1,029,500 | |
| | 1,500,000 | | | Tangipahoa Parish Louisiana Hospital Service District No. 1 (North Oaks Health System) Ser. 09A AGC | | | 7.200 | | | | 02/01/2042 | | | | 1,595,370 | |
| | 500,000 | | | University California Regents Medical Center Pooled Rev. Ser. 09F | | | 6.458 | | | | 05/15/2029 | | | | 630,570 | |
| | | | | | | | | | | | | | | | |
| | | | | | | | | | | | | | | 11,056,655 | |
| | | | | | | | | | | | | | | | |
| | | | Highway Tolls Revenue—5.4% | | | | | | | | | | | | |
| | 3,025,000 | | | Bay Area California Auth. Toll Bridge Rev. (San Francisco Bay Area) Ser. 10S3 | | | 6.907 | | | | 10/01/2050 | | | | 4,619,598 | |
| | 3,605,000 | | | Bay Area California Auth. Toll Bridge Rev. Sub.-Lien Ser. 10S1 | | | 7.043 | | | | 04/01/2050 | | | | 5,512,910 | |
| | 200,000 | | | Illinois State Toll Highway Auth. Toll Highway Rev. Ser. 09A | | | 5.293 | | | | 01/01/2024 | | | | 213,786 | |
| | 1,200,000 | | | Maryland State Transportation Auth. (Transportation Facilities Projects) Rev. Ser. 10B | | | 5.604 | | | | 07/01/2030 | | | | 1,502,424 | |
| | 250,000 | | | New Hampshire State Turnpike System Rev. Ser. 09B | | | 6.259 | | | | 11/01/2029 | | | | 281,083 | |
| | 250,000 | | | New Hampshire State Turnpike System Rev. Ser. 09B | | | 6.009 | | | | 11/01/2039 | | | | 317,438 | |
| | 4,215,000 | | | New Jersey State Turnpike Auth. Rev. Ser. 09F | | | 7.414 | | | | 01/01/2040 | | | | 6,384,798 | |
| | 2,280,000 | | | New York Triborough Bridge & Tunnel Auth. Rev. Ser. 10 | | | 5.450 | | | | 11/15/2032 | | | | 2,826,767 | |
| | 5,000,000 | | | North Texas Tollway Auth. Rev. Sub.-Lien Ser. 10B-2 | | | 8.410 | | | | 02/01/2030 | | | | 6,792,700 | |
| | 1,443,000 | | | Pennsylvania State Turnpike Commission Rev. Ser. 09 | | | 6.105 | | | | 12/01/2039 | | | | 1,922,927 | |
| | 2,000,000 | | | Texas State Transportation Commission Rev. (First Tier) Ser. 10B | | | 5.028 | | | | 04/01/2026 | | | | 2,398,180 | |
| | 11,715,000 | | | Texas State Transportation Commission Rev. (First Tier) Ser. 10B | | | 5.178 | | | | 04/01/2030 | | | | 14,679,012 | |
See accompanying Notes to Financial Statements which are an integral part of the financial statements.
PowerShares Build America Bond Portfolio (BAB) (continued)
October 31, 2016
| | | | | | | | | | | | | | | | |
Principal
Amount | | | | | Interest
Rate | | | Maturity
Date | | | Value | |
| | | | Municipal Bonds (continued) | | | | | | | | | | | | |
| | | | Highway Tolls Revenue (continued) | | | | | | | | | | | | |
| $ | 5,000,000 | | | Triborough Bridge & Tunnel Auth. Ser. 09B | | | 5.420 | % | | | 11/15/2036 | | | $ | 6,330,300 | |
| | 2,715,000 | | | Triborough Bridge & Tunnel Auth. Ser. 09B | | | 5.500 | | | | 11/15/2039 | | | | 3,509,816 | |
| | | | | | | | | | | | | | | | |
| | | | | | | | | | | | | | | 57,291,739 | |
| | | | | | | | | | | | | | | | |
| | | | Hotel Occupancy Tax—0.4% | | | | | | | | | | | | |
| | 2,780,000 | | | Dallas Texas Convention Center Hotel Development Corp. Ser. 09 | | | 7.088 | | | | 01/01/2042 | | | | 3,887,274 | |
| | | | | | | | | | | | | | | | |
| | | | Income Tax Revenue—2.7% | | | | | | | | | | | | |
| | 3,785,000 | | | New York City Transitional Finance Auth. (Building Aid) Rev. Sub.-Ser. 10S-1B | | | 6.828 | | | | 07/15/2040 | | | | 5,228,902 | |
| | 6,475,000 | | | New York City Transitional Finance Auth. (Future Tax Secured) Rev. Ser. 10 | | | 5.932 | | | | 11/01/2036 | | | | 7,409,342 | |
| | 5,730,000 | | | New York City Transitional Finance Auth. Rev. Ser. 10 | | | 4.325 | | | | 11/01/2021 | | | | 6,396,514 | |
| | 200,000 | | | New York State Dormitory Auth. State Personal Income Tax Rev. Ser. 09F | | | 5.292 | | | | 03/15/2025 | | | | 237,348 | |
| | 2,760,000 | | | New York State Dormitory Auth. State Personal Income Tax Rev. Ser. 10 | | | 5.500 | | | | 03/15/2030 | | | | 3,431,977 | |
| | 1,800,000 | | | New York State Dormitory Auth. State Personal Income Tax Rev. Ser. 10 | | | 5.389 | | | | 03/15/2040 | | | | 2,287,494 | |
| | 1,400,000 | | | New York State Dormitory Auth. State Personal Income Tax Rev. Ser. 10C | | | 4.904 | | | | 02/15/2023 | | | | 1,609,748 | |
| | 2,000,000 | | | New York State Urban Development Corp. Rev. State Personal Income Tax Ser. 10C | | | 5.838 | | | | 03/15/2040 | | | | 2,572,860 | |
| | | | | | | | | | | | | | | | |
| | | | | | | | | | | | | | | 29,174,185 | |
| | | | | | | | | | | | | | | | |
| | | | Lease Revenue—3.1% | | | | | | | | | | | | |
| | 300,000 | | | Beverly Hills California Public Financing Auth. Lease Rev. (Various Projects) Ser. 10C | | | 6.674 | | | | 06/01/2030 | | | | 341,175 | |
| | 1,000,000 | | | Beverly Hills California Public Financing Auth. Lease Rev. (Various Projects) Ser. 10C | | | 6.774 | | | | 06/01/2040 | | | | 1,131,810 | |
| | 2,000,000 | | | Brighton Colorado COP Ser. 10B AGM | | | 6.550 | | | | 12/01/2030 | | | | 2,200,320 | |
| | 800,000 | | | California State Public Works Board Lease Rev. (California State University Projects) Ser. 10B-2 | | | 7.804 | | | | 03/01/2035 | | | | 1,131,024 | |
| | 1,000,000 | | | Columbus Indiana Multi-High School Building Corp. Ser. 10 | | | 6.446 | | | | 01/15/2030 | | | | 1,071,700 | |
| | 80,000 | | | Escondido California Union High School District COP (Qualified School Construction Bonds) Ser. 10 AGM | | | 5.000 | | | | 06/01/2017 | | | | 81,147 | |
| | 1,000,000 | | | Franklin County Ohio Convention Facilities Auth. Ser. 10 | | | 6.390 | | | | 12/01/2030 | | | | 1,203,050 | |
| | 1,070,000 | | | Franklin County Ohio Convention Facilities Auth. Ser. 10 | | | 6.540 | | | | 12/01/2036 | | | | 1,317,384 | |
| | 500,000 | | | Los Angeles California Municipal Improvement Corp. Lease Rev. (Recovery Zone Economic Development) Ser. 09D | | | 7.757 | | | | 09/01/2039 | | | | 564,075 | |
| | 2,000,000 | | | Miami-Dade County Florida School Board COP Ser. 10 | | | 6.935 | | | | 06/15/2032 | | | | 2,171,560 | |
| | 1,000,000 | | | New Jersey State Educational Facilities Auth. Rev. Ser. 10B | | | 7.225 | | | | 07/01/2030 | | | | 1,144,450 | |
| | 2,000,000 | | | New York City Educational Construction Fund Rev. Ser. 10 | | | 6.000 | | | | 04/01/2035 | | | | 2,325,160 | |
| | 1,000,000 | | | Passaic County New Jersey Ser. 10 | | | 6.540 | | | | 08/01/2031 | | | | 1,080,280 | |
| | 500,000 | | | Peoria Illinois Public Building Commission (School District Facilities) Rev. Ser. 09C AGC | | | 6.580 | | | | 12/01/2029 | | | | 545,815 | |
| | 5,000,000 | | | Port of Morrow Oregon Transmission Facilities Rev. (Bonneville Corporation Project No. 4) Ser. 16 | | | 2.987 | | | | 09/01/2036 | | | | 4,849,150 | |
| | 3,000,000 | | | Regional Transportation District Colorado COP Ser. 10 | | | 7.672 | | | | 06/01/2040 | | | | 4,069,530 | |
| | 500,000 | | | Salt Lake County Utah Municipal Building Auth. (Lease Rev.) Ser. 09B | | | 5.820 | | | | 12/01/2029 | | | | 635,680 | |
| | 3,000,000 | | | San Francisco California City and County COP Ser. 09D | | | 6.487 | | | | 11/01/2041 | | | | 3,961,650 | |
| | 1,000,000 | | | St. Charles Missouri COP Ser. 10B | | | 5.650 | | | | 02/01/2030 | | | | 1,068,830 | |
| | 2,250,000 | | | Williamsburg County South Carolina Public Facilities Corp. (Installment Purchase Rev.) Ser. 10 | | | 6.526 | | | | 12/01/2030 | | | | 2,521,980 | |
| | | | | | | | | | | | | | | | |
| | | | | | | | | | | | | | | 33,415,770 | |
| | | | | | | | | | | | | | | | |
| | | | Miscellaneous Revenue—3.8% | | | | | | | | | | | | |
| | 500,000 | | | Battery Park City Auth. Rev. Ser. 09A | | | 6.375 | | | | 11/01/2039 | | | | 555,565 | |
| | 500,000 | | | Camden County New Jersey Improvement Auth. Rev. Ser. 09A | | | 6.180 | | | | 01/15/2027 | | | | 584,405 | |
| | 2,000,000 | | | Commonwealth Financing Auth. Pennsylvania Rev. Ser. 10 | | | 5.587 | | | | 06/01/2030 | | | | 2,342,300 | |
| | 1,000,000 | | | Indianapolis Indiana Local Public Improvement Bond Bank Ser. 10 | | | 5.854 | | | | 01/15/2030 | | | | 1,251,650 | |
| | 3,500,000 | | | Indianapolis Indiana Local Public Improvement Bond Bank Ser. 10B-2 | | | 5.966 | | | | 01/15/2030 | | | | 4,419,835 | |
| | 500,000 | | | Kansas State Development Finance Auth. Rev. (Kansas State Projects) Ser. 10E-2 | | | 6.120 | | | | 11/01/2029 | | | | 558,445 | |
| | 2,000,000 | | | Kansas State Development Finance Auth. Rev. Ser. 10 | | | 5.945 | | | | 03/01/2030 | | | | 2,202,620 | |
| | 7,000,000 | | | Miami-Dade County Florida Special Obligation Ser. 10B | | | 6.743 | | | | 04/01/2040 | | | | 7,910,140 | |
| | 1,000,000 | | | Mississippi State Ser. 10 | | | 5.245 | | | | 11/01/2034 | | | | 1,241,910 | |
| | 3,000,000 | | | New Jersey Economic Development Auth. Rev. Ser. 10CC-1 | | | 6.425 | | | | 12/15/2035 | | | | 3,255,060 | |
| | 1,000,000 | | | Port St. Lucie Florida Stormwater Utility Rev. Ser. 10A AGC | | | 7.376 | | | | 05/01/2039 | | | | 1,157,010 | |
| | 2,000,000 | | | St. Cloud Florida Capital Improvement Rev. Ser. 10B AGM | | | 5.849 | | | | 09/01/2030 | | | | 2,205,300 | |
| | 9,680,000 | | | Texas State Ser. 09 | | | 5.517 | | | | 04/01/2039 | | | | 13,108,656 | |
| | | | | | | | | | | | | | | | |
| | | | | | | | | | | | | | | 40,792,896 | |
| | | | | | | | | | | | | | | | |
| | | | Multiple Utility Revenue—0.1% | | | | | | | | | | | | |
| | 810,000 | | | Colorado Springs Colorado Utilities Rev. (Direct Pay) Ser. 10B2 | | | 5.738 | | | | 11/15/2050 | | | | 910,383 | |
| | | | | | | | | | | | | | | | |
See accompanying Notes to Financial Statements which are an integral part of the financial statements.
PowerShares Build America Bond Portfolio (BAB) (continued)
October 31, 2016
| | | | | | | | | | | | | | | | |
Principal
Amount | | | | | Interest
Rate | | | Maturity
Date | | | Value | |
| | | | Municipal Bonds (continued) | | | | | | | | | | | | |
| | | | Nuclear Revenue—0.2% | | | | | | | | | | | | |
| $ | 2,500,000 | | | South Carolina State Public Service Auth. Rev. Obligation Ser. 16D | | | 2.388 | % | | | 12/01/2023 | | | $ | 2,523,100 | |
| | | | | | | | | | | | | | | | |
| | | | Port, Airport & Marina Revenue—3.3% | | | | | | | | | | | | |
| | 3,190,000 | | | Chicago Illinois O’Hare International Airport Ser. 10 | | | 6.845 | | | | 01/01/2038 | | | | 3,567,792 | |
| | 5,750,000 | | | Chicago Illinois O’Hare International Airport Ser. 10 | | | 6.395 | | | | 01/01/2040 | | | | 7,991,580 | |
| | 250,000 | | | Long Beach California Senior Airport Rev. Ser. 09C | | | 7.765 | | | | 06/01/2039 | | | | 278,712 | |
| | 2,000,000 | | | New York State Transportation Development Corp. Special Facilities Rev. (LaGuardia Airport Terminal Redevelopment Project) Ser. 16B | | | 3.023 | | | | 07/01/2024 | | | | 2,009,900 | |
| | 2,750,000 | | | New York State Transportation Development Corp. Special Facilities Rev. (LaGuardia Airport Terminal Redevelopment Project) Ser. 16B | | | 3.123 | | | | 01/01/2025 | | | | 2,776,043 | |
| | 2,500,000 | | | New York State Transportation Development Corp. Special Facilities Rev. (LaGuardia Airport Terminal Redevelopment Project) Ser. 16B | | | 3.223 | | | | 07/01/2025 | | | | 2,524,825 | |
| | 2,000,000 | | | New York State Transportation Development Corp. Special Facilities Rev. (LaGuardia Airport Terminal Redevelopment Project) Ser. 16B | | | 3.273 | | | | 01/01/2026 | | | | 2,023,360 | |
| | 1,000,000 | | | New York State Transportation Development Corp. Special Facilities Rev. (LaGuardia Airport Terminal Redevelopment Project) Ser. 16B | | | 3.323 | | | | 07/01/2026 | | | | 1,013,030 | |
| | 2,000,000 | | | New York State Transportation Development Corp. Special Facilities Rev. (LaGuardia Airport Terminal Redevelopment Project) Ser. 16B | | | 3.423 | | | | 07/01/2027 | | | | 2,018,860 | |
| | 3,000,000 | | | New York State Transportation Development Corp. Special Facilities Rev. (LaGuardia Airport Terminal Redevelopment Project) Ser. 16B | | | 3.473 | | | | 07/01/2028 | | | | 3,017,130 | |
| | 2,000,000 | | | New York State Transportation Development Corp. Special Facilities Rev. (LaGuardia Airport Terminal Redevelopment Project) Ser. 16B | | | 3.573 | | | | 07/01/2029 | | | | 2,010,140 | |
| | 1,000,000 | | | New York State Transportation Development Corp. Special Facilities Rev. (LaGuardia Airport Terminal Redevelopment Project) Ser. 16B | | | 3.673 | | | | 07/01/2030 | | | | 1,008,170 | |
| | 5,000,000 | | | South Jersey Port Corp. New Jersey Rev. (Marine Terminal) Ser. 09-P-3 | | | 7.365 | | | | 01/01/2040 | | | | 5,516,800 | |
| | | | | | | | | | | | | | | | |
| | | | | | | | | | | | | | | 35,756,342 | |
| | | | | | | | | | | | | | | | |
| | | | Sales Tax Revenue—2.0% | | | | | | | | | | | | |
| | 1,855,000 | | | Central Puget Sound Washington Regional Transportation Auth. Sales & Use Ser. 09 | | | 5.491 | | | | 11/01/2039 | | | | 2,461,789 | |
| | 1,000,000 | | | Denver Colorado City & County Dedicated Tax Rev. Ref. & Improvement Ser. 16B | | | 3.818 | | | | 08/01/2032 | | | | 1,037,780 | |
| | 200,000 | | | Glendale Arizona Municipal Property Corp. (Excise Tax) Rev. Ser. 08B AGM | | | 6.157 | | | | 07/01/2033 | | | | 249,074 | |
| | 2,000,000 | | | Massachusetts State Bay Transportation Auth. Sales Tax Rev. Ser. 10 | | | 5.869 | | | | 07/01/2040 | | | | 2,556,320 | |
| | 450,000 | | | Massachusetts State School Building Auth. Dedicated Sales Tax Rev. Ser. 09B | | | 5.715 | | | | 08/15/2039 | | | | 599,413 | |
| | 2,500,000 | | | Miami-Dade County Florida Transit Sales Surtax Rev. Ser. 10B | | | 5.534 | | | | 07/01/2032 | | | | 2,869,050 | |
| | 1,000,000 | | | Missouri State Highways & Transportation Commission (State Road Rev.) Ser. 10 | | | 5.020 | | | | 05/01/2025 | | | | 1,173,930 | |
| | 1,955,000 | | | New York City Transitional Finance Auth. Rev. Ser. 10 | | | 4.867 | | | | 08/01/2024 | | | | 2,282,541 | |
| | 1,025,000 | | | Santa Clara Valley California Transportation Auth. Sales Tax Rev. Ser. 10 | | | 5.876 | | | | 04/01/2032 | | | | 1,306,168 | |
| | 1,815,000 | | | Utah Transit Auth. Sales Tax Rev. Ser. 09B | | | 5.937 | | | | 06/15/2039 | | | | 2,413,533 | |
| | 3,000,000 | | | Washoe County Nevada Sales Tax Rev. Ser. 10 | | | 7.451 | | | | 02/01/2040 | | | | 4,078,140 | |
| | | | | | | | | | | | | | | | |
| | | | | | | | | | | | | | | 21,027,738 | |
| | | | | | | | | | | | | | | | |
| | | | Sewer Revenue—1.1% | | | | | | | | | | | | |
| | 3,000,000 | | | East Bay California Municipal Utility District Wastewater System Rev. Ser. 10 | | | 5.026 | | | | 06/01/2032 | | | | 3,599,490 | |
| | 1,030,000 | | | Jurupa California Community Services District COP Ser. 10B | | | 6.347 | | | | 09/01/2025 | | | | 1,295,163 | |
| | 1,070,000 | | | Jurupa California Community Services District COP Ser. 10B | | | 6.497 | | | | 09/01/2026 | | | | 1,380,407 | |
| | 1,125,000 | | | Jurupa California Community Services District COP Ser. 10B | | | 6.597 | | | | 09/01/2027 | | | | 1,470,577 | |
| | 1,170,000 | | | Jurupa California Community Services District COP Ser. 10B | | | 6.697 | | | | 09/01/2028 | | | | 1,542,891 | |
| | 500,000 | | | Knoxville Tennessee Waste Water System Rev. Ser. 10 | | | 6.300 | | | | 04/01/2045 | | | | 550,850 | |
| | 200,000 | | | Memphis Tennessee Sanitary Sewage System Rev. Ser. 09B AGC | | | 6.300 | | | | 10/01/2029 | | | | 225,230 | |
| | 1,100,000 | | | Riverside California Sewer Rev. Ser. 09 | | | 7.000 | | | | 08/01/2029 | | | | 1,249,842 | |
| | 200,000 | | | Sarasota Florida Water & Sewer System Rev. Ser. 10B | | | 5.425 | | | | 10/01/2030 | | | | 219,058 | |
| | | | | | | | | | | | | | | | |
| | | | | | | | | | | | | | | 11,533,508 | |
| | | | | | | | | | | | | | | | |
| | | | Special Assessment—0.2% | | | | | | | | | | | | |
| | 1,500,000 | | | Macomb Interceptor Drainage District Michigan Ser. 10A | | | 5.375 | | | | 05/01/2035 | | | | 1,551,930 | |
| | | | | | | | | | | | | | | | |
| | | | Tax Increment Revenue—0.2% | | | | | | | | | | | | |
| | 1,000,000 | | | Temecula California Redevelopment Agency Tax Allocation Rev. (Temecula Redevelopment No. 1) Ser. 10B | | | 7.930 | | | | 08/01/2030 | | | | 1,100,390 | |
| | 1,000,000 | | | Temecula California Redevelopment Agency Tax Allocation Rev. (Temecula Redevelopment No. 1) Ser. 10B | | | 8.180 | | | | 08/01/2039 | | | | 1,107,920 | |
| | | | | | | | | | | | | | | | |
| | | | | | | | | | | | | | | 2,208,310 | |
| | | | | | | | | | | | | | | | |
See accompanying Notes to Financial Statements which are an integral part of the financial statements.
PowerShares Build America Bond Portfolio (BAB) (continued)
October 31, 2016
| | | | | | | | | | | | | | | | |
Principal
Amount | | | | | Interest
Rate | | | Maturity
Date | | | Value | |
| | | | Municipal Bonds (continued) | | | | | | | | | | | | |
| | | | Transit Revenue—4.7% | | | | | | | | | | | | |
| $ | 2,500,000 | | | Metropolitan Transportation Auth. New York Dedicated Tax Fund (Metro Transit Auth.) Ser. 10A-2 | | | 6.089 | % | | | 11/15/2040 | | | $ | 3,349,600 | |
| | 335,000 | | | Metropolitan Transportation Auth. New York Rev. Ser. 09 | | | 5.871 | | | | 11/15/2039 | | | | 432,954 | |
| | 1,230,000 | | | Metropolitan Transportation Auth. New York Rev. Ser. 10 | | | 6.648 | | | | 11/15/2039 | | | | 1,688,101 | |
| | 7,250,000 | | | Metropolitan Transportation Auth. New York Rev. Ser. 10A | | | 6.668 | | | | 11/15/2039 | | | | 10,161,673 | |
| | 3,745,000 | | | Metropolitan Transportation Auth. New York Rev. Ser. 10C-1 | | | 6.687 | | | | 11/15/2040 | | | | 5,229,630 | |
| | 12,525,000 | | | Metropolitan Transportation Auth. New York Rev. Ser. 10E | | | 6.814 | | | | 11/15/2040 | | | | 17,550,531 | |
| | 7,455,000 | | | New Jersey State Transportation Trust Fund Auth. Ser. 10B | | | 6.561 | | | | 12/15/2040 | | | | 8,875,923 | |
| | 1,990,000 | | | New Jersey State Transportation Trust Fund Auth. Ser. 10C | | | 5.754 | | | | 12/15/2028 | | | | 2,210,014 | |
| | 1,125,000 | | | New Jersey State Transportation Trust Fund Auth. Ser. 10C | | | 6.104 | | | | 12/15/2028 | | | | 1,248,919 | |
| | | | | | | | | | | | | | | | |
| | | | | | | | | | | | | | | 50,747,345 | |
| | | | | | | | | | | | | | | | |
| | | | Water Revenue—8.6% | | | | | | | | | | | | |
| | 1,500,000 | | | Beaumont Texas Waterworks & Sewer System Ser. 10B | | | 6.007 | | | | 09/01/2030 | | | | 1,704,960 | |
| | 200,000 | | | Davie Florida Water & Sewer Rev. Ser. 10B AGM | | | 6.599 | | | | 10/01/2030 | | | | 230,576 | |
| | 3,000,000 | | | East Bay California Municipal Utility District Water System Rev. Ser. 10 | | | 5.874 | | | | 06/01/2040 | | | | 3,967,560 | |
| | 2,000,000 | | | Fresno California Water System Rev. Ser. 10A-2 | | | 6.500 | | | | 06/01/2030 | | | | 2,435,800 | |
| | 1,250,000 | | | JEA Florida Water & Sewer System Rev. Ser. 10A | | | 6.210 | | | | 10/01/2033 | | | | 1,645,375 | |
| | 2,000,000 | | | Jurupa California Community Services District COP (Water Bonds) Ser. 10B | | | 7.192 | | | | 09/01/2040 | | | | 2,784,700 | |
| | 1,715,000 | | | Los Angeles California Department of Water & Power Rev. Ser. 10 | | | 6.603 | | | | 07/01/2050 | | | | 2,586,494 | |
| | 500,000 | | | Los Angeles California Department of Water & Power Water System Rev. Ser. 09C | | | 5.381 | | | | 07/01/2024 | | | | 601,085 | |
| | 2,270,000 | | | Los Angeles California Department of Water & Power Water System Rev. Ser. 09C | | | 6.008 | | | | 07/01/2039 | | | | 2,960,330 | |
| | 1,125,000 | | | Massachusetts State Water Pollution Abatement Trust Ser. 10 | | | 5.192 | | | | 08/01/2040 | | | | 1,333,755 | |
| | 1,000,000 | | | Metropolitan Water District of Southern California Ser. 10 | | | 6.947 | | | | 07/01/2040 | | | | 1,171,330 | |
| | 1,700,000 | | | New York City Municipal Finance Auth. Water & Sewer System Rev. (Taxable Second General) Ser. 10EE | | | 6.011 | | | | 06/15/2042 | | | | 2,373,982 | |
| | 1,480,000 | | | New York City Municipal Finance Auth. Water & Sewer System Rev. Ser. 10 | | | 5.952 | | | | 06/15/2042 | | | | 2,054,714 | |
| | 2,925,000 | | | New York City Municipal Water Finance Auth. Water & Sewer Rev. Ser. 10 | | | 5.790 | | | | 06/15/2041 | | | | 3,322,361 | |
| | 9,460,000 | | | New York City Municipal Water Finance Auth. Water & Sewer Rev. Ser. 10 | | | 5.724 | | | | 06/15/2042 | | | | 12,862,762 | |
| | 6,100,000 | | | New York City Municipal Water Finance Auth. Water & Sewer Rev. Ser. 10 | | | 6.124 | | | | 06/15/2042 | | | | 6,982,670 | |
| | 4,460,000 | | | New York City Municipal Water Finance Auth. Water & Sewer Rev. Ser. 10 | | | 5.440 | | | | 06/15/2043 | | | | 5,900,981 | |
| | 1,000,000 | | | New York City Municipal Water Finance Auth. Water & Sewer Rev. Ser. 10DD | | | 6.452 | | | | 06/15/2041 | | | | 1,158,510 | |
| | 1,000,000 | | | New York State Environmental Facilities Corp. (State Clean Water & Drinking Water) Ser. 10 | | | 5.707 | | | | 06/15/2030 | | | | 1,234,160 | |
| | 500,000 | | | Passaic Valley New Jersey Water Commission Water Supply Rev. Ser. 09B | | | 7.570 | | | | 12/15/2029 | | | | 648,410 | |
| | 500,000 | | | Passaic Valley New Jersey Water Commission Water Supply Rev. Ser. 09B | | | 7.820 | | | | 12/15/2039 | | | | 699,120 | |
| | 500,000 | | | Riverside California Water Rev. Ser. 09B | | | 6.349 | | | | 10/01/2039 | | | | 703,055 | |
| | 2,245,000 | | | San Francisco California City & County Public Utilities Commission Water Rev. Ser. 10 | | | 6.000 | | | | 11/01/2040 | | | | 2,903,167 | |
| | 3,000,000 | | | San Francisco California City & County Public Utilities Commission Water Rev. Ser. 10DE | | | 5.700 | | | | 11/01/2027 | | | | 3,730,770 | |
| | 2,480,000 | | | San Francisco California City & County Public Utilities Commission Water Rev. Ser. 10DE | | | 6.000 | | | | 11/01/2040 | | | | 3,214,998 | |
| | 4,600,000 | | | San Francisco City & County Public Utilities Commission Ser. 10 | | | 6.950 | | | | 11/01/2050 | | | | 6,879,346 | |
| | 3,000,000 | | | Santa Clara Valley California Water District Ref. Ser. 16B | | | 4.354 | | | | 06/01/2046 | | | | 3,162,090 | |
| | 2,000,000 | | | Seminole County Florida Water & Sewer Rev. Ser. 10B | | | 6.443 | | | | 10/01/2040 | | | | 2,292,700 | |
| | 2,000,000 | | | South Central Connecticut Regional Water Auth. Water System Rev. Ser. 10 | | | 6.243 | | | | 08/01/2030 | | | | 2,402,000 | |
| | 1,645,000 | | | South Central Connecticut Regional Water Auth. Water System Rev. Ser. 10 | | | 6.393 | | | | 08/01/2040 | | | | 2,096,108 | |
| | 1,500,000 | | | Sunrise Florida Utility System Rev. Ser. 10B | | | 5.813 | | | | 10/01/2030 | | | | 1,677,915 | |
| | 1,000,000 | | | Tacoma Washington Water System Rev. Ser. 10B | | | 5.371 | | | | 12/01/2030 | | | | 1,162,840 | |
| | 1,275,000 | | | Tucson Arizona Water Rev. Ser. 10 | | | 5.789 | | | | 07/01/2026 | | | | 1,525,856 | |
| | 1,250,000 | | | Upper Eagle Regional Water Auth. Colorado Rev. Ser. 10 | | | 6.518 | | | | 12/01/2039 | | | | 1,395,538 | |
| | 500,000 | | | Western Nassau County Water Auth. Water System Rev. Ser. 10 | | | 6.701 | | | | 04/01/2040 | | | | 641,915 | |
| | | | | | | | | | | | | | | | |
| | | | | | | | | | | | | | | 92,447,933 | |
| | | | | | | | | | | | | | | | |
| | | | Total Municipal Bonds
(Cost $927,998,753) | | | | | | | | | | | 1,003,501,008 | |
| | | | | | | | | | | | | | | | |
| | | | |
| | | | | | | | | | | | | | | | |
| | | | Corporate Bonds—0.8% | | | | | | | | | | | | |
| | | | Healthcare-Services—0.6% | | | | | | | | | | | | |
| | 3,000,000 | | | Baylor Scott & White Holdings | | | 3.967 | | | | 11/15/2046 | | | | 3,052,983 | |
| | 2,000,000 | | | Mayo Clinic, Series 2016 | | | 4.128 | | | | 11/15/2052 | | | | 2,157,506 | |
| | 1,435,000 | | | Montefiore Medical Center | | | 2.895 | | | | 04/20/2032 | | | | 1,409,279 | |
| | | | | | | | | | | | | | | | |
| | | | | | | | | | | | | | | 6,619,768 | |
| | | | | | | | | | | | | | | | |
See accompanying Notes to Financial Statements which are an integral part of the financial statements.
PowerShares Build America Bond Portfolio (BAB) (continued)
October 31, 2016
| | | | | | | | | | | | | | | | |
Principal
Amount | | | | | Interest
Rate | | | Maturity
Date | | | Value | |
| | | | Corporate Bonds (continued) | | | | | | | | | | | | |
| | | | Commercial Services—0.2% | | | | | | | | | | | | |
| $ | 2,000,000 | | | Trustees of Dartmouth College | | | 3.474 | % | | | 06/01/2046 | | | $ | 2,034,204 | |
| | | | | | | | | | | | | | | | |
| | | | Total Corporate Bonds
(Cost $8,434,900) | | | | | | | | | | | 8,653,972 | |
| | | | | | | | | | | | | | | | |
| | | | |
| | | | | | | | | | | | | | | | |
| | | | | | | | |
Number
of Shares | | | | | | |
| | | | Money Market Fund—3.8% | | | | |
| | 40,960,612 | | | Invesco Premier U.S. Government Money Portfolio—Institutional Class, 0.25%(a)
(Cost $40,960,612) | | | 40,960,612 | |
| | | | | | | | |
| | | | Total Investments
(Cost $977,394,265)— 98.4% | | | 1,053,115,592 | |
| | | | Other assets less liabilities—1.6% | | | 17,563,695 | |
| | | | | | | | |
| | | | Net Assets—100.0% | | $ | 1,070,679,287 | |
| | | | | | | | |
Investment Abbreviations:
AGC—Assured Guaranty Corp.
AGM—Assured Guaranty Municipal Corp.
Auth.—Authority
COP—Certificate of Participation
PSF-GTD—Permanent School Fund Guaranteed
Ref.—Refunding
Rev.—Revenue
Ser.—Series
Sub.—Subordinated
Notes to Schedule of Investments:
| (a) | The security and the Fund are advised by wholly-owned subsidiaries of Invesco Ltd. and are therefore considered to be affiliated. The rate shown is the 7-day SEC standardized yield as of October 31, 2016. |
See accompanying Notes to Financial Statements which are an integral part of the financial statements.
Schedule of Investments
PowerShares California AMT-Free Municipal Bond Portfolio (PWZ)
October 31, 2016
| | | | | | | | | | | | | | | | |
Principal
Amount | | | | | Interest
Rate | | | Maturity
Date | | | Value | |
| | | | Municipal Bonds—98.9% | | | | | | | | | | | | |
| | | | Ad Valorem Property Tax—19.8% | | | | | | | | | | | | |
| $ | 1,350,000 | | | Antelope Valley California Community College District (Election 2004) Ser. 07B NATL(a) | | | 5.250 | % | | | 08/01/2017 | | | $ | 1,396,629 | |
| | 500,000 | | | Arcadia California Unified School District (Election 2006) Ser. 07A AGM | | | 5.000 | | | | 08/01/2037 | | | | 505,105 | |
| | 775,000 | | | California State Ref. Ser. 12 | | | 5.000 | | | | 02/01/2038 | | | | 894,900 | |
| | 1,500,000 | | | California State Ref. Ser. 15 | | | 5.000 | | | | 08/01/2035 | | | | 1,786,530 | |
| | 3,000,000 | | | California State Ser. 15 | | | 5.000 | | | | 08/01/2045 | | | | 3,573,060 | |
| | 1,000,000 | | | California State Various Purpose Ser. 09 | | | 5.500 | | | | 11/01/2039 | | | | 1,124,540 | |
| | 1,965,000 | | | California State Various Purpose Ser. 13 | | | 5.000 | | | | 11/01/2043 | | | | 2,308,993 | |
| | 800,000 | | | Centinela Valley California Union High School District (Election 2010) Ser. 12B AGM | | | 5.000 | | | | 08/01/2050 | | | | 954,784 | |
| | 2,000,000 | | | Chaffey California Joint Union High School District (Election 2012) Ser. 15B | | | 5.000 | | | | 08/01/2044 | | | | 2,347,780 | |
| | 1,000,000 | | | Colton California Joint Unified School District (Election 2008) Ser. 09-A AGC(a) | | | 5.375 | | | | 08/01/2019 | | | | 1,120,590 | |
| | 2,745,000 | | | Contra Costa California Community College District (Election of 2006) Ser. 13 | | | 5.000 | | | | 08/01/2038 | | | | 3,256,751 | |
| | 1,500,000 | | | Corona-Norco California Unified School District (Election 2006) Ser. 09C AGM(a) | | | 5.500 | | | | 08/01/2019 | | | | 1,685,955 | |
| | 500,000 | | | Desert California Community College District Ser. 07C AGM(a) | | | 5.000 | | | | 08/01/2017 | | | | 516,300 | |
| | 1,500,000 | | | El Monte California Union High School District (Election 2008) Ser. 09A AGC(a) | | | 5.500 | | | | 06/01/2019 | | | | 1,674,975 | |
| | 500,000 | | | Los Angeles California Community College District (Election 2001) Ser. 07A NATL(a) | | | 5.000 | | | | 08/01/2017 | | | | 516,300 | |
| | 1,000,000 | | | Los Angeles California Community College District Ref. Ser. 16 | | | 5.000 | | | | 08/01/2036 | | | | 1,214,130 | |
| | 1,505,000 | | | Los Angeles Unified School District (Election 2002) Ser. 07C AGM(a) | | | 5.000 | | | | 07/01/2017 | | | | 1,548,419 | |
| | 1,500,000 | | | Oakland California Unified School District (Alameda County) Ser. 15A | | | 5.000 | | | | 08/01/2040 | | | | 1,759,545 | |
| | 1,100,000 | | | Puerto Rico Commonwealth Public Improvement Ref. Ser. 07A-4 AGM | | | 5.000 | | | | 07/01/2031 | | | | 1,168,288 | |
| | 400,000 | | | San Diego California Community College District (Election 2006) Ser. 07 AGM(a) | | | 5.000 | | | | 08/01/2017 | | | | 413,040 | |
| | 1,000,000 | | | San Diego California Community College District (Election of 2006) Ser. 13 | | | 5.000 | | | | 08/01/2043 | | | | 1,176,770 | |
| | 1,000,000 | | | San Diego California Unified School District (Election 2012) Ser. 13C | | | 5.000 | | | | 07/01/2035 | | | | 1,184,290 | |
| | 1,000,000 | | | San Diego California Unified School District (Election 2012) Ser. 16F | | | 5.000 | | | | 07/01/2040 | | | | 1,185,980 | |
| | 2,000,000 | | | West Contra Costa California Unified School District Ref. Ser. 12 AGM | | | 5.000 | | | | 08/01/2032 | | | | 2,332,580 | |
| | 1,740,000 | | | Yosemite California Community College District (Election 2004) Ser. 08C AGM(a) | | | 5.000 | | | | 08/01/2018 | | | | 1,866,150 | |
| | | | | | | | | | | | | | | | |
| | | | | | | | | | | | | | | 37,512,384 | |
| | | | | | | | | | | | | | | | |
| | | | College Revenue—7.5% | | | | | | | | | | | | |
| | 1,500,000 | | | California State Educational Facilities Auth. Rev. Ref. (Pepperdine University) Ser. 16 | | | 5.000 | | | | 10/01/2046 | | | | 1,790,655 | |
| | 2,100,000 | | | California State University Rev. Ser. 15A | | | 5.000 | | | | 11/01/2038 | | | | 2,522,646 | |
| | 210,000 | | | California State University Rev. Systemwide Ser. 07A AGM(a) | | | 5.000 | | | | 05/01/2017 | | | | 214,546 | |
| | 135,000 | | | California State University Rev. Systemwide Ser. 07A AGM(a) | | | 5.000 | | | | 05/01/2017 | | | | 137,931 | |
| | 155,000 | | | California State University Rev. Systemwide Ser. 07A AGM | | | 5.000 | | | | 11/01/2037 | | | | 158,168 | |
| | 2,940,000 | | | California State University Rev. Systemwide Ser. 12A | | | 5.000 | | | | 11/01/2037 | | | | 3,484,400 | |
| | 2,000,000 | | | California State University Rev. Systemwide Ser. 14A | | | 5.000 | | | | 11/01/2039 | | | | 2,368,460 | |
| | 1,500,000 | | | University of California Rev. (Limited Project) Ser. 12G | | | 5.000 | | | | 05/15/2037 | | | | 1,760,640 | |
| | 1,500,000 | | | University of California Rev. General Ser. 13AI | | | 5.000 | | | | 05/15/2038 | | | | 1,759,470 | |
| | | | | | | | | | | | | | | | |
| | | | | | | | | | | | | | | 14,196,916 | |
| | | | | | | | | | | | | | | | |
| | | | Electric Power Revenue—9.7% | | | | | | | | | | | | |
| | 2,000,000 | | | Guam Power Auth. Rev. Ser. 10A AGM | | | 5.000 | | | | 10/01/2037 | | | | 2,236,720 | |
| | 2,000,000 | | | Guam Power Auth. Rev. Ser. 12A AGM | | | 5.000 | | | | 10/01/2030 | | | | 2,328,340 | |
| | 4,445,000 | | | Los Angeles California Department of Water & Power Rev. (Power System) Ser. 12B | | | 5.000 | | | | 07/01/2043 | | | | 5,218,430 | |
| | 2,500,000 | | | Los Angeles California Department of Water & Power Rev. Ref. (Power System) Ser. 16A | | | 5.000 | | | | 07/01/2046 | | | | 2,970,775 | |
| | 1,000,000 | | | Los Angeles California Department of Water & Power Rev. Ser. 14D | | | 5.000 | | | | 07/01/2039 | | | | 1,182,590 | |
| | 1,000,000 | | | Los Angeles California Department of Water & Power Rev. Ser. 15E | | | 5.000 | | | | 07/01/2044 | | | | 1,174,930 | |
| | 1,500,000 | | | Los Angeles California Department of Water & Power Rev. Ser. 16B | | | 5.000 | | | | 07/01/2042 | | | | 1,789,185 | |
| | 400,000 | | | Los Angeles California Water & Power Rev. (Power System) Sub.-Ser. 07A-1 AMBAC | | | 5.000 | | | | 07/01/2039 | | | | 410,288 | |
| | 1,000,000 | | | Redding California Electric System Rev. COP Ser. 08A AGM | | | 5.000 | | | | 06/01/2030 | | | | 1,057,050 | |
| | | | | | | | | | | | | | | | |
| | | | | | | | | | | | | | | 18,368,308 | |
| | | | | | | | | | | | | | | | |
| | | | General Fund—8.8% | | | | | | | | | | | | |
| | 550,000 | | | California State Ref. Ser. 07 NATL | | | 4.250 | | | | 08/01/2033 | | | | 554,125 | |
| | 1,000,000 | | | California State Ref. Ser. 16 | | | 5.000 | | | | 09/01/2036 | | | | 1,198,390 | |
| | 2,585,000 | | | California State Ref. Various Purpose Ser.16 | | | 5.000 | | | | 09/01/2034 | | | | 3,110,220 | |
| | 2,025,000 | | | California State Ser. 10 | | | 5.250 | | | | 11/01/2040 | | | | 2,327,090 | |
| | 1,000,000 | | | California State Various Purpose Ref. Ser. 16 | | | 5.000 | | | | 09/01/2036 | | | | 1,198,390 | |
| | 2,020,000 | | | California State Various Purpose Ser. 09 | | | 6.000 | | | | 04/01/2038 | | | | 2,254,381 | |
| | 1,160,000 | | | California State Various Purpose Ser. 13 | | | 5.000 | | | | 04/01/2037 | | | | 1,354,868 | |
See accompanying Notes to Financial Statements which are an integral part of the financial statements.
PowerShares California AMT-Free Municipal Bond Portfolio (PWZ) (continued)
October 31, 2016
| | | | | | | | | | | | | | | | |
Principal
Amount | | | | | Interest
Rate | | | Maturity
Date | | | Value | |
| | | | Municipal Bonds (continued) | | | | | | | | | | | | |
| | | | General Fund (continued) | | | | | | | | | | | | |
| $ | 2,000,000 | | | California State Various Purpose Ser. 13 | | | 5.000 | % | | | 04/01/2043 | | | $ | 2,322,980 | |
| | 2,000,000 | | | California State Various Purpose Ser. 16 | | | 5.000 | | | | 09/01/2045 | | | | 2,394,860 | |
| | | | | | | | | | | | | | | | |
| | | | | | | | | | | | | | | 16,715,304 | |
| | | | | | | | | | | | | | | | |
| | | | Health, Hospital, Nursing Home Revenue—10.1% | | | | | | | | | | | | |
| | 1,000,000 | | | California State Health Facilities Auth. Rev. (Lucile Packard Stanford Hospital) Ser. 16B | | | 5.000 | | | | 08/15/2055 | | | | 1,156,480 | |
| | 500,000 | | | California State Health Facilities Financing Auth. Rev. Ref. (Cedars Sinai Medical Center) Ser. 16B | | | 5.000 | | | | 08/15/2035 | | | | 596,235 | |
| | 500,000 | | | California State Health Facilities Financing Auth. Rev. Ref. (Providence St. Joseph Health) Ser. 16A | | | 4.000 | | | | 10/01/2036 | | | | 535,065 | |
| | 2,265,000 | | | California State Health Facilities Financing Auth. Rev. Ref. (Sutter Health) Ser. 08A | | | 5.000 | | | | 08/15/2038 | | | | 2,403,958 | |
| | 3,305,000 | | | California State Health Facilities Financing Auth. Rev. Ref. (Sutter Health) Ser. 11D | | | 5.000 | | | | 08/15/2035 | | | | 3,797,907 | |
| | 1,000,000 | | | California State Health Facilities Financing Auth. Rev. Ref. (Sutter Health) Ser. 15A | | | 5.000 | | | | 08/15/2043 | | | | 1,159,330 | |
| | 495,000 | | | California Statewide Communities Development Auth. Rev. (Adventist Remarketed 05/23/08) Ser. 07B AGC(a) | | | 5.000 | | | | 05/23/2018 | | | | 525,225 | |
| | 1,000,000 | | | California Statewide Communities Development Auth. Rev. (Catholic Healthcare West) Ser. 07K AGC | | | 5.500 | | | | 07/01/2041 | | | | 1,026,140 | |
| | 1,000,000 | | | California Statewide Communities Development Auth. Rev. (Kaiser Permanente) Ser. 12A | | | 5.000 | | | | 04/01/2042 | | | | 1,138,390 | |
| | 1,000,000 | | | California Statewide Communities Development Auth. Rev. (St. Joseph Health System-Remarketed) Insured Ser. 07C FGIC(a) | | | 5.750 | | | | 07/01/2018 | | | | 1,081,860 | |
| | 1,000,000 | | | California Statewide Communities Development Auth. Rev. (Sutter Health) Rev. Ser. 11A | | | 6.000 | | | | 08/15/2042 | | | | 1,169,150 | |
| | 1,000,000 | | | California Statewide Communities Development Auth. Rev. Ref. (Cottage Health System Obligated Group) Ser. 15 | | | 5.000 | | | | 11/01/2043 | | | | 1,159,420 | |
| | 1,000,000 | | | California Statewide Communities Development Auth. Rev. Ref. (John Muir Health) Ser. 16A | | | 4.000 | | | | 08/15/2046 | | | | 1,039,830 | |
| | 1,000,000 | | | California Statewide Communities Development Auth. Rev. Ref. (John Muir Health) Ser. 16A | | | 5.000 | | | | 08/15/2051 | | | | 1,177,990 | |
| | 1,045,000 | | | California Statewide Communities Development Auth. Rev. Ref. (Trinity Health) Ser. 11 | | | 5.000 | | | | 12/01/2041 | | | | 1,196,880 | |
| | | | | | | | | | | | | | | | |
| | | | | | | | | | | | | | | 19,163,860 | |
| | | | | | | | | | | | | | | | |
| | | | Highway Tolls Revenue—6.0% | | | | | | | | | | | | |
| | 9,830,000 | | | Bay Area California Auth. Toll Bridge Rev. Ser. 14S-6 | | | 5.000 | | | | 10/01/2054 | | | | 11,384,811 | |
| | | | | | | | | | | | | | | | |
| | | | Lease Revenue—9.6% | | | | | | | | | | | | |
| | 540,000 | | | Anaheim California Public Financing Auth. Lease Rev. Ref. Ser. 14A | | | 5.000 | | | | 05/01/2039 | | | | 638,280 | |
| | 670,000 | | | California State Public Works Board Lease Rev. Ref. (Various Capital Projects) Ser. 16C | | | 5.000 | | | | 11/01/2034 | | | | 802,312 | |
| | 1,500,000 | | | Kern County California COP (Capital Improvements Projects) Ser. 09A AGC | | | 5.750 | | | | 08/01/2035 | | | | 1,644,450 | |
| | 400,000 | | | Los Angeles California Municipal Improvement Corp. Lease Rev. (Police Headquarters Facility) Ser. 06A NATL(a) | | | 4.250 | | | | 01/01/2017 | | | | 402,408 | |
| | 1,000,000 | | | Los Angeles California Municipal Improvement Corp. Lease Rev. (Real Property) Ser. 09B AGC(a) | | | 5.500 | | | | 04/01/2019 | | | | 1,108,190 | |
| | 1,130,000 | | | Los Angeles County California Public Works Financing Auth. Lease Rev. (Multiple Capital Project II) Ser. 12 | | | 5.000 | | | | 08/01/2037 | | | | 1,324,857 | |
| | 2,330,000 | | | Los Angeles County California Public Works Financing Auth. Lease Rev. (Multiple Capital Project II) Ser. 12 | | | 5.000 | | | | 08/01/2042 | | | | 2,731,785 | |
| | 2,000,000 | | | Los Angeles County California Public Works Financing Auth. Lease Rev. Ser. 15A | | | 5.000 | | | | 12/01/2044 | | | | 2,330,420 | |
| | 1,000,000 | | | Richmond Joint Powers Financing Auth. Lease Rev. (Civic Center Project) Ser. 09 AGC | | | 5.750 | | | | 08/01/2029 | | | | 1,108,690 | |
| | 1,000,000 | | | San Diego California Public Facilities Financing Auth. Lease Rev. (Capital improvement Projects) Ser. 15A | | | 5.000 | | | | 10/15/2044 | | | | 1,175,780 | |
| | 3,000,000 | | | San Jose California Financing Auth. Ref. (Civic Center Project) Ser. 13A | | | 5.000 | | | | 06/01/2039 | | | | 3,468,360 | |
| | 400,000 | | | Santa Clara Valley California Water District (COP Water Utility System Improvement) Ser. 07A NATL | | | 5.000 | | | | 06/01/2037 | | | | 409,424 | |
| | 1,000,000 | | | Yuba California Levee Financing Auth. Rev. (Levee Financing Project) Ser. 08A AGC | | | 5.000 | | | | 09/01/2038 | | | | 1,033,470 | |
| | | | | | | | | | | | | | | | |
| | | | | | | | | | | | | | | 18,178,426 | |
| | | | | | | | | | | | | | | | |
| | | | Local or GTD Housing—0.6% | | | | | | | | | | | | |
| | 1,000,000 | | | California Statewide Communities Development Auth. Student Housing Rev. Ref. (CHF Irvine LLC) Ser. 16 | | | 5.000 | | | | 05/15/2040 | | | | 1,146,950 | |
| | | | | | | | | | | | | | | | |
| | | | Miscellaneous Revenue—3.5% | | | | | | | | | | | | |
| | 1,500,000 | | | California State Various Purpose (Green Bonds) Ser. 14 | | | 5.000 | | | | 10/01/2037 | | | | 1,784,400 | |
| | 1,000,000 | | | California State Various Purpose Ser. 14 | | | 5.000 | | | | 10/01/2044 | | | | 1,184,840 | |
| | 1,000,000 | | | California State Various Purpose Ser. 15 | | | 5.000 | | | | 03/01/2045 | | | | 1,182,850 | |
| | 2,000,000 | | | Pittsburg Unified School District Financing Auth. Rev. (District Bond Program)
Ser. 11 AGM(a) | | | 5.500 | | | | 09/01/2021 | | | | 2,412,520 | |
| | | | | | | | | | | | | | | | |
| | | | | | | | | | | | | | | 6,564,610 | |
| | | | | | | | | | | | | | | | |
See accompanying Notes to Financial Statements which are an integral part of the financial statements.
PowerShares California AMT-Free Municipal Bond Portfolio (PWZ) (continued)
October 31, 2016
| | | | | | | | | | | | | | | | |
Principal
Amount | | | | | Interest
Rate | | | Maturity
Date | | | Value | |
| | | | Municipal Bonds (continued) | | | | | | | | | | | | |
| | | | Natural Gas Revenue—1.5% | | | | | | | | | | | | |
| $ | 2,500,000 | | | Chula Vista California Industrial Development Rev. (San Diego Gas—Remarketed 06/17/09) Ser. 04A | | | 5.875 | % | | | 02/15/2034 | | | $ | 2,782,625 | |
| | | | | | | | | | | | | | | | |
| | | | Port, Airport & Marina Revenue—5.5% | | | | | | | | | | | | |
| | 500,000 | | | Long Beach California Marina Rev. Ser. 15 | | | 5.000 | | | | 05/15/2040 | | | | 561,610 | |
| | 500,000 | | | Long Beach California Marina Rev. Ser. 15 | | | 5.000 | | | | 05/15/2045 | | | | 558,460 | |
| | 1,000,000 | | | Los Angeles California Department of Airports (Senior Los Angeles International Airport) Ser. 10A | | | 5.000 | | | | 05/15/2040 | | | | 1,125,690 | |
| | 2,000,000 | | | Los Angeles California Department of Airports Rev. Ref. Sub.-Ser. 15C | | | 5.000 | | | | 05/15/2038 | | | | 2,362,060 | |
| | 2,000,000 | | | San Francisco California City & County Airports Commission Rev. (San Francisco International Airport) Ser. 14B | | | 5.000 | | | | 05/01/2044 | | | | 2,298,720 | |
| | 3,000,000 | | | San Francisco California City & County Airports Commission Rev. (San Francisco International Airport) Ser. 16C | | | 5.000 | | | | 05/01/2046 | | | | 3,528,030 | |
| | | | | | | | | | | | | | | | |
| | | | | | | | | | | | | | | 10,434,570 | |
| | | | | | | | | | | | | | | | |
| | | | Recreational Revenue—0.6% | | | | | | | | | | | | |
| | 1,000,000 | | | California Infrastructure & Economic Development Bank Rev. Ref. (Academy of Motion Picture Arts & Projects) Ser. 15 | | | 5.000 | | | | 11/01/2041 | | | | 1,164,520 | |
| | | | | | | | | | | | | | | | |
| | | | Sales Tax Revenue—0.8% | | | | | | | | | | | | |
| | 1,500,000 | | | Puerto Rico Sales Tax Financing Corp. Sales Tax Rev. First Sub.-Ser. 10C AGM | | | 5.125 | | | | 08/01/2042 | | | | 1,594,485 | |
| | | | | | | | | | | | | | | | |
| | | | Sewer Revenue—1.7% | | | | | | | | | | | | |
| | 400,000 | | | Bakersfield California Wastewater Rev. Ser. 07A AGM(a) | | | 5.000 | | | | 09/15/2017 | | | | 415,032 | |
| | 400,000 | | | Clovis California Public Financing Auth. Wastewater Rev. Ser. 07 AMBAC | | | 4.500 | | | | 08/01/2038 | | | | 408,972 | |
| | 650,000 | | | Fresno California Sewer Rev. Ser. 08A AGC | | | 5.000 | | | | 09/01/2037 | | | | 695,299 | |
| | 1,525,000 | | | Sacramento County California Sanitation District Financing Auth. Rev. Ref. Ser. 14A | | | 5.000 | | | | 12/01/2044 | | | | 1,790,304 | |
| | | | | | | | | | | | | | | | |
| | | | | | | | | | | | | | | 3,309,607 | |
| | | | | | | | | | | | | | | | |
| | | | Special Assessment—0.9% | | | | | | | | | | | | |
| | 1,500,000 | | | Sacramento California Area Flood Control Agency Consolidated Capital Assessment District Ser. 08 BHAC | | | 5.625 | | | | 10/01/2037 | | | | 1,616,310 | |
| | | | | | | | | | | | | | | | |
| | | | Special Tax—1.6% | | | | | | | | | | | | |
| | 2,600,000 | | | Irvine California Unified School District Special Tax Ref. Ser. 15 BAM | | | 5.000 | | | | 09/01/2038 | | | | 3,035,032 | |
| | | | | | | | | | | | | | | | |
| | | | Tax Increment Revenue—2.2% | | | | | | | | | | | | |
| | 1,000,000 | | | Inland Valley California Development Successor Agency Tax Allocation Ref. Ser. 14A AGM | | | 5.000 | | | | 09/01/2044 | | | | 1,138,500 | |
| | 2,500,000 | | | Santa Cruz County California Redevelopment Successor Agency Tax Allocation Ref. Ser. 15A AGM | | | 5.000 | | | | 09/01/2035 | | | | 2,949,125 | |
| | | | | | | | | | | | | | | | |
| | | | | | | | | | | | | | | 4,087,625 | |
| | | | | | | | | | | | | | | | |
| | | | Transit Revenue—0.9% | | | | | | | | | | | | |
| | 1,500,000 | | | Alameda California Corridor Transportation Auth. Ref. (Second Sub.-Lien) Ser. 16B AGM | | | 5.000 | | | | 10/01/2035 | | | | 1,782,555 | |
| | | | | | | | | | | | | | | | |
| | | | Water Revenue—7.6% | | | | | | | | | | | | |
| | 1,000,000 | | | California State Department of Water Resources (Central Valley Project) Water System Rev. Ref. Ser. 16AW | | | 5.000 | | | | 12/01/2033 | | | | 1,236,660 | |
| | 1,000,000 | | | East Bay California Municipal Utility District Water System Rev. Ref. Ser. 07A NATL(a) | | | 5.000 | | | | 06/01/2017 | | | | 1,025,430 | |
| | 1,500,000 | | | East Bay California Municipal Utility District Water System Rev. Ref. Ser. 15A | | | 5.000 | | | | 06/01/2037 | | | | 1,794,435 | |
| | 2,000,000 | | | Los Angeles California Department of Water & Power Rev. Ser. 12B | | | 5.000 | | | | 07/01/2043 | | | | 2,340,940 | |
| | 1,250,000 | | | Los Angeles California Department of Water & Power Rev. System Ser. 11A | | | 5.000 | | | | 07/01/2041 | | | | 1,432,038 | |
| | 500,000 | | | Puerto Rico Commonwealth Aqueduct & Sewer Auth. Rev. (Senior Lien) Ser. 08A AGC | | | 5.125 | | | | 07/01/2047 | | | | 513,320 | |
| | 1,000,000 | | | San Diego County California Water Auth. Ref. Ser. 16B | | | 5.000 | | | | 05/01/2037 | | | | 1,208,360 | |
| | 4,090,000 | | | Santa Clara Valley California Water District Ref. Ser. 16A | | | 5.000 | | | | 06/01/2046 | | | | 4,864,932 | |
| | | | | | | | | | | | | | | | |
| | | | | | | | | | | | | | | 14,416,115 | |
| | | | | | | | | | | | | | | | |
| | | | Total Investments
(Cost $182,753,892)(b)—98.9% | | | | | | | | | | | 187,455,013 | |
| | | | Other assets less liabilities—1.1% | | | | | | | | | | | 2,165,039 | |
| | | | | | | | | | | | | | | | |
| | | | Net Assets—100.0% | | | | | | | | | | $ | 189,620,052 | |
| | | | | | | | | | | | | | | | |
See accompanying Notes to Financial Statements which are an integral part of the financial statements.
PowerShares California AMT-Free Municipal Bond Portfolio (PWZ) (continued)
October 31, 2016
Investment Abbreviations:
AGC—Assured Guaranty Corp.
AGM—Assured Guaranty Municipal Corp.
AMBAC—American Municipal Bond Assurance Corp.
Auth.—Authority
BAM—Build America Mutual
BHAC—Berkshire Hathaway Assurance Corp.
COP—Certificate of Participation
FGIC—Financial Guaranty Insurance Co.
GTD—Grant To Date
NATL—National Public Finance Guarantee Corp.
Ref.—Refunding
Rev.—Revenue
Ser.—Series
Sub.—Subordinated
Notes to Schedule of Investments:
| (a) | Advance refunded; secured by an escrow fund of U.S. Government obligations or other highly rated collateral. |
| (b) | The following table provides a listing of those entities that have either guaranteed, backed or otherwise enhanced the credit quality of more than 5% of the value of securities held in the portfolio, as of October 31, 2016. In instances where the entity has guaranteed, backed or otherwise enhanced the credit quality of a security, it is not primarily responsible for the borrower’s obligations but may be called upon to satisfy the borrower’s obligations. |
| | | | |
Entities | | Percentage of
Total Investments | |
| Assured Guaranty Municipal Corp. | | | 14.6 | % |
| Assured Guaranty Corp. | | | 5.6 | |
See accompanying Notes to Financial Statements which are an integral part of the financial statements.
Schedule of Investments
PowerShares CEF Income Composite Portfolio (PCEF)
October 31, 2016
| | | | | | | | |
Number
of Shares | | | | | Value | |
| | | | Closed-End Funds—100.0% | |
| | | | Bonds—46.3% | | | | |
| | 2,772,672 | | | Aberdeen Asia-Pacific Income Fund, Inc. | | $ | 13,641,546 | |
| | 510,684 | | | BlackRock Core Bond Trust | | | 6,945,302 | |
| | 1,129,367 | | | BlackRock Credit Allocation Income Trust | | | 14,534,953 | |
| | 481,103 | | | BlackRock Income Trust, Inc. | | | 3,040,571 | |
| | 354,630 | | | BlackRock Limited Duration Income Trust | | | 5,358,459 | |
| | 409,687 | | | BlackRock Multi-Sector Income Trust | | | 6,866,354 | |
| | 375,956 | | | BlackRock Taxable Municipal Bond Trust | | | 8,552,999 | |
| | 484,309 | | | Blackstone/GSO Strategic Credit Fund | | | 7,133,872 | |
| | 240,406 | | | Brookfield Mortgage Opportunity Income Fund, Inc. | | | 3,445,018 | |
| | 133,587 | | | Brookfield Total Return Fund, Inc. | | | 2,885,479 | |
| | 213,674 | | | Cohen & Steers Limited Duration Preferred and Income Fund, Inc. | | | 5,269,201 | |
| | 67,462 | | | Cohen & Steers Select Preferred and Income Fund, Inc. | | | 1,841,038 | |
| | 79,190 | | | Cutwater Select Income Fund | | | 1,552,916 | |
| | 961,197 | | | DoubleLine Income Solutions Fund | | | 18,022,444 | |
| | 74,422 | | | DoubleLine Opportunistic Credit Fund | | | 1,860,550 | |
| | 256,493 | | | Duff & Phelps Utility and Corporate Bond Trust, Inc. | | | 2,421,294 | |
| | 1,232,342 | | | Eaton Vance Limited Duration Income Fund | | | 16,390,149 | |
| | 189,697 | | | Eaton Vance Short Duration Diversified Income Fund | | | 2,534,352 | |
| | 101,812 | | | Eaton Vance Tax-Advantaged Bond and Options Strategies Fund | | | 1,221,744 | |
| | 183,835 | | | First Trust Aberdeen Global Opportunity Income Fund | | | 2,106,749 | |
| | 399,642 | | | First Trust Intermediate Duration Preferred & Income Fund | | | 9,055,888 | |
| | 141,568 | | | Flaherty & Crumrine Dynamic Preferred and Income Fund, Inc. | | | 3,472,663 | |
| | 226,244 | | | Flaherty & Crumrine Preferred Securities Income Fund, Inc. | | | 4,576,916 | |
| | 52,238 | | | Flaherty & Crumrine Total Return Fund, Inc. | | | 1,086,028 | |
| | 279,235 | | | Franklin Limited Duration Income Trust | | | 3,367,574 | |
| | 113,063 | | | Guggenheim Taxable Municipal Managed Duration Trust | | | 2,516,782 | |
| | 85,537 | | | Invesco Bond Fund(a) | | | 1,644,021 | |
| | 1,901,068 | | | Invesco Senior Income Trust(a) | | | 8,345,689 | |
| | 67,063 | | | John Hancock Investors Trust | | | 1,121,964 | |
| | 170,244 | | | John Hancock Preferred Income Fund | | | 3,610,875 | |
| | 119,198 | | | John Hancock Preferred Income Fund II | | | 2,547,261 | |
| | 207,320 | | | John Hancock Preferred Income Fund III | | | 3,781,517 | |
| | 279,398 | | | John Hancock Premium Dividend Fund | | | 4,179,794 | |
| | 572,940 | | | MFS Charter Income Trust | | | 4,841,343 | |
| | 243,453 | | | MFS Government Markets Income Trust | | | 1,268,390 | |
| | 1,098,021 | | | MFS Intermediate Income Trust | | | 4,886,193 | |
| | 819,366 | | | MFS Multimarket Income Trust | | | 4,891,615 | |
| | 173,779 | | | Nuveen Build America Bond Fund | | | 3,737,986 | |
| | 53,095 | | | Nuveen Build America Bond Opportunity Fund | | | 1,157,471 | |
| | 1,437,724 | | | Nuveen Credit Strategies Income Fund | | | 12,105,636 | |
| | 506,819 | | | Nuveen Floating Rate Income Fund | | | 5,651,032 | |
| | 252,477 | | | Nuveen Global High Income Fund, Class I | | | 3,961,364 | |
| | 143,780 | | | Nuveen Preferred & Income Term Fund | | | 3,455,033 | |
| | 653,782 | | | Nuveen Preferred Income Opportunities Fund | | | 6,289,383 | |
| | 1,328,281 | | | Nuveen Preferred Securities Income Fund | | | 12,366,296 | |
| | 203,162 | | | PIMCO Corporate & Income Strategy Fund | | | 3,008,829 | |
| | | | | | | | |
Number
of Shares | | | | | Value | |
| | | | Closed-End Funds (continued) | |
| | | | Bonds (continued) | | | | |
| | 83,161 | | | PIMCO Income Opportunity Fund | | $ | 1,891,913 | |
| | 163,513 | | | PIMCO Income Strategy Fund | | | 1,736,508 | |
| | 380,392 | | | PIMCO Income Strategy Fund II | | | 3,579,489 | |
| | 237,812 | | | Pioneer Floating Rate Trust | | | 2,808,560 | |
| | 314,168 | | | Prudential Short Duration High Yield Fund, Inc. | | | 4,816,195 | |
| | 542,660 | | | Putnam Master Intermediate Income Trust | | | 2,403,984 | |
| | 1,242,703 | | | Putnam Premier Income Trust | | | 6,051,964 | |
| | 86,178 | | | Stone Harbor Emerging Markets Income Fund | | | 1,303,011 | |
| | 462,437 | | | TCW Strategic Income Fund, Inc. | | | 2,455,541 | |
| | 1,434,499 | | | Templeton Global Income Fund | | | 9,094,724 | |
| | 119,439 | | | Virtus Global Multi-Sector Income Fund | | | 1,839,361 | |
| | 140,953 | | | Western Asset Global Corporate Defined Opportunity Fund, Inc. | | | 2,451,173 | |
| | 58,988 | | | Western Asset Income Fund | | | 858,275 | |
| | 56,121 | | | Western Asset Investment Grade Defined Opportunity Trust, Inc. | | | 1,185,332 | |
| | 79,071 | | | Western Asset Premier Bond Fund | | | 1,057,179 | |
| | 712,226 | | | Western Asset/Claymore Inflation-Linked Opportunities & Income Fund | | | 8,012,543 | |
| | 309,142 | | | Western Asset/Claymore Inflation-Linked Securities & Income Fund | | | 3,524,219 | |
| | | | | | | | |
| | | | | | | 297,622,504 | |
| | | | | | | | |
| | | | Bonds/High Yield—26.4% | | | | |
| | 811,922 | | | AllianceBernstein Global High Income Fund, Inc. | | | 10,116,548 | |
| | 192,970 | | | Barings Global Short Duration High Yield Fund | | | 3,577,664 | |
| | 1,218,282 | | | BlackRock Corporate High Yield Fund, Inc. | | | 12,816,327 | |
| | 2,000,230 | | | BlackRock Debt Strategies Fund, Inc. | | | 7,240,833 | |
| | 354,626 | | | BlackRock Floating Rate Income Strategies Fund, Inc. | | | 4,886,746 | |
| | 224,693 | | | BlackRock Floating Rate Income Trust | | | 3,051,331 | |
| | 273,065 | | | Brookfield High Income Fund, Inc. | | | 1,946,953 | |
| | 549,586 | | | Credit Suisse Asset Management Income Fund, Inc. | | | 1,698,221 | |
| | 556,483 | | | Credit Suisse High Yield Bond Fund | | | 1,352,254 | |
| | 141,832 | | | Deutsche High Income Opportunities Fund, Inc. | | | 2,005,505 | |
| | 210,993 | | | Deutsche Multi-Market Income Trust | | | 1,785,001 | |
| | 473,193 | | | Dreyfus High Yield Strategies Fund | | | 1,561,537 | |
| | 370,491 | | | Eaton Vance Floating-Rate Income Trust | | | 5,342,480 | |
| | 342,771 | | | Eaton Vance Senior Floating-Rate Trust | | | 4,850,210 | |
| | 414,298 | | | First Trust High Income Long/Short Fund | | | 6,429,905 | |
| | 199,338 | | | First Trust Senior Floating Rate Income Fund II | | | 2,716,977 | |
| | 36,019 | | | Guggenheim Credit Allocation Fund | | | 780,532 | |
| | 175,341 | | | Ivy High Income Opportunities Fund | | | 2,481,075 | |
| | 162,708 | | | KKR Income Opportunities Fund | | | 2,551,261 | |
| | 255,692 | | | Morgan Stanley Emerging Markets Debt Fund, Inc. | | | 2,383,049 | |
| | 228,569 | | | Neuberger Berman High Yield Strategies Fund, Inc. | | | 2,653,686 | |
| | 243,476 | | | New America High Income Fund, Inc. (The) | | | 2,196,154 | |
| | 357,219 | | | Nuveen Floating Rate Income Opportunity Fund | | | 4,050,864 | |
| | 70,098 | | | Nuveen High Income 2020 Target Term Fund, Class I | | | 727,617 | |
See accompanying Notes to Financial Statements which are an integral part of the financial statements.
PowerShares CEF Income Composite Portfolio (PCEF) (continued)
October 31, 2016
| | | | | | | | |
Number
of Shares | | | | | Value | |
| | | | Closed-End Funds (continued) | |
| | | | Bonds/High Yield (continued) | | | | |
| | 160,944 | | | Nuveen High Income December 2018 Target Term Fund, Class I | | $ | 1,649,676 | |
| | 275,988 | | | Nuveen NASDAQ 100 Dynamic Overwrite Fund | | | 5,042,301 | |
| | 367,089 | | | Nuveen Senior Income Fund | | | 2,389,749 | |
| | 93,956 | | | Nuveen Short Duration Credit Opportunities Fund | | | 1,550,274 | |
| | 367,885 | | | PIMCO Corporate & Income Opportunity Fund | | | 5,242,361 | |
| | 63,574 | | | Pioneer Diversified High Income Trust | | | 1,016,548 | |
| | 161,431 | | | Pioneer High Income Trust | | | 1,620,767 | |
| | 398,625 | | | Prudential Global Short Duration High Yield Fund, Inc. | | | 5,867,760 | |
| | 90,654 | | | Stone Harbor Emerging Markets Total Income Fund | | | 1,335,333 | |
| | 509,308 | | | Templeton Emerging Markets Income Fund | | | 5,561,643 | |
| | 1,552,358 | | | Voya Prime Rate Trust | | | 8,243,021 | |
| | 684,419 | | | Wells Fargo Income Opportunities Fund | | | 5,591,703 | |
| | 442,771 | | | Wells Fargo Multi-Sector Income Fund | | | 5,605,481 | |
| | 325,209 | | | Western Asset Emerging Markets Debt Fund, Inc. | | | 4,978,950 | |
| | 333,034 | | | Western Asset Emerging Markets Income Fund, Inc. | | | 3,660,044 | |
| | 480,099 | | | Western Asset Global High Income Fund, Inc. | | | 4,757,781 | |
| | 657,867 | | | Western Asset High Income Fund II, Inc. | | | 4,651,120 | |
| | 1,371,143 | | | Western Asset High Income Opportunity Fund, Inc. | | | 6,800,869 | |
| | 218,516 | | | Western Asset High Yield Defined Opportunity Fund, Inc. | | | 3,277,740 | |
| | 152,676 | | | Western Asset Worldwide Income Fund, Inc. | | | 1,685,543 | |
| | | | | | | | |
| | | | | | | 169,731,394 | |
| | | | | | | | |
| | | | Domestic Equity—1.5% | | | | |
| | 240,951 | | | BlackRock Science & Technology Trust | | | 4,522,650 | |
| | 245,391 | | | Cohen & Steers Global Income Builder, Inc. | | | 2,132,448 | |
| | 119,015 | | | GAMCO Natural Resources Gold & Income Trust | | | 935,458 | |
| | 136,574 | | | John Hancock Hedged Equity & Income Fund | | | 2,172,892 | |
| | | | | | | | |
| | | | | | | 9,763,448 | |
| | | | | | | | |
| | | | Option Income—25.8% | | | | |
| | 1,107,191 | | | AllianzGI NFJ Dividend, Interest & Premium Strategy Fund | | | 13,529,874 | |
| | 274,895 | | | BlackRock Energy and Resources Trust | | | 3,790,802 | |
| | 331,738 | | | BlackRock Enhanced Capital and Income Fund, Inc. | | | 4,319,229 | |
| | 1,988,179 | | | BlackRock Enhanced Equity Dividend Trust | | | 15,348,742 | |
| | 812,963 | | | BlackRock Global Opportunities Equity Trust | | | 9,446,630 | |
| | 45,890 | | | BlackRock Health Sciences Trust | | | 1,502,438 | |
| | 1,185,636 | | | BlackRock International Growth and Income Trust | | | 6,710,700 | |
| | 1,200,804 | | | BlackRock Resources & Commodities Strategy Trust | | | 9,570,408 | |
| | 80,783 | | | Columbia Seligman Premium Technology Growth Fund, Inc. | | | 1,462,172 | |
| | 299,211 | | | Eaton Vance Enhanced Equity Income Fund | | | 3,611,477 | |
| | 429,305 | | | Eaton Vance Enhanced Equity Income Fund II | | | 5,735,515 | |
| | 588,185 | | | Eaton Vance Risk-Managed Diversified Equity Income Fund | | | 5,399,538 | |
| | | | | | | | |
Number
of Shares | | | | | Value | |
| | | | Closed-End Funds (continued) | |
| | | | Option Income (continued) | | | | |
| | 127,535 | | | Eaton Vance Tax-Managed Buy-Write Income Fund | | $ | 2,089,023 | |
| | 332,717 | | | Eaton Vance Tax-Managed Buy-Write Opportunities Fund | | | 4,851,014 | |
| | 1,354,792 | | | Eaton Vance Tax-Managed Diversified Equity Income Fund | | | 13,940,810 | |
| | 676,535 | | | Eaton Vance Tax-Managed Global Buy-Write Opportunities Fund | | | 7,157,740 | |
| | 2,263,635 | | | Eaton Vance Tax-Managed Global Diversified Equity Income Fund | | | 18,720,261 | |
| | 181,722 | | | First Trust Dynamic Europe Equity Income Fund | | | 2,758,540 | |
| | 208,449 | | | First Trust Enhanced Equity Income Fund | | | 2,743,189 | |
| | 140,754 | | | Guggenheim Enhanced Equity Income Fund | | | 1,104,919 | |
| | 202,607 | | | Madison Covered Call & Equity Strategy Fund | | | 1,560,074 | |
| | 340,579 | | | Nuveen Dow 30sm Dynamic Overwrite Fund | | | 4,822,598 | |
| | 672,040 | | | Nuveen S&P 500 Buy-Write Income Fund | | | 8,467,704 | |
| | 151,567 | | | Nuveen S&P 500 Dynamic Overwrite Fund | | | 2,058,280 | |
| | 147,470 | | | Voya Asia Pacific High Dividend Equity Income Fund | | | 1,396,541 | |
| | 194,473 | | | Voya Global Advantage and Premium Opportunity Fund | | | 1,878,609 | |
| | 1,011,562 | | | Voya Global Equity Dividend and Premium Opportunity Fund | | | 7,141,628 | |
| | 224,893 | | | Voya Infrastructure Industrials and Materials Fund | | | 2,831,403 | |
| | 232,187 | | | Voya Natural Resources Equity Income Fund | | | 1,504,572 | |
| | | | | | | | |
| | | | | | | 165,454,430 | |
| | | | | | | | |
| | | | Total Investments
(Cost $652,775,705)—100.0% | | | 642,571,776 | |
| | | | Other assets less liabilities—(0.0)% | | | (98,712 | ) |
| | | | | | | | |
| | | | Net Assets—100.0% | | $ | 642,473,064 | |
| | | | | | | | |
Notes to Schedule of Investments:
| (a) | Affiliated company. The Fund’s Adviser and the adviser for Invesco Bond Fund and Invesco Senior Income Trust are wholly-owned subsidiaries of Invesco Ltd. and therefore, Invesco Bond Fund and Invesco Senior Income Trust are considered to be affiliated. See Note 4. |
See accompanying Notes to Financial Statements which are an integral part of the financial statements.
Schedule of Investments
PowerShares Chinese Yuan Dim Sum Bond Portfolio (DSUM)
October 31, 2016
| | | | | | | | | | | | | | | | | | | | |
Foreign
Currency(a) | | | Principal
Amount | | | | | Interest
Rate | | | Maturity
Date | | | Value | |
| | | | | | | | Corporate Bonds—68.7% | | | | | | | | | | | | |
| | | | | | | | China—43.7% | | | | | | | | | | | | |
| | CNH | | | | 7,850,000 | | | Agile Group Holdings Ltd. | | | 6.500 | % | | | 02/28/2017 | | | $ | 1,160,627 | |
| | CNH | | | | 5,000,000 | | | AVIC International Finance & Investment Ltd. | | | 4.800 | | | | 04/10/2017 | | | | 739,868 | |
| | CNH | | | | 8,000,000 | | | Bank of China Ltd./Abu Dhabi, EMTN | | | 3.600 | | | | 06/30/2017 | | | | 1,181,076 | |
| | CNH | | | | 10,000,000 | | | Bank of Tokyo-Mitsubishi UFJ China Ltd. | | | 3.050 | | | | 05/26/2017 | | | | 1,472,291 | |
| | CNH | | | | 5,000,000 | | | Bestgain Real Estate Lyra Ltd., EMTN | | | 4.050 | | | | 12/16/2016 | | | | 736,698 | |
| | CNH | | | | 5,000,000 | | | Bestgain Real Estate Lyra Ltd., EMTN | | | 4.500 | | | | 12/04/2018 | | | | 740,569 | |
| | CNH | | | | 6,000,000 | | | China Development Bank Corp. | | | 4.200 | | | | 01/19/2027 | | | | 908,956 | |
| | CNH | | | | 10,000,000 | | | China Development Bank Corp., EMTN | | | 3.600 | | | | 11/13/2018 | | | | 1,476,165 | |
| | CNH | | | | 5,500,000 | | | China Electronics Corp. Holdings Co. Ltd. | | | 4.700 | | | | 01/16/2017 | | | | 808,057 | |
| | CNH | | | | 5,000,000 | | | China Power International Development Ltd. | | | 4.500 | | | | 05/09/2017 | | | | 736,145 | |
| | CNH | | | | 5,000,000 | | | China Unicom Hong Kong Ltd., EMTN | | | 4.000 | | | | 04/16/2017 | | | | 737,988 | |
| | CNH | | | | 5,000,000 | | | Eastern Creation II Investment Holdings Ltd., EMTN | | | 3.750 | | | | 06/27/2017 | | | | 737,988 | |
| | CNH | | | | 1,500,000 | | | Hang Seng Bank China Ltd. | | | 3.250 | | | | 07/03/2017 | | | | 220,733 | |
| | CNH | | | | 5,000,000 | | | Huarui Investment Holding Co. Ltd. | | | 5.250 | | | | 11/26/2018 | | | | 750,153 | |
| | CNH | | | | 4,000,000 | | | ICBCIL Finance Co. Ltd. | | | 3.900 | | | | 06/18/2018 | | | | 591,682 | |
| | CNH | | | | 5,000,000 | | | Jinchuan Group Co. Ltd. | | | 4.750 | | | | 07/17/2017 | | | | 706,840 | |
| | CNH | | | | 5,000,000 | | | Kunzhi Ltd. | | | 5.875 | | | | 01/15/2017 | | | | 736,794 | |
| | CNH | | | | 6,000,000 | | | Lenovo Group Ltd. | | | 4.950 | | | | 06/10/2020 | | | | 907,925 | |
| | CNH | | | | 4,000,000 | | | Power Construction Corp. of China | | | 4.200 | | | | 05/15/2017 | | | | 590,686 | |
| | | | | 5,000,000 | | | Rosy Capital Global Ltd. | | | 5.250 | | | | 07/30/2018 | | | | 749,232 | |
| | CNH | | | | 5,000,000 | | | Shanghai Pudong Development Bank Co. Ltd. | | | 4.080 | | | | 05/22/2017 | | | | 739,057 | |
| | CNH | | | | 5,000,000 | | | Sinochem Offshore Capital Co. Ltd. | | | 3.550 | | | | 05/13/2017 | | | | 736,366 | |
| | CNH | | | | 5,000,000 | | | Sinotrans Sailing Ltd. | | | 4.500 | | | | 06/10/2017 | | | | 735,408 | |
| | CNH | | | | 5,000,000 | | | Tingyi Cayman Islands Holding Corp. | | | 4.375 | | | | 08/06/2018 | | | | 741,306 | |
| | CNH | | | | 5,000,000 | | | Unican Ltd., EMTN | | | 5.600 | | | | 09/18/2017 | | | | 745,545 | |
| | CNH | | | | 5,000,000 | | | Wanhua Chemical International Holding Co. Ltd. | | | 4.500 | | | | 11/19/2017 | | | | 737,251 | |
| | CNH | | | | 5,000,000 | | | Zhuhai DA Heng Qin Investment Co. Ltd. | | | 4.750 | | | | 12/11/2017 | | | | 742,781 | |
| | | | | | | | | | | | | | | | | | | | |
| | | | | | | | | | | | | | | | | | | 21,868,187 | |
| | | | | | | | | | | | | | | | | | | | |
| | | | | | | | France—1.2% | | | | | | | | | | | | |
| | CNH | | | | 4,000,000 | | | Total Capital SA, EMTN | | | 3.750 | | | | 09/24/2018 | | | | 591,275 | |
| | | | | | | | | | | | | | | | | | | | |
| | | | | | | | Germany—1.5% | | | | | | | | | | | | |
| | CNH | | | | 5,000,000 | | | Volkswagen International Finance NV, EMTN | | | 3.750 | | | | 11/30/2017 | | | | 738,910 | |
| | | | | | | | | | | | | | | | | | | | |
| | | | | | | | Hong Kong—8.0% | | | | | | | | | | | | |
| | CNH | | | | 7,000,000 | | | Beijing Capital Hong Kong Ltd. | | | 4.700 | | | | 06/20/2017 | | | | 1,035,351 | |
| | CNH | | | | 5,000,000 | | | Hainan Airlines Hong Kong Co. Ltd. | | | 6.250 | | | | 05/22/2017 | | | | 737,251 | |
| | CNH | | | | 1,000,000 | | | Industrial & Commercial Bank of China Asia Ltd., EMTN | | | 6.000 | | | | 11/04/2021 | | | | 147,487 | |
| | CNH | | | | 5,000,000 | | | Southwest Securities International Securities Ltd. | | | 6.450 | | | | 05/28/2018 | | | | 754,761 | |
| | CNH | | | | 4,000,000 | | | Value Success International Ltd., Series 1, EMTN | | | 4.750 | | | | 11/04/2018 | | | | 599,385 | |
| | CNH | | | | 5,000,000 | | | Value Success International Ltd., Series 2, EMTN | | | 4.000 | | | | 11/21/2016 | | | | 737,251 | |
| | | | | | | | | | | | | | | | | | | | |
| | | | | | | | | | | | | | | | | | | 4,011,486 | |
| | | | | | | | | | | | | | | | | | | | |
| | | | | | | | Malaysia—1.5% | | | | | | | | | | | | |
| | CNH | | | | 5,000,000 | | | Cagamas Global PLC, EMTN | | | 3.700 | | | | 09/22/2017 | | | | 736,514 | |
| | | | | | | | | | | | | | | | | | | | |
| | | | | | | | New Zealand—1.2% | | | | | | | | | | | | |
| | CNH | | | | 4,000,000 | | | Fonterra Co-operative Group Ltd., Series 14, EMTN | | | 4.000 | | | | 06/22/2020 | | | | 593,812 | |
| | | | | | | | | | | | | | | | | | | | |
| | | | | | | | Russia—2.9% | | | | | | | | | | | | |
| | CNH | | | | 10,000,000 | | | Gazprombank OJSC Via GPB Eurobond Finance PLC, EMTN | | | 4.250 | | | | 01/30/2017 | | | | 1,469,946 | |
| | | | | | | | | | | | | | | | | | | | |
| | | | | | | | Singapore—1.5% | | | | | | | | | | | | |
| | CNH | | | | 5,000,000 | | | BOC Aviation Ltd., Series 10, EMTN | | | 4.200 | | | | 11/05/2018 | | | | 742,780 | |
| | | | | | | | | | | | | | | | | | | | |
| | | | | | | | Supranational—4.3% | | | | | | | | | | | | |
| | CNH | | | | 10,000,000 | | | Asian Development Bank, EMTN | | | 2.850 | | | | 10/21/2020 | | | | 1,450,542 | |
| | CNH | | | | 5,000,000 | | | International Finance Corp., GMTN | | | 2.000 | | | | 01/18/2017 | | | | 734,486 | |
| | | | | | | | | | | | | | | | | | | | |
| | | | | | | | | | | | | | | | | | | 2,185,028 | |
| | | | | | | | | | | | | | | | | | | | |
See accompanying Notes to Financial Statements which are an integral part of the financial statements.
PowerShares Chinese Yuan Dim Sum Bond Portfolio (DSUM) (continued)
October 31, 2016
| | | | | | | | | | | | | | | | | | | | |
Foreign
Currency(a) | | | Principal
Amount | | | | | Interest
Rate | | | Maturity
Date | | | Value | |
| | | | | | | | Corporate Bonds (continued) | | | | | | | | | | | | |
| | | | | | | | United Kingdom—1.5% | | | | | | | | | | | | |
| | CNH | | | | 5,000,000 | | | BP Capital Markets PLC, EMTN | | | 3.950 | % | | | 10/08/2018 | | | $ | 740,937 | |
| | | | | | | | | | | | | | | | | | | | |
| | | | | | | | United States—1.4% | | | | | | | | | | | | |
| | CNH | | | | 5,000,000 | | | Caterpillar Financial Services Corp., EMTN | | | 3.550 | | | | 06/23/2018 | | | | 735,408 | |
| | | | | | | | | | | | | | | | | | | | |
| | | | | | | | Total Corporate Bonds
(Cost $36,994,563) | | | | | | | | | | | 34,414,283 | |
| | | | | | | | | | | | | | | | | | | | |
| | | | | |
| | | | | | | | | | | | | | | | | | | | |
| | | | | | | | Sovereign Debt Obligations—28.9% | | | | | | | | | | | | |
| | | | | | | | Canada—1.5% | | | | | | | | | | | | |
| | CNH | | | | 5,000,000 | | | Province of British Columbia Canada | | | 2.850 | | | | 11/13/2016 | | | | 736,993 | |
| | | | | | | | | | | | | | | | | | | | |
| | | | | | | | China—20.1% | | | | | | | | | | | | |
| | CNH | | | | 5,000,000 | | | China Government Bond | | | 2.600 | | | | 11/22/2016 | | | | 736,989 | |
| | CNH | | | | 5,000,000 | | | China Government Bond | | | 2.560 | | | | 06/29/2017 | | | | 734,892 | |
| | CNH | | | | 6,000,000 | | | China Government Bond | | | 2.900 | | | | 07/04/2019 | | | | 882,879 | |
| | CNH | | | | 5,000,000 | | | China Government Bond | | | 3.090 | | | | 06/29/2020 | | | | 738,884 | |
| | CNH | | | | 6,000,000 | | | China Government Bond | | | 2.480 | | | | 12/01/2020 | | | | 866,304 | |
| | CNH | | | | 10,000,000 | | | China Government Bond | | | 2.360 | | | | 08/18/2021 | | | | 1,429,714 | |
| | CNH | | | | 6,500,000 | | | China Government Bond | | | 3.100 | | | | 06/29/2022 | | | | 960,137 | |
| | CNH | | | | 9,000,000 | | | China Government Bond | | | 3.160 | | | | 06/27/2023 | | | | 1,333,774 | |
| | CNH | | | | 6,000,000 | | | Export-Import Bank of China (The) | | | 3.350 | | | | 06/18/2017 | | | | 884,878 | |
| | CNH | | | | 10,000,000 | | | Export-Import Bank of China (The), Series B | | | 3.250 | | | | 01/21/2017 | | | | 1,474,134 | |
| | | | | | | | | | | | | | | | | | | | |
| | | | | | | | | | | | | | | | | | | 10,042,585 | |
| | | | | | | | | | | | | | | | | | | | |
| | | | | | | | France—2.9% | | | | | | | | | | | | |
| | CNH | | | | 10,000,000 | | | Caisse d’Amortissement de la Dette Sociale | | | 3.800 | | | | 02/06/2017 | | | | 1,475,534 | |
| | | | | | | | | | | | | | | | | | | | |
| | | | | | | | South Korea—2.9% | | | | | | | | | | | | |
| | CNH | | | | 10,000,000 | | | Export-Import Bank of Korea, EMTN | | | 3.600 | | | | 06/10/2018 | | | | 1,474,545 | |
| | | | | | | | | | | | | | | | | | | | |
| | | | | | | | United Kingdom—1.5% | | | | | | | | | | | | |
| | CNH | | | | 5,000,000 | | | United Kingdom Government International Bond | | | 2.700 | | | | 10/21/2017 | | | | 734,487 | |
| | | | | | | | | | | | | | | | | | | | |
| | | | | | | | Total Sovereign Debt Obligations
(Cost $15,700,854) | | | | | | | | | | | 14,464,144 | |
| | | | | | | | | | | | | | | | | | | | |
| | | | | | | | Total Investments
(Cost $52,695,417)—97.6% | | | | | | | | | | | 48,878,427 | |
| | | | | | | | Other assets less liabilities—2.4% | | | | | | | | | | | 1,186,236 | |
| | | | | | | | | | | | | | | | | | | | |
| | | | | | | | Net Assets—100.0% | | | | | | | | | | $ | 50,064,663 | |
| | | | | | | | | | | | | | | | | | | | |
Investment Abbreviations:
CNH—Chinese Yuan
EMTN—Euro Medium-Term Note
GMTN—Global Medium-Term Note
Notes to Schedule of Investments:
| (a) | Foreign denominated security. Principal amount denominated in currency indicated. |
See accompanying Notes to Financial Statements which are an integral part of the financial statements.
Schedule of Investments
PowerShares Emerging Markets Sovereign Debt Portfolio (PCY)
October 31, 2016
| | | | | | | | | | | | | | | | |
Principal
Amount | | | | | Interest
Rate | | | Maturity
Date | | | Value | |
| | | | Sovereign Debt Obligations—98.3% | | | | | | | | | | | | |
| | | | Brazil—3.7% | | | | | | | | | | | | |
| $ | 39,180,000 | | | Brazil Government International Bond | | | 8.250 | % | | | 01/20/2034 | | | $ | 49,366,800 | |
| | 44,937,000 | | | Brazil Government International Bond | | | 7.125 | | | | 01/20/2037 | | | | 51,452,865 | |
| | 53,840,000 | | | Brazil Government International Bond | | | 5.625 | | | | 01/07/2041 | | | | 52,224,800 | |
| | | | | | | | | | | | | | | | |
| | | | | | | | | | | | | | | 153,044,465 | |
| | | | | | | | | | | | | | | | |
| | | | Colombia—3.6% | | | | | | | | | | | | |
| | 38,295,000 | | | Colombia Government International Bond | | | 7.375 | | | | 09/18/2037 | | | | 49,209,075 | |
| | 43,214,000 | | | Colombia Government International Bond | | | 6.125 | | | | 01/18/2041 | | | | 49,588,065 | |
| | 44,898,000 | | | Colombia Government International Bond | | | 5.625 | | | | 02/26/2044 | | | | 49,275,555 | |
| | | | | | | | | | | | | | | | |
| | | | | | | | | | | | | | | 148,072,695 | |
| | | | | | | | | | | | | | | | |
| | | | Croatia—3.1% | | | | | | | | | | | | |
| | 37,988,000 | | | Croatia Government International Bond(a) | | | 6.625 | | | | 07/14/2020 | | | | 42,211,316 | |
| | 37,993,000 | | | Croatia Government International Bond(a) | | | 6.375 | | | | 03/24/2021 | | | | 42,264,173 | |
| | 39,256,000 | | | Croatia Government International Bond(a) | | | 6.000 | | | | 01/26/2024 | | | | 44,391,666 | |
| | | | | | | | | | | | | | | | |
| | | | | | | | | | | | | | | 128,867,155 | |
| | | | | | | | | | | | | | | | |
| | | | Dominican Republic—3.3% | | | | | | | | | | | | |
| | 40,793,000 | | | Dominican Republic International Bond(a) | | | 6.600 | | | | 01/28/2024 | | | | 44,464,370 | |
| | 41,320,000 | | | Dominican Republic International Bond(a) | | | 7.450 | | | | 04/30/2044 | | | | 46,071,800 | |
| | 45,167,000 | | | Dominican Republic International Bond(a) | | | 6.850 | | | | 01/27/2045 | | | | 47,199,515 | |
| | | | | | | | | | | | | | | | |
| | | | | | | | | | | | | | | 137,735,685 | |
| | | | | | | | | | | | | | | | |
| | | | El Salvador—3.7% | | | | | | | | | | | | |
| | 44,751,000 | | | El Salvador Government International Bond(a) | | | 8.250 | | | | 04/10/2032 | | | | 48,996,527 | |
| | 49,772,000 | | | El Salvador Government International Bond(a) | | | 7.650 | | | | 06/15/2035 | | | | 51,808,173 | |
| | 51,149,000 | | | El Salvador Government International Bond(a) | | | 7.625 | | | | 02/01/2041 | | | | 52,762,751 | |
| | | | | | | | | | | | | | | | |
| | | | | | | | | | | | | | | 153,567,451 | |
| | | | | | | | | | | | | | | | |
| | | | Hungary—3.2% | | | | | | | | | | | | |
| | 36,807,000 | | | Hungary Government International Bond | | | 5.750 | | | | 11/22/2023 | | | | 43,004,378 | |
| | 36,828,000 | | | Hungary Government International Bond | | | 5.375 | | | | 03/25/2024 | | | | 42,381,736 | |
| | 29,769,000 | | | Hungary Government International Bond | | | 7.625 | | | | 03/29/2041 | | | | 45,479,590 | |
| | | | | | | | | | | | | | | | |
| | | | | | | | | | | | | | | 130,865,704 | |
| | | | | | | | | | | | | | | | |
| | | | Indonesia—3.5% | | | | | | | | | | | | |
| | 32,508,000 | | | Indonesia Government International Bond(a) | | | 8.500 | | | | 10/12/2035 | | | | 48,210,567 | |
| | 38,752,000 | | | Indonesia Government International Bond(a) | | | 6.625 | | | | 02/17/2037 | | | | 48,798,069 | |
| | 35,136,000 | | | Indonesia Government International Bond(a) | | | 7.750 | | | | 01/17/2038 | | | | 49,387,899 | |
| | | | | | | | | | | | | | | | |
| | | | | | | | | | | | | | | 146,396,535 | |
| | | | | | | | | | | | | | | | |
| | | | Kazakhstan—3.4% | | | | | | | | | | | | |
| | 45,888,000 | | | Kazakhstan Government International Bond(a) | | | 4.875 | | | | 10/14/2044 | | | | 46,524,008 | |
| | 41,410,000 | | | Kazakhstan Government International Bond, EMTN(a) | | | 5.125 | | | | 07/21/2025 | | | | 46,017,691 | |
| | 41,260,000 | | | Kazakhstan Government International Bond, EMTN(a) | | | 6.500 | | | | 07/21/2045 | | | | 49,493,845 | |
| | | | | | | | | | | | | | | | |
| | | | | | | | | | | | | | | 142,035,544 | |
| | | | | | | | | | | | | | | | |
| | | | Latvia—3.1% | | | | | | | | | | | | |
| | 124,992,000 | | | Latvia Government International Bond(a) | | | 2.750 | | | | 01/12/2020 | | | | 129,876,687 | |
| | | | | | | | | | | | | | | | |
| | | | Lebanon—3.0% | | | | | | | | | | | | |
| | 40,809,000 | | | Lebanon Government International Bond | | | 6.650 | | | | 04/22/2024 | | | | 40,400,910 | |
| | 42,133,000 | | | Lebanon Government International Bond | | | 6.750 | | | | 11/29/2027 | | | | 41,690,603 | |
| | 42,895,000 | | | Lebanon Government International Bond, EMTN | | | 6.650 | | | | 02/26/2030 | | | | 41,500,913 | |
| | | | | | | | | | | | | | | | |
| | | | | | | | | | | | | | | 123,592,426 | |
| | | | | | | | | | | | | | | | |
| | | | Lithuania—3.0% | | | | | | | | | | | | |
| | 35,388,000 | | | Lithuania Government International Bond(a) | | | 7.375 | | | | 02/11/2020 | | | | 41,654,224 | |
| | 35,469,000 | | | Lithuania Government International Bond(a) | | | 6.125 | | | | 03/09/2021 | | | | 41,365,721 | |
| | 34,571,000 | | | Lithuania Government International Bond(a) | | | 6.625 | | | | 02/01/2022 | | | | 41,928,297 | |
| | | | | | | | | | | | | | | | |
| | | | | | | | | | | | | | | 124,948,242 | |
| | | | | | | | | | | | | | | | |
See accompanying Notes to Financial Statements which are an integral part of the financial statements.
PowerShares Emerging Markets Sovereign Debt Portfolio (PCY) (continued)
October 31, 2016
| | | | | | | | | | | | | | | | |
Principal
Amount | | | | | Interest
Rate | | | Maturity
Date | | | Value | |
| | | | Sovereign Debt Obligations (continued) | | | | | | | | | | | | |
| | | | Mexico—3.3% | | | | | | | | | | | | |
| $ | 46,032,000 | | | Mexico Government International Bond | | | 4.600 | % | | | 01/23/2046 | | | $ | 45,168,900 | |
| | 36,928,000 | | | Mexico Government International Bond, GMTN | | | 6.050 | | | | 01/11/2040 | | | | 44,036,640 | |
| | 40,302,000 | | | Mexico Government International Bond, GMTN | | | 5.550 | | | | 01/21/2045 | | | | 45,289,373 | |
| | | | | | | | | | | | | | | | |
| | | | | | | | | | | | | | | 134,494,913 | |
| | | | | | | | | | | | | | | | |
| | | | Morocco—3.3% | | | | | | | | | | | | |
| | 60,611,000 | | | Morocco Government International Bond(a) | | | 4.250 | | | | 12/11/2022 | | | | 64,741,640 | |
| | 63,232,000 | | | Morocco Government International Bond(a) | | | 5.500 | | | | 12/11/2042 | | | | 71,453,424 | |
| | | | | | | | | | | | | | | | |
| | | | | | | | | | | | | | | 136,195,064 | |
| | | | | | | | | | | | | | | | |
| | | | Pakistan—3.2% | | | | | | | | | | | | |
| | 40,272,000 | | | Pakistan Government International Bond(a) | | | 8.250 | | | | 04/15/2024 | | | | 45,464,672 | |
| | 37,580,000 | | | Pakistan Government International Bond(a) | | | 8.250 | | | | 09/30/2025 | | | | 42,844,732 | |
| | 40,982,000 | | | Second Pakistan International Sukuk Co. Ltd. (The)(a) | | | 6.750 | | | | 12/03/2019 | | | | 43,506,942 | |
| | | | | | | | | | | | | | | | |
| | | | | | | | | | | | | | | 131,816,346 | |
| | | | | | | | | | | | | | | | |
| | | | Panama—3.2% | | | | | | | | | | | | |
| | 32,324,000 | | | Panama Government International Bond | | | 7.125 | | | | 01/29/2026 | | | | 42,910,110 | |
| | 28,836,000 | | | Panama Government International Bond | | | 8.875 | | | | 09/30/2027 | | | | 42,677,280 | |
| | 33,870,000 | | | Panama Government International Bond | | | 6.700 | | | | 01/26/2036 | | | | 45,174,112 | |
| | | | | | | | | | | | | | | | |
| | | | | | | | | | | | | | | 130,761,502 | |
| | | | | | | | | | | | | | | | |
| | | | Peru—3.4% | | | | | | | | | | | | |
| | 40,100,000 | | | Peruvian Government International Bond(b) | | | 4.125 | | | | 08/25/2027 | | | | 44,861,875 | |
| | 28,204,000 | | | Peruvian Government International Bond | | | 8.750 | | | | 11/21/2033 | | | | 44,562,320 | |
| | 39,185,000 | | | Peruvian Government International Bond | | | 5.625 | | | | 11/18/2050 | | | | 49,862,912 | |
| | | | | | | | | | | | | | | | |
| | | | | | | | | | | | | | | 139,287,107 | |
| | | | | | | | | | | | | | | | |
| | | | Philippines—3.1% | | | | | | | | | | | | |
| | 25,331,000 | | | Philippine Government International Bond | | | 9.500 | | | | 02/02/2030 | | | | 42,438,012 | |
| | 28,248,000 | | | Philippine Government International Bond | | | 7.750 | | | | 01/14/2031 | | | | 42,769,167 | |
| | 30,040,000 | | | Philippine Government International Bond | | | 6.375 | | | | 10/23/2034 | | | | 41,957,229 | |
| | | | | | | | | | | | | | | | |
| | | | | | | | | | | | | | | 127,164,408 | |
| | | | | | | | | | | | | | | | |
| | | | Poland—3.1% | | | | | | | | | | | | |
| | 37,126,000 | | | Republic of Poland Government International Bond | | | 5.000 | | | | 03/23/2022 | | | | 42,093,348 | |
| | 39,030,000 | | | Republic of Poland Government International Bond | | | 4.000 | | | | 01/22/2024 | | | | 42,663,693 | |
| | 41,060,000 | | | Republic of Poland Government International Bond | | | 3.250 | | | | 04/06/2026 | | | | 42,684,744 | |
| | | | | | | | | | | | | | | | |
| | | | | | | | | | | | | | | 127,441,785 | |
| | | | | | | | | | | | | | | | |
| | | | Qatar—3.1% | | | | | | | | | | | | |
| | 32,221,000 | | | Qatar Government International Bond(a) | | | 6.400 | | | | 01/20/2040 | | | | 43,510,529 | |
| | 33,877,000 | | | Qatar Government International Bond(a) | | | 5.750 | | | | 01/20/2042 | | | | 42,907,931 | |
| | 40,092,000 | | | Qatar Government International Bond(a) | | | 4.625 | | | | 06/02/2046 | | | | 42,341,963 | |
| | | | | | | | | | | | | | | | |
| | | | | | | | | | | | | | | 128,760,423 | |
| | | | | | | | | | | | | | | | |
| | | | Romania—3.1% | | | | | | | | | | | | |
| | 34,695,000 | | | Romanian Government International Bond, EMTN(a) | | | 6.750 | | | | 02/07/2022 | | | | 41,243,681 | |
| | 39,603,000 | | | Romanian Government International Bond, EMTN(a) | | | 4.375 | | | | 08/22/2023 | | | | 43,109,687 | |
| | 34,576,000 | | | Romanian Government International Bond, EMTN(a) | | | 6.125 | | | | 01/22/2044 | | | | 45,010,864 | |
| | | | | | | | | | | | | | | | |
| | | | | | | | | | | | | | | 129,364,232 | |
| | | | | | | | | | | | | | | | |
| | | | Russia—3.4% | | | | | | | | | | | | |
| | 41,200,000 | | | Russian Foreign Bond—Eurobond(a) | | | 4.875 | | | | 09/16/2023 | | | | 44,378,745 | |
| | 42,600,000 | | | Russian Foreign Bond—Eurobond(a) | | | 5.625 | | | | 04/04/2042 | | | | 47,145,420 | |
| | 41,400,000 | | | Russian Foreign Bond—Eurobond(a) | | | 5.875 | | | | 09/16/2043 | | | | 47,371,950 | |
| | | | | | | | | | | | | | | | |
| | | | | | | | | | | | | | | 138,896,115 | |
| | | | | | | | | | | | | | | | |
| | | | Serbia—3.1% | | | | | | | | | | | | |
| | 62,246,000 | | | Serbia International Bond(a) | | | 4.875 | | | | 02/25/2020 | | | | 64,556,820 | |
| | 54,917,000 | | | Serbia International Bond(a) | | | 7.250 | | | | 09/28/2021 | | | | 63,182,393 | |
| | | | | | | | | | | | | | | | |
| | | | | | | | | | | | | | | 127,739,213 | |
| | | | | | | | | | | | | | | | |
See accompanying Notes to Financial Statements which are an integral part of the financial statements.
PowerShares Emerging Markets Sovereign Debt Portfolio (PCY) (continued)
October 31, 2016
| | | | | | | | | | | | | | | | |
Principal
Amount | | | | | Interest
Rate | | | Maturity
Date | | | Value | |
| | | | Sovereign Debt Obligations (continued) | | | | | | | | | | | | |
| | | | Slovenia—3.2% | | | | | | | | | | | | |
| $ | 37,151,000 | | | Slovenia Government International Bond(a) | | | 5.500 | % | | | 10/26/2022 | | | $ | 43,058,566 | |
| | 36,718,000 | | | Slovenia Government International Bond(a) | | | 5.850 | | | | 05/10/2023 | | | | 43,584,266 | |
| | 37,898,000 | | | Slovenia Government International Bond(a) | | | 5.250 | | | | 02/18/2024 | | | | 44,156,931 | |
| | | | | | | | | | | | | | | | |
| | | | | | | | | | | | | | | 130,799,763 | |
| | | | | | | | | | | | | | | | |
| | | | South Africa—3.4% | | | | | | | | | | | | |
| | 39,530,000 | | | Republic of South Africa Government International Bond | | | 5.875 | | | | 09/16/2025 | | | | 44,454,252 | |
| | 40,112,000 | | | Republic of South Africa Government International Bond(b) | | | 6.250 | | | | 03/08/2041 | | | | 46,898,750 | |
| | 45,060,000 | | | Republic of South Africa Government International Bond(b) | | | 5.375 | | | | 07/24/2044 | | | | 47,020,110 | |
| | | | | | | | | | | | | | | | |
| | | | | | | | | | | | | | | 138,373,112 | |
| | | | | | | | | | | | | | | | |
| | | | South Korea—3.1% | | | | | | | | | | | | |
| | 56,841,000 | | | Korea International Bond | | | 3.875 | | | | 09/11/2023 | | | | 63,880,758 | |
| | 49,482,000 | | | Korea International Bond(b) | | | 4.125 | | | | 06/10/2044 | | | | 62,655,395 | |
| | | | | | | | | | | | | | | | |
| | | | | | | | | | | | | | | 126,536,153 | |
| | | | | | | | | | | | | | | | |
| | | | Sri Lanka—3.4% | | | | | | | | | | | | |
| | 45,471,000 | | | Sri Lanka Government International Bond(a) | | | 6.125 | | | | 06/03/2025 | | | | 45,759,013 | |
| | 45,610,000 | | | Sri Lanka Government International Bond(a) | | | 6.850 | | | | 11/03/2025 | | | | 48,179,713 | |
| | 43,600,000 | | | Sri Lanka Government International Bond(a) | | | 6.825 | | | | 07/18/2026 | | | | 46,165,817 | |
| | | | | | | | | | | | | | | | |
| | | | | | | | | | | | | | | 140,104,543 | |
| | | | | | | | | | | | | | | | |
| | | | Turkey—3.0% | | | | | | | | | | | | |
| | 33,154,000 | | | Turkey Government International Bond | | | 8.000 | | | | 02/14/2034 | | | | 41,847,476 | |
| | 36,223,000 | | | Turkey Government International Bond | | | 6.875 | | | | 03/17/2036 | | | | 41,296,031 | |
| | 35,220,000 | | | Turkey Government International Bond | | | 7.250 | | | | 03/05/2038 | | | | 41,928,354 | |
| | | | | | | | | | | | | | | | |
| | | | | | | | | | | | | | | 125,071,861 | |
| | | | | | | | | | | | | | | | |
| | | | Ukraine—3.3% | | | | | | | | | | | | |
| | 45,123,000 | | | Ukraine Government International Bond(a) | | | 7.750 | | | | 09/01/2019 | | | | 45,117,359 | |
| | 45,343,000 | | | Ukraine Government International Bond(a) | | | 7.750 | | | | 09/01/2020 | | | | 45,050,538 | |
| | 45,382,000 | | | Ukraine Government International Bond(a) | | | 7.750 | | | | 09/01/2021 | | | | 44,814,725 | |
| | | | | | | | | | | | | | | | |
| | | | | | | | | | | | | | | 134,982,622 | |
| | | | | | | | | | | | | | | | |
| | | | Uruguay—3.3% | | | | | | | | | | | | |
| | 33,474,000 | | | Uruguay Government International Bond | | | 8.000 | | | | 11/18/2022 | | | | 43,097,775 | |
| | 34,908,000 | | | Uruguay Government International Bond | | | 7.875 | | | | 01/15/2033 | | | | 48,644,298 | |
| | 33,235,000 | | | Uruguay Government International Bond | | | 7.625 | | | | 03/21/2036 | | | | 45,980,622 | |
| | | | | | | | | | | | | | | | |
| | | | | | | | | | | | | | | 137,722,695 | |
| | | | | | | | | | | | | | | | |
| | | | Venezuela—3.7% | | | | | | | | | | | | |
| | 105,357,000 | | | Venezuela Government International Bond | | | 7.750 | | | | 10/13/2019 | | | | 53,995,463 | |
| | 114,295,000 | | | Venezuela Government International Bond | | | 6.000 | | | | 12/09/2020 | | | | 51,318,455 | |
| | 102,340,000 | | | Venezuela Government International Bond | | | 9.000 | | | | 05/07/2023 | | | | 47,485,760 | |
| | | | | | | | | | | | | | | | |
| | | | | | | | | | | | | | | 152,799,678 | |
| | | | | | | | | | | | | | | | |
| | | | Total Sovereign Debt Obligations
(Cost $3,975,167,709) | | | | | | | | | | | 4,057,314,124 | |
| | | | | | | | | | | | | | | | |
| | | | |
| | | | | | | | | | | | | | | | |
Number
of Shares | | | | | | | | | | | | |
| | | | Money Market Fund—0.3% | |
| | 12,105,680 | | | Invesco Premier U.S. Government Money Portfolio—Institutional Class, 0.25%(c)
(Cost $12,105,680) | | | | | | | | | | | 12,105,680 | |
| | | | | | | | | | | | | | | | |
| | | | Total Investments
(excluding investment purchased with cash collateral from securities on loan)
(Cost $3,987,273,389)—98.6% | | | | | | | | | | | 4,069,419,804 | |
| | | | | | | | | | | | | | | | |
| | | | |
| | | | | | | | | | | | | | | | |
See accompanying Notes to Financial Statements which are an integral part of the financial statements.
PowerShares Emerging Markets Sovereign Debt Portfolio (PCY) (continued)
October 31, 2016
| | | | | | | | |
Number
of Shares | | | | | Value | |
| | | | Investment Purchased with Cash Collateral from Securities on Loan | |
| | |
| | | | | | | | |
| | | | Money Market Fund—2.6% | | | | |
| | 106,777,370 | | | Invesco Government & Agency Portfolio—Institutional Class, 0.29%(c)(d)
(Cost $106,777,370) | | $ | 106,777,370 | |
| | | | | | | | |
| | | | Total Investments
(Cost $4,094,050,759)—101.2% | | | 4,176,197,174 | |
| | | | Other assets less liabilities—(1.2)% | | | (50,600,528 | ) |
| | | | | | | | |
| | | | Net Assets—100.0% | | $ | 4,125,596,646 | |
| | | | | | | | |
Investment Abbreviations:
EMTN—Euro Medium-Term Note
GMTN—Global Medium-Term Note
Notes to Schedule of Investments:
| (a) | Security purchased or received in a transaction exempt from registration under the Securities Act of 1933, as amended (the “1933 Act”). The security may be resold pursuant to an exemption from registration under the 1933 Act, typically to qualified institutional buyers. The aggregate value of these securities at October 31, 2016 was $2,162,085,620, which represented 52.41% of the Fund’s Net Assets. |
| (b) | All or a portion of this security was out on loan at October 31, 2016. |
| (c) | The security and the Fund are advised by wholly-owned subsidiaries of Invesco Ltd. and are therefore considered to be affiliated. The rate shown is the 7-day SEC standardized yield as of October 31, 2016. |
| (d) | The security has been segregated to satisfy the commitment to return the cash collateral received in securities lending transactions upon the borrower’s return of the securities loaned. See Note 2I. |
See accompanying Notes to Financial Statements which are an integral part of the financial statements.
Schedule of Investments
PowerShares Fundamental High Yield® Corporate Bond Portfolio (PHB)
October 31, 2016
| | | | | | | | | | | | | | | | |
Principal
Amount | | | | | Interest
Rate | | | Maturity
Date | | | Value | |
| | | | Corporate Bonds—98.6% | | | | | | | | | | | | |
| | | | Advertising—0.6% | | | | | | | | | | | | |
| $ | 3,109,000 | | | Lamar Media Corp. | | | 5.875 | % | | | 02/01/2022 | | | $ | 3,225,587 | |
| | 3,708,000 | | | Outfront Media Capital LLC/Outfront Media Capital Corp. | | | 5.875 | | | | 03/15/2025 | | | | 3,888,765 | |
| | | | | | | | | | | | | | | | |
| | | | | | | | | | | | | | | 7,114,352 | |
| | | | | | | | | | | | | | | | |
| | | | Aerospace/Defense—1.2% | | | | | | | | | | | | |
| | 4,440,000 | | | Arconic, Inc. | | | 5.400 | | | | 04/15/2021 | | | | 4,746,138 | |
| | 4,610,000 | | | Arconic, Inc. | | | 5.125 | | | | 10/01/2024 | | | | 4,829,067 | |
| | 4,000,000 | | | Triumph Group, Inc. | | | 4.875 | | | | 04/01/2021 | | | | 3,720,000 | |
| | | | | | | | | | | | | | | | |
| | | | | | | | | | | | | | | 13,295,205 | |
| | | | | | | | | | | | | | | | |
| | | | Airlines—0.8% | | | | | | | | | | | | |
| | 8,453,000 | | | American Airlines Group, Inc. | | | 6.125 | | | | 06/01/2018 | | | | 8,822,819 | |
| | | | | | | | | | | | | | | | |
| | | | Apparel—0.3% | | | | | | | | | | | | |
| | 2,794,000 | | | William Carter Co. (The) | | | 5.250 | | | | 08/15/2021 | | | | 2,919,730 | |
| | | | | | | | | | | | | | | | |
| | | | Auto Manufacturers—1.7% | | | | | | | | | | | | |
| | 8,711,000 | | | General Motors Co. | | | 4.875 | | | | 10/02/2023 | | | | 9,393,263 | |
| | 9,500,000 | | | General Motors Financial Co., Inc. | | | 3.200 | | | | 07/06/2021 | | | | 9,600,700 | |
| | | | | | | | | | | | | | | | |
| | | | | | | | | | | | | | | 18,993,963 | |
| | | | | | | | | | | | | | | | |
| | | | Auto Parts & Equipment—1.9% | | | | | | | | | | | | |
| | 3,403,000 | | | American Axle & Manufacturing, Inc. | | | 6.625 | | | | 10/15/2022 | | | | 3,607,180 | |
| | 2,200,000 | | | Dana, Inc. | | | 5.375 | | | | 09/15/2021 | | | | 2,289,375 | |
| | 125,000 | | | Dana, Inc. | | | 5.500 | | | | 12/15/2024 | | | | 130,000 | |
| | 7,051,000 | | | Goodyear Tire & Rubber Co. (The) | | | 5.125 | | | | 11/15/2023 | | | | 7,315,412 | |
| | 4,850,000 | | | Tenneco, Inc. | | | 5.000 | | | | 07/15/2026 | | | | 4,886,375 | |
| | 2,352,000 | | | Titan International, Inc. | | | 6.875 | | | | 10/01/2020 | | | | 2,269,680 | |
| | | | | | | | | | | | | | | | |
| | | | | | | | | | | | | | | 20,498,022 | |
| | | | | | | | | | | | | | | | |
| | | | Banks—0.8% | | | | | | | | | | | | |
| | 4,277,000 | | | Discover Bank | | | 7.000 | | | | 04/15/2020 | | | | 4,833,780 | |
| | 3,800,000 | | | First Horizon National Corp. | | | 3.500 | | | | 12/15/2020 | | | | 3,872,941 | |
| | | | | | | | | | | | | | | | |
| | | | | | | | | | | | | | | 8,706,721 | |
| | | | | | | | | | | | | | | | |
| | | | Beverages—0.5% | | | | | | | | | | | | |
| | 2,600,000 | | | Constellation Brands, Inc. | | | 7.250 | | | | 05/15/2017 | | | | 2,687,750 | |
| | 2,722,000 | | | Constellation Brands, Inc. | | | 4.250 | | | | 05/01/2023 | | | | 2,892,669 | |
| | | | | | | | | | | | | | | | |
| | | | | | | | | | | | | | | 5,580,419 | |
| | | | | | | | | | | | | | | | |
| | | | Building Materials—2.2% | | | | | | | | | | | | |
| | 1,964,000 | | | Eagle Materials, Inc. | | | 4.500 | | | | 08/01/2026 | | | | 1,982,861 | |
| | 2,185,000 | | | Griffon Corp. | | | 5.250 | | | | 03/01/2022 | | | | 2,220,506 | |
| | 2,600,000 | | | Louisiana-Pacific Corp.(a) | | | 4.875 | | | | 09/15/2024 | | | | 2,561,000 | |
| | 2,700,000 | | | Martin Marietta Materials, Inc. | | | 4.250 | | | | 07/02/2024 | | | | 2,829,530 | |
| | 2,100,000 | | | Masco Corp. | | | 7.125 | | | | 03/15/2020 | | | | 2,415,000 | |
| | 2,200,000 | | | Masco Corp. | | | 4.450 | | | | 04/01/2025 | | | | 2,307,250 | |
| | 3,870,000 | | | Owens Corning | | | 4.200 | | | | 12/15/2022 | | | | 4,114,189 | |
| | 1,300,000 | | | US Concrete, Inc. | | | 6.375 | | | | 06/01/2024 | | | | 1,355,250 | |
| | 1,550,000 | | | Vulcan Materials Co. | | | 7.500 | | | | 06/15/2021 | | | | 1,879,375 | |
| | 1,800,000 | | | Vulcan Materials Co. | | | 4.500 | | | | 04/01/2025 | | | | 1,941,750 | |
| | | | | | | | | | | | | | | | |
| | | | | | | | | | | | | | | 23,606,711 | |
| | | | | | | | | | | | | | | | |
| | | | Chemicals—3.2% | | | | | | | | | | | | |
| | 2,400,000 | | | A Schulman, Inc.(a) | | | 6.875 | | | | 06/01/2023 | | | | 2,454,000 | |
| | 4,750,000 | | | Ashland LLC | | | 3.875 | | | | 04/15/2018 | | | | 4,862,812 | |
| | 2,700,000 | | | Blue Cube Spinco, Inc. | | | 9.750 | | | | 10/15/2023 | | | | 3,186,000 | |
| | 3,000,000 | | | CF Industries, Inc. | | | 7.125 | | | | 05/01/2020 | | | | 3,319,665 | |
| | 1,065,000 | | | CF Industries, Inc. | | | 3.450 | | | | 06/01/2023 | | | | 995,769 | |
| | 7,100,000 | | | Chemours Co. (The) | | | 6.625 | | | | 05/15/2023 | | | | 6,922,500 | |
| | 3,310,000 | | | Chemtura Corp. | | | 5.750 | | | | 07/15/2021 | | | | 3,450,675 | |
See accompanying Notes to Financial Statements which are an integral part of the financial statements.
PowerShares Fundamental High Yield® Corporate Bond Portfolio (PHB) (continued)
October 31, 2016
| | | | | | | | | | | | | | | | |
Principal
Amount | | | | | Interest
Rate | | | Maturity
Date | | | Value | |
| | | | Corporate Bonds (continued) | | | | | | | | | | | | |
| | | | Chemicals (continued) | | | | | | | | | | | | |
| $ | 3,050,000 | | | Huntsman International LLC | | | 4.875 | % | | | 11/15/2020 | | | $ | 3,180,235 | |
| | 3,100,000 | | | Huntsman International LLC | | | 5.125 | | | | 11/15/2022 | | | | 3,224,000 | |
| | 3,121,000 | | | PolyOne Corp. | | | 5.250 | | | | 03/15/2023 | | | | 3,209,949 | |
| | | | | | | | | | | | | | | | |
| | | | | | | | | | | | | | | 34,805,605 | |
| | | | | | | | | | | | | | | | |
| | | | Commercial Services—2.6% | | | | | | | | | | | | |
| | 7,318,000 | | | Avis Budget Car Rental LLC/Avis Budget Finance, Inc. | | | 5.500 | | | | 04/01/2023 | | | | 7,272,263 | |
| | 3,132,000 | | | Hertz Corp. (The) | | | 6.750 | | | | 04/15/2019 | | | | 3,197,255 | |
| | 2,150,000 | | | IHS Markit Ltd.(a) | | | 5.000 | | | | 11/01/2022 | | | | 2,284,375 | |
| | 3,140,000 | | | R.R. Donnelley & Sons Co. | | | 7.875 | | | | 03/15/2021 | | | | 3,391,200 | |
| | 3,660,000 | | | R.R. Donnelley & Sons Co. | | | 6.000 | | | | 04/01/2024 | | | | 3,513,600 | |
| | 3,957,000 | | | Service Corp. International | | | 5.375 | | | | 05/15/2024 | | | | 4,174,635 | |
| | 2,735,000 | | | United Rentals North America, Inc. | | | 7.625 | | | | 04/15/2022 | | | | 2,922,019 | |
| | 2,000,000 | | | United Rentals North America, Inc. | | | 5.750 | | | | 11/15/2024 | | | | 2,085,000 | |
| | | | | | | | | | | | | | | | |
| | | | | | | | | | | | | | | 28,840,347 | |
| | | | | | | | | | | | | | | | |
| | | | Computers—2.0% | | | | | | | | | | | | |
| | 3,200,000 | | | Diebold, Inc.(a) | | | 8.500 | | | | 04/15/2024 | | | | 3,403,200 | |
| | 4,175,000 | | | Leidos Holdings, Inc. | | | 4.450 | | | | 12/01/2020 | | | | 4,279,375 | |
| | 4,718,000 | | | NCR Corp. | | | 6.375 | | | | 12/15/2023 | | | | 5,012,875 | |
| | 7,742,000 | | | Western Digital Corp.(a) | | | 10.500 | | | | 04/01/2024 | | | | 8,961,365 | |
| | | | | | | | | | | | | | | | |
| | | | | | | | | | | | | | | 21,656,815 | |
| | | | | | | | | | | | | | | | |
| | | | Cosmetics/Personal Care—1.1% | | | | | | | | | | | | |
| | 8,630,000 | | | Avon Products, Inc. | | | 7.000 | | | | 03/15/2023 | | | | 8,264,951 | |
| | 1,700,000 | | | Edgewell Personal Care Co. | | | 4.700 | | | | 05/19/2021 | | | | 1,787,300 | |
| | 1,800,000 | | | Edgewell Personal Care Co. | | | 4.700 | | | | 05/24/2022 | | | | 1,895,616 | |
| | | | | | | | | | | | | | | | |
| | | | | | | | | | | | | | | 11,947,867 | |
| | | | | | | | | | | | | | | | |
| | | | Distribution/Wholesale—0.7% | | | | | | | | | | | | |
| | 2,550,000 | | | H&E Equipment Services, Inc. | | | 7.000 | | | | 09/01/2022 | | | | 2,695,350 | |
| | 4,465,000 | | | LKQ Corp. | | | 4.750 | | | | 05/15/2023 | | | | 4,604,531 | |
| | | | | | | | | | | | | | | | |
| | | | | | | | | | | | | | | 7,299,881 | |
| | | | | | | | | | | | | | | | |
| | | | Diversified Financial Services—3.6% | | | | | | | | | | | | |
| | 1,500,000 | | | Aircastle Ltd. | | | 5.125 | | | | 03/15/2021 | | | | 1,597,500 | |
| | 1,500,000 | | | Aircastle Ltd. | | | 5.000 | | | | 04/01/2023 | | | | 1,556,250 | |
| | 10,980,000 | | | Ally Financial, Inc. | | | 8.000 | | | | 03/15/2020 | | | | 12,462,300 | |
| | 3,150,000 | | | CIT Group, Inc. | | | 4.250 | | | | 08/15/2017 | | | | 3,194,257 | |
| | 3,200,000 | | | CIT Group, Inc. | | | 5.000 | | | | 08/15/2022 | | | | 3,420,000 | |
| | 5,200,000 | | | Discover Financial Services | | | 3.750 | | | | 03/04/2025 | | | | 5,249,546 | |
| | 6,100,000 | | | Navient Corp., GMTN | | | 5.500 | | | | 01/25/2023 | | | | 5,558,625 | |
| | 5,226,000 | | | Navient Corp., MTN | | | 8.000 | | | | 03/25/2020 | | | | 5,683,275 | |
| | | | | | | | | | | | | | | | |
| | | | | | | | | | | | | | | 38,721,753 | |
| | | | | | | | | | | | | | | | |
| | | | Electric—3.9% | | | | | | | | | | | | |
| | 4,133,000 | | | AES Corp. | | | 7.375 | | | | 07/01/2021 | | | | 4,680,623 | |
| | 4,483,000 | | | AES Corp. | | | 5.500 | | | | 03/15/2024 | | | | 4,572,660 | |
| | 6,773,000 | | | Calpine Corp. | | | 5.750 | | | | 01/15/2025 | | | | 6,612,141 | |
| | 1,700,000 | | | Dynegy, Inc. | | | 6.750 | | | | 11/01/2019 | | | | 1,729,053 | |
| | 2,045,000 | | | Dynegy, Inc. | | | 5.875 | | | | 06/01/2023 | | | | 1,841,338 | |
| | 5,185,000 | | | FirstEnergy Corp., Series A | | | 2.750 | | | | 03/15/2018 | | | | 5,246,722 | |
| | 5,200,000 | | | FirstEnergy Corp., Series B | | | 4.250 | | | | 03/15/2023 | | | | 5,523,840 | |
| | 3,800,000 | | | NRG Energy, Inc. | | | 7.625 | | | | 01/15/2018 | | | | 4,075,500 | |
| | 3,821,000 | | | NRG Energy, Inc. | | | 6.250 | | | | 07/15/2022 | | | | 3,849,658 | |
| | 4,200,000 | | | NRG Energy, Inc.(a) | | | 6.625 | | | | 01/15/2027 | | | | 3,938,802 | |
| | | | | | | | | | | | | | | | |
| | | | | | | | | | | | | | | 42,070,337 | |
| | | | | | | | | | | | | | | | |
| | | | Electrical Components & Equipment—0.9% | | | | | | | | | | | | |
| | 2,270,000 | | | Anixter, Inc. | | | 5.625 | | | | 05/01/2019 | | | | 2,414,712 | |
See accompanying Notes to Financial Statements which are an integral part of the financial statements.
PowerShares Fundamental High Yield® Corporate Bond Portfolio (PHB) (continued)
October 31, 2016
| | | | | | | | | | | | | | | | |
Principal
Amount | | | | | Interest
Rate | | | Maturity
Date | | | Value | |
| | | | Corporate Bonds (continued) | | | | | | | | | | | | |
| | | | Electrical Components & Equipment (continued) | | | | | | | | | | | | |
| $ | 2,200,000 | | | Anixter, Inc. | | | 5.125 | % | | | 10/01/2021 | | | $ | 2,307,800 | |
| | 4,456,000 | | | WESCO Distribution, Inc. | | | 5.375 | | | | 12/15/2021 | | | | 4,572,970 | |
| | | | | | | | | | | | | | | | |
| | | | | | | | | | | | | | | 9,295,482 | |
| | | | | | | | | | | | | | | | |
| | | | Electronics—0.6% | | | | | | | | | | | | |
| | 2,930,000 | | | Jabil Circuit, Inc. | | | 8.250 | | | | 03/15/2018 | | | | 3,175,388 | |
| | 3,000,000 | | | Jabil Circuit, Inc. | | | 4.700 | | | | 09/15/2022 | | | | 3,135,000 | |
| | | | | | | | | | | | | | | | |
| | | | | | | | | | | | | | | 6,310,388 | |
| | | | | | | | | | | | | | | | |
| | | | Engineering & Construction—1.2% | | | | | | | | | | | | |
| | 4,750,000 | | | AECOM | | | 5.875 | | | | 10/15/2024 | | | | 5,040,937 | |
| | 5,000,000 | | | MasTec, Inc. | | | 4.875 | | | | 03/15/2023 | | | | 4,893,750 | |
| | 3,500,000 | | | SBA Communications Corp.(a) | | | 4.875 | | | | 09/01/2024 | | | | 3,508,750 | |
| | | | | | | | | | | | | | | | |
| | | | | | | | | | | | | | | 13,443,437 | |
| | | | | | | | | | | | | | | | |
| | | | Entertainment—2.5% | | | | | | | | | | | | |
| | 3,000,000 | | | AMC Entertainment, Inc. | | | 5.750 | | | | 06/15/2025 | | | | 3,022,500 | |
| | 3,985,000 | | | Cinemark USA, Inc. | | | 4.875 | | | | 06/01/2023 | | | | 4,009,906 | |
| | 1,650,000 | | | GLP Capital LP/GLP Financing II, Inc. | | | 4.875 | | | | 11/01/2020 | | | | 1,767,563 | |
| | 1,700,000 | | | GLP Capital LP/GLP Financing II, Inc. | | | 5.375 | | | | 11/01/2023 | | | | 1,831,750 | |
| | 5,600,000 | | | International Game Technology | | | 7.500 | | | | 06/15/2019 | | | | 6,244,000 | |
| | 2,075,000 | | | National CineMedia LLC | | | 6.000 | | | | 04/15/2022 | | | | 2,168,375 | |
| | 3,125,000 | | | Pinnacle Entertainment, Inc.(a) | | | 5.625 | | | | 05/01/2024 | | | | 3,156,250 | |
| | 4,600,000 | | | Regal Entertainment Group | | | 5.750 | | | | 03/15/2022 | | | | 4,772,500 | |
| | | | | | | | | | | | | | | | |
| | | | | | | | | | | | | | | 26,972,844 | |
| | | | | | | | | | | | | | | | |
| | | | Environmental Control—0.4% | | | | | | | | | | | | |
| | 1,865,000 | | | Covanta Holding Corp. | | | 7.250 | | | | 12/01/2020 | | | | 1,914,423 | |
| | 2,000,000 | | | Covanta Holding Corp. | | | 5.875 | | | | 03/01/2024 | | | | 1,970,000 | |
| | | | | | | | | | | | | | | | |
| | | | | | | | | | | | | | | 3,884,423 | |
| | | | | | | | | | | | | | | | |
| | | | Food—2.1% | | | | | | | | | | | | |
| | 2,400,000 | | | B&G Foods, Inc. | | | 4.625 | | | | 06/01/2021 | | | | 2,478,000 | |
| | 3,155,000 | | | Darling Ingredients, Inc. | | | 5.375 | | | | 01/15/2022 | | | | 3,300,919 | |
| | 3,100,000 | | | Pinnacle Foods Finance LLC/Pinnacle Foods Finance Corp. | | | 5.875 | | | | 01/15/2024 | | | | 3,340,250 | |
| | 3,455,000 | | | SUPERVALU, Inc. | | | 6.750 | | | | 06/01/2021 | | | | 3,489,550 | |
| | 3,600,000 | | | SUPERVALU, Inc. | | | 7.750 | | | | 11/15/2022 | | | | 3,672,000 | |
| | 3,200,000 | | | TreeHouse Foods, Inc. | | | 4.875 | | | | 03/15/2022 | | | | 3,336,000 | |
| | 2,928,000 | | | WhiteWave Foods Co. (The) | | | 5.375 | | | | 10/01/2022 | | | | 3,304,980 | |
| | | | | | | | | | | | | | | | |
| | | | | | | | | | | | | | | 22,921,699 | |
| | | | | | | | | | | | | | | | |
| | | | Food Service—0.5% | | | | | | | | | | | | |
| | 5,700,000 | | | Aramark Services, Inc. | | | 5.125 | | | | 01/15/2024 | | | | 5,985,000 | |
| | | | | | | | | | | | | | | | |
| | | | Healthcare-Products—0.6% | | | | | | | | | | | | |
| | 3,160,000 | | | Alere, Inc. | | | 7.250 | | | | 07/01/2018 | | | | 3,217,275 | |
| | 3,078,000 | | | Teleflex, Inc. | | | 4.875 | | | | 06/01/2026 | | | | 3,162,645 | |
| | | | | | | | | | | | | | | | |
| | | | | | | | | | | | | | | 6,379,920 | |
| | | | | | | | | | | | | | | | |
| | | | Healthcare-Services—5.3% | | | | | | | | | | | | |
| | 1,800,000 | | | Acadia Healthcare Co., Inc. | | | 5.625 | | | | 02/15/2023 | | | | 1,811,250 | |
| | 2,970,000 | | | Amsurg Corp. | | | 5.625 | | | | 07/15/2022 | | | | 3,040,537 | |
| | 2,427,000 | | | Centene Corp. | | | 5.750 | | | | 06/01/2017 | | | | 2,478,574 | |
| | 2,400,000 | | | Centene Corp. | | | 6.125 | | | | 02/15/2024 | | | | 2,562,000 | |
| | 7,100,000 | | | DaVita, Inc. | | | 5.125 | | | | 07/15/2024 | | | | 6,958,000 | |
| | 6,409,000 | | | HCA, Inc. | | | 6.500 | | | | 02/15/2020 | | | | 7,113,990 | |
| | 7,135,000 | | | HCA, Inc. | | | 5.375 | | | | 02/01/2025 | | | | 7,291,613 | |
| | 3,200,000 | | | HealthSouth Corp. | | | 5.750 | | | | 11/01/2024 | | | | 3,316,000 | |
| | 1,800,000 | | | Kindred Healthcare, Inc. | | | 8.000 | | | | 01/15/2020 | | | | 1,791,000 | |
| | 1,900,000 | | | Kindred Healthcare, Inc. | | | 6.375 | | | | 04/15/2022 | | | | 1,765,822 | |
| | 3,900,000 | | | LifePoint Health, Inc. | | | 5.500 | | | | 12/01/2021 | | | | 4,043,812 | |
See accompanying Notes to Financial Statements which are an integral part of the financial statements.
PowerShares Fundamental High Yield® Corporate Bond Portfolio (PHB) (continued)
October 31, 2016
| | | | | | | | | | | | | | | | |
Principal
Amount | | | | | Interest
Rate | | | Maturity
Date | | | Value | |
| | | | Corporate Bonds (continued) | | | | | | | | | | | | |
| | | | Healthcare-Services (continued) | | | | | | | | | | | | |
| $ | 4,000,000 | | | Molina Healthcare, Inc. | | | 5.375 | % | | | 11/15/2022 | | | $ | 4,182,480 | |
| | 6,200,000 | | | Tenet Healthcare Corp. | | | 6.000 | | | | 10/01/2020 | | | | 6,546,456 | |
| | 4,500,000 | | | WellCare Health Plans, Inc. | | | 5.750 | | | | 11/15/2020 | | | | 4,637,813 | |
| | | | | | | | | | | | | | | | |
| | | | | | | | | | | | | | | 57,539,347 | |
| | | | | | | | | | | | | | | | |
| | | | Holding Companies-Diversified—0.6% | | | | | | | | | | | | |
| | 6,750,000 | | | Leucadia National Corp. | | | 5.500 | | | | 10/18/2023 | | | | 7,097,024 | |
| | | | | | | | | | | | | | | | |
| | | | Home Builders—2.2% | | | | | | | | | | | | |
| | 2,398,000 | | | CalAtlantic Group, Inc. | | | 8.375 | | | | 05/15/2018 | | | | 2,625,810 | |
| | 2,100,000 | | | D.R. Horton, Inc. | | | 3.750 | | | | 03/01/2019 | | | | 2,168,250 | |
| | 2,170,000 | | | D.R. Horton, Inc. | | | 4.375 | | | | 09/15/2022 | | | | 2,289,350 | |
| | 1,200,000 | | | KB Home | | | 4.750 | | | | 05/15/2019 | | | | 1,233,000 | |
| | 1,100,000 | | | KB Home | | | 7.000 | | | | 12/15/2021 | | | | 1,185,250 | |
| | 2,100,000 | | | Lennar Corp. | | | 4.500 | | | | 11/15/2019 | | | | 2,223,375 | |
| | 2,200,000 | | | Lennar Corp. | | | 4.750 | | | | 05/30/2025 | | | | 2,242,900 | |
| | 1,900,000 | | | PulteGroup, Inc. | | | 4.250 | | | | 03/01/2021 | | | | 2,004,500 | |
| | 1,850,000 | | | PulteGroup, Inc. | | | 5.500 | | | | 03/01/2026 | | | | 1,933,250 | |
| | 1,460,000 | | | Toll Brothers Finance Corp. | | | 8.910 | | | | 10/15/2017 | | | | 1,560,375 | |
| | 1,555,000 | | | Toll Brothers Finance Corp. | | | 5.875 | | | | 02/15/2022 | | | | 1,722,162 | |
| | 775,000 | | | TRI Pointe Group, Inc./TRI Pointe Homes, Inc. | | | 4.375 | | | | 06/15/2019 | | | | 796,313 | |
| | 685,000 | | | TRI Pointe Group, Inc./TRI Pointe Homes, Inc. | | | 5.875 | | | | 06/15/2024 | | | | 713,256 | |
| | 1,627,000 | | | William Lyon Homes, Inc. | | | 8.500 | | | | 11/15/2020 | | | | 1,712,418 | |
| | | | | | | | | | | | | | | | |
| | | | | | | | | | | | | | | 24,410,209 | |
| | | | | | | | | | | | | | | | |
| | | | Home Furnishings—0.3% | | | | | | | | | | | | |
| | 2,956,000 | | | Tempur Sealy International, Inc. | | | 5.625 | | | | 10/15/2023 | | | | 3,074,240 | |
| | | | | | | | | | | | | | | | |
| | | | Household Products/Wares—0.5% | | | | | | | | | | | | |
| | 5,265,000 | | | Spectrum Brands, Inc. | | | 5.750 | | | | 07/15/2025 | | | | 5,725,688 | |
| | | | | | | | | | | | | | | | |
| | | | Housewares—0.3% | | | | | | | | | | | | |
| | 3,200,000 | | | Scotts Miracle-Gro Co. (The)(a) | | | 6.000 | | | | 10/15/2023 | | | | 3,408,000 | |
| | | | | | | | | | | | | | | | |
| | | | Insurance—2.2% | | | | | | | | | | | | |
| | 4,800,000 | | | CNO Financial Group, Inc. | | | 5.250 | | | | 05/30/2025 | | | | 4,872,000 | |
| | 5,513,000 | | | Genworth Holdings, Inc. | | | 7.625 | | | | 09/24/2021 | | | | 5,196,003 | |
| | 6,100,000 | | | Genworth Holdings, Inc. | | | 4.800 | | | | 02/15/2024 | | | | 5,002,000 | |
| | 4,244,000 | | | Genworth Holdings, Inc., GMTN | | | 6.515 | | | | 05/22/2018 | | | | 4,302,355 | |
| | 2,400,000 | | | MGIC Investment Corp. | | | 5.750 | | | | 08/15/2023 | | | | 2,538,000 | |
| | 2,100,000 | | | Radian Group, Inc. | | | 5.250 | | | | 06/15/2020 | | | | 2,212,875 | |
| | | | | | | | | | | | | | | | |
| | | | | | | | | | | | | | | 24,123,233 | |
| | | | | | | | | | | | | | | | |
| | | | Internet—1.8% | | | | | | | | | | | | |
| | 1,970,000 | | | Expedia, Inc. | | | 5.950 | | | | 08/15/2020 | | | | 2,210,901 | |
| | 328,000 | | | Expedia, Inc. | | | 4.500 | | | | 08/15/2024 | | | | 342,268 | |
| | 2,200,000 | | | Expedia, Inc.(a) | | | 5.000 | | | | 02/15/2026 | | | | 2,312,823 | |
| | 3,255,000 | | | Match Group, Inc. | | | 6.750 | | | | 12/15/2022 | | | | 3,474,713 | |
| | 1,900,000 | | | NetFlix, Inc. | | | 5.375 | | | | 02/01/2021 | | | | 2,068,625 | |
| | 1,800,000 | | | NetFlix, Inc. | | | 5.875 | | | | 02/15/2025 | | | | 2,000,250 | |
| | 3,463,000 | | | VeriSign, Inc. | | | 4.625 | | | | 05/01/2023 | | | | 3,584,205 | |
| | 2,961,000 | | | Zayo Group LLC/Zayo Capital, Inc. | | | 6.375 | | | | 05/15/2025 | | | | 3,128,504 | |
| | | | | | | | | | | | | | | | |
| | | | | | | | | | | | | | | 19,122,289 | |
| | | | | | | | | | | | | | | | |
| | | | Iron/Steel—1.4% | | | | | | | | | | | | |
| | 3,600,000 | | | AK Steel Corp. | | | 7.500 | | | | 07/15/2023 | | | | 3,888,000 | |
| | 2,450,000 | | | Allegheny Technologies, Inc. | | | 5.950 | | | | 01/15/2021 | | | | 2,278,500 | |
| | 2,450,000 | | | Allegheny Technologies, Inc. | | | 7.875 | | | | 08/15/2023 | | | | 2,352,000 | |
| | 3,955,000 | | | Commercial Metals Co. | | | 7.350 | | | | 08/15/2018 | | | | 4,271,400 | |
| | 2,450,000 | | | Steel Dynamics, Inc. | | | 5.125 | | | | 10/01/2021 | | | | 2,566,375 | |
| | 150,000 | | | Steel Dynamics, Inc. | | | 5.500 | | | | 10/01/2024 | | | | 158,625 | |
| | | | | | | | | | | | | | | | |
| | | | | | | | | | | | | | | 15,514,900 | |
| | | | | | | | | | | | | | | | |
See accompanying Notes to Financial Statements which are an integral part of the financial statements.
PowerShares Fundamental High Yield® Corporate Bond Portfolio (PHB) (continued)
October 31, 2016
| | | | | | | | | | | | | | | | |
Principal
Amount | | | | | Interest
Rate | | | Maturity
Date | | | Value | |
| | | | Corporate Bonds (continued) | | | | | | | | | | | | |
| | | | Leisure Time—0.8% | | | | | | | | | | | | |
| $ | 6,000,000 | | | Royal Caribbean Cruises Ltd. | | | 5.250 | % | | | 11/15/2022 | | | $ | 6,592,500 | |
| | 2,000,000 | | | Vista Outdoor, Inc. | | | 5.875 | | | | 10/01/2023 | | | | 2,110,200 | |
| | | | | | | | | | | | | | | | |
| | | | | | | | | | | | | | | 8,702,700 | |
| | | | | | | | | | | | | | | | |
| | | | Lodging—1.4% | | | | | | | | | | | | |
| | 3,295,000 | | | Boyd Gaming Corp.(a) | | | 6.375 | | | | 04/01/2026 | | | | 3,542,125 | |
| | 3,302,000 | | | Choice Hotels International, Inc. | | | 5.750 | | | | 07/01/2022 | | | | 3,628,073 | |
| | 3,325,000 | | | MGM Resorts International | | | 8.625 | | | | 02/01/2019 | | | | 3,746,859 | |
| | 3,500,000 | | | MGM Resorts International | | | 6.625 | | | | 12/15/2021 | | | | 3,917,830 | |
| | | | | | | | | | | | | | | | |
| | | | | | | | | | | | | | | 14,834,887 | |
| | | | | | | | | | | | | | | | |
| | | | Machinery-Construction & Mining—0.4% | | | | | | | | | | | | |
| | 4,085,000 | | | Terex Corp. | | | 6.000 | | | | 05/15/2021 | | | | 4,171,806 | |
| | | | | | | | | | | | | | | | |
| | | | Machinery-Diversified—0.2% | | | | | | | | | | | | |
| | 2,512,000 | | | Zebra Technologies Corp. | | | 7.250 | | | | 10/15/2022 | | | | 2,719,240 | |
| | | | | | | | | | | | | | | | |
| | | | Media—4.6% | | | | | | | | | | | | |
| | 3,450,000 | | | AMC Networks, Inc. | | | 5.000 | | | | 04/01/2024 | | | | 3,506,063 | |
| | 3,800,000 | | | Charter Communications Operating LLC/Charter Communications Operating
Capital(a) | | | 3.579 | | | | 07/23/2020 | | | | 3,943,420 | |
| | 3,400,000 | | | Charter Communications Operating LLC/Charter Communications Operating
Capital(a) | | | 4.908 | | | | 07/23/2025 | | | | 3,673,465 | |
| | 6,450,000 | | | Clear Channel Worldwide Holdings, Inc., Series B | | | 6.500 | | | | 11/15/2022 | | | | 6,601,575 | |
| | 4,021,000 | | | DISH DBS Corp. | | | 6.750 | | | | 06/01/2021 | | | | 4,330,135 | |
| | 4,029,000 | | | DISH DBS Corp. | | | 7.750 | | | | 07/01/2026 | | | | 4,434,438 | |
| | 2,100,000 | | | LIN Television Corp. | | | 5.875 | | | | 11/15/2022 | | | | 2,207,625 | |
| | 2,950,000 | | | McClatchy Co. (The) | | | 9.000 | | | | 12/15/2022 | | | | 3,090,479 | |
| | 5,750,000 | | | Nielsen Finance LLC/Nielsen Finance Co. | | | 4.500 | | | | 10/01/2020 | | | | 5,872,820 | |
| | 3,267,000 | | | Sinclair Television Group, Inc. | | | 6.125 | | | | 10/01/2022 | | | | 3,467,234 | |
| | 4,521,000 | | | TEGNA, Inc. | | | 6.375 | | | | 10/15/2023 | | | | 4,797,911 | |
| | 4,110,000 | | | Tribune Media Co. | | | 5.875 | | | | 07/15/2022 | | | | 4,130,550 | |
| | | | | | | | | | | | | | | | |
| | | | | | | | | | | | | | | 50,055,715 | |
| | | | | | | | | | | | | | | | |
| | | | Mining—2.1% | | | | | | | | | | | | |
| | 8,330,000 | | | Freeport-McMoRan, Inc. | | | 2.375 | | | | 03/15/2018 | | | | 8,267,525 | |
| | 10,500,000 | | | Freeport-McMoRan, Inc. | | | 3.550 | | | | 03/01/2022 | | | | 9,686,250 | |
| | 2,000,000 | | | Hecla Mining Co. | | | 6.875 | | | | 05/01/2021 | | | | 2,050,000 | |
| | 2,200,000 | | | Kaiser Aluminum Corp. | | | 5.875 | | | | 05/15/2024 | | | | 2,329,250 | |
| | | | | | | | | | | | | | | | |
| | | | | | | | | | | | | | | 22,333,025 | |
| | | | | | | | | | | | | | | | |
| | | | Miscellaneous Manufacturing—0.9% | | | | | | | | | | | | |
| | 4,050,000 | | | Harsco Corp. | | | 5.750 | | | | 05/15/2018 | | | | 4,333,500 | |
| | 5,246,000 | | | Trinity Industries, Inc. | | | 4.550 | | | | 10/01/2024 | | | | 5,182,114 | |
| | | | | | | | | | | | | | | | |
| | | | | | | | | | | | | | | 9,515,614 | |
| | | | | | | | | | | | | | | | |
| | | | Office/Business Equipment—0.5% | | | | | | | | | | | | |
| | 4,665,000 | | | CDW LLC/CDW Finance Corp. | | | 6.000 | | | | 08/15/2022 | | | | 4,962,394 | |
| | | | | | | | | | | | | | | | |
| | | | Oil & Gas—14.9% | | | | | | | | | | | | |
| | 4,558,000 | | | Anadarko Petroleum Corp. | | | 8.700 | | | | 03/15/2019 | | | | 5,227,160 | |
| | 3,825,000 | | | Antero Resources Corp. | | | 5.625 | | | | 06/01/2023 | | | | 3,920,625 | |
| | 1,000,000 | | | Callon Petroleum Co.(a) | | | 6.125 | | | | 10/01/2024 | | | | 1,032,500 | |
| | 2,500,000 | | | Carrizo Oil & Gas, Inc. | | | 6.250 | | | | 04/15/2023 | | | | 2,581,250 | |
| | 4,700,000 | | | Concho Resources, Inc. | | | 5.500 | | | | 04/01/2023 | | | | 4,831,600 | |
| | 6,900,000 | | | Continental Resources, Inc. | | | 3.800 | | | | 06/01/2024 | | | | 6,382,500 | |
| | 5,200,000 | | | Devon Energy Corp. | | | 4.000 | | | | 07/15/2021 | | | | 5,436,959 | |
| | 5,475,000 | | | Devon Energy Corp. | | | 3.250 | | | | 05/15/2022 | | | | 5,503,749 | |
| | 7,538,000 | | | Diamond Offshore Drilling, Inc. | | | 5.875 | | | | 05/01/2019 | | | | 7,869,288 | |
| | 4,149,000 | | | Energen Corp. | | | 4.625 | | | | 09/01/2021 | | | | 4,195,676 | |
| | 750,000 | | | Gulfport Energy Corp.(a) | | | 6.000 | | | | 10/15/2024 | | | | 765,000 | |
| | 1,800,000 | | | Hess Corp. | | | 4.300 | | | | 04/01/2027 | | | | 1,795,660 | |
| | 5,125,000 | | | Kerr-McGee Corp. | | | 6.950 | | | | 07/01/2024 | | | | 6,154,351 | |
See accompanying Notes to Financial Statements which are an integral part of the financial statements.
PowerShares Fundamental High Yield® Corporate Bond Portfolio (PHB) (continued)
October 31, 2016
| | | | | | | | | | | | | | | | |
Principal
Amount | | | | | Interest
Rate | | | Maturity
Date | | | Value | |
| | | | Corporate Bonds (continued) | | | | | | | | | | | | |
| | | | Oil & Gas (continued) | | | | | | | | | | | | |
| $ | 3,125,000 | | | Laredo Petroleum, Inc. | | | 5.625 | % | | | 01/15/2022 | | | $ | 3,062,500 | |
| | 5,400,000 | | | Marathon Oil Corp. | | | 5.900 | | | | 03/15/2018 | | | | 5,674,358 | |
| | 6,520,000 | | | Marathon Oil Corp. | | | 2.800 | | | | 11/01/2022 | | | | 6,203,571 | |
| | 1,100,000 | | | Matador Resources Co. | | | 6.875 | | | | 04/15/2023 | | | | 1,160,500 | |
| | 10,000,000 | | | Murphy Oil Corp. | | | 4.700 | | | | 12/01/2022 | | | | 9,499,600 | |
| | 6,275,000 | | | Murphy Oil USA, Inc. | | | 6.000 | | | | 08/15/2023 | | | | 6,635,812 | |
| | 6,158,000 | | | Nabors Industries, Inc. | | | 5.000 | | | | 09/15/2020 | | | | 6,232,315 | |
| | 5,100,000 | | | Newfield Exploration Co. | | | 5.625 | | | | 07/01/2024 | | | | 5,329,500 | |
| | 5,800,000 | | | PBF Holding Co. LLC/PBF Finance Corp.(a) | | | 7.000 | | | | 11/15/2023 | | | | 5,394,000 | |
| | 1,956,000 | | | PDC Energy, Inc. | | | 7.750 | | | | 10/15/2022 | | | | 2,088,030 | |
| | 2,325,000 | | | QEP Resources, Inc. | | | 6.875 | | | | 03/01/2021 | | | | 2,458,688 | |
| | 2,500,000 | | | QEP Resources, Inc. | | | 5.250 | | | | 05/01/2023 | | | | 2,468,750 | |
| | 18,000 | | | Range Resources Corp.(a) | | | 5.750 | | | | 06/01/2021 | | | | 18,360 | |
| | 4,178,000 | | | Range Resources Corp.(a) | | | 5.000 | | | | 03/15/2023 | | | | 4,063,105 | |
| | 2,000,000 | | | Rice Energy, Inc. | | | 6.250 | | | | 05/01/2022 | | | | 2,045,000 | |
| | 1,694,000 | | | Rowan Cos., Inc. | | | 7.875 | | | | 08/01/2019 | | | | 1,842,394 | |
| | 2,200,000 | | | Rowan Cos., Inc. | | | 4.875 | | | | 06/01/2022 | | | | 1,903,000 | |
| | 1,560,000 | | | RSP Permian, Inc. | | | 6.625 | | | | 10/01/2022 | | | | 1,651,650 | |
| | 5,050,000 | | | SM Energy Co. | | | 6.125 | | | | 11/15/2022 | | | | 5,100,500 | |
| | 4,000,000 | | | Southwestern Energy Co. | | | 5.800 | | | | 01/23/2020 | | | | 4,000,000 | |
| | 4,222,000 | | | Southwestern Energy Co. | | | 6.700 | | | | 01/23/2025 | | | | 4,042,565 | |
| | 4,107,000 | | | Tesoro Corp. | | | 4.250 | | | | 10/01/2017 | | | | 4,204,541 | |
| | 4,323,000 | | | Tesoro Corp. | | | 5.375 | | | | 10/01/2022 | | | | 4,458,094 | |
| | 6,500,000 | | | Unit Corp. | | | 6.625 | | | | 05/15/2021 | | | | 6,012,500 | |
| | 6,043,000 | | | Western Refining, Inc. | | | 6.250 | | | | 04/01/2021 | | | | 6,118,538 | |
| | 5,100,000 | | | WPX Energy, Inc. | | | 6.000 | | | | 01/15/2022 | | | | 5,112,750 | |
| | | | | | | | | | | | | | | | |
| | | | | | | | | | | | | | | 162,476,939 | |
| | | | | | | | | | | | | | | | |
| | | | Oil & Gas Services—0.5% | | | | | | | | | | | | |
| | 3,878,000 | | | Bristow Group, Inc. | | | 6.250 | | | | 10/15/2022 | | | | 3,112,095 | |
| | 2,617,000 | | | Forum Energy Technologies, Inc. | | | 6.250 | | | | 10/01/2021 | | | | 2,603,915 | |
| | | | | | | | | | | | | | | | |
| | | | | | | | | | | | | | | 5,716,010 | |
| | | | | | | | | | | | | | | | |
| | | | Packaging & Containers—2.2% | | | | | | | | | | | | |
| | 2,600,000 | | | Ball Corp. | | | 4.375 | | | | 12/15/2020 | | | | 2,782,000 | |
| | 2,722,000 | | | Ball Corp. | | | 4.000 | | | | 11/15/2023 | | | | 2,763,510 | |
| | 4,430,000 | | | Berry Plastics Corp. | | | 5.125 | | | | 07/15/2023 | | | | 4,529,675 | |
| | 5,700,000 | | | Crown Americas LLC/Crown Americas Capital Corp. IV | | | 4.500 | | | | 01/15/2023 | | | | 5,871,000 | |
| | 4,093,000 | | | Graphic Packaging International, Inc. | | | 4.750 | | | | 04/15/2021 | | | | 4,369,278 | |
| | 3,512,000 | | | Silgan Holdings, Inc. | | | 5.000 | | | | 04/01/2020 | | | | 3,599,800 | |
| | | | | | | | | | | | | | | | |
| | | | | | | | | | | | | | | 23,915,263 | |
| | | | | | | | | | | | | | | | |
| | | | Pipelines—3.8% | | | | | | | | | | | | |
| | 4,300,000 | | | Enable Midstream Partners LP | | | 2.400 | | | | 05/15/2019 | | | | 4,244,504 | |
| | 4,665,000 | | | Enable Midstream Partners LP | | | 3.900 | | | | 05/15/2024 | | | | 4,396,679 | |
| | 8,620,000 | | | ONEOK, Inc. | | | 4.250 | | | | 02/01/2022 | | | | 8,555,350 | |
| | 3,200,000 | | | Rose Rock Midstream LP/Rose Rock Finance Corp. | | | 5.625 | | | | 07/15/2022 | | | | 3,072,000 | |
| | 1,400,000 | | | Sabine Pass Liquefaction LLC | | | 5.625 | | | | 02/01/2021 | | | | 1,480,500 | |
| | 1,400,000 | | | Sabine Pass Liquefaction LLC | | | 5.750 | | | | 05/15/2024 | | | | 1,487,500 | |
| | 5,400,000 | | | Targa Resources Partners LP/Targa Resources Partners Finance Corp. | | | 4.250 | | | | 11/15/2023 | | | | 5,103,000 | |
| | 5,700,000 | | | Williams Cos., Inc. (The) | | | 7.875 | | | | 09/01/2021 | | | | 6,640,500 | |
| | 6,256,000 | | | Williams Cos., Inc. (The) | | | 4.550 | | | | 06/24/2024 | | | | 6,396,760 | |
| | | | | | | | | | | | | | | | |
| | | | | | | | | | | | | | | 41,376,793 | |
| | | | | | | | | | | | | | | | |
| | | | Real Estate—0.2% | | | | | | | | | | | | |
| | 1,980,000 | | | Kennedy-Wilson, Inc. | | | 5.875 | | | | 04/01/2024 | | | | 2,009,700 | |
| | | | | | | | | | | | | | | | |
| | | | REITs—3.1% | | | | | | | | | | | | |
| | 1,700,000 | | | CyrusOne LP/CyrusOne Finance Corp. | | | 6.375 | | | | 11/15/2022 | | | | 1,810,500 | |
See accompanying Notes to Financial Statements which are an integral part of the financial statements.
PowerShares Fundamental High Yield® Corporate Bond Portfolio (PHB) (continued)
October 31, 2016
| | | | | | | | | | | | | | | | |
Principal
Amount | | | | | Interest
Rate | | | Maturity
Date | | | Value | |
| | | | Corporate Bonds (continued) | | | | | | | | | | | | |
| | | | REITs (continued) | | | | | | | | | | | | |
| $ | 2,352,000 | | | DuPont Fabros Technology LP | | | 5.875 | % | | | 09/15/2021 | | | $ | 2,465,190 | |
| | 4,001,000 | | | Equinix, Inc. | | | 5.375 | | | | 04/01/2023 | | | | 4,196,049 | |
| | 1,750,000 | | | FelCor Lodging LP | | | 6.000 | | | | 06/01/2025 | | | | 1,824,375 | |
| | 3,250,000 | | | GEO Group, Inc. (The) | | | 6.000 | | | | 04/15/2026 | | | | 2,819,375 | |
| | 6,400,000 | | | Iron Mountain, Inc. | | | 5.750 | | | | 08/15/2024 | | | | 6,592,000 | |
| | 2,200,000 | | | iStar, Inc. | | | 4.000 | | | | 11/01/2017 | | | | 2,208,250 | |
| | 2,280,000 | | | MPT Operating Partnership LP/MPT Finance Corp. | | | 6.375 | | | | 03/01/2024 | | | | 2,468,100 | |
| | 2,800,000 | | | RHP Hotel Properties LP/RHP Finance Corp. | | | 5.000 | | | | 04/15/2023 | | | | 2,870,000 | |
| | 2,375,000 | | | Sabra Health Care LP/Sabra Capital Corp. | | | 5.500 | | | | 02/01/2021 | | | | 2,481,875 | |
| | 2,000,000 | | | VEREIT Operating Partnership LP | | | 3.000 | | | | 02/06/2019 | | | | 2,028,020 | |
| | 2,000,000 | | | VEREIT Operating Partnership LP | | | 4.600 | | | | 02/06/2024 | | | | 2,080,000 | |
| | | | | | | | | | | | | | | | |
| | | | | | | | | | | | | | | 33,843,734 | |
| | | | | | | | | | | | | | | | |
| | | | Retail—6.1% | | | | | | | | | | | | |
| | 3,549,000 | | | Asbury Automotive Group, Inc. | | | 6.000 | | | | 12/15/2024 | | | | 3,673,215 | |
| | 4,781,000 | | | CST Brands, Inc. | | | 5.000 | | | | 05/01/2023 | | | | 5,043,955 | |
| | 5,205,000 | | | Dollar Tree, Inc. | | | 5.750 | | | | 03/01/2023 | | | | 5,569,350 | |
| | 8,200,000 | | | Gap, Inc. (The) | | | 5.950 | | | | 04/12/2021 | | | | 8,803,372 | |
| | 4,020,000 | | | Group 1 Automotive, Inc. | | | 5.000 | | | | 06/01/2022 | | | | 4,030,050 | |
| | 4,410,000 | | | L Brands, Inc. | | | 6.625 | | | | 04/01/2021 | | | | 5,093,550 | |
| | 4,587,000 | | | L Brands, Inc. | | | 5.625 | | | | 02/15/2022 | | | | 5,028,499 | |
| | 5,227,000 | | | Penske Automotive Group, Inc. | | | 5.750 | | | | 10/01/2022 | | | | 5,442,614 | |
| | 4,500,000 | | | PVH Corp. | | | 4.500 | | | | 12/15/2022 | | | | 4,657,500 | |
| | 3,340,000 | | | QVC, Inc. | | | 3.125 | | | | 04/01/2019 | | | | 3,415,447 | |
| | 3,435,000 | | | QVC, Inc. | | | 4.375 | | | | 03/15/2023 | | | | 3,453,360 | |
| | 3,600,000 | | | Sally Holdings LLC/Sally Capital, Inc. | | | 5.750 | | | | 06/01/2022 | | | | 3,762,000 | |
| | 8,700,000 | | | Yum! Brands, Inc. | | | 3.750 | | | | 11/01/2021 | | | | 8,971,875 | |
| | | | | | | | | | | | | | | | |
| | | | | | | | | | | | | | | 66,944,787 | |
| | | | | | | | | | | | | | | | |
| | | | Semiconductors—1.6% | | | | | | | | | | | | |
| | 4,120,000 | | | Amkor Technology, Inc. | | | 6.625 | | | | 06/01/2021 | | | | 4,217,850 | |
| | 10,432,000 | | | Micron Technology, Inc. | | | 5.500 | | | | 02/01/2025 | | | | 10,278,754 | |
| | 3,000,000 | | | Qorvo, Inc. | | | 7.000 | | | | 12/01/2025 | | | | 3,300,000 | |
| | | | | | | | | | | | | | | | |
| | | | | | | | | | | | | | | 17,796,604 | |
| | | | | | | | | | | | | | | | |
| | | | Software—0.2% | | | | | | | | | | | | |
| | 1,911,000 | | | SS&C Technologies Holdings, Inc. | | | 5.875 | | | | 07/15/2023 | | | | 2,011,328 | |
| | | | | | | | | | | | | | | | |
| | | | Telecommunications—4.6% | | | | | | | | | | | | |
| | 6,410,000 | | | CenturyLink, Inc., Series S | | | 6.450 | | | | 06/15/2021 | | | | 6,874,725 | |
| | 6,709,000 | | | CenturyLink, Inc., Series Y | | | 7.500 | | | | 04/01/2024 | | | | 7,002,519 | |
| | 3,851,000 | | | Frontier Communications Corp. | | | 8.500 | | | | 04/15/2020 | | | | 4,125,384 | |
| | 4,031,000 | | | Frontier Communications Corp. | | | 11.000 | | | | 09/15/2025 | | | | 4,142,457 | |
| | 1,800,000 | | | Hughes Satellite Systems Corp. | | | 7.625 | | | | 06/15/2021 | | | | 1,980,000 | |
| | 1,950,000 | | | Hughes Satellite Systems Corp.(a) | | | 6.625 | | | | 08/01/2026 | | | | 1,935,375 | |
| | 5,972,000 | | | Level 3 Financing, Inc. | | | 5.375 | | | | 08/15/2022 | | | | 6,151,160 | |
| | 4,534,000 | | | T-Mobile USA, Inc. | | | 6.250 | | | | 04/01/2021 | | | | 4,732,362 | |
| | 4,686,000 | | | T-Mobile USA, Inc. | | | 6.500 | | | | 01/15/2026 | | | | 5,148,508 | |
| | 2,325,000 | | | ViaSat, Inc. | | | 6.875 | | | | 06/15/2020 | | | | 2,407,828 | |
| | 2,488,000 | | | Windstream Services LLC | | | 7.750 | | | | 10/15/2020 | | | | 2,543,980 | |
| | 2,900,000 | | | Windstream Services LLC | | | 6.375 | | | | 08/01/2023 | | | | 2,581,000 | |
| | | | | | | | | | | | | | | | |
| | | | | | | | | | | | | | | 49,625,298 | |
| | | | | | | | | | | | | | | | |
| | | | Total Corporate Bonds
(Cost $1,041,447,220) | | | | | | | | | | | 1,073,100,507 | |
| | | | | | | | | | | | | | | | |
See accompanying Notes to Financial Statements which are an integral part of the financial statements.
PowerShares Fundamental High Yield® Corporate Bond Portfolio (PHB) (continued)
October 31, 2016
| | | | | | | | |
Number
of Shares | | | | | Value | |
| | | | Money Market Fund—0.3% | | | | |
| | 2,593,269 | | | Invesco Premier U.S. Government Money Portfolio—Institutional Class, 0.25%(b)
(Cost $2,593,269) | | $ | 2,593,269 | |
| | | | | | | | |
| | | | Total Investments
(Cost $1,044,040,489)—98.9% | | | 1,075,693,776 | |
| | | | Other assets less liabilities—1.1% | | | 12,443,402 | |
| | | | | | | | |
| | | | Net Assets—100.0% | | $ | 1,088,137,178 | |
| | | | | | | | |
Investment Abbreviations:
GMTN—Global Medium-Term Note
MTN—Medium-Term Note
REIT—Real Estate Investment Trust
Notes to Schedule of Investments:
| (a) | Security purchased or received in a transaction exempt from registration under the Securities Act of 1933, as amended (the “1933 Act”). The security may be resold pursuant to an exemption from registration under the 1933 Act, typically to qualified institutional buyers. The aggregate value of these securities at October 31, 2016 was $60,355,915, which represented 5.55% of the Fund’s Net Assets. |
| (b) | The security and the Fund are advised by wholly-owned subsidiaries of Invesco Ltd. and are therefore considered to be affiliated. The rate shown is the 7-day SEC standardized yield as of October 31, 2016. |
See accompanying Notes to Financial Statements which are an integral part of the financial statements.
Schedule of Investments
PowerShares Fundamental Investment Grade Corporate Bond Portfolio (PFIG)
October 31, 2016
| | | | | | | | | | | | | | | | |
Principal
Amount | | | | | Interest
Rate | | | Maturity
Date | | | Value | |
| | | | Corporate Bonds—98.6% | | | | | | | | | | | | |
| | | | Advertising—0.5% | | | | | | | | | | | | |
| $ | 100,000 | | | Interpublic Group of Cos., Inc. (The) | | | 4.200 | % | | | 04/15/2024 | | | $ | 106,835 | |
| | 100,000 | | | Omnicom Group, Inc. | | | 4.450 | | | | 08/15/2020 | | | | 108,813 | |
| | 50,000 | | | Omnicom Group, Inc. | | | 3.625 | | | | 05/01/2022 | | | | 53,334 | |
| | | | | | | | | | | | | | | | |
| | | | | | | | | | | | | | | 268,982 | |
| | | | | | | | | | | | | | | | |
| | | | Aerospace/Defense—2.8% | | | | | | | | | | | | |
| | 100,000 | | | Boeing Co. (The) | | | 4.875 | | | | 02/15/2020 | | | | 110,807 | |
| | 100,000 | | | General Dynamics Corp. | | | 1.000 | | | | 11/15/2017 | | | | 99,958 | |
| | 100,000 | | | General Dynamics Corp. | | | 2.250 | | | | 11/15/2022 | | | | 101,290 | |
| | 300,000 | | | L-3 Communications Corp. | | | 5.200 | | | | 10/15/2019 | | | | 327,299 | |
| | 200,000 | | | Lockheed Martin Corp. | | | 2.500 | | | | 11/23/2020 | | | | 205,372 | |
| | 200,000 | | | Lockheed Martin Corp. | | | 3.550 | | | | 01/15/2026 | | | | 212,877 | |
| | 100,000 | | | Northrop Grumman Corp. | | | 1.750 | | | | 06/01/2018 | | | | 100,723 | |
| | 50,000 | | | Northrop Grumman Corp. | | | 3.250 | | | | 08/01/2023 | | | | 52,878 | |
| | 100,000 | | | Raytheon Co. | | | 3.125 | | | | 10/15/2020 | | | | 105,418 | |
| | 100,000 | | | Raytheon Co. | | | 2.500 | | | | 12/15/2022 | | | | 102,686 | |
| | 100,000 | | | United Technologies Corp. | | | 1.800 | | | | 06/01/2017 | | | | 100,511 | |
| | 100,000 | | | United Technologies Corp. | | | 3.100 | | | | 06/01/2022 | | | | 105,827 | |
| | | | | | | | | | | | | | | | |
| | | | | | | | | | | | | | | 1,625,646 | |
| | | | | | | | | | | | | | | | |
| | | | Agriculture—2.2% | | | | | | | | | | | | |
| | 100,000 | | | Altria Group, Inc. | | | 4.750 | | | | 05/05/2021 | | | | 111,678 | |
| | 200,000 | | | Altria Group, Inc. | | | 2.850 | | | | 08/09/2022 | | | | 206,017 | |
| | 100,000 | | | Archer-Daniels-Midland Co. | | | 2.500 | | | | 08/11/2026 | | | | 98,718 | |
| | 100,000 | | | Bunge Ltd. Finance Corp. | | | 8.500 | | | | 06/15/2019 | | | | 116,669 | |
| | 238,000 | | | Philip Morris International, Inc. | | | 5.650 | | | | 05/16/2018 | | | | 253,535 | |
| | 175,000 | | | Philip Morris International, Inc. | | | 3.250 | | | | 11/10/2024 | | | | 184,507 | |
| | 100,000 | | | Reynolds American, Inc. | | | 6.875 | | | | 05/01/2020 | | | | 116,323 | |
| | 100,000 | | | Reynolds American, Inc. | | | 3.250 | | | | 06/12/2020 | | | | 104,510 | |
| | 100,000 | | | Reynolds American, Inc. | | | 4.450 | | | | 06/12/2025 | | | | 109,963 | |
| | | | | | | | | | | | | | | | |
| | | | | | | | | | | | | | | 1,301,920 | |
| | | | | | | | | | | | | | | | |
| | | | Airlines—0.3% | | | | | | | | | | | | |
| | 200,000 | | | Southwest Airlines Co. | | | 2.650 | | | | 11/05/2020 | | | | 204,741 | |
| | | | | | | | | | | | | | | | |
| | | | Apparel—0.6% | | | | | | | | | | | | |
| | 150,000 | | | NIKE, Inc. | | | 2.250 | | | | 05/01/2023 | | | | 151,639 | |
| | 100,000 | | | Under Armour, Inc. | | | 3.250 | | | | 06/15/2026 | | | | 98,797 | |
| | 100,000 | | | VF Corp. | | | 3.500 | | | | 09/01/2021 | | | | 106,765 | |
| | | | | | | | | | | | | | | | |
| | | | | | | | | | | | | | | 357,201 | |
| | | | | | | | | | | | | | | | |
| | | | Auto Manufacturers—1.4% | | | | | | | | | | | | |
| | 100,000 | | | Ford Motor Credit Co. LLC | | | 5.000 | | | | 05/15/2018 | | | | 104,718 | |
| | 200,000 | | | Ford Motor Credit Co. LLC | | | 5.875 | | | | 08/02/2021 | | | | 227,344 | |
| | 300,000 | | | Ford Motor Credit Co. LLC | | | 4.134 | | | | 08/04/2025 | | | | 312,339 | |
| | 200,000 | | | PACCAR Financial Corp., MTN | | | 1.300 | | | | 05/10/2019 | | | | 199,839 | |
| | | | | | | | | | | | | | | | |
| | | | | | | | | | | | | | | 844,240 | |
| | | | | | | | | | | | | | | | |
| | | | Auto Parts & Equipment—0.4% | | | | | | | | | | | | |
| | 100,000 | | | Johnson Controls, Inc. | | | 4.250 | | | | 03/01/2021 | | | | 107,129 | |
| | 100,000 | | | Johnson Controls, Inc. | | | 3.625 | | | | 07/02/2024 | | | | 105,832 | |
| | | | | | | | | | | | | | | | |
| | | | | | | | | | | | | | | 212,961 | |
| | | | | | | | | | | | | | | | |
| | | | Banks—10.7% | | | | | | | | | | | | |
| | 300,000 | | | Bank of America Corp., GMTN | | | 3.300 | | | | 01/11/2023 | | | | 309,016 | |
| | 288,000 | | | Bank of America Corp., MTN | | | 6.875 | | | | 04/25/2018 | | | | 309,929 | |
| | 250,000 | | | Bank of New York Mellon Corp. (The) | | | 3.550 | | | | 09/23/2021 | | | | 266,918 | |
| | 100,000 | | | Bank of New York Mellon Corp. (The), Series G, MTN | | | 2.150 | | | | 02/24/2020 | | | | 101,216 | |
| | 200,000 | | | BB&T Corp., MTN | | | 2.450 | | | | 01/15/2020 | | | | 204,087 | |
| | 100,000 | | | Branch Banking & Trust Co. | | | 3.625 | | | | 09/16/2025 | | | | 105,616 | |
See accompanying Notes to Financial Statements which are an integral part of the financial statements.
PowerShares Fundamental Investment Grade Corporate Bond Portfolio (PFIG) (continued)
October 31, 2016
| | | | | | | | | | | | | | | | |
Principal
Amount | | | | | Interest
Rate | | | Maturity
Date | | | Value | |
| | | | Corporate Bonds (continued) | | | | | | | | | | | | |
| | | | Banks (continued) | | | | | | | | | | | | |
| $ | 50,000 | | | Capital One Financial Corp. | | | 4.750 | % | | | 07/15/2021 | | | $ | 55,211 | |
| | 200,000 | | | Capital One Financial Corp. | | | 4.200 | | | | 10/29/2025 | | | | 208,062 | |
| | 200,000 | | | Capital One NA, Series BKNT | | | 1.650 | | | | 02/05/2018 | | | | 200,223 | |
| | 250,000 | | | Citigroup, Inc. | | | 6.125 | | | | 11/21/2017 | | | | 262,001 | |
| | 250,000 | | | Citigroup, Inc. | | | 2.650 | | | | 10/26/2020 | | | | 254,241 | |
| | 200,000 | | | Citigroup, Inc. | | | 4.500 | | | | 01/14/2022 | | | | 219,793 | |
| | 100,000 | | | Citizens Bank NA, MTN | | | 2.450 | | | | 12/04/2019 | | | | 101,479 | |
| | 50,000 | | | Discover Bank | | | 4.200 | | | | 08/08/2023 | | | | 53,378 | |
| | 100,000 | | | Fifth Third Bancorp | | | 4.300 | | | | 01/16/2024 | | | | 107,088 | |
| | 100,000 | | | Fifth Third Bank, MTN | | | 2.150 | | | | 08/20/2018 | | | | 101,088 | |
| | 199,000 | | | Goldman Sachs Group, Inc. (The) | | | 6.150 | | | | 04/01/2018 | | | | 211,319 | |
| | 50,000 | | | Goldman Sachs Group, Inc. (The) | | | 5.750 | | | | 01/24/2022 | | | | 57,875 | |
| | 325,000 | | | JPMorgan Chase & Co. | | | 6.000 | | | | 01/15/2018 | | | | 342,223 | |
| | 300,000 | | | JPMorgan Chase & Co. | | | 4.500 | | | | 01/24/2022 | | | | 330,732 | |
| | 120,000 | | | KeyCorp, MTN | | | 5.100 | | | | 03/24/2021 | | | | 134,601 | |
| | 250,000 | | | Manufacturers & Traders Trust Co. | | | 2.900 | | | | 02/06/2025 | | | | 251,819 | |
| | 100,000 | | | Morgan Stanley, GMTN | | | 6.625 | | | | 04/01/2018 | | | | 106,805 | |
| | 100,000 | | | Morgan Stanley, Series F, GMTN | | | 3.875 | | | | 04/29/2024 | | | | 105,955 | |
| | 100,000 | | | Northern Trust Corp. | | | 3.450 | | | | 11/04/2020 | | | | 105,958 | |
| | 150,000 | | | Northern Trust Corp. | | | 3.950 | | | | 10/30/2025 | | | | 163,503 | |
| | 100,000 | | | Regions Financial Corp. | | | 3.200 | | | | 02/08/2021 | | | | 103,777 | |
| | 100,000 | | | State Street Corp. | | | 2.550 | | | | 08/18/2020 | | | | 103,066 | |
| | 100,000 | | | State Street Corp. | | | 3.550 | | | | 08/18/2025 | | | | 107,701 | |
| | 200,000 | | | SunTrust Bank, Series BKNT | | | 2.750 | | | | 05/01/2023 | | | | 201,064 | |
| | 100,000 | | | SunTrust Banks, Inc. | | | 2.350 | | | | 11/01/2018 | | | | 101,498 | |
| | 200,000 | | | US Bancorp, MTN | | | 2.950 | | | | 07/15/2022 | | | | 207,519 | |
| | 100,000 | | | US Bank NA, Series BKNT | | | 2.125 | | | | 10/28/2019 | | | | 101,728 | |
| | 250,000 | | | Wells Fargo & Co. | | | 5.625 | | | | 12/11/2017 | | | | 261,533 | |
| | 350,000 | | | Wells Fargo & Co. | | | 3.000 | | | | 04/22/2026 | | | | 348,815 | |
| | | | | | | | | | | | | | | | |
| | | | | | | | | | | | | | | 6,206,837 | |
| | | | | | | | | | | | | | | | |
| | | | Beverages—1.6% | | | | | | | | | | | | |
| | 150,000 | | | Coca-Cola Co. (The) | | | 1.650 | | | | 11/01/2018 | | | | 151,558 | |
| | 100,000 | | | Coca-Cola Co. (The) | | | 2.875 | | | | 10/27/2025 | | | | 103,591 | |
| | 100,000 | | | Coca-Cola European Partners US LLC (United Kingdom) | | | 3.500 | | | | 09/15/2020 | | | | 105,387 | |
| | 60,000 | | | Dr Pepper Snapple Group, Inc. | | | 6.820 | | | | 05/01/2018 | | | | 64,797 | |
| | 100,000 | | | Dr Pepper Snapple Group, Inc. | | | 3.400 | | | | 11/15/2025 | | | | 105,049 | |
| | 100,000 | | | Molson Coors Brewing Co. | | | 3.500 | | | | 05/01/2022 | | | | 106,650 | |
| | 170,000 | | | PepsiCo, Inc. | | | 7.900 | | | | 11/01/2018 | | | | 191,859 | |
| | 100,000 | | | PepsiCo, Inc. | | | 2.750 | | | | 03/01/2023 | | | | 103,779 | |
| | | | | | | | | | | | | | | | |
| | | | | | | | | | | | | | | 932,670 | |
| | | | | | | | | | | | | | | | |
| | | | Biotechnology—1.0% | | | | | | | | | | | | |
| | 100,000 | | | Amgen, Inc. | | | 3.875 | | | | 11/15/2021 | | | | 107,659 | |
| | 100,000 | | | Biogen, Inc. | | | 2.900 | | | | 09/15/2020 | | | | 103,222 | |
| | 175,000 | | | Biogen, Inc. | | | 4.050 | | | | 09/15/2025 | | | | 186,824 | |
| | 100,000 | | | Celgene Corp. | | | 3.875 | | | | 08/15/2025 | | | | 104,951 | |
| | 100,000 | | | Gilead Sciences, Inc. | | | 3.650 | | | | 03/01/2026 | | | | 104,946 | |
| | | | | | | | | | | | | | | | |
| | | | | | | | | | | | | | | 607,602 | |
| | | | | | | | | | | | | | | | |
| | | | Chemicals—2.8% | | | | | | | | | | | | |
| | 100,000 | | | CF Industries, Inc. | | | 7.125 | | | | 05/01/2020 | | | | 110,655 | |
| | 300,000 | | | CF Industries, Inc. | | | 3.450 | | | | 06/01/2023 | | | | 280,498 | |
| | 100,000 | | | Dow Chemical Co. (The) | | | 8.550 | | | | 05/15/2019 | | | | 116,587 | |
| | 100,000 | | | E.I. du Pont de Nemours & Co. | | | 6.000 | | | | 07/15/2018 | | | | 107,624 | |
| | 100,000 | | | E.I. du Pont de Nemours & Co. | | | 2.800 | | | | 02/15/2023 | | | | 101,325 | |
| | 16,000 | | | Eastman Chemical Co. | | | 2.400 | | | | 06/01/2017 | | | | 16,114 | |
| | 100,000 | | | Eastman Chemical Co. | | | 3.600 | | | | 08/15/2022 | | | | 105,343 | |
| | 200,000 | | | Lyondellbasell Industries NV | | | 5.750 | | | | 04/15/2024 | | | | 234,222 | |
See accompanying Notes to Financial Statements which are an integral part of the financial statements.
PowerShares Fundamental Investment Grade Corporate Bond Portfolio (PFIG) (continued)
October 31, 2016
| | | | | | | | | | | | | | | | |
Principal
Amount | | | | | Interest
Rate | | | Maturity
Date | | | Value | |
| | | | Corporate Bonds (continued) | | | | | | | | | | | | |
| | | | Chemicals (continued) | | | | | | | | | | | | |
| $ | 150,000 | | | LyondellBasell Industries NV | | | 5.000 | % | | | 04/15/2019 | | | $ | 160,413 | |
| | 65,000 | | | Monsanto Co. | | | 3.375 | | | | 07/15/2024 | | | | 66,981 | |
| | 148,000 | | | Mosaic Co. (The) | | | 4.250 | | | | 11/15/2023 | | | | 152,061 | |
| | 100,000 | | | Praxair, Inc. | | | 4.500 | | | | 08/15/2019 | | | | 108,231 | |
| | 100,000 | | | Sherwin-Williams Co. (The) | | | 1.350 | | | | 12/15/2017 | | | | 100,185 | |
| | | | | | | | | | | | | | | | |
| | | | | | | | | | | | | | | 1,660,239 | |
| | | | | | | | | | | | | | | | |
| | | | Commercial Services—1.1% | | | | | | | | | | | | |
| | 100,000 | | | Automatic Data Processing, Inc. | | | 2.250 | | | | 09/15/2020 | | | | 102,601 | |
| | 150,000 | | | Automatic Data Processing, Inc. | | | 3.375 | | | | 09/15/2025 | | | | 161,313 | |
| | 100,000 | | | Block Financial LLC | | | 4.125 | | | | 10/01/2020 | | | | 104,145 | |
| | 50,000 | | | Block Financial LLC | | | 5.500 | | | | 11/01/2022 | | | | 54,128 | |
| | 100,000 | | | Ecolab, Inc. | | | 3.000 | | | | 12/08/2016 | | | | 100,204 | |
| | 100,000 | | | Ecolab, Inc. | | | 4.350 | | | | 12/08/2021 | | | | 111,477 | |
| | | | | | | | | | | | | | | | |
| | | | | | | | | | | | | | | 633,868 | |
| | | | | | | | | | | | | | | | |
| | | | Computers—2.6% | | | | | | | | | | | | |
| | 187,000 | | | Apple, Inc. | | | 1.000 | | | | 05/03/2018 | | | | 186,795 | |
| | 250,000 | | | Apple, Inc. | | | 2.400 | | | | 05/03/2023 | | | | 251,393 | |
| | 200,000 | | | EMC Corp. | | | 1.875 | | | | 06/01/2018 | | | | 197,308 | |
| | 100,000 | | | EMC Corp. | | | 3.375 | | | | 06/01/2023 | | | | 94,051 | |
| | 100,000 | | | Hewlett Packard Enterprise Co.(a) | | | 3.850 | | | | 10/15/2020 | | | | 106,042 | |
| | 100,000 | | | Hewlett Packard Enterprise Co.(a) | | | 5.150 | | | | 10/15/2025 | | | | 106,973 | |
| | 100,000 | | | HP, Inc. | | | 3.750 | | | | 12/01/2020 | | | | 105,273 | |
| | 100,000 | | | HP, Inc. | | | 4.650 | | | | 12/09/2021 | | | | 109,130 | |
| | 50,000 | | | International Business Machines Corp. | | | 5.700 | | | | 09/14/2017 | | | | 52,012 | |
| | 100,000 | | | International Business Machines Corp. | | | 3.625 | | | | 02/12/2024 | | | | 107,807 | |
| | 100,000 | | | NetApp, Inc. | | | 3.375 | | | | 06/15/2021 | | | | 104,421 | |
| | 100,000 | | | Seagate HDD Cayman | | | 4.750 | | | | 01/01/2025 | | | | 95,363 | |
| | | | | | | | | | | | | | | | |
| | | | | | | | | | | | | | | 1,516,568 | |
| | | | | | | | | | | | | | | | |
| | | | Cosmetics/Personal Care—1.0% | | | | | | | | | | | | |
| | 100,000 | | | Colgate-Palmolive Co., MTN | | | 1.750 | | | | 03/15/2019 | | | | 101,340 | |
| | 150,000 | | | Colgate-Palmolive Co., MTN | | | 2.300 | | | | 05/03/2022 | | | | 153,590 | |
| | 100,000 | | | Procter & Gamble Co. (The) | | | 4.700 | | | | 02/15/2019 | | | | 107,707 | |
| | 200,000 | | | Procter & Gamble Co. (The) | | | 3.100 | | | | 08/15/2023 | | | | 213,452 | |
| | | | | | | | | | | | | | | | |
| | | | | | | | | | | | | | | 576,089 | |
| | | | | | | | | | | | | | | | |
| | | | Distribution/Wholesale—0.2% | | | | | | | | | | | | |
| | 100,000 | | | Ingram Micro, Inc. | | | 4.950 | | | | 12/15/2024 | | | | 100,902 | |
| | | | | | | | | | | | | | | | |
| | | | Diversified Financial Services—3.5% | | | | | | | | | | | | |
| | 100,000 | | | American Express Co. | | | 7.000 | | | | 03/19/2018 | | | | 107,545 | |
| | 100,000 | | | American Express Co. | | | 3.625 | | | | 12/05/2024 | | | | 103,753 | |
| | 50,000 | | | Ameriprise Financial, Inc. | | | 5.300 | | | | 03/15/2020 | | | | 55,349 | |
| | 100,000 | | | Ameriprise Financial, Inc. | | | 4.000 | | | | 10/15/2023 | | | | 108,343 | |
| | 100,000 | | | BlackRock, Inc. | | | 3.500 | | | | 03/18/2024 | | | | 107,680 | |
| | 100,000 | | | BlackRock, Inc., Series 2 | | | 5.000 | | | | 12/10/2019 | | | | 110,464 | |
| | 120,000 | | | Charles Schwab Corp. (The) | | | 4.450 | | | | 07/22/2020 | | | | 131,342 | |
| | 100,000 | | | Intercontinental Exchange, Inc. | | | 3.750 | | | | 12/01/2025 | | | | 107,161 | |
| | 150,000 | | | Jefferies Group LLC | | | 5.125 | | | | 04/13/2018 | | | | 156,274 | |
| | 200,000 | | | Jefferies Group LLC | | | 6.875 | | | | 04/15/2021 | | | | 232,479 | |
| | 150,000 | | | MasterCard, Inc. | | | 3.375 | | | | 04/01/2024 | | | | 159,858 | |
| | 100,000 | | | NASDAQ, Inc. | | | 5.550 | | | | 01/15/2020 | | | | 110,627 | |
| | 100,000 | | | Raymond James Financial, Inc. | | | 3.625 | | | | 09/15/2026 | | | | 101,219 | |
| | 250,000 | | | TD Ameritrade Holding Corp. | | | 2.950 | | | | 04/01/2022 | | | | 258,625 | |
| | 100,000 | | | Visa, Inc. | | | 2.200 | | | | 12/14/2020 | | | | 102,019 | |
| | 100,000 | | | Visa, Inc. | | | 3.150 | | | | 12/14/2025 | | | | 104,437 | |
| | | | | | | | | | | | | | | | |
| | | | | | | | | | | | | | | 2,057,175 | |
| | | | | | | | | | | | | | | | |
See accompanying Notes to Financial Statements which are an integral part of the financial statements.
PowerShares Fundamental Investment Grade Corporate Bond Portfolio (PFIG) (continued)
October 31, 2016
| | | | | | | | | | | | | | | | |
Principal
Amount | | | | | Interest
Rate | | | Maturity
Date | | | Value | |
| | | | Corporate Bonds (continued) | | | | | | | | | | | | |
| | | | Electric—4.7% | | | | | | | | | | | | |
| $ | 18,000 | | | American Electric Power Co., Inc., Series E | | | 1.650 | % | | | 12/15/2017 | | | $ | 18,051 | |
| | 121,000 | | | Consolidated Edison Co. of New York, Inc. | | | 7.125 | | | | 12/01/2018 | | | | 135,040 | |
| | 100,000 | | | Consumers Energy Co. | | | 6.700 | | | | 09/15/2019 | | | | 114,281 | |
| | 90,000 | | | Dominion Resources, Inc. | | | 3.900 | | | | 10/01/2025 | | | | 96,128 | |
| | 100,000 | | | Duke Energy Corp. | | | 3.750 | | | | 04/15/2024 | | | | 106,312 | |
| | 50,000 | | | Duke Energy Progress LLC | | | 5.300 | | | | 01/15/2019 | | | | 54,191 | |
| | 100,000 | | | Entergy Texas, Inc. | | | 7.125 | | | | 02/01/2019 | | | | 111,711 | |
| | 100,000 | | | Exelon Corp. | | | 3.950 | | | | 06/15/2025 | | | | 106,812 | |
| | 200,000 | | | Exelon Generation Co. LLC | | | 2.950 | | | | 01/15/2020 | | | | 205,370 | |
| | 100,000 | | | Florida Power & Light Co. | | | 3.250 | | | | 06/01/2024 | | | | 106,039 | |
| | 100,000 | | | Georgia Power Co. | | | 4.250 | | | | 12/01/2019 | | | | 108,338 | |
| | 150,000 | | | NextEra Energy Capital Holdings, Inc. | | | 6.000 | | | | 03/01/2019 | | | | 164,592 | |
| | 30,000 | | | Ohio Power Co., Series M | | | 5.375 | | | | 10/01/2021 | | | | 34,057 | |
| | 100,000 | | | Pacific Gas & Electric Co. | | | 3.500 | | | | 10/01/2020 | | | | 106,020 | |
| | 150,000 | | | PPL Capital Funding, Inc. | | | 3.400 | | | | 06/01/2023 | | | | 156,445 | |
| | 100,000 | | | Public Service Electric & Gas Co., MTN | | | 2.375 | | | | 05/15/2023 | | | | 100,936 | |
| | 100,000 | | | Southern California Edison Co. | | | 3.875 | | | | 06/01/2021 | | | | 108,733 | |
| | 100,000 | | | Southern Co. (The) | | | 1.850 | | | | 07/01/2019 | | | | 100,643 | |
| | 100,000 | | | Southern Power Co. | | | 4.150 | | | | 12/01/2025 | | | | 107,182 | |
| | 100,000 | | | Virginia Electric and Power Co. | | | 5.400 | | | | 04/30/2018 | | | | 106,058 | |
| | 100,000 | | | WEC Energy Group, Inc. | | | 3.550 | | | | 06/15/2025 | | | | 105,943 | |
| | 150,000 | | | Xcel Energy, Inc. | | | 4.700 | | | | 05/15/2020 | | | | 163,003 | |
| | 300,000 | | | Xcel Energy, Inc. | | | 3.300 | | | | 06/01/2025 | | | | 312,980 | |
| | | | | | | | | | | | | | | | |
| | | | | | | | | | | | | | | 2,728,865 | |
| | | | | | | | | | | | | | | | |
| | | | Electrical Components & Equipment—0.2% | | | | | | | | | | | | |
| | 100,000 | | | Emerson Electric Co. | | | 4.875 | | | | 10/15/2019 | | | | 109,790 | |
| | | | | | | | | | | | | | | | |
| | | | Electronics—1.0% | | | | | | | | | | | | |
| | 100,000 | | | Agilent Technologies, Inc. | | | 3.875 | | | | 07/15/2023 | | | | 106,101 | |
| | 100,000 | | | Amphenol Corp. | | | 2.550 | | | | 01/30/2019 | | | | 102,039 | |
| | 100,000 | | | Avnet, Inc. | | | 4.625 | | | | 04/15/2026 | | | | 102,250 | |
| | 100,000 | | | Fortive Corp.(a) | | | 3.150 | | | | 06/15/2026 | | | | 101,387 | |
| | 50,000 | | | Honeywell International, Inc. | | | 5.000 | | | | 02/15/2019 | | | | 54,108 | |
| | 100,000 | | | Honeywell International, Inc. | | | 4.250 | | | | 03/01/2021 | | | | 110,319 | |
| | | | | | | | | | | | | | | | |
| | | | | | | | | | | | | | | 576,204 | |
| | | | | | | | | | | | | | | | |
| | | | Engineering & Construction—0.3% | | | | | | | | | | | | |
| | 50,000 | | | Fluor Corp. | | | 3.375 | | | | 09/15/2021 | | | | 53,024 | |
| | 100,000 | | | Fluor Corp. | | | 3.500 | | | | 12/15/2024 | | | | 105,614 | |
| | | | | | | | | | | | | | | | |
| | | | | | | | | | | | | | | 158,638 | |
| | | | | | | | | | | | | | | | |
| | | | Environmental Control—0.6% | | | | | | | | | | | | |
| | 200,000 | | | Republic Services, Inc. | | | 3.550 | | | | 06/01/2022 | | | | 214,433 | |
| | 100,000 | | | Waste Management, Inc. | | | 4.750 | | | | 06/30/2020 | | | | 110,454 | |
| | | | | | | | | | | | | | | | |
| | | | | | | | | | | | | | | 324,887 | |
| | | | | | | | | | | | | | | | |
| | | | Food—2.7% | | | | | | | | | | | | |
| | 100,000 | | | Campbell Soup Co. | | | 4.250 | | | | 04/15/2021 | | | | 109,785 | |
| | 100,000 | | | ConAgra Foods, Inc. | | | 1.900 | | | | 01/25/2018 | | | | 100,508 | |
| | 100,000 | | | ConAgra Foods, Inc. | | | 3.200 | | | | 01/25/2023 | | | | 102,548 | |
| | 100,000 | | | General Mills, Inc. | | | 5.650 | | | | 02/15/2019 | | | | 109,167 | |
| | 100,000 | | | General Mills, Inc. | | | 3.150 | | | | 12/15/2021 | | | | 105,425 | |
| | 100,000 | | | Kellogg Co. | | | 4.000 | | | | 12/15/2020 | | | | 108,296 | |
| | 100,000 | | | Kellogg Co. | | | 3.250 | | | | 04/01/2026 | | | | 102,492 | |
| | 100,000 | | | Kroger Co. (The) | | | 6.150 | | | | 01/15/2020 | | | | 113,037 | |
| | 100,000 | | | Kroger Co. (The) | | | 3.850 | | | | 08/01/2023 | | | | 107,320 | |
| | 100,000 | | | Mondelez International, Inc. | | | 2.250 | | | | 02/01/2019 | | | | 101,560 | |
| | 100,000 | | | Mondelez International, Inc. | | | 4.000 | | | | 02/01/2024 | | | | 111,092 | |
See accompanying Notes to Financial Statements which are an integral part of the financial statements.
PowerShares Fundamental Investment Grade Corporate Bond Portfolio (PFIG) (continued)
October 31, 2016
| | | | | | | | | | | | | | | | |
Principal
Amount | | | | | Interest
Rate | | | Maturity
Date | | | Value | |
| | | | Corporate Bonds (continued) | | | | | | | | | | | | |
| | | | Food (continued) | | | | | | | | | | | | |
| $ | 100,000 | | | Sysco Corp. | | | 3.750 | % | | | 10/01/2025 | | | $ | 105,261 | |
| | 100,000 | | | Sysco Corp. | | | 3.300 | | | | 07/15/2026 | | | | 102,162 | |
| | 100,000 | | | Tyson Foods, Inc. | | | 2.650 | | | | 08/15/2019 | | | | 102,293 | |
| | 100,000 | | | Whole Foods Market, Inc.(a) | | | 5.200 | | | | 12/03/2025 | | | | 107,858 | |
| | | | | | | | | | | | | | | | |
| | | | | | | | | | | | | | | 1,588,804 | |
| | | | | | | | | | | | | | | | |
| | | | Forest Products & Paper—0.3% | | | | | | | | | | | | |
| | 70,000 | | | International Paper Co. | | | 7.950 | | | | 06/15/2018 | | | | 77,031 | |
| | 100,000 | | | International Paper Co. | | | 4.750 | | | | 02/15/2022 | | | | 111,189 | |
| | | | | | | | | | | | | | | | |
| | | | | | | | | | | | | | | 188,220 | |
| | | | | | | | | | | | | | | | |
| | | | Gas—0.8% | | | | | | | | | | | | |
| | 100,000 | | | National Fuel Gas Co. | | | 4.900 | | | | 12/01/2021 | | | | 107,406 | |
| | 50,000 | | | NiSource Finance Corp. | | | 6.400 | | | | 03/15/2018 | | | | 53,175 | |
| | 100,000 | | | NiSource Finance Corp. | | | 6.800 | | | | 01/15/2019 | | | | 110,847 | |
| | 100,000 | | | NiSource Finance Corp. | | | 6.125 | | | | 03/01/2022 | | | | 118,412 | |
| | 100,000 | | | Sempra Energy | | | 4.050 | | | | 12/01/2023 | | | | 107,961 | |
| | | | | | | | | | | | | | | | |
| | | | | | | | | | | | | | | 497,801 | |
| | | | | | | | | | | | | | | | |
| | | | Hand/Machine Tools—0.2% | | | | | | | | | | | | |
| | 100,000 | | | Stanley Black & Decker, Inc. | | | 2.900 | | | | 11/01/2022 | | | | 104,124 | |
| | | | | | | | | | | | | | | | |
| | | | Healthcare-Products—2.0% | | | | | | | | | | | | |
| | 150,000 | | | Abbott Laboratories | | | 5.125 | | | | 04/01/2019 | | | | 162,932 | |
| | 100,000 | | | Becton Dickinson and Co. | | | 3.734 | | | | 12/15/2024 | | | | 106,774 | |
| | 100,000 | | | Boston Scientific Corp. | | | 3.850 | | | | 05/15/2025 | | | | 105,019 | |
| | 100,000 | | | Danaher Corp. | | | 2.400 | | | | 09/15/2020 | | | | 102,258 | |
| | 150,000 | | | St. Jude Medical, Inc. | | | 3.250 | | | | 04/15/2023 | | | | 154,104 | |
| | 100,000 | | | Stryker Corp. | | | 3.375 | | | | 11/01/2025 | | | | 104,060 | |
| | 100,000 | | | Thermo Fisher Scientific, Inc. | | | 4.500 | | | | 03/01/2021 | | | | 110,244 | |
| | 200,000 | | | Thermo Fisher Scientific, Inc. | | | 4.150 | | | | 02/01/2024 | | | | 215,729 | |
| | 100,000 | | | Zimmer Biomet Holdings, Inc. | | | 3.550 | | | | 04/01/2025 | | | | 101,921 | |
| | | | | | | | | | | | | | | | |
| | | | | | | | | | | | | | | 1,163,041 | |
| | | | | | | | | | | | | | | | |
| | | | Healthcare-Services—2.0% | | | | | | | | | | | | |
| | 200,000 | | | Aetna, Inc. | | | 2.750 | | | | 11/15/2022 | | | | 203,770 | |
| | 100,000 | | | Anthem, Inc. | | | 2.250 | | | | 08/15/2019 | | | | 100,996 | |
| | 100,000 | | | Anthem, Inc. | | | 3.125 | | | | 05/15/2022 | | | | 103,393 | |
| | 200,000 | | | Humana, Inc. | | | 3.150 | | | | 12/01/2022 | | | | 206,376 | |
| | 100,000 | | | Laboratory Corp. of America Holdings | | | 2.200 | | | | 08/23/2017 | | | | 100,684 | |
| | 100,000 | | | Quest Diagnostics, Inc. | | | 4.700 | | | | 04/01/2021 | | | | 110,051 | |
| | 170,000 | | | UnitedHealth Group, Inc. | | | 2.700 | | | | 07/15/2020 | | | | 175,079 | |
| | 150,000 | | | UnitedHealth Group, Inc. | | | 2.875 | | | | 03/15/2022 | | | | 155,826 | |
| | | | | | | | | | | | | | | | |
| | | | | | | | | | | | | | | 1,156,175 | |
| | | | | | | | | | | | | | | | |
| | | | Household Products/Wares—0.4% | | | | | | | | | | | | |
| | 200,000 | | | Kimberly-Clark Corp. | | | 6.125 | | | | 08/01/2017 | | | | 207,543 | |
| | | | | | | | | | | | | | | | |
| | | | Housewares—0.4% | | | | | | | | | | | | |
| | 100,000 | | | Newell Brands, Inc. | | | 4.200 | | | | 04/01/2026 | | | | 108,175 | |
| | 100,000 | | | Tupperware Brands Corp. | | | 4.750 | | | | 06/01/2021 | | | | 109,606 | |
| | | | | | | | | | | | | | | | |
| | | | | | | | | | | | | | | 217,781 | |
| | | | | | | | | | | | | | | | |
| | | | Insurance—6.1% | | | | | | | | | | | | |
| | 200,000 | | | Aflac, Inc. | | | 3.625 | | | | 06/15/2023 | | | | 213,585 | |
| | 200,000 | | | Allstate Corp. (The) | | | 3.150 | | | | 06/15/2023 | | | | 210,310 | |
| | 100,000 | | | American International Group, Inc. | | | 3.300 | | | | 03/01/2021 | | | | 104,644 | |
| | 100,000 | | | American International Group, Inc. | | | 4.875 | | | | 06/01/2022 | | | | 111,816 | |
| | 239,000 | | | Berkshire Hathaway Finance Corp. | | | 5.400 | | | | 05/15/2018 | | | | 254,084 | |
| | 100,000 | | | Berkshire Hathaway, Inc. | | | 3.125 | | | | 03/15/2026 | | | | 103,904 | |
| | 100,000 | | | Brown & Brown, Inc. | | | 4.200 | | | | 09/15/2024 | | | | 102,870 | |
See accompanying Notes to Financial Statements which are an integral part of the financial statements.
PowerShares Fundamental Investment Grade Corporate Bond Portfolio (PFIG) (continued)
October 31, 2016
| | | | | | | | | | | | | | | | |
Principal
Amount | | | | | Interest
Rate | | | Maturity
Date | | | Value | |
| | | | Corporate Bonds (continued) | | | | | | | | | | | | |
| | | | Insurance (continued) | | | | | | | | | | | | |
| $ | 100,000 | | | Chubb Corp. (The) | | | 5.750 | % | | | 05/15/2018 | | | $ | 106,668 | |
| | 100,000 | | | Chubb INA Holdings, Inc. | | | 2.300 | | | | 11/03/2020 | | | | 102,096 | |
| | 200,000 | | | Chubb INA Holdings, Inc. | | | 3.350 | | | | 05/03/2026 | | | | 210,493 | |
| | 300,000 | | | Hartford Financial Services Group, Inc. (The) | | | 5.500 | | | | 03/30/2020 | | | | 333,635 | |
| | 200,000 | | | Hartford Financial Services Group, Inc. (The) | | | 5.125 | | | | 04/15/2022 | | | | 226,576 | |
| | 150,000 | | | Lincoln National Corp. | | | 8.750 | | | | 07/01/2019 | | | | 174,982 | |
| | 150,000 | | | Loews Corp. | | | 2.625 | | | | 05/15/2023 | | | | 150,232 | |
| | 200,000 | | | Marsh & McLennan Cos., Inc. | | | 4.800 | | | | 07/15/2021 | | | | 221,496 | |
| | 200,000 | | | Marsh & McLennan Cos., Inc. | | | 3.750 | | | | 03/14/2026 | | | | 213,801 | |
| | 100,000 | | | MetLife, Inc. | | | 4.750 | | | | 02/08/2021 | | | | 111,305 | |
| | 100,000 | | | MetLife, Inc. | | | 3.600 | | | | 04/10/2024 | | | | 106,035 | |
| | 150,000 | | | Prudential Financial, Inc., MTN | | | 3.500 | | | | 05/15/2024 | | | | 157,488 | |
| | 100,000 | | | Travelers Cos., Inc. (The) | | | 5.800 | | | | 05/15/2018 | | | | 106,696 | |
| | 100,000 | | | Travelers Cos., Inc. (The) | | | 3.900 | | | | 11/01/2020 | | | | 108,418 | |
| | 100,000 | | | Voya Financial, Inc. | | | 5.500 | | | | 07/15/2022 | | | | 112,163 | |
| | | | | | | | | | | | | | | | |
| | | | | | | | | | | | | | | 3,543,297 | |
| | | | | | | | | | | | | | | | |
| | | | Internet—1.4% | | | | | | | | | | | | |
| | 100,000 | | | Alphabet, Inc. | | | 3.625 | | | | 05/19/2021 | | | | 109,220 | |
| | 50,000 | | | Amazon.com, Inc. | | | 1.200 | | | | 11/29/2017 | | | | 50,089 | |
| | 100,000 | | | Amazon.com, Inc. | | | 2.500 | | | | 11/29/2022 | | | | 102,151 | |
| | 100,000 | | | eBay, Inc. | | | 1.350 | | | | 07/15/2017 | | | | 100,073 | |
| | 200,000 | | | eBay, Inc. | | | 2.600 | | | | 07/15/2022 | | | | 200,071 | |
| | 100,000 | | | Priceline Group, Inc. (The) | | | 3.650 | | | | 03/15/2025 | | | | 104,117 | |
| | 150,000 | | | Symantec Corp. | | | 4.200 | | | | 09/15/2020 | | | | 156,987 | |
| | | | | | | | | | | | | | | | |
| | | | | | | | | | | | | | | 822,708 | |
| | | | | | | | | | | | | | | | |
| | | | Iron/Steel—0.4% | | | | | | | | | | | | |
| | 100,000 | | | Nucor Corp. | | | 5.750 | | | | 12/01/2017 | | | | 104,396 | |
| | 100,000 | | | Nucor Corp. | | | 4.125 | | | | 09/15/2022 | | | | 108,521 | |
| | | | | | | | | | | | | | | | |
| | | | | | | | | | | | | | | 212,917 | |
| | | | | | | | | | | | | | | | |
| | | | Leisure Time—0.2% | | | | | | | | | | | | |
| | 100,000 | | | Carnival Corp. | | | 3.950 | | | | 10/15/2020 | | | | 107,483 | |
| | | | | | | | | | | | | | | | |
| | | | Lodging—0.2% | | | | | | | | | | | | |
| | 100,000 | | | Marriott International, Inc. | | | 3.000 | | | | 03/01/2019 | | | | 102,668 | |
| | | | | | | | | | | | | | | | |
| | | | Machinery-Construction & Mining—0.5% | | | | | | | | | | | | |
| | 200,000 | | | Caterpillar, Inc. | | | 3.900 | | | | 05/27/2021 | | | | 217,126 | |
| | 100,000 | | | Caterpillar, Inc. | | | 3.400 | | | | 05/15/2024 | | | | 106,307 | |
| | | | | | | | | | | | | | | | |
| | | | | | | | | | | | | | | 323,433 | |
| | | | | | | | | | | | | | | | |
| | | | Machinery-Diversified—0.9% | | | | | | | | | | | | |
| | 150,000 | | | Cummins, Inc. | | | 3.650 | | | | 10/01/2023 | | | | 160,317 | |
| | 150,000 | | | Deere & Co. | | | 2.600 | | | | 06/08/2022 | | | | 154,188 | |
| | 100,000 | | | John Deere Capital Corp., MTN | | | 1.950 | | | | 01/08/2019 | | | | 101,202 | |
| | 100,000 | | | Roper Technologies, Inc. | | | 6.250 | | | | 09/01/2019 | | | | 111,849 | |
| | | | | | | | | | | | | | | | |
| | | | | | | | | | | | | | | 527,556 | |
| | | | | | | | | | | | | | | | |
| | | | Media—2.5% | | | | | | | | | | | | |
| | 100,000 | | | 21st Century Fox America, Inc. | | | 3.000 | | | | 09/15/2022 | | | | 103,350 | |
| | 100,000 | | | CBS Corp. | | | 2.300 | | | | 08/15/2019 | | | | 101,342 | |
| | 100,000 | | | Discovery Communications LLC | | | 3.300 | | | | 05/15/2022 | | | | 102,610 | |
| | 100,000 | | | NBCUniversal Media LLC | | | 5.150 | | | | 04/30/2020 | | | | 111,417 | |
| | 105,000 | | | Scripps Networks Interactive, Inc. | | | 2.700 | | | | 12/15/2016 | | | | 105,213 | |
| | 100,000 | | | Scripps Networks Interactive, Inc. | | | 3.900 | | | | 11/15/2024 | | | | 103,817 | |
| | 100,000 | | | Time Warner Cable LLC | | | 8.250 | | | | 04/01/2019 | | | | 114,392 | |
| | 100,000 | | | Time Warner Cable LLC | | | 4.000 | | | | 09/01/2021 | | | | 104,848 | |
| | 100,000 | | | Time Warner, Inc. | | | 4.875 | | | | 03/15/2020 | | | | 109,236 | |
See accompanying Notes to Financial Statements which are an integral part of the financial statements.
PowerShares Fundamental Investment Grade Corporate Bond Portfolio (PFIG) (continued)
October 31, 2016
| | | | | | | | | | | | | | | | |
Principal
Amount | | | | | Interest
Rate | | | Maturity
Date | | | Value | |
| | | | Corporate Bonds (continued) | | | | | | | | | | | | |
| | | | Media (continued) | | | | | | | | | | | | |
| $ | 100,000 | | | Time Warner, Inc. | | | 3.550 | % | | | 06/01/2024 | | | $ | 103,755 | |
| | 200,000 | | | Viacom, Inc. | | | 4.250 | | | | 09/01/2023 | | | | 212,719 | |
| | 100,000 | | | Walt Disney Co. (The), GMTN | | | 1.100 | | | | 12/01/2017 | | | | 100,053 | |
| | 100,000 | | | Walt Disney Co. (The), GMTN | | | 2.350 | | | | 12/01/2022 | | | | 102,217 | |
| | | | | | | | | | | | | | | | |
| | | | | | | | | | | | | | | 1,474,969 | |
| | | | | | | | | | | | | | | | |
| | | | Mining—0.5% | | | | | | | | | | | | |
| | 100,000 | | | Freeport-McMoRan, Inc. | | | 3.550 | | | | 03/01/2022 | | | | 92,250 | |
| | 200,000 | | | Newmont Mining Corp. | | | 3.500 | | | | 03/15/2022 | | | | 211,624 | |
| | | | | | | | | | | | | | | | |
| | | | | | | | | | | | | | | 303,874 | |
| | | | | | | | | | | | | | | | |
| | | | Miscellaneous Manufacturing—2.8% | | | | | | | | | | | | |
| | 100,000 | | | 3M Co., GMTN | | | 2.000 | | | | 06/26/2022 | | | | 100,775 | |
| | 100,000 | | | Eaton Corp. | | | 1.500 | | | | 11/02/2017 | | | | 100,256 | |
| | 200,000 | | | Eaton Corp. | | | 2.750 | | | | 11/02/2022 | | | | 204,086 | |
| | 400,000 | | | General Electric Co. | | | 5.250 | | | | 12/06/2017 | | | | 417,755 | |
| | 250,000 | | | General Electric Co. | | | 2.700 | | | | 10/09/2022 | | | | 258,555 | |
| | 100,000 | | | Illinois Tool Works, Inc. | | | 6.250 | | | | 04/01/2019 | | | | 111,353 | |
| | 100,000 | | | Illinois Tool Works, Inc. | | | 3.500 | | | | 03/01/2024 | | | | 107,904 | |
| | 100,000 | | | Ingersoll-Rand Global Holding Co. Ltd. | | | 6.875 | | | | 08/15/2018 | | | | 109,355 | |
| | 100,000 | | | Ingersoll-Rand Luxembourg Finance SA | | | 3.550 | | | | 11/01/2024 | | | | 104,977 | |
| | 100,000 | | | Tyco International Finance SA | | | 3.900 | | | | 02/14/2026 | | | | 107,586 | |
| | | | | | | | | | | | | | | | |
| | | | | | | | | | | | | | | 1,622,602 | |
| | | | | | | | | | | | | | | | |
| | | | Office/Business Equipment—0.4% | | | | | | | | | | | | |
| | 100,000 | | | Pitney Bowes, Inc. | | | 4.625 | | | | 03/15/2024 | | | | 103,034 | |
| | 100,000 | | | Xerox Corp. | | | 6.350 | | | | 05/15/2018 | | | | 106,249 | |
| | | | | | | | | | | | | | | | |
| | | | | | | | | | | | | | | 209,283 | |
| | | | | | | | | | | | | | | | |
| | | | Oil & Gas—5.3% | | | | | | | | | | | | |
| | 115,000 | | | Apache Corp. | | | 3.250 | | | | 04/15/2022 | | | | 118,078 | |
| | 200,000 | | | Chevron Corp. | | | 1.104 | | | | 12/05/2017 | | | | 200,026 | |
| | 200,000 | | | Chevron Corp. | | | 2.355 | | | | 12/05/2022 | | | | 201,505 | |
| | 100,000 | | | Cimarex Energy Co. | | | 4.375 | | | | 06/01/2024 | | | | 105,557 | |
| | 100,000 | | | ConocoPhillips | | | 5.750 | | | | 02/01/2019 | | | | 108,290 | |
| | 150,000 | | | ConocoPhillips Co. | | | 4.950 | | | | 03/15/2026 | | | | 168,581 | |
| | 150,000 | | | EOG Resources, Inc. | | | 5.625 | | | | 06/01/2019 | | | | 164,397 | |
| | 100,000 | | | EOG Resources, Inc. | | | 2.625 | | | | 03/15/2023 | | | | 99,841 | |
| | 100,000 | | | Equities Corp. | | | 4.875 | | | | 11/15/2021 | | | | 109,486 | |
| | 300,000 | | | Exxon Mobil Corp. | | | 2.222 | | | | 03/01/2021 | | | | 304,385 | |
| | 400,000 | | | Exxon Mobil Corp. | | | 3.043 | | | | 03/01/2026 | | | | 414,100 | |
| | 200,000 | | | Marathon Petroleum Corp. | | | 5.125 | | | | 03/01/2021 | | | | 221,783 | |
| | 100,000 | | | Noble Energy, Inc. | | | 8.250 | | | | 03/01/2019 | | | | 113,865 | |
| | 100,000 | | | Noble Energy, Inc. | | | 4.150 | | | | 12/15/2021 | | | | 106,196 | |
| | 100,000 | | | Occidental Petroleum Corp. | | | 2.700 | | | | 02/15/2023 | | | | 101,687 | |
| | 200,000 | | | Occidental Petroleum Corp., Series 1 | | | 4.100 | | | | 02/01/2021 | | | | 216,242 | |
| | 100,000 | | | Pioneer Natural Resources Co. | | | 3.950 | | | | 07/15/2022 | | | | 106,874 | |
| | 100,000 | | | Valero Energy Corp. | | | 6.125 | | | | 02/01/2020 | | | | 113,016 | |
| | 100,000 | | | Valero Energy Corp. | | | 3.400 | | | | 09/15/2026 | | | | 98,076 | |
| | | | | | | | | | | | | | | | |
| | | | | | | | | | | | | | | 3,071,985 | |
| | | | | | | | | | | | | | | | |
| | | | Oil & Gas Services—1.6% | | | | | | | | | | | | |
| | 150,000 | | | Baker Hughes, Inc. | | | 3.200 | | | | 08/15/2021 | | | | 157,309 | |
| | 150,000 | | | FMC Technologies, Inc. | | | 3.450 | | | | 10/01/2022 | | | | 151,719 | |
| | 200,000 | | | Halliburton Co. | | | 3.800 | | | | 11/15/2025 | | | | 208,444 | |
| | 100,000 | | | National Oilwell Varco, Inc. | | | 2.600 | | | | 12/01/2022 | | | | 94,424 | |
| | 300,000 | | | Schlumberger Investment SA | | | 3.650 | | | | 12/01/2023 | | | | 321,188 | |
| | | | | | | | | | | | | | | | |
| | | | | | | | | | | | | | | 933,084 | |
| | | | | | | | | | | | | | | | |
See accompanying Notes to Financial Statements which are an integral part of the financial statements.
PowerShares Fundamental Investment Grade Corporate Bond Portfolio (PFIG) (continued)
October 31, 2016
| | | | | | | | | | | | | | | | |
Principal
Amount | | | | | Interest
Rate | | | Maturity
Date | | | Value | |
| | | | Corporate Bonds (continued) | | | | | | | | | | | | |
| | | | Pharmaceuticals—5.6% | | | | | | | | | | | | |
| $ | 150,000 | | | AbbVie, Inc. | | | 1.750 | % | | | 11/06/2017 | | | $ | 150,573 | |
| | 200,000 | | | AbbVie, Inc. | | | 2.900 | | | | 11/06/2022 | | | | 202,730 | |
| | 100,000 | | | AbbVie, Inc. | | | 3.600 | | | | 05/14/2025 | | | | 102,155 | |
| | 200,000 | | | Actavis Funding SCS | | | 3.000 | | | | 03/12/2020 | | | | 206,080 | |
| | 100,000 | | | Actavis Funding SCS | | | 3.800 | | | | 03/15/2025 | | | | 103,962 | |
| | 100,000 | | | AmerisourceBergen Corp. | | | 1.150 | | | | 05/15/2017 | | | | 100,065 | |
| | 100,000 | | | AmerisourceBergen Corp. | | | 3.500 | | | | 11/15/2021 | | | | 105,602 | |
| | 100,000 | | | Baxalta, Inc. | | | 2.875 | | | | 06/23/2020 | | | | 102,139 | |
| | 100,000 | | | Bristol-Myers Squibb Co. | | | 2.000 | | | | 08/01/2022 | | | | 100,566 | |
| | 100,000 | | | Cardinal Health, Inc. | | | 3.200 | | | | 03/15/2023 | | | | 104,143 | |
| | 100,000 | | | Eli Lilly & Co. | | | 5.200 | | | | 03/15/2017 | | | | 101,626 | |
| | 100,000 | | | Express Scripts Holding Co. | | | 4.750 | | | | 11/15/2021 | | | | 110,766 | |
| | 200,000 | | | Johnson & Johnson | | | 5.550 | | | | 08/15/2017 | | | | 207,330 | |
| | 100,000 | | | Johnson & Johnson | | | 2.450 | | | | 03/01/2026 | | | | 101,018 | |
| | 200,000 | | | McKesson Corp. | | | 3.796 | | | | 03/15/2024 | | | | 213,471 | |
| | 15,000 | | | Mead Johnson Nutrition Co. | | | 4.900 | | | | 11/01/2019 | | | | 16,348 | |
| | 100,000 | | | Mead Johnson Nutrition Co. | | | 4.125 | | | | 11/15/2025 | | | | 106,972 | |
| | 200,000 | | | Merck & Co., Inc. | | | 2.750 | | | | 02/10/2025 | | | | 204,097 | |
| | 150,000 | | | Merck Sharp & Dohme Corp. | | | 5.000 | | | | 06/30/2019 | | | | 164,263 | |
| | 100,000 | | | Mylan, Inc. | | | 4.200 | | | | 11/29/2023 | | | | 104,265 | |
| | 200,000 | | | Pfizer, Inc. | | | 6.200 | | | | 03/15/2019 | | | | 221,554 | |
| | 100,000 | | | Pfizer, Inc. | | | 3.000 | | | | 06/15/2023 | | | | 104,962 | |
| | 100,000 | | | Pfizer, Inc. | | | 2.750 | | | | 06/03/2026 | | | | 102,184 | |
| | 100,000 | | | Zoetis, Inc. | | | 1.875 | | | | 02/01/2018 | | | | 100,225 | |
| | 100,000 | | | Zoetis, Inc. | | | 3.250 | | | | 02/01/2023 | | | | 102,326 | |
| | | | | | | | | | | | | | | | |
| | | | | | | | | | | | | | | 3,239,422 | |
| | | | | | | | | | | | | | | | |
| | | | Pipelines—1.5% | | | | | | | | | | | | |
| | 100,000 | | | Kinder Morgan, Inc. | | | 3.050 | | | | 12/01/2019 | | | | 102,536 | |
| | 100,000 | | | Kinder Morgan, Inc. | | | 4.300 | | | | 06/01/2025 | | | | 104,113 | |
| | 100,000 | | | Phillips 66 Partners LP | | | 3.605 | | | | 02/15/2025 | | | | 101,026 | |
| | 100,000 | | | Spectra Energy Capital LLC | | | 6.200 | | | | 04/15/2018 | | | | 105,516 | |
| | 200,000 | | | Spectra Energy Partners LP | | | 4.750 | | | | 03/15/2024 | | | | 218,890 | |
| | 150,000 | | | Williams Partners LP | | | 5.250 | | | | 03/15/2020 | | | | 162,365 | |
| | 100,000 | | | Williams Partners LP | | | 3.600 | | | | 03/15/2022 | | | | 101,903 | |
| | | | | | | | | | | | | | | | |
| | | | | | | | | | | | | | | 896,349 | |
| | | | | | | | | | | | | | | | |
| | | | Real Estate—0.4% | | | | | | | | | | | | |
| | 100,000 | | | CBRE Services, Inc. | | | 5.000 | | | | 03/15/2023 | | | | 105,035 | |
| | 100,000 | | | Prologis LP | | | 4.250 | | | | 08/15/2023 | | | | 109,836 | |
| | | | | | | | | | | | | | | | |
| | | | | | | | | | | | | | | 214,871 | |
| | | | | | | | | | | | | | | | |
| | | | REITs—3.7% | | | | | | | | | | | | |
| | 100,000 | | | Alexandria Real Estate Equities, Inc. | | | 4.600 | | | | 04/01/2022 | | | | 108,590 | |
| | 100,000 | | | American Tower Corp. | | | 4.500 | | | | 01/15/2018 | | | | 103,411 | |
| | 150,000 | | | Boston Properties LP | | | 4.125 | | | | 05/15/2021 | | | | 162,410 | |
| | 100,000 | | | Boston Properties LP | | | 3.650 | | | | 02/01/2026 | | | | 103,698 | |
| | 75,000 | | | Brixmor Operating Partnership LP | | | 3.850 | | | | 02/01/2025 | | | | 76,422 | |
| | 100,000 | | | DDR Corp. | | | 3.625 | | | | 02/01/2025 | | | | 100,491 | |
| | 100,000 | | | ERP Operating LP | | | 4.750 | | | | 07/15/2020 | | | | 109,494 | |
| | 150,000 | | | ERP Operating LP | | | 4.625 | | | | 12/15/2021 | | | | 167,370 | |
| | 100,000 | | | Essex Portfolio LP | | | 3.500 | | | | 04/01/2025 | | | | 102,790 | |
| | 100,000 | | | HCP, Inc. | | | 5.375 | | | | 02/01/2021 | | | | 111,596 | |
| | 100,000 | | | HCP, Inc. | | | 3.875 | | | | 08/15/2024 | | | | 102,814 | |
| | 150,000 | | | Hospitality Properties Trust | | | 5.000 | | | | 08/15/2022 | | | | 162,422 | |
| | 150,000 | | | Kimco Realty Corp. | | | 3.200 | | | | 05/01/2021 | | | | 155,485 | |
| | 100,000 | | | Kimco Realty Corp. | | | 3.400 | | | | 11/01/2022 | | | | 104,698 | |
| | 100,000 | | | Simon Property Group LP | | | 5.650 | | | | 02/01/2020 | | | | 111,339 | |
| | 100,000 | | | Simon Property Group LP | | | 3.375 | | | | 10/01/2024 | | | | 105,126 | |
See accompanying Notes to Financial Statements which are an integral part of the financial statements.
PowerShares Fundamental Investment Grade Corporate Bond Portfolio (PFIG) (continued)
October 31, 2016
| | | | | | | | | | | | | | | | |
Principal
Amount | | | | | Interest
Rate | | | Maturity
Date | | | Value | |
| | | | Corporate Bonds (continued) | | | | | | | | | | | | |
| | | | REITs (continued) | | | | | | | | | | | | |
| $ | 125,000 | | | Ventas Realty LP/Ventas Capital Corp. | | | 4.750 | % | | | 06/01/2021 | | | $ | 138,033 | |
| | 100,000 | | | Weyerhaeuser Co. | | | 7.375 | | | | 10/01/2019 | | | | 114,262 | |
| | | | | | | | | | | | | | | | |
| | | | | | | | | | | | | | | 2,140,451 | |
| | | | | | | | | | | | | | | | |
| | | | Retail—6.7% | | | | | | | | | | | | |
| | 100,000 | | | AutoZone, Inc. | | | 3.125 | | | | 07/15/2023 | | | | 102,425 | |
| | 100,000 | | | Best Buy Co., Inc. | | | 5.500 | | | | 03/15/2021 | | | | 110,750 | |
| | 100,000 | | | Coach, Inc. | | | 4.250 | | | | 04/01/2025 | | | | 102,947 | |
| | 300,000 | | | Costco Wholesale Corp. | | | 1.700 | | | | 12/15/2019 | | | | 302,643 | |
| | 100,000 | | | CVS Health Corp. | | | 2.800 | | | | 07/20/2020 | | | | 103,128 | |
| | 189,000 | | | CVS Health Corp. | | | 3.875 | | | | 07/20/2025 | | | | 202,048 | |
| | 100,000 | | | Dollar General Corp. | | | 4.125 | | | | 07/15/2017 | | | | 102,040 | |
| | 150,000 | | | Dollar General Corp. | | | 3.250 | | | | 04/15/2023 | | | | 153,566 | |
| | 150,000 | | | Gap, Inc. (The) | | | 5.950 | | | | 04/12/2021 | | | | 161,037 | |
| | 400,000 | | | Home Depot, Inc. (The) | | | 2.625 | | | | 06/01/2022 | | | | 413,198 | |
| | 100,000 | | | Lowe’s Cos., Inc. | | | 2.500 | | | | 04/15/2026 | | | | 98,956 | |
| | 100,000 | | | Macy’s Retail Holdings, Inc. | | | 5.900 | | | | 12/01/2016 | | | | 100,387 | |
| | 150,000 | | | Macy’s Retail Holdings, Inc. | | | 2.875 | | | | 02/15/2023 | | | | 144,505 | |
| | 100,000 | | | McDonald’s Corp., GMTN | | | 5.350 | | | | 03/01/2018 | | | | 105,349 | |
| | 100,000 | | | McDonald’s Corp., MTN | | | 2.625 | | | | 01/15/2022 | | | | 102,787 | |
| | 100,000 | | | McDonald’s Corp., MTN | | | 3.700 | | | | 01/30/2026 | | | | 106,039 | |
| | 100,000 | | | Nordstrom, Inc. | | | 4.000 | | | | 10/15/2021 | | | | 106,782 | |
| | 100,000 | | | O’reilly Automotive, Inc. | | | 4.875 | | | | 01/14/2021 | | | | 109,883 | |
| | 100,000 | | | Staples, Inc. | | | 4.375 | | | | 01/12/2023 | | | | 102,432 | |
| | 100,000 | | | Starbucks Corp. | | | 2.100 | | | | 02/04/2021 | | | | 101,614 | |
| | 100,000 | | | Starbucks Corp. | | | 3.850 | | | | 10/01/2023 | | | | 110,208 | |
| | 100,000 | | | Target Corp. | | | 2.900 | | | | 01/15/2022 | | | | 104,222 | |
| | 100,000 | | | TJX Cos., Inc. (The) | | | 2.500 | | | | 05/15/2023 | | | | 101,351 | |
| | 100,000 | | | Walgreens Boots Alliance, Inc. | | | 2.700 | | | | 11/18/2019 | | | | 102,680 | |
| | 100,000 | | | Walgreens Boots Alliance, Inc. | | | 3.800 | | | | 11/18/2024 | | | | 105,345 | |
| | 325,000 | | | Wal-Mart Stores, Inc. | | | 3.250 | | | | 10/25/2020 | | | | 346,320 | |
| | 200,000 | | | Wal-Mart Stores, Inc. | | | 2.550 | | | | 04/11/2023 | | | | 204,970 | |
| | | | | | | | | | | | | | | | |
| | | | | | | | | | | | | | | 3,907,612 | |
| | | | | | | | | | | | | | | | |
| | | | Savings & Loans—0.2% | | | | | | | | | | | | |
| | 100,000 | | | People’s United Financial, Inc. | | | 3.650 | | | | 12/06/2022 | | | | 102,698 | |
| | | | | | | | | | | | | | | | |
| | | | Semiconductors—2.3% | | | | | | | | | | | | |
| | 100,000 | | | Applied Materials, Inc. | | | 4.300 | | | | 06/15/2021 | | | | 110,523 | |
| | 200,000 | | | Intel Corp. | | | 1.350 | | | | 12/15/2017 | | | | 200,776 | |
| | 300,000 | | | Intel Corp. | | | 3.300 | | | | 10/01/2021 | | | | 319,753 | |
| | 100,000 | | | Intel Corp. | | | 3.700 | | | | 07/29/2025 | | | | 109,367 | |
| | 100,000 | | | Lam Research Corp. | | | 2.750 | | | | 03/15/2020 | | | | 101,622 | |
| | 200,000 | | | Maxim Integrated Products, Inc. | | | 3.375 | | | | 03/15/2023 | | | | 202,920 | |
| | 100,000 | | | QUALCOMM, Inc. | | | 3.450 | | | | 05/20/2025 | | | | 104,930 | |
| | 100,000 | | | Xilinx, Inc. | | | 2.125 | | | | 03/15/2019 | | | | 101,102 | |
| | 100,000 | | | Xilinx, Inc. | | | 3.000 | | | | 03/15/2021 | | | | 103,227 | |
| | | | | | | | | | | | | | | | |
| | | | | | | | | | | | | | | 1,354,220 | |
| | | | | | | | | | | | | | | | |
| | | | Software—2.2% | | | | | | | | | | | | |
| | 200,000 | | | Adobe Systems, Inc. | | | 3.250 | | | | 02/01/2025 | | | | 207,771 | |
| | 100,000 | | | CA, Inc. | | | 5.375 | | | | 12/01/2019 | | | | 110,052 | |
| | 100,000 | | | Electronic Arts, Inc. | | | 3.700 | | | | 03/01/2021 | | | | 105,865 | |
| | 100,000 | | | Fidelity National Information Services, Inc. | | | 5.000 | | | | 10/15/2025 | | | | 112,745 | |
| | 100,000 | | | Microsoft Corp. | | | 1.625 | | | | 12/06/2018 | | | | 101,268 | |
| | 200,000 | | | Microsoft Corp. | | | 2.000 | | | | 11/03/2020 | | | | 202,969 | |
| | 50,000 | | | Microsoft Corp. | | | 2.700 | | | | 02/12/2025 | | | | 50,886 | |
| | 100,000 | | | Oracle Corp. | | | 5.750 | | | | 04/15/2018 | | | | 106,586 | |
| | 100,000 | | | Oracle Corp. | | | 1.900 | | | | 09/15/2021 | | | | 99,677 | |
See accompanying Notes to Financial Statements which are an integral part of the financial statements.
PowerShares Fundamental Investment Grade Corporate Bond Portfolio (PFIG) (continued)
October 31, 2016
| | | | | | | | | | | | | | | | |
Principal
Amount | | | | | Interest
Rate | | | Maturity
Date | | | Value | |
| | | | Corporate Bonds (continued) | | | | | | | | | | | | |
| | | | Software (continued) | | | | | | | | | | | | |
| $ | 200,000 | | | Oracle Corp. | | | 2.500 | % | | | 10/15/2022 | | | $ | 203,473 | |
| | | | | | | | | | | | | | | | |
| | | | | | | | | | | | | | | 1,301,292 | |
| | | | | | | | | | | | | | | | |
| | | | Telecommunications—2.8% | | | | | | | | | | | | |
| | 250,000 | | | AT&T, Inc. | | | 5.500 | | | | 02/01/2018 | | | | 262,054 | |
| | 305,000 | | | AT&T, Inc. | | | 3.400 | | | | 05/15/2025 | | | | 304,563 | |
| | 100,000 | | | Cisco Systems, Inc. | | | 4.450 | | | | 01/15/2020 | | | | 108,851 | |
| | 250,000 | | | Cisco Systems, Inc. | | | 3.625 | | | | 03/04/2024 | | | | 271,107 | |
| | 100,000 | | | Motorola Solutions, Inc. | | | 3.750 | | | | 05/15/2022 | | | | 102,938 | |
| | 100,000 | | | Verizon Communications, Inc. | | | 2.625 | | | | 02/21/2020 | | | | 102,058 | |
| | 100,000 | | | Verizon Communications, Inc. | | | 4.500 | | | | 09/15/2020 | | | | 108,802 | |
| | 300,000 | | | Verizon Communications, Inc. | | | 5.150 | | | | 09/15/2023 | | | | 343,662 | |
| | | | | | | | | | | | | | | | |
| | | | | | | | | | | | | | | 1,604,035 | |
| | | | | | | | | | | | | | | | |
| | | | Textiles—0.2% | | | | | | | | | | | | |
| | 100,000 | | | Mohawk Industries, Inc. | | | 3.850 | | | | 02/01/2023 | | | | 104,300 | |
| | | | | | | | | | | | | | | | |
| | | | Toys/Games/Hobbies—0.2% | | | | | | | | | | | | |
| | 100,000 | | | Mattel, Inc. | | | 2.350 | | | | 05/06/2019 | | | | 101,285 | |
| | | | | | | | | | | | | | | | |
| | | | Transportation—1.5% | | | | | | | | | | | | |
| | 130,000 | | | CSX Corp. | | | 6.250 | | | | 03/15/2018 | | | | 138,993 | |
| | 100,000 | | | CSX Corp. | | | 3.700 | | | | 10/30/2020 | | | | 106,673 | |
| | 100,000 | | | CSX Corp. | | | 3.350 | | | | 11/01/2025 | | | | 105,269 | |
| | 100,000 | | | FedEx Corp. | | | 8.000 | | | | 01/15/2019 | | | | 113,902 | |
| | 100,000 | | | Norfolk Southern Corp. | | | 5.750 | | | | 04/01/2018 | | | | 106,121 | |
| | 100,000 | | | Norfolk Southern Corp. | | | 3.000 | | | | 04/01/2022 | | | | 103,683 | |
| | 100,000 | | | Union Pacific Corp. | | | 4.000 | | | | 02/01/2021 | | | | 108,690 | |
| | 100,000 | | | United Parcel Service, Inc. | | | 3.125 | | | | 01/15/2021 | | | | 106,483 | |
| | | | | | | | | | | | | | | | |
| | | | | | | | | | | | | | | 889,814 | |
| | | | | | | | | | | | | | | | |
| | | | Water—0.2% | | | | | | | | | | | | |
| | 100,000 | | | American Water Capital Corp. | | | 6.085 | | | | 10/15/2017 | | | | 104,656 | |
| | | | | | | | | | | | | | | | |
| | | | Total Corporate Bonds
(Cost $56,236,836) | | | | | | | | | | | 57,346,378 | |
| | | | | | | | | | | | | | | | |
| | | | |
| | | | | | | | | | | | | | | | |
Number
of Shares | | | | | | | | | | | | |
| | | | Money Market Fund—0.4% | | | | | | | | | | | | |
| | 240,332 | | | Invesco Premier U.S. Government Money Portfolio—Institutional Class, 0.25%(b)
(Cost $240,332) | | | | | | | | | | | 240,332 | |
| | | | | | | | | | | | | | | | |
| | | | Total Investments
(Cost $56,477,168)—99.0% | | | | | | | | | | | 57,586,710 | |
| | | | Other assets less liabilities—1.0% | | | | | | | | | | | 567,320 | |
| | | | | | | | | | | | | | | | |
| | | | Net Assets—100.0% | | | | | | | | | | $ | 58,154,030 | |
| | | | | | | | | | | | | | | | |
Investment Abbreviations:
BKNT—Bank Note
GMTN—Global Medium-Term Note
MTN—Medium-Term Notes
REIT—Real Estate Investment Trust
Notes to Schedule of Investments:
| (a) | Security purchased or received in a transaction exempt from registration under the Securities Act of 1933, as amended (the “1933 Act”). The security may be resold pursuant to an exemption from registration under the 1933 Act, typically to qualified institutional buyers. The aggregate value of these securities at October 31, 2016 was $422,260, which represented less than 1% of the Fund’s Net Assets. |
| (b) | The security and the Fund are advised by wholly-owned subsidiaries of Invesco Ltd. and are therefore considered to be affiliated. The rate shown is the 7-day SEC standardized yield as of October 31, 2016. |
See accompanying Notes to Financial Statements which are an integral part of the financial statements.
Schedule of Investments
PowerShares Global Short Term High Yield Bond Portfolio (PGHY)
October 31, 2016
| | | | | | | | | | | | | | | | |
Principal
Amount | | | | | Interest
Rate | | | Maturity
Date | | | Value | |
| | | | Corporate Bonds—85.7% | | | | | | | | | | | | |
| | | | Argentina—0.5% | | | | | | | | | | | | |
| $ | 300,000 | | | YPF SA(a) | | | 8.875 | % | | | 12/19/2018 | | | $ | 328,035 | |
| | | | | | | | | | | | | | | | |
| | | | Australia—0.4% | | | | | | | | | | | | |
| | 100,000 | | | Barminco Finance Pty Ltd.(a) | | | 9.000 | | | | 06/01/2018 | | | | 102,375 | |
| | 36,000 | | | BlueScope Steel Finance Ltd./BlueScope Steel Finance USA LLC(a) | | | 7.125 | | | | 05/01/2018 | | | | 36,810 | |
| | 200,000 | | | Emeco Pty Ltd.(a) | | | 9.875 | | | | 03/15/2019 | | | | 145,000 | |
| | | | | | | | | | | | | | | | |
| | | | | | | | | | | | | | | 284,185 | |
| | | | | | | | | | | | | | | | |
| | | | Bangladesh—0.3% | | | | | | | | | | | | |
| | 200,000 | | | Banglalink Digital Communications Ltd.(a) | | | 8.625 | | | | 05/06/2019 | | | | 213,500 | |
| | | | | | | | | | | | | | | | |
| | | | Brazil—3.8% | | | | | | | | | | | | |
| | 400,000 | | | Andrade Gutierrez International SA(a) | | | 4.000 | | | | 04/30/2018 | | | | 328,000 | |
| | 200,000 | | | Banco Bradesco SA(a) | | | 4.500 | | | | 01/12/2017 | | | | 201,500 | |
| | 250,000 | | | BTG Investments LP(a) | | | 4.500 | | | | 04/17/2018 | | | | 236,250 | |
| | 300,000 | | | Caixa Economica Federal(a) | | | 4.250 | | | | 05/13/2019 | | | | 304,200 | |
| | 200,000 | | | Caixa Economica Federal, EMTN(a) | | | 2.375 | | | | 11/06/2017 | | | | 198,640 | |
| | 150,000 | | | Caixa Economica Federal, EMTN(a) | | | 4.500 | | | | 10/03/2018 | | | | 153,405 | |
| | 200,000 | | | Itau Unibanco Holding SA/Cayman Island, EMTN(a) | | | 2.850 | | | | 05/26/2018 | | | | 200,000 | |
| | 200,000 | | | Marfrig Holdings Europe BV(a) | | | 8.375 | | | | 05/09/2018 | | | | 209,000 | |
| | 100,000 | | | Petrobras Global Finance BV | | | 3.500 | | | | 02/06/2017 | | | | 100,450 | |
| | 100,000 | | | Petrobras Global Finance BV | | | 3.250 | | | | 03/17/2017 | | | | 100,450 | |
| | 100,000 | | | Petrobras Global Finance BV | | | 5.875 | | | | 03/01/2018 | | | | 103,570 | |
| | 100,000 | | | Petrobras Global Finance BV | | | 8.375 | | | | 12/10/2018 | | | | 108,430 | |
| | 350,000 | | | Petrobras Global Finance BV | | | 3.000 | | | | 01/15/2019 | | | | 343,525 | |
| | 29,000 | | | Petrobras Global Finance BV | | | 7.875 | | | | 03/15/2019 | | | | 31,247 | |
| | | | | | | | | | | | | | | | |
| | | | | | | | | | | | | | | 2,618,667 | |
| | | | | | | | | | | | | | | | |
| | | | Canada—1.8% | | | | | | | | | | | | |
| | 300,000 | | | Bombardier, Inc.(a) | | | 7.500 | | | | 03/15/2018 | | | | 319,314 | |
| | 175,000 | | | Bombardier, Inc.(a) | | | 5.500 | | | | 09/15/2018 | | | | 181,260 | |
| | 100,000 | | | Bombardier, Inc.(a) | | | 4.750 | | | | 04/15/2019 | | | | 100,000 | |
| | 100,000 | | | Teck Resources Ltd. | | | 3.000 | | | | 03/01/2019 | | | | 99,000 | |
| | 150,000 | | | Telesat Canada/Telesat LLC(a) | | | 6.000 | | | | 05/15/2017 | | | | 150,562 | |
| | 100,000 | | | Tervita Corp.(a)(b) | | | 10.875 | | | | 02/15/2018 | | | | 6,250 | |
| | 250,000 | | | Tervita Corp.(a) | | | 8.000 | | | | 11/15/2018 | | | | 248,750 | |
| | 100,000 | | | Trinidad Drilling Ltd.(a) | | | 7.875 | | | | 01/15/2019 | | | | 98,375 | |
| | | | | | | | | | | | | | | | |
| | | | | | | | | | | | | | | 1,203,511 | |
| | | | | | | | | | | | | | | | |
| | | | China—2.7% | | | | | | | | | | | | |
| | 200,000 | | | China South City Holdings Ltd. | | | 8.250 | | | | 01/29/2019 | | | | 209,759 | |
| | 200,000 | | | Greenland Global Investment Ltd., EMTN | | | 3.500 | | | | 10/17/2017 | | | | 199,914 | |
| | 500,000 | | | Trillion Chance Ltd. | | | 8.500 | | | | 01/10/2019 | | | | 524,075 | |
| | 100,000 | | | Yancoal International Resources Development Co. Ltd.(a) | | | 4.461 | | | | 05/16/2017 | | | | 100,380 | |
| | 200,000 | | | Yingde Gases Investment Ltd.(a) | | | 8.125 | | | | 04/22/2018 | | | | 196,000 | |
| | 200,000 | | | Zhiyuan Group BVI Co. Ltd. | | | 6.200 | | | | 01/11/2019 | | | | 205,747 | |
| | 200,000 | | | Zhongrong International Bond 2015 Ltd. | | | 6.000 | | | | 06/15/2018 | | | | 203,922 | |
| | 200,000 | | | Zoomlion HK SPV Co. Ltd.(a) | | | 6.875 | | | | 04/05/2017 | | | | 202,900 | |
| | | | | | | | | | | | | | | | |
| | | | | | | | | | | | | | | 1,842,697 | |
| | | | | | | | | | | | | | | | |
| | | | Colombia—0.3% | | | | | | | | | | | | |
| | 200,000 | | | Banco GNB Sudameris SA(a) | | | 3.875 | | | | 05/02/2018 | | | | 199,500 | |
| | | | | | | | | | | | | | | | |
| | | | Costa Rica—0.6% | | | | | | | | | | | | |
| | 200,000 | | | Banco de Costa Rica(a) | | | 5.250 | | | | 08/12/2018 | | | | 204,956 | |
| | 200,000 | | | Banco Nacional de Costa Rica(a) | | | 4.875 | | | | 11/01/2018 | | | | 203,924 | |
| | | | | | | | | | | | | | | | |
| | | | | | | | | | | | | | | 408,880 | |
| | | | | | | | | | | | | | | | |
See accompanying Notes to Financial Statements which are an integral part of the financial statements.
PowerShares Global Short Term High Yield Bond Portfolio (PGHY) (continued)
October 31, 2016
| | | | | | | | | | | | | | | | |
Principal
Amount | | | | | Interest
Rate | | | Maturity
Date | | | Value | |
| | | | Corporate Bonds (continued) | | | | | | | | | | | | |
| | | | Croatia—0.2% | | | | | | | | | | | | |
| $ | 150,000 | | | Hrvatska Elektroprivreda(a) | | | 6.000 | % | | | 11/09/2017 | | | $ | 156,097 | |
| | | | | | | | | | | | | | | | |
| | | | Cyprus—0.1% | | | | | | | | | | | | |
| | 208,000 | | | Drill Rigs Holdings, Inc.(a) | | | 6.500 | | | | 10/01/2017 | | | | 70,720 | |
| | | | | | | | | | | | | | | | |
| | | | Denmark—0.3% | | | | | | | | | | | | |
| | 200,000 | | | Welltec A/S(a) | | | 8.000 | | | | 02/01/2019 | | | | 197,500 | |
| | | | | | | | | | | | | | | | |
| | | | Finland—0.5% | | | | | | | | | | | | |
| | 100,000 | | | Nokia OYJ | | | 5.375 | | | | 05/15/2019 | | | | 107,375 | |
| | 200,000 | | | UPM-Kymmene OYJ(a) | | | 5.500 | | | | 01/30/2018 | | | | 209,247 | |
| | | | | | | | | | | | | | | | |
| | | | | | | | | | | | | | | 316,622 | |
| | | | | | | | | | | | | | | | |
| | | | Germany—0.4% | | | | | | | | | | | | |
| | 100,000 | | | Fresenius Medical Care US Finance II, Inc.(a) | | | 6.500 | | | | 09/15/2018 | | | | 108,250 | |
| | 100,000 | | | Fresenius Medical Care US Finance, Inc. | | | 6.875 | | | | 07/15/2017 | | | | 103,500 | |
| | 88,000 | | | Hapag-Lloyd AG(a) | | | 9.750 | | | | 10/15/2017 | | | | 87,780 | |
| | | | | | | | | | | | | | | | |
| | | | | | | | | | | | | | | 299,530 | |
| | | | | | | | | | | | | | | | |
| | | | Guatemala—0.2% | | | | | | | | | | | | |
| | 100,000 | | | Agromercantil Senior Trust(a) | | | 6.250 | | | | 04/10/2019 | | | | 105,250 | |
| | | | | | | | | | | | | | | | |
| | | | India—0.9% | | | | | | | | | | | | |
| | 200,000 | | | Indian Overseas Bank, EMTN | | | 4.625 | | | | 02/21/2018 | | | | 204,343 | |
| | 200,000 | | | Vedanta Resources PLC(a) | | | 9.500 | | | | 07/18/2018 | | | | 212,509 | |
| | 200,000 | | | Vedanta Resources PLC(a) | | | 6.000 | | | | 01/31/2019 | | | | 200,520 | |
| | | | | | | | | | | | | | | | |
| | | | | | | | | | | | | | | 617,372 | |
| | | | | | | | | | | | | | | | |
| | | | Indonesia—1.2% | | | | | | | | | | | | |
| | 200,000 | | | Bank Negara Indonesia Persero Tbk PT | | | 4.125 | | | | 04/27/2017 | | | | 202,780 | |
| | 400,000 | | | Berau Coal Energy Tbk PT(a)(b) | | | 7.250 | | | | 03/13/2017 | | | | 104,000 | |
| | 100,000 | | | Gajah Tunggal Tbk PT(a) | | | 7.750 | | | | 02/06/2018 | | | | 93,250 | |
| | 200,000 | | | Majapahit Holding BV(a) | | | 7.250 | | | | 06/28/2017 | | | | 207,000 | |
| | 200,000 | | | Ottawa Holdings Pte Ltd.(a) | | | 5.875 | | | | 05/16/2018 | | | | 142,000 | |
| | 100,000 | | | TBG Global Pte Ltd.(a) | | | 4.625 | | | | 04/03/2018 | | | | 101,620 | |
| | | | | | | | | | | | | | | | |
| | | | | | | | | | | | | | | 850,650 | |
| | | | | | | | | | | | | | | | |
| | | | Ireland—0.7% | | | | | | | | | | | | |
| | 500,000 | | | Ardagh Packaging Finance PLC/Ardagh Holdings USA, Inc.(a) | | | 6.250 | | | | 01/31/2019 | | | | 511,250 | |
| | | | | | | | | | | | | | | | |
| | | | Italy—0.5% | | | | | | | | | | | | |
| | 150,000 | | | Telecom Italia Capital SA | | | 6.999 | | | | 06/04/2018 | | | | 161,812 | |
| | 150,000 | | | UniCredit Luxembourg Finance SA(a) | | | 6.000 | | | | 10/31/2017 | | | | 154,617 | |
| | | | | | | | | | | | | | | | |
| | | | | | | | | | | | | | | 316,429 | |
| | | | | | | | | | | | | | | | |
| | | | Kazakhstan—1.6% | | | | | | | | | | | | |
| | 200,000 | | | Halyk Savings Bank of Kazakhstan JSC(a) | | | 7.250 | | | | 05/03/2017 | | | | 205,000 | |
| | 200,000 | | | Kazkommertsbank JSC(a) | | | 8.500 | | | | 05/11/2018 | | | | 199,006 | |
| | 100,000 | | | Kazkommertsbank JSC, EMTN(a) | | | 7.500 | | | | 11/29/2016 | | | | 99,750 | |
| | 200,000 | | | KazMunayGas National Co JSC, EMTN(a) | | | 9.125 | | | | 07/02/2018 | | | | 219,662 | |
| | 400,000 | | | Samruk-Energy JSC, EMTN | | | 3.750 | | | | 12/20/2017 | | | | 403,332 | |
| | | | | | | | | | | | | | | | |
| | | | | | | | | | | | | | | 1,126,750 | |
| | | | | | | | | | | | | | | | |
| | | | Luxembourg—1.4% | | | | | | | | | | | | |
| | 100,000 | | | ArcelorMittal | | | 6.125 | | | | 06/01/2018 | | | | 106,250 | |
| | 200,000 | | | ConvaTec Healthcare E SA(a) | | | 10.500 | | | | 12/15/2018 | | | | 202,250 | |
| | 200,000 | | | INEOS Group Holdings SA(a) | | | 5.875 | | | | 02/15/2019 | | | | 204,500 | |
| | 255,000 | | | Intelsat Jackson Holdings SA | | | 7.250 | | | | 04/01/2019 | | | | 206,869 | |
| | 400,000 | | | Intelsat Luxembourg SA | | | 6.750 | | | | 06/01/2018 | | | | 276,000 | |
| | | | | | | | | | | | | | | | |
| | | | | | | | | | | | | | | 995,869 | |
| | | | | | | | | | | | | | | | |
See accompanying Notes to Financial Statements which are an integral part of the financial statements.
PowerShares Global Short Term High Yield Bond Portfolio (PGHY) (continued)
October 31, 2016
| | | | | | | | | | | | | | | | |
Principal
Amount | | | | | Interest
Rate | | | Maturity
Date | | | Value | |
| | | | Corporate Bonds (continued) | | | | | | | | | | | | |
| | | | Mexico—0.5% | | | | | | | | | | | | |
| $ | 200,000 | | | Grupo Elektra SAB de CV | | | 7.250 | % | | | 08/06/2018 | | | $ | 202,700 | |
| | 200,000 | | | TV Azteca SAB de CV, EMTN | | | 7.500 | | | | 05/25/2018 | | | | 173,500 | |
| | | | | | | | | | | | | | | | |
| | | | | | | | | | | | | | | 376,200 | |
| | | | | | | | | | | | | | | | |
| | | | Morocco—0.3% | | | | | | | | | | | | |
| | 200,000 | | | BMCE Bank | | | 6.250 | | | | 11/27/2018 | | | | 210,100 | |
| | | | | | | | | | | | | | | | |
| | | | Netherlands—2.3% | | | | | | | | | | | | |
| | 100,000 | | | AerCap Ireland Capital Ltd./AerCap Global Aviation Trust | | | 2.750 | | | | 05/15/2017 | | | | 100,257 | |
| | 150,000 | | | AerCap Ireland Capital Ltd./AerCap Global Aviation Trust | | | 3.750 | | | | 05/15/2019 | | | | 154,302 | |
| | 200,000 | | | NXP BV/NXP Funding LLC(a) | | | 3.750 | | | | 06/01/2018 | | | | 206,500 | |
| | 200,000 | | | Royal Bank of Scotland NV (The) | | | 4.650 | | | | 06/04/2018 | | | | 205,146 | |
| | 300,000 | | | VimpelCom Holdings BV(a) | | | 6.255 | | | | 03/01/2017 | | | | 304,788 | |
| | 400,000 | | | VimpelCom Holdings BV(a) | | | 5.200 | | | | 02/13/2019 | | | | 413,000 | |
| | 200,000 | | | Zhaikmunai LLP(a) | | | 6.375 | | | | 02/14/2019 | | | | 186,000 | |
| | | | | | | | | | | | | | | | |
| | | | | | | | | | | | | | | 1,569,993 | |
| | | | | | | | | | | | | | | | |
| | | | Nigeria—0.9% | | | | | | | | | | | | |
| | 400,000 | | | Access Finance BV(a) | | | 7.250 | | | | 07/25/2017 | | | | 403,000 | |
| | 200,000 | | | Zenith Bank PLC, EMTN(a) | | | 6.250 | | | | 04/22/2019 | | | | 195,816 | |
| | | | | | | | | | | | | | | | |
| | | | | | | | | | | | | | | 598,816 | |
| | | | | | | | | | | | | | | | |
| | | | Norway—0.3% | | | | | | | | | | | | |
| | 227,000 | | | Eksportfinans ASA, GMTN | | | 5.500 | | | | 06/26/2017 | | | | 232,103 | |
| | | | | | | | | | | | | | | | |
| | | | Paraguay—0.3% | | | | | | | | | | | | |
| | 177,000 | | | Banco Regional SAECA(a) | | | 8.125 | | | | 01/24/2019 | | | | 192,080 | |
| | | | | | | | | | | | | | | | |
| | | | Philippines—0.1% | | | | | | | | | | | | |
| | 100,000 | | | Rizal Commercial Banking Corp., EMTN | | | 5.250 | | | | 01/31/2017 | | | | 100,625 | |
| | | | | | | | | | | | | | | | |
| | | | Russia—11.3% | | | | | | | | | | | | |
| | 200,000 | | | AK Bars Bank Via AK Bars Luxembourg SA | | | 8.000 | | | | 08/06/2018 | | | | 210,000 | |
| | 100,000 | | | AK Transneft OJSC Via TransCapitalInvest Ltd.(a) | | | 8.700 | | | | 08/07/2018 | | | | 110,145 | |
| | 200,000 | | | ALFA Bank AO Via ALFA Bond Issuance PLC, EMTN | | | 5.000 | | | | 11/27/2018 | | | | 207,289 | |
| | 200,000 | | | Borets Finance DAC(a) | | | 7.625 | | | | 09/26/2018 | | | | 198,880 | |
| | 200,000 | | | Brunswick Rail Finance Designated Activity Co.(a) | | | 6.500 | | | | 11/01/2017 | | | | 106,000 | |
| | 200,000 | | | Credit Bank of Moscow Via Cbom Finance PLC(a) | | | 7.700 | | | | 02/01/2018 | | | | 209,500 | |
| | 200,000 | | | DME Airport Ltd. | | | 6.000 | | | | 11/26/2018 | | | | 209,552 | |
| | 200,000 | | | EuroChem Mineral & Chemical Co. OJSC Via EuroChem Global Investments Ltd.(a) | | | 5.125 | | | | 12/12/2017 | | | | 205,692 | |
| | 200,000 | | | Evraz Group SA(a) | | | 6.750 | | | | 04/27/2018 | | | | 208,500 | |
| | 400,000 | | | Gazprom OAO Via GAZ Capital SA, EMTN(a) | | | 6.212 | | | | 11/22/2016 | | | | 400,756 | |
| | 100,000 | | | Gazprom OAO Via GAZ Capital SA, EMTN(a) | | | 8.146 | | | | 04/11/2018 | | | | 107,666 | |
| | 200,000 | | | Gazprombank OJSC Via GPB Eurobond Finance PLC, EMTN | | | 5.625 | | | | 05/17/2017 | | | | 203,331 | |
| | 200,000 | | | Nord Gold SE(a) | | | 6.375 | | | | 05/07/2018 | | | | 208,776 | |
| | 200,000 | | | Novolipetsk Steel Via Steel Funding Dac(a) | | | 4.450 | | | | 02/19/2018 | | | | 205,583 | |
| | 400,000 | | | Phosagro OAO Via Phosagro Bond Funding Dac(a) | | | 4.204 | | | | 02/13/2018 | | | | 408,000 | |
| | 200,000 | | | Promsvyazbank OJSC Via Psb Finance SA(a) | | | 8.500 | | | | 04/25/2017 | | | | 205,231 | |
| | 200,000 | | | Raspadskaya OJSC Via Raspadskaya Securities Ltd.(a) | | | 7.750 | | | | 04/27/2017 | | | | 206,417 | |
| | 200,000 | | | Rosneft Finance SA, EMTN(a) | | | 6.625 | | | | 03/20/2017 | | | | 203,335 | |
| | 100,000 | | | Rosneft Finance SA, EMTN(a) | | | 7.875 | | | | 03/13/2018 | | | | 106,565 | |
| | 200,000 | | | Rosneft Oil Co. Via Rosneft International Finance Ltd.(a) | | | 3.149 | | | | 03/06/2017 | | | | 200,500 | |
| | 100,000 | | | Russian Agricultural Bank OJSC Via RSHB Capital SA(a) | | | 6.299 | | | | 05/15/2017 | | | | 101,879 | |
| | 200,000 | | | Russian Agricultural Bank OJSC Via RSHB Capital SA(a) | | | 5.298 | | | | 12/27/2017 | | | | 204,810 | |
| | 100,000 | | | Russian Agricultural Bank OJSC Via RSHB Capital SA(a) | | | 7.750 | | | | 05/29/2018 | | | | 106,777 | |
| | 200,000 | | | Russian Agricultural Bank OJSC Via RSHB Capital SA(a) | | | 5.100 | | | | 07/25/2018 | | | | 205,750 | |
| | 200,000 | | | Russian Railways Via RZD Capital PLC, EMTN | | | 5.739 | | | | 04/03/2017 | | | | 203,485 | |
| | 200,000 | | | Sberbank of Russia Via SB Capital SA(a) | | | 4.950 | | | | 02/07/2017 | | | | 201,489 | |
| | 100,000 | | | Sberbank of Russia Via SB Capital SA, EMTN | | | 5.400 | | | | 03/24/2017 | | | | 101,318 | |
| | 200,000 | | | SCF Capital Ltd.(a) | | | 5.375 | | | | 10/27/2017 | | | | 205,933 | |
See accompanying Notes to Financial Statements which are an integral part of the financial statements.
PowerShares Global Short Term High Yield Bond Portfolio (PGHY) (continued)
October 31, 2016
| | | | | | | | | | | | | | | | |
Principal
Amount | | | | | Interest
Rate | | | Maturity
Date | | | Value | |
| | | | Corporate Bonds (continued) | | | | | | | | | | | | |
| | | | Russia (continued) | | | | | | | | | | | | |
| $ | 100,000 | | | Severstal OAO Via Steel Capital SA(a) | | | 6.700 | % | | | 10/25/2017 | | | $ | 104,207 | |
| | 200,000 | | | Severstal OAO Via Steel Capital SA, EMTN(a) | | | 4.450 | | | | 03/19/2018 | | | | 204,819 | |
| | 200,000 | | | Sibur Securities DAC(a) | | | 3.914 | | | | 01/31/2018 | | | | 201,900 | |
| | 400,000 | | | Uralkali OJSC Via Uralkali Finance Dac, EMTN(a) | | | 3.723 | | | | 04/30/2018 | | | | 400,116 | |
| | 200,000 | | | Vimpel Communications Via VIP Finance Ireland Ltd. OJSC(a) | | | 9.125 | | | | 04/30/2018 | | | | 217,578 | |
| | 200,000 | | | Vnesheconombank Via VEB Finance PLC(a) | | | 5.375 | | | | 02/13/2017 | | | | 201,840 | |
| | 200,000 | | | Vnesheconombank Via VEB Finance PLC(a) | | | 5.450 | | | | 11/22/2017 | | | | 205,258 | |
| | 200,000 | | | Vnesheconombank Via VEB Finance PLC(a) | | | 4.224 | | | | 11/21/2018 | | | | 202,664 | |
| | 400,000 | | | VTB Bank OJSC Via VTB Capital SA(a) | | | 6.000 | | | | 04/12/2017 | | | | 406,208 | |
| | 200,000 | | | VTB Bank OJSC Via VTB Capital SA(a) | | | 6.315 | | | | 02/22/2018 | | | | 208,535 | |
| | | | | | | | | | | | | | | | |
| | | | | | | | | | | | | | | 7,806,284 | |
| | | | | | | | | | | | | | | | |
| | | | Saudi Arabia—0.9% | | | | | | | | | | | | |
| | 200,000 | | | Dar Al-Arkan Sukuk Co. Ltd. | | | 5.750 | | | | 11/25/2016 | | | | 199,783 | |
| | 200,000 | | | Dar Al-Arkan Sukuk Co. Ltd. | | | 5.750 | | | | 05/24/2018 | | | | 195,570 | |
| | 200,000 | | | Dar Al-Arkan Sukuk Co. Ltd. | | | 6.500 | | | | 05/28/2019 | | | | 200,100 | |
| | | | | | | | | | | | | | | | |
| | | | | | | | | | | | | | | 595,453 | |
| | | | | | | | | | | | | | | | |
| | | | South Africa—0.3% | | | | | | | | | | | | |
| | 200,000 | | | Sappi Papier Holding GmbH(a) | | | 7.750 | | | | 07/15/2017 | | | | 204,000 | |
| | | | | | | | | | | | | | | | |
| | | | South Korea—0.4% | | | | | | | | | | | | |
| | 250,000 | | | Harvest Operations Corp. | | | 6.875 | | | | 10/01/2017 | | | | 251,875 | |
| | | | | | | | | | | | | | | | |
| | | | Sri Lanka—0.8% | | | | | | | | | | | | |
| | 100,000 | | | Bank of Ceylon(a) | | | 6.875 | | | | 05/03/2017 | | | | 101,872 | |
| | 200,000 | | | Bank of Ceylon | | | 5.325 | | | | 04/16/2018 | | | | 202,000 | |
| | 200,000 | | | National Savings Bank(a) | | | 8.875 | | | | 09/18/2018 | | | | 216,680 | |
| | | | | | | | | | | | | | | | |
| | | | | | | | | | | | | | | 520,552 | |
| | | | | | | | | | | | | | | | |
| | | | Supranational—0.3% | | | | | | | | | | | | |
| | 200,000 | | | Eastern and Southern African Trade and Development Bank, EMTN | | | 6.375 | | | | 12/06/2018 | | | | 209,651 | |
| | | | | | | | | | | | | | | | |
| | | | Sweden—0.6% | | | | | | | | | | | | |
| | 200,000 | | | Perstorp Holding AB(a) | | | 8.750 | | | | 05/15/2017 | | | | 200,550 | |
| | 200,000 | | | Perstorp Holding AB(a) | | | 11.000 | | | | 08/15/2017 | | | | 198,750 | |
| | | | | | | | | | | | | | | | |
| | | | | | | | | | | | | | | 399,300 | |
| | | | | | | | | | | | | | | | |
| | | | Turkey—0.6% | | | | | | | | | | | | |
| | 200,000 | | | Finansbank AS(a) | | | 5.150 | | | | 11/01/2017 | | | | 204,000 | |
| | 200,000 | | | Tupras Turkiye Petrol Rafinerileri AS(a) | | | 4.125 | | | | 05/02/2018 | | | | 201,760 | |
| | | | | | | | | | | | | | | | |
| | | | | | | | | | | | | | | 405,760 | |
| | | | | | | | | | | | | | | | |
| | | | Ukraine—0.0% | | | | | | | | | | | | |
| | 8,375 | | | UkrLandFarming PLC(a) | | | 10.875 | | | | 03/26/2018 | | | | 2,806 | |
| | | | | | | | | | | | | | | | |
| | | | United Arab Emirates—0.3% | | | | | | | | | | | | |
| | 200,000 | | | Alpha Star Holding Ltd. | | | 4.970 | | | | 04/09/2019 | | | | 193,481 | |
| | | | | | | | | | | | | | | | |
| | | | United Kingdom—3.2% | | | | | | | | | | | | |
| | 200,000 | | | Algeco Scotsman Global Finance PLC(a) | | | 8.500 | | | | 10/15/2018 | | | | 182,500 | |
| | 200,000 | | | Anglo American Capital PLC(a) | | | 2.625 | | | | 04/03/2017 | | | | 200,500 | |
| | 200,000 | | | Anglo American Capital PLC(a) | | | 2.625 | | | | 09/27/2017 | | | | 200,760 | |
| | 100,000 | | | Anglo American Capital PLC(a) | | | 9.375 | | | | 04/08/2019 | | | | 115,000 | |
| | 220,000 | | | Case New Holland Industrial, Inc. | | | 7.875 | | | | 12/01/2017 | | | | 233,750 | |
| | 200,000 | | | Global Ship Lease, Inc.(a) | | | 10.000 | | | | 04/01/2019 | | | | 179,000 | |
| | 200,000 | | | Globe Luxembourg SCA(a) | | | 9.625 | | | | 05/01/2018 | | | | 192,500 | |
| | 400,000 | | | Jaguar Land Rover Automotive PLC(a) | | | 4.125 | | | | 12/15/2018 | | | | 410,500 | |
| | 200,000 | | | Royal Bank of Scotland Group PLC | | | 4.700 | | | | 07/03/2018 | | | | 204,796 | |
| | 200,000 | | | Tesco PLC(a) | | | 2.700 | | | | 01/05/2017 | | | | 200,175 | |
| | 100,000 | | | Tesco PLC(a) | | | 5.500 | | | | 11/15/2017 | | | | 103,481 | |
| | | | | | | | | | | | | | | | �� |
| | | | | | | | | | | | | | | 2,222,962 | |
| | | | | | | | | | | | | | | | |
See accompanying Notes to Financial Statements which are an integral part of the financial statements.
PowerShares Global Short Term High Yield Bond Portfolio (PGHY) (continued)
October 31, 2016
| | | | | | | | | | | | | | | | |
Principal
Amount | | | | | Interest
Rate | | | Maturity
Date | | | Value | |
| | | | Corporate Bonds (continued) | | | | | | | | | | | | |
| | | | United States—42.5% | | | | | | | | | | | | |
| $ | 200,000 | | | Accuride Corp. | | | 9.500 | % | | | 08/01/2018 | | | $ | 200,500 | |
| | 200,000 | | | ADS Tactical, Inc.(a) | | | 11.000 | | | | 04/01/2018 | | | | 204,000 | |
| | 200,000 | | | AerCap Aviation Solutions BV | | | 6.375 | | | | 05/30/2017 | | | | 205,500 | |
| | 150,000 | | | Affinion Group, Inc. | | | 7.875 | | | | 12/15/2018 | | | | 108,750 | |
| | 100,000 | | | Alcoa, Inc. | | | 6.750 | | | | 07/15/2018 | | | | 107,340 | |
| | 100,000 | | | Alere, Inc. | | | 7.250 | | | | 07/01/2018 | | | | 101,812 | |
| | 100,000 | | | Ally Financial, Inc. | | | 2.750 | | | | 01/30/2017 | | | | 100,060 | |
| | 150,000 | | | Ally Financial, Inc. | | | 5.500 | | | | 02/15/2017 | | | | 151,500 | |
| | 100,000 | | | Ally Financial, Inc. | | | 3.250 | | | | 09/29/2017 | | | | 100,687 | |
| | 100,000 | | | Ally Financial, Inc. | | | 6.250 | | | | 12/01/2017 | | | | 103,750 | |
| | 100,000 | | | Ally Financial, Inc. | | | 3.250 | | | | 02/13/2018 | | | | 100,500 | |
| | 100,000 | | | Ally Financial, Inc. | | | 3.600 | | | | 05/21/2018 | | | | 101,125 | |
| | 100,000 | | | Ally Financial, Inc. | | | 4.750 | | | | 09/10/2018 | | | | 103,011 | |
| | 100,000 | | | Ally Financial, Inc. | | | 3.250 | | | | 11/05/2018 | | | | 100,250 | |
| | 100,000 | | | Ally Financial, Inc. | | | 8.000 | | | | 12/31/2018 | | | | 110,000 | |
| | 200,000 | | | Ally Financial, Inc. | | | 3.500 | | | | 01/27/2019 | | | | 201,000 | |
| | 250,000 | | | Alta Mesa Holdings LP/Alta Mesa Finance Services Corp. | | | 9.625 | | | | 10/15/2018 | | | | 236,875 | |
| | 150,000 | | | American Airlines Group, Inc. | | | 6.125 | | | | 06/01/2018 | | | | 156,563 | |
| | 250,000 | | | Anixter, Inc. | | | 5.625 | | | | 05/01/2019 | | | | 265,937 | |
| | 150,000 | | | Arconic, Inc. | | | 5.550 | | | | 02/01/2017 | | | | 151,687 | |
| | 200,000 | | | Arconic, Inc. | | | 5.720 | | | | 02/23/2019 | | | | 214,608 | |
| | 35,000 | | | Arconic, Inc., Series B | | | 6.500 | | | | 06/15/2018 | | | | 37,546 | |
| | 220,000 | | | Ashland LLC | | | 3.875 | | | | 04/15/2018 | | | | 225,225 | |
| | 175,000 | | | Associated Materials LLC/AMH New Finance, Inc. | | | 9.125 | | | | 11/01/2017 | | | | 168,000 | |
| | 200,000 | | | Atrium Windows & Doors, Inc.(a) | | | 7.750 | | | | 05/01/2019 | | | | 185,500 | |
| | 100,000 | | | Avaya, Inc.(a) | | | 9.000 | | | | 04/01/2019 | | | | 83,500 | |
| | 100,000 | | | Avaya, Inc.(a) | | | 7.000 | | | | 04/01/2019 | | | | 81,750 | |
| | 400,000 | | | Basic Energy Services, Inc.(b)(c) | | | 7.750 | | | | 02/15/2019 | | | | 189,000 | |
| | 200,000 | | | BlueLine Rental Finance Corp.(a) | | | 7.000 | | | | 02/01/2019 | | | | 175,500 | |
| | 100,000 | | | BMC Software, Inc. | | | 7.250 | | | | 06/01/2018 | | | | 100,000 | |
| | 100,000 | | | Bumble Bee Holdings, Inc.(a) | | | 9.000 | | | | 12/15/2017 | | | | 100,125 | |
| | 100,000 | | | Cablevision Systems Corp. | | | 8.625 | | | | 09/15/2017 | | | | 104,625 | |
| | 100,000 | | | Cablevision Systems Corp. | | | 7.750 | | | | 04/15/2018 | | | | 105,625 | |
| | 100,000 | | | CalAtlantic Group, Inc. | | | 8.375 | | | | 05/15/2018 | | | | 109,500 | |
| | 100,000 | | | Cantor Commercial Real Estate Co. LP/CCRE Finance Corp.(a) | | | 7.750 | | | | 02/15/2018 | | | | 100,500 | |
| | 188,000 | | | Casella Waste Systems, Inc. | | | 7.750 | | | | 02/15/2019 | | | | 192,042 | |
| | 100,000 | | | Centene Corp. | | | 5.750 | | | | 06/01/2017 | | | | 102,125 | |
| | 100,000 | | | CenturyLink, Inc., Series N | | | 6.000 | | | | 04/01/2017 | | | | 101,875 | |
| | 100,000 | | | CenturyLink, Inc., Series R | | | 5.150 | | | | 06/15/2017 | | | | 101,875 | |
| | 145,000 | | | Chesapeake Energy Corp.(a) | | | 8.000 | | | | 12/15/2022 | | | | 147,447 | |
| | 200,000 | | | CHS/Community Health Systems, Inc. | | | 5.125 | | | | 08/15/2018 | | | | 198,270 | |
| | 160,000 | | | CIT Group, Inc. | | | 5.000 | | | | 05/15/2017 | | | | 162,200 | |
| | 150,000 | | | CIT Group, Inc. | | | 4.250 | | | | 08/15/2017 | | | | 152,107 | |
| | 100,000 | | | CIT Group, Inc. | | | 5.250 | | | | 03/15/2018 | | | | 103,816 | |
| | 100,000 | | | CIT Group, Inc.(a) | | | 5.500 | | | | 02/15/2019 | | | | 105,500 | |
| | 100,000 | | | CIT Group, Inc. | | | 3.875 | | | | 02/19/2019 | | | | 101,781 | |
| | 100,000 | | | Claire’s Stores, Inc.(a) | | | 9.000 | | | | 03/15/2019 | | | | 51,000 | |
| | 200,000 | | | Claire’s Stores, Inc. | | | 8.875 | | | | 03/15/2019 | | | | 35,500 | |
| | 100,000 | | | Clayton Williams Energy, Inc. | | | 7.750 | | | | 04/01/2019 | | | | 100,250 | |
| | 350,000 | | | CNH Industrial Capital LLC | | | 6.250 | | | | 11/01/2016 | | | | 350,000 | |
| | 100,000 | | | CNH Industrial Capital LLC | | | 3.250 | | | | 02/01/2017 | | | | 100,375 | |
| | 100,000 | | | CNH Industrial Capital LLC | | | 3.625 | | | | 04/15/2018 | | | | 101,375 | |
| | 100,000 | | | CNH Industrial Capital LLC | | | 3.875 | | | | 07/16/2018 | | | | 101,125 | |
| | 100,000 | | | Commercial Metals Co. | | | 6.500 | | | | 07/15/2017 | | | | 102,750 | |
| | 100,000 | | | Commercial Metals Co. | | | 7.350 | | | | 08/15/2018 | | | | 108,000 | |
| | 100,000 | | | Community Choice Financial, Inc. | | | 10.750 | | | | 05/01/2019 | | | | 53,500 | |
| | 100,000 | | | Comstock Resources, Inc., PIK | | | 7.750 | | | | 04/01/2019 | | | | 85,312 | |
See accompanying Notes to Financial Statements which are an integral part of the financial statements.
PowerShares Global Short Term High Yield Bond Portfolio (PGHY) (continued)
October 31, 2016
| | | | | | | | | | | | | | | | |
Principal
Amount | | | | | Interest
Rate | | | Maturity
Date | | | Value | |
| | | | Corporate Bonds (continued) | | | | | | | | | | | | |
| | | | United States (continued) | | | | | | | | | | | | |
| $ | 100,000 | | | Constellation Brands, Inc. | | | 7.250 | % | | | 05/15/2017 | | | $ | 103,375 | |
| | 150,000 | | | Crescent Resources LLC/Crescent Ventures, Inc.(a) | | | 10.250 | | | | 08/15/2017 | | | | 150,413 | |
| | 100,000 | | | CSC Holdings LLC | | | 7.875 | | | | 02/15/2018 | | | | 107,000 | |
| | 100,000 | | | CSC Holdings LLC | | | 7.625 | | | | 07/15/2018 | | | | 107,500 | |
| | 98,000 | | | CSC Holdings LLC | | | 8.625 | | | | 02/15/2019 | | | | 109,025 | |
| | 50,000 | | | Cumulus Media Holdings, Inc. | | | 7.750 | | | | 05/01/2019 | | | | 21,000 | |
| | 100,000 | | | D.R. Horton, Inc. | | | 4.750 | | | | 05/15/2017 | | | | 101,634 | |
| | 100,000 | | | D.R. Horton, Inc. | | | 3.625 | | | | 02/15/2018 | | | | 101,875 | |
| | 100,000 | | | D.R. Horton, Inc. | | | 3.750 | | | | 03/01/2019 | | | | 103,250 | |
| | 200,000 | | | DCP Midstream LLC(a) | | | 9.750 | | | | 03/15/2019 | | | | 225,750 | |
| | 100,000 | | | DCP Midstream Operating LP | | | 2.500 | | | | 12/01/2017 | | | | 99,500 | |
| | 200,000 | | | DCP Midstream Operating LP | | | 2.700 | | | | 04/01/2019 | | | | 196,250 | |
| | 50,000 | | | Dell, Inc. | | | 5.650 | | | | 04/15/2018 | | | | 51,834 | |
| | 100,000 | | | DISH DBS Corp. | | | 4.625 | | | | 07/15/2017 | | | | 102,125 | |
| | 100,000 | | | DISH DBS Corp. | | | 4.250 | | | | 04/01/2018 | | | | 102,625 | |
| | 200,000 | | | Dole Food Co., Inc.(a) | | | 7.250 | | | | 05/01/2019 | | | | 203,250 | |
| | 134,764 | | | DynCorp International, Inc., PIK | | | 11.875 | | | | 11/30/2020 | | | | 110,843 | |
| | 2,350,000 | | | Energy XXI Gulf Coast, Inc.(b)(c) | | | 9.250 | | | | 12/15/2017 | | | | 235,000 | |
| | 100,000 | | | EnLink Midstream Partners LP | | | 2.700 | | | | 04/01/2019 | | | | 100,002 | |
| | 100,000 | | | EV Energy Partners LP/EV Energy Finance Corp. | | | 8.000 | | | | 04/15/2019 | | | | 69,500 | |
| | 100,000 | | | FirstEnergy Corp., Series A | | | 2.750 | | | | 03/15/2018 | | | | 101,190 | |
| | 200,000 | | | Flexi-Van Leasing, Inc.(a) | | | 7.875 | | | | 08/15/2018 | | | | 187,000 | |
| | 100,000 | | | Florida East Coast Holdings Corp.(a) | | | 6.750 | | | | 05/01/2019 | | | | 101,000 | |
| | 49,000 | | | Freeport-McMoRan, Inc. | | | 2.150 | | | | 03/01/2017 | | | | 48,939 | |
| | 100,000 | | | Freeport-McMoRan, Inc. | | | 2.300 | | | | 11/14/2017 | | | | 99,500 | |
| | 100,000 | | | Freeport-McMoRan, Inc. | | | 2.375 | | | | 03/15/2018 | | | | 99,250 | |
| | 281,000 | | | Frontier Communications Corp. | | | 8.250 | | | | 04/15/2017 | | | | 290,132 | |
| | 145,000 | | | Frontier Communications Corp. | | | 8.125 | | | | 10/01/2018 | | | | 158,231 | |
| | 100,000 | | | Frontier Communications Corp. | | | 7.125 | | | | 03/15/2019 | | | | 107,500 | |
| | 300,000 | | | Gastar Exploration, Inc. | | | 8.625 | | | | 05/15/2018 | | | | 273,000 | |
| | 100,000 | | | General Motors Financial Co., Inc. | | | 2.400 | | | | 05/09/2019 | | | | 100,154 | |
| | 100,000 | | | GenOn Energy, Inc. | | | 7.875 | | | | 06/15/2017 | | | | 82,500 | |
| | 100,000 | | | GenOn Energy, Inc. | | | 9.500 | | | | 10/15/2018 | | | | 80,750 | |
| | 200,000 | | | Genworth Holdings, Inc., GMTN | | | 6.515 | | | | 05/22/2018 | | | | 202,750 | |
| | 100,000 | | | Gibson Brands, Inc.(a) | | | 8.875 | | | | 08/01/2018 | | | | 74,250 | |
| | 100,000 | | | GLP Capital LP/GLP Financing II, Inc. | | | 4.375 | | | | 11/01/2018 | | | | 104,375 | |
| | 300,000 | | | Goodman Networks, Inc. | | | 12.125 | | | | 07/01/2018 | | | | 129,750 | |
| | 300,000 | | | Graham Holdings Co. | | | 7.250 | | | | 02/01/2019 | | | | 327,750 | |
| | 100,000 | | | Great Lakes Dredge & Dock Corp. | | | 7.375 | | | | 02/01/2019 | | | | 98,625 | |
| | 100,000 | | | Greif, Inc. | | | 6.750 | | | | 02/01/2017 | | | | 100,875 | |
| | 100,000 | | | Harsco Corp. | | | 5.750 | | | | 05/15/2018 | | | | 107,000 | |
| | 35,000 | | | HCA, Inc. | | | 8.000 | | | | 10/01/2018 | | | | 38,894 | |
| | 100,000 | | | HCA, Inc. | | | 3.750 | | | | 03/15/2019 | | | | 102,500 | |
| | 100,000 | | | Health Net, Inc. | | | 6.375 | | | | 06/01/2017 | | | | 102,875 | |
| | 200,000 | | | Hertz Corp. (The) | | | 4.250 | | | | 04/01/2018 | | | | 206,000 | |
| | 113,000 | | | Hertz Corp. (The) | | | 6.750 | | | | 04/15/2019 | | | | 115,354 | |
| | 100,000 | | | Hexion, Inc. | | | 8.875 | | | | 02/01/2018 | | | | 95,550 | |
| | 140,000 | | | IAC/InterActiveCorp | | | 4.875 | | | | 11/30/2018 | | | | 141,470 | |
| | 100,000 | | | IASIS Healthcare LLC/IASIS Capital Corp. | | | 8.375 | | | | 05/15/2019 | | | | 95,750 | |
| | 200,000 | | | Icahn Enterprises LP/Icahn Enterprises Finance Corp. | | | 3.500 | | | | 03/15/2017 | | | | 200,375 | |
| | 100,000 | | | Icahn Enterprises LP/Icahn Enterprises Finance Corp. | | | 4.875 | | | | 03/15/2019 | | | | 100,050 | |
| | 200,000 | | | iHeartCommunications, Inc. | | | 10.000 | | | | 01/15/2018 | | | | 143,000 | |
| | 200,000 | | | Illinois Power Generating Co., Series H | | | 7.000 | | | | 04/15/2018 | | | | 76,000 | |
| | 100,000 | | | International Lease Finance Corp. | | | 8.750 | | | | 03/15/2017 | | | | 102,578 | |
| | 100,000 | | | International Lease Finance Corp. | | | 8.875 | | | | 09/01/2017 | | | | 105,500 | |
| | 100,000 | | | International Lease Finance Corp. | | | 3.875 | | | | 04/15/2018 | | | | 102,500 | |
| | 100,000 | | | International Lease Finance Corp. | | | 5.875 | | | | 04/01/2019 | | | | 107,718 | |
See accompanying Notes to Financial Statements which are an integral part of the financial statements.
PowerShares Global Short Term High Yield Bond Portfolio (PGHY) (continued)
October 31, 2016
| | | | | | | | | | | | | | | | |
Principal
Amount | | | | | Interest
Rate | | | Maturity
Date | | | Value | |
| | | | Corporate Bonds (continued) | | | | | | | | | | | | |
| | | | United States (continued) | | | | | | | | | | | | |
| $ | 100,000 | | | International Lease Finance Corp. | | | 6.250 | % | | | 05/15/2019 | | | $ | 108,375 | |
| | 100,000 | | | inVentiv Health, Inc.(a) | | | 9.000 | | | | 01/15/2018 | | | | 101,438 | |
| | 200,000 | | | inVentiv Health, Inc. | | | 10.000 | | | | 08/15/2018 | | | | 200,225 | |
| | 100,000 | | | IPALCO Enterprises, Inc. | | | 5.000 | | | | 05/01/2018 | | | | 105,000 | |
| | 100,000 | | | iStar, Inc.—REIT | | | 9.000 | | | | 06/01/2017 | | | | 104,000 | |
| | 100,000 | | | iStar, Inc.—REIT | | | 4.000 | | | | 11/01/2017 | | | | 100,375 | |
| | 100,000 | | | iStar, Inc.—REIT | | | 7.125 | | | | 02/15/2018 | | | | 104,125 | |
| | 100,000 | | | iStar, Inc.—REIT | | | 4.875 | | | | 07/01/2018 | | | | 100,375 | |
| | 100,000 | | | JC Penney Corp., Inc. | | | 5.750 | | | | 02/15/2018 | | | | 103,375 | |
| | 200,000 | | | KB Home | | | 9.100 | | | | 09/15/2017 | | | | 211,000 | |
| | 100,000 | | | KB Home | | | 7.250 | | | | 06/15/2018 | | | | 106,500 | |
| | 100,000 | | | KB Home | | | 4.750 | | | | 05/15/2019 | | | | 102,750 | |
| | 140,000 | | | Kemet Corp. | | | 10.500 | | | | 05/01/2018 | | | | 140,437 | |
| | 100,000 | | | Kratos Defense & Security Solutions, Inc. | | | 7.000 | | | | 05/15/2019 | | | | 91,500 | |
| | 236,000 | | | Ladder Capital Finance Holdings LLLP/Ladder Capital Finance Corp. | | | 7.375 | | | | 10/01/2017 | | | | 240,130 | |
| | 200,000 | | | Lennar Corp. | | | 4.750 | | | | 12/15/2017 | | | | 205,000 | |
| | 100,000 | | | Lennar Corp. | | | 6.950 | | | | 06/01/2018 | | | | 107,000 | |
| | 200,000 | | | Lennar Corp. | | | 4.125 | | | | 12/01/2018 | | | | 206,500 | |
| | 150,000 | | | Lennar Corp., Series B | | | 12.250 | | | | 06/01/2017 | | | | 159,187 | |
| | 493,000 | | | Mallinckrodt International Finance SA | | | 3.500 | | | | 04/15/2018 | | | | 491,768 | |
| | 100,000 | | | MGM Resorts International | | | 11.375 | | | | 03/01/2018 | | | | 112,125 | |
| | 300,000 | | | MGM Resorts International | | | 8.625 | | | | 02/01/2019 | | | | 338,063 | |
| | 200,000 | | | Michael Baker International LLC/CDL Acquisition Co., Inc.(a) | | | 8.250 | | | | 10/15/2018 | | | | 201,000 | |
| | 100,000 | | | Murphy Oil Corp. | | | 3.500 | | | | 12/01/2017 | | | | 100,837 | |
| | 100,000 | | | Nationstar Mortgage LLC/Nationstar Capital Corp. | | | 6.500 | | | | 08/01/2018 | | | | 101,563 | |
| | 100,000 | | | Nationstar Mortgage LLC/Nationstar Capital Corp. | | | 9.625 | | | | 05/01/2019 | | | | 105,125 | |
| | 315,000 | | | Natural Resource Partners LP/NRP Finance Corp. | | | 9.125 | | | | 10/01/2018 | | | | 291,375 | |
| | 200,000 | | | Navient Corp., GMTN | | | 8.450 | | | | 06/15/2018 | | | | 216,810 | |
| | 100,000 | | | Navient Corp., MTN | | | 4.625 | | | | 09/25/2017 | | | | 101,563 | |
| | 325,000 | | | Navient Corp., MTN | | | 5.500 | | | | 01/15/2019 | | | | 332,313 | |
| | 750,000 | | | Navios Maritime Holdings, Inc./Navios Maritime Finance II US, Inc. | | | 8.125 | | | | 02/15/2019 | | | | 438,750 | |
| | 100,000 | | | New Enterprise Stone & Lime Co., Inc. | | | 11.000 | | | | 09/01/2018 | | | | 99,500 | |
| | 200,000 | | | NGPL PipeCo LLC(a) | | | 7.119 | | | | 12/15/2017 | | | | 210,000 | |
| | 100,000 | | | Niska Gas Storage Canada ULC/Niska Gas Storage Canada Finance Corp. | | | 6.500 | | | | 04/01/2019 | | | | 98,500 | |
| | 421,000 | | | Novelis, Inc. | | | 8.375 | | | | 12/15/2017 | | | | 423,368 | |
| | 100,000 | | | NRG Energy, Inc. | | | 7.625 | | | | 01/15/2018 | | | | 107,250 | |
| | 100,000 | | | Nustar Logistics LP | | | 8.150 | | | | 04/15/2018 | | | | 107,750 | |
| | 75,000 | | | Ocwen Financial Corp. | | | 6.625 | | | | 05/15/2019 | | | | 71,625 | |
| | 100,000 | | | Owens-Illinois, Inc. | | | 7.800 | | | | 05/15/2018 | | | | 108,250 | |
| | 275,000 | | | Pacific Drilling V Ltd.(a) | | | 7.250 | | | | 12/01/2017 | | | | 110,000 | |
| | 100,000 | | | Pactiv LLC | | | 8.125 | | | | 06/15/2017 | | | | 103,625 | |
| | 67,000 | | | PetroQuest Energy, Inc.(a) | | | 10.000 | | | | 02/15/2021 | | | | 45,560 | |
| | 280,000 | | | PHI, Inc. | | | 5.250 | | | | 03/15/2019 | | | | 272,300 | |
| | 100,000 | | | Production Resource Group, Inc. | | | 8.875 | | | | 05/01/2019 | | | | 60,500 | |
| | 100,000 | | | QVC, Inc. | | | 3.125 | | | | 04/01/2019 | | | | 102,259 | |
| | 200,000 | | | Rockies Express Pipeline LLC(a) | | | 6.850 | | | | 07/15/2018 | | | | 211,500 | |
| | 200,000 | | | Rowan Cos., Inc. | | | 5.000 | | | | 09/01/2017 | | | | 202,500 | |
| | 248,000 | | | Sabine Pass LNG LP | | | 7.500 | | | | 11/30/2016 | | | | 249,091 | |
| | 250,000 | | | Sears Holdings Corp. | | | 6.625 | | | | 10/15/2018 | | | | 235,625 | |
| | 200,000 | | | Seitel, Inc. | | | 9.500 | | | | 04/15/2019 | | | | 178,750 | |
| | 11,000 | | | Service Corp. International | | | 7.625 | | | | 10/01/2018 | | | | 12,183 | |
| | 100,000 | | | SESI LLC | | | 6.375 | | | | 05/01/2019 | | | | 99,250 | |
| | 100,000 | | | Smithfield Foods, Inc. | | | 7.750 | | | | 07/01/2017 | | | | 103,875 | |
| | 7,000 | | | Smithfield Foods, Inc.(a) | | | 5.250 | | | | 08/01/2018 | | | | 7,061 | |
| | 20,000 | | | Southwestern Energy Co. | | | 7.500 | | | | 02/01/2018 | | | | 21,050 | |
| | 100,000 | | | Springleaf Finance Corp., MTN | | | 6.500 | | | | 09/15/2017 | | | | 103,625 | |
| | 100,000 | | | Springleaf Finance Corp., MTN | | | 6.900 | | | | 12/15/2017 | | | | 105,000 | |
See accompanying Notes to Financial Statements which are an integral part of the financial statements.
PowerShares Global Short Term High Yield Bond Portfolio (PGHY) (continued)
October 31, 2016
| | | | | | | | | | | | | | | | |
Principal
Amount | | | | | Interest
Rate | | | Maturity
Date | | | Value | |
| | | | Corporate Bonds (continued) | | | | | | | | | | | | |
| | | | United States (continued) | | | | | | | | | | | | |
| $ | 150,000 | | | Sprint Capital Corp. | | | 6.900 | % | | | 05/01/2019 | | | $ | 158,250 | |
| | 371,000 | | | Sprint Communications, Inc. | | | 6.000 | | | | 12/01/2016 | | | | 371,928 | |
| | 100,000 | | | Sprint Communications, Inc. | | | 9.125 | | | | 03/01/2017 | | | | 102,250 | |
| | 100,000 | | | Sprint Communications, Inc. | | | 8.375 | | | | 08/15/2017 | | | | 104,250 | |
| | 200,000 | | | Sprint Communications, Inc.(a) | | | 9.000 | | | | 11/15/2018 | | | | 220,500 | |
| | 100,000 | | | SquareTwo Financial Corp.(b) | | | 11.625 | | | | 04/01/2017 | | | | 11,000 | |
| | 100,000 | | | Swift Energy Co. | | | 7.125 | | | | 06/01/2017 | | | | 0 | |
| | 200,000 | | | Syniverse Holdings, Inc. | | | 9.125 | | | | 01/15/2019 | | | | 161,000 | |
| | 100,000 | | | Synovus Financial Corp. | | | 5.125 | | | | 06/15/2017 | | | | 101,750 | |
| | 100,000 | | | Talen Energy Supply LLC | | | 6.500 | | | | 05/01/2018 | | | | 104,250 | |
| | 100,000 | | | Targa Resources Partners LP/Targa Resources Partners Finance Corp. | | | 5.000 | | | | 01/15/2018 | | | | 103,000 | |
| | 218,000 | | | Tenet Healthcare Corp. | | | 6.250 | | | | 11/01/2018 | | | | 231,625 | |
| | 100,000 | | | Tenet Healthcare Corp. | | | 5.500 | | | | 03/01/2019 | | | | 98,250 | |
| | 252,000 | | | Tenet Healthcare Corp. | | | 5.000 | | | | 03/01/2019 | | | | 245,622 | |
| | 120,000 | | | Tesoro Corp. | | | 4.250 | | | | 10/01/2017 | | | | 122,850 | |
| | 175,000 | | | Thompson Creek Metals Co., Inc. | | | 9.750 | | | | 12/01/2017 | | | | 176,033 | |
| | 100,000 | | | T-Mobile USA, Inc. | | | 5.250 | | | | 09/01/2018 | | | | 101,609 | |
| | 100,000 | | | T-Mobile USA, Inc. | | | 6.464 | | | | 04/28/2019 | | | | 101,750 | |
| | 200,000 | | | TMX Finance LLC/TitleMax Finance Corp.(a) | | | 8.500 | | | | 09/15/2018 | | | | 151,000 | |
| | 200,000 | | | Toll Brothers Finance Corp. | | | 8.910 | | | | 10/15/2017 | | | | 213,750 | |
| | 100,000 | | | Toll Brothers Finance Corp. | | | 4.000 | | | | 12/31/2018 | | | | 103,500 | |
| | 100,000 | | | Toys “R” Us Property Co. II LLC | | | 8.500 | | | | 12/01/2017 | | | | 100,250 | |
| | 50,000 | | | Toys “R” Us, Inc. | | | 7.375 | | | | 10/15/2018 | | | | 48,125 | |
| | 396,000 | | | Transocean, Inc. | | | 6.800 | | | | 12/15/2016 | | | | 396,990 | |
| | 100,000 | | | Transocean, Inc. | | | 4.250 | | | | 10/15/2017 | | | | 100,000 | |
| | 350,000 | | | Transocean, Inc. | | | 6.000 | | | | 03/15/2018 | | | | 352,800 | |
| | 48,000 | | | TRU Taj LLC/TRU Taj Finance, Inc.(a) | | | 12.000 | | | | 08/15/2021 | | | | 49,200 | |
| | 100,000 | | | Tutor Perini Corp. | | | 7.625 | | | | 11/01/2018 | | | | 100,013 | |
| | 100,000 | | | U.S. Steel Corp. | | | 7.000 | | | | 02/01/2018 | | | | 104,000 | |
| | 100,000 | | | UCI International LLC(b)(c) | | | 8.625 | | | | 02/15/2019 | | | | 21,500 | |
| | 100,000 | | | United Continental Holdings, Inc. | | | 6.375 | | | | 06/01/2018 | | | | 105,375 | |
| | 100,000 | | | USG Corp. | | | 6.300 | | | | 11/15/2016 | | | | 99,899 | |
| | 140,000 | | | USG Corp. | | | 9.500 | | | | 01/15/2018 | | | | 151,550 | |
| | 150,000 | | | Valeant Pharmaceuticals International, Inc.(a) | | | 6.750 | | | | 08/15/2018 | | | | 147,150 | |
| | 200,000 | | | VEREIT Operating Partnership LP—REIT | | | 3.000 | | | | 02/06/2019 | | | | 202,802 | |
| | 225,000 | | | Weatherford International Ltd. | | | 9.625 | | | | 03/01/2019 | | | | 240,750 | |
| | 200,000 | | | Whiting Petroleum Corp. | | | 6.500 | | | | 10/01/2018 | | | | 198,000 | |
| | 100,000 | | | Whiting Petroleum Corp. | | | 5.000 | | | | 03/15/2019 | | | | 95,500 | |
| | 100,000 | | | XPO CNW, Inc. | | | 7.250 | | | | 01/15/2018 | | | | 104,000 | |
| | 100,000 | | | Yum! Brands, Inc. | | | 6.250 | | | | 03/15/2018 | | | | 106,500 | |
| | | | | | | | | | | | | | | | |
| | | | | | | | | | | | | | | 29,249,614 | |
| | | | | | | | | | | | | | | | |
| | | | Venezuela—1.1% | | | | | | | | | | | | |
| | 550,000 | | | CA La Electricidad de Caracas | | | 8.500 | | | | 04/10/2018 | | | | 321,750 | |
| | 575,000 | | | Petroleos de Venezuela SA | | | 5.250 | | | | 04/12/2017 | | | | 464,313 | |
| | | | | | | | | | | | | | | | |
| | | | | | | | | | | | | | | 786,063 | |
| | | | | | | | | | | | | | | | |
| | | | Vietnam—0.3% | | | | | | | | | | | | |
| | 200,000 | | | Vietnam Joint Stock Commercial Bank for Industry and Trade(a) | | | 8.000 | | | | 05/17/2017 | | | | 205,500 | |
| | | | | | | | | | | | | | | | |
| | | | Total Corporate Bonds
(Cost $58,436,736) | | | | | | | | | | | 58,996,232 | |
| | | | | | | | | | | | | | | | |
| | | | |
| | | | | | | | | | | | | | | | |
| | | | Sovereign Debt Obligations—9.1% | | | | | | | | | | | | |
| | | | Argentina—0.8% | | | | | | | | | | | | |
| | 200,000 | | | Argentine Republic Government International Bond(a) | | | 6.250 | | | | 04/22/2019 | | | | 212,500 | |
| | 100,000 | | | City of Buenos Aires Argentina(a) | | | 9.950 | | | | 03/01/2017 | | | | 102,750 | |
| | 200,000 | | | Provincia de Cordoba(a) | | | 12.375 | | | | 08/17/2017 | | | | 214,750 | |
| | | | | | | | | | | | | | | | |
| | | | | | | | | | | | | | | 530,000 | |
| | | | | | | | | | | | | | | | |
See accompanying Notes to Financial Statements which are an integral part of the financial statements.
PowerShares Global Short Term High Yield Bond Portfolio (PGHY) (continued)
October 31, 2016
| | | | | | | | | | | | | | | | |
Principal
Amount | | | | | Interest
Rate | | | Maturity
Date | | | Value | |
| | | | Sovereign Debt Obligations (continued) | | | | | | | | | | | | |
| | | | Bahrain—0.2% | | | | | | | | | | | | |
| $ | 100,000 | | | CBB International Sukuk Co. SPC | | | 6.273 | % | | | 11/22/2018 | | | $ | 106,500 | |
| | | | | | | | | | | | | | | | |
| | | | Belarus—0.2% | | | | | | | | | | | | |
| | 100,000 | | | Republic of Belarus International Bond | | | 8.950 | | | | 01/26/2018 | | | | 105,708 | |
| | | | | | | | | | | | | | | | |
| | | | Brazil—1.4% | | | | | | | | | | | | |
| | 100,000 | | | Banco Nacional de Desenvolvimento Economico e Social(a) | | | 6.369 | | | | 06/16/2018 | | | | 106,050 | |
| | 200,000 | | | Banco Nacional de Desenvolvimento Economico e Social(a) | | | 4.000 | | | | 04/14/2019 | | | | 202,496 | |
| | 300,000 | | | Brazil Government International Bond | | | 6.000 | | | | 01/17/2017 | | | | 303,435 | |
| | 310,000 | | | Brazil Government International Bond | | | 5.875 | | | | 01/15/2019 | | | | 335,885 | |
| | | | | | | | | | | | | | | | |
| | | | | | | | | | | | | | | 947,866 | |
| | | | | | | | | | | | | | | | |
| | | | Croatia—0.3% | | | | | | | | | | | | |
| | 200,000 | | | Croatia Government International Bond(a) | | | 6.250 | | | | 04/27/2017 | | | | 204,278 | |
| | | | | | | | | | | | | | | | |
| | | | Hungary—0.7% | | | | | | | | | | | | |
| | 100,000 | | | Hungary Government International Bond | | | 4.125 | | | | 02/19/2018 | | | | 103,029 | |
| | 200,000 | | | Hungary Government International Bond | | | 4.000 | | | | 03/25/2019 | | | | 209,450 | |
| | 150,000 | | | Magyar Export-Import Bank Zrt(a) | | | 5.500 | | | | 02/12/2018 | | | | 157,050 | |
| | | | | | | | | | | | | | | | |
| | | | | | | | | | | | | | | 469,529 | |
| | | | | | | | | | | | | | | | |
| | | | Jamaica—0.1% | | | | | | | | | | | | |
| | 100,000 | | | Jamaica Government International Bond | | | 10.625 | | | | 06/20/2017 | | | | 105,486 | |
| | | | | | | | | | | | | | | | |
| | | | Lebanon—1.5% | | | | | | | | | | | | |
| | 270,000 | | | Lebanon Government International Bond | | | 5.150 | | | | 06/12/2018 | | | | 269,041 | |
| | 300,000 | | | Lebanon Government International Bond, EMTN | | | 4.750 | | | | 11/02/2016 | | | | 300,000 | |
| | 100,000 | | | Lebanon Government International Bond, EMTN | | | 9.000 | | | | 03/20/2017 | | | | 101,750 | |
| | 200,000 | | | Lebanon Government International Bond, EMTN | | | 5.150 | | | | 11/12/2018 | | | | 198,096 | |
| | 100,000 | | | Lebanon Government International Bond, GMTN | | | 5.000 | | | | 10/12/2017 | | | | 99,170 | |
| | 100,000 | | | Lebanon Government International Bond, GMTN | | | 5.500 | | | | 04/23/2019 | | | | 99,770 | |
| | | | | | | | | | | | | | | | |
| | | | | | | | | | | | | | | 1,067,827 | |
| | | | | | | | | | | | | | | | |
| | | | Mongolia—0.4% | | | | | | | | | | | | |
| | 200,000 | | | Development Bank of Mongolia LLC, EMTN | | | 5.750 | | | | 03/21/2017 | | | | 196,000 | |
| | 100,000 | | | Mongolia Government International Bond, EMTN(a) | | | 4.125 | | | | 01/05/2018 | | | | 96,500 | |
| | | | | | | | | | | | | | | | |
| | | | | | | | | | | | | | | 292,500 | |
| | | | | | | | | | | | | | | | |
| | | | Nigeria—0.3% | | | | | | | | | | | | |
| | 200,000 | | | Nigeria Government International Bond(a) | | | 5.125 | | | | 07/12/2018 | | | | 201,690 | |
| | | | | | | | | | | | | | | | |
| | | | Pakistan—0.3% | | | | | | | | | | | | |
| | 200,000 | | | Pakistan Government International Bond(a) | | | 6.875 | | | | 06/01/2017 | | | | 204,040 | |
| | | | | | | | | | | | | | | | |
| | | | Russia—0.8% | | | | | | | | | | | | |
| | 200,000 | | | Russian Foreign Bond—Eurobond(a) | | | 3.250 | | | | 04/04/2017 | | | | 201,253 | |
| | 100,000 | | | Russian Foreign Bond—Eurobond(a) | | | 11.000 | | | | 07/24/2018 | | | | 115,177 | |
| | 200,000 | | | Russian Foreign Bond—Eurobond(a) | | | 3.500 | | | | 01/16/2019 | | | | 204,161 | |
| | | | | | | | | | | | | | | | |
| | | | | | | | | | | | | | | 520,591 | |
| | | | | | | | | | | | | | | | |
| | | | Serbia—0.2% | | | | | | | | | | | | |
| | 150,000 | | | Serbia International Bond(a) | | | 5.250 | | | | 11/21/2017 | | | | 154,525 | |
| | | | | | | | | | | | | | | | |
| | | | Sri Lanka—0.3% | | | | | | | | | | | | |
| | 200,000 | | | Sri Lanka Government International Bond(a) | | | 6.000 | | | | 01/14/2019 | | | | 206,878 | |
| | | | | | | | | | | | | | | | |
| | | | Turkey—0.7% | | | | | | | | | | | | |
| | 300,000 | | | Export Credit Bank of Turkey(a) | | | 5.375 | | | | 11/04/2016 | | | | 300,196 | |
| | 200,000 | | | Export Credit Bank of Turkey(a) | | | 5.875 | | | | 04/24/2019 | | | | 208,358 | |
| | | | | | | | | | | | | | | | |
| | | | | | | | | | | | | | | 508,554 | |
| | | | | | | | | | | | | | | | |
See accompanying Notes to Financial Statements which are an integral part of the financial statements.
PowerShares Global Short Term High Yield Bond Portfolio (PGHY) (continued)
October 31, 2016
| | | | | | | | | | | | | | | | |
Principal
Amount | | | | | Interest
Rate | | | Maturity
Date | | | Value | |
| | | | Sovereign Debt Obligations (continued) | | | | | | | | | | | | |
| | | | Venezuela—0.9% | | | | | | | | | | | | |
| $ | 250,000 | | | Venezuela Government International Bond(a) | | | 13.625 | % | | | 08/15/2018 | | | $ | 172,500 | |
| | 200,000 | | | Venezuela Government International Bond | | | 13.625 | | | | 08/15/2018 | | | | 148,000 | |
| | 500,000 | | | Venezuela Government International Bond | | | 7.000 | | | | 12/01/2018 | | | | 295,000 | |
| | | | | | | | | | | | | | | | |
| | | | | | | | | | | | | | | 615,500 | |
| | | | | | | | | | | | | | | | |
| | | | Total Sovereign Debt Obligations
(Cost $6,189,639) | | | | | | | | | | | 6,241,472 | |
| | | | | | | | | | | | | | | | |
| | | | |
| | | | | | | | | | | | | | | | |
Number
of Shares | | | | | | | | | | | | |
| | | | Money Market Fund—2.8% | | | | | | | | | | | | |
| | 1,951,557 | | | Invesco Premier U.S. Government Money Portfolio—Institutional Class, 0.25%(d)
(Cost $1,951,557) | | | | | | | | | | | 1,951,557 | |
| | | | | | | | | | | | | | | | |
| | | | Total Investments
(Cost $66,577,932)—97.6% | | | | | | | | | | | 67,189,261 | |
| | | | Other assets less liabilities—2.4% | | | | | | | | | | | 1,673,235 | |
| | | | | | | | | | | | | | | | |
| | | | Net Assets—100.0% | | | | | | | | | | $ | 68,862,496 | |
| | | | | | | | | | | | | | | | |
Investment Abbreviations:
EMTN—Euro Medium-Term Note
GMTN—Global Medium-Term Note
MTN—Medium-Term Note
PIK—Payment in Kind
REIT—Real Estate Investment Trust
Notes to Schedule of Investments:
| (a) | Security purchased or received in a transaction exempt from registration under the Securities Act of 1933, as amended (the “1933 Act”). The security may be resold pursuant to an exemption from registration under the 1933 Act, typically to qualified institutional buyers. The aggregate value of these securities at October 31, 2016 was $27,449,537, which represented 39.86% of the Fund’s Net Assets. |
| (b) | Defaulted security. Currently, the issuer is partially or fully in default with respect to interest payments. The aggregate value of these securities at October 31, 2016 was $566,750, which represented less than 1% of the Fund’s Net Assets. |
| (c) | The borrower has filed for protection in federal bankruptcy court. |
| (d) | The security and the Fund are advised by wholly-owned subsidiaries of Invesco Ltd. and are therefore considered to be affiliated. The rate shown is the 7-day SEC standardized yield as of October 31, 2016. |
See accompanying Notes to Financial Statements which are an integral part of the financial statements.
Schedule of Investments
PowerShares International Corporate Bond Portfolio (PICB)
October 31, 2016
| | | | | | | | | | | | | | | | | | | | |
Foreign
Currency(a) | | | Principal
Amount | | | | | Interest
Rate | | | Maturity
Date | | | Value | |
| | | | | | | | Corporate Bonds—98.1% | | | | | | | | | | | | |
| | | | | | | | Australia— 2.8% | | | | | | | | | | | | |
| | EUR | | | | 200,000 | | | Australia & New Zealand Banking Group Ltd. | | | 0.750 | % | | | 09/29/2026 | | | $ | 215,237 | |
| | GBP | | | | 350,000 | | | BHP Billiton Finance Ltd., Series 11, EMTN | | | 3.250 | | | | 09/25/2024 | | | | 462,345 | |
| | GBP | | | | 350,000 | | | BHP Billiton Finance Ltd., Series 12, EMTN | | | 4.300 | | | | 09/25/2042 | | | | 513,104 | |
| | EUR | | | | 300,000 | | | BHP Billiton Finance Ltd., Series 9, EMTN | | | 2.250 | | | | 09/25/2020 | | | | 355,359 | |
| | AUD | | | | 350,000 | | | BHP Billiton Finance Ltd., MTN | | | 3.750 | | | | 10/18/2017 | | | | 269,247 | |
| | EUR | | | | 200,000 | | | Commonwealth Bank of Australia, EMTN | | | 5.500 | | | | 08/06/2019 | | | | 251,289 | |
| | EUR | | | | 500,000 | | | National Australia Bank Ltd., EMTN | | | 2.750 | | | | 08/08/2022 | | | | 621,939 | |
| | EUR | | | | 200,000 | | | National Australia Bank Ltd., GMTN | | | 4.625 | | | | 02/10/2020 | | | | 250,128 | |
| | EUR | | | | 100,000 | | | National Australia Bank Ltd., GMTN | | | 2.000 | | | | 11/12/2020 | | | | 117,775 | |
| | EUR | | | | 150,000 | | | Telstra Corp. Ltd., EMTN | | | 3.500 | | | | 09/21/2022 | | | | 194,588 | |
| | EUR | | | | 300,000 | | | Telstra Corp. Ltd., EMTN | | | 2.500 | | | | 09/15/2023 | | | | 373,813 | |
| | AUD | | | | 800,000 | | | Westpac Banking Corp., MTN | | | 4.500 | | | | 02/25/2019 | | | | 635,911 | |
| | EUR | | | | 200,000 | | | Westpac Banking Corp., MTN | | | 0.250 | | | | 01/17/2022 | | | | 217,875 | |
| | | | | | | | | | | | | | | | | | | | |
| | | | | | | | | | | | | | | | | | | 4,478,610 | |
| | | | | | | | | | | | | | | | | | | | |
| | | | | | | | Belgium—2.4% | | | | | | | | | | | | |
| | EUR | | | | 200,000 | | | Anheuser-Busch InBev SA, EMTN | | | 0.800 | | | | 04/20/2023 | | | | 223,948 | |
| | GBP | | | | 250,000 | | | Anheuser-Busch InBev SA, EMTN | | | 9.750 | | | | 07/30/2024 | | | | 475,271 | |
| | EUR | | | | 700,000 | | | Anheuser-Busch InBev SA, EMTN | | | 1.500 | | | | 03/17/2025 | | | | 810,835 | |
| | GBP | | | | 300,000 | | | Anheuser-Busch InBev SA, EMTN | | | 4.000 | | | | 09/24/2025 | | | | 423,097 | |
| | EUR | | | | 200,000 | | | Anheuser-Busch InBev SA, EMTN | | | 2.700 | | | | 03/31/2026 | | | | 254,256 | |
| | EUR | | | | 1,000,000 | | | Anheuser-Busch InBev SA, EMTN | | | 2.000 | | | | 03/17/2028 | | | | 1,194,223 | |
| | EUR | | | | 200,000 | | | Anheuser-Busch InBev SA, EMTN | | | 1.500 | | | | 04/18/2030 | | | | 222,822 | |
| | EUR | | | | 200,000 | | | Anheuser-Busch InBev SA, EMTN | | | 2.750 | | | | 03/17/2036 | | | | 253,945 | |
| | | | | | | | | | | | | | | | | | | | |
| | | | | | | | | | | | | | | | | | | 3,858,397 | |
| | | | | | | | | | | | | | | | | | | | |
| | | | | | | | Canada—13.5% | | | | | | | | | | | | |
| | CAD | | | | 700,000 | | | Bank of Montreal | | | 1.880 | | | | 03/31/2021 | | | | 530,172 | |
| | CAD | | | | 500,000 | | | Bank of Montreal, Series DPNT | | | 2.840 | | | | 06/04/2020 | | | | 391,882 | |
| | CAD | | | | 750,000 | | | Bank of Montreal, Series DPNT | | | 2.100 | | | | 10/06/2020 | | | | 573,878 | |
| | CAD | | | | 900,000 | | | Bank of Montreal, Series DPNT | | | 3.400 | | | | 04/23/2021 | | | | 725,009 | |
| | CAD | | | | 300,000 | | | Bank of Montreal, Series DPNT | | | 2.120 | | | | 03/16/2022 | | | | 228,842 | |
| | CAD | | | | 900,000 | | | Bank of Nova Scotia (The), Series DPNT | | | 2.462 | | | | 03/14/2019 | | | | 690,198 | |
| | CAD | | | | 300,000 | | | Bank of Nova Scotia (The), Series DPNT | | | 2.400 | | | | 10/28/2019 | | | | 230,899 | |
| | CAD | | | | 300,000 | | | Bank of Nova Scotia (The), Series DPNT | | | 2.270 | | | | 01/13/2020 | | | | 229,874 | |
| | CAD | | | | 850,000 | | | Bank of Nova Scotia (The), Series DPNT | | | 2.130 | | | | 06/15/2020 | | | | 649,964 | |
| | CAD | | | | 750,000 | | | Bank of Nova Scotia (The), Series DPNT | | | 2.090 | | | | 09/09/2020 | | | | 572,770 | |
| | CAD | | | | 500,000 | | | Bank of Nova Scotia (The), Series DPNT | | | 3.270 | | | | 01/11/2021 | | | | 399,787 | |
| | CAD | | | | 600,000 | | | Bank of Nova Scotia (The), Series DPNT | | | 2.873 | | | | 06/04/2021 | | | | 473,513 | |
| | CAD | | | | 550,000 | | | Bell Canada, Inc. | | | 3.350 | | | | 06/18/2019 | | | | 429,146 | |
| | CAD | | | | 300,000 | | | Bell Canada, Inc., MTN | | | 4.400 | | | | 03/16/2018 | | | | 232,826 | |
| | CAD | | | | 450,000 | | | Bell Canada, Inc., MTN | | | 3.250 | | | | 06/17/2020 | | | | 352,956 | |
| | CAD | | | | 300,000 | | | Bell Canada, Inc., Series M-26 | | | 3.350 | | | | 03/22/2023 | | | | 237,605 | |
| | CAD | | | | 800,000 | | | Caisse Centrale Desjardins, MTN | | | 1.748 | | | | 03/02/2020 | | | | 601,882 | |
| | CAD | | | | 500,000 | | | Canadian Imperial Bank of Commerce/Canada, Series DPNT | | | 2.350 | | | | 06/24/2019 | | | | 383,220 | |
| | CAD | | | | 400,000 | | | Canadian Imperial Bank of Commerce/Canada, Series DPNT | | | 1.850 | | | | 07/14/2020 | | | | 303,460 | |
| | CAD | | | | 700,000 | | | Canadian Imperial Bank of Commerce/Canada, Series DPNT | | | 1.900 | | | | 04/26/2021 | | | | 530,861 | |
| | CAD | | | | 500,000 | | | Canadian Natural Resources Ltd., MTN | | | 2.890 | | | | 08/14/2020 | | | | 379,455 | |
| | CAD | | | | 400,000 | | | Canadian Natural Resources Ltd., MTN | | | 3.310 | | | | 02/11/2022 | | | | 306,913 | |
| | GBP | | | | 400,000 | | | Glencore Canada Financial Corp., EMTN | | | 7.375 | | | | 05/27/2020 | | | | 569,301 | |
| | CAD | | | | 600,000 | | | HSBC Bank Canada | | | 2.449 | | | | 01/29/2021 | | | | 460,239 | |
| | CAD | | | | 500,000 | | | HSBC Bank Canada, Series DPNT | | | 2.491 | | | | 05/13/2019 | | | | 381,041 | |
| | CAD | | | | 200,000 | | | HSBC Bank Canada, Series DPNT | | | 2.938 | | | | 01/14/2020 | | | | 155,190 | |
| | CAD | | | | 600,000 | | | HSBC Bank Canada, Series DPNT | | | 1.816 | | | | 07/07/2020 | | | | 450,037 | |
| | CAD | | | | 850,000 | | | HSBC Bank Canada, Series DPNT | | | 2.908 | | | | 09/29/2021 | | | | 665,261 | |
| | CAD | | | | 400,000 | | | National Bank of Canada, Series DPNT | | | 2.404 | | | | 10/28/2019 | | | | 307,632 | |
| | CAD | | | | 400,000 | | | National Bank of Canada, Series DPNT | | | 1.742 | | | | 03/03/2020 | | | | 301,499 | |
| | CAD | | | | 600,000 | | | Rogers Communications, Inc. | | | 5.340 | | | | 03/22/2021 | | | | 512,264 | |
See accompanying Notes to Financial Statements which are an integral part of the financial statements.
PowerShares International Corporate Bond Portfolio (PICB) (continued)
October 31, 2016
| | | | | | | | | | | | | | | | | | | | |
Foreign
Currency(a) | | | Principal
Amount | | | | | Interest
Rate | | | Maturity
Date | | | Value | |
| | | | | | | | Corporate Bonds (continued) | | | | | | | | | | | | |
| | | | | | | | Canada (continued) | | | | | | | | | | | | |
| | CAD | | | | 500,000 | | | Royal Bank of Canada | | | 1.583 | % | | | 09/13/2021 | | | $ | 372,098 | |
| | CAD | | | | 700,000 | | | Royal Bank of Canada, Series DPNT | | | 2.980 | | | | 05/07/2019 | | | | 543,866 | |
| | CAD | | | | 800,000 | | | Royal Bank of Canada, Series DPNT | | | 2.350 | | | | 12/09/2019 | | | | 614,799 | |
| | CAD | | | | 700,000 | | | Royal Bank of Canada, Series DPNT | | | 1.920 | | | | 07/17/2020 | | | | 529,859 | |
| | CAD | | | | 900,000 | | | Royal Bank of Canada, Series DPNT | | | 2.860 | | | | 03/04/2021 | | | | 708,839 | |
| | CAD | | | | 1,000,000 | | | Royal Bank of Canada, Series DPNT | | | 1.968 | | | | 03/02/2022 | | | | 755,598 | |
| | CAD | | | | 500,000 | | | Shaw Communications, Inc. | | | 5.650 | | | | 10/01/2019 | | | | 409,931 | |
| | CAD | | | | 600,000 | | | Shaw Communications, Inc. | | | 6.750 | | | | 11/09/2039 | | | | 547,720 | |
| | CAD | | | | 350,000 | | | TELUS Corp., MTN | | | 2.350 | | | | 03/28/2022 | | | | 263,725 | |
| | CAD | | | | 500,000 | | | TELUS Corp., Series CG | | | 5.050 | | | | 12/04/2019 | | | | 410,479 | |
| | CAD | | | | 500,000 | | | TELUS Corp., Series CH | | | 5.050 | | | | 07/23/2020 | | | | 416,031 | |
| | CAD | | | | 400,000 | | | Toronto-Dominion Bank (The), Series DPNT | | | 1.693 | | | | 04/02/2020 | | | | 301,478 | |
| | CAD | | | | 300,000 | | | Toronto-Dominion Bank (The), Series DPNT | | | 2.563 | | | | 06/24/2020 | | | | 232,647 | |
| | CAD | | | | 1,250,000 | | | Toronto-Dominion Bank (The), Series DPNT | | | 2.621 | | | | 12/22/2021 | | | | 977,831 | |
| | CAD | | | | 1,000,000 | | | Toronto-Dominion Bank (The), Series DPNT | | | 1.909 | | | | 07/18/2023 | | | | 745,906 | |
| | CAD | | | | 700,000 | | | Toronto-Dominion Bank (The), Series DPNT | | | 3.226 | | | | 07/24/2024 | | | | 567,051 | |
| | | | | | | | | | | | | | | | | | | | |
| | | | | | | | | | | | | | | | | | | 21,655,434 | |
| | | | | | | | | | | | | | | | | | | | |
| | | | | | | | Denmark—1.5% | | | | | | | | | | | | |
| | EUR | | | | 200,000 | | | AP Moeller—Maersk A/S, EMTN | | | 1.750 | | | | 03/18/2021 | | | | 228,680 | |
| | EUR | | | | 300,000 | | | Danske Bank A/S, EMTN | | | 0.750 | | | | 06/02/2023 | | | | 333,851 | |
| | GBP | | | | 300,000 | | | DONG Energy A/S, EMTN | | | 4.875 | | | | 01/12/2032 | | | | 459,074 | |
| | GBP | | | | 300,000 | | | DONG Energy A/S, EMTN | | | 5.750 | | | | 04/09/2040 | | | | 529,324 | |
| | NOK | | | | 5,000,000 | | | Nykredit Bank A/S, EMTN | | | 5.000 | | | | 08/21/2018 | | | | 639,428 | |
| | GBP | | | | 150,000 | | | TDC A/S, EMTN | | | 5.625 | | | | 02/23/2023 | | | | 200,337 | |
| | | | | | | | | | | | | | | | | | | | |
| | | | | | | | | | | | | | | | | | | 2,390,694 | |
| | | | | | | | | | | | | | | | | | | | |
| | | | | | | | Finland—0.2% | | | | | | | | | | | | |
| | EUR | | | | 250,000 | | | Fortum OYJ, EMTN | | | 2.250 | | | | 09/06/2022 | | | | 300,275 | |
| | | | | | | | | | | | | | | | | | | | |
| | | | | | | | France—18.4% | | | | | | | | | | | | |
| | EUR | | | | 200,000 | | | Air Liquide Finance SA, EMTN | | | 1.250 | | | | 06/13/2028 | | | | 228,175 | |
| | EUR | | | | 300,000 | | | Autoroutes du Sud de la France SA, EMTN | | | 5.625 | | | | 07/04/2022 | | | | 428,033 | |
| | EUR | | | | 200,000 | | | Banque Federative du Credit Mutuel SA, EMTN | | | 4.000 | | | | 10/22/2020 | | | | 251,461 | |
| | EUR | | | | 300,000 | | | Banque Federative du Credit Mutuel SA, EMTN | | | 3.250 | | | | 08/23/2022 | | | | 382,661 | |
| | EUR | | | | 300,000 | | | Banque Federative du Credit Mutuel SA, EMTN | | | 3.000 | | | | 11/28/2023 | | | | 385,645 | |
| | EUR | | | | 500,000 | | | Banque Federative du Credit Mutuel SA, EMTN | | | 2.625 | | | | 03/18/2024 | | | | 628,840 | |
| | EUR | | | | 500,000 | | | Banque Federative du Credit Mutuel SA, EMTN | | | 3.000 | | | | 05/21/2024 | | | | 604,932 | |
| | EUR | | | | 300,000 | | | Banque Federative du Credit Mutuel SA, EMTN | | | 3.000 | | | | 09/11/2025 | | | | 362,498 | |
| | EUR | | | | 400,000 | | | BNP Paribas SA, EMTN | | | 3.750 | | | | 11/25/2020 | | | | 501,905 | |
| | EUR | | | | 550,000 | | | BNP Paribas SA, EMTN | | | 2.250 | | | | 01/13/2021 | | | | 654,076 | |
| | EUR | | | | 300,000 | | | BNP Paribas SA, EMTN | | | 2.875 | | | | 10/24/2022 | | | | 375,889 | |
| | EUR | | | | 200,000 | | | BNP Paribas SA, EMTN | | | 2.875 | | | | 09/26/2023 | | | | 254,169 | |
| | EUR | | | | 600,000 | | | BNP Paribas SA, EMTN | | | 2.375 | | | | 02/17/2025 | | | | 678,290 | |
| | EUR | | | | 300,000 | | | BNP Paribas SA, EMTN | | | 1.625 | | | | 02/23/2026 | | | | 351,822 | |
| | EUR | | | | 300,000 | | | BNP Paribas SA, EMTN | | | 1.500 | | | | 05/25/2028 | | | | 344,031 | |
| | EUR | | | | 400,000 | | | BPCE SA | | | 4.625 | | | | 07/18/2023 | | | | 522,949 | |
| | GBP | | | | 100,000 | | | BPCE SA | | | 5.250 | | | | 04/16/2029 | | | | 134,172 | |
| | EUR | | | | 300,000 | | | BPCE SA, EMTN | | | 4.500 | | | | 02/10/2022 | | | | 400,368 | |
| | EUR | | | | 400,000 | | | Capgemini SA | | | 2.500 | | | | 07/01/2023 | | | | 488,729 | |
| | EUR | | | | 200,000 | | | Cie Financiere et Industrielle des Autoroutes SA | | | 5.000 | | | | 05/24/2021 | | | | 267,873 | |
| | EUR | | | | 850,000 | | | Credit Agricole SA | | | 2.625 | | | | 03/17/2027 | | | | 973,398 | |
| | EUR | | | | 350,000 | | | Credit Agricole SA, EMTN | | | 5.971 | | | | 02/01/2018 | | | | 412,437 | |
| | EUR | | | | 600,000 | | | Credit Agricole SA/London, EMTN | | | 2.375 | | | | 11/27/2020 | | | | 716,697 | |
| | EUR | | | | 700,000 | | | Credit Agricole SA/London, EMTN | | | 0.750 | | | | 12/01/2022 | | | | 780,423 | |
| | EUR | | | | 200,000 | | | Credit Agricole SA/London, EMTN | | | 5.125 | | | | 04/18/2023 | | | | 283,784 | |
| | EUR | | | | 300,000 | | | Credit Agricole SA/London, EMTN | | | 3.125 | | | | 07/17/2023 | | | | 385,232 | |
| | EUR | | | | 500,000 | | | Credit Agricole SA/London, EMTN | | | 2.375 | | | | 05/20/2024 | | | | 618,492 | |
| | EUR | | | | 700,000 | | | Credit Agricole SA/London, EMTN | | | 1.250 | | | | 04/14/2026 | | | | 791,135 | |
See accompanying Notes to Financial Statements which are an integral part of the financial statements.
PowerShares International Corporate Bond Portfolio (PICB) (continued)
October 31, 2016
| | | | | | | | | | | | | | | | | | | | |
Foreign
Currency(a) | | | Principal
Amount | | | | | Interest
Rate | | | Maturity
Date | | | Value | |
| | | | | | | | Corporate Bonds (continued) | | | | | | | | | | | | |
| | | | | | | | France (continued) | | | | | | | | | | | | |
| | EUR | | | | 200,000 | | | Danone SA, EMTN | | | 2.250 | % | | | 11/15/2021 | | | $ | 240,429 | |
| | EUR | | | | 300,000 | | | Electricite de France SA, EMTN | | | 6.250 | | | | 01/25/2021 | | | | 413,652 | |
| | EUR | | | | 300,000 | | | Electricite de France SA, EMTN | | | 2.250 | | | | 04/27/2021 | | | | 358,059 | |
| | EUR | | | | 300,000 | | | Electricite de France SA, EMTN | | | 3.875 | | | | 01/18/2022 | | | | 388,292 | |
| | EUR | | | | 300,000 | | | Electricite de France SA, EMTN | | | 2.750 | | | | 03/10/2023 | | | | 373,054 | |
| | EUR | | | | 600,000 | | | Electricite de France SA, EMTN | | | 4.625 | | | | 09/11/2024 | | | | 853,633 | |
| | EUR | | | | 400,000 | | | Electricite de France SA, EMTN | | | 4.125 | | | | 03/25/2027 | | | | 565,999 | |
| | EUR | | | | 200,000 | | | Electricite de France SA, EMTN | | | 4.625 | | | | 04/26/2030 | | | | 298,220 | |
| | GBP | | | | 250,000 | | | Electricite de France SA, EMTN | | | 5.875 | | | | 07/18/2031 | | | | 407,831 | |
| | GBP | | | | 150,000 | | | Electricite de France SA, EMTN | | | 6.125 | | | | 06/02/2034 | | | | 250,564 | |
| | GBP | | | | 700,000 | | | Electricite de France SA, EMTN | | | 5.500 | | | | 03/27/2037 | | | | 1,115,352 | |
| | GBP | | | | 1,200,000 | | | Electricite de France SA, EMTN | | | 5.500 | | | | 10/17/2041 | | | | 1,940,428 | |
| | GBP | | | | 700,000 | | | Electricite de France SA, EMTN | | | 5.125 | | | | 09/22/2050 | | | | 1,102,445 | |
| | EUR | | | | 300,000 | | | Engie Alliance GIE, EMTN | | | 5.750 | | | | 06/24/2023 | | | | 444,457 | |
| | EUR | | | | 600,000 | | | Engie SA, EMTN | | | 2.375 | | | | 05/19/2026 | | | | 761,111 | |
| | GBP | | | | 450,000 | | | Engie SA, EMTN | | | 5.000 | | | | 10/01/2060 | | | | 893,939 | |
| | EUR | | | | 300,000 | | | Holding d’Infrastructures de Transport SAS | | | 4.875 | | | | 10/27/2021 | | | | 403,492 | |
| | EUR | | | | 200,000 | | | HSBC France SA, EMTN | | | 1.875 | | | | 01/16/2020 | | | | 231,536 | |
| | EUR | | | | 300,000 | | | Orange SA, EMTN | | | 3.000 | | | | 06/15/2022 | | | | 378,235 | |
| | GBP | | | | 900,000 | | | Orange SA, EMTN | | | 5.625 | | | | 01/23/2034 | | | | 1,479,853 | |
| | EUR | | | | 200,000 | | | RTE Reseau de Transport d’Electricite SA, EMTN | | | 1.625 | | | | 11/27/2025 | | | | 237,201 | |
| | EUR | | | | 200,000 | | | Sanofi, EMTN | | | 1.875 | | | | 09/04/2020 | | | | 233,612 | |
| | EUR | | | | 200,000 | | | Sanofi, EMTN | | | 0.500 | | | | 01/13/2027 | | | | 212,004 | |
| | EUR | | | | 300,000 | | | Societe Generale SA, EMTN | | | 4.250 | | | | 07/13/2022 | | | | 400,323 | |
| | EUR | | | | 300,000 | | | Societe Generale SA, EMTN | | | 0.750 | | | | 05/26/2023 | | | | 333,696 | |
| | EUR | | | | 300,000 | | | Societe Generale SA, EMTN | | | 2.625 | | | | 02/27/2025 | | | | 341,198 | |
| | EUR | | | | 200,000 | | | Total Capital Canada Ltd., EMTN | | | 2.125 | | | | 09/18/2029 | | | | 247,245 | |
| | EUR | | | | 300,000 | | | Total Capital International SA, EMTN | | | 2.500 | | | | 03/25/2026 | | | | 383,933 | |
| | EUR | | | | 400,000 | | | Total Capital International SA, EMTN | | | 0.750 | | | | 07/12/2028 | | | | 429,543 | |
| | GBP | | | | 250,000 | | | Veolia Environnement SA, EMTN | | | 6.125 | | | | 10/29/2037 | | | | 456,084 | |
| | EUR | | | | 200,000 | | | Vivendi SA | | | 0.750 | | | | 05/26/2021 | | | | 223,434 | |
| | | | | | | | | | | | | | | | | | | | |
| | | | | | | | | | | | | | | | | | | 29,606,970 | |
| | | | | | | | | | | | | | | | | | | | |
| | | | | | | | Germany—8.5% | | | | | | | | | | | | |
| | EUR | | | | 300,000 | | | Allianz Finance II BV, EMTN | | | 3.500 | | | | 02/14/2022 | | | | 385,334 | |
| | GBP | | | | 300,000 | | | Allianz Finance II BV, Series 62 | | | 4.500 | | | | 03/13/2043 | | | | 479,786 | |
| | EUR | | | | 300,000 | | | BASF SE, Series 10Y | | | 2.000 | | | | 12/05/2022 | | | | 363,733 | |
| | EUR | | | | 200,000 | | | BMW Finance NV, EMTN | | | 0.875 | | | | 11/17/2020 | | | | 226,106 | |
| | EUR | | | | 250,000 | | | BMW US Capital LLC, EMTN | | | 1.125 | | | | 09/18/2021 | | | | 286,082 | |
| | EUR | | | | 200,000 | | | BMW US Capital LLC, EMTN | | | 0.625 | | | | 04/20/2022 | | | | 223,172 | |
| | EUR | | | | 300,000 | | | Commerzbank AG, EMTN | | | 4.000 | | | | 09/16/2020 | | | | 373,747 | |
| | EUR | | | | 250,000 | | | Daimler AG, EMTN | | | 0.875 | | | | 01/12/2021 | | | | 282,579 | |
| | EUR | | | | 400,000 | | | Daimler AG, EMTN | | | 1.400 | | | | 01/12/2024 | | | | 468,543 | |
| | EUR | | | | 250,000 | | | Daimler AG, EMTN | | | 1.500 | | | | 03/09/2026 | | | | 293,636 | |
| | EUR | | | | 200,000 | | | Daimler AG, EMTN | | | 1.375 | | | | 05/11/2028 | | | | 228,460 | |
| | EUR | | | | 200,000 | | | Deutsche Bank AG, EMTN | | | 1.000 | | | | 03/18/2019 | | | | 217,482 | |
| | EUR | | | | 400,000 | | | Deutsche Bank AG, EMTN | | | 1.250 | | | | 09/08/2021 | | | | 433,303 | |
| | EUR | | | | 300,000 | | | Deutsche Bank AG, EMTN | | | 2.375 | | | | 01/11/2023 | | | | 341,558 | |
| | EUR | | | | 200,000 | | | Deutsche Bank AG, EMTN | | | 1.125 | | | | 03/17/2025 | | | | 206,558 | |
| | EUR | | | | 150,000 | | | Deutsche Telekom International Finance BV, EMTN | | | 2.125 | | | | 01/18/2021 | | | | 178,130 | |
| | EUR | | | | 300,000 | | | Deutsche Telekom International Finance BV, EMTN | | | 4.250 | | | | 07/13/2022 | | | | 403,617 | |
| | EUR | | | | 200,000 | | | Deutsche Telekom International Finance BV, EMTN | | | 0.625 | | | | 04/03/2023 | | | | 222,478 | |
| | EUR | | | | 300,000 | | | Deutsche Telekom International Finance BV, EMTN | | | 1.500 | | | | 04/03/2028 | | | | 342,703 | |
| | GBP | | | | 400,000 | | | E.ON International Finance BV, EMTN | | | 6.375 | | | | 06/07/2032 | | | | 690,838 | |
| | GBP | | | | 500,000 | | | E.ON International Finance BV, EMTN | | | 5.875 | | | | 10/30/2037 | | | | 862,016 | |
| | GBP | | | | 200,000 | | | E.ON International Finance BV, EMTN | | | 6.750 | | | | 01/27/2039 | | | | 377,937 | |
| | EUR | | | | 200,000 | | | innogy Finance BV, EMTN | | | 6.625 | | | | 01/31/2019 | | | | 251,606 | |
| | EUR | | | | 100,000 | | | innogy Finance BV, EMTN | | | 6.500 | | | | 08/10/2021 | | | | 141,952 | |
See accompanying Notes to Financial Statements which are an integral part of the financial statements.
PowerShares International Corporate Bond Portfolio (PICB) (continued)
October 31, 2016
| | | | | | | | | | | | | | | | | | | | |
Foreign
Currency(a) | | | Principal
Amount | | | | | Interest
Rate | | | Maturity
Date | | | Value | |
| | | | | | | | Corporate Bonds (continued) | | | | | | | | | | | | |
| | | | | | | | Germany (continued) | | | | | | | | | | | | |
| | GBP | | | | 200,000 | | | innogy Finance BV, EMTN | | | 5.500 | % | | | 07/06/2022 | | | $ | 289,726 | |
| | GBP | | | | 200,000 | | | innogy Finance BV, EMTN | | | 6.250 | | | | 06/03/2030 | | | | 321,302 | |
| | GBP | | | | 700,000 | | | innogy Finance BV, EMTN | | | 4.750 | | | | 01/31/2034 | | | | 986,394 | |
| | GBP | | | | 200,000 | | | innogy Finance BV, EMTN | | | 6.125 | | | | 07/06/2039 | | | | 334,306 | |
| | EUR | | | | 250,000 | | | Landesbank Baden-Wuerttemberg, EMTN | | | 0.375 | | | | 01/29/2019 | | | | 275,626 | |
| | EUR | | | | 200,000 | | | Landesbank Hessen-Thueringen Girozentrale, EMTN | | | 0.375 | | | | 03/10/2020 | | | | 221,007 | |
| | EUR | | | | 200,000 | | | Norddeutsche Landesbank Girozentrale, EMTN | | | 0.625 | | | | 09/24/2018 | | | | 221,112 | |
| | EUR | | | | 200,000 | | | Siemens Financieringsmaatschappij NV, EMTN | | | 2.875 | | | | 03/10/2028 | | | | 272,422 | |
| | GBP | | | | 300,000 | | | Siemens Financieringsmaatschappij NV, EMTN | | | 3.750 | | | | 09/10/2042 | | | | 452,521 | |
| | EUR | | | | 250,000 | | | Volkswagen International Finance NV, EMTN | | | 3.250 | | | | 01/21/2019 | | | | 293,142 | |
| | EUR | | | | 200,000 | | | Volkswagen International Finance NV, EMTN | | | 2.000 | | | | 03/26/2021 | | | | 234,459 | |
| | EUR | | | | 700,000 | | | Volkswagen Leasing GmbH, EMTN | | | 2.375 | | | | 09/06/2022 | | | | 832,181 | |
| | EUR | | | | 200,000 | | | Volkswagen Leasing GmbH, EMTN | | | 2.625 | | | | 01/15/2024 | | | | 241,213 | |
| | EUR | | | | 200,000 | | | Vonovia Finance BV, EMTN | | | 1.625 | | | | 12/15/2020 | | | | 231,108 | |
| | EUR | | | | 200,000 | | | Vonovia Finance BV, EMTN | | | 2.250 | | | | 12/15/2023 | | | | 241,905 | |
| | | | | | | | | | | | | | | | | | | | |
| | | | | | | | | | | | | | | | | | | 13,729,780 | |
| | | | | | | | | | | | | | | | | | | | |
| | | | | | | | Hong Kong—0.4% | | | | | | | | | | | | |
| | EUR | | | | 200,000 | | | CK Hutchison Finance 16 Ltd., Series A | | | 1.250 | | | | 04/06/2023 | | | | 224,358 | |
| | EUR | | | | 300,000 | | | Hutchison Whampoa Finance 14 Ltd. | | | 1.375 | | | | 10/31/2021 | | | | 341,789 | |
| | | | | | | | | | | | | | | | | | | | |
| | | | | | | | | | | | | | | | | | | 566,147 | |
| | | | | | | | | | | | | | | | | | | | |
| | | | | | | | Italy—6.7% | | | | | | | | | | | | |
| | EUR | | | | 250,000 | | | Assicurazioni Generali SpA, EMTN | | | 2.875 | | | | 01/14/2020 | | | | 297,184 | |
| | EUR | | | | 150,000 | | | Assicurazioni Generali SpA, EMTN | | | 5.125 | | | | 09/16/2024 | | | | 216,287 | |
| | EUR | | | | 300,000 | | | Assicurazioni Generali SpA, EMTN | | | 4.125 | | | | 05/04/2026 | | | | 355,717 | |
| | GBP | | | | 300,000 | | | Atlantia SpA, EMTN | | | 6.250 | | | | 06/09/2022 | | | | 449,373 | |
| | EUR | | | | 200,000 | | | Atlantia SpA, EMTN | | | 5.875 | | | | 06/09/2024 | | | | 304,806 | |
| | EUR | | | | 500,000 | | | Enel Finance International NV | | | 1.375 | | | | 06/01/2026 | | | | 562,176 | |
| | EUR | | | | 250,000 | | | Enel Finance International NV, EMTN | | | 5.000 | | | | 09/14/2022 | | | | 348,533 | |
| | GBP | | | | 400,000 | | | Enel Finance International NV, EMTN | | | 5.625 | | | | 08/14/2024 | | | | 599,355 | |
| | EUR | | | | 300,000 | | | Enel Finance International NV, EMTN | | | 1.966 | | | | 01/27/2025 | | | | 357,773 | |
| | GBP | | | | 150,000 | | | Enel Finance International NV, EMTN | | | 5.750 | | | | 09/14/2040 | | | | 244,304 | |
| | EUR | | | | 200,000 | | | Enel SpA | | | 4.875 | | | | 02/20/2018 | | | | 233,040 | |
| | GBP | | | | 600,000 | | | Enel SpA, EMTN | | | 5.750 | | | | 06/22/2037 | | | | 969,289 | |
| | EUR | | | | 200,000 | | | Eni SpA | | | 4.125 | | | | 09/16/2019 | | | | 244,376 | |
| | EUR | | | | 150,000 | | | Eni SpA, EMTN | | | 4.000 | | | | 06/29/2020 | | | | 187,148 | |
| | EUR | | | | 300,000 | | | Eni SpA, EMTN | | | 3.250 | | | | 07/10/2023 | | | | 385,454 | |
| | EUR | | | | 300,000 | | | Eni SpA, EMTN | | | 3.750 | | | | 09/12/2025 | | | | 409,115 | |
| | EUR | | | | 250,000 | | | Eni SpA, EMTN | | | 1.500 | | | | 02/02/2026 | | | | 286,184 | |
| | EUR | | | | 200,000 | | | Eni SpA, EMTN | | | 3.625 | | | | 01/29/2029 | | | | 275,614 | |
| | EUR | | | | 300,000 | | | Intesa Sanpaolo SpA, EMTN | | | 3.000 | | | | 01/28/2019 | | | | 347,835 | |
| | EUR | | | | 400,000 | | | Intesa Sanpaolo SpA, EMTN | | | 4.375 | | | | 10/15/2019 | | | | 487,125 | |
| | EUR | | | | 300,000 | | | Intesa Sanpaolo SpA, EMTN | | | 2.000 | | | | 06/18/2021 | | | | 346,188 | |
| | EUR | | | | 200,000 | | | Intesa Sanpaolo SpA, EMTN | | | 1.125 | | | | 03/04/2022 | | | | 220,750 | |
| | EUR | | | | 250,000 | | | Intesa Sanpaolo SpA, EMTN | | | 4.000 | | | | 10/30/2023 | | | | 322,856 | |
| | EUR | | | | 200,000 | | | Intesa Sanpaolo SpA, GMTN | | | 4.000 | | | | 11/08/2018 | | | | 235,669 | |
| | EUR | | | | 200,000 | | | Snam SpA, EMTN | | | 0.875 | | | | 10/25/2026 | | | | 216,414 | |
| | EUR | | | | 150,000 | | | Terna Rete Elettrica Nazionale SpA, EMTN | | | 4.750 | | | | 03/15/2021 | | | | 196,853 | |
| | EUR | | | | 200,000 | | | Terna Rete Elettrica Nazionale SpA, EMTN | | | 0.875 | | | | 02/02/2022 | | | | 225,279 | |
| | EUR | | | | 300,000 | | | UniCredit SpA, EMTN | | | 3.375 | | | | 01/11/2018 | | | | 341,471 | |
| | EUR | | | | 550,000 | | | UniCredit SpA, EMTN | | | 3.625 | | | | 01/24/2019 | | | | 643,300 | |
| | EUR | | | | 200,000 | | | UniCredit SpA, EMTN | | | 2.000 | | | | 03/04/2023 | | | | 224,652 | |
| | EUR | | | | 150,000 | | | Unione di Banche Italiane SCpA, EMTN | | | 2.875 | | | | 02/18/2019 | | | | 174,412 | |
| | | | | | | | | | | | | | | | | | | | |
| | | | | | | | | | | | | | | | | | | 10,708,532 | |
| | | | | | | | | | | | | | | | | | | | |
| | | | | | | | Japan—0.6% | | | | | | | | | | | | |
| | JPY | | | | 100,000,000 | | | Panasonic Corp., Series 12 | | | 0.387 | | | | 03/19/2020 | | | | 959,797 | |
| | | | | | | | | | | | | | | | | | | | |
See accompanying Notes to Financial Statements which are an integral part of the financial statements.
PowerShares International Corporate Bond Portfolio (PICB) (continued)
October 31, 2016
| | | | | | | | | | | | | | | | | | | | |
Foreign
Currency(a) | | | Principal
Amount | | | | | Interest
Rate | | | Maturity
Date | | | Value | |
| | | | | | | | Corporate Bonds (continued) | | | | | | | | | | | | |
| | | | | | | | Netherlands—6.4% | | | | | | | | | | | | |
| | EUR | | | | 300,000 | | | ABN AMRO Bank NV, EMTN | | | 6.375 | % | | | 04/27/2021 | | | $ | 406,825 | |
| | EUR | | | | 200,000 | | | ABN AMRO Bank NV, EMTN | | | 7.125 | | | | 07/06/2022 | | | | 284,774 | |
| | EUR | | | | 300,000 | | | ABN AMRO Bank NV, EMTN | | | 2.500 | | | | 11/29/2023 | | | | 374,953 | |
| | EUR | | | | 250,000 | | | ABN AMRO Bank NV, EMTN | | | 1.000 | | | | 04/16/2025 | | | | 281,078 | |
| | EUR | | | | 200,000 | | | ASML Holding NV | | | 1.375 | | | | 07/07/2026 | | | | 224,429 | |
| | EUR | | | | 600,000 | | | Cooperatieve Rabobank UA | | | 3.875 | | | | 07/25/2023 | | | | 764,419 | |
| | EUR | | | | 500,000 | | | Cooperatieve Rabobank UA, EMTN | | | 4.125 | | | | 01/12/2021 | | | | 639,237 | |
| | EUR | | | | 400,000 | | | Cooperatieve Rabobank UA, EMTN | | | 4.125 | | | | 09/14/2022 | | | | 510,082 | |
| | GBP | | | | 800,000 | | | Cooperatieve Rabobank UA, EMTN | | | 5.250 | | | | 09/14/2027 | | | | 1,112,226 | |
| | GBP | | | | 200,000 | | | Cooperatieve Rabobank UA, EMTN | | | 4.625 | | | | 05/23/2029 | | | | 262,954 | |
| | EUR | | | | 600,000 | | | Cooperatieve Rabobank UA, GMTN | | | 3.750 | | | | 11/09/2020 | | | | 745,737 | |
| | EUR | | | | 300,000 | | | Cooperatieve Rabobank UA, GMTN | | | 4.000 | | | | 01/11/2022 | | | | 391,689 | |
| | EUR | | | | 1,000,000 | | | Cooperatieve Rabobank UA, GMTN | | | 1.375 | | | | 02/03/2027 | | | | 1,144,233 | |
| | EUR | | | | 250,000 | | | Heineken NV, EMTN | | | 2.125 | | | | 08/04/2020 | | | | 294,414 | |
| | EUR | | | | 450,000 | | | ING Bank NV, EMTN | | | 4.500 | | | | 02/21/2022 | | | | 601,143 | |
| | GBP | | | | 300,000 | | | Koninklijke KPN NV, GMTN | | | 5.750 | | | | 09/17/2029 | | | | 466,212 | |
| | EUR | | | | 400,000 | | | Shell International Finance BV, EMTN | | | 1.000 | | | | 04/06/2022 | | | | 455,904 | |
| | EUR | | | | 200,000 | | | Shell International Finance BV, EMTN | | | 1.875 | | | | 09/15/2025 | | | | 242,168 | |
| | EUR | | | | 350,000 | | | Shell International Finance BV, EMTN | | | 1.625 | | | | 01/20/2027 | | | | 415,503 | |
| | EUR | | | | 550,000 | | | Shell International Finance BV, EMTN | | | 0.750 | | | | 08/15/2028 | | | | 583,780 | |
| | | | | | | | | | | | | | | | | | | | |
| | | | | | | | | | | | | | | | | | | 10,201,760 | |
| | | | | | | | | | | | | | | | | | | | |
| | | | | | | | Norway—1.5% | | | | | | | | | | | | |
| | EUR | | | | 250,000 | | | DNB Bank ASA, EMTN | | | 4.375 | | | | 02/24/2021 | | | | 322,580 | |
| | EUR | | | | 250,000 | | | DNB Bank ASA, EMTN | | | 4.250 | | | | 01/18/2022 | | | | 329,171 | |
| | EUR | | | | 250,000 | | | Statoil ASA, EMTN | | | 5.625 | | | | 03/11/2021 | | | | 339,968 | |
| | EUR | | | | 250,000 | | | Statoil ASA, EMTN | | | 1.250 | | | | 02/17/2027 | | | | 284,822 | |
| | GBP | | | | 400,000 | | | Statoil ASA, EMTN | | | 6.875 | | | | 03/11/2031 | | | | 735,291 | |
| | EUR | | | | 300,000 | | | Statoil ASA, EMTN | | | 1.625 | | | | 02/17/2035 | | | | 345,953 | |
| | SEK | | | | 1,000,000 | | | Telenor ASA, EMTN | | | 2.375 | | | | 03/19/2019 | | | | 116,905 | |
| | | | | | | | | | | | | | | | | | | | |
| | | | | | | | | | | | | | | | | | | 2,474,690 | |
| | | | | | | | | | | | | | | | | | | | |
| | | | | | | | Spain—4.9% | | | | | | | | | | | | |
| | EUR | | | | 200,000 | | | Abertis Infraestructuras SA | | | 1.375 | | | | 05/20/2026 | | | | 226,788 | |
| | EUR | | | | 300,000 | | | BBVA Senior Finance SAU, GMTN | | | 2.375 | | | | 01/22/2019 | | | | 345,607 | |
| | EUR | | | | 200,000 | | | CaixaBank SA, MTN | | | 3.125 | | | | 05/14/2018 | | | | 229,616 | |
| | EUR | | | | 150,000 | | | Iberdrola Finanzas SA, EMTN | | | 4.125 | | | | 03/23/2020 | | | | 186,793 | |
| | GBP | | | | 350,000 | | | Iberdrola Finanzas SA, EMTN | | | 7.375 | | | | 01/29/2024 | | | | 577,560 | |
| | EUR | | | | 200,000 | | | Iberdrola International BV, EMTN | | | 3.500 | | | | 02/01/2021 | | | | 249,465 | |
| | EUR | | | | 200,000 | | | Iberdrola International BV, EMTN | | | 1.125 | | | | 04/21/2026 | | | | 224,633 | |
| | EUR | | | | 200,000 | | | Mapfre SA | | | 1.625 | | | | 05/19/2026 | | | | 226,768 | |
| | EUR | | | | 100,000 | | | Repsol International Finance BV, EMTN | | | 4.875 | | | | 02/19/2019 | | | | 121,642 | |
| | EUR | | | | 300,000 | | | Repsol International Finance BV, EMTN | | | 2.625 | | | | 05/28/2020 | | | | 356,308 | |
| | EUR | | | | 200,000 | | | Repsol International Finance BV, EMTN | | | 3.625 | | | | 10/07/2021 | | | | 252,216 | |
| | EUR | | | | 300,000 | | | Santander Consumer Finance SA, EMTN | | | 0.900 | | | | 02/18/2020 | | | | 334,502 | |
| | EUR | | | | 500,000 | | | Santander Consumer Finance SA, EMTN | | | 1.500 | | | | 11/12/2020 | | | | 570,265 | |
| | EUR | | | | 200,000 | | | Santander International Debt SAU, EMTN | | | 4.000 | | | | 01/24/2020 | | | | 245,555 | |
| | EUR | | | | 300,000 | | | Santander International Debt SAU, EMTN | | | 1.375 | | | | 03/03/2021 | | | | 342,457 | |
| | EUR | | | | 200,000 | | | Santander International Debt SAU, EMTN | | | 1.375 | | | | 12/14/2022 | | | | 229,284 | |
| | EUR | | | | 200,000 | | | Santander Issuances SAU, EMTN | | | 2.500 | | | | 03/18/2025 | | | | 216,737 | |
| | EUR | | | | 200,000 | | | Santander Issuances SAU, Series DIP, EMTN | | | 3.250 | | | | 04/04/2026 | | | | 225,693 | |
| | EUR | | | | 350,000 | | | Telefonica Emisiones SAU, EMTN | | | 4.693 | | | | 11/11/2019 | | | | 435,450 | |
| | EUR | | | | 200,000 | | | Telefonica Emisiones SAU, EMTN | | | 4.710 | | | | 01/20/2020 | | | | 250,324 | |
| | EUR | | | | 400,000 | | | Telefonica Emisiones SAU, EMTN | | | 1.477 | | | | 09/14/2021 | | | | 458,685 | |
| | EUR | | | | 200,000 | | | Telefonica Emisiones SAU, EMTN | | | 0.750 | | | | 04/13/2022 | | | | 220,106 | |
| | EUR | | | | 100,000 | | | Telefonica Emisiones SAU, EMTN | | | 2.242 | | | | 05/27/2022 | | | | 119,044 | |
| | GBP | | | | 300,000 | | | Telefonica Emisiones SAU, EMTN | | | 5.289 | | | | 12/09/2022 | | | | 432,190 | |
| | GBP | | | | 300,000 | | | Telefonica Emisiones SAU, EMTN | | | 5.375 | | | | 02/02/2026 | | | | 445,902 | |
See accompanying Notes to Financial Statements which are an integral part of the financial statements.
PowerShares International Corporate Bond Portfolio (PICB) (continued)
October 31, 2016
| | | | | | | | | | | | | | | | | | | | |
Foreign
Currency(a) | | | Principal
Amount | | | | | Interest
Rate | | | Maturity
Date | | | Value | |
| | | | | | | | Corporate Bonds (continued) | | | | | | | | | | | | |
| | | | | | | | Spain (continued) | | | | | | | | | | | | |
| | EUR | | | | 200,000 | | | Telefonica Emisiones SAU, EMTN | | | 1.460 | % | | | 04/13/2026 | | | $ | 221,599 | |
| | EUR | | | | 100,000 | | | Telefonica Emisiones SAU, GMTN | | | 3.987 | | | | 01/23/2023 | | | | 131,059 | |
| | | | | | | | | | | | | | | | | | | | |
| | | | | | | | | | | | | | | | | | | 7,876,248 | |
| | | | | | | | | | | | | | | | | | | | |
| | | | | | | | Sweden—2.4% | | | | | | | | | | | | |
| | EUR | | | | 350,000 | | | Nordea Bank AB, EMTN | | | 4.500 | | | | 03/26/2020 | | | | 434,594 | |
| | EUR | | | | 300,000 | | | Nordea Bank AB, EMTN | | | 2.000 | | | | 02/17/2021 | | | | 354,403 | |
| | EUR | | | | 200,000 | | | Nordea Bank AB, EMTN | | | 3.250 | | | | 07/05/2022 | | | | 255,126 | |
| | EUR | | | | 200,000 | | | Nordea Bank AB, EMTN | | | 1.125 | | | | 02/12/2025 | | | | 228,643 | |
| | SEK | | | | 1,000,000 | | | SBAB Bank AB, EMTN | | | 3.000 | | | | 10/11/2018 | | | | 117,431 | |
| | EUR | | | | 200,000 | | | Skandinaviska Enskilda Banken AB, EMTN | | | 2.000 | | | | 02/19/2021 | | | | 235,992 | |
| | EUR | | | | 200,000 | | | Skandinaviska Enskilda Banken AB, GMTN | | | 0.750 | | | | 08/24/2021 | | | | 224,634 | |
| | EUR | | | | 400,000 | | | Svenska Handelsbanken AB, EMTN | | | 4.375 | | | | 10/20/2021 | | | | 528,751 | |
| | EUR | | | | 200,000 | | | Svenska Handelsbanken AB, EMTN | | | 2.625 | | | | 08/23/2022 | | | | 248,523 | |
| | SEK | | | | 2,000,000 | | | Telia Co. AB, EMTN | | | 3.625 | | | | 11/08/2023 | | | | 253,451 | |
| | EUR | | | | 150,000 | | | Vattenfall AB, EMTN | | | 6.250 | | | | 03/17/2021 | | | | 207,542 | |
| | GBP | | | | 400,000 | | | Vattenfall AB, EMTN | | | 6.875 | | | | 04/15/2039 | | | | 775,735 | |
| | | | | | | | | | | | | | | | | | | | |
| | | | | | | | | | | | | | | | | | | 3,864,825 | |
| | | | | | | | | | | | | | | | | | | | |
| | | | | | | | Switzerland—4.1% | | | | | | | | | | | | |
| | EUR | | | | 300,000 | | | Credit Suisse AG/London, EMTN | | | 4.750 | | | | 08/05/2019 | | | | 370,533 | |
| | EUR | | | | 550,000 | | | Credit Suisse AG/London, EMTN | | | 1.375 | | | | 11/29/2019 | | | | 625,258 | |
| | EUR | | | | 300,000 | | | Credit Suisse AG/London, EMTN | | | 1.125 | | | | 09/15/2020 | | | | 339,224 | |
| | EUR | | | | 550,000 | | | Credit Suisse AG/London, EMTN | | | 1.375 | | | | 01/31/2022 | | | | 629,856 | |
| | EUR | | | | 400,000 | | | Credit Suisse AG/London, EMTN | | | 1.000 | | | | 06/07/2023 | | | | 445,837 | |
| | EUR | | | | 250,000 | | | Credit Suisse AG/London, EMTN | | | 1.500 | | | | 04/10/2026 | | | | 283,399 | |
| | GBP | | | | 400,000 | | | Credit Suisse Group Funding Guernsey Ltd. | | | 3.000 | | | | 05/27/2022 | | | | 496,918 | |
| | EUR | | | | 200,000 | | | Credit Suisse Group Funding Guernsey Ltd., EMTN | | | 1.250 | | | | 04/14/2022 | | | | 219,304 | |
| | CHF | | | | 450,000 | | | Credit Suisse Group Funding Guernsey Ltd., EMTN | | | 1.000 | | | | 04/14/2023 | | | | 456,135 | |
| | GBP | | | | 250,000 | | | Glencore Finance Europe SA, EMTN | | | 6.500 | | | | 02/27/2019 | | | | 336,592 | |
| | EUR | | | | 200,000 | | | Holcim Finance Luxembourg SA, EMTN | | | 1.375 | | | | 05/26/2023 | | | | 228,620 | |
| | EUR | | | | 200,000 | | | Holcim Finance Luxembourg SA, EMTN | | | 2.250 | | | | 05/26/2028 | | | | 238,028 | |
| | EUR | | | | 250,000 | | | Novartis Finance SA | | | 0.125 | | | | 09/20/2023 | | | | 271,041 | |
| | EUR | | | | 200,000 | | | Roche Finance Europe BV, EMTN | | | 0.875 | | | | 02/25/2025 | | | | 227,051 | |
| | CHF | | | | 600,000 | | | Swisscom AG | | | 3.250 | | | | 09/14/2018 | | | | 647,682 | |
| | EUR | | | | 150,000 | | | UBS AG/London, EMTN | | | 1.125 | | | | 06/30/2020 | | | | 170,267 | |
| | EUR | | | | 100,000 | | | UBS AG/London, EMTN | | | 1.250 | | | | 09/03/2021 | | | | 114,925 | |
| | EUR | | | | 400,000 | | | UBS Group Funding Jersey Ltd. | | | 1.750 | | | | 11/16/2022 | | | | 462,545 | |
| | | | | | | | | | | | | | | | | | | | |
| | | | | | | | | | | | | | | | | | | 6,563,215 | |
| | | | | | | | | | | | | | | | | | | | |
| | | | | | | | United Kingdom—23.8% | | | | | | | | | | | | |
| | GBP | | | | 200,000 | | | ABP Finance PLC, EMTN | | | 6.250 | | | | 12/14/2026 | | | | 315,661 | |
| | EUR | | | | 900,000 | | | Barclays, EMTN | | | 6.000 | | | | 01/14/2021 | | | | 1,143,997 | |
| | EUR | | | | 313,000 | | | Barclays, EMTN | | | 1.875 | | | | 03/23/2021 | | | | 352,845 | |
| | GBP | | | | 700,000 | | | Barclays, EMTN | | | 3.250 | | | | 02/12/2027 | | | | 816,770 | |
| | GBP | | | | 600,000 | | | Barclays Bank PLC, EMTN | | | 10.000 | | | | 05/21/2021 | | | | 925,993 | |
| | GBP | | | | 250,000 | | | BAT International Finance PLC, EMTN | | | 7.250 | | | | 03/12/2024 | | | | 410,663 | |
| | GBP | | | | 300,000 | | | BAT International Finance PLC, EMTN | | | 4.000 | | | | 09/04/2026 | | | | 418,045 | |
| | GBP | | | | 250,000 | | | BAT International Finance PLC, EMTN | | | 6.000 | | | | 11/24/2034 | | | | 435,512 | |
| | GBP | | | | 300,000 | | | BAT International Finance PLC, EMTN | | | 2.250 | | | | 09/09/2052 | | | | 305,029 | |
| | GBP | | | | 300,000 | | | BG Energy Capital PLC, EMTN | | | 5.125 | | | | 12/01/2025 | | | | 457,332 | |
| | GBP | | | | 300,000 | | | BG Energy Capital PLC, EMTN | | | 5.000 | | | | 11/04/2036 | | | | 491,397 | |
| | EUR | | | | 100,000 | | | BP Capital Markets PLC, EMTN | | | 2.177 | | | | 09/28/2021 | | | | 119,624 | |
| | EUR | | | | 300,000 | | | BP Capital Markets PLC, EMTN | | | 1.373 | | | | 03/03/2022 | | | | 345,527 | |
| | EUR | | | | 200,000 | | | BP Capital Markets PLC, EMTN | | | 1.526 | | | | 09/26/2022 | | | | 232,564 | |
| | EUR | | | | 250,000 | | | BP Capital Markets PLC, EMTN | | | 2.972 | | | | 02/27/2026 | | | | 323,419 | |
| | EUR | | | | 300,000 | | | BP Capital Markets PLC, EMTN | | | 1.573 | | | | 02/16/2027 | | | | 344,315 | |
| | GBP | | | | 250,000 | | | British Telecommunications PLC | | | 5.750 | | | | 12/07/2028 | | | | 410,643 | |
| | EUR | | | | 500,000 | | | British Telecommunications PLC, EMTN | | | 0.625 | | | | 03/10/2021 | | | | 552,988 | |
See accompanying Notes to Financial Statements which are an integral part of the financial statements.
PowerShares International Corporate Bond Portfolio (PICB) (continued)
October 31, 2016
| | | | | | | | | | | | | | | | | | |
Foreign
Currency(a) | | Principal
Amount | | | | | Interest
Rate | | | Maturity
Date | | | Value | |
| | | | | | Corporate Bonds (continued) | | | | | | | | | | | | |
| | | | | | United Kingdom (continued) | | | | | | | | | | | | |
| EUR | | | 200,000 | | | British Telecommunications PLC, EMTN | | | 1.125 | % | | | 03/10/2023 | | | $ | 224,891 | |
| EUR | | | 150,000 | | | British Telecommunications PLC, EMTN | | | 1.750 | | | | 03/10/2026 | | | | 173,552 | |
| GBP | | | 150,000 | | | British Telecommunications PLC, EMTN | | | 6.375 | | | | 06/23/2037 | | | | 283,377 | |
| GBP | | | 250,000 | | | BUPA Finance PLC | | | 5.000 | | | | 04/25/2023 | | | | 325,374 | |
| GBP | | | 200,000 | | | Centrica PLC, EMTN | | | 4.375 | | | | 03/13/2029 | | | | 291,053 | |
| GBP | | | 300,000 | | | Centrica PLC, EMTN | | | 7.000 | | | | 09/19/2033 | | | | 570,958 | |
| GBP | | | 300,000 | | | Centrica PLC, EMTN | | | 4.250 | | | | 09/12/2044 | | | | 445,246 | |
| GBP | | | 250,000 | | | Friends Life Holdings PLC | | | 8.250 | | | | 04/21/2022 | | | | 380,561 | |
| EUR | | | 200,000 | | | GlaxoSmithKline Capital PLC, EMTN | | | 1.375 | | | | 12/02/2024 | | | | 232,850 | |
| GBP | | | 200,000 | | | GlaxoSmithKline Capital PLC, EMTN | | | 3.375 | | | | 12/20/2027 | | | | 275,191 | |
| GBP | | | 400,000 | | | GlaxoSmithKline Capital PLC, EMTN | | | 5.250 | | | | 12/19/2033 | | | | 685,899 | |
| GBP | | | 300,000 | | | GlaxoSmithKline Capital PLC, EMTN | | | 6.375 | | | | 03/09/2039 | | | | 596,267 | |
| GBP | | | 600,000 | | | GlaxoSmithKline Capital PLC, EMTN | | | 5.250 | | | | 04/10/2042 | | | | 1,085,256 | |
| GBP | | | 250,000 | | | GlaxoSmithKline Capital PLC, EMTN | | | 4.250 | | | | 12/18/2045 | | | | 402,979 | |
| GBP | | | 300,000 | | | Heathrow Funding Ltd., EMTN | | | 7.125 | | | | 02/14/2024 | | | | 476,210 | |
| GBP | | | 500,000 | | | Heathrow Funding Ltd., EMTN | | | 6.750 | | | | 12/03/2026 | | | | 846,227 | |
| GBP | | | 200,000 | | | Heathrow Funding Ltd., EMTN(b) | | | 6.450 | | | | 12/10/2031 | | | | 358,815 | |
| GBP | | | 600,000 | | | HSBC Bank PLC, EMTN | | | 5.375 | | | | 08/22/2033 | | | | 844,679 | |
| EUR | | | 700,000 | | | HSBC Holdings PLC | | | 0.875 | | | | 09/06/2024 | | | | 759,833 | |
| GBP | | | 1,000,000 | | | HSBC Holdings PLC | | | 2.625 | | | | 08/16/2028 | | | | 1,159,553 | |
| GBP | | | 300,000 | | | HSBC Holdings PLC | | | 6.750 | | | | 09/11/2028 | | | | 445,862 | |
| EUR | | | 250,000 | | | HSBC Holdings PLC, EMTN | | | 6.000 | | | | 06/10/2019 | | | | 315,315 | |
| EUR | | | 600,000 | | | HSBC Holdings PLC, EMTN | | | 3.000 | | | | 06/30/2025 | | | | 703,988 | |
| EUR | | | 300,000 | | | HSBC Holdings PLC, EMTN | | | 3.125 | | | | 06/07/2028 | | | | 352,558 | |
| GBP | | | 200,000 | | | HSBC Holdings PLC, EMTN | | | 7.000 | | | | 04/07/2038 | | | | 325,637 | |
| GBP | | | 200,000 | | | HSBC Holdings PLC, EMTN | | | 6.000 | | | | 03/29/2040 | | | | 291,300 | |
| GBP | | | 200,000 | | | Imperial Brands Finance PLC, EMTN | | | 8.125 | | | | 03/15/2024 | | | | 339,902 | |
| GBP | | | 250,000 | | | Imperial Brands Finance PLC, EMTN | | | 5.500 | | | | 09/28/2026 | | | | 382,787 | |
| GBP | | | 300,000 | | | Lloyds Bank PLC, EMTN | | | 7.500 | | | | 04/15/2024 | | | | 500,913 | |
| EUR | | | 600,000 | | | Lloyds Bank PLC, EMTN | | | 1.250 | | | | 01/13/2025 | | | | 688,694 | |
| GBP | | | 1,000,000 | | | Lloyds Bank PLC, EMTN | | | 7.625 | | | | 04/22/2025 | | | | 1,564,434 | |
| GBP | | | 100,000 | | | Lloyds Bank PLC, EMTN | | | 6.500 | | | | 09/17/2040 | | | | 190,648 | |
| GBP | | | 250,000 | | | Motability Operations Group PLC, EMTN | | | 3.625 | | | | 03/10/2036 | | | | 356,470 | |
| GBP | | | 600,000 | | | National Grid Gas Finance PLC, EMTN | | | 2.125 | | | | 09/22/2028 | | | | 718,800 | |
| GBP | | | 400,000 | | | National Grid Gas Finance PLC, EMTN | | | 2.750 | | | | 09/22/2046 | | | | 469,458 | |
| EUR | | | 400,000 | | | Nationwide Building Society, EMTN | | | 1.125 | | | | 06/03/2022 | | | | 450,594 | |
| EUR | | | 300,000 | | | Nationwide Building Society, EMTN | | | 1.250 | | | | 03/03/2025 | | | | 337,265 | |
| GBP | | | 300,000 | | | Nationwide Building Society, EMTN | | | 3.000 | | | | 05/06/2026 | | | | 381,834 | |
| GBP | | | 200,000 | | | Nationwide Building Society, EMTN | | | 3.250 | | | | 01/20/2028 | | | | 256,123 | |
| GBP | | | 250,000 | | | Rio Tinto Finance PLC, EMTN | | | 4.000 | | | | 12/11/2029 | | | | 351,823 | |
| EUR | | | 250,000 | | | Royal Bank of Scotland PLC (The), EMTN | | | 5.375 | | | | 09/30/2019 | | | | 312,679 | |
| EUR | | | 300,000 | | | Royal Bank of Scotland PLC (The), EMTN | | | 5.500 | | | | 03/23/2020 | | | | 383,349 | |
| GBP | | | 250,000 | | | Santander UK Group Holdings PLC, EMTN | | | 3.625 | | | | 01/14/2026 | | | | 310,898 | |
| EUR | | | 250,000 | | | Santander UK PLC, EMTN | | | 2.000 | | | | 01/14/2019 | | | | 285,287 | |
| GBP | | | 200,000 | | | Scottish Widows Ltd. | | | 5.500 | | | | 06/16/2023 | | | | 258,449 | |
| GBP | | | 400,000 | | | Scottish Widows Ltd. | | | 7.000 | | | | 06/16/2043 | | | | 544,341 | |
| GBP | | | 300,000 | | | Severn Trent Utilities Finance PLC, EMTN | | | 3.625 | | | | 01/16/2026 | | | | 411,516 | |
| EUR | | | 500,000 | | | Sky PLC, EMTN | | | 1.500 | | | | 09/15/2021 | | | | 570,678 | |
| GBP | | | 200,000 | | | Society of Lloyd’s | | | 4.750 | | | | 10/30/2024 | | | | 261,109 | |
| GBP | | | 200,000 | | | SSE PLC, EMTN | | | 8.375 | | | | 11/20/2028 | | | | 392,914 | |
| GBP | | | 200,000 | | | Standard Chartered Bank, EMTN | | | 7.750 | | | | 04/03/2018 | | | | 265,147 | |
| EUR | | | 200,000 | | | Standard Chartered PLC, EMTN | | | 1.625 | | | | 11/20/2018 | | | | 225,784 | |
| EUR | | | 200,000 | | | Standard Chartered PLC, EMTN | | | 1.625 | | | | 06/13/2021 | | | | 230,010 | |
| GBP | | | 500,000 | | | Standard Chartered PLC, EMTN | | | 5.125 | | | | 06/06/2034 | | | | 580,835 | |
| GBP | | | 300,000 | | | Standard Chartered PLC, EMTN | | | 4.375 | | | | 01/18/2038 | | | | 401,635 | |
| GBP | | | 200,000 | | | Thames Water Utilities Cayman Finance Ltd., EMTN | | | 4.000 | | | | 06/19/2025 | | | | 284,646 | |
| GBP | | | 200,000 | | | Thames Water Utilities Cayman Finance Ltd., EMTN | | | 5.500 | | | | 02/11/2041 | | | | 363,122 | |
See accompanying Notes to Financial Statements which are an integral part of the financial statements.
PowerShares International Corporate Bond Portfolio (PICB) (continued)
October 31, 2016
| | | | | | | | | | | | | | | | | | | | |
Foreign
Currency(a) | | | Principal
Amount | | | | | Interest
Rate | | | Maturity
Date | | | Value | |
| | | | | | | | Corporate Bonds (continued) | | | | | | | | | | | | |
| | | | | | | | United Kingdom (continued) | | | | | | | | | | | | |
| | GBP | | | | 450,000 | | | Thames Water Utilities Finance Ltd., EMTN | | | 5.125 | % | | | 09/28/2037 | | | $ | 767,309 | |
| | GBP | | | | 300,000 | | | THFC Funding No. 3 PLC, EMTN | | | 5.200 | | | | 10/11/2043 | | | | 498,111 | |
| | EUR | | | | 300,000 | | | Vodafone Group PLC, EMTN | | | 4.650 | | | | 01/20/2022 | | | | 401,532 | |
| | EUR | | | | 200,000 | | | Vodafone Group PLC, EMTN | | | 1.750 | | | | 08/25/2023 | | | | 233,415 | |
| | EUR | | | | 300,000 | | | Vodafone Group PLC, EMTN | | | 2.200 | | | | 08/25/2026 | | | | 357,753 | |
| | EUR | | | | 400,000 | | | Vodafone Group PLC, EMTN | | | 1.600 | | | | 07/29/2031 | | | | 428,133 | |
| | GBP | | | | 500,000 | | | Vodafone Group PLC, EMTN | | | 3.375 | | | | 08/08/2049 | | | | 571,927 | |
| | GBP | | | | 300,000 | | | Vodafone Group PLC, EMTN | | | 3.000 | | | | 08/12/2056 | | | | 318,181 | |
| | GBP | | | | 200,000 | | | Wellcome Trust Finance PLC | | | 4.625 | | | | 07/25/2036 | | | | 342,992 | |
| | | | | | | | | | | | | | | | | | | | |
| | | | | | | | | | | | | | | | | | | 38,247,252 | |
| | | | | | | | | | | | | | | | | | | | |
| | | | | | | | Total Corporate Bonds
(Cost $172,967,916) | | | | | | | | | | | 157,482,626 | |
| | | | | | | | | | | | | | | | | | | | |
| | | | | |
| | | | | | | | | | | | | | | | | | | | |
| | | | | | | | Sovereign Debt Obligations—0.6% | | | | | | | | | | | | |
| | | | | | | | Japan—0.6% | | | | | | | | | | | | |
| | JPY | | | | 30,000,000 | | | Development Bank of Japan, Inc. | | | 1.050 | | | | 06/20/2023 | | | | 305,729 | |
| | JPY | | | | 60,000,000 | | | Development Bank of Japan, Inc. | | | 2.300 | | | | 03/19/2026 | | | | 690,817 | |
| | | | | | | | | | | | | | | | | | | | |
| | | | | | | | Total Sovereign Debt Obligations
(Cost $1,056,901) | | | | | | | | | | | 996,546 | |
| | | | | | | | | | | | | | | | | | | | |
| | | | | |
| | | | | | | | | | | | | | | | | | | | |
| | | | Number
of Shares | | | | | | | | | | | | |
| | | | | | | | Money Market Fund—0.6% | | | | | | | | | | | | |
| | | | | 891,729 | | | Invesco Premier U.S. Government Money Portfolio—Institutional Class, 0.25%(c)
(Cost $891,729) | | | | | | | | | | | 891,729 | |
| | | | | | | | | | | | | | | | | | | | |
| | | | | | | | Total Investments
(Cost $174,916,546)—99.3% | | | | | | | | | | | 159,370,901 | |
| | | | | | | | Other assets less liabilities—0.7% | | | | | | | | | | | 1,168,157 | |
| | | | | | | | | | | | | | | | | | | | |
| | | | | | | | Net Assets—100.0% | | | | | | | | | | $ | 160,539,058 | |
| | | | | | | | | | | | | | | | | | | | |
Investment Abbreviations:
AUD—Australian Dollar
CAD—Canadian Dollar
CHF—Swiss Franc
DIP—Debtor-In-Possession
DPNT—Deposit Note
EUR—Euro
EMTN—Euro Medium-Term Note
GBP—British Pound
GMTN—Global Medium-Term Note
JPY—Japanese Yen
MTN—Medium-Term Note
NOK—Norwegian Krone
SEK—Swedish Krona
Notes to Schedule of Investments:
| (a) | Foreign denominated security. Principal amount denominated in currency indicated. |
| (b) | Security purchased or received in a transaction exempt from registration under the Securities Act of 1933, as amended (the “1933 Act”). The security may be resold pursuant to an exemption from registration under the 1933 Act, typically to qualified institutional buyers. The value of this security at October 31, 2016 represented less than 1% of the Fund’s Net Assets. |
| (c) | The security and the Fund are advised by wholly-owned subsidiaries of Invesco Ltd. and are therefore considered to be affiliated. The rate shown is the 7-day SEC standardized yield as of October 31, 2016. |
See accompanying Notes to Financial Statements which are an integral part of the financial statements.
Schedule of Investments
PowerShares LadderRite 0-5 Year Corporate Bond Portfolio (LDRI)
October 31, 2016
| | | | | | | | | | | | | | | | |
Principal
Amount | | | | | Interest
Rate | | | Maturity
Date | | | Value | |
| | | | Corporate Bonds—97.4% | | | | | | | | | | | | |
| | | | Aerospace/Defense—0.5% | | | | | | | | | | | | |
| $ | 100,000 | | | Lockheed Martin Corp. | | | 2.500 | % | | | 11/23/2020 | | | $ | 102,686 | |
| | | | | | | | | | | | | | | | |
| | | | Agriculture—1.1% | | | | | | | | | | | | |
| | 100,000 | | | Altria Group, Inc. | | | 2.625 | | | | 01/14/2020 | | | | 102,951 | |
| | 100,000 | | | Philip Morris International, Inc. | | | 1.125 | | | | 08/21/2017 | | | | 100,083 | |
| | 50,000 | | | Philip Morris International, Inc. | | | 4.500 | | | | 03/26/2020 | | | | 54,588 | |
| | | | | | | | | | | | | | | | |
| | | | | | | | | | | | | | | 257,622 | |
| | | | | | | | | | | | | | | | |
| | | | Auto Manufacturers—3.5% | | | | | | | | | | | | |
| | 100,000 | | | American Honda Finance Corp., MTN | | | 1.600 | | | | 07/13/2018 | | | | 100,624 | |
| | 100,000 | | | Ford Motor Credit Co. LLC | | | 8.000 | | | | 12/15/2016 | | | | 100,781 | |
| | 100,000 | | | Ford Motor Credit Co. LLC | | | 8.125 | | | | 01/15/2020 | | | | 117,860 | |
| | 100,000 | | | General Motors Financial Co., Inc. | | | 2.400 | | | | 04/10/2018 | | | | 100,585 | |
| | 100,000 | | | General Motors Financial Co., Inc. | | | 3.500 | | | | 07/10/2019 | | | | 102,959 | |
| | 100,000 | | | General Motors Financial Co., Inc. | | | 3.200 | | | | 07/13/2020 | | | | 101,792 | |
| | 150,000 | | | Toyota Motor Credit Corp., MTN | | | 2.750 | | | | 05/17/2021 | | | | 155,907 | |
| | | | | | | | | | | | | | | | |
| | | | | | | | | | | | | | | 780,508 | |
| | | | | | | | | | | | | | | | |
| | | | Banks—31.4% | | | | | | | | | | | | |
| | 200,000 | | | American Express Bank FSB, Series BKNT | | | 6.000 | | | | 09/13/2017 | | | | 208,014 | |
| | 100,000 | | | Bank of America Corp. | | | 3.875 | | | | 03/22/2017 | | | | 101,076 | |
| | 120,000 | | | Bank of America Corp. | | | 6.000 | | | | 09/01/2017 | | | | 124,548 | |
| | 100,000 | | | Bank of America Corp. | | | 6.875 | | | | 11/15/2018 | | | | 110,168 | |
| | 100,000 | | | Bank of America Corp., MTN | | | 6.875 | | | | 04/25/2018 | | | | 107,614 | |
| | 100,000 | | | Bank of America Corp., MTN | | | 2.625 | | | | 10/19/2020 | | | | 101,769 | |
| | 100,000 | | | Bank of America Corp., MTN | | | 5.000 | | | | 05/13/2021 | | | | 110,978 | |
| | 100,000 | | | Bank of America Corp., Series L, MTN | | | 2.250 | | | | 04/21/2020 | | | | 100,538 | |
| | 200,000 | | | Bank of America NA, Series BKNT | | | 1.250 | | | | 02/14/2017 | | | | 200,118 | |
| | 200,000 | | | Bank of Montreal, MTN (Canada) | | | 1.450 | | | | 04/09/2018 | | | | 200,309 | |
| | 200,000 | | | Bank of Montreal, MTN (Canada) | | | 1.800 | | | | 07/31/2018 | | | | 201,140 | |
| | 125,000 | | | Bank of New York Mellon Corp. (The), MTN | | | 2.300 | | | | 09/11/2019 | | | | 127,732 | |
| | 200,000 | | | Bank of Nova Scotia (The) (Canada) | | | 1.450 | | | | 04/25/2018 | | | | 200,274 | |
| | 200,000 | | | Bank of Nova Scotia (The) (Canada) | | | 1.700 | | | | 06/11/2018 | | | | 200,647 | |
| | 100,000 | | | Bank of Nova Scotia (The), Series BKNT (Canada) | | | 1.250 | | | | 04/11/2017 | | | | 100,072 | |
| | 100,000 | | | BB&T Corp., MTN | | | 2.625 | | | | 06/29/2020 | | | | 102,660 | |
| | 100,000 | | | BNP Paribas SA, Series BKNT, GMTN (France) | | | 5.000 | | | | 01/15/2021 | | | | 111,200 | |
| | 98,000 | | | BNP Paribas SA, MTN (France) | | | 2.450 | | | | 03/17/2019 | | | | 99,509 | |
| | 120,000 | | | Capital One Financial Corp. | | | 2.450 | | | | 04/24/2019 | | | | 122,101 | |
| | 120,000 | | | Citigroup, Inc. | | | 1.300 | | | | 11/15/2016 | | | | 120,001 | |
| | 120,000 | | | Citigroup, Inc. | | | 8.500 | | | | 05/22/2019 | | | | 139,530 | |
| | 61,000 | | | Citigroup, Inc. | | | 5.375 | | | | 08/09/2020 | | | | 68,084 | |
| | 100,000 | | | Citigroup, Inc. | | | 2.650 | | | | 10/26/2020 | | | | 101,696 | |
| | 100,000 | | | Credit Suisse AG/New York NY (Switzerland) | | | 6.000 | | | | 02/15/2018 | | | | 104,868 | |
| | 27,000 | | | Deutsche Bank AG/London, Series 3FXD (Germany) | | | 1.400 | | | | 02/13/2017 | | | | 26,913 | |
| | 100,000 | | | Fifth Third Bancorp | | | 2.875 | | | | 07/27/2020 | | | | 103,539 | |
| | 100,000 | | | Goldman Sachs Group, Inc. (The) | | | 2.750 | | | | 09/15/2020 | | | | 102,067 | |
| | 100,000 | | | Goldman Sachs Group, Inc. (The) | | | 2.875 | | | | 02/25/2021 | | | | 102,392 | |
| | 100,000 | | | Goldman Sachs Group, Inc. (The) | | | 2.625 | | | | 04/25/2021 | | | | 101,172 | |
| | 100,000 | | | Goldman Sachs Group, Inc. (The) | | | 5.250 | | | | 07/27/2021 | | | | 112,513 | |
| | 100,000 | | | Goldman Sachs Group, Inc. (The), GMTN | | | 5.375 | | | | 03/15/2020 | | | | 110,490 | |
| | 120,000 | | | JPMorgan Chase & Co. | | | 6.300 | | | | 04/23/2019 | | | | 133,064 | |
| | 100,000 | | | JPMorgan Chase & Co. | | | 2.250 | | | | 01/23/2020 | | | | 100,741 | |
| | 100,000 | | | JPMorgan Chase & Co. | | | 4.400 | | | | 07/22/2020 | | | | 108,120 | |
| | 100,000 | | | JPMorgan Chase & Co. | | | 4.250 | | | | 10/15/2020 | | | | 108,050 | |
| | 200,000 | | | JPMorgan Chase & Co., MTN | | | 1.350 | | | | 02/15/2017 | | | | 200,161 | |
| | 100,000 | | | KeyCorp, MTN | | | 2.900 | | | | 09/15/2020 | | | | 103,056 | |
| | 200,000 | | | Lloyds Bank PLC (United Kingdom) | | | 2.000 | | | | 08/17/2018 | | | | 201,264 | |
| | 100,000 | | | Morgan Stanley | | | 2.800 | | | | 06/16/2020 | | | | 102,516 | |
| | 100,000 | | | Morgan Stanley | | | 5.750 | | | | 01/25/2021 | | | | 113,482 | |
See accompanying Notes to Financial Statements which are an integral part of the financial statements.
PowerShares LadderRite 0-5 Year Corporate Bond Portfolio (LDRI) (continued)
October 31, 2016
| | | | | | | | | | | | | | | | |
Principal
Amount | | | | | Interest
Rate | | | Maturity
Date | | | Value | |
| | | | Corporate Bonds (continued) | | | | | | | | | | | | |
| | | | Banks (continued) | | | | | | | | | | | | |
| $ | 100,000 | | | Morgan Stanley, GMTN | | | 4.750 | % | | | 03/22/2017 | | | $ | 101,441 | |
| | 50,000 | | | Morgan Stanley, GMTN | | | 6.625 | | | | 04/01/2018 | | | | 53,403 | |
| | 100,000 | | | Morgan Stanley, GMTN | | | 5.500 | | | | 01/26/2020 | | | | 110,329 | |
| | 100,000 | | | Morgan Stanley, GMTN | | | 5.500 | | | | 07/28/2021 | | | | 113,631 | |
| | 200,000 | | | Royal Bank of Canada, GMTN (Canada) | | | 1.800 | | | | 07/30/2018 | | | | 201,091 | |
| | 100,000 | | | Royal Bank of Canada, Series CB8 (Canada) | | | 1.200 | | | | 09/19/2017 | | | | 100,079 | |
| | 100,000 | | | Santander Holdings USA, Inc. | | | 3.450 | | | | 08/27/2018 | | | | 102,265 | |
| | 200,000 | | | Santander UK PLC (United Kingdom) | | | 1.650 | | | | 09/29/2017 | | | | 200,653 | |
| | 100,000 | | | State Street Corp. | | | 4.375 | | | | 03/07/2021 | | | | 110,033 | |
| | 200,000 | | | Sumitomo Mitsui Banking Corp., GMTN (Japan) | | | 1.350 | | | | 07/11/2017 | | | | 199,963 | |
| | 100,000 | | | Toronto-Dominion Bank (The), GMTN (Canada) | | | 1.750 | | | | 07/23/2018 | | | | 100,535 | |
| | 100,000 | | | Toronto-Dominion Bank (The), Series BKNT, GMTN (Canada) | | | 2.125 | | | | 07/02/2019 | | | | 101,475 | |
| | 200,000 | | | US Bancorp, MTN | | | 1.650 | | | | 05/15/2017 | | | | 200,452 | |
| | 200,000 | | | Wells Fargo & Co., GMTN | | | 1.500 | | | | 01/16/2018 | | | | 200,010 | |
| | 200,000 | | | Wells Fargo & Co., MTN | | | 1.400 | | | | 09/08/2017 | | | | 200,047 | |
| | | | | | | | | | | | | | | | |
| | | | | | | | | | | | | | | 7,089,593 | |
| | | | | | | | | | | | | | | | |
| | | | Beverages—2.8% | | | | | | | | | | | | |
| | 75,000 | | | Anheuser-Busch Cos. LLC (Belgium) | | | 5.500 | | | | 01/15/2018 | | | | 78,640 | |
| | 100,000 | | | Anheuser-Busch InBev Finance, Inc. (Belgium) | | | 2.650 | | | | 02/01/2021 | | | | 102,332 | |
| | 120,000 | | | Anheuser-Busch InBev Worldwide, Inc. (Belgium) | | | 7.750 | | | | 01/15/2019 | | | | 135,730 | |
| | 100,000 | | | Coca-Cola Co. (The) | | | 1.875 | | | | 10/27/2020 | | | | 101,103 | |
| | 100,000 | | | Coca-Cola European Partners US LLC (United Kingdom) | | | 3.500 | | | | 09/15/2020 | | | | 105,387 | |
| | 100,000 | | | PepsiCo, Inc. | | | 0.950 | | | | 02/22/2017 | | | | 100,046 | |
| | | | | | | | | | | | | | | | |
| | | | | | | | | | | | | | | 623,238 | |
| | | | | | | | | | | | | | | | |
| | | | Biotechnology—0.9% | | | | | | | | | | | | |
| | 100,000 | | | Amgen, Inc. | | | 5.700 | | | | 02/01/2019 | | | | 109,118 | |
| | 100,000 | | | Gilead Sciences, Inc. | | | 2.550 | | | | 09/01/2020 | | | | 102,543 | |
| | | | | | | | | | | | | | | | |
| | | | | | | | | | | | | | | 211,661 | |
| | | | | | | | | | | | | | | | |
| | | | Chemicals—1.4% | | | | | | | | | | | | |
| | 100,000 | | | Dow Chemical Co. (The) | | | 4.250 | | | | 11/15/2020 | | | | 107,874 | |
| | 100,000 | | | E.I. du Pont de Nemours & Co. | | | 5.750 | | | | 03/15/2019 | | | | 109,505 | |
| | 100,000 | | | Sherwin-Williams Co. (The) | | | 1.350 | | | | 12/15/2017 | | | | 100,185 | |
| | | | | | | | | | | | | | | | |
| | | | | | | | | | | | | | | 317,564 | |
| | | | | | | | | | | | | | | | |
| | | | Computers—1.4% | | | | | | | | | | | | |
| | 100,000 | | | Apple, Inc. | | | 2.100 | | | | 05/06/2019 | | | | 101,984 | |
| | 100,000 | | | International Business Machines Corp. | | | 1.250 | | | | 02/06/2017 | | | | 100,133 | |
| | 100,000 | | | NetApp, Inc. | | | 3.375 | | | | 06/15/2021 | | | | 104,421 | |
| | | | | | | | | | | | | | | | |
| | | | | | | | | | | | | | | 306,538 | |
| | | | | | | | | | | | | | | | |
| | | | Cosmetics/Personal Care—0.5% | | | | | | | | | | | | |
| | 100,000 | | | Procter & Gamble Co. (The) | | | 1.900 | | | | 11/01/2019 | | | | 101,699 | |
| | | | | | | | | | | | | | | | |
| | | | Diversified Financial Services—4.1% | | | | | | | | | | | | |
| | 120,000 | | | Air Lease Corp. | | | 5.625 | | | | 04/01/2017 | | | | 122,543 | |
| | 100,000 | | | American Express Co. | | | 8.125 | | | | 05/20/2019 | | | | 115,694 | |
| | 100,000 | | | American Express Credit Corp., MTN | | | 1.125 | | | | 06/05/2017 | | | | 100,065 | |
| | 100,000 | | | BlackRock, Inc. | | | 6.250 | | | | 09/15/2017 | | | | 104,503 | |
| | 100,000 | | | International Lease Finance Corp. | | | 4.625 | | | | 04/15/2021 | | | | 104,625 | |
| | 60,000 | | | Jefferies Group LLC | | | 8.500 | | | | 07/15/2019 | | | | 68,770 | |
| | 200,000 | | | Synchrony Financial | | | 3.000 | | | | 08/15/2019 | | | | 204,517 | |
| | 100,000 | | | Synchrony Financial | | | 2.700 | | | | 02/03/2020 | | | | 101,167 | |
| | | | | | | | | | | | | | | | |
| | | | | | | | | | | | | | | 921,884 | |
| | | | | | | | | | | | | | | | |
| | | | Electric—2.0% | | | | | | | | | | | | |
| | 120,000 | | | Entergy Texas, Inc. | | | 7.125 | | | | 02/01/2019 | | | | 134,053 | |
| | 100,000 | | | Exelon Generation Co. LLC | | | 5.200 | | | | 10/01/2019 | | | | 109,444 | |
See accompanying Notes to Financial Statements which are an integral part of the financial statements.
PowerShares LadderRite 0-5 Year Corporate Bond Portfolio (LDRI) (continued)
October 31, 2016
| | | | | | | | | | | | | | | | |
Principal
Amount | | | | | Interest
Rate | | | Maturity
Date | | | Value | |
| | | | Corporate Bonds (continued) | | | | | | | | | | | | |
| | | | Electric (continued) | | | | | | | | | | | | |
| $ | 100,000 | | | Southern Co. (The) | | | 2.750 | % | | | 06/15/2020 | | | $ | 102,779 | |
| | 100,000 | | | Xcel Energy, Inc. | | | 4.700 | | | | 05/15/2020 | | | | 108,668 | |
| | | | | | | | | | | | | | | | |
| | | | | | | | | | | | | | | 454,944 | |
| | | | | | | | | | | | | | | | |
| | | | Electrical Components & Equipment—0.5% | | | | | | | | | | | | |
| | 100,000 | | | Emerson Electric Co. | | | 4.875 | | | | 10/15/2019 | | | | 109,790 | |
| | | | | | | | | | | | | | | | |
| | | | Environmental Control—0.5% | | | | | | | | | | | | |
| | 100,000 | | | Republic Services, Inc. | | | 3.800 | | | | 05/15/2018 | | | | 103,616 | |
| | | | | | | | | | | | | | | | |
| | | | Food—2.0% | | | | | | | | | | | | |
| | 100,000 | | | General Mills, Inc. | | | 2.200 | | | | 10/21/2019 | | | | 101,766 | |
| | 100,000 | | | Kraft Heinz Foods Co. | | | 6.125 | | | | 08/23/2018 | | | | 108,077 | |
| | 100,000 | | | Kroger Co. (The) | | | 3.300 | | | | 01/15/2021 | | | | 104,946 | |
| | 120,000 | | | Mondelez International, Inc. | | | 6.125 | | | | 02/01/2018 | | | | 127,467 | |
| | | | | | | | | | | | | | | | |
| | | | | | | | | | | | | | | 442,256 | |
| | | | | | | | | | | | | | | | |
| | | | Gas—0.4% | | | | | | | | | | | | |
| | 100,000 | | | Sempra Energy | | | 2.300 | | | | 04/01/2017 | | | | 100,480 | |
| | | | | | | | | | | | | | | | |
| | | | Healthcare-Products—1.8% | | | | | | | | | | | | |
| | 100,000 | | | Abbott Laboratories | | | 2.000 | | | | 03/15/2020 | | | | 100,888 | |
| | 99,000 | | | Danaher Corp. | | | 2.400 | | | | 09/15/2020 | | | | 101,235 | |
| | 100,000 | | | Life Technologies Corp. | | | 6.000 | | | | 03/01/2020 | | | | 111,500 | |
| | 100,000 | | | Stryker Corp. | | | 1.300 | | | | 04/01/2018 | | | | 100,044 | |
| | | | | | | | | | | | | | | | |
| | | | | | | | | | | | | | | 413,667 | |
| | | | | | | | | | | | | | | | |
| | | | Healthcare-Services—1.8% | | | | | | | | | | | | |
| | 100,000 | | | Aetna, Inc. | | | 1.700 | | | | 06/07/2018 | | | | 100,342 | |
| | 50,000 | | | Anthem, Inc. | | | 1.875 | | | | 01/15/2018 | | | | 50,194 | |
| | 100,000 | | | HCA, Inc. | | | 3.750 | | | | 03/15/2019 | | | | 102,500 | |
| | 100,000 | | | Laboratory Corp. of America Holdings | | | 2.200 | | | | 08/23/2017 | | | | 100,684 | |
| | 50,000 | | | UnitedHealth Group, Inc. | | | 2.700 | | | | 07/15/2020 | | | | 51,494 | |
| | | | | | | | | | | | | | | | |
| | | | | | | | | | | | | | | 405,214 | |
| | | | | | | | | | | | | | | | |
| | | | Household Products/Wares—0.5% | | | | | | | | | | | | |
| | 100,000 | | | Kimberly-Clark Corp. | | | 7.500 | | | | 11/01/2018 | | | | 112,217 | |
| | | | | | | | | | | | | | | | |
| | | | Insurance—1.9% | | | | | | | | | | | | |
| | 100,000 | | | American International Group, Inc. | | | 6.400 | | | | 12/15/2020 | | | | 116,541 | |
| | 100,000 | | | Berkshire Hathaway, Inc. | | | 1.900 | | | | 01/31/2017 | | | | 100,184 | |
| | 100,000 | | | Chubb INA Holdings, Inc. | | | 5.700 | | | | 02/15/2017 | | | | 101,275 | |
| | 100,000 | | | Prudential Financial, Inc., MTN | | | 4.500 | | | | 11/15/2020 | | | | 109,448 | |
| | | | | | | | | | | | | | | | |
| | | | | | | | | | | | | | | 427,448 | |
| | | | | | | | | | | | | | | | |
| | | | Internet—0.9% | | | | | | | | | | | | |
| | 100,000 | | | eBay, Inc. | | | 2.200 | | | | 08/01/2019 | | | | 101,043 | |
| | 100,000 | | | eBay, Inc. | | | 3.250 | | | | 10/15/2020 | | | | 103,679 | |
| | | | | | | | | | | | | | | | |
| | | | | | | | | | | | | | | 204,722 | |
| | | | | | | | | | | | | | | | |
| | | | Machinery-Construction & Mining—0.4% | | | | | | | | | | | | |
| | 100,000 | | | Caterpillar Financial Services Corp., MTN | | | 2.000 | | | | 03/05/2020 | | | | 100,867 | |
| | | | | | | | | | | | | | | | |
| | | | Machinery-Diversified—0.9% | | | | | | | | | | | | |
| | 100,000 | | | Deere & Co. | | | 4.375 | | | | 10/16/2019 | | | | 108,301 | |
| | 100,000 | | | John Deere Capital Corp., MTN | | | 1.125 | | | | 06/12/2017 | | | | 100,015 | |
| | | | | | | | | | | | | | | | |
| | | | | | | | | | | | | | | 208,316 | |
| | | | | | | | | | | | | | | | |
| | | | Media—4.5% | | | | | | | | | | | | |
| | 100,000 | | | CBS Corp. | | | 5.750 | | | | 04/15/2020 | | | | 112,154 | |
| | 50,000 | | | Comcast Cable Communications LLC | | | 8.875 | | | | 05/01/2017 | | | | 51,910 | |
| | 100,000 | | | Comcast Corp. | | | 5.700 | | | | 07/01/2019 | | | | 111,070 | |
| | 100,000 | | | DIRECTV Holdings LLC/DIRECTV Financing Co., Inc. | | | 5.875 | | | | 10/01/2019 | | | | 110,830 | |
See accompanying Notes to Financial Statements which are an integral part of the financial statements.
PowerShares LadderRite 0-5 Year Corporate Bond Portfolio (LDRI) (continued)
October 31, 2016
| | | | | | | | | | | | | | | | |
Principal
Amount | | | | | Interest
Rate | | | Maturity
Date | | | Value | |
| | | | Corporate Bonds (continued) | | | | | | | | | | | | |
| | | | Media (continued) | | | | | | | | | | | | |
| $ | 100,000 | | | DIRECTV Holdings LLC/DIRECTV Financing Co., Inc. | | | 5.000 | % | | | 03/01/2021 | | | $ | 110,034 | |
| | 100,000 | | | NBCUniversal Media LLC | | | 5.150 | | | | 04/30/2020 | | | | 111,417 | |
| | 100,000 | | | Scripps Networks Interactive, Inc. | | | 2.800 | | | | 06/15/2020 | | | | 102,093 | |
| | 150,000 | | | Thomson Reuters Corp. | | | 1.300 | | | | 02/23/2017 | | | | 150,070 | |
| | 50,000 | | | Time Warner Cable LLC | | | 8.250 | | | | 04/01/2019 | | | | 57,196 | |
| | 100,000 | | | Viacom, Inc. | | | 6.125 | | | | 10/05/2017 | | | | 104,024 | |
| | | | | | | | | | | | | | | | |
| | | | | | | | | | | | | | | 1,020,798 | |
| | | | | | | | | | | | | | | | |
| | | | Metal Fabricate/Hardware—0.7% | | | | | | | | | | | | |
| | 150,000 | | | Precision Castparts Corp. | | | 1.250 | | | | 01/15/2018 | | | | 150,104 | |
| | | | | | | | | | | | | | | | |
| | | | Mining—0.9% | | | | | | | | | | | | |
| | 100,000 | | | Freeport-McMoRan, Inc. | | | 2.375 | | | | 03/15/2018 | | | | 99,250 | |
| | 100,000 | | | Newmont Mining Corp. | | | 5.125 | | | | 10/01/2019 | | | | 109,193 | |
| | | | | | | | | | | | | | | | |
| | | | | | | | | | | | | | | 208,443 | |
| | | | | | | | | | | | | | | | |
| | | | Miscellaneous Manufacturing—2.4% | | | | | | | | | | | | |
| | 100,000 | | | 3M Co., GMTN | | | 2.000 | | | | 08/07/2020 | | | | 102,225 | |
| | 100,000 | | | General Electric Co., GMTN | | | 6.000 | | | | 08/07/2019 | | | | 112,329 | |
| | 100,000 | | | General Electric Co., GMTN | | | 5.500 | | | | 01/08/2020 | | | | 111,797 | |
| | 100,000 | | | General Electric Co., GMTN | | | 4.625 | | | | 01/07/2021 | | | | 111,523 | |
| | 100,000 | | | Illinois Tool Works, Inc. | | | 0.900 | | | | 02/25/2017 | | | | 99,956 | |
| | | | | | | | | | | | | | | | |
| | | | | | | | | | | | | | | 537,830 | |
| | | | | | | | | | | | | | | | |
| | | | Oil & Gas—6.0% | | | | | | | | | | | | |
| | 100,000 | | | BP Capital Markets PLC (United Kingdom) | | | 4.742 | | | | 03/11/2021 | | | | 111,402 | |
| | 100,000 | | | Canadian Natural Resources Ltd. (Canada) | | | 1.750 | | | | 01/15/2018 | | | | 99,927 | |
| | 100,000 | | | Chevron Corp. | | | 1.718 | | | | 06/24/2018 | | | | 100,707 | |
| | 47,000 | | | Chevron Corp. | | | 2.427 | | | | 06/24/2020 | | | | 48,194 | |
| | 50,000 | | | ConocoPhillips | | | 5.750 | | | | 02/01/2019 | | | | 54,145 | |
| | 100,000 | | | EOG Resources, Inc. | | | 2.450 | | | | 04/01/2020 | | | | 101,910 | |
| | 150,000 | | | Exxon Mobil Corp. | | | 1.819 | | | | 03/15/2019 | | | | 151,723 | |
| | 100,000 | | | Marathon Oil Corp. | | | 2.700 | | | | 06/01/2020 | | | | 98,695 | |
| | 100,000 | | | Marathon Petroleum Corp. | | | 5.125 | | | | 03/01/2021 | | | | 110,892 | |
| | 100,000 | | | Petro-Canada (Canada) | | | 6.050 | | | | 05/15/2018 | | | | 106,615 | |
| | 100,000 | | | Shell International Finance BV (Netherlands) | | | 0.900 | | | | 11/15/2016 | | | | 100,002 | |
| | 100,000 | | | Shell International Finance BV (Netherlands) | | | 1.875 | | | | 05/10/2021 | | | | 99,472 | |
| | 50,000 | | | Total Capital International SA (France) | | | 1.500 | | | | 02/17/2017 | | | | 50,074 | |
| | 100,000 | | | Total Capital SA (France) | | | 4.125 | | | | 01/28/2021 | | | | 109,174 | |
| | | | | | | | | | | | | | | | |
| | | | | | | | | | | | | | | 1,342,932 | |
| | | | | | | | | | | | | | | | |
| | | | Oil & Gas Services—0.9% | | | | | | | | | | | | |
| | 100,000 | | | Baker Hughes, Inc. | | | 7.500 | | | | 11/15/2018 | | | | 111,466 | |
| | 100,000 | | | Freeport-McMoRan Oil & Gas LLC/FCX Oil & Gas, Inc. | | | 6.500 | | | | 11/15/2020 | | | | 102,625 | |
| | | | | | | | | | | | | | | | |
| | | | | | | | | | | | | | | 214,091 | |
| | | | | | | | | | | | | | | | |
| | | | Pharmaceuticals—4.6% | | | | | | | | | | | | |
| | 100,000 | | | AbbVie, Inc. | | | 1.800 | | | | 05/14/2018 | | | | 100,352 | |
| | 100,000 | | | AbbVie, Inc. | | | 2.500 | | | | 05/14/2020 | | | | 101,341 | |
| | 100,000 | | | AbbVie, Inc. | | | 2.300 | | | | 05/14/2021 | | | | 100,115 | |
| | 100,000 | | | AstraZeneca PLC (United Kingdom) | | | 2.375 | | | | 11/16/2020 | | | | 101,855 | |
| | 100,000 | | | Cardinal Health, Inc. | | | 1.950 | | | | 06/15/2018 | | | | 100,829 | |
| | 100,000 | | | Johnson & Johnson | | | 5.150 | | | | 07/15/2018 | | | | 106,881 | |
| | 100,000 | | | Johnson & Johnson | | | 1.875 | | | | 12/05/2019 | | | | 101,991 | |
| | 100,000 | | | Novartis Securities Investment Ltd. (Switzerland) | | | 5.125 | | | | 02/10/2019 | | | | 108,373 | |
| | 100,000 | | | Pfizer, Inc. | | | 6.200 | | | | 03/15/2019 | | | | 110,777 | |
| | 100,000 | | | Sanofi (France) | | | 4.000 | | | | 03/29/2021 | | | | 109,282 | |
| | | | | | | | | | | | | | | | |
| | | | | | | | | | | | | | | 1,041,796 | |
| | | | | | | | | | | | | | | | |
| | | | Pipelines—2.0% | | | | | | | | | | | | |
| | 100,000 | | | Enbridge Energy Partners LP | | | 4.375 | | | | 10/15/2020 | | | | 106,786 | |
See accompanying Notes to Financial Statements which are an integral part of the financial statements.
PowerShares LadderRite 0-5 Year Corporate Bond Portfolio (LDRI) (continued)
October 31, 2016
| | | | | | | | | | | | | | | | |
Principal
Amount | | | | | Interest
Rate | | | Maturity
Date | | | Value | |
| | | | Corporate Bonds (continued) | | | | | | | | | | | | |
| | | | Pipelines (continued) | | | | | | | | | | | | |
| $ | 100,000 | | | Enterprise Products Operating LLC | | | 5.200 | % | | | 09/01/2020 | | | $ | 111,514 | |
| | 100,000 | | | Kinder Morgan Energy Partners LP | | | 5.950 | | | | 02/15/2018 | | | | 105,169 | |
| | 20,000 | | | Spectra Energy Capital LLC | | | 8.000 | | | | 10/01/2019 | | | | 22,942 | |
| | 100,000 | | | Williams Partners LP/Williams Partners Finance Corp. | | | 7.250 | | | | 02/01/2017 | | | | 101,379 | |
| | | | | | | | | | | | | | | | |
| | | | | | | | | | | | | | | 447,790 | |
| | | | | | | | | | | | | | | | |
| | | | REITs—2.1% | | | | | | | | | | | | |
| | 100,000 | | | American Tower Corp. | | | 3.450 | | | | 09/15/2021 | | | | 104,552 | |
| | 50,000 | | | Boston Properties LP | | | 5.875 | | | | 10/15/2019 | | | | 55,404 | |
| | 100,000 | | | Simon Property Group LP | | | 2.150 | | | | 09/15/2017 | | | | 100,635 | |
| | 100,000 | | | Welltower, Inc. | | | 4.125 | | | | 04/01/2019 | | | | 104,855 | |
| | 100,000 | | | Weyerhaeuser Co. | | | 7.375 | | | | 10/01/2019 | | | | 114,262 | |
| | | | | | | | | | | | | | | | |
| | | | | | | | | | | | | | | 479,708 | |
| | | | | | | | | | | | | | | | |
| | | | Retail—3.2% | | | | | | | | | | | | |
| | 100,000 | | | AutoZone, Inc. | | | 4.000 | | | | 11/15/2020 | | | | 106,912 | |
| | 100,000 | | | Costco Wholesale Corp. | | | 1.125 | | | | 12/15/2017 | | | | 100,073 | |
| | 100,000 | | | CVS Health Corp. | | | 2.250 | | | | 12/05/2018 | | | | 101,429 | |
| | 100,000 | | | Home Depot, Inc. (The) | | | 4.400 | | | | 04/01/2021 | | | | 111,041 | |
| | 100,000 | | | Lowe’s Cos., Inc. | | | 3.750 | | | | 04/15/2021 | | | | 108,522 | |
| | 100,000 | | | McDonald’s Corp., MTN | | | 2.750 | | | | 12/09/2020 | | | | 103,033 | |
| | 100,000 | | | Wal-Mart Stores, Inc. | | | 5.375 | | | | 04/05/2017 | | | | 101,879 | |
| | | | | | | | | | | | | | | | |
| | | | | | | | | | | | | | | 732,889 | |
| | | | | | | | | | | | | | | | |
| | | | Semiconductors—0.9% | | | | | | | | | | | | |
| | 100,000 | | | Intel Corp. | | | 1.350 | | | | 12/15/2017 | | | | 100,388 | |
| | 100,000 | | | Intel Corp. | | | 2.450 | | | | 07/29/2020 | | | | 103,089 | |
| | | | | | | | | | | | | | | | |
| | | | | | | | | | | | | | | 203,477 | |
| | | | | | | | | | | | | | | | |
| | | | Software—1.9% | | | | | | | | | | | | |
| | 100,000 | | | Fidelity National Information Services, Inc. | | | 3.625 | | | | 10/15/2020 | | | | 105,573 | |
| | 100,000 | | | Microsoft Corp. | | | 3.000 | | | | 10/01/2020 | | | | 105,470 | |
| | 100,000 | | | Microsoft Corp. | | | 2.000 | | | | 11/03/2020 | | | | 101,485 | |
| | 100,000 | | | Oracle Corp. | | | 5.000 | | | | 07/08/2019 | | | | 109,346 | |
| | | | | | | | | | | | | | | | |
| | | | | | | | | | | | | | | 421,874 | |
| | | | | | | | | | | | | | | | |
| | | | Telecommunications—5.2% | | | | | | | | | | | | |
| | 100,000 | | | AT&T, Inc. | | | 1.600 | | | | 02/15/2017 | | | | 100,144 | |
| | 100,000 | | | AT&T, Inc. | | | 1.400 | | | | 12/01/2017 | | | | 100,051 | |
| | 130,000 | | | AT&T, Inc. | | | 5.800 | | | | 02/15/2019 | | | | 141,294 | |
| | 100,000 | | | Cisco Systems, Inc. | | | 1.100 | | | | 03/03/2017 | | | | 100,133 | |
| | 100,000 | | | Cisco Systems, Inc. | | | 4.950 | | | | 02/15/2019 | | | | 108,068 | |
| | 100,000 | | | Cisco Systems, Inc. | | | 4.450 | | | | 01/15/2020 | | | | 108,851 | |
| | 100,000 | | | Cisco Systems, Inc. | | | 2.200 | | | | 02/28/2021 | | | | 101,769 | |
| | 125,000 | | | Rogers Communications, Inc. (Canada) | | | 6.800 | | | | 08/15/2018 | | | | 136,449 | |
| | 100,000 | | | Telefonica Emisiones SAU (Spain) | | | 5.877 | | | | 07/15/2019 | | | | 110,239 | |
| | 100,000 | | | Verizon Communications, Inc. | | | 3.650 | | | | 09/14/2018 | | | | 103,793 | |
| | 50,000 | | | Verizon Communications, Inc. | | | 2.550 | | | | 06/17/2019 | | | | 51,223 | |
| | | | | | | | | | | | | | | | |
| | | | | | | | | | | | | | | 1,162,014 | |
| | | | | | | | | | | | | | | | |
| | | | Transportation—0.9% | | | | | | | | | | | | |
| | 100,000 | | | Norfolk Southern Corp. | | | 5.750 | | | | 04/01/2018 | | | | 106,121 | |
| | 100,000 | | | United Parcel Service, Inc. | | | 3.125 | | | | 01/15/2021 | | | | 106,483 | |
| | | | | | | | | | | | | | | | |
| | | | | | | | | | | | | | | 212,604 | |
| | | | | | | | | | | | | | | | |
| | | | Total Corporate Bonds
(Cost $21,830,456) | | | | | | | | | | | 21,972,880 | |
| | | | | | | | | | | | | | | | |
| | | | |
| | | | | | | | | | | | | | | | |
See accompanying Notes to Financial Statements which are an integral part of the financial statements.
PowerShares LadderRite 0-5 Year Corporate Bond Portfolio (LDRI) (continued)
October 31, 2016
| | | | | | | | |
Number
of Shares | | | | | Value | |
| | | | Money Market Fund—1.8% | | | | |
| | 410,163 | | | Invesco Premier U.S. Government Money Portfolio—Institutional Class, 0.25%(a)
(Cost $410,163) | | $ | 410,163 | |
| | | | | | | | |
| | | | Total Investments
(Cost $22,240,619)—99.2% | | | 22,383,043 | |
| | | | Other assets less liabilities—0.8% | | | 170,462 | |
| | | | | | | | |
| | | | Net Assets—100.0% | | $ | 22,553,505 | |
| | | | | | | | |
Investment Abbreviations:
BKNT—Bank Note
GMTN—Global Medium-Term Note
MTN—Medium-Term Note
REIT—Real Estate Investment Trust
Notes to Schedule of Investments:
| (a) | The security and the Fund are advised by wholly-owned subsidiaries of Invesco Ltd. and are therefore considered to be affiliated. The rate shown is the 7-day SEC standardized yield as of October 31, 2016. |
See accompanying Notes to Financial Statements which are an integral part of the financial statements.
Schedule of Investments
PowerShares National AMT-Free Municipal Bond Portfolio (PZA)
October 31, 2016
| | | | | | | | | | | | | | | | |
Principal
Amount | | | | | Interest
Rate | | | Maturity
Date | | | Value | |
| | | | Municipal Bonds—97.7% | | | | | | | | | | | | |
| | | | Ad Valorem Property Tax—10.3% | | | | | | | | | | | | |
| $ | 1,500,000 | | | Beaumont Texas Independent School District School Building Ser. 09 AGC | | | 5.000 | % | | | 02/15/2038 | | | $ | 1,515,090 | |
| | 150,000 | | | Beaver County Pennsylvania Notes Ser. 09 AGM(a) | | | 5.550 | | | | 11/15/2017 | | | | 157,533 | |
| | 2,850,000 | | | Beaver County Pennsylvania Notes Ser. 09 AGM(a) | | | 5.550 | | | | 11/15/2017 | | | | 2,993,127 | |
| | 2,000,000 | | | California State Various Purpose Ser. 09 | | | 5.500 | | | | 11/01/2039 | | | | 2,249,080 | |
| | 4,380,000 | | | California State Various Purpose Ser. 09 | | | 6.000 | | | | 11/01/2039 | | | | 5,002,310 | |
| | 12,050,000 | | | California State Various Purpose Ser. 10 | | | 5.500 | | | | 03/01/2040 | | | | 13,692,053 | |
| | 600,000 | | | Centinela Valley California Union High School District (Election 2010) Ser. 12B AGM | | | 5.000 | | | | 08/01/2050 | | | | 716,088 | |
| | 20,000,000 | | | City of Jasper Alabama Ser. 14 BAM | | | 5.000 | | | | 03/01/2044 | | | | 22,841,000 | |
| | 3,340,000 | | | City of New York Ser. 11A-1 | | | 5.000 | | | | 08/01/2032 | | | | 3,881,715 | |
| | 1,080,000 | | | City of New York Sub.-Ser. 09J-1 | | | 5.000 | | | | 05/15/2036 | | | | 1,186,045 | |
| | 5,000,000 | | | Corona-Norca California Unified School District (Election 2006) Ser. 09B AGC(a) | | | 5.375 | | | | 08/01/2018 | | | | 5,395,900 | |
| | 500,000 | | | Corona-Norco California Unified School District (Election 2006) Ser. 09C AGM(a) | | | 5.500 | | | | 08/01/2019 | | | | 561,985 | |
| | 1,500,000 | | | District of Columbia Ser. 08E BHAC | | | 5.000 | | | | 06/01/2033 | | | | 1,591,770 | |
| | 1,000,000 | | | El Monte California Union High School District (Election 2008) Ser. 09A AGC(a) | | | 5.500 | | | | 06/01/2019 | | | | 1,116,650 | |
| | 4,000,000 | | | Honolulu City & County Hawaii Ser. 15A | | | 5.000 | | | | 10/01/2039 | | | | 4,745,560 | |
| | 2,000,000 | | | Lackawanna County Pennsylvania Ser. 10B AGM | | | 5.000 | | | | 09/01/2035 | | | | 2,230,980 | |
| | 1,650,000 | | | Las Vegas Valley Nevada Water District Ser. 12B | | | 5.000 | | | | 06/01/2042 | | | | 1,902,697 | |
| | 2,500,000 | | | Los Angeles Unified School District (Election 2002) Ser. 07C AGM(a) | | | 5.000 | | | | 07/01/2017 | | | | 2,572,125 | |
| | 1,610,000 | | | Los Angeles Unified School District (Election 2008) Ser. 16A | | | 5.000 | | | | 07/01/2040 | | | | 1,909,428 | |
| | 6,500,000 | | | Massachusetts State Consolidated Loan (Green Bonds) Ser. 13D(a) | | | 5.000 | | | | 08/01/2021 | | | | 7,665,515 | |
| | 4,000,000 | | | Massachusetts State Ref. Ser. 15A | | | 5.000 | | | | 07/01/2036 | | | | 4,747,320 | |
| | 7,150,000 | | | Massachusetts State Ser. 16A | | | 5.000 | | | | 03/01/2041 | | | | 8,330,251 | |
| | 5,000,000 | | | Massachusetts State Ser. 16A | | | 5.000 | | | | 03/01/2046 | | | | 5,807,200 | |
| | 3,500,000 | | | New York City New York Sub.-Ser. 16A-1 | | | 5.000 | | | | 08/01/2038 | | | | 4,149,600 | |
| | 500,000 | | | Puerto Rico Commonwealth Public Improvement Ref. Ser. 07A-4 AGM | | | 5.000 | | | | 07/01/2031 | | | | 531,040 | |
| | 9,150,000 | | | Puerto Rico Commonwealth Public Improvement Ref. Ser. 12A AGM | | | 5.000 | | | | 07/01/2035 | | | | 9,841,740 | |
| | 890,000 | | | Reading Pennsylvania School District (State Aid Withholding) Ser. 08 AGM | | | 5.000 | | | | 03/01/2035 | | | | 948,669 | |
| | 2,045,000 | | | Rockwall Texas Independent School District (School Building) Ser. 16 PSF-GTD | | | 5.000 | | | | 02/15/2046 | | | | 2,378,949 | |
| | 2,500,000 | | | San Jacinto Unified School District (Election 2006) Ser. 07 AGM(a) | | | 5.250 | | | | 08/01/2017 | | | | 2,584,825 | |
| | 2,500,000 | | | Santa Ana California Unified School District (Election 2008) Ser. 08A | | | 5.125 | | | | 08/01/2033 | | | | 2,678,050 | |
| | 2,000,000 | | | State Center California Community College District (Election 2002) Ser. 07A AGM(a) | | | 5.000 | | | | 08/01/2017 | | | | 2,065,360 | |
| | 3,280,000 | | | Texas State Ref. (Transportation Commission) Ser. 14A | | | 5.000 | | | | 10/01/2044 | | | | 3,852,721 | |
| | 2,500,000 | | | Victor Valley California Union High School District (Election 2008) Ser. 09A AGC(a) | | | 5.000 | | | | 08/01/2019 | | | | 2,776,075 | |
| | 1,340,000 | | | Washington State Motor Vehicle Tax (Senior 520 Corridor Program Toll) Ser. 11C | | | 5.000 | | | | 06/01/2041 | | | | 1,541,415 | |
| | 2,535,000 | | | Yosemite California Community College District (Election 2004) Ser. 08C AGM(a) | | | 5.000 | | | | 08/01/2018 | | | | 2,718,788 | |
| | 3,000,000 | | | Ysleta Texas Independent School District (School Building) Ser. 16 PSF-GTD | | | 5.000 | | | | 08/15/2045 | | | | 3,536,520 | |
| | | | | | | | | | | | | | | | |
| | | | | | | | | | | | | | | 142,415,174 | |
| | | | | | | | | | | | | | | | |
| | | | Auto Parking Revenue—0.5% | | | | | | | | | | | | |
| | 2,000,000 | | | Miami Beach Florida Parking Rev. Ser. 15 | | | 5.000 | | | | 09/01/2045 | | | | 2,293,260 | |
| | 2,000,000 | | | Miami Florida Special Obligation (Marlins Stadium Project) Ser. 10A AGM | | | 5.250 | | | | 07/01/2035 | | | | 2,210,720 | |
| | 2,500,000 | | | Miami Florida Special Obligation (Marlins Stadium Project) Ser. 10A AGM | | | 5.250 | | | | 07/01/2039 | | | | 2,763,400 | |
| | | | | | | | | | | | | | | | |
| | | | | | | | | | | | | | | 7,267,380 | |
| | | | | | | | | | | | | | | | |
| | | | College Revenue—7.0% | | | | | | | | | | | | |
| | 5,000,000 | | | Build New York City Resource Corp. Rev. Ref. (New York Law School Project) Ser. 16 | | | 5.000 | | | | 07/01/2041 | | | | 5,692,850 | |
| | 3,000,000 | | | California State Educational Facilities Auth. Rev. Ref. (Pepperdine University) Ser. 16 | | | 5.000 | | | | 10/01/2049 | | | | 3,572,370 | |
| | 4,445,000 | | | California State University Rev. Systemwide Ser. 08A AGM(a) | | | 5.000 | | | | 05/01/2018 | | | | 4,724,546 | |
| | 65,000 | | | California State University Rev. Systemwide Ser. 08A AGM | | | 5.000 | | | | 11/01/2039 | | | | 68,929 | |
| | 2,435,000 | | | District of Columbia Rev. (Catholic University of America) Ser. 07 NATL(a) | | | 5.000 | | | | 04/01/2017 | | | | 2,478,513 | |
| | 565,000 | | | District of Columbia Rev. (Catholic University of America) Ser. 07 NATL | | | 5.000 | | | | 10/01/2029 | | | | 573,351 | |
| | 1,105,000 | | | Georgia State Higher Education Facilities Auth. Rev. (USG Real Estate III)
Ser. 10A AGC(a) | | | 5.000 | | | | 06/15/2020 | | | | 1,255,357 | |
| | 3,140,000 | | | Georgia State Higher Education Facilities Auth. Rev. (USG Real Estate III) Ser. 10A AGC | | | 5.000 | | | | 06/15/2038 | | | | 3,493,093 | |
| | 1,000,000 | | | Lafayette Louisiana Public Trust Financing Auth. Rev. Ragin’ Cajun Facilities (Housing & Parking Project) Ser. 10 AGM | | | 5.500 | | | | 10/01/2041 | | | | 1,131,910 | |
| | 2,000,000 | | | Louisiana State Local Government Environmental Facilities & Community Development Auth. (LCTCS ACT 360 Project) Ser. 14 | | | 5.000 | | | | 10/01/2039 | | | | 2,311,980 | |
| | 875,000 | | | Massachusetts State Development Finance Agency Rev. (Boston University) Ser. 13X | | | 5.000 | | | | 10/01/2048 | | | | 1,007,632 | |
See accompanying Notes to Financial Statements which are an integral part of the financial statements.
PowerShares National AMT-Free Municipal Bond Portfolio (PZA) (continued)
October 31, 2016
| | | | | | | | | | | | | | | | |
Principal
Amount | | | | | Interest
Rate | | | Maturity
Date | | | Value | |
| | | | Municipal Bonds (continued) | | | | | | | | | | | | |
| | | | College Revenue (continued) | | | | | | | | | | | | |
| $ | 1,250,000 | | | Massachusetts State Development Finance Agency Rev. (Massachusetts Institute of Technology) Ser. 09O(a) | | | 6.000 | % | | | 07/01/2018 | | | $ | 1,355,312 | |
| | 1,250,000 | | | New Hope Cultural Education Facilities Finance Corp. Texas Student Housing Rev. (A&M University Project) Ser. 14A AGM | | | 5.000 | | | | 04/01/2046 | | | | 1,382,688 | |
| | 2,000,000 | | | New York State Dormitory Auth. Rev. Non State Supported Debt (Columbia University)
Ser. 16A-2 | | | 5.000 | | | | 10/01/2046 | | | | 2,806,060 | |
| | 500,000 | | | New York State Dormitory Auth. Rev. Non State Supported Debt (Columbia University)
Ser. 16A-2 | | | 5.000 | | | | 10/01/2046 | | | | 602,430 | |
| | 3,060,000 | | | New York State Dormitory Auth. Rev. Non State Supported Debt (Cornell University)
Ser. 10A | | | 5.000 | | | | 07/01/2035 | | | | 3,469,367 | |
| | 250,000 | | | New York State Dormitory Auth. Rev. Non State Supported Debt (Fordham University)
Ser. 08B AGC(a) | | | 5.000 | | | | 07/01/2018 | | | | 267,195 | |
| | 1,200,000 | | | New York State Dormitory Auth. Rev. Non State Supported Debt (New York University)
Ser. 12A | | | 5.000 | | | | 07/01/2037 | | | | 1,401,732 | |
| | 3,000,000 | | | New York State Dormitory Auth. Rev. Non State Supported Debt Ref. (Icahn School of Medicine at Mount Sinai) Ser. 15A | | | 5.000 | | | | 07/01/2035 | | | | 3,463,470 | |
| | 3,235,000 | | | New York State Dormitory Auth. Rev. Non State Supported Debt Ref. (Icahn School of Medicine at Mount Sinai) Ser. 15A | | | 5.000 | | | | 07/01/2040 | | | | 3,716,109 | |
| | 3,500,000 | | | New York State Dormitory Auth. Rev. Non State Supported Debt Ref. (New School) Ser. 15A | | | 5.000 | | | | 07/01/2045 | | | | 4,030,600 | |
| | 2,350,000 | | | New York State Dormitory Auth. Rev. Non State Supported Debt Ref. (New York University) Ser. 15A | | | 5.000 | | | | 07/01/2035 | | | | 2,799,109 | |
| | 6,325,000 | | | New York State Dormitory Auth. Rev. Non State Supported Debt Ref. (State University of New York Dormitory Facilities) Ser. 15B | | | 5.000 | | | | 07/01/2045 | | | | 7,442,248 | |
| | 750,000 | | | New York State Dormitory Auth. Rev. Non State Supported Debt Ref. Ser. 16A | | | 5.000 | | | | 07/01/2041 | | | | 883,995 | |
| | 3,000,000 | | | North Carolina State Capital Facilities Financing Agency Rev. Ref. (Duke University) Ser. 15 | | | 5.000 | | | | 10/01/2055 | | | | 3,522,690 | |
| | 6,100,000 | | | Ohio State University Ser.14A | | | 5.000 | | | | 12/01/2039 | | | | 7,165,853 | |
| | 2,710,000 | | | Pennsylvania State University Ser. 10 | | | 5.000 | | | | 03/01/2040 | | | | 3,018,317 | |
| | 5,000,000 | | | Public Finance Auth. Wisconsin Lease Development Rev. (Central District Development Project) Ser. 16 | | | 5.000 | | | | 03/01/2041 | | | | 5,777,750 | |
| | 500,000 | | | University of California Rev. Ref. Ser. 16AR | | | 5.000 | | | | 05/15/2046 | | | | 595,670 | |
| | 7,515,000 | | | University of Oregon General Rev. Ser. 15A | | | 5.000 | | | | 04/01/2045 | | | | 8,876,643 | |
| | 7,370,000 | | | University of Vermont & State Agricultural College Ser. 09 | | | 5.125 | | | | 10/01/2039 | | | | 8,071,403 | |
| | | | | | | | | | | | | | | | |
| | | | | | | | | | | | | | | 96,959,172 | |
| | | | | | | | | | | | | | | | |
| | | | Electric Power Revenue—4.5% | | | | | | | | | | | | |
| | 2,000,000 | | | American Municipal Power Ohio Inc. Rev. (Greenup Hydroelectric Project) Ser. 16A | | | 5.000 | | | | 02/15/2041 | | | | 2,322,100 | |
| | 2,000,000 | | | American Municipal Power Ohio Inc. Rev. (Greenup Hydroelectric Project) Ser. 16A | | | 5.000 | | | | 02/15/2046 | | | | 2,309,820 | |
| | 3,500,000 | | | Grand River Oklahoma Dam Auth. Rev. Ser. 14A | | | 5.000 | | | | 06/01/2039 | | | | 4,048,590 | |
| | 1,150,000 | | | Guam Power Auth. Rev. Ser. 10A AGM | | | 5.000 | | | | 10/01/2037 | | | | 1,286,114 | |
| | 9,835,000 | | | Guam Power Auth. Rev. Ser. 12A AGM | | | 5.000 | | | | 10/01/2030 | | | | 11,449,612 | |
| | 2,500,000 | | | Imperial California Irrigation District Electric Rev. Ser. 16B-1 | | | 5.000 | | | | 11/01/2046 | | | | 2,998,550 | |
| | 200,000 | | | Kentucky State Municipal Power Agency Power System Rev. (Prairie State Project) Ser. 07A NATL(a) | | | 5.000 | | | | 09/01/2017 | | | | 207,060 | |
| | 700,000 | | | Kentucky State Municipal Power Agency Power System Rev. (Prairie State Project) Ser. 07A NATL(a) | | | 5.000 | | | | 09/01/2017 | | | | 724,710 | |
| | 2,500,000 | | | Long Island Power Auth. New York Auth. Ref. Ser. 14A | | | 5.000 | | | | 09/01/2039 | | | | 2,886,250 | |
| | 4,200,000 | | | Long Island Power Auth. New York Electric Systems Rev. General Ser. 11A AGM | | | 5.000 | | | | 05/01/2036 | | | | 4,766,160 | |
| | 2,500,000 | | | Los Angeles California Department of Water & Power Rev. Ref. Ser. 15A | | | 5.000 | | | | 07/01/2035 | | | | 2,961,050 | |
| | 1,900,000 | | | Lower Colorado River Texas Auth. Rev. Ref. Ser. 12A | | | 5.000 | | | | 05/15/2039 | | | | 2,150,553 | |
| | 1,000,000 | | | Lower Colorado River Texas Auth. Rev. Ref. Ser. 13 | | | 5.000 | | | | 05/15/2039 | | | | 1,142,810 | |
| | 500,000 | | | Lower Colorado River Texas Auth. Transmission Contract Ref. Ser. 15 | | | 5.000 | | | | 05/15/2040 | | | | 572,400 | |
| | 2,050,000 | | | Municipal Energy Agency of Nebraska Ref. Ser. 09A BHAC(a) | | | 5.375 | | | | 04/01/2019 | | | | 2,264,635 | |
| | 1,000,000 | | | Snohomish County Washington Public Utility District No. 1 Electric Rev. System Ser. 15 | | | 5.000 | | | | 12/01/2040 | | | | 1,175,350 | |
| | 3,000,000 | | | Springfield Illinois Electric Rev. Ref. (Senior Lien) Ser. 15 AGM | | | 5.000 | | | | 03/01/2040 | | | | 3,427,500 | |
| | 3,240,000 | | | Turlock California Irrigation District Ref. Ser. 10A(a) | | | 5.000 | | | | 01/01/2020 | | | | 3,640,237 | |
| | 10,000,000 | | | Utility Debt Securitization Auth. New York Restructuring Bonds Ref. Ser. 15 | | | 5.000 | | | | 12/15/2033 | | | | 12,145,900 | |
| | | | | | | | | | | | | | | | |
| | | | | | | | | | | | | | | 62,479,401 | |
| | | | | | | | | | | | | | | | |
| | | | Fuel Sales Tax Revenue—0.7% | | | | | | | | | | | | |
| | 3,250,000 | | | Connecticut State Special Tax Obligation Rev. (Transportation Infrastructure) Ser. 14A | | | 5.000 | | | | 09/01/2034 | | | | 3,827,200 | |
| | 2,000,000 | | | Kansas State Department of Transportation Highway Rev. Ser. 15 | | | 5.000 | | | | 09/01/2035 | | | | 2,416,940 | |
| | 3,000,000 | | | Massachusetts State Transportation Fund Rev. (Rail Enhancement Program) Ser. 15A | | | 5.000 | | | | 06/01/2045 | | | | 3,548,100 | |
| | | | | | | | | | | | | | | | |
| | | | | | | | | | | | | | | 9,792,240 | |
| | | | | | | | | | | | | | | | |
See accompanying Notes to Financial Statements which are an integral part of the financial statements.
PowerShares National AMT-Free Municipal Bond Portfolio (PZA) (continued)
October 31, 2016
| | | | | | | | | | | | | | | | |
Principal
Amount | | | | | Interest
Rate | | | Maturity
Date | | | Value | |
| | | | Municipal Bonds (continued) | | | | | | | | | | | | |
| | | | General Fund—1.4% | | | | | | | | | | | | |
| $ | 500,000 | | | California State Ref. Ser. 07 NATL | | | 4.250 | % | | | 08/01/2033 | | | $ | 503,750 | |
| | 4,000,000 | | | California State Ref. Ser. 16 | | | 5.000 | | | | 09/01/2036 | | | | 4,793,560 | |
| | 7,975,000 | | | California State Various Purpose Ser. 09 | | | 6.500 | | | | 04/01/2033 | | | | 9,011,511 | |
| | 5,000,000 | | | California State Various Purpose Ser. 09 | | | 6.000 | | | | 04/01/2038 | | | | 5,580,150 | |
| | | | | | | | | | | | | | | | |
| | | | | | | | | | | | | | | 19,888,971 | |
| | | | | | | | | | | | | | | | |
| | | | Health, Hospital, Nursing Home Revenue—10.3% | | | | | | | | | | | | |
| | 2,500,000 | | | Birmingham Alabama Special Care Facilities Financing Auth. Health Care Facilities Rev. (Children’s Hospital) Ser. 09 AGC(a) | | | 6.000 | | | | 06/01/2019 | | | | 2,818,650 | |
| | 650,000 | | | Birmingham Alabama Special Care Facilities Financing Auth. Health Care Facilities Rev. (Children’s Hospital) Ser. 09 AGC(a) | | | 6.000 | | | | 06/01/2019 | | | | 732,849 | |
| | 500,000 | | | California State Health Facilities Financing Auth. Rev. (Children’s Hospital Los Angeles) Ser. 10A AGM | | | 5.250 | | | | 07/01/2038 | | | | 550,825 | |
| | 1,000,000 | | | California State Health Facilities Financing Auth. Rev. Ref. (Cedars Sinai Medical Center) Ser. 16B | | | 5.000 | | | | 08/15/2035 | | | | 1,192,470 | |
| | 2,615,000 | | | California State Health Facilities Financing Auth. Rev. Ref. (Sutter Health) Ser. 11D | | | 5.000 | | | | 08/15/2035 | | | | 3,005,001 | |
| | 730,000 | | | California Statewide Communities Development Auth. Rev. (Adventist Remarketed 05/23/08) Ser. 07B AGC(a) | | | 5.000 | | | | 05/23/2018 | | | | 774,574 | |
| | 1,000,000 | | | California Statewide Communities Development Auth. Rev. (Catholic Healthcare West) Ser. 07K AGC | | | 5.500 | | | | 07/01/2041 | | | | 1,026,140 | |
| | 20,355,000 | | | California Statewide Communities Development Auth. Rev. (St. Joseph Health System-Remarketed) Insured Ser. 07C FGIC(a) | | | 5.750 | | | | 07/01/2018 | | | | 22,021,260 | |
| | 905,000 | | | California Statewide Communities Development Auth. Rev. Ref. (John Muir Health) Ser. 16A | | | 4.000 | | | | 08/15/2046 | | | | 941,046 | |
| | 5,000,000 | | | Christian County Kentucky Hospital Rev. (Hospital-Jennie Stuart Medical Center) Ser. 06 AGC | | | 5.500 | | | | 02/01/2036 | | | | 5,228,750 | |
| | 2,500,000 | | | Cobb County Georgia Kennestone Hospital Auth. Rev. Certificates Sub.-Ser. 05B AMBAC | | | 5.500 | | | | 04/01/2037 | | | | 2,802,050 | |
| | 1,570,000 | | | District of Columbia Hospital Rev. (Children’s Hospital Obligation Group) Ser. 08 AGC(a) | | | 5.250 | | | | 07/15/2018 | | | | 1,686,243 | |
| | 3,000,000 | | | Gwinnett County Georgia Hospital Auth. RAC (Gwinnett Hospital System) Ser. 07D AGM | | | 5.500 | | | | 07/01/2041 | | | | 3,274,530 | |
| | 2,000,000 | | | Halifax Hospital Medical Center (Florida Hospital) Rev. Ser. 06B-1 AGM(a) | | | 5.500 | | | | 06/01/2018 | | | | 2,144,180 | |
| | 4,400,000 | | | Hamilton County Ohio Health Care Facilities Rev. (Christ Hospital Project) Ser. 12 AGM | | | 5.000 | | | | 06/01/2042 | | | | 5,005,484 | |
| | 1,250,000 | | | Hamilton County Ohio Health Care Rev. Ref. & Improvement (Life Enriching Communities Project) Ser. 16 | | | 5.000 | | | | 01/01/2046 | | | | 1,360,587 | |
| | 3,800,000 | | | Harris County Health Facilities Development Corp. Thermal Utility Rev. (TECO Project) Ser. 08 AGC | | | 5.125 | | | | 11/15/2037 | | | | 4,086,140 | |
| | 2,000,000 | | | Hawaii State Department of Budget and Finance Special Purpose Rev. Ref. (Queens Health Systems) Ser. 15A | | | 5.000 | | | | 07/01/2035 | | | | 2,361,740 | |
| | 1,000,000 | | | Illinois Finance Auth. Rev. (Carle Foundation) Ser. 11A AGM | | | 6.000 | | | | 08/15/2041 | | | | 1,173,280 | |
| | 1,000,000 | | | Illinois Finance Auth. Rev. (Southern Illinois Healthcare) Ser. 05 AGM | | | 5.250 | | | | 03/01/2030 | | | | 1,101,890 | |
| | 1,700,000 | | | Indiana Health & Educational Facilities Finance Auth. Rev. (St. Francis) Ref. Ser. 06E AGM(a) | | | 5.250 | | | | 05/01/2018 | | | | 1,811,384 | |
| | 1,960,000 | | | Johnston North Carolina Memorial Hospital Auth. Ser. 08 AGM(a) | | | 5.250 | | | | 04/01/2018 | | | | 2,082,030 | |
| | 1,050,000 | | | Lakeland Florida Hospital Systems Rev. (Lakeland Regional Health) Ser. 15 | | | 5.000 | | | | 11/15/2040 | | | | 1,178,667 | |
| | 1,500,000 | | | Lancaster County Pennsylvania Hospital Auth. Ref. (University of Pennsylvania Health System) Ser. 16 | | | 5.000 | | | | 08/15/2046 | | | | 1,747,245 | |
| | 2,500,000 | | | Maine Health & Higher Educational Facilities Auth. Rev. (Eastern Main Healthcare System) Ser. 16A | | | 5.000 | | | | 07/01/2041 | | | | 2,763,050 | |
| | 1,500,000 | | | Maine Health & Higher Educational Facilities Auth. Rev. (Eastern Main Healthcare System) Ser. 16A | | | 5.000 | | | | 07/01/2046 | | | | 1,650,150 | |
| | 2,000,000 | | | Massachusetts State Development Finance Agency Rev. (Dana-Farber Cancer Institute) Ser. 16N | | | 5.000 | | | | 12/01/2046 | | | | 2,337,240 | |
| | 6,595,000 | | | Medford Oregon Hospital Facilities Auth. Rev. Ref. (Asanthe Health System) Ser. 10 AGM | | | 5.500 | | | | 08/15/2028 | | | | 7,455,647 | |
| | 2,000,000 | | | Medical Center Hospital Auth. Georgia RAC (Columbus Regional Healthcare) Ser. 10 AGM | | | 5.000 | | | | 08/01/2041 | | | | 2,153,660 | |
| | 1,200,000 | | | Medical Center Hospital Auth. Georgia RAC (Columbus Regional Healthcare) Ser. 10 AGM | | | 5.000 | | | | 08/01/2045 | | | | 1,288,656 | |
| | 2,000,000 | | | Metropolitan Government Nashville & Davidson County Health & Educational Facilities Board (Vanderbilt University Medical Center) Ser. 16A | | | 5.000 | | | | 07/01/2035 | | | | 2,350,860 | |
| | 3,000,000 | | | Metropolitan Government Nashville & Davidson County Health & Educational Facilities Board (Vanderbilt University Medical Center) Ser. 16A | | | 5.000 | | | | 07/01/2040 | | | | 3,493,290 | |
| | 2,750,000 | | | Metropolitan Government Nashville & Davidson County Health & Educational Facilities Board (Vanderbilt University Medical Center) Ser. 16A | | | 5.000 | | | | 07/01/2046 | | | | 3,179,715 | |
| | 1,000,000 | | | New Hope Cultural Education Facilities Finance Corp. Texas Senior Living Rev. (Cardinal Bay Inc.—Village on the Park Carriage Inn Project) Ser. 16A-1 | | | 5.000 | | | | 07/01/2046 | | | | 1,120,770 | |
| | 1,000,000 | | | New Hope Cultural Education Facilities Finance Corp. Texas Senior Living Rev. (Cardinal Bay Inc.—Village on the Park Carriage Inn Project) Ser. 16A-1 | | | 5.000 | | | | 07/01/2051 | | | | 1,117,940 | |
| | 3,000,000 | | | New Jersey Health Care Facilities Financing Auth. Rev. (University Hospital) Ser. 15A AGM | | | 5.000 | | | | 07/01/2046 | | | | 3,402,120 | |
| | 10,000,000 | | | New Jersey Health Care Facilities Financing Auth. Rev. (Virtua Health) Ser. 09 AGC | | | 5.500 | | | | 07/01/2038 | | | | 11,038,800 | |
See accompanying Notes to Financial Statements which are an integral part of the financial statements.
PowerShares National AMT-Free Municipal Bond Portfolio (PZA) (continued)
October 31, 2016
| | | | | | | | | | | | | | | | |
Principal
Amount | | | | | Interest
Rate | | | Maturity
Date | | | Value | |
| | | | Municipal Bonds (continued) | | | | | | | | | | | | |
| | | | Health, Hospital, Nursing Home Revenue (continued) | | | | | | | | | | | | |
| $ | 500,000 | | | New Jersey Health Care Facilities Financing Auth. Rev. Ref. (Barnabas Health)
Ser. 11A(a) | | | 5.625 | % | | | 07/01/2021 | | | $ | 601,500 | |
| | 1,000,000 | | | New Jersey Health Care Facilities Financing Auth. Rev. Ref. (Princeton Healthcare System) Ser. 16A | | | 5.000 | | | | 07/01/2039 | | | | 1,160,790 | |
| | 2,500,000 | | | New York State Dormitory Auth. Rev. Non State Supported Debt Ref. (NYU Hospitals Center) Ser. 15 | | | 5.000 | | | | 07/01/2034 | | | | 2,924,950 | |
| | 1,000,000 | | | Ohio State Higher Educational Facilities Community Rev. (Summa Health System 2010 Project) Ser. 10 AGM | | | 5.250 | | | | 11/15/2035 | | | | 1,107,240 | |
| | 2,500,000 | | | Palm Beach County Florida Health Facilities Auth. Health Facilities Rev. (Bethesda Healthcare System, Inc. Project) Ser. 10A AGM | | | 5.250 | | | | 07/01/2040 | | | | 2,755,050 | |
| | 15,000 | | | Roanoke Virginia Industrial Development Auth. Hospital Rev. (Carilion Health System-Remarketed) Ser. 05B AGM(a) | | | 5.000 | | | | 07/01/2020 | | | | 17,123 | |
| | 985,000 | | | Roanoke Virginia Industrial Development Auth. Hospital Rev. Ref. (Carilion Health System-Remarketed) Ser. 05B AGM | | | 5.000 | | | | 07/01/2038 | | | | 1,074,704 | |
| | 1,000,000 | | | South Carolina Jobs-Economic Development Auth. Hospital Rev. Ref. & Improvement (Anmed Health) Ser. 09B AGC | | | 5.500 | | | | 02/01/2038 | | | | 1,086,600 | |
| | 4,350,000 | | | South Carolina Jobs-Economic Development Auth. Hospital Rev. Ref. (Palmetto Health) Ser. 11A AGM | | | 6.500 | | | | 08/01/2039 | | | | 5,226,090 | |
| | 1,000,000 | | | South Fork Municipal Auth. Pennsylvania Hospital Rev. (Conemaugh Valley Memorial Hospital) Ser. 10B AGC(a) | | | 5.375 | | | | 07/01/2020 | | | | 1,152,620 | |
| | 1,750,000 | | | Tampa Florida Health System Rev. (BayCare Obligated Group) Ser. 16A | | | 5.000 | | | | 11/15/2046 | | | | 2,043,195 | |
| | 750,000 | | | Tarrant County Texas Cultural Education Facilities Finance Corp. Hospital Rev. Ref. (Baylor Scott & White Health Project) Ser. 16A | | | 5.000 | | | | 11/15/2045 | | | | 877,012 | |
| | 2,050,000 | | | Washington State Health Care Facilities Auth. Rev. (Multicare Health System Remarketed) Ser. 07B AGM | | | 5.500 | | | | 08/15/2038 | | | | 2,182,123 | |
| | 850,000 | | | Washington State Health Care Facilities Auth. Rev. (Providence Health) Ser. 06E AGM | | | 5.250 | | | | 10/01/2033 | | | | 915,085 | |
| | 3,100,000 | | | Wisconsin State Health & Educational Facilities Auth. Rev. Ref. (Ascension Health Credit Group) Ser. 16A | | | 5.000 | | | | 11/15/2039 | | | | 3,653,226 | |
| | 1,500,000 | | | Wisconsin State Health & Educational Facilities Auth. Rev. Ref. (Prohealth Care Obligated Group) Ser. 15 | | | 5.000 | | | | 08/15/2039 | | | | 1,708,605 | |
| | | | | | | | | | | | | | | | |
| | | | | | | | | | | | | | | 141,944,826 | |
| | | | | | | | | | | | | | | | |
| | | | Highway Tolls Revenue—8.6% | | | | | | | | | | | | |
| | 2,500,000 | | | Bay Area California Auth. Toll Bridge Rev. Ser. 14S-6 | | | 5.000 | | | | 10/01/2054 | | | | 2,895,425 | |
| | 1,250,000 | | | Central Texas Regional Mobility Auth. Rev. Ref. Ser. 16 | | | 5.000 | | | | 01/01/2040 | | | | 1,420,037 | |
| | 700,000 | | | Central Texas Regional Mobility Auth. Rev. Ref. Ser. 16 | | | 5.000 | | | | 01/01/2046 | | | | 791,665 | |
| | 7,500,000 | | | Delaware River Port Auth. Pennsylvania & New Jersey Rev. Ser. 10D AGM | | | 5.000 | | | | 01/01/2040 | | | | 8,321,025 | |
| | 1,000,000 | | | Harris County Texas Ref. (Senior Lien) Ser. 16A | | | 5.000 | | | | 08/15/2041 | | | | 1,183,420 | |
| | 1,000,000 | | | Harris County Texas Ref. (Senior Lien) Ser. 16A | | | 5.000 | | | | 08/15/2047 | | | | 1,176,430 | |
| | 4,000,000 | | | Illinois State Toll Highway Auth. Senior Ser. 16B | | | 5.000 | | | | 01/01/2041 | | | | 4,644,960 | |
| | 8,000,000 | | | New York State Thruway Auth. General Rev. (Junior Indebtedness Obligation-Junior Lien) Ser. 16A | | | 5.000 | | | | 01/01/2046 | | | | 9,273,680 | |
| | 5,000,000 | | | New York State Thruway Auth. General Rev. (Junior Indebtedness Obligation-Junior Lien) Ser. 16A | | | 5.000 | | | | 01/01/2051 | | | | 5,731,300 | |
| | 4,000,000 | | | New York State Thruway Auth. General Rev. (Junior Indebtedness Obligation-Junior Lien) Ser. 16A | | | 5.250 | | | | 01/01/2056 | | | | 4,744,240 | |
| | 3,000,000 | | | New York State Thruway Auth. Ref. Ser. 14 | | | 5.000 | | | | 01/01/2032 | | | | 3,543,540 | |
| | 525,000 | | | New York Triborough Bridge & Tunnel Auth. General Rev. Ser. 15A | | | 5.000 | | | | 11/15/2040 | | | | 619,600 | |
| | 4,000,000 | | | New York Triborough Bridge & Tunnel Auth. General Rev. Ser. 16A | | | 5.000 | | | | 11/15/2041 | | | | 4,772,800 | |
| | 3,000,000 | | | New York Triborough Bridge & Tunnel Auth. General Rev. Ser. 16A | | | 5.000 | | | | 11/15/2046 | | | | 3,557,400 | |
| | 4,250,000 | | | North Carolina Turnpike Auth. Triangle Expressway System Rev. Ser. 09A AGC | | | 5.500 | | | | 01/01/2029 | | | | 4,588,215 | |
| | 4,000,000 | | | North Carolina Turnpike Auth. Triangle Expressway System Rev. Ser. 09A AGC | | | 5.750 | | | | 01/01/2039 | | | | 4,339,520 | |
| | 16,000,000 | | | North Texas Tollway Auth. Rev. Ref. (First Tier) Ser. 08K-1 AGC(a) | | | 5.750 | | | | 01/01/2019 | | | | 17,644,640 | |
| | 2,500,000 | | | North Texas Tollway Auth. Rev. Ref. Ser. 15B | | | 5.000 | | | | 01/01/2040 | | | | 2,864,275 | |
| | 1,800,000 | | | North Texas Tollway Auth. Rev. Ref. Ser. 16A | | | 5.000 | | | | 01/01/2039 | | | | 2,099,142 | |
| | 15,000,000 | | | Pennsylvania State Turnpike Commission Rev. Ser. 14B | | | 5.250 | | | | 12/01/2039 | | | | 17,359,650 | |
| | 3,000,000 | | | Pennsylvania State Turnpike Commission Rev. Sub.-Ser. 11A(a) | | | 6.500 | | | | 12/01/2020 | | | | 3,650,460 | |
| | 8,800,000 | | | Pennsylvania State Turnpike Commission Rev. Sub.-Ser. 12B AGM | | | 5.000 | | | | 12/01/2042 | | | | 10,292,040 | |
| | 2,500,000 | | | Texas State Transportation Commission Turnpike System Rev. Ref. Ser. 15C | | | 5.000 | | | | 08/15/2042 | | | | 2,833,750 | |
| | | | | | | | | | | | | | | | |
| | | | | | | | | | | | | | | 118,347,214 | |
| | | | | | | | | | | | | | | | |
See accompanying Notes to Financial Statements which are an integral part of the financial statements.
PowerShares National AMT-Free Municipal Bond Portfolio (PZA) (continued)
October 31, 2016
| | | | | | | | | | | | | | | | |
Principal
Amount | | | | | Interest
Rate | | | Maturity
Date | | | Value | |
| | | | Municipal Bonds (continued) | | | | | | | | | | | | |
| | | | Hotel Occupancy Tax—1.3% | | | | | | | | | | | | |
| $ | 3,950,000 | | | Harris County Houston Texas Sports Auth. Rev. Ref. (Senior Lien) Ser. 14A | | | 5.000 | % | | | 11/15/2053 | | | $ | 4,399,668 | |
| | 2,215,000 | | | Miami-Dade County Florida Special Obligation Ref. Sub.-Ser. 12B | | | 5.000 | | | | 10/01/2037 | | | | 2,513,848 | |
| | 2,000,000 | | | New York State Convention Center Development Corp. Rev. Ref. (Hotel Unit Fee Secured) Ser. 15 | | | 5.000 | | | | 11/15/2040 | | | | 2,340,500 | |
| | 3,000,000 | | | New York State Convention Center Development Corp. Rev. Ref. (Hotel Unit Fee Secured) Ser. 15 | | | 5.000 | | | | 11/15/2045 | | | | 3,497,730 | |
| | 4,000,000 | | | New York State Convention Center Development Corp. Rev. (Senior Lien-Hotel Unit Fee Secured) Ser. 16A | | | 5.000 | | | | 11/15/2046 | | | | 4,723,200 | |
| | | | | | | | | | | | | | | | |
| | | | | | | | | | | | | | | 17,474,946 | |
| | | | | | | | | | | | | | | | |
| | | | Income Tax Revenue—3.3% | | | | | | | | | | | | |
| | 1,200,000 | | | District of Columbia Income Tax Secured Rev. Ser. 11G | | | 5.000 | | | | 12/01/2036 | | | | 1,399,260 | |
| | 4,150,000 | | | New York City Transitional Finance Auth. Rev. Future Tax Secured (Fiscal 2011) Ser.11D | | | 5.000 | | | | 02/01/2035 | | | | 4,758,058 | |
| | 2,000,000 | | | New York City Transitional Finance Auth. Rev. Future Tax Secured (Fiscal 2015) Sub.-Ser.14A-1 | | | 5.000 | | | | 08/01/2035 | | | | 2,417,540 | |
| | 4,330,000 | | | New York City Transitional Finance Auth. Rev. Future Tax Secured (Fiscal 2015) Sub.-Ser.14B-1 | | | 5.000 | | | | 08/01/2042 | | | | 5,101,563 | |
| | 7,500,000 | | | New York City Transitional Finance Auth. Rev. Sub.-Ser. 16A-1 | | | 5.000 | | | | 05/01/2040 | | | | 8,854,275 | |
| | 1,325,000 | | | New York State Dormitory Auth. Personal Income Tax Rev. (General Purpose) Ser. 10F | | | 5.000 | | | | 02/15/2035 | | | | 1,480,330 | |
| | 4,000,000 | | | New York State Dormitory Auth. Personal Income Tax Rev. (General Purpose) Ser. 11C | | | 5.000 | | | | 03/15/2041 | | | | 4,537,960 | |
| | 4,500,000 | | | New York State Dormitory Auth. Personal Income Tax Rev. (General Purpose) Ser. 12B | | | 5.000 | | | | 03/15/2042 | | | | 5,160,600 | |
| | 1,905,000 | | | New York State Dormitory Auth. Personal Income Tax Rev. Ref. Ser. 14E | | | 5.000 | | | | 02/15/2044 | | | | 2,203,875 | |
| | 7,530,000 | | | New York State Dormitory Auth. Personal Income Tax Rev. Ref. Ser. 15A | | | 5.000 | | | | 03/15/2035 | | | | 8,937,658 | |
| | 1,000,000 | | | New York State Urban Development Corp. Rev. State Personal Income Tax Ser. 13A-1 | | | 5.000 | | | | 03/15/2043 | | | | 1,155,310 | |
| | | | | | | | | | | | | | | | |
| | | | | | | | | | | | | | | 46,006,429 | |
| | | | | | | | | | | | | | | | |
| | | | Lease Revenue—2.6% | | | | | | | | | | | | |
| | 1,500,000 | | | California State Public Works Board Lease Rev. Ser. 14B | | | 5.000 | | | | 10/01/2039 | | | | 1,757,220 | |
| | 500,000 | | | Kern County California COP (Capital Improvements Projects) Ser. 09A AGC | | | 5.750 | | | | 08/01/2035 | | | | 548,150 | |
| | 7,000,000 | | | Los Angeles California Municipal Improvement Corp. Lease Rev. (Real Property) Ser. 09B AGC(a) | | | 5.500 | | | | 04/01/2019 | | | | 7,757,330 | |
| | 2,250,000 | | | Los Angeles County California Public Works Financing Auth. Lease Rev. Ser. 15A | | | 5.000 | | | | 12/01/2039 | | | | 2,634,188 | |
| | 1,000,000 | | | Los Angeles County California Public Works Financing Auth. Lease Rev. Ser. 15A | | | 5.000 | | | | 12/01/2044 | | | | 1,165,210 | |
| | 3,000,000 | | | Los Angeles County California Public Works Financing Auth. Lease Rev. Ser. 16D | | | 5.000 | | | | 12/01/2045 | | | | 3,539,220 | |
| | 2,150,000 | | | Miami-Dade County Florida School Board COP Ser. 08B AGC(a) | | | 5.000 | | | | 05/01/2018 | | | | 2,283,214 | |
| | 500,000 | | | Miami-Dade County Florida School Board COP Ser. 09A AGC(a) | | | 5.375 | | | | 02/01/2019 | | | | 548,890 | |
| | 1,000,000 | | | MTA Hudson Rail Yards Trust Obligations Rev. Ser. 16A | | | 5.000 | | | | 11/15/2046 | | | | 1,090,490 | |
| | 2,000,000 | | | MTA Hudson Rail Yards Trust Obligations Rev. Ser. 16A | | | 5.000 | | | | 11/15/2051 | | | | 2,229,640 | |
| | 4,000,000 | | | Richmond Joint Powers Financing Auth. Lease Rev. (Civic Center Project) Ser. 09 AGC | | | 5.750 | | | | 08/01/2029 | | | | 4,434,760 | |
| | 2,000,000 | | | Sandy Spring Georgia Public Facilities Auth. Rev. (City Center Project) Ser. 15 | | | 5.000 | | | | 05/01/2041 | | | | 2,396,160 | |
| | 5,000,000 | | | State Public School Building Auth. Pennsylvania School Rev. (Harrisburg School District Project) Ser. 09A AGC(a) | | | 4.750 | | | | 05/15/2019 | | | | 5,470,550 | |
| | | | | | | | | | | | | | | | |
| | | | | | | | | | | | | | | 35,855,022 | |
| | | | | | | | | | | | | | | | |
| | | | Local or GTD Housing—0.2% | | | | | | | | | | | | |
| | 2,440,000 | | | New York State Dormitory Auth. Rev. Non State Supported Debt Ref. (North Shore Long Island Jewish Obligation Group) Ser. 15A | | | 5.000 | | | | 05/01/2036 | | | | 2,842,551 | |
| | | | | | | | | | | | | | | | |
| | | | Lottery Revenue—0.6% | | | | | | | | | | | | |
| | 7,500,000 | | | Arizona State Lottery Rev. Ser. 10A AGM | | | 5.000 | | | | 07/01/2029 | | | | 8,252,400 | |
| | | | | | | | | | | | | | | | |
| | | | Miscellaneous Revenue—4.2% | | | | | | | | | | | | |
| | 5,000,000 | | | Alamo Texas Regional Mobility Auth. (Senior Lien) Ser. 16 | | | 5.000 | | | | 06/15/2046 | | | | 5,799,900 | |
| | 3,500,000 | | | California State Various Purpose (Green Bonds) Ser. 14 | | | 5.000 | | | | 10/01/2037 | | | | 4,163,600 | |
| | 5,000,000 | | | California State Various Purpose Ser.14 | | | 5.000 | | | | 10/01/2039 | | | | 5,944,050 | |
| | 2,500,000 | | | Dallas Texas Civic Center Rev. Ref. & Improvement Ser. 09 AGC | | | 5.250 | | | | 08/15/2034 | | | | 2,743,575 | |
| | 2,025,000 | | | Indianapolis Indiana Local Public Improvement Bond Bank (PILOT Infrastructure Project) Ser. 10F AGM | | | 5.000 | | | | 01/01/2035 | | | | 2,238,718 | |
| | 535,000 | | | Indianapolis Indiana Local Public Improvement Bond Bank (PILOT Infrastructure Project) Ser. 10F AGM | | | 5.000 | | | | 01/01/2040 | | | | 587,976 | |
| | 2,190,000 | | | Kansas City Missouri Special Obligation Ref. & Improvement (Downtown Arena Project)
Ser. 16E | | | 5.000 | | | | 04/01/2040 | | | | 2,511,842 | |
| | 1,000,000 | | | Kentucky Economic Development Financial Auth. (Louisville Arena Project)
Rev. Sub.-Ser. 08A-1 AGC | | | 6.000 | | | | 12/01/2033 | | | | 1,061,510 | |
| | 5,545,000 | | | Kentucky Economic Development Financial Auth. (Louisville Arena Project) Rev. Sub.-Ser. 08A-1 AGC | | | 6.000 | | | | 12/01/2038 | | | | 5,878,033 | |
See accompanying Notes to Financial Statements which are an integral part of the financial statements.
PowerShares National AMT-Free Municipal Bond Portfolio (PZA) (continued)
October 31, 2016
| | | | | | | | | | | | | | | | |
Principal
Amount | | | | | Interest
Rate | | | Maturity
Date | | | Value | |
| | | | Municipal Bonds (continued) | | | | | | | | | | | | |
| | | | Miscellaneous Revenue (continued) | | | | | | | | | | | | |
| $ | 1,500,000 | | | Kentucky Economic Development Financial Auth. (Louisville Arena Project) Rev. Sub.-Ser. 08A-1 AGC | | | 6.000 | % | | | 12/01/2042 | | | $ | 1,590,090 | |
| | 2,000,000 | | | Maryland State Stadium Auth. Rev. Baltimore City Public Schools Ser. 16 | | | 5.000 | | | | 05/01/2041 | | | | 2,368,460 | |
| | 400,000 | | | New Jersey State Transportation Trust Fund Auth. (Transit System) Ser. 07A AMBAC | | | 5.000 | | | | 12/15/2032 | | | | 413,892 | |
| | 500,000 | | | New York City Industrial Development Agency Rev. (Queens Baseball Stadium-PILOT) Ser. 09 AGC | | | 6.500 | | | | 01/01/2046 | | | | 554,675 | |
| | 3,000,000 | | | New York City Transitional Finance Auth. Building Aid Rev. (Fiscal 2015) Ser. 15S-1 | | | 5.000 | | | | 07/15/2040 | | | | 3,509,490 | |
| | 2,500,000 | | | Newark New Jersey Housing Auth. Rev. (City-Secured Police Facilities) Rev. Ref. Ser. 16 AGM | | | 5.000 | | | | 12/01/2038 | | | | 2,832,125 | |
| | 1,000,000 | | | Newark New Jersey Housing Auth. Rev. (South Ward Police Facility) Ser. 09 AGC(a) | | | 6.750 | | | | 12/01/2019 | | | | 1,173,750 | |
| | 11,535,000 | | | Pittsburg Unified School District Financing Auth. Rev. (District Bond Program) Ser. 11 AGM(a) | | | 5.500 | | | | 09/01/2021 | | | | 13,914,209 | |
| | | | | | | | | | | | | | | | |
| | | | | | | | | | | | | | | 57,285,895 | |
| | | | | | | | | | | | | | | | |
| | | | Miscellaneous Taxes—0.3% | | | | | | | | | | | | |
| | 2,970,000 | | | Miami-Dade County Florida Special Obligation Sub. Ref. Ser. 16 | | | 5.000 | | | | 10/01/2035 | | | | 3,495,690 | |
| | | | | | | | | | | | | | | | |
| | | | Natural Gas Revenue—0.3% | | | | | | | | | | | | |
| | 3,655,000 | | | Chula Vista California Industrial Development Rev. (San Diego Gas—Remarketed 06/17/09) Ser. 04A | | | 5.875 | | | | 02/15/2034 | | | | 4,068,198 | |
| | | | | | | | | | | | | | | | |
| | | | Nuclear Revenue—1.4% | | | | | | | | | | | | |
| | 2,000,000 | | | South Carolina State Public Service Auth. Rev. Obligation Ref. Ser. 14C | | | 5.000 | | | | 12/01/2039 | | | | 2,319,400 | |
| | 4,000,000 | | | South Carolina State Public Service Auth. Rev. Obligation Ref. Ser. 16A | | | 5.000 | | | | 12/01/2036 | | | | 4,702,000 | |
| | 3,000,000 | | | South Carolina State Public Service Auth. Rev. Obligation Ref. Ser. 16A | | | 5.000 | | | | 12/01/2037 | | | | 3,515,520 | |
| | 5,000,000 | | | South Carolina State Public Service Auth. Rev. Obligation Ref. Ser. 16B | | | 5.000 | | | | 12/01/2036 | | | | 5,917,000 | |
| | 2,500,000 | | | South Carolina State Public Service Auth. Rev. Obligation Ref. Ser. 16B | | | 5.000 | | | | 12/01/2056 | | | | 2,852,725 | |
| | | | | | | | | | | | | | | | |
| | | | | | | | | | | | | | | 19,306,645 | |
| | | | | | | | | | | | | | | | |
| | | | Port, Airport & Marina Revenue—5.6% | | | | | | | | | | | | |
| | 3,000,000 | | | Birmingham Alabama Airport Auth. Airport Rev. Ser. 10 AGM | | | 5.250 | | | | 07/01/2030 | | | | 3,374,100 | |
| | 1,500,000 | | | Birmingham Alabama Airport Auth. Airport Rev. Ser. 10 AGM | | | 5.500 | | | | 07/01/2040 | | | | 1,694,625 | |
| | 3,500,000 | | | Chicago Illinois Midway Airport Rev. Ref. Ser. 16B | | | 5.000 | | | | 01/01/2041 | | | | 4,054,190 | |
| | 2,500,000 | | | Chicago Illinois Midway Airport Rev. Ref. Ser. 16B | | | 5.000 | | | | 01/01/2046 | | | | 2,882,850 | |
| | 4,000,000 | | | Chicago Illinois O’Hare International Airport Rev. Ref. Ser. 15B | | | 5.000 | | | | 01/01/2033 | | | | 4,682,880 | |
| | 1,250,000 | | | Chicago Illinois O’Hare International Airport Rev. Ser. 15D | | | 5.000 | | | | 01/01/2046 | | | | 1,441,575 | |
| | 1,000,000 | | | City of Cleveland Ohio Airport System Rev. Ref. Ser. 12A AGM | | | 5.000 | | | | 01/01/2031 | | | | 1,127,670 | |
| | 2,000,000 | | | Dallas Fort Worth Texas International Airport Rev. Ref. Ser. 12B | | | 5.000 | | | | 11/01/2035 | | | | 2,263,140 | |
| | 1,500,000 | | | Manchester New Hampshire General Airport Rev. Ref. Remarketed Ser. 09A AGM | | | 5.125 | | | | 01/01/2030 | | | | 1,582,170 | |
| | 1,500,000 | | | Metropolitan Nashville Tennessee Airport Auth. Rev. Ser. 15A | | | 5.000 | | | | 07/01/2045 | | | | 1,752,330 | |
| | 3,250,000 | | | Miami-Dade County Florida Aviation Rev. Ref. Ser. 16 | | | 5.000 | | | | 10/01/2041 | | | | 3,797,820 | |
| | 7,000,000 | | | Miami-Dade County Florida Aviation Rev. Ser. 10B AGM | | | 5.000 | | | | 10/01/2035 | | | | 7,839,790 | |
| | 600,000 | | | Philadelphia Pennsylvania Airport Rev. Ser. 10A AGM | | | 5.000 | | | | 06/15/2035 | | | | 666,132 | |
| | 2,000,000 | | | Phoenix Arizona Civic Improvement Corp. Airport Rev. (Junior Lien) Ser. 15A | | | 5.000 | | | | 07/01/2045 | | | | 2,303,200 | |
| | 6,000,000 | | | Port Auth. of New York & New Jersey (Consolidated-One Hundred Eighty-Fourth) Ref. Ser. 14 | | | 5.000 | | | | 09/01/2039 | | | | 7,093,680 | |
| | 17,960,000 | | | Port Auth. of New York & New Jersey Ref. (194th Series) Ser. 15 | | | 5.000 | | | | 10/15/2041 | | | | 21,257,815 | |
| | 3,500,000 | | | Port Auth. of New York & New Jersey Ref. (Consolidated) Ser. 15-189 | | | 5.000 | | | | 05/01/2045 | | | | 4,101,965 | |
| | 2,000,000 | | | San Francisco California City & County Airports Commission Rev. (San Francisco International Airport) Ser. 14B | | | 5.000 | | | | 05/01/2044 | | | | 2,298,720 | |
| | 2,000,000 | | | San Jose California Airport Rev. Ser. 07B AMBAC | | | 5.000 | | | | 03/01/2037 | | | | 2,026,180 | |
| | 500,000 | | | Wayne County Michigan Airport Auth. Rev. Ser. 15D | | | 5.000 | | | | 12/01/2040 | | | | 579,415 | |
| | | | | | | | | | | | | | | | |
| | | | | | | | | | | | | | | 76,820,247 | |
| | | | | | | | | | | | | | | | |
| | | | Recreational Revenue—0.2% | | | | | | | | | | | | |
| | 3,000,000 | | | New York City Industrial Development Agency Rev. (Yankee Stadium-PILOT) Ser. 09 AGC | | | 7.000 | | | | 03/01/2049 | | | | 3,400,380 | |
| | | | | | | | | | | | | | | | |
| | | | Sales Tax Revenue—7.3% | | | | | | | | | | | | |
| | 5,240,000 | | | Bi-State Development Agency of Missouri-Illinois Metropolitan District Mass Transit Sales Tax (MetroLink Cross County Extension) Ser. 09 AGC | | | 5.000 | | | | 10/01/2035 | | | | 5,734,656 | |
| | 170,000 | | | Dallas Texas Area Rapid Transit Sales Tax Rev. (Senior Lien) Ser. 07 AMBAC | | | 5.000 | | | | 12/01/2032 | | | | 170,610 | |
| | 230,000 | | | Dallas Texas Area Rapid Transit Sales Tax Rev. Ref. (Senior Lien) Ser. 07
AMBAC(a) | | | 5.000 | | | | 12/01/2016 | | | | 230,826 | |
| | 5,305,000 | | | Dallas Texas Area Rapid Transit Sales Tax Rev. Ref. Ser. 16A | | | 5.000 | | | | 12/01/2048 | | | | 6,198,150 | |
| | 1,000,000 | | | Denver Colorado City & County Dedicated Tax Rev. Ref. & Improvement Ser. 16A | | | 5.000 | | | | 08/01/2042 | | | | 1,180,920 | |
See accompanying Notes to Financial Statements which are an integral part of the financial statements.
PowerShares National AMT-Free Municipal Bond Portfolio (PZA) (continued)
October 31, 2016
| | | | | | | | | | | | | | | | |
Principal
Amount | | | | | Interest
Rate | | | Maturity
Date | | | Value | |
| | | | Municipal Bonds (continued) | | | | | | | | | | | | |
| | | | Sales Tax Revenue (continued) | | | | | | | | | | | | |
| $ | 750,000 | | | Denver Colorado City & County Dedicated Tax Rev. Ref. & Improvement Ser. 16A | | | 5.000 | % | | | 08/01/2044 | | | $ | 882,892 | |
| | 1,815,000 | | | Illinois Regional Transportation Auth. Ser. 00 NATL | | | 6.500 | | | | 07/01/2030 | | | | 2,490,470 | |
| | 300,000 | | | Illinois Regional Transportation Auth. Ser. 06A NATL | | | 4.500 | | | | 07/01/2035 | | | | 300,738 | |
| | 7,145,000 | | | Massachusetts State Bay Transportation Auth. Sales Tax Rev. (Senior Lien) Ser. 15A | | | 5.000 | | | | 07/01/2040 | | | | 8,419,168 | |
| | 18,770,000 | | | Massachusetts State School Building Auth. Dedicated Sales Tax Rev. Ref. Ser. 15C | | | 5.000 | | | | 08/15/2037 | | | | 22,304,579 | |
| | 3,000,000 | | | Pittsburgh & Allegheny County Pennsylvania Sports & Exhibition Auth. Sales Ref. (Regional Asset District) Ser. 10 AGM | | | 5.000 | | | | 02/01/2031 | | | | 3,354,720 | |
| | 2,500,000 | | | Puerto Rico Sales Tax Financing Corp. Sales Tax Rev. First Sub.-Ser. 10A AGM | | | 5.000 | | | | 08/01/2040 | | | | 2,628,025 | |
| | 15,295,000 | | | Regional Transportation District Colorado Sales Tax Rev. (Fastracks Project) Ser. 10A | | | 5.000 | | | | 11/01/2038 | | | | 17,351,872 | |
| | 26,500,000 | | | Sales Tax Asset Receivables Corp. Ref. (Fiscal 2015) Ser. 14A | | | 4.000 | | | | 10/15/2032 | | | | 29,798,985 | |
| | | | | | | | | | | | | | | | |
| | | | | | | | | | | | | | | 101,046,611 | |
| | | | | | | | | | | | | | | | |
| | | | Sewer Revenue—4.6% | | | | | | | | | | | | |
| | 24,375,000 | | | Chicago Illinois Wastewater Transmission Rev. (Second Lien) Ser. 12 AGM | | | 5.000 | | | | 01/01/2037 | | | | 26,557,294 | |
| | 2,500,000 | | | Chicago Illinois Wastewater Transmission Rev. Ser. 08A BHAC | | | 5.500 | | | | 01/01/2038 | | | | 2,606,850 | |
| | 2,000,000 | | | Detroit Michigan Sewage Disposal Rev. (Second Lien-Remarketed) Ser. 06A BHAC(a) | | | 5.500 | | | | 07/01/2018 | | | | 2,143,700 | |
| | 5,000,000 | | | Detroit Michigan Water & Sewerage Department Sewerage Disposal System Rev. Ref. (Senior Lien-Remarketed) Ser. 12A AGM | | | 5.000 | | | | 07/01/2039 | | | | 5,558,650 | |
| | 500,000 | | | Fresno California Sewer Rev. Ser. 08A AGC | | | 5.000 | | | | 09/01/2037 | | | | 534,845 | |
| | 5,000,000 | | | Jefferson County Alabama Sewer Rev. (Senior Lien) Ser. 13A AGM | | | 5.500 | | | | 10/01/2053 | | | | 5,795,400 | |
| | 5,595,000 | | | King County Washington Sewer Rev. Ref. & Improvement Ser. 16B | | | 5.000 | | | | 07/01/2039 | | | | 6,497,305 | |
| | 3,000,000 | | | King County Washington Sewer Rev. Ser. 07 AGM(a) | | | 5.000 | | | | 07/01/2017 | | | | 3,086,340 | |
| | 1,000,000 | | | Los Angeles California Wastewater System Rev. (Green Bonds) Ser. 15A | | | 5.000 | | | | 06/01/2044 | | | | 1,186,080 | |
| | 1,500,000 | | | Los Angeles California Wastewater System Rev. (Green Bonds) Ser. 15C | | | 5.000 | | | | 06/01/2045 | | | | 1,775,325 | |
| | 6,500,000 | | | Northeast Ohio Regional Sewer District Ref. Ser. 14 | | | 5.000 | | | | 11/15/2049 | | | | 7,574,450 | |
| | | | | | | | | | | | | | | | |
| | | | | | | | | | | | | | | 63,316,239 | |
| | | | | | | | | | | | | | | | |
| | | | Special Assessment—0.3% | | | | | | | | | | | | |
| | 4,000,000 | | | Sacramento California Area Flood Control Agency Consolidated Capital Assessment District Ser. 08 BHAC | | | 5.625 | | | | 10/01/2037 | | | | 4,310,160 | |
| | | | | | | | | | | | | | | | |
| | | | Student Loan Revenue—0.2% | | | | | | | | | | | | |
| | 2,320,000 | | | Maine Educational Loan Auth. Student Loan Rev. Ser. 09A-3 Class A AGC | | | 5.875 | | | | 12/01/2039 | | | | 2,520,123 | |
| | | | | | | | | | | | | | | | |
| | | | Tax Increment Revenue—2.6% | | | | | | | | | | | | |
| | 17,000,000 | | | Inland Valley California Development Successor Agency Tax Allocation Ref. Ser. 14A AGM | | | 5.000 | | | | 09/01/2044 | | | | 19,354,500 | |
| | 4,000,000 | | | Miami Beach Florida Redevelopment Agency Ref. Tax Increment Rev. (City Center) Ser. 15A AGM | | | 5.000 | | | | 02/01/2040 | | | | 4,579,280 | |
| | 1,000,000 | | | Park Creek Metropolitan District Colorado Rev. (Senior Limited Property Tax) Ser. 11A AGM(a) | | | 6.125 | | | | 12/01/2020 | | | | 1,196,550 | |
| | 5,000,000 | | | Westminster California Redevelopment Agency Tax Allocation Rev. Sub. (Commercial Redevelopment Project No. 1) Ser. 09 AGC(a) | | | 5.750 | | | | 11/01/2019 | | | | 5,703,600 | |
| | 3,930,000 | | | Westminster California Redevelopment Agency Tax Allocation Rev. Sub. (Commercial Redevelopment Project No. 1) Ser. 09 AGC(a) | | | 6.250 | | | | 11/01/2019 | | | | 4,540,997 | |
| | | | | | | | | | | | | | | | |
| | | | | | | | | | | | | | | 35,374,927 | |
| | | | | | | | | | | | | | | | |
| | | | Transit Revenue—5.7% | | | | | | | | | | | | |
| | 1,000,000 | | | Alameda California Corridor Transportation Auth. Ref. (Second Sub.-Lien) Ser. 16B AGM | | | 5.000 | | | | 10/01/2036 | | | | 1,184,570 | |
| | 440,000 | | | Alameda California Corridor Transportation Auth. Ref. (Second Sub.-Lien) Ser. 16B AGM | | | 5.000 | | | | 10/01/2037 | | | | 520,375 | |
| | 10,690,000 | | | Metropolitan Transportation Auth. New York Rev. Ser. 14A-1 | | | 5.000 | | | | 11/15/2044 | | | | 12,412,480 | |
| | 5,075,000 | | | Metropolitan Transportation Auth. New York Rev. (Green Bonds) Ser. 16A-1 | | | 5.250 | | | | 11/15/2056 | | | | 6,066,604 | |
| | 5,000,000 | | | Metropolitan Transportation Auth. New York Rev. Ref. Sub.-Ser. 15C-1 | | | 5.000 | | | | 11/15/2035 | | | | 5,912,450 | |
| | 6,500,000 | | | Metropolitan Transportation Auth. New York Rev. Ser. 12E AGM | | | 5.000 | | | | 11/15/2042 | | | | 7,519,915 | |
| | 13,190,000 | | | Metropolitan Transportation Auth. New York Rev. Ser.13A-1 | | | 5.000 | | | | 11/15/2040 | | | | 15,210,708 | |
| | 10,000,000 | | | Metropolitan Transportation Auth. New York Rev. Sub.-Ser. 15A-1 | | | 5.000 | | | | 11/15/2045 | | | | 11,619,300 | |
| | 15,000,000 | | | New Jersey State Transportation Trust Fund Auth. (Transit System) Ser. 08A AGC | | | 5.500 | | | | 12/15/2038 | | | | 16,067,100 | |
| | 1,250,000 | | | Northern Indiana Commuter Transportation District Rev. Ser. 16 | | | 5.000 | | | | 07/01/2041 | | | | 1,456,100 | |
| | | | | | | | | | | | | | | | |
| | | | | | | | | | | | | | | 77,969,602 | |
| | | | | | | | | | | | | | | | |
| | | | Water Revenue—13.7% | | | | | | | | | | | | |
| | 9,500,000 | | | Atlanta Georgia Water & Wastewater Rev. Ser. 09-B AGM | | | 5.250 | | | | 11/01/2034 | | | | 10,607,510 | |
| | 1,000,000 | | | Austin Texas Water & Wastewater System Rev. Ref. Ser. 16 | | | 5.000 | | | | 11/15/2041 | | | | 1,193,290 | |
See accompanying Notes to Financial Statements which are an integral part of the financial statements.
PowerShares National AMT-Free Municipal Bond Portfolio (PZA) (continued)
October 31, 2016
| | | | | | | | | | | | | | | | |
Principal
Amount | | | | | Interest
Rate | | | Maturity
Date | | | Value | |
| | | | Municipal Bonds (continued) | | | | | | | | | | | | |
| | | | Water Revenue (continued) | | | | | | | | | | | | |
| $ | 1,000,000 | | | Austin Texas Water & Wastewater System Rev. Ref. Ser. 16 | | | 5.000 | % | | | 11/15/2045 | | | $ | 1,193,290 | |
| | 1,000,000 | | | Birmingham Alabama Waterworks & Sewer Board Rev. Ser. 09A AGC(a) | | | 5.250 | | | | 01/01/2019 | | | | 1,092,100 | |
| | 2,160,000 | | | Bucks County Pennsylvania Water & Sewer Auth. System Rev. Ser. 11 AGM | | | 5.000 | | | | 12/01/2041 | | | | 2,432,117 | |
| | 2,250,000 | | | Chicago Illinois Waterworks Rev. Ref. (Second Lien) Ser. 08 AGM | | | 5.250 | | | | 11/01/2033 | | | | 2,374,492 | |
| | 200,000 | | | City of Cape Coral Florida Water & Sewer Rev. Ref. Ser. 11 AGM | | | 5.000 | | | | 10/01/2041 | | | | 230,492 | |
| | 1,500,000 | | | Detroit Water Supply System Rev. (Second Lien) Ref. Ser. 06C AGM | | | 5.000 | | | | 07/01/2029 | | | | 1,502,325 | |
| | 2,500,000 | | | District of Columbia Water & Sewer Auth. Public Utility Rev. Ref. (Sub.-Lien) Ser. 16A | | | 5.000 | | | | 10/01/2039 | | | | 2,966,100 | |
| | 3,000,000 | | | El Dorado California Irrigation District Rev. Ref. Ser. 14A AGM | | | 5.000 | | | | 03/01/2034 | | | | 3,510,540 | |
| | 3,500,000 | | | El Dorado California Irrigation District Rev. Ref. Ser. 14A AGM | | | 5.250 | | | | 03/01/2039 | | | | 4,138,575 | |
| | 1,500,000 | | | Florida Municipal Loan Council Ser. 11D AGM | | | 5.500 | | | | 10/01/2041 | | | | 1,757,685 | |
| | 3,380,000 | | | Houston Texas Utility System Rev. Ref. Combine (First Lien) Ser. 09A AGC(a) | | | 6.000 | | | | 05/15/2019 | | | | 3,807,401 | |
| | 190,000 | | | Houston Texas Utility System Rev. Ref. Combine (First Lien) Ser. 09A AGC | | | 6.000 | | | | 11/15/2035 | | | | 214,271 | |
| | 6,535,000 | | | Indianapolis Indiana Local Public Improvement Bond Bank (Waterworks Project)
Ser. 09A AGC | | | 5.500 | | | | 01/01/2038 | | | | 7,175,495 | |
| | 1,500,000 | | | Los Angeles California Department of Water & Power Ref. Ser. 16A | | | 5.000 | | | | 07/01/2046 | | | | 1,786,500 | |
| | 8,000,000 | | | Los Angeles California Department of Water & Power Rev. Ser. 12B | | | 5.000 | | | | 07/01/2043 | | | | 9,363,760 | |
| | 1,000,000 | | | Miami-Dade County Florida Water & Sewer System Rev. Ser. 10 AGC | | | 5.000 | | | | 10/01/2027 | | | | 1,133,560 | |
| | 20,000,000 | | | Miami-Dade County Florida Water & Sewer System Rev. Ser. 10 AGC | | | 5.000 | | | | 10/01/2029 | | | | 22,654,800 | |
| | 1,500,000 | | | Miami-Dade County Florida Water & Sewer System Rev. Ser. 10 AGC | | | 4.625 | | | | 10/01/2030 | | | | 1,670,520 | |
| | 600,000 | | | New York City Municipal Water Finance Auth. Rev. Ref. Ser. 14EE | | | 5.000 | | | | 06/15/2036 | | | | 712,656 | |
| | 5,000,000 | | | New York City Municipal Water Finance Auth. Water & Sewer System Rev. (Second General Resolution Fiscal 2009) Ser. 09EE | | | 5.000 | | | | 06/15/2039 | | | | 5,493,550 | |
| | 6,095,000 | | | New York City Municipal Water Finance Auth. Water & Sewer System Rev. (Second General Resolution Fiscal 2009) Ser. 09GG-1 | | | 5.250 | | | | 06/15/2032 | | | | 6,750,944 | |
| | 3,295,000 | | | New York City Municipal Water Finance Auth. Water & Sewer System Rev. (Second General Resolution Fiscal 2012) Ser. 11BB | | | 5.000 | | | | 06/15/2044 | | | | 3,833,535 | |
| | 10,205,000 | | | New York City Municipal Water Finance Auth. Water & Sewer System Rev. (Second General Resolution Fiscal 2012) Ser. 12CC | | | 5.000 | | | | 06/15/2045 | | | | 11,840,249 | |
| | 9,640,000 | | | New York City Municipal Water Finance Auth. Water & Sewer System Rev. (Second General Resolution Fiscal 2013) Ser. 12BB | | | 5.000 | | | | 06/15/2047 | | | | 11,238,023 | |
| | 15,000,000 | | | New York City Municipal Water Finance Auth. Water & Sewer System Rev. (Second General Resolution Fiscal 2013) Ser. 13CC | | | 5.000 | | | | 06/15/2047 | | | | 17,394,300 | |
| | 500,000 | | | New York City Municipal Water Finance Auth. Water & Sewer System Rev. (Second General Resolution Fiscal 2013) Ser. 13EE | | | 5.000 | | | | 06/15/2047 | | | | 579,810 | |
| | 11,180,000 | | | New York City Municipal Water Finance Auth. Water & Sewer System Rev. (Second General Resolution Fiscal 2014) Ser. 14CC-1 | | | 5.000 | | | | 06/15/2047 | | | | 13,007,371 | |
| | 1,000,000 | | | New York City Municipal Water Finance Auth. Water & Sewer System Rev. (Second General Resolution) Ser. 08DD | | | 6.000 | | | | 06/15/2040 | | | | 1,079,480 | |
| | 1,000,000 | | | New York State Environmental Facilities Corp. (State Clean Water & Drinking Water Sub. SRF Bonds) Ref. Ser. 16A | | | 5.000 | | | | 06/15/2041 | | | | 1,204,070 | |
| | 5,000,000 | | | North Fort Bend Texas Water Auth. (Water System) Rev. Ser. 09 AGC | | | 5.250 | | | | 12/15/2034 | | | | 5,560,600 | |
| | 2,500,000 | | | North Fort Bend Texas Water Auth. (Water System) Rev. Ser. 11 AGM | | | 5.000 | | | | 12/15/2036 | | | | 2,799,950 | |
| | 2,000,000 | | | North Sumter County Florida Utility Dependent District Utility Rev. Ser. 10 AGM | | | 5.375 | | | | 10/01/2040 | | | | 2,246,400 | |
| | 875,000 | | | Philadelphia Pennsylvania Water & Wastewater Rev. Ser. 10C AGM | | | 5.000 | | | | 08/01/2040 | | | | 976,264 | |
| | 2,715,000 | | | Port St. Lucie Florida Utility System Rev. Ref. Ser. 09 AGC(a) | | | 5.000 | | | | 09/01/2018 | | | | 2,919,928 | |
| | 285,000 | | | Port St. Lucie Florida Utility System Rev. Ref. Ser. 09 AGC | | | 5.000 | | | | 09/01/2035 | | | | 304,485 | |
| | 4,050,000 | | | Puerto Rico Commonwealth Aqueduct & Sewer Auth. Rev. (Senior Lien) Ser. 08A AGC | | | 5.125 | | | | 07/01/2047 | | | | 4,157,892 | |
| | 5,000,000 | | | San Diego County California Water Auth. Ref. Ser. 16B | | | 5.000 | | | | 05/01/2037 | | | | 6,041,800 | |
| | 5,000,000 | | | San Diego County California Water Auth. Ref. Ser. 16B | | | 5.000 | | | | 05/01/2038 | | | | 6,023,050 | |
| | 1,000,000 | | | San Jacinto Texas River Auth. Special Project Rev. (GRP Project) Ser. 11 AGM | | | 5.000 | | | | 10/01/2037 | | | | 1,094,400 | |
| | 1,000,000 | | | Wyandotte County Kansas City Government Utility System Rev. Improvement
Ser. 16A | | | 5.000 | | | | 09/01/2040 | | | | 1,153,310 | |
| | 1,500,000 | | | Wyandotte County Kansas City Government Utility System Rev. Improvement
Ser. 16A | | | 5.000 | | | | 09/01/2045 | | | | 1,723,695 | |
| | | | | | | | | | | | | | | | |
| | | | | | | | | | | | | | | 188,940,585 | |
| | | | | | | | | | | | | | | | |
| | | | Total Investments
(Cost $1,285,406,100)(b)—97.7% | | | | | | | | | | | 1,347,381,028 | |
| | | | Other assets less liabilities—2.3% | | | | | | | | | | | 32,252,008 | |
| | | | | | | | | | | | | | | | |
| | | | Net Assets—100.0% | | | | | | | | | | $ | 1,379,633,036 | |
| | | | | | | | | | | | | | | | |
See accompanying Notes to Financial Statements which are an integral part of the financial statements.
PowerShares National AMT-Free Municipal Bond Portfolio (PZA) (continued)
October 31, 2016
Investment Abbreviations:
AGC—Assured Guaranty Corp.
AGM—Assured Guaranty Municipal Corp.
AMBAC—American Municipal Bond Assurance Corp.
Auth.—Authority
BAM—Build America Mutual
BHAC—Berkshire Hathaway Assurance Corp.
COP—Certificate of Participation
FGIC—Financial Guaranty Insurance Co.
GTD—Grant To Date
NATL—National Public Finance Guarantee Corp.
PILOT—Payment-in-lieu-of-taxes
PSF-GTD—Permanent School Fund Guaranteed
RAC—Revenue Anticipation Certificates
Ref.—Refunding
Rev.—Revenue
Ser.—Series
SRF—State Revolving Fund
Sub.—Subordinated
Notes to Schedule of Investments:
| (a) | Advance refunded; secured by an escrow fund of U.S. Government obligations or other highly rated collateral. |
| (b) | The following table provides a listing of those entities that have either guaranteed, backed or otherwise enhanced the credit quality of more than 5% of the value of securities held in the portfolio, as of October 31, 2016. In instances where the entity has guaranteed, backed or otherwise enhanced the credit quality of a security, it is not primarily responsible for the borrower’s obligations but may be called upon to satisfy the borrower’s obligations. |
| | | | |
Entities | | Percentage of
Total Investments | |
| Assured Guaranty Municipal Corp. | | | 21.0 | % |
| Assured Guaranty Corp. | | | 14.5 | |
See accompanying Notes to Financial Statements which are an integral part of the financial statements.
Schedule of Investments
PowerShares New York AMT-Free Municipal Bond Portfolio (PZT)
October 31, 2016
| | | | | | | | | | | | | | | | |
Principal
Amount | | | | | Interest
Rate | | | Maturity
Date | | | Value | |
| | | | Municipal Bonds—96.7% | | | | | | | | | | | | |
| | | | Ad Valorem Property Tax—4.2% | | | | | | | | | | | | |
| $ | 500,000 | | | New York City New York Sub.-Ser. 16A-1 | | | 5.000 | % | | | 08/01/2038 | | | $ | 592,800 | |
| | 1,750,000 | | | New York State Ref. (Fiscal 2015) Ser. 14A | | | 5.000 | | | | 08/01/2032 | | | | 2,064,545 | |
| | | | | | | | | | | | | | | | |
| | | | | | | | | | | | | | | 2,657,345 | |
| | | | | | | | | | | | | | | | |
| | | | College Revenue—13.9% | | | | | | | | | | | | |
| | 1,000,000 | | | Build New York City Resource Corp. Rev. Ref. (New York Law School Project) Ser. 16 | | | 5.000 | | | | 07/01/2041 | | | | 1,138,570 | |
| | 1,500,000 | | | New York State Dormitory Auth. Rev. (New York University) Ser. 01 AMBAC | | | 5.500 | | | | 07/01/2040 | | | | 2,061,960 | |
| | 2,500,000 | | | New York State Dormitory Auth. Rev. (The New School) Ser. 10 AGM | | | 5.500 | | | | 07/01/2043 | | | | 2,861,700 | |
| | 500,000 | | | New York State Dormitory Auth. Rev. Non State Supported Debt (Fordham University) Ser. 08B AGC(a) | | | 5.000 | | | | 07/01/2018 | | | | 534,390 | |
| | 2,000,000 | | | New York State Dormitory Auth. Rev. Non State Supported Debt Ref. (Icahn School of Medicine at Mount Sinai) Ser. 15A | | | 5.000 | | | | 07/01/2035 | | | | 2,308,980 | |
| | | | | | | | | | | | | | | | |
| | | | | | | | | | | | | | | 8,905,600 | |
| | | | | | | | | | | | | | | | |
| | | | Electric Power Revenue—9.2% | | | | | | | | | | | | |
| | 1,000,000 | | | Guam Power Auth. Rev. Ser. 12A AGM | | | 5.000 | | | | 10/01/2030 | | | | 1,164,170 | |
| | 2,500,000 | | | Long Island Power Auth. New York Electric Systems Rev. General Ser. 08A BHAC(a) | | | 5.500 | | | | 05/01/2019 | | | | 2,778,075 | |
| | 185,000 | | | New York State Power Auth. Rev. Ser. 07A NATL | | | 4.500 | | | | 11/15/2047 | | | | 191,425 | |
| | 1,500,000 | | | Utility Debt Securitization Auth. New York (Restructuring) Ser. 13TE | | | 5.000 | | | | 12/15/2041 | | | | 1,780,875 | |
| | | | | | | | | | | | | | | | |
| | | | | | | | | | | | | | | 5,914,545 | |
| | | | | | | | | | | | | | | | |
| | | | Health, Hospital, Nursing Home Revenue—5.3% | | | | | | | | | | | | |
| | 500,000 | | | Dutchess County New York Local Development Corp. Rev. (Health Quest Systems Inc. Project) Ser. 16B | | | 5.000 | | | | 07/01/2046 | | | | 574,525 | |
| | 1,500,000 | | | New York State Dormitory Auth. Rev. Non State Supported Debt Ref. (NYU Hospitals Center) Ser. 15 | | | 5.000 | | | | 07/01/2034 | | | | 1,754,970 | |
| | 935,000 | | | New York State Dormitory Auth. Rev. State Supported Debt (Mental Health Services Facilities Improvement) Ser. 08A AGM(a) | | | 5.000 | | | | 08/15/2018 | | | | 1,003,910 | |
| | 65,000 | | | New York State Dormitory Auth. Rev. State Supported Debt (Mental Health Services Facilities Improvement) Ser. 08A AGM | | | 5.000 | | | | 02/15/2038 | | | | 69,355 | |
| | | | | | | | | | | | | | | | |
| | | | | | | | | | | | | | | 3,402,760 | |
| | | | | | | | | | | | | | | | |
| | | | Highway Tolls Revenue—5.5% | | | | | | | | | | | | |
| | 1,000,000 | | | New York State Thruway Auth. General Rev. (Junior Indebtedness Obligation-Junior Lien) Ser. 16A | | | 5.000 | | | | 01/01/2046 | | | | 1,159,210 | |
| | 600,000 | | | New York State Thruway Auth. General Rev. Ser. 07H NATL | | | 5.000 | | | | 01/01/2037 | | | | 626,754 | |
| | 1,470,000 | | | New York Triborough Bridge & Tunnel Auth. General Rev. Ser. 16A | | | 5.000 | | | | 11/15/2046 | | | | 1,743,126 | |
| | | | | | | | | | | | | | | | |
| | | | | | | | | | | | | | | 3,529,090 | |
| | | | | | | | | | | | | | | | |
| | | | Hotel Occupancy Tax—3.4% | | | | | | | | | | | | |
| | 1,885,000 | | | New York State Convention Center Development Corp. Rev. Ref. (Hotel Unit Fee Secured) Ser. 15 | | | 5.000 | | | | 11/15/2040 | | | | 2,205,921 | |
| | | | | | | | | | | | | | | | |
| | | | Income Tax Revenue—11.8% | | | | | | | | | | | | |
| | 1,000,000 | | | New York City Transitional Finance Auth. Rev. Sub.-Ser. 16A-1 | | | 5.000 | | | | 05/01/2040 | | | | 1,180,570 | |
| | 1,000,000 | | | New York State Dormitory Auth. Personal Income Tax Rev. (General Purpose) Ser. 10F | | | 5.000 | | | | 02/15/2035 | | | | 1,117,230 | |
| | 2,170,000 | | | New York State Dormitory Auth. Personal Income Tax Rev. (General Purpose) Ser. 11C | | | 5.000 | | | | 03/15/2041 | | | | 2,461,843 | |
| | 785,000 | | | New York State Dormitory Auth. Personal Income Tax Rev. (General Purpose) Ser. 12B | | | 5.000 | | | | 03/15/2037 | | | | 913,944 | |
| | 1,200,000 | | | New York State Dormitory Auth. Personal Income Tax Rev. (General Purpose) Ser. 12B | | | 5.000 | | | | 03/15/2042 | | | | 1,376,160 | |
| | 500,000 | | | New York State Urban Development Corp. Rev. Personal Income Tax Ser. 07C NATL(a) | | | 4.500 | | | | 03/15/2018 | | | | 525,270 | |
| | | | | | | | | | | | | | | | |
| | | | | | | | | | | | | | | 7,575,017 | |
| | | | | | | | | | | | | | | | |
| | | | Lease Revenue—3.9% | | | | | | | | | | | | |
| | 1,000,000 | | | MTA Hudson Rail Yards Trust Obligations Rev. Ser. 16A | | | 5.000 | | | | 11/15/2046 | | | | 1,090,490 | |
| | 1,240,000 | | | MTA Hudson Rail Yards Trust Obligations Rev. Ser. 16A | | | 5.000 | | | | 11/15/2051 | | | | 1,382,377 | |
| | | | | | | | | | | | | | | | |
| | | | | | | | | | | | | | | 2,472,867 | |
| | | | | | | | | | | | | | | | |
| | | | Miscellaneous Revenue—14.1% | | | | | | | | | | | | |
| | 2,000,000 | | | Brooklyn Arena New York Local Development Corp. PILOT Rev. Ref. (Barclays Center Project) Ser. 16A | | | 5.000 | | | | 07/15/2042 | | | | 2,296,220 | |
| | 2,500,000 | | | New York City Industrial Development Agency Rev. (Queens Baseball Stadium-PILOT) Ser. 09 AGC | | | 6.500 | | | | 01/01/2046 | | | | 2,773,375 | |
| | 1,000,000 | | | New York City Transitional Finance Auth. Building Aid Rev. (Fiscal 2007) Ser. 06S-1 NATL | | | 5.000 | | | | 07/15/2036 | | | | 1,008,690 | |
| | 1,000,000 | | | New York City Transitional Finance Auth. Building Aid Rev. (Fiscal 2015) Ser. 15S-2 | | | 5.000 | | | | 07/15/2035 | | | | 1,185,860 | |
| | 600,000 | | | New York City Transitional Finance Auth. Building Aid Rev. Ser. 07S-2 NATL | | | 4.250 | | | | 01/15/2034 | | | | 603,504 | |
| | 1,000,000 | | | New York City Transitional Finance Auth. Building Aid Rev. Ser. 16S-1 | | | 5.000 | | | | 07/15/2043 | | | | 1,169,440 | |
| | | | | | | | | | | | | | | | |
| | | | | | | | | | | | | | | 9,037,089 | |
| | | | | | | | | | | | | | | | |
See accompanying Notes to Financial Statements which are an integral part of the financial statements.
PowerShares New York AMT-Free Municipal Bond Portfolio (PZT) (continued)
October 31, 2016
| | | | | | | | | | | | | | | | |
Principal
Amount | | | | | Interest
Rate | | | Maturity
Date | | | Value | |
| | | | Municipal Bonds (continued) | | | | | | | | | | | | |
| | | | Port, Airport & Marina Revenue—3.5% | | | | | | | | | | | | |
| $ | 1,000,000 | | | Port Auth. of New York & New Jersey (Consolidated-One Hundred Forty-Eighth) Ser. 07 AGM | | | 5.000 | % | | | 08/15/2033 | | | $ | 1,034,080 | |
| | 1,000,000 | | | Port Auth. of New York & New Jersey Ref. Ser. 15-194 | | | 5.250 | | | | 10/15/2055 | | | | 1,198,900 | |
| | | | | | | | | | | | | | | | |
| | | | | | | | | | | | | | | 2,232,980 | |
| | | | | | | | | | | | | | | | |
| | | | Recreational Revenue—3.5% | | | | | | | | | | | | |
| | 2,000,000 | | | New York City Industrial Development Agency Rev. Yankee Stadium (PILOT) Ser. 09 AGC | | | 7.000 | | | | 03/01/2049 | | | | 2,266,920 | |
| | | | | | | | | | | | | | | | |
| | | | Sales Tax Revenue—7.8% | | | | | | | | | | | | |
| | 1,000,000 | | | New York State Dormitory Auth. Sales Tax Rev. (Supported Debt) Ser. 14A | | | 5.000 | | | | 03/15/2034 | | | | 1,189,570 | |
| | 1,435,000 | | | Puerto Rico Sales Tax Financing Corp. Sales Tax Rev. First Sub.-Ser. 10C AGM | | | 5.125 | | | | 08/01/2042 | | | | 1,525,391 | |
| | 2,000,000 | | | Sales Tax Asset Receivables Corp. Ref. (Fiscal 2015) Ser. 14A | | | 4.000 | | | | 10/15/2032 | | | | 2,248,980 | |
| | | | | | | | | | | | | | | | |
| | | | | | | | | | | | | | | 4,963,941 | |
| | | | | | | | | | | | | | | | |
| | | | Sewer Revenue—3.2% | | | | | | | | | | | | |
| | 2,000,000 | | | New York City Municipal Finance Auth. Water & Sewer System Rev. Ser. 07AA NATL | | | 4.750 | | | | 06/15/2033 | | | | 2,047,500 | |
| | | | | | | | | | | | | | | | |
| | | | Transit Revenue—3.7% | | | | | | | | | | | | |
| | 600,000 | | | Metropolitan Transportation Auth. New York Rev. Ser. 07A NATL(a) | | | 4.750 | | | | 11/15/2017 | | | | 624,786 | |
| | 1,500,000 | | | Metropolitan Transportation Auth. New York Rev. Ser. 11A AGM | | | 5.000 | | | | 11/15/2036 | | | | 1,743,975 | |
| | | | | | | | | | | | | | | | |
| | | | | | | | | | | | | | | 2,368,761 | |
| | | | | | | | | | | | | | | | |
| | | | Water Revenue—3.7% | | | | | | | | | | | | |
| | 1,000,000 | | | New York City Municipal Finance Auth. Water & Sewer System Rev. (Second General Resolution Fiscal 2014) Ser. 13BB | | | 5.000 | | | | 06/15/2046 | | | | 1,160,950 | |
| | 1,000,000 | | | New York State Environmental Facilities Corp. (State Clean Water & Drinking Water Sub. SRF Bonds) Ref. Ser. 16A | | | 5.000 | | | | 06/15/2041 | | | | 1,204,070 | |
| | | | | | | | | | | | | | | | |
| | | | | | | | | | | | | | | 2,365,020 | |
| | | | | | | | | | | | | | | | |
| | | | Total Investments
(Cost $59,364,798)(b)—96.7% | | | | | | | | | | | 61,945,356 | |
| | | | Other assets less liabilities—3.3% | | | | | | | | | | | 2,117,534 | |
| | | | | | | | | | | | | | | | |
| | | | Net Assets—100.0% | | | | | | | | | | $ | 64,062,890 | |
| | | | | | | | | | | | | | | | |
Investment Abbreviations:
AGC—Assured Guaranty Corp.
AGM—Assured Guaranty Municipal Corp.
AMBAC—American Municipal Bond Assurance Corp.
Auth.—Authority
BHAC—Berkshire Hathaway Assurance Corp.
NATL—National Public Finance Guarantee Corp.
PILOT—Payment-in-lieu-of-taxes
Ref.—Refunding
Rev.—Revenue
Ser.—Series
SRF—State Revolving Fund
Sub.—Subordinated
Notes to Schedule of Investments:
| (a) | Advance refunded; secured by an escrow fund of U.S. Government obligations or other highly rated collateral. |
| (b) | The following table provides a listing of those entities that have either guaranteed, backed or otherwise enhanced the credit quality of more than 5% of the value of securities held in the portfolio, as of October 31, 2016. In instances where the entity has guaranteed, backed or otherwise enhanced the credit quality of a security, it is not primarily responsible for the borrower’s obligations but may be called upon to satisfy the borrower’s obligations. |
| | | | |
Entities | | Percentage of
Total Investments | |
| Assured Guaranty Municipal Corp. | | | 15.2 | % |
| National Public Finance Guarantee Corp. | | | 9.1 | |
| Assured Guaranty Corp. | | | 9.0 | |
See accompanying Notes to Financial Statements which are an integral part of the financial statements.
Schedule of Investments(a)
PowerShares Preferred Portfolio (PGX)
October 31, 2016
| | | | | | | | |
Number
of Shares | | | | | Value | |
| | | | Preferred Stocks and Other Equity Interests—100.2% | |
| | | | Banks—43.5% | | | | |
| | 151,224 | | | Associated Banc-Corp., 5.38%, Series D(b) | | $ | 3,780,600 | |
| | 1,100,183 | | | Bank of America Corp., 6.00%, Series EE(b) | | | 28,604,758 | |
| | 1,365,490 | | | Bank of America Corp., 6.20%, Series CC | | | 35,557,360 | |
| | 361,856 | | | Bank of America Corp., 6.20%, Series D | | | 9,263,514 | |
| | 1,914,223 | | | Bank of America Corp., 6.38%, Series 3 | | | 49,386,953 | |
| | 2,685,428 | | | Bank of America Corp., 6.50%, Series Y(b) | | | 72,211,159 | |
| | 986,734 | | | Bank of America Corp., 6.63%, Series I(b) | | | 25,941,237 | |
| | 1,936,345 | | | Bank of America Corp., 6.63%, Series W | | | 52,804,128 | |
| | 5,542,489 | | | Barclays Bank PLC, 8.13%, Series 5 (United Kingdom) | | | 144,326,414 | |
| | 514,131 | | | BB&T Corp., 5.63%(b) | | | 13,609,048 | |
| | 2,993,554 | | | BB&T Corp., 5.63%, Series E | | | 77,233,693 | |
| | 403,461 | | | BB&T Corp., 5.85% | | | 10,340,705 | |
| | 197,433 | | | BOK Financial Corp., 5.38%(b) | | | 4,965,440 | |
| | 1,022,800 | | | Citigroup Capital XIII, 7.26% | | | 26,603,028 | |
| | 1,370,860 | | | Citigroup, Inc., 6.30%, Series S | | | 36,341,499 | |
| | 2,701,081 | | | Citigroup, Inc., 6.88%, Series K | | | 77,494,014 | |
| | 859,290 | | | Citigroup, Inc., 6.88%, Series L(b) | | | 23,235,202 | |
| | 212,929 | | | Commerce Bancshares, Inc., 6.00%, Series B | | | 5,768,247 | |
| | 1,957,343 | | | Countrywide Capital V, 7.00% | | | 50,421,156 | |
| | 177,409 | | | Cullen/Frost Bankers, Inc., 5.38% | | | 4,701,338 | |
| | 615,999 | | | Fifth Third Bancorp, 6.63%, Series I(b) | | | 18,486,130 | |
| | 119,261 | | | First Horizon National Corp., 6.20%, Series A | | | 3,060,237 | |
| | 261,656 | | | First Republic Bank, 5.50%, Series D | | | 6,672,228 | |
| | 176,796 | | | First Republic Bank, 5.50%, Series G | | | 4,619,679 | |
| | 198,463 | | | First Republic Bank, 5.70%, Series F(b) | | | 5,457,733 | |
| | 247,078 | | | First Republic Bank, 6.20%, Series B | | | 6,312,843 | |
| | 393,046 | | | First Republic Bank, 6.70%, Series A | | | 10,022,673 | |
| | 210,887 | | | First Republic Bank, 7.00%, Series E | | | 5,736,126 | |
| | 203,115 | | | Hancock Holding Co., 5.95% | | | 5,301,302 | |
| | 4,939,039 | | | HSBC Holdings PLC, 8.00%, Series 2 (United Kingdom) | | | 128,711,356 | |
| | 4,547,217 | | | HSBC Holdings PLC, 8.13% (United Kingdom)(b) | | | 122,001,832 | |
| | 112,881 | | | Huntington Bancshares, Inc., 5.88%, Series C | | | 2,916,845 | |
| | 590,082 | | | Huntington Bancshares, Inc., 6.25%, Series D | | | 15,790,594 | |
| | 119,102 | | | ING Groep NV, 6.13% (Netherlands)(b) | | | 3,035,910 | |
| | 20,766 | | | ING Groep NV, 6.20% (Netherlands) | | | 533,063 | |
| | 454,448 | | | ING Groep NV, 6.38% (Netherlands) | | | 11,724,758 | |
| | 1,370,807 | | | JPMorgan Chase & Co., 5.45%, Series P(b) | | | 35,311,988 | |
| | 835,110 | | | JPMorgan Chase & Co., 5.50%, Series O(b) | | | 21,228,496 | |
| | 1,680,911 | | | JPMorgan Chase & Co., 6.10%, Series AA(b) | | | 44,846,705 | |
| | 2,563,033 | | | JPMorgan Chase & Co., 6.13%, Series Y(b) | | | 68,843,066 | |
| | 1,838,380 | | | JPMorgan Chase & Co., 6.15%, Series BB | | | 49,029,595 | |
| | 912,136 | | | JPMorgan Chase & Co., 6.30%, Series W(b) | | | 24,509,094 | |
| | 1,036,634 | | | JPMorgan Chase & Co., 6.70%, Series T(b) | | | 28,424,504 | |
| | 224,521 | | | People’s United Financial, Inc., 5.63%, Series A | | | 5,859,998 | |
| | 2,428,359 | | | PNC Financial Services Group, Inc. (The), 6.13%, Series P | | | 68,479,724 | |
| | 671,315 | | | Regions Financial Corp., 6.38%, Series A | | | 17,440,764 | |
| | 650,571 | | | Regions Financial Corp., 6.38%, Series B | | | 18,716,928 | |
| | | | | | | | |
Number
of Shares | | | | | Value | |
| | | | Preferred Stocks and Other Equity Interests (continued) | |
| | | | Banks (continued) | | | | |
| | 1,832,150 | | | Royal Bank of Scotland Group PLC, 5.75%, Series L (United Kingdom) | | $ | 46,078,573 | |
| | 1,500,133 | | | Royal Bank of Scotland Group PLC, 6.60%, Series S (United Kingdom) | | | 38,148,382 | |
| | 158,986 | | | Santander Finance Preferred SAU, 6.50% (Spain) | | | 4,030,295 | |
| | 615,756 | | | SunTrust Banks, Inc., 5.88%, Series E(b) | | | 15,966,553 | |
| | 141,730 | | | TCF Financial Corp., 6.45%, Series B | | | 3,655,217 | |
| | 228,088 | | | TCF Financial Corp., 7.50% | | | 5,957,659 | |
| | 337,290 | | | Texas Capital Bancshares, Inc., 6.50%, Series A | | | 8,698,709 | |
| | 1,877,453 | | | U.S. Bancorp, 6.00%, Series G(b) | | | 48,081,571 | |
| | 518,530 | | | U.S. Bancorp, 6.50%, Series F | | | 15,218,856 | |
| | 169,730 | | | Valley National Bancorp, 6.25%, Series A | | | 4,893,316 | |
| | 151,269 | | | Webster Financial Corp., 6.40%, Series E | | | 3,920,892 | |
| | 674,785 | | | Wells Fargo & Co., 5.13%, Series O(b) | | | 17,105,800 | |
| | 688,847 | | | Wells Fargo & Co., 5.20% | | | 17,455,383 | |
| | 1,443,972 | | | Wells Fargo & Co., 5.50%, Series X(b) | | | 36,749,087 | |
| | 1,122,196 | | | Wells Fargo & Co., 5.70%, Series W(b) | | | 28,896,547 | |
| | 1,960,078 | | | Wells Fargo & Co., 5.85% | | | 52,216,478 | |
| | 974,776 | | | Wells Fargo & Co., 6.00%, Series T(b) | | | 25,539,131 | |
| | 1,206,165 | | | Wells Fargo & Co., 6.00%,
Series V(b) | | | 31,456,783 | |
| | 862,535 | | | Wells Fargo & Co., 6.63%(b) | | | 25,453,408 | |
| | 4,579,620 | | | Wells Fargo & Co., 8.00%, Series J | | | 124,290,887 | |
| | 170,835 | | | Wintrust Financial Corp., 6.50%, Series D(b) | | | 4,819,255 | |
| | 311,508 | | | Zions Bancorp, 5.75%, Series H | | | 8,033,791 | |
| | 203,428 | | | Zions Bancorp, 7.90%, Series F | | | 5,309,471 | |
| | | | | | | | |
| | | | | | | 2,057,639,708 | |
| | | | | | | | |
| | | | Capital Markets—15.8% | | | | |
| | 283,161 | | | Affiliated Managers Group, Inc., 6.38% | | | 7,285,732 | |
| | 407,647 | | | Apollo Investment Corp., 6.88%(b) | | | 10,745,575 | |
| | 405,215 | | | Ares Management LP, 7.00%, Series A | | | 10,507,225 | |
| | 782,462 | | | Bank of New York Mellon Corp. (The), 5.20%(b) | | | 20,735,243 | |
| | 124,516 | | | BGC Partners, Inc., 8.13% | | | 3,249,867 | |
| | 759,440 | | | Charles Schwab Corp. (The), 5.95%, Series D(b) | | | 20,558,041 | |
| | 653,326 | | | Charles Schwab Corp. (The), 6.00%, Series B | | | 17,280,473 | |
| | 820,830 | | | Charles Schwab Corp. (The), 6.00%, Series C(b) | | | 22,695,949 | |
| | 1,097,280 | | | Deutsche Bank Contingent Capital Trust III, 7.60% (Germany)(b) | | | 26,652,931 | |
| | 4,182,073 | | | Deutsche Bank Contingent Capital Trust V, 8.05% (Germany) | | | 103,422,665 | |
| | 1,670,321 | | | Goldman Sachs Group, Inc. (The), 5.50%, Series J | | | 43,545,268 | |
| | 937,905 | | | Goldman Sachs Group, Inc. (The), 5.95% | | | 24,216,707 | |
| | 715,815 | | | Goldman Sachs Group, Inc. (The), 6.20%, Series B(b) | | | 18,482,343 | |
| | 616,295 | | | Goldman Sachs Group, Inc. (The), 6.30%, Series N(b) | | | 16,430,425 | |
| | 1,085,045 | | | Goldman Sachs Group, Inc. (The), 6.38%, Series K(b) | | | 30,956,334 | |
| | 511,560 | | | Goldman Sachs Group, Inc. (The), 6.50% | | | 12,778,769 | |
| | 242,970 | | | KKR & Co. LP, 6.50%, Series B(b) | | | 6,480,010 | |
See accompanying Notes to Financial Statements which are an integral part of the financial statements.
PowerShares Preferred Portfolio (PGX) (continued)
October 31, 2016
| | | | | | | | |
Number
of Shares | | | | | Value | |
| | | | Preferred Stocks and Other Equity Interests (continued) | |
| | | | Capital Markets (continued) | | | | |
| | 434,267 | | | KKR & Co. LP, 6.75%, Series A(b) | | $ | 11,751,265 | |
| | 572,217 | | | KKR Financial Holdings LLC, 7.38%, Series A | | | 14,871,920 | |
| | 450,978 | | | KKR Financial Holdings LLC, 8.38% | | | 11,504,449 | |
| | 580,178 | | | Legg Mason, Inc., 5.45% | | | 14,440,630 | |
| | 434,544 | | | Legg Mason, Inc., 6.38% | | | 11,602,325 | |
| | 2,295,810 | | | Morgan Stanley, 6.38%, Series I | | | 63,364,356 | |
| | 1,129,372 | | | Morgan Stanley, 6.63%, Series G(b) | | | 30,888,324 | |
| | 863,628 | | | Morgan Stanley, 6.88%, Series F(b) | | | 25,097,030 | |
| | 1,279,215 | | | Morgan Stanley, 7.13%, Series E(b) | | | 37,327,494 | |
| | 543,694 | | | Northern Trust Corp., 5.85%, Series C | | | 14,630,805 | |
| | 170,167 | | | OM Asset Management PLC, 5.13%(b) | | | 4,186,108 | |
| | 216,436 | | | Prospect Capital Corp., 6.25% | | | 5,553,748 | |
| | 465,116 | | | Raymond James Financial, Inc., 6.90% | | | 12,004,644 | |
| | 134,566 | | | Solar Capital Ltd., 6.75%(b) | | | 3,440,853 | |
| | 604,647 | | | State Street Corp., 5.25%, Series C | | | 15,358,034 | |
| | 522,536 | | | State Street Corp., 5.35%, Series G | | | 13,988,289 | |
| | 1,081,533 | | | State Street Corp., 5.90%, Series D | | | 30,337,001 | |
| | 1,035,466 | | | State Street Corp., 6.00%, Series E | | | 27,543,396 | |
| | 196,592 | | | Stifel Financial Corp., 6.25%, Series A(b) | | | 5,284,393 | |
| | | | | | | | |
| | | | | | | 749,198,621 | |
| | | | | | | | |
| | | | Chemicals—0.1% | | | | |
| | 61,868 | | | E.I. du Pont de Nemours & Co., 4.50%, Series B | | | 6,651,429 | |
| | | | | | | | |
| | | | Commercial Services & Supplies—0.6% | | | | |
| | 540,060 | | | NuStar Logistics LP, 7.63% | | | 13,830,936 | |
| | 582,432 | | | Pitney Bowes, Inc., 6.70% | | | 15,504,340 | |
| | | | | | | | |
| | | | | | | 29,335,276 | |
| | | | | | | | |
| | | | Consumer Finance—2.9% | | | | |
| | 774,804 | | | Capital One Financial Corp., 5.20%, Series G | | | 19,238,383 | |
| | 1,171,546 | | | Capital One Financial Corp., 6.00%, Series B | | | 30,237,602 | |
| | 693,935 | | | Capital One Financial Corp., 6.20%, Series F | | | 18,521,125 | |
| | 619,862 | | | Capital One Financial Corp., 6.25%, Series C | | | 16,463,535 | |
| | 638,184 | | | Capital One Financial Corp., 6.70%, Series D(b) | | | 17,926,589 | |
| | 763,148 | | | Discover Financial Services, 6.50%, Series B | | | 19,986,846 | |
| | 176,062 | | | GMAC Capital Trust I, 6.60%, Series 2 | | | 4,494,863 | |
| | 433,837 | | | Navient Corp., 6.00% | | | 9,921,852 | |
| | | | | | | | |
| | | | | | | 136,790,795 | |
| | | | | | | | |
| | | | Diversified Telecommunication Services—3.3% | |
| | 1,362,626 | | | Qwest Corp., 6.13%(b) | | | 34,406,306 | |
| | 1,310,586 | | | Qwest Corp., 6.50%(b) | | | 33,341,308 | |
| | 487,157 | | | Qwest Corp., 6.63%(b) | | | 12,451,733 | |
| | 573,065 | | | Qwest Corp., 6.88% | | | 14,785,077 | |
| | 578,256 | | | Qwest Corp., 7.00%(b) | | | 14,687,702 | |
| | 254,340 | | | Qwest Corp., 7.00% | | | 6,724,750 | |
| | 485,530 | | | Qwest Corp., 7.00%(b) | | | 12,526,674 | |
| | 334,221 | | | Qwest Corp., 7.50%(b) | | | 8,495,898 | |
| | | | | | | | |
Number
of Shares | | | | | Value | |
| | | | Preferred Stocks and Other Equity Interests (continued) | |
| | | | Diversified Telecommunication Services (continued) | |
| | 677,076 | | | Verizon Communications, Inc., 5.90% | | $ | 18,138,866 | |
| | | | | | | | |
| | | | | | | 155,558,314 | |
| | | | | | | | |
| | | | Electric Utilities—6.8% | | | | |
| | 316,741 | | | BGE Capital Trust II, 6.20% | | | 8,156,081 | |
| | 683,100 | | | Duke Energy Corp., 5.13% | | | 17,828,910 | |
| | 365,806 | | | Entergy Arkansas, Inc., 4.88% | | | 8,965,905 | |
| | 39,176 | | | Entergy Arkansas, Inc., 4.90% | | | 991,153 | |
| | 300,778 | | | Entergy Louisiana LLC, 4.88% | | | 7,429,216 | |
| | 349,132 | | | Entergy Louisiana LLC, 5.25% | | | 9,011,097 | |
| | 362,837 | | | Entergy Mississippi, Inc., 4.90% | | | 8,871,365 | |
| | 266,196 | | | Entergy New Orleans, Inc., 5.50% | | | 7,000,955 | |
| | 629,517 | | | Entergy Texas, Inc., 5.63% | | | 17,236,175 | |
| | 270,799 | | | Interstate Power & Light Co., 5.10%, Series D | | | 7,273,661 | |
| | 1,029,198 | | | NextEra Energy Capital Holdings, Inc., 5.00%(b) | | | 25,729,950 | |
| | 816,144 | | | NextEra Energy Capital Holdings, Inc., 5.13%, Series I | | | 20,452,569 | |
| | 656,366 | | | NextEra Energy Capital Holdings, Inc., 5.25%, Series K | | | 16,501,041 | |
| | 393,925 | | | NextEra Energy Capital Holdings, Inc., 5.63%, Series H | | | 10,084,480 | |
| | 486,039 | | | NextEra Energy Capital Holdings, Inc., 5.70%, Series G | | | 12,432,878 | |
| | 158,631 | | | Pacific Gas & Electric Co., 6.00%, Series A(b) | | | 5,188,820 | |
| | 600,694 | | | PPL Capital Funding, Inc., 5.90%, Series B | | | 15,654,086 | |
| | 1,293,372 | | | SCE Trust I, 5.63% | | | 33,084,456 | |
| | 236,143 | | | SCE Trust III, 5.75%, Series H | | | 6,777,304 | |
| | 419,507 | | | SCE Trust IV, 5.38%, Series J | | | 11,687,465 | |
| | 376,792 | | | SCE Trust V, 5.45%, Series K | | | 10,625,534 | |
| | 999,367 | | | Southern Co. (The), 5.25% | | | 24,864,251 | |
| | 1,353,207 | | | Southern Co. (The), 6.25% | | | 36,144,159 | |
| | | | | | | | |
| | | | | | | 321,991,511 | |
| | | | | | | | |
| | | | Equity Real Estate Investment Trusts—8.8% | |
| | 184,439 | | | Alexandria Real Estate Equities, Inc., 6.45%, Series E | | | 4,719,794 | |
| | 136,574 | | | Boston Properties, Inc., 5.25%(b) | | | 3,571,410 | |
| | 394,448 | | | DDR Corp., 6.50%, Series J | | | 10,137,314 | |
| | 405,752 | | | Digital Realty Trust, Inc., 5.88%, Series G | | | 10,452,172 | |
| | 325,264 | | | Digital Realty Trust, Inc., 6.35%, Series I | | | 8,674,791 | |
| | 478,570 | | | Digital Realty Trust, Inc., 6.63%, Series F | | | 12,251,392 | |
| | 484,063 | | | Digital Realty Trust, Inc., 7.38%, Series H | | | 13,423,067 | |
| | 268,432 | | | DuPont Fabros Technology, Inc., 6.63%, Series C(b) | | | 7,381,880 | |
| | 144,804 | | | EPR Properties, 6.63%, Series F(b) | | | 3,764,904 | |
| | 253,316 | | | Equity Commonwealth, 5.75% | | | 6,413,961 | |
| | 408,808 | | | Government Properties Income Trust, 5.88% | | | 10,453,221 | |
| | 386,410 | | | Hospitality Properties Trust, 7.13%, Series D | | | 9,791,629 | |
| | 73,482 | | | Kilroy Realty Corp., 6.38%, Series H | | | 1,873,791 | |
| | 65,912 | | | Kilroy Realty Corp., 6.88%, Series G | | | 1,668,233 | |
| | 789,287 | | | Kimco Realty Corp., 6.00%, Series I(b) | | | 20,016,318 | |
See accompanying Notes to Financial Statements which are an integral part of the financial statements.
PowerShares Preferred Portfolio (PGX) (continued)
October 31, 2016
| | | | | | | | |
Number
of Shares | | | | | Value | |
| | | | Preferred Stocks and Other Equity Interests (continued) | |
| | | | Equity Real Estate Investment Trusts (continued) | |
| | 441,762 | | | National Retail Properties, Inc., 5.20%, Series F(b) | | $ | 10,867,345 | |
| | 435,331 | | | National Retail Properties, Inc., 5.70%, Series E | | | 11,153,180 | |
| | 387,472 | | | National Retail Properties, Inc., 6.63%, Series D | | | 9,899,910 | |
| | 248,265 | | | PS Business Parks, Inc., 5.20%, Series W(b) | | | 6,194,212 | |
| | 244,087 | | | PS Business Parks, Inc., 5.70%, Series V | | | 6,302,326 | |
| | 552,948 | | | PS Business Parks, Inc., 6.00%, Series T | | | 14,078,056 | |
| | 470,258 | | | PS Business Parks, Inc., 6.45%, Series S | | | 11,949,256 | |
| | 677,142 | | | Public Storage, 4.90%, Series E | | | 16,413,922 | |
| | 496,244 | | | Public Storage, 4.95%, Series D | | | 12,207,602 | |
| | 418,706 | | | Public Storage, 5.13%, Series C(b) | | | 10,702,125 | |
| | 460,739 | | | Public Storage, 5.20%, Series W(b) | | | 11,711,985 | |
| | 872,025 | | | Public Storage, 5.40%, Series B | | | 22,480,804 | |
| | 302,869 | | | Public Storage, 5.88%, Series A | | | 8,089,631 | |
| | 287,887 | | | Public Storage, 5.90%, Series S | | | 7,289,299 | |
| | 395,360 | | | Public Storage, 6.00%, Series Z | | | 10,654,952 | |
| | 260,328 | | | Public Storage, 6.38%, Series Y | | | 7,109,558 | |
| | 546,738 | | | Realty Income Corp., 6.63%, Series F(b) | | | 13,941,819 | |
| | 322,481 | | | Regency Centers Corp., 6.63%, Series 6 | | | 8,213,591 | |
| | 495,728 | | | Senior Housing Properties Trust, 5.63% | | | 12,343,627 | |
| | 336,960 | | | Senior Housing Properties Trust, 6.25% | | | 8,747,482 | |
| | 325,506 | | | SL Green Realty Corp., 6.50%, Series I | | | 8,459,901 | |
| | 356,748 | | | Ventas Realty LP/Ventas Capital Corp., 5.45% | | | 9,460,957 | |
| | 221,030 | | | Vornado Realty Trust, 5.40%, Series L(b) | | | 5,558,905 | |
| | 574,983 | | | Vornado Realty Trust, 5.70%, Series K(b) | | | 14,564,319 | |
| | 728,783 | | | Vornado Realty Trust, 6.63%, Series I | | | 18,540,240 | |
| | 141,126 | | | Washington Prime Group, Inc., 6.88%, Series I | | | 3,570,488 | |
| | 384,901 | | | Welltower, Inc., 6.50%, Series J(b) | | | 9,761,089 | |
| | | | | | | | |
| | | | | | | 414,860,458 | |
| | | | | | | | |
| | | | Industrial Conglomerates—1.6% | | | | |
| | 1,210,340 | | | General Electric Co., 4.70% | | | 31,275,186 | |
| | 944,832 | | | General Electric Co., 4.88%(b) | | | 24,688,460 | |
| | 798,052 | | | General Electric Co., 4.88% | | | 20,509,936 | |
| | | | | | | | |
| | | | | | | 76,473,582 | |
| | | | | | | | |
| | | | Insurance—12.1% | | | | |
| | 1,768,471 | | | Aegon NV, 6.38% (Netherlands) | | | 45,025,272 | |
| | 881,039 | | | Aegon NV, 8.00% (Netherlands) | | | 23,418,017 | |
| | 675,882 | | | Aflac, Inc., 5.50%(b) | | | 17,478,308 | |
| | 622,628 | | | Allstate Corp. (The), 5.10% | | | 16,723,788 | |
| | 423,987 | | | Allstate Corp. (The), 5.63% | | | 11,155,098 | |
| | 331,076 | | | Allstate Corp. (The), 6.25%, Series F | | | 9,021,821 | |
| | 1,159,641 | | | Allstate Corp. (The), 6.63%, Series E | | | 31,495,850 | |
| | 501,867 | | | Allstate Corp. (The), 6.75%, Series C | | | 13,555,428 | |
| | 155,268 | | | American Financial Group, Inc., 6.00%(b) | | | 4,161,182 | |
| | 390,727 | | | American Financial Group, Inc., 6.25% | | | 10,260,491 | |
| | 351,922 | | | American Financial Group, Inc., 6.38%(b) | | | 9,160,530 | |
| | 614,231 | | | Arch Capital Group Ltd., 5.25%, Series E (Bermuda) | | | 14,974,952 | |
| | 451,231 | | | Arch Capital Group Ltd., 6.75%, Series C (Bermuda) | | | 11,537,977 | |
| | | | | | | | |
Number
of Shares | | | | | Value | |
| | | | Preferred Stocks and Other Equity Interests (continued) | |
| | | | Insurance (continued) | |
| | 172,913 | | | Argo Group US, Inc., 6.50% | | $ | 4,449,051 | |
| | 288,582 | | | Aspen Insurance Holdings Ltd., 5.63% (Bermuda)(b) | | | 7,379,042 | |
| | 227,018 | | | Aspen Insurance Holdings Ltd., 5.95% (Bermuda) | | | 6,460,932 | |
| | 415,033 | | | Aspen Insurance Holdings Ltd., 7.25% (Bermuda) | | | 10,707,851 | |
| | 453,832 | | | Assured Guaranty Municipal Holdings, Inc., 6.25% | | | 12,071,931 | |
| | 552,619 | | | Aviva PLC, 8.25% (United Kingdom)(b) | | | 14,163,625 | |
| | 280,289 | | | Axis Capital Holdings Ltd., 5.50%, Series D | | | 7,127,749 | |
| | 612,500 | | | Axis Capital Holdings Ltd., 5.50%, Series E | | | 15,245,125 | |
| | 47,893 | | | Axis Capital Holdings Ltd., 6.88%, Series C | | | 1,228,455 | |
| | 317,329 | | | Endurance Specialty Holdings Ltd., 6.35%, Series C | | | 8,453,645 | |
| | 244,661 | | | Hanover Insurance Group, Inc. (The), 6.35% | | | 6,295,128 | |
| | 836,959 | | | Hartford Financial Services Group, Inc. (The), 7.88% | | | 26,180,077 | |
| | 206,462 | | | Kemper Corp., 7.38% | | | 5,510,471 | |
| | 203,032 | | | Maiden Holdings Ltd., 7.13%, Series C | | | 5,284,923 | |
| | 477,975 | | | Maiden Holdings Ltd., 8.25%, Series A | | | 12,465,588 | |
| | 199,410 | | | Maiden Holdings North America Ltd., 7.75% | | | 5,348,176 | |
| | 511,984 | | | PartnerRe Ltd., 5.88%, Series I (Bermuda) | | | 14,043,721 | |
| | 477,870 | | | PartnerRe Ltd., 7.25%, Series H (Bermuda) | | | 14,240,526 | |
| | 586,026 | | | Protective Life Corp., 6.25%(b) | | | 15,137,052 | |
| | 983,625 | | | Prudential Financial, Inc., 5.70% | | | 25,544,741 | |
| | 728,441 | | | Prudential Financial, Inc., 5.75%(b) | | | 19,223,558 | |
| | 716,927 | | | Prudential PLC, 6.50% (United Kingdom) | | | 18,704,625 | |
| | 539,360 | | | Reinsurance Group of America, Inc., 5.75%(b) | | | 15,468,845 | |
| | 568,181 | | | Reinsurance Group of America, Inc., 6.20% | | | 16,244,295 | |
| | 539,629 | | | RenaissanceRe Holdings Ltd., 5.38%, Series E (Bermuda) | | | 13,836,088 | |
| | 255,075 | | | Selective Insurance Group, Inc., 5.88% | | | 6,519,717 | |
| | 140,148 | | | Torchmark Corp., 5.88% | | | 3,622,826 | |
| | 447,004 | | | Torchmark Corp., 6.13% | | | 12,082,518 | |
| | 204,468 | | | Validus Holdings Ltd., 5.88%, Series A | | | 5,183,264 | |
| | 482,759 | | | WR Berkley Corp., 5.63% | | | 12,373,113 | |
| | 441,248 | | | WR Berkley Corp., 5.75% | | | 11,357,723 | |
| | 110,153 | | | WR Berkley Corp., 5.90% | | | 2,880,501 | |
| | | | | | | | |
| | | | | | | 572,803,596 | |
| | | | | | | | |
| | | | Internet Software & Services—0.6% | | | | |
| | 1,014,600 | | | eBay, Inc., 6.00%(b) | | | 26,937,630 | |
| | | | | | | | |
| | | | Machinery—0.6% | | | | |
| | 1,034,336 | | | Stanley Black & Decker, Inc., 5.75%(b) | | | 26,768,616 | |
| | | | | | | | |
| | | | Media—0.2% | | | | |
| | 379,534 | | | Comcast Corp., 5.00%(b) | | | 9,856,498 | |
| | | | | | | | |
| | | | Mortgage Real Estate Investment Trusts—0.2% | |
| | 451,328 | | | Wells Fargo Real Estate Investment Corp., 6.38%, Series A | | | 12,221,962 | |
| | | | | | | | |
See accompanying Notes to Financial Statements which are an integral part of the financial statements.
PowerShares Preferred Portfolio (PGX) (continued)
October 31, 2016
| | | | | | | | |
Number
of Shares | | | | | Value | |
| | | | Preferred Stocks and Other Equity Interests (continued) | |
| | | | Multi-Utilities—1.5% | | | | |
| | 1,097,268 | | | Dominion Resources, Inc., 5.25%, Series A | | $ | 27,354,891 | |
| | 401,471 | | | DTE Energy Co., 5.38%, Series B | | | 10,141,158 | |
| | 670,875 | | | DTE Energy Co., 6.50% | | | 17,087,186 | |
| | 541,521 | | | Integrys Holding, Inc., 6.00% | | | 14,512,763 | |
| | | | | | | | |
| | | | | | | 69,095,998 | |
| | | | | | | | |
| | | | Oil, Gas & Consumable Fuels—0.1% | |
| | 171,016 | | | Targa Resources Partners LP, 9.00%, Series A | | | 4,584,939 | |
| | | | | | | | |
| | | | Thrifts & Mortgage Finance—0.1% | |
| | 184,403 | | | Astoria Financial Corp., 6.50%, Series C | | | 4,823,982 | |
| | | | | | | | |
| | | | Trading Companies & Distributors—0.1% | |
| | 191,230 | | | GATX Corp., 5.63% | | | 4,880,190 | |
| | | | | | | | |
| | | | Wireless Telecommunication Services—1.3% | |
| | 400,546 | | | Telephone & Data Systems, Inc., 5.88% | | | 10,169,863 | |
| | 741,170 | | | Telephone & Data Systems, Inc., 6.63%(b) | | | 19,203,715 | |
| | 485,596 | | | United States Cellular Corp., 6.95%(b) | | | 12,688,623 | |
| | 355,512 | | | United States Cellular Corp., 7.25% | | | 9,303,749 | |
| | 414,472 | | | United States Cellular Corp., 7.25% | | | 10,987,653 | |
| | | | | | | | |
| | | | | | | 62,353,603 | |
| | | | | | | | |
| | | | Total Investments
(excluding investments purchased with cash collateral from securities on loan)
(Cost $4,656,334,512)—100.2% | | | 4,742,826,708 | |
| | | | | | | | |
| | |
| | | | | | | | |
| | | | Investments Purchased with Cash Collateral from Securities on Loan | |
| | |
| | | | | | | | |
| | | | Money Market Fund—2.2% | |
| | 101,889,369 | | | Invesco Government & Agency Portfolio—Institutional Class, 0.29%(c)(d)
(Cost $101,889,369) | | | 101,889,369 | |
| | | | | | | | |
| | | | Total Investments
(Cost $4,758,223,881)—102.4% | | | 4,844,716,077 | |
| | | | Other assets less liabilities—(2.4)% | | | (113,871,570 | ) |
| | | | | | | | |
| | | | Net Assets—100.0% | | $ | 4,730,844,507 | |
| | | | | | | | |
Notes to Schedule of Investments:
| (a) | Industry and/or sector classifications used in this report are generally according to the Global Industry Classification Standard, which was developed by and is the exclusive property and a service mark of MSCI Inc. and Standard & Poor’s. |
| (b) | All or a portion of this security was out on loan at October 31, 2016. |
| (c) | The security and the Fund are advised by wholly-owned subsidiaries of Invesco Ltd. and are therefore considered to be affiliated. The rate shown is the 7-day SEC standardized yield as of October 31, 2016. |
| (d) | The security has been segregated to satisfy the commitment to return the cash collateral received in securities lending transactions upon the borrower’s return of the securities loaned. See Note 2I. |
This Fund has holdings greater than 10% of net assets in the following country:
See accompanying Notes to Financial Statements which are an integral part of the financial statements.
Schedule of Investments
PowerShares Variable Rate Preferred Portfolio (VRP)
October 31, 2016
| | | | | | | | | | | | | | | | |
Number
of Shares | | | | | | | | | | | Value | |
| | | | Preferred Stocks and Other Equity Interests—59.4%(a) | | | | | | | | | | | | |
| | | | Banks—29.3% | | | | | | | | | | | | |
| | 166,900 | | | Bank of America Corp., 3.00%, Series H | | | | | | | | | | $ | 3,361,366 | |
| | 117,256 | | | Bank of America Corp., 4.00%, Series 4 | | | | | | | | | | | 2,809,454 | |
| | 213,969 | | | Bank of America Corp., 4.00%, Series 5 | | | | | | | | | | | 5,028,272 | |
| | 169,088 | | | Bank of America Corp., 4.00%, Series E | | | | | | | | | | | 3,868,733 | |
| | 1,259,238 | | | Citigroup Capital XIII, 7.26% | | | | | | | | | | | 32,752,780 | |
| | 840,296 | | | Citigroup, Inc., 6.88%, Series K | | | | | | | | | | | 24,108,092 | |
| | 524,390 | | | Citigroup, Inc., 7.13%, Series J | | | | | | | | | | | 14,955,603 | |
| | 262,139 | | | Fifth Third Bancorp, 6.63%, Series I | | | | | | | | | | | 7,866,791 | |
| | 68,751 | | | FNB Corp., 7.25% | | | | | | | | | | | 2,048,092 | |
| | 214,649 | | | KeyCorp, 8.63%, Series C | | | | | | | | | | | 5,602,339 | |
| | 508,430 | | | Merrill Lynch Capital Trust I, 6.45%, Series K | | | | | | | | | | | 12,964,965 | |
| | 345,171 | | | Merrill Lynch Capital Trust III, 7.38% | | | | | | | | | | | 9,209,162 | |
| | 94,900 | | | People’s United Financial, Inc., 5.63%, Series A | | | | | | | | | | | 2,476,890 | |
| | 865,141 | | | PNC Financial Services Group, Inc. (The), 6.13%, Series P | | | | | | | | | | | 24,396,976 | |
| | 286,689 | | | Regions Financial Corp., 6.38%, Series B | | | | | | | | | | | 8,248,043 | |
| | 161,096 | | | Santander Finance Preferred SAU, 4.00%, Series 6 (Spain) | | | | | | | | | | | 3,859,860 | |
| | 106,970 | | | SunTrust Banks, Inc., 4.00% | | | | | | | | | | | 2,487,053 | |
| | 79,530 | | | Synovus Financial Corp., 7.88%, Series C | | | | | | | | | | | 2,260,243 | |
| | 566,290 | | | U.S. Bancorp, 3.50%, Series B | | | | | | | | | | | 13,942,060 | |
| | 613,115 | | | U.S. Bancorp, 6.00%, Series G | | | | | | | | | | | 15,701,875 | |
| | 622,624 | | | U.S. Bancorp, 6.50%, Series F | | | | | | | | | | | 18,274,014 | |
| | 69,960 | | | Valley National Bancorp, 6.25%, Series A | | | | | | | | | | | 2,016,947 | |
| | 973,166 | | | Wells Fargo & Co., 5.85% | | | | | | | | | | | 25,925,142 | |
| | 473,620 | | | Wells Fargo & Co., 6.63% | | | | | | | | | | | 13,976,526 | |
| | 76,345 | | | Wintrust Financial Corp., 6.50%, Series D | | | | | | | | | | | 2,153,693 | |
| | 91,100 | | | Zions Bancorp, 6.30%, Series G | | | | | | | | | | | 2,851,430 | |
| | | | | | | | | | | | | | | | |
| | | | | | | | | | | | | | | 263,146,401 | |
| | | | | | | | | | | | | | | | |
| | | | Capital Markets—14.6% | | | | | | | | | | | | |
| | 410,635 | | | Goldman Sachs Group, Inc. (The), 3.75%, Series A | | | | | | | | | | | 9,062,714 | |
| | 111,571 | | | Goldman Sachs Group, Inc. (The), 4.00%, Series C | | | | | | | | | | | 2,500,306 | |
| | 750,921 | | | Goldman Sachs Group, Inc. (The), 4.00%, Series D | | | | | | | | | | | 16,835,649 | |
| | 563,422 | | | Goldman Sachs Group, Inc. (The), 5.50%, Series J | | | | | | | | | | | 14,688,411 | |
| | 385,205 | | | Goldman Sachs Group, Inc. (The), 6.38%, Series K | | | | | | | | | | | 10,989,899 | |
| | 605,047 | | | Morgan Stanley, 4.00%, Series A | | | | | | | | | | | 13,861,627 | |
| | 561,643 | | | Morgan Stanley, 6.38%, Series I | | | | | | | | | | | 15,501,347 | |
| | 477,930 | | | Morgan Stanley, 6.88%, Series F | | | | | | | | | | | 13,888,646 | |
| | 484,958 | | | Morgan Stanley, 7.13%, Series E | | | | | | | | | | | 14,151,074 | |
| | 288,672 | | | State Street Corp., 5.35%, Series G | | | | | | | | | | | 7,727,749 | |
| | 433,371 | | | State Street Corp., 5.90%, Series D | | | | | | | | | | | 12,156,057 | |
| | | | | | | | | | | | | | | | |
| | | | | | | | | | | | | | | 131,363,479 | |
| | | | | | | | | | | | | | | | |
| | | | Commercial Services & Supplies—0.7% | | | | | | | | | | | | |
| | 243,197 | | | NuStar Logistics LP, 7.63% | | | | | | | | | | | 6,228,275 | |
| | | | | | | | | | | | | | | | |
| | | | Consumer Finance—4.4% | | | | | | | | | | | | |
| | 1,548,355 | | | GMAC Capital Trust I, 6.60%, Series 2 | | | | | | | | | | | 39,529,503 | |
| | | | | | | | | | | | | | | | |
| | | | Electric Utilities—1.7% | | | | | | | | | | | | |
| | 169,008 | | | SCE Trust III, 5.75%, Series H | | | | | | | | | | | 4,850,530 | |
| | 199,277 | | | SCE Trust IV, 5.38%, Series J | | | | | | | | | | | 5,551,857 | |
| | 179,272 | | | SCE Trust V, 5.45%, Series K | | | | | | | | | | | 5,055,470 | |
| | | | | | | | | | | | | | | | |
| | | | | | | | | | | | | | | 15,457,857 | |
| | | | | | | | | | | | | | | | |
| | | | Food Products—1.8% | | | | | | | | | | | | |
| | 305,025 | | | CHS, Inc., 6.75%, Series 3 | | | | | | | | | | | 8,571,203 | |
| | 261,569 | | | CHS, Inc., 7.10%, Series 2 | | | | | | | | | | | 7,742,442 | |
| | | | | | | | | | | | | | | | |
| | | | | | | | | | | | | | | 16,313,645 | |
| | | | | | | | | | | | | | | | |
See accompanying Notes to Financial Statements which are an integral part of the financial statements.
PowerShares Variable Rate Preferred Portfolio (VRP) (continued)
October 31, 2016
| | | | | | | | | | | | | | | | |
Number
of Shares | | | | | | | | | | | Value | |
| | | | Preferred Stocks and Other Equity Interests (continued) | | | | | | | | | | | | |
| | | | Insurance—5.9% | | | | | | | | | | | | |
| | 157,024 | | | Aegon NV, 4.00%, Series 1 (Netherlands) | | | | | | | | | | $ | 3,902,046 | |
| | 306,080 | | | Allstate Corp. (The), 5.10% | | | | | | | | | | | 8,221,309 | |
| | 168,707 | | | Aspen Insurance Holdings Ltd., 5.95% (Bermuda) | | | | | | | | | | | 4,801,401 | |
| | 82,228 | | | Aspen Insurance Holdings Ltd., 7.40% (Bermuda) | | | | | | | | | | | 2,077,902 | |
| | 353,073 | | | Hartford Financial Services Group, Inc. (The), 7.88% | | | | | | | | | | | 11,044,123 | |
| | 358,066 | | | MetLife, Inc., 4.00%, Series A | | | | | | | | | | | 9,062,651 | |
| | 233,217 | | | Reinsurance Group of America, Inc., 5.75% | | | | | | | | | | | 6,688,664 | |
| | 244,494 | | | Reinsurance Group of America, Inc., 6.20% | | | | | | | | | | | 6,990,083 | |
| | | | | | | | | | | | | | | | |
| | | | | | | | | | | | | | | 52,788,179 | |
| | | | | | | | | | | | | | | | |
| | | | Mortgage Real Estate Investment Trusts—0.2% | | | | | | | | | | | | |
| | 63,824 | | | Resource Capital Corp., 8.63% | | | | | | | | | | | 1,448,805 | |
| | | | | | | | | | | | | | | | |
| | | | Multi-Utilities—0.6% | | | | | | | | | | | | |
| | 217,102 | | | Integrys Holding, Inc., 6.00% | | | | | | | | | | | 5,818,334 | |
| | | | | | | | | | | | | | | | |
| | | | Oil, Gas & Consumable Fuels—0.2% | | | | | | | | | | | | |
| | 76,710 | | | Targa Resources Partners LP, 9.00%, Series A | | | | | | | | | | | 2,056,595 | |
| | | | | | | | | | | | | | | | |
| | | | Total Preferred Stocks and Other Equity Interests
(Cost $520,544,106) | | | | | | | | | | | 534,151,073 | |
| | | | | | | | | | | | | | | | |
| | | | |
| | | | | | | | | | | | | | | | |
Principal
Amount | | | | | Interest
Rate | | | Maturity
Date | | | | |
| | | | Corporate Bonds—40.2% | | | | | | | | | | | | |
| | | | Banks—10.3% | | | | | | | | | | | | |
| $ | 6,095,000 | | | BAC Capital Trust XIV, Series G | | | 4.000 | % | | | 09/29/2049 | | | | 5,074,088 | |
| | 10,992,000 | | | Goldman Sachs Capital II | | | 4.000 | | | | 12/29/2049 | | | | 9,082,140 | |
| | 2,284,000 | | | Goldman Sachs Capital III, Series APE | | | 4.000 | | | | 09/29/2049 | | | | 1,887,155 | |
| | 11,915,000 | | | JPMorgan Chase Capital XXI, Series U(b) | | | 1.709 | | | | 02/02/2037 | | | | 10,068,175 | |
| | 9,136,000 | | | JPMorgan Chase Capital XXIII(b) | | | 1.817 | | | | 05/15/2047 | | | | 7,308,800 | |
| | 7,200,000 | | | Mellon Capital IV, Series 1 | | | 4.000 | | | | 06/29/2049 | | | | 6,318,000 | |
| | 11,521,000 | | | State Street Capital Trust IV(b) | | | 1.850 | | | | 06/15/2037 | | | | 9,949,639 | |
| | 9,460,000 | | | USB Capital IX | | | 3.500 | | | | 10/29/2049 | | | | 8,135,600 | |
| | 34,992,000 | | | Wachovia Capital Trust III | | | 5.570 | | | | 03/29/2049 | | | | 35,079,480 | |
| | | | | | | | | | | | | | | | |
| | | | | | | | | | | | | | | 92,903,077 | |
| | | | | | | | | | | | | | | | |
| | | | Diversified Financial Services—1.5% | | | | | | | | | | | | |
| | 2,045,000 | | | GE Capital Trust I(b) | | | 6.375 | | | | 11/15/2067 | | | | 2,124,244 | |
| | 5,753,000 | | | National Rural Utilities Cooperative Finance Corp. | | | 4.750 | | | | 04/30/2043 | | | | 5,889,150 | |
| | 4,750,000 | | | National Rural Utilities Cooperative Finance Corp. | | | 5.250 | | | | 04/20/2046 | | | | 5,086,386 | |
| | | | | | | | | | | | | | | | |
| | | | | | | | | | | | | | | 13,099,780 | |
| | | | | | | | | | | | | | | | |
| | | | Electric—4.4% | | | | | | | | | | | | |
| | 9,919,000 | | | Dominion Resources, Inc.(b) | | | 5.750 | | | | 10/01/2054 | | | | 10,350,938 | |
| | 16,953,000 | | | Emera, Inc., Series 16-A (Canada) | | | 6.750 | | | | 06/15/2076 | | | | 18,767,276 | |
| | 4,690,000 | | | NextEra Energy Capital Holdings, Inc.(b) | | | 2.913 | | | | 10/01/2066 | | | | 4,083,166 | |
| | 7,076,000 | | | WEC Energy Group, Inc. | | | 6.250 | | | | 05/15/2067 | | | | 6,226,880 | |
| | | | | | | | | | | | | | | | |
| | | | | | | | | | | | | | | 39,428,260 | |
| | | | | | | | | | | | | | | | |
| | | | Hand/Machine Tools—0.7% | | | | | | | | | | | | |
| | 5,755,000 | | | Stanley Black & Decker, Inc. | | | 5.750 | | | | 12/15/2053 | | | | 6,179,431 | |
| | | | | | | | | | | | | | | | |
| | | | Insurance—16.4% | | | | | | | | | | | | |
| | 11,484,000 | | | Allstate Corp. (The) | | | 5.750 | | | | 08/15/2053 | | | | 12,359,655 | |
| | 14,374,000 | | | Chubb Corp. (The) | | | 6.375 | | | | 04/15/2037 | | | | 13,673,267 | |
| | 3,374,000 | | | Everest Reinsurance Holdings, Inc. | | | 6.600 | | | | 05/15/2037 | | | | 2,956,467 | |
| | 8,375,000 | | | Genworth Holdings, Inc. | | | 6.150 | | | | 11/15/2066 | | | | 4,061,875 | |
| | 7,143,000 | | | Hartford Financial Services Group, Inc. (The) | | | 8.125 | | | | 06/15/2038 | | | | 7,857,300 | |
| | 10,200,000 | | | Lincoln National Corp.(b) | | | 3.162 | | | | 05/17/2066 | | | | 8,172,750 | |
See accompanying Notes to Financial Statements which are an integral part of the financial statements.
PowerShares Variable Rate Preferred Portfolio (VRP) (continued)
October 31, 2016
| | | | | | | | | | | | | | | | |
Principal
Amount | | | | | Interest
Rate | | | Maturity
Date | | | Value | |
| | | | Corporate Bonds (continued) | | | | | | | | | | | | |
| | | | Insurance (continued) | | | | | | | | | | | | |
| $ | 7,095,000 | | | Lincoln National Corp. | | | 6.050 | % | | | 04/20/2067 | | | $ | 5,613,919 | |
| | 5,750,000 | | | Principal Financial Group, Inc. | | | 4.700 | | | | 05/15/2055 | | | | 5,710,357 | |
| | 8,364,000 | | | Prudential Financial, Inc. | | | 8.875 | | | | 06/15/2038 | | | | 9,315,405 | |
| | 14,040,000 | | | Prudential Financial, Inc. | | | 5.875 | | | | 09/15/2042 | | | | 15,479,100 | |
| | 21,038,000 | | | Prudential Financial, Inc. | | | 5.625 | | | | 06/15/2043 | | | | 22,773,635 | |
| | 7,045,000 | | | Prudential Financial, Inc. | | | 5.200 | | | | 03/15/2044 | | | | 7,247,544 | |
| | 14,005,000 | | | Prudential Financial, Inc. | | | 5.375 | | | | 05/15/2045 | | | | 14,652,731 | |
| | 4,605,000 | | | Reinsurance Group of America, Inc.(b) | | | 3.515 | | | | 12/15/2065 | | | | 3,879,713 | |
| | 3,505,000 | | | StanCorp Financial Group, Inc. | | | 6.900 | | | | 06/01/2067 | | | | 2,852,194 | |
| | 10,671,000 | | | Voya Financial, Inc. | | | 5.650 | | | | 05/15/2053 | | | | 10,697,677 | |
| | | | | | | | | | | | | | | | |
| | | | | | | | | | | | | | | 147,303,589 | |
| | | | | | | | | | | | | | | | |
| | | | Miscellaneous Manufacturing—0.5% | | | | | | | | | | | | |
| | 3,970,000 | | | General Electric Co., GMTN | | | 6.375 | | | | 11/15/2067 | | | | 4,123,837 | |
| | | | | | | | | | | | | | | | |
| | | | Pipelines—6.4% | | | | | | | | | | | | |
| | 7,445,000 | | | Enterprise Products Operating LLC, Series A(b) | | | 4.464 | | | | 08/01/2066 | | | | 7,147,200 | |
| | 9,712,000 | | | Enterprise Products Operating LLC, Series B | | | 7.034 | | | | 01/15/2068 | | | | 10,306,860 | |
| | 14,160,000 | | | TransCanada Pipelines Ltd. (Canada) | | | 6.350 | | | | 05/15/2067 | | | | 11,432,784 | |
| | 10,610,000 | | | TransCanada Trust (Canada) | | | 5.625 | | | | 05/20/2075 | | | | 10,835,463 | |
| | 17,050,000 | | | TransCanada Trust, Series 16-A (Canada) | | | 5.875 | | | | 08/15/2076 | | | | 18,286,125 | |
| | | | | | | | | | | | | | | | |
| | | | | | | | | | | | | | | 58,008,432 | |
| | | | | | | | | | | | | | | | |
| | | | Total Corporate Bonds
(Cost $351,980,530) | | | | | | | | | | | 361,046,406 | |
| | | | | | | | | | | | | | | | |
| | | | Total Investments
(Cost $872,524,636)—99.6% | | | | | | | | | | | 895,197,479 | |
| | | | | | | | | | | | | | | | |
| | | | Other assets less liabilities—0.4% | | | | | | | | | | | 3,862,199 | |
| | | | | | | | | | | | | | | | |
| | | | Net Assets—100.0% | | | | | | | | | | $ | 899,059,678 | |
| | | | | | | | | | | | | | | | |
Investment Abbreviations:
GMTN—Global Medium-Term Note
Notes to Schedule of Investments:
| (a) | Industry and/or sector classifications used in this report are generally according to the Global Industry Classification Standard, which was developed by and is the exclusive property and a service mark of MSCI Inc. and Standard & Poor’s. |
| (b) | Variable rate coupon. Stated interest rate was in effect at October 31, 2016. |
See accompanying Notes to Financial Statements which are an integral part of the financial statements.
Schedule of Investments
PowerShares VRDO Tax-Free Weekly Portfolio (PVI)
October 31, 2016
| | | | | | | | | | | | | | | | |
Principal
Amount | | | | | Interest
Rate(a) | | | Maturity
Date | | | Value | |
| | | | Municipal Bonds—97.3%(b) | | | | | | | | | | | | |
| | | | College Revenue—8.5% | | | | | | | | | | | | |
| $ | 2,500,000 | | | Michigan State University Rev. (General Remarketed 2/25/15) Ser. 00A | | | 0.630 | % | | | 08/15/2030 | | | $ | 2,500,000 | |
| | 600,000 | | | Rhode Island State Health & Educational Building Corp. Rev. (Catholic School Pool Program) Ser. 05A (LOC—Citizens Bank of Rhode Island)(c) | | | 0.600 | | | | 04/01/2035 | | | | 600,000 | |
| | 2,000,000 | | | WACO Texas Educational Finance Corp. Rev. Ref. (Baylor University) Ser. 08A (LOC—Bank of New York Mellon Trust)(c) | | | 0.640 | | | | 02/01/2032 | | | | 2,000,000 | |
| | | | | | | | | | | | | | | | |
| | | | | | | | | | | | | | | 5,100,000 | |
| | | | | | | | | | | | | | | | |
| | | | Electric Power Revenue—4.2% | | | | | | | | | | | | |
| | 300,000 | | | Orlando Florida Utilities Commission Utility System Rev. (Remarketed 04/07/11)
Ser. 08-1 | | | 0.600 | | | | 10/01/2033 | | | | 300,000 | |
| | 2,225,000 | | | Sevier County Tennessee Public Building Auth. (Local Government Improvement Program) Ser. 10V-D-1 (LOC—Bank of America, N.A.)(c) | | | 0.650 | | | | 06/01/2026 | | | | 2,225,000 | |
| | | | | | | | | | | | | | | | |
| | | | | | | | | | | | | | | 2,525,000 | |
| | | | | | | | | | | | | | | | |
| | | | Health, Hospital, Nursing Home Revenue—31.0% | | | | | | | | | | | | |
| | 1,800,000 | | | ABAG Finance Auth. For Nonprofit Corporations (Sharp HealthCare) Ser. 09A (LOC—Bank of America, N.A.)(c) | | | 0.530 | | | | 08/01/2024 | | | | 1,800,000 | |
| | 195,000 | | | Arizona State Health Facilities Auth. (Banner Health) Ser. 08F (LOC—JPMorgan Chase Bank)(c) | | | 0.650 | | | | 01/01/2029 | | | | 195,000 | |
| | 2,500,000 | | | Charlotte-Mecklenburg Hospital Auth. North Carolina Health Care System Rev. Ref. (Carolina-Remarketed) Ser. 07C | | | 0.630 | | | | 01/15/2037 | | | | 2,500,000 | |
| | 2,400,000 | | | Cleveland-Cuyahoga County Ohio Port Auth. (Carnegie/89th Garage Project) Ser. 07 (LOC—JPMorgan Chase Bank)(c) | | | 0.610 | | | | 01/01/2037 | | | | 2,400,000 | |
| | 2,500,000 | | | Connecticut State Health & Educational Facilities Auth. Rev. (Yale New Heaven Hospital) Ser. 13O (LOC—Wells Fargo Bank, N.A.)(c) | | | 0.590 | | | | 07/01/2053 | | | | 2,500,000 | |
| | 195,000 | | | DeKalb Georgia Private Hospital Auth. (Children’s Healthcare of Atlanta) Ser. 08 | | | 0.600 | | | | 07/01/2042 | | | | 195,000 | |
| | 300,000 | | | Louisiana State Public Facilities Auth. Rev. Ref. (Christus Health) Ser. 09B2 (LOC—Bank of New York Mellon Trust)(c) | | | 0.600 | | | | 07/01/2047 | | | | 300,000 | |
| | 2,900,000 | | | Maryland State Health & Higher Educational Facilities Auth. Rev. (University of Maryland Medical Systems) Ser. 07A (LOC—Wells Fargo Bank, N.A.)(c) | | | 0.630 | | | | 07/01/2034 | | | | 2,900,000 | |
| | 2,500,000 | | | Missouri State Health & Educational Facilities Auth. (BJC Health System) Ser. 08C | | | 0.600 | | | | 05/15/2038 | | | | 2,500,000 | |
| | 3,000,000 | | | North Carolina Medical Care Commission Health Care Facilities (Pennybyrn at Maryfield) Ser. 05A | | | 0.710 | | | | 11/01/2034 | | | | 3,000,000 | |
| | 100,000 | | | Rochester Minnesota Health Care Facilities Rev. (Mayo Foundation—Remarketed 04/10/08) Ser. 02A | | | 0.580 | | | | 08/15/2032 | | | | 100,000 | |
| | 135,000 | | | University of North Carolina at Chapel Hill Rev. Ref. Ser. 03B | | | 0.590 | | | | 02/01/2029 | | | | 135,000 | |
| | | | | | | | | | | | | | | | |
| | | | | | | | | | | | | | | 18,525,000 | |
| | | | | | | | | | | | | | | | |
| | | | Highway Tolls Revenue—11.7% | | | | | | | | | | | | |
| | 3,825,000 | | | Bay Area California Auth. Toll Bridge Rev. Ser. 07 (LOC—Sumitomo Mitsui Banking)(c) | | | 0.520 | | | | 04/01/2047 | | | | 3,825,000 | |
| | 185,000 | | | Massachusetts State Department of Transportation Highway System Rev. Ref. (Contract Assistance—Remarketed 11/20/14) Ser. 10A7 | | | 0.600 | | | | 01/01/2029 | | | | 185,000 | |
| | 3,000,000 | | | Texas State Transportation Commission Rev. (First Tier) Ser. 06B | | | 0.800 | | | | 04/01/2026 | | | | 3,000,000 | |
| | | | | | | | | | | | | | | | |
| | | | | | | | | | | | | | | 7,010,000 | |
| | | | | | | | | | | | | | | | |
| | | | Hotel Occupancy Tax—0.5% | | | | | | | | | | | | |
| | 300,000 | | | Kansas City Missouri Special Obligation Ref. (H. Roe Bartle) Ser. 08F (LOC—Sumitomo Mitsui Banking)(c) | | | 0.600 | | | | 04/15/2025 | | | | 300,000 | |
| | | | | | | | | | | | | | | | |
| | | | Income Tax Revenue—3.3% | | | | | | | | | | | | |
| | 2,000,000 | | | New York City Transitional Finance Auth. Rev. (Future Tax Secured) Sub.-Ser. 99-B3 | | | 0.650 | | | | 11/01/2028 | | | | 2,000,000 | |
| | | | | | | | | | | | | | | | |
| | | | Lease Revenue—3.9% | | | | | | | | | | | | |
| | 2,300,000 | | | Orange County Florida School Board COP Ser. 08C (LOC—Bank of America, N.A.)(c) | | | 0.630 | | | | 08/01/2025 | | | | 2,300,000 | |
| | | | | | | | | | | | | | | | |
| | | | Local or GTD Housing—8.3% | | | | | | | | | | | | |
| | 2,500,000 | | | Indianapolis Indiana Multifamily Housing Rev. (Capital Place-Convington) Ser. 08 (LOC—Fannie Mae)(c) | | | 0.620 | | | | 05/15/2038 | | | | 2,500,000 | |
| | 2,450,000 | | | New York State Housing Finance Agency Rev. (222 E 44th Street Housing) Ser. 15A (LOC—Bank of China)(c) | | | 0.720 | | | | 05/01/2050 | | | | 2,450,000 | |
| | | | | | | | | | | | | | | | |
| | | | | | | | | | | | | | | 4,950,000 | |
| | | | | | | | | | | | | | | | |
See accompanying Notes to Financial Statements which are an integral part of the financial statements.
PowerShares VRDO Tax-Free Weekly Portfolio (PVI) (continued)
October 31, 2016
| | | | | | | | | | | | | | | | |
Principal
Amount | | | | | Interest
Rate(a) | | | Maturity
Date | | | Value | |
| | | | Municipal Bonds (continued) | | | | | | | | | | | | |
| | | | Miscellaneous Revenue—7.3% | | | | | | | | | | | | |
| $ | 1,990,000 | | | Clarksville Tennessee Public Building Auth. Rev. (Pooled Financing Tennessee Municipal Bond Fund) Ser. 99 (LOC—Bank of America, N.A.)(c) | | | 0.680 | % | | | 06/01/2029 | | | $ | 1,990,000 | |
| | 200,000 | | | Montgomery County Tennessee Public Building Auth. (Pooled Funding Government Obligation—Tennessee County Loan Pool) Ser. 95 (LOC—Bank of America, N.A.)(c) | | | 0.680 | | | | 03/01/2025 | | | | 200,000 | |
| | 200,000 | | | New York State Housing Finance Agency Service Contract Rev. Ref. (Remarketed 10/08/08) Ser. 03L (LOC—Bank of America, N.A.)(c) | | | 0.530 | | | | 09/15/2021 | | | | 200,000 | |
| | 2,000,000 | | | New York State Urban Development Corp. Rev. Ref. (CVS Contract) Ser. 08A-1 (LOC—Wells Fargo Bank, N.A.)(c) | | | 0.630 | | | | 01/01/2030 | | | | 2,000,000 | |
| | | | | | | | | | | | | | | | |
| | | | | | | | | | | | | | | 4,390,000 | |
| | | | | | | | | | | | | | | | |
| | | | Multiple Utility Revenue—4.2% | | | | | | | | | | | | |
| | 2,500,000 | | | Colorado Springs Colorado Utilities Rev. (Sub.-Lien Improvement) Ser. 06B | | | 0.690 | | | | 11/01/2036 | | | | 2,500,000 | |
| | | | | | | | | | | | | | | | |
| | | | Sales Tax Revenue—9.4% | | | | | | | | | | | | |
| | 3,130,000 | | | Florida State Department of Environmental Protection Preservation Rev. (Everglades Restoration) Ser. 07A AGC | | | 0.670 | | | | 07/01/2027 | | | | 3,130,000 | |
| | 2,500,000 | | | San Diego County California Regional Transportation Commission (Limited Tax) Ser. 08C | | | 0.580 | | | | 04/01/2038 | | | | 2,500,000 | |
| | | | | | | | | | | | | | | | |
| | | | | | | | | | | | | | | 5,630,000 | |
| | | | | | | | | | | | | | | | |
| | | | Transit Revenue—0.3% | | | | | | | | | | | | |
| | 200,000 | | | Texas State Multi-Mode Mobility Fund Ser. 06B | | | 0.600 | | | | 04/01/2036 | | | | 200,000 | |
| | | | | | | | | | | | | | | | |
| | | | Water Revenue—4.7% | | | | | | | | | | | | |
| | 100,000 | | | Charlotte North Carolina Water & Sewer System Rev. Ser. 06B | | | 0.580 | | | | 07/01/2036 | | | | 100,000 | |
| | 2,500,000 | | | JEA Florida Water & Sewer System Rev. Ser. 08B | | | 0.640 | | | | 10/01/2041 | | | | 2,500,000 | |
| | 200,000 | | | Massachusetts State Water Resources Auth. Ref. (Remarketed 05/07/11) Ser. 08C-2 | | | 0.630 | | | | 11/01/2026 | | | | 200,000 | |
| | | | | | | | | | | | | | | | |
| | | | | | | | | | | | | | | 2,800,000 | |
| | | | | | | | | | | | | | | | |
| | | | Total Investments
(Cost $58,230,000)(d)—97.3% | | | | | | | | | | | 58,230,000 | |
| | | | Other assets less liabilities—2.7% | | | | | | | | | | | 1,600,588 | |
| | | | | | | | | | | | | | | | |
| | | | Net Assets—100.0% | | | | | | | | | | $ | 59,830,588 | |
| | | | | | | | | | | | | | | | |
Investment Abbreviations:
AGC—Assured Guaranty Corp.
Auth.—Authority
COP—Certificate of Participation
GTD—Grant To Date
LOC—Letter of Credit
Ref.—Refunding
Rev.—Revenue
Ser.—Series
Sub.—Subordinated
Notes to Schedule of Investments:
| (a) | Variable rate coupon. Stated interest rate was in effect at October 31, 2016. |
| (b) | Demand Securities payable upon demand by the Fund for an amount equal to par value plus accrued interest at specified time intervals. |
| (c) | Principal and interest payments are fully enhanced by a letter of credit from the bank listed or a predecessor bank, branch or subsidiary. |
| (d) | The following table provides a listing of those entities that have either guaranteed, backed or otherwise enhanced the credit quality of more than 5% of the value of securities held in the portfolio, as of October 31, 2016. In instances where the entity has guaranteed, backed or otherwise enhanced the credit quality of a security, it is not primarily responsible for the borrower’s obligations but may be called upon to satisfy the borrower’s obligations. |
| | | | |
Entities | | Percentage of
Total Investments | |
| Bank of America, N.A. | | | 15.0 | % |
| Wells Fargo Bank, N.A. | | | 12.7 | |
| Sumitomo Mitsui Banking | | | 7.1 | |
| Assured Guaranty Corp. | | | 5.4 | |
See accompanying Notes to Financial Statements which are an integral part of the financial statements.
(This Page Intentionally Left Blank)
Statements of Assets and Liabilities
October 31, 2016
| | | | | | | | | | | | | | | | |
| | | PowerShares
1-30 Laddered
Treasury
Portfolio (PLW) | | | PowerShares
Build America
Bond Portfolio
(BAB) | | |
PowerShares
California
AMT-Free
Municipal Bond
Portfolio (PWZ) | | | PowerShares
CEF Income
Composite
Portfolio
(PCEF) | |
| Assets: | | | | | | | | | | | | | | | | |
Unaffiliated investments, at value(a) | | $ | 219,484,305 | | | $ | 1,012,154,980 | | | $ | 187,455,013 | | | $ | 632,582,066 | |
Affiliated investments, at value | | | 76,586 | | | | 40,960,612 | | | | — | | | | 9,989,710 | |
| | | | | | | | | | | | | | | | |
Total investments, at value | | | 219,560,891 | | | | 1,053,115,592 | | | | 187,455,013 | | | | 642,571,776 | |
Cash | | | — | | | | — | | | | 570,513 | | | | — | |
Cash segregated as collateral | | | — | | | | — | | | | — | | | | — | |
Receivables: | | | | | | | | | | | | | | | | |
Dividends and interest | | | 1,957,703 | | | | 14,736,270 | | | | 2,234,014 | | | | 698,744 | |
Shares sold | | | — | | | | 3,075,497 | | | | — | | | | — | |
Investments sold | | | — | | | | — | | | | — | | | | — | |
Securities lending | | | — | | | | — | | | | — | | | | — | |
| | | | | | | | | | | | | | | | |
Total Assets | | | 221,518,594 | | | | 1,070,927,359 | | | | 190,259,540 | | | | 643,270,520 | |
| | | | | | | | | | | | | | | | |
| | | | |
| Liabilities: | | | | | | | | | | | | | | | | |
Due to custodian | | | — | | | | — | | | | — | | | | 523,032 | |
Due to foreign custodian | | | — | | | | — | | | | — | | | | — | |
Payables: | | | | | | | | | | | | | | | | |
Investments purchased | | | — | | | | — | | | | 592,935 | | | | — | |
Collateral upon return of securities loaned | | | — | | | | — | | | | — | | | | — | |
Collateral upon receipt of securities in-kind | | | — | | | | — | | | | — | | | | — | |
Shares repurchased | | | — | | | | — | | | | — | | | | — | |
Accrued unitary management fees | | | 47,073 | | | | 248,072 | | | | 46,553 | | | | 274,424 | |
Accrued expenses | | | — | | | | — | | | | — | | | | — | |
| | | | | | | | | | | | | | | | |
Total Liabilities | | | 47,073 | | | | 248,072 | | | | 639,488 | | | | 797,456 | |
| | | | | | | | | | | | | | | | |
| Net Assets | | $ | 221,471,521 | | | $ | 1,070,679,287 | | | $ | 189,620,052 | | | $ | 642,473,064 | |
| | | | | | | | | | | | | | | | |
| | | | |
| Net Assets Consist of: | | | | | | | | | | | | | | | | |
Shares of beneficial interest | | $ | 218,482,753 | | | $ | 994,970,742 | | | $ | 186,601,765 | | | $ | 680,924,922 | |
Undistributed net investment income | | | — | | | | — | | | | — | | | | — | |
Undistributed net realized gain (loss) | | | (671,608 | ) | | | (12,782 | ) | | | (1,682,834 | ) | | | (28,247,929 | ) |
Net unrealized appreciation (depreciation) | | | 3,660,376 | | | | 75,721,327 | | | | 4,701,121 | | | | (10,203,929 | ) |
| | | | | | | | | | | | | | | | |
| Net Assets | | $ | 221,471,521 | | | $ | 1,070,679,287 | | | $ | 189,620,052 | | | $ | 642,473,064 | |
| | | | | | | | | | | | | | | | |
Shares outstanding (unlimited amount authorized, $0.01 par value) | | | 6,550,000 | | | | 34,900,000 | | | | 7,250,000 | | | | 28,900,000 | |
Net asset value | | $ | 33.81 | | | $ | 30.68 | | | $ | 26.15 | | | $ | 22.23 | |
| | | | | | | | | | | | | | | | |
Market price | | $ | 33.84 | | | $ | 30.74 | | | $ | 26.21 | | | $ | 22.23 | |
| | | | | | | | | | | | | | | | |
Unaffiliated investments, at cost | | $ | 215,823,929 | | | $ | 936,433,653 | | | $ | 182,753,892 | | | $ | 642,353,449 | |
| | | | | | | | | | | | | | | | |
Affiliated investments, at cost | | $ | 76,586 | | | $ | 40,960,612 | | | $ | — | | | $ | 10,422,256 | |
| | | | | | | | | | | | | | | | |
Total investments, at cost | | $ | 215,900,515 | | | $ | 977,394,265 | | | $ | 182,753,892 | | | $ | 652,775,705 | |
| | | | | | | | | | | | | | | | |
Foreign currencies, at cost | | $ | — | | | $ | — | | | $ | — | | | $ | — | |
| | | | | | | | | | | | | | | | |
(a) Includes securities on loan with an aggregate value of: | | $ | — | | | $ | — | | | $ | — | | | $ | — | |
| | | | | | | | | | | | | | | | |
See accompanying Notes to Financial Statements which are an integral part of the financial statements.
| | | | | | | | | | | | | | |
PowerShares
Chinese Yuan
Dim Sum Bond
Portfolio (DSUM) | | | PowerShares
Emerging Markets
Sovereign Debt
Portfolio (PCY) | | | PowerShares
Fundamental
High Yield®
Corporate Bond
Portfolio (PHB) | | | PowerShares
Fundamental
Investment
Grade
Corporate Bond
Portfolio (PFIG) | |
| | | | | | | | | | | | | | |
| $ | 48,878,427 | | | $ | 4,057,314,124 | | | $ | 1,073,100,507 | | | $ | 57,346,378 | |
| | — | | | | 118,883,050 | | | | 2,593,269 | | | | 240,332 | |
| | | | | | | | | | | | | | |
| | 48,878,427 | | | | 4,176,197,174 | | | | 1,075,693,776 | | | | 57,586,710 | |
| | — | | | | 1,767,068 | | | | 186,198 | | | | — | |
| | — | | | | 17,618,723 | | | | 559,345 | | | | — | |
| | | | | | | | | | | | | | |
| | 622,676 | | | | 55,696,392 | | | | 15,101,695 | | | | 514,900 | |
| | — | | | | 19,870,165 | | | | 532,704 | | | | 3,876,936 | �� |
| | 1,177,779 | | | | 15,123,529 | | | | 13,729,352 | | | | — | |
| | — | | | | 61,294 | | | | — | | | | — | |
| | | | | | | | | | | | | | |
| | 50,678,882 | | | | 4,286,334,345 | | | | 1,105,803,070 | | | | 61,978,546 | |
| | | | | | | | | | | | | | |
| | | |
| | | | | | | | | | | | | | |
| | 587,527 | | | | — | | | | — | | | | — | |
| | 8,431 | | | | — | | | | — | | | | — | |
| | | | | | | | | | | | | | |
| | — | | | | 19,658,514 | | | | 3,473,607 | | | | 3,814,732 | |
| | — | | | | 106,777,370 | | | | — | | | | — | |
| | — | | | | 17,618,723 | | | | 559,345 | | | | — | |
| | — | | | | 14,934,940 | | | | 13,170,957 | | | | — | |
| | 17,678 | | | | 1,748,152 | | | | 461,983 | | | | 9,784 | |
| | 583 | | | | — | | | | — | | | | — | |
| | | | | | | | | | | | | | |
| | 614,219 | | | | 160,737,699 | | | | 17,665,892 | | | | 3,824,516 | |
| | | | | | | | | | | | | | |
| $ | 50,064,663 | | | $ | 4,125,596,646 | | | $ | 1,088,137,178 | | | $ | 58,154,030 | |
| | | | | | | | | | | | | | |
| | | |
| | | | | | | | | | | | | | |
| $ | 57,738,307 | | | $ | 4,123,594,669 | | | $ | 1,078,895,055 | | | $ | 57,105,783 | |
| | — | | | | 877,522 | | | | — | | | | — | |
| | (3,847,770 | ) | | | (81,021,960 | ) | | | (22,411,164 | ) | | | (61,295 | ) |
| | (3,825,874 | ) | | | 82,146,415 | | | | 31,653,287 | | | | 1,109,542 | |
| | | | | | | | | | | | | | |
| $ | 50,064,663 | | | $ | 4,125,596,646 | | | $ | 1,088,137,178 | | | $ | 58,154,030 | |
| | | | | | | | | | | | | | |
| | 2,200,000 | | | | 138,400,000 | | | | 57,900,000 | | | | 2,250,000 | |
| $ | 22.76 | | | $ | 29.81 | | | $ | 18.79 | | | $ | 25.85 | |
| | | | | | | | | | | | | | |
| $ | 22.71 | | | $ | 29.70 | | | $ | 18.70 | | | $ | 25.87 | |
| | | | | | | | | | | | | | |
| $ | 52,695,417 | | | $ | 3,975,167,709 | | | $ | 1,041,447,220 | | | $ | 56,236,836 | |
| | | | | | | | | | | | | | |
| $ | — | | | $ | 118,883,050 | | | $ | 2,593,269 | | | $ | 240,332 | |
| | | | | | | | | | | | | | |
| $ | 52,695,417 | | | $ | 4,094,050,759 | | | $ | 1,044,040,489 | | | $ | 56,477,168 | |
| | | | | | | | | | | | | | |
| $ | (8,414 | ) | | $ | — | | | $ | — | | | $ | — | |
| | | | | | | | | | | | | | |
| $ | — | | | $ | 105,175,049 | | | $ | — | | | $ | — | |
| | | | | | | | | | | | | | |
Statements of Assets and Liabilities (continued)
October 31, 2016
| | | | | | | | | | | | | | | | |
| | | PowerShares
Global Short
Term High
Yield Bond
Portfolio
(PGHY) | | | PowerShares
International
Corporate Bond
Portfolio (PICB) | | | PowerShares
LadderRite 0-5 Year
Corporate Bond
Portfolio (LDRI) | | | PowerShares
National
AMT-Free
Municipal Bond
Portfolio (PZA) | |
| Assets: | | | | | | | | | | | | | | | | |
Unaffiliated investments, at value(a) | | $ | 65,237,704 | | | $ | 158,479,172 | | | $ | 21,972,880 | | | $ | 1,347,381,028 | |
Affiliated investments, at value | | | 1,951,557 | | | | 891,729 | | | | 410,163 | | | | — | |
| | | | | | | | | | | | | | | | |
Total investments, at value | | | 67,189,261 | | | | 159,370,901 | | | | 22,383,043 | | | | 1,347,381,028 | |
Cash | | | 33,688 | | | | — | | | | — | | | | 14,814,719 | |
Cash segregated as collateral | | | 2,332,450 | | | | — | | | | — | | | | — | |
Receivables: | | | | | | | | | | | | | | | | |
Dividends and interest | | | 1,202,286 | | | | 2,042,426 | | | | 174,332 | | | | 17,661,952 | |
Shares sold | | | 2,220,143 | | | | — | | | | — | | | | 1,287,783 | |
Investments sold | | | 146,670 | | | | 911,703 | | | | — | | | | — | |
Securities lending | | | — | | | | — | | | | — | | | | — | |
Foreign tax reclaims | | | — | | | | 89,818 | | | | — | | | | — | |
| | | | | | | | | | | | | | | | |
Total Assets | | | 73,124,498 | | | | 162,414,848 | | | | 22,557,375 | | | | 1,381,145,482 | |
| | | | | | | | | | | | | | | | |
| | | | |
| Liabilities: | | | | | | | | | | | | | | | | |
Due to custodian | | | — | | | | — | | | | — | | | | — | |
Due to foreign custodian | | | — | | | | 270,707 | | | | — | | | | — | |
Payables: | | | | | | | | | | | | | | | | |
Investments purchased | | | 1,910,268 | | | | 1,534,772 | | | | — | | | | 1,185,870 | |
Collateral upon return of securities loaned | | | — | | | | — | | | | — | | | | — | |
Collateral upon receipt of securities in-kind | | | 2,332,450 | | | | — | | | | — | | | | — | |
Accrued unitary management fees | | | 19,284 | | | | 70,311 | | | | 3,870 | | | | 326,576 | |
| | | | | | | | | | | | | | | | |
Total Liabilities | | | 4,262,002 | | | | 1,875,790 | | | | 3,870 | | | | 1,512,446 | |
| | | | | | | | | | | | | | | | |
| Net Assets | | $ | 68,862,496 | | | $ | 160,539,058 | | | $ | 22,553,505 | | | $ | 1,379,633,036 | |
| | | | | | | | | | | | | | | | |
| | | | |
| Net Assets Consist of: | | | | | | | | | | | | | | | | |
Shares of beneficial interest | | $ | 69,246,570 | | | $ | 176,185,416 | | | $ | 22,436,750 | | | $ | 1,318,962,726 | |
Undistributed net investment income | | | — | | | | — | | | | — | | | | — | |
Undistributed net realized gain (loss) | | | (995,403 | ) | | | — | | | | (25,669 | ) | | | (1,304,618 | ) |
Net unrealized appreciation (depreciation) | | | 611,329 | | | | (15,646,358 | ) | | | 142,424 | | | | 61,974,928 | |
| | | | | | | | | | | | | | | | |
| Net Assets | | $ | 68,862,496 | | | $ | 160,539,058 | | | $ | 22,553,505 | | | $ | 1,379,633,036 | |
| | | | | | | | | | | | | | | | |
Shares outstanding (unlimited amount authorized, $0.01 par value) | | | 2,850,000 | | | | 6,400,000 | | | | 900,000 | | | | 53,700,000 | |
Net asset value | | $ | 24.16 | | | $ | 25.08 | | | $ | 25.06 | | | $ | 25.69 | |
| | | | | | | | | | | | | | | | |
Market price | | $ | 24.23 | | | $ | 25.02 | | | $ | 25.14 | | | $ | 25.77 | |
| | | | | | | | | | | | | | | | |
Unaffiliated investments, at cost | | $ | 64,626,375 | | | $ | 174,024,817 | | | $ | 21,830,456 | | | $ | 1,285,406,100 | |
| | | | | | | | | | | | | | | | |
Affiliated investments, at cost | | $ | 1,951,557 | | | $ | 891,729 | | | $ | 410,163 | | | $ | — | |
| | | | | | | | | | | | | | | | |
Total investments, at cost | | $ | 66,577,932 | | | $ | 174,916,546 | | | $ | 22,240,619 | | | $ | 1,285,406,100 | |
| | | | | | | | | | | | | | | | |
Foreign currencies, at cost | | $ | — | | | $ | (280,455 | ) | | $ | — | | | $ | — | |
| | | | | | | | | | | | | | | | |
(a) Includes securities on loan with an aggregate value of: | | $ | — | | | $ | — | | | $ | — | | | $ | — | |
| | | | | | | | | | | | | | | | |
See accompanying Notes to Financial Statements which are an integral part of the financial statements.
| | | | | | | | | | | | | | |
PowerShares
New York
AMT-Free
Municipal Bond
Portfolio (PZT) | | | PowerShares
Preferred
Portfolio (PGX) | | | PowerShares
Variable Rate
Preferred
Portfolio (VRP) | | | PowerShares
VRDO
Tax-Free
Weekly
Portfolio (PVI) | |
| | | | | | | | | | | | | | |
| $ | 61,945,356 | | | $ | 4,742,826,708 | | | $ | 895,197,479 | | | $ | 58,230,000 | |
| | — | | | | 101,889,369 | | | | — | | | | — | |
| | | | | | | | | | | | | | |
| | 61,945,356 | | | | 4,844,716,077 | | | | 895,197,479 | | | | 58,230,000 | |
| | 1,346,652 | | | | — | | | | — | | | | 1,573,411 | |
| | — | | | | 6,639 | | | | 118,071 | | | | — | |
| | | | | | | | | | | | | | |
| | 785,641 | | | | 11,283,689 | | | | 6,553,192 | | | | 40,059 | |
| | — | | | | 9,001,753 | | | | 5,178,462 | | | | — | |
| | — | | | | 14,183,227 | | | | — | | | | — | |
| | — | | | | 436,728 | | | | — | | | | — | |
| | — | | | | — | | | | — | | | | — | |
| | | | | | | | | | | | | | |
| | 64,077,649 | | | | 4,879,628,113 | | | | 907,047,204 | | | | 59,843,470 | |
| | | | | | | | | | | | | | |
| | | |
| | | | | | | | | | | | | | |
| | — | | | | 17,072,110 | | | | 2,445,764 | | | | — | |
| | — | | | | — | | | | — | | | | — | |
| | | | | | | | | | | | | | |
| | — | | | | 27,807,149 | | | | 5,052,730 | | | | — | |
| | — | | | | 101,889,369 | | | | — | | | | — | |
| | — | | | | 6,639 | | | | 118,071 | | | | — | |
| | 14,759 | | | | 2,008,339 | | | | 370,961 | | | | 12,882 | |
| | | | | | | | | | | | | | |
| | 14,759 | | | | 148,783,606 | | | | 7,987,526 | | | | 12,882 | |
| | | | | | | | | | | | | | |
| $ | 64,062,890 | | | $ | 4,730,844,507 | | | $ | 899,059,678 | | | $ | 59,830,588 | |
| | | | | | | | | | | | | | |
| | | |
| | | | | | | | | | | | | | |
| $ | 62,063,018 | | | $ | 4,707,004,411 | | | $ | 877,308,204 | | | $ | 59,830,588 | |
| | — | | | | — | | | | — | | | | — | |
| | (580,686 | ) | | | (62,652,100 | ) | | | (921,369 | ) | | | — | |
| | 2,580,558 | | | | 86,492,196 | | | | 22,672,843 | | | | — | |
| | | | | | | | | | | | | | |
| $ | 64,062,890 | | | $ | 4,730,844,507 | | | $ | 899,059,678 | | | $ | 59,830,588 | |
| | | | | | | | | | | | | | |
| | 2,600,000 | | | | 316,200,000 | | | | 35,500,000 | | | | 2,400,000 | |
| $ | 24.64 | | | $ | 14.96 | | | $ | 25.33 | | | $ | 24.93 | |
| | | | | | | | | | | | | | |
| $ | 24.67 | | | $ | 15.00 | | | $ | 25.42 | | | $ | 24.91 | |
| | | | | | | | | | | | | | |
| $ | 59,364,798 | | | $ | 4,656,334,512 | | | $ | 872,524,636 | | | $ | 58,230,000 | |
| | | | | | | | | | | | | | |
| $ | — | | | $ | 101,889,369 | | | $ | — | | | $ | — | |
| | | | | | | | | | | | | | |
| $ | 59,364,798 | | | $ | 4,758,223,881 | | | $ | 872,524,636 | | | $ | 58,230,000 | |
| | | | | | | | | | | | | | |
| $ | — | | | $ | — | | | $ | — | | | $ | — | |
| | | | | | | | | | | | | | |
| $ | — | | | $ | 98,290,922 | | | $ | — | | | $ | — | |
| | | | | | | | | | | | | | |
Statements of Operations
For the year ended October 31, 2016
| | | | | | | | | | | | | | | | |
| | | PowerShares
1-30 Laddered
Treasury
Portfolio (PLW) | | | PowerShares
Build America
Bond Portfolio
(BAB) | | |
PowerShares
California
AMT-Free
Municipal Bond
Portfolio (PWZ) | | | PowerShares
CEF Income
Composite
Portfolio
(PCEF) | |
| Investment Income: | | | | | | | | | | | | | | | | |
Unaffiliated interest income | | $ | 5,157,122 | | | $ | 38,209,118 | | | $ | 4,324,600 | | | $ | — | |
Unaffiliated dividend income | | | — | | | | — | | | | — | | | | 39,619,626 | |
Affiliated dividend income | | | 1,210 | | | | 116,263 | | | | — | | | | 570,787 | |
Securities lending income | | | — | | | | — | | | | — | | | | — | |
| | | | | | | | | | | | | | | | |
Total Income | | | 5,158,332 | | | | 38,325,381 | | | | 4,324,600 | | | | 40,190,413 | |
| | | | | | | | | | | | | | | | |
| | | | |
| Expenses: | | | | | | | | | | | | | | | | |
Unitary management fees | | | 589,510 | | | | 2,432,020 | | | | 391,332 | | | | 3,097,524 | |
| | | | | | | | | | | | | | | | |
Less: Waivers | | | (670 | ) | | | (59,607 | ) | | | — | | | | (1,351 | ) |
| | | | | | | | | | | | | | | | |
Net Expenses | | | 588,840 | | | | 2,372,413 | | | | 391,332 | | | | 3,096,173 | |
| | | | | | | | | | | | | | | | |
Net Investment Income | | | 4,569,492 | | | | 35,952,968 | | | | 3,933,268 | | | | 37,094,240 | |
| | | | | | | | | | | | | | | | |
| | | | |
| Realized and Unrealized Gain (Loss): | | | | | | | | | | | | | | | | |
Net realized gain (loss) from: | | | | | | | | | | | | | | | | |
Investment securities | | | (28,875 | ) | | | 4,593 | | | | 156,626 | | | | (14,656,528 | ) |
In-kind redemptions | | | 10,108,914 | | | | — | | | | — | | | | 2,818,366 | |
Distributions of underlying fund shares | | | — | | | | — | | | | — | | | | 260,282 | |
Foreign currencies | | | — | | | | — | | | | — | | | | — | |
| | | | | | | | | | | | | | | | |
Net realized gain (loss) | | | 10,080,039 | | | | 4,593 | | | | 156,626 | | | | (11,577,880 | ) |
| | | | | | | | | | | | | | | | |
Change in net unrealized appreciation (depreciation) on: | | | | | | | | | | | | | | | | |
Investment securities | | | 683,766 | | | | 36,415,568 | | | | 1,450,367 | | | | 32,412,423 | |
Foreign currencies | | | — | | | | — | | | | — | | | | — | |
| | | | | | | | | | | | | | | | |
Net change in unrealized appreciation (depreciation) | | | 683,766 | | | | 36,415,568 | | | | 1,450,367 | | | | 32,412,423 | |
| | | | | | | | | | | | | | | | |
Net realized and unrealized gain (loss) | | | 10,763,805 | | | | 36,420,161 | | | | 1,606,993 | | | | 20,834,543 | |
| | | | | | | | | | | | | | | | |
Net increase (decrease) in net assets resulting from operations | | $ | 15,333,297 | | | $ | 72,373,129 | | | $ | 5,540,261 | | | $ | 57,928,783 | |
| | | | | | | | | | | | | | | | |
See accompanying Notes to Financial Statements which are an integral part of the financial statements.
| | | | | | | | | | | | | | |
PowerShares
Chinese Yuan
Dim Sum Bond
Portfolio (DSUM) | | | PowerShares
Emerging Markets
Sovereign Debt
Portfolio (PCY) | | | PowerShares
Fundamental
High Yield®
Corporate Bond
Portfolio (PHB) | | | PowerShares
Fundamental
Investment
Grade
Corporate Bond
Portfolio (PFIG) | |
| | | | | | | | | | | | | | |
| $ | 2,225,344 | | | $ | 175,266,324 | | | $ | 41,925,545 | | | $ | 1,206,499 | |
| | — | | | | — | | | | — | | | | — | |
| | 3,613 | | | | 60,281 | | | | 20,080 | | | | 916 | |
| | — | | | | 411,649 | | | | — | | | | — | |
| | | | | | | | | | | | | | |
| | 2,228,957 | | | | 175,738,254 | | | | 41,945,625 | | | | 1,207,415 | |
| | | | | | | | | | | | | | |
| | | |
| | | | | | | | | | | | | | |
| | 266,952 | | | | 15,807,548 | | | | 4,042,795 | | | | 95,867 | |
| | | | | | | | | | | | | | |
| | (2,044 | ) | | | (31,730 | ) | | | (10,652 | ) | | | (517 | ) |
| | | | | | | | | | | | | | |
| | 264,908 | | | | 15,775,818 | | | | 4,032,143 | | | | 95,350 | |
| | | | | | | | | | | | | | |
| | 1,964,049 | | | | 159,962,436 | | | | 37,913,482 | | | | 1,112,065 | |
| | | | | | | | | | | | | | |
| | | |
| | | | | | | | | | | | | | |
| | | | | | | | | | | | | | |
| | (3,565,322 | ) | | | 6,263,395 | | | | (9,364,823 | ) | | | (40,240 | ) |
| | — | | | | 12,929,444 | | | | (7,399,854 | ) | | | — | |
| | — | | | | — | | | | — | | | | — | |
| | (122,498 | ) | | | — | | | | — | | | | — | |
| | | | | | | | | | | | | | |
| | (3,687,820 | ) | | | 19,192,839 | | | | (16,764,677 | ) | | | (40,240 | ) |
| | | | | | | | | | | | | | |
| | | | | | | | | | | | | | |
| | (592,519 | ) | | | 157,500,059 | | | | 48,202,775 | | | | 1,089,201 | |
| | (10,405 | ) | | | — | | | | — | | | | — | |
| | | | | | | | | | | | | | |
| | (602,924 | ) | | | 157,500,059 | | | | 48,202,775 | | | | 1,089,201 | |
| | | | | | | | | | | | | | |
| | (4,290,744 | ) | | | 176,692,898 | | | | 31,438,098 | | | | 1,048,961 | |
| | | | | | | | | | | | | | |
| $ | (2,326,695 | ) | | $ | 336,655,334 | | | $ | 69,351,580 | | | $ | 2,161,026 | |
| | | | | | | | | | | | | | |
Statements of Operations (continued)
For the year ended October 31, 2016
| | | | | | | | | | | | | | | | |
| | | PowerShares
Global Short
Term High
Yield Bond
Portfolio
(PGHY) | | | PowerShares
International
Corporate Bond
Portfolio (PICB) | | | PowerShares
LadderRite 0-5 Year
Corporate Bond
Portfolio (LDRI) | | | PowerShares
National
AMT-Free
Municipal Bond
Portfolio (PZA) | |
| Investment Income: | | | | | | | | | | | | | | | | |
Unaffiliated interest income | | $ | 2,791,750 | | | $ | 4,578,735 | | | $ | 265,330 | | | $ | 41,488,844 | |
Unaffiliated dividend income | | | — | | | | — | | | | — | | | | — | |
Affiliated dividend income | | | 3,212 | | | | 1,047 | | | | 614 | | | | — | |
Securities lending income | | | — | | | | — | | | | — | | | | — | |
Foreign withholding tax | | | (2,007 | ) | | | — | | | | — | | | | — | |
| | | | | | | | | | | | | | | | |
Total Income | | | 2,792,955 | | | | 4,579,782 | | | | 265,944 | | | | 41,488,844 | |
| | | | | | | | | | | | | | | | |
| | | | |
| Expenses: | | | | | | | | | | | | | | | | |
Unitary management fees | | | 144,346 | | | | 874,320 | | | | 29,841 | | | | 3,364,581 | |
| | | | | | | | | | | | | | | | |
Less: Waivers | | | (1,757 | ) | | | (605 | ) | | | (385 | ) | | | — | |
| | | | | | | | | | | | | | | | |
Net Expenses | | | 142,589 | | | | 873,715 | | | | 29,456 | | | | 3,364,581 | |
| | | | | | | | | | | | | | | | |
Net Investment Income | | | 2,650,366 | | | | 3,706,067 | | | | 236,488 | | | | 38,124,263 | |
| | | | | | | | | | | | | | | | |
| | | | |
| Realized and Unrealized Gain (Loss): | | | | | | | | | | | | | | | | |
Net realized gain (loss) from: | | | | | | | | | | | | | | | | |
Investment securities* | | | 215,825 | | | | (5,090,558 | ) | | | (25,669 | ) | | | 3,949,289 | |
In-kind redemptions | | | (119,956 | ) | | | (2,791,802 | ) | | | (3,748 | ) | | | — | |
Foreign currencies | | | — | | | | (152,918 | ) | | | — | | | | — | |
| | | | | | | | | | | | | | | | |
Net realized gain (loss) | | | 95,869 | | | | (8,035,278 | ) | | | (29,417 | ) | | | 3,949,289 | |
| | | | | | | | | | | | | | | | |
Change in net unrealized appreciation (depreciation) on: | | | | | | | | | | | | | | | | |
Investment securities | | | 1,099,407 | | | | 1,948,128 | | | | 149,321 | | | | 15,301,328 | |
Foreign currencies | | | — | | | | (81,516 | ) | | | — | | | | — | |
| | | | | | | | | | | | | | | | |
Net change in unrealized appreciation | | | 1,099,407 | | | | 1,866,612 | | | | 149,321 | | | | 15,301,328 | |
| | | | | | | | | | | | | | | | |
Net realized and unrealized gain (loss) | | | 1,195,276 | | | | (6,168,666 | ) | | | 119,904 | | | | 19,250,617 | |
| | | | | | | | | | | | | | | | |
Net increase (decrease) in net assets resulting from operations | | $ | 3,845,642 | | | $ | (2,462,599 | ) | | $ | 356,392 | | | $ | 57,374,880 | |
| | | | | | | | | | | | | | | | |
| * | Includes net gains (losses) from securities sold to affiliates of $109,099 and $(32,289) for PowerShares Preferred Portfolio and PowerShares Variable Rate Preferred Portfolio, respectively. |
See accompanying Notes to Financial Statements which are an integral part of the financial statements.
| | | | | | | | | | | | | | |
PowerShares
New York
AMT-Free
Municipal Bond
Portfolio (PZT) | | | PowerShares
Preferred
Portfolio (PGX) | | | PowerShares
Variable Rate
Preferred
Portfolio (VRP) | | | PowerShares
VRDO
Tax-Free
Weekly
Portfolio (PVI) | |
| | | | | | | | | | | | | | |
| $ | 1,932,553 | | | $ | — | | | $ | 12,934,671 | | | $ | 214,660 | |
| | – | | | | 237,368,878 | | | | 21,546,201 | | | | – | |
| | – | | | | 28,419 | | | | 10,992 | | | | – | |
| | – | | | | 5,701,513 | | | | – | | | | – | |
| | – | | | | (107,690 | ) | | | (13,927 | ) | | | – | |
| | | | | | | | | | | | | | |
| | 1,932,553 | | | | 242,991,120 | | | | 34,477,937 | | | | 214,660 | |
| | | | | | | | | | | | | | |
| | | |
| | | | | | | | | | | | | | |
| | 152,790 | | | | 19,825,790 | | | | 3,115,065 | | | | 171,302 | |
| | | | | | | | | | | | | | |
| | – | | | | (16,410 | ) | | | (5,813 | ) | | | – | |
| | | | | | | | | | | | | | |
| | 152,790 | | | | 19,809,380 | | | | 3,109,252 | | | | 171,302 | |
| | | | | | | | | | | | | | |
| | 1,779,763 | | | | 223,181,740 | | | | 31,368,685 | | | | 43,358 | |
| | | | | | | | | | | | | | |
| | | |
| | | | | | | | | | | | | | |
| | | | | | | | | | | | | | |
| | 491,670 | | | | (11,368,089 | ) | | | (759,549 | ) | | | 950 | |
| | – | | | | 19,781,478 | | | | 648,104 | | | | – | |
| | – | | | | – | | | | – | | | | – | |
| | | | | | | | | | | | | | |
| | 491,670 | | | | 8,413,389 | | | | (111,445 | ) | | | 950 | |
| | | | | | | | | | | | | | |
| | | | | | | | | | | | | | |
| | 329,137 | | | | 24,855,342 | | | | 29,032,847 | | | | – | |
| | – | | | | – | | | | – | | | | – | |
| | | | | | | | | | | | | | |
| | 329,137 | | | | 24,855,342 | | | | 29,032,847 | | | | – | |
| | | | | | | | | | | | | | |
| | 820,807 | | | | 33,268,731 | | | | 28,921,402 | | | | 950 | |
| | | | | | | | | | | | | | |
| $ | 2,600,570 | | | $ | 256,450,471 | | | $ | 60,290,087 | | | $ | 44,308 | |
| | | | | | | | | | | | | | |
Statements of Changes in Net Assets
For the years ended October 31, 2016 and 2015
| | | | | | | | | | | | | | | | |
| | | PowerShares 1-30
Laddered Treasury
Portfolio (PLW) | | |
PowerShares Build America Bond
Portfolio (BAB) | |
| | | 2016 | | | 2015 | | | 2016 | | | 2015 | |
| Operations: | | | | | | | | | | | | | | | | |
Net investment income | | $ | 4,569,492 | | | $ | 7,084,501 | | | $ | 35,952,968 | | | $ | 33,259,150 | |
Net realized gain (loss) | | | 10,080,039 | | | | 11,374,720 | | | | 4,593 | | | | 7,860,126 | |
Net change in unrealized appreciation (depreciation) | | | 683,766 | | | | (10,829,679 | ) | | | 36,415,568 | | | | (28,768,560 | ) |
| | | | | | | | | | | | | | | | |
Net increase (decrease) in net assets resulting from operations | | | 15,333,297 | | | | 7,629,542 | | | | 72,373,129 | | | | 12,350,716 | |
| | | | | | | | | | | | | | | | |
| | | | |
| Distributions to Shareholders from: | | | | | | | | | | | | | | | | |
Net investment income | | | (4,583,798 | ) | | | (7,109,980 | ) | | | (36,098,186 | ) | | | (33,376,382 | ) |
Return of capital | | | — | | | | — | | | | — | | | | — | |
| | | | | | | | | | | | | | | | |
Total distributions to shareholders | | | (4,583,798 | ) | | | (7,109,980 | ) | | | (36,098,186 | ) | | | (33,376,382 | ) |
| | | | | | | | | | | | | | | | |
| | | | |
| Shareholder Transactions: | | | | | | | | | | | | | | | | |
Proceeds from shares sold | | | 84,560,450 | | | | 155,013,994 | | | | 366,831,325 | | | | 124,194,303 | |
Value of shares repurchased | | | (141,116,828 | ) | | | (167,890,135 | ) | | | (10,287,020 | ) | | | (122,670,963 | ) |
Transaction fees | | | — | | | | — | | | | 1,019,948 | | | | 1,186,257 | |
| | | | | | | | | | | | | | | | |
Net increase (decrease) in net assets resulting from shares transactions | | | (56,556,378 | ) | | | (12,876,141 | ) | | | 357,564,253 | | | | 2,709,597 | |
| | | | | | | | | | | | | | | | |
Increase (Decrease) in Net Assets | | | (45,806,879 | ) | | | (12,356,579 | ) | | | 393,839,196 | | | | (18,316,069 | ) |
| | | | | | | | | | | | | | | | |
| | | | |
| Net Assets: | | | | | | | | | | | | | | | | |
Beginning of year | | | 267,278,400 | | | | 279,634,979 | | | | 676,840,091 | | | | 695,156,160 | |
| | | | | | | | | | | | | | | | |
End of year | | $ | 221,471,521 | | | $ | 267,278,400 | | | $ | 1,070,679,287 | | | $ | 676,840,091 | |
| | | �� | | | | | | | | | | | | | |
Undistributed net investment income at end of year | | $ | — | | | $ | — | | | $ | — | | | $ | — | |
| | | | | | | | | | | | | | | | |
| | | | |
| Changes in Shares Outstanding: | | | | | | | | | | | | | | | | |
Shares sold | | | 2,500,000 | | | | 4,650,000 | | | | 12,000,000 | | | | 4,100,000 | |
Shares repurchased | | | (4,150,000 | ) | | | (5,200,000 | ) | | | (350,000 | ) | | | (4,200,000 | ) |
Shares outstanding, beginning of year | | | 8,200,000 | | | | 8,750,000 | | | | 23,250,000 | | | | 23,350,000 | |
| | | | | | | | | | | | | | | | |
Shares outstanding, end of year | | | 6,550,000 | | | | 8,200,000 | | | | 34,900,000 | | | | 23,250,000 | |
| | | | | | | | | | | | | | | | |
See accompanying Notes to Financial Statements which are an integral part of the financial statements.
| | | | | | | | | | | | | | | | | | | | | | | | | | | | | | |
PowerShares California
AMT-Free
Municipal Bond Portfolio (PWZ) | | | PowerShares CEF Income
Composite
Portfolio (PCEF) | | | PowerShares Chinese
Yuan Dim Sum
Bond Portfolio (DSUM) | | | PowerShares Emerging
Markets
Sovereign Debt Portfolio (PCY) | |
2016 | | | 2015 | | |
2016 | | | 2015 | | |
2016 | | | 2015 | | |
2016 | | |
2015 | |
| | | | | | | | | | | | | | | | | | | | | | | | | | | | | | |
| $ | 3,933,268 | | | $ | 3,001,923 | | | $ | 37,094,240 | | | $ | 43,076,114 | | | $ | 1,964,049 | | | $ | 3,737,203 | | | $ | 159,962,436 | | | $ | 130,717,062 | |
| | 156,626 | | | | 45,523 | | | | (11,577,880 | ) | | | (7,778,414 | ) | | | (3,687,820 | ) | | | (5,446,478 | ) | | | 19,192,839 | | | | (58,606,662 | ) |
| | 1,450,367 | | | | (483,236 | ) | | | 32,412,423 | | | | (52,015,355 | ) | | | (602,924 | ) | | | (1,943,613 | ) | | | 157,500,059 | | | | (27,719,771 | ) |
| | | | | | | | | | | | | | | | | | | | | | | | | | | | | | |
| | 5,540,261 | | | | 2,564,210 | | | | 57,928,783 | | | | (16,717,655 | ) | | | (2,326,695 | ) | | | (3,652,888 | ) | | | 336,655,334 | | | | 44,390,629 | |
| | | | | | | | | | | | | | | | | | | | | | | | | | | | | | |
| | | | | | | |
| | | | | | | | | | | | | | | | | | | | | | | | | | | | | | |
| | (3,933,268 | ) | | | (3,001,923 | ) | | | (38,325,657 | ) | | | (42,122,623 | ) | | | — | | | | (828,895 | ) | | | (160,711,766 | ) | | | (129,090,210 | ) |
| | (31,261 | ) | | | (15,761 | ) | | | (11,635,257 | ) | | | (13,115,497 | ) | | | (1,961,665 | ) | | | (2,916,799 | ) | | | — | | | | — | |
| | | | | | | | | | | | | | | | | | | | | | | | | | | | | | |
| | (3,964,529 | ) | | | (3,017,684 | ) | | | (49,960,914 | ) | | | (55,238,120 | ) | | | (1,961,665 | ) | | | (3,745,694 | ) | | | (160,711,766 | ) | | | (129,090,210 | ) |
| | | | | | | | | | | | | | | | | | | | | | | | | | | | | | |
| | | | | | | |
| | | | | | | | | | | | | | | | | | | | | | | | | | | | | | |
| | 88,924,511 | | | | 43,454,421 | | | | 51,120,858 | | | | 130,818,754 | | | | 5,712,969 | | | | 27,137,797 | | | | 1,817,405,729 | | | | 737,031,529 | |
| | (10,467,305 | ) | | | — | | | | (45,299,178 | ) | | | (50,091,984 | ) | | | (33,420,127 | ) | | | (104,986,441 | ) | | | (521,137,848 | ) | | | (428,358,201 | ) |
| | 218,389 | | | | 198,343 | | | | — | | | | — | | | | 195,665 | | | | 660,621 | | | | — | | | | — | |
| | | | | | | | | | | | | | | | | | | | | | | | | | | | | | |
| | 78,675,595 | | | | 43,652,764 | | | | 5,821,680 | | | | 80,726,770 | | | | (27,511,493 | ) | | | (77,188,023 | ) | | | 1,296,267,881 | | | | 308,673,328 | |
| | | | | | | | | | | | | | | | | | | | | | | | | | | | | | |
| | 80,251,327 | | | | 43,199,290 | | | | 13,789,549 | | | | 8,770,995 | | | | (31,799,853 | ) | | | (84,586,605 | ) | | | 1,472,211,449 | | | | 223,973,747 | |
| | | | | | | | | | | | | | | | | | | | | | | | | | | | | | |
| | | | | | | |
| | | | | | | | | | | | | | | | | | | | | | | | | | | | | | |
| | 109,368,725 | | | | 66,169,435 | | | | 628,683,515 | | | | 619,912,520 | | | | 81,864,516 | | | | 166,451,121 | | | | 2,653,385,197 | | | | 2,429,411,450 | |
| | | | | | | | | | | | | | | | | | | | | | | | | | | | | | |
| $ | 189,620,052 | | | $ | 109,368,725 | | | $ | 642,473,064 | | | $ | 628,683,515 | | | $ | 50,064,663 | | | $ | 81,864,516 | | | $ | 4,125,596,646 | | | $ | 2,653,385,197 | |
| | | | | | | | | | | | | | | | | | | | | | | | | | | | | | |
| $ | — | | | $ | — | | | $ | — | | | $ | — | | | $ | — | | | $ | — | | | $ | 877,522 | | | $ | 1,626,852 | |
| | | | | | | | | | | | | | | | | | | | | | | | | | | | | | |
| | | | | | | |
| | | | | | | | | | | | | | | | | | | | | | | | | | | | | | |
| | 3,350,000 | | | | 1,700,000 | | | | 2,350,000 | | | | 5,500,000 | | | | 250,000 | | | | 1,100,000 | | | | 62,400,000 | | | | 26,100,000 | |
| | (400,000 | ) | | | — | | | | (2,150,000 | ) | | | (2,200,000 | ) | | | (1,450,000 | ) | | | (4,350,000 | ) | | | (18,500,000 | ) | | | (15,300,000 | ) |
| | 4,300,000 | | | | 2,600,000 | | | | 28,700,000 | | | | 25,400,000 | | | | 3,400,000 | | | | 6,650,000 | | | | 94,500,000 | | | | 83,700,000 | |
| | | | | | | | | | | | | | | | | | | | | | | | | | | | | | |
| | 7,250,000 | | | | 4,300,000 | | | | 28,900,000 | | | | 28,700,000 | | | | 2,200,000 | | | | 3,400,000 | | | | 138,400,000 | | | | 94,500,000 | |
| | | | | | | | | | | | | | | | | | | | | | | | | | | | | | |
Statements of Changes in Net Assets (continued)
For the years ended October 31, 2016 and 2015
| | | | | | | | | | | | | | | | |
| | | PowerShares Fundamental
High Yield® Corporate
Bond Portfolio (PHB) | | | PowerShares Fundamental
Investment Grade Corporate
Bond Portfolio (PFIG) | |
| | | 2016 | | | 2015 | | | 2016 | | | 2015 | |
| Operations: | | | | | | | | | | | | | | | | |
Net investment income | | $ | 37,913,482 | | | $ | 27,511,534 | | | $ | 1,112,065 | | | $ | 811,367 | |
Net realized gain (loss) | | | (16,764,677 | ) | | | (12,545,740 | ) | | | (40,240 | ) | | | (47,795 | ) |
Net change in unrealized appreciation (depreciation) | | | 48,202,775 | | | | (21,537,524 | ) | | | 1,089,201 | | | | (214,829 | ) |
| | | | | | | | | | | | | | | | |
Net increase (decrease) in net assets resulting from operations | | | 69,351,580 | | | | (6,571,730 | ) | | | 2,161,026 | | | | 548,743 | |
| | | | | | | | | | | | | | | | |
| | | | |
| Distributions to Shareholders from: | | | | | | | | | | | | | | | | |
Net investment income | | | (37,984,421 | ) | | | (27,639,812 | ) | | | (1,112,065 | ) | | | (828,174 | ) |
Net realized gains | | | — | | | | — | | | | — | | | | — | |
Return of capital | | | — | | | | — | | | | (6,736 | ) | | | — | |
| | | | | | | | | | | | | | | | |
Total distributions to shareholders | | | (37,984,421 | ) | | | (27,639,812 | ) | | | (1,118,801 | ) | | | (828,174 | ) |
| | | | | | | | | | | | | | | | |
| | | | |
| Shareholder Transactions: | | | | | | | | | | | | | | | | |
Proceeds from shares sold | | | 756,314,570 | | | | 375,117,838 | | | | 23,044,431 | | | | 5,067,646 | |
Value of shares repurchased | | | (365,845,423 | ) | | | (240,375,664 | ) | | | — | | | | (1,259,216 | ) |
Transaction fees | | | — | | | | — | | | | — | | | | — | |
| | | | | | | | | | | | | | | | |
Net increase (decrease) in net assets resulting from shares transactions | | | 390,469,147 | | | | 134,742,174 | | | | 23,044,431 | | | | 3,808,430 | |
| | | | | | | | | | | | | | | | |
Increase (Decrease) in Net Assets | | | 421,836,306 | | | | 100,530,632 | | | | 24,086,656 | | | | 3,528,999 | |
| | | | | | | | | | | | | | | | |
| | | | |
| Net Assets: | | | | | | | | | | | | | | | | |
Beginning of year | | | 666,300,872 | | | | 565,770,240 | | | | 34,067,374 | | | | 30,538,375 | |
| | | | | | | | | | | | | | | | |
End of year | | $ | 1,088,137,178 | | | $ | 666,300,872 | | | $ | 58,154,030 | | | $ | 34,067,374 | |
| | | | | | | | | | | | | | | | |
Undistributed net investment income at end of year | | $ | — | | | $ | — | | | $ | — | | | $ | — | |
| | | | | | | | | | | | | | | | |
| | | | |
| Changes in Shares Outstanding: | | | | | | | | | | | | | | | | |
Shares sold | | | 41,700,000 | | | | 20,000,000 | | | | 900,000 | | | | 200,000 | |
Shares repurchased | | | (20,300,000 | ) | | | (12,900,000 | ) | | | — | | | | (50,000 | ) |
Shares outstanding, beginning of year | | | 36,500,000 | | | | 29,400,000 | | | | 1,350,000 | | | | 1,200,000 | |
| | | | | | | | | | | | | | | | |
Shares outstanding, end of year | | | 57,900,000 | | | | 36,500,000 | | | | 2,250,000 | | | | 1,350,000 | |
| | | | | | | | | | | | | | | | |
See accompanying Notes to Financial Statements which are an integral part of the financial statements.
| | | | | | | | | | | | | | | | | | | | | | | | | | | | | | |
PowerShares Global
Short Term High Yield
Bond Portfolio (PGHY) | | | PowerShares International
Corporate Bond
Portfolio (PICB) | | | PowerShares LadderRite
0-5 Year Corporate Bond
Portfolio (LDRI) | | | PowerShares National AMT-Free
Municipal Bond Portfolio (PZA) | |
| 2016 | | |
2015 | | |
2016 | | |
2015 | | | 2016 | | | 2015 | | |
2016 | | | 2015 | |
| | | | | | | | | | | | | | | | | | | | | | | | | | | | | | |
| $ | 2,650,366 | | | $ | 1,444,072 | | | $ | 3,706,067 | | | $ | 5,080,596 | | | $ | 236,488 | | | $ | 78,770 | | | $ | 38,124,263 | | | $ | 30,862,365 | |
| | 95,869 | | | | (1,176,562 | ) | | | (8,035,278 | ) | | | (6,959,443 | ) | | | (29,417 | ) | | | 3,376 | | | | 3,949,289 | | | | 327,140 | |
| | 1,099,407 | | | | 173,994 | | | | 1,866,612 | | | | (17,441,060 | ) | | | 149,321 | | | | 8,611 | | | | 15,301,328 | | | | (4,528,122 | ) |
| | | | | | | | | | | | | | | | | | | | | | | | | | | | | | |
| | 3,845,642 | | | | 441,504 | | | | (2,462,599 | ) | | | (19,319,907 | ) | | | 356,392 | | | | 90,757 | | | | 57,374,880 | | | | 26,661,383 | |
| | | | | | | | | | | | | | | | | | | | | | | | | | | | | | |
| | | | | | | |
| | | | | | | | | | | | | | | | | | | | | | | | | | | | | | |
| | (2,650,366 | ) | | | (1,444,072 | ) | | | — | | | | (236,037 | ) | | | (237,571 | ) | | | (78,801 | ) | | | (38,124,263 | ) | | | (30,862,365 | ) |
| | — | | | | — | | | | — | | | | — | | | | (7,046 | ) | | | — | | | | — | | | | — | |
| | (40,811 | ) | | | (7,319 | ) | | | (3,733,321 | ) | | | (4,826,517 | ) | | | (1,098 | ) | | | — | | | | (189,479 | ) | | | (118,036 | ) |
| | | | | | | | | | | | | | | | | | | | | | | | | | | | | | |
| | (2,691,177 | ) | | | (1,451,391 | ) | | | (3,733,321 | ) | | | (5,062,554 | ) | | | (245,715 | ) | | | (78,801 | ) | | | (38,313,742 | ) | | | (30,980,401 | ) |
| | | | | | | | | | | | | | | | | | | | | | | | | | | | | | |
| | | | | | | |
| | | | | | | | | | | | | | | | | | | | | | | | | | | | | | |
| | 44,041,238 | | | | 4,729,721 | | | | 17,463,182 | | | | 8,422,218 | | | | 17,419,435 | | | | 3,755,338 | | | | 469,907,438 | | | | 186,095,463 | |
| | (3,362,542 | ) | | | (14,079,177 | ) | | | (40,184,962 | ) | | | (57,832,047 | ) | | | (1,246,709 | ) | | | (3,753,674 | ) | | | (7,925,010 | ) | | | (24,895,192 | ) |
| | — | | | | — | | | | 3,083 | | | | 13,338 | | | | — | | | | — | | | | 1,194,581 | | | | 527,476 | |
| | | | | | | | | | | | | | | | | | | | | | | | | | | | | | |
| | 40,678,696 | | | | (9,349,456 | ) | | | (22,718,697 | ) | | | (49,396,491 | ) | | | 16,172,726 | | | | 1,664 | | | | 463,177,009 | | | | 161,727,747 | |
| | | | | | | | | | | | | | | | | | | | | | | | | | | | | | |
| | 41,833,161 | | | | (10,359,343 | ) | | | (28,914,617 | ) | | | (73,778,952 | ) | | | 16,283,403 | | | | 13,620 | | | | 482,238,147 | | | | 157,408,729 | |
| | | | | | | | | | | | | | | | | | | | | | | | | | | | | | |
| | | | | | | |
| | | | | | | | | | | | | | | | | | | | | | | | | | | | | | |
| | 27,029,335 | | | | 37,388,678 | | | | 189,453,675 | | | | 263,232,627 | | | | 6,270,102 | | | | 6,256,482 | | | | 897,394,889 | | | | 739,986,160 | |
| | | | | | | | | | | | | | | | | | | | | | | | | | | | | | |
| $ | 68,862,496 | | | $ | 27,029,335 | | | $ | 160,539,058 | | | $ | 189,453,675 | | | $ | 22,553,505 | | | $ | 6,270,102 | | | $ | 1,379,633,036 | | | $ | 897,394,889 | |
| | | | | | | | | | | | | | | | | | | | | | | | | | | | | | |
| $ | — | | | $ | — | | | $ | — | | | $ | — | | | $ | — | | | $ | 1,083 | | | $ | — | | | $ | — | |
| | | | | | | | | | | | | | | | | | | | | | | | | | | | | | |
| | | | | | | |
| | | | | | | | | | | | | | | | | | | | | | | | | | | | | | |
| | 1,850,000 | | | | 200,000 | | | | 650,000 | | | | 300,000 | | | | 700,000 | | | | 150,000 | | | | 18,250,000 | | | | 7,350,000 | |
| | (150,000 | ) | | | (600,000 | ) | | | (1,550,000 | ) | | | (2,150,000 | ) | | | (50,000 | ) | | | (150,001 | ) | | | (300,000 | ) | | | (1,000,000 | ) |
| | 1,150,000 | | | | 1,550,000 | | | | 7,300,000 | | | | 9,150,000 | | | | 250,000 | | | | 250,001 | | | | 35,750,000 | | | | 29,400,000 | |
| | | | | | | | | | | | | | | | | | | | | | | | | | | | | | |
| | 2,850,000 | | | | 1,150,000 | | | | 6,400,000 | | | | 7,300,000 | | | | 900,000 | | | | 250,000 | | | | 53,700,000 | | | | 35,750,000 | |
| | | | | | | | | | | | | | | | | | | | | | | | | | | | | | |
Statements of Changes in Net Assets (continued)
For the years ended October 31, 2016 and 2015
| | | | | | | | | | | | | | | | |
| | |
PowerShares New York AMT-Free
Municipal Bond Portfolio (PZT) | | | PowerShares Preferred Portfolio (PGX) | |
| | | 2016 | | | 2015 | | | 2016 | | | 2015 | |
| Operations: | | | | | | | | | | | | | | | | |
Net investment income (loss) | | $ | 1,779,763 | | | $ | 1,666,229 | | | $ | 223,181,740 | | | $ | 161,016,077 | |
Net realized gain (loss) | | | 491,670 | | | | 45,177 | | | | 8,413,389 | | | | 16,774,548 | |
Net change in unrealized appreciation (depreciation) | | | 329,137 | | | | (447,025 | ) | | | 24,855,342 | | | | 19,492,438 | |
| | | | | | | | | | | | | | | | |
Net increase (decrease) in net assets resulting from operations | | | 2,600,570 | | | | 1,264,381 | | | | 256,450,471 | | | | 197,283,063 | |
| | | | | | | | | | | | | | | | |
| | | | |
| Distributions to Shareholders from: | | | | | | | | | | | | | | | | |
Net investment income | | | (1,779,763 | ) | | | (1,666,229 | ) | | | (226,731,995 | ) | | | (161,014,442 | ) |
Return of capital | | | (12,981 | ) | | | (5,115 | ) | | | — | | | | — | |
| | | | | | | | | | | | | | | | |
Total distributions to shareholders | | | (1,792,744 | ) | | | (1,671,344 | ) | | | (226,731,995 | ) | | | (161,014,442 | ) |
| | | | | | | | | | | | | | | | |
| | | | |
| Shareholder Transactions: | | | | | | | | | | | | | | | | |
Proceeds from shares sold | | | 15,018,293 | | | | 3,649,628 | | | | 1,874,743,397 | | | | 1,027,551,075 | |
Value of shares repurchased | | | (2,455,728 | ) | | | — | | | | (290,708,764 | ) | | | (211,486,686 | ) |
Transaction fees | | | — | | | | — | | | | — | | | | — | |
| | | | | | | | | | | | | | | | |
Net increase (decrease) in net assets resulting from shares transactions | | | 12,562,565 | | | | 3,649,628 | | | | 1,584,034,633 | | | | 816,064,389 | |
| | | | | | | | | | | | | | | | |
Increase (Decrease) in Net Assets | | | 13,370,391 | | | | 3,242,665 | | | | 1,613,753,109 | | | | 852,333,010 | |
| | | | | | | | | | | | | | | | |
| | | | |
| Net Assets: | | | | | | | | | | | | | | | | |
Beginning of year | | | 50,692,499 | | | | 47,449,834 | | | | 3,117,091,398 | | | | 2,264,758,388 | |
| | | | | | | | | | | | | | | | |
End of year | | $ | 64,062,890 | | | $ | 50,692,499 | | | $ | 4,730,844,507 | | | $ | 3,117,091,398 | |
| | | | | | | | | | | | | | | | |
Undistributed net investment income at end of year | | $ | — | | | $ | — | | | $ | — | | | $ | 497,674 | |
| | | | | | | | | | | | | | | | |
| | | | |
| Changes in Shares Outstanding: | | | | | | | | | | | | | | | | |
Shares sold | | | 600,000 | | | | 150,000 | | | | 124,900,000 | | | | 69,850,000 | |
Shares repurchased | | | (100,000 | ) | | | — | | | | (19,550,000 | ) | | | (14,400,000 | ) |
Shares outstanding, beginning of year | | | 2,100,000 | | | | 1,950,000 | | | | 210,850,000 | | | | 155,400,000 | |
| | | | | | | | | | | | | | | | |
Shares outstanding, end of year | | | 2,600,000 | | | | 2,100,000 | | | | 316,200,000 | | | | 210,850,000 | |
| | | | | | | | | | | | | | | | |
See accompanying Notes to Financial Statements which are an integral part of the financial statements.
| | | | | | | | | | | | | | |
PowerShares
Variable Rate
Preferred Portfolio (VRP) | | | PowerShares
VRDO Tax-Free Weekly
Portfolio (PVI) | |
| 2016 | | | 2015 | | | 2016 | | | 2015 | |
| | | | | | | | | | | | | | |
| $ | 31,368,685 | | | $ | 10,361,284 | | | $ | 43,358 | | | $ | (140,904 | ) |
| | (111,445 | ) | | | (113,143 | ) | | | 950 | | | | — | |
| | 29,032,847 | | | | (5,677,831 | ) | | | — | | | | — | |
| | | | | | | | | | | | | | |
| | 60,290,087 | | | | 4,570,310 | | | | 44,308 | | | | (140,904 | ) |
| | | | | | | | | | | | | | |
| | | |
| | | | | | | | | | | | | | |
| | (31,532,782 | ) | | | (10,367,687 | ) | | | (44,304 | ) | | | — | |
| | — | | | | (199,490 | ) | | | (2,604 | ) | | | (2,272 | ) |
| | | | | | | | | | | | | | |
| | (31,532,782 | ) | | | (10,567,177 | ) | | | (46,908 | ) | | | (2,272 | ) |
| | | | | | | | | | | | | | |
| | | |
| | | | | | | | | | | | | | |
| | 491,717,702 | | | | 311,112,281 | | | | 7,477,888 | | | | 2,493,361 | |
| | (18,480,727 | ) | | | — | | | | (28,654,688 | ) | | | (39,920,311 | ) |
| | — | | | | — | | | | — | | | | — | |
| | | | | | | | | | | | | | |
| | 473,236,975 | | | | 311,112,281 | | | | (21,176,800 | ) | | | (37,426,950 | ) |
| | | | | | | | | | | | | | |
| | 501,994,280 | | | | 305,115,414 | | | | (21,179,400 | ) | | | (37,570,126 | ) |
| | | | | | | | | | | | | | |
| | | |
| | | | | | | | | | | | | | |
| | 397,065,398 | | | | 91,949,984 | | | | 81,009,988 | | | | 118,580,114 | |
| | | | | | | | | | | | | | |
| $ | 899,059,678 | | | $ | 397,065,398 | | | $ | 59,830,588 | | | $ | 81,009,988 | |
| | | | | | | | | | | | | | |
| $ | — | | | $ | — | | | $ | — | | | $ | — | |
| | | | | | | | | | | | | | |
| | | |
| | | | | | | | | | | | | | |
| | 20,000,000 | | | | 12,600,000 | | | | 300,000 | | | | 100,000 | |
| | (800,000 | ) | | | — | | | | (1,150,000 | ) | | | (1,600,000 | ) |
| | 16,300,000 | | | | 3,700,000 | | | | 3,250,000 | | | | 4,750,000 | |
| | | | | | | | | | | | | | |
| | 35,500,000 | | | | 16,300,000 | | | | 2,400,000 | | | | 3,250,000 | |
| | | | | | | | | | | | | | |
Financial Highlights
PowerShares 1-30 Laddered Treasury Portfolio (PLW)
| | | | | | | | | | | | | | | | | | | | |
| | | Year Ended October 31, | |
| | | 2016 | | | 2015 | | | 2014 | | | 2013 | | | 2012 | |
| Per Share Operating Performance: | | | | | | | | | | | | | | | | | | | | |
Net asset value at beginning of year | | $ | 32.59 | | | $ | 31.96 | | | $ | 30.41 | | | $ | 32.96 | | | $ | 31.40 | |
Net investment income(a) | | | 0.65 | | | | 0.70 | | | | 0.76 | | | | 0.74 | | | | 0.76 | |
Net realized and unrealized gain (loss) on investments | | | 1.22 | | | | 0.63 | | | | 1.54 | | | | (2.55 | ) | | | 1.59 | |
Total from investment operations | | | 1.87 | | | | 1.33 | | | | 2.30 | | | | (1.81 | ) | | | 2.35 | |
Distributions to shareholders from: | | | | | | | | | | | | | | | | | | | | |
Net investment income | | | (0.65 | ) | | | (0.70 | ) | | | (0.75 | ) | | | (0.74 | ) | | | (0.79 | ) |
Net realized gains | | | — | | | | — | | | | — | | | | (0.00 | )(b) | | | — | |
Total distributions | | | (0.65 | ) | | | (0.70 | ) | | | (0.75 | ) | | | (0.74 | ) | | | (0.79 | ) |
Net asset value at end of year | | $ | 33.81 | | | $ | 32.59 | | | $ | 31.96 | | | $ | 30.41 | | | $ | 32.96 | |
Market price at end of year(c) | | $ | 33.84 | | | $ | 32.60 | | | $ | 31.97 | | | $ | 30.40 | | | $ | 32.92 | |
| Net Asset Value Total Return(d) | | | 5.76 | % | | | 4.18 | % | | | 7.71 | % | | | (5.55 | )% | | | 7.56 | % |
| Market Price Total Return(d) | | | 5.82 | % | | | 4.18 | % | | | 7.77 | % | | | (5.47 | )% | | | 6.94 | % |
| Ratios/Supplemental Data: | | | | | | | | | | | | | | | | | | | | |
Net assets at end of year (000’s omitted) | | $ | 221,472 | | | $ | 267,278 | | | $ | 279,635 | | | $ | 150,540 | | | $ | 166,458 | |
Ratio to average net assets of: | | | | | | | | | | | | | | | | | | | | |
Expenses | | | 0.25 | % | | | 0.25 | % | | | 0.25 | % | | | 0.25 | % | | | 0.25 | % |
Net investment income | | | 1.94 | % | | | 2.14 | % | | | 2.47 | % | | | 2.33 | % | | | 2.34 | % |
Portfolio turnover rate(e) | | | 6 | % | | | 7 | % | | | 5 | % | | | 5 | % | | | 4 | % |
| (a) | Based on average shares outstanding. |
| (b) | Amount represents less than $0.005. |
| (c) | The mean between the last bid and ask prices. |
| (d) | Net asset value total return is calculated assuming an initial investment made at the net asset value at the beginning of the period, reinvestment of all dividends and distributions at net asset value during the period, and redemption on the last day of the period. Net asset value total return includes adjustments in accordance with accounting principles generally accepted in the United States of America and as such, the net asset value for financial reporting purposes and the returns based upon those net asset values may differ from the net asset value and returns for shareholder transactions. Market price total return is calculated assuming an initial investment made at the market price at the beginning of the period, reinvestment of all dividends and distributions at market price during the period, and sale at the market price on the last day of the period. Total investment returns calculated for a period of less than one year are not annualized. |
| (e) | Portfolio turnover rate is not annualized for periods less than one year, if applicable, and does not include securities received or delivered from processing creations or redemptions. |
PowerShares Build America Bond Portfolio (BAB)
| | | | | | | | | | | | | | | | | | | | |
| | | Year Ended October 31, | |
| | | 2016 | | | 2015 | | | 2014 | | | 2013 | | | 2012 | |
| Per Share Operating Performance: | | | | | | | | | | | | | | | | | | | | |
Net asset value at beginning of year | | $ | 29.11 | | | $ | 29.77 | | | $ | 27.90 | | | $ | 30.19 | | | $ | 28.16 | |
Net investment income(a) | | | 1.26 | | | | 1.37 | | | | 1.40 | | | | 1.42 | | | | 1.45 | |
Net realized and unrealized gain (loss) on investments | | | 1.54 | | | | (0.71 | ) | | | 1.87 | | | | (2.29 | ) | | | 2.06 | |
Total from investment operations | | | 2.80 | | | | 0.66 | | | | 3.27 | | | | (0.87 | ) | | | 3.51 | |
Distributions to shareholders from: | | | | | | | | | | | | | | | | | | | | |
Net investment income | | | (1.27 | ) | | | (1.37 | ) | | | (1.40 | ) | | | (1.42 | ) | | | (1.48 | ) |
Transaction fees(a) | | | 0.04 | | | | 0.05 | | | | — | | | | — | | | | — | |
Net asset value at end of year | | $ | 30.68 | | | $ | 29.11 | | | $ | 29.77 | | | $ | 27.90 | | | $ | 30.19 | |
Market price at end of year(b) | | $ | 30.74 | | | $ | 29.17 | | | $ | 29.76 | | | $ | 27.79 | | | $ | 30.16 | |
| Net Asset Value Total Return(c) | | | 9.93 | % | | | 2.40 | % | | | 12.03 | % | | | (3.00 | )% | | | 12.74 | % |
| Market Price Total Return(c) | | | 9.90 | % | | | 2.65 | % | | | 12.44 | % | | | (3.28 | )% | | | 12.54 | % |
| Ratios/Supplemental Data: | | | | | | | | | | | | | | | | | | | | |
Net assets at end of year (000’s omitted) | | $ | 1,070,679 | | | $ | 676,840 | | | $ | 695,156 | | | $ | 683,643 | | | $ | 1,070,328 | |
Ratio to average net assets of: | | | | | | | | | | | | | | | | | | | | |
Expenses, after Waivers | | | 0.27 | % | | | 0.28 | % | | | 0.27 | % | | | 0.28 | % | | | 0.28 | % |
Expenses, prior to Waivers | | | 0.28 | % | | | 0.28 | % | | | 0.28 | % | | | 0.28 | % | | | 0.31 | % |
Net investment income, after Waivers | | | 4.14 | % | | | 4.59 | % | | | 4.86 | % | | | 4.80 | % | | | 4.92 | % |
Portfolio turnover rate(d) | | | 0 | %(e) | | | 9 | % | | | 7 | % | | | 5 | % | | | 2 | % |
| (a) | Based on average shares outstanding. |
| (b) | The mean between the last bid and ask prices. |
| (c) | Net asset value total return is calculated assuming an initial investment made at the net asset value at the beginning of the period, reinvestment of all dividends and distributions at net asset value during the period, and redemption on the last day of the period. Net asset value total return includes adjustments in accordance with accounting principles generally accepted in the United States of America and as such, the net asset value for financial reporting purposes and the returns based upon those net asset values may differ from the net asset value and returns for shareholder transactions. Market price total return is calculated assuming an initial investment made at the market price at the beginning of the period, reinvestment of all dividends and distributions at market price during the period, and sale at the market price on the last day of the period. Total investment returns calculated for a period of less than one year are not annualized. |
| (d) | Portfolio turnover rate is not annualized for periods less than one year, if applicable, and does not include securities received or delivered from processing creations or redemptions. |
| (e) | Amount represents less than 0.5%. |
See accompanying Notes to Financial Statements which are an integral part of the financial statements.
Financial Highlights (continued)
PowerShares California AMT-Free Municipal Bond Portfolio (PWZ)
| | | | | | | | | | | | | | | | | | | | |
| | | Year Ended October 31, | |
| | | 2016 | | | 2015 | | | 2014 | | | 2013 | | | 2012 | |
| Per Share Operating Performance: | | | | | | | | | | | | | | | | | | | | |
Net asset value at beginning of year | | $ | 25.43 | | | $ | 25.45 | | | $ | 23.50 | | | $ | 25.34 | | | $ | 23.80 | |
Net investment income(a) | | | 0.74 | | | | 0.82 | | | | 0.97 | | | | 0.91 | | | | 0.99 | |
Net realized and unrealized gain (loss) on investments | | | 0.70 | | | | (0.06 | ) | | | 1.91 | | | | (1.84 | ) | | | 1.54 | |
Total from investment operations | | | 1.44 | | | | 0.76 | | | | 2.88 | | | | (0.93 | ) | | | 2.53 | |
Distributions to shareholders from: | | | | | | | | | | | | | | | | | | | | |
Net investment income | | | (0.75 | ) | | | (0.83 | ) | | | (0.97 | ) | | | (0.91 | ) | | | (0.99 | ) |
Return of capital | | | (0.01 | ) | | | (0.00 | )(b) | | | (0.02 | ) | | | (0.00 | )(b) | | | — | |
Total distributions | | | (0.76 | ) | | | (0.83 | ) | | | (0.99 | ) | | | (0.91 | ) | | | (0.99 | ) |
Transaction fees(a) | | | 0.04 | | | | 0.05 | | | | 0.06 | | | | — | | | | — | |
Net asset value at end of year | | $ | 26.15 | | | $ | 25.43 | | | $ | 25.45 | | | $ | 23.50 | | | $ | 25.34 | |
Market price at end of year(c) | | $ | 26.21 | | | $ | 25.50 | | | $ | 25.61 | | | $ | 23.42 | | | $ | 25.34 | |
| Net Asset Value Total Return(d) | | | 5.84 | % | | | 3.25 | % | | | 12.75 | % | | | (3.74 | )% | | | 10.83 | % |
| Market Price Total Return(d) | | | 5.79 | % | | | 2.87 | % | | | 13.84 | % | | | (4.06 | )% | | | 10.83 | % |
| Ratios/Supplemental Data: | | | | | | | | | | | | | | | | | | | | |
Net assets at end of year (000’s omitted) | | $ | 189,620 | | | $ | 109,369 | | | $ | 66,169 | | | $ | 61,108 | | | $ | 63,338 | |
Ratio to average net assets of: | | | | | | | | | | | | | | | | | | | | |
Expenses, after Waivers | | | 0.28 | % | | | 0.28 | % | | | 0.26 | % | | | 0.30 | % | | | 0.28 | % |
Expenses, prior to Waivers | | | 0.28 | % | | | 0.28 | % | | | 0.26 | % | | | 0.30 | % | | | 0.31 | % |
Net investment income, after Waivers | | | 2.81 | % | | | 3.23 | % | | | 3.95 | % | | | 3.70 | % | | | 3.98 | % |
Portfolio turnover rate(e) | | | 6 | % | | | 3 | % | | | 28 | % | | | 1 | % | | | 6 | % |
| (a) | Based on average shares outstanding. |
| (b) | Amount represents less than $0.005. |
| (c) | The mean between the last bid and ask prices. |
| (d) | Net asset value total return is calculated assuming an initial investment made at the net asset value at the beginning of the period, reinvestment of all dividends and distributions at net asset value during the period, and redemption on the last day of the period. Net asset value total return includes adjustments in accordance with accounting principles generally accepted in the United States of America and as such, the net asset value for financial reporting purposes and the returns based upon those net asset values may differ from the net asset value and returns for shareholder transactions. Market price total return is calculated assuming an initial investment made at the market price at the beginning of the period, reinvestment of all dividends and distributions at market price during the period, and sale at the market price on the last day of the period. Total investment returns calculated for a period of less than one year are not annualized. |
| (e) | Portfolio turnover rate is not annualized for periods less than one year, if applicable, and does not include securities received or delivered from processing creations or redemptions. For the fiscal year ended October 31, 2014, the portfolio turnover calculation includes the value of securities purchased and sold in the effort to realign the Fund’s portfolio holdings due to the underlying index change. |
See accompanying Notes to Financial Statements which are an integral part of the financial statements.
Financial Highlights (continued)
PowerShares CEF Income Composite Portfolio (PCEF)
| | | | | | | | | | | | | | | | | | | | |
| | | Year Ended October 31, | |
| | | 2016 | | | 2015 | | | 2014 | | | 2013 | | | 2012 | |
| Per Share Operating Performance: | | | | | | | | | | | | | | | | | | | | |
Net asset value at beginning of year | | $ | 21.91 | | | $ | 24.41 | | | $ | 24.40 | | | $ | 25.47 | | | $ | 23.84 | |
Net investment income(a) | | | 1.30 | | | | 1.53 | | | | 1.36 | | | | 1.21 | | | | 1.40 | |
Net realized and unrealized gain (loss) on investments | | | 0.77 | | | | (2.07 | ) | | | 0.58 | | | | (0.31 | ) | | | 4.28 | |
Total from investment operations | | | 2.07 | | | | (0.54 | ) | | | 1.94 | | | | 0.90 | | | | 5.68 | |
Distributions to shareholders from: | | | | | | | | | | | | | | | | | | | | |
Net investment income | | | (1.34 | ) | | | (1.49 | ) | | | (1.75 | ) | | | (1.49 | ) | | | (3.83 | ) |
Net realized gains | | | — | | | | — | | | | (0.18 | ) | | | — | | | | — | |
Return of capital | | | (0.41 | ) | | | (0.47 | ) | | | — | | | | (0.48 | ) | | | (0.22 | ) |
Total distributions | | | (1.75 | ) | | | (1.96 | ) | | | (1.93 | ) | | | (1.97 | ) | | | (4.05 | ) |
Net asset value at end of year | | $ | 22.23 | | | $ | 21.91 | | | $ | 24.41 | | | $ | 24.40 | | | $ | 25.47 | |
Market price at end of year(b) | | $ | 22.23 | | | $ | 21.85 | | | $ | 24.42 | | | $ | 24.40 | | | $ | 25.52 | |
| Net Asset Value Total Return(c) | | | 10.11 | % | | | (2.31 | )% | | | 8.23 | % | | | 3.64 | % | | | 16.20 | % |
| Market Price Total Return(c) | | | 10.41 | % | | | (2.62 | )% | | | 8.27 | % | | | 3.43 | % | | | 16.32 | % |
| Ratios/Supplemental Data: | | | | | | | | | | | | | | | | | | | | |
Net assets at end of year (000’s omitted) | | $ | 642,473 | | | $ | 628,684 | | | $ | 619,913 | | | $ | 469,789 | | | $ | 369,266 | |
Ratio to average net assets of: | | | | | | | | | | | | | | | | | | | | |
Expenses(d) | | | 0.50 | % | | | 0.50 | % | | | 0.50 | % | | | 0.50 | % | | | 0.50 | % |
Net investment income | | | 5.99 | % | | | 6.61 | % | | | 5.54 | % | | | 4.82 | % | | | 5.67 | % |
Portfolio turnover rate(e) | | | 20 | % | | | 20 | % | | | 19 | % | | | 33 | % | | | 22 | % |
| (a) | Based on average shares outstanding. |
| (b) | The mean between the last bid and ask prices. |
| (c) | Net asset value total return is calculated assuming an initial investment made at the net asset value at the beginning of the period, reinvestment of all dividends and distributions at net asset value during the period, and redemption on the last day of the period. Net asset value total return includes adjustments in accordance with accounting principles generally accepted in the United States of America and as such, the net asset value for financial reporting purposes and the returns based upon those net asset values may differ from the net asset value and returns for shareholder transactions. Market price total return is calculated assuming an initial investment made at the market price at the beginning of the period, reinvestment of all dividends and distributions at market price during the period, and sale at the market price on the last day of the period. Total investment returns calculated for a period of less than one year are not annualized. |
| (d) | In addition to the fees and expenses which the Fund bears directly, the Fund indirectly bears a pro rata share of the fees and expenses of the investment companies in which the Fund invests. Estimated investment companies’ expenses are not expenses that are incurred directly by the Fund. They are expenses that are incurred directly by the investment companies and are deducted from the value of the investment companies the Fund invests in. The effect of the estimated investment companies’ expenses that the Fund bears indirectly is included in the Fund’s total return. |
| (e) | Portfolio turnover rate is not annualized for periods less than one year, if applicable, and does not include securities received or delivered from processing creations or redemptions. |
See accompanying Notes to Financial Statements which are an integral part of the financial statements.
Financial Highlights (continued)
PowerShares Chinese Yuan Dim Sum Bond Portfolio (DSUM)
| | | | | | | | | | | | | | | | | | | | |
| | | Year Ended October 31, | |
| | | 2016 | | | 2015 | | | 2014 | | | 2013 | | | 2012 | |
| Per Share Operating Performance: | | | | | | | | | | | | | | | | | | | | |
Net asset value at beginning of year | | $ | 24.08 | | | $ | 25.03 | | | $ | 25.23 | | | $ | 24.42 | | | $ | 23.57 | |
Net investment income(a) | | | 0.77 | | | | 0.77 | | | | 0.81 | | | | 0.82 | | | | 0.77 | |
Net realized and unrealized gain (loss) on investments | | | (1.40 | ) | | | (1.09 | ) | | | (0.34 | ) | | | 0.59 | | | | 0.77 | |
Total from investment operations | | | (0.63 | ) | | | (0.32 | ) | | | 0.47 | | | | 1.41 | | | | 1.54 | |
Distributions to shareholders from: | | | | | | | | | | | | | | | | | | | | |
Net investment income | | | — | | | | (0.17 | ) | | | (0.69 | ) | | | (0.82 | ) | | | (0.81 | ) |
Return of capital | | | (0.77 | ) | | | (0.60 | ) | | | (0.11 | ) | | | — | | | | (0.02 | ) |
Total distributions | | | (0.77 | ) | | | (0.77 | ) | | | (0.80 | ) | | | (0.82 | ) | | | (0.83 | ) |
Transaction fees(a) | | | 0.08 | | | | 0.14 | | | | 0.13 | | | | 0.22 | | | | 0.14 | |
Net asset value at end of year | | $ | 22.76 | | | $ | 24.08 | | | $ | 25.03 | | | $ | 25.23 | | | $ | 24.42 | |
Market price at end of year(b) | | $ | 22.71 | | | $ | 23.97 | | | $ | 24.88 | | | $ | 25.41 | | | $ | 24.57 | |
| Net Asset Value Total Return(c) | | | (2.28 | )% | | | (0.71 | )% | | | 2.45 | % | | | 6.77 | % | | | 7.26 | % |
| Market Price Total Return(c) | | | (2.02 | )% | | | (0.56 | )% | | | 1.12 | % | | | 6.85 | % | | | 7.21 | % |
| Ratios/Supplemental Data: | | | | | | | | | | | | | | | | | | | | |
Net assets at end of year (000’s omitted) | | $ | 50,065 | | | $ | 81,865 | | | $ | 166,451 | | | $ | 107,213 | | | $ | 17,093 | |
Ratio to average net assets of: | | | | | | | | | | | | | | | | | | | | |
Expenses | | | 0.45 | % | | | 0.45 | % | | | 0.45 | % | | | 0.45 | % | | | 0.45 | %(d) |
Net investment income | | | 3.31 | % | | | 3.16 | % | | | 3.24 | % | | | 3.30 | % | | | 3.21 | % |
Portfolio turnover rate(e) | | | 22 | % | | | 26 | % | | | 34 | % | | | 25 | % | | | 12 | % |
| (a) | Based on average shares outstanding. |
| (b) | The mean between the last bid and ask prices. |
| (c) | Net asset value total return is calculated assuming an initial investment made at the net asset value at the beginning of the period, reinvestment of all dividends and distributions at net asset value during the period, and redemption on the last day of the period. Net asset value total return includes adjustments in accordance with accounting principles generally accepted in the United States of America and as such, the net asset value for financial reporting purposes and the returns based upon those net asset values may differ from the net asset value and returns for shareholder transactions. Market price total return is calculated assuming an initial investment made at the market price at the beginning of the period, reinvestment of all dividends and distributions at market price during the period, and sale at the market price on the last day of the period. Total investment returns calculated for a period of less than one year are not annualized. |
| (d) | In addition to the fees and expenses which the Fund bears directly, the Fund indirectly bears a pro rata share of the fees and expenses of the investment companies in which the Fund invests. Estimated investment companies’ expenses are not expenses that are incurred directly by the Fund. They are expenses that are incurred directly by the investment companies and are deducted from the value of the investment companies the Fund invests in. The effect of the estimated investment companies’ expenses that the Fund bears indirectly is included in the Fund’s total return. |
| (e) | Portfolio turnover rate is not annualized for periods less than one year, if applicable, and does not include securities received or delivered from processing creations or redemptions. |
See accompanying Notes to Financial Statements which are an integral part of the financial statements.
Financial Highlights (continued)
PowerShares Emerging Markets Sovereign Debt Portfolio (PCY)
| | | | | | | | | | | | | | | | | | | | |
| | | Year Ended October 31, | |
| | | 2016 | | | 2015 | | | 2014 | | | 2013 | | | 2012 | |
| Per Share Operating Performance: | | | | | | | | | | | | | | | | | | | | |
Net asset value at beginning of year | | $ | 28.08 | | | $ | 29.03 | | | $ | 27.93 | | | $ | 31.00 | | | $ | 27.42 | |
Net investment income(a) | | | 1.46 | | | | 1.48 | | | | 1.28 | | | | 1.30 | | | | 1.44 | |
Net realized and unrealized gain (loss) on investments | | | 1.74 | | | | (0.97 | ) | | | 1.10 | | | | (3.08 | ) | | | 3.60 | |
Total from investment operations | | | 3.20 | | | | 0.51 | | | | 2.38 | | | | (1.78 | ) | | | 5.04 | |
Distributions to shareholders from: | | | | | | | | | | | | | | | | | | | | |
Net investment income | | | (1.47 | ) | | | (1.46 | ) | | | (1.28 | ) | | | (1.29 | ) | | | (1.46 | ) |
Net asset value at end of year | | $ | 29.81 | | | $ | 28.08 | | | $ | 29.03 | | | $ | 27.93 | | | $ | 31.00 | |
Market price at end of year(b) | | $ | 29.70 | | | $ | 28.02 | | | $ | 29.08 | | | $ | 27.92 | | | $ | 31.11 | |
| Net Asset Value Total Return(c) | | | 11.79 | % | | | 1.87 | % | | | 8.77 | % | | | (5.85 | )% | | | 19.02 | % |
| Market Price Total Return(c) | | | 11.61 | % | | | 1.49 | % | | | 9.00 | % | | | (6.22 | )% | | | 19.30 | % |
| Ratios/Supplemental Data: | | | | | | | | | | | | | | | | | | | | |
Net assets at end of year (000’s omitted) | | $ | 4,125,597 | | | $ | 2,653,385 | | | $ | 2,429,411 | | | $ | 2,008,276 | | | $ | 2,808,786 | |
Ratio to average net assets of: | | | | | | | | | | | | | | | | | | | | |
Expenses | | | 0.50 | % | | | 0.50 | % | | | 0.50 | % | | | 0.50 | % | | | 0.50 | % |
Net investment income | | | 5.06 | % | | | 5.25 | % | | | 4.52 | % | | | 4.37 | % | | | 5.03 | % |
Portfolio turnover rate(d) | | | 30 | % | | | 27 | % | | | 14 | % | | | 9 | % | | | 4 | % |
| (a) | Based on average shares outstanding. |
| (b) | The mean between the last bid and ask prices. |
| (c) | Net asset value total return is calculated assuming an initial investment made at the net asset value at the beginning of the period, reinvestment of all dividends and distributions at net asset value during the period, and redemption on the last day of the period. Net asset value total return includes adjustments in accordance with accounting principles generally accepted in the United States of America and as such, the net asset value for financial reporting purposes and the returns based upon those net asset values may differ from the net asset value and returns for shareholder transactions. Market price total return is calculated assuming an initial investment made at the market price at the beginning of the period, reinvestment of all dividends and distributions at market price during the period, and sale at the market price on the last day of the period. Total investment returns calculated for a period of less than one year are not annualized. |
| (d) | Portfolio turnover rate is not annualized for periods less than one year, if applicable, and does not include securities received or delivered from processing creations or redemptions. |
PowerShares Fundamental High Yield® Corporate Bond Portfolio (PHB)
| | | | | | | | | | | | | | | | | | | | |
| | | Year Ended October 31, | |
| | | 2016 | | | 2015 | | | 2014 | | | 2013 | | | 2012 | |
| Per Share Operating Performance: | | | | | | | | | | | | | | | | | | | | |
Net asset value at beginning of year | | $ | 18.25 | | | $ | 19.24 | | | $ | 19.24 | | | $ | 19.19 | | | $ | 18.22 | |
Net investment income(a) | | | 0.85 | | | | 0.81 | | | | 0.85 | | | | 0.90 | | | | 0.98 | |
Net realized and unrealized gain (loss) on investments | | | 0.54 | | | | (0.98 | ) | | | (0.00 | )(b) | | | 0.05 | | | | 0.97 | |
Total from investment operations | | | 1.39 | | | | (0.17 | ) | | | 0.85 | | | | 0.95 | | | | 1.95 | |
Distributions to shareholders from: | | | | | | | | | | | | | | | | | | | | |
Net investment income | | | (0.85 | ) | | | (0.82 | ) | | | (0.85 | ) | | | (0.90 | ) | | | (0.98 | ) |
Net asset value at end of year | | $ | 18.79 | | | $ | 18.25 | | | $ | 19.24 | | | $ | 19.24 | | | $ | 19.19 | |
Market price at end of year(c) | | $ | 18.70 | | | $ | 18.23 | | | $ | 19.19 | | | $ | 19.26 | | | $ | 19.17 | |
| Net Asset Value Total Return(d) | | | 7.97 | % | | | (0.90 | )% | | | 4.49 | % | | | 5.06 | % | | | 11.02 | % |
| Market Price Total Return(d) | | | 7.56 | % | | | (0.75 | )% | | | 4.12 | % | | | 5.29 | % | | | 10.95 | % |
| Ratios/Supplemental Data: | | | | | | | | | | | | | | | | | | | | |
Net assets at end of year (000’s omitted) | | $ | 1,088,137 | | | $ | 666,301 | | | $ | 565,770 | | | $ | 621,429 | | | $ | 838,586 | |
Ratio to average net assets of: | | | | | | | | | | | | | | | | | | | | |
Expenses | | | 0.50 | % | | | 0.50 | % | | | 0.50 | % | | | 0.50 | % | | | 0.50 | % |
Net investment income | | | 4.69 | % | | | 4.34 | % | | | 4.37 | % | | | 4.66 | % | | | 5.26 | % |
Portfolio turnover rate(e) | | | 14 | % | | | 16 | % | | | 20 | % | | | 23 | % | | | 21 | % |
| (a) | Based on average shares outstanding. |
| (b) | Amount represents less than $0.005. |
| (c) | The mean between the last bid and ask prices. |
| (d) | Net asset value total return is calculated assuming an initial investment made at the net asset value at the beginning of the period, reinvestment of all dividends and distributions at net asset value during the period, and redemption on the last day of the period. Net asset value total return includes adjustments in accordance with accounting principles generally accepted in the United States of America and as such, the net asset value for financial reporting purposes and the returns based upon those net asset values may differ from the net asset value and returns for shareholder transactions. Market price total return is calculated assuming an initial investment made at the market price at the beginning of the period, reinvestment of all dividends and distributions at market price during the period, and sale at the market price on the last day of the period. Total investment returns calculated for a period of less than one year are not annualized. |
| (e) | Portfolio turnover rate is not annualized for periods less than one year, if applicable, and does not include securities received or delivered from processing creations or redemptions. |
See accompanying Notes to Financial Statements which are an integral part of the financial statements.
Financial Highlights (continued)
PowerShares Fundamental Investment Grade Corporate Bond Portfolio (PFIG)
| | | | | | | | | | | | | | | | | | | | |
| | | Year Ended October 31, | |
| | | 2016 | | | 2015 | | | 2014 | | | 2013 | | | 2012 | |
| Per Share Operating Performance: | | | | | | | | | | | | | | | | | | | | |
Net asset value at beginning of year | | $ | 25.24 | | | $ | 25.45 | | | $ | 25.13 | | | $ | 25.83 | | | $ | 24.79 | |
Net investment income(a) | | | 0.65 | | | | 0.62 | | | | 0.62 | | | | 0.54 | | | | 0.56 | |
Net realized and unrealized gain (loss) on investments | | | 0.62 | | | | (0.19 | ) | | | 0.31 | | | | (0.69 | ) | | | 1.11 | |
Total from investment operations | | | 1.27 | | | | 0.43 | | | | 0.93 | | | | (0.15 | ) | | | 1.67 | |
Distributions to shareholders from: | | | | | | | | | | | | | | | | | | | | |
Net investment income | | | (0.66 | ) | | | (0.64 | ) | | | (0.60 | ) | | | (0.55 | ) | | | (0.63 | ) |
Net realized gains | | | — | | | | — | | | | (0.01 | ) | | | — | | | | — | |
Return of capital | | | (0.00 | )(b) | | | — | | | | — | | | | — | | | | — | |
Total distributions | | | (0.66 | ) | | | (0.64 | ) | | | (0.61 | ) | | | (0.55 | ) | | | (0.63 | ) |
Net asset value at end of year | | $ | 25.85 | | | $ | 25.24 | | | $ | 25.45 | | | $ | 25.13 | | | $ | 25.83 | |
Market price at end of year(c) | | $ | 25.87 | | | $ | 25.27 | | | $ | 25.47 | | | $ | 25.12 | | | $ | 25.85 | |
| Net Asset Value Total Return(d) | | | 5.08 | % | | | 1.69 | % | | | 3.75 | % | | | (0.57 | )% | | | 6.85 | % |
| Market Price Total Return(d) | | | 5.03 | % | | | 1.72 | % | | | 3.88 | % | | | (0.68 | )% | | | 4.97 | % |
| Ratios/Supplemental Data: | | | | | | | | | | | | | | | | | | | | |
Net assets at end of year (000’s omitted) | | $ | 58,154 | | | $ | 34,067 | | | $ | 30,538 | | | $ | 33,925 | | | $ | 30,994 | |
Ratio to average net assets of: | | | | | | | | | | | | | | | | | | | | |
Expenses | | | 0.22 | % | | | 0.22 | % | | | 0.22 | % | | | 0.22 | % | | | 0.22 | % |
Net investment income | | | 2.55 | % | | | 2.45 | % | | | 2.43 | % | | | 2.15 | % | | | 2.23 | % |
Portfolio turnover rate(e) | | | 20 | % | | | 16 | % | | | 9 | % | | | 20 | % | | | 1 | % |
| (a) | Based on average shares outstanding. |
| (b) | Amount represents less than $0.005. |
| (c) | The mean between the last bid and ask prices. |
| (d) | Net asset value total return is calculated assuming an initial investment made at the net asset value at the beginning of the period, reinvestment of all dividends and distributions at net asset value during the period, and redemption on the last day of the period. Net asset value total return includes adjustments in accordance with accounting principles generally accepted in the United States of America and as such, the net asset value for financial reporting purposes and the returns based upon those net asset values may differ from the net asset value and returns for shareholder transactions. Market price total return is calculated assuming an initial investment made at the market price at the beginning of the period, reinvestment of all dividends and distributions at market price during the period, and sale at the market price on the last day of the period. Total investment returns calculated for a period of less than one year are not annualized. |
| (e) | Portfolio turnover rate is not annualized for periods less than one year, if applicable, and does not include securities received or delivered from processing creations or redemptions. |
PowerShares Global Short Term High Yield Bond Portfolio (PGHY)
| | | | | | | | | | | | | | | | |
| | | Year Ended October 31, | | | For the Period
June 17, 2013(a)
Through
October 31, 2013 | |
| | | 2016 | | | 2015 | | | 2014 | | |
| Per Share Operating Performance: | | | | | | | | | | | | | | | | |
Net asset value at beginning of period | | $ | 23.50 | | | $ | 24.12 | | | $ | 24.84 | | | $ | 24.70 | |
Net investment income(b) | | | 1.51 | | | | 1.04 | | | | 0.99 | | | | 0.34 | |
Net realized and unrealized gain (loss) on investments | | | 0.59 | | | | (0.62 | ) | | | (0.67 | ) | | | 0.10 | |
Total from investment operations | | | 2.10 | | | | 0.42 | | | | 0.32 | | | | 0.44 | |
Distributions to shareholders from: | | | | | | | | | | | | | | | | |
Net investment income | | | (1.42 | ) | | | (1.03 | ) | | | (1.00 | ) | | | (0.30 | ) |
Return of capital | | | (0.02 | ) | | | (0.01 | ) | | | (0.04 | ) | | | — | |
Total distributions | | | (1.44 | ) | | | (1.04 | ) | | | (1.04 | ) | | | (0.30 | ) |
Net asset value at end of period | | $ | 24.16 | | | $ | 23.50 | | | $ | 24.12 | | | $ | 24.84 | |
Market price at end of period(c) | | $ | 24.23 | | | $ | 23.37 | | | $ | 24.04 | | | $ | 25.06 | |
| Net Asset Value Total Return(d) | | | 9.27 | % | | | 1.83 | % | | | 1.27 | % | | | 1.78 | %(e) |
| Market Price Total Return(d) | | | 10.17 | % | | | 1.61 | % | | | 0.04 | % | | | 2.67 | %(e) |
| Ratios/Supplemental Data: | | | | | | | | | | | | | | | | |
Net assets at end of period (000’s omitted) | | $ | 68,862 | | | $ | 27,029 | | | $ | 37,389 | | | $ | 14,903 | |
Ratio to average net assets of: | | | | | | | | | | | | | | | | |
Expenses | | | 0.35 | % | | | 0.35 | % | | | 0.35 | % | | | 0.35 | %(f) |
Net investment income | | | 6.43 | % | | | 4.43 | % | | | 4.03 | % | | | 3.71 | %(f) |
Portfolio turnover rate(g) | | | 53 | % | | | 50 | % | | | 29 | % | | | 4 | % |
| (a) | Commencement of investment operations. |
| (b) | Based on average shares outstanding. |
| (c) | The mean between the last bid and ask prices. |
| (d) | Net asset value total return is calculated assuming an initial investment made at the net asset value at the beginning of the period, reinvestment of all dividends and distributions at net asset value during the period, and redemption on the last day of the period. Net asset value total return includes adjustments in accordance with accounting principles generally accepted in the United States of America and as such, the net asset value for financial reporting purposes and the returns based upon those net asset values may differ from the net asset value and returns for shareholder transactions. Market price total return is calculated assuming an initial investment made at the market price at the beginning of the period, reinvestment of all dividends and distributions at market price during the period, and sale at the market price on the last day of the period. Total investment returns calculated for a period of less than one year are not annualized. |
| (e) | The net asset value total return from Fund Inception (June 20, 2013, the first day of trading on the exchange) to October 31, 2013 was 2.82%. The market price total return from Fund Inception to October 31, 2013 was 4.02%. |
| (g) | Portfolio turnover rate is not annualized for periods less than one year, if applicable, and does not include securities received or delivered from processing creations or redemptions. |
See accompanying Notes to Financial Statements which are an integral part of the financial statements.
Financial Highlights (continued)
PowerShares International Corporate Bond Portfolio (PICB)
| | | | | | | | | | | | | | | | | | | | |
| | | Year Ended October 31, | |
| | | 2016 | | | 2015 | | | 2014 | | | 2013 | | | 2012 | |
| Per Share Operating Performance: | | | | | | | | | | | | | | | | | | | | |
Net asset value at beginning of year | | $ | 25.95 | | | $ | 28.77 | | | $ | 29.50 | | | $ | 28.94 | | | $ | 27.92 | |
Net investment income(a) | | | 0.55 | | | | 0.62 | | | | 0.77 | | | | 0.86 | | | | 0.93 | |
Net realized and unrealized gain (loss) on investments | | | (0.86 | ) | | | (2.82 | ) | | | (0.75 | ) | | | 0.49 | | | | 0.99 | |
Total from investment operations | | | (0.31 | ) | | | (2.20 | ) | | | 0.02 | | | | 1.35 | | | | 1.92 | |
Distributions to shareholders from: | | | | | | | | | | | | | | | | | | | | |
Net investment income | | | — | | | | (0.03 | ) | | | (0.74 | ) | | | (0.69 | ) | | | (0.89 | ) |
Net realized gains | | | — | | | | — | | | | (0.03 | ) | | | — | | | | — | |
Return of capital | | | (0.56 | ) | | | (0.59 | ) | | | — | | | | (0.13 | ) | | | (0.04 | ) |
Total distributions | | | (0.56 | ) | | | (0.62 | ) | | | (0.77 | ) | | | (0.82 | ) | | | (0.93 | ) |
Transaction fees(a) | | | 0.00 | (b) | | | 0.00 | (b) | | | 0.02 | | | | 0.03 | | | | 0.03 | |
Net asset value at end of year | | $ | 25.08 | | | $ | 25.95 | | | $ | 28.77 | | | $ | 29.50 | | | $ | 28.94 | |
Market price at end of year(c) | | $ | 25.02 | | | $ | 25.89 | | | $ | 28.77 | | | $ | 29.55 | | | $ | 29.07 | |
| Net Asset Value Total Return(d) | | | (1.26 | )% | | | (7.73 | )% | | | 0.09 | % | | | 4.88 | % | | | 7.28 | % |
| Market Price Total Return(d) | | | (1.26 | )% | | | (7.94 | )% | | | (0.08 | )% | | | 4.59 | % | | | 8.72 | % |
| Ratios/Supplemental Data: | | | | | | | | | | | | | | | | | | | | |
Net assets at end of year (000’s omitted) | | $ | 160,539 | | | $ | 189,454 | | | $ | 263,233 | | | $ | 156,336 | | | $ | 131,675 | |
Ratio to average net assets of: | | | | | | | | | | | | | | | | | | | | |
Expenses | | | 0.50 | % | | | 0.50 | % | | | 0.50 | % | | | 0.50 | % | | | 0.50 | % |
Net investment income | | | 2.12 | % | | | 2.29 | % | | | 2.57 | % | | | 2.99 | % | | | 3.39 | % |
Portfolio turnover rate(e) | | | 24 | % | | | 13 | % | | | 17 | % | | | 27 | % | | | 12 | % |
| (a) | Based on average shares outstanding. |
| (b) | Amount represents less than $0.005. |
| (c) | The mean between the last bid and ask prices. |
| (d) | Net asset value total return is calculated assuming an initial investment made at the net asset value at the beginning of the period, reinvestment of all dividends and distributions at net asset value during the period, and redemption on the last day of the period. Net asset value total return includes adjustments in accordance with accounting principles generally accepted in the United States of America and as such, the net asset value for financial reporting purposes and the returns based upon those net asset values may differ from the net asset value and returns for shareholder transactions. Market price total return is calculated assuming an initial investment made at the market price at the beginning of the period, reinvestment of all dividends and distributions at market price during the period, and sale at the market price on the last day of the period. Total investment returns calculated for a period of less than one year are not annualized. |
| (e) | Portfolio turnover rate is not annualized for periods less than one year, if applicable, and does not include securities received or delivered from processing creations or redemptions. |
See accompanying Notes to Financial Statements which are an integral part of the financial statements.
Financial Highlights (continued)
PowerShares LadderRite 0-5 Year Corporate Bond Portfolio (LDRI)
| | | | | | | | | | | | |
| | | Year Ended October 31, | | | For the Period
September 8, 2014(a)
Through
October 31, 2014 | |
| | | 2016 | | | 2015 | | |
| Per Share Operating Performance: | | | | | | | | | | | | |
Net asset value at beginning of period | | $ | 25.08 | | | $ | 25.03 | | | $ | 25.07 | |
Net investment income(b) | | | 0.43 | | | | 0.32 | | | | 0.03 | |
Net realized and unrealized gain (loss) on investments | | | 0.03 | | | | 0.05 | | | | (0.04 | ) |
Total from investment operations | | | 0.46 | | | | 0.37 | | | | (0.01 | ) |
Distribution to shareholders from: | | | | | | | | | | | | |
Net investment income | | | (0.44 | ) | | | (0.32 | ) | | | (0.03 | ) |
Net realized gains | | | (0.04 | ) | | | — | | | | — | |
Return of capital | | | (0.00 | )(c) | | | — | | | | — | |
Total distributions | | | (0.48 | ) | | | (0.32 | ) | | | (0.03 | ) |
Net asset value at end of period | | $ | 25.06 | | | $ | 25.08 | | | $ | 25.03 | |
Market price at end of period(d) | | $ | 25.14 | | | $ | 25.16 | | | $ | 25.04 | |
| Net Asset Value Total Return(e) | | | 1.84 | % | | | 1.48 | % | | | (0.06 | )%(f) |
| Market Price Total Return(e) | | | 1.84 | % | | | 1.76 | % | | | (0.02 | )%(f) |
| Ratios/Supplemental Data: | | | | | | | | | | | | |
Net assets at end of period (000’s omitted) | | $ | 22,554 | | | $ | 6,270 | | | $ | 6,256 | |
Ratio to average net assets of: | | | | | | | | | | | | |
Expenses | | | 0.22 | % | | | 0.22 | % | | | 0.22 | %(g) |
Net investment income | | | 1.74 | % | | | 1.26 | % | | | 0.96 | %(g) |
Portfolio turnover rate(h) | | | 11 | % | | | 9 | % | | | 0 | % |
| (a) | Commencement of investment operations. |
| (b) | Based on average shares outstanding. |
| (c) | Amount represents less than $0.005. |
| (d) | The mean between the last bid and ask prices. |
| (e) | Net asset value total return is calculated assuming an initial investment made at the net asset value at the beginning of the period, reinvestment of all dividends and distributions at net asset value during the period, and redemption on the last day of the period. Net asset value total return includes adjustments in accordance with accounting principles generally accepted in the United States of America and as such, the net asset value for financial reporting purposes and the returns based upon those net asset values may differ from the net asset value and returns for shareholder transactions. Market price total return is calculated assuming an initial investment made at the market price at the beginning of the period, reinvestment of all dividends and distributions at market price during the period, and sale at the market price on the last day of the period. Total investment returns calculated for a period of less than one year are not annualized. |
| (f) | The net asset value total return from Fund Inception (September 10, 2014, the first day trading on the exchange) to October 31, 2014 was 0.22%. The market price total return from Fund Inception to October 31, 2014 was 0.26%. |
| (h) | Portfolio turnover rate is not annualized for periods less than one year, if applicable, and does not include securities received or delivered from processing creations or redemptions. |
See accompanying Notes to Financial Statements which are an integral part of the financial statements.
Financial Highlights (continued)
PowerShares National AMT-Free Municipal Bond Portfolio (PZA)
| | | | | | | | | | | | | | | | | | | | |
| | | Year Ended October 31, | |
| | | 2016 | | | 2015 | | | 2014 | | | 2013 | | | 2012 | |
| Per Share Operating Performance: | | | | | | | | | | | | | | | | | | | | |
Net asset value at beginning of year | | $ | 25.10 | | | $ | 25.17 | | | $ | 23.28 | | | $ | 25.74 | | | $ | 23.97 | |
Net investment income(a) | | | 0.82 | | | | 0.92 | | | | 1.00 | | | | 0.98 | | | | 1.05 | |
Net realized and unrealized gain (loss) on investments | | | 0.57 | | | | (0.09 | ) | | | 1.87 | | | | (2.46 | ) | | | 1.78 | |
Total from investment operations | | | 1.39 | | | | 0.83 | | | | 2.87 | | | | (1.48 | ) | | | 2.83 | |
Distributions to shareholders from: | | | | | | | | | | | | | | | | | | | | |
Net investment income | | | (0.83 | ) | | | (0.92 | ) | | | (1.01 | ) | | | (0.98 | ) | | | (1.06 | ) |
Return of capital | | | (0.00 | )(b) | | | (0.00 | )(b) | | | (0.01 | ) | | | (0.00 | )(b) | | | — | |
Total distributions | | | (0.83 | ) | | | (0.92 | ) | | | (1.02 | ) | | | (0.98 | ) | | | (1.06 | ) |
Transaction fees(a) | | | 0.03 | | | | 0.02 | | | | 0.04 | | | | — | | | | — | |
Net asset value at end of year | | $ | 25.69 | | | $ | 25.10 | | | $ | 25.17 | | | $ | 23.28 | | | $ | 25.74 | |
Market price at end of year(c) | | $ | 25.77 | | | $ | 25.15 | | | $ | 25.25 | | | $ | 23.23 | | | $ | 25.79 | |
| Net Asset Value Total Return(d) | | | 5.71 | % | | | 3.45 | % | | | 12.77 | % | | | (5.90 | )% | | | 12.02 | % |
| Market Price Total Return(d) | | | 5.82 | % | | | 3.32 | % | | | 13.35 | % | | | (6.27 | )% | | | 12.18 | % |
| Ratios/Supplemental Data: | | | | | | | | | | | | | | | | | | | | |
Net assets at end of year (000’s omitted) | | $ | 1,379,633 | | | $ | 897,395 | | | $ | 739,986 | | | $ | 564,598 | | | $ | 933,177 | |
Ratio to average net assets of: | | | | | | | | | | | | | | | | | | | | |
Expenses, after Waivers | | | 0.28 | % | | | 0.28 | % | | | 0.28 | % | | | 0.28 | % | | | 0.28 | % |
Expenses, prior to Waivers | | | 0.28 | % | | | 0.28 | % | | | 0.28 | % | | | 0.28 | % | | | 0.31 | % |
Net investment income, after Waivers | | | 3.17 | % | | | 3.64 | % | | | 4.13 | % | | | 3.93 | % | | | 4.18 | % |
Portfolio turnover rate(e) | | | 6 | % | | | 4 | % | | | 15 | % | | | 12 | % | | | 15 | % |
| (a) | Based on average shares outstanding. |
| (b) | Amount represents less than $0.005. |
| (c) | The mean between the last bid and ask prices. |
| (d) | Net asset value total return is calculated assuming an initial investment made at the net asset value at the beginning of the period, reinvestment of all dividends and distributions at net asset value during the period, and redemption on the last day of the period. Net asset value total return includes adjustments in accordance with accounting principles generally accepted in the United States of America and as such, the net asset value for financial reporting purposes and the returns based upon those net asset values may differ from the net asset value and returns for shareholder transactions. Market price total return is calculated assuming an initial investment made at the market price at the beginning of the period, reinvestment of all dividends and distributions at market price during the period, and sale at the market price on the last day of the period. Total investment returns calculated for a period of less than one year are not annualized. |
| (e) | Portfolio turnover rate is not annualized for periods less than one year, if applicable, and does not include securities received or delivered from processing creations or redemptions. For the fiscal year ended October 31, 2014, the portfolio turnover calculation includes the value of securities purchased and sold in the effort to realign the Fund’s portfolio holdings due to the underlying index change. |
See accompanying Notes to Financial Statements which are an integral part of the financial statements.
Financial Highlights (continued)
PowerShares New York AMT-Free Municipal Bond Portfolio (PZT)
| | | | | | | | | | | | | | | | | | | | |
| | | Year Ended October 31, | |
| | | 2016 | | | 2015 | | | 2014 | | | 2013 | | | 2012 | |
| Per Share Operating Performance: | | | | | | | | | | | | | | | | | | | | |
Net asset value at beginning of year | | $ | 24.14 | | | $ | 24.33 | | | $ | 22.37 | | | $ | 24.82 | | | $ | 23.49 | |
Net investment income(a) | | | 0.81 | | | | 0.83 | | | | 0.92 | | | | 0.92 | | | | 0.98 | |
Net realized and unrealized gain (loss) on investments | | | 0.51 | | | | (0.19 | ) | | | 1.96 | | | | (2.45 | ) | | | 1.33 | |
Total from investment operations | | | 1.32 | | | | 0.64 | | | | 2.88 | | | | (1.53 | ) | | | 2.31 | |
Distributions to shareholders from: | | | | | | | | | | | | | | | | | | | | |
Net investment income | | | (0.81 | ) | | | (0.83 | ) | | | (0.91 | ) | | | (0.92 | ) | | | (0.98 | ) |
Return of capital | | | (0.01 | ) | | | (0.00 | )(b) | | | (0.01 | ) | | | (0.00 | )(b) | | | (0.00 | )(b) |
Total distributions | | | (0.82 | ) | | | (0.83 | ) | | | (0.92 | ) | | | (0.92 | ) | | | (0.98 | ) |
Net asset value at end of year | | $ | 24.64 | | | $ | 24.14 | | | $ | 24.33 | | | $ | 22.37 | | | $ | 24.82 | |
Market price at end of year(c) | | $ | 24.67 | | | $ | 24.05 | | | $ | 24.22 | | | $ | 22.28 | | | $ | 24.86 | |
| Net Asset Value Total Return(d) | | | 5.50 | % | | | 2.68 | % | | | 13.16 | % | | | (6.32 | )% | | | 10.02 | % |
| Market Price Total Return(d) | | | 6.02 | % | | | 2.77 | % | | | 13.11 | % | | | (6.83 | )% | | | 10.38 | % |
| Ratios/Supplemental Data: | | | | | | | | | | | | | | | | | | | | |
Net assets at end of year (000’s omitted) | | $ | 64,063 | | | $ | 50,692 | | | $ | 47,450 | | | $ | 49,204 | | | $ | 71,983 | |
Ratio to average net assets of: | | | | | | | | | | | | | | | | | | | | |
Expenses, after Waivers | | | 0.28 | % | | | 0.28 | % | | | 0.26 | % | | | 0.30 | % | | | 0.28 | % |
Expenses, prior to Waivers | | | 0.28 | % | | | 0.28 | % | | | 0.26 | % | | | 0.31 | % | | | 0.31 | % |
Net investment income, after Waivers | | | 3.26 | % | | | 3.42 | % | | | 3.92 | % | | | 3.84 | % | | | 4.02 | % |
Portfolio turnover rate(e) | | | 21 | % | | | 18 | % | | | 18 | % | | | 20 | % | | | 0 | % |
| (a) | Based on average shares outstanding. |
| (b) | Amount represents less than $0.005. |
| (c) | The mean between the last bid and ask prices. |
| (d) | Net asset value total return is calculated assuming an initial investment made at the net asset value at the beginning of the period, reinvestment of all dividends and distributions at net asset value during the period, and redemption on the last day of the period. Net asset value total return includes adjustments in accordance with accounting principles generally accepted in the United States of America and as such, the net asset value for financial reporting purposes and the returns based upon those net asset values may differ from the net asset value and returns for shareholder transactions. Market price total return is calculated assuming an initial investment made at the market price at the beginning of the period, reinvestment of all dividends and distributions at market price during the period, and sale at the market price on the last day of the period. Total investment returns calculated for a period of less than one year are not annualized. |
| (e) | Portfolio turnover rate is not annualized for periods less than one year, if applicable, and does not include securities received or delivered from processing creations or redemptions. For the fiscal year ended October 31, 2014, the portfolio turnover calculation includes the value of securities purchased and sold in the effort to realign the Fund’s portfolio holdings due to the underlying index change. |
PowerShares Preferred Portfolio (PGX)
| | | | | | | | | | | | | | | | | | | | |
| | | Year Ended October 31, | |
| | | 2016 | | | 2015 | | | 2014 | | | 2013 | | | 2012 | |
| Per Share Operating Performance: | | | | | | | | | | | | | | | | | | | | |
Net asset value at beginning of year | | $ | 14.78 | | | $ | 14.57 | | | $ | 13.78 | | | $ | 14.82 | | | $ | 13.96 | |
Net investment income(a) | | | 0.84 | | | | 0.87 | | | | 0.88 | | | | 0.91 | | | | 0.94 | |
Net realized and unrealized gain (loss) on investments | | | 0.20 | | | | 0.21 | | | | 0.79 | | | | (1.03 | ) | | | 0.86 | |
Total from investment operations | | | 1.04 | | | | 1.08 | | | | 1.67 | | | | (0.12 | ) | | | 1.80 | |
Distributions to shareholders from: | | | | | | | | | | | | | | | | | | | | |
Net investment income | | | (0.86 | ) | | | (0.87 | ) | | | (0.88 | ) | | | (0.92 | ) | | | (0.94 | ) |
Net asset value at end of year | | $ | 14.96 | | | $ | 14.78 | | | $ | 14.57 | | | $ | 13.78 | | | $ | 14.82 | |
Market price at end of year(b) | | $ | 15.00 | | | $ | 14.80 | | | $ | 14.62 | | | $ | 13.79 | | | $ | 14.84 | |
| Net Asset Value Total Return(c) | | | 7.22 | % | | | 7.66 | % | | | 12.51 | % | | | (0.88 | )% | | | 13.37 | % |
| Market Price Total Return(c) | | | 7.36 | % | | | 7.43 | % | | | 12.81 | % | | | (0.95 | )% | | | 13.18 | % |
| Ratios/Supplemental Data: | | | | | | | | | | | | | | | | | | | | |
Net assets at end of year (000’s omitted) | | $ | 4,730,845 | | | $ | 3,117,091 | | | $ | 2,264,758 | | | $ | 2,107,031 | | | $ | 2,081,189 | |
Ratio to average net assets of: | | | | | | | | | | | | | | | | | | | | |
Expenses | | | 0.50 | % | | | 0.50 | % | | | 0.50 | % | | | 0.50 | % | | | 0.50 | % |
Net investment income | | | 5.63 | % | | | 5.95 | % | | | 6.21 | % | | | 6.27 | % | | | 6.52 | % |
Portfolio turnover rate(d) | | | 14 | % | | | 12 | % | | | 13 | % | | | 29 | % | | | 29 | % |
| (a) | Based on average shares outstanding. |
| (b) | The mean between the last bid and ask prices. |
| (c) | Net asset value total return is calculated assuming an initial investment made at the net asset value at the beginning of the period, reinvestment of all dividends and distributions at net asset value during the period, and redemption on the last day of the period. Net asset value total return includes adjustments in accordance with accounting principles generally accepted in the United States of America and as such, the net asset value for financial reporting purposes and the returns based upon those net asset values may differ from the net asset value and returns for shareholder transactions. Market price total return is calculated assuming an initial investment made at the market price at the beginning of the period, reinvestment of all dividends and distributions at market price during the period, and sale at the market price on the last day of the period. Total investment returns calculated for a period of less than one year are not annualized. |
| (d) | Portfolio turnover rate is not annualized for periods less than one year, if applicable, and does not include securities received or delivered from processing creations or redemptions. |
See accompanying Notes to Financial Statements which are an integral part of the financial statements.
Financial Highlights (continued)
PowerShares Variable Rate Preferred Portfolio (VRP)
| | | | | | | | | | | | |
| | | Year Ended October 31, | | | For the Period
April 28, 2014(a)
Through
October 31, 2014 | |
| | | 2016 | | | 2015 | | |
| Per Share Operating Performance: | | | | | | | | | | | | |
Net asset value at beginning of period | | $ | 24.36 | | | $ | 24.85 | | | $ | 24.87 | |
Net investment income(b) | | | 1.23 | | | | 1.20 | | | | 0.60 | |
Net realized and unrealized gain (loss) on investments | | | 0.98 | | | | (0.47 | ) | | | (0.08 | ) |
Total from investment operations | | | 2.21 | | | | 0.73 | | | | 0.52 | |
Distributions to shareholders from: | | | | | | | | | | | | |
Net investment income | | | (1.24 | ) | | | (1.20 | ) | | | (0.51 | ) |
Return of capital | | | — | | | | (0.02 | ) | | | (0.03 | ) |
Total distributions | | | (1.24 | ) | | | (1.22 | ) | | | (0.54 | ) |
Net asset value at end of period | | $ | 25.33 | | | $ | 24.36 | | | $ | 24.85 | |
Market price at end of period(c) | | $ | 25.42 | | | $ | 24.40 | | | $ | 24.92 | |
| Net Asset Value Total Return(d) | | | 9.43 | % | | | 2.99 | % | | | 2.09 | %(e) |
| Market Price Total Return(d) | | | 9.63 | % | | | 2.85 | % | | | 2.38 | %(e) |
| Ratios/Supplemental Data: | | | | | | | | | | | | |
Net assets at end of period (000’s omitted) | | $ | 899,060 | | | $ | 397,065 | | | $ | 91,950 | |
Ratio to average net assets of: | | | | | | | | | | | | |
Expenses | | | 0.50 | % | | | 0.50 | % | | | 0.50 | %(f) |
Net investment income | | | 5.03 | % | | | 4.88 | % | | | 4.79 | %(f) |
Portfolio turnover rate(g) | | | 17 | % | | | 5 | % | | | 6 | % |
| (a) | Commencement of investment operations. |
| (b) | Based on average shares outstanding. |
| (c) | The mean between the last bid and ask prices. |
| (d) | Net asset value total return is calculated assuming an initial investment made at the net asset value at the beginning of the period, reinvestment of all dividends and distributions at net asset value during the period, and redemption on the last day of the period. Net asset value total return includes adjustments in accordance with accounting principles generally accepted in the United States of America and as such, the net asset value for financial reporting purposes and the returns based upon those net asset values may differ from the net asset value and returns for shareholder transactions. Market price total return is calculated assuming an initial investment made at the market price at the beginning of the period, reinvestment of all dividends and distributions at market price during the period, and sale at the market price on the last day of the period. Total investment returns calculated for a period of less than one year are not annualized. |
| (e) | The net asset value total return from Fund Inception (May 1, 2014, the first day of trading on the exchange) to October 31, 2014 was 1.93%. The market price total return from Fund Inception to October 31, 2014 was 2.01%. |
| (g) | Portfolio turnover rate is not annualized for periods less than one year, if applicable, and does not include securities received or delivered from processing creations or redemptions. |
PowerShares VRDO Tax-Free Weekly Portfolio (PVI)
| | | | | | | | | | | | | | | | | | | | |
| | | Year Ended October 31, | |
| | | 2016 | | | 2015 | | | 2014 | | | 2013 | | | 2012 | |
| Per Share Operating Performance: | | | | | | | | | | | | | | | | | | | | |
Net asset value at beginning of year | | $ | 24.93 | | | $ | 24.96 | | | $ | 24.99 | | | $ | 25.00 | | | $ | 25.00 | |
Net investment income (loss)(a) | | | 0.02 | | | | (0.03 | ) | | | (0.02 | ) | | | 0.01 | | | | 0.06 | |
Net realized and unrealized gain (loss) on investments | | | — | | | | — | | | | (0.01 | ) | | | (0.01 | ) | | | — | |
Total from investment operations | | | 0.02 | | | | (0.03 | ) | | | (0.03 | ) | | | — | | | | 0.06 | |
Distributions to shareholders from: | | | | | | | | | | | | | | | | | | | | |
Net investment income | | | (0.02 | ) | | | — | | | | — | | | | (0.01 | ) | | | (0.06 | ) |
Return of capital | | | (0.00 | )(b) | | | (0.00 | )(b) | | | (0.00 | )(b) | | | (0.00 | )(b) | | | — | |
Total distributions | | | (0.02 | ) | | | (0.00 | )(b) | | | (0.00 | )(b) | | | (0.01 | ) | | | (0.06 | ) |
Net asset value at end of year | | $ | 24.93 | | | $ | 24.93 | | | $ | 24.96 | | | $ | 24.99 | | | $ | 25.00 | |
Market price at end of year(c) | | $ | 24.91 | | | $ | 24.93 | | | $ | 24.97 | | | $ | 24.99 | | | $ | 24.99 | |
| Net Asset Value Total Return(d) | | | 0.07 | % | | | (0.12 | )% | | | (0.12 | )% | | | (0.00 | )%(e) | | | 0.23 | % |
| Market Price Total Return(d) | | | (0.01 | )% | | | (0.16 | )% | | | (0.08 | )% | | | 0.04 | % | | | 0.18 | % |
| Ratios/Supplemental Data: | | | | | | | | | | | | | | | | | | | | |
Net assets at end of year (000’s omitted) | | $ | 59,831 | | | $ | 81,010 | | | $ | 118,580 | | | $ | 193,700 | | | $ | 317,449 | |
Ratio to average net assets of: | | | | | | | | | | | | | | | | | | | | |
Expenses | | | 0.25 | % | | | 0.25 | % | | | 0.25 | % | | | 0.25 | % | | | 0.25 | % |
Net investment income (loss) | | | 0.06 | % | | | (0.15 | )% | | | (0.11 | )% | | | 0.03 | % | | | 0.22 | % |
| (a) | Based on average shares outstanding. |
| (b) | Amount represents less than $0.005. |
| (c) | The mean between the last bid and ask prices. |
| (d) | Net asset value total return is calculated assuming an initial investment made at the net asset value at the beginning of the period, reinvestment of all dividends and distributions at net asset value during the period, and redemption on the last day of the period. Net asset value total return includes adjustments in accordance with accounting principles generally accepted in the United States of America and as such, the net asset value for financial reporting purposes and the returns based upon those net asset values may differ from the net asset value and returns for shareholder transactions. Market price total return is calculated assuming an initial investment made at the market price at the beginning of the period, reinvestment of all dividends and distributions at market price during the period, and sale at the market price on the last day of the period. Total investment returns calculated for a period of less than one year are not annualized. |
| (e) | Amount represents less than 0.005%. |
See accompanying Notes to Financial Statements which are an integral part of the financial statements.
Notes to Financial Statements
PowerShares Exchange-Traded Fund Trust II
October 31, 2016
Note 1. Organization
PowerShares Exchange-Traded Fund Trust II (the “Trust”) was organized as a Massachusetts business trust on October 10, 2006 and is authorized to have multiple series of portfolios. The Trust is an open-end management investment company registered under the Investment Company Act of 1940, as amended (the “1940 Act”). As of October 31, 2016, the Trust offered sixty-seven portfolios. This report includes the following portfolios:
| | |
Full Name | | Short Name |
| PowerShares 1-30 Laddered Treasury Portfolio (PLW) | | “1-30 Laddered Treasury Portfolio” |
| PowerShares Build America Bond Portfolio (BAB) | | “Build America Bond Portfolio” |
| PowerShares California AMT-Free Municipal Bond Portfolio (PWZ) | | “California AMT-Free Municipal Bond Portfolio” |
| PowerShares CEF Income Composite Portfolio (PCEF) | | “CEF Income Composite Portfolio” |
| PowerShares Chinese Yuan Dim Sum Bond Portfolio (DSUM) | | “Chinese Yuan Dim Sum Bond Portfolio” |
| PowerShares Emerging Markets Sovereign Debt Portfolio (PCY) | | “Emerging Markets Sovereign Debt Portfolio” |
| PowerShares Fundamental High Yield® Corporate Bond Portfolio (PHB) | | “Fundamental High Yield® Corporate Bond Portfolio” |
| PowerShares Fundamental Investment Grade Corporate Bond Portfolio (PFIG) | | “Fundamental Investment Grade Corporate Bond Portfolio” |
| PowerShares Global Short Term High Yield Bond Portfolio (PGHY) | | “Global Short Term High Yield Bond Portfolio” |
| PowerShares International Corporate Bond Portfolio (PICB) | | “International Corporate Bond Portfolio” |
| PowerShares LadderRite 0-5 Year Corporate Bond Portfolio (LDRI) | | “LadderRite 0-5 Year Corporate Bond Portfolio” |
| PowerShares National AMT-Free Municipal Bond Portfolio (PZA) | | “National AMT-Free Municipal Bond Portfolio” |
| PowerShares New York AMT-Free Municipal Bond Portfolio (PZT) | | “New York AMT-Free Municipal Bond Portfolio” |
| PowerShares Preferred Portfolio (PGX) | | “Preferred Portfolio” |
| PowerShares Variable Rate Preferred Portfolio (VRP) | | “Variable Rate Preferred Portfolio” |
| PowerShares VRDO Tax-Free Weekly Portfolio (PVI) | | “VRDO Tax-Free Weekly Portfolio” |
Each portfolio (each, a “Fund”, and collectively, the “Funds”) represents a separate series of the Trust. The shares of the Funds are referred to herein as “Shares” or “Fund’s Shares.” Each Fund’s Shares are listed and traded on NYSE Arca, Inc., except for Shares of LadderRite 0-5 Year Corporate Bond Portfolio, which are listed and traded on The NASDAQ Stock Market LLC.
The market price of each Share may differ to some degree from the Fund’s net asset value (“NAV”). Unlike conventional mutual funds, each Fund issues and redeems Shares on a continuous basis, at NAV, only in a large specified number of Shares, each called a “Creation Unit.” Creation Units of 1-30 Laddered Treasury Portfolio, CEF Income Composite Portfolio, Emerging Markets Sovereign Debt Portfolio, Fundamental High Yield® Corporate Bond Portfolio, Fundamental Investment Grade Corporate Bond Portfolio, Global Short Term High Yield Bond Portfolio, LadderRite 0-5 Year Corporate Bond Portfolio, Preferred Portfolio and Variable Rate Preferred Portfolio are issued and redeemed principally in exchange for the deposit or delivery of a basket of securities (“Deposit Securities”). Creation Units of Build America Bond Portfolio, California AMT-Free Municipal Bond Portfolio, Chinese Yuan Dim Sum Bond Portfolio, International Corporate Bond Portfolio, National AMT-Free Municipal Bond Portfolio, New York AMT-Free Municipal Bond Portfolio and VRDO Tax-Free Weekly Portfolio are issued and redeemed principally in exchange for the deposit or delivery of cash. Except when aggregated in Creation Units by Authorized Participants, the Shares are not individually redeemable securities of the Funds.
The investment objective of each Fund is to seek investment results that generally correspond (before fees and expenses) to the price and yield of its respective index listed below (each, an “Underlying Index”):
| | |
Fund | | Underlying Index |
| 1-30 Laddered Treasury Portfolio | | Ryan/NASDAQ U.S. 1-30 Year Treasury Laddered Index |
| Build America Bond Portfolio | | The BofA Merrill Lynch Build America Bond Index |
| California AMT-Free Municipal Bond Portfolio | | The BofA Merrill Lynch California Long-Term Core Plus Municipal Securities Index |
| CEF Income Composite Portfolio | | S-Network Composite Closed-End Fund IndexSM |
| Chinese Yuan Dim Sum Bond Portfolio | | Citi Custom Dim Sum (Offshore CNY) Bond Index |
| Emerging Markets Sovereign Debt Portfolio | | DBIQ Emerging Market USD Liquid Balanced Index |
| Fundamental High Yield® Corporate Bond Portfolio | | RAFI® Bonds U.S. High Yield 1-10 Index |
| Fundamental Investment Grade Corporate Bond Portfolio | | RAFI® Bonds U.S. Investment Grade 1-10 Index |
| | |
Fund | | Underlying Index |
| Global Short Term High Yield Bond Portfolio | | DB Global Short Maturity High Yield Bond Index |
| International Corporate Bond Portfolio | | S&P International Corporate Bond Index® |
| LadderRite 0-5 Year Corporate Bond Portfolio | | NASDAQ LadderRite® 0-5 Year USD Corporate Bond Index |
| National AMT-Free Municipal Bond Portfolio | | The BofA Merrill Lynch National Long-Term Core Plus Municipal Securities Index |
| New York AMT-Free Municipal Bond Portfolio | | The BofA Merrill Lynch New York Long-Term Core Plus Municipal Securities Index |
| Preferred Portfolio | | The BofA Merrill Lynch Core Plus Fixed Rate Preferred Securities Index |
| Variable Rate Preferred Portfolio | | Wells Fargo® Hybrid and Preferred Securities Floating and Variable Rate Index |
| VRDO Tax-Free Weekly Portfolio | | Bloomberg U.S. Municipal AMT-Free Weekly VRDO Index |
Note 2. Significant Accounting Policies
The preparation of the financial statements in accordance with accounting principles generally accepted in the United States of America (“GAAP”) requires management to make estimates and assumptions that affect the reported amounts and disclosures in the financial statements, including estimates and assumptions related to taxation. Actual results could differ from these estimates. Certain prior year amounts have been reclassified to conform to the current year presentation. In addition, the Funds monitor for material events or transactions that may occur or become known after the period-end date and before the date the financial statements are released to print. The following is a summary of the significant accounting policies followed by the Funds in preparation of the financial statements.
A. Security Valuation
Securities, including restricted securities, are valued according to the following policies:
Securities, including restricted securities in a fund that are held as investments (the “Underlying Fund”) of a Fund, are valued in accordance with the Underlying Fund’s valuation policy. The policies of Underlying Funds affiliated with the Funds as a result of having the same investment adviser are the same as those set forth below.
A security listed or traded on an exchange (except convertible securities) is valued at its last sales price or official closing price as of the close of the customary trading session on the exchange where the security is principally traded, or lacking any sales or official closing price on a particular day, the security may be valued at the closing bid price on that day. Securities traded in the over-the-counter market are valued based on prices furnished by independent pricing services or market makers. When such securities are valued by an independent pricing service they may be considered fair valued. Futures contracts are valued at the final settlement price set by an exchange on which they are principally traded. Listed options are valued at the mean between the last bid and asked prices from the exchange on which they are principally traded. Options not listed on an exchange are valued by an independent source at the mean between the last bid and asked prices. For purposes of determining NAV per Share, futures and option contracts generally are valued 15 minutes after the close of the customary trading session of the New York Stock Exchange (“NYSE”).
Investments in open-end and closed-end registered investment companies that do not trade on an exchange are valued at the end of day NAV per share. Investments in open-end and closed-end registered investment companies that trade on an exchange are valued at the last sales price or official closing price as of the close of the customary trading session on the exchange where the security is principally traded.
Debt obligations (including convertible securities) and unlisted equities are fair valued using an evaluated quote provided by an independent pricing service. Evaluated quotes provided by the pricing service may be determined without exclusive reliance on quoted prices, and may reflect appropriate factors such as institution-size trading in similar groups of securities, developments related to specific securities, dividend rate (for unlisted equities), yield (for debt obligations), quality, type of issue, coupon rate (for debt obligations), maturity (for debt obligations), individual trading characteristics and other market data. Securities with a demand feature exercisable within one to seven days are valued at par. Debt obligations are subject to interest rate and credit risks. In addition, all debt obligations involve some risk of default with respect to interest and/or principal payments.
Foreign securities’ (including foreign exchange contracts’) prices are converted into U.S. dollar amounts using the applicable exchange rates as of the close of the London world markets. If market quotations are available and reliable for foreign exchange-traded equity securities, the securities will be valued at the market quotations. Because trading hours for certain foreign securities end before the close of the NYSE, closing market quotations may become unreliable. If between the time trading ends on a particular security and the close of the customary trading session on the NYSE, events occur that Invesco PowerShares Capital Management LLC (the “Adviser”) determines are significant and make the closing price unreliable, the Fund may fair value the security. If the event is likely to have affected the closing price of the security, the security will be valued at fair value in good faith using procedures approved by the Board of Trustees. Adjustments to closing prices to reflect fair value may also be based on a screening process of an independent pricing service to indicate the degree of certainty, based on historical data, that the closing price in the principal market where a foreign security trades is not the current value as of the close of the NYSE. Foreign securities’ prices meeting the approved degree of certainty that the price is not reflective of current value will be priced at the indication of fair value from the independent pricing service. Multiple
factors may be considered by the independent pricing service in determining adjustments to reflect fair value and may include information relating to sector indices, American Depositary Receipts and domestic and foreign index futures. Foreign securities may have additional risks including exchange rate changes, potential for sharply devalued currencies and high inflation, political and economic upheaval, the relative lack of issuer information, relatively low market liquidity and the potential lack of strict financial and accounting controls and standards.
Securities for which market prices are not provided by any of the above methods may be valued based upon quotes furnished by independent sources. The last bid price may be used to value equity securities. The mean between the last bid and asked prices is used to value debt obligations, including corporate loans.
Securities for which market quotations are not readily available or became unreliable are valued at fair value as determined in good faith following procedures approved by the Board of Trustees. Issuer-specific events, market trends, bid/asked quotes of brokers and information providers and other market data may be reviewed in the course of making a good faith determination of a security’s fair value.
Each Fund may invest in securities that are subject to interest rate risk, meaning the risk that the prices will generally fall as interest rates rise and, conversely, the prices will generally rise as interest rates fall. Specific securities differ in their sensitivity to changes in interest rates depending on their individual characteristics. Changes in interest rates may result in increased market volatility, which may affect the value and/or liquidity of certain Fund investments.
Valuations change in response to many factors, including the historical and prospective earnings of the issuer, the value of the issuer’s assets, general economic conditions, interest rates, investor perceptions and market liquidity. Because of the inherent uncertainties of valuation, the values reflected in the financial statements may materially differ from the value received upon actual sale of those investments.
B. Other Risks
Index Risk. Unlike many investment companies, the Funds do not utilize investing strategies that seek returns in excess of their Underlying Indexes. Therefore, a Fund would not necessarily buy or sell a security unless that security is added or removed, respectively, from its respective Underlying Index, even if that security generally is underperforming.
Changing Fixed-Income Market Conditions. Each Fund, except for CEF Income Composite Portfolio and Variable Rate Preferred Portfolio, invests in fixed-income securities. The current historically low interest rate environment was created in part by the Federal Reserve Board (“FRB”) and certain foreign central banks keeping the federal funds and equivalent foreign rates at or near zero. The “tapering” in 2015 of the FRB’s quantitative easing program, combined with the FRB’s raising of the target range for the Federal Funds Rate (and likely eventual increase in equivalent foreign rates) may expose fixed-income markets to heightened volatility and reduced liquidity for certain fixed-income investments, particularly those with longer maturities, although it is difficult to predict the impact of this rate increase and any future rate increases on various markets. In addition, decreases in fixed-income dealer market-making capacity may also potentially lead to heightened volatility and reduced liquidity in the fixed-income markets. As a result, the value of the Fund’s investments and share price may decline. Changes in central bank policies could also result in higher than normal shareholder redemptions, which could potentially increase portfolio turnover and the Funds’ transaction costs.
Fixed-Income Securities Risk. Each Fund, except for CEF Income Composite Portfolio and Variable Rate Preferred Portfolio, invests in fixed-income securities. Fixed-income securities are subject to interest rate risk and credit risk. Interest rate risk refers to fluctuations in the value of a fixed-income security resulting from changes in the general level of interest rates. When the general level of interest rates goes up, the prices of most fixed-income securities go down. When the general level of interest rates goes down, the prices of most fixed-income securities go up. Fixed-income securities with longer maturities typically are more sensitive to changes in interest rates, making them more volatile than securities with shorter maturities. Credit risk refers to the possibility that the issuer of a security will be unable and/or unwilling to make timely interest payments and/or repay the principal on its debt. Debt instruments are subject to varying degrees of credit risk, which may be reflected in credit ratings. There is a possibility that the credit rating of a fixed-income security may be downgraded after purchase, which may adversely affect the value of the security. Securities issued by the U.S. Government are subject to limited credit risk; however, securities issued by U.S. Government agencies are not necessarily backed by the full faith and credit of the U.S. Government.
Call Risk. If interest rates fall, it is possible that issuers of callable securities with high interest coupons will “call” (or prepay) their bonds before their maturity date. If an issuer exercised such a call during a period of declining interest rates, a Fund may have to replace such called security with a lower yielding security. If that were to happen, such Fund’s net investment income could fall.
Industry or Geographic Concentration Risk. In following its methodology, each Fund’s Underlying Index from time to time may be concentrated to a significant degree in securities of issuers located in a single industry or a sector, or, in a specific country or geographic region. To the extent that an Underlying Index concentrates in the securities of issuers in a particular industry, sector, country or region, each Fund will also concentrate its investments to approximately the same extent. By so concentrating its
investments, a Fund may face more risks than if it were diversified broadly over numerous industries, sectors, countries or geographic regions. In addition, at times, an industry or sector may be out of favor and underperform other industries or the market as a whole. Any factors detrimental to the performance of such industry or sector will disproportionately impact a Fund’s NAV. Also, a natural or other disaster could occur in a country or geographic region in which a Fund invests, which could affect the economy or particular business operations of companies in that specific country or geographic region and adversely impact such Fund’s investments in the affected country or region.
Non-Diversified Fund Risk. Each Fund (except for Build America Bond Portfolio, CEF Income Composite Portfolio, Chinese Yuan Dim Sum Bond Portfolio, Fundamental High Yield® Corporate Bond Portfolio, Fundamental Investment Grade Corporate Bond Portfolio, International Corporate Bond Portfolio, National AMT-Free Municipal Bond Portfolio and VRDO Tax-Free Weekly Portfolio) is non-diversified and can invest a greater portion of its assets in securities of individual issuers than diversified funds. As a result, changes in the market value of a single investment could cause greater fluctuations in Share price than would occur in a diversified fund. This may increase a Fund’s volatility and cause the performance of a relatively small number of issuers to have a greater impact on a Fund’s performance.
Non-Correlation Risk. Each Fund’s return may not match the return of its Underlying Index for a number of reasons. For example, each Fund incurs operating expenses not applicable to its Underlying Index, and incurs costs in buying and selling securities, especially when rebalancing the Fund’s securities holdings to reflect changes in the composition of its Underlying Index. To the extent that a Fund issues and redeems Creation Units principally for cash, it will incur higher costs in buying and selling securities than if it issued and redeemed Creation Units principally in-kind. In addition, the performance of each Fund and its Underlying Index may vary due to asset valuation differences and differences between each Fund’s portfolio and its Underlying Index resulting from legal restrictions, cost or liquidity constraints.
Sampling Risk. Each Fund’s (except for 1-30 Laddered Treasury Portfolio and CEF Income Composite Portfolio) use of a representative sampling approach will result in the Fund holding a smaller number of securities than are in its respective Underlying Index. As a result, an adverse development with respect to an issuer of securities that a Fund holds could result in a greater decline in NAV than would be the case if a Fund held all of the securities in its Underlying Index. To the extent the assets in a Fund are smaller, these risks will be greater.
Cash Transaction Risk. Unlike most exchange-traded funds (“ETFs”), the Build America Bond Portfolio, California AMT-Free Municipal Bond Portfolio, Chinese Yuan Dim Sum Bond Portfolio, International Corporate Bond Portfolio, National AMT-Free Municipal Bond Portfolio, New York AMT-Free Municipal Bond Portfolio and VRDO Tax-Free Weekly Portfolio currently effect creations and redemptions principally for cash, rather than primarily in-kind, because of the nature of the Funds’ investments. As such, investments in such Funds’ Shares may be less tax efficient than investments in conventional ETFs.
Foreign Investment Risk. Investments in the securities of non-U.S issuers involve risks beyond those associated with investments in U.S. securities. Foreign securities may have relatively low market liquidity, greater market volatility, decreased publicly available information and less reliable financial information about issuers. Foreign securities also are subject to the risks of expropriation, nationalization, political instability, local taxation, potential currency transfer restrictions or other adverse political or economic developments and the difficulty of enforcing obligations in other countries. These risks may be exacerbated in emerging market countries. If a Fund invests in securities denominated in foreign currencies, fluctuations in the value of the U.S. dollar relative to the values of other currencies may adversely affect investments in foreign securities and may negatively impact the Fund’s returns. Such risks may be exacerbated in emerging markets, where securities laws are relatively new and unsettled.
Valuation Risk. Financial information related to securities of non-U.S. issuers may be less reliable than information related to securities of U.S. issuers, which may make it difficult to obtain a current price for a non-U.S. security held by a Fund. In certain circumstances, market quotations may not be readily available for some Fund securities, and those securities may be fair valued. The value established for a security through fair valuation may be different from what would be produced if the security had been valued using market quotations. Fund securities that are valued using techniques other than market quotations, including “fair valued” securities, may be subject to greater fluctuation in their value from one day to the next than would be the case if market quotations were used. In addition, there is no assurance that a Fund could sell a portfolio security for the value established for it at any time, and it is possible that a Fund would incur a loss because a security is sold at a discount to its established value.
Fund of Funds Risk. Because CEF Income Composite Portfolio is a fund of funds, its investment performance largely depends on the investment performance of the Underlying Funds in which it invests. An investment in the Fund is subject to the risks associated with the Underlying Funds that comprise its Underlying Index. The Fund will pay indirectly a proportional share of the fees and expenses of the Underlying Funds in which it invests, including their investment advisory and administration fees, while continuing to pay its own unitary management fee. As a result, shareholders will absorb duplicate levels of fees with respect to investments in the Underlying Funds. In addition, at times certain segments of the market represented by constituent Underlying Funds in its Underlying Index may be out of favor and underperform other segments.
Global Bonds Risk. Chinese Yuan Dim Sum Bond Portfolio, Emerging Markets Sovereign Debt Portfolio, Global Short Term High Yield Bond Portfolio and International Corporate Bond Portfolio invest in global bonds. Global bonds are subject to the same risks as other debt issues, notably credit risk, market risk, interest rate risk and liquidity risk. Generally, investments in the securities of non-U.S. issuers involve risks beyond those associated with investments in U.S. securities. These additional risks include greater market volatility, the availability of less reliable financial information, higher transactional costs, taxation by foreign governments, decreased market liquidity and political instability. Foreign issuers often are subject to less stringent requirements regarding accounting, auditing, financial reporting and record keeping than are U.S. securities and, therefore, not all material information regarding these issuers will be available. Securities exchanges or foreign governments may adopt rules or regulations that may negatively impact a Fund’s ability to invest in foreign securities or may prevent the Fund from repatriating its investments. In addition, a Fund may not receive shareholder communications or be permitted to vote the securities that it holds, as the issuers may be under no legal obligation to distribute them.
Municipal Securities Risk. Build America Bond Portfolio, California AMT-Free Municipal Bond Portfolio, National AMT-Free Municipal Bond Portfolio, New York AMT-Free Municipal Bond Portfolio and VRDO Tax-Free Weekly Portfolio invest in municipal securities. Municipal securities are subject to the risk that litigation, legislation or other political events, local business or economic conditions or the bankruptcy of the issuer could have a significant effect on an issuer’s ability to make payments of principal and/or interest.
Political changes and uncertainties in the municipal market related to taxation, legislative changes or the rights of municipal security holders can significantly affect municipal securities. Because many securities are issued to finance similar projects, especially those relating to education, health care, transportation and utilities, conditions in those sectors can affect the overall municipal market. In addition, changes in the financial condition of an individual municipal issuer can affect the overall municipal market. If the Internal Revenue Service (“IRS”) determines that an issuer of a municipal security has not complied with applicable tax requirements, interest from the security could become taxable and the security could decline significantly in value.
Municipal Insurance Risk. A portion of the municipal securities that California AMT-Free Municipal Bond Portfolio, National AMT-Free Municipal Bond Portfolio, New York AMT-Free Municipal Bond Portfolio and VRDO Tax-Free Weekly Portfolio hold may be covered by insurance that guarantees the bond’s scheduled payment of interest and repayment of principal. Municipal security insurance does not insure against market fluctuations or fluctuations in a Fund’s Share price. In addition, a municipal security insurance policy will not cover: (i) repayment of a municipal security before maturity (redemption), (ii) prepayment or payment of an acceleration premium (except for a mandatory sinking fund redemption) or any other provision of a bond indenture that advances the maturity of the bond, or (iii) nonpayment of principal or interest caused by negligence or bankruptcy of the paying agent. A mandatory sinking fund redemption may be a provision of a municipal security issue whereby part of the municipal security issue may be retired before maturity.
Tax Risk. There is no guarantee that the income from California AMT-Free Municipal Bond Portfolio, National AMT-Free Municipal Bond Portfolio, New York AMT-Free Municipal Bond Portfolio or VRDO Tax-Free Weekly Portfolio will be exempt from federal or state income taxes. Events occurring after the date of issuance of a municipal bond or after a Fund’s acquisition of a municipal bond may result in a determination that interest on that bond is includible in gross income for federal income tax purposes retroactively to its date of issuance. Such a determination may cause a portion of prior distributions by a Fund to its shareholders to be taxable to those shareholders in the year of receipt. Federal or state changes in income or alternative minimum tax rates or in the tax treatment of municipal bonds may make municipal bonds less attractive as investments and cause them to lose value.
Sovereign Debt Risk. For Chinese Yuan Dim Sum Bond Portfolio, Emerging Markets Sovereign Debt Portfolio and Global Short Term High Yield Bond Portfolio, risks of sovereign debt include the relative size of the debt burden to the economy as a whole and the government debtor’s policy towards the International Monetary Fund and the political constraints to which a government debtor may be subject. The governmental authority that controls the repayment of sovereign debt may be unwilling or unable to repay the principal and/or interest when due in accordance with the terms of such securities due to the extent of its foreign reserves. If an issuer of sovereign debt defaults on payments of principal and/or interest, these Funds may have limited legal recourse against the issuer and/or guarantor. In certain cases, remedies must be pursued in the courts of the defaulting party itself, and the Fund’s ability to obtain recourse may be limited.
Risks of Investing in Closed-End Funds. For CEF Income Composite Portfolio, the shares of closed-end funds may trade at a discount or premium to, or at, their NAV. To the extent that the Fund invests a portion of its assets in closed-end funds, those assets will be subject to the risks of the closed-end fund’s portfolio securities, and a shareholder in the Fund will bear not only his or her proportionate share of the expenses of the Fund, but also, indirectly, the expenses of the closed-end fund. The securities of closed-end funds in which the Fund may invest may be leveraged. As a result, the Fund may be exposed indirectly to leverage through an investment in such securities. An investment in securities of closed-end funds that use leverage may expose the Fund to higher volatility in the market value of such securities and the possibility that the Fund’s long-term returns on such securities (and, indirectly, the long-term returns of the Shares) will be diminished.
Preferred Stock Risk. With respect to Preferred Portfolio and Variable Rate Preferred Portfolio, preferred stock is subject to issuer-specific and overall market risks that are generally applicable to equity securities as a whole; however, there are special risks associated with investing in preferred stock. Preferred stock may be less liquid than many other types of securities, such as common stock, and
generally provides no voting rights with respect to the issuer. Preferred stock also may be subordinated to bonds or other debt instruments in an issuer’s capital structure, meaning that an issuer’s preferred stock generally pays dividends only after the issuer makes required payments to holders of its bonds and other debt. This subjects preferred stock to a greater risk of non-payment than more senior securities. Because of the subordinated position of preferred stock in an issuer’s capital structure, the ability to defer dividend or interest payments for extended periods of time without triggering an event of default for the issuer, and certain other features, its quality and value are heavily dependent on the profitability and cash flows of the issuer rather than on any legal claims to specific assets. Also, in certain circumstances, an issuer of a preferred stock may call or redeem it prior to a specified date or may convert it to common stock, all of which may negatively impact its return.
C. Federal Income Taxes
Each Fund intends to comply with the provisions of the Internal Revenue Code of 1986, as amended (the “Internal Revenue Code”), applicable to regulated investment companies and to distribute substantially all of the Fund’s taxable earnings to its shareholders. As such, the Funds will not be subject to federal income taxes on otherwise taxable income (including net realized gains) that is distributed to the shareholders. Therefore, no provision for federal income taxes is recorded in the financial statements.
Each Fund recognizes the tax benefits of uncertain tax positions only when the position is more likely than not to be sustained. Management has analyzed each Fund’s uncertain tax positions and concluded that no liability for unrecognized tax benefits should be recorded related to uncertain tax positions. Management is not aware of any tax positions for which it is reasonably possible that the total amounts of unrecognized tax benefits will change materially in the next 12 months.
Income and capital gain distributions are determined in accordance with federal income tax regulations, which may differ from GAAP. These differences are primarily due to differing book and tax treatments for in-kind transactions, losses deferred due to wash sales, and passive foreign investment company adjustments, if any.
The Funds file U.S. federal tax returns and tax returns in certain other jurisdictions. Generally, a Fund is subject to examinations by such taxing authorities for up to three years after the filing of the return for the tax period.
D. Investment Transactions and Investment Income
Investment transactions are accounted for on a trade date basis. Realized gains and losses from the sale or disposition of securities are computed on the specific identified cost basis. Bond premiums and discounts are amortized and/or accreted for financial reporting purposes. Interest income is recorded on the accrual basis. Dividend income (net of withholding tax, if any) is recorded on the ex-dividend date. Realized gains, dividends and interest received by a Fund may give rise to withholding and other taxes imposed by foreign countries. Tax conventions between certain countries and the United States may reduce or eliminate such taxes.
The Funds may periodically participate in litigation related to each Fund’s investments. As such, the Funds may receive proceeds from litigation settlements. Any proceeds received are included in the Statements of Operations as realized gain (loss) for investments no longer held and as unrealized gain (loss) for investments still held.
Corporate actions (including cash dividends) are recorded net of non-reclaimable foreign tax withholdings on the ex-date.
Brokerage commissions and mark ups are considered transaction costs and are recorded as an increase to the cost basis of securities purchased and/or a reduction of proceeds on a sale of securities. Such transaction costs are included in the determination of net realized and unrealized gain (loss) from investment securities reported in the Statements of Operations and the Statements of Changes in Net Assets and the net realized and unrealized gains (losses) on securities per share in the Financial Highlights. Transaction costs are included in the calculation of each Fund’s net asset value and, accordingly, they reduce each Fund’s total returns. These transaction costs are not considered operating expenses and are not reflected in net investment income reported in the Statements of Operations and the Statements of Changes in Net Assets, or the net investment income per share and the ratios of expenses and net investment income reported in the Financial Highlights, nor are they limited by any expense limitation arrangements between each Fund and the Adviser.
E. Country Determination
For the purposes of making investment selection decisions and presentation in the Schedule of Investments, the Adviser may determine the country in which an issuer is located and/or credit risk exposure based on various factors. These factors include the laws of the country under which the issuer is organized, where the issuer maintains a principal office, the country in which the issuer derives 50% or more of its total revenues and the country that has the primary market for the issuer’s securities, as well as other criteria. Among the other criteria that may be evaluated for making this determination are the country in which the issuer maintains 50% or more of its assets, the type of security, financial guarantees and enhancements, the nature of the collateral and the sponsor organization. Country of issuer and/or credit risk exposure has been determined to be the United States of America, unless otherwise noted.
F. Expenses
Each Fund has agreed to pay an annual unitary management fee to the Adviser. Out of the unitary management fee, the Adviser has agreed to pay for substantially all expenses of the Funds, including the cost of transfer agency, custody, fund administration, legal, audit and other services, except for advisory fees, distribution fees, if any, brokerage expenses, taxes, interest, acquired fund fees and expenses, if any, litigation expenses and other extraordinary expenses.
Expenses of the Trust that are excluded from a Fund’s unitary management fee and are directly identifiable to a specific Fund are applied to that Fund. Expenses of the Trust that are excluded from each Fund’s unitary management fee and that are not readily identifiable to a specific Fund are allocated in such a manner as deemed equitable, taking into consideration the nature and type of expense and the relative net assets of each Fund.
To the extent a Fund invests in other investment companies, the expenses shown in the accompanying financial statements reflect the expenses of the Fund and do not include any expenses of the investment companies in which it invests. The effects of such investment companies’ expenses are included in the realized and unrealized gain or loss on the investments in the investment companies.
G. Dividends and Distributions to Shareholders
Each Fund declares and pays dividends from net investment income, if any, to its shareholders monthly and records such dividends on ex-dividend date. Generally, each Fund distributes net realized taxable capital gains, if any, annually in cash and records them on ex-dividend date. Such distributions on a tax basis are determined in conformity with federal income tax regulations, which may differ from GAAP. Distributions in excess of tax basis earnings and profits, if any, are reported in such Fund’s financial statements as a tax return of capital at fiscal year-end.
H. Foreign Currency Translations
Foreign currency is valued at the close of the NYSE based on quotations posted by banks and major currency dealers. Portfolio securities and other assets and liabilities denominated in foreign currencies are translated into U.S. dollar amounts at date of valuation. Purchases and sales of portfolio securities (net of foreign taxes withheld on disposition) and income items denominated in foreign currencies are translated into U.S. dollar amounts on the respective dates of such transactions. The Funds do not separately account for the portion of the results of operations resulting from changes in foreign exchange rates on investments and the fluctuations arising from changes in market prices of securities held. The combined results of changes in foreign exchange rates and the fluctuation of market prices on investments (net of estimated foreign tax withholding) are included with the net realized and unrealized gain or loss from investments in the Statements of Operations. Reported net realized foreign currency gains or losses arise from (1) sales of foreign currencies, (2) currency gains or losses realized between the trade and settlement dates on securities transactions, and (3) the difference between the amounts of dividends, interest, and foreign withholding taxes recorded on each Fund’s books and the U.S. dollar equivalent of the amounts actually received or paid. Net unrealized foreign currency gains and losses arise from changes in the fair values of assets and liabilities, other than investments in securities at fiscal period-end, resulting from changes in exchange rates.
The Funds may invest in foreign securities, which may be subject to foreign taxes on income, gains on investments or currency repatriation, a portion of which may be recoverable. Foreign taxes, if any, are recorded based on the tax regulations and rates that exist in the foreign markets in which each Fund invests.
I. Securities Lending
During the fiscal year ended October 31, 2016, Emerging Markets Sovereign Debt Portfolio and Preferred Portfolio participated in securities lending. Each Fund loaned portfolio securities having a market value up to one-third of the Fund’s total assets. Such loans are secured by cash collateral equal to no less than 102% (105% for international securities) of the market value of the loaned securities determined daily by the securities lending provider. Cash collateral received in connection with these loans is invested in an affiliated money market fund and is shown as such on the Schedules of Investments. Each Fund bears the risk of loss with respect to the investment of collateral. It is the policy of these Funds to obtain additional collateral from or return excess collateral to the borrower by the end of the next business day, following the valuation date of the securities loaned. Therefore, the value of the collateral held may be temporarily less than the value of the securities on loan. When loaning securities, each Fund retains certain benefits of owning the securities, including the economic equivalent of dividends or interest generated by the security. Lending securities entails a risk of loss to each Fund if, and to the extent that, the market value of the securities loaned were to increase, and the borrower did not increase the collateral accordingly, and the borrower failed to return the securities. The securities loaned are subject to termination at the option of the borrower or each Fund. Upon termination, the borrower will return to each Fund the securities loaned and each Fund will return the collateral. Upon the failure of the borrower to return the securities, collateral may be liquidated and the securities may be purchased on the open market to replace the loaned securities. Each Fund could experience delays and costs in gaining access to the collateral and the securities may lose value during the delay which could result in potential losses to each Fund. Some of these losses may be indemnified by the lending agent. Each Fund bears the risk of any deficiency in the amount of the collateral available for return to the borrower due to any loss on the collateral invested. Dividends received on cash collateral investments for securities lending transactions, which are net of compensation to counterparties, are included in Securities lending income on the Statements of Operations. The aggregate value of securities out on loan, if any, is shown on the Statements of Assets and Liabilities.
Note 3. Investment Advisory Agreement and Other Agreements
The Trust has entered into an Investment Advisory Agreement with the Adviser on behalf of each Fund, pursuant to which the Adviser has overall responsibility for the selection and ongoing monitoring of the Funds’ investments, managing the Funds’ business affairs and providing certain clerical, bookkeeping and other administrative services.
As compensation for its services, each Fund has agreed to pay the Adviser an annual unitary management fee. Out of the unitary management fee, the Adviser has agreed to pay for substantially all expenses of the Funds, including the cost of transfer agency, custody, fund administration, legal, audit and other services, except for advisory fees, distribution fees, if any, brokerage expenses, taxes, interest, acquired fund fees and expenses, if any, litigation expenses and other extraordinary expenses. The unitary management fee is paid by each Fund to the Adviser at the following annual rates:
| | | | |
| | | % of Average
Daily Net Assets | |
| 1-30 Laddered Treasury Portfolio | | | 0.25 | % |
| Build America Bond Portfolio | | | 0.28 | % |
| California AMT-Free Municipal Bond Portfolio | | | 0.28 | % |
| CEF Income Composite Portfolio | | | 0.50 | % |
| Chinese Yuan Dim Sum Bond Portfolio | | | 0.45 | % |
| Emerging Markets Sovereign Debt Portfolio | | | 0.50 | % |
| Fundamental High Yield® Corporate Bond Portfolio | | | 0.50 | % |
| Fundamental Investment Grade Corporate Bond Portfolio | | | 0.22 | % |
| Global Short Term High Yield Bond Portfolio | | | 0.35 | % |
| International Corporate Bond Portfolio | | | 0.50 | % |
| LadderRite 0-5 Year Corporate Bond Portfolio | | | 0.22 | % |
| National AMT-Free Municipal Bond Portfolio | | | 0.28 | % |
| New York AMT-Free Municipal Bond Portfolio | | | 0.28 | % |
| Preferred Portfolio | | | 0.50 | % |
| Variable Rate Preferred Portfolio | | | 0.50 | % |
| VRDO Tax-Free Weekly Portfolio | | | 0.25 | % |
Further, through August 31, 2018, the Adviser has contractually agreed to waive a portion of each Fund’s management fee in an amount equal to 100% of the net advisory fees an affiliate of the Adviser receives that are attributable to certain of the Fund’s investments in money market funds managed by that affiliate (excluding investments of cash collateral from securities lending). The Adviser cannot discontinue this waiver prior to its expiration.
For the fiscal year ended October 31, 2016, the Adviser waived fees for each Fund in the following amounts:
| | | | |
| 1-30 Laddered Treasury Portfolio | | $ | 670 | |
| Build America Bond Portfolio | | | 59,607 | |
| California AMT-Free Municipal Bond Portfolio | | | — | |
| CEF Income Composite Portfolio | | | 1,351 | |
| Chinese Yuan Dim Sum Bond Portfolio | | | 2,044 | |
| Emerging Markets Sovereign Debt Portfolio | | | 31,730 | |
| Fundamental High Yield® Corporate Bond Portfolio | | | 10,652 | |
| Fundamental Investment Grade Corporate Bond Portfolio | | | 517 | |
| Global Short Term High Yield Bond Portfolio | | | 1,757 | |
| International Corporate Bond Portfolio | | | 605 | |
| LadderRite 0-5 Year Corporate Bond Portfolio | | | 385 | |
| National AMT-Free Municipal Bond Portfolio | | | — | |
| New York AMT-Free Municipal Bond Portfolio | | | — | |
| Preferred Portfolio | | | 16,410 | |
| Variable Rate Preferred Portfolio | | | 5,813 | |
| VRDO Tax-Free Weekly Portfolio | | | — | |
The Trust has entered into a Distribution Agreement with Invesco Distributors, Inc. (the “Distributor”), which serves as the distributor of Creation Units for each Fund. The Distributor does not maintain a secondary market in the Shares. The Funds are not charged any fees pursuant to the Distribution Agreement. The Distributor is an affiliate of the Adviser.
The Adviser has entered into a licensing agreement for each Fund with the following entities (each, a “Licensor”):
| | |
Fund | | Licensor |
| 1-30 Laddered Treasury Portfolio | | Nasdaq, Inc. |
| Build America Bond Portfolio | | Merrill Lynch, Pierce, Fenner & Smith Inc. |
| California AMT-Free Municipal Bond Portfolio | | Merrill Lynch, Pierce, Fenner & Smith Inc. |
| CEF Income Composite Portfolio | | S-Network Global Indexes, LLC |
| Chinese Yuan Dim Sum Bond Portfolio | | Citigroup Index LLC |
| Emerging Markets Sovereign Debt Portfolio | | Deutsche Bank Securities Inc. |
| Fundamental High Yield® Corporate Bond Portfolio | | Research Affiliates® |
| Fundamental Investment Grade Corporate Bond Portfolio | | Research Affiliates® |
| Global Short Term High Yield Bond Portfolio | | Deutsche Bank Securities Inc. |
| International Corporate Bond Portfolio | | S&P Dow Jones Indices LLC |
| LadderRite 0-5 Year Corporate Bond Portfolio | | Nasdaq, Inc. |
| National AMT-Free Municipal Bond Portfolio | | Merrill Lynch, Pierce, Fenner & Smith Inc. |
| New York AMT-Free Municipal Bond Portfolio | | Merrill Lynch, Pierce, Fenner & Smith Inc. |
| Preferred Portfolio | | Merrill Lynch, Pierce, Fenner & Smith Inc. |
| Variable Rate Preferred Portfolio | | Wells Fargo & Company |
| VRDO Tax-Free Weekly Portfolio | | Bloomberg Finance L.P. |
Each Underlying Index name trademark is owned by its respective Licensor. These trademarks have been licensed to the Adviser for use by the Funds. Each Fund is entitled to use its Underlying Index pursuant to the Trust’s sub-licensing agreement with the Adviser. The Funds are not sponsored, endorsed, sold or promoted by the Licensors, and the Licensors make no representation regarding the advisability of investing in any of the Funds.
The Trust has entered into service agreements whereby The Bank of New York Mellon, a wholly-owned subsidiary of The Bank of New York Mellon Corporation, serves as the administrator, custodian, fund accountant and transfer agent for each Fund.
Note 4. Investments in Affiliates
The Fund’s Adviser and the adviser for Invesco Bond Fund and Invesco Senior Income Trust are wholly-owned subsidiaries of Invesco Ltd. and therefore, Invesco Bond Fund and Invesco Senior Income Trust are considered to be affiliated. The table below shows CEF Income Composite Portfolio’s transactions in, and earnings from, its investments in affiliates for the fiscal year ended October 31, 2016.
CEF Income Composite Portfolio
| | | | | | | | | | | | | | | | | | | | | | | | | | | | |
| | | Value
October 31, 2015 | | | Purchases
at Cost | | | Proceeds
from Sales | | | Change in
Unrealized
Appreciation | | | Realized
Gain (Loss) | | | Value
October 31, 2016 | | | Dividend
Income | |
| Invesco Bond Fund | | $ | 1,470,760 | | | $ | 433,189 | | | $ | (330,262 | ) | | $ | 83,634 | | | $ | (13,300 | )(a) | | $ | 1,644,021 | | | $ | 68,570 | |
| Invesco Senior Income Trust | | | 5,482,946 | | | | 3,025,973 | | | | (645,581 | ) | | | 553,004 | | | | (70,653 | ) | | | 8,345,689 | | | | 499,959 | |
| | | | | | | | | | | | | | | | | | | | | | | | | | | | |
| Total Investments in Affiliates | | $ | 6,953,706 | | | $ | 3,459,162 | | | $ | (975,843 | ) | | $ | 636,638 | | | $ | (83,953 | ) | | $ | 9,989,710 | | | $ | 568,529 | |
| | | | | | | | | | | | | | | | | | | | | | | | | | | | |
| (a) | Includes $ 3,462 of capital gains distributions from affiliated Underlying Funds. |
Note 5. Security Transactions with Affiliated Funds
Each Fund is permitted to purchase or sell securities from or to certain other affiliated funds under specified conditions outlined in procedures adopted by the Board of Trustees of the Trust. The procedures have been designed to ensure that any purchase or sale of securities by each Fund from or to another fund or portfolio that is or could be considered an affiliate by virtue of having a common investment adviser (or affiliated investment advisers), common Trustees and/or common officers complies with Rule 17a-7 of the 1940 Act. Further, as defined under the procedures, each transaction is effected at the current market price. For the fiscal year ended October 31, 2016, the following Funds engaged in transactions with affiliates as listed below:
| | | | | | | | | | | | |
| | | Securities Purchases | | | Securities Sales | | | Net Realized
Gains (Losses) | |
| Preferred Portfolio | | $ | 2,537,319 | | | $ | 22,773,300 | | | $ | 109,099 | |
| Variable Rate Preferred Portfolio | | | 22,773,300 | | | | 1,410,720 | | | | (32,289 | ) |
Note 6. Additional Valuation Information
GAAP defines fair value as the price that would be received to sell an asset or paid to transfer a liability in an orderly transaction between market participants at the measurement date, under current market conditions. GAAP establishes a hierarchy that prioritizes the inputs to valuation methods, giving the highest priority to readily available unadjusted quoted prices in an active market for identical assets (Level 1) and the lowest priority to significant unobservable inputs (Level 3), generally when market prices are not readily available or are unreliable. Based on the valuation inputs, the securities or other investments are tiered into one of three levels. Changes in valuation methods may result in transfers in or out of an investment’s assigned level:
| | Level 1 — | Prices are determined using quoted prices in an active market for identical assets. |
| | Level 2 — | Prices are determined using other significant observable inputs. Observable inputs are inputs that other market participants may use in pricing a security. These may include quoted prices for similar securities, interest rates, prepayment speeds, credit risk, yield curves, loss severities, default rates, discount rates, volatilities and others. |
| | Level 3 — | Prices are determined using significant unobservable inputs. In situations where quoted prices or observable inputs are unavailable (for example, when there is little or no market activity for an investment at the end of the period), unobservable inputs may be used. Unobservable inputs reflect a Fund’s own assumptions about the factors market participants would use in determining fair value of the securities or instruments and would be based on the best available information. |
Except for all of the securities in CEF Income Composite Portfolio, Preferred Portfolio and certain Funds listed below, as of October 31, 2016, all of the securities in each Fund were valued based on Level 2 inputs (see the Schedules of Investments for security categories). All of the securities in CEF Income Composite Portfolio and Preferred Portfolio were valued based on Level 1 inputs (see the Schedules of Investments for security categories). The level assigned to the securities valuations may not be an indication of the risk or liquidity associated with investing in those securities. Because of the inherent uncertainties of valuation, the values reflected in the financial statements may materially differ from the value received upon actual sale of those investments.
| | | | | | | | | | | | | | | | |
| | | Investments in Securities | |
| | | Level 1 | | | Level 2 | | | Level 3 | | | Total | |
| 1-30 Laddered Treasury Portfolio | | | | | | | | | | | | | | | | |
U.S. Treasury Securities | | $ | — | | | $ | 219,484,305 | | | $ | — | | | $ | 219,484,305 | |
Money Market Fund | | | 76,586 | | | | — | | | | — | | | | 76,586 | |
| | | | | | | | | | | | | | | | |
Total Investments | | $ | 76,586 | | | $ | 219,484,305 | | | $ | — | | | $ | 219,560,891 | |
| | | | | | | | | | | | | | | | |
| Build America Bond Portfolio | | | | | | | | | | | | | | | | |
Municipal Obligations | | $ | — | | | $ | 1,003,501,008 | | | $ | — | | | $ | 1,003,501,008 | |
Corporate Debt Securities | | | — | | | | 8,653,972 | | | | — | | | | 8,653,972 | |
Money Market Fund | | | 40,960,612 | | | | — | | | | — | | | | 40,960,612 | |
| | | | | | | | | | | | | | | | |
Total Investments | | $ | 40,960,612 | | | $ | 1,012,154,980 | | | $ | — | | | $ | 1,053,115,592 | |
| | | | | | | | | | | | | | | | |
| Emerging Markets Sovereign Debt Portfolio | | | | | | | | | | | | | | | | |
Foreign Government Debt Securities | | $ | — | | | $ | 4,057,314,124 | | | $ | — | | | $ | 4,057,314,124 | |
Money Market Funds | | | 118,883,050 | | | | — | | | | — | | | | 118,883,050 | |
| | | | | | | | | | | | | | | | |
Total Investments | | $ | 118,883,050 | | | $ | 4,057,314,124 | | | $ | — | | | $ | 4,176,197,174 | |
| | | | | | | | | | | | | | | | |
| Fundamental High Yield® Corporate Bond Portfolio | | | | | | | | | | | | | | | | |
Corporate Debt Securities | | $ | — | | | $ | 1,073,100,507 | | | $ | — | | | $ | 1,073,100,507 | |
Money Market Fund | | | 2,593,269 | | | | — | | | | — | | | | 2,593,269 | |
| | | | | | | | | | | | | | | | |
Total Investments | | $ | 2,593,269 | | | $ | 1,073,100,507 | | | $ | — | | | $ | 1,075,693,776 | |
| | | | | | | | | | | | | | | | |
| Fundamental Investment Grade Corporate Bond Portfolio | | | | | | | | | | | | | | | | |
Corporate Debt Securities | | $ | — | | | $ | 57,346,378 | | | $ | — | | | $ | 57,346,378 | |
Money Market Fund | | | 240,332 | | | | — | | | | — | | | | 240,332 | |
| | | | | | | | | | | | | | | | |
Total Investments | | $ | 240,332 | | | $ | 57,346,378 | | | $ | — | | | $ | 57,586,710 | |
| | | | | | | | | | | | | | | | |
| Global Short Term High Yield Bond Portfolio | | | | | | | | | | | | | | | | |
Foreign Corporate Debt Securities | | $ | — | | | $ | 58,996,232 | | | $ | 0 | | | $ | 58,996,232 | |
Foreign Government Debt Securities | | | — | | | | 6,241,472 | | | | — | | | | 6,241,472 | |
Money Market Fund | | | 1,951,557 | | | | — | | | | — | | | | 1,951,557 | |
| | | | | | | | | | | | | | | | |
Total Investments | | $ | 1,951,557 | | | $ | 65,237,704 | | | $ | 0 | | | $ | 67,189,261 | |
| | | | | | | | | | | | | | | | |
| | | | | | | | | | | | | | | | |
| | | Investments in Securities | |
| | | Level 1 | | | Level 2 | | | Level 3 | | | Total | |
| International Corporate Bond Portfolio | | | | | | | | | | | | | | | | |
Foreign Corporate Debt Securities | | $ | — | | | $ | 157,482,626 | | | $ | — | | | $ | 157,482,626 | |
Foreign Government Debt Securities | | | — | | | | 996,546 | | | | — | | | | 996,546 | |
Money Market Fund | | | 891,729 | | | | — | | | | — | | | | 891,729 | |
| | | | | | | | | | | | | | | | |
Total Investments | | $ | 891,729 | | | $ | 158,479,172 | | | $ | — | | | $ | 159,370,901 | |
| | | | | | | | | | | | | | | | |
| LadderRite 0-5 Year Corporate Bond Portfolio | | | | | | | | | | | | | | | | |
Corporate Debt Securities | | $ | — | | | $ | 21,972,880 | | | $ | — | | | $ | 21,972,880 | |
Money Market Fund | | | 410,163 | | | | — | | | | — | | | | 410,163 | |
| | | | | | | | | | | | | | | | |
Total Investments | | $ | 410,163 | | | $ | 21,972,880 | | | $ | — | | | $ | 22,383,043 | |
| | | | | | | | | | | | | | | | |
| Variable Rate Preferred Portfolio | | | | | | | | | | | | | | | | |
Preferred Stocks | | $ | 534,151,073 | | | $ | — | | | $ | — | | | $ | 534,151,073 | |
Corporate Debt Securities | | | — | | | | 361,046,406 | | | | — | | | | 361,046,406 | |
| | | | | | | | | | | | | | | | |
Total Investments | | $ | 534,151,073 | | | $ | 361,046,406 | | | $ | — | | | $ | 895,197,479 | |
| | | | | | | | | | | | | | | | |
Note 7. Distributions to Shareholders and Tax Components of Net Assets
Tax Character of Distributions to Shareholders Paid During the Fiscal Years Ended October 31, 2016 and 2015:
| | | | | | | | | | | | | | | | | | | | | | | | | | | | | | | | |
| | | 2016 | | | 2015 | |
| | | Ordinary
Income | | | Long-Term
Capital Gains | | | Return of
Capital | | | Tax-Exempt
Income | | | Ordinary
Income | | | Long-Term
Capital Gains | | | Return of
Capital | | | Tax-Exempt
Income | |
| 1-30 Laddered Treasury Portfolio | | $ | 4,583,798 | | | $ | — | | | $ | — | | | $ | — | | | $ | 7,109,980 | | | $ | — | | | $ | — | | | $ | — | |
| Build America Bond Portfolio | | | 36,098,186 | | | | — | | | | — | | | | — | | | | 33,376,382 | | | | — | | | | — | | | | — | |
| California AMT-Free Municipal Bond Portfolio | | | — | | | | — | | | | 31,261 | | | | 3,933,268 | | | | 124 | | | | — | | | | 15,761 | | | | 3,001,799 | |
| CEF Income Composite Portfolio | | | 38,325,657 | | | | — | | | | 11,635,257 | | | | — | | | | 42,122,623 | | | | — | | | | 13,115,497 | | | | — | |
| Chinese Yuan Dim Sum Bond Portfolio | | | — | | | | — | | | | 1,961,665 | | | | — | | | | 828,895 | | | | — | | | | 2,916,799 | | | | — | |
| Emerging Markets Sovereign Debt Portfolio | | | 160,711,766 | | | | — | | | | — | | | | — | | | | 129,090,210 | | | | — | | | | — | | | | — | |
| Fundamental High Yield® Corporate Bond Portfolio | | | 37,984,421 | | | | — | | | | — | | | | — | | | | 27,639,812 | | | | — | | | | — | | | | — | |
| Fundamental Investment Grade Corporate Bond Portfolio | | | 1,112,065 | | | | — | | | | 6,736 | | | | — | | | | 828,174 | | | | — | | | | — | | | | — | |
| Global Short Term High Yield Bond Portfolio | | | 2,650,366 | | | | — | | | | 40,811 | | | | — | | | | 1,444,072 | | | | — | | | | 7,319 | | | | — | |
| International Corporate Bond Portfolio | | | — | | | | — | | | | 3,733,321 | | | | — | | | | 223,933 | | | | 12,104 | | | | 4,826,517 | | | | — | |
| LadderRite 0-5 Year Corporate Bond Portfolio | | | 244,489 | | | | 128 | | | | 1,098 | | | | — | | | | 78,801 | | | | — | | | | — | | | | — | |
| National AMT-Free Municipal Bond Portfolio | | | — | | | | — | | | | 189,479 | | | | 38,124,263 | | | | — | | | | — | | | | 118,036 | | | | 30,862,365 | |
| New York AMT-Free Municipal Bond Portfolio | | | — | | | | — | | | | 12,981 | | | | 1,779,763 | | | | — | | | | — | | | | 5,115 | | | | 1,666,229 | |
| Preferred Portfolio | | | 226,731,995 | | | | — | | | | — | | | | — | | | | 161,014,442 | | | | — | | | | — | | | | — | |
| Variable Rate Preferred Portfolio | | | 31,532,782 | | | | — | | | | — | | | | — | | | | 10,363,861 | | | | 3,826 | | | | 199,490 | | | | — | |
| VRDO Tax-Free Weekly Portfolio | | | 25 | | | | 921 | | | | 2,604 | | | | 43,358 | | | | — | | | | — | | | | 2,272 | | | | — | |
Tax Components of Net Assets at Fiscal Year-End:
| | | | | | | | | | | | | | | | | | | | | | | | | | | | |
| | | Undistributed
Ordinary
Income | | | Undistributed
Long-Term
Capital Gains | | | Net Unrealized
Appreciation
(Depreciation)—
Investment
Securities | | | Net Unrealized
Appreciation
(Depreciation)—
Other Investments | | | Capital Loss
Carryforwards | | | Shares of
Beneficial
Interest | | | Total Net
Assets | |
| 1-30 Laddered Treasury Portfolio | | $ | — | | | $ | — | | | $ | 3,213,758 | | | $ | — | | | $ | (224,990 | ) | | $ | 218,482,753 | | | $ | 221,471,521 | |
| Build America Bond Portfolio | | | — | | | | — | | | | 75,721,327 | | | | — | | | | (12,782 | ) | | | 994,970,742 | | | | 1,070,679,287 | |
| California AMT-Free Municipal Bond Portfolio | | | — | | | | — | | | | 4,701,121 | | | | — | | | | (1,682,834 | ) | | | 186,601,765 | | | | 189,620,052 | |
| CEF Income Composite Portfolio | | | — | | | | — | | | | (23,415,054 | ) | | | — | | | | (15,036,804 | ) | | | 680,924,922 | | | | 642,473,064 | |
| Chinese Yuan Dim Sum Bond Portfolio | | | — | | | | — | | | | (3,816,990 | ) | | | (8,884 | ) | | | (3,847,770 | ) | | | 57,738,307 | | | | 50,064,663 | |
| Emerging Markets Sovereign Debt Portfolio | | | 877,522 | | | | — | | | | 77,407,305 | | | | — | | | | (76,282,850 | ) | | | 4,123,594,669 | | | | 4,125,596,646 | |
| Fundamental High Yield® Corporate Bond Portfolio | | | — | | | | — | | | | 31,474,319 | | | | — | | | | (22,232,196 | ) | | | 1,078,895,055 | | | | 1,088,137,178 | |
| Fundamental Investment Grade Corporate Bond Portfolio | | | — | | | | — | | | | 1,085,049 | | | | — | | | | (36,802 | ) | | | 57,105,783 | | | | 58,154,030 | |
| Global Short Term High Yield Bond Portfolio | | | — | | | | — | | | | 611,329 | | | | — | | | | (995,403 | ) | | | 69,246,570 | | | | 68,862,496 | |
| International Corporate Bond Portfolio | | | — | | | | — | | | | (15,545,645 | ) | | | (100,713 | ) | | | — | | | | 176,185,416 | | | | 160,539,058 | |
| LadderRite 0-5 Year Corporate Bond Portfolio | | | — | | | | — | | | | 142,424 | | | | — | | | | (25,669 | ) | | | 22,436,750 | | | | 22,553,505 | |
| National AMT-Free Municipal Bond Portfolio | | | — | | | | — | | | | 61,974,928 | | | | — | | | | (1,304,618 | ) | | | 1,318,962,726 | | | | 1,379,633,036 | |
| New York AMT-Free Municipal Bond Portfolio | | | — | | | | — | | | | 2,580,558 | | | | — | | | | (580,686 | ) | | | 62,063,018 | | | | 64,062,890 | |
| Preferred Portfolio | | | — | | | | — | | | | 80,435,782 | | | | — | | | | (56,595,686 | ) | | | 4,707,004,411 | | | | 4,730,844,507 | |
| Variable Rate Preferred Portfolio | | | — | | | | — | | | | 21,922,716 | | | | — | | | | (171,242 | ) | | | 877,308,204 | | | | 899,059,678 | |
| VRDO Tax-Free Weekly Portfolio | | | — | | | | — | | | | — | | | | — | | | | — | | | | 59,830,588 | | | | 59,830,588 | |
Capital loss carryforwards are calculated and reported as of a specific date. Results of transactions and other activity after that date may affect the amount of capital loss carryforwards actually available for the Funds to utilize. Capital losses generated in years beginning after December 22, 2010 can be carried forward for an unlimited period, whereas previous losses expire in eight tax years. Capital losses with an expiration period may not be used to offset capital gains until all net capital losses without an expiration date have been utilized. Capital loss carryforwards with no expiration date will retain their character as either short-term or long-term capital losses instead of as short-term capital losses as under prior law. The ability to utilize capital loss carryforwards in the future may be limited under the Internal Revenue Code and related regulations based on the results of future transactions.
The following table presents available capital loss carryforwards and expiration dates for each Fund as of October 31, 2016.
| | | | | | | | | | | | | | | | | | | | | | | | | | | | |
| | | | | | | | | | | | Post-effective/no
expiration | | | | | | | |
| | | 2017 | | | 2018 | | | 2019 | | | Short-Term | | | Long-Term | | | Total* | | | Expired | |
| 1-30 Laddered Treasury Portfolio | | $ | — | | | $ | — | | | $ | — | | | $ | 224,990 | | | $ | — | | | $ | 224,990 | | | $ | — | |
| Build America Bond Portfolio | | | — | | | | 6,399 | | | | — | | | | 6,383 | | | | — | | | | 12,782 | | | | — | |
| California AMT-Free Municipal Bond Portfolio | | | — | | | | — | | | | 438,783 | | | | 323,917 | | | | 920,134 | | | | 1,682,834 | | | | — | |
| CEF Income Composite Portfolio | | | — | | | | — | | | | — | | | | 2,165,838 | | | | 12,870,966 | | | | 15,036,804 | | | | — | |
| Chinese Yuan Dim Sum Bond Portfolio | | | — | | | | — | | | | — | | | | 1,260,553 | | | | 2,587,217 | | | | 3,847,770 | | | | — | |
| Emerging Markets Sovereign Debt Portfolio | | | 558,313 | | | | 212,582 | | | | 818,907 | | | | — | | | | 74,693,048 | | | | 76,282,850 | | | | 531,185 | |
| Fundamental High Yield® Corporate Bond Portfolio | | | — | | | | — | | | | — | | | | 13,371,019 | | | | 8,861,177 | | | | 22,232,196 | | | | — | |
| Fundamental Investment Grade Corporate Bond Portfolio | | | — | | | | — | | | | — | | | | 12,119 | | | | 24,683 | | | | 36,802 | | | | — | |
| Global Short Term High Yield Bond Portfolio | | | — | | | | — | | | | — | | | | 34,054 | | | | 961,349 | | | | 995,403 | | | | — | |
| International Corporate Bond Portfolio | | | — | | | | — | | | | — | | | | — | | | | — | | | | — | | | | — | |
| LadderRite 0-5 Year Corporate Bond Portfolio | | | — | | | | — | | | | — | | | | 25,669 | | | | — | | | | 25,669 | | | | — | |
| National AMT-Free Municipal Bond Portfolio | | | — | | | | — | | | | 1,304,618 | | | | — | | | | — | | | | 1,304,618 | | | | — | |
| New York AMT-Free Municipal Bond Portfolio | | | 125,849 | | | | — | | | | 74,902 | | | | 130,283 | | | | 249,652 | | | | 580,686 | | | | 136,120 | |
| Preferred Portfolio | | | 37,146,794 | | | | — | | | | — | | | | 9,048,100 | | | | 10,400,792 | | | | 56,595,686 | | | | — | |
| | | | | | | | | | | | | | | | | | | | | | | | | | | | |
| | | | | | | | | | | | Post-effective/no
expiration | | | | | | | |
| | | 2017 | | | 2018 | | | 2019 | | | Short-Term | | | Long-Term | | | Total* | | | Expired | |
| Variable Rate Preferred Portfolio | | $ | — | | | $ | — | | | $ | — | | | $ | 76,455 | | | $ | 94,787 | | | $ | 171,242 | | | $ | — | |
| VRDO Tax-Free Weekly Portfolio | | | — | | | | — | | | | — | | | | — | | | | — | | | | — | | | | — | |
| * | Capital loss carryforwards as of the date listed above are reduced for limitations, if any, to the extent required by the Internal Revenue Code and may be further limited depending upon a variety of factors, including the realization of net unrealized gains or losses as of the date of any reorganization. |
Note 8. Investment Transactions
For the fiscal year ended October 31, 2016, the cost of securities purchased and proceeds from sales of securities (other than short-term securities, U.S. Treasury obligations, money market funds and in-kind transactions, if any) were as follows:
| | | | | | | | |
| | | Purchases | | | Sales | |
| Build America Bond Portfolio | | $ | 324,065,044 | | | $ | 1,622,541 | |
| California AMT-Free Municipal Bond Portfolio | | | 75,868,248 | | | | 8,249,779 | |
| CEF Income Composite Portfolio | | | 126,690,311 | | | | 125,486,173 | |
| Chinese Yuan Dim Sum Bond Portfolio | | | 11,910,636 | | | | 40,175,252 | |
| Emerging Markets Sovereign Debt Portfolio | | | 1,019,168,573 | | | | 946,422,679 | |
| Fundamental High Yield® Corporate Bond Portfolio | | | 115,015,689 | | | | 119,770,455 | |
| Fundamental Investment Grade Corporate Bond Portfolio | | | 8,492,866 | | | | 8,669,686 | |
| Global Short Term High Yield Bond Portfolio | | | 22,348,745 | | | | 19,952,273 | |
| International Corporate Bond Portfolio | | | 41,765,936 | | | | 44,233,540 | |
| LadderRite 0-5 Year Corporate Bond Portfolio | | | 8,345,137 | | | | 1,304,154 | |
| National AMT-Free Municipal Bond Portfolio | | | 535,618,778 | | | | 69,281,814 | |
| New York AMT-Free Municipal Bond Portfolio | | | 22,933,217 | | | | 11,366,562 | |
| Preferred Portfolio | | | 692,612,357 | | | | 549,325,559 | |
| Variable Rate Preferred Portfolio | | | 126,950,766 | | | | 106,719,991 | |
| VRDO Tax-Free Weekly Portfolio | | | — | | | | — | |
For the fiscal year ended October 31, 2016, the cost of securities purchased and proceeds from sales of U.S. Treasury obligations (other than short-term securities, money market funds and in-kind transactions), for the 1-30 Laddered Treasury Portfolio amounted to $17,802,967 and $13,379,632, respectively.
For the fiscal year ended October 31, 2016, in-kind transactions associated with creations and redemptions were as follows:
| | | | | | | | |
| | | Cost of
Securities
Received | | | Value of
Securities
Delivered | |
| 1-30 Laddered Treasury Portfolio | | $ | 80,821,942 | | | $ | 138,222,789 | |
| Build America Bond Portfolio | | | — | | | | — | |
| California AMT-Free Municipal Bond Portfolio | | | 12,544,585 | | | | — | |
| CEF Income Composite Portfolio | | | 51,066,729 | | | | 45,273,722 | |
| Chinese Yuan Dim Sum Bond Portfolio | | | — | | | | — | |
| Emerging Markets Sovereign Debt Portfolio | | | 1,659,586,458 | | | | 450,346,351 | |
| Fundamental High Yield® Corporate Bond Portfolio | | | 719,895,474 | | | | 327,087,509 | |
| Fundamental Investment Grade Corporate Bond Portfolio | | | 23,308,572 | | | | — | |
| Global Short Term High Yield Bond Portfolio | | | 32,319,264 | | | | 2,866,825 | |
| International Corporate Bond Portfolio | | | 17,426,714 | | | | 35,341,554 | |
| LadderRite 0-5 Year Corporate Bond Portfolio | | | 8,204,971 | | | | 1,223,695 | |
| National AMT-Free Municipal Bond Portfolio | | | — | | | | — | |
| New York AMT-Free Municipal Bond Portfolio | | | — | | | | — | |
| Preferred Portfolio | | | 1,744,818,958 | | | | 281,618,848 | |
| Variable Rate Preferred Portfolio | | | 473,289,993 | | | | 19,355,265 | |
| VRDO Tax-Free Weekly Portfolio | | | — | | | | — | |
Gains (losses) on in-kind transactions are generally not considered taxable gains (losses) for federal income tax purposes.
At October 31, 2016, the aggregate cost and net unrealized appreciation (depreciation) of investments for tax purposes were as follows:
| | | | | | | | | | | | | | | | |
| | | Gross
Unrealized
Appreciation | | | Gross
Unrealized
(Depreciation) | | | Net
Unrealized
Appreciation
(Depreciation) | | | Cost | |
| 1-30 Laddered Treasury Portfolio | | $ | 3,245,357 | | | $ | (31,599 | ) | | $ | 3,213,758 | | | $ | 216,347,133 | |
| Build America Bond Portfolio | | | 81,761,761 | | | | (6,040,434 | ) | | | 75,721,327 | | | | 977,394,265 | |
| California AMT-Free Municipal Bond Portfolio | | | 5,929,206 | | | | (1,228,085 | ) | | | 4,701,121 | | | | 182,753,892 | |
| CEF Income Composite Portfolio | | | 18,652,286 | | | | (42,067,340 | ) | | | (23,415,054 | ) | | | 665,986,830 | |
| Chinese Yuan Dim Sum Bond Portfolio | | | — | | | | (3,816,990 | ) | | | (3,816,990 | ) | | | 52,695,417 | |
| Emerging Markets Sovereign Debt Portfolio | | | 111,506,995 | | | | (34,099,690 | ) | | | 77,407,305 | | | | 4,098,789,869 | |
| Fundamental High Yield® Corporate Bond Portfolio | | | 35,104,575 | | | | (3,630,256 | ) | | | 31,474,319 | | | | 1,044,219,457 | |
| Fundamental Investment Grade Corporate Bond Portfolio | | | 1,168,134 | | | | (83,085 | ) | | | 1,085,049 | | | | 56,501,661 | |
| Global Short Term High Yield Bond Portfolio | | | 1,373,206 | | | | (761,877 | ) | | | 611,329 | | | | 66,577,932 | |
| International Corporate Bond Portfolio | | | 935,434 | | | | (16,481,079 | ) | | | (15,545,645 | ) | | | 174,916,546 | |
| LadderRite 0-5 Year Corporate Bond Portfolio | | | 173,891 | | | | (31,467 | ) | | | 142,424 | | | | 22,240,619 | |
| National AMT-Free Municipal Bond Portfolio | | | 65,459,355 | | | | (3,484,427 | ) | | | 61,974,928 | | | | 1,285,406,100 | |
| New York AMT-Free Municipal Bond Portfolio | | | 2,896,502 | | | | (315,944 | ) | | | 2,580,558 | | | | 59,364,798 | |
| Preferred Portfolio | | | 117,963,741 | | | | (37,527,959 | ) | | | 80,435,782 | | | | 4,764,280,295 | |
| Variable Rate Preferred Portfolio | | | 24,828,701 | | | | (2,905,985 | ) | | | 21,922,716 | | | | 873,274,763 | |
| VRDO Tax-Free Weekly Portfolio | | | — | | | | — | | | | — | | | | 58,230,000 | |
Note 9. Reclassification of Permanent Differences
Primarily as a result of differing book/tax treatment of in-kind transactions, foreign currency transactions, distributions, net operating losses, partnership investments and expired capital loss carryforwards, amounts were reclassified between undistributed net investment income, undistributed net realized gain (loss) and Shares of beneficial interest. These reclassifications had no effect on the net assets of each Fund. For the fiscal year ended October 31, 2016, the reclassifications were as follows:
| | | | | | | | | | | | |
| | | Undistributed
Net Investment
Income | | | Undistributed
Net Realized
Gain (Loss) | | | Shares of
Beneficial
Interest | |
| 1-30 Laddered Treasury Portfolio | | $ | 14,306 | | | $ | (9,787,476 | ) | | $ | 9,773,170 | |
| Build America Bond Portfolio | | | 145,218 | | | | — | | | | (145,218 | ) |
| California AMT-Free Municipal Bond Portfolio | | | — | | | | — | | | | — | |
| CEF Income Composite Portfolio | | | 1,231,417 | | | | 279,946 | | | | (1,511,363 | ) |
| Chinese Yuan Dim Sum Bond Portfolio | | | (1,964,049 | ) | | | 2,966,267 | | | | (1,002,218 | ) |
| Emerging Markets Sovereign Debt Portfolio | | | — | | | | (11,533,332 | ) | | | 11,533,332 | |
| Fundamental High Yield® Corporate Bond Portfolio | | | 70,939 | | | | 7,616,733 | | | | (7,687,672 | ) |
| Fundamental Investment Grade Corporate Bond Portfolio | | | — | | | | — | | | | — | |
| Global Short Term High Yield Bond Portfolio | | | — | | | | 119,956 | | | | (119,956 | ) |
| International Corporate Bond Portfolio | | | (3,706,067 | ) | | | 8,037,930 | | | | (4,331,863 | ) |
| LadderRite 0-5 Year Corporate Bond Portfolio | | | — | | | | 3,748 | | | | (3,748 | ) |
| National AMT-Free Municipal Bond Portfolio | | | — | | | | — | | | | — | |
| New York AMT-Free Municipal Bond Portfolio | | | — | | | | 136,120 | | | | (136,120 | ) |
| Preferred Portfolio | | | 3,052,581 | | | | (19,767,620 | ) | | | 16,715,039 | |
| Variable Rate Preferred Portfolio | | | 164,097 | | | | (648,782 | ) | | | 484,685 | |
| VRDO Tax-Free Weekly Portfolio | | | 946 | | | | (946 | ) | | | — | |
Note 10. Trustees’ and Officer’s Fees
Trustees’ and Officer’s Fees include amounts accrued by the Funds to pay remuneration to each Trustee who is not an “interested person” as defined in the 1940 Act (an “Independent Trustee”), any Trustee who is not an affiliate of the Adviser or Distributor (or any of their affiliates) and who is otherwise an “interested person” of the Trust under the 1940 Act (an “Unaffiliated Trustee”) and an Officer of the Trust. The Adviser, as a result of each Fund’s unitary management fee, pays for such compensation. The Trustee who is an “interested person” of the Trust does not receive any Trustees’ fees.
The Trust has adopted a deferred compensation plan (the “Plan”). Under the Plan, each Independent Trustee or Unaffiliated Trustee who has executed a Deferred Fee Agreement (a “Participating Trustee”) may defer receipt of all or a portion of his compensation (“Deferral Fees”). Such Deferral Fees are deemed to be invested in select PowerShares Funds. The Deferral Fees payable to the Participating Trustee are valued as of the date such Deferral Fees would have been paid to the Participating Trustee. The value increases with contributions or with increases in the value of the Shares selected, and the value decreases with distributions or with declines in the value of the Shares selected. Obligations under the Plan represent unsecured claims against the general assets of the Funds.
Note 11. Capital
Shares are created and redeemed by each Fund only in Creation Units of 50,000 Shares (100,000 Shares for Emerging Markets Sovereign Debt Portfolio, Fundamental High Yield® Corporate Bond Portfolio and Variable Rate Preferred Portfolio). Only Authorized Participants are permitted to purchase or redeem Creation Units from the Funds. For 1-30 Laddered Treasury Portfolio, CEF Income Composite Portfolio, Emerging Markets Sovereign Debt Portfolio, Fundamental High Yield® Corporate Bond Portfolio, Fundamental Investment Grade Corporate Bond Portfolio, Global Short Term High Yield Bond Portfolio, LadderRite 0-5 Year Corporate Bond Portfolio, Preferred Portfolio and Variable Rate Preferred Portfolio, Creation Units are principally permitted in exchange for Deposit Securities, with a balancing cash component to equate the transaction to the NAV per Share of a Fund of the Trust on the transaction date. However, for such Funds, cash in an amount equivalent to the value of certain securities may be substituted, generally when the securities are not available in sufficient quantity for delivery, not eligible for trading by the Authorized Participant or as a result of other market circumstances. For Build America Bond Portfolio, California AMT-Free Municipal Bond Portfolio, Chinese Yuan Dim Sum Bond Portfolio, International Corporate Bond Portfolio, National AMT-Free Municipal Bond Portfolio, New York AMT-Free Municipal Bond Portfolio and VRDO Tax-Free Weekly Portfolio, such transactions are principally in exchange for the deposit or delivery of cash.
To the extent that the Funds permit transactions in exchange for Deposit Securities, each Fund may issue Shares in advance of receipt of Deposit Securities subject to various conditions, including a requirement to maintain on deposit with the Trust cash at least equal to 105% of the market value of the missing Deposit Securities. In accordance with the Trust’s Participant Agreement, Creation Units will be issued to an Authorized Participant, notwithstanding the fact that the corresponding Deposit Securities have not been received in part or in whole, in reliance on the undertaking of the Authorized Participant to deliver the missing Deposit Securities as soon as possible, which undertaking shall be secured by the Authorized Participant’s delivery and maintenance of collateral consisting of cash in the form of U.S. dollars in immediately available funds having a value (marked-to-market daily) at least equal to 105%, which the Adviser may change from time to time, of the value of the missing Deposit Securities.
Certain transaction fees may be charged by the Funds for creations and redemptions, which are treated as increases in capital.
On February 18, 2016, mutual funds affiliated with the Funds’ Adviser sold in the secondary market 2,218,598 Shares of 1-30 Laddered Treasury Portfolio valued at $75,032,984 and purchased in the secondary market 403,841 Shares of LadderRite 0-5 Year Corporate Bond Portfolio valued at $9,991,026.
Transactions in each Fund’s Shares are disclosed in detail in the Statements of Changes in Net Assets.
Note 12. Indemnifications
Under the Trust’s organizational documents, its officers and Trustees are indemnified against certain liabilities arising out of the performance of their duties to the Trust. Each Independent Trustee and Unaffiliated Trustee is also indemnified against certain liabilities arising out of the performance of his duties to the Trust pursuant to an Indemnification Agreement between such trustee and the Trust. Additionally, in the normal course of business, the Trust enters into contracts with service providers that contain general indemnification clauses. The Trust’s maximum exposure under these arrangements is unknown, as this would involve future claims that may be made against the Trust that have not yet occurred. However, based on experience, the Trust believes the risk of loss to be remote.
Note 13. Subsequent Event
Effective December 7, 2016, 1-30 Laddered Treasury Portfolio’s Shares were listed and began trading on the NASDAQ Stock Market LLC.
Report of Independent Registered Public Accounting Firm
To the Board of Trustees and Shareholders of PowerShares Exchange-Traded Fund Trust II:
In our opinion, the accompanying statements of assets and liabilities, including the schedules of investments, and the related statements of operations and of changes in net assets and the financial highlights present fairly, in all material respects, the financial position of PowerShares 1-30 Laddered Treasury Portfolio, PowerShares Build America Bond Portfolio, PowerShares California AMT-Free Municipal Bond Portfolio, PowerShares CEF Income Composite Portfolio, PowerShares Chinese Yuan Dim Sum Bond Portfolio, PowerShares Emerging Markets Sovereign Debt Portfolio, PowerShares Fundamental High Yield® Corporate Bond Portfolio, PowerShares Fundamental Investment Grade Corporate Bond Portfolio, PowerShares Global Short Term High Yield Bond Portfolio, PowerShares International Corporate Bond Portfolio, PowerShares LadderRite 0-5 Year Corporate Bond Portfolio, PowerShares National AMT-Free Municipal Bond Portfolio, PowerShares New York AMT-Free Municipal Bond Portfolio, PowerShares Preferred Portfolio, PowerShares Variable Rate Preferred Portfolio, and PowerShares VRDO Tax-Free Weekly Portfolio (each an individual portfolio of PowerShares Exchange-Traded Fund Trust II, hereafter referred to as the “Funds”) as of October 31, 2016, the results of each of their operations for the year then ended, the changes in each of their net assets and the financial highlights for each of the periods presented, in conformity with accounting principles generally accepted in the United States of America. These financial statements and financial highlights (hereafter referred to as “financial statements”) are the responsibility of the Funds’ management. Our responsibility is to express an opinion on these financial statements based on our audits. We conducted our audits of these financial statements in accordance with the standards of the Public Company Accounting Oversight Board (United States). Those standards require that we plan and perform the audit to obtain reasonable assurance about whether the financial statements are free of material misstatement. An audit includes examining, on a test basis, evidence supporting the amounts and disclosures in the financial statements, assessing the accounting principles used and significant estimates made by management, and evaluating the overall financial statement presentation. We believe that our audits, which included confirmation of securities as of October 31, 2016 by correspondence with the custodian and brokers, and the application of alternative auditing procedures where confirmations of security purchases have not been received, provide a reasonable basis for our opinion.
PricewaterhouseCoopers LLP
Chicago, IL
December 22, 2016
Fees and Expenses
As a shareholder of a Fund of the PowerShares Exchange-Traded Fund Trust II, you incur a unitary management fee. In addition to the unitary management fee, a shareholder may pay distribution fees, if any, brokerage expenses, taxes, interest, acquired fund fees and expenses, if any, litigation expenses and other extraordinary expenses. The expense examples below are intended to help you understand your ongoing costs (in dollars) of investing in the Funds and to compare these costs with the ongoing costs of investing in other funds.
The example is based on an investment of 1,000 invested at the beginning of the period and held through the six-month period ended October 31, 2016.
In addition to the fees and expenses which the PowerShares CEF Income Composite Portfolio (the “Portfolio”) bears directly, the Portfolio indirectly bears a pro rata share of the fees and expenses of the investment companies in which the Portfolio invests. The amount of fees and expenses incurred indirectly by the Portfolio will vary because the investment companies have varied expenses and fee levels and the Portfolio may own different proportions of the investment companies at different times. Estimated investment companies’ expenses are not expenses that are incurred directly by the Portfolio. They are expenses that are incurred directly by the investment companies and are deducted from the value of the investment companies the Portfolio invests in. The effect of the estimated investment companies’ expenses that the Portfolio bears indirectly is included in the Portfolio’s total return.
Actual Expenses
The first line in the following table provides information about actual account values and actual expenses. You may use the information in this line, together with the amount you invested, to estimate the expenses that you paid over the period. Simply divide your account value by 1,000 (for example, an 8,600 account value divided by 1,000 = 8.6), then multiply the result by the number in the first line under the heading “Expenses Paid During the Six-Month Period” to estimate the expenses you paid on your account during this period.
Hypothetical Example for Comparison Purposes
The second line in the following table provides information about hypothetical account values and hypothetical expenses based on each Fund’s actual expense ratio and an assumed annualized rate of return of 5% per year before expenses, which is not the Fund’s actual return. The hypothetical account values and expenses may not be used to estimate the actual ending account balance or expenses you paid for the period. You may use this information to compare the ongoing costs of investing in the Funds and other funds. To do so, compare this 5% hypothetical example with the 5% hypothetical examples that appear in the shareholder reports of the other funds.
Please note that the expenses shown in the table are meant to highlight your ongoing costs only, and do not reflect any transactional costs, such as sales charges and brokerage commissions. Therefore, the second line in the table is useful in comparing ongoing costs only, and will not help you determine the relative total costs of owning different funds. In addition, expenses shown in the table do not include the expenses of the underlying funds, which are borne indirectly by a Fund. If transaction costs and indirect expenses were included, your costs would have been higher.
| | | | | | | | | | | | | | | | |
| | | Beginning
Account Value
November 1, 2015 | | | Ending
Account Value
October 31, 2016 | | | Annualized
Expense Ratio
Based on the
Six-Month Period | | | Expenses Paid
During the
Six-Month Period(1) | |
| PowerShares 1-30 Laddered Treasury Portfolio (PLW) | | | | | | | | | | | | | | | | |
Actual | | $ | 1,000.00 | | | $ | 1,012.95 | | | | 0.25 | % | | $ | 1.26 | |
Hypothetical (5% return before expenses) | | | 1,000.00 | | | | 1,023.88 | | | | 0.25 | | | | 1.27 | |
| PowerShares Build America Bond Portfolio (BAB) | | | | | | | | | | | | | | | | |
Actual | | | 1,000.00 | | | | 1,038.00 | | | | 0.27 | | | | 1.38 | |
Hypothetical (5% return before expenses) | | | 1,000.00 | | | | 1,023.78 | | | | 0.27 | | | | 1.37 | |
| PowerShares California AMT-Free Municipal Bond Portfolio (PWZ) | | | | | | | | | | | | | | | | |
Actual | | | 1,000.00 | | | | 1,009.68 | | | | 0.28 | | | | 1.41 | |
Hypothetical (5% return before expenses) | | | 1,000.00 | | | | 1,023.73 | | | | 0.28 | | | | 1.42 | |
| PowerShares CEF Income Composite Portfolio (PCEF) | | | | | | | | | | | | | | | | |
Actual | | | 1,000.00 | | | | 1,055.48 | | | | 0.50 | | | | 2.58 | |
Hypothetical (5% return before expenses) | | | 1,000.00 | | | | 1,022.62 | | | | 0.50 | | | | 2.54 | |
Fees and Expenses (continued)
| | | | | | | | | | | | | | | | |
| | | Beginning
Account Value
November 1, 2015 | | | Ending
Account Value
October 31, 2016 | | | Annualized
Expense Ratio
Based on the
Six-Month Period | | | Expenses Paid
During the
Six-Month Period(1) | |
| PowerShares Chinese Yuan Dim Sum Bond Portfolio (DSUM) | | | | | | | | | | | | | | | | |
Actual | | $ | 1,000.00 | | | $ | 984.85 | | | | 0.45 | % | | $ | 2.25 | |
Hypothetical (5% return before expenses) | | | 1,000.00 | | | | 1,022.87 | | | | 0.45 | | | | 2.29 | |
| PowerShares Emerging Markets Sovereign Debt Portfolio (PCY) | | | | | | | | | | | | | | | | |
Actual | | | 1,000.00 | | | | 1,066.60 | | | | 0.50 | | | | 2.60 | |
Hypothetical (5% return before expenses) | | | 1,000.00 | | | | 1,022.62 | | | | 0.50 | | | | 2.54 | |
| PowerShares Fundamental High Yield® Corporate Bond Portfolio (PHB) | | | | | | | | | | | | | | | | |
Actual | | | 1,000.00 | | | | 1,053.99 | | | | 0.50 | | | | 2.58 | |
Hypothetical (5% return before expenses) | | | 1,000.00 | | | | 1,022.62 | | | | 0.50 | | | | 2.54 | |
| PowerShares Fundamental Investment Grade Corporate Bond Portfolio (PFIG) | | | | | | | | | | | | | | | | |
Actual | | | 1,000.00 | | | | 1,017.97 | | | | 0.22 | | | | 1.12 | |
Hypothetical (5% return before expenses) | | | 1,000.00 | | | | 1,024.03 | | | | 0.22 | | | | 1.12 | |
| PowerShares Global Short Term High Yield Bond Portfolio (PGHY) | | | | | | | | | | | | | | | | |
Actual | | | 1,000.00 | | | | 1,068.52 | | | | 0.34 | | | | 1.77 | |
Hypothetical (5% return before expenses) | | | 1,000.00 | | | | 1,023.43 | | | | 0.34 | | | | 1.73 | |
| PowerShares International Corporate Bond Portfolio (PICB) | | | | | | | | | | | | | | | | |
Actual | | | 1,000.00 | | | | 947.07 | | | | 0.50 | | | | 2.45 | |
Hypothetical (5% return before expenses) | | | 1,000.00 | | | | 1,022.62 | | | | 0.50 | | | | 2.54 | |
| PowerShares LadderRite 0-5 Year Corporate Bond Portfolio (LDRI) | | | | | | | | | | | | | | | | |
Actual | | | 1,000.00 | | | | 1,009.77 | | | | 0.22 | | | | 1.11 | |
Hypothetical (5% return before expenses) | | | 1,000.00 | | | | 1,024.03 | | | | 0.22 | | | | 1.12 | |
| PowerShares National AMT-Free Municipal Bond Portfolio (PZA) | | | | | | | | | | | | | | | | |
Actual | | | 1,000.00 | | | | 1,009.87 | | | | 0.28 | | | | 1.41 | |
Hypothetical (5% return before expenses) | | | 1,000.00 | | | | 1,023.73 | | | | 0.28 | | | | 1.42 | |
| PowerShares New York AMT-Free Municipal Bond Portfolio (PZT) | | | | | | | | | | | | | | | | |
Actual | | | 1,000.00 | | | | 1,007.63 | | | | 0.28 | | | | 1.41 | |
Hypothetical (5% return before expenses) | | | 1,000.00 | | | | 1,023.73 | | | | 0.28 | | | | 1.42 | |
| PowerShares Preferred Portfolio (PGX) | | | | | | | | | | | | | | | | |
Actual | | | 1,000.00 | | | | 1,029.82 | | | | 0.50 | | | | 2.55 | |
Hypothetical (5% return before expenses) | | | 1,000.00 | | | | 1,022.62 | | | | 0.50 | | | | 2.54 | |
| PowerShares Variable Rate Preferred Portfolio (VRP) | | | | | | | | | | | | | | | | |
Actual | | | 1,000.00 | | | | 1,075.33 | | | | 0.50 | | | | 2.61 | |
Hypothetical (5% return before expenses) | | | 1,000.00 | | | | 1,022.62 | | | | 0.50 | | | | 2.54 | |
| PowerShares VRDO Tax-Free Weekly Portfolio (PVI) | | | | | | | | | | | | | | | | |
Actual | | | 1,000.00 | | | | 1,001.49 | | | | 0.25 | | | | 1.26 | |
Hypothetical (5% return before expenses) | | | 1,000.00 | | | | 1,023.88 | | | | 0.25 | | | | 1.27 | |
| (1) | Expenses are calculated using the annualized expense ratio, which represents the ongoing expenses as a percentage of net assets for the six-month period ended October 31, 2016. Expenses are calculated by multiplying the Fund’s annualized expense ratio by the average account value for the period, then multiplying the result by 184/366. Expense ratios for the most recent six-month period may differ from expense ratios based on the annualized data in the Financial Highlights. |
Tax Information
Form 1099-DIV, Form 1042-S and other year-end tax information provide shareholders with actual calendar year amounts that should be included in their tax returns. Shareholders should consult their tax advisers.
The following distribution information is being provided as required by the Internal Revenue Code or to meet a specific state’s requirement.
Each Fund designates the following amounts or, if subsequently determined to be different, the maximum amount allowable for its fiscal year ended October 31, 2016:
| | | | | | | | | | | | | | | | | | | | | | | | | |
| | | Qualified Interest
Income* | | Qualified Dividend
Income* | | Corporate
Dividends
Received
Deduction* | | Tax Exempt
Income* | | Long-Term
Capital Gain |
| 1-30 Laddered Treasury Portfolio | | | | 100 | % | | | | 0 | % | | | | 0 | % | | | | 0 | % | | | $ | — | |
| Build America Bond Portfolio | | | | 100 | % | | | | 0 | % | | | | 0 | % | | | | 0 | % | | | | — | |
| California AMT-Free Municipal Bond Portfolio | | | | 0 | % | | | | 0 | % | | | | 0 | % | | | | 99 | % | | | | — | |
| CEF Income Composite Portfolio | | | | 0 | % | | | | 20 | % | | | | 20 | % | | | | 0 | % | | | | — | |
| Chinese Yuan Dim Sum Bond Portfolio | | | | 0 | % | | | | 0 | % | | | | 0 | % | | | | 0 | % | | | | — | |
| Emerging Markets Sovereign Debt Portfolio | | | | 0 | % | | | | 0 | % | | | | 0 | % | | | | 0 | % | | | | — | |
| Fundamental High Yield® Corporate Bond Portfolio | | | | 100 | % | | | | 0 | % | | | | 0 | % | | | | 0 | % | | | | — | |
| Fundamental Investment Grade Corporate Bond Portfolio | | | | 100 | % | | | | 0 | % | | | | 0 | % | | | | 0 | % | | | | — | |
| Global Short Term High Yield Bond Portfolio | | | | 51 | % | | | | 0 | % | | | | 0 | % | | | | 0 | % | | | | — | |
| International Corporate Bond Portfolio | | | | 0 | % | | | | 0 | % | | | | 0 | % | | | | 0 | % | | | | — | |
| LadderRite 0-5 Year Corporate Bond Portfolio | | | | 100 | % | | | | 0 | % | | | | 0 | % | | | | 0 | % | | | | 128 | |
| National AMT-Free Municipal Bond Portfolio | | | | 0 | % | | | | 0 | % | | | | 0 | % | | | | 100 | % | | | | — | |
| New York AMT-Free Municipal Bond Portfolio | | | | 0 | % | | | | 0 | % | | | | 0 | % | | | | 99 | % | | | | — | |
| Preferred Portfolio | | | | 0 | % | | | | 69 | % | | | | 60 | % | | | | 0 | % | | | | — | |
| Variable Rate Preferred Portfolio | | | | 0 | % | | | | 46 | % | | | | 45 | % | | | | 0 | % | | | | — | |
| VRDO Tax-Free Weekly Portfolio | | | | 0 | % | | | | 0 | % | | | | 0 | % | | | | 100 | % | | | | 921 | |
| * | The above percentages are based on ordinary income dividends paid to shareholders during the Fund’s fiscal year. |
Trustees and Officers
The Independent Trustees, the Unaffiliated Trustees, the Non-Independent Trustees and the executive officers of the Trust, their term of office and length of time served, their principal business occupations during at least the past five years, the number of portfolios in the Fund Complex overseen by each Trustee and the other directorships, if any, held by a Trustee are shown below.
The Trustees and officers information is current as of October 31, 2016.
| | | | | | | | | | |
Name, Address and Year of Birth
of Independent Trustees | | Position(s)
Held
with Trust | | Term of
Office and
Length of
Time
Served* | | Principal Occupation(s) During Past 5 Years | | Number of
Portfolios in Fund
Complex**
Overseen by
Independent
Trustees | | Other
Directorships
Held by
Independent
Trustees During
the Past 5 Years |
Ronn R. Bagge - 1958 c/o Invesco PowerShares Capital Management LLC 3500 Lacey Road, Suite 700 Downers Grove, IL 60515 | | Chairman of the Nominating and Governance Committee and Trustee | | Chairman of the Nominating and Governance Committee and Trustee since 2007 | | Founder and Principal, YQA Capital Management LLC (1998-Present); formerly Owner/CEO of Electronic Dynamic Balancing Co., Inc. (high-speed rotating equipment service provider). | | 126 | | None |
| | | | | |
Todd J. Barre - 1957 c/o Invesco PowerShares Capital Management LLC 3500 Lacey Road, Suite 700 Downers Grove, IL 60515 | | Trustee | | Since 2010 | | Assistant Professor of Business, Trinity Christian College (2010-2016); formerly Vice President and Senior Investment Strategist (2001-2008), Director of Open Architecture and Trading (2007-2008), Head of Fundamental Research (2004-2007) and Vice President and Senior Fixed Income Strategist (1994-2001), BMO Financial Group/Harris Private Bank. | | 126 | | None |
| | | | | |
Marc M. Kole - 1960 c/o Invesco PowerShares Capital Management LLC 3500 Lacey Road, Suite 700 Downers Grove, IL 60515 | | Chairman of the Audit Committee and Trustee | | Chairman of the Audit Committee since 2008; Trustee since 2007 | | Senior Director of Finance, By The Hand Club for Kids (2015-Present); Formerly: Chief Financial Officer, Hope Network (social services) (2008-2012); Assistant Vice President and Controller, Priority Health (health insurance) (2005-2008); Senior Vice President of Finance, United Healthcare (2004-2005); Chief Accounting Officer, Senior Vice President of Finance, Oxford Health Plans (2000-2004); Audit Partner, Arthur Andersen LLP (1996-2000). | | 126 | | None |
| * | This is the date the Independent Trustee began serving the Trust. He serves an indefinite term, until his successor is elected. |
| ** | Fund Complex includes all open-end funds (including all of their portfolios) advised by the Adviser. At October 31, 2016, the “Fund Family” consisted of the Trust’s 67 portfolios and four other exchange-traded fund trusts with 59 portfolios advised by the Adviser. |
Trustees and Officers (continued)
| | | | | | | | | | |
Name, Address and Year of Birth
of Independent Trustees | | Position(s)
Held
with Trust | | Term of
Office and
Length of
Time
Served* | | Principal Occupation(s) During Past 5 Years | | Number of
Portfolios in Fund
Complex**
Overseen by
Independent
Trustees | | Other
Directorships
Held by
Independent
Trustees During
the Past 5 Years |
Yung Bong Lim - 1964 c/o Invesco PowerShares Capital Management LLC 3500 Lacey Road, Suite 700 Downers Grove, IL 60515 | | Chairman of the Investment Oversight Committee and Trustee | | Chairman of the Investment Oversight Committee since 2014; Trustee since 2013 | | Managing Partner, Residential Dynamics Group LLC (2008-Present); formerly, Managing Director, Citadel Investment Group, L.L.C. (1999-2007). | | 126 | | None |
| | | | | |
Gary R. Wicker - 1961 c/o Invesco PowerShares Capital Management LLC 3500 Lacey Road, Suite 700 Downers Grove, IL 60515 | | Trustee | | Since 2013 | | Senior Vice President of Global Finance and Chief Financial Officer at RBC Ministries (publishing company) (2013-Present); formerly, Executive Vice President and Chief Financial Officer, Zondervan Publishing (a division of Harper Collins/NewsCorp) (2007-2012); Senior Vice President and Group Controller (2005-2006), Senior Vice President and Chief Financial Officer (2003-2004), Chief Financial Officer (2001-2003), Vice President, Finance and Controller (1999-2001) and Assistant Controller (1997-1999), divisions of The Thomson Corporation (information services provider). | | 126 | | None |
| | | | | |
Donald H. Wilson - 1959 c/o Invesco PowerShares Capital Management LLC 3500 Lacey Road, Suite 700 Downers Grove, IL 60515 | | Chairman of the Board and Trustee | | Chairman since 2012; Trustee since 2007 | | Chairman and Chief Executive Officer, Stone Pillar Advisors, Ltd. (2010-Present); formerly, Chairman, President and Chief Executive Officer, Community Financial Shares, Inc. and Community Bank—Wheaton/Glen Ellyn (subsidiary) (2013-2015); Chief Operating Officer, AMCORE Financial, Inc. (bank holding company) (2007-2009); Executive Vice President and Chief Financial Officer, AMCORE Financial, Inc. (2006-2007); Senior Vice President and Treasurer, Marshall & Ilsley Corp. (bank holding company) (1995-2006). | | 126 | | None |
|
| The Unaffiliated Trustees, their term of office and length of time served, their principal business occupations during the past five years, the number of portfolios in the Fund Complex overseen by the Unaffiliated Trustees and the other directorships, if any, held by such Trustees are shown below. |
| | | | | |
Philip M. Nussbaum - 1961 c/o Invesco PowerShares Capital Management LLC 3500 Lacey Road, Suite 700 Downers Grove, IL 60515 | | Trustee*** | | Since 2007 | | Chairman, Performance Trust Capital Partners (2004-Present). | | 126 | | None |
| * | This is the date the Independent Trustee began serving the Trust. He serves an indefinite term, until his successor is elected. |
| ** | Fund Complex includes all open-end funds (including all of their portfolios) advised by the Adviser. At October 31, 2016, the “Fund Family” consisted of the Trust’s 67 portfolios and four other exchange-traded fund trusts with 59 portfolios advised by the Adviser. |
| *** | Effective February 25, 2016, Mr. Nussbaum became an Unaffiliated Trustee. |
Trustees and Officers (continued)
The Non-Independent Trustees and the executive officers of the Trust, their term of office and length of time served, their principal business occupations during the past five years, the number of portfolios in the Fund Complex overseen by the Non-Independent Trustees and the other directorships, if any, held by the Trustees are shown below.
| | | | | | | | | | |
Name, Address and Year of Birth
of Non-Independent Trustees | | Position(s)
Held with Trust | | Term of
Office and
Length of
Time
Served* | | Principal Occupation(s) During Past 5 Years | | Number of
Portfolios in Fund
Complex**
Overseen by
Non-Independent
Trustees | | Other
Directorships
Held by
Non-Independent
Trustees During
the Past 5 Years |
| Kevin M. Carome - 1956 Invesco Ltd. Two Peachtree Pointe, 1555 Peachtree St., N.E., Suite 1800 Atlanta, GA 30309 | | Trustee | | Since 2010 | | Senior Managing Director, Secretary and General Counsel, Invesco Ltd. (2007-Present); Director, Invesco Advisers, Inc. (2009-Present); Director, Invesco Finance PLC, and Invesco Holding Company Limited; Director and Executive Vice President, Invesco Holding Company (US), Inc., Invesco Finance, Inc., Invesco Group Services, Inc., Invesco North American Holdings, Inc., and INVESCO Asset Management (Bermuda) Ltd.; Executive Vice President, Invesco Investments (Bermuda) Ltd., Manager, Horizon Flight Works LLC; Director and Secretary, Invesco Services (Bahamas) Private Limited; formerly, Director and Chairman, INVESCO Funds Group, Inc., Senior Vice President, Secretary and General Counsel, Invesco Advisers, Inc. (2003-2006); Director, Invesco Investments (Bermuda) Ltd. (2008-2016); Senior Vice President and General Counsel, Liberty Financial Companies, Inc. (2000-2001); General Counsel of certain investment management subsidiaries of Liberty Financial Companies, Inc. (1998-2000); Associate General Counsel, Liberty Financial Companies, Inc. (1993-1998); Associate, Ropes & Gray LLP. | | 126 | | None |
| * | This is the date the Non-Independent Trustee began serving the Trust. He serves an indefinite term, until his successor is elected. |
| ** | Fund Complex includes all open-end funds (including all of their portfolios) advised by the Adviser. At October 31, 2016, the “Fund Family” consisted of the Trust’s 67 portfolios and four other exchange-traded fund trusts with 59 portfolios advised by the Adviser. |
Trustees and Officers (continued)
| | | | | | |
Name, Address and Year of Birth
of Executive Officers | | Position(s)
Held with Trust | | Length of
Time
Served* | | Principal Occupation(s) During Past 5 Years |
Daniel E. Draper - 1968 Invesco PowerShares Capital Management LLC 3500 Lacey Road, Suite 700 Downers Grove, IL 60515 | | President and Principal Executive Officer | | Since 2015 | | President and Principal Executive Officer, PowerShares Exchange-Traded Fund Trust, PowerShares Exchange-Traded Fund Trust II, PowerShares India Exchange-Traded Fund Trust, PowerShares Actively Managed Exchange-Traded Fund Trust and PowerShares Actively Managed Exchange-Traded Commodity Fund Trust (2015-Present); Chief Executive Officer and Principal Executive Officer (2016-Present) and Managing Director (2013-Present), Invesco PowerShares Capital Management LLC; Senior Vice President, Invesco Distributors, Inc. (2014-Present); formerly, Vice President, PowerShares Exchange-Traded Fund Trust, PowerShares Exchange-Traded Fund Trust II, PowerShares India Exchange-Traded Fund Trust, PowerShares Actively Managed Exchange-Traded Fund Trust (2013-2015) and PowerShares Actively Managed Exchange-Traded Commodity Fund Trust (2014-2015); Managing Director, Credit Suisse Asset Management (2010-2013) and Lyxor Asset Management/Societe Generale (2007-2010). |
| | | |
Steven M. Hill - 1964 Invesco PowerShares Capital Management LLC 3500 Lacey Road, Suite 700 Downers Grove,IL 60515 | | Vice President and Treasurer | | Since 2013 | | Vice President and Treasurer, PowerShares Exchange-Traded Fund Trust, PowerShares Exchange-Traded Fund Trust II, PowerShares India Exchange-Traded Fund Trust, PowerShares Actively Managed Exchange-Traded Fund Trust (2013-Present) and PowerShares Actively Managed Exchange-Traded Commodity Fund Trust (2014-Present); Head of Global ETF Administration, Invesco PowerShares Capital Management LLC (2011-Present); Principal Financial and Accounting Officer—Investment Pools, Invesco PowerShares Capital Management LLC (2015-Present); formerly, Senior Managing Director and Chief Financial Officer, Destra Capital Management LLC and its subsidiaries (2010-2011); Chief Financial Officer, Destra Investment Trust and Destra Investment Trust II (2010-2011); Senior Managing Director, Claymore Securities, Inc. (2003-2010); and Chief Financial Officer, Claymore sponsored mutual funds (2003-2010). |
| | | |
Peter Hubbard - 1981 Invesco PowerShares Capital Management LLC 3500 Lacey Road, Suite 700 Downers Grove, IL 60515 | | Vice President | | Since 2009 | | Vice President, PowerShares Exchange-Traded Fund Trust, PowerShares Exchange-Traded Fund Trust II, PowerShares India Exchange-Traded Fund Trust, PowerShares Actively Managed Exchange-Traded Fund Trust (2009-Present) and PowerShares Actively Managed Exchange-Traded Commodity Fund Trust (2014-Present); Vice President and Director of Portfolio Management, Invesco PowerShares Capital Management LLC (2010-Present); formerly, Vice President of Portfolio Management, Invesco PowerShares Capital Management LLC (2008-2010); Portfolio Manager, Invesco PowerShares Capital Management LLC (2007-2008); Research Analyst, Invesco PowerShares Capital Management LLC (2005-2007); Research Analyst and Trader, Ritchie Capital, a hedge fund operator (2003-2005). |
| | | |
Christopher Joe - 1969 Invesco PowerShares Capital Management LLC 11 Greenway Plaza, Suite 1000 Houston, TX 77046-1173 | | Chief Compliance Officer | | Since 2012 | | Chief Compliance Officer of Invesco PowerShares Capital Management LLC (2015-Present); Chief Compliance Officer of PowerShares Exchange-Traded Fund Trust, PowerShares Exchange-Traded Fund Trust II, PowerShares India Exchange-Traded Fund Trust, PowerShares Actively Managed Exchange-Traded Fund Trust (2012-Present) and PowerShares Actively Managed Exchange-Traded Commodity Fund Trust (2014-Present); formerly, Chief Compliance Officer, Invesco Investment Advisers, LLC (registered investment adviser) (2010–2013), U.S. Compliance Director, Invesco, Ltd. (2006-2014) and Deputy Chief Compliance Officer of Invesco Advisers, Inc. (2014-2015). |
| * | This is the period for which the Officers began serving the Trust. Each Officer serves an indefinite term, until his or her successor is elected. |
Trustees and Officers (continued)
| | | | | | |
Name, Address and Year of Birth
of Executive Officers | | Position(s)
Held
with Trust | | Length of
Time
Served* | | Principal Occupation(s) During Past 5 Years |
Sheri Morris - 1964 Invesco Management Group, Inc. 11 Greenway Plaza, Suite 1000 Houston, TX 77046 | | Vice President | | Since 2012 | | President and Principal Executive Officer, The Invesco Funds (2016-Present); Treasurer, The Invesco Funds (2008-Present); Vice President, Invesco Advisers, Inc. (formerly known as Invesco Institutional (N.A.), Inc.) (registered investment adviser) (2009-Present) and Vice President, PowerShares Exchange-Traded Fund Trust, PowerShares Exchange-Traded Fund Trust II, PowerShares India Exchange-Traded Fund Trust, PowerShares Actively Managed Exchange-Traded Fund Trust (2012-Present) and PowerShares Actively Managed Exchange-Traded Commodity Fund Trust (2014-Present); formerly, Vice President and Principal Financial Officer, The Invesco Funds (2008-2016); Treasurer, PowerShares Exchange-Traded Fund Trust, PowerShares Exchange-Traded Fund Trust II, PowerShares India Exchange-Traded Fund Trust and PowerShares Actively Managed Exchange-Traded Fund Trust (2011-2013); Vice President, Invesco Aim Advisers, Inc., Invesco Aim Capital Management, Inc. and Invesco Aim Private Asset Management, Inc.; Assistant Vice President and Assistant Treasurer, The Invesco Funds and Assistant Vice President, Invesco Advisers, Inc., Invesco Aim Capital Management, Inc. and Invesco Aim Private Asset Management, Inc. |
| | | |
Anna Paglia - 1974 Invesco PowerShares Capital Management LLC 3500 Lacey Road, Suite 700 Downers Grove, IL 60515 | | Secretary | | Since 2011 | | Secretary, PowerShares Exchange-Traded Fund Trust, PowerShares Exchange-Traded Fund Trust II, PowerShares India Exchange-Traded Fund Trust, PowerShares Actively Managed Exchange-Traded Fund Trust (2011-Present) and PowerShares Actively Managed Exchange-Traded Commodity Fund Trust (2014-Present); Head of Legal (2010-Present) and Secretary (2015-Present), Invesco PowerShares Capital Management LLC (2010-Present); formerly, Partner, K&L Gates LLP (formerly, Bell Boyd & Lloyd LLP) (2007-2010); Associate Counsel at Barclays Global Investors Ltd. (2004-2006). |
| | | |
Rudolf E. Reitmann - 1971 Invesco PowerShares Capital Management LLC 3500 Lacey Road, Suite 700 Downers Grove, IL 60515 | | Vice President | | Since 2013 | | Vice President, PowerShares Exchange-Traded Fund Trust, PowerShares Exchange-Traded Fund Trust II, PowerShares India Exchange-Traded Fund Trust, PowerShares Actively Managed Exchange-Traded Fund Trust (2013-Present) and PowerShares Actively Managed Exchange-Traded Commodity Fund Trust (2014-Present); Head of Global Exchange Traded Funds Services, Invesco PowerShares Capital Management LLC (2013-Present). |
| | | |
David Warren - 1957 Invesco Canada Ltd. 5140 Yonge Street, Suite 800 Toronto, Ontario M2N 6X7 | | Vice President | | Since 2009 | | Vice President, PowerShares Exchange-Traded Fund Trust, PowerShares Exchange-Traded Fund Trust II, PowerShares India Exchange-Traded Fund Trust, and PowerShares Actively Managed Exchange-Traded Fund Trust (2009-Present) and PowerShares Actively Managed Exchange-Traded Commodity Fund Trust (2014-Present); Managing Director—Chief Administrative Officer, Americas, Invesco PowerShares Capital Management LLC; Senior Vice President, Invesco Advisers, Inc. (2009-Present); Director, Invesco Inc. (2009-Present); Senior Vice President, Invesco Management Group, Inc. (2007-Present); Director, Executive Vice President and Chief Financial Officer, Invesco Canada Ltd. (formerly, Invesco Trimark Ltd.); Chief Administrative Officer, North American Retail, Invesco Ltd. (2007-Present); Director, Invesco Corporate Class Inc. (2014-Present); Director, Invesco Global Direct Real Estate Feeder GP Ltd. (2015-Present); Director, Invesco Canada Holdings Inc. (2002-Present); Director, Invesco Financial Services Ltd./Services Financiers Invesco Ltée and Trimark Investments Ltd./Placements Trimark Ltée (2014-Present); Director, Invesco IP Holdings (Canada) Ltd. (2016-Present); Director, Invesco Global Direct Real Estate GP Ltd. (2015-Present); formerly, Executive Vice President and Chief Financial Officer, Invesco Inc. (2009-2015); Director, Executive Vice President and Chief Financial Officer, Invesco Canada Ltd. (formerly, Invesco Trimark Ltd.) (2000-2011). |
Availability of Additional Information About the Trustees
The Statement of Additional Information includes additional information about the Trustees and is available, without charge, upon request at (800) 983-0903.
| * | This is the period for which the Officers began serving the Trust. Each Officer serves an indefinite term, until his or her successor is elected. |
Board Considerations Regarding Approval of Investment Advisory Agreement for PowerShares S&P SmallCap High Dividend Low Volatility Portfolio, PowerShares S&P International Developed High Dividend Low Volatility Portfolio and PowerShares Treasury Collateral Portfolio and Sub-Advisory Agreement for PowerShares Treasury Collateral Portfolio
At a meeting held on September 29, 2016, the Board of Trustees of the PowerShares Exchange-Traded Fund Trust II (the “Trust”), including the Independent Trustees, approved the Investment Advisory Agreement (the “Advisory Agreement”) between Invesco PowerShares Capital Management LLC (the “Adviser”) and the Trust for PowerShares S&P SmallCap High Dividend Low Volatility Portfolio, PowerShares S&P International Developed High Dividend Low Volatility Portfolio and PowerShares Treasury Collateral Portfolio (each, a “Fund” and collectively, the “Funds”) and the Investment Sub-Advisory Agreement for PowerShares Treasury Collateral Portfolio, between the Adviser and the following seven affiliated sub-advisers (the “Sub-Advisory Agreement”): Invesco Advisers, Inc. (as the initial sub-adviser); Invesco Asset Management Deutschland, GmbH; Invesco Asset Management Limited; Invesco Asset Management (Japan) Limited; Invesco Hong Kong Limited; Invesco Senior Secured Management, Inc.; and Invesco Trimark Ltd. (each, a “Sub-Adviser,” and collectively, the “Sub-Advisers”).
The Trustees reviewed information provided by the Adviser describing: (i) the nature, extent and quality of services to be provided, (ii) the costs of services to be provided, (iii) the extent to which economies of scale may be realized as each Fund grows, (iv) whether the fee levels reflect any possible economies of scale for the benefit of Fund shareholders, (v) comparisons of services rendered to and amounts paid by other registered investment companies and (vi) any benefits to be realized by the Adviser from its relationship with each Fund.
Advisory Agreement
Nature, Extent and Quality of Services. In evaluating the nature, extent and quality of the Adviser’s services, the Trustees reviewed information concerning the functions to be performed by the Adviser for each Fund, information describing the Adviser’s current organization and staffing, including operational support that would be provided by the Adviser’s parent organization, Invesco Ltd., and the background and experience of the persons who will be responsible for the day-to-day management of the Funds, and they considered the quality of services provided by the Adviser to other exchange-traded funds (“ETFs”). The Trustees also reviewed information related to the Adviser’s portfolio transaction policies and procedures, as well as reports on the correlation and tracking error between the underlying indexes and the performance of other ETFs for which the Adviser serves as investment adviser.
The Trustees also considered the services to be provided by the Adviser in its oversight of the Funds’ administrator, custodian and transfer agent, and its oversight of the Sub-Advisers for PowerShares Treasury Collateral Portfolio. They noted the significant amount of time, effort and resources that had been devoted to this oversight function for the other ETFs and that was expected to be provided for each Fund.
Based on their review, the Trustees concluded that the nature, extent and quality of the services to be provided by the Adviser to each Fund under the Advisory Agreement were expected to be appropriate and reasonable.
Fees, Expenses and Profitability. The Trustees reviewed and discussed the information provided by the Adviser on each Fund’s proposed advisory fee, as compared to information compiled from Lipper Inc. (“Lipper”) databases on the median net expense ratios of ETF, open-end index and open-end actively managed (non-ETF) peers. The Trustees noted that PowerShares S&P SmallCap High Dividend Low Volatility Portfolio’s advisory fee was compared to peers in two Lipper classifications, Equity Income and Small-Cap Core. The Trustees also noted that the comparable fee data provided by the Adviser for PowerShares Treasury Collateral Portfolio included only eight peer ETFs, eight open-end actively managed funds and only one peer open-end index fund. The Trustees noted that the proposed annual advisory fee to be charged to each Fund was a unitary fee, and that the Adviser has agreed to pay all other expenses of each Fund except for the fee payment under the Advisory Agreement, payments under the Fund’s 12b-1 plan, if any, brokerage expenses, taxes, interest, litigation expenses and other extraordinary expenses. The Trustees noted that each Fund’s proposed unitary fee was below the median net expense ratio of its peer groups as shown below:
Board Considerations Regarding Approval of Investment Advisory Agreement for PowerShares S&P SmallCap High Dividend Low Volatility Portfolio, PowerShares S&P International Developed High Dividend Low Volatility Portfolio and PowerShares Treasury Collateral Portfolio and Sub-Advisory Agreement for PowerShares Treasury Collateral Portfolio (continued)
| | | | | | | | |
Fund | | Lipper
Classification | | ETF Peer Group
(Number of Peers) | | Open-End Index
Fund Peer Group
(Number of Peers) | | Open-End Active
Fund Peer Group
(Number of Peers) |
| PowerShares S&P SmallCap High Dividend Low Volatility Portfolio | | Equity Income | | Lower than median
(25) | | Lower than median
(5) | | Lower than median
(132) |
| | | | |
| PowerShares S&P SmallCap High Dividend Low Volatility Portfolio | | Small-Cap Core | | Lower than median
(26) | | Lower than median
(27) | | Lower than median
(243) |
| | | | |
| PowerShares S&P International Developed High Dividend Low Volatility Portfolio | | International Equity Income | | Lower than median
(22) | | N/A | | Lower than median
(14) |
| | | | |
| PowerShares Treasury Collateral Portfolio | | Short U.S. Treasury | | Lower than median
(8) | | Lower than median
(1) | | Lower than median
(8) |
The Trustees considered each Fund’s proposed unitary advisory fee in light of the administrative, operational and management oversight costs for the Adviser. The Board concluded that the unitary advisory fee to be charged to each Fund is reasonable and appropriate in light of the services expected to be provided by the Adviser.
In conjunction with their review of the unitary advisory fee, the Trustees also considered information provided by the Adviser on the proposed costs of services for each Fund and the sub-advisory fees to be paid by the Adviser for PowerShares Treasury Collateral Portfolio. The Adviser did not provide profitability of the Adviser in managing each Fund because the Funds had not yet commenced operations. However, the Trustees considered other information the Board received at its April meeting on the Adviser’s overall profitability from its relationship with other ETFs for which it serves as investment adviser.
Economies of Scale and Whether Fee Levels Reflect These Economies of Scale. The Trustees reviewed the information provided by the Adviser as to the extent to which economies of scale may be realized as each Fund grows and whether fee levels reflect economies of scale for the benefit of shareholders. The Trustees noted that any reduction in fixed costs associated with the management of each Fund would be enjoyed by the Adviser, but that a unitary fee provides a level of certainty in expenses for each Fund. The Trustees considered whether the proposed advisory fee rate for each Fund is reasonable in relation to the proposed services and product strategy of each Fund, and they concluded that the flat advisory fee was reasonable and appropriate.
Fall-Out Benefits. The Trustees noted that the Adviser had not identified any further benefits that it would derive from its relationships with each Fund, and had noted that it does not have any soft-dollar arrangements.
Based on all of the information considered and the conclusions reached, the Board, including the Independent Trustees, determined to approve the Advisory Agreement for each Fund. No single factor was determinative in the Board’s analysis.
Sub-Advisory Agreement
As noted above, the Board of Trustees of the Trust, including the Independent Trustees, approved the Sub-Advisory Agreement for PowerShares Treasury Collateral Portfolio (“Treasury Collateral Portfolio”) at a meeting held on September 29, 2016. The review process followed by the Board is described in detail above. In connection with the review of the Sub-Advisory Agreement, the Board considered the factors described below, among others.
Nature, Extent and Quality of Services. The Trustees considered the nature, extent and quality of services to be provided under the Sub-Advisory Agreement. The Board also considered the benefits described by the Adviser in having multiple affiliated Sub-Advisers, but noted that Invesco Advisers, Inc. (“IAI”) will be the initial sub-adviser. The Board reviewed the qualifications and background of IAI’s portfolio managers and noted the qualifications and background of the other Sub-Advisers and the resources made available to the Sub-Advisers’ personnel.
Board Considerations Regarding Approval of Investment Advisory Agreement for PowerShares S&P SmallCap High Dividend Low Volatility Portfolio, PowerShares S&P International Developed High Dividend Low Volatility Portfolio and PowerShares Treasury Collateral Portfolio and Sub-Advisory Agreement for PowerShares Treasury Collateral Portfolio (continued)
Based on their review, the Trustees concluded that the nature, extent and quality of services to be provided under the Sub-Advisory Agreement were expected to be appropriate and reasonable.
Fees and Expenses. The Trustees reviewed and discussed the information provided by the Adviser and the Sub-Advisers on the sub-advisory fee rate under the Sub-Advisory Agreement. The Trustees noted that the sub-advisory fee charged by the Sub-Advisers under the Sub-Advisory Agreement is consistent with the compensation structure used throughout Invesco Ltd. when Invesco Ltd.’s affiliates provide sub-advisory services for funds managed by other Invesco Ltd. affiliates. The Board considered how the sub-advisory fees relate to the overall advisory fee for the Fund and noted that the Adviser compensates the Sub-Advisers from its fee.
Economies of Scale and Whether Fee Levels Reflect These Economies of Scale. As part of their review of the Advisory Agreement for the Treasury Collateral Portfolio, the Trustees considered the extent to which economies of scale may be realized as the Treasury Collateral Portfolio grows and whether fee levels reflect economies of scale for the benefit of shareholders. The Trustees considered whether the sub-advisory fee rate for the Treasury Collateral Portfolio was reasonable in relation to the proposed services and product strategy of the Treasury Collateral Portfolio, and they concluded that the flat sub-advisory fee was reasonable and appropriate.
Fall-Out Benefits. The Trustees noted that the Sub-Advisers had not identified any further benefits that they would derive from their relationships with the Treasury Collateral Portfolio.
Based on all of the information considered and the conclusions reached, the Board, including the Independent Trustees, determined to approve the Sub-Advisory Agreement for the Treasury Collateral Portfolio. No single factor was determinative in the Board’s analysis.
(This Page Intentionally Left Blank)
(This Page Intentionally Left Blank)
(This Page Intentionally Left Blank)
(This Page Intentionally Left Blank)
(This Page Intentionally Left Blank)
Proxy Voting Policies and Procedures
A description of the Trust’s proxy voting policies and procedures that the Funds use to determine how to vote proxies relating to portfolio securities is available, without charge and upon request, by calling (800) 983-0903. This information is also available on the Securities and Exchange Commission’s (“Commission”) website at www.sec.gov.
Information regarding how each Fund voted proxies for portfolio securities, if applicable, during the most recent 12-month period ended June 30, is also available, without charge and upon request, by (i) calling (800) 983-0903; or (ii) accessing the Trust’s Form N-PX on the Commission’s website at www.sec.gov.
Quarterly Portfolios
The Trust files its complete schedule of portfolio holdings for the Funds with the Commission for the first and third quarters of each fiscal year on Form N-Q. The Trust’s Forms N-Q are available on the Commission’s website at www.sec.gov. The Trust’s Forms N-Q may also be reviewed and copied at the Commission’s Public Reference Room in Washington, DC; information on the operation of the Public Reference Room may be obtained by calling (800) SEC-0330.
Frequency Distribution of Discounts and Premiums
A table showing the number of days the market price of each Fund’s shares was greater than the Fund’s net asset value, and the number of days it was less than the Fund’s net asset value (i.e., premium or discount) for the most recently completed calendar year, and the calendar quarters since that year end (or the life of the Fund, if shorter) may be found at the Fund’s website at www.invescopowershares.com.
| | | | | | |
| P-PS-AR-9 | |  |
©2016 Invesco PowerShares Capital Management LLC 3500 Lacey Road, Suite 700 Downers Grove, IL 60515 | |
| powershares.com 800 983 0903 | |  | | @PowerShares | |

2016 Annual Report to Shareholders
| | |
| |
| DWLV | | PowerShares DWA Momentum & Low Volatility Rotation Portfolio |
| |
| DWAS | | PowerShares DWA SmallCap Momentum Portfolio |
| |
| DWIN | | PowerShares DWA Tactical Multi-Asset Income Portfolio |
| |
| DWTR | | PowerShares DWA Tactical Sector Rotation Portfolio |
| |
| PSCD | | PowerShares S&P SmallCap Consumer Discretionary Portfolio |
| |
| PSCC | | PowerShares S&P SmallCap Consumer Staples Portfolio |
| |
| PSCE | | PowerShares S&P SmallCap Energy Portfolio |
| |
| PSCF | | PowerShares S&P SmallCap Financials Portfolio |
| |
| PSCH | | PowerShares S&P SmallCap Health Care Portfolio |
| |
| PSCI | | PowerShares S&P SmallCap Industrials Portfolio |
| |
| PSCT | | PowerShares S&P SmallCap Information Technology Portfolio |
| |
| PSCM | | PowerShares S&P SmallCap Materials Portfolio |
| |
| PSCU | | PowerShares S&P SmallCap Utilities Portfolio |
Table of Contents
The Market Environment
US Equity
During the fiscal year ended October 31, 2016, the US economy continued to expand. The initial estimate of US gross domestic product (GDP) showed the US economy grew by 2.9% in the third calendar quarter of 2016, beating consensus estimates.1 However, annualized GDP is expected to be lower. Employment data were mixed, though the unemployment rate had a surprise uptick from 4.9% in August to 5.0% in September before ending the fiscal year at 4.9%.2 Oil prices traded in a range from the high $20s to the low $50s during the reporting period.3
The US Federal Reserve (the Fed) raised interest rates in December 2015—its first increase since 2006—but that was its only increase during the reporting period. Major US stock market indexes posted gains for the reporting period, but they were fairly volatile. Stocks began calendar year 2016 on a negative note, driven by investor concerns about economic weakness in China, falling oil prices and uncertainty over Fed policy, including rumors of possible negative interest rates in the US. Markets recovered in late February and posted gains until June when UK voters opted to leave the European Union, sending markets sharply lower once again. Markets again recovered, and major US equity indexes hit record highs during the summer.4 In this environment, investors generally favored the perceived safety of government bonds and more defensive, dividend-paying equities often found in the telecommunication services, utilities and consumer staples sectors.
| 1 | Source: Bureau of Economic Analysis |
| 2 | Source: Bureau of Labor Statistics |
| 3 | Source: Thompson-Reuters |
| | |
| DWLV | | Manager’s Analysis |
| | PowerShares DWA Momentum & Low Volatility Rotation Portfolio (DWLV) |
As an index fund, the PowerShares DWA Momentum & Low Volatility Rotation Portfolio (the “Fund”) is passively managed and attempts to track the returns of an underlying index. The Fund seeks investment results that generally correspond (before fees and expenses) to the price and yield of the Dorsey Wright® Multi-Factor Global Equity Index (the “Index”). The Fund generally will invest at least 90% of its total assets in securities that comprise the Index. The Fund is a “fund of funds,” meaning that it invests its assets in the shares of other exchange-traded funds (“ETFs”), rather than in securities of individual companies. The Index includes other ETFs that are advised by the Fund’s adviser or its affiliates (the “PowerShares ETFs”), as well as 1- to 6-month U.S. Treasury Bills. The Fund and the PowerShares ETFs are part of the same group of investment companies.
Strictly in accordance with its guidelines and mandated procedures, Dorsey, Wright & Associates, LLC (“Dorsey Wright” or the “Index Provider”) compiles, maintains and calculates the Index, which, at any given time, is composed of up to eight PowerShares ETFs that invest in either domestic or international equity securities, and that employ either a “momentum” or a “low volatility” investment strategy. A “momentum” investment style emphasizes investing in securities that recently have had better relative performance compared to other securities. A low volatility investment style emphasizes investing in securities with the least asset price fluctuations (i.e., increases or decreases in a stock’s price) over time.
The Fund commenced investment operations on July 11, 2016 and began trading on July 14, 2016. During the period from inception to October 31, 2016, on a market price basis, the Fund returned (3.80)%. On a net asset value (“NAV”) basis, the Fund returned (3.84)%. During the same time period, the Index returned (3.82)%. During the fiscal period, the Fund fully replicated the components of the Index; therefore, the Fund’s performance, on a NAV basis, differed from the return of the Index primarily due to fees and operating expenses that the Fund incurred partially offset by beneficial trade execution associated with portfolio rebalances.
During this same time period, the MSCI AC World® Index (Net) (the “Benchmark Index”) returned 0.34%. The Benchmark Index is an unmanaged index weighted by market capitalization and based on the average performance of approximately 2,470 securities. The Benchmark Index was selected for its recognition in the marketplace, and its performance comparison is a useful measure for investors as a broad representation of the overall U.S. stock market. The majority of the Fund’s underperformance relative to the Benchmark Index during the period can be attributed to the Fund’s weighting methodology and thematic objective which placed a heavier weight on the PowerShares S&P 500 Low Volatility Portfolio. Because of this heavier weighting, the Fund had a larger exposure to the financials and information technology sectors. This larger sector exposure as well as security
selection by the PowerShares S&P 500 Low Volatility Portfolio within these sectors significantly contributed to the underperformance.
Positions that contributed most significantly to the Fund’s return included PowerShares S&P SmallCap Low Volatility Portfolio, a PowerShares ETF holding positions in the S&P SmallCap 600® Index (portfolio average weight of 18.20%). Positions that detracted most significantly from the Fund’s return included PowerShares S&P 500 Low Volatility Portfolio, a PowerShares ETF holding positions in the S&P 500® Index (portfolio average weight of 17.54%), and PowerShares DWA SmallCap Momentum Portfolio, a PowerShares ETF holding positions in the Russell 2000® Index (portfolio average weight of 16.99%).
| | | | |
Portfolio Composition
Market Capitalization & Style Allocation*
as of October 31, 2016 | |
| Large-Cap Value | | | 10.0 | % |
| Large-Cap Blend | | | 12.3 | |
| Large-Cap Growth | | | 16.7 | |
| Mid-Cap Value | | | 6.9 | |
| Mid-Cap Blend | | | 6.3 | |
| Mid-Cap Growth | | | 11.4 | |
| Small-Cap Value | | | 7.9 | |
| Small-Cap Blend | | | 13.3 | |
| Small-Cap Growth | | | 15.2 | |
| * | Source: Morningstar. Reflects exposure achieved through investments in underlying funds. |
PowerShares DWA Momentum & Low Volatility Rotation Portfolio (DWLV) (continued)
Growth of a $10,000 Investment Since Inception†

Fund Performance History as of October 31, 2016
| | | | |
| | | Fund Inception† | |
| Index | | Cumulative | |
| Dorsey Wright® Multi-Factor Global Equity Index | | | (3.82 | )% |
| MSCI AC World® Index (Net)†† | | | 0.34 | |
| Fund | | | |
| NAV Return | | | (3.84 | ) |
| Market Price Return | | | (3.80 | ) |
Fund Inception: July 14, 2016
Performance quoted above represents past performance. Past performance is not a guarantee of future results and current performance may be higher or lower than performance quoted. Investment returns and principal value will fluctuate, and shares of the Fund (“Fund Shares”), when redeemed or sold, may be worth more or less than their original cost. Fund performance reflects any applicable fee waivers and/or expense reimbursements. Had the adviser not waived fees and/or reimbursed expenses currently or in the past, returns would have been lower. See current prospectus for more information. According to the Fund’s current prospectus, the Fund’s expense ratio of 0.52% includes the unitary management fee of 0.15% and acquired fund fees and expenses of 0.37%. NAV and Market Price returns assume that dividends and capital gain distributions have been reinvested in the Fund at NAV and Market Price, respectively. The returns shown in the table above do not reflect the deduction of taxes that a shareholder
would pay on Fund distributions or the redemption or sale of Fund Shares. See invescopowershares.com to find the most recent month-end performance numbers.
Index and Benchmark Index performance results are based upon a hypothetical investment in their respective constituent securities. Index and Benchmark Index returns do not represent Fund returns. An investor cannot invest directly in an index. The Index and Benchmark Index do not charge management fees or brokerage expenses, and no such fees or expenses were deducted from the hypothetical performance shown. In addition, the results actual investors might have achieved would have differed from those shown because of differences in the timing, amounts of their investments, and fees and expenses associated with an investment in the Fund.
| † | Fund, Index and Benchmark Index returns are based on the inception date of the Fund. |
| †† | Reflects reinvested dividends net of withholding taxes. |
| | |
| DWAS | | Manager’s Analysis |
| | PowerShares DWA SmallCap Momentum Portfolio (DWAS) |
As an index fund, the PowerShares DWA SmallCap Momentum Portfolio (the “Fund”) is passively managed and attempts to track the returns of an underlying index. The Fund seeks investment results that generally correspond (before fees and expenses) to the price and yield of the Dorsey Wright® SmallCap Technical Leaders Index (the “Index”). The Fund generally will invest at least 90% of its total assets in equity securities of small capitalization companies that comprise the Index.
Strictly in accordance with its guidelines and mandated procedures, Dorsey, Wright & Associates, LLC (“Dorsey Wright” or the “Index Provider”) includes securities in the Index pursuant to a proprietary selection methodology that is designed to identify listed companies that demonstrate powerful relative strength characteristics. “Relative strength” is an investing technique that seeks to determine the strongest performing securities by measuring certain factors, such as a security’s relative performance against the overall market or a security’s relative strength value, which is derived by comparing the rate of increase of the security’s price over a set period as compared to that of a benchmark index. The Index Provider selects securities for inclusion in the Index from an eligible universe of the smallest 2,000 constituents by market capitalization that trade on a U.S. exchange and that are included within the NASDAQ US Benchmark Index. The Index Provider assigns a relative strength score to each eligible security and selects approximately 200 securities with the greatest scores for inclusion in the Index. Component security weights are based on relative scores, with securities with higher scores receiving larger weights. The Fund generally invests in all of the securities comprising the Index in proportion to their weightings in the Index.
For the fiscal year ended October 31, 2016, on a market price basis, the Fund returned (7.00)%. On a net asset value (“NAV”) basis, the Fund returned (6.97)%. During the same time period, the Index returned (6.44)%. During the fiscal year, the Fund fully replicated the components of the Index; therefore, the Fund’s performance (NAV basis) differed from the return of the Index primarily due to fees and operating expenses that the Fund incurred.
During this same time period, the Russell 2000® Index (the “Benchmark Index”) returned 4.11%. The Benchmark Index is an unmanaged index weighted by market capitalization based on the average performance of small cap securities. The adviser provided this additional comparative benchmark to help investors better understand how the investment results of the Fund compare to the performance of a small cap weighted benchmark. The Benchmark Index was selected for its recognition in the marketplace, and its performance comparison is a useful measure for investors as a broad representation of the small cap stock market.
Relative to the Benchmark Index, the Fund was most overweight in the health care sector and most underweight in the real estate sector during the fiscal year ended October 31, 2016. The majority of the Fund’s underperformance relative to the Benchmark Index during the period can be attributed to the Fund’s
stock selection in the health care, information technology, and consumer discretionary sectors.
For the fiscal year ended October 31, 2016, the energy sector contributed most significantly to the Fund’s return, followed by the financials and consumer staples sectors, respectively. The health care sector detracted most significantly from the Fund’s return, followed by the consumer discretionary and information technology sectors, respectively.
Positions that contributed most significantly to the Fund’s return included Clayton Williams Energy, Inc., an energy company (portfolio average weight of 0.38%), and MGP Ingredients, Inc., a consumer staples company (no longer held at fiscal year-end). Positions that detracted most significantly from the Fund’s return included KapStone Paper and Packaging Corp., a materials company (no longer held at fiscal year-end), and Lithia Motors, Inc., Class A, a consumer discretionary company (no longer held at fiscal year-end).
| | | | |
Sector Breakdown
(% of the Fund’s Net Assets)
as of October 31, 2016 | |
| Information Technology | | | 19.3 | |
| Industrials | | | 17.7 | |
| Health Care | | | 17.2 | |
| Financials | | | 16.8 | |
| Consumer Discretionary | | | 12.7 | |
| Energy | | | 5.6 | |
| Materials | | | 5.3 | |
| Consumer Staples | | | 2.3 | |
| Real Estate | | | 1.2 | |
| Utilities | | | 1.1 | |
| Telecommunication Services | | | 0.8 | |
| Money Market Funds Plus Other Assets Less Liabilities | | | 0.0 | |
|
Top Ten Fund Holdings*
(% of the Fund’s Net Assets)
as of October 31, 2016 | |
| Security | | | | |
| Clayton Williams Energy, Inc. | | | 1.8 | |
| FBL Financial Group, Inc., Class A | | | 1.5 | |
| Neenah Paper, Inc. | | | 1.5 | |
| Independent Bank Corp./MI | | | 1.4 | |
| Heska Corp. | | | 1.3 | |
| Exelixis, Inc. | | | 1.3 | |
| Waterstone Financial, Inc. | | | 1.3 | |
| Lydall, Inc. | | | 1.2 | |
| Nautilus, Inc. | | | 1.2 | |
| MGIC Investment Corp. | | | 1.1 | |
| Total | | | 13.6 | |
| * | Excluding money market fund holdings. |
PowerShares DWA SmallCap Momentum Portfolio (DWAS) (continued)
Growth of a $10,000 Investment Since Inception†
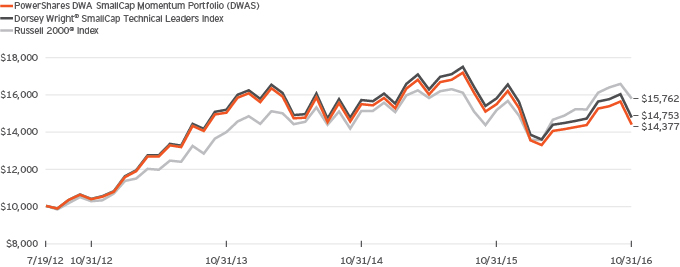
Fund Performance History as of October 31, 2016
| | | | | | | | | | | | | | | | | | | | | | | | |
| | | 1 Year | | | 3 Years
Average
Annualized | | | 3 Years
Cumulative | | | | | | Fund Inception† | |
| Index | | | | | | | | Average
Annualized | | | Cumulative | |
| Dorsey Wright® SmallCap Technical Leaders Index | | | (6.44 | )% | | | (0.89 | )% | | | (2.64 | )% | | | | | | | 9.51 | % | | | 47.53 | % |
| Russell 2000® Index | | | 4.11 | | | | 4.12 | | | | 12.89 | | | | | | | | 11.21 | | | | 57.62 | |
| Fund | | | | | | | | | | | | �� | | | | | | |
| NAV Return | | | (6.97 | ) | | | (1.42 | ) | | | (4.21 | ) | | | | | | | 8.84 | | | | 43.77 | |
| Market Price Return | | | (7.00 | ) | | | (1.51 | ) | | | (4.47 | ) | | | | | | | 8.80 | | | | 43.52 | |
Fund Inception: July 19, 2012
Performance quoted above represents past performance. Past performance is not a guarantee of future results and current performance may be higher or lower than performance quoted. Investment returns and principal value will fluctuate, and shares of the Fund (“Fund Shares”), when redeemed or sold, may be worth more or less than their original cost. Fund performance reflects any applicable fee waivers and/or expense reimbursements. Had the adviser not waived fees and/or reimbursed expenses currently or in the past, returns would have been lower. See current prospectus for more information. According to the Fund’s current prospectus, the Fund’s expense ratio of 0.60% is expressed as a unitary management fee to cover operating expenses and expenses incurred in connection with managing the portfolio. NAV and Market Price returns assume that dividends and capital gain distributions have been reinvested in the Fund at NAV and Market Price, respectively. The returns shown in the table above do not reflect the deduction of taxes that a shareholder would pay on Fund
distributions or the redemption or sale of Fund Shares. See invescopowershares.com to find the most recent month-end performance numbers.
Index and Benchmark Index performance results are based upon a hypothetical investment in their respective constituent securities. Index and Benchmark Index returns do not represent Fund returns. An investor cannot invest directly in an index. The Index and Benchmark Index do not charge management fees or brokerage expenses, and no such fees or expenses were deducted from the hypothetical performance shown. In addition, the results actual investors might have achieved would have differed from those shown because of differences in the timing, amounts of their investments, and fees and expenses associated with an investment in the Fund.
| † | Fund, Index and Benchmark Index returns are based on the inception date of the Fund. |
| | |
| DWIN | | Manager’s Analysis |
| | PowerShares DWA Tactical Multi-Asset Income Portfolio (DWIN) |
As an index fund, the PowerShares DWA Tactical Multi-Asset Income Portfolio (the “Fund”) is passively managed and attempts to track the returns of an underlying index. The Fund seeks investment results that generally correspond (before fees and expenses) to the price and yield of the Dorsey Wright® Multi-Asset Income Index (the “Index”). The Fund generally will invest at least 90% of its total assets in securities that comprise the Index. The Fund is a “fund of funds,” meaning that it invests substantially all of its assets in the shares of other exchange-traded funds (“ETFs”) eligible for inclusion in the Index, rather than in securities of individual companies. The Index is composed exclusively of other ETFs (the “Underlying ETFs”) and, under normal circumstances, most of the Underlying ETFs will be ETFs advised by the Fund’s adviser or its affiliates (the “PowerShares ETFs”). The Fund and the PowerShares ETFs are part of the same group of investment companies.
Strictly in accordance with its guidelines and mandated procedures, Dorsey, Wright & Associates, LLC (“Dorsey Wright”) or the “Index Provider”) compiles, maintains and calculates the Index, which, at any given time, is composed of one to five Underlying ETFs selected from a universe of income-producing ETFs (the “Eligible ETFs”), each of which generally is designed to seek to provide high levels of current income. This universe, which the Index Provider may change from time to time, consists mostly of PowerShares ETFs that employ income-oriented strategies. The Eligible ETFs invest their assets in different segments of the securities markets, such as: U.S. Treasuries, domestic and international bonds, dividend paying equities, preferred stock, real estate investment trusts (“REITs”) and master-limited partnerships (“MLPs”). The various Eligible ETFs may hold fixed income securities of any duration, maturity or quality, and certain Eligible ETFs may invest primarily in high-yield (or “junk”) bonds.
The Fund commenced investment operations on March 7, 2016 and began trading on March 10, 2016. During the period from inception to October 31, 2016, on a market price basis, the Fund returned 11.05%. On a net asset value (“NAV”) basis, the Fund returned 10.88%. During the same time period, the Index returned 11.19%. During the fiscal year, the Fund fully replicated the components of the Index; therefore, the Fund’s performance (NAV basis) differed from the return of the Index primarily due to fees and operating expenses that the Fund incurred, as well as trading costs around the rebalances during the period.
During this same time period, the Bloomberg Barclays U.S. Aggregate Index returned 3.19% and the S&P 500® Index returned 8.24% (both are “Benchmark Indices”). The Benchmark Indices are unmanaged indices weighted by market capitalization and based on the average performance of approximately 9,980 securities and 500 securities, respectively. The Benchmark Indices were selected for their recognition in the marketplace, and their performance comparison is a useful measure for investors as a broad representation of the US fixed income and equity markets, respectively.
Relative to the Bloomberg Barclays U.S. Aggregate Index, the Fund was most underweight in the information technology sector during the fiscal period ended October 31, 2016. The majority of the Fund’s outperformance relative to the Bloomberg Barclays U.S. Aggregate Index during the period can be attributed to the Fund’s thematic objective and weighting methodology across the underlying ETFs.
The majority of the Fund’s outperformance relative to the S&P 500® Index during the period can be attributed to the Fund being overweight an energy MLP ETF, a global short-term high yield bond ETF and an emerging market sovereign debt ETF.
For the fiscal period ended October 31, 2016, the MLP sector contributed most significantly to the Fund’s return, followed by the global short term high yield bond and emerging markets sovereign debt sectors. There were no detracting sectors.
Positions that contributed most significantly to the Fund’s return included Alerian MLP ETF, an MLP holding (portfolio average weight of 13.00%), and PowerShares Emerging Markets Sovereign Debt Portfolio, a PowerShares ETF holding positions in emerging markets sovereign debt (portfolio average weight of 18.76%). There were no detracting positions.
| | | | |
Portfolio Composition
Market Segment Breakdown
(% of the Fund’s Net Assets)*
as of October 31, 2016 | |
| International Bond | | | 38.3 | % |
| MLP | | | 22.3 | |
| Preferreds | | | 20.4 | |
| Real Estate | | | 19.0 | |
| * | Reflects exposure achieved through investments in underlying funds. |
PowerShares DWA Tactical Multi-Asset Income Portfolio (DWIN) (continued)
Growth of a $10,000 Investment Since Inception†
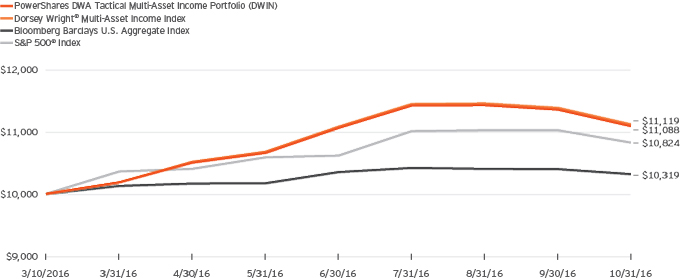
Fund Performance History as of October 31, 2016
| | | | |
| | | Fund Inception† | |
| Index | | Cumulative | |
| Dorsey Wright® Multi-Asset Income Index | | | 11.19 | % |
| Bloomberg Barclays U.S. Aggregate Index | | | 3.19 | |
| S&P 500® Index | | | 8.24 | |
| Fund | | | |
| NAV Return | | | 10.88 | |
| Market Price Return | | | 11.05 | |
Fund Inception: March 10, 2016
Performance quoted above represents past performance. Past performance is not a guarantee of future results and current performance may be higher or lower than performance quoted. Investment returns and principal value will fluctuate, and shares of the Fund (“Fund Shares”), when redeemed or sold, may be worth more or less than their original cost. Fund performance reflects any applicable fee waivers and/or expense reimbursements. Had the adviser not waived fees and/or reimbursed expenses currently or in the past, returns would have been lower. See current prospectus for more information. According to the Fund’s current prospectus, the Fund’s expense ratio of 0.69% includes the unitary management fee of 0.25% and acquired fund fees and expenses of 0.44%. NAV and Market Price returns assume that dividends and capital gain distributions have been reinvested in the Fund at NAV and Market Price, respectively. The returns shown in the table above do not reflect the deduction of taxes that a shareholder
would pay on Fund distributions or the redemption or sale of Fund Shares. See invescopowershares.com to find the most recent month-end performance numbers.
Index and Benchmark Indices performance results are based upon a hypothetical investment in their respective constituent securities. Index and Benchmark Indices returns do not represent Fund returns. An investor cannot invest directly in an index. The Index and Benchmark Indices do not charge management fees or brokerage expenses, and no such fees or expenses were deducted from the hypothetical performance shown. In addition, the results actual investors might have achieved would have differed from those shown because of differences in the timing, amounts of their investments, and fees and expenses associated with an investment in the Fund.
| † | Fund, Index and Benchmark Indices returns are based on the inception date of the Fund. |
| | |
| DWTR | | Manager’s Analysis |
| | PowerShares DWA Tactical Sector Rotation Portfolio (DWTR) |
As an index fund, the PowerShares DWA Tactical Sector Rotation Portfolio (the “Fund”) is passively managed and attempts to track the returns of an underlying index. The Fund seeks investment results that generally correspond (before fees and expenses) to the price and yield of the Dorsey Wright® Sector 4 Index (the “Index”). The Fund generally will invest at least 90% of its total assets in securities that comprise the Index. The Fund is a “fund of funds,” meaning that it invests its assets in the shares of other exchange-traded funds (“ETFs”) eligible for inclusion in the Index, rather than in securities of individual companies. The Fund also may invest in 1 to 6-month U.S. Treasury Bills included in the Index. The underlying funds included in the Index are ETFs advised by the Fund’s adviser or its affiliates (the “PowerShares ETFs”). The Fund and the PowerShares ETFs are part of the same group of investment companies.
Strictly in accordance with its guidelines and mandated procedures, Dorsey, Wright & Associates, LLC (“Dorsey Wright” or the “Index Provider”) compiles, maintains and calculates the Index which, at any given time, is composed of up to four PowerShares ETFs from an eligible universe of nine PowerShares ETFs, each of which is designed to seek to track separate sector specific underlying indexes. Each PowerShares ETF’s underlying index also is compiled and maintained by the Index Provider. The Index seeks to gain exposure to the sectors of the U.S. equity markets that display the strongest relative strength, as evaluated on a monthly basis. “Relative Strength” is the measurement of a security’s performance in a given universe as compared to the performance of all other securities in that universe. Therefore, at any given time, the components of the Index are those PowerShares ETFs that the Index Provider believes offer the greatest potential to outperform each other eligible PowerShares ETF. The Fund generally invests in all of the securities comprising the Index in proportion to their weightings in the Index.
For the fiscal year ended October 31, 2016, on a market price basis, the Fund returned (5.47)%. On a net asset value (“NAV”) basis, the Fund returned (5.40)%. During the same time period, the Index returned (5.20)%. During the fiscal year, the Fund fully replicated the components of the Index; therefore, the Fund’s performance (NAV basis) differed from the return of the Index primarily due to fees and operating expenses that the Fund incurred, as well as trading costs associated with rebalances during the period.
During this same time period, the Russell® 3000 Index (the “Benchmark Index”) returned 4.24%. The Benchmark Index is an unmanaged index weighted by market capitalization based on the average performance of approximately 2,970 securities. The Benchmark Index was selected for its recognition in the marketplace, and its performance comparison is a useful measure for investors as a broad representation of the overall U.S. stock market. The performance of the Fund differed from the
Benchmark Index primarily due to the Fund’s thematic objective and weighting methodology across the underlying PowerShares ETFs.
Relative to the Benchmark Index, the Fund was most underweight in the information technology sector during the fiscal year ended October 31, 2016. The majority of the Fund’s underperformance relative to the Benchmark Index during the period can be attributed to the Fund being underweight in the industrial and financial sectors as well as individual stock selection within the information technology sector.
For the fiscal year ended October 31, 2016, the basic materials sector contributed most significantly to the Fund’s return, followed by the utilities sector. The healthcare sector detracted most significantly from the Fund’s return, followed by the consumer cyclicals and technology sectors, respectively.
Positions that contributed most significantly to the Fund’s return included PowerShares DWA Basic Materials Momentum Portfolio, a PowerShares ETF holding positions in basic materials companies (portfolio average weight of 16.21%), and PowerShares DWA Utilities Momentum Portfolio, a PowerShares ETF holding positions in utilities companies (portfolio average weight of 16.14%). Positions that detracted most significantly from the Fund’s return included PowerShares DWA Healthcare Momentum Portfolio, a PowerShares ETF holding positions in healthcare companies (no longer held at fiscal year-end), and PowerShares DWA Consumer Cyclicals Momentum Portfolio, a PowerShares ETF holding positions in consumer cyclical companies (no longer held at fiscal year-end).
| | | | |
Sector Breakdown (% of the Fund’s Net Assets)
as of October 31, 2016 | |
| Consumer Staples | | | 28.4 | |
| Materials | | | 28.2 | |
| Information Technology | | | 21.9 | |
| Utilities | | | 21.5 | |
| Money Market Fund Plus Other Assets Less Liabilities | | | (0.0) | |
PowerShares DWA Tactical Sector Rotation Portfolio (DWTR) (continued)
Growth of a $10,000 Investment Since Inception†
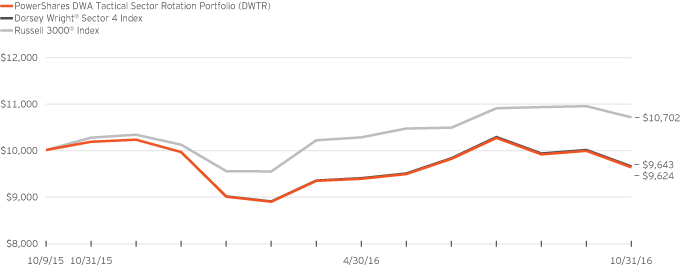
Fund Performance History as of October 31, 2016
| | | | | | | | | | | | | | | | |
| | | 1 Year | | | | | | Fund Inception† | |
| Index | | | | | | Average
Annualized | | | Cumulative | |
| Dorsey Wright® Sector 4 Index | | | (5.20 | )% | | | | | | | (3.37 | )% | | | (3.57 | )% |
| Russell 3000® Index | | | 4.24 | | | | | | | | 6.62 | | | | 7.02 | |
| Fund | | | | | | | | | | | | |
| NAV Return | | | (5.40 | ) | | | | | | | (3.55 | ) | | | (3.76 | ) |
| Market Price Return | | | (5.47 | ) | | | | | | | (3.55 | ) | | | (3.76 | ) |
Fund Inception: October 9, 2015
Performance quoted above represents past performance. Past performance is not a guarantee of future results and current performance may be higher or lower than performance quoted. Investment returns and principal value will fluctuate, and shares of the Fund (“Fund Shares”), when redeemed or sold, may be worth more or less than their original cost. Fund performance reflects any applicable fee waivers and/or expense reimbursements. Had the adviser not waived fees and/or reimbursed expenses currently or in the past, returns would have been lower. See current prospectus for more information. According to the Fund’s current prospectus, the Fund’s expense ratio of 0.75% includes the unitary management fee of 0.15% and acquired fund fees and expenses of 0.60%. NAV and Market Price returns assume that dividends and capital gain distributions have been reinvested in the Fund at NAV and Market Price, respectively. The returns shown in the table above do not reflect the deduction of taxes that a shareholder would pay
on Fund distributions or the redemption or sale of Fund Shares. See invescopowershares.com to find the most recent month-end performance numbers.
Index and Benchmark Index performance results are based upon a hypothetical investment in their respective constituent securities. Index and Benchmark Index returns do not represent Fund returns. An investor cannot invest directly in an index. The Index and Benchmark Index do not charge management fees or brokerage expenses, and no such fees or expenses were deducted from the hypothetical performance shown. In addition, the results actual investors might have achieved would have differed from those shown because of differences in the timing, amounts of their investments, and fees and expenses associated with an investment in the Fund.
| † | Fund, Index and Benchmark Index returns are based on the inception date of the Fund. |
| | |
| PSCD | | Manager’s Analysis |
| | PowerShares S&P SmallCap Consumer Discretionary Portfolio (PSCD) |
As an index fund, the PowerShares S&P SmallCap Consumer Discretionary Portfolio (the “Fund”) is passively managed and attempts to track the returns of an underlying index. The Fund seeks investment results that generally correspond (before fees and expenses) to the price and yield of the S&P SmallCap 600® Capped Consumer Discretionary Index (the “Index”). The Fund generally will invest at least 90% of its total assets in common stocks of small capitalization U.S. consumer discretionary companies that comprise the Index. These companies are principally engaged in the business of providing consumer goods and services that are cyclical in nature, including, but not limited to, household durables, leisure products and services, apparel and luxury goods, computers and electronics, automobiles and auto components, hotel and restaurant services and television and other entertainment goods and services.
S&P Dow Jones Indices, LLC, the Index provider, defines sectors according to the Global Industry Classification Standard (“GICS”) and compiles, maintains and calculates the Index strictly in accordance with its existing guidelines and mandated procedures. The Fund generally invests in all of the securities comprising the Index in proportion to their weightings in the Index.
For the fiscal year ended October 31, 2016, on a market price basis, the Fund returned (5.24)%. On a net asset value (“NAV”) basis, the Fund returned (5.23)%. During the same time period, the Index returned (5.04)%. During the fiscal year, the Fund fully replicated the components of the Index; therefore, the Fund’s performance (NAV basis) differed from the return of the Index primarily due to fees and operating expenses that the Fund incurred during the period.
During this same time period, the S&P SmallCap 600® Index (the “Benchmark Index”) returned 6.35%. The Benchmark Index is an unmanaged index weighted by market capitalization based on the average performance of small cap securities. The adviser provided this additional comparative benchmark to help investors better understand how the investment results of the Fund compare to the performance of a broad-based market benchmark. The Benchmark Index was selected for its recognition in the marketplace, and its performance comparison is a useful measure for investors as a broad representation of the overall U.S. small cap stock market.
Relative to the Benchmark Index, the Fund was most overweight in the specialty retail industry and most underweight in the banks industry during the fiscal year ended October 31, 2016. The majority of the Fund’s underperformance relative to the Benchmark Index during the period can be attributed to the Fund’s concentration in the specialty retail industry.
For the fiscal year ended October 31, 2016, the household durables industry contributed most significantly to the Fund’s return, followed by the hotels, restaurants & leisure and auto
components industries, respectively. The specialty retail industry detracted most significantly from the Fund’s return, followed by the media and textiles, apparel & luxury goods industries, respectively.
Positions that contributed most significantly to the Fund’s return included Drew Industries, Inc., an auto components company (portfolio average weight of 2.07%), and Texas Roadhouse, Inc., a hotels, restaurants & leisure company (no longer held at fiscal year-end). Positions that detracted most significantly from the Fund’s return included Tailored Brands, Inc., a specialty retail company (portfolio average weight of 0.87%), and G-III Apparel Group Ltd., a textiles, apparel & luxury goods company (portfolio average weight of 1.98%).
| | | | |
Industry Breakdown
(% of the Fund’s Net Assets)
as of October 31, 2016 | |
| Specialty Retail | | | 27.9 | |
| Hotels, Restaurants & Leisure | | | 21.5 | |
| Auto Components | | | 12.0 | |
| Household Durables | | | 11.9 | |
| Textiles, Apparel & Luxury Goods | | | 9.3 | |
| Media | | | 3.8 | |
| Leisure Products | | | 3.2 | |
| Diversified Consumer Services | | | 3.0 | |
| Internet & Direct Marketing Retail | | | 2.4 | |
| Multi-line Retail | | | 2.1 | |
| Distributors | | | 1.9 | |
| Automobiles | | | 0.9 | |
| Money Market Funds Plus Other Assets Less Liabilities | | | 0.1 | |
|
Top Ten Fund Holdings*
(% of the Fund’s Net Assets)
as of October 31, 2016 | |
| Security | | | | |
| Drew Industries, Inc. | | | 2.5 | |
| Wolverine World Wide, Inc. | | | 2.4 | |
| Five Below, Inc. | | | 2.3 | |
| Papa John’s International, Inc. | | | 2.3 | |
| Lithia Motors, Inc., Class A | | | 2.2 | |
| Dorman Products, Inc. | | | 2.2 | |
| Steven Madden Ltd. | | | 2.1 | |
| Monro Muffler Brake, Inc. | | | 2.0 | |
| Ilg, Inc. | | | 2.0 | |
| Core-Mark Holding Co., Inc. | | | 1.8 | |
| Total | | | 21.8 | |
| * | Excluding money market fund holdings. |
PowerShares S&P SmallCap Consumer Discretionary Portfolio (PSCD) (continued)
Growth of a $10,000 Investment Since Inception†
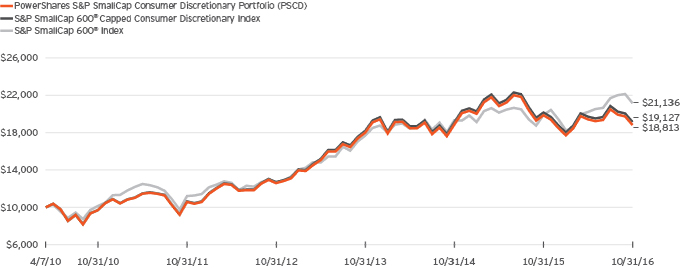
Fund Performance History as of October 31, 2016
| | | | | | | | | | | | | | | | | | | | | | | | | | | | | | | | |
| | | 1 Year | | | 3 Years
Average
Annualized | | | 3 Years
Cumulative | | | 5 Years
Average
Annualized | | | 5 Years
Cumulative | | | | | | Fund Inception† | |
| Index | | | | | | | | | | Average
Annualized | | | Cumulative | |
| S&P SmallCap 600® Capped Consumer Discretionary Index | | | (5.04 | )% | | | 1.71 | % | | | 5.21 | % | | | 12.49 | % | | | 80.14 | % | | | | | | | 10.38 | % | | | 91.27 | % |
| S&P SmallCap 600® Index | | | 6.35 | | | | 6.13 | | | | 19.55 | | | | 13.56 | | | | 88.89 | | | | | | | | 12.08 | | | | 111.36 | |
| Fund | | | | | | | | | | | | | | | | | | | | | | | | | | | | | | | | |
| NAV Return | | | (5.23 | ) | | | 1.50 | | | | 4.57 | | | | 12.22 | | | | 77.98 | | | | | | | | 10.10 | | | | 88.13 | |
| Market Price Return | | | (5.24 | ) | | | 1.44 | | | | 4.37 | | | | 12.20 | | | | 77.83 | | | | | | | | 10.12 | | | | 88.34 | |
Fund Inception: April 7, 2010
Performance quoted above represents past performance. Past performance is not a guarantee of future results and current performance may be higher or lower than performance quoted. Investment returns and principal value will fluctuate, and shares of the Fund (“Fund Shares”), when redeemed or sold, may be worth more or less than their original cost. Fund performance reflects any applicable fee waivers and/or expense reimbursements. Had the adviser not waived fees and/or reimbursed expenses currently or in the past, returns would have been lower. See current prospectus for more information. According to the Fund’s current prospectus, the Fund’s expense ratio of 0.29% is expressed as a unitary management fee to cover operating expenses and expenses incurred in connection with managing the portfolio. NAV and Market Price returns assume that dividends and capital gain distributions have been reinvested in the Fund at NAV and Market Price, respectively. The returns shown in the table above do not reflect the deduction of taxes that a shareholder would pay on Fund
distributions or the redemption or sale of Fund Shares. See invescopowershares.com to find the most recent month-end performance numbers.
Index and Benchmark Index performance results are based upon a hypothetical investment in their respective constituent securities. Index and Benchmark Index returns do not represent Fund returns. An investor cannot invest directly in an index. The Index and Benchmark Index do not charge management fees or brokerage expenses, and no such fees or expenses were deducted from the hypothetical performance shown. In addition, the results actual investors might have achieved would have differed from those shown because of differences in the timing, amounts of their investments, and fees and expenses associated with an investment in the Fund.
| † | Fund, Index and Benchmark Index returns are based on the inception date of the Fund. |
| | |
| PSCC | | Manager’s Analysis |
| | PowerShares S&P SmallCap Consumer Staples Portfolio (PSCC) |
As an index fund, the PowerShares S&P SmallCap Consumer Staples Portfolio (the “Fund”) is passively managed and attempts to track the returns of an underlying index. The Fund seeks investment results that generally correspond (before fees and expenses) to the price and yield of the S&P SmallCap 600® Capped Consumer Staples Index (the “Index”). The Fund generally will invest at least 90% of its total assets in common stocks of small capitalization U.S. consumer staples companies that comprise the Index. These companies are principally engaged in the business of providing consumer goods and services that have noncyclical characteristics, including tobacco, food and beverage, and non-discretionary retail.
S&P Dow Jones Indices, LLC, the Index provider, defines sectors according to the Global Industry Classification Standard (“GICS”) and compiles, maintains and calculates the Index strictly in accordance with its existing guidelines and mandated procedures. The Fund generally invests in all of the securities comprising the Index in proportion to their weightings in the Index.
For the fiscal year ended October 31, 2016, on a market price basis, the Fund returned 11.59%. On a net asset value (“NAV”) basis, the Fund returned 11.81%. During the same time period, the Index returned 12.62%. During the fiscal year, the Fund deviated slightly from the Index in order to comply with the diversification requirements to qualify as a regulated investment company under the Internal Revenue Code. The Fund’s performance (NAV basis) differed from the return of the Index primarily due to fees and operating expenses incurred by the Fund during the period as well as due to these changes in portfolio composition.
During this same time period, the S&P SmallCap 600® Index (the “Benchmark Index”) returned 6.35%. The Benchmark Index is an unmanaged index weighted by market capitalization based on the average performance of small cap securities. The adviser provided this additional comparative benchmark to help investors better understand how the investment results of the Fund compare to the performance of a broad-based market benchmark. The Benchmark Index was selected for its recognition in the marketplace, and its performance comparison is a useful measure for investors as a broad representation of the overall U.S. small cap stock market.
Relative to the Benchmark Index, the Fund was most overweight in the food products industry and most underweight in the banks industry during the fiscal year ended October 31, 2016. The majority of the Fund’s outperformance relative to the Benchmark Index during the period can be attributed to the Fund’s concentration in the food products industry.
For the fiscal year ended October 31, 2016, the food products industry contributed most significantly to the Fund’s return, followed by the personal products and household products industries, respectively. There were no detracting industries.
Positions that contributed most significantly to the Fund’s return included Darling Ingredients, Inc., a food products company (portfolio average weight of 11.91%), and B&G Foods, Inc., a food products company (portfolio average weight of 14.51%). Positions that detracted most significantly from the Fund’s return included Cal-Maine Foods, Inc., a food products company (portfolio average weight of 6.65%), and Snyder’s-Lance, Inc., a food products company (no longer held at fiscal year-end).
| | | | |
Industry Breakdown
(% of the Fund’s Net Assets)
as of October 31, 2016 | |
| Food Products | | | 58.9 | |
| Food & Staples Retailing | | | 14.3 | |
| Household Products | | | 9.6 | |
| Personal Products | | | 9.6 | |
| Tobacco | | | 4.9 | |
| Money Market Fund Plus Other Assets Less Liabilities | | | 2.7 | |
|
Top Ten Fund Holdings*
(% of the Fund’s Net Assets)
as of October 31, 2016 | |
| Security | | | | |
| B&G Foods, Inc. | | | 14.7 | |
| Darling Ingredients, Inc. | | | 11.7 | |
| Sanderson Farms, Inc. | | | 9.4 | |
| J & J Snack Foods Corp. | | | 9.3 | |
| Universal Corp. | | | 4.8 | |
| Andersons, Inc. (The) | | | 4.8 | |
| Inter Parfums, Inc. | | | 4.8 | |
| Medifast, Inc. | | | 4.8 | |
| Seneca Foods Corp., Class A | | | 4.8 | |
| WD-40 Co. | | | 4.8 | |
| Total | | | 73.9 | |
| * | Excluding money market fund holdings. |
PowerShares S&P SmallCap Consumer Staples Portfolio (PSCC) (continued)
Growth of a $10,000 Investment Since Inception†
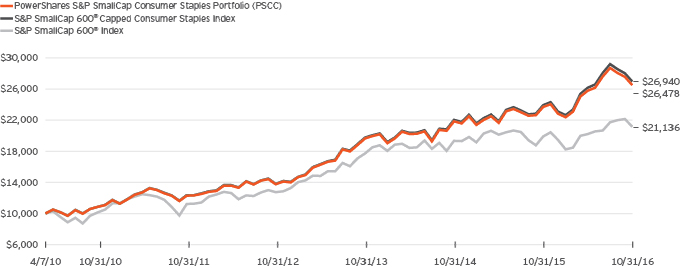
Fund Performance History as of October 31, 2016
| | | | | | | | | | | | | | | | | | | | | | | | | | | | | | | | |
| | | 1 Year | | | 3 Years
Average
Annualized | | | 3 Years
Cumulative | | | 5 Years
Average
Annualized | | | 5 Years
Cumulative | | | | | | Fund Inception† | |
| Index | | | | | | | | | | Average
Annualized | | | Cumulative | |
| S&P SmallCap 600® Capped Consumer Staples Index | | | 12.62 | % | | | 10.94 | % | | | 36.53 | % | | | 16.93 | % | | | 118.57 | % | | | | | | | 16.30 | % | | | 169.40 | % |
| S&P SmallCap 600® Index | | | 6.35 | | | | 6.13 | | | | 19.55 | | | | 13.56 | | | | 88.89 | | | | | | | | 12.08 | | | | 111.36 | |
| Fund | | | | | | | | | | | | | | | | | | | | | | | | |
| NAV Return | | | 11.81 | | | | 10.51 | | | | 34.97 | | | | 16.61 | | | | 115.66 | | | | | | | | 15.98 | | | | 164.78 | |
| Market Price Return | | | 11.59 | | | | 10.40 | | | | 34.54 | | | | 16.57 | | | | 115.22 | | | | | | | | 15.96 | | | | 164.50 | |
Fund Inception: April 7, 2010
Performance quoted above represents past performance. Past performance is not a guarantee of future results and current performance may be higher or lower than performance quoted. Investment returns and principal value will fluctuate, and shares of the Fund (“Fund Shares”), when redeemed or sold, may be worth more or less than their original cost. Fund performance reflects any applicable fee waivers and/or expense reimbursements. Had the adviser not waived fees and/or reimbursed expenses currently or in the past, returns would have been lower. See current prospectus for more information. According to the Fund’s current prospectus, the Fund’s expense ratio of 0.29% is expressed as a unitary management fee to cover operating expenses and expenses incurred in connection with managing the portfolio. NAV and Market Price returns assume that dividends and capital gain distributions have been reinvested in the Fund at NAV and Market Price, respectively. The returns shown in the table above do not
reflect the deduction of taxes that a shareholder would pay on Fund distributions or the redemption or sale of Fund Shares. See invescopowershares.com to find the most recent month-end performance numbers.
Index and Benchmark Index performance results are based upon a hypothetical investment in their respective constituent securities. Index and Benchmark Index returns do not represent Fund returns. An investor cannot invest directly in an index. The Index and Benchmark Index do not charge management fees or brokerage expenses, and no such fees or expenses were deducted from the hypothetical performance shown. In addition, the results actual investors might have achieved would have differed from those shown because of differences in the timing, amounts of their investments, and fees and expenses associated with an investment in the Fund.
| † | Fund, Index and Benchmark Index returns are based on the inception date of the Fund. |
| | |
| PSCE | | Manager’s Analysis |
| | PowerShares S&P SmallCap Energy Portfolio (PSCE) |
As an index fund, the PowerShares S&P SmallCap Energy Portfolio (the “Fund”) is passively managed and attempts to track the returns of an underlying index. The Fund seeks investment results that generally correspond (before fees and expenses) to the price and yield of the S&P SmallCap 600® Capped Energy Index (the “Index”). The Fund generally will invest at least 90% of its total assets in common stocks of small capitalization U.S. energy companies that comprise the Index. These companies are principally engaged in the business of producing, distributing or servicing energy related products, including oil and gas exploration and production, refining, oil services and pipelines.
S&P Dow Jones Indices, LLC, the Index provider, defines sectors according to the Global Industry Classification Standard (“GICS”) and compiles, maintains and calculates the Index strictly in accordance with its existing guidelines and mandated procedures. The Fund generally invests in all of the securities comprising the Index in proportion to their weightings in the Index.
For the fiscal year ended October 31, 2016, on a market price basis, the Fund returned (7.05)%. On a net asset value (“NAV”) basis, the Fund returned (7.11)%. During the same time period, the Index returned (7.02)%. During the fiscal year, the Fund fully replicated the components of the Index; therefore, the Fund’s performance (NAV basis) differed from the return of the Index primarily due to fees and operating expenses that the Fund incurred, which was partially offset by income received through securities lending.
During this same time period, the S&P SmallCap 600® Index (the “Benchmark Index”) returned 6.35%. The Benchmark Index is an unmanaged index weighted by market capitalization based on the average performance of small-cap securities. The adviser provided this additional comparative benchmark to help investors better understand how the investment results of the Fund compare to the performance of a broad-based market benchmark. The Benchmark Index was selected for its recognition in the marketplace, and its performance comparison is a useful measure for investors as a broad representation of the overall U.S. small cap stock market.
Relative to the Benchmark Index, the Fund was most overweight in the energy equipment & services industry and most underweight in the banks industry during the fiscal year ended October 31, 2016. The majority of the Fund’s underperformance relative to the Benchmark Index during the period can be attributed to the Fund’s concentration in the oil gas & consumable fuels industry.
For the fiscal year ended October 31, 2016, there were no contributing industries. The oil, gas & consumable fuels industry detracted most significantly from the Fund’s return, followed by the energy equipment & services industry.
Positions that contributed most significantly to the Fund’s return included US Silica Holdings, Inc., an energy equipment & services company (portfolio average weight of 9.61%), and PDC Energy, Inc., an oil, gas & consumable fuels company (portfolio average weight of 15.19%). Positions that detracted most significantly from the Fund’s return included Bristow Group, Inc., an energy equipment & services company (portfolio average weight of 3.70%), and Stone Energy Corporation, an oil, gas & consumable fuels company (no longer held at fiscal year-end).
| | | | |
Industry Breakdown
(% of the Fund’s Net Assets)
as of October 31, 2016 | |
| Energy Equipment & Services | | | 54.7 | |
| Oil, Gas & Consumable Fuels | | | 44.9 | |
| Money Market Funds Plus Other Assets Less Liabilities | | | 0.4 | |
|
Top Ten Fund Holdings*
(% of the Fund’s Net Assets)
as of October 31, 2016 | |
| Security | | | | |
| PDC Energy, Inc. | | | 17.5 | |
| US Silica Holdings, Inc. | | | 14.9 | |
| Carrizo Oil & Gas, Inc. | | | 10.4 | |
| Helix Energy Solutions Group, Inc. | | | 4.8 | |
| Synergy Resources Corp. | | | 4.7 | |
| Green Plains, Inc. | | | 4.7 | |
| Archrock, Inc. | | | 4.4 | |
| Unit Corp. | | | 4.3 | |
| SEACOR Holdings, Inc. | | | 3.8 | |
| Newpark Resources, Inc. | | | 2.9 | |
| Total | | | 72.4 | |
| * | Excluding money market fund holdings. |
PowerShares S&P SmallCap Energy Portfolio (PSCE) (continued)
Growth of a $10,000 Investment Since Inception†
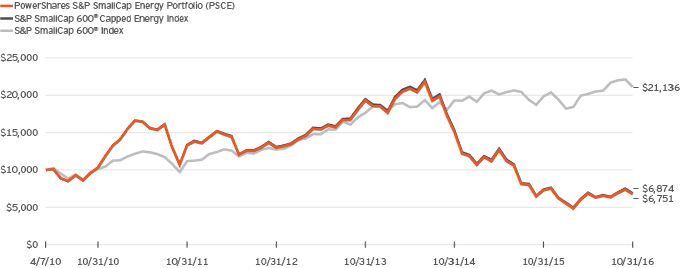
Fund Performance History as of October 31, 2016
| | | | | | | | | | | | | | | | | | | | | | | | | | | | | | | | |
| | | 1 Year | | | 3 Years
Average
Annualized | | | 3 Years
Cumulative | | | 5 Years
Average
Annualized | | | 5 Years
Cumulative | | | | | | Fund Inception† | |
| Index | | | | | | | | | | Average
Annualized | | | Cumulative | |
| S&P SmallCap 600® Capped Energy Index | | | (7.02 | )% | | | (29.35 | )% | | | (64.73 | )% | | | (12.46 | )% | | | (48.58 | )% | | | | | | | (5.55 | )% | | | (31.26 | )% |
| S&P SmallCap 600® Index | | | 6.35 | | | | 6.13 | | | | 19.55 | | | | 13.56 | | | | 88.89 | | | | | | | | 12.08 | | | | 111.36 | |
| Fund | | | | | | | | | | | | | | | | | | | | | | | | | | | | | | | | |
| NAV Return | | | (7.11 | ) | | | (29.49 | ) | | | (64.95 | ) | | | (12.67 | ) | | | (49.22 | ) | | | | | | | (5.81 | ) | | | (32.49 | ) |
| Market Price Return | | | (7.05 | ) | | | (29.53 | ) | | | (65.01 | ) | | | (12.67 | ) | | | (49.20 | ) | | | | | | | (5.77 | ) | | | (32.30 | ) |
Fund Inception: April 7, 2010
Performance quoted above represents past performance. Past performance is not a guarantee of future results and current performance may be higher or lower than performance quoted. Investment returns and principal value will fluctuate, and shares of the Fund (“Fund Shares”), when redeemed or sold, may be worth more or less than their original cost. Fund performance reflects any applicable fee waivers and/or expense reimbursements. Had the adviser not waived fees and/or reimbursed expenses currently or in the past, returns would have been lower. See current prospectus for more information. According to the Fund’s current prospectus, the Fund’s expense ratio of 0.29% is expressed as a unitary management fee to cover operating expenses and expenses incurred in connection with managing the portfolio. NAV and Market Price returns assume that dividends and capital gain distributions have been reinvested in the Fund at NAV and Market Price, respectively. The returns shown in the table above do not reflect the deduction of taxes that a shareholder would pay on Fund
distributions or the redemption or sale of Fund Shares. See invescopowershares.com to find the most recent month-end performance numbers.
Index and Benchmark Index performance results are based upon a hypothetical investment in their respective constituent securities. Index and Benchmark Index returns do not represent Fund returns. An investor cannot invest directly in an index. The Index and Benchmark Index do not charge management fees or brokerage expenses, and no such fees or expenses were deducted from the hypothetical performance shown. In addition, the results actual investors might have achieved would have differed from those shown because of differences in the timing, amounts of their investments, and fees and expenses associated with an investment in the Fund.
| † | Fund, Index and Benchmark Index returns are based on the inception date of the Fund. |
| | |
| PSCF | | Manager’s Analysis |
| | PowerShares S&P SmallCap Financials Portfolio (PSCF) |
As an index fund, the PowerShares S&P SmallCap Financials Portfolio (the “Fund”) is passively managed and attempts to track the returns of an underlying index. The Fund seeks investment results that generally correspond (before fees and expenses) to the price and yield of the S&P SmallCap 600® Capped Financials and Real Estate Index (the “Index”). The Fund generally will invest at least 90% of its total assets in common stocks of small capitalization U.S. financials companies that comprise the Index. These companies are principally engaged in the business of providing financial services and products, including, but not limited to, banking, investment services, insurance and real estate finance services.
S&P Dow Jones Indices, LLC, the Index provider, defines sectors according to the Global Industry Classification Standard (“GICS”) and compiles, maintains and calculates the Index strictly in accordance with its existing guidelines and mandated procedures. The Fund generally invests in all of the securities comprising the Index in proportion to their weightings in the Index.
For the fiscal year ended October 31, 2016, on a market price basis, the Fund returned 6.19%. On a net asset value (“NAV”) basis, the Fund returned 6.29%. During the same time period, the Index returned 6.58%. During the fiscal year, the Fund fully replicated the components of the Index; therefore, the Fund’s performance (NAV basis) differed from the return of the Index primarily due to fees and operating expenses that the Fund incurred during the period.
During this same time period, the S&P SmallCap 600® Index (the “Benchmark Index”) returned 6.35%. The Benchmark Index is an unmanaged index weighted by market capitalization based on the average performance of small-cap securities. The adviser provided this additional comparative benchmark to help investors better understand how the investment results of the Fund compare to the performance of a broad-based market benchmark. The Benchmark Index was selected for its recognition in the marketplace, and its performance comparison is a useful measure for investors as a broad representation of the overall U.S. small cap stock market.
Relative to the Benchmark Index, the Fund was most overweight in the banks industry and most underweight in the health care equipment & supplies industry during the fiscal year ended October 31, 2016. In addition to fees and operating expenses that the Fund incurred during the period, the majority of the Fund’s underperformance relative to the Benchmark Index can be attributed to the Fund’s focus on the financial industry while the best performing industries within the Benchmark Index were in the electronic equipment instruments & components, the semiconductors & semiconductor equipment, and the insurance industries.
For the fiscal year ended October 31, 2016, the equity real estate investment trusts (REITs) industry contributed most significantly
to the Fund’s return, followed by the banks and real estate investment trusts (REITs) industries, respectively. The capital markets industry detracted most significantly from the Fund’s return, followed by the consumer finance and insurance industries, respectively.
Positions that contributed most significantly to the Fund’s return included Medical Properties Trust, Inc., a real estate investment trusts (REITs) company (no longer held at fiscal year-end), and CoreSite Realty Corp. REIT, an equity real estate investment trusts (REITs) company (portfolio average weight of 1.51%). Positions that detracted most significantly from the Fund’s return included PRA Group, Inc., a diversified financial services company (portfolio average weight of 0.99%), and American Equity Investment Life Holding Co., an insurance company (portfolio average weight of 1.00%).
| | | | |
Industry Breakdown
(% of the Fund’s Net Assets)
as of October 31, 2016 | |
| Banks | | | 41.7 | |
| Equity REITs | | | 26.1 | |
| Insurance | | | 13.1 | |
| Capital Markets | | | 6.5 | |
| Thrifts & Mortgage Finance | | | 6.4 | |
| Consumer Finance | | | 4.2 | |
| Real Estate Management & Development | | | 1.4 | |
| Mortgage REITs | | | 0.6 | |
| Money Market Fund Plus Other Assets Less Liabilities | | | (0.0) | |
|
Top Ten Fund Holdings*
(% of the Fund’s Net Assets)
as of October 31, 2016 | |
| Security | | | | |
| ProAssurance Corp. | | | 1.9 | |
| Wintrust Financial Corp. | | | 1.9 | |
| Texas Capital Bancshares, Inc. | | | 1.9 | |
| UMB Financial Corp. | | | 1.8 | |
| Acadia Realty Trust | | | 1.8 | |
| Home BancShares, Inc. | | | 1.8 | |
| United Bankshares, Inc. | | | 1.7 | |
| CoreSite Realty Corp. | | | 1.7 | |
| First Financial Bankshares, Inc. | | | 1.6 | |
| Sterling Bancorp | | | 1.6 | |
| Total | | | 17.7 | |
| * | Excluding money market fund holdings. |
PowerShares S&P SmallCap Financials Portfolio (PSCF) (continued)
Growth of a $10,000 Investment Since Inception†
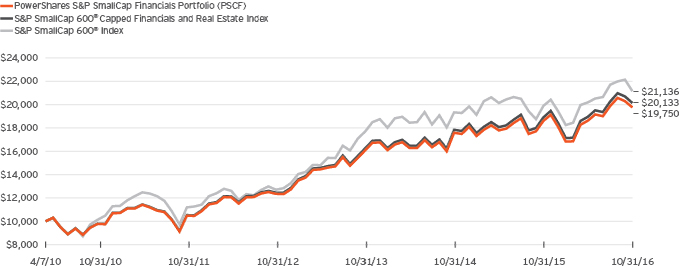
Fund Performance History as of October 31, 2016
| | | | | | | | | | | | | | | | | | | | | | | | | | | | | | | | |
| | | 1 Year | | | 3 Years
Average
Annualized | | | 3 Years
Cumulative | | | 5 Years
Average
Annualized | | | 5 Years
Cumulative | | | | | | Fund Inception† | |
| Index | | | | | | | | | | Average
Annualized | | | Cumulative | |
| S&P SmallCap 600® Capped Financials and Real Estate Index | | | 6.58 | % | | | 7.41 | % | | | 23.91 | % | | | 13.82 | % | | | 91.04 | % | | | | | | | 11.25 | % | | | 101.33 | % |
| S&P SmallCap 600® Index | | | 6.35 | | | | 6.13 | | | | 19.55 | | | | 13.56 | | | | 88.89 | | | | | | | | 12.08 | | | | 111.36 | |
| Fund | | | | | | | | | | | | | | | | | | | | | | | | |
| NAV Return | | | 6.29 | | | | 7.11 | | | | 22.88 | | | | 13.50 | | | | 88.35 | | | | | | | | 10.92 | | | | 97.50 | |
| Market Price Return | | | 6.19 | | | | 7.03 | | | | 22.61 | | | | 13.47 | | | | 88.11 | | | | | | | | 10.91 | | | | 97.41 | |
Fund Inception: April 7, 2010
Performance quoted above represents past performance. Past performance is not a guarantee of future results and current performance may be higher or lower than performance quoted. Investment returns and principal value will fluctuate, and shares of the Fund (“Fund Shares”), when redeemed or sold, may be worth more or less than their original cost. Fund performance reflects any applicable fee waivers and/or expense reimbursements. Had the adviser not waived fees and/or reimbursed expenses currently or in the past, returns would have been lower. See current prospectus for more information. According to the Fund’s current prospectus, the Fund’s expense ratio of 0.29% is expressed as a unitary management fee to cover operating expenses and expenses incurred in connection with managing the portfolio. NAV and Market Price returns assume that dividends and capital gain distributions have been reinvested in the Fund at NAV and Market Price, respectively. The returns shown in the table above do not
reflect the deduction of taxes that a shareholder would pay on Fund distributions or the redemption or sale of Fund Shares. See invescopowershares.com to find the most recent month-end performance numbers.
Index and Benchmark Index performance results are based upon a hypothetical investment in their respective constituent securities. Index and Benchmark Index returns do not represent Fund returns. An investor cannot invest directly in an index. The Index and Benchmark Index do not charge management fees or brokerage expenses, and no such fees or expenses were deducted from the hypothetical performance shown. In addition, the results actual investors might have achieved would have differed from those shown because of differences in the timing, amounts of their investments, and fees and expenses associated with an investment in the Fund.
| † | Fund, Index and Benchmark Index returns are based on the inception date of the Fund. |
| | |
| PSCH | | Manager’s Analysis |
| | PowerShares S&P SmallCap Health Care Portfolio (PSCH) |
As an index fund, the PowerShares S&P SmallCap Health Care Portfolio (the “Fund”) is passively managed and attempts to track the returns of an underlying index. The Fund seeks investment results that generally correspond (before fees and expenses) to the price and yield of the S&P SmallCap 600® Capped Health Care Index (the “Index”). The Fund generally will invest at least 90% of its total assets in common stocks of small capitalization U.S. healthcare companies that comprise the Index. These companies are principally engaged in the business of providing healthcare-related products, facilities and services including, but not limited to, biotechnology, pharmaceuticals, medical technology and supplies.
S&P Dow Jones Indices, LLC, the Index provider, defines sectors according to the Global Industry Classification Standard (“GICS”) and compiles, maintains and calculates the Index strictly in accordance with its existing guidelines and mandated procedures. The Fund generally invests in all of the securities comprising the Index in proportion to their weightings in the Index.
For the fiscal year ended October 31, 2016, on a market price basis, the Fund returned 0.21%. On a net asset value (“NAV”) basis, the Fund returned 0.33%. During the same time period, the Index returned 0.58%. During the fiscal year, the Fund fully replicated the components of the Index; therefore, the Fund’s performance (NAV basis) differed from the return of the Index primarily due to fees and operating expenses that the Fund incurred during the period.
During this same time period, the S&P SmallCap 600® Index (the “Benchmark Index”) returned 6.35%. The Benchmark Index is an unmanaged index weighted by market capitalization based on the average performance of small cap securities. The adviser provided this additional comparative benchmark to help investors better understand how the investment results of the Fund compare to the performance of a broad-based market benchmark. The Benchmark Index was selected for its recognition in the marketplace, and its performance comparison is a useful measure for investors as a broad representation of the overall U.S. small cap stock market.
Relative to the Benchmark Index, the Fund was most overweight in the health care equipment & supplies industry and most underweight in the banks industry during the fiscal year ended October 31, 2016. The majority of the Fund’s underperformance relative to the Benchmark Index during the period can be attributed to the Fund’s concentration in the health care providers & services industry.
For the fiscal year ended October 31, 2016, the health care equipment & supplies industry contributed most significantly to the Fund’s return, followed by the health care technology and life sciences tools & services industries, respectively. The health care providers & services industry detracted most significantly from the
Fund’s return, followed by the biotechnology and pharmaceuticals industries, respectively.
Positions that contributed most significantly to the Fund’s return included NuVasive, Inc., a health care equipment & supplies company (no longer held at fiscal year-end), and HMS Holdings Corp., a health care providers & services company (portfolio average weight of 1.73%). Positions that detracted most significantly from the Fund’s return included Impax Laboratories, Inc., a pharmaceuticals company (portfolio average weight of 2.80%), and Acorda Therapeutics, Inc., a biotechnology company (portfolio average weight of 1.67%).
| | | | |
Industry Breakdown
(% of the Fund’s Net Assets)
as of October 31, 2016 | |
| Health Care Equipment & Supplies | | | 34.4 | |
| Health Care Providers & Services | | | 27.9 | |
| Pharmaceuticals | | | 14.2 | |
| Biotechnology | | | 10.7 | |
| Health Care Technology | | | 9.5 | |
| Life Sciences Tools & Services | | | 3.3 | |
| Money Market Funds Plus Other Assets Less Liabilities | | | 0.0 | |
|
Top Ten Fund Holdings*
(% of the Fund’s Net Assets)
as of October 31, 2016 | |
| Security | | | | |
| Medidata Solutions, Inc. | | | 3.5 | |
| Cantel Medical Corp. | | | 3.4 | |
| Masimo Corp. | | | 3.2 | |
| Integra LifeSciences Holdings Corp. | | | 3.2 | |
| Medicines Co. (The) | | | 3.1 | |
| Chemed Corp. | | | 3.1 | |
| ICU Medical, Inc. | | | 2.7 | |
| Neogen Corp. | | | 2.6 | |
| Nektar Therapeutics, Class A | | | 2.5 | |
| Ligand Pharmaceuticals, Inc. | | | 2.4 | |
| Total | | | 29.7 | |
| * | Excluding money market fund holdings. |
PowerShares S&P SmallCap Health Care Portfolio (PSCH) (continued)
Growth of a $10,000 Investment Since Inception†
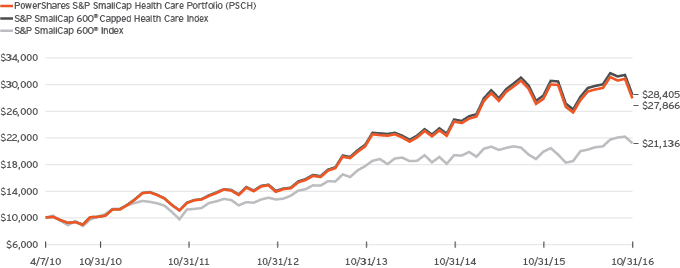
Fund Performance History as of October 31, 2016
| | | | | | | | | | | | | | | | | | | | | | | | | | | | | | | | |
| | | 1 Year | | | 3 Years
Average
Annualized | | | 3 Years
Cumulative | | | 5 Years
Average
Annualized | | | 5 Years
Cumulative | | | | | | Fund Inception† | |
| Index | | | | | | | | | | Average
Annualized | | | Cumulative | |
| S&P SmallCap 600® Capped Health Care Index | | | 0.58 | % | | | 10.84 | % | | | 36.19 | % | | | 18.39 | % | | | 132.53 | % | | | | | | | 17.24 | % | | | 184.05 | % |
| S&P SmallCap 600® Index | | | 6.35 | | | | 6.13 | | | | 19.55 | | | | 13.56 | | | | 88.89 | | | | | | | | 12.08 | | | | 111.36 | |
| Fund | | | | | | | | | | | | | | | | | | | | | | | | | | | | | | | | |
| NAV Return | | | 0.33 | | | | 10.53 | | | | 35.03 | | | | 18.04 | | | | 129.15 | | | | | | | | 16.89 | | | | 178.66 | |
| Market Price Return | | | 0.21 | | | | 10.45 | | | | 34.73 | | | | 18.00 | | | | 128.76 | | | | | | | | 16.90 | | | | 178.76 | |
Fund Inception: April 7, 2010
Performance quoted above represents past performance. Past performance is not a guarantee of future results and current performance may be higher or lower than performance quoted. Investment returns and principal value will fluctuate, and shares of the Fund (“Fund Shares”), when redeemed or sold, may be worth more or less than their original cost. Fund performance reflects any applicable fee waivers and/or expense reimbursements. Had the adviser not waived fees and/or reimbursed expenses currently or in the past, returns would have been lower. See current prospectus for more information. According to the Fund’s current prospectus, the Fund’s expense ratio of 0.29% is expressed as a unitary management fee to cover operating expenses and expenses incurred in connection with managing the portfolio. NAV and Market Price returns assume that dividends and capital gain distributions have been reinvested in the Fund at NAV and Market Price, respectively. The returns shown in the table above do not reflect the deduction of taxes that a shareholder would pay on Fund
distributions or the redemption or sale of Fund Shares. See invescopowershares.com to find the most recent month-end performance numbers.
Index and Benchmark Index performance results are based upon a hypothetical investment in their respective constituent securities. Index and Benchmark Index returns do not represent Fund returns. An investor cannot invest directly in an index. The Index and Benchmark Index do not charge management fees or brokerage expenses, and no such fees or expenses were deducted from the hypothetical performance shown. In addition, the results actual investors might have achieved would have differed from those shown because of differences in the timing, amounts of their investments, and fees and expenses associated with an investment in the Fund.
| † | Fund, Index and Benchmark Index returns are based on the inception date of the Fund. |
| | |
| PSCI | | Manager’s Analysis |
| | PowerShares S&P SmallCap Industrials Portfolio (PSCI) |
As an index fund, the PowerShares S&P SmallCap Industrials Portfolio (the “Fund”) is passively managed and attempts to track the returns of an underlying index. The Fund seeks investment results that generally correspond (before fees and expenses) to the price and yield of the S&P SmallCap 600® Capped Industrials Index (the “Index”). The Fund generally will invest at least 90% of its total assets in common stocks of small capitalization U.S. industrial companies that comprise the Index. These companies are principally engaged in the business of providing industrial products and services including, but not limited to, engineering, heavy machinery, construction, electrical equipment, aerospace and defense, and general manufacturing.
S&P Dow Jones Indices, LLC, the Index provider, defines sectors according to the Global Industry Classification Standard (“GICS”) and compiles, maintains and calculates the Index strictly in accordance with its existing guidelines and mandated procedures. The Fund generally invests in all of the securities comprising the Index in proportion to their weightings in the Index.
For the fiscal year ended October 31, 2016, on a market price basis, the Fund returned 4.86%. On a net asset value (“NAV”) basis, the Fund returned 5.10%. During the same time period, the Index returned 5.37%. During the fiscal year, the Fund fully replicated the components of the Index; therefore, the Fund’s performance (NAV basis) differed from the return of the Index primarily due to fees and operating expenses that the Fund incurred during the period.
During this same time period, the S&P SmallCap 600® Index (the “Benchmark Index”) returned 6.35%. The Benchmark Index is an unmanaged index weighted by market capitalization based on the average performance of small cap securities. The adviser provided this additional comparative benchmark to help investors better understand how the investment results of the Fund compare to the performance of a broad-based market benchmark. The Benchmark Index was selected for its recognition in the marketplace, and its performance comparison is a useful measure for investors as a broad representation of the overall U.S. small cap stock market.
Relative to the Benchmark Index, the Fund was most overweight in the machinery industry and most underweight in the banks industry during the fiscal year ended October 31, 2016. The majority of the Fund’s underperformance relative to the Benchmark Index during the period can be attributed to the Fund’s concentration in the professional services industry.
For the fiscal year ended October 31, 2016, the machinery industry contributed most significantly to the Fund’s return, followed by the commercial services & supplies and building products industries, respectively. The professional services industry detracted most significantly from the Fund’s return, followed by the marine and air freight & logistics industries, respectively.
Positions that contributed most significantly to the Fund’s return included John Bean Technologies Corp., a machinery company (portfolio average weight of 1.54%), and ABM Industries, Inc., a commercial services & supplies company (portfolio average weight of 1.72%). Positions that detracted most significantly from the Fund’s return included Korn/Ferry International, a commercial services & supplies company (portfolio average weight of 1.38%), and Allegiant Travel Co., an airlines company (portfolio average weight of 1.89%).
| | | | |
Industry Breakdown
(% of the Fund’s Net Assets)
as of October 31, 2016 | |
| Machinery | | | 26.6 | |
| Commercial Services & Supplies | | | 21.3 | |
| Building Products | | | 10.6 | |
| Professional Services | | | 9.9 | |
| Aerospace & Defense | | | 7.9 | |
| Airlines | | | 5.1 | |
| Road & Rail | | | 4.4 | |
| Air Freight & Logistics | | | 3.6 | |
| Trading Companies & Distributors | | | 3.4 | |
| Electrical Equipment | | | 2.9 | |
| Construction & Engineering | | | 2.1 | |
| Marine | | | 1.5 | |
| Industrial Conglomerates | | | 0.7 | |
| Money Market Fund Plus Other Assets Less Liabilities | | | (0.0) | |
|
Top Ten Fund Holdings*
(% of the Fund’s Net Assets)
as of October 31, 2016 | |
| Security | | | | |
| Healthcare Services Group, Inc. | | | 2.4 | |
| Hawaiian Holdings, Inc. | | | 2.1 | |
| John Bean Technologies Corp. | | | 2.0 | |
| Tetra Tech, Inc. | | | 1.9 | |
| ABM Industries, Inc. | | | 1.9 | |
| WageWorks, Inc. | | | 1.9 | |
| Barnes Group, Inc. | | | 1.8 | |
| Applied Industrial Technologies, Inc. | | | 1.7 | |
| Knight Transportation, Inc. | | | 1.7 | |
| Matthews International Corp., Class A | | | 1.7 | |
| Total | | | 19.1 | |
| * | Excluding money market fund holdings. |
PowerShares S&P SmallCap Industrials Portfolio (PSCI) (continued)
Growth of a $10,000 Investment Since Inception†
Fund Performance History as of October 31, 2016
| | | | | | | | | | | | | | | | | | | | | | | | | | | | | | | | |
| | | 1 Year | | | 3 Years
Average
Annualized | | | 3 Years
Cumulative | | | 5 Years
Average
Annualized | | | 5 Years
Cumulative | | | | | | Fund Inception† | |
| Index | | | | | | | | | | Average
Annualized | | | Cumulative | |
| S&P SmallCap 600® Capped Industrials Index | | | 5.37 | % | | | 5.10 | % | | | 16.10 | % | | | 13.44 | % | | | 87.83 | % | | | | | | | 11.41 | % | | | 103.20 | % |
| S&P SmallCap 600® Index | | | 6.35 | | | | 6.13 | | | | 19.55 | | | | 13.56 | | | | 88.89 | | | | | | | | 12.08 | | | | 111.36 | |
| Fund | | | | | | | | | | | | | | | | | | | | | | | | |
| NAV Return | | | 5.10 | | | | 4.81 | | | | 15.14 | | | | 13.09 | | | | 84.97 | | | | | | | | 11.06 | | | | 99.19 | |
| Market Price Return | | | 4.86 | | | | 4.68 | | | | 14.71 | | | | 13.03 | | | | 84.47 | | | | | | | | 11.04 | | | | 98.89 | |
Fund Inception: April 7, 2010
Performance quoted above represents past performance. Past performance is not a guarantee of future results and current performance may be higher or lower than performance quoted. Investment returns and principal value will fluctuate, and shares of the Fund (“Fund Shares”), when redeemed or sold, may be worth more or less than their original cost. Fund performance reflects any applicable fee waivers and/or expense reimbursements. Had the adviser not waived fees and/or reimbursed expenses currently or in the past, returns would have been lower. See current prospectus for more information. According to the Fund’s current prospectus, the Fund’s expense ratio of 0.29% is expressed as a unitary management fee to cover operating expenses and expenses incurred in connection with managing the portfolio. NAV and Market Price returns assume that dividends and capital gain distributions have been reinvested in the Fund at NAV and Market Price, respectively. The returns shown in the table above do not
reflect the deduction of taxes that a shareholder would pay on Fund distributions or the redemption or sale of Fund Shares. See invescopowershares.com to find the most recent month-end performance numbers.
Index and Benchmark Index performance results are based upon a hypothetical investment in their respective constituent securities. Index and Benchmark Index returns do not represent Fund returns. An investor cannot invest directly in an index. The Index and Benchmark Index do not charge management fees or brokerage expenses, and no such fees or expenses were deducted from the hypothetical performance shown. In addition, the results actual investors might have achieved would have differed from those shown because of differences in the timing, amounts of their investments, and fees and expenses associated with an investment in the Fund.
| † | Fund, Index and Benchmark Index returns are based on the inception date of the Fund. |
| | |
| PSCT | | Manager’s Analysis |
| | PowerShares S&P SmallCap Information Technology Portfolio (PSCT) |
As an index fund, the PowerShares S&P SmallCap Information Technology Portfolio (the “Fund”) is passively managed and attempts to track the returns of an underlying index. The Fund seeks investment results that generally correspond (before fees and expenses) to the price and yield of the S&P SmallCap 600® Capped Information Technology Index (the “Index”). The Fund generally will invest at least 90% of its total assets in common stocks of small capitalization U.S. information technology companies that comprise the Index. These companies are principally engaged in the business of providing information technology-related products and services including, but not limited to, computer hardware and software, Internet, electronics and semiconductors, and communication technologies.
S&P Dow Jones Indices, LLC, the Index provider, defines sectors according to the Global Industry Classification Standard (“GICS”) and compiles, maintains and calculates the Index strictly in accordance with its existing guidelines and mandated procedures. The Fund generally invests in all of the securities comprising the Index in proportion to their weightings in the Index.
For the fiscal year ended October 31, 2016, on a market price basis, the Fund returned 18.63%. On a net asset value (“NAV”) basis, the Fund returned 18.75%. During the same time period, the Index returned 19.10%. During the fiscal year, the Fund fully replicated the components of the Index; therefore, the Fund’s performance (NAV basis) differed from the return of the Index primarily due to fees and operating expenses that the Fund incurred during the period.
During this same time period, the S&P SmallCap 600® Index (the “Benchmark Index”) returned 6.35%. The Benchmark Index is an unmanaged index weighted by market capitalization based on the average performance of approximately 600 small cap securities. The adviser provided this additional comparative benchmark to help investors better understand how the investment results of the Fund compare to the performance of a broad-based market benchmark. The Benchmark Index was selected for its recognition in the marketplace, and its performance comparison is a useful measure for investors as a broad representation of the overall U.S. small cap stock market.
Relative to the Benchmark Index, the Fund was most overweight in the electronic equipment, instruments & components industry and most underweight in the banks industry during the fiscal year ended October 31, 2016. The majority of the Fund’s outperformance relative to the Benchmark Index during the period can be attributed to the Fund’s concentration in the semiconductors & semiconductor equipment industry.
For the fiscal year ended October 31, 2016, the electronic equipment, instruments & components industry contributed most significantly to the Fund’s return, followed by the semiconductors & semiconductor equipment and software
industries, respectively. The technology hardware, storage & peripherals industry was the only detracting industry.
Positions that contributed most significantly to the Fund’s return included Cirrus Logic, Inc., a semiconductors & semiconductor equipment company (no longer held at fiscal year-end), and Coherent, Inc., an electronic equipment, instruments & components company (portfolio average weight of 2.09%). Positions that detracted most significantly from the Fund’s return included Virtusa Corp., an it services company (portfolio average weight of 0.92%), and Cray, Inc., a technology hardware, storage & peripherals company (portfolio average weight of 0.97%).
| | | | |
Industry Breakdown
(% of the Fund’s Net Assets)
as of October 31, 2016 | |
| Electronic Equipment, Instruments & Components | | | 28.5 | |
| Software | | | 20.2 | |
| Semiconductors & Semiconductor Equipment | | | 18.7 | |
| IT Services | | | 11.1 | |
| Internet Software & Services | | | 9.6 | |
| Communications Equipment | | | 8.3 | |
| Technology Hardware, Storage & Peripherals | | | 3.6 | |
| Money Market Fund Plus Other Assets Less Liabilities | | | (0.0) | |
|
Top Ten Fund Holdings*
(% of the Fund’s Net Assets)
as of October 31, 2016 | |
| Security | | | | |
| Take-Two Interactive Software, Inc. | | | 3.7 | |
| Littelfuse, Inc. | | | 3.0 | |
| Blackbaud, Inc. | | | 2.8 | |
| MKS Instruments, Inc. | | | 2.6 | |
| Coherent, Inc. | | | 2.5 | |
| Tivo Corp. | | | 2.3 | |
| LogMeIn, Inc. | | | 2.3 | |
| CACI International, Inc., Class A | | | 2.3 | |
| Cardtronics PLC, Class A | | | 2.2 | |
| Sanmina Corp. | | | 2.0 | |
| Total | | | 25.7 | |
| * | Excluding money market fund holdings. |
PowerShares S&P SmallCap Information Technology Portfolio (PSCT) (continued)
Growth of a $10,000 Investment Since Inception†
Fund Performance History as of October 31, 2016
| | | | | | | | | | | | | | | | | | | | | | | | | | | | | | | | |
| | | 1 Year | | | 3 Years
Average
Annualized | | | 3 Years
Cumulative | | | 5 Years
Average
Annualized | | | 5 Years
Cumulative | | | | | | Fund Inception† | |
| Index | | | | | | | | | | Average
Annualized | | | Cumulative | |
| S&P SmallCap 600® Capped Information Technology Index | | | 19.10 | % | | | 14.30 | % | | | 49.34 | % | | | 17.83 | % | | | 127.18 | % | | | | | | | 14.92 | % | | | 149.10 | % |
| S&P SmallCap 600® Index | | | 6.35 | | | | 6.13 | | | | 19.55 | | | | 13.56 | | | | 88.89 | | | | | | | | 12.08 | | | | 111.36 | |
| Fund | | | | | | | | | | | | | | | | | | | | | | | | | | | | | | | | |
| NAV Return | | | 18.75 | | | | 13.97 | | | | 48.04 | | | | 17.49 | | | | 123.91 | | | | | | | | 14.56 | | | | 144.23 | |
| Market Price Return | | | 18.63 | | | | 13.91 | | | | 47.80 | | | | 17.50 | | | | 123.98 | | | | | | | | 14.58 | | | | 144.41 | |
Fund Inception: April 7, 2010
Performance quoted above represents past performance. Past performance is not a guarantee of future results and current performance may be higher or lower than performance quoted. Investment returns and principal value will fluctuate, and shares of the Fund (“Fund Shares”), when redeemed or sold, may be worth more or less than their original cost. Fund performance reflects any applicable fee waivers and/or expense reimbursements. Had the adviser not waived fees and/or reimbursed expenses currently or in the past, returns would have been lower. See current prospectus for more information. According to the Fund’s current prospectus, the Fund’s expense ratio of 0.29% is expressed as a unitary management fee to cover operating expenses and expenses incurred in connection with managing the portfolio. NAV and Market Price returns assume that dividends and capital gain distributions have been reinvested in the Fund at NAV and Market Price, respectively. The returns shown in the table above do not reflect the deduction of taxes that a shareholder would pay on Fund
distributions or the redemption or sale of Fund Shares. See invescopowershares.com to find the most recent month-end performance numbers.
Index and Benchmark Index performance results are based upon a hypothetical investment in their respective constituent securities. Index and Benchmark Index returns do not represent Fund returns. An investor cannot invest directly in an index. The Index and Benchmark Index do not charge management fees or brokerage expenses, and no such fees or expenses were deducted from the hypothetical performance shown. In addition, the results actual investors might have achieved would have differed from those shown because of differences in the timing, amounts of their investments, and fees and expenses associated with an investment in the Fund.
| † | Fund, Index and Benchmark Index returns are based on the inception date of the Fund. |
| | |
| PSCM | | Manager’s Analysis |
| | PowerShares S&P SmallCap Materials Portfolio (PSCM) |
As an index fund, the PowerShares S&P SmallCap Materials Portfolio (the “Fund”) is passively managed and attempts to track the returns of an underlying index. The Fund seeks investment results that generally correspond (before fees and expenses) to the price and yield of the S&P SmallCap 600® Capped Materials Index (the “Index”). The Fund generally will invest at least 90% of its total assets in common stocks of small capitalization U.S. basic materials companies that comprise the Index. These companies are principally engaged in the business of producing raw materials, including paper or wood products, chemicals, construction materials, and mining and metals.
S&P Dow Jones Indices, LLC, the Index provider, defines sectors according to the Global Industry Classification Standard (“GICS”) and compiles, maintains and calculates the Index strictly in accordance with its existing guidelines and mandated procedures. The Fund generally invests in all of the securities comprising the Index in proportion to their weightings in the Index.
For the fiscal year ended October 31, 2016, on a market price basis, the Fund returned 14.07%. On a net asset value (“NAV”) basis, the Fund returned 13.89%. During the same time period, the Index returned 14.24%. During the fiscal year, the Fund fully replicated the components of the Index; therefore, the Fund’s performance (NAV basis) differed from the return of the Index primarily due to fees and operating expenses that the Fund incurred during the period.
During this same time period, the S&P SmallCap 600® Index (the “Benchmark Index”) returned 6.35%. The Benchmark Index is an unmanaged index weighted by market capitalization based on the average performance of approximately 600 small cap securities. The adviser provided this additional comparative benchmark to help investors better understand how the investment results of the Fund compare to the performance of a broad-based market benchmark. The Benchmark Index was selected for its recognition in the marketplace, and its performance comparison is a useful measure for investors as a broad representation of the overall U.S. small cap stock market.
Relative to the Benchmark Index, the Fund was most overweight in the chemicals industry and most underweight in the banks industry during the fiscal year ended October 31, 2016. The majority of the Fund’s outperformance relative to the Benchmark Index during the period can be attributed to the Fund’s concentration in the chemicals industry.
For the fiscal year ended October 31, 2016, the chemicals industry contributed most significantly to the Fund’s return, followed by the metals & mining and construction materials industries, respectively. The paper & forest products industry detracted most significantly from the Fund’s return, followed by the containers & packaging industry.
Positions that contributed most significantly to the Fund’s return included Chemours Co. (The), a chemicals company (portfolio average weight of 3.99%), and Stillwater Mining Co., a metals & mining company (portfolio average weight of 4.04%). Positions that detracted most significantly from the Fund’s return included KapStone Paper and Packaging Corp., a paper & forest products company (portfolio average weight of 4.60%), and Boise Cascade Co., a paper & forest products company (portfolio average weight of 2.92%).
| | | | |
Industry Breakdown
(% of the Fund’s Net Assets)
as of October 31, 2016 | |
| Chemicals | | | 55.7 | |
| Paper & Forest Products | | | 19.4 | |
| Metals & Mining | | | 19.1 | |
| Construction Materials | | | 5.1 | |
| Containers & Packaging | | | 0.7 | |
| Other Assets Less Liabilities | | | (0.0) | |
|
Top Ten Fund Holdings
(% of the Fund’s Net Assets)
as of October 31, 2016 | |
| Security | | | | |
| Chemours Co. (The) | | | 8.0 | |
| Balchem Corp. | | | 6.4 | |
| H.B. Fuller Co. | | | 5.7 | |
| Ingevity Corp. | | | 4.7 | |
| Stillwater Mining Co. | | | 4.3 | |
| KapStone Paper and Packaging Corp. | | | 4.3 | |
| AK Steel Holding Corp. | | | 4.2 | |
| Innospec, Inc. | | | 3.9 | |
| Quaker Chemical Corp. | | | 3.8 | |
| Stepan Co. | | | 3.7 | |
| Total | | | 49.0 | |
PowerShares S&P SmallCap Materials Portfolio (PSCM) (continued)
Growth of a $10,000 Investment Since Inception†
Fund Performance History as of October 31, 2016
| | | | | | | | | | | | | | | | | | | | | | | | | | | | | | | | |
| | | 1 Year | | | 3 Years
Average
Annualized | | | 3 Years
Cumulative | | | 5 Years
Average
Annualized | | | 5 Years
Cumulative | | | | | | Fund Inception† | |
| Index | | | | | | | | | | Average
Annualized | | | Cumulative | |
| S&P SmallCap 600® Capped Materials Index | | | 14.24 | % | | | (0.14 | )% | | | (0.43 | )% | | | 9.65 | % | | | 58.50 | % | | | | | | | 7.67 | % | | | 62.41 | % |
| S&P SmallCap 600® Index | | | 6.35 | | | | 6.13 | | | | 19.55 | | | | 13.56 | | | | 88.89 | | | | | | | | 12.08 | | | | 111.36 | |
| Fund | | | | | | | | | | | | | | | | | | | | | | | | | | | | | | | | |
| NAV Return | | | 13.89 | | | | (0.45 | ) | | | (1.35 | ) | | | 9.32 | | | | 56.14 | | | | | | | | 7.34 | | | | 59.27 | |
| Market Price Return | | | 14.07 | | | | (0.46 | ) | | | (1.36 | ) | | | 9.39 | | | | 56.60 | | | | | | | | 7.38 | | | | 59.57 | |
Fund Inception: April 7, 2010
Performance quoted above represents past performance. Past performance is not a guarantee of future results and current performance may be higher or lower than performance quoted. Investment returns and principal value will fluctuate, and shares of the Fund (“Fund Shares”), when redeemed or sold, may be worth more or less than their original cost. Fund performance reflects any applicable fee waivers and/or expense reimbursements. Had the adviser not waived fees and/or reimbursed expenses currently or in the past, returns would have been lower. See current prospectus for more information. According to the Fund’s current prospectus, the Fund’s expense ratio of 0.29% is expressed as a unitary management fee to cover operating expenses and expenses incurred in connection with managing the portfolio. NAV and Market Price returns assume that dividends and capital gain distributions have been reinvested in the Fund at NAV and Market Price, respectively. The returns shown in the table above do not reflect the deduction of taxes that a shareholder would pay on Fund
distributions or the redemption or sale of Fund Shares. See invescopowershares.com to find the most recent month-end performance numbers.
Index and Benchmark Index performance results are based upon a hypothetical investment in their respective constituent securities. Index and Benchmark returns do not represent Fund returns. An investor cannot invest directly in an index. The Index and Benchmark Index do not charge management fees or brokerage expenses, and no such fees or expenses were deducted from the hypothetical performance shown. In addition, the results actual investors might have achieved would have differed from those shown because of differences in the timing, amounts of their investments, and fees and expenses associated with an investment in the Fund.
| † | Fund, Index and Benchmark Index returns are based on the inception date of the Fund. |
| | |
| PSCU | | Manager’s Analysis |
| | PowerShares S&P SmallCap Utilities Portfolio (PSCU) |
As an index fund, the PowerShares S&P SmallCap Utilities Portfolio (the “Fund”) is passively managed and attempts to track the returns of an underlying index. The Fund seeks investment results that generally correspond (before fees and expenses) to the price and yield of the S&P SmallCap 600® Capped Utilities & Telecommunication Services Index (the “Index”). The Fund generally will invest at least 90% of its total assets in common stocks of small capitalization U.S. utility companies that comprise the Index. These companies are principally engaged in providing either energy, water, electric or natural gas utilities or providing telecommunications services. These companies may include, but are not limited to, companies that generate and supply electricity, including electricity wholesalers; distribute natural gas to customers; provide water to customers, as well as deal with associated wastewater; and provide land line or wireless telephone services.
S&P Dow Jones Indices, LLC, the Index provider, defines sectors according to the Global Industry Classification Standard (“GICS”) and compiles, maintains and calculates the Index strictly in accordance with its existing guidelines and mandated procedures. The Fund generally invests in all of the securities comprising the Index in proportion to their weightings in the Index.
For the fiscal year ended October 31, 2016, on a market price basis, the Fund returned 11.23%. On a net asset value (“NAV”) basis, the Fund returned 11.40%. During the same time period, the Index returned 11.83%. During the fiscal year, the Fund deviated slightly from the Index in order to comply with the diversification requirements to qualify as a regulated investment company under the Internal Revenue Code. The Fund’s performance (NAV basis) differed from the return of the Index primarily due to fees and operating expenses incurred by the Fund during the period as well as due to these changes in portfolio composition.
During this same time period, the S&P SmallCap 600® Index (the “Benchmark Index”) returned 6.35%. The Benchmark Index is an unmanaged index weighted by market capitalization based on the average performance of small cap securities. The adviser provided this additional comparative benchmark to help investors better understand how the investment results of the Fund compare to the performance of a broad-based market benchmark. The Benchmark Index was selected for its recognition in the marketplace, and its performance comparison is a useful measure for investors as a broad representation of the overall U.S. small cap stock market.
Relative to the Benchmark Index, the Fund was most overweight in the gas utilities industry and most underweight in the banks industry during the fiscal year ended October 31, 2016. The majority of the Fund’s outperformance relative to the Benchmark Index during the period can be attributed to the Fund’s concentration in the gas utilities industry.
For the fiscal year ended October 31, 2016, the gas utilities industry contributed most significantly to the Fund’s return, followed by the multi-utilities and software industries, respectively. The diversified telecommunication services industry was the only detracting industry.
Positions that contributed most significantly to the Fund’s return included Southwest Gas Corp., a gas utilities company (no longer held at fiscal year-end), and ALLETE, Inc., an electric utilities company (portfolio average weight of 5.76%). Positions that detracted most significantly from the Fund’s return included Avangrid, Inc., an electric utilities company (no longer held at fiscal year-end), and General Communication, Inc., Class A, a diversified telecommunication services company (portfolio average weight of 2.33%).
| | | | |
Industry Breakdown
(% of the Fund’s Net Assets)
as of October 31, 2016 | |
| Diversified Telecommunication Services | | | 35.0 | |
| Gas Utilities | | | 21.5 | |
| Electric Utilities | | | 18.5 | |
| Water Utilities | | | 9.6 | |
| Multi-Utilities | | | 5.9 | |
| Wireless Telecommunication Services | | | 2.7 | |
| Other Assets Less Liabilities | | | 6.8 | |
|
Top Ten Fund Holdings
(% of the Fund’s Net Assets)
as of October 31, 2016 | |
| Security | | | | |
| ALLETE, Inc. | | | 12.6 | |
| Spire, Inc. | | | 11.9 | |
| Cogent Communications Group, Inc. | | | 6.0 | |
| El Paso Electric Co. | | | 6.0 | |
| Avista Corp. | | | 5.9 | |
| ATN International, Inc. | | | 4.8 | |
| South Jersey Industries, Inc. | | | 4.8 | |
| American States Water Co. | | | 4.8 | |
| Cincinnati Bell, Inc. | | | 4.8 | |
| Northwest Natural Gas Co. | | | 4.8 | |
| Total | | | 66.4 | |
PowerShares S&P SmallCap Utilities Portfolio (PSCU) (continued)
Growth of a $10,000 Investment Since Inception†
Fund Performance History as of October 31, 2016
| | | | | | | | | | | | | | | | | | | | | | | | | | | | | | | | |
| | | 1 Year | | | 3 Years
Average
Annualized | | | 3 Years
Cumulative | | | 5 Years
Average
Annualized | | | 5 Years
Cumulative | | | | | | Fund Inception† | |
| Index | | | | | | | | | | Average
Annualized | | | Cumulative | |
| S&P SmallCap 600® Capped Utilities & Telecommunication Services Index | | | 11.83 | % | | | 13.59 | % | | | 46.54 | % | | | 12.60 | % | | | 80.99 | % | | | | | | | 13.04 | % | | | 123.56 | % |
| S&P SmallCap 600® Index | | | 6.35 | | | | 6.13 | | | | 19.55 | | | | 13.56 | | | | 88.89 | | | | | | | | 12.08 | | | | 111.36 | |
| Fund | | | | | | | | | | | | | | | | | | | | | | | | | | | | | | | | |
| NAV Return | | | 11.40 | | | | 13.23 | | | | 45.17 | | | | 12.24 | | | | 78.16 | | | | | | | | 12.69 | | | | 119.09 | |
| Market Price Return | | | 11.23 | | | | 13.14 | | | | 44.82 | | | | 12.23 | | | | 78.04 | | | | | | | | 12.67 | | | | 118.86 | |
Fund Inception: April 7, 2010
Performance quoted above represents past performance. Past performance is not a guarantee of future results and current performance may be higher or lower than performance quoted. Investment returns and principal value will fluctuate, and shares of the Fund (“Fund Shares”), when redeemed or sold, may be worth more or less than their original cost. Fund performance reflects any applicable fee waivers and/or expense reimbursements. Had the adviser not waived fees and/or reimbursed expenses currently or in the past, returns would have been lower. See current prospectus for more information. According to the Fund’s current prospectus, the Fund’s expense ratio of 0.29% is expressed as a unitary management fee to cover operating expenses and expenses incurred in connection with managing the portfolio. NAV and Market Price returns assume that dividends and capital gain distributions have been reinvested in the Fund at NAV and Market Price, respectively. The returns shown in the table above do not reflect the deduction of taxes that a shareholder would pay on Fund
distributions or the redemption or sale of Fund Shares. See invescopowershares.com to find the most recent month-end performance numbers.
Index and Benchmark Index performance results are based upon a hypothetical investment in their respective constituent securities. Index and Benchmark Index returns do not represent Fund returns. An investor cannot invest directly in an index. The Index and Benchmark Index do not charge management fees or brokerage expenses, and no such fees or expenses were deducted from the hypothetical performance shown. In addition, the results actual investors might have achieved would have differed from those shown because of differences in the timing, amounts of their investments, and fees and expenses associated with an investment in the Fund.
| † | Fund, Index and Benchmark Index returns are based on the inception date of the Fund. |
Schedule of Investments
PowerShares DWA Momentum & Low Volatility Rotation Portfolio (DWLV)
October 31, 2016
| | | | | | | | |
Number
of Shares | | | | | Value | |
| | | | Exchange—Traded Funds—100.0%(a) | |
| | 22,007 | | | PowerShares DWA Developed Markets Momentum Portfolio | | $ | 490,096 | |
| | 31,922 | | | PowerShares DWA Emerging Markets Momentum Portfolio | | | 513,944 | |
| | 66,913 | | | PowerShares DWA Momentum Portfolio | | | 2,756,815 | |
| | 73,712 | | | PowerShares DWA SmallCap Momentum Portfolio | | | 2,607,193 | |
| | 27,970 | | | PowerShares S&P 500® Low Volatility Portfolio | | | 1,131,666 | |
| | 54,033 | | | PowerShares S&P Emerging Markets Low Volatility Portfolio | | | 1,196,291 | |
| | 39,670 | | | PowerShares S&P International Developed Low Volatility Portfolio | | | 1,165,505 | |
| | 31,436 | | | PowerShares S&P SmallCap Low Volatility Portfolio | | | 1,190,481 | |
| | | | | | | | |
| | | | Total Exchange—Traded Funds
(Cost $11,522,096) | | | 11,051,991 | |
| | | | | | | | |
| | |
| | | | Money Market Fund—0.0% | | | | |
| | 1,070 | | | Invesco Premier U.S. Government Money Portfolio—Institutional Class, 0.25%(b)
(Cost $1,070) | | | 1,070 | |
| | | | | | | | |
| | | | Total Investments
(Cost $11,523,166)—100.0% | | | 11,053,061 | |
| | | | Other assets less liabilities—(0.0)% | | | (1,216 | ) |
| | | | | | | | |
| | | | Net Assets—100.0% | | $ | 11,051,845 | |
| | | | | | | | |
Notes to Schedule of Investments:
| (a) | Affiliated company. The security and the Fund are affiliated by having the same investment adviser. See Note 4. |
| (b) | The security and the Fund are advised by wholly-owned subsidiaries of Invesco Ltd. and are therefore considered to be affiliated. The rate shown is the 7-day SEC standardized yield as of October 31, 2016. |
See accompanying Notes to Financial Statements which are an integral part of the financial statements.
Schedule of Investments(a)
PowerShares DWA SmallCap Momentum Portfolio (DWAS)
October 31, 2016
| | | | | | | | |
Number
of Shares | | | | | Value | |
| | | | Common Stocks and Other Equity Interests—100.0% | |
| | | | Consumer Discretionary—12.7% | |
| | 29,719 | | | Ascent Capital Group, Inc., Class A(b) | | $ | 605,673 | |
| | 90,647 | | | Career Education Corp.(b) | | | 651,752 | |
| | 13,754 | | | Cheesecake Factory, Inc. (The) | | | 731,575 | |
| | 59,556 | | | Denny’s Corp.(b) | | | 617,596 | |
| | 24,079 | | | Dorman Products, Inc.(b) | | | 1,546,835 | |
| | 7,294 | | | Drew Industries, Inc. | | | 653,178 | |
| | 22,706 | | | Duluth Holdings, Inc., Class B(b)(c) | | | 616,468 | |
| | 57,990 | | | Eldorado Resorts, Inc.(b) | | | 701,679 | |
| | 15,535 | | | Grand Canyon Education, Inc.(b) | | | 677,947 | |
| | 33,333 | | | Horizon Global Corp.(b) | | | 667,993 | |
| | 37,378 | | | Intrawest Resorts Holdings, Inc.(b) | | | 613,373 | |
| | 24,368 | | | La-Z-Boy, Inc. | | | 570,211 | |
| | 17,684 | | | LGI Homes, Inc.(b)(c) | | | 526,276 | |
| | 37,828 | | | LifeLock, Inc.(b) | | | 609,031 | |
| | 8,796 | | | Marriott Vacations Worldwide Corp. | | | 559,250 | |
| | 26,532 | | | Monarch Casino & Resort, Inc.(b) | | | 627,482 | |
| | 107,586 | | | Nautilus, Inc.(b) | | | 1,893,514 | |
| | 28,097 | | | Nexstar Broadcasting Group, Inc., Class A(c) | | | 1,371,134 | |
| | 17,712 | | | Papa John’s International, Inc. | | | 1,336,370 | |
| | 24,096 | | | Smith & Wesson Holding Corp.(b)(c) | | | 636,857 | |
| | 71,775 | | | Spartan Motors, Inc. | | | 613,676 | |
| | 15,758 | | | Standard Motor Products, Inc. | | | 770,566 | |
| | 35,059 | | | Stoneridge, Inc.(b) | | | 519,574 | |
| | 12,970 | | | Universal Electronics, Inc.(b) | | | 909,846 | |
| | 27,847 | | | Winnebago Industries, Inc. | | | 786,678 | |
| | | | | | | | |
| | | | | | | 19,814,534 | |
| | | | | | | | |
| | | | Consumer Staples—2.3% | |
| | 29,363 | | | Alliance One International, Inc.(b) | | | 436,040 | |
| | 111,003 | | | Avon Products, Inc. | | | 727,070 | |
| | 17,644 | | | Farmer Brothers Co.(b) | | | 576,959 | |
| | 10,694 | | | Fresh Del Monte Produce, Inc. | | | 645,383 | |
| | 26,484 | | | Omega Protein Corp.(b) | | | 590,593 | |
| | 5,458 | | | WD-40 Co. | | | 581,959 | |
| | | | | | | | |
| | | | | | | 3,558,004 | |
| | | | | | | | |
| | | | Energy—5.6% | |
| | 54,517 | | | Archrock, Inc. | | | 632,397 | |
| | 42,992 | | | Callon Petroleum Co.(b) | | | 558,466 | |
| | 31,195 | | | Clayton Williams Energy, Inc.(b)(c) | | | 2,723,635 | |
| | 168,291 | | | Fairmount Santrol Holdings, Inc.(b)(c) | | | 1,445,620 | |
| | 9,546 | | | PDC Energy, Inc.(b) | | | 585,456 | |
| | 11,297 | | | REX American Resources Corp.(b) | | | 892,350 | |
| | 81,226 | | | Sanchez Energy Corp.(b)(c) | | | 517,410 | |
| | 43,073 | | | Unit Corp.(b) | | | 737,841 | |
| | 15,042 | | | US Silica Holdings, Inc. | | | 694,790 | |
| | | | | | | | |
| | | | | | | 8,787,965 | |
| | | | | | | | |
| | | | Financials—16.8% | |
| | 18,721 | | | Ameris Bancorp | | | 679,572 | |
| | 10,706 | | | AMERISAFE, Inc. | | | 595,254 | |
| | 25,600 | | | BNC Bancorp | | | 637,440 | |
| | 20,439 | | | Cathay General Bancorp | | | 612,148 | |
| | 35,505 | | | Centerstate Banks, Inc. | | | 663,234 | |
| | 17,808 | | | Eagle Bancorp, Inc.(b) | | | 875,263 | |
| | 58,840 | | | Farmers National Banc Corp. | | | 617,820 | |
| | 37,185 | | | FBL Financial Group, Inc., Class A | | | 2,353,811 | |
| | 14,118 | | | First Defiance Financial Corp. | | | 557,379 | |
| | | | | | | | |
Number
of Shares | | | | | Value | |
| | | | Common Stocks and Other Equity Interests (continued) | |
| | | | Financials (continued) | |
| | 32,352 | | | First Financial Bankshares, Inc.(c) | | $ | 1,171,142 | |
| | 24,178 | | | First Merchants Corp. | | | 680,611 | |
| | 17,347 | | | Franklin Financial Network, Inc.(b) | | | 565,512 | |
| | 24,392 | | | Hanmi Financial Corp. | | | 609,800 | |
| | 17,605 | | | Horace Mann Educators Corp. | | | 632,900 | |
| | 132,109 | | | Independent Bank Corp./MI | | | 2,219,431 | |
| | 16,196 | | | INTL FCStone, Inc.(b) | | | 581,436 | |
| | 40,739 | | | Meridian Bancorp, Inc. | | | 649,787 | |
| | 11,465 | | | Meta Financial Group, Inc. | | | 839,811 | |
| | 212,861 | | | MGIC Investment Corp.(b) | | | 1,736,946 | |
| | 38,811 | | | Pacific Premier Bancorp, Inc.(b) | | | 1,003,264 | |
| | 13,955 | | | Pinnacle Financial Partners, Inc. | | | 720,078 | |
| | 20,881 | | | ProAssurance Corp. | | | 1,112,957 | |
| | 26,560 | | | ServisFirst Bancshares, Inc.(c) | | | 1,437,958 | |
| | 15,641 | | | Stewart Information Services Corp. | | | 703,063 | |
| | 40,895 | | | Trupanion, Inc.(b)(c) | | | 662,090 | |
| | 30,551 | | | United Community Banks, Inc. | | | 658,985 | |
| | 115,870 | | | Waterstone Financial, Inc. | | | 1,963,997 | |
| | 17,399 | | | WSFS Financial Corp. | | | 609,835 | |
| | | | | | | | |
| | | | | | | 26,151,524 | |
| | | | | | | | |
| | | | Health Care—17.2% | |
| | 23,304 | | | Accelerate Diagnostics, Inc.(b)(c) | | | 495,210 | |
| | 25,476 | | | Aclaris Therapeutics, Inc.(b)(c) | | | 541,365 | |
| | 17,989 | | | Aerie Pharmaceuticals, Inc.(b) | | | 598,134 | |
| | 32,298 | | | Amphastar Pharmaceuticals, Inc.(b) | | | 585,886 | |
| | 70,268 | | | Aratana Therapeutics, Inc.(b) | | | 569,171 | |
| | 46,818 | | | ARIAD Pharmaceuticals, Inc.(b) | | | 408,253 | |
| | 98,967 | | | Axogen, Inc.(b) | | | 875,858 | |
| | 33,016 | | | Bellicum Pharmaceuticals, Inc.(b)(c) | | | 546,745 | |
| | 122,945 | | | ChemoCentryx, Inc.(b)(c) | | | 735,211 | |
| | 17,977 | | | Clovis Oncology, Inc.(b) | | | 522,771 | |
| | 35,329 | | | CryoLife, Inc. | | | 600,593 | |
| | 11,894 | | | Cynosure, Inc., Class A(b) | | | 507,279 | |
| | 27,942 | | | Evolent Health, Inc., Class A(b) | | | 588,179 | |
| | 40,043 | | | Exact Sciences Corp.(b)(c) | | | 623,870 | |
| | 187,193 | | | Exelixis, Inc.(b) | | | 1,982,374 | |
| | 14,203 | | | Five Prime Therapeutics, Inc.(b) | | | 689,272 | |
| | 54,072 | | | GenMark Diagnostics, Inc.(b) | | | 576,948 | |
| | 16,373 | | | Glaukos Corp.(b) | | | 546,858 | |
| | 16,983 | | | HealthEquity, Inc.(b) | | | 564,345 | |
| | 24,262 | | | Healthways, Inc.(b) | | | 601,698 | |
| | 41,680 | | | Heska Corp.(b) | | | 2,058,992 | |
| | 5,045 | | | ICU Medical, Inc.(b) | | | 702,768 | |
| | 15,197 | | | Inogen, Inc.(b) | | | 815,623 | |
| | 46,878 | | | Invuity, Inc.(b) | | | 475,812 | |
| | 32,558 | | | LeMaitre Vascular, Inc. | | | 681,765 | |
| | 23,809 | | | Loxo Oncology, Inc.(b)(c) | | | 496,656 | |
| | 10,755 | | | Masimo Corp.(b) | | | 591,525 | |
| | 57,223 | | | Minerva Neurosciences, Inc.(b) | | | 638,036 | |
| | 17,052 | | | Natus Medical, Inc.(b) | | | 670,996 | |
| | 32,624 | | | Nektar Therapeutics, Class A(b) | | | 404,538 | |
| | 25,722 | | | NxStage Medical, Inc.(b) | | | 584,918 | |
| | 10,002 | | | Puma Biotechnology, Inc.(b) | | | 383,077 | |
| | 20,609 | | | Sarepta Therapeutics, Inc.(b) | | | 808,697 | |
| | 10,241 | | | Spark Therapeutics, Inc.(b) | | | 481,429 | |
| | 25,704 | | | Spectranetics Corp. (The)(b) | | | 557,777 | |
See accompanying Notes to Financial Statements which are an integral part of the financial statements.
PowerShares DWA SmallCap Momentum Portfolio (DWAS) (continued)
October 31, 2016
| | | | | | | | |
Number
of Shares | | | | | Value | |
| | | | Common Stocks and Other Equity Interests (continued) | |
| | | | Health Care (continued) | |
| | 24,488 | | | Supernus Pharmaceuticals, Inc.(b) | | $ | 484,862 | |
| | 19,180 | | | Theravance Biopharma, Inc. (Cayman Islands)(b) | | | 481,993 | |
| | 10,171 | | | U.S. Physical Therapy, Inc. | | | 578,730 | |
| | 38,321 | | | Vanda Pharmaceuticals, Inc.(b) | | | 569,067 | |
| | 14,826 | | | Vascular Solutions, Inc.(b) | | | 676,066 | |
| | 25,338 | | | Xencor, Inc.(b) | | | 539,446 | |
| | | | | | | | |
| | | | | | | 26,842,793 | |
| | | | | | | | |
| | | | Industrials—17.7% | |
| | 22,711 | | | AAON, Inc. | | | 680,195 | |
| | 10,024 | | | Alamo Group, Inc. | | | 650,758 | |
| | 13,441 | | | American Woodmark Corp.(b) | | | 1,004,043 | |
| | 19,894 | | | Argan, Inc. | | | 1,130,974 | |
| | 9,633 | | | AZZ, Inc. | | | 512,957 | |
| | 53,934 | | | Builders FirstSource, Inc.(b) | | | 521,542 | |
| | 70,567 | | | Casella Waste Systems, Inc., Class A(b) | | | 790,350 | |
| | 20,011 | | | Douglas Dynamics, Inc. | | | 642,353 | |
| | 52,902 | | | Energous Corp.(b)(c) | | | 721,054 | |
| | 128,444 | | | Energy Recovery, Inc.(b)(c) | | | 1,568,301 | |
| | 9,172 | | | EnerSys | | | 597,372 | |
| | 44,323 | | | ExOne Co. (The)(b)(c) | | | 528,773 | |
| | 16,929 | | | Gibraltar Industries, Inc.(b) | | | 658,538 | |
| | 22,531 | | | Global Brass & Copper Holdings, Inc. | | | 646,640 | |
| | 39,002 | | | Healthcare Services Group, Inc. | | | 1,441,904 | |
| | 100,011 | | | Hudson Technologies, Inc.(b) | | | 610,067 | |
| | 47,822 | | | IES Holdings, Inc.(b) | | | 714,939 | |
| | 17,853 | | | Insteel Industries, Inc. | | | 480,246 | |
| | 11,349 | | | John Bean Technologies Corp. | | | 906,218 | |
| | 12,003 | | | Kadant, Inc. | | | 619,955 | |
| | 58,272 | | | KEYW Holding Corp. (The)(b)(c) | | | 611,273 | |
| | 41,565 | | | Lydall, Inc.(b) | | | 1,943,164 | |
| | 26,969 | | | Mercury Systems, Inc.(b) | | | 749,199 | |
| | 62,257 | | | Mueller Water Products, Inc., Class A | | | 767,006 | |
| | 30,289 | | | Navistar International Corp.(b)(c) | | | 675,445 | |
| | 31,807 | | | NV5 Global, Inc.(b) | | | 909,680 | |
| | 25,484 | | | Patrick Industries, Inc.(b) | | | 1,461,507 | |
| | 27,483 | | | SkyWest, Inc. | | | 828,613 | |
| | 10,462 | | | Standex International Corp. | | | 799,297 | |
| | 97,515 | | | Supreme Industries, Inc., Class A | | | 1,188,708 | |
| | 70,518 | | | Titan International, Inc. | | | 718,578 | |
| | 18,263 | | | Trex Co., Inc.(b) | | | 982,732 | |
| | 6,575 | | | Universal Forest Products, Inc. | | | 565,384 | |
| | | | | | | | |
| | | | | | | 27,627,765 | |
| | | | | | | | |
| | | | Information Technology—19.3% | |
| | 41,532 | | | 8x8, Inc.(b) | | | 591,831 | |
| | 61,164 | | | A10 Networks, Inc.(b) | | | 468,516 | |
| | 13,678 | | | Advanced Energy Industries, Inc.(b) | | | 652,441 | |
| | 32,201 | | | Alpha & Omega Semiconductor Ltd.(b) | | | 680,407 | |
| | 67,976 | | | Amkor Technology, Inc.(b) | | | 630,138 | |
| | 30,683 | | | Applied Optoelectronics, Inc.(b) | | | 590,034 | |
| | 48,397 | | | Axcelis Technologies, Inc.(b) | | | 660,619 | |
| | 48,295 | | | Brightcove, Inc.(b) | | | 538,489 | |
| | 13,458 | | | BroadSoft, Inc.(b) | | | 559,180 | |
| | 40,426 | | | Callidus Software, Inc.(b) | | | 737,775 | |
| | 17,670 | | | CEVA, Inc.(b) | | | 530,984 | |
| | | | | | | | |
Number
of Shares | | | | | Value | |
| | | | Common Stocks and Other Equity Interests (continued) | |
| | | | Information Technology (continued) | |
| | 21,299 | | | Convergys Corp. | | $ | 621,931 | |
| | 23,506 | | | Ebix, Inc.(c) | | | 1,316,336 | |
| | 13,226 | | | Electronics for Imaging, Inc.(b) | | | 562,502 | |
| | 8,897 | | | Ellie Mae, Inc.(b) | | | 942,103 | |
| | 12,609 | | | ExlService Holdings, Inc.(b) | | | 555,174 | |
| | 15,106 | | | Fabrinet (Thailand)(b) | | | 573,424 | |
| | 21,817 | | | Finisar Corp.(b) | | | 597,349 | |
| | 59,104 | | | Five9, Inc.(b) | | | 846,369 | |
| | 24,505 | | | Gigamon, Inc.(b) | | | 1,355,127 | |
| | 27,409 | | | GTT Communications, Inc.(b) | | | 616,703 | |
| | 19,882 | | | Inphi Corp.(b) | | | 737,622 | |
| | 8,276 | | | InterDigital, Inc. | | | 584,699 | |
| | 8,977 | | | Littelfuse, Inc. | | | 1,252,292 | |
| | 10,765 | | | LogMeIn, Inc.(c) | | | 1,022,675 | |
| | 15,588 | | | Lumentum Holdings, Inc.(b) | | | 523,757 | |
| | 15,798 | | | MACOM Technology Solutions Holdings, Inc.(b) | | | 580,734 | |
| | 106,855 | | | MeetMe, Inc.(b)(c) | | | 522,521 | |
| | 112,209 | | | NeoPhotonics Corp.(b) | | | 1,570,926 | |
| | 193,875 | | | Oclaro, Inc.(b) | | | 1,417,226 | |
| | 14,375 | | | Paylocity Holding Corp.(b)(c) | | | 625,169 | |
| | 24,393 | | | PC Connection, Inc. | | | 566,162 | |
| | 32,616 | | | PCM, Inc.(b) | | | 691,459 | |
| | 22,654 | | | Q2 Holdings, Inc.(b) | | | 636,577 | |
| | 46,980 | | | Quotient Technology, Inc.(b) | | | 497,988 | |
| | 119,031 | | | Radisys Corp.(b) | | | 496,359 | |
| | 26,736 | | | RingCentral, Inc., Class A(b) | | | 553,435 | |
| | 9,020 | | | Science Applications International Corp. | | | 621,568 | |
| | 7,954 | | | Stamps.com, Inc.(b) | | | 775,913 | |
| | 140,116 | | | USA Technologies, Inc.(b) | | | 630,522 | |
| | 46,347 | | | Xactly Corp.(b) | | | 597,876 | |
| | 32,776 | | | XO Group, Inc.(b) | | | 603,078 | |
| | | | | | | | |
| | | | | | | 30,135,990 | |
| | | | | | | | |
| | | | Materials—5.3% | |
| | 12,684 | | | Chase Corp. | | | 866,951 | |
| | 46,622 | | | Flotek Industries, Inc.(b)(c) | | | 549,207 | |
| | 173,831 | | | Gold Resource Corp.(c) | | | 987,360 | |
| | 13,354 | | | Ingevity Corp.(b) | | | 552,856 | |
| | 27,971 | | | Innospec, Inc. | | | 1,685,253 | |
| | 18,793 | | | Kraton Corp.(b) | | | 481,665 | |
| | 29,287 | | | Neenah Paper, Inc. | | | 2,340,031 | |
| | 6,627 | | | Quaker Chemical Corp. | | | 712,402 | |
| | | | | | | | |
| | | | | | | 8,175,725 | |
| | | | | | | | |
| | | | Real Estate—1.2% | |
| | 30,091 | | | One Liberty Properties, Inc. REIT | | | 708,944 | |
| | 11,660 | | | QTS Realty Trust, Inc., Class A REIT | | | 535,894 | |
| | 17,810 | | | RMR Group, Inc. (The), Class A | | | 611,773 | |
| | | | | | | | |
| | | | | | | 1,856,611 | |
| | | | | | | | |
| | | | Telecommunication Services—0.8% | |
| | 62,144 | | | ORBCOMM, Inc.(b) | | | 554,946 | |
| | 96,610 | | | Vonage Holdings Corp.(b) | | | 662,745 | |
| | | | | | | | |
| | | | | | | 1,217,691 | |
| | | | | | | | |
| | | | Utilities—1.1% | |
| | 12,731 | | | Ormat Technologies, Inc. | | | 614,016 | |
| | 21,680 | | | Spark Energy, Inc., Class A | | | 524,656 | |
See accompanying Notes to Financial Statements which are an integral part of the financial statements.
PowerShares DWA SmallCap Momentum Portfolio (DWAS) (continued)
October 31, 2016
| | | | | | | | |
Number
of Shares | | | | | Value | |
| | | | Common Stocks and Other Equity Interests (continued) | |
| | | | Utilities (continued) | |
| | 43,652 | | | TerraForm Power, Inc., Class A(b)(c) | | $ | 541,721 | |
| | | | | | | | |
| | | | | | | 1,680,393 | |
| | | | | | | | |
| | | | Total Common Stocks and Other Equity Interests
(Cost $150,618,685) | | | 155,848,995 | |
| | | | | | | | |
| | |
| | | | | | | | |
| | | | Money Market Fund—0.0% | |
| | 44,051 | | | Invesco Premier U.S. Government Money Portfolio—Institutional Class, 0.25%(d)
(Cost $44,051) | | | 44,051 | |
| | | | | | | | |
| | | | Total Investments
(excluding investments purchased with cash collateral from securities on loan)
(Cost $150,662,736)—100.0% | | | 155,893,046 | |
| | | | | | | | |
| | |
| | | | | | | | |
| | | | Investments Purchased with Cash Collateral from Securities on Loan | |
| | |
| | | | | | | | |
| | | | Money Market Fund—9.8% | |
| | 15,263,759 | | | Invesco Government & Agency Portfolio—Institutional Class, 0.29%(d)(e)
(Cost $15,263,759) | | | 15,263,759 | |
| | | | | | | | |
| | | | Total Investments
(Cost $165,926,495)—109.8% | | | 171,156,805 | |
| | | | Other assets less liabilities—(9.8)% | | | (15,299,632 | ) |
| | | | | | | | |
| | | | Net Assets—100.0% | | $ | 155,857,173 | |
| | | | | | | | |
Investment Abbreviations:
REIT—Real Estate Investment Trust
Notes to Schedule of Investments:
| (a) | Industry and/or sector classifications used in this report are generally according to the Global Industry Classification Standard, which was developed by and is the exclusive property and a service mark of MSCI Inc. and Standard & Poor’s. |
| (b) | Non-income producing security. |
| (c) | All or a portion of this security was out on loan at October 31, 2016. |
| (d) | The security and the Fund are advised by wholly-owned subsidiaries of Invesco Ltd. and are therefore considered to be affiliated. The rate shown is the 7-day SEC standardized yield as of October 31, 2016. |
| (e) | The security has been segregated to satisfy the commitment to return the cash collateral received in securities lending transactions upon the borrower’s return of the securities loaned. See Note 2H. |
See accompanying Notes to Financial Statements which are an integral part of the financial statements.
Schedule of Investments
PowerShares DWA Tactical Multi-Asset Income Portfolio (DWIN)
October 31, 2016
| | | | | | | | |
Number
of Shares | | | | | Value | |
| | | | Exchange-Traded Funds—100.0% | |
| | 2,168,577 | | | Alerian MLP ETF | | $ | 26,521,697 | |
| | 769,426 | | | PowerShares Emerging Markets Sovereign Debt Portfolio(a) | | | 22,836,564 | |
| | 936,546 | | | PowerShares Global Short Term High Yield Bond Portfolio(a) | | | 22,748,703 | |
| | 664,397 | | | PowerShares KBW Premium Yield Equity REIT Portfolio(a) | | | 22,542,990 | |
| | 1,615,338 | | | PowerShares Preferred Portfolio(a) | | | 24,197,763 | |
| | | | | | | | |
| | | | Total Exchange-Traded Funds
(Cost $117,451,052) | | | 118,847,717 | |
| | | | | | | | |
| |
| | | | Money Market Fund—1.5% | |
| | 1,731,358 | | | Invesco Premier U.S. Government Money Portfolio—Institutional Class, 0.25%(b)
(Cost $1,731,358) | | | 1,731,358 | |
| | | | | | | | |
| | | | Total Investments
(Cost $119,182,410)—101.5% | | | 120,579,075 | |
| | | | Other assets less liabilities—(1.5)% | | | (1,732,933 | ) |
| | | | | | | | |
| | | | Net Assets—100.0% | | $ | 118,846,142 | |
| | | | | | | | |
Investment Abbreviations:
ETF—Exchange-Traded Fund
REIT—Real Estate Investment Trust
Notes to Schedule of Investments:
| (a) | Affiliated company. The security and the Fund are affiliated by having the same investment adviser. See Note 4. |
| (b) | The security and the Fund are advised by wholly-owned subsidiaries of Invesco Ltd. and are therefore considered to be affiliated. The rate shown is the 7-day SEC standardized yield as of October 31, 2016. |
See accompanying Notes to Financial Statements which are an integral part of the financial statements.
Schedule of Investments
PowerShares DWA Tactical Sector Rotation Portfolio (DWTR)
October 31, 2016
| | | | | | | | |
Number
of Shares | | | | | Value | |
| | | | Exchange-Traded Funds—100.0%(a) | |
| | 883,893 | | | PowerShares DWA Basic Materials Momentum Portfolio | | $ | 48,614,115 | |
| | 888,762 | | | PowerShares DWA Consumer Staples Momentum Portfolio | | | 48,810,898 | |
| | 955,973 | | | PowerShares DWA Technology Momentum Portfolio(b) | | | 37,693,155 | |
| | 1,443,282 | | | PowerShares DWA Utilities Momentum Portfolio | | | 37,020,472 | |
| | | | | | | | |
| | | | Total Exchange-Traded Funds
(Cost $169,832,040) | | | 172,138,640 | |
| | | | | | | | |
| | |
| | | | | | | | |
| | | | Money Market Fund—0.0% | | | | |
| | 4,837 | | | Invesco Premier U.S. Government Money Portfolio—Institutional Class, 0.25%(c)
(Cost $4,837) | | | 4,837 | |
| | | | | | | | |
| | | | Total Investments
(Cost $169,836,877)—100.0% | | | 172,143,477 | |
| | | | Other assets less liabilities—(0.0)% | | | (22,068 | ) |
| | | | | | | | |
| | | | Net Assets—100.0% | | $ | 172,121,409 | |
| | | | | | | | |
Notes to Schedule of Investments:
| (a) | Affiliated company. The security and the Fund are affiliated by having the same investment adviser. See Note 4. |
| (b) | Non-income producing security. |
| (c) | The security and the Fund are advised by wholly-owned subsidiaries of Invesco Ltd. and are therefore considered to be affiliated. The rate shown is the 7-day SEC standardized yield as of October 31, 2016. |
See accompanying Notes to Financial Statements which are an integral part of the financial statements.
Schedule of Investments(a)
PowerShares S&P SmallCap Consumer Discretionary Portfolio (PSCD)
October 31, 2016
| | | | | | | | |
Number
of Shares | | | | | Value | |
| | | | Common Stocks—99.9% | | | | |
| | | | Auto Components—12.0% | | | | |
| | 64,037 | | | American Axle & Manufacturing Holdings, Inc.(b) | | $ | 1,147,543 | |
| | 14,499 | | | Cooper-Standard Holding, Inc.(b) | | | 1,323,324 | |
| | 25,425 | | | Dorman Products, Inc.(b) | | | 1,633,302 | |
| | 20,597 | | | Drew Industries, Inc. | | | 1,844,461 | |
| | 20,021 | | | Fox Factory Holding Corp.(b) | | | 434,456 | |
| | 30,558 | | | Gentherm, Inc.(b) | | | 860,208 | |
| | 15,606 | | | Motorcar Parts of America, Inc.(b) | | | 409,501 | |
| | 16,745 | | | Standard Motor Products, Inc. | | | 818,831 | |
| | 19,162 | | | Superior Industries International, Inc. | | | 469,469 | |
| | | | | | | | |
| | | | | | | 8,941,095 | |
| | | | | | | | |
| | | | Automobiles—0.9% | | | | |
| | 22,529 | | | Winnebago Industries, Inc. | | | 636,444 | |
| | | | | | | | |
| | | | Distributors—1.9% | | | | |
| | 38,756 | | | Core-Mark Holding Co., Inc. | | | 1,370,025 | |
| | | | | | | | |
| | | | Diversified Consumer Services—3.0% | | | | |
| | 13,464 | | | American Public Education, Inc.(b) | | | 271,299 | |
| | 9,687 | | | Capella Education Co. | | | 708,120 | |
| | 53,906 | | | Career Education Corp.(b) | | | 387,584 | |
| | 29,384 | | | Regis Corp.(b) | | | 372,589 | |
| | 8,736 | | | Strayer Education, Inc.(b) | | | 512,454 | |
| | | | | | | | |
| | | | | | | 2,252,046 | |
| | | | | | | | |
| | | | Hotels, Restaurants & Leisure—21.5% | | | | |
| | 70,738 | | | Belmond Ltd., Class A (United Kingdom)(b) | | | 916,057 | |
| | 849 | | | Biglari Holdings, Inc.(b) | | | 372,015 | |
| | 16,808 | | | BJ’s Restaurants, Inc.(b) | | | 606,769 | |
| | 16,558 | | | Bob Evans Farms, Inc. | | | 682,521 | |
| | 68,659 | | | Boyd Gaming Corp.(b) | | | 1,226,250 | |
| | 14,069 | | | Chuy’s Holdings, Inc.(b) | | | 399,560 | |
| | 31,132 | | | Dave & Buster’s Entertainment, Inc.(b) | | | 1,287,308 | |
| | 14,341 | | | DineEquity, Inc. | | | 1,134,373 | |
| | 18,023 | | | El Pollo Loco Holdings, Inc.(b)(c) | | | 219,881 | |
| | 22,552 | | | Fiesta Restaurant Group, Inc.(b) | | | 595,373 | |
| | 89,098 | | | Ilg, Inc. | | | 1,459,425 | |
| | 15,799 | | | Marcus Corp. (The) | | | 418,673 | |
| | 20,346 | | | Marriott Vacations Worldwide Corp. | | | 1,293,599 | |
| | 9,139 | | | Monarch Casino & Resort, Inc.(b) | | | 216,137 | |
| | 22,306 | | | Papa John’s International, Inc. | | | 1,682,988 | |
| | 17,821 | | | Popeyes Louisiana Kitchen, Inc.(b) | | | 951,285 | |
| | 11,131 | | | Red Robin Gourmet Burgers, Inc.(b) | | | 512,026 | |
| | 50,376 | | | Ruby Tuesday, Inc.(b) | | | 149,617 | |
| | 25,464 | | | Ruth’s Hospitality Group, Inc. | | | 403,604 | |
| | 42,525 | | | Scientific Games Corp., Class A(b)(c) | | | 527,310 | |
| | 39,828 | | | Sonic Corp. | | | 912,459 | |
| | | | | | | | |
| | | | | | | 15,967,230 | |
| | | | | | | | |
| | | | Household Durables—11.9% | | | | |
| | 7,065 | | | Cavco Industries, Inc.(b) | | | 652,806 | |
| | 21,384 | | | Ethan Allen Interiors, Inc. | | | 656,489 | |
| | 16,616 | | | Installed Building Products, Inc.(b) | | | 549,159 | |
| | 22,769 | | | iRobot Corp.(b) | | | 1,154,388 | |
| | 41,188 | | | La-Z-Boy, Inc. | | | 963,799 | |
| | 14,088 | | | LGI Homes, Inc.(b)(c) | | | 419,259 | |
| | 20,665 | | | M/I Homes, Inc.(b) | | | 444,504 | |
| | 32,860 | | | MDC Holdings, Inc. | | | 779,111 | |
| | 31,512 | | | Meritage Homes Corp.(b) | | | 975,296 | |
| | 32,204 | | | TopBuild Corp.(b) | | | 970,306 | |
| | | | | | | | |
Number
of Shares | | | | | Value | |
| | | | Common Stocks (continued) | | | | |
| | | | Household Durables (continued) | | | | |
| | 12,124 | | | Universal Electronics, Inc.(b) | | $ | 850,499 | |
| | 18,312 | | | WCI Communities, Inc.(b) | | | 423,923 | |
| | | | | | | | |
| | | | | | | 8,839,539 | |
| | | | | | | | |
| | | | Internet & Direct Marketing Retail—2.4% | |
| | 9,731 | | | Blue Nile, Inc. | | | 339,904 | |
| | 14,445 | | | FTD Cos., Inc.(b) | | | 290,633 | |
| | 24,737 | | | Nutrisystem, Inc. | | | 784,163 | |
| | 17,195 | | | PetMed Express, Inc.(c) | | | 341,665 | |
| | | | | | | | |
| | | | | | | 1,756,365 | |
| | | | | | | | |
| | | | Leisure Products—3.2% | | | | |
| | 10,931 | | | Arctic Cat, Inc. | | | 163,856 | |
| | 78,769 | | | Callaway Golf Co. | | | 804,231 | |
| | 26,057 | | | Nautilus, Inc.(b) | | | 458,603 | |
| | 15,893 | | | Sturm Ruger & Co., Inc. | | | 977,420 | |
| | | | | | | | |
| | | | | | | 2,404,110 | |
| | | | | | | | |
| | | | Media—3.8% | | | | |
| | 47,986 | | | E.W. Scripps Co. (The), Class A(b) | | | 636,295 | |
| | 97,625 | | | Gannett Co., Inc. | | | 758,546 | |
| | 38,969 | | | Harte-Hanks, Inc. | | | 54,946 | |
| | 22,433 | | | Scholastic Corp. | | | 858,062 | |
| | 30,912 | | | World Wrestling Entertainment, Inc., Class A | | | 546,524 | |
| | | | | | | | |
| | | | | | | 2,854,373 | |
| | | | | | | | |
| | | | Multi-line Retail—2.1% | | | | |
| | 29,363 | | | Fred’s, Inc., Class A | | | 268,084 | |
| | 39,708 | | | Ollie’s Bargain Outlet Holdings, Inc.(b) | | | 1,086,014 | |
| | 37,321 | | | Tuesday Morning Corp.(b) | | | 184,739 | |
| | | | | | | | |
| | | | | | | 1,538,837 | |
| | | | | | | | |
| | | | Specialty Retail—27.9% | | | | |
| | 56,679 | | | Abercrombie & Fitch Co., Class A | | | 828,080 | |
| | 16,524 | | | Asbury Automotive Group, Inc.(b) | | | 841,898 | |
| | 32,197 | | | Barnes & Noble Education, Inc.(b) | | | 299,754 | |
| | 46,811 | | | Barnes & Noble, Inc. | | | 482,153 | |
| | 14,944 | | | Big 5 Sporting Goods Corp. | | | 231,632 | |
| | 23,371 | | | Buckle, Inc. (The)(c) | | | 487,285 | |
| | 36,352 | | | Caleres, Inc. | | | 909,163 | |
| | 21,810 | | | Cato Corp. (The), Class A | | | 647,103 | |
| | 15,375 | | | Children’s Place, Inc. (The) | | | 1,167,731 | |
| | 65,679 | | | Express, Inc.(b) | | | 789,462 | |
| | 34,719 | | | Finish Line, Inc. (The), Class A | | | 683,617 | |
| | 45,964 | | | Five Below, Inc.(b) | | | 1,727,327 | |
| | 31,766 | | | Francesca’s Holdings Corp.(b) | | | 510,480 | |
| | 17,372 | | | Genesco, Inc.(b) | | | 934,614 | |
| | 16,636 | | | Group 1 Automotive, Inc. | | | 1,002,652 | |
| | 15,980 | | | Haverty Furniture Cos., Inc. | | | 283,645 | |
| | 18,747 | | | Hibbett Sports, Inc.(b)(c) | | | 728,321 | |
| | 12,247 | | | Kirkland’s, Inc.(b) | | | 149,536 | |
| | 19,603 | | | Lithia Motors, Inc., Class A | | | 1,681,545 | |
| | 22,737 | | | Lumber Liquidators Holdings, Inc.(b)(c) | | | 352,651 | |
| | 20,345 | | | MarineMax, Inc.(b) | | | 405,883 | |
| | 27,048 | | | Monro Muffler Brake, Inc. | | | 1,487,640 | |
| | 44,494 | | | Rent-A-Center, Inc. | | | 448,944 | |
| | 38,474 | | | Select Comfort Corp.(b) | | | 738,316 | |
| | 11,846 | | | Shoe Carnival, Inc. | | | 300,533 | |
| | 22,397 | | | Sonic Automotive, Inc., Class A | | | 400,906 | |
| | 21,089 | | | Stage Stores, Inc.(c) | | | 107,343 | |
See accompanying Notes to Financial Statements which are an integral part of the financial statements.
PowerShares S&P SmallCap Consumer Discretionary Portfolio (PSCD) (continued)
October 31, 2016
| | | | | | | | |
Number
of Shares | | | | | Value | |
| | | | Common Stocks (continued) | | | | |
| | | | Specialty Retail (continued) | | | | |
| | 25,931 | | | Stein Mart, Inc. | | $ | 156,105 | |
| | 40,750 | | | Tailored Brands, Inc. | | | 643,850 | |
| | 27,619 | | | Tile Shop Holdings, Inc. (The)(b) | | | 468,142 | |
| | 20,105 | | | Vitamin Shoppe, Inc.(b) | | | 503,630 | |
| | 14,751 | | | Zumiez, Inc.(b)(c) | | | 328,210 | |
| | | | | | | | |
| | | | | | | 20,728,151 | |
| | | | | | | | |
| | | | Textiles, Apparel & Luxury Goods—9.3% | | | | |
| | 61,558 | | | Crocs, Inc.(b) | | | 473,381 | |
| | 34,497 | | | G-III Apparel Group Ltd.(b) | | | 901,062 | |
| | 47,017 | | | Iconix Brand Group, Inc.(b)(c) | | | 370,494 | |
| | 12,840 | | | Movado Group, Inc. | | | 283,122 | |
| | 12,502 | | | Oxford Industries, Inc. | | | 784,125 | |
| | 10,125 | | | Perry Ellis International, Inc.(b) | | | 188,224 | |
| | 46,193 | | | Steven Madden Ltd.(b) | | | 1,542,846 | |
| | 12,649 | | | Unifi, Inc.(b) | | | 363,659 | |
| | 16,380 | | | Vera Bradley, Inc.(b) | | | 219,001 | |
| | 83,304 | | | Wolverine World Wide, Inc. | | | 1,778,540 | |
| | | | | | | | |
| | | | | | | 6,904,454 | |
| | | | | | | | |
| | | | Total Common Stocks
(Cost $80,690,969) | | | 74,192,669 | |
| | | | | | | | |
| | |
| | | | Money Market Fund—0.1% | | | | |
| | 50,097 | | | Invesco Premier U.S. Government Money Portfolio—Institutional Class, 0.25%(d) (Cost $50,097) | | | 50,097 | |
| | | | | | | | |
| | | | Total Investments
(excluding investments purchased with cash collateral from securities on loan) (Cost $80,741,066)—100.0% | | | 74,242,766 | |
| | | | | | | | |
| | |
| | | | | | | | |
| | | | Investments Purchased with Cash Collateral from Securities on Loan | |
| | |
| | | | | | | | |
| | | | Money Market Fund—3.3% | | | | |
| | 2,435,067 | | | Invesco Government & Agency Portfolio—Institutional Class, 0.29%(d)(e) (Cost $2,435,067) | | | 2,435,067 | |
| | | | | | | | |
| | | | Total Investments
(Cost $83,176,133)—103.3% | | | 76,677,833 | |
| | | | Other assets less liabilities—(3.3)% | | | (2,442,525 | ) |
| | | | | | | | |
| | | | Net Assets—100.0% | | $ | 74,235,308 | |
| | | | | | | | |
Notes to Schedule of Investments:
| (a) | Industry and/or sector classifications used in this report are generally according to the Global Industry Classification Standard, which was developed by and is the exclusive property and a service mark of MSCI Inc. and Standard & Poor’s. |
| (b) | Non-income producing security. |
| (c) | All or a portion of this security was out on loan at October 31, 2016. |
| (d) | The security and the Fund are advised by wholly-owned subsidiaries of Invesco Ltd. and are therefore considered to be affiliated. The rate shown is the 7-day SEC standardized yield as of October 31, 2016. |
| (e) | The security has been segregated to satisfy the commitment to return the cash collateral received in securities lending transactions upon the borrower’s return of the securities loaned. See Note 2H. |
See accompanying Notes to Financial Statements which are an integral part of the financial statements.
Schedule of Investments(a)
PowerShares S&P SmallCap Consumer Staples Portfolio (PSCC)
October 31, 2016
| | | | | | | | |
Number
of Shares | | | | | Value | |
| | | | Common Stocks—97.3% | |
| | | | Food & Staples Retailing—14.3% | |
| | 88,165 | | | Andersons, Inc. (The) | | $ | 3,354,678 | |
| | 117,712 | | | SpartanNash Co. | | | 3,295,936 | |
| | 755,051 | | | SUPERVALU, Inc.(b) | | | 3,239,169 | |
| | | | | | | | |
| | | | | | | 9,889,783 | |
| | | | | | | | |
| | | | Food Products—58.9% | |
| | 241,090 | | | B&G Foods, Inc. | | | 10,222,216 | |
| | 52,823 | | | Calavo Growers, Inc. | | | 3,124,481 | |
| | 82,177 | | | Cal-Maine Foods, Inc.(c) | | | 3,176,141 | |
| | 597,559 | | | Darling Ingredients, Inc.(b) | | | 8,126,802 | |
| | 52,654 | | | J & J Snack Foods Corp. | | | 6,431,686 | |
| | 72,137 | | | Sanderson Farms, Inc. | | | 6,490,887 | |
| | 112,755 | | | Seneca Foods Corp., Class A(b) | | | 3,314,997 | |
| | | | | | | | |
| | | | | | | 40,887,210 | |
| | | | | | | | |
| | | | Household Products—9.6% | |
| | 30,405 | | | Central Garden & Pet Co.(b) | | | 739,450 | |
| | 113,192 | | | Central Garden & Pet Co., Class A(b) | | | 2,641,901 | |
| | 31,018 | | | WD-40 Co. | | | 3,307,294 | |
| | | | | | | | |
| | | | | | | 6,688,645 | |
| | | | | | | | |
| | | | Personal Products—9.6% | |
| | 102,157 | | | Inter Parfums, Inc. | | | 3,330,319 | |
| | 80,853 | | | Medifast, Inc. | | | 3,319,824 | |
| | | | | | | | |
| | | | | | | 6,650,143 | |
| | | | | | | | |
| | | | Tobacco—4.9% | |
| | 62,090 | | | Universal Corp. | | | 3,365,278 | |
| | | | | | | | |
| | | | Total Investments
(excluding investments purchased with cash collateral from securities on loan)
(Cost $71,374,819)—97.3% | | | 67,481,059 | |
| | | | | | | | |
| | |
| | | | | | | | |
| | | | Investments Purchased with Cash Collateral from Securities on Loan | |
| | |
| | | | | | | | |
| | | | Money Market Fund—2.6% | |
| | 1,817,400 | | | Invesco Government & Agency Portfolio—Institutional Class, 0.29%(d)(e)
(Cost $1,817,400) | | | 1,817,400 | |
| | | | | | | | |
| | | | Total Investments
(Cost $73,192,219)—99.9% | | | 69,298,459 | |
| | | | Other assets less liabilities—0.1% | | | 61,286 | |
| | | | | | | | |
| | | | Net Assets—100.0% | | $ | 69,359,745 | |
| | | | | | | | |
Notes to Schedule of Investments:
| (a) | Industry and/or sector classifications used in this report are generally according to the Global Industry Classification Standard, which was developed by and is the exclusive property and a service mark of MSCI Inc. and Standard & Poor’s. |
| (b) | Non-income producing security. |
| (c) | All or a portion of this security was out on loan at October 31, 2016. |
| (d) | The security and the Fund are advised by wholly-owned subsidiaries of Invesco Ltd. and are therefore considered to be affiliated. The rate shown is the 7-day SEC standardized yield as of October 31, 2016. |
| (e) | The security has been segregated to satisfy the commitment to return the cash collateral received in securities lending transactions upon the borrower’s return of the securities loaned. See Note 2H. |
See accompanying Notes to Financial Statements which are an integral part of the financial statements.
Schedule of Investments(a)
PowerShares S&P SmallCap Energy Portfolio (PSCE)
October 31, 2016
| | | | | | | | |
Number
of Shares | | | | | Value | |
| | | | Common Stocks—99.6% | |
| | | | Energy Equipment & Services—54.7% | |
| | 197,802 | | | Archrock, Inc. | | $ | 2,294,503 | |
| | 171,194 | | | Atwood Oceanics, Inc.(b) | | | 1,306,210 | |
| | 90,642 | | | Bristow Group, Inc. | | | 907,326 | |
| | 52,066 | | | CARBO Ceramics, Inc. | | | 317,603 | |
| | 55,161 | | | Era Group, Inc.(c) | | | 416,466 | |
| | 88,845 | | | Exterran Corp.(c) | | | 1,404,639 | |
| | 37,861 | | | Geospace Technologies Corp.(c) | | | 697,778 | |
| | 38,242 | | | Gulf Island Fabrication, Inc. | | | 382,420 | |
| | 291,843 | | | Helix Energy Solutions Group, Inc.(c) | | | 2,544,871 | |
| | 91,869 | | | Hornbeck Offshore Services, Inc.(c) | | | 364,720 | |
| | 75,338 | | | Matrix Service Co.(c) | | | 1,333,483 | |
| | 240,100 | | | Newpark Resources, Inc.(c) | | | 1,512,630 | |
| | 183,674 | | | Pioneer Energy Services Corp.(c) | | | 652,043 | |
| | 40,330 | | | SEACOR Holdings, Inc.(c) | | | 1,988,672 | |
| | 131,821 | | | Tesco Corp. | | | 902,974 | |
| | 263,354 | | | TETRA Technologies, Inc.(c) | | | 1,435,279 | |
| | 133,708 | | | Tidewater, Inc.(b) | | | 231,315 | |
| | 133,791 | | | Unit Corp.(c) | | | 2,291,840 | |
| | 169,475 | | | US Silica Holdings, Inc. | | | 7,828,050 | |
| | | | | | | | |
| | | | | | | 28,812,822 | |
| | | | | | | | |
| | | | Oil, Gas & Consumable Fuels—44.9% | |
| | 171,039 | | | Bill Barrett Corp.(c) | | | 887,693 | |
| | 162,816 | | | Carrizo Oil & Gas, Inc.(c) | | | 5,508,065 | |
| | 174,197 | | | Cloud Peak Energy, Inc.(c) | | | 1,073,054 | |
| | 62,988 | | | Contango Oil & Gas Co.(c) | | | 493,196 | |
| | 94,648 | | | Green Plains, Inc. | | | 2,460,848 | |
| | 126,614 | | | Northern Oil and Gas, Inc.(c) | | | 265,889 | |
| | 150,408 | | | PDC Energy, Inc.(c) | | | 9,224,523 | |
| | 16,079 | | | REX American Resources Corp.(c) | | | 1,270,080 | |
| | 361,151 | | | Synergy Resources Corp.(c) | | | 2,470,273 | |
| | | | | | | | |
| | | | | | | 23,653,621 | |
| | | | | | | | |
| | | | Total Common Stocks
(Cost $57,891,578) | | | 52,466,443 | |
| | | | | | | | |
| | |
| | | | | | | | |
| | | | Money Market Fund—0.0% | | | | |
| | 9,984 | | | Invesco Premier U.S. Government Money Portfolio—Institutional Class, 0.25%(d)
(Cost $9,984) | | | 9,984 | |
| | | | | | | | |
| | | | Total Investments
(excluding investments purchased with cash collateral from securities on loan)
(Cost $57,901,562)—99.6% | | | 52,476,427 | |
| | | | | | | | |
| | |
| | | | | | | | |
| | | | Investments Purchased with Cash Collateral from Securities on Loan | |
| | |
| | | | | | | | |
| | | | Money Market Fund—2.2% | | | | |
| | 1,150,950 | | | Invesco Government & Agency Portfolio—Institutional Class, 0.29%(d)(e)
(Cost $1,150,950) | | | 1,150,950 | |
| | | | | | | | |
| | | | Total Investments
(Cost $59,052,512)—101.8% | | | 53,627,377 | |
| | | | Other assets less liabilities—(1.8)% | | | (941,183 | ) |
| | | | | | | | |
| | | | Net Assets—100.0% | | $ | 52,686,194 | |
| | | | | | | | |
Notes to Schedule of Investments:
| (a) | Industry and/or sector classifications used in this report are generally according to the Global Industry Classification Standard, which was developed by and is the exclusive property and a service mark of MSCI Inc. and Standard & Poor’s. |
| (b) | All or a portion of this security was out on loan at October 31, 2016. |
| (c) | Non-income producing security. |
| (d) | The security and the Fund are advised by wholly-owned subsidiaries of Invesco Ltd. and are therefore considered to be affiliated. The rate shown is the 7-day SEC standardized yield as of October 31, 2016. |
| (e) | The security has been segregated to satisfy the commitment to return the cash collateral received in securities lending transactions upon the borrower’s return of the securities loaned. See Note 2H. |
See accompanying Notes to Financial Statements which are an integral part of the financial statements.
Schedule of Investments(a)
PowerShares S&P SmallCap Financials Portfolio (PSCF)
October 31, 2016
| | | | | | | | |
Number
of Shares | | | | | Value | |
| | | | Common Stocks and Other Equity Interests—100.0% | |
| | | | Banks—41.7% | | | | |
| | 46,803 | | | Ameris Bancorp | | $ | 1,698,949 | |
| | 66,518 | | | Banc of California, Inc. | | | 884,689 | |
| | 35,794 | | | Banner Corp. | | | 1,615,741 | |
| | 111,964 | | | Boston Private Financial Holdings, Inc. | | | 1,472,327 | |
| | 94,640 | | | Brookline Bancorp, Inc. | | | 1,211,392 | |
| | 43,563 | | | Cardinal Financial Corp. | | | 1,144,836 | |
| | 41,590 | | | Central Pacific Financial Corp. | | | 1,065,952 | |
| | 20,138 | | | City Holding Co. | | | 1,052,613 | |
| | 77,907 | | | Columbia Banking System, Inc. | | | 2,572,489 | |
| | 59,404 | | | Community Bank System, Inc. | | | 2,798,522 | |
| | 34,431 | | | Customers Bancorp, Inc.(b) | | | 932,047 | |
| | 134,747 | | | CVB Financial Corp. | | | 2,261,055 | |
| | 154,481 | | | First BanCorp/Puerto Rico(b) | | | 792,488 | |
| | 119,379 | | | First Commonwealth Financial Corp. | | | 1,212,891 | |
| | 83,163 | | | First Financial Bancorp | | | 1,788,004 | |
| | 88,659 | | | First Financial Bankshares, Inc.(c) | | | 3,209,456 | |
| | 109,134 | | | First Midwest Bancorp, Inc. | | | 2,107,378 | |
| | 21,422 | | | First NBC Bank Holding Co.(b) | | | 115,679 | |
| | 102,230 | | | Glacier Bancorp, Inc. | | | 2,889,020 | |
| | 78,771 | | | Great Western Bancorp, Inc. | | | 2,539,577 | |
| | 43,300 | | | Hanmi Financial Corp. | | | 1,082,500 | |
| | 165,803 | | | Home BancShares, Inc. | | | 3,566,423 | |
| | 170,409 | | | Hope Bancorp, Inc. | | | 2,750,401 | |
| | 35,336 | | | Independent Bank Corp./MA | | | 1,948,780 | |
| | 55,672 | | | LegacyTexas Financial Group, Inc. | | | 1,904,539 | |
| | 57,803 | | | NBT Bancorp, Inc. | | | 1,948,539 | |
| | 58,937 | | | OFG Bancorp | | | 627,679 | |
| | 181,189 | | | Old National Bancorp | | | 2,663,478 | |
| | 24,381 | | | Opus Bank | | | 488,839 | |
| | 58,209 | | | Pinnacle Financial Partners, Inc. | | | 3,003,584 | |
| | 46,860 | | | S&T Bancorp, Inc. | | | 1,470,935 | |
| | 29,595 | | | ServisFirst Bancshares, Inc. | | | 1,602,273 | |
| | 38,781 | | | Simmons First National Corp., Class A | | | 1,913,842 | |
| | 32,765 | | | Southside Bancshares, Inc. | | | 1,068,794 | |
| | 175,352 | | | Sterling Bancorp | | | 3,156,336 | |
| | 61,679 | | | Texas Capital Bancshares, Inc.(b) | | | 3,657,565 | |
| | 16,352 | | | Tompkins Financial Corp. | | | 1,296,387 | |
| | 58,497 | | | UMB Financial Corp. | | | 3,629,739 | |
| | 90,208 | | | United Bankshares, Inc. | | | 3,400,842 | |
| | 95,048 | | | United Community Banks, Inc. | | | 2,050,185 | |
| | 34,401 | | | Westamerica Bancorp.(c) | | | 1,704,914 | |
| | 69,347 | | | Wintrust Financial Corp. | | | 3,741,271 | |
| | | | | | | | |
| | | | | | | 82,042,950 | |
| | | | | | | | |
| | | | Capital Markets—6.5% | | | | |
| | 22,319 | | | Calamos Asset Management, Inc., Class A | | | 144,181 | |
| | 35,146 | | | Donnelley Financial Solutions, Inc.(b) | | | 753,882 | |
| | 52,058 | | | Evercore Partners, Inc., Class A | | | 2,798,117 | |
| | 71,315 | | | Financial Engines, Inc. | | | 1,971,860 | |
| | 36,964 | | | Greenhill & Co., Inc. | | | 866,806 | |
| | 90,280 | | | Interactive Brokers Group, Inc., Class A | | | 2,996,393 | |
| | 20,018 | | | INTL FCStone, Inc.(b) | | | 718,646 | |
| | 41,956 | | | Investment Technology Group, Inc. | | | 642,346 | |
| | 19,195 | | | Piper Jaffray Cos.(b) | | | 1,085,477 | |
| | 7,665 | | | Virtus Investment Partners, Inc. | | | 822,455 | |
| | | | | | | | |
| | | | | | | 12,800,163 | |
| | | | | | | | |
| | | | | | | | |
Number
of Shares | | | | | Value | |
| | | | Common Stocks and Other Equity Interests (continued) | |
| | | | Consumer Finance—4.2% | | | | |
| | 31,508 | | | Encore Capital Group, Inc.(b) | | $ | 625,434 | |
| | 31,204 | | | Enova International, Inc.(b) | | | 293,318 | |
| | 65,038 | | | EZCORP, Inc., Class A(b) | | | 634,121 | |
| | 64,965 | | | Firstcash, Inc. | | | 3,066,348 | |
| | 57,516 | | | Green Dot Corp., Class A(b) | | | 1,276,855 | |
| | 62,198 | | | PRA Group, Inc.(b) | | | 1,984,116 | |
| | 8,022 | | | World Acceptance Corp.(b)(c) | | | 381,205 | |
| | | | | | | | |
| | | | | | | 8,261,397 | |
| | | | | | | | |
| | | | Equity REITs—26.1% | | | | |
| | 106,875 | | | Acadia Realty Trust REIT | | | 3,600,619 | |
| | 33,864 | | | Agree Realty Corp. REIT | | | 1,637,324 | |
| | 53,632 | | | American Assets Trust, Inc. REIT | | | 2,129,727 | |
| | 77,702 | | | CareTrust REIT, Inc. REIT | | | 1,094,044 | |
| | 101,937 | | | Cedar Realty Trust, Inc. REIT | | | 690,114 | |
| | 80,662 | | | Chesapeake Lodging Trust REIT | | | 1,751,172 | |
| | 45,533 | | | CoreSite Realty Corp. REIT | | | 3,357,603 | |
| | 269,612 | | | DiamondRock Hospitality Co. REIT | | | 2,466,950 | |
| | 44,139 | | | EastGroup Properties, Inc. REIT | | | 2,997,479 | |
| | 80,373 | | | Four Corners Property Trust, Inc. REIT | | | 1,613,890 | |
| | 142,681 | | | Franklin Street Properties Corp. REIT | | | 1,650,819 | |
| | 100,646 | | | Geo Group, Inc. (The) REIT | | | 2,411,478 | |
| | 35,331 | | | Getty Realty Corp. REIT | | | 803,074 | |
| | 95,475 | | | Government Properties Income Trust REIT | | | 1,827,392 | |
| | 111,910 | | | Kite Realty Group Trust REIT | | | 2,789,916 | |
| | 286,240 | | | Lexington Realty Trust REIT | | | 2,902,474 | |
| | 52,640 | | | LTC Properties, Inc. REIT | | | 2,637,790 | |
| | 57,265 | | | Parkway, Inc. REIT(b) | | | 1,031,915 | |
| | 93,296 | | | Pennsylvania Real Estate Investment Trust REIT | | | 1,820,205 | |
| | 26,172 | | | PS Business Parks, Inc. REIT | | | 2,873,424 | |
| | 146,112 | | | Retail Opportunity Investments Corp. REIT | | | 2,938,312 | |
| | 87,623 | | | Sabra Health Care REIT, Inc. REIT | | | 2,041,616 | |
| | 15,796 | | | Saul Centers, Inc. REIT | | | 955,342 | |
| | 117,132 | | | Summit Hotel Properties, Inc. REIT | | | 1,521,545 | |
| | 16,779 | | | Universal Health Realty Income Trust REIT | | | 984,927 | |
| | 38,702 | | | Urstadt Biddle Properties, Inc., Class A REIT | | | 832,093 | |
| | | | | | | | |
| | | | | | | 51,361,244 | |
| | | | | | | | |
| | | | Insurance—13.1% | | | | |
| | 118,101 | | | American Equity Investment Life Holding Co. | | | 2,117,551 | |
| | 25,770 | | | AMERISAFE, Inc. | | | 1,432,812 | |
| | 22,238 | | | eHealth, Inc.(b) | | | 174,123 | |
| | 43,535 | | | Employers Holdings, Inc. | | | 1,364,822 | |
| | 11,572 | | | HCI Group, Inc. | | | 313,717 | |
| | 53,904 | | | Horace Mann Educators Corp. | | | 1,937,849 | |
| | 14,849 | | | Infinity Property & Casualty Corp. | | | 1,216,875 | |
| | 84,396 | | | Maiden Holdings Ltd. | | | 1,152,005 | |
| | 14,848 | | | Navigators Group, Inc. (The) | | | 1,383,834 | |
| | 71,405 | | | ProAssurance Corp. | | | 3,805,886 | |
| | 51,136 | | | RLI Corp. | | | 2,850,321 | |
| | 19,123 | | | Safety Insurance Group, Inc. | | | 1,294,627 | |
| | 77,589 | | | Selective Insurance Group, Inc. | | | 2,866,914 | |
| | 31,366 | | | Stewart Information Services Corp. | | | 1,409,902 | |
| | 28,971 | | | United Fire Group, Inc. | | | 1,144,934 | |
| | 23,820 | | | United Insurance Holdings Corp. | | | 345,390 | |
| | 43,782 | | | Universal Insurance Holdings, Inc.(c) | | | 932,557 | |
| | | | | | | | |
| | | | | | | 25,744,119 | |
| | | | | | | | |
See accompanying Notes to Financial Statements which are an integral part of the financial statements.
PowerShares S&P SmallCap Financials Portfolio (PSCF) (continued)
October 31, 2016
| | | | | | | | |
Number
of Shares | | | | | Value | |
| | | | Common Stocks and Other Equity Interests (continued) | |
| | | | Mortgage REITs—0.6% | | | | |
| | 128,826 | | | Capstead Mortgage Corp. REIT | | $ | 1,225,135 | |
| | | | | | | | |
| | | | Real Estate Management & Development—1.4% | | | | |
| | 35,650 | | | Forestar Group, Inc.(b) | | | 392,150 | |
| | 47,022 | | | HFF, Inc., Class A | | | 1,252,196 | |
| | 23,683 | | | RE/MAX Holdings, Inc., Class A | | | 1,029,026 | |
| | | | | | | | |
| | | | | | | 2,673,372 | |
| | | | | | | | |
| | | | Thrifts & Mortgage Finance—6.4% | | | | |
| | 122,408 | | | Astoria Financial Corp. | | | 1,790,829 | |
| | 56,291 | | | Bank Mutual Corp. | | | 439,070 | |
| | 77,272 | | | BofI Holding, Inc.(b) | | | 1,439,577 | |
| | 42,092 | | | Dime Community Bancshares, Inc. | | | 681,890 | |
| | 9,647 | | | LendingTree, Inc.(b)(c) | | | 770,313 | |
| | 60,339 | | | Northfield Bancorp, Inc. | | | 992,577 | |
| | 137,590 | | | Northwest Bancshares, Inc. | | | 2,165,667 | |
| | 51,010 | | | Oritani Financial Corp. | | | 798,306 | |
| | 80,390 | | | Provident Financial Services, Inc. | | | 1,824,049 | |
| | 128,304 | | | TrustCo Bank Corp. NY | | | 898,128 | |
| | 37,216 | | | Walker & Dunlop, Inc.(b) | | | 895,789 | |
| | | | | | | | |
| | | | | | | 12,696,195 | |
| | | | | | | | |
| | | | Total Investments
(excluding investments purchased with cash collateral from securities on loan)
(Cost $172,025,250)—100.0% | | | 196,804,575 | |
| | | | | | | | |
| | |
| | | | | | | | |
| | | | Investments Purchased with Cash Collateral from Securities on Loan | |
| | |
| | | | | | | | |
| | | | Money Market Fund—3.2% | | | | |
| | 6,252,813 | | | Invesco Government & Agency Portfolio—Institutional
Class, 0.29%(d)(e)
(Cost $6,252,813) | | | 6,252,813 | |
| | | | | | | | |
| | | | Total Investments
(Cost $178,278,063)—103.2% | | | 203,057,388 | |
| | | | Other assets less liabilities—(3.2)% | | | (6,260,858 | ) |
| | | | | | | | |
| | | | Net Assets—100.0% | | $ | 196,796,530 | |
| | | | | | | | |
Investment Abbreviations:
REIT—Real Estate Investment Trust
Notes to Schedule of Investments:
| (a) | Industry and/or sector classifications used in this report are generally according to the Global Industry Classification Standard, which was developed by and is the exclusive property and a service mark of MSCI Inc. and Standard & Poor’s. |
| (b) | Non-income producing security. |
| (c) | All or a portion of this security was out on loan at October 31, 2016. |
| (d) | The security and the Fund are advised by wholly-owned subsidiaries of Invesco Ltd. and are therefore considered to be affiliated. The rate shown is the 7-day SEC standardized yield as of October 31, 2016. |
| (e) | The security has been segregated to satisfy the commitment to return the cash collateral received in securities lending transactions upon the borrower’s return of the securities loaned. See Note 2H. |
See accompanying Notes to Financial Statements which are an integral part of the financial statements.
Schedule of Investments(a)
PowerShares S&P SmallCap Health Care Portfolio (PSCH)
October 31, 2016
| | | | | | | | |
Number
of Shares | | | | | Value | |
| | | | Common Stocks—100.0% | |
| | | | Biotechnology—10.7% | |
| | 103,161 | | | Acorda Therapeutics, Inc.(b) | | $ | 1,825,950 | |
| | 76,364 | | | AMAG Pharmaceuticals, Inc.(b) | | | 1,962,555 | |
| | 17,828 | | | Eagle Pharmaceuticals, Inc.(b)(c) | | | 996,229 | |
| | 76,891 | | | Emergent BioSolutions, Inc.(b) | | | 2,054,527 | |
| | 31,072 | | | Enanta Pharmaceuticals, Inc.(b) | | | 730,813 | |
| | 42,428 | | | Ligand Pharmaceuticals, Inc.(b) | | | 4,061,632 | |
| | 226,355 | | | MiMedx Group, Inc.(b)(c) | | | 2,016,823 | |
| | 139,844 | | | Momenta Pharmaceuticals, Inc.(b) | | | 1,559,261 | |
| | 75,542 | | | Repligen Corp.(b) | | | 2,158,235 | |
| | 157,829 | | | Spectrum Pharmaceuticals, Inc.(b) | | | 558,715 | |
| | | | | | | | |
| | | | | | | 17,924,740 | |
| | | | | | | | |
| | | | Health Care Equipment & Supplies—34.4% | |
| | 50,379 | | | Abaxis, Inc. | | | 2,405,093 | |
| | 27,673 | | | Analogic Corp. | | | 2,265,035 | |
| | 64,332 | | | AngioDynamics, Inc.(b) | | | 1,025,452 | |
| | 33,041 | | | Anika Therapeutics, Inc.(b) | | | 1,465,699 | |
| | 81,124 | | | Cantel Medical Corp. | | | 5,778,463 | |
| | 55,356 | | | CONMED Corp. | | | 2,214,240 | |
| | 60,051 | | | CryoLife, Inc. | | | 1,020,867 | |
| | 53,062 | | | Cynosure, Inc., Class A(b) | | | 2,263,094 | |
| | 114,692 | | | Haemonetics Corp.(b) | | | 3,831,860 | |
| | 32,463 | | | ICU Medical, Inc.(b) | | | 4,522,096 | |
| | 35,496 | | | Inogen, Inc.(b) | | | 1,905,070 | |
| | 61,290 | | | Integer Holdings Corp.(b) | | | 1,351,445 | |
| | 66,825 | | | Integra LifeSciences Holdings Corp.(b) | | | 5,313,256 | |
| | 70,967 | | | Invacare Corp. | | | 649,348 | |
| | 98,204 | | | Masimo Corp.(b) | | | 5,401,220 | |
| | 94,100 | | | Meridian Bioscience, Inc. | | | 1,547,945 | |
| | 99,257 | | | Merit Medical Systems, Inc.(b) | | | 2,178,691 | |
| | 73,675 | | | Natus Medical, Inc.(b) | | | 2,899,111 | |
| | 84,013 | | | Neogen Corp.(b) | | | 4,426,645 | |
| | 29,170 | | | SurModics, Inc.(b) | | | 726,333 | |
| | 39,110 | | | Vascular Solutions, Inc.(b) | | | 1,783,416 | |
| | 79,739 | | | Zeltiq Aesthetics, Inc.(b)(c) | | | 2,639,361 | |
| | | | | | | | |
| | | | | | | 57,613,740 | |
| | | | | | | | |
| | | | Health Care Providers & Services—27.9% | |
| | 66,290 | | | Aceto Corp. | | | 1,215,096 | |
| | 33,632 | | | Adeptus Health, Inc., Class A(b)(c) | | | 1,012,996 | |
| | 77,488 | | | Air Methods Corp.(b) | | | 2,049,558 | |
| | 19,974 | | | Almost Family, Inc.(b) | | | 783,979 | |
| | 62,256 | | | Amedisys, Inc.(b) | | | 2,693,194 | |
| | 107,429 | | | AMN Healthcare Services, Inc.(b) | | | 3,523,671 | |
| | 62,661 | | | BioTelemetry, Inc.(b) | | | 1,109,100 | |
| | 36,201 | | | Chemed Corp. | | | 5,119,545 | |
| | 254,075 | | | Community Health Systems, Inc.(b) | | | 1,341,516 | |
| | 22,348 | | | CorVel Corp.(b) | | | 772,123 | |
| | 73,750 | | | Cross Country Healthcare, Inc.(b) | | | 823,787 | |
| | 96,469 | | | Diplomat Pharmacy, Inc.(b)(c) | | | 2,235,187 | |
| | 106,096 | | | Ensign Group, Inc. (The) | | | 1,959,593 | |
| | 96,107 | | | HealthEquity, Inc.(b) | | | 3,193,636 | |
| | 70,642 | | | Healthways, Inc.(b) | | | 1,751,922 | |
| | 190,614 | | | Kindred Healthcare, Inc. | | | 1,877,548 | |
| | 21,475 | | | Landauer, Inc. | | | 934,162 | |
| | 33,280 | | | LHC Group, Inc.(b) | | | 1,140,506 | |
| | 54,960 | | | Magellan Health, Inc.(b) | | | 2,827,692 | |
| | 68,785 | | | PharMerica Corp.(b) | | | 1,637,083 | |
| | 27,877 | | | Providence Service Corp. (The)(b) | | | 1,128,043 | |
| | 65,927 | | | Quorum Health Corp.(b) | | | 266,345 | |
| | 238,101 | | | Select Medical Holdings Corp.(b) | | | 3,095,313 | |
| | | | | | | | |
Number
of Shares | | | | | Value | |
| | | | Common Stocks (continued) | |
| | | | Health Care Providers & Services (continued) | |
| | 62,025 | | | Surgical Care Affiliates, Inc.(b) | | $ | 2,654,050 | |
| | 27,992 | | | U.S. Physical Therapy, Inc. | | | 1,592,745 | |
| | | | | | | | |
| | | | | | | 46,738,390 | |
| | | | | | | | |
| | | | Health Care Technology—9.5% | |
| | 23,904 | | | Computer Programs & Systems, Inc.(c) | | | 623,894 | |
| | 56,773 | | | HealthStream, Inc.(b) | | | 1,531,168 | |
| | 188,800 | | | HMS Holdings Corp.(b) | | | 3,978,016 | |
| | 122,113 | | | Medidata Solutions, Inc.(b) | | | 5,860,203 | |
| | 80,853 | | | Omnicell, Inc.(b) | | | 2,637,829 | |
| | 101,765 | | | Quality Systems, Inc. | | | 1,311,751 | |
| | | | | | | | |
| | | | | | | 15,942,861 | |
| | | | | | | | |
| | | | Life Sciences Tools & Services—3.3% | |
| | 49,842 | | | Albany Molecular Research, Inc.(b) | | | 777,037 | |
| | 71,875 | | | Cambrex Corp.(b) | | | 2,896,562 | |
| | 88,606 | | | Luminex Corp.(b) | | | 1,845,663 | |
| | | | | | | | |
| | | | | | | 5,519,262 | |
| | | | | | | | |
| | | | Pharmaceuticals—14.2% | |
| | 78,689 | | | Amphastar Pharmaceuticals, Inc.(b) | | | 1,427,418 | |
| | 17,764 | | | ANI Pharmaceuticals, Inc.(b) | | | 1,060,511 | |
| | 137,206 | | | Depomed, Inc.(b)(c) | | | 3,067,926 | |
| | 165,137 | | | Impax Laboratories, Inc.(b) | | | 3,319,254 | |
| | 65,164 | | | Lannett Co., Inc.(b)(c) | | | 1,427,091 | |
| | 155,548 | | | Medicines Co. (The)(b)(c) | | | 5,125,307 | |
| | 334,777 | | | Nektar Therapeutics, Class A(b) | | | 4,151,235 | |
| | 41,409 | | | Phibro Animal Health Corp., Class A | | | 1,074,563 | |
| | 111,657 | | | SciClone Pharmaceuticals, Inc.(b) | | | 999,330 | |
| | 110,692 | | | Supernus Pharmaceuticals, Inc.(b) | | | 2,191,702 | |
| | | | | | | | |
| | | | | | | 23,844,337 | |
| | | | | | | | |
| | | | Total Common Stocks
(Cost $184,166,456) | | | 167,583,330 | |
| | | | | | | | |
| | |
| | | | | | | | |
| | | | Money Market Fund—0.0% | | | | |
| | 44,344 | | | Invesco Premier U.S. Government Money Portfolio—Institutional Class, 0.25%(d)
(Cost $44,344) | | | 44,344 | |
| | | | | | | | |
| | | | Total Investments
(excluding investments purchased with cash collateral from securities on loan)
(Cost $184,210,800)—100.0% | | | 167,627,674 | |
| | | | | | | | |
| | |
| | | | | | | | |
| | | | Investments Purchased with Cash Collateral from Securities on Loan | |
| | |
| | | | | | | | |
| | | | Money Market Fund—6.7% | | | | |
| | 11,267,270 | | | Invesco Government & Agency Portfolio—Institutional
Class, 0.29%(d)(e)
(Cost $11,267,270) | | | 11,267,270 | |
| | | | | | | | |
| | | | Total Investments
(Cost $195,478,070)—106.7% | | | 178,894,944 | |
| | | | Other assets less liabilities—(6.7)% | | | (11,308,709 | ) |
| | | | | | | | |
| | | | Net Assets—100.0% | | $ | 167,586,235 | |
| | | | | | | | |
See accompanying Notes to Financial Statements which are an integral part of the financial statements.
PowerShares S&P SmallCap Health Care Portfolio (PSCH) (continued)
October 31, 2016
Notes to Schedule of Investments:
| (a) | Industry and/or sector classifications used in this report are generally according to the Global Industry Classification Standard, which was developed by and is the exclusive property and a service mark of MSCI Inc. and Standard & Poor’s. |
| (b) | Non-income producing security. |
| (c) | All or a portion of this security was out on loan at October 31, 2016. |
| (d) | The security and the Fund are advised by wholly-owned subsidiaries of Invesco Ltd. and are therefore considered to be affiliated. The rate shown is the 7-day SEC standardized yield as of October 31, 2016. |
| (e) | The security has been segregated to satisfy the commitment to return the cash collateral received in securities lending transactions upon the borrower’s return of the securities loaned. See Note 2H. |
See accompanying Notes to Financial Statements which are an integral part of the financial statements.
Schedule of Investments(a)
PowerShares S&P SmallCap Industrials Portfolio (PSCI)
October 31, 2016
| | | | | | | | |
Number
of Shares | | | | | Value | |
| | | | Common Stocks—100.0% | | | | |
| | | | Aerospace & Defense—7.9% | | | | |
| | 16,182 | | | AAR Corp. | | $ | 520,575 | |
| | 34,899 | | | Aerojet Rocketdyne Holdings, Inc.(b) | | | 614,222 | |
| | 10,320 | | | Aerovironment, Inc.(b) | | | 247,577 | |
| | 12,451 | | | Cubic Corp. | | | 531,658 | |
| | 8,850 | | | Engility Holdings, Inc.(b) | | | 254,260 | |
| | 20,238 | | | Mercury Systems, Inc.(b) | | | 562,212 | |
| | 16,315 | | | Moog, Inc., Class A(b) | | | 947,412 | |
| | 2,473 | | | National Presto Industries, Inc. | | | 215,769 | |
| | 26,171 | | | TASER International, Inc.(b) | | | 585,707 | |
| | | | | | | | |
| | | | | | | 4,479,392 | |
| | | | | | | | |
| | | | Air Freight & Logistics—3.6% | | | | |
| | 12,450 | | | Atlas Air Worldwide Holdings, Inc.(b) | | | 521,032 | |
| | 13,813 | | | Echo Global Logistics, Inc.(b) | | | 292,836 | |
| | 15,171 | | | Forward Air Corp. | | | 626,866 | |
| | 16,829 | | | Hub Group, Inc., Class A(b) | | | 613,417 | |
| | | | | | | | |
| | | | | | | 2,054,151 | |
| | | | | | | | |
| | | | Airlines—5.1% | | | | |
| | 6,529 | | | Allegiant Travel Co. | | | 900,349 | |
| | 26,785 | | | Hawaiian Holdings, Inc.(b) | | | 1,205,995 | |
| | 25,844 | | | SkyWest, Inc. | | | 779,196 | |
| | | | | | | | |
| | | | | | | 2,885,540 | |
| | | | | | | | |
| | | | Building Products—10.6% | | | | |
| | 19,904 | | | AAON, Inc. | | | 596,125 | |
| | 7,031 | | | American Woodmark Corp.(b) | | | 525,216 | |
| | 14,439 | | | Apogee Enterprises, Inc. | | | 588,389 | |
| | 15,698 | | | Gibraltar Industries, Inc.(b) | | | 610,652 | |
| | 15,240 | | | Griffon Corp. | | | 254,508 | |
| | 7,300 | | | Patrick Industries, Inc.(b) | | | 418,655 | |
| | 24,542 | | | PGT, Inc.(b) | | | 240,511 | |
| | 17,162 | | | Quanex Building Products Corp. | | | 279,741 | |
| | 20,624 | | | Simpson Manufacturing Co., Inc. | | | 882,707 | |
| | 14,716 | | | Trex Co., Inc.(b) | | | 791,868 | |
| | 10,183 | | | Universal Forest Products, Inc. | | | 875,636 | |
| | | | | | | | |
| | | | | | | 6,064,008 | |
| | | | | | | | |
| | | | Commercial Services & Supplies—21.3% | |
| | 28,042 | | | ABM Industries, Inc. | | | 1,095,881 | |
| | 23,427 | | | Brady Corp., Class A | | | 775,434 | |
| | 22,355 | | | Brink’s Co. (The) | | | 884,140 | |
| | 18,702 | | | Essendant, Inc. | | | 287,076 | |
| | 9,870 | | | G&K Services, Inc., Class A | | | 934,689 | |
| | 36,333 | | | Healthcare Services Group, Inc. | | | 1,343,231 | |
| | 32,496 | | | Interface, Inc. | | | 515,062 | |
| | 13,131 | | | Lsc Communications, Inc.(b) | | | 318,295 | |
| | 16,102 | | | Matthews International Corp., Class A | | | 964,510 | |
| | 22,284 | | | Mobile Mini, Inc. | | | 564,899 | |
| | 6,596 | | | Multi-Color Corp. | | | 428,245 | |
| | 35,016 | | | RR Donnelley & Sons Co. | | | 621,534 | |
| | 14,705 | | | Team, Inc.(b) | | | 452,179 | |
| | 28,796 | | | Tetra Tech, Inc. | | | 1,107,206 | |
| | 7,725 | | | UniFirst Corp. | | | 946,312 | |
| | 10,918 | | | US Ecology, Inc. | | | 461,286 | |
| | 10,171 | | | Viad Corp. | | | 422,097 | |
| | | | | | | | |
| | | | | | | 12,122,076 | |
| | | | | | | | |
| | | | | | | | |
Number
of Shares | | | | | Value | |
| | | | Common Stocks (continued) | | | | |
| | | | Construction & Engineering—2.1% | | | | |
| | 17,350 | | | Aegion Corp.(b) | | $ | 321,149 | |
| | 18,617 | | | Comfort Systems USA, Inc. | | | 537,100 | |
| | 8,050 | | | MYR Group, Inc.(b) | | | 240,212 | |
| | 13,880 | | | Orion Group Holdings, Inc.(b) | | | 112,150 | |
| | | | | | | | |
| | | | | | | 1,210,611 | |
| | | | | | | | |
| | | | Electrical Equipment—2.9% | | | | |
| | 13,003 | | | AZZ, Inc. | | | 692,410 | |
| | 10,378 | | | Encore Wire Corp. | | | 354,409 | |
| | 24,714 | | | General Cable Corp. | | | 345,996 | |
| | 4,284 | | | Powell Industries, Inc. | | | 151,611 | |
| | 8,006 | | | Vicor Corp.(b) | | | 102,076 | |
| | | | | | | | |
| | | | | | | 1,646,502 | |
| | | | | | | | |
| | | | Industrial Conglomerates—0.7% | | | | |
| | 18,131 | | | Raven Industries, Inc. | | | 388,910 | |
| | | | | | | | |
| | | | Machinery—26.6% | | | | |
| | 29,549 | | | Actuant Corp., Class A | | | 658,943 | |
| | 4,728 | | | Alamo Group, Inc. | | | 306,942 | |
| | 14,491 | | | Albany International Corp., Class A | | | 590,508 | |
| | 9,589 | | | Astec Industries, Inc. | | | 530,847 | |
| | 25,110 | | | Barnes Group, Inc. | | | 1,000,382 | |
| | 21,617 | | | Briggs & Stratton Corp. | | | 402,508 | |
| | 15,340 | | | Chart Industries, Inc.(b) | | | 425,532 | |
| | 8,235 | | | CIRCOR International, Inc. | | | 442,878 | |
| | 10,786 | | | EnPro Industries, Inc. | | | 583,738 | |
| | 12,895 | | | ESCO Technologies, Inc. | | | 574,472 | |
| | 30,052 | | | Federal Signal Corp. | | | 369,039 | |
| | 19,234 | | | Franklin Electric Co., Inc. | | | 701,079 | |
| | 14,142 | | | Greenbrier Cos., Inc. (The) | | | 445,473 | |
| | 40,202 | | | Harsco Corp. | | | 391,969 | |
| | 31,645 | | | Hillenbrand, Inc. | | | 960,426 | |
| | 14,619 | | | John Bean Technologies Corp. | | | 1,167,327 | |
| | 5,330 | | | Lindsay Corp.(c) | | | 417,339 | |
| | 8,595 | | | Lydall, Inc.(b) | | | 401,816 | |
| | 28,668 | | | Mueller Industries, Inc. | | | 868,354 | |
| | 12,188 | | | Proto Labs, Inc.(b) | | | 544,804 | |
| | 20,939 | | | SPX Corp.(b) | | | 398,050 | |
| | 20,962 | | | SPX FLOW, Inc.(b) | | | 525,937 | |
| | 6,407 | | | Standex International Corp. | | | 489,495 | |
| | 8,818 | | | Tennant Co. | | | 555,093 | |
| | 21,951 | | | Titan International, Inc. | | | 223,681 | |
| | 32,051 | | | Wabash National Corp.(b) | | | 360,574 | |
| | 13,970 | | | Watts Water Technologies, Inc., Class A | | | 838,200 | |
| | | | | | | | |
| | | | | | | 15,175,406 | |
| | | | | | | | |
| | | | Marine—1.5% | | | | |
| | 21,540 | | | Matson, Inc. | | | 860,308 | |
| | | | | | | | |
| | | | Professional Services—9.9% | | | | |
| | 6,900 | | | CDI Corp. | | | 42,435 | |
| | 13,029 | | | Exponent, Inc. | | | 745,910 | |
| | 9,318 | | | Heidrick & Struggles International, Inc. | | | 172,383 | |
| | 9,548 | | | Insperity, Inc. | | | 718,010 | |
| | 14,597 | | | Kelly Services, Inc., Class A | | | 273,402 | |
| | 28,732 | | | Korn/Ferry International | | | 585,845 | |
| | 23,768 | | | Navigant Consulting, Inc.(b) | | | 556,171 | |
| | 24,610 | | | On Assignment, Inc.(b) | | | 846,830 | |
| | 18,175 | | | Resources Connection, Inc. | | | 269,899 | |
| | 21,298 | | | TrueBlue, Inc.(b) | | | 372,715 | |
| | 18,350 | | | WageWorks, Inc.(b) | | | 1,081,733 | |
| | | | | | | | |
| | | | | | | 5,665,333 | |
| | | | | | | | |
See accompanying Notes to Financial Statements which are an integral part of the financial statements.
PowerShares S&P SmallCap Industrials Portfolio (PSCI) (continued)
October 31, 2016
| | | | | | | | |
Number
of Shares | | | | | Value | |
| | | | Common Stocks (continued) | | | | |
| | | | Road & Rail—4.4% | | | | |
| | 12,008 | | | ArcBest Corp. | | $ | 238,959 | |
| | 13,846 | | | Celadon Group, Inc. | | | 89,999 | |
| | 21,716 | | | Heartland Express, Inc. | | | 399,575 | |
| | 33,301 | | | Knight Transportation, Inc. | | | 974,054 | |
| | 11,563 | | | Marten Transport Ltd. | | | 237,042 | |
| | 15,182 | | | Roadrunner Transportation Systems, Inc.(b) | | | 115,383 | |
| | 12,639 | | | Saia, Inc.(b) | | | 450,580 | |
| | | | | | | | |
| | | | | | | 2,505,592 | |
| | | | | | | | |
| | | | Trading Companies & Distributors—3.4% | |
| | 19,584 | | | Applied Industrial Technologies, Inc. | | | 994,867 | |
| | 7,424 | | | DXP Enterprises, Inc.(b) | | | 161,769 | |
| | 13,585 | | | Kaman Corp. | | | 593,121 | |
| | 4,092 | | | Veritiv Corp.(b) | | | 220,764 | |
| | | | | | | | |
| | | | | | | 1,970,521 | |
| | | | | | | | |
| | | | Total Investments
(excluding investments purchased with cash collateral from securities on loan)
(Cost $54,691,885)—100.0% | | | 57,028,350 | |
| | | | | | | | |
| | |
| | | | | | | | |
| | | | Investments Purchased with Cash Collateral from Securities on Loan | |
| | |
| | | | | | | | |
| | | | Money Market Fund—0.6% | |
| | 333,120 | | | Invesco Government & Agency
Portfolio—Institutional
Class, 0.29%(d)(e)
(Cost $333,120) | | | 333,120 | |
| | | | | | | | |
| | | | Total Investments
(Cost $55,025,005)—100.6% | | | 57,361,470 | |
| | | | Other assets less liabilities—(0.6)% | | | (354,947 | ) |
| | | | | | | | |
| | | | Net Assets—100.0% | | $ | 57,006,523 | |
| | | | | | | | |
Notes to Schedule of Investments:
| (a) | Industry and/or sector classifications used in this report are generally according to the Global Industry Classification Standard, which was developed by and is the exclusive property and a service mark of MSCI Inc. and Standard & Poor’s. |
| (b) | Non-income producing security. |
| (c) | All or a portion of this security was out on loan at October 31, 2016. |
| (d) | The security and the Fund are advised by wholly-owned subsidiaries of Invesco Ltd. and are therefore considered to be affiliated. The rate shown is the 7-day SEC standardized yield as of October 31, 2016. |
| (e) | The security has been segregated to satisfy the commitment to return the cash collateral received in securities lending transactions upon the borrower’s return of the securities loaned. See Note 2H. |
See accompanying Notes to Financial Statements which are an integral part of the financial statements.
Schedule of Investments(a)
PowerShares S&P SmallCap Information Technology Portfolio (PSCT)
October 31, 2016
| | | | | | | | |
Number
of Shares | | | | | Value | |
| | | | Common Stocks—100.0% | |
| | | | Communications Equipment—8.3% | |
| | 238,968 | | | ADTRAN, Inc. | | $ | 4,337,269 | |
| | 42,902 | | | Bel Fuse, Inc., Class B | | | 1,023,213 | |
| | 74,795 | | | Black Box Corp. | | | 860,142 | |
| | 178,964 | | | CalAmp Corp.(b) | | | 2,312,215 | |
| | 115,116 | | | Comtech Telecommunications Corp. | | | 1,197,206 | |
| | 128,183 | | | Digi International, Inc.(b) | | | 1,172,874 | |
| | 385,265 | | | Harmonic, Inc.(b) | | | 1,964,852 | |
| | 309,118 | | | Ixia(b) | | | 3,693,960 | |
| | 269,948 | | | Lumentum Holdings, Inc.(b) | | | 9,070,253 | |
| | 161,750 | | | NETGEAR, Inc.(b) | | | 8,168,375 | |
| | 1,146,941 | | | Viavi Solutions, Inc.(b) | | | 8,166,220 | |
| | | | | | | | |
| | | | | | | 41,966,579 | |
| | | | | | | | |
| | | | Electronic Equipment, Instruments & Components—28.5% | |
| | 73,614 | | | Agilysys, Inc.(b) | | | 710,375 | |
| | 140,340 | | | Anixter International, Inc.(b) | | | 9,227,355 | |
| | 143,659 | | | Badger Meter, Inc. | | | 4,618,637 | |
| | 241,792 | | | Benchmark Electronics, Inc.(b) | | | 6,081,069 | |
| | 120,088 | | | Coherent, Inc.(b) | | | 12,503,563 | |
| | 161,741 | | | CTS Corp. | | | 2,943,686 | |
| | 197,118 | | | Daktronics, Inc. | | | 1,645,935 | |
| | 87,093 | | | DTS, Inc. | | | 3,688,389 | |
| | 155,389 | | | Electro Scientific Industries, Inc.(b) | | | 804,915 | |
| | 32,572 | | | ePlus, Inc.(b) | | | 2,981,967 | |
| | 178,754 | | | Fabrinet (Thailand)(b) | | | 6,785,502 | |
| | 82,326 | | | FARO Technologies, Inc.(b) | | | 2,762,037 | |
| | 269,060 | | | II-VI, Inc.(b) | | | 7,479,868 | |
| | 175,134 | | | Insight Enterprises, Inc.(b) | | | 5,042,108 | |
| | 164,273 | | | Itron, Inc.(b) | | | 8,854,315 | |
| | 110,860 | | | Littelfuse, Inc. | | | 15,464,970 | |
| | 182,450 | | | Methode Electronics, Inc. | | | 5,692,440 | |
| | 82,331 | | | MTS Systems Corp. | | | 3,914,839 | |
| | 88,916 | | | OSI Systems, Inc.(b) | | | 6,235,679 | |
| | 93,915 | | | Park Electrochemical Corp. | | | 1,449,108 | |
| | 165,068 | | | Plexus Corp.(b) | | | 7,561,765 | |
| | 140,290 | | | Rofin-Sinar Technologies, Inc.(b) | | | 4,566,439 | |
| | 89,078 | | | Rogers Corp.(b) | | | 4,848,515 | |
| | 364,900 | | | Sanmina Corp.(b) | | | 10,089,485 | |
| | 126,524 | | | ScanSource, Inc.(b) | | | 4,428,340 | |
| | 356,384 | | | TTM Technologies, Inc.(b) | | | 4,686,450 | |
| | | | | | | | |
| | | | | | | 145,067,751 | |
| | | | | | | | |
| | | | Internet Software & Services—9.6% | |
| | 188,586 | | | Blucora, Inc.(b) | | | 2,508,194 | |
| | 247,305 | | | DHI Group, Inc.(b) | | | 1,409,639 | |
| | 118,387 | | | Liquidity Services, Inc.(b) | | | 1,047,725 | |
| | 262,454 | | | LivePerson, Inc.(b) | | | 2,230,859 | |
| | 124,953 | | | LogMeIn, Inc. | | | 11,870,535 | |
| | 439,747 | | | Monster Worldwide, Inc.(b) | | | 1,499,537 | |
| | 306,207 | | | NIC, Inc. | | | 7,027,451 | |
| | 178,449 | | | QuinStreet, Inc.(b) | | | 517,502 | |
| | 95,089 | | | Shutterstock, Inc.(b) | | | 5,609,300 | |
| | 83,827 | | | SPS Commerce, Inc.(b) | | | 5,229,128 | |
| | 79,293 | | | Stamps.com, Inc.(b) | | | 7,735,032 | |
| | 122,732 | | | XO Group, Inc.(b) | | | 2,258,269 | |
| | | | | | | | |
| | | | | | | 48,943,171 | |
| | | | | | | | |
| | | | | | | | |
Number
of Shares | | | | | Value | |
| | | | Common Stocks (continued) | |
| | | | IT Services—11.1% | |
| | 120,088 | | | CACI International, Inc., Class A(b) | | $ | 11,750,611 | |
| | 223,325 | | | Cardtronics PLC, Class A(b) | | | 11,166,250 | |
| | 364,899 | | | Ciber, Inc.(b) | | | 372,197 | |
| | 159,741 | | | CSG Systems International, Inc. | | | 6,074,950 | |
| | 165,399 | | | ExlService Holdings, Inc.(b) | | | 7,282,518 | |
| | 49,039 | | | Forrester Research, Inc. | | | 1,826,703 | |
| | 123,653 | | | ManTech International Corp., Class A | | | 4,801,446 | |
| | 178,260 | | | Perficient, Inc.(b) | | | 3,317,419 | |
| | 195,519 | | | Sykes Enterprises, Inc.(b) | | | 5,228,178 | |
| | 79,309 | | | TeleTech Holdings, Inc. | | | 2,228,583 | |
| | 135,674 | | | Virtusa Corp.(b) | | | 2,569,665 | |
| | | | | | | | |
| | | | | | | 56,618,520 | |
| | | | | | | | |
| | | | Semiconductors & Semiconductor Equipment—18.7% | |
| | 195,895 | | | Advanced Energy Industries, Inc.(b) | | | 9,344,191 | |
| | 338,878 | | | Brooks Automation, Inc. | | | 4,415,580 | |
| | 119,179 | | | Cabot Microelectronics Corp. | | | 6,585,831 | |
| | 103,484 | | | CEVA, Inc.(b) | | | 3,109,694 | |
| | 122,495 | | | Cohu, Inc. | | | 1,370,719 | |
| | 190,397 | | | Diodes, Inc.(b) | | | 3,943,122 | |
| | 108,097 | | | DSP Group, Inc.(b) | | | 1,178,257 | |
| | 205,610 | | | Exar Corp.(b) | | | 1,854,602 | |
| | 299,997 | | | Kopin Corp.(b) | | | 626,994 | |
| | 347,601 | | | Kulicke & Soffa Industries, Inc. (Singapore)(b) | | | 4,602,237 | |
| | 264,497 | | | MKS Instruments, Inc. | | | 13,343,874 | |
| | 122,409 | | | Nanometrics, Inc.(b) | | | 2,557,124 | |
| | 142,629 | | | Power Integrations, Inc. | | | 9,192,439 | |
| | 542,606 | | | Rambus, Inc.(b) | | | 6,614,367 | |
| | 152,760 | | | Rudolph Technologies, Inc.(b) | | | 2,764,956 | |
| | 323,728 | | | Semtech Corp.(b) | | | 7,834,218 | |
| | 239,826 | | | Tessera Technologies, Inc. | | | 8,897,545 | |
| | 116,295 | | | Ultratech, Inc.(b) | | | 2,475,921 | |
| | 200,648 | | | Veeco Instruments, Inc.(b) | | | 4,354,062 | |
| | | | | | | | |
| | | | | | | 95,065,733 | |
| | | | | | | | |
| | | | Software—20.2% | |
| | 442,786 | | | 8x8, Inc.(b) | | | 6,309,700 | |
| | 234,616 | | | Blackbaud, Inc. | | | 14,405,422 | |
| | 183,727 | | | Bottomline Technologies (de), Inc.(b) | | | 4,168,766 | |
| | 110,659 | | | Ebix, Inc. | | | 6,196,904 | |
| | 87,837 | | | Interactive Intelligence Group, Inc.(b) | | | 5,309,747 | |
| | 46,388 | | | MicroStrategy, Inc., Class A(b) | | | 9,036,846 | |
| | 201,496 | | | Monotype Imaging Holdings, Inc. | | | 3,848,574 | |
| | 239,350 | | | Progress Software Corp.(b) | | | 6,440,908 | |
| | 141,469 | | | Qualys, Inc.(b) | | | 5,269,720 | |
| | 207,245 | | | Synchronoss Technologies, Inc.(b) | | | 7,607,964 | |
| | 424,686 | | | Take-Two Interactive Software, Inc.(b) | | | 18,851,812 | |
| | 114,865 | | | Tangoe, Inc.(b) | | | 985,542 | |
| | 601,287 | | | Tivo Corp.(b) | | | 11,935,547 | |
| | 148,860 | | | VASCO Data Security International,
Inc.(b) | | | 2,046,825 | |
| | | | | | | | |
| | | | | | | 102,414,277 | |
| | | | | | | | |
| | | | Technology Hardware, Storage & Peripherals—3.6% | |
| | 201,082 | | | Cray, Inc.(b) | | | 4,182,506 | |
| | 230,668 | | | Electronics for Imaging, Inc.(b) | | | 9,810,310 | |
| | 187,383 | | | Super Micro Computer, Inc.(b) | | | 4,440,977 | |
| | | | | | | | |
| | | | | | | 18,433,793 | |
| | | | | | | | |
| | | | Total Common Stocks
(Cost $459,438,396) | | | 508,509,824 | |
| | | | | | | | |
| | |
| | | | | | | | |
See accompanying Notes to Financial Statements which are an integral part of the financial statements.
PowerShares S&P SmallCap Information Technology Portfolio (PSCT) (continued)
October 31, 2016
| | | | | | | | |
Number
of Shares | | | | | Value | |
| | | | Money Market Fund—0.0% | |
| | 15,418 | | | Invesco Premier U.S. Government Money Portfolio—Institutional Class, 0.25%(c)
(Cost $15,418) | | $ | 15,418 | |
| | | | | | | | |
| | | | Total Investments
(Cost $459,453,814)—100.0% | | | 508,525,242 | |
| | | | Other assets less liabilities—(0.0)% | | | (77,911 | ) |
| | | | | | | | |
| | | | Net Assets—100.0% | | $ | 508,447,331 | |
| | | | | | | | |
Notes to Schedule of Investments:
| (a) | Industry and/or sector classifications used in this report are generally according to the Global Industry Classification Standard, which was developed by and is the exclusive property and a service mark of MSCI Inc. and Standard & Poor’s. |
| (b) | Non-income producing security. |
| (c) | The security and the Fund are advised by wholly-owned subsidiaries of Invesco Ltd. and are therefore considered to be affiliated. The rate shown is the 7-day SEC standardized yield as of October 31, 2016. |
See accompanying Notes to Financial Statements which are an integral part of the financial statements.
Schedule of Investments(a)
PowerShares S&P SmallCap Materials Portfolio (PSCM)
October 31, 2016
| | | | | | | | |
Number
of Shares | | | | | Value | |
| | | | Common Stocks—100.0% | |
| | | | Chemicals—55.7% | |
| | 13,593 | | | A. Schulman, Inc. | | $ | 390,799 | |
| | 14,169 | | | Advansix, Inc.(b) | | | 226,137 | |
| | 12,023 | | | American Vanguard Corp. | | | 182,750 | |
| | 14,723 | | | Balchem Corp. | | | 1,117,476 | |
| | 23,567 | | | Calgon Carbon Corp. | | | 372,359 | |
| | 84,480 | | | Chemours Co. (The) | | | 1,388,006 | |
| | 25,035 | | | Flotek Industries, Inc.(b) | | | 294,912 | |
| | 10,584 | | | FutureFuel Corp. | | | 116,001 | |
| | 23,410 | | | H.B. Fuller Co. | | | 984,859 | |
| | 4,443 | | | Hawkins, Inc. | | | 179,275 | |
| | 19,600 | | | Ingevity Corp.(b) | | | 811,440 | |
| | 9,045 | | | Innophos Holdings, Inc. | | | 414,623 | |
| | 11,161 | | | Innospec, Inc. | | | 672,450 | |
| | 26,031 | | | Intrepid Potash, Inc.(b) | | | 27,072 | |
| | 9,614 | | | Koppers Holdings, Inc.(b) | | | 314,858 | |
| | 14,364 | | | Kraton Corp.(b) | | | 368,149 | |
| | 9,363 | | | LSB Industries, Inc.(b) | | | 49,530 | |
| | 6,168 | | | Quaker Chemical Corp. | | | 663,060 | |
| | 20,140 | | | Rayonier Advanced Materials, Inc. | | | 260,410 | |
| | 9,058 | | | Stepan Co. | | | 643,390 | |
| | 11,792 | | | Tredegar Corp. | | | 218,152 | |
| | | | | | | | |
| | | | | | | 9,695,708 | |
| | | | | | | | |
| | | | Construction Materials—5.1% | |
| | 34,500 | | | Headwaters, Inc.(b) | | | 565,800 | |
| | 6,594 | | | US Concrete, Inc.(b) | | | 329,041 | |
| | | | | | | | |
| | | | | | | 894,841 | |
| | | | | | | | |
| | | | Containers & Packaging—0.7% | |
| | 10,160 | | | Myers Industries, Inc. | | | 122,428 | |
| | | | | | | | |
| | | | Metals & Mining—19.1% | |
| | 141,148 | | | AK Steel Holding Corp.(b) | | | 733,970 | |
| | 23,106 | | | Century Aluminum Co.(b) | | | 168,905 | |
| | 5,815 | | | Haynes International, Inc. | | | 187,068 | |
| | 8,373 | | | Kaiser Aluminum Corp. | | | 606,959 | |
| | 9,295 | | | Materion Corp. | | | 281,638 | |
| | 4,234 | | | Olympic Steel, Inc. | | | 97,763 | |
| | 56,365 | | | Stillwater Mining Co.(b) | | | 750,782 | |
| | 29,878 | | | SunCoke Energy, Inc. | | | 305,054 | |
| | 18,116 | | | TimkenSteel Corp.(b) | | | 185,689 | |
| | | | | | | | |
| | | | | | | 3,317,828 | |
| | | | | | | | |
| | | | Paper & Forest Products—19.4% | |
| | 18,040 | | | Boise Cascade Co.(b) | | | 347,270 | |
| | 7,911 | | | Clearwater Paper Corp.(b) | | | 420,074 | |
| | 4,921 | | | Deltic Timber Corp. | | | 276,462 | |
| | 40,911 | | | KapStone Paper and Packaging Corp. | | | 742,125 | |
| | 7,812 | | | Neenah Paper, Inc. | | | 624,179 | |
| | 20,273 | | | P.H. Glatfelter Co. | | | 450,466 | |
| | 14,225 | | | Schweitzer-Mauduit International, Inc. | | | 525,045 | |
| | | | | | | | |
| | | | | | | 3,385,621 | |
| | | | | | | | |
| | | | Total Investments
(Cost $18,042,534)—100.0% | | | 17,416,426 | |
| | | | Other assets less liabilities—(0.0)% | | | (2,291 | ) |
| | | | | | | | |
| | | | Net Assets—100.0% | | $ | 17,414,135 | |
| | | | | | | | |
Notes to Schedule of Investments:
| (a) | Industry and/or sector classifications used in this report are generally according to the Global Industry Classification Standard, which was developed by and is the exclusive property and a service mark of MSCI Inc. and Standard & Poor’s. |
| (b) | Non-income producing security. |
See accompanying Notes to Financial Statements which are an integral part of the financial statements.
Schedule of Investments(a)
PowerShares S&P SmallCap Utilities Portfolio (PSCU)
October 31, 2016
| | | | | | | | |
Number
of Shares | | | | | Value | |
| | | | Common Stocks—93.2% | | | | |
| | | | Diversified Telecommunication Services—35.0% | |
| | 34,295 | | | ATN International, Inc. | | $ | 2,319,714 | |
| | 116,991 | | | Cincinnati Bell, Inc.(b) | | | 2,298,873 | |
| | 77,750 | | | Cogent Communications Group, Inc. | | | 2,868,975 | |
| | 95,935 | | | Consolidated Communications Holdings, Inc. | | | 2,295,724 | |
| | 95,914 | | | General Communication, Inc.,
Class A(b) | | | 1,519,278 | |
| | 119,349 | | | Inteliquent, Inc. | | | 2,003,870 | |
| | 280,048 | | | Iridium Communications, Inc.(b) | | | 2,282,391 | |
| | 81,805 | | | Lumos Networks Corp.(b) | | | 1,162,449 | |
| | | | | | | | |
| | | | | | | 16,751,274 | |
| | | | | | | | |
| | | | Electric Utilities—18.5% | | | | |
| | 98,180 | | | ALLETE, Inc. | | | 6,017,452 | |
| | 61,902 | | | El Paso Electric Co. | | | 2,859,873 | |
| | | | | | | | |
| | | | | | | 8,877,325 | |
| | | | | | | | |
| | | | Gas Utilities—21.5% | | | | |
| | 39,064 | | | Northwest Natural Gas Co. | | | 2,296,963 | |
| | 77,755 | | | South Jersey Industries, Inc. | | | 2,305,436 | |
| | 90,746 | | | Spire, Inc. | | | 5,698,849 | |
| | | | | | | | |
| | | | | | | 10,301,248 | |
| | | | | | | | |
| | | | Multi-Utilities—5.9% | | | | |
| | 68,517 | | | Avista Corp. | | | 2,836,604 | |
| | | | | | | | |
| | | | Water Utilities—9.6% | | | | |
| | 57,580 | | | American States Water Co. | | | 2,302,048 | |
| | 74,069 | | | California Water Service Group | | | 2,296,139 | |
| | | | | | | | |
| | | | | | | 4,598,187 | |
| | | | | | | | |
| | | | Wireless Telecommunication Services—2.7% | |
| | 71,630 | | | Spok Holdings, Inc. | | | 1,292,921 | |
| | | | | | | | |
| | | | Total Investments
(Cost $46,487,811)—93.2% | | | 44,657,559 | |
| | | | Other assets less
liabilities—6.8% | | | 3,237,748 | |
| | | | | | | | |
| | | | Net Assets—100.0% | | $ | 47,895,307 | |
| | | | | | | | |
Notes to Schedule of Investments:
| (a) | Industry and/or sector classifications used in this report are generally according to the Global Industry Classification Standard, which was developed by and is the exclusive property and a service mark of MSCI Inc. and Standard & Poor’s. |
| (b) | Non-income producing security. |
See accompanying Notes to Financial Statements which are an integral part of the financial statements.
Statements of Assets and Liabilities
October 31, 2016
| | | | | | | | | | | | | | | | |
| | | PowerShares
DWA Momentum &
Low Volatility
Rotation
Portfolio (DWLV) | | | PowerShares
DWA SmallCap
Momentum
Portfolio (DWAS) | | | PowerShares
DWA Tactical
Multi-Asset
Income
Portfolio (DWIN) | | | PowerShares
DWA Tactical
Sector Rotation
Portfolio (DWTR) | |
| Assets: | | | | | | | | | | | | | | | | |
Unaffiliated investments, at value(a) | | $ | — | | | $ | 155,848,995 | | | $ | 26,521,697 | | | $ | — | |
Affiliated investments, at value | | | 11,053,061 | | | | 15,307,810 | | | | 94,057,378 | | | | 172,143,477 | |
| | | | | | | | | | | | | | | | |
Total investments, at value | | | 11,053,061 | | | | 171,156,805 | | | | 120,579,075 | | | | 172,143,477 | |
Cash | | | — | | | | — | | | | 57,248 | | | | — | |
Receivables: | | | | | | | | | | | | | | | | |
Dividends | | | 129 | | | | 17,789 | | | | 14 | | | | 5 | |
Securities lending | | | — | | | | 39,518 | | | | — | | | | — | |
Investments sold | | | — | | | | — | | | | — | | | | 3,619,511 | |
Shares sold | | | — | | | | — | | | | — | | | | — | |
| | | | | | | | | | | | | | | | |
Total Assets | | | 11,053,190 | | | | 171,214,112 | | | | 120,636,337 | | | | 175,762,993 | |
| | | | | | | | | | | | | | | | |
| | | | |
| Liabilities: | | | | | | | | | | | | | | | | |
Due to custodian | | | — | | | | 8,688 | | | | — | | | | — | |
Payables: | | | | | | | | | | | | | | | | |
Collateral upon return of securities loaned | | | — | | | | 15,263,759 | | | | — | | | | — | |
Investments purchased | | | — | | | | — | | | | 1,764,895 | | | | — | |
Shares repurchased | | | — | | | | — | | | | — | | | | 3,619,098 | |
Accrued unitary management fees | | | 1,345 | | | | 84,492 | | | | 25,300 | | | | 22,486 | |
| | | | | | | | | | | | | | | | |
Total Liabilities | | | 1,345 | | | | 15,356,939 | | | | 1,790,195 | | | | 3,641,584 | |
| | | | | | | | | | | | | | | | |
| Net Assets | | $ | 11,051,845 | | | $ | 155,857,173 | | | $ | 118,846,142 | | | $ | 172,121,409 | |
| | | | | | | | | | | | | | | | |
| | | | |
| Net Assets Consist of: | | | | | | | | | | | | | | | | |
Shares of beneficial interest | | $ | 11,563,032 | | | $ | 278,814,729 | | | $ | 117,563,033 | | | $ | 180,101,824 | |
Undistributed net investment income | | | 14,847 | | | | 292,417 | | | | — | | | | — | |
Undistributed net realized gain (loss) | | | (55,929 | ) | | | (128,480,283 | ) | | | (113,556 | ) | | | (10,287,015 | ) |
Net unrealized appreciation (depreciation) | | | (470,105 | ) | | | 5,230,310 | | | | 1,396,665 | | | | 2,306,600 | |
| | | | | | | | | | | | | | | | |
| Net Assets | | $ | 11,051,845 | | | $ | 155,857,173 | | | $ | 118,846,142 | | | $ | 172,121,409 | |
| | | | | | | | | | | | | | | | |
Shares outstanding (unlimited amount authorized, $0.01 par value) | | | 450,001 | | | | 4,400,000 | | | | 4,400,001 | | | | 7,100,001 | |
Net asset value | | $ | 24.56 | | | $ | 35.42 | | | $ | 27.01 | | | $ | 24.24 | |
| | | | | | | | | | | | | | | | |
Market price | | $ | 24.57 | | | $ | 35.40 | | | $ | 27.04 | | | $ | 24.24 | |
| | | | | | | | | | | | | | | | |
Unaffiliated investments, at cost | | $ | — | | | $ | 150,618,685 | | | $ | 25,633,715 | | | $ | — | |
| | | | | | | | | | | | | | | | |
Affiliated investments, at cost | | $ | 11,523,166 | | | $ | 15,307,810 | | | $ | 93,548,695 | | | $ | 169,836,877 | |
| | | | | | | | | | | | | | | | |
Total investments, at cost | | $ | 11,523,166 | | | $ | 165,926,495 | | | $ | 119,182,410 | | | $ | 169,836,877 | |
| | | | | | | | | | | | | | | | |
(a) Includes securities on loan with an aggregate value of: | | $ | — | | | $ | 14,884,199 | | | $ | — | | | $ | — | |
| | | | | | | | | | | | | | | | |
See accompanying Notes to Financial Statements which are an integral part of the financial statements.
| | | | | | | | | | | | | | | | | | | | | | | | | | | | | | | | | | |
PowerShares
S&P
SmallCap
Consumer
Discretionary
Portfolio
(PSCD) | | | PowerShares
S&P SmallCap
Consumer
Staples
Portfolio
(PSCC) | | | PowerShares
S&P
SmallCap
Energy
Portfolio
(PSCE) | | | PowerShares
S&P
SmallCap
Financials
Portfolio
(PSCF) | | | PowerShares
S&P
SmallCap
Health Care
Portfolio
(PSCH) | | | PowerShares
S&P
SmallCap
Industrials
Portfolio
(PSCI) | | | PowerShares
S&P
SmallCap
Information
Technology
Portfolio
(PSCT) | | | PowerShares
S&P
SmallCap
Materials
Portfolio
(PSCM) | | | PowerShares
S&P
SmallCap
Utilities
Portfolio
(PSCU) | |
| | | | | | | | | | | | | | | | | | | | | | | | | | | | | | | | | | |
| $ | 74,192,669 | | | $ | 67,481,059 | | | $ | 52,466,443 | | | $ | 196,804,575 | | | $ | 167,583,330 | | | $ | 57,028,350 | | | $ | 508,509,824 | | | $ | 17,416,426 | | | $ | 44,657,559 | |
| | 2,485,164 | | | | 1,817,400 | | | | 1,160,934 | | | | 6,252,813 | | | | 11,311,614 | | | | 333,120 | | | | 15,418 | | | | — | | | | — | |
| | | | | | | | | | | | | | | | | | | | | | | | | | | | | | | | | | |
| | 76,677,833 | | | | 69,298,459 | | | | 53,627,377 | | | | 203,057,388 | | | | 178,894,944 | | | | 57,361,470 | | | | 508,525,242 | | | | 17,416,426 | | | | 44,657,559 | |
| | — | | | | — | | | | — | | | | — | | | | — | | | | — | | | | — | | | | — | | | | — | |
| | | | | | | | | | | | | | | | | | | | | | | | | | | | | | | | | | |
| | 8,452 | | | | 70,682 | | | | 5 | | | | 165,805 | | | | 3 | | | | 10,267 | | | | 46,091 | | | | 12,627 | | | | 79,828 | |
| | 2,300 | | | | — | | | | 1,095 | | | | 3,075 | | | | 5,735 | | | | 210 | | | | 213 | | | | — | | | | — | |
| | — | | | | 1,880,993 | | | | 221,026 | | | | — | | | | 10,037,415 | | | | 2,376,027 | | | | — | | | | 141,047 | | | | 5,457,784 | |
| | — | | | | — | | | | 1,710,240 | | | | — | | | | — | | | | — | | | | — | | | | — | | | | — | |
| | | | | | | | | | | | | | | | | | | | | | | | | | | | | | | | | | |
| | 76,688,585 | | | | 71,250,134 | | | | 55,559,743 | | | | 203,226,268 | | | | 188,938,097 | | | | 59,747,974 | | | | 508,571,546 | | | | 17,570,100 | | | | 50,195,171 | |
| | | | | | | | | | | | | | | | | | | | | | | | | | | | | | | | | | |
| | | | | | | | |
| | | | | | | | | | | | | | | | | | | | | | | | | | | | | | | | | | |
| | — | | | | 55,429 | | | | — | | | | 127,259 | | | | — | | | | 18,193 | | | | 38 | | | | 1,025 | | | | 51,827 | |
| | | | | | | | | | | | | | | | | | | | | | | | | | | | | | | | | | |
| | 2,435,067 | | | | 1,817,400 | | | | 1,150,950 | | | | 6,252,813 | | | | 11,267,270 | | | | 333,120 | | | | — | | | | — | | | | — | |
| | — | | | | — | | | | 1,710,125 | | | | 811 | | | | — | | | | — | | | | — | | | | 150,573 | | | | — | |
| | — | | | | — | | | | — | | | | — | | | | 10,037,142 | | | | 2,375,272 | | | | — | | | | — | | | | 2,235,014 | |
| | 18,210 | | | | 17,560 | | | | 12,474 | | | | 48,855 | | | | 47,450 | | | | 14,866 | | | | 124,177 | | | | 4,367 | | | | 13,023 | |
| | | | | | | | | | | | | | | | | | | | | | | | | | | | | | | | | | |
| | 2,453,277 | | | | 1,890,389 | | | | 2,873,549 | | | | 6,429,738 | | | | 21,351,862 | | | | 2,741,451 | | | | 124,215 | | | | 155,965 | | | | 2,299,864 | |
| | | | | | | | | | | | | | | | | | | | | | | | | | | | | | | | | | |
| $ | 74,235,308 | | | $ | 69,359,745 | | | $ | 52,686,194 | | | $ | 196,796,530 | | | $ | 167,586,235 | | | $ | 57,006,523 | | | $ | 508,447,331 | | | $ | 17,414,135 | | | $ | 47,895,307 | |
| | | | | | | | | | | | | | | | | | | | | | | | | | | | | | | | | | |
| | | | | | | | |
| | | | | | | | | | | | | | | | | | | | | | | | | | | | | | | | | | |
| $ | 87,020,513 | | | $ | 75,220,567 | | | $ | 94,679,743 | | | $ | 175,282,836 | | | $ | 190,339,804 | | | $ | 57,588,757 | | | $ | 472,830,849 | | | $ | 19,717,649 | | | $ | 48,506,639 | |
| | 164,877 | | | | 454,049 | | | | 12,073 | | | | 545,760 | | | | (38,835 | ) | | | 79,539 | | | | 247,922 | | | | 23,877 | | | | 371,420 | |
| | (6,451,782 | ) | | | (2,421,111 | ) | | | (36,580,487 | ) | | | (3,811,391 | ) | | | (6,131,608 | ) | | | (2,998,238 | ) | | | (13,702,868 | ) | | | (1,701,283 | ) | | | 847,500 | |
| | (6,498,300 | ) | | | (3,893,760 | ) | | | (5,425,135 | ) | | | 24,779,325 | | | | (16,583,126 | ) | | | 2,336,465 | | | | 49,071,428 | | | | (626,108 | ) | | | (1,830,252 | ) |
| | | | | | | | | | | | | | | | | | | | | | | | | | | | | | | | | | |
| $ | 74,235,308 | | | $ | 69,359,745 | | | $ | 52,686,194 | | | $ | 196,796,530 | | | $ | 167,586,235 | | | $ | 57,006,523 | | | $ | 508,447,331 | | | $ | 17,414,135 | | | $ | 47,895,307 | |
| | | | | | | | | | | | | | | | | | | | | | | | | | | | | | | | | | |
| | 1,600,000 | | | | 1,100,000 | | | | 3,150,000 | | | | 4,500,000 | | | | 2,500,000 | | | | 1,200,000 | | | | 8,300,000 | | | | 450,000 | | | | 1,050,000 | |
| $ | 46.40 | | | $ | 63.05 | | | $ | 16.73 | | | $ | 43.73 | | | $ | 67.03 | | | $ | 47.51 | | | $ | 61.26 | | | $ | 38.70 | | | $ | 45.61 | |
| | | | | | | | | | | | | | | | | | | | | | | | | | | | | | | | | | |
| $ | 46.41 | | | $ | 62.99 | | | $ | 16.75 | | | $ | 43.73 | | | $ | 67.00 | | | $ | 47.42 | | | $ | 61.28 | | | $ | 38.77 | | | $ | 45.57 | |
| | | | | | | | | | | | | | | | | | | | | | | | | | | | | | | | | | |
| $ | 80,690,969 | | | $ | 71,374,819 | | | $ | 57,891,578 | | | $ | 172,025,250 | | | $ | 184,166,456 | | | $ | 54,691,885 | | | $ | 459,438,396 | | | $ | 18,042,534 | | | $ | 46,487,811 | |
| | | | | | | | | | | | | | | | | | | | | | | | | | | | | | | | | | |
| $ | 2,485,164 | | | $ | 1,817,400 | | | $ | 1,160,934 | | | $ | 6,252,813 | | | $ | 11,311,614 | | | $ | 333,120 | | | $ | 15,418 | | | $ | — | | | $ | — | |
| | | | | | | | | | | | | | | | | | | | | | | | | | | | | | | | | | |
| $ | 83,176,133 | | | $ | 73,192,219 | | | $ | 59,052,512 | | | $ | 178,278,063 | | | $ | 195,478,070 | | | $ | 55,025,005 | | | $ | 459,453,814 | | | $ | 18,042,534 | | | $ | 46,487,811 | |
| | | | | | | | | | | | | | | | | | | | | | | | | | | | | | | | | | |
| $ | 2,370,110 | | | $ | 1,801,090 | | | $ | 1,026,291 | | | $ | 6,185,878 | | | $ | 10,982,584 | | | $ | 326,041 | | | $ | — | | | $ | — | | | $ | — | |
| | | | | | | | | | | | | | | | | | | | | | | | | | | | | | | | | | |
Statements of Operations
For the year ended October 31, 2016
| | | | | | | | | | | | | | | | |
| | | PowerShares
DWA Momentum &
Low Volatility
Rotation
Portfolio (DWLV)(a) | | | PowerShares
DWA SmallCap
Momentum
Portfolio (DWAS) | | | PowerShares
DWA Tactical
Multi-Asset
Income
Portfolio (DWIN)(b) | | | PowerShares
DWA Tactical
Sector Rotation
Portfolio (DWTR) | |
| Investment Income: | | | | | | | | | | | | | | | | |
Unaffiliated dividend income | | $ | — | | | $ | 1,928,146 | | | $ | — | | | $ | — | |
Affiliated dividend income | | | 23,058 | | | | 294 | | | | 2,514,130 | | | | 1,302,159 | |
Unaffiliated interest income | | | 2,491 | | | | — | | | | — | | | | — | |
Securities lending income | | | — | | | | 424,720 | | | | — | | | | — | |
Foreign withholding tax | | | — | | | | (211 | ) | | | — | | | | — | |
| | | | | | | | | | | | | | | | |
Total Income | | | 25,549 | | | | 2,352,949 | | | | 2,514,130 | | | | 1,302,159 | |
| | | | | | | | | | | | | | | | |
| | | | |
| Expenses: | | | | | | | | | | | | | | | | |
Unitary management fees | | | 5,533 | | | | 1,392,311 | | | | 125,101 | | | | 218,026 | |
| | | | | | | | | | | | | | | | |
Less: Waivers | | | (96 | ) | | | (169 | ) | | | (21 | ) | | | (31 | ) |
| | | | | | | | | | | | | | | | |
Net Expenses | | | 5,437 | | | | 1,392,142 | | | | 125,080 | | | | 217,995 | |
| | | | | | | | | | | | | | | | |
Net Investment Income | | | 20,112 | | | | 960,807 | | | | 2,389,050 | | | | 1,084,164 | |
| | | | | | | | | | | | | | | | |
| | | | |
| Realized and Unrealized Gain (Loss): | | | | | | | | | | | | | | | | |
Net realized gain (loss) from: | | | | | | | | | | | | | | | | |
Investment securities | | | (59,615 | ) | | | (27,920,577 | ) | | | (114,753 | ) | | | (10,318,116 | ) |
In-kind redemptions | | | 97,450 | | | | 5,524,423 | | | | 306,262 | | | | 448,972 | |
| | | | | | | | | | | | | | | | |
Net realized gain (loss) | | | 37,835 | | | | (22,396,154 | ) | | | 191,509 | | | | (9,869,144 | ) |
| | | | | | | | | | | | | | | | |
Net change in unrealized appreciation (depreciation) on investment securities | | | (470,105 | ) | | | (23,056,492 | ) | | | 1,396,665 | | | | 1,527,655 | |
| | | | | | | | | | | | | | | | |
Net realized and unrealized gain (loss) | | | (432,270 | ) | | | (45,452,646 | ) | | | 1,588,174 | | | | (8,341,489 | ) |
| | | | | | | | | | | | | | | | |
Net increase (decrease) in net assets resulting from operations | | $ | (412,158 | ) | | $ | (44,491,839 | ) | | $ | 3,977,224 | | | $ | (7,257,325 | ) |
| | | | | | | | | | | | | | | | |
| (a) | For the period July 11, 2016 (commencement of investment operations) through October 31, 2016. |
| (b) | For the period March 7, 2016 (commencement of investment operations) through October 31, 2016. |
See accompanying Notes to Financial Statements which are an integral part of the financial statements.
| | | | | | | | | | | | | | | | | | | | | | | | | | | | | | | | | | |
PowerShares
S&P
SmallCap
Consumer
Discretionary
Portfolio
(PSCD) | | | PowerShares
S&P
SmallCap
Consumer
Staples
Portfolio
(PSCC) | | | PowerShares
S&P
SmallCap
Energy
Portfolio
(PSCE) | | | PowerShares
S&P
SmallCap
Financials
Portfolio
(PSCF) | | | PowerShares
S&P
SmallCap
Health Care
Portfolio
(PSCH) | | | PowerShares
S&P
SmallCap
Industrials
Portfolio
(PSCI) | | | PowerShares
S&P
SmallCap
Information
Technology
Portfolio
(PSCT) | | | PowerShares
S&P
SmallCap
Materials
Portfolio
(PSCM) | | | PowerShares
S&P
SmallCap
Utilities
Portfolio
(PSCU) | |
| | | | | | | | | | | | | | | | | | | | | | | | | | | | | | | | | | |
| $ | 906,091 | | | $ | 1,095,387 | | | $ | 211,694 | | | $ | 5,599,031 | | | $ | 557,908 | | | $ | 627,757 | | | $ | 1,803,189 | | | $ | 159,270 | | | $ | 2,578,736 | |
| | 117 | | | | 174 | | | | 34 | | | | 482 | | | | 534 | | | | 81 | | | | 871 | | | | 14 | | | | 206 | |
| | — | | | | — | | | | — | | | | — | | | | — | | | | — | | | | — | | | | — | | | | — | |
| | 75,873 | | | | — | | | | 72,343 | | | | 55,037 | | | | 78,563 | | | | 10,130 | | | | 90,284 | | | | — | | | | — | |
| | — | | | | — | | | | (614 | ) | | | (1,366 | ) | | | — | | | | — | | | | — | | | | — | | | | — | |
| | | | | | | | | | | | | | | | | | | | | | | | | | | | | | | | | | |
| | 982,081 | | | | 1,095,561 | | | | 283,457 | | | | 5,653,184 | | | | 637,005 | | | | 637,968 | | | | 1,894,344 | | | | 159,284 | | | | 2,578,942 | |
| | | | | | | | | | | | | | | | | | | | | | | | | | | | | | | | | | |
| | | | | | | | |
| | | | | | | | | | | | | | | | | | | | | | | | | | | | | | | | | | |
| | 247,772 | | | | 181,251 | | | | 122,848 | | | | 542,415 | | | | 623,585 | | | | 177,752 | | | | 1,163,658 | | | | 35,450 | | | | 283,294 | |
| | | | | | | | | | | | | | | | | | | | | | | | | | | | | | | | | | |
| | (53 | ) | | | (116 | ) | | | (22 | ) | | | (275 | ) | | | (351 | ) | | | (41 | ) | | | (444 | ) | | | (8 | ) | | | (117 | ) |
| | | | | | | | | | | | | | | | | | | | | | | | | | | | | | | | | | |
| | 247,719 | | | | 181,135 | | | | 122,826 | | | | 542,140 | | | | 623,234 | | | | 177,711 | | | | 1,163,214 | | | | 35,442 | | | | 283,177 | |
| | | | | | | | | | | | | | | | | | | | | | | | | | | | | | | | | | |
| | 734,362 | | | | 914,426 | | | | 160,631 | | | | 5,111,044 | | | | 13,771 | | | | 460,257 | | | | 731,130 | | | | 123,842 | | | | 2,295,765 | |
| | | | | | | | | | | | | | | | | | | | | | | | | | | | | | | | | | |
| | | | | | | | |
| | | | | | | | | | | | | | | | | | | | | | | | | | | | | | | | | | |
| | | | | | | | | | | | | | | | | | | | | | | | | | | | | | | | | | |
| | (6,662,265 | ) | | | (3,535,883 | ) | | | (16,179,025 | ) | | | (2,267,246 | ) | | | (6,745,351 | ) | | | (2,256,144 | ) | | | (6,271,811 | ) | | | (1,019,891 | ) | | | 1,580,396 | |
| | 8,172,554 | | | | 11,588,171 | | | | 1,784,610 | | | | 12,367,265 | | | | 28,291,707 | | | | 6,206,243 | | | | 52,273,936 | | | | (464,495 | ) | | | 12,067,980 | |
| | | | | | | | | | | | | | | | | | | | | | | | | | | | | | | | | | |
| | 1,510,289 | | | | 8,052,288 | | | | (14,394,415 | ) | | | 10,100,019 | | | | 21,546,356 | | | | 3,950,099 | | | | 46,002,125 | | | | (1,484,386 | ) | | | 13,648,376 | |
| | | | | | | | | | | | | | | | | | | | | | | | | | | | | | | | | | |
| | | | | | | | | | | | | | | | | | | | | | | | | | | | | | | | | | |
| | (10,046,153 | ) | | | (4,262,072 | ) | | | 13,547,987 | | | | (2,235,856 | ) | | | (26,442,732 | ) | | | (1,722,069 | ) | | | 14,244,630 | | | | 2,856,477 | | | | (4,788,469 | ) |
| | | | | | | | | | | | | | | | | | | | | | | | | | | | | | | | | | |
| | (8,535,864 | ) | | | 3,790,216 | | | | (846,428 | ) | | | 7,864,163 | | | | (4,896,376 | ) | | | 2,228,030 | | | | 60,246,755 | | | | 1,372,091 | | | | 8,859,907 | |
| | | | | | | | | | | | | | | | | | | | | | | | | | | | | | | | | | |
| $ | (7,801,502 | ) | | $ | 4,704,642 | | | $ | (685,797 | ) | | $ | 12,975,207 | | | $ | (4,882,605 | ) | | $ | 2,688,287 | | | $ | 60,977,885 | | | $ | 1,495,933 | | | $ | 11,155,672 | |
| | | | | | | | | | | | | | | | | | | | | | | | | | | | | | | | | | |
Statements of Changes in Net Assets
For the years ended October 31, 2016 and 2015
| | | | | | | | | | | | | | | | |
| | | PowerShares
DWA Momentum &
Low Volatility
Rotation
Portfolio (DWLV) | | | PowerShares DWA SmallCap
Momentum Portfolio (DWAS) | | | PowerShares
DWA Tactical
Multi-Asset
Income
Portfolio (DWIN) | |
| | | 2016(a) | | | 2016 | | | 2015 | | | 2016(b) | |
| Operations: | | | | | | | | | | | | | | | | |
Net investment income (loss) | | $ | 20,112 | | | $ | 960,807 | | | $ | 229,543 | | | $ | 2,389,050 | |
Net realized gain (loss) | | | 37,835 | | | | (22,396,154 | ) | | | (16,844,089 | ) | | | 191,509 | |
Net change in unrealized appreciation (depreciation) | | | (470,105 | ) | | | (23,056,492 | ) | | | 1,721,890 | | | | 1,396,665 | |
| | | | | | | | | | | | | | | | |
Net increase (decrease) in net assets resulting from operations | | | (412,158 | ) | | | (44,491,839 | ) | | | (14,892,656 | ) | | | 3,977,224 | |
| | | | | | | | | | | | | | | | |
| | | | |
| Distributions to Shareholders from: | | | | | | | | | | | | | | | | |
Net investment income | | | (5,265 | ) | | | (825,119 | ) | | | (313,026 | ) | | | (2,392,101 | ) |
Net realized gains | | | — | | | | — | | | | — | | | | — | |
Return of capital | | | — | | | | — | | | | — | | | | — | |
| | | | | | | | | | | | | | | | |
Total distributions to shareholders | | | (5,265 | ) | | | (825,119 | ) | | | (313,026 | ) | | | (2,392,101 | ) |
| | | | | | | | | | | | | | | | |
| | | | |
| Shareholder Transactions: | | | | | | | | | | | | | | | | |
Proceeds from shares sold | | | 14,037,994 | | | | 67,039,578 | | | | 330,233,347 | | | | 130,144,242 | |
Value of shares repurchased | | | (2,568,726 | ) | | | (282,181,365 | ) | | | (191,228,931 | ) | | | (12,883,223 | ) |
| | | | | | | | | | | | | | | | |
Net increase (decrease) in net assets resulting from shares transactions | | | 11,469,268 | | | | (215,141,787 | ) | | | 139,004,416 | | | | 117,261,019 | |
| | | | | | | | | | | | | | | | |
Increase (Decrease) in Net Assets | | | 11,051,845 | | | | (260,458,745 | ) | | | 123,798,734 | | | | 118,846,142 | |
| | | | | | | | | | | | | | | | |
| | | | |
| Net Assets: | | | | | | | | | | | | | | | | |
Beginning of year | | | — | | | | 416,315,918 | | | | 292,517,184 | | | | — | |
| | | | | | | | | | | | | | | | |
End of year | | $ | 11,051,845 | | | $ | 155,857,173 | | | $ | 416,315,918 | | | $ | 118,846,142 | |
| | | | | | | | | | | | | | | | |
Undistributed net investment income (loss) at end of year | | $ | 14,847 | | | $ | 292,417 | | | $ | 156,729 | | | $ | — | |
| | | | | | | | | | | | | | | | |
| | | | |
| Changes in Shares Outstanding: | | | | | | | | | | | | | | | | |
Shares sold | | | 550,001 | | | | 1,750,000 | | | | 8,100,000 | | | | 4,900,001 | |
Shares repurchased | | | (100,000 | ) | | | (8,250,000 | ) | | | (4,850,000 | ) | | | (500,000 | ) |
Shares outstanding, beginning of year | | | — | | | | 10,900,000 | | | | 7,650,000 | | | | — | |
| | | | | | | | | | | | | | | | |
Shares outstanding, end of year | | | 450,001 | | | | 4,400,000 | | | | 10,900,000 | | | | 4,400,001 | |
| | | | | | | | | | | | | | | | |
| (a) | For the period July 11, 2016 (commencement of investment operations) through October 31, 2016. |
| (b) | For the period March 7, 2016 (commencement of investment operations) through October 31, 2016. |
| (c) | For the period October 7, 2015 (commencement of investment operations) through October 31, 2015. |
See accompanying Notes to Financial Statements which are an integral part of the financial statements.
| | | | | | | | | | | | | | | | | | | | | | | | | | | | | | |
PowerShares DWA
Tactical
Sector Rotation
Portfolio (DWTR) | | |
PowerShares
S&P SmallCap
Consumer
Discretionary
Portfolio (PSCD) | | | PowerShares
S&P SmallCap
Consumer
Staples
Portfolio (PSCC) | | | PowerShares
S&P SmallCap
Energy
Portfolio (PSCE) | |
2016 | | |
2015(c) | | |
2016 | | |
2015 | | |
2016 | | |
2015 | | |
2016 | | |
2015 | |
| | | | | | | | | | | | | | | | | | | | | | | | | | | | | | |
| $ | 1,084,164 | | | $ | (2,846 | ) | | $ | 734,362 | | | $ | 1,084,460 | | | $ | 914,426 | | | $ | 386,942 | | | $ | 160,631 | | | $ | 228,008 | |
| | (9,869,144 | ) | | | (115 | ) | | | 1,510,289 | | | | 9,651,378 | | | | 8,052,288 | | | | 4,094,351 | | | | (14,394,415 | ) | | | (15,289,670 | ) |
| | 1,527,655 | | | | 778,945 | | | | (10,046,153 | ) | | | (7,660,124 | ) | | | (4,262,072 | ) | | | (1,405,657 | ) | | | 13,547,987 | | | | (10,658,757 | ) |
| | | | | | | | | | | | | | | | | | | | | | | | | | | | | | |
| | (7,257,325 | ) | | | 775,984 | | | | (7,801,502 | ) | | | 3,075,714 | | | | 4,704,642 | | | | 3,075,636 | | | | (685,797 | ) | | | (25,720,419 | ) |
| | | | | | | | | | | | | | | | | | | | | | | | | | | | | | |
| | | | | | | |
| | | | | | | | | | | | | | | | | | | | | | | | | | | | | | |
| | (1,081,384 | ) | | | — | | | | (707,191 | ) | | | (1,104,227 | ) | | | (700,261 | ) | | | (236,050 | ) | | | (204,998 | ) | | | (171,568 | ) |
| | — | | | | — | | | | — | | | | — | | | | — | | | | (487,206 | ) | | | — | | | | — | |
| | (2,439 | ) | | | — | | | | — | | | | — | | | | — | | | | — | | | | — | | | | — | |
| | | | | | | | | | | | | | | | | | | | | | | | | | | | | | |
| | (1,083,823 | ) | | | — | | | | (707,191 | ) | | | (1,104,227 | ) | | | (700,261 | ) | | | (723,256 | ) | | | (204,998 | ) | | | (171,568 | ) |
| | | | | | | | | | | | | | | | | | | | | | | | | | | | | | |
| | | | | | | |
| | | | | | | | | | | | | | | | | | | | | | | | | | | | | | |
| | 166,921,314 | | | | 41,828,050 | | | | 18,192,524 | | | | 50,801,801 | | | | 129,860,817 | | | | 30,057,465 | | | | 30,659,258 | | | | 35,063,123 | |
| | (29,062,791 | ) | | | — | | | | (51,422,549 | ) | | | (28,947,395 | ) | | | (95,999,049 | ) | | | (33,211,698 | ) | | | (14,231,177 | ) | | | (2,303,063 | ) |
| | | | | | | | | | | | | | | | | | | | | | | | | | | | | | |
| | 137,858,523 | | | | 41,828,050 | | | | (33,230,025 | ) | | | 21,854,406 | | | | 33,861,768 | | | | (3,154,233 | ) | | | 16,428,081 | | | | 32,760,060 | |
| | | | | | | | | | | | | | | | | | | | | | | | | | | | | | |
| | 129,517,375 | | | | 42,604,034 | | | | (41,738,718 | ) | | | 23,825,893 | | | | 37,866,149 | | | | (801,853 | ) | | | 15,537,286 | | | | 6,868,073 | |
| | | | | | | | | | | | | | | | | | | | | | | | | | | | | | |
| | | | | | | |
| | | | | | | | | | | | | | | | | | | | | | | | | | | | | | |
| | 42,604,034 | | | | — | | | | 115,974,026 | | | | 92,148,133 | | | | 31,493,596 | | | | 32,295,449 | | | | 37,148,908 | | | | 30,280,835 | |
| | | | | | | | | | | | | | | | | | | | | | | | | | | | | | |
| $ | 172,121,409 | | | $ | 42,604,034 | | | $ | 74,235,308 | | | $ | 115,974,026 | | | $ | 69,359,745 | | | $ | 31,493,596 | | | $ | 52,686,194 | | | $ | 37,148,908 | |
| | | | | | | | | | | | | | | | | | | | | | | | | | | | | | |
| $ | — | | | $ | (2,780 | ) | | $ | 164,877 | | | $ | 137,706 | | | $ | 454,049 | | | $ | 239,884 | | | $ | 12,073 | | | $ | 56,440 | |
| | | | | | | | | | | | | | | | | | | | | | | | | | | | | | |
| | | | | | | |
| | | | | | | | | | | | | | | | | | | | | | | | | | | | | | |
| | 6,700,000 | | | | 1,650,001 | | | | 400,000 | | | | 950,000 | | | | 2,100,000 | | | | 550,000 | | | | 2,000,000 | | | | 1,350,000 | |
| | (1,250,000 | ) | | | — | | | | (1,150,000 | ) | | | (550,000 | ) | | | (1,550,000 | ) | | | (600,000 | ) | | | (900,000 | ) | | | (100,000 | ) |
| | 1,650,001 | | | | — | | | | 2,350,000 | | | | 1,950,000 | | | | 550,000 | | | | 600,000 | | | | 2,050,000 | | | | 800,000 | |
| | | | | | | | | | | | | | | | | | | | | | | | | | | | | | |
| | 7,100,001 | | | | 1,650,001 | | | | 1,600,000 | | | | 2,350,000 | | | | 1,100,000 | | | | 550,000 | | | | 3,150,000 | | | | 2,050,000 | |
| | | | | | | | | | | | | | | | | | | | | | | | | | | | | | |
Statements of Changes in Net Assets (continued)
For the years ended October 31, 2016 and 2015
| | | | | | | | | | | | | | | | |
| | | PowerShares S&P SmallCap
Financials Portfolio (PSCF) | | |
PowerShares S&P SmallCap
Health Care Portfolio (PSCH) | |
| | | 2016 | | | 2015 | | | 2016 | | | 2015 | |
| Operations: | | | | | | | | | | | | | | | | |
Net investment income (loss) | | $ | 5,111,044 | | | $ | 3,021,936 | | | $ | 13,771 | | | $ | (42,912 | ) |
Net realized gain (loss) | | | 10,100,019 | | | | 6,779,553 | | | | 21,546,356 | | | | 24,660,602 | |
Net change in unrealized appreciation (depreciation) | | | (2,235,856 | ) | | | (2,029,901 | ) | | | (26,442,732 | ) | | | (9,397,398 | ) |
| | | | | | | | | | | | | | | | |
Net increase (decrease) in net assets resulting from operations | | | 12,975,207 | | | | 7,771,588 | | | | (4,882,605 | ) | | | 15,220,292 | |
| | | | | | | | | | | | | | | | |
| | | | |
| Distributions to Shareholders from: | | | | | | | | | | | | | | | | |
Net investment income | | | (5,304,095 | ) | | | (2,648,802 | ) | | | — | | | | (74,412 | ) |
Net realized gains | | | (338,778 | ) | | | — | | | | — | | | | (3,889,593 | ) |
| | | | | | | | | | | | | | | | |
Total distributions to shareholders | | | (5,642,873 | ) | | | (2,648,802 | ) | | | — | | | | (3,964,005 | ) |
| | | | | | | | | | | | | | | | |
| | | | |
| Shareholder Transactions: | | | | | | | | | | | | | | | | |
Proceeds from shares sold | | | 61,415,237 | | | | 85,664,792 | | | | 80,367,486 | | | | 153,561,248 | |
Value of shares repurchased | | | (54,297,695 | ) | | | (23,193,508 | ) | | | (138,402,774 | ) | | | (99,513,782 | ) |
| | | | | | | | | | | | | | | | |
Net increase (decrease) in net assets resulting from shares transactions | | | 7,117,542 | | | | 62,471,284 | | | | (58,035,288 | ) | | | 54,047,466 | |
| | | | | | | | | | | | | | | | |
Increase (Decrease) in Net Assets | | | 14,449,876 | | | | 67,594,070 | | | | (62,917,893 | ) | | | 65,303,753 | |
| | | | | | | | | | | | | | | | |
| | | | |
| Net Assets: | | | | | | | | | | | | | | | | |
Beginning of year | | | 182,346,654 | | | | 114,752,584 | | | | 230,504,128 | | | | 165,200,375 | |
| | | | | | | | | | | | | | | | |
End of year | | $ | 196,796,530 | | | $ | 182,346,654 | | | $ | 167,586,235 | | | $ | 230,504,128 | |
| | | | | | | | | | | | | | | | |
Undistributed net investment income (loss) at end of year | | $ | 545,760 | | | $ | 738,811 | | | $ | (38,835 | ) | | $ | (71,383 | ) |
| | | | | | | | | | | | | | | | |
| | | | |
| Changes in Shares Outstanding: | | | | | | | | | | | | | | | | |
Shares sold | | | 1,500,000 | | | | 2,050,000 | | | | 1,150,000 | | | | 2,200,000 | |
Shares repurchased | | | (1,300,000 | ) | | | (550,000 | ) | | | (2,100,000 | ) | | | (1,500,000 | ) |
Shares outstanding, beginning of year | | | 4,300,000 | | | | 2,800,000 | | | | 3,450,000 | | | | 2,750,000 | |
| | | | | | | | | | | | | | | | |
Shares outstanding, end of year | | | 4,500,000 | | | | 4,300,000 | | | | 2,500,000 | | | | 3,450,000 | |
| | | | | | | | | | | | | | | | |
See accompanying Notes to Financial Statements which are an integral part of the financial statements.
| | | | | | | | | | | | | | | | | | | | | | | | | | | | | | |
PowerShares
S&P SmallCap
Industrials
Portfolio (PSCI) | | | PowerShares
S&P SmallCap
Information
Technology
Portfolio (PSCT) | | | PowerShares
S&P SmallCap
Materials
Portfolio (PSCM) | | | PowerShares
S&P SmallCap
Utilities
Portfolio (PSCU) | |
2016 | | |
2015 | | |
2016 | | |
2015 | | |
2016 | | |
2015 | | |
2016 | | |
2015 | |
| | | | | | | | | | | | | | | | | | | | | | | | | | | | | | |
| $ | 460,257 | | | $ | 843,834 | | | $ | 731,130 | | | $ | 467,212 | | | $ | 123,842 | | | $ | 174,792 | | | $ | 2,295,765 | | | $ | 924,382 | |
| | 3,950,099 | | | | 7,839,656 | | | | 46,002,125 | | | | 21,397,128 | | | | (1,484,386 | ) | | | (1,363,884 | ) | | | 13,648,376 | | | | 7,422,636 | |
| | (1,722,069 | ) | | | (6,337,677 | ) | | | 14,244,630 | | | | 907,630 | | | | 2,856,477 | | | | (3,414,711 | ) | | | (4,788,469 | ) | | | (5,488,733 | ) |
| | | | | | | | | | | | | | | | | | | | | | | | | | | | | | |
| | 2,688,287 | | | | 2,345,813 | | | | 60,977,885 | | | | 22,771,970 | | | | 1,495,933 | | | | (4,603,803 | ) | | | 11,155,672 | | | | 2,858,285 | |
| | | | | | | | | | | | | | | | | | | | | | | | | | | | | | |
| | | | | | | |
| | | | | | | | | | | | | | | | | | | | | | | | | | | | | | |
| | (476,137 | ) | | | (878,298 | ) | | | (880,007 | ) | | | (210,333 | ) | | | (122,745 | ) | | | (223,243 | ) | | | (2,016,277 | ) | | | (1,042,947 | ) |
| | — | | | | — | | | | — | | | | — | | | | — | | | | — | | | | — | | | | — | |
| | | | | | | | | | | | | | | | | | | | | | | | | | | | | | |
| | (476,137 | ) | | | (878,298 | ) | | | (880,007 | ) | | | (210,333 | ) | | | (122,745 | ) | | | (223,243 | ) | | | (2,016,277 | ) | | | (1,042,947 | ) |
| | | | | | | | | | | | | | | | | | | | | | | | | | | | | | |
| | | | | | | |
| | | | | | | | | | | | | | | | | | | | | | | | | | | | | | |
| | 24,256,729 | | | | 6,725,540 | | | | 249,989,678 | | | | 215,140,141 | | | | 7,105,064 | | | | — | | | | 130,908,237 | | | | 30,306,896 | |
| | (40,070,787 | ) | | | (38,582,315 | ) | | | (191,955,428 | ) | | | (73,086,656 | ) | | | (1,372,670 | ) | | | (35,428,789 | ) | | | (132,039,699 | ) | | | (32,494,100 | ) |
| | | | | | | | | | | | | | | | | | | | | | | | | | | | | | |
| | (15,814,058 | ) | | | (31,856,775 | ) | | | 58,034,250 | | | | 142,053,485 | | | | 5,732,394 | | | | (35,428,789 | ) | | | (1,131,462 | ) | | | (2,187,204 | ) |
| | | | | | | | | | | | | | | | | | | | | | | | | | | | | | |
| | (13,601,908 | ) | | | (30,389,260 | ) | | | 118,132,128 | | | | 164,615,122 | | | | 7,105,582 | | | | (40,255,835 | ) | | | 8,007,933 | | | | (371,866 | ) |
| | | | | | | | | | | | | | | | | | | | | | | | | | | | | | |
| | | | | | | |
| | | | | | | | | | | | | | | | | | | | | | | | | | | | | | |
| | 70,608,431 | | | | 100,997,691 | | | | 390,315,203 | | | | 225,700,081 | | | | 10,308,553 | | | | 50,564,388 | | | | 39,887,374 | | | | 40,259,240 | |
| | | | | | | | | | | | | | | | | | | | | | | | | | | | | | |
| $ | 57,006,523 | | | $ | 70,608,431 | | | $ | 508,447,331 | | | $ | 390,315,203 | | | $ | 17,414,135 | | | $ | 10,308,553 | | | $ | 47,895,307 | | | $ | 39,887,374 | |
| | | | | | | | | | | | | | | | | | | | | | | | | | | | | | |
| $ | 79,539 | | | $ | 95,419 | | | $ | 247,922 | | | $ | 396,799 | | | $ | 23,877 | | | $ | 22,780 | | | $ | 371,420 | | | $ | 91,932 | |
| | | | | | | | | | | | | | | | | | | | | | | | | | | | | | |
| | | | | | | |
| | | | | | | | | | | | | | | | | | | | | | | | | | | | | | |
| | 550,000 | | | | 150,000 | | | | 4,300,000 | | | | 4,300,000 | | | | 200,000 | | | | — | | | | 3,000,000 | | | | 750,000 | |
| | (900,000 | ) | | | (850,000 | ) | | | (3,550,000 | ) | | | (1,450,000 | ) | | | (50,000 | ) | | | (850,000 | ) | | | (2,900,000 | ) | | | (850,000 | ) |
| | 1,550,000 | | | | 2,250,000 | | | | 7,550,000 | | | | 4,700,000 | | | | 300,000 | | | | 1,150,000 | | | | 950,000 | | | | 1,050,000 | |
| | | | | | | | | | | | | | | | | | | | | | | | | | | | | | |
| | 1,200,000 | | | | 1,550,000 | | | | 8,300,000 | | | | 7,550,000 | | | | 450,000 | | | | 300,000 | | | | 1,050,000 | | | | 950,000 | |
| | | | | | | | | | | | | | | | | | | | | | | | | | | | | | |
Financial Highlights
PowerShares DWA Momentum & Low Volatility Rotation Portfolio (DWLV)
| | | | |
| | | For the Period
July 11, 2016(a)
Through
October 31, 2016 | |
| Per Share Operating Performance: | | | | |
Net asset value at beginning of period | | $ | 25.47 | |
Net investment income(b) | | | 0.04 | |
Net realized and unrealized gain (loss) on investments | | | (0.94 | ) |
Total from investment operations | | | (0.90 | ) |
Distributions to shareholders from: | | | | |
Net investment income | | | (0.01 | ) |
Net asset value at end of period | | $ | 24.56 | |
Market price at end of period(c) | | $ | 24.57 | |
| Net Asset Value Total Return(d) | | | (3.53 | )%(e) |
| Market Price Total Return(d) | | | (3.49 | )%(e) |
| Ratios/Supplemental Data: | | | | |
Net assets at end of period (000’s omitted) | | $ | 11,052 | |
Ratio to average net assets of: | | | | |
Expenses(f) | | | 0.15 | %(g) |
Net investment income | | | 0.53 | %(g) |
Portfolio turnover rate(h) | | | 27 | % |
| (a) | Commencement of investment operations. |
| (b) | Based on average shares outstanding. |
| (c) | The mean between the last bid and ask prices. |
| (d) | Net asset value total return is calculated assuming an initial investment made at the net asset value at the beginning of the period, reinvestment of all dividends and distributions at net asset value during the period, and the redemption on the last day of the period. Net asset value total return includes adjustments in accordance with accounting principles generally accepted in the United States of America and as such, the net asset value for financial reporting purposes and the returns based upon those net asset values may differ from the net asset value and returns for shareholder transactions. Market price total return is calculated assuming an initial investment made at the market price at the beginning of the period, reinvestment of all dividends and distributions at market price during the period, and sale at the market price on the last day of the period. Total investment returns calculated for a period of less than one year are not annualized. |
| (e) | The net asset value total return from Fund Inception (July 14, 2016, the first day of trading on the Exchange) to October 31, 2016 was (3.84)%. The market price total return from Fund Inception to October 31, 2016 was (3.80)%. |
| (f) | In addition to the fees and expenses which the Fund bears directly, the Fund indirectly bears a pro rata share of the fees and expenses of the investment companies in which the Fund invests. Estimated investment companies’ expenses are not expenses that are incurred directly by the Fund. They are expenses that are incurred directly by the investment companies and are deducted from the value of the investment companies the Fund invests in. The effect of the estimated investment companies’ expenses that the Fund bears indirectly is included in the Fund’s total return. |
| (h) | Portfolio turnover rate is not annualized and does not include securities received or delivered from processing creations or redemptions. |
See accompanying Notes to Financial Statements which are an integral part of the financial statements.
Financial Highlights (continued)
PowerShares DWA SmallCap Momentum Portfolio (DWAS)
| | | | | | | | | | | | | | | | | | | | |
| | | Year Ended October 31, | | | For the Period
July 16, 2012(a)
Through
October 31, 2012 | |
| | | 2016 | | | 2015 | | | 2014 | | | 2013 | | |
| Per Share Operating Performance: | | | | | | | | | | | | | | | | | | | | |
Net asset value at beginning of year | | $ | 38.19 | | | $ | 38.24 | | | $ | 37.14 | | | $ | 25.87 | | | $ | 24.85 | |
Net investment income(b) | | | 0.15 | | | | 0.02 | | | | 0.01 | | | | 0.04 | | | | 0.03 | |
Net realized and unrealized gain (loss) on investments | | | (2.81 | ) | | | (0.04 | ) | | | 1.11 | | | | 11.50 | | | | 0.99 | (c) |
Total from investment operations | | | (2.66 | ) | | | (0.02 | ) | | | 1.12 | | | | 11.54 | | | | 1.02 | |
Distributions to shareholders from: | | | | | | | | | | | | | | | | | | | | |
Net investment income | | | (0.11 | ) | | | (0.03 | ) | | | (0.01 | ) | | | (0.27 | ) | | | — | |
Return of capital | | | — | | | | — | | | | (0.01 | ) | | | — | | | | — | |
Total distributions | | | (0.11 | ) | | | (0.03 | ) | | | (0.02 | ) | | | (0.27 | ) | | | — | |
Net asset value at end of year | | $ | 35.42 | | | $ | 38.19 | | | $ | 38.24 | | | $ | 37.14 | | | $ | 25.87 | |
Market price at end of year(d) | | $ | 35.40 | | | $ | 38.18 | | | $ | 38.24 | | | $ | 37.22 | | | $ | 25.80 | |
| Net Asset Value Total Return(e) | | | (6.97 | )% | | | (0.05 | )% | | | 3.03 | % | | | 44.98 | % | | | 4.10 | %(f) |
| Market Price Total Return(e) | | | (7.00 | )% | | | (0.08 | )% | | | 2.80 | % | | | 45.69 | % | | | 3.82 | %(f) |
| Ratios/Supplemental Data: | | | | | | | | | | | | | | | | | | | | |
Net assets at end of year (000’s omitted) | | $ | 155,857 | | | $ | 416,316 | | | $ | 292,517 | | | $ | 505,046 | | | $ | 14,231 | |
Ratio to average net assets of: | | | | | | | | | | | | | | | | | | | | |
Expenses | | | 0.60 | % | | | 0.60 | % | | | 0.60 | % | | | 0.60 | %(g) | | | 0.60 | %(h) |
Net investment income | | | 0.41 | % | | | 0.06 | % | | | 0.04 | % | | | 0.10 | % | | | 0.41 | %(h) |
Portfolio turnover rate(i) | | | 169 | % | | | 141 | % | | | 168 | % | | | 145 | % | | | 18 | % |
| (a) | Commencement of investment operations. |
| (b) | Based on average shares outstanding. |
| (c) | Due to the timing of creations and redemptions of capital shares, the net realized and unrealized gain (loss) per share is not in accord with the Fund’s change in net realized and unrealized gain (loss) on investment securities and in-kind transactions for the period. |
| (d) | The mean between the last bid and ask prices. |
| (e) | Net asset value total return is calculated assuming an initial investment made at the net asset value at the beginning of the period, reinvestment of all dividends and distributions at net asset value during the period, and the redemption on the last day of the period. Net asset value total return includes adjustments in accordance with accounting principles generally accepted in the United States of America and as such, the net asset value for financial reporting purposes and the returns based upon those net asset values may differ from the net asset value and returns for shareholder transactions. Market price total return is calculated assuming an initial investment made at the market price at the beginning of the period, reinvestment of all dividends and distributions at market price during the period, and sale at the market price on the last day of the period. Total investment returns calculated for a period of less than one year are not annualized. |
| (f) | The net asset value total return from Fund Inception (July 19, 2012, the first day of trading on the exchange) to October 31, 2012 was 3.52%. The market price total return from Fund Inception to October 31, 2012 was 3.12%. |
| (g) | In addition to the fees and expenses which the Fund bears directly, the Fund indirectly bears a pro rata share of the fees and expenses of the investment companies in which the Fund invests. Estimated investment companies’ expenses are not expenses that are incurred directly by the Fund. They are expenses that are incurred directly by the investment companies and are deducted from the value of the investment companies the Fund invests in. The effect of the estimated investment companies’ expenses that the Fund bears indirectly is included in the Fund’s total return. |
| (i) | Portfolio turnover rate is not annualized for periods less than one year, if applicable, and does not include securities received or delivered from processing creations or redemptions. |
See accompanying Notes to Financial Statements which are an integral part of the financial statements.
Financial Highlights (continued)
PowerShares DWA Tactical Multi-Asset Income Portfolio (DWIN)
| | | | |
| | | For the Period
March 7, 2016(a)
Through
October 31, 2016 | |
| Per Share Operating Performance: | | | | |
Net asset value at beginning of period | | $ | 25.09 | |
Net investment income(b) | | | 0.84 | |
Net realized and unrealized gain on investments | | | 1.86 | |
Total from investment operations | | | 2.70 | |
Distributions to shareholders from: | | | | |
Net investment income | | | (0.78 | ) |
Net asset value at end of period | | $ | 27.01 | |
Market price at end of period(c) | | $ | 27.04 | |
| Net Asset Value Total Return(d) | | | 10.80 | %(e) |
| Market Price Total Return(d) | | | 10.92 | %(e) |
| Ratios/Supplemental Data: | | | | |
Net assets at end of period (000’s omitted) | | $ | 118,846 | |
Ratio to average net assets of: | | | | |
Expenses(f) | | | 0.25 | %(g) |
Net investment income | | | 4.71 | %(g) |
Portfolio turnover rate(h) | | | 21 | % |
| (a) | Commencement of investment operations. |
| (b) | Based on average shares outstanding. |
| (c) | The mean between the last bid and ask prices. |
| (d) | Net asset value total return is calculated assuming an initial investment made at the net asset value at the beginning of the period, reinvestment of all dividends and distributions at net asset value during the period, and the redemption on the last day of the period. Net asset value total return includes adjustments in accordance with accounting principles generally accepted in the United States of America and as such, the net asset value for financial reporting purposes and the returns based upon those net asset values may differ from the net asset value and returns for shareholder transactions. Market price total return is calculated assuming an initial investment made at the market price at the beginning of the period, reinvestment of all dividends and distributions at market price during the period, and sale at the market price on the last day of the period. Total investment returns calculated for a period of less than one year are not annualized. |
| (e) | The net asset value total return from Fund Inception (March 10, 2016, the first day of trading on the Exchange) to October 31, 2016 was 10.88%. The market price total return from Fund Inception to October 31, 2016 was 11.05%. |
| (f) | In addition to the fees and expenses which the Fund bears directly, the Fund indirectly bears a pro rata share of the fees and expenses of the investment companies in which the Fund invests. Estimated investment companies’ expenses are not expenses that are incurred directly by the Fund. They are expenses that are incurred directly by the investment companies and are deducted from the value of the investment companies the Fund invests in. The effect of the estimated investment companies’ expenses that the Fund bears indirectly is included in the Fund’s total return. |
| (h) | Portfolio turnover rate is not annualized and does not include securities received or delivered from processing creations or redemptions. |
See accompanying Notes to Financial Statements which are an integral part of the financial statements.
Financial Highlights (continued)
PowerShares DWA Tactical Sector Rotation Portfolio (DWTR)
| | | | | | | | |
| | | Year Ended
October 31, 2016 | | | For the Period
October 7, 2015(a)
Through
October 31, 2015 | |
| Per Share Operating Performance: | | | | | | | | |
Net asset value at beginning of year | | $ | 25.82 | | | $ | 25.17 | |
Net investment income (loss)(b) | | | 0.18 | | | | (0.00 | )(c) |
Net realized and unrealized gain (loss) on investments | | | (1.57 | ) | | | 0.65 | |
Total from investment operations | | | (1.39 | ) | | | 0.65 | |
Distributions to shareholders from: | | | | | | | | |
Net investment income | | | (0.19 | ) | | | — | |
Return of capital | | | (0.00 | )(c) | | | — | |
Total distributions | | | (0.19 | ) | | | — | |
Net asset value at end of year | | $ | 24.24 | | | $ | 25.82 | |
Market price at end of year(d) | | $ | 24.24 | | | $ | 25.84 | |
| Net Asset Value Total Return(e) | | | (5.40 | )% | | | 2.58 | %(f) |
| Market Price Total Return(e) | | | (5.47 | )% | | | 2.66 | %(f) |
| Ratios/Supplemental Data: | | | | | | | | |
Net assets at end of year (000’s omitted) | | $ | 172,121 | | | $ | 42,604 | |
Ratio to average net assets of: | | | | | | | | |
Expenses(g) | | | 0.15 | % | | | 0.15 | %(h) |
Net investment income | | | 0.75 | % | | | (0.15 | )%(h) |
Portfolio turnover rate(i) | | | 49 | % | | | 0 | %(j) |
| (a) | Commencement of investment operations |
| (b) | Based on average shares outstanding. |
| (c) | Amount represents less than $(0.005). |
| (d) | The mean between the last bid and ask prices. |
| (e) | Net asset value total return is calculated assuming an initial investment made at the net asset value at the beginning of the period, reinvestment of all dividends and distributions at net asset value during the period, and the redemption on the last day of the period. Net asset value total return includes adjustments in accordance with accounting principles generally accepted in the United States of America and as such, the net asset value for financial reporting purposes and the returns based upon those net asset values may differ from the net asset value and returns for shareholder transactions. Market price total return is calculated assuming an initial investment made at the market price at the beginning of the period, reinvestment of all dividends and distributions at market price during the period, and sale at the market price on the last day of the period. Total investment returns calculated for a period of less than one year are not annualized. |
| (f) | The net asset value total return from Fund Inception (October 9, 2015, the first day of trading on the exchange) to October 31, 2015 was 1.73%. The market price total return from Fund Inception to October 31, 2015 was 1.81%. |
| (g) | In addition to the fees and expenses which the Fund bears directly, the Fund indirectly bears a pro rata share of the fees and expenses of the investment companies in which the Fund invests. Estimated investment companies’ expenses are not expenses that are incurred directly by the Fund. They are expenses that are incurred directly by the investment companies and are deducted from the value of the investment companies the Fund invests in. The effect of the estimated investment companies’ expenses that the Fund bears indirectly is included in the Fund’s total return. |
| (i) | Portfolio turnover rate is not annualized for periods less than one year, if applicable, and does not include securities received or delivered from processing creations or redemptions. |
| (j) | Amount represents less than 0.5%. |
See accompanying Notes to Financial Statements which are an integral part of the financial statements.
Financial Highlights (continued)
PowerShares S&P SmallCap Consumer Discretionary Portfolio (PSCD)
| | | | | | | | | | | | | | | | | | | | |
| | | Year Ended October 31, | |
| | | 2016 | | | 2015 | | | 2014 | | | 2013 | | | 2012 | |
| Per Share Operating Performance: | | | | | | | | | | | | | | | | | | | | |
Net asset value at beginning of year | | $ | 49.35 | | | $ | 47.26 | | | $ | 45.42 | | | $ | 32.18 | | | $ | 27.16 | |
Net investment income(a) | | | 0.41 | | | | 0.50 | | | | 0.32 | | | | 0.40 | | | | 0.15 | |
Net realized and unrealized gain (loss) on investments | | | (2.99 | ) | | | 2.10 | | | | 1.80 | | | | 13.25 | | | | 5.03 | |
Total from investment operations | | | (2.58 | ) | | | 2.60 | | | | 2.12 | | | | 13.65 | | | | 5.18 | |
Distributions to shareholders from: | | | | | | | | | | | | | | | | | | | | |
Net investment income | | | (0.37 | ) | | | (0.51 | ) | | | (0.28 | ) | | | (0.41 | ) | | | (0.16 | ) |
Net asset value at end of year | | $ | 46.40 | | | $ | 49.35 | | | $ | 47.26 | | | $ | 45.42 | | | $ | 32.18 | |
Market price at end of year(b) | | $ | 46.41 | | | $ | 49.37 | | | $ | 47.27 | | | $ | 45.52 | | | $ | 32.18 | |
| Net Asset Value Total Return(c) | | | (5.23 | )% | | | 5.43 | % | | | 4.66 | % | | | 42.81 | % | | | 19.17 | % |
| Market Price Total Return(c) | | | (5.24 | )% | | | 5.45 | % | | | 4.45 | % | | | 43.13 | % | | | 19.04 | % |
| Ratios/Supplemental Data: | | | | | | | | | | | | | | | | | | | | |
Net assets at end of year (000’s omitted) | | $ | 74,235 | | | $ | 115,974 | | | $ | 92,148 | | | $ | 102,198 | | | $ | 61,151 | |
Ratio to average net assets of: | | | | | | | | | | | | | | | | | | | | |
Expenses | | | 0.29 | % | | | 0.29 | % | | | 0.29 | % | | | 0.30 | % | | | 0.29 | % |
Net investment income | | | 0.86 | % | | | 0.96 | % | | | 0.69 | % | | | 1.04 | % | | | 0.50 | % |
Portfolio turnover rate(d) | | | 33 | % | | | 19 | % | | | 13 | % | | | 10 | % | | | 8 | % |
| (a) | Based on average shares outstanding. |
| (b) | The mean between the last bid and ask prices. |
| (c) | Net asset value total return is calculated assuming an initial investment made at the net asset value at the beginning of the period, reinvestment of all dividends and distributions at net asset value during the period, and the redemption on the last day of the period. Net asset value total return includes adjustments in accordance with accounting principles generally accepted in the United States of America and as such, the net asset value for financial reporting purposes and the returns based upon those net asset values may differ from the net asset value and returns for shareholder transactions. Market price total return is calculated assuming an initial investment made at the market price at the beginning of the period, reinvestment of all dividends and distributions at market price during the period, and sale at the market price on the last day of the period. Total investment returns calculated for a period of less than one year are not annualized. |
| (d) | Portfolio turnover rate is not annualized for periods less than one year, if applicable, and does not include securities received or delivered from processing creations or redemptions. |
PowerShares S&P SmallCap Consumer Staples Portfolio (PSCC)
| | | | | | | | | | | | | | | | | | | | |
| | | Year Ended October 31, | |
| | | 2016 | | | 2015 | | | 2014 | | | 2013 | | | 2012 | |
| Per Share Operating Performance: | | | | | | | | | | | | | | | | | | | | |
Net asset value at beginning of year | | $ | 57.26 | | | $ | 53.83 | | | $ | 48.58 | | | $ | 34.23 | | | $ | 30.81 | |
Net investment income(a) | | | 0.90 | | | | 0.61 | | | | 0.28 | | | | 0.28 | | | | 0.34 | |
Net realized and unrealized gain on investments | | | 5.75 | | | | 3.88 | | | | 5.21 | | | | 14.31 | | | | 3.30 | |
Total from investment operations | | | 6.65 | | | | 4.49 | | | | 5.49 | | | | 14.59 | | | | 3.64 | |
Distributions to shareholders from: | | | | | | | | | | | | | | | | | | | | |
Net investment income | | | (0.86 | ) | | | (0.36 | ) | | | (0.24 | ) | | | (0.24 | ) | | | (0.22 | ) |
Net realized gains | | | — | | | | (0.70 | ) | | | — | | | | — | | | | — | |
Total distributions | | | (0.86 | ) | | | (1.06 | ) | | | (0.24 | ) | | | (0.24 | ) | | | (0.22 | ) |
Net asset value at end of year | | $ | 63.05 | | | $ | 57.26 | | | $ | 53.83 | | | $ | 48.58 | | | $ | 34.23 | |
Market price at end of year(b) | | $ | 62.99 | | | $ | 57.31 | | | $ | 53.82 | | | $ | 48.68 | | | $ | 34.14 | |
| Net Asset Value Total Return(c) | | | 11.79 | % | | | 8.43 | % | | | 11.34 | % | | | 42.83 | % | | | 11.86 | % |
| Market Price Total Return(c) | | | 11.59 | % | | | 8.54 | % | | | 11.08 | % | | | 43.51 | % | | | 11.45 | % |
| Ratios/Supplemental Data: | | | | | | | | | | | | | | | | | | | | |
Net assets at end of year (000’s omitted) | | $ | 69,360 | | | $ | 31,494 | | | $ | 32,295 | | | $ | 46,151 | | | $ | 29,097 | |
Ratio to average net assets of: | | | | | | | | | | | | | | | | | | | | |
Expenses | | | 0.29 | % | | | 0.29 | % | | | 0.29 | % | | | 0.30 | % | | | 0.29 | % |
Net investment income | | | 1.46 | % | | | 1.11 | % | | | 0.57 | % | | | 0.69 | % | | | 1.01 | % |
Portfolio turnover rate(d) | | | 68 | % | | | 39 | % | | | 33 | % | | | 23 | % | | | 14 | % |
| (a) | Based on average shares outstanding. |
| (b) | The mean between the last bid and ask price. |
| (c) | Net asset value total return is calculated assuming an initial investment made at the net asset value at the beginning of the period, reinvestment of all dividends and distributions at net asset value during the period, and the redemption on the last day of the period. Net asset value total return includes adjustments in accordance with accounting principles generally accepted in the United States of America and as such, the net asset value for financial reporting purposes and the returns based upon those net asset values may differ from the net asset value and returns for shareholder transactions. Market price total return is calculated assuming an initial investment made at the market price at the beginning of the period, reinvestment of all dividends and distributions at market price during the period, and sale at the market price on the last day of the period. Total investment returns calculated for a period of less than one year are not annualized. |
| (d) | Portfolio turnover rate is not annualized for periods less than one year, if applicable, and does not include securities received or delivered from processing creations or redemptions. |
See accompanying Notes to Financial Statements which are an integral part of the financial statements.
Financial Highlights (continued)
PowerShares S&P SmallCap Energy Portfolio (PSCE)
| | | | | | | | | | | | | | | | | | | | |
| | | Year Ended October 31, | |
| | | 2016 | | | 2015 | | | 2014 | | | 2013 | | | 2012 | |
| Per Share Operating Performance: | | | | | | | | | | | | | | | | | | | | |
Net asset value at beginning of year | | $ | 18.12 | | | $ | 37.85 | | | $ | 48.28 | | | $ | 32.77 | | | $ | 33.59 | |
Net investment income(a) | | | 0.06 | | | | 0.14 | | | | 0.04 | | | | 0.29 | | | | 0.01 | |
Net realized and unrealized gain (loss) on investments | | | (1.36 | ) | | | (19.74 | ) | | | (10.45 | ) | | | 15.47 | | | | (0.81 | ) |
Total from investment operations | | | (1.30 | ) | | | (19.60 | ) | | | (10.41 | ) | | | 15.76 | | | | (0.80 | ) |
Distributions to shareholders from: | | | | | | | | | | | | | | | | | | | | |
Net investment income | | | (0.09 | ) | | | (0.13 | ) | | | (0.02 | ) | | | (0.25 | ) | | | (0.02 | ) |
Return of capital | | | — | | | | — | | | | (0.00 | )(b) | | | — | | | | (0.00 | )(b) |
Total distributions | | | (0.09 | ) | | | (0.13 | ) | | | (0.02 | ) | | | (0.25 | ) | | | (0.02 | ) |
Net asset value at end of year | | $ | 16.73 | | | $ | 18.12 | | | $ | 37.85 | | | $ | 48.28 | | | $ | 32.77 | |
Market price at end of year(c) | | $ | 16.75 | | | $ | 18.13 | | | $ | 37.84 | | | $ | 48.42 | | | $ | 32.72 | |
| Net Asset Value Total Return(d) | | | (7.11 | )% | | | (51.89 | )% | | | (21.57 | )% | | | 48.41 | % | | | (2.37 | )% |
| Market Price Total Return(d) | | | (7.05 | )% | | | (51.85 | )% | | | (21.82 | )% | | | 49.07 | % | | | (2.61 | )% |
| Ratios/Supplemental Data: | | | | | | | | | | | | | | | | | | | | |
Net assets at end of year (000’s omitted) | | $ | 52,686 | | | $ | 37,149 | | | $ | 30,281 | | | $ | 48,279 | | | $ | 39,320 | |
Ratio to average net assets of: | | | | | | | | | | | | | | | | | | | | |
Expenses | | | 0.29 | % | | | 0.29 | % | | | 0.29 | % | | | 0.29 | % | | | 0.29 | % |
Net investment income | | | 0.38 | % | | | 0.57 | % | | | 0.07 | % | | | 0.74 | % | | | 0.03 | % |
Portfolio turnover rate(e) | | | 21 | % | | | 38 | % | | | 27 | % | | | 38 | % | | | 36 | % |
| (a) | Based on average shares outstanding. |
| (b) | Amount represents less than $(0.005). |
| (c) | The mean between the last bid and ask price. |
| (d) | Net asset value total return is calculated assuming an initial investment made at the net asset value at the beginning of the period, reinvestment of all dividends and distributions at net asset value during the period, and the redemption on the last day of the period. Net asset value total return includes adjustments in accordance with accounting principles generally accepted in the United States of America and as such, the net asset value for financial reporting purposes and the returns based upon those net asset values may differ from the net asset value and returns for shareholder transactions. Market price total return is calculated assuming an initial investment made at the market price at the beginning of the period, reinvestment of all dividends and distributions at market price during the period, and sale at the market price on the last day of the period. Total investment returns calculated for a period of less than one year are not annualized. |
| (e) | Portfolio turnover rate is not annualized for periods less than one year, if applicable, and does not include securities received or delivered from processing creations or redemptions. |
PowerShares S&P SmallCap Financials Portfolio (PSCF)
| | | | | | | | | | | | | | | | | | | | |
| | | Year Ended October 31, | |
| | | 2016 | | | 2015 | | | 2014 | | | 2013 | | | 2012 | |
| Per Share Operating Performance: | | | | | | | | | | | | | | | | | | | | |
Net asset value at beginning of year | | $ | 42.41 | | | $ | 40.98 | | | $ | 38.42 | | | $ | 30.41 | | | $ | 26.33 | |
Net investment income(a) | | | 1.14 | | | | 0.98 | | | | 0.89 | | | | 0.88 | | | | 0.60 | |
Net realized and unrealized gain on investments | | | 1.44 | | | | 1.32 | | | | 2.67 | | | | 8.14 | | | | 3.99 | |
Total from investment operations | | | 2.58 | | | | 2.30 | | | | 3.56 | | | | 9.02 | | | | 4.59 | |
Distributions to shareholders from: | | | | | | | | | | | | | | | | | | | | |
Net investment income | | | (1.18 | ) | | | (0.87 | ) | | | (0.97 | ) | | | (1.01 | ) | | | (0.51 | ) |
Net realized gains | | | (0.08 | ) | | | — | | | | (0.03 | ) | | | — | | | | — | |
Total distributions | | | (1.26 | ) | | | (0.87 | ) | | | (1.00 | ) | | | (1.01 | ) | | | (0.51 | ) |
Net asset value at end of year | | $ | 43.73 | | | $ | 42.41 | | | $ | 40.98 | | | $ | 38.42 | | | $ | 30.41 | |
Market price at end of year(b) | | $ | 43.73 | | | $ | 42.45 | | | $ | 40.97 | | | $ | 38.50 | | | $ | 30.39 | |
| Net Asset Value Total Return(c) | | | 6.29 | % | | | 5.68 | % | | | 9.40 | % | | | 30.26 | % | | | 17.67 | % |
| Market Price Total Return(c) | | | 6.19 | % | | | 5.80 | % | | | 9.14 | % | | | 30.62 | % | | | 17.46 | % |
| Ratios/Supplemental Data: | | | | | | | | | | | | | | | | | | | | |
Net assets at end of year (000’s omitted) | | $ | 196,797 | | | $ | 182,347 | | | $ | 114,753 | | | $ | 97,969 | | | $ | 71,475 | |
Ratio to average net assets of: | | | | | | | | | | | | | | | | | | | | |
Expenses | | | 0.29 | % | | | 0.29 | %(d) | | | 0.29 | %(d) | | | 0.30 | %(d) | | | 0.29 | % |
Net investment income | | | 2.73 | % | | | 2.38 | % | | | 2.31 | % | | | 2.56 | % | | | 2.05 | % |
Portfolio turnover rate(e) | | | 16 | % | | | 16 | % | | | 16 | % | | | 24 | % | | | 10 | % |
| (a) | Based on average shares outstanding. |
| (b) | The mean between the last bid and ask prices. |
| (c) | Net asset value total return is calculated assuming an initial investment made at the net asset value at the beginning of the period, reinvestment of all dividends and distributions at net asset value during the period, and the redemption on the last day of the period. Net asset value total return includes adjustments in accordance with accounting principles generally accepted in the United States of America and as such, the net asset value for financial reporting purposes and the returns based upon those net asset values may differ from the net asset value and returns for shareholder transactions. Market price total return is calculated assuming an initial investment made at the market price at the beginning of the period, reinvestment of all dividends and distributions at market price during the period, and sale at the market price on the last day of the period. Total investment returns calculated for a period of less than one year are not annualized. |
| (d) | In addition to the fees and expenses which the Fund bears directly, the Fund indirectly bears a pro rata share of the fees and expenses of the investment companies in which the Fund invests. Estimated investment companies’ expenses are not expenses that are incurred directly by the Fund. They are expenses that are incurred directly by the investment companies and are deducted from the value of the investment companies the Fund invests in. The effect of the estimated investment companies’ expenses that the Fund bears indirectly is included in the Fund’s total return. |
| (e) | Portfolio turnover rate is not annualized for periods less than one year, if applicable, and does not include securities received or delivered from processing creations or redemptions. |
See accompanying Notes to Financial Statements which are an integral part of the financial statements.
Financial Highlights (continued)
PowerShares S&P SmallCap Health Care Portfolio (PSCH)
| | | | | | | | | | | | | | | | | | | | |
| | | Year Ended October 31, | |
| | | 2016 | | | 2015 | | | 2014 | | | 2013 | | | 2012 | |
| Per Share Operating Performance: | | | | | | | | | | | | | | | | | | | | |
Net asset value at beginning of year | | $ | 66.81 | | | $ | 60.07 | | | $ | 50.90 | | | $ | 34.33 | | | $ | 30.42 | |
Net investment income (loss)(a) | | | 0.00 | (b) | | | (0.01 | ) | | | 0.04 | | | | 0.15 | | | | 0.01 | |
Net realized and unrealized gain on investments | | | 0.22 | | | | 8.22 | | | | 9.17 | | | | 16.56 | | | | 4.22 | |
Total from investment operations | | | 0.22 | | | | 8.21 | | | | 9.21 | | | | 16.71 | | | | 4.23 | |
Distributions to shareholders from: | | | | | | | | | | | | | | | | | | | | |
Net investment income | | | — | | | | (0.03 | ) | | | (0.04 | ) | | | (0.14 | ) | | | (0.32 | ) |
Net realized gains | | | — | | | | (1.44 | ) | | | — | | | | — | | | | — | |
Total distributions | | | — | | | | (1.47 | ) | | | (0.04 | ) | | | (0.14 | ) | | | (0.32 | ) |
Net asset value at end of year | | $ | 67.03 | | | $ | 66.81 | | | $ | 60.07 | | | $ | 50.90 | | | $ | 34.33 | |
Market price at end of year(c) | | $ | 67.00 | | | $ | 66.86 | | | $ | 60.03 | | | $ | 50.99 | | | $ | 34.30 | |
| Net Asset Value Total Return(d) | | | 0.33 | % | | | 13.96 | % | | | 18.10 | % | | | 48.85 | % | | | 14.01 | % |
| Market Price Total Return(d) | | | 0.21 | % | | | 14.12 | % | | | 17.81 | % | | | 49.25 | % | | | 13.77 | % |
| Ratios/Supplemental Data: | | | | | | | | | | | | | | | | | | | | |
Net assets at end of year (000’s omitted) | | $ | 167,586 | | | $ | 230,504 | | | $ | 165,200 | | | $ | 178,164 | | | $ | 121,865 | |
Ratio to average net assets of: | | | | | | | | | | | | | | | | | | | | |
Expenses | | | 0.29 | % | | | 0.29 | % | | | 0.29 | % | | | 0.30 | % | | | 0.29 | % |
Net investment income (loss) | | | 0.01 | % | | | (0.02 | )% | | | 0.08 | % | | | 0.35 | % | | | 0.04 | % |
Portfolio turnover rate(e) | | | 23 | % | | | 22 | % | | | 27 | % | | | 16 | % | | | 23 | % |
| (a) | Based on average shares outstanding. |
| (b) | Amount represents less than $0.005. |
| (c) | The mean between the last bid and ask prices. |
| (d) | Net asset value total return is calculated assuming an initial investment made at the net asset value at the beginning of the period, reinvestment of all dividends and distributions at net asset value during the period, and the redemption on the last day of the period. Net asset value total return includes adjustments in accordance with accounting principles generally accepted in the United States of America and as such, the net asset value for financial reporting purposes and the returns based upon those net asset values may differ from the net asset value and returns for shareholder transactions. Market price total return is calculated assuming an initial investment made at the market price at the beginning of the period, reinvestment of all dividends and distributions at market price during the period, and sale at the market price on the last day of the period. Total investment returns calculated for a period of less than one year are not annualized. |
| (e) | Portfolio turnover rate is not annualized for periods less than one year, if applicable, and does not include securities received or delivered from processing creations or redemptions. |
PowerShares S&P SmallCap Industrials Portfolio (PSCI)
| | | | | | | | | | | | | | | | | | | | | | | | |
| | | | | | Year Ended October 31, | |
| | | | | | 2016 | | | 2015 | | | 2014 | | | 2013 | | | 2012 | |
| Per Share Operating Performance: | | | | | | | | | | | | | | | | | | | | | | | | |
Net asset value at beginning of year | | | | | | $ | 45.55 | | | $ | 44.89 | | | $ | 42.30 | | | $ | 30.61 | | | $ | 27.05 | |
Net investment income(a) | | | | | | | 0.34 | | | | 0.45 | | | | 0.34 | | | | 0.32 | | | | 0.42 | (b) |
Net realized and unrealized gain on investments | | | | | | | 1.96 | | | | 0.68 | | | | 2.57 | | | | 11.97 | | | | 3.39 | |
Total from investment operations | | | | | | | 2.30 | | | | 1.13 | | | | 2.91 | | | | 12.29 | | | | 3.81 | |
Distributions to shareholders from: | | | | | | | | | | | | | | | | | | | | | | | | |
Net investment income | | | | | | | (0.34 | ) | | | (0.47 | ) | | | (0.32 | ) | | | (0.60 | ) | | | (0.25 | ) |
Net asset value at end of year | | | | | | $ | 47.51 | | | $ | 45.55 | | | $ | 44.89 | | | $ | 42.30 | | | $ | 30.61 | |
Market price at end of year(c) | | | | | | $ | 47.42 | | | $ | 45.57 | | | $ | 44.83 | | | $ | 42.38 | | | $ | 30.55 | |
| Net Asset Value Total Return(d) | | | | | | | 5.10 | % | | | 2.51 | % | | | 6.87 | % | | | 40.72 | % | | | 14.16 | % |
| Market Price Total Return(d) | | | | | | | 4.86 | % | | | 2.69 | % | | | 6.53 | % | | | 41.27 | % | | | 13.85 | % |
| Ratios/Supplemental Data: | | | | | | | | | | | | | | | | | | | | | | | | |
Net assets at end of year (000’s omitted) | | | | | | $ | 57,007 | | | $ | 70,608 | | | $ | 100,998 | | | $ | 74,027 | | | $ | 18,363 | |
Ratio to average net assets of: | | | | | | | | | | | | | | | | | | | | | | | | |
Expenses | | | | | | | 0.29 | % | | | 0.29 | % | | | 0.29 | % | | | 0.30 | % | | | 0.29 | % |
Net investment income | | | | | | | 0.75 | % | | | 0.98 | % | | | 0.78 | % | | | 0.88 | % | | | 1.44 | %(b) |
Portfolio turnover rate(e) | | | | | | | 16 | % | | | 11 | % | | | 15 | % | | | 30 | % | | | 9 | % |
| (a) | Based on average shares outstanding. |
| (b) | Net Investment income per share and the ratio of net investment income to average net assets include a special cash dividend received of $10.50 per share owned of Kaydon Corp. on March 27, 2012. Net investment income per share and the ratio of net investment income to average net assets excluding the special dividends are $0.26 and 0.88%, respectively. |
| (c) | The mean between the last bid and ask price. |
| (d) | Net asset value total return is calculated assuming an initial investment made at the net asset value at the beginning of the period, reinvestment of all dividends and distributions at net asset value during the period, and the redemption on the last day of the period. Net asset value total return includes adjustments in accordance with accounting principles generally accepted in the United States of America and as such, the net asset value for financial reporting purposes and the returns based upon those net asset values may differ from the net asset value and returns for shareholder transactions. Market price total return is calculated assuming an initial investment made at the market price at the beginning of the period, reinvestment of all dividends and distributions at market price during the period, and sale at the market price on the last day of the period. Total investment returns calculated for a period of less than one year are not annualized. |
| (e) | Portfolio turnover rate is not annualized for periods less than one year, if applicable, and does not include securities received or delivered from processing creations or redemptions. |
See accompanying Notes to Financial Statements which are an integral part of the financial statements.
Financial Highlights (continued)
PowerShares S&P SmallCap Information Technology Portfolio (PSCT)
| | | | | | | | | | | | | | | | | | | | |
| | | Year Ended October 31, | |
| | | 2016 | | | 2015 | | | 2014 | | | 2013 | | | 2012 | |
| Per Share Operating Performance: | | | | | | | | | | | | | | | | | | | | |
Net asset value at beginning of year | | $ | 51.70 | | | $ | 48.02 | | | $ | 41.59 | | | $ | 29.62 | | | $ | 27.80 | |
Net investment income(a) | | | 0.10 | | | | 0.08 | | | | 0.09 | | | | 0.08 | | | | 0.22 | |
Net realized and unrealized gain on investments | | | 9.58 | | | | 3.64 | | | | 6.43 | | | | 12.21 | | | | 1.62 | |
Total from investment operations | | | 9.68 | | | | 3.72 | | | | 6.52 | | | | 12.29 | | | | 1.84 | |
Distributions to shareholders from: | | | | | | | | | | | | | | | | | | | | |
Net investment income | | | (0.12 | ) | | | (0.04 | ) | | | (0.09 | ) | | | (0.32 | ) | | | (0.02 | ) |
Net asset value at end of year | | $ | 61.26 | | | $ | 51.70 | | | $ | 48.02 | | | $ | 41.59 | | | $ | 29.62 | |
Market price at end of
year(b) | | $ | 61.28 | | | $ | 51.77 | | | $ | 48.01 | | | $ | 41.67 | | | $ | 29.59 | |
Net Asset Value Total
Return(c) | | | 18.75 | % | | | 7.75 | % | | | 15.69 | % | | | 41.86 | % | | | 6.61 | % |
| Market Price Total Return(c) | | | 18.63 | % | | | 7.92 | % | | | 15.44 | % | | | 42.28 | % | | | 6.50 | % |
| Ratios/Supplemental Data: | | | | | | | | | | | | | | | | | | | | |
Net assets at end of year (000’s omitted) | | $ | 508,447 | | | $ | 390,315 | | | $ | 225,700 | | | $ | 210,018 | | | $ | 78,506 | |
Ratio to average net assets of: | | | | | | | | | | | | | | | | | | | | |
Expenses | | | 0.29 | % | | | 0.29 | % | | | 0.29 | % | | | 0.29 | % | | | 0.29 | % |
Net investment income | | | 0.18 | % | | | 0.16 | % | | | 0.21 | % | | | 0.23 | % | | | 0.74 | % |
Portfolio turnover rate(d) | | | 15 | % | | | 15 | % | | | 10 | % | | | 17 | % | | | 14 | % |
| (a) | Based on average shares outstanding. |
| (b) | The mean between the last bid and ask price. |
| (c) | Net asset value total return is calculated assuming an initial investment made at the net asset value at the beginning of the period, reinvestment of all dividends and distributions at net asset value during the period, and the redemption on the last day of the period. Net asset value total return includes adjustments in accordance with accounting principles generally accepted in the United States of America and as such, the net asset value for financial reporting purposes and the returns based upon those net asset values may differ from the net asset value and returns for shareholder transactions. Market price total return is calculated assuming an initial investment made at the market price at the beginning of the period, reinvestment of all dividends and distributions at market price during the period, and sale at the market price on the last day of the period. Total investment returns calculated for a period of less than one year are not annualized. |
| (d) | Portfolio turnover rate is not annualized for periods less than one year, if applicable, and does not include securities received or delivered from processing creations or redemptions. |
PowerShares S&P SmallCap Materials Portfolio (PSCM)
| | | | | | | | | | | | | | | | | | | | |
| | | Year Ended October 31, | |
| | | 2016 | | | 2015 | | | 2014 | | | 2013 | | | 2012 | |
| Per Share Operating Performance: | | | | | | | | | | | | | | | | | | | | |
Net asset value at beginning of year | | $ | 34.36 | | | $ | 43.97 | | | $ | 40.34 | | | $ | 30.23 | | | $ | 25.92 | |
Net investment income(a) | | | 0.35 | | | | 0.35 | | | | 0.28 | | | | 0.32 | | | | 0.19 | |
Net realized and unrealized gain (loss) on investments | | | 4.36 | | | | (9.50 | ) | | | 3.58 | | | | 10.18 | | | | 4.26 | |
Total from investment operations | | | 4.71 | | | | (9.15 | ) | | | 3.86 | | | | 10.50 | | | | 4.45 | |
Distributions to shareholders from: | | | | | | | | | | | | | | | | | | | | |
Net investment income | | | (0.37 | ) | | | (0.46 | ) | | | (0.23 | ) | | | (0.39 | ) | | | (0.14 | ) |
Net asset value at end of year | | $ | 38.70 | | | $ | 34.36 | | | $ | 43.97 | | | $ | 40.34 | | | $ | 30.23 | |
Market price at end of year(b) | | $ | 38.77 | | | $ | 34.37 | | | $ | 43.95 | | | $ | 40.42 | | | $ | 30.22 | |
| Net Asset Value Total Return(c) | | | 13.89 | % | | | (20.94 | )% | | | 9.56 | % | | | 35.00 | % | | | 17.24 | % |
| Market Price Total Return(c) | | | 14.07 | % | | | (20.88 | )% | | | 9.30 | % | | | 35.31 | % | | | 17.34 | % |
| Ratios/Supplemental Data: | | | | | | | | | | | | | | | | | | | | |
Net assets at end of year (000’s omitted) | | $ | 17,414 | | | $ | 10,309 | | | $ | 50,564 | | | $ | 18,154 | | | $ | 6,045 | |
Ratio to average net assets of: | | | | | | | | | | | | | | | | | | | | |
Expenses | | | 0.29 | % | | | 0.29 | % | | | 0.29 | % | | | 0.30 | % | | | 0.29 | % |
Net investment income | | | 1.01 | % | | | 0.87 | % | | | 0.63 | % | | | 0.91 | % | | | 0.68 | % |
Portfolio turnover rate(d) | | | 16 | % | | | 17 | % | | | 12 | % | | | 15 | % | | | 14 | % |
| (a) | Based on average shares outstanding. |
| (b) | The mean between the last bid and ask price. |
| (c) | Net asset value total return is calculated assuming an initial investment made at the net asset value at the beginning of the period, reinvestment of all dividends and distributions at net asset value during the period, and the redemption on the last day of the period. Net asset value total return includes adjustments in accordance with accounting principles generally accepted in the United States of America and as such, the net asset value for financial reporting purposes and the returns based upon those net asset values may differ from the net asset value and returns for shareholder transactions. Market price total return is calculated assuming an initial investment made at the market price at the beginning of the period, reinvestment of all dividends and distributions at market price during the period, and sale at the market price on the last day of the period. Total investment returns calculated for a period of less than one year are not annualized. |
| (d) | Portfolio turnover rate is not annualized for periods less than one year, if applicable, and does not include securities received or delivered from processing creations or redemptions. |
See accompanying Notes to Financial Statements which are an integral part of the financial statements.
Financial Highlights (continued)
PowerShares S&P SmallCap Utilities Portfolio (PSCU)
| | | | | | | | | | | | | | | | | | | | |
| | | Year Ended October 31, | |
| | | 2016 | | | 2015 | | | 2014 | | | 2013 | | | 2012 | |
| Per Share Operating Performance: | | | | | | | | | | | | | | | | | | | | |
Net asset value at beginning of year | | $ | 41.99 | | | $ | 38.34 | | | $ | 34.29 | | | $ | 31.10 | | | $ | 30.03 | |
Net investment income(a) | | | 1.06 | | | | 1.02 | | | | 1.00 | | | | 1.00 | | | | 1.13 | (b) |
Net realized and unrealized gain on investments | | | 3.67 | | | | 3.96 | | | | 4.01 | | | | 3.53 | | | | 0.84 | |
Total from investment operations | | | 4.73 | | | | 4.98 | | | | 5.01 | | | | 4.53 | | | | 1.97 | |
Distributions to shareholders from: | | | | | | | | | | | | | | | | | | | | |
Net investment income | | | (1.11 | ) | | | (1.33 | ) | | | (0.96 | ) | | | (1.34 | ) | | | (0.90 | ) |
Net asset value at end of year | | $ | 45.61 | | | $ | 41.99 | | | $ | 38.34 | | | $ | 34.29 | | | $ | 31.10 | |
Market price at end of year(c) | | $ | 45.57 | | | $ | 42.01 | | | $ | 38.33 | | | $ | 34.34 | | | $ | 31.07 | |
| Net Asset Value Total Return(d) | | | 11.38 | % | | | 13.43 | % | | | 14.87 | % | | | 15.06 | % | | | 6.66 | % |
| Market Price Total Return(d) | | | 11.23 | % | | | 13.52 | % | | | 14.68 | % | | | 15.34 | % | | | 6.59 | % |
| Ratios/Supplemental Data: | | | | | | | | | | | | | | | | | | | | |
Net assets at end of year (000’s omitted) | | $ | 47,895 | | | $ | 39,887 | | | $ | 40,259 | | | $ | 32,573 | | | $ | 29,541 | |
Ratio to average net assets of: | | | | | | | | | | | | | | | | | | | | |
Expenses | | | 0.29 | % | | | 0.29 | % | | | 0.29 | % | | | 0.30 | % | | | 0.29 | % |
Net investment income | | | 2.35 | % | | | 2.63 | % | | | 2.86 | % | | | 3.10 | % | | | 3.70 | %(b) |
Portfolio turnover rate(e) | | | 69 | % | | | 18 | % | | | 34 | % | | | 17 | % | | | 6 | % |
| (a) | Based on average shares outstanding. |
| (b) | Net Investment income per share and the ratio of net investment income to average net assets include a special cash dividend received of $3.00 per share owned of Neutral Tandem, Inc. on October 31, 2012. Net investment income per share and the ratio of net investment income to average net assets excluding the special dividends are $0.97 and 3.17%, respectively. |
| (c) | The mean between the last bid and ask price. |
| (d) | Net asset value total return is calculated assuming an initial investment made at the net asset value at the beginning of the period, reinvestment of all dividends and distributions at net asset value during the period, and the redemption on the last day of the period. Net asset value total return includes adjustments in accordance with accounting principles generally accepted in the United States of America and as such, the net asset value for financial reporting purposes and the returns based upon those net asset values may differ from the net asset value and returns for shareholder transactions. Market price total return is calculated assuming an initial investment made at the market price at the beginning of the period, reinvestment of all dividends and distributions at market price during the period, and sale at the market price on the last day of the period. Total investment returns calculated for a period of less than one year are not annualized. |
| (e) | Portfolio turnover rate is not annualized for periods less than one year, if applicable, and does not include securities received or delivered from processing creations or redemptions. |
See accompanying Notes to Financial Statements which are an integral part of the financial statements.
Notes to Financial Statements
PowerShares Exchange-Traded Fund Trust II
October 31, 2016
Note 1. Organization
PowerShares Exchange-Traded Fund Trust II (the “Trust”) was organized as a Massachusetts business trust on October 10, 2006 and is authorized to have multiple series of portfolios. The Trust is an open-end management investment company registered under the Investment Company Act of 1940, as amended (the “1940 Act”). As of October 31, 2016, the Trust offered sixty-seven portfolios. This report includes the following portfolios:
| | |
Full Name | | Short Name |
| PowerShares DWA Momentum & Low Volatility Rotation Portfolio (DWLV)* | | “DWA Momentum & Low Volatility Rotation Portfolio” |
| PowerShares DWA SmallCap Momentum Portfolio (DWAS) | | “DWA SmallCap Momentum Portfolio” |
| PowerShares DWA Tactical Multi-Asset Income Portfolio (DWIN)** | | “DWA Tactical Multi-Asset Income Portfolio” |
| PowerShares DWA Tactical Sector Rotation Portfolio (DWTR) | | “DWA Tactical Sector Rotation Portfolio” |
| PowerShares S&P SmallCap Consumer Discretionary Portfolio (PSCD) | | “S&P SmallCap Consumer Discretionary Portfolio” |
| PowerShares S&P SmallCap Consumer Staples Portfolio (PSCC) | | “S&P SmallCap Consumer Staples Portfolio” |
| PowerShares S&P SmallCap Energy Portfolio (PSCE) | | “S&P SmallCap Energy Portfolio” |
| PowerShares S&P SmallCap Financials Portfolio (PSCF) | | “S&P SmallCap Financials Portfolio” |
| PowerShares S&P SmallCap Health Care Portfolio (PSCH) | | “S&P SmallCap Health Care Portfolio” |
| PowerShares S&P SmallCap Industrials Portfolio (PSCI) | | “S&P SmallCap Industrials Portfolio” |
| PowerShares S&P SmallCap Information Technology Portfolio (PSCT) | | “S&P SmallCap Information Technology Portfolio” |
| PowerShares S&P SmallCap Materials Portfolio (PSCM) | | “S&P SmallCap Materials Portfolio” |
| PowerShares S&P SmallCap Utilities Portfolio (PSCU) | | “S&P SmallCap Utilities Portfolio” |
| * | Commenced operations on July 11, 2016 |
| ** | Commenced operations on March 7, 2016 |
Each portfolio (each, a “Fund”, and collectively, the “Funds”) represents a separate series of the Trust. The shares of the Funds are referred to herein as “Shares” or “Fund’s Shares.” Each Fund’s Shares are listed and traded on The NASDAQ Stock Market LLC, except for Shares of the DWA SmallCap Momentum Portfolio, which are listed and traded on NYSE Arca, Inc.
The market price of each Share may differ to some degree from the Fund’s net asset value (“NAV”). Unlike conventional mutual funds, each Fund issues and redeems Shares on a continuous basis, at NAV, only in a large specified number of Shares, each called a “Creation Unit.” Creation Units are issued and redeemed principally in exchange for the deposit or delivery of a basket of securities (“Deposit Securities”). Except when aggregated in Creation Units by Authorized Participants, the Shares are not individually redeemable securities of the Funds.
The investment objective of each Fund is to seek investment results that generally correspond (before fees and expenses) to the price and yield of its respective index listed below (each, an “Underlying Index”):
| | |
Fund | | Underlying Index |
| DWA Momentum & Low Volatility Rotation Portfolio | | Dorsey Wright® Multi-Factor Global Equity Index |
| DWA SmallCap Momentum Portfolio | | Dorsey Wright® SmallCap Technical Leaders Index |
| DWA Tactical Multi-Asset Income Portfolio | | Dorsey Wright® Multi-Asset Income Index |
| DWA Tactical Sector Rotation Portfolio | | Dorsey Wright® Sector 4 Index |
| S&P SmallCap Consumer Discretionary Portfolio | | S&P SmallCap 600® Capped Consumer Discretionary Index |
| S&P SmallCap Consumer Staples Portfolio | | S&P SmallCap 600® Capped Consumer Staples Index |
| S&P SmallCap Energy Portfolio | | S&P SmallCap 600® Capped Energy Index |
| S&P SmallCap Financials Portfolio | | S&P SmallCap 600® Capped Financials Index |
| S&P SmallCap Health Care Portfolio | | S&P SmallCap 600® Capped Health Care Index |
| S&P SmallCap Industrials Portfolio | | S&P SmallCap 600® Capped Industrials Index |
| S&P SmallCap Information Technology Portfolio | | S&P SmallCap 600® Capped Information Technology Index |
| S&P SmallCap Materials Portfolio | | S&P SmallCap 600® Capped Materials Index |
| S&P SmallCap Utilities Portfolio | | S&P SmallCap 600® Capped Utilities & Telecommunication Services Index |
Note 2. Significant Accounting Policies
The preparation of the financial statements in accordance with accounting principles generally accepted in the United States of America (“GAAP”) requires management to make estimates and assumptions that affect the reported amounts and disclosures in the financial statements, including estimates and assumptions related to taxation. Actual results could differ from these estimates. In addition, the Funds monitor for material events or transactions that may occur or become known after the period-end date and before the date the financial statements are released to print. The following is a summary of the significant accounting policies followed by the Funds in preparation of the financial statements.
A. Security Valuation
Securities, including restricted securities, are valued according to the following policies:
Securities, including restricted securities in a fund that are held as investments (the “Underlying Fund”) of a Fund, are valued in accordance with the Underlying Fund’s valuation policy. The policies of Underlying Funds affiliated with the Funds as a result of having the same investment adviser are the same as those set forth below.
A security listed or traded on an exchange (except convertible securities) is valued at its last sales price or official closing price as of the close of the customary trading session on the exchange where the security is principally traded, or lacking any sales or official closing price on a particular day, the security may be valued at the closing bid price on that day. Securities traded in the over-the-counter market are valued based on prices furnished by independent pricing services or market makers. When such securities are valued by an independent pricing service they may be considered fair valued. Futures contracts are valued at the final settlement price set by an exchange on which they are principally traded. Listed options are valued at the mean between the last bid and asked prices from the exchange on which they are principally traded. Options not listed on an exchange are valued by an independent source at the mean between the last bid and asked prices. For purposes of determining NAV per Share, futures and option contracts generally are valued 15 minutes after the close of the customary trading session of the New York Stock Exchange (“NYSE”).
Investments in open-end and closed-end registered investment companies that do not trade on an exchange are valued at the end of day NAV per share. Investments in open-end and closed-end registered investment companies that trade on an exchange are valued at the last sales price or official closing price as of the close of the customary trading session on the exchange where the security is principally traded.
Debt obligations (including convertible securities) and unlisted equities are fair valued using an evaluated quote provided by an independent pricing service. Evaluated quotes provided by the pricing service may be determined without exclusive reliance on quoted prices, and may reflect appropriate factors such as institution-size trading in similar groups of securities, developments related to specific securities, dividend rate (for unlisted equities), yield (for debt obligations), quality, type of issue, coupon rate (for debt obligations), maturity (for debt obligations), individual trading characteristics and other market data. Securities with a demand feature exercisable within one to seven days are valued at par. Debt obligations are subject to interest rate and credit risks. In addition, all debt obligations involve some risk of default with respect to interest and/or principal payments.
Foreign securities’ (including foreign exchange contracts’) prices are converted into U.S. dollar amounts using the applicable exchange rates as of the close of the London world markets. If market quotations are available and reliable for foreign exchange-traded equity securities, the securities will be valued at the market quotations. Because trading hours for certain foreign securities end before the close of the NYSE, closing market quotations may become unreliable. If between the time trading ends on a particular security and the close of the customary trading session on the NYSE, events occur that Invesco PowerShares Capital Management LLC (the “Adviser”) determines are significant and make the closing price unreliable, the Fund may fair value the security. If the event is likely to have affected the closing price of the security, the security will be valued at fair value in good faith using procedures approved by the Board of Trustees. Adjustments to closing prices to reflect fair value may also be based on a screening process of an independent pricing service to indicate the degree of certainty, based on historical data, that the closing price in the principal market where a foreign security trades is not the current value as of the close of the NYSE. Foreign securities’ prices meeting the approved degree of certainty that the price is not reflective of current value will be priced at the indication of fair value from the independent pricing service. Multiple factors may be considered by the independent pricing service in determining adjustments to reflect fair value and may include information relating to sector indices, American Depositary Receipts and domestic and foreign index futures. Foreign securities may have additional risks including exchange rate changes, potential for sharply devalued currencies and high inflation, political and economic upheaval, the relative lack of issuer information, relatively low market liquidity and the potential lack of strict financial and accounting controls and standards.
Securities for which market prices are not provided by any of the above methods may be valued based upon quotes furnished by independent sources. The last bid price may be used to value equity securities. The mean between the last bid and asked prices is used to value debt obligations, including corporate loans.
Securities for which market quotations are not readily available or became unreliable are valued at fair value as determined in good faith following procedures approved by the Board of Trustees. Issuer-specific events, market trends, bid/asked quotes of brokers and information providers and other market data may be reviewed in the course of making a good faith determination of a security’s fair value.
Each Fund may invest in securities that are subject to interest rate risk, meaning the risk that the prices will generally fall as interest rates rise and, conversely, the prices will generally rise as interest rates fall. Specific securities differ in their sensitivity to changes in interest rates depending on their individual characteristics. Changes in interest rates may result in increased market volatility, which may affect the value and/or liquidity of certain Fund investments.
Valuations change in response to many factors, including the historical and prospective earnings of the issuer, the value of the issuer’s assets, general economic conditions, interest rates, investor perceptions and market liquidity. Because of the inherent uncertainties of valuation, the values reflected in the financial statements may materially differ from the value received upon actual sale of those investments.
B. Other Risks
Index Risk. Unlike many investment companies, the Funds do not utilize investing strategies that seek returns in excess of their Underlying Indexes. Therefore, a Fund would not necessarily buy or sell a security unless that security is added or removed, respectively, from its respective Underlying Index, even if that security generally is underperforming.
Equity Risk. Equity risk is the risk that the value of the securities that each Fund holds will fall due to general market and economic conditions, perceptions regarding the industries in which the issuers of securities that a Fund holds participate or factors relating to specific companies in which the Fund invests. For example, an adverse event, such as an unfavorable earnings report, may depress the value of securities a Fund holds; the price of securities may be particularly sensitive to general movements in the stock market; or a drop in the stock market may depress the price of most or all of the securities a Fund holds. In addition, securities of an issuer in the Fund’s portfolio may decline in price if the issuer fails to make anticipated dividend payments because, among other reasons, the issuer of the security experiences a decline in its financial condition.
Industry Concentration Risk. In following its methodology, each Fund’s Underlying Index from time to time will be concentrated to a significant degree in securities of issuers located in a single industry or a sector. To the extent that an Underlying Index concentrates in the securities of issuers in a particular industry or sector, each Fund will also concentrate its investments to approximately the same extent. By concentrating its investments in an industry or sector, a Fund may face more risks than if it were diversified broadly over numerous industries or sectors. In addition, at times, an industry or sector may be out of favor and underperform other industries or the market as a whole. Any factors detrimental to the performance of such industry or sector will disproportionately impact a Fund’s NAV.
Non-Diversified Fund Risk. Each Fund (except DWA SmallCap Momentum Portfolio, S&P SmallCap Consumer Discretionary Portfolio, S&P SmallCap Financials Portfolio and S&P SmallCap Information Technology Portfolio) is non-diversified and can invest a greater portion of its assets in securities of individual issuers than diversified funds. As a result, changes in the market value of a single investment could cause greater fluctuations in Share price than would occur in a diversified fund. This may increase a Fund’s volatility and cause the performance of a relatively small number of issuers to have a greater impact on a Fund’s performance.
Non-Correlation Risk. Each Fund’s return may not match the return of its Underlying Index for a number of reasons. For example, each Fund incurs operating expenses not applicable to its Underlying Index, and incurs costs in buying and selling securities, especially when rebalancing the Fund’s securities holdings to reflect changes in the composition of its Underlying Index. In addition, the performance of each Fund and its Underlying Index may vary due to asset valuation differences and differences between each Fund’s portfolio and its Underlying Index resulting from legal restrictions, cost or liquidity constraints.
Portfolio Turnover Risk. DWA Momentum & Low Volatility Rotation Portfolio and DWA SmallCap Momentum Portfolio may engage in frequent trading of its portfolio securities in connection with the rebalancing or adjustment of its Underlying Index. A portfolio turnover rate of 200%, for example, is equivalent to a Fund buying and selling all of its securities two times during the course of a year. A high portfolio turnover rate (such as 100% or more) could result in high brokerage costs. While a high portfolio turnover rate can result in an increase in taxable capital gains distributions to a Fund’s shareholders, the Funds will seek to utilize an in-kind creation and redemption mechanism to minimize realization of capital gains to the extent possible.
Small- and Mid-Capitalization Company Risk. Investing in securities of small- and mid-capitalization companies involves greater risk than customarily is associated with investing in larger, more established companies. These companies’ securities may be more volatile and less liquid than those of more established companies. These securities may have returns that vary, sometimes significantly, from the overall securities market. Often small- and mid-capitalization companies and the industries in which they focus are still evolving and, as a result, they may be more sensitive to changing market conditions.
Fund of Funds Risk. Because DWA Momentum & Low Volatility Rotation Portfolio, DWA Tactical Multi-Asset Income Portfolio and DWA Tactical Sector Rotation Portfolio invest primarily in other funds, each Fund’s investment performance largely depends on the investment performance of those Underlying Funds. An investment in each Fund is subject to the risks associated with the Underlying Funds that comprise each Underlying Index. There is a risk that each index provider’s evaluations and assumptions regarding the asset classes represented by the Underlying Funds in each Underlying Index at any given time may be incorrect based on actual market conditions. In addition, at times, certain of the segments of the market represented by constituent Underlying Funds in each Underlying Index may be out of favor and underperform other segments. Each Fund indirectly pays a proportional share of the expense of the Underlying Funds in which it invests (including operating expenses and management fees), in addition to the fees and expenses it already pays to the Adviser.
C. Federal Income Taxes
Each Fund intends to comply with the provisions of the Internal Revenue Code of 1986, as amended (the “Internal Revenue Code”), applicable to regulated investment companies and to distribute substantially all of the Fund’s taxable earnings to its shareholders. As such, the Funds will not be subject to federal income taxes on otherwise taxable income (including net realized gains) that is distributed to the shareholders. Therefore, no provision for federal income taxes is recorded in the financial statements.
Each Fund recognizes the tax benefits of uncertain tax positions only when the position is more likely than not to be sustained. Management has analyzed each Fund’s uncertain tax positions and concluded that no liability for unrecognized tax benefits should be recorded related to uncertain tax positions. Management is not aware of any tax positions for which it is reasonably possible that the total amounts of unrecognized tax benefits will change materially in the next 12 months.
Income and capital gain distributions are determined in accordance with federal income tax regulations, which may differ from GAAP. These differences are primarily due to differing book and tax treatments for in-kind transactions, losses deferred due to wash sales, and passive foreign investment company adjustments, if any.
The Funds file U.S. federal tax returns and tax returns in certain other jurisdictions. Generally, a Fund is subject to examinations by such taxing authorities for up to three years after the filing of the return for the tax period.
D. Investment Transactions and Investment Income
Investment transactions are accounted for on a trade date basis. Realized gains and losses from the sale or disposition of securities are computed on the specific identified cost basis. Interest income is recorded on the accrual basis. Dividend income (net of withholding tax, if any) is recorded on the ex-dividend date. Realized gains, dividends and interest received by a Fund may give rise to withholding and other taxes imposed by foreign countries. Tax conventions between certain countries and the United States may reduce or eliminate such taxes.
The Funds may periodically participate in litigation related to each Fund’s investments. As such, the Funds may receive proceeds from litigation settlements. Any proceeds received are included in the Statements of Operations as realized gain (loss) for investments no longer held and as unrealized gain (loss) for investments still held.
Corporate actions (including cash dividends) are recorded net of non-reclaimable foreign tax withholdings on the ex-date.
Brokerage commissions and mark ups are considered transaction costs and are recorded as an increase to the cost basis of securities purchased and/or a reduction of proceeds on a sale of securities. Such transaction costs are included in the determination of net realized and unrealized gain (loss) from investment securities reported in the Statements of Operations and the Statements of Changes in Net Assets and the net realized and unrealized gains (losses) on securities per share in the Financial Highlights. Transaction costs are included in the calculation of each Fund’s net asset value and, accordingly, they reduce each Fund’s total returns. These transaction costs are not considered operating expenses and are not reflected in net investment income reported in the Statements of Operations and the Statements of Changes in Net Assets, or the net investment income per share and the ratios of expenses and net investment income reported in the Financial Highlights, nor are they limited by any expense limitation arrangements between each Fund and the Adviser.
E. Country Determination
For the purposes of making investment selection decisions and presentation in the Schedule of Investments, the Adviser may determine the country in which an issuer is located and/or credit risk exposure based on various factors. These factors include the laws of the country under which the issuer is organized, where the issuer maintains a principal office, the country in which the issuer derives 50% or more of its total revenues and the country that has the primary market for the issuer’s securities, as well as other criteria. Among the other criteria that may be evaluated for making this determination are the country in which the issuer maintains 50% or more of its assets, the type of security, financial guarantees and enhancements, the nature of the collateral and the sponsor organization. Country of issuer and/or credit risk exposure has been determined to be the United States of America, unless otherwise noted.
F. Expenses
Each Fund has agreed to pay an annual unitary management fee to the Adviser. Out of the unitary management fee, the Adviser has agreed to pay for substantially all expenses of the Funds, including the cost of transfer agency, custody, fund administration, legal, audit and other services, except for advisory fees, distribution fees, if any, brokerage expenses, taxes, interest, acquired fund fees and expenses, if any, litigation expenses and other extraordinary expenses.
Expenses of the Trust that are excluded from a Fund’s unitary management fee and are directly identifiable to a specific Fund are applied to that Fund. Expenses of the Trust that are excluded from each Fund’s unitary management fee and that are not readily identifiable to a specific Fund are allocated in such a manner as deemed equitable, taking into consideration the nature and type of expense and the relative net assets of each Fund.
To the extent a Fund invests in other investment companies, the expenses shown in the accompanying financial statements reflect the expenses of the Fund and do not include any expenses of the investment companies in which it invests. The effects of such investment companies’ expenses are included in the realized and unrealized gain or loss on the investments in the investment companies.
G. Dividends and Distributions to Shareholders
Each Fund declares and pays dividends from net investment income, if any, to its shareholders quarterly and records such dividends on ex-dividend date. Generally, each Fund distributes net realized taxable capital gains, if any, annually in cash and records them on ex-dividend date. Such distributions on a tax basis are determined in conformity with federal income tax regulations, which may differ from GAAP. Distributions in excess of tax basis earnings and profits, if any, are reported in such Fund’s financial statements as a tax return of capital at fiscal year-end.
H. Securities Lending
During the fiscal year ended October 31, 2016, DWA SmallCap Momentum Portfolio, S&P SmallCap Consumer Discretionary Portfolio, S&P SmallCap Consumer Staples Portfolio, S&P SmallCap Energy Portfolio, S&P SmallCap Financials Portfolio, S&P SmallCap Health Care Portfolio, S&P SmallCap Industrials Portfolio and S&P SmallCap Information Technology Portfolio participated in securities lending. Each Fund loaned portfolio securities having a market value up to one-third of each Fund’s total assets. Such loans are secured by cash collateral equal to no less than 102% (105% for international securities) of the market value of the loaned securities determined daily by the securities lending provider. Cash collateral received in connection with these loans is invested in an affiliated money market fund and is shown as such on the Schedules of Investments. Each Fund bears the risk of loss with respect to the investment of collateral. It is the policy of these Funds to obtain additional collateral from or return excess collateral to the borrower by the end of the next business day, following the valuation date of the securities loaned. Therefore, the value of the collateral held may be temporarily less than the value of the securities on loan. When loaning securities, each Fund retains certain benefits of owning the securities, including the economic equivalent of dividends or interest generated by the security. Lending securities entails a risk of loss to each Fund if, and to the extent that, the market value of the securities loaned were to increase, and the borrower did not increase the collateral accordingly, and the borrower failed to return the securities. The securities loaned are subject to termination at the option of the borrower or each Fund. Upon termination, the borrower will return to each Fund the securities loaned and each Fund will return the collateral. Upon the failure of the borrower to return the securities, collateral may be liquidated and the securities may be purchased on the open market to replace the loaned securities. Each Fund could experience delays and costs in gaining access to the collateral and the securities may lose value during the delay which could result in potential losses to each Fund. Some of these losses may be indemnified by the lending agent. Each Fund bears the risk of any deficiency in the amount of the collateral available for return to the borrower due to any loss on the collateral invested. Dividends received on cash collateral investments for securities lending transactions, which are net of compensation to counterparties, are included in Securities lending income on the Statements of Operations. The aggregate value of securities out on loan, if any, is shown on the Statements of Assets and Liabilities.
Note 3. Investment Advisory Agreement and Other Agreements
The Trust has entered into an Investment Advisory Agreement with the Adviser on behalf of each Fund, pursuant to which the Adviser has overall responsibility for the selection and ongoing monitoring of the Funds’ investments, managing the Funds’ business affairs and providing certain clerical, bookkeeping and other administrative services.
As compensation for its services, each Fund has agreed to pay the Adviser an annual unitary management fee. Out of the unitary management fee, the Adviser has agreed to pay for substantially all expenses of the Funds, including the cost of transfer agency, custody, fund administration, legal, audit and other services, except for advisory fees, distribution fees, if any, brokerage expenses, taxes, interest, acquired fund fees and expenses, if any, litigation expenses and other extraordinary expenses. The unitary management fee is paid by each Fund to the Adviser at the following annual rates:
| | | | |
| | | % of Average
Daily Net Assets | |
| DWA Momentum & Low Volatility Rotation Portfolio | | | 0.15 | % |
| DWA SmallCap Momentum Portfolio | | | 0.60 | % |
| DWA Tactical Multi-Asset Income Portfolio | | | 0.25 | % |
| | | | |
| | | % of Average
Daily Net Assets | |
| DWA Tactical Sector Rotation Portfolio | | | 0.15 | % |
| S&P SmallCap Consumer Discretionary Portfolio | | | 0.29 | % |
| S&P SmallCap Consumer Staples Portfolio | | | 0.29 | % |
| S&P SmallCap Energy Portfolio | | | 0.29 | % |
| S&P SmallCap Financials Portfolio | | | 0.29 | % |
| S&P SmallCap Health Care Portfolio | | | 0.29 | % |
| S&P SmallCap Industrials Portfolio | | | 0.29 | % |
| S&P SmallCap Information Technology Portfolio | | | 0.29 | % |
| S&P SmallCap Materials Portfolio | | | 0.29 | % |
| S&P SmallCap Utilities Portfolio | | | 0.29 | % |
Further, through August 31, 2018, the Adviser has contractually agreed to waive a portion of each Fund’s management fee in an amount equal to 100% of the net advisory fees an affiliate of the Adviser receives that are attributable to certain of the Fund’s investments in money market funds managed by that affiliate (excluding investments of cash collateral from securities lending). The Adviser cannot discontinue this waiver prior to its expiration.
For the fiscal year ended October 31, 2016, the Adviser waived fees for each Fund in the following amounts:
| | | | |
| DWA Momentum & Low Volatility Rotation Portfolio | | $ | 96 | |
| DWA SmallCap Momentum Portfolio | | | 169 | |
| DWA Tactical Multi-Asset Income Portfolio | | | 21 | |
| DWA Tactical Sector Rotation Portfolio | | | 31 | |
| S&P SmallCap Consumer Discretionary Portfolio | | | 53 | |
| S&P SmallCap Consumer Staples Portfolio | | | 116 | |
| S&P SmallCap Energy Portfolio | | | 22 | |
| S&P SmallCap Financials Portfolio | | | 275 | |
| S&P SmallCap Health Care Portfolio | | | 351 | |
| S&P SmallCap Industrials Portfolio | | | 41 | |
| S&P SmallCap Information Technology Portfolio | | | 444 | |
| S&P SmallCap Materials Portfolio | | | 8 | |
| S&P SmallCap Utilities Portfolio | | | 117 | |
The Trust has entered into a Distribution Agreement with Invesco Distributors, Inc. (the “Distributor”), which serves as the distributor of Creation Units for each Fund. The Distributor does not maintain a secondary market in the Shares. The Funds are not charged any fees pursuant to the Distribution Agreement. The Distributor is an affiliate of the Adviser.
The Adviser has entered into a licensing agreement for each Fund with the following entities (each, a “Licensor”):
| | |
Fund | | Licensor |
| DWA Momentum & Low Volatility Rotation Portfolio | | Dorsey Wright & Associates, LLC |
| DWA SmallCap Momentum Portfolio | | Dorsey Wright & Associates, LLC |
| DWA Tactical Multi-Asset Income Portfolio | | Dorsey Wright & Associates, LLC |
| DWA Tactical Sector Rotation Portfolio | | Dorsey Wright & Associates, LLC |
| S&P SmallCap Consumer Discretionary Portfolio | | S&P Dow Jones Indices LLC |
| S&P SmallCap Consumer Staples Portfolio | | S&P Dow Jones Indices LLC |
| S&P SmallCap Energy Portfolio | | S&P Dow Jones Indices LLC |
| S&P SmallCap Financials Portfolio | | S&P Dow Jones Indices LLC |
| S&P SmallCap Health Care Portfolio | | S&P Dow Jones Indices LLC |
| S&P SmallCap Industrials Portfolio | | S&P Dow Jones Indices LLC |
| S&P SmallCap Information Technology Portfolio | | S&P Dow Jones Indices LLC |
| S&P SmallCap Materials Portfolio | | S&P Dow Jones Indices LLC |
| S&P SmallCap Utilities Portfolio | | S&P Dow Jones Indices LLC |
Each Underlying Index name trademark is owned by its respective Licensor. These trademarks have been licensed to the Adviser for use by the Funds. Each Fund is entitled to use its Underlying Index pursuant to the Trust’s sub-licensing agreement with the Adviser. The Funds are not sponsored, endorsed, sold or promoted by the Licensors, and the Licensors make no representation regarding the advisability of investing in any of the Funds.
The Trust has entered into service agreements whereby The Bank of New York Mellon, a wholly-owned subsidiary of The Bank of New York Mellon Corporation, serves as the administrator, custodian, fund accountant and transfer agent for each Fund.
Note 4. Investments in Affiliates
The Adviser also serves as the adviser for each Underlying Fund listed within the tables below, and therefore is considered to be affiliated with the Funds.
The table below shows DWA Momentum & Low Volatility Rotation Portfolio’s transactions in, and earnings from, its investment in affiliates for the period July 11, 2016 (commencement of investment operations) through October 31, 2016.
DWA Momentum & Low Volatility Rotation Portfolio
| | | | | | | | | | | | | | | | | | | | | | | | | | | | |
| | | Value
July 11, 2016 | | | Purchases
at Cost | | | Proceeds
from Sales | | | Change in
Unrealized
Appreciation
(Depreciation) | | | Realized
Gain (Loss) | | | Value
October 31, 2016 | | | Dividend
Income | |
| PowerShares DWA Developed Markets Momentum Portfolio | | $ | — | | | $ | 519,458 | | | $ | (676 | ) | | $ | (28,678 | ) | | $ | (8 | ) | | $ | 490,096 | | | $ | — | |
| PowerShares DWA Emerging Markets Momentum Portfolio | | | — | | | | 523,663 | | | | (680 | ) | | | (9,031 | ) | | | (8 | ) | | | 513,944 | | | | — | |
| PowerShares DWA Momentum Portfolio | | | — | | | | 3,186,842 | | | | (313,522 | ) | | | (113,606 | ) | | | (2,899 | ) | | | 2,756,815 | | | | 3,133 | |
| PowerShares DWA SmallCap Momentum Portfolio | | | — | | | | 3,126,967 | | | | (351,374 | ) | | | (182,480 | ) | | | 14,080 | | | | 2,607,193 | | | | — | |
| PowerShares S&P 500® Low Volatility Portfolio | | | — | | | | 3,421,793 | | | | (2,160,410 | ) | | | (71,245 | ) | | | (58,472 | ) | | | 1,131,666 | | | | 13,418 | |
| PowerShares S&P Emerging Markets Low Volatility Portfolio | | | — | | | | 1,219,327 | | | | (1,582 | ) | | | (21,436 | ) | | | (18 | ) | | | 1,196,291 | | | | — | |
| PowerShares S&P International Developed Low Volatility Portfolio | | | — | | | | 1,208,006 | | | | (1,566 | ) | | | (40,920 | ) | | | (15 | ) | | | 1,165,505 | | | | — | |
| PowerShares S&P SmallCap Low Volatility Portfolio | | | — | | | | 3,502,279 | | | | (2,394,196 | ) | | | (2,709 | ) | | | 85,107 | | | | 1,190,481 | | | | 6,361 | |
| | | | | | | | | | | | | | | | | | | | | | | | | | | | |
| Total Investments in Affiliates | | $ | — | | | $ | 16,708,335 | | | $ | (5,224,006 | ) | | $ | (470,105 | ) | | $ | 37,767 | | | $ | 11,051,991 | | | $ | 22,912 | |
| | | | | | | | | | | | | | | | | | | | | | | | | | | | |
The table below shows DWA Tactical Multi-Asset Income Portfolio’s transactions in, and earnings from, its investment in affiliates for the period March 7, 2016 (commencement of investment operations) through October 31, 2016.
DWA Tactical Multi-Asset Income Portfolio
| | | | | | | | | | | | | | | | | | | | | | | | | | | | |
| | | Value
March 7, 2016 | | | Purchases
at Cost | | | Proceeds
from Sales | | | Change in
Unrealized
Appreciation
(Depreciation) | | | Realized
Gain (Loss) | | | Value
October 31, 2016 | | | Dividend
Income | |
| PowerShares Build America Bond Portfolio* | | $ | — | | | $ | 8,805,567 | | | $ | (8,882,403 | ) | | $ | — | | | $ | 76,836 | | | $ | — | | | $ | 49,723 | |
| PowerShares Emerging Markets Sovereign Debt Portfolio | | | — | | | | 24,800,827 | | | | (2,460,371 | ) | | | 459,443 | | | | 36,665 | | | | 22,836,564 | | | | 464,638 | |
| PowerShares Global Short Term High Yield Bond Portfolio | | | — | | | | 24,650,602 | | | | (2,451,216 | ) | | | 524,068 | | | | 25,249 | | | | 22,748,703 | | | | 680,886 | |
| PowerShares High Yield Equity Dividend AchieversTM Portfolio* | | | — | | | | 8,868,148 | | | | (9,012,710 | ) | | | — | | | | 144,562 | | | | — | | | | 22,265 | |
| PowerShares KBW Premium Yield Equity REIT Portfolio | | | — | | | | 25,058,166 | | | | (2,017,513 | ) | | | (335,918 | ) | | | (161,745 | ) | | | 22,542,990 | | | | 722,763 | |
| PowerShares Preferred Portfolio | | | — | | | | 27,020,854 | | | | (2,701,259 | ) | | | (138,910 | ) | | | 17,078 | | | | 24,197,763 | | | | 573,808 | |
| | | | | | | | | | | | | | | | | | | | | | | | | | | | |
| Total Investments in Affiliates | | $ | — | | | $ | 119,204,164 | | | $ | (27,525,472 | ) | | $ | 508,683 | | | $ | 138,645 | | | $ | 92,326,020 | | | $ | 2,514,083 | |
| | | | | | | | | | | | | | | | | | | | | | | | | | | | |
| * | At October 31, 2016, this security was no longer held. |
The table below shows DWA Tactical Sector Rotation Portfolio’s transactions in, and earnings from, its investment in affiliates for the fiscal year ended October 31, 2016.
DWA Tactical Sector Rotation Portfolio
| | | | | | | | | | | | | | | | | | | | | | | | | | | | |
| | | Value
October 31, 2015 | | | Purchases
at Cost | | | Proceeds
from Sales | | | Change in
Unrealized
Appreciation
(Depreciation) | | | Realized
Gain (Loss) | | | Value
October 31, 2016 | | | Dividend
Income | |
| PowerShares DWA Basic Materials Momentum Portfolio | | $ | — | | | $ | 48,872,521 | | | $ | (3,739,081 | ) | | $ | 3,188,324 | | | $ | 292,351 | | | $ | 48,614,115 | | | $ | 183,722 | |
| PowerShares DWA Consumer Cyclicals Momentum Portfolio* | | | 11,110,351 | | | | 34,104,851 | | | | (43,517,382 | ) | | | (75,782 | ) | | | (1,622,038 | ) | | | — | | | | 25,375 | |
| PowerShares DWA Consumer Staples Momentum Portfolio | | | 11,753,038 | | | | 47,758,739 | | | | (8,909,670 | ) | | | (1,846,494 | ) | | | 55,285 | | | | 48,810,898 | | | | 484,245 | |
| PowerShares DWA Healthcare Momentum Portfolio* | | | 10,541,968 | | | | 29,533,143 | | | | (30,939,514 | ) | | | (310,975 | ) | | | (8,824,622 | ) | | | — | | | | — | |
| PowerShares DWA Technology Momentum Portfolio | | | 9,202,050 | | | | 35,662,169 | | | | (6,286,816 | ) | | | (930,289 | ) | | | 46,041 | | | | 37,693,155 | | | | — | |
| PowerShares DWA Utilities Momentum Portfolio | | | — | | | | 40,922,192 | | | | (5,588,430 | ) | | | 1,502,871 | | | | 183,839 | | | | 37,020,472 | | | | 608,773 | |
| | | | | | | | | | | | | | | | | | | | | | | | | | | | |
| Total Investments in Affiliates | | $ | 42,607,407 | | | $ | 236,853,615 | | | $ | (98,980,893 | ) | | $ | 1,527,655 | | | $ | (9,869,144 | ) | | $ | 172,138,640 | | | $ | 1,302,115 | |
| | | | | | | | | | | | | | | | | | | | | | | | | | | | |
| * | At October 31, 2016, this security was no longer held. |
Note 5. Additional Valuation Information
GAAP defines fair value as the price that would be received to sell an asset or paid to transfer a liability in an orderly transaction between market participants at the measurement date, under current market conditions. GAAP establishes a hierarchy that prioritizes the inputs to valuation methods, giving the highest priority to readily available unadjusted quoted prices in an active market for identical assets (Level 1) and the lowest priority to significant unobservable inputs (Level 3), generally when market prices are not readily available or are unreliable. Based on the valuation inputs, the securities or other investments are tiered into one of three levels. Changes in valuation methods may result in transfers in or out of an investment’s assigned level:
| | Level 1 — | Prices are determined using quoted prices in an active market for identical assets. |
| | Level 2 — | Prices are determined using other significant observable inputs. Observable inputs are inputs that other market participants may use in pricing a security. These may include quoted prices for similar securities, interest rates, prepayment speeds, credit risk, yield curves, loss severities, default rates, discount rates, volatilities and others. |
| | Level 3 — | Prices are determined using significant unobservable inputs. In situations where quoted prices or observable inputs are unavailable (for example, when there is little or no market activity for an investment at the end of the period), unobservable inputs may be used. Unobservable inputs reflect a Fund’s own assumptions about the factors market participants would use in determining fair value of the securities or instruments and would be based on the best available information. |
As of October 31, 2016, all of the securities in each Fund were valued based on Level 1 inputs (see the Schedules of Investments for security categories). The level assigned to the securities valuations may not be an indication of the risk or liquidity associated with investing in those securities. Because of the inherent uncertainties of valuation, the values reflected in the financial statements may materially differ from the value received upon actual sale of those investments.
Note 6. Distributions to Shareholders and Tax Components of Net Assets
Tax Character of Distributions to Shareholders Paid During the Fiscal Years Ended October 31, 2016 and 2015:
| | | | | | | | | | | | | | | | | | | | | | | | |
| | | For the Year Ended
October 31, 2016 | | | For the Year Ended
October 31, 2015 | |
| | | Ordinary
Income | | | Long-Term
Capital Gains | | | Return of
Capital | | | Ordinary
Income | | | Long-Term
Capital Gains | | | Return of
Capital | |
| DWA Momentum & Low Volatility Rotation Portfolio | | $ | 5,265 | | | $ | — | | | $ | — | | | $ | — | | | $ | — | | | $ | — | |
| DWA SmallCap Momentum Portfolio | | | 825,119 | | | | — | | | | — | | | | 313,026 | | | | — | | | | — | |
| DWA Tactical Multi-Asset Income Portfolio | | | 2,392,101 | | | | — | | | | — | | | | — | | | | — | | | | — | |
| DWA Tactical Sector Rotation Portfolio | | | 1,081,384 | | | | — | | | | 2,439 | | | | — | | | | — | | | | — | |
| S&P SmallCap Consumer Discretionary Portfolio | | | 707,191 | | | | — | | | | — | | | | 1,104,227 | | | | — | | | | — | |
| S&P SmallCap Consumer Staples Portfolio | | | 700,261 | | | | — | | | | — | | | | 341,358 | | | | 381,898 | | | | — | |
| | | | | | | | | | | | | | | | | | | | | | | | |
| | | For the Year Ended
October 31, 2016 | | | For the Year Ended
October 31, 2015 | |
| | | Ordinary
Income | | | Long-Term
Capital Gains | | | Return of
Capital | | | Ordinary
Income | | | Long-Term
Capital Gains | | | Return of
Capital | |
| S&P SmallCap Energy Portfolio | | $ | 204,998 | | | $ | — | | | $ | — | | | $ | 171,568 | | | $ | — | | | $ | — | |
| S&P SmallCap Financials Portfolio | | | 5,473,136 | | | | 169,737 | | | | — | | | | 2,648,802 | | | | — | | | | — | |
| S&P SmallCap Health Care Portfolio | | | — | | | | — | | | | — | | | | 1,577,214 | | | | 2,386,791 | | | | — | |
| S&P SmallCap Industrials Portfolio | | | 476,137 | | | | — | | | | — | | | | 878,298 | | | | — | | | | — | |
| S&P SmallCap Information Technology Portfolio | | | 880,007 | | | | — | | | | — | | | | 210,333 | | | | — | | | | — | |
| S&P SmallCap Materials Portfolio | | | 122,745 | | | | — | | | | — | | | | 223,243 | | | | — | | | | — | |
| S&P SmallCap Utilities Portfolio | | | 2,016,277 | | | | — | | | | — | | | | 1,042,947 | | | | — | | | | — | |
Tax Components of Net Assets at Fiscal Year-End:
| | | | | | | | | | | | | | | | | | | | | | | | | | | | |
| | | Undistributed
Ordinary
Income | | | Undistributed
Long-Term
Capital Gains | | | Net
Unrealized
Appreciation
(Depreciation) | | | Capital Loss
Carryforwards | | | Late-year
Ordinary
Loss
Deferrals | | | Shares of
Beneficial
Interest | | | Total Net
Assets | |
| DWA Momentum & Low Volatility Rotation Portfolio | | $ | 14,847 | | | $ | — | | | $ | (475,652 | ) | | $ | (50,382 | ) | | $ | — | | | $ | 11,563,032 | | | $ | 11,051,845 | |
| DWA SmallCap Momentum Portfolio | | | 292,417 | | | | — | | | | 5,114,476 | | | | (128,364,449 | ) | | | — | | | | 278,814,729 | | | | 155,857,173 | |
| DWA Tactical Multi-Asset Income Portfolio | | | — | | | | — | | | | 1,333,413 | | | | (50,304 | ) | | | — | | | | 117,563,033 | | | | 118,846,142 | |
| DWA Tactical Sector Rotation Portfolio | | | — | | | | — | | | | 2,295,468 | | | | (10,275,883 | ) | | | — | | | | 180,101,824 | | | | 172,121,409 | |
| S&P SmallCap Consumer Discretionary Portfolio | | | 164,877 | | | | — | | | | (11,363,970 | ) | | | (1,586,112 | ) | | | — | | | | 87,020,513 | | | | 74,235,308 | |
| S&P SmallCap Consumer Staples Portfolio | | | 454,049 | | | | — | | | | (5,788,205 | ) | | | (526,666 | ) | | | — | | | | 75,220,567 | | | | 69,359,745 | |
| S&P SmallCap Energy Portfolio | | | 12,073 | | | | — | | | | (13,092,643 | ) | | | (28,912,979 | ) | | | — | | | | 94,679,743 | | | | 52,686,194 | |
| S&P SmallCap Financials Portfolio | | | 781,135 | | | | 732,390 | | | | 20,000,169 | | | | — | | | | — | | | | 175,282,836 | | | | 196,796,530 | |
| S&P SmallCap Health Care Portfolio | | | — | | | | — | | | | (21,477,963 | ) | | | (1,236,771 | ) | | | (38,835 | ) | | | 190,339,804 | | | | 167,586,235 | |
| S&P SmallCap Industrials Portfolio | | | 79,539 | | | | — | | | | 1,221,031 | | | | (1,882,804 | ) | | | — | | | | 57,588,757 | | | | 57,006,523 | |
| S&P SmallCap Information Technology Portfolio | | | 247,922 | | | | — | | | | 37,369,035 | | | | (2,000,475 | ) | | | — | | | | 472,830,849 | | | | 508,447,331 | |
| S&P SmallCap Materials Portfolio | | | 23,877 | | | | — | | | | (943,996 | ) | | | (1,383,395 | ) | | | — | | | | 19,717,649 | | | | 17,414,135 | |
| S&P SmallCap Utilities Portfolio | | | 1,837,102 | | | | — | | | | (2,448,434 | ) | | | — | | | | — | | | | 48,506,639 | | | | 47,895,307 | |
Capital loss carryforwards are calculated and reported as of a specific date. Results of transactions and other activity after that date may affect the amount of capital loss carryforwards actually available for the Funds to utilize. Capital losses generated in years beginning after December 22, 2010 can be carried forward for an unlimited period, whereas previous losses expire in eight tax years. Capital losses with an expiration period may not be used to offset capital gains until all net capital losses without an expiration date have been utilized. Capital loss carryforwards with no expiration date will retain their character as either short-term or long-term capital losses instead of as short-term capital losses as under prior law. The ability to utilize capital loss carryforwards in the future may be limited under the Internal Revenue Code and related regulations based on the results of future transactions.
The following table presents available capital loss carryforwards and expiration dates for each Fund as of October 31, 2016.
| | | | | | | | | | | | | | | | |
| | | | | | Post-effective/no expiration | | | | |
| | | 2019 | | | Short-Term | | | Long-Term | | | Total* | |
| DWA Momentum & Low Volatility Rotation Portfolio | | $ | — | | | $ | 50,382 | | | $ | — | | | $ | 50,382 | |
| DWA SmallCap Momentum Portfolio | | | — | | | | 128,364,449 | | | | — | | | | 128,364,449 | |
| DWA Tactical Multi-Asset Income Portfolio | | | — | | | | 50,304 | | | | — | | | | 50,304 | |
| DWA Tactical Sector Rotation Portfolio | | | — | | | | 10,275,883 | | | | — | | | | 10,275,883 | |
| S&P SmallCap Consumer Discretionary Portfolio | | | 8,689 | | | | — | | | | 1,577,423 | | | | 1,586,112 | |
| S&P SmallCap Consumer Staples Portfolio | | | — | | | | 526,666 | | | | — | | | | 526,666 | |
| S&P SmallCap Energy Portfolio | | | 2,406,357 | | | | 5,668,408 | | | | 20,838,214 | | | | 28,912,979 | |
| S&P SmallCap Financials Portfolio | | | — | | | | — | | | | — | | | | — | |
| S&P SmallCap Health Care Portfolio | | | — | | | | — | | | | 1,236,771 | | | | 1,236,771 | |
| S&P SmallCap Industrials Portfolio | | | 74,295 | | | | 781,461 | | | | 1,027,048 | | | | 1,882,804 | |
| | | | | | | | | | | | | | | | |
| | | | | | Post-effective/no expiration | | | | |
| | | 2019 | | | Short-Term | | | Long-Term | | | Total* | |
| S&P SmallCap Information Technology Portfolio | | $ | 567,102 | | | $ | 367,624 | | | $ | 1,065,749 | | | $ | 2,000,475 | |
| S&P SmallCap Materials Portfolio | | | 82,457 | | | | 407,471 | | | | 893,467 | | | | 1,383,395 | |
| S&P SmallCap Utilities Portfolio | | | — | | | | — | | | | — | | | | — | |
| * | Capital loss carryforwards as of the date listed above are reduced for limitations, if any, to the extent required by the Internal Revenue Code and may be further limited depending upon a variety of factors, including the realization of net unrealized gains or losses as of the date of any reorganization. |
Note 7. Investment Transactions
For the fiscal year ended October 31, 2016, the cost of securities purchased and proceeds from sales of securities (other than short-term securities, U.S. Treasury obligations, money market funds and in-kind transactions, if any) were as follows:
| | | | | | | | |
| | | Purchases | | | Sales | |
| DWA Momentum & Low Volatility Rotation Portfolio | | $ | 14,001,656 | | | $ | 2,400,246 | |
| DWA SmallCap Momentum Portfolio | | | 408,896,249 | | | | 408,248,327 | |
| DWA Tactical Multi-Asset Income Portfolio | | | 16,443,934 | | | | 16,052,391 | |
| DWA Tactical Sector Rotation Portfolio | | | 69,921,335 | | | | 69,916,862 | |
| S&P SmallCap Consumer Discretionary Portfolio | | | 28,333,594 | | | | 31,947,841 | |
| S&P SmallCap Consumer Staples Portfolio | | | 40,263,033 | | | | 41,466,213 | |
| S&P SmallCap Energy Portfolio | | | 9,011,231 | | | | 9,158,902 | |
| S&P SmallCap Financials Portfolio | | | 30,847,765 | | | | 34,498,364 | |
| S&P SmallCap Health Care Portfolio | | | 48,785,078 | | | | 49,647,335 | |
| S&P SmallCap Industrials Portfolio | | | 9,700,362 | | | | 12,760,160 | |
| S&P SmallCap Information Technology Portfolio | | | 59,962,268 | | | | 62,560,513 | |
| S&P SmallCap Materials Portfolio | | | 1,981,971 | | | | 1,976,417 | |
| S&P SmallCap Utilities Portfolio | | | 63,198,156 | | | | 66,062,129 | |
For the fiscal year ended October 31, 2016, in-kind transactions associated with creations and redemptions were as follows:
| | | | | | | | |
| | | Cost of
Securities
Received | | | Value of
Securities
Delivered | |
| DWA Momentum & Low Volatility Rotation Portfolio | | $ | 2,706,679 | | | $ | 2,823,760 | |
| DWA SmallCap Momentum Portfolio | | | 66,979,142 | | | | 282,721,128 | |
| DWA Tactical Multi-Asset Income Portfolio | | | 130,116,226 | | | | 12,649,196 | |
| DWA Tactical Sector Rotation Portfolio | | | 166,932,280 | | | | 29,064,031 | |
| S&P SmallCap Consumer Discretionary Portfolio | | | 18,190,776 | | | | 47,724,441 | |
| S&P SmallCap Consumer Staples Portfolio | | | 129,814,032 | | | | 95,347,371 | |
| S&P SmallCap Energy Portfolio | | | 30,563,434 | | | | 14,229,408 | |
| S&P SmallCap Financials Portfolio | | | 61,118,441 | | | | 50,111,569 | |
| S&P SmallCap Health Care Portfolio | | | 79,806,925 | | | | 136,924,416 | |
| S&P SmallCap Industrials Portfolio | | | 24,217,715 | | | | 36,904,911 | |
| S&P SmallCap Information Technology Portfolio | | | 248,465,236 | | | | 187,840,692 | |
| S&P SmallCap Materials Portfolio | | | 7,103,009 | | | | 1,373,067 | |
| S&P SmallCap Utilities Portfolio | | | 130,922,249 | | | | 132,038,657 | |
Gains (losses) on in-kind transactions are generally not considered taxable gains (losses) for federal income tax purposes.
At October 31, 2016, the aggregate cost and net unrealized appreciation (depreciation) of investments for tax purposes were as follows:
| | | | | | | | | | | | | | | | |
| | | Gross
Unrealized
Appreciation | | | Gross
Unrealized
(Depreciation) | | | Net
Unrealized
Appreciation
(Depreciation) | | | Cost | |
| DWA Momentum & Low Volatility Rotation Portfolio | | $ | — | | | $ | (475,652 | ) | | $ | (475,652 | ) | | $ | 11,528,713 | |
| DWA SmallCap Momentum Portfolio | | | 15,067,881 | | | | (9,953,405 | ) | | | 5,114,476 | | | | 166,042,329 | |
| DWA Tactical Multi-Asset Income Portfolio | | | 1,871,088 | | | | (537,675 | ) | | | 1,333,413 | | | | 119,245,662 | |
| DWA Tactical Sector Rotation Portfolio | | | 4,690,445 | | | | (2,394,977 | ) | | | 2,295,468 | | | | 169,848,009 | |
| S&P SmallCap Consumer Discretionary Portfolio | | | 5,278,586 | | | | (16,642,556 | ) | | | (11,363,970 | ) | | | 88,041,803 | |
| S&P SmallCap Consumer Staples Portfolio | | | 977,002 | | | | (6,765,207 | ) | | | (5,788,205 | ) | | | 75,086,664 | |
| S&P SmallCap Energy Portfolio | | | 4,871,045 | | | | (17,963,688 | ) | | | (13,092,643 | ) | | | 66,720,020 | |
| S&P SmallCap Financials Portfolio | | | 27,595,074 | | | | (7,594,905 | ) | | | 20,000,169 | | | | 183,057,219 | |
| S&P SmallCap Health Care Portfolio | | | 9,380,416 | | | | (30,858,379 | ) | | | (21,477,963 | ) | | | 200,372,907 | |
| S&P SmallCap Industrials Portfolio | | | 7,218,685 | | | | (5,997,654 | ) | | | 1,221,031 | | | | 56,140,439 | |
| S&P SmallCap Information Technology Portfolio | | | 65,679,958 | | | | (28,310,923 | ) | | | 37,369,035 | | | | 471,156,207 | |
| S&P SmallCap Materials Portfolio | | | 1,881,624 | | | | (2,825,620 | ) | | | (943,996 | ) | | | 18,360,422 | |
| S&P SmallCap Utilities Portfolio | | | 62,201 | | | | (2,510,635 | ) | | | (2,448,434 | ) | | | 47,105,993 | |
Note 8. Reclassification of Permanent Differences
Primarily as a result of differing book/tax treatment of in-kind transactions, amounts were reclassified between undistributed net investment income, undistributed net realized gain (loss) and Shares of beneficial interest. These reclassifications had no effect on the net assets of each Fund. For the fiscal year ended October 31, 2016, the reclassifications were as follows:
| | | | | | | | | | | | |
| | | Undistributed
Net Investment
Income | | | Undistributed
Net Realized
Gain (Loss) | | | Shares of
Beneficial
Interest | |
| DWA Momentum & Low Volatility Rotation Portfolio | | $ | — | | | $ | (93,764 | ) | | $ | 93,764 | |
| DWA SmallCap Momentum Portfolio | | | — | | | | (5,217,170 | ) | | | 5,217,170 | |
| DWA Tactical Multi-Asset Income Portfolio | | | 3,051 | | | | (305,065 | ) | | | 302,014 | |
| DWA Tactical Sector Rotation Portfolio | | | — | | | | (417,690 | ) | | | 417,690 | |
| S&P SmallCap Consumer Discretionary Portfolio | | | — | | | | (3,478,166 | ) | | | 3,478,166 | |
| S&P SmallCap Consumer Staples Portfolio | | | — | | | | (9,475,673 | ) | | | 9,475,673 | |
| S&P SmallCap Energy Portfolio | | | — | | | | 3,334,968 | | | | (3,334,968 | ) |
| S&P SmallCap Financials Portfolio | | | — | | | | (11,364,683 | ) | | | 11,364,683 | |
| S&P SmallCap Health Care Portfolio | | | 18,777 | | | | (22,445,676 | ) | | | 22,426,899 | |
| S&P SmallCap Industrials Portfolio | | | — | | | | (4,876,759 | ) | | | 4,876,759 | |
| S&P SmallCap Information Technology Portfolio | | | — | | | | (49,024,836 | ) | | | 49,024,836 | |
| S&P SmallCap Materials Portfolio | | | — | | | | 773,685 | | | | (773,685 | ) |
| S&P SmallCap Utilities Portfolio | | | — | | | | (11,360,305 | ) | | | 11,360,305 | |
Note 9. Trustees’ and Officer’s Fees
Trustees’ and Officer’s Fees include amounts accrued by the Funds to pay remuneration to each Trustee who is not an “interested person” as defined in the 1940 Act (an “Independent Trustee”), any Trustee who is not an affiliate of the Adviser or Distributor (or any of their affiliates) and who is otherwise an “interested person” of the Trust under the 1940 Act (an “Unaffiliated Trustee”) and an Officer of the Trust. The Adviser, as a result of each Fund’s unitary management fee, pays for such compensation. The Trustee who is an “interested person” of the Trust does not receive any Trustees’ fees.
The Trust has adopted a deferred compensation plan (the “Plan”). Under the Plan, each Independent Trustee or Unaffiliated Trustee who has executed a Deferred Fee Agreement (a “Participating Trustee”) may defer receipt of all or a portion of his compensation (“Deferral Fees”). Such Deferral Fees are deemed to be invested in select PowerShares Funds. The Deferral Fees payable to the Participating Trustee are valued as of the date such Deferral Fees would have been paid to the Participating Trustee. The value increases with contributions or with increases in the value of the Shares selected, and the value decreases with distributions or with declines in the value of the Shares selected. Obligations under the Plan represent unsecured claims against the general assets of the Funds.
Note 10. Capital
Shares are created and redeemed by each Fund only in Creation Units of 50,000 Shares. Only Authorized Participants are permitted to purchase or redeem Creation Units from the Funds. Such transactions are principally permitted in exchange for Deposit Securities, with a balancing cash component to equate the transaction to the NAV per Share of a Fund of the Trust on the transaction date. However, for all Funds, cash in an amount equivalent to the value of certain securities may be substituted, generally when the securities are not available in sufficient quantity for delivery, not eligible for trading by the Authorized Participant or as a result of other market circumstances.
To the extent that the Funds permit transactions in exchange for Deposit Securities, each Fund may issue Shares in advance of receipt of Deposit Securities subject to various conditions, including a requirement to maintain on deposit with the Trust cash at least equal to 105% of the market value of the missing Deposit Securities. In accordance with the Trust’s Participant Agreement, Creation Units will be issued to an Authorized Participant, notwithstanding the fact that the corresponding Deposit Securities have not been received in part or in whole, in reliance on the undertaking of the Authorized Participant to deliver the missing Deposit Securities as soon as possible, which undertaking shall be secured by the Authorized Participant’s delivery and maintenance of collateral consisting of cash in the form of U.S. dollars in immediately available funds having a value (marked-to-market daily) at least equal to 105%, which the Adviser may change from time to time, of the value of the missing Deposit Securities.
Certain transaction fees may be charged by the Funds for creations and redemptions, which are treated as increases in capital.
Transactions in each Fund’s Shares are disclosed in detail in the Statements of Changes in Net Assets.
Note 11. Indemnifications
Under the Trust’s organizational documents, its officers and Trustees are indemnified against certain liabilities arising out of the performance of their duties to the Trust. Each Independent Trustee and Unaffiliated Trustee is also indemnified against certain liabilities arising out of the performance of his duties to the Trust pursuant to an Indemnification Agreement between such trustee and the Trust. Additionally, in the normal course of business, the Trust enters into contracts with service providers that contain general indemnification clauses. The Trust’s maximum exposure under these arrangements is unknown, as this would involve future claims that may be made against the Trust that have not yet occurred. However, based on experience, the Trust believes the risk of loss to be remote.
Note 12. Subsequent Event
Effective December 7, 2016, DWA SmallCap Momentum Portfolio’s Shares were listed and began trading on The NASDAQ Stock Market LLC.
Report of Independent Registered Public Accounting Firm
To the Board of Trustees and Shareholders of PowerShares Exchange-Traded Fund Trust II:
In our opinion, the accompanying statements of assets and liabilities, including the schedules of investments, and the related statements of operations and of changes in net assets and the financial highlights present fairly, in all material respects, the financial position of PowerShares DWA Momentum & Low Volatility Rotation Portfolio, PowerShares DWA SmallCap Momentum Portfolio, PowerShares DWA Tactical Multi-Asset Income Portfolio, PowerShares DWA Tactical Sector Rotation Portfolio, PowerShares S&P SmallCap Consumer Discretionary Portfolio, PowerShares S&P SmallCap Consumer Staples Portfolio, PowerShares S&P SmallCap Energy Portfolio, PowerShares S&P SmallCap Financials Portfolio, PowerShares S&P SmallCap Health Care Portfolio, PowerShares S&P SmallCap Industrials Portfolio, PowerShares S&P SmallCap Information Technology Portfolio, PowerShares S&P SmallCap Materials Portfolio, and PowerShares S&P SmallCap Utilities Portfolio (each an individual portfolio of PowerShares Exchange-Traded Fund Trust II, hereafter referred to as the “Funds”) as of October 31, 2016, the results of each of their operations, the changes in each of their net assets and the financial highlights for each of the periods presented, in conformity with accounting principles generally accepted in the United States of America. These financial statements and financial highlights (hereafter referred to as “financial statements”) are the responsibility of the Funds’ management. Our responsibility is to express an opinion on these financial statements based on our audits. We conducted our audits of these financial statements in accordance with the standards of the Public Company Accounting Oversight Board (United States). Those standards require that we plan and perform the audit to obtain reasonable assurance about whether the financial statements are free of material misstatement. An audit includes examining, on a test basis, evidence supporting the amounts and disclosures in the financial statements, assessing the accounting principles used and significant estimates made by management, and evaluating the overall financial statement presentation. We believe that our audits, which included confirmation of securities as of October 31, 2016 by correspondence with the custodian and brokers, and the application of alternative auditing procedures where confirmations of security purchases have not been received, provide a reasonable basis for our opinion.
PricewaterhouseCoopers LLP
Chicago, IL
December 22, 2016
Fees and Expenses
As a shareholder of a Fund of the PowerShares Exchange-Traded Fund Trust II, you incur a unitary management fee. In addition to the unitary management fee, a shareholder may pay distribution fees, if any, brokerage expenses, taxes, interest, acquired fund fees and expenses, if any, litigation expenses and other extraordinary expenses. The expense examples below are intended to help you understand your ongoing costs (in dollars) of investing in the Funds and to compare these costs with the ongoing costs of investing in other funds.
The example is based on an investment of $1,000 invested at the beginning of the period and held through the six-month period ended October 31, 2016.
In addition to the fees and expenses which the PowerShares DWA Momentum & Low Volatility Rotation Portfolio, PowerShares DWA Tactical Multi-Asset Income Portfolio and PowerShares DWA Tactical Sector Rotation Portfolio (collectively, the “Portfolios”) bear directly, the Portfolios indirectly bear a pro rata share of the fees and expenses of the investment companies in which the Portfolios invest. The amount of fees and expenses incurred indirectly by the Portfolios will vary because the investment companies have varied expenses and fee levels and the Portfolios may own different proportions of the investment companies at different times. Estimated investment companies’ expenses are not expenses that are incurred directly by the Portfolios. They are expenses that are incurred directly by the investment companies and are deducted from the value of the investment companies the Portfolios invest in. The effect of the estimated investment companies’ expenses that the Portfolios bear indirectly is included in each Portfolio’s total return.
Actual Expenses
The first line in the following table provides information about actual account values and actual expenses. You may use the information in this line, together with the amount you invested, to estimate the expenses that you paid over the period. Simply divide your account value by $1,000 (for example, an $8,600 account value divided by $1,000 = 8.6), then multiply the result by the number in the first line under the heading “Expenses Paid During the Six-Month Period” to estimate the expenses you paid on your account during this period.
Hypothetical Example for Comparison Purposes
The second line in the following table provides information about hypothetical account values and hypothetical expenses based on each Fund’s actual expense ratio and an assumed annualized rate of return of 5% per year before expenses, which is not the Fund’s actual return. The hypothetical account values and expenses may not be used to estimate the actual ending account balance or expenses you paid for the period. You may use this information to compare the ongoing costs of investing in the Funds and other funds. To do so, compare this 5% hypothetical example with the 5% hypothetical examples that appear in the shareholder reports of the other funds.
Please note that the expenses shown in the table are meant to highlight your ongoing costs only, and do not reflect any transactional costs, such as sales charges and brokerage commissions. Therefore, the second line in the table is useful in comparing ongoing costs only, and will not help you determine the relative total costs of owning different funds. In addition, expenses shown in the table do not include the expenses of the underlying funds, which are borne indirectly by a Fund. If transaction costs and indirect expenses were included, your costs would have been higher.
| | | | | | | | | | | | | | | | |
| | | Beginning
Account Value
May 1, 2016 | | | Ending
Account Value
October 31, 2016 | | | Annualized
Expense Ratio
Based on the
Six-Month Period | | | Expenses Paid
During the
Six-Month Period(1) | |
| PowerShares DWA Momentum & Low Volatility Rotation Portfolio (DWLV)(2) | | | | | | | | | | | | | | | | |
Actual | | $ | 1,000.00 | | | $ | 964.70 | | | | 0.15 | % | | $ | 0.45 | |
Hypothetical (5% return before expenses) | | | 1,000.00 | | | | 1,024.38 | | | | 0.15 | | | | 0.76 | |
| PowerShares DWA SmallCap Momentum Portfolio (DWAS) | | | | | | | | | | | | | | | | |
Actual | | | 1,000.00 | | | | 1,018.08 | | | | 0.60 | | | | 3.04 | |
Hypothetical (5% return before expenses) | | | 1,000.00 | | | | 1,022.12 | | | | 0.60 | | | | 3.05 | |
| PowerShares DWA Tactical Multi-Asset Income Portfolio (DWIN) | | | | | | | | | | | | | | | | |
Actual | | | 1,000.00 | | | | 1,055.90 | | | | 0.25 | | | | 1.29 | |
Hypothetical (5% return before expenses) | | | 1,000.00 | | | | 1,023.88 | | | | 0.25 | | | | 1.27 | |
| PowerShares DWA Tactical Sector Rotation Portfolio (DWTR) | | | | | | | | | | | | | | | | |
Actual | | | 1,000.00 | | | | 1,025.84 | | | | 0.15 | | | | 0.76 | |
Hypothetical (5% return before expenses) | | | 1,000.00 | | | | 1,024.38 | | | | 0.15 | | | | 0.76 | |
Fees and Expenses (continued)
| | | | | | | | | | | | | | | | |
| | | Beginning
Account Value
May 1, 2016 | | | Ending
Account Value
October 31, 2016 | | | Annualized
Expense Ratio
Based on the
Six-Month Period | | | Expenses Paid
During the
Six-Month Period(1) | |
| PowerShares S&P SmallCap Consumer Discretionary Portfolio (PSCD) | | | | | | | | | | | | | | | | |
Actual | | $ | 1,000.00 | | | $ | 970.32 | | | | 0.29 | % | | $ | 1.44 | |
Hypothetical (5% return before expenses) | | | 1,000.00 | | | | 1,023.68 | | | | 0.29 | | | | 1.48 | |
| PowerShares S&P SmallCap Consumer Staples Portfolio (PSCC) | | | | | | | | | | | | | | | | |
Actual | | | 1,000.00 | | | | 1,028.16 | | | | 0.29 | | | | 1.48 | |
Hypothetical (5% return before expenses) | | | 1,000.00 | | | | 1,023.68 | | | | 0.29 | | | | 1.48 | |
| PowerShares S&P SmallCap Energy Portfolio (PSCE) | | | | | | | | | | | | | | | | |
Actual | | | 1,000.00 | | | | 987.66 | | | | 0.29 | | | | 1.45 | |
Hypothetical (5% return before expenses) | | | 1,000.00 | | | | 1,023.68 | | | | 0.29 | | | | 1.48 | |
| PowerShares S&P SmallCap Financials Portfolio (PSCF) | | | | | | | | | | | | | | | | |
Actual | | | 1,000.00 | | | | 1,061.50 | | | | 0.29 | | | | 1.50 | |
Hypothetical (5% return before expenses) | | | 1,000.00 | | | | 1,023.68 | | | | 0.29 | | | | 1.48 | |
| PowerShares S&P SmallCap Health Care Portfolio (PSCH) | | | | | | | | | | | | | | | | |
Actual | | | 1,000.00 | | | | 965.30 | | | | 0.29 | | | | 1.43 | |
Hypothetical (5% return before expenses) | | | 1,000.00 | | | | 1,023.68 | | | | 0.29 | | | | 1.48 | |
| PowerShares S&P SmallCap Industrials Portfolio (PSCI) | | | | | | | | | | | | | | | | |
Actual | | | 1,000.00 | | | | 1,061.94 | | | | 0.29 | | | | 1.50 | |
Hypothetical (5% return before expenses) | | | 1,000.00 | | | | 1,023.68 | | | | 0.29 | | | | 1.48 | |
| PowerShares S&P SmallCap Information Technology Portfolio (PSCT) | | | | | | | | | | | | | | | | |
Actual | | | 1,000.00 | | | | 1,136.37 | | | | 0.29 | | | | 1.56 | |
Hypothetical (5% return before expenses) | | | 1,000.00 | | | | 1,023.68 | | | | 0.29 | | | | 1.48 | |
| PowerShares S&P SmallCap Materials Portfolio (PSCM) | | | | | | | | | | | | | | | | |
Actual | | | 1,000.00 | | | | 1,096.68 | | | | 0.29 | | | | 1.53 | |
Hypothetical (5% return before expenses) | | | 1,000.00 | | | | 1,023.68 | | | | 0.29 | | | | 1.48 | |
| PowerShares S&P SmallCap Utilities Portfolio (PSCU) | | | | | | | | | | | | | | | | |
Actual | | | 1,000.00 | | | | 1,048.89 | | | | 0.29 | | | | 1.49 | |
Hypothetical (5% return before expenses) | | | 1,000.00 | | | | 1,023.68 | | | | 0.29 | | | | 1.48 | |
| (1) | Expenses are calculated using the annualized expense ratio, which represents the ongoing expenses as a percentage of net assets for the six-month period ended October 31, 2016. Expenses are calculated by multiplying the Fund’s annualized expense ratio by the average account value for the period, then multiplying the result by 184/366. Expense ratios for the most recent six-month period may differ from expense ratios based on the annualized data in the Financial Highlights. |
| (2) | Expenses are calculated using the annualized expense ratio, which represents the ongoing expenses as a percentage of net assets for the period July 11, 2016 (commencement of investment operations) to October 31, 2016. Expenses are calculated by multiplying the Fund’s annualized expense ratio by the average account value for the period, then multiplying the result by 113/366. Hypothetical expenses are calculated by multiplying the Fund’s annualized expense ratio by the average account value for the period, then multiplying the result by 184/366. |
Tax Information
Form 1099-DIV, Form 1042-S and other year-end tax information provide shareholders with actual calendar year amounts that should be included in their tax returns. Shareholders should consult their tax advisers.
The following distribution information is being provided as required by the Internal Revenue Code or to meet a specific state’s requirement.
Each Fund designates the following amounts or, if subsequently determined to be different, the maximum amount allowable for its fiscal year ended October 31, 2016:
| | | | | | | | | | | | | | | |
| | | Qualified Dividend
Income* | | Corporate
Dividends Received
Deduction* | | Long-Term
Capital Gains |
| PowerShares DWA Momentum & Low Volatility Rotation Portfolio | | | | 100 | % | | | | 100 | % | | | $ | — | |
| PowerShares DWA SmallCap Momentum Portfolio | | | | 100 | % | | | | 100 | % | | | | — | |
| PowerShares DWA Tactical Multi-Asset Income Portfolio | | | | 18 | % | | | | 16 | % | | | | — | |
| PowerShares DWA Tactical Sector Rotation Portfolio | | | | 100 | % | | | | 100 | % | | | | — | |
| PowerShares S&P SmallCap Consumer Discretionary Portfolio | | | | 100 | % | | | | 98 | % | | | | — | |
| PowerShares S&P SmallCap Consumer Staples Portfolio | | | | 100 | % | | | | 100 | % | | | | — | |
| PowerShares S&P SmallCap Energy Portfolio | | | | 100 | % | | | | 100 | % | | | | — | |
| PowerShares S&P SmallCap Financials Portfolio | | | | 87 | % | | | | 86 | % | | | | 169,737 | |
| PowerShares S&P SmallCap Health Care Portfolio | | | | 0 | % | | | | 0 | % | | | | — | |
| PowerShares S&P SmallCap Industrials Portfolio | | | | 100 | % | | | | 100 | % | | | | — | |
| PowerShares S&P SmallCap Information Technology Portfolio | | | | 100 | % | | | | 100 | % | | | | — | |
| PowerShares S&P SmallCap Materials Portfolio | | | | 100 | % | | | | 100 | % | | | | — | |
| PowerShares S&P SmallCap Utilities Portfolio | | | | 100 | % | | | | 100 | % | | | | — | |
| * | The above percentages are based on ordinary income dividends paid to shareholders during the Fund’s fiscal year. |
Trustees and Officers
The Independent Trustees, the Unaffiliated Trustees, the Non-Independent Trustees and the executive officers of the Trust, their term of office and length of time served, their principal business occupations during at least the past five years, the number of portfolios in the Fund Complex overseen by each Trustee and the other directorships, if any, held by a Trustee are shown below.
The Trustees and officers information is current as of October 31, 2016.
| | | | | | | | | | |
Name, Address and Year of
Birth of Independent Trustees | | Position(s)
Held
with Trust | | Term of
Office
and
Length of
Time
Served* | | Principal
Occupation(s) During
Past 5 Years | | Number of
Portfolios
in Fund
Complex**
Overseen by
Independent
Trustees | | Other
Directorships
Held by
Independent
Trustees During
the Past 5 Years |
Ronn R. Bagge—1958
c/o Invesco PowerShares
Capital Management LLC
3500 Lacey Road, Suite 700
Downers Grove, IL 60515 | | Chairman of the Nominating and Governance Committee and Trustee | | Chairman of the Nominating and Governance Committee and Trustee since 2007 | | Founder and Principal, YQA Capital Management LLC (1998-Present); formerly Owner/CEO of Electronic Dynamic Balancing Co., Inc. (high-speed rotating equipment service provider). | | 126 | | None |
| | | | | |
Todd J. Barre—1957
c/o Invesco PowerShares
Capital Management LLC
3500 Lacey Road, Suite 700
Downers Grove, IL 60515 | | Trustee | | Since 2010 | | Assistant Professor of Business, Trinity Christian College (2010-2016); formerly Vice President and Senior Investment Strategist (2001-2008), Director of Open Architecture and Trading (2007-2008), Head of Fundamental Research (2004-2007) and Vice President and Senior Fixed Income Strategist (1994-2001), BMO Financial Group/Harris Private Bank. | | 126 | | None |
| | | | | |
Marc M. Kole—1960
c/o Invesco PowerShares
Capital Management LLC
3500 Lacey Road, Suite 700
Downers Grove, IL 60515 | | Chairman of the Audit Committee and Trustee | | Chairman of the Audit Committee since 2008; Trustee since 2007 | | Senior Director of Finance, By The Hand Club for Kids (2015-Present); Formerly: Chief Financial Officer, Hope Network (social services) (2008-2012); Assistant Vice President and Controller, Priority Health (health insurance) (2005-2008); Senior Vice President of Finance, United Healthcare (2004-2005); Chief Accounting Officer, Senior Vice President of Finance, Oxford Health Plans (2000-2004); Audit Partner, Arthur Andersen LLP (1996-2000). | | 126 | | None |
| | | | | |
Yung Bong Lim—1964
c/o Invesco PowerShares Capital Management LLC
3500 Lacey Road, Suite 700
Downers Grove, IL 60515 | | Chairman of the Investment Oversight Committee and Trustee | | Chairman of the Investment Oversight Committee since 2014; Trustee since 2013 | | Managing Partner, Residential Dynamics Group LLC (2008-Present); formerly, Managing Director, Citadel Investment Group, L.L.C. (1999-2007). | | 126 | | None |
| * | This is the date the Independent Trustee began serving the Trust. He serves an indefinite term, until his successor is elected. |
| ** | Fund Complex includes all open-end funds (including all of their portfolios) advised by the Adviser. At October 31, 2016, the “Fund Family” consisted of the Trust’s 67 portfolios and four other exchange-traded fund trusts with 59 portfolios advised by the Adviser. |
Trustees and Officers (continued)
| | | | | | | | | | |
Name, Address and Year of
Birth of Independent Trustees | | Position(s)
Held
with Trust | | Term of
Office
and
Length of
Time
Served* | | Principal
Occupation(s) During
Past 5 Years | | Number of
Portfolios
in Fund
Complex**
Overseen by
Independent
Trustees | | Other
Directorships
Held by
Independent
Trustees During
the Past 5 Years |
Gary R. Wicker—1961
c/o Invesco PowerShares Capital Management LLC
3500 Lacey Road, Suite 700
Downers Grove, IL 60515 | | Trustee | | Since 2013 | | Senior Vice President of Global Finance and Chief Financial Officer at RBC Ministries (publishing company) (2013-Present); formerly, Executive Vice President and Chief Financial Officer, Zondervan Publishing (a division of Harper Collins/NewsCorp) (2007-2012); Senior Vice President and Group Controller (2005-2006), Senior Vice President and Chief Financial Officer (2003-2004), Chief Financial Officer (2001-2003), Vice President, Finance and Controller (1999-2001) and Assistant Controller (1997-1999), divisions of The Thomson Corporation (information services provider). | | 126 | | None |
| | | | | |
Donald H. Wilson—1959
c/o Invesco PowerShares Capital Management LLC
3500 Lacey Road, Suite 700
Downers Grove, IL 60515 | | Chairman of the Board and Trustee | | Chairman since 2012; Trustee since 2007 | | Chairman and Chief Executive Officer, Stone Pillar Advisors, Ltd. (2010-Present); formerly, Chairman, President and Chief Executive Officer, Community Financial Shares, Inc. and Community Bank—Wheaton/Glen Ellyn (subsidiary) (2013-2015); Chief Operating Officer, AMCORE Financial, Inc. (bank holding company) (2007-2009); Executive Vice President and Chief Financial Officer, AMCORE Financial, Inc. (2006-2007); Senior Vice President and Treasurer, Marshall & Ilsley Corp. (bank holding company) (1995-2006). | | 126 | | None |
The Unaffiliated Trustees, their term of office and length of time served, their principal business occupations during the past five years, the number of portfolios in the Fund Complex overseen by the Unaffiliated Trustees and the other directorships, if any, held by such Trustees are shown below.
| | | | | | | | | | |
Philip M. Nussbaum—1961
c/o Invesco PowerShares Capital Management LLC
3500 Lacey Road, Suite 700
Downers Grove, IL 60515 | | Trustee*** | | Since 2007 | | Chairman, Performance Trust Capital Partners (2004-Present). | | 126 | | None |
| * | This is the date the Independent Trustee began serving the Trust. He serves an indefinite term, until his successor is elected. |
| ** | Fund Complex includes all open-end funds (including all of their portfolios) advised by the Adviser. At October 31, 2016, the “Fund Family” consisted of the Trust’s 67 portfolios and four other exchange-traded fund trusts with 59 portfolios advised by the Adviser. |
| *** | Effective February 25, 2016, Mr. Nussbaum became an Unaffiliated Trustee. |
Trustees and Officers (continued)
The Non-Independent Trustees and the executive officers of the Trust, their term of office and length of time served, their principal business occupations during the past five years, the number of portfolios in the Fund Complex overseen by the Non-Independent Trustees and the other directorships, if any, held by the Trustees are shown below.
| | | | | | | | | | |
Name, Address and Year of
Birth of Non-Independent
Trustees | | Position(s)
Held
with Trust | | Term of
Office
and
Length of
Time
Served* | | Principal
Occupation(s) During
Past 5 Years | | Number of
Portfolios
in Fund
Complex**
Overseen by
Non-Independent
Trustees | | Other
Directorships
Held by
Non-Independent
Trustees During
the Past 5 Years |
Kevin M. Carome—1956
Invesco Ltd.
Two Peachtree Pointe,
1555 Peachtree St., N.E.,
Suite 1800
Atlanta, GA 30309 | | Trustee | | Since 2010 | | Senior Managing Director, Secretary and General Counsel, Invesco Ltd. (2007-Present); Director, Invesco Advisers, Inc. (2009-Present); Director, Invesco Finance PLC, and Invesco Holding Company Limited; Director and Executive Vice President, Invesco Holding Company (US), Inc., Invesco Finance, Inc., Invesco Group Services, Inc., Invesco North American Holdings, Inc., and INVESCO Asset Management (Bermuda) Ltd.; Executive Vice President, Invesco Investments (Bermuda) Ltd., Manager, Horizon Flight Works LLC; Director and Secretary, Invesco Services (Bahamas) Private Limited; formerly, Director and Chairman, INVESCO Funds Group, Inc., Senior Vice President, Secretary and General Counsel, Invesco Advisers, Inc. (2003-2006); Director, Invesco Investments (Bermuda) Ltd. (2008-2016); Senior Vice President and General Counsel, Liberty Financial Companies, Inc. (2000-2001); General Counsel of certain investment management subsidiaries of Liberty Financial Companies, Inc. (1998-2000); Associate General Counsel, Liberty Financial Companies, Inc. (1993-1998); Associate, Ropes & Gray LLP. | | 126 | | None |
| * | This is the date the Non-Independent Trustee began serving the Trust. He serves an indefinite term, until his successor is elected. |
| ** | Fund Complex includes all open-end funds (including all of their portfolios) advised by the Adviser. At October 31, 2016, the “Fund Family” consisted of the Trust’s 67 portfolios and four other exchange-traded fund trusts with 59 portfolios advised by the Adviser. |
Trustees and Officers (continued)
| | | | | | |
Name, Address and Year of
Birth of Executive Officers | | Position(s)
Held
with Trust | | Length of
Time
Served* | | Principal
Occupation(s) During
Past 5 Years |
Daniel E. Draper—1968 Invesco PowerShares
Capital Management LLC 3500 Lacey Road, Suite 700 Downers Grove, IL 60515 | | President and Principal Executive Officer | | Since 2015 | | President and Principal Executive Officer, PowerShares Exchange-Traded Fund Trust, PowerShares Exchange-Traded Fund Trust II, PowerShares India Exchange-Traded Fund Trust, PowerShares Actively Managed Exchange-Traded Fund Trust and PowerShares Actively Managed Exchange-Traded Commodity Fund Trust (2015-Present); Chief Executive Officer and Principal Executive Officer (2016-Present) and Managing Director (2013-Present), Invesco PowerShares Capital Management LLC; Senior Vice President, Invesco Distributors, Inc. (2014-Present); formerly, Vice President, PowerShares Exchange-Traded Fund Trust, PowerShares Exchange-Traded Fund Trust II, PowerShares India Exchange-Traded Fund Trust, PowerShares Actively Managed Exchange-Traded Fund Trust (2013-2015) and PowerShares Actively Managed Exchange-Traded Commodity Fund Trust (2014-2015); Managing Director, Credit Suisse Asset Management (2010-2013) and Lyxor Asset Management/Societe Generale (2007-2010). |
| | | |
Steven M. Hill—1964 Invesco PowerShares
Capital Management LLC 3500 Lacey Road, Suite 700 Downers Grove, IL 60515 | | Vice President and Treasurer | | Since 2013 | | Vice President and Treasurer, PowerShares Exchange-Traded Fund Trust, PowerShares Exchange-Traded Fund Trust II, PowerShares India Exchange-Traded Fund Trust, PowerShares Actively Managed Exchange-Traded Fund Trust (2013-Present) and PowerShares Actively Managed Exchange-Traded Commodity Fund Trust (2014-Present); Head of Global ETF Administration, Invesco PowerShares Capital Management LLC (2011-Present); Principal Financial and Accounting Officer—Investment Pools, Invesco PowerShares Capital Management LLC (2015-Present); formerly, Senior Managing Director and Chief Financial Officer, Destra Capital Management LLC and its subsidiaries (2010-2011); Chief Financial Officer, Destra Investment Trust and Destra Investment Trust II (2010-2011); Senior Managing Director, Claymore Securities, Inc. (2003-2010); and Chief Financial Officer, Claymore sponsored mutual funds (2003-2010). |
| | | |
Peter Hubbard—1981 Invesco PowerShares
Capital Management LLC 3500 Lacey Road, Suite 700 Downers Grove, IL 60515 | | Vice President | | Since 2009 | | Vice President, PowerShares Exchange-Traded Fund Trust, PowerShares Exchange-Traded Fund Trust II, PowerShares India Exchange-Traded Fund Trust, PowerShares Actively Managed Exchange-Traded Fund Trust (2009-Present) and PowerShares Actively Managed Exchange-Traded Commodity Fund Trust (2014-Present); Vice President and Director of Portfolio Management, Invesco PowerShares Capital Management LLC (2010-Present); formerly, Vice President of Portfolio Management, Invesco PowerShares Capital Management LLC (2008-2010); Portfolio Manager, Invesco PowerShares Capital Management LLC (2007-2008); Research Analyst, Invesco PowerShares Capital Management LLC (2005-2007); Research Analyst and Trader, Ritchie Capital, a hedge fund operator (2003-2005). |
| | | |
Christopher Joe—1969 Invesco PowerShares Capital Management LLC 11 Greenway Plaza, Suite 1000 Houston, TX 77046-1173 | | Chief Compliance Officer | | Since 2012 | | Chief Compliance Officer of Invesco PowerShares Capital Management LLC (2015-Present); Chief Compliance Officer of PowerShares Exchange-Traded Fund Trust, PowerShares Exchange-Traded Fund Trust II, PowerShares India Exchange-Traded Fund Trust, PowerShares Actively Managed Exchange-Traded Fund Trust (2012-Present) and PowerShares Actively Managed Exchange-Traded Commodity Fund Trust (2014-Present); formerly, Chief Compliance Officer, Invesco Investment Advisers, LLC (registered investment adviser) (2010–2013), U.S. Compliance Director, Invesco, Ltd. (2006-2014) and Deputy Chief Compliance Officer of Invesco Advisers, Inc. (2014-2015). |
| * | This is the period for which the Officers began serving the Trust. Each Officer serves an indefinite term, until his or her successor is elected. |
Trustees and Officers (continued)
| | | | | | |
Name, Address and Year of
Birth of Executive Officers | | Position(s)
Held
with Trust | | Length of
Time
Served* | | Principal
Occupation(s) During
Past 5 Years |
Sheri Morris—1964 Invesco Management Group, Inc. 11 Greenway Plaza, Suite 1000 Houston, TX 77046 | | Vice President | | Since 2012 | | President and Principal Executive Officer, The Invesco Funds (2016-Present); Treasurer, The Invesco Funds (2008-Present); Vice President, Invesco Advisers, Inc. (formerly known as Invesco Institutional (N.A.), Inc.) (registered investment adviser) (2009-Present) and Vice President, PowerShares Exchange-Traded Fund Trust, PowerShares Exchange-Traded Fund Trust II, PowerShares India Exchange-Traded Fund Trust, PowerShares Actively Managed Exchange-Traded Fund Trust (2012-Present) and PowerShares Actively Managed Exchange-Traded Commodity Fund Trust (2014-Present); formerly, Vice President and Principal Financial Officer, The Invesco Funds (2008-2016); Treasurer, PowerShares Exchange-Traded Fund Trust, PowerShares Exchange-Traded Fund Trust II, PowerShares India Exchange-Traded Fund Trust and PowerShares Actively Managed Exchange-Traded Fund Trust (2011-2013); Vice President, Invesco Aim Advisers, Inc., Invesco Aim Capital Management, Inc. and Invesco Aim Private Asset Management, Inc.; Assistant Vice President and Assistant Treasurer, The Invesco Funds and Assistant Vice President, Invesco Advisers, Inc., Invesco Aim Capital Management, Inc. and Invesco Aim Private Asset Management, Inc. |
| | | |
Anna Paglia—1974 Invesco PowerShares Capital Management LLC 3500 Lacey Road, Suite 700 Downers Grove, IL 60515 | | Secretary | | Since 2011 | | Secretary, PowerShares Exchange-Traded Fund Trust, PowerShares Exchange-Traded Fund Trust II, PowerShares India Exchange-Traded Fund Trust, PowerShares Actively Managed Exchange-Traded Fund Trust (2011-Present) and PowerShares Actively Managed Exchange-Traded Commodity Fund Trust (2014-Present); Head of Legal (2010-Present) and Secretary (2015-Present), Invesco PowerShares Capital Management LLC (2010-Present); formerly, Partner, K&L Gates LLP (formerly, Bell Boyd & Lloyd LLP) (2007-2010); Associate Counsel at Barclays Global Investors Ltd. (2004-2006). |
| | | |
Rudolf E. Reitmann—1971 Invesco PowerShares Capital Management LLC 3500 Lacey Road, Suite 700 Downers Grove, IL 60515 | | Vice President | | Since 2013 | | Vice President, PowerShares Exchange-Traded Fund Trust, PowerShares Exchange-Traded Fund Trust II, PowerShares India Exchange-Traded Fund Trust, PowerShares Actively Managed Exchange-Traded Fund Trust (2013-Present) and PowerShares Actively Managed Exchange-Traded Commodity Fund Trust (2014-Present); Head of Global Exchange Traded Funds Services, Invesco PowerShares Capital Management LLC (2013-Present). |
| | | |
David Warren—1957 Invesco Canada Ltd. 5140 Yonge Street, Suite 800 Toronto, Ontario M2N 6X7 | | Vice President | | Since 2009 | | Vice President, PowerShares Exchange-Traded Fund Trust, PowerShares Exchange-Traded Fund Trust II, PowerShares India Exchange-Traded Fund Trust, and PowerShares Actively Managed Exchange-Traded Fund Trust (2009-Present) and PowerShares Actively Managed Exchange-Traded Commodity Fund Trust (2014-Present); Managing Director—Chief Administrative Officer, Americas, Invesco PowerShares Capital Management LLC; Senior Vice President, Invesco Advisers, Inc. (2009-Present); Director, Invesco Inc. (2009-Present); Senior Vice President, Invesco Management Group, Inc. (2007-Present); Director, Executive Vice President and Chief Financial Officer, Invesco Canada Ltd. (formerly, Invesco Trimark Ltd.); Chief Administrative Officer, North American Retail, Invesco Ltd. (2007-Present); Director, Invesco Corporate Class Inc. (2014-Present); Director, Invesco Global Direct Real Estate Feeder GP Ltd. (2015-Present); Director, Invesco Canada Holdings Inc. (2002-Present); Director, Invesco Financial Services Ltd./Services Financiers Invesco Ltée and Trimark Investments Ltd./Placements Trimark Ltée (2014-Present); Director, Invesco IP Holdings (Canada) Ltd. (2016-Present); Director, Invesco Global Direct Real Estate GP Ltd. (2015-Present); formerly, Executive Vice President and Chief Financial Officer, Invesco Inc. (2009-2015); Director, Executive Vice President and Chief Financial Officer, Invesco Canada Ltd. (formerly, Invesco Trimark Ltd.) (2000-2011). |
Availability of Additional Information About the Trustees
The Statement of Additional Information includes additional information about the Trustees and is available, without charge, upon request at (800) 983-0903.
| * | This is the period for which the Officers began serving the Trust. Each Officer serves an indefinite term, until his or her successor is elected. |
Board Considerations Regarding Approval of Investment Advisory Agreement for PowerShares DWA Momentum & Low Volatility Rotation Portfolio and PowerShares DWA Tactical International Rotation Portfolio
At a meeting held on June 21, 2016, the Board of Trustees of the PowerShares Exchange-Traded Fund Trust II (the “Trust”), including the Independent Trustees, approved the Investment Advisory Agreement (the “Agreement”) between Invesco PowerShares Capital Management LLC (the “Adviser”) and the Trust for PowerShares DWA Momentum & Low Volatility Rotation Portfolio and PowerShares DWA Tactical International Rotation Portfolio (each, a “Fund” and collectively, the “Funds”).
The Trustees reviewed information provided by the Adviser describing: (i) the nature, extent and quality of services to be provided, (ii) the costs of services to be provided, (iii) the extent to which economies of scale may be realized as each Fund grows, (iv) whether the fee levels reflect any possible economies of scale for the benefit of Fund shareholders, (v) comparisons of services rendered to and amounts paid by other registered investment companies and (vi) any benefits to be realized by the Adviser from its relationship with each Fund.
Nature, Extent and Quality of Services. In evaluating the nature, extent and quality of the Adviser’s services, the Trustees reviewed information concerning the functions to be performed by the Adviser for each Fund, information describing the Adviser’s current organization and staffing, including operational support that would be provided by the Adviser’s parent organization, Invesco Ltd., and the background and experience of the persons who will be responsible for the day-to-day management of the Funds, and they considered the quality of services provided by the Adviser to other exchange-traded funds (“ETFs”). The Trustees also reviewed information related to the Adviser’s portfolio transaction policies and procedures, as well as reports on the correlation and tracking error between the underlying indexes and the performance of other ETFs for which the Adviser serves as investment adviser.
The Trustees also considered the services to be provided by the Adviser in its oversight of the Funds’ administrator, custodian and transfer agent. They noted the significant amount of time, effort and resources that had been devoted to this oversight function for the other ETFs and that was expected to be provided for each Fund.
Based on their review, the Trustees concluded that the nature, extent and quality of the services to be provided by the Adviser to each Fund under the Agreement were expected to be appropriate and reasonable.
Fees, Expenses and Profitability. The Trustees reviewed and discussed the information provided by the Adviser on each Fund’s proposed advisory fee, as compared to information compiled from Lipper Inc. (“Lipper”) databases on the median net expense ratios of ETF, open-end index and open-end actively managed (non-ETF) peers that, like the Funds, are structured as “fund-of-funds.” The Trustees noted that the proposed annual advisory fee to be charged to each Fund was a unitary fee, and that the Adviser has agreed to pay all other expenses of each Fund except for the fee payment under the Agreement, payments under the Fund’s 12b-1 plan, if any, brokerage expenses, taxes, interest, litigation expenses and other extraordinary expenses. The Trustees noted the small size of the peer groups and that the proposed unitary fee was at or below the median of the peer groups as shown below:
| | | | | | | | |
Fund | | ETF Peer Group
(Number of Peers) | | Open-End Index
Fund Peer Group
(Number of Peers) | | | Open-End Active
Fund Peer Group
(Number of Peers) |
| PowerShares DWA Momentum & Low Volatility Rotation Portfolio | | Lower than median (2) | | | N/A | | | N/A |
| PowerShares DWA Tactical International Rotation Portfolio | | Same as median (3) | | | N/A | | | Lower than median (2) |
The Trustees also reviewed the fees, and any difference in fees, between each Fund and PowerShares DWA Tactical Sector Rotation Portfolio and PowerShares Tactical Multi-Asset Income Portfolio, two other funds managed by the Adviser that are also structured as fund-of-funds and invest in funds that comprise an index developed by Dorsey Wright & Associates, LLC (both before and after payment by the Adviser of the applicable license fees). The Trustees noted that, for PowerShares DWA Tactical International Rotation Portfolio, the proposed unitary fee was higher than the unitary fee for PowerShares DWA Tactical Sector Rotation Portfolio and PowerShares Tactical Multi-Asset Income Portfolio, but that PowerShares DWA Tactical International Rotation Portfolio, unlike PowerShares DWA Tactical Sector Rotation Portfolio and PowerShares Tactical Multi-Asset Income Portfolio, could invest at times, in non-affiliated funds.
The Trustees considered each Fund’s proposed advisory fee in light of the administrative, operational and management oversight costs for the Adviser. The Board concluded that the unitary advisory fee to be charged to each Fund is reasonable and appropriate in light of the services expected to be provided by the Adviser.
In conjunction with their review of the unitary advisory fee, the Trustees also considered information provided by the Adviser on the proposed costs of services for each Fund and the fees to be paid by the Adviser. The Adviser did not provide profitability of the Adviser in managing each Fund because the Funds had not yet commenced operations. However, the Trustees considered other information the Board received at its April meeting on the Adviser’s overall profitability from its relationship with other ETFs for which it serves as investment adviser.
Board Considerations Regarding Approval of Investment Advisory Agreement for PowerShares DWA Momentum & Low Volatility Rotation Portfolio and PowerShares DWA Tactical International Rotation Portfolio (continued)
Economies of Scale and Whether Fee Levels Reflect These Economies of Scale. The Trustees reviewed the information provided by the Adviser as to the extent to which economies of scale may be realized as each Fund grows and whether fee levels reflect economies of scale for the benefit of shareholders. The Trustees noted that any reduction in fixed costs associated with the management of each Fund would be enjoyed by the Adviser, but that a unitary fee provides a level of certainty in expenses for each Fund. The Trustees considered whether the proposed advisory fee rate for each Fund is reasonable in relation to the proposed services and product strategy of each Fund, and they concluded that the flat advisory fee was reasonable and appropriate.
Fall-Out Benefits. The Trustees noted that the Adviser had not identified any further benefits that it would derive from its relationships with each Fund, and had noted that it does not have any soft-dollar arrangements.
Based on all of the information considered and the conclusions reached, the Board, including the Independent Trustees, determined to approve the Agreement for each Fund. No single factor was determinative in the Board’s analysis.
(This Page Intentionally Left Blank)
Proxy Voting Policies and Procedures
A description of the Trust’s proxy voting policies and procedures that the Funds use to determine how to vote proxies relating to portfolio securities is available, without charge and upon request, by calling (800) 983-0903. This information is also available on the Securities and Exchange Commission’s (“Commission”) website at www.sec.gov.
Information regarding how each Fund voted proxies for portfolio securities, if applicable, during the most recent 12-month period ended June 30, is also available, without charge and upon request, by (i) calling (800) 983-0903; or (ii) accessing the Trust’s Form N-PX on the Commission’s website at www.sec.gov.
Quarterly Portfolios
The Trust files its complete schedule of portfolio holdings for the Funds with the Commission for the first and third quarters of each fiscal year on Form N-Q. The Trust’s Forms N-Q are available on the Commission’s website at www.sec.gov. The Trust’s Forms N-Q may also be reviewed and copied at the Commission’s Public Reference Room in Washington, DC; information on the operation of the Public Reference Room may be obtained by calling (800) SEC-0330.
Frequency Distribution of Discounts and Premiums
A table showing the number of days the market price of each Fund’s shares was greater than the Fund’s net asset value, and the number of days it was less than the Fund’s net asset value (i.e., premium or discount) for the most recently completed calendar year, and the calendar quarters since that year end (or the life of the Fund, if shorter) may be found at the Fund’s website at www.invescopowershares.com.
| | | | | | |
| P-SCS-AR-1 | |  |
©2016 Invesco PowerShares Capital Management LLC 3500 Lacey Road, Suite 700 Downers Grove, IL 60515 | |
| powershares.com 800 983 0903 | |  | | @PowerShares | |

2016 Annual Report to Shareholders
| | |
| |
| CNTR | | PowerShares Contrarian Opportunities Portfolio |
| |
| KBWB | | PowerShares KBW Bank Portfolio |
| |
| KBWD | | PowerShares KBW High Dividend Yield Financial Portfolio |
| |
| KBWY | | PowerShares KBW Premium Yield Equity REIT Portfolio |
| |
| KBWP | | PowerShares KBW Property & Casualty Insurance Portfolio |
| |
| KBWR | | PowerShares KBW Regional Banking Portfolio |
| |
| EQAL | | PowerShares Russell 1000 Equal Weight Portfolio |
Table of Contents
The Market Environment
US Equity
During the fiscal year ended October 31, 2016, the US economy continued to expand. The initial estimate of US gross domestic product (GDP) showed the US economy grew by 2.9% in the third calendar quarter of 2016, beating consensus estimates.1 However, annualized GDP is expected to be lower. Employment data were mixed, though the unemployment rate had a surprise uptick from 4.9% in August to 5.0% in September before ending the fiscal year at 4.9%.2 Oil prices traded in a range from the high $20s to the low $50s during the reporting period.3
The US Federal Reserve (the Fed) raised interest rates in December 2015—its first increase since 2006—but that was its only increase during the reporting period. Major US stock market indexes posted gains for the reporting period, but they were fairly volatile. Stocks began calendar year 2016 on a negative note, driven by investor concerns about economic weakness in China, falling oil prices and uncertainty over Fed policy, including rumors of possible negative interest rates in the US. Markets recovered in late February and posted gains until June when UK voters opted to leave the European Union, sending markets sharply lower once again. Markets again recovered, and major US equity indexes hit record highs during the summer.4 In this environment, investors generally favored the perceived safety of government bonds and more defensive, dividend-paying equities often found in the telecommunication services, utilities and consumer staples sectors.
| 1 | Source: Bureau of Economic Analysis |
| 2 | Source: Bureau of Labor Statistics |
| 3 | Source: Thompson-Reuters |
| | |
| CNTR | | Manager’s Analysis |
| | PowerShares Contrarian Opportunities Portfolio (CNTR) |
As an index fund, the PowerShares Contrarian Opportunities Portfolio (the “Fund”) is passively managed and attempts to track the returns of an underlying index. The Fund seeks investment results that generally correspond (before fees and expenses) to the price and yield of the Dow Jones U.S. Contrarian Opportunities Index (the “Index”). The Fund generally will invest at least 90% of its total assets in common stocks that comprise the Index.
Strictly in accordance with its guidelines and mandated procedures, S&P Dow Jones Indices, LLC (the “Index Provider”) compiles and maintains the Index, which employs a contrarian investment methodology to identify stocks whose recent performance lags that of the broader equity market, yet still outrank their peers based on company fundamentals and other qualitative criteria. A contrarian investment process seeks to identify companies that may have experienced adverse developments or negative investor sentiment, causing its securities to be out of favor or potentially undervalued, but which may offer promising future growth prospects. The Fund generally invests in all of the securities comprising the Index in proportion to their weightings in the Index.
For the fiscal year ended October 31, 2016, on a market price basis, the Fund returned 2.12%. On a net asset value (“NAV”) basis, the Fund returned 2.16%. During the same time period, the Index returned 2.64%. During this period, the Fund fully replicated the components of the Index; therefore, the Fund’s performance (NAV basis) differed from the return of the Index primarily due to fees and operating expenses that the Fund incurred during the period.
During this same time period, the S&P 500® Index (the “Benchmark Index”) returned 4.51%. The Benchmark Index is an unmanaged index weighted by market capitalization based on the average performance of approximately 500 securities. The adviser provided this additional comparative benchmark to help investors better understand how the investment results of the Fund compare to the performance of a broad-based market benchmark.
Relative to the Benchmark Index, the Fund was most overweight in the industrials sector and most underweight in the health care sector during the fiscal year ended October 31, 2016. The majority of the Fund’s underperformance relative to the Benchmark Index during the period can be attributed to stock selection within the energy and industrials sectors.
For the fiscal year ended October 31, 2016, the information technology sector contributed most significantly to the Fund’s return, followed by the consumer discretionary and consumer staples sectors. The health care sector detracted most significantly from the Fund’s return, followed by the energy and industrials sectors.
Positions that contributed most significantly to the Fund’s return included NVIDIA Corp., an information technology company (no longer held at fiscal year-end), and Nu Skin Enterprises, Inc., Class A, a consumer staples company (no longer held at fiscal year-end). Positions that detracted most significantly from the Fund’s return included Parker Drilling Company, an energy company (no longer held at fiscal year-end), and GNC Holdings, Inc., Class A, a consumer discretionary company (portfolio average weight of 0.68%).
| | | | |
Sector Breakdown
(% of the Fund’s Net Assets)
as of October 31, 2016 | |
| Industrials | | | 28.5 | |
| Consumer Discretionary | | | 27.9 | |
| Information Technology | | | 15.5 | |
| Financials | | | 11.5 | |
| Materials | | | 5.5 | |
| Health Care | | | 5.0 | |
| Consumer Staples | | | 4.0 | |
| Energy | | | 1.4 | |
| Real Estate | | | 0.7 | |
| Money Market Fund Plus Other Assets Less Liabilities | | | 0.0 | |
|
Top Ten Fund Holdings*
(% of the Fund’s Net Assets)
as of October 31, 2016 | |
| Security | | | | |
| Zumiez, Inc. | | | 1.1 | |
| II-VI, Inc. | | | 1.1 | |
| Swift Transportation Co., Class A | | | 1.0 | |
| United Continental Holdings, Inc. | | | 1.0 | |
| Spirit Airlines, Inc. | | | 1.0 | |
| PRA Group, Inc. | | | 1.0 | |
| KapStone Paper and Packaging Corp. | | | 1.0 | |
| Quanta Services, Inc. | | | 1.0 | |
| Team Health Holdings, Inc. | | | 0.9 | |
| ON Semiconductor Corp. | | | 0.9 | |
| Total | | | 10.0 | |
| * | Excluding money market fund holdings. |
PowerShares Contrarian Opportunities Portfolio (CNTR) (continued)
Growth of a $10,000 Investment Since Inception†
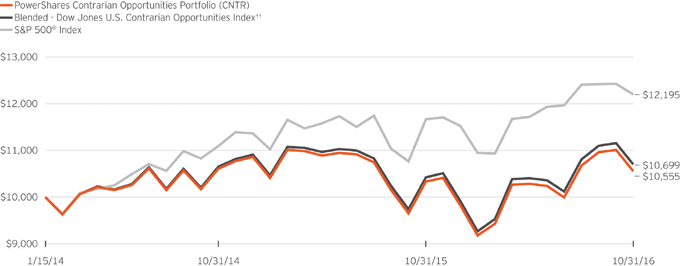
Fund Performance History as of October 31, 2016
| | | | | | | | | | | | | | | | |
| | | 1 Year | | | | | | Fund Inception† | |
| Index | | | | | | Average
Annualized | | | Cumulative | |
| Blended-Dow Jones U.S. Contrarian Opportunities Index†† | | | 2.64 | % | | | | | | | 2.45 | % | | | 6.99 | % |
| S&P 500® Index | | | 4.51 | | | | | | | | 7.36 | | | | 21.95 | |
| Fund | | | | | | | | | | | | | | | | |
| NAV Return | | | 2.16 | | | | | | | | 1.95 | | | | 5.55 | |
| Market Price Return | | | 2.12 | | | | | | | | 1.95 | | | | 5.55 | |
Fund Inception: January 15, 2014
Performance quoted above represents past performance. Past performance is not a guarantee of future results and current performance may be higher or lower than performance quoted. Investment returns and principal value will fluctuate, and shares of the Fund (“Fund Shares”), when redeemed or sold, may be worth more or less than their original cost. Fund performance reflects any applicable fee waivers and/or expense reimbursements. Had the adviser not waived fees and/or reimbursed expenses currently or in the past, returns would have been lower. See current prospectus for more information. According to the Fund’s current prospectus, the Fund’s expense ratio of 0.35% is expressed as a unitary management fee to cover operating expenses and expenses incurred in connection with managing the portfolio. NAV and Market Price returns assume that dividends and capital gain distributions have been reinvested in the Fund at NAV and Market Price, respectively. The returns shown in the table above do not reflect the deduction of taxes that a shareholder would pay on Fund distributions or the redemption or sale of Fund Shares. See invescopowershares.com to find the most recent month-end performance numbers.
Blended-Index and Benchmark Index performance results are based upon a hypothetical investment in their respective constituent securities. Blended-Index and Benchmark Index returns do not represent Fund returns. An investor cannot invest directly in an index. The Blended-Index and Benchmark Index do not charge management fees or brokerage expenses, and no such fees or expenses were deducted from the hypothetical performance shown. In addition, the results actual investors might have achieved would have differed from those shown because of differences in the timing, amounts of their investments, and fees and expenses associated with an investment in the Fund.
| † | Fund, Blended-Index and Benchmark Index returns are based on the inception date of the Fund. |
| †† | The Blended-Dow Jones U.S. Contrarian Opportunities Index performance is comprised of the performance of the NYSE Century Index, the Fund’s previous underlying index, from Fund inception through the conversion date, May 22, 2015, followed by the performance of the Index starting from the conversion date through October 31, 2016. |
| | |
| KBWB | | Manager’s Analysis |
| | PowerShares KBW Bank Portfolio (KBWB) |
As an index fund, the PowerShares KBW Bank Portfolio (the “Fund”) is passively managed and attempts to track the returns of an underlying index. The Fund seeks investment results that generally correspond (before fees and expenses) to the price and yield of the KBW Nasdaq Bank Index (the “Index”). The Fund generally will invest at least 90% of its total assets in securities of national money centers (which are banks with more than $50 billion in assets and that have a branch network across geographic regions) and regional banks and thrifts that are listed on a U.S. national securities exchange and that comprise the Index.
Keefe, Bruyette & Woods, Inc. (“KBW”), the Index provider, compiles, calculates and maintains the Index, which is a modified-market capitalization-weighted index that seeks to reflect the performance of national money centers and regional banks and thrifts that are publicly traded in the U.S. The Fund generally invests in all of the securities comprising the Index in proportion to their weightings in the Index.
For the fiscal year ended October 31, 2016, on a market price basis, the Fund returned 4.55%. On a net asset value (“NAV”) basis, the Fund returned 4.61%. During the same time period, the Index returned 5.00%. During the fiscal year, the Fund fully replicated the components of the Index; therefore, the Fund’s performance (NAV basis) differed from the return of the Index primarily due to fees and operating expenses incurred by the Fund.
During this same time period, the S&P 500® Financials Sector Index (the “Benchmark Index”) returned 3.45%. The Benchmark Index is an unmanaged index weighted by market capitalization and based on the average performance of approximately 65 securities.
The Benchmark Index was selected for its recognition in the marketplace, and its performance comparison is a useful measure for investors as a broad representation of the United States financial sector equity market. The performance of the Fund differed from the Benchmark Index in part because the Benchmark Index is broadly diversified across all financial sub-industries and is not concentrated just on the banking sub-industry.
Relative to the Benchmark Index, the Fund was most overweight in the regional banks sub-industry and most underweight in the multi-sector holdings sub-industry during the fiscal year ended October 31, 2016. The majority of the Fund’s outperformance relative to the Benchmark Index during the period can be attributed to the Fund’s overweight position in the regional banks sub-industry, as well as stock selection within the Fund relative to the Benchmark Index.
For the fiscal year ended October 31, 2016, the regional banks sub-industry contributed most significantly to the Fund’s return, followed by the asset management & custody banks and diversified banks sub-industries, respectively. The thrifts & mortgage finance sub-industry was the only detracting sub-industry.
Positions that contributed most significantly to the Fund’s return included JPMorgan Chase & Co., a diversified banks company (portfolio average weight of 8.12%), and U.S. Bancorp, a diversified banks company (portfolio average weight of 8.11%). Positions that detracted most significantly from the Fund’s return included Wells Fargo & Co., a diversified banks company (portfolio average weight of 7.84%), and Citigroup, Inc., a diversified banks company (portfolio average weight of 7.91%).
| | | | |
Sub-Industry Breakdown
(% of the Fund’s Net Assets)
as of October 31, 2016 | |
| Diversified Banks | | | 41.3 | |
| Regional Banks | | | 40.9 | |
| Asset Management & Custody Banks | | | 12.0 | |
| Consumer Finance | | | 4.0 | |
| Thrifts & Mortgage Finance | | | 1.8 | |
| Money Market Fund Plus Other Assets Less Liabilities | | | 0.0 | |
|
Top Ten Fund Holdings*
(% of the Fund’s Net Assets)
as of October 31, 2016 | |
| Security | | | | |
| Citigroup, Inc. | | | 8.0 | |
| JPMorgan Chase & Co. | | | 8.0 | |
| Bank of America Corp. | | | 8.0 | |
| U.S. Bancorp | | | 7.9 | |
| Wells Fargo & Co. | | | 7.1 | |
| Fifth Third Bancorp | | | 4.2 | |
| PNC Financial Services Group, Inc. (The) | | | 4.1 | |
| Bank of New York Mellon Corp. (The) | | | 4.1 | |
| M&T Bank Corp. | | | 4.0 | |
| Capital One Financial Corp. | | | 4.0 | |
| Total | | | 59.4 | |
| * | Excluding money market fund holdings. |
PowerShares KBW Bank Portfolio (KBWB) (continued)
Growth of a $10,000 Investment Since Inception†
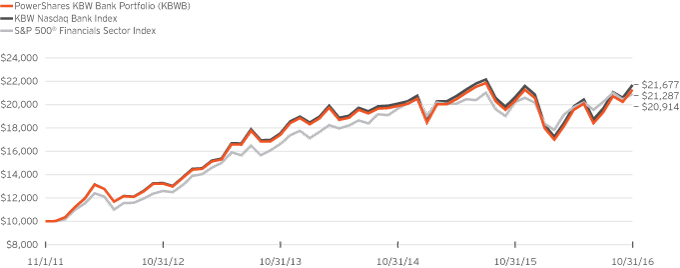
Fund Performance History as of October 31, 2016
| | | | | | | | | | | | | | | | | | | | | | | | |
| | | 1 Year | | | 3 Years
Average
Annualized | | | 3 Years
Cumulative | | | | | | Fund Inception† | |
| Index | | | | | | | | Average
Annualized | | | Cumulative | |
| KBW Nasdaq Bank Index | | | 5.00 | % | | | 7.31 | % | | | 23.58 | % | | | | | | | 16.75 | % | | | 116.77 | % |
| S&P 500® Financials Sector Index | | | 3.45 | | | | 7.93 | | | | 25.72 | | | | | | | | 15.91 | | | | 109.14 | |
| Fund | | | | | | | | | | | | | | | | | | | | | | | | |
| NAV Return | | | 4.61 | | | | 6.92 | | | | 22.23 | | | | | | | | 16.31 | | | | 112.87 | |
| Market Price Return | | | 4.55 | | | | 6.93 | | | | 22.25 | | | | | | | | 16.36 | | | | 113.31 | |
Fund Inception: November 1, 2011
Performance quoted above represents past performance. Past performance is not a guarantee of future results and current performance may be higher or lower than performance quoted. Investment returns and principal value will fluctuate, and shares of the Fund (“Fund Shares”), when redeemed or sold, may be worth more or less than their original cost. Fund performance reflects any applicable fee waivers and/or expense reimbursements. Had the adviser not waived fees and/or reimbursed expenses currently or in the past, returns would have been lower. See current prospectus for more information. According to the Fund’s current prospectus, the Fund’s expense ratio of 0.35% is expressed as a unitary management fee to cover operating expenses and expenses incurred in connection with managing the portfolio. NAV and Market Price returns assume that dividends and capital gain distributions have been reinvested in the Fund at NAV and Market Price, respectively. The returns shown in the table above do not
reflect the deduction of taxes that a shareholder would pay on Fund distributions or the redemption or sale of Fund Shares. See invescopowershares.com to find the most recent month-end performance numbers.
Index and Benchmark Index performance results are based upon a hypothetical investment in their respective constituent securities. Index and Benchmark Index returns do not represent Fund returns. An investor cannot invest directly in an index. The Index and Benchmark Index do not charge management fees or brokerage expenses, and no such fees or expenses were deducted from the hypothetical performance shown. In addition, the results actual investors might have achieved would have differed from those shown because of differences in the timing, amounts of their investments, and fees and expenses associated with an investment in the Fund.
| † | Fund, Index and Benchmark Index returns are based on the inception date of the Fund. |
| | |
| KBWD | | Manager’s Analysis |
| | PowerShares KBW High Dividend Yield Financial Portfolio (KBWD) |
As an index fund, the PowerShares KBW High Dividend Yield Financial Portfolio (the “Fund”) is passively managed and attempts to track the returns of an underlying index. The Fund seeks investment results that generally correspond (before fees and expenses) to the price and yield of the KBW Nasdaq Financial Sector Dividend Yield Index (the “Index”). The Fund generally will invest at least 90% of its total assets in the securities of publicly listed financial companies that principally are engaged in the business of providing financial services and products, including banking, insurance and diversified financial services, in the United States and that comprise the Index.
Keefe, Bruyette & Woods, Inc. (“KBW”), the Index provider, compiles, maintains and calculates the Index, which is a modified dividend yield-weighted index that seeks to reflect the performance of such companies. The Fund generally invests in all of the securities comprising the Index in proportion to their weightings in the Index.
For the fiscal year ended October 31, 2016, on a market price basis, the Fund returned 5.56%. On a net asset value (“NAV”) basis, the Fund returned 5.46%. During the same time period, the Index returned 5.72%. During the fiscal year, the Fund fully replicated the components of the Index; therefore, the Fund’s performance (NAV basis) differed from the return of the Index primarily due to fees and operating expenses incurred by the Fund.
During this same time period, the S&P 500® Financials Sector Index (the “Benchmark Index”) returned 3.45%. The Benchmark Index is an unmanaged index weighted by market capitalization and based on the average performance of approximately 65 securities.
The Benchmark Index was selected for its recognition in the marketplace, and its performance comparison is a useful measure for investors as a broad representation of the United States financial services equity market. The performance of the Fund differed from the Benchmark Index in part because of stock selection in the asset management & custody banks sub-industry, as well as sub-industry allocation differences.
Relative to the Benchmark Index, the Fund was most overweight in the mortgage REITs sub-industry and most underweight in the diversified banks sub-industry during the fiscal year ended October 31, 2016. The majority of the Fund’s outperformance relative to the Benchmark Index during the period can be attributed to investments in the asset management & custody banks sub-industry as well as security selection within the mortgage REITs sub-industry.
For the fiscal year ended October 31, 2016, the mortgage REITs sub-industry contributed most significantly to the Fund’s return, followed by the asset management & custody banks and thrifts & mortgage finance sub-industries, respectively. The trading
companies & distributors sub-industry detracted most significantly from the Fund’s return, followed by the property & casualty insurance and investment banking & brokerage sub-industries, respectively.
Positions that contributed most significantly to the Fund’s return included PennantPark Investment Corp., an asset management & custody banks company (portfolio average weight of 4.56%), and New Residential Investment Corp. REIT, a mortgage REITs company (portfolio average weight of 3.54%). Positions that detracted most significantly from the Fund’s return included Textainer Group Holdings Ltd., a trading companies & distributors company (portfolio average weight of 1.79%), and Waddell & Reed Financial, Inc., Class A, an asset management & custody banks company (portfolio average weight of 1.66%).
| | | | |
Sub-Industry Breakdown
(% of the Fund’s Net Assets)
as of October 31, 2016 | |
| Asset Management & Custody Banks | | | 41.4 | |
| Mortgage REITs | | | 31.4 | |
| Regional Banks | | | 7.6 | |
| Investment Banking & Brokerage | | | 7.4 | |
| Thrifts & Mortgage Finance | | | 5.7 | |
| Property & Casualty Insurance | | | 3.0 | |
| Reinsurance | | | 1.5 | |
| Consumer Finance | | | 1.5 | |
| Trading Companies & Distributors | | | 0.4 | |
| Money Market Fund Plus Other Assets Less Liabilities | | | 0.1 | |
|
Top Ten Fund Holdings*
(% of the Fund’s Net Assets)
as of October 31, 2016 | |
| Security | | | | |
| Arlington Asset Investment Corp., Class A | | | 5.9 | |
| PennantPark Investment Corp. | | | 4.9 | |
| New Residential Investment Corp. REIT | | | 4.6 | |
| Resource Capital Corp. REIT | | | 4.4 | |
| Agnc Investment Corp. REIT | | | 4.3 | |
| ARMOUR Residential REIT, Inc. REIT | | | 4.2 | |
| Medley Capital Corp. | | | 4.2 | |
| THL Credit, Inc. | | | 4.1 | |
| AG Mortgage Investment Trust, Inc. REIT | | | 4.1 | |
| Western Asset Mortgage Capital Corp. REIT | | | 4.0 | |
| Total | | | 44.7 | |
| * | Excluding money market fund holdings. |
PowerShares KBW High Dividend Yield Financial Portfolio (KBWD) (continued)
Growth of a $10,000 Investment Since Inception†
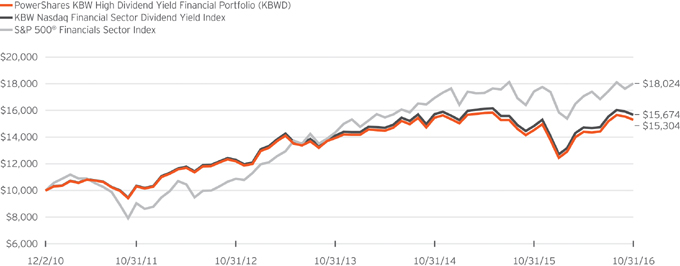
Fund Performance History as of October 31, 2016
| | | | | | | | | | | | | | | | | | | | | | | | | | | | | | | | |
| | | 1 Year | | | 3 Years
Average
Annualized | | | 3 Years
Cumulative | | | 5 Years
Average
Annualized | | | 5 Years
Cumulative | | | | | | Fund Inception† | |
| Index | | | | | | | | | | Average
Annualized | | | Cumulative | |
| KBW Nasdaq Financial Sector Dividend Yield Index | | | 5.72 | % | | | 3.60 | % | | | 11.21 | % | | | 8.68 | % | | | 51.58 | % | | | | | | | 7.90 | % | | | 56.74 | % |
| S&P 500® Financials Sector Index | | | 3.45 | | | | 7.93 | | | | 25.72 | | | | 14.79 | | | | 99.28 | | | | | | | | 10.48 | | | | 80.24 | |
| Fund | | | | | | | | | | | | | | | | | | | | | | | | | | | | | | | | |
| NAV Return | | | 5.46 | | | | 3.22 | | | | 9.99 | | | | 8.25 | | | | 48.63 | | | | | | | | 7.46 | | | | 53.04 | |
| Market Price Return | | | 5.56 | | | | 3.20 | | | | 9.91 | | | | 8.21 | | | | 48.36 | | | | | | | | 7.50 | | | | 53.37 | |
Fund Inception: December 2, 2010
Performance quoted above represents past performance. Past performance is not a guarantee of future results and current performance may be higher or lower than performance quoted. Investment returns and principal value will fluctuate, and shares of the Fund (“Fund Shares”), when redeemed or sold, may be worth more or less than their original cost. Fund performance reflects any applicable fee waivers and/or expense reimbursements. Had the adviser not waived fees and/or reimbursed expenses currently or in the past, returns would have been lower. See current prospectus for more information. According to the Fund’s current prospectus, the Fund’s expense ratio of 3.08% includes the unitary management fee of 0.35% and acquired fund fees and expenses of 2.73%. NAV and Market Price returns assume that dividends and capital gain distributions have been reinvested in the Fund at NAV and Market Price, respectively. The returns shown in the table above do not reflect the deduction of taxes that a shareholder
would pay on Fund distributions or the redemption or sale of Fund Shares. See invescopowershares.com to find the most recent month-end performance numbers.
Index and Benchmark Index performance results are based upon a hypothetical investment in their respective constituent securities. Index and Benchmark Index returns do not represent Fund returns. An investor cannot invest directly in an index. The Index and Benchmark Index do not charge management fees or brokerage expenses, and no such fees or expenses were deducted from the hypothetical performance shown. In addition, the results actual investors might have achieved would have differed from those shown because of differences in the timing, amounts of their investments, and fees and expenses associated with an investment in the Fund.
| † | Fund, Index and Benchmark Index returns are based on the inception date of the Fund. |
| | |
| KBWY | | Manager’s Analysis |
| | PowerShares KBW Premium Yield Equity REIT Portfolio (KBWY) |
As an index fund, the PowerShares KBW Premium Yield Equity REIT Portfolio (the “Fund”) is passively managed and attempts to track the returns of an underlying index. The Fund seeks investment results that generally correspond (before fees and expenses) to the price and yield of the KBW Nasdaq Premium Yield Equity REIT Index (the “Index”). The Fund generally will invest at least 90% of its total assets in the securities of small- and mid-cap equity real estate investment trusts (“REITs”) in the United States that comprise the Index.
Keefe, Bruyette & Woods, Inc. (“KBW”), the Index provider, compiles, maintains and calculates the Index, which is a modified-dividend yield-weighted index that seeks to reflect the performance of small- and mid-cap equity REITs in the U.S. The Fund generally invests in all of the securities comprising the Index in proportion to their weightings in the Index.
For the fiscal year ended October 31, 2016, on a market price basis, the Fund returned 15.64%. On a net asset value (“NAV”) basis, the Fund returned 15.68%. During the same time period, the Index returned 16.01%. During the fiscal year, the Fund fully replicated the components of the Index; therefore, the Fund’s performance (NAV basis) differed from the return of the Index primarily due to fees and operating expenses incurred by the Fund.
During this same time period, the Dow Jones U.S. Real Estate Index (the “Benchmark Index”) returned 6.50%. The Benchmark Index is an unmanaged index weighted by market capitalization and based on the average performance of approximately 130 securities.
The Benchmark Index was selected for its recognition in the marketplace, and its performance comparison is a useful measure for investors as a broad representation of the United States REIT market.
Relative to the Benchmark Index, the Fund was most overweight in the diversified real estate activities sub-industry and most underweight in the diversified REITs sub-industry during the fiscal year ended October 31, 2016. The majority of the Fund’s outperformance relative to the Benchmark Index during the period can be attributed to the Fund’s underweight in the Benchmark Index’s biggest detractor, hotel & resort REITs.
For the fiscal year ended October 31, 2016, the health care REITs sub-industry contributed most significantly to the Fund’s return, followed by the diversified REITs and specialized REITs sub-industries. The hotel & resort REITs sub-industry was the only detracting sub-industry.
Positions that contributed most significantly to the Fund’s return included Senior Housing Properties Trust REIT, a health care REITs company (portfolio average weight of 4.33%), and Government Properties Income Trust REIT, an office REITs
company (portfolio average weight of 4.58%). Positions that detracted most significantly from the Fund’s return included One Liberty Properties, Inc. REIT, a diversified REITs company (no longer held at fiscal year-end), and CBL & Associates Properties, Inc., a retail REITs company (portfolio average weight of 3.73%).
| | | | |
REIT Sub-Industry Breakdown
(% of the Fund’s Net Assets)
as of October 31, 2016 | |
| Diversified | | | 29.1 | |
| Specialized | | | 20.7 | |
| Health Care | | | 20.3 | |
| Residential | | | 6.5 | |
| Hotel & Resort | | | 6.2 | |
| Office | | | 6.2 | |
| Retail | | | 5.9 | |
| Industrial | | | 5.1 | |
| Other Assets Less Liabilities | | | (0.0) | |
|
Top Ten Fund Holdings
(% of the Fund’s Net Assets)
as of October 31, 2016 | |
| Security | | | | |
| Geo Group, Inc. (The) | | | 8.2 | |
| Corrections Corp. of America | | | 6.5 | |
| Gladstone Commercial Corp. | | | 4.4 | |
| Global NET Lease, Inc. | | | 4.0 | |
| Whitestone | | | 3.8 | |
| Investors Real Estate Trust | | | 3.8 | |
| New Senior Investment Group, Inc. | | | 3.7 | |
| Care Capital Properties, Inc. | | | 3.6 | |
| Gaming and Leisure Properties, Inc. | | | 3.6 | |
| Independence Realty Trust, Inc. | | | 3.5 | |
| Total | | | 45.1 | |
PowerShares KBW Premium Yield Equity REIT Portfolio (KBWY) (continued)
Growth of a $10,000 Investment Since Inception†
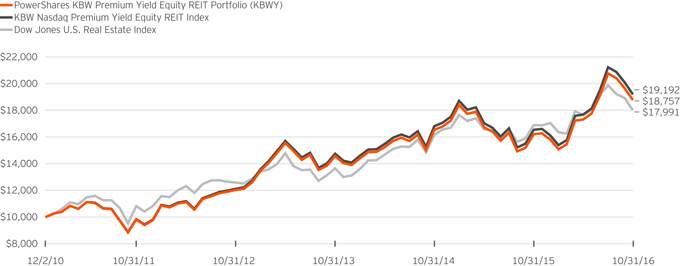
Fund Performance History as of October 31, 2016
| | | | | | | | | | | | | | | | | | | | | | | | | | | | | | | | |
| | | 1 Year | | | 3 Years
Average
Annualized | | | 3 Years
Cumulative | | | 5 Years
Average
Annualized | | | 5 Years
Cumulative | | | | | | Fund Inception† | |
| Index | | | | | | | | | | Average
Annualized | | | Cumulative | |
| KBW Nasdaq Premium Yield Equity REIT Index | | | 16.01 | % | | | 9.17 | % | | | 30.13 | % | | | 14.28 | % | | | 94.89 | % | | | | | | | 11.66 | % | | | 91.92 | % |
| Dow Jones U.S. Real Estate Index | | | 6.50 | | | | 9.69 | | | | 31.97 | | | | 10.71 | | | | 66.32 | | | | | | | | 10.45 | | | | 79.91 | |
| Fund | | | | | | | | | | | | | | | | | | | | | | | | | | | | | | | | |
| NAV Return | | | 15.68 | | | | 8.80 | | | | 28.78 | | | | 13.83 | | | | 91.13 | | | | | | | | 11.22 | | | | 87.57 | |
| Market Price Return | | | 15.64 | | | | 8.73 | | | | 28.53 | | | | 13.80 | | | | 90.86 | | | | | | | | 11.26 | | | | 87.90 | |
Fund Inception: December 2, 2010
Performance quoted above represents past performance. Past performance is not a guarantee of future results and current performance may be higher or lower than performance quoted. Investment returns and principal value will fluctuate, and shares of the Fund (“Fund Shares”), when redeemed or sold, may be worth more or less than their original cost. Fund performance reflects any applicable fee waivers and/or expense reimbursements. Had the adviser not waived fees and/or reimbursed expenses currently or in the past, returns would have been lower. See current prospectus for more information. According to the Fund’s current prospectus, the Fund’s expense ratio of 0.35% is expressed as a unitary management fee to cover operating expenses and expenses incurred in connection with managing the portfolio. NAV and Market Price returns assume that dividends and capital gain distributions have been reinvested in the Fund at NAV and Market Price, respectively. The returns shown in the table above do not
reflect the deduction of taxes that a shareholder would pay on Fund distributions or the redemption or sale of Fund Shares. See invescopowershares.com to find the most recent month-end performance numbers.
Index and Benchmark Index performance results are based upon a hypothetical investment in their respective constituent securities. Index and Benchmark Index returns do not represent Fund returns. An investor cannot invest directly in an index. The Index and Benchmark Index do not charge management fees or brokerage expenses, and no such fees or expenses were deducted from the hypothetical performance shown. In addition, the results actual investors might have achieved would have differed from those shown because of differences in the timing, amounts of their investments, and fees and expenses associated with an investment in the Fund.
| † | Fund, Index and Benchmark Index returns are based on the inception date of the Fund. |
| | |
| KBWP | | Manager’s Analysis |
| | PowerShares KBW Property & Casualty Insurance Portfolio (KBWP) |
As an index fund, the PowerShares KBW Property & Casualty Insurance Portfolio (the “Fund”) is passively managed and attempts to track the returns of an underlying index. The Fund seeks investment results that generally correspond (before fees and expenses) to the price and yield of the KBW Nasdaq Property & Casualty Index (the “Index”). The Fund generally will invest at least 90% of its total assets in the securities of property and casualty insurance companies that comprise the Index.
Keefe, Bruyette & Woods, Inc. (“KBW”), the Index provider, compiles, maintains and calculates the Index using a modified market capitalization-weighted methodology that seeks to reflect the performance of such property and casualty insurance companies. The Fund generally invests in all of the securities comprising the Index in proportion to their weightings in the Index.
For the fiscal year ended October 31, 2016, on a market price basis, the Fund returned 6.43%. On a net asset value (“NAV”) basis, the Fund returned 6.63%. During the same time period, the Index returned 6.99%. During the fiscal year, the Fund fully replicated the components of the Index; therefore, the Fund’s performance (NAV basis) differed from the return of the Index primarily due to fees and operating expenses incurred by the Fund.
During this same time period, the S&P 500® Property & Casualty Index (the “Benchmark Index”) returned 7.87%. The Benchmark Index is an unmanaged index weighted by market capitalization and based on the average performance.
The Benchmark Index was selected for its recognition in the marketplace, and its performance comparison is a useful measure for investors as a representation of the United States property and casualty market. The performance of the Fund differed from the Benchmark Index in part because of the Fund’s allocation in the multi-line insurance and reinsurance sub-industries.
Relative to the Benchmark Index, the Fund was most overweight in the reinsurance sub-industry and most underweight in the property & casualty insurance sub-industry during the fiscal year ended October 31, 2016. The majority of the Fund’s underperformance relative to the Benchmark Index during the period can be attributed to the broader diversification in the Fund relative to the Benchmark Index.
For the fiscal year ended October 31, 2016, the reinsurance sub-industry contributed most significantly to the Fund’s return, followed by the property & casualty insurance and multi-line insurance sub-industries, respectively. There were no detracting sub-industries.
Positions that contributed most significantly to the Fund’s return included Endurance Specialty Holdings Ltd., a reinsurance company (portfolio average weight of 3.72%), and Cincinnati Financial Corp., a property & casualty insurance company
(portfolio average weight of 6.45%). Positions that detracted most significantly from the Fund’s return included AmTrust Financial Services, Inc., a property & casualty insurance company (portfolio average weight of 3.46%), and XL Group Ltd. (Ireland), a property & casualty insurance company (portfolio average weight of 4.91%).
| | | | |
Sub-Industry Breakdown
(% of the Fund’s Net Assets)
as of October 31, 2016 | |
| Property & Casualty Insurance | | | 74.3 | |
| Reinsurance | | | 16.5 | |
| Multi-line Insurance | | | 9.2 | |
| Money Market Fund Plus Other Assets Less Liabilities | | | (0.0) | |
|
Top Ten Fund Holdings*
(% of the Fund’s Net Assets)
as of October 31, 2016 | |
| Security | | | | |
| Chubb Ltd. | | | 8.1 | |
| Allstate Corp. (The) | | | 8.0 | |
| Progressive Corp. (The) | | | 7.8 | |
| Cincinnati Financial Corp. | | | 7.4 | |
| Travelers Cos., Inc. (The) | | | 7.4 | |
| Endurance Specialty Holdings Ltd. | | | 4.9 | |
| Everest Re Group Ltd. | | | 4.3 | |
| XL Group Ltd. | | | 4.1 | |
| RenaissanceRe Holdings Ltd. | | | 4.1 | |
| Axis Capital Holdings Ltd. | | | 4.0 | |
| Total | | | 60.1 | |
| * | Excluding money market fund holdings. |
PowerShares KBW Property & Casualty Insurance Portfolio (KBWP) (continued)
Growth of a $10,000 Investment Since Inception†
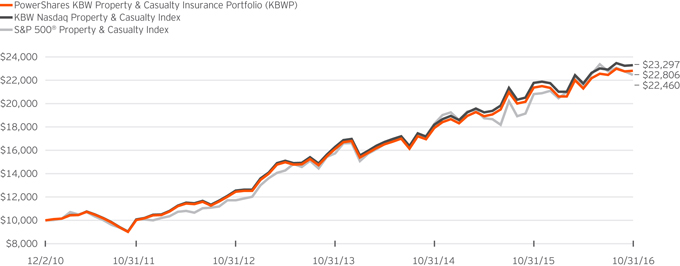
Fund Performance History as of October 31, 2016
| | | | | | | | | | | | | | | | | | | | | | | | | | | | | | | | |
| | | 1 Year | | | 3 Years
Average
Annualized | | | 3 Years
Cumulative | | | 5 Years
Average
Annualized | | | 5 Years
Cumulative | | | | | | Fund Inception† | |
| Index | | | | | | | | | | Average
Annualized | | | Cumulative | |
| KBW Nasdaq Property & Casualty Index | | | 6.99 | % | | | 12.65 | % | | | 42.96 | % | | | 18.25 | % | | | 131.24 | % | | | | | | | 15.38 | % | | | 132.97 | % |
| S&P 500® Property & Casualty Index | | | 7.87 | | | | 12.57 | | | | 42.66 | | | | 17.38 | | | | 122.83 | | | | | | | | 14.67 | | | | 124.60 | |
| Fund | | | | | | | | | | | | | | | | | | | | | | | | | | | | | | | | |
| NAV Return | | | 6.63 | | | | 12.25 | | | | 41.43 | | | | 17.84 | | | | 127.21 | | | | | | | | 14.96 | | | | 128.06 | |
| Market Price Return | | | 6.43 | | | | 12.25 | | | | 41.44 | | | | 17.84 | | | | 127.24 | | | | | | | | 14.98 | | | | 128.28 | |
Fund Inception: December 2, 2010
Performance quoted above represents past performance. Past performance is not a guarantee of future results and current performance may be higher or lower than performance quoted. Investment returns and principal value will fluctuate, and shares of the Fund (“Fund Shares”), when redeemed or sold, may be worth more or less than their original cost. Fund performance reflects any applicable fee waivers and/or expense reimbursements. Had the adviser not waived fees and/or reimbursed expenses currently or in the past, returns would have been lower. See current prospectus for more information. According to the Fund’s current prospectus, the Fund’s expense ratio of 0.35% is expressed as a unitary management fee to cover operating expenses and expenses incurred in connection with managing the portfolio. NAV and Market Price returns assume that dividends and capital gain distributions have been reinvested in the Fund at NAV and Market Price, respectively. The returns shown in the table above do not
reflect the deduction of taxes that a shareholder would pay on Fund distributions or the redemption or sale of Fund Shares. See invescopowershares.com to find the most recent month-end performance numbers.
Index and Benchmark Index performance results are based upon a hypothetical investment in their respective constituent securities. Index and Benchmark Index returns do not represent Fund returns. An investor cannot invest directly in an index. The Index and Benchmark Index do not charge management fees or brokerage expenses, and no such fees or expenses were deducted from the hypothetical performance shown. In addition, the results actual investors might have achieved would have differed from those shown because of differences in the timing, amounts of their investments, and fees and expenses associated with an investment in the Fund.
| † | Fund, Index and Benchmark Index returns are based on the inception date of the Fund. |
| | |
| KBWR | | Manager’s Analysis |
| | PowerShares KBW Regional Banking Portfolio (KBWR) |
As an index fund, the PowerShares KBW Regional Banking Portfolio (the “Fund”) is passively managed and attempts to track the returns of an underlying index. The Fund seeks investment results that generally correspond (before fees and expenses) to the price and yield of the KBW Nasdaq Regional Banking Index (the “Index”). The Fund generally will invest at least 90% of its total assets in securities of publicly traded mid-capitalization companies that do business as regional banks and thrifts listed on U.S. stock markets and that comprise the Index.
Keefe, Bruyette & Woods, Inc. (“KBW”), the Index provider, compiles, maintains and calculates the Index, which is a modified-market capitalization-weighted index comprised of securities of 50 mid-cap banking companies that are publicly listed in the United States. The Fund generally invests in all of the securities comprising the Index in proportion to their weightings in the Index.
For the fiscal year ended October 31, 2016, on a market price basis, the Fund returned 6.14%. On a net asset value (“NAV”) basis, the Fund returned 6.05%. During the same time period, the Index returned 6.43%. During the fiscal year, the Fund fully replicated the components of the Index; therefore, the Fund’s performance (NAV basis) differed from the return of the Index primarily due to fees and operating expenses incurred by the Fund.
During this same time period, the S&P Composite 1500® Commercial Banks Index (the “Benchmark Index”) returned 1.53%. The Benchmark Index is an unmanaged index weighted by market capitalization based on the average performance of approximately 80 securities.
The Benchmark Index was selected for its recognition in the marketplace, and its performance comparison is a useful measure for investors as a representation of the United States commercial banking market.
Relative to the Benchmark Index, the Fund was most overweight in the regional banks sub-industry and most underweight in the diversified banks sub-industry during the fiscal year ended October 31, 2016. The majority of the Fund’s outperformance relative to the Benchmark Index during the period can be attributed to the Fund’s overweighting the regional banks sub-industry and not having an allocation to the diversified banks sub-industry.
For the fiscal year ended October 31, 2016, the regional banks sub-industry contributed most significantly to the Fund’s return, followed by the thrifts & mortgage finance sub-industry. There were no detracting sub-industries.
Positions that contributed most significantly to the Fund’s return included UMB Financial Corp., a regional banks company (portfolio average weight of 2.02%), and Cullen/Frost Bankers, Inc., a regional banks company (portfolio average weight of 1.76%). Positions that detracted most significantly from the Fund’s return
included Bank of the Ozarks, Inc., a regional banks company (portfolio average weight of 2.22%), and Signature Bank, a regional banks company (portfolio average weight of 3.91%).
| | | | |
Sub-Industry Breakdown
(% of the Fund’s Net Assets)
as of October 31, 2016 | |
| Regional Banks | | | 96.4 | |
| Thrifts & Mortgage Finance | | | 3.6 | |
| Money Market Fund Plus Other Assets Less Liabilities | | | (0.0) | |
|
Top Ten Fund Holdings*
(% of the Fund’s Net Assets)
as of October 31, 2016 | |
| Security | | | | |
| East West Bancorp, Inc. | | | 4.1 | |
| Signature Bank | | | 4.0 | |
| PacWest Bancorp | | | 3.7 | |
| Commerce Bancshares, Inc. | | | 3.4 | |
| Bank of the Ozarks, Inc. | | | 3.2 | |
| Texas Capital Bancshares, Inc. | | | 2.3 | |
| F.N.B. Corp. | | | 2.1 | |
| Webster Financial Corp. | | | 2.1 | |
| Bank of Hawaii Corp. | | | 2.1 | |
| Cullen/Frost Bankers, Inc. | | | 2.1 | |
| Total | | | 29.1 | |
| * | Excluding money market fund holdings. |
PowerShares KBW Regional Banking Portfolio (KBWR) (continued)
Growth of a $10,000 Investment Since Inception†
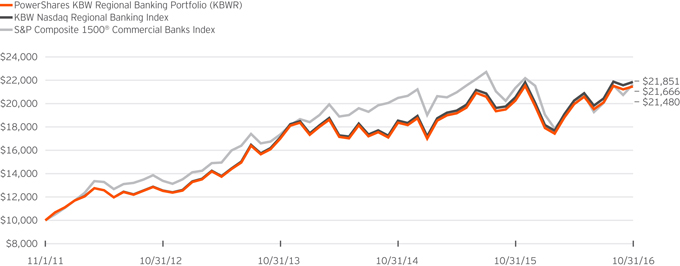
Fund Performance History as of October 31, 2016
| | | | | | | | | | | | | | | | | | | | | | | | |
| | | 1 Year | | | 3 Years
Average
Annualized | | | 3 Years
Cumulative | | | | | | Fund Inception† | |
| Index | | | | | | | | Average
Annualized | | | Cumulative | |
| KBW Nasdaq Regional Banking Index | | | 6.43 | % | | | 8.49 | % | | | 27.69 | % | | | | | | | 16.93 | % | | | 118.51 | % |
| S&P Composite 1500® Commercial Banks Index | | | 1.53 | | | | 7.69 | | | | 24.88 | | | | | | | | 16.73 | | | | 116.66 | |
| Fund | | | | | | | | | | | | | | | | | | | | | | | | |
| NAV Return | | | 6.05 | | | | 8.09 | | | | 26.29 | | | | | | | | 16.52 | | | | 114.80 | |
| Market Price Return | | | 6.14 | | | | 8.10 | | | | 26.32 | | | | | | | | 16.60 | | | | 115.56 | |
Fund Inception: November 1, 2011
Performance quoted above represents past performance. Past performance is not a guarantee of future results and current performance may be higher or lower than performance quoted. Investment returns and principal value will fluctuate, and shares of the Fund (“Fund Shares”), when redeemed or sold, may be worth more or less than their original cost. Fund performance reflects any applicable fee waivers and/or expense reimbursements. Had the adviser not waived fees and/or reimbursed expenses currently or in the past, returns would have been lower. See current prospectus for more information. According to the Fund’s current prospectus, the Fund’s expense ratio of 0.35% is expressed as a unitary management fee to cover operating expenses and expenses incurred in connection with managing the portfolio. NAV and Market Price returns assume that dividends and capital gain distributions have been reinvested in the Fund at NAV and Market Price, respectively. The returns shown in the table above do not
reflect the deduction of taxes that a shareholder would pay on Fund distributions or the redemption or sale of Fund Shares. See invescopowershares.com to find the most recent month-end performance numbers.
Index and Benchmark Index performance results are based upon a hypothetical investment in their respective constituent securities. Index and Benchmark Index returns do not represent Fund returns. An investor cannot invest directly in an index. The Index and Benchmark Index do not charge management fees or brokerage expenses, and no such fees or expenses were deducted from the hypothetical performance shown. In addition, the results actual investors might have achieved would have differed from those shown because of differences in the timing, amounts of their investments, and fees and expenses associated with an investment in the Fund.
| † | Fund, Index and Benchmark Index returns are based on the inception date of the Fund. |
| | |
| EQAL | | Manager’s Analysis |
| | PowerShares Russell 1000 Equal Weight Portfolio (EQAL) |
As an index fund, the PowerShares Russell 1000 Equal Weight Portfolio (the “Fund”) is passively managed and attempts to track the returns of an underlying index. The Fund seeks investment results that generally correspond (before fees and expenses) to the price and yield of the Russell 1000® Equal Weight Index (the “Index”). The Fund generally will invest at least 90% of its total assets in securities that comprise the Index.
Frank Russell Company (the “Index Provider”) compiles, maintains and calculates the Index strictly in accordance with its existing guidelines and mandated procedures. The Index is composed of all the securities in the Russell 1000® Index (the “Benchmark Index”). The Index Provider equally weights the Index by applying a two-step weighting process. First, the Index Provider separates the component securities of the Russell 1000 into different economic sector groups based on the Russell Global Sectors (the “RGS”) classification system. There are nine economic sectors within the RGS classification system. Next, the Index Provider equally weights those nine sector groups, and then equally weights the individual securities within each of those sector groups. The Index Provider re-weights the Index quarterly and reconstitutes it annually in accordance with this equally-weighted methodology. The Fund generally invests in all of the securities comprising the Index in proportion to their weightings in the Index.
For the fiscal year ended October 31, 2016, on a market price basis, the Fund returned 5.62%. On a net asset value (“NAV”) basis, the Fund returned 5.67%. During the same time period, the Index returned 5.97%. During the fiscal year, the Fund fully replicated the components of the Index; therefore, the Fund’s performance (NAV basis) differed from the return of the Index primarily due to fees and operating expenses incurred by the Fund.
During this same time period, the Benchmark Index returned 4.26%. The Benchmark Index is an unmanaged index weighted by market capitalization based on the average performance of approximately 1,000 securities.
The Benchmark Index was selected for its recognition in the marketplace, and its performance comparison is a useful measure for investors as a broad representation of the overall U.S. stock market. The performance of the Fund differed from the Benchmark Index in part because the Benchmark Index is weighted by market capitalization, whereas the Fund follows the methodology used by the Index.
Relative to the Benchmark Index, the Fund was most overweight in the materials sector and most underweight in the information technology sector during the fiscal year ended October 31, 2016. The majority of the Fund’s outperformance relative to the Benchmark Index during the period can be attributed to the Fund’s overweight allocation in the utilities and materials sectors.
For the fiscal year ended October 31, 2016, the utilities sector contributed most significantly to the Fund’s return, followed by the consumer staples and materials sectors. The health care sector detracted most significantly from the Fund’s return, followed by the energy and consumer discretionary sectors.
Positions that contributed most significantly to the Fund’s return included CONSOL Energy, Inc., an energy company (portfolio average weight of 0.17%), and Keurig Green Mountain, Inc., a consumer staples company (no longer held at fiscal year-end). Positions that detracted most significantly from the Fund’s return included SunEdison, Inc., an information technology company (no longer held at fiscal year-end), and Cobalt International Energy, Inc., an energy company (no longer held at fiscal year-end).
| | | | |
Sector Breakdown
(% of the Fund’s Net Assets)
as of October 31, 2016 | |
| Information Technology | | | 13.6 | |
| Industrials | | | 12.7 | |
| Consumer Staples | | | 11.8 | |
| Energy | | | 11.0 | |
| Health Care | | | 10.5 | |
| Consumer Discretionary | | | 10.3 | |
| Materials | | | 9.0 | |
| Utilities | | | 8.7 | |
| Financials | | | 6.5 | |
| Real Estate | | | 3.6 | |
| Telecommunication Services | | | 2.3 | |
| Money Market Fund Plus Other Assets Less Liabilities | | | 0.0 | |
|
Top Ten Fund Holdings*
(% of the Fund’s Net Assets)
as of October 31, 2016 | |
| Security | | | | |
| Level 3 Communications, Inc. | | | 0.3 | |
| Reynolds American, Inc. | | | 0.3 | |
| ConAgra Foods, Inc. | | | 0.3 | |
| Sprouts Farmers Market, Inc. | | | 0.3 | |
| Hershey Co. (The) | | | 0.2 | |
| Zayo Group Holdings, Inc. | | | 0.2 | |
| T-Mobile US, Inc. | | | 0.2 | |
| Hain Celestial Group, Inc. (The) | | | 0.2 | |
| Blue Buffalo Pet Products, Inc. | | | 0.2 | |
| Great Plains Energy, Inc. | | | 0.2 | |
| Total | | | 2.4 | |
| * | Excluding money market fund holdings. |
PowerShares Russell 1000 Equal Weight Portfolio (EQAL) (continued)
Growth of a $10,000 Investment Since Inception†
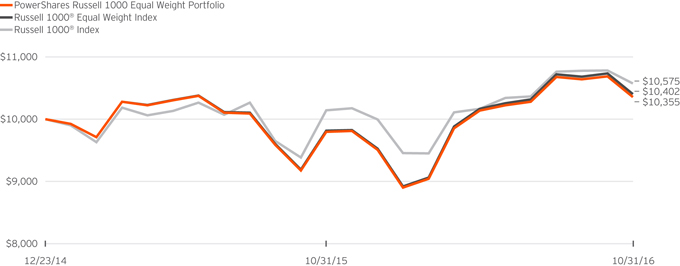
Fund Performance History as of October 31, 2016
| | | | | | | | | | | | | | | | |
| | | 1 Year | | | | | | Fund Inception† | |
| Index | | | | | | Average
Annualized | | | Cumulative | |
| Russell 1000® Equal Weight Index | | | 5.97 | % | | | | | | | 2.14 | % | �� | | 4.02 | % |
| Russell 1000® Index | | | 4.26 | | | | | | | | 3.06 | | | | 5.75 | |
| Fund | | | | | | | | | | | | | | | | |
| NAV Return | | | 5.67 | | | | | | | | 1.90 | | | | 3.55 | |
| Market Price Return | | | 5.62 | | | | | | | | 1.92 | | | | 3.59 | |
Fund Inception: December 23, 2014
Performance quoted above represents past performance. Past performance is not a guarantee of future results and current performance may be higher or lower than performance quoted. Investment returns and principal value will fluctuate, and shares of the Fund (“Fund Shares”), when redeemed or sold, may be worth more or less than their original cost. Fund performance reflects any applicable fee waivers and/or expense reimbursements. Had the adviser not waived fees and/or reimbursed expenses currently or in the past, returns would have been lower. See current prospectus for more information. According to the Fund’s current prospectus, the Fund’s expense ratio of 0.20% is expressed as a unitary management fee to cover operating expenses and expenses incurred in connection with managing the portfolio. NAV and Market Price returns assume that dividends and capital gain distributions have been reinvested in the Fund at NAV and Market Price, respectively. The returns shown in the table above do not
reflect the deduction of taxes that a shareholder would pay on Fund distributions or the redemption or sale of Fund Shares. See invescopowershares.com to find the most recent month-end performance numbers.
Index and Benchmark Index performance results are based upon a hypothetical investment in their respective constituent securities. Index and Benchmark Index returns do not represent Fund returns. An investor cannot invest directly in an index. The Index and Benchmark Index do not charge management fees or brokerage expenses, and no such fees or expenses were deducted from the hypothetical performance shown. In addition, the results actual investors might have achieved would have differed from those shown because of differences in the timing, amounts of their investments, and fees and expenses associated with an investment in the Fund.
| † | Fund, Index and Benchmark Index returns are based on the inception date of the Fund. |
Schedule of Investments(a)
PowerShares Contrarian Opportunities Portfolio (CNTR)
October 31, 2016
| | | | | | | | |
Number
of Shares | | | | | Value | |
| | | | Common Stocks—100.0% | |
| | | | Consumer Discretionary—27.9% | |
| | 392 | | | AMC Networks, Inc., Class A(b) | | $ | 19,181 | |
| | 1,200 | | | American Axle & Manufacturing Holdings, Inc.(b) | | | 21,504 | |
| | 1,122 | | | American Eagle Outfitters, Inc. | | | 19,119 | |
| | 956 | | | American Public Education, Inc.(b) | | | 19,263 | |
| | 380 | | | Asbury Automotive Group, Inc.(b) | | | 19,361 | |
| | 1,000 | | | Ascent Capital Group, Inc., Class A(b) | | | 20,380 | |
| | 426 | | | AutoNation, Inc.(b) | | | 18,689 | |
| | 468 | | | Bed Bath & Beyond, Inc. | | | 18,917 | |
| | 618 | | | Best Buy Co., Inc. | | | 24,046 | |
| | 384 | | | Big Lots, Inc. | | | 16,666 | |
| | 632 | | | BorgWarner, Inc. | | | 22,651 | |
| | 852 | | | Caleres, Inc. | | | 21,309 | |
| | 216 | | | Cavco Industries, Inc.(b) | | | 19,958 | |
| | 256 | | | Children’s Place, Inc. (The) | | | 19,443 | |
| | 652 | | | D.R. Horton, Inc. | | | 18,797 | |
| | 1,528 | | | Dana, Inc. | | | 23,653 | |
| | 392 | | | Dick’s Sporting Goods, Inc. | | | 21,815 | |
| | 1,712 | | | Ford Motor Co. | | | 20,099 | |
| | 1,116 | | | GNC Holdings, Inc., Class A | | | 14,988 | |
| | 586 | | | Hibbett Sports, Inc.(b) | | | 22,766 | |
| | 1,224 | | | Ilg, Inc. | | | 20,049 | |
| | 1,818 | | | K12, Inc.(b) | | | 19,707 | |
| | 478 | | | Kohl’s Corp. | | | 20,912 | |
| | 1,166 | | | Libbey, Inc. | | | 18,668 | |
| | 430 | | | Michael Kors Holdings Ltd.(b) | | | 21,835 | |
| | 904 | | | Movado Group, Inc. | | | 19,933 | |
| | 1,428 | | | Penn National Gaming, Inc.(b) | | | 18,464 | |
| | 332 | | | Scripps Networks Interactive, Inc., Class A | | | 21,368 | |
| | 798 | | | Shoe Carnival, Inc. | | | 20,245 | |
| | 384 | | | Tenneco, Inc.(b) | | | 21,147 | |
| | 704 | | | Urban Outfitters, Inc.(b) | | | 23,549 | |
| | 802 | | | Vitamin Shoppe, Inc.(b) | | | 20,090 | |
| | 408 | | | Williams-Sonoma, Inc. | | | 18,858 | |
| | 304 | | | Wyndham Worldwide Corp. | | | 20,015 | |
| | 1,318 | | | Zumiez, Inc.(b) | | | 29,326 | |
| | | | | | | | |
| | | | | | | 716,771 | |
| | | | | | | | |
| | | | Consumer Staples—4.0% | |
| | 1,850 | | | Chefs’ Warehouse, Inc. (The)(b) | | | 21,090 | |
| | 1,226 | | | Dean Foods Co. | | | 22,387 | |
| | 258 | | | PriceSmart, Inc. | | | 23,465 | |
| | 4,368 | | | SUPERVALU, Inc.(b) | | | 18,739 | |
| | 426 | | | United Natural Foods, Inc.(b) | | | 17,781 | |
| | | | | | | | |
| | | | | | | 103,462 | |
| | | | | | | | |
| | | | Energy—1.4% | |
| | 2,130 | | | Atwood Oceanics, Inc. | | | 16,252 | |
| | 1,510 | | | Rowan Cos. PLC, Class A | | | 20,038 | |
| | | | | | | | |
| | | | | | | 36,290 | |
| | | | | | | | |
| | | | Financials—11.5% | |
| | 148 | | | Affiliated Managers Group, Inc.(b) | | | 19,634 | |
| | 40 | | | Alleghany Corp.(b) | | | 20,648 | |
| | 1,208 | | | Ambac Financial Group, Inc.(b) | | | 22,287 | |
| | 1,354 | | | American Equity Investment Life Holding Co. | | | 24,277 | |
| | 106 | | | Credit Acceptance Corp.(b) | | | 19,514 | |
| | 738 | | | Employers Holdings, Inc. | | | 23,136 | |
| | 1,042 | | | Encore Capital Group, Inc.(b) | | | 20,684 | |
| | 608 | | | Lazard Ltd., Class A | | | 22,168 | |
| | | | | | | | |
Number
of Shares | | | | | Value | |
| | | | Common Stocks (continued) | |
| | | | Financials (continued) | |
| | 1,520 | | | Maiden Holdings Ltd. | | $ | 20,748 | |
| | 650 | | | National Interstate Corp. | | | 21,060 | |
| | 782 | | | PRA Group, Inc.(b) | | | 24,946 | |
| | 374 | | | Primerica, Inc. | | | 20,458 | |
| | 782 | | | Walker & Dunlop, Inc.(b) | | | 18,823 | |
| | 2,022 | | | WisdomTree Investments, Inc. | | | 17,349 | |
| | | | | | | | |
| | | | | | | 295,732 | |
| | | | | | | | |
| | | | Health Care—5.0% | |
| | 670 | | | Air Methods Corp.(b) | | | 17,722 | |
| | 68 | | | Biogen, Inc.(b) | | | 19,052 | |
| | 1,944 | | | Community Health Systems, Inc.(b) | | | 10,264 | |
| | 372 | | | LifePoint Health, Inc.(b) | | | 22,264 | |
| | 360 | | | Magellan Health, Inc.(b) | | | 18,522 | |
| | 570 | | | Team Health Holdings, Inc.(b) | | | 24,425 | |
| | 824 | | | Tenet Healthcare Corp.(b) | | | 16,241 | |
| | | | | | | | |
| | | | | | | 128,490 | |
| | | | | | | | |
| | | | Industrials—28.5% | |
| | 1,130 | | | Aegion Corp.(b) | | | 20,916 | |
| | 776 | | | Air Lease Corp. | | | 23,482 | |
| | 500 | | | American Railcar Industries, Inc. | | | 18,390 | |
| | 1,212 | | | ArcBest Corp. | | | 24,119 | |
| | 582 | | | Avis Budget Group, Inc.(b) | | | 18,834 | |
| | 480 | | | Barrett Business Services, Inc. | | | 21,518 | |
| | 306 | | | C.H. Robinson Worldwide, Inc. | | | 20,845 | |
| | 626 | | | Chicago Bridge & Iron Co. NV | | | 20,045 | |
| | 688 | | | Colfax Corp.(b) | | | 21,872 | |
| | 780 | | | DigitalGlobe, Inc.(b) | | | 19,578 | |
| | 328 | | | Genesee & Wyoming, Inc., Class A(b) | | | 22,284 | |
| | 892 | | | GP Strategies Corp.(b) | | | 23,058 | |
| | 472 | | | Hertz Global Holdings, Inc.(b) | | | 15,647 | |
| | 522 | | | ICF International, Inc.(b) | | | 24,221 | |
| | 612 | | | Insteel Industries, Inc. | | | 16,463 | |
| | 1,282 | | | Interface, Inc. | | | 20,320 | |
| | 1,204 | | | Kforce, Inc. | | | 20,889 | |
| | 766 | | | MYR Group, Inc.(b) | | | 22,857 | |
| | 370 | | | PACCAR, Inc. | | | 20,320 | |
| | 622 | | | Park-Ohio Holdings Corp. | | | 19,873 | |
| | 856 | | | Quanta Services, Inc.(b) | | | 24,610 | |
| | 340 | | | Regal Beloit Corp. | | | 20,094 | |
| | 1,944 | | | RPX Corp.(b) | | | 18,973 | |
| | 576 | | | Southwest Airlines Co. | | | 23,069 | |
| | 522 | | | Spirit Airlines, Inc.(b) | | | 25,019 | |
| | 1,504 | | | Steelcase, Inc., Class A | | | 20,078 | |
| | 1,134 | | | Swift Transportation Co., Class A(b) | | | 25,379 | |
| | 622 | | | Timken Co. (The) | | | 20,557 | |
| | 908 | | | Trinity Industries, Inc. | | | 19,386 | |
| | 956 | | | TrueBlue, Inc.(b) | | | 16,730 | |
| | 228 | | | Union Pacific Corp. | | | 20,105 | |
| | 450 | | | United Continental Holdings, Inc.(b) | | | 25,303 | |
| | 268 | | | United Rentals, Inc.(b) | | | 20,277 | |
| | 772 | | | USG Corp.(b) | | | 19,439 | |
| | 1,574 | | | Wabash National Corp.(b) | | | 17,708 | |
| | | | | | | | |
| | | | | | | 732,258 | |
| | | | | | | | |
| | | | Information Technology—15.5% | |
| | 198 | | | Apple, Inc. | | | 22,481 | |
| | 492 | | | Aspen Technology, Inc.(b) | | | 24,226 | |
See accompanying Notes to Financial Statements which are an integral part of the financial statements.
PowerShares Contrarian Opportunities Portfolio (CNTR) (continued)
October 31, 2016
| | | | | | | | |
Number
of Shares | | | | | Value | |
| | | | Common Stocks (continued) | |
| | | | Information Technology (continued) | |
| | 294 | | | Belden, Inc. | | $ | 19,054 | |
| | 454 | | | Cardtronics PLC, Class A(b) | | | 22,700 | |
| | 422 | | | Cirrus Logic, Inc.(b) | | | 22,780 | |
| | 658 | | | FARO Technologies, Inc.(b) | | | 22,076 | |
| | 1,006 | | | II-VI, Inc.(b) | | | 27,967 | |
| | 316 | | | InterDigital, Inc. | | | 22,325 | |
| | 250 | | | IPG Photonics Corp.(b) | | | 24,252 | |
| | 912 | | | Juniper Networks, Inc. | | | 24,022 | |
| | 854 | | | NeuStar, Inc., Class A(b) | | | 19,172 | |
| | 2,088 | | | ON Semiconductor Corp.(b) | | | 24,367 | |
| | 708 | | | Rackspace Hosting, Inc.(b) | | | 22,614 | |
| | 390 | | | Rogers Corp.(b) | | | 21,228 | |
| | 384 | | | Synaptics, Inc.(b) | | | 20,014 | |
| | 510 | | | Synchronoss Technologies, Inc.(b) | | | 18,722 | |
| | 254 | | | VeriSign, Inc.(b) | | | 21,341 | |
| | 1,018 | | | Western Union Co. (The) | | | 20,431 | |
| | | | | | | | |
| | | | | | | 399,772 | |
| | | | | | | | |
| | | | Materials—5.5% | |
| | 248 | | | Kaiser Aluminum Corp. | | | 17,978 | |
| | 1,358 | | | KapStone Paper and Packaging Corp. | | | 24,634 | |
| | 2,566 | | | Mercer International, Inc. (Canada) | | | 20,271 | |
| | 750 | | | Mosaic Co. (The) | | | 17,647 | |
| | 634 | | | PolyOne Corp. | | | 18,532 | |
| | 550 | | | Schweitzer-Mauduit International, Inc. | | | 20,300 | |
| | 466 | | | WestRock Co. | | | 21,525 | |
| | | | | | | | |
| | | | | | | 140,887 | |
| | | | | | | | |
| | | | Real Estate—0.7% | |
| | 182 | | | Jones Lang LaSalle, Inc. | | | 17,627 | |
| | | | | | | | |
| | | | Total Common Stocks
(Cost $2,632,040) | | | 2,571,289 | |
| | | | | | | | |
| | |
| | | | | | | | |
| | | | Money Market Fund—0.0% | | | | |
| | 625 | | | Invesco Premier U.S. Government Money Portfolio—Institutional Class, 0.25%(c)
(Cost $625) | | | 625 | |
| | | | | | | | |
| | | | Total Investments
(Cost $2,632,665)—100.0% | | | 2,571,914 | |
| | | | Other assets less liabilities—(0.0)% | | | (16 | ) |
| | | | | | | | |
| | | | Net Assets—100.0% | | $ | 2,571,898 | |
| | | | | | | | |
Notes to Schedule of Investments:
| (a) | Industry and/or sector classifications used in this report are generally according to the Global Industry Classification Standard, which was developed by and is the exclusive property and a service mark of MSCI Inc. and Standard & Poor’s. |
| (b) | Non-income producing security. |
| (c) | The security and the Fund are advised by wholly-owned subsidiaries of Invesco Ltd. and are therefore considered to be affiliated. The rate shown is the 7-day SEC standardized yield as of October 31, 2016. |
See accompanying Notes to Financial Statements which are an integral part of the financial statements.
Schedule of Investments(a)
PowerShares KBW Bank Portfolio (KBWB)
October 31, 2016
| | | | | | | | |
Number
of Shares | | | | | Value | |
| | | | Common Stocks—100.0% | | | | |
| | | | Asset Management & Custody Banks—12.0% | |
| | 402,421 | | | Bank of New York Mellon Corp. (The) | | $ | 17,412,756 | |
| | 237,552 | | | Northern Trust Corp. | | | 17,203,516 | |
| | 238,737 | | | State Street Corp. | | | 16,761,725 | |
| | | | | | | | |
| | | | | | | 51,377,997 | |
| | | | | | | | |
| | | | Consumer Finance—4.0% | |
| | 234,201 | | | Capital One Financial Corp. | | | 17,340,242 | |
| | | | | | | | |
| | | | Diversified Banks—41.3% | |
| | 2,077,937 | | | Bank of America Corp. | | | 34,285,961 | |
| | 702,514 | | | Citigroup, Inc. | | | 34,528,563 | |
| | 191,857 | | | Comerica, Inc. | | | 9,993,831 | |
| | 496,859 | | | JPMorgan Chase & Co. | | | 34,412,454 | |
| | 759,638 | | | U.S. Bancorp | | | 34,001,397 | |
| | 660,197 | | | Wells Fargo & Co. | | | 30,375,664 | |
| | | | | | | | |
| | | | | | | 177,597,870 | |
| | | | | | | | |
| | | | Regional Banks—40.9% | |
| | 435,560 | | | BB&T Corp. | | | 17,073,952 | |
| | 573,097 | | | Citizens Financial Group, Inc. | | | 15,095,375 | |
| | 831,796 | | | Fifth Third Bancorp | | | 18,099,881 | |
| | 165,310 | | | First Republic Bank | | | 12,304,023 | |
| | 881,649 | | | Huntington Bancshares, Inc. | | | 9,345,480 | |
| | 1,193,891 | | | KeyCorp | | | 16,857,741 | |
| | 141,712 | | | M&T Bank Corp. | | | 17,392,314 | |
| | 343,342 | | | People’s United Financial, Inc. | | | 5,575,874 | |
| | 186,114 | | | PNC Financial Services Group, Inc. (The) | | | 17,792,498 | |
| | 1,384,769 | | | Regions Financial Corp. | | | 14,830,876 | |
| | 380,506 | | | SunTrust Banks, Inc. | | | 17,210,286 | |
| | 57,411 | | | SVB Financial Group(b) | | | 7,019,643 | |
| | 226,285 | | | Zions Bancorporation | | | 7,288,640 | |
| | | | | | | | |
| | | | | | | 175,886,583 | |
| | | | | | | | |
| | | | Thrifts & Mortgage Finance—1.8% | |
| | 537,346 | | | New York Community Bancorp, Inc. | | | 7,716,289 | |
| | | | | | | | |
| | | | Total Common Stocks
(Cost $440,531,683) | | | 429,918,981 | |
| | | | | | | | |
| | |
| | | | | | | | |
| | | | Money Market Fund—0.0% | |
| | 14,760 | | | Invesco Premier U.S. Government Money Portfolio—Institutional Class, 0.25%(c)
(Cost $14,760) | | | 14,760 | |
| | | | | | | | |
| | | | Total Investments
(Cost $440,546,443)—100.0% | | | 429,933,741 | |
| | | | Other assets less liabilities—0.0% | | | 199,877 | |
| | | | | | | | |
| | | | Net Assets—100.0% | | $ | 430,133,618 | |
| | | | | | | | |
Notes to Schedule of Investments:
| (a) | Industry and/or sector classifications used in this report are generally according to the Global Industry Classification Standard, which was developed by and is the exclusive property and a service mark of MSCI Inc. and Standard & Poor’s. |
| (b) | Non-income producing security. |
| (c) | The security and the Fund are advised by wholly-owned subsidiaries of Invesco Ltd. and are therefore considered to be affiliated. The rate shown is the 7-day SEC standardized yield as of October 31, 2016. |
See accompanying Notes to Financial Statements which are an integral part of the financial statements.
Schedule of Investments(a)
PowerShares KBW High Dividend Yield Financial Portfolio (KBWD)
October 31, 2016
| | | | | | | | |
Number
of Shares | | | | | Value | |
| | | | Common Stocks and Other Equity Interests—99.9% | |
| | | | Asset Management & Custody Banks—41.4% | |
| | 1,320,487 | | | Apollo Investment Corp. | | $ | 7,804,078 | |
| | 481,355 | | | Ares Capital Corp.(b) | | | 7,364,732 | |
| | 920,092 | | | Arlington Asset Investment Corp., Class A | | | 13,138,914 | |
| | 290,250 | | | Artisan Partners Asset Management, Inc., Class A | | | 7,546,500 | |
| | 79,269 | | | Federated Investors, Inc., Class B | | | 2,140,263 | |
| | 549,572 | | | Hercules Capital, Inc. | | | 7,534,632 | |
| | 1,220,563 | | | Medley Capital Corp. | | | 9,203,045 | |
| | 214,102 | | | NorthStar Asset Management Group, Inc. | | | 2,933,197 | |
| | 1,436,810 | | | PennantPark Investment Corp. | | | 10,819,179 | |
| | 990,821 | | | THL Credit, Inc. | | | 9,125,461 | |
| | 367,723 | | | Triangle Capital Corp. | | | 7,067,636 | |
| | 439,841 | | | Waddell & Reed Financial, Inc., Class A | | | 6,914,301 | |
| | | | | | | | |
| | | | | | | 91,591,938 | |
| | | | | | | | |
| | | | Consumer Finance—1.5% | |
| | 255,958 | | | Navient Corp. | | | 3,271,143 | |
| | | | | | | | |
| | | | Investment Banking & Brokerage—7.4% | |
| | 688,154 | | | BGC Partners, Inc., Class A | | | 5,911,243 | |
| | 282,872 | | | Greenhill & Co., Inc. | | | 6,633,349 | |
| | 298,448 | | | Virtu Financial, Inc., Class A | | | 3,820,134 | |
| | | | | | | | |
| | | | | | | 16,364,726 | |
| | | | | | | | |
| | | | Mortgage REITs—31.4% | |
| | 583,277 | | | AG Mortgage Investment Trust, Inc. REIT | | | 9,058,292 | |
| | 477,860 | | | Agnc Investment Corp. REIT | | | 9,585,871 | |
| | 412,328 | | | Altisource Residential Corp. REIT | | | 4,152,143 | |
| | 414,903 | | | ARMOUR Residential REIT, Inc. REIT | | | 9,405,851 | |
| | 559,579 | | | Chimera Investment Corp. REIT | | | 8,768,603 | |
| | 728,135 | | | New Residential Investment Corp. REIT | | | 10,164,765 | |
| | 777,437 | | | Resource Capital Corp. REIT | | | 9,632,444 | |
| | 872,161 | | | Western Asset Mortgage Capital Corp. REIT | | | 8,834,991 | |
| | | | | | | | |
| | | | | | | 69,602,960 | |
| | | | | | | | |
| | | | Property & Casualty Insurance—3.0% | |
| | 69,560 | | | Mercury General Corp. | | | 3,788,933 | |
| | 167,728 | | | Old Republic International Corp. | | | 2,827,894 | |
| | | | | | | | |
| | | | | | | 6,616,827 | |
| | | | | | | | |
| | | | Regional Banks—7.6% | |
| | 88,177 | | | PacWest Bancorp | | | 3,826,000 | |
| | 212,964 | | | People’s United Financial, Inc. | | | 3,458,535 | |
| | 94,597 | | | Trustmark Corp. | | | 2,618,445 | |
| | 196,309 | | | Umpqua Holdings Corp. | | | 2,999,602 | |
| | 390,753 | | | Valley National Bancorp | | | 3,852,825 | |
| | | | | | | | |
| | | | | | | 16,755,407 | |
| | | | | | | | |
| | | | Reinsurance—1.5% | |
| | 242,832 | | | Maiden Holdings Ltd. | | | 3,314,657 | |
| | | | | | | | |
| | | | Thrifts & Mortgage Finance—5.7% | |
| | 206,002 | | | Northwest Bancshares, Inc. | | | 3,242,472 | |
| | 224,166 | | | Oritani Financial Corp. | | | 3,508,198 | |
| | 425,831 | | | TrustCo Bank Corp. NY | | | 2,980,817 | |
| | 202,820 | | | United Financial Bancorp, Inc. | | | 2,983,482 | |
| | | | | | | | |
| | | | | | | 12,714,969 | |
| | | | | | | | |
| | | | | | | | |
Number
of Shares | | | | | Value | |
| | | | Common Stocks and Other Equity Interests (continued) | |
| | | | Trading Companies & Distributors—0.4% | |
| | 125,570 | | | Textainer Group Holdings Ltd. | | $ | 954,332 | |
| | | | | | | | |
| | | | Total Investments
(excluding investments purchased with cash collateral from securities on loan)
(Cost $220,259,472)-99.9% | | | 221,186,959 | |
| | | | | | | | |
| | |
| | | | | | | | |
| | | | Investments Purchased with Cash Collateral from Securities on Loan | |
| | |
| | | | | | | | |
| | | | Money Market Fund—2.6% | |
| | 5,775,408 | | | Invesco Government & Agency Portfolio—Institutional Class, 0.29%(c)(d)
(Cost $5,775,408) | | | 5,775,408 | |
| | | | | | | | |
| | | | Total Investments
(Cost $226,034,880)—102.5% | | | 226,962,367 | |
| | | | Other assets less liabilities—(2.5)% | | | (5,583,241 | ) |
| | | | | | | | |
| | | | Net Assets—100.0% | | $ | 221,379,126 | |
| | | | | | | | |
Investment Abbreviations:
REIT—Real Estate Investment Trust
Notes to Schedule of Investments:
| (a) | Industry and/or sector classifications used in this report are generally according to the Global Industry Classification Standard, which was developed by and is the exclusive property and a service mark of MSCI Inc. and Standard & Poor’s. |
| (b) | All or a portion of this security was out on loan at October 31, 2016. |
| (c) | The security and the Fund are advised by wholly-owned subsidiaries of Invesco Ltd. and are therefore considered to be affiliated. The rate shown is the 7-day SEC standardized yield as of October 31, 2016. |
| (d) | The security has been segregated to satisfy the commitment to return the cash collateral received in securities lending transactions upon the borrower’s return of the securities loaned. See Note 2I. |
See accompanying Notes to Financial Statements which are an integral part of the financial statements.
Schedule of Investments(a)
PowerShares KBW Premium Yield Equity REIT Portfolio (KBWY)
October 31, 2016
| | | | | | | | |
Number
of Shares | | | | | Value | |
| | | | Real Estate Investment Trusts—100.0% | |
| | | | Diversified—29.1% | |
| | 377,555 | | | Armada Hoffler Properties, Inc. | | $ | 5,070,564 | |
| | 461,427 | | | Gladstone Commercial Corp. | | | 8,236,472 | |
| | 1,027,212 | | | Global NET Lease, Inc. | | | 7,611,641 | |
| | 468,021 | | | Gramercy Property Trust | | | 4,315,154 | |
| | 1,175,505 | | | Investors Real Estate Trust | | | 7,135,315 | |
| | 582,134 | | | Lexington Realty Trust | | | 5,902,839 | |
| | 397,396 | | | Spirit Realty Capital, Inc. | | | 4,732,986 | |
| | 501,987 | | | VEREIT, Inc. | | | 4,718,678 | |
| | 541,162 | | | Whitestone | | | 7,197,454 | |
| | | | | | | | |
| | | | | | | 54,921,103 | |
| | | | | | | | |
| | | | Health Care—20.3% | |
| | 252,661 | | | Care Capital Properties, Inc. | | | 6,713,203 | |
| | 289,022 | | | Community Healthcare Trust, Inc. | | | 6,468,312 | |
| | 393,251 | | | Medical Properties Trust, Inc. | | | 5,481,919 | |
| | 675,229 | | | New Senior Investment Group, Inc. | | | 7,035,886 | |
| | 257,910 | | | Sabra Health Care REIT, Inc. | | | 6,009,303 | |
| | 311,543 | | | Senior Housing Properties Trust | | | 6,626,520 | |
| | | | | | | | |
| | | | | | | 38,335,143 | |
| | | | | | | | |
| | | | Hotel & Resort—6.2% | |
| | 984,775 | | | Ashford Hospitality Trust, Inc. | | | 5,721,543 | |
| | 218,712 | | | Hospitality Properties Trust | | | 5,983,960 | |
| | | | | | | | |
| | | | | | | 11,705,503 | |
| | | | | | | | |
| | | | Industrial—5.1% | |
| | 325,447 | | | Monmouth Real Estate Investment Corp. | | | 4,448,860 | |
| | 224,710 | | | STAG Industrial, Inc., Class A | | | 5,184,060 | |
| | | | | | | | |
| | | | | | | 9,632,920 | |
| | | | | | | | |
| | | | Office—6.2% | |
| | 480,171 | | | Franklin Street Properties Corp. | | | 5,555,579 | |
| | 315,774 | | | Government Properties Income Trust | | | 6,043,914 | |
| | | | | | | | |
| | | | | | | 11,599,493 | |
| | | | | | | | |
| | | | Residential—6.5% | |
| | 803,572 | | | Independence Realty Trust, Inc. | | | 6,693,755 | |
| | 421,475 | | | Preferred Apartment Communities, Inc., Class A | | | 5,487,604 | |
| | | | | | | | |
| | | | | | | 12,181,359 | |
| | | | | | | | |
| | | | Retail—5.9% | |
| | 518,822 | | | CBL & Associates Properties, Inc. | | | 5,551,396 | |
| | 527,939 | | | Washington Prime Group, Inc. | | | 5,538,080 | |
| | | | | | | | |
| | | | | | | 11,089,476 | |
| | | | | | | | |
| | | | Specialized—20.7% | |
| | 848,360 | | | Corrections Corp. of America | | | 12,258,802 | |
| | 62,395 | | | EPR Properties | | | 4,537,365 | |
| | 204,392 | | | Gaming and Leisure Properties, Inc. | | | 6,710,189 | |
| | 645,265 | | | Geo Group, Inc. (The) | | | 15,460,549 | |
| | | | | | | | |
| | | | | | | 38,966,905 | |
| | | | | | | | |
| | | | Total Investments
(Cost $191,952,120)—100.0% | | | 188,431,902 | |
| | | | Other assets less liabilities—(0.0)% | | | (6,603 | ) |
| | | | | | | | |
| | | | Net Assets—100.0% | | $ | 188,425,299 | |
| | | | | | | | |
Investment Abbreviations:
REIT—Real Estate Investment Trust
Notes to Schedule of Investments:
| (a) | Industry and/or sector classifications used in this report are generally according to the Global Industry Classification Standard, which was developed by and is the exclusive property and a service mark of MSCI Inc. and Standard & Poor’s. |
See accompanying Notes to Financial Statements which are an integral part of the financial statements.
Schedule of Investments(a)
PowerShares KBW Property & Casualty Insurance Portfolio (KBWP)
October 31, 2016
| | | | | | | | |
Number
of Shares | | | | | Value | |
| | | | Common Stocks—100.0% | |
| | | | Multi-line Insurance—9.2% | | | | |
| | 33,945 | | | American Financial Group, Inc. | | $ | 2,528,902 | |
| | 28,486 | | | Assurant, Inc. | | | 2,293,693 | |
| | 25,517 | | | Kemper Corp. | | | 958,163 | |
| | | | | | | | |
| | | | | | | 5,780,758 | |
| | | | | | | | |
| | | | Property & Casualty Insurance—74.3% | |
| | 43,590 | | | Allied World Assurance Co. Holdings AG | | | 1,873,498 | |
| | 73,984 | | | Allstate Corp. (The) | | | 5,023,514 | |
| | 85,170 | | | AmTrust Financial Services, Inc. | | | 2,247,636 | |
| | 31,517 | | | Arch Capital Group Ltd. (Bermuda)(b) | | | 2,457,380 | |
| | 30,045 | | | Aspen Insurance Holdings Ltd. (Bermuda) | | | 1,449,671 | |
| | 44,856 | | | Axis Capital Holdings Ltd. | | | 2,555,446 | |
| | 40,195 | | | Chubb Ltd. | | | 5,104,765 | |
| | 66,164 | | | Cincinnati Financial Corp. | | | 4,683,088 | |
| | 21,331 | | | Hanover Insurance Group, Inc. (The) | | | 1,625,209 | |
| | 27,574 | | | Mercury General Corp. | | | 1,501,956 | |
| | 26,551 | | | ProAssurance Corp. | | | 1,415,168 | |
| | 156,693 | | | Progressive Corp. (The) | | | 4,937,396 | |
| | 21,855 | | | RLI Corp. | | | 1,218,198 | |
| | 28,850 | | | Selective Insurance Group, Inc. | | | 1,066,008 | |
| | 42,978 | | | Travelers Cos., Inc. (The) | | | 4,649,360 | |
| | 42,967 | | | W.R. Berkley Corp. | | | 2,453,416 | |
| | 74,524 | | | XL Group Ltd. (Ireland) | | | 2,585,983 | |
| | | | | | | | |
| | | | | | | 46,847,692 | |
| | | | | | | | |
| | | | Reinsurance—16.5% | |
| | 33,724 | | | Endurance Specialty Holdings Ltd. | | | 3,100,922 | |
| | 13,191 | | | Everest Re Group Ltd. | | | 2,684,632 | |
| | 20,564 | | | RenaissanceRe Holdings Ltd. (Bermuda) | | | 2,555,900 | |
| | 40,091 | | | Validus Holdings Ltd. | | | 2,048,650 | |
| | | | | | | | |
| | | | | | | 10,390,104 | |
| | | | | | | | |
| | | | Total Common Stocks
(Cost $61,689,153) | | | 63,018,554 | |
| | | | | | | | |
| | |
| | | | | | | | |
| | | | Money Market Fund—0.0% | |
| | 9,857 | | | Invesco Premier U.S. Government Money Portfolio—Institutional Class, 0.25%(c)
(Cost $9,857) | | | 9,857 | |
| | | | | | | | |
| | | | Total Investments
(Cost $61,699,010)—100.0% | | | 63,028,411 | |
| | | | Other assets less liabilities—(0.0)% | | | (18,805 | ) |
| | | | | | | | |
| | | | Net Assets—100.0% | | $ | 63,009,606 | |
| | | | | | | | |
Notes to Schedule of Investments:
| (a) | Industry and/or sector classifications used in this report are generally according to the Global Industry Classification Standard, which was developed by and is the exclusive property and a service mark of MSCI Inc. and Standard & Poor’s. |
| (b) | Non-income producing security. |
| (c) | The security and the Fund are advised by wholly-owned subsidiaries of Invesco Ltd. and are therefore considered to be affiliated. The rate shown is the 7-day SEC standardized yield as of October 31, 2016. |
This Fund has holdings greater than 10% of net assets in the following country:
See accompanying Notes to Financial Statements which are an integral part of the financial statements.
Schedule of Investments(a)
PowerShares KBW Regional Banking Portfolio (KBWR)
October 31, 2016
| | | | | | | | |
Number
of Shares | | | | | Value | |
| | | | Common Stocks—100.0% | |
| | | | Regional Banks—96.4% | |
| | 138,237 | | | Associated Banc-Corp. | | $ | 2,806,211 | |
| | 110,146 | | | BancorpSouth, Inc. | | | 2,588,431 | |
| | 38,183 | | | Bank of Hawaii Corp. | | | 2,869,452 | |
| | 118,435 | | | Bank of the Ozarks, Inc. | | | 4,377,358 | |
| | 85,306 | | | BankUnited, Inc. | | | 2,485,817 | |
| | 39,825 | | | BOK Financial Corp. | | | 2,828,371 | |
| | 115,750 | | | Boston Private Financial Holdings, Inc. | | | 1,522,112 | |
| | 97,839 | | | Brookline Bancorp, Inc. | | | 1,252,339 | |
| | 87,289 | | | Cathay General Bancorp | | | 2,614,306 | |
| | 20,820 | | | City Holding Co. | | | 1,088,261 | |
| | 80,540 | | | Columbia Banking System, Inc. | | | 2,659,431 | |
| | 94,418 | | | Commerce Bancshares, Inc. | | | 4,703,905 | |
| | 57,799 | | | Community Bank System, Inc. | | | 2,722,911 | |
| | 37,734 | | | Cullen/Frost Bankers, Inc. | | | 2,867,407 | |
| | 149,787 | | | CVB Financial Corp. | | | 2,513,426 | |
| | 140,853 | | | East West Bancorp, Inc. | | | 5,565,102 | |
| | 220,233 | | | F.N.B. Corp. | | | 2,878,445 | |
| | 123,417 | | | First Commonwealth Financial Corp. | | | 1,253,917 | |
| | 85,975 | | | First Financial Bancorp | | | 1,848,463 | |
| | 74,893 | | | First Financial Bankshares, Inc. | | | 2,711,127 | |
| | 178,321 | | | First Horizon National Corp. | | | 2,747,927 | |
| | 112,825 | | | First Midwest Bancorp, Inc. | | | 2,178,651 | |
| | 190,236 | | | Fulton Financial Corp. | | | 2,834,516 | |
| | 91,601 | | | Glacier Bancorp, Inc. | | | 2,588,644 | |
| | 84,304 | | | Hancock Holding Co. | | | 2,828,399 | |
| | 39,880 | | | IBERIABANK Corp. | | | 2,618,122 | |
| | 223,885 | | | Investors Bancorp, Inc. | | | 2,744,830 | |
| | 70,000 | | | MB Financial, Inc. | | | 2,547,300 | |
| | 187,314 | | | Old National Bancorp | | | 2,753,516 | |
| | 117,717 | | | PacWest Bancorp | | | 5,107,741 | |
| | 21,271 | | | Park National Corp. | | | 2,061,798 | |
| | 48,377 | | | Pinnacle Financial Partners, Inc. | | | 2,496,253 | |
| | 69,767 | | | Popular, Inc. | | | 2,532,542 | |
| | 49,441 | | | Prosperity Bancshares, Inc. | | | 2,742,492 | |
| | 48,444 | | | S&T Bancorp, Inc. | | | 1,520,657 | |
| | 45,040 | | | Signature Bank(b) | | | 5,430,022 | |
| | 82,907 | | | Synovus Financial Corp. | | | 2,741,734 | |
| | 187,206 | | | TCF Financial Corp. | | | 2,677,046 | |
| | 52,363 | | | Texas Capital Bancshares, Inc.(b) | | | 3,105,126 | |
| | 93,826 | | | Trustmark Corp. | | | 2,597,104 | |
| | 45,110 | | | UMB Financial Corp. | | | 2,799,076 | |
| | 167,027 | | | Umpqua Holdings Corp. | | | 2,552,173 | |
| | 69,610 | | | United Bankshares, Inc. | | | 2,624,297 | |
| | 284,510 | | | Valley National Bancorp | | | 2,805,269 | |
| | 71,206 | | | Webster Financial Corp. | | | 2,876,722 | |
| | 35,565 | | | Westamerica Bancorp. | | | 1,762,601 | |
| | 71,756 | | | Western Alliance Bancorp(b) | | | 2,680,804 | |
| | 49,345 | | | Wintrust Financial Corp. | | | 2,662,163 | |
| | | | | | | | |
| | | | | | | 131,774,317 | |
| | | | | | | | |
| | | | Thrifts & Mortgage Finance—3.6% | | | | |
| | 91,806 | | | Provident Financial Services, Inc. | | | 2,083,078 | |
| | 103,804 | | | Washington Federal, Inc. | | | 2,828,659 | |
| | | | | | | | |
| | | | | | | 4,911,737 | |
| | | | | | | | |
| | | | Total Common Stocks
(Cost $126,494,489) | | | 136,686,054 | |
| | | | | | | | |
| | | | | | | | |
Number
of Shares | | | | | Value | |
| | | | Money Market Fund—0.1% | | | | |
| | 130,098 | | | Invesco Premier U.S. Government Money Portfolio—Institutional Class, 0.25%(c)
(Cost $130,098) | | $ | 130,098 | |
| | | | | | | | |
| | | | Total Investments
(Cost $126,624,587)—100.1% | | | 136,816,152 | |
| | | | Other assets less liabilities—(0.1)% | | | (134,161 | ) |
| | | | | | | | |
| | | | Net Assets—100.0% | | $ | 136,681,991 | |
| | | | | | | | |
Notes to Schedule of Investments:
| (a) | Industry and/or sector classifications used in this report are generally according to the Global Industry Classification Standard, which was developed by and is the exclusive property and a service mark of MSCI Inc. and Standard & Poor’s. |
| (b) | Non-income producing security. |
| (c) | The security and the Fund are advised by wholly-owned subsidiaries of Invesco Ltd. and are therefore considered to be affiliated. The rate shown is the 7-day SEC standardized yield as of October 31, 2016. |
See accompanying Notes to Financial Statements which are an integral part of the financial statements.
Schedule of Investments(a)
PowerShares Russell 1000 Equal Weight Portfolio (EQAL)
October 31, 2016
| | | | | | | | |
Number
of Shares | | | | | Value | |
| | | | Common Stocks and Other Equity Interests—100.0% | |
| | | | Consumer Discretionary—10.3% | |
| | 231 | | | Adient PLC(b) | | $ | 10,513 | |
| | 537 | | | Advance Auto Parts, Inc. | | | 75,223 | |
| | 104 | | | Amazon.com, Inc.(b) | | | 82,141 | |
| | 1,584 | | | AMC Networks, Inc., Class A(b) | | | 77,505 | |
| | 2,152 | | | Aramark | | | 80,119 | |
| | 1,703 | | | AutoNation, Inc.(b) | | | 74,711 | |
| | 109 | | | AutoZone, Inc.(b) | | | 80,895 | |
| | 1,919 | | | Bed Bath & Beyond, Inc. | | | 77,566 | |
| | 2,114 | | | Best Buy Co., Inc. | | | 82,256 | |
| | 2,350 | | | BorgWarner, Inc. | | | 84,224 | |
| | 1,548 | | | Brinker International, Inc. | | | 76,224 | |
| | 1,640 | | | Brunswick Corp. | | | 71,340 | |
| | 973 | | | Burlington Stores, Inc.(b) | | | 72,917 | |
| | 1,546 | | | Cabela’s, Inc.(b) | | | 95,249 | |
| | 145 | | | Cable One, Inc. | | | 83,627 | |
| | 2,371 | | | CalAtlantic Group, Inc. | | | 76,631 | |
| | 1,513 | | | CarMax, Inc.(b) | | | 75,559 | |
| | 1,670 | | | Carnival Corp. | | | 81,997 | |
| | 902 | | | Carter’s, Inc. | | | 77,879 | |
| | 1,555 | | | CBS Corp., Class B | | | 88,044 | |
| | 291 | | | Charter Communications, Inc.,
Class A(b) | | | 72,718 | |
| | 192 | | | Chipotle Mexican Grill, Inc.(b) | | | 69,266 | |
| | 1,799 | | | Choice Hotels International, Inc. | | | 87,162 | |
| | 2,115 | | | Cinemark Holdings, Inc. | | | 84,177 | |
| | 13,382 | | | Clear Channel Outdoor Holdings, Inc., Class A | | | 76,946 | |
| | 2,272 | | | Coach, Inc. | | | 81,542 | |
| | 1,219 | | | Comcast Corp., Class A | | | 75,359 | |
| | 1,694 | | | CST Brands, Inc. | | | 81,346 | |
| | 2,701 | | | D.R. Horton, Inc. | | | 77,870 | |
| | 1,311 | | | Darden Restaurants, Inc. | | | 84,940 | |
| | 1,184 | | | Delphi Automotive PLC (United Kingdom) | | | 77,043 | |
| | 1,343 | | | Dick’s Sporting Goods, Inc. | | | 74,738 | |
| | 1,388 | | | Dillard’s, Inc., Class A | | | 85,084 | |
| | 3,073 | | | Discovery Communications, Inc., Class A(b) | | | 80,236 | |
| | 1,486 | | | DISH Network Corp., Class A(b) | | | 87,020 | |
| | 1,126 | | | Dollar General Corp. | | | 77,795 | |
| | 1,006 | | | Dollar Tree, Inc.(b) | | | 76,003 | |
| | 529 | | | Domino’s Pizza, Inc. | | | 89,528 | |
| | 1,613 | | | Dunkin’ Brands Group, Inc. | | | 78,005 | |
| | 717 | | | Expedia, Inc., Class A | | | 92,658 | |
| | 5,709 | | | Extended Stay America, Inc. | | | 81,639 | |
| | 1,189 | | | Foot Locker, Inc. | | | 79,390 | |
| | 6,756 | | | Ford Motor Co. | | | 79,315 | |
| | 2,947 | | | GameStop Corp., Class A | | | 70,875 | |
| | 3,633 | | | Gap, Inc. (The) | | | 100,234 | |
| | 1,650 | | | Garmin Ltd. | | | 79,794 | |
| | 2,561 | | | General Motors Co. | | | 80,928 | |
| | 4,628 | | | Gentex Corp. | | | 78,259 | |
| | 808 | | | Genuine Parts Co. | | | 73,197 | |
| | 2,539 | | | Goodyear Tire & Rubber Co. (The) | | | 73,707 | |
| | 168 | | | Graham Holdings Co., Class B | | | 79,800 | |
| | 22,175 | | | Groupon, Inc., Class A(b) | | | 88,478 | |
| | 3,558 | | | H&R Block, Inc. | | | 81,727 | |
| | 3,157 | | | Hanesbrands, Inc. | | | 81,135 | |
| | 1,552 | | | Harley-Davidson, Inc. | | | 88,495 | |
| | 977 | | | Harman International Industries, Inc. | | | 77,877 | |
| | | | | | | | |
Number
of Shares | | | | | Value | |
| | | | Common Stocks and Other Equity Interests (continued) | |
| | | | Consumer Discretionary (continued) | |
| | 1,012 | | | Hasbro, Inc. | | $ | 84,411 | |
| | 3,516 | | | Hilton Worldwide Holdings, Inc. | | | 79,462 | |
| | 638 | | | Home Depot, Inc. (The) | | | 77,842 | |
| | 1,659 | | | Hyatt Hotels Corp., Class A(b) | | | 84,261 | |
| | 3,275 | | | International Game Technology PLC | | | 94,058 | |
| | 3,645 | | | Interpublic Group of Cos., Inc. (The) | | | 81,612 | |
| | 8,476 | | | J.C. Penney Co., Inc.(b) | | | 72,809 | |
| | 1,625 | | | John Wiley & Sons, Inc., Class A | | | 83,850 | |
| | 4,478 | | | Kate Spade & Co.(b) | | | 75,006 | |
| | 1,898 | | | Kohl’s Corp. | | | 83,038 | |
| | 1,107 | | | L Brands, Inc. | | | 79,914 | |
| | 1,427 | | | Las Vegas Sands Corp. | | | 82,595 | |
| | 677 | | | Lear Corp. | | | 83,122 | |
| | 1,671 | | | Leggett & Platt, Inc. | | | 76,665 | |
| | 1,897 | | | Lennar Corp., Class A | | | 79,086 | |
| | 1,109 | | | Liberty Broadband Corp., Class C(b) | | | 73,915 | |
| | 4,038 | | | Liberty Interactive Corp. QVC Group, Series A(b) | | | 74,663 | |
| | 2,442 | | | Liberty Media Corp.-Liberty SiriusXM, Class C(b) | | | 81,050 | |
| | 2,038 | | | Liberty Ventures, Series A(b) | | | 81,316 | |
| | 3,970 | | | Lions Gate Entertainment Corp. | | | 80,829 | |
| | 2,942 | | | Live Nation Entertainment, Inc.(b) | | | 81,405 | |
| | 2,285 | | | LKQ Corp.(b) | | | 73,760 | |
| | 1,128 | | | Lowe’s Cos., Inc. | | | 75,181 | |
| | 1,257 | | | Lululemon Athletica, Inc.(b) | | | 71,963 | |
| | 2,209 | | | Macy’s, Inc. | | | 80,606 | |
| | 474 | | | Madison Square Garden Co. (The), Class A(b) | | | 78,442 | |
| | 1,205 | | | Marriott International, Inc., Class A | | | 82,784 | |
| | 2,578 | | | Mattel, Inc. | | | 81,284 | |
| | 697 | | | McDonald’s Corp. | | | 78,461 | |
| | 3,169 | | | MGM Resorts International(b) | | | 82,933 | |
| | 1,676 | | | Michael Kors Holdings Ltd.(b) | | | 85,107 | |
| | 3,352 | | | Michaels Cos., Inc. (The)(b) | | | 77,934 | |
| | 395 | | | Mohawk Industries, Inc.(b) | | | 72,799 | |
| | 1,106 | | | Murphy USA, Inc.(b) | | | 76,071 | |
| | 832 | | | Netflix, Inc.(b) | | | 103,892 | |
| | 1,545 | | | Newell Brands, Inc. | | | 74,191 | |
| | 5,803 | | | News Corp., Class A | | | 70,332 | |
| | 1,462 | | | NIKE, Inc., Class B | | | 73,363 | |
| | 1,564 | | | Nordstrom, Inc. | | | 81,328 | |
| | 2,153 | | | Norwegian Cruise Line Holdings
Ltd.(b) | | | 83,687 | |
| | 54 | | | NVR, Inc.(b) | | | 82,242 | |
| | 948 | | | Omnicom Group, Inc. | | | 75,669 | |
| | 283 | | | O’Reilly Automotive, Inc.(b) | | | 74,837 | |
| | 423 | | | Panera Bread Co., Class A(b) | | | 80,691 | |
| | 1,664 | | | Penske Automotive Group, Inc. | | | 74,464 | |
| | 1,078 | | | Polaris Industries, Inc. | | | 82,586 | |
| | 845 | | | Pool Corp. | | | 78,230 | |
| | 60 | | | Priceline Group, Inc. (The)(b) | | | 88,454 | |
| | 4,074 | | | PulteGroup, Inc. | | | 75,776 | |
| | 757 | | | PVH Corp. | | | 80,984 | |
| | 826 | | | Ralph Lauren Corp., Class A | | | 81,031 | |
| | 3,746 | | | Regal Entertainment Group, Class A | | | 80,576 | |
| | 1,259 | | | Ross Stores, Inc. | | | 78,738 | |
| | 1,089 | | | Royal Caribbean Cruises Ltd. | | | 83,711 | |
See accompanying Notes to Financial Statements which are an integral part of the financial statements.
PowerShares Russell 1000 Equal Weight Portfolio (EQAL) (continued)
October 31, 2016
| | | | | | | | |
Number
of Shares | | | | | Value | |
| | | | Common Stocks and Other Equity Interests (continued) | |
| | | | Consumer Discretionary (continued) | |
| | 2,880 | | | Sally Beauty Holdings, Inc.(b) | | $ | 74,707 | |
| | 1,302 | | | Scripps Networks Interactive, Inc., Class A | | | 83,797 | |
| | 3,026 | | | Service Corp. International | | | 77,466 | |
| | 2,377 | | | ServiceMaster Global Holdings, Inc.(b) | | | 85,073 | |
| | 1,085 | | | Signet Jewelers Ltd. | | | 88,167 | |
| | 19,465 | | | Sirius XM Holdings, Inc.(b) | | | 81,169 | |
| | 1,494 | | | Six Flags Entertainment Corp. | | | 83,141 | |
| | 3,652 | | | Skechers U.S.A., Inc., Class A(b) | | | 76,802 | |
| | 9,680 | | | Staples, Inc. | | | 71,632 | |
| | 1,490 | | | Starbucks Corp. | | | 79,074 | |
| | 2,576 | | | Starz, Class A(b) | | | 81,041 | |
| | 1,185 | | | Target Corp. | | | 81,445 | |
| | 3,805 | | | TEGNA, Inc. | | | 74,654 | |
| | 1,088 | | | Tempur Sealy International, Inc.(b) | | | 58,828 | |
| | 390 | | | Tesla Motors, Inc.(b) | | | 77,115 | |
| | 941 | | | Thor Industries, Inc. | | | 74,631 | |
| | 1,125 | | | Tiffany & Co. | | | 82,598 | |
| | 1,035 | | | Time Warner, Inc. | | | 92,105 | |
| | 1,078 | | | TJX Cos., Inc. (The) | | | 79,503 | |
| | 2,759 | | | Toll Brothers, Inc.(b) | | | 75,707 | |
| | 1,175 | | | Tractor Supply Co. | | | 73,590 | |
| | 2,283 | | | Tribune Media Co., Class A | | | 74,426 | |
| | 1,262 | | | TripAdvisor, Inc., Class A(b) | | | 81,374 | |
| | 1,260 | | | Tupperware Brands Corp. | | | 74,995 | |
| | 3,348 | | | Twenty-First Century Fox, Inc., Class A | | | 87,952 | |
| | 336 | | | Ulta Salon, Cosmetics & Fragrance, Inc.(b) | | | 81,762 | |
| | 2,069 | | | Under Armour, Inc., Class A(b) | | | 64,346 | |
| | 2,301 | | | Urban Outfitters, Inc.(b) | | | 76,968 | |
| | 523 | | | Vail Resorts, Inc. | | | 83,387 | |
| | 1,434 | | | VF Corp. | | | 77,737 | |
| | 2,282 | | | Viacom, Inc., Class B | | | 85,712 | |
| | 2,035 | | | Vista Outdoor, Inc.(b) | | | 78,693 | |
| | 1,128 | | | Visteon Corp. | | | 79,648 | |
| | 886 | | | Walt Disney Co. (The) | | | 82,123 | |
| | 7,487 | | | Wendy’s Co. (The) | | | 81,159 | |
| | 492 | | | Whirlpool Corp. | | | 73,711 | |
| | 1,606 | | | Williams-Sonoma, Inc. | | | 74,229 | |
| | 1,200 | | | Wyndham Worldwide Corp. | | | 79,008 | |
| | 806 | | | Wynn Resorts Ltd. | | | 76,207 | |
| | 902 | | | Yum! Brands, Inc. | | | 77,825 | |
| | | | | | | | |
| | | | | | | 11,885,429 | |
| | | | | | | | |
| | | | Consumer Staples—11.8% | |
| | 3,986 | | | Altria Group, Inc. | | | 263,554 | |
| | 6,150 | | | Archer-Daniels-Midland Co. | | | 267,955 | |
| | 10,779 | | | Blue Buffalo Pet Products, Inc.(b) | | | 270,768 | |
| | 5,351 | | | Brown-Forman Corp., Class B | | | 247,056 | |
| | 4,256 | | | Bunge Ltd. | | | 263,914 | |
| | 4,622 | | | Campbell Soup Co. | | | 251,159 | |
| | 2,233 | | | Casey’s General Stores, Inc. | | | 252,307 | |
| | 5,383 | | | Church & Dwight Co., Inc. | | | 259,784 | |
| | 2,054 | | | Clorox Co. (The) | | | 246,521 | |
| | 6,064 | | | Coca-Cola Co. (The) | | | 257,114 | |
| | 3,437 | | | Colgate-Palmolive Co. | | | 245,264 | |
| | 5,955 | | | ConAgra Foods, Inc. | | | 286,912 | |
| | 1,523 | | | Constellation Brands, Inc., Class A | | | 254,524 | |
| | 539 | | | Costco Wholesale Corp. | | | 79,702 | |
| | | | | | | | |
Number
of Shares | | | | | Value | |
| | | | Common Stocks and Other Equity Interests (continued) | |
| | | | Consumer Staples (continued) | |
| | 3,453 | | | Coty, Inc., Class A | | $ | 79,384 | |
| | 2,790 | | | CVS Health Corp. | | | 234,639 | |
| | 2,787 | | | Dr Pepper Snapple Group, Inc. | | | 244,671 | |
| | 3,349 | | | Edgewell Personal Care Co.(b) | | | 252,515 | |
| | 5,519 | | | Energizer Holdings, Inc. | | | 256,689 | |
| | 906 | | | Estee Lauder Cos., Inc. (The), Class A | | | 78,940 | |
| | 17,055 | | | Flowers Foods, Inc.(c) | | | 264,694 | |
| | 4,037 | | | General Mills, Inc. | | | 250,213 | |
| | 7,446 | | | Hain Celestial Group, Inc. (The)(b) | | | 270,811 | |
| | 4,214 | | | Herbalife Ltd.(b) | | | 255,705 | |
| | 2,726 | | | Hershey Co. (The) | | | 279,306 | |
| | 6,739 | | | Hormel Foods Corp. | | | 259,451 | |
| | 1,989 | | | Ingredion, Inc. | | | 260,897 | |
| | 1,890 | | | JM Smucker Co. (The) | | | 248,176 | |
| | 3,262 | | | Kellogg Co. | | | 245,074 | |
| | 2,054 | | | Kimberly-Clark Corp. | | | 234,998 | |
| | 2,890 | | | Kraft Heinz Co. (The) | | | 257,065 | |
| | 8,625 | | | Kroger Co. (The) | | | 267,202 | |
| | 2,645 | | | McCormick & Co., Inc. | | | 253,576 | |
| | 3,354 | | | Mead Johnson Nutrition Co. | | | 250,779 | |
| | 2,397 | | | Molson Coors Brewing Co., Class B | | | 248,833 | |
| | 5,972 | | | Mondelez International, Inc., Class A | | | 268,382 | |
| | 1,710 | | | Monster Beverage Corp.(b) | | | 246,821 | |
| | 3,975 | | | Nu Skin Enterprises, Inc., Class A | | | 245,059 | |
| | 2,349 | | | PepsiCo, Inc. | | | 251,813 | |
| | 2,541 | | | Philip Morris International, Inc. | | | 245,054 | |
| | 12,353 | | | Pilgrim’s Pride Corp. | | | 269,789 | |
| | 5,202 | | | Pinnacle Foods, Inc. | | | 267,487 | |
| | 3,277 | | | Post Holdings, Inc.(b) | | | 249,806 | |
| | 2,920 | | | Procter & Gamble Co. (The) | | | 253,456 | |
| | 5,390 | | | Reynolds American, Inc. | | | 296,881 | |
| | 31,252 | | | Rite Aid Corp.(b) | | | 209,701 | |
| | 1,903 | | | Spectrum Brands Holdings, Inc. | | | 257,362 | |
| | 12,791 | | | Sprouts Farmers Market, Inc.(b) | | | 283,321 | |
| | 5,242 | | | Sysco Corp. | | | 252,245 | |
| | 3,014 | | | TreeHouse Foods, Inc.(b) | | | 263,665 | |
| | 3,336 | | | Tyson Foods, Inc., Class A | | | 236,356 | |
| | 11,006 | | | US Foods Holding Corp.(b) | | | 248,736 | |
| | 3,188 | | | Walgreens Boots Alliance, Inc. | | | 263,743 | |
| | 1,116 | | | Wal-Mart Stores, Inc. | | | 78,142 | |
| | 4,604 | | | WhiteWave Foods Co. (The)(b) | | | 250,872 | |
| | 9,051 | | | Whole Foods Market, Inc. | | | 256,053 | |
| | | | | | | | |
| | | | | | | 13,634,896 | |
| | | | | | | | |
| | | | Energy—11.0% | | | | |
| | 3,212 | | | Anadarko Petroleum Corp. | | | 190,921 | |
| | 7,295 | | | Antero Resources Corp.(b) | | | 193,099 | |
| | 3,149 | | | Apache Corp. | | | 187,303 | |
| | 3,901 | | | Baker Hughes, Inc. | | | 216,115 | |
| | 7,703 | | | Cabot Oil & Gas Corp. | | | 160,839 | |
| | 4,441 | | | Cheniere Energy, Inc.(b) | | | 167,426 | |
| | 30,083 | | | Chesapeake Energy Corp.(b) | | | 165,757 | |
| | 1,895 | | | Chevron Corp. | | | 198,501 | |
| | 1,532 | | | Cimarex Energy Co. | | | 197,827 | |
| | 1,527 | | | Concho Resources, Inc.(b) | | | 193,837 | |
| | 4,750 | | | ConocoPhillips | | | 206,388 | |
| | 10,255 | | | CONSOL Energy, Inc. | | | 173,822 | |
See accompanying Notes to Financial Statements which are an integral part of the financial statements.
PowerShares Russell 1000 Equal Weight Portfolio (EQAL) (continued)
October 31, 2016
| | | | | | | | |
Number
of Shares | | | | | Value | |
| | | | Common Stocks and Other Equity Interests (continued) | |
| | | | Energy (continued) | |
| | 4,341 | | | Continental Resources, Inc.(b) | | $ | 212,318 | |
| | 4,886 | | | Devon Energy Corp. | | | 185,131 | |
| | 11,708 | | | Diamond Offshore Drilling, Inc. | | | 193,065 | |
| | 2,114 | | | Diamondback Energy, Inc.(b) | | | 192,987 | |
| | 3,646 | | | Dril-Quip, Inc.(b) | | | 173,185 | |
| | 3,680 | | | Energen Corp. | | | 184,478 | |
| | 25,814 | | | Ensco PLC, Class A | | | 201,866 | |
| | 2,113 | | | EOG Resources, Inc. | | | 191,057 | |
| | 2,730 | | | EQT Corp. | | | 180,180 | |
| | 2,254 | | | Exxon Mobil Corp. | | | 187,803 | |
| | 6,831 | | | FMC Technologies, Inc.(b) | | | 220,436 | |
| | 15,540 | | | Frank’s International NV(c) | | | 174,825 | |
| | 7,134 | | | Gulfport Energy Corp.(b) | | | 172,001 | |
| | 4,573 | | | Halliburton Co. | | | 210,358 | |
| | 3,292 | | | Helmerich & Payne, Inc. | | | 207,758 | |
| | 4,003 | | | Hess Corp. | | | 192,024 | |
| | 7,865 | | | HollyFrontier Corp. | | | 196,232 | |
| | 8,580 | | | Kinder Morgan, Inc. | | | 175,289 | |
| | 33,046 | | | Kosmos Energy Ltd.(b) | | | 172,170 | |
| | 16,809 | | | Laredo Petroleum, Inc.(b) | | | 200,363 | |
| | 13,322 | | | Marathon Oil Corp. | | | 175,584 | |
| | 4,475 | | | Marathon Petroleum Corp. | | | 195,065 | |
| | 7,210 | | | Murphy Oil Corp. | | | 186,523 | |
| | 18,871 | | | Nabors Industries Ltd. | | | 224,565 | |
| | 5,608 | | | National Oilwell Varco, Inc. | | | 180,017 | |
| | 4,742 | | | Newfield Exploration Co.(b) | | | 192,478 | |
| | 34,131 | | | Noble Corp. PLC (United Kingdom) | | | 168,607 | |
| | 5,645 | | | Noble Energy, Inc. | | | 194,583 | |
| | 2,730 | | | Occidental Petroleum Corp. | | | 199,044 | |
| | 7,553 | | | Oceaneering International, Inc. | | | 179,761 | |
| | 3,838 | | | ONEOK, Inc. | | | 185,874 | |
| | 6,028 | | | Parsley Energy, Inc., Class A(b) | | | 198,321 | |
| | 10,193 | | | Patterson-UTI Energy, Inc. | | | 229,139 | |
| | 8,356 | | | PBF Energy, Inc., Class A | | | 182,161 | |
| | 2,360 | | | Phillips 66 | | | 191,514 | |
| | 1,085 | | | Pioneer Natural Resources Co. | | | 194,237 | |
| | 10,551 | | | QEP Resources, Inc. | | | 169,555 | |
| | 5,072 | | | Range Resources Corp. | | | 171,383 | |
| | 7,491 | | | Rice Energy, Inc.(b) | | | 165,476 | |
| | 14,034 | | | Rowan Cos. PLC, Class A | | | 186,231 | |
| | 12,005 | | | RPC, Inc.(b) | | | 207,326 | |
| | 2,484 | | | Schlumberger Ltd. | | | 194,323 | |
| | 5,738 | | | SM Energy Co. | | | 192,969 | |
| | 14,273 | | | Southwestern Energy Co.(b) | | | 148,297 | |
| | 4,516 | | | Spectra Energy Corp. | | | 188,814 | |
| | 13,112 | | | Superior Energy Services, Inc. | | | 185,666 | |
| | 3,992 | | | Targa Resources Corp. | | | 175,249 | |
| | 2,262 | | | Tesoro Corp. | | | 192,202 | |
| | 19,897 | | | Transocean Ltd.(b)(c) | | | 191,210 | |
| | 3,401 | | | Valero Energy Corp. | | | 201,475 | |
| | 35,964 | | | Weatherford International PLC(b) | | | 173,347 | |
| | 25,920 | | | Whiting Petroleum Corp.(b) | | | 213,581 | |
| | 6,112 | | | Williams Cos., Inc. (The) | | | 178,470 | |
| | 4,094 | | | World Fuel Services Corp. | | | 164,784 | |
| | 16,208 | | | WPX Energy, Inc.(b) | | | 176,019 | |
| | | | | | | | |
| | | | | | | 12,629,211 | |
| | | | | | | | |
| | | | | | | | |
Number
of Shares | | | | | Value | |
| | | | Common Stocks and Other Equity Interests (continued) | |
| | | | Financials—6.5% | | | | |
| | 379 | | | Affiliated Managers Group, Inc.(b) | | $ | 50,278 | |
| | 743 | | | Aflac, Inc. | | | 51,170 | |
| | 2,729 | | | Agnc Investment Corp. REIT | | | 54,744 | |
| | 101 | | | Alleghany Corp.(b) | | | 52,137 | |
| | 1,336 | | | Allied World Assurance Co. Holdings AG | | | 57,421 | |
| | 787 | | | Allstate Corp. (The) | | | 53,437 | |
| | 2,819 | | | Ally Financial, Inc. | | | 50,939 | |
| | 837 | | | American Express Co. | | | 55,594 | |
| | 729 | | | American Financial Group, Inc. | | | 54,310 | |
| | 921 | | | American International Group, Inc. | | | 56,826 | |
| | 448 | | | American National Insurance Co. | | | 52,488 | |
| | 548 | | | Ameriprise Financial, Inc. | | | 48,438 | |
| | 2,068 | | | AmTrust Financial Services, Inc. | | | 54,575 | |
| | 4,952 | | | Annaly Capital Management, Inc. REIT | | | 51,303 | |
| | 477 | | | Aon PLC | | | 52,866 | |
| | 668 | | | Arch Capital Group Ltd. (Bermuda)(b) | | | 52,084 | |
| | 1,066 | | | Arthur J. Gallagher & Co. | | | 51,413 | |
| | 2,015 | | | Artisan Partners Asset Management, Inc., Class A | | | 52,390 | |
| | 1,169 | | | Aspen Insurance Holdings Ltd. (Bermuda) | | | 56,404 | |
| | 2,798 | | | Associated Banc-Corp. | | | 56,799 | |
| | 600 | | | Assurant, Inc. | | | 48,312 | |
| | 2,029 | | | Assured Guaranty Ltd. | | | 60,647 | |
| | 987 | | | Axis Capital Holdings Ltd. | | | 56,229 | |
| | 3,533 | | | Bank of America Corp. | | | 58,295 | |
| | 747 | | | Bank of Hawaii Corp. | | | 56,137 | |
| | 1,366 | | | Bank of New York Mellon Corp. (The) | | | 59,107 | |
| | 1,800 | | | BankUnited, Inc. | | | 52,452 | |
| | 1,445 | | | BB&T Corp. | | | 56,644 | |
| | 370 | | | Berkshire Hathaway, Inc., Class B(b) | | | 53,391 | |
| | 153 | | | BlackRock, Inc. | | | 52,210 | |
| | 806 | | | BOK Financial Corp. | | | 57,242 | |
| | 1,441 | | | Brown & Brown, Inc. | | | 53,115 | |
| | 749 | | | Capital One Financial Corp. | | | 55,456 | |
| | 808 | | | CBOE Holdings, Inc. | | | 51,074 | |
| | 1,753 | | | Charles Schwab Corp. (The) | | | 55,570 | |
| | 3,244 | | | Chimera Investment Corp. REIT | | | 50,833 | |
| | 434 | | | Chubb Ltd. | | | 55,118 | |
| | 718 | | | Cincinnati Financial Corp. | | | 50,820 | |
| | 1,524 | | | CIT Group, Inc. | | | 55,367 | |
| | 1,166 | | | Citigroup, Inc. | | | 57,309 | |
| | 2,216 | | | Citizens Financial Group, Inc. | | | 58,369 | |
| | 515 | | | CME Group, Inc., Class A | | | 51,552 | |
| | 1,633 | | | CNA Financial Corp. | | | 59,719 | |
| | 1,167 | | | Comerica, Inc. | | | 60,789 | |
| | 1,109 | | | Commerce Bancshares, Inc. | | | 55,250 | |
| | 277 | | | Credit Acceptance Corp.(b) | | | 50,996 | |
| | 783 | | | Cullen/Frost Bankers, Inc. | | | 59,500 | |
| | 941 | | | Discover Financial Services | | | 53,007 | |
| | 2,350 | | | Donnelley Financial Solutions, Inc.(b) | | | 50,408 | |
| | 1,920 | | | E*TRADE Financial Corp.(b) | | | 54,067 | |
| | 1,490 | | | East West Bancorp, Inc. | | | 58,870 | |
| | 1,393 | | | Eaton Vance Corp. | | | 48,839 | |
| | 822 | | | Endurance Specialty Holdings Ltd. | | | 75,583 | |
| | 532 | | | Erie Indemnity Co., Class A | | | 54,471 | |
| | 281 | | | Everest Re Group Ltd. | | | 57,189 | |
See accompanying Notes to Financial Statements which are an integral part of the financial statements.
PowerShares Russell 1000 Equal Weight Portfolio (EQAL) (continued)
October 31, 2016
| | | | | | | | |
Number
of Shares | | | | | Value | |
| | | | Common Stocks and Other Equity Interests (continued) | |
| | | | Financials (continued) | | | | |
| | 333 | | | FactSet Research Systems, Inc. | | $ | 51,522 | |
| | 1,812 | | | Federated Investors, Inc., Class B | | | 48,924 | |
| | 2,609 | | | Fifth Third Bancorp | | | 56,772 | |
| | 1,353 | | | First American Financial Corp. | | | 52,848 | |
| | 2,012 | | | First Hawaiian, Inc.(b) | | | 54,887 | |
| | 3,614 | | | First Horizon National Corp. | | | 55,692 | |
| | 699 | | | First Republic Bank | | | 52,027 | |
| | 1,451 | | | FNF Group | | | 52,105 | |
| | 1,558 | | | Franklin Resources, Inc. | | | 52,442 | |
| | 335 | | | Goldman Sachs Group, Inc. (The) | | | 59,710 | |
| | 719 | | | Hanover Insurance Group, Inc. (The) | | | 54,781 | |
| | 1,265 | | | Hartford Financial Services Group, Inc. (The) | | | 55,799 | |
| | 5,543 | | | Huntington Bancshares, Inc. | | | 58,756 | |
| | 1,526 | | | Interactive Brokers Group, Inc., Class A | | | 50,648 | |
| | 195 | | | Intercontinental Exchange, Inc. | | | 52,726 | |
| | 1,754 | | | Invesco Ltd.(d) | | | 49,270 | |
| | 814 | | | JPMorgan Chase & Co. | | | 56,378 | |
| | 4,445 | | | KeyCorp | | | 62,763 | |
| | 1,494 | | | Lazard Ltd., Class A | | | 54,471 | |
| | 1,620 | | | Legg Mason, Inc. | | | 46,526 | |
| | 2,882 | | | Leucadia National Corp. | | | 53,807 | |
| | 1,173 | | | Lincoln National Corp. | | | 57,583 | |
| | 1,339 | | | Loews Corp. | | | 57,617 | |
| | 1,860 | | | LPL Financial Holdings, Inc. | | | 57,586 | |
| | 466 | | | M&T Bank Corp. | | | 57,192 | |
| | 63 | | | Markel Corp.(b) | | | 55,278 | |
| | 312 | | | MarketAxess Holdings, Inc. | | | 47,037 | |
| | 803 | | | Marsh & McLennan Cos., Inc. | | | 50,902 | |
| | 982 | | | Mercury General Corp. | | | 53,490 | |
| | 1,239 | | | MetLife, Inc. | | | 58,183 | |
| | 7,179 | | | MFA Financial, Inc. REIT | | | 52,478 | |
| | 486 | | | Moody’s Corp. | | | 48,853 | |
| | 1,723 | | | Morgan Stanley | | | 57,841 | |
| | 691 | | | Morningstar, Inc. | | | 48,805 | |
| | 633 | | | MSCI, Inc. | | | 50,760 | |
| | 791 | | | Nasdaq, Inc. | | | 50,600 | |
| | 3,726 | | | Navient Corp. | | | 47,618 | |
| | 3,721 | | | New York Community Bancorp, Inc. | | | 53,434 | |
| | 801 | | | Northern Trust Corp. | | | 58,008 | |
| | 4,262 | | | NorthStar Asset Management Group, Inc. | | | 58,389 | |
| | 3,021 | | | Old Republic International Corp. | | | 50,934 | |
| | 1,733 | | | OneMain Holdings, Inc.(b) | | | 49,113 | |
| | 1,272 | | | PacWest Bancorp | | | 55,192 | |
| | 3,446 | | | People’s United Financial, Inc. | | | 55,963 | |
| | 613 | | | PNC Financial Services Group, Inc. (The) | | | 58,603 | |
| | 1,404 | | | Popular, Inc. | | | 50,965 | |
| | 1,073 | | | Principal Financial Group, Inc. | | | 58,586 | |
| | 1,031 | | | ProAssurance Corp. | | | 54,952 | |
| | 1,719 | | | Progressive Corp. (The) | | | 54,166 | |
| | 665 | | | Prudential Financial, Inc. | | | 56,385 | |
| | 943 | | | Raymond James Financial, Inc. | | | 56,693 | |
| | 5,558 | | | Regions Financial Corp. | | | 59,526 | |
| | 495 | | | Reinsurance Group of America, Inc. | | | 53,391 | |
| | 449 | | | RenaissanceRe Holdings Ltd. (Bermuda) | | | 55,806 | |
| | 429 | | | S&P Global, Inc. | | | 52,274 | |
| | 4,497 | | | Santander Consumer USA Holdings, Inc.(b) | | | 54,863 | |
| | | | | | | | |
Number
of Shares | | | | | Value | |
| | | | Common Stocks and Other Equity Interests (continued) | |
| | | | Financials (continued) | | | | |
| | 1,175 | | | SEI Investments Co. | | $ | 52,088 | |
| | 464 | | | Signature Bank(b) | | | 55,940 | |
| | 7,258 | | | SLM Corp.(b) | | | 51,169 | |
| | 2,339 | | | Starwood Property Trust, Inc. REIT | | | 52,019 | |
| | 765 | | | State Street Corp. | | | 53,711 | |
| | 1,249 | | | SunTrust Banks, Inc. | | | 56,492 | |
| | 508 | | | SVB Financial Group(b) | | | 62,113 | |
| | 1,937 | | | Synchrony Financial | | | 55,379 | |
| | 1,697 | | | Synovus Financial Corp. | | | 56,120 | |
| | 823 | | | T. Rowe Price Group, Inc. | | | 52,680 | |
| | 3,799 | | | TCF Financial Corp. | | | 54,326 | |
| | 1,655 | | | TD Ameritrade Holding Corp. | | | 56,618 | |
| | 3,013 | | | TFS Financial Corp. | | | 53,692 | |
| | 1,312 | | | Thomson Reuters Corp. | | | 51,706 | |
| | 847 | | | Torchmark Corp. | | | 53,708 | |
| | 470 | | | Travelers Cos., Inc. (The) | | | 50,845 | |
| | 6,087 | | | Two Harbors Investment Corp. REIT | | | 50,705 | |
| | 1,260 | | | U.S. Bancorp | | | 56,398 | |
| | 1,549 | | | Unum Group | | | 54,835 | |
| | 1,082 | | | Validus Holdings Ltd. | | | 55,290 | |
| | 1,901 | | | Voya Financial, Inc. | | | 58,076 | |
| | 930 | | | W.R. Berkley Corp. | | | 53,103 | |
| | 1,195 | | | Wells Fargo & Co. | | | 54,982 | |
| | 1,458 | | | Western Alliance Bancorp(b) | | | 54,471 | |
| | 68 | | | White Mountains Insurance Group Ltd. | | | 56,421 | |
| | 1,604 | | | XL Group Ltd. (Ireland) | | | 55,659 | |
| | 1,769 | | | Zions Bancorporation | | | 56,979 | |
| | | | | | | | |
| | | | | | | 7,516,998 | |
| | | | | | | | |
| | | | Health Care—10.5% | | | | |
| | 3,034 | | | Abbott Laboratories | | | 119,054 | |
| | 1,993 | | | AbbVie, Inc. | | | 111,170 | |
| | 996 | | | ABIOMED, Inc.(b) | | | 104,570 | |
| | 2,666 | | | Acadia Healthcare Co., Inc.(b) | | | 95,869 | |
| | 3,649 | | | ACADIA Pharmaceuticals, Inc.(b) | | | 85,058 | |
| | 1,109 | | | Aetna, Inc. | | | 119,051 | |
| | 2,751 | | | Agilent Technologies, Inc. | | | 119,861 | |
| | 2,358 | | | Agios Pharmaceuticals, Inc.(b) | | | 112,807 | |
| | 4,631 | | | Akorn, Inc.(b) | | | 110,912 | |
| | 2,946 | | | Alere, Inc.(b) | | | 131,627 | |
| | 1,018 | | | Alexion Pharmaceuticals, Inc.(b) | | | 132,849 | |
| | 1,362 | | | Align Technology, Inc.(b) | | | 117,023 | |
| | 2,579 | | | Alkermes PLC(b) | | | 130,007 | |
| | 538 | | | Allergan PLC(b) | | | 112,410 | |
| | 9,838 | | | Allscripts Healthcare Solutions,
Inc.(b) | | | 118,154 | |
| | 1,646 | | | Alnylam Pharmaceuticals, Inc.(b) | | | 58,598 | |
| | 1,545 | | | AmerisourceBergen Corp. | | | 108,644 | |
| | 747 | | | Amgen, Inc. | | | 105,447 | |
| | 1,970 | | | AmSurg Corp.(b) | | | 117,708 | |
| | 1,016 | | | Anthem, Inc. | | | 123,810 | |
| | 1,033 | | | athenahealth, Inc.(b) | | | 106,730 | |
| | 2,719 | | | Baxter International, Inc. | | | 129,397 | |
| | 720 | | | Becton, Dickinson and Co. | | | 120,895 | |
| | 429 | | | Biogen, Inc.(b) | | | 120,197 | |
| | 1,330 | | | BioMarin Pharmaceutical, Inc.(b) | | | 107,092 | |
| | 795 | | | Bio-Rad Laboratories, Inc.,
Class A(b) | | | 125,674 | |
| | 1,177 | | | Bio-Techne Corp. | | | 122,396 | |
See accompanying Notes to Financial Statements which are an integral part of the financial statements.
PowerShares Russell 1000 Equal Weight Portfolio (EQAL) (continued)
October 31, 2016
| | | | | | | | |
Number
of Shares | | | | | Value | |
| | | | Common Stocks and Other Equity Interests (continued) | |
| | | | Health Care (continued) | | | | |
| | 5,426 | | | Boston Scientific Corp.(b) | | $ | 119,372 | |
| | 2,303 | | | Bristol-Myers Squibb Co. | | | 117,246 | |
| | 7,411 | | | Brookdale Senior Living, Inc.(b) | | | 106,941 | |
| | 5,678 | | | Bruker Corp. | | | 116,342 | |
| | 561 | | | C.R. Bard, Inc. | | | 121,557 | |
| | 1,645 | | | Cardinal Health, Inc. | | | 112,995 | |
| | 1,196 | | | Celgene Corp.(b) | | | 122,207 | |
| | 1,857 | | | Centene Corp.(b) | | | 116,025 | |
| | 2,072 | | | Cerner Corp.(b) | | | 121,378 | |
| | 1,534 | | | Charles River Laboratories International, Inc.(b) | | | 116,400 | |
| | 979 | | | Cigna Corp. | | | 116,335 | |
| | 722 | | | Cooper Cos., Inc. (The) | | | 127,101 | |
| | 1,654 | | | Danaher Corp. | | | 129,922 | |
| | 1,935 | | | DaVita, Inc.(b) | | | 113,430 | |
| | 2,162 | | | DENTSPLY Sirona, Inc. | | | 124,466 | |
| | 1,371 | | | DexCom, Inc.(b) | | | 107,267 | |
| | 1,065 | | | Edwards Lifesciences Corp.(b) | | | 101,409 | |
| | 1,585 | | | Eli Lilly & Co. | | | 117,036 | |
| | 5,711 | | | Endo International PLC(b) | | | 107,081 | |
| | 5,930 | | | Envision Healthcare Holdings, Inc.(b) | | | 117,295 | |
| | 1,817 | | | Express Scripts Holding Co.(b) | | | 122,466 | |
| | 1,625 | | | Gilead Sciences, Inc. | | | 119,649 | |
| | 1,714 | | | HCA Holdings, Inc.(b) | | | 131,172 | |
| | 789 | | | Henry Schein, Inc.(b) | | | 117,719 | |
| | 2,099 | | | Hill-Rom Holdings, Inc. | | | 116,306 | |
| | 3,313 | | | Hologic, Inc.(b) | | | 119,301 | |
| | 726 | | | Humana, Inc. | | | 124,531 | |
| | 1,130 | | | IDEXX Laboratories, Inc.(b) | | | 121,068 | |
| | 715 | | | Illumina, Inc.(b) | | | 97,340 | |
| | 1,445 | | | Incyte Corp.(b) | | | 125,672 | |
| | 8,099 | | | Inovalon Holdings, Inc., Class A(b) | | | 110,146 | |
| | 745 | | | Intercept Pharmaceuticals, Inc.(b) | | | 92,186 | |
| | 4,679 | | | Intrexon Corp.(b) | | | 122,122 | |
| | 179 | | | Intuitive Surgical, Inc.(b) | | | 120,302 | |
| | 3,497 | | | Ionis Pharmaceuticals, Inc.(b) | | | 90,852 | |
| | 1,080 | | | Johnson & Johnson | | | 125,269 | |
| | 3,845 | | | Juno Therapeutics, Inc.(b) | | | 93,395 | |
| | 930 | | | Laboratory Corp. of America
Holdings(b) | | | 116,566 | |
| | 2,200 | | | LifePoint Health, Inc.(b) | | | 131,670 | |
| | 1,807 | | | Mallinckrodt PLC(b) | | | 107,083 | |
| | 768 | | | McKesson Corp. | | | 97,667 | |
| | 1,978 | | | MEDNAX, Inc.(b) | | | 121,153 | |
| | 1,480 | | | Medtronic PLC | | | 121,390 | |
| | 2,060 | | | Merck & Co., Inc. | | | 120,963 | |
| | 254 | | | Mettler-Toledo International, Inc.(b) | | | 102,636 | |
| | 3,111 | | | Mylan NV(b) | | | 113,552 | |
| | 2,405 | | | Neurocrine Biosciences, Inc.(b) | | | 105,267 | |
| | 11,489 | | | OPKO Health, Inc.(b)(c) | | | 108,226 | |
| | 4,312 | | | Patheon NV(b) | | | 109,482 | |
| | 2,804 | | | Patterson Cos., Inc. | | | 119,759 | |
| | 2,293 | | | PerkinElmer, Inc. | | | 116,691 | |
| | 1,333 | | | Perrigo Co. PLC | | | 110,892 | |
| | 3,804 | | | Pfizer, Inc. | | | 120,625 | |
| | 4,006 | | | Premier, Inc., Class A(b) | | | 127,551 | |
| | 4,741 | | | QIAGEN NV(b) | | | 115,586 | |
| | 1,519 | | | Quest Diagnostics, Inc. | | | 123,707 | |
| | | | | | | | |
Number
of Shares | | | | | Value | |
| | | | Common Stocks and Other Equity Interests (continued) | |
| | | | Health Care (continued) | | | | |
| | 1,616 | | | Quintiles IMS Holdings, Inc.(b) | | $ | 115,932 | |
| | 315 | | | Regeneron Pharmaceuticals,
Inc.(b) | | | 108,681 | |
| | 1,995 | | | ResMed, Inc. | | | 119,241 | |
| | 2,273 | | | Seattle Genetics, Inc.(b) | | | 117,514 | |
| | 1,613 | | | St. Jude Medical, Inc. | | | 125,556 | |
| | 1,092 | | | Stryker Corp. | | | 125,962 | |
| | 760 | | | Teleflex, Inc. | | | 108,779 | |
| | 5,930 | | | Tenet Healthcare Corp.(b) | | | 116,880 | |
| | 811 | | | Thermo Fisher Scientific, Inc. | | | 119,241 | |
| | 1,059 | | | United Therapeutics Corp.(b) | | | 127,154 | |
| | 913 | | | UnitedHealth Group, Inc. | | | 129,034 | |
| | 1,061 | | | Universal Health Services, Inc., Class B | | | 128,073 | |
| | 1,298 | | | Varian Medical Systems, Inc.(b) | | | 117,768 | |
| | 1,916 | | | VCA, Inc.(b) | | | 117,757 | |
| | 3,103 | | | Veeva Systems, Inc., Class A(b) | | | 120,552 | |
| | 1,445 | | | Vertex Pharmaceuticals, Inc.(b) | | | 109,618 | |
| | 4,562 | | | VWR Corp.(b) | | | 125,501 | |
| | 651 | | | Waters Corp.(b) | | | 90,580 | |
| | 1,104 | | | WellCare Health Plans, Inc.(b) | | | 125,315 | |
| | 1,747 | | | West Pharmaceutical Services, Inc. | | | 132,824 | |
| | 1,004 | | | Zimmer Biomet Holdings, Inc. | | | 105,822 | |
| | 2,477 | | | Zoetis, Inc. | | | 118,401 | |
| | | | | | | | |
| | | | | | | 12,144,962 | |
| | | | | | | | |
| | | | Industrials—12.7% | | | | |
| | 621 | | | 3M Co. | | | 102,651 | |
| | 2,115 | | | A.O. Smith Corp. | | | 95,535 | |
| | 726 | | | Acuity Brands, Inc. | | | 162,312 | |
| | 3,605 | | | AECOM(b) | | | 100,399 | |
| | 2,220 | | | AGCO Corp. | | | 113,398 | |
| | 3,784 | | | Air Lease Corp. | | | 114,504 | |
| | 1,574 | | | Alaska Air Group, Inc. | | | 113,674 | |
| | 1,515 | | | Allegion PLC | | | 96,718 | |
| | 3,750 | | | Allison Transmission Holdings, Inc. | | | 109,838 | |
| | 251 | | | AMERCO | | | 80,920 | |
| | 2,894 | | | American Airlines Group, Inc. | | | 117,496 | |
| | 2,188 | | | AMETEK, Inc. | | | 96,491 | |
| | 6,564 | | | Arconic, Inc. | | | 188,518 | |
| | 4,637 | | | Armstrong World Industries, Inc.(b) | | | 173,888 | |
| | 2,265 | | | Avis Budget Group, Inc.(b) | | | 73,295 | |
| | 2,065 | | | B/E Aerospace, Inc. | | | 122,909 | |
| | 796 | | | Boeing Co. (The) | | | 113,374 | |
| | 2,666 | | | BWX Technologies, Inc. | | | 104,561 | |
| | 1,481 | | | C.H. Robinson Worldwide, Inc. | | | 100,886 | |
| | 1,019 | | | Carlisle Cos., Inc. | | | 106,842 | |
| | 1,258 | | | Caterpillar, Inc. | | | 104,993 | |
| | 3,884 | | | Chicago Bridge & Iron Co. NV | | | 124,366 | |
| | 917 | | | Cintas Corp. | | | 97,816 | |
| | 2,246 | | | Clean Harbors, Inc.(b) | | | 106,281 | |
| | 3,575 | | | Colfax Corp.(b) | | | 113,649 | |
| | 1,205 | | | Copa Holdings SA, Class A (Panama) | | | 111,137 | |
| | 1,924 | | | Copart, Inc.(b) | | | 100,952 | |
| | 6,834 | | | Covanta Holding Corp. | | | 102,510 | |
| | 1,671 | | | Crane Co. | | | 113,645 | |
| | 3,519 | | | CSX Corp. | | | 107,365 | |
| | 859 | | | Cummins, Inc. | | | 109,797 | |
| | 1,256 | | | Deere & Co. | | | 110,905 | |
See accompanying Notes to Financial Statements which are an integral part of the financial statements.
PowerShares Russell 1000 Equal Weight Portfolio (EQAL) (continued)
October 31, 2016
| | | | | | | | |
Number
of Shares | | | | | Value | |
| | | | Common Stocks and Other Equity Interests (continued) | |
| | | | Industrials (continued) | | | | |
| | 2,653 | | | Delta Air Lines, Inc. | | $ | 110,816 | |
| | 2,818 | | | Donaldson Co., Inc. | | | 102,913 | |
| | 1,494 | | | Dover Corp. | | | 99,934 | |
| | 395 | | | Dun & Bradstreet Corp. (The) | | | 49,316 | |
| | 1,641 | | | Eaton Corp. PLC | | | 104,647 | |
| | 2,008 | | | Emerson Electric Co. | | | 101,765 | |
| | 402 | | | Equifax, Inc. | | | 49,836 | |
| | 2,022 | | | Expeditors International of Washington, Inc. | | | 104,072 | |
| | 4,710 | | | Fastenal Co. | | | 183,596 | |
| | 618 | | | FedEx Corp. | | | 107,730 | |
| | 2,272 | | | Flowserve Corp. | | | 96,219 | |
| | 2,111 | | | Fluor Corp. | | | 109,751 | |
| | 2,015 | | | Fortive Corp. | | | 102,866 | |
| | 1,372 | | | Fortune Brands Home & Security, Inc. | | | 74,952 | |
| | 666 | | | General Dynamics Corp. | | | 100,393 | |
| | 3,481 | | | General Electric Co. | | | 101,297 | |
| | 1,569 | | | Genesee & Wyoming, Inc.,
Class A(b) | | | 106,598 | |
| | 1,424 | | | Graco, Inc. | | | 106,658 | |
| | 3,315 | | | HD Supply Holdings, Inc.(b) | | | 109,395 | |
| | 1,512 | | | HEICO Corp. | | | 102,151 | |
| | 3,249 | | | Herc Holdings, Inc.(b) | | | 97,762 | |
| | 1,944 | | | Hertz Global Holdings, Inc.(b) | | | 64,444 | |
| | 4,355 | | | Hexcel Corp. | | | 198,109 | |
| | 903 | | | Honeywell International, Inc. | | | 99,041 | |
| | 979 | | | Hubbell, Inc. | | | 102,325 | |
| | 672 | | | Huntington Ingalls Industries, Inc. | | | 108,434 | |
| | 1,126 | | | IDEX Corp. | | | 97,331 | |
| | 879 | | | Illinois Tool Works, Inc. | | | 99,828 | |
| | 2,847 | | | Ingersoll-Rand PLC | | | 191,575 | |
| | 3,001 | | | ITT, Inc. | | | 105,695 | |
| | 1,329 | | | J.B. Hunt Transport Services, Inc. | | | 108,460 | |
| | 2,056 | | | Jacobs Engineering Group, Inc.(b) | | | 106,049 | |
| | 6,007 | | | JetBlue Airways Corp.(b) | | | 105,002 | |
| | 2,310 | | | Johnson Controls International PLC | | | 93,139 | |
| | 1,131 | | | Kansas City Southern | | | 99,257 | |
| | 1,880 | | | KAR Auction Services, Inc. | | | 80,050 | |
| | 7,244 | | | KBR, Inc. | | | 107,284 | |
| | 1,752 | | | Kirby Corp.(b) | | | 103,280 | |
| | 677 | | | L-3 Communications Holdings, Inc. | | | 92,708 | |
| | 1,575 | | | Landstar System, Inc. | | | 112,061 | |
| | 1,203 | | | Lennox International, Inc. | | | 175,506 | |
| | 1,675 | | | Lincoln Electric Holdings, Inc. | | | 110,265 | |
| | 427 | | | Lockheed Martin Corp. | | | 105,204 | |
| | 3,285 | | | LSC Communications, Inc.(b) | | | 79,628 | |
| | 1,254 | | | Macquarie Infrastructure Corp. | | | 102,590 | |
| | 6,378 | | | Manitowoc Foodservice, Inc.(b) | | | 96,372 | |
| | 1,473 | | | ManpowerGroup, Inc. | | | 113,126 | |
| | 5,460 | | | Masco Corp. | | | 168,605 | |
| | 831 | | | Middleby Corp. (The)(b) | | | 93,163 | |
| | 1,455 | | | MSC Industrial Direct Co., Inc., Class A | | | 105,924 | |
| | 1,518 | | | Nielsen Holdings PLC | | | 68,340 | |
| | 1,056 | | | Nordson Corp. | | | 105,737 | |
| | 1,101 | | | Norfolk Southern Corp. | | | 102,393 | |
| | 475 | | | Northrop Grumman Corp. | | | 108,775 | |
| | 1,553 | | | Old Dominion Freight Line, Inc.(b) | | | 115,978 | |
| | 1,357 | | | Orbital ATK, Inc. | | | 100,907 | |
| | | | | | | | |
Number
of Shares | | | | | Value | |
| | | | Common Stocks and Other Equity Interests (continued) | |
| | | | Industrials (continued) | | | | |
| | 1,944 | | | Oshkosh Corp. | | $ | 104,004 | |
| | 3,532 | | | Owens Corning | | | 172,291 | |
| | 1,815 | | | PACCAR, Inc. | | | 99,680 | |
| | 845 | | | Parker-Hannifin Corp. | | | 103,724 | |
| | 1,698 | | | Pentair PLC (United Kingdom) | | | 93,611 | |
| | 5,894 | | | Pitney Bowes, Inc. | | | 105,149 | |
| | 3,878 | | | Quanta Services, Inc.(b) | | | 111,493 | |
| | 746 | | | Raytheon Co. | | | 101,911 | |
| | 1,813 | | | Regal Beloit Corp. | | | 107,148 | |
| | 2,056 | | | Republic Services, Inc. | | | 108,207 | |
| | 2,731 | | | Robert Half International, Inc. | | | 102,194 | |
| | 902 | | | Rockwell Automation, Inc. | | | 107,987 | |
| | 1,217 | | | Rockwell Collins, Inc. | | | 102,617 | |
| | 3,619 | | | Rollins, Inc. | | | 111,538 | |
| | 576 | | | Roper Technologies, Inc. | | | 99,827 | |
| | 4,256 | | | RR Donnelley & Sons Co. | | | 75,544 | |
| | 1,625 | | | Ryder System, Inc. | | | 112,759 | |
| | 694 | | | Snap-on, Inc. | | | 106,945 | |
| | 9,374 | | | SolarCity Corp.(b) | | | 183,730 | |
| | 2,705 | | | Southwest Airlines Co. | | | 108,335 | |
| | 2,359 | | | Spirit AeroSystems Holdings, Inc., Class A(b) | | | 118,799 | |
| | 2,479 | | | Spirit Airlines, Inc.(b) | | | 118,818 | |
| | 848 | | | Stanley Black & Decker, Inc. | | | 96,536 | |
| | 1,294 | | | Stericycle, Inc.(b) | | | 103,636 | |
| | 4,428 | | | Terex Corp. | | | 105,741 | |
| | 2,631 | | | Textron, Inc. | | | 105,451 | |
| | 5,625 | | | Timken Co. (The) | | | 185,906 | |
| | 2,199 | | | Toro Co. (The) | | | 105,288 | |
| | 359 | | | TransDigm Group, Inc. | | | 97,813 | |
| | 1,617 | | | TransUnion(b) | | | 50,515 | |
| | 4,367 | | | Trinity Industries, Inc. | | | 93,235 | |
| | 1,097 | | | Union Pacific Corp. | | | 96,733 | |
| | 2,068 | | | United Continental Holdings,
Inc.(b) | | | 116,284 | |
| | 942 | | | United Parcel Service, Inc., Class B | | | 101,510 | |
| | 1,426 | | | United Rentals, Inc.(b) | | | 107,891 | |
| | 1,015 | | | United Technologies Corp. | | | 103,733 | |
| | 7,308 | | | USG Corp.(b) | | | 184,015 | |
| | 1,459 | | | Valmont Industries, Inc. | | | 186,679 | |
| | 1,278 | | | Verisk Analytics, Inc.(b) | | | 104,221 | |
| | 475 | | | W.W. Grainger, Inc. | | | 98,857 | |
| | 738 | | | WABCO Holdings, Inc.(b) | | | 72,664 | |
| | 1,334 | | | Wabtec Corp. | | | 103,132 | |
| | 1,630 | | | Waste Management, Inc. | | | 107,026 | |
| | 1,346 | | | Watsco, Inc. | | | 184,792 | |
| | 1,782 | | | WESCO International, Inc.(b) | | | 96,584 | |
| | 1,999 | | | Xylem, Inc. | | | 96,612 | |
| | | | | | | | |
| | | | | | | 14,702,042 | |
| | | | | | | | |
| | | | Information Technology—13.6% | | | | |
| | 898 | | | Accenture PLC, Class A | | | 104,383 | |
| | 2,669 | | | Activision Blizzard, Inc. | | | 115,221 | |
| | 1,079 | | | Adobe Systems, Inc.(b) | | | 116,003 | |
| | 2,248 | | | Akamai Technologies, Inc.(b) | | | 156,169 | |
| | 255 | | | Alliance Data Systems Corp. | | | 52,140 | |
| | 155 | | | Alphabet, Inc., Class C(b) | | | 121,604 | |
| | 2,031 | | | Amdocs Ltd. | | | 118,712 | |
See accompanying Notes to Financial Statements which are an integral part of the financial statements.
PowerShares Russell 1000 Equal Weight Portfolio (EQAL) (continued)
October 31, 2016
| | | | | | | | |
Number
of Shares | | | | | Value | |
| | | | Common Stocks and Other Equity Interests (continued) | |
| | | | Information Technology (continued) | | | | |
| | 1,831 | | | Amphenol Corp., Class A | | $ | 120,718 | |
| | 1,848 | | | Analog Devices, Inc. | | | 118,457 | |
| | 1,285 | | | ANSYS, Inc.(b) | | | 117,385 | |
| | 1,040 | | | Apple, Inc. | | | 118,082 | |
| | 3,989 | | | Applied Materials, Inc. | | | 116,000 | |
| | 1,368 | | | Arista Networks, Inc.(b) | | | 115,938 | |
| | 4,163 | | | ARRIS International PLC(b) | | | 115,648 | |
| | 1,872 | | | Arrow Electronics, Inc.(b) | | | 114,417 | |
| | 3,972 | | | Atlassian Corp. PLC, Class A (Australia)(b) | | | 106,688 | |
| | 1,643 | | | Autodesk, Inc.(b) | | | 118,756 | |
| | 1,172 | | | Automatic Data Processing, Inc. | | | 102,034 | |
| | 2,918 | | | Avnet, Inc. | | | 122,410 | |
| | 2,939 | | | Black Knight Financial Services, Inc., Class A(b) | | | 115,650 | |
| | 3,295 | | | Booz Allen Hamilton Holding Corp. | | | 100,399 | |
| | 696 | | | Broadcom Ltd. (Singapore) | | | 118,515 | |
| | 786 | | | Broadridge Financial Solutions, Inc. | | | 50,823 | |
| | 12,891 | | | Brocade Communications Systems, Inc. | | | 136,645 | |
| | 3,620 | | | CA, Inc. | | | 111,279 | |
| | 4,703 | | | Cadence Design Systems, Inc.(b) | | | 120,303 | |
| | 2,056 | | | CDK Global, Inc. | | | 112,278 | |
| | 2,583 | | | CDW Corp. | | | 116,002 | |
| | 3,751 | | | Cisco Systems, Inc. | | | 115,081 | |
| | 1,384 | | | Citrix Systems, Inc.(b) | | | 117,363 | |
| | 2,266 | | | Cognex Corp. | | | 116,926 | |
| | 2,174 | | | Cognizant Technology Solutions Corp., Class A(b) | | | 111,635 | |
| | 7,502 | | | CommerceHub, Inc., Series C(b) | | | 112,905 | |
| | 3,878 | | | CommScope Holding, Inc.(b) | | | 118,473 | |
| | 2,269 | | | Computer Sciences Corp. | | | 123,547 | |
| | 1,353 | | | CoreLogic, Inc.(b) | | | 57,584 | |
| | 5,069 | | | Corning, Inc. | | | 115,117 | |
| | 471 | | | CoStar Group, Inc.(b) | | | 88,133 | |
| | 4,657 | | | Cree, Inc.(b) | | | 103,851 | |
| | 4,394 | | | CSRA, Inc. | | | 110,245 | |
| | 10,062 | | | Cypress Semiconductor Corp. | | | 100,318 | |
| | 2,471 | | | Dell Technologies, Inc., Class V(b) | | | 121,301 | |
| | 2,175 | | | Dolby Laboratories, Inc., Class A | | | 103,508 | |
| | 1,001 | | | DST Systems, Inc. | | | 96,256 | |
| | 2,537 | | | eBay, Inc.(b) | | | 72,330 | |
| | 2,843 | | | EchoStar Corp., Class A(b) | | | 132,882 | |
| | 1,384 | | | Electronic Arts, Inc.(b) | | | 108,672 | |
| | 661 | | | Euronet Worldwide, Inc.(b) | | | 52,583 | |
| | 967 | | | F5 Networks, Inc.(b) | | | 133,649 | |
| | 917 | | | Facebook, Inc., Class A(b) | | | 120,118 | |
| | 698 | | | Fidelity National Information Services, Inc. | | | 51,596 | |
| | 7,997 | | | FireEye, Inc.(b) | | | 92,925 | |
| | 4,082 | | | First Data Corp., Class A(b) | | | 57,107 | |
| | 4,797 | | | First Solar, Inc.(b) | | | 194,231 | |
| | 538 | | | Fiserv, Inc.(b) | | | 52,982 | |
| | 4,900 | | | Fitbit, Inc., Class A(b)(c) | | | 64,974 | |
| | 310 | | | FleetCor Technologies, Inc.(b) | | | 54,343 | |
| | 3,276 | | | FLIR Systems, Inc. | | | 107,846 | |
| | 3,275 | | | Fortinet, Inc.(b) | | | 104,996 | |
| | 1,328 | | | Gartner, Inc.(b) | | | 114,261 | |
| | 4,450 | | | Genpact Ltd.(b) | | | 102,305 | |
| | 712 | | | Global Payments, Inc. | | | 51,634 | |
| | | | | | | | |
Number
of Shares | | | | | Value | |
| | | | Common Stocks and Other Equity Interests (continued) | |
| | | | Information Technology (continued) | | | | |
| | 3,448 | | | GoDaddy, Inc., Class A(b) | | $ | 123,404 | |
| | 1,972 | | | Guidewire Software, Inc.(b) | | | 113,291 | |
| | 1,288 | | | Harris Corp. | | | 114,902 | |
| | 5,160 | | | Hewlett Packard Enterprise Co. | | | 115,945 | |
| | 7,707 | | | HP, Inc. | | | 111,674 | |
| | 1,890 | | | IAC/InterActiveCorp. | | | 121,792 | |
| | 3,431 | | | Ingram Micro, Inc., Class A | | | 127,633 | |
| | 3,179 | | | Intel Corp. | | | 110,852 | |
| | 751 | | | International Business Machines Corp. | | | 115,421 | |
| | 1,075 | | | Intuit, Inc. | | | 116,895 | |
| | 1,427 | | | IPG Photonics Corp.(b) | | | 138,433 | |
| | 5,388 | | | Jabil Circuit, Inc. | | | 114,980 | |
| | 625 | | | Jack Henry & Associates, Inc. | | | 50,637 | |
| | 4,915 | | | Juniper Networks, Inc. | | | 129,461 | |
| | 3,345 | | | Keysight Technologies, Inc.(b) | | | 109,716 | |
| | 1,693 | | | KLA-Tencor Corp. | | | 127,161 | |
| | 1,277 | | | Lam Research Corp. | | | 123,690 | |
| | 2,710 | | | Leidos Holdings, Inc. | | | 112,655 | |
| | 3,020 | | | Lexmark International, Inc., Class A | | | 119,864 | |
| | 2,000 | | | Linear Technology Corp. | | | 120,120 | |
| | 618 | | | LinkedIn Corp., Class A(b) | | | 117,173 | |
| | 2,027 | | | Manhattan Associates, Inc.(b) | | | 102,647 | |
| | 9,025 | | | Marvell Technology Group Ltd. (Bermuda) | | | 117,596 | |
| | 534 | | | MasterCard, Inc., Class A | | | 57,149 | |
| | 6,676 | | | Match Group, Inc., Class A(b) | | | 120,569 | |
| | 3,011 | | | Maxim Integrated Products, Inc. | | | 119,326 | |
| | 1,925 | | | Microchip Technology, Inc. | | | 116,559 | |
| | 6,563 | | | Micron Technology, Inc.(b) | | | 112,621 | |
| | 2,035 | | | Microsoft Corp. | | | 121,937 | |
| | 1,548 | | | Motorola Solutions, Inc. | | | 112,354 | |
| | 3,662 | | | National Instruments Corp. | | | 102,866 | |
| | 3,707 | | | NCR Corp.(b) | | | 129,930 | |
| | 3,347 | | | NetApp, Inc. | | | 113,597 | |
| | 1,078 | | | NetSuite, Inc.(b) | | | 100,383 | |
| | 8,139 | | | Nuance Communications, Inc.(b) | | | 114,109 | |
| | 1,781 | | | NVIDIA Corp. | | | 126,736 | |
| | 10,021 | | | ON Semiconductor Corp.(b) | | | 116,945 | |
| | 3,006 | | | Oracle Corp. | | | 115,490 | |
| | 783 | | | Palo Alto Networks, Inc.(b) | | | 120,449 | |
| | 5,727 | | | Pandora Media, Inc.(b) | | | 64,887 | |
| | 1,727 | | | Paychex, Inc. | | | 95,330 | |
| | 1,310 | | | PayPal Holdings, Inc.(b) | | | 54,575 | |
| | 2,664 | | | PTC, Inc.(b) | | | 126,380 | |
| | 2,167 | | | Qorvo, Inc.(b) | | | 120,594 | |
| | 1,872 | | | QUALCOMM, Inc. | | | 128,644 | |
| | 3,740 | | | Rackspace Hosting, Inc.(b) | | | 119,456 | |
| | 1,489 | | | Red Hat, Inc.(b) | | | 115,323 | |
| | 4,285 | | | Sabre Corp. | | | 110,682 | |
| | 1,692 | | | salesforce.com, inc.(b) | | | 127,171 | |
| | 1,490 | | | ServiceNow, Inc.(b) | | | 130,986 | |
| | 1,603 | | | Skyworks Solutions, Inc. | | | 123,335 | |
| | 2,012 | | | Splunk, Inc.(b) | | | 121,102 | |
| | 4,578 | | | Square, Inc., Class A(b) | | | 51,274 | |
| | 3,636 | | | SS&C Technologies Holdings, Inc. | | | 116,097 | |
| | 21,542 | | | SunPower Corp.(b)(c) | | | 155,964 | |
| | 4,701 | | | Symantec Corp. | | | 117,666 | |
See accompanying Notes to Financial Statements which are an integral part of the financial statements.
PowerShares Russell 1000 Equal Weight Portfolio (EQAL) (continued)
October 31, 2016
| | | | | | | | |
Number
of Shares | | | | | Value | |
| | | | Common Stocks and Other Equity Interests (continued) | |
| | | | Information Technology (continued) | | | | |
| | 1,984 | | | Synopsys, Inc.(b) | | $ | 117,671 | |
| | 2,159 | | | Tableau Software, Inc., Class A(b) | | | 103,740 | |
| | 3,890 | | | Teradata Corp.(b) | | | 104,874 | |
| | 5,576 | | | Teradyne, Inc. | | | 129,865 | |
| | 1,705 | | | Texas Instruments, Inc. | | | 120,799 | |
| | 1,144 | | | Total System Services, Inc. | | | 57,063 | |
| | 3,697 | | | Trimble, Inc.(b) | | | 102,185 | |
| | 1,732 | | | Twilio, Inc., Class A(b) | | | 59,096 | |
| | 4,985 | | | Twitter, Inc.(b) | | | 89,481 | |
| | 694 | | | Tyler Technologies, Inc.(b) | | | 111,318 | |
| | 562 | | | Ultimate Software Group, Inc. (The)(b) | | | 118,576 | |
| | 966 | | | Vantiv, Inc., Class A(b) | | | 56,376 | |
| | 7,404 | | | VeriFone Systems, Inc.(b) | | | 114,614 | |
| | 1,508 | | | VeriSign, Inc.(b) | | | 126,702 | |
| | 8,500 | | | Versum Materials, Inc.(b) | | | 192,950 | |
| | 655 | | | Visa, Inc., Class A | | | 54,044 | |
| | 1,609 | | | VMware, Inc., Class A(b) | | | 126,467 | |
| | 2,007 | | | Western Digital Corp. | | | 117,289 | |
| | 2,661 | | | Western Union Co. (The) | | | 53,406 | |
| | 518 | | | WEX, Inc.(b) | | | 56,514 | |
| | 1,311 | | | Workday, Inc., Class A(b) | | | 113,637 | |
| | 10,378 | | | Xerox Corp. | | | 101,393 | |
| | 2,216 | | | Xilinx, Inc. | | | 112,728 | |
| | 2,725 | | | Yahoo!, Inc.(b) | | | 113,224 | |
| | 2,834 | | | Yelp, Inc., Class A(b) | | | 92,558 | |
| | 1,514 | | | Zebra Technologies Corp., Class A(b) | | | 99,682 | |
| | 1,516 | | | Zillow Group, Inc., Class C(b) | | | 50,574 | |
| | 41,032 | | | Zynga, Inc., Class A(b) | | | 115,300 | |
| | | | | | | | |
| | | | | | | 15,682,890 | |
| | | | | | | | |
| | | | Materials—9.0% | |
| | 10,411 | | | Advansix, Inc.(b) | | | 166,160 | |
| | 1,380 | | | Air Products & Chemicals, Inc. | | | 184,120 | |
| | 2,295 | | | Albemarle Corp. | | | 191,747 | |
| | 2,447 | | | AptarGroup, Inc. | | | 174,814 | |
| | 1,620 | | | Ashland Global Holdings, Inc. | | | 181,003 | |
| | 1,342 | | | Avery Dennison Corp. | | | 93,658 | |
| | 6,791 | | | Axalta Coating Systems Ltd.(b) | | | 170,590 | |
| | 2,387 | | | Ball Corp. | | | 183,966 | |
| | 3,757 | | | Bemis Co., Inc. | | | 183,041 | |
| | 4,164 | | | Berry Plastics Group, Inc.(b) | | | 182,175 | |
| | 3,635 | | | Cabot Corp. | | | 189,529 | |
| | 2,984 | | | Celanese Corp., Series A | | | 217,593 | |
| | 8,302 | | | CF Industries Holdings, Inc. | | | 199,331 | |
| | 2,626 | | | Compass Minerals International, Inc. | | | 188,678 | |
| | 3,390 | | | Crown Holdings, Inc.(b) | | | 183,907 | |
| | 5,204 | | | Domtar Corp. | | | 187,084 | |
| | 3,619 | | | Dow Chemical Co. (The) | | | 194,738 | |
| | 2,826 | | | E.I. du Pont de Nemours & Co. | | | 194,401 | |
| | 2,491 | | | Eagle Materials, Inc. | | | 201,696 | |
| | 2,903 | | | Eastman Chemical Co. | | | 208,755 | |
| | 1,633 | | | Ecolab, Inc. | | | 186,440 | |
| | 3,929 | | | FMC Corp. | | | 184,231 | |
| | 18,623 | | | Freeport-McMoRan, Inc. | | | 208,205 | |
| | 13,719 | | | Graphic Packaging Holding Co. | | | 171,488 | |
| | 12,246 | | | Huntsman Corp. | | | 207,570 | |
| | 1,348 | | | International Flavors & Fragrances, Inc. | | | 176,291 | |
| | | | | | | | |
Number
of Shares | | | | | Value | |
| | | | Common Stocks and Other Equity Interests (continued) | |
| | | | Materials (continued) | | | | |
| | 4,002 | | | International Paper Co. | | $ | 180,210 | |
| | 2,446 | | | LyondellBasell Industries NV, Class A | | | 194,579 | |
| | 1,069 | | | Martin Marietta Materials, Inc. | | | 198,171 | |
| | 1,915 | | | Monsanto Co. | | | 192,975 | |
| | 7,923 | | | Mosaic Co. (The) | | | 186,428 | |
| | 453 | | | NewMarket Corp. | | | 181,612 | |
| | 4,937 | | | Newmont Mining Corp. | | | 182,866 | |
| | 3,879 | | | Nucor Corp. | | | 189,489 | |
| | 10,618 | | | Owens-Illinois, Inc.(b) | | | 204,927 | |
| | 2,355 | | | Packaging Corp. of America | | | 194,288 | |
| | 22,956 | | | Platform Specialty Products
Corp.(b) | | | 167,349 | |
| | 1,907 | | | PPG Industries, Inc. | | | 177,599 | |
| | 1,626 | | | Praxair, Inc. | | | 190,340 | |
| | 2,639 | | | Reliance Steel & Aluminum Co. | | | 181,510 | |
| | 2,437 | | | Royal Gold, Inc. | | | 167,714 | |
| | 3,585 | | | RPM International, Inc. | | | 170,431 | |
| | 2,288 | | | Scotts Miracle-Gro Co. (The), Class A | | | 201,550 | |
| | 4,107 | | | Sealed Air Corp. | | | 187,402 | |
| | 696 | | | Sherwin-Williams Co. (The) | | | 170,423 | |
| | 3,798 | | | Silgan Holdings, Inc. | | | 193,508 | |
| | 3,605 | | | Sonoco Products Co. | | | 181,295 | |
| | 7,389 | | | Southern Copper Corp. (Peru) | | | 209,774 | |
| | 7,482 | | | Steel Dynamics, Inc. | | | 205,456 | |
| | 14,467 | | | Tahoe Resources, Inc. | | | 174,472 | |
| | 9,890 | | | United States Steel Corp. | | | 191,273 | |
| | 1,792 | | | Valspar Corp. (The) | | | 178,483 | |
| | 1,714 | | | Vulcan Materials Co. | | | 194,025 | |
| | 2,664 | | | W.R. Grace & Co. | | | 178,381 | |
| | 3,766 | | | Westlake Chemical Corp. | | | 195,041 | |
| | 3,995 | | | WestRock Co. | | | 184,529 | |
| | | | | | | | |
| | | | | | | 10,417,311 | |
| | | | | | | | |
| | | | Real Estate—3.6% | |
| | 477 | | | Alexandria Real Estate Equities, Inc. REIT | | | 51,425 | |
| | 1,057 | | | American Campus Communities, Inc. REIT | | | 55,080 | |
| | 2,492 | | | American Homes 4 Rent, Class A REIT | | | 52,606 | |
| | 477 | | | American Tower Corp. REIT | | | 55,900 | |
| | 1,149 | | | Apartment Investment & Management Co., Class A REIT | | | 50,636 | |
| | 2,914 | | | Apple Hospitality REIT, Inc. REIT | | | 52,539 | |
| | 294 | | | AvalonBay Communities, Inc. REIT | | | 50,327 | |
| | 388 | | | Boston Properties, Inc. REIT | | | 46,746 | |
| | 3,439 | | | Brandywine Realty Trust REIT | | | 53,304 | |
| | 1,896 | | | Brixmor Property Group, Inc. REIT | | | 48,196 | |
| | 625 | | | Camden Property Trust REIT | | | 50,900 | |
| | 1,885 | | | Care Capital Properties, Inc. REIT | | | 50,084 | |
| | 1,908 | | | CBRE Group, Inc., Class A(b) | | | 49,150 | |
| | 2,382 | | | Columbia Property Trust, Inc. REIT | | | 50,213 | |
| | 1,668 | | | Communications Sales & Leasing, Inc. REIT | | | 47,421 | |
| | 1,882 | | | Corporate Office Properties Trust REIT | | | 50,231 | |
| | 3,651 | | | Corrections Corp. of America REIT | | | 52,757 | |
| | 566 | | | Crown Castle International Corp. REIT | | | 51,500 | |
| | 1,926 | | | CubeSmart REIT | | | 50,211 | |
| | 1,115 | | | CyrusOne, Inc. REIT | | | 49,740 | |
| | 1,102 | | | DCT Industrial Trust, Inc. REIT | | | 51,518 | |
| | 3,058 | | | DDR Corp. REIT | | | 46,757 | |
| | 556 | | | Digital Realty Trust, Inc. REIT | | | 51,947 | |
See accompanying Notes to Financial Statements which are an integral part of the financial statements.
PowerShares Russell 1000 Equal Weight Portfolio (EQAL) (continued)
October 31, 2016
| | | | | | | | |
Number
of Shares | | | | | Value | |
| | | | Common Stocks and Other Equity Interests (continued) | |
| | | | Real Estate (continued) | | | | |
| | 1,447 | | | Douglas Emmett, Inc. REIT | | $ | 52,815 | |
| | 1,973 | | | Duke Realty Corp. REIT | | | 51,594 | |
| | 2,532 | | | Empire State Realty Trust, Inc., Class A REIT | | | 49,551 | |
| | 673 | | | EPR Properties REIT | | | 48,941 | |
| | 153 | | | Equinix, Inc. REIT | | | 54,664 | |
| | 1,756 | | | Equity Commonwealth REIT(b) | | | 53,049 | |
| | 691 | | | Equity LifeStyle Properties, Inc. REIT | | | 52,405 | |
| | 1,730 | | | Equity One, Inc. REIT | | | 49,305 | |
| | 834 | | | Equity Residential REIT | | | 51,500 | |
| | 241 | | | Essex Property Trust, Inc. REIT | | | 51,596 | |
| | 664 | | | Extra Space Storage, Inc. REIT | | | 48,572 | |
| | 344 | | | Federal Realty Investment Trust REIT | | | 49,959 | |
| | 2,308 | | | Forest City Realty Trust, Inc., Class A REIT | | | 49,830 | |
| | 1,604 | | | Gaming and Leisure Properties, Inc. REIT | | | 52,659 | |
| | 1,908 | | | General Growth Properties, Inc. REIT | | | 47,605 | |
| | 1,389 | | | HCP, Inc. REIT | | | 47,573 | |
| | 1,628 | | | Healthcare Trust of America, Inc., Class A REIT | | | 49,817 | |
| | 1,029 | | | Highwoods Properties, Inc. REIT | | | 51,069 | |
| | 1,832 | | | Hospitality Properties Trust REIT | | | 50,124 | |
| | 3,433 | | | Host Hotels & Resorts, Inc. REIT | | | 53,143 | |
| | 473 | | | Howard Hughes Corp. (The)(b) | | | 51,950 | |
| | 1,426 | | | Iron Mountain, Inc. REIT | | | 48,099 | |
| | 470 | | | Jones Lang LaSalle, Inc. | | | 45,520 | |
| | 792 | | | Kilroy Realty Corp. REIT | | | 56,889 | |
| | 1,815 | | | Kimco Realty Corp. REIT | | | 48,297 | |
| | 829 | | | Lamar Advertising Co., Class A REIT | | | 52,600 | |
| | 1,309 | | | Liberty Property Trust REIT | | | 52,923 | |
| | 577 | | | Life Storage, Inc. REIT | | | 46,535 | |
| | 655 | | | Macerich Co. (The) REIT | | | 46,361 | |
| | 561 | | | Mid-America Apartment Communities, Inc. REIT | | | 52,033 | |
| | 1,037 | | | National Retail Properties, Inc. REIT | | | 47,308 | |
| | 4,222 | | | NorthStar Realty Finance Corp. REIT | | | 61,303 | |
| | 1,485 | | | OMEGA Healthcare Investors, Inc. REIT | | | 47,268 | |
| | 2,346 | | | Outfront Media, Inc. REIT | | | 50,462 | |
| | 3,213 | | | Paramount Group, Inc. REIT | | | 49,962 | |
| | 2,482 | | | Piedmont Office Realty Trust, Inc., Class A REIT | | | 50,831 | |
| | 799 | | | Post Properties, Inc. REIT | | | 52,566 | |
| | 1,002 | | | Prologis, Inc. REIT | | | 52,264 | |
| | 246 | | | Public Storage REIT | | | 52,575 | |
| | 2,013 | | | Rayonier, Inc. REIT | | | 53,989 | |
| | 2,096 | | | Realogy Holdings Corp. | | | 47,977 | |
| | 795 | | | Realty Income Corp. REIT | | | 47,096 | |
| | 692 | | | Regency Centers Corp. REIT | | | 49,872 | |
| | 3,201 | | | Retail Properties of America, Inc., Class A REIT | | | 49,840 | |
| | 2,339 | | | Senior Housing Properties Trust REIT | | | 49,751 | |
| | 256 | | | Simon Property Group, Inc. REIT | | | 47,606 | |
| | 483 | | | SL Green Realty Corp. REIT | | | 47,440 | |
| | 3,994 | | | Spirit Realty Capital, Inc. REIT | | | 47,569 | |
| | 1,806 | | | STORE Capital Corp. REIT | | | 49,286 | |
| | 663 | | | Sun Communities, Inc. REIT | | | 51,005 | |
| | 1,360 | | | Tanger Factory Outlet Centers, Inc. REIT | | | 47,328 | |
| | 717 | | | Taubman Centers, Inc. REIT | | | 51,954 | |
| | | | | | | | |
Number
of Shares | | | | | Value | |
| | | | Common Stocks and Other Equity Interests (continued) | |
| | | | Real Estate (continued) | | | | |
| | 1,471 | | | UDR, Inc. REIT | | $ | 51,441 | |
| | 747 | | | Ventas, Inc. REIT | | | 50,609 | |
| | 5,225 | | | VEREIT, Inc. REIT | | | 49,115 | |
| | 528 | | | Vornado Realty Trust REIT | | | 48,988 | |
| | 1,359 | | | Weingarten Realty Investors REIT | | | 49,209 | |
| | 716 | | | Welltower, Inc. REIT | | | 49,067 | |
| | 1,705 | | | Weyerhaeuser Co. REIT | | | 51,031 | |
| | 813 | | | WP Carey, Inc. REIT | | | 49,382 | |
| | | | | | | | |
| | | | | | | 4,190,260 | |
| | | | | | | | |
| | | | Telecommunication Services—2.3% | |
| | 6,086 | | | AT&T, Inc. | | | 223,904 | |
| | 9,426 | | | CenturyLink, Inc. | | | 250,543 | |
| | 58,125 | | | Frontier Communications Corp. | | | 233,662 | |
| | 5,485 | | | Level 3 Communications, Inc.(b) | | | 307,983 | |
| | 1,060 | | | SBA Communications Corp.,
Class A(b) | | | 120,077 | |
| | 38,306 | | | Sprint Corp.(b) | | | 235,965 | |
| | 9,504 | | | Telephone & Data Systems, Inc. | | | 245,583 | |
| | 5,492 | | | T-Mobile US, Inc.(b) | | | 273,117 | |
| | 7,093 | | | United States Cellular Corp.(b) | | | 248,610 | |
| | 4,808 | | | Verizon Communications, Inc. | | | 231,265 | |
| | 8,635 | | | Zayo Group Holdings, Inc.(b) | | | 277,874 | |
| | | | | | | | |
| | | | | | | 2,648,583 | |
| | | | | | | | |
| | | | Utilities—8.7% | |
| | 19,286 | | | AES Corp. (The) | | | 226,996 | |
| | 6,359 | | | Alliant Energy Corp. | | | 241,960 | |
| | 4,991 | | | Ameren Corp. | | | 249,300 | |
| | 3,941 | | | American Electric Power Co., Inc. | | | 255,534 | |
| | 3,392 | | | American Water Works Co., Inc. | | | 251,144 | |
| | 8,087 | | | Aqua America, Inc. | | | 248,271 | |
| | 3,328 | | | Atmos Energy Corp. | | | 247,570 | |
| | 5,906 | | | Avangrid, Inc. | | | 232,755 | |
| | 19,178 | | | Calpine Corp.(b) | | | 228,218 | |
| | 10,822 | | | CenterPoint Energy, Inc. | | | 246,742 | |
| | 5,974 | | | CMS Energy Corp. | | | 251,804 | |
| | 3,244 | | | Consolidated Edison, Inc. | | | 245,084 | |
| | 3,333 | | | Dominion Resources, Inc. | | | 250,642 | |
| | 2,716 | | | DTE Energy Co. | | | 260,763 | |
| | 3,173 | | | Duke Energy Corp. | | | 253,903 | |
| | 3,480 | | | Edison International | | | 255,710 | |
| | 3,171 | | | Entergy Corp. | | | 233,639 | |
| | 4,660 | | | Eversource Energy | | | 256,580 | |
| | 7,556 | | | Exelon Corp. | | | 257,433 | |
| | 7,671 | | | FirstEnergy Corp. | | | 263,039 | |
| | 9,499 | | | Great Plains Energy, Inc. | | | 270,151 | |
| | 8,421 | | | Hawaiian Electric Industries, Inc. | | | 248,419 | |
| | 10,183 | | | MDU Resources Group, Inc. | | | 266,896 | |
| | 4,639 | | | National Fuel Gas Co. | | | 242,991 | |
| | 1,991 | | | NextEra Energy, Inc. | | | 254,848 | |
| | 10,214 | | | NiSource, Inc. | | | 237,578 | |
| | 23,060 | | | NRG Energy, Inc. | | | 245,128 | |
| | 7,953 | | | OGE Energy Corp. | | | 246,861 | |
| | 4,108 | | | PG&E Corp. | | | 255,189 | |
| | 3,289 | | | Pinnacle West Capital Corp. | | | 250,392 | |
| | 7,162 | | | PPL Corp. | | | 245,943 | |
| | 5,896 | | | Public Service Enterprise Group, Inc. | | | 248,104 | |
See accompanying Notes to Financial Statements which are an integral part of the financial statements.
PowerShares Russell 1000 Equal Weight Portfolio (EQAL) (continued)
October 31, 2016
| | | | | | | | |
Number
of Shares | | | | | Value | |
| | | | Common Stocks and Other Equity Interests (continued) | |
| | | | Utilities (continued) | | | | |
| | 3,488 | | | SCANA Corp. | | $ | 255,880 | |
| | 2,336 | | | Sempra Energy | | | 250,186 | |
| | 4,894 | | | Southern Co. (The) | | | 252,384 | |
| | 5,516 | | | UGI Corp. | | | 255,336 | |
| | 5,039 | | | Vectren Corp. | | | 253,512 | |
| | 4,190 | | | WEC Energy Group, Inc. | | | 250,227 | |
| | 4,565 | | | Westar Energy, Inc. | | | 261,666 | |
| | 6,095 | | | Xcel Energy, Inc. | | | 253,247 | |
| | | | | | | | |
| | | | | | | 10,002,025 | |
| | | | | | | | |
| | | | Total Investments
(excluding investments purchased with cash collateral from securities on loan)
(Cost $120,653,224)—100.0% | | | 115,454,607 | |
| | | | | | | | |
| | |
| | | | | | | | |
| | | | Investments Purchased with Cash Collateral from Securities on Loan | |
| | |
| | | | | | | | |
| | | | Money Market Fund—0.6% | | | | |
| | 764,975 | | | Invesco Government & Agency Portfolio—Institutional Class, 0.29%(e)(f)
(Cost $764,975) | | | 764,975 | |
| | | | | | | | |
| | | | Total Investments
(Cost $121,418,199)—100.6% | | | 116,219,582 | |
| | | | Other assets less liabilities—(0.6)% | | | (735,890 | ) |
| | | | | | | | |
| | | | Net Assets—100.0% | | $ | 115,483,692 | |
| | | | | | | | |
Investment Abbreviations:
REIT—Real Estate Investment Trust
Notes to Schedule of Investments:
| (a) | Industry and/or sector classifications used in this report are generally according to the Global Industry Classification Standard, which was developed by and is the exclusive property and a service mark of MSCI Inc. and Standard & Poor’s. |
| (b) | Non-income producing security. |
| (c) | All or a portion of this security was out on loan at October 31, 2016. |
| (d) | Affiliated company. The Fund’s Adviser is a wholly-owned subsidiary of Invesco Ltd. and therefore, Invesco Ltd. is considered to be affiliated with the Fund. See Note 4. |
| (e) | The security and the Fund are advised by wholly-owned subsidiaries of Invesco Ltd. and are therefore considered to be affiliated. The rate shown is the 7-day SEC standardized yield as of October 31, 2016. |
| (f) | The security has been segregated to satisfy the commitment to return the cash collateral received in securities lending transactions upon the borrower’s return of the securities loaned. See Note 2I. |
See accompanying Notes to Financial Statements which are an integral part of the financial statements.
(This Page Intentionally Left Blank)
Statements of Assets and Liabilities
October 31, 2016
| | | | | | | | | | | | | | | | |
| | | PowerShares
Contrarian
Opportunities
Portfolio (CNTR) | | | PowerShares
KBW Bank
Portfolio (KBWB) | | | PowerShares
KBW High
Dividend Yield
Financial
Portfolio (KBWD) | | | PowerShares
KBW Premium
Yield Equity REIT
Portfolio (KBWY) | |
| Assets: | | | | | | | | | | | | | | | | |
Unaffiliated investments, at value(a) | | $ | 2,571,289 | | | $ | 429,918,981 | | | $ | 221,186,959 | | | $ | 188,431,902 | |
Affiliated investments, at value | | | 625 | | | | 14,760 | | | | 5,775,408 | | | | — | |
| | | | | | | | | | | | | | | | |
Total investments, at value | | | 2,571,914 | | | | 429,933,741 | | | | 226,962,367 | | | | 188,431,902 | |
Receivables: | | | | | | | | | | | | | | | | |
Dividends | | | 463 | | | | 333,610 | | | | 347,984 | | | | 1,022,370 | |
Shares sold | | | — | | | | 7,740,481 | | | | — | | | | — | |
Securities lending | | | — | | | | — | | | | 2,576 | | | | — | |
| | | | | | | | | | | | | | | | |
Total Assets | | | 2,572,377 | | | | 438,007,832 | | | | 227,312,927 | | | | 189,454,272 | |
| | | | | | | | | | | | | | | | |
| | | | |
| Liabilities: | | | | | | | | | | | | | | | | |
Due to custodian | | | — | | | | 398 | | | | 92,743 | | | | 422,265 | |
Payables: | | | | | | | | | | | | | | | | |
Investments purchased | | | — | | | | 7,740,348 | | | | — | | | | 544,830 | |
Collateral upon return of securities loaned | | | — | | | | — | | | | 5,775,408 | | | | — | |
Accrued unitary management fees | | | 479 | | | | 133,468 | | | | 65,650 | | | | 61,878 | |
| | | | | | | | | | | | | | | | |
Total Liabilities | | | 479 | | | | 7,874,214 | | | | 5,933,801 | | | | 1,028,973 | |
| | | | | | | | | | | | | | | | |
| Net Assets | | $ | 2,571,898 | | | $ | 430,133,618 | | | $ | 221,379,126 | | | $ | 188,425,299 | |
| | | | | | | | | | | | | | | | |
| | | | |
| Net Assets Consist of: | | | | | | | | | | | | | | | | |
Shares of beneficial interest | | $ | 2,954,110 | | | $ | 442,458,942 | | | $ | 282,650,725 | | | $ | 202,574,885 | |
Undistributed net investment income | | | 5,319 | | | | 929,039 | | | | — | | | | — | |
Undistributed net realized gain (loss) | | | (326,780 | ) | | | (2,641,661 | ) | | | (62,199,086 | ) | | | (10,629,368 | ) |
Net unrealized appreciation (depreciation) | | | (60,751 | ) | | | (10,612,702 | ) | | | 927,487 | | | | (3,520,218 | ) |
| | | | | | | | | | | | | | | | |
| Net Assets | | $ | 2,571,898 | | | $ | 430,133,618 | | | $ | 221,379,126 | | | $ | 188,425,299 | |
| | | | | | | | | | | | | | | | |
Shares outstanding (unlimited amount authorized, $0.01 par value) | | | 100,001 | | | | 11,200,000 | | | | 10,300,000 | | | | 5,550,000 | |
Net asset value | | $ | 25.72 | | | $ | 38.40 | | | $ | 21.49 | | | $ | 33.95 | |
| | | | | | | | | | | | | | | | |
Market price | | $ | 25.72 | | | $ | 38.44 | | | $ | 21.51 | | | $ | 33.95 | |
| | | | | | | | | | | | | | | | |
Unaffiliated investments, at cost | | $ | 2,632,040 | | | $ | 440,531,683 | | | $ | 220,259,472 | | | $ | 191,952,120 | |
| | | | | | | | | | | | | | | | |
Affiliated investments, at cost | | $ | 625 | | | $ | 14,760 | | | $ | 5,775,408 | | | $ | — | |
| | | | | | | | | | | | | | | | |
Total investments, at cost | | $ | 2,632,665 | | | $ | 440,546,443 | | | $ | 226,034,880 | | | $ | 191,952,120 | |
| | | | | | | | | | | | | | | | |
(a) Includes securities on loan with an aggregate value of: | | $ | — | | | $ | — | | | $ | 5,522,734 | | | $ | — | |
| | | | | | | | | | | | | | | | |
See accompanying Notes to Financial Statements which are an integral part of the financial statements.
| | | | | | | | | | |
PowerShares
KBW Property &
Casualty Insurance
Portfolio (KBWP) | | | PowerShares
KBW Regional
Banking
Portfolio (KBWR) | | | PowerShares
Russell 1000
Equal Weight
Portfolio (EQAL) | |
| | | | | | | | | | |
| $ | 63,018,554 | | | $ | 136,686,054 | | | $ | 115,405,337 | |
| | 9,857 | | | | 130,098 | | | | 814,245 | |
| | | | | | | | | | |
| | 63,028,411 | | | | 136,816,152 | | | | 116,219,582 | |
| | | | | | | | | | |
| | 3 | | | | 26,778 | | | | 72,304 | |
| | — | | | | 6,613,646 | | | | 1,267,948 | |
| | — | | | | — | | | | — | |
| | | | | | | | | | |
| | 63,028,414 | | | | 143,456,576 | | | | 117,559,834 | |
| | | | | | | | | | |
| | |
| | | | | | | | | | |
| | — | | | | — | | | | 22,279 | |
| | | | | | | | | | |
| | — | | | | 6,736,923 | | | | 1,270,318 | |
| | — | | | | — | | | | 764,975 | |
| | 18,808 | | | | 37,662 | | | | 18,570 | |
| | | | | | | | | | |
| | 18,808 | | | | 6,774,585 | | | | 2,076,142 | |
| | | | | | | | | | |
| $ | 63,009,606 | | | $ | 136,681,991 | | | $ | 115,483,692 | |
| | | | | | | | | | |
| | |
| | | | | | | | | | |
| $ | 61,975,927 | | | $ | 127,970,923 | | | $ | 126,930,181 | |
| | 198,579 | | | | 258,588 | | | | 251,668 | |
| | (494,301 | ) | | | (1,739,085 | ) | | | (6,499,540 | ) |
| | 1,329,401 | | | | 10,191,565 | | | | (5,198,617 | ) |
| | | | | | | | | | |
| $ | 63,009,606 | | | $ | 136,681,991 | | | $ | 115,483,692 | |
| | | | | | | | | | |
| | 1,250,000 | | | | 3,100,000 | | | | 4,550,001 | |
| $ | 50.41 | | | $ | 44.09 | | | $ | 25.38 | |
| | | | | | | | | | |
| $ | 50.44 | | | $ | 44.15 | | | $ | 25.41 | |
| | | | | | | | | | |
| $ | 61,689,153 | | | $ | 126,494,489 | | | $ | 120,595,480 | |
| | | | | | | | | | |
| $ | 9,857 | | | $ | 130,098 | | | $ | 822,719 | |
| | | | | | | | | | |
| $ | 61,699,010 | | | $ | 126,624,587 | | | $ | 121,418,199 | |
| | | | | | | | | | |
| $ | — | | | $ | — | | | $ | 722,374 | |
| | | | | | | | | | |
Statements of Operations
For the year ended October 31, 2016
| | | | | | | | | | | | | | | | |
| | | PowerShares
Contrarian
Opportunities
Portfolio (CNTR) | | | PowerShares
KBW Bank
Portfolio (KBWB) | | | PowerShares
KBW High
Dividend Yield
Financial
Portfolio (KBWD) | | | PowerShares
KBW Premium
Yield Equity REIT
Portfolio (KBWY) | |
| Investment Income: | | | | | | | | | | | | | | | | |
Unaffiliated dividend income | | $ | 20,576 | | | $ | 9,206,590 | | | $ | 16,585,999 | | | $ | 6,957,195 | |
Affiliated dividend income | | | — | | | | 643 | | | | 709 | | | | 840 | |
Securities lending income | | | — | | | | — | | | | 2,576 | | | | — | |
Foreign withholding tax | | | (18 | ) | | | — | | | | — | | | | (2 | ) |
| | | | | | | | | | | | | | | | |
Total Income | | | 20,558 | | | | 9,207,233 | | | | 16,589,284 | | | | 6,958,033 | |
| | | | | | | | | | | | | | | | |
| | | | |
| Expenses: | | | | | | | | | | | | | | | | |
Unitary management fees | | | 7,129 | | | | 1,416,555 | | | | 744,143 | | | | 538,219 | |
| | | | | | | | | | | | | | | | |
Less: Waivers | | | — | | | | (376 | ) | | | (413 | ) | | | (476 | ) |
| | | | | | | | | | | | | | | | |
Net Expenses | | | 7,129 | | | | 1,416,179 | | | | 743,730 | | | | 537,743 | |
| | | | | | | | | | | | | | | | |
Net Investment Income | | | 13,429 | | | | 7,791,054 | | | | 15,845,554 | | | | 6,420,290 | |
| | | | | | | | | | | | | | | | |
| | | | |
| Realized and Unrealized Gain (Loss): | | | | | | | | | | | | | | | | |
Net realized gain (loss) from: | | | | | | | | | | | | | | | | |
Investment securities | | | (136,047 | ) | | | (8,012,092 | ) | | | (34,149,558 | ) | | | (12,901,071 | ) |
In-kind redemptions | | | 70,800 | | | | (4,612,085 | ) | | | (1,376,399 | ) | | | 14,268,448 | |
| | | | | | | | | | | | | | | | |
Net realized gain (loss) | | | (65,247 | ) | | | (12,624,177 | ) | | | (35,525,957 | ) | | | 1,367,377 | |
| | | | | | | | | | | | | | | | |
Net change in unrealized appreciation (depreciation) on investment securities | | | 25,231 | | | | 10,087,559 | | | | 19,019,996 | | | | 2,720,795 | |
| | | | | | | | | | | | | | | | |
Net realized and unrealized gain (loss) | | | (40,016 | ) | | | (2,536,618 | ) | | | (16,505,961 | ) | | | 4,088,172 | |
| | | | | | | | | | | | | | | | |
Net increase (decrease) in net assets resulting from operations | | $ | (26,587 | ) | | $ | 5,254,436 | | | $ | (660,407 | ) | | $ | 10,508,462 | |
| | | | | | | | | | | | | | | | |
See accompanying Notes to Financial Statements which are an integral part of the financial statements.
| | | | | | | | | | |
PowerShares
KBW Property &
Casualty Insurance
Portfolio (KBWP) | | |
PowerShares
KBW Regional
Banking
Portfolio (KBWR) | | | PowerShares
Russell 1000
Equal Weight
Portfolio (EQAL) | |
| | | | | | | | | | |
| $ | 1,990,443 | | | $ | 2,333,048 | | | $ | 1,806,384 | |
| | 137 | | | | 168 | | | | 1,776 | |
| | — | | | | — | | | | — | |
| | — | | | | — | | | | (5,048 | ) |
| | | | | | | | | | |
| | 1,990,580 | | | | 2,333,216 | | | | 1,803,112 | |
| | | | | | | | | | |
| | |
| | | | | | | | | | |
| | 269,600 | | | | 331,845 | | | | 189,451 | |
| | | | | | | | | | |
| | (75 | ) | | | (98 | ) | | | (115 | ) |
| | | | | | | | | | |
| | 269,525 | | | | 331,747 | | | | 189,336 | |
| | | | | | | | | | |
| | 1,721,055 | | | | 2,001,469 | | | | 1,613,776 | |
| | | | | | | | | | |
| | |
| | | | | | | | | | |
| | | | | | | | | | |
| | (799,581 | ) | | | (1,822,213 | ) | | | (6,458,501 | ) |
| | 4,669,299 | | | | 1,229,866 | | | | 4,423,643 | |
| | | | | | | | | | |
| | 3,869,718 | | | | (592,347 | ) | | | (2,034,858 | ) |
| | | | | | | | | | |
| | (1,722,440 | ) | | | 9,554,208 | | | | 4,409,245 | |
| | | | | | | | | | |
| | 2,147,278 | | | | 8,961,861 | | | | 2,374,387 | |
| | | | | | | | | | |
| $ | 3,868,333 | | | $ | 10,963,330 | | | $ | 3,988,163 | |
| | | | | | | | | | |
Statements of Changes in Net Assets
For the years ended October 31, 2016 and 2015
| | | | | | | | | | | | | | | | |
| | | PowerShares Contrarian
Opportunities
Portfolio (CNTR) | | | PowerShares
KBW Bank Portfolio (KBWB) | |
| | | 2016 | | | 2015 | | | 2016 | | | 2015 | |
| Operations: | | | | | | | | | | | | | | | | |
Net investment income | | $ | 13,429 | | | $ | 33,474 | | | $ | 7,791,054 | | | $ | 5,875,975 | |
Net realized gain (loss) | | | (65,247 | ) | | | 211,270 | | | | (12,624,177 | ) | | | 16,481,773 | |
Net change in unrealized appreciation (depreciation) | | | 25,231 | | | | (329,165 | ) | | | 10,087,559 | | | | (28,464,427 | ) |
| | | | | | | | | | | | | | | | |
Net increase (decrease) in net assets resulting from operations | | | (26,587 | ) | | | (84,421 | ) | | | 5,254,436 | | | | (6,106,679 | ) |
| | | | | | | | | | | | | | | | |
| | | | |
| Distributions to Shareholders from: | | | | | | | | | | | | | | | | |
Net investment income | | | (11,962 | ) | | | (40,081 | ) | | | (8,225,074 | ) | | | (5,033,214 | ) |
Net realized gains | | | — | | | | (3,828 | ) | | | — | | | | (133,000 | ) |
Return of capital | | | — | | | | — | | | | — | | | | — | |
| | | | | | | | | | | | | | | | |
Total distributions to shareholders | | | (11,962 | ) | | | (43,909 | ) | | | (8,225,074 | ) | | | (5,166,214 | ) |
| | | | | | | | | | | | | | | | |
| | | | |
| Shareholder Transactions: | | | | | | | | | | | | | | | | |
Proceeds from shares sold | | | 1,320,326 | | | | 2,727,373 | | | | 792,589,249 | | | | 497,643,837 | |
Value of shares repurchased | | | (1,239,458 | ) | | | (4,015,559 | ) | | | (919,116,603 | ) | | | (216,274,911 | ) |
| | | | | | | | | | | | | | | | |
Net increase (decrease) in net assets resulting from shares transactions | | | 80,868 | | | | (1,288,186 | ) | | | (126,527,354 | ) | | | 281,368,926 | |
| | | | | | | | | | | | | | | | |
Increase (Decrease) in Net Assets | | | 42,319 | | | | (1,416,516 | ) | | | (129,497,992 | ) | | | 270,096,033 | |
| | | | | | | | | | | | | | | | |
| | | | |
| Net Assets: | | | | | | | | | | | | | | | | |
Beginning of year | | | 2,529,579 | | | | 3,946,095 | | | | 559,631,610 | | | | 289,535,577 | |
| | | | | | | | | | | | | | | | |
End of year | | $ | 2,571,898 | | | $ | 2,529,579 | | | $ | 430,133,618 | | | $ | 559,631,610 | |
| | | | | | | | | | | | | | | | |
Undistributed net investment income at end of year | | $ | 5,319 | | | $ | 2,450 | | | $ | 929,039 | | | $ | 1,363,059 | |
| | | | | | | | | | | | | | | | |
| | | | |
| Changes in Shares Outstanding: | | | | | | | | | | | | | | | | |
Shares sold | | | 50,000 | | | | 100,000 | | | | 22,400,000 | | | | 12,800,000 | |
Shares repurchased | | | (50,000 | ) | | | (150,000 | ) | | | (26,150,000 | ) | | | (5,650,000 | ) |
Shares outstanding, beginning of year | | | 100,001 | | | | 150,001 | | | | 14,950,000 | | | | 7,800,000 | |
| | | | | | | | | | | | | | | | |
Shares outstanding, end of year | | | 100,001 | | | | 100,001 | | | | 11,200,000 | | | | 14,950,000 | |
| | | | | | | | | | | | | | | | |
See accompanying Notes to Financial Statements which are an integral part of the financial statements.
| | | | | | | | | | | | | | | | | | | | | | |
PowerShares KBW
High Dividend Yield
Financial Portfolio (KBWD) | | | PowerShares KBW
Premium Yield Equity
REIT Portfolio (KBWY) | | | PowerShares KBW
Property & Casualty
Insurance Portfolio (KBWP) | |
| 2016 | | | 2015 | | | 2016 | | | 2015 | | | 2016 | | | 2015 | |
| | | | | | | | | | | | | | | | | | | | | | |
| $ | 15,845,554 | | | $ | 21,332,310 | | | $ | 6,420,290 | | | $ | 4,217,177 | | | $ | 1,721,055 | | | $ | 313,880 | |
| | (35,525,957 | ) | | | (17,698,330 | ) | | | 1,367,377 | | | | 2,446,600 | | | | 3,869,718 | | | | 2,104,417 | |
| | 19,019,996 | | | | (24,246,761 | ) | | | 2,720,795 | | | | (10,376,305 | ) | | | (1,722,440 | ) | | | 1,568,196 | |
| | | | | | | | | | | | | | | | | | | | | | |
| | (660,407 | ) | | | (20,612,781 | ) | | | 10,508,462 | | | | (3,712,528 | ) | | | 3,868,333 | | | | 3,986,493 | |
| | | | | | | | | | | | | | | | | | | | | | |
| | | | | |
| | | | | | | | | | | | | | | | | | | | | | |
| | (18,056,090 | ) | | | (22,592,480 | ) | | | (10,877,502 | ) | | | (6,050,718 | ) | | | (1,590,127 | ) | | | (279,184 | ) |
| | — | | | | — | | | | — | | | | — | | | | (84,880 | ) | | | (25,369 | ) |
| | (1,310,772 | ) | | | (929,525 | ) | | | — | | | | — | | | | — | | | | — | |
| | | | | | | | | | | | | | | | | | | | | | |
| | (19,366,862 | ) | | | (23,522,005 | ) | | | (10,877,502 | ) | | | (6,050,718 | ) | | | (1,675,007 | ) | | | (304,553 | ) |
| | | | | | | | | | | | | | | | | | | | | | |
| | | | | |
| | | | | | | | | | | | | | | | | | | | | | |
| | 98,967,320 | | | | 103,911,321 | | | | 201,750,993 | | | | 45,313,904 | | | | 53,368,691 | | | | 93,296,692 | |
| | (135,253,331 | ) | | | (54,341,384 | ) | | | (123,235,903 | ) | | | (23,374,221 | ) | | | (79,380,432 | ) | | | (20,469,263 | ) |
| | | | | | | | | | | | | | | | | | | | | | |
| | (36,286,011 | ) | | | 49,569,937 | | | | 78,515,090 | | | | 21,939,683 | | | | (26,011,741 | ) | | | 72,827,429 | |
| | | | | | | | | | | | | | | | | | | | | | |
| | (56,313,280 | ) | | | 5,435,151 | | | | 78,146,050 | | | | 12,176,437 | | | | (23,818,415 | ) | | | 76,509,369 | |
| | | | | | | | | | | | | | | | | | | | | | |
| | | | | |
| | | | | | | | | | | | | | | | | | | | | | |
| | 277,692,406 | | | | 272,257,255 | | | | 110,279,249 | | | | 98,102,812 | | | | 86,828,021 | | | | 10,318,652 | |
| | | | | | | | | | | | | | | | | | | | | | |
| $ | 221,379,126 | | | $ | 277,692,406 | | | $ | 188,425,299 | | | $ | 110,279,249 | | | $ | 63,009,606 | | | $ | 86,828,021 | |
| | | | | | | | | | | | | | | | | | | | | | |
| $ | — | | | $ | — | | | $ | — | | | $ | — | | | $ | 198,579 | | | $ | 67,677 | |
| | | | | | | | | | | | | | | | | | | | | | |
| | | | | |
| | | | | | | | | | | | | | | | | | | | | | |
| | 4,550,000 | | | | 4,100,000 | | | | 5,800,000 | | | | 1,300,000 | | | | 1,100,000 | | | | 2,000,000 | |
| | (6,650,000 | ) | | | (2,250,000 | ) | | | (3,750,000 | ) | | | (700,000 | ) | | | (1,650,000 | ) | | | (450,000 | ) |
| | 12,400,000 | | | | 10,550,000 | | | | 3,500,000 | | | | 2,900,000 | | | | 1,800,000 | | | | 250,000 | |
| | | | | | | | | | | | | | | | | | | | | | |
| | 10,300,000 | | | | 12,400,000 | | | | 5,550,000 | | | | 3,500,000 | | | | 1,250,000 | | | | 1,800,000 | |
| | | | | | | | | | | | | | | | | | | | | | |
Statements of Changes in Net Assets (continued)
For the years ended October 31, 2016 and 2015
| | | | | | | | | | | | | | | | |
| | | PowerShares KBW Regional
Banking Portfolio (KBWR) | | | PowerShares Russell 1000
Equal Weight Portfolio (EQAL) | |
| | | 2016 | | | 2015 | | | 2016 | | | 2015(a) | |
| Operations: | | | | | | | | | | | | | | | | |
Net investment income | | $ | 2,001,469 | | | $ | 763,023 | | | $ | 1,613,776 | | | $ | 1,623,108 | |
Net realized gain (loss) | | | (592,347 | ) | | | 1,538,842 | | | | (2,034,858 | ) | | | 2,916,058 | |
Net change in unrealized appreciation (depreciation) | | | 9,554,208 | | | | (37,364 | ) | | | 4,409,245 | | | | (9,607,862 | ) |
| | | | | | | | | | | | | | | | |
Net increase (decrease) in net assets resulting from operations | | | 10,963,330 | | | | 2,264,501 | | | | 3,988,163 | | | | (5,068,696 | ) |
| | | | | | | | | | | | | | | | |
| | | | |
| Distributions to Shareholders from: | | | | | | | | | | | | | | | | |
Net investment income | | | (1,882,396 | ) | | | (742,022 | ) | | | (1,669,387 | ) | | | (1,316,380 | ) |
| | | | | | | | | | | | | | | | |
| | | | |
| Shareholder Transactions: | | | | | | | | | | | | | | | | |
Proceeds from shares sold | | | 88,644,290 | | | | 32,777,095 | | | | 98,849,289 | | | | 203,035,132 | |
Value of shares repurchased | | | (14,038,950 | ) | | | (16,595,453 | ) | | | (134,768,145 | ) | | | (47,566,284 | ) |
| | | | | | | | | | | | | | | | |
Net increase (decrease) in net assets resulting from shares transactions | | | 74,605,340 | | | | 16,181,642 | | | | (35,918,856 | ) | | | 155,468,848 | |
| | | | | | | | | | | | | | | | |
Increase (Decrease) in Net Assets | | | 83,686,274 | | | | 17,704,121 | | | | (33,600,080 | ) | | | 149,083,772 | |
| | | | | | | | | | | | | | | | |
| | | | |
| Net Assets: | | | | | | | | | | | | | | | | |
Beginning of year | | | 52,995,717 | | | | 35,291,596 | | | | 149,083,772 | | | | — | |
| | | | | | | | | | | | | | | | |
End of year | | $ | 136,681,991 | | | $ | 52,995,717 | | | $ | 115,483,692 | | | $ | 149,083,772 | |
| | | | | | | | | | | | | | | | |
Undistributed net investment income at end of year | | $ | 258,588 | | | $ | 139,515 | | | $ | 251,668 | | | $ | 306,782 | |
| | | | | | | | | | | | | | | | |
| | | | |
| Changes in Shares Outstanding: | | | | | | | | | | | | | | | | |
Shares sold | | | 2,200,000 | | | | 750,000 | | | | 3,900,000 | | | | 8,000,001 | |
Shares repurchased | | | (350,000 | ) | | | (400,000 | ) | | | (5,450,000 | ) | | | (1,900,000 | ) |
Shares outstanding, beginning of year | | | 1,250,000 | | | | 900,000 | | | | 6,100,001 | | | | — | |
| | | | | | | | | | | | | | | | |
Shares outstanding, end of year | | | 3,100,000 | | | | 1,250,000 | | | | 4,550,001 | | | | 6,100,001 | |
| | | | | | | | | | | | | | | | |
| (a) | For the period December 22, 2014 (commencement of investment operations) through October 31, 2015. |
See accompanying Notes to Financial Statements which are an integral part of the financial statements.
Financial Highlights
PowerShares Contrarian Opportunities Portfolio (CNTR)
| | | | | | | | | | | | |
| | |
Year Ended October 31, | | | For the Period
January 13, 2014(a)
Through
October 31, 2014 | |
| | | 2016 | | | 2015 | | |
| Per Share Operating Performance: | | | | | | | | | | | | |
Net asset value at beginning of period | | $ | 25.30 | | | $ | 26.31 | | | $ | 24.70 | |
Net investment income(b) | | | 0.16 | | | | 0.30 | | | | 0.33 | |
Net realized and unrealized gain (loss) on investments | | | 0.38 | | | | (0.96 | ) | | | 1.53 | |
Total from investment operations | | | 0.54 | | | | (0.66 | ) | | | 1.86 | |
Distributions to shareholders from: | | | | | | | | | | | | |
Net investment income | | | (0.12 | ) | | | (0.32 | ) | | | (0.25 | ) |
Net realized gains | | | — | | | | (0.03 | ) | | | — | |
Total distributions | | | (0.12 | ) | | | (0.35 | ) | | | (0.25 | ) |
Net asset value at end of period | | $ | 25.72 | | | $ | 25.30 | | | $ | 26.31 | |
Market price at end of period(c) | | $ | 25.72 | | | $ | 25.31 | | | $ | 26.30 | |
| Net Asset Value Total Return(d) | | | 2.16 | % | | | (2.59 | )% | | | 7.56 | %(e) |
| Market Price Total Return(d) | | | 2.12 | % | | | (2.52 | )% | | | 7.52 | %(e) |
| Ratios/Supplemental Data: | | | | | | | | | | | | |
Net assets at end of period (000’s omitted) | | $ | 2,572 | | | $ | 2,530 | | | $ | 3,946 | |
Ratio to average net assets of: | | | | | | | | | | | | |
Expenses | | | 0.35 | % | | | 0.44 | % | | | 0.50 | %(f) |
Net investment income | | | 0.66 | % | | | 1.15 | % | | | 1.61 | %(f) |
Portfolio turnover rate(g) | | | 76 | % | | | 128 | % | | | 2 | % |
| (a) | Commencement of investment operations. |
| (b) | Based on average shares outstanding. |
| (c) | The mean between the last bid and ask prices. |
| (d) | Net asset value total return is calculated assuming an initial investment made at the net asset value at the beginning of the period, reinvestment of all dividends and distributions at net asset value during the period, and redemption on the last day of the period. Net asset value total return includes adjustments in accordance with accounting principles generally accepted in the United States of America and as such, the net asset value for financial reporting purposes and the returns based upon those net asset values may differ from the net asset value and returns for shareholder transactions. Market price total return is calculated assuming an initial investment made at the market price at the beginning of the period, reinvestment of all dividends and distributions at market price during the period, and sale at the market price on the last day of the period. Total investment returns calculated for a period of less than one year are not annualized. |
| (e) | The net asset value total return from Fund Inception (January 15, 2014, the first day of trading on the exchange) to October 31, 2014 was 6.06%. The market price total return from Fund Inception to October 31, 2014 was 6.02%. |
| (g) | Portfolio turnover rate is not annualized for periods less than one year, if applicable, and does not include securities received or delivered from processing creations or redemptions. For the fiscal year ended October 31, 2015, the portfolio turnover calculation includes the value of securities purchased and sold in the effort to realign the Fund’s portfolio holdings due to the underlying index change. |
PowerShares KBW Bank Portfolio (KBWB)
| | | | | | | | | | | | | | | | | | | | |
| | |
Year Ended October 31, | | | For the Period
November 1, 2011(a)
through
October 31, 2012 | |
| | | 2016 | | | 2015 | | | 2014 | | | 2013 | | |
| Per Share Operating Performance: | | | | | | | | | | | | | | | | | | | | |
Net asset value at beginning of period | | $ | 37.43 | | | $ | 37.12 | | | $ | 33.00 | | | $ | 25.44 | | | $ | 20.68 | |
Net investment income(b) | | | 0.68 | | | | 0.66 | | | | 0.55 | | | | 0.45 | | | | 0.43 | |
Net realized and unrealized gain on investments | | | 0.98 | | | | 0.22 | | | | 4.11 | | | | 7.52 | | | | 4.84 | |
Total from investment operations | | | 1.66 | | | | 0.88 | | | | 4.66 | | | | 7.97 | | | | 5.27 | |
Distributions to shareholders from: | | | | | | | | | | | | | | | | | | | | |
Net investment income | | | (0.69 | ) | | | (0.55 | ) | | | (0.54 | ) | | | (0.41 | ) | | | (0.50 | ) |
Net realized gains | | | — | | | | (0.02 | ) | | | — | | | | — | | | | — | |
Return of capital | | | — | | | | — | | | | — | | | | — | | | | (0.01 | ) |
Total distributions | | | (0.69 | ) | | | (0.57 | ) | | | (0.54 | ) | | | (0.41 | ) | | | (0.51 | ) |
Net asset value at end of period | | $ | 38.40 | | | $ | 37.43 | | | $ | 37.12 | | | $ | 33.00 | | | $ | 25.44 | |
Market price at end of period(c) | | $ | 38.44 | | | $ | 37.49 | | | $ | 37.13 | | | $ | 33.03 | | | $ | 25.46 | |
| Net Asset Value Total Return(d) | | | 4.61 | % | | | 2.35 | % | | | 14.16 | % | | | 31.51 | % | | | 25.97 | % |
| Market Price Total Return(d) | | | 4.55 | % | | | 2.49 | % | | | 14.09 | % | | | 31.52 | % | | | 26.07 | % |
| Ratios/Supplemental Data: | | | | | | | | | | | | | | | | | | | | |
Net assets at end of period (000’s omitted) | | $ | 430,134 | | | $ | 559,632 | | | $ | 289,536 | | | $ | 150,169 | | | $ | 164,072 | |
Ratio to average net assets of: | | | | | | | | | | | | | | | | | | | | |
Expenses, after Waivers | | | 0.35 | % | | | 0.35 | % | | | 0.35 | % | | | 0.35 | % | | | 0.27 | %(e) |
Expenses, prior to Waivers | | | 0.35 | % | | | 0.35 | % | | | 0.35 | % | | | 0.35 | % | | | 0.35 | %(e) |
Net investment income, after Waivers | | | 1.92 | % | | | 1.74 | % | | | 1.55 | % | | | 1.51 | % | | | 1.84 | %(e) |
Portfolio turnover rate(f) | | | 12 | % | | | 17 | % | | | 5 | % | | | 8 | % | | | 4 | % |
| (a) | Commencement of investment operations. |
| (b) | Based on average shares outstanding. |
| (c) | The mean between the last bid and ask prices. |
| (d) | Net asset value total return is calculated assuming an initial investment made at the net asset value at the beginning of the period, reinvestment of all dividends and distributions at net asset value during the period, and redemption on the last day of the period. Net asset value total return includes adjustments in accordance with accounting principles generally accepted in the United States of America and as such, the net asset value for financial reporting purposes and the returns based upon those net asset values may differ from the net asset value and returns for shareholder transactions. Market price total return is calculated assuming an initial investment made at the market price at the beginning of the period, reinvestment of all dividends and distributions at market price during the period, and sale at the market price on the last day of the period. Total investment returns calculated for a period of less than one year are not annualized. |
| (f) | Portfolio turnover rate is not annualized for periods less than one year, if applicable, and does not include securities received or delivered from processing creations or redemptions. |
See accompanying Notes to Financial Statements which are an integral part of the financial statements.
Financial Highlights (continued)
PowerShares KBW High Dividend Yield Financial Portfolio (KBWD)
| | | | | | | | | | | | | | | | | | | | |
| | |
Year Ended October 31, | |
| | | 2016 | | | 2015 | | | 2014 | | | 2013 | | | 2012 | |
| Per Share Operating Performance: | | | | | | | | | | | | | | | | | | | | |
Net asset value at beginning of year | | $ | 22.39 | | | $ | 25.81 | | | $ | 25.20 | | | $ | 23.91 | | | $ | 22.37 | |
Net investment income(a) | | | 1.57 | | | | 1.75 | | | | 2.04 | (b) | | | 1.90 | | | | 2.01 | |
Net realized and unrealized gain (loss) on investments | | | (0.53 | ) | | | (3.22 | ) | | | 0.62 | | | | 1.37 | | | | 1.88 | |
Total from investment operations | | | 1.04 | | | | (1.47 | ) | | | 2.66 | | | | 3.27 | | | | 3.89 | |
Distributions to shareholders from: | | | | | | | | | | | | | | | | | | | | |
Net investment income | | | (1.81 | ) | | | (1.87 | ) | | | (2.05 | ) | | | (1.98 | ) | | | (2.35 | ) |
Return of capital | | | (0.13 | ) | | | (0.08 | ) | | | — | | | | — | | | | — | |
Total distributions | | | (1.94 | ) | | | (1.95 | ) | | | (2.05 | ) | | | (1.98 | ) | | | (2.35 | ) |
Net asset value at end of year | | $ | 21.49 | | | $ | 22.39 | | | $ | 25.81 | | | $ | 25.20 | | | $ | 23.91 | |
Market price at end of year(c) | | $ | 21.51 | | | $ | 22.39 | | | $ | 25.82 | | | $ | 25.24 | | | $ | 23.86 | |
| Net Asset Value Total Return(d) | | | 5.46 | % | | | (6.08 | )% | | | 11.05 | % | | | 14.21 | % | | | 18.32 | % |
| Market Price Total Return(d) | | | 5.56 | % | | | (6.12 | )% | | | 10.91 | % | | | 14.62 | % | | | 17.75 | % |
| Ratios/Supplemental Data: | | | | | | | | | | | | | | | | | | | | |
Net assets at end of year (000’s omitted) | | $ | 221,379 | | | $ | 277,692 | | | $ | 272,257 | | | $ | 234,348 | | | $ | 170,976 | |
Ratio to average net assets of: | | | | | | | | | | | | | | | | | | | | |
Expenses(e) | | | 0.35 | % | | | 0.35 | % | | | 0.35 | % | | | 0.37 | % | | | 0.35 | % |
Net investment income | | | 7.45 | % | | | 7.15 | % | | | 8.00 | %(b) | | | 7.64 | % | | | 8.56 | % |
Portfolio turnover rate(f) | | | 113 | % | | | 49 | % | | | 30 | % | | | 37 | % | | | 19 | % |
| (a) | Based on average shares outstanding. |
| (b) | Net investment income per share and the ratio of net investment income to average net assets include a significant dividend during the year. Net investment income per share and the ratio of net investment income to average net excluding the significant dividend are $1.90 and 7.47%, respectively. |
| (c) | The mean between the last bid and ask prices. |
| (d) | Net asset value total return is calculated assuming an initial investment made at the net asset value at the beginning of the period, reinvestment of all dividends and distributions at net asset value during the period, and redemption on the last day of the period. Net asset value total return includes adjustments in accordance with accounting principles generally accepted in the United States of America and as such, the net asset value for financial reporting purposes and the returns based upon those net asset values may differ from the net asset value and returns for shareholder transactions. Market price total return is calculated assuming an initial investment made at the market price at the beginning of the period, reinvestment of all dividends and distributions at market price during the period, and sale at the market price on the last day of the period. Total investment returns calculated for a period of less than one year are not annualized. |
| (e) | In addition to the fees and expenses which the Fund bears directly, the Fund indirectly bears a pro rata share of the fees and expenses of the investment companies in which the Fund invests. Estimated investment companies’ expenses are not expenses that are incurred directly by the Fund. They are expenses that are incurred directly by the investment companies and are deducted from the value of the investment companies the Fund invests in. The effect of the estimated investment companies’ expenses that the Fund bears indirectly is included in the Fund’s total return. |
| (f) | Portfolio turnover rate is not annualized for periods less than one year, if applicable, and does not include securities received or delivered from processing creations or redemptions. |
PowerShares KBW Premium Yield Equity REIT Portfolio (KBWY)
| | | | | | | | | | | | | | | | | | | | |
| | |
Year Ended October 31, | |
| | | 2016 | | | 2015 | | | 2014 | | | 2013 | | | 2012 | |
| Per Share Operating Performance: | | | | | | | | | | | | | | | | | | | | |
Net asset value at beginning of year | | $ | 31.51 | | | $ | 33.83 | | | $ | 31.32 | | | $ | 27.13 | | | $ | 23.37 | |
Net investment income(a) | | | 1.40 | | | | 1.19 | | | | 1.07 | | | | 0.89 | | | | 0.91 | |
Net realized and unrealized gain (loss) on investments | | | 3.36 | | | | (1.80 | ) | | | 3.01 | | | | 4.76 | | | | 4.22 | |
Total from investment operations | | | 4.76 | | | | (0.61 | ) | | | 4.08 | | | | 5.65 | | | | 5.13 | |
Distributions to shareholders from: | | | | | | | | | | | | | | | | | | | | |
Net investment income | | | (2.32 | ) | | | (1.71 | ) | | | (1.57 | ) | | | (1.46 | ) | | | (1.11 | ) |
Return of capital | | | — | | | | — | | | | — | | | | — | | | | (0.26 | ) |
Total distributions | | | (2.32 | ) | | | (1.71 | ) | | | (1.57 | ) | | | (1.46 | ) | | | (1.37 | ) |
Net asset value at end of year | | $ | 33.95 | | | $ | 31.51 | | | $ | 33.83 | | | $ | 31.32 | | | $ | 27.13 | |
Market price at end of year(b) | | $ | 33.95 | | | $ | 31.52 | | | $ | 33.82 | | | $ | 31.38 | | | $ | 27.11 | |
| Net Asset Value Total Return(c) | | | 15.68 | % | | | (1.94 | )% | | | 13.51 | % | | | 21.11 | % | | | 22.54 | % |
| Market Price Total Return(c) | | | 15.64 | % | | | (1.88 | )% | | | 13.27 | % | | | 21.42 | % | | | 22.30 | % |
| Ratios/Supplemental Data: | | | | | | | | | | | | | | | | | | | | |
Net assets at end of year (000’s omitted) | | $ | 188,425 | | | $ | 110,279 | | | $ | 98,103 | | | $ | 68,908 | | | $ | 25,769 | |
Ratio to average net assets of: | | | | | | | | | | | | | | | | | | | | |
Expenses | | | 0.35 | % | | | 0.35 | % | | | 0.35 | % | | | 0.36 | % | | | 0.35 | % |
Net investment income | | | 4.18 | % | | | 3.58 | % | | | 3.39 | % | | | 2.85 | % | | | 3.58 | % |
Portfolio turnover rate(d) | | | 87 | % | | | 25 | % | | | 27 | % | | | 21 | % | | | 40 | % |
| (a) | Based on average shares outstanding. |
| (b) | The mean between the last bid and ask prices. |
| (c) | Net asset value total return is calculated assuming an initial investment made at the net asset value at the beginning of the period, reinvestment of all dividends and distributions at net asset value during the period, and redemption on the last day of the period. Net asset value total return includes adjustments in accordance with accounting principles generally accepted in the United States of America and as such, the net asset value for financial reporting purposes and the returns based upon those net asset values may differ from the net asset value and returns for shareholder transactions. Market price total return is calculated assuming an initial investment made at the market price at the beginning of the period, reinvestment of all dividends and distributions at market price during the period, and sale at the market price on the last day of the period. Total investment returns calculated for a period of less than one year are not annualized. |
| (d) | Portfolio turnover rate is not annualized for periods less than one year, if applicable, and does not include securities received or delivered from processing creations or redemptions. |
See accompanying Notes to Financial Statements which are an integral part of the financial statements.
Financial Highlights (continued)
PowerShares KBW Property & Casualty Insurance Portfolio (KBWP)
| | | | | | | | | | | | | | | | | | | | |
| | |
Year Ended October 31, | |
| | | 2016 | | | 2015 | | | 2014 | | | 2013 | | | 2012 | |
| Per Share Operating Performance: | | | | | | | | | | | | | | | | | | | | |
Net asset value at beginning of year | | $ | 48.24 | | | $ | 41.27 | | | $ | 38.07 | | | $ | 30.25 | | | $ | 24.83 | |
Net investment income(a) | | | 1.08 | | | | 0.75 | | | | 0.88 | | | | 0.59 | | | | 0.53 | |
Net realized and unrealized gain on investments | | | 2.06 | | | | 7.10 | | | | 3.29 | | | | 8.09 | | | | 5.41 | |
Total from investment operations | | | 3.14 | | | | 7.85 | | | | 4.17 | | | | 8.68 | | | | 5.94 | |
Distributions to shareholders from: | | | | | | | | | | | | | | | | | | | | |
Net investment income | | | (0.93 | ) | | | (0.78 | ) | | | (0.92 | ) | | | (0.86 | ) | | | (0.52 | ) |
Net realized gains | | | (0.04 | ) | | | (0.10 | ) | | | (0.05 | ) | | | — | | | | — | |
Total distributions | | | (0.97 | ) | | | (0.88 | ) | | | (0.97 | ) | | | (0.86 | ) | | | (0.52 | ) |
Net asset value at end of year | | $ | 50.41 | | | $ | 48.24 | | | $ | 41.27 | | | $ | 38.07 | | | $ | 30.25 | |
Market price at end of year(b) | | $ | 50.44 | | | $ | 48.36 | | | $ | 41.27 | | | $ | 38.09 | | | $ | 30.24 | |
| Net Asset Value Total Return(c) | | | 6.63 | % | | | 19.31 | % | | | 11.17 | % | | | 29.33 | % | | | 24.21 | % |
| Market Price Total Return(c) | | | 6.43 | % | | | 19.60 | % | | | 11.12 | % | | | 29.44 | % | | | 24.12 | % |
| Ratios/Supplemental Data: | | | | | | | | | | | | | | | | | | | | |
Net assets at end of year (000’s omitted) | | $ | 63,010 | | | $ | 86,828 | | | $ | 10,319 | | | $ | 20,937 | | | $ | 3,025 | |
Ratio to average net assets of: | | | | | | | | | | | | | | | | | | | | |
Expenses | | | 0.35 | % | | | 0.35 | % | | | 0.35 | % | | | 0.36 | % | | | 0.35 | % |
Net investment income | | | 2.23 | % | | | 1.69 | % | | | 2.30 | % | | | 1.69 | % | | | 1.94 | % |
Portfolio turnover rate(d) | | | 20 | % | | | 35 | % | | | 4 | % | | | 12 | % | | | 2 | % |
| (a) | Based on average shares outstanding. |
| (b) | The mean between the last bid and ask prices. |
| (c) | Net asset value total return is calculated assuming an initial investment made at the net asset value at the beginning of the period, reinvestment of all dividends and distributions at net asset value during the period, and redemption on the last day of the period. Net asset value total return includes adjustments in accordance with accounting principles generally accepted in the United States of America and as such, the net asset value for financial reporting purposes and the returns based upon those net asset values may differ from the net asset value and returns for shareholder transactions. Market price total return is calculated assuming an initial investment made at the market price at the beginning of the period, reinvestment of all dividends and distributions at market price during the period, and sale at the market price on the last day of the period. Total investment returns calculated for a period of less than one year are not annualized. |
| (d) | Portfolio turnover rate is not annualized for periods less than one year, if applicable, and does not include securities received or delivered from processing creations or redemptions. |
PowerShares KBW Regional Banking Portfolio (KBWR)
| | | | | | | | | | | | | | | | | | | | |
| | |
Year Ended October 31, | | | For the Period
November 1, 2011(a)
Through
October 31, 2012 | |
| | | 2016 | | | 2015 | | | 2014 | | | 2013 | | |
| Per Share Operating Performance: | | | | | | | | | | | | | | | | | | | | |
Net asset value at beginning of period | | $ | 42.40 | | | $ | 39.21 | | | $ | 36.92 | | | $ | 27.67 | | | $ | 23.85 | |
Net investment income(b) | | | 0.87 | | | | 0.80 | | | | 0.68 | | | | 0.66 | | | | 0.63 | |
Net realized and unrealized gain on investments | | | 1.63 | | | | 3.17 | | | | 2.28 | | | | 9.12 | | | | 3.94 | |
Total from investment operations | | | 2.50 | | | | 3.97 | | | | 2.96 | | | | 9.78 | | | | 4.57 | |
Distributions to shareholders from: | | | | | | | | | | | | | | | | | | | | |
Net investment income | | | (0.81 | ) | | | (0.78 | ) | | | (0.67 | ) | | | (0.53 | ) | | | (0.75 | ) |
Net asset value at end of period | | $ | 44.09 | | | $ | 42.40 | | | $ | 39.21 | | | $ | 36.92 | | | $ | 27.67 | |
Market price at end of period(c) | | $ | 44.15 | | | $ | 42.42 | | | $ | 39.21 | | | $ | 36.96 | | | $ | 27.67 | |
| Net Asset Value Total Return(d) | | | 6.05 | % | | | 10.24 | % | | | 8.03 | % | | | 35.80 | % | | | 19.20 | % |
| Market Price Total Return(d) | | | 6.14 | % | | | 10.29 | % | | | 7.91 | % | | | 35.94 | % | | | 19.20 | % |
| Ratios/Supplemental Data: | | | | | | | | | | | | | | | | | | | | |
Net assets at end of period (000’s omitted) | | $ | 136,682 | | | $ | 52,996 | | | $ | 35,292 | | | $ | 33,225 | | | $ | 17,987 | |
Ratio to average net assets of: | | | | | | | | | | | | | | | | | | | | |
Expenses, after Waivers | | | 0.35 | % | | | 0.35 | % | | | 0.35 | % | | | 0.35 | % | | | 0.11 | %(e) |
Expenses, prior to Waivers | | | 0.35 | % | | | 0.35 | % | | | 0.35 | % | | | 0.35 | % | | | 0.35 | %(e) |
Net investment income, after Waivers | | | 2.11 | % | | | 1.97 | % | | | 1.80 | % | | | 2.05 | % | | | 2.44 | %(e) |
Portfolio turnover rate(f) | | | 23 | % | | | 25 | % | | | 13 | % | | | 7 | % | | | 3 | % |
| (a) | Commencement of investment operations. |
| (b) | Based on average shares outstanding. |
| (c) | The mean between the last bid and ask prices. |
| (d) | Net asset value total return is calculated assuming an initial investment made at the net asset value at the beginning of the period, reinvestment of all dividends and distributions at net asset value during the period, and redemption on the last day of the period. Net asset value total return includes adjustments in accordance with accounting principles generally accepted in the United States of America and as such, the net asset value for financial reporting purposes and the returns based upon those net asset values may differ from the net asset value and returns for shareholder transactions. Market price total return is calculated assuming an initial investment made at the market price at the beginning of the period, reinvestment of all dividends and distributions at market price during the period, and sale at the market price on the last day of the period. Total investment returns calculated for a period of less than one year are not annualized. |
| (f) | Portfolio turnover rate is not annualized for periods less than one year, if applicable, and does not include securities received or delivered from processing creations or redemptions. |
See accompanying Notes to Financial Statements which are an integral part of the financial statements.
Financial Highlights (continued)
PowerShares Russell 1000 Equal Weight Portfolio (EQAL)
| | | | | | | | |
| | | Year Ended
October 31, 2016 | | | For the Period
December��22, 2014(a)
Through
October 31, 2015 | |
| Per Share Operating Performance: | | | | | | | | |
Net asset value at beginning of period | | $ | 24.44 | | | $ | 25.05 | |
Net investment income(b) | | | 0.41 | | | | 0.32 | |
Net realized and unrealized gain (loss) on investments | | | 0.95 | | | | (0.71 | ) |
Total from investment operations | | | 1.36 | | | | (0.39 | ) |
Distributions to shareholders from: | | | | | | | | |
Net investment income | | | (0.42 | ) | | | (0.22 | ) |
Net asset value at end of period | | $ | 25.38 | | | $ | 24.44 | |
Market price at end of period(c) | | $ | 25.41 | | | $ | 24.48 | |
| Net Asset Value Total Return(d) | | | 5.67 | % | | | (1.58 | )%(e) |
| Market Price Total Return(d) | | | 5.62 | % | | | (1.42 | )%(e) |
| Ratios/Supplemental Data: | | | | | | | | |
Net assets at end of period (000’s omitted) | | $ | 115,484 | | | $ | 149,084 | |
Ratio to average net assets of: | | | | | | | | |
Expenses | | | 0.20 | % | | | 0.20 | %(f) |
Net investment income | | | 1.70 | % | | | 1.49 | %(f) |
Portfolio turnover rate(g) | | | 31 | % | | | 24 | % |
| (a) | Commencement of investment operations. |
| (b) | Based on average shares outstanding. |
| (c) | The mean between the last bid and ask prices. |
| (d) | Net asset value total return is calculated assuming an initial investment made at the net asset value at the beginning of the period, reinvestment of all dividends and distributions at net asset value during the period, and redemption on the last day of the period. Net asset value total return includes adjustments in accordance with accounting principles generally accepted in the United States of America and as such, the net asset value for financial reporting purposes and the returns based upon those net asset values may differ from the net asset value and returns for shareholder transactions. Market price total return is calculated assuming an initial investment made at the market price at the beginning of the period, reinvestment of all dividends and distributions at market price during the period, and sale at the market price on the last day of the period. Total investment returns calculated for a period of less than one year are not annualized. |
| (e) | The net asset value total return from Fund Inception (December 23, 2014, the first day of trading on the exchange) to October 31, 2015 was (2.01)%. The market price total return from Fund Inception to October 31, 2015 was (1.93)%. |
| (g) | Portfolio turnover rate is not annualized for periods less than one year, if applicable, and does not include securities received or delivered from processing creations or redemptions. |
See accompanying Notes to Financial Statements which are an integral part of the financial statements.
Notes to Financial Statements
PowerShares Exchange-Traded Fund Trust II
October 31, 2016
Note 1. Organization
PowerShares Exchange-Traded Fund Trust II (the “Trust”) was organized as a Massachusetts business trust on October 10, 2006 and is authorized to have multiple series of portfolios. The Trust is an open-end management investment company registered under the Investment Company Act of 1940, as amended (the “1940 Act”). As of October 31, 2016, the Trust offered sixty-seven portfolios. This report includes the following portfolios:
| | |
Full Name | | Short Name |
| PowerShares Contrarian Opportunities Portfolio (CNTR) | | “Contrarian Opportunities Portfolio” |
| PowerShares KBW Bank Portfolio (KBWB) | | “KBW Bank Portfolio” |
| PowerShares KBW High Dividend Yield Financial Portfolio (KBWD) | | “KBW High Dividend Yield Financial Portfolio” |
| PowerShares KBW Premium Yield Equity REIT Portfolio (KBWY) | | “KBW Premium Yield Equity REIT Portfolio” |
| PowerShares KBW Property & Casualty Insurance Portfolio (KBWP) | | “KBW Property & Casualty Insurance Portfolio” |
| PowerShares KBW Regional Banking Portfolio (KBWR) | | “KBW Regional Banking Portfolio” |
| PowerShares Russell 1000 Equal Weight Portfolio (EQAL) | | “Russell 1000 Equal Weight Portfolio” |
Each portfolio (each, a “Fund”, and collectively, the “Funds”) represents a separate series of the Trust. The shares of the Funds are referred to herein as “Shares” or “Fund’s Shares.” Each Fund’s Shares are listed and traded on NYSE Arca, Inc.
The market price of each Share may differ to some degree from the Fund’s net asset value (“NAV”). Unlike conventional mutual funds, each Fund issues and redeems Shares on a continuous basis, at NAV, only in a large specified number of Shares, each called a “Creation Unit.” Creation Units are issued and redeemed principally in exchange for the deposit or delivery of a basket of securities (“Deposit Securities”). Except when aggregated in Creation Units by Authorized Participants, the Shares are not individually redeemable securities of the Funds.
The investment objective of each Fund is to seek investment results that generally correspond (before fees and expenses) to the price and yield of its respective index listed below (each, an “Underlying Index”):
| | |
Fund | | Underlying Index |
| Contrarian Opportunities Portfolio | | Dow Jones U.S. Contrarian Opportunities Index |
| KBW Bank Portfolio | | KBW Nasdaq Bank Index |
| KBW High Dividend Yield Financial Portfolio | | KBW Nasdaq Financial Sector Dividend Yield Index |
| KBW Premium Yield Equity REIT Portfolio | | KBW Nasdaq Premium Yield Equity REIT Index |
| KBW Property & Casualty Insurance Portfolio | | KBW Nasdaq Property & Casualty Index |
| KBW Regional Banking Portfolio | | KBW Nasdaq Regional Banking Index |
| Russell 1000 Equal Weight Portfolio | | Russell 1000® Equal Weight Index |
Note 2. Significant Accounting Policies
The preparation of the financial statements in accordance with accounting principles generally accepted in the United States of America (“GAAP”) requires management to make estimates and assumptions that affect the reported amounts and disclosures in the financial statements, including estimates and assumptions related to taxation. Actual results could differ from these estimates. In addition, the Funds monitor for material events or transactions that may occur or become known after the period-end date and before the date the financial statements are released to print. The following is a summary of the significant accounting policies followed by the Funds in preparation of the financial statements.
A. Security Valuation
Securities, including restricted securities, are valued according to the following policies:
A security listed or traded on an exchange (except convertible securities) is valued at its last sales price or official closing price as of the close of the customary trading session on the exchange where the security is principally traded, or lacking any sales or official closing price on a particular day, the security may be valued at the closing bid price on that day. Securities traded in the over-the-counter market are valued based on prices furnished by independent pricing services or market makers. When such securities are valued by an independent pricing service they may be considered fair valued. Futures contracts are valued at the final settlement price set by an exchange on which they are principally traded. Listed options are valued at the mean between the last bid and asked prices from the
exchange on which they are principally traded. Options not listed on an exchange are valued by an independent source at the mean between the last bid and asked prices. For purposes of determining NAV per Share, futures and option contracts generally are valued 15 minutes after the close of the customary trading session of the New York Stock Exchange (“NYSE”).
Investments in open-end and closed-end registered investment companies that do not trade on an exchange are valued at the end of day NAV per share. Investments in open-end and closed-end registered investment companies that trade on an exchange are valued at the last sales price or official closing price as of the close of the customary trading session on the exchange where the security is principally traded.
Debt obligations (including convertible securities) and unlisted equities are fair valued using an evaluated quote provided by an independent pricing service. Evaluated quotes provided by the pricing service may be determined without exclusive reliance on quoted prices, and may reflect appropriate factors such as institution-size trading in similar groups of securities, developments related to specific securities, dividend rate (for unlisted equities), yield (for debt obligations), quality, type of issue, coupon rate (for debt obligations), maturity (for debt obligations), individual trading characteristics and other market data. Securities with a demand feature exercisable within one to seven days are valued at par. Debt obligations are subject to interest rate and credit risks. In addition, all debt obligations involve some risk of default with respect to interest and/or principal payments.
Foreign securities’ (including foreign exchange contracts’) prices are converted into U.S. dollar amounts using the applicable exchange rates as of the close of the London world markets. If market quotations are available and reliable for foreign exchange-traded equity securities, the securities will be valued at the market quotations. Because trading hours for certain foreign securities end before the close of the NYSE, closing market quotations may become unreliable. If between the time trading ends on a particular security and the close of the customary trading session on the NYSE, events occur that Invesco PowerShares Capital Management LLC (the “Adviser”) determines are significant and make the closing price unreliable, the Fund may fair value the security. If the event is likely to have affected the closing price of the security, the security will be valued at fair value in good faith using procedures approved by the Board of Trustees. Adjustments to closing prices to reflect fair value may also be based on a screening process of an independent pricing service to indicate the degree of certainty, based on historical data, that the closing price in the principal market where a foreign security trades is not the current value as of the close of the NYSE. Foreign securities’ prices meeting the approved degree of certainty that the price is not reflective of current value will be priced at the indication of fair value from the independent pricing service. Multiple factors may be considered by the independent pricing service in determining adjustments to reflect fair value and may include information relating to sector indices, American Depositary Receipts and domestic and foreign index futures. Foreign securities may have additional risks including exchange rate changes, potential for sharply devalued currencies and high inflation, political and economic upheaval, the relative lack of issuer information, relatively low market liquidity and the potential lack of strict financial and accounting controls and standards.
Securities for which market prices are not provided by any of the above methods may be valued based upon quotes furnished by independent sources. The last bid price may be used to value equity securities. The mean between the last bid and asked prices is used to value debt obligations, including corporate loans.
Securities for which market quotations are not readily available or became unreliable are valued at fair value as determined in good faith following procedures approved by the Board of Trustees. Issuer-specific events, market trends, bid/asked quotes of brokers and information providers and other market data may be reviewed in the course of making a good faith determination of a security’s fair value.
Each Fund may invest in securities that are subject to interest rate risk, meaning the risk that the prices will generally fall as interest rates rise and, conversely, the prices will generally rise as interest rates fall. Specific securities differ in their sensitivity to changes in interest rates depending on their individual characteristics. Changes in interest rates may result in increased market volatility, which may affect the value and/or liquidity of certain Fund investments.
Valuations change in response to many factors, including the historical and prospective earnings of the issuer, the value of the issuer’s assets, general economic conditions, interest rates, investor perceptions and market liquidity. Because of the inherent uncertainties of valuation, the values reflected in the financial statements may materially differ from the value received upon actual sale of those investments.
B. Other Risks
Index Risk. Unlike many investment companies, the Funds do not utilize investing strategies that seek returns in excess of their Underlying Indexes. Therefore, a Fund would not necessarily buy or sell a security unless that security is added or removed, respectively, from its respective Underlying Index, even if that security generally is underperforming.
Equity Risk. Equity risk is the risk that the value of the securities that each Fund holds will fall due to general market and economic conditions, perceptions regarding the industries in which the issuers of securities that a Fund holds participate or factors relating to specific companies in which the Fund invests. For example, an adverse event, such as an unfavorable earnings report, may depress the value of securities a Fund holds; the price of securities may be particularly sensitive to general movements in the stock market; or a
drop in the stock market may depress the price of most or all of the securities a Fund holds. In addition, securities of an issuer in the Fund’s portfolio may decline in price if the issuer fails to make anticipated dividend payments because, among other reasons, the issuer of the security experiences a decline in its financial condition.
Industry Concentration Risk. In following its methodology, each Fund’s Underlying Index from time to time will be concentrated to a significant degree in securities of issuers located in a single industry or a sector. To the extent that an Underlying Index concentrates in the securities of issuers in a particular industry or sector, each Fund will also concentrate its investments to approximately the same extent. By concentrating its investments in an industry or sector, a Fund may face more risks than if it were diversified broadly over numerous industries or sectors. In addition, at times, an industry or sector may be out of favor and underperform other industries or the market as a whole. Any factors detrimental to the performance of such industry or sector will disproportionately impact a Fund’s NAV.
Non-Diversified Fund Risk. Each of KBW Bank Portfolio, KBW Property & Casualty Portfolio and KBW Regional Banking Portfolio is non-diversified and can invest a greater portion of its assets in securities of individual issuers than diversified funds. As a result, changes in the market value of a single investment could cause greater fluctuations in Share price than would occur in a diversified fund. This may increase a Fund’s volatility and cause the performance of a relatively small number of issuers to have a greater impact on a Fund’s performance.
Non-Correlation Risk. Each Fund’s return may not match the return of its Underlying Index for a number of reasons. For example, each Fund incurs operating expenses not applicable to its Underlying Index, and incurs costs in buying and selling securities, especially when rebalancing the Fund’s securities holdings to reflect changes in the composition of its Underlying Index. In addition, the performance of each Fund and its Underlying Index may vary due to asset valuation differences and differences between each Fund’s portfolio and its Underlying Index resulting from legal restrictions, cost or liquidity constraints.
Portfolio Turnover Risk. Contrarian Opportunities Portfolio and KBW High Dividend Yield Financial Portfolio may engage in frequent trading of its portfolio securities in connection with the rebalancing or adjustment of the Underlying Index. A portfolio turnover rate of 200%, for example, is equivalent to the Fund buying and selling all of its securities two times during the course of a year. A high portfolio turnover rate (such as 100% or more) could result in high brokerage costs for the Fund. While a high portfolio turnover rate can result in an increase in taxable capital gains distributions to the Fund’s shareholders, the Fund will seek to utilize the in-kind creation and redemption mechanism (described below) to minimize realization of capital gains to the extent possible.
High Dividend Paying Securities Risk. KBW High Dividend Yield Financial Portfolio and KBW Premium Yield Equity REIT Portfolio invest in securities that pay high dividends. As a group, these securities can fall out of favor with the market, causing such companies to underperform companies that do not pay high dividends. Also, changes in the dividend policies of the companies in an Underlying Index and the capital resources available for such companies’ dividend payments may affect a Fund.
Small- and Mid-Capitalization Company Risk. For KBW High Dividend Yield Financial Portfolio, KBW Premium Yield Equity REIT Portfolio and Russell 1000 Equal Weight Portfolio, investing in securities of small- and mid-capitalization companies involves greater risk than customarily is associated with investing in larger, more established companies. These companies’ securities may be more volatile and less liquid than those of more established companies. These securities may have returns that vary, sometimes significantly, from the overall securities market. Often small- and mid-capitalization companies and the industries in which they focus are still evolving and, as a result, they may be more sensitive to changing market conditions.
REIT Risk. For KBW High Dividend Yield Financial Portfolio and KBW Premium Yield Equity REIT Portfolio, although the Funds will not invest in real estate directly, the REITs in which the Funds invest are subject to risks inherent in the direct ownership of real estate. These risks include, but are not limited to, a possible lack of mortgage funds and associated interest rate risks, overbuilding, property vacancies, increases in property taxes and operating expenses, changes in zoning laws, losses due to environmental damages and changes in neighborhood values and appeal to purchasers.
C. Federal Income Taxes
Each Fund intends to comply with the provisions of the Internal Revenue Code of 1986, as amended (the “Internal Revenue Code”), applicable to regulated investment companies and to distribute substantially all of the Fund’s taxable earnings to its shareholders. As such, the Funds will not be subject to federal income taxes on otherwise taxable income (including net realized gains) that is distributed to the shareholders. Therefore, no provision for federal income taxes is recorded in the financial statements.
Each Fund recognizes the tax benefits of uncertain tax positions only when the position is more likely than not to be sustained. Management has analyzed each Fund’s uncertain tax positions and concluded that no liability for unrecognized tax benefits should be recorded related to uncertain tax positions. Management is not aware of any tax positions for which it is reasonably possible that the total amounts of unrecognized tax benefits will change materially in the next 12 months.
Income and capital gain distributions are determined in accordance with federal income tax regulations, which may differ from GAAP. These differences are primarily due to differing book and tax treatments for in-kind transactions, losses deferred due to wash sales, and passive foreign investment company adjustments, if any.
The Funds file U.S. federal tax returns and tax returns in certain other jurisdictions. Generally, a Fund is subject to examinations by such taxing authorities for up to three years after the filing of the return for the tax period.
D. Investment Transactions and Investment Income
Investment transactions are accounted for on a trade date basis. Realized gains and losses from the sale or disposition of securities are computed on the specific identified cost basis. Interest income is recorded on the accrual basis. Dividend income (net of withholding tax, if any) is recorded on the ex-dividend date. Realized gains, dividends and interest received by a Fund may give rise to withholding and other taxes imposed by foreign countries. Tax conventions between certain countries and the United States may reduce or eliminate such taxes.
The Funds may periodically participate in litigation related to each Fund’s investments. As such, the Funds may receive proceeds from litigation settlements. Any proceeds received are included in the Statements of Operations as realized gain (loss) for investments no longer held and as unrealized gain (loss) for investments still held.
Corporate actions (including cash dividends) are recorded net of non-reclaimable foreign tax withholdings on the ex-date.
Brokerage commissions and mark ups are considered transaction costs and are recorded as an increase to the cost basis of securities purchased and/or a reduction of proceeds on a sale of securities. Such transaction costs are included in the determination of net realized and unrealized gain (loss) from investment securities reported in the Statements of Operations and the Statements of Changes in Net Assets and the net realized and unrealized gains (losses) on securities per share in the Financial Highlights. Transaction costs are included in the calculation of each Fund’s net asset value and, accordingly, they reduce each Fund’s total returns. These transaction costs are not considered operating expenses and are not reflected in net investment income reported in the Statements of Operations and the Statements of Changes in Net Assets, or the net investment income per share and the ratios of expenses and net investment income reported in the Financial Highlights, nor are they limited by any expense limitation arrangements between each Fund and the Adviser.
E. Country Determination
For the purposes of making investment selection decisions and presentation in the Schedule of Investments, the Adviser may determine the country in which an issuer is located and/or credit risk exposure based on various factors. These factors include the laws of the country under which the issuer is organized, where the issuer maintains a principal office, the country in which the issuer derives 50% or more of its total revenues and the country that has the primary market for the issuer’s securities, as well as other criteria. Among the other criteria that may be evaluated for making this determination are the country in which the issuer maintains 50% or more of its assets, the type of security, financial guarantees and enhancements, the nature of the collateral and the sponsor organization. Country of issuer and/or credit risk exposure has been determined to be the United States of America, unless otherwise noted.
F. Expenses
Each Fund has agreed to pay an annual unitary management fee to the Adviser. Out of the unitary management fee, the Adviser has agreed to pay for substantially all expenses of the Funds, including the cost of transfer agency, custody, fund administration, legal, audit and other services, except for advisory fees, distribution fees, if any, brokerage expenses, taxes, interest, acquired fund fees and expenses, if any, litigation expenses and other extraordinary expenses.
Expenses of the Trust that are excluded from a Fund’s unitary management fee and are directly identifiable to a specific Fund are applied to that Fund. Expenses of the Trust that are excluded from each Fund’s unitary management fee and that are not readily identifiable to a specific Fund are allocated in such a manner as deemed equitable, taking into consideration the nature and type of expense and the relative net assets of each Fund.
To the extent a Fund invests in other investment companies, the expenses shown in the accompanying financial statements reflect the expenses of the Fund and do not include any expenses of the investment companies in which it invests. The effects of such investment companies’ expenses are included in the realized and unrealized gain or loss on the investments in the investment companies.
G. Dividends and Distributions to Shareholders
Each Fund (except for KBW High Dividend Yield Financial Portfolio and KBW Premium Yield Equity REIT Portfolio) declares and pays dividends from net investment income, if any, to its shareholders quarterly and records such dividends on ex-dividend date. KBW High Dividend Yield Financial Portfolio and KBW Premium Yield Equity REIT Portfolio each declares and pays dividends from net investment income, if any, to its shareholders monthly and records such dividends on ex-dividend date. Generally, each Fund distributes net realized taxable capital gains, if any, annually in cash and records them on ex-dividend date. Such distributions on a tax basis are determined in conformity with federal income tax regulations, which may differ from GAAP. Distributions in excess of tax basis earnings and profits, if any, are reported in such Fund’s financial statements as a tax return of capital at fiscal year-end.
H. Foreign Currency Translations
Foreign currency is valued at the close of the NYSE based on quotations posted by banks and major currency dealers. Portfolio securities and other assets and liabilities denominated in foreign currencies are translated into U.S. dollar amounts at date of valuation. Purchases and sales of portfolio securities (net of foreign taxes withheld on disposition) and income items denominated in foreign currencies are translated into U.S. dollar amounts on the respective dates of such transactions. The Funds do not separately account for
the portion of the results of operations resulting from changes in foreign exchange rates on investments and the fluctuations arising from changes in market prices of securities held. The combined results of changes in foreign exchange rates and the fluctuation of market prices on investments (net of estimated foreign tax withholding) are included with the net realized and unrealized gain or loss from investments in the Statements of Operations. Reported net realized foreign currency gains or losses arise from (1) sales of foreign currencies, (2) currency gains or losses realized between the trade and settlement dates on securities transactions, and (3) the difference between the amounts of dividends, interest, and foreign withholding taxes recorded on each Fund’s books and the U.S. dollar equivalent of the amounts actually received or paid. Net unrealized foreign currency gains and losses arise from changes in the fair values of assets and liabilities, other than investments in securities at fiscal period-end, resulting from changes in exchange rates.
The Funds may invest in foreign securities, which may be subject to foreign taxes on income, gains on investments or currency repatriation, a portion of which may be recoverable. Foreign taxes, if any, are recorded based on the tax regulations and rates that exist in the foreign markets in which each Fund invests.
I. Securities Lending
During the fiscal year ended October 31, 2016, KBW High Dividend Yield Financial Portfolio and Russell 1000 Equal Weight Portfolio participated in securities lending. Each Fund loaned portfolio securities having a market value up to one-third of each Fund’s total assets. Such loans are secured by cash collateral equal to no less than 102% (105% for international securities) of the market value of the loaned securities determined daily by the securities lending provider. Cash collateral received in connection with these loans is invested in an affiliated money market fund and is shown as such on the Schedules of Investments. Each Fund bears the risk of loss with respect to the investment of collateral. It is the policy of these Funds to obtain additional collateral from or return excess collateral to the borrower by the end of the next business day, following the valuation date of the securities loaned. Therefore, the value of the collateral held may be temporarily less than the value of the securities on loan. When loaning securities, each Fund retains certain benefits of owning the securities, including the economic equivalent of dividends or interest generated by the security. Lending securities entails a risk of loss to each Fund if, and to the extent that, the market value of the securities loaned were to increase, and the borrower did not increase the collateral accordingly, and the borrower failed to return the securities. The securities loaned are subject to termination at the option of the borrower or each Fund. Upon termination, the borrower will return to each Fund the securities loaned and each Fund will return the collateral. Upon the failure of the borrower to return the securities, collateral may be liquidated and the securities may be purchased on the open market to replace the loaned securities. Each Fund could experience delays and costs in gaining access to the collateral and the securities may lose value during the delay which could result in potential losses to each Fund. Some of these losses may be indemnified by the lending agent. Each Fund bears the risk of any deficiency in the amount of the collateral available for return to the borrower due to any loss on the collateral invested. Dividends received on cash collateral investments for securities lending transactions, which are net of compensation to Counterparties, are included in Securities lending income on the Statements of Operations. The aggregate value of securities out on loan, if any, is shown on the Statements of Assets and Liabilities.
Note 3. Investment Advisory Agreement and Other Agreements
The Trust has entered into an Investment Advisory Agreement with the Adviser on behalf of each Fund, pursuant to which the Adviser has overall responsibility for the selection and ongoing monitoring of the Funds’ investments, managing the Funds’ business affairs and providing certain clerical, bookkeeping and other administrative services.
As compensation for its services, each Fund (except for Russell 1000 Equal Weight Portfolio) has agreed to pay the Adviser an annual unitary management fee of 0.35% of each Fund’s average daily net assets. The Russell 1000 Equal Weight Portfolio has agreed to pay the Adviser an annual unitary management fee of 0.20% of the Fund’s average daily net assets. Out of the unitary management fee, the Adviser has agreed to pay for substantially all expenses of the Funds, including the cost of transfer agency, custody, fund administration, legal, audit and other services, except for advisory fees, distribution fees, if any, brokerage expenses, taxes, interest, acquired fund fees and expenses, if any, litigation expenses and other extraordinary expenses.
Further, through August 31, 2018, the Adviser has contractually agreed to waive a portion of each Fund’s management fee in an amount equal to 100% of the net advisory fees an affiliate of the Adviser receives that are attributable to certain of the Fund’s investments in money market funds managed by that affiliate (excluding investments of cash collateral from securities lending). The Adviser cannot discontinue this waiver prior to its expiration.
For the fiscal year ended October 31, 2016, the Adviser waived fees for each Fund in the following amounts:
| | | | |
| Contrarian Opportunities Portfolio | | $ | — | |
| KBW Bank Portfolio | | | 376 | |
| KBW High Dividend Yield Financial Portfolio | | | 413 | |
| KBW Premium Yield Equity REIT Portfolio | | | 476 | |
| KBW Property & Casualty Insurance Portfolio | | | 75 | |
| KBW Regional Banking Portfolio | | | 98 | |
| Russell 1000 Equal Weight Portfolio | | | 115 | |
The Trust has entered into a Distribution Agreement with Invesco Distributors, Inc. (the “Distributor”), which serves as the distributor of Creation Units for each Fund. The Distributor does not maintain a secondary market in the Shares. The Funds are not charged any fees pursuant to the Distribution Agreement. The Distributor is an affiliate of the Adviser.
The Adviser has entered into a licensing agreement for each Fund with the following entities (each, a “Licensor”):
| | |
Fund | | Licensor |
| Contrarian Opportunities Portfolio | | S&P Dow Jones Indices LLC |
| KBW Bank Portfolio | | Keefe, Bruyette & Woods, Inc. |
| KBW High Dividend Yield Financial Portfolio | | Keefe, Bruyette & Woods, Inc. |
| KBW Premium Yield Equity REIT Portfolio | | Keefe, Bruyette & Woods, Inc. |
| KBW Property & Casualty Insurance Portfolio | | Keefe, Bruyette & Woods, Inc. |
| KBW Regional Banking Portfolio | | Keefe, Bruyette & Woods, Inc. |
| Russell 1000 Equal Weight Portfolio | | Frank Russell Company |
Each Underlying Index name trademark is owned by its respective Licensor. These trademarks have been licensed to the Adviser for use by the Funds. Each Fund is entitled to use its Underlying Index pursuant to the Trust’s sub-licensing agreement with the Adviser. The Funds are not sponsored, endorsed, sold or promoted by the Licensors, and the Licensors make no representation regarding the advisability of investing in any of the Funds.
The Trust has entered into service agreements whereby The Bank of New York Mellon, a wholly-owned subsidiary of The Bank of New York Mellon Corporation, serves as the administrator, custodian, fund accountant and transfer agent for each Fund.
Note 4. Investments in Affiliates
The Adviser and Invesco Mortgage Capital, Inc. REIT are wholly-owned subsidiaries of Invesco Ltd. and therefore, Invesco Ltd. and Invesco Mortgage Capital, Inc. REIT are considered to be affiliated with the Funds. The table below shows certain Funds’ transactions in, and earnings from, investments in affiliates for the fiscal year ended October 31, 2016.
KBW High Dividend Yield Financial Portfolio
| | | | | | | | | | | | | | | | | | | | | | | | | | | | |
| | | Value
October 31, 2015 | | | Purchases
at Cost | | | Proceeds
from Sales | | | Change in
Unrealized
Appreciation | | | Realized
Gain (Loss) | | | Value
October 31, 2016 | | | Dividend
Income | |
| Invesco Mortgage Capital, Inc. REIT* | | $ | 8,002,321 | | | $ | 1,938,191 | | | $ | (10,575,022 | ) | | $ | 2,950,216 | | | $ | (2,315,706 | ) | | $ | — | | | $ | — | |
| * | At October 31, 2016, this security was no longer held. |
Russell 1000 Equal Weight Portfolio
| | | | | | | | | | | | | | | | | | | | | | | | | | | | |
| | | Value
October 31, 2015 | | | Purchases
at Cost | | | Proceeds
from Sales | | | Change in
Unrealized
Appreciation | | | Realized
Gain (Loss) | | | Value
October 31, 2016 | | | Dividend
Income | |
| Invesco Ltd. | | $ | 67,999 | | | $ | 52,453 | | | $ | (65,221 | ) | | $ | 3,331 | | | $ | (9,292 | ) | | $ | 49,270 | | | $ | 1,571 | |
Note 5. Additional Valuation Information
GAAP defines fair value as the price that would be received to sell an asset or paid to transfer a liability in an orderly transaction between market participants at the measurement date, under current market conditions. GAAP establishes a hierarchy that prioritizes the inputs to valuation methods, giving the highest priority to readily available unadjusted quoted prices in an active market for identical assets (Level 1) and the lowest priority to significant unobservable inputs (Level 3), generally when market prices are not readily available or are unreliable. Based on the valuation inputs, the securities or other investments are tiered into one of three levels. Changes in valuation methods may result in transfers in or out of an investment’s assigned level:
| | Level 1 — | Prices are determined using quoted prices in an active market for identical assets. |
| | Level 2 — | Prices are determined using other significant observable inputs. Observable inputs are inputs that other market participants may use in pricing a security. These may include quoted prices for similar securities, interest rates, prepayment speeds, credit risk, yield curves, loss severities, default rates, discount rates, volatilities and others. |
| | Level 3 — | Prices are determined using significant unobservable inputs. In situations where quoted prices or observable inputs are unavailable (for example, when there is little or no market activity for an investment at the end of the period), unobservable inputs may be used. Unobservable inputs reflect a Fund’s own assumptions about the factors market participants would use in determining fair value of the securities or instruments and would be based on the best available information. |
As of October 31, 2016, all of the securities in each Fund were valued based on Level 1 inputs (see the Schedules of Investments for security categories). The level assigned to the securities valuations may not be an indication of the risk or liquidity associated with investing in those securities. Because of the inherent uncertainties of valuation, the values reflected in the financial statements may materially differ from the value received upon actual sale of those investments.
Note 6. Distributions to Shareholders and Tax Components of Net Assets
Tax Character of Distributions to Shareholders Paid During the Fiscal Years Ended October 31, 2016 and 2015:
| | | | | | | | | | | | | | | | | | | | | | | | |
| | | 2016 | | | 2015 | |
| | | Ordinary
Income | | | Long-Term
Capital Gains | | | Return of
Capital | | | Ordinary
Income | | | Long-Term
Capital Gains | | | Return of
Capital | |
| Contrarian Opportunities Portfolio | | | 11,962 | | | | — | | | | — | | | $ | 43,417 | | | $ | 492 | | | $ | — | |
| KBW Bank Portfolio | | | 8,225,074 | | | | — | | | | — | | | | 5,166,214 | | | | — | | | | — | |
| KBW High Dividend Yield Financial Portfolio | | | 18,056,090 | | | | — | | | | 1,310,772 | | | | 22,592,480 | | | | — | | | | 929,525 | |
| KBW Premium Yield Equity REIT Portfolio | | | 10,877,502 | | | | — | | | | — | | | | 6,050,718 | | | | — | | | | — | |
| KBW Property & Casualty Insurance Portfolio | | | 1,641,784 | | | | 33,223 | | | | — | | | | 295,777 | | | | 8,776 | | | | — | |
| KBW Regional Banking Portfolio | | | 1,882,396 | | | | — | | | | — | | | | 742,022 | | | | — | | | | — | |
| Russell 1000 Equal Weight Portfolio | | | 1,669,387 | | | | — | | | | — | | | | 1,316,380 | | | | — | | | | — | |
Tax Components of Net Assets at Fiscal Year-End:
| | | | | | | | | | | | | | | | | | | | |
| | | Undistributed
Ordinary
Income | | | Net
Unrealized
Appreciation
(Depreciation) | | | Capital Loss
Carryforwards | | | Shares of
Beneficial
Interest | | | Total Net
Assets | |
| Contrarian Opportunities Portfolio | | $ | 5,319 | | | $ | (61,102 | ) | | $ | (326,429 | ) | | $ | 2,954,110 | | | $ | 2,571,898 | |
| KBW Bank Portfolio | | | 929,039 | | | | (11,754,331 | ) | | | (1,500,032 | ) | | | 442,458,942 | | | | 430,133,618 | |
| KBW High Dividend Yield Financial Portfolio | | | — | | | | (4,624,253 | ) | | | (56,647,346 | ) | | | 282,650,725 | | | | 221,379,126 | |
| KBW Premium Yield Equity REIT Portfolio | | | — | | | | (6,400,283 | ) | | | (7,749,303 | ) | | | 202,574,885 | | | | 188,425,299 | |
| KBW Property & Casualty Insurance Portfolio | | | 198,579 | | | | 1,030,407 | | | | (195,307 | ) | | | 61,975,927 | | | | 63,009,606 | |
| KBW Regional Banking Portfolio | | | 258,588 | | | | 9,158,749 | | | | (706,269 | ) | | | 127,970,923 | | | | 136,681,991 | |
| Russell 1000 Equal Weight Portfolio | | | 251,668 | | | | (7,169,251 | ) | | | (4,528,906 | ) | | | 126,930,181 | | | | 115,483,692 | |
Capital loss carryforwards are calculated and reported as of a specific date. Results of transactions and other activity after that date may affect the amount of capital loss carryforwards actually available for the Funds to utilize. Capital losses generated in years beginning after December 22, 2010 can be carried forward for an unlimited period, whereas previous losses expire in eight tax years. Capital losses with an expiration period may not be used to offset capital gains until all net capital losses without an expiration date have been utilized. Capital loss carryforwards with no expiration date will retain their character as either short-term or long-term capital losses instead of as short-term capital losses as under prior law. The ability to utilize capital loss carryforwards in the future may be limited under the Internal Revenue Code and related regulations based on the results of future transactions.
The following table presents available capital loss carryforwards and expiration dates for each Fund as of October 31, 2016.
| | | | | | | | | | | | |
| | | Post-effective/no expiration | |
| | | Short-Term | | | Long-Term | | | Total* | |
| Contrarian Opportunities Portfolio | | $ | 195,525 | | | $ | 130,904 | | | $ | 326,429 | |
| KBW Bank Portfolio | | | 496,085 | | | | 1,003,947 | | | | 1,500,032 | |
| KBW High Dividend Yield Financial Portfolio | | | 20,107,278 | | | | 36,540,068 | | | | 56,647,346 | |
| KBW Premium Yield Equity REIT Portfolio | | | 3,033,026 | | | | 4,716,277 | | | | 7,749,303 | |
| KBW Property & Casualty Insurance Portfolio | | | 193,858 | | | | 1,449 | | | | 195,307 | |
| KBW Regional Banking Portfolio | | | 431,635 | | | | 274,634 | | | | 706,269 | |
| Russell 1000 Equal Weight Portfolio | | | 2,492,599 | | | | 2,036,307 | | | | 4,528,906 | |
| * | Capital loss carryforwards as of the date listed above are reduced for limitations, if any, to the extent required by the Internal Revenue Code and may be further limited depending upon a variety of factors, including the realization of net unrealized gains or losses as of the date of any reorganization. |
Note 7. Investment Transactions
For the fiscal year ended October 31, 2016, the cost of securities purchased and proceeds from sales of securities (other than short-term securities, U.S. Treasury obligations, money market funds and in-kind transactions, if any) were as follows:
| | | | | | | | |
| | | Purchases | | | Sales | |
| Contrarian Opportunities Portfolio | | $ | 1,607,151 | | | $ | 1,596,377 | |
| KBW Bank Portfolio | | | 49,496,939 | | | | 49,532,664 | |
| KBW High Dividend Yield Financial Portfolio | | | 254,147,334 | | | | 243,780,920 | |
| KBW Premium Yield Equity REIT Portfolio | | | 142,438,076 | | | | 135,262,213 | |
| KBW Property & Casualty Insurance Portfolio | | | 15,776,016 | | | | 15,765,698 | |
| KBW Regional Banking Portfolio | | | 23,260,488 | | | | 21,866,173 | |
| Russell 1000 Equal Weight Portfolio | | | 30,438,580 | | | | 29,941,008 | |
For the fiscal year ended October 31, 2016, in-kind transactions associated with creation and redemptions were as follows:
| | | | | | | | |
| | | Cost of
Securities
Received | | | Value of
Securities
Delivered | |
| Contrarian Opportunities Portfolio | | $ | 1,309,844 | | | $ | 1,238,015 | |
| KBW Bank Portfolio | | | 792,478,945 | | | | 919,269,381 | |
| KBW High Dividend Yield Financial Portfolio | | | 87,202,022 | | | | 130,723,992 | |
| KBW Premium Yield Equity REIT Portfolio | | | 193,233,234 | | | | 121,241,034 | |
| KBW Property & Casualty Insurance Portfolio | | | 53,303,198 | | | | 79,342,075 | |
| KBW Regional Banking Portfolio | | | 88,625,841 | | | | 15,268,820 | |
| Russell 1000 Equal Weight Portfolio | | | 98,843,476 | | | | 135,135,101 | |
Gains (losses) on in-kind transactions are generally not considered taxable gains (losses) for federal income tax purposes.
At October 31, 2016, the aggregate cost and net unrealized appreciation (depreciation) of investments for tax purposes were as follows:
| | | | | | | | | | | | | | | | |
| | | Gross
Unrealized
Appreciation | | | Gross
Unrealized
(Depreciation) | | | Net
Unrealized
Appreciation
(Depreciation) | | | Cost | |
| Contrarian Opportunities Portfolio | | $ | 103,050 | | | $ | (164,152 | ) | | $ | (61,102 | ) | | $ | 2,633,016 | |
| KBW Bank Portfolio | | | 4,686,155 | | | | (16,440,486 | ) | | | (11,754,331 | ) | | | 441,688,072 | |
| KBW High Dividend Yield Financial Portfolio | | | 9,548,200 | | | | (14,172,453 | ) | | | (4,624,253 | ) | | | 231,586,620 | |
| KBW Premium Yield Equity REIT Portfolio | | | 3,519,165 | | | | (9,919,448 | ) | | | (6,400,283 | ) | | | 194,832,185 | |
| KBW Property & Casualty Insurance Portfolio | | | 2,493,075 | | | | (1,462,668 | ) | | | 1,030,407 | | | | 61,998,004 | |
| KBW Regional Banking Portfolio | | | 11,178,613 | | | | (2,019,864 | ) | | | 9,158,749 | | | | 127,657,403 | |
| Russell 1000 Equal Weight Portfolio | | | 2,729,470 | | | | (9,898,721 | ) | | | (7,169,251 | ) | | | 123,388,833 | |
Note 8. Reclassification of Permanent Differences
Primarily as a result of differing book/tax treatment of in-kind transactions, amounts were reclassified between undistributed net investment income, undistributed net realized gain (loss) and Shares of beneficial interest. These reclassifications had no effect on the net assets of each Fund. For the fiscal year ended October 31, 2016, the reclassifications were as follows:
| | | | | | | | | | | | |
| | | Undistributed
Net Investment
Income | | | Undistributed
Net Realized
Gain (Loss) | | | Shares of
Beneficial Interest | |
| Contrarian Opportunities Portfolio | | $ | 1,402 | | | $ | (67,633 | ) | | $ | 66,231 | |
| KBW Bank Portfolio | | | — | | | | 11,153,303 | | | | (11,153,303 | ) |
| KBW High Dividend Yield Financial Portfolio | | | 2,210,536 | | | | 8,584,211 | | | | (10,794,747 | ) |
| KBW Premium Yield Equity REIT Portfolio | | | 4,457,212 | | | | (9,161,877 | ) | | | 4,704,665 | |
| KBW Property & Casualty Insurance Portfolio | | | (26 | ) | | | (4,015,562 | ) | | | 4,015,588 | |
| KBW Regional Banking Portfolio | | | — | | | | (796,244 | ) | | | 796,244 | |
| Russell 1000 Equal Weight Portfolio | | | 497 | | | | (2,780,416 | ) | | | 2,779,919 | |
Note 9. Trustees’ and Officer’s Fees
Trustees’ and Officer’s Fees include amounts accrued by the Funds to pay remuneration to each Trustee who is not an “interested person” as defined in the 1940 Act (an “Independent Trustee”), any Trustee who is not an affiliate of the Adviser or Distributor (or any of their affiliates) and who is otherwise an “interested person” of the Trust under the 1940 Act (an “Unaffiliated Trustee”) and an Officer of the Trust. The Adviser, as a result of each Fund’s unitary management fee, pays for such compensation. The Trustee who is an “interested person” of the Trust does not receive any Trustees’ fees.
The Trust has adopted a deferred compensation plan (the “Plan”). Under the Plan, each Independent Trustee or Unaffiliated Trustee who has executed a Deferred Fee Agreement (a “Participating Trustee”) may defer receipt of all or a portion of his compensation (“Deferral Fees”). Such Deferral Fees are deemed to be invested in select PowerShares Funds. The Deferral Fees payable to the Participating Trustee are valued as of the date such Deferral Fees would have been paid to the Participating Trustee. The value increases with contributions or with increases in the value of the Shares selected, and the value decreases with distributions or with declines in the value of the Shares selected. Obligations under the Plan represent unsecured claims against the general assets of the Funds.
Note 10. Capital
Shares are created and redeemed by each Fund only in Creation Units of 50,000 Shares. Only Authorized Participants are permitted to purchase or redeem Creation Units from the Funds. Such transactions are principally permitted in exchange for Deposit Securities, with a balancing cash component to equate the transaction to the NAV per Share of a Fund of the Trust on the transaction date. However, for all Funds, cash in an amount equivalent to the value of certain securities may be substituted, generally when the securities are not available in sufficient quantity for delivery, not eligible for trading by the Authorized Participant or as a result of other market circumstances.
To the extent that the Funds permit transactions in exchange for Deposit Securities, each Fund may issue Shares in advance of receipt of Deposit Securities subject to various conditions, including a requirement to maintain on deposit with the Trust cash at least equal to 105% of the market value of the missing Deposit Securities. In accordance with the Trust’s Participant Agreement, Creation Units will be issued to an Authorized Participant, notwithstanding the fact that the corresponding Deposit Securities have not been received in part or in whole, in reliance on the undertaking of the Authorized Participant to deliver the missing Deposit Securities as soon as possible, which undertaking shall be secured by the Authorized Participant’s delivery and maintenance of collateral consisting of cash in the form of U.S. dollars in immediately available funds having a value (marked-to-market daily) at least equal to 105%, which the Adviser may change from time to time, of the value of the missing Deposit Securities.
Certain transaction fees may be charged by the Funds for creations and redemptions, which are treated as increases in capital.
Transactions in each Fund’s Shares are disclosed in detail in the Statements of Changes in Net Assets.
Note 11. Indemnifications
Under the Trust’s organizational documents, its officers and Trustees are indemnified against certain liabilities arising out of the performance of their duties to the Trust. Each Independent Trustee and Unaffiliated Trustee is also indemnified against certain liabilities arising out of the performance of his duties to the Trust pursuant to an Indemnification Agreement between such trustee and the Trust. Additionally, in the normal course of business, the Trust enters into contracts with service providers that contain general indemnification clauses. The Trust’s maximum exposure under these arrangements is unknown, as this would involve future claims that may be made against the Trust that have not yet occurred. However, based on experience, the Trust believes the risk of loss to be remote.
Note 12. Subsequent Event
Effective December 7, 2016, each Fund’s Shares (except for Contrarian Opportunities Portfolio and Russell 1000 Equal Weight Portfolio) were listed and began trading on The NASDAQ Stock Market LLC.
Report of Independent Registered Public Accounting Firm
To the Board of Trustees and Shareholders of PowerShares Exchange-Traded Fund Trust II:
In our opinion, the accompanying statements of assets and liabilities, including the schedules of investments, and the related statements of operations and of changes in net assets and the financial highlights present fairly, in all material respects, the financial position of PowerShares Contrarian Opportunities Portfolio, PowerShares KBW Bank Portfolio, PowerShares KBW High Dividend Yield Financial Portfolio, PowerShares KBW Premium Yield Equity REIT Portfolio, PowerShares KBW Property & Casualty Insurance Portfolio, PowerShares KBW Regional Banking Portfolio, and PowerShares Russell 1000 Equal Weight Portfolio (each an individual portfolio of PowerShares Exchange-Traded Fund Trust II, hereafter referred to as the “Funds”) as of October 31, 2016, the results of each of their operations for the year then ended, the changes in each of their net assets and the financial highlights for each of the periods presented, in conformity with accounting principles generally accepted in the United States of America. These financial statements and financial highlights (hereafter referred to as “financial statements”) are the responsibility of the Funds’ management. Our responsibility is to express an opinion on these financial statements based on our audits. We conducted our audits of these financial statements in accordance with the standards of the Public Company Accounting Oversight Board (United States). Those standards require that we plan and perform the audit to obtain reasonable assurance about whether the financial statements are free of material misstatement. An audit includes examining, on a test basis, evidence supporting the amounts and disclosures in the financial statements, assessing the accounting principles used and significant estimates made by management, and evaluating the overall financial statement presentation. We believe that our audits, which included confirmation of securities as of October 31, 2016 by correspondence with the custodian and brokers, and the application of alternative auditing procedures where confirmations of security purchases have not been received, provide a reasonable basis for our opinion.
PricewaterhouseCoopers LLP
Chicago, IL
December 22, 2016
Fees and Expenses
As a shareholder of a Fund of the PowerShares Exchange-Traded Fund Trust II, you incur a unitary management fee. In addition to the unitary management fee, a shareholder may pay distribution fees, if any, brokerage expenses, taxes, interest, acquired fund fees and expenses, if any, litigation expenses and other extraordinary expenses. The expense examples below are intended to help you understand your ongoing costs (in dollars) of investing in the Funds and to compare these costs with the ongoing costs of investing in other funds.
The example is based on an investment of $1,000 invested at the beginning of the period and held through the six-month period ended October 31, 2016.
In addition to the fees and expenses which the PowerShares KBW High Dividend Yield Financial Portfolio (the “Portfolio”) bears directly, the Portfolio indirectly bears a pro rata share of the fees and expenses of the investment companies in which the Portfolio invests. The amount of fees and expenses incurred indirectly by the Portfolio will vary because the investment companies have varied expenses and fee levels and the Portfolio may own different proportions of the investment companies at different times. Estimated investment companies’ expenses are not expenses that are incurred directly by the Portfolio. They are expenses that are incurred directly by the investment companies and are deducted from the value of the investment companies the Portfolio invests in. The effect of the estimated investment companies’ expenses that the Portfolio bears indirectly are included in the Portfolio’s total returns.
Actual Expenses
The first line in the following table provides information about actual account values and actual expenses. You may use the information in this line, together with the amount you invested, to estimate the expenses that you paid over the period. Simply divide your account value by $1,000 (for example, an $8,600 account value divided by $1,000 = 8.6), then multiply the result by the number in the first line under the heading “Expenses Paid During the Six-Month Period” to estimate the expenses you paid on your account during this period.
Hypothetical Example for Comparison Purposes
The second line in the following table provides information about hypothetical account values and hypothetical expenses based on each Fund’s actual expense ratio and an assumed annualized rate of return of 5% per year before expenses, which is not the Fund’s actual return. The hypothetical account values and expenses may not be used to estimate the actual ending account balance or expenses you paid for the period. You may use this information to compare the ongoing costs of investing in the Funds and other funds. To do so, compare this 5% hypothetical example with the 5% hypothetical examples that appear in the shareholder reports of the other funds.
Please note that the expenses shown in the table are meant to highlight your ongoing costs only, and do not reflect any transactional costs, such as sales charges and brokerage commissions. Therefore, the second line in the table is useful in comparing ongoing costs only, and will not help you determine the relative total costs of owning different funds. In addition, expenses shown in the table do not include the expenses of the underlying funds, which are borne indirectly by a Fund. If transaction costs and indirect expenses were included, your costs would have been higher.
| | | | | | | | | | | | | | | | |
| | | Beginning Account Value May 1, 2016 | | | Ending Account Value October 31, 2016 | | | Annualized Expense Ratio Based on the Six-Month Period | | | Expenses Paid During the Six-Month Period(1) | |
| PowerShares Contrarian Opportunities Portfolio (CNTR) | | | | | | | | | | | | | | | | |
Actual | | $ | 1,000.00 | | | $ | 1,026.67 | | | | 0.35 | % | | $ | 1.78 | |
Hypothetical (5% return before expenses) | | | 1,000.00 | | | | 1,023.38 | | | | 0.35 | | | | 1.78 | |
| PowerShares KBW Bank Portfolio (KBWB) | | | | | | | | | | | | | | | | |
Actual | | | 1,000.00 | | | | 1,088.91 | | | | 0.35 | | | | 1.84 | |
Hypothetical (5% return before expenses) | | | 1,000.00 | | | | 1,023.38 | | | | 0.35 | | | | 1.78 | |
| PowerShares KBW High Dividend Yield Financial Portfolio (KBWD) | | | | | | | | | | | | | | | | |
Actual | | | 1,000.00 | | | | 1,063.17 | | | | 0.35 | | | | 1.82 | |
Hypothetical (5% return before expenses) | | | 1,000.00 | | | | 1,023.38 | | | | 0.35 | | | | 1.78 | |
| PowerShares KBW Premium Yield Equity REIT Portfolio (KBWY) | | | | | | | | | | | | | | | | |
Actual | | | 1,000.00 | | | | 1,083.72 | | | | 0.35 | | | | 1.83 | |
Hypothetical (5% return before expenses) | | | 1,000.00 | | | | 1,023.38 | | | | 0.35 | | | | 1.78 | |
Fees and Expenses (continued)
| | | | | | | | | | | | | | | | |
| | | Beginning Account Value May 1, 2016 | | | Ending Account Value October 31, 2016 | | | Annualized Expense Ratio Based on the Six-Month Period | | | Expenses Paid During the Six-Month Period(1) | |
| PowerShares KBW Property & Casualty Insurance Portfolio (KBWP) | | | | | | | | | | | | | | | | |
Actual | | $ | 1,000.00 | | | $ | 1,070.25 | | | | 0.35 | % | | $ | 1.82 | |
Hypothetical (5% return before expenses) | | | 1,000.00 | | | | 1,023.38 | | | | 0.35 | | | | 1.78 | |
| PowerShares KBW Regional Banking Portfolio (KBWR) | | | | | | | | | | | | | | | | |
Actual | | | 1,000.00 | | | | 1,076.19 | | | | 0.35 | | | | 1.83 | |
Hypothetical (5% return before expenses) | | | 1,000.00 | | | | 1,023.38 | | | | 0.35 | | | | 1.78 | |
| PowerShares Russell 1000 Equal Weight Portfolio (EQAL) | | | | | | | | | | | | | | | | |
Actual | | | 1,000.00 | | | | 1,021.24 | | | | 0.20 | | | | 1.02 | |
Hypothetical (5% return before expenses) | | | 1,000.00 | | | | 1,024.13 | | | | 0.20 | | | | 1.02 | |
| (1) | Expenses are calculated using the annualized expense ratio, which represents the ongoing expenses as a percentage of net assets for the six-month period ended October 31, 2016. Expenses are calculated by multiplying the Fund’s annualized expense ratio by the average account value for the period, then multiplying the result by 184/366. Expense ratios for the most recent six-month period may differ from expense ratios based on the annualized data in the Financial Highlights. |
Tax Information
Form 1099-DIV, Form 1042-S and other year-end tax information provide shareholders with actual calendar year amounts that should be included in their tax returns. Shareholders should consult their tax advisers.
The following distribution information is being provided as required by the Internal Revenue Code or to meet a specific state’s requirement.
Each Fund designates the following amounts or, if subsequently determined to be different, the maximum amount allowable for its fiscal year ended October 31, 2016:
| | | | | | | | | | | | | | | |
| | | Qualified Dividend
Income* | | Corporate
Dividends Received
Deduction* | | Long-Term
Capital Gains |
| PowerShares Contrarian Opportunities Portfolio | | | | 100 | % | | | | 100 | % | | | $ | — | |
| PowerShares KBW Bank Portfolio | | | | 100 | % | | | | 100 | % | | | | — | |
| PowerShares KBW High Dividend Yield Financial Portfolio | | | | 95 | % | | | | 95 | % | | | | — | |
| PowerShares KBW Premium Yield Equity REIT Portfolio | | | | 2 | % | | | | 2 | % | | | | — | |
| PowerShares KBW Property & Casualty Insurance Portfolio | | | | 100 | % | | | | 71 | % | | | | 33,223 | |
| PowerShares KBW Regional Banking Portfolio | | | | 100 | % | | | | 100 | % | | | | — | |
| PowerShares Russell 1000 Equal Weight Portfolio | | | | 100 | % | | | | 98 | % | | | | — | |
| * | The above percentages are based on ordinary income dividends paid to shareholders during the fiscal year. |
Trustees and Officers
The Independent Trustees, the Unaffiliated Trustees, the Non-Independent Trustees and the executive officers of the Trust, their term of office and length of time served, their principal business occupations during at least the past five years, the number of portfolios in the Fund Complex overseen by each Trustee and the other directorships, if any, held by a Trustee are shown below.
The Trustees and officers information is current as of October 31, 2016.
| | | | | | | | | | |
Name, Address and Year of Birth
of Independent Trustees | | Position(s)
Held
with Trust | | Term of
Office
and
Length of
Time
Served* | | Principal
Occupation(s) During
Past 5 Years | | Number of
Portfolios
in Fund
Complex**
Overseen by
Independent
Trustees | | Other
Directorships
Held by
Independent
Trustees During
the Past 5 Years |
Ronn R. Bagge—1958
c/o Invesco PowerShares
Capital Management LLC
3500 Lacey Road,
Suite 700
Downers Grove, IL 60515 | | Chairman of the Nominating and Governance Committee and Trustee | | Chairman of the Nominating and Governance Committee and Trustee since 2007 | | Founder and Principal, YQA Capital Management LLC (1998-Present); formerly Owner/CEO of Electronic Dynamic Balancing Co., Inc. (high-speed rotating equipment service provider). | | 126 | | None |
| | | | | |
Todd J. Barre—1957
c/o Invesco PowerShares Capital Management LLC
3500 Lacey Road,
Suite 700
Downers Grove, IL 60515 | | Trustee | | Since 2010 | | Assistant Professor of Business, Trinity Christian College (2010-2016); formerly Vice President and Senior Investment Strategist (2001-2008), Director of Open Architecture and Trading (2007-2008), Head of Fundamental Research (2004-2007) and Vice President and Senior Fixed Income Strategist (1994-2001), BMO Financial Group/Harris Private Bank. | | 126 | | None |
| | | | | |
Marc M. Kole—1960
c/o Invesco PowerShares Capital Management LLC
3500 Lacey Road,
Suite 700
Downers Grove, IL 60515 | | Chairman of the Audit Committee and Trustee | | Chairman of the Audit Committee since 2008; Trustee since 2007 | | Senior Director of Finance, By The Hand Club for Kids (2015-Present); Formerly: Chief Financial Officer, Hope Network (social services) (2008-2012); Assistant Vice President and Controller, Priority Health (health insurance) (2005-2008); Senior Vice President of Finance, United Healthcare (2004-2005); Chief Accounting Officer, Senior Vice President of Finance, Oxford Health Plans (2000-2004); Audit Partner, Arthur Andersen LLP (1996-2000). | | 126 | | None |
| | | | | |
Yung Bong Lim—1964
c/o Invesco PowerShares Capital Management LLC
3500 Lacey Road,
Suite 700
Downers Grove, IL 60515 | | Chairman of the Investment Oversight Committee and Trustee | | Chairman of the Investment Oversight Committee since 2014; Trustee since 2013 | | Managing Partner, Residential Dynamics Group LLC (2008-Present); formerly, Managing Director, Citadel Investment Group, L.L.C. (1999-2007). | | 126 | | None |
| * | This is the date the Independent Trustee began serving the Trust. He serves an indefinite term, until his successor is elected. |
| ** | Fund Complex includes all open-end funds (including all of their portfolios) advised by the Adviser. At October 31, 2016, the “Fund Family” consisted of the Trust’s 67 portfolios and four other exchange-traded fund trusts with 59 portfolios advised by the Adviser. |
Trustees and Officers (continued)
| | | | | | | | | | |
Name, Address and Year of Birth
of Independent Trustees | | Position(s)
Held
with Trust | | Term of
Office
and
Length of
Time
Served* | | Principal
Occupation(s) During
Past 5 Years | | Number of
Portfolios
in Fund
Complex**
Overseen by
Independent
Trustees | | Other
Directorships
Held by
Independent
Trustees During
the Past 5 Years |
Gary R. Wicker—1961
c/o Invesco PowerShares Capital Management LLC
3500 Lacey Road,
Suite 700
Downers Grove, IL 60515 | | Trustee | | Since 2013 | | Senior Vice President of Global Finance and Chief Financial Officer at RBC Ministries (publishing company) (2013-Present); formerly, Executive Vice President and Chief Financial Officer, Zondervan Publishing (a division of Harper Collins/NewsCorp) (2007-2012); Senior Vice President and Group Controller (2005-2006), Senior Vice President and Chief Financial Officer (2003-2004), Chief Financial Officer (2001-2003), Vice President, Finance and Controller (1999-2001) and Assistant Controller (1997-1999), divisions of The Thomson Corporation (information services provider). | | 126 | | None |
| | | | | |
Donald H. Wilson—1959
c/o Invesco PowerShares Capital Management LLC
3500 Lacey Road,
Suite 700
Downers Grove, IL 60515 | | Chairman of the Board and Trustee | | Chairman since 2012; Trustee since 2007 | | Chairman and Chief Executive Officer, Stone Pillar Advisors, Ltd. (2010-Present); formerly, Chairman, President and Chief Executive Officer, Community Financial Shares, Inc. and Community Bank—Wheaton/Glen Ellyn (subsidiary) (2013-2015); Chief Operating Officer, AMCORE Financial, Inc. (bank holding company) (2007-2009); Executive Vice President and Chief Financial Officer, AMCORE Financial, Inc. (2006-2007); Senior Vice President and Treasurer, Marshall & Ilsley Corp. (bank holding company) (1995-2006). | | 126 | | None |
The Unaffiliated Trustees, their term of office and length of time served, their principal business occupations during the past five years, the number of portfolios in the Fund Complex overseen by the Unaffiliated Trustees and the other directorships, if any, held by such Trustees are shown below.
| | | | | | | | | | |
Philip M. Nussbaum—1961
c/o Invesco PowerShares Capital Management LLC 3500 Lacey Road,
Suite 700
Downers Grove, IL 60515 | | Trustee*** | | Since 2007 | | Chairman, Performance Trust Capital Partners (2004-Present). | | 126 | | None |
| * | This is the date the Independent Trustee began serving the Trust. He serves an indefinite term, until his successor is elected. |
| ** | Fund Complex includes all open-end funds (including all of their portfolios) advised by the Adviser. At October 31, 2016, the “Fund Family” consisted of the Trust’s 67 portfolios and four other exchange-traded fund trusts with 59 portfolios advised by the Adviser. |
| *** | Effective February 25, 2016, Mr. Nussbaum became an Unaffiliated Trustee. |
Trustees and Officers (continued)
The Non-Independent Trustees and the executive officers of the Trust, their term of office and length of time served, their principal business occupations during the past five years, the number of portfolios in the Fund Complex overseen by the Non-Independent Trustees and the other directorships, if any, held by the Trustees are shown below.
| | | | | | | | | | |
Name, Address and Year of Birth
of Non-Independent Trustees | | Position(s)
Held
with Trust | | Term of
Office
and
Length of
Time
Served* | | Principal
Occupation(s) During
Past 5 Years | | Number of
Portfolios
in Fund
Complex**
Overseen by
Non-Independent
Trustees | | Other
Directorships
Held by
Non-Independent
Trustees During
the Past 5 Years |
Kevin M. Carome—1956 Invesco Ltd.
Two Peachtree Pointe, 1555 Peachtree St., N.E., Suite 1800 Atlanta, GA 30309 | | Trustee | | Since 2010 | | Senior Managing Director, Secretary and General Counsel, Invesco Ltd. (2007-Present); Director, Invesco Advisers, Inc. (2009-Present); Director, Invesco Finance PLC, and Invesco Holding Company Limited; Director and Executive Vice President, Invesco Holding Company (US), Inc., Invesco Finance, Inc., Invesco Group Services, Inc., Invesco North American Holdings, Inc., and INVESCO Asset Management (Bermuda) Ltd.; Executive Vice President, Invesco Investments (Bermuda) Ltd., Manager, Horizon Flight Works LLC; Director and Secretary, Invesco Services (Bahamas) Private Limited; formerly, Director and Chairman, INVESCO Funds Group, Inc., Senior Vice President, Secretary and General Counsel, Invesco Advisers, Inc. (2003-2006); Director, Invesco Investments (Bermuda) Ltd. (2008-2016); Senior Vice President and General Counsel, Liberty Financial Companies, Inc. (2000-2001); General Counsel of certain investment management subsidiaries of Liberty Financial Companies, Inc. (1998-2000); Associate General Counsel, Liberty Financial Companies, Inc. (1993-1998); Associate, Ropes & Gray LLP. | | 126 | | None |
| * | This is the period for which the Officers began serving the Trust. Each Officer serves an indefinite term, until his or her successor is elected. |
| ** | Fund Complex includes all open-end funds (including all of their portfolios) advised by the Adviser. At October 31, 2016, the “Fund Family” consisted of the Trust’s 67 portfolios and four other exchange-traded fund trusts with 59 portfolios advised by the Adviser. |
Trustees and Officers (continued)
| | | | | | |
Name, Address and Year of Birth
of Executive Officers | | Position(s)
Held
with Trust | | Length of
Time
Served* | | Principal
Occupation(s) During
Past 5 Years |
Daniel E. Draper—1968
Invesco PowerShares Capital Management LLC 3500 Lacey Road, Suite 700 Downers Grove, IL 60515 | | President and Principal Executive Officer | | Since 2015 | | President and Principal Executive Officer, PowerShares Exchange-Traded Fund Trust, PowerShares Exchange-Traded Fund Trust II, PowerShares India Exchange-Traded Fund Trust, PowerShares Actively Managed Exchange-Traded Fund Trust and PowerShares Actively Managed Exchange-Traded Commodity Fund Trust (2015-Present); Chief Executive Officer and Principal Executive Officer (2016-Present) and Managing Director (2013-Present), Invesco PowerShares Capital Management LLC; Senior Vice President, Invesco Distributors, Inc. (2014-Present); formerly, Vice President, PowerShares Exchange-Traded Fund Trust, PowerShares Exchange-Traded Fund Trust II, PowerShares India Exchange-Traded Fund Trust, PowerShares Actively Managed Exchange-Traded Fund Trust (2013-2015) and PowerShares Actively Managed Exchange-Traded Commodity Fund Trust (2014-2015); Managing Director, Credit Suisse Asset Management (2010-2013) and Lyxor Asset Management/Societe Generale (2007-2010). |
| | | |
Steven M. Hill—1964
Invesco PowerShares
Capital Management LLC 3500 Lacey Road, Suite 700 Downers Grove, IL 60515 | | Vice President and Treasurer | | Since 2013 | | Vice President and Treasurer, PowerShares Exchange-Traded Fund Trust, PowerShares Exchange-Traded Fund Trust II, PowerShares India Exchange-Traded Fund Trust, PowerShares Actively Managed Exchange-Traded Fund Trust (2013-Present) and PowerShares Actively Managed Exchange-Traded Commodity Fund Trust (2014-Present); Head of Global ETF Administration, Invesco PowerShares Capital Management LLC (2011-Present); Principal Financial and Accounting Officer —Investment Pools, Invesco PowerShares Capital Management LLC (2015-Present); formerly, Senior Managing Director and Chief Financial Officer, Destra Capital Management LLC and its subsidiaries (2010-2011); Chief Financial Officer, Destra Investment Trust and Destra Investment Trust II (2010-2011); Senior Managing Director, Claymore Securities, Inc. (2003-2010); and Chief Financial Officer, Claymore sponsored mutual funds (2003-2010). |
| | | |
Peter Hubbard���1981
Invesco PowerShares Capital Management LLC 3500 Lacey Road, Suite 700 Downers Grove, IL 60515 | | Vice President | | Since 2009 | | Vice President, PowerShares Exchange-Traded Fund Trust, PowerShares Exchange-Traded Fund Trust II, PowerShares India Exchange-Traded Fund Trust, PowerShares Actively Managed Exchange-Traded Fund Trust (2009-Present) and PowerShares Actively Managed Exchange-Traded Commodity Fund Trust (2014-Present); Vice President and Director of Portfolio Management, Invesco PowerShares Capital Management LLC (2010-Present); formerly, Vice President of Portfolio Management, Invesco PowerShares Capital Management LLC (2008-2010); Portfolio Manager, Invesco PowerShares Capital Management LLC (2007-2008); Research Analyst, Invesco PowerShares Capital Management LLC (2005-2007); Research Analyst and Trader, Ritchie Capital, a hedge fund operator (2003-2005). |
| | | |
Christopher Joe—1969 Invesco PowerShares Capital Management LLC 11 Greenway Plaza, Suite 1000 Houston, TX 77046-1173 | | Chief Compliance Officer | | Since 2012 | | Chief Compliance Officer of Invesco PowerShares Capital Management LLC (2015-Present); Chief Compliance Officer of PowerShares Exchange-Traded Fund Trust, PowerShares Exchange-Traded Fund Trust II, PowerShares India Exchange-Traded Fund Trust, PowerShares Actively Managed Exchange-Traded Fund Trust (2012-Present) and PowerShares Actively Managed Exchange-Traded Commodity Fund Trust (2014-Present); formerly, Chief Compliance Officer, Invesco Investment Advisers, LLC (registered investment adviser) (2010–2013), U.S. Compliance Director, Invesco, Ltd. (2006-2014) and Deputy Chief Compliance Officer of Invesco Advisers, Inc. (2014-2015). |
| * | This is the period for which the Officers began serving the Trust. Each Officer serves an indefinite term, until his or her successor is elected. |
Trustees and Officers (continued)
| | | | | | |
Name, Address and Year of Birth
of Executive Officers | | Position(s)
Held
with Trust | | Length of
Time
Served* | | Principal
Occupation(s) During
Past 5 Years |
Sheri Morris—1964 Invesco Management Group, Inc. 11 Greenway Plaza, Suite 1000
Houston, TX 77046 | | Vice President | | Since 2012 | | President and Principal Executive Officer, The Invesco Funds (2016-Present); Treasurer, The Invesco Funds (2008-Present); Vice President, Invesco Advisers, Inc. (formerly known as Invesco Institutional (N.A.), Inc.) (registered investment adviser) (2009-Present) and Vice President, PowerShares Exchange-Traded Fund Trust, PowerShares Exchange-Traded Fund Trust II, PowerShares India Exchange-Traded Fund Trust, PowerShares Actively Managed Exchange-Traded Fund Trust (2012-Present) and PowerShares Actively Managed Exchange-Traded Commodity Fund Trust (2014-Present); formerly, Vice President and Principal Financial Officer, The Invesco Funds (2008-2016); Treasurer, PowerShares Exchange-Traded Fund Trust, PowerShares Exchange-Traded Fund Trust II, PowerShares India Exchange-Traded Fund Trust and PowerShares Actively Managed Exchange-Traded Fund Trust (2011-2013); Vice President, Invesco Aim Advisers, Inc., Invesco Aim Capital Management, Inc. and Invesco Aim Private Asset Management, Inc.; Assistant Vice President and Assistant Treasurer, The Invesco Funds and Assistant Vice President, Invesco Advisers, Inc., Invesco Aim Capital Management, Inc. and Invesco Aim Private Asset Management, Inc. |
| | | |
Anna Paglia—1974
Invesco PowerShares
Capital Management LLC 3500 Lacey Road,
Suite 700
Downers Grove, IL 60515 | | Secretary | | Since 2011 | | Secretary, PowerShares Exchange-Traded Fund Trust, PowerShares Exchange-Traded Fund Trust II, PowerShares India Exchange-Traded Fund Trust, PowerShares Actively Managed Exchange-Traded Fund Trust (2011-Present) and PowerShares Actively Managed Exchange-Traded Commodity Fund Trust (2014-Present); Head of Legal (2010-Present) and Secretary (2015-Present), Invesco PowerShares Capital Management LLC (2010-Present); formerly, Partner, K&L Gates LLP (formerly, Bell Boyd & Lloyd LLP) (2007-2010); Associate Counsel at Barclays Global Investors Ltd. (2004-2006). |
| | | |
Rudolf E. Reitmann—1971 Invesco PowerShares Capital Management LLC 3500 Lacey Road, Suite 700 Downers Grove, IL 60515 | | Vice President | | Since 2013 | | Vice President, PowerShares Exchange-Traded Fund Trust, PowerShares Exchange-Traded Fund Trust II, PowerShares India Exchange-Traded Fund Trust, PowerShares Actively Managed Exchange-Traded Fund Trust (2013-Present) and PowerShares Actively Managed Exchange-Traded Commodity Fund Trust (2014-Present); Head of Global Exchange Traded Funds Services, Invesco PowerShares Capital Management LLC (2013-Present). |
| | | |
David Warren—1957 Invesco Canada Ltd. 5140 Yonge Street, Suite 800 Toronto, Ontario M2N 6X7 | | Vice President | | Since 2009 | | Vice President, PowerShares Exchange-Traded Fund Trust, PowerShares Exchange-Traded Fund Trust II, PowerShares India Exchange-Traded Fund Trust, and PowerShares Actively Managed Exchange-Traded Fund Trust (2009-Present) and PowerShares Actively Managed Exchange-Traded Commodity Fund Trust (2014-Present); Managing Director—Chief Administrative Officer, Americas, Invesco PowerShares Capital Management LLC; Senior Vice President, Invesco Advisers, Inc. (2009-Present); Director, Invesco Inc. (2009-Present); Senior Vice President, Invesco Management Group, Inc. (2007-Present); Director, Executive Vice President and Chief Financial Officer, Invesco Canada Ltd. (formerly, Invesco Trimark Ltd.); Chief Administrative Officer, North American Retail, Invesco Ltd. (2007-Present); Director, Invesco Corporate Class Inc. (2014-Present); Director, Invesco Global Direct Real Estate Feeder GP Ltd. (2015-Present); Director, Invesco Canada Holdings Inc. (2002-Present); Director, Invesco Financial Services Ltd. / Services Financiers Invesco Ltée and Trimark Investments Ltd./Placements Trimark Ltée (2014-Present); Director, Invesco IP Holdings (Canada) Ltd. (2016-Present); Director, Invesco Global Direct Real Estate GP Ltd. (2015-Present); formerly, Executive Vice President and Chief Financial Officer, Invesco Inc. (2009-2015); Director, Executive Vice President and Chief Financial Officer, Invesco Canada Ltd. (formerly, Invesco Trimark Ltd.) (2000-2011). |
| * | This is the period for which the Officers began serving the Trust. Each Officer serves an indefinite term, until his or her successor is elected. |
Trustees and Officers (continued)
Availability of Additional Information About the Trustees
The Statement of Additional Information includes additional information about the Trustees and is available, without charge, upon request at (800) 983-0903.
(This Page Intentionally Left Blank)
Proxy Voting Policies and Procedures
A description of the Trust’s proxy voting policies and procedures that the Funds use to determine how to vote proxies relating to portfolio securities is available, without charge and upon request, by calling (800) 983-0903. This information is also available on the Securities and Exchange Commission’s (the “Commission”) website at www.sec.gov.
Information regarding how each Fund voted proxies for portfolio securities, if applicable, during the most recent 12-month period ended June 30, is available, without charge and upon request, by (i) calling (800) 983-0903; or (ii) accessing the Trust’s Form N-PX on the Commission’s website at www.sec.gov.
Quarterly Portfolios
The Trust files its complete schedule of portfolio holdings for the Funds with the Commission for the first and third quarters of each fiscal year on Form N-Q. The Form N-Qs will be available on the Commission’s website at www.sec.gov. The Trust’s Form N-Qs may also be reviewed and copied at the Commission’s Public Reference Room in Washington, D.C. Information on the operation of the Public Reference Room may be obtained by calling (800) SEC-0330.
Frequency Distribution of Discounts and Premiums
A table showing the number of days the market price of each Fund’s shares was greater than the Fund’s net asset value, and the number of days it was less than the Fund’s net assets value (i.e., premium or discount) for the most recently completed calendar year, and the calendar quarters since that year end (or the life of the Fund, if shorter) may be found at the Fund’s website at www.invescopowershares.com.
| | | | | | |
| P-KBW-AR-1 | |  |
©2016 Invesco PowerShares Capital Management LLC 3500 Lacey Road, Suite 700 Downers Grove, IL 60515 | |
| powershares.com 800 983 0903 | |  | | @PowerShares | |

2016 Annual Report to Shareholders
| | |
| |
| BKLN | | PowerShares Senior Loan Portfolio |
Table of Contents
The Market Environment
Bank Loans
During the fiscal year covered by this report, the senior loan market was characterized by weakness in the latter part of 2015 and a strong reversal mid-way through the first quarter of 2016. During late 2015, negative sentiment in the broader capital markets that was brought on by uncertainty surrounding China’s economy, slower global growth prospects, and volatility in commodity-related sectors seeped into the loan asset class. Senior secured loan’s volatility was relatively muted versus other risk asset classes due to their relatively low exposure to commodities as well as their defensive position at the top of the capital structure. The tone of the market improved in the second half of February and positive momentum continued to build through the end of October as macroeconomic indicators improved, commodity prices stabilized and technical factors strengthened. The loan index delivered positive monthly performance for 8 consecutive months following February, driven by a combination of the strong current income as well as price appreciation.1
Fundamentals remained supportive with a trailing 12-month default rate of 1.95% as of October 31, 2016.1 Slow but positive growth in the US economy should continue to support fundamentals with defaults relatively isolated to a few “pockets of weakness”—primarily in commodity related sectors.
Stable fundamentals combined with strong technicals pushed senior secured loan prices higher as demand outstripped supply in the second half of the fiscal year. Demand from institutional accounts was robust as longer-term investors continued to view senior loans as a strategic allocation due to their defensive nature, relatively high coupon and diversification benefits. Collateralized loan obligation (CLO) issuance started the year slowly but gathered momentum—totaling $67 billion during the fiscal year.2 Flows from retail mutual funds were largely negative for the fiscal year, but experienced a shift in momentum in the last few months—with 13 consecutive weeks of inflows totaling $3.7 billion over that period. Despite the turnaround, net outflows from retail accounts totaled -$15.7 billion over the trailing 12 months. Steady demand from institutional buyers was met with limited net new issuance, leading issuers to opportunistically refinance and re-price transactions in an effort to extend maturities and reduce interest expense.
Loans continued to be well positioned for the current economic and rate environment, providing investors with a relatively high level of current income with protection from rising rates due to their floating rate structure.
Fixed Income
The fiscal year began amid heightened global financial market volatility triggered by a significant summer sell-off in Chinese equities caused by economic growth concerns and uncertainty over the country’s monetary and fiscal policy response. The 10-year
US Treasury yield mirrored this volatility as lower oil prices began to threaten the solvency of several US energy companies. In January 2016, the confluence of these factors produced a “perfect storm” that roiled global financial markets. This caused Treasury prices to rise as Treasury bonds played their traditional role of buffering risk-asset volatility such as that of equities. Riskier asset classes posted significant losses.
The US Federal Reserve (the Fed) went ahead with its first interest rate hike in nearly a decade in December 2015, lifting the federal funds rate, the rate that banks lend to each other overnight, from a range of zero to 0.25% to a range of 0.25% to 0.50%.3 Realizing the systemic risks from the fallout of financial markets and the subsequent financial tightening which could significantly hamper economic growth and overall economic health, global central banks quickly acted to provide liquidity and more accommodative monetary policy measures to help spur growth. The Bank of Japan (BOJ) and the European Central Bank (ECB) adopted negative interest rates in an attempt to stimulate growth by forcing investors to spend rather than save. These actions along with the stabilization in oil prices, calmed markets and induced a significant rally across most risk assets. This rally more than offset the losses posted at the beginning of the year and carried through to the end of the reporting period.
Geopolitics, including the decision by UK voters to leave the European Union, did its part to reignite volatility. However, it was short-lived as central banks remained committed to keeping financial markets functioning and to promote economic growth. This had the effect of driving the 10-year US Treasury yield to an all-time low of 1.37%.3 The 10-year US Treasury yield ended the reporting period at 1.83%, 33 basis points lower than at the beginning of the fiscal year.3
For the reporting period, the broader bond market posted gains largely attributable to the decline in US Treasury yields and global government bond yields. All fixed income sectors (Treasuries, global government bonds, corporate, and securitized) posted positive returns for the fiscal year. Riskier fixed income sectors, such as high yield and emerging market (EM) debt, notched strong gains despite concerns over global growth, volatile commodity prices and the possibility of Fed interest rate hikes.
| 1 | S&P LSTA Index as of 10/31/2016 |
| 2 | S&P LCD as of 10/31/2016 |
| 3 | Source: US Federal Reserve |
| | |
| BKLN | | Manager’s Analysis |
| | PowerShares Senior Loan Portfolio (BKLN) |
As an index fund, the PowerShares Senior Loan Portfolio (the “Fund”) is passively managed and attempts to track the returns of an underlying index. The Fund seeks investment results that generally correspond (before fees and expenses) to the price and yield of the S&P/LSTA U.S. Leveraged Loan 100 Index (the “Index”). The Fund generally will invest at least 80% of its net assets (plus any borrowings for investment purposes) in senior loans that comprise the Index. The Fund’s adviser, Invesco PowerShares Capital Management LLC (the “Adviser”) and the Fund’s sub-adviser, Invesco Senior Secured Management, Inc., define senior loans to include loans referred to as leveraged loans, bank loans and/or floating rate loans. Banks and other lending institutions generally issue senior loans to corporations, partnerships or other entities (“borrowers”). These borrowers operate in a variety of industries and geographic regions, including foreign countries.
S&P Dow Jones Indices LLC (the “Index Provider”) compiles, maintains and calculates the Index, which tracks the market-weighted performance of the largest institutional leveraged loans based on market weightings, spreads and interest payments. A leveraged loan is rated below investment grade quality or is unrated but deemed to be of comparable quality. The Fund will invest in loans that are expected to be below investment grade quality and to bear interest at a floating rate that periodically resets. The Index may include, and the Fund may acquire and retain, loans of borrowers that have filed for bankruptcy protection. The Fund does not purchase all of the securities in the Index; instead, the Fund utilizes a “sampling” methodology to seek to achieve its investment objective.
For the fiscal year ended October 31, 2016, on a market price basis, the Fund returned 5.64%. On a net asset value (“NAV”) basis, the Fund returned 5.27%. During the same time period, the Index returned 6.80%. The Fund’s performance differed from the return of the Index primarily due to differences in holdings in defaulted names as they neared emergence from bankruptcy. Specifically, positions in TXU and Arch Coal detracted from performance as it proved difficult to time the emergence from bankruptcy and exit the positions from the Fund’s portfolio compared to their removal from the Index. Additionally, the performance of the Fund differed from the Index due to the Fund’s cash balance that has been set aside as a liquidity tool. While those were the two largest drivers of return differential, other factors include the bid/ask spread from portfolio rebalancing and fees and operating expenses incurred by the Fund during the period.
During this same time period, the Bloomberg Barclays U.S. Aggregate Index (the “Benchmark Index”) returned 4.37%. The Benchmark Index is an unmanaged index weighted by market capitalization based on the average performance of approximately 9,980 securities. The adviser provided this additional comparative benchmark to help investors better understand how the investment results of the Fund compare to the performance of a
benchmark representative of the U.S investment-grade, fixed-rate bond market. The majority of the Fund’s outperformance relative to the Benchmark Index during the period can be attributed to the Fund’s concentration in the bank loan sector in general, coupled with the Benchmark Index’s investment grade focus versus the Fund’s below investment grade focus.
For the fiscal year ended October 31, 2016, the lodging industry contributed most significantly to the Fund’s return, followed by the pharmaceuticals and insurance industries. The oil & gas industry detracted most significantly from the Fund’s return, followed by the environmental controls industry.
Positions that contributed most significantly to the Fund’s return included Fortescue Metals Group Ltd., Series Term Loan (Australia), a mining company (portfolio average weight of 1.54%), and Harrah’s Operating Co., Inc., Series Term Loan B6, a lodging company (portfolio average weight of 0.90%). Positions that detracted most significantly from the Fund’s return included Cumulus Media Holdings, Inc., Series Term Loan, a media company (portfolio average weight of 0.51%), and Fieldwood Energy LLC, an oil & gas company (no longer held at fiscal year-end).
| | | | |
Credit Quality Rating Breakdown* (% of the Fund’s Net Assets)
as of October 31, 2016 | |
| Baa2 | | | 1.4 | |
| Baa3 | | | 4.4 | |
| Ba1 | | | 17.5 | |
| Ba2 | | | 11.7 | |
| Ba3 | | | 18.6 | |
| B1 | | | 20.9 | |
| B2 | | | 9.5 | |
| B3 | | | 3.0 | |
| Caa1 | | | 2.4 | |
| Caa2 | | | 0.9 | |
| Not Rated | | | 1.9 | |
| Money Market Fund Plus Other Assets Less Liabilities | | | 7.8 | |
| * | Source: Moody’s. A credit rating is an assessment provided by a nationally recognized statistical rating organization (NRSRO) of the creditworthiness of an issuer with respect to debt obligations, including specific securities, money market instruments or other debts. Ratings are measured on a scale that generally ranges from Aaa (highest) to C (lowest); ratings are subject to change without notice. “Non-Rated” indicates the debtor was not rated, and should not be interpreted as indicating low quality. For more information on Moody’s rating methodology, please visit moodys.com and select “Rating Methodologies” under Research and Ratings on the homepage. |
PowerShares Senior Loan Portfolio (BKLN) (continued)
| | | | |
Top Ten Fund Holdings* (% of the Fund’s Net Assets)
as of October 31, 2016 | |
| Security | | | | |
| Avago Technologies Cayman Finance Ltd., Term Loan B3, 3.535%, 02/01/2023 | | | 2.2 | |
| New Red Finance, Inc., Term Loan B2, 3.750%, 12/10/2021 | | | 1.9 | |
| Energy Future Intermediate Holding Co. LLC, DIP Term Loan, 4.250%, 06/30/2017 | | | 1.8 | |
| Western Digital Corp., Term Loan A, 2.535%, 04/29/2021 | | | 1.7 | |
| PetSmart, Inc., Term Loan B2, 4.000%, 03/11/2022 | | | 1.6 | |
| Valeant Pharmaceuticals International, Inc., Series F-1 Term Loan B, 5.500%, 04/01/2022 | | | 1.6 | |
| Dell International LLC, Term Loan B, 4.000%, 09/07/2023 | | | 1.4 | |
| RPI Finance Trust, Term Loan B5, 3.168%, 10/14/2022 | | | 1.4 | |
| DaVita HealthCare Partners, Inc., Term Loan B, 3.500%, 06/24/2021 | | | 1.4 | |
| Grifols Worldwide Operations USA, Inc., Term Loan B, 3.456%, 02/27/2021 | | | 1.3 | |
| Total | | | 16.3 | |
| * | Excluding money market fund holdings. |
Growth of a $10,000 Investment Since Inception†
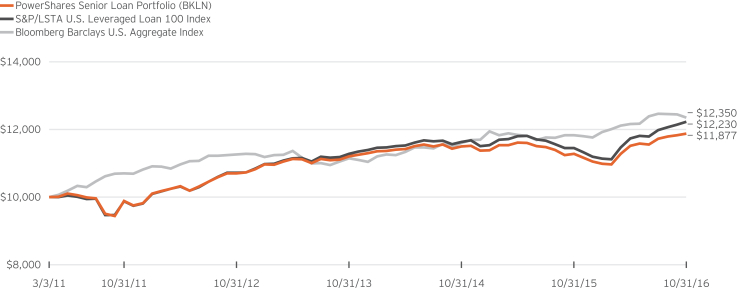
Fund Performance History as of October 31, 2016
| | | | | | | | | | | | | | | | | | | | | | | | | | | | | | | | |
| | | 1 Year | | | 3 Years
Average
Annualized | | | 3 Years
Cumulative | | | 5 Years
Average
Annualized | | | 5 Years
Cumulative | | | | | | Fund Inception† | |
| Index | | | | | | | | | | Average
Annualized | | | Cumulative | |
| S&P/LSTA U.S. Leveraged Loan 100 Index | | | 6.80 | % | | | 2.71 | % | | | 8.36 | % | | | 4.35 | % | | | 23.75 | % | | | | | | | 3.62 | % | | | 22.30 | % |
| Bloomberg Barclays U.S. Aggregate Index | | | 4.37 | | | | 3.48 | | | | 10.81 | | | | 2.90 | | | | 15.37 | | | | | | | | 3.80 | | | | 23.50 | |
| Fund | | | | | | | | | | | | | | | | | | | | | | | | | | | | | | | | |
| NAV Return | | | 5.27 | | | | 1.96 | | | | 6.00 | | | | 3.74 | | | | 20.17 | | | | | | | | 3.08 | | | | 18.77 | |
| Market Price Return | | | 5.64 | | | | 1.94 | | | | 5.95 | | | | 3.79 | | | | 20.45 | | | | | | | | 3.00 | | | | 18.22 | |
PowerShares Senior Loan Portfolio (BKLN) (continued)
Fund Inception: March 3, 2011
Performance quoted above represents past performance. Past performance is not a guarantee of future results and current performance may be higher or lower than performance quoted. Investment returns and principal value will fluctuate, and shares of the Fund (“Fund Shares”), when redeemed or sold, may be worth more or less than their original cost. Fund performance reflects any applicable fee waivers and/or expense reimbursements. Had the adviser not waived fees and/or reimbursed expenses currently or in the past, returns would have been lower. See current prospectus for more information. According to the Fund’s current prospectus, the Fund’s expense ratio of 0.65% is expressed as a unitary management fee to cover operating expenses and expenses incurred in connection with managing the portfolio. NAV and Market Price returns assume that dividends and capital gain distributions have been reinvested in the Fund at NAV and Market Price, respectively. The returns shown in the table above do not
reflect the deduction of taxes that a shareholder would pay on Fund distributions or the redemption or sale of Fund Shares. See invescopowershares.com to find the most recent month-end performance numbers.
Index and Benchmark Index performance results are based upon a hypothetical investment in their respective constituent securities. Index and Benchmark Index returns do not represent Fund returns. An investor cannot invest directly in an index. The Index and Benchmark Index do not charge management fees or brokerage expenses, and no such fees or expenses were deducted from the hypothetical performance shown. In addition, the results actual investors might have achieved would have differed from those shown because of differences in the timing, amounts of their investments, and fees and expenses associated with an investment in the Fund.
| † | Fund, Index and Benchmark Index returns are based on the inception date of the Fund. |
Schedule of Investments
PowerShares Senior Loan Portfolio (BKLN)
October 31, 2016
| | | | | | | | | | | | | | | | |
Principal
Amount | | | | | Interest
Rate | | | Maturity
Date | | | Value | |
| | | | Variable Rate Senior Loan Interests—88.5%(a)(b) | | | | | | | | | | | | |
| | | | Advertising—2.1% | | | | | | | | | | | | |
| $ | 48,540,611 | | | Acosta, Inc., Term Loan B1 | | | 4.250 | % | | | 09/26/2021 | | | $ | 46,865,960 | |
| | 43,516,488 | | | Getty Images, Inc., Term Loan | | | 4.750 | | | | 10/18/2019 | | | | 37,084,316 | |
| | 53,681,970 | | | Karman Buyer Corp., Term Loan | | | 4.250 | | | | 07/25/2021 | | | | 53,234,531 | |
| | | | | | | | | | | | | | | | |
| | | | | | | | | | | | | | | 137,184,807 | |
| | | | | | | | | | | | | | | | |
| | | | Aerospace/Defense—0.9% | | | | | | | | | | | | |
| | 49,910,869 | | | BE Aerospace, Inc., Term Loan | | | 3.860 | | | | 12/16/2021 | | | | 50,316,644 | |
| | 10,197,534 | | | TransDigm, Inc., Term Loan C | | | 3.820 | | | | 02/28/2020 | | | | 10,207,629 | |
| | | | | | | | | | | | | | | | |
| | | | | | | | | | | | | | | 60,524,273 | |
| | | | | | | | | | | | | | | | |
| | | | Airlines—0.7% | | | | | | | | | | | | |
| | 42,843,887 | | | American Airlines, Inc., Term Loan | | | 3.250 | | | | 06/27/2020 | | | | 42,955,923 | |
| | | | | | | | | | | | | | | | |
| | | | Auto Manufacturers—0.7% | | | | | | | | | | | | |
| | 42,891,400 | | | FCA US LLC, Term Loan | | | 3.500 | | | | 05/24/2017 | | | | 42,988,763 | |
| | | | | | | | | | | | | | | | |
| | | | Auto Parts & Equipment—0.7% | | | | | | | | | | | | |
| | 3,000,000 | | | Allison Transmission, Inc., Extended Term Loan | | | 3.250 | | | | 09/23/2022 | | | | 3,026,430 | |
| | 43,637,121 | | | Federal-Mogul Holdings Corp., Term Loan C | | | 4.750 | | | | 04/15/2021 | | | | 42,429,245 | |
| | | | | | | | | | | | | | | | |
| | | | | | | | | | | | | | | 45,455,675 | |
| | | | | | | | | | | | | | | | |
| | | | Beverages—1.8% | | | | | | | | | | | | |
| | | | Keurig Green Mountain, Inc. | | | | | | | | | | | | |
| | 76,215,208 | | | Term Loan A | | | 2.313 | | | | 03/03/2021 | | | | 75,167,249 | |
| | 43,543,166 | | | Term Loan B | | | 5.250 | | | | 03/03/2023 | | | | 44,207,199 | |
| | | | | | | | | | | | | | | | |
| | | | | | | | | | | | | | | 119,374,448 | |
| | | | | | | | | | | | | | | | |
| | | | Chemicals—0.8% | | | | | | | | | | | | |
| | 49,794,771 | | | Axalta Coating Systems Dutch Holding B.V., Term Loan B | | | 3.750 | | | | 02/01/2020 | | | | 50,238,940 | |
| | | | | | | | | | | | | | | | |
| | | | Commercial Services—4.6% | | | | | | | | | | | | |
| | 22,635,518 | | | Laureate Education, Inc., Term Loan | | | 8.868 | | | | 03/17/2021 | | | | 22,502,535 | |
| | 70,175,142 | | | Pharmaceutical Product Development, Inc., Term Loan | | | 4.250 | | | | 08/18/2022 | | | | 70,187,423 | |
| | 52,259,063 | | | Prime Security Services Borrower LLC, Term Loan B1 | | | 4.750 | | | | 05/02/2022 | | | | 52,725,474 | |
| | 57,636,162 | | | ServiceMaster Co. (The), Term Loan | | | 4.250 | | | | 07/01/2021 | | | | 57,840,482 | |
| | 55,866,794 | | | Trans Union LLC, Term Loan B2 | | | 3.500 | | | | 04/09/2021 | | | | 56,111,211 | |
| | 50,966,752 | | | Weight Watchers International, Inc., Term Loan B2 | | | 4.070 | | | | 04/02/2020 | | | | 38,951,340 | |
| | | | | | | | | | | | | | | | |
| | | | | | | | | | | | | | | 298,318,465 | |
| | | | | | | | | | | | | | | | |
| | | | Computers—2.9% | | | | | | | | | | | | |
| | | | Western Digital Corp. | | | | | | | | | | | | |
| | 108,178,585 | | | Term Loan A | | | 2.535 | | | | 04/29/2021 | | | | 107,367,787 | |
| | 80,832,500 | | | Term Loan B1 | | | 4.500 | | | | 04/29/2023 | | | | 81,849,777 | |
| | | | | | | | | | | | | | | | |
| | | | | | | | | | | | | | | 189,217,564 | |
| | | | | | | | | | | | | | | | |
| | | | Distribution/Wholesale—0.9% | | | | | | | | | | | | |
| | 55,115,646 | | | Univar, Inc., Term Loan | | | 4.250 | | | | 07/01/2022 | | | | 55,276,308 | |
| | | | | | | | | | | | | | | | |
| | | | Electric—2.0% | | | | | | | | | | | | |
| | 117,454,579 | | | Energy Future Intermediate Holding Co. LLC, DIP Term Loan | | | 4.250 | | | | 06/30/2017 | | | | 118,262,667 | |
| | 9,476,250 | | | NRG Energy, Inc., Term Loan | | | 3.500 | | | | 06/30/2023 | | | | 9,505,863 | |
| | | | | | | | | | | | | | | | |
| | | | | | | | | | | | | | | 127,768,530 | |
| | | | | | | | | | | | | | | | |
| | | | Entertainment—4.8% | | | | | | | | | | | | |
| | 75,495,004 | | | Alpha Topco Ltd., Term Loan B3 (United Kingdom) | | | 4.750 | | | | 07/30/2021 | | | | 75,757,350 | |
| | 55,488,262 | | | Amaya (US) Co-Borrower LLC, Term Loan B (Canada) | | | 5.000 | | | | 08/01/2021 | | | | 55,557,622 | |
| | 12,411,465 | | | Lions Gate Entertainment Corp., Term Loan B | | | 3.750 | | | | 10/13/2023 | | | | 12,424,373 | |
| | | | Scientific Games International, Inc. | | | | | | | | | | | | |
| | 68,127,630 | | | Term Loan | | | 6.000 | | | | 10/18/2020 | | | | 68,596,008 | |
| | 39,462,799 | | | Term Loan B2 | | | 6.000 | | | | 10/01/2021 | | | | 39,684,777 | |
See accompanying Notes to Financial Statements which are an integral part of the financial statements.
PowerShares Senior Loan Portfolio (BKLN) (continued)
October 31, 2016
| | | | | | | | | | | | | | | | |
Principal
Amount | | | | | Interest
Rate | | | Maturity
Date | | | Value | |
| | | | Variable Rate Senior Loan Interests (continued) | | | | | | | | | | | | |
| | | | Entertainment (continued) | | | | | | | | | | | | |
| $ | 55,002,439 | | | William Morris Endeavor Entertainment LLC, Term Loan | | | 5.250 | % | | | 05/06/2021 | | | $ | 55,401,206 | |
| | | | | | | | | | | | | | | | |
| | | | | | | | | | | | | | | 307,421,336 | |
| | | | | | | | | | | | | | | | |
| | | | Food—2.5% | | | | | | | | | | | | |
| | | | Albertson’s LLC | | | | | | | | | | | | |
| | 68,857,086 | | | Term Loan B4 | | | 4.500 | | | | 08/25/2021 | | | | 69,454,765 | |
| | 29,728,237 | | | Term Loan B6 | | | 4.750 | | | | 06/22/2023 | | | | 30,085,422 | |
| | 58,871,250 | | | US Foods, Inc., Term Loan | | | 4.000 | | | | 06/27/2023 | | | | 59,312,785 | |
| | | | | | | | | | | | | | | | |
| | | | | | | | | | | | | | | 158,852,972 | |
| | | | | | | | | | | | | | | | |
| | | | Food Service—0.9% | | | | | | | | | | | | |
| | 58,160,753 | | | Aramark Corp., Term Loan F | | | 3.338 | | | | 02/24/2021 | | | | 58,571,077 | |
| | | | | | | | | | | | | | | | |
| | | | Healthcare-Products—1.4% | | | | | | | | | | | | |
| | 41,333,622 | | | Kinetic Concepts, Inc., Term Loan F1 | | | 5.000 | | | | 11/04/2020 | | | | 41,714,718 | |
| | 51,254,211 | | | Ortho-Clinical Diagnostics, Inc., Term Loan | | | 4.750 | | | | 06/30/2021 | | | | 50,212,981 | |
| | | | | | | | | | | | | | | | |
| | | | | | | | | | | | | | | 91,927,699 | |
| | | | | | | | | | | | | | | | |
| | | | Healthcare-Services—4.4% | | | | | | | | | | | | |
| | 74,254,269 | | | CHS/Community Health Systems, Inc., Term Loan H | | | 4.000 | | | | 01/27/2021 | | | | 70,365,201 | |
| | 88,228,505 | | | DaVita HealthCare Partners, Inc., Term Loan B | | | 3.500 | | | | 06/24/2021 | | | | 88,393,934 | |
| | 85,342,482 | | | MPH Acquisition Holdings LLC, Term Loan B | | | 5.000 | | | | 06/07/2023 | | | | 86,389,208 | |
| | 37,864,523 | | | U.S. Renal Care, Inc., Term Loan | | | 5.250 | | | | 12/30/2022 | | | | 36,361,680 | |
| | | | | | | | | | | | | | | | |
| | | | | | | | | | | | | | | 281,510,023 | |
| | | | | | | | | | | | | | | | |
| | | | Holding Companies-Diversified—1.0% | | | | | | | | | | | | |
| | 61,480,743 | | | Travelport LLC, Term Loan B (Luxembourg) | | | 5.000 | | | | 09/02/2021 | | | | 61,934,164 | |
| | | | | | | | | | | | | | | | |
| | | | Household Products/Wares—2.4% | | | | | | | | | | | | |
| | | | Dell International LLC | | | | | | | | | | | | |
| | 63,800,000 | | | Term Loan A2 | | | 2.790 | | | | 09/07/2021 | | | | 63,347,020 | |
| | 88,823,150 | | | Term Loan B | | | 4.000 | | | | 09/07/2023 | | | | 89,578,147 | |
| | | | | | | | | | | | | | | | |
| | | | | | | | | | | | | | | 152,925,167 | |
| | | | | | | | | | | | | | | | |
| | | | Insurance—3.5% | | | | | | | | | | | | |
| | | | Asurion LLC | | | | | | | | | | | | |
| | 55,770,440 | | | Term Loan | | | 8.500 | | | | 03/03/2021 | | | | 56,374,434 | |
| | 50,638,957 | | | Term Loan B1 | | | 5.000 | | | | 05/24/2019 | | | | 50,747,578 | |
| | 67,356,505 | | | Term Loan B4 | | | 5.000 | | | | 08/04/2022 | | | | 67,777,820 | |
| | 53,123,209 | | | HUB International Ltd., Term Loan | | | 4.000 | | | | 10/02/2020 | | | | 53,178,723 | |
| | | | | | | | | | | | | | | | |
| | | | | | | | | | | | | | | 228,078,555 | |
| | | | | | | | | | | | | | | | |
| | | | Investment Companies—1.4% | | | | | | | | | | | | |
| | 87,547,859 | | | RPI Finance Trust, Term Loan B5 | | | 3.168 | | | | 10/14/2022 | | | | 88,454,417 | |
| | | | | | | | | | | | | | | | |
| | | | Lodging—5.9% | | | | | | | | | | | | |
| | 61,350,464 | | | Caesars Entertainment Resort Properties LLC, Term Loan B | | | 7.000 | | | | 10/11/2020 | | | | 61,810,592 | |
| | | | Harrah’s Operating Co., Inc.(c) | | | | | | | | | | | | |
| | 63,832,820 | | | Term Loan B6 | | | 2.168 | | | | 03/01/2017 | | | | 71,067,313 | |
| | 45,626,551 | | | Term Loan B7 | | | 2.500 | | | | 03/01/2017 | | | | 53,383,064 | |
| | | | Hilton Worldwide Finance LLC | | | | | | | | | | | | |
| | 6,973,482 | | | Term Loan | | | 3.500 | | | | 10/26/2020 | | | | 7,011,069 | |
| | 83,340,339 | | | Series B-2 Term Loan | | | 3.034 | | | | 10/25/2023 | | | | 83,880,385 | |
| | 44,433,542 | | | La Quinta Intermediate Holdings LLC, Term Loan | | | 3.750 | | | | 04/14/2021 | | | | 44,440,651 | |
| | 58,093,151 | | | Las Vegas Sands LLC, Term Loan B | | | 3.250 | | | | 12/19/2020 | | | | 58,519,846 | |
| | | | | | | | | | | | | | | | |
| | | | | | | | | | | | | | | 380,112,920 | |
| | | | | | | | | | | | | | | | |
| | | | Machinery-Diversified—2.1% | | | | | | | | | | | | |
| | 45,017,174 | | | Gardner Denver, Inc., Term Loan | | | 4.250 | | | | 07/30/2020 | | | | 43,802,161 | |
| | 43,446,874 | | | Rexnord LLC, Term Loan B | | | 4.000 | | | | 08/21/2020 | | | | 43,626,092 | |
See accompanying Notes to Financial Statements which are an integral part of the financial statements.
PowerShares Senior Loan Portfolio (BKLN) (continued)
October 31, 2016
| | | | | | | | | | | | | | | | |
Principal
Amount | | | | | Interest
Rate | | | Maturity
Date | | | Value | |
| | | | Variable Rate Senior Loan Interests (continued) | | | | | | | | | | | | |
| | | | Machinery-Diversified (continued) | | | | | | | | | | | | |
| $ | 47,036,255 | | | Zebra Technologies Corp., Term Loan | | | 4.089 | % | | | 10/27/2021 | | | $ | 47,570,352 | |
| | | | | | | | | | | | | | | | |
| | | | | | | | | | | | | | | 134,998,605 | |
| | | | | | | | | | | | | | | | |
| | | | Media—6.7% | | | | | | | | | | | | |
| | 74,037,246 | | | Charter Communications Operating LLC, Term Loan I | | | 3.500 | | | | 01/24/2023 | | | | 74,582,161 | |
| | 67,136,986 | | | CSC Holdings LLC, Extended Term Loan | | | 3.876 | | | | 10/09/2024 | | | | 67,504,226 | |
| | 43,691,918 | | | Cumulus Media Holdings, Inc., Term Loan | | | 4.250 | | | | 12/23/2020 | | | | 30,303,403 | |
| | 92,674,940 | | | iHeartCommunications, Inc., Term Loan D | | | 7.284 | | | | 01/30/2019 | | | | 70,474,658 | |
| | 19,830,086 | | | Numericable-SFR S.A., Term Loan B10 (France) | | | 4.000 | | | | 01/31/2025 | | | | 19,776,446 | |
| | 56,839,320 | | | Tribune Media Co., Term Loan B | | | 3.750 | | | | 12/28/2020 | | | | 57,265,614 | |
| | 22,237,593 | | | Univision Communications, Inc., Term Loan | | | 4.000 | | | | 03/01/2020 | | | | 22,303,638 | |
| | 51,793,554 | | | Virgin Media Investment Holdings Ltd., Term Loan F (United Kingdom) | | | 3.500 | | | | 06/30/2023 | | | | 52,075,311 | |
| | 39,436,033 | | | WideOpenWest Finance LLC, Term Loan B | | | 4.500 | | | | 08/19/2023 | | | | 39,411,385 | |
| | | | | | | | | | | | | | | | |
| | | | | | | | | | | | | | | 433,696,842 | |
| | | | | | | | | | | | | | | | |
| | | | Mining—1.9% | | | | | | | | | | | | |
| | 81,703,635 | | | Fortescue Metals Group Ltd., Term Loan (Australia) | | | 3.750 | | | | 06/30/2019 | | | | 81,754,700 | |
| | 43,577,602 | | | Novelis, Inc., Term Loan | | | 4.000 | | | | 06/02/2022 | | | | 43,756,488 | |
| | | | | | | | | | | | | | | | |
| | | | | | | | | | | | | | | 125,511,188 | |
| | | | | | | | | | | | | | | | |
| | | | Miscellaneous Manufacturing—0.9% | | | | | | | | | | | | |
| | 60,606,455 | | | Gates Global LLC, Term Loan | | | 4.250 | | | | 07/05/2021 | | | | 59,864,632 | |
| | | | | | | | | | | | | | | | |
| | | | Oil & Gas—0.9% | | | | | | | | | | | | |
| | 44,020,108 | | | Drillships Financing Holding, Inc., Term Loan B1 (Cyprus) | | | 6.000 | | | | 03/31/2021 | | | | 22,780,406 | |
| | 68,102,195 | | | Seadrill Operating LP, Term Loan (United Kingdom) | | | 4.000 | | | | 02/21/2021 | | | | 38,307,825 | |
| | | | | | | | | | | | | | | | |
| | | | | | | | | | | | | | | 61,088,231 | |
| | | | | | | | | | | | | | | | |
| | | | Packaging & Containers—1.0% | | | | | | | | | | | | |
| | 51,390,012 | | | Berry Plastics Group, Inc., Term Loan H | | | 3.750 | | | | 10/01/2022 | | | | 51,617,927 | |
| | 16,365,623 | | | Reynolds Group Holdings, Inc., Term Loan (New Zealand) | | | 4.250 | | | | 02/05/2023 | | | | 16,430,594 | |
| | | | | | | | | | | | | | | | |
| | | | | | | | | | | | | | | 68,048,521 | |
| | | | | | | | | | | | | | | | |
| | | | Pharmaceuticals—5.0% | | | | | | | | | | | | |
| | 66,386,946 | | | Endo Pharmaceuticals Holdings, Inc., Term Loan B (Luxembourg) | | | 3.750 | | | | 09/25/2022 | | | | 66,399,560 | |
| | 85,728,033 | | | Grifols Worldwide Operations USA, Inc., Term Loan B (Spain) | | | 3.456 | | | | 02/27/2021 | | | | 86,565,596 | |
| | | | Valeant Pharmaceuticals International, Inc. | | | | | | | | | | | | |
| | 66,291,426 | | | Series E-1 Term Loan B | | | 5.250 | | | | 08/05/2020 | | | | 66,153,208 | |
| | 101,948,346 | | | Series F-1 Term Loan B | | | 5.500 | | | | 04/01/2022 | | | | 101,857,103 | |
| | | | | | | | | | | | | | | | |
| | | | | | | | | | | | | | | 320,975,467 | |
| | | | | | | | | | | | | | | | |
| | | | Real Estate—0.9% | | | | | | | | | | | | |
| | 60,360,999 | | | Cushman & Wakefield, Term Loan | | | 4.250 | | | | 11/04/2021 | | | | 60,329,612 | |
| | | | | | | | | | | | | | | | |
| | | | REITs—1.6% | | | | | | | | | | | | |
| | 52,031,925 | | | Communications Sales & Leasing, Inc., Term Loan | | | 4.500 | | | | 10/24/2022 | | | | 52,304,832 | |
| | 49,572,596 | | | MGM Growth Properties Operating Partnership LP, Term Loan B | | | 4.000 | | | | 04/25/2023 | | | | 49,762,459 | |
| | | | | | | | | | | | | | | | |
| | | | | | | | | | | | | | | 102,067,291 | |
| | | | | | | | | | | | | | | | |
| | | | Retail—8.0% | | | | | | | | | | | | |
| | 36,801,064 | | | Academy Ltd., Term Loan | | | 5.000 | | | | 07/01/2022 | | | | 35,768,794 | |
| | 32,283,835 | | | Ascena Retail Group, Inc., Term Loan B | | | 5.250 | | | | 08/21/2022 | | | | 31,453,172 | |
| | 54,307,717 | | | Harbor Freight Tools USA, Inc., Term Loan | | | 4.137 | | | | 08/19/2023 | | | | 54,757,385 | |
| | 56,631,893 | | | Michaels Stores, Inc., Term Loan B1 | | | 3.750 | | | | 01/28/2023 | | | | 57,127,422 | |
| | 70,779,906 | | | Neiman Marcus Group, Inc., Term Loan | | | 4.250 | | | | 10/25/2020 | | | | 65,298,002 | |
| | 122,762,613 | | | New Red Finance, Inc., Term Loan B2 (Canada) | | | 3.750 | | | | 12/10/2021 | | | | 123,491,823 | |
| | 43,814,448 | | | Petco Animal Supplies, Inc., Term Loan B1 | | | 5.000 | | | | 01/26/2023 | | | | 44,252,593 | |
| | 104,942,117 | | | PetSmart, Inc., Term Loan B2 | | | 4.000 | | | | 03/11/2022 | | | | 105,307,315 | |
| | | | | | | | | | | | | | | | |
| | | | | | | | | | | | | | | 517,456,506 | |
| | | | | | | | | | | | | | | | |
See accompanying Notes to Financial Statements which are an integral part of the financial statements.
PowerShares Senior Loan Portfolio (BKLN) (continued)
October 31, 2016
| | | | | | | | | | | | | | | | |
Principal
Amount | | | | | Interest
Rate | | | Maturity
Date | | | Value | |
| | | | Variable Rate Senior Loan Interests (continued) | | | | | | | | | | | | |
| | | | Semiconductors—3.1% | | | | | | | | | | | | |
| $ | 140,548,654 | | | Avago Technologies Cayman Finance Ltd., Term Loan B3 (Singapore) | | | 3.535 | % | | | 02/01/2023 | | | $ | 142,168,477 | |
| | 60,577,513 | | | ON Semiconductor Corp., Term Loan | | | 3.777 | | | | 03/31/2023 | | | | 61,039,417 | |
| | | | | | | | | | | | | | | | |
| | | | | | | | | | | | | | | 203,207,894 | |
| | | | | | | | | | | | | | | | |
| | | | Software—4.5% | | | | | | | | | | | | |
| | 65,680,019 | | | BMC Software Finance, Inc., Term Loan | | | 5.000 | | | | 09/10/2020 | | | | 64,843,584 | |
| | | | First Data Corp. | | | | | | | | | | | | |
| | 64,609,897 | | | Term Loan | | | 3.524 | | | | 03/24/2021 | | | | 64,973,328 | |
| | 37,000,000 | | | Term Loan | | | 4.274 | | | | 07/10/2022 | | | | 37,309,320 | |
| | | | Infor US, Inc. | | | | | | | | | | | | |
| | 4,140,914 | | | Term Loan B3 | | | 3.750 | | | | 06/03/2020 | | | | 4,141,783 | |
| | 63,744,053 | | | Term Loan B5 | | | 3.750 | | | | 06/03/2020 | | | | 63,698,795 | |
| | 57,481,764 | | | Veritas US, Inc., Term Loan B1 | | | 6.625 | | | | 01/27/2023 | | | | 53,682,794 | |
| | | | | | | | | | | | | | | | |
| | | | | | | | | | | | | | | 288,649,604 | |
| | | | | | | | | | | | | | | | |
| | | | Telecommunications—5.6% | | | | | | | | | | | | |
| | 46,939,072 | | | Avaya, Inc., Term Loan B7 | | | 6.250 | | | | 05/29/2020 | | | | 38,636,724 | |
| | 80,170,397 | | | Intelsat Jackson Holdings SA, Term Loan B2 (Luxembourg) | | | 3.750 | | | | 06/30/2019 | | | | 76,890,626 | |
| | | | Level 3 Communications, Inc. | | | | | | | | | | | | |
| | 40,000,000 | | | Term Loan B | | | 4.000 | | | | 01/15/2020 | | | | 40,285,000 | |
| | 54,630,000 | | | Term Loan B2 | | | 3.500 | | | | 05/31/2022 | | | | 54,942,211 | |
| | 47,138,243 | | | LTS Buyer LLC, Term Loan B | | | 4.088 | | | | 04/13/2020 | | | | 47,373,935 | |
| | 48,996,117 | | | T-Mobile USA, Inc., Term Loan | | | 3.500 | | | | 11/09/2022 | | | | 49,447,126 | |
| | 51,750,000 | | | UPC Financing Partnership, Term Loan | | | 4.080 | | | | 08/23/2024 | | | | 52,069,815 | |
| | | | | | | | | | | | | | | | |
| | | | | | | | | | | | | | | 359,645,437 | |
| | | | | | | | | | | | | | | | |
| | | | Total Variable Rate Senior Loan Interests
(Cost $5,729,482,132) | | | | | | | | | | | 5,714,631,856 | |
| | | | | | | | | | | | | | | | |
| | | | |
| | | | Corporate Bonds—3.7% | | | | | | | | | | | | |
| | | | Computers—0.4% | | | | | | | | | | | | |
| | 24,793,000 | | | Dell International LLC(d) | | | 5.450 | | | | 06/15/2023 | | | | 26,585,980 | |
| | | | | | | | | | | | | | | | |
| | | | Media—1.4% | | | | | | | | | | | | |
| | 37,174,000 | | | iHeartCommunications, Inc. | | | 9.000 | | | | 12/15/2019 | | | | 28,345,175 | |
| | 5,802,000 | | | Univision Communications, Inc.(d) | | | 6.750 | | | | 09/15/2022 | | | | 6,135,905 | |
| | 52,098,000 | | | Univision Communications, Inc.(d) | | | 5.125 | | | | 05/15/2023 | | | | 53,139,960 | |
| | | | | | | | | | | | | | | | |
| | | | | | | | | | | | | | | 87,621,040 | |
| | | | | | | | | | | | | | | | |
| | | | Packaging & Containers—0.5% | | | | | | | | | | | | |
| | 29,500,000 | | | Reynolds Group Holdings, Inc. (New Zealand) | | | 5.750 | | | | 10/15/2020 | | | | 30,312,135 | |
| | 5,000,000 | | | Reynolds Group Holdings, Inc. (New Zealand)(d)(e) | | | 4.380 | | | | 07/15/2021 | | | | 5,112,500 | |
| | | | | | | | | | | | | | | | |
| | | | | | | | | | | | | | | 35,424,635 | |
| | | | | | | | | | | | | | | | |
| | | | Software—1.4% | | | | | | | | | | | | |
| | 35,015,000 | | | First Data Corp.(d) | | | 6.750 | | | | 11/01/2020 | | | | 36,327,292 | |
| | 51,000,000 | | | First Data Corp.(d) | | | 5.000 | | | | 01/15/2024 | | | | 51,956,250 | |
| | | | | | | | | | | | | | | | |
| | | | | | | | | | | | | | | 88,283,542 | |
| | | | | | | | | | | | | | | | |
| | | | Telecommunications—0.0% | | | | | | | | | | | | |
| | 2,986,000 | | | Avaya, Inc.(d) | | | 7.000 | | | | 04/01/2019 | | | | 2,441,055 | |
| | | | | | | | | | | | | | | | |
| | | | Total Corporate Bonds
(Cost $246,989,286) | | | | | | | | | | | 240,356,252 | |
| | | | | | | | | | | | | | | | |
| | | | |
| | | | | | | | | | | | | | | | |
See accompanying Notes to Financial Statements which are an integral part of the financial statements.
PowerShares Senior Loan Portfolio (BKLN) (continued)
October 31, 2016
| | | | | | | | |
Number
of Shares | | | | | Value | |
| | | | Money Market Fund—17.0% | | | | |
| | 1,096,540,470 | | | Invesco Premier U.S. Government Money Portfolio—Institutional Class, 0.25%(f)
(Cost $1,096,540,470) | | $ | 1,096,540,470 | |
| | | | | | | | |
| | | | Total Investments
(Cost $7,073,011,888)—109.2% | | | 7,051,528,578 | |
| | | | Other assets less liabilities—(9.2)% | | | (592,781,362 | ) |
| | | | | | | | |
| | | | Net Assets—100.0% | | $ | 6,458,747,216 | |
| | | | | | | | |
Investment Abbreviations:
DIP—Debtor-in-Possession
REIT—Real Estate Investment Trust
Notes to Schedule of Investments:
| (a) | Variable rate senior loan interests often require prepayments from excess cash flow or permit the borrower to repay at its election. The degree to which borrowers repay, whether as a contractual requirement or at their election, cannot be predicted with any accuracy. As a result, the actual remaining maturity may be substantially less than the stated maturities shown. However, it is anticipated that the variable rate senior loan interests will have an expected average life of three to five years. |
| (b) | Variable rate senior loan interests are, at present, not readily marketable, not registered under the Securities Act of 1933, as amended (the “1933 Act”) and may be subject to contractual and legal restrictions on sale. Variable rate senior loan interests in the Fund’s portfolio generally have variable rates which adjust to a base, such as the London Interbank Offered Rate (“LIBOR”), on set dates, typically every 30 days, but not greater than one year, and/or have interest rates that float at margin above a widely recognized base lending rate such as the Prime Rate of a designated U.S. bank. |
| (c) | The borrower has filed for protection in federal bankruptcy court. |
| (d) | Security purchased or received in a transaction exempt from registration under the 1933 Act. The security may be resold pursuant to an exemption from registration under the 1933 Act, typically to qualified institutional buyers. The aggregate value of these securities at October 31, 2016 was $181,698,942, which represented 2.81% of the Fund’s Net Assets. |
| (e) | Interest and dividend rate is redetermined periodically. Rate shown is the rate in effect on October 31, 2016. |
| (f) | The security and the Fund are advised by wholly-owned subsidiaries of Invesco Ltd. and are therefore considered to be affiliated. The rate shown is the 7-day SEC standardized yield as of October 31, 2016. |
See accompanying Notes to Financial Statements which are an integral part of the financial statements.
Statement of Assets and Liabilities
October 31, 2016
| | | | |
| | | PowerShares
Senior Loan
Portfolio (BKLN) | |
| Assets: | | | | |
Unaffiliated investments, at value | | $ | 5,954,988,108 | |
Affiliated investments, at value | | | 1,096,540,470 | |
| | | | |
Total investments, at value | | | 7,051,528,578 | |
Cash | | | 101,862,998 | |
Receivables: | | | | |
Investments sold | | | 113,965,193 | |
Shares sold | | | 23,190,419 | |
Interest | | | 18,806,350 | |
| | | | |
Total Assets | | | 7,309,353,538 | |
| | | | |
| |
| Liabilities: | | | | |
Payables: | | | | |
Investments purchased | | | 847,428,373 | |
Accrued unitary management fees | | | 3,177,949 | |
| | | | |
Total Liabilities | | | 850,606,322 | |
| | | | |
| Net Assets | | $ | 6,458,747,216 | |
| | | | |
| |
| Net Assets Consist of: | | | | |
Shares of beneficial interest | | $ | 6,912,129,772 | |
Undistributed net realized gain (loss) | | | (431,899,246 | ) |
Net unrealized appreciation (depreciation) | | | (21,483,310 | ) |
| | | | |
| Net Assets | | $ | 6,458,747,216 | |
| | | | |
Shares outstanding (unlimited amount authorized, $0.01 par value) | | | 278,900,000 | |
Net asset value | | $ | 23.16 | |
| | | | |
Market price | | $ | 23.19 | |
| | | | |
Unaffiliated investments, at cost | | $ | 5,976,471,418 | |
| | | | |
Affiliated investments, at cost | | $ | 1,096,540,470 | |
| | | | |
Total investments, at cost | | $ | 7,073,011,888 | |
| | | | |
See accompanying Notes to Financial Statements which are an integral part of the financial statements.
Statement of Operations
For the year ended October 31, 2016
| | | | |
| | | PowerShares
Senior Loan
Portfolio (BKLN) | |
| Investment Income: | | | | |
Interest income | | $ | 219,700,535 | |
Affiliated dividend income | | | 1,181,298 | |
Other income | | | 1,514,097 | |
| | | | |
Total Income | | | 222,395,930 | |
| | | | |
| |
| Expenses: | | | | |
Unitary management fees | | | 29,117,400 | |
| | | | |
Less: Waivers | | | (631,998 | ) |
| | | | |
Net Expenses | | | 28,485,402 | |
| | | | |
Net Investment Income | | | 193,910,528 | |
| | | | |
| |
| Realized and Unrealized Gain (Loss): | | | | |
Net realized gain (loss) from investment securities | | | (333,584,745 | ) |
Net change in unrealized appreciation on investment securities | | | 344,726,561 | |
| | | | |
Net realized and unrealized gain | | | 11,141,816 | |
| | | | |
Net increase in net assets resulting from operations | | $ | 205,052,344 | |
| | | | |
See accompanying Notes to Financial Statements which are an integral part of the financial statements.
Statement of Changes in Net Assets
For the years ended October 31, 2016 and 2015
| | | | | | | | |
| | | PowerShares Senior Loan
Portfolio (BKLN) | |
| | | 2016 | | | 2015 | |
| Operations: | | | | | | | | |
Net investment income | | $ | 193,910,528 | | | $ | 211,354,937 | |
Net realized gain (loss) | | | (333,584,745 | ) | | | (70,375,887 | ) |
Net change in unrealized appreciation (depreciation) | | | 344,726,561 | | | | (249,175,964 | ) |
| | | | | | | | |
Net increase (decrease) in net assets resulting from operations | | | 205,052,344 | | | | (108,196,914 | ) |
| | | | | | | | |
| | |
| Distributions to Shareholders from: | | | | | | | | |
Net investment income | | | (193,910,528 | ) | | | (211,354,937 | ) |
Return of capital | | | (16,890,704 | ) | | | (655,582 | ) |
| | | | | | | | |
Total distributions to shareholders | | | (210,801,232 | ) | | | (212,010,519 | ) |
| | | | | | | | |
| | |
| Shareholder Transactions: | | | | | | | | |
Proceeds from shares sold | | | 3,101,232,402 | | | | 638,379,563 | |
Value of shares repurchased | | | (1,453,713,841 | ) | | | (1,783,328,111 | ) |
Transaction fees | | | 7,999,052 | | | | 3,214,983 | |
| | | | | | | | |
Net increase (decrease) in net assets resulting from shares transactions | | | 1,655,517,613 | | | | (1,141,733,565 | ) |
| | | | | | | | |
Increase (Decrease) in Net Assets | | | 1,649,768,725 | | | | (1,461,940,998 | ) |
| | | | | | | | |
| | |
| Net Assets: | | | | | | | | |
Beginning of year | | | 4,808,978,491 | | | | 6,270,919,489 | |
| | | | | | | | |
End of year | | $ | 6,458,747,216 | | | $ | 4,808,978,491 | |
| | | | | | | | |
Undistributed net investment income at end of year | | $ | — | | | $ | — | |
| | | | | | | | |
| | |
| Changes in Shares Outstanding: | | | | | | | | |
Shares sold | | | 134,900,000 | | | | 26,800,000 | |
Shares repurchased | | | (64,600,000 | ) | | | (74,900,000 | ) |
Shares outstanding, beginning of year | | | 208,600,000 | | | | 256,700,000 | |
| | | | | | | | |
Shares outstanding, end of year | | | 278,900,000 | | | | 208,600,000 | |
| | | | | | | | |
See accompanying Notes to Financial Statements which are an integral part of the financial statements.
Statement of Cash Flows
For the year ended October 31, 2016
| | | | |
| | | PowerShares
Senior Loan
Portfolio (BKLN) | |
| Cash Provided By Operating Activities: | | | | |
Net increase in net assets resulting from operations | | $ | 205,052,344 | |
| | | | |
| |
| Adjustments to Reconcile the Change in Net Assets from Operations to Net Cash Provided By (Used In) Operating Activities: | | | | |
Purchases of investments | | | (4,823,698,959 | ) |
Proceeds from disposition of investments sold | | | 3,371,056,171 | |
Amortization of premiums and accretion of discounts on investments | | | 4,231,582 | |
Net cash paid for purchases, sales, and maturities of short-term investments | | | (113,172,805 | ) |
Increase in receivable for investments sold | | | (66,806,042 | ) |
Decrease in interest receivable | | | 3,988,948 | |
Increase in payable for investments purchased | | | 740,466,828 | |
Increase in payable for accrued expenses | | | 540,850 | |
Net realized loss on investments | | | 333,584,745 | |
Net change in unrealized appreciation (depreciation) on investments | | | (344,726,561 | ) |
| | | | |
Net cash provided by (used in) operating activities | | | (689,482,899 | ) |
| |
| Cash Provided By Financing Activities: | | | | |
Distributions paid to shareholders | | | (210,801,232 | ) |
Proceeds from shares of beneficial interest sold | | | 3,078,041,983 | |
Disbursements for shares of beneficial interest repurchased | | | (1,522,883,319 | ) |
Net proceeds from transaction fees | | | 7,999,052 | |
| | | | |
Net cash provided by financing activities | | | 1,352,356,484 | |
| | | | |
| Net increase in cash and cash equivalents | | | 662,873,585 | |
| | | | |
| Cash and cash equivalents at beginning of year | | | 535,529,883 | |
| | | | |
| Cash and cash equivalents at end of year | | $ | 1,198,403,468 | |
| | | | |
See accompanying Notes to Financial Statements which are an integral part of the financial statements.
Financial Highlights
PowerShares Senior Loan Portfolio (BKLN)
| | | | | | | | | | | | | | | | | | | | |
| | | Year Ended October 31, | |
| | | 2016 | | | 2015 | | | 2014 | | | 2013 | | | 2012 | |
| Per Share Operating Performance: | | | | | | | | | | | | | | | | | | | | |
Net asset value at beginning of year | | $ | 23.05 | | | $ | 24.43 | | | $ | 24.78 | | | $ | 24.76 | | | $ | 24.05 | |
Net investment income(a) | | | 0.99 | | | | 0.92 | | | | 1.00 | | | | 1.06 | | | | 1.21 | |
Net realized and unrealized gain (loss) on investments | | | 0.15 | | | | (1.39 | ) | | | (0.36 | ) | | | 0.04 | | | | 0.58 | |
Total from investment operations | | | 1.14 | | | | (0.47 | ) | | | 0.64 | | | | 1.10 | | | | 1.79 | |
Distributions to shareholders from: | | | | | | | | | | | | | | | | | | | | |
Net investment income | | | (0.99 | ) | | | (0.92 | ) | | | (1.00 | ) | | | (1.10 | ) | | | (1.22 | ) |
Return of capital | | | (0.08 | ) | | | (0.00 | )(b) | | | (0.00 | )(b) | | | (0.02 | ) | | | (0.00 | )(b) |
Total distributions | | | (1.07 | ) | | | (0.92 | ) | | | (1.00 | ) | | | (1.12 | ) | | | (1.22 | ) |
Transaction fees(a) | | | 0.04 | | | | 0.01 | | | | 0.01 | | | | 0.04 | | | | 0.14 | |
Net asset value at end of year | | $ | 23.16 | | | $ | 23.05 | | | $ | 24.43 | | | $ | 24.78 | | | $ | 24.76 | |
Market price at end of year(c) | | $ | 23.19 | | | $ | 23.01 | | | $ | 24.37 | | | $ | 24.83 | | | $ | 24.83 | |
| Net Asset Value Total Return(d) | | | 5.32 | % | | | (1.96 | )% | | | 2.66 | % | | | 4.70 | % | | | 8.26 | % |
| Market Price Total Return(d) | | | 5.64 | % | | | (1.89 | )% | | | 2.21 | % | | | 4.61 | % | | | 8.67 | % |
| Ratios/Supplemental Data: | | | | | | | | | | | | | | | | | | | | |
Net assets at end of year (000’s omitted) | | $
| 6,458,747
|
| | $ | 4,808,978 | | | $ | 6,270,919 | | | $ | 6,064,711 | | | $ | 1,195,811 | |
Ratio to average net assets of: | | | | | | | | | | | | | | | | | | | | |
Expenses, after Waivers | | | 0.64 | % | | | 0.65 | %(e) | | | 0.64 | % | | | 0.65 | %(e) | | | 0.65 | %(e) |
Expenses, prior to Waivers | | | 0.65 | % | | | 0.65 | %(e) | | | 0.65 | % | | | 0.65 | %(e) | | | 0.67 | %(e) |
Net investment income, after Waivers and Interest Expenses | | | 4.33 | % | | | 3.82 | % | | | 4.03 | % | | | 4.30 | % | | | 5.00 | % |
Portfolio turnover rate(f) | | | 81 | % | | | 43 | % | | | 61 | % | | | 47 | % | | | 49 | % |
| (a) | Based on average shares outstanding. |
| (b) | Amount represents less than $0.005. |
| (c) | The mean between the last bid and ask prices. |
| (d) | Net asset value total return is calculated assuming an initial investment made at the net asset value at the beginning of the period, reinvestment of all dividends and distributions at net asset value during the period, and redemption on the last day of the period. Net asset value total return includes adjustments in accordance with accounting principles generally accepted in the United States of America and as such, the net asset value for financial reporting purposes and the returns based upon those net asset values may differ from the net asset value and returns for shareholder transactions. Market price total return is calculated assuming an initial investment made at the market price at the beginning of the period, reinvestment of all dividends and distributions at market price during the period, and sale at the market price on the last day of the period. Total investment returns calculated for a period of less than one year are not annualized. |
| (e) | In addition to the fees and expenses which the Fund bears directly, the Fund indirectly bears a pro rata share of the fees and expenses of the investment companies in which the Fund invests. Estimated investment companies’ expenses are not expenses that are incurred directly by the Fund. They are expenses that are incurred directly by the investment companies and are deducted from the value of the investment companies the Fund invests in. The effect of the estimated investment companies’ expenses that the Fund bears indirectly is included in the Fund’s total return. |
| (f) | Portfolio turnover rate is not annualized for periods less than one year, if applicable, and does not include securities received or delivered from processing creations or redemptions. |
See accompanying Notes to Financial Statements which are an integral part of the financial statements.
Notes to Financial Statements
PowerShares Exchange-Traded Fund Trust II
October 31, 2016
Note 1. Organization
PowerShares Exchange-Traded Fund Trust II (the “Trust”) was organized as a Massachusetts business trust on October 10, 2006 and is authorized to have multiple series of portfolios. The Trust is an open-end management investment company registered under the Investment Company Act of 1940, as amended (the “1940 Act”). As of October 31, 2016, the Trust offered sixty-seven portfolios. This report includes the following portfolio:
| | |
Full Name | | Short Name |
| PowerShares Senior Loan Portfolio (BKLN) | | “Senior Loan Portfolio” |
The portfolio (the “Fund”) represents a separate series of the Trust. The shares of the Fund are referred to herein as “Shares” or “Fund’s Shares.” The Fund’s Shares are listed and traded on NYSE Arca, Inc.
The market price of a Share may differ to some degree from the Fund’s net asset value (“NAV”). Unlike conventional mutual funds, the Fund issues and redeems Shares on a continuous basis, at NAV, only in a large specified number of Shares, each called a “Creation Unit.” Creation Units are issued and redeemed principally in exchange for the deposit or delivery of cash. Except when aggregated in Creation Units by Authorized Participants, the Shares are not individually redeemable securities of the Fund.
The investment objective of the Fund is to seek investment results that generally correspond (before fees and expenses) to the price and yield of the S&P/LSTA U.S. Leveraged Loan 100 Index (the “Underlying Index”).
Note 2. Significant Accounting Policies
The preparation of the financial statements in accordance with accounting principles generally accepted in the United States of America (“GAAP”) requires management to make estimates and assumptions that affect the reported amounts and disclosures in the financial statements, including estimates and assumptions related to taxation. Actual results could differ from these estimates. In addition, the Fund monitors for material events or transactions that may occur or become known after the period-end date and before the date the financial statements are released to print. The following is a summary of the significant accounting policies followed by the Fund in preparation of the financial statements.
A. Security Valuation
Securities, including restricted securities, are valued according to the following policies:
Variable rate senior loan interests are fair valued using an evaluated quote provided by an independent pricing service. Evaluated quotes provided by the pricing service may reflect appropriate factors such as ratings, tranche type, industry, company performance, spread, individual trading characteristics, institution-size trading in similar groups of securities and other market data.
A security listed or traded on an exchange (except convertible securities) is valued at its last sales price or official closing price as of the close of the customary trading session on the exchange where the security is principally traded, or lacking any sales or official closing price on a particular day, the security may be valued at the closing bid price on that day. Securities traded in the over-the-counter market are valued based on prices furnished by independent pricing services or market makers. When such securities are valued by an independent pricing service they may be considered fair valued. Futures contracts are valued at the final settlement price set by an exchange on which they are principally traded. Listed options are valued at the mean between the last bid and asked prices from the exchange on which they are principally traded. Options not listed on an exchange are valued by an independent source at the mean between the last bid and asked prices. For purposes of determining NAV per Share, futures and option contracts generally are valued 15 minutes after the close of the customary trading session of the New York Stock Exchange (“NYSE”).
Investments in open-end and closed-end registered investment companies that do not trade on an exchange are valued at the end of day NAV per share. Investments in open-end and closed-end registered investment companies that trade on an exchange are valued at the last sales price or official closing price as of the close of the customary trading session on the exchange where the security is principally traded.
Debt obligations (including convertible securities) and unlisted equities are fair valued using an evaluated quote provided by an independent pricing service. Evaluated quotes provided by the pricing service may be determined without exclusive reliance on quoted prices, and may reflect appropriate factors such as institution-size trading in similar groups of securities, developments related to specific securities, dividend rate (for unlisted equities), yield (for debt obligations), quality, type of issue, coupon rate (for debt obligations), maturity (for debt obligations), individual trading characteristics and other market data. Securities with a demand feature
exercisable within one to seven days are valued at par. Debt obligations are subject to interest rate and credit risks. In addition, all debt obligations involve some risk of default with respect to interest and/or principal payments.
Foreign securities’ (including foreign exchange contracts’) prices are converted into U.S. dollar amounts using the applicable exchange rates as of the close of the London world markets. If market quotations are available and reliable for foreign exchange-traded equity securities, the securities will be valued at the market quotations. Because trading hours for certain foreign securities end before the close of the NYSE, closing market quotations may become unreliable. If between the time trading ends on a particular security and the close of the customary trading session on the NYSE, events occur that Invesco PowerShares Capital Management LLC (the “Adviser”) determines are significant and make the closing price unreliable, the Fund may fair value the security. If the event is likely to have affected the closing price of the security, the security will be valued at fair value in good faith using procedures approved by the Board of Trustees. Adjustments to closing prices to reflect fair value may also be based on a screening process of an independent pricing service to indicate the degree of certainty, based on historical data, that the closing price in the principal market where a foreign security trades is not the current value as of the close of the NYSE. Foreign securities’ prices meeting the approved degree of certainty that the price is not reflective of current value will be priced at the indication of fair value from the independent pricing service. Multiple factors may be considered by the independent pricing service in determining adjustments to reflect fair value and may include information relating to sector indices, American Depositary Receipts and domestic and foreign index futures. Foreign securities may have additional risks including exchange rate changes, potential for sharply devalued currencies and high inflation, political and economic upheaval, the relative lack of issuer information, relatively low market liquidity and the potential lack of strict financial and accounting controls and standards.
Securities for which market prices are not provided by any of the above methods may be valued based upon quotes furnished by independent sources. The last bid price may be used to value equity securities. The mean between the last bid and asked prices is used to value debt obligations, including corporate loans.
Securities for which market quotations are not readily available or became unreliable are valued at fair value as determined in good faith following procedures approved by the Board of Trustees. Issuer-specific events, market trends, bid/asked quotes of brokers and information providers and other market data may be reviewed in the course of making a good faith determination of a security’s fair value.
The Fund may invest in securities that are subject to interest rate risk, meaning the risk that the prices will generally fall as interest rates rise and, conversely, the prices will generally rise as interest rates fall. Specific securities differ in their sensitivity to changes in interest rates depending on their individual characteristics. Changes in interest rates may result in increased market volatility, which may affect the value and/or liquidity of certain Fund investments.
Valuations change in response to many factors, including the historical and prospective earnings of the issuer, the value of the issuer’s assets, general economic conditions, interest rates, investor perceptions and market liquidity. Because of the inherent uncertainties of valuation, the values reflected in the financial statements may materially differ from the value received upon actual sale of those investments.
B. Other Risks
Index Risk. Unlike many investment companies, the Fund does not utilize an investing strategy that seeks returns in excess of its Underlying Index. Therefore, the Fund would not necessarily buy or sell a security unless that security is added or removed, respectively, from its Underlying Index, even if that security generally is underperforming.
Fixed-Income Securities Risk. Fixed-income securities are subject to interest rate risk and credit risk. Interest rate risk refers to fluctuations in the value of a fixed-income security resulting from changes in the general level of interest rates. When the general level of interest rates goes up, the prices of most fixed-income securities go down. When the general level of interest rates goes down, the prices of most fixed-income securities go up. Fixed-income securities with longer maturities typically are more sensitive to changes in interest rates, making them more volatile than securities with shorter maturities. Credit risk refers to the possibility that the issuer of a security will be unable and/or unwilling to make timely interest payments and/or repay the principal on its debt. Debt instruments are subject to varying degrees of credit risk, which may be reflected in credit ratings. There is a possibility that the credit rating of a fixed-income security may be downgraded after purchase, which may adversely affect the value of the security.
Changing Fixed-Income Market Conditions. The current historically low interest rate environment was created in part by the Federal Reserve Board (“FRB”) and certain foreign central banks keeping the federal funds and equivalent foreign rates at or near zero. The “tapering” in 2015 of the FRB’s quantitative easing program, combined with the FRB’s raising of the target range for the Federal Funds Rate (and likely eventual increase in equivalent foreign rates) may expose fixed-income markets to heightened volatility and reduced liquidity for certain fixed-income investments, particularly those with longer maturities, although it is difficult to predict the impact of this rate increase and any future rate increases on various markets. In addition, decreases in fixed-income dealer market-making capacity may persist in the future, potentially leading to heightened volatility and reduced liquidity in the fixed-income markets. As a result, the
value of the Fund’s investments and share price may decline. In addition, because of changing central bank policies, the Fund may experience higher than normal shareholder redemptions, which could potentially increase portfolio turnover and the Fund’s transaction costs and potentially lower the Fund’s returns.
Non-Correlation Risk. The Fund’s return may not match the return of its Underlying Index for a number of reasons. For example, the Fund incurs operating expenses not applicable to its Underlying Index, and incurs costs in buying and selling securities, especially when rebalancing the Fund’s securities holdings to reflect changes in the composition of its Underlying Index. Because the Fund issues and redeems Creation Units principally for cash, it will incur higher costs in buying and selling securities than if it issued and redeemed Creation Units principally in-kind. In addition, the performance of the Fund and its Underlying Index may vary due to asset valuation differences and differences between the Fund’s portfolio and its Underlying Index resulting from legal restrictions, cost or liquidity constraints.
Liquidity Risk. A majority of the Fund’s assets are likely to be invested in loans that are less liquid than securities traded on national exchanges. Loans with reduced liquidity involve greater risk than securities with more liquid markets. Available market quotations for such loans may vary over time, and if the credit quality of a loan unexpectedly declines, secondary trading of that loan may decline for a period of time. In the event that the Fund voluntarily or involuntarily liquidates portfolio assets during periods of infrequent trading, it may not receive full value for those assets.
Sampling Risk. The Fund’s use of a representative sampling approach will result in the Fund holding a smaller number of securities than are in its Underlying Index. As a result, an adverse development respecting to an issuer of securities held by the Fund could result in a greater decline in NAV than would be the case if the Fund held all of the securities in its Underlying Index. To the extent the assets in the Fund are smaller, these risks will be greater.
Cash Transaction Risk. Unlike most exchange-traded funds (“ETFs”), the Fund currently effects creations and redemptions principally for cash, rather than primarily in-kind because of the nature of the Fund’s investments. As such, investments in the Fund’s Shares may be less tax efficient than investments in conventional ETFs.
Non-Investment Grade Securities Risk. All or a significant portion of the loans in which the Fund will invest may be determined to be non-investment grade loans that are considered speculative. The Fund also may invest in junk bonds. Non-investment grade loans and bonds, and unrated loans and bonds of comparable credit quality are subject to the increased risk of a borrower’s or issuer’s inability to meet principal and interest payment obligations. These securities may be subject to greater price volatility due to such factors as specific corporate developments, interest rate sensitivity, negative perceptions of the non-investment grade securities markets generally, real or perceived adverse economic and competitive industry conditions and less secondary market liquidity. If the borrower of lower-rated loans or issuer of lower-rated bonds defaults, the Fund may incur additional expenses to seek recovery.
Risk of Investing in Loans. Investments in loans are subject to interest rate risk and credit risk. Interest rate risk refers to fluctuations in the value of a loan resulting from changes in the general level of interest rates. Credit risk refers to the possibility that the borrower of a loan will be unable and/or unwilling to make timely interest payments and/or repay the principal on its obligation. Default in the payment of interest or principal on a loan will result in a reduction in the value of the loan and consequently a reduction in the value of the Fund’s investments and a potential decrease in the NAV of the Fund. Although the loans in which the Fund will invest generally will be secured by specific collateral, there can be no assurance that such collateral would satisfy the borrower’s obligation in the event of non-payment of scheduled interest or principal or that such collateral could be readily liquidated. In the event of the bankruptcy of a borrower, the Fund’s access to the collateral may be limited by bankruptcy or other insolvency loans and, therefore, the Fund could experience delays or limitations with respect to its ability to realize the benefits of the collateral securing a loan.
There is no organized exchange on which loans are traded and reliable market quotations may not be readily available. Therefore, elements of judgment may play a greater role in valuation of loans than for securities with a more developed secondary market and the Fund may not realize full value in the event of the need to sell a loan. To the extent that a secondary market does exist for certain loans, the market may be subject to volatility, irregular trading activity, wide bid/asked spreads, decreased liquidity and extended trade settlement periods. Some loans are subject to the risk that a court, pursuant to fraudulent conveyance or other similar laws, could subordinate the loans to presently existing or future indebtedness of the borrower or take other action detrimental to lenders, including the Fund, such as invalidation of loans or causing interest previously paid to be refunded to the borrower. Investments in loans also are subject to the risk of changes in legislation or state or federal regulations. If such legislation or regulations impose additional requirements or restrictions on the ability of financial institutions to make loans, the availability of loans for investment by the Fund may be adversely affected. Many loans are not registered with the Securities and Exchange Commission (the “SEC”) or any state securities commission and often are not rated by any nationally recognized rating service. Generally, there is less readily available, reliable information about most loans than is the case for many other types of securities. Although a loan may be senior to equity and other debt securities in a borrower’s capital structure, such obligations may be structurally subordinated to obligations of the borrower’s subsidiaries.
Senior Loans Risk. The risks associated with senior loans are similar to the risks of junk bonds, although senior loans typically are senior and secured, whereas junk bonds often are subordinated and unsecured. Investments in senior loans typically are below investment grade and are considered speculative because of the credit risk of their issuers. Such companies are more likely to default on their payments of interest and principal owed, and such defaults could reduce the Fund’s NAV and income distributions. An economic downturn generally leads to a higher non-payment rate, and a senior loan may lose significant value before a default occurs. There is no assurance that the liquidation of the collateral would satisfy the claims of the borrower’s obligations in the event of the non-payment of scheduled interest or principal, or that the collateral could be readily liquidated. Economic and other events (whether real or perceived) can reduce the demand for certain senior loans or senior loans generally, which may reduce market prices. Senior loans and other debt securities also are subject to the risk of price declines and to increases in prevailing interest rates, although floating-rate debt instruments such as senior loans in which the Fund may be expected to invest are substantially less exposed to this risk than fixed-rate debt instruments. No active trading market may exist for certain senior loans, which may impair the ability of the Fund to realize full value in the event of the need to liquidate such assets. Adverse market conditions may impair the liquidity of some actively traded senior loans. Longer interest rate reset periods generally increase fluctuations in value as a result of changes in market interest rates.
Risks of Loan Assignments and Participations. As the purchaser of an assignment, the Fund typically succeeds to all the rights and obligations of the assigning institution and becomes a lender under the credit agreement with respect to the debt obligation; however, the Fund may not be able to unilaterally enforce all rights and remedies under the loan and with regard to any associated collateral. Because assignments may be arranged through private negotiations between potential assignees and potential assignors, the rights and obligations acquired by the Fund as the purchaser of an assignment may differ from, and be more limited than, those held by the assigning lender. In addition, if the loan is foreclosed, the Fund could become part owner of any collateral and could bear the costs and liabilities of owning and disposing of the collateral. The Fund may be required to pass along to a purchaser that buys a loan from the Fund by way of assignment, a portion of any fees to which the Fund is entitled under the loan. In connection with purchasing participations, the Fund generally will have no right to enforce compliance by the borrower with the terms of the loan agreement relating to the loan, nor any rights of set-off against the borrower, and the Fund may not directly benefit from any collateral supporting the loan in which it has purchased the participation. As a result, the Fund will be subject to the credit risk of both the borrower and the lender that is selling the participation. In the event of the insolvency of the lender selling a participation, the Fund may be treated as a general creditor of the lender and may not benefit from any set-off between the lender and the borrower.
C. Cash and Cash Equivalents
For the purposes of the Statement of Cash Flows, the Fund defines Cash and Cash Equivalents as cash (including foreign currency), money market funds and other investments held in lieu of cash and excludes investments made with cash collateral received.
D. Securities Purchased on a When-Issued and Delayed Delivery Basis
The Fund may purchase and sell interests in corporate loans and corporate debt securities and other portfolio securities on a when-issued and delayed delivery basis, with payment and delivery scheduled for a future date. No income accrues to the Fund on such interests or securities in connection with such transactions prior to the date the Fund actually takes delivery of such interests or securities. These transactions are subject to market fluctuations and are subject to the risk that the value of the interests or securities at delivery may be more or less than the trade date purchase price. Although the Fund will generally purchase these securities with the intention of acquiring such securities, it may sell such securities prior to the settlement date.
E. Federal Income Taxes
The Fund intends to comply with the provisions of the Internal Revenue Code of 1986, as amended (the “Internal Revenue Code”), applicable to regulated investment companies and to distribute substantially all of the Fund’s taxable earnings to its shareholders. As such, the Fund will not be subject to federal income taxes on otherwise taxable income (including net realized gains) that is distributed to the shareholders. Therefore, no provision for federal income taxes is recorded in the financial statements.
The Fund recognizes the tax benefits of uncertain tax positions only when the position is more likely than not to be sustained. Management has analyzed the Fund’s uncertain tax positions and concluded that no liability for unrecognized tax benefits should be recorded related to uncertain tax positions. Management is not aware of any tax positions for which it is reasonably possible that the total amounts of unrecognized tax benefits will change materially in the next 12 months.
Income and capital gain distributions are determined in accordance with federal income tax regulations, which may differ from GAAP. These differences are primarily due to differing book and tax treatments for losses deferred due to wash sales and passive foreign investment company adjustments, if any.
The Fund files U.S. federal tax returns and tax returns in certain other jurisdictions. Generally, the Fund is subject to examinations by such taxing authorities for up to three years after the filing of the return for the tax period.
F. Investment Transactions and Investment Income
Investment transactions are accounted for on a trade date basis. Realized gains and losses from the sale or disposition of securities are computed on the specific identified cost basis. Bond premiums and discounts are amortized and/or accreted for financial reporting
purposes. Interest income is recorded on the accrual basis. Dividend income (net of withholding tax, if any) is recorded on the ex-dividend date. Realized gains, dividends and interest received by the Fund may give rise to withholding and other taxes imposed by foreign countries. Tax conventions between certain countries and the United States may reduce or eliminate such taxes.
The Fund may periodically participate in litigation related to the Fund’s investments. As such, the Fund may receive proceeds from litigation settlements. Any proceeds received are included in the Statement of Operations as realized gain (loss) for investments no longer held and as unrealized gain (loss) for investments still held.
Other income is comprised primarily of amendment fees which are recorded when received. Amendment fees are received in return for changes in the terms of a loan or note.
Corporate actions (including cash dividends) are recorded net of non-reclaimable foreign tax withholdings on the ex-date.
Brokerage commissions and mark ups are considered transaction costs and are recorded as an increase to the cost basis of securities purchased and/or a reduction of proceeds on a sale of securities. Such transaction costs are included in the determination of net realized and unrealized gain (loss) from investment securities reported in the Statement of Operations and the Statement of Changes in Net Assets and the net realized and unrealized gains (losses) on securities per share in the Financial Highlights. Transaction costs are included in the calculation of the Fund’s net asset value and, accordingly, they reduce the Fund’s total returns. These transaction costs are not considered operating expenses and are not reflected in net investment income reported in the Statement of Operations and the Statement of Changes in Net Assets, or the net investment income per share and the ratios of expenses and net investment income reported in the Financial Highlights, nor are they limited by any expense limitation arrangements between the Fund and the Adviser.
G. Country Determination
For the purposes of making investment selection decisions and presentation in the Schedule of Investments, the Adviser may determine the country in which an issuer is located and/or credit risk exposure based on various factors. These factors include the laws of the country under which the issuer is organized, where the issuer maintains a principal office, the country in which the issuer derives 50% or more of its total revenues and the country that has the primary market for the issuer’s securities, as well as other criteria. Among the other criteria that may be evaluated for making this determination are the country in which the issuer maintains 50% or more of its assets, the type of security, financial guarantees and enhancements, the nature of the collateral and the sponsor organization. Country of issuer and/or credit risk exposure has been determined to be the United States of America, unless otherwise noted.
H. Expenses
The Fund has agreed to pay an annual unitary management fee to the Adviser. Out of the unitary management fee, the Adviser has agreed to pay for substantially all expenses of the Fund, including the payments to Invesco Senior Secured Management, Inc. (the “Sub-Adviser”), set-up fees and commitment fees associated with the line of credit and the cost of transfer agency, custody, fund administration, legal, audit and other services, except for advisory fees, distribution fees, if any, brokerage expenses, taxes, interest (including interest expenses associated with the line of credit), acquired fund fees and expenses, if any, litigation expenses and other extraordinary expenses.
Expenses of the Trust that are excluded from the Fund’s unitary management fee and are directly identifiable to the Fund are applied to the Fund. Expenses of the Trust that are excluded from the Fund’s unitary management fee and that are not readily identifiable to the Fund are allocated in such a manner as deemed equitable, taking into consideration the nature and type of expense and the relative net assets of the Fund.
To the extent the Fund invests in other investment companies, the expenses shown in the accompanying financial statements reflect the expenses of the Fund and do not include any expenses of the investment companies in which it invests. The effects of such investment companies’ expenses are included in the realized and unrealized gain or loss on the investments in the investment companies.
I. Dividends and Distributions to Shareholders
The Fund declares and pays dividends from net investment income, if any, to its shareholders monthly and records such dividends on ex-dividend date. Generally, the Fund distributes net realized taxable capital gains, if any, annually in cash and records them on ex-dividend date. Such distributions on a tax basis are determined in conformity with federal income tax regulations, which may differ from GAAP. Distributions in excess of tax basis earnings and profits, if any, are reported in the Fund’s financial statements as a tax return of capital at fiscal year-end.
Note 3. Investment Advisory Agreement and Other Agreements
The Trust has entered into an Investment Advisory Agreement with the Adviser on behalf of the Fund, pursuant to which the Adviser has overall responsibility for the selection and ongoing monitoring of the Fund’s investments, managing the Fund’s business affairs and providing certain clerical, bookkeeping and other administrative services, and oversight of the Sub-Adviser.
As compensation for its services, the Fund has agreed to pay the Adviser an annual unitary management fee of 0.65% of the Fund’s average daily net assets. Out of the unitary management fee, the Adviser has agreed to pay for substantially all expenses of the Fund, including payments to the Sub-Adviser, set-up fees and commitment fees associated with the Fund’s line of credit and the cost of transfer agency, custody, fund administration, legal, audit and other services, except for advisory fees, distribution fees, if any, brokerage expenses, taxes, interest (including interest expenses associated with the line of credit), acquired fund fees and expenses, if any, litigation expenses and other extraordinary expenses.
The Adviser has entered into a sub-advisory agreement with the Sub-Adviser. The sub-advisory fee is paid by the Adviser to the Sub-Adviser at the annual rate of 40% of compensation paid to the Adviser from the Fund.
Further, through August 31, 2018, the Adviser has contractually agreed to waive a portion of the Fund’s management fee in an amount equal to 100% of the net advisory fees an affiliate of the Adviser receives that are attributable to certain of the Fund’s investments in money market funds managed by that affiliate (excluding investments of cash collateral from securities lending). The Adviser cannot discontinue this waiver prior to its expiration.
For the fiscal year ended October 31, 2016, the Adviser waived fees of $631,998.
The Trust has entered into a Distribution Agreement with Invesco Distributors, Inc. (the “Distributor”), which serves as the distributor of Creation Units for the Fund. The Distributor does not maintain a secondary market in the Shares. The Fund is not charged any fees pursuant to the Distribution Agreement. The Distributor is an affiliate of the Adviser.
The Adviser has entered into a licensing agreement for the Fund with S&P Dow Jones Indices LLC (the “Licensor”). The Underlying Index name trademark is owned by the Licensor. This trademark has been licensed to the Adviser for use by the Fund. The Fund is entitled to use its Underlying Index pursuant to the Trust’s sub-licensing agreement with the Adviser. The Fund is not sponsored, endorsed, sold or promoted by the Licensor, and the Licensor makes no representation regarding the advisability of investing in the Fund.
The Trust has entered into service agreements whereby The Bank of New York Mellon, a wholly-owned subsidiary of The Bank of New York Mellon Corporation, serves as the administrator, custodian, fund accountant and transfer agent for the Fund.
Note 4. Additional Valuation Information
GAAP defines fair value as the price that would be received to sell an asset or paid to transfer a liability in an orderly transaction between market participants at the measurement date, under current market conditions. GAAP establishes a hierarchy that prioritizes the inputs to valuation methods, giving the highest priority to readily available unadjusted quoted prices in an active market for identical assets (Level 1) and the lowest priority to significant unobservable inputs (Level 3), generally when market prices are not readily available or are unreliable. Based on the valuation inputs, the securities or other investments are tiered into one of three levels. Changes in valuation methods may result in transfers in or out of an investment’s assigned level:
| | Level 1 — | Prices are determined using quoted prices in an active market for identical assets. |
| | Level 2 — | Prices are determined using other significant observable inputs. Observable inputs are inputs that other market participants may use in pricing a security. These may include quoted prices for similar securities, interest rates, prepayment speeds, credit risk, yield curves, loss severities, default rates, discount rates, volatilities and others. |
| | Level 3 — | Prices are determined using significant unobservable inputs. In situations where quoted prices or observable inputs are unavailable (for example, when there is little or no market activity for an investment at the end of the period), unobservable inputs may be used. Unobservable inputs reflect the Fund’s own assumptions about the factors market participants would use in determining fair value of the securities or instruments and would be based on the best available information. |
The following is a summary of the tiered valuation input levels, as of October 31, 2016. The level assigned to the securities valuations may not be an indication of the risk or liquidity associated with investing in those securities. Because of the inherent uncertainties of valuation, the values reflected in the financial statements may materially differ from the value received upon actual sale of those investments.
| | | | | | | | | | | | | | | | |
| | | Investments in Securities | |
| | | Level 1 | | | Level 2 | | | Level 3 | | | Total | |
| Variable Rate Senior Loan Interests | | $ | — | | | $ | 5,714,631,856 | | | $ | — | | | $ | 5,714,631,856 | |
| Corporate Bonds | | | — | | | | 240,356,252 | | | | — | | | | 240,356,252 | |
| Money Market Fund | | | 1,096,540,470 | | | | — | | | | — | | | | 1,096,540,470 | |
| | | | | | | | | | | | | | | | |
Total Investments | | $ | 1,096,540,470 | | | $ | 5,954,988,108 | | | $ | — | | | $ | 7,051,528,578 | |
| | | | | | | | | | | | | | | | |
Note 5. Distributions to Shareholders and Tax Components of Net Assets
Tax Character of Distributions to Shareholders Paid During the Fiscal Years Ended October 31, 2016 and 2015:
| | | | | | | | |
| | | 2016 | | | 2015 | |
| Ordinary Income | | | 193,910,528 | | | | 211,354,937 | |
| Return of Capital | | | 16,890,704 | | | | 655,582 | |
Tax Components of Net Assets at Fiscal Year-End:
| | | | |
| Net Unrealized Appreciation (Depreciation) Investments | | $ | (21,483,310 | ) |
| Capital Loss Carryforward | | | (431,899,246 | ) |
| Shares of Beneficial Interest | | | 6,912,129,772 | |
| | | | |
| Total Net Assets | | $ | 6,458,747,216 | |
| | | | |
Capital loss carryforwards are calculated and reported as of a specific date. Results of transactions and other activity after that date may affect the amount of capital loss carryforwards actually available for the Fund to utilize. Capital losses generated in years beginning after December 22, 2010 can be carried forward for an unlimited period, whereas previous losses expire in eight tax years. Capital losses with an expiration period may not be used to offset capital gains until all net capital losses without an expiration date have been utilized. Capital loss carryforwards with no expiration date will retain their character as either short-term or long-term capital losses instead of as short-term capital losses as under prior law. The ability to utilize capital loss carryforwards in the future may be limited under the Internal Revenue Code and related regulations based on the results of future transactions.
The following table presents available capital loss carryforwards and expiration dates for the Fund as of October 31, 2016.
| | | | | | | | | | | | |
| | | Post-effective/no
expiration | | | | |
| | | Short-Term | | | Long-Term | | | Total* | |
| | $ | 93,613,264 | | | $ | 338,285,982 | | | $ | 431,899,246 | |
| * | Capital loss carryforwards as of the date listed above are reduced for limitations, if any, to the extent required by the Internal Revenue Code and may be further limited depending upon a variety of factors, including the realization of net unrealized gains or losses as of the date of any reorganization. |
Note 6. Investment Transactions
For the fiscal year ended October 31, 2016, the cost of securities purchased and proceeds from sales of securities (other than short-term securities, U.S. Treasury obligations and money market funds, if any) were $4,823,698,959 and $3,371,056,171, respectively.
At October 31, 2016, the aggregate cost and net unrealized appreciation (depreciation) of investments for tax purposes were as follows:
| | | | |
| Aggregate unrealized appreciation of investment securities | | $ | 49,362,410 | |
| Aggregate unrealized (depreciation) of investment securities | | | (70,845,720 | ) |
| | | | |
| Net unrealized appreciation (depreciation) of investment securities | | $ | (21,483,310 | ) |
| | | | |
Cost of investments for tax and financial reporting purposes is the same.
Note 7. Trustees’ and Officer’s Fees
Trustees’ and Officer’s Fees include amounts accrued by the Fund to pay remuneration to each Trustee who is not an “interested person” as defined in the 1940 Act (an “Independent Trustee”), any Trustee who is not an affiliate of the Adviser or Distributor (or any of their affiliates) and who is otherwise an “interested person” of the Trust under the 1940 Act (an “Unaffiliated Trustee”) and an Officer of the Trust. The Adviser, as a result of the unitary management fee, pays for such compensation. The Trustee who is an “interested person” of the Trust does not receive any Trustees’ fees.
The Trust has adopted a deferred compensation plan (the “Plan”). Under the Plan, each Independent Trustee or Unaffiliated Trustee who has executed a Deferred Fee Agreement (a “Participating Trustee”) may defer receipt of all or a portion of his compensation (“Deferral Fees”). Such Deferral Fees are deemed to be invested in select PowerShares Funds. The Deferral Fees payable to the Participating Trustee are valued as of the date such Deferral Fees would have been paid to the Participating Trustee. The value increases with contributions or with increases in the value of the Shares selected, and the value decreases with distributions or with declines in the value of the Shares selected. Obligations under the Plan represent unsecured claims against the general assets of the Fund.
Note 8. Senior Loan Participation Commitments
The Fund may invest in participations, assignments, or act as a party to the primary lending syndicate of a senior loan interest to corporations, partnerships, and other entities. When the Fund purchases a participation of a senior loan interest, the Fund typically
enters into a contractual agreement with the lender or other third party selling the participation, but not with the borrower directly. As such, the Fund assumes the credit risk of the borrower, selling participant or other persons interpositioned between the Fund and the borrower.
During the fiscal year end October 31, 2016, there were no interests in senior loans purchased by the Fund on a participation basis.
Note 9. Borrowing
The Fund is a party to a committed line of credit facility with a syndicate administered by State Street Bank and Trust Company. The Fund may borrow up to the lesser of (1) $600,000,000 or (2) the limits set by its prospectus for borrowings. The Adviser, on behalf of the Fund, pays an upfront fee of 0.05% on the commitment amount and a commitment fee of 0.15% on the amount of the commitment that has not been utilized. In case of borrowings from the line of credit, the Fund pays the associated interest expenses. On March 1, 2016, the Board of Trustees approved changes to the upfront fee from 0.05% to 0.10% on the commitment amount, which went into effect on June 1, 2016.
During the fiscal year end October 31, 2016, there were no outstanding borrowings from the line of credit.
Note 10. Capital
Shares are created and redeemed by the Fund only in Creation Units of 100,000 Shares. Only Authorized Participants are permitted to purchase or redeem Creation Units from the Fund. Unlike most ETFs, the Fund currently effects creations and redemptions principally in exchange for the deposit or delivery of cash, rather than principally in exchange for the deposit or delivery of a basket of securities (“Deposit Securities”) because of the nature of the Fund’s investments.
To the extent that the Fund permits transactions in exchange for Deposit Securities, the Fund may issue Shares in advance of receipt of Deposit Securities subject to various conditions, including a requirement to maintain on deposit with the Trust cash at least equal to 105% of the market value of the missing Deposit Securities. In accordance with the Trust’s Participant Agreement, Creation Units will be issued to an Authorized Participant, notwithstanding the fact that the corresponding Deposit Securities have not been received in part or in whole, in reliance on the undertaking of the Authorized Participant to deliver the missing Deposit Securities as soon as possible, which undertaking shall be secured by the Authorized Participant’s delivery and maintenance of collateral consisting of cash in the form of U.S. dollars in immediately available funds having a value (marked-to-market daily) at least equal to 105%, which the Adviser may change from time to time, of the value of the missing Deposit Securities.
Certain transaction fees may be charged by the Fund for creations and redemptions, which are treated as increases in capital.
Transactions in the Fund’s Shares are disclosed in detail in the Statement of Changes in Net Assets.
Note 11. Indemnifications
Under the Trust’s organizational documents, its officers and Trustees are indemnified against certain liabilities arising out of the performance of their duties to the Trust. Each Independent Trustee and Unaffiliated Trustee is also indemnified against certain liabilities arising out of the performance of his duties to the Trust pursuant to an Indemnification Agreement between such trustee and the Trust. Additionally, in the normal course of business, the Trust enters into contracts with service providers that contain general indemnification clauses. The Trust’s maximum exposure under these arrangements is unknown, as this would involve future claims that may be made against the Trust that have not yet occurred. However, based on experience, the Trust believes the risk of loss to be remote.
Report of Independent Registered Public Accounting Firm
To the Board of Trustees and Shareholders of PowerShares Exchange-Traded Fund Trust II:
In our opinion, the accompanying statement of assets and liabilities, including the schedule of investments, and the related statements of operations, of changes in net assets, and of cash flows and the financial highlights present fairly, in all material respects, the financial position of PowerShares Senior Loan Portfolio (a portfolio of PowerShares Exchange-Traded Fund Trust II, hereafter referred to as the “Fund”) as of October 31, 2016, the results of its operations and its cash flows for the year then ended, the changes in its net assets for each of the two years in the period then ended and the financial highlights for each of the five years in the period then ended, in conformity with accounting principles generally accepted in the United States of America. These financial statements and financial highlights (hereafter referred to as “financial statements”) are the responsibility of the Fund’s management. Our responsibility is to express an opinion on these financial statements based on our audit. We conducted our audit of these financial statements in accordance with the standards of the Public Company Accounting Oversight Board (United States). Those standards require that we plan and perform the audit to obtain reasonable assurance about whether the financial statements are free of material misstatement. An audit includes examining, on a test basis, evidence supporting the amounts and disclosures in the financial statements, assessing the accounting principles used and significant estimates made by management, and evaluating the overall financial statement presentation. We believe that our audits, which included confirmation of securities as of October 31, 2016 by correspondence with the custodian and brokers, and the application of alternative auditing procedures where confirmations of security purchases have not been received, provide a reasonable basis for our opinion.
PricewaterhouseCoopers LLP
Chicago, IL
December 22, 2016
Fees and Expenses
As a shareholder of the PowerShares Senior Loan Portfolio (the “Fund”), a series of the PowerShares Exchange-Traded Fund Trust II, you incur a unitary management fee. In addition to the unitary management fee, a shareholder may pay distribution fees, if any, brokerage expenses, taxes, interest (including interest expenses associated with the line of credit), acquired fund fees and expenses, if any, litigation expenses and other extraordinary expenses. The expense examples below are intended to help you understand your ongoing costs (in dollars) of investing in the Fund and to compare these costs with the ongoing costs of investing in other funds.
The example is based on an investment of $1,000 invested at the beginning of the period and held through the six-month period ended October 31, 2016.
Actual Expenses
The first line in the following table provides information about actual account values and actual expenses. You may use the information in this line, together with the amount you invested, to estimate the expenses that you paid over the period. Simply divide your account value by $1,000 (for example, an $8,600 account value divided by $1,000 = 8.6), then multiply the result by the number in the first line under the heading “Expenses Paid During the Six-Month Period” to estimate the expenses you paid on your account during this period.
Hypothetical Example for Comparison Purposes
The second line in the following table provides information about hypothetical account values and hypothetical expenses based on the Fund’s actual expense ratio and an assumed annualized rate of return of 5% per year before expenses, which is not the Fund’s actual return. The hypothetical account values and expenses may not be used to estimate the actual ending account balance or expenses you paid for the period. You may use this information to compare the ongoing costs of investing in the Fund and other funds. To do so, compare this 5% hypothetical example with the 5% hypothetical examples that appear in the shareholder reports of the other funds.
Please note that the expenses shown in the table are meant to highlight your ongoing costs only, and do not reflect any transactional costs, such as sales charges and brokerage commissions. Therefore, the second line in the table is useful in comparing ongoing costs only, and will not help you determine the relative total costs of owning different funds. In addition, if these transactional costs were included, your costs would have been higher.
| | | | | | | | | | | | | | | | |
| | | Beginning
Account Value
May 1, 2016 | | | Ending
Account Value
October 31, 2016 | | | Annualized
Expense Ratio
Based on the
Six-Month Period | | | Expenses Paid
During the
Six-Month Period(1) | |
| PowerShares Senior Loan Portfolio (BKLN) | | | | | | | | | | | | | | | | |
Actual | | $ | 1,000.00 | | | $ | 1,031.01 | | | | 0.63 | % | | $ | 3.22 | |
Hypothetical (5% return before expenses) | | | 1,000.00 | | | | 1,021.97 | | | | 0.63 | | | | 3.20 | |
| (1) | Expenses are calculated using the annualized expense ratio, which represents the ongoing expenses as a percentage of net assets for the six-month period ended October 31, 2016. Expenses are calculated by multiplying the Fund’s annualized expense ratio by the average account value for the period, then multiplying the result by 184/366. Expense ratios for the most recent six-month period may differ from expense ratios based on the annualized data in the Financial Highlights. |
Tax Information
Form 1099-DIV, Form 1042-S and other year-end tax information provide shareholders with actual calendar year amounts that should be included in their tax returns. Shareholders should consult their tax advisors.
The following distribution information is being provided as required by the Internal Revenue Code or to meet a specific state’s requirement.
The Fund designates the following amounts or, if subsequently determined to be different the maximum amount allowable for the fiscal year ended October 31, 2016:
| | | | | |
| Qualified Dividend Income* | | | | 0 | % |
| Corporate Dividends Received Deduction* | | | | 0 | % |
| Qualified Interest Income* | | | | 100 | % |
| * | The above percentages are based on ordinary income dividends paid to shareholders during the Fund’s fiscal year. |
Trustees and Officers
The Independent Trustees, the Unaffiliated Trustees, the Non-Independent Trustees and the executive officers of the Trust, their term of office and length of time served, their principal business occupations during at least the past five years, the number of portfolios in the Fund Complex overseen by each Trustee and the other directorships, if any, held by a Trustee are shown below.
The Trustees and officers information is current as of October 31, 2016.
| | | | | | | | | | |
Name, Address and Year of Birth
of Independent Trustees | | Position(s)
Held
with Trust | | Term of
Office
and
Length of
Time
Served* | | Principal
Occupation(s) During
Past 5 Years | | Number of
Portfolios
in Fund
Complex**
Overseen by
Independent
Trustees | | Other
Directorships
Held by
Independent
Trustees During
the Past 5 Years |
Ronn R. Bagge — 1958 c/o Invesco PowerShares Capital Management LLC 3500 Lacey Road, Suite 700 Downers Grove, IL 60515 | | Chairman of the Nominating and Governance Committee and Trustee | | Chairman of the Nominating and Governance Committee and Trustee since 2007 | | Founder and Principal, YQA Capital Management LLC (1998-Present); formerly Owner/CEO of Electronic Dynamic Balancing Co., Inc. (high-speed rotating equipment service provider). | | 126 | | None |
| | | | | |
Todd J. Barre — 1957 c/o Invesco PowerShares Capital Management LLC 3500 Lacey Road, Suite 700 Downers Grove, IL 60515 | | Trustee | | Since 2010 | | Assistant Professor of Business, Trinity Christian College (2010-2016); formerly Vice President and Senior Investment Strategist (2001-2008), Director of Open Architecture and Trading (2007-2008), Head of Fundamental Research (2004-2007) and Vice President and Senior Fixed Income Strategist (1994-2001), BMO Financial Group/Harris Private Bank. | | 126 | | None |
| | | | | |
Marc M. Kole — 1960 c/o Invesco PowerShares Capital Management LLC 3500 Lacey Road, Suite 700 Downers Grove, IL 60515 | | Chairman of the Audit Committee and Trustee | | Chairman of the Audit Committee since 2008; Trustee since 2007 | | Senior Director of Finance, By The Hand Club for Kids (2015-Present); Formerly: Chief Financial Officer, Hope Network (social services) (2008-2012); Assistant Vice President and Controller, Priority Health (health insurance) (2005-2008); Senior Vice President of Finance, United Healthcare (2004-2005); Chief Accounting Officer, Senior Vice President of Finance, Oxford Health Plans (2000-2004); Audit Partner, Arthur Andersen LLP (1996-2000). | | 126 | | None |
| | | | | |
Yung Bong Lim — 1964 c/o Invesco PowerShares Capital Management LLC 3500 Lacey Road, Suite 700 Downers Grove, IL 60515 | | Chairman of the Investment Oversight Committee and Trustee | | Chairman of the Investment Oversight Committee since 2014; Trustee since 2013 | | Managing Partner, Residential Dynamics Group LLC (2008-Present); formerly, Managing Director, Citadel Investment Group, L.L.C. (1999-2007). | | 126 | | None |
| * | This is the date the Independent Trustee began serving the Trust. He serves an indefinite term, until his successor is elected. |
| ** | Fund Complex includes all open-end funds (including all of their portfolios) advised by the Adviser. At October 31, 2016, the “Fund Family” consisted of the Trust’s 67 portfolios and four other exchange-traded fund trusts with 59 portfolios advised by the Adviser. |
Trustees and Officers (continued)
| | | | | | | | | | |
Name, Address and Year of Birth
of Independent Trustees | | Position(s)
Held
with Trust | | Term of
Office
and
Length of
Time
Served* | | Principal
Occupation(s) During
Past 5 Years | | Number of
Portfolios
in Fund
Complex**
Overseen by
Independent
Trustees | | Other
Directorships
Held by
Independent
Trustees During
the Past 5 Years |
Gary R. Wicker — 1961 c/o Invesco PowerShares Capital Management LLC 3500 Lacey Road, Suite 700 Downers Grove, IL 60515 | | Trustee | | Since 2013 | | Senior Vice President of Global Finance and Chief Financial Officer at RBC Ministries (publishing company) (2013-Present); formerly, Executive Vice President and Chief Financial Officer, Zondervan Publishing (a division of Harper Collins/NewsCorp) (2007-2012); Senior Vice President and Group Controller (2005-2006), Senior Vice President and Chief Financial Officer (2003-2004), Chief Financial Officer (2001-2003), Vice President, Finance and Controller (1999-2001) and Assistant Controller (1997-1999), divisions of The Thomson Corporation (information services provider). | | 126 | | None |
| | | | | |
Donald H. Wilson — 1959 c/o Invesco PowerShares Capital Management LLC 3500 Lacey Road, Suite 700 Downers Grove, IL 60515 | | Chairman of the Board and Trustee | | Chairman since 2012; Trustee since 2007 | | Chairman and Chief Executive Officer, Stone Pillar Advisors, Ltd. (2010-Present); formerly, Chairman, President and Chief Executive Officer, Community Financial Shares, Inc. and Community Bank—Wheaton/Glen Ellyn (subsidiary) (2013-2015); Chief Operating Officer, AMCORE Financial, Inc. (bank holding company) (2007-2009); Executive Vice President and Chief Financial Officer, AMCORE Financial, Inc. (2006-2007); Senior Vice President and Treasurer, Marshall & Ilsley Corp. (bank holding company) (1995-2006). | | 126 | | None |
The Unaffiliated Trustees, their term of office and length of time served, their principal business occupations during the past five years, the number of portfolios in the Fund Complex overseen by the Unaffiliated Trustees and the other directorships, if any, held by such Trustees are shown below.
| | | | | | | | | | |
Philip M. Nussbaum — 1961 c/o Invesco PowerShares Capital Management LLC 3500 Lacey Road, Suite 700 Downers Grove, IL 60515 | | Trustee*** | | Since 2007 | | Chairman, Performance Trust Capital Partners (2004-Present). | | 126 | | None |
| * | This is the date the Independent Trustee began serving the Trust. He serves an indefinite term, until his successor is elected. |
| ** | Fund Complex includes all open-end funds (including all of their portfolios) advised by the Adviser. At October 31, 2016, the “Fund Family” consisted of the Trust’s 67 portfolios and four other exchange-traded fund trusts with 59 portfolios advised by the Adviser. |
| *** | Effective February 25, 2016, Mr. Nussbaum became an Unaffiliated Trustee. |
Trustees and Officers (continued)
The Non-Independent Trustees and the executive officers of the Trust, their term of office and length of time served, their principal business occupations during the past five years, the number of portfolios in the Fund Complex overseen by the Non-Independent Trustees and the other directorships, if any, held by the Trustees are shown below.
| | | | | | | | | | |
Name, Address and Year of Birth
of Non-Independent Trustees | | Position(s)
Held
with Trust | | Term of
Office
and
Length of
Time
Served* | | Principal
Occupation(s) During
Past 5 Years | | Number of
Portfolios
in Fund
Complex**
Overseen by
Non-Independent
Trustees | | Other
Directorships
Held by
Non-Independent
Trustees During
the Past 5 Years |
Kevin M. Carome — 1956 Invesco Ltd. Two Peachtree Pointe, 1555 Peachtree St., N.E., Suite 1800 Atlanta, GA 30309 | | Trustee | | Since 2010 | | Senior Managing Director, Secretary and General Counsel, Invesco Ltd. (2007-Present); Director, Invesco Advisers, Inc. (2009-Present); Director, Invesco Finance PLC, and Invesco Holding Company Limited; Director and Executive Vice President, Invesco Holding Company (US), Inc., Invesco Finance, Inc., Invesco Group Services, Inc., Invesco North American Holdings, Inc., and INVESCO Asset Management (Bermuda) Ltd.; Executive Vice President, Invesco Investments (Bermuda) Ltd., Manager, Horizon Flight Works LLC; Director and Secretary, Invesco Services (Bahamas) Private Limited; formerly, Director and Chairman, INVESCO Funds Group, Inc., Senior Vice President, Secretary and General Counsel, Invesco Advisers, Inc. (2003-2006); Director, Invesco Investments (Bermuda) Ltd. (2008-2016); Senior Vice President and General Counsel, Liberty Financial Companies, Inc. (2000-2001); General Counsel of certain investment management subsidiaries of Liberty Financial Companies, Inc. (1998-2000); Associate General Counsel, Liberty Financial Companies, Inc. (1993-1998); Associate, Ropes & Gray LLP. | | 126 | | None |
| * | This is the date the Non-Independent Trustee began serving the Trust. He serves an indefinite term, until his successor is elected. |
| ** | Fund Complex includes all open-end funds (including all of their portfolios) advised by the Adviser. At October 31, 2016, the “Fund Family” consisted of the Trust’s 67 portfolios and four other exchange-traded fund trusts with 59 portfolios advised by the Adviser. |
Trustees and Officers (continued)
| | | | | | |
Name, Address and Year of Birth
of Executive Officers | | Position(s)
Held
with Trust | | Length of
Time
Served* | | Principal
Occupation(s) During
Past 5 Years |
Daniel E. Draper — 1968 Invesco PowerShares Capital Management LLC 3500 Lacey Road, Suite 700 Downers Grove, IL 60515 | | President and Principal Executive Officer | | Since 2015 | | President and Principal Executive Officer, PowerShares Exchange-Traded Fund Trust, PowerShares Exchange-Traded Fund Trust II, PowerShares India Exchange-Traded Fund Trust, PowerShares Actively Managed Exchange-Traded Fund Trust and PowerShares Actively Managed Exchange-Traded Commodity Fund Trust (2015-Present); Chief Executive Officer and Principal Executive Officer (2016-Present) and Managing Director (2013-Present), Invesco PowerShares Capital Management LLC; Senior Vice President, Invesco Distributors, Inc. (2014-Present); formerly, Vice President, PowerShares Exchange-Traded Fund Trust, PowerShares Exchange-Traded Fund Trust II, PowerShares India Exchange-Traded Fund Trust, PowerShares Actively Managed Exchange-Traded Fund Trust (2013-2015) and PowerShares Actively Managed Exchange-Traded Commodity Fund Trust (2014-2015); Managing Director, Credit Suisse Asset Management (2010-2013) and Lyxor Asset Management/Societe Generale (2007-2010). |
| | | |
Steven M. Hill — 1964 Invesco PowerShares Capital Management LLC 3500 Lacey Road, Suite 700 Downers Grove, IL 60515 | | Vice President and Treasurer | | Since 2013 | | Vice President and Treasurer, PowerShares Exchange-Traded Fund Trust, PowerShares Exchange-Traded Fund Trust II, PowerShares India Exchange-Traded Fund Trust, PowerShares Actively Managed Exchange-Traded Fund Trust (2013-Present) and PowerShares Actively Managed Exchange-Traded Commodity Fund Trust (2014-Present); Head of Global ETF Administration, Invesco PowerShares Capital Management LLC (2011-Present); Principal Financial and Accounting Officer—Investment Pools, Invesco PowerShares Capital Management LLC (2015-Present); formerly, Senior Managing Director and Chief Financial Officer, Destra Capital Management LLC and its subsidiaries (2010-2011); Chief Financial Officer, Destra Investment Trust and Destra Investment Trust II (2010-2011); Senior Managing Director, Claymore Securities, Inc. (2003-2010); and Chief Financial Officer, Claymore sponsored mutual funds (2003-2010). |
| | | |
Peter Hubbard — 1981 Invesco PowerShares Capital Management LLC 3500 Lacey Road, Suite 700 Downers Grove, IL 60515 | | Vice President | | Since 2009 | | Vice President, PowerShares Exchange-Traded Fund Trust, PowerShares Exchange-Traded Fund Trust II, PowerShares India Exchange-Traded Fund Trust, PowerShares Actively Managed Exchange-Traded Fund Trust (2009-Present) and PowerShares Actively Managed Exchange-Traded Commodity Fund Trust (2014-Present); Vice President and Director of Portfolio Management, Invesco PowerShares Capital Management LLC (2010-Present); formerly, Vice President of Portfolio Management, Invesco PowerShares Capital Management LLC (2008-2010); Portfolio Manager, Invesco PowerShares Capital Management LLC (2007-2008); Research Analyst, Invesco PowerShares Capital Management LLC (2005-2007); Research Analyst and Trader, Ritchie Capital, a hedge fund operator (2003-2005). |
| | | |
Christopher Joe — 1969 Invesco PowerShares Capital Management LLC 11 Greenway Plaza, Suite 1000 Houston, TX 77046-1173 | | Chief Compliance Officer | | Since 2012 | | Chief Compliance Officer of Invesco PowerShares Capital Management LLC (2015-Present); Chief Compliance Officer of PowerShares Exchange-Traded Fund Trust, PowerShares Exchange-Traded Fund Trust II, PowerShares India Exchange-Traded Fund Trust, PowerShares Actively Managed Exchange-Traded Fund Trust (2012-Present) and PowerShares Actively Managed Exchange-Traded Commodity Fund Trust (2014-Present); formerly, Chief Compliance Officer, Invesco Investment Advisers, LLC (registered investment adviser) (2010–2013), U.S. Compliance Director, Invesco, Ltd. (2006-2014) and Deputy Chief Compliance Officer of Invesco Advisers, Inc. (2014-2015). |
| * | This is the period for which the Officers began serving the Trust. Each Officer serves an indefinite term, until his or her successor is elected. |
Trustees and Officers (continued)
| | | | | | |
Name, Address and Year of Birth
of Executive Officers | | Position(s)
Held
with Trust | | Length of
Time
Served* | | Principal
Occupation(s) During
Past 5 Years |
Sheri Morris — 1964 Invesco Management Group, Inc. 11 Greenway Plaza, Suite 1000 Houston, TX 77046 | | Vice President | | Since 2012 | | President and Principal Executive Officer, The Invesco Funds (2016-Present); Treasurer, The Invesco Funds (2008-Present); Vice President, Invesco Advisers, Inc. (formerly known as Invesco Institutional (N.A.), Inc.) (registered investment adviser) (2009-Present) and Vice President, PowerShares Exchange-Traded Fund Trust, PowerShares Exchange-Traded Fund Trust II, PowerShares India Exchange-Traded Fund Trust, PowerShares Actively Managed Exchange-Traded Fund Trust (2012-Present) and PowerShares Actively Managed Exchange-Traded Commodity Fund Trust (2014-Present); formerly, Vice President and Principal Financial Officer, The Invesco Funds (2008-2016); Treasurer, PowerShares Exchange-Traded Fund Trust, PowerShares Exchange-Traded Fund Trust II, PowerShares India Exchange-Traded Fund Trust and PowerShares Actively Managed Exchange-Traded Fund Trust (2011-2013); Vice President, Invesco Aim Advisers, Inc., Invesco Aim Capital Management, Inc. and Invesco Aim Private Asset Management, Inc.; Assistant Vice President and Assistant Treasurer, The Invesco Funds and Assistant Vice President, Invesco Advisers, Inc., Invesco Aim Capital Management, Inc. and Invesco Aim Private Asset Management, Inc. |
| | | |
Anna Paglia — 1974 Invesco PowerShares Capital Management LLC 3500 Lacey Road, Suite 700 Downers Grove, IL 60515 | | Secretary | | Since 2011 | | Secretary, PowerShares Exchange-Traded Fund Trust, PowerShares Exchange-Traded Fund Trust II, PowerShares India Exchange-Traded Fund Trust, PowerShares Actively Managed Exchange-Traded Fund Trust (2011-Present) and PowerShares Actively Managed Exchange-Traded Commodity Fund Trust (2014-Present); Head of Legal (2010-Present) and Secretary (2015-Present), Invesco PowerShares Capital Management LLC (2010-Present); formerly, Partner, K&L Gates LLP (formerly, Bell Boyd & Lloyd LLP) (2007-2010); Associate Counsel at Barclays Global Investors Ltd. (2004-2006). |
| | | |
Rudolf E. Reitmann — 1971 Invesco PowerShares Capital Management LLC 3500 Lacey Road, Suite 700 Downers Grove, IL 60515 | | Vice President | | Since 2013 | | Vice President, PowerShares Exchange-Traded Fund Trust, PowerShares Exchange-Traded Fund Trust II, PowerShares India Exchange-Traded Fund Trust, PowerShares Actively Managed Exchange-Traded Fund Trust (2013-Present) and PowerShares Actively Managed Exchange-Traded Commodity Fund Trust (2014-Present); Head of Global Exchange Traded Funds Services, Invesco PowerShares Capital Management LLC (2013-Present). |
| | | |
David Warren — 1957 Invesco Canada Ltd. 5140 Yonge Street, Suite 800 Toronto, Ontario M2N 6X7 | | Vice President | | Since 2009 | | Vice President, PowerShares Exchange-Traded Fund Trust, PowerShares Exchange-Traded Fund Trust II, PowerShares India Exchange-Traded Fund Trust, and PowerShares Actively Managed Exchange-Traded Fund Trust (2009-Present) and PowerShares Actively Managed Exchange-Traded Commodity Fund Trust (2014-Present); Managing Director—Chief Administrative Officer, Americas, Invesco PowerShares Capital Management LLC; Senior Vice President, Invesco Advisers, Inc. (2009-Present); Director, Invesco Inc. (2009-Present); Senior Vice President, Invesco Management Group, Inc. (2007-Present); Director, Executive Vice President and Chief Financial Officer, Invesco Canada Ltd. (formerly, Invesco Trimark Ltd.); Chief Administrative Officer, North American Retail, Invesco Ltd. (2007-Present); Director, Invesco Corporate Class Inc. (2014-Present); Director, Invesco Global Direct Real Estate Feeder GP Ltd. (2015-Present); Director, Invesco Canada Holdings Inc. (2002-Present); Director, Invesco Financial Services Ltd./Services Financiers Invesco Ltée and Trimark Investments Ltd./Placements Trimark Ltée (2014-Present); Director, Invesco IP Holdings (Canada) Ltd. (2016-Present); Director, Invesco Global Direct Real Estate GP Ltd. (2015-Present); formerly, Executive Vice President and Chief Financial Officer, Invesco Inc. (2009-2015); Director, Executive Vice President and Chief Financial Officer, Invesco Canada Ltd. (formerly, Invesco Trimark Ltd.) (2000-2011). |
Availability of Additional Information About the Trustees
The Statement of Additional Information includes additional information about the Trustees and is available, without charge, upon request at (800) 983-0903.
| * | This is the period for which the Officers began serving the Trust. Each Officer serves an indefinite term, until his or her successor is elected. |
(This Page Intentionally Left Blank)
(This Page Intentionally Left Blank)
Proxy Voting Policies and Procedures
A description of the Trust’s proxy voting policies and procedures that the Fund uses to determine how to vote proxies relating to portfolio securities is available, without charge and upon request, by calling (800) 983-0903. This information is also available on the Securities and Exchange Commission’s (“Commission”) website at www.sec.gov.
Information regarding how the Fund voted proxies for portfolio securities, if applicable, during the most recent 12-month period ended June 30, is also available, without charge and upon request, by (i) calling (800) 983-0903; or (ii) accessing the Trust’s Form N-PX on the Commission’s website at www.sec.gov.
Quarterly Portfolios
The Trust files its complete schedule of portfolio holdings for the Fund with the Commission for the first and third quarters of each fiscal year on Form N-Q. The Trust’s Forms N-Q are available on the Commission’s website at www.sec.gov. The Trust’s Forms N-Q may also be reviewed and copied at the Commission’s Public Reference Room in Washington, DC; information on the operation of the Public Reference Room may be obtained by calling (800) SEC-0330.
Frequency Distribution of Discounts and Premiums
A table showing the number of days the market price of the Fund’s shares was greater than the Fund’s net asset value, and the number of days it was less than the Fund’s net asset value (i.e., premium or discount) for the most recently completed calendar year, and the calendar quarters since that year end (or the life of the Fund, if shorter) may be found at the Fund’s website at www.invescopowershares.com.
| | | | | | |
| P-BKLN-AR-1 | |  |
©2016 Invesco PowerShares Capital Management LLC 3500 Lacey Road, Suite 700 Downers Grove, IL 60515 | |
| powershares.com 800 983 0903 | |  | | @PowerShares | |

2016 Annual Report to Shareholders
| | |
| |
| IDLB | | PowerShares FTSE International Low Beta Equal Weight Portfolio |
| |
| USLB | | PowerShares Russell 1000 Low Beta Equal Weight Portfolio |
| |
| XRLV | | PowerShares S&P 500® ex-Rate Sensitive Low Volatility Portfolio |
| |
| SPHB | | PowerShares S&P 500® High Beta Portfolio |
| |
| SPHD | | PowerShares S&P 500® High Dividend Low Volatility Portfolio |
| |
| SPLV | | PowerShares S&P 500® Low Volatility Portfolio |
| |
| SPMO | | PowerShares S&P 500 Momentum Portfolio |
| |
| SPVU | | PowerShares S&P 500 Value Portfolio |
| |
| EELV | | PowerShares S&P Emerging Markets Low Volatility Portfolio |
| |
| EEMO | | PowerShares S&P Emerging Markets Momentum Portfolio |
| |
| IDLV | | PowerShares S&P International Developed Low Volatility Portfolio |
| |
| IDMO | | PowerShares S&P International Developed Momentum Portfolio |
| |
| XMLV | | PowerShares S&P MidCap Low Volatility Portfolio |
| |
| XSLV | | PowerShares S&P SmallCap Low Volatility Portfolio |
Table of Contents
The Market Environment
US Equity
During the fiscal year ended October 31, 2016, the US economy continued to expand. The initial estimate of US gross domestic product (GDP) showed the US economy grew by 2.9% in the third calendar quarter of 2016, beating consensus estimates.1 However, annualized GDP is expected to be lower. Employment data were mixed, though the unemployment rate had a surprise uptick from 4.9% in August to 5.0% in September before ending the fiscal year at 4.9%.2 Oil prices traded in a range from the high $20s to the low $50s during the reporting period.3
The US Federal Reserve (the Fed) raised interest rates in December 2015—its first increase since 2006—but that was its only increase during the reporting period. Major US stock market indexes posted gains for the reporting period, but they were fairly volatile. Stocks began calendar year 2016 on a negative note, driven by investor concerns about economic weakness in China, falling oil prices and uncertainty over Fed policy, including rumors of possible negative interest rates in the US. Markets recovered in late February and posted gains until June when UK voters opted to leave the European Union, sending markets sharply lower once again. Markets again recovered, and major US equity indexes hit record highs during the summer.4 In this environment, investors generally favored the perceived safety of government bonds and more defensive, dividend-paying equities often found in the telecommunication services, utilities and consumer staples sectors.
Global Equity
The global economy continued to expand, albeit slowly, for the fiscal year ended October 31, 2016. However, that growth became increasingly uneven across developed and emerging economies, amid continued volatility in oil prices and as the policies of central banks globally began to diverge.
Equity market rallies in October and November 2015 were offset by negative performance in December, as a late-year crash in oil prices rattled the markets. Also in December, the US Federal Reserve (the Fed) followed through on its commitment to normalize monetary policy by raising interest rates—its first increase since 2006—even as the European Central Bank extended its asset purchase program and Japan introduced additional quantitative easing and negative interest rates.1
Stocks began calendar year 2016 on a negative note, driven by investor concerns about economic weakness in China and falling oil prices. Markets recovered in late February and posted gains amid concerted central bank commitments to very loose monetary policy. As a result, the US dollar fell sharply against the euro and Japanese yen, a development that was largely supportive of oil and stock prices.
All major global stock indexes experienced steep declines again in June after UK voters opted to leave the European Union—resulting in a sharp stock-market sell-off. Stocks in economically sensitive sectors, including energy and financials, were hardest hit, and investors flocked to the perceived safety of US Treasuries and more defensive, dividend-paying equities often found in the telecommunication services, utilities and consumer staples sectors.
After the initial shock of the UK vote, stocks made a strong recovery, regaining most of their losses as fears of a shock to consumer confidence never materialized. For the remainder of the reporting period, emerging markets outperformed as the Fed left interest rates unchanged and expectations for an interest rate increase were delayed again.
| 1 | Source: Bureau of Economic Analysis |
| 2 | Source: Bureau of Labor Statistics |
| 3 | Source: Thompson-Reuters |
| | |
| IDLB | | Manager’s Analysis |
| | PowerShares FTSE International Low Beta Equal Weight Portfolio (IDLB) |
As an index fund, the PowerShares FTSE International Low Beta Equal Weight Portfolio (the “Fund”) is passively managed and attempts to track the returns of an underlying index. The Fund seeks investment results that generally correspond (before fees and expenses) to the price and yield of the FTSE Developed ex U.S. Low Beta Equal Weight Index (Net) (the “Index”). The Fund generally will invest at least 90% of its total assets in common stocks that comprise the Index.
Strictly in accordance with its guidelines and mandated procedures, FTSE International Limited (the “Index Provider”) compiles, maintains and calculates the Index, which is designed to provide exposure to constituents of the FTSE Developed ex US Index (the “Developed ex US Index”) that exhibit low beta characteristics. The Developed ex US Index is designed to measure the performance of the international equity markets, and consists of large and mid-cap companies from developed markets throughout the world, excluding the U.S. Beta is a measure of a security’s price sensitivity (i.e., volatility); it reflects the rate of change in a security’s price that results from overall market movements. Securities with a beta score less than that of the average beta score of the relevant country index (that is, securities whose price changes exhibit less volatility than the average amount of volatility in the market of the issuer’s country) are eligible for inclusion in the Index. The Index is equally weighted, meaning that the Index Provider assigns each component security the same weight in the Index. The Fund generally invests in all of the securities comprising the Index in proportion to their weighting in the Index.
The Fund commenced investment operations on November 4, 2015, and began trading on November 5, 2015. During the period from inception to October 31, 2016, on a market price basis, the Fund returned 2.16%. On a net asset value (“NAV”) basis, the Fund returned 2.17%. During the same time period, the Index returned 2.77%. During the fiscal period, the Fund fully replicated the components of the Index; therefore, the Fund’s performance (NAV basis) differed from the return of the Index primarily due to fees and operating expenses that the Fund incurred during the period.
During this same time period, the MSCI World ex USA Index (Net) (the “Benchmark Index”) returned (1.59)%. The Benchmark Index is an unmanaged index weighted by market capitalization based on the average performance of approximately 1,020 securities.
The Benchmark Index was selected for its recognition in the marketplace, and its performance comparison is a useful measure for investors as a broad representation of the overall international equity market. The performance of the Fund differed from the Benchmark Index primarily due to stock selection in health care, consumer staples and consumer discretionary sectors.
Relative to the Benchmark Index, the Fund was most overweight in the industrials sector and most underweight in the financials sector during the fiscal period ended October 31, 2016.
For the fiscal period ended October 31, 2016, the consumer staples sector contributed most significantly to the Fund’s return, followed by the information technology and materials sectors. The financials sector detracted most significantly from the Fund’s return, followed by the telecommunication services and utilities sectors.
Positions that contributed most significantly to the Fund’s return included Fortescue Metals Group Ltd., a materials company (no longer held at fiscal year-end), and Melrose Industries PLC, an industrials company (no longer held at fiscal year-end). Positions that detracted most significantly from the Fund’s return included Sports Direct International PLC, a consumer discretionary company (portfolio average weight of 0.09%), and Capita PLC, an industrials company (portfolio average weight of 0.11%).
| | | | |
Sector Breakdown
(% of the Fund’s Net Assets)
as of October 31, 2016 | |
| Industrials | | | 19.0 | |
| Consumer Discretionary | | | 18.1 | |
| Consumer Staples | | | 13.2 | |
| Financials | | | 12.3 | |
| Information Technology | | | 7.6 | |
| Health Care | | | 7.0 | |
| Real Estate | | | 6.7 | |
| Materials | | | 5.7 | |
| Utilities | | | 4.8 | |
| Telecommunication Services | | | 3.7 | |
| Energy | | | 1.7 | |
| Money Market Fund Plus Other Assets Less Liabilities | | | 0.2 | |
|
Top Ten Fund Holdings*
(% of the Fund’s Net Assets)
as of October 31, 2016 | |
| Security | | | | |
| Calsonic Kansei Corp. | | | 0.2 | |
| Kusuri NO Aoki Co. Ltd. | | | 0.2 | |
| Daikyo, Inc. | | | 0.2 | |
| Coca-Cola West Co. Ltd. | | | 0.2 | |
| STMicroelectronics NV | | | 0.2 | |
| Ryohin Keikaku Co. Ltd. | | | 0.1 | |
| Coca-Cola East Japan Co. Ltd. | | | 0.1 | |
| Cosmos Pharmaceutical Corp. | | | 0.1 | |
| ASM Pacific Technology Ltd. | | | 0.1 | |
| Global Brands Group Holding Ltd. | | | 0.1 | |
| Total | | | 1.5 | |
| * | Excluding money market fund holdings. |
PowerShares FTSE International Low Beta Equal Weight Portfolio (IDLB) (continued)
Growth of a $10,000 Investment Since Inception†
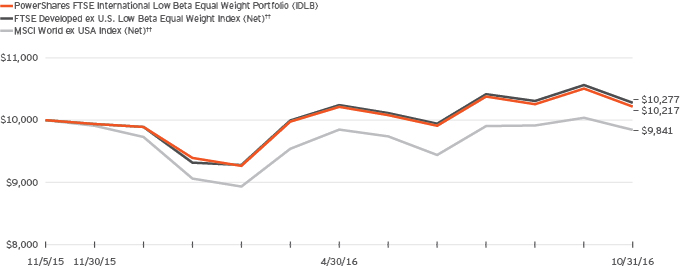
Fund Performance History as of October 31, 2016
| | | | |
| | | Fund Inception† | |
| Index | | Cumulative | |
| FTSE Developed ex U.S. Low Beta Equal Weight Index (Net)†† | | | 2.77 | % |
| MSCI World ex USA Index (Net)†† | | | (1.59 | ) |
| Fund | | | |
| NAV Return | | | 2.17 | |
| Market Price Return | | | 2.16 | |
Fund Inception: November 5, 2015
Performance quoted above represents past performance. Past performance is not a guarantee of future results and current performance may be higher or lower than performance quoted. Investment returns and principal value will fluctuate, and shares of the Fund (“Fund Shares”), when redeemed or sold, may be worth more or less than their original cost. Fund performance reflects any applicable fee waivers and/or expense reimbursements. Had the adviser not waived fees and/or reimbursed expenses currently or in the past, returns would have been lower. See current prospectus for more information. According to the Fund’s current prospectus, the Fund’s expense ratio of 0.45% is expressed as a unitary management fee to cover operating expenses and expenses incurred in connection with managing the portfolio. NAV and Market Price returns assume that dividends and capital gain distributions have been reinvested in the Fund at NAV and Market Price, respectively. The returns shown in the table above do not reflect the deduction of taxes that a shareholder would pay on Fund
distributions or the redemption or sale of Fund Shares. See invescopowershares.com to find the most recent month-end performance numbers.
Index and Benchmark Index performance results are based upon a hypothetical investment in their respective constituent securities. Index and Benchmark Index returns do not represent Fund returns. An investor cannot invest directly in an index. The Index and Benchmark Index do not charge management fees or brokerage expenses, and no such fees or expenses were deducted from the hypothetical performance shown. In addition, the results actual investors might have achieved would have differed from those shown because of differences in the timing, amounts of their investments, and fees and expenses associated with an investment in the Fund.
| † | Fund, Index and Benchmark Index returns are based on the inception date of the Fund. |
| †† | Reflects reinvested dividends net of withholding taxes. |
| | |
| USLB | | Manager’s Analysis |
| | PowerShares Russell 1000 Low Beta Equal Weight Portfolio (USLB) |
As an index fund, the PowerShares Russell 1000 Low Beta Equal Weight Portfolio (the “Fund”) is passively managed and attempts to track the returns of an underlying index. The Fund seeks investment results that generally correspond (before fees and expenses) to the price and yield of the Russell 1000® Low Beta Equal Weight Index (the “Index”). The Fund generally will invest at least 90% of its total assets in common stocks that comprise the Index.
Strictly in accordance with its guidelines and mandated procedures, Frank Russell Company (the “Index Provider”) compiles, maintains and calculates the Index, which is designed to provide exposure to constituents of the Russell 1000® Index (the “Russell 1000” or “Benchmark Index”) that exhibit low beta characteristics. The Russell 1000 is designed to measure the performance of the U.S. equity market, and consists of the stocks of the largest 1,000 companies by capitalization in the U.S. Beta is a measure of a security’s price sensitivity (i.e., volatility); it reflects the rate of change in a security’s price that results from overall market movements. To calculate the beta score for each security in the Russell 1000, the Index Provider analyzes the security’s monthly returns over the past eighteen months to see the extent to which they correlate to overall market movements. Securities with a beta score of less than that of the overall U.S. equity market average (that is, securities whose price changes exhibit less volatility than the average amount of volatility in the market) are eligible for inclusion in the Index. The Index is equally weighted, meaning that the Index Provider assigns each component security the same weight in the Index. The Fund generally invests in all of the securities comprising the Index proportion to their weighting in the Index.
The Fund commenced investment operations on November 2, 2015, and began trading on November 5, 2015. During the period from inception to October 31, 2016, on a market price basis, the Fund returned 4.15%. On a net asset value (“NAV”) basis, the Fund returned 4.19%. During the same time period, the Index returned 4.55%. During the fiscal period, the Fund fully replicated the components of the Index; therefore, the Fund’s performance (NAV basis) differed from the return of the Index primarily due to adverse trade execution associated with portfolio rebalances and to a lesser extent fees and operating expenses that the Fund incurred.
During this same time period, the Benchmark Index returned 3.16%. The Benchmark Index is an unmanaged index weighted by market capitalization based on the average performance of approximately 1,000 securities. The Benchmark Index was selected for its recognition in the marketplace, and its performance comparison is a useful measure for investors as a broad representation of the overall U.S. stock market.
Relative to the Benchmark Index, the Fund was most overweight in the real estate sector and most underweight in the information technology sector during the fiscal period ended October 31, 2016. The majority of the Fund’s outperformance relative to the Benchmark Index during the period can be attributed to its allocation to the utilities sector.
For the fiscal period ended October 31, 2016, the utilities sector contributed most significantly to the Fund’s return, followed by the industrials and consumer staples sectors. The energy sector detracted most significantly from the Fund’s return, followed by the consumer discretionary sector.
Positions that contributed most significantly to the Fund’s return included Newmont Mining Corp., a materials company (portfolio average weight of 0.36%), and ONEOK, Inc., a utilities company (no longer held at fiscal year-end). Positions that detracted most significantly from the Fund’s return included CF Industries Holdings, Inc., a materials company (portfolio average weight of 0.21%), and Perrigo Co. PLC, a health care company (portfolio average weight of 0.23%).
| | | | |
Sector Breakdown
(% of the Fund’s Net Assets)
as of October 31, 2016 | |
| Consumer Discretionary | | | 17.2 | |
| Financials | | | 14.2 | |
| Real Estate | | | 13.3 | |
| Industrials | | | 13.1 | |
| Health Care | | | 11.9 | |
| Information Technology | | | 10.4 | |
| Consumer Staples | | | 8.5 | |
| Utilities | | | 7.0 | |
| Materials | | | 2.3 | |
| Energy | | | 1.3 | |
| Telecommunication Services | | | 0.8 | |
| Money Market Fund Plus Other Assets Less Liabilities | | | 0.0 | |
|
Top Ten Fund Holdings*
(% of the Fund’s Net Assets)
as of October 31, 2016 | |
| Security | | | | |
| Quintiles IMS Holdings, Inc. | | | 0.4 | |
| KeyCorp | | | 0.4 | |
| Gap, Inc. (The) | | | 0.3 | |
| Domino’s Pizza, Inc. | | | 0.3 | |
| Nordstrom, Inc. | | | 0.3 | |
| Endurance Specialty Holdings Ltd. | | | 0.3 | |
| Spectra Energy Corp. | | | 0.3 | |
| Dick’s Sporting Goods, Inc. | | | 0.3 | |
| American Airlines Group, Inc. | | | 0.3 | |
| Cabela’s, Inc. | | | 0.3 | |
| Total | | | 3.2 | |
| * | Excluding money market fund holdings. |
PowerShares Russell 1000 Low Beta Equal Weight Portfolio (USLB) (continued)
Growth of a $10,000 Investment Since Inception†
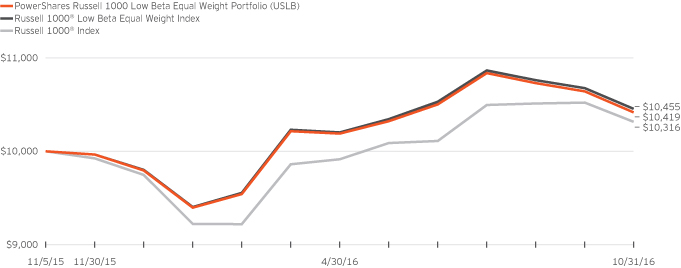
Fund Performance History as of October 31, 2016
| | | | |
| | | Fund Inception† | |
| Index | | Cumulative | |
| Russell 1000® Low Beta Equal Weight Index | | | 4.55 | % |
| Russell 1000® Index | | | 3.16 | |
| Fund | | | |
| NAV Return | | | 4.19 | |
| Market Price Return | | | 4.15 | |
Fund Inception: November 5, 2015
Performance quoted above represents past performance. Past performance is not a guarantee of future results and current performance may be higher or lower than performance quoted. Investment returns and principal value will fluctuate, and shares of the Fund (“Fund Shares”), when redeemed or sold, may be worth more or less than their original cost. Fund performance reflects any applicable fee waivers and/or expense reimbursements. Had the adviser not waived fees and/or reimbursed expenses currently or in the past, returns would have been lower. See current prospectus for more information. According to the Fund’s current prospectus, the Fund’s expense ratio of 0.35% is expressed as a unitary management fee to cover operating expenses and expenses incurred in connection with managing the portfolio. NAV and Market Price returns assume that dividends and capital gain distributions have been reinvested in the Fund at NAV and Market Price, respectively. The returns shown in the table above do not
reflect the deduction of taxes that a shareholder would pay on Fund distributions or the redemption or sale of Fund Shares. See invescopowershares.com to find the most recent month-end performance numbers.
Index and Benchmark Index performance results are based upon a hypothetical investment in their respective constituent securities. Index and Benchmark Index returns do not represent Fund returns. An investor cannot invest directly in an index. The Index and Benchmark Index do not charge management fees or brokerage expenses, and no such fees or expenses were deducted from the hypothetical performance shown. In addition, the results actual investors might have achieved would have differed from those shown because of differences in the timing, amounts of their investments, and fees and expenses associated with an investment in the Fund.
| † | Fund, Index and Benchmark Index returns are based on the inception date of the Fund. |
| | |
| XRLV | | Manager’s Analysis |
| | PowerShares S&P 500® ex-Rate Sensitive Low Volatility Portfolio (XRLV) |
As an index fund, the PowerShares S&P 500® ex-Rate Sensitive Low Volatility Portfolio (the “Fund”) is passively managed and attempts to track the returns of an underlying index. The Fund seeks investment results that generally correspond (before fees and expenses) to the price and yield of the S&P 500® Low Volatility Rate Response Index (the “Index”). The Fund generally will invest at least 90% of its total assets in common stocks that comprise the Index.
Strictly in accordance with its guidelines and mandated procedures, S&P Dow Jones Indices LLC (the “Index Provider”) compiles, maintains and calculates the Index, which is designed to provide exposure to the 100 constituents of the S&P 500® Index (the “Benchmark Index”) that exhibit both low volatility and low interest rate risk. The Index is designed to include stocks exhibiting low volatility characteristics, after removing stocks that historically have performed poorly in rising interest rate environments. Volatility is a statistical measurement of the magnitude of up and down asset price fluctuations (increases or decreases in a stock’s price) over time. The Index Provider determines a stock’s “rate sensitivity” by performing a regression of the stock’s returns over a five-year period to changes in interest rates over that same period. The Fund generally invests in all of the securities comprising the Index in proportion to their weightings in the Index.
For the fiscal year ended October 31, 2016, on a market price basis, the Fund returned 7.08%. On a net asset value (“NAV”) basis, the Fund returned 7.29%. During the same time period, the Index returned 7.55%. During the fiscal year, the Fund fully replicated the components of the Index; therefore, the Fund’s performance (NAV basis) differed from the return of the Index primarily due to fees and operating expenses that the Fund incurred during the period.
During this same time period, the Benchmark Index returned 4.51%. The Benchmark Index is an unmanaged index weighted by market capitalization based on the average performance of approximately 500 securities. The Benchmark Index was selected for its recognition in the marketplace, and its performance comparison is a useful measure for investors as a broad representation of the overall U.S. stock market. The performance of the Fund differed from the Benchmark Index in part because the Fund attempts to track an Index that is a subset of the Benchmark Index, consisting of the 100 securities within the Benchmark Index that historically have had the highest sensitivity to interest rate movements and the lowest volatility.
Relative to the Benchmark Index, the Fund was most overweight in the industrials sector and most underweight in the information technology sector during the fiscal year ended October 31, 2016. The majority of the Fund’s outperformance relative to the Benchmark Index during the period can be attributed to security selection within the health care and financials sectors.
For the fiscal year ended October 31, 2016, the industrials sector contributed most significantly to the Fund’s return, followed by the consumer staples and health care sectors. The real estate sector detracted most significantly from the Fund’s return, followed by the energy sector.
Positions that contributed most significantly to the Fund’s return included Airgas, Inc., a materials company (no longer held at fiscal year-end), and AT&T, Inc., a telecommunication services company (no longer held at fiscal year-end). Positions that detracted most significantly from the Fund’s return included SL Green Realty Corp. REIT, a financials company (no longer held at fiscal year-end), and AmerisourceBergen Corp., a health care company (portfolio average weight of 1.02%).
| | | | |
Sector Breakdown
(% of the Fund’s Net Assets)
as of October 31, 2016 | |
| Industrials | | | 25.6 | |
| Health Care | | | 22.2 | |
| Financials | | | 16.9 | |
| Consumer Staples | | | 12.7 | |
| Consumer Discretionary | | | 9.2 | |
| Information Technology | | | 8.8 | |
| Materials | | | 2.8 | |
| Real Estate | | | 1.8 | |
| Other Assets Less Liabilities | | | (0.0) | |
|
Top Ten Fund Holdings
(% of the Fund’s Net Assets)
as of October 31, 2016 | |
| Security | | | | |
| Republic Services, Inc. | | | 1.4 | |
| Procter & Gamble Co. (The) | | | 1.3 | |
| Coca-Cola Co. (The) | | | 1.3 | |
| United Parcel Service, Inc., Class B | | | 1.3 | |
| Johnson & Johnson | | | 1.3 | |
| Lockheed Martin Corp. | | | 1.3 | |
| Philip Morris International, Inc. | | | 1.2 | |
| Northrop Grumman Corp. | | | 1.2 | |
| Loews Corp. | | | 1.2 | |
| Berkshire Hathaway, Inc., Class B | | | 1.2 | |
| Total | | | 12.7 | |
PowerShares S&P 500® ex-Rate Sensitive Low Volatility Portfolio (XRLV) (continued)
Growth of a $10,000 Investment Since Inception†
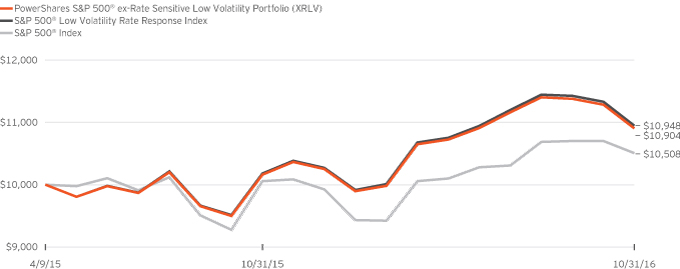
Fund Performance History as of October 31, 2016
| | | | | | | | | | | | | | | | | | | | | | | | | | | | | | | | |
| | | | | | | | | | | | | | | 1 Year | | | | | | Fund Inception† | |
| Index | | | | | | | | Average
Annualized | | | Cumulative | |
| S&P 500® Low Volatility Rate Response Index | | | | | | | | | | | | | | | | | | | 7.55 | % | | | | | | | 5.98 | % | | | 9.48 | % |
| S&P 500® Index | | | | | | | | | | | | | | | | | | | 4.51 | | | | | | | | 3.23 | | | | 5.08 | |
| Fund | | | | | | | | | | | | | | | | | | | | | | | | |
| NAV Return | | | | | | | | | | | | | | | | | | | 7.29 | | | | | | | | 5.70 | | | | 9.04 | |
| Market Price Return | | | | | | | | | | | | | | | | | | | 7.08 | | | | | | | | 5.67 | | | | 8.99 | |
Fund Inception: April 9, 2015
Performance quoted above represents past performance. Past performance is not a guarantee of future results and current performance may be higher or lower than performance quoted. Investment returns and principal value will fluctuate, and shares of the Fund (“Fund Shares”), when redeemed or sold, may be worth more or less than their original cost. Fund performance reflects any applicable fee waivers and/or expense reimbursements. Had the adviser not waived fees and/or reimbursed expenses currently or in the past, returns would have been lower. See current prospectus for more information. According to the Fund’s current prospectus, the Fund’s expense ratio of 0.25% is expressed as a unitary management fee to cover operating expenses and expenses incurred in connection with managing the portfolio. NAV and Market Price returns assume that dividends and capital gain distributions have been reinvested in the Fund at NAV and Market Price, respectively. The returns shown in the table above do not
reflect the deduction of taxes that a shareholder would pay on Fund distributions or the redemption or sale of Fund Shares. See invescopowershares.com to find the most recent month-end performance numbers.
Index and Benchmark Index performance results are based upon a hypothetical investment in their respective constituent securities. Index and Benchmark Index returns do not represent Fund returns. An investor cannot invest directly in an index. The Index and Benchmark Index do not charge management fees or brokerage expenses, and no such fees or expenses were deducted from the hypothetical performance shown. In addition, the results actual investors might have achieved would have differed from those shown because of differences in the timing, amounts of their investments, and fees and expenses associated with an investment in the Fund.
| † | Fund, Index and Benchmark Index returns are based on the inception date of the Fund. |
| | |
| SPHB | | Manager’s Analysis |
| | PowerShares S&P 500® High Beta Portfolio (SPHB) |
As an index fund, the PowerShares S&P 500® High Beta Portfolio (the “Fund”) is passively managed and attempts to track the returns of an underlying index. The Fund seeks investment results that generally correspond (before fees and expenses) to the price and yield of the S&P 500® High Beta Index (the “Index”). The Fund generally will invest at least 90% of its total assets in securities that comprise the Index.
S&P Dow Jones Indices LLC (“S&P DJI” or the “Index Provider”) compiles, maintains and calculates the Index. Strictly in accordance with its existing guidelines and mandated procedures, S&P DJI selects 100 securities from the S&P 500® Index (the “Benchmark Index”) for inclusion in the Index that have the highest sensitivity to market movements, or “beta,” over the past 12 months as determined by the Index Provider. Beta is a measure of a security’s price sensitivity (i.e., volatility); it reflects the rate of change in a security’s price that results from overall market movements. The Fund generally invests in all of the securities comprising the Index in proportion to their weightings in the Index.
For the fiscal year ended October 31, 2016, on a market price basis, the Fund returned 3.98%. On a net asset value (“NAV”) basis, the Fund returned 4.02%. During the same time period, the Index returned 4.32%. During the fiscal year, the Fund fully replicated the components of the Index; therefore, the Fund’s performance (NAV basis) differed from the return of the Index primarily due to fees and operating expenses that the Fund incurred during the period.
During this same time period, the Benchmark Index returned 4.51%. The Benchmark Index is an unmanaged index weighted by market capitalization based on the average performance of approximately 500 securities. The Benchmark Index was selected for its recognition in the marketplace, and its performance comparison is a useful measure for investors as a broad representation of the overall U.S. stock market.
Relative to the Benchmark Index, the Fund was most overweight in the energy sector and most underweight in the consumer staples sector during the fiscal year ended October 31, 2016. The majority of the Fund’s underperformance relative to the Benchmark Index during the period can be attributed to stock selection within the financials and health care sectors, allocations to the consumer staples and utilities sectors, as well as fees and operating expenses that the Fund incurred during the period.
For the fiscal year ended October 31, 2016, the energy sector contributed most significantly to the Fund’s return, followed by the information technology and materials sectors, respectively. The health care sector detracted most significantly from the Fund’s return, followed by the financials and consumer discretionary sectors, respectively.
Positions that contributed most significantly to the Fund’s return included ONEOK, Inc., a utilities company (portfolio average weight of 1.18%), and Freeport-McMoRan, Inc., a materials company (portfolio average weight of 1.83%). Positions that detracted most significantly from the Fund’s return included Endo International PLC, a health care company (portfolio average weight of 0.95%), and Vertex Pharmaceuticals, Inc., a health care company (portfolio average weight of 1.01%).
| | | | |
Sector Breakdown
(% of the Fund’s Net Assets)
as of October 31, 2016 | |
| Financials | | | 33.0 | |
| Energy | | | 27.4 | |
| Information Technology | | | 14.1 | |
| Consumer Discretionary | | | 7.6 | |
| Materials | | | 6.0 | |
| Health Care | | | 5.4 | |
| Industrials | | | 3.9 | |
| Real Estate | | | 1.6 | |
| Telecommunication Services | | | 1.0 | |
| Money Market Fund Plus Other Assets Less Liabilities | | | 0.0 | |
|
Top Ten Fund Holdings*
(% of the Fund’s Net Assets)
as of October 31, 2016 | |
| Security | | | | |
| Williams Cos., Inc. (The) | | | 1.8 | |
| Chesapeake Energy Corp. | | | 1.7 | |
| Freeport-McMoRan, Inc. | | | 1.6 | |
| Western Digital Corp. | | | 1.4 | |
| Apache Corp. | | | 1.4 | |
| Micron Technology, Inc. | | | 1.3 | |
| Anadarko Petroleum Corp. | | | 1.3 | |
| Morgan Stanley | | | 1.2 | |
| Lincoln National Corp. | | | 1.2 | |
| E*TRADE Financial Corp. | | | 1.2 | |
| Total | | | 14.1 | |
| * | Excluding money market fund holdings. |
PowerShares S&P 500® High Beta Portfolio (SPHB) (continued)
Growth of a $10,000 Investment Since Inception†
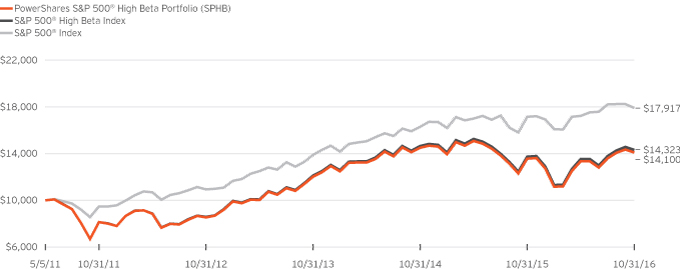
Fund Performance History as of October 31, 2016
| | | | | | | | | | | | | | | | | | | | | | | | | | | | | | | | |
| | | 1 Year | | | 3 Years Average
Annualized | | | 3 Years Cumulative | | | 5 Years Average
Annualized | | | 5 Years Cumulative | | | | | | Fund Inception† | |
| Index | | | | | | | | | | Average
Annualized | | | Cumulative | |
| S&P 500® High Beta Index | | | 4.32 | % | | | 5.73 | % | | | 18.19 | % | | | 11.98 | % | | | 76.08 | % | | | | | | | 6.77 | % | | | 43.23 | % |
| S&P 500® Index | | | 4.51 | | | | 8.84 | | | | 28.93 | | | | 13.57 | | | | 88.90 | | | | | | | | 11.21 | | | | 79.17 | |
| Fund | | | | | | | | | | | | | | | | | | | | | | | | |
| NAV Return | | | 4.02 | | | | 5.42 | | | | 17.17 | | | | 11.66 | | | | 73.59 | | | | | | | | 6.46 | | | | 41.00 | |
| Market Price Return | | | 3.98 | | | | 5.42 | | | | 17.17 | | | | 11.66 | | | | 73.58 | | | | | | | | 6.49 | | | | 41.20 | |
Fund Inception: May 5, 2011
Performance quoted above represents past performance. Past performance is not a guarantee of future results and current performance may be higher or lower than performance quoted. Investment returns and principal value will fluctuate, and shares of the Fund (“Fund Shares”), when redeemed or sold, may be worth more or less than their original cost. Fund performance reflects any applicable fee waivers and/or expense reimbursements. Had the adviser not waived fees and/or reimbursed expenses currently or in the past, returns would have been lower. See current prospectus for more information. According to the Fund’s current prospectus, the Fund’s expense ratio of 0.25% is expressed as a unitary management fee to cover operating expenses and expenses incurred in connection with managing the portfolio. NAV and Market Price returns assume that dividends and capital gain distributions have been reinvested in the Fund at NAV and Market Price, respectively. The returns shown in the table above do not
reflect the deduction of taxes that a shareholder would pay on Fund distributions or the redemption or sale of Fund Shares. See invescopowershares.com to find the most recent month-end performance numbers.
Index and Benchmark Index performance results are based upon a hypothetical investment in their respective constituent securities. Index and Benchmark Index returns do not represent Fund returns. An investor cannot invest directly in an index. The Index and Benchmark Index do not charge management fees or brokerage expenses, and no such fees or expenses were deducted from the hypothetical performance shown. In addition, the results actual investors might have achieved would have differed from those shown because of differences in the timing, amounts of their investments, and fees and expenses associated with an investment in the Fund.
| † | Fund, Index and Benchmark Index returns are based on the inception date of the Fund. |
| | |
| SPHD | | Manager’s Analysis |
| | PowerShares S&P 500® High Dividend Low Volatility Portfolio (SPHD) |
As an index fund, the PowerShares S&P 500® High Dividend Low Volatility Portfolio (the “Fund”) is passively managed and attempts to track the returns of an underlying index. The Fund seeks investment results that generally correspond (before fees and expenses) to the price and yield of the S&P 500® Low Volatility High Dividend Index (the “Index”). The Fund generally will invest at least 90% of its total assets in common stocks that comprise the Index.
S&P Dow Jones Indices LLC (“S&P DJI” or the “Index Provider”) compiles, maintains and calculates the Index, which is composed of 50 securities in the S&P 500® Index (the “Benchmark Index”) that historically have provided high dividend yields with lower volatility. Strictly in accordance with its guidelines and mandated procedures, S&P DJI identifies from the Benchmark Index the 75 securities with the highest dividend yields over the past 12 months, with no one sector within the Benchmark Index allowed to contribute more than 10 securities. From those securities, S&P DJI selects for inclusion in the Index the 50 securities with the lowest volatility over the past 12 months. Volatility is a statistical measurement of the magnitude of up and down asset price fluctuations (increases or decreases in a stock’s price) over time. The Index Provider weights each of the constituent securities in the Index by its dividend yield, with the highest dividend yielding securities receiving the highest weights. The Fund generally invests in all of the securities comprising its Index in proportion to their weightings in the Index.
For the fiscal year ended October 31, 2016, on a market price basis, the Fund returned 17.66%. On a net asset value (“NAV”) basis, the Fund returned 17.75%. During the same time period, the Index returned 18.12%. During the fiscal year, the Fund fully replicated the components of the Index; therefore, the Fund’s performance (NAV basis) differed from the return of the Index primarily due to fees and operating expenses that the Fund incurred during that period.
During this same time period, the Benchmark Index returned 4.51%. The Benchmark Index is an unmanaged index weighted by market capitalization based on the average performance of approximately 500 securities. The adviser provided this additional comparative benchmark to help investors better understand how the investment results of the Fund compare to the performance of a broad-based market benchmark.
The Benchmark Index was selected for its recognition in the marketplace, and its performance comparison is a useful measure for investors as a broad representation of the overall U.S. stock market. The performance of the Fund differed from the Benchmark Index in part because the Fund attempts to track an Index that is a subset of the Benchmark Index, consisting of the 50 securities within the Benchmark Index that historically have provided high dividend yields with lower volatility.
Relative to the Benchmark Index, the Fund was most overweight in the utilities sector and most underweight in the information
technology sector during the fiscal year ended October 31, 2016.
The majority of the Fund’s outperformance relative to the Benchmark Index during the period can be attributed to allocation to the utilities sector and stock selection within the real estate and consumer discretionary sector.
For the fiscal year ended October 31, 2016, the utilities sector contributed most significantly to the Fund’s return, followed by the real estate and industrials sectors, respectively. There were no detracting sectors.
Positions that contributed most significantly to the Fund’s return included Iron Mountain, Inc. REIT, a real estate company (portfolio average weight of 2.37%), and Garmin Ltd., a consumer discretionary company (portfolio average weight of 2.03%). Positions that detracted most significantly from the Fund’s return included E.I. du Pont de Nemours & Co., a materials company (no longer held at fiscal year-end), and Ford Motor Co., a consumer discretionary company (portfolio average weight of 1.90%).
| | | | |
Sector Breakdown
(% of the Fund’s Net Assets)
as of October 31, 2016 | |
| Utilities | | | 18.8 | |
| Industrials | | | 14.4 | |
| Real Estate | | | 13.3 | |
| Information Technology | | | 12.1 | |
| Materials | | | 8.0 | |
| Consumer Discretionary | | | 7.6 | |
| Consumer Staples | | | 6.9 | |
| Telecommunication Services | | | 6.6 | |
| Financials | | | 5.3 | |
| Health Care | | | 4.8 | |
| Energy | | | 2.2 | |
| Other Assets Less Liabilities | | | (0.0) | |
|
Top Ten Fund Holdings
(% of the Fund’s Net Assets)
as of October 31, 2016 | |
| Security | | | | |
| HCP, Inc. | | | 2.8 | |
| CME Group, Inc., Class A | | | 2.8 | |
| General Motors Co. | | | 2.7 | |
| CenturyLink, Inc. | | | 2.7 | |
| Garmin Ltd. | | | 2.7 | |
| People’s United Financial, Inc. | | | 2.6 | |
| PACCAR, Inc. | | | 2.4 | |
| LyondellBasell Industries NV, Class A | | | 2.3 | |
| Caterpillar, Inc. | | | 2.3 | |
| Host Hotels & Resorts, Inc. | | | 2.3 | |
| Total | | | 25.6 | |
PowerShares S&P 500® High Dividend Low Volatility Portfolio (SPHD) (continued)
Growth of a $10,000 Investment Since Inception†
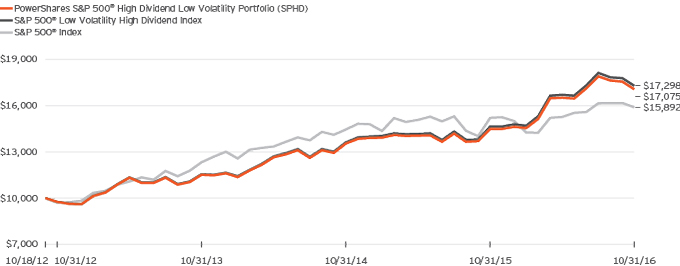
Fund Performance History as of October 31, 2016
| | | | | | | | | | | | | | | | | | | | | | | | | | | | | | |
| | | | | | | | | 1 Year | | | 3 Years
Average
Annualized | | | 3 Years Cumulative | | | | | Fund Inception† | |
| Index | | | | | | | | Average
Annualized | | | Cumulative | |
| S&P 500® Low Volatility High Dividend Index | | | | | | | | | | | 18.12 | % | | | 14.39 | % | | | 49.69 | % | | | | 14.55 | % | | | 72.98 | % |
| S&P 500® Index | | | | | | | | | | | 4.51 | | | | 8.84 | | | | 28.93 | | | | | 12.16 | | | | 58.92 | |
| Fund | | | | | | | | | | |
| NAV Return | | | | | | | | | | | 17.75 | | | | 14.02 | | | | 48.23 | | | | | 14.18 | | | | 70.75 | |
| Market Price Return | | | | | | | | | | | 17.66 | | | | 14.01 | | | | 48.18 | | | | | 14.19 | | | | 70.82 | |
Fund Inception: October 18, 2012
Performance quoted above represents past performance. Past performance is not a guarantee of future results and current performance may be higher or lower than performance quoted. Investment returns and principal value will fluctuate, and shares of the Fund (“Fund Shares”), when redeemed or sold, may be worth more or less than their original cost. Fund performance reflects any applicable fee waivers and/or expense reimbursements. Had the adviser not waived fees and/or reimbursed expenses currently or in the past, returns would have been lower. See current prospectus for more information. According to the Fund’s current prospectus, the Fund’s expense ratio of 0.30% is expressed as a unitary management fee to cover operating expenses and expenses incurred in connection with managing the portfolio. NAV and Market Price returns assume that dividends and capital gain distributions have been reinvested in the Fund at NAV and Market Price, respectively. The returns shown in the table above do not
reflect the deduction of taxes that a shareholder would pay on Fund distributions or the redemption or sale of Fund Shares. See invescopowershares.com to find the most recent month-end performance numbers.
Index and Benchmark Index performance results are based upon a hypothetical investment in their respective constituent securities. Index and Benchmark Index returns do not represent Fund returns. An investor cannot invest directly in an index. The Index and Benchmark Index do not charge management fees or brokerage expenses, and no such fees or expenses were deducted from the hypothetical performance shown. In addition, the results actual investors might have achieved would have differed from those shown because of differences in the timing, amounts of their investments, and fees and expenses associated with an investment in the Fund.
| † | Fund, Index and Benchmark Index returns are based on the inception date of the Fund. |
| | |
| SPLV | | Manager’s Analysis |
| | PowerShares S&P 500® Low Volatility Portfolio (SPLV) |
As an index fund, the PowerShares S&P 500® Low Volatility Portfolio (the “Fund”) is passively managed and attempts to track the returns of an underlying index. The Fund seeks investment results that generally correspond (before fees and expenses) to the price and yield of the S&P 500® Low Volatility Index (the “Index”). The Fund generally will invest at least 90% of its total assets in common stocks that comprise the Index.
S&P Dow Jones Indices LLC (“S&P DJI” or the “Index Provider”) compiles, maintains and calculates the Index. Strictly in accordance with its existing guidelines and mandated procedures, S&P DJI selects 100 securities from the S&P 500® Index (the “Benchmark Index”) for inclusion in the Index that have the lowest realized volatility over the past 12 months as determined by the Index Provider. Volatility is a statistical measurement of the magnitude of up and down asset price fluctuations (increases or decreases in a stock’s price) over time. The Fund generally invests in all of the securities comprising the Index in proportion to their weightings in the Index.
For the fiscal year ended October 31, 2016, on a market price basis, the Fund returned 7.72%. On a net asset value (“NAV”) basis, the Fund returned 7.80%. During the same time period, the Index returned 8.09%. During the fiscal year, the Fund fully replicated the components of the Index; therefore, the Fund’s performance (NAV basis) differed from the return of the Index primarily due to fees and operating expenses that the Fund incurred during the period.
During this same time period, the Benchmark Index returned 4.51%. The Benchmark Index is an unmanaged index weighted by market capitalization based on the average performance of approximately 500 securities. The adviser provided this additional comparative benchmark to help investors better understand how the investment results of the Fund compare to the performance of a broad-based market benchmark.
The Benchmark Index was selected for its recognition in the marketplace, and its performance comparison is a useful measure for investors as a broad representation of the overall U.S. stock market. The performance of the Fund differed from the Benchmark Index in part because the Fund attempts to track an Index that is a subset of the Benchmark Index, consisting of the 100 securities within the Benchmark Index that have the lowest realized volatility over the past 12 months.
Relative to the Benchmark Index, the Fund was most overweight in the utilities sector and most underweight in the information technology sector during the fiscal year ended October 31, 2016. The majority of the Fund’s outperformance relative to the Benchmark Index during the period can be attributed to the utilities sector and stock selection within the health care sector.
For the fiscal year ended October 31, 2016, the utilities sector contributed most significantly to the Fund’s return, followed by the consumer staples and industrials sectors, respectively. The real estate sector was the only detracting sector.
Positions that contributed most significantly to the Fund’s return included Airgas, Inc., a materials company (no longer held at fiscal year-end), and Waste Management, Inc., an industrials company (portfolio average weight of 1.19%). Positions that detracted most significantly from the Fund’s return included SL Green Realty Corp. REIT, a financials company (no longer held at fiscal year-end), and AmerisourceBergen Corp., a health care company (portfolio average weight of 0.98%).
| | | | |
Sector Breakdown
(% of the Fund’s Net Assets)
as of October 31, 2016 | |
| Utilities | | | 23.8 | |
| Consumer Staples | | | 20.4 | |
| Industrials | | | 15.5 | |
| Financials | | | 12.1 | |
| Health Care | | | 10.3 | |
| Real Estate | | | 6.4 | |
| Consumer Discretionary | | | 5.4 | |
| Information Technology | | | 2.8 | |
| Telecommunication Services | | | 2.2 | |
| Materials | | | 1.0 | |
| Other Assets Less Liabilities | | | 0.1 | |
|
Top Ten Fund Holdings
(% of the Fund’s Net Assets)
as of October 31, 2016 | |
| Security | | | | |
| Waste Management, Inc. | | | 1.3 | |
| PepsiCo, Inc. | | | 1.3 | |
| Republic Services, Inc. | | | 1.2 | |
| Procter & Gamble Co. (The) | | | 1.2 | |
| Coca-Cola Co. (The) | | | 1.2 | |
| United Parcel Service, Inc., Class B | | | 1.2 | |
| Southern Co. (The) | | | 1.2 | |
| Johnson & Johnson | | | 1.2 | |
| Dominion Resources, Inc. | | | 1.2 | |
| Lockheed Martin Corp. | | | 1.2 | |
| Total | | | 12.2 | |
PowerShares S&P 500® Low Volatility Portfolio (SPLV) (continued)
Growth of a $10,000 Investment Since Inception†
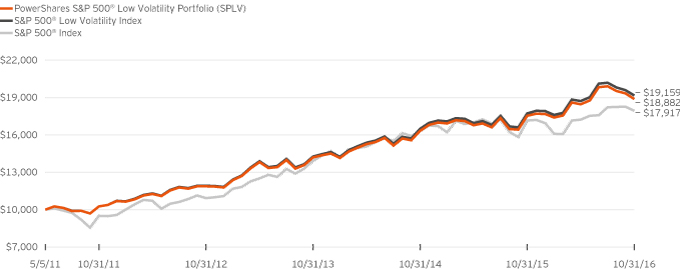
Fund Performance History as of October 31, 2016
| | | | | | | | | | | | | | | | | | | | | | | | | | | | | | | | |
| | | 1 Year | | | 3 Years Average
Annualized | | | 3 Years Cumulative | | | 5 Years Average
Annualized | | | 5 Years Cumulative | | | | | | Fund Inception† | |
| Index | | | | | | | | Average
Annualized | | | Cumulative | |
| S&P 500® Low Volatility Index | | | 8.09 | % | | | 10.32 | % | | | 34.27 | % | | | 13.29 | % | | | 86.64 | % | | | | | | | 12.58 | % | | | 91.59 | % |
| S&P 500® Index | | | 4.51 | | | | 8.84 | | | | 28.93 | | | | 13.57 | | | | 88.90 | | | | | | | | 11.21 | | | | 79.17 | |
| Fund | | | | | | | | | | | | | | | | | | | | | | | | | | | | | | | | |
| NAV Return | | | 7.80 | | | | 10.03 | | | | 33.21 | | | | 12.99 | | | | 84.19 | | | | | | | | 12.27 | | | | 88.82 | |
| Market Price Return | | | 7.72 | | | | 10.02 | | | | 33.18 | | | | 12.98 | | | | 84.10 | | | | | | | | 12.29 | | | | 88.96 | |
Fund Inception: May 5, 2011
Performance quoted above represents past performance. Past performance is not a guarantee of future results and current performance may be higher or lower than performance quoted. Investment returns and principal value will fluctuate, and shares of the Fund (“Fund Shares”), when redeemed or sold, may be worth more or less than their original cost. Fund performance reflects any applicable fee waivers and/or expense reimbursements. Had the adviser not waived fees and/or reimbursed expenses currently or in the past, returns would have been lower. See current prospectus for more information. According to the Fund’s current prospectus, the Fund’s expense ratio of 0.25% is expressed as a unitary management fee to cover operating expenses and expenses incurred in connection with managing the portfolio. NAV and Market Price returns assume that dividends and capital gain distributions have been reinvested in the Fund at NAV and Market Price, respectively. The returns shown in the table above do not
reflect the deduction of taxes that a shareholder would pay on Fund distributions or the redemption or sale of Fund Shares. See invescopowershares.com to find the most recent month-end performance numbers.
Index and Benchmark Index performance results are based upon a hypothetical investment in their respective constituent securities. Index and Benchmark Index returns do not represent Fund returns. An investor cannot invest directly in an index. The Index and Benchmark Index do not charge management fees or brokerage expenses, and no such fees or expenses were deducted from the hypothetical performance shown. In addition, the results actual investors might have achieved would have differed from those shown because of differences in the timing, amounts of their investments, and fees and expenses associated with an investment in the Fund.
| † | Fund, Index and Benchmark Index returns are based on the inception date of the Fund. |
| | |
| SPMO | | Manager’s Analysis |
| | PowerShares S&P 500 Momentum Portfolio (SPMO) |
As an index fund, the PowerShares S&P 500 Momentum Portfolio (the “Fund”) is passively managed and attempts to track the returns of an underlying index. The Fund seeks investment results that generally correspond (before fees and expenses) to the price and yield of the S&P 500® Momentum Index (the “Index”). The Fund generally will invest at least 90% of its total assets in common stocks that comprise the Index.
S&P Dow Jones Indices LLC (the “Index Provider”) compiles, maintains and calculates the Index. Strictly in accordance with its existing guidelines and mandated procedures, the Index Provider selects approximately 100 stocks from the S&P 500® Index (the “Benchmark Index”) that have the highest “momentum score.” In general, momentum is the tendency of an investment to exhibit persistence in its relative performance; a “momentum style” of investing emphasizes investing in securities that have had better recent performance compared to other securities. The momentum score for each security included in the Index is based on upward price movements of the security as compared to other eligible securities within the Benchmark Index.
The Index Provider calculates the momentum score of each stock in the Benchmark Index by evaluating the percentage change in the stock’s price over the last 12 months, excluding the most recent month and then selects the 100 stocks with the highest momentum score for inclusion in the Index using a modified market capitalization-weighted strategy. The Fund generally invests in all of the securities comprising the Index in proportion to their weightings in the Index.
For the fiscal year ended October 31, 2016, on a market price basis, the Fund returned 3.12%. On a net asset value (“NAV”) basis, the Fund returned 3.28%. During the same time period, the Index returned 3.55%. During the fiscal year, the Fund fully replicated the components of the Index; therefore, the Fund’s performance (NAV basis) differed from the return of the Index primarily due to fees and operating expenses that the Fund incurred, as well as trading costs around the semi-annual rebalances during the period.
During this same time period, the Benchmark Index returned 4.51%. The Benchmark Index is an unmanaged index weighted by market capitalization based on the average performance of approximately 500 securities.
The Benchmark Index was selected for its recognition in the marketplace, and its performance comparison is a useful measure for investors as a broad representation of the overall U.S. stock market. The performance of the Fund differed from the Benchmark Index primarily due to the Fund’s thematic objective and the Index Provider’s proprietary weighting methodology.
Relative to the Benchmark Index, the Fund was most overweight in the consumer discretionary sector and most underweight in the financials sector during the fiscal year ended October 31, 2016. The
majority of the Fund’s underperformance relative to the Benchmark Index during the period can be attributed to stock selection in the energy, telecommunication services and utilities sectors.
For the fiscal year ended October 31, 2016, the information technology sector contributed most significantly to the Fund’s return, followed by the consumer staples and consumer discretionary sectors, respectively. The health care sector detracted most significantly from the Fund’s return, followed by the telecommunication services and energy sectors, respectively.
Positions that contributed most significantly to the Fund’s return included Amazon.com, Inc., a consumer discretionary company (portfolio average weight of 6.59%), and Facebook, Inc., Class A, an information technology company (portfolio average weight of 3.68%). Positions that detracted most significantly from the Fund’s return included Walt Disney Co. (The), a consumer discretionary company (no longer held at fiscal year-end), and Pfizer, Inc., a health care company (no longer held at fiscal year-end).
| | | | |
Sector Breakdown
(% of the Fund’s Net Assets)
as of October 31, 2016 | |
| Information Technology | | | 21.9 | |
| Consumer Staples | | | 15.4 | |
| Industrials | | | 12.5 | |
| Consumer Discretionary | | | 11.2 | |
| Telecommunication Services | | | 10.4 | |
| Utilities | | | 10.1 | |
| Health Care | | | 10.0 | |
| Real Estate | | | 6.7 | |
| Materials | | | 1.3 | |
| Financials | | | 0.5 | |
| Other Assets Less Liabilities | | | 0.0 | |
|
Top Ten Fund Holdings
(% of the Fund’s Net Assets)
as of October 31, 2016 | |
| Security | | | | |
| Johnson & Johnson | | | 7.9 | |
| Microsoft Corp. | | | 7.0 | |
| AT&T, Inc. | | | 6.4 | |
| Amazon.com, Inc. | | | 5.8 | |
| Facebook, Inc., Class A | | | 4.9 | |
| General Electric Co. | | | 4.4 | |
| Verizon Communications, Inc. | | | 4.0 | |
| Alphabet, Inc., Class C | | | 3.5 | |
| Altria Group, Inc. | | | 3.1 | |
| Philip Morris International, Inc. | | | 2.9 | |
| Total | | | 49.9 | |
PowerShares S&P 500 Momentum Portfolio (SPMO) (continued)
Growth of a $10,000 Investment Since Inception†
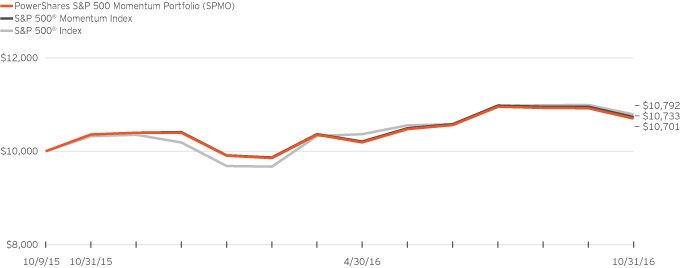
Fund Performance History as of October 31, 2016
| | | | | | | | | | | | | | | | | | | | | | | | | | | | | | | | |
| | | | | | | | | | | | | | | 1 Year | | | | | | Fund Inception† | |
| Index | | | | | | | | | | | | | | | | | | Average
Annualized | | | Cumulative | |
| S&P 500® Momentum Index | | | | | | | | | | | | | | | | | | | 3.55 | % | | | | | | | 6.91 | % | | | 7.33 | % |
| S&P 500® Index | | | | | | | | | | | | | | | | | | | 4.51 | | | | | | | | 7.46 | | | | 7.92 | |
| Fund | | | | | | | | | | | | | | | | | | | | | | | | |
| NAV Return | | | | | | | | | | | | | | | | | | | 3.28 | | | | | | | | 6.60 | | | | 7.01 | |
| Market Price Return | | | | | | | | | | | | | | | | | | | 3.12 | | | | | | | | 6.60 | | | | 7.01 | |
Fund Inception: October 9, 2015
Performance quoted above represents past performance. Past performance is not a guarantee of future results and current performance may be higher or lower than performance quoted. Investment returns and principal value will fluctuate, and shares of the Fund (“Fund Shares”), when redeemed or sold, may be worth more or less than their original cost. Fund performance reflects any applicable fee waivers and/or expense reimbursements. Had the adviser not waived fees and/or reimbursed expenses currently or in the past, returns would have been lower. See current prospectus for more information. According to the Fund’s current prospectus, the Fund’s expense ratio of 0.25% is expressed as a unitary management fee to cover operating expenses and expenses incurred in connection with managing the portfolio. NAV and Market Price returns assume that dividends and capital gain distributions have been reinvested in the Fund at NAV and
Market Price, respectively. See invescopowershares.com to find the most recent month-end performance numbers.
Index and Benchmark Index performance results are based upon a hypothetical investment in their respective constituent securities. Index and Benchmark Index returns do not represent Fund returns. An investor cannot invest directly in an index. The Index and Benchmark Index do not charge management fees or brokerage expenses, and no such fees or expenses were deducted from the hypothetical performance shown. In addition, the results actual investors might have achieved would have differed from those shown because of differences in the timing, amounts of their investments, and fees and expenses associated with an investment in the Fund.
| † | Fund, Index and Benchmark Index returns are based on the inception date of the Fund. |
| | |
| SPVU | | Manager’s Analysis |
| | PowerShares S&P 500 Value Portfolio (SPVU) |
As an index fund, the PowerShares S&P 500 Value Portfolio (the “Fund”) is passively managed and attempts to track the returns of an underlying index. The Fund seeks investment results that generally correspond (before fees and expenses) to the price and yield of the S&P 500® Enhanced Value (the “Index”). The Fund generally will invest at least 90% of its total assets in common stocks that comprise the Index.
Strictly in accordance with its existing guidelines and mandated procedures, S&P Dow Jones Indices LLC (the “Index Provider”) compiles, maintains and calculates the Index, which is designed to track the performance of approximately 100 stocks in the S&P 500® Index (the “Benchmark Index”) that have the highest “value score.”
In selecting constituent securities for the Index, the Index Provider calculates the value score of each stock in the Benchmark Index by evaluating each stock’s: (i) book value-to-price ratio, (ii) earnings-to-price ratio, and (iii) sales-to-price ratio. The Index Provider selects the 100 stocks with the highest value score for inclusion in the Index. The Index uses a modified market capitalization-weighted strategy, as the Index Provider weights securities by multiplying their market capitalization and their value score. The Fund generally invests in all of the securities comprising the Index in proportion to their weightings in the Index.
For the fiscal year ended October 31, 2016, on a market price basis, the Fund returned 3.86%. On a net asset value (“NAV”) basis, the Fund returned 4.03%. During the same time period, the Index returned 4.33%. During the fiscal year, the Fund fully replicated the components of the Index; therefore, the Fund’s performance (NAV basis) differed from the return of the Index primarily due to fees and operating expenses that the Fund incurred, as well as trading costs around the semi-annual rebalances during the period.
During this same time period, the Benchmark Index returned 4.51%. The Benchmark Index is an unmanaged index weighted by market capitalization based on the average performance of approximately 500 securities.
The Benchmark Index was selected for its recognition in the marketplace, and its performance comparison is a useful measure for investors as a broad representation of the overall U.S. stock market. The performance of the Fund differed from the Benchmark Index primarily due to the Fund’s thematic objective and proprietary weighting methodology.
Relative to the Benchmark Index, the Fund was most overweight in the financials sector and most underweight in the information technology sector during the fiscal year ended October 31, 2016. The majority of the Fund’s underperformance relative to the Benchmark Index during the period can be attributed to stock selection in the consumer discretionary and health care sectors.
For the fiscal year ended October 31, 2016, the consumer staples sector contributed most significantly to the Fund’s return, followed by the utilities and information technology sectors, respectively. The health care sector detracted most significantly from the Fund’s return, followed by the energy and consumer discretionary sectors, respectively.
Positions that contributed most significantly to the Fund’s return included Wal-Mart Stores, Inc., a consumer staples company (portfolio average weight of 4.82%), and Chevron Corp., an energy company (no longer held at fiscal year-end). Positions that detracted most significantly from the Fund’s return included McKesson Corp., a health care company (portfolio average weight of 1.61%), and Citigroup, Inc., a financials company (portfolio average weight of 4.64%).
| | | | |
Sector Breakdown
(% of the Fund’s Net Assets)
as of October 31, 2016 | |
| Financials | | | 41.9 | |
| Consumer Discretionary | | | 15.5 | |
| Health Care | | | 9.3 | |
| Consumer Staples | | | 8.1 | |
| Information Technology | | | 6.5 | |
| Industrials | | | 6.2 | |
| Energy | | | 5.8 | |
| Materials | | | 3.0 | |
| Utilities | | | 2.2 | |
| Telecommunication Services | | | 1.5 | |
| Money Market Fund Plus Other Assets Less Liabilities | | | 0.0 | |
|
Top Ten Fund Holdings*
(% of the Fund’s Net Assets)
as of October 31, 2016 | |
| Security | | | | |
| Bank of America Corp. | | | 5.6 | |
| Citigroup, Inc. | | | 5.2 | |
| JPMorgan Chase & Co. | | | 5.2 | |
| Berkshire Hathaway, Inc., Class B | | | 4.9 | |
| Wal-Mart Stores, Inc. | | | 4.8 | |
| General Motors Co. | | | 3.1 | |
| Ford Motor Co. | | | 2.5 | |
| Morgan Stanley | | | 2.3 | |
| MetLife, Inc. | | | 2.2 | |
| Goldman Sachs Group, Inc. (The) | | | 2.1 | |
| Total | | | 37.9 | |
| * | Excluding money market fund holdings. |
PowerShares S&P 500 Value Portfolio (SPVU) (continued)
Growth of a $10,000 Investment Since Inception†
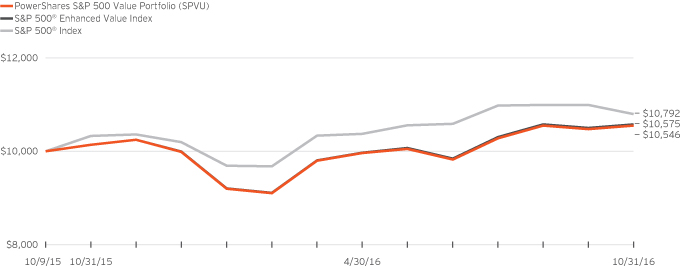
Fund Performance History as of October 31, 2016
| | | | | | | | | | | | | | | | | | | | | | | | | | | | | | | | |
| | | | | | | | | | | | | | | | | | | | | Fund Inception† | |
| Index | | | | | | | | | | | | | | 1 Year | | | | | | Average
Annualized | | | Cumulative | |
| S&P 500® Enhanced Value Index | | | | | | | | | | | | | | | | | | | 4.33 | % | | | | | | | 5.42 | % | | | 5.75 | % |
| S&P 500® Index | | | | | | | | | | | | | | | | | | | 4.51 | | | | | | | | 7.46 | | | | 7.92 | |
| Fund | | | | | | | | | | | | | | | | | | | | | | | | |
| NAV Return | | | | | | | | | | | | | | | | | | | 4.03 | | | | | | | | 5.14 | | | | 5.46 | |
| Market Price Return | | | | | | | | | | | | | | | | | | | 3.86 | | | | | | | | 5.06 | | | | 5.37 | |
Fund Inception: October 9, 2015
Performance quoted above represents past performance. Past performance is not a guarantee of future results and current performance may be higher or lower than performance quoted. Investment returns and principal value will fluctuate, and shares of the Fund (“Fund Shares”), when redeemed or sold, may be worth more or less than their original cost. Fund performance reflects any applicable fee waivers and/or expense reimbursements. Had the adviser not waived fees and/or reimbursed expenses currently or in the past, returns would have been lower. See current prospectus for more information. According to the Fund’s current prospectus, the Fund’s expense ratio of 0.25% is expressed as a unitary management fee to cover operating expenses and expenses incurred in connection with managing the portfolio. NAV and Market Price returns assume that dividends and capital gain distributions have been reinvested in the Fund at NAV and
Market Price, respectively. See invescopowershares.com to find the most recent month-end performance numbers.
Index and Benchmark Index performance results are based upon a hypothetical investment in their respective constituent securities. Index and Benchmark Index returns do not represent Fund returns. An investor cannot invest directly in an index. The Index and Benchmark Index do not charge management fees or brokerage expenses, and no such fees or expenses were deducted from the hypothetical performance shown. In addition, the results actual investors might have achieved would have differed from those shown because of differences in the timing, amounts of their investments, and fees and expenses associated with an investment in the Fund.
| † | Fund, Index and Benchmark Index returns are based on the inception date of the Fund. |
| | |
| EELV | | Manager’s Analysis |
| | PowerShares S&P Emerging Markets Low Volatility Portfolio (EELV) |
As an index fund, the PowerShares S&P Emerging Markets Low Volatility Portfolio (the “Fund”) is passively managed and attempts to track the returns of an underlying index. The Fund seeks investment results that generally correspond (before fees and expenses) to the price and yield of the S&P BMI Emerging Markets Low Volatility IndexTM (Net) (the “Index”). The Fund generally will invest at least 90% of its total assets in securities that comprise the Index.
S&P Dow Jones Indices LLC (“S&P DJI” or the “Index Provider”) compiles, maintains and calculates the Index, which is designed to measure the performance of 200 of the least volatile stocks of the S&P Emerging Plus LargeMidCap Index. Strictly in accordance with its existing guidelines and mandated procedures, the Index Provider determines which securities are the least volatile over the past 12 months of companies in the S&P Emerging Plus LargeMidCap Index for inclusion in the Index. Historically, the S&P Emerging Plus LargeMidCap Index has included all publicly listed equity securities with float-adjusted market values of at least $100 million and annual dollar value traded of at least $50 million from the following countries: Brazil, Chile, China, Colombia, Czech Republic, Egypt, Greece, Hungary, India, Indonesia, Malaysia, Mexico, Morocco, Peru, Qatar, the Philippines, Poland, Russia, South Africa, South Korea, Taiwan, Thailand, Turkey, and the United Arab Emirates. Volatility is a statistical measurement of the magnitude of up and down asset price fluctuations (increases or decreases in a stock’s price) over time. The Fund generally invests in all of the securities comprising the Index in proportion to their weightings in the Index.
For the fiscal year ended October 31, 2016, on a market price basis, the Fund returned 2.39%. On a net asset value (“NAV”) basis, the Fund returned 2.12%. During the same time period, the Index returned 2.98%. During the fiscal year, the Fund fully replicated the components of the Index; therefore, the Fund’s performance (NAV basis) differed from the return of the Index primarily due to fees and operating expenses the Fund incurred as well as trading costs around rebalances during the period.
During this same time period, the MSCI Emerging Markets IndexSM (Net) (the “Benchmark Index”) returned 9.27%. The Benchmark Index is an unmanaged index weighted by market capitalization based on the average performance of approximately 830 securities. The adviser provided this additional comparative benchmark to help investors better understand how the investment results of the Fund compare to the performance of a broad emerging markets equity benchmark.
The Benchmark Index was selected for its recognition in the marketplace, and its performance comparison is a useful measure for investors as a broad representation of the emerging equity market. The performance of the Fund trailed that of the Benchmark Index in part because the Fund follows an Index that employs a volatility-driven weighting and stock selection methodology whereas the Benchmark Index selects and weights stocks based on market capitalization.
Relative to the Benchmark Index, the Fund was most overweight in the financials sector and most underweight in the information technology sector during the fiscal year ended October 31, 2016. The majority of the Fund’s underperformance relative to the
Benchmark Index during the period can be attributed to security selection within the financials sector.
For the fiscal year ended October 31, 2016, the information technology sector contributed most significantly to the Fund’s return, followed by the energy and utilities sectors, respectively. The consumer discretionary sector detracted most significantly from the Fund’s return, followed by the industrials and health care sectors, respectively.
Positions that contributed most significantly to the Fund’s return included PT Telekomunikasi Indonesia Persero Tbk, a telecommunication services company (portfolio average weight of 0.51%), and Thai Beverage PCL, a consumer staples company (portfolio average weight of 0.52%). Positions that detracted most significantly from the Fund’s return included Total Access Communication PCL NVDR, a telecommunication services company (no longer held at fiscal year-end), and Cosco Shipping Ports Ltd., an industrials company (no longer held at fiscal year-end).
| | | | |
Sector Breakdown
(% of the Fund’s Net Assets)
as of October 31, 2016 | |
| Financials | | | 30.6 | |
| Industrials | | | 12.0 | |
| Consumer Staples | | | 11.5 | |
| Telecommunication Services | | | 10.4 | |
| Information Technology | | | 7.0 | |
| Materials | | | 6.5 | |
| Utilities | | | 6.5 | |
| Consumer Discretionary | | | 6.3 | |
| Energy | | | 5.0 | |
| Health Care | | | 2.4 | |
| Real Estate | | | 1.9 | |
| Other Assets Less Liabilities | | | (0.1) | |
|
Top Ten Fund Holdings
(% of the Fund’s Net Assets)
as of October 31, 2016 | |
| Security | | | | |
| Telekom Malaysia Bhd | | | 1.2 | |
| Public Bank Bhd | | | 1.2 | |
| Banco de Chile | | | 0.9 | |
| First Financial Holding Co. Ltd. | | | 0.9 | |
| Chunghwa Telecom Co. Ltd. | | | 0.9 | |
| Tenaga Nasional Bhd | | | 0.8 | |
| Taiwan Cooperative Financial Holding Co. Ltd. | | | 0.8 | |
| IHH Healthcare Bhd | | | 0.8 | |
| Kuala Lumpur Kepong Bhd | | | 0.7 | |
| Malayan Banking Bhd | | | 0.7 | |
| Total | | | 8.9 | |
PowerShares S&P Emerging Markets Low Volatility Portfolio (EELV) (continued)
Growth of a $10,000 Investment Since Inception†
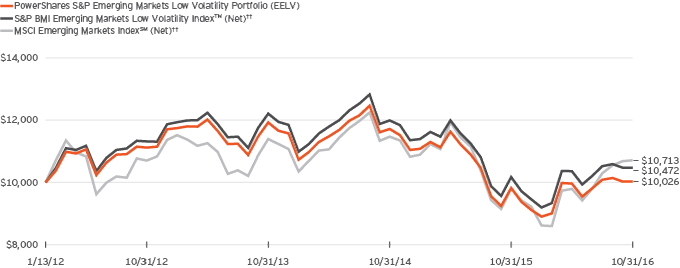
Fund Performance History as of October 31, 2016
| | | | | | | | | | | | | | | | | | | | | | | | | | | | | | | | |
| | | | | | | | | 1 Year | | | 3 Years
Average
Annualized | | | 3 Years
Cumulative | | | | | | Fund Inception† | |
Index | | | | | | | | | | | | Average
Annualized | | | Cumulative | |
| S&P BMI Emerging Markets Low Volatility Index™ (Net)†† | | | | | | | | | | | 2.98 | % | | | (4.99 | )% | | | (14.24 | )% | | | | | | | 0.97 | % | | | 4.72 | % |
| MSCI Emerging Markets IndexSM (Net)†† | | | | | | | | | | | 9.27 | | | | (2.05 | ) | | | (6.01 | ) | | | | | | | 1.45 | | | | 7.13 | |
| Fund | | | | | | | | | | | | | | | | | | | | | | | | |
| NAV Return | | | | | | | | | | | 2.12 | | | | (5.62 | ) | | | (15.93 | ) | | | | | | | 0.05 | | | | 0.26 | |
| Market Price Return | | | | | | | | | | | 2.39 | | | | (5.75 | ) | | | (16.28 | ) | | | | | | | (0.22 | ) | | | (1.06 | ) |
Fund Inception: January 13, 2012
Performance quoted above represents past performance. Past performance is not a guarantee of future results and current performance may be higher or lower than performance quoted. Investment returns and principal value will fluctuate, and shares of the Fund (“Fund Shares”), when redeemed or sold, may be worth more or less than their original cost. Fund performance reflects any applicable fee waivers and/or expense reimbursements. Had the adviser not waived fees and/or reimbursed expenses currently or in the past, returns would have been lower. See current prospectus for more information. The adviser has contractually agreed to waive fees and/or pay certain Fund expenses through February 28, 2018. According to the Fund’s current prospectus, the Fund’s expense ratio of 0.45% (0.29% after fee waiver) is expressed as a unitary management fee to cover operating expenses and expenses incurred in connection with managing the portfolio. NAV and Market Price returns assume that dividends and capital gain distributions have been reinvested in the Fund at NAV and Market Price, respectively. The returns shown in the table above do not reflect the
deduction of taxes that a shareholder would pay on Fund distributions or the redemption or sale of Fund Shares. See invescopowershares.com to find the most recent month-end performance numbers.
Index and Benchmark Index performance results are based upon a hypothetical investment in their respective constituent securities. Index and Benchmark Index returns do not represent Fund returns. An investor cannot invest directly in an index. The Index and Benchmark Index do not charge management fees or brokerage expenses, and no such fees or expenses were deducted from the hypothetical performance shown. In addition, the results actual investors might have achieved would have differed from those shown because of differences in the timing, amounts of their investments, and fees and expenses associated with an investment in the Fund.
| † | Fund, Index and Benchmark Index returns are based on the inception date of the Fund. |
| †† | Reflects reinvested dividends net of withholding taxes. |
| | |
| EEMO | | Manager’s Analysis |
| | PowerShares S&P Emerging Markets Momentum Portfolio (EEMO) |
Effective after the close of markets on March 18, 2016 the Fund’s name changed from PowerShares S&P Emerging Markets High Beta Portfolio to PowerShares S&P Emerging Markets Momentum Portfolio and the underlying index changed from S&P BMI Emerging Markets High Beta IndexTM (Net) (the “Previous Index”) to S&P Momentum Emerging Plus LargeMidCap IndexTM (the “Index”). At that time, the Fund also changed its ticker symbol from EEHB to EEMO and changed its investment objective and investment policies.
As an index fund, the PowerShares S&P Emerging Markets Momentum Portfolio (the “Fund”) is passively managed and seeks investment results that generally correspond (before fees and expenses) to the price and yield of the Index and, through March 18, 2016, the Previous Index. The Fund will invest at least 90% of its total assets in the securities of companies that comprise the Index and, through March 18, 2016, the Previous Index.
S&P Dow Jones Indices LLC (the “Index Provider”) compiles, maintains and calculates the Index, which is comprised of constituents of the S&P Emerging LargeMidCap Index (the “Emerging LargeMidCap Index”) that have the highest “momentum score.” In general, momentum is the tendency of an investment to exhibit persistence in its relative performance; a “momentum style” of investing emphasizes investing in securities that have had better recent performance compared to other securities. The momentum score for each security included in the Index is based on upward price movements of the security as compared to other eligible securities within the Emerging LargeMidCap Index. The Emerging LargeMidCap Index is composed of stocks that represent the top 85% of float-adjusted market capitalization companies in each emerging country represented in that index. The Index Provider first calculates the momentum score of each stock in the Emerging LargeMidCap Index by evaluating the percentage change in the stock’s price over the last 12 months, excluding the most recent month, and applying an adjustment based on the security’s volatility over that period. The Index Provider then ranks all the stocks in descending order by momentum score and selects the top 20% for inclusion in the Index. The Fund generally will invest in all the companies comprising the Index in proportion to their weighting in the Index.
For the fiscal year ended October 31, 2016, on a market price basis, the Fund returned 0.69%. On a net asset value (“NAV”) basis, the Fund returned 0.17%. During the same time period, the Blended-S&P Momentum Emerging Plus LargeMidCap IndexTM (Net) (a composite of the returns of the Previous Index through March 18, 2016, and of the Index for the remainder of the fiscal year, referred to herein as the “Blended-Index”) returned 2.80%. During the fiscal year, the Fund utilized a sampling methodology to achieve exposure for the Indian and Russian securities in the Blended-Index. The Fund’s performance (NAV basis) differed from the return of the Blended-Index primarily due to sampling of these
Indian and Russian securities, performance differences as a result of the Fund’s use of GDRs and ADRs, and the fees and expenses that the Fund incurred during the period.
During this same time period, the MSCI Emerging Markets IndexSM (Net) (the “Benchmark Index”) returned 9.27%. The Benchmark Index is an unmanaged index weighted by market capitalization based on the average performance of approximately 830 securities. The Benchmark Index was selected for its recognition in the marketplace, and its performance comparison is a useful measure for investors as a broad representation of the emerging market equities market.
Relative to the Benchmark Index, the Fund was most overweight in the consumer staples sector and most underweight in the information technology sector during the fiscal year ended October 31, 2016. The majority of the Fund’s underperformance relative to the Benchmark Index during the period can be attributed to its underweight position in the information technology and financials sectors compared to the Benchmark Index.
For the fiscal year ended October 31, 2016, the consumer staples sector contributed most significantly to the Fund’s return, followed by the energy and materials sectors. The industrials sector detracted most significantly from the Fund’s return, followed by the financials and health care sectors.
Positions that contributed most significantly to the Fund’s return included Sberbank of Russia PJSC ADR, a financials company (portfolio average weight of 2.72%), and Naspers Ltd. Class N, a consumer discretionary company (portfolio average weight of 3.84%). Positions that detracted most significantly from the Fund’s return included Piraeus Bank S.A., a financials company (no longer held at fiscal year-end), and National Bank of Greece S.A., a financials company (no longer held at fiscal year-end).
PowerShares S&P Emerging Markets Momentum Portfolio (EEMO) (continued)
| | | | |
Sector Breakdown
(% of the Fund’s Net Assets)
as of October 31, 2016 | |
| Information Technology | | | 36.2 | |
| Consumer Discretionary | | | 12.0 | |
| Financials | | | 11.1 | |
| Consumer Staples | | | 9.1 | |
| Telecommunication Services | | | 5.7 | |
| Materials | | | 5.2 | |
| Industrials | | | 4.8 | |
| Utilities | | | 4.6 | |
| Energy | | | 4.2 | |
| Real Estate | | | 3.0 | |
| Health Care | | | 2.1 | |
| Investment Companies | | | 2.0 | |
| Money Market Fund Plus Other Assets Less Liabilities | | | 0.0 | |
|
Top Ten Fund Holdings*
(% of the Fund’s Net Assets)
as of October 31, 2016 | |
| Security | | | | |
| Taiwan Semiconductor Manufacturing Co. Ltd. | | | 8.3 | |
| Tencent Holdings Ltd. | | | 7.9 | |
| Samsung Electronics Co. Ltd. | | | 6.9 | |
| Naspers Ltd., Class N | | | 4.0 | |
| Sberbank of Russia PJSC ADR | | | 3.9 | |
| Naver Corp. | | | 2.2 | |
| PT Telekomunikasi Indonesia Persero Tbk | | | 2.0 | |
| PowerShares India Portfolio | | | 1.9 | |
| NetEase, Inc. ADR | | | 1.8 | |
| Chunghwa Telecom Co. Ltd. | | | 1.7 | |
| Total | | | 40.6 | |
| * | Excluding money market fund holdings. |
PowerShares S&P Emerging Markets Momentum Portfolio (EEMO) (continued)
Growth of a $10,000 Investment Since Inception†
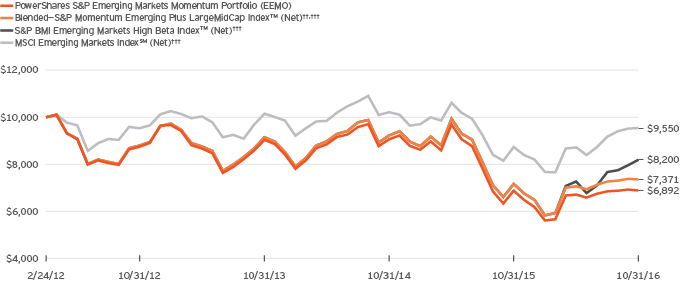
Fund Performance History as of October 31, 2016
| | | | | | | | | | | | | | | | | | | | | | | | | | | | | | | | |
| | | | | | | | | 1 Year | | | 3 Years
Average
Annualized | | | 3 Years
Cumulative | | | | | | Fund Inception† | |
| Index | | | | | | | | Average
Annualized | | | Cumulative | |
| Blended—S&P Momentum Emerging Plus LargeMidCap IndexTM (Net)††,††† | | | | | | | | | | | 2.80 | % | | | (6.96 | )% | | | (19.47 | )% | | | | | | | (6.31 | )% | | | (26.29 | )% |
| S&P Momentum Emerging Plus LargeMidCap IndexTM (Net)††,††† | | | | | | | | | | | N/A | | | | N/A | | | | N/A | | | | | | | | N/A | | | | N/A | |
| S&P BMI Emerging Markets High Beta Index™ (Net)††† | | | | | | | | | | | 14.37 | | | | (3.60 | ) | | | (10.40 | ) | | | | | | | (4.15 | ) | | | (18.00 | ) |
| MSCI Emerging Markets IndexSM (Net)††† | | | | | | | | | | | 9.27 | | | | (2.05 | ) | | | (6.01 | ) | | | | | | | (0.98 | ) | | | (4.50 | ) |
| Fund | | | | | | | | | | | | | | | | | | | | | | | | |
| NAV Return | | | | | | | | | | | 0.17 | | | | (8.68 | ) | | | (23.84 | ) | | | | | | | (7.64 | ) | | | (31.08 | ) |
| Market Price Return | | | | | | | | | | | 0.69 | | | | (8.45 | ) | | | (23.26 | ) | | | | | | | (7.84 | ) | | | (31.79 | ) |
Fund Inception: February 24, 2012
Performance quoted above represents past performance. Past performance is not a guarantee of future results and current performance may be higher or lower than performance quoted. Investment returns and principal value will fluctuate, and shares of the Fund (“Fund Shares”), when redeemed or sold, may be worth more or less than their original cost. Fund performance reflects any applicable fee waivers and/or expense reimbursements. Had the adviser not waived fees and/or reimbursed expenses currently, or in the past, returns would have been lower. See current prospectus for more information. The adviser has contractually agreed to waive fees and/or pay certain Fund expenses through February 28, 2018. According to the Fund’s current prospectus, the Fund’s expense ratio of 0.45% (0.29% after fee waiver) is expressed as a unitary management fee to cover operating expenses and expenses incurred in connection with managing the portfolio. NAV and Market Price returns assume that dividends and capital gain distributions have been reinvested in the Fund at NAV and Market Price, respectively. The returns shown in the table above do not reflect the deduction of taxes that a shareholder would pay on Fund distributions or the redemption or sale of Fund Shares. See invescopowershares.com to find the most recent month-end performance numbers.
Blended-Index, Index, Previous Index and Benchmark Index performance results are based upon a hypothetical investment in their respective constituent securities. Blended-Index, Index, Previous Index and Benchmark Index returns do not represent Fund returns. An investor cannot invest directly in an index. The Blended-Index, Index, Previous Index and Benchmark Index do not charge management fees or brokerage expenses, and no such fees or expenses were deducted from the hypothetical performance shown. In addition, the results actual investors might have achieved would have differed from those shown because of differences in the timing, amounts of their investments, and fees and expenses associated with an investment in the Fund.
| † | Fund, Blended-Index, Index, Previous Index and Benchmark Index returns are based on the inception date of the Fund. |
| †† | “1 Year”, “3 Years”, “5 Years” and “Fund Inception” performance for the Index is not available because the Index did not commence until February 16, 2016. The Blended-Index is comprised of the performance of the Previous Index from Fund inception through the conversion date, March 18, 2016, followed by the performance of the Index for the period March 18, 2016 through October 31, 2016. |
| ††† | Reflects reinvested dividends net of withholding taxes. |
| | |
| IDLV | | Manager’s Analysis |
| | PowerShares S&P International Developed Low Volatility Portfolio (IDLV) |
As an index fund, the PowerShares S&P International Developed Low Volatility Portfolio (the “Fund”) is passively managed and attempts to track the returns of an underlying index. The Fund seeks investment results that generally correspond (before fees and expenses) to the price and yield of the S&P BMI International Developed Low Volatility IndexTM (Net) (the “Index”). The Fund generally will invest at least 90% of its total assets in securities that comprise the Index.
S&P Dow Jones Indices LLC (the “Index Provider”) compiles, maintains and calculates the Index, which is designed to measure the performance of 200 of the least volatile stocks of the S&P Developed ex US and South Korea LargeMidCap Index. Strictly in accordance with its guidelines and mandated procedures, the Index Provider determines which securities are the least volatile over the past 12 months of companies in the S&P Developed ex US and South Korea LargeMidCap Index for inclusion in the Index. Historically, the S&P Developed ex US and South Korea LargeMidCap Index has included all publicly listed equity securities with float-adjusted market values of at least $100 million and annual dollar value traded of at least $50 million from the following countries: Australia, Austria, Belgium, Canada, Denmark, Finland, France, Germany, Hong Kong, Ireland, Israel, Italy, Japan, Luxembourg, the Netherlands, New Zealand, Norway, Portugal, Singapore, Spain, Sweden, Switzerland, and the United Kingdom. Volatility is a statistical measurement of the magnitude of up and down asset price fluctuations (increases or decreases in a stock’s price) over time. The Fund generally invests in all of the securities comprising the Index in proportion to their weightings in the Index.
For the fiscal year ended October 31, 2016, on a market price basis, the Fund returned 2.07%. On a net asset value (“NAV”) basis, the Fund returned 1.56%. During the same time period, the Index returned 1.69%. During the fiscal year, the Fund fully replicated the components of the Index; therefore, the Fund’s performance (NAV basis) differed from the return of the Index primarily due to fees and operating expenses the Fund incurred during the period.
During this same time period, the MSCI EAFE® Index (Net) (the “Benchmark Index”) returned (3.23)%. The Benchmark Index is an unmanaged index weighted by market capitalization based on the average performance of approximately 930 securities. The adviser provided this additional comparative benchmark to help investors better understand how the investment results of the Fund compare to the performance of a broad equity benchmark of developed countries.
The Benchmark Index was selected for its recognition in the marketplace, and its performance comparison is a useful measure for investors as a broad representation of the international developed country equity markets. The performance of the Fund differed from the Benchmark Index in part because the Fund employs a volatility driven weighting and stock selection methodology, whereas the Benchmark Index selects and weights stocks based on market capitalization.
Relative to the Benchmark Index, the Fund was most overweight in the real estate sector and most underweight in the health care
sector during the fiscal year ended October 31, 2016. The majority of the Fund’s outperformance relative to the Benchmark Index during the period can be attributed to security selection within the financials sector. For the fiscal year ended October 31, 2016, the real estate sector contributed most significantly to the Fund’s return, followed by the materials and consumer staples sectors, respectively. The consumer discretionary sector detracted most significantly from the Fund’s return, followed by the telecommunication services and energy sectors, respectively.
Positions that contributed most significantly to the Fund’s return included HK Electric Investments & HK Electric Investments Ltd., a utilities company (portfolio average weight of 0.78%), and Saputo, Inc., a consumer staples company (portfolio average weight of 0.50%). Positions that detracted most significantly from the Fund’s return included Next PLC, a consumer discretionary company (no longer held at fiscal year-end), and Sky PLC, a consumer discretionary company (portfolio average weight of 0.45%).
| | | | |
Sector Breakdown
(% of the Fund’s Net Assets)
as of October 31, 2016 | |
| Financials | | | 18.9 | |
| Industrials | | | 18.5 | |
| Real Estate | | | 16.0 | |
| Utilities | | | 12.4 | |
| Consumer Staples | | | 11.7 | |
| Telecommunication Services | | | 6.2 | |
| Consumer Discretionary | | | 5.8 | |
| Health Care | | | 4.6 | |
| Information Technology | | | 4.0 | |
| Materials | | | 1.8 | |
| Money Market Fund Plus Other Assets Less Liabilities | | | 0.1 | |
|
Top Ten Fund Holdings*
(% of the Fund’s Net Assets)
as of October 31, 2016 | |
| Security | | | | |
| MAN SE | | | 1.2 | |
| BCE, Inc. | | | 0.8 | |
| Emera, Inc. | | | 0.7 | |
| CLP Holdings Ltd. | | | 0.7 | |
| Toronto-Dominion Bank (The) | | | 0.7 | |
| First Capital Realty, Inc. | | | 0.7 | |
| Venture Corp. Ltd. | | | 0.7 | |
| Sofina SA | | | 0.6 | |
| Bank of Montreal | | | 0.6 | |
| Thomson Reuters Corp. | | | 0.6 | |
| Total | | | 7.3 | |
| * | Excluding money market fund holdings. |
PowerShares S&P International Developed Low Volatility Portfolio (IDLV) (continued)
Growth of a $10,000 Investment Since Inception†
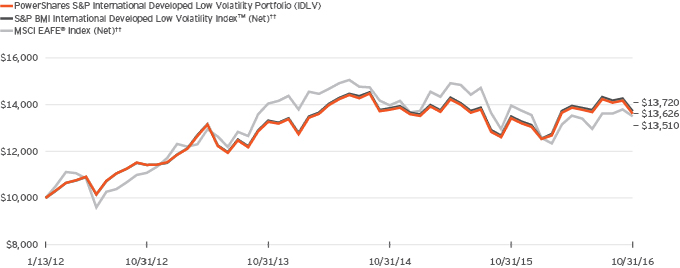
Fund Performance History as of October 31, 2016
| | | | | | | | | | | | | | | | | | | | | | | | | | | | | | | | |
| | | | | | | | | 1 Year | | | 3 Years
Average
Annualized | | | 3 Years
Cumulative | | | | | | Fund Inception† | |
Index | | | | | | | | | | Average
Annualized | | | Cumulative | |
| S&P BMI International Developed Low Volatility Index™ (Net)†† | | | | | | | | | | | 1.69 | % | | | 1.01 | % | | | 3.06 | % | | | | | | | 6.81 | % | | | 37.20 | % |
| MSCI EAFE® Index (Net)†† | | | | | | | | | | | (3.23 | ) | | | (1.31 | ) | | | (3.87 | ) | | | | | | | 6.47 | | | | 35.10 | |
| Fund | | | | | | | | | | | | | | | | | | | | | | | | |
| NAV Return | | | | | | | | | | | 1.56 | | | | 0.88 | | | | 2.67 | | | | | | | | 6.66 | | | | 36.26 | |
| Market Price Return | | | | | | | | | | | 2.07 | | | | 0.80 | | | | 2.43 | | | | | | | | 6.60 | | | | 35.89 | |
Fund Inception: January 13, 2012
Performance quoted above represents past performance. Past performance is not a guarantee of future results and current performance may be higher or lower than performance quoted. Investment returns and principal value will fluctuate, and shares of the Fund (“Fund Shares”), when redeemed or sold, may be worth more or less than their original cost. Fund performance reflects any applicable fee waivers and/or expense reimbursements. Had the adviser not waived fees and/or reimbursed expenses currently or in the past, returns would have been lower. See current prospectus for more information. The adviser has contractually agreed to waive fees and/or pay certain Fund expenses through February 28, 2018. According to the Fund’s current prospectus, the Fund’s expense ratio of 0.35% (0.25% after fee waiver) is expressed as a unitary management fee to cover operating expenses and expenses incurred in connection with managing the portfolio. NAV and Market Price returns assume that dividends and capital gain distributions have been reinvested in the Fund at NAV and Market Price,
respectively. The returns shown in the table above do not reflect the deduction of taxes that a shareholder would pay on Fund distributions or the redemption or sale of Fund Shares. See invescopowershares.com to find the most recent month-end performance numbers.
Index and Benchmark Index performance results are based upon a hypothetical investment in their respective constituent securities. Index and Benchmark Index returns do not represent Fund returns. An investor cannot invest directly in an index. The Index and Benchmark Index do not charge management fees or brokerage expenses, and no such fees or expenses were deducted from the hypothetical performance shown. In addition, the results actual investors might have achieved would have differed from those shown because of differences in the timing, amounts of their investments, and fees and expenses associated with an investment in the Fund.
| † | Fund, Index and Benchmark Index returns are based on the inception date of the Fund. |
| †† | Reflects reinvested dividends net of withholding taxes. |
| | |
| IDMO | | Manager’s Analysis |
| | PowerShares S&P International Developed Momentum Portfolio (IDMO) |
Effective after the close of markets on March 18, 2016, the Fund’s name changed from PowerShares S&P International Developed High Beta Portfolio to PowerShares S&P International Developed Momentum Portfolio and the underlying index changed from S&P BMI International Developed High Beta IndexTM (Net) (the “Previous Index”) to S&P Momentum Developed ex-U.S. and South Korea LargeMidCap IndexTM (Net) (the “Index”). At that time, the Fund also changed its ticker symbol from IDHB to IDMO and changed its investment objective and investment policies.
As an index fund, PowerShares S&P International Developed Momentum Portfolio (the “Fund”) is passively managed and attempts to track the returns of an underlying index. The Fund seeks investment results that generally correspond (before fees and expenses) to the price and yield of the Index and, through March 18, 2016, the Previous Index. The Fund generally will invest at least 90% of its total assets in the securities of companies that comprise the Index and, through March 18, 2016, the Previous Index.
Strictly in accordance with its guidelines and mandated procedures, S&P Dow Jones Indices LLC (“S&P DJI” or the “Index Provider”) compiles, maintains and calculates the Index, which is composed of constituents of the S&P Developed ex-U.S. & South Korea LargeMidCap Index (the “Developed ex-U.S. & South Korea Index”) that have the highest “momentum score.” In general, momentum is the tendency of an investment to exhibit persistence in its relative performance; a “momentum style” of investing emphasizes investing in securities that have had better recent performance compared to other securities. The momentum score for each security included in the Index is based on upward price movements of the security as compared to other eligible securities within the Developed ex-U.S. & South Korea Index. The Developed ex-U.S. & South Korea Index is composed of stocks that represent the top 85% of float-adjusted market capitalization companies in each developed country (excluding the United States and South Korea) represented in that index. In selecting constituent securities for the Index, the Index Provider first calculates the momentum score of each stock in the Developed ex-U.S. & South Korea Index by evaluating the percentage change in the stock’s price over the last 12 months, excluding the most recent month, and applying an adjustment based on the security’s volatility over that period. The Index Provider then ranks all the stocks in descending order by momentum score and selects the top 20% for inclusion in the Index. The Index uses a modified market capitalization-weighted strategy, as the Index Provider weights component securities by multiplying their market capitalization and their momentum score. The Fund generally will invest in all of the securities comprising the Index in proportion to their weighting in the Index.
For the fiscal year ended October 31, 2016, on a market price basis, the Fund returned (6.77)%. On a net asset value (“NAV”) basis, the Fund returned (6.92)%. During the same time period,
the Blended—S&P Momentum Developed ex-U.S. and South Korea LargeMidCap IndexTM (Net) (a composite of the returns of the previous Index through March 18, 2016, and of the Index for the remainder for the fiscal year, referred to herein as the “Blended-Index”) returned (6.29)%. During the fiscal year, the Fund fully replicated the components of the Blended-Index; therefore, the Fund’s performance (NAV basis) differed from the return of the Blended-Index primarily due to fees and expenses that the Fund incurred during the period as well as trading expenses incurred as part of the semi-annual rebalance process.
During this same time period, the MSCI EAFE® Index (Net) (the “Benchmark Index”) returned (3.23)%. The Benchmark Index is an unmanaged index weighted by market capitalization and based on the average performance of approximately 930 securities. The Benchmark Index was selected for its recognition in the marketplace, and its performance comparison is a useful measure for investors as a broad representation of the international equity market.
Relative to the Benchmark Index, the Fund was most overweight in the materials sector and most underweight in the financials sector during the fiscal year ended October 31, 2016. The majority of the Fund’s underperformance relative to the Benchmark Index during the period can be attributed to its underweight position in the financials and energy sectors compared to the Benchmark Index.
For the fiscal year ended October 31, 2016, the materials sector contributed most significantly to the Fund’s return, followed by the information technology and industrials sectors. The financials sector detracted most significantly from the Fund’s return, followed by the energy and health care sectors.
Positions that contributed most significantly to the Fund’s return included Teck Resources Ltd., Class B, a materials company (portfolio average weight of 0.40%), and Glencore PLC, a materials company (no longer held at fiscal year-end). Positions that detracted most significantly from the Fund’s return included Novo Nordisk A/S, Class B, a health care company (no longer held at fiscal year-end), and Banca Monte dei Paschi di Siena SpA, a financials company (no longer held at fiscal year-end).
PowerShares S&P International Developed Momentum Portfolio (IDMO) (continued)
| | | | |
Sector Breakdown
(% of the Fund’s Net Assets)
as of October 31, 2016 | |
| Consumer Staples | | | 21.7 | |
| Industrials | | | 15.0 | |
| Health Care | | | 12.1 | |
| Materials | | | 10.0 | |
| Consumer Discretionary | | | 8.4 | |
| Utilities | | | 7.6 | |
| Information Technology | | | 7.3 | |
| Real Estate | | | 6.6 | |
| Financials | | | 5.7 | |
| Energy | | | 3.3 | |
| Telecommunication Services | | | 2.2 | |
| Other Assets Less Liabilities | | | 0.1 | |
|
Top Ten Fund Holdings
(% of the Fund’s Net Assets)
as of October 31, 2016 | |
| Security | | | | |
| British American Tobacco PLC | | | 5.5 | |
| GlaxoSmithKline PLC | | | 4.4 | |
| SAP SE | | | 3.1 | |
| Diageo PLC | | | 2.9 | |
| National Grid PLC | | | 2.8 | |
| Toronto-Dominion Bank (The) | | | 2.7 | |
| AstraZeneca PLC | | | 2.4 | |
| Adidas AG | | | 2.3 | |
| Reckitt Benckiser Group PLC | | | 2.3 | |
| Unilever PLC | | | 2.2 | |
| Total | | | 30.6 | |
PowerShares S&P International Developed Momentum Portfolio (IDMO) (continued)
Growth of a $10,000 Investment Since Inception†
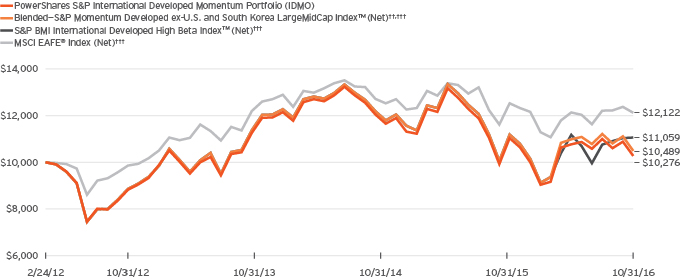
Fund Performance History as of October 31, 2016
| | | | | | | | | | | | | | | | | | | | | | | | | | | | | | | | |
| | | | | | | | | 1 Year | | | 3 Years
Average
Annualized | | | 3 Years
Cumulative | | | | | | Fund Inception† | |
| Index | | | | | | | | Average
Annualized | | | Cumulative | |
| Blended—S&P Momentum Developed ex-U.S. and South Korea LargeMidCap IndexTM (Net)††,††† | | | | (6.29 | )% | | | (4.46 | )% | | | (12.80 | )% | | | | | | | 1.03 | % | | | 4.89 | % |
| S&P Momentum Developed ex-U.S. and South Korea LargeMidCap IndexTM (Net)††,††† | | | | | | | | | | | N/A | | | | N/A | | | | N/A | | | | | | | | N/A | | | | N/A | |
| S&P BMI International Developed High Beta Index™ (Net)††† | | | | | | | | | | | (1.20 | ) | | | (2.76 | ) | | | (8.07 | ) | | | | | | | 2.17 | | | | 10.59 | |
| MSCI EAFE® Index (Net)††† | | | | | | | | | | | (3.23 | ) | | | (1.31 | ) | | | (3.87 | ) | | | | | | | 4.20 | | | | 21.22 | |
| Fund | | | | | | | | | | | | | | | | | | | | | | | | |
| NAV Return | | | | | | | | | | | (6.92 | ) | | | (4.79 | ) | | | (13.71 | ) | | | | | | | 0.58 | | | | 2.76 | |
| Market Price Return | | | | | | | | | | | (6.77 | ) | | | (5.01 | ) | | | (14.28 | ) | | | | | | | 0.36 | | | | 1.68 | |
Fund Inception: February 24, 2012
Performance quoted above represents past performance. Past performance is not a guarantee of future results and current performance may be higher or lower than performance quoted. Investment returns and principal value will fluctuate, and shares of the Fund (“Fund Shares”), when redeemed or sold, may be worth more or less than their original cost. Fund performance reflects any applicable fee waivers and/or expense reimbursements. Had the adviser not waived fees and/or reimbursed expenses currently, or in the past, returns would have been lower. See current prospectus for more information. The adviser has contractually agreed to waive fees and/or pay certain Fund expenses through February 28, 2018. According to the Fund’s current prospectus, the Fund’s expense ratio of 0.36% (0.26% after fee waiver) includes the unitary management fee of 0.35% and other expenses of 0.01%. NAV and Market Price returns assume that dividends and capital gain distributions have been reinvested in the Fund at NAV and Market Price, respectively. The returns shown in the table above do not reflect the deduction of taxes that a shareholder would pay on Fund distributions or the redemption or sale of Fund Shares. See invescopowershares.com to find the most recent month-end performance numbers.
Blended-Index, Index, Previous Index and Benchmark Index performance results are based upon a hypothetical investment in their respective constituent securities. Blended-Index, Index, Previous Index and Benchmark Index returns do not represent Fund returns. An investor cannot invest directly in an index. The Blended-Index, Index, Previous Index and Benchmark Index do not charge management fees or brokerage expenses, and no such fees or expenses were deducted from the hypothetical performance shown. In addition, the results actual investors might have achieved would have differed from those shown because of differences in the timing, amounts of their investments, and fees and expenses associated with an investment in the Fund.
| † | Fund, Blended-Index, Index, Previous Index and Benchmark Index returns are based on the inception date of the Fund. |
| †† | “1 Year”, “3 Years”, “5 Years” and “Fund Inception” performance for the Index is not available because the Index did not commence until February 16, 2016. The Blended-Index is comprised of the performance of the Previous Index from Fund inception through the conversion date, March 18, 2016, followed by the performance of the Index for the period March 18, 2016 through October 31, 2016. |
| ††† | Reflects reinvested dividends net of withholding taxes. |
| | |
| XMLV | | Manager’s Analysis |
| | PowerShares S&P MidCap Low Volatility Portfolio (XMLV) |
As an index fund, the PowerShares S&P MidCap Low Volatility Portfolio (the “Fund”) is passively managed and attempts to track the returns of an underlying index. The Fund seeks investment results that generally correspond (before fees and expenses) to the price and yield of the S&P MidCap 400® Low Volatility Index (the “Index”). The Fund generally will invest at least 90% of its total assets in common stocks that comprise the Index.
S&P Dow Jones Indices LLC (“S&P DJI” or the “Index Provider”) compiles, maintains and calculates the Index. Strictly in accordance with its guidelines and mandated procedures, S&P DJI selects 80 securities from the S&P MidCap 400® Index (the “Benchmark Index”) for inclusion in the Index that have the lowest realized volatility over the past 12 months as determined by the Index Provider. Volatility is a statistical measurement of the magnitude of up and down asset price fluctuations (increases or decreases in a stock’s price) over time. S&P DJI weights the 80 securities within the Index based upon the inverse of each security’s volatility, with the least volatile securities receiving the highest weights in the Index. The Fund generally invests in all of the securities comprising the Index in proportion to their weightings in the Index.
For the fiscal year ended October 31, 2016, on a market price basis, the Fund returned 12.89%. On a net asset value (“NAV”) basis, the Fund returned 12.96%. During the same time period, the Index returned 13.34%. During the fiscal year, the Fund fully replicated the components of the Index; therefore, the Fund’s performance (NAV basis) differed from the return of the Index primarily due to fees and operating expenses incurred during the period.
During this same time period, the Benchmark Index returned 6.26%. The Benchmark Index is an unmanaged index weighted by market capitalization based on the average performance of approximately 400 mid cap securities. The adviser provided this additional comparative benchmark to help investors better understand how the investment results of the Fund compare to the performance of a broad-based mid cap market benchmark.
The Benchmark Index was selected for its recognition in the marketplace, and its performance comparison is a useful measure for investors as a broad representation of the overall U.S. mid cap equity market. The performance of the Fund differed from the Benchmark Index in part because the Fund attempts to track an Index that is a subset of the Benchmark Index, consisting of the 80 securities within the Benchmark Index that have the lowest realized volatility over the past 12 months.
Relative to the Benchmark Index, the Fund was most overweight in the real estate sector and most underweight in the information technology sector during the fiscal year ended October 31, 2016. The majority of the Fund’s outperformance relative to the Benchmark Index during the period can be attributed to allocation to the real estate sector and energy sector, and stock selection within the industrials sector.
For the fiscal year ended October 31, 2016, the real estate sector contributed most significantly to the Fund’s return, followed by the utilities and financials sectors, respectively. The consumer discretionary sector detracted most significantly from the Fund’s return, followed by the consumer staples sector.
Positions that contributed most significantly to the Fund’s return included Endurance Specialty Holdings Ltd., a financials company (portfolio average weight of 1.46%), and Copart, Inc., an industrials company (portfolio average weight of 1.40%). Positions that detracted most significantly from the Fund’s return included Kilroy Realty Corp. REIT, a financials company (no longer held at fiscal year-end), and John Wiley & Sons, Inc., Class A, a consumer discretionary company (no longer held at fiscal year-end).
| | | | |
Sector Breakdown
(% of the Fund’s Net Assets)
as of October 31, 2016 | |
| Real Estate | | | 28.6 | |
| Financials | | | 20.1 | |
| Utilities | | | 17.1 | |
| Industrials | | | 8.4 | |
| Materials | | | 7.3 | |
| Information Technology | | | 7.2 | |
| Consumer Discretionary | | | 5.5 | |
| Health Care | | | 4.6 | |
| Consumer Staples | | | 1.2 | |
| Other Assets Less Liabilities | | | 0.0 | |
|
Top Ten Fund Holdings
(% of the Fund’s Net Assets)
as of October 31, 2016 | |
| Security | | | | |
| Endurance Specialty Holdings Ltd. | | | 2.1 | |
| RenaissanceRe Holdings Ltd. | | | 1.9 | |
| Everest Re Group Ltd. | | | 1.6 | |
| American Financial Group, Inc. | | | 1.6 | |
| IDACORP, Inc. | | | 1.5 | |
| Post Properties, Inc. | | | 1.4 | |
| Atmos Energy Corp. | | | 1.4 | |
| W.R. Berkley Corp. | | | 1.4 | |
| Brown & Brown, Inc. | | | 1.4 | |
| Alleghany Corp. | | | 1.4 | |
| Total | | | 15.7 | |
PowerShares S&P MidCap Low Volatility Portfolio (XMLV) (continued)
Growth of a $10,000 Investment Since Inception†
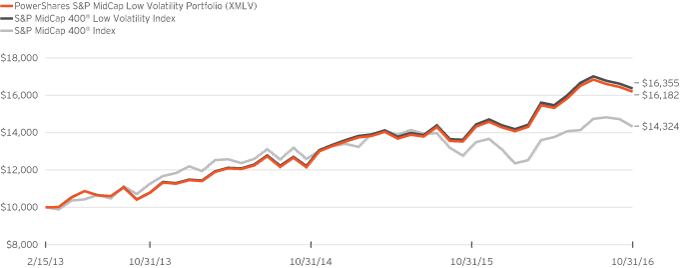
Fund Performance History as of October 31, 2016
| | | | | | | | | | | | | | | | | | | | | | | | | | | | |
| | | 1 Year | | | 3 Years
Average
Annualized | | | 3 Years
Cumulative | | | | | | Fund Inception† | |
| Index | | | | | | | | Average
Annualized | | | Cumulative | |
| S&P MidCap 400® Low Volatility Index | | | 13.34 | % | | | 12.97 | % | | | 44.16 | % | | | | | | | 14.20 | % | | | 63.55 | % |
| S&P MidCap 400® Index | | | 6.26 | | | | 7.06 | | | | 22.70 | | | | | | | | 10.18 | | | | 43.24 | |
| Fund | | | | | | | | | | | | | | | | | | |
| NAV Return | | | 12.96 | | | | 12.64 | | | | 42.92 | | | | | | | | 13.86 | | | | 61.82 | |
| Market Price Return | | | 12.89 | | | | 12.62 | | | | 42.85 | | | | | | | | 13.88 | | | | 61.89 | |
Fund Inception: February 15, 2013
Performance quoted above represents past performance. Past performance is not a guarantee of future results and current performance may be higher or lower than performance quoted. Investment returns and principal value will fluctuate, and shares of the Fund (“Fund Shares”), when redeemed or sold, may be worth more or less than their original cost. Fund performance reflects any applicable fee waivers and/or expense reimbursements. Had the adviser not waived fees and/or reimbursed expenses currently or in the past, returns would have been lower. See current prospectus for more information. According to the Fund’s current prospectus, the Fund’s expense ratio of 0.25% is expressed as a unitary management fee to cover operating expenses and expenses incurred in connection with managing the portfolio. NAV and Market Price returns assume that dividends and capital gain distributions have been reinvested in the Fund at NAV and Market Price, respectively. The returns shown in the table above do not
reflect the deduction of taxes that a shareholder would pay on Fund distributions or the redemption or sale of Fund Shares. See invescopowershares.com to find the most recent month-end performance numbers.
Index and Benchmark Index performance results are based upon a hypothetical investment in their respective constituent securities. Index and Benchmark Index returns do not represent Fund returns. An investor cannot invest directly in an index. The Index and Benchmark Index do not charge management fees or brokerage expenses, and no such fees or expenses were deducted from the hypothetical performance shown. In addition, the results actual investors might have achieved would have differed from those shown because of differences in the timing, amounts of their investments, and fees and expenses associated with an investment in the Fund.
| † | Fund, Index and Benchmark Index returns are based on the inception date of the Fund. |
| | |
| XSLV | | Manager’s Analysis |
| | PowerShares S&P SmallCap Low Volatility Portfolio (XSLV) |
As an index fund, the PowerShares S&P SmallCap Low Volatility Portfolio (the “Fund”) is passively managed and attempts to track the returns of an underlying index. The Fund seeks investment results that generally correspond (before fees and expenses) to the price and yield of the S&P SmallCap 600® Low Volatility Index (the “Index”). The Fund generally will invest at least 90% of its total assets in common stocks that comprise the Index.
S&P Dow Jones Indices LLC (“S&P DJI” or the “Index Provider”) compiles, maintains and calculates the Index. Strictly in accordance with its guidelines and mandated procedures, the Index Provider selects for inclusion in the Index the 120 securities from the S&P SmallCap 600® Index (the “Benchmark Index”) that it has determined have the lowest realized volatility over the past 12 months. Volatility is a statistical measurement of the magnitude of up and down asset price fluctuations (increases or decreases in a stock’s price) over time. S&P DJI weights the 120 securities within the Index based upon the inverse of each security’s volatility, with the least volatile securities receiving the highest weights in the Index. The Fund generally invests in all of the securities comprising the Index in proportion to their weightings in the index.
For the fiscal year ended October 31, 2016, on a market price basis, the Fund returned 12.99%. On a net asset value (“NAV”) basis, the Fund returned 12.90%. During the same time period, the Index returned 13.16%. During the fiscal year, the Fund fully replicated the component of the index; therefore, the fund’s performance (NAV basis) differed from the return of the Index primarily due to fees and operating expenses that the Fund incurred during the period.
During this same time period, the Benchmark Index returned 6.35%. The Benchmark Index is an unmanaged index weighted by market capitalization based on the average performance of approximately 600 small cap securities. The adviser provided this additional comparative benchmark to help investors better understand how the investment results of the Fund compare to the performance of a broad-based small cap market benchmark.
The Benchmark Index was selected for its recognition in the marketplace, and its performance comparison is a useful measure for investors as a broad representation of the overall U.S. small cap equity market. The performance of the Fund differed from the Benchmark Index in part because the Fund attempts to track an Index that is a subset of the Benchmark Index, consisting of the 120 securities within the Benchmark Index that have the lowest realized volatility over the past 12 months.
Relative to the Benchmark Index, the Fund was most overweight in the financials sector and most underweight in the health care sector during the fiscal year ended October 31, 2016. The majority of the Fund’s outperformance relative to the Benchmark Index during the period can be attributed to stock selection within the financials and real estate sectors.
For the fiscal year ended October 31, 2016, the financials sector contributed most significantly to the Fund’s return, followed by the real estate and utilities sectors, respectively. The telecommunication services sector detracted most significantly from the Fund’s return, followed by the health care sector.
Positions that contributed most significantly to the Fund’s return included Agree Realty Corp. REIT, a financials company (portfolio average weight of 1.02%), and Getty Realty Corp. REIT, a financials company (portfolio average weight of 1.14%). Positions that detracted most significantly from the Fund’s return included Moog, Inc., Class A, an industrials company (no longer held at fiscal year-end), and OSI Systems, Inc., an information technology company (no longer held at fiscal year-end).
| | | | |
Sector Breakdown
(% of the Fund’s Net Assets)
as of October 31, 2016 | |
| Financials | | | 33.8 | |
| Industrials | | | 15.9 | |
| Real Estate | | | 15.2 | |
| Consumer Discretionary | | | 10.2 | |
| Utilities | | | 7.5 | |
| Information Technology | | | 6.9 | |
| Materials | | | 3.8 | |
| Consumer Staples | | | 3.6 | |
| Health Care | | | 2.2 | |
| Telecommunication Services | | | 0.8 | |
| Money Market Funds Plus Other Assets Less Liabilities | | | 0.1 | |
|
Top Ten Fund Holdings*
(% of the Fund’s Net Assets)
as of October 31, 2016 | |
| Security | | | | |
| Northfield Bancorp, Inc. | | | 1.3 | |
| ProAssurance Corp. | | | 1.3 | |
| Getty Realty Corp. | | | 1.2 | |
| Spire, Inc. | | | 1.1 | |
| Northwest Bancshares, Inc. | | | 1.1 | |
| PS Business Parks, Inc. | | | 1.1 | |
| J & J Snack Foods Corp. | | | 1.1 | |
| G&K Services, Inc., Class A | | | 1.1 | |
| Infinity Property & Casualty Corp. | | | 1.1 | |
| Provident Financial Services, Inc. | | | 1.1 | |
| Total | | | 11.5 | |
| * | Excluding money market fund holdings. |
PowerShares S&P SmallCap Low Volatility Portfolio (XSLV) (continued)
Growth of a $10,000 Investment Since Inception†
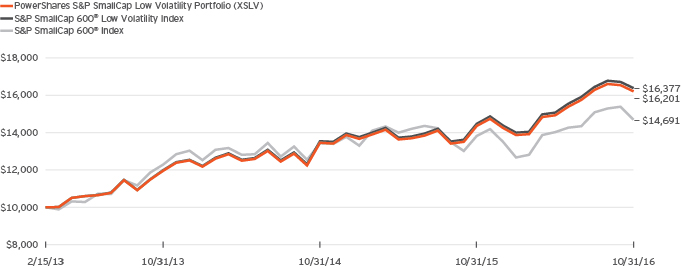
Fund Performance History as of October 31, 2016
| | | | | | | | | | | | | | | | | | | | | | | | | | | | | | | | |
| | | | | | | | | 1 Year | | | 3 Years
Average
Annualized | | | 3 Years
Cumulative | | | | | | Fund Inception† | |
| Index | | | | | | | | Average
Annualized | | | Cumulative | |
| S&P SmallCap 600® Low Volatility Index | | | | | | | | | | | 13.16 | % | | | 10.96 | % | | | 36.61 | % | | | | | | | 14.24 | % | | | 63.77 | % |
| S&P SmallCap 600® Index | | | | | | | | | | | 6.35 | | | | 6.13 | | | | 19.55 | | | | | | | | 10.94 | | | | 46.91 | |
| Fund | | | | | | | | | | | | | | | | | | | | | | | | | | | | | | | | |
| NAV Return | | | | | | | | | | | 12.90 | | | | 10.64 | | | | 35.43 | | | | | | | | 13.90 | | | | 62.01 | |
| Market Price Return | | | | | | | | | | | 12.99 | | | | 10.62 | | | | 35.36 | | | | | | | | 13.89 | | | | 61.93 | |
Fund Inception: February 15, 2013
Performance quoted above represents past performance. Past performance is not a guarantee of future results and current performance may be higher or lower than performance quoted. Investment returns and principal value will fluctuate, and shares of the Fund (“Fund Shares”), when redeemed or sold, may be worth more or less than their original cost. Fund performance reflects any applicable fee waivers and/or expense reimbursements. Had the adviser not waived fees and/or reimbursed expenses currently or in the past, returns would have been lower. See current prospectus for more information. According to the Fund’s current prospectus, the Fund’s expense ratio of 0.25% is expressed as a unitary management fee to cover operating expenses and expenses incurred in connection with managing the portfolio. NAV and Market Price returns assume that dividends and capital gain distributions have been reinvested in the Fund at NAV and Market Price, respectively. The returns shown in the table above do not
reflect the deduction of taxes that a shareholder would pay on Fund distributions or the redemption or sale of Fund Shares. See invescopowershares.com to find the most recent month-end performance numbers.
Index and Benchmark Index performance results are based upon a hypothetical investment in their respective constituent securities. Index and Benchmark Index returns do not represent Fund returns. An investor cannot invest directly in an index. The Index and Benchmark Index do not charge management fees or brokerage expenses, and no such fees or expenses were deducted from the hypothetical performance shown. In addition, the results actual investors might have achieved would have differed from those shown because of differences in the timing, amounts of their investments, and fees and expenses associated with an investment in the Fund.
| † | Fund, Index and Benchmark Index returns are based on the inception date of the Fund. |
Schedule of Investments
PowerShares FTSE International Low Beta Equal Weight Portfolio (IDLB)
October 31, 2016
| | | | | | | | |
Number
of Shares | | | | | Value | |
| | | | Common Stocks and Other Equity
Interests—99.8% | |
| | | | Australia—5.0% | |
| | 43,673 | | | Adelaide Brighton Ltd. | | $ | 177,796 | |
| | 14,132 | | | Amcor Ltd. | | | 158,080 | |
| | 24,473 | | | APA Group | | | 148,237 | |
| | 4,421 | | | ASX Ltd. | | | 158,553 | |
| | 52,223 | | | Aurizon Holdings Ltd. | | | 193,927 | |
| | 131,463 | | | AusNet Services | | | 150,055 | |
| | 18,352 | | | Brambles Ltd. | | | 161,016 | |
| | 6,757 | | | Caltex Australia Ltd. | | | 158,006 | |
| | 7,751 | | | CIMIC Group Ltd. | | | 174,525 | |
| | 23,127 | | | Coca-Cola Amatil Ltd. | | | 167,890 | |
| | 23,272 | | | Dexus Property Group REIT | | | 158,317 | |
| | 85,975 | | | DUET Group | | | 155,706 | |
| | 35,776 | | | DuluxGroup Ltd. | | | 175,321 | |
| | 6,227 | | | Flight Centre Travel Group Ltd. | | | 160,491 | |
| | 29,790 | | | Goodman Group REIT | | | 153,920 | |
| | 42,422 | | | GPT Group (The) REIT | | | 150,429 | |
| | 42,030 | | | Harvey Norman Holdings Ltd. | | | 161,513 | |
| | 73,903 | | | Healthscope Ltd. | | | 124,283 | |
| | 80,525 | | | Incitec Pivot Ltd. | | | 180,763 | |
| | 40,814 | | | Macquarie Atlas Roads Group | | | 146,591 | |
| | 9,573 | | | Magellan Financial Group Ltd. | | | 155,089 | |
| | 84,059 | | | Medibank Private Ltd. | | | 165,029 | |
| | 97,472 | | | Mirvac Group REIT | | | 155,018 | |
| | 10,193 | | | Newcrest Mining Ltd. | | | 174,983 | |
| | 72,947 | | | Orora Ltd. | | | 160,976 | |
| | 35,392 | | | OZ Minerals Ltd. | | | 180,441 | |
| | 2,768 | | | Ramsay Health Care Ltd. | | | 154,519 | |
| | 3,918 | | | REA Group Ltd. | | | 152,469 | |
| | 45,497 | | | Scentre Group REIT | | | 145,754 | |
| | 289,891 | | | Seven West Media Ltd. | | | 150,003 | |
| | 97,885 | | | Shopping Centres Australasia Property Group REIT | | | 163,123 | |
| | 9,830 | | | Sonic Healthcare Ltd. | | | 153,268 | |
| | 38,878 | | | Star Entertainment Group Ltd. (The) | | | 147,625 | |
| | 47,326 | | | Stockland REIT | | | 159,176 | |
| | 17,789 | | | Suncorp Group Ltd. | | | 162,032 | |
| | 31,059 | | | Sydney Airport | | | 147,951 | |
| | 45,505 | | | Tabcorp Holdings Ltd. | | | 167,595 | |
| | 59,347 | | | Tatts Group Ltd. | | | 183,350 | |
| | 43,636 | | | Telstra Corp. Ltd. | | | 165,360 | |
| | 18,549 | | | TPG Telecom Ltd. | | | 106,708 | |
| | 20,029 | | | Transurban Group | | | 158,355 | |
| | 20,143 | | | Treasury Wine Estates Ltd. | | | 164,621 | |
| | 68,313 | | | Vicinity Centres REIT | | | 149,190 | |
| | 29,404 | | | Vocus Communications Ltd. | | | 127,761 | |
| | 5,402 | | | Wesfarmers Ltd. | | | 168,578 | |
| | 22,124 | | | Westfield Corp. REIT | | | 149,834 | |
| | | | | | | | |
| | | | | | | 7,284,227 | |
| | | | | | | | |
| | | | Austria—0.4% | |
| | 29,799 | | | Telekom Austria AG, Class A | | | 170,972 | |
| | 8,651 | | | Vienna Insurance Group AG Wiener Versicherung Gruppe | | | 170,414 | |
| | 5,142 | | | voestalpine AG | | | 181,669 | |
| | | | | | | | |
| | | | | | | 523,055 | |
| | | | | | | | |
| | | | | | | | |
Number
of Shares | | | | | Value | |
| | | | Common Stocks and Other Equity Interests (continued) | |
| | | | Belgium—1.3% | | | | |
| | 1,451 | | | Ackermans & van Haaren NV | | $ | 201,289 | |
| | 4,925 | | | Ageas | | | 179,645 | |
| | 6,690 | | | bpost SA | | | 177,729 | |
| | 3,103 | | | Colruyt SA | | | 166,555 | |
| | 2,876 | | | KBC Groep NV(a) | | | 175,005 | |
| | 5,612 | | | Proximus SADP | | | 160,441 | |
| | 1,244 | | | Sofina SA | | | 173,596 | |
| | 1,583 | | | Solvay SA | | | 181,424 | |
| | 3,698 | | | Telenet Group Holding NV(a) | | | 197,681 | |
| | 2,074 | | | UCB SA | | | 140,253 | |
| | 2,888 | | | Umicore SA | | | 175,355 | |
| | | | | | | | |
| | | | | | | 1,928,973 | |
| | | | | | | | |
| | | | Canada—4.1% | | | | |
| | 3,407 | | | Agnico Eagle Mines Ltd. | | | 173,165 | |
| | 1,793 | | | Agrium, Inc. | | | 164,725 | |
| | 3,295 | | | Alimentation Couche-Tard, Inc., Class B | | | 165,654 | |
| | 2,563 | | | Bank of Montreal | | | 163,237 | |
| | 3,638 | | | BCE, Inc. | | | 165,417 | |
| | 5,118 | | | Brookfield Asset Management, Inc., Class A | | | 179,364 | |
| | 2,140 | | | Canadian Imperial Bank of Commerce | | | 160,470 | |
| | 2,647 | | | Canadian National Railway Co. | | | 166,532 | |
| | 1,685 | | | Canadian Tire Corp. Ltd., Class A | | | 163,917 | |
| | 5,930 | | | Canadian Utilities Ltd., Class A | | | 169,593 | |
| | 3,493 | | | CGI Group, Inc., Class A(a) | | | 166,043 | |
| | 8,683 | | | CI Financial Corp. | | | 159,893 | |
| | 393 | | | Constellation Software, Inc. | | | 184,250 | |
| | 4,315 | | | Enbridge, Inc. | | | 186,476 | |
| | 306 | | | Fairfax Financial Holdings Ltd. | | | 156,841 | |
| | 5,403 | | | Fortis, Inc. | | | 177,984 | |
| | 2,443 | | | Franco-Nevada Corp. | | | 160,023 | |
| | 1,975 | | | George Weston Ltd. | | | 161,065 | |
| | 7,119 | | | Great-West Lifeco, Inc. | | | 178,951 | |
| | 5,625 | | | Imperial Oil Ltd. | | | 182,569 | |
| | 2,342 | | | Intact Financial Corp. | | | 159,331 | |
| | 7,818 | | | Inter Pipeline Ltd. | | | 162,222 | |
| | 3,126 | | | Loblaw Cos. Ltd. | | | 154,358 | |
| | 4,289 | | | Magna International, Inc. | | | 176,232 | |
| | 12,464 | | | Manulife Financial Corp. | | | 180,694 | |
| | 5,006 | | | Metro, Inc. | | | 154,858 | |
| | 5,652 | | | Pembina Pipeline Corp. | | | 173,788 | |
| | 8,044 | | | Power Corp. of Canada | | | 172,674 | |
| | 7,379 | | | Power Financial Corp. | | | 174,530 | |
| | 8,228 | | | RioCan Real Estate Investment Trust REIT | | | 160,109 | |
| | 3,970 | | | Rogers Communications, Inc., Class B | | | 159,837 | |
| | 5,123 | | | Saputo, Inc. | | | 184,241 | |
| | 5,387 | | | Sun Life Financial, Inc. | | | 180,431 | |
| | 5,267 | | | TELUS Corp. | | | 170,674 | |
| | 3,811 | | | Toronto-Dominion Bank (The) | | | 173,055 | |
| | 2,264 | | | Waste Connections, Inc. | | | 170,039 | |
| | | | | | | | |
| | | | | | | 6,093,242 | |
| | | | | | | | |
| | | | China—0.4% | | | | |
| | 15,207 | | | AAC Technologies Holdings, Inc. | | | 145,111 | |
| | 1,546,579 | | | Semiconductor Manufacturing International Corp.(a) | | | 187,468 | |
See accompanying Notes to Financial Statements which are an integral part of the financial statements.
PowerShares FTSE International Low Beta Equal Weight Portfolio (IDLB) (continued)
October 31, 2016
| | | | | | | | |
Number
of Shares | | | | | Value | |
| | | | Common Stocks and Other Equity Interests (continued) | |
| | | | China (continued) | | | | |
| | 238,653 | | | Uni-President China Holdings Ltd. | | $ | 161,567 | |
| | 258,018 | | | Want Want China Holdings Ltd. | | | 157,376 | |
| | | | | | | | |
| | | | | | | 651,522 | |
| | | | | | | | |
| | | | Denmark—1.1% | | | | |
| | 2,806 | | | Chr. Hansen Holding A/S | | | 167,794 | |
| | 2,268 | | | Coloplast A/S, Class B | | | 158,015 | |
| | 5,801 | | | Danske Bank A/S | | | 178,830 | |
| | 3,438 | | | DSV A/S | | | 166,374 | |
| | 4,262 | | | ISS A/S | | | 167,311 | |
| | 3,599 | | | Jyske Bank A/S | | | 163,081 | |
| | 1,369 | | | Pandora A/S | | | 177,930 | |
| | 8,531 | | | Tryg A/S | | | 166,443 | |
| | 2,057 | | | Vestas Wind Systems A/S | | | 164,744 | |
| | 8,147 | | | William Demant Holding A/S(a) | | | 151,507 | |
| | | | | | | | |
| | | | | | | 1,662,029 | |
| | | | | | | | |
| | | | Finland—1.0% | |
| | 4,835 | | | Elisa Oyj | | | 162,714 | |
| | 3,915 | | | Kesko Oyj, Class B | | | 194,325 | |
| | 3,386 | | | Kone Oyj, Class B | | | 155,633 | |
| | 4,091 | | | Neste Oyj | | | 176,377 | |
| | 4,711 | | | Nokian Renkaat Oyj | | | 157,869 | |
| | 4,495 | | | Orion Oyj, Class B | | | 191,135 | |
| | 3,964 | | | Sampo Oyj, Class A | | | 181,505 | |
| | 4,135 | | | Wartsila Oyj Abp | | | 178,592 | |
| | | | | | | | |
| | | | | | | 1,398,150 | |
| | | | | | | | |
| | | | France—6.1% | |
| | 4,510 | | | Accor SA | | | 170,984 | |
| | 1,673 | | | Aeroports de Paris | | | 168,741 | |
| | 1,617 | | | Air Liquide SA | | | 164,281 | |
| | 6,433 | | | Alstom SA(a) | | | 172,559 | |
| | 1,736 | | | Atos SE | | | 180,062 | |
| | 1,128 | | | bioMerieux | | | 164,209 | |
| | 47,120 | | | Bollore SA | | | 154,959 | |
| | 5,367 | | | Bouygues SA | | | 174,764 | |
| | 7,938 | | | Bureau Veritas SA | | | 149,755 | |
| | 1,747 | | | Capgemini SA | | | 144,549 | |
| | 1,002 | | | Christian Dior SE | | | 193,043 | |
| | 3,879 | | | Cie de Saint-Gobain | | | 171,979 | |
| | 1,602 | | | Cie Generale des Etablissements Michelin | | | 173,205 | |
| | 10,576 | | | CNP Assurances | | | 183,002 | |
| | 2,239 | | | Danone SA | | | 154,823 | |
| | 2,056 | | | Dassault Systemes | | | 162,588 | |
| | 2,175 | | | Eiffage SA | | | 160,793 | |
| | 1,364 | | | Essilor International SA | | | 153,110 | |
| | 2,061 | | | Euler Hermes Group | | | 178,595 | |
| | 2,805 | | | Eurazeo SA | | | 161,214 | |
| | 8,756 | | | Eutelsat Communications SA | | | 183,328 | |
| | 1,823 | | | Fonciere des Regions REIT | | | 159,130 | |
| | 1,087 | | | Gecina SA REIT | | | 158,240 | |
| | 15,474 | | | Groupe Eurotunnel SE | | | 144,708 | |
| | 412 | | | Hermes International | | | 166,698 | |
| | 825 | | | Iliad SA | | | 172,824 | |
| | 2,450 | | | Imerys SA | | | 170,165 | |
| | 1,582 | | | Ingenico Group | | | 125,035 | |
| | | | | | | | |
Number
of Shares | | | | | Value | |
| | | | Common Stocks and Other Equity Interests (continued) | |
| | | | France (continued) | |
| | 2,657 | | | Ipsen SA | | $ | 183,378 | |
| | 4,951 | | | JCDecaux SA | | | 151,177 | |
| | 6,979 | | | Lagardere SCA | | | 177,489 | |
| | 902 | | | L’Oreal SA | | | 161,219 | |
| | 1,021 | | | LVMH Moet Hennessy Louis Vuitton SE | | | 185,287 | |
| | 11,144 | | | Orange SA | | | 175,300 | |
| | 1,961 | | | Orpea | | | 163,029 | |
| | 2,294 | | | Publicis Groupe SA | | | 157,168 | |
| | 1,958 | | | Remy Cointreau SA | | | 158,616 | |
| | 2,435 | | | Safran SA | | | 167,175 | |
| | 2,209 | | | Sanofi | | | 171,830 | |
| | 2,455 | | | Sartorius Stedim Biotech | | | 165,319 | |
| | 5,787 | | | SCOR SE | | | 187,076 | |
| | 1,166 | | | Societe BIC SA | | | 161,433 | |
| | 1,472 | | | Sodexo SA | | | 170,720 | |
| | 11,406 | | | Suez | | | 180,360 | |
| | 2,882 | | | Technip SA | | | 190,882 | |
| | 1,648 | | | Teleperformance | | | 173,915 | |
| | 1,966 | | | Thales SA | | | 184,846 | |
| | 3,571 | | | Total SA | | | 171,143 | |
| | 629 | | | Unibail-Rodamco SE REIT | | | 149,624 | |
| | 3,335 | | | Valeo SA | | | 191,931 | |
| | 8,075 | | | Veolia Environnement SA | | | 175,974 | |
| | 2,243 | | | Vinci SA | | | 162,230 | |
| | 8,778 | | | Vivendi SA | | | 177,246 | |
| | | | | | | | |
| | | | | | | 8,911,710 | |
| | | | | | | | |
| | | | Germany—4.8% | |
| | 1,029 | | | Adidas AG | | | 168,522 | |
| | 1,143 | | | Allianz SE | | | 177,920 | |
| | 3,343 | | | Axel Springer SE | | | 167,161 | |
| | 2,093 | | | BASF SE | | | 184,236 | |
| | 1,591 | | | Bayer AG | | | 157,471 | |
| | 1,855 | | | Beiersdorf AG | | | 163,083 | |
| | 3,128 | | | Brenntag AG | | | 166,971 | |
| | 2,004 | | | Deutsche Boerse AG(a) | | | 155,708 | |
| | 14,607 | | | Deutsche Lufthansa AG | | | 186,462 | |
| | 5,377 | | | Deutsche Post AG | | | 166,395 | |
| | 10,190 | | | Deutsche Telekom AG | | | 165,823 | |
| | 4,536 | | | Deutsche Wohnen AG-BR | | | 147,779 | |
| | 5,061 | | | Evonik Industries AG | | | 157,892 | |
| | 2,177 | | | Fielmann AG | | | 150,775 | |
| | 3,050 | | | Fraport AG Frankfurt Airport Services Worldwide | | | 180,778 | |
| | 1,952 | | | Fresenius Medical Care AG & Co. KGaA | | | 158,793 | |
| | 2,363 | | | Fresenius SE & Co. KGaA | | | 174,173 | |
| | 1,263 | | | FUCHS PETROLUB SE | | | 49,856 | |
| | 2,576 | | | FUCHS PETROLUB SE (Preference Shares) | | | 115,000 | |
| | 3,171 | | | GEA Group AG | | | 122,444 | |
| | 1,687 | | | Hannover Rueck SE | | | 187,795 | |
| | 559 | | | Henkel AG & Co. KGaA | | | 61,461 | |
| | 822 | | | Henkel AG & Co. KGaA (Preference Shares) | | | 105,336 | |
| | 1,271 | | | HOCHTIEF AG | | | 173,253 | |
| | 2,787 | | | HUGO BOSS AG | | | 174,783 | |
| | 8,176 | | | K+S AG | | | 165,179 | |
| | 2,998 | | | KION Group AG | | | 180,818 | |
| | 1,768 | | | LEG Immobilien AG | | | 148,922 | |
See accompanying Notes to Financial Statements which are an integral part of the financial statements.
PowerShares FTSE International Low Beta Equal Weight Portfolio (IDLB) (continued)
October 31, 2016
| | | | | | | | |
Number
of Shares | | | | | Value | |
| | | | Common Stocks and Other Equity Interests (continued) | |
| | | | Germany (continued) | |
| | 999 | | | Linde AG | | $ | 164,594 | |
| | 1,636 | | | MAN SE | | | 167,072 | |
| | 1,672 | | | MTU Aero Engines AG | | | 174,267 | |
| | 954 | | | Muenchener Rueckversicherungs-Gesellschaft AG | | | 184,684 | |
| | 3,293 | | | Osram Licht AG | | | 186,446 | |
| | 3,957 | | | ProSiebenSat.1 Media SE | | | 170,297 | |
| | 351 | | | Rational AG | | | 181,802 | |
| | 2,152 | | | Sartorius AG (Preference Shares) | | | 168,835 | |
| | 6,520 | | | Suedzucker AG | | | 166,816 | |
| | 2,313 | | | Symrise AG | | | 158,495 | |
| | 5,824 | | | Talanx AG | | | 180,515 | |
| | 12,208 | | | TUI AG | | | 154,562 | |
| | 4,196 | | | United Internet AG | | | 171,981 | |
| | 4,371 | | | Vonovia SE | | | 153,735 | |
| | 3,440 | | | Wirecard AG | | | 162,961 | |
| | 4,513 | | | Zalando SE(a)(b) | | | 197,837 | |
| | | | | | | | |
| | | | | | | 7,059,688 | |
| | | | | | | | |
| | | | Hong Kong—4.8% | |
| | 27,161 | | | AIA Group Ltd. | | | 171,445 | |
| | 21,826 | | | ASM Pacific Technology Ltd. | | | 210,665 | |
| | 618,487 | | | Brightoil Petroleum Holdings Ltd. | | | 178,651 | |
| | 48,947 | | | Cafe de Coral Holdings Ltd. | | | 172,943 | |
| | 265,806 | | | Champion REIT | | | 151,158 | |
| | 20,816 | | | Cheung Kong Infrastructure Holdings Ltd. | | | 170,584 | |
| | 243,512 | | | Chow Tai Fook Jewellery Group Ltd. | | | 172,707 | |
| | 13,576 | | | CK Hutchison Holdings Ltd. | | | 167,974 | |
| | 16,554 | | | CLP Holdings Ltd. | | | 168,425 | |
| | 91,937 | | | Dah Sing Banking Group Ltd. | | | 166,450 | |
| | 229,578 | | | First Pacific Co. Ltd. | | | 174,074 | |
| | 1,829,445 | | | Global Brands Group Holding Ltd.(a) | | | 207,601 | |
| | 9,638 | | | Hang Seng Bank Ltd. | | | 174,121 | |
| | 88,828 | | | Hong Kong & China Gas Co. Ltd. | | | 174,108 | |
| | 26,166 | | | Hongkong Land Holdings Ltd. | | | 175,312 | |
| | 290,255 | | | Hopewell Highway Infrastructure Ltd. | | | 155,330 | |
| | 48,969 | | | Hopewell Holdings Ltd. | | | 171,758 | |
| | 399,392 | | | Hutchison Port Holdings Trust | | | 177,729 | |
| | 492,686 | | | Hutchison Telecommunications Hong Kong Holdings Ltd. | | | 158,832 | |
| | 35,462 | | | Hysan Development Co. Ltd. | | | 163,709 | |
| | 2,932 | | | Jardine Matheson Holdings Ltd. | | | 178,588 | |
| | 5,273 | | | Jardine Strategic Holdings Ltd. | | | 185,030 | |
| | 63,168 | | | Johnson Electric Holdings Ltd. | | | 152,812 | |
| | 123,723 | | | Kerry Logistics Network Ltd. | | | 164,329 | |
| | 332,191 | | | Li & Fung Ltd. | | | 163,636 | |
| | 112,900 | | | Lifestyle International Holdings Ltd. | | | 151,410 | |
| | 23,466 | | | Link REIT | | | 167,337 | |
| | 30,939 | | | MTR Corp. Ltd. | | | 171,355 | |
| | 96,268 | | | NWS Holdings Ltd. | | | 170,567 | |
| | 267,511 | | | PCCW Ltd. | | | 159,371 | |
| | 18,430 | | | Power Assets Holdings Ltd. | | | 173,371 | |
| | 411,016 | | | Sa Sa International Holdings Ltd. | | | 188,154 | |
| | 98,929 | | | Sino Land Co. Ltd. | | | 168,393 | |
| | 263,924 | | | Sun Art Retail Group Ltd. | | | 186,163 | |
| | 15,671 | | | Swire Pacific Ltd., Class A | | | 162,977 | |
| | 60,266 | | | Swire Properties Ltd. | | | 173,302 | |
| | | | | | | | |
Number
of Shares | | | | | Value | |
| | | | Common Stocks and Other Equity Interests (continued) | |
| | | | Hong Kong (continued) | |
| | 41,678 | | | Techtronic Industries Co. Ltd. | | $ | 156,934 | |
| | 47,745 | | | Television Broadcasts Ltd. | | | 173,006 | |
| | 239,493 | | | Texwinca Holdings Ltd. | | | 168,003 | |
| | 15,173 | | | VTech Holdings Ltd. | | | 186,267 | |
| | 40,611 | | | Yue Yuen Industrial Holdings Ltd. | | | 154,749 | |
| | | | | | | | |
| | | | | | | 7,019,330 | |
| | | | | | | | |
| | | | Indonesia—0.1% | |
| | 643,254 | | | Golden Agri-Resources Ltd. | | | 177,924 | |
| | | | | | | | |
| | | | Ireland—0.4% | |
| | 5,133 | | | CRH PLC | | | 165,696 | |
| | 8,940 | | | Glanbia PLC | | | 145,433 | |
| | 2,002 | | | Kerry Group PLC, Class A | | | 145,150 | |
| | 1,436 | | | Paddy Power Betfair PLC | | | 148,497 | |
| | | | | | | | |
| | | | | | | 604,776 | |
| | | | | | | | |
| | | | Israel—2.7% | |
| | 15,814 | | | Airport City Ltd.(a) | | | 171,905 | |
| | 18,619 | | | Alony Hetz Properties & Investments Ltd. REIT | | | 159,978 | |
| | 37,929 | | | Amot Investments Ltd. | | | 158,206 | |
| | 3,908 | | | Azrieli Group Ltd. | | | 166,263 | |
| | 31,735 | | | Bank Hapoalim BM | | | 182,939 | |
| | 45,458 | | | Bank Leumi Le-Israel BM(a) | | | 171,383 | |
| | 84,957 | | | Bezeq The Israeli Telecommunication Corp. Ltd. | | | 154,178 | |
| | 19,454 | | | Delek Automotive Systems Ltd. | | | 166,139 | |
| | 326 | | | Delek Energy Systems Ltd.(a) | | | 168,657 | |
| | 1,775 | | | Elbit Systems Ltd. | | | 175,619 | |
| | 13,570 | | | First International Bank of Israel Ltd. | | | 174,541 | |
| | 3,217 | | | Frutarom Industries Ltd. | | | 170,034 | |
| | 47,247 | | | Harel Insurance Investments & Financial Services Ltd. | | | 182,557 | |
| | 40,142 | | | Israel Chemicals Ltd. | | | 142,771 | |
| | 926 | | | Israel Corp. Ltd. (The)(a) | | | 137,910 | |
| | 94,073 | | | Israel Discount Bank Ltd., Class A(a) | | | 172,656 | |
| | 4,061 | | | Melisron Ltd. | | | 172,032 | |
| | 14,081 | | | Mizrahi Tefahot Bank Ltd. | | | 183,313 | |
| | 2,492 | | | Nice Ltd. | | | 165,260 | |
| | 465,599 | | | Oil Refineries Ltd.(a) | | | 164,142 | |
| | 1,046 | | | Paz Oil Co. Ltd. | | | 163,244 | |
| | 99,561 | | | Shikun & Binui Ltd. | | | 172,645 | |
| | 10,861 | | | Strauss Group Ltd. | | | 170,803 | |
| | 10,845 | | | Tower Semiconductor Ltd.(a) | | | 167,700 | |
| | | | | | | | |
| | | | | | | 4,014,875 | |
| | | | | | | | |
| | | | Italy—1.3% | |
| | 6,618 | | | Atlantia SpA | | | 161,851 | |
| | 15,644 | | | Davide Campari-Milano SpA | | | 157,342 | |
| | 38,550 | | | Enel SpA | | | 165,654 | |
| | 27,997 | | | Finecobank Banca Fineco SpA | | | 163,273 | |
| | 3,584 | | | Luxottica Group SpA | | | 178,170 | |
| | 65,039 | | | Parmalat SpA | | | 171,538 | |
| | 56,519 | | | Prada SpA | | | 198,239 | |
| | 5,707 | | | Recordati SpA | | | 161,280 | |
| | 7,564 | | | Salvatore Ferragamo SpA | | | 184,821 | |
| | 30,700 | | | Snam SpA | | | 161,603 | |
See accompanying Notes to Financial Statements which are an integral part of the financial statements.
PowerShares FTSE International Low Beta Equal Weight Portfolio (IDLB) (continued)
October 31, 2016
| | | | | | | | |
Number
of Shares | | | | | Value | |
| | | | Common Stocks and Other Equity Interests (continued) | |
| | | | Italy (continued) | |
| | 32,939 | | | Terna-Rete Elettrica Nationale SpA | | $ | 161,113 | |
| | | | | | | | |
| | | | | | | 1,864,884 | |
| | | | | | | | |
| | | | Japan—35.2% | |
| | 40,433 | | | 77 Bank Ltd. (The) | | | 182,763 | |
| | 2,682 | | | ABC-Mart, Inc. | | | 163,087 | |
| | 35,507 | | | ACOM Co. Ltd.(a) | | | 163,538 | |
| | 7,625 | | | Adastria Co. Ltd. | | | 199,686 | |
| | 11,321 | | | Advantest Corp. | | | 161,921 | |
| | 12,015 | | | AEON Mall Co. Ltd. | | | 178,364 | |
| | 52,865 | | | Aiful Corp.(a) | | | 160,982 | |
| | 3,030 | | | Ain Holdings, Inc. | | | 204,432 | |
| | 7,973 | | | Ajinomoto Co., Inc. | | | 177,275 | |
| | 9,097 | | | Alfresa Holdings Corp. | | | 192,354 | |
| | 62,619 | | | ANA Holdings, Inc. | | | 175,906 | |
| | 5,237 | | | Aoyama Trading Co. Ltd. | | | 184,393 | |
| | 48,105 | | | Aozora Bank Ltd. | | | 158,847 | |
| | 3,654 | | | Ariake Japan Co. Ltd. | | | 204,111 | |
| | 26,903 | | | Asahi Glass Co. Ltd. | | | 188,169 | |
| | 5,238 | | | Asahi Group Holdings Ltd. | | | 186,970 | |
| | 3,858 | | | Asahi Intecc Co. Ltd. | | | 167,045 | |
| | 20,300 | | | Asahi Kasei Corp. | | | 183,093 | |
| | 4,679 | | | ASKUL Corp. | | | 192,574 | |
| | 11,016 | | | Astellas Pharma, Inc. | | | 163,481 | |
| | 12,261 | | | Autobacs Seven Co. Ltd. | | | 174,315 | |
| | 5,817 | | | Azbil Corp. | | | 172,708 | |
| | 6,210 | | | Bandai Namco Holdings, Inc. | | | 186,149 | |
| | 21,465 | | | Bic Camera, Inc. | | | 184,858 | |
| | 4,976 | | | Bridgestone Corp. | | | 185,384 | |
| | 4,718 | | | Calbee, Inc. | | | 171,057 | |
| | 21,543 | | | Calsonic Kansei Corp. | | | 269,582 | |
| | 9,630 | | | Canon Marketing Japan, Inc. | | | 166,327 | |
| | 5,922 | | | Canon, Inc. | | | 170,021 | |
| | 7,804 | | | Capcom Co. Ltd. | | | 201,626 | |
| | 11,975 | | | Casio Computer Co. Ltd. | | | 167,059 | |
| | 1,047 | | | Central Japan Railway Co. | | | 177,995 | |
| | 21,389 | | | Chiyoda Corp. | | | 186,646 | |
| | 12,489 | | | Chubu Electric Power Co., Inc. | | | 183,559 | |
| | 5,376 | | | Chugai Pharmaceutical Co. Ltd. | | | 183,148 | |
| | 13,737 | | | Chugoku Bank Ltd. (The) | | | 184,319 | |
| | 14,095 | | | Chugoku Electric Power Co., Inc. (The) | | | 164,711 | |
| | 9,674 | | | Coca-Cola East Japan Co. Ltd. | | | 213,208 | |
| | 7,526 | | | Coca-Cola West Co. Ltd. | | | 222,375 | |
| | 11,305 | | | Colopl, Inc. | | | 162,768 | |
| | 8,994 | | | COMSYS Holdings Corp. | | | 158,423 | |
| | 16,962 | | | Cookpad, Inc. | | | 161,251 | |
| | 979 | | | Cosmos Pharmaceutical Corp. | | | 213,063 | |
| | 6,278 | | | CyberAgent, Inc. | | | 182,512 | |
| | 17,035 | | | Dai Nippon Printing Co. Ltd. | | | 170,861 | |
| | 9,715 | | | Daifuku Co. Ltd. | | | 175,838 | |
| | 7,393 | | | Daiichi Sankyo Co. Ltd. | | | 177,711 | |
| | 4,390 | | | Daiichikosho Co. Ltd. | | | 190,706 | |
| | 106,675 | | | Daikyo, Inc. | | | 228,404 | |
| | 43,958 | | | Daishi Bank Ltd. (The) | | | 189,076 | |
| | 1,210 | | | Daito Trust Construction Co. Ltd. | | | 202,367 | |
| | 6,511 | | | Daiwa House Industry Co. Ltd. | | | 178,815 | |
| | 29,602 | | | Daiwa Securities Group, Inc. | | | 176,820 | |
| | | | | | | | |
Number
of Shares | | | | | Value | |
| | | | Common Stocks and Other Equity Interests (continued) | |
| | | | Japan (continued) | |
| | 5,679 | | | DeNA Co. Ltd. | | $ | 182,662 | |
| | 5,204 | | | Don Quijote Holdings Co. Ltd. | | | 197,840 | |
| | 1,985 | | | East Japan Railway Co. | | | 174,860 | |
| | 2,955 | | | Eisai Co. Ltd. | | | 188,348 | |
| | 6,971 | | | Electric Power Development Co. Ltd. | | | 162,326 | |
| | 3,439 | | | Ezaki Glico Co. Ltd. | | | 195,374 | |
| | 2,423 | | | Familymart UNY Holdings Co. Ltd. | | | 151,718 | |
| | 1,045 | | | FANUC Corp. | | | 195,704 | |
| | 3,237 | | | FP Corp. | | | 174,349 | |
| | 4,568 | | | FUJIFILM Holdings Corp. | | | 172,792 | |
| | 8,360 | | | Fujitsu General Ltd. | | | 191,886 | |
| | 29,895 | | | Fukuyama Transporting Co. Ltd. | | | 170,121 | |
| | 5,285 | | | Glory Ltd. | | | 174,767 | |
| | 3,655 | | | Gmo Payment Gateway, Inc. | | | 167,994 | |
| | 33,431 | | | Gree, Inc. | | | 185,471 | |
| | 43,739 | | | GS Yuasa Corp. | | | 188,966 | |
| | 71,360 | | | GungHo Online Entertainment, Inc.(c) | | | 180,632 | |
| | 12,406 | | | H2O Retailing Corp. | | | 184,169 | |
| | 32,060 | | | Hachijuni Bank Ltd. (The) | | | 174,814 | |
| | 15,636 | | | Hakuhodo DY Holdings, Inc. | | | 187,927 | |
| | 5,434 | | | Hamamatsu Photonics K.K. | | | 164,439 | |
| | 5,229 | | | Hankyu Hanshin Holdings, Inc. | | | 173,164 | |
| | 7,930 | | | Heiwa Corp. | | | 186,393 | |
| | 1,950 | | | Hikari Tsushin, Inc. | | | 178,884 | |
| | 1,354 | | | Hirose Electric Co. Ltd. | | | 178,841 | |
| | 6,763 | | | HIS Co. Ltd. | | | 184,577 | |
| | 3,771 | | | Hisamitsu Pharmaceutical Co., Inc. | | | 201,316 | |
| | 12,425 | | | Hokuhoku Financial Group, Inc. | | | 179,130 | |
| | 14,174 | | | Hokuriku Electric Power Co. | | | 160,913 | |
| | 3,655 | | | Horiba Ltd. | | | 174,602 | |
| | 2,138 | | | Hoshizaki Corp. | | | 192,875 | |
| | 7,834 | | | House Foods Group, Inc. | | | 174,818 | |
| | 17,924 | | | Hulic Co. Ltd. | | | 170,737 | |
| | 41,685 | | | Ichigo, Inc. | | | 180,886 | |
| | 5,629 | | | Ito EN Ltd. | | | 205,158 | |
| | 14,315 | | | ITOCHU Corp. | | | 180,972 | |
| | 6,962 | | | ITOCHU Techno-Solutions Corp. | | | 171,789 | |
| | 17,865 | | | Itoham Yonekyu Holdings, Inc.(a) | | | 170,345 | |
| | 26,287 | | | Iyo Bank Ltd. (The) | | | 161,597 | |
| | 4,353 | | | Izumi Co. Ltd. | | | 201,319 | |
| | 5,582 | | | Japan Airlines Co. Ltd. | | | 164,456 | |
| | 4,416 | | | Japan Tobacco, Inc. | | | 167,840 | |
| | 61,388 | | | Juroku Bank Ltd. (The) | | | 185,183 | |
| | 7,483 | | | Kagome Co. Ltd. | | | 196,038 | |
| | 25,712 | | | Kajima Corp. | | | 173,477 | |
| | 10,135 | | | Kakaku.com, Inc. | | | 170,227 | |
| | 3,014 | | | Kaken Pharmaceutical Co. Ltd. | | | 189,872 | |
| | 19,413 | | | Kamigumi Co. Ltd. | | | 165,708 | |
| | 19,035 | | | Kandenko Co. Ltd. | | | 187,479 | |
| | 19,745 | | | Kansai Electric Power Co., Inc. (The)(a) | | | 188,741 | |
| | 3,304 | | | Kao Corp. | | | 169,940 | |
| | 5,778 | | | KDDI Corp. | | | 175,509 | |
| | 26,881 | | | Keihan Holdings Co. Ltd. | | | 181,364 | |
| | 18,719 | | | Keikyu Corp. | | | 188,642 | |
| | 20,234 | | | Keio Corp. | | | 167,518 | |
| | 7,043 | | | Keisei Electric Railway Co. Ltd. | | | 170,035 | |
| | 41,889 | | | Keiyo Bank Ltd. (The) | | | 176,190 | |
See accompanying Notes to Financial Statements which are an integral part of the financial statements.
PowerShares FTSE International Low Beta Equal Weight Portfolio (IDLB) (continued)
October 31, 2016
| | | | | | | | |
Number
of Shares | | | | | Value | |
| | | | Common Stocks and Other Equity Interests (continued) | |
| | | | Japan (continued) | |
| | 6,166 | | | Kewpie Corp. | | $ | 175,149 | |
| | 271 | | | Keyence Corp. | | | 198,727 | |
| | 5,242 | | | Kikkoman Corp. | | | 166,860 | |
| | 15,479 | | | Kinden Corp. | | | 186,482 | |
| | 44,815 | | | Kintetsu Group Holdings Co. Ltd. | | | 180,821 | |
| | 7,002 | | | Kissei Pharmaceutical Co. Ltd. | | | 183,104 | |
| | 3,663 | | | Kobayashi Pharmaceutical Co. Ltd. | | | 191,368 | |
| | 7,270 | | | Komeri Co. Ltd. | | | 177,590 | |
| | 4,831 | | | Konami Holdings Corp. | | | 190,555 | |
| | 10,690 | | | K’s Holdings Corp. | | | 185,042 | |
| | 11,809 | | | Kuraray Co. Ltd. | | | 179,127 | |
| | 7,396 | | | Kurita Water Industries Ltd. | | | 175,038 | |
| | 4,699 | | | Kusuri NO Aoki Co. Ltd. | | | 239,679 | |
| | 3,631 | | | Kyocera Corp. | | | 176,566 | |
| | 8,416 | | | KYORIN Holdings, Inc. | | | 188,206 | |
| | 11,963 | | | Kyowa Hakko Kirin Co. Ltd. | | | 182,715 | |
| | 5,330 | | | Kyudenko Corp. | | | 171,690 | |
| | 28,625 | | | Kyushu Financial Group, Inc. | | | 190,407 | |
| | 2,453 | | | Lawson, Inc. | | | 186,277 | |
| | 25,595 | | | Leopalace21 Corp. | | | 166,598 | |
| | 9,035 | | | Lintec Corp. | | | 196,890 | |
| | 12,558 | | | Lion Corp. | | | 205,426 | |
| | 8,360 | | | LIXIL Group Corp. | | | 191,965 | |
| | 5,663 | | | M3, Inc. | | | 172,447 | |
| | 2,381 | | | Makita Corp. | | | 164,723 | |
| | 34,498 | | | Marubeni Corp. | | | 181,444 | |
| | 19,003 | | | Matsui Securities Co. Ltd. | | | 152,082 | |
| | 3,835 | | | Matsumotokiyoshi Holdings Co. Ltd. | | | 197,434 | |
| | 5,535 | | | Megmilk Snow Brand Co. Ltd. | | | 192,515 | |
| | 1,911 | | | MEIJI Holdings Co. Ltd. | | | 190,582 | |
| | 9,715 | | | MISUMI Group, Inc. | | | 177,225 | |
| | 9,461 | | | Mitsubishi Estate Co. Ltd. | | | 187,401 | |
| | 5,912 | | | Mitsubishi Shokuhin Co. Ltd. | | | 194,094 | |
| | 9,154 | | | Mitsubishi Tanabe Pharma Corp. | | | 178,228 | |
| | 8,560 | | | Mitsui Fudosan Co. Ltd. | | | 194,725 | |
| | 8,985 | | | Miura Co. Ltd. | | | 155,015 | |
| | 2,467 | | | Mochida Pharmaceutical Co. Ltd. | | | 193,209 | |
| | 35,251 | | | Nagoya Railroad Co. Ltd. | | | 185,841 | |
| | 37,117 | | | Nankai Electric Railway Co. Ltd. | | | 168,481 | |
| | 66,731 | | | NEC Corp. | | | 178,440 | |
| | 8,158 | | | NH Foods Ltd. | | | 195,168 | |
| | 18,028 | | | NHK Spring Co. Ltd. | | | 169,841 | |
| | 8,700 | | | Nichirei Corp. | | | 190,334 | |
| | 7,448 | | | Nihon Kohden Corp. | | | 181,655 | |
| | 6,151 | | | Nihon M&a Center, Inc. | | | 199,892 | |
| | 11,501 | | | Nikon Corp. | | | 173,689 | |
| | 10,002 | | | Nippo Corp. | | | 193,025 | |
| | 33,548 | | | Nippon Electric Glass Co. Ltd. | | | 182,290 | |
| | 35,541 | | | Nippon Express Co. Ltd. | | | 175,532 | |
| | 15,436 | | | Nippon Kayaku Co. Ltd. | | | 177,885 | |
| | 3,662 | | | Nippon Shinyaku Co. Ltd. | | | 185,740 | |
| | 3,894 | | | Nippon Telegraph & Telephone Corp. | | | 172,680 | |
| | 13,600 | | | Nipro Corp. | | | 167,986 | |
| | 36,562 | | | Nishi-Nippon Railroad Co. Ltd. | | | 173,268 | |
| | 5,520 | | | Nissan Chemical Industries Ltd. | | | 187,266 | |
| | 18,584 | | | Nissan Shatai Co. Ltd. | | | 191,879 | |
| | | | | | | | |
Number
of Shares | | | | | Value | |
| | | | Common Stocks and Other Equity Interests (continued) | |
| | | | Japan (continued) | |
| | 11,963 | | | Nisshin Seifun Group, Inc. | | $ | 176,226 | |
| | 3,050 | | | Nissin Foods Holdings Co. Ltd. | | | 176,467 | |
| | 1,725 | | | Nitori Holdings Co. Ltd. | | | 206,340 | |
| | 10,339 | | | Nomura Real Estate Holdings, Inc. | | | 174,834 | |
| | 4,990 | | | Nomura Research Institute Ltd. | | | 173,084 | |
| | 3,237 | | | NTT Data Corp. | | | 166,956 | |
| | 6,675 | | | NTT DoCoMo, Inc. | | | 167,725 | |
| | 18,432 | | | NTT Urban Development Corp. | | | 169,086 | |
| | 18,318 | | | Obayashi Corp. | | | 176,582 | |
| | 3,333 | | | OBIC Co. Ltd. | | | 173,176 | |
| | 8,284 | | | Odakyu Electric Railway Co. Ltd. | | | 169,093 | |
| | 6,523 | | | Ono Pharmaceutical Co. Ltd. | | | 165,550 | |
| | 2,930 | | | Oracle Corp. Japan | | | 159,486 | |
| | 2,886 | | | Oriental Land Co. Ltd. | | | 168,543 | |
| | 42,867 | | | Osaka Gas Co. Ltd. | | | 178,142 | |
| | 9,091 | | | OSG Corp. | | | 193,698 | |
| | 4,002 | | | Otsuka Corp. | | | 190,417 | |
| | 3,916 | | | Otsuka Holdings Co. Ltd. | | | 171,308 | |
| | 23,506 | | | PanaHome Corp. | | | 174,698 | |
| | 5,834 | | | Park24 Co. Ltd. | | | 180,153 | |
| | 3,970 | | | Peptidream, Inc.(a) | | | 204,762 | |
| | 6,375 | | | Pigeon Corp. | | | 179,569 | |
| | 4,285 | | | Pilot Corp. | | | 191,650 | |
| | 2,167 | | | Pola Orbis Holdings, Inc. | | | 180,231 | |
| | 4,490 | | | Recruit Holdings Co. Ltd. | | | 180,309 | |
| | 1,255 | | | Relo Group, Inc. | | | 207,206 | |
| | 29,068 | | | Rengo Co. Ltd. | | | 182,289 | |
| | 7,922 | | | Resorttrust, Inc. | | | 158,387 | |
| | 18,800 | | | Ricoh Co. Ltd. | | | 153,141 | |
| | 1,866 | | | Rinnai Corp. | | | 179,346 | |
| | 10,825 | | | Rohto Pharmaceutical Co. Ltd. | | | 189,954 | |
| | 1,013 | | | Ryohin Keikaku Co. Ltd. | | | 216,317 | |
| | 24,776 | | | San-in Godo Bank Ltd. (The) | | | 178,243 | |
| | 4,917 | | | Sankyo Co. Ltd. | | | 173,126 | |
| | 9,032 | | | Sanrio Co. Ltd. | | | 169,234 | |
| | 13,483 | | | Santen Pharmaceutical Co. Ltd. | | | 196,821 | |
| | 6,915 | | | Sapporo Holdings Ltd. | | | 195,372 | |
| | 2,615 | | | Sawai Pharmaceutical Co. Ltd. | | | 168,967 | |
| | 4,618 | | | SCSK Corp. | | | 172,266 | |
| | 2,262 | | | Secom Co. Ltd. | | | 163,227 | |
| | 12,432 | | | Sega Sammy Holdings, Inc. | | | 183,490 | |
| | 10,344 | | | Seibu Holdings, Inc. | | | 178,757 | |
| | 8,790 | | | Seiko Epson Corp. | | | 178,418 | |
| | 10,613 | | | Sekisui House Ltd. | | | 175,377 | |
| | 37,513 | | | Senshu Ikeda Holdings, Inc. | | | 170,635 | |
| | 3,996 | | | Seven & i Holdings Co. Ltd. | | | 166,670 | |
| | 47,939 | | | Seven Bank Ltd. | | | 147,350 | |
| | 34,889 | | | Shiga Bank Ltd. (The) | | | 180,944 | |
| | 17,818 | | | Shikoku Electric Power Co., Inc. | | | 167,523 | |
| | 7,560 | | | Shimachu Co. Ltd. | | | 202,876 | |
| | 11,210 | | | Shimadzu Corp. | | | 163,107 | |
| | 1,493 | | | Shimamura Co. Ltd. | | | 191,091 | |
| | 1,177 | | | Shimano, Inc. | | | 201,160 | |
| | 19,316 | | | Shimizu Corp. | | | 171,681 | |
| | 3,818 | | | Shionogi & Co. Ltd. | | | 188,130 | |
| | 6,723 | | | Shiseido Co. Ltd. | | | 173,249 | |
See accompanying Notes to Financial Statements which are an integral part of the financial statements.
PowerShares FTSE International Low Beta Equal Weight Portfolio (IDLB) (continued)
October 31, 2016
| | | | | | | | |
Number
of Shares | | | | | Value | |
| | | | Common Stocks and Other Equity Interests (continued) | |
| | | | Japan (continued) | |
| | 16,327 | | | Shochiku Co. Ltd. | | $ | 182,870 | |
| | 37,391 | | | SKY Perfect JSAT Holdings, Inc. | | | 185,380 | |
| | 13,580 | | | Skylark Co. Ltd. | | | 190,871 | |
| | 2,581 | | | SoftBank Group Corp. | | | 162,152 | |
| | 3,426 | | | Sohgo Security Services Co. Ltd. | | | 156,164 | |
| | 34,126 | | | Sotetsu Holdings, Inc. | | | 166,595 | |
| | 5,703 | | | Square Enix Holdings Co. Ltd. | | | 188,861 | |
| | 6,652 | | | Stanley Electric Co. Ltd. | | | 183,130 | |
| | 10,875 | | | START TODAY Co. Ltd. | | | 190,831 | |
| | 3,444 | | | Sugi Holdings Co. Ltd. | | | 184,515 | |
| | 15,565 | | | Sumitomo Corp. | | | 179,149 | |
| | 10,121 | | | Sumitomo Dainippon Pharma Co. Ltd. | | | 175,385 | |
| | 37,782 | | | Sumitomo Osaka Cement Co. Ltd. | | | 156,399 | |
| | 8,988 | | | Sumitomo Real Estate Sales Co. Ltd. | | | 203,563 | |
| | 7,124 | | | Sumitomo Realty & Development Co. Ltd. | | | 187,311 | |
| | 11,357 | | | Sumitomo Rubber Industries Ltd. | | | 189,995 | |
| | 2,424 | | | Sundrug Co. Ltd. | | | 190,764 | |
| | 4,294 | | | Suntory Beverage & Food Ltd. | | | 187,762 | |
| | 22,839 | | | Taisei Corp. | | | 171,263 | |
| | 1,911 | | | Taisho Pharmaceutical Holdings Co. Ltd. | | | 186,399 | |
| | 16,715 | | | Taiyo Nippon Sanso Corp. | | | 175,763 | |
| | 22,985 | | | Takashimaya Co. Ltd. | | | 187,450 | |
| | 3,865 | | | Takeda Pharmaceutical Co. Ltd. | | | 172,865 | |
| | 10,580 | | | Temp Holdings Co. Ltd. | | | 179,412 | |
| | 4,338 | | | Terumo Corp. | | | 167,807 | |
| | 7,107 | | | TIS, Inc. | | | 160,894 | |
| | 35,440 | | | Tobu Railway Co., Ltd. | | | 174,021 | |
| | 5,841 | | | Toho Co. Ltd. | | | 175,366 | |
| | 19,918 | | | Toho Gas Co. Ltd. | | | 184,424 | |
| | 13,444 | | | Tohoku Electric Power Co., Inc. | | | 164,396 | |
| | 4,302 | | | Tokio Marine Holdings, Inc. | | | 169,853 | |
| | 12,326 | | | Tokyo Broadcasting System Holdings, Inc. | | | 193,889 | |
| | 39,999 | | | Tokyo Gas Co. Ltd. | | | 181,258 | |
| | 14,560 | | | Tokyo Tatemono Co. Ltd. | | | 185,109 | |
| | 22,757 | | | Tokyu Corp. | | | 170,431 | |
| | 30,493 | | | Tokyu Fudosan Holdings Corp. | | | 172,074 | |
| | 16,120 | | | Toppan Forms Co. Ltd. | | | 160,303 | |
| | 19,054 | | | Toppan Printing Co. Ltd. | | | 179,144 | |
| | 17,619 | | | Toray Industries, Inc. | | | 164,110 | |
| | 4,490 | | | TOTO Ltd. | | | 179,455 | |
| | 4,197 | | | Toyo Suisan Kaisha Ltd. | | | 169,941 | |
| | 12,015 | | | Toyo Tire & Rubber Co. Ltd. | | | 185,110 | |
| | 106,833 | | | Toyobo Co. Ltd. | | | 174,861 | |
| | 4,804 | | | Trend Micro, Inc. | | | 169,147 | |
| | 7,269 | | | TS Tech Co. Ltd. | | | 194,721 | |
| | 6,459 | | | Tsumura & Co. | | | 183,533 | |
| | 1,774 | | | Tsuruha Holdings, Inc. | | | 204,605 | |
| | 10,542 | | | TV Asahi Corp. | | | 197,929 | |
| | 6,929 | | | Unicharm Corp. | | | 164,744 | |
| | 15,196 | | | Ushio, Inc. | | | 183,217 | |
| | 10,591 | | | USS Co. Ltd. | | | 179,196 | |
| | 15,844 | | | Wacoal Holdings Corp. | | | 182,737 | |
| | 2,938 | | | Welcia Holdings Co. Ltd. | | | 200,461 | |
| | 3,029 | | | West Japan Railway Co. | | | 186,551 | |
| | 41,580 | | | Yahoo! Japan Corp. | | | 159,459 | |
| | 3,834 | | | Yakult Honsha Co. Ltd. | | | 178,775 | |
| | | | | | | | |
Number
of Shares | | | | | Value | |
| | | | Common Stocks and Other Equity Interests (continued) | |
| | | | Japan (continued) | |
| | 36,282 | | | Yamada Denki Co. Ltd. | | $ | 187,478 | |
| | 16,715 | | | Yamaguchi Financial Group, Inc. | | | 184,193 | |
| | 5,237 | | | Yamaha Corp. | | | 187,134 | |
| | 7,197 | | | Yamato Holdings Co. Ltd. | | | 164,027 | |
| | 7,420 | | | Yamazaki Baking Co. Ltd. | | | 166,356 | |
| | 11,491 | | | Yaskawa Electric Corp. | | | 183,379 | |
| | 4,340 | | | Zenkoku Hosho Co. Ltd. | | | 186,676 | |
| | 9,820 | | | Zensho Holdings Co. Ltd. | | | 183,345 | |
| | | | | | | | |
| | | | | | | 51,672,042 | |
| | | | | | | | |
| | | | Luxembourg—0.3% | |
| | 79,417 | | | L’Occitane International SA | | | 164,060 | |
| | 2,053 | | | RTL Group SA | | | 160,686 | |
| | 7,409 | | | SES SA FDR, Class A | | | 170,150 | |
| | | | | | | | |
| | | | | | | 494,896 | |
| | | | | | | | |
| | | | Netherlands—1.2% | |
| | 1,601 | | | ASML Holding NV | | | 169,359 | |
| | 4,761 | | | Boskalis Westminster NV | | | 153,413 | |
| | 2,443 | | | Gemalto NV | | | 132,656 | |
| | 6,011 | | | Grandvision NV(b) | | | 137,485 | |
| | 2,152 | | | Heineken Holding NV, Class A | | | 165,391 | |
| | 1,939 | | | Heineken NV | | | 159,521 | |
| | 7,108 | | | Koninklijke Ahold Delhaize NV | | | 162,030 | |
| | 52,128 | | | Koninklijke KPN NV | | | 169,771 | |
| | 3,357 | | | Koninklijke Vopak NV | | | 169,296 | |
| | 5,720 | | | NN Group NV | | | 172,119 | |
| | 4,056 | | | Wolters Kluwer NV | | | 156,750 | |
| | | | | | | | |
| | | | | | | 1,747,791 | |
| | | | | | | | |
| | | | New Zealand—1.1% | |
| | 31,230 | | | Auckland International Airport Ltd. | | | 147,233 | |
| | 24,222 | | | Fisher & Paykel Healthcare Corp. Ltd. | | | 153,530 | |
| | 151,129 | | | Kiwi Property Group Ltd. | | | 158,392 | |
| | 73,898 | | | Mercury NZ Ltd. | | | 161,243 | |
| | 80,771 | | | Meridian Energy Ltd. | | | 148,504 | |
| | 24,399 | | | Ryman Healthcare Ltd. | | | 155,001 | |
| | 48,206 | | | Sky Network Television Ltd. | | | 159,328 | |
| | 61,559 | | | Spark New Zealand Ltd. | | | 161,184 | |
| | 67,893 | | | Vector Ltd. | | | 154,455 | |
| | 81,050 | | | Warehouse Group Ltd. (The) | | | 173,950 | |
| | | | | | | | |
| | | | | | | 1,572,820 | |
| | | | | | | | |
| | | | Norway—0.7% | |
| | 9,906 | | | Gjensidige Forsikring ASA | | | 177,797 | |
| | 11,177 | | | Marine Harvest ASA | | | 203,047 | |
| | 40,019 | | | Norsk Hydro ASA | | | 179,205 | |
| | 18,576 | | | Orkla ASA | | | 175,709 | |
| | 5,357 | | | Schibsted ASA, Class A | | | 128,610 | |
| | 9,740 | | | Telenor ASA | | | 155,223 | |
| | | | | | | | |
| | | | | | | 1,019,591 | |
| | | | | | | | |
| | | | Portugal—0.2% | |
| | 50,776 | | | EDP-Energias de Portugal SA | | | 167,594 | |
| | 10,546 | | | Jeronimo Martins SGPS SA | | | 181,154 | |
| | | | | | | | |
| | | | | | | 348,748 | |
| | | | | | | | |
| | | | Russia—0.2% | |
| | 12,321 | | | Polymetal International PLC | | | 134,030 | |
See accompanying Notes to Financial Statements which are an integral part of the financial statements.
PowerShares FTSE International Low Beta Equal Weight Portfolio (IDLB) (continued)
October 31, 2016
| | | | | | | | |
Number
of Shares | | | | | Value | |
| | | | Common Stocks and Other Equity Interests (continued) | |
| | | | Russia (continued) | |
| | 465,596 | | | United Co. RUSAL PLC | | $ | 165,709 | |
| | | | | | | | |
| | | | | | | 299,739 | |
| | | | | | | | |
| | | | Singapore—2.0% | |
| | 94,521 | | | Ascendas Real Estate Investment Trust REIT | | | 160,942 | |
| | 149,813 | | | CapitaLand Commercial Trust Ltd. REIT | | | 169,520 | |
| | 107,197 | | | CapitaLand Mall Trust REIT | | | 159,421 | |
| | 81,794 | | | ComfortDelGro Corp. Ltd. | | | 149,261 | |
| | 5,458 | | | Jardine Cycle & Carriage Ltd. | | | 165,556 | |
| | 86,663 | | | M1 Ltd. | | | 127,015 | |
| | 111,270 | | | Olam International Ltd. | | | 171,873 | |
| | 26,941 | | | Oversea-Chinese Banking Corp. Ltd. | | | 164,135 | |
| | 50,314 | | | SATS Ltd. | | | 174,955 | |
| | 60,573 | | | SIA Engineering Co. Ltd. | | | 160,582 | |
| | 22,009 | | | Singapore Airlines Ltd. | | | 160,178 | |
| | 31,162 | | | Singapore Exchange Ltd. | | | 158,732 | |
| | 61,369 | | | Singapore Press Holdings Ltd. | | | 164,015 | |
| | 57,551 | | | Singapore Telecommunications Ltd. | | | 160,427 | |
| | 63,279 | | | StarHub Ltd. | | | 153,663 | |
| | 138,171 | | | Suntec Real Estate Investment Trust REIT | | | 166,770 | |
| | 25,136 | | | Venture Corp. Ltd. | | | 171,558 | |
| | 183,751 | | | Yanlord Land Group Ltd. | | | 182,840 | |
| | | | | | | | |
| | | | | | | 2,921,443 | |
| | | | | | | | |
| | | | South Korea—8.3% | |
| | 490 | | | Amorepacific Corp. | | | 153,734 | |
| | 873 | | | Amorepacific Corp. (Preference Shares) | | | 152,589 | |
| | 1,325 | | | AMOREPACIFIC Group | | | 171,379 | |
| | 951 | | | BGF Retail Co. Ltd. | | | 144,613 | |
| | 1,773 | | | Celltrion, Inc.(a) | | | 164,555 | |
| | 11,920 | | | Cheil Worldwide, Inc. | | | 176,573 | |
| | 493 | | | CJ CheilJedang Corp. | | | 150,582 | |
| | 933 | | | CJ CheilJedang Corp. (Preference Shares) | | | 143,507 | |
| | 1,009 | | | CJ Corp. | | | 153,874 | |
| | 955 | | | CJ Korea Express Co. Ltd.(a) | | | 167,756 | |
| | 2,304 | | | Coway Co. Ltd. | | | 180,414 | |
| | 31,175 | | | Daewoo Engineering & Construction Co. Ltd.(a) | | | 172,460 | |
| | 20,739 | | | DGB Financial Group, Inc. | | | 173,996 | |
| | 6,145 | | | Dongsuh Cos., Inc. | | | 145,804 | |
| | 1,219 | | | E-Mart, Inc. | | | 173,116 | |
| | 6,591 | | | GS Engineering & Construction Corp.(a) | | | 154,371 | |
| | 4,021 | | | GS Retail Co. Ltd. | | | 171,488 | |
| | 3,396 | | | Hankook Tire Co. Ltd. | | | 163,827 | |
| | 1,413 | | | Hanmi Science Co. Ltd. | | | 93,974 | |
| | 16,201 | | | Hanon Systems | | | 151,497 | |
| | 1,305 | | | Hanssem Co. Ltd. | | | 202,436 | |
| | 7,402 | | | Hanwha Chemical Corp. | | | 174,983 | |
| | 5,170 | | | Hanwha Corp. | | | 168,756 | |
| | 33,428 | | | Hanwha Life Insurance Co. Ltd. | | | 182,587 | |
| | 8,654 | | | Hite Jinro Co. Ltd. | | | 166,387 | |
| | 2,795 | | | Hotel Shilla Co. Ltd. | | | 139,964 | |
| | 1,510 | | | Hyundai Department Store Co. Ltd. | | | 155,058 | |
| | 4,064 | | | Hyundai Development Co.-Engineering & Construction | | | 172,256 | |
| | 1,037 | | | Hyundai Glovis Co. Ltd. | | | 157,238 | |
| | 736 | | | Hyundai Mobis Co. Ltd. | | | 176,241 | |
| | | | | | | | |
Number
of Shares | | | | | Value | |
| | | | Common Stocks and Other Equity Interests (continued) | |
| | | | South Korea (continued) | |
| | 1,092 | | | Hyundai Motor Co. | | $ | 133,607 | |
| | 170 | | | Hyundai Motor Co. (Preference Shares) | | | 14,203 | |
| | 271 | | | Hyundai Motor Co. (2nd Preference Shares) | | | 23,802 | |
| | 2,331 | | | Kakao Corp. | | | 155,638 | |
| | 4,802 | | | Kangwon Land, Inc. | | | 159,262 | |
| | 466 | | | KCC Corp. | | | 164,734 | |
| | 2,942 | | | KEPCO Plant Service & Engineering Co. Ltd. | | | 141,154 | |
| | 4,519 | | | Kia Motors Corp. | | | 160,737 | |
| | 2,236 | | | Korea Aerospace Industries Ltd. | | | 126,627 | |
| | 3,268 | | | Korea Electric Power Corp. | | | 140,659 | |
| | 4,463 | | | Korea Gas Corp. | | | 180,782 | |
| | 4,725 | | | Korea Investment Holdings Co. Ltd. | | | 169,716 | |
| | 400 | | | Korea Zinc Co. Ltd. | | | 159,056 | |
| | 778 | | | KT Corp. ADR | | | 12,440 | |
| | 5,612 | | | KT Corp. | | | 158,416 | |
| | 1,620 | | | KT&G Corp. | | | 159,982 | |
| | 2,878 | | | LG Corp. | | | 154,181 | |
| | 6,307 | | | LG Display Co. Ltd. | | | 150,475 | |
| | 3,401 | | | LG Electronics, Inc. | | | 142,074 | |
| | 543 | | | LG Electronics, Inc. (Preference Shares) | | | 11,270 | |
| | 1,739 | | | LG Hausys Ltd. | | | 143,922 | |
| | 178 | | | LG Household & Health Care Ltd. | | | 127,560 | |
| | 39 | | | LG Household & Health Care Ltd. (Preference Shares) | | | 16,224 | |
| | 16,268 | | | LG Uplus Corp. | | | 167,763 | |
| | 716 | | | Lotte Chemical Corp. | | | 180,525 | |
| | 127 | | | Lotte Chilsung Beverage Co. Ltd. | | | 170,924 | |
| | 1,120 | | | Lotte Confectionery Co. Ltd. | | | 187,931 | |
| | 5,384 | | | Lotte Fine Chemical Co. Ltd. | | | 136,453 | |
| | 735 | | | Mando Corp. | | | 172,469 | |
| | 711 | | | NCSOFT Corp. | | | 164,352 | |
| | 3,236 | | | NHN Entertainment Corp.(a) | | | 141,968 | |
| | 639 | | | Nongshim Co. Ltd. | | | 160,832 | |
| | 257 | | | Orion Corp. | | | 160,590 | |
| | 273 | | | Ottogi Corp. | | | 156,988 | |
| | 11,316 | | | Paradise Co. Ltd. | | | 128,563 | |
| | 1,841 | | | S-1 Corp. | | | 148,825 | |
| | 1,252 | | | Samsung C&T Corp. | | | 176,708 | |
| | 4,285 | | | Samsung Card Co. Ltd. | | | 180,500 | |
| | 3,565 | | | Samsung Electro-Mechanics Co. Ltd. | | | 146,744 | |
| | 711 | | | Samsung Fire & Marine Insurance Co. Ltd. | | | 181,129 | |
| | 1,841 | | | Samsung Life Insurance Co. Ltd. | | | 177,785 | |
| | 1,640 | | | Samsung SDI Co. Ltd. | | | 135,156 | |
| | 1,203 | | | Samsung SDS Co. Ltd. | | | 162,433 | |
| | 4,625 | | | Shinhan Financial Group Co. Ltd. | | | 177,239 | |
| | 931 | | | Shinsegae, Inc. | | | 151,336 | |
| | 895 | | | SK Holdings Co. Ltd. | | | 174,815 | |
| | 5,202 | | | SK Hynix, Inc. | | | 186,395 | |
| | 29,943 | | | SK Networks Co. Ltd. | | | 170,617 | |
| | 882 | | | SK Telecom Co. Ltd. | | | 172,276 | |
| | 6,904 | | | SKC Co. Ltd. | | | 163,210 | |
| | 658 | | | Yuhan Corp. | | | 120,760 | |
| | | | | | | | |
| | | | | | | 12,217,822 | |
| | | | | | | | |
| | | | Spain—2.2% | |
| | 10,988 | | | Abertis Infraestructuras SA | | | 162,909 | |
| | 2,386 | | | Acciona SA | | | 181,361 | |
See accompanying Notes to Financial Statements which are an integral part of the financial statements.
PowerShares FTSE International Low Beta Equal Weight Portfolio (IDLB) (continued)
October 31, 2016
| | | | | | | | |
Number
of Shares | | | | | Value | |
| | | | Common Stocks and Other Equity Interests (continued) | |
| | | | Spain (continued) | |
| | 1,202 | | | Aena SA(b) | | $ | 176,233 | |
| | 3,705 | | | Amadeus It Group SA, Class A | | | 174,641 | |
| | 200,907 | | | Bankia SA | | | 176,628 | |
| | 23,204 | | | Bankinter SA | | | 177,392 | |
| | 4,164 | | | Corp. Financiera Alba SA | | | 182,218 | |
| | 27,870 | | | Distribuidora Internacional de Alimentacion SA | | | 148,998 | |
| | 21,301 | | | EDP Renovaveis SA | | | 160,743 | |
| | 5,797 | | | Enagas SA | | | 166,175 | |
| | 8,358 | | | Endesa SA | | | 177,423 | |
| | 8,637 | | | Ferrovial SA | | | 167,818 | |
| | 7,415 | | | Gamesa Corp. Tecnologica SA | | | 171,304 | |
| | 8,247 | | | Gas Natural SDG SA | | | 162,501 | |
| | 5,089 | | | Grifols SA | | | 100,470 | |
| | 4,076 | | | Grifols SA (Preference Shares), Class B | | | 58,711 | |
| | 25,860 | | | Iberdrola SA | | | 176,011 | |
| | 4,802 | | | Industria de Diseno Textil SA | | | 167,631 | |
| | 7,905 | | | Red Electrica Corp. SA | | | 164,687 | |
| | 18,058 | | | Zardoya Otis SA | | | 152,225 | |
| | | | | | | | |
| | | | | | | 3,206,079 | |
| | | | | | | | |
| | | | Sweden—2.0% | |
| | 10,958 | | | Alfa Laval AB | | | 157,662 | |
| | 6,535 | | | Electrolux AB, Series B, | | | 154,945 | |
| | 5,561 | | | Fastighets AB Balder, Class B(a) | | | 126,489 | |
| | 374 | | | Fastighets AB Balder (Preference Shares) | | | 14,186 | |
| | 5,649 | | | Hennes & Mauritz AB, Class B | | | 159,110 | |
| | 19,687 | | | Husqvarna AB, Class B | | | 148,283 | |
| | 4,977 | | | ICA Gruppen AB | | | 154,747 | |
| | 4,165 | | | Investment AB Latour, Class B | | | 153,922 | |
| | 2,829 | | | L E Lundbergforetagen AB, Class B | | | 183,447 | |
| | 17,411 | | | Skandinaviska Enskilda Banken AB, Class A | | | 175,914 | |
| | 7,763 | | | Skanska AB, Class B | | | 168,830 | |
| | 476 | | | SKF AB, Class A | | | 8,089 | |
| | 9,655 | | | SKF AB, Class B | | | 163,851 | |
| | 5,536 | | | Svenska Cellulosa AB (SCA), Class B | | | 157,032 | |
| | 13,088 | | | Svenska Handelsbanken AB, Class A | | | 178,733 | |
| | 350 | | | Svenska Handelsbanken AB, Class B | | | 4,710 | |
| | 7,399 | | | Swedbank AB, Class A | | | 173,544 | |
| | 4,775 | | | Swedish Match AB | | | 166,356 | |
| | 20,453 | | | Tele2 AB, Class B | | | 169,242 | |
| | 23,871 | | | Telefonaktiebolaget LM Ericsson, Class B | | | 115,684 | |
| | 37,688 | | | Telia Co. AB | | | 150,810 | |
| | | | | | | | |
| | | | | | | 2,885,586 | |
| | | | | | | | |
| | | | Switzerland—3.7% | |
| | 7,834 | | | ABB Ltd. | | | 161,607 | |
| | 1,025 | | | Actelion Ltd. | | | 148,220 | |
| | 4,261 | | | Aryzta AG | | | 187,348 | |
| | 1,446 | | | Baloise Holding AG | | | 178,100 | |
| | 261 | | | Banque Cantonale Vaudoise | | | 164,032 | |
| | 137 | | | Barry Callebaut AG | | | 170,679 | |
| | 1 | | | Chocoladefabriken Lindt & Sprungli AG | | | 62,089 | |
| | 13 | | | Chocoladefabriken Lindt & Sprungli AG-PC | | | 67,570 | |
| | 2,946 | | | Compagnie Financiere Richemont SA | | | 189,618 | |
| | 2,450 | | | DKSH Holding AG | | | 169,957 | |
| | 320 | | | EMS-CHEMIE HOLDING AG | | | 160,744 | |
| | | | | | | | |
Number
of Shares | | | | | Value | |
| | | | Common Stocks and Other Equity Interests (continued) | |
| | | | Switzerland (continued) | |
| | 918 | | | Flughafen Zuerich AG | | $ | 168,951 | |
| | 145 | | | Galenica AG | | | 145,455 | |
| | 389 | | | Geberit AG | | | 164,703 | |
| | 85 | | | Givaudan SA | | | 164,602 | |
| | 340 | | | Helvetia Holding AG | | | 177,065 | |
| | 1,214 | | | Kuehne + Nagel International AG | | | 164,748 | |
| | 2,131 | | | Nestle SA | | | 154,615 | |
| | 2,154 | | | Novartis AG | | | 153,344 | |
| | 374 | | | Partners Group Holding AG | | | 189,477 | |
| | 1,771 | | | PSP Swiss Property AG | | | 158,493 | |
| | 679 | | | Roche Holding AG | | | 156,206 | |
| | 33 | | | Roche Holding AG-BR | | | 7,679 | |
| | 306 | | | Schindler Holding AG | | | 56,627 | |
| | 595 | | | Schindler Holding AG-PC | | | 110,649 | |
| | 80 | | | SGS SA | | | 162,281 | |
| | 35 | | | Sika AG-BR | | | 168,328 | |
| | 22,763 | | | STMicroelectronics NV(a) | | | 216,765 | |
| | 438 | | | Straumann Holding AG | | | 164,543 | |
| | 1,784 | | | Sulzer AG | | | 175,892 | |
| | 796 | | | Swatch Group AG (The) | | | 45,922 | |
| | 501 | | | Swatch Group AG (The)-BR | | | 150,822 | |
| | 1,932 | | | Swiss Prime Site AG | | | 160,300 | |
| | 2,040 | | | Swiss Re AG | | | 189,580 | |
| | 355 | | | Swisscom AG | | | 162,512 | |
| | 3,007 | | | Wolseley PLC | | | 156,065 | |
| | | | | | | | |
| | | | | | | 5,385,588 | |
| | | | | | | | |
| | | | United Kingdom—8.8% | |
| | 6,411 | | | Admiral Group PLC | | | 150,047 | |
| | 4,269 | | | Associated British Foods PLC | | | 128,320 | |
| | 2,652 | | | AstraZeneca PLC | | | 148,551 | |
| | 30,287 | | | Aviva PLC | | | 163,736 | |
| | 12,403 | | | Babcock International Group PLC | | | 149,763 | |
| | 24,094 | | | BAE Systems PLC | | | 159,584 | |
| | 26,265 | | | Barratt Developments PLC | | | 145,488 | |
| | 5,570 | | | Bellway PLC | | | 160,898 | |
| | 4,858 | | | Berkeley Group Holdings PLC (The) | | | 139,915 | |
| | 73,681 | | | Booker Group PLC | | | 161,383 | |
| | 19,572 | | | British Land Co. PLC (The) REIT | | | 139,908 | |
| | 33,585 | | | BT Group PLC | | | 154,154 | |
| | 12,534 | | | Capita PLC | | | 89,674 | |
| | 43,748 | | | Capital & Counties Properties PLC | | | 153,987 | |
| | 9,126 | | | Compass Group PLC | | | 165,012 | |
| | 17,971 | | | Daily Mail & General Trust PLC NV, Class A | | | 164,556 | |
| | 1,872 | | | DCC PLC | | | 152,330 | |
| | 4,750 | | | Derwent London PLC REIT | | | 140,284 | |
| | 6,239 | | | Diageo PLC | | | 166,017 | |
| | 35,162 | | | Direct Line Insurance Group PLC | | | 148,578 | |
| | 35,003 | | | Dixons Carphone PLC | | | 134,488 | |
| | 31,762 | | | DS Smith PLC | | | 154,648 | |
| | 11,744 | | | easyJet PLC | | | 134,349 | |
| | 56,267 | | | G4S PLC | | | 151,132 | |
| | 12,241 | | | Halma PLC | | | 156,624 | |
| | 22,373 | | | Hammerson PLC REIT | | | 150,507 | |
| | 55,157 | | | Henderson Group PLC | | | 156,030 | |
| | 28,429 | | | Howden Joinery Group PLC | | | 130,124 | |
| | 27,127 | | | ICAP PLC | | | 160,463 | |
See accompanying Notes to Financial Statements which are an integral part of the financial statements.
PowerShares FTSE International Low Beta Equal Weight Portfolio (IDLB) (continued)
October 31, 2016
| | | | | | | | |
Number
of Shares | | | | | Value | |
| | | | Common Stocks and Other Equity Interests (continued) | |
| | | | United Kingdom (continued) | |
| | 12,456 | | | IMI PLC | | $ | 151,163 | |
| | 3,296 | | | Imperial Brands PLC | | | 159,173 | |
| | 18,495 | | | Inchcape PLC | | | 146,886 | |
| | 19,939 | | | Informa PLC | | | 163,710 | |
| | 16,828 | | | Inmarsat PLC | | | 144,125 | |
| | 33,877 | | | International Consolidated Airlines Group SA | | | 179,670 | |
| | 41,062 | | | Intu Properties PLC REIT | | | 138,115 | |
| | 64,651 | | | ITV PLC | | | 134,580 | |
| | 53,995 | | | J Sainsbury PLC | | | 165,400 | |
| | 18,887 | | | John Wood Group PLC | | | 177,325 | |
| | 34,963 | | | Kingfisher PLC | | | 154,226 | |
| | 11,862 | | | Land Securities Group PLC REIT | | | 144,678 | |
| | 61,698 | | | Legal & General Group PLC | | | 157,735 | |
| | 218,623 | | | Lloyds Banking Group PLC | | | 152,837 | |
| | 4,778 | | | London Stock Exchange Group PLC | | | 163,920 | |
| | 37,642 | | | Marks & Spencer Group PLC | | | 156,484 | |
| | 27,706 | | | Meggitt PLC | | | 147,246 | |
| | 27,250 | | | Merlin Entertainments PLC(b) | | | 153,306 | |
| | 6,500 | | | Micro Focus International PLC | | | 169,907 | |
| | 12,577 | | | National Grid PLC | | | 163,533 | |
| | 2,347 | | | Next PLC | | | 138,000 | |
| | 14,990 | | | Pearson PLC | | | 138,632 | |
| | 14,788 | | | Pennon Group PLC | | | 150,666 | |
| | 7,113 | | | Persimmon PLC | | | 147,111 | |
| | 4,378 | | | Provident Financial PLC | | | 157,680 | |
| | 9,515 | | | Prudential PLC | | | 155,027 | |
| | 1,789 | | | Reckitt Benckiser Group PLC | | | 159,730 | |
| | 9,595 | | | RELX NV | | | 161,715 | |
| | 8,979 | | | RELX PLC | | | 160,162 | |
| | 60,664 | | | Rentokil Initial PLC | | | 169,090 | |
| | 3,209 | | | Rightmove PLC | | | 146,332 | |
| | 4,826 | | | Rio Tinto Ltd. | | | 198,968 | |
| | 25,242 | | | Royal Mail PLC | | | 151,316 | |
| | 4,661 | | | Schroders PLC | | | 160,418 | |
| | 28,629 | | | Segro PLC REIT | | | 152,815 | |
| | 5,451 | | | Severn Trent PLC | | | 154,931 | |
| | 15,500 | | | Sky PLC | | | 154,798 | |
| | 10,713 | | | Smith & Nephew PLC | | | 154,731 | |
| | 9,687 | | | Smiths Group PLC | | | 167,705 | |
| | 43,644 | | | Sports Direct International PLC(a) | | | 147,439 | |
| | 8,752 | | | SSE PLC | | | 170,003 | |
| | 13,212 | | | St. James’s Place PLC | | | 152,434 | |
| | 35,597 | | | Standard Life PLC | | | 146,809 | |
| | 61,492 | | | TalkTalk Telecom Group PLC | | | 152,854 | |
| | 17,946 | | | Tate & Lyle PLC | | | 170,900 | |
| | 80,442 | | | Taylor Wimpey PLC | | | 139,166 | |
| | 79,069 | | | Tesco PLC(a) | | | 203,448 | |
| | 7,794 | | | Travis Perkins PLC | | | 126,844 | |
| | 3,712 | | | Unilever NV CVA | | | 155,358 | |
| | 3,676 | | | Unilever PLC | | | 153,401 | |
| | 13,551 | | | United Utilities Group PLC | | | 155,517 | |
| | 3,120 | | | Whitbread PLC | | | 137,703 | |
| | 40,776 | | | William Hill PLC | | | 147,259 | |
| | 66,766 | | | WM Morrison Supermarkets PLC | | | 184,631 | |
| | 7,495 | | | WPP PLC | | | 162,698 | |
| | | | | | | | |
| | | | | | | 12,920,860 | |
| | | | | | | | |
| | | | | | | | |
Number
of Shares | | | | | Value | |
| | | | Common Stocks and Other Equity Interests (continued) | |
| | | | United States—0.4% | |
| | 3,602 | | | Carnival PLC | | $ | 173,093 | |
| | 6,426 | | | QIAGEN NV(a) | | | 157,121 | |
| | 53,684 | | | Samsonite International SA | | | 168,912 | |
| | 4,104 | | | Thomson Reuters Corp. | | | 161,863 | |
| | | | | | | | |
| | | | | | | 660,989 | |
| | | | | | | | |
| | | | Total Common Stocks and Other Equity Interests
(Cost $146,175,489) | | | 146,548,379 | |
| | | | | | | | |
| | |
| | | | | | | | |
| | | | Rights—0.0% | |
| | | | Spain—0.0% | |
| | 8,637 | | | Ferrovial SA, expiring 11/14/16(a) | | | 3,693 | |
| | | | | | | | |
| | | | Sweden—0.0% | |
| | 20,453 | | | Tele2 AB, expiring 11/16/16(a) | | | 6,135 | |
| | | | | | | | |
| | | | Total Rights
(Cost $3,863) | | | 9,828 | |
| | | | | | | | |
| | | | Total Investments
(excluding investments purchased with cash collateral from securities on loan)
(Cost $146,179,352)-99.8% | | | 146,558,207 | |
| | | | | | | | |
| | |
| | | | | | | | |
| | | | Investments Purchased with Cash Collateral from Securities on Loan | |
| | |
| | | | | | | | |
| | | | Money Market Fund—0.1% | |
| | 140,450 | | | Invesco Government & Agency Portfolio—Institutional Class, 0.29%(d)(e)
(Cost $140,450) | | | 140,450 | |
| | | | | | | | |
| | | | Total Investments
(Cost $146,319,802)—99.9% | | | 146,698,657 | |
| | | | Other assets less liabilities—0.1% | | | 98,184 | |
| | | | | | | | |
| | | | Net Assets—100.0% | | $ | 146,796,841 | |
| | | | | | | | |
Investment Abbreviations:
ADR—American Depositary Receipt
BR—Bearer Shares
CVA—Dutch Certificates
FDR—Fiduciary Depositary Receipt
PC—Participation Certificate
REIT—Real Estate Investment Trust
Notes to Schedule of Investments:
| (a) | Non-income producing security. |
| (b) | Security purchased or received in a transaction exempt from registration under the Securities Act of 1933, as amended (the “1933 Act”). The security may be resold pursuant to an exemption from registration under the 1933 Act, typically to qualified institutional buyers. The aggregate value of these securities at October 31, 2016 was $664,861, which represented less than 1% of the Fund’s Net Assets. |
| (c) | All or a portion of this security was out on loan at October 31, 2016. |
| (d) | The security and the Fund are advised by wholly-owned subsidiaries of Invesco Ltd. and are therefore considered to be affiliated. The rate shown is the 7-day SEC standardized yield as of October 31, 2016. |
| (e) | The security has been segregated to satisfy the commitment to return the cash collateral received in securities lending transactions upon the borrower’s return of the securities loaned. See Note 2H. |
See accompanying Notes to Financial Statements which are an integral part of the financial statements.
Schedule of Investments(a)
PowerShares Russell 1000 Low Beta Equal Weight Portfolio (USLB)
October 31, 2016
| | | | | | | | |
Number
of Shares | | | | | Value | |
| | | | Common Stocks and Other Equity
Interests—100.0% | |
| | | | Consumer Discretionary—17.2% | |
| | 643 | | | Adient PLC(b) | | $ | 29,263 | |
| | 1,902 | | | Advance Auto Parts, Inc. | | | 266,432 | |
| | 4,589 | | | AMC Networks, Inc., Class A(b) | | | 224,540 | |
| | 8,760 | | | Aramark | | | 326,135 | |
| | 5,869 | | | AutoNation, Inc.(b) | | | 257,473 | |
| | 384 | | | AutoZone, Inc.(b) | | | 284,989 | |
| | 6,548 | | | Bed Bath & Beyond, Inc. | | | 264,670 | |
| | 9,049 | | | Best Buy Co., Inc. | | | 352,097 | |
| | 6,489 | | | Brinker International, Inc. | | | 319,518 | |
| | 4,777 | | | Burlington Stores, Inc.(b) | | | 357,988 | |
| | 6,079 | | | Cabela’s, Inc.(b) | | | 374,527 | |
| | 6,067 | | | Carnival Corp. | | | 297,890 | |
| | 2,921 | | | Carter’s, Inc. | | | 252,199 | |
| | 685 | | | Chipotle Mexican Grill, Inc.(b) | | | 247,121 | |
| | 6,384 | | | Choice Hotels International, Inc. | | | 309,305 | |
| | 7,410 | | | Coach, Inc. | | | 265,945 | |
| | 7,668 | | | CST Brands, Inc. | | | 368,217 | |
| | 9,439 | | | D.R. Horton, Inc. | | | 272,126 | |
| | 4,323 | | | Darden Restaurants, Inc. | | | 280,087 | |
| | 6,865 | | | Dick’s Sporting Goods, Inc. | | | 382,037 | |
| | 4,920 | | | Dillard’s, Inc., Class A | | | 301,596 | |
| | 3,289 | | | Dollar General Corp. | | | 227,237 | |
| | 3,277 | | | Dollar Tree, Inc.(b) | | | 247,577 | |
| | 2,434 | | | Domino’s Pizza, Inc. | | | 411,930 | |
| | 6,857 | | | Dunkin’ Brands Group, Inc. | | | 331,605 | |
| | 5,311 | | | Foot Locker, Inc. | | | 354,615 | |
| | 16,501 | | | Gap, Inc. (The) | | | 455,263 | |
| | 6,991 | | | Garmin Ltd. | | | 338,085 | |
| | 3,026 | | | Genuine Parts Co. | | | 274,125 | |
| | 13,507 | | | H&R Block, Inc. | | | 310,256 | |
| | 10,545 | | | Hanesbrands, Inc. | | | 271,007 | |
| | 6,306 | | | Harley-Davidson, Inc. | | | 359,568 | |
| | 3,346 | | | Hasbro, Inc. | | | 279,090 | |
| | 2,212 | | | Home Depot, Inc. (The) | | | 269,886 | |
| | 5,408 | | | John Wiley & Sons, Inc., Class A | | | 279,053 | |
| | 13,163 | | | Kate Spade & Co.(b) | | | 220,480 | |
| | 8,059 | | | Kohl’s Corp. | | | 352,581 | |
| | 4,261 | | | L Brands, Inc. | | | 307,602 | |
| | 5,758 | | | Leggett & Platt, Inc. | | | 264,177 | |
| | 11,057 | | | Liberty Interactive Corp. QVC Group, Series A(b) | | | 204,444 | |
| | 7,733 | | | Liberty Ventures, Series A(b) | | | 308,547 | |
| | 8,916 | | | LKQ Corp.(b) | | | 287,808 | |
| | 3,632 | | | Lowe’s Cos., Inc. | | | 242,073 | |
| | 4,405 | | | Lululemon Athletica, Inc.(b) | | | 252,186 | |
| | 8,824 | | | Macy’s, Inc. | | | 321,988 | |
| | 9,158 | | | Mattel, Inc. | | | 288,752 | |
| | 2,389 | | | McDonald’s Corp. | | | 268,930 | |
| | 6,400 | | | Michael Kors Holdings Ltd.(b) | | | 324,992 | |
| | 10,062 | | | Michaels Cos., Inc. (The)(b) | | | 233,942 | |
| | 4,254 | | | Murphy USA, Inc.(b) | | | 292,590 | |
| | 5,307 | | | NIKE, Inc., Class B | | | 266,305 | |
| | 7,733 | | | Nordstrom, Inc. | | | 402,116 | |
| | 170 | | | NVR, Inc.(b) | | | 258,910 | |
| | 1,123 | | | O’Reilly Automotive, Inc.(b) | | | 296,966 | |
| | 1,328 | | | Panera Bread Co., Class A(b) | | | 253,329 | |
| | | | | | | | |
Number
of Shares | | | | | Value | |
| | | | Common Stocks and Other Equity Interests (continued) | |
| | | | Consumer Discretionary (continued) | |
| | 7,386 | | | Penske Automotive Group, Inc. | | $ | 330,524 | |
| | 3,452 | | | Polaris Industries, Inc. | | | 264,458 | |
| | 3,182 | | | Pool Corp. | | | 294,590 | |
| | 15,446 | | | PulteGroup, Inc. | | | 287,296 | |
| | 3,054 | | | PVH Corp. | | | 326,717 | |
| | 3,054 | | | Ralph Lauren Corp., Class A | | | 299,597 | |
| | 13,846 | | | Regal Entertainment Group, Class A | | | 297,827 | |
| | 5,469 | | | Ross Stores, Inc. | | | 342,031 | |
| | 9,913 | | | Sally Beauty Holdings, Inc.(b) | | | 257,143 | |
| | 10,535 | | | Service Corp. International | | | 269,696 | |
| | 7,470 | | | ServiceMaster Global Holdings, Inc.(b) | | | 267,351 | |
| | 3,018 | | | Signet Jewelers Ltd. | | | 245,243 | |
| | 9,493 | | | Skechers U.S.A., Inc., Class A(b) | | | 199,638 | |
| | 5,319 | | | Starbucks Corp. | | | 282,279 | |
| | 10,639 | | | Starz, Class A(b) | | | 334,703 | |
| | 4,262 | | | Target Corp. | | | 292,927 | |
| | 3,806 | | | TJX Cos., Inc. (The) | | | 280,693 | |
| | 3,097 | | | Tractor Supply Co. | | | 193,965 | |
| | 1,232 | | | Ulta Salon, Cosmetics & Fragrance,
Inc.(b) | | | 299,795 | �� |
| | 8,041 | | | Under Armour, Inc., Class A(b) | | | 250,075 | |
| | 10,227 | | | Urban Outfitters, Inc.(b) | | | 342,093 | |
| | 2,218 | | | Vail Resorts, Inc. | | | 353,638 | |
| | 4,688 | | | VF Corp. | | | 254,136 | |
| | 3,938 | | | Visteon Corp. | | | 278,062 | |
| | 28,603 | | | Wendy’s Co. (The) | | | 310,057 | |
| | 5,485 | | | Williams-Sonoma, Inc. | | | 253,517 | |
| | 3,536 | | | Yum! Brands, Inc. | | | 305,086 | |
| | | | | | | | |
| | | | | | | 23,805,307 | |
| | | | | | | | |
| | | | Consumer Staples—8.5% | |
| | 4,529 | | | Altria Group, Inc. | | | 299,457 | |
| | 1,934 | | | Brown-Forman Corp., Class A | | | 93,799 | |
| | 3,980 | | | Brown-Forman Corp., Class B | | | 183,757 | |
| | 4,319 | | | Bunge Ltd. | | | 267,821 | |
| | 4,775 | | | Campbell Soup Co. | | | 259,473 | |
| | 2,360 | | | Casey’s General Stores, Inc. | | | 266,656 | |
| | 5,892 | | | Church & Dwight Co., Inc. | | | 284,348 | |
| | 2,244 | | | Clorox Co. (The) | | | 269,325 | |
| | 6,522 | | | Coca-Cola Co. (The) | | | 276,533 | |
| | 4,093 | | | Colgate-Palmolive Co. | | | 292,076 | |
| | 1,896 | | | Constellation Brands, Inc., Class A | | | 316,859 | |
| | 1,912 | | | Costco Wholesale Corp. | | | 282,727 | |
| | 10,963 | | | Coty, Inc., Class A | | | 252,039 | |
| | 3,018 | | | CVS Health Corp. | | | 253,814 | |
| | 3,155 | | | Dr Pepper Snapple Group, Inc. | | | 276,977 | |
| | 3,134 | | | Estee Lauder Cos., Inc. (The), Class A | | | 273,065 | |
| | 15,894 | | | Flowers Foods, Inc. | | | 246,675 | |
| | 4,614 | | | General Mills, Inc. | | | 285,976 | |
| | 4,923 | | | Herbalife Ltd.(b) | | | 298,728 | |
| | 3,133 | | | Hershey Co. (The) | | | 321,007 | |
| | 8,466 | | | Hormel Foods Corp. | | | 325,941 | |
| | 2,468 | | | Ingredion, Inc. | | | 323,728 | |
| | 2,247 | | | JM Smucker Co. (The) | | | 295,054 | |
| | 3,891 | | | Kellogg Co. | | | 292,331 | |
| | 2,277 | | | Kimberly-Clark Corp. | | | 260,512 | |
| | 3,471 | | | Kraft Heinz Co. (The) | | | 308,745 | |
| | 8,170 | | | Kroger Co. (The) | | | 253,107 | |
See accompanying Notes to Financial Statements which are an integral part of the financial statements.
PowerShares Russell 1000 Low Beta Equal Weight Portfolio (USLB) (continued)
October 31, 2016
| | | | | | | | |
Number
of Shares | | | | | Value | |
| | | | Common Stocks and Other Equity Interests (continued) | |
| | | | Consumer Staples (continued) | |
| | 2,997 | | | McCormick & Co., Inc. | | $ | 287,322 | |
| | 2,854 | | | Molson Coors Brewing Co., Class B | | | 296,274 | |
| | 6,503 | | | Mondelez International, Inc., Class A | | | 292,245 | |
| | 2,870 | | | PepsiCo, Inc. | | | 307,664 | |
| | 2,932 | | | Philip Morris International, Inc. | | | 282,762 | |
| | 11,712 | | | Pilgrim’s Pride Corp. | | | 255,790 | |
| | 6,983 | | | Pinnacle Foods, Inc. | | | 359,066 | |
| | 3,563 | | | Procter & Gamble Co. (The) | | | 309,268 | |
| | 5,827 | | | Reynolds American, Inc. | | | 320,951 | |
| | 11,486 | | | Sprouts Farmers Market, Inc.(b) | | | 254,415 | |
| | 5,973 | | | Sysco Corp. | | | 287,421 | |
| | 3,085 | | | TreeHouse Foods, Inc.(b) | | | 269,876 | |
| | 4,601 | | | Tyson Foods, Inc., Class A | | | 325,981 | |
| | 4,136 | | | Wal-Mart Stores, Inc. | | | 289,603 | |
| | 8,589 | | | Whole Foods Market, Inc. | | | 242,983 | |
| | | | | | | | |
| | | | | | | 11,742,151 | |
| | | | | | | | |
| | | | Energy—1.3% | |
| | 10,009 | | | Antero Resources Corp.(b) | | | 264,938 | |
| | 4,834 | | | Dril-Quip, Inc.(b) | | | 229,615 | |
| | 3,267 | | | Exxon Mobil Corp. | | | 272,206 | |
| | 16,232 | | | Kinder Morgan, Inc. | | | 331,620 | |
| | 3,843 | | | Schlumberger Ltd. | | | 300,638 | |
| | 9,211 | | | Spectra Energy Corp. | | | 385,112 | |
| | | | | | | | |
| | | | | | | 1,784,129 | |
| | | | | | | | |
| | | | Financials—14.2% | |
| | 536 | | | Alleghany Corp.(b) | | | 276,689 | |
| | 7,800 | | | Allied World Assurance Co. Holdings AG | | | 335,244 | |
| | 4,321 | | | Allstate Corp. (The) | | | 293,396 | |
| | 3,980 | | | American Financial Group, Inc. | | | 296,510 | |
| | 27,165 | | | Annaly Capital Management, Inc. REIT | | | 281,429 | |
| | 4,020 | | | Arch Capital Group Ltd. (Bermuda)(b) | | | 313,439 | |
| | 6,044 | | | Aspen Insurance Holdings Ltd. (Bermuda) | | | 291,623 | |
| | 3,372 | | | Assurant, Inc. | | | 271,513 | |
| | 10,697 | | | Assured Guaranty Ltd. | | | 319,733 | |
| | 5,277 | | | Axis Capital Holdings Ltd. | | | 300,631 | |
| | 4,056 | | | Bank of Hawaii Corp. | | | 304,808 | |
| | 8,835 | | | BankUnited, Inc. | | | 257,452 | |
| | 2,053 | | | Berkshire Hathaway, Inc., Class B(b) | | | 296,248 | |
| | 8,092 | | | Brown & Brown, Inc. | | | 298,271 | |
| | 4,610 | | | CBOE Holdings, Inc. | | | 291,398 | |
| | 19,240 | | | Chimera Investment Corp. REIT | | | 301,491 | |
| | 2,328 | | | Chubb Ltd. | | | 295,656 | |
| | 4,202 | | | Cincinnati Financial Corp. | | | 297,418 | |
| | 2,975 | | | CME Group, Inc., Class A | | | 297,798 | |
| | 5,916 | | | Commerce Bancshares, Inc. | | | 294,735 | |
| | 1,582 | | | Credit Acceptance Corp.(b) | | | 291,246 | |
| | 4,332 | | | Endurance Specialty Holdings Ltd. | | | 398,327 | |
| | 2,947 | | | Erie Indemnity Co., Class A | | | 301,743 | |
| | 1,654 | | | Everest Re Group Ltd. | | | 336,622 | |
| | 1,838 | | | FactSet Research Systems, Inc. | | | 284,375 | |
| | 7,599 | | | First American Financial Corp. | | | 296,817 | |
| | 4,089 | | | First Republic Bank | | | 304,344 | |
| | 8,380 | | | FNF Group | | | 300,926 | |
| | 3,337 | | | Hanover Insurance Group, Inc. (The) | | | 254,246 | |
| | 6,459 | | | Hartford Financial Services Group, Inc. (The) | | | 284,907 | |
| | | | | | | | |
Number
of Shares | | | | | Value | |
| | | | Common Stocks and Other Equity Interests (continued) | |
| | | | Financials (continued) | |
| | 7,290 | | | Interactive Brokers Group, Inc., Class A | | $ | 241,955 | |
| | 1,083 | | | Intercontinental Exchange, Inc. | | | 292,832 | |
| | 41,165 | | | KeyCorp | | | 581,250 | |
| | 7,207 | | | Loews Corp. | | | 310,117 | |
| | 2,445 | | | M&T Bank Corp. | | | 300,075 | |
| | 303 | | | Markel Corp.(b) | | | 265,861 | |
| | 2,072 | | | MarketAxess Holdings, Inc. | | | 312,375 | |
| | 4,405 | | | Marsh & McLennan Cos., Inc. | | | 279,233 | |
| | 5,487 | | | Mercury General Corp. | | | 298,877 | |
| | 40,205 | | | MFA Financial, Inc. REIT | | | 293,899 | |
| | 2,949 | | | Moody’s Corp. | | | 296,433 | |
| | 3,463 | | | Morningstar, Inc. | | | 244,592 | |
| | 3,703 | | | MSCI, Inc. | | | 296,944 | |
| | 4,444 | | | Nasdaq, Inc. | | | 284,283 | |
| | 18,252 | | | People’s United Financial, Inc. | | | 296,412 | |
| | 3,247 | | | PNC Financial Services Group, Inc. (The) | | | 310,413 | |
| | 5,561 | | | ProAssurance Corp. | | | 296,401 | |
| | 8,729 | | | Progressive Corp. (The) | | | 275,051 | |
| | 2,981 | | | Reinsurance Group of America, Inc. | | | 321,531 | |
| | 2,552 | | | RenaissanceRe Holdings Ltd. (Bermuda) | | | 317,188 | |
| | 2,156 | | | Signature Bank(b) | | | 259,927 | |
| | 42,428 | | | SLM Corp.(b) | | | 299,117 | |
| | 14,067 | | | Starwood Property Trust, Inc. REIT | | | 312,850 | |
| | 9,317 | | | Synchrony Financial | | | 266,373 | |
| | 9,010 | | | Synovus Financial Corp. | | | 297,961 | |
| | 3,784 | | | T. Rowe Price Group, Inc. | | | 242,214 | |
| | 15,758 | | | TFS Financial Corp. | | | 280,808 | |
| | 6,933 | | | Thomson Reuters Corp. | | | 273,230 | |
| | 4,744 | | | Torchmark Corp. | | | 300,817 | |
| | 34,290 | | | Two Harbors Investment Corp. REIT | | | 285,636 | |
| | 6,778 | | | U.S. Bancorp | | | 303,383 | |
| | 5,987 | | | Validus Holdings Ltd. | | | 305,936 | |
| | 5,108 | | | W.R. Berkley Corp. | | | 291,667 | |
| | 5,715 | | | Wells Fargo & Co. | | | 262,947 | |
| | 364 | | | White Mountains Insurance Group Ltd. | | | 302,018 | |
| | 8,516 | | | XL Group Ltd. (Ireland) | | | 295,505 | |
| | | | | | | | |
| | | | | | | 19,665,146 | |
| | | | | | | | |
| | | | Health Care—11.9% | |
| | 2,870 | | | ABIOMED, Inc.(b) | | | 301,321 | |
| | 4,886 | | | Acadia Healthcare Co., Inc.(b) | | | 175,701 | |
| | 2,577 | | | Aetna, Inc. | | | 276,641 | |
| | 6,814 | | | Alere, Inc.(b) | | | 304,450 | |
| | 3,854 | | | AmerisourceBergen Corp. | | | 271,013 | |
| | 3,865 | | | AmSurg Corp.(b) | | | 230,934 | |
| | 2,201 | | | Anthem, Inc. | | | 268,214 | |
| | 6,728 | | | Baxter International, Inc. | | | 320,186 | |
| | 1,745 | | | Becton, Dickinson and Co. | | | 293,003 | |
| | 1,032 | | | Biogen, Inc.(b) | | | 289,146 | |
| | 1,954 | | | Bio-Rad Laboratories, Inc., Class A(b) | | | 308,888 | |
| | 2,616 | | | Bio-Techne Corp. | | | 272,038 | |
| | 4,162 | | | Bristol-Myers Squibb Co. | | | 211,887 | |
| | 1,352 | | | C.R. Bard, Inc. | | | 292,951 | |
| | 3,703 | | | Cardinal Health, Inc. | | | 254,359 | |
| | 4,608 | | | Centene Corp.(b) | | | 287,908 | |
| | 5,241 | | | Cerner Corp.(b) | | | 307,018 | |
| | 3,368 | | | Charles River Laboratories International, Inc.(b) | | | 255,564 | |
See accompanying Notes to Financial Statements which are an integral part of the financial statements.
PowerShares Russell 1000 Low Beta Equal Weight Portfolio (USLB) (continued)
October 31, 2016
| | | | | | | | |
Number
of Shares | | | | | Value | |
| | | | Common Stocks and Other Equity Interests (continued) | |
| | | | Health Care (continued) | |
| | 2,281 | | | Cigna Corp. | | $ | 271,051 | |
| | 1,787 | | | Cooper Cos., Inc. (The) | | | 314,583 | |
| | 3,760 | | | DaVita, Inc.(b) | | | 220,411 | |
| | 2,920 | | | Edwards Lifesciences Corp.(b) | | | 278,042 | |
| | 3,889 | | | Eli Lilly & Co. | | | 287,164 | |
| | 11,718 | | | Envision Healthcare Holdings,
Inc.(b) | | | 231,782 | |
| | 3,844 | | | Express Scripts Holding Co.(b) | | | 259,086 | |
| | 3,720 | | | HCA Holdings, Inc.(b) | | | 284,692 | |
| | 1,685 | | | Henry Schein, Inc.(b) | | | 251,402 | |
| | 5,863 | | | Hill-Rom Holdings, Inc. | | | 324,869 | |
| | 8,410 | | | Hologic, Inc.(b) | | | 302,844 | |
| | 1,671 | | | Humana, Inc. | | | 286,627 | |
| | 3,306 | | | IDEXX Laboratories, Inc.(b) | | | 354,205 | |
| | 2,000 | | | Illumina, Inc.(b) | | | 272,280 | |
| | 3,422 | | | Incyte Corp.(b) | | | 297,611 | |
| | 464 | | | Intuitive Surgical, Inc.(b) | | | 311,845 | |
| | 2,584 | | | Johnson & Johnson | | | 299,718 | |
| | 4,341 | | | LifePoint Health, Inc.(b) | | | 259,809 | |
| | 1,578 | | | McKesson Corp. | | | 200,674 | |
| | 4,287 | | | MEDNAX, Inc.(b) | | | 262,579 | |
| | 3,621 | | | Medtronic PLC | | | 296,994 | |
| | 5,174 | | | Merck & Co., Inc. | | | 303,817 | |
| | 5,965 | | | Patterson Cos., Inc. | | | 254,765 | |
| | 5,319 | | | PerkinElmer, Inc. | | | 270,684 | |
| | 3,007 | | | Perrigo Co. PLC | | | 250,152 | |
| | 8,387 | | | Pfizer, Inc. | | | 265,952 | |
| | 8,924 | | | Premier, Inc., Class A(b) | | | 284,140 | |
| | 13,269 | | | QIAGEN NV(b) | | | 323,498 | |
| | 3,771 | | | Quest Diagnostics, Inc. | | | 307,110 | |
| | 8,636 | | | Quintiles IMS Holdings, Inc.(b) | | | 619,547 | |
| | 4,926 | | | ResMed, Inc. | | | 294,427 | |
| | 3,725 | | | St. Jude Medical, Inc. | | | 289,954 | |
| | 2,653 | | | Stryker Corp. | | | 306,024 | |
| | 1,787 | | | Teleflex, Inc. | | | 255,773 | |
| | 2,166 | | | UnitedHealth Group, Inc. | | | 306,121 | |
| | 2,145 | | | Universal Health Services, Inc., Class B | | | 258,923 | |
| | 3,526 | | | Varian Medical Systems, Inc.(b) | | | 319,914 | |
| | 4,483 | | | VCA, Inc.(b) | | | 275,525 | |
| | 10,022 | | | VWR Corp.(b) | | | 275,705 | |
| | 2,837 | | | WellCare Health Plans, Inc.(b) | | | 322,028 | |
| | | | | | | | |
| | | | | | | 16,573,549 | |
| | | | | | | | |
| | | | Industrials—13.1% | | | | |
| | 1,728 | | | 3M Co. | | | 285,638 | |
| | 5,625 | | | AGCO Corp. | | | 287,325 | |
| | 4,418 | | | Alaska Air Group, Inc. | | | 319,068 | |
| | 787 | | | AMERCO | | | 253,721 | |
| | 9,251 | | | American Airlines Group, Inc. | | | 375,591 | |
| | 6,086 | | | AMETEK, Inc. | | | 268,393 | |
| | 6,128 | | | B/E Aerospace, Inc. | | | 364,739 | |
| | 8,175 | | | BWX Technologies, Inc. | | | 320,624 | |
| | 3,927 | | | C.H. Robinson Worldwide, Inc. | | | 267,507 | |
| | 2,787 | | | Carlisle Cos., Inc. | | | 292,217 | |
| | 3,075 | | | Cintas Corp. | | | 328,010 | |
| | 10,768 | | | Colfax Corp.(b) | | | 342,315 | |
| | 11,117 | | | CSX Corp. | | | 339,180 | |
| | 2,554 | | | Cummins, Inc. | | | 326,452 | |
| | | | | | | | |
Number
of Shares | | | | | Value | |
| | | | Common Stocks and Other Equity Interests (continued) | |
| | | | Industrials (continued) | |
| | 3,519 | | | Deere & Co. | | $ | 310,728 | |
| | 6,701 | | | Delta Air Lines, Inc. | | | 279,901 | |
| | 8,759 | | | Donaldson Co., Inc. | | | 319,879 | |
| | 5,995 | | | Expeditors International of Washington, Inc. | | | 308,563 | |
| | 6,305 | | | Fastenal Co. | | | 245,769 | |
| | 2,060 | | | General Dynamics Corp. | | | 310,524 | |
| | 3,617 | | | Graco, Inc. | | | 270,913 | |
| | 1,581 | | | HEICO Corp. | | | 106,812 | |
| | 3,465 | | | HEICO Corp., Class A | | | 207,900 | |
| | 6,656 | | | Hexcel Corp. | | | 302,781 | |
| | 2,559 | | | Honeywell International, Inc. | | | 280,671 | |
| | 3,472 | | | IDEX Corp. | | | 300,120 | |
| | 2,732 | | | Illinois Tool Works, Inc. | | | 310,273 | |
| | 16,259 | | | JetBlue Airways Corp.(b) | | | 284,207 | |
| | 6,437 | | | Johnson Controls International PLC | | | 259,540 | |
| | 3,154 | | | Kansas City Southern | | | 276,795 | |
| | 4,281 | | | Landstar System, Inc. | | | 304,593 | |
| | 2,115 | | | Lennox International, Inc. | | | 308,557 | |
| | 4,825 | | | Lincoln Electric Holdings, Inc. | | | 317,630 | |
| | 1,244 | | | Lockheed Martin Corp. | | | 306,497 | |
| | 3,638 | | | ManpowerGroup, Inc. | | | 279,398 | |
| | 3,844 | | | MSC Industrial Direct Co., Inc., Class A | | | 279,843 | |
| | 5,440 | | | Nielsen Holdings PLC | | | 244,909 | |
| | 1,362 | | | Northrop Grumman Corp. | | | 311,898 | |
| | 3,364 | | | Orbital ATK, Inc. | | | 250,147 | |
| | 5,626 | | | Owens Corning | | | 274,436 | |
| | 5,236 | | | PACCAR, Inc. | | | 287,561 | |
| | 15,588 | | | Pitney Bowes, Inc. | | | 278,090 | |
| | 12,175 | | | Quanta Services, Inc.(b) | | | 350,031 | |
| | 2,222 | | | Raytheon Co. | | | 303,547 | |
| | 6,019 | | | Republic Services, Inc. | | | 316,780 | |
| | 3,291 | | | Rockwell Collins, Inc. | | | 277,497 | |
| | 10,208 | | | Rollins, Inc. | | | 314,611 | |
| | 6,853 | | | Southwest Airlines Co. | | | 274,463 | |
| | 6,715 | | | Spirit Airlines, Inc.(b) | | | 321,850 | |
| | 3,016 | | | Stericycle, Inc.(b) | | | 241,551 | |
| | 6,582 | | | Toro Co. (The) | | | 315,146 | |
| | 1,113 | | | TransDigm Group, Inc. | | | 303,248 | |
| | 3,515 | | | Union Pacific Corp. | | | 309,953 | |
| | 6,442 | | | United Continental Holdings, Inc.(b) | | | 362,234 | |
| | 2,855 | | | United Parcel Service, Inc., Class B | | | 307,655 | |
| | 2,904 | | | United Technologies Corp. | | | 296,789 | |
| | 9,875 | | | USG Corp.(b) | | | 248,653 | |
| | 3,668 | | | Verisk Analytics, Inc.(b) | | | 299,125 | |
| | 1,278 | | | W.W. Grainger, Inc. | | | 265,977 | |
| | 4,781 | | | Waste Management, Inc. | | | 313,920 | |
| | 2,168 | | | Watsco, Inc. | | | 297,645 | |
| | 6,504 | | | Xylem, Inc. | | | 314,338 | |
| | | | | | | | |
| | | | | | | 18,224,728 | |
| | | | | | | | |
| | | | Information Technology—10.4% | | | | |
| | 7,654 | | | Activision Blizzard, Inc. | | | 330,423 | |
| | 5,357 | | | Akamai Technologies, Inc.(b) | | | 372,151 | |
| | 390 | | | Alphabet, Inc., Class A(b) | | | 315,861 | |
| | 5,052 | | | Amdocs Ltd. | | | 295,289 | |
| | 5,034 | | | Amphenol Corp., Class A | | | 331,892 | |
| | 3,299 | | | ANSYS, Inc.(b) | | | 301,364 | |
See accompanying Notes to Financial Statements which are an integral part of the financial statements.
PowerShares Russell 1000 Low Beta Equal Weight Portfolio (USLB) (continued)
October 31, 2016
| | | | | | | | |
Number
of Shares | | | | | Value | |
| | | | Common Stocks and Other Equity Interests (continued) | |
| | | | Information Technology (continued) | |
| | 4,470 | | | Arrow Electronics, Inc.(b) | | $ | 273,206 | |
| | 3,309 | | | Automatic Data Processing, Inc. | | | 288,082 | |
| | 7,056 | | | Avnet, Inc. | | | 295,999 | |
| | 9,893 | | | Booz Allen Hamilton Holding Corp. | | | 301,440 | |
| | 4,541 | | | Broadridge Financial Solutions, Inc. | | | 293,621 | |
| | 32,315 | | | Brocade Communications Systems, Inc. | | | 342,539 | |
| | 8,975 | | | CA, Inc. | | | 275,892 | |
| | 11,782 | | | Cadence Design Systems, Inc.(b) | | | 301,384 | |
| | 5,262 | | | CDK Global, Inc. | | | 287,358 | |
| | 6,841 | | | CDW Corp. | | | 307,229 | |
| | 4,770 | | | Cognizant Technology Solutions Corp., Class A(b) | | | 244,940 | |
| | 770 | | | CommerceHub, Inc., Series A(b) | | | 11,565 | |
| | 1,540 | | | CommerceHub, Inc., Series C(b) | | | 23,177 | |
| | 7,775 | | | CoreLogic, Inc.(b) | | | 330,904 | |
| | 14,034 | | | Corning, Inc. | | | 318,712 | |
| | 6,070 | | | Dolby Laboratories, Inc., Class A | | | 288,871 | |
| | 7,264 | | | EchoStar Corp., Class A(b) | | | 339,519 | |
| | 3,805 | | | Electronic Arts, Inc.(b) | | | 298,769 | |
| | 2,663 | | | F5 Networks, Inc.(b) | | | 368,053 | |
| | 2,454 | | | Facebook, Inc., Class A(b) | | | 321,450 | |
| | 3,900 | | | Fidelity National Information Services, Inc. | | | 288,288 | |
| | 2,805 | | | Fiserv, Inc.(b) | | | 276,236 | |
| | 9,409 | | | FLIR Systems, Inc. | | | 309,744 | |
| | 8,447 | | | Fortinet, Inc.(b) | | | 270,811 | |
| | 2,873 | | | Gartner, Inc.(b) | | | 247,193 | |
| | 10,375 | | | Genpact Ltd.(b) | | | 238,521 | |
| | 3,664 | | | Harris Corp. | | | 326,865 | |
| | 8,357 | | | Ingram Micro, Inc., Class A | | | 310,880 | |
| | 1,912 | | | International Business Machines Corp. | | | 293,855 | |
| | 15,026 | | | Jabil Circuit, Inc. | | | 320,655 | |
| | 3,447 | | | Jack Henry & Associates, Inc. | | | 279,276 | |
| | 6,200 | | | Linear Technology Corp. | | | 372,372 | |
| | 4,287 | | | Motorola Solutions, Inc. | | | 311,150 | |
| | 10,157 | | | National Instruments Corp. | | | 285,310 | |
| | 5,352 | | | Paychex, Inc. | | | 295,430 | |
| | 10,373 | | | Sabre Corp. | | | 267,935 | |
| | 4,335 | | | Skyworks Solutions, Inc. | | | 333,535 | |
| | 9,472 | | | SS&C Technologies Holdings, Inc. | | | 302,441 | |
| | 5,430 | | | Vantiv, Inc., Class A(b) | | | 316,895 | |
| | 1,011 | | | Versum Materials, Inc.(b) | | | 22,950 | |
| | 4,739 | | | VMware, Inc., Class A(b) | | | 372,485 | |
| | 14,979 | | | Western Union Co. (The) | | | 300,629 | |
| | 29,206 | | | Xerox Corp. | | | 285,343 | |
| | 6,154 | | | Xilinx, Inc. | | | 313,054 | |
| | | | | | | | |
| | | | | | | 14,401,543 | |
| | | | | | | | |
| | | | Materials—2.3% | | | | |
| | 102 | | | Advansix, Inc.(b) | | | 1,628 | |
| | 2,024 | | | Air Products & Chemicals, Inc. | | | 270,042 | |
| | 3,774 | | | AptarGroup, Inc. | | | 269,615 | |
| | 5,843 | | | Bemis Co., Inc. | | | 284,671 | |
| | 10,548 | | | CF Industries Holdings, Inc. | | | 253,257 | |
| | 3,724 | | | Compass Minerals International, Inc. | | | 267,569 | |
| | 2,627 | | | Monsanto Co. | | | 264,723 | |
| | 719 | | | NewMarket Corp. | | | 288,254 | |
| | 8,925 | | | Newmont Mining Corp. | | | 330,582 | |
| | | | | | | | |
Number
of Shares | | | | | Value | |
| | | | Common Stocks and Other Equity Interests (continued) | |
| | | | Materials (continued) | |
| | 4,231 | | | Scotts Miracle-Gro Co. (The), Class A | | $ | 372,709 | |
| | 5,690 | | | Silgan Holdings, Inc. | | | 289,906 | |
| | 11,190 | | | Southern Copper Corp. (Peru) | | | 317,684 | |
| | | | | | | | |
| | | | | | | 3,210,640 | |
| | | | | | | | |
| | | | Real Estate—13.3% | | | | |
| | 3,022 | | | Alexandria Real Estate Equities, Inc. REIT | | | 325,802 | |
| | 6,261 | | | American Campus Communities, Inc. REIT | | | 326,261 | |
| | 6,960 | | | Apartment Investment & Management Co., Class A REIT | | | 306,727 | |
| | 1,681 | | | AvalonBay Communities, Inc. REIT | | | 287,754 | |
| | 2,331 | | | Boston Properties, Inc. REIT | | | 280,839 | |
| | 11,440 | | | Brixmor Property Group, Inc. REIT | | | 290,805 | |
| | 3,465 | | | Camden Property Trust REIT | | | 282,190 | |
| | 13,802 | | | Columbia Property Trust, Inc. REIT | | | 290,946 | |
| | 10,772 | | | Corporate Office Properties Trust REIT | | | 287,505 | |
| | 8,672 | | | Corrections Corp. of America REIT | | | 125,310 | |
| | 3,210 | | | Crown Castle International Corp. REIT | | | 292,078 | |
| | 9,228 | | | CubeSmart REIT | | | 240,574 | |
| | 6,713 | | | DCT Industrial Trust, Inc. REIT | | | 313,833 | |
| | 16,819 | | | DDR Corp. REIT | | | 257,163 | |
| | 3,048 | | | Digital Realty Trust, Inc. REIT | | | 284,775 | |
| | 8,641 | | | Douglas Emmett, Inc. REIT | | | 315,396 | |
| | 12,241 | | | Duke Realty Corp. REIT | | | 320,102 | |
| | 15,228 | | | Empire State Realty Trust, Inc., Class A REIT | | | 298,012 | |
| | 4,095 | | | EPR Properties REIT | | | 297,788 | |
| | 811 | | | Equinix, Inc. REIT | | | 289,754 | |
| | 9,988 | | | Equity Commonwealth REIT(b) | | | 301,737 | |
| | 3,950 | | | Equity LifeStyle Properties, Inc. REIT | | | 299,568 | |
| | 9,854 | | | Equity One, Inc. REIT | | | 280,839 | |
| | 4,392 | | | Equity Residential REIT | | | 271,206 | |
| | 1,331 | | | Essex Property Trust, Inc. REIT | | | 284,954 | |
| | 3,134 | | | Extra Space Storage, Inc. REIT | | | 229,252 | |
| | 1,931 | | | Federal Realty Investment Trust REIT | | | 280,439 | |
| | 8,762 | | | Gaming and Leisure Properties, Inc. REIT | | | 287,656 | |
| | 10,855 | | | General Growth Properties, Inc. REIT | | | 270,832 | |
| | 9,623 | | | Healthcare Trust of America, Inc., Class A REIT | | | 294,464 | |
| | 5,965 | | | Highwoods Properties, Inc. REIT | | | 296,043 | |
| | 11,402 | | | Hospitality Properties Trust REIT | | | 311,959 | |
| | 18,877 | | | Host Hotels & Resorts, Inc. REIT | | | 292,216 | |
| | 7,952 | | | Iron Mountain, Inc. REIT | | | 268,221 | |
| | 4,634 | | | Kilroy Realty Corp. REIT | | | 332,860 | |
| | 10,249 | | | Kimco Realty Corp. REIT | | | 272,726 | |
| | 4,533 | | | Lamar Advertising Co., Class A REIT | | | 287,619 | |
| | 7,771 | | | Liberty Property Trust REIT | | | 314,182 | |
| | 2,753 | | | Life Storage, Inc. REIT | | | 222,029 | |
| | 3,802 | | | Macerich Co. (The) REIT | | | 269,106 | |
| | 2,838 | | | Mid-America Apartment Communities, Inc. REIT | | | 263,224 | |
| | 6,378 | | | National Retail Properties, Inc. REIT | | | 290,964 | |
| | 9,125 | | | OMEGA Healthcare Investors, Inc. REIT | | | 290,449 | |
| | 14,372 | | | Piedmont Office Realty Trust, Inc., Class A REIT | | | 294,339 | |
| | 4,857 | | | Post Properties, Inc. REIT | | | 319,542 | |
| | 6,099 | | | Prologis, Inc. REIT | | | 318,124 | |
| | 1,156 | | | Public Storage REIT | | | 247,060 | |
| | 11,266 | | | Rayonier, Inc. REIT | | | 302,154 | |
See accompanying Notes to Financial Statements which are an integral part of the financial statements.
PowerShares Russell 1000 Low Beta Equal Weight Portfolio (USLB) (continued)
October 31, 2016
| | | | | | | | |
Number
of Shares | | | | | Value | |
| | | | Common Stocks and Other Equity Interests (continued) | |
| | | | Real Estate (continued) | |
| | 4,791 | | | Realty Income Corp. REIT | | $ | 283,819 | |
| | 3,785 | | | Regency Centers Corp. REIT | | | 272,785 | |
| | 18,275 | | | Retail Properties of America, Inc., Class A REIT | | | 284,542 | |
| | 15,690 | | | Senior Housing Properties Trust REIT | | | 333,726 | |
| | 1,497 | | | Simon Property Group, Inc. REIT | | | 278,382 | |
| | 25,461 | | | Spirit Realty Capital, Inc. REIT | | | 303,241 | |
| | 11,428 | | | STORE Capital Corp. REIT | | | 311,870 | |
| | 4,257 | | | Sun Communities, Inc. REIT | | | 327,491 | |
| | 8,206 | | | Tanger Factory Outlet Centers, Inc. REIT | | | 285,569 | |
| | 4,204 | | | Taubman Centers, Inc. REIT | | | 304,622 | |
| | 8,322 | | | UDR, Inc. REIT | | | 291,020 | |
| | 4,378 | | | Ventas, Inc. REIT | | | 296,609 | |
| | 3,057 | | | Vornado Realty Trust REIT | | | 283,628 | |
| | 7,669 | | | Weingarten Realty Investors REIT | | | 277,694 | |
| | 4,224 | | | Welltower, Inc. REIT | | | 289,471 | |
| | 4,486 | | | WP Carey, Inc. REIT | | | 272,480 | |
| | | | | | | | |
| | | | | | | 18,404,327 | |
| | | | | | | | |
| | | | Telecommunication Services—0.8% | | | | |
| | 7,525 | | | AT&T, Inc. | | | 276,845 | |
| | 10,835 | | | CenturyLink, Inc. | | | 287,994 | |
| | 6,839 | | | T-Mobile US, Inc.(b) | | | 340,103 | |
| | 5,780 | | | Verizon Communications, Inc. | | | 278,018 | |
| | | | | | | | |
| | | | | | | 1,182,960 | |
| | | | | | | | |
| | | | Utilities—7.0% | | | | |
| | 7,815 | | | Alliant Energy Corp. | | | 297,361 | |
| | 5,897 | | | Ameren Corp. | | | 294,555 | |
| | 4,493 | | | American Electric Power Co., Inc. | | | 291,326 | |
| | 3,874 | | | American Water Works Co., Inc. | | | 286,831 | |
| | 8,877 | | | Aqua America, Inc. | | | 272,524 | |
| | 3,997 | | | Atmos Energy Corp. | | | 297,337 | |
| | 6,860 | | | Avangrid, Inc. | | | 270,352 | |
| | 6,938 | | | CMS Energy Corp. | | | 292,437 | |
| | 3,958 | | | Consolidated Edison, Inc. | | | 299,027 | |
| | 4,067 | | | Dominion Resources, Inc. | | | 305,838 | |
| | 3,199 | | | DTE Energy Co. | | | 307,136 | |
| | 3,687 | | | Duke Energy Corp. | | | 295,034 | |
| | 4,073 | | | Edison International | | | 299,284 | |
| | 5,250 | | | Eversource Energy | | | 289,065 | |
| | 8,471 | | | Exelon Corp. | | | 288,607 | |
| | 8,813 | | | FirstEnergy Corp. | | | 302,198 | |
| | 10,063 | | | Great Plains Energy, Inc. | | | 286,192 | |
| | 8,931 | | | Hawaiian Electric Industries, Inc. | | | 263,464 | |
| | 2,427 | | | NextEra Energy, Inc. | | | 310,656 | |
| | 12,129 | | | NiSource, Inc. | | | 282,120 | |
| | 9,571 | | | OGE Energy Corp. | | | 297,084 | |
| | 4,833 | | | PG&E Corp. | | | 300,226 | |
| | 3,923 | | | Pinnacle West Capital Corp. | | | 298,658 | |
| | 7,546 | | | PPL Corp. | | | 259,130 | |
| | 6,472 | | | Public Service Enterprise Group, Inc. | | | 272,342 | |
| | 4,153 | | | SCANA Corp. | | | 304,664 | |
| | 2,730 | | | Sempra Energy | | | 292,383 | |
| | 5,880 | | | Southern Co. (The) | | | 303,231 | |
| | 6,785 | | | UGI Corp. | | | 314,078 | |
| | 5,863 | | | Vectren Corp. | | | 294,967 | |
| | 4,822 | | | WEC Energy Group, Inc. | | | 287,970 | |
| | | | | | | | |
Number
of Shares | | | | | Value | |
| | | | Common Stocks and Other Equity Interests (continued) | |
| | | | Utilities (continued) | |
| | 5,178 | | | Westar Energy, Inc. | | $ | 296,803 | |
| | 7,014 | | | Xcel Energy, Inc. | | | 291,432 | |
| | | | | | | | |
| | | | | | | 9,644,312 | |
| | | | | | | | |
| | | | Total Common Stocks and Other Equity Interests
(Cost $134,396,193) | | | 138,638,792 | |
| | | | | | | | |
| | |
| | | | | | | | |
| | | | Money Market Fund—0.1% | | | | |
| | 137,567 | | | Invesco Premier U.S. Government Money Portfolio—Institutional Class, 0.25%(c)
(Cost $137,567) | | | 137,567 | |
| | | | | | | | |
| | | | Total Investments
(Cost $134,533,760)—100.1% | | | 138,776,359 | |
| | | | Other assets less liabilities—(0.1)% | | | (72,589 | ) |
| | | | | | | | |
| | | | Net Assets—100.0% | | $ | 138,703,770 | |
| | | | | | | | |
Investment Abbreviations:
REIT—Real Estate Investment Trust
Notes to Schedule of Investments:
| (a) | Industry and/or sector classifications used in this report are generally according to the Global Industry Classification Standard, which was developed by and is the exclusive property and a service mark of MSCI Inc. and Standard & Poor’s. |
| (b) | Non-income producing security. |
| (c) | The security and the Fund are advised by wholly-owned subsidiaries of Invesco Ltd. and are therefore considered to be affiliated. The rate shown is the 7-day SEC standardized yield as of October 31, 2016. |
See accompanying Notes to Financial Statements which are an integral part of the financial statements.
Schedule of Investments(a)
PowerShares S&P 500® ex-Rate Sensitive Low Volatility Portfolio (XRLV)
October 31, 2016
| | | | | | | | |
Number
of Shares | | | | | Value | |
| | | | Common Stocks and Other Equity Interests—100.0% | |
| | | | Consumer Discretionary—9.2% | |
| | 25,552 | | | Comcast Corp., Class A | | $ | 1,579,625 | |
| | 17,540 | | | Genuine Parts Co. | | | 1,588,949 | |
| | 12,652 | | | Home Depot, Inc. (The) | | | 1,543,670 | |
| | 66,076 | | | Interpublic Group of Cos., Inc. (The) | | | 1,479,442 | |
| | 31,200 | | | Leggett & Platt, Inc. | | | 1,431,456 | |
| | 19,700 | | | Lowe’s Cos., Inc. | | | 1,313,005 | |
| | 15,636 | | | McDonald’s Corp. | | | 1,760,144 | |
| | 21,261 | | | Omnicom Group, Inc. | | | 1,697,053 | |
| | 20,086 | | | Target Corp. | | | 1,380,511 | |
| | 18,854 | | | TJX Cos., Inc. (The) | | | 1,390,482 | |
| | | | | | | | |
| | | | | | | 15,164,337 | |
| | | | | | | | |
| | | | Consumer Staples—12.7% | |
| | 35,908 | | | Brown-Forman Corp., Class B | | | 1,657,872 | |
| | 52,524 | | | Coca-Cola Co. (The) | | | 2,227,018 | |
| | 35,177 | | | ConAgra Foods, Inc. | | | 1,694,828 | |
| | 9,246 | | | Constellation Brands, Inc., Class A | | | 1,545,191 | |
| | 10,786 | | | Costco Wholesale Corp. | | | 1,594,926 | |
| | 17,717 | | | CVS Health Corp. | | | 1,490,000 | |
| | 16,604 | | | Estee Lauder Cos., Inc. (The), Class A | | | 1,446,706 | |
| | 11,266 | | | JM Smucker Co. (The) | | | 1,479,338 | |
| | 18,623 | | | McCormick & Co., Inc. | | | 1,785,387 | |
| | 20,983 | | | Philip Morris International, Inc. | | | 2,023,601 | |
| | 25,762 | | | Procter & Gamble Co. (The) | | | 2,236,142 | |
| | 36,157 | | | Sysco Corp. | | | 1,739,875 | |
| | | | | | | | |
| | | | | | | 20,920,884 | |
| | | | | | | | |
| | | | Financials—16.9% | |
| | 24,857 | | | Aflac, Inc. | | | 1,711,902 | |
| | 25,031 | | | Allstate Corp. (The) | | | 1,699,605 | |
| | 16,429 | | | Aon PLC | | | 1,820,826 | |
| | 38,603 | | | Arthur J. Gallagher & Co. | | | 1,861,823 | |
| | 13,298 | | | Berkshire Hathaway, Inc.,
Class B(b) | | | 1,918,902 | |
| | 14,919 | | | Chubb Ltd. | | | 1,894,713 | |
| | 25,821 | | | Cincinnati Financial Corp. | | | 1,827,610 | |
| | 14,692 | | | CME Group, Inc., Class A | | | 1,470,669 | |
| | 44,942 | | | Loews Corp. | | | 1,933,854 | |
| | 28,652 | | | Marsh & McLennan Cos., Inc. | | | 1,816,250 | |
| | 21,626 | | | Nasdaq, Inc. | | | 1,383,415 | |
| | 56,441 | | | Progressive Corp. (The) | | | 1,778,456 | |
| | 27,386 | | | Torchmark Corp. | | | 1,736,546 | |
| | 16,432 | | | Travelers Cos., Inc. (The) | | | 1,777,614 | |
| | 12,909 | | | Willis Towers Watson PLC | | | 1,625,243 | |
| | 46,311 | | | XL Group Ltd. (Ireland) | | | 1,606,992 | |
| | | | | | | | |
| | | | | | | 27,864,420 | |
| | | | | | | | |
| | | | Health Care—22.2% | |
| | 19,040 | | | AmerisourceBergen Corp. | | | 1,338,893 | |
| | 32,452 | | | Baxter International, Inc. | | | 1,544,391 | |
| | 10,691 | | | Becton, Dickinson and Co. | | | 1,795,126 | |
| | 8,062 | | | C.R. Bard, Inc. | | | 1,746,874 | |
| | 24,340 | | | Danaher Corp. | | | 1,911,907 | |
| | 28,138 | | | DaVita, Inc.(b) | | | 1,649,449 | |
| | 27,074 | | | DENTSPLY Sirona, Inc. | | | 1,558,650 | |
| | 20,735 | | | Express Scripts Holding Co.(b) | | | 1,397,539 | |
| | 10,925 | | | Henry Schein, Inc.(b) | | | 1,630,010 | |
| | 2,393 | | | Intuitive Surgical, Inc.(b) | | | 1,608,287 | |
| | 18,108 | | | Johnson & Johnson | | | 2,100,347 | |
| | | | | | | | |
Number
of Shares | | | | | Value | |
| | | | Common Stocks and Other Equity Interests (continued) | |
| | | | Health Care (continued) | |
| | 11,315 | | | Laboratory Corp. of America Holdings(b) | | $ | 1,418,222 | |
| | 19,927 | | | Medtronic PLC | | | 1,634,412 | |
| | 25,736 | | | Merck & Co., Inc. | | | 1,511,218 | |
| | 33,386 | | | Patterson Cos., Inc. | | | 1,425,916 | |
| | 47,722 | | | Pfizer, Inc. | | | 1,513,265 | |
| | 18,577 | | | Quest Diagnostics, Inc. | | | 1,512,911 | |
| | 15,737 | | | Stryker Corp. | | | 1,815,263 | |
| | 9,927 | | | Thermo Fisher Scientific, Inc. | | | 1,459,567 | |
| | 10,796 | | | UnitedHealth Group, Inc. | | | 1,525,799 | |
| | 17,055 | | | Varian Medical Systems, Inc.(b) | | | 1,547,400 | |
| | 10,158 | | | Waters Corp.(b) | | | 1,413,384 | |
| | 13,015 | | | Zimmer Biomet Holdings, Inc. | | | 1,371,781 | |
| | | | | | | | |
| | | | | | | 36,430,611 | |
| | | | | | | | |
| | | | Industrials—25.6% | |
| | 10,731 | | | 3M Co. | | | 1,773,834 | |
| | 33,039 | | | AMETEK, Inc. | | | 1,457,020 | |
| | 23,565 | | | C.H. Robinson Worldwide, Inc. | | | 1,605,248 | |
| | 15,985 | | | Cintas Corp. | | | 1,705,120 | |
| | 11,852 | | | Equifax, Inc. | | | 1,469,292 | |
| | 34,610 | | | Expeditors International of Washington, Inc. | | | 1,781,377 | |
| | 12,066 | | | General Dynamics Corp. | | | 1,818,829 | |
| | 52,991 | | | General Electric Co. | | | 1,542,038 | |
| | 14,697 | | | Honeywell International, Inc. | | | 1,611,967 | |
| | 14,790 | | | Illinois Tool Works, Inc. | | | 1,679,700 | |
| | 18,875 | | | J.B. Hunt Transport Services, Inc. | | | 1,540,389 | |
| | 11,235 | | | L-3 Communications Holdings, Inc. | | | 1,538,521 | |
| | 8,486 | | | Lockheed Martin Corp. | | | 2,090,781 | |
| | 30,406 | | | Nielsen Holdings PLC | | | 1,368,878 | |
| | 8,605 | | | Northrop Grumman Corp. | | | 1,970,545 | |
| | 13,359 | | | Raytheon Co. | | | 1,824,973 | |
| | 43,067 | | | Republic Services, Inc. | | | 2,266,616 | |
| | 19,314 | | | Rockwell Collins, Inc. | | | 1,628,557 | |
| | 9,165 | | | Roper Technologies, Inc. | | | 1,588,386 | |
| | 10,251 | | | Snap-on, Inc. | | | 1,579,679 | |
| | 12,673 | | | Stanley Black & Decker, Inc. | | | 1,442,694 | |
| | 19,833 | | | United Parcel Service, Inc., Class B | | | 2,137,204 | |
| | 16,563 | | | United Technologies Corp. | | | 1,692,739 | |
| | 19,062 | | | Verisk Analytics, Inc.(b) | | | 1,554,506 | |
| | 6,644 | | | W.W. Grainger, Inc. | | | 1,382,749 | |
| | | | | | | | |
| | | | | | | 42,051,642 | |
| | | | | | | | |
| | | | Information Technology—8.8% | |
| | 13,927 | | | Accenture PLC, Class A | | | 1,618,875 | |
| | 26,760 | | | Amphenol Corp., Class A | | | 1,764,287 | |
| | 19,173 | | | Automatic Data Processing, Inc. | | | 1,669,201 | |
| | 47,428 | | | CA, Inc. | | | 1,457,937 | |
| | 16,992 | | | Fiserv, Inc.(b) | | | 1,673,372 | |
| | 9,613 | | | International Business Machines Corp. | | | 1,477,422 | |
| | 15,746 | | | MasterCard, Inc., Class A | | | 1,685,137 | |
| | 38,258 | | | Oracle Corp. | | | 1,469,872 | |
| | 29,522 | | | Paychex, Inc. | | | 1,629,614 | |
| | | | | | | | |
| | | | | | | 14,445,717 | |
| | | | | | | | |
| | | | Materials—2.8% | |
| | 10,750 | | | Air Products & Chemicals, Inc. | | | 1,434,265 | |
| | 12,656 | | | Ecolab, Inc. | | | 1,444,936 | |
See accompanying Notes to Financial Statements which are an integral part of the financial statements.
PowerShares S&P 500® ex-Rate Sensitive Low Volatility Portfolio (XRLV) (continued)
October 31, 2016
| | | | | | | | |
Number
of Shares | | | | | Value | |
| | | | Common Stocks and Other Equity Interests (continued) | |
| | | | Materials (continued) | |
| | 14,923 | | | Praxair, Inc. | | $ | 1,746,886 | |
| | | | | | | | |
| | | | | | | 4,626,087 | |
| | | | | | | | |
| | | | Real Estate—1.8% | |
| | 28,670 | | | Prologis, Inc. REIT | | | 1,495,427 | |
| | 15,773 | | | Vornado Realty Trust REIT | | | 1,463,419 | |
| | | | | | | | |
| | | | | | | 2,958,846 | |
| | | | | | | | |
| | | | Total Investments
(Cost $160,566,003)—100.0% | | | 164,462,544 | |
| | | | Other assets less
liabilities—(0.0)% | | | (39,889 | ) |
| | | | | | | | |
| | | | Net Assets—100.0% | | $ | 164,422,655 | |
| | | | | | | | |
Investment Abbreviations:
REIT—Real Estate Investment Trust
Notes to Schedule of Investments:
| (a) | Industry and/or sector classifications used in this report are generally according to the Global Industry Classification Standard, which was developed by and is the exclusive property and a service mark of MSCI Inc. and Standard & Poor’s. |
| (b) | Non-income producing security. |
See accompanying Notes to Financial Statements which are an integral part of the financial statements.
Schedule of Investments(a)
PowerShares S&P 500® High Beta Portfolio (SPHB)
October 31, 2016
| | | | | | | | |
Number
of Shares | | | | | Value | |
| | | | Common Stocks and Other Equity Interests—100.0% | |
| | | | Consumer Discretionary—7.6% | |
| | 130,053 | | | BorgWarner, Inc. | | $ | 4,661,099 | |
| | 131,138 | | | D.R. Horton, Inc. | | | 3,780,709 | |
| | 71,552 | | | Delphi Automotive PLC (United Kingdom) | | | 4,655,889 | |
| | 63,031 | | | Harman International Industries, Inc. | | | 5,024,201 | |
| | 43,935 | | | Netflix, Inc.(b) | | | 5,486,163 | |
| | 318,762 | | | News Corp., Class A | | | 3,863,395 | |
| | 60,916 | | | Royal Caribbean Cruises Ltd. | | | 4,682,613 | |
| | 52,096 | | | Wynn Resorts Ltd. | | | 4,925,677 | |
| | | | | | | | |
| | | | | | | 37,079,746 | |
| | | | | | | | |
| | | | Energy—27.4% | |
| | 104,564 | | | Anadarko Petroleum Corp. | | | 6,215,284 | |
| | 112,772 | | | Apache Corp. | | | 6,707,679 | |
| | 93,651 | | | Baker Hughes, Inc. | | | 5,188,265 | |
| | 1,516,542 | | | Chesapeake Energy Corp.(b) | | | 8,356,146 | |
| | 36,419 | | | Cimarex Energy Co. | | | 4,702,785 | |
| | 39,427 | | | Concho Resources, Inc.(b) | | | 5,004,863 | |
| | 117,018 | | | ConocoPhillips | | | 5,084,432 | |
| | 154,540 | | | Devon Energy Corp. | | | 5,855,521 | |
| | 46,949 | | | EOG Resources, Inc. | | | 4,245,129 | |
| | 182,712 | | | FMC Technologies, Inc.(b) | | | 5,896,116 | |
| | 104,879 | | | Halliburton Co. | | | 4,824,434 | |
| | 76,101 | | | Helmerich & Payne, Inc. | | | 4,802,734 | |
| | 96,661 | | | Hess Corp. | | | 4,636,828 | |
| | 226,327 | | | Kinder Morgan, Inc. | | | 4,623,861 | |
| | 447,517 | | | Marathon Oil Corp. | | | 5,898,274 | |
| | 123,064 | | | Marathon Petroleum Corp. | | | 5,364,360 | |
| | 215,734 | | | Murphy Oil Corp. | | | 5,581,039 | |
| | 115,444 | | | Newfield Exploration Co.(b) | | | 4,685,872 | |
| | 139,430 | | | Noble Energy, Inc. | | | 4,806,152 | |
| | 105,763 | | | ONEOK, Inc. | | | 5,122,102 | |
| | 24,500 | | | Pioneer Natural Resources Co. | | | 4,385,990 | |
| | 299,940 | | | Southwestern Energy Co.(b) | | | 3,116,377 | |
| | 57,019 | | | Tesoro Corp. | | | 4,844,904 | |
| | 545,043 | | | Transocean Ltd.(b) | | | 5,237,863 | |
| | 297,193 | | | Williams Cos., Inc. (The) | | | 8,678,036 | |
| | | | | | | | |
| | | | | | | 133,865,046 | |
| | | | | | | | |
| | | | Financials—33.0% | |
| | 38,822 | | | Affiliated Managers Group, Inc.(b) | | | 5,150,127 | |
| | 49,339 | | | Ameriprise Financial, Inc. | | | 4,361,074 | |
| | 329,404 | | | Bank of America Corp. | | | 5,435,166 | |
| | 108,472 | | | Bank of New York Mellon Corp. (The) | | | 4,693,583 | |
| | 11,797 | | | BlackRock, Inc. | | | 4,025,608 | |
| | 62,681 | | | Capital One Financial Corp. | | | 4,640,901 | |
| | 180,560 | | | Charles Schwab Corp. (The) | | | 5,723,752 | |
| | 112,740 | | | Citigroup, Inc. | | | 5,541,171 | |
| | 176,074 | | | Citizens Financial Group, Inc. | | | 4,637,789 | |
| | 106,418 | | | Comerica, Inc. | | | 5,543,314 | |
| | 212,753 | | | E*TRADE Financial Corp.(b) | | | 5,991,125 | |
| | 248,470 | | | Fifth Third Bancorp | | | 5,406,707 | |
| | 120,842 | | | Franklin Resources, Inc. | | | 4,067,542 | |
| | 26,338 | | | Goldman Sachs Group, Inc. (The) | | | 4,694,485 | |
| | 442,320 | | | Huntington Bancshares, Inc. | | | 4,688,592 | |
| | 178,485 | | | Invesco Ltd.(c) | | | 5,013,644 | |
| | 66,029 | | | JPMorgan Chase & Co. | | | 4,573,169 | |
| | 384,568 | | | KeyCorp | | | 5,430,100 | |
| | 139,316 | | | Legg Mason, Inc. | | | 4,001,156 | |
| | | | | | | | |
Number
of Shares | | | | | Value | |
| | | | Common Stocks and Other Equity Interests (continued) | |
| | | | Financials (continued) | |
| | 122,405 | | | Lincoln National Corp. | | $ | 6,008,861 | |
| | 117,271 | | | MetLife, Inc. | | | 5,507,046 | |
| | 40,539 | | | Moody’s Corp. | | | 4,074,980 | |
| | 183,034 | | | Morgan Stanley | | | 6,144,451 | |
| | 344,576 | | | Navient Corp. | | | 4,403,681 | |
| | 66,375 | | | Northern Trust Corp. | | | 4,806,878 | |
| | 105,788 | | | Principal Financial Group, Inc. | | | 5,776,025 | |
| | 66,117 | | | Prudential Financial, Inc. | | | 5,606,060 | |
| | 540,610 | | | Regions Financial Corp. | | | 5,789,933 | |
| | 68,835 | | | State Street Corp. | | | 4,832,905 | |
| | 107,877 | | | SunTrust Banks, Inc. | | | 4,879,277 | |
| | 127,809 | | | Unum Group | | | 4,524,439 | |
| | 169,946 | | | Zions Bancorporation | | | 5,473,961 | |
| | | | | | | | |
| | | | | | | 161,447,502 | |
| | | | | | | | |
| | | | Health Care—5.4% | |
| | 32,742 | | | Alexion Pharmaceuticals, Inc.(b) | | | 4,272,831 | |
| | 39,058 | | | Celgene Corp.(b) | | | 3,990,946 | |
| | 212,393 | | | Endo International PLC(b) | | | 3,982,369 | |
| | 24,583 | | | Illumina, Inc.(b) | | | 3,346,730 | |
| | 63,317 | | | Mallinckrodt PLC(b) | | | 3,752,165 | |
| | 10,310 | | | Regeneron Pharmaceuticals, Inc.(b) | | | 3,557,156 | |
| | 48,108 | | | Vertex Pharmaceuticals, Inc.(b) | | | 3,649,473 | |
| | | | | | | | |
| | | | | | | 26,551,670 | |
| | | | | | | | |
| | | | Industrials—3.9% | |
| | 116,673 | | | American Airlines Group, Inc. | | | 4,736,924 | |
| | 150,966 | | | Arconic, Inc. | | | 4,335,744 | |
| | 70,849 | | | Ryder System, Inc. | | | 4,916,212 | |
| | 65,517 | | | United Rentals, Inc.(b) | | | 4,957,016 | |
| | | | | | | | |
| | | | | | | 18,945,896 | |
| | | | | | | | |
| | | | Information Technology—14.1% | |
| | 78,749 | | | Akamai Technologies, Inc.(b) | | | 5,470,693 | |
| | 66,360 | | | Autodesk, Inc.(b) | | | 4,796,501 | |
| | 26,620 | | | Broadcom Ltd. (Singapore) | | | 4,532,854 | |
| | 49,707 | | | Citrix Systems, Inc.(b) | | | 4,215,154 | |
| | 71,151 | | | Cognizant Technology Solutions Corp., Class A(b) | | | 3,653,604 | |
| | 118,782 | | | First Solar, Inc.(b) | | | 4,809,483 | |
| | 295,418 | | | HP, Inc. | | | 4,280,607 | |
| | 375,396 | | | Micron Technology, Inc.(b) | | | 6,441,795 | |
| | 97,872 | | | Qorvo, Inc.(b) | | | 5,446,577 | |
| | 50,651 | | | salesforce.com, inc.(b) | | | 3,806,929 | |
| | 147,194 | | | Seagate Technology PLC | | | 5,050,226 | |
| | 76,059 | | | Skyworks Solutions, Inc. | | | 5,851,979 | |
| | 131,440 | | | Teradata Corp.(b) | | | 3,543,622 | |
| | 117,612 | | | Western Digital Corp. | | | 6,873,245 | |
| | | | | | | | |
| | | | | | | 68,773,269 | |
| | | | | | | | |
| | | | Materials—6.0% | |
| | 49,707 | | | Albemarle Corp. | | | 4,153,020 | |
| | 88,769 | | | FMC Corp. | | | 4,162,378 | |
| | 684,767 | | | Freeport-McMoRan, Inc. | | | 7,655,695 | |
| | 54,876 | | | LyondellBasell Industries NV, Class A | | | 4,365,386 | |
| | 244,883 | | | Owens-Illinois, Inc.(b) | | | 4,726,242 | |
| | 98,535 | | | WestRock Co. | | | 4,551,332 | |
| | | | | | | | |
| | | | | | | 29,614,053 | |
| | | | | | | | |
See accompanying Notes to Financial Statements which are an integral part of the financial statements.
PowerShares S&P 500® High Beta Portfolio (SPHB) (continued)
October 31, 2016
| | | | | | | | |
Number
of Shares | | | | | Value | |
| | | | Common Stocks and Other Equity Interests (continued) | |
| | | | Real Estate—1.6% | |
| | 170,017 | | | CBRE Group, Inc., Class A(b) | | $ | 4,379,638 | |
| | 226,067 | | | Host Hotels & Resorts, Inc. REIT | | | 3,499,517 | |
| | | | | | | | |
| | | | | | | 7,879,155 | |
| | | | | | | | |
| | | | Telecommunication Services—1.0% | | | | |
| | 86,003 | | | Level 3 Communications, Inc.(b) | | | 4,829,068 | |
| | | | | | | | |
| | | | Total Common Stocks and Other Equity Interests
(Cost $498,573,968) | | | 488,985,405 | |
| | | | | | | | |
| | |
| | | | | | | | |
| | | | Money Market Fund—0.0% | | | | |
| | 36,792 | | | Invesco Premier U.S. Government Money Portfolio—Institutional Class, 0.25%(d)
(Cost $36,792) | | | 36,792 | |
| | | | | | | | |
| | | | Total Investments
(Cost $498,610,760)—100.0% | | | 489,022,197 | |
| | | | Other assets less
liabilities—0.0% | | | 182,228 | |
| | | | | | | | |
| | | | Net Assets—100.0% | | $ | 489,204,425 | |
| | | | | | | | |
Investment Abbreviations:
REIT—Real Estate Investment Trust
Notes to Schedule of Investments:
| (a) | Industry and/or sector classifications used in this report are generally according to the Global Industry Classification Standard, which was developed by and is the exclusive property and a service mark of MSCI Inc. and Standard & Poor’s. |
| (b) | Non-income producing security. |
| (c) | Affiliated company. The Fund’s Adviser is a wholly-owned subsidiary of Invesco Ltd. and therefore, Invesco Ltd. is considered to be affiliated. See Note 4. |
| (d) | The security and the Fund are advised by wholly-owned subsidiaries of Invesco Ltd. and are therefore considered to be affiliated. The rate shown is the 7-day SEC standardized yield as of October 31, 2016. |
See accompanying Notes to Financial Statements which are an integral part of the financial statements.
Schedule of Investments(a)
PowerShares S&P 500® High Dividend Low Volatility (SPHD)
October 31, 2016
| | | | | | | | |
Number
of Shares | | | | | Value | |
| | | | Common Stocks and Other Equity Interests—100.0% | |
| | | | Consumer Discretionary—7.6% | |
| | 4,833,597 | | | Ford Motor Co. | | $ | 56,746,429 | |
| | 1,463,594 | | | Garmin Ltd. | | | 70,779,406 | |
| | 2,279,029 | | | General Motors Co. | | | 72,017,316 | |
| | | | | | | | |
| | | | | | | 199,543,151 | |
| | | | | | | | |
| | | | Consumer Staples—6.9% | |
| | 667,014 | | | Altria Group, Inc. | | | 44,102,966 | |
| | 917,474 | | | Coca-Cola Co. (The) | | | 38,900,898 | |
| | 563,042 | | | Philip Morris International, Inc. | | | 54,299,770 | |
| | 513,294 | | | Procter & Gamble Co. (The) | | | 44,553,919 | |
| | | | | | | | |
| | | | | | | 181,857,553 | |
| | | | | | | | |
| | | | Energy—2.2% | |
| | 541,549 | | | Chevron Corp. | | | 56,727,258 | |
| | | | | | | | |
| | | | Financials—5.3% | |
| | 720,936 | | | CME Group, Inc., Class A | | | 72,165,694 | |
| | 4,169,313 | | | People’s United Financial, Inc. | | | 67,709,643 | |
| | | | | | | | |
| | | | | | | 139,875,337 | |
| | | | | | | | |
| | | | Health Care—4.8% | |
| | 766,294 | | | AbbVie, Inc. | | | 42,743,879 | |
| | 756,865 | | | Merck & Co., Inc. | | | 44,443,113 | |
| | 1,256,733 | | | Pfizer, Inc. | | | 39,851,003 | |
| | | | | | | | |
| | | | | | | 127,037,995 | |
| | | | | | | | |
| | | | Industrials—14.4% | |
| | 323,414 | | | Boeing Co. (The) | | | 46,063,856 | |
| | 717,305 | | | Caterpillar, Inc. | | | 59,866,275 | |
| | 411,226 | | | Cummins, Inc. | | | 52,562,907 | |
| | 829,265 | | | Eaton Corp. PLC | | | 52,882,229 | |
| | 912,327 | | | Emerson Electric Co. | | | 46,236,733 | |
| | 1,159,374 | | | PACCAR, Inc. | | | 63,672,820 | |
| | 3,141,044 | | | Pitney Bowes, Inc. | | | 56,036,225 | |
| | | | | | | | |
| | | | | | | 377,321,045 | |
| | | | | | | | |
| | | | Information Technology—12.1% | |
| | 1,247,174 | | | CA, Inc. | | | 38,338,129 | |
| | 1,415,696 | | | Cisco Systems, Inc. | | | 43,433,553 | |
| | 1,232,786 | | | Intel Corp. | | | 42,987,248 | |
| | 301,960 | | | International Business Machines Corp. | | | 46,408,232 | |
| | 842,828 | | | QUALCOMM, Inc. | | | 57,919,140 | |
| | 2,272,182 | | | Western Union Co. (The) | | | 45,602,693 | |
| | 4,450,037 | | | Xerox Corp. | | | 43,476,862 | |
| | | | | | | | |
| | | | | | | 318,165,857 | |
| | | | | | | | |
| | | | Materials—8.0% | |
| | 955,348 | | | Dow Chemical Co. (The) | | | 51,407,276 | |
| | 1,260,633 | | | International Paper Co. | | | 56,766,304 | |
| | 768,612 | | | LyondellBasell Industries NV, Class A | | | 61,143,084 | |
| | 805,688 | | | Nucor Corp. | | | 39,357,859 | |
| | | | | | | | |
| | | | | | | 208,674,523 | |
| | | | | | | | |
| | | | Real Estate—13.3% | |
| | 2,133,500 | | | HCP, Inc. REIT | | | 73,072,375 | |
| | 3,861,908 | | | Host Hotels & Resorts, Inc. REIT | | | 59,782,336 | |
| | 1,653,936 | | | Iron Mountain, Inc. REIT | | | 55,787,261 | |
| | 760,670 | | | Ventas, Inc. REIT | | | 51,535,393 | |
| | 787,382 | | | Welltower, Inc. REIT | | | 53,959,288 | |
| | | | | | | | |
Number
of Shares | | | | | Value | |
| | | | Common Stocks and Other Equity Interests (continued) | |
| | | | Real Estate (continued) | |
| | 1,800,058 | | | Weyerhaeuser Co. REIT | | $ | 53,875,736 | |
| | | | | | | | |
| | | | | | | 348,012,389 | |
| | | | | | | | |
| | | | Telecommunication Services—6.6% | |
| | 1,429,492 | | | AT&T, Inc. | | | 52,591,011 | |
| | 2,685,864 | | | CenturyLink, Inc. | | | 71,390,265 | |
| | 1,004,380 | | | Verizon Communications, Inc. | | | 48,310,678 | |
| | | | | | | | |
| | | | | | | 172,291,954 | |
| | | | | | | | |
| | | | Utilities—18.8% | |
| | 3,728,504 | | | AES Corp. (The) | | | 43,884,492 | |
| | 2,388,799 | | | CenterPoint Energy, Inc. | | | 54,464,617 | |
| | 617,334 | | | Dominion Resources, Inc. | | | 46,423,517 | |
| | 623,234 | | | Duke Energy Corp. | | | 49,871,185 | |
| | 713,171 | | | Entergy Corp. | | | 52,546,439 | |
| | 1,285,859 | | | Exelon Corp. | | | 43,809,216 | |
| | 1,583,401 | | | FirstEnergy Corp. | | | 54,294,820 | |
| | 1,491,917 | | | PPL Corp. | | | 51,232,430 | |
| | 1,032,393 | | | Public Service Enterprise Group, Inc. | | | 43,443,097 | |
| | 1,048,131 | | | Southern Co. (The) | | | 54,052,116 | |
| | | | | | | | |
| | | | | | | 494,021,929 | |
| | | | | | | | |
| | | | Total Investments
(Cost $2,622,579,647)—100.0% | | | 2,623,528,991 | |
| | | | Other assets less liabilities—(0.0)% | | | (98,333 | ) |
| | | | | | | | |
| | | | Net Assets—100.0% | | $ | 2,623,430,658 | |
| | | | | | | | |
Investment Abbreviations:
REIT—Real Estate Investment Trust
Notes to Schedule of Investments:
| (a) | Industry and/or sector classifications used in this report are generally according to the Global Industry Classification Standard, which was developed by and is the exclusive property and a service mark of MSCI Inc. and Standard & Poor’s. |
See accompanying Notes to Financial Statements which are an integral part of the financial statements.
Schedule of Investments(a)
PowerShares S&P 500® Low Volatility Portfolio (SPLV)
October 31, 2016
| | | | | | | | |
Number
of Shares | | | | | Value | |
| | | | Common Stocks and Other Equity
Interests—99.9% | |
| | | | Consumer Discretionary—5.4% | |
| | 77,615 | | | AutoZone, Inc.(b) | | $ | 57,602,748 | |
| | 916,323 | | | Comcast Corp., Class A | | | 56,647,088 | |
| | 628,993 | | | Genuine Parts Co. | | | 56,980,476 | |
| | 453,714 | | | Home Depot, Inc. (The) | | | 55,357,645 | |
| | 560,712 | | | McDonald’s Corp. | | | 63,119,350 | |
| | 762,417 | | | Omnicom Group, Inc. | | | 60,856,125 | |
| | | | | | | | |
| | | | | | | 350,563,432 | |
| | | | | | | | |
| | | | Consumer Staples—20.4% | |
| | 1,128,230 | | | Altria Group, Inc. | | | 74,598,568 | |
| | 1,287,672 | | | Brown-Forman Corp., Class B | | | 59,451,816 | |
| | 1,020,064 | | | Campbell Soup Co. | | | 55,430,278 | |
| | 1,447,000 | | | Church & Dwight Co., Inc. | | | 69,832,220 | |
| | 552,534 | | | Clorox Co. (The) | | | 66,315,131 | |
| | 1,883,480 | | | Coca-Cola Co. (The) | | | 79,859,552 | |
| | 941,405 | | | Colgate-Palmolive Co. | | | 67,178,661 | |
| | 386,798 | | | Costco Wholesale Corp. | | | 57,195,820 | |
| | 635,366 | | | CVS Health Corp. | | | 53,434,281 | |
| | 692,546 | | | Dr Pepper Snapple Group, Inc. | | | 60,798,613 | |
| | 1,001,545 | | | General Mills, Inc. | | | 62,075,759 | |
| | 403,995 | | | JM Smucker Co. (The) | | | 53,048,584 | |
| | 802,701 | | | Kellogg Co. | | | 60,306,926 | |
| | 552,084 | | | Kimberly-Clark Corp. | | | 63,163,930 | |
| | 667,852 | | | McCormick & Co., Inc. | | | 64,026,971 | |
| | 768,577 | | | PepsiCo, Inc. | | | 82,391,454 | |
| | 752,458 | | | Philip Morris International, Inc. | | | 72,567,050 | |
| | 923,805 | | | Procter & Gamble Co. (The) | | | 80,186,274 | |
| | 1,273,691 | | | Reynolds American, Inc. | | | 70,154,900 | |
| | 1,296,568 | | | Sysco Corp. | | | 62,390,852 | |
| | | | | | | | |
| | | | | | | 1,314,407,640 | |
| | | | | | | | |
| | | | Financials—12.1% | |
| | 891,342 | | | Aflac, Inc. | | | 61,386,724 | |
| | 897,586 | | | Allstate Corp. (The) | | | 60,946,089 | |
| | 589,143 | | | Aon PLC | | | 65,294,719 | |
| | 1,384,321 | | | Arthur J. Gallagher & Co. | | | 66,765,802 | |
| | 476,843 | | | Berkshire Hathaway, Inc., Class B(b) | | | 68,808,445 | |
| | 534,985 | | | Chubb Ltd. | | | 67,943,095 | |
| | 925,950 | | | Cincinnati Financial Corp. | | | 65,538,741 | |
| | 1,611,587 | | | Loews Corp. | | | 69,346,589 | |
| | 1,027,464 | | | Marsh & McLennan Cos., Inc. | | | 65,130,943 | |
| | 2,023,949 | | | Progressive Corp. (The) | | | 63,774,633 | |
| | 982,064 | | | Torchmark Corp. | | | 62,272,678 | |
| | 589,230 | | | Travelers Cos., Inc. (The) | | | 63,742,901 | |
| | | | | | | | |
| | | | | | | 780,951,359 | |
| | | | | | | | |
| | | | Health Care—10.3% | |
| | 682,792 | | | AmerisourceBergen Corp. | | | 48,013,933 | |
| | 383,416 | | | Becton, Dickinson and Co. | | | 64,379,381 | |
| | 289,081 | | | C.R. Bard, Inc. | | | 62,638,071 | |
| | 872,799 | | | Danaher Corp. | | | 68,558,361 | |
| | 1,009,003 | | | DaVita, Inc.(b) | | | 59,147,756 | |
| | 391,747 | | | Henry Schein, Inc.(b) | | | 58,448,652 | |
| | 649,321 | | | Johnson & Johnson | | | 75,314,743 | |
| | 714,613 | | | Medtronic PLC | | | 58,612,558 | |
| | 1,711,280 | | | Pfizer, Inc. | | | 54,264,689 | |
| | 564,329 | | | Stryker Corp. | | | 65,095,350 | |
| | | | | | | | |
Number
of Shares | | | | | Value | |
| | | | Common Stocks and Other Equity Interests (continued) | |
| | | | Health Care (continued) | |
| | 466,729 | | | Zimmer Biomet Holdings, Inc. | | $ | 49,193,237 | |
| | | | | | | | |
| | | | | | | 663,666,731 | |
| | | | | | | | |
| | | | Industrials—15.5% | |
| | 384,803 | | | 3M Co. | | | 63,607,936 | |
| | 573,205 | | | Cintas Corp. | | | 61,143,777 | |
| | 1,241,135 | | | Expeditors International of Washington, Inc. | | | 63,881,218 | |
| | 432,665 | | | General Dynamics Corp. | | | 65,219,922 | |
| | 527,054 | | | Honeywell International, Inc. | | | 57,807,283 | |
| | 530,363 | | | Illinois Tool Works, Inc. | | | 60,233,326 | |
| | 402,887 | | | L-3 Communications Holdings, Inc. | | | 55,171,346 | |
| | 304,325 | | | Lockheed Martin Corp. | | | 74,979,593 | |
| | 308,544 | | | Northrop Grumman Corp. | | | 70,656,576 | |
| | 479,085 | | | Raytheon Co. | | | 65,447,802 | |
| | 1,544,390 | | | Republic Services, Inc. | | | 81,281,246 | |
| | 711,208 | | | United Parcel Service, Inc., Class B | | | 76,639,774 | |
| | 593,967 | | | United Technologies Corp. | | | 60,703,427 | |
| | 1,287,012 | | | Waste Management, Inc. | | | 84,505,208 | |
| | 1,257,754 | | | Xylem, Inc. | | | 60,787,251 | |
| | | | | | | | |
| | | | | | | 1,002,065,685 | |
| | | | | | | | |
| | | | Information Technology—2.8% | |
| | 687,532 | | | Automatic Data Processing, Inc. | | | 59,856,536 | |
| | 609,347 | | | Fiserv, Inc.(b) | | | 60,008,492 | |
| | 1,058,663 | | | Paychex, Inc. | | | 58,438,198 | |
| | | | | | | | |
| | | | | | | 178,303,226 | |
| | | | | | | | |
| | | | Materials—1.0% | |
| | 535,116 | | | Praxair, Inc. | | | 62,640,679 | |
| | | | | | | | |
| | | | Real Estate—6.4% | |
| | 526,216 | | | American Tower Corp. REIT | | | 61,667,253 | |
| | 353,931 | | | AvalonBay Communities, Inc. REIT | | | 60,585,909 | |
| | 734,428 | | | Crown Castle International Corp. REIT | | | 66,825,604 | |
| | 439,723 | | | Federal Realty Investment Trust REIT | | | 63,860,971 | |
| | 2,013,851 | | | Kimco Realty Corp. REIT | | | 53,588,575 | |
| | 898,994 | | | Realty Income Corp. REIT | | | 53,256,404 | |
| | 297,972 | | | Simon Property Group, Inc. REIT | | | 55,410,873 | |
| | | | | | | | |
| | | | | | | 415,195,589 | |
| | | | | | | | |
| | | | Telecommunication Services—2.2% | |
| | 2,009,417 | | | AT&T, Inc. | | | 73,926,452 | |
| | 1,392,863 | | | Verizon Communications, Inc. | | | 66,996,710 | |
| | | | | | | | |
| | | | | | | 140,923,162 | |
| | | | | | | | |
| | | | Utilities—23.8% | |
| | 1,676,530 | | | Alliant Energy Corp. | | | 63,791,967 | |
| | 1,349,405 | | | Ameren Corp. | | | 67,402,780 | |
| | 1,008,491 | | | American Electric Power Co., Inc. | | | 65,390,557 | |
| | 851,735 | | | American Water Works Co., Inc. | | | 63,062,459 | |
| | 1,654,115 | | | CMS Energy Corp. | | | 69,720,947 | |
| | 898,191 | | | Consolidated Edison, Inc. | | | 67,858,330 | |
| | 1,000,313 | | | Dominion Resources, Inc. | | | 75,223,538 | |
| | 741,920 | | | DTE Energy Co. | | | 71,231,739 | |
| | 814,205 | | | Duke Energy Corp. | | | 65,152,684 | |
| | 904,318 | | | Edison International | | | 66,449,287 | |
| | 803,507 | | | Entergy Corp. | | | 59,202,396 | |
| | 1,179,469 | | | Eversource Energy | | | 64,941,563 | |
| | 567,697 | | | NextEra Energy, Inc. | | | 72,665,216 | |
See accompanying Notes to Financial Statements which are an integral part of the financial statements.
PowerShares S&P 500® Low Volatility Portfolio (SPLV) (continued)
October 31, 2016
| | | | | | | | |
Number
of Shares | | | | | Value | |
| | | | Common Stocks and Other Equity Interests (continued) | |
| | | | Utilities (continued) | |
| | 2,527,314 | | | NiSource, Inc. | | $ | 58,785,324 | |
| | 1,092,862 | | | PG&E Corp. | | | 67,888,587 | |
| | 891,206 | | | Pinnacle West Capital Corp. | | | 67,847,513 | |
| | 1,802,702 | | | PPL Corp. | | | 61,904,787 | |
| | 1,466,948 | | | Public Service Enterprise Group, Inc. | | | 61,729,172 | |
| | 919,776 | | | SCANA Corp. | | | 67,474,767 | |
| | 621,043 | | | Sempra Energy | | | 66,513,705 | |
| | 1,470,862 | | | Southern Co. (The) | | | 75,852,353 | |
| | 1,124,724 | | | WEC Energy Group, Inc. | | | 67,168,517 | |
| | 1,725,771 | | | Xcel Energy, Inc. | | | 71,705,785 | |
| | | | | | | | |
| | | | | | | 1,538,963,973 | |
| | | | | | | | |
| | | | Total Investments
(Cost $6,230,920,475)—99.9% | | | 6,447,681,476 | |
| | | | Other assets less liabilities—0.1% | | | 3,333,320 | |
| | | | | | | | |
| | | | Net Assets—100.0% | | $ | 6,451,014,796 | |
| | | | | | | | |
Investment Abbreviations:
REIT—Real Estate Investment Trust
Notes to Schedule of Investments:
| (a) | Industry and/or sector classifications used in this report are generally according to the Global Industry Classification Standard, which was developed by and is the exclusive property and a service mark of MSCI Inc. and Standard & Poor’s. |
| (b) | Non-income producing security. |
See accompanying Notes to Financial Statements which are an integral part of the financial statements.
Schedule of Investments(a)
PowerShares S&P 500 Momentum Portfolio (SPMO)
October 31, 2016
| | | | | | | | |
Number
of Shares | | | | | Value | |
| | | | Common Stocks and Other Equity Interests—100.0% | |
| | | | Consumer Discretionary—11.2% | |
| | 98 | | | Amazon.com, Inc.(b) | | $ | 77,402 | |
| | 73 | | | Coach, Inc. | | | 2,620 | |
| | 26 | | | Garmin Ltd. | | | 1,257 | |
| | 263 | | | Home Depot, Inc. (The) | | | 32,089 | |
| | 101 | | | Mattel, Inc. | | | 3,185 | |
| | 199 | | | McDonald’s Corp. | | | 22,402 | |
| | 19 | | | O’Reilly Automotive, Inc.(b) | | | 5,024 | |
| | 18 | | | Ulta Salon, Cosmetics & Fragrance, Inc.(b) | | | 4,380 | |
| | | | | | | | |
| | | | | | | 148,359 | |
| | | | | | | | |
| | | | Consumer Staples—15.4% | |
| | 623 | | | Altria Group, Inc. | | | 41,193 | |
| | 53 | | | Campbell Soup Co. | | | 2,880 | |
| | 31 | | | Clorox Co. (The) | | | 3,721 | |
| | 54 | | | Constellation Brands, Inc., Class A | | | 9,024 | |
| | 49 | | | Dr Pepper Snapple Group, Inc. | | | 4,302 | |
| | 172 | | | General Mills, Inc. | | | 10,661 | |
| | 65 | | | Hormel Foods Corp. | | | 2,502 | |
| | 41 | | | JM Smucker Co. (The) | | | 5,384 | |
| | 72 | | | Kellogg Co. | | | 5,409 | |
| | 71 | | | Kimberly-Clark Corp. | | | 8,123 | |
| | 32 | | | McCormick & Co., Inc. | | | 3,068 | |
| | 54 | | | Molson Coors Brewing Co., Class B | | | 5,606 | |
| | 322 | | | PepsiCo, Inc. | | | 34,518 | |
| | 404 | | | Philip Morris International, Inc. | | | 38,962 | |
| | 181 | | | Reynolds American, Inc. | | | 9,969 | |
| | 215 | | | Sysco Corp. | | | 10,346 | |
| | 118 | | | Tyson Foods, Inc., Class A | | | 8,360 | |
| | | | | | | | |
| | | | | | | 204,028 | |
| | | | | | | | |
| | | | Financials—0.5% | |
| | 58 | | | Cincinnati Financial Corp. | | | 4,105 | |
| | 37 | | | Nasdaq, Inc. | | | 2,367 | |
| | | | | | | | |
| | | | | | | 6,472 | |
| | | | | | | | |
| | | | Health Care—10.0% | |
| | 371 | | | Boston Scientific Corp.(b) | | | 8,162 | |
| | 61 | | | Edwards Lifesciences Corp.(b) | | | 5,808 | |
| | 19 | | | Henry Schein, Inc.(b) | | | 2,835 | |
| | 10 | | | Intuitive Surgical, Inc.(b) | | | 6,721 | |
| | 898 | | | Johnson & Johnson | | | 104,159 | |
| | 51 | | | Zimmer Biomet Holdings, Inc. | | | 5,375 | |
| | | | | | | | |
| | | | | | | 133,060 | |
| | | | | | | | |
| | | | Industrials—12.5% | |
| | 142 | | | 3M Co. | | | 23,473 | |
| | 22 | | | Cintas Corp. | | | 2,347 | |
| | 32 | | | Equifax, Inc. | | | 3,967 | |
| | 41 | | | Fortune Brands Home & Security, Inc. | | | 2,240 | |
| | 2,012 | | | General Electric Co. | | | 58,549 | |
| | 94 | | | Illinois Tool Works, Inc. | | | 10,675 | |
| | 23 | | | L-3 Communications Holdings, Inc. | | | 3,150 | |
| | 76 | | | Lockheed Martin Corp. | | | 18,725 | |
| | 94 | | | Masco Corp. | | | 2,903 | |
| | 49 | | | Northrop Grumman Corp. | | | 11,221 | |
| | 90 | | | Raytheon Co. | | | 12,295 | |
| | 66 | | | Republic Services, Inc. | | | 3,473 | |
| | 157 | | | Waste Management, Inc. | | | 10,309 | |
| | | | | | | | |
Number
of Shares | | | | | Value | |
| | | | Common Stocks and Other Equity Interests (continued) | |
| | | | Industrials (continued) | |
| | 62 | | | Xylem, Inc. | | $ | 2,996 | |
| | | | | | | | |
| | | | | | | 166,323 | |
| | | | | | | | |
| | | | Information Technology—21.9% | |
| | 208 | | | Activision Blizzard, Inc. | | | 8,979 | |
| | 59 | | | Alphabet, Inc., Class C(b) | | | 46,288 | |
| | 346 | | | Applied Materials, Inc. | | | 10,062 | |
| | 70 | | | CA, Inc. | | | 2,152 | |
| | 499 | | | Facebook, Inc., Class A(b) | | | 65,364 | |
| | 57 | | | Fiserv, Inc.(b) | | | 5,613 | |
| | 366 | | | Hewlett Packard Enterprise Co. | | | 8,224 | |
| | 53 | | | Microchip Technology, Inc. | | | 3,209 | |
| | 1,543 | | | Microsoft Corp. | | | 92,457 | |
| | 253 | | | NVIDIA Corp. | | | 18,004 | |
| | 96 | | | Paychex, Inc. | | | 5,299 | |
| | 295 | | | Texas Instruments, Inc. | | | 20,901 | |
| | 19 | | | VeriSign, Inc.(b) | | | 1,596 | |
| | 53 | | | Xilinx, Inc. | | | 2,696 | |
| | | | | | | | |
| | | | | | | 290,844 | |
| | | | | | | | |
| | | | Materials—1.3% | |
| | 35 | | | Albemarle Corp. | | | 2,924 | |
| | 22 | | | Avery Dennison Corp. | | | 1,535 | |
| | 251 | | | Newmont Mining Corp. | | | 9,297 | |
| | 33 | | | Vulcan Materials Co. | | | 3,736 | |
| | | | | | | | |
| | | | | | | 17,492 | |
| | | | | | | | |
| | | | Real Estate—6.7% | |
| | 100 | | | American Tower Corp. REIT | | | 11,719 | |
| | 86 | | | Crown Castle International Corp. REIT | | | 7,825 | |
| | 69 | | | Digital Realty Trust, Inc. REIT | | | 6,447 | |
| | 22 | | | Equinix, Inc. REIT | | | 7,860 | |
| | 20 | | | Federal Realty Investment Trust REIT | | | 2,904 | |
| | 85 | | | Iron Mountain, Inc. REIT | | | 2,867 | |
| | 130 | | | Kimco Realty Corp. REIT | | | 3,459 | |
| | 27 | | | Macerich Co. (The) REIT | | | 1,911 | |
| | 167 | | | Prologis, Inc. REIT | | | 8,711 | |
| | 30 | | | Public Storage REIT | | | 6,412 | |
| | 115 | | | Realty Income Corp. REIT | | | 6,813 | |
| | 80 | | | Simon Property Group, Inc. REIT | | | 14,877 | |
| | 100 | | | Ventas, Inc. REIT | | | 6,775 | |
| | | | | | | | |
| | | | | | | 88,580 | |
| | | | | | | | |
| | | | Telecommunication Services—10.4% | |
| | 2,315 | | | AT&T, Inc. | | | 85,169 | |
| | 1,108 | | | Verizon Communications, Inc. | | | 53,295 | |
| | | | | | | | |
| | | | | | | 138,464 | |
| | | | | | | | |
| | | | Utilities—10.1% | |
| | 76 | | | Alliant Energy Corp. | | | 2,892 | |
| | 81 | | | Ameren Corp. | | | 4,046 | |
| | 137 | | | American Electric Power Co., Inc. | | | 8,883 | |
| | 84 | | | American Water Works Co., Inc. | | | 6,219 | |
| | 112 | | | CenterPoint Energy, Inc. | | | 2,554 | |
| | 101 | | | CMS Energy Corp. | | | 4,257 | |
| | 96 | | | Consolidated Edison, Inc. | | | 7,253 | |
| | 49 | | | DTE Energy Co. | | | 4,705 | |
| | 157 | | | Duke Energy Corp. | | | 12,563 | |
See accompanying Notes to Financial Statements which are an integral part of the financial statements.
PowerShares S&P 500 Momentum Portfolio (SPMO) (continued)
October 31, 2016
| | | | | | | | |
Number
of Shares | | | | | Value | |
| | | | Common Stocks and Other Equity Interests (continued) | |
| | | | Utilities (continued) | |
| | 104 | | | Edison International | | $ | 7,642 | |
| | 75 | | | Eversource Energy | | | 4,130 | |
| | 129 | | | NextEra Energy, Inc. | | | 16,512 | |
| | 140 | | | NiSource, Inc. | | | 3,256 | |
| | 136 | | | PG&E Corp. | | | 8,448 | |
| | 36 | | | Pinnacle West Capital Corp. | | | 2,741 | |
| | 166 | | | PPL Corp. | | | 5,700 | |
| | 55 | | | SCANA Corp. | | | 4,035 | |
| | 285 | | | Southern Co. (The) | | | 14,697 | |
| | 113 | | | WEC Energy Group, Inc. | | | 6,748 | |
| | 167 | | | Xcel Energy, Inc. | | | 6,939 | |
| | | | | | | | |
| | | | | | | 134,220 | |
| | | | | | | | |
| | | | Total Investments
(Cost $1,274,131)—100.0% | | | 1,327,842 | |
| | | | Other assets less
liabilities—0.0% | | | 415 | |
| | | | | | | | |
| | | | Net Assets—100.0% | | $ | 1,328,257 | |
| | | | | | | | |
Investment Abbreviations:
REIT—Real Estate Investment Trust
Notes to Schedule of Investments:
| (a) | Industry and/or sector classifications used in this report are generally according to the Global Industry Classification Standard, which was developed by and is the exclusive property and a service mark of MSCI Inc. and Standard & Poor’s. |
| (b) | Non-income producing security. |
See accompanying Notes to Financial Statements which are an integral part of the financial statements.
Schedule of Investments(a)
PowerShares S&P 500 Value Portfolio (SPVU)
October 31, 2016
| | | | | | | | |
Number
of Shares | | | | | Value | |
| | | | Common Stocks—100.0% | |
| | | | Consumer Discretionary—15.5% | |
| | 117 | | | AutoNation, Inc.(b) | | $ | 5,133 | |
| | 135 | | | Bed Bath & Beyond, Inc. | | | 5,457 | |
| | 284 | | | Best Buy Co., Inc. | | | 11,050 | |
| | 162 | | | BorgWarner, Inc. | | | 5,806 | |
| | 214 | | | D.R. Horton, Inc. | | | 6,170 | |
| | 2,769 | | | Ford Motor Co. | | | 32,508 | |
| | 328 | | | Gap, Inc. (The) | | | 9,049 | |
| | 1,313 | | | General Motors Co. | | | 41,491 | |
| | 221 | | | Goodyear Tire & Rubber Co. (The) | | | 6,416 | |
| | 60 | | | Harman International Industries, Inc. | | | 4,782 | |
| | 190 | | | Kohl’s Corp. | | | 8,312 | |
| | 126 | | | Lennar Corp., Class A | | | 5,253 | |
| | 240 | | | Macy’s, Inc. | | | 8,758 | |
| | 404 | | | News Corp., Class A | | | 4,896 | |
| | 134 | | | Nordstrom, Inc. | | | 6,968 | |
| | 281 | | | PulteGroup, Inc. | | | 5,227 | |
| | 62 | | | PVH Corp. | | | 6,633 | |
| | 759 | | | Staples, Inc. | | | 5,617 | |
| | 269 | | | Target Corp. | | | 18,488 | |
| | 41 | | | Whirlpool Corp. | | | 6,143 | |
| | | | | | | | |
| | | | | | | 204,157 | |
| | | | | | | | |
| | | | Consumer Staples—8.1% | |
| | 378 | | | Archer-Daniels-Midland Co. | | | 16,470 | |
| | 532 | | | Kroger Co. (The) | | | 16,481 | |
| | 161 | | | Tyson Foods, Inc., Class A | | | 11,407 | |
| | 903 | | | Wal-Mart Stores, Inc. | | | 63,228 | |
| | | | | | | | |
| | | | | | | 107,586 | |
| | | | | | | | |
| | | | Energy—5.8% | |
| | 408 | | | Marathon Petroleum Corp. | | | 17,785 | |
| | 267 | | | Phillips 66 | | | 21,667 | |
| | 111 | | | Tesoro Corp. | | | 9,432 | |
| | 476 | | | Transocean Ltd.(b) | | | 4,574 | |
| | 393 | | | Valero Energy Corp. | | | 23,281 | |
| | | | | | | | |
| | | | | | | 76,739 | |
| | | | | | | | |
| | | | Financials—41.9% | |
| | 121 | | | Aflac, Inc. | | | 8,333 | |
| | 122 | | | Allstate Corp. (The) | | | 8,284 | |
| | 418 | | | American International Group, Inc. | | | 25,791 | |
| | 8 | | | Assurant, Inc. | | | 644 | |
| | 4,458 | | | Bank of America Corp. | | | 73,557 | |
| | 217 | | | BB&T Corp. | | | 8,506 | |
| | 451 | | | Berkshire Hathaway, Inc., Class B(b) | | | 65,079 | |
| | 238 | | | Capital One Financial Corp. | | | 17,621 | |
| | 128 | | | Chubb Ltd. | | | 16,256 | |
| | 1,412 | | | Citigroup, Inc. | | | 69,400 | |
| | 144 | | | Citizens Financial Group, Inc. | | | 3,793 | |
| | 14 | | | Comerica, Inc. | | | 729 | |
| | 230 | | | Fifth Third Bancorp | | | 5,005 | |
| | 157 | | | Goldman Sachs Group, Inc. (The) | | | 27,984 | |
| | 137 | | | Hartford Financial Services Group, Inc. (The) | | | 6,043 | |
| | 62 | | | Huntington Bancshares, Inc. | | | 657 | |
| | 986 | | | JPMorgan Chase & Co. | | | 68,290 | |
| | 162 | | | KeyCorp | | | 2,287 | |
| | 19 | | | Legg Mason, Inc. | | | 546 | |
| | 37 | | | Leucadia National Corp. | | | 691 | |
| | 91 | | | Lincoln National Corp. | | | 4,467 | |
| | | | | | | | |
Number
of Shares | | | | | Value | |
| | | | Common Stocks (continued) | |
| | | | Financials (continued) | |
| | 94 | | | Loews Corp. | | $ | 4,045 | |
| | 626 | | | MetLife, Inc. | | | 29,397 | |
| | 913 | | | Morgan Stanley | | | 30,649 | |
| | 48 | | | Navient Corp. | | | 613 | |
| | 40 | | | People’s United Financial, Inc. | | | 650 | |
| | 161 | | | PNC Financial Services Group, Inc. (The) | | | 15,392 | |
| | 73 | | | Principal Financial Group, Inc. | | | 3,986 | |
| | 115 | | | Progressive Corp. (The) | | | 3,624 | |
| | 283 | | | Prudential Financial, Inc. | | | 23,995 | |
| | 386 | | | Regions Financial Corp. | | | 4,134 | |
| | 151 | | | SunTrust Banks, Inc. | | | 6,830 | |
| | 95 | | | Travelers Cos., Inc. (The) | | | 10,277 | |
| | 64 | | | Unum Group | | | 2,266 | |
| | 104 | | | XL Group Ltd. (Ireland) | | | 3,609 | |
| | 22 | | | Zions Bancorporation | | | 709 | |
| | | | | | | | |
| | | | | | | 554,139 | |
| | | | | | | | |
| | | | Health Care—9.3% | |
| | 138 | | | Aetna, Inc. | | | 14,814 | |
| | 151 | | | AmerisourceBergen Corp. | | | 10,618 | |
| | 155 | | | Anthem, Inc. | | | 18,888 | |
| | 241 | | | Baxter International, Inc. | | | 11,469 | |
| | 194 | | | Cardinal Health, Inc. | | | 13,326 | |
| | 124 | | | Centene Corp.(b) | | | 7,747 | |
| | 269 | | | Express Scripts Holding Co.(b) | | | 18,131 | |
| | 69 | | | Humana, Inc. | | | 11,836 | |
| | 121 | | | McKesson Corp. | | | 15,388 | |
| | | | | | | | |
| | | | | | | 122,217 | |
| | | | | | | | |
| | | | Industrials—6.2% | |
| | 374 | | | American Airlines Group, Inc. | | | 15,184 | |
| | 255 | | | Arconic, Inc. | | | 7,323 | |
| | 395 | | | Delta Air Lines, Inc. | | | 16,499 | |
| | 115 | | | Fluor Corp. | | | 5,979 | |
| | 108 | | | Jacobs Engineering Group, Inc.(b) | | | 5,571 | |
| | 197 | | | Quanta Services, Inc.(b) | | | 5,664 | |
| | 67 | | | Ryder System, Inc. | | | 4,649 | |
| | 167 | | | Textron, Inc. | | | 6,693 | |
| | 255 | | | United Continental Holdings, Inc.(b) | | | 14,339 | |
| | | | | | | | |
| | | | | | | 81,901 | |
| | | | | | | | |
| | | | Information Technology—6.5% | |
| | 113 | | | First Solar, Inc.(b) | | | 4,575 | |
| | 977 | | | Hewlett Packard Enterprise Co. | | | 21,953 | |
| | 1,561 | | | HP, Inc. | | | 22,619 | |
| | 697 | | | Micron Technology, Inc.(b) | | | 11,961 | |
| | 210 | | | Seagate Technology PLC | | | 7,205 | |
| | 179 | | | Western Digital Corp. | | | 10,461 | |
| | 735 | | | Xerox Corp. | | | 7,181 | |
| | | | | | | | |
| | | | | | | 85,955 | |
| | | | | | | | |
| | | | Materials—3.0% | |
| | 165 | | | CF Industries Holdings, Inc. | | | 3,962 | |
| | 396 | | | Dow Chemical Co. (The) | | | 21,309 | |
| | 272 | | | Mosaic Co. (The) | | | 6,400 | |
| | 177 | | | WestRock Co. | | | 8,175 | |
| | | | | | | | |
| | | | | | | 39,846 | |
| | | | | | | | |
See accompanying Notes to Financial Statements which are an integral part of the financial statements.
PowerShares S&P 500 Value Portfolio (SPVU) (continued)
October 31, 2016
| | | | | | | | |
Number
of Shares | | | | | Value | |
| | | | Common Stocks (continued) | |
| | | | Telecommunication Services—1.5% | |
| | 352 | | | CenturyLink, Inc. | | $ | 9,356 | |
| | 188 | | | Level 3 Communications, Inc.(b) | | | 10,556 | |
| | | | | | | | |
| | | | | | | 19,912 | |
| | | | | | | | |
| | | | Utilities—2.2% | |
| | 503 | | | AES Corp. (The) | | | 5,921 | |
| | 418 | | | Exelon Corp. | | | 14,241 | |
| | 249 | | | FirstEnergy Corp. | | | 8,538 | |
| | | | | | | | |
| | | | | | | 28,700 | |
| | | | | | | | |
| | | | Total Common Stocks
(Cost $1,298,868) | | | 1,321,152 | |
| | | | | | | | |
| | |
| | | | | | | | |
| | | | Money Market Fund—0.0% | | | | |
| | 386 | | | Invesco Premier U.S. Government Money Portfolio—Institutional Class, 0.25%(c)
(Cost $386) | | | 386 | |
| | | | | | | | |
| | | | Total Investments
(Cost $1,299,254)—100.0% | | | 1,321,538 | |
| | | | Other assets less
liabilities—0.0% | | | 545 | |
| | | | | | | | |
| | | | Net Assets—100.0% | | $ | 1,322,083 | |
| | | | | | | | |
Notes to Schedule of Investments:
| (a) | Industry and/or sector classifications used in this report are generally according to the Global Industry Classification Standard, which was developed by and is the exclusive property and a service mark of MSCI Inc. and Standard & Poor’s. |
| (b) | Non-income producing security. |
| (c) | The security and the Fund are advised by wholly-owned subsidiaries of Invesco Ltd. and are therefore considered to be affiliated. The rate shown is the 7-day SEC standardized yield as of October 31, 2016. |
See accompanying Notes to Financial Statements which are an integral part of the financial statements.
Schedule of Investments
PowerShares S&P Emerging Markets Low Volatility Portfolio (EELV)
October 31, 2016
| | | | | | | | |
Number
of Shares | | | | | Value | |
| | | | Common Stocks and Other Equity Interests—100.1% | |
| | | | Brazil—1.8% | |
| | 225,107 | | | Ambev SA | | $ | 1,338,902 | |
| | 101,290 | | | Engie Brasil Energia SA | | | 1,297,380 | |
| | 73,100 | | | Telefonica Brasil SA (Preference Shares) | | | 1,066,304 | |
| | 54,014 | | | Ultrapar Participacoes SA | | | 1,234,055 | |
| | | | | | | | |
| | | | | | | 4,936,641 | |
| | | | | | | | |
| | | | Chile—5.1% | |
| | 21,232,250 | | | Banco de Chile | | | 2,526,798 | |
| | 32,108,675 | | | Banco Santander Chile | | | 1,796,320 | |
| | 434,013 | | | Cencosud SA | | | 1,414,668 | |
| | 2,239,329 | | | Empresa Nacional de Electricidad SA | | | 1,544,517 | |
| | 696,222 | | | Empresas CMPC SA | | | 1,507,920 | |
| | 160,448 | | | Empresas COPEC SA | | | 1,611,995 | |
| | 7,575,374 | | | Enersis Americas SA | | | 1,282,892 | |
| | 252,497 | | | S.A.C.I. Falabella | | | 1,982,348 | |
| | | | | | | | |
| | | | | | | 13,667,458 | |
| | | | | | | | |
| | | | China—6.0% | |
| | 2,983,900 | | | Agricultural Bank of China Ltd.,
H-Shares | | | 1,258,226 | |
| | 2,575,351 | | | Bank of China Ltd., H-Shares | | | 1,155,692 | |
| | 1,480,660 | | | Bank of Communications Co. Ltd.,
H-Shares | | | 1,128,417 | |
| | 3,108,959 | | | China Cinda Asset Management Co. Ltd., H-Shares | | | 1,118,525 | |
| | 1,916,270 | | | China CITIC Bank Corp. Ltd.,
H-Shares | | | 1,238,001 | |
| | 590,110 | | | China Conch Venture Holdings Ltd. | | | 1,103,386 | |
| | 1,666,796 | | | China Construction Bank Corp.,
H-Shares | | | 1,220,836 | |
| | 1,067,424 | | | China Minsheng Banking Corp. Ltd., H-Shares | | | 1,218,167 | |
| | 110,111 | | | China Mobile Ltd. | | | 1,261,580 | |
| | 745,976 | | | CITIC Ltd. | | | 1,071,610 | |
| | 125,296 | | | Hengan International Group Co. Ltd. | | | 997,702 | |
| | 1,943,183 | | | Industrial & Commercial Bank of China Ltd., H-Shares | | | 1,170,192 | |
| | 840,823 | | | Jiangsu Expressway Co. Ltd.,
H-Shares | | | 1,144,973 | |
| | 44,813 | | | Tencent Holdings Ltd. | | | 1,189,258 | |
| | | | | | | | |
| | | | | | | 16,276,565 | |
| | | | | | | | |
| | | | Colombia—0.8% | |
| | 122,008 | | | Banco Davivienda SA | | | 1,246,100 | |
| | 109,871 | | | Bancolombia SA (Preference Shares) | | | 1,046,598 | |
| | | | | | | | |
| | | | | | | 2,292,698 | |
| | | | | | | | |
| | | | Czech Republic—0.9% | |
| | 63,916 | | | CEZ AS | | | 1,202,961 | |
| | 32,387 | | | Komercni banka AS | | | 1,184,691 | |
| | | | | | | | |
| | | | | | | 2,387,652 | |
| | | | | | | | |
| | | | Hong Kong—0.5% | |
| | 1,503,212 | | | WH Group Ltd.(a) | | | 1,219,263 | |
| | | | | | | | |
| | | | Hungary—1.5% | |
| | 22,469 | | | MOL Hungarian Oil & Gas PLC, Class A | | | 1,446,667 | |
| | 44,825 | | | OTP Bank PLC | | | 1,260,009 | |
| | 64,854 | | | Richter Gedeon Nyrt | | | 1,394,953 | |
| | | | | | | | |
| | | | | | | 4,101,629 | |
| | | | | | | | |
| | | | India—1.5% | |
| | 18,725 | | | HDFC Bank Ltd. ADR | | | 1,325,355 | |
| | 41,327 | | | Reliance Industries Ltd. GDR(a) | | | 1,310,066 | |
| | 134,843 | | | Wipro Ltd. ADR | | | 1,303,932 | |
| | | | | | | | |
| | | | | | | 3,939,353 | |
| | | | | | | | |
| | | | | | | | |
Number
of Shares | | | | | Value | |
| | | | Common Stocks and Other Equity Interests (continued) | |
| | | | Indonesia—1.8% | |
| | 1,248,470 | | | PT Bank Central Asia Tbk | | $ | 1,485,476 | |
| | 3,527,570 | | | PT Telekomunikasi Indonesia Persero Tbk | | | 1,140,891 | |
| | 319,405 | | | PT Unilever Indonesia Tbk | | | 1,088,714 | |
| | 5,648,724 | | | PT Waskita Karya Persero Tbk | | | 1,134,247 | |
| | | | | | | | |
| | | | | | | 4,849,328 | |
| | | | | | | | |
| | | | Malaysia—14.6% | |
| | 1,054,472 | | | Axiata Group Bhd | | | 1,236,711 | |
| | 1,008,995 | | | CIMB Group Holdings Bhd | | | 1,209,832 | |
| | 1,351,363 | | | DiGi.Com Bhd | | | 1,620,347 | |
| | 1,204,089 | | | Gamuda Bhd | | | 1,409,315 | |
| | 1,053,513 | | | Genting Malaysia Bhd | | | 1,195,405 | |
| | 815,213 | | | Hap Seng Consolidated Bhd | | | 1,513,828 | |
| | 1,349,147 | | | IHH Healthcare Bhd | | | 2,058,293 | |
| | 1,877,807 | | | IJM Corp. Bhd | | | 1,477,178 | |
| | 1,075,159 | | | IOI Corp. Bhd | | | 1,153,329 | |
| | 354,778 | | | Kuala Lumpur Kepong Bhd | | | 2,026,336 | |
| | 1,056,492 | | | Malayan Banking Bhd | | | 1,989,580 | |
| | 1,018,674 | | | Maxis Bhd | | | 1,447,270 | |
| | 810,405 | | | MISC Bhd | | | 1,452,740 | |
| | 916,745 | | | Petronas Chemicals Group Bhd | | | 1,529,729 | |
| | 346,003 | | | Petronas Dagangan Bhd | | | 1,926,730 | |
| | 359,106 | | | Petronas Gas Bhd | | | 1,883,273 | |
| | 678,324 | | | Public Bank Bhd | | | 3,211,327 | |
| | 1,113,300 | | | RHB Capital Bhd | | | 1,281,821 | |
| | 599,083 | | | Sime Darby Bhd | | | 1,169,604 | |
| | 2,067,533 | | | Telekom Malaysia Bhd | | | 3,223,282 | |
| | 636,272 | | | Tenaga Nasional Bhd | | | 2,175,004 | |
| | 1,592,500 | | | Westports Holdings Bhd | | | 1,674,118 | |
| | 3,622,300 | | | YTL Corp. Bhd | | | 1,372,934 | |
| | | | | | | | |
| | | | | | | 39,237,986 | |
| | | | | | | | |
| | | | Mexico—11.3% | |
| | 799,371 | | | Alfa SAB de CV, Class A | | | 1,218,130 | |
| | 1,912,354 | | | America Movil SAB de CV, Series L | | | 1,273,039 | |
| | 234,101 | | | Arca Continental SAB de CV | | | 1,464,041 | |
| | 215,596 | | | Coca-Cola Femsa SAB de CV, Series L | | | 1,627,559 | |
| | 851,088 | | | Fibra Uno Administracion SA de CV REIT | | | 1,632,261 | |
| | 176,956 | | | Fomento Economico Mexicano SAB de CV | | | 1,705,815 | |
| | 92,983 | | | Gruma SAB de CV, Class B | | | 1,296,546 | |
| | 132,988 | | | Grupo Aeroportuario del Pacifico SAB de CV, Class B | | | 1,291,803 | |
| | 97,193 | | | Grupo Aeroportuario del Sureste SAB de CV, Series B | | | 1,553,589 | |
| | 465,121 | | | Grupo Bimbo SAB de CV, Series A | | | 1,259,035 | |
| | 81,219 | | | Grupo Elektra SAB de CV | | | 1,138,081 | |
| | 206,527 | | | Grupo Financiero Banorte SAB de CV, Class O | | | 1,222,306 | |
| | 687,898 | | | Grupo Financiero Inbursa SAB de CV, Class O | | | 1,121,778 | |
| | 664,354 | | | Grupo Financiero Santander Mexico SAB de CV, Series B | | | 1,208,430 | |
| | 649,436 | | | Grupo Lala SAB de CV | | | 1,215,135 | |
| | 468,209 | | | Grupo Mexico SAB de CV, Series B | | | 1,159,351 | |
| | 233,838 | | | Grupo Televisa SAB, Series CPO (b) | | | 1,156,290 | |
| | 345,566 | | | Infraestructura Energetica Nova SAB de CV | | | 1,537,523 | |
| | 560,509 | | | Kimberly-Clark de Mexico SAB de CV, Class A | | | 1,214,747 | |
See accompanying Notes to Financial Statements which are an integral part of the financial statements.
PowerShares S&P Emerging Markets Low Volatility Portfolio (EELV) (continued)
October 31, 2016
| | | | | | | | |
Number
of Shares | | | | | Value | |
| | | | Common Stocks and Other Equity Interests (continued) | |
| | | | Mexico (continued) | |
| | 507,806 | | | Mexichem SAB de CV | | $ | 1,220,408 | |
| | 1,349,911 | | | Nemak SAB de CV(a) | | | 1,408,228 | |
| | 113,967 | | | Promotora y Operadora de Infraestructura SAB de CV | | | 1,280,406 | |
| | 565,491 | | | Wal-Mart de Mexico SAB de CV | | | 1,202,392 | |
| | | | | | | | |
| | | | | | | 30,406,893 | |
| | | | | | | | |
| | | | Netherlands—0.4% | |
| | 202,453 | | | Steinhoff International Holdings NV | | | 1,093,014 | |
| | | | | | | | |
| | | | Philippines—4.6% | |
| | 826,579 | | | Aboitiz Equity Ventures, Inc. | | | 1,331,471 | |
| | 66,443 | | | Ayala Corp. | | | 1,145,746 | |
| | 731,051 | | | Bank of the Philippine Islands | | | 1,526,341 | |
| | 554,535 | | | BDO Unibank, Inc. | | | 1,291,787 | |
| | 41,713 | | | GT Capital Holdings, Inc. | | | 1,129,346 | |
| | 267,494 | | | Jollibee Foods Corp. | | | 1,314,752 | |
| | 8,396,643 | | | Metro Pacific Investments Corp. | | | 1,248,507 | |
| | 1,244,216 | | | Puregold Price Club, Inc. | | | 1,047,071 | |
| | 80,817 | | | SM Investments Corp. | | | 1,121,566 | |
| | 336,977 | | | Universal Robina Corp. | | | 1,266,556 | |
| | | | | | | | |
| | | | | | | 12,423,143 | |
| | | | | | | | |
| | | | Poland—1.3% | |
| | 761,348 | | | Orange Polska SA | | | 1,083,260 | |
| | 66,127 | | | Polski Koncern Naftowy Orlen SA | | | 1,307,133 | |
| | 152,175 | | | Powszechny Zaklad Ubezpieczen SA | | | 1,053,203 | |
| | | | | | | | |
| | | | | | | 3,443,596 | |
| | | | | | | | |
| | | | Qatar—1.0% | |
| | 120,464 | | | Masraf Al Rayan Qsc | | | 1,144,582 | |
| | 33,246 | | | Qatar National Bank SAQ | | | 1,460,741 | |
| | | | | | | | |
| | | | | | | 2,605,323 | |
| | | | | | | | |
| | | | Russia—0.4% | |
| | 87,298 | | | PhosAgro PJSC GDR(a) | | | 1,082,495 | |
| | | | | | | | |
| | | | South Africa—1.4% | |
| | 455,147 | | | Life Healthcare Group Holdings Ltd. | | | 1,215,301 | |
| | 52,951 | | | Mondi Ltd. | | | 1,034,866 | |
| | 152,100 | | | Vodacom Group Ltd. | | | 1,640,864 | |
| | | | | | | | |
| | | | | | | 3,891,031 | |
| | | | | | | | |
| | | | South Korea—9.9% | |
| | 3,402 | | | CJ CheilJedang Corp. | | | 1,039,108 | |
| | 156,764 | | | DGB Financial Group, Inc. | | | 1,315,215 | |
| | 8,833 | | | E-Mart, Inc. | | | 1,254,413 | |
| | 24,676 | | | GS Holdings Corp. | | | 1,101,983 | |
| | 248,715 | | | Hanwha Life Insurance Co. Ltd. | | | 1,358,504 | |
| | 10,271 | | | Hyundai Department Store Co. Ltd. | | | 1,054,702 | |
| | 11,349 | | | Hyundai Home Shopping Network Corp. | | | 1,125,726 | |
| | 4,358 | | | Hyundai Mobis Co. Ltd. | | | 1,043,559 | |
| | 9,574 | | | Hyundai Motor Co. | | | 1,171,387 | |
| | 113,260 | | | Industrial Bank of Korea | | | 1,306,561 | |
| | 31,453 | | | Kangwon Land, Inc. | | | 1,043,165 | |
| | 34,604 | | | KB Financial Group, Inc. | | | 1,279,221 | |
| | 29,186 | | | Kia Motors Corp. | | | 1,038,121 | |
| | 24,863 | | | Korea Electric Power Corp. | | | 1,070,136 | |
| | 28,625 | | | Korea Gas Corp. | | | 1,159,509 | |
| | 2,455 | | | Korea Zinc Co. Ltd. | | | 976,207 | |
| | | | | | | | |
Number
of Shares | | | | | Value | |
| | | | Common Stocks and Other Equity Interests (continued) | |
| | | | South Korea (continued) | |
| | 36,261 | | | KT Corp. ADR | | $ | 579,813 | |
| | 52,540 | | | KT Corp. | | | 1,483,104 | |
| | 18,093 | | | LG Corp. | | | 969,282 | |
| | 839 | | | Samsung Electronics Co. Ltd. | | | 1,201,766 | |
| | 35,604 | | | Shinhan Financial Group Co. Ltd. | | | 1,364,418 | |
| | 6,724 | | | SK Telecom Co. Ltd. | | | 1,313,362 | |
| | 136,212 | | | Woori Bank | | | 1,488,005 | |
| | | | | | | | |
| | | | | | | 26,737,267 | |
| | | | | | | | |
| | | | Taiwan—23.0% | |
| | 1,017,000 | | | Aerospace Industrial Development Corp. | | | 1,289,075 | |
| | 1,233,707 | | | Asia Cement Corp. | | | 1,077,038 | |
| | 155,838 | | | Asustek Computer, Inc. | | | 1,365,419 | |
| | 878,442 | | | Cathay Financial Holding Co. Ltd. | | | 1,139,894 | |
| | 673,000 | | | Chailease Holding Co. Ltd. | | | 1,164,408 | |
| | 3,339,000 | | | Chang Hwa Commercial Bank | | | 1,708,781 | |
| | 577,435 | | | Cheng Shin Rubber Industry Co. Ltd. | | | 1,176,553 | |
| | 4,468,000 | | | China Airlines Ltd. | | | 1,352,116 | |
| | 5,473,472 | | | China Development Financial Holding Corp. | | | 1,371,945 | |
| | 1,354,000 | | | China Life Insurance Co. Ltd. | | | 1,250,704 | |
| | 1,731,140 | | | China Steel Corp. | | | 1,250,733 | |
| | 671,222 | | | Chunghwa Telecom Co. Ltd. | | | 2,297,139 | |
| | 1,896,000 | | | Compal Electronics, Inc. | | | 1,129,519 | |
| | 2,494,053 | | | CTBC Financial Holding Co. Ltd. | | | 1,343,544 | |
| | 2,426,984 | | | E.Sun Financial Holding Co. Ltd. | | | 1,380,476 | |
| | 2,348,000 | | | Eva Airways Corp. | | | 1,130,939 | |
| | 1,772,432 | | | Far Eastern New Century Corp. | | | 1,373,238 | |
| | 795,993 | | | Far EasTone Telecommunications Co. Ltd. | | | 1,881,679 | |
| | 4,416,365 | | | First Financial Holding Co. Ltd. | | | 2,316,116 | |
| | 479,095 | | | Formosa Chemicals & Fibre Corp. | | | 1,425,557 | |
| | 427,235 | | | Formosa Petrochemical Corp. | | | 1,428,291 | |
| | 583,146 | | | Formosa Plastics Corp. | | | 1,578,093 | |
| | 404,000 | | | Foxconn Technology Co. Ltd. | | | 1,172,666 | |
| | 824,875 | | | Fubon Financial Holding Co. Ltd. | | | 1,171,018 | |
| | 597,814 | | | Hon Hai Precision Industry Co. Ltd. | | | 1,615,893 | |
| | 3,652,892 | | | Hua Nan Financial Holdings Co. Ltd. | | | 1,857,844 | |
| | 2,147,777 | | | Mega Financial Holding Co. Ltd. | | | 1,470,078 | |
| | 684,930 | | | Nan Ya Plastics Corp. | | | 1,425,965 | |
| | 417,000 | | | Powertech Technology, Inc. | | | 1,190,579 | |
| | 159,353 | | | President Chain Store Corp. | | | 1,191,707 | |
| | 2,607,000 | | | Qisda Corp. | | | 1,098,728 | |
| | 591,016 | | | Quanta Computer, Inc. | | | 1,198,606 | |
| | 5,805,718 | | | Shin Kong Financial Holding Co. Ltd.(c) | | | 1,260,213 | |
| | 355,414 | | | Simplo Technology Co. Ltd. | | | 1,098,087 | |
| | 4,758,704 | | | SinoPac Financial Holdings Co. Ltd. | | | 1,373,740 | |
| | 1,121,264 | | | Synnex Technology International Corp. | | | 1,197,389 | |
| | 3,814,669 | | | Taishin Financial Holding Co. Ltd. | | | 1,396,163 | |
| | 4,763,188 | | | Taiwan Cooperative Financial Holding Co. Ltd. | | | 2,090,475 | |
| | 561,162 | | | Taiwan Mobile Co. Ltd. | | | 1,964,934 | |
| | 231,397 | | | Taiwan Semiconductor Manufacturing Co. Ltd. | | | 1,382,186 | |
| | 750,181 | | | Uni-President Enterprises Corp. | | | 1,452,462 | |
| | 3,178,451 | | | United Microelectronics Corp. | | | 1,183,452 | |
| | 1,236,323 | | | WPG Holdings Ltd. | | | 1,449,543 | |
| | 3,610,472 | | | Yuanta Financial Holding Co. Ltd. | | | 1,350,030 | |
| | | | | | | | |
| | | | | | | 62,023,015 | |
| | | | | | | | |
See accompanying Notes to Financial Statements which are an integral part of the financial statements.
PowerShares S&P Emerging Markets Low Volatility Portfolio (EELV) (continued)
October 31, 2016
| | | | | | | | |
Number
of Shares | | | | | Value | |
| | | | Common Stocks and Other Equity Interests (continued) | |
| | | | Thailand—9.4% | |
| | 125,378 | | | Airports of Thailand PCL NVDR | | $ | 1,364,927 | |
| | 1,250,612 | | | Bangchak Petroleum PCL (The) NVDR | | | 1,080,963 | |
| | 1,817,091 | | | Bangkok Airways PCL NVDR | | | 1,292,823 | |
| | 275,520 | | | Bangkok Bank PCL NVDR | | | 1,255,674 | |
| | 2,615,544 | | | Bangkok Dusit Medical Services PCL NVDR | | | 1,703,962 | |
| | 6,462,975 | | | BTS Group Holdings PCL NVDR | | | 1,578,925 | |
| | 773,404 | | | Central Pattana PCL NVDR | | | 1,232,010 | |
| | 670,853 | | | CP ALL PCL NVDR | | | 1,164,492 | |
| | 287,415 | | | Electricity Generating PCL NVDR | | | 1,601,426 | |
| | 1,211,555 | | | Global Power Synergy Co. Ltd. NVDR | | | 1,228,951 | |
| | 3,850,615 | | | Home Product Center PCL NVDR | | | 1,111,257 | |
| | 8,066,262 | | | IRPC PCL NVDR | | | 1,101,700 | |
| | 210,824 | | | Kasikornbank PCL NVDR | | | 1,036,123 | |
| | 2,563,549 | | | Krung Thai Bank PCL NVDR | | | 1,259,891 | |
| | 4,482,465 | | | Land & Houses PCL NVDR | | | 1,178,332 | |
| | 2,463,372 | | | Muangthai Leasing PCL NVDR | | | 1,323,277 | |
| | 1,662,316 | | | Pruksa Real Estate PCL NVDR | | | 1,097,207 | |
| | 91,756 | | | Siam Cement PCL (The) NVDR | | | 1,310,894 | |
| | 259,618 | | | Siam Commercial Bank PCL (The) NVDR | | | 1,064,510 | |
| | 1,750,757 | | | Thai Beverage PCL | | | 1,213,794 | |
| | | | | | | | |
| | | | | | | 25,201,138 | |
| | | | | | | | |
| | | | Turkey—2.0% | |
| | 70,284 | | | BIM Birlesik Magazalar AS | | | 1,143,955 | |
| | 736,490 | | | Enka Insaat ve Sanayi AS | | | 1,122,615 | |
| | 743,589 | | | Petkim Petrokimya Holding AS | | | 1,008,565 | |
| | 566,562 | | | Turk Telekomunikasyon AS | | | 1,046,563 | |
| | 346,734 | | | Turkcell Iletisim Hizmetleri AS(c) | | | 1,116,384 | |
| | | | | | | | |
| | | | | | | 5,438,082 | |
| | | | | | | | |
| | | | United Arab Emirates—0.9% | |
| | 775,917 | | | Dubai Islamic Bank PJSC | | | 1,106,914 | |
| | 282,975 | | | Emirates Telecommunications Group Co. PJSC | | | 1,452,201 | |
| | | | | | | | |
| | | | | | | 2,559,115 | |
| | | | | | | | |
| | | | Total Investments
(Cost $272,527,531)—100.1% | | | 269,812,685 | |
| | | | Other assets less
liabilities—(0.1)% | | | (335,116 | ) |
| | | | | | | | |
| | | | Net Assets—100.0% | | $ | 269,477,569 | |
| | | | | | | | |
Investment Abbreviations:
ADR—American Depositary Receipt
CPO—Certificate of Ordinary Participation
GDR—Global Depositary Receipt
NVDR—Non-voting Depositary Receipt
REIT—Real Estate Investment Trust
Notes to Schedule of Investments:
| (a) | Security purchased or received in a transaction exempt from registration under the Securities Act of 1933, as amended (the “1933 Act”). The security may be resold pursuant to an exemption from registration under the 1933 Act, typically to qualified institutional buyers. The aggregate value of these securities at October 31, 2016 was $5,020,052, which represented 1.86% of the Fund’s Net Assets. |
| (b) | Each CPO represents twenty-five Series A shares, twenty-two Series B shares, thirty-five Series D shares and thirty-five Series L shares. |
| (c) | Non-income producing security. |
See accompanying Notes to Financial Statements which are an integral part of the financial statements.
Schedule of Investments
PowerShares S&P Emerging Markets Momentum Portfolio (EEMO)
October 31, 2016
| | | | | | | | |
Number
of Shares | | | | | Value | |
| | | | Common Stocks and Other Equity Interests—100.0% | | | | |
| | | | Brazil—6.6% | |
| | 600 | | | Banco Santander Brasil SA | | $ | 4,984 | |
| | 4,600 | | | BM&FBOVESPA SA | | | 27,317 | |
| | 1,000 | | | Centrais Eletricas Brasileiras SA(a) | | | 7,486 | |
| | 700 | | | Centrais Eletricas Brasileiras SA (Preference Shares), Class B(a) | | | 6,047 | |
| | 800 | | | Cia de Saneamento Basico do Estado de Sao Paulo | | | 8,516 | |
| | 1,200 | | | Cia Siderurgica Nacional SA(a) | | | 4,071 | |
| | 400 | | | Cosan SA Industria e Comercio | | | 5,423 | |
| | 400 | | | Hypermarcas SA | | | 3,381 | |
| | 1,900 | | | Kroton Educacional SA | | | 9,542 | |
| | 760 | | | Lojas Americanas SA (Preference Shares) | | | 4,969 | |
| | 700 | | | Lojas Renner SA | | | 5,970 | |
| | 100 | | | M Dias Branco SA | | | 4,306 | |
| | 200 | | | Multiplan Empreendimentos Imobiliarios SA | | | 4,053 | |
| | 400 | | | Raia Drogasil SA | | | 8,953 | |
| | | | | | | | |
| | | | | | | 105,018 | |
| | | | | | | | |
| | | | Chile—1.3% | |
| | 28,293 | | | Banco de Chile | | | 3,367 | |
| | 1,971 | | | Cencosud SA | | | 6,425 | |
| | 476 | | | LATAM Airlines Group SA(a) | | | 4,558 | |
| | 234 | | | Sociedad Quimica y Minera de Chile SA, Series B | | | 6,940 | |
| | | | | | | | |
| | | | | | | 21,290 | |
| | | | | | | | |
| | | | China—15.7% | |
| | 2,000 | | | AAC Technologies Holdings, Inc. | | | 19,085 | |
| | 1,000 | | | BYD Co. Ltd., H-Shares(a) | | | 6,576 | |
| | 2,000 | | | China Resources Beer Holdings Co.
Ltd.(a) | | | 4,255 | |
| | 10,000 | | | Geely Automobile Holdings Ltd. | | | 10,316 | |
| | 6,000 | | | Guangzhou Automobile Group Co. Ltd.,
H-Shares | | | 7,257 | |
| | 3,200 | | | Guangzhou R&F Properties Co. Ltd.,
H-Shares | | | 4,523 | |
| | 110 | | | NetEase, Inc. ADR | | | 28,269 | |
| | 368 | | | New Oriental Education & Technology Group, Inc. ADR(a) | | | 18,448 | |
| | 69 | | | SINA Corp.(a) | | | 4,978 | |
| | 2,000 | | | Sunny Optical Technology Group Co. Ltd. | | | 9,775 | |
| | 4,700 | | | Tencent Holdings Ltd. | | | 124,730 | |
| | 2,000 | | | TravelSky Technology Ltd., H-Shares | | | 4,276 | |
| | 9,000 | | | Zall Group Ltd.(a) | | | 6,139 | |
| | | | | | | | |
| | | | | | | 248,627 | |
| | | | | | | | |
| | | | Egypt—0.2% | |
| | 4,581 | | | Global Telecom Holding SAE(a) | | | 2,481 | |
| | | | | | | | |
| | | | Hong Kong—1.3% | |
| | 20,000 | | | Fullshare Holdings Ltd. | | | 11,167 | |
| | 11,000 | | | WH Group Ltd.(b) | | | 8,922 | |
| | | | | | | | |
| | | | | | | 20,089 | |
| | | | | | | | |
| | | | Hungary—1.1% | |
| | 87 | | | MOL Hungarian Oil & Gas PLC, Class A | | | 5,601 | |
| | 248 | | | OTP Bank PLC | | | 6,971 | |
| | 237 | | | Richter Gedeon Nyrt | | | 5,098 | |
| | | | | | | | |
| | | | | | | 17,670 | |
| | | | | | | | |
| | | | India—6.7% | |
| | 198 | | | Axis Bank Ltd. GDR(b) | | | 7,168 | |
| | 247 | | | GAIL India Ltd. GDR(b) | | | 9,510 | |
| | | | | | | | |
Number
of Shares | | | | | Value | |
| | | | Common Stocks and Other Equity Interests (continued) | |
| | | | India (continued) | |
| | 102 | | | HDFC Bank Ltd. ADR | | $ | 7,220 | |
| | 577 | | | ICICI Bank Ltd. ADR | | | 4,783 | |
| | 308 | | | Larsen & Toubro Ltd. GDR(b) | | | 6,776 | |
| | 431 | | | Mahindra & Mahindra Ltd. GDR(b) | | | 8,426 | |
| | 1,485 | | | PowerShares India Portfolio(c) | | | 30,843 | |
| | 297 | | | Reliance Industries Ltd. GDR(b) | | | 9,415 | |
| | 214 | | | Reliance Infrastructure Ltd. GDR(b) | | | 5,168 | |
| | 226 | | | State Bank of India GDR(b) | | | 8,611 | |
| | 45 | | | Tata Motors Ltd. ADR | | | 1,773 | |
| | 891 | | | Tata Steel Ltd. GDR(b) | | | 5,257 | |
| | 169 | | | Wipro Ltd. ADR | | | 1,634 | |
| | | | | | | | |
| | | | | | | 106,584 | |
| | | | | | | | |
| | | | Indonesia—2.9% | |
| | 27,000 | | | PT Adaro Energy Tbk | | | 3,280 | |
| | 700 | | | PT Gudang Garam Tbk | | | 3,643 | |
| | 5,700 | | | PT Indofood Sukses Makmur Tbk | | | 3,713 | |
| | 36,900 | | | PT Pakuwon Jati Tbk | | | 2,036 | |
| | 97,400 | | | PT Telekomunikasi Indonesia Persero Tbk | | | 31,501 | |
| | 10,000 | | | PT Waskita Karya Persero Tbk | | | 2,008 | |
| | | | | | | | |
| | | | | | | 46,181 | |
| | | | | | | | |
| | | | Luxembourg—0.1% | |
| | 63 | | | Ternium SA ADR | | | 1,506 | |
| | | | | | | | |
| | | | Malaysia—1.3% | | | | |
| | 3,300 | | | AirAsia Bhd | | | 2,179 | |
| | 1,800 | | | Hap Seng Consolidated Bhd | | | 3,343 | |
| | 4,300 | | | Tenaga Nasional Bhd | | | 14,699 | |
| | | | | | | | |
| | | | | | | 20,221 | |
| | | | | | | | |
| | | | Mexico—5.7% | |
| | 800 | | | Alpek SAB de CV, Class A | | | 1,197 | |
| | 500 | | | Arca Continental SAB de CV | | | 3,127 | |
| | 800 | | | Coca-Cola Femsa SAB de CV, Series L | | | 6,039 | |
| | 2,700 | | | Fomento Economico Mexicano SAB de CV | | | 26,027 | |
| | 285 | | | Gruma SAB de CV, Class B | | | 3,974 | |
| | 800 | | | Grupo Aeroportuario del Pacifico SAB de CV, Class B | | | 7,771 | |
| | 280 | | | Grupo Aeroportuario del Sureste SAB de CV, Series B | | | 4,476 | |
| | 1,900 | | | Grupo Bimbo SAB de CV, Series A | | | 5,143 | |
| | 3,000 | | | Grupo Financiero Banorte SAB de CV, Class O | | | 17,755 | |
| | 2,200 | | | Grupo Financiero Santander Mexico SAB de CV, Series B | | | 4,002 | |
| | 220 | | | Industrias Penoles SAB de CV | | | 5,362 | |
| | 1,700 | | | Kimberly-Clark de Mexico SAB de CV, Class A | | | 3,684 | |
| | 215 | | | Promotora y Operadora de Infraestructura SAB de CV | | | 2,416 | |
| | | | | | | | |
| | | | | | | 90,973 | |
| | | | | | | | |
| | | | Peru—0.3% | |
| | 320 | | | Cia de Minas Buenaventura SAA ADR(a) | | | 4,253 | |
| | | | | | | | |
| | | | Philippines—1.6% | |
| | 3,800 | | | Aboitiz Equity Ventures, Inc. | | | 6,121 | |
| | 770 | | | Jollibee Foods Corp. | | | 3,785 | |
| | 25,100 | | | Metro Pacific Investments Corp. | | | 3,732 | |
| | 560 | | | Security Bank Corp. | | | 2,549 | |
See accompanying Notes to Financial Statements which are an integral part of the financial statements.
PowerShares S&P Emerging Markets Momentum Portfolio (EEMO) (continued)
October 31, 2016
| | | | | | | | |
Number
of Shares | | | | | Value | |
| | | | Common Stocks and Other Equity Interests (continued) | | | | |
| | | | Philippines (continued) | |
| | 16,600 | | | SM Prime Holdings, Inc. | | $ | 9,222 | |
| | | | | | | | |
| | | | | | | 25,409 | |
| | | | | | | | |
| | | | Russia—5.9% | |
| | 42 | | | Novatek OJSC GDR(b) | | | 4,490 | |
| | 687 | | | Polymetal International PLC | | | 7,473 | |
| | 6,528 | | | Sberbank of Russia PJSC ADR | | | 61,951 | |
| | 944 | | | Surgutneftegas OJSC ADR | | | 4,057 | |
| | 151 | | | Tatneft PJSC ADR | | | 5,054 | |
| | 1,961 | | | VTB Bank PJSC GDR(b) | | | 4,106 | |
| | 333 | | | Yandex NV, Class A(a) | | | 6,557 | |
| | | | | | | | |
| | | | | | | 93,688 | |
| | | | | | | | |
| | | | South Africa—9.2% | |
| | 132 | | | Anglo American Platinum Ltd.(a) | | | 3,110 | |
| | 1,346 | | | AngloGold Ashanti Ltd.(a) | | | 18,035 | |
| | 878 | | | Bidvest Group Ltd. (The) | | | 10,902 | |
| | 123 | | | Capitec Bank Holdings Ltd. | | | 6,249 | |
| | 1,900 | | | Gold Fields Ltd. | | | 7,724 | |
| | 378 | | | Naspers Ltd., Class N | | | 63,359 | |
| | 896 | | | Pick n Pay Stores Ltd. | | | 4,385 | |
| | 781 | | | Resilient REIT Ltd. REIT | | | 6,463 | |
| | 2,447 | | | Sibanye Gold Ltd. | | | 6,670 | |
| | 308 | | | Tiger Brands Ltd. | | | 8,772 | |
| | 917 | | | Vodacom Group Ltd. | | | 9,893 | |
| | | | | | | | |
| | | | | | | 145,562 | |
| | | | | | | | |
| | | | South Korea—17.7% | |
| | 146 | | | Celltrion, Inc.(a) | | | 13,551 | |
| | 179 | | | Hankook Tire Co. Ltd. | | | 8,635 | |
| | 13 | | | Hanmi Pharm Co. Ltd. | | | 4,113 | |
| | 483 | | | Hanon Systems | | | 4,517 | |
| | 86 | | | Hanwha Techwin Co. Ltd. | | | 4,795 | |
| | 64 | | | Hyundai Mipo Dockyard Co. Ltd.(a) | | | 3,932 | |
| | 48 | | | Innocean Worldwide, Inc. | | | 2,907 | |
| | 79 | | | Kolon Industries, Inc. | | | 5,137 | |
| | 128 | | | Komipharm International Co. Ltd.(a) | | | 4,335 | |
| | 424 | | | Korea Electric Power Corp. | | | 18,249 | |
| | 429 | | | LG Display Co. Ltd. | | | 10,235 | |
| | 198 | | | LG Electronics, Inc. | | | 8,271 | |
| | 11 | | | LG Household & Health Care Ltd. (Preference Shares) | | | 4,576 | |
| | 74 | | | LS Corp. | | | 3,550 | |
| | 20 | | | Mando Corp. | | | 4,693 | |
| | 47 | | | Naver Corp. | | | 35,201 | |
| | 77 | | | Samsung Electronics Co. Ltd. | | | 110,293 | |
| | 13 | | | Samsung Electronics Co. Ltd. (Preference Shares) | | | 14,963 | |
| | 122 | | | SK Innovation Co. Ltd. | | | 16,153 | |
| | 467 | | | Yungjin Pharmaceutical Co. Ltd.(a) | | | 3,571 | |
| | | | | | | | |
| | | | | | | 281,677 | |
| | | | | | | | |
| | | | Taiwan—16.6% | |
| | 2,000 | | | Chin-Poon Industrial Co. Ltd. | | | 3,834 | |
| | 8,000 | | | Chunghwa Telecom Co. Ltd. | | | 27,379 | |
| | 3,000 | | | Formosa Petrochemical Corp. | | | 10,029 | |
| | 6,000 | | | Inventec Corp. | | | 4,696 | |
| | 4,000 | | | King Yuan Electronics Co. Ltd. | | | 3,518 | |
| | 3,000 | | | LCY Chemical Corp. | | | 3,670 | |
| | | | | | | | |
Number
of Shares | | | | | Value | |
| | | | Common Stocks and Other Equity Interests (continued) | |
| | | | Taiwan (continued) | |
| | 5,000 | | | Lite-On Technology Corp. | | $ | 7,177 | |
| | 3,000 | | | Micro-Star International Co. Ltd. | | | 8,641 | |
| | 2,000 | | | Powertech Technology, Inc. | | | 5,710 | |
| | 6,000 | | | Qisda Corp. | | | 2,529 | |
| | 2,000 | | | Realtek Semiconductor Corp. | | | 6,781 | |
| | 92 | | | Silicon Motion Technology Corp. ADR | | | 3,736 | |
| | 4,000 | | | Siliconware Precision Industries Co. Ltd. | | | 6,053 | |
| | 22,000 | | | Taiwan Semiconductor Manufacturing Co. Ltd. | | | 131,411 | |
| | 2,000 | | | Tong Yang Industry Co. Ltd. | | | 4,652 | |
| | 8,000 | | | Uni-President Enterprises Corp. | | | 15,489 | |
| | 3,000 | | | Vanguard International Semiconductor Corp. | | | 6,122 | |
| | 1,694 | | | Win Semiconductors Corp. | | | 4,708 | |
| | 10,000 | | | Winbond Electronics Corp. | | | 3,144 | |
| | 3,000 | | | WPG Holdings Ltd. | | | 3,517 | |
| | | | | | | | |
| | | | | | | 262,796 | |
| | | | | | | | |
| | | | Thailand—3.9% | |
| | 800 | | | Airports of Thailand PCL NVDR | | | 8,709 | |
| | 4,200 | | | Bangkok Dusit Medical Services PCL NVDR | | | 2,736 | |
| | 1,800 | | | Berli Jucker PCL NVDR | | | 2,713 | |
| | 700 | | | Carabao Group PCL NVDR | | | 1,380 | |
| | 1,700 | | | Central Pattana PCL NVDR | | | 2,708 | |
| | 600 | | | CH Karnchang PCL NVDR | | | 506 | |
| | 4,300 | | | Charoen Pokphand Foods PCL NVDR | | | 3,870 | |
| | 500 | | | Electricity Generating PCL NVDR | | | 2,786 | |
| | 1,000 | | | Global Power Synergy Co. Ltd. NVDR | | | 1,015 | |
| | 2,200 | | | Group Lease PCL NVDR | | | 2,892 | |
| | 9,700 | | | Home Product Center PCL NVDR | | | 2,799 | |
| | 11,400 | | | IRPC PCL NVDR | | | 1,557 | |
| | 800 | | | KCE Electronics PCL NVDR | | | 2,560 | |
| | 6,000 | | | Land & Houses PCL NVDR | | | 1,577 | |
| | 3,300 | | | Minor International PCL NVDR | | | 3,630 | |
| | 1,100 | | | Robinson Department Store PCL NVDR | | | 1,823 | |
| | 3,200 | | | Siam Global House PCL NVDR | | | 1,408 | |
| | 1,400 | | | Thai Airways International PCL NVDR(a) | | | 1,120 | |
| | 17,500 | | | Thai Beverage PCL | | | 12,133 | |
| | 1,100 | | | Thai Oil PCL NVDR | | | 2,200 | |
| | 1,100 | | | Thanachart Capital PCL NVDR | | | 1,242 | |
| | 2,400 | | | Vgi Global Media PCL NVDR | | | 391 | |
| | | | | | | | |
| | | | | | | 61,755 | |
| | | | | | | | |
| | | | Turkey—0.5% | |
| | 451 | | | Arcelik AS | | | 2,977 | |
| | 190 | | | Aselsan Elektronik Sanayi Ve Ticaret AS | | | 577 | |
| | 1,768 | | | Petkim Petrokimya Holding AS | | | 2,398 | |
| | 166 | | | Tofas Turk Otomobil Fabrikasi AS | | | 1,249 | |
| | 229 | | | Ulker Biskuvi Sanayi AS | | | 1,420 | |
| | | | | | | | |
| | | | | | | 8,621 | |
| | | | | | | | |
| | | | United Arab Emirates—1.4% | |
| | 3,833 | | | Dxb Entertainments PJSC(a)(b) | | | 1,639 | |
| | 3,890 | | | Emirates Telecommunications Group Co. PJSC | | | 19,963 | |
| | | | | | | | |
| | | | | | | 21,602 | |
| | | | | | | | |
| | | | Total Common Stocks and Other Equity Interests
(Cost $1,521,851) | | | 1,586,003 | |
| | | | | | | | |
| | |
| | | | | | | | |
See accompanying Notes to Financial Statements which are an integral part of the financial statements.
PowerShares S&P Emerging Markets Momentum Portfolio (EEMO) (continued)
October 31, 2016
| | | | | | | | |
Number
of Shares | | | | | Value | |
| | | | Money Market Fund—0.2% | | | | |
| | 3,732 | | | Invesco Premier U.S. Government Money Portfolio—Institutional Class, 0.25%(d)
(Cost $3,732) | | $ | 3,732 | |
| | |
| | | | | | | | |
| | | | Total Investments
(Cost $1,525,583)—100.2% | | | 1,589,735 | |
| | | | Other assets less
liabilities—(0.2)% | | | (2,640 | ) |
| | | | | | | | |
| | | | Net Assets—100.0% | | $ | 1,587,095 | |
| | | | | | | | |
Investment Abbreviations:
ADR—American Depositary Receipt
GDR—Global Depositary Receipt
NVDR—Non-voting Depositary Receipt
REIT—Real Estate Investment Trust
Notes to Schedule of Investments:
| (a) | Non-income producing security. |
| (b) | Security purchased or received in a transaction exempt from registration under the Securities Act of 1933, as amended (the “1933 Act”). The security may be resold pursuant to an exemption from registration under the 1933 Act, typically to qualified institutional buyers. The aggregate value of these securities at October 31, 2016 was $79,488, which represented 5.01% of the Fund’s Net Assets. |
| (c) | Affiliated company. The Fund’s Adviser also serves as the adviser for PowerShares India Portfolio and therefore, PowerShares India Portfolio is considered to be affiliated. See Note 4. |
| (d) | The security and the Fund are advised by wholly-owned subsidiaries of Invesco Ltd. and are therefore considered to be affiliated. The rate shown is the 7-day SEC standardized yield as of October 31, 2016. |
See accompanying Notes to Financial Statements which are an integral part of the financial statements.
Schedule of Investments
PowerShares S&P International Developed Low Volatility Portfolio (IDLV)
October 31, 2016
| | | | | | | | |
Number
of Shares | | | | | Value | |
| | | | Common Stocks and Other Equity
Interests—99.9% | |
| | | | Australia—13.1% | |
| | 155,689 | | | AGL Energy Ltd. | | $ | 2,272,284 | |
| | 422,666 | | | AMP Ltd. | | | 1,469,838 | |
| | 281,717 | | | APA Group | | | 1,706,405 | |
| | 53,962 | | | ASX Ltd. | | | 1,935,270 | |
| | 1,609,280 | | | AusNet Services | | | 1,836,872 | |
| | 353,062 | | | Boral Ltd. | | | 1,692,574 | |
| | 203,325 | | | Brambles Ltd. | | | 1,783,923 | |
| | 240,794 | | | Coca-Cola Amatil Ltd. | | | 1,748,035 | |
| | 33,220 | | | Commonwealth Bank of Australia | | | 1,855,208 | |
| | 26,912 | | | CSL Ltd. | | | 2,058,312 | |
| | 272,633 | | | Dexus Property Group REIT | | | 1,854,693 | |
| | 354,209 | | | Goodman Group REIT | | | 1,830,145 | |
| | 559,621 | | | GPT Group (The) REIT | | | 1,984,431 | |
| | 417,550 | | | Insurance Australia Group Ltd. | | | 1,750,718 | |
| | 1,205,476 | | | Mirvac Group REIT | | | 1,917,171 | |
| | 30,803 | | | Ramsay Health Care Ltd. | | | 1,719,525 | |
| | 39,137 | | | REA Group Ltd. | | | 1,523,015 | |
| | 642,352 | | | Scentre Group REIT | | | 2,057,838 | |
| | 618,461 | | | Stockland REIT | | | 2,080,131 | |
| | 179,801 | | | Suncorp Group Ltd. | | | 1,637,730 | |
| | 368,254 | | | Sydney Airport | | | 1,754,195 | |
| | 656,552 | | | Tatts Group Ltd. | | | 2,028,389 | |
| | 545,253 | | | Telstra Corp. Ltd. | | | 2,066,253 | |
| | 278,562 | | | Transurban Group | | | 2,202,386 | |
| | 807,279 | | | Vicinity Centres REIT | | | 1,763,038 | |
| | 62,460 | | | Wesfarmers Ltd. | | | 1,949,161 | |
| | 276,985 | | | Westfield Corp. REIT | | | 1,875,868 | |
| | | | | | | | |
| | | | | | | 50,353,408 | |
| | | | | | | | |
| | | | Austria—0.4% | |
| | 67,547 | | | BUWOG AG | | | 1,630,102 | |
| | | | | | | | |
| | | | Belgium—3.2% | |
| | 71,997 | | | bpost SA | | | 1,912,702 | |
| | 35,796 | | | Colruyt SA | | | 1,921,366 | |
| | 23,728 | | | Groupe Bruxelles Lambert SA | | | 2,038,194 | |
| | 58,491 | | | Proximus SADP | | | 1,672,194 | |
| | 17,855 | | | Sofina SA | | | 2,491,599 | |
| | 37,940 | | | Telenet Group Holding NV(a) | | | 2,028,129 | |
| | | | | | | | |
| | | | | | | 12,064,184 | |
| | | | | | | | |
| | | | Canada—21.1% | |
| | 18,631 | | | Agrium, Inc. | | | 1,711,647 | |
| | 49,131 | | | ATCO Ltd., Class I | | | 1,723,663 | |
| | 38,534 | | | Bank of Montreal(b) | | | 2,454,215 | |
| | 38,405 | | | Bank of Nova Scotia | | | 2,065,460 | |
| | 64,526 | | | BCE, Inc. | | | 2,933,941 | |
| | 52,511 | | | Brookfield Asset Management, Inc., Class A | | | 1,840,285 | |
| | 141,157 | | | CAE, Inc. | | | 1,984,255 | |
| | 30,543 | | | Canadian Imperial Bank of Commerce | | | 2,290,298 | |
| | 30,615 | | | Canadian National Railway Co. | | | 1,926,101 | |
| | 16,504 | | | Canadian Tire Corp. Ltd., Class A | | | 1,605,515 | |
| | 60,531 | | | Canadian Utilities Ltd., Class A | | | 1,731,135 | |
| | 35,992 | | | CGI Group, Inc., Class A(a) | | | 1,710,912 | |
| | 102,236 | | | CI Financial Corp.(b) | | | 1,882,622 | |
| | 77,297 | | | Emera, Inc.(b) | | | 2,697,970 | |
| | 159,849 | | | First Capital Realty, Inc. | | | 2,551,144 | |
| | 60,205 | | | Fortis, Inc. | | | 1,983,250 | |
| | | | | | | | |
Number
of Shares | | | | | Value | |
| | | | Common Stocks and Other Equity Interests (continued) | |
| | | | Canada (continued) | |
| | 28,223 | | | George Weston Ltd. | | $ | 2,301,641 | |
| | 56,915 | | | Gildan Activewear, Inc. | | | 1,462,952 | |
| | 90,678 | | | Great-West Lifeco, Inc. | | | 2,279,382 | |
| | 121,542 | | | H&R Real Estate Investment Trust REIT | | | 2,068,549 | |
| | 67,768 | | | IGM Financial, Inc. | | | 1,820,293 | |
| | 48,711 | | | Industrial Alliance Insurance and Financial Services, Inc. | | | 1,887,744 | |
| | 31,752 | | | Intact Financial Corp. | | | 2,160,155 | |
| | 44,856 | | | Loblaw Cos. Ltd. | | | 2,214,938 | |
| | 64,159 | | | Metro, Inc. | | | 1,984,728 | |
| | 49,863 | | | National Bank of Canada | | | 1,781,340 | |
| | 36,327 | | | Onex Corp. | | | 2,351,599 | |
| | 29,881 | | | Open Text Corp. | | | 1,856,735 | |
| | 98,800 | | | Power Corp. of Canada | | | 2,120,855 | |
| | 97,138 | | | Power Financial Corp. | | | 2,297,537 | |
| | 114,797 | | | RioCan Real Estate Investment Trust REIT | | | 2,233,841 | |
| | 50,871 | | | Rogers Communications, Inc., Class B | | | 2,048,125 | |
| | 35,947 | | | Royal Bank of Canada(b) | | | 2,247,609 | |
| | 57,385 | | | Saputo, Inc. | | | 2,063,762 | |
| | 100,241 | | | Shaw Communications, Inc., Class B | | | 1,987,992 | |
| | 39,964 | | | SNC-Lavalin Group, Inc. | | | 1,625,098 | |
| | 62,135 | | | Sun Life Financial, Inc. | | | 2,081,134 | |
| | 74,880 | | | TELUS Corp. | | | 2,426,442 | |
| | 56,497 | | | Toronto-Dominion Bank (The) | | | 2,565,497 | |
| | | | | | | | |
| | | | | | | 80,960,361 | |
| | | | | | | | |
| | | | Denmark—0.5% | |
| | 51,449 | | | ISS A/S | | | 2,019,704 | |
| | | | | | | | |
| | | | France—5.6% | |
| | 19,403 | | | Aeroports de Paris | | | 1,957,014 | |
| | 85,769 | | | Bureau Veritas SA | | | 1,618,084 | |
| | 23,686 | | | Danone SA | | | 1,637,847 | |
| | 20,716 | | | Dassault Systemes | | | 1,638,219 | |
| | 13,055 | | | Essilor International SA | | | 1,465,436 | |
| | 3,918 | | | Hermes International | | | 1,585,252 | |
| | 8,818 | | | L’Oreal SA | | | 1,576,089 | |
| | 14,952 | | | Pernod Ricard SA | | | 1,775,899 | |
| | 14,441 | | | Sodexo SA | | | 1,674,838 | |
| | 19,369 | | | Thales SA | | | 1,821,095 | |
| | 6,260 | | | Unibail-Rodamco SE REIT | | | 1,489,100 | |
| | 74,822 | | | Veolia Environnement SA | | | 1,630,556 | |
| | 24,225 | | | Vinci SA | | | 1,752,129 | |
| | | | | | | | |
| | | | | | | 21,621,558 | |
| | | | | | | | |
| | | | Germany—3.1% | |
| | 19,515 | | | Beiersdorf AG | | | 1,715,667 | |
| | 13,217 | | | Henkel AG & Co. KGaA (Preference Shares) | | | 1,693,703 | |
| | 46,861 | | | MAN SE | | | 4,785,540 | |
| | 9,651 | | | Muenchener Rueckversicherungs-Gesellschaft AG | | | 1,868,327 | |
| | 20,024 | | | SAP SE | | | 1,761,294 | |
| | | | | | | | |
| | | | | | | 11,824,531 | |
| | | | | | | | |
| | | | Hong Kong—9.9% | |
| | 234,862 | | | Cheung Kong Infrastructure Holdings Ltd. | | | 1,924,664 | |
| | 153,156 | | | CK Hutchison Holdings Ltd. | | | 1,894,984 | |
| | 259,922 | | | CLP Holdings Ltd. | | | 2,644,519 | |
See accompanying Notes to Financial Statements which are an integral part of the financial statements.
PowerShares S&P International Developed Low Volatility Portfolio (IDLV) (continued)
October 31, 2016
| | | | | | | | |
Number
of Shares | | | | | Value | |
| | | | Common Stocks and Other Equity Interests (continued) | |
| | | | Hong Kong (continued) | |
| | 112,260 | | | Hang Seng Bank Ltd. | | $ | 2,028,102 | |
| | 2,321,590 | | | HK Electric Investments & HK Electric Investments Ltd.(c) | | | 2,299,182 | |
| | 1,612,375 | | | HKT Trust & HKT Ltd. | | | 2,216,409 | |
| | 1,216,560 | | | Hong Kong & China Gas Co. Ltd. | | | 2,384,535 | |
| | 258,034 | | | Hongkong Land Holdings Ltd. | | | 1,728,828 | |
| | 430,503 | | | Hysan Development Co. Ltd. | | | 1,987,402 | |
| | 27,183 | | | Jardine Matheson Holdings Ltd. | | | 1,655,716 | |
| | 55,462 | | | Jardine Strategic Holdings Ltd. | | | 1,946,161 | |
| | 587,774 | | | Kerry Properties Ltd. | | | 1,860,752 | |
| | 271,039 | | | Link REIT | | | 1,932,785 | |
| | 393,270 | | | MTR Corp. Ltd. | | | 2,178,114 | |
| | 2,935,974 | | | PCCW Ltd. | | | 1,749,125 | |
| | 202,935 | | | Power Assets Holdings Ltd. | | | 1,909,013 | |
| | 183,865 | | | Swire Pacific Ltd., Class A | | | 1,912,185 | |
| | 667,750 | | | Swire Properties Ltd. | | | 1,920,195 | |
| | 159,730 | | | VTech Holdings Ltd. | | | 1,960,876 | |
| | | | | | | | |
| | | | | | | 38,133,547 | |
| | | | | | | | |
| | | | Ireland—0.9% | |
| | 85,344 | | | Experian PLC | | | 1,639,011 | |
| | 22,822 | | | Kerry Group PLC, Class A | | | 1,654,656 | |
| | | | | | | | |
| | | | | | | 3,293,667 | |
| | | | | | | | |
| | | | Israel—3.8% | |
| | 43,329 | | | Azrieli Group Ltd. | | | 1,843,403 | |
| | 421,331 | | | Bank Hapoalim BM | | | 2,428,794 | |
| | 526,224 | | | Bank Leumi Le-Israel BM(a) | | | 1,983,941 | |
| | 25,121 | | | Check Point Software Technologies Ltd.(a) | | | 2,124,232 | |
| | 20,040 | | | Elbit Systems Ltd. | | | 1,982,764 | |
| | 1,116,087 | | | Israel Discount Bank Ltd., Class A(a) | | | 2,048,402 | |
| | 176,564 | | | Mizrahi Tefahot Bank Ltd. | | | 2,298,591 | |
| | | | | | | | |
| | | | | | | 14,710,127 | |
| | | | | | | | |
| | | | Italy—0.9% | |
| | 324,939 | | | Snam SpA | | | 1,710,464 | |
| | 365,706 | | | Terna-Rete Elettrica Nationale SpA | | | 1,788,758 | |
| | | | | | | | |
| | | | | | | 3,499,222 | |
| | | | | | | | |
| | | | Japan—1.4% | |
| | 703 | | | Advance Residence Investment Corp. REIT | | | 1,962,794 | |
| | 1,372 | | | GLP J-REIT REIT | | | 1,716,877 | |
| | 1,042 | | | ORIX JREIT Inc. REIT | | | 1,781,866 | |
| | | | | | | | |
| | | | | | | 5,461,537 | |
| | | | | | | | |
| | | | Netherlands—1.8% | |
| | 23,753 | | | Heineken Holding NV, Class A | | | 1,825,527 | |
| | 75,552 | | | Koninklijke Ahold Delhaize NV | | | 1,722,245 | |
| | 57,782 | | | Koninklijke Philips NV | | | 1,739,334 | |
| | 45,145 | | | Wolters Kluwer NV | | | 1,744,698 | |
| | | | | | | | |
| | | | | | | 7,031,804 | |
| | | | | | | | |
| | | | New Zealand—3.1% | |
| | 327,225 | | | Auckland International Airport Ltd. | | | 1,542,698 | |
| | 640,745 | | | Contact Energy Ltd. | | | 2,177,348 | |
| | 264,743 | | | Fisher & Paykel Healthcare Corp. Ltd. | | | 1,678,059 | |
| | 222,709 | | | Fletcher Building Ltd. | | | 1,652,212 | |
| | 761,459 | | | Meridian Energy Ltd. | | | 1,400,002 | |
| | 334,018 | | | Ryman Healthcare Ltd. | | | 2,121,934 | |
| | | | | | | | |
Number
of Shares | | | | | Value | |
| | | | Common Stocks and Other Equity Interests (continued) | |
| | | | New Zealand (continued) | |
| | 483,715 | | | SKYCITY Entertainment Group Ltd. | | $ | 1,349,594 | |
| | | | | | | | |
| | | | | | | 11,921,847 | |
| | | | | | | | |
| | | | Norway—0.6% | |
| | 220,967 | | | Orkla ASA | | | 2,090,114 | |
| | | | | | | | |
| | | | Singapore—11.2% | |
| | 1,003,311 | | | Ascendas Real Estate Investment Trust REIT | | | 1,708,346 | |
| | 1,784,352 | | | CapitaLand Commercial Trust Ltd. REIT | | | 2,019,078 | |
| | 797,433 | | | CapitaLand Ltd. | | | 1,770,291 | |
| | 1,338,617 | | | CapitaLand Mall Trust REIT | | | 1,990,759 | |
| | 915,428 | | | ComfortDelGro Corp. Ltd. | | | 1,670,513 | |
| | 185,037 | | | DBS Group Holdings Ltd. | | | 1,994,076 | |
| | 920,249 | | | M1 Ltd. | | | 1,348,738 | |
| | 1,684,693 | | | Mapletree Commercial Trust REIT | | | 1,851,843 | |
| | 2,335,880 | | | Mapletree Greater China Commercial Trust REIT(c) | | | 1,745,323 | |
| | 3,005,644 | | | Mapletree Logistics Trust REIT | | | 2,234,960 | |
| | 339,646 | | | Oversea-Chinese Banking Corp. Ltd. | | | 2,069,256 | |
| | 525,112 | | | SATS Ltd. | | | 1,825,952 | |
| | 291,038 | | | Singapore Airlines Ltd. | | | 2,118,123 | |
| | 377,454 | | | Singapore Exchange Ltd. | | | 1,922,659 | |
| | 1,734,684 | | | Singapore Post Ltd. | | | 1,994,033 | |
| | 789,612 | | | Singapore Press Holdings Ltd. | | | 2,110,322 | |
| | 649,075 | | | Singapore Telecommunications Ltd. | | | 1,809,333 | |
| | 825,523 | | | StarHub Ltd. | | | 2,004,647 | |
| | 1,625,371 | | | Suntec Real Estate Investment Trust REIT | | | 1,961,795 | |
| | 158,910 | | | United Overseas Bank Ltd. | | | 2,144,069 | |
| | 497,126 | | | UOL Group Ltd. | | | 2,025,077 | |
| | 366,660 | | | Venture Corp. Ltd. | | | 2,502,529 | |
| | | | | | | | |
| | | | | | | 42,821,722 | |
| | | | | | | | |
| | | | Spain—3.3% | |
| | 106,962 | | | Abertis Infraestructuras SA | | | 1,585,830 | |
| | 11,809 | | | Aena SA(c) | | | 1,731,398 | |
| | 35,749 | | | Amadeus It Group SA, Class A | | | 1,685,087 | |
| | 91,985 | | | Endesa SA | | | 1,952,650 | |
| | 82,917 | | | Grifols SA | | | 1,636,995 | |
| | 286,940 | | | Iberdrola SA | | | 1,953,002 | |
| | 106,740 | | | Red Electrica Corp. SA | | | 2,223,745 | |
| | | | | | | | |
| | | | | | | 12,768,707 | |
| | | | | | | | |
| | | | Sweden—0.5% | |
| | 49,957 | | | Swedish Match AB | | | 1,740,452 | |
| | | | | | | | |
| | | | Switzerland—5.0% | |
| | 83,107 | | | ABB Ltd. | | | 1,714,413 | |
| | 953 | | | Givaudan SA | | | 1,845,480 | |
| | 15,398 | | | Kuehne + Nagel International AG | | | 2,089,606 | |
| | 29,071 | | | Nestle SA | | | 2,109,257 | |
| | 24,791 | | | Novartis AG | | | 1,764,877 | |
| | 8,014 | | | Roche Holding AG | | | 1,843,649 | |
| | 9,913 | | | Schindler Holding AG-PC | | | 1,843,463 | |
| | 944 | | | SGS SA | | | 1,914,920 | |
| | 21,602 | | | Swiss Re AG | | | 2,007,507 | |
| | 4,261 | | | Swisscom AG | | | 1,950,606 | |
| | | | | | | | |
| | | | | | | 19,083,778 | |
| | | | | | | | |
See accompanying Notes to Financial Statements which are an integral part of the financial statements.
PowerShares S&P International Developed Low Volatility Portfolio (IDLV) (continued)
October 31, 2016
| | | | | | | | |
Number
of Shares | | | | | Value | |
| | | | Common Stocks and Other Equity Interests (continued) | |
| | | | United Kingdom—9.9% | |
| | 267,303 | | | BAE Systems PLC | | $ | 1,770,450 | |
| | 33,916 | | | British American Tobacco PLC | | | 1,942,658 | |
| | 70,383 | | | Bunzl PLC | | | 1,889,614 | |
| | 106,460 | | | Compass Group PLC | | | 1,924,959 | |
| | 79,192 | | | Diageo PLC | | | 2,107,261 | |
| | 93,672 | | | GlaxoSmithKline PLC | | | 1,850,984 | |
| | 40,231 | | | Imperial Brands PLC | | | 1,942,863 | |
| | 164,772 | | | National Grid PLC | | | 2,142,462 | |
| | 22,307 | | | Reckitt Benckiser Group PLC | | | 1,991,667 | |
| | 103,304 | | | RELX NV | | | 1,741,094 | |
| | 111,129 | | | RELX PLC | | | 1,982,247 | |
| | 244,708 | | | Royal Mail PLC | | | 1,466,931 | |
| | 73,792 | | | Severn Trent PLC | | | 2,097,357 | |
| | 152,067 | | | Sky PLC | | | 1,518,687 | |
| | 113,789 | | | Smith & Nephew PLC | | | 1,643,482 | |
| | 84,434 | | | SSE PLC | | | 1,640,090 | |
| | 36,905 | | | Unilever NV CVA | | | 1,544,582 | |
| | 42,288 | | | Unilever PLC | | | 1,764,693 | |
| | 166,666 | | | United Utilities Group PLC | | | 1,912,735 | |
| | 588,307 | | | Vodafone Group PLC | | | 1,614,657 | |
| | 74,984 | | | WPP PLC | | | 1,627,723 | |
| | | | | | | | |
| | | | | | | 38,117,196 | |
| | | | | | | | |
| | | | United States—0.6% | |
| | 61,977 | | | Thomson Reuters Corp. | | | 2,444,398 | |
| | | | | | | | |
| | | | Total Investments
(excluding investments purchased with cash collateral from securities on loan)
(Cost $386,567,416)—99.9% | | | 383,591,966 | |
| | | | | | | | |
| | |
| | | | | | | | |
| | | | Investments Purchased with Cash Collateral from Securities on Loan | |
| | |
| | | | | | | | |
| | | | Money Market Fund—1.3% | | | | |
| | 4,986,577 | | | Invesco Government & Agency Portfolio—Institutional Class, 0.29%(d)(e)
(Cost $4,986,577) | | | 4,986,577 | |
| | | | | | | | |
| | | | Total Investments
(Cost $391,553,993)—101.2% | | | 388,578,543 | |
| | | | Other assets less
liabilities—(1.2)% | | | (4,442,029 | ) |
| | | | | | | | |
| | | | Net Assets—100.0% | | $ | 384,136,514 | |
| | | | | | | | |
Investment Abbreviations:
CVA—Dutch Certificates
PC—Participation Certificate
REIT—Real Estate Investment Trust
Notes to Schedule of Investments:
| (a) | Non-income producing security. |
| (b) | All or a portion of this security was out on loan at October 31, 2016. |
| (c) | Security purchased or received in a transaction exempt from registration under the Securities Act of 1933, as amended (the “1933 Act”). The security may be resold pursuant to an exemption from registration under the 1933 Act, typically to qualified institutional buyers. The aggregate value of these securities at October 31, 2016 was $5,775,903, which represented 1.50% of the Fund’s Net Assets. |
| (d) | The security and the Fund are advised by wholly-owned subsidiaries of Invesco Ltd. and are therefore considered to be affiliated. The rate shown is the 7-day SEC standardized yield as of October 31, 2016. |
| (e) | The security has been segregated to satisfy the commitment to return the cash collateral received in securities lending transactions upon the borrower’s return of the securities loaned. See Note 2H. |
See accompanying Notes to Financial Statements which are an integral part of the financial statements.
Schedule of Investments
PowerShares S&P International Developed Momentum Portfolio (IDMO)
October 31, 2016
| | | | | | | | |
Number
of Shares | | | | | Value | |
| | | | Common Stocks and Other Equity
Interests—99.9% | |
| | | | Australia—10.9% | |
| | 1,118 | | | AGL Energy Ltd. | | $ | 16,317 | |
| | 1,465 | | | Aristocrat Leisure Ltd. | | | 17,101 | |
| | 35 | | | ASX Ltd. | | | 1,255 | |
| | 3,106 | | | AusNet Services | | | 3,545 | |
| | 1,357 | | | BlueScope Steel Ltd. | | | 8,054 | |
| | 2,288 | | | Brambles Ltd. | | | 20,074 | |
| | 851 | | | Challenger Ltd. | | | 6,968 | |
| | 106 | | | CIMIC Group Ltd. | | | 2,387 | |
| | 113 | | | Cochlear Ltd. | | | 11,003 | |
| | 651 | | | CSL Ltd. | | | 49,790 | |
| | 1,581 | | | Dexus Property Group REIT | | | 10,755 | |
| | 151 | | | Domino’s Pizza Enterprises Ltd. | | | 7,383 | |
| | 5,039 | | | DUET Group | | | 9,126 | |
| | 3,572 | | | Fortescue Metals Group Ltd. | | | 14,950 | |
| | 1,976 | | | Goodman Group REIT | | | 10,210 | |
| | 2,851 | | | GPT Group (The) REIT | | | 10,110 | |
| | 5,140 | | | Medibank Private Ltd. | | | 10,091 | |
| | 5,099 | | | Mirvac Group REIT | | | 8,109 | |
| | 1,833 | | | Newcrest Mining Ltd. | | | 31,467 | |
| | 160 | | | Ramsay Health Care Ltd. | | | 8,932 | |
| | 105 | | | REA Group Ltd. | | | 4,086 | |
| | 11,754 | | | Scentre Group REIT | | | 37,655 | |
| | 3,716 | | | Stockland REIT | | | 12,498 | |
| | 2,171 | | | Sydney Airport | | | 10,342 | |
| | 493 | | | TPG Telecom Ltd. | | | 2,836 | |
| | 3,901 | | | Transurban Group | | | 30,842 | |
| | 1,667 | | | Treasury Wine Estates Ltd. | | | 13,624 | |
| | 4,369 | | | Vicinity Centres REIT | | | 9,542 | |
| | 1,138 | | | Vocus Communications Ltd. | | | 4,945 | |
| | | | | | | | |
| | | | | | | 383,997 | |
| | | | | | | | |
| | | | Austria—0.1% | |
| | 91 | | | BUWOG AG | | | 2,196 | |
| | | | | | | | |
| | | | Belgium—0.3% | |
| | 70 | | | Colruyt SA | | | 3,757 | |
| | 135 | | | Umicore SA | | | 8,197 | |
| | | | | | | | |
| | | | | | | 11,954 | |
| | | | | | | | |
| | | | Canada—17.9% | |
| | 539 | | | Agnico Eagle Mines Ltd. | | | 27,395 | |
| | 108 | | | ATCO Ltd., Class I | | | 3,789 | |
| | 908 | | | Bank of Montreal | | | 57,830 | |
| | 2,826 | | | Barrick Gold Corp. | | | 49,762 | |
| | 503 | | | BCE, Inc. | | | 22,871 | |
| | 339 | | | CAE, Inc. | | | 4,765 | |
| | 1,195 | | | Canadian Natural Resources Ltd. | | | 37,956 | |
| | 33 | | | CCL Industries, Inc., Class B | | | 5,873 | |
| | 402 | | | CGI Group, Inc., Class A(a) | | | 19,109 | |
| | 420 | | | Detour Gold Corp.(a) | | | 8,013 | |
| | 138 | | | Dollarama, Inc. | | | 10,320 | |
| | 260 | | | Emera, Inc. | | | 9,075 | |
| | 284 | | | First Capital Realty, Inc. | | | 4,533 | |
| | 349 | | | Fortis, Inc. | | | 11,497 | |
| | 397 | | | Franco-Nevada Corp. | | | 26,005 | |
| | 41 | | | Genworth MI Canada, Inc. | | | 891 | |
| | 927 | | | Goldcorp, Inc. | | | 14,089 | |
| | 2,975 | | | Kinross Gold Corp.(a) | | | 11,565 | |
| | | | | | | | |
Number
of Shares | | | | | Value | |
| | | | Common Stocks and Other Equity Interests (continued) | |
| | | | Canada (continued) | |
| | 455 | | | Metro, Inc. | | $ | 14,075 | |
| | 216 | | | Open Text Corp. | | | 13,422 | |
| | 213 | | | Peyto Exploration & Development Corp. | | | 5,477 | |
| | 200 | | | RioCan Real Estate Investment Trust REIT | | | 3,892 | |
| | 621 | | | Rogers Communications, Inc., Class B | | | 25,002 | |
| | 368 | | | Saputo, Inc. | | | 13,235 | |
| | 432 | | | Seven Generations Energy Ltd.,
Class A(a) | | | 9,219 | |
| | 1,024 | | | Silver Wheaton Corp. | | | 24,694 | |
| | 100 | | | Smart Real Estate Investment Trust REIT | | | 2,496 | |
| | 234 | | | SNC-Lavalin Group, Inc. | | | 9,515 | |
| | 718 | | | Teck Resources Ltd., Class B | | | 15,514 | |
| | 37 | | | TMX Group Ltd. | | | 1,709 | |
| | 2,087 | | | Toronto-Dominion Bank (The) | | | 94,769 | |
| | 1,052 | | | TransCanada Corp. | | | 47,661 | |
| | 263 | | | Waste Connections, Inc. | | | 19,753 | |
| | 2,275 | | | Yamana Gold, Inc. | | | 8,131 | |
| | | | | | | | |
| | | | | | | 633,902 | |
| | | | | | | | |
| | | | Denmark—2.2% | |
| | 101 | | | Carlsberg A/S, Class B | | | 9,094 | |
| | 92 | | | Chr. Hansen Holding A/S | | | 5,501 | |
| | 247 | | | DSV A/S | | | 11,953 | |
| | 127 | | | Genmab A/S(a) | | | 20,923 | |
| | 110 | | | H. Lundbeck A/S(a) | | | 3,542 | |
| | 200 | | | ISS A/S | | | 7,851 | |
| | 258 | | | Vestas Wind Systems A/S | | | 20,663 | |
| | | | | | | | |
| | | | | | | 79,527 | |
| | | | | | | | |
| | | | Finland—1.2% | |
| | 46 | | | Cargotec Oyj, Class B | | | 1,885 | |
| | 117 | | | Huhtamaki Oyj | | | 4,717 | |
| | 68 | | | Kesko Oyj, Class B | | | 3,375 | |
| | 450 | | | Kone Oyj, Class B | | | 20,684 | |
| | 183 | | | Neste Oyj | | | 7,890 | |
| | 125 | | | Nokian Renkaat Oyj | | | 4,189 | |
| | | | | | | | |
| | | | | | | 42,740 | |
| | | | | | | | |
| | | | France—2.1% | |
| | 132 | | | Sodexo SA | | | 15,309 | |
| | 166 | | | Thales SA | | | 15,608 | |
| | 617 | | | Vinci SA | | | 44,626 | |
| | | | | | | | |
| | | | | | | 75,543 | |
| | | | | | | | |
| | | | Germany—8.0% | |
| | 506 | | | Adidas AG | | | 82,869 | |
| | 123 | | | Covestro AG(b) | | | 7,259 | |
| | 688 | | | Deutsche Wohnen AG-BR | | | 22,414 | |
| | 216 | | | GEA Group AG | | | 8,341 | |
| | 1,711 | | | Infineon Technologies AG | | | 30,675 | |
| | 1,231 | | | SAP SE | | | 108,278 | |
| | 628 | | | Vonovia SE | | | 22,088 | |
| | | | | | | | |
| | | | | | | 281,924 | |
| | | | | | | | |
| | | | Hong Kong—3.3% | |
| | 4,000 | | | CLP Holdings Ltd. | | | 40,697 | |
| | 5,000 | | | HK Electric Investments & HK Electric Investments Ltd.(b) | | | 4,952 | |
| | 5,000 | | | HKT Trust & HKT Ltd. | | | 6,873 | |
See accompanying Notes to Financial Statements which are an integral part of the financial statements.
PowerShares S&P International Developed Momentum Portfolio (IDMO) (continued)
October 31, 2016
| | | | | | | | |
Number
of Shares | | | | | Value | |
| | | | Common Stocks and Other Equity Interests (continued) | |
| | | | Hong Kong (continued) | |
| | 4,000 | | | Link REIT | | $ | 28,524 | |
| | 3,000 | | | MTR Corp. Ltd. | | | 16,615 | |
| | 5,000 | | | PCCW Ltd. | | | 2,979 | |
| | 4,000 | | | Sino Land Co. Ltd. | | | 6,809 | |
| | 1,500 | | | Techtronic Industries Co. Ltd. | | | 5,648 | |
| | 1,000 | | | Yue Yuen Industrial Holdings Ltd. | | | 3,810 | |
| | | | | | | | |
| | | | | | | 116,907 | |
| | | | | | | | |
| | | | Ireland—1.5% | | | | |
| | 1,312 | | | Experian PLC | | | 25,197 | |
| | 478 | | | James Hardie Industries PLC | | | 7,140 | |
| | 148 | | | Kerry Group PLC, Class A | | | 10,730 | |
| | 102 | | | Paddy Power Betfair PLC | | | 10,544 | |
| | | | | | | | |
| | | | | | | 53,611 | |
| | | | | | | | |
| | | | Israel—0.3% | | | | |
| | 2,094 | | | Bezeq The Israeli Telecommunication Corp. Ltd. | | | 3,800 | |
| | 32 | | | Elbit Systems Ltd. | | | 3,166 | |
| | 41 | | | Frutarom Industries Ltd. | | | 2,167 | |
| | | | | | | | |
| | | | | | | 9,133 | |
| | | | | | | | |
| | | | Italy—0.9% | | | | |
| | 375 | | | Davide Campari-Milano SpA | | | 3,771 | |
| | 137 | | | Recordati SpA | | | 3,872 | |
| | 3,015 | | | Snam SpA | | | 15,871 | |
| | 1,704 | | | Terna-Rete Elettrica Nationale SpA | | | 8,335 | |
| | | | | | | | |
| | | | | | | 31,849 | |
| | | | | | | | |
| | | | Japan—7.0% | | | | |
| | 200 | | | Advantest Corp. | | | 2,860 | |
| | 100 | | | Coca-Cola West Co. Ltd. | | | 2,955 | |
| | 100 | | | Daito Trust Construction Co. Ltd. | | | 16,725 | |
| | 100 | | | Harmonic Drive Systems, Inc. | | | 2,818 | |
| | 100 | | | Hisamitsu Pharmaceutical Co., Inc. | | | 5,338 | |
| | 100 | | | Hoshizaki Corp. | | | 9,021 | |
| | 100 | | | Ito EN Ltd. | | | 3,645 | |
| | 300 | | | Itoham Yonekyu Holdings, Inc.(a) | | | 2,860 | |
| | 100 | | | Kagome Co. Ltd. | | | 2,620 | |
| | 1,000 | | | Kajima Corp. | | | 6,747 | |
| | 200 | | | Konami Holdings Corp. | | | 7,889 | |
| | 1,000 | | | Lion Corp. | | | 16,358 | |
| | 100 | | | Maruichi Steel Tube Ltd. | | | 3,221 | |
| | 100 | | | McDonald’s Holdings Co. Japan Ltd. | | | 2,874 | |
| | 200 | | | MEIJI Holdings Co. Ltd. | | | 19,946 | |
| | 1,000 | | | Nagoya Railroad Co. Ltd. | | | 5,272 | |
| | 100 | | | Nippon Shinyaku Co. Ltd. | | | 5,072 | |
| | 700 | | | Obayashi Corp. | | | 6,748 | |
| | 500 | | | Ono Pharmaceutical Co. Ltd. | | | 12,690 | |
| | 3 | | | ORIX JREIT Inc. REIT | | | 5,130 | |
| | 200 | | | Park24 Co. Ltd. | | | 6,176 | |
| | 100 | | | Peptidream, Inc.(a) | | | 5,158 | |
| | 200 | | | SCREEN Holdings Co. Ltd. | | | 13,684 | |
| | 300 | | | START TODAY Co. Ltd. | | | 5,264 | |
| | 100 | | | Sumitomo Dainippon Pharma Co. Ltd. | | | 1,733 | |
| | 1,000 | | | Taisei Corp. | | | 7,499 | |
| | 100 | | | Taisho Pharmaceutical Holdings Co. Ltd. | | | 9,754 | |
| | 500 | | | Terumo Corp. | | | 19,341 | |
| | 1,000 | | | Toho Gas Co. Ltd. | | | 9,259 | |
| | | | | | | | |
Number
of Shares | | | | | Value | |
| | | | Common Stocks and Other Equity Interests (continued) | |
| | | | Japan (continued) | |
| | 200 | | | Tokyo Electron Ltd. | | $ | 18,058 | |
| | 600 | | | Yamada Denki Co. Ltd. | | | 3,100 | |
| | 300 | | | Yamazaki Baking Co. Ltd. | | | 6,726 | |
| | 100 | | | Zensho Holdings Co. Ltd. | | | 1,867 | |
| | | | | | | | |
| | | | | | | 248,408 | |
| | | | | | | | |
| | | | Jersey Island—0.6% | | | | |
| | 221 | | | Randgold Resources Ltd. | | | 19,535 | |
| | | | | | | | |
| | | | Mexico—0.2% | | | | |
| | 442 | | | Fresnillo PLC | | | 8,850 | |
| | | | | | | | |
| | | | Netherlands—2.4% | | | | |
| | 143 | | | Heineken Holding NV, Class A | | | 10,990 | |
| | 258 | | | Heineken NV | | | 21,226 | |
| | 1,614 | | | Koninklijke Ahold Delhaize NV | | | 36,792 | |
| | 457 | | | Wolters Kluwer NV | | | 17,661 | |
| | | | | | | | |
| | | | | | | 86,669 | |
| | | | | | | | |
| | | | New Zealand—1.6% | | | | |
| | 1,625 | | | A2 Milk Co. Ltd.(a) | | | 2,162 | |
| | 1,761 | | | Auckland International Airport Ltd. | | | 8,302 | |
| | 894 | | | Contact Energy Ltd. | | | 3,038 | |
| | 1,197 | | | Fisher & Paykel Healthcare Corp. Ltd. | | | 7,587 | |
| | 1,062 | | | Fletcher Building Ltd. | | | 7,879 | |
| | 2,088 | | | Meridian Energy Ltd. | | | 3,839 | |
| | 578 | | | Ryman Healthcare Ltd. | | | 3,672 | |
| | 830 | | | SKYCITY Entertainment Group Ltd. | | | 2,316 | |
| | 3,240 | | | Spark New Zealand Ltd. | | | 8,483 | |
| | 853 | | | Trade Me Ltd. | | | 2,966 | |
| | 859 | | | Z Energy Ltd. | | | 4,806 | |
| | | | | | | | |
| | | | | | | 55,050 | |
| | | | | | | | |
| | | | Norway—1.1% | | | | |
| | 218 | | | AKER BP ASA(a) | | | 3,503 | |
| | 201 | | | Gjensidige Forsikring ASA | | | 3,608 | |
| | 38 | | | Leroy Seafood Group ASA | | | 2,012 | |
| | 751 | | | Marine Harvest ASA | | | 13,643 | |
| | 1,217 | | | Orkla ASA | | | 11,512 | |
| | 136 | | | Salmar ASA | | | 4,420 | |
| | | | | | | | |
| | | | | | | 38,698 | |
| | | | | | | | |
| | | | Portugal—0.1% | | | | |
| | 242 | | | Jeronimo Martins SGPS SA | | | 4,157 | |
| | | | | | | | |
| | | | Singapore—0.5% | | | | |
| | 3,000 | | | CapitaLand Mall Trust REIT | | | 4,462 | |
| | 100 | | | Jardine Cycle & Carriage Ltd. | | | 3,033 | |
| | 2,200 | | | Mapletree Commercial Trust REIT | | | 2,418 | |
| | 2,400 | | | Mapletree Greater China Commercial Trust REIT(b) | | | 1,793 | |
| | 900 | | | SATS Ltd. | | | 3,130 | |
| | 400 | | | Venture Corp. Ltd. | | | 2,730 | |
| | | | | | | | |
| | | | | | | 17,566 | |
| | | | | | | | |
| | | | Spain—0.8% | | | | |
| | 111 | | | Aena SA(b) | | | 16,275 | |
| | 533 | | | Red Electrica Corp. SA | | | 11,104 | |
| | | | | | | | |
| | | | | | | 27,379 | |
| | | | | | | | |
| | | | Sweden—1.6% | | | | |
| | 107 | | | Axfood AB | | | 1,675 | |
See accompanying Notes to Financial Statements which are an integral part of the financial statements.
PowerShares S&P International Developed Momentum Portfolio (IDMO) (continued)
October 31, 2016
| | | | | | | | |
Number
of Shares | | | | | Value | |
| | | | Common Stocks and Other Equity Interests (continued) | |
| | | | Sweden (continued) | |
| | 398 | | | Castellum AB | | $ | 5,400 | |
| | 209 | | | Fastighets AB Balder, Class B(a) | | | 4,754 | |
| | 534 | | | Fingerprint Cards AB, Class B(a) | | | 5,179 | |
| | 284 | | | Hexagon AB, Class B | | | 9,954 | |
| | 190 | | | Hufvudstaden AB, Class A | | | 2,944 | |
| | 451 | | | Husqvarna AB, Class B | | | 3,397 | |
| | 403 | | | Nibe Industrier AB, Class B | | | 3,002 | |
| | 118 | | | Saab AB, Class B | | | 4,186 | |
| | 331 | | | Securitas AB, Class B | | | 5,122 | |
| | 284 | | | Swedish Match AB | | | 9,894 | |
| | | | | | | | |
| | | | | | | 55,507 | |
| | | | | | | | |
| | | | Switzerland—2.3% | | | | |
| | 128 | | | Actelion Ltd. | | | 18,509 | |
| | 43 | | | Geberit AG | | | 18,206 | |
| | 9 | | | Givaudan SA | | | 17,429 | |
| | 26 | | | Schindler Holding AG | | | 4,811 | |
| | 52 | | | Schindler Holding AG-PC | | | 9,670 | |
| | 7 | | | SGS SA | | | 14,200 | |
| | | | | | | | |
| | | | | | | 82,825 | |
| | | | | | | | |
| | | | United Kingdom—32.5% | | | | |
| | 538 | | | Admiral Group PLC | | | 12,592 | |
| | 530 | | | Ashtead Group PLC | | | 8,270 | |
| | 1,527 | | | AstraZeneca PLC | | | 85,535 | |
| | 3,639 | | | BAE Systems PLC | | | 24,102 | |
| | 3,373 | | | British American Tobacco PLC | | | 193,200 | |
| | 585 | | | Bunzl PLC | | | 15,706 | |
| | 3,618 | | | Compass Group PLC | | | 65,419 | |
| | 143 | | | DCC PLC | | | 11,636 | |
| | 3,811 | | | Diageo PLC | | | 101,409 | |
| | 7,903 | | | GlaxoSmithKline PLC | | | 156,165 | |
| | 1,405 | | | Imperial Brands PLC | | | 67,851 | |
| | 990 | | | Informa PLC | | | 8,128 | |
| | 311 | | | Intertek Group PLC | | | 12,978 | |
| | 217 | | | Johnson Matthey PLC | | | 9,034 | |
| | 653 | | | Merlin Entertainments PLC(b) | | | 3,674 | |
| | 361 | | | Micro Focus International PLC | | | 9,436 | |
| | 7,598 | | | National Grid PLC | | | 98,794 | |
| | 923 | | | Reckitt Benckiser Group PLC | | | 82,410 | |
| | 1,935 | | | RELX PLC | | | 34,515 | |
| | 1,939 | | | Sage Group PLC (The) | | | 17,080 | |
| | 290 | | | Severn Trent PLC | | | 8,243 | |
| | 1,866 | | | Unilever PLC | | | 77,869 | |
| | 888 | | | United Utilities Group PLC | | | 10,191 | |
| | 1,554 | | | WPP PLC | | | 33,734 | |
| | | | | | | | |
| | | | | | | 1,147,971 | |
| | | | | | | | |
| | | | United States—0.5% | | | | |
| | 555 | | | Tahoe Resources, Inc. | | | 6,659 | |
| | 271 | | | Thomson Reuters Corp. | | | 10,688 | |
| | | | | | | | |
| | | | | | | 17,347 | |
| | | | | | | | |
| | | | Total Investments
(Cost $3,589,773)—99.9% | | | 3,533,245 | |
| | | | Other assets less
liabilities—0.1% | | | 2,184 | |
| | | | | | | | |
| | | | Net Assets—100.0% | | $ | 3,535,429 | |
| | | | | | | | |
Investment Abbreviations:
BR—Bearer Shares
PC—Participation Certificate
REIT—Real Estate Investment Trust
Notes to Schedule of Investments:
| (a) | Non-income producing security. |
| (b) | Security purchased or received in a transaction exempt from registration under the Securities Act of 1933, as amended (the “1933 Act”). The security may be resold pursuant to an exemption from registration under the 1933 Act, typically to qualified institutional buyers. The aggregate value of these securities at October 31, 2016 was $33,953, which represented less than 1% of the Fund’s Net Assets. |
See accompanying Notes to Financial Statements which are an integral part of the financial statements.
Schedule of Investments(a)
PowerShares S&P MidCap Low Volatility Portfolio (XMLV)
October 31, 2016
| | | | | | | | |
Number
of Shares | | | | | Value | |
| | | | Common Stocks and Other Equity
Interests—100.0% | |
| | | | Consumer Discretionary—5.5% | |
| | 152,741 | | | Cheesecake Factory, Inc. (The) | | $ | 8,124,294 | |
| | 617,436 | | | New York Times Co. (The), Class A | | | 6,730,052 | |
| | 5,267 | | | NVR, Inc.(b) | | | 8,021,641 | |
| | 35,755 | | | Panera Bread Co., Class A(b) | | | 6,820,624 | |
| | 82,782 | | | Pool Corp. | | | 7,663,958 | |
| | | | | | | | |
| | | | | | | 37,360,569 | |
| | | | | | | | |
| | | | Consumer Staples—1.2% | | | | |
| | 236,830 | | | Tootsie Roll Industries, Inc., Class A | | | 8,395,623 | |
| | | | | | | | |
| | | | Financials—20.1% | | | | |
| | 18,550 | | | Alleghany Corp.(b) | | | 9,575,696 | |
| | 142,540 | | | American Financial Group, Inc. | | | 10,619,230 | |
| | 196,717 | | | Aspen Insurance Holdings Ltd. (Bermuda) | | | 9,491,595 | |
| | 261,016 | | | Brown & Brown, Inc. | | | 9,621,050 | |
| | 138,286 | | | CBOE Holdings, Inc. | | | 8,741,058 | |
| | 156,132 | | | Endurance Specialty Holdings Ltd. | | | 14,356,337 | |
| | 53,173 | | | Everest Re Group Ltd. | | | 10,821,769 | |
| | 45,243 | | | FactSet Research Systems, Inc. | | | 6,999,997 | |
| | 118,343 | | | Hanover Insurance Group, Inc. (The) | | | 9,016,553 | |
| | 160,509 | | | Mercury General Corp. | | | 8,742,925 | |
| | 495,627 | | | Old Republic International Corp. | | | 8,356,271 | |
| | 78,673 | | | Reinsurance Group of America, Inc. | | | 8,485,670 | |
| | 101,412 | | | RenaissanceRe Holdings Ltd. (Bermuda) | | | 12,604,498 | |
| | 170,008 | | | W.R. Berkley Corp. | | | 9,707,457 | |
| | | | | | | | |
| | | | | | | 137,140,106 | |
| | | | | | | | |
| | | | Health Care—4.6% | | | | |
| | 59,945 | | | Bio-Rad Laboratories, Inc.,
Class A(b) | | | 9,476,106 | |
| | 233,761 | | | Owens & Minor, Inc. | | | 7,585,544 | |
| | 47,159 | | | Teleflex, Inc. | | | 6,749,868 | |
| | 98,086 | | | West Pharmaceutical Services, Inc. | | | 7,457,478 | |
| | | | | | | | |
| | | | | | | 31,268,996 | |
| | | | | | | | |
| | | | Industrials—8.4% | | | | |
| | 160,692 | | | Copart, Inc.(b) | | | 8,431,509 | |
| | 76,372 | | | Hubbell, Inc. | | | 7,982,401 | |
| | 96,224 | | | IDEX Corp. | | | 8,317,603 | |
| | 52,795 | | | Lennox International, Inc. | | | 7,702,263 | |
| | 108,018 | | | MSC Industrial Direct Co., Inc., Class A | | | 7,863,710 | |
| | 278,273 | | | Rollins, Inc. | | | 8,576,374 | |
| | 177,408 | | | Toro Co. (The) | | | 8,494,295 | |
| | | | | | | | |
| | | | | | | 57,368,155 | |
| | | | | | | | |
| | | | Information Technology—7.2% | | | | |
| | 80,973 | | | ANSYS, Inc.(b) | | | 7,396,884 | |
| | 130,350 | | | Broadridge Financial Solutions, Inc. | | | 8,428,431 | |
| | 88,034 | | | Gartner, Inc.(b) | | | 7,574,445 | |
| | 113,899 | | | Jack Henry & Associates, Inc. | | | 9,228,097 | |
| | 280,757 | | | National Instruments Corp. | | | 7,886,464 | |
| | 143,267 | | | Synopsys, Inc.(b) | | | 8,497,166 | |
| | | | | | | | |
| | | | | | | 49,011,487 | |
| | | | | | | | |
| | | | Materials—7.3% | | | | |
| | 126,532 | | | AptarGroup, Inc. | | | 9,039,446 | |
| | 163,105 | | | Bemis Co., Inc. | | | 7,946,475 | |
| | 152,179 | | | RPM International, Inc. | | | 7,234,590 | |
| | 102,065 | | | Scotts Miracle-Gro Co. (The), Class A | | | 8,990,906 | |
| | 165,299 | | | Silgan Holdings, Inc. | | | 8,421,984 | |
| | 164,804 | | | Sonoco Products Co. | | | 8,287,993 | |
| | | | | | | | |
| | | | | | | 49,921,394 | |
| | | | | | | | |
| | | | | | | | |
Number
of Shares | | | | | Value | |
| | | | Common Stocks and Other Equity Interests (continued) | |
| | | | Real Estate—28.6% | | | | |
| | 76,857 | | | Alexandria Real Estate Equities, Inc. REIT | | $ | 8,285,953 | |
| | 165,999 | | | American Campus Communities, Inc. REIT | | | 8,650,208 | |
| | 101,848 | | | Camden Property Trust REIT | | | 8,294,501 | |
| | 301,116 | | | Corporate Office Properties Trust REIT | | | 8,036,786 | |
| | 181,633 | | | DCT Industrial Trust, Inc. REIT | | | 8,491,343 | |
| | 215,520 | | | Douglas Emmett, Inc. REIT | | | 7,866,480 | |
| | 298,673 | | | Duke Realty Corp. REIT | | | 7,810,299 | |
| | 172,366 | | | Education Realty Trust, Inc. REIT | | | 7,341,068 | |
| | 111,646 | | | EPR Properties REIT | | | 8,118,897 | |
| | 293,307 | | | Equity One, Inc. REIT | | | 8,359,250 | |
| | 291,406 | | | First Industrial Realty Trust, Inc. REIT | | | 7,696,033 | |
| | 261,760 | | | Healthcare Realty Trust, Inc. REIT | | | 8,347,526 | |
| | 165,486 | | | Highwoods Properties, Inc. REIT | | | 8,213,070 | |
| | 124,851 | | | Lamar Advertising Co., Class A REIT | | | 7,921,796 | |
| | 211,698 | | | Liberty Property Trust REIT | | | 8,558,950 | |
| | 87,174 | | | Life Storage, Inc. REIT | | | 7,030,583 | |
| | 84,120 | | | Mid-America Apartment Communities, Inc. REIT | | | 7,802,130 | |
| | 179,626 | | | National Retail Properties, Inc. REIT | | | 8,194,538 | |
| | 148,806 | | | Post Properties, Inc. REIT | | | 9,789,947 | |
| | 116,770 | | | Regency Centers Corp. REIT | | | 8,415,614 | |
| | 236,828 | | | Tanger Factory Outlet Centers, Inc. REIT | | | 8,241,614 | |
| | 111,500 | | | Taubman Centers, Inc. REIT | | | 8,079,290 | |
| | 281,154 | | | Urban Edge Properties REIT | | | 7,256,585 | |
| | 221,724 | | | Weingarten Realty Investors REIT | | | 8,028,626 | |
| | | | | | | | |
| | | | | | | 194,831,087 | |
| | | | | | | | |
| | | | Utilities—17.1% | | | | |
| | 301,180 | | | Aqua America, Inc. | | | 9,246,226 | |
| | 131,385 | | | Atmos Energy Corp. | | | 9,773,730 | |
| | 316,573 | | | Great Plains Energy, Inc. | | | 9,003,336 | |
| | 284,284 | | | Hawaiian Electric Industries, Inc. | | | 8,386,378 | |
| | 127,668 | | | IDACORP, Inc. | | | 10,007,894 | |
| | 234,648 | | | New Jersey Resources Corp. | | | 7,966,300 | |
| | 139,564 | | | ONE Gas, Inc. | | | 8,552,482 | |
| | 271,426 | | | PNM Resources, Inc. | | | 8,916,344 | |
| | 122,163 | | | Southwest Gas Corp. | | | 8,851,931 | |
| | 204,597 | | | UGI Corp. | | | 9,470,795 | |
| | 183,222 | | | Vectren Corp. | | | 9,217,899 | |
| | 157,460 | | | Westar Energy, Inc. | | | 9,025,607 | |
| | 132,611 | | | WGL Holdings, Inc. | | | 8,363,776 | |
| | | | | | | | |
| | | | | | | 116,782,698 | |
| | | | | | | | |
| | | | Total Investments
(Cost $658,674,473)—100.0% | | | 682,080,115 | |
| | | | Other assets less
liabilities—0.0% | | | 14,266 | |
| | | | | | | | |
| | | | Net Assets—100.0% | | $ | 682,094,381 | |
| | | | | | | | |
Investment Abbreviations:
REIT—Real Estate Investment Trust
Notes to Schedule of Investments:
| (a) | Industry and/or sector classifications used in this report are generally according to the Global Industry Classification Standard, which was developed by and is the exclusive property and a service mark of MSCI Inc. and Standard & Poor’s. |
| (b) | Non-income producing security. |
See accompanying Notes to Financial Statements which are an integral part of the financial statements.
Schedule of Investments(a)
PowerShares S&P SmallCap Low Volatility Portfolio (XSLV)
October 31, 2016
| | | | | | | | |
Number
of Shares | | | | | Value | |
| | | | Common Stocks and Other Equity Interests—99.9% | | | | |
| | | | Consumer Discretionary—10.2% | | | | |
| | 11,695 | | | Biglari Holdings, Inc.(b) | | $ | 5,124,515 | |
| | 133,427 | | | Bob Evans Farms, Inc. | | | 5,499,861 | |
| | 418,511 | | | Callaway Golf Co. | | | 4,272,997 | |
| | 79,157 | | | DineEquity, Inc. | | | 6,261,319 | |
| | 76,743 | | | Dorman Products, Inc.(b) | | | 4,929,971 | |
| | 52,200 | | | Drew Industries, Inc. | | | 4,674,510 | |
| | 238,988 | | | Haverty Furniture Cos., Inc. | | | 4,242,037 | |
| | 221,944 | | | Marcus Corp. (The) | | | 5,881,516 | |
| | 87,477 | | | Monro Muffler Brake, Inc. | | | 4,811,235 | |
| | 278,121 | | | PetMed Express, Inc. | | | 5,526,264 | |
| | 91,058 | | | Popeyes Louisiana Kitchen, Inc.(b) | | | 4,860,676 | |
| | 327,852 | | | Ruth’s Hospitality Group, Inc. | | | 5,196,454 | |
| | 135,059 | | | Scholastic Corp. | | | 5,166,007 | |
| | | | | | | | |
| | | | | | | 66,447,362 | |
| | | | | | | | |
| | | | Consumer Staples—3.6% | | | | |
| | 59,015 | | | J & J Snack Foods Corp. | | | 7,208,682 | |
| | 131,832 | | | Medifast, Inc. | | | 5,413,022 | |
| | 88,556 | | | Universal Corp. | | | 4,799,735 | |
| | 55,185 | | | WD-40 Co. | | | 5,884,101 | |
| | | | | | | | |
| | | | | | | 23,305,540 | |
| | | | | | | | |
| | | | Financials—33.8% | | | | |
| | 153,260 | | | Ameris Bancorp | | | 5,563,338 | |
| | 93,468 | | | AMERISAFE, Inc. | | | 5,196,821 | |
| | 360,967 | | | Astoria Financial Corp. | | | 5,280,947 | |
| | 710,903 | | | Bank Mutual Corp. | | | 5,545,043 | |
| | 483,519 | | | Brookline Bancorp, Inc. | | | 6,189,043 | |
| | 644,969 | | | Capstead Mortgage Corp. REIT | | | 6,133,655 | |
| | 191,446 | | | Cardinal Financial Corp. | | | 5,031,201 | |
| | 119,528 | | | City Holding Co. | | | 6,247,729 | |
| | 125,777 | | | Community Bank System, Inc. | | | 5,925,354 | |
| | 282,416 | | | CVB Financial Corp. | | | 4,738,941 | |
| | 347,968 | | | Dime Community Bancshares, Inc. | | | 5,637,082 | |
| | 501,883 | | | First Commonwealth Financial Corp. | | | 5,099,131 | |
| | 248,142 | | | First Financial Bancorp | | | 5,335,053 | |
| | 254,127 | | | First Midwest Bancorp, Inc. | | | 4,907,192 | |
| | 160,327 | | | Horace Mann Educators Corp. | | | 5,763,756 | |
| | 95,681 | | | Independent Bank Corp./MA | | | 5,276,807 | |
| | 86,797 | | | Infinity Property & Casualty Corp. | | | 7,113,014 | |
| | 68,315 | | | Navigators Group, Inc. (The) | | | 6,366,958 | |
| | 182,736 | | | NBT Bancorp, Inc. | | | 6,160,031 | |
| | 523,833 | | | Northfield Bancorp, Inc. | | | 8,617,053 | |
| | 464,679 | | | Northwest Bancshares, Inc. | | | 7,314,047 | |
| | 367,223 | | | Old National Bancorp | | | 5,398,178 | |
| | 410,753 | | | Oritani Financial Corp. | | | 6,428,284 | |
| | 157,090 | | | ProAssurance Corp. | | | 8,372,897 | |
| | 305,602 | | | Provident Financial Services, Inc. | | | 6,934,109 | |
| | 91,076 | | | RLI Corp. | | | 5,076,576 | |
| | 180,109 | | | S&T Bancorp, Inc. | | | 5,653,622 | |
| | 95,617 | | | Safety Insurance Group, Inc. | | | 6,473,271 | |
| | 143,983 | | | Selective Insurance Group, Inc. | | | 5,320,172 | |
| | 290,532 | | | Sterling Bancorp | | | 5,229,576 | |
| | 118,786 | | | Stewart Information Services Corp. | | | 5,339,431 | |
| | 70,555 | | | Tompkins Financial Corp. | | | 5,593,600 | |
| | 761,456 | | | TrustCo Bank Corp. NY | | | 5,330,192 | |
| | 84,359 | | | UMB Financial Corp. | | | 5,234,476 | |
| | | | | | | | |
Number
of Shares | | | | | Value | |
| | | | Common Stocks and Other Equity Interests (continued) | |
| | | | Financials (continued) | | | | |
| | 136,164 | | | United Bankshares, Inc. | | $ | 5,133,383 | |
| | 248,259 | | | United Community Banks, Inc. | | | 5,354,947 | |
| | 112,789 | | | United Fire Group, Inc. | | | 4,457,421 | |
| | 108,035 | | | Westamerica Bancorp.(c) | | | 5,354,215 | |
| | | | | | | | |
| | | | | | | 220,126,546 | |
| | | | | | | | |
| | | | Health Care—2.2% | | | | |
| | 56,003 | | | Analogic Corp. | | | 4,583,845 | |
| | 65,759 | | | Integra LifeSciences Holdings
Corp.(b) | | | 5,228,498 | |
| | 271,164 | | | Meridian Bioscience, Inc. | | | 4,460,648 | |
| | | | | | | | |
| | | | | | | 14,272,991 | |
| | | | | | | | |
| | | | Industrials—15.9% | | | | |
| | 174,478 | | | ABM Industries, Inc. | | | 6,818,600 | |
| | 129,314 | | | Applied Industrial Technologies, Inc. | | | 6,569,151 | |
| | 144,518 | | | ESCO Technologies, Inc. | | | 6,438,277 | |
| | 104,164 | | | Exponent, Inc. | | | 5,963,389 | |
| | 75,562 | | | G&K Services, Inc., Class A | | | 7,155,722 | |
| | 303,542 | | | Griffon Corp. | | | 5,069,151 | |
| | 162,421 | | | Healthcare Services Group, Inc. | | | 6,004,704 | |
| | 167,218 | | | Hillenbrand, Inc. | | | 5,075,066 | |
| | 154,534 | | | Kaman Corp. | | | 6,746,955 | |
| | 97,309 | | | Matthews International Corp., Class A | | | 5,828,809 | |
| | 157,636 | | | Mueller Industries, Inc. | | | 4,774,795 | |
| | 53,121 | | | National Presto Industries, Inc. | | | 4,634,807 | |
| | 154,500 | | | Simpson Manufacturing Co., Inc. | | | 6,612,600 | |
| | 57,058 | | | Standex International Corp. | | | 4,359,231 | |
| | 79,918 | | | Tennant Co. | | | 5,030,838 | |
| | 157,467 | | | Tetra Tech, Inc. | | | 6,054,606 | |
| | 47,721 | | | UniFirst Corp. | | | 5,845,823 | |
| | 72,869 | | | Watts Water Technologies, Inc., Class A | | | 4,372,140 | |
| | | | | | | | |
| | | | | | | 103,354,664 | |
| | | | | | | | |
| | | | Information Technology—6.9% | | | | |
| | 137,320 | | | Badger Meter, Inc. | | | 4,414,838 | |
| | 102,628 | | | Cabot Microelectronics Corp. | | | 5,671,223 | |
| | 96,968 | | | ExlService Holdings, Inc.(b) | | | 4,269,501 | |
| | 129,095 | | | Forrester Research, Inc. | | | 4,808,789 | |
| | 41,190 | | | Littelfuse, Inc. | | | 5,746,005 | |
| | 123,141 | | | ManTech International Corp., Class A | | | 4,781,565 | |
| | 111,336 | | | MKS Instruments, Inc. | | | 5,616,901 | |
| | 177,383 | | | Sykes Enterprises, Inc.(b) | | | 4,743,221 | |
| | 185,417 | | | TeleTech Holdings, Inc. | | | 5,210,218 | |
| | | | | | | | |
| | | | | | | 45,262,261 | |
| | | | | | | | |
| | | | Materials—3.8% | | | | |
| | 76,428 | | | Deltic Timber Corp. | | | 4,293,725 | |
| | 117,103 | | | H.B. Fuller Co. | | | 4,926,523 | |
| | 82,780 | | | Innospec, Inc. | | | 4,987,495 | |
| | 67,385 | | | Kaiser Aluminum Corp. | | | 4,884,739 | |
| | 73,469 | | | Neenah Paper, Inc. | | | 5,870,173 | |
| | | | | | | | |
| | | | | | | 24,962,655 | |
| | | | | | | | |
| | | | Real Estate—15.2% | | | | |
| | 181,100 | | | Acadia Realty Trust REIT | | | 6,101,259 | |
| | 141,496 | | | Agree Realty Corp. REIT | | | 6,841,332 | |
| | 148,286 | | | American Assets Trust, Inc. REIT | | | 5,888,437 | |
| | 733,611 | | | Cedar Realty Trust, Inc. REIT | | | 4,966,546 | |
See accompanying Notes to Financial Statements which are an integral part of the financial statements.
PowerShares S&P SmallCap Low Volatility Portfolio (XSLV) (continued)
October 31, 2016
| | | | | | | | |
Number
of Shares | | | | | Value | |
| | | | Common Stocks and Other Equity Interests (continued) | |
| | | | Real Estate (continued) | | | | |
| | 64,509 | | | CoreSite Realty Corp. REIT | | $ | 4,756,894 | |
| | 91,545 | | | EastGroup Properties, Inc. REIT | | | 6,216,821 | |
| | 429,105 | | | Franklin Street Properties Corp. REIT | | | 4,964,745 | |
| | 328,738 | | | Getty Realty Corp. REIT | | | 7,472,215 | |
| | 214,392 | | | Government Properties Income Trust REIT | | | 4,103,463 | |
| | 217,131 | | | Kite Realty Group Trust REIT | | | 5,413,076 | |
| | 539,504 | | | Lexington Realty Trust REIT | | | 5,470,570 | |
| | 133,888 | | | LTC Properties, Inc. REIT | | | 6,709,128 | |
| | 66,283 | | | PS Business Parks, Inc. REIT | | | 7,277,210 | |
| | 305,187 | | | Retail Opportunity Investments Corp. REIT | | | 6,137,311 | |
| | 91,861 | | | Saul Centers, Inc. REIT | | | 5,555,753 | |
| | 94,011 | | | Universal Health Realty Income Trust REIT | | | 5,518,446 | |
| | 264,037 | | | Urstadt Biddle Properties, Inc., Class A REIT | | | 5,676,795 | |
| | | | | | | | |
| | | | | | | 99,070,001 | |
| | | | | | | | |
| | | | Telecommunication Services—0.8% | | | | |
| | 81,723 | | | ATN International, Inc. | | | 5,527,744 | |
| | | | | | | | |
| | | | Utilities—7.5% | | | | |
| | 109,229 | | | ALLETE, Inc. | | | 6,694,646 | |
| | 123,812 | | | American States Water Co. | | | 4,950,004 | |
| | 162,895 | | | Avista Corp. | | | 6,743,853 | |
| | 172,243 | | | California Water Service Group | | | 5,339,533 | |
| | 137,517 | | | El Paso Electric Co. | | | 6,353,285 | |
| | 112,210 | | | Northwest Natural Gas Co. | | | 6,597,948 | |
| | 172,243 | | | South Jersey Industries, Inc. | | | 5,107,005 | |
| | 118,103 | | | Spire, Inc. | | | 7,416,868 | |
| | | | | | | | |
| | | | | | | 49,203,142 | |
| | | | | | | | |
| | | | Total Common Stocks and Other Equity Interests
(Cost $614,881,093) | | | 651,532,906 | |
| | | | | | | | |
| | |
| | | | | | | | |
| | | | Money Market Fund—0.0% | | | | |
| | 24,990 | | | Invesco Premier U.S. Government Money Portfolio—Institutional Class,
0.25%(d)
(Cost $24,990) | | | 24,990 | |
| | | | | | | | |
| | | | Total Investments
(excluding investments purchased with cash collateral from securities on loan)
(Cost $614,906,083)—99.9% | | | 651,557,896 | |
| | | | | | | | |
| | |
| | | | | | | | |
| | | | Investments Purchased with Cash Collateral from Securities on Loan | |
| | |
| | | | | | | | |
| | | | Money Market Fund—0.8% | | | | |
| | 5,101,700 | | | Invesco Government & Agency Portfolio—Institutional Class, 0.29%(d)(e)
(Cost $5,101,700) | | | 5,101,700 | |
| | | | | | | | |
| | | | Total Investments
(Cost $620,007,783)—100.7% | | | 656,659,596 | |
| | | | Other assets less liabilities—(0.7)% | | | (4,838,514 | ) |
| | | | | | | | |
| | | | Net Assets—100.0% | | $ | 651,821,082 | |
| | | | | | | | |
Investment Abbreviations:
REIT—Real Estate Investment Trust
Notes to Schedule of Investments:
| (a) | Industry and/or sector classifications used in this report are generally according to the Global Industry Classification Standard, which was developed by and is the exclusive property and a service mark of MSCI Inc. and Standard & Poor’s. |
| (b) | Non-income producing security. |
| (c) | All or a portion of this security was out on loan at October 31, 2016. |
| (d) | The security and the Fund are advised by wholly-owned subsidiaries of Invesco Ltd. and are therefore considered to be affiliated. The rate shown is the 7-day SEC standardized yield as of October 31, 2016. |
| (e) | The security has been segregated to satisfy the commitment to return the cash collateral received in securities lending transactions upon the borrower’s return of the securities loaned. See Note 2H. |
See accompanying Notes to Financial Statements which are an integral part of the financial statements.
Statements of Assets and Liabilities
October 31, 2016
| | | | | | | | | | | | | | | | | | | | |
| | | PowerShares FTSE
International Low
Beta Equal Weight
Portfolio (IDLB) | | | PowerShares
Russell 1000 Low
Beta Equal Weight
Portfolio (USLB) | | | PowerShares
S&P 500®
ex-Rate Sensitive
Low Volatility
Portfolio (XRLV) | | | PowerShares
S&P 500®
High Beta
Portfolio (SPHB) | | | PowerShares
S&P 500®
High Dividend
Low Volatility
Portfolio (SPHD) | |
| Assets: | | | | | | | | | | | | | | | | | | | | |
Unaffiliated investments, at value(a) | | $ | 146,558,207 | | | $ | 138,638,792 | | | $ | 164,462,544 | | | $ | 483,971,761 | | | $ | 2,623,528,991 | |
Affiliated investments, at value | | | 140,450 | | | | 137,567 | | | | — | | | | 5,050,436 | | | | — | |
| | | | | | | | | | | | | | | | | | | | |
Total investments, at value | | | 146,698,657 | | | | 138,776,359 | | | | 164,462,544 | | | | 489,022,197 | | | | 2,623,528,991 | |
Cash segregated as collateral | | | 19,660 | | | | — | | | | — | | | | — | | | | — | |
Foreign currencies, at value | | | — | | | | — | | | | — | | | | — | | | | — | |
Receivables: | | | | | | | | | | | | | | | | | | | | |
Dividends | | | 385,776 | | | | 115,933 | | | | 123,178 | | | | 281,600 | | | | 5,318,806 | |
Foreign tax reclaims | | | 119,564 | | | | — | | | | — | | | | — | | | | — | |
Shares sold | | | 17,287 | | | | — | | | | — | | | | — | | | | — | |
Securities lending | | | 485 | | | | — | | | | — | | | | — | | | | — | |
Investments sold | | | 2 | | | | — | | | | — | | | | 12,909,822 | | | | 3,761,644 | |
| | | | | | | | | | | | | | | | | | | | |
Total Assets | | | 147,241,431 | | | | 138,892,292 | | | | 164,585,722 | | | | 502,213,619 | | | | 2,632,609,441 | |
| | | | | | | | | | | | | | | | | | | | |
| | | | | |
| Liabilities: | | | | | | | | | | | | | | | | | | | | |
Due to custodian | | | 97,775 | | | | 147,532 | | | | 127,663 | | | | 1,356 | | | | 1,638,588 | |
Due to foreign custodian | | | 113,893 | | | | — | | | | — | | | | — | | | | — | |
Payables: | | | | | | | | | | | | | | | | | | | | |
Collateral upon return of securities loaned | | | 140,450 | | | | — | | | | — | | | | — | | | | — | |
Investments purchased | | | 17,354 | | | | — | | | | — | | | | — | | | | 3,103,726 | |
Collateral upon receipt of securities in-kind | | | 19,660 | | | | — | | | | — | | | | — | | | | — | |
Shares repurchased | | | — | | | | — | | | | — | | | | 12,916,289 | | | | 3,761,969 | |
Accrued unitary management fees | | | 55,458 | | | | 40,990 | | | | 35,404 | | | | 91,549 | | | | 674,500 | |
Accrued expenses | | | — | | | | — | | | | — | | | | — | | | | — | |
| | | | | | | | | | | | | | | | | | | | |
Total Liabilities | | | 444,590 | | | | 188,522 | | | | 163,067 | | | | 13,009,194 | | | | 9,178,783 | |
| | | | | | | | | | | | | | | | | | | | |
| Net Assets | | $ | 146,796,841 | | | $ | 138,703,770 | | | $ | 164,422,655 | | | $ | 489,204,425 | | | $ | 2,623,430,658 | |
| | | | | | | | | | | | | | | | | | | | |
| | | | | |
| Net Assets Consist of: | | | | | | | | | | | | | | | | | | | | |
Shares of beneficial interest | | $ | 148,039,950 | | | $ | 142,769,677 | | | $ | 165,361,924 | | | $ | 530,058,426 | | | $ | 2,644,243,085 | |
Undistributed net investment income | | | 557,868 | | | | 302,667 | | | | — | | | | 566,758 | | | | — | |
Undistributed net realized gain (loss) | | | (2,169,852 | ) | | | (8,611,173 | ) | | | (4,835,810 | ) | | | (31,832,196 | ) | | | (21,761,771 | ) |
Net unrealized appreciation (depreciation) | | | 368,875 | | | | 4,242,599 | | | | 3,896,541 | | | | (9,588,563 | ) | | | 949,344 | |
| | | | | | | | | | | | | | | | | | | | |
| Net Assets | | $ | 146,796,841 | | | $ | 138,703,770 | | | $ | 164,422,655 | | | $ | 489,204,425 | | | $ | 2,623,430,658 | |
| | | | | | | | | | | | | | | | | | | | |
Shares outstanding (unlimited amount authorized, $0.01 par value) | | | 5,850,001 | | | | 5,350,001 | | | | 6,150,001 | | | | 15,150,000 | | | | 69,600,000 | |
Net asset value | | $ | 25.09 | | | $ | 25.93 | | | $ | 26.74 | | | $ | 32.29 | | | $ | 37.69 | |
| | | | | | | | | | | | | | | | | | | | |
Market price | | $ | 25.20 | | | $ | 25.95 | | | $ | 26.75 | | | $ | 32.32 | | | $ | 37.72 | |
| | | | | | | | | | | | | | | | | | | | |
Unaffiliated investments, at cost | | $ | 146,179,352 | | | $ | 134,396,193 | | | $ | 160,566,003 | | | $ | 492,860,542 | | | $ | 2,622,579,647 | |
| | | | | | | | | | | | | | | | | | | | |
Affiliated investments, at cost | | $ | 140,450 | | | $ | 137,567 | | | $ | — | | | $ | 5,750,218 | | | $ | — | |
| | | | | | | | | | | | | | | | | | | | |
Total investments, at cost | | $ | 146,319,802 | | | $ | 134,533,760 | | | $ | 160,566,003 | | | $ | 498,610,760 | | | $ | 2,622,579,647 | |
| | | | | | | | | | | | | | | | | | | | |
Foreign currencies, at cost | | $ | (120,525 | ) | | $ | — | | | $ | — | | | $ | — | | | $ | — | |
| | | | | | | | | | | | | | | | | | | | |
(a) Includes securities on loan with an aggregate value of: | | $ | 134,158 | | | $ | — | | | $ | — | | | $ | — | | | $ | — | |
| | | | | | | | | | | | | | | | | | | | |
See accompanying Notes to Financial Statements which are an integral part of the financial statements.
| | | | | | | | | | | | | | | | | | | | | | | | | | | | | | | | | | |
PowerShares
S&P 500®
Low Volatility
Portfolio
(SPLV) | | | PowerShares
S&P 500
Momentum
Portfolio
(SPMO) | | | PowerShares
S&P 500
Value
Portfolio
(SPVU) | | | PowerShares
S&P
Emerging
Markets
Low
Volatility
Portfolio
(EELV) | | | PowerShares
S&P
Emerging
Markets
Momentum
Portfolio
(EEMO) | | | PowerShares
S&P
International
Developed
Low Volatility
Portfolio
(IDLV) | | | PowerShares
S&P
International
Developed
Momentum
Portfolio
(IDMO) | | | PowerShares
S&P MidCap
Low
Volatility
Portfolio
(XMLV) | | | PowerShares
S&P
SmallCap
Low
Volatility
Portfolio
(XSLV) | |
| | | | | | | | | | | | | | | | | | | | | | | | | | | | | | | | | | |
| $ | 6,447,681,476 | | | $ | 1,327,842 | | | $ | 1,321,152 | | | $ | 269,812,685 | | | $ | 1,555,160 | | | $ | 383,591,966 | | | $ | 3,533,245 | | | $ | 682,080,115 | | | $ | 651,532,906 | |
| | — | | | | — | | | | 386 | | | | — | | | | 34,575 | | | | 4,986,577 | | | | — | | | | — | | | | 5,126,690 | |
| | | | | | | | | | | | | | | | | | | | | | | | | | | | | | | | | | |
| | 6,447,681,476 | | | | 1,327,842 | | | | 1,321,538 | | | | 269,812,685 | | | | 1,589,735 | | | | 388,578,543 | | | | 3,533,245 | | | | 682,080,115 | | | | 656,659,596 | |
| | — | | | | — | | | | — | | | | — | | | | — | | | | 4,602,588 | | | | — | | | | — | | | | — | |
| | — | | | | — | | | | — | | | | 7,332 | | | | — | | | | 146,979 | | | | 3,438 | | | | — | | | | — | |
| | | | | | | | | | | | | | | | | | | | | | | | | | | | | | | | | | |
| | 7,790,148 | | | | 2,080 | | | | 824 | | | | 128,369 | | | | 597 | | | | 425,295 | | | | 3,992 | | | | 475,701 | | | | 397,182 | |
| | — | | | | — | | | | — | | | | 37,760 | | | | — | | | | 391,675 | | | | 12,449 | | | | — | | | | — | |
| | — | | | | — | | | | — | | | | — | | | | — | | | | 7,412,462 | | | | — | | | | — | | | | 1,872,471 | |
| | — | | | | — | | | | — | | | | — | | | | — | | | | 4,198 | | | | — | | | | — | | | | 3,132 | |
| | 38,204,048 | | | | — | | | | — | | | | — | | | | — | | | | 61 | | | | 2 | | | | 3,769,958 | | | | — | |
| | | | | | | | | | | | | | | | | | | | | | | | | | | | | | | | | | |
| | 6,493,675,672 | | | | 1,329,922 | | | | 1,322,362 | | | | 269,986,146 | | | | 1,590,332 | | | | 401,561,801 | | | | 3,553,126 | | | | 686,325,774 | | | | 658,932,381 | |
| | | | | | | | | | | | | | | | | | | | | | | | | | | | | | | | | | |
| | | | | | | | |
| | | | | | | | | | | | | | | | | | | | | | | | | | | | | | | | | | |
| | 3,018,652 | | | | 1,382 | | | | — | | | | 436,463 | | | | 1,768 | | | | 341,166 | | | | 16,934 | | | | 316,614 | | | | 1,094 | |
| | — | | | | — | | | | — | | | | — | | | | 1,078 | | | | — | | | | — | | | | — | | | | — | |
| | | | | | | | | | | | | | | | | | | | | | | | | | | | | | | | | | |
| | — | | | | — | | | | — | | | | — | | | | — | | | | 4,986,577 | | | | — | | | | — | | | | 5,101,700 | |
| | — | | | | — | | | | — | | | | — | | | | — | | | | 7,412,728 | | | | — | | | | — | | | | 1,871,847 | |
| | — | | | | — | | | | — | | | | — | | | | — | | | | 4,602,588 | | | | — | | | | — | | | | — | |
| | 38,228,959 | | | | — | | | | — | | | | — | | | | — | | | | — | | | | — | | | | 3,769,229 | | | | — | |
| | 1,413,265 | | | | 283 | | | | 279 | | | | 66,282 | | | | 391 | | | | 78,924 | | | | 763 | | | | 145,550 | | | | 136,658 | |
| | — | | | | — | | | | — | | | | 5,832 | | | | — | | | | 3,304 | | | | — | | | | — | | | | — | |
| | | | | | | | | | | | | | | | | | | | | | | | | | | | | | | | | | |
| | 42,660,876 | | | | 1,665 | | | | 279 | | | | 508,577 | | | | 3,237 | | | | 17,425,287 | | | | 17,697 | | | | 4,231,393 | | | | 7,111,299 | |
| | | | | | | | | | | | | | | | | | | | | | | | | | | | | | | | | | |
| $ | 6,451,014,796 | | | $ | 1,328,257 | | | $ | 1,322,083 | | | $ | 269,477,569 | | | $ | 1,587,095 | | | $ | 384,136,514 | | | $ | 3,535,429 | | | $ | 682,094,381 | | | $ | 651,821,082 | |
| | | | | | | | | | | | | | | | | | | | | | | | | | | | | | | | �� | | |
| | | | | | | | |
| | | | | | | | | | | | | | | | | | | | | | | | | | | | | | | | | | |
| $ | 6,507,612,180 | | | $ | 1,282,327 | | | $ | 1,359,200 | | | $ | 321,379,291 | | | $ | 3,293,516 | | | $ | 415,357,879 | | | $ | 5,180,810 | | | $ | 662,283,695 | | | $ | 620,854,295 | |
| | — | | | | 4,268 | | | | 2,987 | | | | 426,731 | | | | 15,012 | | | | 1,270,356 | | | | 18,540 | | | | 1,885,150 | | | | 1,239,452 | |
| | (273,358,385 | ) | | | (12,049 | ) | | | (62,388 | ) | | | (49,607,184 | ) | | | (1,785,638 | ) | | | (29,493,434 | ) | | | (1,607,026 | ) | | | (5,480,106 | ) | | | (6,924,478 | ) |
| | 216,761,001 | | | | 53,711 | | | | 22,284 | | | | (2,721,269 | ) | | | 64,205 | | | | (2,998,287 | ) | | | (56,895 | ) | | | 23,405,642 | | | | 36,651,813 | |
| | | | | | | | | | | | | | | | | | | | | | | | | | | | | | | | | | |
| $ | 6,451,014,796 | | | $ | 1,328,257 | | | $ | 1,322,083 | | | $ | 269,477,569 | | | $ | 1,587,095 | | | $ | 384,136,514 | | | $ | 3,535,429 | | | $ | 682,094,381 | | | $ | 651,821,082 | |
| | | | | | | | | | | | | | | | | | | | | | | | | | | | | | | | | | |
|
159,400,000 |
| | | 50,001 | | | | 50,001 | | | | 12,100,000 | | | | 100,000 | | | | 13,100,000 | | | | 150,000 | | | | 17,850,000 | | | | 17,200,000 | |
| $ | 40.47 | | | $ | 26.56 | | | $ | 26.44 | | | $ | 22.27 | | | $ | 15.87 | | | $ | 29.32 | | | $ | 23.57 | | | $ | 38.21 | | | $ | 37.90 | |
| | | | | | | | | | | | | | | | | | | | | | | | | | | | | | | | | | |
| $ | 40.50 | | | $ | 26.58 | | | $ | 26.45 | | | $ | 22.15 | | | $ | 15.84 | | | $ | 29.38 | | | $ | 23.51 | | | $ | 38.23 | | | $ | 37.93 | |
| | | | | | | | | | | | | | | | | | | | | | | | | | | | | | | | | | |
| $ | 6,230,920,475 | | | $ | 1,274,131 | | | $ | 1,298,868 | | | $ | 272,527,531 | | | $ | 1,493,888 | | | $ | 386,567,416 | | | $ | 3,589,773 | | | $ | 658,674,473 | | | $ | 614,881,093 | |
| | | | | | | | | | | | | | | | | | | | | | | | | | | | | | | | | | |
| $ | — | | | $ | — | | | $ | 386 | | | $ | — | | | $ | 31,695 | | | $ | 4,986,577 | | | $ | — | | | $ | — | | | $ | 5,126,690 | |
| | | | | | | | | | | | | | | | | | | | | | | | | | | | | | | | | | |
| $ | 6,230,920,475 | | | $ | 1,274,131 | | | $ | 1,299,254 | | | $ | 272,527,531 | | | $ | 1,525,583 | | | $ | 391,553,993 | | | $ | 3,589,773 | | | $ | 658,674,473 | | | $ | 620,007,783 | |
| | | | | | | | | | | | | | | | | | | | | | | | | | | | | | | | | | |
| $ | — | | | $ | — | | | $ | — | | | $ | 7,455 | | | $ | (1,106 | ) | | $ | 146,807 | | | $ | 3,447 | | | $ | — | | | $ | — | |
| | | | | | | | | | | | | | | | | | | | | | | | | | | | | | | | | | |
| $ | — | | | $ | — | | | $ | — | | | $ | — | | | $ | — | | | $ | 4,754,425 | | | $ | — | | | $ | — | | | $ | 5,056,805 | |
| | | | | | | | | | | | | | | | | | | | | | | | | | | | | | | | | | |
Statements of Operations
For the year ended October 31, 2016
| | | | | | | | | | | | | | | | | | | | |
| | | PowerShares FTSE
International Low
Beta Equal Weight
Portfolio (IDLB)(a) | | | PowerShares
Russell 1000 Low
Beta Equal Weight
Portfolio (USLB)(b) | | | PowerShares
S&P 500®
ex-Rate Sensitive
Low Volatility
Portfolio (XRLV) | | | PowerShares
S&P 500®
High Beta
Portfolio (SPHB) | | | PowerShares
S&P 500®
High Dividend
Low Volatility
Portfolio (SPHD) | |
| Investment Income: | | | | | | | | | | | | | | | | | | | | |
Unaffiliated dividend income | | $ | 3,619,407 | | | $ | 2,377,928 | | | $ | 2,507,395 | | | $ | 1,751,768 | | | $ | 58,250,648 | |
Affiliated dividend income | | | 233 | | | | 278 | | | | 76 | | | | 27,849 | | | | 2,608 | |
Securities lending income | | | 485 | | | | — | | | | — | | | | — | | | | — | |
Foreign withholding tax | | | (378,553 | ) | | | (569 | ) | | | — | | | | — | | | | — | |
| | | | | | | | | | | | | | | | | | | | |
Total Income | | | 3,241,572 | | | | 2,377,637 | | | | 2,507,471 | | | | 1,779,617 | | | | 58,253,256 | |
| | | | | | | | | | | | | | | | | | | | |
| | | | | |
| Expenses: | | | | | | | | | | | | | | | | | | | | |
Unitary management fees | | | 544,675 | | | | 410,751 | | | | 329,829 | | | | 291,389 | | | | 4,623,502 | |
Professional fees | | | — | | | | — | | | | — | | | | — | | | | — | |
| | | | | | | | | | | | | | | | | | | | |
Total Expenses | | | 544,675 | | | | 410,751 | | | | 329,829 | | | | 291,389 | | | | 4,623,502 | |
| | | | | | | | | | | | | | | | | | | | |
Less: Waivers | | | (131 | ) | | | (144 | ) | | | (41 | ) | | | (51 | ) | | | (1,493 | ) |
| | | | | | | | | | | | | | | | | | | | |
Net Expenses | | | 544,544 | | | | 410,607 | | | | 329,788 | | | | 291,338 | | | | 4,622,009 | |
| | | | | | | | | | | | | | | | | | | | |
Net Investment Income | | | 2,697,028 | | | | 1,967,030 | | | | 2,177,683 | | | | 1,488,279 | | | | 53,631,247 | |
| | | | | | | | | | | | | | | | | | | | |
| | | | | |
| Realized and Unrealized Gain (Loss): | | | | | | | | | | | | | | | | | | | | |
Net realized gain (loss) from: | | | | | | | | | | | | | | | | | | | | |
Investment securities | | | (2,193,495 | ) | | | (8,733,356 | ) | | | (4,034,006 | ) | | | (15,713,444 | ) | | | (20,170,953 | ) |
In-kind redemptions | | | 2,505,294 | | | | 5,796,961 | | | | 6,277,150 | | | | 6,028,896 | | | | 130,265,334 | |
Foreign currencies | | | 69,226 | | | | — | | | | — | | | | — | | | | — | |
| | | | | | | | | | | | | | | | | | | | |
Net realized gain (loss) | | | 381,025 | | | | (2,936,395 | ) | | | 2,243,144 | | | | (9,684,548 | ) | | | 110,094,381 | |
| | | | | | | | | | | | | | | | | | | | |
Change in net unrealized appreciation (depreciation) on: | | | | | | | | | | | | | | | | | | | | |
Investment securities | | | 378,855 | | | | 4,242,599 | | | | 2,922,337 | | | | 3,338,974 | | | | 5,606,532 | |
Foreign currencies | | | (9,980 | ) | | | — | | | | — | | | | — | | | | — | |
| | | | | | | | | | | | | | | | | | | | |
Net change in unrealized appreciation (depreciation) | | | 368,875 | | | | 4,242,599 | | | | 2,922,337 | | | | 3,338,974 | | | | 5,606,532 | |
| | | | | | | | | | | | | | | | | | | | |
Net realized and unrealized gain (loss) | | | 749,900 | | | | 1,306,204 | | | | 5,165,481 | | | | (6,345,574 | ) | | | 115,700,913 | |
| | | | | | | | | | | | | | | | | | | | |
Net increase (decrease) in net assets resulting from operations | | $ | 3,446,928 | | | $ | 3,273,234 | | | $ | 7,343,164 | | | $ | (4,857,295 | ) | | $ | 169,332,160 | |
| | | | | | | | | | | | | | | | | | | | |
| (a) | For the period November 4, 2015 (commencement of investment operations) through October 31, 2016. |
| (b) | For the period November 2, 2015 (commencement of investment operations) through October 31, 2016. |
See accompanying Notes to Financial Statements which are an integral part of the financial statements.
| | | | | | | | | | | | | | | | | | | | | | | | | | | | | | | | | | |
PowerShares
S&P 500®
Low Volatility
Portfolio (SPLV) | | | PowerShares
S&P 500
Momentum
Portfolio (SPMO) | | | PowerShares
S&P 500 Value
Portfolio (SPVU) | | | PowerShares
S&P Emerging
Markets
Low Volatility
Portfolio (EELV) | | | PowerShares
S&P Emerging
Markets
Momentum
Portfolio (EEMO) | | | PowerShares
S&P International
Developed
Low Volatility
Portfolio (IDLV) | | | PowerShares
S&P International
Developed
Momentum
Portfolio (IDMO) | | | PowerShares
S&P MidCap
Low Volatility
Portfolio (XMLV) | | | PowerShares
S&P SmallCap
Low Volatility
Portfolio (XSLV) | |
| | | | | | | | | | | | | | | | | | | | | | | | | | | | | | | | | | |
| $ | 148,924,054 | | | $ | 39,370 | | | $ | 57,057 | | | $ | 6,351,892 | | | $ | 27,736 | | | $ | 10,504,905 | | | $ | 94,237 | | | $ | 8,265,675 | | | $ | 8,543,185 | |
| | 5,928 | | | | 3 | | | | 11 | | | | 1,370 | | | | 277 | | | | 562 | | | | 27 | | | | 543 | | | | 509 | |
| | — | | | | — | | | | — | | | | — | | | | — | | | | 205,338 | | | | — | | | | — | | | | 26,601 | |
| | — | | | | — | | | | — | | | | (901,723 | ) | | | (2,163 | ) | | | (741,223 | ) | | | (8,761 | ) | | | — | | | | — | |
| | | | | | | | | | | | | | | | | | | | | | | | | | | | | | | | | | |
| | 148,929,982 | | | | 39,373 | | | | 57,068 | | | | 5,451,539 | | | | 25,850 | | | | 9,969,582 | | | | 85,503 | | | | 8,266,218 | | | | 8,570,295 | |
| | | | | | | | | | | | | | | | | | | | | | | | | | | | | | | | | | |
| | | | | | | | |
| | | | | | | | | | | | | | | | | | | | | | | | | | | | | | | | | | |
| | 16,402,462 | | | | 5,321 | | | | 5,128 | | | | 848,555 | | | | 6,776 | | | | 974,715 | | | | 12,541 | | | | 980,077 | | | | 892,856 | |
| | — | | | | — | | | | — | | | | — | | | | — | | | | 3,843 | | | | 351 | | | | — | | | | — | |
| | | | | | | | | | | | | | | | | | | | | | | | | | | | | | | | | | |
| | 16,402,462 | | | | 5,321 | | | | 5,128 | | | | 848,555 | | | | 6,776 | | | | 978,558 | | | | 12,892 | | | | 980,077 | | | | 892,856 | |
| | | | | | | | | | | | | | | | | | | | | | | | | | | | | | | | | | |
| | (3,434 | ) | | | (2 | ) | | | (6 | ) | | | (302,181 | ) | | | (2,572 | ) | | | (278,742 | ) | | | (3,614 | ) | | | (297 | ) | | | (271 | ) |
| | | | | | | | | | | | | | | | | | | | | | | | | | | | | | | | | | |
| | 16,399,028 | | | | 5,319 | | | | 5,122 | | | | 546,374 | | | | 4,204 | | | | 699,816 | | | | 9,278 | | | | 979,780 | | | | 892,585 | |
| | | | | | | | | | | | | | | | | | | | | | | | | | | | | | | | | | |
| | 132,530,954 | | | | 34,054 | | | | 51,946 | | | | 4,905,165 | | | | 21,646 | | | | 9,269,766 | | | | 76,225 | | | | 7,286,438 | | | | 7,677,710 | |
| | | | | | | | | | | | | | | | | | | | | | | | | | | | | | | | | | |
| | | | | | | | |
| | | | | | | | | | | | | | | | | | | | | | | | | | | | | | | | | | |
| | | | | | | | | | | | | | | | | | | | | | | | | | | | | | | | | | |
| | (163,359,537 | ) | | | (16,256 | ) | | | (139,129 | ) | | | (18,160,564 | ) | | | (494,016 | ) | | | (16,329,341 | ) | | | (952,684 | ) | | | (3,569,273 | ) | | | (4,786,676 | ) |
| | 565,461,465 | | | | 123,054 | | | | 140,193 | | | | (1,783,049 | ) | | | — | | | | (3,006,080 | ) | | | — | | | | 19,440,513 | | | | 16,667,242 | |
| | — | | | | — | | | | — | | | | (313,138 | ) | | | (827 | ) | | | (223,388 | ) | | | (4,074 | ) | | | — | | | | — | |
| | | | | | | | | | | | | | | | | | | | | | | | | | | | | | | | | | |
| | 402,101,928 | | | | 106,798 | | | | 1,064 | | | | (20,256,751 | ) | | | (494,843 | ) | | | (19,558,809 | ) | | | (956,758 | ) | | | 15,871,240 | | | | 11,880,566 | |
| | | | | | | | | | | | | | | | | | | | | | | | | | | | | | | | | | |
| | | | | | | | | | | | | | | | | | | | | | | | | | | | | | | | | | |
| | (63,587,546 | ) | | | (87,049 | ) | | | (50,556 | ) | | | 17,686,519 | | | | 471,876 | | | | 9,633,237 | | | | 612,700 | | | | 17,799,553 | | | | 30,269,530 | |
| | — | | | | — | | | | — | | | | 92 | | | | 579 | | | | (9,374 | ) | | | (336 | ) | | | — | | | | — | |
| | | | | | | | | | | | | | | | | | | | | | | | | | | | | | | | | | |
| | (63,587,546 | ) | | | (87,049 | ) | | | (50,556 | ) | | | 17,686,611 | | | | 472,455 | | | | 9,623,863 | | | | 612,364 | | | | 17,799,553 | | | | 30,269,530 | |
| | | | | | | | | | | | | | | | | | | | | | | | | | | | | | | | | | |
| | 338,514,382 | | | | 19,749 | | | | (49,492 | ) | | | (2,570,140 | ) | | | (22,388 | ) | | | (9,934,946 | ) | | | (344,394 | ) | | | 33,670,793 | | | | 42,150,096 | |
| | | | | | | | | | | | | | | | | | | | | | | | | | | | | | | | | | |
$ |
471,045,336 |
| | $ | 53,803 | | | $ | 2,454 | | | $ | 2,335,025 | | | $ | (742 | ) | | $ | (665,180 | ) | | $ | (268,169 | ) | | $ | 40,957,231 | | | $ | 49,827,806 | |
| | | | | | | | | | | | | | | | | | | | | | | | | | | | | | | | | | |
Statements of Changes in Net Assets
For the years ended October 31, 2016 and 2015
| | | | | | | | | | | | | | | | |
| | | PowerShares FTSE
International Low
Beta Equal Weight
Portfolio (IDLB) | | | PowerShares
Russell 1000 Low
Beta Equal Weight
Portfolio (USLB) | | | PowerShares S&P 500®
ex-Rate Sensitive Low Volatility
Portfolio (XRLV) | |
| | | 2016(a) | | | 2016(b) | | | 2016 | | | 2015(c) | |
| Operations: | | | | | | | | | | | | | | | | |
Net investment income | | $ | 2,697,028 | | | $ | 1,967,030 | | | $ | 2,177,683 | | | $ | 585,447 | |
Net realized gain (loss) | | | 381,025 | | | | (2,936,395 | ) | | | 2,243,144 | | | | (706,250 | ) |
Net change in unrealized appreciation (depreciation) | | | 368,875 | | | | 4,242,599 | | | | 2,922,337 | | | | 974,204 | |
| | | | | | | | | | | | | | | | |
Net increase (decrease) in net assets resulting from operations | | | 3,446,928 | | | | 3,273,234 | | | | 7,343,164 | | | | 853,401 | |
| | | | | | | | | | | | | | | | |
| | | | |
| Distributions to Shareholders from: | | | | | | | | | | | | | | | | |
Net investment income | | | (2,208,386 | ) | | | (1,664,363 | ) | | | (2,230,409 | ) | | | (585,447 | ) |
Return of capital | | | — | | | | — | | | | — | | | | (10,253 | ) |
| | | | | | | | | | | | | | | | |
Total distributions to shareholders | | | (2,208,386 | ) | | | (1,664,363 | ) | | | (2,230,409 | ) | | | (595,700 | ) |
| | | | | | | | | | | | | | | | |
| | | | |
| Shareholder Transactions: | | | | | | | | | | | | | | | | |
Proceeds from shares sold | | | 160,658,954 | | | | 186,748,265 | | | | 107,507,979 | | | | 118,619,572 | |
Value of shares repurchased | | | (15,100,655 | ) | | | (49,653,366 | ) | | | (55,983,273 | ) | | | (11,092,079 | ) |
Transaction fees | | | — | | | | — | | | | — | | | | — | |
| | | | | | | | | | | | | | | | |
Net increase (decrease) in net assets resulting from shares transactions | | | 145,558,299 | | | | 137,094,899 | | | | 51,524,706 | | | | 107,527,493 | |
| | | | | | | | | | | | | | | | |
Increase (Decrease) in Net Assets | | | 146,796,841 | | | | 138,703,770 | | | | 56,637,461 | | | | 107,785,194 | |
| | | | | | | | | | | | | | | | |
| | | | |
| Net Assets: | | | | | | | | | | | | | | | | |
Beginning of year | | | — | | | | — | | | | 107,785,194 | | | | — | |
| | | | | | | | | | | | | | | | |
End of year | | $ | 146,796,841 | | | $ | 138,703,770 | | | $ | 164,422,655 | | | $ | 107,785,194 | |
| | | | | | | | | | | | | | | | |
Undistributed net investment income at end of year | | $ | 557,868 | | | $ | 302,667 | | | $ | — | | | $ | — | |
| | | | | | | | | | | | | | | | |
| | | | |
| Changes in Shares Outstanding: | | | | | | | | | | | | | | | | |
Shares sold | | | 6,450,001 | | | | 7,300,001 | | | | 4,000,000 | | | | 4,700,001 | |
Shares repurchased | | | (600,000 | ) | | | (1,950,000 | ) | | | (2,100,000 | ) | | | (450,000 | ) |
Shares outstanding, beginning of year | | | — | | | | — | | | | 4,250,001 | | | | – | |
| | | | | | | | | | | | | | | | |
Shares outstanding, end of year | | | 5,850,001 | | | | 5,350,001 | | | | 6,150,001 | | | | 4,250,001 | |
| | | | | | | | | | | | | | | | |
| (a) | For the period November 4, 2015 (commencement of investment operations) through October 31, 2016. |
| (b) | For the period November 2, 2015 (commencement of investment operations) through October 31, 2016. |
| (c) | For the period April 6, 2015 (commencement of investment operations) through October 31, 2015. |
| (d) | For the period October 6, 2015 (commencement of investment operations) through October 31, 2015. |
See accompanying Notes to Financial Statements which are an integral part of the financial statements.
| | | | | | | | | | | | | | | | | | | | | | | | | | | | | | |
PowerShares S&P 500®
High Beta
Portfolio (SPHB) | | | PowerShares S&P 500®
High Dividend Low Volatility
Portfolio (SPHD) | | | PowerShares S&P 500®
Low Volatility
Portfolio (SPLV) | | | PowerShares
S&P 500 Momentum
Portfolio (SPMO) | |
| 2016 | | | 2015 | | | 2016 | | | 2015 | | | 2016 | | | 2015 | | | 2016 | | | 2015(d) | |
| | | | | | | | | | | | | | | | | | | | | | | | | | | | | | |
| $ | 1,488,279 | | | $ | 2,424,834 | | | $ | 53,631,247 | | | $ | 15,699,548 | | | $ | 132,530,954 | | | $ | 113,409,079 | | | $ | 34,054 | | | $ | 1,101 | |
| | (9,684,548 | ) | | | 10,507,637 | | | | 110,094,381 | | | | 29,997,961 | | | | 402,101,928 | | | | 390,535,775 | | | | 106,798 | | | | (185 | ) |
| | 3,338,974 | | | | (23,077,407 | ) | | | 5,606,532 | | | | (21,770,244 | ) | | | (63,587,546 | ) | | | (187,322,549 | ) | | | (87,049 | ) | | | 140,760 | |
| | | | | | | | | | | | | | | | | | | | | | | | | | | | | | |
| | (4,857,295 | ) | | | (10,144,936 | ) | | | 169,332,160 | | | | 23,927,265 | | | | 471,045,336 | | | | 316,622,305 | | | | 53,803 | | | | 141,676 | |
| | | | | | | | | | | | | | | | | | | | | | | | | | | | | | |
| | | | | | | |
| | | | | | | | | | | | | | | | | | | | | | | | | | | | | | |
| | (1,082,016 | ) | | | (2,644,196 | ) | | | (55,786,559 | ) | | | (16,582,835 | ) | | | (136,098,330 | ) | | | (121,208,205 | ) | | | (30,887 | ) | | | — | |
| | — | | | | — | | | | — | | | | — | | | | — | | | | — | | | | — | | | | — | |
| | | | | | | | | | | | | | | | | | | | | | | | | | | | | | |
| | (1,082,016 | ) | | | (2,644,196 | ) | | | (55,786,559 | ) | | | (16,582,835 | ) | | | (136,098,330 | ) | | | (121,208,205 | ) | | | (30,887 | ) | | | — | |
| | | | | | | | | | | | | | | | | | | | | | | | | | | | | | |
| | | | | | | |
| | | | | | | | | | | | | | | | | | | | | | | | | | | | | | |
| | 558,099,509 | | | | 332,013,112 | | | | 2,961,903,602 | | | | 675,772,284 | | | | 5,898,583,249 | | | | 4,162,771,118 | | | | 1,268,358 | | | | 2,464,719 | |
| | (142,980,317 | ) | | | (472,366,099 | ) | | | (990,198,392 | ) | | | (355,459,484 | ) | | | (4,833,748,058 | ) | | | (3,805,469,077 | ) | | | (2,569,412 | ) | | | — | |
| | — | | | | — | | | | — | | | | — | | | | — | | | | — | | | | — | | | | — | |
| | | | | | | | | | | | | | | | | | | | | | | | | | | | | | |
|
415,119,192 |
| | | (140,352,987 | ) | | | 1,971,705,210 | | | | 320,312,800 | | | | 1,064,835,191 | | | | 357,302,041 | | | | (1,301,054 | ) | | | 2,464,719 | �� |
| | | | | | | | | | | | | | | | | | | | | | | | | | | | | | |
| | 409,179,881 | | | | (153,142,119 | ) | | | 2,085,250,811 | | | | 327,657,230 | | | | 1,399,782,197 | | | | 552,716,141 | | | | (1,278,138 | ) | | | 2,606,395 | |
| | | | | | | | | | | | | | | | | | | | | | | | | | | | | | |
| | | | | | | |
| | | | | | | | | | | | | | | | | | | | | | | | | | | | | | |
| | 80,024,544 | | | | 233,166,663 | | | | 538,179,847 | | | | 210,522,617 | | | | 5,051,232,599 | | | | 4,498,516,458 | | | | 2,606,395 | | | | — | |
| | | | | | | | | | | | | | | | | | | | | | | | | | | | | | |
| $ | 489,204,425 | | | $ | 80,024,544 | | | $ | 2,623,430,658 | | | $ | 538,179,847 | | | $ | 6,451,014,796 | | | $ | 5,051,232,599 | | | $ | 1,328,257 | | | $ | 2,606,395 | |
| | | | | | | | | | | | | | | | | | | | | | | | | | | | | | |
| $ | 566,758 | | | $ | 160,495 | | | $ | — | | | $ | — | | | $ | — | | | $ | — | | | $ | 4,268 | | | $ | 1,101 | |
| | | | | | | | | | | | | | | | | | | | | | | | | | | | | | |
| | | | | | | |
| | | | | | | | | | | | | | | | | | | | | | | | | | | | | | |
| | 17,450,000 | | | | 9,600,000 | | | | 79,800,000 | | | | 20,600,000 | | | | 148,200,000 | | | | 110,250,000 | | | | 50,000 | | | | 100,001 | |
| | (4,850,000 | ) | | | (13,900,000 | ) | | | (26,400,000 | ) | | | (10,950,000 | ) | | | (120,550,000 | ) | | | (101,400,000 | ) | | | (100,000 | ) | | | — | |
| | 2,550,000 | | | | 6,850,000 | | | | 16,200,000 | | | | 6,550,000 | | | | 131,750,000 | | | | 122,900,000 | | | | 100,001 | | | | — | |
| | | | | | | | | | | | | | | | | | | | | | | | | | | | | | |
| | 15,150,000 | | | | 2,550,000 | | | | 69,600,000 | | | | 16,200,000 | | | | 159,400,000 | | | | 131,750,000 | | | | 50,001 | | | | 100,001 | |
| | | | | | | | | | | | | | | | | | | | | | | | | | | | | | |
Statements of Changes in Net Assets (continued)
For the years ended October 31, 2016 and 2015
| | | | | | | | | | | | | | | | | | | | | | | | |
| | | PowerShares S&P 500 Value
Portfolio (SPVU) | | | PowerShares S&P Emerging
Markets Low Volatility
Portfolio (EELV) | | | PowerShares S&P Emerging
Markets Momentum
Portfolio (EEMO) | |
| | | 2016 | | | 2015(a) | | | 2016 | | | 2015 | | | 2016 | | | 2015 | |
| Operations: | | | | | | | | | | | | | | | | | | | | | | | | |
Net investment income | | $ | 51,946 | | | $ | 1,021 | | | $ | 4,905,165 | | | $ | 6,176,994 | | | $ | 21,646 | | | $ | 108,080 | |
Net realized gain (loss) | | | 1,064 | | | | (84 | ) | | | (20,256,751 | ) | | | (25,328,336 | ) | | | (494,843 | ) | | | (1,101,118 | ) |
Net change in unrealized appreciation (depreciation) | | | (50,556 | ) | | | 72,840 | | | | 17,686,611 | | | | (21,373,299 | ) | | | 472,455 | | | | (114,809 | ) |
| | | | | | | | | | | | | | | | | | | | | | | | |
Net increase (decrease) in net assets resulting from operations | | | 2,454 | | | | 73,777 | | | | 2,335,025 | | | | (40,524,641 | ) | | | (742 | ) | | | (1,107,847 | ) |
| | | | | | | | | | | | | | | | | | | | | | | | |
| | | | | | |
| Distributions to Shareholders from: | | | | | | | | | | | | | | | | | | | | | | | | |
Net investment income | | | (50,033 | ) | | | — | | | | (4,568,384 | ) | | | (5,829,953 | ) | | | (32,105 | ) | | | (94,542 | ) |
Return of capital | | | — | | | | — | | | | — | | | | — | | | | — | | | | — | |
| | | | | | | | | | | | | | | | | | | | | | | | |
Total distributions to shareholders | | | (50,033 | ) | | | — | | | | (4,568,384 | ) | | | (5,829,953 | ) | | | (32,105 | ) | | | (94,542 | ) |
| | | | | | | | | | | | | | | | | | | | | | | | |
| | | | | | |
| Shareholder Transactions: | | | | | | | | | | | | | | | | | | | | | | | | |
Proceeds from shares sold | | | 2,493,761 | | | | 2,504,269 | | | | 127,771,866 | | | | 33,644,866 | | | | — | | | | 2,119,862 | |
Value of shares repurchased | | | (3,702,145 | ) | | | — | | | | (32,435,110 | ) | | | (49,293,311 | ) | | | — | | | | (5,807,510 | ) |
Transaction fees | | | — | | | | — | | | | 129,925 | | | | 151,175 | | | | — | | | | — | |
| | | | | | | | | | | | | | | | | | | | | | | | |
Net increase (decrease) in net assets resulting from shares transactions | | | (1,208,384 | ) | | | 2,504,269 | | | | 95,466,681 | | | | (15,497,270 | ) | | | — | | | | (3,687,648 | ) |
| | | | | | | | | | | | | | | | | | | | | | | | |
Increase (Decrease) in Net Assets | | | (1,255,963 | ) | | | 2,578,046 | | | | 93,233,322 | | | | (61,851,864 | ) | | | (32,847 | ) | | | (4,890,037 | ) |
| | | | | | | | | | | | | | | | | | | | | | | | |
| | | | | | |
| Net Assets: | | | | | | | | | | | | | | | | | | | | | | | | |
Beginning of year | | | 2,578,046 | | | | — | | | | 176,244,247 | | | | 238,096,111 | | | | 1,619,942 | | | | 6,509,979 | |
| | | | | | | | | | | | | | | | | | | | | | | | |
End of year | | $ | 1,322,083 | | | $ | 2,578,046 | | | $ | 269,477,569 | | | $ | 176,244,247 | | | $ | 1,587,095 | | | $ | 1,619,942 | |
| | | | | | | | | | | | | | | | | | | | | | | | |
Undistributed net investment income at end of year | | $ | 2,987 | | | $ | 1,021 | | | $ | 426,731 | | | $ | 362,848 | | | $ | 15,012 | | | $ | 24,089 | |
| | | | | | | | | | | | | | | | | | | | | | | | |
| | | | | | |
| Changes in Shares Outstanding: | | | | | | | | | | | | | | | | | | | | | | | | |
Shares sold | | | 100,000 | | | | 100,001 | | | | 5,750,000 | | | | 1,300,000 | | | | — | | | | 100,000 | |
Shares repurchased | | | (150,000 | ) | | | — | | | | (1,550,000 | ) | | | (2,100,000 | ) | | | — | | | | (300,000 | ) |
Shares outstanding, beginning of year | | | 100,001 | | | | — | | | | 7,900,000 | | | | 8,700,000 | | | | 100,000 | | | | 300,000 | |
| | | | | | | | | | | | | | | | | | | | | | | | |
Shares outstanding, end of year | | | 50,001 | | | | 100,001 | | | | 12,100,000 | | | | 7,900,000 | | | | 100,000 | | | | 100,000 | |
| | | | | | | | | | | | | | | | | | | | | | | | |
| (a) | For the period October 6, 2015 (commencement of investment operations) through October 31, 2015. |
See accompanying Notes to Financial Statements which are an integral part of the financial statements.
| | | | | | | | | | | | | | | | | | | | | | | | | | | | | | |
PowerShares S&P International
Developed Low Volatility
Portfolio (IDLV) | | | PowerShares S&P International
Developed Momentum
Portfolio (IDMO) | | | PowerShares S&P MidCap
Low Volatility
Portfolio (XMLV) | | | PowerShares S&P SmallCap
Low Volatility
Portfolio (XSLV) | |
| 2016 | | | 2015 | | | 2016 | | | 2015 | | | 2016 | | | 2015 | | | 2016 | | | 2015 | |
| | | | | | | | | | | | | | | | | | | | | | | | | | | | | | |
| $ | 9,269,766 | | | $ | 10,392,975 | | | $ | 76,225 | | | $ | 183,233 | | | $ | 7,286,438 | | | $ | 1,689,636 | | | $ | 7,677,710 | | | $ | 1,957,382 | |
| | (19,558,809 | ) | | | (7,865,771 | ) | | | (956,758 | ) | | | (593,817 | ) | | | 15,871,240 | | | | 2,741,502 | | | | 11,880,566 | | | | 1,211,827 | |
|
9,623,863 |
| | | (13,960,067 | ) | | | 612,364 | | | | (333,420 | ) | | | 17,799,553 | | | | 2,324,716 | | | | 30,269,530 | | | | 2,581,765 | |
| | | | | | | | | | | | | | | | | | | | | | | | | | | | | | |
| (665,180 | ) | | | (11,432,863 | ) | | | (268,169 | ) | | | (744,004 | ) | | | 40,957,231 | | | | 6,755,854 | | | | 49,827,806 | | | | 5,750,974 | |
| | | | | | | | | | | | | | | | | | | | | | | | | | | | | | |
| | | | | | | |
| | | | | | | | | | | | | | | | | | | | | | | | | | | | | | |
| | (9,700,064 | ) | | | (9,605,676 | ) | | | (73,374 | ) | | | (166,413 | ) | | | (5,648,124 | ) | | | (1,549,096 | ) | | | (6,839,137 | ) | | | (1,805,010 | ) |
| | — | | | | — | | | | — | | | | — | | | | — | | | | — | | | | — | | | | — | |
| | | | | | | | | | | | | | | | | | | | | | | | | | | | | | |
| | (9,700,064 | ) | | | (9,605,676 | ) | | | (73,374 | ) | | | (166,413 | ) | | | (5,648,124 | ) | | | (1,549,096 | ) | | | (6,839,137 | ) | | | (1,805,010 | ) |
| | | | | | | | | | | | | | | | | | | | | | | | | | | | | | |
| | | | | | | |
| | | | | | | | | | | | | | | | | | | | | | | | | | | | | | |
| | 207,958,509 | | | | 132,799,559 | | | | — | | | | 8,879,956 | | | | 690,631,478 | | | | 93,686,053 | | | | 604,177,339 | | | | 101,767,030 | |
| | (126,884,811 | ) | | | (61,879,387 | ) | | | — | | | | (11,028,998 | ) | | | (150,411,608 | ) | | | (36,873,605 | ) | | | (122,270,444 | ) | | | (34,772,156 | ) |
| | — | | | | — | | | | — | | | | — | | | | — | | | | — | | | | — | | | | — | |
| | | | | | | | | | | | | | | | | | | | | | | | | | | | | | |
|
81,073,698 |
| | | 70,920,172 | | | | — | | | | (2,149,042 | ) | | | 540,219,870 | | | | 56,812,448 | | | | 481,906,895 | | | | 66,994,874 | |
| | | | | | | | | | | | | | | | | | | | | | | | | | | | | | |
| | 70,708,454 | | | | 49,881,633 | | | | (341,543 | ) | | | (3,059,459 | ) | | | 575,528,977 | | | | 62,019,206 | | | | 524,895,564 | | | | 70,940,838 | |
| | | | | | | | | | | | | | | | | | | | | | | | | | | | | | |
| | | | | | | |
| | | | | | | | | | | | | | | | | | | | | | | | | | | | | | |
| | 313,428,060 | | | | 263,546,427 | | | | 3,876,972 | | | | 6,936,431 | | | | 106,565,404 | | | | 44,546,198 | | | | 126,925,518 | | | | 55,984,680 | |
| | | | | | | | | | | | | | | | | | | | | | | | | | | | | | |
| $ | 384,136,514 | | | $ | 313,428,060 | | | $ | 3,535,429 | | | $ | 3,876,972 | | | $ | 682,094,381 | | | $ | 106,565,404 | | | $ | 651,821,082 | | | $ | 126,925,518 | |
| | | | | | | | | | | | | | | | | | | | | | | | | | | | | | |
| $ | 1,270,356 | | | $ | 1,654,038 | | | $ | 18,540 | | | $ | 19,495 | | | $ | 1,885,150 | | | $ | 246,836 | | | $ | 1,239,452 | | | $ | 400,879 | |
| | | | | | | | | | | | | | | | | | | | | | | | | | | | | | |
| | | | | | | |
| | | | | | | | | | | | | | | | | | | | | | | | | | | | | | |
| | 7,000,000 | | | | 4,200,000 | | | | — | | | | 300,000 | | | | 18,800,000 | | | | 2,800,000 | | | | 16,850,000 | | | | 3,050,000 | |
| | (4,350,000 | ) | | | (2,050,000 | ) | | | — | | | | (400,001 | ) | | | (4,050,000 | ) | | | (1,100,000 | ) | | | (3,350,000 | ) | | | (1,050,000 | ) |
| | 10,450,000 | | | | 8,300,000 | | | | 150,000 | | | | 250,001 | | | | 3,100,000 | | | | 1,400,000 | | | | 3,700,000 | | | | 1,700,000 | |
| | | | | | | | | | | | | | | | | | | | | | | | | | | | | | |
| | 13,100,000 | | | | 10,450,000 | | | | 150,000 | | | | 150,000 | | | | 17,850,000 | | | | 3,100,000 | | | | 17,200,000 | | | | 3,700,000 | |
| | | | | | | | | | | | | | | | | | | | | | | | | | | | | | |
Financial Highlights
PowerShares FTSE International Low Beta Equal Weight Portfolio (IDLB)
| | | | |
| | | For the Period
November 4, 2015(a)
Through
October 31, 2016 | |
| | |
| Per Share Operating Performance: | | | | |
Net asset value at beginning of period | | $ | 24.92 | |
Net investment income(b) | | | 0.54 | |
Net realized and unrealized gain on investments | | | 0.03 | |
Total from investment operations | | | 0.57 | |
Distributions to shareholders from: | | | | |
Net investment income | | | (0.40 | ) |
Net asset value at end of period | | $ | 25.09 | |
Market price at end of period(c) | | $ | 25.20 | |
| Net Asset Value Total Return(d) | | | 2.33 | %(e) |
| Market Price Total Return(d) | | | 2.77 | %(e) |
| Ratios/Supplemental Data: | | | | |
Net assets at end of period (000’s omitted) | | $ | 146,797 | |
Ratio to average net assets of: | | | | |
Expenses | | | 0.45 | %(f) |
Net investment income | | | 2.22 | %(f) |
Portfolio turnover rate(g) | | | 59 | % |
| (a) | Commencement of investment operations. |
| (b) | Based on average shares outstanding. |
| (c) | The mean between the last bid and ask prices. |
| (d) | Net asset value total return is calculated assuming an initial investment made at the net asset value at the beginning of the period, reinvestment of all dividends and distributions at net asset value during the period, and redemption on the last day of the period. Net asset value total return includes adjustments in accordance with accounting principles generally accepted in the United States of America and as such, the net asset value for financial reporting purposes and the returns based upon those net asset values may differ from the net asset value and returns for shareholder transactions. Market price total return is calculated assuming an initial investment made at the market price at the beginning of the period, reinvestment of all dividends and distributions at market price during the period, and the sale at the market price on the last day of the period. Total investment returns calculated for a period of less than one year are not annualized. |
| (e) | The net asset value total return from Fund Inception (November 5, 2015, the first day of trading on the exchange) to October 31, 2016 was 2.17%. The market price total return from Fund Inception to October 31, 2016 was 2.16%. |
| (g) | Portfolio turnover rate is not annualized for periods less than one year, if applicable, and does not include securities received or delivered from processing creations or redemptions. |
See accompanying Notes to Financial Statements which are an integral part of the financial statements.
Financial Highlights (continued)
PowerShares Russell 1000 Low Beta Equal Weight Portfolio (USLB)
| | | | |
| | | For the Period
November 2, 2015(a)
Through
October 31, 2016 | |
| | |
| Per Share Operating Performance: | | | | |
Net asset value at beginning of period | | $ | 25.31 | |
Net investment income(b) | | | 0.42 | |
Net realized and unrealized gain on investments | | | 0.53 | |
Total from investment operations | | | 0.95 | |
Distributions to shareholders from: | | | | |
Net investment income | | | (0.33 | ) |
Net asset value at end of period | | $ | 25.93 | |
Market price at end of period(c) | | $ | 25.95 | |
| Net Asset Value Total Return(d) | | | 3.78 | %(e) |
| Market Price Total Return(d) | | | 3.86 | %(e) |
| Ratios/Supplemental Data: | | | | |
Net assets at end of period (000’s omitted) | | $ | 138,704 | |
Ratio to average net assets of: | | | | |
Expenses | | | 0.35 | %(f) |
Net investment income | | | 1.66 | %(f) |
Portfolio turnover rate(g) | | | 118 | % |
| (a) | Commencement of investment operations. |
| (b) | Based on average shares outstanding. |
| (c) | The mean between the last bid and ask prices. |
| (d) | Net asset value total return is calculated assuming an initial investment made at the net asset value at the beginning of the period, reinvestment of all dividends and distributions at net asset value during the period, and redemption on the last day of the period. Net asset value total return includes adjustments in accordance with accounting principles generally accepted in the United States of America and as such, the net asset value for financial reporting purposes and the returns based upon those net asset values may differ from the net asset value and returns for shareholder transactions. Market price total return is calculated assuming an initial investment made at the market price at the beginning of the period, reinvestment of all dividends and distributions at market price during the period, and the sale at the market price on the last day of the period. Total investment returns calculated for a period of less than one year are not annualized. |
| (e) | The net asset value total return from Fund Inception (November 5, 2015, the first day of trading on the exchange) to October 31, 2016 was 4.19%. The market price total return from Fund Inception to October 31, 2016 was 4.15%. |
| (g) | Portfolio turnover rate is not annualized for periods less than one year, if applicable, and does not include securities received or delivered from processing creations or redemptions. |
See accompanying Notes to Financial Statements which are an integral part of the financial statements.
Financial Highlights (continued)
PowerShares S&P 500® ex-Rate Sensitive Low Volatility Portfolio (XRLV)
| | | | | | | | |
| | | Year Ended
October 31, 2016 | | | For the Period
April 6, 2015(a)
Through
October 31, 2015
| |
| | | |
| Per Share Operating Performance: | | | | | | | | |
Net asset value at beginning of period | | $ | 25.36 | | | $ | 25.14 | |
Net investment income(b) | | | 0.44 | | | | 0.23 | |
Net realized and unrealized gain on investments | | | 1.39 | | | | 0.18 | |
Total from investment operations | | | 1.83 | | | | 0.41 | |
Distributions to shareholders from: | | | | | | | | |
Net investment income | | | (0.45 | ) | | | (0.19 | ) |
Return of capital | | | — | | | | (0.00 | )(c) |
Total distributions | | | (0.45 | ) | | | (0.19 | ) |
Net asset value at end of period | | $ | 26.74 | | | $ | 25.36 | |
Market price at end of period(d) | | $ | 26.75 | | | $ | 25.42 | |
| Net Asset Value Total Return(e) | | | 7.29 | % | | | 1.62 | %(f) |
| Market Price Total Return(e) | | | 7.08 | % | | | 1.86 | %(f) |
| Ratios/Supplemental Data: | | | | | | | | |
Net assets at end of period (000’s omitted) | | $ | 164,423 | | | $ | 107,785 | |
Ratio to average net assets of: | | | | | | | | |
Expenses | | | 0.25 | % | | | 0.25 | %(g) |
Net investment income | | | 1.65 | % | | | 1.65 | %(g) |
Portfolio turnover rate(h) | | | 52 | % | | | 32 | % |
| (a) | Commencement of investment operations. |
| (b) | Based on average shares outstanding. |
| (c) | Amount represents less than $(0.005). |
| (d) | The mean between the last bid and ask prices. |
| (e) | Net asset value total return is calculated assuming an initial investment made at the net asset value at the beginning of the period, reinvestment of all dividends and distributions at net asset value during the period, and redemption on the last day of the period. Net asset value total return includes adjustments in accordance with accounting principles generally accepted in the United States of America and as such, the net asset value for financial reporting purposes and the returns based upon those net asset values may differ from the net asset value and returns for shareholder transactions. Market price total return is calculated assuming an initial investment made at the market price at the beginning of the period, reinvestment of all dividends and distributions at market price during the period, and the sale at the market price on the last day of the period. Total investment returns calculated for a period of less than one year are not annualized. |
| (f) | The net asset value total return from Fund Inception (April 9, 2015, the first day of trading on the exchange) to October 31, 2015 was 1.62%. The market price total return from Fund Inception to October 31, 2015 was 1.78%. |
| (h) | Portfolio turnover rate is not annualized for periods less than one year, if applicable, and does not include securities received or delivered from processing creations or redemptions. |
See accompanying Notes to Financial Statements which are an integral part of the financial statements.
Financial Highlights (continued)
PowerShares S&P 500® High Beta Portfolio (SPHB)
| | | | | | | | | | | | | | | | | | | | |
| | | Year Ended October 31, | |
| | | 2016 | | | 2015 | | | 2014 | | | 2013 | | | 2012 | |
| Per Share Operating Performance: | | | | | | | | | | | | | | | | | | | | |
Net asset value at beginning of year | | $ | 31.38 | | | $ | 34.04 | | | $ | 28.51 | | | $ | 20.42 | | | $ | 19.56 | |
Net investment income(a) | | | 0.39 | | | | 0.37 | | | | 0.29 | | | | 0.22 | | | | 0.19 | |
Net realized and unrealized gain (loss) on investments | | | 0.84 | | | | (2.58 | ) | | | 5.54 | | | | 8.08 | | | | 0.81 | (b) |
Total from investment operations | | | 1.23 | | | | (2.21 | ) | | | 5.83 | | | | 8.30 | | | | 1.00 | |
Distributions to shareholders from: | | | | | | | | | | | | | | | | | | | | |
Net investment income | | | (0.32 | ) | | | (0.45 | ) | | | (0.30 | ) | | | (0.21 | ) | | | (0.14 | ) |
Net asset value at end of year | | $ | 32.29 | | | $ | 31.38 | | | $ | 34.04 | | | $ | 28.51 | | | $ | 20.42 | |
Market price at end of year(c) | | $ | 32.32 | | | $ | 31.42 | | | $ | 34.05 | | | $ | 28.54 | | | $ | 20.41 | |
| Net Asset Value Total Return(d) | | | 4.02 | % | | | (6.56 | )% | | | 20.55 | % | | | 40.88 | % | | | 5.17 | % |
| Market Price Total Return(d) | | | 3.98 | % | | | (6.47 | )% | | | 20.47 | % | | | 41.10 | % | | | 5.01 | % |
| Ratios/Supplemental Data: | | | | | | | | | | | | | | | | | | | | |
Net assets at end of year (000’s omitted) | | $ | 489,204 | | | $ | 80,025 | | | $ | 233,167 | | | $ | 530,209 | | | $ | 108,208 | |
Ratio to average net assets of: | | | | | | | | | | | | | | | | | | | | |
Expenses | | | 0.25 | % | | | 0.25 | % | | | 0.25 | % | | | 0.25 | % | | | 0.25 | % |
Net investment income | | | 1.28 | % | | | 1.09 | % | | | 0.93 | % | | | 0.89 | % | | | 0.93 | % |
Portfolio turnover rate(e) | | | 55 | % | | | 90 | % | | | 78 | % | | | 65 | % | | | 31 | % |
| (a) | Based on average shares outstanding. |
| (b) | Due to timing of creations and redemptions of capital shares, the net realized and unrealized gain (loss) per share is not in accord with the Fund’s change in net realized and unrealized gain (loss) on investment securities and in-kind transactions for the period. |
| (c) | The mean between the last bid and ask prices. |
| (d) | Net asset value total return is calculated assuming an initial investment made at the net asset value at the beginning of the period, reinvestment of all dividends and distributions at net asset value during the period, and redemption on the last day of the period. Net asset value total return includes adjustments in accordance with accounting principles generally accepted in the United States of America and as such, the net asset value for financial reporting purposes and the returns based upon those net asset values may differ from the net asset value and returns for shareholder transactions. Market price total return is calculated assuming an initial investment made at the market price at the beginning of the period, reinvestment of all dividends and distributions at market price during the period, and the sale at the market price on the last day of the period. Total investment returns calculated for a period of less than one year are not annualized. |
| (e) | Portfolio turnover rate is not annualized for periods less than one year, if applicable, and does not include securities received or delivered from processing creations or redemptions. |
See accompanying Notes to Financial Statements which are an integral part of the financial statements.
Financial Highlights (continued)
PowerShares S&P 500® High Dividend Low Volatility Portfolio (SPHD)
| | | | | | | | | | | | | | | | | | | | |
| | | Year Ended October 31, | | | For the Period
October 12, 2012(a)
Through
October 31, 2012 | |
| | | 2016 | | | 2015 | | | 2014 | | | 2013 | | |
| Per Share Operating Performance: | | | | | | | | | | | | | | | | | | | | |
Net asset value at beginning of period | | $ | 33.22 | | | $ | 32.14 | | | $ | 28.36 | | | $ | 25.03 | | | $ | 25.00 | |
Net investment income(b) | | | 1.29 | | | | 1.10 | | | | 1.01 | | | | 0.98 | | | | 0.04 | |
Net realized and unrealized gain (loss) on investments | | | 4.51 | | | | 1.13 | | | | 3.86 | | | | 3.41 | | | | (0.01 | ) |
Total from investment operations | | | 5.80 | | | | 2.23 | | | | 4.87 | | | | 4.39 | | | | 0.03 | |
Distributions to shareholders from: | | | | | | | | | | | | | | | | | | | | |
Net investment income | | | (1.33 | ) | | | (1.15 | ) | | | (1.07 | ) | | | (1.06 | ) | | | — | |
Net realized gains | | | — | | | | — | | | | (0.02 | ) | | | — | | | | — | |
Total distributions | | | (1.33 | ) | | | (1.15 | ) | | | (1.09 | ) | | | (1.06 | ) | | | — | |
Net asset value at end of period | | $ | 37.69 | | | $ | 33.22 | | | $ | 32.14 | | | $ | 28.36 | | | $ | 25.03 | |
Market price at end of period(c) | | $ | 37.72 | | | $ | 33.27 | | | $ | 32.15 | | | $ | 28.39 | | | $ | 25.04 | |
| Net Asset Value Total Return(d) | | | 17.75 | % | | | 7.07 | % | | | 17.59 | % | | | 17.95 | % | | | 0.12 | %(e) |
| Market Price Total Return(d) | | | 17.66 | % | | | 7.20 | % | | | 17.50 | % | | | 18.03 | % | | | 0.16 | %(e) |
| Ratios/Supplemental Data: | | | | | | | | | | | | | | | | | | | | |
Net assets at end of period (000’s omitted) | | $ | 2,623,431 | | | $ | 538,180 | | | $ | 210,523 | | | $ | 138,965 | | | $ | 7,508 | |
Ratio to average net assets of: | | | | | | | | | | | | | | | | | | | | |
Expenses | | | 0.30 | % | | | 0.30 | % | | | 0.30 | % | | | 0.30 | % | | | 0.30 | %(f) |
Net investment income | | | 3.48 | % | | | 3.38 | % | | | 3.39 | % | | | 3.59 | % | | | 5.03 | %(f) |
Portfolio turnover rate(g) | | | 50 | % | | | 48 | % | | | 53 | % | | | 47 | % | | | — | % |
| (a) | Commencement of investment operations. |
| (b) | Based on average shares outstanding. |
| (c) | The mean between the last bid and ask prices. |
| (d) | Net asset value total return is calculated assuming an initial investment made at the net asset value at the beginning of the period, reinvestment of all dividends and distributions at net asset value during the period, and redemption on the last day of the period. Net asset value total return includes adjustments in accordance with accounting principles generally accepted in the United States of America and as such, the net asset value for financial reporting purposes and the returns based upon those net asset values may differ from the net asset value and returns for shareholder transactions. Market price total return is calculated assuming an initial investment made at the market price at the beginning of the period, reinvestment of all dividends and distributions at market price during the period, and the sale at the market price on the last day of the period. Total investment returns calculated for a period of less than one year are not annualized. |
| (e) | The net asset value total return from Fund Inception (October 18, 2012, the first day of trading on the exchange) to October 31, 2012 was (2.34)%. The market price total return from Fund Inception to October 31, 2012 was (2.34)%. |
| (g) | Portfolio turnover rate is not annualized for periods less than one year, if applicable, and does not include securities received or delivered from processing creations or redemptions. |
See accompanying Notes to Financial Statements which are an integral part of the financial statements.
Financial Highlights (continued)
PowerShares S&P 500® Low Volatility Portfolio (SPLV)
| | | | | | | | | | | | | | | | | | | | |
| | | Year Ended October 31, | |
| | | 2016 | | | 2015 | | | 2014 | | | 2013 | | | 2012 | |
| Per Share Operating Performance: | | | | | | | | | | | | | | | | | | | | |
Net asset value at beginning of year | | $ | 38.34 | | | $ | 36.60 | | | $ | 32.56 | | | $ | 28.07 | | | $ | 25.01 | |
Net investment income(a) | | | 0.81 | | | | 0.85 | | | | 0.83 | | | | 0.88 | | | | 0.80 | |
Net realized and unrealized gain on investments | | | 2.16 | | | | 1.78 | | | | 4.04 | | | | 4.51 | | | | 3.07 | |
Total from investment operations | | | 2.97 | | | | 2.63 | | | | 4.87 | | | | 5.39 | | | | 3.87 | |
Distributions to shareholders from: | | | | | | | | | | | | | | | | | | | | |
Net investment income | | | (0.84 | ) | | | (0.89 | ) | | | (0.83 | ) | | | (0.90 | ) | | | (0.81 | ) |
| | | | | | | | | | | | | | | | | | | | |
Net asset value at end of year | | $ | 40.47 | �� | | $ | 38.34 | | | $ | 36.60 | | | $ | 32.56 | | | $ | 28.07 | |
Market price at end of year(b) | | $ | 40.50 | | | $ | 38.40 | | | $ | 36.62 | | | $ | 32.59 | | | $ | 28.08 | |
| Net Asset Value Total Return(c) | | | 7.80 | % | | | 7.28 | % | | | 15.18 | % | | | 19.51 | % | | | 15.70 | % |
| Market Price Total Return(c) | | | 7.72 | % | | | 7.39 | % | | | 15.14 | % | | | 19.58 | % | | | 15.60 | % |
| Ratios/Supplemental Data: | | | | | | | | | | | | | | | | | | | | |
Net assets at end of year (000’s omitted) | | $ | 6,451,015 | | | $ | 5,051,233 | | | $ | 4,498,516 | | | $ | 3,975,657 | | | $ | 2,749,115 | |
Ratio to average net assets of: | | | | | | | | | | | | | | | | | | | | |
Expenses | | | 0.25 | % | | | 0.25 | % | | | 0.25 | % | | | 0.25 | % | | | 0.25 | % |
Net investment income | | | 2.02 | % | | | 2.26 | % | | | 2.44 | % | | | 2.87 | % | | | 2.95 | % |
Portfolio turnover rate(d) | | | 53 | % | | | 65 | % | | | 51 | % | | | 50 | % | | | 17 | % |
| (a) | Based on average shares outstanding. |
| (b) | The mean between the last bid and ask prices. |
| (c) | Net asset value total return is calculated assuming an initial investment made at the net asset value at the beginning of the period, reinvestment of all dividends and distributions at net asset value during the period, and redemption on the last day of the period. Net asset value total return includes adjustments in accordance with accounting principles generally accepted in the United States of America and as such, the net asset value for financial reporting purposes and the returns based upon those net asset values may differ from the net asset value and returns for shareholder transactions. Market price total return is calculated assuming an initial investment made at the market price at the beginning of the period, reinvestment of all dividends and distributions at market price during the period, and the sale at the market price on the last day of the period. Total investment returns calculated for a period of less than one year are not annualized. |
| (d) | Portfolio turnover rate is not annualized for periods less than one year, if applicable, and does not include securities received or delivered from processing creations or redemptions. |
PowerShares S&P 500 Momentum Portfolio (SPMO)
| | | | | | | | |
| | | Year Ended
October 31, 2016 | | | For the Period
October 6, 2015(a)
Through
October 31, 2015
| |
| Per Share Operating Performance: | | | | | | | | |
Net asset value at beginning of period | | $ | 26.06 | | | $ | 24.65 | |
Net investment income(b) | | | 0.41 | | | | 0.01 | |
Net realized and unrealized gain on investments | | | 0.44 | | | | 1.40 | |
Total from investment operations | | | 0.85 | | | | 1.41 | |
Distributions to shareholders from: | | | | | | | | |
Net investment income | | | (0.35 | ) | | | — | |
Net asset value at end of period | | $ | 26.56 | | | $ | 26.06 | |
Market price at end of period(c) | | $ | 26.58 | | | $ | 26.12 | |
| Net Asset Value Total Return(d) | | | 3.28 | % | | | 5.72 | %(e) |
| Market Price Total Return(d) | | | 3.12 | % | | | 5.96 | %(e) |
| Ratios/Supplemental Data: | | | | | | | | |
Net assets at end of period (000’s omitted) | | $ | 1,328 | | | $ | 2,606 | |
Ratio to average net assets of: | | | | | | | | |
Expenses | | | 0.25 | % | | | 0.25 | %(f) |
Net investment income | | | 1.60 | % | | | 0.69 | %(f) |
Portfolio turnover rate(g) | | | 105 | % | | | 1 | % |
| (a) | Commencement of investment operations. |
| (b) | Based on average shares outstanding. |
| (c) | The mean between the last bid and ask prices. |
| (d) | Net asset value total return is calculated assuming an initial investment made at the net asset value at the beginning of the period, reinvestment of all dividends and distributions at net asset value during the period, and redemption on the last day of the period. Net asset value total return includes adjustments in accordance with accounting principles generally accepted in the United States of America and as such, the net asset value for financial reporting purposes and the returns based upon those net asset values may differ from the net asset value and returns for shareholder transactions. Market price total return is calculated assuming an initial investment made at the market price at the beginning of the period, reinvestment of all dividends and distributions at market price during the period, and the sale at the market price on the last day of the period. Total investment returns calculated for a period of less than one year are not annualized. |
| (e) | The net asset value total return from Fund Inception (October 9, 2015, the first day of trading on the exchange) to October 31, 2015 was 3.62%. The market price total return from Fund Inception to October 31, 2015 was 3.77%. |
| (g) | Portfolio turnover rate is not annualized for periods less than one year, if applicable, and does not include securities received or delivered from processing creations or redemptions. |
See accompanying Notes to Financial Statements which are an integral part of the financial statements.
Financial Highlights (continued)
PowerShares S&P 500 Value Portfolio (SPVU)
| | | | | | | | |
| | | Year Ended
October 31, 2016 | | | For the Period
October 6, 2015(a)
Through
October 31, 2015 | |
| | | |
| Per Share Operating Performance: | | | | | | | | |
Net asset value at beginning of period | | $ | 25.78 | | | $ | 25.04 | |
Net investment income(b) | | | 0.63 | | | | 0.01 | |
Net realized and unrealized gain on investments | | | 0.38 | | | | 0.73 | |
Total from investment operations | | | 1.01 | | | | 0.74 | |
Distributions to shareholders from: | | | | | | | | |
Net investment income | | | (0.35 | ) | | | — | |
Net asset value at end of period | | $ | 26.44 | | | $ | 25.78 | |
Market price at end of period(c) | | $ | 26.45 | | | $ | 25.83 | |
| Net Asset Value Total Return(d) | | | 4.03 | % | | | 2.96 | %(e) |
| Market Price Total Return(d) | | | 3.86 | % | | | 3.15 | %(e) |
| Ratios/Supplemental Data: | | | | | | | | |
Net assets at end of period (000’s omitted) | | $ | 1,322 | | | $ | 2,578 | |
Ratio to average net assets of: | | | | | | | | |
Expenses | | | 0.25 | % | | | 0.25 | %(f) |
Net investment income | | | 2.53 | % | | | 0.63 | %(f) |
Portfolio turnover rate(g) | | | 42 | % | | | 0 | %(h) |
| (a) | Commencement of investment operations. |
| (b) | Based on average shares outstanding. |
| (c) | The mean between the last bid and ask prices. |
| (d) | Net asset value total return is calculated assuming an initial investment made at the net asset value at the beginning of the period, reinvestment of all dividends and distributions at net asset value during the period, and redemption on the last day of the period. Net asset value total return includes adjustments in accordance with accounting principles generally accepted in the United States of America and as such, the net asset value for financial reporting purposes and the returns based upon those net asset values may differ from the net asset value and returns for shareholder transactions. Market price total return is calculated assuming an initial investment made at the market price at the beginning of the period, reinvestment of all dividends and distributions at market price during the period, and the sale at the market price on the last day of the period. Total investment returns calculated for a period of less than one year are not annualized. |
| (e) | The net asset value total return from Fund Inception (October 9, 2015, the first day of trading on the exchange) to October 31, 2015 was 1.38%. The market price total return from Fund Inception to October 31, 2015 was 1.45%. |
| (g) | Portfolio turnover rate is not annualized for periods less than one year, if applicable, and does not include securities received or delivered from processing creations or redemptions. |
| (h) | Amount represents less than 0.5%. |
PowerShares S&P Emerging Markets Low Volatility Portfolio (EELV)
| | | | | | | | | | | | | | | | | | | | |
| | | Year Ended October 31, | | | For the Period
January 11, 2012(a)
Through
October 31, 2012 | |
| | | 2016 | | | 2015 | | | 2014 | | | 2013 | | |
| Per Share Operating Performance: | | | | | | | | | | | | | | | | | | | | |
Net asset value at beginning of period | | $ | 22.31 | | | $ | 27.37 | | | $ | 28.59 | | | $ | 27.15 | | | $ | 25.00 | |
Net investment income(b) | | | 0.57 | | | | 0.69 | | | | 0.75 | | | | 0.75 | | | | 0.65 | |
Net realized and unrealized gain (loss) on investments | | | (0.14 | ) | | | (5.11 | ) | | | (1.26 | ) | | | 1.17 | | | | 1.64 | |
Total from investment operations | | | 0.43 | | | | (4.42 | ) | | | (0.51 | ) | | | 1.92 | | | | 2.29 | |
Distributions to shareholders from: | | | | | | | | | | | | | | | | | | | | |
Net investment income | | | (0.49 | ) | | | (0.66 | ) | | | (0.72 | ) | | | (0.50 | ) | | | (0.19 | ) |
Transaction fees(b) | | | 0.02 | | | | 0.02 | | | | 0.01 | | | | 0.02 | | | | 0.05 | |
Net asset value at end of period | | $ | 22.27 | | | $ | 22.31 | | | $ | 27.37 | | | $ | 28.59 | | | $ | 27.15 | |
Market price at end of period(c) | | $ | 22.15 | | | $ | 22.13 | | | $ | 27.24 | | | $ | 28.56 | | | $ | 27.03 | |
| Net Asset Value Total Return(d) | | | 2.12 | % | | | (16.21 | )% | | | (1.74 | )% | | | 7.24 | % | | | 9.37 | %(e) |
| Market Price Total Return(d) | | | 2.39 | % | | | (16.48 | )% | | | (2.11 | )% | | | 7.60 | % | | | 8.88 | %(e) |
| Ratios/Supplemental Data: | | | | | | | | | | | | | | | | | | | | |
Net assets at end of period (000’s omitted) | | $ | 269,478 | | | $ | 176,244 | | | $ | 238,096 | | | $ | 217,254 | | | $ | 13,575 | |
Ratio to average net assets of: | | | | | | | | | | | | | | | | | | | | |
Expenses, after Waivers | | | 0.29 | % | | | 0.29 | % | | | 0.29 | % | | | 0.29 | % | | | 0.29 | %(f) |
Expenses, prior to Waivers | | | 0.45 | % | | | 0.45 | % | | | 0.45 | % | | | 0.45 | % | | | 0.45 | %(f) |
Net investment income, after Waivers | | | 2.60 | % | | | 2.78 | % | | | 2.72 | % | | | 2.70 | % | | | 3.09 | %(f) |
Portfolio turnover rate(g) | | | 73 | % | | | 89 | % | | | 82 | % | | | 101 | % | | | 50 | % |
| (a) | Commencement of investment operations. |
| (b) | Based on average shares outstanding. |
| (c) | The mean between the last bid and ask prices. |
| (d) | Net asset value total return is calculated assuming an initial investment made at the net asset value at the beginning of the period, reinvestment of all dividends and distributions at net asset value during the period, and redemption on the last day of the period. Net asset value total return includes adjustments in accordance with accounting principles generally accepted in the United States of America and as such, the net asset value for financial reporting purposes and the returns based upon those net asset values may differ from the net asset value and returns for shareholder transactions. Market price total return is calculated assuming an initial investment made at the market price at the beginning of the period, reinvestment of all dividends and distributions at market price during the period, and the sale at the market price on the last day of the period. Total investment returns calculated for a period of less than one year are not annualized. |
| (e) | The net asset value total return from Fund Inception (January 13, 2012, the first day of trading on the exchange) to October 31, 2012 was 11.19%. The market price total return from Fund Inception to October 31, 2012 was 9.85%. |
| (g) | Portfolio turnover rate is not annualized for periods less than one year, if applicable, and does not include securities received or delivered from processing creations or redemptions. |
See accompanying Notes to Financial Statements which are an integral part of the financial statements.
Financial Highlights (continued)
PowerShares S&P Emerging Markets Momentum Portfolio (EEMO)
| | | | | | | | | | | | | | | | | | | | |
| | | Year Ended October 31, | | | For the Period
February 22, 2012(a)
Through
October 31, 2012 | |
| | | 2016 | | | 2015 | | | 2014 | | | 2013 | | |
| Per Share Operating Performance: | | | | | | | | | | | | | | | | | | | | |
Net asset value at beginning of period | | $ | 16.20 | | | $ | 21.70 | | | $ | 22.11 | | | $ | 21.74 | | | $ | 25.00 | |
Net investment income(b) | | | 0.22 | | | | 0.52 | | | | 0.47 | | | | 0.34 | | | | 0.29 | |
Net realized and unrealized gain (loss) on investments | | | (0.23 | ) | | | (5.69 | ) | | | (0.43 | ) | | | 0.38 | | | | (3.40 | ) |
Total from investment operations | | | (0.01 | ) | | | (5.17 | ) | | | 0.04 | | | | 0.72 | | | | (3.11 | ) |
Distributions to shareholders from: | | | | | | | | | | | | | | | | | | | | |
Net investment income | | | (0.32 | ) | | | (0.33 | ) | | | (0.45 | ) | | | (0.35 | ) | | | (0.15 | ) |
Net asset value at end of period | | $ | 15.87 | | | $ | 16.20 | | | $ | 21.70 | | | $ | 22.11 | | | $ | 21.74 | |
Market price at end of period(c) | | $ | 15.84 | | | $ | 16.09 | | | $ | 21.56 | | | $ | 21.90 | | | $ | 21.78 | |
| Net Asset Value Total Return(d) | | | 0.17 | % | | | (24.15 | )% | | | 0.22 | % | | | 3.38 | % | | | (12.44 | )%(e) |
| Market Price Total Return(d) | | | 0.69 | % | | | (24.18 | )% | | | 0.52 | % | | | 2.21 | % | | | (12.27 | )%(e) |
| Ratios/Supplemental Data: | | | | | | | | | | | | | | | | | | | | |
Net assets at end of period (000’s omitted) | | $ | 1,587 | | | $ | 1,620 | | | $ | 6,510 | | | $ | 4,422 | | | $ | 2,174 | |
Ratio to average net assets of: | | | | | | | | | | | | | | | | | | | | |
Expenses, after Waivers | | | 0.28 | % | | | 0.29 | % | | | 0.29 | % | | | 0.31 | % | | | 0.29 | %(f) |
Expenses, prior to Waivers | | | 0.45 | % | | | 0.45 | % | | | 0.45 | % | | | 0.47 | % | | | 0.45 | %(f) |
Net investment income, after Waivers | | | 1.44 | % | | | 2.52 | % | | | 2.21 | % | | | 1.60 | % | | | 1.97 | %(f) |
Portfolio turnover rate(g) | | | 182 | % | | | 134 | % | | | 127 | % | | | 117 | % | | | 47 | % |
| (a) | Commencement of investment operations. |
| (b) | Based on average shares outstanding. |
| (c) | The mean between the last bid and ask prices. |
| (d) | Net asset value total return is calculated assuming an initial investment made at the net asset value at the beginning of the period, reinvestment of all dividends and distributions at net asset value during the period, and redemption on the last day of the period. Net asset value total return includes adjustments in accordance with accounting principles generally accepted in the United States of America and as such, the net asset value for financial reporting purposes and the returns based upon those net asset values may differ from the net asset value and returns for shareholder transactions. Market price total return is calculated assuming an initial investment made at the market price at the beginning of the period, reinvestment of all dividends and distributions at market price during the period, and the sale at the market price on the last day of the period. Total investment returns calculated for a period of less than one year are not annualized. |
| (e) | The net asset value total return from Fund Inception (February 24, 2012, the first day of trading on the exchange) to October 31, 2012 was (12.47)%. The market price total return from Fund Inception to October 31, 2012 was (13.04)%. |
| (g) | Portfolio turnover rate is not annualized for periods less than one year, if applicable, and does not include securities received or delivered from processing creations or redemptions. For the year ended October 31, 2016, the portfolio turnover calculation includes the value of securities purchased and sold in the effort to realign the Fund’s portfolio holdings due to the underlying index change. |
PowerShares S&P International Developed Low Volatility Portfolio (IDLV)
| | | | | | | | | | | | | | | | | | | | |
| | | Year Ended October 31, | | | For the Period
January 11, 2012(a)
Through
October 31, 2012 | |
| | | 2016 | | | 2015 | | | 2014 | | | 2013 | | |
| Per Share Operating Performance: | | | | | | | | | | | | | | | | | | | | |
Net asset value at beginning of period | | $ | 29.99 | | | $ | 31.75 | | | $ | 31.54 | | | $ | 27.93 | | | $ | 25.00 | |
Net investment income(b) | | | 0.99 | | | | 1.02 | | | | 1.09 | | | | 0.90 | | | | 0.73 | |
Net realized and unrealized gain (loss) on investments | | | (0.55 | ) | | | (1.86 | ) | | | 0.13 | | | | 3.53 | | | | 2.55 | |
Total from investment operations | | | 0.44 | | | | (0.84 | ) | | | 1.22 | | | | 4.43 | | | | 3.28 | |
Distributions to shareholders from: | | | | | | | | | | | | | | | | | | | | |
Net investment income | | | (1.11 | ) | | | (0.92 | ) | | | (1.01 | ) | | | (0.82 | ) | | | (0.35 | ) |
Net asset value at end of period | | $ | 29.32 | | | $ | 29.99 | | | $ | 31.75 | | | $ | 31.54 | | | $ | 27.93 | |
Market price at end of period(c) | | $ | 29.38 | | | $ | 29.90 | | | $ | 32.01 | | | $ | 31.67 | | | $ | 27.88 | |
| Net Asset Value Total Return(d) | | | 1.56 | % | | | (2.69 | )% | | | 3.89 | % | | | 16.19 | % | | | 13.22 | %(e) |
| Market Price Total Return(d) | | | 2.07 | % | | | (3.78 | )% | | | 4.29 | % | | | 16.87 | % | | | 13.01 | %(e) |
| Ratios/Supplemental Data: | | | | | | | | | | | | | | | | | | | | |
Net assets at end of period (000’s omitted) | | $ | 384,137 | | | $ | 313,428 | | | $ | 263,546 | | | $ | 135,617 | | | $ | 19,553 | |
Ratio to average net assets of: | | | | | | | | | | | | | | | | | | | | |
Expenses, after Waivers | | | 0.25 | % | | | 0.25 | % | | | 0.25 | % | | | 0.25 | % | | | 0.25 | %(f) |
Expenses, prior to Waivers | | | 0.35 | % | | | 0.35 | % | | | 0.35 | % | | | 0.35 | % | | | 0.35 | %(f) |
Net investment income, after Waivers | | | 3.33 | % | | | 3.32 | % | | | 3.41 | % | | | 3.03 | % | | | 3.40 | %(f) |
Portfolio turnover rate(g) | | | 56 | % | | | 66 | % | | | 61 | % | | | 84 | % | | | 41 | % |
| (a) | Commencement of investment operations. |
| (b) | Based on average shares outstanding. |
| (c) | The mean between the last bid and ask prices. |
| (d) | Net asset value total return is calculated assuming an initial investment made at the net asset value at the beginning of the period, reinvestment of all dividends and distributions at net asset value during the period, and redemption on the last day of the period. Net asset value total return includes adjustments in accordance with accounting principles generally accepted in the United States of America and as such, the net asset value for financial reporting purposes and the returns based upon those net asset values may differ from the net asset value and returns for shareholder transactions. Market price total return is calculated assuming an initial investment made at the market price at the beginning of the period, reinvestment of all dividends and distributions at market price during the period, and the sale at the market price on the last day of the period. Total investment returns calculated for a period of less than one year are not annualized. |
| (e) | The net asset value total return from Fund Inception (January 13, 2012, the first day of trading on the exchange) to October 31, 2012 was 14.23%. The market price total return from Fund Inception to October 31, 2012 was 13.51%. |
| (g) | Portfolio turnover rate is not annualized for periods less than one year, if applicable, and does not include securities received or delivered from processing creations or redemptions. |
See accompanying Notes to Financial Statements which are an integral part of the financial statements.
Financial Highlights (continued)
PowerShares S&P International Developed Momentum Portfolio (IDMO)
| | | | | | | | | | | | | | | | | | | | |
| | | Year Ended October 31, | | | For the Period
February 22, 2012(a)
Through
October 31, 2012 | |
| | | 2016 | | | 2015 | | | 2014 | | | 2013 | | |
| Per Share Operating Performance: | | | | | | | | | | | | | | | | | | | | |
Net asset value at beginning of period | | $ | 25.85 | | | $ | 27.75 | | | $ | 29.00 | | | $ | 22.60 | | | $ | 25.00 | |
Net investment income(b) | | | 0.51 | | | | 0.69 | | | | 0.49 | | | | 0.51 | | | | 0.54 | |
Net realized and unrealized gain (loss) on investments | | | (2.30 | ) | | | (2.13 | ) | | | (1.02 | ) | | | 6.50 | | | | (2.65 | ) |
Total from investment operations | | | (1.79 | ) | | | (1.44 | ) | | | (0.53 | ) | | | 7.01 | | | | (2.11 | ) |
Distributions to shareholders from: | | | | | | | | | | | | | | | | | | | | |
Net investment income | | | (0.49 | ) | | | (0.46 | ) | | | (0.72 | ) | | | (0.61 | ) | | | (0.29 | ) |
Net asset value at end of period | | $ | 23.57 | | | $ | 25.85 | | | $ | 27.75 | | | $ | 29.00 | | | $ | 22.60 | |
Market price at end of period(c) | | $ | 23.51 | | | $ | 25.74 | | | $ | 28.12 | | | $ | 29.11 | | | $ | 22.73 | |
| Net Asset Value Total Return(d) | | | (6.92 | )% | | | (5.34 | )% | | | (2.06 | )% | | | 31.49 | % | | | (8.30 | )%(e) |
| Market Price Total Return(d) | | | (6.77 | )% | | | (6.99 | )% | | | (1.15 | )% | | | 31.19 | % | | | (7.78 | )%(e) |
| Ratios/Supplemental Data: | | | | | | | | | | | | | | | | | | | | |
Net assets at end of period (000’s omitted) | | $ | 3,535 | | | $ | 3,877 | | | $ | 6,936 | | | $ | 5,799 | | | $ | 2,260 | |
Ratio to average net assets of: | | | | | | | | | | | | | | | | | | | | |
Expenses, after Waivers | | | 0.26 | % | | | 0.26 | % | | | 0.26 | % | | | 0.26 | % | | | 0.25 | %(f) |
Expenses, prior to Waivers | | | 0.36 | % | | | 0.36 | % | | | 0.36 | % | | | 0.36 | % | | | 0.35 | %(f) |
Net investment income, after Waivers | | | 2.13 | % | | | 2.42 | % | | | 1.68 | % | | | 2.00 | % | | | 3.60 | %(f) |
Portfolio turnover rate(g) | | | 198 | % | | | 98 | % | | | 109 | % | | | 74 | % | | | 35 | % |
| (a) | Commencement of investment operations. |
| (b) | Based on average shares outstanding. |
| (c) | The mean between the last bid and ask prices. |
| (d) | Net asset value total return is calculated assuming an initial investment made at the net asset value at the beginning of the period, reinvestment of all dividends and distributions at net asset value during the period, and redemption on the last day of the period. Net asset value total return includes adjustments in accordance with accounting principles generally accepted in the United States of America and as such, the net asset value for financial reporting purposes and the returns based upon those net asset values may differ from the net asset value and returns for shareholder transactions. Market price total return is calculated assuming an initial investment made at the market price at the beginning of the period, reinvestment of all dividends and distributions at market price during the period, and the sale at the market price on the last day of the period. Total investment returns calculated for a period of less than one year are not annualized. |
| (e) | The net asset value total return from Fund Inception (February 24, 2012, the first day of trading on the exchange) to October 31, 2012 was (9.43)%. The market price total return from Fund Inception to October 31, 2012 was (9.59)%. |
| (g) | Portfolio turnover rate is not annualized for periods less than one year, if applicable, and does not include securities received or delivered from processing creations or redemptions. For the year ended October 31, 2016, the portfolio turnover calculation includes the value of securities purchased and sold in the effort to realign the Fund’s portfolio holdings due to the underlying index change. |
PowerShares S&P MidCap Low Volatility Portfolio (XMLV)
| | | | | | | | | | | | | | | | |
| | | Year Ended October 31, | | | For the Period
February 12, 2013(a)
Through
October 31, 2013 | |
| | | 2016 | | | 2015 | | | 2014 | | |
| Per Share Operating Performance: | | | | | | | | | | | | | | | | |
Net asset value at beginning of period | | $ | 34.38 | | | $ | 31.82 | | | $ | 28.25 | | | $ | 25.12 | |
Net investment income(b) | | | 0.69 | | | | 0.66 | | | | 0.62 | | | | 0.38 | |
Net realized and unrealized gain on investments | | | 3.72 | | | | 2.55 | | | | 3.52 | | | | 3.02 | |
Total from investment operations | | | 4.41 | | | | 3.21 | | | | 4.14 | | | | 3.40 | |
Distributions to shareholders from: | | | | | | | | | | | | | | | | |
Net investment income | | | (0.58 | ) | | | (0.65 | ) | | | (0.57 | ) | | | (0.27 | ) |
Net asset value at end of period | | $ | 38.21 | | | $ | 34.38 | | | $ | 31.82 | | | $ | 28.25 | |
Market price at end of period(c) | | $ | 38.23 | | | $ | 34.42 | | | $ | 31.82 | | | $ | 28.28 | |
| Net Asset Value Total Return(d) | | | 12.96 | % | | | 10.18 | % | | | 14.84 | % | | | 13.62 | %(e) |
| Market Price Total Return(d) | | | 12.89 | % | | | 10.30 | % | | | 14.72 | % | | | 13.77 | %(e) |
| Ratios/Supplemental Data: | | | | | | | | | | | | | | | | |
Net assets at end of period (000’s omitted) | | $ | 682,094 | | | $ | 106,565 | | | $ | 44,546 | | | $ | 21,189 | |
Ratio to average net assets of: | | | | | | | | | | | | | | | | |
Expenses | | | 0.25 | % | | | 0.25 | % | | | 0.25 | % | | | 0.26 | %(f) |
Net investment income | | | 1.86 | % | | | 1.97 | % | | | 2.09 | % | | | 1.98 | %(f) |
Portfolio turnover rate(g) | | | 51 | % | | | 57 | % | | | 58 | % | | | 29 | % |
| (a) | Commencement of investment operations. |
| (b) | Based on average shares outstanding. |
| (c) | The mean between the last bid and ask prices. |
| (d) | Net asset value total return is calculated assuming an initial investment made at the net asset value at the beginning of the period, reinvestment of all dividends and distributions at net asset value during the period, and redemption on the last day of the period. Net asset value total return includes adjustments in accordance with accounting principles generally accepted in the United States of America and as such, the net asset value for financial reporting purposes and the returns based upon those net asset values may differ from the net asset value and returns for shareholder transactions. Market price total return is calculated assuming an initial investment made at the market price at the beginning of the period, reinvestment of all dividends and distributions at market price during the period, and the sale at the market price on the last day of the period. Total investment returns calculated for a period of less than one year are not annualized. |
| (e) | The net asset value total return from Fund Inception (February 15, 2013, the first day of trading on the exchange) to October 31, 2013 was 13.21%. The market price total return from Fund Inception to October 31, 2013 was 13.37%. |
| (g) | Portfolio turnover rate is not annualized for periods less than one year, if applicable, and does not include securities received or delivered from processing creations or redemptions. |
See accompanying Notes to Financial Statements which are an integral part of the financial statements.
Financial Highlights (continued)
PowerShares S&P SmallCap Low Volatility Portfolio (XSLV)
| | | | | | | | | | | | | | | | |
| | | Year Ended October 31, | | | For the Period
February 12, 2013(a)
Through
October 31, 2013 | |
| | | 2016 | | | 2015 | | | 2014 | | |
| Per Share Operating Performance: | | | | | | | | | | | | | | | | |
Net asset value at beginning of period | | $ | 34.30 | | | $ | 32.93 | | | $ | 29.92 | | | $ | 25.10 | |
Net investment income(b) | | | 0.78 | | | | 0.77 | | | | 0.75 | | | | 0.43 | |
Net realized and unrealized gain on investments | | | 3.58 | | | | 1.38 | | | | 2.95 | | | | 4.63 | |
Total from investment operations | | | 4.36 | | | | 2.15 | | | | 3.70 | | | | 5.06 | |
Distributions to shareholders from: | | | | | | | | | | | | | | | | |
Net investment income | | | (0.76 | ) | | | (0.78 | ) | | | (0.69 | ) | | | (0.24 | ) |
Net asset value at end of period | | $ | 37.90 | | | $ | 34.30 | | | $ | 32.93 | | | $ | 29.92 | |
Market price at end of period(c) | | $ | 37.93 | | | $ | 34.30 | | | $ | 32.91 | | | $ | 29.96 | |
| Net Asset Value Total Return(d) | | | 12.90 | % | | | 6.63 | % | | | 12.50 | % | | | 20.28 | %(e) |
| Market Price Total Return(d) | | | 12.99 | % | | | 6.70 | % | | | 12.29 | % | | | 20.45 | %(e) |
| Ratios/Supplemental Data: | | | | | | | | | | | | | | | | |
Net assets at end of period (000’s omitted) | | $ | 651,821 | | | $ | 126,926 | | | $ | 55,985 | | | $ | 31,411 | |
Ratio to average net assets of: | | | | | | | | | | | | | | | | |
Expenses | | | 0.25 | % | | | 0.25 | %(f) | | | 0.25 | %(f) | | | 0.26 | %(g) |
Net investment income | | | 2.15 | % | | | 2.33 | % | | | 2.41 | % | | | 2.17 | %(g) |
Portfolio turnover rate(h) | | | 48 | % | | | 57 | % | | | 68 | % | | | 35 | % |
| (a) | Commencement of investment operations. |
| (b) | Based on average shares outstanding. |
| (c) | The mean between the last bid and ask prices. |
| (d) | Net asset value total return is calculated assuming an initial investment made at the net asset value at the beginning of the period, reinvestment of all dividends and distributions at net asset value during the period, and redemption on the last day of the period. Net asset value total return includes adjustments in accordance with accounting principles generally accepted in the United States of America and as such, the net asset value for financial reporting purposes and the returns based upon those net asset values may differ from the net asset value and returns for shareholder transactions. Market price total return is calculated assuming an initial investment made at the market price at the beginning of the period, reinvestment of all dividends and distributions at market price during the period, and the sale at the market price on the last day of the period. Total investment returns calculated for a period of less than one year are not annualized. |
| (e) | The net asset value total return from Fund Inception (February 15, 2013, the first day of trading on the exchange) to October 31, 2013 was 19.62%. The market price total return from Fund Inception to October 31, 2013 was 19.63%. |
| (f) | In addition to the fees and expenses which the Fund bears directly, the Fund indirectly bears a pro rata share of the fees and expenses of the investment companies in which the Fund invests. Estimated investment companies’ expenses are not expenses that are incurred directly by the Fund. They are expenses that are incurred directly by the investment companies and are deducted from the value of the investment companies the Fund invests in. The effect of the estimated investment companies’ expenses that the Fund bears indirectly is included in the Fund’s total return. |
| (h) | Portfolio turnover rate is not annualized for periods less than one year, if applicable, and does not include securities received or delivered from processing creations or redemptions. |
See accompanying Notes to Financial Statements which are an integral part of the financial statements.
Notes to Financial Statements
PowerShares Exchange-Traded Fund Trust II
October 31, 2016
Note 1. Organization
PowerShares Exchange-Traded Fund Trust II (the “Trust”) was organized as a Massachusetts business trust on October 10, 2006 and is authorized to have multiple series of portfolios. The Trust is an open-end management investment company registered under the Investment Company Act of 1940, as amended (the “1940 Act”). As of October 31, 2016, the Trust offered sixty-seven portfolios. This report includes the following portfolios:
| | |
Full Name | | Short Name |
| PowerShares FTSE International Low Beta Equal Weight Portfolio (IDLB)* | | “FTSE International Low Beta Equal Weight Portfolio” |
| PowerShares Russell 1000 Low Beta Equal Weight Portfolio (USLB)** | | “Russell 1000 Low Beta Equal Weight Portfolio” |
| PowerShares S&P 500® ex-Rate Sensitive Low Volatility Portfolio (XRLV) | | “S&P 500® ex-Rate Sensitive Low Volatility Portfolio” |
| PowerShares S&P 500® High Beta Portfolio (SPHB) | | “S&P 500® High Beta Portfolio” |
| PowerShares S&P 500® High Dividend Low Volatility Portfolio (SPHD) | | “S&P 500® High Dividend Low Volatility Portfolio” |
| PowerShares S&P 500® Low Volatility Portfolio (SPLV) | | “S&P 500® Low Volatility Portfolio” |
| PowerShares S&P 500 Momentum Portfolio (SPMO) | | “S&P 500 Momentum Portfolio” |
| PowerShares S&P 500 Value Portfolio (SPVU) | | “S&P 500 Value Portfolio” |
| PowerShares S&P Emerging Markets Low Volatility Portfolio (EELV) | | “S&P Emerging Markets Low Volatility Portfolio” |
PowerShares S&P Emerging Markets Momentum Portfolio (EEMO)
(formerly, PowerShares S&P Emerging Markets High Beta Portfolio (EEHB)) | | “S&P Emerging Markets Momentum Portfolio” |
| PowerShares S&P International Developed Low Volatility Portfolio (IDLV) | | “S&P International Developed Low Volatility Portfolio” |
PowerShares S&P International Developed Momentum Portfolio (IDMO)
(formerly, PowerShares S&P International Developed High Beta Portfolio (IDHB)) | | “S&P International Developed Momentum Portfolio” |
| PowerShares S&P MidCap Low Volatility Portfolio (XMLV) | | “S&P MidCap Low Volatility Portfolio” |
| PowerShares S&P SmallCap Low Volatility Portfolio (XSLV) | | “S&P SmallCap Low Volatility Portfolio” |
| * | Commenced operations on November 4, 2015. |
| ** | Commenced operations on November 2, 2015. |
Each portfolio (each, a “Fund”, and collectively, the “Funds”) represents a separate series of the Trust. The shares of the Funds are referred to herein as “Shares” or “Fund’s Shares.” Each Fund’s Shares are listed and traded on NYSE Arca, Inc., except for Shares of FTSE International Low Beta Equal Weight Portfolio and Russell 1000 Low Beta Equal Weight Portfolio, which are listed and traded on The NASDAQ Stock Market LLC.
The market price of each Share may differ to some degree from the Fund’s net asset value (“NAV”). Unlike conventional mutual funds, each Fund issues and redeems Shares on a continuous basis, at NAV, only in a large specified number of Shares, each called a “Creation Unit.” Creation Units are issued and redeemed principally in exchange for the deposit or delivery of a basket of securities (“Deposit Securities”). Except when aggregated in Creation Units by Authorized Participants, the Shares are not individually redeemable securities of the Funds.
The investment objective of each Fund is to seek investment results that generally correspond (before fees and expenses) to the price and yield of its respective index listed below (each, an “Underlying Index”):
| | |
Fund | | Underlying Index |
| FTSE International Low Beta Equal Weight Portfolio | | FTSE Developed ex US Low Beta Equal Weight Index |
| Russell 1000 Low Beta Equal Weight Portfolio | | Russell 1000® Low Beta Equal Weight Index |
| S&P 500® ex-Rate Sensitive Low Volatility Portfolio | | S&P 500 Low Volatility Rate Response Index |
| S&P 500® High Beta Portfolio | | S&P 500® High Beta Index |
| S&P 500® High Dividend Low Volatility Portfolio | | S&P 500® Low Volatility High Dividend Index |
| S&P 500® Low Volatility Portfolio | | S&P 500® Low Volatility Index |
| S&P 500 Momentum Portfolio | | S&P 500 Momentum Index |
| S&P 500 Value Portfolio | | S&P 500 Enhanced Value Index |
| S&P Emerging Markets Low Volatility Portfolio | | S&P BMI Emerging Markets Low Volatility IndexTM |
| S&P Emerging Markets Momentum Portfolio | | S&P Momentum Emerging Plus LargeMidCap IndexTM* |
| | |
Fund | | Underlying Index |
| S&P International Developed Low Volatility Portfolio | | S&P BMI International Developed Low Volatility IndexTM |
| S&P International Developed Momentum Portfolio | | S&P Momentum Developed ex-U.S. and South Korea LargeMidCap IndexTM** |
| S&P MidCap Low Volatility Portfolio | | S&P MidCap 400® Low Volatility Index |
| S&P SmallCap Low Volatility Portfolio | | S&P SmallCap 600® Low Volatility Index |
| * | Effective after the close of markets on March 18, 2016, the underlying index changed from S&P BMI Emerging Markets High Beta IndexTM to S&P Momentum Emerging Plus LargeMidCap IndexTM. |
| ** | Effective after the close of markets on March 18, 2016, the underlying index changed from S&P BMI International Developed High Beta IndexTM to S&P Momentum Developed ex-U.S. and South Korea LargeMidCap IndexTM. |
Note 2. Significant Accounting Policies
The preparation of the financial statements in accordance with accounting principles generally accepted in the United States of America (“GAAP”) requires management to make estimates and assumptions that affect the reported amounts and disclosures in the financial statements, including estimates and assumptions related to taxation. Actual results could differ from these estimates. In addition, the Funds monitor for material events or transactions that may occur or become known after the period-end date and before the date the financial statements are released to print. The following is a summary of the significant accounting policies followed by the Funds in preparation of the financial statements.
A. Security Valuation
Securities, including restricted securities, are valued according to the following policies:
A security listed or traded on an exchange (except convertible securities) is valued at its last sales price or official closing price as of the close of the customary trading session on the exchange where the security is principally traded, or lacking any sales or official closing price on a particular day, the security may be valued at the closing bid price on that day. Securities traded in the over-the-counter market are valued based on prices furnished by independent pricing services or market makers. When such securities are valued by an independent pricing service they may be considered fair valued. Futures contracts are valued at the final settlement price set by an exchange on which they are principally traded. Listed options are valued at the mean between the last bid and asked prices from the exchange on which they are principally traded. Options not listed on an exchange are valued by an independent source at the mean between the last bid and asked prices. For purposes of determining NAV per Share, futures and option contracts generally are valued 15 minutes after the close of the customary trading session of the New York Stock Exchange (“NYSE”).
Investments in open-end and closed-end registered investment companies that do not trade on an exchange are valued at the end of day NAV per share. Investments in open-end and closed-end registered investment companies that trade on an exchange are valued at the last sales price or official closing price as of the close of the customary trading session on the exchange where the security is principally traded.
Debt obligations (including convertible securities) and unlisted equities are fair valued using an evaluated quote provided by an independent pricing service. Evaluated quotes provided by the pricing service may be determined without exclusive reliance on quoted prices, and may reflect appropriate factors such as institution-size trading in similar groups of securities, developments related to specific securities, dividend rate (for unlisted equities), yield (for debt obligations), quality, type of issue, coupon rate (for debt obligations), maturity (for debt obligations), individual trading characteristics and other market data. Securities with a demand feature exercisable within one to seven days are valued at par. Debt obligations are subject to interest rate and credit risks. In addition, all debt obligations involve some risk of default with respect to interest and/or principal payments.
Foreign securities’ (including foreign exchange contracts’) prices are converted into U.S. dollar amounts using the applicable exchange rates as of the close of the London world markets. If market quotations are available and reliable for foreign exchange-traded equity securities, the securities will be valued at the market quotations. Because trading hours for certain foreign securities end before the close of the NYSE, closing market quotations may become unreliable. If between the time trading ends on a particular security and the close of the customary trading session on the NYSE, events occur that Invesco PowerShares Capital Management LLC (the “Adviser”) determines are significant and make the closing price unreliable, the Fund may fair value the security. If the event is likely to have affected the closing price of the security, the security will be valued at fair value in good faith using procedures approved by the Board of Trustees. Adjustments to closing prices to reflect fair value may also be based on a screening process of an independent pricing service to indicate the degree of certainty, based on historical data, that the closing price in the principal market where a foreign security trades is not the current value as of the close of the NYSE. Foreign securities’ prices meeting the approved degree of certainty that the price is not reflective of current value will be priced at the indication of fair value from the independent pricing service. Multiple factors may be considered by the independent pricing service in determining adjustments to reflect fair value and may include information relating to sector indices, American Depositary Receipts and domestic and foreign index futures. Foreign securities may have additional risks including exchange rate changes, potential for sharply devalued currencies and high inflation, political and economic upheaval, the relative lack of issuer information, relatively low market liquidity and the potential lack of strict financial and accounting controls and standards.
Securities for which market prices are not provided by any of the above methods may be valued based upon quotes furnished by independent sources. The last bid price may be used to value equity securities. The mean between the last bid and asked prices is used to value debt obligations, including corporate loans.
Securities for which market quotations are not readily available or became unreliable are valued at fair value as determined in good faith following procedures approved by the Board of Trustees. Issuer-specific events, market trends, bid/asked quotes of brokers and information providers and other market data may be reviewed in the course of making a good faith determination of a security’s fair value.
Each Fund may invest in securities that are subject to interest rate risk, meaning the risk that the prices will generally fall as interest rates rise and, conversely, the prices will generally rise as interest rates fall. Specific securities differ in their sensitivity to changes in interest rates depending on their individual characteristics. Changes in interest rates may result in increased market volatility, which may affect the value and/or liquidity of certain Fund investments.
Valuations change in response to many factors, including the historical and prospective earnings of the issuer, the value of the issuer’s assets, general economic conditions, interest rates, investor perceptions and market liquidity. Because of the inherent uncertainties of valuation, the values reflected in the financial statements may materially differ from the value received upon actual sale of those investments.
B. Other Risks
Index Risk. Unlike many investment companies, the Funds do not utilize investing strategies that seek returns in excess of their Underlying Indexes. Therefore, a Fund would not necessarily buy or sell a security unless that security is added or removed, respectively, from its respective Underlying Index, even if that security generally is underperforming.
Equity Risk. Equity risk is the risk that the value of the securities that each Fund holds will fall due to general market and economic conditions, perceptions regarding the industries in which the issuers of securities that a Fund holds participate or factors relating to specific companies in which the Fund invests. For example, an adverse event, such as an unfavorable earnings report, may depress the value of securities a Fund holds; the price of securities may be particularly sensitive to general movements in the stock market; or a drop in the stock market may depress the price of most or all of the securities a Fund holds. In addition, securities of an issuer in the Fund’s portfolio may decline in price if the issuer fails to make anticipated dividend payments because, among other reasons, the issuer of the security experiences a decline in its financial condition.
Industry Concentration Risk. In following its methodology, each Fund’s Underlying Index from time to time will be concentrated to a significant degree in securities of issuers located in a single industry or a sector. To the extent that an Underlying Index concentrates in the securities of issuers in a particular industry or sector, each Fund will also concentrate its investments to approximately the same extent. By concentrating its investments in an industry or sector, a Fund may face more risks than if it were diversified broadly over numerous industries or sectors. In addition, at times, an industry or sector may be out of favor and underperform other industries or the market as a whole. Any factors detrimental to the performance of such industry or sector will disproportionately impact a Fund’s NAV.
Non-Diversified Fund Risk. Each Fund (except FTSE International Low Beta Equal Weight Portfolio, Russell 1000 Low Beta Equal Weight Portfolio and S&P 500® High Dividend Low Volatility Portfolio) is non-diversified and can invest a greater portion of its assets in securities of individual issuers than diversified funds. As a result, changes in the market value of a single investment could cause greater fluctuations in Share price than would occur in a diversified fund. This may increase a Fund’s volatility and cause the performance of a relatively small number of issuers to have a greater impact on a Fund’s performance.
Non-Correlation Risk. Each Fund’s return may not match the return of its Underlying Index for a number of reasons. For example, each Fund incurs operating expenses not applicable to its Underlying Index, and incurs costs in buying and selling securities, especially when rebalancing the Fund’s securities holdings to reflect changes in the composition of its Underlying Index. In addition, the performance of each Fund and its Underlying Index may vary due to asset valuation differences and differences between each Fund’s portfolio and its Underlying Index resulting from legal restrictions, cost or liquidity constraints.
Small- and Mid-Capitalization Company Risk. For FTSE International Low Beta Equal Weight Portfolio, S&P Emerging Markets Low Volatility Portfolio, S&P Emerging Markets Momentum Portfolio, S&P International Developed Low Volatility Portfolio, S&P International Developed Momentum Portfolio, S&P MidCap Low Volatility Portfolio and S&P SmallCap Low Volatility Portfolio, investing in securities of small- and medium-capitalization companies involves greater risk than customarily is associated with investing in larger, more established companies. These companies’ securities may be more volatile and less liquid than those of more established companies. These securities may have returns that vary, sometimes significantly, from the overall securities market. Often small- and medium-capitalization companies and the industries in which they focus are still evolving and, as a result, they may be more sensitive to changing market conditions.
Foreign Investment Risk. For FTSE International Low Beta Equal Weight Portfolio, S&P Emerging Markets Low Volatility Portfolio, S&P Emerging Markets Momentum Portfolio, S&P International Developed Low Volatility Portfolio, S&P International Developed Momentum Portfolio, investments in the securities of non-U.S. issuers involve risks beyond those associated with investments in U.S. securities. Foreign securities may have relatively low market liquidity, greater market volatility, decreased publicly available information and less reliable financial information about issuers, and inconsistent and potentially less stringent accounting, auditing and financial reporting requirements and standards of practice comparable to those applicable to domestic issuers. Foreign securities also are subject to the risks of expropriation, nationalization, political instability or other adverse political or economic developments and the difficulty of enforcing obligations in other countries. As the Funds may invest in securities denominated in foreign currencies, fluctuations in the value of the U.S. dollar relative to the values of other currencies may adversely affect investments in foreign securities and may negatively impact the Funds’ returns. Such risks may be exacerbated in emerging markets, where securities laws are relatively new and unsettled.
Momentum Investing Risk. For S&P 500 Momentum Portfolio, S&P Emerging Markets Momentum Portfolio and S&P International Developed Momentum Portfolio, the momentum style of investing is subject to the risk that the securities may be more volatile than the market as a whole, or that the returns on securities that previously have exhibited price momentum are less than returns on other styles of investing. Momentum can turn quickly, and stocks that previously have exhibited high momentum may not experience continued positive momentum. In addition, there may be periods when the momentum style of investing is out of favor and therefore, the investment performance of a Fund may suffer.
Sampling Risk. S&P Emerging Markets Momentum Portfolio’s use of a representative sampling approach in certain countries will result in the Fund holding a smaller number of securities than are in its Underlying Index. As a result, an adverse development to an issuer of securities held by the Fund could result in a greater decline in NAV than would be the case if the Fund held all of the securities in its Underlying Index. To the extent the assets in the Fund are smaller, these risks will be greater.
C. Federal Income Taxes
Each Fund intends to comply with the provisions of the Internal Revenue Code of 1986, as amended (the “Internal Revenue Code”), applicable to regulated investment companies and to distribute substantially all of the Fund’s taxable earnings to its shareholders. As such, the Funds will not be subject to federal income taxes on otherwise taxable income (including net realized gains) that is distributed to the shareholders. Therefore, no provision for federal income taxes is recorded in the financial statements.
Each Fund recognizes the tax benefits of uncertain tax positions only when the position is more likely than not to be sustained. Management has analyzed each Fund’s uncertain tax positions and concluded that no liability for unrecognized tax benefits should be recorded related to uncertain tax positions. Management is not aware of any tax positions for which it is reasonably possible that the total amounts of unrecognized tax benefits will change materially in the next 12 months.
Income and capital gain distributions are determined in accordance with federal income tax regulations, which may differ from GAAP. These differences are primarily due to differing book and tax treatments for in-kind transactions, losses deferred due to wash sales, and passive foreign investment company adjustments, if any.
The Funds file U.S. federal tax returns and tax returns in certain other jurisdictions. Generally, a Fund is subject to examinations by such taxing authorities for up to three years after the filing of the return for the tax period.
D. Investment Transactions and Investment Income
Investment transactions are accounted for on a trade date basis. Realized gains and losses from the sale or disposition of securities are computed on the specific identified cost basis. Interest income is recorded on the accrual basis. Dividend income (net of withholding tax, if any) is recorded on the ex-dividend date. Realized gains, dividends and interest received by a Fund may give rise to withholding and other taxes imposed by foreign countries. Tax conventions between certain countries and the United States may reduce or eliminate such taxes.
The Funds may periodically participate in litigation related to each Fund’s investments. As such, the Funds may receive proceeds from litigation settlements. Any proceeds received are included in the Statements of Operations as realized gain (loss) for investments no longer held and as unrealized gain (loss) for investments still held.
Corporate actions (including cash dividends) are recorded net of non-reclaimable foreign tax withholdings on the ex-date.
Brokerage commissions and mark ups are considered transaction costs and are recorded as an increase to the cost basis of securities purchased and/or a reduction of proceeds on a sale of securities. Such transaction costs are included in the determination of net realized and unrealized gain (loss) from investment securities reported in the Statements of Operations and the Statements of Changes in Net Assets and the net realized and unrealized gains (losses) on securities per share in the Financial Highlights. Transaction costs are included in the calculation of each Fund’s net asset value and, accordingly, they reduce each Fund’s total returns. These transaction costs are not considered operating expenses and are not reflected in net investment income reported in the Statements of Operations and the Statements of Changes in Net Assets, or the net investment income per share and the ratios of expenses and net investment income reported in the Financial Highlights, nor are they limited by any expense limitation arrangements between each Fund and the Adviser.
E. Country Determination
For the purposes of making investment selection decisions and presentation in the Schedule of Investments, the Adviser may determine the country in which an issuer is located and/or credit risk exposure based on various factors. These factors include the laws of the country under which the issuer is organized, where the issuer maintains a principal office, the country in which the issuer derives 50% or more of its total revenues and the country that has the primary market for the issuer’s securities, as well as other criteria. Among the other criteria that may be evaluated for making this determination are the country in which the issuer maintains 50% or more of its assets, the type of security, financial guarantees and enhancements, the nature of the collateral and the sponsor organization. Country of issuer and/or credit risk exposure has been determined to be the United States of America, unless otherwise noted.
F. Expenses
Each Fund has agreed to pay an annual unitary management fee to the Adviser. Out of the unitary management fee, the Adviser has agreed to pay for substantially all expenses of the Funds, including the cost of transfer agency, custody, fund administration, legal, audit and other services, except for advisory fees, distribution fees, if any, brokerage expenses, taxes, interest, acquired fund fees and expenses, if any, litigation expenses and other extraordinary expenses.
Expenses of the Trust that are excluded from a Fund’s unitary management fee and are directly identifiable to a specific Fund are applied to that Fund. Expenses of the Trust that are excluded from each Fund’s unitary management fee and that are not readily identifiable to a specific Fund are allocated in such a manner as deemed equitable, taking into consideration the nature and type of expense and the relative net assets of each Fund.
To the extent a Fund invests in other investment companies, the expenses shown in the accompanying financial statements reflect the expenses of the Fund and do not include any expenses of the investment companies in which it invests. The effects of such investment companies’ expenses are included in the realized and unrealized gain or loss on the investments in the investment companies.
G. Dividends and Distributions to Shareholders
Each Fund (except for S&P 500® High Dividend Low Volatility Portfolio and S&P 500® Low Volatility Portfolio) declares and pays dividends from net investment income, if any, to its shareholders quarterly and records such dividends on ex-dividend date. S&P 500® High Dividend Low Volatility Portfolio and S&P 500® Low Volatility Portfolio each declares and pays dividends from net investment income, if any, to its shareholders monthly and records such dividends on ex-dividend date. Generally, each Fund distributes net realized taxable capital gains, if any, annually in cash and records them on ex-dividend date. Such distributions on a tax basis are determined in conformity with federal income tax regulations, which may differ from GAAP. Distributions in excess of tax basis earnings and profits, if any, are reported in such Fund’s financial statements as a tax return of capital at fiscal year-end.
H. Securities Lending
During the fiscal year ended October 31, 2016, FTSE International Low Beta Equal Weight Portfolio, S&P International Developed Low Volatility Portfolio and S&P SmallCap Low Volatility Portfolio participated in securities lending. Each Fund loaned portfolio securities having a market value up to one-third of each Fund’s total assets. Such loans are secured by cash collateral equal to no less than 102% (105% for international securities) of the market value of the loaned securities determined daily by the securities lending provider. Cash collateral received in connection with these loans is invested in an affiliated money market fund and is shown as such on the Schedule of Investments. Each Fund bears the risk of loss with respect to the investment of collateral. It is the policy of these Funds to obtain additional collateral from or return excess collateral to the borrower by the end of the next business day, following the valuation date of the securities loaned. Therefore, the value of the collateral held may be temporarily less than the value of the securities on loan. When loaning securities, each Fund retains certain benefits of owning the securities, including the economic equivalent of dividends or interest generated by the security. Lending securities entails a risk of loss to each Fund if, and to the extent that, the market value of the securities loaned were to increase, and the borrower did not increase the collateral accordingly, and the borrower failed to return the securities. The securities loaned are subject to termination at the option of the borrower or each Fund. Upon termination, the borrower will return to each Fund the securities loaned and each Fund will return the collateral. Upon the failure of the borrower to return the securities, collateral may be liquidated and the securities may be purchased on the open market to replace the loaned securities. Each Fund could experience delays and costs in gaining access to the collateral and the securities may lose value during the delay which could result in potential losses to each Fund. Some of these losses may be indemnified by the lending agent. Each Fund bears the risk of any deficiency in the amount of the collateral available for return to the borrower due to any loss on the collateral invested. Dividends received on cash collateral investments for securities lending transactions, which are net of compensation to counterparties, are included in Securities lending income on the Statements of Operations. The aggregate value of securities out on loan, if any, is shown on the Statements of Assets and Liabilities.
Note 3. Investment Advisory Agreement and Other Agreements
The Trust has entered into an Investment Advisory Agreement with the Adviser on behalf of each Fund, pursuant to which the Adviser has overall responsibility for the selection and ongoing monitoring of the Funds’ investments, managing the Funds’ business affairs and providing certain clerical, bookkeeping and other administrative services.
As compensation for its services, each Fund has agreed to pay the Adviser an annual unitary management fee. Out of the unitary management fee, the Adviser has agreed to pay for substantially all expenses of the Funds, including the cost of transfer agency, custody, fund administration, legal, audit and other services, except for advisory fees, distribution fees, if any, brokerage expenses, taxes, interest, acquired fund fees and expenses, if any, litigation expenses and other extraordinary expenses. The unitary management fee is paid by each Fund to the Adviser at the following annual rates:
| | | | |
| | | % of Average
Daily Net Assets | |
| FTSE International Low Beta Equal Weight Portfolio | | | 0.45 | % |
| Russell 1000 Low Beta Equal Weight Portfolio | | | 0.35 | % |
| S&P 500® ex-Rate Sensitive Low Volatility Portfolio | | | 0.25 | % |
| S&P 500® High Beta Portfolio | | | 0.25 | % |
| S&P 500® High Dividend Low Volatility Portfolio | | | 0.30 | % |
| S&P 500® Low Volatility Portfolio | | | 0.25 | % |
| S&P 500 Momentum Portfolio | | | 0.25 | % |
| S&P 500 Value Portfolio | | | 0.25 | % |
| S&P Emerging Markets Low Volatility Portfolio | | | 0.45 | %* |
| S&P Emerging Markets Momentum Portfolio | | | 0.45 | %* |
| S&P International Developed Low Volatility Portfolio | | | 0.35 | %** |
| S&P International Developed Momentum Portfolio | | | 0.35 | %** |
| S&P MidCap Low Volatility Portfolio | | | 0.25 | % |
| S&P SmallCap Low Volatility Portfolio | | | 0.25 | % |
| * | The Adviser has agreed to waive a portion of its unitary management fee through February 28, 2018. After giving effect to such waiver, the Fund’s net unitary management fee is 0.29% of its average daily net assets. Unless the Adviser continues the fee waiver agreement, it will terminate on February 28, 2018. The fee waiver agreement cannot be terminated during its term. |
| ** | The Adviser has agreed to waive a portion of its unitary management fee through February 28, 2018. After giving effect to such waiver, the Fund’s net unitary management fee is 0.25% of its average daily net assets. Unless the Adviser continues the fee waiver agreement, it will terminate on February 28, 2018. The fee waiver agreement cannot be terminated during its term. |
Further, through August 31, 2018, the Adviser has contractually agreed to waive a portion of each Fund’s management fee in an amount equal to 100% of the net advisory fees an affiliate of the Adviser receives that are attributable to certain of the Fund’s investments in money market funds managed by that affiliate (excluding investments of cash collateral from securities lending). The Adviser cannot discontinue this waiver prior to its expiration.
For the fiscal year ended October 31, 2016, the Adviser waived fees for each Fund in the following amounts:
| | | | |
| FTSE International Low Beta Equal Weight Portfolio | | $ | 131 | |
| Russell 1000 Low Beta Equal Weight Portfolio | | | 144 | |
| S&P 500® ex-Rate Sensitive Low Volatility Portfolio | | | 41 | |
| S&P 500® High Beta Portfolio | | | 51 | |
| S&P 500® High Dividend Low Volatility Portfolio | | | 1,493 | |
| S&P 500® Low Volatility Portfolio | | | 3,434 | |
| S&P 500 Momentum Portfolio | | | 2 | |
| S&P 500 Value Portfolio | | | 6 | |
| S&P Emerging Markets Low Volatility Portfolio | | | 302,181 | |
| S&P Emerging Markets Momentum Portfolio | | | 2,572 | |
| S&P International Developed Low Volatility Portfolio | | | 278,742 | |
| S&P International Developed Momentum Portfolio | | | 3,614 | |
| S&P MidCap Low Volatility Portfolio | | | 297 | |
| S&P SmallCap Low Volatility Portfolio | | | 271 | |
The Trust has entered into a Distribution Agreement with Invesco Distributors, Inc. (the “Distributor”), which serves as the distributor of Creation Units for each Fund. The Distributor does not maintain a secondary market in the Shares. The Funds are not charged any fees pursuant to the Distribution Agreement. The Distributor is an affiliate of the Adviser.
The Adviser has entered into a licensing agreement for each Fund with the following entities (each, a “Licensor”):
| | |
Fund | | Licensor |
| FTSE International Low Beta Equal Weight Portfolio | | FTSE International Ltd. |
| Russell 1000 Low Beta Equal Weight Portfolio | | Frank Russell Company |
| S&P 500® ex-Rate Sensitive Low Volatility Portfolio | | S&P Dow Jones Indices LLC |
| S&P 500® High Beta Portfolio | | S&P Dow Jones Indices LLC |
| S&P 500® High Dividend Low Volatility Portfolio | | S&P Dow Jones Indices LLC |
| S&P 500® Low Volatility Portfolio | | S&P Dow Jones Indices LLC |
| S&P 500 Momentum Portfolio | | S&P Dow Jones Indices LLC |
| S&P 500 Value Portfolio | | S&P Dow Jones Indices LLC |
| S&P Emerging Markets Low Volatility Portfolio | | S&P Dow Jones Indices LLC |
| S&P Emerging Markets Momentum Portfolio | | S&P Dow Jones Indices LLC |
| S&P International Developed Low Volatility Portfolio | | S&P Dow Jones Indices LLC |
| S&P International Developed Momentum Portfolio | | S&P Dow Jones Indices LLC |
| S&P MidCap Low Volatility Portfolio | | S&P Dow Jones Indices LLC |
| S&P SmallCap Low Volatility Portfolio | | S&P Dow Jones Indices LLC |
Each Underlying Index name trademark is owned by its respective Licensor. These trademarks have been licensed to the Adviser for use by the Funds. Each Fund is entitled to use its Underlying Index pursuant to the Trust’s sub-licensing agreement with the Adviser. The Funds are not sponsored, endorsed, sold or promoted by the Licensors, and the Licensors make no representation regarding the advisability of investing in any of the Funds.
The Trust has entered into service agreements whereby The Bank of New York Mellon, a wholly-owned subsidiary of The Bank of New York Mellon Corporation, serves as the administrator, custodian, fund accountant and transfer agent for each Fund.
Note 4. Investments in Affiliates
The Adviser is a wholly-owned subsidiary of Invesco Ltd. and therefore, Invesco Ltd. is considered to be affiliated with the Funds. The table below shows S&P 500® High Beta Portfolio’s transactions in, and earnings from, its investment in affiliates for the fiscal year ended October 31, 2016.
S&P 500® High Beta Portfolio
| | | | | | | | | | | | | | | | | | | | | | | | | | | | |
| | | Value
October 31, 2015 | | | Purchases
at Cost | | | Proceeds
from Sales | | | Change in
Unrealized
Appreciation
(Depreciation) | | | Realized
Gain (Loss) | | | Value
October 31, 2016 | | | Dividend
Income | |
| Invesco Ltd. | | $ | 690,235 | | | $ | 6,284,649 | | | $ | (1,285,005 | ) | | $ | (551,670 | ) | | $ | (124,565 | ) | | $ | 5,013,644 | | | $ | 27,744 | |
The Adviser also serves as the adviser for PowerShares India Portfolio, and therefore PowerShares India Portfolio is considered to be affiliated with the Funds. The table below shows S&P Emerging Markets Momentum Portfolio’s transactions in, and earnings from, its investments in affiliates for the fiscal year ended October 31, 2016.
S&P Emerging Markets Momentum Portfolio
| | | | | | | | | | | | | | | | | | | | | | | | | | | | |
| | | Value
October 31, 2015 | | | Purchases
at Cost | | | Proceeds
from
Sales | | | Change in
Unrealized
Appreciation | | | Realized
Gain | | | Value
October 31, 2016 | | | Dividend
Income | |
| PowerShares India Portfolio | | $ | — | | | $ | 46,565 | | | $ | (20,205 | ) | | $ | 2,880 | | | $ | 1,603 | | | $ | 30,843 | | | $ | 256 | |
Note 5. Additional Valuation Information
GAAP defines fair value as the price that would be received to sell an asset or paid to transfer a liability in an orderly transaction between market participants at the measurement date, under current market conditions. GAAP establishes a hierarchy that prioritizes the inputs to valuation methods, giving the highest priority to readily available unadjusted quoted prices in an active market for identical assets (Level 1) and the lowest priority to significant unobservable inputs (Level 3), generally when market prices are not readily available or are unreliable. Based on the valuation inputs, the securities or other investments are tiered into one of three levels. Changes in valuation methods may result in transfers in or out of an investment’s assigned level:
| | Level 1 — | Prices are determined using quoted prices in an active market for identical assets. |
| | Level 2 — | Prices are determined using other significant observable inputs. Observable inputs are inputs that other market participants may use in pricing a security. These may include quoted prices for similar securities, interest rates, prepayment speeds, credit risk, yield curves, loss severities, default rates, discount rates, volatilities and others. |
| | Level 3 — | Prices are determined using significant unobservable inputs. In situations where quoted prices or observable inputs are unavailable (for example, when there is little or no market activity for an investment at the end of the period), unobservable inputs may be used. Unobservable inputs reflect a Fund’s own assumptions about the factors market participants would use in determining fair value of the securities or instruments and would be based on the best available information. |
Except for the Funds listed below, as of October 31, 2016, all of the securities in each Fund were valued based on Level 1 inputs (see the Schedules of Investments for security categories). The level assigned to the securities valuations may not be an indication of the risk or liquidity associated with investing in those securities. Because of the inherent uncertainties of valuation, the values reflected in the financial statements may materially differ from the value received upon actual sale of those investments.
| | | | | | | | | | | | | | | | |
| | | Investments in Securities | |
| | | Level 1 | | | Level 2 | | | Level 3 | | | Total | |
| FTSE International Low Beta Equal Weight Portfolio | | | | | | | | | | | | | | | | |
Equity Securities | | $ | 146,692,522 | | | $ | 6,135 | | | $ | — | | | $ | 146,698,657 | |
| | | | | | | | | | | | | | | | |
| S&P Emerging Markets Momentum Portfolio | | | | | | | | | | | | | | | | |
Equity Securities | | $ | 1,583,596 | | | $ | 6,139 | | | $ | — | | | $ | 1,589,735 | |
| | | | | | | | | | | | | | | | |
A reconciliation of Level 3 investments is presented when a Fund had a significant amount of Level 3 investments at the beginning and/or end of the reporting period in relation to net assets.
The following is a reconciliation of the fair valuations using significant unobservable inputs (Level 3) for S&P Emerging Markets Momentum Portfolio during the fiscal year ended October 31, 2016.
| | | | | | | | | | | | | | | | | | | | | | | | | | | | | | | | |
| | | Beginning Balance,
as of
October 31, 2015 | | | Purchases | | | Sales | | | Net
Realized
Gain
(Loss) | | | Net Change in
Unrealized
Appreciation | | | Transfers into
Level 3 | | | Transfers out
of Level 3 | | | Ending Balance,
as of
October 31, 2016 | |
| Equity Securities | | $ | 41,444 | | | $ | — | | | $ | (29,200 | ) | | $ | (16,981 | ) | | $ | 4,737 | | | $ | — | | | $ | — | | | $ | — | |
Note 6. Distributions to Shareholders and Tax Components of Net Assets
Tax Character of Distributions to Shareholders Paid During the Fiscal Years Ended October 31, 2016 and 2015:
| | | | | | | | | | | | | | | | |
| | | 2016 | | | 2015 | |
| | | Ordinary
Income | | | Return of
Capital | | | Ordinary
Income | | | Return of
Capital | |
| FTSE International Low Beta Equal Weight Portfolio | | $ | 2,208,386 | | | $ | — | | | $ | — | | | $ | — | |
| Russell 1000 Low Beta Equal Weight Portfolio | | | 1,664,363 | | | | — | | | | — | | | | — | |
| S&P 500® ex-Rate Sensitive Low Volatility Portfolio | | | 2,230,409 | | | | — | | | | 585,447 | | | | 10,253 | |
| S&P 500® High Beta Portfolio | | | 1,082,016 | | | | — | | | | 2,644,196 | | | | — | |
| S&P 500® High Dividend Low Volatility Portfolio | | | 55,786,559 | | | | — | | | | 16,582,835 | | | | — | |
| S&P 500® Low Volatility Portfolio | | | 136,098,330 | | | | — | | | | 121,208,205 | | | | — | |
| S&P 500 Momentum Portfolio | | | 30,887 | | | | — | | | | — | | | | — | |
| S&P 500 Value Portfolio | | | 50,033 | | | | — | | | | — | | | | — | |
| S&P Emerging Markets Low Volatility Portfolio | | | 4,568,384 | | | | — | | | | 5,829,953 | | | | — | |
| S&P Emerging Markets Momentum Portfolio | | | 32,105 | | | | — | | | | 94,542 | | | | — | |
| S&P International Developed Low Volatility Portfolio | | | 9,700,064 | | | | — | | | | 9,605,676 | | | | — | |
| S&P International Developed Momentum Portfolio | | | 73,374 | | | | — | | | | 166,413 | | | | — | |
| S&P MidCap Low Volatility Portfolio | | | 5,648,124 | | | | — | | | | 1,549,096 | | | | — | |
| S&P SmallCap Low Volatility Portfolio | | | 6,839,137 | | | | — | | | | 1,805,010 | | | | — | |
Tax Components of Net Assets at Fiscal Year-End:
| | | | | | | | | | | | | | | | | | | | | | | | |
| | | Undistributed
Ordinary
Income | | | Net
Unrealized
Appreciation
(Depreciation)—
Investment
Securities | | | Net Unrealized
Appreciation
(Depreciation)—
Other Investments | | | Capital Loss
Carryforward | | | Shares of
Beneficial
Interest | | | Total Net
Assets | |
| FTSE International Low Beta Equal Weight Portfolio | | $ | 557,868 | | | $ | 60,649 | | | $ | (9,980 | ) | | $ | (1,851,646 | ) | | $ | 148,039,950 | | | $ | 146,796,841 | |
| Russell 1000 Low Beta Equal Weight Portfolio | | | 302,667 | | | | 2,675,890 | | | | — | | | | (7,044,464 | ) | | | 142,769,677 | | | | 138,703,770 | |
| S&P 500® ex-Rate Sensitive Low Volatility Portfolio | | | — | | | | 2,882,718 | | | | — | | | | (3,821,987 | ) | | | 165,361,924 | | | | 164,422,655 | |
| S&P 500® High Beta Portfolio | | | 566,758 | | | | (14,348,550 | ) | | | — | | | | (27,072,209 | ) | | | 530,058,426 | | | | 489,204,425 | |
| S&P 500® High Dividend Low Volatility Portfolio | | | — | | | | (12,217,650 | ) | | | — | | | | (8,594,777 | ) | | | 2,644,243,085 | | | | 2,623,430,658 | |
| S&P 500® Low Volatility Portfolio | | | — | | | | 178,215,385 | | | | — | | | | (234,812,769 | ) | | | 6,507,612,180 | | | | 6,451,014,796 | |
| S&P 500 Momentum Portfolio | | | 4,268 | | | | 53,561 | | | | — | | | | (11,899 | ) | | | 1,282,327 | | | | 1,328,257 | |
| S&P 500 Value Portfolio | | | 2,987 | | | | 9,508 | | | | — | | | | (49,612 | ) | | | 1,359,200 | | | | 1,322,083 | |
| S&P Emerging Markets Low Volatility Portfolio | | | 426,731 | | | | (5,113,501 | ) | | | (6,423 | ) | | | (47,208,529 | ) | | | 321,379,291 | | | | 269,477,569 | |
| S&P Emerging Markets Momentum Portfolio | | | 15,012 | | | | 64,150 | | | | 53 | | | | (1,785,636 | ) | | | 3,293,516 | | | | 1,587,095 | |
| S&P International Developed Low Volatility Portfolio | | | 2,897,256 | | | | (7,100,993 | ) | | | (22,837 | ) | | | (26,994,791 | ) | | | 415,357,879 | | | | 384,136,514 | |
| S&P International Developed Momentum Portfolio | | | 18,540 | | | | (56,664 | ) | | | (367 | ) | | | (1,606,890 | ) | | | 5,180,810 | | | | 3,535,429 | |
| S&P MidCap Low Volatility Portfolio | | | 1,885,150 | | | | 20,093,198 | | | | — | | | | (2,167,662 | ) | | | 662,283,695 | | | | 682,094,381 | |
| S&P SmallCap Low Volatility Portfolio | | | 1,239,452 | | | | 32,563,322 | | | | — | | | | (2,835,987 | ) | | | 620,854,295 | | | | 651,821,082 | |
Capital loss carryforwards are calculated and reported as of a specific date. Results of transactions and other activity after that date may affect the amount of capital loss carryforwards actually available for the Funds to utilize. Capital losses generated in years beginning after December 22, 2010 can be carried forward for an unlimited period, whereas previous losses expire in eight tax years. Capital losses with an expiration period may not be used to offset capital gains until all net capital losses without an expiration date have been utilized. Capital loss carryforwards with no expiration date will retain their character as either short-term or long-term capital losses instead of as short-term capital losses as under prior law. The ability to utilize capital loss carryforwards in the future may be limited under the Internal Revenue Code and related regulations based on the results of future transactions.
The following table presents available capital loss carryforwards and expiration dates for each Fund as of October 31, 2016.
| | | | | | | | | | | | |
| | | Post-effective/no expiration | | | | |
| | | Short-Term | | | Long-Term | | | Total* | |
| FTSE International Low Beta Equal Weight Portfolio | | $ | 1,851,646 | | | $ | — | | | $ | 1,851,646 | |
| Russell 1000 Low Beta Equal Weight Portfolio | | | 7,044,464 | | | | — | | | | 7,044,464 | |
| S&P 500® ex-Rate Sensitive Low Volatility Portfolio | | | 3,722,320 | | | | 99,667 | | | | 3,821,987 | |
| S&P 500® High Beta Portfolio | | | 17,870,811 | | | | 9,201,398 | | | | 27,072,209 | |
| S&P 500® High Dividend Low Volatility Portfolio | | | 8,594,777 | | | | — | | | | 8,594,777 | |
| S&P 500® Low Volatility Portfolio | | | 206,817,367 | | | | 27,995,402 | | | | 234,812,769 | |
| S&P 500 Momentum Portfolio | | | 11,899 | | | | — | | | | 11,899 | |
| S&P 500 Value Portfolio | | | 49,612 | | | | — | | | | 49,612 | |
| | | | | | | | | | | | |
| | | Post-effective/no expiration | | | | |
| | | Short-Term | | | Long-Term | | | Total* | |
| S&P Emerging Markets Low Volatility Portfolio | | $ | 24,739,303 | | | $ | 22,469,226 | | | $ | 47,208,529 | |
| S&P Emerging Markets Momentum Portfolio | | | 1,179,978 | | | | 605,658 | | | | 1,785,636 | |
| S&P International Developed Low Volatility Portfolio | | | 17,680,676 | | | | 9,314,115 | | | | 26,994,791 | |
| S&P International Developed Momentum Portfolio | | | 1,027,966 | | | | 578,924 | | | | 1,606,890 | |
| S&P MidCap Low Volatility Portfolio | | | 2,167,662 | | | | — | | | | 2,167,662 | |
| S&P SmallCap Low Volatility Portfolio | | | 2,835,987 | | | | — | | | | 2,835,987 | |
| * | Capital loss carryforwards as of the date listed above are reduced for limitations, if any, to the extent required by the Internal Revenue Code and may be further limited depending upon a variety of factors, including the realization of net unrealized gains or losses as of the date of any reorganization. |
Note 7. Investment Transactions
For the fiscal year ended October 31, 2016, the cost of securities purchased and proceeds from sales of securities (other than short-term securities, U.S. Treasury obligations, money market funds and in-kind transactions, if any) were as follows:
| | | | | | | | |
| | | Purchases | | | Sales | |
| FTSE International Low Beta Equal Weight Portfolio | | $ | 79,789,458 | | | $ | 67,307,401 | |
| Russell 1000 Low Beta Equal Weight Portfolio | | | 132,149,007 | | | | 130,341,648 | |
| S&P 500® ex-Rate Sensitive Low Volatility Portfolio | | | 69,160,358 | | | | 71,031,217 | |
| S&P 500® High Beta Portfolio | | | 73,302,004 | | | | 68,738,175 | |
| S&P 500® High Dividend Low Volatility Portfolio | | | 776,634,394 | | | | 777,495,730 | |
| S&P 500® Low Volatility Portfolio | | | 3,458,610,976 | | | | 3,455,701,652 | |
| S&P 500 Momentum Portfolio | | | 2,204,890 | | | | 2,572,271 | |
| S&P 500 Value Portfolio | | | 858,941 | | | | 2,458,114 | |
| S&P Emerging Markets Low Volatility Portfolio | | | 192,344,794 | | | | 140,613,606 | |
| S&P Emerging Markets Momentum Portfolio | | | 2,759,214 | | | | 2,771,998 | |
| S&P International Developed Low Volatility Portfolio | | | 160,219,820 | | | | 160,943,065 | |
| S&P International Developed Momentum Portfolio | | | 7,145,940 | | | | 7,145,115 | |
| S&P MidCap Low Volatility Portfolio | | | 208,862,932 | | | | 202,198,790 | |
| S&P SmallCap Low Volatility Portfolio | | | 175,109,716 | | | | 172,381,811 | |
For the fiscal year ended October 31, 2016, in-kind transactions associated with creations and redemptions were as follows:
| | | | | | | | |
| | | Cost of
Securities
Received | | | Value of
Securities
Delivered | |
| FTSE International Low Beta Equal Weight Portfolio | | $ | 148,392,278 | | | $ | 15,006,717 | |
| Russell 1000 Low Beta Equal Weight Portfolio | | | 185,667,152 | | | | 49,756,701 | |
| S&P 500® ex-Rate Sensitive Low Volatility Portfolio | | | 107,254,154 | | | | 53,731,584 | |
| S&P 500® High Beta Portfolio | | | 553,821,430 | | | | 142,966,914 | |
| S&P 500® High Dividend Low Volatility Portfolio | | | 2,959,449,694 | | | | 985,380,148 | |
| S&P 500® Low Volatility Portfolio | | | 5,897,264,130 | | | | 4,832,648,694 | |
| S&P 500 Momentum Portfolio | | | 1,264,799 | | | | 2,195,587 | |
| S&P 500 Value Portfolio | | | 2,490,279 | | | | 2,098,351 | |
| S&P Emerging Markets Low Volatility Portfolio | | | 58,933,474 | | | | 15,065,001 | |
| S&P Emerging Markets Momentum Portfolio | | | — | | | | — | |
| S&P International Developed Low Volatility Portfolio | | | 206,602,127 | | | | 125,728,579 | |
| S&P International Developed Momentum Portfolio | | | — | | | | — | |
| S&P MidCap Low Volatility Portfolio | | | 688,008,787 | | | | 151,727,209 | |
| S&P SmallCap Low Volatility Portfolio | | | 603,824,260 | | | | 123,182,966 | |
Gains (losses) on in-kind transactions are generally not considered taxable gains (losses) for federal income tax purposes.
At October 31, 2016, the aggregate cost and net unrealized appreciation (depreciation) of investments for tax purposes were as follows:
| | | | | | | | | | | | | | | | |
| | | Gross
Unrealized
Appreciation | | | Gross
Unrealized
(Depreciation) | | | Net
Unrealized
Appreciation
(Depreciation) | | | Cost | |
| FTSE International Low Beta Equal Weight Portfolio | | $ | 8,431,239 | | | $ | (8,370,590 | ) | | $ | 60,649 | | | $ | 146,638,008 | |
| Russell 1000 Low Beta Equal Weight Portfolio | | | 8,611,043 | | | | (5,935,153 | ) | | | 2,675,890 | | | | 136,100,469 | |
| S&P 500® ex-Rate Sensitive Low Volatility Portfolio | | | 7,010,269 | | | | (4,127,551 | ) | | | 2,882,718 | | | | 161,579,826 | |
| S&P 500® High Beta Portfolio | | | 11,311,143 | | | | (25,659,693 | ) | | | (14,348,550 | ) | | | 503,370,747 | |
| S&P 500® High Dividend Low Volatility Portfolio | | | 67,546,324 | | | | (79,763,974 | ) | | | (12,217,650 | ) | | | 2,635,746,641 | |
| S&P 500® Low Volatility Portfolio | | | 288,434,750 | | | | (110,219,365 | ) | | | 178,215,385 | | | | 6,269,466,091 | |
| S&P 500 Momentum Portfolio | | | 84,359 | | | | (30,798 | ) | | | 53,561 | | | | 1,274,281 | |
| S&P 500 Value Portfolio | | | 65,455 | | | | (55,947 | ) | | | 9,508 | | | | 1,312,030 | |
| S&P Emerging Markets Low Volatility Portfolio | | | 10,407,483 | | | | (15,520,984 | ) | | | (5,113,501 | ) | | | 274,926,186 | |
| S&P Emerging Markets Momentum Portfolio | | | 121,560 | | | | (57,410 | ) | | | 64,150 | | | | 1,525,585 | |
| S&P International Developed Low Volatility Portfolio | | | 10,463,779 | | | | (17,564,772 | ) | | | (7,100,993 | ) | | | 395,679,536 | |
| S&P International Developed Momentum Portfolio | | | 116,625 | | | | (173,289 | ) | | | (56,664 | ) | | | 3,589,909 | |
| S&P MidCap Low Volatility Portfolio | | | 33,205,605 | | | | (13,112,407 | ) | | | 20,093,198 | | | | 661,986,917 | |
| S&P SmallCap Low Volatility Portfolio | | | 43,413,175 | | | | (10,849,853 | ) | | | 32,563,322 | | | | 624,096,274 | |
Note 8. Reclassification of Permanent Differences
Primarily as a result of differing book/tax treatment of in-kind transactions, foreign currency transactions and passive foreign investment companies, amounts were reclassified between undistributed net investment income, undistributed net realized gain (loss) and Shares of beneficial interest. These reclassifications had no effect on the net assets of each Fund. For the fiscal year ended October 31, 2016, the reclassifications were as follows:
| | | | | | | | | | | | |
| | | Undistributed
Net Investment
Income | | | Undistributed
Net Realized
Gain (Loss) | | | Shares of
Beneficial
Interest | |
| FTSE International Low Beta Equal Weight Portfolio | | $ | 69,226 | | | $ | (2,550,877 | ) | | $ | 2,481,651 | |
| Russell 1000 Low Beta Equal Weight Portfolio | | | — | | | | (5,674,778 | ) | | | 5,674,778 | |
| S&P 500® ex-Rate Sensitive Low Volatility Portfolio | | | 52,726 | | | | (6,006,924 | ) | | | 5,954,198 | |
| S&P 500® High Beta Portfolio | | | — | | | | (1,937,176 | ) | | | 1,937,176 | |
| S&P 500® High Dividend Low Volatility Portfolio | | | 2,155,312 | | | | (120,052,640 | ) | | | 117,897,328 | |
| S&P 500® Low Volatility Portfolio | | | 3,567,376 | | | | (539,410,308 | ) | | | 535,842,932 | |
| S&P 500 Momentum Portfolio | | | — | | | | (118,662 | ) | | | 118,662 | |
| S&P 500 Value Portfolio | | | 53 | | | | (63,368 | ) | | | 63,315 | |
| S&P Emerging Markets Low Volatility Portfolio | | | (272,898 | ) | | | 2,118,522 | | | | (1,845,624 | ) |
| S&P Emerging Markets Momentum Portfolio | | | 1,382 | | | | (1,382 | ) | | | — | |
| S&P International Developed Low Volatility Portfolio | | | 46,616 | | | | 3,910,780 | | | | (3,957,396 | ) |
| S&P International Developed Momentum Portfolio | | | (3,806 | ) | | | 3,806 | | | | — | |
| S&P MidCap Low Volatility Portfolio | | | — | | | | (18,767,893 | ) | | | 18,767,893 | |
| S&P SmallCap Low Volatility Portfolio | | | — | | | | (15,469,239 | ) | | | 15,469,239 | |
Note 9. Trustees’ and Officer’s Fees
Trustees’ and Officer’s Fees include amounts accrued by the Funds to pay remuneration to each Trustee who is not an “interested person” as defined in the 1940 Act (an “Independent Trustee”), any Trustee who is not an affiliate of the Adviser or Distributor (or any of their affiliates) and who is otherwise an “interested person” of the Trust under the 1940 Act (an “Unaffiliated Trustee”) and an Officer of the Trust. The Adviser, as a result of each Fund’s unitary management fee, pays for such compensation. The Trustee who is an “interested person” of the Trust does not receive any Trustees’ fees.
The Trust has adopted a deferred compensation plan (the “Plan”). Under the Plan, each Independent Trustee or Unaffiliated Trustee who has executed a Deferred Fee Agreement (a “Participating Trustee”) may defer receipt of all or a portion of his compensation (“Deferral Fees”). Such Deferral Fees are deemed to be invested in select PowerShares Funds. The Deferral Fees payable to the
Participating Trustee are valued as of the date such Deferral Fees would have been paid to the Participating Trustee. The value increases with contributions or with increases in the value of the Shares selected, and the value decreases with distributions or with declines in the value of the Shares selected. Obligations under the Plan represent unsecured claims against the general assets of the Funds.
Note 10. Capital
Shares are created and redeemed by each Fund only in Creation Units of 50,000 Shares. Only Authorized Participants are permitted to purchase or redeem Creation Units from the Funds. Such transactions are principally permitted in exchange for Deposit Securities, with a balancing cash component to equate the transaction to the NAV per Share of a Fund of the Trust on the transaction date. However, for all Funds, cash in an amount equivalent to the value of certain securities may be substituted, generally when the securities are not available in sufficient quantity for delivery, not eligible for trading by the Authorized Participant or as a result of other market circumstances.
To the extent that the Funds permit transactions in exchange for Deposit Securities, each Fund may issue Shares in advance of receipt of Deposit Securities subject to various conditions, including a requirement to maintain on deposit with the Trust cash at least equal to 105% of the market value of the missing Deposit Securities. In accordance with the Trust’s Participant Agreement, Creation Units will be issued to an Authorized Participant, notwithstanding the fact that the corresponding Deposit Securities have not been received in part or in whole, in reliance on the undertaking of the Authorized Participant to deliver the missing Deposit Securities as soon as possible, which undertaking shall be secured by the Authorized Participant’s delivery and maintenance of collateral consisting of cash in the form of U.S. dollars in immediately available funds having a value (marked-to-market daily) at least equal to 105%, which the Adviser may change from time to time, of the value of the missing Deposit Securities.
Certain transaction fees may be charged by the Funds for creations and redemptions, which are treated as increases in capital.
On February 18, 2016, mutual funds affiliated with the Funds’ Adviser purchased in the secondary market 820,187 Shares of S&P International Developed Low Volatility Portfolio valued at $22,776,511, 1,348,361 Shares of S&P MidCap Low Volatility Portfolio valued at $45,385,427 and 1,389,862 Shares of S&P SmallCap Low Volatility Portfolio valued at $45,339,383.
Transactions in each Fund’s Shares are disclosed in detail in the Statements of Changes in Net Assets.
Note 11. Indemnifications
Under the Trust’s organizational documents, its officers and Trustees are indemnified against certain liabilities arising out of the performance of their duties to the Trust. Each Independent Trustee and Unaffiliated Trustee is also indemnified against certain liabilities arising out of the performance of his duties to the Trust pursuant to an Indemnification Agreement between such trustee and the Trust. Additionally, in the normal course of business, the Trust enters into contracts with service providers that contain general indemnification clauses. The Trust’s maximum exposure under these arrangements is unknown, as this would involve future claims that may be made against the Trust that have not yet occurred. However, based on experience, the Trust believes the risk of loss to be remote.
Report of Independent Registered Public Accounting Firm
To the Board of Trustees and Shareholders of PowerShares Exchange-Traded Fund Trust II:
In our opinion, the accompanying statements of assets and liabilities, including the schedules of investments, and the related statements of operations and of changes in net assets and the financial highlights present fairly, in all material respects, the financial position of PowerShares FTSE International Low Beta Equal Weight Portfolio, PowerShares Russell 1000 Low Beta Equal Weight Portfolio, PowerShares S&P 500® ex-Rate Sensitive Low Volatility Portfolio, PowerShares S&P 500® High Beta Portfolio, PowerShares S&P 500® High Dividend Low Volatility Portfolio, PowerShares S&P 500® Low Volatility Portfolio, PowerShares S&P 500 Momentum Portfolio, PowerShares S&P 500 Value Portfolio, PowerShares S&P Emerging Markets Low Volatility Portfolio, PowerShares S&P Emerging Markets Momentum Portfolio (formerly PowerShares S&P Emerging Markets High Beta Portfolio), PowerShares S&P International Developed Low Volatility Portfolio, PowerShares S&P International Developed Momentum Portfolio (formerly PowerShares S&P International Developed High Beta Portfolio), PowerShares S&P MidCap Low Volatility Portfolio, and PowerShares S&P SmallCap Low Volatility Portfolio (each an individual portfolio of PowerShares Exchange-Traded Fund Trust II, hereafter referred to as the “Funds”) as of October 31, 2016, the results of each of their operations, the changes in each of their net assets and the financial highlights for each of the periods presented, in conformity with accounting principles generally accepted in the United States of America. These financial statements and financial highlights (hereafter referred to as “financial statements”) are the responsibility of the Funds’ management. Our responsibility is to express an opinion on these financial statements based on our audits. We conducted our audits of these financial statements in accordance with the standards of the Public Company Accounting Oversight Board (United States). Those standards require that we plan and perform the audit to obtain reasonable assurance about whether the financial statements are free of material misstatement. An audit includes examining, on a test basis, evidence supporting the amounts and disclosures in the financial statements, assessing the accounting principles used and significant estimates made by management, and evaluating the overall financial statement presentation. We believe that our audits, which included confirmation of securities as of October 31, 2016 by correspondence with the custodian and brokers, and the application of alternative auditing procedures where confirmations of security purchases have not been received, provide a reasonable basis for our opinion.
PricewaterhouseCoopers LLP
Chicago, IL
December 22, 2016
Fees and Expenses
As a shareholder of a Fund of the PowerShares Exchange-Traded Fund Trust II, you incur a unitary management fee. In addition to the unitary management fee, a shareholder may pay distribution fees, if any, brokerage expenses, taxes, interest, acquired fund fees and expenses, if any, litigation expenses and other extraordinary expenses. The expense examples below are intended to help you understand your ongoing costs (in dollars) of investing in the Funds and to compare these costs with the ongoing costs of investing in other funds.
The example is based on an investment of $1,000 invested at the beginning of the period and held through the six-month period ended October 31, 2016.
Actual Expenses
The first line in the following table provides information about actual account values and actual expenses. You may use the information in this line, together with the amount you invested, to estimate the expenses that you paid over the period. Simply divide your account value by $1,000 (for example, an $8,600 account value divided by $1,000 = 8.6), then multiply the result by the number in the first line under the heading “Expenses Paid During the Six-Month Period” to estimate the expenses you paid on your account during this period.
Hypothetical Example for Comparison Purposes
The second line in the following table provides information about hypothetical account values and hypothetical expenses based on each Fund’s actual expense ratio and an assumed annualized rate of return of 5% per year before expenses, which is not the Fund’s actual return. The hypothetical account values and expenses may not be used to estimate the actual ending account balance or expenses you paid for the period. You may use this information to compare the ongoing costs of investing in the Funds and other funds. To do so, compare this 5% hypothetical example with the 5% hypothetical examples that appear in the shareholder reports of the other funds.
Please note that the expenses shown in the table are meant to highlight your ongoing costs only, and do not reflect any transactional costs, such as sales charges and brokerage commissions. Therefore, the second line in the table is useful in comparing ongoing costs only, and will not help you determine the relative total costs of owning different funds. In addition, if these transactional costs were included, your costs would have been higher.
| | | | | | | | | | | | | | | | |
| | | Beginning
Account Value
May 1, 2016 | | | Ending
Account Value
October 31, 2016 | | | Annualized
Expense Ratio
Based on the
Six-Month Period | | | Expenses Paid
During the
Six-Month Period(1) | |
| PowerShares FSTE International Low Beta Equal Weight Portfolio (IDLB) | | | | | | | | | | | | | |
Actual | | $ | 1,000.00 | | | $ | 1,000.56 | | | | 0.45 | % | | $ | 2.26 | |
Hypothetical (5% return before expenses) | | | 1,000.00 | | | | 1,022.87 | | | | 0.45 | | | | 2.29 | |
| PowerShares Russell 1000 Low Beta Equal Weight Portfolio (USLB) | | | | | | | | | | | | | | | | |
Actual | | | 1,000.00 | | | | 1,022.52 | | | | 0.35 | | | | 1.78 | |
Hypothetical (5% return before expenses) | | | 1,000.00 | | | | 1,023.38 | | | | 0.35 | | | | 1.78 | |
| PowerShares S&P 500® ex-Rate Sensitive Low Volatility Portfolio (XRLV) | | | | | | | | | | | | | |
Actual | | | 1,000.00 | | | | 1,016.76 | | | | 0.25 | | | | 1.27 | |
Hypothetical (5% return before expenses) | | | 1,000.00 | | | | 1,023.88 | | | | 0.25 | | | | 1.27 | |
| PowerShares S&P 500® High Beta Portfolio (SPHB) | | | | | | | | | | | | | | | | |
Actual | | | 1,000.00 | | | | 1,056.53 | | | | 0.25 | | | | 1.29 | |
Hypothetical (5% return before expenses) | | | 1,000.00 | | | | 1,023.88 | | | | 0.25 | | | | 1.27 | |
| PowerShares S&P 500® High Dividend Low Volatility Portfolio (SPHD) | | | | | | | | | | | | | |
Actual | | | 1,000.00 | | | | 1,033.65 | | | | 0.30 | | | | 1.53 | |
Hypothetical (5% return before expenses) | | | 1,000.00 | | | | 1,023.63 | | | | 0.30 | | | | 1.53 | |
| PowerShares S&P 500® Low Volatility Portfolio (SPLV) | | | | | | | | | | | | | | | | |
Actual | | | 1,000.00 | | | | 1,023.04 | | | | 0.25 | | | | 1.27 | |
Hypothetical (5% return before expenses) | | | 1,000.00 | | | | 1,023.88 | | | | 0.25 | | | | 1.27 | |
Fees and Expenses (continued)
| | | | | | | | | | | | | | | | |
| | | Beginning
Account Value
May 1, 2016 | | | Ending
Account Value
October 31, 2016 | | | Annualized
Expense Ratio
Based on the
Six-Month Period | | | Expenses Paid
During the
Six-Month Period(1) | |
| PowerShares S&P 500 Momentum Portfolio (SPMO) | | | | | | | | | | | | | |
Actual | | $ | 1,000.00 | | | $ | 1,049.68 | | | | 0.25 | % | | $ | 1.29 | |
Hypothetical (5% return before expenses) | | | 1,000.00 | | | | 1,023.88 | | | | 0.25 | | | | 1.27 | |
| PowerShares S&P 500 Value Portfolio (SPVU) | | | | | | | | | | | | | | | | |
Actual | | | 1,000.00 | | | | 1,059.00 | | | | 0.25 | | | | 1.29 | |
Hypothetical (5% return before expenses) | | | 1,000.00 | | | | 1,023.88 | | | | 0.25 | | | | 1.27 | |
| PowerShares S&P Emerging Markets Low Volatility Portfolio (EELV) | | | | | | | | | | | | | |
Actual | | | 1,000.00 | | | | 1,006.63 | | | | 0.29 | | | | 1.46 | |
Hypothetical (5% return before expenses) | | | 1,000.00 | | | | 1,023.68 | | | | 0.29 | | | | 1.48 | |
| PowerShares S&P Emerging Markets Momentum Portfolio (EEMO) | | | | | | | | | | | | | | | | |
Actual | | | 1,000.00 | | | | 1,025.19 | | | | 0.27 | | | | 1.37 | |
Hypothetical (5% return before expenses) | | | 1,000.00 | | | | 1,023.78 | | | | 0.27 | | | | 1.37 | |
| PowerShares S&P International Developed Low Volatility Portfolio (IDLV) | | | | | | | | | | | | | |
Actual | | | 1,000.00 | | | | 982.63 | | | | 0.25 | | | | 1.25 | |
Hypothetical (5% return before expenses) | | | 1,000.00 | | | | 1,023.88 | | | | 0.25 | | | | 1.27 | |
| PowerShares S&P International Developed Momentum Portfolio (IDMO) | | | | | | | | | | | | | | | | |
Actual | | | 1,000.00 | | | | 953.83 | | | | 0.25 | | | | 1.23 | |
Hypothetical (5% return before expenses) | | | 1,000.00 | | | | 1,023.88 | | | | 0.25 | | | | 1.27 | |
| PowerShares S&P MidCap Low Volatility Portfolio (XMLV) | | | | | | | | | | | | | |
Actual | | | 1,000.00 | | | | 1,056.62 | | | | 0.25 | | | | 1.29 | |
Hypothetical (5% return before expenses) | | | 1,000.00 | | | | 1,023.88 | | | | 0.25 | | | | 1.27 | |
| PowerShares S&P SmallCap Low Volatility Portfolio (XSLV) | | | | | | | | | | | | | | | | |
Actual | | | 1,000.00 | | | | 1,085.95 | | | | 0.25 | | | | 1.31 | |
Hypothetical (5% return before expenses) | | | 1,000.00 | | | | 1,023.88 | | | | 0.25 | | | | 1.27 | |
| (1) | Expenses are calculated using the annualized expense ratio, which represents the ongoing expenses as a percentage of net assets for the six-month period ended October 31, 2016. Expenses are calculated by multiplying the Fund’s annualized expense ratio by the average account value for the period, then multiplying the result by 184/366. Expense ratios for the most recent six-month period may differ from expense ratios based on the annualized data in the Financial Highlights. |
Tax Information
Form 1099-DIV, Form 1042-S and other year-end tax information provide shareholders with actual calendar year amounts that should be included in their tax returns. Shareholders should consult their tax advisers.
The following distribution information is being provided as required by the Internal Revenue Code or to meet a specific state’s requirement.
Each Fund designates the following amounts or, if subsequently determined to be different, the maximum amount allowable for its fiscal year ended October 31, 2016:
| | | | | | | | | | |
| | | Qualified Dividend
Income* | | Corporate
Dividends Received
Deduction* |
| PowerShares FTSE International Low Beta Equal Weight Portfolio | | | | 100 | % | | | | 0 | % |
| PowerShares Russell 1000 Low Beta Equal Weight Portfolio | | | | 100 | % | | | | 95 | % |
| PowerShares S&P 500® ex-Rate Sensitive Low Volatility Portfolio | | | | 100 | % | | | | 100 | % |
| PowerShares S&P 500® High Beta Portfolio | | | | 100 | % | | | | 100 | % |
| PowerShares S&P 500® High Dividend Low Volatility Portfolio | | | | 100 | % | | | | 95 | % |
| PowerShares S&P 500® Low Volatility Portfolio | | | | 100 | % | | | | 100 | % |
| PowerShares S&P 500 Momentum Portfolio | | | | 100 | % | | | | 100 | % |
| PowerShares S&P 500 Value Portfolio | | | | 100 | % | | | | 100 | % |
| PowerShares S&P Emerging Markets Low Volatility Portfolio | | | | 65 | % | | | | 0 | % |
| PowerShares S&P Emerging Markets Momentum Portfolio | | | | 62 | % | | | | 0 | % |
| PowerShares S&P International Developed Low Volatility Portfolio | | | | 63 | % | | | | 0 | % |
| PowerShares S&P International Developed Momentum Portfolio | | | | 100 | % | | | | 0 | % |
| PowerShares S&P MidCap Low Volatility Portfolio | | | | 69 | % | | | | 63 | % |
| PowerShares S&P SmallCap Low Volatility Portfolio | | | | 84 | % | | | | 84 | % |
| * | The above percentages are based on ordinary income dividends paid to shareholders during the fiscal year. |
The Funds intend to elect to pass through to shareholders the credit for taxes paid to foreign countries. The gross foreign source income and foreign taxes paid are as follows:
| | | | | | | | | | |
| | | Gross Foreign
Income | | Foreign Taxes
Paid |
| PowerShares FTSE International Low Beta Equal Weight Portfolio | | | $ | 3,614,928 | | | | $ | 364,866 | |
| PowerShares S&P Emerging Markets Low Volatility Portfolio | | | | 6,351,892 | | | | | 901,243 | |
| PowerShares S&P International Developed Low Volatility Portfolio | | | | 9,057,603 | | | | | 434,607 | |
| PowerShares S&P International Developed Momentum Portfolio | | | | 94,164 | | | | | 8,492 | |
Trustees and Officers
The Independent Trustees, the Unaffiliated Trustees, the Non-Independent Trustees and the executive officers of the Trust, their term of office and length of time served, their principal business occupations during at least the past five years, the number of portfolios in the Fund Complex overseen by each Trustee and the other directorships, if any, held by a Trustee are shown below.
The Trustees and officers information is current as of October 31, 2016.
| | | | | | | | | | |
Name, Address and Year of Birth
of Independent Trustees | | Position(s)
Held
with Trust | | Term of
Office
and
Length of
Time
Served* | | Principal
Occupation(s)
During Past 5 Years | | Number of
Portfolios
in Fund
Complex**
Overseen by
Independent
Trustees | | Other
Directorships
Held by
Independent
Trustees During
the Past 5 Years |
Ronn R. Bagge - 1958
c/o Invesco PowerShares
Capital Management LLC
3500 Lacey Road, Suite 700
Downers Grove, IL 60515 | | Chairman of the Nominating and Governance Committee and Trustee | | Chairman of the Nominating and Governance Committee and Trustee since 2007 | | Founder and Principal, YQA Capital Management LLC (1998-Present); formerly Owner/CEO of Electronic Dynamic Balancing Co., Inc. (high-speed rotating equipment service provider). | | 126 | | None |
| | | | | |
Todd J. Barre - 1957
c/o Invesco PowerShares
Capital Management LLC
3500 Lacey Road, Suite 700
Downers Grove, IL 60515 | | Trustee | | Since 2010 | | Assistant Professor of Business, Trinity Christian College (2010-2016); formerly Vice President and Senior Investment Strategist (2001-2008), Director of Open Architecture and Trading (2007-2008), Head of Fundamental Research (2004-2007) and Vice President and Senior Fixed Income Strategist (1994-2001), BMO Financial Group/Harris Private Bank. | | 126 | | None |
| | | | | |
Marc M. Kole - 1960
c/o Invesco PowerShares
Capital Management LLC
3500 Lacey Road, Suite 700
Downers Grove, IL 60515 | | Chairman of the Audit Committee and Trustee | | Chairman of the Audit Committee since 2008; Trustee since 2007 | | Senior Director of Finance, By The Hand Club for Kids (2015-Present); Formerly: Chief Financial Officer, Hope Network (social services) (2008-2012); Assistant Vice President and Controller, Priority Health (health insurance) (2005-2008); Senior Vice President of Finance, United Healthcare (2004-2005); Chief Accounting Officer, Senior Vice President of Finance, Oxford Health Plans (2000-2004); Audit Partner, Arthur Andersen LLP (1996-2000). | | 126 | | None |
| | | | | |
Yung Bong Lim - 1964
c/o Invesco PowerShares
Capital Management LLC
3500 Lacey Road, Suite 700
Downers Grove, IL 60515 | | Chairman of the Investment Oversight Committee and Trustee | | Chairman of the Investment Oversight Committee since 2014; Trustee since 2013 | | Managing Partner, Residential Dynamics Group LLC (2008-Present); formerly, Managing Director, Citadel Investment Group, L.L.C. (1999-2007). | | 126 | | None |
| * | This is the date the Independent Trustee began serving the Trust. He serves an indefinite term, until his successor is elected. |
| ** | Fund Complex includes all open-end funds (including all of their portfolios) advised by the Adviser. At October 31, 2016, the “Fund Family” consisted of the Trust’s 67 portfolios and four other exchange-traded fund trusts with 59 portfolios advised by the Adviser. |
Trustees and Officers (continued)
| | | | | | | | | | |
Name, Address and Year of Birth
of Independent Trustees | | Position(s)
Held
with Trust | | Term of
Office
and
Length of
Time
Served* | | Principal
Occupation(s)
During Past 5 Years | | Number of
Portfolios
in Fund
Complex**
Overseen by
Independent
Trustees | | Other
Directorships
Held by
Independent
Trustees During
the Past 5 Years |
Gary R. Wicker - 1961
c/o Invesco PowerShares
Capital Management LLC
3500 Lacey Road, Suite 700
Downers Grove, IL 60515 | | Trustee | | Since 2013 | | Senior Vice President of Global Finance and Chief Financial Officer at RBC Ministries (publishing company) (2013-Present); formerly, Executive Vice President and Chief Financial Officer, Zondervan Publishing (a division of Harper Collins/NewsCorp) (2007-2012); Senior Vice President and Group Controller (2005-2006), Senior Vice President and Chief Financial Officer (2003-2004), Chief Financial Officer (2001-2003), Vice President, Finance and Controller (1999-2001) and Assistant Controller (1997-1999), divisions of The Thomson Corporation (information services provider). | | 126 | | None |
| | | | | |
Donald H. Wilson - 1959
c/o Invesco PowerShares
Capital Management LLC
3500 Lacey Road, Suite 700
Downers Grove, IL 60515 | | Chairman of the Board and Trustee | | Chairman since 2012; Trustee since 2007 | | Chairman and Chief Executive Officer, Stone Pillar Advisors, Ltd. (2010-Present); formerly, Chairman, President and Chief Executive Officer, Community Financial Shares, Inc. and Community Bank—Wheaton/Glen Ellyn (subsidiary) (2013-2015); Chief Operating Officer, AMCORE Financial, Inc. (bank holding company) (2007-2009); Executive Vice President and Chief Financial Officer, AMCORE Financial, Inc. (2006-2007); Senior Vice President and Treasurer, Marshall & Ilsley Corp. (bank holding company) (1995-2006). | | 126 | | None |
The Unaffiliated Trustees, their term of office and length of time served, their principal business occupations during the past five years, the number of portfolios in the Fund Complex overseen by the Unaffiliated Trustees and the other directorships, if any, held by such Trustees are shown below.
| | | | | | | | | | |
Philip M. Nussbaum - 1961
c/o Invesco PowerShares
Capital Management LLC
3500 Lacey Road, Suite 700
Downers Grove, IL 60515 | | Trustee*** | | Since 2007 | | Chairman, Performance Trust Capital Partners (2004-Present). | | 126 | | None |
| * | This is the date the Independent Trustee began serving the Trust. He serves an indefinite term, until his successor is elected. |
| ** | Fund Complex includes all open-end funds (including all of their portfolios) advised by the Adviser. At October 31, 2016, the “Fund Family” consisted of the Trust’s 67 portfolios and four other exchange-traded fund trusts with 59 portfolios advised by the Adviser. |
| *** | Effective February 25, 2016, Mr. Nussbaum became an Unaffiliated Trustee. |
Trustees and Officers (continued)
The Non-Independent Trustees and the executive officers of the Trust, their term of office and length of time served, their principal business occupations during the past five years, the number of portfolios in the Fund Complex overseen by the Non-Independent Trustees and the other directorships, if any, held by the Trustees are shown below.
| | | | | | | | | | |
Name, Address and Year of Birth
of Non-Independent Trustees | | Position(s)
Held
with Trust | | Term of
Office
and
Length of
Time
Served* | | Principal
Occupation(s) During
Past 5 Years | | Number of
Portfolios
in Fund
Complex**
Overseen by
Non-Independent
Trustees | | Other
Directorships
Held by
Non-Independent
Trustees During
the Past 5 Years |
Kevin M. Carome — 1956
Invesco Ltd.
Two Peachtree Pointe,
1555 Peachtree St., N.E.,
Suite 1800
Atlanta, GA 30309 | | Trustee | | Since 2010 | | Senior Managing Director, Secretary and General Counsel, Invesco Ltd. (2007-Present); Director, Invesco Advisers, Inc. (2009-Present); Director, Invesco Finance PLC, and Invesco Holding Company Limited; Director and Executive Vice President, Invesco Holding Company (US), Inc., Invesco Finance, Inc., Invesco Group Services, Inc., Invesco North American Holdings, Inc., and INVESCO Asset Management (Bermuda) Ltd.; Executive Vice President, Invesco Investments (Bermuda) Ltd., Manager, Horizon Flight Works LLC; Director and Secretary, Invesco Services (Bahamas) Private Limited; formerly, Director and Chairman, INVESCO Funds Group, Inc., Senior Vice President, Secretary and General Counsel, Invesco Advisers, Inc. (2003-2006); Director, Invesco Investments (Bermuda) Ltd. (2008-2016); Senior Vice President and General Counsel, Liberty Financial Companies, Inc. (2000-2001); General Counsel of certain investment management subsidiaries of Liberty Financial Companies, Inc. (1998-2000); Associate General Counsel, Liberty Financial Companies, Inc. (1993-1998); Associate, Ropes & Gray LLP. | | 126 | | None |
| * | This is the date the Non-Independent Trustee began serving the Trust. He serves an indefinite term, until his successor is elected. |
| ** | Fund Complex includes all open-end funds (including all of their portfolios) advised by the Adviser. At October 31, 2016, the “Fund Family” consisted of the Trust’s 67 portfolios and four other exchange-traded fund trusts with 59 portfolios advised by the Adviser. |
Trustees and Officers (continued)
| | | | | | |
Name, Address and Year of Birth
of Executive Officers | | Position(s)
Held
with Trust | | Length of
Time
Served* | | Principal Occupation(s) During Past 5 Years |
Daniel E. Draper - 1968 Invesco PowerShares
Capital Management LLC 3500 Lacey Road, Suite 700 Downers Grove, IL 60515 | | President and Principal Executive Officer | | Since
2015 | | President and Principal Executive Officer, PowerShares Exchange-Traded Fund Trust, PowerShares Exchange-Traded Fund Trust II, PowerShares India Exchange-Traded Fund Trust, PowerShares Actively Managed Exchange-Traded Fund Trust and PowerShares Actively Managed Exchange-Traded Commodity Fund Trust (2015-Present); Chief Executive Officer and Principal Executive Officer (2016-Present) and Managing Director (2013-Present), Invesco PowerShares Capital Management LLC; Senior Vice President, Invesco Distributors, Inc. (2014-Present); formerly, Vice President, PowerShares Exchange-Traded Fund Trust, PowerShares Exchange-Traded Fund Trust II, PowerShares India Exchange-Traded Fund Trust, PowerShares Actively Managed Exchange-Traded Fund Trust (2013-2015) and PowerShares Actively Managed Exchange-Traded Commodity Fund Trust (2014-2015); Managing Director, Credit Suisse Asset Management (2010-2013) and Lyxor Asset Management/Societe Generale (2007-2010). |
| | | |
Steven M. Hill - 1964 Invesco PowerShares
Capital Management LLC 3500 Lacey Road, Suite 700 Downers Grove, IL 60515 | | Vice President and Treasurer | | Since
2013 | | Vice President and Treasurer, PowerShares Exchange-Traded Fund Trust, PowerShares Exchange-Traded Fund Trust II, PowerShares India Exchange-Traded Fund Trust, PowerShares Actively Managed Exchange-Traded Fund Trust (2013-Present) and PowerShares Actively Managed Exchange-Traded Commodity Fund Trust (2014-Present); Head of Global ETF Administration, Invesco PowerShares Capital Management LLC (2011-Present); Principal Financial and Accounting Officer—Investment Pools, Invesco PowerShares Capital Management LLC (2015-Present); formerly, Senior Managing Director and Chief Financial Officer, Destra Capital Management LLC and its subsidiaries (2010-2011); Chief Financial Officer, Destra Investment Trust and Destra Investment Trust II (2010-2011); Senior Managing Director, Claymore Securities, Inc. (2003-2010); and Chief Financial Officer, Claymore sponsored mutual funds (2003-2010). |
| | | |
Peter Hubbard - 1981 Invesco PowerShares Capital Management LLC 3500 Lacey Road, Suite 700 Downers Grove, IL 60515 | | Vice President | | Since
2009 | | Vice President, PowerShares Exchange-Traded Fund Trust, PowerShares Exchange-Traded Fund Trust II, PowerShares India Exchange-Traded Fund Trust, PowerShares Actively Managed Exchange-Traded Fund Trust (2009-Present) and PowerShares Actively Managed Exchange-Traded Commodity Fund Trust (2014-Present); Vice President and Director of Portfolio Management, Invesco PowerShares Capital Management LLC (2010-Present); formerly, Vice President of Portfolio Management, Invesco PowerShares Capital Management LLC (2008-2010); Portfolio Manager, Invesco PowerShares Capital Management LLC (2007-2008); Research Analyst, Invesco PowerShares Capital Management LLC (2005-2007); Research Analyst and Trader, Ritchie Capital, a hedge fund operator (2003-2005). |
| | | |
Christopher Joe - 1969 Invesco PowerShares
Capital Management LLC 11 Greenway Plaza, Suite 1000 Houston, TX 77046-1173 | | Chief Compliance
Officer | | Since
2012 | | Chief Compliance Officer of Invesco PowerShares Capital Management LLC (2015-Present); Chief Compliance Officer of PowerShares Exchange-Traded Fund Trust, PowerShares Exchange-Traded Fund Trust II, PowerShares India Exchange-Traded Fund Trust, PowerShares Actively Managed Exchange-Traded Fund Trust (2012-Present) and PowerShares Actively Managed Exchange-Traded Commodity Fund Trust (2014-Present); formerly, Chief Compliance Officer, Invesco Investment Advisers, LLC (registered investment adviser) (2010–2013), U.S. Compliance Director, Invesco, Ltd. (2006-2014) and Deputy Chief Compliance Officer of Invesco Advisers, Inc. (2014-2015). |
| * | This is the period for which the Officers began serving the Trust. Each Officer serves an indefinite term, until his or her successor is elected. |
Trustees and Officers (continued)
| | | | | | |
Name, Address and Year of Birth
of Executive Officers | | Position(s)
Held
with Trust | | Length of
Time
Served* | | Principal Occupation(s) During Past 5 Years |
Sheri Morris - 1964 Invesco Management Group, Inc. 11 Greenway Plaza, Suite 1000 Houston, TX 77046 | | Vice President | | Since 2012 | | President and Principal Executive Officer, The Invesco Funds (2016-Present); Treasurer, The Invesco Funds (2008-Present); Vice President, Invesco Advisers, Inc. (formerly known as Invesco Institutional (N.A.), Inc.) (registered investment adviser) (2009-Present) and Vice President, PowerShares Exchange-Traded Fund Trust, PowerShares Exchange-Traded Fund Trust II, PowerShares India Exchange-Traded Fund Trust, PowerShares Actively Managed Exchange-Traded Fund Trust (2012-Present) and PowerShares Actively Managed Exchange-Traded Commodity Fund Trust (2014-Present); formerly, Vice President and Principal Financial Officer, The Invesco Funds (2008-2016); Treasurer, PowerShares Exchange-Traded Fund Trust, PowerShares Exchange-Traded Fund Trust II, PowerShares India Exchange-Traded Fund Trust and PowerShares Actively Managed Exchange-Traded Fund Trust (2011-2013); Vice President, Invesco Aim Advisers, Inc., Invesco Aim Capital Management, Inc. and Invesco Aim Private Asset Management, Inc.; Assistant Vice President and Assistant Treasurer, The Invesco Funds and Assistant Vice President, Invesco Advisers, Inc., Invesco Aim Capital Management, Inc. and Invesco Aim Private Asset Management, Inc. |
| | | |
Anna Paglia - 1974 Invesco PowerShares
Capital Management LLC 3500 Lacey Road, Suite 700 Downers Grove, IL 60515 | | Secretary | | Since 2011 | | Secretary, PowerShares Exchange-Traded Fund Trust, PowerShares Exchange-Traded Fund Trust II, PowerShares India Exchange-Traded Fund Trust, PowerShares Actively Managed Exchange-Traded Fund Trust (2011-Present) and PowerShares Actively Managed Exchange-Traded Commodity Fund Trust (2014-Present); Head of Legal (2010-Present) and Secretary (2015-Present), Invesco PowerShares Capital Management LLC (2010-Present); formerly, Partner, K&L Gates LLP (formerly, Bell Boyd & Lloyd LLP) (2007-2010); Associate Counsel at Barclays Global Investors Ltd. (2004-2006). |
| | | |
Rudolf E. Reitmann - 1971 Invesco PowerShares Capital Management LLC 3500 Lacey Road, Suite 700 Downers Grove, IL 60515 | | Vice President | | Since 2013 | | Vice President, PowerShares Exchange-Traded Fund Trust, PowerShares Exchange-Traded Fund Trust II, PowerShares India Exchange-Traded Fund Trust, PowerShares Actively Managed Exchange-Traded Fund Trust (2013-Present) and PowerShares Actively Managed Exchange-Traded Commodity Fund Trust (2014-Present); Head of Global Exchange Traded Funds Services, Invesco PowerShares Capital Management LLC (2013-Present). |
| * | This is the period for which the Officers began serving the Trust. Each Officer serves an indefinite term, until his or her successor is elected. |
Trustees and Officers (continued)
| | | | | | |
Name, Address and Year of Birth
of Executive Officers | | Position(s)
Held
with Trust | | Length of
Time
Served* | | Principal Occupation(s) During Past 5 Years |
David Warren - 1957 Invesco Canada Ltd. 5140 Yonge Street, Suite 800 Toronto, Ontario M2N 6X7 | | Vice President | | Since 2009 | | Vice President, PowerShares Exchange-Traded Fund Trust, PowerShares Exchange-Traded Fund Trust II, PowerShares India Exchange-Traded Fund Trust, and PowerShares Actively Managed Exchange-Traded Fund Trust (2009-Present) and PowerShares Actively Managed Exchange-Traded Commodity Fund Trust (2014-Present); Managing Director—Chief Administrative Officer, Americas, Invesco PowerShares Capital Management LLC; Senior Vice President, Invesco Advisers, Inc. (2009-Present); Director, Invesco Inc. (2009-Present); Senior Vice President, Invesco Management Group, Inc. (2007-Present); Director, Executive Vice President and Chief Financial Officer, Invesco Canada Ltd. (formerly, Invesco Trimark Ltd.); Chief Administrative Officer, North American Retail, Invesco Ltd. (2007-Present); Director, Invesco Corporate Class Inc. (2014-Present); Director, Invesco Global Direct Real Estate Feeder GP Ltd. (2015-Present); Director, Invesco Canada Holdings Inc. (2002-Present); Director, Invesco Financial Services Ltd./Services Financiers Invesco Ltée and Trimark Investments Ltd./Placements Trimark Ltée (2014-Present); Director, Invesco IP Holdings (Canada) Ltd. (2016-Present); Director, Invesco Global Direct Real Estate GP Ltd. (2015-Present); formerly, Executive Vice President and Chief Financial Officer, Invesco Inc. (2009-2015); Director, Executive Vice President and Chief Financial Officer, Invesco Canada Ltd. (formerly, Invesco Trimark Ltd.) (2000-2011). |
| * | This is the period for which the Officers began serving the Trust. Each Officer serves an indefinite term, until his or her successor is elected. |
Availability of Additional Information About the Trustees
The Statement of Additional Information includes additional information about the Trustees and is available, without charge, upon request at (800) 983-0903.
Board Considerations Regarding Approval of Investment Advisory Agreement for PowerShares S&P SmallCap High Dividend Low Volatility Portfolio, PowerShares S&P International Developed High Dividend Low Volatility Portfolio and PowerShares Treasury Collateral Portfolio and Sub-Advisory Agreement for PowerShares Treasury Collateral Portfolio
At a meeting held on September 29, 2016, the Board of Trustees of the PowerShares Exchange-Traded Fund Trust II (the “Trust”), including the Independent Trustees, approved the Investment Advisory Agreement (the “Advisory Agreement”) between Invesco PowerShares Capital Management LLC (the “Adviser”) and the Trust for PowerShares S&P SmallCap High Dividend Low Volatility Portfolio, PowerShares S&P International Developed High Dividend Low Volatility Portfolio and PowerShares Treasury Collateral Portfolio (each, a “Fund” and collectively, the “Funds”) and the Investment Sub-Advisory Agreement for PowerShares Treasury Collateral Portfolio, between the Adviser and the following seven affiliated sub-advisers (the “Sub-Advisory Agreement”): Invesco Advisers, Inc. (as the initial sub-adviser); Invesco Asset Management Deutschland, GmbH; Invesco Asset Management Limited; Invesco Asset Management (Japan) Limited; Invesco Hong Kong Limited; Invesco Senior Secured Management, Inc.; and Invesco Trimark Ltd. (each, a “Sub-Adviser,” and collectively, the “Sub-Advisers”).
The Trustees reviewed information provided by the Adviser describing: (i) the nature, extent and quality of services to be provided, (ii) the costs of services to be provided, (iii) the extent to which economies of scale may be realized as each Fund grows, (iv) whether the fee levels reflect any possible economies of scale for the benefit of Fund shareholders, (v) comparisons of services rendered to and amounts paid by other registered investment companies and (vi) any benefits to be realized by the Adviser from its relationship with each Fund.
Advisory Agreement
Nature, Extent and Quality of Services. In evaluating the nature, extent and quality of the Adviser’s services, the Trustees reviewed information concerning the functions to be performed by the Adviser for each Fund, information describing the Adviser’s current organization and staffing, including operational support that would be provided by the Adviser’s parent organization, Invesco Ltd., and the background and experience of the persons who will be responsible for the day-to-day management of the Funds, and they considered the quality of services provided by the Adviser to other exchange-traded funds (“ETFs”). The Trustees also reviewed information related to the Adviser’s portfolio transaction policies and procedures, as well as reports on the correlation and tracking error between the underlying indexes and the performance of other ETFs for which the Adviser serves as investment adviser.
The Trustees also considered the services to be provided by the Adviser in its oversight of the Funds’ administrator, custodian and transfer agent, and its oversight of the Sub-Advisers for PowerShares Treasury Collateral Portfolio. They noted the significant amount of time, effort and resources that had been devoted to this oversight function for the other ETFs and that was expected to be provided for each Fund.
Based on their review, the Trustees concluded that the nature, extent and quality of the services to be provided by the Adviser to each Fund under the Advisory Agreement were expected to be appropriate and reasonable.
Fees, Expenses and Profitability. The Trustees reviewed and discussed the information provided by the Adviser on each Fund’s proposed advisory fee, as compared to information compiled from Lipper Inc. (“Lipper”) databases on the median net expense ratios of ETF, open-end index and open-end actively managed (non-ETF) peers. The Trustees noted that PowerShares S&P SmallCap High Dividend Low Volatility Portfolio’s advisory fee was compared to peers in two Lipper classifications, Equity Income and Small-Cap Core. The Trustees also noted that the comparable fee data provided by the Adviser for PowerShares Treasury Collateral Portfolio included only eight peer ETFs, eight open-end actively managed funds and only one peer open-end index fund. The Trustees noted that the proposed annual advisory fee to be charged to each Fund was a unitary fee, and that the Adviser has agreed to pay all other expenses of each Fund except for the fee payment under the Advisory Agreement, payments under the Fund’s 12b-1 plan, if any, brokerage expenses, taxes, interest, litigation expenses and other extraordinary expenses. The Trustees noted that each Fund’s proposed unitary fee was below the median net expense ratio of its peer groups as shown below:
Board Considerations Regarding Approval of Investment Advisory Agreement for PowerShares S&P SmallCap High Dividend Low Volatility Portfolio, PowerShares S&P International Developed High Dividend Low Volatility Portfolio and PowerShares Treasury Collateral Portfolio and Sub-Advisory Agreement for PowerShares Treasury Collateral Portfolio (continued)
| | | | | | | | |
Fund | | Lipper
Classification | | ETF Peer Group
(Number of Peers) | | Open-End Index
Fund Peer Group
(Number of Peers) | | Open-End Active
Fund Peer Group
(Number of Peers) |
| PowerShares S&P SmallCap High Dividend Low Volatility Portfolio | | Equity Income | | Lower than median (25) | | Lower than median
(5) | | Lower than median (132) |
| | | | |
| PowerShares S&P SmallCap High Dividend Low Volatility Portfolio | | Small-Cap Core | | Lower than median (26) | | Lower than median (27) | | Lower than median (243) |
| | | | |
| PowerShares S&P International Developed High Dividend Low Volatility Portfolio | | International Equity Income | | Lower than median (22) | | N/A | | Lower than median (14) |
| | | | |
| PowerShares Treasury Collateral Portfolio | | Short U.S. Treasury | | Lower than median
(8) | | Lower than median
(1) | | Lower than median
(8) |
The Trustees considered each Fund’s proposed unitary advisory fee in light of the administrative, operational and management oversight costs for the Adviser. The Board concluded that the unitary advisory fee to be charged to each Fund is reasonable and appropriate in light of the services expected to be provided by the Adviser.
In conjunction with their review of the unitary advisory fee, the Trustees also considered information provided by the Adviser on the proposed costs of services for each Fund and the sub-advisory fees to be paid by the Adviser for PowerShares Treasury Collateral Portfolio. The Adviser did not provide profitability of the Adviser in managing each Fund because the Funds had not yet commenced operations. However, the Trustees considered other information the Board received at its April meeting on the Adviser’s overall profitability from its relationship with other ETFs for which it serves as investment adviser.
Economies of Scale and Whether Fee Levels Reflect These Economies of Scale. The Trustees reviewed the information provided by the Adviser as to the extent to which economies of scale may be realized as each Fund grows and whether fee levels reflect economies of scale for the benefit of shareholders. The Trustees noted that any reduction in fixed costs associated with the management of each Fund would be enjoyed by the Adviser, but that a unitary fee provides a level of certainty in expenses for each Fund. The Trustees considered whether the proposed advisory fee rate for each Fund is reasonable in relation to the proposed services and product strategy of each Fund, and they concluded that the flat advisory fee was reasonable and appropriate.
Fall-Out Benefits. The Trustees noted that the Adviser had not identified any further benefits that it would derive from its relationships with each Fund, and had noted that it does not have any soft-dollar arrangements.
Based on all of the information considered and the conclusions reached, the Board, including the Independent Trustees, determined to approve the Advisory Agreement for each Fund. No single factor was determinative in the Board’s analysis.
Sub-Advisory Agreement
As noted above, the Board of Trustees of the Trust, including the Independent Trustees, approved the Sub-Advisory Agreement for PowerShares Treasury Collateral Portfolio (“Treasury Collateral Portfolio”) at a meeting held on September 29, 2016. The review process followed by the Board is described in detail above. In connection with the review of the Sub-Advisory Agreement, the Board considered the factors described below, among others.
Nature, Extent and Quality of Services. The Trustees considered the nature, extent and quality of services to be provided under the Sub-Advisory Agreement. The Board also considered the benefits described by the Adviser in having multiple affiliated Sub-Advisers, but noted that Invesco Advisers, Inc. (“IAI”) will be the initial sub-adviser. The Board reviewed the qualifications and background of IAI’s portfolio managers and noted the qualifications and background of the other Sub-Advisers and the resources made available to the Sub-Advisers’ personnel.
Board Considerations Regarding Approval of Investment Advisory Agreement for PowerShares S&P SmallCap High Dividend Low Volatility Portfolio, PowerShares S&P International Developed High Dividend Low Volatility Portfolio and PowerShares Treasury Collateral Portfolio and Sub-Advisory Agreement for PowerShares Treasury Collateral Portfolio (continued)
Based on their review, the Trustees concluded that the nature, extent and quality of services to be provided under the Sub-Advisory Agreement were expected to be appropriate and reasonable.
Fees and Expenses. The Trustees reviewed and discussed the information provided by the Adviser and the Sub-Advisers on the sub-advisory fee rate under the Sub-Advisory Agreement. The Trustees noted that the sub-advisory fee charged by the Sub-Advisers under the Sub-Advisory Agreement is consistent with the compensation structure used throughout Invesco Ltd. when Invesco Ltd.’s affiliates provide sub-advisory services for funds managed by other Invesco Ltd. affiliates. The Board considered how the sub-advisory fees relate to the overall advisory fee for the Fund and noted that the Adviser compensates the Sub-Advisers from its fee.
Economies of Scale and Whether Fee Levels Reflect These Economies of Scale. As part of their review of the Advisory Agreement for the Treasury Collateral Portfolio, the Trustees considered the extent to which economies of scale may be realized as the Treasury Collateral Portfolio grows and whether fee levels reflect economies of scale for the benefit of shareholders. The Trustees considered whether the sub-advisory fee rate for the Treasury Collateral Portfolio was reasonable in relation to the proposed services and product strategy of the Treasury Collateral Portfolio, and they concluded that the flat sub-advisory fee was reasonable and appropriate.
Fall-Out Benefits. The Trustees noted that the Sub-Advisers had not identified any further benefits that they would derive from their relationships with the Treasury Collateral Portfolio.
Based on all of the information considered and the conclusions reached, the Board, including the Independent Trustees, determined to approve the Sub-Advisory Agreement for the Treasury Collateral Portfolio. No single factor was determinative in the Board’s analysis.
(This Page Intentionally Left Blank)
(This Page Intentionally Left Blank)
Proxy Voting Policies and Procedures
A description of the Trust’s proxy voting policies and procedures that the Funds use to determine how to vote proxies relating to portfolio securities is available, without charge and upon request, by calling (800) 983-0903. This information is also available on the Securities and Exchange Commission’s (the “Commission”) website at www.sec.gov.
Information regarding how each Fund voted proxies for portfolio securities, if applicable, during the most recent 12-month period ended June 30, is available, without charge and upon request, by (i) calling (800) 983-0903; or (ii) accessing the Trust’s Form N-PX on the Commission’s website at www.sec.gov.
Quarterly Portfolios
The Trust files its complete schedule of portfolio holdings for the Funds with the Commission for the first and third quarters of each fiscal year on Form N-Q. The Form N-Qs will be available on the Commission’s website at www.sec.gov. The Trust’s Form N-Qs may also be reviewed and copied at the Commission’s Public Reference Room in Washington, D.C. Information on the operation of the Public Reference Room may be obtained by calling (800) SEC-0330.
Frequency Distribution of Discounts and Premiums
A table showing the number of days the market price of each Fund’s shares was greater than the Fund’s net asset value, and the number of days it was less than the Fund’s net asset value (i.e., premium or discount) for the most recently completed calendar year, and the calendar quarters since that year end (or the life of the Fund, if shorter) may be found at the Fund’s website at www.invescopowershares.com.
| | | | | | |
| P-PS-AR-12 | |  |
©2016 Invesco PowerShares Capital Management LLC 3500 Lacey Road, Suite 700 Downers Grove, IL 60515 | |
| powershares.com 800 983 0903 | |  | | @PowerShares | |
Item 2. Code of Ethics.
The Registrant has adopted a Code of Ethics that applies to the Registrant’s principal executive officer and principal financial officer. This Code is filed as an exhibit to this report on Form N-CSR under Item 12(a)(1). No substantive amendments to this Code were made during the reporting period. There were no waivers for the fiscal year ended October 31, 2016.
Item 3. Audit Committee Financial Expert.
The Registrant’s Board of Trustees (the “Board”) has determined that the Registrant has three “audit committee financial experts” serving on its audit committee: Mr. Marc M. Kole, Mr. Gary R. Wicker and Mr. Donald H. Wilson. Each of these audit committee members is “independent,” meaning that he is not an “interested person” of the Registrant (as that term is defined in Section 2(a)(19) of the Investment Company Act of 1940, as amended) and he does not accept any consulting, advisory, or other compensatory fee from the Registrant (except in his capacity as a Board or committee member).
An “audit committee financial expert” is not an “expert” for any purpose, including for purposes of Section 11 of the Securities Act of 1933, as a result of being designated as an “audit committee financial expert.” Further, the designation of a person as an “audit committee financial expert” does not mean that person has any greater duties, obligations, or liability than those imposed on a person without the “audit committee financial expert” designation. Similarly, the designation of a person as an “audit committee financial expert” does not affect the duties, obligations, or liability of any other member of the audit committee or Board of Trustees.
Item 4. Principal Accountant Fees and Services.
(a) to (d)
PricewaterhouseCoopers LLP (“PwC”), the Registrant’s independent registered public accounting firm, billed the Registrant aggregate fees for services rendered to the Registrant for the last two fiscal years shown in the following table. The Audit Committee pre-approved all audit services and non-audit services provided to the Registrant.
| | | | |
| | | Fees Billed by PwC for Services
Rendered to the
Registrant for fiscal year end 2016 | | Fees Billed by PwC
for Services
Rendered to the
Registrant for fiscal
year end 2015 |
| | |
Audit Fees | | $ 1,107,915 | | $ 1,093,585 |
Audit-Related Fees | | $ 0 | | $ 0 |
Tax Fees(1) | | $ 528,270 | | $ 498,190 |
All Other Fees | | $ 0 | | $ 0 |
Total Fees | | $ 1,636,185 | | 1,591,775 |
(1) Tax fees for the fiscal year ended October 31, 2016 include fees billed for reviewing tax returns, 2016 excise tax returns and excise tax distributions calculations and fees billed for preparing the final tax returns for the three liquidated portfolios of the Registrant. Tax fees for the fiscal year ended October 31, 2015 included fees billed for reviewing tax returns, 2015 excise tax returns and excise tax distribution calculations.
Fees Billed by PwC Related to PowerShares and PowerShares Affiliates
PwC billed PowerShares Capital Management LLC (“PowerShares”), the Registrant’s adviser, and any entity controlling, controlled by or under common control with PowerShares that provides ongoing services to the Registrant (“Affiliates”), aggregate fees for pre-approved non-audit services rendered to PowerShares and Affiliates for the last two fiscal years as shown in the following table:
| | | | |
| | | Fees Billed for Non-
Audit Services
Rendered to
PowerShares and
Affiliates for fiscal
year end 2016 That
Were Required to be Pre-Approved by the Registrant’s Audit Committee | | Fees Billed for Non-
Audit Services
Rendered to
PowerShares and
Affiliates for fiscal
year end 2015 That
Were Required to be Pre-Approved by the Registrant’s Audit Committee |
| | |
Audit-Related Fees | | $ 635,000 | | $ 574,000 |
Tax Fees | | $ 0 | | $ 0 |
All Other Fees | | $2,662,000 | | $ 3,750,000 |
Total Fees(1) | | $3,297,000 | | $4.324,000 |
| (1) | Audit-Related fees for the year end 2016 include fees billed related to reviewing controls at a service organization. Audit-Related fees for the year end 2015 include fees billed related to reviewing controls at a service organization. |
All other fees for the year end 2016 include fees billed related to the identification of structural and organizational alternatives, informed by industry practices, for certain of the company’s administrative activities and functions. All other fees for the year end 2015 include fees billed related to reviewing operating effectiveness of strategic projects
(e) (1) Audit Committee Pre Approval Policies and Procedures
PRE-APPROVAL OF AUDIT AND NON-AUDIT SERVICES
POLICIES AND PROCEDURES
As Adopted by the Audit Committee of
the PowerShares Funds (the “Funds”)
Adopted June 26, 2009, amended September 29, 2016
Statement of Principles
Under the Sarbanes-Oxley Act of 2002 and rules adopted by the Securities and Exchange Commission (“SEC”) (“Rules”), the Audit Committee of the Funds’ (the “Audit Committee”) Board of Trustees (the “Board”) is responsible for the appointment, compensation and oversight of the work of independent accountants (an “Auditor”). As part of this responsibility and to assure that the Auditor’s independence is not impaired, the Audit Committee pre-approves the audit and non-audit services provided to the Funds by each Auditor, as well as all non-audit services provided by the Auditor to the Funds’ investment adviser and to affiliates of the adviser that provide ongoing services to the Funds (“Service Affiliates”) if the services directly impact the Funds’ operations or financial reporting. The SEC Rules also specify the types of services that an Auditor may not provide to its audit client. The following policies and procedures comply with the requirements for pre-approval and provide a mechanism by which management of the Funds may request and secure pre-approval of audit and non-audit services in an orderly manner with minimal disruption to normal business operations.
Proposed services either may be pre-approved without consideration of specific case-by-case services by the Audit Committee (“general pre-approval”) or require the specific pre-approval of the Audit Committee (“specific pre-approval”). As set forth in these policies and procedures, unless a type of service has received general pre-approval, it will require specific pre-approval by the Audit Committee. Additionally, any fees exceeding 110% of estimated pre-approved fee levels provided at the time the service was pre-approved will also require specific approval by the Audit Committee before payment is made. The Audit Committee will also consider the impact of additional fees on the Auditor’s independence when determining whether to approve any additional fees for previously pre-approved services.
The Audit Committee will annually review and generally pre-approve the services that may be provided by each Auditor without obtaining specific pre-approval from the Audit Committee. The term of any general pre-approval runs from the date of such pre-approval through June 30th of the following year, unless the Audit Committee considers a different period and states otherwise. The Audit Committee will add to or subtract from the list of general pre-approved services from time to time, based on subsequent determinations.
The purpose of these policies and procedures is to set forth the guidelines to assist the Audit Committee in fulfilling its responsibilities.
Delegation
The Chairman of the Audit Committee (or, in his or her absence, any member of the Audit Committee) may grant specific pre-approval for non-prohibited services. All such delegated pre-approvals shall be presented to the Audit Committee no later than the next Audit Committee meeting.
Audit Services
The annual Audit services engagement terms will be subject to specific pre-approval of the Audit Committee. Audit services include the annual financial statement audit and other procedures such as tax provision work that is required to be performed by the independent auditor to be able to form an opinion on the Funds’ financial statements. The Audit Committee will obtain, review and consider sufficient information concerning the proposed Auditor to make a reasonable evaluation of the Auditor’s qualifications and independence.
In addition to the annual Audit services engagement, the Audit Committee may grant either general or specific pre-approval of other Audit services, which are those services that only the independent auditor reasonably can provide. Other Audit services may include services such as issuing consents for the inclusion of audited financial statements with SEC registration statements, periodic reports and other documents filed with the SEC or other documents issued in connection with securities offerings.
Non-Audit Services
The Audit Committee may provide either general or specific pre-approval of any non-audit services to the Funds and its Service Affiliates if the Audit Committee believes that the provision of the service will not impair the
independence of the Auditor, is consistent with the SEC’s Rules on auditor independence, and otherwise conforms to the Audit Committee’s general principles and policies as set forth herein.
Audit-Related Services
“Audit-related services” are assurance and related services that are reasonably related to the performance of the audit or review of the Funds’ financial statements or that are traditionally performed by the independent auditor. Audit-related services include, among others, accounting consultations related to accounting, financial reporting or disclosure matters not classified as “Audit services”; and assistance with understanding and implementing new accounting and financial reporting guidance from rulemaking authorities.
Tax Services
“Tax services” include, but are not limited to, the review and signing of the Funds’ federal tax returns, the review of required distributions by the Funds and consultations regarding tax matters such as the tax treatment of new investments or the impact of new regulations. The Audit Committee will scrutinize carefully the retention of the Auditor in connection with a transaction initially recommended by the Auditor, the major business purpose of which may be tax avoidance or the tax treatment of which may not be supported in the Internal Revenue Code and related regulations. The Audit Committee will consult with the Funds’ Treasurer (or his or her designee) and may consult with outside counsel or advisors as necessary to ensure the consistency of Tax services rendered by the Auditor with the foregoing policy.
No Auditor shall represent any Fund or any Service Affiliate before a tax court, district court or federal court of claims.
Under rules adopted by the Public Company Accounting Oversight Board and approved by the SEC, in connection with seeking Audit Committee pre-approval of permissible Tax services, the Auditor shall:
| | 1. | Describe in writing to the Audit Committee, which writing may be in the form of the proposed engagement letter: |
| | a. | The scope of the service, the fee structure for the engagement, and any side letter or amendment to the engagement letter, or any other agreement between the Auditor and the Fund, relating to the service; and |
| | b. | Any compensation arrangement or other agreement, such as a referral agreement, a referral fee or fee-sharing arrangement, between the Auditor and any person (other than the Fund) with respect to the promoting, marketing, or recommending of a transaction covered by the service; |
| | 2. | Discuss with the Audit Committee the potential effects of the services on the independence of the Auditor; and |
| | 3. | Document the substance of its discussion with the Audit Committee. |
All Other Auditor Services
The Audit Committee may pre-approve non-audit services classified as “All other services” that are not categorically prohibited by the SEC, as listed in Exhibit 1 to this policy.
Pre-Approval Fee Levels or Established Amounts
Pre-approval of estimated fees or established amounts for services to be provided by the Auditor under general or specific pre-approval policies will be set periodically by the Audit Committee. Any proposed fees exceeding 110% of the maximum estimated pre-approved fees or established amounts for pre-approved audit and non-audit services will be reported to the Audit Committee at the quarterly Audit Committee meeting and will require specific approval by the Audit Committee before payment is made. The Audit Committee will always factor in the overall relationship of fees for audit and non-audit services in determining whether to pre-approve any such services and in determining whether to approve any additional fees exceeding 110% of the maximum pre-approved fees or established amounts for previously pre-approved services.
Procedures
On an annual basis, the Auditor will submit to the Audit Committee for general pre-approval, a list of non-audit services that the Funds or Service Affiliates of the Funds may request from the Auditor. The list will describe the non-audit services in reasonable detail and will include an estimated range of fees and such other information as the Audit Committee may request.
Each request for services to be provided by the Auditor under the general pre-approval of the Audit Committee will be submitted to the Funds’ Treasurer (or his or her designee) and must include a detailed description of the services to be rendered. The Treasurer or his or her designee will ensure that such services are included within the list of services that have received the general pre-approval of the Audit Committee.
Each request to provide services that require specific approval by the Audit Committee shall be submitted to the Audit Committee jointly by the Funds’ Treasurer or his or her designee and the Auditor, and must include a joint statement that, in their view, such request is consistent with the pre-approval policies and procedures and the SEC Rules.
Each request to provide Tax services under either the general or specific pre-approval of the Audit Committee will describe in writing: (i) the scope of the service, the fee structure for the engagement, and any side letter or amendment to the engagement letter, or any other agreement between the Auditor and the audit client, relating to the service; and (ii) any compensation arrangement or other agreement between the Auditor and any person (other than the audit client) with respect to the promoting, marketing, or recommending of a transaction covered by the service. The Auditor will discuss with the Audit Committee the potential effects of the services on the Auditor’s independence and will document the substance of the discussion.
Non-audit services pursuant to the de minimis exception provided by the SEC Rules will be promptly brought to the attention of the Audit Committee for approval, including documentation that each of the conditions for this exception, as set forth in the SEC Rules, has been satisfied.
On at least an annual basis, the Auditor will prepare a summary of all the services provided to any entity in the investment company complex as defined in section 2-01(f)(14) of Regulation S-X in sufficient detail as to the nature of the engagement and the fees associated with those services.
The Audit Committee has designated the Funds’ Treasurer to monitor the performance of all services provided by the Auditor and to ensure such services are in compliance with these policies and procedures. The Funds’ Treasurer will report to the Audit Committee on a periodic basis as to the results of such monitoring. Both the Funds’ Treasurer and management will immediately report to the Chairman of the Audit Committee any breach of these policies and procedures that comes to the attention of the Funds’ Treasurer or senior management.
Exhibit 1 to Pre-Approval of Audit and Non-Audit Services Policies and Procedures
Conditionally Prohibited Non-Audit Services (not prohibited if the Fund can reasonably conclude that the results of the service would not be subject to audit procedures in connection with the audit of the Fund’s financial statements)
| | • | Bookkeeping or other services related to the accounting records or financial statements of the audit client |
| | • | Financial information systems design and implementation |
| | • | Appraisal or valuation services, fairness opinions, or contribution-in-kind reports |
| | • | Internal audit outsourcing services |
Categorically Prohibited Non-Audit Services
| | • | Broker-dealer, investment adviser, or investment banking services |
| | • | Expert services unrelated to the audit |
| | • | Any service or product provided for a contingent fee or a commission |
| | • | Services related to marketing, planning, or opining in favor of the tax treatment of confidential transactions or aggressive tax position transactions, a significant purpose of which is tax avoidance |
| | • | Tax services for persons in financial reporting oversight roles at the Fund |
| | • | Any other service that the Public Company Oversight Board determines by regulation is impermissible. |
(e) (2) There were no amounts that were pre-approved by the Audit Committee pursuant to the de minimus exception under Rule 2-01 of Regulation S-X.
In addition to the amounts shown in the tables above, PwC billed PowerShares and Affiliates additional aggregate fees of $2,204,000 for the fiscal year ended 2016 and $4,775,000 for the fiscal year ended 2015, for non-audit services not required to be pre-approved by the registrant’s audit committee. In total, PwC billed the Registrant,PowerShares and Affiliates aggregate non-audit fees of $6,029,000 for the fiscal year ended 2016, and $8,908,000 for the fiscal year ended 2015.
(h)With respect to the non-audit services above billed to PowerShares and Affiliates that were not required to be pre-approved by the Registrant’s Audit Committee, the Audit Committee received information from PwC about such services, including by way of comparison, that PwC provided audit services to entities within the Investment Company Complex, as defined by Rule2-01(f)(14) of Regulation S-X, of approximately $22 million and non-audit
services of approximately $15 million for the fiscal year ended 2016. The Audit Committee considered this information in evaluating PwC’s independence.
PwC informed the Audit Committee of the Board of the Trust (the “Audit Committee”) that it has identified an issue related to its independence under Rule 2-01(c)(1)(ii)(A) of Regulation S-X (referred to as the “Loan Rule”). The Loan Rule prohibits accounting firms, such as PwC, from being deemed independent if they have certain financial relationships with their audit clients or certain affiliates of those clients. The Trust is required under various securities laws to have its financial statements audited by an independent accounting firm.
The Loan Rule specifically provides that an accounting firm would not be independent if it receives a loan from a lender that is a record or beneficial owner of more than ten percent of an audit client’s equity securities. For purposes of the Loan Rule, audit clients include the Funds as well as all registered investment companies advised by the Adviser and its affiliates, including other subsidiaries of the Adviser’s parent company, Invesco Ltd. (collectively, the Invesco Fund Complex). PwC informed the Audit Committee it has relationships with lenders who hold, as record owner, more than ten percent of the shares of certain funds within the Invesco Fund Complex. These relationships call into question PwC’s independence under the Loan Rule with respect to those funds, as well as all other funds in the Invesco Fund Complex.
On June 20, 2016, the SEC Staff issued a “no-action” letter to another mutual fund complex (see Fidelity Management & Research Company et al., No-Action Letter) related to the audit independence issue described above. In that letter, the SEC confirmed that it would not recommend enforcement action against a fund that relied on audit services performed by an audit firm that was not in compliance with the Loan Rule in certain specified circumstances.
In an August 18, 2016 letter, and in subsequent communications, PwC affirmed to the Audit Committee that, as of the date of the letter and the subsequent communications, respectively, PwC is an independent accountant with respect to the Trust, within the meaning of PCAOB Rule 3520. In its letter and in its subsequent communications , PwC also informed the Audit Committee that, after evaluating the facts and circumstances and the applicable independence rules, PwC has concluded that with regard to its compliance with the independence criteria set forth in the rules and regulations of the SEC related to the Loan Rule, it believes that it remains objective and impartial despite matters that may ultimately be determined to be inconsistent with these criteria and therefore it can continue to serve as the Trust’s registered public accounting firm. PWC has advised the Audit Committee that this conclusion is based in part on the following considerations: (1) the lenders to PwC have no influence over any Fund, or other entity within the Invesco Fund Complex, or its investment adviser; (2) none of the officers or trustees of the Invesco Fund Complex whose shares are owned by PwC lenders are associated with those lenders; (3) PwC understands that the shares held by PwC lenders are held for the benefit of and on behalf of its policy owners/end investors; (4) investments in funds such as the Invesco Fund Complex funds are passive; (5) the PwC lenders are part of various syndicates of unrelated lenders; (6) there have been no changes to the loans in question since the origination of each respective note; (7) the debts are in good standing and no lender has the right to take action against PwC, as borrower, in connection with the financings; (8) the debt balances with each lender are immaterial to PwC and to each lender; and (9) the PwC audit engagement team has no involvement in PwC’s treasury function and PwC’s treasury function has no oversight of or ability to influence the PwC audit engagement team. In addition, PwC has communicated that the lending relationships appear to be consistent with the lending relationships described in the no-action letter and that they are not aware of other relationships that would be implicated by the Loan Rule. In addition to relying on PwC’s August 18, 2016 letter and subsequent communications regarding its independence, the Trust intends to rely upon the no-action letter.
If in the future the independence of PwC is called into question under the Loan Rule by circumstances that are not addressed in the SEC’s no-action letter, the Fund may need to take other action in order for the Fund’s filings with the SEC containing financial statements to be deemed compliant with applicable securities laws. Such additional actions could result in additional costs, impair the ability of the Funds to issue new shares or have other material adverse effects on the Funds. In addition, the SEC has indicated that the no-action relief will expire 18 months from its issuance after which the Invesco Funds will no longer be able rely on the letter unless it’s term is extended or made permanent by the SEC Staff.
Item 5. Audit Committee of Listed Registrants.
| | (a) | The Registrant has a separately designated Audit Committee established in accordance with Section 3(a)(58)(A) of the Securities Exchange Act of 1934, as amended, which consists solely of independent trustees. The Audit Committee members are: Marc M. Kole, Gary R. Wicker and Donald H. Wilson. |
Item 6. Schedule of Investments.
| | (a) | The Schedules of Investments are included as a part of the report to shareholders filed under Item 1 of this Form N-CSR. |
Item 7. Disclosure of Proxy Voting Policies and Procedures for Closed-End Management Investment Companies.
Not applicable.
Item 8. Portfolio Managers of Closed-End Management Investment Companies.
Not applicable.
Item 9. Purchases of Equity Securities by Closed-End Management Investment Company and Affiliated Purchasers.
Not applicable.
Item 10. Submission of Matters to a Vote of Security Holders.
There have been no material changes to the procedures by which shareholders may recommend nominees to the Registrant’s Board of Trustees that would require disclosure herein.
Item 11. Controls and Procedures.
| | (a) | Based on their evaluation of the Registrant’s disclosure controls and procedures (as defined in Rule 30a-3(c) under the Investment Company Act of 1940) as of a date within 90 days of the filing date of this report, the Registrant’s President (principal executive officer) and Treasurer (principal financial officer) have concluded that such disclosure controls and procedures are effective. |
| | (b) | There were no changes in the Registrant’s internal control over financial reporting (as defined in Rule 30a-3(d) under the Investment Company Act of 1940) that occurred during the second fiscal quarter of the period covered by this report that have materially affected, or are reasonably likely to materially affect, the Registrant’s internal control over financial reporting. |
Item 12. Exhibits.
| (a)(1) | Code of Ethics is attached as Exhibit 99.CODEETH. |
| (a)(2) | Certifications of the Registrant’s President and Treasurer pursuant to Rule30a-2(a) under the Invetment Company Act of 1940 and Section 302 of the Sarbanes-Oxley Act of 2002 are attached as Exhibit 99.CERT. |
| (b) | Certifications of the Registrant’s President and Treasurer pursuant to Rule 30a-2(b) under the Investment Company Act of 1940 andSection 906 of the Sarbanes-Oxley Act of 2002 are attached as Exhibit 99.906CERT. |
SIGNATURES
Pursuant to the requirements of the Securities Exchange Act of 1934 and the Investment Company Act of 1940, the Registrant has duly caused this report to be signed on its behalf by the undersigned, thereunto duly authorized.
(Registrant) PowerShares Exchange-Traded Fund Trust II
By: /s/ Daniel E. Draper
Name: Daniel E. Draper
Title: President
Date: January 5, 2017
Pursuant to the requirements of the Securities Exchange Act of 1934 and the Investment Company Act of 1940, this report has been signed below by the following persons on behalf of the Registrant and in the capacities and on the dates indicated.
By: /s/ Daniel E. Draper
Name: Daniel E. Draper
Title: President
Date: January 5, 2017
By: /s/ Steven Hill
Name: Steven Hill
Title: Treasurer
Date: January 5, 2017