UNITED STATES
SECURITIES AND EXCHANGE COMMISSION
Washington, D.C. 20549
FORM N-CSR
CERTIFIED SHAREHOLDER REPORT OF REGISTERED MANAGEMENT
INVESTMENT COMPANIES
Investment Company Act file number 811-21977
| | | | |
| | Invesco Exchange-Traded Fund Trust II | | |
| | (Exact name of registrant as specified in charter) | | |
| | | | |
| | 3500 Lacey Road Downers Grove, IL 60515 | | |
| | (Address of principal executive offices) (Zip code) | | |
| | Daniel E. Draper President 3500 Lacey Road Downers Grove, IL 60515 | | |
| | (Name and address of agent for service) | | |
Registrant’s telephone number, including area code: 800-983-0903
Date of fiscal year end: August 31
Date of reporting period: August 31, 2018
Form N-CSR is to be used by management investment companies to file reports with the Commission not later than 10 days after the transmission to stockholders of any report that is required to be transmitted to stockholders under Rule 30e-1 under the Investment Company Act of 1940 (17 CFR 270.30e-1). The Commission may use the information provided on Form N-CSR in its regulatory, disclosure review, inspection, and policymaking roles.
A registrant is required to disclose the information specified by Form N-CSR, and the Commission will make this information public. A registrant is not required to respond to the collection of information contained in Form N-CSR unless the Form displays a currently valid Office of Management and Budget (“OMB”) control number. Please direct comments concerning the accuracy of the information collection burden estimate and any suggestions for reducing the burden to Secretary, Securities and Exchange Commission, 450 Fifth Street, NW, Washington, DC 20549-0609. The OMB has reviewed this collection of information under the clearance requirements of 44 U.S.C. § 3507.
Item 1. Reports to Stockholders.
The Registrant’s annual report transmitted to shareholders pursuant to Rule 30e-1 under the Investment Company Act of 1940 is as follows:

Invesco Annual Report to Shareholders
August 31, 2018
| | |
| YAO | | Invesco China All-Cap ETF |
| CQQQ | | Invesco China Technology ETF |
| CGW | | Invesco S&P Global Water Index ETF |
| GHII | | Invesco S&P High Income Infrastructure ETF |
| SEA | | Invesco Shipping ETF |
| TAN | | Invesco Solar ETF |
Table of Contents
Effective June 4, 2018, the Funds’ names changed as part of an overall rebranding strategy whereby the PowerShares name was changed to the Invesco brand. This resulted in all references to the PowerShares name being changed to Invesco.
The Market Environment
Domestic Equity
The fiscal period proved to be another strong, albeit increasingly volatile, time for US equities. As the fiscal period unfolded in the later months of 2017, several major US stock market indexes repeatedly reached new highs amid improving economic data, strong corporate profits and the prospect of tax reform legislation. Stock market volatility remained exceedingly low—a hallmark of 2017.
At the outset of 2018, US equity markets continued to steadily move higher in January as investors remained enthused about the passage of the Tax Cuts and Jobs Act signed into law in late December 2017, which significantly cut corporate tax rates. However, in February 2018, volatility returned to the US stock and bond markets. Worries about how rising interest rates might affect economic growth, concerns about a potential trade war and heightened geopolitical tensions, caused the US stock market to pull back and volatility to increase. In addition, in April 2018, the yield on the 10-year US Treasury bond climbed above 3%—a psychologically important level—for the first time since December 2013.1
Despite a disappointing first quarter, US equity markets generally recovered in the second quarter of 2018. Strong US retail sales and low unemployment continued to buoy US equity markets. In the final months of the fiscal period, US equities moved higher, despite several potential headwinds including trade tensions, tariff announcements and contagion concerns over a Turkish currency crisis. Ultimately, the fiscal period ended the same way it began with several US equity indexes reaching new record highs.
Given signs of a strong economy, the US Federal Reserve raised interest rates three times during the fiscal period: in December 2017 and in March and June 2018.2 In contrast, the European Central Bank and central banks in several other countries maintained extraordinarily accommodative monetary policies.
| 2 | Source: US Federal Reserve |
International Equity
Global equity markets delivered positive returns for the fiscal period ended August 31, 2018. That positive performance was despite significant turbulence in late January and early February 2018, when stocks were whipsawed—first by concerns about accelerated US Federal Reserve tightening and then, later in the year, by fears of brewing trade wars. Geopolitical risks and tighter monetary policies overseas were additional headwinds to global equity markets. In spite of these risks, global equities generally rose during the fiscal period.
In Europe, economic growth remained positive amid improving employment, industrial production and consumption trends in many countries. However, European equity markets retrenched in August amid concerns regarding Italy’s budget concerns and contagion fears regarding the Turkish lira. The political environment in Germany improved, with Chancellor Angela Merkel finally securing a coalition government in order to continue her leadership. French President Emmanuel Macron continued his efforts at labor reform, boosting business confidence and business spending. The European Central Bank remained supportive of European equities, maintaining a dovish tone throughout the fiscal period.
Weakness in emerging equity markets during August was broad based. Investors worried about threats to global trade as the US prepared to impose tariffs on an additional $200 billion worth of Chinese imports. While the prospect of a deepening trade dispute pushed Chinese equity markets into negative territory, Latin America was the worst-performing region, with losses in Brazil accentuated by political uncertainties and currency weakness. Economic growth in emerging markets remained relatively strong over the fiscal period. However, volatility increased toward the end of the fiscal period with several markets registering losses.
At the close of the fiscal period, equity valuations in developed and emerging markets appeared relatively full in absolute terms—but overseas equity markets were trading at a material discount to those of the US. In sum, while valuations were not cheap, recent earnings growth and upward earnings revisions improved in many non-US developed markets.
| | |
| YAO | | Manager’s Analysis |
| | Invesco China All-Cap ETF (YAO) |
Welcome to Invesco! Effective after the close of business on April 6, 2018, Guggenheim China All-Cap ETF (the “Predecessor Fund”) was reorganized into Invesco China All-Cap ETF (formerly known as PowerShares China All-Cap Portfolio), a newly created exchange-traded fund in Invesco’s family of ETFs, in a tax-free transaction. The ticker symbol and Index did not change. Performance information set forth below refers to both the performance of the Predecessor Fund and the Fund.
As an index fund, the Invesco China All-Cap ETF (the “Fund”) is passively managed and seeks investment results that correspond generally to the performance, before the Fund’s fees and expenses, of an equity index called the AlphaShares China All Cap Index (the “Index”). The Index is designed to measure and monitor the performance of the investable universe of publicly traded companies based in mainland China (as classified by the S&P BMI Country Code classification system). The Index was created by AlphaShares, LLC ( the “Index Provider”) and is maintained by Standard & Poor’s. The Index includes equity securities of companies of all categories of market capitalizations, as defined by the Index Provider (subject to a minimum float-adjusted capitalization of U.S. $400 million). The Index may include Hong Kong listed securities, including China H-shares and Red Chip shares. China H-shares are issued by companies incorporated in mainland China and listed on the Hong Kong Stock Exchange. Red Chip shares are issued by companies with controlling Chinese shareholders that are incorporated outside mainland China and listed on the Hong Kong Stock Exchange. The Index may also include N-Shares, which are issued by companies based in mainland China and listed on the NYSE Arca, Inc. or The Nasdaq Stock Market. The Index does not include China A-Shares (which are subject to substantial restrictions on foreign investment) or China B-Shares (which offer a generally smaller market and limited liquidity), each of which trade on the Shanghai Stock Exchange and the Shenzhen Stock Exchange. The Fund will invest at least 90% of its total assets in common stocks, American depositary receipts (“ADRs”), American depositary shares (“ADSs”), global depositary receipts (“GDRs”) and international depositary receipts (“IDRs”) that comprise the Index and depositary receipts or shares representing common stocks included in the Index (or underlying securities representing ADRs, ADSs, GDRs and IDRs included in the Index). The Fund generally will invest in all of the securities comprising the Index in proportion to their weightings in the Index.
For the fiscal year ended August 31, 2018, on a market price basis, the Fund returned (0.44)%. On a net asset value (“NAV”) basis, the Fund returned 0.19%. During the same time period, the Index returned 1.03%. During the fiscal year, the Fund’s performance, on a NAV basis, differed from the return of the Index primarily due to fees and operating expenses that the Fund incurred during the period.
During this same time period, the MSCI China Index (Net) (the “Benchmark Index”) returned 0.22%. The Benchmark Index is an unmanaged index weighted by market capitalization based on the
average performance of approximately 450 securities. The Benchmark Index was selected for its recognition in the marketplace, and its performance comparison is a useful measure for investors as a broad representation of the Chinese equity market.
The performance of the Fund differed from the Benchmark Index because the Fund seeks to track an Index that employs a proprietary stock selection and weighting methodology, whereas the Benchmark Index selects and weights stocks based on market capitalization.
Relative to the Benchmark Index, the Fund was most overweight in the financials sector and most underweight in the information technology sector during the fiscal year ended August 31, 2018. The majority of the Fund’s underperformance relative to the Benchmark Index during that period can be attributed to the Fund being underweight in the information technology sector as well as fees and operating expenses that the Fund incurred.
For the fiscal year ended August 31, 2018, the health care sector contributed most significantly to the Fund’s return, followed by the energy and consumer staples sectors, respectively. The consumer discretionary and telecommunication services sectors were the greatest detracting sectors.
Positions that contributed most significantly to the Fund’s return for the fiscal year ended August 31, 2018, included Ping An Insurance Group Co. of China Ltd., H-Shares (China), a financials company (portfolio average weight of 3.49%), and CNOOC Ltd. (China), an energy company (portfolio average weight of 1.71%). Positions that detracted most significantly from the Fund’s return during this period included JD.com, Inc., Class A ADR (China), a consumer discretionary company (portfolio average weight of 2.23%), and China Life Insurance Co. Ltd., H-Shares (China), a financials company (portfolio average weight of 1.55%).
| | | | |
Sector Breakdown (% of the Fund’s Net Assets)
as of August 31, 2018 | |
| Financials | | | 26.8 | |
| Information Technology | | | 21.8 | |
| Consumer Discretionary | | | 11.7 | |
| Real Estate | | | 7.5 | |
| Energy | | | 6.6 | |
| Industrials | | | 6.4 | |
| Telecommunication Services | | | 5.2 | |
| Health Care | | | 4.7 | |
| Consumer Staples | | | 3.5 | |
| Utilities | | | 3.0 | |
| Materials | | | 2.6 | |
| Money Market Funds Plus Other Assets Less Liabilities | | | 0.2 | |
Invesco China All-Cap ETF (YAO) (continued)
| | | | |
Top Ten Fund Holdings*
(% of the Fund’s Net Assets)
as of August 31, 2018 | |
| Security | | | | |
| China Construction Bank Corp., H-Shares | | | 5.4 | |
| Alibaba Group Holding Ltd. ADR | | | 5.2 | |
| Baidu, Inc. ADR | | | 4.8 | |
| Tencent Holdings Ltd. | | | 4.5 | |
| Industrial & Commercial Bank of China Ltd., H-Shares | | | 4.4 | |
| China Mobile Ltd. | | | 4.0 | |
| Ping An Insurance Group Co. of China Ltd., H-Shares | | | 3.7 | |
| Bank of China Ltd., H-Shares | | | 2.6 | |
| CNOOC Ltd. | | | 2.2 | |
| China Petroleum & Chemical Corp. (Sinopec), H-Shares | | | 2.0 | |
| Total | | | 38.8 | |
| * | Excluding money market fund holdings. |
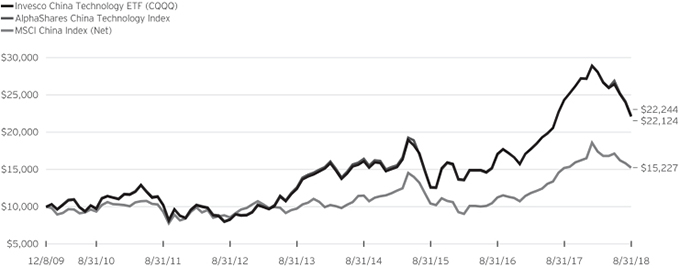
Growth of a $10,000 Investment Since Inception

Fund Performance History as of August 31, 2018
| | | | | | | | | | | | | | | | | | | | | | | | | | | | | | | | |
| | | 1 Year | | | 3 Years Average
Annualized | | | 3 Years Cumulative | | | 5 Years Average
Annualized | | | 5 Years Cumulative | | | | | | Fund Inception | |
| Index | | | | | Average
Annualized | | | Cumulative | |
| AlphaShares China All Cap Index | | | 1.03 | % | | | 13.66 | % | | | 46.84 | % | | | 8.69 | % | | | 51.70 | % | | | | | | | 5.55 | % | | | 61.36 | % |
| MSCI China Index (Net) | | | 0.22 | | | | 13.49 | | | | 46.16 | | | | 9.27 | | | | 55.79 | | | | | | | | 5.14 | | | | 55.89 | |
| Fund | | | | | | | | | | | | | | | | | | | | | | | | | | | | | | | | |
| NAV Return | | | 0.19 | | | | 12.87 | | | | 43.81 | | | | 8.23 | | | | 48.54 | | | | | | | | 5.17 | | | | 56.36 | |
| Market Price Return | | | (0.44 | ) | | | 13.20 | | | | 45.07 | | | | 8.28 | | | | 48.87 | | | | | | | | 5.13 | | | | 55.79 | |
Invesco China All—Cap ETF (YAO) (continued)
Predecessor Fund Inception: October 19, 2009
Performance quoted above represents past performance. Past performance is not a guarantee of future results and current performance may be higher or lower than performance quoted. Investment returns and principal value will fluctuate, and shares of the Fund (“Fund Shares”), when redeemed or sold, may be worth more or less than their original cost. Fund performance reflects any applicable fee waivers and/or expense reimbursements. Had the adviser not waived fees and/or reimbursed expenses currently or in the past, returns would have been lower. See current prospectus for more information. According to the Fund’s current prospectus, the Fund’s expense ratio of 0.70% is expressed as a unitary management fee to cover operating expenses and expenses incurred in connection with managing the portfolio. NAV and Market Price returns assume that dividends and capital gain distributions have been reinvested in the Fund at NAV and Market Price, respectively. The returns shown in the table above do not reflect the deduction of taxes that a shareholder would pay on Fund distributions or the redemption or sale of Fund Shares. See invesco.com/ETFs to find the most recent month-end performance numbers.
Index and Benchmark Index performance results are based upon a hypothetical investment in their respective constituent securities. Index and Benchmark Index returns do not represent Fund returns. An investor cannot invest directly in an index. The Index and Benchmark Index do not charge management fees or brokerage expenses, and no such fees or expenses were deducted from the hypothetical performance shown. In addition, the results actual investors might have achieved would have differed from those shown because of differences in the timing, amounts of their investments, and fees and expenses associated with an investment in the Fund.
Notes Regarding Indexes and Fund Performance History:
| - | Effective after the close of business on April 6, 2018, the Predecessor Fund was reorganized into the Fund. Fund returns shown are blended returns of the Predecessor Fund and the Fund. |
| - | Average Annualized and Cumulative Inception returns for the Fund, Index and Benchmark Index are based on the inception date of the Predecessor Fund. |
| - | Net returns reflect reinvested dividends net of withholding taxes. |
| | |
| CQQQ | | Manager’s Analysis |
| | Invesco China Technology ETF (CQQQ) |
Welcome to Invesco! Effective after the close of business on May 18, 2018, Guggenheim China Technology ETF (the “Predecessor Fund”) was reorganized into Invesco China Technology ETF (formerly known as PowerShares China Technology Portfolio), a newly created exchange-traded fund in Invesco’s family of ETFs, in a tax-free transaction. The ticker symbol and Index did not change. Performance information set forth below refers to both the performance of the Predecessor Fund and the Fund.
As an index fund, the Invesco China Technology ETF (the “Fund”) is passively managed and seeks investment results that correspond generally to the performance, before the Fund’s fees and expenses, of an equity index called the AlphaShares China Technology Index (the “Index”). The Index is designed to measure and monitor the performance of the universe of publicly traded companies which are based in mainland China, Hong Kong or Macau (as classified by the S&P BMI Country Code classification system), are in the Information Technology Sector, as defined by S&P Global Industry Classification Standard (“GICS”) and are open to foreign investment. The Index was created by AlphaShares, LLC (“AlphaShares” or the “Index Provider”) and is maintained by Standard & Poor’s. The Index includes equity securities of companies of all categories of market capitalizations, as defined by the Index Provider (subject to a minimum float-adjusted capitalization of U.S. $150 million). The Index may include Hong Kong listed securities, including China H-shares and Red Chip shares. China H-shares are issued by companies incorporated in mainland China and listed on the Hong Kong Stock Exchange. Red Chip shares are issued by companies with controlling Chinese shareholders that are incorporated outside mainland China and listed on the Hong Kong Stock Exchange. The Index may also include N-Shares, which are issued by companies based in mainland China and listed on the NYSE Arca, Inc. or The Nasdaq Stock Market. The Index does not include China A-Shares (which are subject to substantial restrictions on foreign investment) or China B-Shares (which offer a generally smaller market and limited liquidity), each of which trade on the Shanghai Stock Exchange and the Shenzhen Stock Exchange. The Fund will invest at least 90% of its total assets in common stocks, American depositary receipts (“ADRs”), American depositary shares (“ADSs”), global depositary receipts (“GDRs”) and international depositary receipts (“IDRs”) that comprise the Index and depositary receipts or shares representing common stocks included in the Index (or underlying securities representing ADRs, ADSs, GDRs and IDRs included in the Index). The Fund generally will invest in all of the securities comprising the Index in proportion to their weightings in the Index.
For the fiscal year ended August 31, 2018, on a market price basis, the Fund returned (9.33)%. On a net asset value (“NAV”) basis, the Fund returned (9.05)%. During the same time period, the Index returned (8.58)%. During the fiscal year, the Fund’s
performance, on a NAV basis, differed from the return of the Index primarily due to fees and operating expenses that the Fund incurred during the period.
During this same time period, the MSCI China Index (Net) (the “Benchmark Index”) returned 0.22%. The Benchmark Index is an unmanaged index weighted by market capitalization based on the average performance of approximately 450 securities. The Benchmark Index was selected for its recognition in the marketplace, and its performance comparison is a useful measure for investors as a broad representation of the Chinese equity market.
The performance of the Fund differed from the Benchmark Index because the Fund seeks to track an Index that employs a proprietary stock selection and weighting methodology, whereas the Benchmark Index selects and weights stocks based on market capitalization.
Relative to the Benchmark Index, the Fund was most overweight in the internet software & services sub-industry and most underweight in the diversified banks sub-industry during the fiscal year ended August 31, 2018. The majority of the Fund’s underperformance relative to the Benchmark Index during that period can be attributed to the Fund being overweight in the electronic components and electronic manufacturing services sub-industries.
For the fiscal year ended August 31, 2018, the semiconductors sub-industry contributed most significantly to the Fund’s return, followed by the technology distributors sub-industry. The electronic components, electronic manufacturing services and the internet software & services sub-industries were the primary detracting sub-industries.
Positions that contributed most significantly to the Fund’s return for the fiscal year ended August 31, 2018, included 58.com, Inc., Class A ADR (China) ,an internet software & services company (portfolio average weight of 4.27%), and Lenovo Group Ltd. (China), a technology hardware, storage & peripherals company (portfolio average weight of 2.30%). Positions that detracted most significantly from the Fund’s return during this period included NetEase, Inc. ADR (China), an internet software & services company (portfolio average weight of 6.10%), and AAC Technologies Holdings, Inc. (China), an electronic equipment, instruments & components company (portfolio average weight of 4.06%).
Invesco China Technology ETF (CQQQ) (continued)
| | | | |
Industry Breakdown
(% of the Fund’s Net Assets)
as of August 31, 2018 | |
| Internet Software & Services | | | 58.8 | |
| Electronic Equipment, Instruments & Components | | | 14.6 | |
| Semiconductors & Semiconductor Equipment | | | 8.1 | |
| IT Services | | | 5.5 | |
| Technology Hardware, Storage & Peripherals | | | 5.2 | |
| Software | | | 4.6 | |
| Communications Equipment | | | 2.6 | |
| Real Estate Management & Development | | | 0.5 | |
| Consumer Finance | | | 0.1 | |
| Specialty Retail | | | 0.0 | |
| Money Market Funds Plus Other Assets Less Liabilities | | | (0.0) | |
| | | | |
Top Ten Fund Holdings*
(% of the Fund’s Net Assets)
as of August 31, 2018 | |
| Security | | | | |
| Tencent Holdings Ltd. | | | 10.3 | |
| Alibaba Group Holding Ltd. ADR | | | 9.5 | |
| Baidu, Inc. ADR | | | 8.5 | |
| NetEase, Inc. ADR | | | 6.8 | |
| 58.com, Inc., Class A ADR | | | 4.8 | |
| Sunny Optical Technology Group Co. Ltd. | | | 4.4 | |
| AAC Technologies Holdings, Inc. | | | 3.5 | |
| Autohome, Inc., Class A ADR | | | 3.4 | |
| Lenovo Group Ltd. | | | 3.2 | |
| SINA Corp. | | | 3.2 | |
| Total | | | 57.6 | |
| * | Excluding money market fund holdings. |
Growth of a $10,000 Investment Since Inception
Fund Performance History as of August 31, 2018
| | | | | | | | | | | | | | | | | | | | | | | | | | | | | | | | |
| | | 1 Year | | | 3 Years Average
Annualized | | | 3 Years Cumulative | | | 5 Years Average
Annualized | | | 5 Years Cumulative | | | | | | Fund Inception | |
| Index | | | | | Average
Annualized | | | Cumulative | |
| AlphaShares China Technology Index | | | (8.58 | )% | | | 21.05 | % | | | 77.37 | % | | | 12.03 | % | | | 76.46 | % | | | | | | | 9.59 | % | | | 122.44 | % |
| MSCI China Index (Net) | | | 0.22 | | | | 13.49 | | | | 46.16 | | | | 9.27 | | | | 55.79 | | | | | | | | 4.94 | | | | 52.27 | |
| Fund | | | | | | | | | | | | | | | | | | | | | | | | | | | | | | | | |
| NAV Return | | | (9.05 | ) | | | 20.53 | | | | 75.12 | | | | 12.26 | | | | 78.27 | | | | | | | | 9.52 | | | | 121.24 | |
| Market Price Return | | | (9.33 | ) | | | 20.90 | | | | 76.74 | | | | 12.25 | | | | 78.20 | | | | | | | | 9.53 | | | | 121.41 | |
Invesco China Technology ETF (CQQQ) (continued)
Predecessor Fund Inception: December 08, 2009
Performance quoted above represents past performance. Past performance is not a guarantee of future results and current performance may be higher or lower than performance quoted. Investment returns and principal value will fluctuate, and shares of the Fund (“Fund Shares”), when redeemed or sold, may be worth more or less than their original cost. Fund performance reflects any applicable fee waivers and/or expense reimbursements. Had the adviser not waived fees and/or reimbursed expenses currently or in the past, returns would have been lower. See current prospectus for more information. According to the Fund’s current prospectus, the Fund’s expense ratio of 0.70% is expressed as a unitary management fee to cover operating expenses and expenses incurred in connection with managing the portfolio. NAV and Market Price returns assume that dividends and capital gain distributions have been reinvested in the Fund at NAV and Market Price, respectively. The returns shown in the table above do not reflect the deduction of taxes that a shareholder would pay on Fund distributions or the redemption or sale of Fund Shares. See invesco.com/ETFs to find the most recent month-end performance numbers.
Index and Benchmark Index performance results are based upon a hypothetical investment in their respective constituent securities. Index and Benchmark Index returns do not represent Fund returns. An investor cannot invest directly in an index. The Index and Benchmark Index do not charge management fees or brokerage expenses, and no such fees or expenses were deducted from the hypothetical performance shown. In addition, the results actual investors might have achieved would have differed from those shown because of differences in the timing, amounts of their investments, and fees and expenses associated with an investment in the Fund.
Notes Regarding Indexes and Fund Performance History:
| - | Effective after the close of business on May 18, 2018, the Predecessor Fund was reorganized into the Fund. Fund returns shown are blended returns of the Predecessor Fund and the Fund. |
| - | Average Annualized and Cumulative Inception returns for the Fund, Index and Benchmark Index are based on the inception date of the Predecessor Fund. |
| - | Net returns reflect reinvested dividends net of withholding taxes. |
| | |
| CGW | | Manager’s Analysis |
| | Invesco S&P Global Water Index ETF (CGW) |
Welcome to Invesco! Effective after the close of business on April 6, 2018, Guggenheim S&P Global Water Index ETF (the “Predecessor Fund”) was reorganized into Invesco S&P Global Water Index ETF (formerly known as PowerShares S&P Global Water Index Portfolio), a newly created exchange-traded fund in Invesco’s family of ETFs, in a tax-free transaction. The ticker symbol and Index did not change. Performance information set forth below refers to both the performance of the Predecessor Fund and the Fund.
As an index fund, the Invesco S&P Global Water Index ETF (the “Fund”) is passively managed and seeks investment results that correspond generally to the performance, before the Fund’s fees and expenses, of an equity index called the S&P Global Water Index (the “Index”). The Index is comprised of 50 equity securities selected, based on investment and other criteria, from a universe of companies listed on global developed market exchanges. Standard & Poor’s Financial Services LLC, a subsidiary of The McGraw-Hill Companies (“S&P”), generally defines “developed markets” as the capital markets of those countries with high levels of per capita income and strict market regulation resulting in greater transparency. Specifically, all or any subset of the following countries/regions are currently considered to be developed markets—Australia, Austria, Belgium, Canada, Denmark, Finland, France, Germany, Hong Kong, Ireland, Israel, Italy, Japan, Luxembourg, the Netherlands, New Zealand, Norway, Portugal, Singapore, South Korea, Spain, Sweden, Switzerland, the United Kingdom and the United States. The universe of companies includes all companies classified by Standard & Poor’s Global Industry Classifications as being associated (in a manner representing a major component of such companies’ business) with the global demand for water, including water utilities, infrastructure, equipment, instruments and materials. Total market capitalization and float-adjusted market capitalization of securities in the Index must be at least $250 million and $100 million, respectively, at the time of each reconstitution, which includes small-, mid-, and large-capitalization securities as defined by S&P. The companies in the universe are selected using criteria as identified by S&P. The Fund will invest at least 90% of its total assets in common stock and American depositary receipts (“ADRs”) that comprise the Index and depositary receipts representing common stocks included in the Index (or underlying securities representing ADRs included in the Index). The Fund generally will invest in all of the securities comprising the Index in proportion to their weightings in the Index.
For the fiscal year ended August 31, 2018, on a market price basis, the Fund returned 7.09%. On a net asset value (“NAV”) basis, the Fund returned 7.51%. During the same time period, the Index returned 7.89%. During the fiscal year, the Fund’s performance, on a NAV basis, differed from the return of the Index primarily due to fees and operating expenses that the Fund incurred during the period.
During this same time period, the MSCI EAFE® Index (Net) (the “Benchmark Index”) returned 4.39%. The Benchmark Index is an unmanaged index weighted by market capitalization based on the average performance of approximately 925 securities. The Benchmark Index was selected for its recognition in the marketplace, and its performance comparison is a useful measure for investors as a broad representation of the equities market in developed countries outside the U.S.
The performance of the Fund differed from the Benchmark Index because the Fund seeks to track an Index that employs a proprietary stock selection and weighting methodology, whereas the Benchmark Index selects and weights stocks based on market capitalization.
Relative to the Benchmark Index, the Fund was most overweight in the water utilities sub-industry and most underweight in the diversified banks sub-industry during the fiscal year ended August 31, 2018. The majority of the Fund’s outperformance relative to the Benchmark Index during that period can be attributed to the Fund being overweight in the industrial machinery sub-industry.
For the fiscal year ended August 31, 2018, the industrial machinery sub-industry contributed most significantly to the Fund’s return, followed by the health care equipment and environmental & facilities services sub-industries, respectively.
Positions that contributed most significantly to the Fund’s return for the fiscal year ended August 31, 2018, included IDEX Corp., an industrial machinery company (portfolio average weight of 4.69%), and Xylem Inc., an industrial machinery company (portfolio average weight of 5.69%). Positions that detracted most significantly from the Fund’s return during this period included Companhia de Saneamento Basico do Estado de Sao Paulo SABESP Sponsored ADR, a water utilities company (no longer held at fiscal year-end), and Beijing Enterprises Water Group Ltd., a water utilities company (portfolio average weight of 1.89%).
Invesco S&P Global Water Index ETF (CGW) (continued)
| | | | |
Industry Breakdown
(% of the Fund’s Net Assets)
as of August 31, 2018 | |
| Water Utilities | | | 33.4 | |
| Machinery | | | 28.7 | |
| Multi-Utilities | | | 12.3 | |
| Building Products | | | 6.5 | |
| Health Care Equipment & Supplies | | | 5.1 | |
| Electronic Equipment, Instruments & Components | | | 3.8 | |
| Chemicals | | | 2.3 | |
| Commercial Services & Supplies | | | 2.4 | |
| Household Durables | | | 2.0 | |
| Electrical Equipment | | | 2.0 | |
| Construction & Engineering | | | 0.7 | |
| Energy Equipment & Services | | | 0.2 | |
| Construction Materials | | | 0.1 | |
| Money Market Funds Plus Other Assets Less Liabilities | | | 0.5 | |
| | | | |
Top Ten Fund Holdings*
(% of the Fund’s Net Assets)
as of August 31, 2018 | |
| Security | | | | |
| American Water Works Co., Inc. | | | 9.1 | |
| Xylem, Inc. | | | 6.1 | |
| IDEX Corp. | | | 5.2 | |
| Geberit AG | | | 5.1 | |
| Danaher Corp. | | | 5.1 | |
| Veolia Environnement SA | | | 4.4 | |
| Aqua America, Inc. | | | 3.8 | |
| United Utilities Group PLC | | | 3.8 | |
| Severn Trent PLC | | | 3.6 | |
| Alfa Laval AB | | | 3.6 | |
| Total | | | 49.8 | |
| * | Excluding money market fund holdings. |
Growth of a $10,000 Investment

Fund Performance History as of August 31, 2018
| | | | | | | | | | | | | | | | | | | | | | | | | | | | | | | | | | | | | | | | |
| | | | | | 3 Years Average
Annualized | | | 3 Years Cumulative | | | 5 Years Average
Annualized | | | 5 Years Cumulative | | | 10 Years Average
Annualized | | | 10 Years Cumulative | | | | | | Fund Inception | |
| Index | | 1 Year | | | | | | Average
Annualized | | | Cumulative | |
| S&P Global Water Index (Net) | | | 7.89 | % | | | 11.92 | % | | | 40.19 | % | | | 10.19 | % | | | 62.47 | % | | | 7.22 | % | | | 100.81 | % | | | | | | | 5.89 | % | | | 90.91 | % |
| MSCI EAFE® Index (Net) | | | 4.39 | | | | 7.04 | | | | 22.66 | | | | 5.73 | | | | 32.15 | | | | 3.66 | | | | 43.22 | | | | | | | | 1.66 | | | | 20.45 | |
| MSCI World Index (Net) | | | 13.10 | | | | 11.92 | | | | 40.19 | | | | 10.23 | | | | 62.76 | | | | 7.13 | | | | 99.18 | | | | | | | | 4.95 | | | | 72.63 | |
| Fund | | | | | | | | | | | | | | | | | | | | | | | | | | | | | | |
| NAV Return | | | 7.51 | | | | 11.62 | | | | 39.06 | | | | 9.90 | | | | 60.34 | | | | 6.80 | | | | 93.00 | | | | | | | | 5.42 | | | | 81.62 | |
| Market Price Return | | | 7.09 | | | | 11.61 | | | | 39.02 | | | | 9.89 | | | | 60.24 | | | | 6.68 | | | | 90.97 | | | | | | | | 5.41 | | | | 81.33 | |
Invesco S&P Global Water Index ETF (CGW) (continued)
Predecessor Fund Inception: May 14, 2007
Performance quoted above represents past performance. Past performance is not a guarantee of future results and current performance may be higher or lower than performance quoted. Investment returns and principal value will fluctuate, and shares of the Fund (“Fund Shares”), when redeemed or sold, may be worth more or less than their original cost. Fund performance reflects any applicable fee waivers and/or expense reimbursements. Had the adviser not waived fees and/or reimbursed expenses currently or in the past, returns would have been lower. See current prospectus for more information. According to the Fund’s current prospectus, the total annual operating expense ratio was indicated as 0.61%. The Financial Highlights section of the Shareholder Report presents the expense ratios based on expenses incurred during the period covered by this report. NAV and Market Price returns assume that dividends and capital gain distributions have been reinvested in the Fund at NAV and Market Price, respectively. The returns shown in the table above do not reflect the deduction of taxes that a shareholder would pay on Fund distributions or the redemption or sale of Fund Shares. See invesco.com/ETFs to find the most recent month-end performance numbers.
Index and Benchmark Indexes performance results are based upon a hypothetical investment in their respective constituent securities. Index
and Benchmark Indexes returns do not represent Fund returns. An investor cannot invest directly in an index. The Index and Benchmark Indexes do not charge management fees or brokerage expenses, and no such fees or expenses were deducted from the hypothetical performance shown. In addition, the results actual investors might have achieved would have differed from those shown because of differences in the timing, amounts of their investments, and fees and expenses associated with an investment in the Fund.
Notes Regarding Indexes and Fund Performance History:
| - | Effective after the close of business on April 6, 2018, the Predecessor Fund was reorganized into the Fund. Fund returns shown are blended returns of the Predecessor Fund and the Fund. |
| - | Average Annualized and Cumulative Inception returns for the Fund, Index and Benchmark Indexes are based on the inception date of the Predecessor Fund. |
| - | Net returns reflect reinvested dividends net of withholding taxes. |
| - | The Fund has elected to use the MSCI EAFE® Index to represent its broad-based index rather than the MSCI World Index because the MSCI EAFE® Index more closely reflects the performance of the types of securities in which the Fund invests. |
| | |
| GHII | | Manager’s Analysis |
| | Invesco S&P High Income Infrastructure ETF (GHII) |
Welcome to Invesco! Effective after the close of business on May 18, 2018, Guggenheim S&P High Income Infrastructure ETF (the “Predecessor Fund”) was reorganized into Invesco S&P High Income Infrastructure ETF (formerly known as PowerShares S&P High Income Infrastructure Portfolio), a newly created exchange-traded fund in Invesco’s family of ETFs, in a tax-free transaction. The ticker symbol and Index did not change. Performance information set forth below refers to both the performance of the Predecessor Fund and the Fund.
As an index fund, the Invesco S&P High Income Infrastructure ETF (the “Fund”) is passively managed and seeks investment results that correspond generally to the performance, before the Fund’s fees and expenses, of an equity index called the S&P High Income Infrastructure Index (the “Index”). The Index is designed to measure and monitor the performance of 50 high-yielding global equity securities of companies that engage in various infrastructure-related sub-industries. Index constituents must meet size, listing and liquidity requirements and also be part of the S&P Global BMI Index, which is a rules-based index that measures global stock market performance. Index constituents must be equity securities of companies classified in one of the infrastructure clusters (the “Infrastructure Clusters”) determined by the S&P Dow Jones Index Group, based on the Global Industry Classification Standard (“GICS® ”) sub-industry classifications. Securities in the Infrastructure Clusters must have a float-adjusted market capitalization (i.e., a market capitalization that is calculated based on the number of shares that are readily available in the market rather than all shares outstanding) greater than $250 million, a three-month average daily value traded of $1 million or higher and be listed on a developed market stock exchange. The top 50 highest-yielding securities that meet these criteria (ranked by 12-month dividend yield) are selected for inclusion in the Index. The Fund will invest at least 90% of its total assets in common stocks that comprise the Index and depositary receipts representing common stocks included in the Index. The Fund generally will invest in all of the securities comprising the Index in proportion to their weightings in the Index.
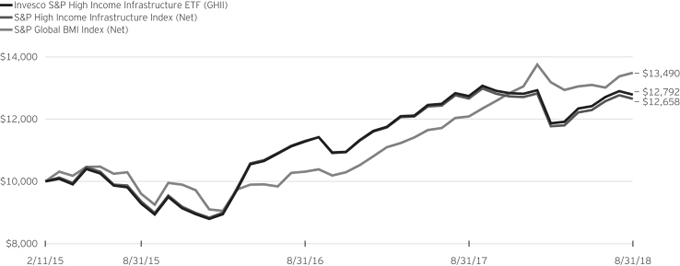
For the fiscal year ended August 31, 2018, on a market price basis, the Fund returned 0.37%. On a net asset value (“NAV”) basis, the Fund returned 0.40%. During the same time period, the Index returned (0.03)%. During the fiscal year, the Fund’s performance, on a NAV basis, differed from the return of the Index primarily due to differences in the treatment of dividends between the Fund and the Index.
During this same time period, the S&P Global BMI Index (the “Benchmark Index”) returned 11.63%. The Benchmark Index is an unmanaged index weighted by market capitalization based on the average performance of approximately 11,200 securities. The Benchmark Index was selected for its recognition in the marketplace, and its performance comparison is a useful measure for investors as a broad representation of equity markets in developed countries.
The performance of the Fund differed from the Benchmark Index because the Fund seeks to track an Index that employs a proprietary stock selection and weighting methodology, whereas the Benchmark Index selects and weights stocks based on market capitalization.
Relative to the Benchmark Index, the Fund was most overweight in the utilities sector and most underweight in the industrials sector during the fiscal year ended August 31, 2018. The majority of the Fund’s underperformance relative to the Benchmark Index during that period can be attributed to the Fund being overweight in the utilities sector and underweight in the information technology sector.
For the fiscal year ended August 31, 2018, the energy sector contributed most significantly to the Fund’s return, followed by the utilities sector. The industrials sector was the only detracting sector.
Positions that contributed most significantly to the Fund’s return for the fiscal year ended August 31, 2018, included Targa Resources Corp., an energy company (portfolio average weight of 4.32%), and Electricite de France S.A., an electric utilities company (no longer held at fiscal year-end). Positions that detracted most significantly from the Fund’s return during this period included Macquarie Infrastructure Corp., an industrials company (portfolio average weight of 3.49%), and Hutchison Port Holdings Trust (Hong Kong), an industrials company (portfolio average weight of 2.28%).
| | | | |
Sector Breakdown
(% of the Fund’s Net Assets)
as of August 31, 2018 | |
| Utilities | | | 53.4 | |
| Energy | | | 33.4 | |
| Industrials | | | 12.8 | |
| Other Assets Less Liabilities | | | 0.4 | |
|
Top Ten Fund Holdings
(% of the Fund’s Net Assets)
as of August 31, 2018 | |
| Security | | | | |
| Macquarie Infrastructure Corp. | | | 5.2 | |
| Ship Finance International Ltd. | | | 4.5 | |
| Hutchison Port Holdings Trust | | | 4.5 | |
| Targa Resources Corp. | | | 3.8 | |
| SemGroup Corp., Class A | | | 3.5 | |
| AltaGas Ltd. | | | 3.5 | |
| Enbridge Income Fund Holdings, Inc. | | | 3.4 | |
| Inter Pipeline Ltd. | | | 3.3 | |
| Pattern Energy Group, Inc., Class A | | | 3.0 | |
| Snam SpA | | | 2.8 | |
| Total | | | 37.5 | |
Invesco S&P High Income Infrastructure ETF (GHII) (continued)
Growth of a $10,000 Investment Since Inception
Fund Performance History as of August 31, 2018
| | | | | | | | | | | | | | | | | | | | | | | | |
| | | 1 Year | | | 3 Years Average
Annualized | | | 3 Years Cumulative | | | | | | Fund Inception | |
| Index | | | | | Average
Annualized | | | Cumulative | |
| S&P High Income Infrastructure Index (Net) | | | (0.03 | )% | | | 10.60 | % | | | 35.31 | % | | | | | | | 6.86 | % | | | 26.58 | % |
| S&P Global BMI Index (Net) | | | 11.63 | | | | 11.98 | | | | 40.41 | | | | | | | | 8.80 | | | | 34.90 | |
| Fund | | | | | | | | | | | | | | | | | | |
| NAV Return | | | 0.40 | | | | 11.24 | | | | 37.64 | | | | | | | | 7.18 | | | | 27.92 | |
| Market Price Return | | | 0.37 | | | | 11.75 | | | | 39.56 | | | | | | | | 7.17 | | | | 27.87 | |
Predecessor Fund Inception: February 11, 2015
Performance quoted above represents past performance. Past performance is not a guarantee of future results and current performance may be higher or lower than performance quoted. Investment returns and principal value will fluctuate, and shares of the Fund (“Fund Shares”), when redeemed or sold, may be worth more or less than their original cost. Fund performance reflects any applicable fee waivers and/or expense reimbursements. Had the adviser not waived fees and/or reimbursed expenses currently or in the past, returns would have been lower. See current prospectus for more information. According to the Fund’s current prospectus, the Fund’s expense ratio of 0.45% is expressed as a unitary management fee to cover operating expenses and expenses incurred in connection with managing the portfolio. NAV and Market Price returns assume that dividends and capital gain distributions have been reinvested in the Fund at NAV and Market Price, respectively. The returns shown in the table above do not reflect the deduction of taxes that a shareholder would pay on Fund distributions or the redemption or sale of Fund Shares. See invesco.com/ETFs to find the most recent month-end performance numbers.
Index and Benchmark Index performance results are based upon a hypothetical investment in their respective constituent securities. Index and Benchmark Index returns do not represent Fund returns. An investor cannot invest directly in an index. The Index and Benchmark Index do not charge management fees or brokerage expenses, and no such fees or expenses were deducted from the hypothetical performance shown. In addition, the results actual investors might have achieved would have differed from those shown because of differences in the timing, amounts of their investments, and fees and expenses associated with an investment in the Fund.
Notes Regarding Indexes and Fund Performance History:
| - | Effective after the close of business on May 18, 2018, the Predecessor Fund was reorganized into the Fund. Fund returns shown are blended returns of the Predecessor Fund and the Fund. |
| - | Average Annualized and Cumulative Inception returns for the Fund, Index and Benchmark Index are based on the inception date of the Predecessor Fund. |
| - | Net returns reflect reinvested dividends net of withholding taxes. |
| | |
| SEA | | Manager’s Analysis |
| | Invesco Shipping ETF (SEA) |
As an index fund, the Invesco Shipping ETF (the “Fund”) is passively managed and seeks investment results that correspond generally to the performance, before the Fund’s fees and expenses, of an equity index called the Dow Jones Global Shipping IndexSM (the “Index”). The Index is designed to measure the performance of high dividend-paying companies in the shipping industry. CME Group Index Services LLC (“CME Indexes” or the “Index Provider”) uses a rules-based methodology to rank companies by yield that are involved in the shipping industry globally that primarily transport goods and materials. The Index Provider determines whether a company is “high-dividend paying” by ranking it relative to other companies in the shipping industry based upon indicated annual yield (most recent distribution annualized and divided by the current share price). The Index Provider considers a company to be in the shipping industry if its revenues are derived primarily from shipping activities (excluding companies solely involved in transporting passengers). The Index constituents are weighted based on their float-adjusted market capitalization. The Fund will at all times invest at least 90% of its total assets in common stock, American depositary receipts (“ADRs”), global depositary receipts (“GDRs”) and master limited partnerships (“MLPs”) that comprise the Index and the underlying stocks in respect of the ADRs and GDRs in the Index. The depositary receipts included in the Index may be sponsored or unsponsored. The Fund generally will invest in all of the securities comprising the Index in proportion to their weightings in the Index.
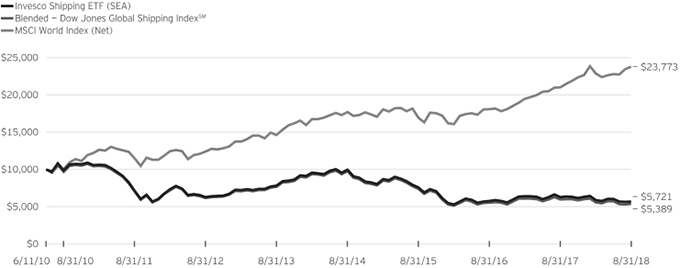
The Board of Trustees approved a change in the fiscal year end for the Fund from May 31 to August 31. For the fiscal period from June 1, 2018 to August 31, 2018, on a market price basis, the Fund returned (5.69)%. On a net asset value (“NAV”) basis, the Fund returned (5.67)%. During the same time period, the Index returned (5.89)%. During the fiscal period, the Fund’s performance, on a NAV basis, differed from the return of the Index primarily due to revenue generated from the securities lending program in which the Fund participates partially offset by the fees and operating expenses that the Fund incurred, as well as trading costs associated with portfolio rebalances during the period.
During this same time period, the MSCI World Index (Net) (the “Benchmark Index”) returned 4.35%. The Benchmark Index is an unmanaged index weighted by market capitalization based on the average performance of approximately 1,640 securities. The Benchmark Index was selected for its recognition in the marketplace, and its performance comparison is a useful measure for investors as a broad representation of equity markets in developed countries.
The performance of the Fund differed from the Benchmark Index because the Fund seeks to track an Index that employs a proprietary stock selection and weighting methodology, whereas the Benchmark Index selects and weights stocks based on market capitalization.
Relative to the Benchmark Index, the Fund was most overweight in the marine sub-industry and most underweight in the banks sub-industry during the fiscal period ended August 31, 2018. The majority of the Fund’s underperformance relative to the Benchmark Index during that period can be attributed to the Fund being underweight in the technology hardware, storage & peripherals sub-industry.
For the fiscal period ended August 31, 2018, the metals & mining sub-industry contributed most significantly to the Fund’s return, followed by the automobiles and semiconductors sub-industries, respectively. The oil, gas & consumable fuels sub-industry was the most significant detracting sub-industry.
Positions that contributed most significantly to the Fund’s return for the fiscal period ended August 31, 2018, included AP Moller – Maersk A/S, Class B, an oil, gas & consumable fuels company (portfolio average weight of 18.30%), and Maston, Inc., an oil, gas & consumable fuels company (portfolio average weight of 4.39%). Positions that detracted most significantly from the Fund’s return during this period included Scorpio Tankers, Inc., (portfolio average weight of 1.98%), and Nippon Yusen KK, an oil, gas & consumable fuels company (portfolio average weight of 6.15%).
| | | | |
Sector Breakdown
(% of the Fund’s Net Assets)
as of August 31, 2018 | |
| Industrials | | | 67.2 | |
| Energy | | | 32.8 | |
| Money Market Fund Plus Other Assets Less Liabilities | | | 0.0 | |
| | | | |
Top Ten Fund Holdings*
(% of the Fund’s Net Assets)
as of August 31, 2018 | |
| Security | | | | |
| AP Moller—Maersk A/S, Class B | | | 20.6 | |
| Mitsui OSK Lines Ltd. | | | 7.4 | |
| Nippon Yusen KK | | | 7.2 | |
| Golar LNG Ltd. | | | 5.8 | |
| Euronav NV | | | 4.3 | |
| Matson, Inc. | | | 4.3 | |
| Ship Finance International Ltd. | | | 4.0 | |
| Kawasaki Kisen Kaisha Ltd. | | | 3.9 | |
| Hapag-Lloyd AG | | | 3.4 | |
| GasLog Partners LP | | | 3.1 | |
| Total | | | 64.0 | |
| * | Excluding money market fund holdings. |
Invesco Shipping ETF (SEA) (continued)
Growth of a $10,000 Investment Since Inception
Fund Performance History as of August 31, 2018
| | | | | | | | | | | | | | | | | | | | | | | | | | | | | | | | |
| | | 1 Year | | | 3 Years Average
Annualized | | | 3 Years Cumulative | | | 5 Years Average
Annualized | | | 5 Years Cumulative | | | | | | Fund Inception | |
| Index | | | | | Average
Annualized | | | Cumulative | |
| Blended—Dow Jones Global Shipping IndexSM | | | (9.72 | )% | | | (9.95 | )% | | | (26.99 | )% | | | (6.80 | )% | | | (29.69 | )% | | | | | | | (7.24 | )% | | | (46.11 | )% |
| MSCI World Index (Net) | | | 13.10 | | | | 11.92 | | | | 40.19 | | | | 10.23 | | | | 62.76 | | | | | | | | 11.11 | | | | 137.73 | |
| Fund | | | | | | | | | | | | | | | | | | | | | | | | | | | | | | | | |
| NAV Return | | | (9.09 | ) | | | (8.95 | ) | | | (24.53 | ) | | | (6.07 | ) | | | (26.87 | ) | | | | | | | (6.57 | ) | | | (42.79 | ) |
| Market Price Return | | | (9.35 | ) | | | (8.96 | ) | | | (24.55 | ) | | | (6.16 | ) | | | (27.23 | ) | | | | | | | (6.61 | ) | | | (42.98 | ) |
Predecessor Fund Inception: June 11, 2010
Performance quoted above represents past performance. Past performance is not a guarantee of future results and current performance may be higher or lower than performance quoted. Investment returns and principal value will fluctuate, and shares of the Fund (“Fund Shares”), when redeemed or sold, may be worth more or less than their original cost. Fund performance reflects any applicable fee waivers and/or expense reimbursements. Had the adviser not waived fees and/or reimbursed expenses currently or in the past, returns would have been lower. See current prospectus for more information. According to the Fund’s current prospectus, the Fund’s expense ratio of 0.65% is expressed as a unitary management fee to cover operating expenses and expenses incurred in connection with managing the portfolio. NAV and Market Price returns assume that dividends and capital gain distributions have been reinvested in the Fund at NAV and Market Price, respectively. The returns shown in the table above do not reflect the deduction of taxes that a shareholder would pay on Fund distributions or the redemption or sale of Fund Shares. See invesco.com/ETFs to find the most recent month-end performance numbers.
Blended-Index and Benchmark Index performance results are based upon a hypothetical investment in their respective constituent securities.
Blended-Index and Benchmark Index returns do not represent Fund returns. An investor cannot invest directly in an index. The Blended-Index and Benchmark Index do not charge management fees or brokerage expenses, and no such fees or expenses were deducted from the hypothetical performance shown. In addition, the results actual investors might have achieved would have differed from those shown because of differences in the timing, amounts of their investments, and fees and expenses associated with an investment in the Fund.
Notes Regarding Indexes and Fund Performance History:
| - | Effective after the close of business on April 6, 2018, the Predecessor Fund was reorganized into the Fund. Fund returns shown are blended returns of the Predecessor Fund and the Fund. |
| - | Average Annualized and Cumulative Inception returns for the Fund, Blended-Index and Benchmark Index are based on the inception date of the Predecessor Fund. |
| - | The Blended-Dow Jones Global Shipping IndexSM performance is comprised of the performance of the Delta Global Shipping Index, the Fund’s previous underlying index, prior to the conversion date, July 27, 2011, followed by the performance of the Index, starting from the conversion date through August 31, 2018. |
| - | Net returns reflect reinvested dividends net of withholding taxes. |
| | |
| TAN | | Manager’s Analysis |
| | Invesco Solar ETF (TAN) |
Welcome to Invesco! Effective after the close of business on May 18, 2018, Guggenheim Solar ETF (the “Predecessor Fund”) was reorganized into Invesco Solar ETF (formerly known as PowerShares Solar Portfolio), a newly created exchange-traded fund in Invesco’s family of ETFs, in a tax-free transaction. The ticker symbol and Index did not change. Performance information set forth below refers to both the performance of the Predecessor Fund and the Fund.
As an index fund, the Invesco Solar ETF (the “Fund”) is passively managed and seeks investment results that correspond generally to the performance, before the Fund’s fees and expenses, of an equity index called the MAC Global Solar Energy Index (the “Index”). The Index is comprised of securities selected based on the relative importance of solar power within the company’s business model, as determined by MAC Indexing LLC (the “Index Provider”). The Index is designed to track companies within the following business segments of the solar energy industry, including those companies that derive a significant amount of their revenues from the solar industry: companies that produce solar power equipment and products for end-users, companies that produce fabrication products (such as the equipment used by solar cell and module producers to manufacture solar power equipment) or services (such as companies specializing in the solar cell manufacturing or the provision of consulting services to solar cell and module producers) for solar power equipment producers, companies that supply raw materials or components to solar power equipment producers or integrators; companies that derive a significant portion of their business from solar power system sales, distribution, installation, integration or financing; and companies that specialize in selling electricity derived from solar power. The Index is comprised of equity securities, including American depositary receipts (“ADRs”) and global depositary receipts (“GDRs”), traded in developed markets. While the equity securities comprising the Index are traded in developed markets, the issuers of such securities may be located in emerging markets. Emerging market countries are countries that major international financial institutions, such as the World Bank, generally consider to be less economically mature than developed nations. The Fund will invest at least 90% of its total assets in common stock, ADRs and GDRs that comprise the Index and depositary receipts representing common stocks included in the Index (or underlying securities representing ADRs and GDRs included in the Index). The Fund generally will invest in all of the securities comprising the Index in proportion to their weightings in the Index.
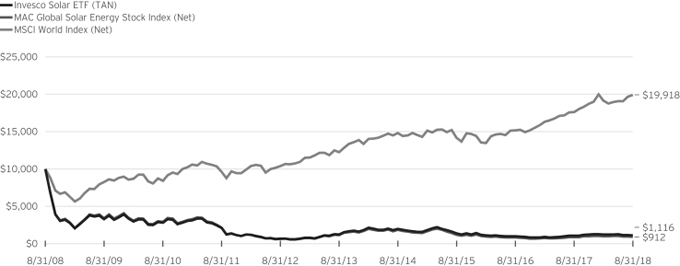
For the fiscal year ended August 31, 2018, on a market price basis, the Fund returned 2.33%. On a net asset value (“NAV”) basis, the Fund returned 3.19%. During the same time period, the Index returned 1.97%. During the fiscal year, the Fund’s performance, on a NAV basis, differed from the return of the Index primarily due to revenue generated from the securities
lending program in which the Fund participates, which was offset by the fees and operating expenses that the Fund incurred, as well as trading costs associated with portfolio rebalances during the period.
During this same time period, the MSCI World Index (Net) (the “Benchmark Index”) returned 13.10%. The Benchmark Index is an unmanaged index weighted by market capitalization based on the average performance of approximately 1,640 securities. The Benchmark Index was selected for its recognition in the marketplace, and its performance comparison is a useful measure for investors as a broad representation of equity markets in developed countries.
The performance of the Fund differed from the Benchmark Index because the Fund seeks to track an Index that employs a proprietary stock selection and weighting methodology, whereas the Benchmark Index selects and weights stocks based on market capitalization.
Relative to the Benchmark Index, the Fund was most overweight in the semiconductors & semiconductor equipment industry and most underweight in the banks industry during the fiscal year ended August 31, 2018. The majority of the Fund’s underperformance relative to the Benchmark Index during that period can be attributed to the Fund being underweight in the internet & direct marketing retail industry as well as fees and operating expenses that the Fund incurred.
For the fiscal year ended August 31, 2018, the electrical equipment industry contributed most significantly to the Fund’s return, followed by the independent power and renewable electricity producers and mortgage real estate investment trusts (REITs) industries, respectively. The semiconductors & semiconductor equipment and containers & packaging industries detracted most significantly.
Positions that contributed most significantly to the Fund’s return for the fiscal year ended August 31, 2018, included SolarEdge Technologies, Inc., a semiconductors & semiconductor equipment company (portfolio average weight of 6.78%), and Sunrun, Inc., an electrical equipment company(portfolio average weight of 4.69%). Positions that detracted most significantly from the Fund’s return during this period included Meyer Burger Technology AG (Switzerland), a semiconductors & semiconductor equipment company (portfolio average weight of 4.76%), and JinkoSolar Holding Co. Ltd. ADR (China), a semiconductors & semiconductor equipment company (portfolio average weight of 4.11%).
Invesco Solar ETF (TAN) (continued)
| | | | |
Industry Breakdown
(% of the Fund’s Net Assets)
as of August 31, 2018 | |
| Semiconductors & Semiconductor Equipment | | | 50.7 | |
| Independent Power & Renewable Electricity Producers | | | 25.0 | |
| Electrical Equipment | | | 12.9 | |
| Mortgage REITs | | | 5.5 | |
| Containers & Packaging | | | 3.0 | |
| Construction & Engineering | | | 2.4 | |
| Money Market Funds Plus Other Assets Less Liabilities | | | 0.5 | |
| | | | |
Top Ten Fund Holdings*
(% of the Fund’s Net Assets)
as of August 31, 2018 | |
| Security | | | | |
| First Solar, Inc. | | | 9.1 | |
| SolarEdge Technologies, Inc. | | | 6.7 | |
| Xinyi Solar Holdings Ltd. | | | 6.2 | |
| Sunrun, Inc. | | | 5.7 | |
| Canadian Solar, Inc. | | | 5.5 | |
| Hannon Armstrong Sustainable Infrastructure Capital, Inc. | | | 5.5 | |
| Atlantica Yield PLC | | | 5.1 | |
| Scatec Solar ASA | | | 4.7 | |
| Encavis AG | | | 4.6 | |
| JinkoSolar Holding Co. Ltd. ADR | | | 4.4 | |
| Total | | | 57.5 | |
| * | Excluding money market fund holdings. |
Growth of a $10,000 Investment
Fund Performance History as of August 31, 2018
| | | | | | | | | | | | | | | | | | | | | | | | | | | | | | | | | | | | | | | | |
| | | | | | 3 Years Average
Annualized | | | 3 Years Cumulative | | | 5 Years Average
Annualized | | | 5 Years Cumulative | | | 10 Years Average
Annualized | | | 10 Years Cumulative | | | | | | Fund Inception | |
| Index | | 1 Year | | | | | | Average
Annualized | | | Cumulative | |
| MAC Global Solar Energy Index (Net) | | | 1.97 | % | | | (9.23 | )% | | | (25.22 | )% | | | (4.72 | )% | | | (21.49 | )% | | | (21.29 | )% | | | (90.88 | )% | | | | | | | (20.48 | )% | | | (90.73 | )% |
| MSCI World Index (Net) | | | 13.10 | | | | 11.92 | | | | 40.19 | | | | 10.23 | | | | 62.76 | | | | 7.13 | | | | 99.18 | | | | | | | | 6.15 | | | | 85.70 | |
| Fund | | | | | | | | | | | | | | | | | | | | | | | | | | | | | | |
| NAV Return | | | 3.19 | | | | (7.12 | ) | | | (19.89 | ) | | | (2.04 | ) | | | (9.79 | ) | | | (19.69 | ) | | | (88.84 | ) | | | | | | | (18.72 | ) | | | (88.36 | ) |
| Market Price Return | | | 2.33 | | | | (7.11 | ) | | | (19.86 | ) | | | (2.08 | ) | | | (9.97 | ) | | | (19.75 | ) | | | (88.92 | ) | | | | | | | (18.76 | ) | | | (88.42 | ) |
Invesco Solar ETF (TAN) (continued)
Predecessor Fund Inception: April 15, 2008
Performance quoted above represents past performance. Past performance is not a guarantee of future results and current performance may be higher or lower than performance quoted. Investment returns and principal value will fluctuate, and shares of the Fund (“Fund Shares”), when redeemed or sold, may be worth more or less than their original cost. Fund performance reflects any applicable fee waivers and/or expense reimbursements. Had the adviser not waived fees and/or reimbursed expenses currently or in the past, returns would have been lower. See current prospectus for more information. According to the Fund’s current prospectus, the Fund’s expense ratio of 0.50% is expressed as a unitary management fee to cover operating expenses and expenses incurred in connection with managing the portfolio. NAV and Market Price returns assume that dividends and capital gain distributions have been reinvested in the Fund at NAV and Market Price, respectively. The returns shown in the table above do not reflect the deduction of taxes that a shareholder would pay on Fund distributions or the redemption or sale of Fund Shares. See invesco.com/ETFs to find the most recent month-end performance numbers.
Index and Benchmark Index performance results are based upon a hypothetical investment in their respective constituent securities. Index and Benchmark Index returns do not represent Fund returns. An investor cannot invest directly in an index. The Index and Benchmark Index do not charge management fees or brokerage expenses, and no such fees or expenses were deducted from the hypothetical performance shown. In addition, the results actual investors might have achieved would have differed from those shown because of differences in the timing, amounts of their investments, and fees and expenses associated with an investment in the Fund.
Notes Regarding Indexes and Fund Performance History:
| - | Effective after the close of business on May 18, 2018, the Predecessor Fund was reorganized into the Fund. Fund returns shown are blended returns of the Predecessor Fund and the Fund. |
| - | Average Annualized and Cumulative Inception returns for the Fund, Index and Benchmark Index are based on the inception date of the Predecessor Fund. |
| - | Net returns reflect reinvested dividends net of withholding taxes. |
Schedule of Investments(a)
Invesco China All-Cap ETF (YAO)
August 31, 2018
| | | | | | | | |
Number
of Shares | | | | | Value | |
| | | | Common Stocks & Other Equity Interests—99.8% | |
| | | | Consumer Discretionary—11.7% | |
| | 230,000 | | | Alibaba Pictures Group Ltd. (Hong
Kong)(b) | | $ | 27,838 | |
| | 20,000 | | | ANTA Sports Products Ltd. (China) | | | 108,933 | |
| | 30,453 | | | BAIC Motor Corp. Ltd. (China)(c) | | | 25,607 | |
| | 51,996 | | | Brilliance China Automotive Holdings Ltd. (China) | | | 82,410 | |
| | 12,000 | | | BYD Co. Ltd., H-Shares (China)(d) | | | 71,322 | |
| | 58,000 | | | China Dongxiang Group Co. Ltd. (China) | | | 9,606 | |
| | 54,000 | | | China First Capital Group Ltd. (Hong Kong)(b) | | | 28,896 | |
| | 24,000 | | | China Maple Leaf Educational Systems Ltd. (China) | | | 13,118 | |
| | 35,999 | | | China Travel International Investment Hong Kong Ltd. (China) | | | 11,696 | |
| | 13,000 | | | China Yongda Automobiles Services Holdings Ltd. (China) | | | 11,809 | |
| | 19,500 | | | China ZhengTong Auto Services Holdings Ltd. (China) | | | 11,950 | |
| | 7,357 | | | Ctrip.com International Ltd. ADR
(China)(b) | | | 288,027 | |
| | 50,000 | | | Dongfeng Motor Group Co. Ltd., H-Shares (China) | | | 55,868 | |
| | 18,000 | | | Fu Shou Yuan International Group Ltd. (China) | | | 16,122 | |
| | 8,863 | | | Fuyao Glass Industry Group Co. Ltd., H-Shares (China)(c) | | | 32,690 | |
| | 87,993 | | | Geely Automobile Holdings Ltd. (China) | | | 186,997 | |
| | 8,000 | | | Golden Eagle Retail Group Ltd. (China) | | | 9,061 | |
| | 198,991 | | | GOME Retail Holdings Ltd. (China)(b) | | | 19,268 | |
| | 54,000 | | | Great Wall Motor Co. Ltd., H-Shares (China) | | | 33,230 | |
| | 48,398 | | | Guangzhou Automobile Group Co. Ltd., H-Shares (China) | | | 52,536 | |
| | 22,000 | | | Haier Electronics Group Co. Ltd. (Hong Kong)(b) | | | 57,320 | |
| | 2,029 | | | Huazhu Group Ltd. ADR (China) | | | 69,838 | |
| | 860,000 | | | Imperial Pacific International Holdings Ltd. (Hong Kong)(b) | | | 7,999 | |
| | 13,713 | | | JD.com, Inc., Class A ADR (China)(b) | | | 429,217 | |
| | 27,500 | | | Li Ning Co. Ltd. (China)(b) | | | 29,010 | |
| | 12,000 | | | Minth Group Ltd. (China) | | | 49,153 | |
| | 2,283 | | | New Oriental Education & Technology Group, Inc. ADR (China) | | | 179,444 | |
| | 5,000 | | | Q Technology Group Co. Ltd. (China) | | | 3,230 | |
| | 11,999 | | | Shenzhou International Group Holdings Ltd. (China) | | | 157,461 | |
| | 33,999 | | | Skyworth Digital Holdings Ltd. (Hong Kong) | | | 11,003 | |
| | 4,983 | | | TAL Education Group ADR (China)(b) | | | 147,497 | |
| | 12,000 | | | Tianneng Power International Ltd. (China) | | | 14,907 | |
| | 1,393 | | | Tuniu Corp., Class A ADR (China)(b) | | | 10,434 | |
| | 7,524 | | | Vipshop Holdings Ltd., Class A ADR (China)(b) | | | 52,518 | |
| | 19,000 | | | Virscend Education Co. Ltd. (China)(c) | | | 11,571 | |
| | 43,999 | | | Xinyi Glass Holdings Ltd. (Hong Kong) | | | 54,936 | |
| | 6,766 | | | Yum China Holdings, Inc. (China) | | | 261,709 | |
| | 11,000 | | | Zhongsheng Group Holdings Ltd. (China) | | | 24,133 | |
| | | | | | | | |
| | | | | | | 2,668,364 | |
| | | | | | | | |
| | | | Consumer Staples—3.5% | |
| | 105,993 | | | C.P. Pokphand Co. Ltd. (Hong Kong) | | | 9,723 | |
| | 37,999 | | | China Agri-Industries Holdings Ltd. (China) | | | 15,105 | |
| | 59,000 | | | China Huishan Dairy Holdings Co. Ltd. (China)(b)(e) | | | 0 | |
| | 46,998 | | | China Mengniu Dairy Co. Ltd. (China)(b) | | | 135,625 | |
| | 45,989 | | | China Modern Dairy Holdings Ltd. (China)(b) | | | 7,031 | |
| | | | | | | | |
Number
of Shares | | | | | Value | |
| | | | Common Stocks & Other Equity Interests
(continued) | |
| | | | Consumer Staples (continued) | |
| | 28,000 | | | China Resources Beer Holdings Co. Ltd. (China) | | $ | 119,150 | |
| | 68,000 | | | China Shengmu Organic Milk Ltd.
(China)(b)(c) | | | 3,379 | |
| | 35,500 | | | Dali Foods Group Co. Ltd. (China)(c) | | | 25,781 | |
| | 3,000 | | | Health and Happiness H&H International Holdings Ltd. (China)(b) | | | 19,015 | |
| | 12,501 | | | Hengan International Group Co. Ltd. (China) | | | 112,525 | |
| | 37,999 | | | Sun Art Retail Group Ltd. (Hong Kong) | | | 43,814 | |
| | 24,000 | | | Tibet Water Resources Ltd. (Hong Kong)(b) | | | 7,247 | |
| | 31,999 | | | Tingyi Cayman Islands Holding Corp. (China) | | | 57,158 | |
| | 5,928 | | | Tsingtao Brewery Co. Ltd., H-Shares (China) | | | 28,171 | |
| | 23,000 | | | Uni-President China Holdings Ltd. (China) | | | 22,652 | |
| | 5,000 | | | Vinda International Holdings Ltd. (Hong Kong) | | | 8,371 | |
| | 109,993 | | | Want Want China Holdings Ltd. (China) | | | 89,828 | |
| | 123,000 | | | WH Group Ltd. (Hong Kong)(c) | | | 92,772 | |
| | 10,500 | | | Zhou Hei Ya International Holdings Co. Ltd. (China)(b)(c) | | | 6,287 | |
| | | | | | | | |
| | | | | | | 803,634 | |
| | | | | | | | |
| | | | Energy—6.6% | |
| | 35,993 | | | China Coal Energy Co. Ltd., H-Shares (China) | | | 15,316 | |
| | 31,999 | | | China Oilfield Services Ltd., H-Shares (China) | | | 28,375 | |
| | 447,183 | | | China Petroleum & Chemical Corp. (Sinopec), H-Shares (China) | | | 449,525 | |
| | 58,996 | | | China Shenhua Energy Co. Ltd., H-Shares (China) | | | 131,538 | |
| | 282,990 | | | CNOOC Ltd. (China) | | | 500,440 | |
| | 59,994 | | | Kunlun Energy Co. Ltd. (China) | | | 62,678 | |
| | 371,986 | | | PetroChina Co. Ltd., H-Shares (China) | | | 276,777 | |
| | 18,000 | | | Sinopec Kantons Holdings Ltd. (China) | | | 8,027 | |
| | 31,999 | | | Yanzhou Coal Mining Co. Ltd., H-Shares (China) | | | 36,977 | |
| | | | | | | | |
| | | | | | | 1,509,653 | |
| | | | | | | | |
| | | | Financials—26.8% | |
| | 465,982 | | | Agricultural Bank of China Ltd., H-Shares (China) | | | 225,602 | |
| | 1,332,466 | | | Bank of China Ltd., H-Shares (China) | | | 599,269 | |
| | 373,993 | | | Bank of Communications Co. Ltd., H-Shares (China) | | | 270,170 | |
| | 20,000 | | | Central China Securities Co. Ltd., H-Shares (China) | | | 5,122 | |
| | 153,000 | | | China Cinda Asset Management Co. Ltd., H-Shares (China) | | | 39,571 | |
| | 202,993 | | | China CITIC Bank Corp. Ltd., H-Shares (China) | | | 126,727 | |
| | 1,395,219 | | | China Construction Bank Corp., H-Shares (China) | | | 1,235,431 | |
| | 14,000 | | | China Everbright Ltd. (China) | | | 24,508 | |
| | 61,000 | | | China Galaxy Securities Co. Ltd., H-Shares (China) | | | 29,844 | |
| | 192,000 | | | China Huarong Asset Management Co. Ltd., H-Shares (China)(c) | | | 39,873 | |
| | 16,400 | | | China International Capital Corp. Ltd., H-Shares (China)(c) | | | 30,005 | |
| | 129,995 | | | China Life Insurance Co. Ltd., H-Shares (China) | | | 293,813 | |
| | 66,493 | | | China Merchants Bank Co. Ltd., H-Shares (China) | | | 254,996 | |
| | 14,800 | | | China Merchants Securities Co. Ltd., H-Shares (China)(c) | | | 17,140 | |
See accompanying Notes to Financial Statements which are an integral part of the financial statements.
Invesco China All-Cap ETF (YAO) (continued)
August 31, 2018
| | | | | | | | |
Number
of Shares | | | | | Value | |
| | | | Common Stocks & Other Equity Interests
(continued) | |
| | | | Financials (continued) | |
| | 131,388 | | | China Minsheng Banking Corp. Ltd., H-Shares (China) | | $ | 94,077 | |
| | 170,000 | | | China Minsheng Financial Holding Corp. Ltd. (Hong Kong)(b) | | | 8,664 | |
| | 48,600 | | | China Pacific Insurance (Group) Co. Ltd., H-Shares (China) | | | 181,115 | |
| | 105,000 | | | China Reinsurance Group Corp., H-Shares (China) | | | 20,735 | |
| | 25,200 | | | China Taiping Insurance Holdings Co. Ltd. (China) | | | 79,945 | |
| | 266,515 | | | Chong Sing Holdings Fintech GR (China)(b) | | | 18,676 | |
| | 43,994 | | | Chongqing Rural Commercial Bank Co. Ltd., H-Shares (China) | | | 23,710 | |
| | 40,001 | | | CITIC Securities Co. Ltd., H-Shares (China) | | | 71,655 | |
| | 13,500 | | | CSC Financial Co. Ltd., H-Shares (China)(b)(c) | | | 8,187 | |
| | 12,200 | | | Everbright Securities Co. Ltd., H-Shares (China)(c) | | | 11,891 | |
| | 716 | | | Fanhua, Inc. ADR (China) | | | 16,668 | |
| | 38,000 | | | Far East Horizon Ltd. (China) | | | 35,972 | |
| | 25,272 | | | GF Securities Co. Ltd., H-Shares (China) | | | 31,715 | |
| | 55,000 | | | Guotai Junan International Holdings Ltd. (China) | | | 10,231 | |
| | 10,800 | | | Guotai Junan Securities Co. Ltd., H-Shares (China)(c) | | | 22,291 | |
| | 55,200 | | | Haitong Securities Co. Ltd., H-Shares (China) | | | 48,808 | |
| | 27,927 | | | Huatai Securities Co. Ltd., H-Shares (China)(b)(c) | | | 41,843 | |
| | 18,700 | | | Huishang Bank Corp. Ltd., H-Shares (China) | | | 8,100 | |
| | 1,368,126 | | | Industrial & Commercial Bank of China Ltd., H-Shares (China) | | | 1,007,500 | |
| | 12,600 | | | New China Life Insurance Co. Ltd., H-Shares (China) | | | 57,069 | |
| | 423 | | | Noah Holdings Ltd. ADR (China)(b) | | | 19,898 | |
| | 14,000 | | | Orient Securities Co. Ltd., H-Shares (China)(c) | | | 9,436 | |
| | 121,000 | | | People’s Insurance Co. Group of China Ltd. (The), H-Shares (China) | | | 52,415 | |
| | 119,992 | | | PICC Property & Casualty Co. Ltd., H-Shares (China) | | | 135,144 | |
| | 88,652 | | | Ping An Insurance Group Co. of China Ltd., H-Shares (China) | | | 853,889 | |
| | 69,000 | | | Postal Savings Bank of China Co. Ltd., H-Shares (China)(c) | | | 40,615 | |
| | 10,318 | | | Shengjing Bank Co. Ltd., H-Shares (China)(c) | | | 5,390 | |
| | | | | | | | |
| | | | | | | 6,107,710 | |
| | | | | | | | |
| | | | Health Care—4.7% | |
| | 19,954 | | | 3SBio, Inc. (China)(c) | | | 38,083 | |
| | 860 | | | BeiGene Ltd. ADR (China)(b) | | | 152,676 | |
| | 36,000 | | | China Animal Healthcare Ltd.
(China)(b)(e) | | | 0 | |
| | 387 | | | China Biologic Products Holdings, Inc. (China)(b) | | | 34,699 | |
| | 23,495 | | | China Medical System Holdings Ltd. (China) | | | 38,914 | |
| | 28,000 | | | China Resources Pharmaceutical Group Ltd. (China)(c) | | | 44,806 | |
| | 9,500 | | | China Resources Phoenix Healthcare Holdings Co. Ltd. (China) | | | 8,799 | |
| | 78,000 | | | CSPC Pharmaceutical Group Ltd. (China) | | | 196,767 | |
| | 12,136 | | | Genertec Universal Medical Group Co. Ltd. (China)(c) | | | 9,648 | |
| | | | | | | | |
Number
of Shares | | | | | Value | |
| | | | Common Stocks & Other Equity Interests
(continued) | |
| | | | Health Care (continued) | |
| | 16,000 | | | Genscript Biotech Corp. (China)(b) | | $ | 34,451 | |
| | 3,827 | | | Guangzhou Baiyunshan Pharmaceutical Holdings Co. Ltd., H-Shares (China) | | | 14,091 | |
| | 91,200 | | | Hua Han Health Industry Holdings Ltd. (Hong Kong)(b)(e) | | | 0 | |
| | 2,080 | | | Livzon Pharmaceutical Group, Inc., H-Shares (China) | | | 8,401 | |
| | 30,500 | | | Luye Pharma Group Ltd. (China)(c) | | | 28,717 | |
| | 8,000 | | | Microport Scientific Corp. (China) | | | 10,101 | |
| | 40,001 | | | Shandong Weigao Group Medical Polymer Co. Ltd., H-Shares (China) | | | 37,866 | |
| | 8,000 | | | Shanghai Fosun Pharmaceutical Group Co. Ltd., H-Shares (China) | | | 32,310 | |
| | 14,500 | | | Shanghai Pharmaceuticals Holding Co. Ltd., H-Shares (China) | | | 38,056 | |
| | 82,000 | | | Sihuan Pharmaceutical Holdings Group Ltd. (China) | | | 18,178 | |
| | 111,988 | | | Sino Biopharmaceutical Ltd. (China) | | | 141,824 | |
| | 20,801 | | | Sinopharm Group Co. Ltd., H-Shares (China) | | | 103,490 | |
| | 32,000 | | | SSY Group Ltd. (Hong Kong) | | | 29,762 | |
| | 10,000 | | | Tong Ren Tang Technologies Co. Ltd., H-Shares (China) | | | 14,499 | |
| | 4,000 | | | Wuxi Biologics Cayman, Inc. (China)(b)(c) | | | 39,496 | |
| | | | | | | | |
| | | | | | | 1,075,634 | |
| | | | | | | | |
| | | | Industrials—6.4% | |
| | 395 | | | 51job, Inc. ADR (China)(b) | | | 30,538 | |
| | 33,999 | | | Air China Ltd., H-Shares (China) | | | 31,881 | |
| | 46,999 | | | AviChina Industry & Technology Co. Ltd., H-Shares (China) | | | 27,245 | |
| | 26,000 | | | Beijing Capital International Airport Co. Ltd., H-Shares (China) | | | 27,693 | |
| | 13,818 | | | CAR, Inc. (China)(b) | | | 11,091 | |
| | 76,993 | | | China Communications Construction Co. Ltd., H-Shares (China) | | | 76,415 | |
| | 31,500 | | | China Conch Venture Holdings Ltd. (China) | | | 108,359 | |
| | 28,000 | | | China Eastern Airlines Corp. Ltd., H-Shares (China) | | | 17,908 | |
| | 108,000 | | | China Energy Engineering Corp. Ltd., H-Shares (China) | | | 13,210 | |
| | 45,999 | | | China Everbright International Ltd. (China) | | | 38,738 | |
| | 17,036 | | | China Everbright International Ltd. (China) Rts. expiring 09/13/18(b) | | | 1,324 | |
| | 7,000 | | | China High Speed Transmission Equipment Group Co. Ltd. (Hong Kong) | | | 7,786 | |
| | 7,300 | | | China International Marine Containers Group Co. Ltd., H-Shares (China) | | | 7,766 | |
| | 17,000 | | | China Lesso Group Holdings Ltd. (China) | | | 9,812 | |
| | 13,000 | | | China Machinery Engineering Corp., H-Shares (China) | | | 6,327 | |
| | 21,320 | | | China Merchants Port Holdings Co. Ltd. (China) | | | 43,515 | |
| | 33,499 | | | China Railway Construction Corp. Ltd., H-Shares (China) | | | 40,503 | |
| | 66,993 | | | China Railway Group Ltd., H-Shares (China) | | | 57,870 | |
| | 34,000 | | | China Southern Airlines Co. Ltd., H-Shares (China) | | | 22,482 | |
| | 31,999 | | | China State Construction International Holdings Ltd. (China) | | | 33,308 | |
See accompanying Notes to Financial Statements which are an integral part of the financial statements.
Invesco China All-Cap ETF (YAO) (continued)
August 31, 2018
| | | | | | | | |
Number
of Shares | | | | | Value | |
| | | | Common Stocks & Other Equity Interests
(continued) | |
| | | | Industrials (continued) | |
| | 111,000 | | | CITIC Ltd. (China) | | $ | 157,826 | |
| | 65,990 | | | COSCO SHIPPING Development Co. Ltd., H-Shares (China)(b) | | | 9,585 | |
| | 22,000 | | | COSCO SHIPPING Energy Transportation Co. Ltd., H-Shares (China) | | | 9,614 | |
| | 45,000 | | | COSCO SHIPPING Holdings Co. Ltd., H-Shares (China)(b) | | | 18,748 | |
| | 30,000 | | | COSCO SHIPPING Ports Ltd. (China) | | | 31,762 | |
| | 71,000 | | | CRRC Corp. Ltd., H-Shares (China) | | | 58,798 | |
| | 119,384 | | | Fullshare Holdings Ltd. (Hong Kong)(b)(d) | | | 47,760 | |
| | 20,000 | | | Greentown Service Group Co. Ltd. (China) | | | 15,798 | |
| | 24,000 | | | Guangshen Railway Co. Ltd., H-Shares (China) | | | 10,488 | |
| | 11,000 | | | Haitian International Holdings Ltd. (China) | | | 22,087 | |
| | 22,000 | | | Jiangsu Expressway Co. Ltd., H-Shares (China) | | | 27,805 | |
| | 32,000 | | | Lonking Holdings Ltd. (China) | | | 11,008 | |
| | 49,000 | | | Metallurgical Corp. of China Ltd., H-Shares (China) | | | 13,422 | |
| | 19,000 | | | Qingdao Port International Co. Ltd., H-Shares (China)(b)(c) | | | 14,403 | |
| | 45,998 | | | Shanghai Electric Group Co. Ltd., H-Shares (China) | | | 14,417 | |
| | 8,000 | | | Shanghai Industrial Holdings Ltd. (China) | | | 19,060 | |
| | 12,000 | | | Shenzhen Expressway Co. Ltd., H-Shares (China) | | | 11,635 | |
| | 16,407 | | | Shenzhen International Holdings Ltd. (China) | | | 30,770 | |
| | 20,500 | | | Sinopec Engineering Group Co. Ltd., H-Shares (China) | | | 21,365 | |
| | 37,000 | | | Sinotrans Ltd., H-Shares (China) | | | 15,509 | |
| | 11,500 | | | Sinotruk Hong Kong Ltd. (China) | | | 17,172 | |
| | 22,000 | | | SITC International Holdings Co. Ltd. (China) | | | 16,425 | |
| | 33,600 | | | Weichai Power Co. Ltd., H-Shares (China) | | | 35,617 | |
| | 11,280 | | | Xinjiang Goldwind Science & Technology Co. Ltd., H-Shares (China) | | | 12,072 | |
| | 38,700 | | | Yangzijiang Shipbuilding Holdings Ltd. (China) | | | 30,225 | |
| | 25,999 | | | Zhejiang Expressway Co. Ltd. H-Shares (China) | | | 20,637 | |
| | 9,500 | | | Zhuzhou CRRC Times Electric Co. Ltd., H-Shares (China) | | | 51,259 | |
| | 22,599 | | | Zoomlion Heavy Industry Science and Technology Co. Ltd., H-Shares (China) | | | 8,292 | |
| | 4,633 | | | ZTO Express Cayman, Inc. ADR (China) | | | 85,525 | |
| | | | | | | | |
| | | | | | | 1,452,855 | |
| | | | | | | | |
| | | | Information Technology—21.8% | |
| | 1,582 | | | 58.com, Inc., Class A ADR (China)(b) | | | 120,359 | |
| | 12,982 | | | AAC Technologies Holdings, Inc. (China) | | | 143,897 | |
| | 48,000 | | | AGTech Holdings Ltd. (Hong Kong)(b) | | | 3,914 | |
| | 6,819 | | | Alibaba Group Holding Ltd. ADR
(China)(b) | | | 1,193,393 | |
| | 966 | | | Autohome, Inc., Class A ADR (China) | | | 79,801 | |
| | 4,848 | | | Baidu, Inc. ADR (China)(b) | | | 1,097,975 | |
| | 508 | | | Baozun, Inc. ADR (China)(b)(d) | | | 27,122 | |
| | 707 | | | Bitauto Holdings Ltd. ADR (China)(b)(d) | | | 16,763 | |
| | 11,000 | | | BYD Electronic International Co. Ltd. (China) | | | 11,562 | |
| | 273 | | | Changyou.com Ltd., Class A ADR (China) | | | 3,683 | |
| | 25,077 | | | China Railway Signal & Communication Corp. Ltd., H-Shares (China)(c) | | | 17,732 | |
| | 38,000 | | | Chinasoft International Ltd. (China)(b) | | | 27,112 | |
| | 18,000 | | | Digital China Holdings Ltd. (Hong Kong)(b) | | | 9,403 | |
| | | | | | | | |
Number
of Shares | | | | | Value | |
| | | | Common Stocks & Other Equity Interests
(continued) | |
| | | | Information Technology (continued) | |
| | 3,131 | | | Fang Holdings Ltd. ADR (China)(b) | | $ | 9,612 | |
| | 26,000 | | | FIT Hon Teng Ltd. (Taiwan)(c) | | | 13,283 | |
| | 214,995 | | | GCL-Poly Energy Holdings Ltd. (China)(b) | | | 14,518 | |
| | 850 | | | Hollysys Automation Technologies Ltd. (China) | | | 18,445 | |
| | 6,000 | | | Hua Hong Semiconductor Ltd. (China)(c) | | | 16,359 | |
| | 385 | | | JinkoSolar Holding Co. Ltd. ADR
(China)(b)(d) | | | 5,055 | |
| | 11,800 | | | Kingboard Holdings Ltd. (China) | | | 41,945 | |
| | 15,000 | | | Kingboard Laminates Holdings Ltd. (Hong Kong) | | | 14,161 | |
| | 36,000 | | | Kingdee International Software Group Co. Ltd. (China) | | | 41,004 | |
| | 19,000 | | | Kingsoft Corp. Ltd. (China) | | | 34,519 | |
| | 9,550 | | | Legend Holdings Corp., H-Shares (China)(c) | | | 29,567 | |
| | 113,995 | | | Lenovo Group Ltd. (China) | | | 74,361 | |
| | 27,500 | | | Meitu, Inc. (China)(b)(c) | | | 14,891 | |
| | 1,127 | | | Momo, Inc., Class A ADR (China)(b) | | | 52,169 | |
| | 3,500 | | | NetDragon Websoft Holdings Ltd. (Hong Kong) | | | 7,331 | |
| | 1,289 | | | NetEase, Inc. ADR (China) | | | 254,848 | |
| | 58,692 | | | Semiconductor Manufacturing International Corp. (China)(b) | | | 69,244 | |
| | 1,033 | | | SINA Corp. (China)(b) | | | 73,302 | |
| | 536 | | | Sohu.com Ltd. ADR (China)(b) | | | 11,444 | |
| | 11,870 | | | Sunny Optical Technology Group Co. Ltd. (China) | | | 150,853 | |
| | 23,642 | | | Tencent Holdings Ltd. (China) | | | 1,024,128 | |
| | 16,000 | | | TravelSky Technology Ltd., H-Shares (China) | | | 40,974 | |
| | 908 | | | Weibo Corp., Class A ADR (China)(b) | | | 69,680 | |
| | 78,000 | | | Xinyi Solar Holdings Ltd. (China) | | | 23,254 | |
| | 3,000 | | | Yangtze Optical Fibre and Cable Joint Stock Ltd. Co., H-Shares (China)(b)(c) | | | 10,186 | |
| | 790 | | | YY, Inc., Class A ADR (China)(b) | | | 60,380 | |
| | 13,248 | | | ZTE Corp. H-Shares (China)(b) | | | 25,723 | |
| | | | | | | | |
| | | | | | | 4,953,952 | |
| | | | | | | | |
| | | | Materials—2.6% | |
| | 67,994 | | | Aluminum Corp. of China Ltd., H-Shares (China)(b) | | | 28,761 | |
| | 20,000 | | | Angang Steel Co. Ltd., H-Shares (China) | | | 19,672 | |
| | 20,500 | | | Anhui Conch Cement Co. Ltd., H-Shares (China) | | | 124,846 | |
| | 41,000 | | | BBMG Corp., H-Shares (China) | | | 15,253 | |
| | 579,031 | | | Beijing Enterprises Clean Energy Group Ltd. (China)(b) | | | 11,582 | |
| | 27,999 | | | China BlueChemical Ltd., H-Shares (China) | | | 9,774 | |
| | 63,000 | | | China Molybdenum Co. Ltd., H-Shares (China) | | | 25,846 | |
| | 65,998 | | | China National Building Material Co. Ltd., H-Shares (China) | | | 61,719 | |
| | 34,000 | | | China Resources Cement Holdings Ltd. (China) | | | 39,679 | |
| | 105,999 | | | China Shanshui Cement Group Ltd. (China)(b)(e) | | | 0 | |
| | 24,799 | | | China Zhongwang Holdings Ltd. (China) | | | 11,627 | |
| | 22,000 | | | Fufeng Group Ltd. (China)(b) | | | 10,427 | |
| | 19,000 | | | Greatview Aseptic Packaging Co. Ltd. (China) | | | 10,167 | |
| | 14,999 | | | Huabao International Holdings Ltd. (Hong Kong) | | | 8,829 | |
| | 20,999 | | | Jiangxi Copper Co. Ltd., H-Shares (China) | | | 24,881 | |
| | 23,999 | | | Lee & Man Paper Manufacturing Ltd. (China) | | | 22,993 | |
| | 30,000 | | | Maanshan Iron & Steel Co. Ltd., H-Shares (China) | | | 15,709 | |
See accompanying Notes to Financial Statements which are an integral part of the financial statements.
Invesco China All-Cap ETF (YAO) (continued)
August 31, 2018
| | | | | | | | |
Number
of Shares | | | | | Value | |
| | | | Common Stocks & Other Equity Interests
(continued) | |
| | | | Materials (continued) | |
| | 36,000 | | | MMG Ltd. (China)(b) | | $ | 18,026 | |
| | 28,999 | | | Nine Dragons Paper Holdings Ltd. (Hong Kong) | | | 32,883 | |
| | 66,000 | | | Shougang Fushan Resources Group Ltd. (China) | | | 14,715 | |
| | 59,998 | | | Sinopec Shanghai Petrochemical Co. Ltd., H-Shares (China) | | | 35,239 | |
| | 17,500 | | | Zhaojin Mining Industry Co. Ltd., H-Shares (China) | | | 13,645 | |
| | 99,992 | | | Zijin Mining Group Co. Ltd., H-Shares (China) | | | 37,327 | |
| | | | | | | | |
| | | | | | | 593,600 | |
| | | | | | | | |
| | | | Real Estate—7.5% | |
| | 26,000 | | | Agile Group Holdings Ltd. (China) | | | 42,467 | |
| | 140,000 | | | Carnival Group International Holdings Ltd. (Hong Kong)(b) | | | 5,797 | |
| | 22,000 | | | China Aoyuan Property Group Ltd. (China) | | | 16,425 | |
| | 59,994 | | | China Evergrande Group (China)(b) | | | 215,168 | |
| | 77,998 | | | China Jinmao Holdings Group Ltd. (China) | | | 36,769 | |
| | 28,000 | | | China Logistics Property Holdings Co. Ltd. (China)(b)(c) | | | 10,524 | |
| | 67,995 | | | China Overseas Land & Investment Ltd. (China) | | | 215,275 | |
| | 47,999 | | | China Resources Land Ltd. (China) | | | 167,256 | |
| | 28,000 | | | China SCE Property Holdings Ltd. (China) | | | 12,557 | |
| | 54,000 | | | China South City Holdings Ltd. (China) | | | 9,494 | |
| | 22,796 | | | China Vanke Co. Ltd., H-Shares (China) | | | 78,998 | |
| | 62,000 | | | CIFI Holdings Group Co. Ltd. (China) | | | 35,941 | |
| | 120,873 | | | Country Garden Holdings Co. Ltd. (China) | | | 179,872 | |
| | 28,000 | | | Future Land Development Holdings Ltd. (China) | | | 21,654 | |
| | 11,000 | | | Greentown China Holdings Ltd. (China) | | | 11,072 | |
| | 17,600 | | | Guangzhou R&F Properties Co. Ltd., H-Shares (China) | | | 35,519 | |
| | 12,000 | | | Hopson Development Holdings Ltd. (China) | | | 11,115 | |
| | 20,000 | | | Jiayuan International Group Ltd. (China) | | | 39,955 | |
| | 66,000 | | | Joy City Property Ltd. (China) | | | 8,072 | |
| | 41,000 | | | Kaisa Group Holdings Ltd. (China)(b) | | | 15,253 | |
| | 23,815 | | | KWG Property Holding Ltd. (China) | | | 25,457 | |
| | 22,000 | | | Logan Property Holdings Co. Ltd. (China) | | | 27,469 | |
| | 24,499 | | | Longfor Properties Co. Ltd. (China) | | | 68,045 | |
| | 31,999 | | | Poly Property Group Co. Ltd. (China) | | | 12,190 | |
| | 24,000 | | | Powerlong Real Estate Holdings Ltd. (China) | | | 12,262 | |
| | 11,837 | | | Red Star Macalline Group Corp. Ltd., H-Shares (China)(c) | | | 12,155 | |
| | 371,930 | | | Renhe Commercial Holdings Co. Ltd. (China)(b) | | | 9,003 | |
| | 10,000 | | | Ronshine China Holdings Ltd. (China)(b) | | | 12,002 | |
| | 53,999 | | | Shenzhen Investment Ltd. (China) | | | 17,681 | |
| | 18,999 | | | Shimao Property Holdings Ltd. (China) | | | 56,642 | |
| | 58,493 | | | Shui On Land Ltd. (China) | | | 13,936 | |
| | 52,493 | | | Sino-Ocean Group Holding Ltd. (China) | | | 26,685 | |
| | 32,499 | | | SOHO China Ltd. (China) | | | 13,043 | |
| | 38,000 | | | Sunac China Holdings Ltd. (China) | | | 124,425 | |
| | 10,000 | | | Times China Holdings Ltd. (China) | | | 11,861 | |
| | 11,500 | | | Yanlord Land Group Ltd. (China) | | | 12,759 | |
| | 105,992 | | | Yuexiu Property Co. Ltd. (China) | | | 19,176 | |
| | 27,000 | | | Yuzhou Properties Co. Ltd. (China) | | | 14,345 | |
| | 53,000 | | | Zall Smart Commerce Group Ltd. (China) | | | 44,904 | |
| | | | | | | | |
| | | | | | | 1,703,223 | |
| | | | | | | | |
| | | | | | | | |
Number
of Shares | | | | | Value | |
| | | | Common Stocks & Other Equity Interests
(continued) | |
| | | | Telecommunication Services—5.2% | |
| | 41,993 | | | China Communications Services Corp. Ltd., H-Shares (China) | | $ | 34,776 | |
| | 96,951 | | | China Mobile Ltd. (China) | | | 911,590 | |
| | 243,981 | | | China Telecom Corp. Ltd., H-Shares (China) | | | 114,703 | |
| | 107,995 | | | China Unicom Hong Kong Ltd. (China) | | | 125,622 | |
| | | | | | | | |
| | | | | | | 1,186,691 | |
| | | | | | | | |
| | | | Utilities—3.0% | |
| | 8,500 | | | Beijing Enterprises Holdings Ltd. (China) | | | 40,773 | |
| | 91,986 | | | Beijing Enterprises Water Group Ltd. (China)(b) | | | 50,160 | |
| | 42,000 | | | Beijing Jingneng Clean Energy Co. Ltd., H-Shares (China) | | | 8,936 | |
| | 178,271 | | | CGN Power Co. Ltd., H-Shares (China)(c) | | | 42,246 | |
| | 39,999 | | | China Gas Holdings Ltd. (Hong Kong) | | | 127,148 | |
| | 53,998 | | | China Longyuan Power Group Corp., H-Shares (China) | | | 45,475 | |
| | 74,999 | | | China Power International Development Ltd. (China) | | | 16,340 | |
| | 14,000 | | | China Resources Gas Group Ltd. (China) | | | 63,767 | |
| | 31,999 | | | China Resources Power Holdings Co. Ltd. (China) | | | 57,647 | |
| | 16,000 | | | China Water Affairs Group Ltd. (Hong Kong) | | | 18,326 | |
| | 50,000 | | | CT Environmental Group Ltd. (China) | | | 6,498 | |
| | 47,996 | | | Datang International Power Generation Co. Ltd., H-Shares (China) | | | 12,291 | |
| | 49,998 | | | Guangdong Investment Ltd. (China) | | | 88,671 | |
| | 44,000 | | | Huadian Fuxin Energy Corp. Ltd., H-Shares (China) | | | 9,082 | |
| | 28,000 | | | Huadian Power International Corp. Ltd., H-Shares (China) | | | 10,417 | |
| | 73,994 | | | Huaneng Power International, Inc., H-Shares (China) | | | 47,514 | |
| | 83,456 | | | Huaneng Renewables Corp. Ltd., H-Shares (China) | | | 26,688 | |
| | | | | | | | |
| | | | | | | 671,979 | |
| | | | | | | | |
| | | | Total Common Stocks & Other Equity Interests (Cost $20,769,027) | | | 22,727,295 | |
| | | | | | | | |
| | |
| | | | | | | | |
| | | | Money Market Fund—0.1% | |
| | 23,274 | | | Invesco Premier U.S. Government Money Portfolio—Institutional Class, 1.83%(f)
(Cost $23,274) | | | 23,274 | |
| | | | | | | | |
| | | | Total Investments in Securities
(excluding investments purchased with cash collateral from securities on loan)
(Cost $20,792,301)—99.9% | | | 22,750,569 | |
| | | | | | | | |
| | |
| | | | | | | | |
| | | | Investments Purchased with Cash Collateral from
Securities on Loan | |
| | |
| | | | | | | | |
| | | | Money Market Fund—0.5% | |
| | 111,189 | | | Invesco Government & Agency Portfolio—Institutional Class, 1.85%(f)(g)
(Cost $111,189) | | | 111,189 | |
| | | | | | | | |
| | | | Total Investments in Securities
(Cost $20,903,490)—100.4% | | | 22,861,758 | |
| | | | Other assets less liabilities—(0.4)% | | | (84,225 | ) |
| | | | | | | | |
| | | | Net Assets—100.0% | | $ | 22,777,533 | |
| | | | | | | | |
See accompanying Notes to Financial Statements which are an integral part of the financial statements.
Invesco China All-Cap ETF (YAO) (continued)
August 31, 2018
Investment Abbreviations:
ADR—American Depositary Receipt
Rts.—Rights
Notes to Schedule of Investments:
| (a) | Industry and/or sector classifications used in this report are generally according to the Global Industry Classification Standard, which was developed by and is the exclusive property and a service mark of MSCI Inc. and Standard & Poor’s. |
| (b) | Non-income producing security. |
| (c) | Security purchased or received in a transaction exempt from registration under the Securities Act of 1933, as amended (the “1933 Act”). The security may be resold pursuant to an exemption from registration under the 1933 Act, typically to qualified institutional buyers. The aggregate value of these securities at August 31, 2018 was $766,854, which represented 3.37% of the Fund’s Net Assets. |
| (d) | All or a portion of this security was out on loan at August 31, 2018. |
| (e) | Security valued using significant unobservable inputs (Level 3). See Note 4. |
| (f) | The security and the Fund are advised by wholly-owned subsidiaries of Invesco Ltd. and are therefore considered to be affiliated. The rate shown is the 7-day SEC standardized yield as of August 31, 2018. |
| (g) | The security has been segregated to satisfy the commitment to return the cash collateral received in securities lending transactions upon the borrower’s return of the securities loaned. See Note 6. |
This Fund has holdings greater than 10% of net assets in the following country:
See accompanying Notes to Financial Statements which are an integral part of the financial statements.
Schedule of Investments(a)
Invesco China Technology ETF (CQQQ)
August 31, 2018
| | | | | | | | |
Number
of Shares | | | | | Value | |
| | | | Common Stocks & Other Equity Interests—100.0% | |
| | | | Communications Equipment—2.6% | |
| | 1,826,176 | | | BYD Electronic International Co. Ltd. (China) | | $ | 1,919,499 | |
| | 4,051,219 | | | China All Access Holdings Ltd. (Hong Kong) | | | 392,275 | |
| | 4,066,825 | | | Comba Telecom Systems Holdings Ltd. (Hong Kong)(b) | | | 647,674 | |
| | 1,043,110 | | | O-NET Technologies Group Ltd. (China)(b) | | | 594,058 | |
| | 1,401,394 | | | Xi’an Haitiantian Holdings Co. Ltd. (China)(b) | | | 535,640 | |
| | 498,776 | | | Yangtze Optical Fibre and Cable Joint Stock Ltd. Co., H-Shares (China)(b)(c) | | | 1,693,534 | |
| | 2,186,712 | | | ZTE Corp. H-Shares (China)(b) | | | 4,245,880 | |
| | | | | | | | |
| | | | | | | 10,028,560 | |
| | | | | | | | |
| | | | Consumer Finance—0.1% | |
| | 29,862 | | | Yirendai Ltd. ADR (China)(d) | | | 541,398 | |
| | | | | | | | |
| | | | Electronic Equipment, Instruments & Components—14.6% | |
| | 1,200,474 | | | AAC Technologies Holdings, Inc. (China) | | | 13,306,481 | |
| | 2,144,054 | | | Anxin-China Holdings Ltd. (China)(b)(e) | | | 0 | |
| | 1,153,289 | | | Camsing International Holding Ltd. (Hong Kong)(b)(d) | | | 999,167 | |
| | 5,536,001 | | | China Aerospace International Holdings Ltd. (China) | | | 458,459 | |
| | 4,103,375 | | | China Railway Signal & Communication Corp. Ltd., H-Shares (China)(c) | | | 2,901,519 | |
| | 24,607,128 | | | China Youzan Ltd. (Hong Kong)(b)(d) | | | 2,414,031 | |
| | 4,483,132 | | | FIT Hon Teng Ltd. (Taiwan)(c) | | | 2,290,430 | |
| | 148,469 | | | Hollysys Automation Technologies Ltd. (China) | | | 3,221,777 | |
| | 2,424,609 | | | Ju Teng International Holdings Ltd. (Hong Kong) | | | 457,188 | |
| | 1,914,058 | | | Kingboard Holdings Ltd. (China) | | | 6,803,784 | |
| | 2,497,090 | | | Kingboard Laminates Holdings Ltd. (Hong Kong) | | | 2,357,456 | |
| | 2,133,993 | | | PAX Global Technology Ltd. (Hong Kong) | | | 1,054,911 | |
| | 1,319,936 | | | Sunny Optical Technology Group Co. Ltd. (China) | | �� | 16,774,786 | |
| | 11,389,382 | | | Tongda Group Holdings Ltd. (Hong Kong) | | | 1,712,275 | |
| | 4,786,614 | | | Truly International Holdings Ltd. (Hong Kong)(b) | | | 768,405 | |
| | 1,250,858 | | | Wasion Holdings Ltd. (China) | | | 631,095 | |
| | | | | | | | |
| | | | | | | 56,151,764 | |
| | | | | | | | |
| | | | Internet Software & Services—58.8% | |
| | 134,163 | | | 21Vianet Group, Inc., Class A ADR (China)(b) | | | 1,308,089 | |
| | 240,358 | | | 58.com, Inc., Class A ADR (China)(b) | | | 18,286,437 | |
| | 208,781 | | | Alibaba Group Holding Ltd. ADR (China)(b) | | | 36,538,763 | |
| | 159,668 | | | Autohome, Inc., Class A ADR (China) | | | 13,190,174 | |
| | 145,096 | | | Baidu, Inc. ADR (China)(b) | | | 32,861,342 | |
| | 84,551 | | | Baozun, Inc. ADR (China)(b)(d) | | | 4,514,178 | |
| | 113,706 | | | Bitauto Holdings Ltd. ADR
(China)(b)(d) | | | 2,695,969 | |
| | 520,708 | | | Fang Holdings Ltd. ADR (China)(b) | | | 1,598,574 | |
| | 1,655,309 | | | HC Group, Inc. (China) | | | 1,162,042 | |
| | 189,121 | | | Momo, Inc., Class A ADR (China)(b) | | | 8,754,411 | |
| | 131,876 | | | NetEase, Inc. ADR (China) | | | 26,073,204 | |
| | 88,905 | | | Phoenix New Media Ltd. ADR
(China)(b) | | | 455,194 | |
| | 171,628 | | | SINA Corp. (China)(b) | | | 12,178,723 | |
| | 88,981 | | | Sohu.com Ltd. ADR (China)(b) | | | 1,899,744 | |
| | 1,749,566 | | | SUNeVision Holdings Ltd. (Hong Kong) | | | 1,415,452 | |
| | 911,876 | | | Tencent Holdings Ltd. (China) | | | 39,500,801 | |
| | | | | | | | |
Number
of Shares | | | | | Value | |
| | | | Common Stocks & Other Equity Interests
(continued) | |
| | | | Internet Software & Services (continued) | |
| | 1,680,087 | | | Tian Ge Interactive Holdings Ltd. (China)(c) | | $ | 1,115,220 | |
| | 151,008 | | | Weibo Corp., Class A ADR (China)(b) | | | 11,588,354 | |
| | 98,496 | | | Xunlei Ltd. ADR (China)(b)(d) | | | 937,682 | |
| | 131,353 | | | YY, Inc., Class A ADR (China)(b) | | | 10,039,310 | |
| | | | | | | | |
| | | | | | | 226,113,663 | |
| | | | | | | | |
| | | | IT Services—5.5% | |
| | 8,804,124 | | | AGTech Holdings Ltd. (Hong Kong)(b) | | | 717,889 | |
| | 6,259,909 | | | Chinasoft International Ltd. (China)(b) | | | 4,466,293 | |
| | 2,961,726 | | | Digital China Holdings Ltd. (Hong Kong)(b) | | | 1,547,106 | |
| | 166,561 | | | GDS Holdings Ltd. ADR (China)(b)(d) | | | 6,357,633 | |
| | 14,175,756 | | | Green Leader Holdings Group Ltd. (Hong Kong)(b) | | | 121,008 | |
| | 5,305,909 | | | Hi Sun Technology China Ltd. (Hong Kong)(b) | | | 790,928 | |
| | 2,699,161 | | | TravelSky Technology Ltd., H-Shares (China) | | | 6,912,196 | |
| | 7,721,573 | | | Vision Values Holdings Ltd. (Hong Kong)(b) | | | 403,349 | |
| | | | | | | | |
| | | | | | | 21,316,402 | |
| | | | | | | | |
| | | | Real Estate Management & Development—0.5% | |
| | 4,586,872 | | | Landing International Development Ltd. (Hong Kong)(b) | | | 1,852,538 | |
| | | | | | | | |
| | | | Semiconductors & Semiconductor Equipment—8.1% | |
| | 714,625 | | | ASM Pacific Technology Ltd. (Hong Kong) | | | 7,538,757 | |
| | 2,408,868 | | | China Electronics Huada Technology Co. Ltd. (China) | | | 242,455 | |
| | 26,064 | | | Daqo New Energy Corp. ADR
(China)(b) | | | 929,703 | |
| | 35,517,729 | | | GCL-Poly Energy Holdings Ltd.
(China)(b) | | | 2,398,348 | |
| | 1,023,108 | | | Hua Hong Semiconductor Ltd.
(China)(c) | | | 2,789,501 | |
| | 75,916 | | | JinkoSolar Holding Co. Ltd. ADR (China)(b)(d) | | | 996,777 | |
| | 9,845,840 | | | Semiconductor Manufacturing International Corp. (China)(b)(d) | | | 11,615,956 | |
| | 823,668 | | | Shanghai Fudan Microelectronics Group Co. Ltd., H-Shares (China)(b) | | | 841,623 | |
| | 12,682,245 | | | Xinyi Solar Holdings Ltd. (China) | | | 3,780,970 | |
| | | | | | | | |
| | | | | | | 31,134,090 | |
| | | | | | | | |
| | | | Software—4.6% | |
| | 1,438,993 | | | Boyaa Interactive International Ltd. (China)(b) | | | 363,007 | |
| | 45,437 | | | Changyou.com Ltd., Class A ADR (China) | | | 612,945 | |
| | 103,451 | | | Cheetah Mobile, Inc., Class A ADR (China)(b)(d) | | | 1,034,510 | |
| | 5,969,057 | | | Kingdee International Software Group Co. Ltd. (China) | | | 6,798,834 | |
| | 3,099,887 | | | Kingsoft Corp. Ltd. (China) | | | 5,631,922 | |
| | 3,466,682 | | | Leyou Technologies Holdings Ltd. (China)(b) | | | 1,236,697 | |
| | 282,887 | | | Link Motion, Inc. ADR (China)(b)(d) | | | 264,839 | |
| | 534,446 | | | National Agricultural Holdings Ltd. (China)(b)(e) | | | 0 | |
| | 602,123 | | | NetDragon Websoft Holdings Ltd. (Hong Kong) | | | 1,261,183 | |
| | 10,324,178 | | | Rentian Technology Holdings Ltd. (Hong Kong)(b) | | | 420,917 | |
| | | | | | | | |
| | | | | | | 17,624,854 | |
| | | | | | | | |
See accompanying Notes to Financial Statements which are an integral part of the financial statements.
Invesco China Technology ETF (CQQQ) (continued)
August 31, 2018
| | | | | | | | |
Number
of Shares | | | | | Value | |
| | | | Common Stocks & Other Equity Interests
(continued) | |
| | | | Specialty Retail—0.0% | |
| | 54,902 | | | Renren, Inc., Class A ADR (China)(d) | | $ | 94,980 | |
| | | | | | | | |
| | | | Technology Hardware, Storage & Peripherals—5.2% | |
| | 1,977,868 | | | Coolpad Group Ltd. (China)(b)(e) | | | 0 | |
| | 1,581,515 | | | Legend Holdings Corp., H-Shares (China)(c) | | | 4,896,331 | |
| | 19,120,534 | | | Lenovo Group Ltd. (China) | | | 12,472,720 | |
| | 4,582,093 | | | Meitu, Inc. (China)(b)(c) | | | 2,481,099 | |
| | | | | | | | |
| | | | | | | 19,850,150 | |
| | | | | | | | |
| | | | Total Common Stocks & Other Equity Interests
(Cost $450,726,318) | | | 384,708,399 | |
| | | | | | | | |
| | |
| | | | | | | | |
| | | | Money Market Fund—0.0% | |
| | 67,535 | | | Invesco Premier U.S. Government Money Portfolio—Institutional Class, 1.83%(f)
(Cost $67,535) | | | 67,535 | |
| | | | | | | | |
| | | | Total Investments in Securities
(excluding investments purchased with cash collateral from securities on loan)
(Cost $450,793,853)—100.0% | | | 384,775,934 | |
| | | | | | | | |
| | |
| | | | | | | | |
| | | | Investments Purchased with Cash Collateral from
Securities on Loan | |
| | |
| | | | | | | | |
| | | | Money Market Fund—5.9% | |
| | 22,464,958 | | | Invesco Government & Agency Portfolio—Institutional Class, 1.85%(f)(g)
(Cost $22,464,958) | | | 22,464,958 | |
| | | | | | | | |
| | | | Total Investments in Securities
(Cost $473,258,811)—105.9% | | | 407,240,892 | |
| | | | Other assets less liabilities—(5.9)% | | | (22,552,214 | ) |
| | | | | | | | |
| | | | Net Assets-100.0% | | $ | 384,688,678 | |
| | | | | | | | |
Investment Abbreviations:
ADR—American Depositary Receipt
Notes to Schedule of Investments:
| (a) | Industry and/or sector classifications used in this report are generally according to the Global Industry Classification Standard, which was developed by and is the exclusive property and a service mark of MSCI Inc. and Standard & Poor’s. |
| (b) | Non-income producing security. |
| (c) | Security purchased or received in a transaction exempt from registration under the Securities Act of 1933, as amended (the “1933 Act”). The security may be resold pursuant to an exemption from registration under the 1933 Act, typically to qualified institutional buyers. The aggregate value of these securities at August 31, 2018 was $18,167,634, which represented 4.72% of the Fund’s Net Assets. |
| (d) | All or a portion of this security was out on loan at August 31, 2018. |
| (e) | Security valued using significant unobservable inputs (Level 3). See Note 4. |
| (f) | The security and the Fund are advised by wholly-owned subsidiaries of Invesco Ltd. and are therefore considered to be affiliated. The rate shown is the 7-day SEC standardized yield as of August 31, 2018. |
| (g) | The security has been segregated to satisfy the commitment to return the cash collateral received in securities lending transactions upon the borrower’s return of the securities loaned. See Note 6. |
This Fund has holdings greater than 10% of net assets in the following country:
See accompanying Notes to Financial Statements which are an integral part of the financial statements.
Schedule of Investments
Invesco S&P Global Water Index ETF (CGW)
August 31, 2018
| | | | | | | | |
Number
of Shares | | | | | Value | |
| | | | Common Stocks & Other Equity Interests—99.5% | |
| | | | Austria—1.9% | |
| | 187,252 | | | ANDRITZ AG | | $ | 11,111,249 | |
| | | | | | | | |
| | | | Brazil—1.2% | |
| | 1,178,996 | | | Cia de Saneamento Basico do Estado de Sao Paulo ADR | | | 7,085,766 | |
| | | | | | | | |
| | | | Canada—2.6% | |
| | 1,493,596 | | | Algonquin Power & Utilities Corp. | | | 15,486,344 | |
| | | | | | | | |
| | | | China—4.6% | |
| | 17,861,299 | | | Beijing Enterprises Water Group Ltd.(a) | | | 9,739,754 | |
| | 9,923,756 | | | Guangdong Investment Ltd. | | | 17,599,751 | |
| | | | | | | | |
| | | | | | | 27,339,505 | |
| | | | | | | | |
| | | | France—7.9% | |
| | 1,462,336 | | | Suez | | | 21,191,278 | |
| | 1,236,372 | | | Veolia Environnement SA | | | 26,123,493 | |
| | | | | | | | |
| | | | | | | 47,314,771 | |
| | | | | | | | |
| | | | Hong Kong—0.6% | |
| | 3,053,656 | | | China Water Affairs Group Ltd. | | | 3,497,607 | |
| | | | | | | | |
| | | | Italy—1.7% | | | |
| | 154,564 | | | ACEA SpA | | | 2,208,376 | |
| | 2,517,939 | | | Hera SpA | | | 7,915,836 | |
| | | | | | | | |
| | | | | | | 10,124,212 | |
| | | | | | | | |
| | | | Japan—3.0% | |
| | 250,681 | | | Ebara Corp. | | | 8,590,772 | |
| | 280,045 | | | Kurita Water Industries Ltd. | | | 8,334,297 | |
| | 28,899 | | | METAWATER Co. Ltd. | | | 780,561 | |
| | | | | | | | |
| | | | | | | 17,705,630 | |
| | | | | | | | |
| | | | Netherlands—2.6% | |
| | 254,729 | | | Aalberts Industries NV | | | 10,948,170 | |
| | 250,278 | | | Arcadis NV | | | 4,449,511 | |
| | | | | | | | |
| | | | | | | 15,397,681 | |
| | | | | | | | |
| | | | Singapore—0.1% | |
| | 3,152,967 | | | SIIC Enviornment Holdings Ltd. | | | 724,926 | |
| | | | | | | | |
| | | | South Korea—2.0% | | | |
| | 144,614 | | | Coway Co. Ltd. | | | 11,874,159 | |
| | | | | | | | |
| | | | Sweden—3.6% | | | |
| | 793,406 | | | Alfa Laval AB | | | 21,284,395 | |
| | | | | | | | |
| | | | Switzerland—5.1% | | | |
| | 66,803 | | | Geberit AG | | | 30,448,519 | |
| | | | | | | | |
| | | | United Kingdom—18.0% | | | |
| | 1,000,549 | | | Halma PLC | | | 18,622,632 | |
| | 413,521 | | | nVent Electric PLC | | | 11,615,805 | |
| | 1,436,681 | | | Pennon Group PLC | | | 14,352,263 | |
| | 413,521 | | | Pentair PLC | | | 17,979,893 | |
| | 828,565 | | | Severn Trent PLC | | | 21,549,309 | |
| | 2,352,386 | | | United Utilities Group PLC | | | 22,674,513 | |
| | | | | | | | |
| | | | | | | 106,794,415 | |
| | | | | | | | |
| | | | United States—44.6% | |
| | 107,259 | | | Advanced Drainage Systems, Inc. | | | 3,362,570 | |
| | 126,664 | | | American States Water Co. | | | 7,654,306 | |
| | 615,974 | | | American Water Works Co., Inc. | | | 53,916,204 | |
| | 613,211 | | | Aqua America, Inc. | | | 22,799,185 | |
| | 77,088 | | | Badger Meter, Inc. | | | 4,235,986 | |
| | 165,502 | | | California Water Service Group | | | 6,810,407 | |
| | | | | | | | |
Number
of Shares | | | | | Value | |
| | | | Common Stocks & Other Equity Interests
(continued) | |
| | | | United States (continued) | |
| | 41,710 | | | Connecticut Water Service, Inc. | | $ | 2,857,552 | |
| | 292,094 | | | Danaher Corp. | | | 30,243,413 | |
| | 88,143 | | | Energy Recovery, Inc.(a)(b) | | | 854,106 | |
| | 149,950 | | | Evoqua Water Technologies Corp.(a) | | | 2,906,031 | |
| | 49,447 | | | Forterra, Inc.(a) | | | 418,322 | |
| | 102,478 | | | Franklin Electric Co., Inc. | | | 5,011,174 | |
| | 50,552 | | | Gorman-Rupp Co. (The) | | | 1,853,236 | |
| | 202,649 | | | IDEX Corp. | | | 31,047,853 | |
| | 28,198 | | | Lindsay Corp. | | | 2,700,522 | |
| | 56,493 | | | Middlesex Water Co. | | | 2,587,379 | |
| | 420,348 | | | Mueller Water Products, Inc., Class A | | | 4,863,426 | |
| | 442,446 | | | Olin Corp. | | | 13,596,366 | |
| | 79,997 | | | PICO Holdings, Inc.(a) | | | 955,964 | |
| | 1,290,005 | | | Reliance Worldwide Corp. Ltd. | | | 4,953,868 | |
| | 71,610 | | | Select Energy Services, Inc., Class A(a) | | | 977,476 | |
| | 55,927 | | | SJW Corp. | | | 3,238,733 | |
| | 192,677 | | | Tetra Tech, Inc. | | | 13,448,855 | |
| | 73,321 | | | Watts Water Technologies, Inc., Class A | | | 6,045,316 | |
| | 476,320 | | | Xylem, Inc. | | | 36,157,451 | |
| | 44,445 | | | York Water Co. (The) | | | 1,337,795 | |
| | | | | | | | |
| | | | | | | 264,833,496 | |
| | | | | | | | |
| | | | Total Common Stocks & Other Equity Interests
(Cost $477,329,792) | | | 591,022,675 | |
| | | | | | | | |
| | |
| | | | | | | | |
| | | | Money Market Fund—0.2% | |
| | 940,748 | | | Invesco Premier U.S. Government Money Portfolio—Institutional Class, 1.83%(c)
(Cost $940,748) | | | 940,748 | |
| | | | | | | | |
| | | | Total Investments in Securities
(excluding investments purchased with cash collateral from securities on loan)
(Cost $478,270,540)—99.7% | | | 591,963,423 | |
| | | | | | | | |
| | |
| | | | | | | | |
| | | | Investments Purchased with Cash Collateral from
Securities on Loan | |
| | |
| | | | | | | | |
| | | | Money Market Fund—0.1% | |
| | 859,521 | | | Invesco Government & Agency Portfolio—Institutional Class, 1.85%(c)(d)
(Cost $859,521) | | | 859,521 | |
| | | | | | | | |
| | | | Total Investments in Securities
(Cost $479,130,061)—99.8% | | | 592,822,944 | |
| | | | Other assets less liabilities—0.2% | | | 1,281,968 | |
| | | | | | | | |
| | | | Net Assets—100.0% | | $ | 594,104,912 | |
| | | | | | | | |
Investment Abbreviations:
ADR—American Depositary Receipt
Notes to Schedule of Investments:
| (a) | Non-income producing security. |
| (b) | All or a portion of this security was out on loan at August 31, 2018. |
| (c) | The security and the Fund are advised by wholly-owned subsidiaries of Invesco Ltd. and are therefore considered to be affiliated. The rate shown is the 7-day SEC standardized yield as of August 31, 2018. |
| (d) | The security has been segregated to satisfy the commitment to return the cash collateral received in securities lending transactions upon the borrower’s return of the securities loaned. See Note 6. |
See accompanying Notes to Financial Statements which are an integral part of the financial statements.
Schedule of Investments(a)
Invesco S&P High Income Infrastructure ETF (GHII)
August 31, 2018
| | | | | | | | |
Number
of Shares | | | | | Value | |
| | | | Common Stocks—99.6% | |
| | | | Energy—33.4% | |
| | 59,543 | | | Enagas SA (Spain) | | $ | 1,659,214 | |
| | 80,463 | | | Enbridge Income Fund Holdings, Inc. (Canada) | | | 2,028,930 | |
| | 46,499 | | | Enbridge, Inc. (Canada) | | | 1,587,232 | |
| | 15,759 | | | Gaztransport Et Technigaz SA (France) | | | 1,079,966 | |
| | 64,457 | | | Gibson Energy, Inc. (Canada) | | | 957,994 | |
| | 107,085 | | | Inter Pipeline Ltd. (Canada) | | | 1,969,323 | |
| | 280,037 | | | Nordic American Tankers Ltd. | | | 624,483 | |
| | 39,765 | | | Pembina Pipeline Corp. (Canada) | | | 1,357,368 | |
| | 87,660 | | | SemGroup Corp., Class A | | | 2,121,372 | |
| | 192,554 | | | Ship Finance International Ltd. (Norway) | | | 2,734,267 | |
| | 411,379 | | | Snam SpA (Italy) | | | 1,692,469 | |
| | 42,034 | | | Targa Resources Corp. | | | 2,314,812 | |
| | | | | | | | |
| | | | | | | 20,127,430 | |
| | | | | | | | |
| | | | Industrials—12.8% | | | |
| | 10,988,727 | | | Hutchison Port Holdings Trust (Hong Kong) | | | 2,692,238 | |
| | 67,138 | | | Macquarie Infrastructure Corp. | | | 3,158,172 | |
| | 282,738 | | | Sydney Airport (Australia) | | | 1,474,273 | |
| | 500,000 | | | Yuexiu Transport Infrastructure Ltd. (China) | | | 388,589 | |
| | | | | | | | |
| | | | | | | 7,713,272 | |
| | | | | | | | |
| | | | Utilities—53.4% | | | |
| | 112,886 | | | AltaGas Ltd. (Canada) | | | 2,099,379 | |
| | 110,686 | | | APA Group (Australia) | | | 800,481 | |
| | 50,388 | | | Atlantica Yield PLC (Spain) | | | 1,039,756 | |
| | 824,588 | | | AusNet Services (Australia) | | | 980,983 | |
| | 41,541 | | | Capital Power Corp. (Canada) | | | 871,630 | |
| | 653,887 | | | Centrica PLC (United Kingdom) | | | 1,217,891 | |
| | 4,050,231 | | | China Power International Development Ltd. (China) | | | 882,403 | |
| | 560,433 | | | China Resources Power Holdings Co. Ltd. (China) | | | 1,009,635 | |
| | 173,016 | | | Contact Energy Ltd. (New Zealand) | | | 637,119 | |
| | 238,790 | | | EDP-Energias de Portugal SA (Portugal) | | | 934,905 | |
| | 27,344 | | | Emera, Inc. (Canada) | | | 865,857 | |
| | 54,491 | | | Endesa SA (Spain) | | | 1,222,991 | |
| | 58,472 | | | Engie SA (France) | | | 859,246 | |
| | 36,787 | | | Fortum Oyj (Finland) | | | 933,076 | |
| | 880,155 | | | HK Electric Investments & HK Electric Investments Ltd. (Hong Kong)(b) | | | 889,249 | |
| | 121,527 | | | Infratil Ltd. (New Zealand) | | | 274,556 | |
| | 96,184 | | | Just Energy Group, Inc. (Canada) | | | 287,678 | |
| | 974,399 | | | Keppel Infrastructure Trust (Singapore) | | | 369,831 | |
| | 394,767 | | | Mercury NZ Ltd. (New Zealand) | | | 860,433 | |
| | 84,978 | | | National Grid PLC (United Kingdom) | | | 894,646 | |
| | 42,863 | | | Northland Power, Inc. (Canada) | | | 717,588 | |
| | 65,544 | | | NRG Yield, Inc., Class C | | | 1,301,048 | |
| | 88,296 | | | Pattern Energy Group, Inc., Class A | | | 1,799,473 | |
| | 120,000 | | | Power Assets Holdings Ltd. (Hong Kong) | | | 841,647 | |
| | 34,576 | | | PPL Corp. | | | 1,028,290 | |
| | 42,733 | | | Red Electrica Corp. SA (Spain) | | | 899,929 | |
| | | | | | | | |
Number
of Shares | | | | | Value | |
| | | | Common Stocks (continued) | |
| | | | Utilities (continued) | | | |
| | 350,991 | | | REN—Redes Energeticas Nacionais SGPS SA (Portugal) | | $ | 996,442 | |
| | 20,420 | | | SCANA Corp. | | | 782,903 | |
| | 682,959 | | | Spark Infrastructure Group (Australia) | | | 1,185,399 | |
| | 65,490 | | | SSE PLC (United Kingdom) | | | 1,066,561 | |
| | 74,083 | | | Suez (France) | | | 1,073,566 | |
| | 93,805 | | | Superior Plus Corp., Class Common Subscription Receipt (Canada) | | | 930,892 | |
| | 70,773 | | | TransAlta Renewables, Inc. (Canada) | | | 656,195 | |
| | 94,257 | | | United Utilities Group PLC (United Kingdom) | | | 908,538 | |
| | | | | | | | |
| | | | | | | 32,120,216 | |
| | | | | | | | |
| | | | Total Investments in Securities
(Cost $60,556,688)—99.6% | | | 59,960,918 | |
| | | | Other assets less liabilities—0.4% | | | 218,990 | |
| | | | | | | | |
| | | | Net Assets—100.0% | | $ | 60,179,908 | |
| | | | | | | | |
Notes to Schedule of Investments:
| (a) | Industry and/or sector classifications used in this report are generally according to the Global Industry Classification Standard, which was developed by and is the exclusive property and a service mark of MSCI Inc. and Standard & Poor’s. |
| (b) | Security purchased or received in a transaction exempt from registration under the Securities Act of 1933, as amended (the “1933 Act”). The security may be resold pursuant to an exemption from registration under the 1933 Act, typically to qualified institutional buyers. The value of this security at August 31, 2018 represented 1.48% of the Fund’s Net Assets. |
This Fund has holdings greater than 10% of net assets in the following country:
See accompanying Notes to Financial Statements which are an integral part of the financial statements.
Schedule of Investments
Invesco Shipping ETF (SEA)
August 31, 2018
| | | | | | | | |
Number
of Shares | | | | | Value | |
| | | | Common Stocks & Other Equity Interests—100.0% | |
| | | | Belgium—4.3% | |
| | 339,899 | | | Euronav NV | | $ | 2,954,178 | |
| | | | | | | | |
| | | | Bermuda—10.4% | |
| | 154,564 | | | Golar LNG Ltd. | | | 3,950,656 | |
| | 190,256 | | | Teekay Corp.(a) | | | 1,289,935 | |
| | 118,013 | | | Teekay LNG Partners LP | | | 1,858,705 | |
| | | | | | | | |
| | | | | | | 7,099,296 | |
| | | | | | | | |
| | | | China—4.9% | |
| | 3,106,047 | | | COSCO SHIPPING Energy Transportation Co. Ltd., H-Shares | | | 1,357,355 | |
| | 4,836,572 | | | COSCO SHIPPING Holdings Co. Ltd.,
H-Shares(b) | | | 2,015,007 | |
| | | | | | | | |
| | | | | | | 3,372,362 | |
| | | | | | | | |
| | | | Denmark—20.6% | |
| | 9,108 | | | AP Moller—Maersk A/S, Class B | | | 14,089,284 | |
| | | | | | | | |
| | | | Germany—3.5% | |
| | 55,914 | | | Hapag-Lloyd AG(c) | | | 2,362,831 | |
| | | | | | | | |
| | | | Hong Kong—5.2% | |
| | 8,338,986 | | | Pacific Basin Shipping Ltd. | | | 1,997,387 | |
| | 172,661 | | | Seaspan Corp.(a) | | | 1,591,935 | |
| | | | | | | | |
| | | | | | | 3,589,322 | |
| | | | | | | | |
| | | | Japan—18.5% | |
| | 144,098 | | | Kawasaki Kisen Kaisha Ltd.(b) | | | 2,671,827 | |
| | 188,304 | | | Mitsui OSK Lines Ltd. | | | 5,074,197 | |
| | 261,588 | | | Nippon Yusen KK | | | 4,944,658 | |
| | | | | | | | |
| | | | | | | 12,690,682 | |
| | | | | | | | |
| | | | Monaco—9.2% | |
| | 178,525 | | | Costamare, Inc. | | | 1,255,031 | |
| | 99,450 | | | GasLog Ltd. | | | 1,670,760 | |
| | 87,425 | | | GasLog Partners LP | | | 2,124,428 | |
| | 670,108 | | | Scorpio Tankers, Inc. | | | 1,286,607 | |
| | | | | | | | |
| | | | | | | 6,336,826 | |
| | | | | | | | |
| | | | Norway—6.6% | |
| | 187,899 | | | Golden Ocean Group Ltd. | | | 1,761,546 | |
| | 194,388 | | | Ship Finance International Ltd. | | | 2,760,310 | |
| | | | | | | | |
| | | | | | | 4,521,856 | |
| | | | | | | | |
| | | | South Korea—5.8% | |
| | 504,827 | | | Hyundai Merchant Marine Co. Ltd.(b) | | | 2,063,480 | |
| | 417,377 | | | Pan Ocean Co. Ltd.(b) | | | 1,934,749 | |
| | | | | | | | |
| | | | | | | 3,998,229 | |
| | | | | | | | |
| | | | United Kingdom—4.5% | |
| | 115,991 | | | Golar LNG Partners LP | | | 1,568,198 | |
| | 68,750 | | | KNOT Offshore Partners LP | | | 1,481,563 | |
| | | | | | | | |
| | | | | | | 3,049,761 | |
| | | | | | | | |
| | | | | | | | |
Number
of Shares | | | | | Value | |
| | | | Common Stocks & Other Equity Interests
(continued) | |
| | | | United States—6.5% | |
| | 320,616 | | | DHT Holdings, Inc. | | $ | 1,500,483 | |
| | 78,418 | | | Matson, Inc. | | | 2,929,696 | |
| | | | | | | | |
| | | | | | | 4,430,179 | |
| | | | | | | | |
| | | | Total Investments in Securities
(excluding investments purchased with cash collateral from securities on loan)
(Cost $73,153,966)—100.0% | | | 68,494,806 | |
| | | | | | | | |
| | |
| | | | | | | | |
| | | | Investments Purchased with Cash Collateral from
Securities on Loan | |
| | |
| | | | | | | | |
| | | | Money Market Fund—3.6% | | | |
| | 2,478,668 | | | Invesco Government & Agency Portfolio—Institutional Class, 1.85%(d)(e)
(Cost $2,478,668) | | | 2,478,668 | |
| | | | | | | | |
| | | | Total Investments in Securities
(Cost $75,632,634)—103.6% | | | 70,973,474 | |
| | | | Other assets less liabilities—(3.6)% | | | (2,453,391 | ) |
| | | | | | | | |
| | | | Net Assets—100.0% | | $ | 68,520,083 | |
| | | | | | | | |
Notes to Schedule of Investments:
| (a) | All or a portion of this security was out on loan at August 31, 2018. |
| (b) | Non-income producing security. |
| (c) | Security purchased or received in a transaction exempt from registration under the Securities Act of 1933, as amended (the “1933 Act”). The security may be resold pursuant to an exemption from registration under the 1933 Act, typically to qualified institutional buyers. The value of this security at August 31, 2018 represented 3.45% of the Fund’s Net Assets. |
| (d) | The security and the Fund are advised by wholly-owned subsidiaries of Invesco Ltd. and are therefore considered to be affiliated. The rate shown is the 7-day SEC standardized yield as of August 31, 2018. |
| (e) | The security has been segregated to satisfy the commitment to return the cash collateral received in securities lending transactions upon the borrower’s return of the securities loaned. See Note 6. |
See accompanying Notes to Financial Statements which are an integral part of the financial statements.
Schedule of Investments(a)
Invesco Solar ETF (TAN)
August 31, 2018
| | | | | | | | |
Number
of Shares | | | | | Value | |
| | | | Common Stocks & Other Equity Interests—99.5% | |
| | | | Construction & Engineering—2.4% | |
| | 24,287,555 | | | China Singyes Solar Technologies Holdings Ltd. (China) | | $ | 7,674,086 | |
| | | | | | | | |
| | | | Containers & Packaging—3.0% | |
| | 486,273,874 | | | Beijing Enterprises Clean Energy Group Ltd. (China)(b) | | | 9,726,840 | |
| | | | | | | | |
| | | | Electrical Equipment—12.9% | |
| | 2,681,194 | | | Enphase Energy, Inc.(b)(c) | | | 13,111,039 | |
| | 1,376,165 | | | Sunrun, Inc.(b) | | | 18,055,285 | |
| | 1,890,942 | | | Vivint Solar, Inc.(b)(c) | | | 9,927,445 | |
| | | | | | | | |
| | | | | | | 41,093,769 | |
| | | | | | | | |
| | | | Independent Power & Renewable Electricity Producers—25.0% | |
| | 793,281 | | | Atlantica Yield PLC (Spain) | | | 16,369,353 | |
| | 2,038,861 | | | Encavis AG (Germany) | | | 14,755,171 | |
| | 168,086,285 | | | GCL New Energy Holdings Ltd. (China)(b) | | | 6,317,504 | |
| | 2,119,680 | | | Scatec Solar ASA (Norway)(d) | | | 14,954,634 | |
| | 2,039,026 | | | Solaria Energia y Medio Ambiente SA (Spain)(b) | | | 13,902,299 | |
| | 1,218,264 | | | TerraForm Power, Inc., Class A | | | 13,620,192 | |
| | | | | | | | |
| | | | | | | 79,919,153 | |
| | | | | | | | |
| | | | Mortgage REITs—5.5% | |
| | 808,526 | | | Hannon Armstrong Sustainable Infrastructure Capital, Inc. REIT | | | 17,431,821 | |
| | | | | | | | |
| | | | Semiconductors & Semiconductor Equipment—50.7% | |
| | 1,230,729 | | | Canadian Solar, Inc. (Canada)(b)(c) | | | 17,673,268 | |
| | 342,838 | | | Daqo New Energy Corp. ADR (China)(b) | | | 12,229,031 | |
| | 556,840 | | | First Solar, Inc.(b) | | | 29,000,227 | |
| | 138,565,863 | | | GCL-Poly Energy Holdings Ltd. (China)(b) | | | 9,356,713 | |
| | 1,058,906 | | | JinkoSolar Holding Co. Ltd. ADR (China)(b)(c) | | | 13,903,436 | |
| | 13,487,002 | | | Meyer Burger Technology AG (Switzerland)(b) | | | 8,604,571 | |
| | 74,722,995 | | | REC Silicon ASA(b) | | | 6,357,446 | |
| | 280,690 | | | SMA Solar Technology AG (Germany) | | | 10,202,444 | |
| | 447,015 | | | SolarEdge Technologies, Inc.(b) | | | 21,434,369 | |
| | 1,987,329 | | | SunPower Corp.(b)(c) | | | 13,354,851 | |
| | 66,250,856 | | | Xinyi Solar Holdings Ltd. (China) | | | 19,751,431 | |
| | | | | | | | |
| | | | | | | 161,867,787 | |
| | | | | | | | |
| | | | Total Common Stocks & Other Equity Interests
(Cost $337,500,911) | | | 317,713,456 | |
| | | | | | | | |
| | |
| | | | | | | | |
| | | | | | | | |
Number
of Shares | | | | | Value | |
| | | | Money Market Fund—0.2% | |
| | 637,997 | | | Invesco Premier U.S. Government Money Portfolio—Institutional Class, 1.83%(e)
(Cost $637,997) | | $ | 637,997 | |
| | | | | | | | |
| | | | Total Investments in Securities
(excluding investments purchased with cash collateral from securities on loan)
(Cost $338,138,908)-99.7% | | | 318,351,453 | |
| | | | | | | | |
| | |
| | | | | | | | |
| | | | Investments Purchased with Cash Collateral from
Securities on Loan | |
| | |
| | | | | | | | |
| | | | Money Market Fund—11.9% | | | |
| | 38,036,785 | | | Invesco Government & Agency Portfolio—Institutional Class, 1.85%(e)(f)
(Cost $38,036,785) | | | 38,036,785 | |
| | | | | | | | |
| | | | Total Investments in Securities
(Cost $376,175,693)—111.6% | | | 356,388,238 | |
| | | | Other assets less liabilities—(11.6)% | | | (37,005,052 | ) |
| | | | | | | | |
| | | | Net Assets—100.0% | | $ | 319,383,186 | |
| | | | | | | | |
Investment Abbreviations:
ADR—American Depositary Receipt
REIT—Real Estate Investment Trust
Notes to Schedule of Investments:
| (a) | Industry and/or sector classifications used in this report are generally according to the Global Industry Classification Standard, which was developed by and is the exclusive property and a service mark of MSCI Inc. and Standard & Poor’s. |
| (b) | Non-income producing security. |
| (c) | All or a portion of this security was out on loan at August 31, 2018. |
| (d) | Security purchased or received in a transaction exempt from registration under the Securities Act of 1933, as amended (the “1933 Act”). The security may be resold pursuant to an exemption from registration under the 1933 Act, typically to qualified institutional buyers. The value of this security at August 31, 2018 represented 4.68% of the Fund’s Net Assets. |
| (e) | The security and the Fund are advised by wholly-owned subsidiaries of Invesco Ltd. and are therefore considered to be affiliated. The rate shown is the 7-day SEC standardized yield as of August 31, 2018. |
| (f) | The security has been segregated to satisfy the commitment to return the cash collateral received in securities lending transactions upon the borrower’s return of the securities loaned. See Note 6. |
This Fund has holdings greater than 10% of net assets in the following country:
See accompanying Notes to Financial Statements which are an integral part of the financial statements.
(This Page Intentionally Left Blank)
Statements of Assets and Liabilities
August 31, 2018
| | | | | | | | | | | | | | | | |
| | | Invesco China
All-Cap
ETF (YAO) | | | Invesco China
Technology
ETF (CQQQ) | | | Invesco
S&P Global
Water Index
ETF (CGW) | | | Invesco S&P
High Income
Infrastructure
ETF (GHII) | |
| Assets: | | | | | | | | | | | | | | | | |
Unaffiliated investments in securities, at value(a) | | $ | 22,727,295 | | | $ | 384,708,399 | | | $ | 591,022,675 | | | $ | 59,960,918 | |
Affiliated investments in securities, at value | | | 134,463 | | | | 22,532,493 | | | | 1,800,269 | | | | — | |
Cash segregated as collateral | | | — | | | | 2,832,112 | | | | — | | | | — | |
Foreign currencies, at value | | | 9,017 | | | | 548 | | | | 48,600 | | | | 3,097 | |
Receivables: | | | | | | | | | | | | | | | | |
Dividends | | | 31,147 | | | | 209,125 | | | | 1,274,601 | | | | 269,039 | |
Securities lending | | | 324 | | | | 43,321 | | | | 1,306 | | | | 503 | |
Foreign tax reclaims | | | — | | | | — | | | | 1,391,672 | | | | 39,205 | |
Shares sold | | | — | | | | 7,394,392 | | | | — | | | | — | |
Other assets | | | — | | | | — | | | | — | | | | — | |
| | | | | | | | | | | | | | | | |
Total Assets | | | 22,902,246 | | | | 417,720,390 | | | | 595,539,123 | | | | 60,272,762 | |
| | | | | | | | | | | | | | | | |
| | | | |
| Liabilities: | | | | | | | | | | | | | | | | |
Due to custodian | | | — | | | | 9,681 | | | | — | | | | 56,122 | |
Due to foreign custodian | | | — | | | | — | | | | — | | | | — | |
Payables: | | | | | | | | | | | | | | | | |
Collateral upon return of securities loaned | | | 111,189 | | | | 22,464,958 | | | | 859,521 | | | | — | |
Investments purchased | | | — | | | | 7,394,592 | | | | — | | | | — | |
Collateral upon receipt of securities in-kind | | | — | | | | 2,832,112 | | | | — | | | | — | |
Accrued advisory fees | | | 13,524 | | | | 330,369 | | | | 249,852 | | | | 36,732 | |
Accrued trustees’ and officer’s fees | | | — | | | | — | | | | 8,411 | | | | — | |
Accrued expenses | | | — | | | | — | | | | 316,427 | | | | — | |
| | | | | | | | | | | | | | | | |
Total Liabilities | | | 124,713 | | | | 33,031,712 | | | | 1,434,211 | | | | 92,854 | |
| | | | | | | | | | | | | | | | |
| Net Assets | | $ | 22,777,533 | | | $ | 384,688,678 | | | $ | 594,104,912 | | | $ | 60,179,908 | |
| | | | | | | | | | | | | | | | |
| | | | |
| Net Assets Consist of: | | | | | | | | | | | | | | | | |
Shares of beneficial interest | | $ | 30,392,038 | | | $ | 482,640,766 | | | $ | 511,892,754 | | | $ | 62,807,069 | |
Undistributed net investment income. | | | 280,897 | | | | (951,811 | ) | | | 8,753,543 | | | | 381,342 | |
Undistributed net realized gain (loss) | | | (9,853,657 | ) | | | (30,982,340 | ) | | | (40,232,527 | ) | | | (2,411,558 | ) |
Net unrealized appreciation (depreciation) | | | 1,958,255 | | | | (66,017,937 | ) | | | 113,691,142 | | | | (596,945 | ) |
| | | | | | | | | | | | | | | | |
| Net Assets | | $ | 22,777,533 | | | $ | 384,688,678 | | | $ | 594,104,912 | | | $ | 60,179,908 | |
| | | | | | | | | | | | | | | | |
Shares outstanding (unlimited amount authorized, $0.01 par value) | | | 700,000 | | | | 7,800,000 | | | | 16,840,000 | | | | 2,250,000 | |
Net asset value | | $ | 32.54 | | | $ | 49.32 | | | $ | 35.28 | | | $ | 26.75 | |
| | | | | | | | | | | | | | | | |
Market price | | $ | 32.42 | | | $ | 49.36 | | | $ | 35.23 | | | $ | 26.77 | |
| | | | | | | | | | | | | | | | |
Unaffiliated investments in securities, at cost | | $ | 20,769,027 | | | $ | 450,726,318 | | | $ | 477,329,792 | | | $ | 60,556,688 | |
| | | | | | | | | | | | | | | | |
Affiliated investments in securities, at cost | | $ | 134,463 | | | $ | 22,532,493 | | | $ | 1,800,269 | | | $ | — | |
| | | | | | | | | | | | | | | | |
Foreign currencies, at cost | | $ | 9,017 | | | $ | 548 | | | $ | 48,302 | | | $ | 3,096 | |
| | | | | | | | | | | | | | | | |
(a) Includes securities on loan with an aggregate value of | | $ | 106,815 | | | $ | 21,963,945 | | | $ | 845,559 | | | $ | — | |
| | | | | | | | | | | | | | | | |
See accompanying Notes to Financial Statements which are an integral part of the financial statements.
| | | | | | |
Invesco
Shipping
ETF (SEA) | | | Invesco
Solar
ETF (TAN) | |
| | | | | | |
| $ | 68,494,806 | | | $ | 317,713,456 | |
| | 2,478,668 | | | | 38,674,782 | |
| | 208 | | | | — | |
| | 2,223 | | | | — | |
| | | | | | |
| | 16,960 | | | | 1,184,726 | |
| | 5,446 | | | | 289,434 | |
| | 333,972 | | | | 93,826 | |
| | 208 | | | | — | |
| | — | | | | 857 | |
| | | | | | |
| | 71,332,491 | | | | 357,957,081 | |
| | | | | | |
| |
| | | | | | |
| | 295,759 | | | | — | |
| | — | | | | 1,239 | |
| | | | | | |
| | 2,478,668 | | | | 38,036,785 | |
| | — | | | | — | |
| | 208 | | | | — | |
| | 37,773 | | | | 99,111 | |
| | — | | | | 8,453 | |
| | — | | | | 428,307 | |
| | | | | | |
| | 2,812,408 | | | | 38,573,895 | |
| | | | | | |
| $ | 68,520,083 | | | $ | 319,383,186 | |
| | | | | | |
| |
| | | | | | |
| $ | 113,751,226 | | | $ | 742,604,313 | |
| | (1,507,196 | ) | | | 9,652 | |
| | (39,080,974 | ) | | | (403,443,215 | ) |
| | (4,642,973 | ) | | | (19,787,564 | ) |
| | | | | | |
| $ | 68,520,083 | | | $ | 319,383,186 | |
| | | | | | |
| | 6,700,000 | | | | 14,568,000 | |
| $ | 10.23 | | | $ | 21.92 | |
| | | | | | |
| $ | 10.20 | | | $ | 21.82 | |
| | | | | | |
| $ | 73,153,966 | | | $ | 337,500,911 | |
| | | | | | |
| $ | 2,478,668 | | | $ | 38,674,782 | |
| | | | | | |
| $ | 2,211 | | | $ | (1,111 | ) |
| | | | | | |
| $ | 2,369,703 | | | $ | 37,082,913 | |
| | | | | | |
Statements of Operations
For the year ended August 31, 2018(a)
| | | | | | | | | | | | | | | | |
| | | Invesco
China
All-Cap ETF
(YAO) | | | Invesco China
Technology
ETF (CQQQ) | | | Invesco S&P
Global Water
Index ETF
(CGW) | | | Invesco S&P
High Income
Infrastructure
ETF (GHII) | |
| | | Year Ended
August 31,
2018 | | | Year Ended
August 31,
2018 | | | Year Ended
August 31,
2018 | | | Year Ended
August 31,
2018 | |
| Investment Income: | | | | | | | | | | | | | | | | |
Unaffiliated dividend income* | | $ | 603,829 | | | $ | 3,890,091 | | | $ | 14,232,764 | | | $ | 2,424,185 | |
Affiliated dividend income | | | 48 | | | | 772 | | | | 2,210 | | | | 289 | |
Securities lending income | | | 14,710 | | | | 767,847 | | | | 37,378 | | | | 67,327 | |
| | | | | | | | | | | | | | | | |
Total Income | | | 618,587 | | | | 4,658,710 | | | | 14,272,352 | | | | 2,491,801 | |
| | | | | | | | | | | | | | | | |
| | | | |
| Expenses: | | | | | | | | | | | | | | | | |
Advisory fees | | | 180,499 | | | | 2,571,332 | | | | 3,066,586 | | | | 180,356 | |
Accounting & administration fees | | | — | | | | — | | | | 130,093 | | | | — | |
Sub-licensing fees | | | — | | | | — | | | | 269,861 | | | | — | |
Custodian & transfer agent fees | | | — | | | | — | | | | 131,298 | | | | — | |
Trustees’ and officer’s fees | | | — | | | | — | | | | 26,198 | | | | — | |
Printing | | | — | | | | — | | | | 85,496 | | | | — | |
Professional fees | | | — | | | | — | | | | 62,542 | | | | — | |
Insurance | | | — | | | | — | | | | 4,104 | | | | — | |
Intraday valuation fees | | | — | | | | — | | | | 2,570 | | | | — | |
Listing fee and expenses | | | — | | | | — | | | | 5,110 | | | | — | |
Other | | | — | | | | — | | | | 1,911 | | | | — | |
| | | | | | | | | | | | | | | | |
Total Expenses | | | 180,499 | | | | 2,571,332 | | | | 3,785,769 | | | | 180,356 | |
| | | | | | | | | | | | | | | | |
Less: Waivers | | | (4 | ) | | | (150 | ) | | | (2,586 | ) | | | (39 | ) |
| | | | | | | | | | | | | | | | |
Net Expenses | | | 180,495 | | | | 2,571,182 | | | | 3,783,183 | | | | 180,317 | |
| | | | | | | | | | | | | | | | |
Net Investment Income | | | 438,092 | | | | 2,087,528 | | | | 10,489,169 | | | | 2,311,484 | |
| | | | | | | | | | | | | | | | |
| | | | |
| Realized and Unrealized Gain (Loss): | | | | | | | | | | | | | | | | |
Net realized gain (loss) from: | | | | | | | | | | | | | | | | |
Investment securities | | | 545,967 | | | | (16,550,736 | ) | | | 1,469,612 | | | | (2,231,295 | ) |
In-kind redemptions | | | 1,340,951 | | | | 54,723,140 | | | | 69,513,361 | | | | 2,106,526 | |
Foreign currencies | | | 321 | | | | (7,336 | ) | | | (74,692 | ) | | | (5,747 | ) |
| | | | | | | | | | | | | | | | |
Net realized gain (loss) | | | 1,887,239 | | | | 38,165,068 | | | | 70,908,281 | | | | (130,516 | ) |
| | | | | | | | | | | | | | | | |
Net change in unrealized appreciation (depreciation) | | | | | | | | | | | | | | | | |
Investment securities | | | (2,069,467 | ) | | | (102,225,582 | ) | | | (37,428,408 | ) | | | (1,595,579 | ) |
Foreign currencies | | | (38 | ) | | | 1,088 | | | | (11,753 | ) | | | (1,843 | ) |
| | | | | | | | | | | | | | | | |
Net change in unrealized appreciation (depreciation) | | | (2,069,505 | ) | | | (102,224,494 | ) | | | (37,440,161 | ) | | | (1,597,422 | ) |
| | | | | | | | | | | | | | | | |
Net realized and unrealized gain (loss) | | | (182,266 | ) | | | (64,059,426 | ) | | | 33,468,120 | | | | (1,727,938 | ) |
| | | | | | | | | | | | | | | | |
Net increase (decrease) in net assets resulting from operations | | $ | 255,826 | | | $ | (61,971,898 | ) | | $ | 43,957,289 | | | $ | 583,546 | |
| | | | | | | | | | | | | | | | |
* Foreign taxes withheld | | | 44,924 | | | | 22,645 | | | | 917,915 | | | | 211,684 | |
| (a) | Effective August 31, 2018, Invesco Shipping ETF changed its fiscal year end to August 31. |
See accompanying Notes to Financial Statements which are an integral part of the financial statements.
| | | | | | | | | | |
| Invesco Shipping ETF (SEA) | | | Invesco Solar
ETF (TAN) | |
Three Months Ended
August 31,
2018 | | | Year Ended
May 31,
2018 | | | Year Ended
August 31,
2018 | |
| | | | | | | | | | |
| $ | 400,508 | | | $ | 2,428,255 | | | $ | 6,881,581 | |
| | 1,499 | | | | 17 | | | | 4,414 | |
| | 9,709 | | | | 987,469 | | | | 4,519,723 | |
| | | | | | | | | | |
| | 411,716 | | | | 3,415,741 | | | | 11,405,718 | |
| | | | | | | | | | |
| | |
| | | | | | | | | | |
| | 116,015 | | | | 687,669 | | | | 1,753,294 | |
| | — | | | | — | | | | 90,641 | |
| | — | | | | — | | | | 568,883 | |
| | — | | | | — | | | | 141,236 | |
| | — | | | | — | | | | 19,769 | |
| | — | | | | — | | | | 72,996 | |
| | — | | | | — | | | | 63,326 | |
| | — | | | | — | | | | 1,473 | |
| | — | | | | — | | | | 7,340 | |
| | — | | | | — | | | | 5,110 | |
| | — | | | | — | | | | 1,443 | |
| | | | | | | | | | |
| | 116,015 | | | | 687,669 | | | | 2,725,511 | |
| | | | | | | | | | |
| | (149 | ) | | | — | | | | (155,183 | ) |
| | | | | | | | | | |
| | 115,866 | | | | 687,669 | | | | 2,570,328 | |
| | | | | | | | | | |
| | 295,850 | | | | 2,728,072 | | | | 8,835,390 | |
| | | | | | | | | | |
| | |
| | | | | | | | | | |
| | | | | | | | | | |
| | (8,509,118 | ) | | | (7,376,973 | ) | | | (12,693,824 | ) |
| | (32,209 | ) | | | 5,098,482 | | | | 46,533,049 | |
| | (20,676 | ) | | | (20,564 | ) | | | (102,604 | ) |
| | | | | | | | | | |
| | (8,562,003 | ) | | | (2,299,055 | ) | | | 33,736,621 | |
| | | | | | | | | | |
| | | | | | | | | | |
| | 3,916,894 | | | | 276,262 | | | | (33,134,048 | ) |
| | (1,506 | ) | | | 7,313 | | | | (557 | ) |
| | | | | | | | | | |
| | 3,915,388 | | | | 283,575 | | | | (33,134,605 | ) |
| | | | | | | | | | |
| | (4,646,615 | ) | | | (2,015,480 | ) | | | 602,016 | |
| | | | | | | | | | |
| $ | (4,350,765 | ) | | $ | 712,592 | | | $ | 9,437,406 | |
| | | | | | | | | | |
| | 2,414 | | | | 58,542 | | | | 170,704 | |
Statements of Changes in Net Assets
For the years ended August 31, 2018 and August 31, 2017(a)
| | | | | | | | | | | | | | | | |
| | | Invesco China All-Cap
ETF (YAO) | | | Invesco China Technology
ETF (CQQQ) | |
| | | Year Ended
August 31,
2018 | | | Year Ended
August 31,
2017 | | | Year Ended
August 31,
2018 | | | Year Ended
August 31,
2017 | |
| Operations: | | | | | | | | | | | | | | | | |
Net investment income | | $ | 438,092 | | | $ | 400,762 | | | $ | 2,087,528 | | | $ | 932,753 | |
Net realized gain (loss) | | | 1,887,239 | | | | 620,333 | | | | 38,165,068 | | | | (471,513 | ) |
Net change in unrealized appreciation (depreciation) | | | (2,069,505 | ) | | | 4,766,854 | | | | (102,224,494 | ) | | | 35,523,479 | |
| | | | | | | | | | | | | | | | |
Net increase (decrease) in net assets resulting from operations | | | 255,826 | | | | 5,787,949 | | | | (61,971,898 | ) | | | 35,984,719 | |
| | | | | | | | | | | | | | | | |
| | | | |
| Distributions to Shareholders from: | | | | | | | | | | | | | | | | |
Net investment income | | | (500,080 | ) | | | (433,200 | ) | | | (5,489,280 | ) | | | (773,890 | ) |
Net realized gains | | | — | | | | — | | | | — | | | | — | |
Return of capital | | | — | | | | — | | | | — | | | | — | |
| | | | | | | | | | | | | | | | |
Total distributions to shareholders | | | (500,080 | ) | | | (433,200 | ) | | | (5,489,280 | ) | | | (773,890 | ) |
| | | | | | | | | | | | | | | | |
| | | | |
| Shareholder Transactions: | | | | | | | | | | | | | | | | |
Proceeds from shares sold | | | — | | | | 2,958,308 | | | | 398,909,634 | | | | 137,778,697 | |
Value of shares repurchased | | | (3,488,455 | ) | | | (5,376,934 | ) | | | (155,778,516 | ) | | | (9,123,754 | ) |
| | | | | | | | | | | | | | | | |
Net increase (decrease) in net assets resulting from shares transactions | | | (3,488,455 | ) | | | (2,418,626 | ) | | | 243,131,118 | | | | 128,654,943 | |
| | | | | | | | | | | | | | | | |
Increase (Decrease) in Net Assets | | | (3,732,709 | ) | | | 2,936,123 | | | | 175,669,940 | | | | 163,865,772 | |
| | | | | | | | | | | | | | | | |
| | | | |
| Net Assets: | | | | | | | | | | | | | | | | |
Beginning of year | | | 26,510,242 | | | | 23,574,119 | | | | 209,018,738 | | | | 45,152,966 | |
| | | | | | | | | | | | | | | | |
End of year | | $ | 22,777,533 | | | $ | 26,510,242 | | | $ | 384,688,678 | | | $ | 209,018,738 | |
| | | | | | | | | | | | | | | | |
Undistributed net investment income at end of year | | $ | 280,897 | | | $ | 324,385 | | | $ | (951,811 | ) | | $ | 741,562 | |
| | | | | | | | | | | | | | | | |
| | | | |
| Changes in Shares Outstanding: | | | | | | | | | | | | | | | | |
Shares sold | | | — | | | | 100,000 | | | | 6,650,000 | | | | 2,900,000 | |
Shares repurchased | | | (100,000 | ) | | | (200,000 | ) | | | (2,650,000 | ) | | | (250,000 | ) |
Shares outstanding, beginning of year | | | 800,000 | | | | 900,000 | | | | 3,800,000 | | | | 1,150,000 | |
| | | | | | | | | | | | | | | | |
Shares outstanding, end of year | | | 700,000 | | | | 800,000 | | | | 7,800,000 | | | | 3,800,000 | |
| | | | | | | | | | | | | | | | |
| (a) | Effective August 31, 2018, Invesco Shipping ETF changed its fiscal year end to August 31. |
See accompanying Notes to Financial Statements which are an integral part of the financial statements.
| | | | | | | | | | | | | | | | | | | | | | | | | | | | | | | | | | |
Invesco S&P Global Water
Index ETF (CGW) | | | Invesco S&P High Income
Infrastructure ETF (GHII) | | | Invesco Shipping
ETF (SEA) | | | Invesco Solar
ETF (TAN) | |
Year Ended
August 31,
2018 | | | Year Ended
August 31,
2017 | | | Year Ended
August 31,
2018 | | | Year Ended
August 31,
2017 | | | Three Months
Ended
August 31,
2018 | | | Year Ended
May 31,
2018 | | | Year Ended
May 31,
2017 | | | Year Ended
August 31,
2018 | | | Year Ended
August 31,
2017 | |
| | | | | | | | | | | | | | | | | | | | | | | | | | | | | | | | | | |
| $ | 10,489,169 | | | $ | 9,845,065 | | | $ | 2,311,484 | | | $ | 1,574,243 | | | $ | 295,850 | | | $ | 2,728,072 | | | $ | 3,511,559 | | | $ | 8,835,390 | | | $ | 5,825,420 | |
| | 70,908,281 | | | | (7,735,767 | ) | | | (130,516 | ) | | | 1,627,979 | | | | (8,562,003 | ) | | | (2,299,055 | ) | | | (12,835,162 | ) | | | 33,736,621 | | | | (119,481,205 | ) |
| | (37,440,161 | ) | | | 58,531,503 | | | | (1,597,422 | ) | | | 957,603 | | | | 3,915,388 | | | | 283,575 | | | | 9,369,976 | | | | (33,134,605 | ) | | | 140,389,181 | |
| | | | | | | | | | | | | | | | | | | | | | | | | | | | | | | | | | |
| | 43,957,289 | | | | 60,640,801 | | | | 583,546 | | | | 4,159,825 | | | | (4,350,765 | ) | | | 712,592 | | | | 46,373 | | | | 9,437,406 | | | | 26,733,396 | |
| | | | | | | | | | | | | | | | | | | | | | | | | | | | | | | | | | |
| | | | | | | | |
| | | | | | | | | | | | | | | | | | | | | | | | | | | | | | | | | | |
| | (10,492,264 | ) | | | (7,164,324 | ) | | | (2,046,184 | ) | | | (1,197,010 | ) | | | (85,244 | ) | | | (5,308,659 | ) | | | (3,310,900 | ) | | | (7,869,391 | ) | | | (8,422,471 | ) |
| | — | | | | — | | | | (369,125 | ) | | | (8,160 | ) | | | — | | | | — | | | | — | | | | — | | | | — | |
| | — | | | | — | | | | — | | | | — | | | | (864,886 | ) | | | (71,081 | ) | | | — | | | | — | | | | — | |
| | | | | | | | | | | | | | | | | | | | | | | | | | | | | | | | | | |
| | (10,492,264 | ) | | | (7,164,324 | ) | | | (2,415,309 | ) | | | (1,205,170 | ) | | | (950,130 | ) | | | (5,379,740 | ) | | | (3,310,900 | ) | | | (7,869,391 | ) | | | (8,422,471 | ) |
| | | | | | | | | | | | | | | | | | | | | | | | | | | | | | | | | | |
| | | | | | | | |
| | | | | | | | | | | | | | | | | | | | | | | | | | | | | | | | | | |
| | 98,720,757 | | | | 126,926,729 | | | | 37,535,728 | | | | 38,347,143 | | | | — | | | | 25,524,866 | | | | 80,133,626 | | | | 122,053,573 | | | | 160,809,968 | |
| | (148,333,764 | ) | | | (2,394,469 | ) | | | (10,932,189 | ) | | | (9,836,192 | ) | | | (4,183,730 | ) | | | (46,337,290 | ) | | | (10,609,735 | ) | | | (164,246,290 | ) | | | (49,867,230 | ) |
| | | | | | | | | | | | | | | | | | | | | | | | | | | | | | | | | | |
| | (49,613,007 | ) | | | 124,532,260 | | | | 26,603,539 | | | | 28,510,951 | | | | (4,183,730 | ) | | | (20,812,424 | ) | | | 69,523,891 | | | | (42,192,717 | ) | | | 110,942,738 | |
| | | | | | | | | | | | | | | | | | | | | | | | | | | | | | | | | | |
| | (16,147,982 | ) | | | 178,008,737 | | | | 24,771,776 | | | | 31,465,606 | | | | (9,484,625 | ) | | | (25,479,572 | ) | | | 66,259,364 | | | | (40,624,702 | ) | | | 129,253,663 | |
| | | | | | | | | | | | | | | | | | | | | | | | | | | | | | | | | | |
| | | | | | | | |
| | | | | | | | | | | | | | | | | | | | | | | | | | | | | | | | | | |
| | 610,252,894 | | | | 432,244,157 | | | | 35,408,132 | | | | 3,942,526 | | | | 78,004,708 | | | | 103,484,280 | | | | 37,224,916 | | | | 360,007,888 | | | | 230,754,225 | |
| | | | | | | | | | | | | | | | | | | | | | | | | | | | | | | | | | |
| $ | 594,104,912 | | | $ | 610,252,894 | | | $ | 60,179,908 | | | $ | 35,408,132 | | | $ | 68,520,083 | | | $ | 78,004,708 | | | $ | 103,484,280 | | | $ | 319,383,186 | | | $ | 360,007,888 | |
| | | | | | | | | | | | | | | | | | | | | | | | | | | | | | | | | | |
| $ | 8,753,543 | | | $ | 8,831,330 | | | $ | 381,342 | | | $ | 405,325 | | | $ | (1,507,196 | ) | | $ | (1,698,503 | ) | | $ | 1,052,504 | | | $ | 9,652 | | | $ | 1,929,227 | |
| | | | | | | | | | | | | | | | | | | | | | | | | | | | | | | | | | |
| | | | | | | | |
| | | | | | | | | | | | | | | | | | | | | | | | | | | | | | | | | | |
| | 2,800,000 | | | | 4,080,000 | | | | 1,400,000 | | | | 1,450,000 | | | | — | | | | 2,200,000 | | | | 6,800,000 | | | | 4,960,000 | | | | 8,320,000 | |
| | (4,240,000 | ) | | | (80,000 | ) | | | (400,000 | ) | | | (350,000 | ) | | | (400,000 | ) | | | (4,100,000 | ) | | | (900,000 | ) | | | (7,040,000 | ) | | | (2,720,000 | ) |
| | 18,280,000 | | | | 14,280,000 | | | | 1,250,000 | | | | 150,000 | | | | 7,100,000 | | | | 9,000,000 | | | | 3,100,000 | | | | 16,648,000 | | | | 11,048,000 | |
| | | | | | | | | | | | | | | | | | | | | | | | | | | | | | | | | | |
| | 16,840,000 | | | | 18,280,000 | | | | 2,250,000 | | | | 1,250,000 | | | | 6,700,000 | | | | 7,100,000 | | | | 9,000,000 | | | | 14,568,000 | | | | 16,648,000 | |
| | | | | | | | | | | | | | | | | | | | | | | | | | | | | | | | | | |
Financial Highlights
Invesco China All-Cap ETF (YAO)
| | | | | | | | | | | | | | | | | | | | |
| | | Year Ended August 31, | |
| | | 2018 | | | 2017 | | | 2016 | | | 2015 | | | 2014 | |
| Per Share Data: | | | | | | | | | | | | | | | | | | | | |
Net asset value, beginning of year | | $ | 33.14 | | | $ | 26.19 | | | $ | 24.42 | | | $ | 28.56 | | | $ | 24.63 | |
Income from investment operations: | | | | | | | | | | | | | | | | | | | | |
Net investment income(a) | | | 0.60 | | | | 0.50 | | | | 0.52 | | | | 0.53 | | | | 0.62 | |
Net gain (loss) on investments (realized and unrealized) | | | (0.49 | ) | | | 6.99 | | | | 2.12 | | | | (4.02 | ) | | | 3.80 | |
Total from investment operations | | | 0.11 | | | | 7.49 | | | | 2.64 | | | | (3.49 | ) | | | 4.42 | |
Less distributions from: | | | | | | | | | | | | | | | | | | | | |
Net investment income | | | (0.71 | ) | | | (0.54 | ) | | | (0.87 | ) | | | (0.65 | ) | | | (0.49 | ) |
Net asset value, end of year | | $ | 32.54 | | | $ | 33.14 | | | $ | 26.19 | | | $ | 24.42 | | | $ | 28.56 | |
Market value, end of year | | $ | 32.42 | (b) | | $ | 33.23 | | | $ | 26.23 | | | $ | 24.13 | | | $ | 28.52 | |
| Net Asset Value Total Return(c) | | | 0.19 | % | | | 29.33 | % | | | 10.99 | % | | | (12.51 | )% | | | 18.05 | % |
| Market Price Total Return(c) | | | (0.44 | )% | | | | | | | | | | | | | | | | |
| Ratios/Supplemental Data: | | | | | | | | | | | | | | | | | | | | |
Net assets, end of year (in thousands) | | $ | 22,778 | | | $ | 26,510 | | | $ | 23,574 | | | $ | 29,308 | | | $ | 54,262 | |
Ratio to average net assets of: | | | | | | | | | | | | | | | | | | | | |
Expenses | | | 0.70 | % | | | 0.70 | % | | | 0.70 | % | | | 0.70 | % | | | 0.71 | % |
Net investment income | | | 1.70 | % | | | 1.81 | % | | | 2.17 | % | | | 1.84 | % | | | 2.35 | % |
Portfolio turnover rate(d) | | | 10 | % | | | 10 | % | | | 26 | % | | | 17 | % | | | 12 | % |
| (a) | Based on average shares outstanding. |
| (b) | The mean between the last bid and ask prices. |
| (c) | Net asset value total return is calculated assuming an initial investment made at the net asset value at the beginning of the period, reinvestment of all dividends and distributions at net asset value during the period, and redemption on the last day of the period. Net asset value total return includes adjustments in accordance with accounting principles generally accepted in the United States of America and as such, the net asset value for financial reporting purposes and the returns based upon those net asset values may differ from the net asset value and returns for shareholder transactions. Market price total return is calculated assuming an initial investment made at the market price at the beginning of the period, reinvestment of all dividends and distributions at market price during the period, and sale at the market price on the last day of the period. Total investment returns calculated for a period of less than one year are not annualized. |
| (d) | Portfolio turnover rate is not annualized for periods less than one year, if applicable, and does not include securities received or delivered from processing creations or redemptions. |
Invesco China Technology ETF (CQQQ)
| | | | | | | | | | | | | | | | | | | | |
| | | Year Ended August 31, | |
| | | 2018 | | | 2017 | | | 2016 | | | 2015 | | | 2014 | |
| Per Share Data: | | | | | | | | | | | | | | | | | | | | |
Net asset value, beginning of year | | $ | 55.00 | | | $ | 39.26 | | | $ | 29.55 | | | $ | 38.09 | | | $ | 29.55 | |
Income from investment operations: | | | | | | | | | | | | | | | | | | | | |
Net investment income(a) | | | 0.31 | | | | 0.52 | | | | 0.32 | | | | 0.46 | | | | 0.43 | |
Net gain (loss) on investments (realized and unrealized) | | | (5.13 | ) | | | 15.82 | | | | 10.03 | | | | (8.65 | ) | | | 8.39 | |
Total from investment operations | | | (4.82 | ) | | | 16.34 | | | | 10.35 | | | | (8.19 | ) | | | 8.82 | |
Less distributions from: | | | | | | | | | | | | | | | | | | | | |
Net investment income | | | (0.86 | ) | | | (0.60 | ) | | | (0.64 | ) | | | (0.35 | ) | | | (0.28 | ) |
Net asset value, end of year | | $ | 49.32 | | | $ | 55.00 | | | $ | 39.26 | | | $ | 29.55 | | | $ | 38.09 | |
Market value, end of year | | $ | 49.36 | (b) | | $ | 55.21 | | | $ | 39.08 | | | $ | 29.31 | | | $ | 37.88 | |
| Net Asset Value Total Return(c) | | | (9.05 | )% | | | 42.43 | % | | | 35.19 | % | | | (21.62 | )% | | | 29.89 | % |
| Market Price Total Return(c) | | | (9.33 | )% | | | | | | | | | | | | | | | | |
| Ratios/Supplemental Data: | | | | | | | | | | | | | | | | | | | | |
Net assets, end of year (in thousands) | | $ | 384,689 | | | $ | 209,019 | | | $ | 45,153 | | | $ | 45,804 | | | $ | 78,077 | |
Ratio to average net assets of: | | | | | | | | | | | | | | | | | | | | |
Expenses | | | 0.65 | % | | | 0.70 | % | | | 0.70 | % | | | 0.70 | % | | | 0.71 | % |
Net investment income | | | 0.52 | % | | | 1.20 | % | | | 0.94 | % | | | 1.20 | % | | | 1.22 | % |
Portfolio turnover rate(d) | | | 21 | % | | | 10 | % | | | 48 | % | | | 32 | % | | | 39 | % |
| (a) | Based on average shares outstanding. |
| (b) | The mean between the last bid and ask prices. |
| (c) | Net asset value total return is calculated assuming an initial investment made at the net asset value at the beginning of the period, reinvestment of all dividends and distributions at net asset value during the period, and redemption on the last day of the period. Net asset value total return includes adjustments in accordance with accounting principles generally accepted in the United States of America and as such, the net asset value for financial reporting purposes and the returns based upon those net asset values may differ from the net asset value and returns for shareholder transactions. Market price total return is calculated assuming an initial investment made at the market price at the beginning of the period, reinvestment of all dividends and distributions at market price during the period, and sale at the market price on the last day of the period. Total investment returns calculated for a period of less than one year are not annualized. |
| (d) | Portfolio turnover rate is not annualized for periods less than one year, if applicable, and does not include securities received or delivered from processing creations or redemptions. |
See accompanying Notes of Financial Statements which are an integral part of the financial statements.
Financial Highlights (continued)
Invesco S&P Global Water Index ETF (CGW)
| | | | | | | | | | | | | | | | | | | | |
| | | Year Ended August 31, | |
| | | 2018 | | | 2017 | | | 2016 | | | 2015 | | | 2014 | |
| Per Share Data: | | | | | | | | | | | | | | | | | | | | |
Net asset value, beginning of year | | $ | 33.38 | | | $ | 30.27 | | | $ | 26.67 | | | $ | 29.02 | | | $ | 23.90 | |
Income from investment operations: | | | | | | | | | | | | | | | | | | | | |
Net investment income(a) | | | 0.59 | | | | 0.61 | | | | 0.54 | | | | 0.48 | | | | 0.51 | |
Net gain (loss) on investments (realized and unrealized) | | | 1.92 | | | | 2.97 | | | | 3.51 | | | | (2.33 | ) | | | 5.03 | |
Total from investment operations | | | 2.51 | | | | 3.58 | | | | 4.05 | | | | (1.85 | ) | | | 5.54 | |
Less distributions from: | | | | | | | | | | | | | | | | | | | | |
Net investment income | | | (0.61 | ) | | | (0.47 | ) | | | (0.45 | ) | | | (0.50 | ) | | | (0.42 | ) |
Net asset value, end of year | | $ | 35.28 | | | $ | 33.38 | | | $ | 30.27 | | | $ | 26.67 | | | $ | 29.02 | |
Market value, end of year | | $ | 35.23 | (b) | | $ | 33.46 | | | $ | 30.32 | | | $ | 26.64 | | | $ | 29.08 | |
| Net Asset Value Total Return(c) | | | 7.51 | % | | | 12.09 | % | | | 15.40 | % | | | (6.47 | )% | | | 23.27 | % |
| Market Price Total Return(c) | | | 7.09 | % | | | | | | | | | | | | | | | | |
| Ratios/Supplemental Data: | | | | | | | | | | | | | | | | | | | | |
Net assets, end of year (in thousands) | | $ | 594,105 | | | $ | 610,253 | | | $ | 432,244 | | | $ | 346,709 | | | $ | 367,914 | |
Ratio to average net assets of: | | | | | | | | | | | | | | | | | | | | |
Net expenses | | | 0.62 | % | | | 0.63 | % | | | 0.64 | % | | | 0.64 | % | | | 0.65 | % |
Net investment income | | | 1.71 | % | | | 1.98 | % | | | 1.93 | % | | | 1.69 | % | | | 1.83 | % |
Portfolio turnover rate(d) | | | 13 | % | | | 8 | % | | | 6 | % | | | 9 | % | | | 7 | % |
| (a) | Based on average shares outstanding. |
| (b) | The mean between the last bid and ask prices. |
| (c) | Net asset value total return is calculated assuming an initial investment made at the net asset value at the beginning of the period, reinvestment of all dividends and distributions at net asset value during the period, and redemption on the last day of the period. Net asset value total return includes adjustments in accordance with accounting principles generally accepted in the United States of America and as such, the net asset value for financial reporting purposes and the returns based upon those net asset values may differ from the net asset value and returns for shareholder transactions. Market price total return is calculated assuming an initial investment made at the market price at the beginning of the period, reinvestment of all dividends and distributions at market price during the period, and sale at the market price on the last day of the period. Total investment returns calculated for a period of less than one year are not annualized. |
| (d) | Portfolio turnover rate is not annualized for periods less than one year, if applicable, and does not include securities received or delivered from processing creations or redemptions. |
Invesco S&P High Income Infrastructure ETF (GHII)
| | | | | | | | | | | | | | | | |
| | | Year Ended August 31, | | | Period Ended
August 31, 2015(a) | |
| | | 2018 | | | 2017 | | | 2016 | |
| Per Share Data: | | | | | | | | | | | | | | | | |
Net asset value, beginning of period | | $ | 28.33 | | | $ | 26.28 | | | $ | 22.87 | | | $ | 25.05 | |
Income from investment operations: | | | | | | | | | | | | | | | | |
Net investment income(b) | | | 1.53 | | | | 1.76 | | | | 1.34 | | | | 0.71 | |
Net gain (loss) on investments (realized and unrealized) | | | (1.43 | ) | | | 1.57 | | | | 3.34 | | | | (2.45 | ) |
Total from investment operations | | | 0.10 | | | | 3.33 | | | | 4.68 | | | | (1.74 | ) |
Less distributions from: | | | | | | | | | | | | | | | | |
Net investment income | | | (1.38 | ) | | | (1.27 | ) | | | (1.27 | ) | | | (0.44 | ) |
Capital gains | | | (0.30 | ) | | | (0.01 | ) | | | — | | | | — | |
Total distributions to shareholders | | | (1.68 | ) | | | (1.28 | ) | | | (1.27 | ) | | | (0.44 | ) |
Net asset value, end of period | | $ | 26.75 | | | $ | 28.33 | | | $ | 26.28 | | | $ | 22.87 | |
Market value, end of period | | $ | 26.77 | (c) | | $ | 28.35 | | | $ | 26.48 | | | $ | 22.56 | |
| Net Asset Value Total Return(d) | | | 0.40 | % | | | 12.98 | % | | | 21.35 | % | | | (7.02 | )% |
| Market Price Total Return(d) | | | 0.37 | % | | | | | | | | | | | | |
| Ratios/Supplemental Data: | | | | | | | | | | | | | | | | |
Net assets, end of period (in thousands) | | $ | 60,180 | | | $ | 35,408 | | | $ | 3,943 | | | $ | 2,287 | |
Ratio to average net assets of: | | | | | | | | | | | | | | | | |
Expenses | | | 0.44 | % | | | 0.45 | % | | | 0.45 | % | | | 0.45 | %(e) |
Net investment income | | | 5.66 | % | | | 6.46 | % | | | 5.82 | % | | | 5.13 | %(e) |
Portfolio turnover rate(f) | | | 45 | % | | | 66 | % | | | 61 | % | | | 13 | % |
| (a) | The Fund commenced operations on February 11, 2015. |
| (b) | Based on average shares outstanding. |
| (c) | The mean between the last bid and ask prices. |
| (d) | Net asset value total return is calculated assuming an initial investment made at the net asset value at the beginning of the period, reinvestment of all dividends and distributions at net asset value during the period, and redemption on the last day of the period. Net asset value total return includes adjustments in accordance with accounting principles generally accepted in the United States of America and as such, the net asset value for financial reporting purposes and the returns based upon those net asset values may differ from the net asset value and returns for shareholder transactions. Market price total return is calculated assuming an initial investment made at the market price at the beginning of the period, reinvestment of all dividends and distributions at market price during the period, and sale at the market price on the last day of the period. Total investment returns calculated for a period of less than one year are not annualized. |
| (f) | Portfolio turnover rate is not annualized for periods less than one year, if applicable, and does not include securities received or delivered from processing creations or redemptions. |
See accompanying Notes to Financial Statements which are in integral part of the financial statements.
Financial Highlights (continued)
Invesco Shipping ETF (SEA)
| | | | | | | | | | | | | | | | | | | | | | | | |
| | | Three Months Ended
August 31, 2018 | | | Year Ended May 31, | |
| | | 2018 | | | 2017 | | | 2016 | | | 2015 | | | 2014 | |
| Per Share Data: | | | | | | | | | | | | | | | | | | | | | | | | |
Net asset value, beginning of period | | $ | 10.99 | | | $ | 11.50 | | | $ | 12.01 | | | $ | 19.60 | | | $ | 22.68 | | | $ | 17.51 | |
Income from investment operations: | | | | | | | | | | | | | | | | | | | | | | | | |
Net investment income(a) | | | 0.04 | | | | 0.30 | | | | 0.57 | | | | 1.02 | | | | 0.99 | | | | 0.56 | |
Net gain (loss) on investments (realized and unrealized) | | | (0.66 | ) | | | (0.21 | ) | | | (0.38 | ) | | | (7.15 | ) | | | (3.35 | ) | | | 5.06 | |
Total from investment operations | | | (0.62 | ) | | | 0.09 | | | | 0.19 | | | | (6.13 | ) | | | (2.36 | ) | | | 5.62 | |
Less distributions from: | | | | | | | | | | | | | | | | | | | | | | | | |
Net investment income | | | (0.01 | ) | | | (0.59 | ) | | | (0.70 | ) | | | (1.46 | ) | | | (0.72 | ) | | | (0.45 | ) |
Return of capital | | | (0.13 | ) | | | (0.01 | ) | | | — | | | | — | | | | — | | | | — | |
Total distributions to shareholders | | | (0.14 | ) | | | (0.60 | ) | | | (0.70 | ) | | | (1.46 | ) | | | (0.72 | ) | | | (0.45 | ) |
Net asset value, end of period | | $ | 10.23 | | | $ | 10.99 | | | $ | 11.50 | | | $ | 12.01 | | | $ | 19.60 | | | $ | 22.68 | |
Market price, end of period | | $ | 10.20 | (b) | | $ | 10.96 | (b) | | $ | 11.49 | | | $ | 12.00 | | | $ | 19.55 | | | $ | 22.69 | |
| Net Asset Value Total Return(c) | | | (5.67 | )% | | | 0.58 | % | | | 1.83 | % | | | (32.56 | )% | | | (10.52 | )% | | | 32.57 | % |
| Market Price Total Return(c) | | | (5.69 | )% | | | 0.40 | % | | | | | | | | | | | | | | | | |
| Ratios/Supplemental Data: | | | | | | | | | | | | | | | | | | | | | | | | |
Net assets, end of period (in thousands) | | $ | 68,520 | | | $ | 78,005 | | | $ | 103,484 | | | $ | 37,225 | | | $ | 70,577 | | | $ | 117,953 | |
Ratio to average net assets of: | | | | | | | | | | | | | | | | | | | | | | | | |
Expenses | | | 0.65 | %(d) | | | 0.65 | % | | | 0.65 | % | | | 0.65 | % | | | 0.65 | % | | | 0.66 | % |
Net investment income | | | 1.66 | %(d) | | | 2.58 | % | | | 4.84 | % | | | 6.95 | % | | | 4.82 | % | | | 2.72 | % |
Portfolio turnover rate(e) | | | 45 | % | | | 37 | % | | | 24 | % | | | 34 | % | | | 27 | % | | | 18 | % |
| (a) | Based on average shares outstanding. |
| (b) | The mean between the last bid and ask prices. |
| (c) | Net asset value total return is calculated assuming an initial investment made at the net asset value at the beginning of the period, reinvestment of all dividends and distributions at net asset value during the period, and redemption on the last day of the period. Net asset value total return includes adjustments in accordance with accounting principles generally accepted in the United States of America and as such, the net asset value for financial reporting purposes and the returns based upon those net asset values may differ from the net asset value and returns for shareholder transactions. Market price total return is calculated assuming an initial investment made at the market price at the beginning of the period, reinvestment of all dividends and distributions at market price during the period, and sale at the market price on the last day of the period. Total investment returns calculated for a period of less than one year are not annualized. |
| (e) | Portfolio turnover rate is not annualized for periods less than one year, if applicable, and does not include securities received or delivered from processing creations or redemptions. |
Invesco Solar ETF (TAN)
| | | | | | | | | | | | | | | | | | | | |
| | | Year Ended August 31, | |
| | | 2018 | | | 2017 | | | 2016 | | | 2015 | | | 2014 | |
| Per Share Data: | | | | | | | | | | | | | | | | | | | | |
Net asset value, beginning of year | | $ | 21.62 | | | $ | 20.89 | | | $ | 29.72 | | | $ | 43.58 | | | $ | 27.23 | |
Income from investment operations: | | | | | | | | | | | | | | | | | | | | |
Net investment income(a) | | | 0.54 | | | | 0.49 | | | | 0.80 | | | | 0.72 | | | | 0.52 | |
Net gain (loss) on investments (realized and unrealized) | | | 0.20 | | | | 1.07 | | | | (9.14 | ) | | | (13.94 | ) | | | 16.28 | |
Total from investment operations | | | 0.74 | | | | 1.56 | | | | (8.34 | ) | | | (13.22 | ) | | | 16.80 | |
Less distributions from: | | | | | | | | | | | | | | | | | | | | |
Net investment income | | | (0.44 | ) | | | (0.83 | ) | | | (0.49 | ) | | | (0.64 | ) | | | (0.45 | ) |
Net asset value, end of year | | $ | 21.92 | | | $ | 21.62 | | | $ | 20.89 | | | $ | 29.72 | | | $ | 43.58 | |
Market value, end of year | | $ | 21.82 | (b) | | $ | 21.70 | | | $ | 20.91 | | | $ | 29.57 | | | $ | 43.39 | |
| Net Asset Value Total Return(c) | | | 3.19 | % | | | 8.72 | % | | | (28.59 | )% | | | (30.51 | )% | | | 62.06 | % |
| Market Price Total Return(c) | | | 2.33 | % | | | | | | | | | | | | | | | | |
| Ratios/Supplemental Data: | | | | | | | | | | | | | | | | | | | | |
Net assets, end of year (in thousands) | | $ | 319,383 | | | $ | 360,008 | | | $ | 230,754 | | | $ | 266,545 | | | $ | 429,167 | |
Ratio to average net assets of: | | | | | | | | | | | | | | | | | | | | |
Expenses, prior Waivers | | | 0.69 | % | | | 0.76 | % | | | 0.88 | % | | | 0.73 | % | | | 0.76 | % |
Expenses, after Waiver | | | 0.65 | % | | | 0.70 | % | | | 0.71 | % | | | 0.70 | % | | | 0.71 | % |
Net investment income, after Waivers | | | 2.23 | % | | | 2.57 | % | | | 3.26 | % | | | 1.83 | % | | | 1.28 | % |
Portfolio turnover rate(d) | | | 54 | % | | | 57 | % | | | 53 | % | | | 51 | % | | | 47 | % |
| (a) | Based on average shares outstanding. |
| (b) | The mean between the last bid and ask prices. |
| (c) | Net asset value total return is calculated assuming an initial investment made at the net asset value at the beginning of the period, reinvestment of all dividends and distributions at net asset value during the period, and redemption on the last day of the period. Net asset value total return includes adjustments in accordance with accounting principles generally accepted in the United States of America and as such, the net asset value for financial reporting purposes and the returns based upon those net asset values may differ from the net asset value and returns for shareholder transactions. Market price total return is calculated assuming an initial investment made at the market price at the beginning of the period, reinvestment of all dividends and distributions at market price during the period, and sale at the market price on the last day of the period. Total investment returns calculated for a period of less than one year are not annualized. |
| (d) | Portfolio turnover rate is not annualized for periods less than one year, if applicable, and does not include securities received or delivered from processing creations or redemptions. |
See accompanying Notes to Financial Statements which are in integral part of the financial statements.
Notes to Financial Statements
Invesco Exchange-Traded Fund Trust II
August 31, 2018
Note 1—Organization
Invesco Exchange-Traded Fund Trust II (the “Trust”), formerly PowerShares Exchange-Traded Fund Trust II, was organized as a Massachusetts business trust on October 10, 2006 and is authorized to have multiple series of portfolios. The Trust is an open-end management investment company registered under the Investment Company Act of 1940, as amended (the “1940 Act”). This report includes the following portfolios:
| | | | |
Full Name | | Predecessor Fund (as defined below) | | Short Name |
| Invesco China All-Cap ETF | | Guggenheim China All-Cap ETF | | “China All-Cap ETF” |
| Invesco China Technology ETF | | Guggenheim China Technology ETF | | “China Technology ETF” |
| Invesco S&P Global Water Index ETF | | Guggenheim S&P Global Water Index ETF | | “S&P Global Water Index ETF” |
| Invesco S&P High Income Infrastructure ETF | | Guggenheim S&P High Income Infrastructure ETF | | “S&P High Income Infrastructure ETF” |
| Invesco Shipping ETF | | Guggenheim Shipping ETF | | “Shipping ETF” |
| Invesco Solar ETF | | Guggenheim Solar ETF | | “Solar ETF” |
Each portfolio (each, a “Fund”, and collectively, the “Funds”) represents a separate series of the Trust. The shares of the Funds are referred to herein as “Shares” or “Fund’s Shares.” Each Fund’s Shares are listed and traded on NYSE Arca, Inc.
Effective June 4, 2018, the Funds’ names changed as part of an overall rebranding strategy whereby the PowerShares name was changed to the Invesco brand. This resulted in all references to the PowerShares name being changed to Invesco.
Each Fund acquired all or substantially all of the assets and all of the stated liabilities included in the financial statements of a corresponding fund of the Claymore Exchange-Traded Fund Trust 2 (each a “Predecessor Fund”) after the close of business on April 6, 2018 for China All-Cap ETF, S&P Global Water Index and Shipping ETF, or May 18, 2018 for China Technology ETF, S&P High Income Infrastructure ETF and Solar ETF (each a “Reorganization”). Each Fund adopted the performance and financial information of its corresponding Predecessor Fund. Information presented prior to the close of business on April 6, 2018 or May 18, 2018, as applicable, is that of the Predecessor Fund.
Effective August 31, 2018, the Shipping ETF’s fiscal year-end changed from May 31 to August 31.
On April 19, 2018, the Board of Trustees of Invesco Exchange-Traded Fund Trust II approved a change in fiscal year end for funds China All-Cap ETF, China Technology ETF and S&P Global Water Index ETF from August 31 to October 31, effective October 31, 2018.
The market price of each Share may differ to some degree from a Fund’s net asset value (“NAV”). Unlike conventional mutual funds, each Fund issues and redeems Shares on a continuous basis, at NAV, only in a large specified number of Shares, each called a “Creation Unit.” Creation Units are issued and redeemed principally in exchange for the deposit or delivery of a basket of securities. Except when aggregated in Creation Units by Authorized Participants, the Shares are not individually redeemable securities of the Funds.
The investment objective of each of the Funds is to seek investment results that correspond generally to the performance, before the Fund’s fees and expenses, of each Fund’s respective index listed below (each, an Underlying Index):
| | |
Fund | | Underlying Index |
| China All-Cap ETF | | AlphaShares China All Cap Index |
| China Technology ETF | | AlphaShares China Technology Index |
| S&P Global Water Index ETF | | S&P Global Water Index |
| S&P High Income Infrastructure ETF | | S&P High Income Infrastructure Index |
| Shipping ETF | | Dow Jones Global Shipping IndexSM |
| Solar ETF | | MAC Global Solar Energy Index |
Note 2—Significant Accounting Policies
The following is a summary of the significant accounting policies followed by the Funds in preparation of their financial statements.
Each Fund is an investment company and accordingly follows the investment company accounting and reporting guidance in accordance with Financial Accounting Standards Board Accounting Standards Codification Topic 946, Financial Services—Investment Companies.
A. Security Valuation
Securities, including restricted securities, are valued according to the following policies:
A security listed or traded on an exchange (except convertible securities) is generally valued at its last sales price or official closing price as of the close of the customary trading session on the exchange where the security is principally traded or, lacking any sales or official closing price on a particular day, the security may be valued at the closing bid price on that day. Securities traded in the over-the-counter (“OTC”) market are valued based on prices furnished by independent pricing services or market makers. When such securities are valued by an independent pricing service they may be considered fair valued. Futures contracts are valued at the final settlement price set by an exchange on which they are principally traded. Listed options are valued at the mean between the last bid and asked prices from the exchange on which they are principally traded, or at the final settlement price set by such exchange. Swaps and options not listed on an exchange are valued by an independent source. For purposes of determining NAV per Share, futures and option contracts generally are valued 15 minutes after the close of the customary trading session of the New York Stock Exchange (“NYSE”).
Investment companies are valued using such company’s NAV per share, unless the shares are exchange-traded, in which case they are valued at the last sales price or official closing price as of the close of the customary trading session on the exchange where the security is principally traded.
Debt obligations (including convertible securities) and unlisted equities are fair valued using an evaluated quote provided by an independent pricing service. Evaluated quotes provided by the pricing service may be determined without exclusive reliance on quoted prices, and may reflect appropriate factors such as institution-size trading in similar groups of securities, developments related to specific securities, dividend rate (for unlisted equities), yield (for debt obligations), quality, type of issue, coupon rate (for debt obligations), maturity (for debt obligations), individual trading characteristics and other market data. Securities with a demand feature exercisable within one to seven days are valued at par. Pricing services generally value debt obligations assuming orderly transactions of institutional round lot size, but a Fund may hold or transact in the same securities in smaller, odd lot sizes. Odd lots often trade at lower prices than institutional round lots. Debt obligations are subject to interest rate and credit risks. In addition, all debt obligations involve some risk of default with respect to interest and/or principal payments.
Foreign securities’ (including foreign exchange contracts’) prices are converted into U.S. dollar amounts using the applicable exchange rates as of the close of the London world markets. If market quotations are available and reliable for foreign exchange-traded equity securities, the securities will be valued at the market quotations. Because trading hours for certain foreign securities end before the close of the NYSE, closing market quotations may become unreliable. If between the time trading ends on a particular security and the close of the customary trading session on the NYSE, events occur that Invesco Capital Management LLC (the “Adviser”), formerly Invesco PowerShares Capital Management LLC, determines are significant and make the closing price unreliable, a Fund may fair value the security. If the event is likely to have affected the closing price of the security, the security will be valued at fair value in good faith using procedures approved by the Board of Trustees. Adjustments to closing prices to reflect fair value may also be based on a screening process of an independent pricing service to indicate the degree of certainty, based on historical data, that the closing price in the principal market where a foreign security trades is not the current value as of the close of the NYSE. Foreign securities’ prices meeting the approved degree of certainty that the price is not reflective of current value will be priced at the indication of fair value from the independent pricing service. Multiple factors may be considered by the independent pricing service in determining adjustments to reflect fair value and may include information relating to sector indices, American Depositary Receipts (“ADRs”) and domestic and foreign index futures. Foreign securities may have additional risks including exchange rate changes, potential for sharply devalued currencies and high inflation, political and economic upheaval, the relative lack of issuer information, relatively low market liquidity and the potential lack of strict financial and accounting controls and standards.
Securities for which market prices are not provided by any of the above methods may be valued based upon quotes furnished by independent sources. The last bid price may be used to value exchange-traded equity securities. The mean between the last bid and asked prices may be used to value debt obligations, including corporate loans, and unlisted equity securities.
Securities for which market quotations are not readily available or became unreliable are valued at fair value as determined in good faith following procedures approved by the Board of Trustees. Issuer-specific events, market trends, bid/asked quotes of brokers and information providers and other market data may be reviewed in the course of making a good faith determination of a security’s fair value.
Each Fund may invest in securities that are subject to interest rate risk, meaning the risk that the prices will generally fall as interest rates rise and, conversely, the prices will generally rise as interest rates fall. Specific securities differ in their sensitivity to changes in interest rates depending on their individual characteristics. Changes in interest rates may result in increased market volatility, which may affect the value and/or liquidity of certain Fund investments.
Valuations change in response to many factors, including the historical and prospective earnings of the issuer, the value of the issuer’s assets, general economic conditions, interest rates, investor perceptions and market liquidity. Because of the inherent uncertainties of valuation, the values reflected in the financial statements may materially differ from the value received upon actual sale of those investments.
B. Other Risks
Authorized Participant Concentration Risk. Only Authorized Participants (“APs”) may engage in creation or redemption transactions directly with each Fund. Each Fund has a limited number of institutions that may act as APs, and such APs have no obligation to submit creation or redemption orders. Consequently, there is no assurance that those APs will establish or maintain an active trading market for the Shares. This risk may be heightened to the extent that securities underlying each Fund are traded outside a collateralized settlement system. In that case, APs may be required to post collateral on certain trades on an agency basis (i.e., on behalf of other market participants), which only a limited number of APs may be able to do. In addition, to the extent that APs exit the business or are unable to proceed with creation and/or redemption orders with respect to each Fund and no other AP is able to step forward to create or redeem Creation Units, this may result in a significantly diminished trading market for Fund Shares, which may be more likely to trade at a premium or discount to each Fund’s net asset value (“NAV”) and to face trading halts and/or delisting. This risk may be heightened for each Fund because it invests in non-U.S. securities, which may have lower trading volumes.
Equity Securities Risk. Each Fund is subject to the risk that the value of the equity securities and equity-based derivatives, if any, in each Fund’s portfolio will decline due to volatility in the equity market caused by general market and economic conditions, perceptions regarding particular industries represented in the equity market, or factors relating to specific companies to which each Fund has investment exposure.
Tracking Error Risk. The performance of each Fund may diverge from that of its Underlying Index for a number of reasons, including operating expenses, transaction costs, cash flows and operational inefficiencies. Each Fund’s return also may diverge from the return of the Underlying Index because the Fund bears the costs and risks associated with buying and selling securities (especially when rebalancing the Fund’s securities holdings to reflect changes in the Underlying Index) while such costs and risks are not factored into the return of the Underlying Index. Transaction costs, including brokerage costs, will decrease each Fund’s NAV to the extent not offset by the transaction fee payable by an AP. Market disruptions and regulatory restrictions could have an adverse effect on each Fund’s ability to adjust its exposure to the required levels in order to track the Underlying Index. In addition, each Fund may use a representative sampling approach, which may cause each Fund’s returns to not be as well correlated with the return of the Underlying Index as would be the case if the Fund purchased all of the securities in the Underlying Index in the proportions represented in the Underlying Index. Errors in the Underlying Index data, the Underlying Index computations and/or the construction of the Underlying Index in accordance with its methodology may occur from time to time and may not be identified and corrected by the Index Provider for a period of time or at all, which may have an adverse impact on the Fund and its shareholders. In addition, each Fund may be unable to invest in certain securities included in its Underlying Index, or invest in them in the exact proportions in which they are represented in the Underlying Index, due to legal restrictions or limitations imposed by the governments of certain countries, a lack of liquidity on stock exchanges in which such securities trade, potential adverse tax consequences or other regulatory reasons. To the extent each Fund calculates its NAV based on fair value prices and the value of its Underlying Index is based on the securities’ closing prices (i.e., the value of the Underlying Index is not based on fair value prices), each Fund’s ability to track the Underlying Index may be adversely affected. For tax efficiency purposes, each Fund may sell certain securities, and such sale may cause each Fund to realize a loss and, thus, each Fund’s performance to deviate from the performance of the Underlying Index. In light of the factors discussed above, each Fund’s return may deviate significantly from the return of its Underlying Index.
Industry Concentration Risk. The Underlying Index from time to time may be concentrated to a significant degree in securities of issuers located in a single industry or sector. To the extent that the Underlying Index concentrates in the securities of issuers in a particular industry or sector, the Fund will also concentrate its investments to approximately the same extent. By concentrating its investments in an industry or sector, the Fund faces more risks than if it were diversified broadly over numerous industries or sectors. Such industry-based risks, any of which may adversely affect the companies in which the Fund invests, may include, but are not limited to, the following: general economic conditions or cyclical market patterns that could negatively affect supply and demand in a particular industry; competition for resources, adverse labor relations, political or world events; obsolescence of technologies; and increased competition or new product introductions that may affect the profitability or viability of companies in an industry. In addition, at times, such industry or sector may be out of favor and underperform other industries or the market as a whole.
Non-Diversification Risk. Each Fund is considered non-diversified and can invest a greater portion of its assets in securities of individual issuers than a diversified fund. As a result, changes in the market value of a single issuer’s securities could cause greater fluctuations in the value of the Shares than would occur in a diversified fund.
Issuer-Specific Changes Risk. The value of an individual security or particular type of security can be more volatile than the market as a whole and can perform differently from the value of the market as a whole. The value of securities of smaller issuers can be more volatile than that of larger issuers.
Micro-Capitalization Securities Risk. For China All-Cap ETF, China Technology ETF, Shipping ETF and Solar ETF, micro-capitalization stocks involve substantially greater risks of loss and price fluctuations because their earnings and revenues tend to be less predictable (and some companies may be experiencing significant losses), and their share prices tend to be more volatile and their markets less liquid than companies with larger market capitalizations.
Small- and Mid-Capitalization Securities Risk. Small- and mid-capitalization securities may underperform other segments of the equity market or the equity market as a whole. Securities of small- and mid-capitalization companies may be more speculative, volatile and less liquid than securities of large companies. Small- and mid-capitalization companies tend to have inexperienced management as well as limited product and market diversification and financial resources, and may be more vulnerable to adverse developments than large capitalization companies.
Passive Management Risk. Each Fund is not actively managed and the Adviser does not attempt to take defensive positions in declining markets. Therefore, each Fund may be subject to greater losses in a declining market than a fund that is actively managed.
Emerging Markets Risk. The risks of foreign investments are usually much greater for emerging markets. Emerging markets are riskier because they develop unevenly and may never fully develop. They are more likely to experience hyperinflation and currency devaluations, which adversely affect returns to U.S. investors. In addition, the securities markets in many of these countries have far lower trading volumes and less liquidity then developed markets. Because these markets are so small, they may be more likely to suffer sharp and frequent price changes or long term price depression due to adverse publicity, investor perceptions or the transactions of a few large investors. Traditional measures of investment value used in the U.S., such as price to earnings ratios, may not apply to certain small markets, making it more difficult to value their securities.
Depositary Receipt Risk. Each Fund may hold the securities of non-U.S. companies in the form of depositary receipts. The underlying securities of the depositary receipts in each Fund’s portfolio are subject to fluctuations in foreign currency exchange rates that may affect the value of each Fund’s portfolio. In addition, the value of the securities underlying the depositary receipts may change materially when U.S. markets are not open for trading. Investments in the underlying foreign securities also involve political and economic risks distinct from those associated with investing in the securities of U.S. issuers.
REIT Risk. For Solar ETF, in addition to the risks pertaining to real estate investments more generally, REITs are subject to additional risks. The value of a REIT can depend on the structure of and cash flow generated by the REIT. REITs whose investments are concentrated in a limited number or type of properties, investments or narrow geographic area are also subject to certain requirements under federal tax law. In addition, REITs may have expenses, including advisory and administration expenses, and Solar ETF and its shareholders will incur its pro rata share of the underlying expenses.
Foreign Securities and Currency Risk. Foreign securities carry unique or additional risks when compared to U.S. securities, including currency fluctuations, adverse political and economic developments, unreliable or untimely information, less liquidity and more volatility, limited legal recourse and higher transactional costs. Because foreign exchanges may be open on days when a Fund does not price its shares, the value of the non-U.S. securities in the Fund’s portfolio may change on days when you will not be able to purchase or sell your shares. As a result, trading spreads and the resulting premium or discount on the shares may widen, and, therefore, increase the difference between the market price of the shares and the NAV of such shares. Securities exchanges or foreign governments may adopt rules or regulations that may negatively impact a Fund’s ability to invest in foreign securities or may prevent the Fund from repatriating its investments.
C. Country Determination
For the purposes of presentation in the Schedules of Investments, the Adviser may determine the country in which an issuer is located and/or credit risk exposure based on various factors. These factors include whether each Fund’s Underlying Index has made a country determination and may include the laws of the country under which the issuer is organized, where the issuer maintains a principal office, the country in which the issuer derives 50% or more of its total revenues and the country that has the primary market for the issuer’s securities, as well as other criteria. Among the other criteria that may be evaluated for making this determination are the country in which the issuer maintains 50% or more of its assets, the type of security, financial guarantees and enhancements, the nature of the collateral and the sponsor organization. Country of issuer and/or credit risk exposure has been determined to be the United States of America, unless otherwise noted.
D. Repurchase Agreements
The Funds may enter into repurchase agreements with financial institutions. In a repurchase agreement, a Fund buys a security and the seller simultaneously agrees to repurchase the security on a specified future date at an agreed-upon price. The repurchase price reflects an agreed-upon interest-rate during the time the Fund’s money is invested in the security. Because the security constitutes collateral for the repurchase obligation, a repurchase agreement can be considered a collateralized loan. The Funds follow certain procedures designed to minimize the risks inherent in such agreements. These procedures include effecting repurchase transactions only with large, well-capitalized and well-established financial institutions whose condition will be continually monitored. In addition, the value of the collateral underlying the repurchase agreement will always be at least equal to the repurchase price, including any accrued interest earned on the repurchase agreement. In the event of a default or bankruptcy by a selling financial institution, the Funds will seek to liquidate such collateral. However, the exercising of the Funds right to liquidate such collateral could involve certain costs or delays and, to the extent that proceeds from any sale upon a default of the obligation to repurchase were less than the repurchase price, the Funds could suffer a loss. It is the current policy of the Funds not to invest in repurchase agreements that do not mature within seven days if
any such investment, together with any other illiquid assets held by the Funds, amounts to more than 15% of each Fund’s net assets. The investments of the Funds in repurchase agreements, at times, may be substantial when, in the view of the Adviser, liquidity or other considerations so warrant.
E. Foreign Currency Translations
The accounting records of the Funds are maintained in U.S. dollars. All assets and liabilities initially expressed in foreign currencies are converted into U.S. dollars at prevailing exchange rates. Purchases and sales of investment securities, dividend and interest income, and certain expenses are translated at the rates of exchange prevailing on the respective dates of such transactions. Changes in the relationship of these foreign currencies to the U.S. dollar can significantly affect the value of the investments and earnings of the Funds. Foreign investments may also subject the Funds to foreign government exchange restrictions, expropriation, taxation, or other political, social or economic developments, all of which could affect the market and/or credit risk of the investments.
The Funds do not isolate that portion of the results of operations resulting from changes in the foreign exchange rates on investments from the fluctuations arising from changes in the market prices of securities held. Such fluctuations are included with the net realized and unrealized gain or loss on investments.
Reported net realized foreign exchange gains and losses arise from sales of foreign currencies and currency gains or losses realized between the trade and settlement dates on investment transactions. Net unrealized exchange gains and losses arise from changes in the fair values of assets and liabilities other than investments in securities at the fiscal period end, resulting from changes in exchange rates.
F. Investment Transactions and Investment Income
Security transactions are recorded on the trade date for financial reporting purposes. Realized gains and losses from securities transactions are recorded using the identified cost basis. Dividend income is recorded on the ex-dividend date, net of applicable taxes withheld by foreign countries. Taxable non-cash dividends are recorded as dividend income. Interest income, including amortization of premiums and accretion of discounts, is accrued on a daily basis. For Solar ETF, dividend income from REITs is recorded based on the income included in the distributions received from the REIT investments using published REIT classifications, including some management estimates when actual amounts are not available. Distributions received in excess of this estimated amount are recorded as a reduction of the cost of investments or reclassified to capital gains. The actual amounts of income, return of capital, and capital gains are only determined by each REIT after its fiscal year-end, and may differ from the estimated amounts.
The Funds may periodically participate in litigation related to each Fund’s investments. As such, the Funds may receive proceeds from litigation settlements. Any proceeds received are included in the Statements of Operations as realized gain (loss) for investments no longer held and as unrealized gain (loss) for investments still held.
Brokerage commissions and mark ups are considered transaction costs and are recorded as an increase to the cost basis of securities purchased and/or a reduction of proceeds on a sale of securities. Such transaction costs are included in the determination of net realized and unrealized gain (loss) from investment securities reported in the Statements of Operations and the Statements of Changes in Net Assets and the net realized and unrealized gains (losses) on securities per share in the Financial Highlights. Transaction costs are included in the calculation of each Fund’s NAV and, accordingly, they reduce each Fund’s total returns. These transaction costs are not considered operating expenses and are not reflected in net investment income reported in the Statements of Operations and the Statements of Changes in Net Assets, or the net investment income per share and the ratios of expenses and net investment income reported in the Financial Highlights, nor are they limited by any expense limitation arrangements between each Fund and the Adviser.
G. Dividends and Distributions to Shareholders
The Funds intend to pay substantially all of their net investment income to shareholders. Distribution frequency is as follows:
| | |
Fund | | Frequency |
| China All-Cap ETF | | Annually |
| China Technology ETF | | Annually |
| S&P Global Water Index ETF | | Annually |
| S&P High Income Infrastructure ETF | | Quarterly |
| Shipping ETF | | Quarterly |
| Solar ETF | | Annually |
Each Fund records such dividends on ex-dividend date. In addition, the Funds intend to distribute any capital gains to shareholders as capital gain dividends at least annually. The amount and timing of distributions are determined in accordance with federal income tax regulations, which may differ from U.S. GAAP. Distributions in excess of tax basis earnings and profits, if any, are reported in such Fund’s financial statements as a tax return of capital at fiscal year-end.
H. Federal Income Taxes
Each Fund intends to comply with the requirements of Subchapter M of the Internal Revenue Code of 1986, as amended (the “Internal Revenue Code”), necessary to qualify as a regulated investment company and to distribute substantially all of the Fund’s taxable earnings to shareholders. As such, the Fund will not be subject to federal income taxes on otherwise taxable income (including net realized capital gain) that is distributed to shareholders. Therefore, no provision for federal income taxes is recorded in the financial statements.
The Funds recognize the tax benefits of uncertain tax positions only when the position is more likely than not to be sustained. Management has analyzed the Fund’s uncertain tax positions and concluded that no liability for unrecognized tax benefits should be recorded related to uncertain tax positions. Management is not aware of any tax positions for which it is reasonably possible that the total amounts of unrecognized tax benefits will change materially in the next 12 months.
The Funds file tax returns in the U.S. Federal jurisdiction and certain other jurisdictions. Generally, a Fund is subject to examinations by such taxing authorities for up to three years after the filing of the return for the tax period.
I. Expenses
Expenses of the Trust that are directly identifiable to a specific Fund are applied to that Fund. Expenses of the Trust that are not readily identifiable to a specific Fund are allocated in such a manner as deemed equitable, taking into consideration the nature and type of expense and the relative net assets of each Fund.
S&P Global Water Index ETF and Solar ETF are responsible for all of their expenses, including the investment advisory fees, cost of transfer agency, custody, fund administration, legal, audit and other services, interest, taxes, brokerage commissions and other expenses connected with executions of portfolio transactions, licensing fees related to its respective Underlying Index, any distribution fees or expenses, litigation expenses, fees payable to the Trust’s Board members and officers who are not “interested persons” (as defined in the 1940 Act) of the Trust (the “Independent Trustees”), any Trustee who is not an affiliate of the Adviser or Distributor (or any of their affiliates) and who is otherwise an “interested person” of the Trust under the 1940 Act (an “Unaffiliated Trustee”) or the Adviser, expenses incurred in connection with the Board members’ services, including travel expenses and legal fees of counsel for the Independent Trustees and any Unaffiliated Trustee, acquired fund fees and expenses, if any, and extraordinary expenses.
China All-Cap ETF, China Technology ETF, S&P High Income Infrastructure ETF and Shipping ETF have agreed to pay an annual unitary management fee to the Adviser. Out of the unitary management fee, the Adviser has agreed to pay for substantially all expenses of the Funds, including the cost of transfer agency, custody, fund administration, legal, audit and other services, except for advisory fees, distribution fees, if any, brokerage expenses, taxes, interest, acquired fund fees and expenses, if any, litigation expenses and other extraordinary expenses.
To the extent a Fund invests in other investment companies, the expenses shown in the accompanying financial statements reflect the expenses of the Fund and do not include any expenses of the investment companies in which it invests. The effects of such investment companies’ expenses are included in the realized and unrealized gain or loss on the investments in the investment companies.
J. Accounting Estimates
The preparation of the financial statements in accordance with GAAP requires management to make estimates and assumptions that affect the reported amounts and disclosures in the financial statements, including estimates and assumptions related to taxation. Actual results could differ from these estimates. In addition, the Funds monitor for material events or transactions that may occur or become known after the period-end date and before the date the financial statements are released to print.
Note 3—Investment Advisory Agreements and Other Agreements
The Trust has entered into Investment Advisory Agreements with the Adviser on behalf of the Funds, pursuant to which the Adviser has overall responsibility for the selection and ongoing monitoring of each Fund’s investments, managing each Fund’s business affairs and providing certain clerical, bookkeeping and other administrative services. Pursuant to an Investment Advisory Agreement, each of the following Funds accrues daily and pays monthly to the Adviser an annual fee equal to a percentage of its average daily net assets as stated below. During the period April 6, 2018 through the Reorganization, pursuant to an Interim Investment Advisory Agreement, GFIA did not receive an advisory fee from Solar ETF.
| | | | |
Fund | | Management Fees
(as a % of Net Assets) | |
| S&P Global Water Index ETF | | | 0.50 | % |
| Solar ETF | | | 0.50 | % |
Effective as of Reorganization, the Adviser has agreed to waive fees and/or pay Fund expenses to the extent necessary to prevent the operating expenses of each Fund (excluding interest expenses, brokerage commissions and other trading expenses, sub-licensing fees, offering costs, taxes, acquired fund fees and expenses, if any, and extraordinary expenses) from exceeding the percentage of the Fund’s average daily net assets per year (the “Expense Cap”) shown in the table below through at least April 6, 2020 for S&P Global Water Index ETF and May 18, 2020 for Solar ETF. Neither the Adviser nor the Fund can discontinue the agreement prior to its expiration. The limits are listed below:
| | | | |
Fund | | Expense Cap | |
| S&P Global Water Index ETF | | | 0.63 | % |
| Solar ETF | | | 0.65 | % |
Prior to the Reorganization, GFIA limited expenses for the Predecessor Funds shown above in the table to 0.65% and 0.65%, respectively.
Further, the Adviser agrees to reimburse S&P Global Water Index ETF and Solar ETF in the amount equal to the licensing fees that each Fund pays that cause the Fund’s operating expenses (excluding interest expenses, offering costs, brokerage commissions and other trading expenses, taxes, acquired fund fees and expenses and extraordinary expenses) to exceed the following percentages:
| | | | | | | | |
Fund | | Limit | | | Contract End Date | |
| S&P Global Water Index ETF | | | 0.63 | % | | | 4/6/20 | |
| Solar ETF | | | 0.70 | % | | | 5/18/20 | |
Pursuant to another Investment Advisory Agreement, each Fund listed below accrues daily and pays monthly to the Adviser, as compensation for its services, an annual unitary management fee equal to a percentage of its average daily net assets as stated below. During the period April 6, 2018 through the Reorganization, pursuant to an Interim Investment Advisory Agreement, China Technology ETF and S&P High Income Infrastructure ETF paid GFIA a reduced unitary fee equal to each Fund’s expenses paid by GFIA.
| | | | |
Fund | | Unitary Management Fees
(as a % of Net Assets) | |
| China All-Cap ETF | | | 0.70 | % |
| China Technology ETF | | | 0.70 | % |
| S&P High Income Infrastructure ETF | | | 0.45 | % |
| Shipping ETF | | | 0.65 | % |
Out of the unitary management fee, the Adviser has agreed to pay for substantially all expenses of China All-Cap ETF, China Technology ETF, S&P High Income Infrastructure ETF and Shipping ETF, including the cost of transfer agency, custody, fund administration, legal, audit and other services, except for advisory fees, distribution fees, if any, brokerage expenses, taxes, interest, acquired fund fees and expenses, if any, litigation expenses and other extraordinary expenses.
Prior to the Reorganization, the Predecessor Funds were managed by Guggenheim Funds Investment Advisors LLC (“GFIA”) and each Predecessor Fund paid GFIA an investment advisory fee calculated at the same annualized rates as disclosed above for each respective Fund.
Effective as of the Reorganization, the Adviser has agreed to waive a portion of its unitary management fee to prevent the expenses of the China All-Cap ETF, China Technology ETF, S&P High Income Infrastructure ETF and Shipping ETF (excluding interest expenses, brokerage commissions and other trading expenses, acquired fund fees and expenses, if any, taxes, and litigation expenses and other extraordinary expenses) from exceeding such Fund’s unitary management fee through at least April 6, 2020 for China All-Cap ETF and Shipping ETF, and May 18, 2020 for China Technology ETF and S&P High Income Infrastructure ETF. Neither the Adviser nor the Funds can discontinue the agreement prior to its expiration.
Additionally, through at least August 31, 2020, the Adviser has contractually agreed to waive a portion of each Fund’s management fee in an amount equal to 100% of the net advisory fees an affiliate of the Adviser receives that are attributable to certain of the Fund’s investment in money market funds managed by that affiliate (excluding investment of cash collateral from securities lending). The Adviser cannot discontinue this waiver prior to its expiration date.
For the period September 1, 2017 to April 6, 2018 (or as otherwise indicated), GFIA waived fees and/or paid Fund expenses for each Predecessor Fund and for the period after the close of business on April 6, 2018 (or as otherwise indicated) to August 31, 2018, the Adviser waived Fund fees in the following amounts:
| | | | | | | | |
| | | Period after the close of business | | | Period September 1, 2017 | |
| | | April 6, 2018 to August 31, 2018 | | | to April 6, 2018 | |
| China All-Cap ETF | | $ | 4 | | | $ | — | |
| China Technology ETF | | | 150 | * | | | — | ** |
| S&P Global Water Index ETF | | | 224 | | | | 2,362 | |
| S&P High Income Infrastructure ETF | | | 39 | * | | | — | ** |
| Shipping ETF | | | 149 | *** | | | — | |
| Solar ETF | | | 64,676 | * | | | 90,507 | ** |
| * | For the period after the close of business May 18, 2018 to August 31, 2018 |
| ** | For the period September 1, 2017 to May 18, 2018 |
| *** | For the period June 1, 2018 to August 31, 2018 |
The fees waived and/or expenses borne by the Adviser for S&P Global Water Index ETF and Solar ETF are subject to recapture by the Adviser up to three years from the date the fees were waived or the expenses were incurred, but no recapture payment will be made by the Funds if it would result in the Funds exceeding (i) the Expense Cap or (ii) the expense cap in effect at the time the fees and/or expenses subject to recapture were waived and/or borne by the Adviser. Amounts waived by GFIA prior to the Reorganization are not subject to recapture.
For the fiscal year ended August 31, 2018, there were no amounts available for potential recapture by the Adviser under the Expense Agreement for S&P Global Water Index ETF.
For the following Funds, the amounts available for potential recapture by the Adviser and the expiration schedule at August 31, 2018 are as follows:
| | | | | | | | | | | | | | | | |
| | | Total
Potential
Recapture
Amounts | | | Potential Recapture Amounts
Expiring | |
Fund | | 8/31/19 | | | 8/31/20 | | | 8/31/21 | |
| Solar ETF | | $ | 64,219 | | | $ | — | | | $ | — | | | $ | 64,219 | |
The Trust has entered into a Distribution Agreement with Invesco Distributors, Inc. (the “Distributor”), which serves as the distributor of Creation Units for each Fund. The Distributor does not maintain a secondary market in the Shares. The Funds are not charged any fees pursuant to the Distribution Agreement. The Distributor is an affiliate of the Adviser. Prior to the Reorganization, the Board of Trustees for each Predecessor Fund adopted a distribution and service plan pursuant to rule 12b-1 under the 1940 Act. No 12b-1 fees were paid by the Predecessor Funds under this plan.
The Trust has entered into service agreements whereby The Bank of New York Mellon, a wholly-owned subsidiary of The Bank of New York Mellon Corporation, serves as the administrator, custodian, fund accountant and transfer agent for each Fund. Prior to the Reorganization, GFIA engaged external service providers to perform these services for each Predecessor Fund.
The Adviser has entered into licensing agreements on behalf of each Fund with the following entities (each a “Licensor”):
| | |
Fund | | Licensor |
| China All-Cap ETF | | AlphaShares |
| China Technology ETF | | AlphaShares |
| S&P Global Water Index ETF | | Standard & Poor’s Financial Services LLC |
| S&P High Income Infrastructure ETF | | S&P Dow Jones Index Group |
| Shipping ETF | | CME Group Index Services LLC |
| Solar ETF | | MAC Indexing LLC |
Each Underlying Index name trademark is owned by the Licensor. These trademarks have been licensed to the Adviser for use by the Funds. Each Fund is entitled to use its Underlying Index pursuant to the Trust’s sub-licensing agreement with the Adviser. Prior to the Reorganization, each Underlying Index name trademark had been licensed to GFIA for use by the corresponding Predecessor Fund. The Funds are not sponsored, endorsed, sold or promoted by the Licensors, and the Licensors make no representation regarding the advisability of investing in any of the Funds.
Note 4—Additional Valuation Information
GAAP defines fair value as the price that would be received to sell an asset or paid to transfer a liability in an orderly transaction between market participants at the measurement date, under current market conditions. GAAP establishes a hierarchy that prioritizes the inputs to valuation methods, giving the highest priority to readily available unadjusted quoted prices in an active market for identical assets (Level 1) and the lowest priority to significant unobservable inputs (Level 3), generally when market prices are not readily available or are unreliable. Based on the valuation inputs, the securities or other investments are tiered into one of three levels. Changes in valuation methods may result in transfers in or out of an investment’s assigned level:
| | Level 1 — | Prices are determined using quoted prices in an active market for identical assets. |
| | Level 2 — | Prices are determined using other significant observable inputs. Observable inputs are inputs that other market participants may use in pricing a security. These may include quoted prices for similar securities, interest rates, prepayment speeds, credit risk, yield curves, loss severities, default rates, discount rates, volatilities and others. |
| | Level 3 — | Prices are determined using significant unobservable inputs. In situations where quoted prices or observable inputs are unavailable (for example, when there is little or no market activity for an investment at the end of the period), unobservable inputs may be used. Unobservable inputs reflect the Fund’s own assumptions about the factors market participants would use in determining fair value of the securities or instruments and would be based on the best available information. |
Except for the Funds listed below, as of August 31, 2018, all of the securities in each Fund were valued based on Level 1 inputs (see the Schedules of Investments for security categories). The level assigned to the securities valuations may not be an indication of the risk or liquidity associated with investing in those securities. Because of the inherent uncertainties of valuation, the values reflected in the financial statements may materially differ from the value received upon actual sale of those investments.
Each Fund’s policy is to recognize transfers in and out of the valuation levels as of the end of the reporting period. During the fiscal year or period ended August 31, 2018, there were no transfers between valuation levels.
| | | | | | | | | | | | | | | | |
| | | Level 1 | | | Level 2 | | | Level 3 | | | Total | |
| China All-Cap ETF | | | | | | | | | | | | | | | | |
| Investments in Securities | | | | | | | | | | | | | | | | |
Common Stocks & Other Equity Interests | | $ | 22,725,971 | | | $ | 1,324 | | | $ | 0 | | | $ | 22,727,295 | |
Money Market Funds | | | 134,463 | | | | — | | | | — | | | | 134,463 | |
| | | | | | | | | | | | | | | | |
Total Investments | | $ | 22,860,434 | | | $ | 1,324 | | | $ | 0 | | | $ | 22,861,758 | |
| | | | | | | | | | | | | | | | |
| China Technology ETF | | | | | | | | | | | | | | | | |
| Investments in Securities | | | | | | | | | | | | | | | | |
Common Stocks & Other Equity Interests | | $ | 384,708,399 | | | $ | — | | | $ | 0 | | | $ | 384,708,399 | |
Money Market Funds | | | 22,532,493 | | | | — | | | | — | | | | 22,532,493 | |
| | | | | | | | | | | | | | | | |
Total Investments | | $ | 407,240,892 | | | $ | — | | | $ | 0 | | | $ | 407,240,892 | |
| | | | | | | | | | | | | | | | |
Note 5—Distributions to Shareholders and Tax Components of Net Assets
Tax Character of Distributions to Shareholder Paid during the Fiscal Years or Period ended August 31, 2018 and 2017:
| | | | | | | | |
| | | 2018 | | | 2017 | |
| | | Ordinary
Income | | | Ordinary
Income | |
| China All-Cap ETF | | $ | 500,080 | | | $ | 433,200 | |
| China Technology ETF | | | 5,489,280 | | | | 773,890 | |
| S&P Global Water Index ETF | | | 10,492,264 | | | | 7,164,324 | |
| S&P High Income Infrastructure ETF | | | 2,415,309 | | | | 1,205,170 | |
| Solar ETF | | | 7,869,391 | | | | 8,422,471 | |
Tax Character of Distributions to Shareholder Paid for Shipping ETF during the Period June 1, 2018 to August 31, 2018, Fiscal Year ended May 31, 2018 and Fiscal Year ended May 31, 2017:
| | | | | | | | | | | | | | | | | | | | | | | | |
| | | August 31, 2018 | | | May 31, 2018 | | | May 31, 2017 | |
| | | Ordinary
Income | | | Return of
Capital | | | Ordinary
Income | | | Return of
Capital | | | Ordinary
Income | | | Return of
Capital | |
| Shipping ETF | | $ | 85,244 | | | $ | 864,886 | | | $ | 5,308,659 | | | $ | 71,081 | | | $ | 3,310,900 | | | $ | — | |
Tax Components of Net Assets at Fiscal Year or Period End:
| | | | | | | | | | | | | | | | | | | | | | | | | | | | | | | | |
| | | Undistributed
Ordinary
Income | | | Temporary
Book/Tax
Differences | | | Net
Unrealized
Appreciation
(Depreciation)—
Investment
Securities | | | Net
Unrealized
Appreciation
(Depreciation)—
Other Investments | | | Capital Loss
Carryforwards | | | Late-Year
Ordinary
Loss
Deferral | | | Shares of
Beneficial
Interest | | | Total Net
Assets | |
| China All-Cap ETF | | $ | 341,730 | | | $ | — | | | $ | 1,771,687 | | | $ | (13 | ) | | $ | (9,727,909 | ) | | $ | — | | | $ | 30,392,038 | | | $ | 22,777,533 | |
| China Technology ETF | | | — | | | | — | | | | (75,288,742 | ) | | | (18 | ) | | | (21,826,504 | ) | | | (836,824 | ) | | | 482,640,766 | | | | 384,688,678 | |
| S&P Global Water Index ETF | | | 8,753,543 | | | | — | | | | 108,235,574 | | | | (1,741 | ) | | | (34,775,218 | ) | | | — | | | | 511,892,754 | | | | 594,104,912 | |
| S&P High Income Infrastructure ETF | | | 562,025 | | | | — | | | | (1,336,670 | ) | | | (1,175 | ) | | | (1,851,341 | ) | | | — | | | | 62,807,069 | | | | 60,179,908 | |
| Shipping ETF | | | — | | | | (1,503,881 | ) | | | (6,951,615 | ) | | | 16,187 | | | | (36,791,834 | ) | | | — | | | | 113,751,226 | | | | 68,520,083 | |
| Solar ETF | | | 9,652 | | | | — | | | | (50,162,548 | ) | | | (109 | ) | | | (373,068,122 | ) | | | — | | | | 742,604,313 | | | | 319,383,186 | |
Capital loss carryforwards are calculated and reported as of a specific date. Results of transactions and other activity after that date may affect the amount of capital loss carryforwards actually available for the Funds to utilize. The ability to utilize capital loss carryforwards in the future may be limited under the Internal Revenue Code and related regulations based on the results of future transactions.
The following table presents available capital loss carryforwards for each Fund as of August 31, 2018:
| | | | | | | | | | | | | | | | | | | | |
| | | | | | Post-effective/no expiration | | | | | | | |
| | | 2019 | | | Short-Term | | | Long-Term | | | Total* | | | Expired | |
| China All-Cap ETF | | $ | 853,049 | | | $ | 1,218,478 | | | $ | 7,656,382 | | | $ | 9,727,909 | | | $ | 29,627 | |
| China Technology ETF | | | 188,097 | | | | 10,606,656 | | | | 11,031,751 | | | | 21,826,504 | | | | — | |
| S&P Global Water Index ETF | | | 16,548,141 | | | | 989,249 | | | | 17,237,828 | | | | 34,775,218 | | | | 38,476,281 | |
| S&P High Income Infrastructure ETF | | | — | | | | — | | | | 1,851,341 | | | | 1,851,341 | | | | — | |
| Shipping ETF | | | — | | | | 7,082,469 | | | | 29,709,365 | | | | 36,791,834 | | | | — | |
| Solar ETF | | | 21,764,929 | | | | 71,458,522 | | | | 279,844,671 | | | | 373,068,122 | | | | 118,836,026 | |
| * | Capital loss carryforwards as of the date listed above is reduced for limitations, if any, to the extent required by the Internal Revenue Code and may be further limited depending upon a variety of factors, including the realization of net unrealized gains or losses as of the date of any reorganization. |
Note 6—Securities Lending
During the fiscal year or period ended August 31, 2018, each Fund participated in securities lending. Each Fund loaned portfolio securities having a market value up to one-third of each Fund’s total assets. Such loans are secured by cash collateral equal to no less than 102% (105% for international securities) of the market value of the loaned securities determined daily by the securities lending provider. Cash collateral received in connection with these loans is generally invested in an affiliated money market fund and is shown as such on the Schedules of Investments. Each Fund bears the risk of loss with respect to the investment of collateral. It is the policy of these Funds to obtain additional collateral from or return excess collateral to the borrower by the end of the next business day, following the valuation date of the securities loaned. Therefore, the value of the collateral held may be temporarily less than the value of the securities on loan. When loaning securities, each Fund retains certain benefits of owning the securities, including the economic equivalent of dividends or interest generated by the security. Lending securities entails a risk of loss to each Fund if, and to the extent that, the market value of the securities loaned were to increase, and the borrower did not increase the collateral accordingly, and the borrower failed to return the securities. The securities loaned are subject to termination at the option of the borrower or each Fund. Upon termination, the borrower will return to each Fund the securities loaned and each Fund will return the collateral. Upon the failure of the borrower to return the securities, collateral may be liquidated and the securities may be purchased on the open market to replace the loaned securities. Each Fund could experience delays and costs in gaining access to the collateral and the securities may lose value during the delay which could result in potential losses to each Fund. Some of these losses may be indemnified by the lending agent. Each Fund bears the risk of any deficiency in the amount of the collateral available for return to the borrower due to any loss on the collateral invested. Dividends received on cash collateral investments for securities lending transactions, which are net of compensation to Counterparties, are included in Securities lending income on the Statements of Operations. The aggregate value of securities out on loan, if any, is shown on the Statements of Assets and Liabilities.
Note 7—Investment Transactions
For the fiscal year or period ended August 31, 2018, the cost of securities purchased and proceeds from sales of securities, (other than short-term securities, U.S. Treasury obligations, money market funds and in-kind transactions, if any), were as follows:
| | | | | | | | |
| | | Purchases | | | Sales | |
| China All-Cap ETF | | $ | 2,517,649 | | | $ | 2,544,978 | |
| China Technology ETF | | | 82,853,254 | | | | 82,089,692 | |
| S&P Global Water Index ETF | | | 80,829,726 | | | | 83,020,285 | |
| S&P High Income Infrastructure ETF | | | 19,233,061 | | | | 19,006,430 | |
| Shipping ETF* | | | 32,035,723 | | | | 32,733,915 | |
| Solar ETF | | | 212,546,266 | | | | 210,780,896 | |
| * | For the period June 1, 2018 to August 31, 2018. |
For the fiscal year or period ended August 31, 2018, in-kind transactions associated with creations and redemptions were as follows:
| | | | | | | | |
| | | Cost of
Securities
Received | | | Value of
Securities
Delivered | |
| China All-Cap ETF | | $ | — | | | $ | 3,473,969 | |
| China Technology ETF | | | 398,570,548 | | | | 155,566,740 | |
| S&P Global Water Index ETF | | | 95,556,674 | | | | 144,622,481 | |
| S&P High Income Infrastructure ETF | | | 37,522,985 | | | | 10,981,727 | |
| Shipping ETF* | | | — | | | | 4,059,931 | |
| Solar ETF | | | 120,703,246 | | | | 162,546,890 | |
| * | For the period June 1, 2018 to August 31, 2018. |
Gains (losses) on in-kind transactions are generally not considered taxable gains (losses) for federal income tax purposes.
At August 31, 2018, the aggregate cost of investment, including any derivatives, on a tax basis includes adjustments for financial reporting purposes as of the most recently completed federal income tax reporting period-end:
| | | | | | | | | | | | | | | | |
| | | Gross
Unrealized
Appreciation | | | Gross
Unrealized
(Depreciation) | | | Net
Unrealized
Appreciation
(Depreciation) | | | Cost | |
| China All-Cap ETF | | $ | 5,473,712 | | | $ | (3,702,025 | ) | | $ | 1,771,687 | | | $ | 21,090,071 | |
| China Technology ETF | | | 19,635,832 | | | | (94,924,574 | ) | | | (75,288,742 | ) | | | 460,064,676 | |
| S&P Global Water Index ETF | | | 134,504,124 | | | | (26,268,550 | ) | | | 108,235,574 | | | | 484,587,370 | |
| S&P High Income Infrastructure ETF | | | 78,546 | | | | (1,415,216 | ) | | | (1,336,670 | ) | | | 61,297,588 | |
| Shipping ETF | | | 2,209,987 | | | | (9,161,602 | ) | | | (6,951,615 | ) | | | 77,925,089 | |
| Solar ETF | | | 11,264,595 | | | | (61,427,143 | ) | | | (50,162,548 | ) | | | 406,550,786 | |
Note 8—Reclassification of Permanent Differences
Primarily as a result of differing book/tax treatment of in-kind transactions and expired capital loss carryforwards, amounts were reclassified between undistributed net investment income, undistributed net realized gain (loss) and shares of beneficial interest. These reclassifications had no effect on the net asset of each Fund. For the fiscal year or period ended August 31, 2018, the reclassifications were as follows:
| | | | | | | | | | | | |
| | | Undistributed
Net Investment
Income | | | Undistributed
Net Realized
Gain (Loss) | | | Shares of
Beneficial
Interest | |
| China All-Cap ETF | | $ | 18,500 | | | $ | (1,295,694 | ) | | $ | 1,277,194 | |
| China Technology ETF | | | 1,708,379 | | | | (49,725,357 | ) | | | 48,016,978 | |
| S&P Global Water Index ETF | | | (74,692 | ) | | | (30,056,258 | ) | | | 30,130,950 | |
| S&P High Income Infrastructure ETF | | | (289,283 | ) | | | (1,697,326 | ) | | | 1,986,609 | |
| Shipping ETF | | | (19,299 | ) | | | 184,476 | | | | (165,177 | ) |
| Solar ETF | | | (2,885,574 | ) | | | 99,557,372 | | | | (96,671,798 | ) |
Note 9—Trustees’ and Officer’s Fees
Trustees’ and Officer’s Fees include amounts accrued by each Fund to pay remuneration to the Independent Trustees, any Unaffiliated Trustee, and an Officer of the Trust. The Adviser, as a result of the unitary management fee, pays for such compensation for China All-Cap ETF, China Technology ETF, S&P High Income Infrastructure ETF and Shipping ETF. The Trustee who is an “interested person” of the Trust does not receive any Trustees’ Fees.
The Trust has adopted a deferred compensation plan (the “Plan”). Under the Plan, each Independent Trustee or Unaffiliated Trustee who has executed a Deferred Fee Agreement (a “Participating Trustee”) may defer receipt of all or a portion of his compensation (“Deferral Fees”). Such Deferral Fees are deemed to be invested in select Invesco Funds. The Deferral Fees payable to a Participating Trustee are valued as of the date such Deferral Fees would have been paid to the Participating Trustee. The value increases with contributions or with increases in the value of the Shares selected, and the value decreases with distributions or with declines in the value of the Shares selected. Obligations under the Plan represent unsecured claims against the general assets of the Funds.
Note 10—Capital
Shares are issued and redeemed by the Funds only in creation units of 50,000 shares for China Technology ETF and S&P High Income Infrastructure ETF, 80,000 shares for S&P Global Water Index ETF and Solar ETF and 100,000 shares for China All-Cap ETF and Shipping ETF. Only Authorized Participants are permitted to purchase or redeem Creation Units from the Funds. Such transactions are generally in exchange for the deposit or delivery of a basket of securities (“Deposit Securities”). However, for all Funds, cash in an amount equivalent to the value of certain securities may be substituted, generally when the securities are not available in sufficient quantity for delivery, not eligible for trading by the Authorized Participant or as a result of other market circumstances.
To the extent that the Funds permit transactions in exchange for Deposit Securities, each Fund may issue Shares in advance of receipt of Deposit Securities subject to various conditions, including a requirement to maintain on deposit with the Trust cash at least equal to 105% of the market value of the missing Deposit Securities. In accordance with the Trust’s Participating Agreement, Creation Units will be issued to an Authorized Participant, notwithstanding the fact that the corresponding Deposit Securities have not been received in part or in whole, in reliance on the undertaking of the Authorized Participant to deliver the missing Deposit Securities as soon as possible, which undertaking shall be secured by the Authorized Participant’s delivery and maintenance of collateral consisting of cash in the form of U.S. dollars in immediately available funds having a value (marked-to-market daily) at least equal to 105%, which the Adviser may change from time to time, of the value of the missing Deposit Securities.
Certain transaction fees may be charged by the Funds for creations and redemptions, which are treated as increases in capital.
Transactions in each Fund’s Shares are disclosed in detail in the Statements of Changes in Net Assets.
Note 11—Indemnifications
Under the Trust’s organizational documents, its Officers and Trustees are indemnified against certain liabilities arising out of the performance of their duties to the Trust. Each Independent Trustee and Unaffiliated Trustee is also indemnified against certain liabilities arising out of the performance of his duties to the Trust pursuant to an Indemnification Agreement between such trustee and the Trust. Additionally, in the normal course of business, the Trust enters into contracts with service providers that contain general indemnification clauses. The Trust’s maximum exposure under these arrangements is unknown, as this would involve future claims that may be made against the Trust that have not yet occurred. However, based on experience, the Trust believes the risk of loss to be remote.
Report of Independent Registered Public Accounting Firm
To the Board of Trustees of Invesco Exchange-Traded Fund Trust II and Shareholders of Invesco China All-Cap ETF, Invesco China Technology ETF, Invesco S&P Global Water Index ETF, Invesco S&P High Income Infrastructure ETF, Invesco Shipping ETF and Invesco Solar ETF
Opinions on the Financial Statements
We have audited the accompanying statements of assets and liabilities, including the schedules of investments, of Invesco China All-Cap ETF, Invesco China Technology ETF, Invesco S&P Global Water Index ETF, Invesco S&P High Income Infrastructure ETF, Invesco Shipping ETF and Invesco Solar ETF (six of the funds constituting Invesco Exchange-Traded Fund Trust II, hereafter collectively referred to as the “Funds”) as of August 31, 2018, the related statements of operations and changes in net assets, including the related notes, and the financial highlights for the year ended August 31, 2018 (or for Invesco Shipping ETF, for the period June 1, 2018 through August 31, 2018 and for the year ended May 31, 2018), (collectively referred to as the “financial statements”). In our opinion, the financial statements present fairly, in all material respects, the financial position of each of the Funds as of August 31, 2018, and the results of each of their operations, changes in each of their net assets, and each of the financial highlights for the year ended August 31, 2018 (or for Invesco Shipping ETF, for the period June 1, 2018 through August 31, 2018 and for the year ended May 31, 2018) in conformity with accounting principles generally accepted in the United States of America.
The financial statements of Invesco China All-Cap ETF (Predecessor Fund Guggenheim China All-Cap ETF), Invesco China Technology ETF (Predecessor Fund Guggenheim China Technology ETF), Invesco S&P Global Water Index ETF (Predecessor Fund Guggenheim S&P Global Water Index ETF), Invesco S&P High Income Infrastructure ETF (Predecessor Fund Guggenheim S&P High Income Infrastructure ETF) and Invesco Solar ETF (Predecessor Fund Guggenheim Solar ETF) as of and for the year ended August 31, 2017 and the financial highlights for each of the periods ended on or prior to August 31, 2017 (not presented herein, other than the statement of changes in net assets and the financial highlights) were audited by other auditors whose report dated October 30, 2017 expressed an unqualified opinion on those financial statements and financial highlights. The financial statements of Invesco Shipping ETF (Predecessor Fund Guggenheim Shipping ETF) as of and for the year ended May 31, 2017 and the financial highlights for each of the periods ended on or prior to May 31, 2017 (not presented herein, other than the statement of changes in net assets and the financial highlights) were audited by other auditors whose report dated July 31, 2017 expressed an unqualified opinion on those financial statements and financial highlights.
Basis for Opinions
These financial statements are the responsibility of the Funds’ management. Our responsibility is to express an opinion on the Funds’ financial statements based on our audits. We are a public accounting firm registered with the Public Company Accounting Oversight Board (United States) (“PCAOB”) and are required to be independent with respect to the Funds in accordance with the U.S. federal securities laws and the applicable rules and regulations of the Securities and Exchange Commission and the PCAOB.
We conducted our audits of these financial statements in accordance with the standards of the PCAOB. Those standards require that we plan and perform the audit to obtain reasonable assurance about whether the financial statements are free of material misstatement, whether due to error or fraud.
Our audits included performing procedures to assess the risks of material misstatement of the financial statements, whether due to error or fraud, and performing procedures that respond to those risks. Such procedures included examining, on a test basis, evidence regarding the amounts and disclosures in the financial statements. Our audits also included evaluating the accounting principles used and significant estimates made by management, as well as evaluating the overall presentation of the financial statements. Our procedures included confirmation of securities owned as of August 31, 2018 by correspondence with the custodian, transfer agent, and brokers; when replies were not received from brokers, we performed other auditing procedures. We believe that our audits provide a reasonable basis for our opinions.
PricewaterhouseCoopers LLP
Chicago, Illinois
October 26, 2018
We have served as the auditor of one or more of the investment companies in the Invesco group of investment companies since at least 1995. We have not been able to determine the specific year we began serving as auditor.
Change in Independent Registered Public Accounting Firm
The Board of Trustees appointed, upon recommendation of the Audit Committee, PricewaterhouseCoopers LLP (“PwC”) as the independent registered public accounting firm of the Funds for the Funds’ current fiscal year. PwC serves as the independent registered public accounting firm for other Invesco ETFs.
Prior to April 6, 2018, each of the Predecessor Funds was a separate series of an unaffiliated investment company that was audited by a different independent registered public accounting firm (the “Prior Auditor”). The Board of Trustees selected a new independent auditor for the Funds’ current fiscal year.
Effective April 9, 2018, the Prior Auditor resigned as the independent registered public accounting firm of the Predecessor Funds. The Prior Auditor’s report on the financial statements of the Predecessor Funds for the past two years did not contain an adverse or disclaimer of opinion, and was not qualified or modified as to uncertainty, audit scope or accounting principles. During the Predecessor Funds’ two most recent fiscal years and through April 9, 2018 there were no (1) disagreements with the Prior Auditor on any matter of accounting principles or practices, financial statement disclosure, or auditing scope or procedure, which disagreements, if not resolved to the Prior Auditor’s satisfaction, would have caused it to make reference to that matter in connection with its report; or (2) “reportable events,” as that term is defined in Item 304(a)(1)(v) of Regulation S-K under the Securities Exchange Act of 1934.
Fees and Expenses
As a shareholder of Invesco S&P Global Water Index ETF and Invesco Solar ETF, you incur advisory fees and other Fund expenses. As a shareholder of the Invesco China All-Cap ETF, Invesco China Technology ETF, Invesco S&P High Income Infrastructure ETF and Invesco Shipping ETF, you incur a unitary management fee. In addition to the unitary management fee, a shareholder of the Invesco China All-Cap ETF, Invesco China Technology ETF, Invesco S&P High Income Infrastructure ETF and Invesco Shipping ETF may pay distribution fees, if any, brokerage expenses, taxes, interest, acquired fund fees and expenses, if any, litigation expenses and other extraordinary expenses. The expense examples below are intended to help you understand your ongoing costs (in dollars) of investing in the Funds and to compare these costs with the ongoing costs of investing in other funds.
The example is based on an investment of $1,000 invested at the beginning of the period and held through the six-month period ended August 31, 2018.
Actual Expenses
The first line in the following table provides information about actual account values and actual expenses. You may use the information in this line, together with the amount you invested, to estimate the expenses that you paid over the period. Simply divide your account value by $1,000 (for example, an $8,600 account value divided by $1,000 = 8.6), then multiply the result by the number in the first line under the heading “Expenses Paid During the Six-Month Period” to estimate the expenses you paid on your account during this period.
Hypothetical Example for Comparison Purposes
The second line in the following table provides information about hypothetical account values and hypothetical expenses based on each Fund’s actual expense ratio and an assumed annualized rate of return of 5% per year before expenses, which is not the Fund’s actual return. The hypothetical account values and expenses may not be used to estimate the actual ending account balance or expenses you paid for the period. You may use this information to compare the ongoing costs of investing in the Funds and other funds. To do so, compare this 5% hypothetical example with the 5% hypothetical examples that appear in the shareholder reports of the other funds.
Please note that the expenses shown in the table are meant to highlight your ongoing costs only, and do not reflect any transactional costs, such as sales charges and brokerage commissions. Therefore, the second line in the table is useful in comparing ongoing costs only, and will not help you determine the relative total costs of owning different funds. In addition, if these transaction costs were included, your costs would have been higher.
| | | | | | | | | | | | | | | | |
| | | Beginning
Account Value
March 1, 2018 | | | Ending
Account Value
August 31, 2018 | | | Annualized
Expense Ratio
Based on the
Six-Month Period | | | Expenses Paid
During the
Six-Month Period(1) | |
| Invesco China All-Cap ETF (YAO) | | | | | | | | | | | | | | | | |
Actual | | $ | 1,000.00 | | | $ | 885.70 | | | | 0.70 | % | | $ | 3.33 | |
Hypothetical (5% return before expenses) | | | 1,000.00 | | | | 1,021.68 | | | | 0.70 | | | | 3.57 | |
| Invesco China Technology ETF (CQQQ) | | | | | | | | | | | | | | | | |
Actual | | | 1,000.00 | | | | 788.40 | | | | 0.60 | | | | 2.70 | |
Hypothetical (5% return before expenses) | | | 1,000.00 | | | | 1,022.18 | | | | 0.60 | | | | 3.06 | |
| Invesco S&P Global Water Index ETF (CGW) | | | | | | | | | | | | | | | | |
Actual | | | 1,000.00 | | | | 1,047.50 | | | | 0.62 | | | | 3.20 | |
Hypothetical (5% return before expenses) | | | 1,000.00 | | | | 1,022.08 | | | | 0.62 | | | | 3.16 | |
| Invesco S&P High Income Infrastructure ETF (GHII) | | | | | | | | | | | | | | | | |
Actual | | | 1,000.00 | | | | 1,077.90 | | | | 0.44 | | | | 2.30 | |
Hypothetical (5% return before expenses) | | | 1,000.00 | | | | 1,022.99 | | | | 0.44 | | | | 2.24 | |
| Invesco Shipping ETF (SEA) | | | | | | | | | | | | | | | | |
Actual | | | 1,000.00 | | | | 968.20 | | | | 0.65 | | | | 3.22 | |
Hypothetical (5% return before expenses) | | | 1,000.00 | | | | 1,021.93 | | | | 0.65 | | | | 3.31 | |
| Invesco Solar ETF (TAN) | | | | | | | | | | | | | | | | |
Actual | | | 1,000.00 | | | | 896.90 | | | | 0.59 | | | | 2.82 | |
Hypothetical (5% return before expenses) | | | 1,000.00 | | | | 1,022.23 | | | | 0.59 | | | | 3.01 | |
| (1) | Expenses are calculated using the annualized expense ratio, which represents the ongoing expenses as a percentage of net assets for the six-month period ended August 31, 2018. Expenses are calculated by multiplying the Fund’s annualized expense ratio by the average account value for the period, then multiplying the result by 184/365. Expense ratios for the most recent six-month period may differ from expense ratios based on the annualized data in the Financial Highlights. |
Tax Information
Form 1099-DIV, Form 1042-S and other year-end tax information provide shareholders with actual calendar year amounts that should be included in their tax returns. Shareholders should consult their tax advisers.
The following distribution information is being provided as required by the Internal Revenue Code or to meet a specific state’s requirement.
Each Fund designates the following amounts or, if subsequently determined to be different, the maximum amount allowable for its fiscal year ended August 31, 2018:
| | | | | | | | | | |
| | | Qualified Dividend
Income* | | Corporate
Dividends-Received
Deduction* |
| Invesco China All-Cap ETF | | | | 57 | % | | | | 0 | % |
| Invesco China Technology ETF | | | | 15 | % | | | | 0 | % |
| Invesco S&P Global Water Index ETF | | | | 100 | % | | | | 39 | % |
| Invesco S&P High Income Infrastructure ETF | | | | 67 | % | | | | 6 | % |
| Invesco Shipping ETF | | | | 100 | % | | | | 20 | % |
| Invesco Solar ETF | | | | 23 | % | | | | 8 | % |
| * | The above percentages are based on ordinary income dividends paid to shareholders during the Fund’s fiscal year. |
Proxy Results
A Special Meeting (“Meeting”) of Shareholders of Guggenheim S&P Global Water Index ETF was held on Friday, March 16, 2018. The Meeting was held for the following purpose:
| (1) | Approve an Agreement and Plan of Reorganization that provides for the reorganization of the Guggenheim S&P Global Water Index ETF into PowerShares S&P Global Water Index Portfolio (now known as the Invesco S&P Global Water Index ETF). |
The results of the voting on the above matter were as follows:
| | | | | | | | | | | | | | |
Matter | | Votes For | | | Votes
Against | | | Votes
Abstain | | | Broker
Non-Votes |
(1) Approve an Agreement and Plan of Reorganization. | | | | | | | | | | | | | | |
Guggenheim S&P Global Water Index ETF | | | 7,208,872 | | | | 137,055 | | | | 1,286,911 | | | N/A |
A Special Meeting (“Meeting”) of Shareholders of Guggenheim China All-Cap ETF was held on Monday, March 26, 2018. The Meeting was held for the following purpose:
| (1) | Approve an Agreement and Plan of Reorganization that provides for the reorganization of the Guggenheim China All-Cap ETF into PowerShares China All-Cap Portfolio (now known as the Invesco China All-Cap ETF). |
The results of the voting on the above matter were as follows:
| | | | | | | | | | | | | | |
Matter | | Votes For | | | Votes
Against | | | Votes
Abstain | | | Broker
Non-Votes |
(1) Approve an Agreement and Plan of Reorganization. | | | | | | | | | | | | | | |
Guggenheim China All-Cap ETF | | | 304,108 | | | | 20,258 | | | | 52,736 | | | N/A |
A Special Meeting (“Meeting”) of Shareholders of Guggenheim S&P High Income Infrastructure ETF was held on Tuesday, April 10, 2018. The Meeting was held for the following purpose:
| (1) | Approve an Agreement and Plan of Reorganization that provides for the reorganization of the Guggenheim S&P High Income Infrastructure ETF into PowerShares S&P High Income Infrastructure Portfolio (now known as the Invesco S&P High Income Infrastructure ETF). |
The results of the voting on the above matter were as follows:
| | | | | | | | | | | | | | |
Matter | | Votes For | | | Votes
Against | | | Votes
Abstain | | | Broker
Non-Votes |
(1) Approve an Agreement and Plan of Reorganization. | | | | | | | | | | | | | | |
Guggenheim S&P High Income Infrastructure ETF | | | 520,681 | | | | 12,316 | | | | 104,193 | | | N/A |
Special Meetings (“Meetings”) of Shareholders of Guggenheim China Technology ETF and Guggenheim Solar ETF were held on Tuesday, May 1, 2018. The Meetings were held for the following purpose:
| (1) | Approve an Agreement and Plan of Reorganization that provides for the reorganization of the Guggenheim China Technology ETF into PowerShares China Technology Portfolio (now known as the Invesco China Technology ETF) and Guggenheim Solar ETF into PowerShares Solar Portfolio (now known as the Invesco Solar ETF). |
The results of the voting on the above matter were as follows:
| | | | | | | | | | | | | | |
Matter | | Votes For | | | Votes
Against | | | Votes
Abstain | | | Broker
Non-Votes |
(1) Approve an Agreement and Plan of Reorganization. | | | | | | | | | | | | | | |
Guggenheim China Technology ETF | | | 2,864,080 | | | | 77,111 | | | | 654,700 | | | N/A |
Guggenheim Solar ETF | | | 7,202,163 | | | | 213,143 | | | | 1,500,485 | | | N/A |
Trustees and Officers
The Independent Trustees of the Trust, their term of office and length of time served, their principal business occupations during at least the past five years, the number of portfolios in the Fund Complex (as defined below) overseen by each Independent Trustee and the other directorships, if any, held by each Independent Trustee are shown below.
| | | | | | | | | | |
Name, Address and Year of
Birth of Independent Trustees | | Position(s)
Held
with Trust | | Term of
Office
and
Length of
Time
Served* | | Principal
Occupation(s) During
Past 5 Years | | Number of
Portfolios
in Fund
Complex**
Overseen by
Independent
Trustees | | Other
Directorships
Held by
Independent
Trustees During
the Past 5 Years |
Ronn R. Bagge—1958
c/o Invesco Capital Management LLC
3500 Lacey Road, Suite 700
Downers Grove, IL 60515 | | Chairman of the Nominating and Governance Committee and Trustee | | Chairman of the Nominating and Governance Committee and Trustee since 2007 | | Founder and Principal, YQA Capital Management LLC (1998-Present); formerly, Owner/CEO of Electronic Dynamic Balancing Co., Inc. (high-speed rotating equipment service provider). | | 221 | | Trustee and Investment Oversight Committee member, Mission Aviation Fellowship (2017–Present) |
| | | | | |
Todd J. Barre—1957
c/o Invesco Capital Management LLC
3500 Lacey Road, Suite 700
Downers Grove, IL 60515 | | Trustee | | Since 2010 | | Assistant Professor of Business, Trinity Christian College (2010-2016); formerly, Vice President and Senior Investment Strategist (2001-2008), Director of Open Architecture and Trading (2007-2008), Head of Fundamental Research (2004-2007) and Vice President and Senior Fixed Income Strategist (1994-2001), BMO Financial Group/Harris Private Bank. | | 221 | | None |
| | | | | |
Marc M. Kole—1960
c/o Invesco Capital Management LLC
3500 Lacey Road, Suite 700
Downers Grove, IL 60515 | | Chairman of the Audit Committee and Trustee | | Chairman of the Audit Committee since 2008; Trustee since 2007 | | Senior Director of Finance, By The Hand Club for Kids (2015-Present); formerly, Chief Financial Officer, Hope Network (social services) (2008-2012); Assistant Vice President and Controller, Priority Health (health insurance) (2005-2008); Senior Vice President of Finance, United Healthcare (2004-2005); Chief Accounting Officer, Senior Vice President of Finance, Oxford Health Plans (2000-2004); Audit Partner, Arthur Andersen LLP (1996-2000). | | 221 | | None |
| * | This is the date the Independent Trustee began serving the Trust. Each Independent Trustee serves an indefinite term, until his successor is elected. |
| ** | Fund Complex includes all open- and closed-end funds (including all of their portfolios) advised by the Adviser and any affiliated person of the Adviser. |
Trustees and Officers (continued)
| | | | | | | | | | |
Name, Address and Year of
Birth of Independent Trustees | | Position(s)
Held
with Trust | | Term of
Office
and
Length of
Time
Served* | | Principal
Occupation(s) During
Past 5 Years | | Number of
Portfolios
in Fund
Complex**
Overseen by
Independent
Trustees | | Other
Directorships
Held by
Independent
Trustees During
the Past 5 Years |
Yung Bong Lim—1964
c/o Invesco Capital Management LLC
3500 Lacey Road, Suite 700
Downers Grove, IL 60515 | | Chairman of the Investment Oversight Committee and Trustee | | Chairman of the Investment Oversight Committee since 2014; Trustee since 2013 | | Managing Partner, RDG Funds LLC (2008-Present); formerly, Managing Director, Citadel LLC (1999-2007). | | 221 | | None |
| | | | | |
Gary R. Wicker—1961
c/o Invesco Capital Management LLC
3500 Lacey Road, Suite 700
Downers Grove, IL 60515 | | Trustee | | Since 2013 | | Senior Vice President of Global Finance and Chief Financial Officer at RBC Ministries (publishing company) (2013-Present); formerly, Executive Vice President and Chief Financial Officer, Zondervan Publishing (a division of Harper Collins/NewsCorp) (2007-2012); Senior Vice President and Group Controller (2005-2006), Senior Vice President and Chief Financial Officer (2003-2004), Chief Financial Officer (2001-2003), Vice President, Finance and Controller (1999-2001) and Assistant Controller (1997-1999), divisions of The Thomson Corporation (information services provider). | | 221 | | None |
| | | | | |
Donald H. Wilson—1959
c/o Invesco Capital Management LLC
3500 Lacey Road, Suite 700
Downers Grove, IL 60515 | | Chairman of the Board and Trustee | | Chairman since 2012; Trustee since 2007 | | Chairman, President and Chief Executive Officer, McHenry Bancorp Inc. and McHenry Savings Bank (subsidiary) (2018-Present); Chairman and Chief Executive Officer, Stone Pillar Advisors, Ltd. (2010-Present); President and Chief Executive Officer, Stone Pillar Investments, Ltd. (2016-Present); formerly, Chairman, President and Chief Executive Officer, Community Financial Shares, Inc. and Community Bank—Wheaton/Glen Ellyn (subsidiary) (2013-2015); Chief Operating Officer, AMCORE Financial, Inc. (bank holding company) (2007-2009); Executive Vice President and Chief Financial Officer, AMCORE Financial, Inc. (2006-2007); Senior Vice President and Treasurer, Marshall & Ilsley Corp. (bank holding company) (1995-2006). | | 221 | | None |
| * | This is the date the Independent Trustee began serving the Trust. Each Independent Trustee serves an indefinite term, until his successor is elected. |
| ** | Fund Complex includes all open- and closed-end funds (including all of their portfolios) advised by the Adviser and any affiliated person of the Adviser. |
Trustees and Officers (continued)
The Unaffiliated Trustee, his term of office and length of time served, his principal business occupations during at least the past five years, the number of portfolios in the Fund Complex (as defined below) overseen by the Unaffiliated Trustee and the other directorships, if any, held by the Unaffiliated Trustee are shown below.
| | | | | | | | | | |
Name, Address and Year of
Birth of Unaffiliated Trustee | | Position(s)
Held
with Trust | | Term of
Office
and
Length of
Time
Served* | | Principal Occupation(s) During Past 5 Years | | Number of
Portfolios
in Fund
Complex**
Overseen by
Unaffiliated
Trustee | | Other
Directorships
Held by
Unaffiliated
Trustee During
the Past 5 Years |
Philip M. Nussbaum***—1961
c/o Invesco Capital Management LLC
3500 Lacey Road, Suite 700
Downers Grove, IL 60515 | | Trustee | | Since 2007 | | Chairman, Performance Trust Capital Partners (2004-Present). | | 221 | | None |
| * | This is the date the Unaffiliated Trustee began serving the Trust. The Unaffiliated Trustee serves an indefinite term, until his successor is elected. |
| ** | Fund Complex includes all open- and closed-end funds (including all of their portfolios) advised by the Adviser and any affiliated person of the Adviser. |
| *** | Effective September 19, 2018, Mr. Nussbaum resigned from the Board of Trustees of the Trust. |
Trustees and Officers (continued)
The Interested Trustee and the executive officers of the Trust, their term of office and length of time served, their principal business occupations during at least the past five years, the number of portfolios in the Fund Complex (as defined below) overseen by the Interested Trustee and the other directorships, if any, held by the Interested Trustee are shown below.
| | | | | | | | | | |
Name, Address and Year of Birth of Interested Trustee | | Position(s)
Held
with Trust | | Term of
Office
and
Length of
Time
Served* | | Principal Occupation(s) During Past 5 Years | | Number of
Portfolios
in Fund
Complex**
Overseen by
Interested
Trustee | | Other
Directorships
Held by
Interested
Trustee During
the Past 5 Years |
Kevin M. Carome—1956
Invesco Ltd.
Two Peachtree Pointe,
1555 Peachtree St., N.E.,
Suite 1800
Atlanta, GA 30309 | | Trustee | | Since 2010 | | Senior Managing Director, Secretary and General Counsel, Invesco Ltd. (2007-Present); Director, Invesco Advisers, Inc. (2009-Present); Director (2006-Present) and Executive Vice President (2008–Present), Invesco Group Services, Inc., Invesco Holding Company (US), Inc. and Invesco North American Holdings, Inc.; Director, Invesco Holding Company Limited (2007-Present); Executive Vice President (2008–Present), Invesco Investments (Bermuda) Ltd.; Manager, Horizon Flight Works LLC, Director and Executive Vice President, Invesco Finance, Inc. and Director, Invesco Finance PLC (2011-Present); Director and Secretary (2012–Present), Invesco Services (Bahamas) Private Limited; and Director and Executive Vice President (2014–Present), INVESCO Asset Management (Bermuda) Ltd.; formerly, Director and Chairman, INVESCO Funds Group, Inc., Senior Vice President, Secretary and General Counsel, Invesco Advisers, Inc. (2003-2006); Director, Invesco Investments (Bermuda) Ltd. (2008-2016); Senior Vice President and General Counsel, Liberty Financial Companies, Inc. (2000-2001); General Counsel of certain investment management subsidiaries of Liberty Financial Companies, Inc. (1998-2000); Associate General Counsel, Liberty Financial Companies, Inc. (1993-1998); Associate, Ropes & Gray LLP. | | 221 | | None |
| * | This is the date the Interested Trustee began serving the Trust. The Interested Trustee serves an indefinite term, until his successor is elected. |
| ** | Fund Complex includes all open- and closed-end funds (including all of their portfolios) advised by the Adviser and any affiliated person of the Adviser. |
Trustees and Officers (continued)
| | | | | | |
Name, Address and Year of Birth of Executive Officers | | Position(s)
Held
with Trust | | Length of
Time
Served* | | Principal Occupation(s) During Past 5 Years |
Daniel E. Draper—1968 Invesco Capital Management LLC 3500 Lacey Road, Suite 700 Downers Grove, IL 60515 | | President and Principal Executive Officer | | Since 2015 | | President and Principal Executive Officer, Invesco Exchange-Traded Fund Trust, Invesco Exchange-Traded Fund Trust II, Invesco India Exchange-Traded Fund Trust, Invesco Actively Managed Exchange-Traded Fund Trust and Invesco Actively Managed Exchange-Traded Commodity Fund Trust (2015-Present) and Invesco Exchange-Traded Self-Indexed Fund Trust (2016-Present); Chief Executive Officer and Principal Executive Officer (2016-Present) and Managing Director (2013-Present), Invesco Capital Management LLC; Senior Vice President, Invesco Distributors, Inc. (2014-Present); formerly, Vice President, Invesco Exchange-Traded Fund Trust, Invesco Exchange-Traded Fund Trust II, Invesco India Exchange-Traded Fund Trust, Invesco Actively Managed Exchange-Traded Fund Trust (2013-2015) and Invesco Actively Managed Exchange-Traded Commodity Fund Trust (2014-2015); Managing Director, Credit Suisse Asset Management (2010-2013) and Lyxor Asset Management/Societe Generale (2007-2010). |
| | | |
Kelli Gallegos—1970 Invesco Capital Management LLC 3500 Lacey Road, Suite 700 Downers Grove, IL 60515 | | Vice President
and Treasurer | | Since 2018 | | Vice President and Treasurer, Invesco Exchange-Traded Fund Trust, Invesco Exchange-Traded Fund Trust II, Invesco India Exchange-Traded Fund Trust, Invesco Actively Managed Exchange-Traded Fund Trust, Invesco Actively Managed Exchange-Traded Commodity Fund Trust and Invesco Exchange-Traded Self-Indexed Fund Trust (2018-Present); Principal Financial and Accounting Officer-Pooled Investments, Invesco Capital Management LLC (2018-Present); Vice President, Principal Financial Officer (2016-Present) and Assistant Treasurer (2008-Present), The Invesco Funds; formerly, Assistant Treasurer Invesco Exchange-Traded Fund Trust, Invesco Exchange-Traded Fund Trust II, Invesco India Exchange-Traded Fund Trust and Invesco Actively Managed Exchange-Traded Fund Trust (2012-2018), Invesco Actively Managed Exchange-Traded Commodity Fund Trust (2014-2018) and Invesco Exchange-Traded Self-Indexed Fund Trust (2016-2018); Assistant Treasurer, Invesco Capital Management LLC (2013-2018); and Assistant Vice President, The Invesco Funds (2008-2016). |
| | | |
Peter Hubbard—1981 Invesco Capital Management LLC 3500 Lacey Road, Suite 700 Downers Grove, IL 60515 | | Vice President | | Since 2009 | | Vice President, Invesco Exchange-Traded Fund Trust, Invesco Exchange-Traded Fund Trust II, Invesco India Exchange-Traded Fund Trust, Invesco Actively Managed Exchange-Traded Fund Trust (2009-Present), Invesco Actively Managed Exchange-Traded Commodity Fund Trust (2014-Present) and Invesco Exchange-Traded Self-Indexed Fund Trust (2016-Present); Vice President and Director of Portfolio Management, Invesco Capital Management LLC (2010-Present); formerly, Vice President of Portfolio Management, Invesco Capital Management LLC (2008-2010); Portfolio Manager, Invesco Capital Management LLC (2007-2008); Research Analyst, Invesco Capital Management LLC (2005-2007); Research Analyst and Trader, Ritchie Capital, a hedge fund operator (2003-2005). |
| | | |
Sheri Morris—1964 Invesco Capital Management LLC 3500 Lacey Road, Suite 700 Downers Grove, IL 60515 | | Vice President | | Since 2012 | | President and Principal Executive Officer, The Invesco Funds (2016-Present); Treasurer, The Invesco Funds (2008-Present); Vice President, Invesco Advisers, Inc. (formerly known as Invesco Institutional (N.A.), Inc.) (registered investment adviser) (2009-Present) and Vice President, Invesco Exchange-Traded Fund Trust, Invesco Exchange-Traded Fund Trust II, Invesco India Exchange-Traded Fund Trust, Invesco Actively Managed Exchange-Traded Fund Trust (2012-Present), Invesco Actively Managed Exchange-Traded Commodity Fund Trust (2014-Present) and Invesco Exchange-Traded Self-Indexed Fund Trust (2016-Present); formerly, Vice President and Principal Financial Officer, The Invesco Funds (2008-2016); Treasurer, Invesco Exchange-Traded Fund Trust, Invesco Exchange-Traded Fund Trust II, Invesco India Exchange-Traded Fund Trust and Invesco Actively Managed Exchange-Traded Fund Trust (2011-2013); Vice President, Invesco Aim Advisers, Inc., Invesco Aim Capital Management, Inc. and Invesco Aim Private Asset Management, Inc.; Assistant Vice President and Assistant Treasurer, The Invesco Funds and Assistant Vice President, Invesco Advisers, Inc., Invesco Aim Capital Management, Inc. and Invesco Aim Private Asset Management, Inc. |
| * | This is the date each Officer began serving the Trust. Each Officer serves an indefinite term, until his or her successor is elected. |
Trustees and Officers (continued)
| | | | | | |
Name, Address and Year of Birth of Executive Officers | | Position(s)
Held
with Trust | | Length of
Time
Served* | | Principal Occupation(s) During Past 5 Years |
Anna Paglia—1974 Invesco Capital Management LLC 3500 Lacey Road, Suite 700 Downers Grove, IL 60515 | | Secretary | | Since 2011 | | Secretary, Invesco Exchange-Traded Fund Trust, Invesco Exchange-Traded Fund Trust II, Invesco India Exchange-Traded Fund Trust, Invesco Actively Managed Exchange-Traded Fund Trust (2011-Present), Invesco Actively Managed Exchange-Traded Commodity Fund Trust (2014-Present) and Invesco Exchange-Traded Self-Indexed Fund Trust (2015-Present); Head of Legal (2010-Present) and Secretary (2015-Present), Invesco Capital Management LLC; Manager and Assistant Secretary, Invesco Indexing LLC (2017-Present); formerly, Partner, K&L Gates LLP (formerly, Bell Boyd & Lloyd LLP) (2007-2010); Associate Counsel at Barclays Global Investors Ltd. (2004-2006). |
| | | |
Rudolf E. Reitmann—1971 Invesco Capital Management LLC 3500 Lacey Road, Suite 700 Downers Grove, IL 60515 | | Vice President | | Since 2013 | | Vice President, Invesco Exchange-Traded Fund Trust, Invesco Exchange-Traded Fund Trust II, Invesco India Exchange-Traded Fund Trust, Invesco Actively Managed Exchange-Traded Fund Trust (2013-Present), Invesco Actively Managed Exchange-Traded Commodity Fund Trust (2014-Present) and Invesco Exchange-Traded Self-Indexed Fund Trust (2016-Present); Head of Global Exchange Traded Funds Services, Invesco Capital Management LLC (2013-Present); Vice President, Invesco Capital Markets, Inc. (2018-Present). |
| | | |
David Warren—1957 Invesco Canada Ltd. 5140 Yonge Street, Suite 800 Toronto, Ontario M2N 6X7 | | Vice President | | Since 2009 | | Vice President, Invesco Exchange-Traded Fund Trust, Invesco Exchange-Traded Fund Trust II, Invesco India Exchange-Traded Fund Trust, and Invesco Actively Managed Exchange-Traded Fund Trust (2009-Present), Invesco Actively Managed Exchange-Traded Commodity Fund Trust (2014-Present) and Invesco Exchange-Traded Self-Indexed Fund Trust (2016-Present); Managing Director—Chief Administrative Officer, Americas, Invesco Capital Management LLC; Senior Vice President, Invesco Advisers, Inc. (2009-Present); Director, Invesco Inc. (2009-Present); Director, Executive Vice President and Chief Financial Officer, Invesco Canada Ltd. (formerly, Invesco Trimark Ltd.) (2011-Present); Chief Administrative Officer, North American Retail, Invesco Ltd. (2007-Present); Director, Invesco Corporate Class Inc. (2014-Present); Director, Invesco Global Direct Real Estate Feeder GP Ltd. (2015-Present); Director, Invesco Canada Holdings Inc. (2002-Present); Director, Invesco Financial Services Ltd. / Services Financiers Invesco Ltée and Trimark Investments Ltd./Placements Trimark Ltée (2014-Present); Director, Invesco IP Holdings (Canada) Ltd. (2016-Present); Director, Invesco Global Direct Real Estate GP Ltd. (2015-Present); formerly, Senior Vice President, Invesco Management Group, Inc. (2007-2018); Executive Vice President and Chief Financial Officer, Invesco Inc. (2009-2015); Director, Executive Vice President and Chief Financial Officer, Invesco Canada Ltd. (formerly, Invesco Trimark Ltd.) (2000-2011). |
| | | |
Melanie Zimdars—1976 Invesco Capital Management LLC 3500 Lacey Road, Suite 700 Downers Grove, IL 60515 | | Chief Compliance
Officer | | Since 2017 | | Chief Compliance Officer of Invesco Capital Management LLC (2017-Present); Chief Compliance Officer of Invesco Exchange-Traded Fund Trust, Invesco Exchange-Traded Fund Trust II, Invesco India Exchange-Traded Fund Trust, Invesco Actively Managed Exchange-Traded Fund Trust, Invesco Actively Managed Exchange-Traded Commodity Fund Trust and Invesco Exchange-Traded Self-Indexed Fund Trust (2017-Present); formerly, Vice President and Deputy Chief Compliance Officer at ALPS Holding, Inc. (2009-2017); Mutual Fund Treasurer/Chief Financial Officer at Wasatch Advisors, Inc. (2005-2008); Compliance Officer, U.S. Bancorp Fund Services, LLC (2001-2005). |
Availability of Additional Information About the Trustees
The Statement of Additional Information includes additional information about the Trustees and is available, without charge, upon request at (800) 983-0903.
| * | This is the date each Officer began serving the Trust. Each Officer serves an indefinite term, until his or her successor is elected. |
Board Considerations Regarding Approval of Investment Advisory Agreement
Board Considerations Regarding Approval of Investment Advisory Agreement for
PowerShares China All-Cap Portfolio
PowerShares China Technology Portfolio
PowerShares MSCI Emerging Markets Equal Country Weight Portfolio
PowerShares S&P High Income Infrastructure Portfolio
PowerShares Shipping Portfolio
At a meeting held on December 19, 2017, the Board of Trustees of the PowerShares Exchange-Traded Fund Trust II (the “Trust”), including the Independent Trustees, approved the Investment Advisory Agreement (the “Agreement”) between Invesco PowerShares Capital Management LLC (the “Adviser”) and the Trust for the funds listed above (each, a “Fund” and collectively, the “Funds”).
The Trustees reviewed information provided by the Adviser describing: (i) the nature, extent and quality of services to be provided, (ii) the proposed unitary advisory fee for each Fund and comparisons to amounts paid by other comparable registered investment companies, (iii) the extent to which economies of scale may be realized as each Fund grows, (iv) whether the fee levels reflect any possible economies of scale for the benefit of Fund shareholders, and (v) any benefits to be realized by the Adviser from its relationship with each Fund.
The Trustees noted that each Fund was created in connection with the purchase by Invesco Ltd. of the exchange-traded funds business of Guggenheim Capital LLC (the “Transaction”) and that each Fund was structured substantially similar to a corresponding Guggenheim ETF, including the unitary advisory fee, that would be reorganized into the Fund in connection with the Transaction.
Nature, Extent and Quality of Services. In evaluating the nature, extent and quality of the Adviser’s services, the Trustees reviewed information concerning the functions to be performed by the Adviser for each Fund, information describing the Adviser’s current organization and staffing, including operational support that would be provided by the Adviser’s parent organization, Invesco Ltd., and the background and experience of the persons who will be responsible for the day-to-day management of the Funds, and they considered the quality of services provided by the Adviser to other exchange-traded funds (“ETFs”). The Trustees also reviewed information related to the Adviser’s portfolio transaction policies and procedures, as well as reports on the correlation and tracking error between the underlying indexes and the performance of other ETFs for which the Adviser serves as investment adviser.
The Trustees also considered the services to be provided by the Adviser in its oversight of the Funds’ administrator, custodian and transfer agent. They noted the significant amount of time, effort and resources that had been devoted to this oversight function for the other ETFs and that was expected to be provided for each Fund.
The Trustees also considered information provided by the Adviser regarding the resources that would be added in connection with the Transaction to maintain and enhance the services provided to the Funds and all other PowerShares ETFs.
Based on their review, the Trustees concluded that the nature, extent and quality of the services to be provided by the Adviser to each Fund under the Agreement were expected to be appropriate and reasonable.
Fees, Expenses and Profitability. The Trustees reviewed and discussed the information provided by the Adviser on each Fund’s proposed advisory fee, as compared to information compiled by the Adviser from Lipper Inc. (“Lipper”) databases on the median net expense ratios of comparable passive ETFs, open-end (non-ETF) index funds and open-end (non-ETF) actively managed funds peers. The Trustees noted that the fee data provided by the Adviser included only six passive peer ETFs for PowerShares China Technology Portfolio and PowerShares S&P High Income Infrastructure Portfolio. The Trustees also considered fee and expense data on Adviser-identified selected peers for certain Funds. The Trustees noted that the proposed annual advisory fee to be charged to each Fund was a unitary fee, and that the Adviser has agreed to pay all other expenses of each Fund except for the fee payment under the Agreement, payments under the Fund’s 12b-1 plan, if any, brokerage expenses, taxes, interest, acquired fund fees and expenses, if any, litigation
Effective June 4, 2018, the Trust and the PowerShares Funds became the Invesco ETFs and Invesco PowerShares Capital Management LLC became Invesco Capital Management LLC.
Board Considerations Regarding Approval of Investment Advisory Agreement (continued)
expenses and other extraordinary expenses. The Trustees noted each Fund’s proposed unitary advisory fee as compared to the median net expense ratio of its peer groups and select peer group, as applicable, as shown below:
| | | | | | | | |
Fund | | ETF Peer Group
(Number of Peers) | | Open-End
Index Fund
Peer Group
(Number of Peers)1 | | Open-End Active
Fund Peer Group
(Number of Peers) | | Select Peer Group
(Number of Peers)2 |
| PowerShares China All-Cap Portfolio | | Higher than
median (21) | | N/A | | Lower than
median (19) | | Higher than
median (3) |
| PowerShares China Technology Portfolio | | Higher than
median (6) | | N/A | | Lower than
median (6) | | Lower than
median (2) |
| PowerShares MSCI Emerging Markets Equal Country Weight Portfolio | | Higher than
median (54) | | Higher than
median (7) | | Lower than
median (211) | | Higher than
median (4) |
| PowerShares S&P High Income Infrastructure Portfolio | | Lower than
median (6) | | N/A | | Lower than
median (22) | | Lower than
median (4) |
| PowerShares Shipping Portfolio | | Higher than
median (20) | | Higher than
median (1) | | Lower than
median (10) | | N/A |
| 1 | The information provided by the Adviser indicated that certain Funds did not have any comparable open-end index fund peers. Those Funds have been designated with an “N/A” for not available. |
| 2 | The information provided by the Adviser did not include select peer groups for certain Funds. Those Funds have been designated with an “N/A” for not available. |
The Trustees noted that the net expense ratios for all of the Funds were lower than the median net expense ratios of their open-end actively-managed peer funds. The Trustees considered each Fund’s proposed unitary advisory fee in light of the administrative, operational and management oversight services to be provided by the Adviser. The Board concluded that the unitary advisory fee to be charged to each Fund is reasonable and appropriate in light of the services expected to be provided by the Adviser.
In conjunction with their review of the unitary advisory fee, the Trustees considered that the Adviser did not provide a profitability analysis for the Adviser in managing each Fund because the Funds had not yet commenced operations. However, the Trustees noted other information the Board received at its April 2017 meeting on the Adviser’s overall profitability from its relationship with other ETFs for which it serves as investment adviser.
Economies of Scale and Whether Fee Levels Reflect These Economies of Scale. The Trustees reviewed the information provided by the Adviser as to the extent to which economies of scale may be realized as each Fund grows and whether fee levels reflect economies of scale for the benefit of shareholders. The Trustees noted that any reduction in fixed costs associated with the management of each Fund would be enjoyed by the Adviser, but that a unitary advisory fee provides a level of certainty in expenses for each Fund. The Trustees considered whether the proposed advisory fee rate for each Fund is reasonable in relation to the proposed services and product strategy of each Fund, and they concluded that the flat advisory fee was reasonable and appropriate.
Fall-Out Benefits. The Trustees noted that the Adviser had not identified any further benefits that it would derive from its relationships with each Fund, and had noted that it does not have any soft-dollar arrangements.
Based on all of the information considered and the conclusions reached, the Board, including the Independent Trustees, determined to approve the Agreement for each Fund. No single factor was determinative in the Board’s analysis.
Board Considerations Regarding Approval of Investment Advisory Agreement (continued)
Board Considerations Regarding Approval of Investment Advisory Agreement for
PowerShares Canadian Energy Income Portfolio
PowerShares China Real Estate Portfolio
PowerShares China Small Cap Portfolio
PowerShares Frontier Markets Portfolio
PowerShares MSCI Global Timber Portfolio
PowerShares S&P Global Dividend Opportunities Index Portfolio
PowerShares S&P Global Water Index Portfolio
PowerShares Solar Portfolio
PowerShares Zacks International Multi-Asset Income Portfolio
At a meeting held on December 19, 2017, the Board of Trustees of the PowerShares Exchange-Traded Fund Trust II (the “Trust”), including the Independent Trustees, approved the Investment Advisory Agreement (the “Agreement”) between Invesco PowerShares Capital Management LLC (the “Adviser”) and the Trust for the funds listed above (each, a “Fund” and collectively, the “Funds”).
The Trustees reviewed information provided by the Adviser describing: (i) the nature, extent and quality of services to be provided, (ii) the proposed advisory fee and net expense ratio for each Fund and comparisons to amounts paid by other comparable registered investment companies, (iii) the extent to which economies of scale may be realized as each Fund grows, (iv) whether the fee levels reflect any possible economies of scale for the benefit of Fund shareholders, and (v) any benefits to be realized by the Adviser from its relationship with each Fund.
The Trustees noted that each Fund was created in connection with the purchase by Invesco Ltd. of the exchange-traded funds business of Guggenheim Capital LLC (the “Transaction”) and that each Fund was structured substantially similar to a corresponding Guggenheim ETF, including the advisory fee and net expense ratio, that would be reorganized into the Fund (a “Reorganization”) in connection with the Transaction.
Nature, Extent and Quality of Services. In evaluating the nature, extent and quality of the Adviser’s services, the Trustees reviewed information concerning the functions to be performed by the Adviser for each Fund, information describing the Adviser’s current organization and staffing, including operational support that would be provided by the Adviser’s parent organization, Invesco Ltd., and the background and experience of the persons who will be responsible for the day-to-day management of the Funds, and they considered the quality of services provided by the Adviser to other exchange-traded funds (“ETFs”). The Trustees also reviewed information related to the Adviser’s portfolio transaction policies and procedures, as well as reports on the correlation and tracking error between the underlying indexes and the performance of other ETFs for which the Adviser serves as investment adviser.
The Trustees also considered the services to be provided by the Adviser in its oversight of the Funds’ administrator, custodian and transfer agent. They noted the significant amount of time, effort and resources that had been devoted to this oversight function for the other ETFs and that was expected to be provided for each Fund.
The Trustees also considered information provided by the Adviser regarding the resources that would be added in connection with the Transaction to maintain and enhance the services provided to the Funds and all other PowerShares ETFs.
Based on their review, the Trustees concluded that the nature, extent and quality of the services to be provided by the Adviser to each Fund under the Agreement were expected to be appropriate and reasonable.
Fees, Expenses and Profitability. The Trustees reviewed and discussed the information provided by the Adviser on each Fund’s proposed advisory fee and net expense ratio, as compared to information compiled by the Adviser from Lipper Inc. (“Lipper”) databases on the net advisory fees and net expense ratios of comparable passive ETFs, open-end (non-ETF) index funds and open-end (non-ETF) actively managed funds peers. The Trustees noted that the fee data provided by the Adviser included only seven passive peer ETFs for PowerShares S&P Global Dividend Opportunities Index Portfolio and only eight passive peer ETFs for PowerShares China Real Estate Portfolio. The Trustees also considered fee and expense data on Adviser-identified selected peers for certain Funds. The Trustees noted that the proposed annual advisory fee to be charged to each Fund, except for PowerShares China Small Cap Portfolio, is 0.50% of the average daily net assets for each Fund. The Trustees noted that the proposed annual advisory fee to be charged to PowerShares China Small Cap Portfolio is 0.55% of the average daily net assets of the Fund.
The Trustees also noted that the Adviser has agreed to waive a portion of its contractual advisory fee and/or reimburse Fund expenses (an “Expense Cap”) to the extent necessary to prevent the annual operating expenses of each Fund from exceeding the percentage of
Effective June 4, 2018, the Trust and the PowerShares Funds became the Invesco ETFs and Invesco PowerShares Capital Management LLC became Invesco Capital Management LLC.
Board Considerations Regarding Approval of Investment Advisory Agreement (continued)
that Fund’s average daily net assets as set forth in the table below, excluding interest expenses, brokerage commissions and other trading expenses, offering costs, taxes, acquired fund fees and expenses, if applicable, and extraordinary expenses, through the later of two years from the closing date of the Reorganization or December 31, 2020 for each Fund except PowerShares S&P Global Water Index Portfolio and PowerShares Solar Portfolio, and through two years from the closing date of the Reorganization for PowerShares S&P Global Water Index Portfolio and PowerShares Solar Portfolio:
| | | | |
Fund | | Fee Waiver | |
| PowerShares Canadian Energy Income Portfolio | | | 0.66 | % |
| PowerShares China Real Estate Portfolio | | | 0.70 | % |
| PowerShares China Small Cap Portfolio | | | 0.75 | % |
| PowerShares Frontier Markets Portfolio | | | 0.70 | % |
| PowerShares MSCI Global Timber Portfolio | | | 0.55 | % |
| PowerShares S&P Global Dividend Opportunities Index Portfolio | | | 0.64 | % |
| PowerShares S&P Global Water Index Portfolio | | | 0.63 | % |
| PowerShares Solar Portfolio | | | 0.70 | % |
| PowerShares Zacks International Multi-Asset Income Portfolio | | | 0.70 | % |
The Trustees noted each Fund’s proposed contractual advisory fee as compared to the median net advisory fees of its peer groups and select peer groups, as shown below:
| | | | | | | | |
Fund | | ETF Peer Group
(Number of Peers) | | Open-End
Index Fund
Peer Group
(Number of Peers)1 | | Open-End
Active Fund
Peer Group
(Number of Peers) | | Select Peer Group
(Number of Peers)2 |
| PowerShares Canadian Energy Income Portfolio | | Higher than
median (15) | | N/A | | Lower than
median (29) | | N/A |
| PowerShares China Real Estate Portfolio | | Higher than
median (8) | | Higher than
median (1) | | Lower than
median (12) | | N/A |
| PowerShares China Small Cap Portfolio | | Lower than
median (21) | | N/A | | Lower than
median (19) | | Lower than
median (2) |
| PowerShares Frontier Markets Portfolio | | Lower than
median (54) | | Higher than
median (7) | | Lower than
median (211) | | Lower than
median (1) |
| PowerShares MSCI Global Timber Portfolio | | Higher than
median (18) | | Higher than
median (1) | | Lower than
median (3) | | Higher than
median (1) |
| PowerShares S&P Global Dividend Opportunities Index Portfolio | | Lower than
median (7) | | Higher than
median (2) | | Lower than
median (35) | | Lower than
median (4) |
| PowerShares S&P Global Water Index Portfolio | | Higher than
median (15) | | N/A | | Lower than
median (29) | | Higher than
median (1) |
| PowerShares Solar Portfolio | | Higher than
median (15) | | N/A | | Lower than
median (29) | | Higher than
median (4) |
| PowerShares Zacks International Multi-Asset Income Portfolio | | Same as
median (42) | | Higher than
median (2) | | Lower than
median (21) | | Higher than
median (2) |
| 1 | The information provided by the Adviser indicated that certain Funds did not have open-end index fund peers. Those Funds have been designated with an “N/A” for not available. |
| 2 | The information provided by the Adviser did not include select peer groups for certain Funds. Those Funds have been designated with an “N/A” for not available. |
Board Considerations Regarding Approval of Investment Advisory Agreement (continued)
The Trustees also noted each Fund’s net expense ratio as compared to the median net expense ratios of its peer groups and select peer group, as shown below:
| | | | | | | | |
Fund | | ETF Peer Group
(Number of Peers) | | Open-End
Index Fund
Peer Group
(Number of Peers)1 | | Open-End
Active Fund
Peer Group
(Number of Peers) | | Select Peer Group
(Number of Peers)2 |
| PowerShares Canadian Energy Income Portfolio | | Higher than
median (15) | | N/A | | Lower than
median (29) | | N/A |
| PowerShares China Real Estate Portfolio | | Higher than
median (8) | | Higher than
median (1) | | Lower than
median (12) | | N/A |
| PowerShares China Small Cap Portfolio | | Higher than
median (21) | | N/A | | Lower than
median (19) | | Higher than
median (2) |
| PowerShares Frontier Markets Portfolio | | Higher than
median (54) | | Higher than
median (7) | | Lower than
median (211) | | Lower than
median (1) |
| PowerShares MSCI Global Timber Portfolio | | Higher than
median (18) | | Higher than
median (1) | | Lower than
median (3) | | Higher than
median (1) |
| PowerShares S&P Global Dividend Opportunities Index Portfolio | | Higher than
median (7) | | Lower than
median (2) | | Lower than
median (35) | | Higher than
median (4) |
| PowerShares S&P Global Water Index Portfolio | | Higher than
median (15) | | N/A | | Lower than
median (29) | | Higher than
median (1) |
| PowerShares Solar Portfolio | | Higher than
median (15) | | N/A | | Lower than
median (29) | | Higher than
median (4) |
| PowerShares Zacks International Multi-Asset Income Portfolio | | Higher than
median (42) | | Higher than
median (2) | | Lower than
median (21) | | Higher than
median (2) |
The Trustees considered each Fund’s proposed contractual advisory fee in light of the administrative, operational and management oversight services to be provided by the Adviser. The Board concluded that the contractual advisory fee to be charged to each Fund and expense ratio of each Fund (giving effect to the Fund’s Expense Cap) were reasonable and appropriate in light of the services expected to be provided by the Adviser.
In conjunction with their review of the contractual advisory fee, the Trustees considered that the Adviser did not provide a profitability analysis for the Adviser in managing each Fund because the Funds had not yet commenced operations. However, the Trustees noted other information the Board received at its April 2017 meeting on the Adviser’s overall profitability from its relationship with other ETFs for which it serves as investment adviser.
Economies of Scale and Whether Fee Levels Reflect These Economies of Scale. The Trustees reviewed the information provided by the Adviser as to the extent to which economies of scale may be realized as each Fund grows and whether fee levels reflect economies of scale for the benefit of shareholders. The Trustees also noted that the Excess Expense Agreement with the Trust provides that the Adviser is entitled to be reimbursed by each Fund for fees waived or expenses absorbed pursuant to the Expense Cap for a period of three years from the date the fee or expense was incurred, provided that no reimbursement would be made that would result in a Fund exceeding its Expense Cap. The Trustees considered whether the proposed advisory fee rate for each Fund is reasonable in relation to the proposed services and product strategy of each Fund, and they concluded that the flat advisory fee was reasonable and appropriate.
Fall-Out Benefits. The Trustees noted that the Adviser had not identified any further benefits that it would derive from its relationships with each Fund, and had noted that it does not have any soft-dollar arrangements.
Based on all of the information considered and the conclusions reached, the Board, including the Independent Trustees, determined to approve the Agreement for each Fund. No single factor was determinative in the Board’s analysis.
(This Page Intentionally Left Blank)
(This Page Intentionally Left Blank)
Proxy Voting Policies and Procedures
A description of the Trust’s proxy voting policies and procedures that the Funds use to determine how to vote proxies relating to portfolio securities is available, without charge and upon request, by calling (800) 983-0903. This information is also available on the Securities and Exchange Commission’s (“Commission”) website at www.sec.gov.
Information regarding how each Fund voted proxies for portfolio securities, if applicable, during the most recent 12-month period ended June 30, is also available, without charge and upon request, by (i) calling (800) 983-0903; or (ii) accessing the Trust’s Form N-PX on the Commission’s website at www.sec.gov.
Quarterly Portfolios
The Trust files its complete schedule of portfolio holdings for the Funds with the Commission for the first and third quarters of each fiscal year on Form N-Q. The Trust’s Forms N-Q are available on the Commission’s website at www.sec.gov. The Trust’s Forms N-Q may also be reviewed and copied at the Commission’s Public Reference Room in Washington, DC; information on the operation of the Public Reference Room may be obtained by calling (800) SEC-0330.
Frequency Distribution of Discounts and Premiums
A table showing the number of days the market price of each Fund’s shares was greater than the Fund’s net asset value, and the number of days it was less than the Fund’s net asset value (i.e., premium or discount) for the most recently completed calendar year, and the calendar quarters since that year end (or the life of the Fund, if shorter) may be found at the Fund’s website at www.invesco.com/ETFs.
| | | | |
©2018 Invesco Capital Management LLC 3500 Lacey Road, Suite 700 Downers Grove, IL 60515 | | P-TRST2-AR-2 | | invesco.com/ETFs |

Invesco Annual Report to Shareholders
August 31, 2018
| | |
| PLW | | Invesco 1-30 Laddered Treasury ETF |
| PWZ | | Invesco California AMT-Free Municipal Bond ETF |
| PCEF | | Invesco CEF Income Composite ETF |
| PHB | | Invesco Fundamental High Yield® Corporate Bond ETF |
| PFIG | | Invesco Fundamental Investment Grade Corporate Bond ETF |
| LDRI | | Invesco LadderRite 0-5 Year Corporate Bond ETF |
| PZA | | Invesco National AMT-Free Municipal Bond ETF |
| PZT | | Invesco New York AMT-Free Municipal Bond ETF |
| PGX | | Invesco Preferred ETF |
| BAB | | Invesco Taxable Municipal Bond ETF |
| CLTL | | Invesco Treasury Collateral ETF |
| VRP | | Invesco Variable Rate Preferred ETF |
| PVI | | Invesco VRDO Tax-Free Weekly ETF |
Table of Contents
The Market Environment
Domestic Equity
The fiscal period proved to be another strong, albeit increasingly volatile, time for US equities. As the fiscal period unfolded in the later months of 2017, several major US stock market indexes repeatedly reached new highs amid improving economic data, strong corporate profits and the prospect of tax reform legislation. Stock market volatility remained exceedingly low—a hallmark of 2017.
At the outset of 2018, US equity markets continued to steadily move higher in January as investors remained enthused about the passage of the Tax Cuts and Jobs Act signed into law in late December 2017, which significantly cut corporate tax rates. However, in February 2018, volatility returned to the US stock and bond markets. Worries about how rising interest rates might affect economic growth, concerns about a potential trade war and heightened geopolitical tensions, caused the US stock market to pull back and volatility to increase. In addition, in April 2018, the yield on the 10-year US Treasury bond climbed above 3%—a psychologically important level—for the first time since December 2013.1
Despite a disappointing first quarter, US equity markets generally recovered in the second quarter of 2018. Strong US retail sales and low unemployment continued to buoy US equity markets. In the final months of the fiscal period, US equities moved higher, despite several potential headwinds including trade tensions, tariff announcements and contagion concerns over a Turkish currency crisis. Ultimately, the fiscal period ended the same way it began with several US equity indexes reaching new record highs.
Given signs of a strong economy, the US Federal Reserve raised interest rates three times during the fiscal period: in December 2017 and in March and June 2018.2 In contrast, the European Central Bank and central banks in several other countries maintained extraordinarily accommodative monetary policies.
| 2 | Source: US Federal Reserve |
Fixed Income
Throughout the fiscal period, US economic data remained positive; economic growth in the second quarter of 2018 was particularly strong. The US economy continued to add jobs, pushing the unemployment rate to 3.9% at the close of the fiscal period, while inflation remained subdued.1 Against this backdrop, the US Federal Reserve (the Fed) raised the federal funds target rate from a range of 1.00% to 1.25% at the start of the fiscal period to a range of 1.75% to 2.00% at the close of the fiscal period. This was accomplished with three 0.25% rate hikes in December 2017, and in March and June 2018.2 Working against these positive developments, however, were global macroeconomic headwinds in the form of geopolitical trade tension, sub-optimal inflation, and the lingering unknown of Brexit—the decision by UK voters to leave the European Union. These headwinds could limit future Fed rate hikes in the near-term. The Bank of Japan and the European Central Bank maintained their negative interest rates in a continued attempt to stimulate growth and inflation by encouraging investors to spend rather than save. These actions continued to drive overseas investments into higher yielding segments of the fixed income markets.
The 10-year US Treasury yield continued to move upward at the start of the fiscal period and spiked in early 2018 due to the continued strength in the global economy, the rising risks of inflation and the high probability of additional Fed rate hikes throughout the fiscal period. Due to these factors, the 10-year US Treasury note declined steadily throughout the first quarter of 2018, resulting in higher government yields and a brief move above 3.00% before normalizing near the end of the fiscal period.3 The 10-year US Treasury yield ended the fiscal period at 2.86%, 74 basis points higher than at the beginning of the fiscal period.3 (A basis point is one one-hundredth of a percentage point.)
The broader bond market, as represented by the Bloomberg Barclays U.S. Aggregate Bond Index, fell 1.05% for the fiscal period. Poor performance was largely attributable to the broad increase in US Treasury yields, a widening of credit spreads and reduced overseas bond purchase demand during the fiscal period. All four primary sectors of the Bloomberg Barclays U.S. Aggregate Bond Index—government-related, corporate, securitized and treasury—posted negative returns for the fiscal period.
| 1 | Bureau of Labor Statistics |
| | |
| PLW | | Manager’s Analysis |
| | Invesco 1-30 Laddered Treasury ETF (PLW) |
As an index fund, the Invesco 1-30 Laddered Treasury ETF (the “Fund”) is passively managed and attempts to track the returns of an underlying index. The Fund seeks to track the investment results (before fees and expenses) of the Ryan/NASDAQ U.S. 1-30 Year Treasury Laddered Index (the “Index”). The Fund generally will invest at least 80% of its total assets in U.S. Treasury securities that comprise the Index. The Index measures potential returns of a theoretical portfolio of U.S. Treasury securities with a yield curve based upon 30 distinct annual maturities. The Index seeks to maintain a continuous maturity laddered portfolio of securities, meaning that securities holdings are scheduled to mature in a proportional, annual sequential pattern. Nasdaq, Inc. (the “Index Provider”) allows a six-month maturity deviation if securities with a desired maturity date are not available.
Strictly in accordance with its guidelines and mandated procedures, the Index Provider selects securities for inclusion in the Index that are U.S. Treasury-auctioned issues with fixed coupon rates that are non-callable. The Index Provider does not include treasury inflation-protected securities, bills or zero-coupon securities in the Index. The Fund generally invests in all of the securities comprising its Index in proportion to their weightings in the Index.
The Board of Trustees approved a change in the fiscal year end for the Fund from October 31 to August 31. For the fiscal period from November 1, 2017 to August 31, 2018, on a market price basis, the Fund returned (1.17)%. On a net asset value (“NAV”) basis, the Fund returned (1.01)%. During the same time period, the Index returned (0.87)%. During the fiscal period, the Fund fully replicated the components of the Index; therefore, the Fund’s performance (NAV basis) differed from the return of the Index primarily due to fees and operating expenses that the Fund incurred during the period.
During this same time period, the Bloomberg Barclays U.S. Treasury Index (the “Benchmark Index”) returned (0.57)%. The Benchmark Index is an unmanaged index weighted by market capitalization based on the average performance of approximately 250 securities. The Benchmark Index was selected for its recognition in the marketplace, and its performance comparison is a useful measure for investors as a broad representation of the roughly 5-year average duration U.S. Treasury market.
Relative to the Benchmark Index, the Fund was most overweight in bonds with maturities between 10-20 years duration and most underweight in bonds with maturities between 0-5 years duration during the fiscal period ended August 31, 2018. The majority of the Fund’s underperformance relative to the Benchmark Index during the period can be attributed to the Fund’s overweight position in bonds with maturities between 10-15 years duration as well as fees and operating expenses incurred by the Fund.
For the fiscal period ended August 31, 2018, bonds with maturities with between 29-30 years duration contributed most significantly to the Fund’s return, followed by bonds with maturities between 0-1 year duration. The bonds with maturities between 7-10 years duration detracted most significantly from the Fund’s return, followed by bonds with maturities between 12-13 years duration and bonds with maturities between 17-18 years duration, respectively.
Positions that contributed most significantly to the Fund’s return for the fiscal period ended August 31, 2018, included U.S. Treasury Bonds, 3.00% coupon, due 02/15/2048 (portfolio average weight of 2.01%), and U.S. Treasury Bonds, 8.875% coupon, due 02/15/2019 (portfolio average weight of 3.24%). Positions that detracted most significantly from the Fund’s return included U.S. Treasury Bonds, 5.375% coupon, due 02/15/2031 (portfolio average weight of 9.95%), and U.S. Treasury Bonds, 4.50% coupon, due 02/15/2036 (portfolio average weight of 10.03%).
| | | | |
Duration Breakdown
(% of the Fund’s Net Assets)
as of August 31, 2018 | |
| Maturing in 0-5 Years | | | 19.5 | |
| Maturing in 6-10 Years | | | 16.4 | |
| Maturing in 11-15 Years | | | 13.2 | |
| Maturing in 16-20 Years | | | 20.1 | |
| Maturing in 21-25 Years | | | 16.9 | |
| Maturing in 26-30 Years | | | 13.6 | |
| Money Market Fund Plus Other Assets Less Liabilities | | | 0.3 | |
|
Top Ten Fund Holdings*
(% of the Fund’s Net Assets)
as of August 31, 2018 | |
| Security | | | | |
| U.S. Treasury Bonds, 4.500%, 02/15/2036 | | | 10.0 | |
| U.S. Treasury Bonds, 5.375%, 02/15/2031 | | | 10.0 | |
| U.S. Treasury Bonds, 2.500%, 02/15/2046 | | | 3.4 | |
| U.S. Treasury Bonds, 3.000%, 02/15/2047 | | | 3.4 | |
| U.S. Treasury Bonds, 3.000%, 02/15/2048 | | | 3.4 | |
| U.S. Treasury Bonds, 2.500%, 02/15/2045 | | | 3.4 | |
| U.S. Treasury Bonds, 3.625%, 02/15/2044 | | | 3.4 | |
| U.S. Treasury Bonds, 3.125%, 02/15/2043 | | | 3.4 | |
| U.S. Treasury Bonds, 3.125%, 02/15/2042 | | | 3.4 | |
| U.S. Treasury Bonds, 3.500%, 02/15/2039 | | | 3.4 | |
| Total | | | 47.2 | |
* Excluding money market fund holdings.
Invesco 1-30 Laddered Treasury ETF (PLW) (continued)
Growth of a $10,000 Investment
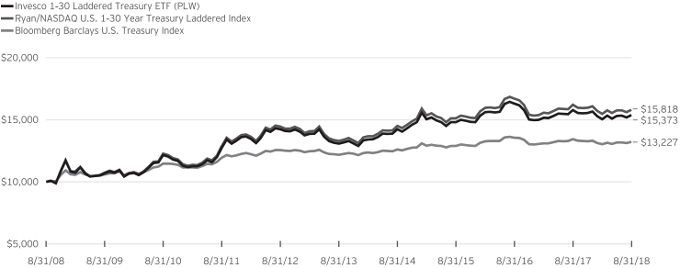
Fund Performance History as of August 31, 2018
| | | | | | | | | | | | | | | | | | | | | | | | | | | | | | | | | | | | | | | | |
| | | 1 Year | | | 3 Years Average
Annualized | | | 3 Years Cumulative | | | 5 Years Average
Annualized | | | 5 Years Cumulative | | | 10 Years Average
Annualized | | | 10 Years Cumulative | | | | | | Fund Inception | |
| Index | | | | | Average
Annualized | | | Cumulative | |
| Ryan/NASDAQ U.S. 1-30 Year Treasury Laddered Index | | | (2.48 | )% | | | 1.49 | % | | | 4.55 | % | | | 3.52 | % | | | 18.91 | % | | | 4.69 | % | | | 58.18 | % | | | | | | | 5.23 | % | | | 74.11 | % |
| Bloomberg Barclays U.S. Treasury Index | | | (1.54 | ) | | | 0.84 | | | | 2.54 | | | | 1.67 | | | | 8.64 | | | | 2.84 | | | | 32.27 | | | | | | | | 3.37 | | | | 43.50 | |
| Fund | | | | | | | | | | | | | | | | | | | | | | | | | | | | | | | | | | | | | | | | |
| NAV Return | | | (2.65 | ) | | | 1.26 | | | | 3.83 | | | | 3.27 | | | | 17.47 | | | | 4.39 | | | | 53.73 | | | | | | | | 4.93 | | | | 68.93 | |
| Market Price Return | | | (2.81 | ) | | | 1.29 | | | | 3.91 | | | | 3.28 | | | | 17.52 | | | | 4.38 | | | | 53.52 | | | | | | | | 4.90 | | | | 68.27 | |
Fund Inception: October 11, 2007
Performance quoted above represents past performance. Past performance is not a guarantee of future results and current performance may be higher or lower than performance quoted. Investment returns and principal value will fluctuate, and shares of the Fund (“Fund Shares”), when redeemed or sold, may be worth more or less than their original cost. Fund performance reflects any applicable fee waivers and/or expense reimbursements. Had the adviser not waived fees and/or reimbursed expenses currently or in the past, returns would have been lower. See current prospectus for more information. According to the Fund’s current prospectus, the Fund’s expense ratio of 0.25% is expressed as a unitary management fee to cover operating expenses and expenses incurred in connection with managing the portfolio. NAV and Market Price returns assume that dividends and capital gain distributions have been reinvested in the Fund at NAV and Market Price, respectively. The returns shown in the table above do not reflect the deduction of taxes that a shareholder would pay on Fund distributions or the redemption or sale of Fund Shares.
See invesco.com/ETFs to find the most recent month-end performance numbers.
Index and Benchmark Index performance results are based upon a hypothetical investment in their respective constituent securities. Index and Benchmark Index returns do not represent Fund returns. An investor cannot invest directly in an index. The Index and Benchmark Index do not charge management fees or brokerage expenses, and no such fees or expenses were deducted from the hypothetical performance shown. In addition, the results actual investors might have achieved would have differed from those shown because of differences in the timing, amounts of their investments, and fees and expenses associated with an investment in the Fund.
Notes Regarding Indexes and Fund Performance History:
| - | Average Annualized and Cumulative Inception returns for the Fund, Index and Benchmark Index are based on the inception date of the Fund. |
| | |
| PWZ | | Manager’s Analysis |
| | Invesco California AMT-Free Municipal Bond ETF (PWZ) |
As an index fund, the Invesco California AMT-Free Municipal Bond ETF (the “Fund”) is passively managed and attempts to track the returns of an underlying index. The Fund seeks to track the investment results (before fees and expenses) of ICE BofAML California Long-Term Core Plus Municipal Securities Index (the “Index”). The Fund generally will invest at least 80% of its total assets in municipal securities that comprise the Index and that are also exempt from the federal alternative minimum tax.
ICE Data Indices, LLC is the Index provider for the Index. The Index is composed of U.S. dollar-denominated, investment grade, tax-exempt debt publicly issued by California or any U.S. territory, or their political subdivisions, in the U.S. domestic market with a term of at least 15 years remaining to final maturity. The Fund does not purchase all of the securities in the Index; instead, the Fund utilizes a “sampling” methodology to seek to achieve its investment objective.
The Board of Trustees approved a change in the fiscal year end for the Fund from October 31 to August 31. For the fiscal period from November 1, 2017 to August 31, 2018, on a market price basis, the Fund returned 1.15%. On a net asset value (“NAV”) basis, the Fund returned 1.22%. During the same time period, the Index returned 1.56%. During the fiscal period, the Fund’s performance (NAV basis) differed from the return of the Index due to the Fund’s sampling methodology in addition to fees and operating expenses incurred by the Fund during the period.
During this same time period, the Bloomberg Barclays Municipal Bond 20 Year Index (the “Benchmark Index”) returned 1.33%. The Benchmark Index is an unmanaged index weighted by market capitalization based on the average performance of approximately 5,742 securities. The Benchmark Index was selected for its recognition in the marketplace, and its performance comparison is a useful measure for investors as a broad representation of municipal securities with maturities of 17 to 22 years.
Relative to the Benchmark Index, the Fund was most overweight in the State of California and most underweight in the territory of the U.S. Virgin Islands during the fiscal period ended August 31, 2018. The majority of the Fund’s underperformance relative to the Benchmark Index during the period can be attributed to California bonds underperforming the general municipal market as well as fees and operating expenses incurred by the Fund during the period.
For the fiscal period ended August 31, 2018, the State of California contributed most significantly to the Fund’s return. Puerto Rico detracted most significantly from the Fund’s return.
Positions that contributed most significantly to the Fund’s return for the fiscal period ended August 31, 2018, included California State Various Purpose Ser. 09, 6.00% coupon, due 04/01/2038 (portfolio average weight of 0.54%), and San Francisco California City & County Airports Commission (San Francisco International
Airport) Rev. Ser.18D, 5.00% coupon, due 05/01/2048 (portfolio average weight of 1.14%). Positions that detracted most significantly from the Fund’s return included California State Various Purpose Ser. 09, 6.00% coupon, due 04/01/2038 (portfolio average weight of 1.28%), and Alameda California Corridor Transportation Auth. (Second Sub.-Lien) Ref. Ser. 16B AGM, 3.00% coupon, due 10/01/2034 (portfolio average weight of 0.76%).
| | | | |
Revenue Type Breakdown
(% of the Fund’s Net Assets)
as of August 31, 2018 | |
| Ad Valorem Property Tax | | | 21.6 | |
| Health, Hospital, Nursing Home Revenue | | | 11.2 | |
| Port, Airport & Marina Revenue | | | 11.1 | |
| College & University Revenue | | | 9.3 | |
| Water Revenue | | | 8.9 | |
| General Fund | | | 7.2 | |
| Electric Power Revenue | | | 6.4 | |
| Lease Revenue | | | 6.0 | |
| Sales Tax Revenue | | | 4.8 | |
| Highway Tolls Revenue | | | 2.5 | |
| Miscellaneous Revenue | | | 2.0 | |
| Tax Increment Revenue | | | 1.6 | |
| Sewer Revenue | | | 1.4 | |
| Transit Revenue | | | 1.4 | |
| Special Tax | | | 1.1 | |
| Natural Gas Revenue | | | 1.0 | |
| Recreational Revenue | | | 0.4 | |
| Local or GTD Housing | | | 0.4 | |
| Other Assets Less Liabilities | | | 1.7 | |
Invesco California AMT-Free Municipal Bond ETF (PWZ) (continued)
| | | | |
Top Ten Fund Holdings
(% of the Fund’s Net Assets)
as of August 31, 2018 | |
| Security | | | | |
| San Francisco California City & County Airports Commission (San Francisco International Airport) Rev. Ser. 18D, 5.000%, 05/01/2048 | | | 3.2 | |
| Los Angeles County California Metropolitan Transportation Auth. Sales Tax Rev. Ser. 17A, 5.000%, 07/01/2038 | | | 2.3 | |
| Marin California Healthcare District (Election 2013) Ser. 17A, 5.000%, 08/01/2041 | | | 2.3 | |
| San Rafael California High School District (Election 2015) Ser. 18B, 4.000%, 08/01/2047 | | | 2.1 | |
| San Francisco California City & County Airports Commission (San Francisco International Airport) Rev. Ser. 16C, 5.000%, 05/01/2046 | | | 2.0 | |
| Chabot-Las Positas California Community College District (Election 2016) Ser. 17A, 4.000%, 08/01/2047 | | | 2.0 | |
| Los Angeles California Department of Water & Power (Power System) Rev. Ser. 12B, 5.000%, 07/01/2043 | | | 2.0 | |
| Santa Clara Valley California Water District Ref. Ser. 16A, 5.000%, 06/01/2046 | | | 1.9 | |
| California State Various Purpose Ser. 17, 5.000%, 11/01/2047 | | | 1.8 | |
| San Diego County California Regional Transportation Commission Ser. 16A, 5.000%, 04/01/2048 | | | 1.8 | |
| Total | | | 21.4 | |
Invesco California AMT-Free Municipal Bond ETF (PWZ) (continued)
Growth of a $10,000 Investment
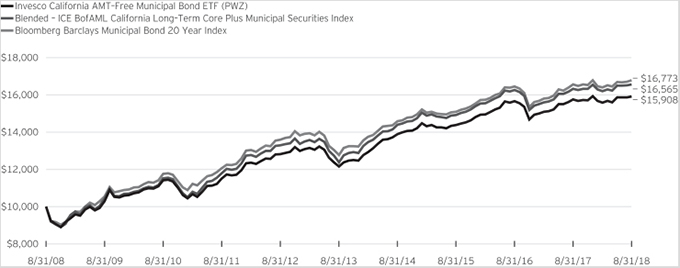
Fund Performance History as of August 31, 2018
| | | | | | | | | | | | | | | | | | | | | | | | | | | | | | | | | | | | | | | | |
| | | 1 Year | | | 3 Years Average
Annualized | | | 3 Years Cumulative | | | 5 Years Average
Annualized | | | 5 Years Cumulative | | | 10 Years Average
Annualized | | | 10 Years Cumulative | | | | | | Fund Inception | |
| Index | | | | | Average
Annualized | | | Cumulative | |
| Blended—ICE BofAML California Long-Term Core Plus Municipal Securities Index | | | 1.50 | % | | | 3.55 | % | | | 11.02 | % | | | 6.02 | % | | | 33.98 | % | | | 5.18 | % | | | 65.65 | % | | | | | | | 4.71 | % | | | 64.98 | % |
| Bloomberg Barclays Municipal Bond 20 Year Index | | | 1.32 | | | | 3.59 | | | | 11.18 | | | | 5.61 | | | | 31.36 | | | | 5.31 | | | | 67.73 | | | | | | | | 5.01 | | | | 70.23 | |
| Fund | | | | | | | | | | | | | | | | | | | | | | | | | | | | | | | | | | | | | | | | |
| NAV Return | | | 0.97 | | | | 3.44 | | | | 10.68 | | | | 5.54 | | | | 30.97 | | | | 4.75 | | | | 59.08 | | | | | | | | 4.22 | | | | 56.91 | |
| Market Price Return | | | 0.65 | | | | 3.31 | | | | 10.27 | | | | 5.76 | | | | 32.30 | | | | 4.74 | | | | 58.83 | | | | | | | | 4.15 | | | | 55.61 | |
Fund Inception: October 11, 2007
Performance quoted above represents past performance. Past performance is not a guarantee of future results and current performance may be higher or lower than performance quoted. Investment returns and principal value will fluctuate, and shares of the Fund (“Fund Shares”), when redeemed or sold, may be worth more or less than their original cost. Fund performance reflects any applicable fee waivers and/or expense reimbursements. Had the adviser not waived fees and/or reimbursed expenses currently or in the past, returns would have been lower. See current prospectus for more information. According to the Fund’s current prospectus, the Fund’s expense ratio of 0.28% is expressed as a unitary management fee to cover operating expenses and expenses incurred in connection with managing the portfolio. NAV and Market Price returns assume that dividends and capital gain distributions have been reinvested in the Fund at NAV and Market Price, respectively. The returns shown in the table above do not reflect the deduction of taxes that a shareholder would pay on Fund distributions or the redemption or sale of Fund Shares. See invesco.com/ETFs to find the most recent month-end performance numbers.
Blended-Index and Benchmark Index performance results are based upon a hypothetical investment in their respective constituent securities.
Blended-Index and Benchmark Index returns do not represent Fund returns. An investor cannot invest directly in an index. The Blended-Index and Benchmark Index do not charge management fees or brokerage expenses, and no such fees or expenses were deducted from the hypothetical performance shown. In addition, the results actual investors might have achieved would have differed from those shown because of differences in the timing, amounts of their investments, and fees and expenses associated with an investment in the Fund.
Notes Regarding Indexes and Fund Performance History:
| - | The Blended – ICE BofAML California Long-Term Core Plus Municipal Securities Index is comprised of the performance of the BofA Merrill Lynch California Insured Long-Term Core Municipal Securities Index, the Fund’s underlying index from Fund inception through the conversion date, May 29, 2009, followed by the performance of the BofA Merrill Lynch California Insured Long-Term Core Plus Municipal Securities Index, the Fund’s underlying index for the period May 29, 2009 through July 8, 2014, followed by the performance of the Index for the period July 8, 2014 through August 31, 2018. |
| - | Average Annualized and Cumulative Inception returns for the Fund, Blended-Index and Benchmark Index are based on the inception date of the Fund. |
| | |
| PCEF | | Manager’s Analysis |
| | Invesco CEF Income Composite ETF (PCEF) |
As an index fund, the Invesco CEF Income Composite ETF (the “Fund”) is passively managed and attempts to track the returns of an underlying index. The Fund seeks to track the investment results (before fees and expenses) of the S-Network Composite Closed-End Fund IndexSM (the “Index”). The Fund generally will invest at least 90% of its total assets in securities of U.S.-listed closed-end funds that comprise the Index. The Fund is a “fund of funds,” as it invests its assets in the common shares of funds included in the Index rather than in individual securities.
S-Network Global Indexes, Inc. (the “Index Provider”) compiles, maintains and calculates the Index, which tracks the overall performance of a universe of U.S.-listed closed-end funds that are organized under the laws of the United States, which may be invested in taxable investment grade fixed-income securities, taxable high yield fixed-income securities and taxable equity options. The Index may include closed-end funds that are advised by an affiliate of Invesco Capital Management LLC (the “Adviser”). The Fund generally invests in all of the securities comprising its Index in proportion to their weightings in the Index.
The Board of Trustees approved a change in the fiscal year end for the Fund from October 31 to August 31. For the fiscal period from November 1, 2017 to August 31, 2018, on a market price basis, the Fund returned 1.94%. On a net asset value (“NAV”) basis, the Fund returned 1.85%. During the same time period, the Index returned 2.22%. During the fiscal period, the Fund fully replicated the components of the Index; therefore, the Fund’s performance (NAV basis) differed from the return of the Index primarily due to fees and operating expenses that the Fund incurred during the period partially offset by beneficial trade executions associated with portfolio rebalances.
During this same time period, the S&P 500® Index (the “Benchmark Index”) returned 14.57%. The Benchmark Index is an unmanaged index weighted by market capitalization based on the average performance of approximately 500 equity securities. The Benchmark Index was selected for its recognition in the marketplace, and its performance comparison is a useful measure for investors as a broad representation of the overall U.S. stock market.
Relative to the Benchmark Index, the Fund was most overweight in investment grade and high yield fixed-income closed-end funds during the fiscal period ended August 31, 2018. The majority of the Fund’s underperformance relative to the Benchmark Index can be attributed to this exposure to fixed-income, which generally underperformed the equity markets during the period. Additionally, the rising interest rate environment weakened the financial leverage opportunities, which are utilized by many closed-end funds to enhance their returns.
For the fiscal period ended August 31, 2018, the Eaton Vance Tax-Managed Global Diversified Equity Income Fund (portfolio
average weight of 3.46%) contributed most significantly to the Fund’s return, followed by the Eaton Vance Tax-Managed Diversified Equity Income Fund (portfolio average weight of 1.93%), and the Blackrock Science & Technology Trust (portfolio average weight of 0.76%), respectively. Positions that detracted most significantly from the Fund’s return included Nuveen Preferred & Income Securities Fund (portfolio average weight of 2.20%), and Aberdeen Asia-Pacific Income Fund, Inc. (portfolio average weight of 1.88%).
| | | | |
Asset Class Breakdown*
(% of the Fund’s Net Assets)
as of August 31, 2018 | |
| Bonds | | | 44.1 | |
| Bonds/High Yield | | | 28.0 | |
| Option Income | | | 27.4 | |
| Domestic Equity | | | 0.4 | |
| Money Market Funds Plus Other Assets Less Liabilities | | | 0.1 | |
| * | Reflects exposure achieved through investments in underlying funds. |
| | | | |
|
Top Ten Fund Holdings*
(% of the Fund’s Net Assets)
as of August 31, 2018 | |
| Security | | | | |
| Eaton Vance Tax-Managed Global Diversified Equity Income Fund | | | 2.7 | |
| Eaton Vance Limited Duration Income Fund | | | 2.7 | |
| BlackRock Enhanced Equity Dividend Trust | | | 2.5 | |
| BlackRock Credit Allocation Income Trust | | | 2.4 | |
| BlackRock Corporate High Yield Fund, Inc. | | | 2.4 | |
| DoubleLine Income Solutions Fund | | | 2.3 | |
| AllianzGI NFJ Dividend, Interest & Premium Strategy Fund | | | 2.2 | |
| Nuveen Preferred & Income Securities Fund | | | 2.1 | |
| First Trust Intermediate Duration Preferred & Income Fund | | | 1.9 | |
| Nuveen Credit Strategies Income Fund | | | 1.9 | |
| Total | | | 23.1 | |
| * | Excluding money market fund holdings. |
Invesco CEF Income Composite ETF (PCEF) (continued)
Growth of a $10,000 Investment Since Inception
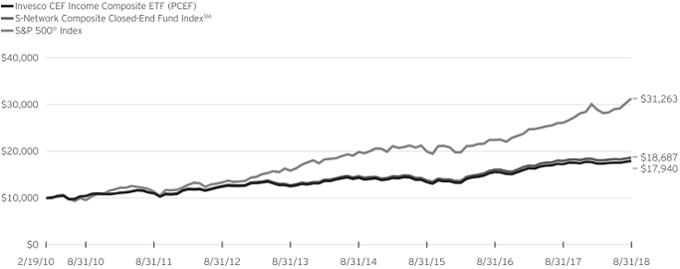
Fund Performance History as of August 31, 2018
| | | | | | | | | | | | | | | | | | | | | | | | | | | | | | | | |
| | | 1 Year | | | 3 Years Average
Annualized | | | 3 Years Cumulative | | | 5 Years Average
Annualized | | | 5 Years Cumulative | | | | | | Fund Inception | |
| Index | | | | | Average
Annualized | | | Cumulative | |
| S-Network Composite Closed-End Fund IndexSM | | | 4.27 | % | | | 10.62 | % | | | 35.37 | % | | | 8.00 | % | | | 46.90 | % | | | | | | | 7.61 | % | | | 86.87 | % |
| S&P 500® Index | | | 19.66 | | | | 16.11 | | | | 56.55 | | | | 14.52 | | | | 97.01 | | | | | | | | 14.30 | | | | 212.63 | |
| Fund | | | | | | | | | | | | | | | | | | | | | | | | | | | | | | | | |
| NAV Return | | | 3.82 | | | | 10.10 | | | | 33.46 | | | | 7.49 | | | | 43.47 | | | | | | | | 7.09 | | | | 79.40 | |
| Market Price Return | | | 3.77 | | | | 10.16 | | | | 33.70 | | | | 7.51 | | | | 43.64 | | | | | | | | 7.08 | | | | 79.26 | |
Fund Inception: February 19, 2010
Performance quoted above represents past performance. Past performance is not a guarantee of future results and current performance may be higher or lower than performance quoted. Investment returns and principal value will fluctuate, and shares of the Fund (“Fund Shares”), when redeemed or sold, may be worth more or less than their original cost. Fund performance reflects any applicable fee waivers and/or expense reimbursements. Had the adviser not waived fees and/or reimbursed expenses currently or in the past, returns would have been lower. See current prospectus for more information. According to the Fund’s current prospectus, the Fund’s expense ratio of 2.07% includes the unitary management fee of 0.50% and acquired fund fees and expenses of 1.57%. NAV and Market Price returns assume that dividends and capital gain distributions have been reinvested in the Fund at NAV and Market Price, respectively. The returns shown in the table above do not reflect the deduction of taxes that a shareholder would pay on Fund distributions or the redemption or sale of Fund
Shares. See invesco.com/ETFs to find the most recent month-end performance numbers.
Index and Benchmark Index performance results are based upon a hypothetical investment in their respective constituent securities. Index and Benchmark Index returns do not represent Fund returns. An investor cannot invest directly in an index. The Index and Benchmark Index do not charge management fees or brokerage expenses, and no such fees or expenses were deducted from the hypothetical performance shown. In addition, the results actual investors might have achieved would have differed from those shown because of differences in the timing, amounts of their investments, and fees and expenses associated with an investment in the Fund.
Notes Regarding Indexes and Fund Performance History:
| - | Average Annualized and Cumulative Inception returns for the Fund, Index and Benchmark Index are based on the inception date of the Fund. |
| | |
| PHB | | Manager’s Analysis |
| | Invesco Fundamental High Yield® Corporate Bond ETF (PHB) |
As an index fund, the Invesco Fundamental High Yield® Corporate Bond ETF (the “Fund”) is passively managed and attempts to track the returns of an underlying index. The Fund seeks to track the investment results (before fees and expenses) of the RAFI® Bonds U.S. High Yield 1-10 Index (the “Index”). The Fund generally will invest at least 80% of its total assets in high-yield corporate bonds that comprise the Index.
The Index is comprised of U.S. dollar-denominated bonds that are registered with the U.S. Securities and Exchange Commission or that are Rule 144A securities that provide for registration rights (issued after July 31, 2013) and whose issuers are public companies listed on a major U.S. stock exchange. Only investible, non-convertible, non-exchangeable, non-zero, fixed coupon high-yield corporate bonds qualify for inclusion in the Index. Bonds of foreign agencies, governments or supra-nationals, as well as those issuers that are not domiciled in the United States, are excluded from the Index. ALM Research Solutions, LLC compiles and calculates the Index, which measures potential returns based on the Fundamental Index® methodology developed by Research Affiliates, LLC (the “Index Provider”). The Fund does not purchase all of the securities in the Index; instead, the Fund utilizes a “sampling” methodology to seek to achieve its investment objective.
The Board of Trustees approved a change in the fiscal year end for the Fund from October 31 to August 31. For the fiscal period from November 1, 2017 to August 31, 2018, on a market price basis, the Fund returned 0.70%. On a net asset value (“NAV”) basis, the Fund returned 0.75%. During the same time period, the Index returned 1.29%. The Fund’s performance differed from the return of the Index primarily due to fees and operating expenses that the Fund incurred during the period as well as negative impacts from the Fund’s sampling methodology.
During this same time period, the Bloomberg Barclays U.S. Corporate High Yield Index (the “Benchmark Index”) returned 2.05%. The Benchmark Index is an unmanaged index weighted by market capitalization and based on the average performance of approximately 1,977 securities. The Benchmark Index was selected for its recognition in the marketplace, and its performance comparison is a useful measure for investors as a broad representation of the broad-based U.S. high-yield corporate bond market.
Relative to the Benchmark Index, the Fund was most overweight in the oil & gas industry and most underweight in the media industry during the fiscal period ended August 31, 2018. The majority of the Fund’s underperformance relative to the Benchmark Index during the period can be attributed to security selection within the pharmaceuticals and media industries.
For the fiscal period ended August 31, 2018, the insurance industry contributed most significantly to the Fund’s return,
followed by the healthcare-services and food industries, respectively. Industries that detracted from performance for the year included the pharmaceuticals industry, followed by the media and oil & gas industries.
Positions that contributed most significantly to the Fund’s return for the fiscal period ended August 31, 2018, included PBF Holding Co. LLC/PBF Finance Corp., 7.25% coupon, due 06/15/2025, an oil & gas company (portfolio average weight of 0.49%), and SUPERVALU, Inc., 7.75% coupon, due 11/15/2022, a food company (portfolio average weight of 0.52%). Positions that detracted most significantly from the Fund’s return included Whiting Petroleum Corp., 6.25% coupon, due 04/01/2023, an oil & gas company (portfolio average weight of 0.02%), and AMC Networks, Inc., 5.00% coupon, due 04/01/2024, a media company (portfolio average weight of 0.30%).
Invesco Fundamental High Yield® Corporate Bond ETF (PHB) (continued)
| | | | |
Industry Breakdown
(% of the Fund’s Net Assets)
as of August 31, 2018 | |
| Oil & Gas | | | 12.1 | |
| Healthcare-Services | | | 7.7 | |
| Retail | | | 5.3 | |
| Media | | | 5.0 | |
| REITs | | | 5.0 | |
| Telecommunications | | | 3.6 | |
| Electric | | | 3.6 | |
| Commercial Services | | | 3.1 | |
| Diversified Financial Services | | | 3.0 | |
| Computers | | | 3.0 | |
| Chemicals | | | 2.8 | |
| Airlines | | | 2.8 | |
| Lodging | | | 2.7 | |
| Iron/Steel | | | 2.6 | |
| Internet | | | 2.6 | |
| Home Builders | | | 2.5 | |
| Food | | | 2.5 | |
| Insurance | | | 2.2 | |
| Packaging & Containers | | | 2.1 | |
| Auto Parts & Equipment | | | 2.1 | |
| Pipelines | | | 1.8 | |
| Entertainment | | | 1.7 | |
| Mining | | | 1.5 | |
| Banks | | | 1.2 | |
| Healthcare-Products | | | 1.2 | |
| Office/Business Equipment | | | 1.1 | |
| Engineering & Construction | | | 1.1 | |
| Software | | | 1.1 | |
| Oil & Gas Services | | | 1.0 | |
| Semiconductors | | | 1.0 | |
| Building Materials | | | 0.9 | |
| Advertising | | | 0.9 | |
| Distribution/Wholesale | | | 0.8 | |
| Aerospace/Defense | | | 0.7 | |
| Apparel | | | 0.7 | |
| Toys/Games/Hobbies | | | 0.7 | |
| Electronics | | | 0.7 | |
| Food Service | | | 0.6 | |
| Electrical Components & Equipment | | | 0.5 | |
| Miscellaneous Manufacturing | | | 0.5 | |
| Household Products/Wares | | | 0.4 | |
| Environmental Control | | | 0.4 | |
| Housewares | | | 0.4 | |
| Cosmetics/Personal Care | | | 0.4 | |
| Home Furnishings | | | 0.4 | |
| Leisure Time | | | 0.3 | |
| Real Estate | | | 0.3 | |
| Money Market Funds Plus Other Assets Less Liabilities | | | 1.4 | |
| | | | |
Credit Quality Rating Breakdown*
(% of the Fund’s Net Assets) as of August 31, 2018 | |
| BBB | | | 4.5 | |
| BBB- | | | 12.5 | |
| BB+ | | | 23.2 | |
| BB | | | 15.9 | |
| BB- | | | 18.1 | |
| B+ | | | 12.0 | |
| B | | | 8.7 | |
| B- | | | 3.6 | |
| CCC+ | | | 0.1 | |
| Money Market Funds Plus Other Assets Less Liabilities | | | 1.4 | |
| * | Source: Standard & Poor’s. A credit rating is an assessment provided by a nationally recognized statistical rating organization (NRSRO) of the creditworthiness of an issuer with respect to debt obligations, including specific securities, money market instruments or other debts. Ratings are measured on a scale that generally ranges from AAA (highest) to C (lowest); ratings are subject to change without notice. For more information on Standard & Poor’s rating methodology, please visit standardandpoors.com and select “Understanding Ratings” under Ratings Resources on the homepage. |
| | | | |
Top Ten Fund Holdings*
(% of the Fund’s Net Assets)
as of August 31, 2018 | |
| Security | | | | |
| United Continental Holdings, Inc., 4.250%, 10/01/2022 | | | 1.3 | |
| Ally Financial, Inc., 8.000%, 03/15/2020 | | | 1.1 | |
| Micron Technology, Inc., 5.500%, 02/01/2025 | | | 1.0 | |
| Vistra Energy Corp., 8.125%, 01/30/2026 | | | 0.9 | |
| Hess Corp., 4.300%, 04/01/2027 | | | 0.9 | |
| Western Digital Corp., 4.750%, 02/15/2026 | | | 0.9 | |
| Yum! Brands, Inc., 3.750%, 11/01/2021 | | | 0.9 | |
| Symantec Corp., 4.200%, 09/15/2020 | | | 0.8 | |
| Gap, Inc. (The), 5.950%, 04/12/2021 | | | 0.8 | |
| Centene Corp., 6.125%, 02/15/2024 | | | 0.8 | |
| Total | | | 9.4 | |
| * | Excluding money market fund holdings. |
Invesco Fundamental High Yield® Corporate Bond ETF (PHB) (continued)
Growth of a $10,000 Investment
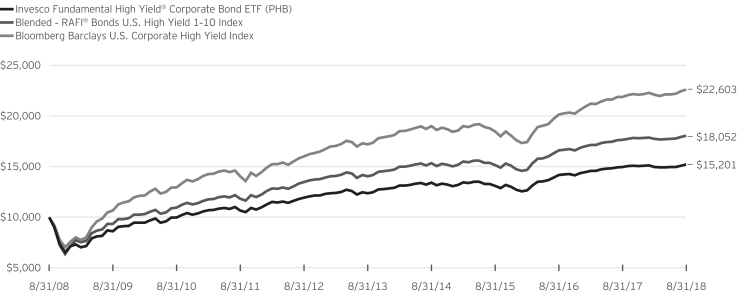
Fund Performance History as of August 31, 2018
| | | | | | | | | | | | | | | | | | | | | | | | | | | | | | | | | | | | | | | | |
| | | 1 Year | | | 3 Years Average
Annualized | | | 3 Years Cumulative | | | 5 Years Average
Annualized | | | 5 Years Cumulative | | | 10 Years Average
Annualized | | | 10 Years Cumulative | | | | | | Fund Inception | |
| Index | | | | | Average
Annualized | | | Cumulative | |
| Blended—RAFI® Bonds U.S. High Yield 1-10 Index | | | 2.45 | % | | | 6.01 | % | | | 19.12 | % | | | 5.16 | % | | | 28.61 | % | | | 6.08 | % | | | 80.52 | % | | | | | | | 5.22 | % | | | 73.25 | % |
| Bloomberg Barclays U.S. Corporate High Yield Index | | | 3.40 | | | | 7.00 | | | | 22.51 | | | | 5.63 | | | | 31.50 | | | | 8.50 | | | | 126.03 | | | | | | | | 7.62 | | | | 120.78 | |
| Fund | | | | | | | | | | | | | | | | | | | | | | | | | | | | | | | | | | | | | | | | |
| NAV Return | | | 1.78 | | | | 5.13 | | | | 16.20 | | | | 4.24 | | | | 23.06 | | | | 4.28 | | | | 52.01 | | | | | | | | 3.39 | | | | 43.37 | |
| Market Price Return | | | 1.57 | | | | 5.06 | | | | 15.96 | | | | 4.25 | | | | 23.16 | | | | 4.12 | | | | 49.79 | | | | | | | | 3.16 | | | | 39.95 | |
Fund Inception: November 15, 2007
Performance quoted above represents past performance. Past performance is not a guarantee of future results and current performance may be higher or lower than performance quoted. Investment returns and principal value will fluctuate, and shares of the Fund (“Fund Shares”), when redeemed or sold, may be worth more or less than their original cost. Fund performance reflects any applicable fee waivers and/or expense reimbursements. Had the adviser not waived fees and/or reimbursed expenses currently or in the past, returns would have been lower. See current prospectus for more information. According to the Fund’s current prospectus, the Fund’s expense ratio of 0.50% is expressed as a unitary management fee to cover operating expenses and expenses incurred in connection with managing the portfolio. NAV and Market Price returns assume that dividends and capital gain distributions have been reinvested in the Fund at NAV and Market Price, respectively. The returns shown in the table above do not reflect the deduction of taxes that a shareholder would pay on Fund distributions or the redemption or sale of Fund Shares. See invesco.com/ETFs to find the most recent month-end performance numbers.
Blended-Index and Benchmark Index performance results are based upon a hypothetical investment in their respective constituent securities. Blended-Index and Benchmark Index returns do not represent Fund returns. An investor cannot invest directly in an index. The Blended-Index and Benchmark Index do not charge management fees or brokerage expenses, and no such fees or expenses were deducted from the hypothetical performance shown. In addition, the results actual investors might have achieved would have differed from those shown because of differences in the timing, amounts of their investments, and fees and expenses associated with an investment in the Fund.
Notes Regarding Indexes and Fund Performance History:
| - | Average Annualized and Cumulative Inception returns for the Fund, Blended-Index and Benchmark Index are based on the inception date of the Fund. |
| - | The Blended-RAFI® Bonds U.S. High Yield 1-10 Index is comprised of performance of the original underlying index from Fund inception through the conversion date, August 2, 2010, followed by the performance of the Index starting at the conversion date through August 31, 2018. |
| | |
| PFIG | | Manager’s Analysis |
| | Invesco Fundamental Investment Grade Corporate Bond ETF (PFIG) |
As an index fund, the Invesco Fundamental Investment Grade Corporate Bond ETF (the “Fund”) is passively managed and attempts to track the returns of an underlying index. The Fund seeks to track the investment results (before fees and expenses) of the RAFI® Bonds US Investment Grade 1-10 Index (the “Index”). The Fund generally will invest at least 80% of its total assets in the component securities that comprise the Index.
The Index is comprised of U.S. dollar-denominated bonds that are registered with the U.S. Securities and Exchange Commission or that are Rule 144A securities that provide for registration rights (issued after July 31, 2013) and whose issuers are public companies listed on a major U.S. stock exchange. Only investible, non-convertible, non-exchangeable, non-zero, fixed coupon investment grade corporate bonds qualify for inclusion in the Index. Bonds of foreign agencies, governments or supra-nationals, as well as those issuers that are not domiciled in the United States are excluded from the Index. ALM Research Solutions, LLC compiles and calculates the Index, which measures potential returns based on a methodology approach developed by Research Affiliates, LLC, (the “Index Provider”), utilizing fundamental measures. The Fund does not purchase all of the securities in the Index; instead, the Fund utilizes a “sampling” methodology to seek to achieve its investment objective.
The Board of Trustees approved a change in the fiscal year end for the Fund from October 31 to August 31. For the fiscal period from November 1, 2017 to August 31, 2018, on a market price basis, the Fund returned (0.98)%. On a net asset value (“NAV”) basis, the Fund returned (1.01)%. During the same time period, the Index returned (0.73)%. The Fund’s performance differed from the return of the Index primarily due to fees and expenses that the Fund incurred during the period.
During this same time period, the Bloomberg Barclays U.S. Corporate Index (the “Benchmark Index”) returned (1.23)%. The Benchmark Index is an unmanaged index weighted by market capitalization and based on the average performance of approximately 5,719 securities. The Benchmark Index was selected for its recognition in the marketplace, and its performance comparison is a useful measure for investors as a broad representation of the broad-based U.S. corporate bond market.
Relative to the Benchmark Index, the Fund was most overweight in the insurance industry and most underweight in the banks industry during the fiscal period ended August 31, 2018. The majority of the Fund’s outperformance relative to the Benchmark Index during the period can be attributed to security selection within the banks and biotechnology industries.
For the fiscal period ended August 31, 2018, the banks industry contributed most significantly to the Fund’s return, followed by the biotechnology and electric industries, respectively. The diversified
financial services detracted most significantly from the Fund’s return, followed by the machinery-diversified and retail industries, respectively.
Positions that contributed most significantly to the Fund’s return for the fiscal period ended August 31, 2018, included Apple, Inc., 3.25% coupon, due 02/23/2026, a computers company (portfolio average weight of 0.25%), and Walmart, Inc., 2.65% coupon, due 12/15/2024, a retail company (portfolio average weight of 0.24%). Positions that detracted most significantly from the Fund’s return included Citigroup, Inc., 3.20% coupon, due 10/21/2026, a banks company (portfolio average weight of 0.62%), and JPMorgan Chase & Co., 2.95% coupon, due 10/01/2026, a banks company (portfolio average weight of 0.69%).
Invesco Fundamental Investment Grade Corporate Bond ETF (PFIG) (continued)
| | | | |
Industry Breakdown
(% of the Fund’s Net Assets)
as of August 31, 2018 | |
| Banks | | | 10.4 | |
| Insurance | | | 6.2 | |
| Retail | | | 6.1 | |
| Pharmaceuticals | | | 6.0 | |
| Oil & Gas | | | 5.8 | |
| Electric | | | 5.7 | |
| REITs | | | 4.6 | |
| Diversified Financial Services | | | 4.1 | |
| Food | | | 3.1 | |
| Software | | | 2.8 | |
| Aerospace/Defense | | | 2.7 | |
| Telecommunications | | | 2.6 | |
| Semiconductors | | | 2.5 | |
| Computers | | | 2.4 | |
| Healthcare-Services | | | 2.2 | |
| Chemicals | | | 2.1 | |
| Media | | | 2.0 | |
| Transportation | | | 2.0 | |
| Electronics | | | 1.8 | |
| Agriculture | | | 1.7 | |
| Beverages | | | 1.6 | |
| Healthcare-Products | | | 1.6 | |
| Internet | | | 1.5 | |
| Miscellaneous Manufacturing | | | 1.4 | |
| Auto Manufacturers | | | 1.4 | |
| Biotechnology | | | 1.2 | |
| Cosmetics/Personal Care | | | 1.2 | |
| Machinery-Diversified | | | 1.1 | |
| Commercial Services | | | 1.1 | |
| Pipelines | | | 1.0 | |
| Oil & Gas Services | | | 0.9 | |
| Building Materials | | | 0.6 | |
| Apparel | | | 0.5 | |
| Environmental Control | | | 0.5 | |
| Real Estate | | | 0.5 | |
| Gas | | | 0.5 | |
| Machinery-Construction & Mining | | | 0.4 | |
| Leisure Time | | | 0.4 | |
| Iron/Steel | | | 0.4 | |
| Advertising | | | 0.4 | |
| Auto Parts & Equipment | | | 0.3 | |
| Packaging & Containers | | | 0.3 | |
| Electrical Components & Equipment | | | 0.3 | |
| Forest Products & Paper | | | 0.3 | |
| Home Builders | | | 0.3 | |
| Textiles | | | 0.3 | |
| Housewares | | | 0.3 | |
| Lodging | | | 0.2 | |
| Airlines | | | 0.2 | |
| Engineering & Construction | | | 0.2 | |
| Mining | | | 0.2 | |
| Water | | | 0.2 | |
| Hand/Machine Tools | | | 0.2 | |
| Office/Business Equipment | | | 0.2 | |
| Household Products/Wares | | | 0.2 | |
| Savings & Loans | | | 0.1 | |
| Home Furnishings | | | 0.1 | |
| Toys/Games/Hobbies | | | 0.1 | |
| Shipbuilding | | | 0.1 | |
| Money Market Fund Plus Other Assets Less Liabilities | | | 0.9 | |
| | | | |
Credit Quality Rating Breakdown* (% of the Fund’s Net Assets) as of August 31, 2018 | |
| AAA | | | 1.5 | |
| AA+ | | | 2.6 | |
| AA | | | 3.3 | |
| AA- | | | 5.8 | |
| A+ | | | 7.2 | |
| A | | | 14.7 | |
| A- | | | 15.8 | |
| BBB+ | | | 19.4 | |
| BBB | | | 20.0 | |
| BBB- | | | 8.8 | |
| Money Market Fund Plus Other Assets Less Liabilities | | | 0.9 | |
| * | Source: Standard & Poor’s. A credit rating is an assessment provided by a nationally recognized statistical rating organization (NRSRO) of the creditworthiness of an issuer with respect to debt obligations, including specific securities, money market instruments or other debts. Ratings are measured on a scale that generally ranges from AAA (highest) to C (lowest); ratings are subject to change without notice. For more information on Standard & Poor’s rating methodology, please visit standardandpoors.com and select “Understanding Ratings” under Ratings Resources on the homepage. |
| | | | |
Top Ten Fund Holdings*
(% of the Fund’s Net Assets)
as of August 31, 2018 | |
| Security | | | | |
| JPMorgan Chase & Co., 4.500%, 01/24/2022 | | | 0.6 | |
| Exxon Mobil Corp., 2.222%, 03/01/2021 | | | 0.6 | |
| JPMorgan Chase & Co., 2.950%, 10/01/2026 | | | 0.5 | |
| Wells Fargo & Co., MTN, 2.625%, 07/22/2022 | | | 0.5 | |
| Apple, Inc., 3.250%, 02/23/2026 | | | 0.5 | |
| Exxon Mobil Corp., 3.043%, 03/01/2026 | | | 0.5 | |
| ConocoPhillips Co., 4.950%, 03/15/2026 | | | 0.5 | |
| Boeing Co. (The), 4.875%, 02/15/2020 | | | 0.5 | |
| Apple, Inc., 2.400%, 05/03/2023 | | | 0.5 | |
| Walmart, Inc., 2.650%, 12/15/2024 | | | 0.5 | |
| Total | | | 5.2 | |
| * | Excluding money market fund holdings. |
Invesco Fundamental Investment Grade Corporate Bond ETF (PFIG) (continued)
Growth of a $10,000 Investment Since Inception

Fund Performance History as of August 31, 2018
| | | | | | | | | | | | | | | | | | | | | | | | | | | | | | | | |
| | | 1 Year | | | 3 Years Average
Annualized | | | 3 Years Cumulative | | | 5 Years Average
Annualized | | | 5 Years Cumulative | | | | | | Fund Inception | |
| Index | | | | | Average
Annualized | | | Cumulative | |
| RAFI® Bonds U.S. Investment Grade 1-10 Index | | | (0.86 | )% | | | 2.44 | % | | | 7.51 | % | | | 2.91 | % | | | 15.41 | % | | | | | | | 2.96 | % | | | 22.48 | % |
| Bloomberg Barclays U.S. Corporate Index | | | (1.01 | ) | | | 3.50 | | | | 10.86 | | | | 3.76 | | | | 20.27 | | | | | | | | 3.89 | | | | 30.41 | |
| Fund | | | | | | | | | | | | | | | | | | | | | | | | | | | | | | | | |
| NAV Return | | | (1.12 | ) | | | 2.23 | | | | 6.83 | | | | 2.64 | | | | 13.91 | | | | | | | | 2.54 | | | | 19.10 | |
| Market Price Return | | | (1.32 | ) | | | 2.16 | | | | 6.61 | | | | 2.75 | | | | 14.54 | | | | | | | | 2.57 | | | | 19.27 | |
Fund Inception: September 15, 2011
Performance quoted above represents past performance. Past performance is not a guarantee of future results and current performance may be higher or lower than performance quoted. Investment returns and principal value will fluctuate, and shares of the Fund (“Fund Shares”), when redeemed or sold, may be worth more or less than their original cost. Fund performance reflects any applicable fee waivers and/or expense reimbursements. Had the adviser not waived fees and/or reimbursed expenses currently or in the past, returns would have been lower. See current prospectus for more information. According to the Fund’s current prospectus, the Fund’s expense ratio of 0.22% is expressed as a unitary management fee to cover operating expenses and expenses incurred in connection with managing the portfolio. NAV and Market Price returns assume that dividends and capital gain distributions have been reinvested in the Fund at NAV and Market Price, respectively. The returns shown in the table above do not reflect the deduction of taxes that a shareholder would pay on Fund distributions or the redemption or sale of Fund Shares.
See invesco.com/ETFs to find the most recent month-end performance numbers.
Index and Benchmark Index performance results are based upon a hypothetical investment in their respective constituent securities. Index and Benchmark Index returns do not represent Fund returns. An investor cannot invest directly in an index. The Index and Benchmark Index do not charge management fees or brokerage expenses, and no such fees or expenses were deducted from the hypothetical performance shown. In addition, the results actual investors might have achieved would have differed from those shown because of differences in the timing, amounts of their investments, and fees and expenses associated with an investment in the Fund.
Notes Regarding Indexes and Fund Performance History:
| - | Average Annualized and Cumulative Inception returns for the Fund, Index and Benchmark Index are based on the inception date of the Fund. |
| | |
| LDRI | | Manager’s Analysis |
| | Invesco LadderRite 0-5 Year Corporate Bond ETF (LDRI) |
As an index fund, the Invesco LadderRite 0-5 Year Corporate Bond ETF (the “Fund”) is passively managed and attempts to track the returns of an underlying index. The Fund seeks to track the investment results (before fees and expenses) of the NASDAQ LadderRite® 0-5 Year USD Corporate Bond Index (the “Index”). The Fund generally will invest at least 80% of its total assets in U.S. and foreign investment grade corporate bonds that comprise the Index. The Index measures potential returns of a theoretical portfolio of fixed income securities with a yield curve based upon remaining effective terms to maturity of five years or less.
Using a “laddered strategy,” Nasdaq, Inc. (the “Index Provider”) includes in the Index a portfolio of bonds with short- to intermediate-term maturities, meaning that it divides the components of the Index into five equally weighted groups of bonds with staggered terms to maturity in an annual, sequential (“laddered”) structure from zero to five years. Strictly in accordance with its guidelines and mandated procedures, the Index Provider selects such bonds issued by companies domiciled in the U.S. and other developed countries for inclusion in the Index that: (i) are denominated in U.S. dollars; (ii) pay fixed amounts of taxable interest; (iii) are rated as “investment grade” by at least one of Standard & Poor’s Ratings Group, a division of The McGraw-Hill Companies, Inc. (“S&P”), Moody’s Investors Service, Inc. (“Moody’s”) or Fitch Ratings Inc. (“Fitch”) (i.e., have a grade of BBB- or higher from Fitch or S&P or of Baa3 or higher from Moody’s); (iv) have an outstanding face value of at least $500 million; and (v) have five years or less to maturity. Bonds must have an initial term to maturity of at least one year to be eligible for inclusion in the Index. The Fund does not purchase all of the securities in the Index; instead, the Fund utilizes a “sampling” methodology to seek to achieve its investment objective.
The Board of Trustees approved a change in the fiscal year end for the Fund from October 31 to August 31. For the fiscal period from November 1, 2017 to August 31, 2018, on a market price basis, the Fund returned 0.30%. On a net asset value (“NAV”) basis, the Fund returned 0.34%. During the same time period, the Index returned 0.42%. The Fund’s performance (NAV basis) differed from the return of the Index primarily due to the fees and operating expenses that the Fund incurred during the period as well as due to the Fund’s sampling methodology.
During this same time period, the ICE BofAML 0-5 Year U.S. Corporate Index (the “Benchmark Index”) returned 0.34%. The Benchmark Index is an unmanaged index weighted by capitalization and based on current amount outstanding times the market price plus accrued interest based on the average performance of approximately 3,440 securities. The Benchmark Index was selected for its recognition in the marketplace, and its performance comparison is a useful measure for investors as a broad representation of the short-term investment grade U.S. corporate bond market.
Relative to the Benchmark Index, the Fund was most overweight in the wirelines and pharmaceuticals industries and most underweight in the electric and insurance industries during the fiscal period ended August 31, 2018. The Fund’s performance (NAV basis) matched the return of the Benchmark Index primarily due to the fees and operating expenses the Fund incurred during the period, offset by beneficial impacts of the Fund’s sampling methodology.
The Fund’s positive performance relative to the Benchmark Index during the period can be attributed to the Fund’s relative overweight in the pharmaceuticals and food and beverage industries. The electric and technology industries detracted the most from the Fund’s performance relative to the Benchmark Index.
Positions that contributed most significantly to the Fund’s return for the fiscal period ended August 31, 2018, included Whitewave Foods Co., 5.375% coupon, due 10/01/2022, a food and beverage company (no longer held at fiscal period-end), and Deutsche Bank AG, 4.25% coupon, due 10/14/2021, a banks company (no longer held at fiscal period-end). Positions that detracted most significantly from the Fund’s return included Fifth Third Bank, coupon 2.875%, due 10/01/2021, a banking company (no longer held at fiscal period-end), and Air Lease Corp., 3.75% coupon, due 02/01/2022, a diversified financial services company (portfolio average weight of 0.31%).
Invesco LadderRite 0-5 Year Corporate Bond ETF (LDRI) (continued)
| | | | |
Industry Breakdown
(% of the Fund’s Net Assets)
as of August 31, 2018 | |
| Banks | | | 31.3 | |
| Oil & Gas | | | 5.7 | |
| Pharmaceuticals | | | 4.0 | |
| Telecommunications | | | 4.0 | |
| Auto Manufacturers | | | 3.7 | |
| Computers | | | 3.3 | |
| Pipelines | | | 3.3 | |
| Media | | | 2.9 | |
| REITs | | | 2.8 | |
| Healthcare-Products | | | 2.7 | |
| Diversified Financial Services | | | 2.7 | |
| Food | | | 2.5 | |
| Beverages | | | 2.4 | |
| Biotechnology | | | 2.4 | |
| Electric | | | 2.3 | |
| Retail | | | 2.0 | |
| Healthcare-Services | | | 2.0 | |
| Insurance | | | 1.9 | |
| Semiconductors | | | 1.6 | |
| Machinery-Diversified | | | 1.6 | |
| Chemicals | | | 1.6 | |
| Internet | | | 1.6 | |
| Aerospace/Defense | | | 1.6 | |
| Agriculture | | | 1.3 | |
| Software | | | 1.2 | |
| Miscellaneous Manufacturing | | | 1.2 | |
| Electrical Components & Equipment | | | 0.8 | |
| Machinery-Construction & Mining | | | 0.8 | |
| Investment Companies | | | 0.8 | |
| Household Products/Wares | | | 0.8 | |
| Transportation | | | 0.8 | |
| Office/Business Equipment | | | 0.8 | |
| Advertising | | | 0.4 | |
| Oil & Gas Services | | | 0.3 | |
| Money Market Fund Plus Other Assets Less Liabilities | | | 0.9 | |
| | | | |
Credit Quality Rating Breakdown* (% of the Fund’s Net Assets) as of August 31, 2018 | |
| AA+ | | | 1.6 | |
| AA | | | 0.2 | |
| AA- | | | 6.9 | |
| A+ | | | 11.4 | |
| A | | | 15.1 | |
| A- | | | 18.2 | |
| BBB+ | | | 20.1 | |
| BBB | | | 17.1 | |
| BBB- | | | 6.0 | |
| BB+ | | | 1.6 | |
| BB | | | 0.9 | |
| Money Market Fund Plus Other Assets Less Liabilities | | | 0.9 | |
| * | Source: Standard & Poor’s. A credit rating is an assessment provided by a nationally recognized statistical rating organization (NRSRO) of the creditworthiness of an issuer with respect to debt obligations, including specific securities, money market instruments or other debts. Ratings are measured on a scale that generally ranges from AAA (highest) to C (lowest); ratings are subject to change without notice. For more information on Standard & Poor’s rating methodology, please visit standardandpoors.com and select “Understanding Ratings” under Ratings Resources on the homepage. |
| | | | |
Top Ten Fund Holdings*
(% of the Fund’s Net Assets)
as of August 31, 2018 | |
| Security | | | | |
| HSBC Holdings PLC, 2.650%, 01/05/2022 | | | 1.6 | |
| Credit Suisse AG, GMTN, 5.400%, 01/14/2020 | | | 1.3 | |
| American International Group, Inc., 6.400%, 12/15/2020 | | | 0.9 | |
| International Business Machines Corp., 8.375%, 11/01/2019 | | | 0.9 | |
| Royal Bank of Scotland Group PLC, 6.100%, 06/10/2023 | | | 0.9 | |
| Bank of America Corp., MTN, 5.000%, 05/13/2021 | | | 0.8 | |
| Bank of America Corp., MTN, 5.625%, 07/01/2020 | | | 0.8 | |
| BNP Paribas SA, BKNT, GMTN, 5.000%, 01/15/2021 | | | 0.8 | |
| Home Depot, Inc. (The), 4.400%, 04/01/2021 | | | 0.8 | |
| Warner Media LLC, 4.750%, 03/29/2021 | | | 0.8 | |
| Total | | | 9.6 | |
| * | Excluding money market fund holdings. |
Invesco LadderRite 0-5 Year Corporate Bond ETF (LDRI) (continued)
Growth of a $10,000 Investment Since Inception
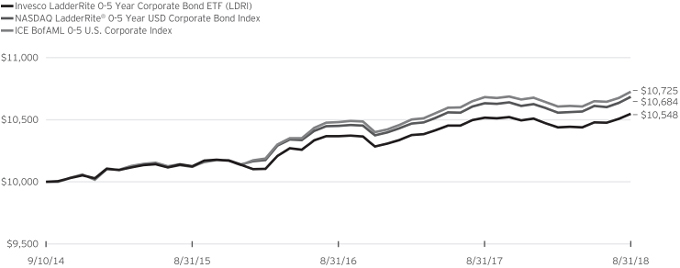
Fund Performance History as of August 31, 2018
| | | | | | | | | | | | | | | | | | | | | | | | |
| | | 1 Year | | | 3 Years Average
Annualized | | | 3 Years Cumulative | | | | | | Fund Inception | |
| Index | | | | | Average
Annualized | | | Cumulative | |
| NASDAQ LadderRite® 0-5 Year USD Corporate Bond Index | | | 0.48 | % | | | 1.82 | % | | | 5.56 | % | | | | | | | 1.68 | % | | | 6.84 | % |
| ICE BofAML 0-5 U.S. Corporate Index | | | 0.41 | | | | 1.94 | | | | 5.93 | | | | | | | | 1.78 | | | | 7.25 | |
| Fund | | | | | | | | | | | | | | | | | | | | | | | | |
| NAV Return | | | 0.36 | | | | 1.40 | | | | 4.26 | | | | | | | | 1.35 | | | | 5.48 | |
| Market Price Return | | | 0.24 | | | | 1.38 | | | | 4.20 | | | | | | | | 1.34 | | | | 5.44 | |
Fund Inception: September 10, 2014
Performance quoted above represents past performance. Past performance is not a guarantee of future results and current performance may be higher or lower than performance quoted. Investment returns and principal value will fluctuate, and shares of the Fund (“Fund Shares”), when redeemed or sold, may be worth more or less than their original cost. Fund performance reflects any applicable fee waivers and/or expense reimbursements. Had the adviser not waived fees and/or reimbursed expenses currently or in the past, returns would have been lower. See current prospectus for more information. According to the Fund’s current prospectus, the Fund’s expense ratio of 0.22% is expressed as a unitary management fee to cover operating expenses and expenses incurred in connection with managing the portfolio. NAV and Market Price returns assume that dividends and capital gain distributions have been reinvested in the Fund at NAV and Market Price, respectively. See invesco.com/ETFs to find the most recent month-end performance numbers.
Index and Benchmark Index performance results are based upon a hypothetical investment in their respective constituent securities. Index and Benchmark Index returns do not represent Fund returns. An investor cannot invest directly in an index. The Index and Benchmark Index do not charge management fees or brokerage expenses, and no such fees or expenses were deducted from the hypothetical performance shown. In addition, the results actual investors might have achieved would have differed from those shown because of differences in the timing, amounts of their investments, and fees and expenses associated with an investment in the Fund.
Notes Regarding Indexes and Fund Performance History:
| - | Average Annualized and Cumulative Inception returns for the Fund, Index and Benchmark Index are based on the inception date of the Fund. |
| | |
| PZA | | Manager’s Analysis |
| | Invesco National AMT-Free Municipal Bond ETF (PZA) |
As an index fund, the Invesco National AMT-Free Municipal Bond ETF (the “Fund”) is passively managed and attempts to track the returns of an underlying index. The Fund seeks to track the investment results (before fees and expenses) of the ICE BofAML National Long-Term Core Plus Municipal Securities Index (the “Index”). The Fund generally will invest at least 80% of its total assets in municipal securities that comprise the Index and that are also exempt from the federal alternative minimum tax.
ICE Data Indices, LLC is the Index provider for the Index. The Index is composed of U.S. dollar-denominated, investment grade, tax- exempt debt publicly issued by U.S. states and territories, or their political subdivisions, in the U.S. domestic market with a term of at least 15 years remaining to final maturity. The Fund does not purchase all of the securities in the Index; instead, the Fund utilizes a “sampling” methodology to seek to achieve its investment objective.
The Board of Trustees approved a change in the fiscal year end for the Fund from October 31 to August 31. For the fiscal period from November 1, 2017 to August 31, 2018, on a market price basis, the Fund returned 0.93%. On a net asset value (“NAV”) basis, the Fund returned 0.81%. During the same time period, the Index returned 1.23%. The Fund’s performance (NAV basis) differed from the return of the Index primarily due to fees and operating expenses that the Fund incurred during the period.
During this same time period, the Bloomberg Barclays Municipal Bond 20 Year Index (the “Benchmark Index”) returned 1.33%. The Benchmark Index is an unmanaged index weighted by market capitalization based on the average performance of approximately 5,742 securities. The Benchmark Index was selected for its recognition in the marketplace, and its performance comparison is a useful measure for investors as a broad representation of insured municipal securities with maturities of 17 to 22 years.
Relative to the Benchmark Index, the Fund was most overweight in the State of Illinois and most underweight in the State of New York during the fiscal period ended August 31, 2018. The majority of the Fund’s underperformance relative to the Benchmark Index during the period can be attributed to differences in state weightings relative to the Benchmark Index as well as fees and trading costs incurred by the Fund.
For the fiscal period ended August 31, 2018, the State of Texas contributed most significantly to the Fund’s return, followed by Puerto Rico and the State of Oregon, respectively. The State of New York detracted most significantly from the Fund’s return, followed by the State of Colorado and the State of New Jersey, respectively.
Positions that contributed most significantly to the Fund’s return for the fiscal period ended August 31, 2018, included Chicago Illinois Wastewater Transmission (Second Lien) Rev. Ser. 12 AGM, 5.00% coupon, due 01/01/2037 (portfolio average weight of
1.60%), and Puerto Rico Commonwealth Public Improvement Ref. Ser. 12A AGM, 5.00% coupon, due 07/01/2035 (portfolio average weight of 0.46%). Positions that detracted most significantly from the Fund’s return included Miami-Dade County Florida Water & Sewer Systems Rev. Ser. 17A, 3.375% coupon, due 10/01/2047 (portfolio average weight of 0.49%), and Utility Debt Securitization Authority New York, 5.00% coupon, due 12/15/2033 (no longer held at fiscal period-end)
| | | | |
State and Territory Breakdown (% of the Fund’s Net Assets) | |
| California | | | 17.5 | |
| Florida | | | 4.5 | |
| Illinois | | | 6.6 | |
| Massachusetts | | | 5.5 | |
| New York | | | 18.0 | |
| Pennsylvania | | | 4.2 | |
| Texas | | | 11.5 | |
| Other States Less Than 3% Each | | | 30.4 | |
| Other Assets Less Liabilities | | | 1.8 | |
|
Top Ten Fund Holdings
(% of the Fund’s Net Assets)
as of August 31, 2018 | |
| Security | | | | |
| Sales Tax Asset Receivables Corp. (Fiscal 2015) Ref. Ser. 14A, 4.000%, 10/15/2032 | | | 1.7 | |
| Chicago Illinois Wastewater Transmission (Second Lien) Rev. Ser. 12, 5.000%, 01/01/2037 | | | 1.6 | |
| Grand Parkway Transportation Corp. Texas Systems Toll (Sub.-Tier Tela Supported) Rev. Ser. 18A, 5.000%, 10/01/2043 | | | 1.4 | |
| City of Jasper Alabama Ser. 14, 5.000%, 03/01/2044 | | | 1.3 | |
| Miami-Dade County Florida Water & Sewer System Rev. Ser. 10, 5.000%, 10/01/2020 | | | 1.3 | |
| Port Auth. of New York & New Jersey (194th Series) Ref. Ser. 15, 5.000%, 10/15/2041 | | | 1.2 | |
| San Francisco California City & County Airports Commission (San Francisco International Airport) Rev. Ser. 16C, 5.000%, 05/01/2046 | | | 1.2 | |
Inland Valley California Development Successor Agency Tax Allocation Ref. Ser. 14A, 5.000%, 09/01/2044 | | | 1.1 | |
| Pennsylvania State Turnpike Commission Rev. Ser. 14B, 5.250%, 12/01/2039 | | | 1.0 | |
| King County Washington Sewer & Improvement Rev. Ref. Ser. 16B, 5.000%, 07/01/2039 | | | 1.0 | |
| Total | | | 12.8 | |
Invesco National AMT-Free Municipal Bond ETF (PZA) (continued)
Growth of a $10,000 Investment
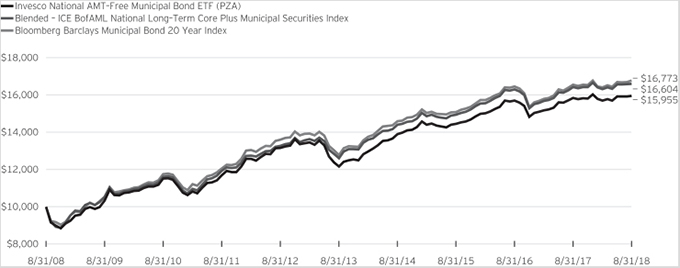
Fund Performance History as of August 31, 2018
| | | | | | | | | | | | | | | | | | | | | | | | | | | | | | | | | | | | | | | | |
| | | 1 Year | | | 3 Years Average
Annualized | | | 3 Years Cumulative | | | 5 Years Average
Annualized | | | 5 Years Cumulative | | | 10 Years Average
Annualized | | | 10 Years Cumulative | | | | | | Fund Inception | |
| Index | | | | | Average
Annualized | | | Cumulative | |
| Blended—ICE BofAML National Long-Term Core Plus Municipal Securities Index | | | 1.23 | % | | | 3.58 | % | | | 11.13 | % | | | 5.67 | % | | | 31.76 | % | | | 5.20 | % | | | 66.04 | % | | | | | | | 4.74 | % | | | 65.58 | % |
| Bloomberg Barclays Municipal Bond 20 Year Index | | | 1.32 | | | | 3.59 | | | | 11.18 | | | | 5.61 | | | | 31.36 | | | | 5.31 | | | | 67.73 | | | | | | | | 5.01 | | | | 70.23 | |
| Fund | | | | | | | | | | | | | | | | | | | | | | | | | | | | | | | | | | | | | | | | |
| NAV Return | | | 0.72 | | | | 3.37 | | | | 10.46 | | | | 5.59 | | | | 31.28 | | | | 4.78 | | | | 59.55 | | | | | | | | 4.22 | | | | 56.83 | |
| Market Price Return | | | 0.73 | | | | 3.37 | | | | 10.46 | | | | 5.79 | | | | 32.52 | | | | 4.79 | | | | 59.73 | | | | | | | | 4.13 | | | | 55.40 | |
Fund Inception: October 11, 2007
Performance quoted above represents past performance. Past performance is not a guarantee of future results and current performance may be higher or lower than performance quoted. Investment returns and principal value will fluctuate, and shares of the Fund (“Fund Shares”), when redeemed or sold, may be worth more or less than their original cost. Fund performance reflects any applicable fee waivers and/or expense reimbursements. Had the adviser not waived fees and/or reimbursed expenses currently or in the past, returns would have been lower. See current prospectus for more information. According to the Fund’s current prospectus, the Fund’s expense ratio of 0.28% is expressed as a unitary management fee to cover operating expenses and expenses incurred in connection with managing the portfolio. NAV and Market Price returns assume that dividends and capital gain distributions have been reinvested in the Fund at NAV and Market Price, respectively. The returns shown in the table above do not reflect the deduction of taxes that a shareholder would pay on Fund distributions or the redemption or sale of Fund Shares. See invesco.com/ETFs to find the most recent month-end performance numbers.
Blended-Index and Benchmark Index performance results are based upon a hypothetical investment in their respective constituent securities.
Blended-Index and Benchmark Index returns do not represent Fund returns. An investor cannot invest directly in an index. The Blended-Index and Benchmark Index do not charge management fees or brokerage expenses, and no such fees or expenses were deducted from the hypothetical performance shown. In addition, the results actual investors might have achieved would have differed from those shown because of differences in the timing, amounts of their investments, and fees and expenses associated with an investment in the Fund.
Notes Regarding Indexes and Fund Performance History:
| - | The Blended-ICE BofAML National Long-Term Core Plus Municipal Securities Index is comprised of the performance of the BofA Merrill Lynch National Insured Long-Term Core Municipal Securities Index, the Fund’s underlying index from Fund inception through the conversion date, May 29, 2009, followed by the performance of the BofA Merrill Lynch National Insured Long-Term Core Plus Municipal Securities Index, the Fund’s underlying index for the period May 29, 2009 through July 8, 2014, followed by the performance of the Index for the period July 8, 2014 through August 31, 2018. |
| - | Average Annualized and Cumulative Inception returns for the Fund, Blended-Index and Benchmark Index are based on the inception date of the Fund. |
| | |
| PZT | | Manager’s Analysis |
| | Invesco New York AMT-Free Municipal Bond ETF (PZT) |
As an index fund, the Invesco New York AMT-Free Municipal Bond ETF (the “Fund”) is passively managed and attempts to track the returns of an underlying index. The Fund seeks to track the investment results (before fees and expenses) of the ICE BofAML New York Long-Term Core Plus Municipal Securities Index (formerly The BofA Merrill Lynch New York Long-Term Core Plus Municipal Securities Index, the “Index”). The Fund generally will invest at least 80% of its total assets in municipal securities that comprise the Index and that are also exempt from federal alternative minimum tax.
ICE Data Indices, LLC is the Index provider for the Index. The Index is composed of U.S. dollar-denominated, investment grade, tax-exempt debt publicly issued by New York or any U.S. territory, or their political subdivisions in the U.S. domestic market with a term of at least 15 years remaining to final maturity. The Fund does not purchase all of the securities in the Index; instead, the Fund utilizes a “sampling” methodology to seek to achieve its investment objective.
The Board of Trustees approved a change in the fiscal year end for the Fund from October 31 to August 31. For the fiscal period from November 1, 2017 to August 31, 2018, on a market price basis, the Fund returned (0.08)%. On a net asset value (“NAV”) basis, the Fund returned 0.50%. During the same time period, the Index returned 0.66%. The Fund’s performance (NAV basis) differed from the return of the Index primarily due to a positive impact as a result of the Fund’s sampling methodology partially offset by fees and operating expenses incurred by the Fund during the period.
During this same time period, the Bloomberg Barclays Municipal Bond 20 Year Index (the “Benchmark Index”) returned 1.33%. The Benchmark Index is an unmanaged index weighted by market capitalization based on the average performance of approximately 5,742 securities. The Benchmark Index was selected for its recognition in the marketplace, and its performance comparison is a useful measure for investors as a broad representation of municipal securities with maturities of 17 to 22 years.
Relative to the Benchmark Index, the Fund was most overweight in the State of New York and most underweight in the territory of the US Virgin Islands during the fiscal period ended August 31, 2018. The majority of the Fund’s underperformance relative to the Benchmark Index during the period can be attributed to New York bonds underperforming the general municipal market as well as fees and operating expenses incurred by the Fund during the period.
For the fiscal period ended August 31, 2018, the State of New York contributed most significantly to the Fund’s return, followed by the US territory of Guam. Puerto Rico detracted most significantly from the Fund’s return.
Positions that contributed most significantly to the Fund’s return for the fiscal period ended August 31, 2018, included New York State Dormitory Auth. Non State Supported Debt (Icahn School of Medicine at Mount Sinai) Rev. Ref. Ser. 15A, 5.00% coupon, due 07/01/2035 (portfolio average weight of 3.35%), and Long Island Power Auth. New York Electric Systems Rev. Ref. Ser. 14A, 5.00% coupon, due 09/01/2044 (portfolio average weight of 3.36%). Positions that detracted most significantly from the Fund’s return included New York City Transitional Finance Auth. (Sub.-Future Tax Secured Fiscal 1999) Rev. Ser. 17A Sub.-Ser. E-1, 5.00% coupon, due 02/01/2043 (portfolio average weight of 2.02%), and New York State Dormitory Auth. (New York University) Rev. Ser. 01 AMBAC, 5.50% coupon, due 07/01/2040 (portfolio average weight of 2.98%).
| | | | |
Revenue Type Breakdown
(% of the Fund’s Net Assets)
as of August 31, 2018 | |
| Income Tax Revenue | | | 18.4 | |
| College & University Revenue | | | 12.1 | |
| Electric Power Revenue | | | 11.8 | |
| Miscellaneous Revenue | | | 11.7 | |
| Highway Tolls Revenue | | | 6.2 | |
| Ad Valorem Property Tax | | | 5.9 | |
| Sales Tax Revenue | | | 5.5 | |
| Water Revenue | | | 5.4 | |
| Lease Revenue | | | 3.7 | |
| Health, Hospital, Nursing Home Revenue | | | 3.6 | |
| Industrial Revenue | | | 3.4 | |
| Hotel Occupancy Tax | | | 3.3 | |
| Recreational Revenue | | | 3.2 | |
| Transit Revenue | | | 2.6 | |
| Port, Airport & Marina Revenue | | | 1.8 | |
| Other Assets Less Liabilities | | | 1.4 | |
Invesco New York AMT-Free Municipal Bond ETF (PZT) (continued)
| | | | |
Top Ten Fund Holdings
(% of the Fund’s Net Assets)
as of August 31, 2018 | |
| Security | | | | |
| New York City Industrial Development Agency (Queens Baseball Stadium PILOT) Rev. Ser. 09, 6.500%, 01/01/2046 | | | 4.0 | |
| Utility Debt Securitization Auth. New York (Restructuring) Ser. 17, 5.000%, 12/15/2038 | | | 3.7 | |
| New York State Dormitory Auth. Personal Income Tax (General Purpose) Rev. Ser. 11C, 5.000%, 03/15/2041 | | | 3.6 | |
| New York State Dormitory Auth. Non State Supported Debt (Icahn School of Medicine at Mount Sinai) Rev. Ref. Ser. 15A, 5.000%, 07/01/2035 | | | 3.5 | |
| Long Island Power Auth. New York Electric Systems Rev. Ref. Ser. 14A, 5.000%, 09/01/2044 | | | 3.5 | |
| Brooklyn Arena New York Local Development Corp. PILOT (Barclays Center Project) Rev. Ref. Ser. 16A, 5.000%, 07/15/2042 | | | 3.4 | |
| New York State Liberty Development Corp. (4 World Trade Center Project) Rev. Ref. Ser. 11, 5.000%, 11/15/2044 | | | 3.4 | |
| New York State Convention Center Development Corp. (Hotel Unit Fee Secured) Rev. Ref. Ser. 15, 5.000%, 11/15/2040 | | | 3.3 | |
| New York City New York Ser. 16B-1, 4.000%, 12/01/2043 | | | 3.3 | |
| New York City Industrial Development Agency (Yankee Stadium PILOT) Rev. Ser. 09, 7.000%, 03/01/2049 | | | 3.2 | |
| Total | | | 34.9 | |
Invesco New York AMT-Free Municipal Bond ETF (PZT) (continued)
Growth of a $10,000 Investment
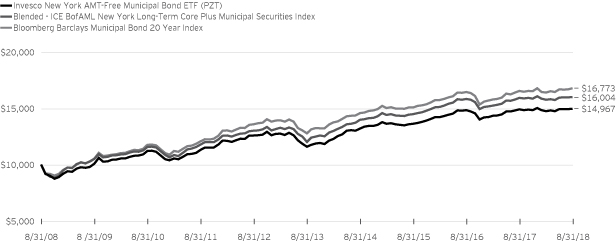
Fund Performance History as of August 31, 2018
| | | | | | | | | | | | | | | | | | | | | | | | | | | | | | | | | | | | | | | | |
| | | 1 Year | | | 3 Years Average
Annualized | | | 3 Years Cumulative | | | 5 Years Average
Annualized | | | 5 Years Cumulative | | | 10 Years Average
Annualized | | | 10 Years Cumulative | | | | | | Fund Inception | |
| Index | | | | | Average
Annualized | | | Cumulative | |
| Blended—ICE BofAML New York Long-Term Core Plus Municipal Securities Index | | | 0.61 | % | | | 3.41 | % | | | 10.58 | % | | | 5.92 | % | | | 33.32 | % | | | 4.81 | % | | | 60.04 | % | | | | | | | 4.36 | % | | | 59.09 | % |
| Bloomberg Barclays Municipal Bond 20 Year Index | | | 1.32 | | | | 3.59 | | | | 11.18 | | | | 5.61 | | | | 31.36 | | | | 5.31 | | | | 67.73 | | | | | | | | 5.01 | | | | 70.23 | |
| Fund | | | | | | | | | | | | | | | | | | | | | | | | | | | | | | | | | | | | | | | | |
| NAV Return | | | 0.40 | | | | 3.15 | | | | 9.74 | | | | 5.23 | | | | 29.05 | | | | 4.12 | | | | 49.67 | | | | | | | | 3.68 | | | | 48.18 | |
| Market Price Return | | | 0.18 | | | | 3.09 | | | | 9.56 | | | | 5.43 | | | | 30.29 | | | | 4.04 | | | | 48.64 | | | | | | | | 3.56 | | | | 46.28 | |
Fund Inception: October 11, 2007
Performance quoted above represents past performance. Past performance is not a guarantee of future results and current performance may be higher or lower than performance quoted. Investment returns and principal value will fluctuate, and shares of the Fund (“Fund Shares”), when redeemed or sold, may be worth more or less than their original cost. Fund performance reflects any applicable fee waivers and/or expense reimbursements. Had the adviser not waived fees and/or reimbursed expenses currently or in the past, returns would have been lower. See current prospectus for more information. According to the Fund’s current prospectus, the Fund’s expense ratio of 0.28% is expressed as a unitary management fee to cover operating expenses and expenses incurred in connection with managing the portfolio. NAV and Market Price returns assume that dividends and capital gain distributions have been reinvested in the Fund at NAV and Market Price, respectively. The returns shown in the table above do not reflect the deduction of taxes that a shareholder would pay on Fund distributions or the redemption or sale of Fund Shares. See invesco.com/ETFs to find the most recent month-end performance numbers.
Blended-Index and Benchmark Index performance results are based upon a hypothetical investment in their respective constituent securities.
Blended-Index and Benchmark Index returns do not represent Fund returns. An investor cannot invest directly in an index. The Blended-Index and Benchmark Index do not charge management fees or brokerage expenses, and no such fees or expenses were deducted from the hypothetical performance shown. In addition, the results actual investors might have achieved would have differed from those shown because of differences in the timing, amounts of their investments, and fees and expenses associated with an investment in the Fund.
Notes Regarding Indexes and Fund Performance History:
| - | The Blended-ICE BofAML New York Long-Term Core Plus Municipal Securities Index is comprised of the performance of the BofA Merrill Lynch New York Insured Long-Term Core Municipal Securities Index, the Fund’s underlying index from Fund inception through the conversion date, May 29, 2009, followed by the performance of the BofA Merrill Lynch New York Insured Long-Term Core Plus Municipal Securities Index, the Fund’s underlying index for the period May 29, 2009 through July 8, 2014, followed by the performance of the Index for the period July 8, 2014 through August 31, 2018. |
| - | Average Annualized and Cumulative Inception returns for the Fund, Blended-Index and Benchmark Index are based on the inception date of the Fund. |
| | |
| PGX | | Manager’s Analysis |
| | Invesco Preferred ETF (PGX) |
As an index fund, the Invesco Preferred ETF (the “Fund”) is passively managed and attempts to track the returns of an underlying index. The Fund seeks to track the investment results (before fees and expenses) of the ICE BofAML Core Plus Fixed Rate Preferred Securities Index (the “Index”). The Fund generally will invest at least 80% of its total assets in fixed-rate U.S. dollar-denominated preferred securities that comprise the Index.
The Index is a market capitalization-weighted index designed to reflect the total return performance of the fixed-rate U.S. dollar-denominated preferred securities market. The Index includes both traditional and other preferred securities, including preferred securities issued by foreign companies in the form of American depositary receipts, as well as senior and subordinated debt securities. Unlisted preferred securities are excluded from the Index, but unlisted senior or subordinated debt-like securities are eligible for inclusion. The Index may include Rule 144A securities. Strictly in accordance with its guidelines and mandated procedures, ICE Data Indices, LLC (the “Index Provider”) selects securities for the Index using a rules-based methodology. Qualifying securities must be rated at least B3 (based on an average of Moody’s Investors Services, Inc. (“Moody’s”), S&P Global Ratings, a division of S&P Global Inc. (“S&P”) and Fitch Ratings, Inc. (“Fitch”)) and must have an investment grade country risk profile (based on an average of Moody’s, S&P and Fitch foreign currency long-term sovereign debt ratings). The Fund does not purchase all of the securities in the Index; instead, the Fund utilizes a “sampling” methodology to seek to achieve its investment objective.
The Board of Trustees approved a change in the fiscal year end for the Fund from October 31 to August 31. For the fiscal period from November 1, 2017 to August 31, 2018, on a market price basis, the Fund returned 2.39%. On a net asset value (“NAV”) basis, the Fund returned 2.25%. During the same time period, the Index returned 2.69%. The Fund’s performance (NAV basis) differed from the return of the Index primarily due to fees and operating expenses that the Fund incurred during the period.
During this same time period, the S&P U.S. Preferred Stock Index (the “Benchmark Index”) returned 3.60%. The Benchmark Index is an unmanaged index weighted by modified market capitalization based on the average performance of approximately 290 securities. The Benchmark Index was selected for its recognition in the marketplace, and its performance comparison is a useful measure for investors as a broad representation of the preferred stock market, which includes convertible preferred stocks.
Relative to the Benchmark Index, the Fund was most overweight in the electric utilities industry and most underweight in the mortgage REITs industry during the fiscal period ended August 31, 2018. The majority of the Fund’s underperformance relative to the Benchmark Index during the period can be
attributed to the benchmark’s inclusion of convertible preferred securities, which are excluded from the Fund. Convertible preferred securities outperformed the overall preferred market during the reporting period.
For the fiscal period ended August 31, 2018, the banking industry contributed most significantly to the Fund’s return, followed by the insurance and REIT industries, respectively. The multi-utilities industry detracted most significantly from the Fund’s return.
Positions that contributed most significantly to the Fund’s return for the fiscal period ended August 31, 2018, included Wells Fargo & Co., 8.00%, Series J, a banks company (portfolio average weight 2.43%), and Barclays Bank PLC, 8.13%, Series 5 (United Kingdom), a banks company (portfolio average weight 2.41%). Positions that detracted most significantly from the Fund’s return included HSBC Holdings PLC, 8.125%, a banking company (no longer held at fiscal period-end), and HSBC Holdings PLC, 8.00%, a banks company (no longer held at fiscal period-end).
| | | | |
Industry Breakdown
(% of the Fund’s Net Assets)
as of August 31, 2018 | |
| Banks | | | 37.5 | |
| Capital Markets | | | 15.2 | |
| Insurance | | | 13.0 | |
| Equity REITs | | | 10.3 | |
| Electric Utilities | | | 7.5 | |
| Diversified Telecommunication Services | | | 5.1 | |
| Consumer Finance | | | 3.1 | |
| Multi-Utilities | | | 2.2 | |
| Oil, Gas & Consumable Fuels | | | 1.9 | |
| Wireless Telecommunication Services | | | 1.5 | |
| Internet Software & Services | | | 0.7 | |
| Machinery | | | 0.6 | |
| Thrifts & Mortgage Finance | | | 0.5 | |
| Commercial Services & Supplies | | | 0.3 | |
| Mortgage REITs | | | 0.3 | |
| Chemicals | | | 0.1 | |
| Trading Companies & Distributors | | | 0.1 | |
| Money Market Fund Plus Other Assets Less Liabilities | | | 0.1 | |
Invesco Preferred ETF (PGX) (continued)
| | | | |
Top Ten Fund Holdings* (% of the Fund’s Net Assets)
as of August 31, 2018 | |
| Security | | | | |
| Barclays Bank PLC, 8.13%, 12/15/2166, Series 5 | | | 2.0 | |
| Deutsche Bank Contingent Capital Trust V, 8.05% | | | 1.9 | |
| Citigroup, Inc., 6.88%, 02/15/2166, Series K | | | 1.8 | |
| BB&T Corp., 5.63%, Series E | | | 1.8 | |
| PNC Financial Services Group, Inc. (The), 6.13%, 11/01/2166, Series P | | | 1.7 | |
| Bank of America Corp., 6.50%, Series Y | | | 1.5 | |
| JPMorgan Chase & Co., 6.13%, Series Y | | | 1.5 | |
| Wells Fargo & Co., 5.85%, 12/15/2166, Series Q | | | 1.5 | |
| Bank of America Corp., 6.63%, Series W | | | 1.2 | |
| Bank of America Corp., 6.00%, Series GG | | | 1.2 | |
| Total | | | 16.1 | |
| * | Excluding money market fund holdings. |
Growth of a $10,000 Investment
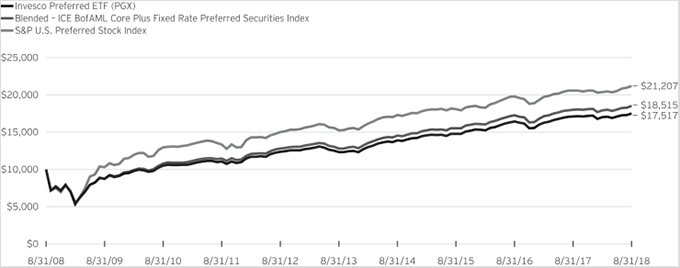
Fund Performance History as of August 31, 2018
| | | | | | | | | | | | | | | | | | | | | | | | | | | | | | | | | | | | | | | | |
| | | | | | 3 Years Average
Annualized | | | 3 Years Cumulative | | | 5 Years Average
Annualized | | | 5 Years Cumulative | | | 10 Years Average
Annualized | | | 10 Years Cumulative | | | | | | Fund Inception | |
| Index | | 1 Year | | | Average
Annualized | | | Cumulative | |
| Blended—ICE BofAML Core Plus Fixed Rate Preferred Securities Index | | | 2.78 | % | | | 6.07 | % | | | 19.35 | % | | | 7.63 | % | | | 44.45 | % | | | 6.35 | % | | | 85.15 | % | | | | | | | 4.36 | % | | | 57.16 | % |
| S&P U.S. Preferred Stock Index | | | 2.99 | | | | 5.46 | | | | 17.30 | | | | 6.79 | | | | 38.91 | | | | 7.81 | | | | 112.07 | | | | | | | | 5.69 | | | | 79.62 | |
| Fund | | | | | | | | | | | | | | | | | | | | | | | | | | | | | | | | | | | | | | | | |
| NAV Return | | | 2.27 | | | | 5.85 | | | | 18.60 | | | | 7.29 | | | | 42.19 | | | | 5.77 | | | | 75.17 | | | | | | | | 3.70 | | | | 46.89 | |
| Market Price Return | | | 2.48 | | | | 5.87 | | | | 18.67 | | | | 7.34 | | | | 42.48 | | | | 5.51 | | | | 70.90 | | | | | | | | 3.55 | | | | 44.70 | |
Invesco Preferred ETF (PGX) (continued)
Fund Inception: January 31, 2008
Performance quoted above represents past performance. Past performance is not a guarantee of future results and current performance may be higher or lower than performance quoted. Investment returns and principal value will fluctuate, and shares of the Fund (“Fund Shares”), when redeemed or sold, may be worth more or less than their original cost. Fund performance reflects any applicable fee waivers and/or expense reimbursements. Had the adviser not waived fees and/or reimbursed expenses currently or in the past, returns would have been lower. See current prospectus for more information. According to the Fund’s current prospectus, the Fund’s expense ratio of 0.51% includes the unitary management fee of 0.50% and acquired fund fees and expenses of 0.01%. NAV and Market Price returns assume that dividends and capital gain distributions have been reinvested in the Fund at NAV and Market Price, respectively. The returns shown in the table above do not reflect the deduction of taxes that a shareholder would pay on Fund distributions or the redemption or sale of Fund Shares. See invesco.com/ETFs to find the most recent month-end performance numbers.
Blended-Index and Benchmark Index performance results are based upon a hypothetical investment in their respective constituent securities.
Blended-Index and Benchmark Index returns do not represent Fund returns. An investor cannot invest directly in an index. The Blended-Index and Benchmark Index do not charge management fees or brokerage expenses, and no such fees or expenses were deducted from the hypothetical performance shown. In addition, the results actual investors might have achieved would have differed from those shown because of differences in the timing, amounts of their investments, and fees and expenses associated with an investment in the Fund.
Notes Regarding Indexes and Fund Performance History:
| - | Average Annualized and Cumulative Inception returns for the Fund, Blended-Index and Benchmark Index are based on the inception date of the Fund. |
| - | The Blended-ICE BofAML Core Plus Fixed Rate Preferred Securities Index performance is comprised of the performance of The BofA Merrill Lynch Core Fixed Rate Preferred Securities Index, the Fund’s previous underlying index, from Fund inception through the conversion date, April 1, 2012, followed by the performance of the Index, starting from the conversion date through August 31, 2018. |
| | |
| BAB | | Manager’s Analysis |
| | Invesco Taxable Municipal Bond ETF (BAB) |
As an index fund, the Invesco Taxable Municipal Bond ETF (the “Fund”) is passively managed and attempts to track the returns of an underlying index. The Fund seeks to track the investment results (before fees and expenses) of the ICE BofAML US Taxable Municipal Securities Plus Index (the “Index”). The Fund generally will invest at least 80% of its total assets in taxable municipal securities that comprise the Index. The Index is designed to track the performance of U.S. dollar denominated taxable municipal debt publicly issued by U.S. states and territories, and their political subdivisions, in the U.S. market.
Securities eligible for inclusion in the Index must have: (i) at least 18 months to final maturity at the time of issuance, (ii) at least one year remaining term to final maturity, (iii) a fixed coupon schedule, and (iv) an investment grade rating (based on an average of Moody’s Investors Services, Inc. (“Moody’s”), S&P Global Ratings, a division of S&P Global Inc. (“S&P”) and Fitch Ratings, Inc. (“Fitch”). Securities also must have a minimum amount outstanding that varies according to the bond’s initial term to final maturity at time of issuance: maturities between 1-5 years must have at least $10 million outstanding; maturities between 5-10 years must have at least $15 million outstanding; maturities of 10 years or more must have at least $25 million outstanding. The Index excludes Rule 144A securities and securities in default. However, it may include bonds eligible to participate in the Build America Bond program created under the American Recovery and Reinvestment Act of 2009 or other legislation providing for the issuance of taxable municipal securities on which the issuer receives federal support of the interest paid.
ICE Data Indices, LLC (the “Index Provider”) uses a capitalization-weighted methodology, weighting the Index’s constituent bonds using a factor that equals their current amount outstanding multiplied by their market price, plus accrued interest. The Fund does not purchase all of the securities in the Index; instead, the Fund utilizes a “sampling” methodology to seek to achieve its investment objective.
The Board of Trustees approved a change in the fiscal year end for the Fund from October 31 to August 31. For the fiscal period from November 1, 2017 to August 31, 2018, on a market price basis, the Fund returned 0.29%. On a net asset value (“NAV”) basis, the Fund returned 1.09%. During the same time period, the Index returned 0.79%. During the fiscal period, the Fund employed a “sampling” methodology to attempt to track the Index, rather than a full replication methodology. The Fund’s performance (NAV basis) differed from the return of the Index primarily due to a positive impact as a result of the Fund’s sampling methodology partially offset by fees and operating expenses incurred by the Fund during the period.
During this same time period, ICE BofAML U.S. Corporate Master Index returned (1.17)% and Bloomberg Barclays U.S. Aggregate
Bond Index returned (0.63)% (each, a “Benchmark Index” and, collectively “Benchmark Indices”). The Benchmark Indices are unmanaged indices weighted by market capitalization and based on the average performance of approximately 7,818 securities and 10,122 securities, respectively. These Benchmark Indices were selected for their recognition in the marketplace, and their performance comparisons are a useful measure for investors as broad representations of the market for investment grade corporate debt with at least one year to maturity, and of the market for U.S. investment grade, fixed-rate bonds, respectively.
Relative to ICE BofAML U.S. Corporate Master Index, the majority of the Fund’s outperformance relative to this Benchmark Index during the period can be attributed to the limited supply of Build America Bonds held by the Fund.
Relative to the Bloomberg Barclays U.S. Aggregate Bond Index, the majority of the Fund’s outperformance relative to this Benchmark Index during the period can be attributed to the limited supply of Build America Bonds as well as the shorter duration of taxable municipal bonds held by the Fund compared to the duration of the Benchmark Index.
For the fiscal period ended August 31, 2018, the State of California contributed most significantly to the Fund’s return, followed by the State of Illinois and the State of Missouri, respectively. The State of Utah detracted most significantly from the Fund’s return, followed by the State of Oregon and District of Columbia, respectively.
Positions that contributed most significantly to the Fund’s return for the fiscal period ended August 31, 2018, included South Jersey Port Corp. New Jersey (Marine Terminal) Rev. Ser. 09-P-3, Build America Bonds taxable, 7.365% coupon, due 01/01/2040 (portfolio average weight of 0.63%), and Regional Transportation District Colorado COP Ser.10, Build America Bonds, 7.672% coupon, due 06/01/2040 (portfolio average weight of 0.42%). Positions that detracted most significantly from the Fund’s return included Kauai County Hawaii Ser.10, Build America Bonds, 5.763% coupon, due 08/01/2033 (portfolio average weight of 0.26%), and Jurupa California Community Services District COP Ser.10B, Build American Bonds, 6.697% coupon, due 09/01/2028 (portfolio average weight of 0.15%).
Invesco Taxable Municipal Bond ETF (BAB) (continued)
| | | | |
State and Territory Breakdown (% of the Fund’s Net Assets) | |
| California | | | 25.3 | |
| Florida | | | 3.5 | |
| Illinois | | | 7.2 | |
| New Jersey | | | 3.8 | |
| New York | | | 16.3 | |
| Ohio | | | 3.7 | |
| Texas | | | 8.5 | |
| Washington | | | 3.4 | |
| Other States Less Than 3% Each | | | 26.7 | |
| Money Market Fund Plus Other Assets Less Liabilities | | | 1.6 | |
| | | | |
Top Ten Fund Holdings*
(% of the Fund’s Net Assets)
as of August 31, 2018 | |
| Security | | | | |
| California State Ser. 09, 7.500%, 04/01/2034 | | | 2.6 | |
| California State Ser. 10, 7.950%, 03/01/2036 | | | 2.6 | |
| California State Ser. 10, 7.600%, 11/01/2040 | | | 1.8 | |
| California State Highway Safety Air Quality Remarketed Ser. 09B, 6.509%, 04/01/2039 | | | 1.8 | |
| California State Various Purpose Ser. 09, 7.550%, 04/01/2039 | | | 1.7 | |
| Illinois State Ser. 10-1, 5.563%, 02/01/2021 | | | 1.6 | |
| University of California Rev. Ser. 10, 5.946%, 05/15/2045 | | | 1.4 | |
| Texas State Transportation Commission (First Tier) Rev. Ser. 10B, 5.178%, 04/01/2030 | | | 1.4 | |
| Missouri Joint Municipal Electric Utility Commission Power Project Rev. Ser. 09A, 6.890%, 01/01/2042 | | | 1.4 | |
| New York City Municipal Water Finance Auth. Water & Sewer Rev. Ser. 10, 5.440%, 06/15/2043 | | | 1.3 | |
| Total | | | 17.6 | |
| * | Excluding money market fund holdings. |
Invesco Taxable Municipal Bond ETF (BAB) (continued)
Growth of a $10,000 Investment Since Inception
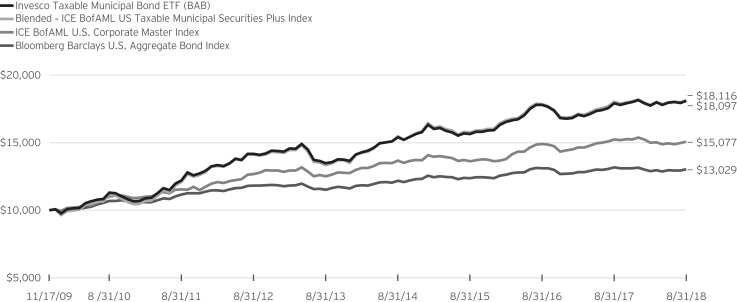
Fund Performance History as of August 31, 2018
| | | | | | | | | | | | | | | | | | | | | | | | | | | | | | | | |
| | | 1 Year | | | 3 Years Average
Annualized | | | 3 Years Cumulative | | | 5 Years Average
Annualized | | | 5 Years Cumulative | | | | | | Fund Inception | |
| Index | | Average
Annualized | | | Cumulative | |
| Blended—ICE BofAML US Taxable Municipal Securities Plus Index | | | 0.49 | % | | | 4.75 | % | | | 14.95 | % | | | 6.30 | % | | | 35.72 | % | | | | | | | 7.00 | % | | | 81.16 | % |
| ICE BofAML U.S. Corporate Master Index | | | (1.00 | ) | | | 3.44 | | | | 10.67 | | | | 3.80 | | | | 20.48 | | | | | | | | 4.78 | | | | 50.77 | |
| Bloomberg Barclays U.S. Aggregate Bond Index | | | (1.05 | ) | | | 1.76 | | | | 5.37 | | | | 2.49 | | | | 13.06 | | | | | | | | 3.06 | | | | 30.29 | |
| Fund | | | | | | | | | | | | | | | | | | | | | | | | | | | | | | | | |
| NAV Return | | | 0.98 | | | | 4.98 | | | | 15.69 | | | | 6.08 | | | | 34.33 | | | | | | | | 6.98 | | | | 80.97 | |
| Market Price Return | | | 0.28 | | | | 4.95 | | | | 15.59 | | | | 6.17 | | | | 34.88 | | | | | | | | 6.88 | | | | 79.36 | |
Fund Inception: November 17, 2009
Performance quoted above represents past performance. Past performance is not a guarantee of future results and current performance may be higher or lower than performance quoted. Investment returns and principal value will fluctuate, and shares of the Fund (“Fund Shares”), when redeemed or sold, may be worth more or less than their original cost. Fund performance reflects any applicable fee waivers and/or expense reimbursements. Had the adviser not waived fees and/or reimbursed expenses currently or in the past, returns would have been lower. See current prospectus for more information. According to the Fund’s current prospectus, the Fund’s expense ratio of 0.28% is expressed as a unitary management fee to cover operating expenses and expenses incurred in connection with managing the portfolio. NAV and Market Price returns assume that dividends and capital gain distributions have been reinvested in the Fund at NAV and Market Price, respectively. The returns shown in the table above do not reflect the deduction of taxes that a shareholder would pay on Fund distributions or the redemption or sale of Fund Shares. See invesco.com/ETFs to find the most recent month-end performance numbers.
Blended-Index and Benchmark Indices performance results are based upon a hypothetical investment in their respective constituent securities.
Blended-Index and Benchmark Indices returns do not represent Fund returns. An investor cannot invest directly in an index. The Blended-Index and Benchmark Indices do not charge management fees or brokerage expenses, and no such fees or expenses were deducted from the hypothetical performance shown. In addition, the results actual investors might have achieved would have differed from those shown because of differences in the timing, amounts of their investments, and fees and expenses associated with an investment in the Fund.
Notes Regarding Indexes and Fund Performance History:
| - | Average Annualized and Cumulative Inception returns for the Fund, Blended-Index and Benchmark Indices are based on the inception date of the Fund. |
| - | The Blended-ICE BofAML US Taxable Municipal Securities Plus Index is comprised of the performance of the ICE BofAML Build America Bond Index, the Fund’s underlying index from Fund inception through the conversion date, May 31, 2017, followed by the performance of the Index starting at the conversion date through August 31, 2018. |
| | |
| CLTL | | Manager’s Analysis |
| | Invesco Treasury Collateral ETF (CLTL) |
As an index fund, the Invesco Treasury Collateral ETF (the “Fund”) is passively managed and attempts to track the returns of an underlying index. The Fund seeks to track the investment results (before fees and expenses) of the ICE U.S. Treasury Short Bond Index (the “Index”). The Fund generally will invest at least 80% of its total assets in components of the Index. The Index is designed to measure the performance of U.S. Treasury Obligations with a maximum remaining maturity of 12 months. “U.S. Treasury Obligations” refer to securities issued or guaranteed by the U.S. Treasury where the payment of principal and interest is backed by the full faith and credit of the U.S. government. They include U.S. Treasury notes, U.S. Treasury bills and U.S. Treasury floating rate bonds. The Index includes all publicly-issued, non-convertible U.S. Treasury Obligations that: (i) are issued in U.S. dollars, (ii) have a minimum remaining maturity of at least one month and a maximum remaining maturity of 12 months at the time of rebalance, and (iii) have a minimum amount outstanding of $300 million.
The Index excludes inflation-linked securities, floating rate notes, cash management bills, and any government agency debt issued with or without a government guarantee and Separate Trading of Registered Interest and Principal of Securities. The Index uses a market capitalization-weighted methodology. The Fund does not purchase all of the securities in the Index; instead, the Fund utilizes a “sampling” methodology to seek to achieve its investment objective.
The Board of Trustees approved a change in the fiscal year end for the Fund from October 31 to August 31. For the fiscal period from November 1, 2017 to August 31, 2018, on a market price basis, the Fund returned 1.27%. On a net asset value (“NAV”) basis, the Fund returned 1.22%. During the same time period, the Index returned 1.30%. During the fiscal period the Fund’s performance (NAV basis) differed from the return of the Index primarily due to fees and operating expenses that the Fund incurred during the period.
For the fiscal period ended August 31, 2018, the bonds with maturities between 61-90 days duration contributed most significantly to the Fund’s return, followed by the bonds with maturities between 31-60 days duration and bonds with maturities between 91-120 days duration, respectively. The bonds with maturities between 8-14 days duration detracted most significantly from the Fund’s return, followed by the bonds with maturities between 15-30 days duration and bonds with maturities between 331-360 days duration, respectively.
Positions that contributed most significantly to the Fund’s return for the fiscal period ended August 31, 2018, included U.S. Treasury Notes, 3.50% coupon, due 02/15/2018 (no longer held at fiscal period-end), and U.S. Treasury Notes, 1.25% coupon, due 12/31/2018 (portfolio average weight of 0.15%). Positions that detracted most significantly from the Fund’s return included U.S.
Treasury Bills, due 06/28/2018 (no longer held at fiscal period-end), and U.S. Treasury Notes, 0.75% coupon, due 01/31/2018 (no longer held at fiscal period-end).
| | | | |
Security Type Breakdown (% of the Fund’s Net Assets)
as of August 31, 2018 | |
| U.S. Treasury Bills | | | 56.9 | |
| U.S. Treasury Notes | | | 42.4 | |
| U.S. Treasury Bonds | | | 0.5 | |
| Other Assets Less Liabilities | | | 0.2 | |
|
Top Ten Fund Holdings
(% of the Fund’s Net Assets)
as of August 31, 2018 | |
| Security | | | | |
| U.S. Treasury Bills, 1.916%, 10/18/2018 | | | 1.8 | |
| U.S. Treasury Bills, 1.962%, 11/01/2018 | | | 1.8 | |
| U.S. Treasury Bills, 1.930%, 10/25/2018 | | | 1.8 | |
| U.S. Treasury Bills, 1.881%, 10/04/2018 | | | 1.7 | |
| U.S. Treasury Bills, 1.915%, 11/08/2018 | | | 1.7 | |
| U.S. Treasury Bills, 1.899%, 10/11/2018 | | | 1.7 | |
| U.S. Treasury Bills, 2.094%, 01/17/2019 | | | 1.6 | |
| U.S. Treasury Bills, 2.116%, 01/24/2019 | | | 1.6 | |
| U.S. Treasury Bills, 2.128%, 01/31/2019 | | | 1.6 | |
| U.S. Treasury Bills, 2.162%, 02/28/2019 | | | 1.6 | |
| Total | | | 16.9 | |
Invesco Treasury Collateral ETF (CLTL) (continued)
Growth of a $10,000 Investment Since Inception
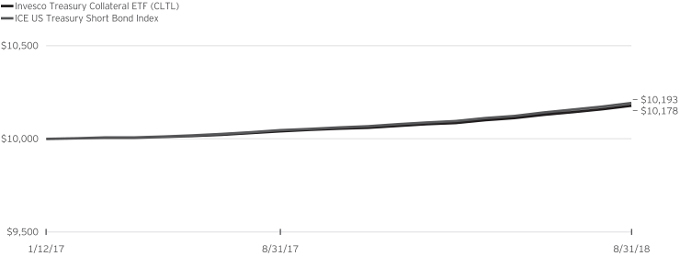
Fund Performance History as of August 31, 2018
| | | | | | | | | | | | | | | | |
| | | 1 Year | | | | | | Fund Inception | |
| Index | | | | | Average
Annualized | | | Cumulative | |
| ICE U.S. Treasury Short Bond Index | | | 1.45 | % | | | | | | | 1.17 | % | | | 1.93 | % |
| Fund | | | | | | | | | | | | | | | | |
| NAV Return | | | 1.37 | | | | | | | | 1.08 | | | | 1.78 | |
| Market Price Return | | | 1.40 | | | | | | | | 1.10 | | | | 1.80 | |
Fund Inception: January 12, 2017
Performance quoted above represents past performance. Past performance is not a guarantee of future results and current performance may be higher or lower than performance quoted. Investment returns and principal value will fluctuate, and shares of the Fund (“Fund Shares”), when redeemed or sold, may be worth more or less than their original cost. Fund performance reflects any applicable fee waivers and/or expense reimbursements. Had the adviser not waived fees and/or reimbursed expenses currently or in the past, returns would have been lower. See current prospectus for more information. According to the Fund’s current prospectus, the Fund’s expense ratio of 0.08% is expressed as a unitary management fee to cover operating expenses and expenses incurred in connection with managing the portfolio. NAV and Market Price returns assume that dividends and capital gain distributions have been reinvested in the Fund at NAV and Market Price, respectively. The returns shown in the table above do not reflect the deduction of taxes that a shareholder
would pay on Fund distributions or the redemption or sale of Fund Shares. See invesco.com/ETFs to find the most recent month-end performance numbers.
Index performance results are based upon a hypothetical investment in their respective constituent securities. Index returns do not represent Fund returns. An investor cannot invest directly in an index. The Index does not charge management fees or brokerage expenses, and no such fees or expenses were deducted from the hypothetical performance shown. In addition, the results actual investors might have achieved would have differed from those shown because of differences in the timing, amounts of their investments, and fees and expenses associated with an investment in the Fund.
Notes Regarding Index and Fund Performance History:
| - | Average Annualized and Cumulative Inception returns for the Fund and Index are based on the inception date of the Fund. |
| | |
| VRP | | Manager’s Analysis |
| | Invesco Variable Rate Preferred ETF (VRP) |
As an index fund, the Invesco Variable Rate Preferred ETF (the “Fund”) is passively managed and attempts to track the returns of an underlying index. The Fund seeks to track the investment results (before fees and expenses) of the Wells Fargo® Hybrid and Preferred Securities Floating and Variable Rate Index (the “Index”). The Fund generally will invest at least 90% of its total assets in the securities that comprise the Index. The Index is a market capitalization-weighted index designed to track the performance of preferred stock, as well as certain types of “hybrid securities” that are functionally equivalent to preferred stocks, that are issued by U.S.-based or foreign issuers and that pay a floating or variable rate dividend or coupon.
Strictly in accordance with its guidelines and mandated procedures, Wells Fargo Securities, LLC (together with Wells Fargo & Company, the “Index Provider”), employs a proprietary methodology to select for the Index issues of preferred stock and hybrid securities that, in the Index Provider’s judgment, are functionally equivalent to preferred stock based on the inclusion of equity features. To be eligible for inclusion in the Index, the preferred stock or hybrid security must: (i) maintain a minimum par value of $100 million outstanding or a minimum of 10 million shares outstanding; (ii) have floating or variable dividends or coupons; and (iii) be U.S. dollar-denominated and U.S. registered (or otherwise exempt from registration in the United States). The Fund considers the traditional preferred stocks and functionally equivalent hybrid securities included in the Index, collectively, to be “Hybrid and Preferred Securities.” The Index is a market capitalization-weighted index designed to track the performance of preferred stock, as well as certain types of hybrid securities that are functionally equivalent to preferred stocks, that are issued by U.S.-based or foreign issuers and that pay a floating or variable rate dividend or coupon. The Fund does not purchase all of the Hybrid and Preferred Securities in the Index; instead, the Fund utilizes a “sampling” methodology to seek to achieve its investment objective.
The Board of Trustees approved a change in the fiscal year end for the Fund from October 31 to August 31. For the fiscal period from November 1, 2017 to August 31, 2018, on a market price basis, the Fund returned 0.62%. On a net asset value (“NAV”) basis, the Fund returned 1.05%. During the same time period, the Index returned 1.26%. The Fund’s performance (NAV basis) differed from the return of the Index primarily due to the fees and operating expenses that the Fund incurred during the period, partially offset by beneficial impacts of the Fund’s sampling methodology.
During this same time period, the S&P U.S. Preferred Stock Index (the “Benchmark Index”) returned 3.60%. The Benchmark Index is an unmanaged index weighted by modified market capitalization and based on the average performance of approximately 290 securities. The Benchmark Index was selected for its recognition in the marketplace, and its performance comparison is a useful
measure for investors as a broad representation of the primarily fixed-rate preferred stock market.
Relative to the Benchmark Index, the Fund was most overweight in the banks industry and most underweight in the mortgage REITs industry during the fiscal period ended August 31, 2018. The majority of the Fund’s underperformance relative to the Benchmark Index during the period can be attributed to the Benchmark Index’s inclusion of convertible preferred securities, which are excluded from the Fund. Convertible preferred securities outperformed the overall preferred market during the reporting period.
For the fiscal period ended August 31, 2018, the banking industry contributed most significantly to the Fund’s return, followed by the insurance industry. The diversified manufacturing industry detracted most significantly from the Fund’s return, followed by the capital goods industry.
Positions that contributed most significantly to the Fund’s return for the fiscal period ended August 31, 2018, included GMAC Capital Trust I, 8.125%, a consumer finance company (no longer held at fiscal period-end), and JPMorgan Chase & Co, 7.90%, a banks company (no longer held at fiscal period-end). Positions that detracted most significantly from the Fund’s return included General Electric Co., Series D, 5.00%, a miscellaneous manufacturing company (portfolio average weight of 3.36%), and Enbridge, Inc. (Canada), 5.50%, a pipelines company (portfolio average weight of 0.65%).
| | | | |
Industry Breakdown (% of the Fund’s Net Assets)
as of August 31, 2018 | |
| Banks | | | 56.5 | |
| Insurance | | | 9.7 | |
| Pipelines | | | 8.1 | |
| Capital Markets | | | 5.5 | |
| Miscellaneous Manufacturing | | | 3.5 | |
| Diversified Financial Services | | | 3.3 | |
| Electric | | | 2.3 | |
| Oil, Gas & Consumable Fuels | | | 2.2 | |
| Mortgage REITs | | | 2.0 | |
| Consumer Finance | | | 1.8 | |
| Media | | | 0.8 | |
| Food Products | | | 0.6 | |
| Auto Manufacturers | | | 0.6 | |
| Electric Utilities | | | 0.6 | |
| Thrifts & Mortgage Finance | | | 0.4 | |
| Multi-Utilities | | | 0.3 | |
| Commercial Services & Supplies | | | 0.3 | |
| Gas | | | 0.3 | |
| Hand/Machine Tools | | | 0.2 | |
| Money Market Fund Plus Other Assets Less Liabilities | | | 1.0 | |
Invesco Variable Rate Preferred ETF (VRP) (continued)
| | | | |
|
Top Ten Fund Holdings* (% of the Fund’s Net Assets)
as of August 31, 2018 | |
| Security | | | | |
| JPMorgan Chase & Co., Series 1, 5.809%, 04/29/2049 | | | 3.6 | |
| General Electric Co., Series D, 5.000%, 06/15/2165 | | | 3.5 | |
| Wells Fargo & Co., Series K, 6.111%, 03/29/2049 | | | 2.0 | |
| GMAC Capital Trust I, 8.10%, 02/15/2040, Series 2 | | | 1.8 | |
| JPMorgan Chase & Co., Series V, 5.000%, 12/31/2049 | | | 1.5 | |
| Wachovia Capital Trust III, 5.570%, 03/29/2049 | | | 1.5 | |
| Citigroup Capital XIII, 8.71%, 10/30/2040 | | | 1.5 | |
| Bank of America Corp., Series FF, 5.875%, 09/15/2166 | | | 1.4 | |
| JPMorgan Chase & Co., Series S, 6.750%, 01/29/2049 | | | 1.3 | |
| Wells Fargo & Co., Series U, 5.875%, 12/29/2049 | | | 1.2 | |
| Total | | | 19.3 | |
| * | Excluding money market fund holdings. |
Invesco Variable Rate Preferred ETF (VRP) (continued)
Growth of a $10,000 Investment Since Inception
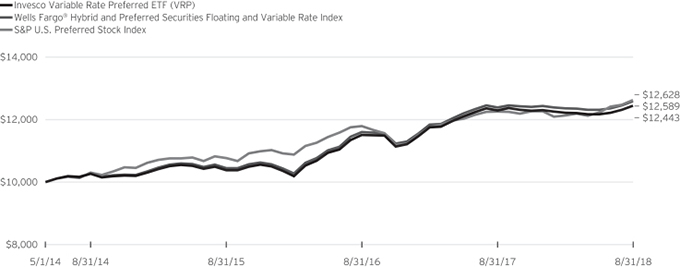
Fund Performance History as of August 31, 2018
| | | | | | | | | | | | | | | | | | | | | | | | |
| | | 1 Year | | | 3 Years Average
Annualized | | | 3 Years Cumulative | | | | | | Fund Inception | |
| Index | | | | | Average
Annualized | | | Cumulative | |
| Wells Fargo® Hybrid and Preferred Securities Floating and Variable Rate Index | | | 1.61 | % | | | 6.42 | % | | | 20.53 | % | | | | | | | 5.46 | % | | | 25.89 | % |
| S&P U.S. Preferred Stock Index | | | 2.99 | | | | 5.46 | | | | 17.30 | | | | | | | | 5.53 | | | | 26.28 | |
| Fund | | | | | | | | | | | | | | | | | | | | | | | | |
| NAV Return | | | 1.25 | | | | 6.22 | | | | 19.84 | | | | | | | | 5.18 | | | | 24.43 | |
| Market Price Return | | | 1.01 | | | | 6.01 | | | | 19.15 | | | | | | | | 5.08 | | | | 23.94 | |
Fund Inception: May 1, 2014
Performance quoted above represents past performance. Past performance is not a guarantee of future results and current performance may be higher or lower than performance quoted. Investment returns and principal value will fluctuate, and shares of the Fund (“Fund Shares”), when redeemed or sold, may be worth more or less than their original cost. Fund performance reflects any applicable fee waivers and/or expense reimbursements. Had the adviser not waived fees and/or reimbursed expenses currently or in the past, returns would have been lower. See current prospectus for more information. According to the Fund’s current prospectus, the Fund’s expense ratio of 0.50% is expressed as a unitary management fee to cover operating expenses and expenses incurred in connection with managing the portfolio. NAV and Market Price returns assume that dividends and capital gain distributions have been reinvested in the Fund at NAV and Market Price, respectively. The returns shown in the table above do not reflect the deduction of taxes that a shareholder would pay on Fund distributions or the redemption or sale of Fund Shares.
See invesco.com/ETFs to find the most recent month-end performance numbers.
Index and Benchmark Index performance results are based upon a hypothetical investment in their respective constituent securities. Index and Benchmark Index returns do not represent Fund returns. An investor cannot invest directly in an index. The Index and Benchmark Index do not charge management fees or brokerage expenses, and no such fees or expenses were deducted from the hypothetical performance shown. In addition, the results actual investors might have achieved would have differed from those shown because of differences in the timing, amounts of their investments, and fees and expenses associated with an investment in the Fund.
Notes Regarding Indexes and Fund Performance History:
| - | Average Annualized and Cumulative Inception returns for the Fund, Index and Benchmark Index are based on the inception date of the Fund. |
| | |
| PVI | | Manager’s Analysis |
| | Invesco VRDO Tax-Free Weekly ETF (PVI) |
As an index fund, the Invesco VRDO Tax-Free Weekly ETF (the “Fund”) is passively managed and attempts to track the returns of an underlying index. The Fund seeks to track the investment results (before fees and expenses) of the Bloomberg U.S. Municipal AMT-Free Weekly VRDO Index (the “Index”). The Fund generally will invest at least 80% of its total assets in variable rate demand obligation (“VRDO”) bonds that are exempt from federal income tax with interest rates that reset weekly, which comprise the Index.
Bloomberg Index Services Limited (collectively with its affiliates, “Bloomberg” or the “Index Provider”) compiles and calculates the Index, which is comprised of municipal securities issued in the primary market as VRDOs. Bonds in the Index must be rated by at least one of the following statistical rating agencies: Moody’s Investors Services, Inc. (“Moody’s”) as A-3 for long-term bonds or Prime-2 for short-term bonds; by S&P Global Ratings, a division of S&P Global Inc. (“S&P”) as A- for long-term bonds or A-2 for short-term bonds; and by Fitch Ratings, Inc. (“Fitch”) as A- for long-term bonds or F-2 for short-term bonds. The Fund does not purchase all of the securities in the Index; instead, the Fund utilizes a “sampling” methodology to seek to achieve its investment objective.
The Board of Trustees approved a change in the fiscal year end for the Fund from October 31 to August 31. For the fiscal period from November 1, 2017 to August 31, 2018, on a market price basis, the Fund returned 0.82%. On a net asset value (“NAV”) basis, the Fund returned 0.82%. During the same time period, the Index returned 0.99%. The Fund’s performance (NAV basis) differed from the return of the Index due to a positive impact as a result of the Fund’s sampling methodology partially offset by fees and operating expenses incurred by the Fund during the period.
During this same time period, the Bloomberg Barclays Municipal 1-Year Index (the “Benchmark Index”) returned 0.75%. The Benchmark Index is an unmanaged index weighted by market capitalization based on the average performance of approximately 3,886 securities. The Benchmark Index was selected for its recognition in the marketplace, and its performance comparison is a useful measure for investors as a broad representation of the market for municipal securities with no more than 1 year duration.
Relative to the Benchmark Index, the Fund was most overweight in the State of Florida and most underweight in the State of New York during the fiscal period ended August 31, 2018. The majority of the Fund’s outperformance relative to the Benchmark Index during the period can be attributed to a positive impact as a result of the Fund’s sampling methodology.
For the fiscal period ended August 31, 2018, the State of Florida contributed most significantly to the Fund’s return, followed by the State of California and the State of New York, respectively. There were no detracting states.
Positions that contributed most significantly to the Fund’s return for the fiscal period ended August 31, 2018, included Florida State Department of Environmental Protection Preservation (Everglades Restoration) Rev. Ser.07A AGC, 1.49% coupon, due 07/01/2027 (portfolio average weight of 0.56%), and Maryland State Health & Higher Educational Facilities Auth. (University of Maryland Medical Systems) Rev. Ser. 07A (LOC-Wells Fargo Bank N.A.), 1.50% coupon, due 07/01/2034 (portfolio average weight of 4.01%). There were no detracting positions.
| | | | |
| State Breakdown (% of the Fund’s Net Assets) | |
| Arizona | | | 4.3 | |
| California | | | 14.5 | |
| Colorado | | | 3.9 | |
| Connecticut | | | 4.0 | |
| Florida | | | 14.6 | |
| Indiana | | | 4.0 | |
| Louisiana | | | 3.7 | |
| Maryland | | | 8.0 | |
| Massachusetts | | | 4.0 | |
| Michigan | | | 6.4 | |
| Missouri | | | 4.5 | |
| Nevada | | | 4.0 | |
| New York | | | 8.4 | |
| Ohio | | | 3.5 | |
| Tennessee | | | 5.3 | |
| Washington | | | 3.1 | |
| Other States Less Than 3% Each | | | 1.3 | |
| Other Assets Less Liabilities | | | 2.5 | |
Invesco VRDO Tax-Free Weekly ETF (PVI) (continued)
| | | | |
Top Ten Fund Holdings (% of the Fund’s Net Assets)
as of August 31, 2018 | |
| Security | | | | |
| Maryland State Health & Higher Educational Facilities Auth. (University of Maryland Medical Systems) Rev. Ser. 07A, 1.550%, 07/01/2034 | | | 4.4 | |
| Florida State Department of Environmental Protection Preservation (Everglades Restoration) Rev. Ser. 07A, 1.580%, 07/01/2027 | | | 4.2 | |
| Missouri State Health & Educational Facilities Auth. (BJC Health System) Ser. 08C, 1.530%, 05/15/2038 | | | 4.0 | |
| Massachusetts State Health & Educational Facilities Auth. (Partners Healthcare P-1—Remarketed 05/14/09) Rev. Ser. 97, 1.500%, 07/01/2027 | | | 4.0 | |
| Connecticut State Health & Educational Facilities Auth. (Yale New Heaven Hospital) Rev. Ser. 13O, 1.510%, 07/01/2053 | | | 4.0 | |
| California State Statewide Community Development Auth. (Kaiser Permanente) Ser. 04M, 1.510%, 04/01/2038 | | | 4.0 | |
| Clark County Nevada Appropriation (Sub.-Lien) Rev. Ser. 08D-3, 1.570%, 07/01/2029 | | | 4.0 | |
| Arizona State Health Facilities Auth. (Dignity Health) Ser. 05B, 1.550%, 07/01/2035 | | | 4.0 | |
| Indianapolis Indiana Multifamily Housing (Capital Place-Convington) Rev. Ser. 08, 1.540%, 05/15/2038 | | | 4.0 | |
| Florida Keys Aqueduct Auth. Water Rev. Ref. Ser. 08, 1.560%, 09/01/2035 | | | 4.0 | |
| Total | | | 40.6 | |
Invesco VRDO Tax-Free Weekly ETF (PVI) (continued)
Growth of a $10,000 Investment
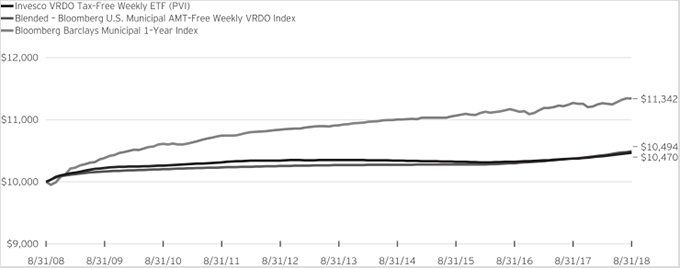
Fund Performance History as of August 31, 2018
| | | | | | | | | | | | | | | | | | | | | | | | | | | | | | | | | | | | | | | | |
| | | 1 Year | | | 3 Years Average
Annualized | | | 3 Years Cumulative | | | 5 Years Average
Annualized | | | 5 Years Cumulative | | | 10 Years Average
Annualized | | | 10 Years Cumulative | | | | | | Fund Inception | |
| Index | | | | | Average
Annualized | | | Cumulative | |
| Blended—Bloomberg U.S. Municipal AMT-Free Weekly VRDO Index | | | 1.13 | % | | | 0.68 | % | | | 2.05 | % | | | 0.43 | % | | | 2.17 | % | | | 0.48 | % | | | 4.94 | % | | | | | | | 0.65 | % | | | 7.19 | % |
| Bloomberg Barclays Municipal 1-Year Index | | | 0.64 | | | | 0.82 | | | | 2.47 | | | | 0.78 | | | | 3.95 | | | | 1.27 | | | | 13.42 | | | | | | | | 1.55 | | | | 18.12 | |
| Fund | | | | | | | | | | | | | | | | | | | | | | | | | | | | | | | | | | | | | | | | |
| NAV Return | | | 0.92 | | | | 0.47 | | | | 1.41 | | | | 0.23 | | | | 1.17 | | | | 0.46 | | | | 4.70 | | | | | | | | 0.66 | | | | 7.33 | |
| Market Price Return | | | 0.96 | | | | 0.45 | | | | 1.37 | | | | 0.23 | | | | 1.17 | | | | 0.45 | | | | 4.57 | | | | | | | | 0.66 | | | | 7.32 | |
Fund Inception: November 15, 2007
Performance quoted above represents past performance. Past performance is not a guarantee of future results and current performance may be higher or lower than performance quoted. Investment returns and principal value will fluctuate, and shares of the Fund (“Fund Shares”), when redeemed or sold, may be worth more or less than their original cost. Fund performance reflects any applicable fee waivers and/or expense reimbursements. Had the adviser not waived fees and/or reimbursed expenses currently or in the past, returns would have been lower. See current prospectus for more information. According to the Fund’s current prospectus, the Fund’s expense ratio of 0.25% is expressed as a unitary management fee to cover operating expenses and expenses incurred in connection with managing the portfolio. NAV and Market Price returns assume that dividends and capital gain distributions have been reinvested in the Fund at NAV and Market Price, respectively. The returns shown in the table above do not reflect the deduction of taxes that a shareholder would pay on Fund distributions or the redemption or sale of Fund Shares. See invesco.com/ETFs to find the most recent month-end performance numbers.
Blended-Index and Benchmark Index performance results are based upon a hypothetical investment in their respective constituent securities. Blended-Index and Benchmark Index returns do not represent Fund returns. An investor cannot invest directly in an index. The Blended-Index and Benchmark Index do not charge management fees or brokerage expenses, and no such fees or expenses were deducted from the hypothetical performance shown. In addition, the results actual investors might have achieved would have differed from those shown because of differences in the timing, amounts of their investments, and fees and expenses associated with an investment in the Fund.
Notes Regarding Indexes and Fund Performance History:
| - | Average Annualized and Cumulative Inception returns for the Fund, Blended-Index and Benchmark Index are based on the inception date of the Fund. |
| - | The Blended-Bloomberg U.S. Municipal AMT-Free Weekly VRDO Index is comprised of the performance of the Thompson Municipal Market Data VRDO Index, the Fund’s original underlying index, from Fund inception through the conversion date, August 5, 2010, followed by the performance of the Index starting at the conversion date through August 31, 2018. |
Schedule of Investments
Invesco 1-30 Laddered Treasury ETF (PLW)
August 31, 2018
| | | | | | | | |
Principal
Amount | | | | | Value | |
| | | | Long-Term Investments—96.5% | |
| | | | U.S. Treasury Securities—96.5% | |
| | | | U.S. Treasury Bonds—93.2% | |
| $ | 4,538,200 | | | 8.500%, 02/15/2020 | | $ | 4,918,629 | |
| | 4,401,200 | | | 7.875%, 02/15/2021 | | | 4,942,410 | |
| | 4,214,300 | | | 7.125%, 02/15/2023 | | | 4,986,455 | |
| | 4,310,800 | | | 6.250%, 08/15/2023 | | | 5,010,042 | |
| | 3,902,300 | | | 7.625%, 02/15/2025 | | | 5,012,093 | |
| | 4,159,700 | | | 6.000%, 02/15/2026 | | | 5,054,604 | |
| | 3,925,800 | | | 6.625%, 02/15/2027 | | | 5,047,413 | |
| | 3,954,900 | | | 6.125%, 11/15/2027 | | | 4,998,855 | |
| | 4,186,700 | | | 5.250%, 02/15/2029 | | | 5,085,859 | |
| | 3,759,300 | | | 6.250%, 05/15/2030 | | | 5,014,480 | |
| | 12,123,900 | | | 5.375%, 02/15/2031 | | | 15,275,404 | |
| | 12,653,500 | | | 4.500%, 02/15/2036 | | | 15,427,137 | |
| | 4,074,100 | | | 4.750%, 02/15/2037 | | | 5,145,700 | |
| | 4,248,700 | | | 4.375%, 02/15/2038 | | | 5,160,096 | |
| | 4,773,400 | | | 3.500%, 02/15/2039 | | | 5,182,775 | |
| | 4,085,800 | | | 4.625%, 02/15/2040 | | | 5,160,717 | |
| | 4,005,600 | | | 4.750%, 02/15/2041 | | | 5,164,486 | |
| | 5,084,400 | | | 3.125%, 02/15/2042 | | | 5,199,891 | |
| | 5,097,800 | | | 3.125%, 02/15/2043 | | | 5,205,332 | |
| | 4,690,000 | | | 3.625%, 02/15/2044 | | | 5,206,816 | |
| | 5,771,500 | | | 2.500%, 02/15/2045 | | | 5,236,734 | |
| | 5,796,900 | | | 2.500%, 02/15/2046 | | | 5,244,609 | |
| | 5,245,700 | | | 3.000%, 02/15/2047 | | | 5,240,475 | |
| | 5,247,000 | | | 3.000%, 02/15/2048 | | | 5,238,084 | |
| | | | | | | | |
| | | | | | | 143,159,096 | |
| | | | | | | | |
| | | | U.S. Treasury Notes—3.3% | | | | |
| | 5,210,200 | | | 2.000%, 02/15/2022 | | | 5,088,493 | |
| | | | | | | | |
| | | | Total Long-Term Investments (Cost $156,244,927) | | | 148,247,589 | |
| | | | | | | | |
| | |
| | | | | | | | |
| | | | Short-Term Investments—3.3% | |
| | | | U.S. Treasury Securities—3.2% | | | |
| | | | U.S. Treasury Bonds—3.2% | | | | |
| | 4,778,200 | | | 8.875%, 02/15/2019
(Cost $4,928,002) | | | 4,916,693 | |
| | | | | | | | |
| | |
| | | | | | | | |
Number
of Shares | | | | | | |
| | | | | | | | |
| | | | Money Market Fund—0.1% | | | |
| | 97,162 | | | Invesco Premier U.S. Government Money Portfolio—Institutional Class, 1.83%(a) (Cost $97,162) | | | 97,162 | |
| | | | | | | | |
| | | | Total Short-Term Investments (Cost $5,025,164) | | | 5,013,855 | |
| | | | | | | | |
| | | | Total Investments in Securities
(Cost $161,270,091)—99.8% | | | 153,261,444 | |
| | | | Other assets less liabilities—0.2% | | | 373,044 | |
| | | | | | | | |
| | | | Net Assets—100.0% | | $ | 153,634,488 | |
| | | | | | | | |
Notes to Schedule of Investments:
| (a) | The security and the Fund are advised by wholly-owned subsidiaries of Invesco Ltd. and are therefore considered to be affiliated. The rate shown is the 7-day SEC standardized yield as of August 31, 2018. |
See accompanying Notes to Financial Statements which are an integral part of the financial statements.
Schedule of Investments
Invesco California AMT-Free Municipal Bond ETF (PWZ)
August 31, 2018
| | | | | | | | | | | | | | | | |
Principal
Amount | | | | | Interest
Rate | | | Maturity
Date | | | Value | |
| | | | Municipal Bonds—98.3% | | | | | | | | | |
| | | | Ad Valorem Property Tax—21.6% | | | | | | | | | |
| $ | 775,000 | | | California State Ref. Ser. 12 | | | 5.000 | % | | | 02/01/2038 | | | $ | 846,346 | |
| | 1,500,000 | | | California State Ref. Ser. 15 | | | 5.000 | | | | 08/01/2035 | | | | 1,721,070 | |
| | 1,000,000 | | | California State Various Purpose Ser. 09 | | | 5.500 | | | | 11/01/2039 | | | | 1,043,630 | |
| | 1,540,000 | | | California State Various Purpose Ser. 09 | | | 6.000 | | | | 11/01/2039 | | | | 1,617,046 | |
| | 1,965,000 | | | California State Various Purpose Ser. 13 | | | 5.000 | | | | 11/01/2043 | | | | 2,208,267 | |
| | 800,000 | | | Centinela Valley California Union High School District (Election 2010) Ser. 12B AGM | | | 5.000 | | | | 08/01/2050 | | | | 880,856 | |
| | 4,750,000 | | | Chabot-Las Positas California Community College District (Election 2016) Ser. 17A | | | 4.000 | | | | 08/01/2047 | | | | 4,933,920 | |
| | 2,000,000 | | | Chaffey California Joint Union High School District (Election 2012) Ser. 15B | | | 5.000 | | | | 08/01/2044 | | | | 2,248,840 | |
| | 1,500,000 | | | Coachella Valley California Unified School District (2005 Election) Ser. 16E AGM | | | 4.000 | | | | 08/01/2045 | | | | 1,552,410 | |
| | 2,745,000 | | | Contra Costa California Community College District (Election of 2006) Ser. 13 | | | 5.000 | | | | 08/01/2038 | | | | 3,069,322 | |
| | 2,000,000 | | | Jurupa California Unified School District Ser. 17B | | | 4.000 | | | | 08/01/2041 | | | | 2,083,680 | |
| | 250,000 | | | Los Angeles California Community College District (2008 Election) Ser. 17J | | | 4.000 | | | | 08/01/2041 | | | | 263,797 | |
| | 1,000,000 | | | Los Angeles California Community College District Ref. Ser. 16 | | | 5.000 | | | | 08/01/2036 | | | | 1,155,790 | |
| | 1,215,000 | | | Los Angeles California Community College District Ref. Ser.16 | | | 4.000 | | | | 08/01/2037 | | | | 1,287,621 | |
| | 1,000,000 | | | Los Angeles California Unified School District (Election 2008) Ser. 18B-1 | | | 5.000 | | | | 07/01/2038 | | | | 1,174,890 | |
| | 3,000,000 | | | Madera California Unified School District Election 2014 Ser. 17 | | | 4.000 | | | | 08/01/2046 | | | | 3,104,550 | |
| | 5,000,000 | | | Marin California Healthcare District (Election 2013) Ser. 17A | | | 5.000 | | | | 08/01/2041 | | | | 5,823,050 | |
| | 3,000,000 | | | Morgan Hill California Unified School District (Election 2012) Ser. 17B | | | 4.000 | | | | 08/01/2047 | | | | 3,132,540 | |
| | 1,500,000 | | | Oakland California Unified School District (Alameda County) Ser. 15A | | | 5.000 | | | | 08/01/2040 | | | | 1,704,855 | |
| | 1,100,000 | | | Puerto Rico Commonwealth Public Improvement Ref. Ser. 07A-4 AGM | | | 5.000 | | | | 07/01/2031 | | | | 1,146,156 | |
| | 1,000,000 | | | San Diego California Community College District (Election of 2006) Ser. 13 | | | 5.000 | | | | 08/01/2043 | | | | 1,117,170 | |
| | 1,000,000 | | | San Diego California Unified School District (Election 2012) Ser. 13C | | | 5.000 | | | | 07/01/2035 | | | | 1,126,440 | |
| | 1,000,000 | | | San Diego California Unified School District (Election 2012) Ser. 16F | | | 5.000 | | | | 07/01/2040 | | | | 1,145,750 | |
| | 3,000,000 | | | San Diego California Unified School District (Election 2012) Ser. 17I | | | 5.000 | | | | 07/01/2047 | | | | 3,474,540 | |
| | 5,000,000 | | | San Rafael California High School District (Election 2015) Ser. 18B | | | 4.000 | | | | 08/01/2047 | | | | 5,246,100 | |
| | 1,000,000 | | | Simi Valley California Unified School District (Election 2016) Ser. 17A | | | 4.000 | | | | 08/01/2046 | | | | 1,045,740 | |
| | | | | | | | | | | | | | | | |
| | | | | | | | | | | | | | | 54,154,376 | |
| | | | | | | | | | | | | | | | |
| | | | College & University Revenue—9.3% | | | | | | | | | |
| | 1,500,000 | | | California State Educational Facilities Auth. (Pepperdine University) Rev. Ref. Ser. 16 | | | 5.000 | | | | 10/01/2046 | | | | 1,701,825 | |
| | 1,000,000 | | | California State Municipal Financing Auth. (Pomona College) Rev. Ref. Ser. 17A | | | 5.000 | | | | 01/01/2048 | | | | 1,168,640 | |
| | 2,940,000 | | | California State University Systemwide Rev. Ser. 12A | | | 5.000 | | | | 11/01/2037 | | | | 3,262,665 | |
| | 2,000,000 | | | California State University Systemwide Rev. Ser. 14A | | | 5.000 | | | | 11/01/2039 | | | | 2,275,000 | |
| | 2,100,000 | | | California State University Systemwide Rev. Ser. 15A | | | 5.000 | | | | 11/01/2038 | | | | 2,400,552 | |
| | 3,000,000 | | | California State University Systemwide Rev. Ser. 18A | | | 5.000 | | | | 11/01/2048 | | | | 3,496,080 | |
| | 1,500,000 | | | California Statewide Communities Development Auth. Student Housing (University of California, Irvine Campus Apartments Phase IV) Rev. Ser. 17A | | | 5.000 | | | | 05/15/2047 | | | | 1,679,265 | |
| | 745,000 | | | University of California (Limited Project) Rev. Ser. 12G(a) | | | 5.000 | | | | 05/15/2022 | | | | 832,374 | |
| | 755,000 | | | University of California (Limited Project) Rev. Ser. 12G | | | 5.000 | | | | 05/15/2037 | | | | 830,719 | |
| | 1,500,000 | | | University of California (Limited Project) Rev. Ser. 18O | | | 5.000 | | | | 05/15/2058 | | | | 1,711,365 | |
| | 1,500,000 | | | University of California General Rev. Ser. 13AI | | | 5.000 | | | | 05/15/2038 | | | | 1,674,945 | |
| | 2,000,000 | | | University of California Rev. Ser. 17AV | | | 5.250 | | | | 05/15/2042 | | | | 2,350,420 | |
| | | | | | | | | | | | | | | | |
| | | | | | | | | | | | | | | 23,383,850 | |
| | | | | | | | | | | | | | | | |
| | | | Electric Power Revenue—6.4% | | | | | | | | | |
| | 2,000,000 | | | Guam Power Auth. Rev. Ser. 10A AGM(a) | | | 5.000 | | | | 10/01/2020 | | | | 2,132,120 | |
| | 2,000,000 | | | Guam Power Auth. Rev. Ser. 12A AGM | | | 5.000 | | | | 10/01/2030 | | | | 2,185,920 | |
| | 2,500,000 | | | Los Angeles California Department of Water & Power (Power System) Rev. Ref. Ser. 16A | | | 5.000 | | | | 07/01/2046 | | | | 2,847,550 | |
| | 4,445,000 | | | Los Angeles California Department of Water & Power (Power System) Rev. Ser. 12B | | | 5.000 | | | | 07/01/2043 | | | | 4,895,279 | |
| | 1,000,000 | | | Los Angeles California Department of Water & Power Rev. Ser. 14D | | | 5.000 | | | | 07/01/2039 | | | | 1,130,010 | |
| | 1,000,000 | | | Los Angeles California Department of Water & Power Rev. Ser. 15E | | | 5.000 | | | | 07/01/2044 | | | | 1,125,980 | |
| | 1,500,000 | | | Los Angeles California Department of Water & Power Rev. Ser. 16B | | | 5.000 | | | | 07/01/2042 | | | | 1,717,050 | |
| | | | | | | | | | | | | | | | |
| | | | | | | | | | | | | | | 16,033,909 | |
| | | | | | | | | | | | | | | | |
| | | | General Fund—7.2% | | | | | | | | | |
| | 25,000 | | | California State Ref. Ser. 07 NATL | | | 4.250 | | | | 08/01/2033 | | | | 25,030 | |
| | 2,000,000 | | | California State Ser. 16 | | | 5.000 | | | | 09/01/2046 | | | | 2,288,380 | |
| | 1,000,000 | | | California State Various Purpose Ref. Ser. 16 | | | 5.000 | | | | 09/01/2036 | | | | 1,156,510 | |
| | 2,585,000 | | | California State Various Purpose Ref. Ser.16 | | | 5.000 | | | | 09/01/2034 | | | | 3,007,647 | |
See accompanying Notes to Financial Statements which are an integral part of the financial statements.
Invesco California AMT-Free Municipal Bond ETF (PWZ) (continued)
August 31, 2018
| | | | | | | | | | | | | | | | |
Principal
Amount | | | | | Interest
Rate | | | Maturity
Date | | | Value | |
| | | | Municipal Bonds (continued) | | | | | | | | | |
| | | | General Fund (continued) | | | | | | | | | |
| $ | 3,230,000 | | | California State Various Purpose Ser. 09 | | | 6.000 | % | | | 04/01/2038 | | | $ | 3,310,007 | |
| | 1,160,000 | | | California State Various Purpose Ser. 13 | | | 5.000 | | | | 04/01/2037 | | | | 1,291,440 | |
| | 2,000,000 | | | California State Various Purpose Ser. 13 | | | 5.000 | | | | 04/01/2043 | | | | 2,221,120 | |
| | 4,000,000 | | | California State Various Purpose Ser. 17 | | | 5.000 | | | | 11/01/2047 | | | | 4,618,840 | |
| | | | | | | | | | | | | | | | |
| | | | | | | | | | | | | | | 17,918,974 | |
| | | | | | | | | | | | | | | | |
| | | | Health, Hospital, Nursing Home Revenue—11.2% | | | | | | | | | |
| | 1,000,000 | | | California State Health Facilities Auth. (Lucile Packard Stanford Hospital) Rev. Ser. 16B | | | 5.000 | | | | 08/15/2055 | | | | 1,115,710 | |
| | 3,300,000 | | | California State Health Facilities Financing Auth. (Adventist Health System/West) Rev. Ref. Ser. 16A | | | 4.000 | | | | 03/01/2039 | | | | 3,407,877 | |
| | 500,000 | | | California State Health Facilities Financing Auth. (Cedars Sinai Medical Center) Rev. Ref. Ser. 16B | | | 5.000 | | | | 08/15/2035 | | | | 577,470 | |
| | 1,500,000 | | | California State Health Facilities Financing Auth. (Children’s Hospital) Ref. Ser. 17A | | | 5.000 | | | | 08/15/2042 | | | | 1,680,045 | |
| | 1,000,000 | | | California State Health Facilities Financing Auth. (Kaiser Permanente) Rev. Sub.-Ser. 17A-2 | | | 5.000 | | | | 11/01/2047 | | | | 1,279,160 | |
| | 500,000 | | | California State Health Facilities Financing Auth. (Providence St. Joseph Health) Rev. Ref. Ser. 16A | | | 4.000 | | | | 10/01/2036 | | | | 522,090 | |
| | 3,305,000 | | | California State Health Facilities Financing Auth. (Sutter Health) Rev. Ref. Ser. 11D | | | 5.000 | | | | 08/15/2035 | | | | 3,565,434 | |
| | 1,000,000 | | | California State Health Facilities Financing Auth. (Sutter Health) Rev. Ref. Ser. 15A | | | 5.000 | | | | 08/15/2043 | | | | 1,125,850 | |
| | 685,000 | | | California State Health Facilities Financing Auth. (Sutter Health) Rev. Ref. Ser. 16B | | | 4.000 | | | | 11/15/2041 | | | | 708,694 | |
| | 2,000,000 | | | California State Health Facilities Financing Auth. (Sutter Health) Rev. Ref. Ser. 16B | | | 5.000 | | | | 11/15/2046 | | | | 2,257,600 | |
| | 1,000,000 | | | California State Municipal Financing Auth. (Community Medical Centers) Ref. Ser. 17A | | | 4.000 | | | | 02/01/2042 | | | | 1,008,510 | |
| | 1,000,000 | | | California State Municipal Financing Auth. (Eisenhower Medical Center) Rev. Ref. Ser. 17A | | | 5.000 | | | | 07/01/2042 | | | | 1,098,620 | |
| | 1,000,000 | | | California State Municipal Financing Auth. (Northbay Healthcare) Rev. Ser. 17A | | | 5.000 | | | | 11/01/2047 | | | | 1,072,550 | |
| | 500,000 | | | California State Municipal Financing Auth. (Northbay Healthcare) Rev. Ser. 17A | | | 5.250 | | | | 11/01/2047 | | | | 544,190 | |
| | 1,000,000 | | | California Statewide Communities Development Auth. (Cottage Health System Obligated Group) Rev. Ref. Ser. 15 | | | 5.000 | | | | 11/01/2043 | | | | 1,102,740 | |
| | 1,650,000 | | | California Statewide Communities Development Auth. (John Muir Health) Rev. Ref. Ser. 16A | | | 4.000 | | | | 08/15/2046 | | | | 1,690,639 | |
| | 1,000,000 | | | California Statewide Communities Development Auth. (John Muir Health) Rev. Ref. Ser. 16A | | | 5.000 | | | | 08/15/2051 | | | | 1,115,710 | |
| | 850,000 | | | California Statewide Communities Development Auth. (John Muir Health) Rev. Ref. Ser. 18A | | | 5.000 | | | | 12/01/2057 | | | | 958,452 | |
| | 1,000,000 | | | California Statewide Communities Development Auth. (Kaiser Permanente) Rev. Ser. 12A | | | 5.000 | | | | 04/01/2042 | | | | 1,088,120 | |
| | 1,000,000 | | | California Statewide Communities Development Auth. (Marin General) Rev. Ser. 18A | | | 4.000 | | | | 08/01/2045 | | | | 1,016,460 | |
| | 1,045,000 | | | California Statewide Communities Development Auth. (Trinity Health) Rev. Ref. Ser. 11 | | | 5.000 | | | | 12/01/2041 | | | | 1,144,881 | |
| | | | | | | | | | | | | | | | |
| | | | | | | | | | | | | | | 28,080,802 | |
| | | | | | | | | | | | | | | | |
| | | | Highway Tolls Revenue—2.5% | | | | | | | | | |
| | 3,000,000 | | | Bay Area California Auth. Toll Bridge (San Francisco Bay Area Subordinate Toll Bridge) Rev. Ser. 17S-7 | | | 4.000 | | | | 04/01/2042 | | | | 3,126,000 | |
| | 2,000,000 | | | Foothill-Eastern Transportation Corridor Agency California Toll Road Remarketed Rev. Ref. Sub.-Ser. 14 B-1 | | | 3.950 | | | | 01/15/2053 | | | | 2,007,360 | |
| | 1,000,000 | | | San Diego California Association of Governments South Bay Expressway Toll (Senior Lien) Rev. Ser. 17A | | | 5.000 | | | | 07/01/2042 | | | | 1,148,130 | |
| | | | | | | | | | | | | | | | |
| | | | | | | | | | | | | | | 6,281,490 | |
| | | | | | | | | | | | | | | | |
| | | | Lease Revenue—6.0% | | | | | | | | | |
| | 540,000 | | | Anaheim California Public Financing Auth. Lease Rev. Ref. Ser. 14A | | | 5.000 | | | | 05/01/2039 | | | | 602,316 | |
| | 1,000,000 | | | California State Municipal Financing Auth. Lease (Orange County Civic Center Infrastructure Improvement Program) Rev. Ser. 17A | | | 5.000 | | | | 06/01/2042 | | | | 1,152,700 | |
| | 670,000 | | | California State Public Works Board Lease (Various Capital Projects) Rev. Ref. Ser. 16C | | | 5.000 | | | | 11/01/2034 | | | | 779,974 | |
| | 1,130,000 | | | Los Angeles County California Public Works Financing Auth. Lease (Multiple Capital Project II) Rev. Ser. 12 | | | 5.000 | | | | 08/01/2037 | | | | 1,241,542 | |
| | 2,330,000 | | | Los Angeles County California Public Works Financing Auth. Lease (Multiple Capital Project II) Rev. Ser. 12 | | | 5.000 | | | | 08/01/2042 | | | | 2,553,610 | |
| | 2,000,000 | | | Los Angeles County California Public Works Financing Auth. Lease Rev. Ser. 15A | | | 5.000 | | | | 12/01/2044 | | | | 2,248,960 | |
| | 1,050,000 | | | Los Angeles County California Public Works Financing Auth. Lease Rev. Ser. 16D | | | 5.000 | | | | 12/01/2045 | | | | 1,191,530 | |
| | 1,000,000 | | | San Diego California Public Facilities Financing Auth. Lease (Capital Improvement Projects) Rev. Ser. 15A | | | 5.000 | | | | 10/15/2044 | | | | 1,130,610 | |
| | 700,000 | | | San Diego California Public Facilities Financing Auth. Lease (Master Project) Rev. Ref. Ser. 10A(a) | | | 5.250 | | | | 09/01/2020 | | | | 751,534 | |
| | 3,000,000 | | | San Jose California Financing Auth. (Civic Center Project) Ref. Ser. 13A | | | 5.000 | | | | 06/01/2039 | | | | 3,334,500 | |
| | | | | | | | | | | | | | | | |
| | | | | | | | | | | | | | | 14,987,276 | |
| | | | | | | | | | | | | | | | |
| | | | Local or GTD Housing—0.4% | | | | | | | | | |
| | 1,000,000 | | | California Statewide Communities Development Auth. Student Housing (CHF Irvine LLC) Rev. Ref. Ser. 16 | | | 5.000 | | | | 05/15/2040 | | | | 1,112,490 | |
| | | | | | | | | | | | | | | | |
See accompanying Notes to Financial Statements which are an integral part of the financial statements.
Invesco California AMT-Free Municipal Bond ETF (PWZ) (continued)
August 31, 2018
| | | | | | | | | | | | | | | | |
Principal
Amount | | | | | Interest
Rate | | | Maturity
Date | | | Value | |
| | | | Municipal Bonds (continued) | | | | | | | | | |
| | | | Miscellaneous Revenue—2.0% | | | | | | | | | |
| $ | 1,000,000 | | | California Infrastructure & Economic Development Bank Rev. Ser. 16 | | | 4.000 | % | | | 10/01/2045 | | | $ | 1,042,020 | |
| | 1,500,000 | | | California State Various Purpose (Green Bonds) Ser. 14 | | | 5.000 | | | | 10/01/2037 | | | | 1,702,785 | |
| | 1,000,000 | | | California State Various Purpose Ser. 14 | | | 5.000 | | | | 10/01/2044 | | | | 1,130,990 | |
| | 1,000,000 | | | California State Various Purpose Ser. 15 | | | 5.000 | | | | 03/01/2045 | | | | 1,127,810 | |
| | | | | | | | | | | | | | | | |
| | | | | | | | | | | | | | | 5,003,605 | |
| | | | | | | | | | | | | | | | |
| | | | Natural Gas Revenue—1.0% | | | | | | | | | |
| | 2,500,000 | | | Chula Vista California Industrial Development (San Diego Gas—Remarketed 06/17/09) Rev. Ser. 04A | | | 5.875 | | | | 02/15/2034 | | | | 2,575,300 | |
| | | | | | | | | | | | | | | | |
| | | | Port, Airport & Marina Revenue—11.1% | | | | | | | | | |
| | 1,500,000 | | | Long Beach California Harbor Rev. Ref. Ser. 17C | | | 5.000 | | | | 05/15/2047 | | | | 1,721,850 | |
| | 500,000 | | | Long Beach California Marina Rev. Ser. 15 | | | 5.000 | | | | 05/15/2040 | | | | 549,545 | |
| | 500,000 | | | Long Beach California Marina Rev. Ser. 15 | | | 5.000 | | | | 05/15/2045 | | | | 548,770 | |
| | 1,000,000 | | | Los Angeles California Department of Airports (Senior Los Angeles International Airport) Ser. 10A | | | 5.000 | | | | 05/15/2040 | | | | 1,054,000 | |
| | 2,000,000 | | | Los Angeles California Department of Airports Rev. Ref. Sub.-Ser. 15C | | | 5.000 | | | | 05/15/2038 | | | | 2,265,520 | |
| | 3,500,000 | | | Los Angeles California Department of Airports Rev. Sub.-Ser. 17B | | | 5.000 | | | | 05/15/2042 | | | | 4,014,745 | |
| | 2,000,000 | | | San Francisco California City & County Airports Commission (San Francisco International Airport) Rev. Ser. 14B | | | 5.000 | | | | 05/01/2044 | | | | 2,227,480 | |
| | 4,465,000 | | | San Francisco California City & County Airports Commission (San Francisco International Airport) Rev. Ser. 16C | | | 5.000 | | | | 05/01/2046 | | | | 5,026,072 | |
| | 2,000,000 | | | San Francisco California City & County Airports Commission (San Francisco International Airport) Rev. Ser. 17B | | | 5.000 | | | | 05/01/2047 | | | | 2,275,080 | |
| | 7,000,000 | | | San Francisco California City & County Airports Commission (San Francisco International Airport) Rev. Ser. 18D | | | 5.000 | | | | 05/01/2048 | | | | 8,051,750 | |
| | | | | | | | | | | | | | | | |
| | | | | | | | | | | | | | | 27,734,812 | |
| | | | | | | | | | | | | | | | |
| | | | Recreational Revenue—0.4% | | | | | | | | | |
| | 1,000,000 | | | California Infrastructure & Economic Development Bank (Academy of Motion Picture Arts & Projects) Rev. Ref. Ser. 15 | | | 5.000 | | | | 11/01/2041 | | | | 1,114,560 | |
| | | | | | | | | | | | | | | | |
| | | | Sales Tax Revenue—4.8% | | | | | | | | | |
| | 4,990,000 | | | Los Angeles County California Metropolitan Transportation Auth. Sales Tax Rev. Ser. 17A | | | 5.000 | | | | 07/01/2038 | | | | 5,838,450 | |
| | 1,500,000 | | | Puerto Rico Sales Tax Financing Corp. Sales Tax Rev. First Sub.-Ser. 10C AGM | | | 5.125 | | | | 08/01/2042 | | | | 1,567,650 | |
| | 4,000,000 | | | San Diego County California Regional Transportation Commission Ser. 16A | | | 5.000 | | | | 04/01/2048 | | | | 4,579,000 | |
| | | | | | | | | | | | | | | | |
| | | | | | | | | | | | | | | 11,985,100 | |
| | | | | | | | | | | | | | | | |
| | | | Sewer Revenue—1.4% | | | | | | | | | |
| | 650,000 | | | Fresno California Sewer Rev. Ser. 08A AGC | | | 5.000 | | | | 09/01/2037 | | | | 650,000 | |
| | 1,000,000 | | | Los Angeles California Wastewater System (Green Bonds) Rev. Sub.-Ser. 17A | | | 5.250 | | | | 06/01/2047 | | | | 1,183,600 | |
| | 1,525,000 | | | Sacramento County California Sanitation District Financing Auth. Rev. Ref. Ser. 14A | | | 5.000 | | | | 12/01/2044 | | | | 1,717,165 | |
| | | | | | | | | | | | | | | | |
| | | | | | | | | | | | | | | 3,550,765 | |
| | | | | | | | | | | | | | | | |
| | | | Special Tax—1.1% | | | | | | | | | |
| | 2,600,000 | | | Irvine California Unified School District Special Tax Ref. Ser. 15 BAM | | | 5.000 | | | | 09/01/2038 | | | | 2,862,652 | |
| | | | | | | | | | | | | | | | |
| | | | Tax Increment Revenue—1.6% | | | | | | | | | |
| | 1,000,000 | | | Inland Valley California Development Successor Agency Tax Allocation Ref. Ser. 14A AGM | | | 5.000 | | | | 09/01/2044 | | | | 1,084,190 | |
| | 2,500,000 | | | Santa Cruz County California Redevelopment Successor Agency Tax Allocation Ref. Ser. 15A AGM | | | 5.000 | | | | 09/01/2035 | | | | 2,848,625 | |
| | | | | | | | | | | | | | | | |
| | | | | | | | | | | | | | | 3,932,815 | |
| | | | | | | | | | | | | | | | |
| | | | Transit Revenue—1.4% | | | | | | | | | |
| | 2,000,000 | | | Alameda California Corridor Transportation Auth. (Second Sub.-Lien) Ref. Ser. 16B AGM | | | 3.000 | | | | 10/01/2034 | | | | 1,848,360 | |
| | 1,500,000 | | | Alameda California Corridor Transportation Auth. (Second Sub.-Lien) Ref. Ser. 16B AGM | | | 5.000 | | | | 10/01/2035 | | | | 1,697,550 | |
| | | | | | | | | | | | | | | | |
| | | | | | | | | | | | | | | 3,545,910 | |
| | | | | | | | | | | | | | | | |
| | | | Water Revenue—8.9% | | | | | | | | | |
| | 1,000,000 | | | California State Department of Water Resources (Central Valley Project) Water System Rev. Ref. Ser. 16AW | | | 5.000 | | | | 12/01/2033 | | | | 1,186,700 | |
| | 1,500,000 | | | East Bay California Municipal Utility District Water System (Green Bond) Ser. 17A | | | 5.000 | | | | 06/01/2042 | | | | 1,742,820 | |
| | 1,500,000 | | | East Bay California Municipal Utility District Water System Rev. Ref. Ser. 15A | | | 5.000 | | | | 06/01/2037 | | | | 1,726,170 | |
| | 2,000,000 | | | Los Angeles California Department of Water & Power Rev. Ser. 12B | | | 5.000 | | | | 07/01/2043 | | | | 2,202,600 | |
| | 1,250,000 | | | Los Angeles California Department of Water & Power System Rev. Ser. 11A | | | 5.000 | | | | 07/01/2041 | | | | 1,335,237 | |
See accompanying Notes to Financial Statements which are an integral part of the financial statements.
Invesco California AMT-Free Municipal Bond ETF (PWZ) (continued)
August 31, 2018
| | | | | | | | | | | | | | | | |
Principal
Amount | | | | | Interest
Rate | | | Maturity
Date | | | Value | |
| | | | Municipal Bonds (continued) | | | | | | | | | |
| | | | Water Revenue (continued) | | | | | | | | | |
| $ | 2,000,000 | | | Los Angeles California Department of Water & Power Waterworks Rev. Ser. 18A | | | 5.000 | % | | | 07/01/2048 | | | $ | 2,316,060 | |
| | 2,000,000 | | | Orange County California Water District Rev. Ref. Ser. 17A | | | 4.000 | | | | 08/15/2041 | | | | 2,094,900 | |
| | 500,000 | | | Puerto Rico Commonwealth Aqueduct & Sewer Auth. (Senior Lien) Rev. Ser. 08A AGC | | | 5.125 | | | | 07/01/2047 | | | | 508,705 | |
| | 1,000,000 | | | San Diego County California Water Auth. Ref. Ser. 16B | | | 5.000 | | | | 05/01/2037 | | | | 1,158,830 | |
| | 3,000,000 | | | San Francisco California City & County Public Utilities Commission (WSIP) Sub.-Ser. 11A | | | 5.000 | | | | 11/01/2037 | | | | 3,273,810 | |
| | 4,090,000 | | | Santa Clara Valley California Water District Ref. Ser. 16A | | | 5.000 | | | | 06/01/2046 | | | | 4,693,030 | |
| | | | | | | | | | | | | | | | |
| | | | | | | | | | | | | | | 22,238,862 | |
| | | | | | | | | | | | | | | | |
| | | | Total Investments in Securities
(Cost $245,686,050)(b)—98.3% | | | | | | | | | | | 246,497,548 | |
| | | | Other assets less liabilities—1.7% | | | | | | | | | | | 4,298,315 | |
| | | | | | | | | | | | | | | | |
| | | | Net Assets—100.0% | | | | | | | | | | $ | 250,795,863 | |
| | | | | | | | | | | | | | | | |
Investment Abbreviations:
AGC—Assured Guaranty Corp.
AGM—Assured Guaranty Municipal Corp.
Auth.—Authority
BAM—Build America Mutual
GTD—Grant To Date
NATL—National Public Finance Guarantee Corp.
Ref.—Refunding
Rev.—Revenue
Ser.—Series
Sub.—Subordinated
WSIP—Water System Improvement Program
Notes to Schedule of Investments:
| (a) | Advance refunded; secured by an escrow fund of U.S. Government obligations or other highly rated collateral. |
| (b) | The following table provides a listing of those entities that have either guaranteed, backed or otherwise enhanced the credit quality of more than 5% of the value of securities held in the portfolio, as of August 31, 2018. In instances where the entity has guaranteed, backed or otherwise enhanced the credit quality of a security, it is not primarily responsible for the borrower’s obligations but may be called upon to satisfy the borrower’s obligations. |
| | | | |
Entities | | Percentage of
Total Investments | |
| Assured Guaranty Municipal Corp. | | | 6.9 | % |
See accompanying Notes to Financial Statements which are an integral part of the financial statements.
Schedule of Investments
Invesco CEF Income Composite ETF (PCEF)
August 31, 2018
| | | | | | | | |
Number
of Shares | | | | | Value | |
| | | | Closed-End Funds—99.9% | | | |
| | | | Bonds—44.1% | | | |
| | 3,238,816 | | | Aberdeen Asia-Pacific Income Fund, Inc. | | $ | 13,603,027 | |
| | 173,743 | | | BlackRock 2022 Global Income Opportunity Trust | | | 1,553,262 | |
| | 623,102 | | | BlackRock Core Bond Trust | | | 8,006,861 | |
| | 1,406,748 | | | BlackRock Credit Allocation Income Trust | | | 17,429,608 | |
| | 735,048 | | | BlackRock Income Trust, Inc. | | | 4,241,227 | |
| | 433,362 | | | BlackRock Limited Duration Income Trust | | | 6,526,432 | |
| | 439,734 | | | BlackRock Multi-Sector Income Trust | | | 7,756,908 | |
| | 475,712 | | | BlackRock Taxable Municipal Bond Trust | | | 10,446,636 | |
| | 231,550 | | | Cohen & Steers Limited Duration Preferred and Income Fund, Inc. | | | 5,703,076 | |
| | 80,466 | | | Cohen & Steers Select Preferred and Income Fund, Inc. | | | 2,169,363 | |
| | 87,702 | | | DoubleLine Funds Trust—DoubleLine Opportunistic Credit Fund | | | 1,852,266 | |
| | 805,851 | | | DoubleLine Income Solutions Fund | | | 16,415,185 | |
| | 312,137 | | | Duff & Phelps Utility and Corporate Bond Trust, Inc. | | | 2,656,286 | |
| | 1,526,161 | | | Eaton Vance Limited Duration Income Fund | | | 19,412,768 | |
| | 231,088 | | | Eaton Vance Short Duration Diversified Income Fund | | | 2,960,237 | |
| | 118,206 | | | Eaton Vance Tax-Advantaged Bond and Options Strategies Fund | | | 1,050,851 | |
| | 168,441 | | | First Trust Aberdeen Global Opportunity Income Fund | | | 1,623,771 | |
| | 634,909 | | | First Trust Intermediate Duration Preferred & Income Fund | | | 13,974,347 | |
| | 195,039 | | | Flaherty & Crumrine Dynamic Preferred and Income Fund, Inc. | | | 4,760,902 | |
| | 78,815 | | | Flaherty & Crumrine Preferred Income Fund, Inc. | | | 1,108,927 | |
| | 359,245 | | | Flaherty & Crumrine Preferred Securities Income Fund, Inc. | | | 6,872,357 | |
| | 101,852 | | | Flaherty & Crumrine Total Return Fund, Inc. | | | 2,006,484 | |
| | 277,004 | | | Franklin Limited Duration Income Trust | | | 3,143,995 | |
| | 175,319 | | | Guggenheim Taxable Municipal Managed Duration Trust | | | 3,876,303 | |
| | 112,476 | | | Insight Select Income Fund | | | 2,124,672 | |
| | 118,197 | | | Invesco Bond Fund(a) | | | 2,101,543 | |
| | 2,122,181 | | | Invesco Senior Income Trust(a) | | | 9,189,044 | |
| | 180,249 | | | John Hancock Preferred Income Fund | | | 4,079,035 | |
| | 167,014 | | | John Hancock Preferred Income Fund II | | | 3,612,513 | |
| | 255,705 | | | John Hancock Preferred Income Fund III | | | 4,899,308 | |
| | 274,012 | | | John Hancock Premium Dividend Fund | | | 4,452,695 | |
| | 579,653 | | | MFS Charter Income Trust | | | 4,608,241 | |
| | 1,227,562 | | | MFS Intermediate Income Trust | | | 4,677,011 | |
| | 827,425 | | | MFS Multimarket Income Trust | | | 4,716,323 | |
| | 269,627 | | | Nuveen Build America Bond Fund | | | 5,619,027 | |
| | 1,731,815 | | | Nuveen Credit Strategies Income Fund | | | 13,767,929 | |
| | 593,730 | | | Nuveen Floating Rate Income Fund | | | 6,109,482 | |
| | 304,593 | | | Nuveen Global High Income Fund | | | 4,836,937 | |
| | 47,565 | | | Nuveen Preferred & Income 2022 Term Fund | | | 1,100,178 | |
| | 850,922 | | | Nuveen Preferred & Income Opportunities Fund | | | 7,990,158 | |
| | 1,684,041 | | | Nuveen Preferred & Income Securities Fund | | | 14,920,603 | |
| | 186,524 | | | Nuveen Preferred & Income Term Fund | | | 4,334,818 | |
| | 199,816 | | | PIMCO Corporate & Income Strategy Fund | | | 3,622,664 | |
| | | | | | | | |
Number
of Shares | | | | | Value | |
| | | | Closed-End Funds (continued) | | | |
| | | | Bonds (continued) | | | |
| | 85,092 | | | PIMCO Income Opportunity Fund | | $ | 2,331,521 | |
| | 143,358 | | | PIMCO Income Strategy Fund | | | 1,736,065 | |
| | 341,597 | | | PIMCO Income Strategy Fund II | | | 3,644,840 | |
| | 259,941 | | | Pioneer Floating Rate Trust | | | 2,864,550 | |
| | 559,205 | | | Putnam Master Intermediate Income Trust | | | 2,561,159 | |
| | 885,810 | | | Putnam Premier Income Trust(b) | | | 4,641,644 | |
| | 113,078 | | | RiverNorth/DoubleLine Strategic Opportunity Fund, Inc. | | | 1,973,211 | |
| | 87,206 | | | Stone Harbor Emerging Markets Income Fund | | | 1,170,305 | |
| | 495,044 | | | TCW Strategic Income Fund, Inc. | | | 2,742,544 | |
| | 1,748,457 | | | Templeton Global Income Fund | | | 10,473,257 | |
| | 72,279 | | | Virtus Global Multi-Sector Income Fund | | | 955,528 | |
| | 169,875 | | | Western Asset Global Corporate Defined Opportunity Fund, Inc. | | | 2,772,360 | |
| | 721,750 | | | Western Asset Inflation-Linked Opportunities & Income Fund | | | 7,989,773 | |
| | 376,124 | | | Western Asset Inflation-Linked Securities & Income Fund | | | 4,314,142 | |
| | 63,845 | | | Western Asset Investment Grade Defined Opportunity Trust, Inc. | | | 1,278,177 | |
| | 123,664 | | | Western Asset Premier Bond Fund | | | 1,558,166 | |
| | | | | | | | |
| | | | | | | 318,920,502 | |
| | | | | | | | |
| | | | Bonds/High Yield—28.0% | | | |
| | 1,124,043 | | | AllianceBernstein Global High Income Fund, Inc. | | | 13,173,784 | |
| | 229,500 | | | Barings Global Short Duration High Yield Fund | | | 4,553,280 | |
| | 1,620,650 | | | BlackRock Corporate High Yield Fund, Inc. | | | 17,340,955 | |
| | 726,224 | | | BlackRock Debt Strategies Fund, Inc. | | | 8,235,380 | |
| | 310,737 | | | BlackRock Floating Rate Income Strategies Fund, Inc. | | | 4,288,171 | |
| | 246,753 | | | BlackRock Floating Rate Income Trust | | | 3,247,270 | |
| | 102,480 | | | Blackstone/GSO Long-Short Credit Income Fund | | | 1,681,697 | |
| | 604,101 | | | Credit Suisse Asset Management Income Fund, Inc. | | | 1,908,959 | |
| | 728,843 | | | Credit Suisse High Yield Bond Fund | | | 1,905,924 | |
| | 180,414 | | | Deutsche Multi-Market Income Trust | | | 1,620,118 | |
| | 755,674 | | | Dreyfus High Yield Strategies Fund | | | 2,403,043 | |
| | 329,407 | | | Eaton Vance Floating-Rate Income Trust | | | 4,848,871 | |
| | 154,133 | | | Eaton Vance High Income 2021 Target Term Trust | | | 1,495,090 | |
| | 302,749 | | | Eaton Vance Senior Floating-Rate Trust | | | 4,268,761 | |
| | 458,140 | | | First Trust High Income Long/Short Fund | | | 6,862,937 | |
| | 288,658 | | | First Trust Senior Floating Rate 2022 Target Term Fund | | | 2,683,076 | |
| | 278,781 | | | First Trust Senior Floating Rate Income Fund II | | | 3,554,458 | |
| | 43,442 | | | Guggenheim Credit Allocation Fund | | | 970,929 | |
| | 151,242 | | | Invesco High Income 2023 Target Term Fund(a) | | | 1,507,127 | |
| | 193,621 | | | Ivy High Income Opportunities Fund | | | 2,782,334 | |
| | 227,074 | | | KKR Income Opportunities Fund | | | 3,833,009 | |
| | 270,638 | | | Morgan Stanley Emerging Markets Debt Fund, Inc. | | | 2,376,202 | |
| | 259,710 | | | Neuberger Berman High Yield Strategies Fund, Inc. | | | 2,854,213 | |
See accompanying Notes to Financial Statements which are an integral part of the financial statements.
Invesco CEF Income Composite ETF (PCEF) (continued)
August 31, 2018
| | | | | | | | |
Number
of Shares | | | | | Value | |
| | | | Closed-End Funds (continued) | |
| | | | Bonds/High Yield (continued) | | | |
| | 295,570 | | | New America High Income Fund, Inc. (The) | | $ | 2,512,345 | |
| | 226,943 | | | Nuveen Credit Opportunities 2022 Target Term Fund | | | 2,169,575 | |
| | 423,338 | | | Nuveen Floating Rate Income Opportunity Fund | | | 4,275,714 | |
| | 108,582 | | | Nuveen High Income 2020 Target Term Fund | | | 1,069,533 | |
| | 207,583 | | | Nuveen High Income December 2018 Target Term Fund | | | 2,046,768 | |
| | 461,080 | | | Nuveen High Income November 2021 Target Term Fund | | | 4,467,865 | |
| | 190,870 | | | Nuveen NASDAQ 100 Dynamic Overwrite Fund | | | 4,829,011 | |
| | 326,121 | | | Nuveen Senior Income Fund | | | 1,976,293 | |
| | 81,570 | | | Nuveen Short Duration Credit Opportunities Fund | | | 1,353,246 | |
| | 544,966 | | | PGIM Global Short Duration High Yield Fund, Inc. | | | 7,520,531 | |
| | 437,548 | | | PGIM Short Duration High Yield Fund, Inc. | | | 6,226,308 | |
| | 108,893 | | | Pioneer Diversified High Income Trust | | | 1,610,527 | |
| | 342,157 | | | Pioneer High Income Trust | | | 3,192,325 | |
| | 65,804 | | | Stone Harbor Emerging Markets Total Income Fund | | | 848,214 | |
| | 562,787 | | | Templeton Emerging Markets Income Fund | | | 5,622,242 | |
| | 1,716,091 | | | Voya Prime Rate Trust | | | 8,546,133 | |
| | 818,525 | | | Wells Fargo Income Opportunities Fund | | | 6,580,941 | |
| | 362,633 | | | Wells Fargo Multi-Sector Income Fund | | | 4,529,286 | |
| | 794,225 | | | Western Asset Emerging Markets Debt Fund, Inc. | | | 10,777,633 | |
| | 582,608 | | | Western Asset Global High Income Fund, Inc. | | | 5,371,646 | |
| | 1,097,814 | | | Western Asset High Income Fund II, Inc. | | | 7,004,053 | |
| | 1,632,747 | | | Western Asset High Income Opportunity Fund, Inc. | | | 7,853,513 | |
| | 265,360 | | | Western Asset High Yield Defined Opportunity Fund, Inc. | | | 3,842,413 | |
| | | | | | | | |
| | | | | | | 202,621,703 | |
| | | | | | | | |
| | | | Domestic Equity—0.4% | |
| | 130,804 | | | Guggenheim Strategic Opportunities Fund | | | 2,871,148 | |
| | | | | | | | |
| | | | Option Income—27.4% | |
| | 1,211,675 | | | AllianzGI NFJ Dividend, Interest & Premium Strategy Fund | | | 15,969,877 | |
| | 302,626 | | | BlackRock Energy and Resources Trust | | | 4,415,313 | |
| | 443,095 | | | BlackRock Enhanced Capital and Income Fund, Inc. | | | 7,616,803 | |
| | 1,912,925 | | | BlackRock Enhanced Equity Dividend Trust | | | 18,115,400 | |
| | 708,189 | | | BlackRock Enhanced Global Dividend Trust | | | 7,903,389 | |
| | 1,246,477 | | | BlackRock Enhanced International Dividend Trust | | | 7,217,102 | |
| | 60,636 | | | BlackRock Health Sciences Trust | | | 2,523,670 | |
| | 1,130,723 | | | BlackRock Resources & Commodities Strategy Trust | | | 10,165,200 | |
| | 129,743 | | | BlackRock Science & Technology Trust | | | 4,581,225 | |
| | 367,743 | | | Brookfield Real Assets Income Fund, Inc. | | | 8,590,476 | |
| | 232,723 | | | Cohen & Steers Global Income Builder, Inc. | | | 2,215,523 | |
| | 92,990 | | | Columbia Seligman Premium Technology Growth Fund, Inc. | | | 2,036,339 | |
| | 262,404 | | | Eaton Vance Enhanced Equity Income Fund | | | 4,253,569 | |
| | 284,287 | | | Eaton Vance Enhanced Equity Income Fund II | | | 5,088,737 | |
| | | | | | | | |
Number
of Shares | | | | | Value | |
| | | | Closed-End Funds (continued) | | | |
| | | | Option Income (continued) | |
| | 508,266 | | | Eaton Vance Risk-Managed Diversified Equity Income Fund | | $ | 5,026,751 | |
| | 147,897 | | | Eaton Vance Tax-Managed Buy-Write Income Fund | | | 2,459,527 | |
| | 379,073 | | | Eaton Vance Tax-Managed Buy-Write Opportunities Fund(b) | | | 6,129,610 | |
| | 1,033,522 | | | Eaton Vance Tax-Managed Diversified Equity Income Fund | | | 13,198,076 | |
| | 601,653 | | | Eaton Vance Tax-Managed Global Buy-Write Opportunities Fund(b) | | | 7,231,869 | |
| | 2,038,967 | | | Eaton Vance Tax-Managed Global Diversified Equity Income Fund | | | 19,716,811 | |
| | 177,333 | | | First Trust Dynamic Europe Equity Income Fund | | | 2,807,004 | |
| | 197,080 | | | First Trust Enhanced Equity Income Fund | | | 3,247,878 | |
| | 212,639 | | | GAMCO Natural Resources Gold & Income Trust | | | 1,275,834 | |
| | 334,736 | | | Guggenheim Enhanced Equity Income Fund | | | 3,012,624 | |
| | 81,428 | | | John Hancock Hedged Equity & Income Fund | | | 1,310,177 | |
| | 218,986 | | | Madison Covered Call & Equity Strategy Fund | | | 1,719,040 | |
| | 214,767 | | | Nuveen Dow 30sm Dynamic Overwrite Fund | | | 4,207,286 | |
| | 711,056 | | | Nuveen S&P 500 Buy-Write Income Fund | | | 10,281,870 | |
| | 90,549 | | | Nuveen S&P 500 Dynamic Overwrite Fund | | | 1,553,821 | |
| | 137,120 | | | Voya Asia Pacific High Dividend Equity Income Fund | | | 1,295,784 | |
| | 184,725 | | | Voya Global Advantage and Premium Opportunity Fund | | | 2,147,428 | |
| | 971,840 | | | Voya Global Equity Dividend and Premium Opportunity Fund | | | 7,211,053 | |
| | 151,443 | | | Voya Infrastructure Industrials and Materials Fund | | | 2,321,621 | |
| | 177,856 | | | Voya Natural Resources Equity Income Fund | | | 1,099,150 | |
| | | | | | | | |
| | | | | | | 197,945,837 | |
| | | | | | | | |
| | | | Total Closed-End Funds
(Cost $709,353,743) | | | 722,359,190 | |
| | | | | | | | |
| | |
| | | | | | | | |
| | | | Money Market Fund—0.0% | |
| | 170,060 | | | Invesco Premier U.S. Government Money Portfolio—Institutional Class, 1.83%(c)
(Cost $170,060) | | | 170,060 | |
| | | | | | | | |
| | | | Total Investments in Securities
(excluding investments purchased with cash collateral from securities on loan)
(Cost $709,523,803)-99.9% | | | 722,529,250 | |
| | | | | | | | |
| | |
| | | | | | | | |
| | | | Investments Purchased with Cash Collateral from
Securities on Loan | |
| | |
| | | | | | | | |
| | | | Money Market Fund—0.3% | |
| | 2,101,525 | | | Invesco Government & Agency Portfolio—
Institutional Class, 1.85%(c)(d)
(Cost $2,101,525) | | | 2,101,525 | |
| | | | | | | | |
| | | | Total Investments in Securities
(Cost $711,625,328)—100.2% | | | 724,630,775 | |
| | | | Other assets less liabilities—(0.2)% | | | (1,454,055 | ) |
| | | | | | | | |
| | | | Net Assets—100.0% | | $ | 723,176,720 | |
| | | | | | | | |
See accompanying Notes to Financial Statements which are an integral part of the financial statements.
Invesco CEF Income Composite ETF (PCEF) (continued)
August 31, 2018
Notes to Schedule of Investments:
| (a) | Affiliated company. The Fund’s Adviser and the adviser for Invesco Bond Fund, Invesco High Income 2023 Target Term Fund and Invesco Senior Income Trust are wholly-owned subsidiaries of Invesco Ltd. and therefore, Invesco Bond Fund, Invesco High Income 2023 Target Term Fund and Invesco Senior Income Trust are considered to be affiliated. See Note 4. |
| (b) | All or a portion of this security was out on loan at August 31, 2018. |
| (c) | The security and the Fund are advised by wholly-owned subsidiaries of Invesco Ltd. and are therefore considered to be affiliated. The rate shown is the 7-day SEC standardized yield as of August 31, 2018. |
| (d) | The security has been segregated to satisfy the commitment to return the cash collateral received in securities lending transactions upon the borrower’s return of the securities loaned. See Note 2J. |
See accompanying Notes to Financial Statements which are an integral part of the financial statements.
Schedule of Investments
Invesco Fundamental High Yield® Corporate Bond ETF (PHB)
August 31, 2018
| | | | | | | | | | | | | | | | |
Principal
Amount | | | | | Interest
Rate | | | Maturity
Date | | | Value | |
| | | | Corporate Bonds—98.6% | | | | | | | | | |
| | | | Advertising—0.9% | | | | | | | | | |
| $ | 3,884,000 | | | Lamar Media Corp. | | | 5.750 | % | | | 02/01/2026 | | | $ | 4,049,070 | |
| | 4,153,000 | | | Outfront Media Capital LLC/Outfront Media Capital Corp. | | | 5.875 | | | | 03/15/2025 | | | | 4,204,913 | |
| | | | | | | | | | | | | | | | |
| | | | | | | | | | | | | | | 8,253,983 | |
| | | | | | | | | | | | | | | | |
| | | | Aerospace/Defense—0.7% | | | | | | | | | |
| | 6,962,075 | | | TransDigm, Inc. | | | 6.500 | | | | 07/15/2024 | | | | 7,092,614 | |
| | | | | | | | | | | | | | | | |
| | | | Airlines—2.8% | | | | | | | | | |
| | 2,641,000 | | | Allegiant Travel Co. | | | 5.500 | | | | 07/15/2019 | | | | 2,680,615 | |
| | 6,067,000 | | | Delta Air Lines, Inc. | | | 3.625 | | | | 03/15/2022 | | | | 6,019,640 | |
| | 6,200,000 | | | Delta Air Lines, Inc. | | | 4.375 | | | | 04/19/2028 | | | | 6,070,579 | |
| | 12,296,100 | | | United Continental Holdings, Inc. | | | 4.250 | | | | 10/01/2022 | | | | 12,096,288 | |
| | | | | | | | | | | | | | | | |
| | | | | | | | | | | | | | | 26,867,122 | |
| | | | | | | | | | | | | | | | |
| | | | Apparel—0.7% | | | | | | | | | |
| | 4,127,000 | | | Under Armour, Inc. | | | 3.250 | | | | 06/15/2026 | | | | 3,700,667 | |
| | 3,197,000 | | | William Carter Co. (The) | | | 5.250 | | | | 08/15/2021 | | | | 3,246,953 | |
| | | | | | | | | | | | | | | | |
| | | | | | | | | | | | | | | 6,947,620 | |
| | | | | | | | | | | | | | | | |
| | | | Auto Parts & Equipment—2.1% | | | | | | | | | |
| | 3,709,000 | | | American Axle & Manufacturing, Inc.(a) | | | 6.250 | | | | 04/01/2025 | | | | 3,704,364 | |
| | 4,167,000 | | | Dana, Inc. | | | 5.500 | | | | 12/15/2024 | | | | 4,151,374 | |
| | 7,242,000 | | | Goodyear Tire & Rubber Co. (The)(a) | | | 5.125 | | | | 11/15/2023 | | | | 7,242,000 | |
| | 5,269,000 | | | Tenneco, Inc. | | | 5.000 | | | | 07/15/2026 | | | | 4,689,410 | |
| | | | | | | | | | | | | | | | |
| | | | | | | | | | | | | | | 19,787,148 | |
| | | | | | | | | | | | | | | | |
| | | | Banks—1.2% | | | | | | | | | |
| | 3,308,000 | | | CIT Group, Inc. | | | 5.000 | | | | 08/15/2022 | | | | 3,382,430 | |
| | 3,214,000 | | | CIT Group, Inc. | | | 5.250 | | | | 03/07/2025 | | | | 3,276,271 | |
| | 4,802,000 | | | Discover Bank | | | 7.000 | | | | 04/15/2020 | | | | 5,050,637 | |
| | | | | | | | | | | | | | | | |
| | | | | | | | | | | | | | | 11,709,338 | |
| | | | | | | | | | | | | | | | |
| | | | Building Materials—0.9% | | | | | | | | | |
| | 2,247,000 | | | Griffon Corp. | | | 5.250 | | | | 03/01/2022 | | | | 2,225,204 | |
| | 2,182,000 | | | Owens Corning | | | 4.200 | | | | 12/15/2022 | | | | 2,207,710 | |
| | 2,435,000 | | | Owens Corning | | | 3.400 | | | | 08/15/2026 | | | | 2,264,917 | |
| | 1,591,000 | | | US Concrete, Inc. | | | 6.375 | | | | 06/01/2024 | | | | 1,612,876 | |
| | | | | | | | | | | | | | | | |
| | | | | | | | | | | | | | | 8,310,707 | |
| | | | | | | | | | | | | | | | |
| | | | Chemicals—2.8% | | | | | | | | | |
| | 3,382,000 | | | Blue Cube Spinco LLC | | | 9.750 | | | | 10/15/2023 | | | | 3,851,252 | |
| | 6,990,000 | | | CF Industries, Inc.(a) | | | 3.450 | | | | 06/01/2023 | | | | 6,736,613 | |
| | 2,051,000 | | | Chemours Co. (The) | | | 6.625 | | | | 05/15/2023 | | | | 2,150,986 | |
| | 2,181,000 | | | Chemours Co. (The) | | | 5.375 | | | | 05/15/2027 | | | | 2,148,285 | |
| | 5,672,000 | | | Huntsman International LLC | | | 4.875 | | | | 11/15/2020 | | | | 5,823,726 | |
| | 3,257,000 | | | PolyOne Corp. | | | 5.250 | | | | 03/15/2023 | | | | 3,367,901 | |
| | 3,100,000 | | | Valvoline, Inc. | | | 4.375 | | | | 08/15/2025 | | | | 2,964,375 | |
| | | | | | | | | | | | | | | | |
| | | | | | | | | | | | | | | 27,043,138 | |
| | | | | | | | | | | | | | | | |
| | | | Commercial Services—3.1% | | | | | | | | | |
| | 7,521,000 | | | Avis Budget Car Rental LLC/Avis Budget Finance, Inc.(a) | | | 5.500 | | | | 04/01/2023 | | | | 7,511,599 | |
| | 6,521,000 | | | Nielsen Finance LLC/Nielsen Finance Co. | | | 4.500 | | | | 10/01/2020 | | | | 6,521,000 | |
| | 4,148,000 | | | R.R. Donnelley & Sons Co.(a) | | | 7.875 | | | | 03/15/2021 | | | | 4,391,695 | |
| | 4,167,000 | | | Service Corp. International | | | 5.375 | | | | 05/15/2024 | | | | 4,265,966 | |
| | 6,452,000 | | | United Rentals North America, Inc. | | | 5.750 | | | | 11/15/2024 | | | | 6,683,949 | |
| | | | | | | | | | | | | | | | |
| | | | | | | | | | | | | | | 29,374,209 | |
| | | | | | | | | | | | | | | | |
| | | | Computers—3.0% | | | | | | | | | |
| | 833,000 | | | Diebold Nixdorf, Inc. | | | 8.500 | | | | 04/15/2024 | | | | 592,471 | |
| | 5,755,000 | | | Leidos Holdings, Inc. | | | 4.450 | | | | 12/01/2020 | | | | 5,871,827 | |
| | 4,829,000 | | | NCR Corp. | | | 6.375 | | | | 12/15/2023 | | | | 4,859,181 | |
See accompanying Notes to Financial Statements which are an integral part of the financial statements.
Invesco Fundamental High Yield® Corporate Bond ETF (PHB) (continued)
August 31, 2018
| | | | | | | | | | | | | | | | |
Principal
Amount | | | | | Interest
Rate | | | Maturity
Date | | | Value | |
| | | | Corporate Bonds (continued) | | | | | | | | | |
| | | | Computers (continued) | | | | | | | | | |
| $ | 4,475,000 | | | Seagate HDD Cayman | | | 4.250 | % | | | 03/01/2022 | | | $ | 4,457,444 | |
| | 4,544,000 | | | Seagate HDD Cayman | | | 4.750 | | | | 01/01/2025 | | | | 4,361,389 | |
| | 8,400,000 | | | Western Digital Corp. | | | 4.750 | | | | 02/15/2026 | | | | 8,251,362 | |
| | | | | | | | | | | | | | | | |
| | | | | | | | | | | | | | | 28,393,674 | |
| | | | | | | | | | | | | | | | |
| | | | Cosmetics/Personal Care—0.4% | | | | | | | | | |
| | 3,508,000 | | | Edgewell Personal Care Co. | | | 4.700 | | | | 05/24/2022 | | | | 3,500,282 | |
| | | | | | | | | | | | | | | | |
| | | | Distribution/Wholesale—0.8% | | | | | | | | | |
| | 2,807,000 | | | H&E Equipment Services, Inc. | | | 5.625 | | | | 09/01/2025 | | | | 2,793,807 | |
| | 5,016,000 | | | LKQ Corp. | | | 4.750 | | | | 05/15/2023 | | | | 5,053,620 | |
| | | | | | | | | | | | | | | | |
| | | | | | | | | | | | | | | 7,847,427 | |
| | | | | | | | | | | | | | | | |
| | | | Diversified Financial Services—3.0% | | | | | | | | | |
| | 1,590,000 | | | Aircastle Ltd. | | | 5.000 | | | | 04/01/2023 | | | | 1,655,031 | |
| | 1,565,000 | | | Aircastle Ltd. | | | 4.125 | | | | 05/01/2024 | | | | 1,557,801 | |
| | 10,087,000 | | | Ally Financial, Inc. | | | 8.000 | | | | 03/15/2020 | | | | 10,730,046 | |
| | 5,372,000 | | | Discover Financial Services | | | 4.100 | | | | 02/09/2027 | | | | 5,218,247 | |
| | 4,446,000 | | | Navient Corp., MTN | | | 8.000 | | | | 03/25/2020 | | | | 4,724,986 | |
| | 4,607,000 | | | Navient Corp., MTN | | | 6.125 | | | | 03/25/2024 | | | | 4,595,483 | |
| | | | | | | | | | | | | | | | |
| | | | | | | | | | | | | | | 28,481,594 | |
| | | | | | | | | | | | | | | | |
| | | | Electric—3.6% | | | | | | | | | |
| | 4,400,000 | | | AES Corp. | | | 5.125 | | | | 09/01/2027 | | | | 4,455,000 | |
| | 4,295,000 | | | DPL, Inc. | | | 7.250 | | | | 10/15/2021 | | | | 4,665,444 | |
| | 4,600,000 | | | FirstEnergy Corp., Series B | | | 4.250 | | | | 03/15/2023 | | | | 4,697,683 | |
| | 4,800,000 | | | FirstEnergy Corp., Series B | | | 3.900 | | | | 07/15/2027 | | | | 4,726,712 | |
| | 6,698,000 | | | NRG Energy, Inc. | | | 6.625 | | | | 01/15/2027 | | | | 7,041,272 | |
| | 7,795,000 | | | Vistra Energy Corp.(b) | | | 8.125 | | | | 01/30/2026 | | | | 8,720,656 | |
| | | | | | | | | | | | | | | | |
| | | | | | | | | | | | | | | 34,306,767 | |
| | | | | | | | | | | | | | | | |
| | | | Electrical Components & Equipment—0.5% | | | | | | | | | |
| | 2,345,000 | | | WESCO Distribution, Inc. | | | 5.375 | | | | 12/15/2021 | | | | 2,383,107 | |
| | 2,425,000 | | | WESCO Distribution, Inc. | | | 5.375 | | | | 06/15/2024 | | | | 2,415,906 | |
| | | | | | | | | | | | | | | | |
| | | | | | | | | | | | | | | 4,799,013 | |
| | | | | | | | | | | | | | | | |
| | | | Electronics—0.7% | | | | | | | | | |
| | 3,048,000 | | | Jabil, Inc. | | | 4.700 | | | | 09/15/2022 | | | | 3,129,686 | |
| | 3,300,000 | | | Jabil, Inc. | | | 3.950 | | | | 01/12/2028 | | | | 3,161,070 | |
| | | | | | | | | | | | | | | | |
| | | | | | | | | | | | | | | 6,290,756 | |
| | | | | | | | | | | | | | | | |
| | | | Engineering & Construction—1.1% | | | | | | | | | |
| | 6,320,000 | | | AECOM | | | 5.125 | | | | 03/15/2027 | | | | 6,225,200 | |
| | 3,883,000 | | | MasTec, Inc. | | | 4.875 | | | | 03/15/2023 | | | | 3,834,463 | |
| | | | | | | | | | | | | | | | |
| | | | | | | | | | | | | | | 10,059,663 | |
| | | | | | | | | | | | | | | | |
| | | | Entertainment—1.7% | | | | | | | | | |
| | 3,738,000 | | | AMC Entertainment Holdings, Inc.(a) | | | 5.750 | | | | 06/15/2025 | | | | 3,642,232 | |
| | 4,100,000 | | | Cinemark USA, Inc. | | | 4.875 | | | | 06/01/2023 | | | | 4,069,250 | |
| | 1,661,000 | | | Eldorado Resorts, Inc. | | | 6.000 | | | | 04/01/2025 | | | | 1,696,296 | |
| | 1,767,000 | | | GLP Capital LP/GLP Financing II, Inc. | | | 4.875 | | | | 11/01/2020 | | | | 1,815,593 | |
| | 1,805,000 | | | GLP Capital LP/GLP Financing II, Inc. | | | 5.375 | | | | 04/15/2026 | | | | 1,878,915 | |
| | 3,025,000 | | | Pinnacle Entertainment, Inc. | | | 5.625 | | | | 05/01/2024 | | | | 3,191,375 | |
| | | | | | | | | | | | | | | | |
| | | | | | | | | | | | | | | 16,293,661 | |
| | | | | | | | | | | | | | | | |
| | | | Environmental Control—0.4% | | | | | | | | | |
| | 3,623,000 | | | Covanta Holding Corp. | | | 5.875 | | | | 03/01/2024 | | | | 3,659,230 | |
| | | | | | | | | | | | | | | | |
| | | | Food—2.5% | | | | | | | | | |
| | 1,399,925 | | | B&G Foods, Inc. | | | 4.625 | | | | 06/01/2021 | | | | 1,396,425 | |
| | 1,494,000 | | | B&G Foods, Inc.(a) | | | 5.250 | | | | 04/01/2025 | | | | 1,454,782 | |
See accompanying Notes to Financial Statements which are an integral part of the financial statements.
Invesco Fundamental High Yield® Corporate Bond ETF (PHB) (continued)
August 31, 2018
| | | | | | | | | | | | | | | | |
Principal
Amount | | | | | Interest
Rate | | | Maturity
Date | | | Value | |
| | | | Corporate Bonds (continued) | | | | | | | | | |
| | | | Food (continued) | | | | | | | | | |
| $ | 3,463,000 | | | Darling Ingredients, Inc. | | | 5.375 | % | | | 01/15/2022 | | | $ | 3,510,616 | |
| | 3,839,000 | | | Pinnacle Foods Finance LLC/Pinnacle Foods Finance Corp. | | | 5.875 | | | | 01/15/2024 | | | | 4,050,145 | |
| | 3,694,000 | | | Post Holdings, Inc.(b) | | | 5.750 | | | | 03/01/2027 | | | | 3,657,060 | |
| | 5,329,000 | | | SUPERVALU, Inc.(a) | | | 7.750 | | | | 11/15/2022 | | | | 5,555,483 | |
| | 3,720,000 | | | TreeHouse Foods, Inc. | | | 4.875 | | | | 03/15/2022 | | | | 3,733,950 | |
| | | | | | | | | | | | | | | | |
| | | | | | | | | | | | | | | 23,358,461 | |
| | | | | | | | | | | | | | | | |
| | | | Food Service—0.6% | | | | | | | | | |
| | 6,180,000 | | | Aramark Services, Inc. | | | 4.750 | | | | 06/01/2026 | | | | 6,102,750 | |
| | | | | | | | | | | | | | | | |
| | | | Healthcare-Products—1.2% | | | | | | | | | |
| | 4,125,000 | | | Becton Dickinson & Co. | | | 2.894 | | | | 06/06/2022 | | | | 4,021,085 | |
| | 4,200,000 | | | Becton Dickinson & Co. | | | 3.700 | | | | 06/06/2027 | | | | 4,032,663 | |
| | 3,224,000 | | | Teleflex, Inc. | | | 4.625 | | | | 11/15/2027 | | | | 3,082,950 | |
| | | | | | | | | | | | | | | | |
| | | | | | | | | | | | | | | 11,136,698 | |
| | | | | | | | | | | | | | | | |
| | | | Healthcare-Services—7.7% | | | | | | | | | |
| | 2,842,000 | | | Acadia Healthcare Co., Inc. | | | 5.625 | | | | 02/15/2023 | | | | 2,913,050 | |
| | 7,342,000 | | | Centene Corp. | | | 6.125 | | | | 02/15/2024 | | | | 7,736,632 | |
| | 7,300,000 | | | CHS/Community Health Systems, Inc. | | | 6.250 | | | | 03/31/2023 | | | | 6,971,500 | |
| | 7,818,000 | | | DaVita, Inc. | | | 5.125 | | | | 07/15/2024 | | | | 7,576,580 | |
| | 3,775,000 | | | Encompass Health Corp. | | | 5.750 | | | | 11/01/2024 | | | | 3,836,344 | |
| | 4,248,000 | | | Envision Healthcare Corp. | | | 5.625 | | | | 07/15/2022 | | | | 4,375,440 | |
| | 6,078,000 | | | HCA, Inc. | | | 6.500 | | | | 02/15/2020 | | | | 6,324,159 | |
| | 6,355,000 | | | HCA, Inc. | | | 5.375 | | | | 02/01/2025 | | | | 6,443,525 | |
| | 2,182,000 | | | LifePoint Health, Inc. | | | 5.500 | | | | 12/01/2021 | | | | 2,225,640 | |
| | 2,203,000 | | | LifePoint Health, Inc. | | | 5.375 | | | | 05/01/2024 | | | | 2,296,628 | |
| | 3,550,000 | | | Magellan Health, Inc. | | | 4.400 | | | | 09/22/2024 | | | | 3,479,116 | |
| | 5,458,000 | | | Molina Healthcare, Inc. | | | 5.375 | | | | 11/15/2022 | | | | 5,594,450 | |
| | 3,732,000 | | | Tenet Healthcare Corp. | | | 6.000 | | | | 10/01/2020 | | | | 3,890,610 | |
| | 4,027,000 | | | Tenet Healthcare Corp. | | | 5.125 | | | | 05/01/2025 | | | | 4,006,865 | |
| | 5,435,000 | | | WellCare Health Plans, Inc. | | | 5.250 | | | | 04/01/2025 | | | | 5,570,875 | |
| | | | | | | | | | | | | | | | |
| | | | | | | | | | | | | | | 73,241,414 | |
| | | | | | | | | | | | | | | | |
| | | | Home Builders—2.5% | | | | | | | | | |
| | 2,171,000 | | | Beazer Homes USA, Inc. | | | 5.875 | | | | 10/15/2027 | | | | 1,861,632 | |
| | 1,400,000 | | | Century Communities, Inc. | | | 5.875 | | | | 07/15/2025 | | | | 1,316,000 | |
| | 2,497,000 | | | KB Home | | | 7.000 | | | | 12/15/2021 | | | | 2,640,578 | |
| | 2,539,000 | | | Lennar Corp. | | | 4.500 | | | | 11/15/2019 | | | | 2,564,390 | |
| | 2,723,000 | | | Lennar Corp. | | | 4.750 | | | | 11/29/2027 | | | | 2,610,676 | |
| | 2,369,500 | | | PulteGroup, Inc. | | | 4.250 | | | | 03/01/2021 | | | | 2,387,982 | |
| | 2,355,000 | | | PulteGroup, Inc. | | | 5.500 | | | | 03/01/2026 | | | | 2,346,169 | |
| | 2,012,160 | | | Toll Brothers Finance Corp. | | | 4.375 | | | | 04/15/2023 | | | | 2,010,087 | |
| | 1,977,000 | | | Toll Brothers Finance Corp. | | | 4.875 | | | | 03/15/2027 | | | | 1,897,920 | |
| | 1,311,000 | | | TRI Pointe Group, Inc./TRI Pointe Homes, Inc. | | | 4.375 | | | | 06/15/2019 | | | | 1,324,110 | |
| | 1,168,000 | | | TRI Pointe Group, Inc./TRI Pointe Homes, Inc. | | | 5.875 | | | | 06/15/2024 | | | | 1,169,402 | |
| | 1,895,620 | | | William Lyon Homes, Inc. | | | 5.875 | | | | 01/31/2025 | | | | 1,803,209 | |
| | | | | | | | | | | | | | | | |
| | | | | | | | | | | | | | | 23,932,155 | |
| | | | | | | | | | | | | | | | |
| | | | Home Furnishings—0.4% | | | | | | | | | |
| | 3,482,000 | | | Tempur Sealy International, Inc. | | | 5.500 | | | | 06/15/2026 | | | | 3,403,655 | |
| | | | | | | | | | | | | | | | |
| | | | Household Products/Wares—0.4% | | | | | | | | | |
| | 4,248,000 | | | Spectrum Brands, Inc. | | | 5.750 | | | | 07/15/2025 | | | | 4,311,720 | |
| | | | | | | | | | | | | | | | |
| | | | Housewares—0.4% | | | | | | | | | |
| | 3,567,000 | | | Scotts Miracle-Gro Co. (The) | | | 6.000 | | | | 10/15/2023 | | | | 3,638,340 | |
| | | | | | | | | | | | | | | | |
| | | | Insurance—2.2% | | | | | | | | | |
| | 5,152,000 | | | CNO Financial Group, Inc. | | | 5.250 | | | | 05/30/2025 | | | | 5,255,040 | |
| | 4,731,000 | | | Genworth Holdings, Inc. | | | 7.625 | | | | 09/24/2021 | | | | 4,920,240 | |
See accompanying Notes to Financial Statements which are an integral part of the financial statements.
Invesco Fundamental High Yield® Corporate Bond ETF (PHB) (continued)
August 31, 2018
| | | | | | | | | | | | | | | | |
Principal
Amount | | | | | Interest
Rate | | | Maturity
Date | | | Value | |
| | | | Corporate Bonds (continued) | | | | | | | | | |
| | | | Insurance (continued) | | | | | | | | | |
| $ | 5,740,000 | | | Genworth Holdings, Inc. | | | 4.800 | % | | | 02/15/2024 | | | $ | 5,137,300 | |
| | 2,660,000 | | | MGIC Investment Corp. | | | 5.750 | | | | 08/15/2023 | | | | 2,795,394 | |
| | 2,590,000 | | | Radian Group, Inc. | | | 4.500 | | | | 10/01/2024 | | | | 2,564,100 | |
| | | | | | | | | | | | | | | | |
| | | | | | | | | | | | | | | 20,672,074 | |
| | | | | | | | | | | | | | | | |
| | | | Internet—2.6% | | | | | | | | | |
| | 2,467,000 | | | Expedia Group, Inc. | | | 5.950 | | | | 08/15/2020 | | | | 2,587,194 | |
| | 2,912,000 | | | Expedia Group, Inc. | | | 3.800 | | | | 02/15/2028 | | | | 2,738,273 | |
| | 2,311,000 | | | Netflix, Inc. | | | 5.375 | | | | 02/01/2021 | | | | 2,388,996 | |
| | 2,428,000 | | | NetFlix, Inc.(a) | | | 4.375 | | | | 11/15/2026 | | | | 2,299,777 | |
| | 7,863,000 | | | Symantec Corp. | | | 4.200 | | | | 09/15/2020 | | | | 7,933,697 | |
| | 1,484,000 | | | VeriSign, Inc. | | | 4.625 | | | | 05/01/2023 | | | | 1,512,493 | |
| | 1,500,000 | | | VeriSign, Inc. | | | 4.750 | | | | 07/15/2027 | | | | 1,451,250 | |
| | 3,223,000 | | | Zayo Group LLC/Zayo Capital, Inc. | | | 6.375 | | | | 05/15/2025 | | | | 3,380,121 | |
| | | | | | | | | | | | | | | | |
| | | | | | | | | | | | | | | 24,291,801 | |
| | | | | | | | | | | | | | | | |
| | | | Iron/Steel—2.6% | | | | | | | | | |
| | 1,759,000 | | | AK Steel Corp. | | | 7.500 | | | | 07/15/2023 | | | | 1,846,950 | |
| | 1,800,000 | | | AK Steel Corp. | | | 7.000 | | | | 03/15/2027 | | | | 1,714,500 | |
| | 1,556,000 | | | Allegheny Technologies, Inc. | | | 5.950 | | | | 01/15/2021 | | | | 1,587,120 | |
| | 1,481,000 | | | Allegheny Technologies, Inc. | | | 7.875 | | | | 08/15/2023 | | | | 1,590,224 | |
| | 4,289,000 | | | Cleveland-Cliffs, Inc. | | | 5.750 | | | | 03/01/2025 | | | | 4,228,139 | |
| | 4,100,000 | | | Commercial Metals Co.(b) | | | 5.750 | | | | 04/15/2026 | | | | 3,966,750 | |
| | 2,346,000 | | | Steel Dynamics, Inc. | | | 5.125 | | | | 10/01/2021 | | | | 2,381,776 | |
| | 2,269,220 | | | Steel Dynamics, Inc. | | | 5.500 | | | | 10/01/2024 | | | | 2,331,624 | |
| | 2,521,000 | | | U.S. Steel Corp. | | | 6.875 | | | | 08/15/2025 | | | | 2,571,420 | |
| | 2,418,000 | | | United States Steel Corp.(a) | | | 7.375 | | | | 04/01/2020 | | | | 2,543,434 | |
| | | | | | | | | | | | | | | | |
| | | | | | | | | | | | | | | 24,761,937 | |
| | | | | | | | | | | | | | | | |
| | | | Leisure Time—0.3% | | | | | | | | | |
| | 2,820,000 | | | Vista Outdoor, Inc. | | | 5.875 | | | | 10/01/2023 | | | | 2,777,700 | |
| | | | | | | | | | | | | | | | |
| | | | Lodging—2.7% | | | | | | | | | |
| | 3,028,000 | | | Boyd Gaming Corp. | | | 6.375 | | | | 04/01/2026 | | | | 3,107,485 | |
| | 3,129,000 | | | Choice Hotels International, Inc. | | | 5.750 | | | | 07/01/2022 | | | | 3,308,917 | |
| | 5,269,000 | | | Hilton Worldwide Finance LLC/Hilton Worldwide Finance Corp. | | | 4.625 | | | | 04/01/2025 | | | | 5,216,310 | |
| | 1,000,000 | | | Marriott Ownership Resorts, Inc.(b) | | | 6.500 | | | | 09/15/2026 | | | | 1,022,500 | |
| | 3,502,000 | | | MGM Resorts International | | | 6.000 | | | | 03/15/2023 | | | | 3,644,356 | |
| | 3,827,000 | | | MGM Resorts International | | | 4.625 | | | | 09/01/2026 | | | | 3,626,083 | |
| | 5,690,000 | | | Wyndham Destinations, Inc. | | | 4.250 | | | | 03/01/2022 | | | | 5,504,734 | |
| | | | | | | | | | | | | | | | |
| | | | | | | | | | | | | | | 25,430,385 | |
| | | | | | | | | | | | | | | | |
| | | | Media—5.0% | | | | | | | | | |
| | 3,827,000 | | | AMC Networks, Inc. | | | 5.000 | | | | 04/01/2024 | | | | 3,774,379 | |
| | 6,060,000 | | | Charter Communications Operating LLC/Charter Communications Operating Capital | | | 4.464 | | | | 07/23/2022 | | | | 6,188,779 | |
| | 6,074,000 | | | Charter Communications Operating LLC/Charter Communications Operating Capital | | | 4.908 | | | | 07/23/2025 | | | | 6,211,617 | |
| | 6,832,000 | | | Clear Channel Worldwide Holdings, Inc., Series B | | | 6.500 | | | | 11/15/2022 | | | | 7,019,880 | |
| | 3,770,000 | | | DISH DBS Corp. | | | 6.750 | | | | 06/01/2021 | | | | 3,835,975 | |
| | 4,044,000 | | | DISH DBS Corp. | | | 7.750 | | | | 07/01/2026 | | | | 3,664,875 | |
| | 2,146,000 | | | LIN Television Corp. | | | 5.875 | | | | 11/15/2022 | | | | 2,199,650 | |
| | 2,946,000 | | | Meredith Corp.(b) | | | 6.875 | | | | 02/01/2026 | | | | 2,990,190 | |
| | 3,656,050 | | | Sinclair Television Group, Inc. | | | 6.125 | | | | 10/01/2022 | | | | 3,761,893 | |
| | 3,572,660 | | | TEGNA, Inc. | | | 6.375 | | | | 10/15/2023 | | | | 3,715,566 | |
| | 4,261,000 | | | Tribune Media Co. | | | 5.875 | | | | 07/15/2022 | | | | 4,346,220 | |
| | | | | | | | | | | | | | | | |
| | | | | | | | | | | | | | | 47,709,024 | |
| | | | | | | | | | | | | | | | |
| | | | Mining—1.5% | | | | | | | | | |
| | 5,383,000 | | | Freeport-McMoRan, Inc. | | | 3.550 | | | | 03/01/2022 | | | | 5,208,053 | |
| | 5,222,000 | | | Freeport-McMoRan, Inc. | | | 4.550 | | | | 11/14/2024 | | | | 5,052,285 | |
| | 1,649,000 | | | Hecla Mining Co. | | | 6.875 | | | | 05/01/2021 | | | | 1,668,046 | |
See accompanying Notes to Financial Statements which are an integral part of the financial statements.
Invesco Fundamental High Yield® Corporate Bond ETF (PHB) (continued)
August 31, 2018
| | | | | | | | | | | | | | | | |
Principal
Amount | | | | | Interest
Rate | | | Maturity
Date | | | Value | |
| | | | Corporate Bonds (continued) | | | | | | | | | |
| | | | Mining (continued) | | | | | | | | | |
| $ | 1,966,000 | | | Kaiser Aluminum Corp. | | | 5.875 | % | | | 05/15/2024 | | | $ | 2,020,065 | |
| | | | | | | | | | | | | | | | |
| | | | | | | | | | | | | | | 13,948,449 | |
| | | | | | | | | | | | | | | | |
| | | | Miscellaneous Manufacturing—0.5% | | | | | | | | | |
| | 4,864,000 | | | Trinity Industries, Inc. | | | 4.550 | | | | 10/01/2024 | | | | 4,723,165 | |
| | | | | | | | | | | | | | | | |
| | | | Office/Business Equipment—1.1% | | | | | | | | | |
| | 5,652,000 | | | CDW LLC/CDW Finance Corp. | | | 5.000 | | | | 09/01/2025 | | | | 5,644,935 | |
| | 2,597,000 | | | Pitney Bowes, Inc. | | | 3.625 | | | | 10/01/2021 | | | | 2,475,266 | |
| | 2,659,000 | | | Pitney Bowes, Inc.(a) | | | 4.625 | | | | 03/15/2024 | | | | 2,397,620 | |
| | | | | | | | | | | | | | | | |
| | | | | | | | | | | | | | | 10,517,821 | |
| | | | | | | | | | | | | | | | |
| | | | Oil & Gas—12.1% | | | | | | | | | |
| | 4,650,000 | | | Anadarko Petroleum Corp. | | | 4.850 | | | | 03/15/2021 | | | | 4,798,024 | |
| | 4,400,000 | | | Anadarko Petroleum Corp. | | | 5.550 | | | | 03/15/2026 | | | | 4,738,692 | |
| | 4,673,000 | | | Antero Resources Corp. | | | 5.625 | | | | 06/01/2023 | | | | 4,832,116 | |
| | 1,334,000 | | | Callon Petroleum Co. | | | 6.125 | | | | 10/01/2024 | | | | 1,370,685 | |
| | 1,533,000 | | | Carrizo Oil & Gas, Inc.(a) | | | 6.250 | | | | 04/15/2023 | | | | 1,575,157 | |
| | 5,861,000 | | | Continental Resources, Inc. | | | 3.800 | | | | 06/01/2024 | | | | 5,779,406 | |
| | 3,300,000 | | | Devon Energy Corp. | | | 3.250 | | | | 05/15/2022 | | | | 3,255,371 | |
| | 2,925,000 | | | Devon Energy Corp. | | | 5.850 | | | | 12/15/2025 | | | | 3,220,206 | |
| | 5,287,000 | | | Diamond Offshore Drilling, Inc.(a) | | | 7.875 | | | | 08/15/2025 | | | | 5,405,957 | |
| | 2,040,000 | | | Diamondback Energy, Inc. | | | 4.750 | | | | 11/01/2024 | | | | 2,060,400 | |
| | 2,869,000 | | | Energen Corp. | | | 4.625 | | | | 09/01/2021 | | | | 2,912,035 | |
| | 1,942,000 | | | Gulfport Energy Corp. | | | 6.000 | | | | 10/15/2024 | | | | 1,927,435 | |
| | 8,925,000 | | | Hess Corp. | | | 4.300 | | | | 04/01/2027 | | | | 8,684,383 | |
| | 745,000 | | | Jagged Peak Energy LLC(b) | | | 5.875 | | | | 05/01/2026 | | | | 735,687 | |
| | 1,525,000 | | | Laredo Petroleum, Inc. | | | 5.625 | | | | 01/15/2022 | | | | 1,528,812 | |
| | 4,681,000 | | | Marathon Oil Corp. | | | 2.800 | | | | 11/01/2022 | | | | 4,534,663 | |
| | 4,360,000 | | | Marathon Oil Corp. | | | 4.400 | | | | 07/15/2027 | | | | 4,378,748 | |
| | 3,206,000 | | | Murphy Oil Corp. | | | 4.450 | | | | 12/01/2022 | | | | 3,207,988 | |
| | 3,113,000 | | | Murphy Oil Corp. | | | 5.750 | | | | 08/15/2025 | | | | 3,127,797 | |
| | 5,511,000 | | | Murphy Oil USA, Inc. | | | 6.000 | | | | 08/15/2023 | | | | 5,683,219 | |
| | 2,426,000 | | | Nabors Industries, Inc.(a) | | | 5.500 | | | | 01/15/2023 | | | | 2,431,748 | |
| | 2,527,000 | | | Nabors Industries, Inc.(b) | | | 5.750 | | | | 02/01/2025 | | | | 2,437,517 | |
| | 1,170,000 | | | Newfield Exploration Co. | | | 5.750 | | | | 01/30/2022 | | | | 1,240,200 | |
| | 1,146,000 | | | Newfield Exploration Co. | | | 5.625 | | | | 07/01/2024 | | | | 1,227,653 | |
| | 5,878,000 | | | PBF Holding Co. LLC/PBF Finance Corp. | | | 7.250 | | | | 06/15/2025 | | | | 6,215,985 | |
| | 2,624,000 | | | PDC Energy, Inc. | | | 6.125 | | | | 09/15/2024 | | | | 2,624,000 | |
| | 1,609,000 | | | QEP Resources, Inc. | | | 5.250 | | | | 05/01/2023 | | | | 1,576,820 | |
| | 1,900,000 | | | QEP Resources, Inc.(a) | | | 5.625 | | | | 03/01/2026 | | | | 1,824,000 | |
| | 2,016,000 | | | Range Resources Corp. | | | 5.000 | | | | 03/15/2023 | | | | 1,982,333 | |
| | 1,972,000 | | | Range Resources Corp.(a) | | | 4.875 | | | | 05/15/2025 | | | | 1,898,050 | |
| | 1,801,000 | | | SM Energy Co.(a) | | | 6.125 | | | | 11/15/2022 | | | | 1,861,784 | |
| | 1,886,000 | | | SM Energy Co.(a) | | | 6.750 | | | | 09/15/2026 | | | | 1,963,798 | |
| | 1,588,000 | | | Southwestern Energy Co.(a) | | | 4.100 | | | | 03/15/2022 | | | | 1,556,240 | |
| | 1,563,000 | | | Southwestern Energy Co. | | | 6.200 | | | | 01/23/2025 | | | | 1,570,815 | |
| | 780,000 | | | SRC Energy, Inc. | | | 6.250 | | | | 12/01/2025 | | | | 760,500 | |
| | 2,164,000 | | | Unit Corp. | | | 6.625 | | | | 05/15/2021 | | | | 2,172,115 | |
| | 1,936,050 | | | Whiting Petroleum Corp. | | | 6.250 | | | | 04/01/2023 | | | | 1,998,972 | |
| | 1,969,000 | | | Whiting Petroleum Corp. | | | 6.625 | | | | 01/15/2026 | | | | 2,055,144 | |
| | 1,810,000 | | | WPX Energy, Inc. | | | 6.000 | | | | 01/15/2022 | | | | 1,877,875 | |
| | 1,843,000 | | | WPX Energy, Inc. | | | 5.250 | | | | 09/15/2024 | | | | 1,866,038 | |
| | | | | | | | | | | | | | | | |
| | | | | | | | | | | | | | | 114,898,368 | |
| | | | | | | | | | | | | | | | |
| | | | Oil & Gas Services—1.0% | | | | | | | | | |
| | 2,258,000 | | | Forum Energy Technologies, Inc. | | | 6.250 | | | | 10/01/2021 | | | | 2,269,290 | |
| | 4,153,000 | | | Oceaneering International, Inc. | | | 4.650 | | | | 11/15/2024 | | | | 3,956,659 | |
| | 3,066,000 | | | SESI LLC | | | 7.750 | | | | 09/15/2024 | | | | 3,180,975 | |
| | | | | | | | | | | | | | | | |
| | | | | | | | | | | | | | | 9,406,924 | |
| | | | | | | | | | | | | | | | |
See accompanying Notes to Financial Statements which are an integral part of the financial statements.
Invesco Fundamental High Yield® Corporate Bond ETF (PHB) (continued)
August 31, 2018
| | | | | | | | | | | | | | | | |
Principal
Amount | | | | | Interest
Rate | | | Maturity
Date | | | Value | |
| | | | Corporate Bonds (continued) | | | | | | | | | |
| | | | Packaging & Containers—2.1% | | | | | | | | | |
| $ | 2,747,000 | | | Ball Corp. | | | 4.375 | % | | | 12/15/2020 | | | $ | 2,791,639 | |
| | 2,972,000 | | | Ball Corp. | | | 4.000 | | | | 11/15/2023 | | | | 2,916,275 | |
| | 4,732,000 | | | Berry Global, Inc. | | | 5.125 | | | | 07/15/2023 | | | | 4,726,085 | |
| | 2,893,000 | | | Crown Americas LLC/Crown Americas Capital Corp. IV | | | 4.500 | | | | 01/15/2023 | | | | 2,900,233 | |
| | 3,059,000 | | | Crown Americas LLC/Crown Americas Capital Corp. VI(b) | | | 4.750 | | | | 02/01/2026 | | | | 2,944,287 | |
| | 3,812,000 | | | Graphic Packaging International LLC | | | 4.750 | | | | 04/15/2021 | | | | 3,871,505 | |
| | | | | | | | | | | | | | | | |
| | | | | | | | | | | | | | | 20,150,024 | |
| | | | | | | | | | | | | | | | |
| | | | Pipelines—1.8% | | | | | | | | | |
| | 3,363,000 | | | Cheniere Corpus Christi Holdings LLC | | | 5.875 | | | | 03/31/2025 | | | | 3,585,799 | |
| | 2,762,000 | | | SemGroup Corp./Rose Rock Finance Corp. | | | 5.625 | | | | 07/15/2022 | | | | 2,751,642 | |
| | 5,763,000 | | | Targa Resources Partners LP/Targa Resources Partners Finance Corp. | | | 4.250 | | | | 11/15/2023 | | | | 5,604,518 | |
| | 5,505,000 | | | Williams Cos., Inc. (The) | | | 3.700 | | | | 01/15/2023 | | | | 5,456,831 | |
| | | | | | | | | | | | | | | | |
| | | | | | | | | | | | | | | 17,398,790 | |
| | | | | | | | | | | | | | | | |
| | | | Real Estate—0.3% | | | | | | | | | |
| | 2,532,000 | | | Kennedy-Wilson, Inc. | | | 5.875 | | | | 04/01/2024 | | | | 2,522,505 | |
| | | | | | | | | | | | | | | | |
| | | | REITs—5.0% | | | | | | | | | |
| | 4,810,000 | | | CBL & Associates LP(a) | | | 5.950 | | | | 12/15/2026 | | | | 3,920,150 | |
| | 2,409,000 | | | CyrusOne LP/CyrusOne Finance Corp. | | | 5.000 | | | | 03/15/2024 | | | | 2,445,135 | |
| | 5,109,000 | | | Equinix, Inc. | | | 5.375 | | | | 05/15/2027 | | | | 5,211,180 | |
| | 3,376,000 | | | FelCor Lodging LP | | | 6.000 | | | | 06/01/2025 | | | | 3,502,600 | |
| | 4,007,000 | | | GEO Group, Inc. (The) | | | 6.000 | | | | 04/15/2026 | | | | 3,886,790 | |
| | 7,188,000 | | | Iron Mountain, Inc. | | | 5.750 | | | | 08/15/2024 | | | | 7,143,075 | |
| | 2,285,000 | | | iStar, Inc. | | | 4.625 | | | | 09/15/2020 | | | | 2,279,287 | |
| | 3,102,000 | | | MPT Operating Partnership LP/MPT Finance Corp. | | | 5.000 | | | | 10/15/2027 | | | | 3,047,715 | |
| | 3,503,000 | | | RHP Hotel Properties LP/RHP Finance Corp. | | | 5.000 | | | | 04/15/2023 | | | | 3,519,464 | |
| | 2,145,000 | | | Sabra Health Care LP/Sabra Capital Corp. | | | 5.500 | | | | 02/01/2021 | | | | 2,187,900 | |
| | 3,918,000 | | | SBA Communications Corp. | | | 4.875 | | | | 09/01/2024 | | | | 3,875,686 | |
| | 3,218,000 | | | Starwood Property Trust, Inc. | | | 5.000 | | | | 12/15/2021 | | | | 3,250,180 | |
| | 3,408,000 | | | Starwood Property Trust, Inc. | | | 4.750 | | | | 03/15/2025 | | | | 3,246,120 | |
| | | | | | | | | | | | | | | | |
| | | | | | | | | | | | | | | 47,515,282 | |
| | | | | | | | | | | | | | | | |
| | | | Retail—5.3% | | | | | | | | | |
| | 3,902,000 | | | Asbury Automotive Group, Inc. | | | 6.000 | | | | 12/15/2024 | | | | 3,931,265 | |
| | 7,552,000 | | | Gap, Inc. (The) | | | 5.950 | | | | 04/12/2021 | | | | 7,904,537 | |
| | 4,330,000 | | | Group 1 Automotive, Inc. | | | 5.000 | | | | 06/01/2022 | | | | 4,308,350 | |
| | 4,660,000 | | | L Brands, Inc. | | | 5.625 | | | | 02/15/2022 | | | | 4,735,725 | |
| | 4,552,000 | | | L Brands, Inc.(a) | | | 5.625 | | | | 10/15/2023 | | | | 4,574,760 | |
| | 2,891,000 | | | Penske Automotive Group, Inc. | | | 5.750 | | | | 10/01/2022 | | | | 2,950,627 | |
| | 2,965,000 | | | Penske Automotive Group, Inc. | | | 5.500 | | | | 05/15/2026 | | | | 2,913,112 | |
| | 6,821,000 | | | QVC, Inc. | | | 4.375 | | | | 03/15/2023 | | | | 6,753,150 | |
| | 3,994,000 | | | Sally Holdings LLC/Sally Capital, Inc.(a) | | | 5.625 | | | | 12/01/2025 | | | | 3,684,465 | |
| | 8,182,000 | | | Yum! Brands, Inc. | | | 3.750 | | | | 11/01/2021 | | | | 8,100,180 | |
| | | | | | | | | | | | | | | | |
| | | | | | | | | | | | | | | 49,856,171 | |
| | | | | | | | | | | | | | | | |
| | | | Semiconductors—1.0% | | | | | | | | | |
| | 8,830,000 | | | Micron Technology, Inc. | | | 5.500 | | | | 02/01/2025 | | | | 9,182,317 | |
| | | | | | | | | | | | | | | | |
| | | | Software—1.1% | | | | | | | | | |
| | 3,244,000 | | | CDK Global, Inc. | | | 4.875 | | | | 06/01/2027 | | | | 3,203,450 | |
| | 3,697,000 | | | Citrix Systems, Inc. | | | 4.500 | | | | 12/01/2027 | | | | 3,603,337 | |
| | 3,220,000 | | | Nuance Communications, Inc. | | | 5.625 | | | | 12/15/2026 | | | | 3,224,025 | |
| | | | | | | | | | | | | | | | |
| | | | | | | | | | | | | | | 10,030,812 | |
| | | | | | | | | | | | | | | | |
| | | | Telecommunications—3.6% | | | | | | | | | |
| | 3,997,000 | | | Anixter, Inc. | | | 5.500 | | | | 03/01/2023 | | | | 4,191,854 | |
| | 6,372,000 | | | CenturyLink, Inc., Series S | | | 6.450 | | | | 06/15/2021 | | | | 6,658,740 | |
| | 6,418,000 | | | CenturyLink, Inc., Series Y(a) | | | 7.500 | | | | 04/01/2024 | | | | 6,883,305 | |
See accompanying Notes to Financial Statements which are an integral part of the financial statements.
Invesco Fundamental High Yield® Corporate Bond ETF (PHB) (continued)
August 31, 2018
| | | | | | | | | | | | | | | | |
Principal
Amount | | | | | Interest
Rate | | | Maturity
Date | | | Value | |
| | | | Corporate Bonds (continued) | | | | | | | | | |
| | | | Telecommunications (continued) | | | | | | | | | |
| $ | 2,081,150 | | | Hughes Satellite Systems Corp. | | | 7.625 | % | | | 06/15/2021 | | | $ | 2,247,642 | |
| | 2,212,000 | | | Hughes Satellite Systems Corp. | | | 6.625 | | | | 08/01/2026 | | | | 2,123,520 | |
| | 6,208,000 | | | T-Mobile USA, Inc. | | | 4.000 | | | | 04/15/2022 | | | | 6,184,720 | |
| | 5,843,000 | | | T-Mobile USA, Inc. | | | 6.500 | | | | 01/15/2026 | | | | 6,191,768 | |
| | | | | | | | | | | | | | | | |
| | | | | | | | | | | | | | | 34,481,549 | |
| | | | | | | | | | | | | | | | |
| | | | Toys/Games/Hobbies—0.7% | | | | | | | | | |
| | 7,625,000 | | | Mattel, Inc. | | | 2.350 | | | | 08/15/2021 | | | | 6,900,625 | |
| | | | | | | | | | | | | | | | |
| | | | Total Corporate Bonds
(Cost $951,241,066) | | | | | | | | | | | 935,318,862 | |
| | | | | | | | | | | | | | | | |
| | | | |
| | | | | | | | | | | | | | | | |
Number
of Shares | | | | | | | | | | | | |
| | | | Money Market Fund—0.2% | | | | | | | | | |
| | 2,156,582 | | | Invesco Premier U.S. Government Money Portfolio—Institutional Class, 1.83%(c)
(Cost $2,156,582) | | | | | | | | | | | 2,156,582 | |
| | | | | | | | | | | | | | | | |
| | | | Total Investments in Securities
(excluding investments purchased with cash collateral from securities on loan)
(Cost 953,397,648)—98.8% | | | | | | | | | | | 937,475,444 | |
| | | | | | | | | | | | | | | | |
| | | | |
| | | | | | | | | | | | | | | | |
| | | | Investments Purchased with Cash Collateral from Securities on Loan | | | | | | | | | |
| | | | |
| | | | | | | | | | | | | | | | |
| | | | Money Market Fund—5.7% | | | | | | | | | |
| | 53,481,918 | | | Invesco Government & Agency Portfolio—Institutional Class, 1.85%(c)(d)
(Cost $53,481,918) | | | | | | | | | | | 53,481,918 | |
| | | | | | | | | | | | | | | | |
| | | | Total Investments in Securities
(Cost $1,006,879,566)—104.5% | | | | | | | | | | | 990,957,362 | |
| | | | Other assets less liabilities—(4.5)% | | | | | | | | | | | (42,427,516 | ) |
| | | | | | | | | | | | | | | | |
| | | | Net Assets—100.0% | | | | | | | | | | $ | 948,529,846 | |
| | | | | | | | | | | | | | | | |
Investment Abbreviations:
MTN—Medium-Term Note
REIT—Real Estate Investment Trust
Notes to Schedule of Investments:
| (a) | All or a portion of this security was out on loan at August 31, 2018. |
| (b) | Security purchased or received in a transaction exempt from registration under the Securities Act of 1933, as amended (the “1933 Act”). The security may be resold pursuant to an exemption from registration under the 1933 Act, typically to qualified institutional buyers. The aggregate value of these securities at August 31, 2018 was $26,474,647, which represented 2.79% of the Fund’s Net Assets. |
| (c) | The security and the Fund are advised by wholly-owned subsidiaries of Invesco Ltd. and are therefore considered to be affiliated. The rate shown is the 7-day SEC standardized yield as of August 31, 2018. |
| (d) | The security has been segregated to satisfy the commitment to return the cash collateral received in securities lending transactions upon the borrower’s return of the securities loaned. See Note 2J. |
See accompanying Notes to Financial Statements which are an integral part of the financial statements.
Schedule of Investments
Invesco Fundamental Investment Grade Corporate Bond ETF (PFIG)
August 31, 2018
| | | | | | | | | | | | | | | | |
Principal
Amount | | | | | Interest
Rate | | | Maturity
Date | | | Value | |
| | | | Corporate Bonds—99.1% | | | | | | | | | |
| | | | Advertising—0.4% | | | | | | | | | |
| $ | 100,000 | | | Interpublic Group of Cos., Inc. (The) | | | 3.750 | % | | | 02/15/2023 | | | $ | 98,684 | |
| | 50,000 | | | Interpublic Group of Cos., Inc. (The) | | | 4.200 | | | | 04/15/2024 | | | | 50,116 | |
| | 157,000 | | | Omnicom Group, Inc./Omnicom Capital, Inc. | | | 3.625 | | | | 05/01/2022 | | | | 156,507 | |
| | 100,000 | | | Omnicom Group, Inc./Omnicom Capital, Inc. | | | 3.600 | | | | 04/15/2026 | | | | 96,701 | |
| | | | | | | | | | | | | | | | |
| | | | | | | | | | | | | | | 402,008 | |
| | | | | | | | | | | | | | | | |
| | | | Aerospace/Defense—2.7% | | | | | | | | | |
| | 525,000 | | | Boeing Co. (The) | | | 4.875 | | | | 02/15/2020 | | | | 541,804 | |
| | 150,000 | | | General Dynamics Corp. | | | 3.000 | | | | 05/11/2021 | | | | 149,783 | |
| | 175,000 | | | General Dynamics Corp. | | | 2.625 | | | | 11/15/2027 | | | | 163,073 | |
| | 125,000 | | | Harris Corp. | | | 4.400 | | | | 06/15/2028 | | | | 127,255 | |
| | 75,000 | | | L3 Technologies, Inc. | | | 3.850 | | | | 06/15/2023 | | | | 75,557 | |
| | 100,000 | | | L3 Technologies, Inc. | | | 3.850 | | | | 12/15/2026 | | | | 97,454 | |
| | 190,000 | | | Lockheed Martin Corp. | | | 2.500 | | | | 11/23/2020 | | | | 187,889 | |
| | 218,000 | | | Lockheed Martin Corp. | | | 3.550 | | | | 01/15/2026 | | | | 217,062 | |
| | 152,000 | | | Northrop Grumman Corp. | | | 2.550 | | | | 10/15/2022 | | | | 147,473 | |
| | 150,000 | | | Northrop Grumman Corp. | | | 3.250 | | | | 01/15/2028 | | | | 142,561 | |
| | 327,000 | | | Raytheon Co. | | | 2.500 | | | | 12/15/2022 | | | | 319,354 | |
| | 100,000 | | | Rockwell Collins, Inc. | | | 2.800 | | | | 03/15/2022 | | | | 97,728 | |
| | 100,000 | | | Rockwell Collins, Inc. | | | 3.500 | | | | 03/15/2027 | | | | 96,033 | |
| | 80,000 | | | Spirit AeroSystems, Inc. | | | 4.600 | | | | 06/15/2028 | | | | 80,581 | |
| | 236,000 | | | United Technologies Corp. | | | 3.100 | | | | 06/01/2022 | | | | 233,258 | |
| | 250,000 | | | United Technologies Corp. | | | 4.125 | | | | 11/16/2028 | | | | 250,626 | |
| | | | | | | | | | | | | | | | |
| | | | | | | | | | | | | | | 2,927,491 | |
| | | | | | | | | | | | | | | | |
| | | | Agriculture—1.7% | | | | | | | | | |
| | 325,000 | | | Altria Group, Inc. | | | 2.850 | | | | 08/09/2022 | | | | 319,255 | |
| | 257,000 | | | Altria Group, Inc. | | | 4.000 | | | | 01/31/2024 | | | | 262,822 | |
| | 367,000 | | | Archer-Daniels-Midland Co. | | | 2.500 | | | | 08/11/2026 | | | | 339,722 | |
| | 135,000 | | | Bunge Ltd. Finance Corp. | | | 8.500 | | | | 06/15/2019 | | | | 140,651 | |
| | 150,000 | | | Bunge Ltd. Finance Corp. | | | 3.250 | | | | 08/15/2026 | | | | 137,373 | |
| | 323,000 | | | Philip Morris International, Inc. | | | 2.500 | | | | 11/02/2022 | | | | 312,436 | |
| | 293,000 | | | Philip Morris International, Inc. | | | 3.250 | | | | 11/10/2024 | | | | 288,498 | |
| | | | | | | | | | | | | | | | |
| | | | | | | | | | | | | | | 1,800,757 | |
| | | | | | | | | | | | | | | | |
| | | | Airlines—0.2% | | | | | | | | | |
| | 237,000 | | | Southwest Airlines Co. | | | 2.650 | | | | 11/05/2020 | | | | 234,493 | |
| | | | | | | | | | | | | | | | |
| | | | Apparel—0.5% | | | | | | | | | |
| | 200,000 | | | NIKE, Inc. | | | 2.250 | | | | 05/01/2023 | | | | 192,413 | |
| | 200,000 | | | NIKE, Inc. | | | 2.375 | | | | 11/01/2026 | | | | 183,678 | |
| | 200,000 | | | VF Corp. | | | 3.500 | | | | 09/01/2021 | | | | 201,415 | |
| | | | | | | | | | | | | | | | |
| | | | | | | | | | | | | | | 577,506 | |
| | | | | | | | | | | | | | | | |
| | | | Auto Manufacturers—1.4% | | | | | | | | | |
| | 310,000 | | | Ford Motor Credit Co. LLC | | | 5.875 | | | | 08/02/2021 | | | | 323,956 | |
| | 300,000 | | | Ford Motor Credit Co. LLC | | | 4.134 | | | | 08/04/2025 | | | | 283,817 | |
| | 300,000 | | | General Motors Co. | | | 4.875 | | | | 10/02/2023 | | | | 307,499 | |
| | 300,000 | | | General Motors Financial Co., Inc. | | | 3.200 | | | | 07/06/2021 | | | | 296,247 | |
| | 250,000 | | | PACCAR Financial Corp., MTN | | | 1.300 | | | | 05/10/2019 | | | | 248,329 | |
| | | | | | | | | | | | | | | | |
| | | | | | | | | | | | | | | 1,459,848 | |
| | | | | | | | | | | | | | | | |
| | | | Auto Parts & Equipment—0.3% | | | | | | | | | |
| | 150,000 | | | BorgWarner, Inc. | | | 3.375 | | | | 03/15/2025 | | | | 146,508 | |
| | 200,000 | | | Lear Corp. | | | 5.250 | | | | 01/15/2025 | | | | 207,774 | |
| | | | | | | | | | | | | | | | |
| | | | | | | | | | | | | | | 354,282 | |
| | | | | | | | | | | | | | | | |
| | | | Banks—10.4% | | | | | | | | | |
| | 503,000 | | | Bank of America Corp., GMTN | | | 3.300 | | | | 01/11/2023 | | | | 499,642 | |
| | 440,000 | | | Bank of America Corp., MTN | | | 4.200 | | | | 08/26/2024 | | | | 442,697 | |
See accompanying Notes to Financial Statements which are an integral part of the financial statements.
Invesco Fundamental Investment Grade Corporate Bond ETF (PFIG) (continued)
August 31, 2018
| | | | | | | | | | | | | | | | |
Principal
Amount | | | | | Interest
Rate | | | Maturity
Date | | | Value | |
| | | | Corporate Bonds (continued) | | | | | | | | | |
| | | | Banks (continued) | | | | | | | | | |
| $ | 219,000 | | | Bank of New York Mellon Corp. (The), MTN | | | 2.200 | % | | | 08/16/2023 | | | $ | 207,062 | |
| | 200,000 | | | Bank of New York Mellon Corp. (The), MTN | | | 3.850 | | | | 04/28/2028 | | | | 203,555 | |
| | 200,000 | | | BB&T Corp., MTN | | | 2.450 | | | | 01/15/2020 | | | | 198,897 | |
| | 150,000 | | | Branch Banking & Trust Co. | | | 3.625 | | | | 09/16/2025 | | | | 148,688 | |
| | 250,000 | | | Capital One Financial Corp. | | | 2.500 | | | | 05/12/2020 | | | | 247,540 | |
| | 250,000 | | | Capital One Financial Corp. | | | 4.200 | | | | 10/29/2025 | | | | 246,532 | |
| | 454,000 | | | Citigroup, Inc. | | | 4.500 | | | | 01/14/2022 | | | | 469,196 | |
| | 450,000 | | | Citigroup, Inc. | | | 4.450 | | | | 09/29/2027 | | | | 446,651 | |
| | 300,000 | | | Citizens Bank NA, MTN | | | 2.450 | | | | 12/04/2019 | | | | 297,341 | |
| | 200,000 | | | Comerica, Inc. | | | 3.700 | | | | 07/31/2023 | | | | 200,853 | |
| | 125,000 | | | Discover Bank | | | 3.450 | | | | 07/27/2026 | | | | 117,853 | |
| | 250,000 | | | Discover Bank, BKNT | | | 3.100 | | | | 06/04/2020 | | | | 249,075 | |
| | 200,000 | | | Fifth Third Bancorp | | | 4.300 | | | | 01/16/2024 | | | | 204,204 | |
| | 100,000 | | | Fifth Third Bank, BKNT | | | 2.250 | | | | 06/14/2021 | | | | 97,645 | |
| | 100,000 | | | First Horizon National Corp. | | | 3.500 | | | | 12/15/2020 | | | | 100,302 | |
| | 250,000 | | | First Republic Bank | | | 2.500 | | | | 06/06/2022 | | | | 242,013 | |
| | 250,000 | | | Goldman Sachs Group, Inc. (The) | | | 5.750 | | | | 01/24/2022 | | | | 267,493 | |
| | 310,000 | | | Goldman Sachs Group, Inc. (The), GMTN | | | 4.000 | | | | 03/03/2024 | | | | 313,190 | |
| | 102,000 | | | Huntington Bancshares, Inc. | | | 3.150 | | | | 03/14/2021 | | | | 101,616 | |
| | 100,000 | | | Huntington Bancshares, Inc. | | | 4.000 | | | | 05/15/2025 | | | | 100,769 | |
| | 575,000 | | | JPMorgan Chase & Co. | | | 4.500 | | | | 01/24/2022 | | | | 596,456 | |
| | 610,000 | | | JPMorgan Chase & Co. | | | 2.950 | | | | 10/01/2026 | | | | 571,920 | |
| | 200,000 | | | KeyBank NA | | | 3.300 | | | | 06/01/2025 | | | | 195,071 | |
| | 125,000 | | | KeyCorp, MTN | | | 5.100 | | | | 03/24/2021 | | | | 130,714 | |
| | 100,000 | | | Manufacturers & Traders Trust Co. | | | 2.900 | | | | 02/06/2025 | | | | 96,429 | |
| | 200,000 | | | Manufacturers & Traders Trust Co., BKNT | | | 2.300 | | | | 01/30/2019 | | | | 199,823 | |
| | 300,000 | | | Morgan Stanley, GMTN | | | 2.750 | | | | 05/19/2022 | | | | 292,763 | |
| | 250,000 | | | Morgan Stanley, Series F, GMTN | | | 3.875 | | | | 04/29/2024 | | | | 251,587 | |
| | 100,000 | | | Northern Trust Corp. | | | 3.450 | | | | 11/04/2020 | | | | 101,041 | |
| | 180,000 | | | Northern Trust Corp. | | | 3.950 | | | | 10/30/2025 | | | | 183,848 | |
| | 250,000 | | | PNC Bank NA, BKNT | | | 2.150 | | | | 04/29/2021 | | | | 243,905 | |
| | 250,000 | | | PNC Bank NA, BKNT | | | 3.100 | | | | 10/25/2027 | | | | 238,634 | |
| | 300,000 | | | Regions Financial Corp. | | | 3.200 | | | | 02/08/2021 | | | | 299,061 | |
| | 181,000 | | | State Street Corp. | | | 2.550 | | | | 08/18/2020 | | | | 179,928 | |
| | 175,000 | | | State Street Corp. | | | 3.550 | | | | 08/18/2025 | | | | 176,174 | |
| | 230,000 | | | SunTrust Bank, BKNT | | | 2.250 | | | | 01/31/2020 | | | | 227,735 | |
| | 150,000 | | | SunTrust Banks, Inc. | | | 4.000 | | | | 05/01/2025 | | | | 151,598 | |
| | 307,000 | | | U.S. Bancorp, Series V, MTN | | | 2.375 | | | | 07/22/2026 | | | | 281,484 | |
| | 250,000 | | | U.S. Bank NA, BKNT | | | 2.125 | | | | 10/28/2019 | | | | 248,541 | |
| | 585,000 | | | Wells Fargo & Co., MTN | | | 2.625 | | | | 07/22/2022 | | | | 566,698 | |
| | 536,000 | | | Wells Fargo & Co. | | | 3.000 | | | | 04/22/2026 | | | | 503,542 | |
| | | | | | | | | | | | | | | | |
| | | | | | | | | | | | | | | 11,139,766 | |
| | | | | | | | | | | | | | | | |
| | | | Beverages—1.6% | | | | | | | | | |
| | 250,000 | | | Coca-Cola Co. (The) | | | 1.650 | | | | 11/01/2018 | | | | 249,638 | |
| | 353,000 | | | Coca-Cola Co. (The) | | | 2.875 | | | | 10/27/2025 | | | | 341,593 | |
| | 81,000 | | | Constellation Brands, Inc. | | | 4.250 | | | | 05/01/2023 | | | | 82,669 | |
| | 100,000 | | | Constellation Brands, Inc. | | | 3.600 | | | | 02/15/2028 | | | | 94,649 | |
| | 100,000 | | | Keurig Dr Pepper, Inc.(a) | | | 4.057 | | | | 05/25/2023 | | | | 100,721 | |
| | 100,000 | | | Keurig Dr Pepper, Inc.(a) | | | 4.597 | | | | 05/25/2028 | | | | 101,691 | |
| | 100,000 | | | Molson Coors Brewing Co. | | | 2.100 | | | | 07/15/2021 | | | | 96,500 | |
| | 100,000 | | | Molson Coors Brewing Co. | | | 3.000 | | | | 07/15/2026 | | | | 92,089 | |
| | 300,000 | | | PepsiCo, Inc. | | | 2.750 | | | | 03/01/2023 | | | | 295,285 | |
| | 300,000 | | | PepsiCo, Inc. | | | 3.000 | | | | 10/15/2027 | | | | 287,862 | |
| | | | | | | | | | | | | | | | |
| | | | | | | | | | | | | | | 1,742,697 | |
| | | | | | | | | | | | | | | | |
| | | | Biotechnology—1.2% | | | | | | | | | |
| | 182,000 | | | Amgen, Inc. | | | 3.875 | | | | 11/15/2021 | | | | 185,505 | |
| | 200,000 | | | Amgen, Inc. | | | 3.625 | | | | 05/22/2024 | | | | 201,450 | |
See accompanying Notes to Financial Statements which are an integral part of the financial statements.
Invesco Fundamental Investment Grade Corporate Bond ETF (PFIG) (continued)
August 31, 2018
| | | | | | | | | | | | | | | | |
Principal
Amount | | | | | Interest
Rate | | | Maturity
Date | | | Value | |
| | | | Corporate Bonds (continued) | | | | | | | | | |
| | | | Biotechnology (continued) | | | | | | | | | |
| $ | 148,000 | | | Biogen, Inc. | | | 2.900 | % | | | 09/15/2020 | | | $ | 147,574 | |
| | 100,000 | | | Biogen, Inc. | | | 4.050 | | | | 09/15/2025 | | | | 101,309 | |
| | 115,000 | | | Celgene Corp. | | | 2.875 | | | | 08/15/2020 | | | | 114,497 | |
| | 100,000 | | | Celgene Corp. | | | 3.875 | | | | 08/15/2025 | | | | 98,765 | |
| | 261,000 | | | Gilead Sciences, Inc. | | | 2.550 | | | | 09/01/2020 | | | | 258,760 | |
| | 209,000 | | | Gilead Sciences, Inc. | | | 3.650 | | | | 03/01/2026 | | | | 207,342 | |
| | | | | | | | | | | | | | | | |
| | | | | | | | | | | | | | | 1,315,202 | |
| | | | | | | | | | | | | | | | |
| | | | Building Materials—0.6% | | | | | | | | | |
| | 133,000 | | | Fortune Brands Home & Security, Inc. | | | 4.000 | | | | 06/15/2025 | | | | 132,782 | |
| | 262,000 | | | Johnson Controls International PLC | | | 3.900 | | | | 02/14/2026 | | | | 260,695 | |
| | 100,000 | | | Martin Marietta Materials, Inc. | | | 3.500 | | | | 12/15/2027 | | | | 93,041 | |
| | 140,000 | | | Masco Corp. | | | 4.375 | | | | 04/01/2026 | | | | 140,456 | |
| | | | | | | | | | | | | | | | |
| | | | | | | | | | | | | | | 626,974 | |
| | | | | | | | | | | | | | | | |
| | | | Chemicals—2.1% | | | | | | | | | |
| | 100,000 | | | Celanese US Holdings LLC | | | 4.625 | | | | 11/15/2022 | | | | 102,847 | |
| | 100,000 | | | Eastman Chemical Co. | | | 3.600 | | | | 08/15/2022 | | | | 100,241 | |
| | 100,000 | | | Eastman Chemical Co. | | | 3.800 | | | | 03/15/2025 | | | | 99,713 | |
| | 450,000 | | | EI du Pont de Nemours & Co. | | | 2.200 | | | | 05/01/2020 | | | | 444,817 | |
| | 200,000 | | | LyondellBasell Industries NV | | | 5.000 | | | | 04/15/2019 | | | | 201,557 | |
| | 200,000 | | | LyondellBasell Industries NV | | | 5.750 | | | | 04/15/2024 | | | | 217,504 | |
| | 100,000 | | | Mosaic Co. (The) | | | 3.250 | | | | 11/15/2022 | | | | 98,247 | |
| | 100,000 | | | Mosaic Co. (The) | | | 4.250 | | | | 11/15/2023 | | | | 101,536 | |
| | 230,000 | | | PPG Industries, Inc. | | | 3.600 | | | | 11/15/2020 | | | | 231,743 | |
| | 100,000 | | | PPG Industries, Inc. | | | 3.750 | | | | 03/15/2028 | | | | 100,155 | |
| | 120,000 | | | Praxair, Inc. | | | 4.500 | | | | 08/15/2019 | | | | 122,061 | |
| | 95,000 | | | Praxair, Inc. | | | 3.200 | | | | 01/30/2026 | | | | 93,506 | |
| | 100,000 | | | Sherwin-Williams Co. (The) | | | 2.250 | | | | 05/15/2020 | | | | 98,684 | |
| | 95,000 | | | Sherwin-Williams Co. (The) | | | 3.450 | | | | 06/01/2027 | | | | 90,731 | |
| | 159,000 | | | Westlake Chemical Corp. | | | 3.600 | | | | 08/15/2026 | | | | 150,649 | |
| | | | | | | | | | | | | | | | |
| | | | | | | | | | | | | | | 2,253,991 | |
| | | | | | | | | | | | | | | | |
| | | | Commercial Services—1.1% | | | | | | | | | |
| | 100,000 | | | Automatic Data Processing, Inc. | | | 2.250 | | | | 09/15/2020 | | | | 98,984 | |
| | 150,000 | | | Automatic Data Processing, Inc. | | | 3.375 | | | | 09/15/2025 | | | | 149,885 | |
| | 100,000 | | | Block Financial LLC | | | 4.125 | | | | 10/01/2020 | | | | 100,996 | |
| | 100,000 | | | Ecolab, Inc. | | | 4.350 | | | | 12/08/2021 | | | | 103,536 | |
| | 100,000 | | | Ecolab, Inc. | | | 2.700 | | | | 11/01/2026 | | | | 93,426 | |
| | 157,000 | | | Equifax, Inc. | | | 3.300 | | | | 12/15/2022 | | | | 154,270 | |
| | 100,000 | | | Total System Services, Inc. | | | 3.800 | | | | 04/01/2021 | | | | 100,763 | |
| | 50,000 | | | Total System Services, Inc. | | | 4.800 | | | | 04/01/2026 | | | | 51,809 | |
| | 125,000 | | | Verisk Analytics, Inc. | | | 4.000 | | | | 06/15/2025 | | | | 124,256 | |
| | 175,000 | | | Western Union Co. (The) | | | 3.600 | | | | 03/15/2022 | | | | 173,828 | |
| | | | | | | | | | | | | | | | |
| | | | | | | | | | | | | | | 1,151,753 | |
| | | | | | | | | | | | | | | | |
| | | | Computers—2.4% | | | | | | | | | |
| | 540,000 | | | Apple, Inc. | | | 2.400 | | | | 05/03/2023 | | | | 522,978 | |
| | 560,000 | | | Apple, Inc. | | | 3.250 | | | | 02/23/2026 | | | | 551,638 | |
| | 179,000 | | | Hewlett Packard Enterprise Co. | | | 3.600 | | | | 10/15/2020 | | | | 180,475 | |
| | 125,000 | | | Hewlett Packard Enterprise Co. | | | 4.900 | | | | 10/15/2025 | | | | 129,101 | |
| | 352,000 | | | HP, Inc. | | | 4.650 | | | | 12/09/2021 | | | | 365,349 | |
| | 350,000 | | | International Business Machines Corp. | | | 1.625 | | | | 05/15/2020 | | | | 343,273 | |
| | 300,000 | | | International Business Machines Corp. | | | 3.625 | | | | 02/12/2024 | | | | 303,727 | |
| | 137,000 | | | NetApp, Inc. | | | 3.375 | | | | 06/15/2021 | | | | 136,086 | |
| | | | | | | | | | | | | | | | |
| | | | | | | | | | | | | | | 2,532,627 | |
| | | | | | | | | | | | | | | | |
| | | | Cosmetics/Personal Care—1.2% | | | | | | | | | |
| | 250,000 | | | Colgate-Palmolive Co., MTN | | | 2.300 | | | | 05/03/2022 | | | | 244,728 | |
| | 100,000 | | | Colgate-Palmolive Co., MTN | | | 3.250 | | | | 03/15/2024 | | | | 100,410 | |
See accompanying Notes to Financial Statements which are an integral part of the financial statements.
Invesco Fundamental Investment Grade Corporate Bond ETF (PFIG) (continued)
August 31, 2018
| | | | | | | | | | | | | | | | |
Principal
Amount | | | | | Interest
Rate | | | Maturity
Date | | | Value | |
| | | | Corporate Bonds (continued) | | | | | | | | | |
| | | | Cosmetics/Personal Care (continued) | | | | | | | | | |
| $ | 100,000 | | | Estee Lauder Cos., Inc. (The) | | | 1.800 | % | | | 02/07/2020 | | | $ | 98,633 | |
| | 100,000 | | | Estee Lauder Cos., Inc. (The) | | | 3.150 | | | | 03/15/2027 | | | | 96,880 | |
| | 376,000 | | | Procter & Gamble Co. (The) | | | 2.150 | | | | 08/11/2022 | | | | 364,634 | |
| | 375,000 | | | Procter & Gamble Co. (The) | | | 2.450 | | | | 11/03/2026 | | | | 349,437 | |
| | | | | | | | | | | | | | | | |
| | | | | | | | | | | | | | | 1,254,722 | |
| | | | | | | | | | | | | | | | |
| | | | Diversified Financial Services��4.1% | | | | | | | | | |
| | 240,000 | | | American Express Co. | | | 2.500 | | | | 08/01/2022 | | | | 231,378 | |
| | 240,000 | | | American Express Credit Corp., MTN | | | 3.300 | | | | 05/03/2027 | | | | 234,661 | |
| | 150,000 | | | Ameriprise Financial, Inc. | | | 5.300 | | | | 03/15/2020 | | | | 155,073 | |
| | 150,000 | | | Ameriprise Financial, Inc. | | | 4.000 | | | | 10/15/2023 | | | | 153,698 | |
| | 220,000 | | | BlackRock, Inc. | | | 3.500 | | | | 03/18/2024 | | | | 222,726 | |
| | 177,000 | | | BlackRock, Inc., Series 2 | | | 5.000 | | | | 12/10/2019 | | | | 182,217 | |
| | 71,000 | | | Cboe Global Markets, Inc. | | | 3.650 | | | | 01/12/2027 | | | | 69,113 | |
| | 170,000 | | | Charles Schwab Corp. (The) | | | 4.450 | | | | 07/22/2020 | | | | 174,637 | |
| | 150,000 | | | Charles Schwab Corp. (The) | | | 3.200 | | | | 03/02/2027 | | | | 145,082 | |
| | 150,000 | | | CME Group, Inc. | | | 3.000 | | | | 09/15/2022 | | | | 148,782 | |
| | 150,000 | | | CME Group, Inc. | | | 3.000 | | | | 03/15/2025 | | | | 146,020 | |
| | 200,000 | | | E*TRADE Financial Corp. | | | 2.950 | | | | 08/24/2022 | | | | 194,762 | |
| | 450,000 | | | GE Capital International Funding Co. Unlimited Co. | | | 2.342 | | | | 11/15/2020 | | | | 440,957 | |
| | 500,000 | | | GE Capital International Funding Co. Unlimited Co. | | | 3.373 | | | | 11/15/2025 | | | | 484,589 | |
| | 100,000 | | | Intercontinental Exchange, Inc. | | | 2.750 | | | | 12/01/2020 | | | | 99,294 | |
| | 150,000 | | | Intercontinental Exchange, Inc. | | | 3.750 | | | | 12/01/2025 | | | | 151,279 | |
| | 119,000 | | | Mastercard, Inc. | | | 2.000 | | | | 11/21/2021 | | | | 115,576 | |
| | 100,000 | | | Mastercard, Inc. | | | 3.375 | | | | 04/01/2024 | | | | 100,511 | |
| | 50,000 | | | Nasdaq, Inc. | | | 5.550 | | | | 01/15/2020 | | | | 51,664 | |
| | 100,000 | | | Nasdaq, Inc. | | | 4.250 | | | | 06/01/2024 | | | | 102,003 | |
| | 200,000 | | | Raymond James Financial, Inc. | | | 3.625 | | | | 09/15/2026 | | | | 193,748 | |
| | 100,000 | | | TD Ameritrade Holding Corp. | | | 2.950 | | | | 04/01/2022 | | | | 98,728 | |
| | 100,000 | | | TD Ameritrade Holding Corp. | | | 3.300 | | | | 04/01/2027 | | | | 96,789 | |
| | 224,000 | | | Visa, Inc. | | | 2.200 | | | | 12/14/2020 | | | | 220,921 | |
| | 180,000 | | | Visa, Inc. | | | 3.150 | | | | 12/14/2025 | | | | 176,525 | |
| | | | | | | | | | | | | | | | |
| | | | | | | | | | | | | | | 4,390,733 | |
| | | | | | | | | | | | | | | | |
| | | | Electric—5.7% | | | | | | | | | |
| | 200,000 | | | American Electric Power Co., Inc. | | | 3.200 | | | | 11/13/2027 | | | | 189,332 | |
| | 150,000 | | | Arizona Public Service Co. | | | 8.750 | | | | 03/01/2019 | | | | 154,322 | |
| | 200,000 | | | Avangrid, Inc. | | | 3.150 | | | | 12/01/2024 | | | | 192,048 | |
| | 256,000 | | | Consolidated Edison Co. of New York, Inc. | | | 7.125 | | | | 12/01/2018 | | | | 258,684 | |
| | 200,000 | | | Consumers Energy Co. | | | 6.700 | | | | 09/15/2019 | | | | 207,942 | |
| | 158,000 | | | Dominion Energy, Inc. | | | 2.579 | | | | 07/01/2020 | | | | 155,916 | |
| | 140,000 | | | Dominion Energy, Inc. | | | 3.900 | | | | 10/01/2025 | | | | 138,059 | |
| | 200,000 | | | DTE Energy Co. | | | 2.850 | | | | 10/01/2026 | | | | 185,735 | |
| | 125,000 | | | DTE Energy Co., Series D | | | 3.700 | | | | 08/01/2023 | | | | 125,915 | |
| | 250,000 | | | Duke Energy Corp. | | | 1.800 | | | | 09/01/2021 | | | | 239,748 | |
| | 277,000 | | | Duke Energy Corp. | | | 2.650 | | | | 09/01/2026 | | | | 252,575 | |
| | 125,000 | | | Entergy Corp. | | | 4.000 | | | | 07/15/2022 | | | | 127,442 | |
| | 106,000 | | | Entergy Corp. | | | 2.950 | | | | 09/01/2026 | | | | 98,298 | |
| | 100,000 | | | Eversource Energy, Series K | | | 2.750 | | | | 03/15/2022 | | | | 98,069 | |
| | 200,000 | | | Exelon Corp. | | | 3.950 | | | | 06/15/2025 | | | | 201,305 | |
| | 200,000 | | | Exelon Generation Co. LLC | | | 2.950 | | | | 01/15/2020 | | | | 199,348 | |
| | 150,000 | | | Interstate Power & Light Co. | | | 3.250 | | | | 12/01/2024 | | | | 147,512 | |
| | 200,000 | | | Nextera Energy Capital Holdings, Inc. | | | 2.800 | | | | 01/15/2023 | | | | 193,888 | |
| | 201,000 | | | Nextera Energy Capital Holdings, Inc. | | | 3.550 | | | | 05/01/2027 | | | | 195,939 | |
| | 100,000 | | | NSTAR Electric Co. | | | 3.200 | | | | 05/15/2027 | | | | 97,057 | |
| | 180,000 | | | Ohio Power Co., Series M | | | 5.375 | | | | 10/01/2021 | | | | 191,649 | |
| | 185,000 | | | Pacific Gas & Electric Co. | | | 3.500 | | | | 10/01/2020 | | | | 185,099 | |
| | 150,000 | | | Pacific Gas & Electric Co. | | | 3.300 | | | | 12/01/2027 | | | | 138,052 | |
See accompanying Notes to Financial Statements which are an integral part of the financial statements.
Invesco Fundamental Investment Grade Corporate Bond ETF (PFIG) (continued)
August 31, 2018
| | | | | | | | | | | | | | | | |
Principal
Amount | | | | | Interest
Rate | | | Maturity
Date | | | Value | |
| | | | Corporate Bonds (continued) | | | | | | | | | |
| | | | Electric (continued) | | | | | | | | | |
| $ | 301,000 | | | PPL Capital Funding, Inc. | | | 3.400 | % | | | 06/01/2023 | | | $ | 295,894 | |
| | 125,000 | | | PPL Capital Funding, Inc. | | | 3.100 | | | | 05/15/2026 | | | | 117,363 | |
| | 275,000 | | | PSEG Power LLC | | | 3.000 | | | | 06/15/2021 | | | | 273,093 | |
| | 126,000 | | | Sempra Energy | | | 2.400 | | | | 03/15/2020 | | | | 124,420 | |
| | 160,000 | | | Sempra Energy | | | 3.400 | | | | 02/01/2028 | | | | 150,791 | |
| | 157,000 | | | Southern California Edison Co. | | | 3.875 | | | | 06/01/2021 | | | | 159,373 | |
| | 124,000 | | | Southern California Edison Co., Series C | | | 3.500 | | | | 10/01/2023 | | | | 124,449 | |
| | 240,000 | | | Southern Co. (The) | | | 2.350 | | | | 07/01/2021 | | | | 233,218 | |
| | 202,000 | | | Southern Co. (The) | | | 3.250 | | | | 07/01/2026 | | | | 190,501 | |
| | 80,000 | | | WEC Energy Group, Inc. | | | 3.375 | | | | 06/15/2021 | | | | 80,369 | |
| | 154,000 | | | WEC Energy Group, Inc. | | | 3.550 | | | | 06/15/2025 | | | | 152,733 | |
| | 118,000 | | | Xcel Energy, Inc. | | | 4.700 | | | | 05/15/2020 | | | | 120,383 | |
| | 100,000 | | | Xcel Energy, Inc. | | | 3.300 | | | | 06/01/2025 | | | | 97,630 | |
| | | | | | | | | | | | | | | | |
| | | | | | | | | | | | | | | 6,094,151 | |
| | | | | | | | | | | | | | | | |
| | | | Electrical Components & Equipment—0.3% | | | | | | | | | |
| | 150,000 | | | Emerson Electric Co. | | | 2.625 | | | | 02/15/2023 | | | | 145,650 | |
| | 200,000 | | | Emerson Electric Co. | | | 3.150 | | | | 06/01/2025 | | | | 194,433 | |
| | | | | | | | | | | | | | | | |
| | | | | | | | | | | | | | | 340,083 | |
| | | | | | | | | | | | | | | | |
| | | | Electronics—1.8% | | | | | | | | | |
| | 100,000 | | | Agilent Technologies, Inc. | | | 3.875 | | | | 07/15/2023 | | | | 100,485 | |
| | 150,000 | | | Amphenol Corp. | | | 2.550 | | | | 01/30/2019 | | | | 149,953 | |
| | 250,000 | | | Arrow Electronics, Inc. | | | 3.875 | | | | 01/12/2028 | | | | 236,745 | |
| | 200,000 | | | Avnet, Inc. | | | 4.625 | | | | 04/15/2026 | | | | 200,339 | |
| | 150,000 | | | Flex Ltd. | | | 5.000 | | | | 02/15/2023 | | | | 155,529 | |
| | 100,000 | | | Flex Ltd. | | | 4.750 | | | | 06/15/2025 | | | | 101,623 | |
| | 100,000 | | | Fortive Corp. | | | 2.350 | | | | 06/15/2021 | | | | 97,240 | |
| | 100,000 | | | Fortive Corp. | | | 3.150 | | | | 06/15/2026 | | | | 94,049 | |
| | 195,000 | | | Honeywell International, Inc. | | | 1.850 | | | | 11/01/2021 | | | | 187,720 | |
| | 200,000 | | | Honeywell International, Inc. | | | 2.500 | | | | 11/01/2026 | | | | 186,309 | |
| | 100,000 | | | Keysight Technologies, Inc. | | | 4.600 | | | | 04/06/2027 | | | | 102,241 | |
| | 100,000 | | | Tech Data Corp. | | | 3.700 | | | | 02/15/2022 | | | | 98,752 | |
| | 111,000 | | | Tech Data Corp. | | | 4.950 | | | | 02/15/2027 | | | | 110,124 | |
| | 75,000 | | | Trimble, Inc. | | | 4.900 | | | | 06/15/2028 | | | | 76,674 | |
| | | | | | | | | | | | | | | | |
| | | | | | | | | | | | | | | 1,897,783 | |
| | | | | | | | | | | | | | | | |
| | | | Engineering & Construction—0.2% | | | | | | | | | |
| | 100,000 | | | Fluor Corp. | | | 3.375 | | | | 09/15/2021 | | | | 101,218 | |
| | 100,000 | | | Fluor Corp. | | | 3.500 | | | | 12/15/2024 | | | | 98,535 | |
| | | | | | | | | | | | | | | | |
| | | | | | | | | | | | | | | 199,753 | |
| | | | | | | | | | | | | | | | |
| | | | Environmental Control—0.5% | | | | | | | | | |
| | 100,000 | | | Republic Services, Inc. | | | 3.550 | | | | 06/01/2022 | | | | 100,644 | |
| | 136,000 | | | Republic Services, Inc. | | | 3.950 | | | | 05/15/2028 | | | | 136,963 | |
| | 100,000 | | | Waste Management, Inc. | | | 4.750 | | | | 06/30/2020 | | | | 103,241 | |
| | 200,000 | | | Waste Management, Inc. | | | 3.150 | | | | 11/15/2027 | | | | 191,097 | |
| | | | | | | | | | | | | | | | |
| | | | | | | | | | | | | | | 531,945 | |
| | | | | | | | | | | | | | | | |
| | | | Food—3.1% | | | | | | | | | |
| | 100,000 | | | Campbell Soup Co. | | | 3.650 | | | | 03/15/2023 | | | | 97,915 | |
| | 100,000 | | | Campbell Soup Co. | | | 4.150 | | | | 03/15/2028 | | | | 96,581 | |
| | 197,000 | | | Conagra Brands, Inc. | | | 3.200 | | | | 01/25/2023 | | | | 191,764 | |
| | 200,000 | | | General Mills, Inc. | | | 3.150 | | | | 12/15/2021 | | | | 198,815 | |
| | 150,000 | | | General Mills, Inc. | | | 3.200 | | | | 02/10/2027 | | | | 140,476 | |
| | 100,000 | | | Hershey Co. (The) | | | 3.375 | | | | 05/15/2023 | | | | 100,685 | |
| | 100,000 | | | Hershey Co. (The) | | | 2.300 | | | | 08/15/2026 | | | | 91,399 | |
| | 100,000 | | | JM Smucker Co. (The) | | | 3.500 | | | | 10/15/2021 | | | | 100,463 | |
| | 100,000 | | | JM Smucker Co. (The) | | | 3.500 | | | | 03/15/2025 | | | | 97,289 | |
See accompanying Notes to Financial Statements which are an integral part of the financial statements.
Invesco Fundamental Investment Grade Corporate Bond ETF (PFIG) (continued)
August 31, 2018
| | | | | | | | | | | | | | | | |
Principal
Amount | | | | | Interest
Rate | | | Maturity
Date | | | Value | |
| | | | Corporate Bonds (continued) | | | | | | | | | |
| | | | Food (continued) | | | | | | | | | |
| $ | 143,000 | | | Kellogg Co. | | | 4.000 | % | | | 12/15/2020 | | | $ | 145,918 | |
| | 150,000 | | | Kellogg Co. | | | 3.250 | | | | 04/01/2026 | | | | 142,693 | |
| | 206,000 | | | Kraft Heinz Foods Co. | | | 3.500 | | | | 06/06/2022 | | | | 205,531 | |
| | 220,000 | | | Kraft Heinz Foods Co. | | | 3.950 | | | | 07/15/2025 | | | | 217,005 | |
| | 200,000 | | | Kroger Co. (The) | | | 6.150 | | | | 01/15/2020 | | | | 208,494 | |
| | 200,000 | | | Kroger Co. (The) | | | 2.650 | | | | 10/15/2026 | | | | 180,449 | |
| | 75,000 | | | McCormick & Co., Inc. | | | 2.700 | | | | 08/15/2022 | | | | 73,103 | |
| | 100,000 | | | McCormick & Co., Inc. | | | 3.400 | | | | 08/15/2027 | | | | 96,097 | |
| | 175,000 | | | Mondelez International, Inc. | | | 3.625 | | | | 05/07/2023 | | | | 174,978 | |
| | 200,000 | | | Mondelez International, Inc. | | | 4.000 | | | | 02/01/2024 | | | | 202,668 | |
| | 155,000 | | | Sysco Corp. | | | 2.600 | | | | 10/01/2020 | | | | 153,608 | |
| | 170,000 | | | Sysco Corp. | | | 3.300 | | | | 07/15/2026 | | | | 163,582 | |
| | 147,000 | | | Tyson Foods, Inc. | | | 2.650 | | | | 08/15/2019 | | | | 146,707 | |
| | 100,000 | | | Tyson Foods, Inc. | | | 3.950 | | | | 08/15/2024 | | | | 100,529 | |
| | | | | | | | | | | | | | | | |
| | | | | | | | | | | | | | | 3,326,749 | |
| | | | | | | | | | | | | | | | |
| | | | Forest Products & Paper—0.3% | | | | | | | | | |
| | 150,000 | | | International Paper Co. | | | 4.750 | | | | 02/15/2022 | | | | 155,999 | |
| | 167,000 | | | International Paper Co. | | | 3.000 | | | | 02/15/2027 | | | | 154,952 | |
| | | | | | | | | | | | | | | | |
| | | | | | | | | | | | | | | 310,951 | |
| | | | | | | | | | | | | | | | |
| | | | Gas—0.5% | | | | | | | | | |
| | 100,000 | | | Atmos Energy Corp. | | | 3.000 | | | | 06/15/2027 | | | | 94,952 | |
| | 100,000 | | | CenterPoint Energy Resources Corp. | | | 4.500 | | | | 01/15/2021 | | | | 102,147 | |
| | 100,000 | | | National Fuel Gas Co. | | | 3.750 | | | | 03/01/2023 | | | | 99,292 | |
| | 100,000 | | | NiSource, Inc. | | | 2.650 | | | | 11/17/2022 | | | | 96,570 | |
| | 95,000 | | | NiSource, Inc. | | | 3.490 | | | | 05/15/2027 | | | | 92,002 | |
| | | | | | | | | | | | | | | | |
| | | | | | | | | | | | | | | 484,963 | |
| | | | | | | | | | | | | | | | |
| | | | Hand/Machine Tools—0.2% | | | | | | | | | |
| | 200,000 | | | Stanley Black & Decker, Inc. | | | 2.900 | | | | 11/01/2022 | | | | 196,419 | |
| | | | | | | | | | | | | | | | |
| | | | Healthcare-Products—1.6% | | | | | | | | | |
| | 100,000 | | | Abbott Laboratories | | | 2.900 | | | | 11/30/2021 | | | | 99,013 | |
| | 200,000 | | | Abbott Laboratories | | | 3.750 | | | | 11/30/2026 | | | | 199,485 | |
| | 250,000 | | | Baxter International, Inc. | | | 2.600 | | | | 08/15/2026 | | | | 229,885 | |
| | 100,000 | | | Boston Scientific Corp. | | | 6.000 | | | | 01/15/2020 | | | | 103,915 | |
| | 125,000 | | | Danaher Corp. | | | 2.400 | | | | 09/15/2020 | | | | 123,556 | |
| | 100,000 | | | Danaher Corp. | | | 3.350 | | | | 09/15/2025 | | | | 99,237 | |
| | 150,000 | | | Edwards Lifesciences Corp. | | | 2.875 | | | | 10/15/2018 | | | | 150,067 | |
| | 50,000 | | | Edwards Lifesciences Corp. | | | 4.300 | | | | 06/15/2028 | | | | 50,815 | |
| | 100,000 | | | Stryker Corp. | | | 2.625 | | | | 03/15/2021 | | | | 98,816 | |
| | 150,000 | | | Stryker Corp. | | | 3.500 | | | | 03/15/2026 | | | | 147,381 | |
| | 126,000 | | | Thermo Fisher Scientific, Inc. | | | 4.500 | | | | 03/01/2021 | | | | 129,679 | |
| | 125,000 | | | Thermo Fisher Scientific, Inc. | | | 4.150 | | | | 02/01/2024 | | | | 128,111 | |
| | 79,000 | | | Zimmer Biomet Holdings, Inc. | | | 2.700 | | | | 04/01/2020 | | | | 78,384 | |
| | 100,000 | | | Zimmer Biomet Holdings, Inc. | | | 3.550 | | | | 04/01/2025 | | | | 96,608 | |
| | | | | | | | | | | | | | | | |
| | | | | | | | | | | | | | | 1,734,952 | |
| | | | | | | | | | | | | | | | |
| | | | Healthcare-Services—2.2% | | | | | | | | | |
| | 199,000 | | | Aetna, Inc. | | | 2.800 | | | | 06/15/2023 | | | | 192,116 | |
| | 175,000 | | | Aetna, Inc. | | | 3.500 | | | | 11/15/2024 | | | | 171,787 | |
| | 235,000 | | | Anthem, Inc. | | | 3.125 | | | | 05/15/2022 | | | | 232,088 | |
| | 200,000 | | | Anthem, Inc. | | | 3.650 | | | | 12/01/2027 | | | | 191,010 | |
| | 100,000 | | | Cigna Corp. | | | 4.000 | | | | 02/15/2022 | | | | 101,446 | |
| | 153,000 | | | Cigna Corp. | | | 3.250 | | | | 04/15/2025 | | | | 145,653 | |
| | 150,000 | | | Humana, Inc. | | | 3.150 | | | | 12/01/2022 | | | | 147,754 | |
| | 153,000 | | | Humana, Inc. | | | 3.950 | | | | 03/15/2027 | | | | 151,625 | |
| | 100,000 | | | Laboratory Corp. of America Holdings | | | 4.625 | | | | 11/15/2020 | | | | 102,461 | |
See accompanying Notes to Financial Statements which are an integral part of the financial statements.
Invesco Fundamental Investment Grade Corporate Bond ETF (PFIG) (continued)
August 31, 2018
| | | | | | | | | | | | | | | | |
Principal
Amount | | | | | Interest
Rate | | | Maturity
Date | | | Value | |
| | | | Corporate Bonds (continued) | | | | | | | | | |
| | | | Healthcare-Services (continued) | | | | | | | | | |
| $ | 100,000 | | | Laboratory Corp. of America Holdings | | | 3.600 | % | | | 02/01/2025 | | | $ | 98,164 | |
| | 50,000 | | | Quest Diagnostics, Inc. | | | 4.700 | | | | 04/01/2021 | | | | 51,457 | |
| | 100,000 | | | Quest Diagnostics, Inc. | | | 3.500 | | | | 03/30/2025 | | | | 97,082 | |
| | 332,000 | | | UnitedHealth Group, Inc. | | | 2.700 | | | | 07/15/2020 | | | | 331,173 | |
| | 300,000 | | | UnitedHealth Group, Inc. | | | 3.100 | | | | 03/15/2026 | | | | 290,323 | |
| | | | | | | | | | | | | | | | |
| | | | | | | | | | | | | | | 2,304,139 | |
| | | | | | | | | | | | | | | | |
| | | | Home Builders—0.3% | | | | | | | | | |
| | 150,000 | | | DR Horton, Inc. | | | 4.000 | | | | 02/15/2020 | | | | 151,257 | |
| | 150,000 | | | NVR, Inc. | | | 3.950 | | | | 09/15/2022 | | | | 151,061 | |
| | | | | | | | | | | | | | | | |
| | | | | | | | | | | | | | | 302,318 | |
| | | | | | | | | | | | | | | | |
| | | | Home Furnishings—0.1% | | | | | | | | | |
| | 150,000 | | | Leggett & Platt, Inc. | | | 3.500 | | | | 11/15/2027 | | | | 142,329 | |
| | | | | | | | | | | | | | | | |
| | | | Household Products/Wares—0.2% | | | | | | | | | |
| | 74,000 | | | Clorox Co. (The) | | | 3.050 | | | | 09/15/2022 | | | | 73,463 | |
| | 100,000 | | | Clorox Co. (The) | | | 3.500 | | | | 12/15/2024 | | | | 99,874 | |
| | | | | | | | | | | | | | | | |
| | | | | | | | | | | | | | | 173,337 | |
| | | | | | | | | | | | | | | | |
| | | | Housewares—0.3% | | | | | | | | | |
| | 91,000 | | | Newell Brands, Inc. | | | 3.850 | | | | 04/01/2023 | | | | 89,463 | |
| | 100,000 | | | Newell Brands, Inc. | | | 4.200 | | | | 04/01/2026 | | | | 96,643 | |
| | 100,000 | | | Tupperware Brands Corp. | | | 4.750 | | | | 06/01/2021 | | | | 102,496 | |
| | | | | | | | | | | | | | | | |
| | | | | | | | | | | | | | | 288,602 | |
| | | | | | | | | | | | | | | | |
| | | | Insurance—6.2% | | | | | | | | | |
| | 300,000 | | | Aflac, Inc. | | | 3.625 | | | | 06/15/2023 | | | | 303,006 | |
| | 140,000 | | | Aflac, Inc. | | | 3.625 | | | | 11/15/2024 | | | | 140,340 | |
| | 355,000 | | | Allstate Corp. (The) | | | 3.150 | | | | 06/15/2023 | | | | 352,706 | |
| | 140,000 | | | Allstate Corp. (The) | | | 3.280 | | | | 12/15/2026 | | | | 136,435 | |
| | 200,000 | | | American International Group, Inc. | | | 4.875 | | | | 06/01/2022 | | | | 209,807 | |
| | 300,000 | | | American International Group, Inc. | | | 3.900 | | | | 04/01/2026 | | | | 295,041 | |
| | 429,000 | | | Berkshire Hathaway, Inc. | | | 2.750 | | | | 03/15/2023 | | | | 422,625 | |
| | 511,000 | | | Berkshire Hathaway, Inc. | | | 3.125 | | | | 03/15/2026 | | | | 497,754 | |
| | 350,000 | | | Brighthouse Financial, Inc. | | | 3.700 | | | | 06/22/2027 | | | | 313,304 | |
| | 100,000 | | | Brown & Brown, Inc. | | | 4.200 | | | | 09/15/2024 | | | | 100,217 | |
| | 200,000 | | | Chubb INA Holdings, Inc. | | | 2.300 | | | | 11/03/2020 | | | | 196,966 | |
| | 175,000 | | | Chubb INA Holdings, Inc. | | | 3.350 | | | | 05/03/2026 | | | | 172,138 | |
| | 250,000 | | | Hartford Financial Services Group, Inc. (The) | | | 5.125 | | | | 04/15/2022 | | | | 264,038 | |
| | 300,000 | | | Lincoln National Corp. | | | 3.800 | | | | 03/01/2028 | | | | 292,154 | |
| | 265,000 | | | Loews Corp. | | | 2.625 | | | | 05/15/2023 | | | | 256,413 | |
| | 100,000 | | | Loews Corp. | | | 3.750 | | | | 04/01/2026 | | | | 100,416 | |
| | 130,000 | | | Marsh & McLennan Cos., Inc. | | | 4.800 | | | | 07/15/2021 | | | | 134,778 | |
| | 114,000 | | | Marsh & McLennan Cos., Inc. | | | 3.750 | | | | 03/14/2026 | | | | 114,190 | |
| | 255,000 | | | MetLife, Inc. | | | 4.750 | | | | 02/08/2021 | | | | 263,892 | |
| | 370,000 | | | MetLife, Inc. | | | 3.600 | | | | 04/10/2024 | | | | 372,612 | |
| | 100,000 | | | Old Republic International Corp. | | | 3.875 | | | | 08/26/2026 | | | | 96,967 | |
| | 143,000 | | | Progressive Corp. (The) | | | 3.750 | | | | 08/23/2021 | | | | 145,028 | |
| | 132,000 | | | Progressive Corp. (The) | | | 2.450 | | | | 01/15/2027 | | | | 121,142 | |
| | 300,000 | | | Prudential Financial, Inc., MTN | | | 3.500 | | | | 05/15/2024 | | | | 302,300 | |
| | 300,000 | | | Prudential Financial, Inc., Series D, MTN | | | 7.375 | | | | 06/15/2019 | | | | 310,851 | |
| | 382,000 | | | Travelers Cos., Inc. (The) | | | 3.900 | | | | 11/01/2020 | | | | 388,570 | |
| | 316,000 | | | Voya Financial, Inc. | | | 3.650 | | | | 06/15/2026 | | | | 305,420 | |
| | | | | | | | | | | | | | | | |
| | | | | | | | | | | | | | | 6,609,110 | |
| | | | | | | | | | | | | | | | |
| | | | Internet—1.5% | | | | | | | | | |
| | 288,000 | | | Alphabet, Inc. | | | 3.625 | | | | 05/19/2021 | | | | 294,324 | |
| | 307,000 | | | Alphabet, Inc. | | | 1.998 | | | | 08/15/2026 | | | | 279,684 | |
| | 250,000 | | | Amazon.com, Inc. | | | 1.900 | | | | 08/21/2020 | | | | 245,464 | |
See accompanying Notes to Financial Statements which are an integral part of the financial statements.
Invesco Fundamental Investment Grade Corporate Bond ETF (PFIG) (continued)
August 31, 2018
| | | | | | | | | | | | | | | | |
Principal
Amount | | | | | Interest
Rate | | | Maturity
Date | | | Value | |
| | | | Corporate Bonds (continued) | | | | | | | | | |
| | | | Internet (continued) | | | | | | | | | |
| $ | 250,000 | | | Amazon.com, Inc. | | | 3.150 | % | | | 08/22/2027 | | | $ | 241,943 | |
| | 100,000 | | | Booking Holdings, Inc. | | | 2.750 | | | | 03/15/2023 | | | | 96,463 | |
| | 150,000 | | | Booking Holdings, Inc. | | | 3.600 | | | | 06/01/2026 | | | | 146,945 | |
| | 166,000 | | | eBay, Inc. | | | 2.600 | | | | 07/15/2022 | | | | 161,257 | |
| | 100,000 | | | eBay, Inc. | | | 3.600 | | | | 06/05/2027 | | | | 95,810 | |
| | | | | | | | | | | | | | | | |
| | | | | | | | | | | | | | | 1,561,890 | |
| | | | | | | | | | | | | | | | |
| | | | Iron/Steel—0.4% | | | | | | | | | |
| | 150,000 | | | Nucor Corp. | | | 4.125 | | | | 09/15/2022 | | | | 153,983 | |
| | 100,000 | | | Nucor Corp. | | | 3.950 | | | | 05/01/2028 | | | | 100,643 | |
| | 153,000 | | | Reliance Steel & Aluminum Co. | | | 4.500 | | | | 04/15/2023 | | | | 156,108 | |
| | | | | | | | | | | | | | | | |
| | | | | | | | | | | | | | | 410,734 | |
| | | | | | | | | | | | | | | | |
| | | | Leisure Time—0.4% | | | | | | | | | |
| | 300,000 | | | Carnival Corp. | | | 3.950 | | | | 10/15/2020 | | | | 304,748 | |
| | 150,000 | | | Royal Caribbean Cruises Ltd. | | | 3.700 | | | | 03/15/2028 | | | | 140,824 | |
| | | | | | | | | | | | | | | | |
| | | | | | | | | | | | | | | 445,572 | |
| | | | | | | | | | | | | | | | |
| | | | Lodging—0.2% | | | | | | | | | |
| | 100,000 | | | Marriott International, Inc. | | | 2.300 | | | | 01/15/2022 | | | | 96,545 | |
| | 150,000 | | | Marriott International, Inc., Series R | | | 3.125 | | | | 06/15/2026 | | | | 141,203 | |
| | | | | | | | | | | | | | | | |
| | | | | | | | | | | | | | | 237,748 | |
| | | | | | | | | | | | | | | | |
| | | | Machinery-Construction & Mining—0.4% | | | | | | | | | |
| | 217,000 | | | Caterpillar, Inc. | | | 3.900 | | | | 05/27/2021 | | | | 222,657 | |
| | 247,000 | | | Caterpillar, Inc. | | | 3.400 | | | | 05/15/2024 | | | | 248,612 | |
| | | | | | | | | | | | | | | | |
| | | | | | | | | | | | | | | 471,269 | |
| | | | | | | | | | | | | | | | |
| | | | Machinery-Diversified—1.1% | | | | | | | | | |
| | 227,000 | | | Cummins, Inc. | | | 3.650 | | | | 10/01/2023 | | | | 230,685 | |
| | 189,000 | | | Deere & Co. | | | 2.600 | | | | 06/08/2022 | | | | 185,697 | |
| | 100,000 | | | Flowserve Corp. | | | 3.500 | | | | 09/15/2022 | | | | 97,925 | |
| | 200,000 | | | John Deere Capital Corp., MTN | | | 2.650 | | | | 06/10/2026 | | | | 187,717 | |
| | 100,000 | | | Roper Technologies, Inc. | | | 6.250 | | | | 09/01/2019 | | | | 103,183 | |
| | 75,000 | | | Roper Technologies, Inc. | | | 3.000 | | | | 12/15/2020 | | | | 74,666 | |
| | 100,000 | | | Roper Technologies, Inc. | | | 3.800 | | | | 12/15/2026 | | | | 98,052 | |
| | 100,000 | | | Wabtec Corp. | | | 3.450 | | | | 11/15/2026 | | | | 93,207 | |
| | 100,000 | | | Xylem, Inc. | | | 4.875 | | | | 10/01/2021 | | | | 104,350 | |
| | | | | | | | | | | | | | | | |
| | | | | | | | | | | | | | | 1,175,482 | |
| | | | | | | | | | | | | | | | |
| | | | Media—2.0% | | | | | | | | | |
| | 203,000 | | | 21st Century Fox America, Inc. | | | 3.000 | | | | 09/15/2022 | | | | 200,285 | |
| | 150,000 | | | 21st Century Fox America, Inc. | | | 3.700 | | | | 10/15/2025 | | | | 149,553 | |
| | 151,000 | | | CBS Corp. | | | 3.375 | | | | 03/01/2022 | | | | 149,640 | |
| | 100,000 | | | CBS Corp. | | | 4.000 | | | | 01/15/2026 | | | | 98,014 | |
| | 347,000 | | | Comcast Corp. | | | 3.150 | | | | 03/01/2026 | | | | 331,103 | |
| | 100,000 | | | Discovery Communications LLC | | | 2.950 | | | | 03/20/2023 | | | | 96,286 | |
| | 100,000 | | | Discovery Communications LLC | | | 3.950 | | | | 03/20/2028 | | | | 95,559 | |
| | 275,000 | | | NBCUniversal Media LLC | | | 5.150 | | | | 04/30/2020 | | | | 284,804 | |
| | 120,000 | | | Viacom, Inc. | | | 5.625 | | | | 09/15/2019 | | | | 123,087 | |
| | 109,000 | | | Viacom, Inc. | | | 4.250 | | | | 09/01/2023 | | | | 109,783 | |
| | 250,000 | | | Walt Disney Co. (The), GMTN | | | 2.350 | | | | 12/01/2022 | | | | 241,285 | |
| | 300,000 | | | Walt Disney Co. (The), MTN | | | 2.950 | | | | 06/15/2027 | | | | 287,473 | |
| | | | | | | | | | | | | | | | |
| | | | | | | | | | | | | | | 2,166,872 | |
| | | | | | | | | | | | | | | | |
| | | | Mining—0.2% | | | | | | | | | |
| | 200,000 | | | Newmont Mining Corp. | | | 3.500 | | | | 03/15/2022 | | | | 199,250 | |
| | | | | | | | | | | | | | | | |
| | | | Miscellaneous Manufacturing—1.4% | | | | | | | | | |
| | 200,000 | | | 3M Co., GMTN | | | 2.000 | | | | 06/26/2022 | | | | 193,162 | |
| | 230,000 | | | 3M Co. | | | 2.875 | | | | 10/15/2027 | | | | 219,924 | |
See accompanying Notes to Financial Statements which are an integral part of the financial statements.
Invesco Fundamental Investment Grade Corporate Bond ETF (PFIG) (continued)
August 31, 2018
| | | | | | | | | | | | | | | | |
Principal
Amount | | | | | Interest
Rate | | | Maturity
Date | | | Value | |
| | | | Corporate Bonds (continued) | | | | | | | | | |
| | | | Miscellaneous Manufacturing (continued) | | | | | | | | | |
| $ | 100,000 | | | Carlisle Cos., Inc. | | | 3.750 | % | | | 12/01/2027 | | | $ | 96,667 | |
| | 180,000 | | | Eaton Corp. | | | 2.750 | | | | 11/02/2022 | | | | 175,880 | |
| | 145,000 | | | Eaton Corp. | | | 3.103 | | | | 09/15/2027 | | | | 137,049 | |
| | 140,000 | | | Illinois Tool Works, Inc. | | | 6.250 | | | | 04/01/2019 | | | | 142,839 | |
| | 154,000 | | | Illinois Tool Works, Inc. | | | 2.650 | | | | 11/15/2026 | | | | 144,263 | |
| | 200,000 | | | Ingersoll-Rand Luxembourg Finance SA | | | 3.550 | | | | 11/01/2024 | | | | 197,260 | |
| | 200,000 | | | Parker-Hannifin Corp. | | | 3.250 | | | | 03/01/2027 | | | | 194,806 | |
| | | | | | | | | | | | | | | | |
| | | | | | | | | | | | | | | 1,501,850 | |
| | | | | | | | | | | | | | | | |
| | | | Office/Business Equipment—0.2% | | | | | | | | | |
| | 183,000 | | | Xerox Corp. | | | 4.500 | | | | 05/15/2021 | | | | 184,787 | |
| | | | | | | | | | | | | | | | |
| | | | Oil & Gas—5.8% | | | | | | | | | |
| | 265,000 | | | Andeavor | | | 4.750 | | | | 12/15/2023 | | | | 276,682 | |
| | 150,000 | | | Apache Corp. | | | 3.250 | | | | 04/15/2022 | | | | 148,616 | |
| | 487,000 | | | Chevron Corp. | | | 2.355 | | | | 12/05/2022 | | | | 472,241 | |
| | 450,000 | | | Chevron Corp. | | | 2.954 | | | | 05/16/2026 | | | | 433,279 | |
| | 86,000 | | | Cimarex Energy Co. | | | 4.375 | | | | 06/01/2024 | | | | 87,261 | |
| | 115,000 | | | Concho Resources, Inc. | | | 3.750 | | | | 10/01/2027 | | | | 110,270 | |
| | 500,000 | | | ConocoPhillips Co. | | | 4.950 | | | | 03/15/2026 | | | | 541,813 | |
| | 100,000 | | | EOG Resources, Inc. | | | 2.625 | | | | 03/15/2023 | | | | 96,698 | |
| | 150,000 | | | EOG Resources, Inc. | | | 4.150 | | | | 01/15/2026 | | | | 154,481 | |
| | 100,000 | | | EQT Corp. | | | 4.875 | | | | 11/15/2021 | | | | 103,155 | |
| | 50,000 | | | EQT Corp. | | | 3.900 | | | | 10/01/2027 | | | | 47,151 | |
| | 600,000 | | | Exxon Mobil Corp. | | | 2.222 | | | | 03/01/2021 | | | | 590,919 | |
| | 560,000 | | | Exxon Mobil Corp. | | | 3.043 | | | | 03/01/2026 | | | | 547,328 | |
| | 150,000 | | | Helmerich & Payne International Drilling Co. | | | 4.650 | | | | 03/15/2025 | | | | 155,292 | |
| | 195,000 | | | HollyFrontier Corp. | | | 5.875 | | | | 04/01/2026 | | | | 210,317 | |
| | 181,000 | | | Marathon Petroleum Corp. | | | 5.125 | | | | 03/01/2021 | | | | 188,306 | |
| | 189,000 | | | Marathon Petroleum Corp. | | | 3.625 | | | | 09/15/2024 | | | | 188,102 | |
| | 100,000 | | | Noble Energy, Inc. | | | 4.150 | | | | 12/15/2021 | | | | 101,693 | |
| | 112,000 | | | Noble Energy, Inc. | | | 3.900 | | | | 11/15/2024 | | | | 111,122 | |
| | 225,000 | | | Occidental Petroleum Corp. | | | 2.700 | | | | 02/15/2023 | | | | 219,226 | |
| | 200,000 | | | Occidental Petroleum Corp. | | | 3.400 | | | | 04/15/2026 | | | | 198,417 | |
| | 150,000 | | | Patterson-UTI Energy, Inc.(a) | | | 3.950 | | | | 02/01/2028 | | | | 141,256 | |
| | 450,000 | | | Phillips 66 | | | 3.900 | | | | 03/15/2028 | | | | 447,185 | |
| | 105,000 | | | Pioneer Natural Resources Co. | | | 3.950 | | | | 07/15/2022 | | | | 106,676 | |
| | 50,000 | | | Pioneer Natural Resources Co. | | | 4.450 | | | | 01/15/2026 | | | | 51,696 | |
| | 201,000 | | | Valero Energy Corp. | | | 6.125 | | | | 02/01/2020 | | | | 209,480 | |
| | 235,000 | | | Valero Energy Corp. | | | 3.400 | | | | 09/15/2026 | | | | 224,465 | |
| | | | | | | | | | | | | | | | |
| | | | | | | | | | | | | | | 6,163,127 | |
| | | | | | | | | | | | | | | | |
| | | | Oil & Gas Services—0.9% | | | | | | | | | |
| | 150,000 | | | Halliburton Co. | | | 3.500 | | | | 08/01/2023 | | | | 150,693 | |
| | 167,000 | | | Halliburton Co. | | | 3.800 | | | | 11/15/2025 | | | | 167,044 | |
| | 259,000 | | | National Oilwell Varco, Inc. | | | 2.600 | | | | 12/01/2022 | | | | 248,465 | |
| | 400,000 | | | Schlumberger Investment SA | | | 3.650 | | | | 12/01/2023 | | | | 405,923 | |
| | | | | | | | | | | | | | | | |
| | | | | | | | | | | | | | | 972,125 | |
| | | | | | | | | | | | | | | | |
| | | | Packaging & Containers—0.3% | | | | | | | | | |
| | 100,000 | | | Packaging Corp. of America | | | 2.450 | | | | 12/15/2020 | | | | 98,352 | |
| | 104,000 | | | Packaging Corp. of America | | | 4.500 | | | | 11/01/2023 | | | | 107,976 | |
| | 150,000 | | | WestRock Co.(a) | | | 3.375 | | | | 09/15/2027 | | | | 142,127 | |
| | | | | | | | | | | | | | | | |
| | | | | | | | | | | | | | | 348,455 | |
| | | | | | | | | | | | | | | | |
| | | | Pharmaceuticals—6.0% | | | | | | | | | |
| | 205,000 | | | AbbVie, Inc. | | | 2.500 | | | | 05/14/2020 | | | | 203,006 | |
| | 287,000 | | | AbbVie, Inc. | | | 3.600 | | | | 05/14/2025 | | | | 280,761 | |
| | 161,000 | | | Allergan Funding SCS | | | 3.000 | | | | 03/12/2020 | | | | 160,630 | |
See accompanying Notes to Financial Statements which are an integral part of the financial statements.
Invesco Fundamental Investment Grade Corporate Bond ETF (PFIG) (continued)
August 31, 2018
| | | | | | | | | | | | | | | | |
Principal
Amount | | | | | Interest
Rate | | | Maturity
Date | | | Value | |
| | | | Corporate Bonds (continued) | | | | | | | | | |
| | | | Pharmaceuticals (continued) | | | | | | | | | |
| $ | 150,000 | | | Allergan Funding SCS | | | 3.800 | % | | | 03/15/2025 | | | $ | 148,877 | |
| | 200,000 | | | AmerisourceBergen Corp. | | | 3.500 | | | | 11/15/2021 | | | | 200,956 | |
| | 250,000 | | | AmerisourceBergen Corp. | | | 3.450 | | | | 12/15/2027 | | | | 235,204 | |
| | 153,000 | | | Bristol-Myers Squibb Co. | | | 2.000 | | | | 08/01/2022 | | | | 146,539 | |
| | 200,000 | | | Bristol-Myers Squibb Co. | | | 3.250 | | | | 02/27/2027 | | | | 195,712 | |
| | 215,000 | | | Cardinal Health, Inc. | | | 2.616 | | | | 06/15/2022 | | | | 206,600 | |
| | 200,000 | | | Cardinal Health, Inc. | | | 3.410 | | | | 06/15/2027 | | | | 184,693 | |
| | 300,000 | | | CVS Health Corp. | | | 3.700 | | | | 03/09/2023 | | | | 300,141 | |
| | 300,000 | | | CVS Health Corp. | | | 4.300 | | | | 03/25/2028 | | | | 298,261 | |
| | 200,000 | | | Eli Lilly & Co. | | | 2.350 | | | | 05/15/2022 | | | | 195,701 | |
| | 200,000 | | | Eli Lilly & Co. | | | 2.750 | | | | 06/01/2025 | | | | 192,347 | |
| | 243,000 | | | Express Scripts Holding Co. | | | 4.750 | | | | 11/15/2021 | | | | 251,405 | |
| | 225,000 | | | Express Scripts Holding Co. | | | 3.400 | | | | 03/01/2027 | | | | 208,824 | |
| | 371,000 | | | Johnson & Johnson | | | 2.250 | | | | 03/03/2022 | | | | 363,284 | |
| | 423,000 | | | Johnson & Johnson | | | 2.450 | | | | 03/01/2026 | | | | 400,644 | |
| | 260,000 | | | McKesson Corp. | | | 2.284 | | | | 03/15/2019 | | | | 259,705 | |
| | 200,000 | | | McKesson Corp. | | | 3.796 | | | | 03/15/2024 | | | | 199,329 | |
| | 300,000 | | | Merck & Co., Inc. | | | 2.800 | | | | 05/18/2023 | | | | 295,652 | |
| | 340,000 | | | Merck & Co., Inc. | | | 2.750 | | | | 02/10/2025 | | | | 329,583 | |
| | 121,000 | | | Mylan NV | | | 3.150 | | | | 06/15/2021 | | | | 119,310 | |
| | 100,000 | | | Mylan NV | | | 3.950 | | | | 06/15/2026 | | | | 95,065 | |
| | 350,000 | | | Pfizer, Inc. | | | 2.100 | | | | 05/15/2019 | | | | 349,634 | |
| | 375,000 | | | Pfizer, Inc. | | | 3.000 | | | | 12/15/2026 | | | | 364,592 | |
| | 100,000 | | | Zoetis, Inc. | | | 3.250 | | | | 02/01/2023 | | | | 98,838 | |
| | 100,000 | | | Zoetis, Inc. | | | 3.000 | | | | 09/12/2027 | | | | 93,737 | |
| | | | | | | | | | | | | | | | |
| | | | | | | | | | | | | | | 6,379,030 | |
| | | | | | | | | | | | | | | | |
| | | | Pipelines—1.0% | | | | | | | | | |
| | 100,000 | | | Enable Midstream Partners LP | | | 4.400 | | | | 03/15/2027 | | | | 96,124 | |
| | 183,000 | | | Kinder Morgan, Inc. | | | 3.050 | | | | 12/01/2019 | | | | 183,049 | |
| | 182,000 | | | Kinder Morgan, Inc. | | | 4.300 | | | | 06/01/2025 | | | | 184,035 | |
| | 100,000 | | | ONEOK Partners LP | | | 3.375 | | | | 10/01/2022 | | | | 98,916 | |
| | 100,000 | | | ONEOK, Inc. | | | 4.550 | | | | 07/15/2028 | | | | 101,204 | |
| | 163,000 | | | Williams Cos., Inc. (The) | | | 3.600 | | | | 03/15/2022 | | | | 162,823 | |
| | 184,000 | | | Williams Cos., Inc. (The) | | | 4.300 | | | | 03/04/2024 | | | | 186,941 | |
| | | | | | | | | | | | | | | | |
| | | | | | | | | | | | | | | 1,013,092 | |
| | | | | | | | | | | | | | | | |
| | | | Real Estate—0.5% | | | | | | | | | |
| | 200,000 | | | CBRE Services, Inc. | | | 4.875 | | | | 03/01/2026 | | | | 208,170 | |
| | 200,000 | | | Prologis LP | | | 4.250 | | | | 08/15/2023 | | | | 207,457 | |
| | 100,000 | | | Prologis LP | | | 3.750 | | | | 11/01/2025 | | | | 101,216 | |
| | | | | | | | | | | | | | | | |
| | | | | | | | | | | | | | | 516,843 | |
| | | | | | | | | | | | | | | | |
| | | | REITs—4.6% | | | | | | | | | |
| | 50,000 | | | Alexandria Real Estate Equities, Inc. | | | 3.900 | | | | 06/15/2023 | | | | 50,552 | |
| | 50,000 | | | Alexandria Real Estate Equities, Inc. | | | 3.450 | | | | 04/30/2025 | | | | 48,353 | |
| | 100,000 | | | American Homes 4 Rent LP | | | 4.250 | | | | 02/15/2028 | | | | 97,116 | |
| | 100,000 | | | American Tower Corp. | | | 3.500 | | | | 01/31/2023 | | | | 98,745 | |
| | 125,000 | | | American Tower Corp. | | | 3.375 | | | | 10/15/2026 | | | | 117,557 | |
| | 200,000 | | | AvalonBay Communities, Inc., GMTN | | | 3.450 | | | | 06/01/2025 | | | | 197,029 | |
| | 100,000 | | | Boston Properties LP | | | 4.125 | | | | 05/15/2021 | | | | 102,121 | |
| | 100,000 | | | Boston Properties LP | | | 3.650 | | | | 02/01/2026 | | | | 97,976 | |
| | 50,000 | | | Brixmor Operating Partnership LP | | | 3.875 | | | | 08/15/2022 | | | | 49,984 | |
| | 75,000 | | | Brixmor Operating Partnership LP | | | 3.850 | | | | 02/01/2025 | | | | 73,012 | |
| | 105,000 | | | Crown Castle International Corp. | | | 5.250 | | | | 01/15/2023 | | | | 110,582 | |
| | 150,000 | | | Crown Castle International Corp. | | | 3.650 | | | | 09/01/2027 | | | | 142,276 | |
| | 100,000 | | | Digital Realty Trust LP | | | 3.950 | | | | 07/01/2022 | | | | 101,307 | |
| | 100,000 | | | Digital Realty Trust LP | | | 3.700 | | | | 08/15/2027 | | | | 96,270 | |
| | 100,000 | | | ERP Operating LP | | | 4.625 | | | | 12/15/2021 | | | | 103,740 | |
See accompanying Notes to Financial Statements which are an integral part of the financial statements.
Invesco Fundamental Investment Grade Corporate Bond ETF (PFIG) (continued)
August 31, 2018
| | | | | | | | | | | | | | | | |
Principal
Amount | | | | | Interest
Rate | | | Maturity
Date | | | Value | |
| | | | Corporate Bonds (continued) | | | | | | | | | |
| | | | REITs (continued) | | | | | | | | | |
| $ | 100,000 | | | ERP Operating LP | | | 2.850 | % | | | 11/01/2026 | | | $ | 93,807 | |
| | 150,000 | | | Essex Portfolio LP | | | 3.500 | | | | 04/01/2025 | | | | 146,313 | |
| | 75,000 | | | Hcp, Inc. | | | 4.000 | | | | 12/01/2022 | | | | 75,427 | |
| | 91,000 | | | HCP, Inc. | | | 3.875 | | | | 08/15/2024 | | | | 89,704 | |
| | 100,000 | | | Healthcare Trust of America Holdings LP | | | 3.750 | | | | 07/01/2027 | | | | 95,372 | |
| | 123,000 | | | Hospitality Properties Trust | | | 5.000 | | | | 08/15/2022 | | | | 126,984 | |
| | 200,000 | | | Host Hotels & Resorts LP, Series E | | | 4.000 | | | | 06/15/2025 | | | | 196,406 | |
| | 105,000 | | | Kimco Realty Corp. | | | 3.400 | | | | 11/01/2022 | | | | 103,779 | |
| | 100,000 | | | Kimco Realty Corp. | | | 3.300 | | | | 02/01/2025 | | | | 95,552 | |
| | 50,000 | | | LifeStorage LP | | | 3.500 | | | | 07/01/2026 | | | | 47,054 | |
| | 100,000 | | | Mid-America Apartments LP | | | 3.600 | | | | 06/01/2027 | | | | 96,931 | |
| | 100,000 | | | Omega Healthcare Investors, Inc. | | | 5.250 | | | | 01/15/2026 | | | | 102,458 | |
| | 50,000 | | | OMEGA Healthcare Investors, Inc. | | | 4.375 | | | | 08/01/2023 | | | | 50,065 | |
| | 105,000 | | | Public Storage | | | 2.370 | | | | 09/15/2022 | | | | 101,362 | |
| | 100,000 | | | Public Storage | | | 3.094 | | | | 09/15/2027 | | | | 95,121 | |
| | 61,000 | | | Realty Income Corp. | | | 4.650 | | | | 08/01/2023 | | | | 63,696 | |
| | 75,000 | | | Realty Income Corp. | | | 4.125 | | | | 10/15/2026 | | | | 75,962 | |
| | 112,000 | | | Regency Centers LP | | | 3.600 | | | | 02/01/2027 | | | | 107,984 | |
| | 150,000 | | | Senior Housing Properties Trust | | | 4.750 | | | | 02/15/2028 | | | | 147,447 | |
| | 135,000 | | | Simon Property Group LP | | | 4.375 | | | | 03/01/2021 | | | | 138,700 | |
| | 165,000 | | | Simon Property Group LP | | | 3.375 | | | | 10/01/2024 | �� | | | 163,108 | |
| | 150,000 | | | SL Green Operating Partnership LP | | | 3.250 | | | | 10/15/2022 | | | | 146,448 | |
| | 100,000 | | | Ventas Realty LP | | | 4.400 | | | | 01/15/2029 | | | | 100,999 | |
| | 100,000 | | | Ventas Realty LP/Ventas Capital Corp. | | | 4.250 | | | | 03/01/2022 | | | | 102,240 | |
| | 140,000 | | | VEREIT Operating Partnership LP | | | 4.875 | | | | 06/01/2026 | | | | 142,502 | |
| | 125,000 | | | Washington Prime Group LP | | | 5.950 | | | | 08/15/2024 | | | | 121,386 | |
| | 135,000 | | | Welltower, Inc. | | | 4.125 | | | | 04/01/2019 | | | | 135,572 | |
| | 150,000 | | | Welltower, Inc. | | | 4.000 | | | | 06/01/2025 | | | | 149,062 | |
| | 100,000 | | | Weyerhaeuser Co. | | | 7.375 | | | | 10/01/2019 | | | | 104,549 | |
| | 100,000 | | | Weyerhaeuser Co. | | | 4.625 | | | | 09/15/2023 | | | | 103,680 | |
| | 100,000 | | | WP Carey, Inc. | | | 4.600 | | | | 04/01/2024 | | | | 101,641 | |
| | | | | | | | | | | | | | | | |
| | | | | | | | | | | | | | | 4,907,931 | |
| | | | | | | | | | | | | | | | |
| | | | Retail—6.1% | | | | | | | | | |
| | 125,000 | | | Autozone, Inc. | | | 3.750 | | | | 06/01/2027 | | | | 121,574 | |
| | 100,000 | | | AutoZone, Inc. | | | 3.125 | | | | 07/15/2023 | | | | 97,855 | |
| | 246,000 | | | Best Buy Co., Inc. | | | 5.500 | | | | 03/15/2021 | | | | 258,816 | |
| | 250,000 | | | Costco Wholesale Corp. | | | 1.700 | | | | 12/15/2019 | | | | 246,990 | |
| | 250,000 | | | Costco Wholesale Corp. | | | 3.000 | | | | 05/18/2027 | | | | 241,230 | |
| | 150,000 | | | Darden Restaurants, Inc. | | | 3.850 | | | | 05/01/2027 | | | | 146,686 | |
| | 82,000 | | | Dollar General Corp. | | | 3.250 | | | | 04/15/2023 | | | | 80,933 | |
| | 100,000 | | | Dollar General Corp. | | | 3.875 | | | | 04/15/2027 | | | | 98,444 | |
| | 100,000 | | | Dollar Tree, Inc. | | | 3.700 | | | | 05/15/2023 | | | | 99,410 | |
| | 100,000 | | | Dollar Tree, Inc. | | | 4.200 | | | | 05/15/2028 | | | | 98,670 | |
| | 319,000 | | | Home Depot, Inc. (The) | | | 2.625 | | | | 06/01/2022 | | | | 314,661 | |
| | 300,000 | | | Home Depot, Inc. (The) | | | 3.000 | | | | 04/01/2026 | | | | 289,872 | |
| | 250,000 | | | Kohl’s Corp. | | | 4.250 | | | | 07/17/2025 | | | | 251,755 | |
| | 232,000 | | | Lowe’s Cos., Inc. | | | 3.750 | | | | 04/15/2021 | | | | 236,271 | |
| | 187,000 | | | Lowe’s Cos., Inc. | | | 2.500 | | | | 04/15/2026 | | | | 173,030 | |
| | 146,000 | | | Macy’s Retail Holdings, Inc. | | | 2.875 | | | | 02/15/2023 | | | | 138,157 | |
| | 150,000 | | | Macy’s Retail Holdings, Inc. | | | 3.625 | | | | 06/01/2024 | | | | 144,832 | |
| | 250,000 | | | McDonald’s Corp., MTN | | | 2.625 | | | | 01/15/2022 | | | | 245,215 | |
| | 250,000 | | | McDonald’s Corp., MTN | | | 3.700 | | | | 01/30/2026 | | | | 249,423 | |
| | 204,000 | | | Nordstrom, Inc. | | | 4.000 | | | | 10/15/2021 | | | | 206,644 | |
| | 100,000 | | | O’reilly Automotive, Inc. | | | 3.600 | | | | 09/01/2027 | | | | 95,780 | |
| | 100,000 | | | O’Reilly Automotive, Inc. | | | 4.875 | | | | 01/14/2021 | | | | 103,539 | |
| | 150,000 | | | Starbucks Corp. | | | 2.100 | | | | 02/04/2021 | | | | 146,747 | |
| | 200,000 | | | Tapestry, Inc. | | | 4.250 | | | | 04/01/2025 | | | | 198,605 | |
See accompanying Notes to Financial Statements which are an integral part of the financial statements.
Invesco Fundamental Investment Grade Corporate Bond ETF (PFIG) (continued)
August 31, 2018
| | | | | | | | | | | | | | | | |
Principal
Amount | | | | | Interest
Rate | | | Maturity
Date | | | Value | |
| | | | Corporate Bonds (continued) | | | | | | | | | |
| | | | Retail (continued) | | | | | | | | | |
| $ | 244,000 | | | Target Corp. | | | 2.900 | % | | | 01/15/2022 | | | $ | 243,461 | |
| | 200,000 | | | Target Corp. | | | 2.500 | | | | 04/15/2026 | | | | 186,732 | |
| | 118,000 | | | TJX Cos., Inc. (The) | | | 2.750 | | | | 06/15/2021 | | | | 117,248 | |
| | 170,000 | | | TJX Cos., Inc. (The) | | | 2.250 | | | | 09/15/2026 | | | | 155,402 | |
| | 238,000 | | | Walgreens Boots Alliance, Inc. | | | 2.700 | | | | 11/18/2019 | | | | 237,287 | |
| | 213,000 | | | Walgreens Boots Alliance, Inc. | | | 3.800 | | | | 11/18/2024 | | | | 210,976 | |
| | 500,000 | | | Walmart, Inc. | | | 3.400 | | | | 06/26/2023 | | | | 506,576 | |
| | 541,000 | | | Walmart, Inc. | | | 2.650 | | | | 12/15/2024 | | | | 521,397 | |
| | | | | | | | | | | | | | | | |
| | | | | | | | | | | | | | | 6,464,218 | |
| | | | | | | | | | | | | | | | |
| | | | Savings & Loans—0.1% | | | | | | | | | |
| | 150,000 | | | People’s United Financial, Inc. | | | 3.650 | | | | 12/06/2022 | | | | 149,599 | |
| | | | | | | | | | | | | | | | |
| | | | Semiconductors—2.5% | | | | | | | | | |
| | 75,000 | | | Analog Devices, Inc. | | | 2.875 | | | | 06/01/2023 | | | | 72,541 | |
| | 100,000 | | | Analog Devices, Inc. | | | 3.900 | | | | 12/15/2025 | | | | 99,659 | |
| | 100,000 | | | Applied Materials, Inc. | | | 4.300 | | | | 06/15/2021 | | | | 103,565 | |
| | 100,000 | | | Applied Materials, Inc. | | | 3.300 | | | | 04/01/2027 | | | | 97,899 | |
| | 100,000 | | | Broadcom Corp./Broadcom Cayman Finance Ltd. | | | 3.000 | | | | 01/15/2022 | | | | 97,617 | |
| | 121,000 | | | Broadcom Corp./Broadcom Cayman Finance Ltd. | | | 3.875 | | | | 01/15/2027 | | | | 113,406 | |
| | 250,000 | | | Intel Corp. | | | 3.300 | | | | 10/01/2021 | | | | 252,756 | |
| | 333,000 | | | Intel Corp. | | | 3.700 | | | | 07/29/2025 | | | | 337,958 | |
| | 100,000 | | | KLA-Tencor Corp. | | | 4.125 | | | | 11/01/2021 | | | | 101,854 | |
| | 137,000 | | | KLA-Tencor Corp. | | | 4.650 | | | | 11/01/2024 | | | | 142,064 | |
| | 100,000 | | | Lam Research Corp. | | | 2.800 | | | | 06/15/2021 | | | | 98,667 | |
| | 100,000 | | | Maxim Integrated Products, Inc. | | | 3.375 | | | | 03/15/2023 | | | | 98,611 | |
| | 50,000 | | | Maxim Integrated Products, Inc. | | | 3.450 | | | | 06/15/2027 | | | | 47,577 | |
| | 100,000 | | | NVIDIA Corp. | | | 2.200 | | | | 09/16/2021 | | | | 97,362 | |
| | 100,000 | | | NVIDIA Corp. | | | 3.200 | | | | 09/16/2026 | | | | 97,628 | |
| | 200,000 | | | QUALCOMM, Inc. | | | 2.250 | | | | 05/20/2020 | | | | 197,665 | |
| | 250,000 | | | QUALCOMM, Inc. | | | 3.450 | | | | 05/20/2025 | | | | 243,737 | |
| | 180,000 | | | Texas Instruments, Inc. | | | 1.650 | | | | 08/03/2019 | | | | 178,484 | |
| | 150,000 | | | Texas Instruments, Inc. | | | 2.900 | | | | 11/03/2027 | | | | 143,248 | |
| | | | | | | | | | | | | | | | |
| | | | | | | | | | | | | | | 2,622,298 | |
| | | | | | | | | | | | | | | | |
| | | | Shipbuilding—0.1% | | | | | | | | | |
| | 130,000 | | | Huntington Ingalls Industries, Inc. | | | 3.483 | | | | 12/01/2027 | | | | 123,786 | |
| | | | | | | | | | | | | | | | |
| | | | Software—2.8% | | | | | | | | | |
| | 100,000 | | | Activision Blizzard, Inc. | | | 2.300 | | | | 09/15/2021 | | | | 96,951 | |
| | 100,000 | | | Activision Blizzard, Inc. | | | 3.400 | | | | 09/15/2026 | | | | 96,332 | |
| | 100,000 | | | Adobe Systems, Inc. | | | 4.750 | | | | 02/01/2020 | | | | 102,710 | |
| | 50,000 | | | Adobe Systems, Inc. | | | 3.250 | | | | 02/01/2025 | | | | 49,379 | |
| | 100,000 | | | Autodesk, Inc. | | | 3.500 | | | | 06/15/2027 | | | | 93,865 | |
| | 90,000 | | | Broadridge Financial Solutions, Inc. | | | 3.400 | | | | 06/27/2026 | | | | 86,352 | |
| | 150,000 | | | CA, Inc. | | | 5.375 | | | | 12/01/2019 | | | | 153,904 | |
| | 135,000 | | | Electronic Arts, Inc. | | | 3.700 | | | | 03/01/2021 | | | | 136,796 | |
| | 179,000 | | | Fidelity National Information Services, Inc. | | | 3.625 | | | | 10/15/2020 | | | | 180,443 | |
| | 100,000 | | | Fidelity National Information Services, Inc. | | | 3.000 | | | | 08/15/2026 | | | | 93,366 | |
| | 100,000 | | | Fiserv, Inc. | | | 2.700 | | | | 06/01/2020 | | | | 99,198 | |
| | 50,000 | | | Fiserv, Inc. | | | 3.850 | | | | 06/01/2025 | | | | 49,828 | |
| | 406,000 | | | Microsoft Corp. | | | 1.550 | | | | 08/08/2021 | | | | 391,399 | |
| | 450,000 | | | Microsoft Corp. | | | 3.300 | | | | 02/06/2027 | | | | 446,596 | |
| | 274,000 | | | Oracle Corp. | | | 1.900 | | | | 09/15/2021 | | | | 265,344 | |
| | 297,000 | | | Oracle Corp. | | | 2.650 | | | | 07/15/2026 | | | | 277,676 | |
| | 69,000 | | | salesforce.Com, Inc. | | | 3.250 | | | | 04/11/2023 | | | | 68,995 | |
| | 69,000 | | | salesforce.Com, Inc. | | | 3.700 | | | | 04/11/2028 | | | | 69,056 | |
| | 85,000 | | | VMware, Inc. | | | 2.950 | | | | 08/21/2022 | | | | 82,566 | |
| | 100,000 | | | VMware, Inc. | | | 3.900 | | | | 08/21/2027 | | | | 94,918 | |
| | | | | | | | | | | | | | | | |
| | | | | | | | | | | | | | | 2,935,674 | |
| | | | | | | | | | | | | | | | |
See accompanying Notes to Financial Statements which are an integral part of the financial statements.
Invesco Fundamental Investment Grade Corporate Bond ETF (PFIG) (continued)
August 31, 2018
| | | | | | | | | | | | | | | | |
Principal
Amount | | | | | Interest
Rate | | | Maturity
Date | | | Value | |
| | | | Corporate Bonds (continued) | | | | | | | | | |
| | | | Telecommunications—2.6% | | | | | | | | | |
| $ | 520,000 | | | AT&T, Inc. | | | 2.450 | % | | | 06/30/2020 | | | $ | 513,508 | |
| | 507,000 | | | AT&T, Inc. | | | 3.400 | | | | 05/15/2025 | | | | 482,748 | |
| | 296,000 | | | Cisco Systems, Inc. | | | 4.450 | | | | 01/15/2020 | | | | 302,789 | |
| | 321,000 | | | Cisco Systems, Inc. | | | 2.500 | | | | 09/20/2026 | | | | 299,146 | |
| | 100,000 | | | Juniper Networks, Inc. | | | 4.500 | | | | 03/15/2024 | | | | 102,312 | |
| | 100,000 | | | Motorola Solutions, Inc. | | | 3.750 | | | | 05/15/2022 | | | | 99,935 | |
| | 100,000 | | | Motorola Solutions, Inc. | | | 4.000 | | | | 09/01/2024 | | | | 99,157 | |
| | 475,000 | | | Verizon Communications, Inc. | | | 2.946 | | | | 03/15/2022 | | | | 469,074 | |
| | 383,000 | | | Verizon Communications, Inc. | | | 5.150 | | | | 09/15/2023 | | | | 411,410 | |
| | | | | | | | | | | | | | | | |
| | | | | | | | | | | | | | | 2,780,079 | |
| | | | | | | | | | | | | | | | |
| | | | Textiles—0.3% | | | | | | | | | |
| | 100,000 | | | Cintas Corp. No. 2 | | | 3.700 | | | | 04/01/2027 | | | | 99,289 | |
| | 200,000 | | | Mohawk Industries, Inc. | | | 3.850 | | | | 02/01/2023 | | | | 201,570 | |
| | | | | | | | | | | | | | | | |
| | | | | | | | | | | | | | | 300,859 | |
| | | | | | | | | | | | | | | | |
| | | | Toys/Games/Hobbies—0.1% | | | | | | | | | |
| | 150,000 | | | Hasbro, Inc. | | | 3.500 | | | | 09/15/2027 | | | | 140,775 | |
| | | | | | | | | | | | | | | | |
| | | | Transportation—2.0% | | | | | | | | | |
| | 179,000 | | | CH Robinson Worldwide, Inc. | | | 4.200 | | | | 04/15/2028 | | | | 177,891 | |
| | 160,000 | | | CSX Corp. | | | 3.700 | | | | 10/30/2020 | | | | 161,587 | |
| | 167,000 | | | CSX Corp. | | | 3.250 | | | | 06/01/2027 | | | | 159,196 | |
| | 200,000 | | | FedEx Corp. | | | 8.000 | | | | 01/15/2019 | | | | 203,790 | |
| | 200,000 | | | FedEx Corp. | | | 4.000 | | | | 01/15/2024 | | | | 205,103 | |
| | 100,000 | | | Kirby Corp. | | | 4.200 | | | | 03/01/2028 | | | | 99,015 | |
| | 100,000 | | | Norfolk Southern Corp. | | | 3.000 | | | | 04/01/2022 | | | | 99,031 | |
| | 200,000 | | | Norfolk Southern Corp. | | | 2.900 | | | | 06/15/2026 | | | | 189,838 | |
| | 154,000 | | | Union Pacific Corp. | | | 4.163 | | | | 07/15/2022 | | | | 159,172 | |
| | 200,000 | | | Union Pacific Corp. | | | 3.950 | | | | 09/10/2028 | | | | 202,046 | |
| | 250,000 | | | United Parcel Service, Inc. | | | 3.125 | | | | 01/15/2021 | | | | 251,505 | |
| | 250,000 | | | United Parcel Service, Inc. | | | 2.400 | | | | 11/15/2026 | | | | 230,423 | |
| | | | | | | | | | | | | | | | |
| | | | | | | | | | | | | | | 2,138,597 | |
| | | | | | | | | | | | | | | | |
| | | | Water—0.2% | | | | | | | | | |
| | 200,000 | | | American Water Capital Corp. | | | 3.400 | | | | 03/01/2025 | | | | 198,807 | |
| | | | | | | | | | | | | | | | |
| | | | Total Corporate Bonds
(Cost $107,492,951) | | | | | | | | | | | 105,613,183 | |
| | | | | | | | | | | | | | | | |
Number
of Shares | | | | | | | | | | | | |
| | | | Money Market Fund—0.0% | | | | | | | |
| | 37,252 | | | Invesco Premier U.S. Government Money Portfolio—Institutional Class, 1.83%(b)
(Cost $37,252) | | | | | | | | | | | 37,252 | |
| | | | | | | | | | | | | | | | |
| | | | Total Investments in Securities
(Cost $107,530,203)—99.1% | | | | | | | | | | | 105,650,435 | |
| | | | Other assets less liabilities—0.9% | | | | | | | | | | | 969,690 | |
| | | | | | | | | | | | | | | | |
| | | | Net Assets—100.0% | | | | | | | | | | $ | 106,620,125 | |
| | | | | | | | | | | | | | | | |
Investment Abbreviations:
BKNT—Bank Note
GMTN—Global Medium-Term Note
MTN—Medium-Term Note
REIT—Real Estate Investment Trust
Notes to Schedule of Investments:
| (a) | Security purchased or received in a transaction exempt from registration under the Securities Act of 1933, as amended (the “1933 Act”). The security may be resold pursuant to an exemption from registration under the 1933 Act, typically to qualified institutional buyers. The aggregate value of these securities at August 31, 2018 was $485,795, which represented less than 1% of the Fund’s Net Assets. |
| (b) | The security and the Fund are advised by wholly-owned subsidiaries of Invesco Ltd. and are therefore considered to be affiliated. The rate shown is the 7-day SEC standardized yield as of August 31, 2018. |
See accompanying Notes to Financial Statements which are an integral part of the financial statements.
Schedule of Investments
Invesco LadderRite 0-5 Year Corporate Bond ETF (LDRI)
August 31, 2018
| | | | | | | | | | | | | | | | |
Principal
Amount | | | | | Interest
Rate | | | Maturity
Date | | | Value | |
| | | | Corporate Bonds—99.1% | | | | | | | | | |
| | | | Advertising—0.4% | | | | | | | | | |
| $ | 50,000 | | | WPP Finance 2010 (United Kingdom) | | | 4.750 | % | | | 11/21/2021 | | | $ | 51,455 | |
| | | | | | | | | | | | | | | | |
| | | | Aerospace/Defense—1.6% | | | | | | | | | |
| | 100,000 | | | General Dynamics Corp. | | | 2.250 | | | | 11/15/2022 | | | | 96,175 | |
| | 100,000 | | | Lockheed Martin Corp. | | | 2.500 | | | | 11/23/2020 | | | | 98,889 | |
| | | | | | | | | | | | | | | | |
| | | | | | | | | | | | | | | 195,064 | |
| | | | | | | | | | | | | | | | |
| | | | Agriculture—1.3% | | | | | | | | | |
| | 50,000 | | | Philip Morris International, Inc. | | | 4.500 | | | | 03/26/2020 | | | | 51,205 | |
| | 100,000 | | | Reynolds American, Inc. (United Kingdom) | | | 4.000 | | | | 06/12/2022 | | | | 101,342 | |
| | | | | | | | | | | | | | | | |
| | | | | | | | | | | | | | | 152,547 | |
| | | | | | | | | | | | | | | | |
| | | | Auto Manufacturers—3.7% | | | | | | | | | |
| | 100,000 | | | American Honda Finance Corp., MTN | | | 2.000 | | | | 02/14/2020 | | | | 98,821 | |
| | 100,000 | | | General Motors Financial Co., Inc. | | | 3.500 | | | | 07/10/2019 | | | | 100,554 | |
| | 100,000 | | | Toyota Motor Credit Corp., GMTN | | | 1.700 | | | | 02/19/2019 | | | | 99,625 | |
| | 50,000 | | | Toyota Motor Credit Corp., MTN | | | 2.125 | | | | 07/18/2019 | | | | 49,812 | |
| | 100,000 | | | Toyota Motor Credit Corp., MTN | | | 3.300 | | | | 01/12/2022 | | | | 100,600 | |
| | | | | | | | | | | | | | | | |
| | | | | | | | | | | | | | | 449,412 | |
| | | | | | | | | | | | | | | | |
| | | | Banks—31.3% | | | | | | | | | |
| | 100,000 | | | Bank of America Corp., MTN | | | 5.000 | | | | 05/13/2021 | | | | 104,608 | |
| | 100,000 | | | Bank of America Corp., Series L, GMTN | | | 2.600 | | | | 01/15/2019 | | | | 100,017 | |
| | 100,000 | | | Bank of America Corp., MTN | | | 5.625 | | | | 07/01/2020 | | | | 104,470 | |
| | 100,000 | | | Bank of New York Mellon Corp. (The), Series G | | | 2.200 | | | | 05/15/2019 | | | | 99,765 | |
| | 100,000 | | | Bank of Nova Scotia (The) (Canada) | | | 2.350 | | | | 10/21/2020 | | | | 98,468 | |
| | 100,000 | | | BB&T Corp., MTN | | | 2.625 | | | | 06/29/2020 | | | | 99,386 | |
| | 100,000 | | | BNP Paribas SA, BKNT, GMTN (France) | | | 5.000 | | | | 01/15/2021 | | | | 104,066 | |
| | 100,000 | | | Citigroup, Inc. | | | 2.500 | | | | 07/29/2019 | | | | 99,807 | |
| | 100,000 | | | Citigroup, Inc. | | | 2.750 | | | | 04/25/2022 | | | | 97,577 | |
| | 100,000 | | | Citigroup, Inc. | | | 4.050 | | | | 07/30/2022 | | | | 101,219 | |
| | 100,000 | | | Cooperatieve Rabobank UA, GMTN (Netherlands) | | | 3.875 | | | | 02/08/2022 | | | | 101,456 | |
| | 150,000 | | | Credit Suisse AG/New York NY, GMTN (Switzerland) | | | 5.400 | | | | 01/14/2020 | | | | 154,283 | |
| | 100,000 | | | Goldman Sachs Group, Inc. (The) | | | 2.625 | | | | 01/31/2019 | | | | 99,998 | |
| | 100,000 | | | Goldman Sachs Group, Inc. (The) | | | 2.000 | | | | 04/25/2019 | | | | 99,551 | |
| | 100,000 | | | Goldman Sachs Group, Inc. (The) | | | 3.625 | | | | 01/22/2023 | | | | 100,065 | |
| | 200,000 | | | HSBC Holdings PLC (United Kingdom) | | | 2.650 | | | | 01/05/2022 | | | | 194,773 | |
| | 100,000 | | | HSBC USA, Inc. | | | 2.250 | | | | 06/23/2019 | | | | 99,691 | |
| | 100,000 | | | Huntington Bancshares, Inc. | | | 2.300 | | | | 01/14/2022 | | | | 96,351 | |
| | 100,000 | | | JPMorgan Chase & Co. | | | 2.200 | | | | 10/22/2019 | | | | 99,412 | |
| | 100,000 | | | JPMorgan Chase & Co. | | | 4.250 | | | | 10/15/2020 | | | | 102,242 | |
| | 100,000 | | | JPMorgan Chase & Co. | | | 3.250 | | | | 09/23/2022 | | | | 99,600 | |
| | 100,000 | | | JPMorgan Chase & Co. | | | 2.972 | | | | 01/15/2023 | | | | 98,023 | |
| | 100,000 | | | KeyCorp, MTN | | | 2.900 | | | | 09/15/2020 | | | | 99,455 | |
| | 100,000 | | | Morgan Stanley, GMTN | | | 5.625 | | | | 09/23/2019 | | | | 102,829 | |
| | 100,000 | | | Morgan Stanley | | | 2.650 | | | | 01/27/2020 | | | | 99,485 | |
| | 100,000 | | | Morgan Stanley | | | 2.800 | | | | 06/16/2020 | | | | 99,475 | |
| | 100,000 | | | Morgan Stanley, MTN | | | 2.625 | | | | 11/17/2021 | | | | 97,663 | |
| | 100,000 | | | Northern Trust Corp. | | | 3.375 | | | | 08/23/2021 | | | | 100,662 | |
| | 100,000 | | | Royal Bank of Canada, GMTN (Canada) | | | 1.500 | | | | 07/29/2019 | | | | 98,957 | |
| | 100,000 | | | Royal Bank of Scotland Group PLC (United Kingdom) | | | 6.100 | | | | 06/10/2023 | | | | 105,083 | |
| | 100,000 | | | State Street Corp. | | | 4.375 | | | | 03/07/2021 | | | | 103,104 | |
| | 100,000 | | | Sumitomo Mitsui Financial Group, Inc. (Japan) | | | 2.058 | | | | 07/14/2021 | | | | 96,378 | |
| | 100,000 | | | Toronto-Dominion Bank (The), BKNT, GMTN (Canada) | | | 2.125 | | | | 07/02/2019 | | | | 99,586 | |
| | 100,000 | | | U.S. Bancorp, MTN | | | 1.950 | | | | 11/15/2018 | | | | 99,939 | |
| | 100,000 | | | Wells Fargo & Co. | | | 2.125 | | | | 04/22/2019 | | | | 99,721 | |
| | 100,000 | | | Wells Fargo & Co., MTN | | | 2.550 | | | | 12/07/2020 | | | | 98,805 | |
| | 100,000 | | | Wells Fargo & Co., Series M, GMTN | | | 3.450 | | | | 02/13/2023 | | | | 98,674 | |
| | | | | | | | | | | | | | | | |
| | | | | | | | | | | | | | | 3,854,644 | |
| | | | | | | | | | | | | | | | |
See accompanying Notes to Financial Statements which are an integral part of the financial statements.
Invesco LadderRite 0-5 Year Corporate Bond ETF (LDRI) (continued)
August 31, 2018
| | | | | | | | | | | | | | | | |
Principal
Amount | | | | | Interest
Rate | | | Maturity
Date | | | Value | |
| | | | Corporate Bonds (continued) | | | | | | | | | |
| | | | Beverages—2.4% | | | | | | | | | |
| $ | 100,000 | | | Anheuser-Busch InBev Finance, Inc. (Belgium) | | | 3.300 | % | | | 02/01/2023 | | | $ | 99,362 | |
| | 100,000 | | | Coca-Cola Co. (The) | | | 1.650 | | | | 11/01/2018 | | | | 99,855 | |
| | 100,000 | | | PepsiCo, Inc. | | | 3.125 | | | | 11/01/2020 | | | | 100,563 | |
| | | | | | | | | | | | | | | | |
| | | | | | | | | | | | | | | 299,780 | |
| | | | | | | | | | | | | | | | |
| | | | Biotechnology—2.4% | | | | | | | | | |
| | 100,000 | | | Amgen, Inc. | | | 1.850 | | | | 08/19/2021 | | | | 96,355 | |
| | 100,000 | | | Celgene Corp. | | | 3.950 | | | | 10/15/2020 | | | | 101,905 | |
| | 100,000 | | | Gilead Sciences, Inc. | | | 2.550 | | | | 09/01/2020 | | | | 99,141 | |
| | | | | | | | | | | | | | | | |
| | | | | | | | | | | | | | | 297,401 | |
| | | | | | | | | | | | | | | | |
| | | | Chemicals—1.6% | | | | | | | | | |
| | 100,000 | | | Dow Chemical Co. (The) | | | 4.125 | | | | 11/15/2021 | | | | 102,102 | |
| | 100,000 | | | Praxair, Inc. | | | 2.200 | | | | 08/15/2022 | | | | 96,533 | |
| | | | | | | | | | | | | | | | |
| | | | | | | | | | | | | | | 198,635 | |
| | | | | | | | | | | | | | | | |
| | | | Computers—3.3% | | | | | | | | | |
| | 100,000 | | | Apple, Inc. | | | 2.000 | | | | 05/06/2020 | | | | 98,745 | |
| | 100,000 | | | Apple, Inc. | | | 2.400 | | | | 05/03/2023 | | | | 96,848 | |
| | 100,000 | | | Hewlett Packard Enterprise Co. | | | 4.400 | | | | 10/15/2022 | | | | 103,104 | |
| | 100,000 | | | International Business Machines Corp. | | | 8.375 | | | | 11/01/2019 | | | | 106,510 | |
| | | | | | | | | | | | | | | | |
| | | | | | | | | | | | | | | 405,207 | |
| | | | | | | | | | | | | | | | |
| | | | Diversified Financial Services—2.7% | | | | | | | | | |
| | 100,000 | | | Air Lease Corp. | | | 3.875 | | | | 04/01/2021 | | | | 100,746 | |
| | 100,000 | | | American Express Credit Corp., GMTN | | | 2.250 | | | | 08/15/2019 | | | | 99,582 | |
| | 60,000 | | | Jefferies Group LLC | | | 8.500 | | | | 07/15/2019 | | | | 62,814 | |
| | 70,000 | | | National Rural Utilities Cooperative Finance Corp. | | | 10.375 | | | | 11/01/2018 | | | | 70,862 | |
| | | | | | | | | | | | | | | | |
| | | | | | | | | | | | | | | 334,004 | |
| | | | | | | | | | | | | | | | |
| | | | Electric—2.3% | | | | | | | | | |
| | 40,000 | | | Sempra Energy | | | 2.875 | | | | 10/01/2022 | | | | 39,025 | |
| | 50,000 | | | Southern Co. (The) | | | 2.350 | | | | 07/01/2021 | | | | 48,587 | |
| | 100,000 | | | Virginia Electric & Power Co., Series C | | | 2.750 | | | | 03/15/2023 | | | | 97,596 | |
| | 100,000 | | | Xcel Energy, Inc. | | | 4.700 | | | | 05/15/2020 | | | | 102,020 | |
| | | | | | | | | | | | | | | | |
| | | | | | | | | | | | | | | 287,228 | |
| | | | | | | | | | | | | | | | |
| | | | Electrical Components & Equipment—0.8% | | | | | | | | | |
| | 100,000 | | | Emerson Electric Co. | | | 4.875 | | | | 10/15/2019 | | | | 102,226 | |
| | | | | | | | | | | | | | | | |
| | | | Food—2.5% | | | | | | | | | |
| | 60,000 | | | Kraft Heinz Foods Co. | | | 3.500 | | | | 06/06/2022 | | | | 59,863 | |
| | 100,000 | | | Kraft Heinz Foods Co. | | | 3.500 | | | | 07/15/2022 | | | | 99,522 | |
| | 40,000 | | | Kroger Co. (The) | | | 6.150 | | | | 01/15/2020 | | | | 41,699 | |
| | 100,000 | | | Tyson Foods, Inc. | | | 4.500 | | | | 06/15/2022 | | | | 103,145 | |
| | | | | | | | | | | | | | | | |
| | | | | | | | | | | | | | | 304,229 | |
| | | | | | | | | | | | | | | | |
| | | | Healthcare-Products—2.7% | | | | | | | | | |
| | 100,000 | | | Abbott Laboratories | | | 2.000 | | | | 03/15/2020 | | | | 98,607 | |
| | 40,000 | | | Becton Dickinson & Co. | | | 3.250 | | | | 11/12/2020 | | | | 39,967 | |
| | 100,000 | | | Becton Dickinson & Co. | | | 3.125 | | | | 11/08/2021 | | | | 98,959 | |
| | 100,000 | | | Thermo Fisher Scientific, Inc. | | | 3.000 | | | | 04/15/2023 | | | | 97,430 | |
| | | | | | | | | | | | | | | | |
| | | | | | | | | | | | | | | 334,963 | |
| | | | | | | | | | | | | | | | |
| | | | Healthcare-Services—2.0% | | | | | | | | | |
| | 100,000 | | | Anthem, Inc. | | | 4.350 | | | | 08/15/2020 | | | | 102,253 | |
| | 40,000 | | | Anthem, Inc. | | | 3.300 | | | | 01/15/2023 | | | | 39,685 | |
| | 100,000 | | | Laboratory Corp. of America Holdings | | | 3.750 | | | | 08/23/2022 | | | | 100,807 | |
| | | | | | | | | | | | | | | | |
| | | | | | | | | | | | | | | 242,745 | |
| | | | | | | | | | | | | | | | |
| | | | Household Products/Wares—0.8% | | | | | | | | | |
| | 100,000 | | | Clorox Co. (The) | | | 3.050 | | | | 09/15/2022 | | | | 99,274 | |
| | | | | | | | | | | | | | | | |
See accompanying Notes to Financial Statements which are an integral part of the financial statements.
Invesco LadderRite 0-5 Year Corporate Bond ETF (LDRI) (continued)
August 31, 2018
| | | | | | | | | | | | | | | | |
Principal
Amount | | | | | Interest
Rate | | | Maturity
Date | | | Value | |
| | | | Corporate Bonds (continued) | | | | | | | | | |
| | | | Insurance—1.9% | | | | | | | | | |
| $ | 100,000 | | | American International Group, Inc. | | | 6.400 | % | | | 12/15/2020 | | | $ | 106,990 | |
| | 25,000 | | | Berkshire Hathaway, Inc. | | | 2.100 | | | | 08/14/2019 | | | | 24,899 | |
| | 100,000 | | | Chubb INA Holdings, Inc. | | | 2.300 | | | | 11/03/2020 | | | | 98,483 | |
| | | | | | | | | | | | | | | | |
| | | | | | | | | | | | | | | 230,372 | |
| | | | | | | | | | | | | | | | |
| | | | Internet—1.6% | | | | | | | | | |
| | 100,000 | | | Booking Holdings, Inc. | | | 2.750 | | | | 03/15/2023 | | | | 96,463 | |
| | 100,000 | | | Symantec Corp. | | | 4.200 | | | | 09/15/2020 | | | | 100,899 | |
| | | | | | | | | | | | | | | | |
| | | | | | | | | | | | | | | 197,362 | |
| | | | | | | | | | | | | | | | |
| | | | Investment Companies—0.8% | | | | | | | | | |
| | 100,000 | | | Ares Capital Corp. | | | 4.875 | | | | 11/30/2018 | | | | 100,455 | |
| | | | | | | | | | | | | | | | |
| | | | Machinery-Construction & Mining—0.8% | | | | | | | | | |
| | 100,000 | | | Caterpillar Financial Services Corp., MTN | | | 7.150 | | | | 02/15/2019 | | | | 102,056 | |
| | | | | | | | | | | | | | | | |
| | | | Machinery-Diversified—1.6% | | | | | | | | | |
| | 100,000 | | | John Deere Capital Corp., MTN | | | 2.750 | | | | 03/15/2022 | | | | 98,846 | |
| | 100,000 | | | Roper Technologies, Inc. | | | 2.050 | | | | 10/01/2018 | | | | 99,958 | |
| | | | | | | | | | | | | | | | |
| | | | | | | | | | | | | | | 198,804 | |
| | | | | | | | | | | | | | | | |
| | | | Media—2.9% | | | | | | | | | |
| | 60,000 | | | Comcast Corp. | | | 3.125 | | | | 07/15/2022 | | | | 59,642 | |
| | 60,000 | | | NBCUniversal Media LLC | | | 5.150 | | | | 04/30/2020 | | | | 62,139 | |
| | 30,000 | | | Time Warner Cable LLC | | | 8.250 | | | | 04/01/2019 | | | | 30,899 | |
| | 100,000 | | | Walt Disney Co. (The), GMTN | | | 1.850 | | | | 05/30/2019 | | | | 99,416 | |
| | 100,000 | | | Warner Media LLC | | | 4.750 | | | | 03/29/2021 | | | | 103,167 | |
| | | | | | | | | | | | | | | | |
| | | | | | | | | | | | | | | 355,263 | |
| | | | | | | | | | | | | | | | |
| | | | Miscellaneous Manufacturing—1.2% | | | | | | | | | |
| | 50,000 | | | 3M Co., GMTN | | | 2.000 | | | | 08/07/2020 | | | | 49,203 | |
| | 100,000 | | | General Electric Co., GMTN | | | 3.150 | | | | 09/07/2022 | | | | 99,633 | |
| | | | | | | | | | | | | | | | |
| | | | | | | | | | | | | | | 148,836 | |
| | | | | | | | | | | | | | | | |
| | | | Office/Business Equipment—0.8% | | | | | | | | | |
| | 100,000 | | | Pitney Bowes, Inc. | | | 3.625 | | | | 10/01/2021 | | | | 95,313 | |
| | | | | | | | | | | | | | | | |
| | | | Oil & Gas—5.7% | | | | | | | | | |
| | 100,000 | | | BP Capital Markets PLC (United Kingdom) | | | 3.561 | | | | 11/01/2021 | | | | 101,181 | |
| | 100,000 | | | BP Capital Markets PLC (United Kingdom) | | | 3.062 | | | | 03/17/2022 | | | | 99,466 | |
| | 100,000 | | | Chevron Corp. | | | 2.100 | | | | 05/16/2021 | | | | 97,874 | |
| | 100,000 | | | EOG Resources, Inc. | | | 2.450 | | | | 04/01/2020 | | | | 99,089 | |
| | 100,000 | | | Pioneer Natural Resources Co. | | | 3.950 | | | | 07/15/2022 | | | | 101,597 | |
| | 100,000 | | | Shell International Finance BV (Netherlands) | | | 1.375 | | | | 09/12/2019 | | | | 98,716 | |
| | 100,000 | | | Total Capital SA (France) | | | 4.450 | | | | 06/24/2020 | | | | 102,828 | |
| | | | | | | | | | | | | | | | |
| | | | | | | | | | | | | | | 700,751 | |
| | | | | | | | | | | | | | | | |
| | | | Oil & Gas Services—0.3% | | | | | | | | | |
| | 30,000 | | | Halliburton Co. | | | 3.250 | | | | 11/15/2021 | | | | 30,153 | |
| | | | | | | | | | | | | | | | |
| | | | Pharmaceuticals—4.0% | | | | | | | | | |
| | 100,000 | | | AbbVie, Inc. | | | 2.850 | | | | 05/14/2023 | | | | 96,870 | |
| | 100,000 | | | Allergan Finance LLC | | | 3.250 | | | | 10/01/2022 | | | | 98,306 | |
| | 100,000 | | | Allergan Funding SCS | | | 3.450 | | | | 03/15/2022 | | | | 99,352 | |
| | 100,000 | | | AstraZeneca PLC (United Kingdom) | | | 1.950 | | | | 09/18/2019 | | | | 99,211 | |
| | 100,000 | | | CVS Health Corp. | | | 2.800 | | | | 07/20/2020 | | | | 99,366 | |
| | | | | | | | | | | | | | | | |
| | | | | | | | | | | | | | | 493,105 | |
| | | | | | | | | | | | | | | | |
| | | | Pipelines—3.3% | | | | | | | | | |
| | 100,000 | | | Energy Transfer Partners LP | | | 4.650 | | | | 06/01/2021 | | | | 102,686 | |
| | 100,000 | | | Kinder Morgan Energy Partners LP | | | 3.950 | | | | 09/01/2022 | | | | 101,183 | |
| | 100,000 | | | Kinder Morgan, Inc. | | | 3.050 | | | | 12/01/2019 | | | | 100,027 | |
See accompanying Notes to Financial Statements which are an integral part of the financial statements.
Invesco LadderRite 0-5 Year Corporate Bond ETF (LDRI) (continued)
August 31, 2018
| | | | | | | | | | | | | | | | |
Principal
Amount | | | | | Interest
Rate | | | Maturity
Date | | | Value | |
| | | | Corporate Bonds (continued) | | | | | | | | | |
| | | | Pipelines (continued) | | | | | | | | | |
| $ | 100,000 | | | TransCanada PipeLines Ltd. (Canada) | | | 2.500 | % | | | 08/01/2022 | | | $ | 96,542 | |
| | | | | | | | | | | | | | | | |
| | | | | | | | | | | | | | | 400,438 | |
| | | | | | | | | | | | | | | | |
| | | | REITs—2.8% | | | | | | | | | |
| | 50,000 | | | American Tower Corp. | | | 3.400 | | | | 02/15/2019 | | | | 50,105 | |
| | 50,000 | | | American Tower Corp. | | | 3.450 | | | | 09/15/2021 | | | | 50,050 | |
| | 50,000 | | | Boston Properties LP | | | 5.875 | | | | 10/15/2019 | | | | 51,284 | |
| | 100,000 | | | Simon Property Group LP | | | 2.625 | | | | 06/15/2022 | | | | 97,685 | |
| | 100,000 | | | Welltower, Inc. | | | 4.125 | | | | 04/01/2019 | | | | 100,424 | |
| | | | | | | | | | | | | | | | |
| | | | | | | | | | | | | | | 349,548 | |
| | | | | | | | | | | | | | | | |
| | | | Retail—2.0% | | | | | | | | | |
| | 100,000 | | | Home Depot, Inc. (The) | | | 4.400 | | | | 04/01/2021 | | | | 103,642 | |
| | 50,000 | | | Lowe’s Cos., Inc. | | | 3.750 | | | | 04/15/2021 | | | | 50,920 | |
| | 100,000 | | | Macy’s Retail Holdings, Inc. | | | 2.875 | | | | 02/15/2023 | | | | 94,628 | |
| | | | | | | | | | | | | | | | |
| | | | | | | | | | | | | | | 249,190 | |
| | | | | | | | | | | | | | | | |
| | | | Semiconductors—1.6% | | | | | | | | | |
| | 100,000 | | | Applied Materials, Inc. | | | 2.625 | | | | 10/01/2020 | | | | 98,998 | |
| | 100,000 | | | Intel Corp. | | | 3.300 | | | | 10/01/2021 | | | | 101,102 | |
| | | | | | | | | | | | | | | | |
| | | | | | | | | | | | | | | 200,100 | |
| | | | | | | | | | | | | | | | |
| | | | Software—1.2% | | | | | | | | | |
| | 100,000 | | | Oracle Corp. | | | 5.000 | | | | 07/08/2019 | | | | 102,015 | |
| | 50,000 | | | Oracle Corp. | | | 2.500 | | | | 05/15/2022 | | | | 49,003 | |
| | | | | | | | | | | | | | | | |
| | | | | | | | | | | | | | | 151,018 | |
| | | | | | | | | | | | | | | | |
| | | | Telecommunications—4.0% | | | | | | | | | |
| | 75,000 | | | AT&T, Inc. | | | 2.375 | | | | 11/27/2018 | | | | 74,962 | |
| | 75,000 | | | AT&T, Inc. | | | 2.450 | | | | 06/30/2020 | | | | 74,064 | |
| | 100,000 | | | AT&T, Inc. | | | 3.000 | | | | 06/30/2022 | | | | 97,768 | |
| | 100,000 | | | Cisco Systems, Inc. | | | 4.950 | | | | 02/15/2019 | | | | 101,091 | |
| | 40,000 | | | Qwest Corp. | | | 6.750 | | | | 12/01/2021 | | | | 42,952 | |
| | 100,000 | | | Verizon Communications, Inc. | | | 3.000 | | | | 11/01/2021 | | | | 99,491 | |
| | | | | | | | | | | | | | | | |
| | | | | | | | | | | | | | | 490,328 | |
| | | | | | | | | | | | | | | | |
| | | | Transportation— 0.8% | | | | | | | | | |
| | 100,000 | | | Burlington Northern Santa Fe LLC | | | 3.000 | | | | 03/15/2023 | | | | 98,857 | |
| | | | | | | | | | | | | | | | |
| | | | Total Corporate Bonds
(Cost $12,345,442) | | | | | | | | | | | 12,200,763 | |
| | | | | | | | | | | | | | | | |
Number
of Shares | | | | | | | | | | | | |
| | | | Money Market Fund—0.8% | | | | | | | | | |
| | 100,817 | | | Invesco Premier U.S. Government Money Portfolio—Institutional Class, 1.83%(a)
(Cost $100,817) | | | | | | | | | | | 100,817 | |
| | | | | | | | | | | | | | | | |
| | | | Total Investments in Securities
(Cost $12,446,259)—99.9% | | | | | | | | | | | 12,301,580 | |
| | | | Other assets less liabilities—0.1% | | | | | | | | | | | 13,643 | |
| | | | | | | | | | | | | | | | |
| | | | Net Assets—100.0% | | | | | | | | | | $ | 12,315,223 | |
| | | | | | | | | | | | | | | | |
Investment Abbreviations:
BKNT—Bank Note
GMTN—Global Medium-Term Note
MTN—Medium-Term Note
REIT—Real Estate Investment Trust
Notes to Schedule of Investments:
| (a) | The security and the Fund are advised by wholly-owned subsidiaries of Invesco Ltd. and are therefore considered to be affiliated. The rate shown is the 7-day SEC standardized yield as of August 31, 2018. |
See accompanying Notes to Financial Statements which are an integral part of the financial statements.
Schedule of Investments
Invesco National AMT-Free Municipal Bond ETF (PZA)
August 31, 2018
| | | | | | | | | | | | | | | | |
Principal
Amount | | | | | Interest
Rate | | | Maturity
Date | | | Value | |
| | | | Municipal Bonds—98.2% | | | | | | | | | |
| | | | Ad Valorem Property Tax—14.4% | | | | | | | | | |
| $ | 8,000,000 | | | Aldine Texas Independent School District Ref. Ser. 17 PSF-GTD | | | 5.000 | % | | | 02/15/2042 | | | $ | 9,077,040 | |
| | 600,000 | | | Centinela Valley California Union High School District (Election 2010) Ser. 12B AGM | | | 5.000 | | | | 08/01/2050 | | | | 660,642 | |
| | 5,000,000 | | | Chicago Illinois Board of Education Dedicated Ref. Ser. 17B(a) | | | 7.000 | | | | 12/01/2042 | | | | 5,998,800 | |
| | 1,000,000 | | | Chicago Illinois Ser. 17A | | | 6.000 | | | | 01/01/2038 | | | | 1,133,510 | |
| | 10,000,000 | | | City of Hutto Texas (Certificates of Obligation) Ser. 17 AGM | | | 5.000 | | | | 08/01/2057 | | | | 11,195,700 | |
| | 20,000,000 | | | City of Jasper Alabama Ser. 14 BAM | | | 5.000 | | | | 03/01/2044 | | | | 21,872,800 | |
| | 4,955,000 | | | City of New York Ser. 16B-1 | | | 5.000 | | | | 12/01/2041 | | | | 5,615,402 | |
| | 260,000 | | | City of New York Sub.-Ser. 09J-1(b) | | | 5.000 | | | | 05/15/2019 | | | | 266,313 | |
| | 820,000 | | | City of New York Sub.-Ser. 09J-1 | | | 5.000 | | | | 05/15/2036 | | | | 837,548 | |
| | 4,500,000 | | | District of Columbia Ref. Ser. 17A | | | 5.000 | | | | 06/01/2035 | | | | 5,213,385 | |
| | 2,500,000 | | | District of Columbia Ref. Ser. 17A | | | 5.000 | | | | 06/01/2036 | | | | 2,887,975 | |
| | 2,000,000 | | | District of Columbia Ref. Ser. 17A | | | 5.000 | | | | 06/01/2037 | | | | 2,305,400 | |
| | 4,000,000 | | | Honolulu City & County Hawaii Ser. 15A | | | 5.000 | | | | 10/01/2039 | | | | 4,525,360 | |
| | 10,000,000 | | | Jurupa California Unified School District Ser. 17B | | | 4.000 | | | | 08/01/2041 | | | | 10,418,400 | |
| | 2,000,000 | | | King & Snohomish County Washington School District No. 417 Ser. 18 | | | 5.000 | | | | 12/01/2036 | | | | 2,330,040 | |
| | 2,250,000 | | | Klein Texas Independent School District (Schoolhouse) Ser. 17 PSF-GTD | | | 4.000 | | | | 08/01/2046 | | | | 2,320,762 | |
| | 1,255,000 | | | Lackawanna County Pennsylvania Ser. 10B AGM(b) | | | 5.000 | | | | 09/01/2020 | | | | 1,333,877 | |
| | 745,000 | | | Lackawanna County Pennsylvania Ser. 10B AGM | | | 5.000 | | | | 09/01/2035 | | | | 781,363 | |
| | 5,000,000 | | | Lamar Texas Consolidated Independent School District Ser. 18 PSF-GTD | | | 5.000 | | | | 02/15/2043 | | | | 5,665,250 | |
| | 1,650,000 | | | Las Vegas Valley Nevada Water District Ser. 12B | | | 5.000 | | | | 06/01/2042 | | | | 1,793,236 | |
| | 1,610,000 | | | Los Angeles Unified School District (Election 2008) Ser. 16A | | | 5.000 | | | | 07/01/2040 | | | | 1,837,107 | |
| | 5,000,000 | | | Madera California Unified School District Election 2014 Ser. 17 | | | 4.000 | | | | 08/01/2046 | | | | 5,174,250 | |
| | 3,000,000 | | | Marrin California Healthcare District (Election 2013) Ser. 17A | | | 4.000 | | | | 08/01/2047 | | | | 3,130,200 | |
| | 4,210,000 | | | Massachusetts State (Consolidated Loan) Ser. 17A | | | 5.000 | | | | 04/01/2042 | | | | 4,787,654 | |
| | 4,000,000 | | | Massachusetts State Ref. Ser. 15A | | | 5.000 | | | | 07/01/2036 | | | | 4,511,120 | |
| | 7,150,000 | | | Massachusetts State Ser. 16A | | | 5.000 | | | | 03/01/2041 | | | | 7,972,107 | |
| | 5,000,000 | | | Massachusetts State Ser. 16A | | | 5.000 | | | | 03/01/2046 | | | | 5,561,450 | |
| | 5,000,000 | | | Mesquite Texas Independent School District Ser. 18 PSF-GTD | | | 5.000 | | | | 08/15/2048 | | | | 5,682,650 | |
| | 2,000,000 | | | Morgan Hill California Unified School District (Election 2012) Ser. 17B | | | 4.000 | | | | 08/01/2047 | | | | 2,088,360 | |
| | 10,110,000 | | | New York City New York Sub.-Ser. 18F-1 | | | 3.500 | | | | 04/01/2046 | | | | 9,813,272 | |
| | 5,000,000 | | | North Royalton Ohio City School District School Improvement Ser. 17 | | | 5.000 | | | | 12/01/2047 | | | | 5,579,950 | |
| | 10,000,000 | | | Northwest Texas Independent School District (School Building) Ser. 18 PSF-GTD | | | 4.000 | | | | 02/15/2043 | | | | 10,358,200 | |
| | 10,000,000 | | | Oxnard California School District (Election 2016) Ser. 17A BAM | | | 5.000 | | | | 08/01/2045 | | | | 11,426,600 | |
| | 1,000,000 | | | Prosper Texas Independent School District (School Building) Ser. 17 PSF-GTD | | | 5.000 | | | | 02/15/2047 | | | | 1,136,220 | |
| | 500,000 | | | Puerto Rico Commonwealth Public Improvement Ref. Ser. 07A-4 AGM | | | 5.000 | | | | 07/01/2031 | | | | 520,980 | |
| | 7,150,000 | | | Puerto Rico Commonwealth Public Improvement Ref. Ser. 12A AGM | | | 5.000 | | | | 07/01/2035 | | | | 7,772,980 | |
| | 890,000 | | | Reading Pennsylvania School District (State Aid Withholding) Ser. 08 AGM(b) | | | 5.000 | | | | 03/01/2035 | | | | 890,000 | |
| | 2,285,000 | | | Richardson Texas Independent School District (School Building) Ser. 17 PSF-GTD | | | 5.000 | | | | 02/15/2042 | | | | 2,579,696 | |
| | 2,045,000 | | | Rockwall Texas Independent School District (School Building) Ser. 16 PSF-GTD | | | 5.000 | | | | 02/15/2046 | | | | 2,270,359 | |
| | 5,000,000 | | | San Diego California Unified School District (Election 2012) Ser. 17I | | | 4.000 | | | | 07/01/2047 | | | | 5,211,300 | |
| | 12,000,000 | | | San Diego California Unified School District (Election 2012) Ser. 17I | | | 5.000 | | | | 07/01/2047 | | | | 13,898,160 | |
| | 2,000,000 | | | San Francisco California Bay Area Rapid Transit District Election 2016 (Green Bond) Ser. 17A-1 | | | 5.000 | | | | 08/01/2047 | | | | 2,325,800 | |
| | 6,785,000 | | | Sherman Texas Independent School District (School Building) Ser. 18A PSF-GTD | | | 5.000 | | | | 02/15/2045 | | | | 7,803,429 | |
| | 4,000,000 | | | Simi Valley California Unified School District (Election 2016) Ser. 17A | | | 4.000 | | | | 08/01/2046 | | | | 4,182,960 | |
| | 2,000,000 | | | Spring Texas Independent School District (School Building) Ser. 17 PSF-GTD | | | 5.000 | | | | 08/15/2042 | | | | 2,276,300 | |
| | 3,280,000 | | | Texas State (Transportation Commission) Ref. Ser. 14A | | | 5.000 | | | | 10/01/2044 | | | | 3,684,194 | |
| | 2,500,000 | | | Victor Valley California Union High School District (Election 2008) Ser. 09A AGC(b) | | | 5.000 | | | | 08/01/2019 | | | | 2,579,975 | |
| | 1,340,000 | | | Washington State Motor Vehicle Tax (Senior 520 Corridor Program Toll) Ser. 11C | | | 5.000 | | | | 06/01/2041 | | | | 1,433,251 | |
| | 3,000,000 | | | Ysleta Texas Independent School District (School Building) Ser. 16 PSF-GTD | | | 5.000 | | | | 08/15/2045 | | | | 3,393,630 | |
| | 2,500,000 | | | Ysleta Texas Independent School District (School Building) Ser. 17 PSF-GTD | | | 5.000 | | | | 08/15/2047 | | | | 2,811,575 | |
| | | | | | | | | | | | | | | | |
| | | | | | | | | | | | | | | 238,926,532 | |
| | | | | | | | | | | | | | | | |
| | | | Auto Parking Revenue—0.4% | | | | | | | | | |
| | 2,000,000 | | | Miami Beach Florida Parking Rev. Ser. 15 | | | 5.000 | | | | 09/01/2045 | | | | 2,233,140 | |
| | 2,000,000 | | | Miami Florida Special Obligation (Marlins Stadium Project) Ser. 10A AGM | | | 5.250 | | | | 07/01/2035 | | | | 2,112,000 | |
| | 2,500,000 | | | Miami Florida Special Obligation (Marlins Stadium Project) Ser. 10A AGM | | | 5.250 | | | | 07/01/2039 | | | | 2,638,600 | |
| | | | | | | | | | | | | | | | |
| | | | | | | | | | | | | | | 6,983,740 | |
| | | | | | | | | | | | | | | | |
See accompanying Notes to Financial Statements which are an integral part of the financial statements.
Invesco National AMT-Free Municipal Bond ETF (PZA) (continued)
August 31, 2018
| | | | | | | | | | | | | | | | |
Principal
Amount | | | | | Interest
Rate | | | Maturity
Date | | | Value | |
| | | | Municipal Bonds (continued) | | | | | | | | | |
| | | | Charter School Aid—0.5% | | | | | | | | | |
| $ | 8,500,000 | | | Clifton Texas Higher Education Finance Corp. (Idea Public Schools) Rev. Ref. Ser. 17 PSF-GTD | | | 4.000 | % | | | 08/15/2042 | | | $ | 8,705,530 | |
| | | | | | | | | | | | | | | | |
| | | | College & University Revenue—10.0% | | | | | | | | | |
| | 5,000,000 | | | Build New York City Resource Corp. (New York Law School Project) Rev. Ref. Ser. 16 | | | 5.000 | | | | 07/01/2041 | | | | 5,357,000 | |
| | 2,000,000 | | | California State Educational Facilities Auth. (Pepperdine University) Rev. Ref. Ser. 16 | | | 5.000 | | | | 10/01/2046 | | | | 2,269,100 | |
| | 3,000,000 | | | California State Educational Facilities Auth. (Pepperdine University) Rev. Ref. Ser. 16 | | | 5.000 | | | | 10/01/2049 | | | | 3,397,140 | |
| | 1,000,000 | | | California State Municipal Financing Auth. (Pomona College) Rev. Ref. Ser. 17A | | | 5.000 | | | | 01/01/2048 | | | | 1,168,640 | |
| | 1,750,000 | | | California State Municipal Financing Auth. (University of La Verne) Rev. Ref. Ser. 17A | | | 5.000 | | | | 06/01/2043 | | | | 1,964,287 | |
| | 2,500,000 | | | California State University Systemwide Rev. Ref. Ser. 17A | | | 5.000 | | | | 11/01/2038 | | | | 2,905,475 | |
| | 2,500,000 | | | California State University Systemwide Rev. Ref. Ser. 17A | | | 5.000 | | | | 11/01/2042 | | | | 2,886,825 | |
| | 11,310,000 | | | California State University Systemwide Rev. Ref. Ser. 17A | | | 5.000 | | | | 11/01/2047 | | | | 13,013,399 | |
| | 65,000 | | | California State University Systemwide Rev. Ser. 08A AGM | | | 5.000 | | | | 11/01/2039 | | | | 65,033 | |
| | 2,000,000 | | | Colorado State Educational & Cultural Facilities Auth. (University Denver Project) Rev. Ser. 17A | | | 5.000 | | | | 03/01/2047 | | | | 2,248,360 | |
| | 2,000,000 | | | Davie Florida Educational Facilities (Nova Southeastern University Project) Rev. Ref. Ser. 18 | | | 5.000 | | | | 04/01/2048 | | | | 2,202,840 | |
| | 3,500,000 | | | Eastern Michigan University Rev. Ser. 18A AGM | | | 4.000 | | | | 03/01/2044 | | | | 3,541,370 | |
| | 1,105,000 | | | Georgia State Higher Education Facilities Auth. (USG Real Estate III) Rev. Ser. 10A AGC(b) | | | 5.000 | | | | 06/15/2020 | | | | 1,167,963 | |
| | 3,140,000 | | | Georgia State Higher Education Facilities Auth. (USG Real Estate III) Rev. Ser. 10A AGC | | | 5.000 | | | | 06/15/2038 | | | | 3,286,198 | |
| | 1,000,000 | | | Illinois State Finance Auth. Student Housing & Academic Facility (CHF-Chicago LLC-University of Illinois at Chicago Project) Rev. Ser. 17A | | | 5.000 | | | | 02/15/2047 | | | | 1,081,580 | |
| | 1,000,000 | | | Lafayette Louisiana Public Trust Financing Auth. Ragin’ Cajun Facilities (Housing & Parking Project) Rev. Ser. 10 AGM(b) | | | 5.500 | | | | 10/01/2020 | | | | 1,075,550 | |
| | 2,000,000 | | | Louisiana State Local Government Environmental Facilities & Community Development Auth. (LCTCS ACT 360 Project) Ser. 14 | | | 5.000 | | | | 10/01/2039 | | | | 2,225,200 | |
| | 3,500,000 | | | Louisiana State Local Government National Environmental Facilities & Community Development Auth. (Rgain Cajun Facilities, Inc.—Student Housing & Parking Project) Rev. Ser. 18 AGM | | | 5.000 | | | | 10/01/2048 | | | | 3,842,195 | |
| | 875,000 | | | Massachusetts State Development Finance Agency (Boston University) Rev. Ser. 13X | | | 5.000 | | | | 10/01/2048 | | | | 961,074 | |
| | 4,500,000 | | | Massachusetts State Development Financing Agency (Boston University) Rev. Ser. 16BB1 | | | 5.000 | | | | 10/01/2046 | | | | 5,078,925 | |
| | 1,000,000 | | | Minnesota State High Education Facilities Auth. (Bethel University) Rev. Ref. Ser. 17 | | | 5.000 | | | | 05/01/2047 | | | | 1,086,220 | |
| | 500,000 | | | New York State Dormitory Auth. Non State Supported Debt (Columbia University) Rev. Ser. 16A-2 | | | 5.000 | | | | 10/01/2046 | | | | 571,645 | |
| | 3,060,000 | | | New York State Dormitory Auth. Non State Supported Debt (Cornell University) Rev. Ser. 10A | | | 5.000 | | | | 07/01/2035 | | | | 3,226,770 | |
| | 3,000,000 | | | New York State Dormitory Auth. Non State Supported Debt (Icahn School of Medicine at Mount Sinai) Rev. Ref. Ser. 15A | | | 5.000 | | | | 07/01/2035 | | | | 3,338,190 | |
| | 3,235,000 | | | New York State Dormitory Auth. Non State Supported Debt (Icahn School of Medicine at Mount Sinai) Rev. Ref. Ser. 15A | | | 5.000 | | | | 07/01/2040 | | | | 3,572,508 | |
| | 3,500,000 | | | New York State Dormitory Auth. Non State Supported Debt (New School) Rev. Ref. Ser. 15A | | | 5.000 | | | | 07/01/2045 | | | | 3,849,440 | |
| | 2,350,000 | | | New York State Dormitory Auth. Non State Supported Debt (New York University) Rev. Ref. Ser. 15A | | | 5.000 | | | | 07/01/2035 | | | | 2,672,068 | |
| | 1,200,000 | | | New York State Dormitory Auth. Non State Supported Debt (New York University) Rev. Ser. 12A | | | 5.000 | | | | 07/01/2037 | | | | 1,314,636 | |
| | 6,325,000 | | | New York State Dormitory Auth. Non State Supported Debt (State University of New York Dormitory Facilities) Rev. Ref. Ser. 15B | | | 5.000 | | | | 07/01/2045 | | | | 7,070,971 | |
| | 1,000,000 | | | New York State Dormitory Auth. Non State Supported Debt (The New School Project) Rev. Ref. Ser. 16A | | | 5.000 | | | | 07/01/2046 | | | | 1,114,320 | |
| | 750,000 | | | New York State Dormitory Auth. Non State Supported Debt Rev. Ref. Ser. 16A | | | 5.000 | | | | 07/01/2041 | | | | 838,882 | |
| | 5,000,000 | | | New York State Dormitory Auth. Non-State Supported Debt (Columbia University) Rev. Ref. Ser. 18B | | | 5.000 | | | | 10/01/2038 | | | | 5,890,350 | |
| | 3,000,000 | | | North Carolina State Capital Facilities Financing Agency (Duke University) Rev. Ref. Ser. 15 | | | 5.000 | | | | 10/01/2055 | | | | 3,361,440 | |
| | 11,100,000 | | | Ohio State University Ser.14A | | | 5.000 | | | | 12/01/2039 | | | | 12,495,270 | |
| | 1,000,000 | | | Oregon State Facilities Auth. (Reed College Project) Rev. Ref. Ser.17A | | | 5.000 | | | | 07/01/2047 | | | | 1,139,010 | |
| | 2,000,000 | | | Pennsylvania State Higher Educational Facilities Auth. (Trustees University of Pennsylvania) Rev. Ser. 17A | | | 5.000 | | | | 08/15/2046 | | | | 2,266,100 | |
| | 2,710,000 | | | Pennsylvania State University Ser. 10 | | | 5.000 | | | | 03/01/2040 | | | | 2,823,793 | |
| | 1,950,000 | | | Philadelphia Pennsylvania Auth. For Industrial Development (Thomas Jefferson University) Rev. Ref. Ser. 17A | | | 5.000 | | | | 09/01/2042 | | | | 2,161,692 | |
| | 5,000,000 | | | Public Finance Auth. Wisconsin Lease Development (Central District Development Project) Rev. Ser. 16 | | | 5.000 | | | | 03/01/2041 | | | | 5,521,500 | |
| | 2,000,000 | | | Rhode Island State Health & Educational Building Corp. Higher Education Facility (Providence College) Rev. Ser. 17 | | | 5.000 | | | | 11/01/2047 | | | | 2,256,540 | |
| | 3,000,000 | | | Tennessee State School Bond Auth. (Higher Educational Facilities 2nd Program) Ser. 17A | | | 5.000 | | | | 11/01/2042 | | | | 3,471,930 | |
See accompanying Notes to Financial Statements which are an integral part of the financial statements.
Invesco National AMT-Free Municipal Bond ETF (PZA) (continued)
August 31, 2018
| | | | | | | | | | | | | | | | |
Principal
Amount | | | | | Interest
Rate | | | Maturity
Date | | | Value | |
| | | | Municipal Bonds (continued) | | | | | | | | | |
| | | | College & University Revenue (continued) | | | | | | | | | |
| $ | 2,000,000 | | | University of Arkansas Arizona Various Facilities (Fayetteville Campus) Rev. Ser. 17 | | | 5.000 | % | | | 11/01/2047 | | | $ | 2,290,500 | |
| | 1,500,000 | | | University of California (Limited Project) Rev. Ref. Ser. 18O | | | 5.000 | | | | 05/15/2043 | | | | 1,742,460 | |
| | 9,500,000 | | | University of California Rev. Ref. Ser. 16AR | | | 5.000 | | | | 05/15/2046 | | | | 10,845,485 | |
| | 2,000,000 | | | University of Michigan Ref. Ser. 17A | | | 5.000 | | | | 04/01/2042 | | | | 2,308,500 | |
| | 3,100,000 | | | University of Michigan Ref. Ser. 17A | | | 5.000 | | | | 04/01/2047 | | | | 3,557,932 | |
| | 7,515,000 | | | University of Oregon General Rev. Ser. 15A | | | 5.000 | | | | 04/01/2045 | | | | 8,481,805 | |
| | 7,370,000 | | | University of Vermont & State Agricultural College Ser. 09 | | | 5.125 | | | | 10/01/2039 | | | | 7,595,522 | |
| | | | | | | | | | | | | | | | |
| | | | | | | | | | | | | | | 166,603,633 | |
| | | | | | | | | | | | | | | | |
| | | | Electric Power Revenue—3.4% | | | | | | | | | |
| | 2,000,000 | | | American Municipal Power Ohio Inc. (Greenup Hydroelectric Project) Rev. Ser. 16A | | | 5.000 | | | | 02/15/2041 | | | | 2,215,800 | |
| | 2,000,000 | | | American Municipal Power Ohio Inc. (Greenup Hydroelectric Project) Rev. Ser. 16A | | | 5.000 | | | | 02/15/2046 | | | | 2,208,860 | |
| | 10,000,000 | | | City of San Antonio Texas Electric and Gas Rev. Ser. 17 | | | 5.000 | | | | 02/01/2047 | | | | 11,393,300 | |
| | 3,500,000 | | | Grand River Oklahoma Dam Auth. Rev. Ser. 14A | | | 5.000 | | | | 06/01/2039 | | | | 3,915,310 | |
| | 1,150,000 | | | Guam Power Auth. Rev. Ser. 10A AGM(b) | | | 5.000 | | | | 10/01/2020 | | | | 1,225,969 | |
| | 9,835,000 | | | Guam Power Auth. Rev. Ser. 12A AGM | | | 5.000 | | | | 10/01/2030 | | | | 10,749,262 | |
| | 950,000 | | | JEA Florida Electric Systems Rev. Sub.-Ser. 13C | | | 5.000 | | | | 10/01/2037 | | | | 1,034,854 | |
| | 1,300,000 | | | Long Island New York Power Auth. Electric Systems General Rev. Ser. 17 | | | 5.000 | | | | 09/01/2042 | | | | 1,472,848 | |
| | 1,000,000 | | | Long Island New York Power Auth. Electric Systems General Rev. Ser. 17 | | | 5.000 | | | | 09/01/2047 | | | | 1,128,810 | |
| | 2,500,000 | | | Long Island Power Auth. New York Auth. Ref. Ser. 14A | | | 5.000 | | | | 09/01/2039 | | | | 2,773,650 | |
| | 4,200,000 | | | Long Island Power Auth. New York Electric Systems General Rev. Ser. 11A AGM(b) | | | 5.000 | | | | 05/01/2021 | | | | 4,553,724 | |
| | 2,500,000 | | | Los Angeles California Department of Water & Power Rev. Ref. Ser. 15A | | | 5.000 | | | | 07/01/2035 | | | | 2,858,600 | |
| | 1,900,000 | | | Lower Colorado River Texas Auth. Rev. Ref. Ser. 12A | | | 5.000 | | | | 05/15/2039 | | | | 2,048,428 | |
| | 1,000,000 | | | Lower Colorado River Texas Auth. Rev. Ref. Ser. 13 | | | 5.000 | | | | 05/15/2039 | | | | 1,091,050 | |
| | 500,000 | | | Lower Colorado River Texas Auth. Transmission Contract Ref. Ser. 15 | | | 5.000 | | | | 05/15/2040 | | | | 550,660 | |
| | 2,050,000 | | | Municipal Energy Agency of Nebraska Ref. Ser. 09A BHAC(b) | | | 5.375 | | | | 04/01/2019 | | | | 2,094,587 | |
| | 1,000,000 | | | Omaha Nebraska Public Power District Power District Electric Rev. Ref. Ser. 17A | | | 5.000 | | | | 02/01/2042 | | | | 1,154,180 | |
| | 1,000,000 | | | Snohomish County Washington Public Utility District No.1 Electric System Rev. Ser. 15 | | | 5.000 | | | | 12/01/2040 | | | | 1,121,620 | |
| | 3,000,000 | | | Springfield Illinois Electric (Senior Lien) Rev. Ref. Ser. 15 AGM | | | 5.000 | | | | 03/01/2040 | | | | 3,273,750 | |
| | | | | | | | | | | | | | | | |
| | | | | | | | | | | | | | | 56,865,262 | |
| | | | | | | | | | | | | | | | |
| | | | Franchised Tax Business & License Fees—0.3% | | | | | | | | | |
| | 5,000,000 | | | Pennsylvania State Turnpike Commission Oil Franchise Tax Rev. Sub.-Ser. 18B | | | 5.250 | | | | 12/01/2048 | | | | 5,728,700 | |
| | | | | | | | | | | | | | | | |
| | | | Fuel Sales Tax Revenue—0.9% | | | | | | | | | |
| | 3,250,000 | | | Connecticut State Special Tax Obligation (Transportation Infrastructure) Rev. Ser. 14A | | | 5.000 | | | | 09/01/2034 | | | | 3,536,943 | |
| | 2,000,000 | | | Kansas State Department of Transportation Highway Rev. Ser. 15 | | | 5.000 | | | | 09/01/2035 | | | | 2,284,340 | |
| | 5,000,000 | | | Massachusetts State Transportation Fund (Rail Enhancement & Accelerated Bridge Programs) Rev. Ser. 18A | | | 5.250 | | | | 06/01/2043 | | | | 5,929,850 | |
| | 3,000,000 | | | Massachusetts State Transportation Fund (Rail Enhancement Program) Rev. Ser. 15A | | | 5.000 | | | | 06/01/2045 | | | | 3,363,480 | |
| | | | | | | | | | | | | | | | |
| | | | | | | | | | | | | | | 15,114,613 | |
| | | | | | | | | | | | | | | | |
| | | | General Fund—0.6% | | | | | | | | | |
| | 1,000,000 | | | California State Ref. Ser. 17 | | | 4.000 | | | | 08/01/2038 | | | | 1,060,490 | |
| | 3,000,000 | | | California State Ser. 16 | | | 5.000 | | | | 09/01/2046 | | | | 3,432,570 | |
| | 5,000,000 | | | Washington State Ser. 17D | | | 5.000 | | | | 02/01/2038 | | | | 5,702,050 | |
| | | | | | | | | | | | | | | | |
| | | | | | | | | | | | | | | 10,195,110 | |
| | | | | | | | | | | | | | | | |
| | | | Health, Hospital, Nursing Home Revenue—8.2% | | | | | | | | | |
| | 1,000,000 | | | Berks County Pennsylvania Industrial Development Auth. Health System (Tower Health Project) Rev. Ref. Ser. 17 | | | 3.750 | | | | 11/01/2042 | | | | 967,500 | |
| | 650,000 | | | Birmingham Alabama Special Care Facilities Financing Auth. Health Care Facilities (Children’s Hospital) Rev. Ser. 09 AGC(b) | | | 6.000 | | | | 06/01/2019 | | | | 670,806 | |
| | 1,000,000 | | | California State Health Facilities Financing Auth. (Cedars Sinai Medical Center) Rev. Ref. Ser. 16B | | | 5.000 | | | | 08/15/2035 | | | | 1,154,940 | |
| | 500,000 | | | California State Health Facilities Financing Auth. (Children’s Hospital Los Angeles) Rev. Ser. 10A AGM(b) | | | 5.250 | | | | 07/01/2020 | | | | 533,010 | |
| | 3,000,000 | | | California State Health Facilities Financing Auth. (El Camino Hospital) Rev. Ser. 17 | | | 4.000 | | | | 02/01/2042 | | | | 3,055,740 | |
| | 2,250,000 | | | California State Health Facilities Financing Auth. (El Camino Hospital) Rev. Ser. 17 | | | 5.000 | | | | 02/01/2042 | | | | 2,542,815 | |
| | 3,500,000 | | | California State Health Facilities Financing Auth. (Kaiser Permanente) Rev. Sub.-Ser. 17A-2 | | | 5.000 | | | | 11/01/2047 | | | | 4,477,060 | |
See accompanying Notes to Financial Statements which are an integral part of the financial statements.
Invesco National AMT-Free Municipal Bond ETF (PZA) (continued)
August 31, 2018
| | | | | | | | | | | | | | | | |
Principal
Amount | | | | | Interest
Rate | | | Maturity
Date | | | Value | |
| | | | Municipal Bonds (continued) | | | | | | | | | |
| | | | Health, Hospital, Nursing Home Revenue (continued) | | | | | | | | | |
| $ | 8,000,000 | | | California State Health Facilities Financing Auth. (Sutter Health) Rev. Ref. Ser. 16B | | | 5.000 | % | | | 11/15/2046 | | | $ | 9,030,400 | |
| | 4,000,000 | | | California State Municipal Financing Auth. (Community Medical Centers) Ref. Ser. 17A | | | 4.000 | | | | 02/01/2042 | | | | 4,034,040 | |
| | 1,715,000 | | | California State Municipal Financing Auth. (Community Medical Centers) Ref. Ser. 17A | | | 5.000 | | | | 02/01/2042 | | | | 1,899,551 | |
| | 2,500,000 | | | California State Municipal Financing Auth. (Community Medical Centers) Ref. Ser. 17A | | | 5.000 | | | | 02/01/2047 | | | | 2,759,450 | |
| | 1,000,000 | | | California State Municipal Financing Auth. (Northbay Healthcare Group) Rev. Ser. 17A | | | 5.250 | | | | 11/01/2041 | | | | 1,094,210 | |
| | 500,000 | | | California Statewide Communities Development Auth. (John Muir Health) Rev. Ref. Ser. 18A | | | 4.000 | | | | 12/01/2057 | | | | 505,360 | |
| | 1,000,000 | | | Cape Girardeau County Missouri Industrial Development Auth. (Southeasthealth Obligated Group) Ref. Ser. 17A | | | 5.000 | | | | 03/01/2036 | | | | 1,078,840 | |
| | 2,500,000 | | | Cobb County Georgia Kennestone Hospital Auth. Certificates Rev. Sub.-Ser. 05B AMBAC(b) | | | 5.500 | | | | 04/01/2020 | | | | 2,644,325 | |
| | 1,750,000 | | | Colorado State Health Facilities Auth. Hospital (Evangelical Lutheran Good Sam Aritan Society Project) Rev. Ref. Ser. 17 | | | 5.000 | | | | 06/01/2047 | | | | 1,908,900 | |
| | 2,000,000 | | | Gainesville & Hall County Georgia Hospital Auth. (Northeast Georgia Health System, Inc. Project) Ref. Ser. 17B | | | 5.500 | | | | 02/15/2042 | | | | 2,352,560 | |
| | 3,000,000 | | | Glynn-Brunswick Georgia Memorial Hospital Auth. Anticipation Certificates (Southeast Georgia Health Systems Project) Ser. 17 | | | 5.000 | | | | 08/01/2047 | | | | 3,269,730 | |
| | 3,000,000 | | | Gwinnett County Georgia Hospital Auth. RAC (Gwinnett Hospital System) Ser. 07D AGM | | | 5.500 | | | | 07/01/2041 | | | | 3,082,380 | |
| | 4,400,000 | | | Hamilton County Ohio Health Care Facilities (Christ Hospital Project) Rev. Ser. 12 AGM | | | 5.000 | | | | 06/01/2042 | | | | 4,762,340 | |
| | 3,800,000 | | | Harris County Health Facilities Development Corp. Thermal Utility (TECO Project) Rev. Ser. 08 AGC(b) | | | 5.125 | | | | 11/15/2018 | | | | 3,826,828 | |
| | 2,000,000 | | | Hawaii State Department of Budget and Finance Special Purpose (Queens Health Systems) Rev. Ref. Ser. 15A | | | 5.000 | | | | 07/01/2035 | | | | 2,235,880 | |
| | 1,000,000 | | | Illinois Finance Auth. (Carle Foundation) Rev. Ser. 11A AGM | | | 6.000 | | | | 08/15/2041 | | | | 1,096,950 | |
| | 1,000,000 | | | Illinois Finance Auth. (Southern Illinois Healthcare) Rev. Ser. 05 AGM(b) | | | 5.250 | | | | 03/01/2020 | | | | 1,051,970 | |
| | 3,000,000 | | | Indiana State Health & Educational Facilities Financing Auth. (Acension Senior Credit Group Ser. 2006B-7 Remarketed 11/3/16) Rev. Ref. Ser. 06 | | | 5.000 | | | | 11/15/2046 | | | | 3,384,090 | |
| | 1,050,000 | | | Lakeland Florida Hospital Systems (Lakeland Regional Health) Rev. Ser. 15 | | | 5.000 | | | | 11/15/2040 | | | | 1,146,757 | |
| | 1,500,000 | | | Lancaster County Pennsylvania Hospital Auth. (University of Pennsylvania Health System) Ref. Ser. 16 | | | 5.000 | | | | 08/15/2046 | | | | 1,690,305 | |
| | 4,285,000 | | | Louisiana State Local Government Environmental Facilities & Community (Woman’s Hospital Foundation Project) Ref. Ser. 17A | | | 5.000 | | | | 10/01/2041 | | | | 4,742,209 | |
| | 1,000,000 | | | Lynchburg Virginia Economic Development Auth. Hospital (Center Health Obligated Group) Rev. Ref. Ser. 17A | | | 5.000 | | | | 01/01/2047 | | | | 1,111,250 | |
| | 4,750,000 | | | Massachusetts State Development Finance Agency (Dana-Farber Cancer Institute) Rev. Ser. 16N | | | 5.000 | | | | 12/01/2046 | | | | 5,299,100 | |
| | 6,595,000 | | | Medford Oregon Hospital Facilities Auth. (Asanthe Health System) Rev. Ref. Ser. 10 AGM | | | 5.500 | | | | 08/15/2028 | | | | 7,029,083 | |
| | 1,200,000 | | | Medical Center Hospital Auth. Georgia RAC (Columbus Regional Healthcare) Ser. 10 AGM(b) | | | 5.000 | | | | 08/01/2020 | | | | 1,268,808 | |
| | 2,000,000 | | | Medical Center Hospital Auth. Georgia RAC (Columbus Regional Healthcare) Ser. 10 AGM(b) | | | 5.000 | | | | 08/01/2020 | | | | 2,114,680 | |
| | 2,000,000 | | | Metropolitan Government Nashville & Davidson County Health & Educational Faculties Board (Vanderbilt University Medical Center) Ser. 16A | | | 5.000 | | | | 07/01/2035 | | | | 2,234,100 | |
| | 3,000,000 | | | Metropolitan Government Nashville & Davidson County Health & Educational Faculties Board (Vanderbilt University Medical Center) Ser. 16A | | | 5.000 | | | | 07/01/2040 | | | | 3,316,260 | |
| | 2,750,000 | | | Metropolitan Government Nashville & Davidson County Health & Educational Faculties Board (Vanderbilt University Medical Center) Ser. 16A | | | 5.000 | | | | 07/01/2046 | | | | 3,020,133 | |
| | 1,250,000 | | | Metropolitan Government Nashville & Davidson County Tennessee Health & Educational Faculties Board (Vanderbilt University Medical Center) Ser. 17A | | | 4.000 | | | | 07/01/2047 | | | | 1,265,725 | |
| | 2,000,000 | | | Metropolitan Government Nashville & Davidson County Tennessee Health & Educational Faculties Board (Vanderbilt University Medical Center) Ser. 17A | | | 5.000 | | | | 07/01/2048 | | | | 2,203,580 | |
| | 1,000,000 | | | New Hope Cultural Education Facilities Finance Corp. Texas Senior Living (Cardinal Bay Inc.—Village on the Park Carriage Inn Project) Rev. Ser. 16A-1 | | | 5.000 | | | | 07/01/2046 | | | | 1,083,310 | |
| | 1,000,000 | | | New Hope Cultural Education Facilities Finance Corp. Texas Senior Living (Cardinal Bay Inc.—Village on the Park Carriage Inn Project) Rev. Ser. 16A-1 | | | 5.000 | | | | 07/01/2051 | | | | 1,079,790 | |
| | 500,000 | | | New Jersey Health Care Facilities Financing Auth. (Barnabas Health) Rev. Ref. Ser. 11A(b) | | | 5.625 | | | | 07/01/2021 | | | | 551,510 | |
| | 1,000,000 | | | New Jersey Health Care Facilities Financing Auth. (Princeton Healthcare System) Rev. Ref. Ser. 16A | | | 5.000 | | | | 07/01/2039 | | | | 1,137,730 | |
| | 3,000,000 | | | New Jersey Health Care Facilities Financing Auth. (University Hospital) Rev. Ser. 15A AGM | | | 5.000 | | | | 07/01/2046 | | | | 3,288,030 | |
| | 10,000,000 | | | New Jersey Health Care Facilities Financing Auth. (Virtua Health) Rev. Ser. 09 AGC | | | 5.500 | | | | 07/01/2038 | | | | 10,306,200 | |
| | 2,500,000 | | | New York State Dormitory Auth. Non State Supported Debt (New York University Hospitals Center) Rev. Ref. Ser. 15 | | | 5.000 | | | | 07/01/2034 | | | | 2,780,725 | |
See accompanying Notes to Financial Statements which are an integral part of the financial statements.
Invesco National AMT-Free Municipal Bond ETF (PZA) (continued)
August 31, 2018
| | | | | | | | | | | | | | | | |
Principal
Amount | | | | | Interest
Rate | | | Maturity
Date | | | Value | |
| | | | Municipal Bonds (continued) | | | | | | | | | |
| | | | Health, Hospital, Nursing Home Revenue (continued) | | | | | | | | | |
| $ | 1,000,000 | | | Ohio State Higher Educational Facilities Community (Summa Health System 2010 Project) Rev. Ser. 10 AGM | | | 5.250 | % | | | 11/15/2035 | | | $ | 1,050,250 | |
| | 2,500,000 | | | Palm Beach County Florida Health Facilities Auth. Health Facilities (Bethesda Healthcare System, Inc. Project) Rev. Ser. 10A AGM(b) | | | 5.250 | | | | 07/01/2020 | | | | 2,658,525 | |
| | 985,000 | | | Roanoke Virginia Industrial Development Auth. Hospital (Carilion Health System-Remarketed) Rev. Ref. Ser. 05B AGM | | | 5.000 | | | | 07/01/2038 | | | | 1,027,670 | |
| | 15,000 | | | Roanoke Virginia Industrial Development Auth. Hospital (Carilion Health System-Remarketed) Rev. Ser. 05B AGM(b) | | | 5.000 | | | | 07/01/2020 | | | | 15,870 | |
| | 4,350,000 | | | South Carolina Jobs-Economic Development Auth. Hospital (Palmetto Health) Rev. Ref. Ser. 11A AGM(b) | | | 6.500 | | | | 08/01/2021 | | | | 4,908,975 | |
| | 1,000,000 | | | South Fork Municipal Auth. Pennsylvania Hospital (Conemaugh Valley Memorial Hospital) Rev. Ser. 10B AGC(b) | | | 5.375 | | | | 07/01/2020 | | | | 1,061,920 | |
| | 1,750,000 | | | Tampa Florida Health System (BayCare Obligated Group) Rev. Ser. 16A | | | 5.000 | | | | 11/15/2046 | | | | 1,935,588 | |
| | 750,000 | | | Tarrant County Texas Cultural Education Facilities Finance Corp. Hospital (Baylor Scott & White Health Project) Rev. Ref. Ser. 16A | | | 5.000 | | | | 11/15/2045 | | | | 831,143 | |
| | 1,000,000 | | | Washington State Health Care Facilities Auth. (Virginia Mason Medical Center) Ref. Ser. 17 | | | 4.000 | | | | 08/15/2042 | | | | 999,980 | |
| | 1,500,000 | | | Wisconsin State Health & Educational Facilities Auth. (Prohealth Care Obligated Group) Rev. Ref. Ser. 15 | | | 5.000 | | | | 08/15/2039 | | | | 1,626,480 | |
| | | | | | | | | | | | | | | | |
| | | | | | | | | | | | | | | 136,205,361 | |
| | | | | | | | | | | | | | | | |
| | | | Highway Tolls Revenue—8.7% | | | | | | | | | |
| | 2,500,000 | | | Bay Area California Auth. Toll Bridge (San Francisco Bay Area Subordinate Toll Bridge) Rev. Ser. 17S-7 | | | 4.000 | | | | 04/01/2042 | | | | 2,605,000 | |
| | 2,500,000 | | | Bay Area California Auth. Toll Bridge Rev. Ser. 14S-6 | | | 5.000 | | | | 10/01/2054 | | | | 2,765,400 | |
| | 5,000,000 | | | Bay Area California Auth. Toll Bridge Rev. Ser. 17F-1 | | | 4.000 | | | | 04/01/2056 | | | | 5,164,950 | |
| | 1,250,000 | | | Central Texas Regional Mobility Auth. Rev. Ref. Ser. 16 | | | 5.000 | | | | 01/01/2040 | | | | 1,372,675 | |
| | 700,000 | | | Central Texas Regional Mobility Auth. Rev. Ref. Ser. 16 | | | 5.000 | | | | 01/01/2046 | | | | 764,911 | |
| | 1,000,000 | | | Delaware River Joint Pennsylvania Toll Bridge Commission Ser. 17 | | | 5.000 | | | | 07/01/2042 | | | | 1,141,490 | |
| | 7,500,000 | | | Delaware River Port Auth. Pennsylvania & New Jersey Rev. Ser. 10D AGM | | | 5.000 | | | | 01/01/2040 | | | | 7,794,975 | |
| | 3,000,000 | | | Foothill-Eastern Transportation Corridor Agency California Toll Road Remarketed Rev. Ref. Sub.-Ser. 14 B-1 | | | 3.950 | | | | 01/15/2053 | | | | 3,011,040 | |
| | 20,000,000 | | | Grand Parkway Transportation Corp. Texas Systems Toll (Sub.-Tier Tela Supported) Rev. Ser. 18A | | | 5.000 | | | | 10/01/2043 | | | | 22,876,600 | |
| | 2,000,000 | | | Greater New Orleans Louisiana Expressway Commission Toll (Sub.-Lien Bond) Rev. Ser. 17 AGM | | | 5.000 | | | | 11/01/2042 | | | | 2,220,420 | |
| | 2,000,000 | | | Greater New Orleans Louisiana Expressway Commission Toll (Sub.-Lien Bond) Rev. Ser. 17 AGM | | | 5.000 | | | | 11/01/2047 | | | | 2,207,000 | |
| | 4,000,000 | | | Illinois State Toll Highway Auth. Senior Ser. 16B | | | 5.000 | | | | 01/01/2041 | | | | 4,462,320 | |
| | 1,000,000 | | | New Jersey State Turnpike Auth. Ref. Ser. 17B | | | 5.000 | | | | 01/01/2040 | | | | 1,138,860 | |
| | 6,000,000 | | | New Jersey State Turnpike Auth. Ser. 17A | | | 5.000 | | | | 01/01/2034 | | | | 6,853,980 | |
| | 4,000,000 | | | New York State Thruway Auth. General (Junior Indebtedness Obligation-Junior Lien) Rev. Ser. 16A | | | 5.250 | | | | 01/01/2056 | | | | 4,511,840 | |
| | 1,500,000 | | | New York Triborough Bridge & Tunnel Auth. General Rev. Ref. Ser. 17B | | | 5.000 | | | | 11/15/2038 | | | | 1,718,145 | |
| | 525,000 | | | New York Triborough Bridge & Tunnel Auth. General Rev. Ser. 15A | | | 5.000 | | | | 11/15/2040 | | | | 590,945 | |
| | 4,000,000 | | | New York Triborough Bridge & Tunnel Auth. General Rev. Ser. 16A | | | 5.000 | | | | 11/15/2041 | | | | 4,528,240 | |
| | 3,000,000 | | �� | New York Triborough Bridge & Tunnel Auth. General Rev. Ser. 16A | | | 5.000 | | | | 11/15/2046 | | | | 3,385,230 | |
| | 4,000,000 | | | North Carolina Turnpike Auth. Triangle Expressway System Rev. Ser. 09A AGC(b) | | | 5.750 | | | | 01/01/2019 | | | | 4,053,800 | |
| | 2,500,000 | | | North Texas Tollway Auth. Rev. Ref. Ser. 15B | | | 5.000 | | | | 01/01/2040 | | | | 2,715,975 | |
| | 1,800,000 | | | North Texas Tollway Auth. Rev. Ref. Ser. 16A | | | 5.000 | | | | 01/01/2039 | | | | 2,007,432 | |
| | 10,000,000 | | | North Texas Tollway Auth. System (1st Tier) Rev. Ref. Ser. 17A | | | 5.000 | | | | 01/01/2043 | | | | 11,337,000 | |
| | 1,660,000 | | | Oklahoma State Turnpike Auth. (Second) Ser. 17C | | | 5.000 | | | | 01/01/2047 | | | | 1,879,319 | |
| | 5,000,000 | | | Oklahoma State Turnpike Auth. Ser. 17A | | | 5.000 | | | | 01/01/2042 | | | | 5,610,850 | |
| | 15,000,000 | | | Pennsylvania State Turnpike Commission Rev. Ser. 14B | | | 5.250 | | | | 12/01/2039 | | | | 16,788,900 | |
| | 8,800,000 | | | Pennsylvania State Turnpike Commission Rev. Sub.-Ser. 12B AGM | | | 5.000 | | | | 12/01/2042 | | | | 9,498,896 | |
| | 5,000,000 | | | Tampa-Hillsborough County Florida Expressway Auth. Rev. Ser. 17 | | | 5.000 | | | | 07/01/2047 | | | | 5,629,500 | |
| | 2,000,000 | | | Tampa-Hillsborough County Florida Expressway Auth. Ser. 17C | | | 5.000 | | | | 07/01/2048 | | | | 2,265,220 | |
| | 2,500,000 | | | Texas State Transportation Commission Turnpike System Rev. Ref. Ser. 15C | | | 5.000 | | | | 08/15/2042 | | | | 2,694,075 | |
| | | | | | | | | | | | | | | | |
| | | | | | | | | | | | | | | 143,594,988 | |
| | | | | | | | | | | | | | | | |
| | | | Hotel Occupancy Tax—0.7% | | | | | | | | | |
| | 3,950,000 | | | Harris County Houston Texas Sports Auth. (Senior Lien) Rev. Ref. Ser. 14A | | | 5.000 | | | | 11/15/2053 | | | | 4,286,342 | |
| | 2,215,000 | | | Miami-Dade County Florida Special Obligation Ref. Sub.-Ser. 12B | | | 5.000 | | | | 10/01/2037 | | | | 2,408,392 | |
See accompanying Notes to Financial Statements which are an integral part of the financial statements.
Invesco National AMT-Free Municipal Bond ETF (PZA) (continued)
August 31, 2018
| | | | | | | | | | | | | | | | |
Principal
Amount | | | | | Interest
Rate | | | Maturity
Date | | | Value | |
| | | | Municipal Bonds (continued) | | | | | | | | | |
| | | | Hotel Occupancy Tax (continued) | | | | | | | | | |
| $ | 2,000,000 | | | New York State Convention Center Development Corp. (Hotel Unit Fee Secured) Rev. Ref. Ser. 15 | | | 5.000 | % | | | 11/15/2040 | | | $ | 2,254,280 | |
| | 3,000,000 | | | New York State Convention Center Development Corp. (Hotel Unit Fee Secured) Rev. Ref. Ser. 15 | | | 5.000 | | | | 11/15/2045 | | | | 3,362,850 | |
| | | | | | | | | | | | | | | | |
| | | | | | | | | | | | | | | 12,311,864 | |
| | | | | | | | | | | | | | | | |
| | | | Income Tax Revenue—2.2% | | | | | | | | | |
| | 1,200,000 | | | District of Columbia Income Tax Secured Rev. Ser. 11G | | | 5.000 | | | | 12/01/2036 | | | | 1,301,316 | |
| | 4,150,000 | | | New York City Transitional Finance Auth. Future Tax Secured (Fiscal 2011) Rev. Ser.11D | | | 5.000 | | | | 02/01/2035 | | | | 4,426,763 | |
| | 2,000,000 | | | New York City Transitional Finance Auth. Future Tax Secured (Fiscal 2015) Rev. Sub.-Ser.14A-1 | | | 5.000 | | | | 08/01/2035 | | | | 2,264,680 | |
| | 4,330,000 | | | New York City Transitional Finance Auth. Future Tax Secured (Fiscal 2015) Rev. Sub.-Ser.14B-1 | | | 5.000 | | | | 08/01/2042 | | | | 4,852,588 | |
| | 1,850,000 | | | New York City Transitional Finance Auth. Future Tax Secured Rev. Sub.-Ser.16B-1 | | | 4.000 | | | | 08/01/2041 | | | | 1,922,427 | |
| | 1,325,000 | | | New York State Dormitory Auth. Personal Income Tax (General Purpose) Rev. Ser. 10F | | | 5.000 | | | | 02/15/2035 | | | | 1,384,016 | |
| | 4,000,000 | | | New York State Dormitory Auth. Personal Income Tax (General Purpose) Rev. Ser. 11C | | | 5.000 | | | | 03/15/2041 | | | | 4,268,800 | |
| | 4,500,000 | | | New York State Dormitory Auth. Personal Income Tax (General Purpose) Rev. Ser. 12B | | | 5.000 | | | | 03/15/2042 | | | | 4,877,595 | |
| | 1,905,000 | | | New York State Dormitory Auth. Personal Income Tax Rev. Ref. Ser. 14E | | | 5.000 | | | | 02/15/2044 | | | | 2,118,455 | |
| | 7,530,000 | | | New York State Dormitory Auth. Personal Income Tax Rev. Ref. Ser. 15A | | | 5.000 | | | | 03/15/2035 | | | | 8,473,735 | |
| | 1,000,000 | | | New York State Urban Development Corp. State Personal Income Tax Rev. Ser. 13A-1 | | | 5.000 | | | | 03/15/2043 | | | | 1,098,740 | |
| | | | | | | | | | | | | | | | |
| | | | | | | | | | | | | | | 36,989,115 | |
| | | | | | | | | | | | | | | | |
| | | | Lease Revenue—2.5% | | | | | | | | | |
| | 6,000,000 | | | California State Municipal Financing Auth. Lease (Orange County Civic Center Infrastructure Improvement Program) Rev. Ser. 17A | | | 5.000 | | | | 06/01/2042 | | | | 6,916,200 | |
| | 1,500,000 | | | California State Public Works Board Lease Rev. Ser. 14B | | | 5.000 | | | | 10/01/2039 | | | | 1,693,785 | |
| | 500,000 | | | Kern County California COP (Capital Improvements Projects) Ser. 09A AGC(b) | | | 5.750 | | | | 02/01/2019 | | | | 508,900 | |
| | 4,400,000 | | | Los Angeles County California Facilities Inc. Lease (Vermont Corridor County Administration Building) Rev. Ser. 18A | | | 5.000 | | | | 12/01/2051 | | | | 5,061,716 | |
| | 2,250,000 | | | Los Angeles County California Public Works Financing Auth. Lease Rev. Ser. 15A | | | 5.000 | | | | 12/01/2039 | | | | 2,539,710 | |
| | 1,000,000 | | | Los Angeles County California Public Works Financing Auth. Lease Rev. Ser. 15A | | | 5.000 | | | | 12/01/2044 | | | | 1,124,480 | |
| | 11,400,000 | | | Los Angeles County California Public Works Financing Auth. Lease Rev. Ser. 16D | | | 5.000 | | | | 12/01/2045 | | | | 12,936,606 | |
| | 500,000 | | | Miami-Dade County Florida School Board COP Ser. 09A AGC(b) | | | 5.375 | | | | 02/01/2019 | | | | 507,755 | |
| | 1,000,000 | | | MTA Hudson Rail Yards Trust Obligations Rev. Ser. 16A | | | 5.000 | | | | 11/15/2046 | | | | 1,031,480 | |
| | 2,000,000 | | | MTA Hudson Rail Yards Trust Obligations Rev. Ser. 16A | | | 5.000 | | | | 11/15/2051 | | | | 2,133,480 | |
| | 250,000 | | | Pennsylvania State COP Ref. Ser. 18A | | | 5.000 | | | | 07/01/2043 | | | | 275,395 | |
| | 4,000,000 | | | Richmond Joint Powers Financing Auth. Lease (Civic Center Project) Rev. Ser. 09 AGC | | | 5.750 | | | | 08/01/2029 | | | | 4,137,520 | |
| | 2,000,000 | | | Sandy Spring Georgia Public Facilities Auth. (City Center Project) Rev. Ser. 15 | | | 5.000 | | | | 05/01/2041 | | | | 2,277,580 | |
| | | | | | | | | | | | | | | | |
| | | | | | | | | | | | | | | 41,144,607 | |
| | | | | | | | | | | | | | | | |
| | | | Local or GTD Housing—0.3% | | | | | | | | | |
| | 1,250,000 | | | New Hope Cultural Education Facilities Finance Corp. Texas Student Housing (A&M University Project) Rev. Ser. 14A AGM | | | 5.000 | | | | 04/01/2046 | | | | 1,352,037 | |
| | 2,440,000 | | | New York State Dormitory Auth. Non State Supported Debt (North Shore Long Island Jewish Obligation Group) Rev. Ref. Ser. 15A | | | 5.000 | | | | 05/01/2036 | | | | 2,718,331 | |
| | | | | | | | | | | | | | | | |
| | | | | | | | | | | | | | | 4,070,368 | |
| | | | | | | | | | | | | | | | |
| | | | Lottery Revenue—0.5% | | | | | | | | | |
| | 7,500,000 | | | Arizona State Lottery Rev. Ser. 10A AGM | | | 5.000 | | | | 07/01/2029 | | | | 7,796,925 | |
| | | | | | | | | | | | | | | | |
| | | | Miscellaneous Revenue—3.8% | | | | | | | | | |
| | 3,500,000 | | | California State Various Purpose (Green Bonds) Ser. 14 | | | 5.000 | | | | 10/01/2037 | | | | 3,973,165 | |
| | 5,000,000 | | | California State Various Purpose Ser.14 | | | 5.000 | | | | 10/01/2039 | | | | 5,663,950 | |
| | 3,745,000 | | | Connecticut State Ser. 17A | | | 5.000 | | | | 04/15/2035 | | | | 4,127,215 | |
| | 2,500,000 | | | Dallas Texas Civic Center & Improvement Rev. Ref. Ser. 09 AGC | | | 5.250 | | | | 08/15/2034 | | | | 2,576,325 | |
| | 5,000,000 | | | Hudson Yards Infrastructure Corporation Second Indenture Rev. Ref. Ser. 17A | | | 5.000 | | | | 02/15/2042 | | | | 5,665,250 | |
| | 2,025,000 | | | Indianapolis Indiana Local Public Improvement Bond Bank (PILOT Infrastructure Project) Ser. 10F AGM(b) | | | 5.000 | | | | 01/01/2020 | | | | 2,111,954 | |
| | 535,000 | | | Indianapolis Indiana Local Public Improvement Bond Bank (PILOT Infrastructure Project) Ser. 10F AGM(b) | | | 5.000 | | | | 01/01/2020 | | | | 557,973 | |
| | 2,190,000 | | | Kansas City Missouri Special Obligation & Improvement (Downtown Arena Project) Ref. Ser. 16E | | | 5.000 | | | | 04/01/2040 | | | | 2,419,205 | |
| | 2,000,000 | | | Maryland State Stadium Auth. Baltimore City Public Schools Rev. Ser. 16 | | | 5.000 | | | | 05/01/2041 | | | | 2,245,540 | |
| | 2,900,000 | | | Massachusetts State Ser. 16J | | | 4.000 | | | | 12/01/2044 | | | | 2,984,013 | |
See accompanying Notes to Financial Statements which are an integral part of the financial statements.
Invesco National AMT-Free Municipal Bond ETF (PZA) (continued)
August 31, 2018
| | | | | | | | | | | | | | | | |
Principal
Amount | | | | | Interest
Rate | | | Maturity
Date | | | Value | |
| | | | Municipal Bonds (continued) | | | | | | | | | |
| | | | Miscellaneous Revenue (continued) | | | | | | | | | |
| $ | 400,000 | | | New Jersey State Transportation Trust Fund Auth. (Transit System) Ser. 07A AMBAC | | | 5.000 | % | | | 12/15/2032 | | | $ | 400,764 | |
| | 500,000 | | | New York City Industrial Development Agency (Queens Baseball Stadium PILOT) Rev. Ser. 09 AGC | | | 6.500 | | | | 01/01/2046 | | | | 507,495 | |
| | 3,000,000 | | | New York City Transitional Finance Auth. Building Aid (Fiscal 2015) Rev. Ser. 15S-1 | | | 5.000 | | | | 07/15/2040 | | | | 3,333,990 | |
| | 4,200,000 | | | New York City Transitional Finance Auth. Building Aid Rev. Sub.-Ser. 11S-1A | | | 5.250 | | | | 07/15/2037 | | | | 4,565,400 | |
| | 2,500,000 | | | Newark New Jersey Housing Auth. Rev. (City-Secured Police Facilities) Rev. Ref. Ser. 16 AGM | | | 5.000 | | | | 12/01/2038 | | | | 2,783,300 | |
| | 5,000,000 | | | Oregon State (Article XI-G OHSU Project) Ser. 17H | | | 5.000 | | | | 08/01/2042 | | | | 5,763,650 | |
| | 2,500,000 | | | Oregon State (Article XI-Q State Project) Ser. 17A | | | 5.000 | | | | 05/01/2042 | | | | 2,872,400 | |
| | 2,000,000 | | | South Carolina State Public Service Auth. Obligation Rev. Ref. Ser. 14C | | | 5.000 | | | | 12/01/2039 | | | | 2,136,660 | |
| | 4,975,000 | | | Texas State Water Development Board Ser. 17A | | | 5.000 | | | | 10/15/2047 | | | | 5,690,405 | |
| | 2,000,000 | | | Virginia State Commonwealth Transportation Board Rev. Ref. Ser. 17A | | | 4.000 | | | | 05/15/2036 | | | | 2,113,420 | |
| | | | | | | | | | | | | | | | |
| | | | | | | | | | | | | | | 62,492,074 | |
| | | | | | | | | | | | | | | | |
| | | | Miscellaneous Taxes—0.3% | | | | | | | | | |
| | 1,000,000 | | | Baltimore Maryland Convention Center Hotel Project (Convention Center Hotel) Ref. Ser. 17 | | | 5.000 | | | | 09/01/2039 | | | | 1,103,460 | |
| | 500,000 | | | Baltimore Maryland Convention Center Hotel Project (Convention Center Hotel) Ref. Ser. 17 | | | 5.000 | | | | 09/01/2042 | | | | 549,320 | |
| | 2,000,000 | | | Chicago Illinois Board of Education Dedicated Capital Improvement Ser. 17 | | | 6.000 | | | | 04/01/2046 | | | | 2,339,220 | |
| | 1,000,000 | | | Tuscaloosa Alabama City Board of Education School Tax Warrants Ser. 16 | | | 5.000 | | | | 08/01/2046 | | | | 1,122,590 | |
| | | | | | | | | | | | | | | | |
| | | | | | | | | | | | | | | 5,114,590 | |
| | | | | | | | | | | | | | | | |
| | | | Natural Gas Revenue—0.7% | | | | | | | | | |
| | 3,655,000 | | | Chula Vista California Industrial Development (San Diego Gas—Remarketed 06/17/09) Rev. Ser. 04A | | | 5.875 | | | | 02/15/2034 | | | | 3,765,089 | |
| | 3,000,000 | | | Philadelphia Pennsylvania Gas Works (1998 General Ordinance-Fifteenth) Rev. Ref. Ser. 17 | | | 5.000 | | | | 08/01/2042 | | | | 3,358,710 | |
| | 4,000,000 | | | Philadelphia Pennsylvania Gas Works (1998 General Ordinance-Fifteenth) Rev. Ref. Ser. 17 | | | 5.000 | | | | 08/01/2047 | | | | 4,462,040 | |
| | | | | | | | | | | | | | | | |
| | | | | | | | | | | | | | | 11,585,839 | |
| | | | | | | | | | | | | | | | |
| | | | Nuclear Revenue—1.3% | | | | | | | | | |
| | 7,000,000 | | | South Carolina State Public Service Auth. Obligation Rev. Ref. Ser. 16A | | | 5.000 | | | | 12/01/2037 | | | | 7,612,080 | |
| | 2,500,000 | | | South Carolina State Public Service Auth. Obligation Rev. Ser. 15E | | | 5.250 | | | | 12/01/2055 | | | | 2,717,500 | |
| | 6,250,000 | | | South Carolina State Public Service Auth. Rev. Ref. Ser. 16A | | | 5.000 | | | | 12/01/2035 | | | | 6,814,063 | |
| | 4,660,000 | | | South Carolina State Public Service Auth. Rev. Ser. 13E | | | 5.000 | | | | 12/01/2048 | | | | 4,902,739 | |
| | | | | | | | | | | | | | | | |
| | | | | | | | | | | | | | | 22,046,382 | |
| | | | | | | | | | | | | | | | |
| | | | Port, Airport & Marina Revenue—8.0% | | | | | | | | | |
| | 3,000,000 | | | Birmingham Alabama Airport Auth. Airport Rev. Ser. 10 AGM | | | 5.250 | | | | 07/01/2030 | | | | 3,165,780 | |
| | 1,500,000 | | | Birmingham Alabama Airport Auth. Airport Rev. Ser. 10 AGM | | | 5.500 | | | | 07/01/2040 | | | | 1,592,610 | |
| | 1,925,000 | | | Charlotte North Airport Rev. Ser. 17A | | | 5.000 | | | | 07/01/2042 | | | | 2,203,740 | |
| | 3,500,000 | | | Chicago Illinois Midway Airport Rev. Ref. Ser. 16B | | | 5.000 | | | | 01/01/2041 | | | | 3,838,730 | |
| | 2,500,000 | | | Chicago Illinois Midway Airport Rev. Ref. Ser. 16B | | | 5.000 | | | | 01/01/2046 | | | | 2,733,500 | |
| | 2,900,000 | | | Chicago Illinois O’Hare International Airport (General Senior Lien) Rev. Ref. Ser. 16C | | | 5.000 | | | | 01/01/2037 | | | | 3,216,245 | |
| | 7,500,000 | | | Chicago Illinois O’Hare International Airport (General Senior Lien) Rev. Ref. Ser. 17B | | | 5.000 | | | | 01/01/2039 | | | | 8,374,650 | |
| | 4,000,000 | | | Chicago Illinois O’Hare International Airport Rev. Ref. Ser. 15B | | | 5.000 | | | | 01/01/2033 | | | | 4,418,640 | |
| | 1,250,000 | | | Chicago Illinois O’Hare International Airport Rev. Ser. 15D | | | 5.000 | | | | 01/01/2046 | | | | 1,359,888 | |
| | 1,000,000 | | | City of Cleveland Ohio Airport System Rev. Ref. Ser. 12A AGM | | | 5.000 | | | | 01/01/2031 | | | | 1,078,530 | |
| | 9,335,000 | | | Clark County Nevada Airport Rev. Ref. Sub.-Ser. 17A-2 | | | 5.000 | | | | 07/01/2040 | | | | 10,586,543 | |
| | 2,000,000 | | | Los Angeles California Department of Airports (Senior Los Angeles International Airport) Ser. 10A | | | 5.000 | | | | 05/15/2040 | | | | 2,108,000 | |
| | 1,500,000 | | | Manchester New Hampshire General Airport Remarketed Rev. Ref. Ser. 09A AGM | | | 5.125 | | | | 01/01/2030 | | | | 1,514,340 | |
| | 1,500,000 | | | Metropolitan Nashville Tennessee Airport Auth. Rev. Ser. 15A | | | 5.000 | | | | 07/01/2045 | | | | 1,674,945 | |
| | 7,000,000 | | | Miami-Dade County Florida Aviation Rev. Ser. 10B AGM | | | 5.000 | | | | 10/01/2035 | | | | 7,403,550 | |
| | 600,000 | | | Philadelphia Pennsylvania Airport Rev. Ser. 10A AGM | | | 5.000 | | | | 06/15/2035 | | | | 630,078 | |
| | 2,000,000 | | | Phoenix Arizona Civic Improvement Corp. Airport (Junior Lien) Rev. Ser. 15A | | | 5.000 | | | | 07/01/2045 | | | | 2,218,980 | |
| | 17,960,000 | | | Port Auth. of New York & New Jersey (194th Series) Ref. Ser. 15 | | | 5.000 | | | | 10/15/2041 | | | | 20,256,545 | |
| | 2,400,000 | | | Port Auth. of New York & New Jersey (Consolidated Bonds Two Hundredth) Ref. Ser. 17 | | | 5.250 | | | | 10/15/2057 | | | | 2,755,992 | |
| | 3,500,000 | | | Port Auth. of New York & New Jersey (Consolidated) Ref. Ser. 15-189 | | | 5.000 | | | | 05/01/2045 | | | | 3,912,650 | |
| | 6,000,000 | | | Port Auth. of New York & New Jersey (Consolidated-One Hundred Eighty-Fourth) Ref. Ser. 14 | | | 5.000 | | | | 09/01/2039 | | | | 6,740,760 | |
| | 2,400,000 | | | Sacramento County California Airport System Senior Rev. Ref. Ser. 16A | | | 5.000 | | | | 07/01/2041 | | | | 2,728,776 | |
| | 2,250,000 | | | Sacramento County California Airport System Senior Rev. Ref. Sub.-Ser. 16B | | | 5.000 | | | | 07/01/2041 | | | | 2,549,835 | |
| | 2,000,000 | | | Salt Lake City Utah Airport Rev. Ser. 17B | | | 5.000 | | | | 07/01/2042 | | | | 2,279,660 | |
| | 4,000,000 | | | Salt Lake City Utah Airport Rev. Ser. 17B | | | 5.000 | | | | 07/01/2047 | | | | 4,542,840 | |
See accompanying Notes to Financial Statements which are an integral part of the financial statements.
Invesco National AMT-Free Municipal Bond ETF (PZA) (continued)
August 31, 2018
| | | | | | | | | | | | | | | | |
Principal
Amount | | | | | Interest
Rate | | | Maturity
Date | | | Value | |
| | | | Municipal Bonds (continued) | | | | | | | | | |
| | | | Port, Airport & Marina Revenue (continued) | | | | | | | | | |
| $ | 2,000,000 | | | San Francisco California City & County Airports Commission (San Francisco International Airport) Rev. Ser. 14B | | | 5.000 | % | | | 05/01/2044 | | | $ | 2,227,480 | |
| | 17,315,000 | | | San Francisco California City & County Airports Commission (San Francisco International Airport) Rev. Ser. 16C | | | 5.000 | | | | 05/01/2046 | | | | 19,490,803 | |
| | 1,300,000 | | | San Jose California Airport Rev. Ref. Ser. 17B | | | 5.000 | | | | 03/01/2042 | | | | 1,478,958 | |
| | 5,000,000 | | | San Jose California Airport Rev. Ref. Ser. 17B | | | 5.000 | | | | 03/01/2047 | | | | 5,668,350 | |
| | 500,000 | | | Wayne County Michigan Airport Auth. Rev. Ser. 15D | | | 5.000 | | | | 12/01/2040 | | | | 557,720 | |
| | | | | | | | | | | | | | | | |
| | | | | | | | | | | | | | | 133,309,118 | |
| | | | | | | | | | | | | | | | |
| | | | Recreational Revenue—0.2% | | | | | | | | | |
| | 3,000,000 | | | New York City Industrial Development Agency (Yankee Stadium PILOT) Rev. Ser. 09 AGC | | | 7.000 | | | | 03/01/2049 | | | | 3,075,870 | |
| | | | | | | | | | | | | | | | |
| | | | Sales Tax Revenue—7.0% | | | | | | | | | |
| | 5,240,000 | | | Bi-State Development Agency of Missouri-Illinois Metropolitan District Mass Transit Sales Tax (MetroLink Cross County Extension) Ser. 09 AGC | | | 5.000 | | | | 10/01/2035 | | | | 5,405,269 | |
| | 6,500,000 | | | Central Puget Sound Washington State Regional Transit Auth. (Green Bonds) Ser. 16S-1 | | | 5.000 | | | | 11/01/2041 | | | | 7,418,905 | |
| | 3,000,000 | | | Central Puget Sound Washington State Regional Transit Auth. (Green Bonds) Ser. 16S-1 | | | 5.000 | | | | 11/01/2046 | | | | 3,872,220 | |
| | 10,000,000 | | | Chicago Illinois Transit Auth. Sales Tax Receipts Second Lien Rev. Ser. 17 AGM | | | 5.000 | | | | 12/01/2051 | | | | 10,775,500 | |
| | 5,540,000 | | | Dallas Texas Area Rapid Transit Sales Tax Rev. Ref. Ser. 16A | | | 5.000 | | | | 12/01/2046 | | | | 6,232,888 | |
| | 1,000,000 | | | Denver Colorado City & County Dedicated Tax & Improvement Rev. Ref. Ser. 16A | | | 5.000 | | | | 08/01/2042 | | | | 1,123,340 | |
| | 750,000 | | | Denver Colorado City & County Dedicated Tax & Improvement Rev. Ref. Ser. 16A | | | 5.000 | | | | 08/01/2044 | | | | 841,387 | |
| | 1,815,000 | | | Illinois Regional Transportation Auth. Ser. 00 NATL | | | 6.500 | | | | 07/01/2030 | | | | 2,330,097 | |
| | 10,000,000 | | | Illinois State Sales Tax Securitization Corporation Ref. Ser. 18A | | | 5.000 | | | | 01/01/2040 | | | | 11,058,100 | |
| | 2,750,000 | | | Jefferson Louisiana Sales Tax District Special Sales Tax Rev. Ser. 17B AGM | | | 5.000 | | | | 12/01/2042 | | | | 3,135,990 | |
| | 7,145,000 | | | Massachusetts State Bay Transportation Auth. Sales Tax (Senior Lien) Rev. Ser. 15A | | | 5.000 | | | | 07/01/2040 | | | | 8,062,704 | |
| | 8,770,000 | | | Massachusetts State School Building Auth. Dedicated Sales Tax Rev. Ref. Ser. 15C | | | 5.000 | | | | 08/15/2037 | | | | 9,903,084 | |
| | 3,410,000 | | | Massachusetts State School Building Auth. Sales Tax Rev. Ser. 16A | | | 5.000 | | | | 11/15/2045 | | | | 3,834,136 | |
| | 3,000,000 | | | Pittsburgh & Allegheny County Pennsylvania Sports & Exhibition Auth. Sales (Regional Asset District) Ref. Ser. 10 AGM | | | 5.000 | | | | 02/01/2031 | | | | 3,157,020 | |
| | 2,500,000 | | | Puerto Rico Sales Tax Financing Corp. Sales Tax Rev. First Sub.-Ser. 10A AGM | | | 5.000 | | | | 08/01/2040 | | | | 2,578,725 | |
| | 26,500,000 | | | Sales Tax Asset Receivables Corp. (Fiscal 2015) Ref. Ser. 14A | | | 4.000 | | | | 10/15/2032 | | | | 28,567,795 | |
| | 6,620,000 | | | San Diego County California Regional Transportation Commission Ser. 16A | | | 5.000 | | | | 04/01/2048 | | | | 7,578,245 | |
| | | | | | | | | | | | | | | | |
| | | | | | | | | | | | | | | 115,875,405 | |
| | | | | | | | | | | | | | | | |
| | | | Sewer Revenue—5.0% | | | | | | | | | |
| | 24,375,000 | | | Chicago Illinois Wastewater Transmission (Second Lien) Rev. Ser. 12 AGM | | | 5.000 | | | | 01/01/2037 | | | | 25,801,669 | |
| | 2,500,000 | | | Chicago Illinois Wastewater Transmission (Second Lien) Rev. Ser. 17A AGM | | | 5.250 | | | | 01/01/2042 | | | | 2,798,050 | |
| | 7,000,000 | | | Chicago Illinois Wastewater Transmission (Second Lien) Rev. Ser. 17A AGM | | | 4.000 | | | | 01/01/2052 | | | | 7,029,260 | |
| | 5,000,000 | | | Detroit Michigan Water & Sewerage Department Sewerage Disposal System (Senior Lien-Remarketed) Rev. Ref. Ser. 12A AGM | | | 5.000 | | | | 07/01/2039 | | | | 5,375,250 | |
| | 500,000 | | | Fresno California Sewer Rev. Ser. 08A AGC | | | 5.000 | | | | 09/01/2037 | | | | 500,000 | |
| | 5,000,000 | | | Jefferson County Alabama Sewer (Senior Lien) Rev. Ser. 13A AGM | | | 5.500 | | | | 10/01/2053 | | | | 5,552,200 | |
| | 14,695,000 | | | King County Washington Sewer & Improvement Rev. Ref. Ser. 16B | | | 5.000 | | | | 07/01/2039 | | | | 16,248,114 | |
| | 1,000,000 | | | Los Angeles California Wastewater System (Green Bonds) Rev. Ser. 15A | | | 5.000 | | | | 06/01/2044 | | | | 1,136,190 | |
| | 1,500,000 | | | Los Angeles California Wastewater System (Green Bonds) Rev. Ser. 15C | | | 5.000 | | | | 06/01/2045 | | | | 1,703,295 | |
| | 1,500,000 | | | Los Angeles California Wastewater System (Green Bonds) Rev. Sub.-Ser. 17A | | | 5.250 | | | | 06/01/2047 | | | | 1,775,400 | |
| | 1,000,000 | | | Metropolitan St. Louis Missouri Sewer District Wastewater System Rev. Ser. 16C | | | 5.000 | | | | 05/01/2046 | | | | 1,133,660 | |
| | 750,000 | | | Metropolitan St. Louis Missouri Sewer District Wastewater Systems & Improvement Rev. Ref. Ser. 17A | | | 5.000 | | | | 05/01/2047 | | | | 859,260 | |
| | 6,500,000 | | | Northeast Ohio Regional Sewer District Ref. Ser. 14 | | | 5.000 | | | | 11/15/2049 | | | | 7,229,625 | |
| | 5,000,000 | | | West Rankin Mississippi Utility Auth. Rev. Ser. 18 AGM | | | 5.000 | | | | 01/01/2048 | | | | 5,604,600 | |
| | | | | | | | | | | | | | | | |
| | | | | | | | | | | | | | | 82,746,573 | |
| | | | | | | | | | | | | | | | |
| | | | Special Tax—0.2% | | | | | | | | | |
| | 3,000,000 | | | Birmingham-Jefferson Alabama Civic Center Auth. Special Tax Ser. 18A | | | 5.000 | | | | 07/01/2048 | | | | 3,368,520 | |
| | | | | | | | | | | | | | | | |
| | | | Student Loan Revenue—0.1% | | | | | | | | | |
| | 1,510,000 | | | Maine Educational Loan Auth. Student Loan Rev. Ser. 09A-3 AGC | | | 5.875 | | | | 12/01/2039 | | | | 1,545,893 | |
| | | | | | | | | | | | | | | | |
See accompanying Notes to Financial Statements which are an integral part of the financial statements.
Invesco National AMT-Free Municipal Bond ETF (PZA) (continued)
August 31, 2018
| | | | | | | | | | | | | | | | |
Principal
Amount | | | | | Interest
Rate | | | Maturity
Date | | | Value | |
| | | | Municipal Bonds (continued) | | | | | | | | | |
| | | | Tax Increment Revenue—1.5% | | | | | | | | | |
| $ | 17,000,000 | | | Inland Valley California Development Successor Agency Tax Allocation Ref. Ser. 14A AGM | | | 5.000 | % | | | 09/01/2044 | | | $ | 18,431,230 | |
| | 1,000,000 | | | Kentucky State Economic Development Financing Auth. (Louisville Arena Project) Rev. Ref. Ser. 17A AGM | | | 5.000 | | | | 12/01/2045 | | | | 1,114,140 | |
| | 1,000,000 | | | Kentucky State Economic Development Financing Auth. (Louisville Arena Project) Rev. Ref. Ser. 17A AGM | | | 5.000 | | | | 12/01/2047 | | | | 1,084,820 | |
| | 4,000,000 | | | Miami Beach Florida Redevelopment Agency Tax Increment (City Center) Rev. Ref. Ser. 15A AGM | | | 5.000 | | | | 02/01/2040 | | | | 4,470,400 | |
| | | | | | | | | | | | | | | | |
| | | | | | | | | | | | | | | 25,100,590 | |
| | | | | | | | | | | | | | | | |
| | | | Transit Revenue—3.8% | | | | | | | | | |
| | 1,000,000 | | | Alameda California Corridor Transportation Auth. (Second Sub.-Lien) Ref. Ser. 16B AGM | | | 5.000 | | | | 10/01/2036 | | | | 1,128,650 | |
| | 940,000 | | | Alameda California Corridor Transportation Auth. (Second Sub.-Lien) Ref. Ser. 16B AGM | | | 5.000 | | | | 10/01/2037 | | | | 1,058,797 | |
| | 5,000,000 | | | Massachusetts State Transportation Fund Rev. Ref. Ser. 17A | | | 5.000 | | | | 06/01/2043 | | | | 5,749,200 | |
| | 4,990,000 | | | Metropolitan Transportation Auth. New York Rev Ser. 12E-1 AGM(b) | | | 5.000 | | | | 11/15/2022 | | | | 5,623,581 | |
| | 1,510,000 | | | Metropolitan Transportation Auth. New York Rev Ser. 12E-1 AGM | | | 5.000 | | | | 11/15/2042 | | | | 1,655,594 | |
| | 5,000,000 | | | Metropolitan Transportation Auth. New York Rev. Ref. Sub.-Ser. 15C-1 | | | 5.000 | | | | 11/15/2035 | | | | 5,594,500 | |
| | 13,190,000 | | | Metropolitan Transportation Auth. New York Rev. Ser.13A-1 | | | 5.000 | | | | 11/15/2040 | | | | 14,312,469 | |
| | 10,000,000 | | | Metropolitan Transportation Auth. New York Rev. Sub.-Ser. 15A-1 | | | 5.000 | | | | 11/15/2045 | | | | 11,032,100 | |
| | 15,000,000 | | | New Jersey State Transportation Trust Fund Auth. (Transit System) Ser. 08A AGC | | | 5.500 | | | | 12/15/2038 | | | | 15,152,100 | |
| | 1,250,000 | | | Northern Indiana Commuter Transportation District Rev. Ser. 16 | | | 5.000 | | | | 07/01/2041 | | | | 1,387,200 | |
| | | | | | | | | | | | | | | | |
| | | | | | | | | | | | | | | 62,694,191 | |
| | | | | | | | | | | | | | | | |
| | | | Water Revenue—12.7% | | | | | | | | | |
| | 3,695,000 | | | Atlanta Georgia Water & Wastewater Rev. Ser. 09-B AGM(b) | | | 5.250 | | | | 11/01/2019 | | | | 3,846,975 | |
| | 3,305,000 | | | Atlanta Georgia Water & Wastewater Rev. Ser. 09-B AGM | | | 5.250 | | | | 11/01/2034 | | | | 3,430,491 | |
| | 5,000,000 | | | Atlanta Georgia Water & Wastewater Rev. Ser. 18B | | | 5.000 | | | | 11/01/2047 | | | | 5,730,550 | |
| | 1,000,000 | | | Austin Texas Water & Wastewater System Rev. Ref. Ser. 16 | | | 5.000 | | | | 11/15/2041 | | | | 1,138,850 | |
| | 1,000,000 | | | Austin Texas Water & Wastewater System Rev. Ref. Ser. 16 | | | 5.000 | | | | 11/15/2045 | | | | 1,135,740 | |
| | 9,510,000 | | | Baltimore Maryland Project (Water Projects) Rev. Sub.-Ser. 17A | | | 5.000 | | | | 07/01/2046 | | | | 10,751,626 | |
| | 1,000,000 | | | Birmingham Alabama Waterworks Broad Water Rev. Ref. Ser. 15A | | | 5.000 | | | | 01/01/2042 | | | | 1,108,890 | |
| | 2,160,000 | | | Bucks County Pennsylvania Water & Sewer Auth. System Rev. Ser. 11 AGM(b) | | | 5.000 | | | | 12/01/2021 | | | | 2,373,602 | |
| | 1,485,000 | | | Chicago Illinois Wastewater (2017 Second Lien) Rev. Ref. Ser. 08 AGM(b) | | | 5.250 | | | | 11/01/2018 | | | | 1,493,554 | |
| | 440,000 | | | Chicago Illinois Wastewater (2017 Second Lien) Rev. Ref. Ser. 08 AGM | | | 5.250 | | | | 11/01/2033 | | | | 442,011 | |
| | 3,500,000 | | | Chicago Illinois Wastewater (Second Lien) Rev. Ref. Ser. 17-2 AGM | | | 5.000 | | | | 11/01/2038 | | | | 3,887,800 | |
| | 325,000 | | | Chicago Illinois Waterworks (Second Lien) Rev. Ref. Ser. 08 AGM(b) | | | 5.250 | | | | 11/01/2018 | | | | 326,872 | |
| | 200,000 | | | City of Cape Coral Florida Water & Sewer Rev. Ref. Ser. 11 AGM(b) | | | 5.000 | | | | 10/01/2021 | | | | 218,792 | |
| | 6,000,000 | | | Dallas Texas Waterworks & Sewer System Rev. Ser. 17 | | | 5.000 | | | | 10/01/2046 | | | | 6,854,580 | |
| | 5,000,000 | | | Denver Colorado City & County Board of Water Commissioners Water (Green Bond) Rev. Ser. 17A | | | 5.000 | | | | 09/15/2047 | | | | 5,768,600 | |
| | 2,500,000 | | | District of Columbia Water & Sewer Auth. Public Utility (Sub.-Lien) Rev. Ref. Ser. 16A | | | 5.000 | | | | 10/01/2039 | | | | 2,829,150 | |
| | 5,000,000 | | | District of Columbia Water & Sewer Auth. Public Utility (Sub.-Lien) Rev. Ser. 13A | | | 5.000 | | | | 10/01/2048 | | | | 5,506,750 | |
| | 3,000,000 | | | El Dorado California Irrigation District Rev. Ref. Ser. 14A AGM | | | 5.000 | | | | 03/01/2034 | | | | 3,380,790 | |
| | 3,500,000 | | | El Dorado California Irrigation District Rev. Ref. Ser. 14A AGM | | | 5.250 | | | | 03/01/2039 | | | | 3,963,925 | |
| | 1,500,000 | | | Florida Municipal Loan Council Ser. 11D AGM | | | 5.500 | | | | 10/01/2041 | | | | 1,642,035 | |
| | 190,000 | | | Houston Texas Utility System Combine (First Lien) Rev. Ref. Ser. 09A AGC(b) | | | 6.000 | | | | 05/15/2019 | | | | 195,732 | |
| | 1,275,000 | | | Indianapolis Indiana Local Public Improvement Bond Bank (Waterworks Project) Ser. 09A AGC(b) | | | 5.500 | | | | 01/01/2019 | | | | 1,291,256 | |
| | 5,260,000 | | | Indianapolis Indiana Local Public Improvement Bond Bank (Waterworks Project) Ser. 09A AGC | | | 5.500 | | | | 01/01/2038 | | | | 5,323,962 | |
| | 1,500,000 | | | Los Angeles California Department of Water & Power Ref. Ser. 16A | | | 5.000 | | | | 07/01/2046 | | | | 1,708,530 | |
| | 8,000,000 | | | Los Angeles California Department of Water & Power Rev. Ser. 12B | | | 5.000 | | | | 07/01/2043 | | | | 8,810,400 | |
| | 10,000,000 | | | Massachusetts State Water Resources Auth. (Green Bonds) Ref. Ser. 16C | | | 5.000 | | | | 08/01/2040 | | | | 11,367,900 | |
| | 5,000,000 | | | Massachusetts State Water Resources Auth. Ser. 18B | | | 5.000 | | | | 08/01/2043 | | | | 5,804,800 | |
| | 1,000,000 | | | Miami-Dade County Florida Water & Sewer System Rev. Ser. 10 AGM(b) | | | 5.000 | | | | 10/01/2020 | | | | 1,066,480 | |
| | 20,000,000 | | | Miami-Dade County Florida Water & Sewer System Rev. Ser. 10 AGM(b) | | | 5.000 | | | | 10/01/2020 | | | | 21,329,600 | |
| | 10,000,000 | | | Miami-Dade County Florida Water & Sewer Systems Rev. Ser. 17A | | | 3.375 | | | | 10/01/2047 | | | | 9,107,800 | |
| | 600,000 | | | New York City Municipal Water Finance Auth. Rev. Ref. Ser. 14EE | | | 5.000 | | | | 06/15/2036 | | | | 673,686 | |
| | 5,000,000 | | | New York City Municipal Water Finance Auth. Water & Sewer System (Second General Resolution Fiscal 2009) Rev. Ser. 09EE | | | 5.000 | | | | 06/15/2039 | | | | 5,120,150 | |
| | 3,295,000 | | | New York City Municipal Water Finance Auth. Water & Sewer System (Second General Resolution Fiscal 2012) Rev. Ser. 11BB | | | 5.000 | | | | 06/15/2044 | | | | 3,564,465 | |
| | 10,205,000 | | | New York City Municipal Water Finance Auth. Water & Sewer System (Second General Resolution Fiscal 2012) Rev. Ser. 12CC | | | 5.000 | | | | 06/15/2045 | | | | 11,036,197 | |
See accompanying Notes to Financial Statements which are an integral part of the financial statements.
Invesco National AMT-Free Municipal Bond ETF (PZA) (continued)
August 31, 2018
| | | | | | | | | | | | | | | | |
Principal
Amount | | | | | Interest
Rate | | | Maturity
Date | | | Value | |
| | | | Municipal Bonds (continued) | | | | | | | | | |
| | | | Water Revenue (continued) | | | | | | | | | |
| $ | 9,640,000 | | | New York City Municipal Water Finance Auth. Water & Sewer System (Second General Resolution Fiscal 2013) Rev. Ser. 12BB | | | 5.000 | % | | | 06/15/2047 | | | $ | 10,574,694 | |
| | 500,000 | | | New York City Municipal Water Finance Auth. Water & Sewer System (Second General Resolution Fiscal 2013) Rev. Ser. 13EE | | | 5.000 | | | | 06/15/2047 | | | | 550,025 | |
| | 11,180,000 | | | New York City Municipal Water Finance Auth. Water & Sewer System (Second General Resolution Fiscal 2014) Rev. Ser. 14CC-1 | | | 5.000 | | | | 06/15/2047 | | | | 12,451,725 | |
| | 5,750,000 | | | New York City Municipal Water Finance Auth. Water & Sewer System Rev. Ref. Ser. 17EE | | | 5.000 | | | | 06/15/2037 | | | | 6,597,952 | |
| | 5,000,000 | | | North Fort Bend Texas Water Auth. (Water System) Rev. Ser. 09 AGC | | | 5.250 | | | | 12/15/2034 | | | | 5,209,000 | |
| | 2,500,000 | | | North Fort Bend Texas Water Auth. (Water System) Rev. Ser. 11 AGM | | | 5.000 | | | | 12/15/2036 | | | | 2,698,700 | |
| | 2,000,000 | | | North Sumter County Florida Utility Dependent District Utility Rev. Ser. 10 AGM | | | 5.375 | | | | 10/01/2040 | | | | 2,130,420 | |
| | 875,000 | | | Philadelphia Pennsylvania Water & Wastewater Rev. Ser. 10C AGM | | | 5.000 | | | | 08/01/2040 | | | | 919,118 | |
| | 285,000 | | | Port St. Lucie Florida Utility System Rev. Ref. Ser. 09 AGC | | | 5.000 | | | | 09/01/2035 | | | | 285,000 | |
| | 4,050,000 | | | Puerto Rico Commonwealth Aqueduct & Sewer Auth. (Senior Lien) Rev. Ser. 08A AGC | | | 5.125 | | | | 07/01/2047 | | | | 4,120,511 | |
| | 2,500,000 | | | San Antonio Texas Water (Junior Lien) Rev. Ref. Ser. 18A | | | 5.000 | | | | 05/15/2043 | | | | 2,874,675 | |
| | 1,000,000 | | | San Jacinto Texas River Auth. Special Project (GRP Project) Rev. Ser. 11 AGM | | | 5.000 | | | | 10/01/2037 | | | | 1,029,820 | |
| | 1,000,000 | | | Texas State Water Development Board (State Water Implementation Rev. Fund For Texas) Ser. 16 | | | 5.000 | | | | 10/15/2046 | | | | 1,129,190 | |
| | 3,910,000 | | | Texas State Water Development Board Ser. 15A | | | 5.000 | | | | 10/15/2045 | | | | 4,412,670 | |
| | 1,000,000 | | | Wyandotte County Kansas City Government Utility System Improvement Rev. Ser. 16A | | | 5.000 | | | | 09/01/2040 | | | | 1,113,910 | |
| | 1,500,000 | | | Wyandotte County Kansas City Government Utility System Improvement Rev. Ser. 16A | | | 5.000 | | | | 09/01/2045 | | | | 1,665,900 | |
| | | | | | | | | | | | | | | | |
| | | | | | | | | | | | | | | 209,995,851 | |
| | | | | | | | | | | | | | | | |
| | | | Total Investments in Securities
(Cost $1,603,586,195)(c)—98.2% | | | | | | | | | | | 1,630,187,244 | |
| | | | Other assets less liabilities—1.8% | | | | | | | | | | | 29,793,279 | |
| | | | | | | | | | | | | | | | |
| | | | Net Assets—100.0% | | | | | | | | | | $ | 1,659,980,523 | |
| | | | | | | | | | | | | | | | |
Investment Abbreviations:
AGC—Assured Guaranty Corp.
AGM—Assured Guaranty Municipal Corp.
AMBAC—American Municipal Bond Assurance Corp.
Auth.—Authority
BAM—Build America Mutual
BHAC—Berkshire Hathaway Assurance Corp.
COP—Certificate of Participation
GTD—Grant To Date
NATL—National Public Finance Guarantee Corp.
PILOT—Payment-in-lieu-of-taxes
PSF-GTD—Permanent School Fund Guaranteed
RAC—Revenue Anticipation Certificates
Ref.—Refunding
Rev.—Revenue
Ser.—Series
Sub.—Subordinated
Notes to Schedule of Investments:
| (a) | Security purchased or received in a transaction exempt from registration under the Securities Act of 1933, as amended (the “1933 Act”). The security may be resold pursuant to an exemption from registration under the 1933 Act, typically to qualified institutional buyers. The value of this security at August 31, 2018 represented less than 1% of the Fund’s Net Assets. |
| (b) | Advance refunded; secured by an escrow fund of U.S. Government obligations or other highly rated collateral. |
| (c) | The following table provides a listing of those entities that have either guaranteed, backed or otherwise enhanced the credit quality of more than 5% of the value of securities held in the portfolio, as of August 31, 2018. In instances where the entity has guaranteed, backed or otherwise enhanced the credit quality of a security, it is not primarily responsible for the borrower’s obligations but may be called upon to satisfy the borrower’s obligations. |
| | | | |
Entities | | Percentage of
Total Investments | |
| Assured Guaranty Municipal Corp. | | | 18.5 | % |
See accompanying Notes to Financial Statements which are an integral part of the financial statements.
Schedule of Investments
Invesco New York AMT-Free Municipal Bond ETF (PZT)
August 31, 2018
| | | | | | | | | | | | | | | | |
Principal
Amount | | | | | Interest
Rate | | | Maturity
Date | | | Value | |
| | | | Municipal Bonds—98.6% | | | | | | | | | |
| | | | Ad Valorem Property Tax—5.9% | | | | | | | | | |
| $ | 1,000,000 | | | City of New York Ser. 18E-1 | | | 5.000 | % | | | 03/01/2038 | | | $ | 1,150,720 | |
| | 2,000,000 | | | New York City New York Ser. 16B-1 | | | 4.000 | | | | 12/01/2043 | | | | 2,066,600 | |
| | 500,000 | | | New York City New York Sub.-Ser. 16A-1 | | | 5.000 | | | | 08/01/2038 | | | | 565,765 | |
| | | | | | | | | | | | | | | | |
| | | | | | | | | | | | | | | 3,783,085 | |
| | | | | | | | | | | | | | | | |
| | | | College & University Revenue—12.1% | | | | | | | | | |
| | 1,000,000 | | | Build New York City Resource Corp. (New York Law School Project) Rev. Ref. Ser. 16 | | | 5.000 | | | | 07/01/2041 | | | | 1,071,400 | |
| | 1,500,000 | | | New York State Dormitory Auth. (New York University) Rev. Ser. 01 AMBAC | | | 5.500 | | | | 07/01/2040 | | | | 1,943,535 | |
| | 1,000,000 | | | New York State Dormitory Auth. Non State Supported Debt (Columbia University) Rev. Ser. 17A | | | 5.000 | | | | 10/01/2047 | | | | 1,318,460 | |
| | 2,000,000 | | | New York State Dormitory Auth. Non State Supported Debt (Icahn School of Medicine at Mount Sinai) Rev. Ref. Ser. 15A | | | 5.000 | | | | 07/01/2035 | | | | 2,225,460 | |
| | 1,000,000 | | | New York State Dormitory Auth. Non State Supported Debt (The New School Project) Rev. Ref. Ser. 16A | | | 5.000 | | | | 07/01/2046 | | | | 1,114,320 | |
| | | | | | | | | | | | | | | | |
| | | | | | | | | | | | | | | 7,673,175 | |
| | | | | | | | | | | | | | | | |
| | | | Electric Power Revenue—11.8% | | | | | | | | | |
| | 1,000,000 | | | Guam Power Auth. Rev. Ser. 12A AGM | | | 5.000 | | | | 10/01/2030 | | | | 1,092,960 | |
| | 2,000,000 | | | Long Island Power Auth. New York Electric Systems Rev. Ref. Ser. 14A | | | 5.000 | | | | 09/01/2044 | | | | 2,214,300 | |
| | 185,000 | | | New York State Power Auth. Rev. Ser. 07A NATL | | | 4.500 | | | | 11/15/2047 | | | | 185,390 | |
| | 1,500,000 | | | Utility Debt Securitization Auth. New York (Restructuring) Ser. 13TE | | | 5.000 | | | | 12/15/2041 | | | | 1,675,635 | |
| | 2,000,000 | | | Utility Debt Securitization Auth. New York (Restructuring) Ser. 17 | | | 5.000 | | | | 12/15/2038 | | | | 2,328,800 | |
| | | | | | | | | | | | | | | | |
| | | | | | | | | | | | | | | 7,497,085 | |
| | | | | | | | | | | | | | | | |
| | | | Health, Hospital, Nursing Home Revenue—3.6% | | | | | | | | | |
| | 500,000 | | | Dutchess County New York Local Development Corp. (Health Quest Systems Inc. Project) Rev. Ser. 16B | | | 5.000 | | | | 07/01/2046 | | | | 548,760 | |
| | 1,500,000 | | | New York State Dormitory Auth. Non State Supported Debt (New York University Hospitals Center) Rev. Ref. Ser. 15 | | | 5.000 | | | | 07/01/2034 | | | | 1,668,435 | |
| | 65,000 | | | New York State Dormitory Auth. State Supported Debt (Mental Health Services Facilities Improvement) Rev. Ser. 08A AGM | | | 5.000 | | | | 02/15/2038 | | | | 65,153 | |
| | | | | | | | | | | | | | | | |
| | | | | | | | | | | | | | | 2,282,348 | |
| | | | | | | | | | | | | | | | |
| | | | Highway Tolls Revenue—6.2% | | | | | | | | | |
| | 1,000,000 | | | New York State Thruway Auth. General (Junior Indebtedness Obligation-Junior Lien) Rev. Ser. 16A | | | 5.000 | | | | 01/01/2046 | | | | 1,110,420 | |
| | 1,000,000 | | | New York Triborough Bridge & Tunnel Auth. General Rev. Ref. Ser. 17B | | | 5.000 | | | | 11/15/2038 | | | | 1,145,430 | |
| | 1,470,000 | | | New York Triborough Bridge & Tunnel Auth. General Rev. Ser. 16A | | | 5.000 | | | | 11/15/2046 | | | | 1,658,763 | |
| | | | | | | | | | | | | | | | |
| | | | | | | | | | | | | | | 3,914,613 | |
| | | | | | | | | | | | | | | | |
| | | | Hotel Occupancy Tax—3.3% | | | | | | | | | |
| | 1,885,000 | | | New York State Convention Center Development Corp. (Hotel Unit Fee Secured) Rev. Ref. Ser. 15 | | | 5.000 | | | | 11/15/2040 | | | | 2,124,659 | |
| | | | | | | | | | | | | | | | |
| | | | Income Tax Revenue—18.4% | | | | | | | | | |
| | 1,000,000 | | | New York City Transitional Finance Auth. (Building Aid) Rev. Ref. Ser. 18S-4A | | | 5.000 | | | | 07/15/2037 | | | | 1,153,900 | |
| | 1,500,000 | | | New York City Transitional Finance Auth. (Sub.-Future Tax Secured Fiscal 1999) Rev. Ser. 17A Sub.-Ser. E-1 | | | 5.000 | | | | 02/01/2043 | | | | 1,698,750 | |
| | 1,000,000 | | | New York City Transitional Finance Auth. Rev. Sub.-Ser. 17B-1 | | | 5.000 | | | | 08/01/2045 | | | | 1,137,670 | |
| | 1,000,000 | | | New York City Transitional Finance Authority Building AID Revenue | | | 4.000 | | | | 07/15/2046 | | | | 1,032,080 | |
| | 1,000,000 | | | New York State Dormitory Auth. Personal Income Tax (General Purpose) Rev. Ref. Ser. 17A | | | 5.000 | | | | 02/15/2038 | | | | 1,138,600 | |
| | 1,000,000 | | | New York State Dormitory Auth. Personal Income Tax (General Purpose) Rev. Ser. 10F | | | 5.000 | | | | 02/15/2035 | | | | 1,044,540 | |
| | 2,170,000 | | | New York State Dormitory Auth. Personal Income Tax (General Purpose) Rev. Ser. 11C | | | 5.000 | | | | 03/15/2041 | | | | 2,315,824 | |
| | 785,000 | | | New York State Dormitory Auth. Personal Income Tax (General Purpose) Rev. Ser. 12B | | | 5.000 | | | | 03/15/2037 | | | | 852,808 | |
| | 1,200,000 | | | New York State Dormitory Auth. Personal Income Tax (General Purpose) Rev. Ser. 12B | | | 5.000 | | | | 03/15/2042 | | | | 1,300,692 | |
| | | | | | | | | | | | | | | | |
| | | | | | | | | | | | | | | 11,674,864 | |
| | | | | | | | | | | | | | | | |
| | | | Industrial Revenue—3.4% | | | | | | | | | |
| | 2,000,000 | | | New York State Liberty Development Corp. (4 World Trade Center Project) Rev. Ref. Ser. 11 | | | 5.000 | % | | | 11/15/2044 | | | | 2,154,440 | |
| | | | | | | | | | | | | | | | |
| | | | Lease Revenue—3.7% | | | | | | | | | |
| | 1,000,000 | | | MTA Hudson Rail Yards Trust Obligations Rev. Ser. 16A | | | 5.000 | | | | 11/15/2046 | | | | 1,031,480 | |
| | 1,240,000 | | | MTA Hudson Rail Yards Trust Obligations Rev. Ser. 16A | | | 5.000 | | | | 11/15/2051 | | | | 1,322,758 | |
| | | | | | | | | | | | | | | | |
| | | | | | | | | | | | | | | 2,354,238 | |
| | | | | | | | | | | | | | | | |
See accompanying Notes to Financial Statements which are an integral part of the financial statements.
Invesco New York AMT-Free Municipal Bond ETF (PZT) (continued)
August 31, 2018
| | | | | | | | | | | | | | | | |
Principal
Amount | | | | | Interest
Rate | | | Maturity
Date | | | Value | |
| | | | Municipal Bonds (continued) | | | | | | | | | |
| | | | Miscellaneous Revenue—11.7% | | | | | | | | | |
| $ | 2,000,000 | | | Brooklyn Arena New York Local Development Corp. PILOT (Barclays Center Project) Rev. Ref. Ser. 16A | | | 5.000 | % | | | 07/15/2042 | | | $ | 2,167,460 | |
| | 450,000 | | | Hudson Yards Infrastructure Corporation Second Indenture Rev. Ref. Ser. 17A | | | 5.000 | | | | 02/15/2042 | | | | 509,872 | |
| | 2,500,000 | | | New York City Industrial Development Agency (Queens Baseball Stadium PILOT) Rev. Ser. 09 AGC | | | 6.500 | | | | 01/01/2046 | | | | 2,537,475 | |
| | 1,000,000 | | | New York City Transitional Finance Auth. Building Aid (Fiscal 2015) Rev. Ser. 15S-2 | | | 5.000 | | | | 07/15/2035 | | | | 1,127,780 | |
| | 1,000,000 | | | New York City Transitional Finance Auth. Building Aid Rev. Ser. 16S-1 | | | 5.000 | | | | 07/15/2043 | | | | 1,117,180 | |
| | | | | | | | | | | | | | | | |
| | | | | | | | | | | | | | | 7,459,767 | |
| | | | | | | | | | | | | | | | |
| | | | Port, Airport & Marina Revenue—1.8% | | | | | | | | | |
| | 1,000,000 | | | Port Auth. of New York & New Jersey Ref. Ser. 15-194 | | | 5.250 | | | | 10/15/2055 | | | | 1,138,970 | |
| | | | | | | | | | | | | | | | |
| | | | Recreational Revenue—3.2% | | | | | | | | | |
| | 2,000,000 | | | New York City Industrial Development Agency (Yankee Stadium PILOT) Rev. Ser. 09 AGC | | | 7.000 | | | | 03/01/2049 | | | | 2,050,580 | |
| | | | | | | | | | | | | | | | |
| | | | Sales Tax Revenue—5.5% | | | | | | | | | |
| | 1,000,000 | | | New York State Dormitory Auth. Sales Tax Supported Debt Rev. Ser. 14A | | | 5.000 | | | | 03/15/2034 | | | | 1,127,220 | |
| | 1,435,000 | | | Puerto Rico Sales Tax Financing Corp. Sales Tax Rev. First Sub.-Ser. 10C AGM | | | 5.125 | | | | 08/01/2042 | | | | 1,499,719 | |
| | 800,000 | | | Sales Tax Asset Receivables Corp. (Fiscal 2015) Ref. Ser. 14A | | | 4.000 | | | | 10/15/2032 | | | | 862,424 | |
| | | | | | | | | | | | | | | | |
| | | | | | | | | | | | | | | 3,489,363 | |
| | | | | | | | | | | | | | | | |
| | | | Transit Revenue—2.6% | | | | | | | | | |
| | 1,000,000 | | | Metropolitan Transportation Auth. New York (Green Bonds) Rev. Ser. 16A-1 | | | 5.250 | | | | 11/15/2056 | | | | 1,122,840 | |
| | 500,000 | | | Metropolitan Transportation Auth. New York Rev. Ser. 11A AGM(a) | | | 5.000 | | | | 11/15/2021 | | | | 550,260 | |
| | | | | | | | | | | | | | | | |
| | | | | | | | | | | | | | | 1,673,100 | |
| | | | | | | | | | | | | | | | |
| | | | Water Revenue—5.4% | | | | | | | | | |
| | 1,000,000 | | | New York City Municipal Finance Auth. Water & Sewer System (Second General Resolution Fiscal 2014) Rev. Ser. 13BB | | | 5.000 | | | | 06/15/2046 | | | | 1,100,520 | |
| | 1,000,000 | | | New York City Municipal Finance Auth. Water & Sewer System Rev. Ref. Ser. 17EE | | | 5.250 | | | | 06/15/2037 | | | | 1,170,780 | |
| | 1,000,000 | | | New York State Environmental Facilities Corp. (State Clean Water & Drinking Water Sub. SRF Bonds) Ref. Ser. 16A | | | 5.000 | | | | 06/15/2041 | | | | 1,136,290 | |
| | | | | | | | | | | | | | | | |
| | | | | | | | | | | | | | | 3,407,590 | |
| | | | | | | | | | | | | | | | |
| | | | Total Investments in Securities
(Cost $62,555,833)(b)— 98.6% | | | | | | | | | | | 62,677,877 | |
| | | | Other assets less liabilities—1.4% | | | | | | | | | | | 898,759 | |
| | | | | | | | | | | | | | | | |
| | | | Net Assets—100.0% | | | | | | | | | | $ | 63,576,636 | |
| | | | | | | | | | | | | | | | |
Investment Abbreviations:
AGC—Assured Guaranty Corp.
AGM—Assured Guaranty Municipal Corp.
AMBAC—American Municipal Bond Assurance Corp.
Auth.—Authority
NATL—National Public Finance Guarantee Corp.
PILOT—Payment-in-lieu-of-taxes
Rev.—Revenue
Ser.—Series
SRF—State Revolving Fund
Sub.—Subordinated
Notes to Schedule of Investments:
| (a) | Advance refunded; secured by an escrow fund of U.S. Government obligations or other highly rated collateral. |
| (b) | The following table provides a listing of those entities that have either guaranteed, backed or otherwise enhanced the credit quality of more than 5% of the value of securities held in the portfolio, as of August 31, 2018. In instances where the entity has guaranteed, backed or otherwise enhanced the credit quality of a security, it is not primarily responsible for the borrower’s obligations but may be called upon to satisfy the borrower’s obligations. |
| | | | |
Entities | | Percentage of
Total Investments | |
| Assured Guaranty Corp. | | | 7.3 | % |
| Assured Guaranty Municipal Corp. | | | 5.1 | % |
See accompanying Notes to Financial Statements which are an integral part of the financial statements.
Schedule of Investments(a)
Invesco Preferred ETF (PGX)
August 31, 2018
| | | | | | | | |
Number
of Shares | | | | | Value | |
| | | | Preferred Stocks & Other Equity
Interests—99.9% | |
| | | | Banks—37.5% | | | |
| | 99,822 | | | Associated Banc-Corp., 5.38%, Series D | | $ | 2,465,603 | |
| | 1,472,552 | | | Bank of America Corp., 5.88%, Series HH | | | 37,903,488 | |
| | 1,527,617 | | | Bank of America Corp., 6.00%, Series EE(b) | | | 39,855,528 | |
| | 2,355,875 | | | Bank of America Corp., 6.00%, Series GG(b) | | | 61,841,719 | |
| | 1,829,405 | | | Bank of America Corp., 6.20%, Series CC | | | 47,802,353 | |
| | 3,152,798 | | | Bank of America Corp., 6.50%, Series Y | | | 82,445,668 | |
| | 2,410,182 | | | Bank of America Corp., 6.63%, Series W | | | 62,351,408 | |
| | 4,172,647 | | | Barclays Bank PLC, 8.13%, Series 5 (United Kingdom)(b) | | | 110,324,787 | |
| | 759,054 | | | BB&T Corp., 5.63%(b) | | | 19,818,900 | |
| | 3,811,784 | | | BB&T Corp., 5.63%, Series E | | | 96,323,782 | |
| | 508,451 | | | BB&T Corp., 5.85% | | | 13,128,205 | |
| | 255,945 | | | BOK Financial Corp., 5.38% | | | 6,421,660 | |
| | 413,739 | | | Citigroup Capital XIII, 8.71% (3 mo. USD LIBOR + 6.37%)(c) | | | 11,249,563 | |
| | 1,813,686 | | | Citigroup, Inc., 6.30%, Series S | | | 47,699,942 | |
| | 3,512,833 | | | Citigroup, Inc., 6.88%, Series K | | | 97,305,474 | |
| | 1,131,467 | | | Citigroup, Inc., 6.88%, Series L | | | 29,282,366 | |
| | 405,464 | | | Citigroup, Inc., 7.13%, Series J | | | 11,474,631 | |
| | 264,590 | | | Commerce Bancshares, Inc., 6.00%, Series B(b) | | | 6,810,547 | |
| | 259,920 | | | Cullen/Frost Bankers, Inc., 5.38% | | | 6,513,595 | |
| | 802,097 | | | Fifth Third Bancorp, 6.63%, Series I | | | 22,258,192 | |
| | 159,865 | | | First Horizon National Corp., 6.20%, Series A | | | 4,084,551 | |
| | 316,450 | | | First Republic Bank, 5.13%, Series H(b) | | | 7,927,072 | |
| | 330,997 | | | First Republic Bank, 5.50%, Series D(b) | | | 8,463,593 | |
| | 271,274 | | | First Republic Bank, 5.50%, Series G | | | 6,814,403 | |
| | 518,220 | | | First Republic Bank, 5.50%, Series I | | | 12,971,047 | |
| | 276,331 | | | First Republic Bank, 5.70%, Series F | | | 7,057,494 | |
| | 267,554 | | | First Republic Bank, 7.00%, Series E | | | 6,868,111 | |
| | 259,278 | | | Hancock Whitney Corp., 5.95%(b) | | | 6,616,775 | |
| | 175,330 | | | Huntington Bancshares, Inc., 5.88%, Series C | | | 4,498,091 | |
| | 904,516 | | | Huntington Bancshares, Inc., 6.25%, Series D | | | 23,852,087 | |
| | 92,213 | | | ING Groep NV, 6.13% (Netherlands) | | | 2,364,341 | |
| | 572,962 | | | ING Groep NV, 6.38% (Netherlands) | | | 14,713,664 | |
| | 1,617,331 | | | JPMorgan Chase & Co., 5.45%, Series P | | | 41,080,207 | |
| | 2,119,594 | | | JPMorgan Chase & Co., 6.10%, Series AA | | | 56,232,829 | |
| | 3,121,640 | | | JPMorgan Chase & Co., 6.13%, Series Y(b) | | | 82,255,214 | |
| | 2,225,889 | | | JPMorgan Chase & Co., 6.15%, Series BB | | | 58,741,211 | |
| | 1,149,897 | | | JPMorgan Chase & Co., 6.30%, Series W(b) | | | 29,931,819 | |
| | 1,220,795 | | | JPMorgan Chase & Co., 6.70%, Series T | | | 31,765,086 | |
| | 773,042 | | | KeyCorp, 5.65%, Series F | | | 19,387,893 | |
| | 904,898 | | | KeyCorp, 6.13%, Series E(b) | | | 25,047,577 | |
| | 349,325 | | | MB Financial, Inc., 6.00%, Series C(b) | | | 9,117,382 | |
| | 437,048 | | | People’s United Financial, Inc., 5.63%, Series A | | | 11,402,582 | |
| | 3,219,928 | | | PNC Financial Services Group, Inc. (The), 6.13%, Series P | | | 89,095,408 | |
| | 860,716 | | | Regions Financial Corp., 6.38%, Series A | | | 21,758,900 | |
| | 861,826 | | | Regions Financial Corp., 6.38%, Series B(b) | | | 23,424,431 | |
| | | | | | | | |
Number
of Shares | | | | | Value | |
| | | | Preferred Stocks & Other Equity
Interests (continued) | |
| | | | Banks (continued) | | | |
| | 1,272,054 | | | Royal Bank of Scotland Group PLC, 6.60%, Series S (United Kingdom)(b) | | $ | 32,946,199 | |
| | 342,061 | | | Synovus Financial Corp., 6.30%, Series D | | | 8,979,101 | |
| | 316,256 | | | TCF Financial Corp., 5.70%, Series C | | | 7,874,774 | |
| | 429,587 | | | Texas Capital Bancshares, Inc., 6.50%, Series A | | | 10,898,622 | |
| | 682,959 | | | U.S. Bancorp, 5.15% | | | 17,388,136 | |
| | 1,662,392 | | | U.S. Bancorp, 6.50%, Series F | | | 46,513,728 | |
| | 517,560 | | | Unum Group, 6.25% | | | 13,099,444 | |
| | 665,478 | | | US Bancorp, 5.50%, Series K | | | 17,042,892 | |
| | 173,715 | | | Valley National Bancorp, 5.50%, Series B | | | 4,551,333 | |
| | 211,409 | | | Valley National Bancorp, 6.25%, Series A(b) | | | 5,644,620 | |
| | 261,982 | | | Webster Financial Corp., 5.25%, Series F(b) | | | 6,408,080 | |
| | 904,751 | | | Wells Fargo & Co., 5.13%, Series O(b) | | | 22,365,445 | |
| | 893,908 | | | Wells Fargo & Co., 5.20%(b) | | | 22,088,467 | |
| | 2,111,715 | | | Wells Fargo & Co., 5.50%, Series X | | | 52,940,695 | |
| | 1,393,916 | | | Wells Fargo & Co., 5.63%, Series Y | | | 35,335,771 | |
| | 1,796,388 | | | Wells Fargo & Co., 5.70%, Series W(b) | | | 45,520,472 | |
| | 3,127,338 | | | Wells Fargo & Co., 5.85%, Series Q | | | 80,497,680 | |
| | 1,266,832 | | | Wells Fargo & Co., 6.00%, Series T | | | 32,430,899 | |
| | 1,655,767 | | | Wells Fargo & Co., 6.00%, Series V | | | 42,801,577 | |
| | 1,272,917 | | | Wells Fargo & Co., 6.63%, Series R | | | 35,017,947 | |
| | 1,703,741 | | | Wells Fargo & Co., 8.00%, Series J | | | 42,525,375 | |
| | 215,280 | | | Wintrust Financial Corp., 6.50%, Series D(b) | | | 5,840,546 | |
| | 245,678 | | | Zions Bancorp, 5.75%, Series H(b) | | | 6,240,221 | |
| | 19,504 | | | Zions Bancorp, 6.30%, Series G | | | 528,558 | |
| | | | | | | | |
| | | | | | | 2,014,229,761 | |
| | | | | | | | |
| | | | Capital Markets—15.2% | | | |
| | 497,420 | | | Apollo Global Management LLC, 6.38%, Series A(b) | | | 12,798,617 | |
| | 542,162 | | | Apollo Global Management LLC, 6.38%, Series B | | | 13,662,482 | |
| | 272,802 | | | Apollo Investment Corp., 6.88%(b) | | | 6,948,267 | |
| | 560,986 | | | Ares Management LP, 7.00%, Series A | | | 15,225,160 | |
| | 1,001,796 | | | Bank of New York Mellon Corp. (The), 5.20% | | | 25,595,888 | |
| | 148,462 | | | BGC Partners, Inc., 8.13% | | | 3,773,904 | |
| | 209,218 | | | Brightsphere Investment Group PLC, 5.13% | | | 4,835,028 | |
| | 722,014 | | | Carlyle Group LP (The), 5.88%, Series A | | | 17,256,135 | |
| | 1,221,312 | | | Charles Schwab Corp. (The), 5.95%, Series D | | | 31,656,407 | |
| | 1,040,591 | | | Charles Schwab Corp. (The), 6.00%, Series C | | | 27,169,831 | |
| | 3,880,168 | | | Deutsche Bank Contingent Capital Trust V, 8.05% (Germany) | | | 101,117,178 | |
| | 1,997,996 | | | Goldman Sachs Group, Inc. (The), 5.50%, Series J(b) | | | 52,207,636 | |
| | 385,245 | | | Goldman Sachs Group, Inc. (The), 6.20%, Series B(b) | | | 10,286,042 | |
| | 989,125 | | | Goldman Sachs Group, Inc. (The), 6.30%, Series N | | | 26,459,094 | |
| | 1,340,756 | | | Goldman Sachs Group, Inc. (The), 6.38%, Series K | | | 36,508,786 | |
See accompanying Notes to Financial Statements which are an integral part of the financial statements.
Invesco Preferred ETF (PGX) (continued)
August 31, 2018
| | | | | | | | |
Number
of Shares | | | | | Value | |
| | | | Preferred Stocks & Other Equity Interests
(continued) | |
| | | | Capital Markets (continued) | | | |
| | 270,453 | | | KKR & Co., Inc., 6.50%, Series B | | $ | 7,183,232 | |
| | 588,291 | | | KKR & Co., Inc., 6.75%, Series A | | | 15,807,379 | |
| | 759,447 | | | Legg Mason, Inc., 5.45% | | | 18,773,530 | |
| | 598,498 | | | Legg Mason, Inc., 6.38%(b) | | | 15,776,407 | |
| | 1,847,427 | | | Morgan Stanley, 5.85%, Series K | | | 48,051,576 | |
| | 1,900,292 | | | Morgan Stanley, 6.38%, Series I | | | 51,687,942 | |
| | 1,307,251 | | | Morgan Stanley, 6.63%, Series G(b) | | | 34,550,644 | |
| | 949,973 | | | Morgan Stanley, 6.88%, Series F | | | 26,637,243 | |
| | 1,309,489 | | | Morgan Stanley, 7.13%, Series E(b) | | | 37,687,093 | |
| | 686,227 | | | Northern Trust Corp., 5.85%, Series C(b) | | | 18,445,782 | |
| | 438,612 | | | Oaktree Capital Group LLC, 6.55%, Series B | | | 10,974,072 | |
| | 324,732 | | | Oaktree Capital Group LLC, 6.63%, Series A | | | 8,215,720 | |
| | 345,696 | | | Prospect Capital Corp., 6.25%(b) | | | 8,742,652 | |
| | 775,903 | | | State Street Corp., 5.25%, Series C | | | 19,459,647 | |
| | 774,462 | | | State Street Corp., 5.35%, Series G | | | 20,252,181 | |
| | 1,459,612 | | | State Street Corp., 5.90%,
Series D(b) | | | 39,438,716 | |
| | 1,342,534 | | | State Street Corp., 6.00%, Series E | | | 34,946,160 | |
| | 394,069 | | | Stifel Financial Corp., 5.20%(b) | | | 9,761,089 | |
| | 271,237 | | | Stifel Financial Corp., 6.25%, Series A | | | 7,003,339 | |
| | | | | | | | |
| | | | | | | 818,894,859 | |
| | | | | | | | |
| | | | Chemicals—0.1% | | | |
| | 75,444 | | | E.I. du Pont de Nemours & Co., 4.50%, Series B(b) | | | 7,695,288 | |
| | | | | | | | |
| | | | Commercial Services & Supplies—0.3% | | | |
| | 762,291 | | | Pitney Bowes, Inc., 6.70%(b) | | | 17,425,972 | |
| | | | | | | | |
| | | | Consumer Finance—3.1% | | | |
| | 1,076,661 | | | Capital One Financial Corp., 5.20%, Series G(b) | | | 26,873,459 | |
| | 1,469,539 | | | Capital One Financial Corp., 6.00%, Series B | | | 37,502,635 | |
| | 859,140 | | | Capital One Financial Corp., 6.00%, Series H | | | 22,492,285 | |
| | 903,536 | | | Capital One Financial Corp., 6.20%, Series F | | | 23,690,714 | |
| | 796,833 | | | Capital One Financial Corp., 6.25%, Series C | | | 20,653,911 | |
| | 820,091 | | | Capital One Financial Corp., 6.70%, Series D | | | 21,519,188 | |
| | 546,863 | | | Navient Corp., 6.00% | | | 12,829,406 | |
| | | | | | | | |
| | | | | | | 165,561,598 | |
| | | | | | | | |
| | | | Diversified Telecommunication Services—5.1% | | | | |
| | 2,347,395 | | | AT&T, Inc., 5.35%(b) | | | 58,802,245 | |
| | 1,323,876 | | | AT&T, Inc., 5.63% | | | 33,348,436 | |
| | 1,804,702 | | | Qwest Corp., 6.13% | | | 40,732,124 | |
| | 1,767,014 | | | Qwest Corp., 6.50% | | | 41,489,489 | |
| | 631,690 | | | Qwest Corp., 6.63%(b) | | | 15,577,475 | |
| | 995,144 | | | Qwest Corp., 6.75% | | | 24,261,611 | |
| | 778,363 | | | Qwest Corp., 6.88%(b) | | | 19,373,455 | |
| | 147,487 | | | Qwest Corp., 7.00% | | | 3,725,522 | |
| | 321,463 | | | Qwest Corp., 7.00% | | | 8,203,414 | |
| | 265,122 | | | Qwest Corp., 7.00%(b) | | | 6,696,982 | |
| | 20,504 | | | Qwest Corp., 7.50% | | | 520,186 | |
| | 874,336 | | | Verizon Communications, Inc., 5.90% | | | 22,435,462 | |
| | | | | | | | |
| | | | | | | 275,166,401 | |
| | | | | | | | |
| | | | | | | | |
Number
of Shares | | | | | Value | |
| | | | Preferred Stocks & Other Equity Interests
(continued) | |
| | | | Electric Utilities—7.5% | | | |
| | 406,697 | | | Alabama Power Co., 5.00%,
Series A(b) | | $ | 10,606,658 | |
| | 906,072 | | | Duke Energy Corp., 5.13% | | | 22,932,682 | |
| | 497,485 | | | Entergy Arkansas, Inc., 4.88% | | | 12,218,232 | |
| | 55,851 | | | Entergy Arkansas, Inc., 4.90% | | | 1,361,089 | |
| | 452,619 | | | Entergy Louisiana LLC, 4.88% | | | 11,075,587 | |
| | 452,503 | | | Entergy Louisiana LLC, 5.25% | | | 11,371,400 | |
| | 457,636 | | | Entergy Mississippi, Inc., 4.90% | | | 11,331,067 | |
| | 465,393 | | | Entergy New Orleans LLC, 5.50%(b) | | | 12,323,607 | |
| | 722,645 | | | Entergy Texas, Inc., 5.63% | | | 19,070,602 | |
| | 506,310 | | | Georgia Power Co., 5.00%, Series 2017 | | | 12,353,964 | |
| | 332,879 | | | Interstate Power & Light Co., 5.10%, Series D(b) | | | 8,335,290 | |
| | 1,253,582 | | | NextEra Energy Capital Holdings, Inc., 5.00% | | | 31,201,656 | |
| | 1,043,709 | | | NextEra Energy Capital Holdings, Inc., 5.13%, Series I(b) | | | 26,113,599 | |
| | 807,770 | | | NextEra Energy Capital Holdings, Inc., 5.25%, Series K | | | 20,081,162 | |
| | 199,692 | | | Pacific Gas & Electric Co., 6.00%, Series A(b) | | | 5,086,155 | |
| | 759,913 | | | PPL Capital Funding, Inc., 5.90%, Series B | | | 19,271,394 | |
| | 285,914 | | | SCE Trust II, 5.10%(b) | | | 6,927,696 | |
| | 314,325 | | | SCE Trust III, 5.75%, Series H | | | 8,383,048 | |
| | 544,387 | | | SCE Trust IV, 5.38%, Series J | | | 13,930,863 | |
| | 544,668 | | | SCE Trust V, 5.45%, Series K | | | 14,063,328 | |
| | 1,036,159 | | | SCE Trust VI, 5.00% | | | 24,183,951 | |
| | 1,357,385 | | | Southern Co. (The), 5.25% | | | 33,418,819 | |
| | 857,777 | | | Southern Co. (The), 5.25% | | | 20,981,225 | |
| | 1,764,598 | | | Southern Co. (The), 6.25%(b) | | | 45,985,424 | |
| | | | | | | | |
| | | | | | | 402,608,498 | |
| | | | | | | | |
| | | | Equity REITs—10.3% | | | |
| | 253,060 | | | American Homes 4 Rent, 5.88%, Series F | | | 6,326,500 | |
| | 168,942 | | | American Homes 4 Rent, 5.88%, Series G | | | 4,149,216 | |
| | 203,750 | | | Apartment Investment & Management Co., 6.88%, Series A | | | 5,338,250 | |
| | 199,033 | | | Boston Properties, Inc., 5.25%, Series B(b) | | | 4,975,825 | |
| | 95,831 | | | CBL & Associates Properties, Inc., 6.63%, Series E | | | 1,564,920 | |
| | 710,406 | | | CBL & Associates Properties, Inc., 7.38%, Series D(b) | | | 13,000,430 | |
| | 316,547 | | | DDR Corp., 6.25%, Series K | | | 7,796,553 | |
| | 216,610 | | | DDR Corp., 6.38%, Series A | | | 5,519,223 | |
| | 359,748 | | | DDR Corp., 6.50%, Series J | | | 9,029,675 | |
| | 423,286 | | | Digital Realty Trust, Inc., 5.25%, Series J | | | 10,446,698 | |
| | 542,698 | | | Digital Realty Trust, Inc., 5.88%, Series G(b) | | | 13,654,282 | |
| | 409,902 | | | Digital Realty Trust, Inc., 6.35%, Series I(b) | | | 10,661,551 | |
| | 276,056 | | | Digital Realty Trust, Inc., 6.63%, Series C(b) | | | 7,340,329 | |
| | 504,723 | | | Digital Realty Trust, Inc., 7.38%,
Series H | | | 13,097,562 | |
| | 268,944 | | | EPR Properties, 5.75%, Series G | | | 6,527,271 | |
| | 259,965 | | | Federal Realty Investment Trust, 5.00%, Series C | | | 6,358,744 | |
| | 576,512 | | | Government Properties Income Trust, 5.88% | | | 14,585,754 | |
See accompanying Notes to Financial Statements which are an integral part of the financial statements.
Invesco Preferred ETF (PGX) (continued)
August 31, 2018
| | | | | | | | |
Number
of Shares | | | | | Value | |
| | | | Preferred Stocks & Other Equity Interests
(continued) | |
| | | | Equity REITs (continued) | | | |
| | 563,099 | | | Kimco Realty Corp., 5.13%,
Series L(b) | | $ | 12,993,509 | |
| | 453,328 | | | Kimco Realty Corp., 5.25%, Series M | | | 10,589,742 | |
| | 360,968 | | | Kimco Realty Corp., 5.50%, Series J | | | 8,829,277 | |
| | 347,382 | | | Kimco Realty Corp., 6.00%, Series I | | | 8,726,236 | |
| | 587,905 | | | National Retail Properties, Inc., 5.20%, Series F | | | 14,003,897 | |
| | 587,118 | | | National Retail Properties, Inc., 5.70%, Series E | | | 14,672,079 | |
| | 414,063 | | | PS Business Parks, Inc., 5.20%, Series W(b) | | | 9,929,231 | |
| | 355,383 | | | PS Business Parks, Inc., 5.20%, Series Y | | | 8,415,469 | |
| | 574,447 | | | PS Business Parks, Inc., 5.25%, Series X(b) | | | 13,798,217 | |
| | 245,539 | | | PS Business Parks, Inc., 5.70%, Series V | | | 6,140,930 | |
| | 977,327 | | | Public Storage, 4.90%, Series E(b) | | | 23,905,418 | |
| | 844,629 | | | Public Storage, 4.95%, Series D | | | 20,879,229 | |
| | 779,841 | | | Public Storage, 5.05%, Series G(b) | | | 19,457,033 | |
| | 491,091 | | | Public Storage, 5.13%, Series C | | | 12,301,830 | |
| | 475,222 | | | Public Storage, 5.15%, Series F | | | 11,923,320 | |
| | 772,785 | | | Public Storage, 5.20%, Series W | | | 19,195,979 | |
| | 965,941 | | | Public Storage, 5.40%, Series B | | | 24,805,365 | |
| | 331,749 | | | Public Storage, 5.88%, Series A(b) | | | 8,685,189 | |
| | 466,804 | | | Public Storage, 6.00%, Series Z | | | 12,108,896 | |
| | 261,868 | | | Public Storage, 6.38%, Series Y | | | 6,847,848 | |
| | 50,546 | | | QTS Realty Trust, Inc., 7.13%, Series A | | | 1,306,109 | |
| | 624,706 | | | Senior Housing Properties Trust, 5.63% | | | 15,317,791 | |
| | 452,080 | | | Senior Housing Properties Trust, 6.25% | | | 11,695,310 | |
| | 410,597 | | | SL Green Realty Corp., 6.50%, Series I | | | 10,531,813 | |
| | 301,016 | | | Spirit Realty Capital, Inc., 6.00%, Series A | | | 7,209,333 | |
| | 462,335 | | | Ventas Realty LP/Ventas Capital Corp., 5.45%(b) | | | 11,613,855 | |
| | 1,936,676 | | | VEREIT, Inc., 6.70%, Series F | | | 48,997,903 | |
| | 448,684 | | | Vornado Realty Trust, 5.25%, Series M | | | 10,530,613 | |
| | 360,405 | | | Vornado Realty Trust, 5.40%, Series L(b) | | | 8,894,795 | |
| | 615,253 | | | Vornado Realty Trust, 5.70%, Series K(b) | | | 15,756,629 | |
| | 178,231 | | | Washington Prime Group, Inc., 6.88%, Series I | | | 3,778,497 | |
| | | | | | | | |
| | | | | | | 554,214,125 | |
| | | | | | | | |
| | | | Insurance—13.0% | | | |
| | 2,229,887 | | | Aegon NV, 6.38% (Netherlands) | | | 57,575,682 | |
| | 841,387 | | | Allstate Corp. (The), 5.10% | | | 21,817,165 | |
| | 525,205 | | | Allstate Corp. (The), 5.63%, Series A | | | 13,345,459 | |
| | 1,041,087 | | | Allstate Corp. (The), 5.63%,
Series G(b) | | | 27,224,425 | |
| | 428,106 | | | Allstate Corp. (The), 6.25%, Series F | | | 11,276,312 | |
| | 1,464,950 | | | Allstate Corp. (The), 6.63%, Series E | | | 37,868,957 | |
| | 632,458 | | | Allstate Corp. (The), 6.75%, Series C | | | 16,026,486 | |
| | 192,747 | | | American Financial Group, Inc., 6.00% | | | 4,915,049 | |
| | 503,248 | | | American Financial Group, Inc., 6.25% | | | 13,064,318 | |
| | 814,372 | | | Arch Capital Group Ltd., 5.25%, Series E | | | 19,585,647 | |
| | 542,853 | | | Arch Capital Group Ltd., 5.45%, Series F | | | 13,457,326 | |
| | 218,150 | | | Argo Group US, Inc., 6.50% | | | 5,501,743 | |
| | 494,294 | | | Aspen Insurance Holdings Ltd., 5.63% (Bermuda) | | | 12,387,008 | |
| | 407,159 | | | Aspen Insurance Holdings Ltd., 5.95% (Bermuda) | | | 10,500,631 | |
| | 572,440 | | | Assured Guaranty Municipal Holdings, Inc., 6.25% | | | 14,694,535 | |
| | | | | | | | |
Number
of Shares | | | | | Value | |
| | | | Preferred Stocks & Other Equity Interests
(continued) | |
| | | | Insurance (continued) | | | |
| | 336,675 | | | Axis Capital Holdings Ltd., 5.50%, Series D | | $ | 8,416,875 | |
| | 995,423 | | | Axis Capital Holdings Ltd., 5.50%, Series E(b) | | | 24,875,621 | |
| | 694,218 | | | Enstar Group Ltd., 7.00%, Series D (Bermuda) | | | 18,126,032 | |
| | 308,479 | | | Hanover Insurance Group, Inc. (The), 6.35% | | | 7,860,045 | |
| | 1,086,525 | | | Hartford Financial Services Group, Inc. (The), 7.88% | | | 30,879,041 | |
| | 260,134 | | | Kemper Corp., 7.38% | | | 6,690,646 | |
| | 1,423,690 | | | MetLife, Inc., 5.63%, Series E | | | 36,175,963 | |
| | 676,563 | | | PartnerRe Ltd., 5.88%, Series I (Bermuda) | | | 17,015,559 | |
| | 602,208 | | | PartnerRe Ltd., 7.25%, Series H (Bermuda) | | | 16,759,449 | |
| | 972,238 | | | Prudential Financial, Inc., 5.63% | | | 24,403,174 | |
| | 1,309,908 | | | Prudential Financial, Inc., 5.70% | | | 32,852,493 | |
| | 938,083 | | | Prudential Financial, Inc., 5.75%(b) | | | 23,611,549 | |
| | 915,076 | | | Prudential PLC, 6.50% (United Kingdom) | | | 24,505,735 | |
| | 717,160 | | | Reinsurance Group of America, Inc., 5.75% | | | 18,488,385 | |
| | 716,714 | | | Reinsurance Group of America, Inc., 6.20% | | | 19,444,451 | |
| | 705,574 | | | RenaissanceRe Holdings Ltd., 5.38%, Series E (Bermuda) | | | 17,413,566 | |
| | 379,476 | | | RenaissanceRe Holdings Ltd., 5.75%, Series F (Bermuda) | | | 9,574,179 | |
| | 321,586 | | | Selective Insurance Group, Inc., 5.88% | | | 8,081,456 | |
| | 588,001 | | | Torchmark Corp., 6.13% | | | 15,152,786 | |
| | 444,532 | | | Validus Holdings Ltd., 5.80%, Series B | | | 11,228,878 | |
| | 258,035 | | | Validus Holdings Ltd., 5.88%, Series A | | | 6,517,964 | |
| | 633,413 | | | W.R. Berkley Corp., 5.63% | | | 15,645,301 | |
| | 579,705 | | | W.R. Berkley Corp., 5.75%(b) | | | 14,359,293 | |
| | 137,839 | | | W.R. Berkley Corp., 5.90% | | | 3,454,245 | |
| | 316,838 | | | WR Berkley Corp., 5.70% | | | 7,924,118 | |
| | | | | | | | |
| | | | | | | 698,697,547 | |
| | | | | | | | |
| | | | Internet Software & Services—0.7% | | | |
| | 1,356,938 | | | eBay, Inc., 6.00% | | | 35,565,345 | |
| | | | | | | | |
| | | | Machinery—0.6% | | | |
| | 1,308,907 | | | Stanley Black & Decker, Inc., 5.75% | | | 33,350,950 | |
| | | | | | | | |
| | | | Mortgage REITs—0.3% | | | |
| | 626,371 | | | Wells Fargo Real Estate Investment Corp., 6.38%, Series A | | | 16,273,119 | |
| | | | | | | | |
| | | | Multi-Utilities—2.2% | | | |
| | 361,540 | | | CMS Energy Corp., 5.63%(b) | | | 9,038,500 | |
| | 1,436,194 | | | Dominion Energy, Inc., 5.25%, Series A | | | 35,086,219 | |
| | 722,275 | | | DTE Energy Co., 5.25%, Series E | | | 17,775,188 | |
| | 542,286 | | | DTE Energy Co., 5.38%, Series B | | | 13,269,738 | |
| | 905,153 | | | DTE Energy Co., 6.00%, Series F(b) | | | 23,479,669 | |
| | 705,421 | | | Integrys Holding, Inc., 6.00% | | | 18,199,862 | |
| | | | | | | | |
| | | | | | | 116,849,176 | |
| | | | | | | | |
| | | | Oil, Gas & Consumable Fuels—1.9% | | | |
| | 287,243 | | | DCP Midstream LP, 7.88%, Series B | | | 7,399,380 | |
| | 1,074,323 | | | Enbridge, Inc., 6.38%, Series B (Canada) | | | 27,534,898 | |
See accompanying Notes to Financial Statements which are an integral part of the financial statements.
Invesco Preferred ETF (PGX) (continued)
August 31, 2018
| | | | | | | | |
Number
of Shares | | | | | Value | |
| | | | Preferred Stocks & Other Equity
Interests (continued) | |
| | | | Oil, Gas & Consumable Fuels (continued) | |
| | 814,437 | | | Energy Transfer Partners LP, 7.38%, Series C(b) | | $ | 20,841,443 | |
| | 549,738 | | | Energy Transfer Partners LP, 7.63%, Series D | | | 14,430,623 | |
| | 452,661 | | | NuStar Energy LP, 7.63%,
Series B(b) | | | 10,537,948 | |
| | 408,061 | | | NuStar Energy LP, 8.50%, Series A | | | 9,793,464 | |
| | 331,787 | | | NuStar Energy LP, 9.00%, Series C | | | 8,284,721 | |
| | 215,438 | | | Targa Resources Partners LP, 9.00%, Series A | | | 5,851,296 | |
| | | | | | | | |
| | | | | | | 104,673,773 | |
| | | | | | | | |
| | | | Thrifts & Mortgage Finance—0.5% | | | |
| | 930,896 | | | New York Community Bancorp, Inc., 6.38%, Series A | | | 25,962,689 | |
| | | | | | | | |
| | | | Trading Companies & Distributors—0.1% | | | |
| | 271,773 | | | GATX Corp., 5.63% | | | 6,826,938 | |
| | | | | | | | |
| | | | Wireless Telecommunication Services—1.5% | | | |
| | 498,073 | | | Telephone & Data Systems, Inc., 5.88% | | | 12,272,519 | |
| | 918,752 | | | Telephone & Data Systems, Inc., 6.63% | | | 23,198,488 | |
| | 615,686 | | | United States Cellular Corp., 6.95% | | | 15,699,993 | |
| | 497,647 | | | United States Cellular Corp.,
7.25%(b) | | | 12,565,587 | |
| | 543,305 | | | United States Cellular Corp.,
7.25%(b) | | | 14,294,354 | |
| | | | | | | | |
| | | | | | | 78,030,941 | |
| | | | | | | | |
| | | | Total Investments in Securities
(excluding investments purchased with cash collateral from securities on loan)
(Cost $5,386,421,479)—99.9% | | | 5,372,026,980 | |
| | | | | | | | |
| | |
| | | | | | | | |
| | | | Investments Purchased with Cash Collateral from
Securities on Loan | |
| | |
| | | | | | | | |
| | | | Money Market Fund—1.6% | | | |
| | 84,114,534 | | | Invesco Government & Agency Portfolio—Institutional Class,
1.85%(d)(e)
(Cost $84,114,534) | | | 84,114,534 | |
| | | | | | | | |
| | | | Total Investments in Securities
(Cost $5,470,536,013)—101.5% | | | 5,456,141,514 | |
| | | | Other assets less liabilities—(1.5)% | | | (78,130,606 | ) |
| | | | | | | | |
| | | | Net Assets—100.0% | | $ | 5,378,010,908 | |
| | | | | | | | |
Investment Abbreviations:
LIBOR—London Interbank Offered Rate
REIT—Real Estate Investment Trust
USD—U.S.Dollar
Notes to Schedule of Investments:
| (a) | Industry and/or sector classifications used in this report are generally according to the Global Industry Classification Standard, which was developed by and is the exclusive property and a service mark of MSCI Inc. and Standard & Poor’s. |
| (b) | All or a portion of this security was out on loan at August 31, 2018. |
| (c) | Variable rate coupon. Stated interest rate was in effect at August 31, 2018. |
| (d) | The security and the Fund are advised by wholly-owned subsidiaries of Invesco Ltd. and are therefore considered to be affiliated. The rate shown is the 7-day SEC standardized yield as of August 31, 2018. |
| (e) | The security has been segregated to satisfy the commitment to return the cash collateral received in securities lending transactions upon the borrower’s return of the securities loaned. See Note 2J. |
See accompanying Notes to Financial Statements which are an integral part of the financial statements.
Schedule of Investments
Invesco Taxable Municipal Bond ETF (BAB)
August 31, 2018
| | | | | | | | | | | | | | | | |
Principal
Amount | | | | | Interest
Rate | | | Maturity
Date | | | Value | |
| | | | Municipal Bonds—97.6% | | | | | | | | | |
| | | | Ad Valorem Property Tax—17.8% | | | | | | | | | |
| $ | 3,000,000 | | | Anchorage Alaska Ser. 10A-2 | | | 5.910 | % | | | 04/01/2030 | | | $ | 3,135,900 | |
| | 1,500,000 | | | Bexar County Texas Ser. 10 | | | 5.755 | | | | 06/15/2040 | | | | 1,529,100 | |
| | 14,890,000 | | | California State Highway Safety Air Quality Remarketed Ser. 09B | | | 6.509 | | | | 04/01/2039 | | | | 16,341,924 | |
| | 8,505,000 | | | California State Ser. 09 | | | 7.350 | | | | 11/01/2039 | | | | 12,084,329 | |
| | 1,010,000 | | | Carson City Nevada (Water Improvement) Ser. 10A | | | 6.662 | | | | 11/01/2039 | | | | 1,066,439 | |
| | 2,000,000 | | | Channelview Texas Independent School District Ser. 10 PSF-GTD | | | 5.926 | | | | 08/15/2035 | | | | 2,078,780 | |
| | 2,000,000 | | | Chicago Illinois (Recovery Zone Economic Development) Ser. 10D | | | 6.257 | | | | 01/01/2040 | | | | 2,024,380 | |
| | 2,000,000 | | | Chicago Illinois (Taxable Project) Ser. 10B | | | 7.517 | | | | 01/01/2040 | | | | 2,282,880 | |
| | 6,205,000 | | | Chicago Illinois Ser. 10C | | | 6.207 | | | | 01/01/2036 | | | | 6,342,503 | |
| | 1,500,000 | | | Clark County Nevada Las Vegas Convention and Visitors Auth. Ser. 10A | | | 6.554 | | | | 07/01/2030 | | | | 1,820,895 | |
| | 1,620,000 | | | Clark County Nevada Las Vegas Convention and Visitors Auth. Ser. 10A | | | 6.754 | | | | 07/01/2038 | | | | 2,173,505 | |
| | 4,560,000 | | | Clark County Nevada Ser. 10 | | | 7.000 | | | | 07/01/2038 | | | | 4,892,014 | |
| | 4,955,000 | | | Commonwealth of Pennsylvania First Ser. 10B | | | 4.650 | | | | 02/15/2026 | | | | 5,214,295 | |
| | 1,600,000 | | | Cook County Illinois Community Consolidated (School District No. 65) Ser. 09 | | | 4.400 | | | | 12/01/2020 | | | | 1,601,664 | |
| | 700,000 | | | Corpus Christi Texas Independent School District (School Building) Ser. 10B PSF-GTD | | | 6.124 | | | | 08/15/2032 | | | | 740,187 | |
| | 5,170,000 | | | Dallas Texas Independent School District Ser. 10C PSF-GTD | | | 6.450 | | | | 02/15/2035 | | | | 5,573,312 | |
| | 200,000 | | | Delaware State Ser. 09D | | | 5.200 | | | | 10/01/2026 | | | | 204,236 | |
| | 500,000 | | | Denver Colorado City & County School District No. 1 Ser. 09C | | | 5.664 | | | | 12/01/2033 | | | | 599,870 | |
| | 1,000,000 | | | Douglas County Nevada School District Ser. 10A PSF-GTD | | | 6.110 | | | | 04/01/2030 | | | | 1,041,450 | |
| | 605,000 | | | Hallettsville Texas Independent School Ser. 10 PSF-GTD | | | 6.265 | | | | 08/15/2030 | | | | 637,658 | |
| | 1,000,000 | | | Hallettsville Texas Independent School Ser. 10 PSF-GTD | | | 6.465 | | | | 08/15/2035 | | | | 1,042,140 | |
| | 1,000,000 | | | Hawaii State Ser. 10DX | | | 5.530 | | | | 02/01/2030 | | | | 1,170,260 | |
| | 2,000,000 | | | Hayward California Unified School District Ser. 10 AGM | | | 7.350 | | | | 08/01/2043 | | | | 2,142,720 | |
| | 1,000,000 | | | Hillsborough County Florida Ser. 09B | | | 6.350 | | | | 07/01/2039 | | | | 1,026,500 | |
| | 200,000 | | | Itasca Illinois Ser. 09A | | | 6.100 | | | | 02/01/2034 | | | | 207,786 | |
| | 320,000 | | | Itasca Illinois Ser. 09A | | | 6.200 | | | | 02/01/2039 | | | | 333,072 | |
| | 2,000,000 | | | Kiski Pennsylvania Area School District Ser. 10 AGM | | | 6.526 | | | | 09/01/2031 | | | | 2,144,340 | |
| | 1,000,000 | | | Lancaster Texas Ser. 10 | | | 6.528 | | | | 02/15/2040 | | | | 1,044,140 | |
| | 1,000,000 | | | Las Vegas Valley Nevada Water District Ser. 09A | | | 7.100 | | | | 06/01/2039 | | | | 1,032,260 | |
| | 500,000 | | | Los Angeles California Unified School District Qualified School Construction Bonds (Election of 2005) Ser. 10J-1 | | | 5.981 | | | | 05/01/2027 | | | | 586,570 | |
| | 200,000 | | | Louisville & Jefferson County Kentucky Metro Government (Recovery Zone Economic Development) Ser. 09E | | | 5.450 | | | | 11/15/2027 | | | | 230,130 | |
| | 4,300,000 | | | Massachusetts State Ser. 10 | | | 4.480 | | | | 05/01/2024 | | | | 4,576,920 | |
| | 7,765,000 | | | Massachusetts State Ser. 10 | | | 4.910 | | | | 05/01/2029 | | | | 8,621,868 | |
| | 1,595,000 | | | Massachusetts State Ser. 10E | | | 4.200 | | | | 12/01/2021 | | | | 1,640,697 | |
| | 1,500,000 | | | Massachusetts State Ser. 16F | | | 3.277 | | | | 06/01/2046 | | | | 1,376,640 | |
| | 3,000,000 | | | Mississippi State Ser. 09D | | | 5.539 | | | | 10/01/2029 | | | | 3,424,470 | |
| | 1,000,000 | | | Montgomery County Pennsylvania Ser. 10 | | | 6.030 | | | | 09/01/2039 | | | | 1,050,580 | |
| | 3,000,000 | | | Napa Valley California University School District Ser. 10B | | | 6.507 | | | | 08/01/2043 | | | | 4,090,350 | |
| | 4,835,000 | | | New Britain Connecticut Ref. Ser. 18 BAM | | | 4.350 | | | | 03/01/2039 | | | | 4,913,134 | |
| | 1,000,000 | | | New Orleans Louisiana Ser. 10A | | | 8.800 | | | | 12/01/2039 | | | | 1,070,470 | |
| | 1,500,000 | | | New York City New York Ser. 09 | | | 5.985 | | | | 12/01/2036 | | | | 1,876,080 | |
| | 1,000,000 | | | New York City New York Ser. 09D-1 | | | 6.385 | | | | 12/01/2029 | | | | 1,038,000 | |
| | 1,000,000 | | | New York City New York Ser. 10 | | | 5.646 | | | | 06/01/2027 | | | | 1,134,600 | |
| | 2,710,000 | | | New York City New York Ser. 10 | | | 5.817 | | | | 10/01/2031 | | | | 2,855,961 | |
| | 3,920,000 | | | New York City New York Ser. 10 | | | 6.246 | | | | 06/01/2035 | | | | 4,119,998 | |
| | 8,495,000 | | | New York City New York Ser. 10 | | | 5.968 | | | | 03/01/2036 | | | | 10,597,597 | |
| | 1,965,000 | | | New York City New York Taxable Ser. 10F-1 | | | 6.271 | | | | 12/01/2037 | | | | 2,535,950 | |
| | 960,000 | | | North Las Vegas Nevada Ser. 10 | | | 5.372 | | | | 06/01/2019 | | | | 970,973 | |
| | 1,000,000 | | | NYE County Nevada Ser. 10B AGM | | | 6.300 | | | | 08/01/2035 | | | | 1,040,930 | |
| | 1,000,000 | | | NYE County Nevada Ser. 10B AGM | | | 6.400 | | | | 08/01/2040 | | | | 1,040,890 | |
| | 1,450,000 | | | Peoria Illinois Community Unit (School District No. 323) Ser. 10 | | | 6.020 | | | | 04/01/2028 | | | | 1,506,941 | |
| | 1,000,000 | | | Philadelphia Pennsylvania School District Ser. 10 | | | 6.615 | | | | 06/01/2030 | | | | 1,168,950 | |
| | 1,000,000 | | | Quaker Valley Pennsylvania School District Ser. 10 AGM | | | 5.959 | | | | 10/01/2030 | | | | 1,063,080 | |
| | 2,000,000 | | | Round Rock Texas Independent School District Ser. 10 PSF-GTD | | | 5.774 | | | | 08/01/2030 | | | | 2,105,680 | |
| | 1,000,000 | | | Round Rock Texas Independent School District Ser. 10B | | | 6.054 | | | | 08/01/2035 | | | | 1,029,100 | |
| | 2,000,000 | | | San Antonio Texas Independent School District Ser. 10 PSF-GTD | | | 6.397 | | | | 08/15/2040 | | | | 2,133,860 | |
See accompanying Notes to Financial Statements which are an integral part of the financial statements.
Invesco Taxable Municipal Bond ETF (BAB) (continued)
August 31, 2018
| | | | | | | | | | | | | | | | |
Principal
Amount | | | | | Interest
Rate | | | Maturity
Date | | | Value | |
| | | | Municipal Bonds (continued) | | | | | | | | | |
| | | | Ad Valorem Property Tax (continued) | | | | | | | | | |
| $ | 1,500,000 | | | San Francisco California City & County Ser. 10 | | | 6.260 | % | | | 06/15/2030 | | | $ | 1,871,865 | |
| | 3,850,000 | | | San Francisco California City & County Ser. 10D | | | 6.260 | | | | 06/15/2030 | | | | 4,804,453 | |
| | 1,000,000 | | | San Mateo California Union High School District Ser. 10B | | | 6.733 | | | | 09/01/2034 | | | | 1,070,420 | |
| | 1,000,000 | | | Snohomish County Washington Public Hospital District No. 3 (Cascade Valley Hospital) Ser. 10B | | | 6.329 | | | | 12/01/2035 | | | | 1,008,210 | |
| | 200,000 | | | Southwestern Community College District California Ser. 09B | | | 7.130 | | | | 08/01/2031 | | | | 207,784 | |
| | 2,175,000 | | | Utah State Ser. 09D | | | 4.154 | | | | 07/01/2019 | | | | 2,202,275 | |
| | 725,000 | | | Utah State Ser. 09D | | | 4.554 | | | | 07/01/2024 | | | | 761,163 | |
| | 5,000,000 | | | Utah State Ser. 10B | | | 3.369 | | | | 07/01/2021 | | | | 5,057,800 | |
| | 675,000 | | | Wilson County Tennessee Tenth Special School District Ser. 10 | | | 6.130 | | | | 04/01/2035 | | | | 696,769 | |
| | | | | | | | | | | | | | | | |
| | | | | | | | | | | | | | | 167,009,697 | |
| | | | | | | | | | | | | | | | |
| | | | College & University Revenue—9.3% | | | | | | | | | |
| | 1,000,000 | | | California Infrastructure & Economic Development Bank (California Infrastructure Economic Development) Rev. Ser. 10 | | | 6.486 | | | | 05/15/2049 | | | | 1,326,260 | |
| | 900,000 | | | California State University Rev. Ser. 10 | | | 6.484 | | | | 11/01/2041 | | | | 1,207,053 | |
| | 1,000,000 | | | Colorado State Board Governors University Enterprise System Rev. Ser. 10 | | | 5.957 | | | | 03/01/2033 | | | | 1,194,680 | |
| | 2,000,000 | | | Indiana University Rev. Ser. 10 | | | 5.536 | | | | 06/01/2030 | | | | 2,064,560 | |
| | 1,500,000 | | | Indiana University Rev. Ser. 10 | | | 5.636 | | | | 06/01/2035 | | | | 1,543,980 | |
| | 5,000,000 | | | Massachusetts State College Building Auth. Ser. 09C | | | 5.832 | | | | 05/01/2030 | | | | 5,816,950 | |
| | 1,215,000 | | | Mesa State College Colorado (Auxiliary Facilities Enterprise) Rev. Ser. 09B | | | 5.800 | | | | 05/15/2040 | | | | 1,480,575 | |
| | 3,000,000 | | | New Jersey State Educational Facilities Auth. Rev. Ser. 10 | | | 6.190 | | | | 07/01/2040 | | | | 3,125,820 | |
| | 425,000 | | | New Mexico State University Regents Improvement Rev. Ser. 10B(a) | | | 6.124 | | | | 04/01/2020 | | | | 445,957 | |
| | 575,000 | | | New Mexico State University Regents Improvement Rev. Ser. 10B | | | 6.124 | | | | 04/01/2030 | | | | 603,468 | |
| | 5,000,000 | | | New York State Dormitory Auth. Non-State Supported Debt (New York University) Rev. Ser. 18B | | | 4.850 | | | | 07/01/2048 | | | | 5,341,250 | |
| | 1,000,000 | | | North Carolina State University at Raleigh Rev. Ser. 10B | | | 5.927 | | | | 10/01/2030 | | | | 1,060,780 | |
| | 3,000,000 | | | Northern Arizona University (Arizona Board of Regents) Rev. Ser. 10A | | | 6.593 | | | | 08/01/2030 | | | | 3,179,070 | |
| | 500,000 | | | Northern Arizona University Rev. Ser. 09A | | | 6.687 | | | | 06/01/2039 | | | | 529,890 | |
| | 1,000,000 | | | Pennsylvania State Higher Educational Facilities Auth. (Temple University) Rev. Ser. 10 | | | 6.141 | | | | 04/01/2030 | | | | 1,166,600 | |
| | 905,000 | | | Rutgers The State University of New Jersey Ser. 10 | | | 5.545 | | | | 05/01/2029 | | | | 1,014,252 | |
| | 2,000,000 | | | Texas State A&M University Fund Ref. Ser. 17B | | | 3.660 | | | | 07/01/2047 | | | | 1,918,440 | |
| | 1,500,000 | | | University of California Rev. Ref. Ser. 16AS | | | 3.552 | | | | 05/15/2039 | | | | 1,432,110 | |
| | 10,745,000 | | | University of California Rev. Ser. 10 | | | 5.946 | | | | 05/15/2045 | | | | 13,495,612 | |
| | 5,770,000 | | | University of Delaware Ser. 18 | | | 4.071 | | | | 11/01/2050 | | | | 5,867,859 | |
| | 3,000,000 | | | University of Hawaii Rev. Ser. 10 | | | 5.834 | | | | 10/01/2030 | | | | 3,173,640 | |
| | 5,000,000 | | | University of Hawaii Rev. Ser. 10 | | | 6.034 | | | | 10/01/2040 | | | | 5,297,850 | |
| | 1,500,000 | | | University of Massachusetts Building Auth. Project Rev. Ser. 10 | | | 4.550 | | | | 11/01/2025 | | | | 1,599,510 | |
| | 250,000 | | | University of Michigan University Rev. Ser. 10A | | | 5.513 | | | | 04/01/2030 | | | | 286,727 | |
| | 500,000 | | | University of North Carolina University Ser. 09B | | | 5.757 | | | | 12/01/2039 | | | | 518,180 | |
| | 10,000,000 | | | University of Texas Permanent Fund (Permanent University Fund Boards) Ser. 17A | | | 3.376 | | | | 07/01/2047 | | | | 9,291,600 | |
| | 500,000 | | | University of Texas Ser. 09B | | | 6.276 | | | | 08/15/2041 | | | | 515,125 | |
| | 10,000,000 | | | University of Texas System Ser. 10C | | | 4.644 | | | | 08/15/2030 | | | | 10,848,200 | |
| | 1,435,000 | | | Washington State Biomedical Research Facilities No. 3 Ser. 10B | | | 6.416 | | | | 07/01/2030 | | | | 1,722,316 | |
| | 250,000 | | | Wayne State University Ser. 09B | | | 6.536 | | | | 11/15/2039 | | | | 259,510 | |
| | | | | | | | | | | | | | �� | | |
| | | | | | | | | | | | | | | 87,327,824 | |
| | | | | | | | | | | | | | | | |
| | | | Electric Power Revenue—12.6% | | | | | | | | | |
| | 7,665,000 | | | American Municipal Power Ohio Inc. (Combined Hydroelectric Projects) Rev. Ser. 10 | | | 8.084 | | | | 02/15/2050 | | | | 12,353,067 | |
| | 2,090,000 | | | American Municipal Power Ohio Inc. (Meldahl Hydroelectric-Remarketed) Rev. Ser. 10E | | | 6.270 | | | | 02/15/2050 | | | | 2,638,249 | |
| | 8,005,000 | | | American Municipal Power Ohio Inc. Rev. Ser. 09 | | | 6.053 | | | | 02/15/2043 | | | | 10,202,613 | |
| | 3,395,000 | | | American Municipal Power Ohio Inc. Rev. Ser. 10 | | | 7.499 | | | | 02/15/2050 | | | | 4,907,269 | |
| | 750,000 | | | Benton County Washington Public Utility District No. 1 Electric Rev. Ser. 10 | | | 6.546 | | | | 11/01/2030 | | | | 918,322 | |
| | 6,500,000 | | | Cowlitz County Washington Public Utility District No. 1 Electric Ser. 10 | | | 6.884 | | | | 09/01/2032 | | | | 8,245,835 | |
| | 2,000,000 | | | Douglas County Washington Public Utility District No. 1 Wells Hydroelectric Ser. 10B | | | 5.245 | | | | 09/01/2030 | | | | 2,179,620 | |
| | 2,500,000 | | | Grant County Washington Public Utility District No. 2 (Priest Rapids Hydroelectric) Ref. Ser. 10L | | | 5.730 | | | | 01/01/2030 | | | | 2,889,400 | |
| | 2,750,000 | | | Grant County Washington Public Utility District No. 2 (Priest Rapids Hydroelectric) Ref. Ser. 10L | | | 5.830 | | | | 01/01/2040 | | | | 3,335,530 | |
| | 500,000 | | | JEA Florida Electric Systems Rev. Ser. 09F | | | 6.406 | | | | 10/01/2034 | | | | 613,760 | |
| | 8,000,000 | | | Los Angeles California Department of Water & Power Rev. Ser. 10 | | | 6.166 | | | | 07/01/2040 | | | | 8,411,600 | |
| | 1,500,000 | | | Los Angeles California Department of Water & Power Rev. Ser. 10 | | | 7.000 | | | | 07/01/2041 | | | | 1,647,435 | |
| | 500,000 | | | Missouri Joint Municipal Electric Utility Commission Power Project Rev. Ser. 09A | | | 6.790 | | | | 01/01/2029 | | | | 506,860 | |
See accompanying Notes to Financial Statements which are an integral part of the financial statements.
Invesco Taxable Municipal Bond ETF (BAB) (continued)
August 31, 2018
| | | | | | | | | | | | | | | | |
Principal
Amount | | | | | Interest
Rate | | | Maturity
Date | | | Value | |
| | | | Municipal Bonds (continued) | | | | | | | | | |
| | | | Electric Power Revenue (continued) | | | | | | | | | |
| $ | 10,000,000 | | | Missouri Joint Municipal Electric Utility Commission Power Project Rev. Ser. 09A | | | 6.890 | % | | | 01/01/2042 | | | $ | 12,755,000 | |
| | 1,000,000 | | | Missouri Joint Municipal Electric Utility Commission Power Project Rev. Ser. 10 | | | 7.597 | | | | 01/01/2032 | | | | 1,244,870 | |
| | 9,906,000 | | | Municipal Electric Auth. of Georgia (Plant Vogtle Units 3&4 Project P) Ser. 10 | | | 7.055 | | | | 04/01/2057 | | | | 11,869,765 | |
| | 6,678,000 | | | Municipal Electric Auth. of Georgia Ser. 10 | | | 6.655 | | | | 04/01/2057 | | | | 8,027,757 | |
| | 1,000,000 | | | Northern California Power Agency (Lodi Energy Center) Rev. Ser. 10B | | | 7.311 | | | | 06/01/2040 | | | | 1,319,020 | |
| | 250,000 | | | Northern Illinois Municipal Power Agency Power Project Rev. Ser. 10 | | | 7.620 | | | | 01/01/2030 | | | | 301,300 | |
| | 9,050,000 | | | South Carolina State Public Service Auth. Obligation Rev. Ser. 10C | | | 6.454 | | | | 01/01/2050 | | | | 12,028,807 | |
| | 2,000,000 | | | Southern California Public Power Auth. Rev. Ser. 10 | | | 5.921 | | | | 07/01/2035 | | | | 2,437,320 | |
| | 2,570,000 | | | Tacoma Washington Electric System Rev. Ser. 10 AGM | | | 5.791 | | | | 01/01/2032 | | | | 3,027,589 | |
| | 5,795,000 | | | Virgin Islands Water & Power Auth. (Electric System) Rev. Ser. 10C AGM | | | 6.850 | | | | 07/01/2035 | | | | 5,946,076 | |
| | | | | | | | | | | | | | | | |
| | | | | | | | | | | | | | | 117,807,064 | |
| | | | | | | | | | | | | | | | |
| | | | Fuel Sales Tax Revenue—3.6% | | | | | | | | | |
| | 595,000 | | | Idaho Housing & Financing Association Ser. 10A-2 | | | 6.348 | | | | 07/15/2028 | | | | 696,793 | |
| | 2,250,000 | | | Missouri State Highways & Transportation Commission (State Road) Rev. Ser. 09 | | | 4.963 | | | | 05/01/2023 | | | | 2,416,792 | |
| | 6,000,000 | | | Missouri State Highways & Transportation Commission (Taxable Third Lien State Road) Ser. 09C | | | 5.063 | | | | 05/01/2024 | | | | 6,504,540 | |
| | 2,000,000 | | | Texas State Transportation Commission (First Tier) Rev. Ser. 10B | | | 5.028 | | | | 04/01/2026 | | | | 2,171,040 | |
| | 11,715,000 | | | Texas State Transportation Commission (First Tier) Rev. Ser. 10B | | | 5.178 | | | | 04/01/2030 | | | | 13,290,199 | |
| | 2,000,000 | | | Washington State Ser. 10 | | | 5.090 | | | | 08/01/2033 | | | | 2,284,580 | |
| | 1,400,000 | | | Washoe County Nevada Highway Rev. Ser. 10 | | | 7.063 | | | | 02/01/2030 | | | | 1,477,322 | |
| | 5,000,000 | | | Washoe County Nevada Highway Rev. Ser. 10 | | | 7.213 | | | | 02/01/2039 | | | | 5,260,600 | |
| | | | | | | | | | | | | | | | |
| | | | | | | | | | | | | | | 34,101,866 | |
| | | | | | | | | | | | | | | | |
| | | | General Fund—13.1% | | | | | | | | | |
| | 5,400,000 | | | California State Ref. Ser. 18 | | | 4.600 | | | | 04/01/2038 | | | | 5,692,788 | |
| | 17,590,000 | | | California State Ser. 09 | | | 7.500 | | | | 04/01/2034 | | | | 24,767,951 | |
| | 22,850,000 | | | California State Ser. 10 | | | 7.950 | | | | 03/01/2036 | | | | 24,502,741 | |
| | 10,955,000 | | | California State Ser. 10 | | | 7.600 | | | | 11/01/2040 | | | | 16,595,620 | |
| | 10,860,000 | | | California State Various Purpose Ser. 09 | | | 7.550 | | | | 04/01/2039 | | | | 16,145,236 | |
| | 9,300,000 | | | Illinois State Ser. 10 | | | 6.900 | | | | 03/01/2035 | | | | 10,017,960 | |
| | 5,000,000 | | | Illinois State Ser. 10-1 | | | 5.363 | | | | 02/01/2019 | | | | 5,036,550 | |
| | 14,795,000 | | | Illinois State Ser. 10-1 | | | 5.563 | | | | 02/01/2021 | | | | 15,251,426 | |
| | 2,500,000 | | | Illinois State Ser. 10-2 | | | 5.650 | | | | 03/01/2020 | | | | 2,562,425 | |
| | 2,000,000 | | | Kauai County Hawaii Ser. 10 | | | 5.763 | | | | 08/01/2033 | | | | 2,386,120 | |
| | | | | | | | | | | | | | | | |
| | | | | | | | | | | | | | | 122,958,817 | |
| | | | | | | | | | | | | | | | |
| | | | Government Fund/Grant Revenue—0.9% | | | | | | | | | |
| | 8,700,000 | | | Chicago Board of Education Ser. 09E | | | 6.138 | | | | 12/01/2039 | | | | 8,473,626 | |
| | | | | | | | | | | | | | | | |
| | | | Health, Hospital, Nursing Home Revenue—1.4% | | | | | | | | | |
| | 2,000,000 | | | California Statewide Communities Development Auth. (Marin General Hospital Project) Rev. Ser. 18B | | | 4.821 | | | | 08/01/2045 | | | | 2,055,400 | |
| | 1,000,000 | | | Cuyahoga County Ohio Hospital Rev. Ser. 10 | | | 8.223 | | | | 02/15/2040 | | | | 1,235,940 | |
| | 2,000,000 | | | King County Washington Public Hospital District No. 1 Hospital Facilities Rev. Ser. 10 | | | 7.900 | | | | 06/15/2030 | | | | 2,138,400 | |
| | 2,500,000 | | | Lee Memorial Health System Florida Hospital Rev. Ser. 10A | | | 7.281 | | | | 04/01/2027 | | | | 2,953,275 | |
| | 1,000,000 | | | Metropolitan Government Nashville & Davidson County Health & Educational Faculties Board (Vanderbilt University Medical Center) Ser. 16B | | | 4.053 | | | | 07/01/2026 | | | | 1,030,560 | |
| | 1,000,000 | | | Oak Valley California Hospital District (Health Facilities) Rev. Ser. 10B | | | 9.000 | | | | 11/01/2039 | | | | 1,010,610 | |
| | 1,000,000 | | | Ohio State Hospital Facilities (Cleveland Clinic Health System) Rev. Ref. Ser. 17B | | | 3.700 | | | | 01/01/2043 | | | | 978,660 | |
| | 1,500,000 | | | Tangipahoa Parish Louisiana Hospital Service District No. 1 (North Oaks Health System) Ser. 09A AGC | | | 7.200 | | | | 02/01/2042 | | | | 1,557,075 | |
| | 500,000 | | | University California Regents Medical Center Pooled Rev. Ser. 09F | | | 6.458 | | | | 05/15/2029 | | | | 591,915 | |
| | | | | | | | | | | | | | | | |
| | | | | | | | | | | | | | | 13,551,835 | |
| | | | | | | | | | | | | | | | |
| | | | Highway Tolls Revenue—4.1% | | | | | | | | | |
| | 3,025,000 | | | Bay Area California Auth. Toll Bridge (San Francisco Bay Area) Rev. Ser. 10S3 | | | 6.907 | | | | 10/01/2050 | | | | 4,458,366 | |
| | 3,605,000 | | | Bay Area California Auth. Toll Bridge (Sub.-Lien) Rev. Ser. 10S1 | | | 7.043 | | | | 04/01/2050 | | | | 5,327,072 | |
| | 200,000 | | | Illinois State Toll Highway Auth. Toll Highway Rev. Ser. 09A | | | 5.293 | | | | 01/01/2024 | | | | 201,730 | |
| | 1,200,000 | | | Maryland State Transportation Auth. (Transportation Facilities Projects) Rev. Ser. 10B | | | 5.604 | | | | 07/01/2030 | | | | 1,384,260 | |
| | 250,000 | | | New Hampshire State Turnpike System Rev. Ser. 09B | | | 6.259 | | | | 11/01/2029 | | | | 259,508 | |
| | 250,000 | | | New Hampshire State Turnpike System Rev. Ser. 09B | | | 6.009 | | | | 11/01/2039 | | | | 305,928 | |
| | 4,215,000 | | | New Jersey State Turnpike Auth. Rev. Ser. 09F | | | 7.414 | | | | 01/01/2040 | | | | 6,118,873 | |
See accompanying Notes to Financial Statements which are an integral part of the financial statements.
Invesco Taxable Municipal Bond ETF (BAB) (continued)
August 31, 2018
| | | | | | | | | | | | | | | | |
Principal
Amount | | | | | Interest
Rate | | | Maturity
Date | | | Value | |
| | | | Municipal Bonds (continued) | | | | | | | | | |
| | | | Highway Tolls Revenue (continued) | | | | | | | | | |
| $ | 2,280,000 | | | New York Triborough Bridge & Tunnel Auth. Rev. Ser. 10 | | | 5.450 | % | | | 11/15/2032 | | | $ | 2,678,270 | |
| | 5,000,000 | | | North Texas Tollway Auth. (Sub.-Lien) Rev. Ser. 10B-2 | | | 8.410 | | | | 02/01/2030 | | | | 6,492,950 | |
| | 1,443,000 | | | Pennsylvania State Turnpike Commission Rev. Ser. 09 | | | 6.105 | | | | 12/01/2039 | | | | 1,844,919 | |
| | 5,000,000 | | | Triborough Bridge & Tunnel Auth. Ser. 09B | | | 5.420 | | | | 11/15/2036 | | | | 5,940,800 | |
| | 2,715,000 | | | Triborough Bridge & Tunnel Auth. Ser. 09B | | | 5.500 | | | | 11/15/2039 | | | | 3,264,299 | |
| | | | | | | | | | | | | | | | |
| | | | | | | | | | | | | | | 38,276,975 | |
| | | | | | | | | | | | | | | | |
| | | | Hotel Occupancy Tax—0.4% | | | | | | | | | |
| | 2,780,000 | | | Dallas Texas Convention Center Hotel Development Corp. Ser. 09 | | | 7.088 | | | | 01/01/2042 | | | | 3,665,319 | |
| | | | | | | | | | | | | | | | |
| | | | Income Tax Revenue—2.8% | | | | | | | | | |
| | 4,500,000 | | | District of Columbia Income Tax Secured Rev. Ser. 10 | | | 4.909 | | | | 12/01/2023 | | | | 4,861,125 | |
| | 3,785,000 | | | New York City Transitional Finance Auth. (Building Aid) Rev. Sub.-Ser. 10S-1B | | | 6.828 | | | | 07/15/2040 | | | | 5,035,867 | |
| | 6,475,000 | | | New York City Transitional Finance Auth. (Future Tax Secured) Rev. Ser. 10 | | | 5.932 | | | | 11/01/2036 | | | | 6,875,932 | |
| | 200,000 | | | New York State Dormitory Auth. State Personal Income Tax Rev. Ser. 09F | | | 5.292 | | | | 03/15/2025 | | | | 221,430 | |
| | 2,760,000 | | | New York State Dormitory Auth. State Personal Income Tax Rev. Ser. 10 | | | 5.500 | | | | 03/15/2030 | | | | 3,139,500 | |
| | 1,800,000 | | | New York State Dormitory Auth. State Personal Income Tax Rev. Ser. 10 | | | 5.389 | | | | 03/15/2040 | | | | 2,150,190 | |
| | 1,400,000 | | | New York State Dormitory Auth. State Personal Income Tax Rev. Ser. 10C | | | 4.904 | | | | 02/15/2023 | | | | 1,507,744 | |
| | 2,000,000 | | | New York State Urban Development Corp. State Personal Income Tax Rev. Ser. 10C | | | 5.838 | | | | 03/15/2040 | | | | 2,413,360 | |
| | | | | | | | | | | | | | | | |
| | | | | | | | | | | | | | | 26,205,148 | |
| | | | | | | | | | | | | | | | |
| | | | Lease Revenue—3.6% | | | | | | | | | |
| | 300,000 | | | Beverly Hills California Public Financing Auth. Lease (Various Projects) Rev. Ser. 10C | | | 6.674 | | | | 06/01/2030 | | | | 316,218 | |
| | 1,000,000 | | | Beverly Hills California Public Financing Auth. Lease (Various Projects) Rev. Ser. 10C | | | 6.774 | | | | 06/01/2040 | | | | 1,056,920 | |
| | 2,000,000 | | | Brighton Colorado COP Ser. 10B AGM | | | 6.550 | | | | 12/01/2030 | | | | 2,127,240 | |
| | 800,000 | | | California State Public Works Board Lease (California State University Projects) Rev. Ser. 10B-2 | | | 7.804 | | | | 03/01/2035 | | | | 1,101,264 | |
| | 1,000,000 | | | Columbus Indiana Multi-High School Building Corp. Ser. 10 | | | 6.446 | | | | 01/15/2030 | | | | 1,047,710 | |
| | 1,000,000 | | | Franklin County Ohio Convention Facilities Auth. Ser. 10 | | | 6.390 | | | | 12/01/2030 | | | | 1,212,920 | |
| | 1,070,000 | | | Franklin County Ohio Convention Facilities Auth. Ser. 10 | | | 6.540 | | | | 12/01/2036 | | | | 1,391,289 | |
| | 500,000 | | | Los Angeles California Municipal Improvement Corp. Lease (Recovery Zone Economic Development) Rev. Ser. 09D | | | 7.757 | | | | 09/01/2039 | | | | 523,120 | |
| | 2,000,000 | | | Miami-Dade County Florida School Board COP Ser. 10 | | | 6.935 | | | | 06/15/2032 | | | | 2,108,480 | |
| | 1,000,000 | | | New Jersey State Educational Facilities Auth. Rev. Ser. 10B | | | 7.225 | | | | 07/01/2030 | | | | 1,036,250 | |
| | 2,000,000 | | | New York City Educational Construction Fund Rev. Ser. 10 | | | 6.000 | | | | 04/01/2035 | | | | 2,291,100 | |
| | 1,000,000 | | | Passaic County New Jersey Ser. 10 | | | 6.540 | | | | 08/01/2031 | | | | 1,061,030 | |
| | 500,000 | | | Peoria Illinois Public Building Commission (School District Facilities) Rev. Ser. 09C AGC | | | 6.580 | | | | 12/01/2029 | | | | 520,980 | |
| | 4,000,000 | | | Port of Morrow Oregon Transmission Facilities (Bonneville Corporation Project No. 4) Rev. Ser. 16 | | | 2.987 | | | | 09/01/2036 | | | | 3,543,560 | |
| | 3,000,000 | | | Regional Transportation District Colorado COP Ser. 10 | | | 7.672 | | | | 06/01/2040 | | | | 4,192,680 | |
| | 500,000 | | | Salt Lake County Utah Municipal Building Auth. (Lease) Rev. Ser. 09B | | | 5.820 | | | | 12/01/2029 | | | | 587,755 | |
| | 2,000,000 | | | San Diego California Public Facilities Financing Auth. Lease Rev. Ref. Ser. 18A | | | 4.232 | | | | 10/15/2038 | | | | 2,023,360 | |
| | 3,000,000 | | | San Francisco California City & County COP Ser. 09D | | | 6.487 | | | | 11/01/2041 | | | | 3,890,970 | |
| | 1,000,000 | | | St. Charles Missouri COP Ser. 10B | | | 5.650 | | | | 02/01/2030 | | | | 1,037,900 | |
| | 2,250,000 | | | Williamsburg County South Carolina Public Facilities Corp. (Installment Purchase) Rev. Ser. 10 | | | 6.526 | | | | 12/01/2030 | | | | 2,399,017 | |
| | | | | | | | | | | | | | | | |
| | | | | | | | | | | | | | | 33,469,763 | |
| | | | | | | | | | | | | | | | |
| | | | Local or GTD Housing—0.1% | | | | | | | | | |
| | 1,000,000 | | | Phoenix Arizona Industrial Development Auth. Student Housing (Downtown Phoenix Student Housing LLC-Arizona State University Project) Rev. Ref. Ser. 18A | | | 5.000 | | | | 07/01/2042 | | | | 1,097,550 | |
| | | | | | | | | | | | | | | | |
| | | | Miscellaneous Revenue—5.4% | | | | | | | | | |
| | 500,000 | | | Battery Park City Auth. Rev. Ser. 09A | | | 6.375 | | | | 11/01/2039 | | | | 518,900 | |
| | 500,000 | | | Camden County New Jersey Improvement Auth. Rev. Ser. 09A | | | 6.180 | | | | 01/15/2027 | | | | 567,460 | |
| | 2,000,000 | | | Commonwealth Financing Auth. Pennsylvania Rev. Ser. 10 | | | 5.587 | | | | 06/01/2030 | | | | 2,270,940 | |
| | 7,775,000 | | | Florida State Board of Administration Financing Corporation Rev. Ser. 16A | | | 2.638 | | | | 07/01/2021 | | | | 7,689,164 | |
| | 1,000,000 | | | Indianapolis Indiana Local Public Improvement Bond Bank Ser. 10 | | | 5.854 | | | | 01/15/2030 | | | | 1,152,890 | |
| | 3,500,000 | | | Indianapolis Indiana Local Public Improvement Bond Bank Ser. 10B-2 | | | 5.966 | | | | 01/15/2030 | | | | 4,058,880 | |
| | 500,000 | | | Kansas State Development Finance Auth. (Kansas State Projects) Rev. Ser. 10E-2 | | | 6.120 | | | | 11/01/2029 | | | | 529,665 | |
| | 2,000,000 | | | Kansas State Development Finance Auth. Rev. Ser. 10 | | | 5.945 | | | | 03/01/2030 | | | | 2,077,180 | |
| | 7,000,000 | | | Miami-Dade County Florida Special Obligation Ser. 10B | | | 6.743 | | | | 04/01/2040 | | | | 7,373,730 | |
| | 1,000,000 | | | Mississippi State Ser. 10 | | | 5.245 | | | | 11/01/2034 | | | | 1,163,840 | |
See accompanying Notes to Financial Statements which are an integral part of the financial statements.
Invesco Taxable Municipal Bond ETF (BAB) (continued)
August 31, 2018
| | | | | | | | | | | | | | | | |
Principal
Amount | | | | | Interest
Rate | | | Maturity
Date | | | Value | |
| | | | Municipal Bonds (continued) | | | | | | | | | |
| | | | Miscellaneous Revenue (continued) | | | | | | | | | |
| $ | 3,000,000 | | | New Jersey Economic Development Auth. Rev. Ser. 10CC-1 | | | 6.425 | % | | | 12/15/2035 | | | $ | 3,096,480 | |
| | 1,000,000 | | | Port St. Lucie Florida Stormwater Utility Rev. Ser. 10A AGC | | | 7.376 | | | | 05/01/2039 | | | | 1,074,260 | |
| | 2,000,000 | | | St. Cloud Florida Capital Improvement Rev. Ser. 10B AGM | | | 5.849 | | | | 09/01/2030 | | | | 2,083,520 | |
| | 9,680,000 | | | Texas State Ser. 09 | | | 5.517 | | | | 04/01/2039 | | | | 12,087,513 | |
| | 2,000,000 | | | Tulare County California Pension Obligation Bonds Ser. 18 | | | 4.445 | | | | 06/01/2037 | | | | 2,018,240 | |
| | 3,000,000 | | | Wisconsin State General Fund Annual Appropriation Rev. Ref. Ser. 17A | | | 3.954 | | | | 05/01/2036 | | | | 3,038,160 | |
| | | | | | | | | | | | | | | | |
| | | | | | | | | | | | | | | 50,800,822 | |
| | | | | | | | | | | | | | | | |
| | | | Miscellaneous Taxes—0.2% | | | | | | | | | |
| | 2,000,000 | | | Oregon State (Taxable-Pension) Ser. 03 | | | 5.892 | | | | 06/01/2027 | | | | 2,324,900 | |
| | | | | | | | | | | | | | | | |
| | | | Multiple Utility Revenue—0.1% | | | | | | | | | |
| | 810,000 | | | Colorado Springs Colorado Utilities (Direct Pay) Rev. Ser. 10B2 | | | 5.738 | | | | 11/15/2050 | | | | 851,213 | |
| | | | | | | | | | | | | | | | |
| | | | Nuclear Revenue—0.3% | | | | | | | | | |
| | 2,500,000 | | | South Carolina State Public Service Auth. Obligation Rev. Ser. 16D | | | 2.388 | | | | 12/01/2023 | | | | 2,343,825 | |
| | | | | | | | | | | | | | | | |
| | | | Port, Airport & Marina Revenue—3.9% | | | | | | | | | |
| | 3,190,000 | | | Chicago Illinois O’Hare International Airport Ser. 10 | | | 6.845 | | | | 01/01/2038 | | | | 3,330,583 | |
| | 5,750,000 | | | Chicago Illinois O’Hare International Airport Ser. 10 | | | 6.395 | | | | 01/01/2040 | | | | 7,572,807 | |
| | 1,250,000 | | | Hawaii State Airports System Customer Facilities Charge Rev. Ser. 17A | | | 3.894 | | | | 07/01/2037 | | | | 1,244,575 | |
| | 250,000 | | | Long Beach California Senior Airport Rev. Ser. 09C | | | 7.765 | | | | 06/01/2039 | | | | 260,305 | |
| | 2,000,000 | | | New York State Transportation Development Corp. Special Facilities (LaGuardia Airport Terminal Redevelopment Project) Rev. Ser. 16B | | | 3.023 | | | | 07/01/2024 | | | | 1,917,400 | |
| | 2,750,000 | | | New York State Transportation Development Corp. Special Facilities (LaGuardia Airport Terminal Redevelopment Project) Rev. Ser. 16B | | | 3.123 | | | | 01/01/2025 | | | | 2,628,533 | |
| | 2,500,000 | | | New York State Transportation Development Corp. Special Facilities (LaGuardia Airport Terminal Redevelopment Project) Rev. Ser. 16B | | | 3.223 | | | | 07/01/2025 | | | | 2,397,350 | |
| | 2,000,000 | | | New York State Transportation Development Corp. Special Facilities (LaGuardia Airport Terminal Redevelopment Project) Rev. Ser. 16B | | | 3.273 | | | | 01/01/2026 | | | | 1,912,380 | |
| | 1,000,000 | | | New York State Transportation Development Corp. Special Facilities (LaGuardia Airport Terminal Redevelopment Project) Rev. Ser. 16B | | | 3.323 | | | | 07/01/2026 | | | | 956,940 | |
| | 2,000,000 | | | New York State Transportation Development Corp. Special Facilities (LaGuardia Airport Terminal Redevelopment Project) Rev. Ser. 16B | | | 3.423 | | | | 07/01/2027 | | | | 1,910,740 | |
| | 3,000,000 | | | New York State Transportation Development Corp. Special Facilities (LaGuardia Airport Terminal Redevelopment Project) Rev. Ser. 16B | | | 3.473 | | | | 07/01/2028 | | | | 2,858,220 | |
| | 2,000,000 | | | New York State Transportation Development Corp. Special Facilities (LaGuardia Airport Terminal Redevelopment Project) Rev. Ser. 16B | | | 3.573 | | | | 07/01/2029 | | | | 1,904,860 | |
| | 1,000,000 | | | New York State Transportation Development Corp. Special Facilities (LaGuardia Airport Terminal Redevelopment Project) Rev. Ser. 16B | | | 3.673 | | | | 07/01/2030 | | | | 952,260 | |
| | 500,000 | | | Port of Seattle Washington Rev. (Intermediate Lien) Ref. Ser. 17B | | | 3.755 | | | | 05/01/2036 | | | | 488,980 | |
| | 5,000,000 | | | South Jersey Port Corp. New Jersey (Marine Terminal) Rev. Ser. 09-P-3 | | | 7.365 | | | | 01/01/2040 | | | | 6,145,200 | |
| | | | | | | | | | | | | | | | |
| | | | | | | | | | | | | | | 36,481,133 | |
| | | | | | | | | | | | | | | | |
| | | | Sales Tax Revenue—2.2% | | | | | | | | | |
| | 1,855,000 | | | Central Puget Sound Washington Regional Transportation Auth. Sales & Use Ser. 09 | | | 5.491 | | | | 11/01/2039 | | | | 2,295,118 | |
| | 1,000,000 | | | Denver Colorado City & County Dedicated Tax & Improvement Rev. Ref. Ser. 16B | | | 3.818 | | | | 08/01/2032 | | | | 999,870 | |
| | 2,000,000 | | | Massachusetts State Bay Transportation Auth. Sales Tax Rev. Ser. 10 | | | 5.869 | | | | 07/01/2040 | | | | 2,470,480 | |
| | 450,000 | | | Massachusetts State School Building Auth. Dedicated Sales Tax Rev. Ser. 09B | | | 5.715 | | | | 08/15/2039 | | | | 549,306 | |
| | 2,500,000 | | | Miami-Dade County Florida Transit Sales Surtax Rev. Ser. 10B | | | 5.534 | | | | 07/01/2032 | | | | 2,770,175 | |
| | 1,000,000 | | | Missouri State Highways & Transportation Commission (State Road) Rev. Ser. 10 | | | 5.020 | | | | 05/01/2025 | | | | 1,089,570 | |
| | 1,955,000 | | | New York City Transitional Finance Auth. Rev. Ser. 10 | | | 4.867 | | | | 08/01/2024 | | | | 2,115,564 | |
| | 1,000,000 | | | Salt Lake County Utah Transportation Tax (Salt Lake County) Rev. Ser. 10 | | | 3.358 | | | | 08/15/2019 | | | | 1,005,110 | |
| | 1,025,000 | | | Santa Clara Valley California Transportation Auth. Sales Tax Rev. Ser. 10 | | | 5.876 | | | | 04/01/2032 | | | | 1,200,982 | |
| | 1,815,000 | | | Utah Transit Auth. Sales Tax Rev. Ser. 09B | | | 5.937 | | | | 06/15/2039 | | | | 2,280,511 | |
| | 3,000,000 | | | Washoe County Nevada Sales Tax Rev. Ser. 10 | | | 7.451 | | | | 02/01/2040 | | | | 3,947,190 | |
| | | | | | | | | | | | | | | | |
| | | | | | | | | | | | | | | 20,723,876 | |
| | | | | | | | | | | | | | | | |
| | | | Sewer Revenue—1.1% | | | | | | | | | |
| | 3,000,000 | | | East Bay California Municipal Utility District Wastewater System Rev. Ser. 10 | | | 5.026 | | | | 06/01/2032 | | | | 3,397,650 | |
| | 1,030,000 | | | Jurupa California Community Services District COP Ser. 10B | | | 6.347 | | | | 09/01/2025 | | | | 1,178,886 | |
See accompanying Notes to Financial Statements which are an integral part of the financial statements.
Invesco Taxable Municipal Bond ETF (BAB) (continued)
August 31, 2018
| | | | | | | | | | | | | | | | |
Principal
Amount | | | | | Interest
Rate | | | Maturity
Date | | | Value | |
| | | | Municipal Bonds (continued) | | | | | | | | | |
| | | | Sewer Revenue (continued) | | | | | | | | | |
| $ | 1,070,000 | | | Jurupa California Community Services District COP Ser. 10B | | | 6.497 | % | | | 09/01/2026 | | | $ | 1,246,283 | |
| | 1,125,000 | | | Jurupa California Community Services District COP Ser. 10B | | | 6.597 | | | | 09/01/2027 | | | | 1,327,455 | |
| | 1,170,000 | | | Jurupa California Community Services District COP Ser. 10B | | | 6.697 | | | | 09/01/2028 | | | | 1,407,955 | |
| | 500,000 | | | Knoxville Tennessee Waste Water System Rev. Ser. 10 | | | 6.300 | | | | 04/01/2045 | | | | 527,205 | |
| | 200,000 | | | Memphis Tennessee Sanitary Sewage System Rev. Ser. 09B AGC | | | 6.300 | | | | 10/01/2029 | | | | 207,630 | |
| | 1,100,000 | | | Riverside California Sewer Rev. Ser. 09 | | | 7.000 | | | | 08/01/2029 | | | | 1,139,952 | |
| | 200,000 | | | Sarasota Florida Water & Sewer System Rev. Ser. 10B | | | 5.425 | | | | 10/01/2030 | | | | 210,316 | |
| | | | | | | | | | | | | | | | |
| | | | | | | | | | | | | | | 10,643,332 | |
| | | | | | | | | | | | | | | | |
| | | | Tax Increment Revenue—0.4% | | | | | | | | | |
| | 2,000,000 | | | San Jose California Redevelopment Agency Successor Tax Allocation (Senior) Ref. Ser. 17A-T | | | 3.076 | | | | 08/01/2025 | | | | 1,971,700 | |
| | 1,000,000 | | | Temecula California Redevelopment Agency Tax Allocation (Temecula Redevelopment No. 1) Rev. Ser. 10B(a) | | | 7.930 | | | | 08/01/2020 | | | | 1,092,410 | |
| | 1,000,000 | | | Temecula California Redevelopment Agency Tax Allocation (Temecula Redevelopment No. 1) Rev. Ser. 10B(a) | | | 8.180 | | | | 08/01/2020 | | | | 1,097,010 | |
| | | | | | | | | | | | | | | | |
| | | | | | | | | | | | | | | 4,161,120 | |
| | | | | | | | | | | | | | | | |
| | | | Transit Revenue—4.5% | | | | | | | | | |
| | 2,500,000 | | | Metropolitan Transportation Auth. New York Dedicated Tax Fund (Metro Transit Auth.) Ser. 10A-2 | | | 6.089 | | | | 11/15/2040 | | | | 3,182,925 | |
| | 335,000 | | | Metropolitan Transportation Auth. New York Rev. Ser. 09 | | | 5.871 | | | | 11/15/2039 | | | | 408,650 | |
| | 1,800,000 | | | Metropolitan Transportation Auth. New York Rev. Ser. 10 | | | 6.648 | | | | 11/15/2039 | | | | 2,348,244 | |
| | 7,250,000 | | | Metropolitan Transportation Auth. New York Rev. Ser. 10A | | | 6.668 | | | | 11/15/2039 | | | | 9,637,860 | |
| | 3,745,000 | | | Metropolitan Transportation Auth. New York Rev. Ser. 10C-1 | | | 6.687 | | | | 11/15/2040 | | | | 4,994,070 | |
| | 6,525,000 | | | Metropolitan Transportation Auth. New York Rev. Ser. 10E | | | 6.814 | | | | 11/15/2040 | | | | 8,732,212 | |
| | 7,455,000 | | | New Jersey State Transportation Trust Fund Auth. Ser. 10B | | | 6.561 | | | | 12/15/2040 | | | | 9,219,598 | |
| | 1,990,000 | | | New Jersey State Transportation Trust Fund Auth. Ser. 10C | | | 5.754 | | | | 12/15/2028 | | | | 2,221,218 | |
| | 1,125,000 | | | New Jersey State Transportation Trust Fund Auth. Ser. 10C | | | 6.104 | | | | 12/15/2028 | | | | 1,178,527 | |
| | | | | | | | | | | | | | | | |
| | | | | | | | | | | | | | | 41,923,304 | |
| | | | | | | | | | | | | | | | |
| | | | Water Revenue—9.8% | | | | | | | | | |
| | 1,500,000 | | | Beaumont Texas Waterworks & Sewer System Ser. 10B | | | 6.007 | | | | 09/01/2030 | | | | 1,578,360 | |
| | 200,000 | | | Davie Florida Water & Sewer Rev. Ser. 10B AGM | | | 6.599 | | | | 10/01/2030 | | | | 214,172 | |
| | 3,000,000 | | | East Bay California Municipal Utility District Water System Rev. Ser. 10 | | | 5.874 | | | | 06/01/2040 | | | | 3,822,630 | |
| | 2,000,000 | | | Fresno California Water System Rev. Ser. 10A-2 | | | 6.500 | | | | 06/01/2030 | | | | 2,385,320 | |
| | 1,250,000 | | | JEA Florida Water & Sewer System Rev. Ser. 10A | | | 6.210 | | | | 10/01/2033 | | | | 1,508,887 | |
| | 2,000,000 | | | Jurupa California Community Services District COP (Water Bonds) Ser. 10B | | | 7.192 | | | | 09/01/2040 | | | | 2,734,020 | |
| | 1,715,000 | | | Los Angeles California Department of Water & Power Rev. Ser. 10 | | | 6.603 | | | | 07/01/2050 | | | | 2,474,831 | |
| | 500,000 | | | Los Angeles California Department of Water & Power Water System Rev. Ser. 09C | | | 5.381 | | | | 07/01/2024 | | | | 554,395 | |
| | 2,270,000 | | | Los Angeles California Department of Water & Power Water System Rev. Ser. 09C | | | 6.008 | | | | 07/01/2039 | | | | 2,766,018 | |
| | 1,125,000 | | | Massachusetts State Water Pollution Abatement Trust Ser. 10 | | | 5.192 | | | | 08/01/2040 | | | | 1,240,481 | |
| | 1,000,000 | | | Metropolitan Water District of Southern California Ser. 10 | | | 6.947 | | | | 07/01/2040 | | | | 1,068,640 | |
| | 7,425,000 | | | New York City Municipal Finance Auth. Water & Sewer System Rev. Ser. 10EE | | | 6.491 | | | | 06/15/2042 | | | | 7,851,789 | |
| | 2,925,000 | | | New York City Municipal Water Finance Auth. Water & Sewer Rev. Ser. 10 | | | 5.790 | | | | 06/15/2041 | | | | 3,054,753 | |
| | 4,460,000 | | | New York City Municipal Water Finance Auth. Water & Sewer Rev. Ser. 10 | | | 5.724 | | | | 06/15/2042 | | | | 5,666,341 | |
| | 6,100,000 | | | New York City Municipal Water Finance Auth. Water & Sewer Rev. Ser. 10 | | | 6.124 | | | | 06/15/2042 | | | | 6,399,266 | |
| | 10,230,000 | | | New York City Municipal Water Finance Auth. Water & Sewer Rev. Ser. 10 | | | 5.440 | | | | 06/15/2043 | | | | 12,558,962 | |
| | 1,000,000 | | | New York City Municipal Water Finance Auth. Water & Sewer Rev. Ser. 10DD | | | 6.452 | | | | 06/15/2041 | | | | 1,057,310 | |
| | 1,000,000 | | | New York State Environmental Facilities Corp. (State Clean Water & Drinking Water) Ser. 10 | | | 5.707 | | | | 06/15/2030 | | | | 1,188,060 | |
| | 500,000 | | | Passaic Valley New Jersey Water Commission Water Supply Rev. Ser. 09B | | | 7.570 | | | | 12/15/2029 | | | | 634,465 | |
| | 500,000 | | | Passaic Valley New Jersey Water Commission Water Supply Rev. Ser. 09B | | | 7.820 | | | | 12/15/2039 | | | | 718,495 | |
| | 500,000 | | | Riverside California Water Rev. Ser. 09B | | | 6.349 | | | | 10/01/2039 | | | | 651,445 | |
| | 2,245,000 | | | San Francisco California City & County Public Utilities Commission Water Rev. Ser. 10 | | | 6.000 | | | | 11/01/2040 | | | | 2,806,677 | |
| | 3,000,000 | | | San Francisco California City & County Public Utilities Commission Water Rev. Ser. 10DE | | | 5.700 | | | | 11/01/2027 | | | | 3,480,690 | |
| | 2,480,000 | | | San Francisco California City & County Public Utilities Commission Water Rev. Ser. 10DE | | | 6.000 | | | | 11/01/2040 | | | | 3,109,275 | |
| | 4,600,000 | | | San Francisco City & County Public Utilities Commission Ser. 10 | | | 6.950 | | | | 11/01/2050 | | | | 6,622,022 | |
| | 3,000,000 | | | Santa Clara Valley California Water District Ref. Ser. 16B | | | 4.354 | | | | 06/01/2046 | | | | 3,151,170 | |
| | 2,000,000 | | | Seminole County Florida Water & Sewer Rev. Ser. 10B | | | 6.443 | | | | 10/01/2040 | | | | 2,135,860 | |
| | 2,000,000 | | | South Central Connecticut Regional Water Auth. Water System Rev. Ser. 10 | | | 6.243 | | | | 08/01/2030 | | | | 2,358,060 | |
| | 1,645,000 | | | South Central Connecticut Regional Water Auth. Water System Rev. Ser. 10 | | | 6.393 | | | | 08/01/2040 | | | | 2,056,711 | |
See accompanying Notes to Financial Statements which are an integral part of the financial statements.
Invesco Taxable Municipal Bond ETF (BAB) (continued)
August 31, 2018
| | | | | | | | | | | | | | | | |
Principal
Amount | | | | | Interest
Rate | | | Maturity
Date | | | Value | |
| | | | Municipal Bonds (continued) | | | | | | | | | |
| | | | Water Revenue (continued) | | | | | | | | | |
| $ | 1,500,000 | | | Sunrise Florida Utility System Rev. Ser. 10B | | | 5.813 | % | | | 10/01/2030 | | | $ | 1,582,785 | |
| | 1,000,000 | | | Tacoma Washington Water System Rev. Ser. 10B | | | 5.371 | | | | 12/01/2030 | | | | 1,139,330 | |
| | 1,275,000 | | | Tucson Arizona Water Rev. Ser. 10 | | | 5.789 | | | | 07/01/2026 | | | | 1,439,819 | |
| | 1,250,000 | | | Upper Eagle Regional Water Auth. Colorado Rev. Ser. 10 | | | 6.518 | | | | 12/01/2039 | | | | 1,318,087 | |
| | 500,000 | | | Western Nassau County Water Auth. Water System Rev. Ser. 10 | | | 6.701 | | | | 04/01/2040 | | | | 619,420 | |
| | | | | | | | | | | | | | | | |
| | | | | | | | | | | | | | | 91,948,546 | |
| | | | | | | | | | | | | | | | |
| | | | Total Municipal Bonds
(Cost $874,121,049) | | | | | | | | | | | 916,147,555 | |
| | | | | | | | | | | | | | | | |
| | | | |
| | | | | | | | | | | | | | | | |
| | | | Corporate Bonds—0.8% | | | | | | | | | |
| | | | Commercial Services—0.2% | | | | | | | | | |
| | 2,000,000 | | | Trustees of Dartmouth College | | | 3.474 | | | | 06/01/2046 | | | | 1,897,551 | |
| | | | | | | | | | | | | | | | |
| | | | Healthcare-Services—0.6% | | | | | | | | | |
| | 3,000,000 | | | Baylor Scott & White Holdings | | | 3.967 | | | | 11/15/2046 | | | | 2,935,287 | |
| | 2,000,000 | | | Mayo Clinic, Series 2016 | | | 4.128 | | | | 11/15/2052 | | | | 2,033,994 | |
| | 1,325,000 | | | Montefiore Medical Center | | | 2.895 | | | | 04/20/2032 | | | | 1,255,855 | |
| | | | | | | | | | | | | | | | |
| | | | | | | | | | | | | | | 6,225,136 | |
| | | | | | | | | | | | | | | | |
| | | | Total Corporate Bonds
(Cost $8,324,900) | | | | | | | | | | | 8,122,687 | |
| | | | | | | | | | | | | | | | |
Number
of Shares | | | | | | | | | | | | |
| | | | Money Market Fund—0.2% | | | | | | | | | |
| | 1,761,575 | | | Invesco Premier U.S. Government Money Portfolio—Institutional Class, 1.83%(b)
(Cost $1,761,575) | | | | | | | | | | | 1,761,575 | |
| | | | | | | | | | | | | | | | |
| | | | Total Investments in Securities
(Cost $884,207,524)(c)—98.6% | | | | | | | | | | | 926,031,817 | |
| | | | Other assets less liabilities—1.4% | | | | | | | | | | | 12,839,181 | |
| | | | | | | | | | | | | | | | |
| | | | Net Assets—100.0% | | | | | | | | | | $ | 938,870,998 | |
| | | | | | | | | | | | | | | | |
Investment Abbreviations:
AGC—Assured Guaranty Corp.
AGM—Assured Guaranty Municipal Corp.
Auth.—Authority
BAM—Build America Mutual
COP—Certificate of Participation
GTD—Grant To Date
PSF—GTD—Permanent School Fund Guaranteed
Ref.—Refunding
Rev.—Revenue
Ser.—Series
Sub.—Subordinated
Notes to Schedule of Investments:
| (a) | Advance refunded; secured by an escrow fund of U.S. Government obligations or other highly rated collateral. |
| (b) | The security and the Fund are advised by wholly-owned subsidiaries of Invesco Ltd. and are therefore considered to be affiliated. The rate shown is the 7-day SEC standardized yield as of August 31, 2018. |
| (c) | Entities may either issue, guarantee, back or otherwise enhance the credit quality of a security. The entities are not primarily responsible for the borrower’s obligations but may be called upon to satisfy the borrower’s obligations. No concentration of any single entity was greater than 5% each. |
See accompanying Notes to Financial Statements which are an integral part of the financial statements.
Schedule of Investments
Invesco Treasury Collateral ETF (CLTL)
August 31, 2018
| | | | | | | | |
Principal
Amount | | | | | Value | |
| | | | Short-Term Investments—99.8% | |
| | | | U.S. Treasury Securities—99.8% | | | |
| | | | U.S. Treasury Bills—56.9%(a) | | | |
| $ | 34,000 | | | 1.872%, 10/04/2018 | | $ | 33,945 | |
| | 8,000,000 | | | 1.881%, 10/04/2018 | | | 7,987,135 | |
| | 16,000 | | | 1.882%, 10/04/2018 | | | 15,974 | |
| | 7,000,000 | | | 1.913%, 10/04/2018 | | | 6,988,743 | |
| | 3,500,000 | | | 1.384%, 10/11/2018 | | | 3,492,949 | |
| | 8,000 | | | 1.466%, 10/11/2018 | | | 7,984 | |
| | 72,000 | | | 1.792%, 10/11/2018 | | | 71,855 | |
| | 8,000 | | | 1.802%, 10/11/2018 | | | 7,984 | |
| | 24,000 | | | 1.893%, 10/11/2018 | | | 23,952 | |
| | 7,800,000 | | | 1.899%, 10/11/2018 | | | 7,784,287 | |
| | 42,000 | | | 1.908%, 10/11/2018 | | | 41,915 | |
| | 16,000 | | | 1.910%, 10/11/2018 | | | 15,968 | |
| | 7,000,000 | | | 1.926%, 10/11/2018 | | | 6,985,899 | |
| | 16,000 | | | 1.905%, 10/18/2018 | | | 15,961 | |
| | 8,600,000 | | | 1.916%, 10/18/2018 | | | 8,579,214 | |
| | 35,000 | | | 1.930%, 10/18/2018 | | | 34,915 | |
| | 7,000,000 | | | 1.938%, 10/18/2018 | | | 6,983,081 | |
| | 16,000 | | | 1.908%, 10/25/2018 | | | 15,955 | |
| | 8,500,000 | �� | | 1.930%, 10/25/2018 | | | 8,476,052 | |
| | 35,000 | | | 1.935%, 10/25/2018 | | | 34,901 | |
| | 7,000,000 | | | 1.950%, 10/25/2018 | | | 6,980,278 | |
| | 7,000,000 | | | 1.953%, 11/01/2018 | | | 6,977,360 | |
| | 16,000 | | | 1.957%, 11/01/2018 | | | 15,948 | |
| | 8,600,000 | | | 1.962%, 11/01/2018 | | | 8,572,185 | |
| | 35,000 | | | 1.983%, 11/01/2018 | | | 34,887 | |
| | 3,600,000 | | | 1.556%, 11/08/2018 | | | 3,586,781 | |
| | 72,000 | | | 1.812%, 11/08/2018 | | | 71,736 | |
| | 8,000 | | | 1.842%, 11/08/2018 | | | 7,971 | |
| | 16,000 | | | 1.866%, 11/08/2018 | | | 15,941 | |
| | 8,000,000 | | | 1.915%, 11/08/2018 | | | 7,970,624 | |
| | 6,713,000 | | | 1.964%, 11/08/2018 | | | 6,688,350 | |
| | 24,000 | | | 1.968%, 11/08/2018 | | | 23,912 | |
| | 24,000 | | | 1.998%, 11/08/2018 | | | 23,912 | |
| | 5,000,000 | | | 1.933%, 11/15/2018 | | | 4,979,663 | |
| | 7,000,000 | | | 1.971%, 11/15/2018 | | | 6,971,528 | |
| | 16,000 | | | 1.983%, 11/15/2018 | | | 15,935 | |
| | 16,000 | | | 2.004%, 11/15/2018 | | | 15,935 | |
| | 5,000,000 | | | 1.952%, 11/23/2018 | | | 4,977,194 | |
| | 7,000,000 | | | 1.975%, 11/23/2018 | | | 6,968,072 | |
| | 16,000 | | | 1.993%, 11/23/2018 | | | 15,927 | |
| | 16,000 | | | 2.026%, 11/23/2018 | | | 15,927 | |
| | 5,100,000 | | | 1.973%, 11/29/2018 | | | 5,074,872 | |
| | 7,000,000 | | | 2.016%, 11/29/2018 | | | 6,965,510 | |
| | 16,000 | | | 2.019%, 11/29/2018 | | | 15,921 | |
| | 16,000 | | | 2.039%, 11/29/2018 | | | 15,921 | |
| | 500,000 | | | 1.670%, 12/06/2018 | | | 497,318 | |
| | 3,000,000 | | | 1.680%, 12/06/2018 | | | 2,983,910 | |
| | 16,000 | | | 1.804%, 12/06/2018 | | | 15,914 | |
| | 72,000 | | | 1.847%, 12/06/2018 | | | 71,614 | |
| | 8,000 | | | 1.849%, 12/06/2018 | | | 7,957 | |
| | 7,000,000 | | | 1.982%, 12/06/2018 | | | 6,962,456 | |
| | 8,000 | | | 2.017%, 12/06/2018 | | | 7,957 | |
| | 24,000 | | | 2.051%, 12/06/2018 | | | 23,871 | |
| | 7,000,000 | | | 1.988%, 12/13/2018 | | | 6,959,701 | |
| | 16,000 | | | 2.049%, 12/13/2018 | | | 15,908 | |
| | 7,000,000 | | | 1.984%, 12/20/2018 | | | 6,956,725 | |
| | 16,000 | | | 2.059%, 12/20/2018 | | | 15,901 | |
| | | | | | | | |
Principal
Amount | | | | | Value | |
| | | | Short-Term Investments (continued) | |
| | | | U.S. Treasury Securities (continued) | | | |
| | | | U.S. Treasury Bills (continued) | | | | |
| $ | 7,000,000 | | | 2.023%, 12/27/2018 | | $ | 6,953,228 | |
| | 16,000 | | | 2.077%, 12/27/2018 | | | 15,893 | |
| | 3,300,000 | | | 1.733%, 01/03/2019 | | | 3,276,486 | |
| | 72,000 | | | 1.883%, 01/03/2019 | | | 71,487 | |
| | 8,000 | | | 1.893%, 01/03/2019 | | | 7,943 | |
| | 16,000 | | | 1.932%, 01/03/2019 | | | 15,886 | |
| | 8,000 | | | 2.024%, 01/03/2019 | | | 7,943 | |
| | 7,000,000 | | | 2.077%, 01/03/2019 | | | 6,950,121 | |
| | 23,000 | | | 2.093%, 01/03/2019 | | | 22,836 | |
| | 7,000,000 | | | 2.089%, 01/10/2019 | | | 6,946,769 | |
| | 16,000 | | | 2.119%, 01/10/2019 | | | 15,878 | |
| | 7,500,000 | | | 2.094%, 01/17/2019 | | | 7,439,320 | |
| | 17,000 | | | 2.142%, 01/17/2019 | | | 16,862 | |
| | 7,500,000 | | | 2.116%, 01/24/2019 | | | 7,435,730 | |
| | 17,000 | | | 2.153%, 01/24/2019 | | | 16,854 | |
| | 3,400,000 | | | 1.833%, 01/31/2019 | | | 3,369,287 | |
| | 8,000 | | | 1.912%, 01/31/2019 | | | 7,928 | |
| | 72,000 | | | 1.934%, 01/31/2019 | | | 71,350 | |
| | 16,000 | | | 2.016%, 01/31/2019 | | | 15,856 | |
| | 8,000 | | | 2.042%, 01/31/2019 | | | 7,928 | |
| | 7,400,000 | | | 2.128%, 01/31/2019 | | | 7,333,155 | |
| | 25,000 | | | 2.163%, 01/31/2019 | | | 24,774 | |
| | 7,300,000 | | | 2.125%, 02/07/2019 | | | 7,231,034 | |
| | 7,300,000 | | | 2.139%, 02/14/2019 | | | 7,227,278 | |
| | 7,300,000 | | | 2.145%, 02/21/2019 | | | 7,224,155 | |
| | 63,000 | | | 1.954%, 02/28/2019 | | | 62,314 | |
| | 3,000,000 | | | 2.002%, 02/28/2019 | | | 2,967,329 | |
| | 14,000 | | | 2.084%, 02/28/2019 | | | 13,848 | |
| | 7,000 | | | 2.111%, 02/28/2019 | | | 6,924 | |
| | 7,400,000 | | | 2.162%, 02/28/2019 | | | 7,319,411 | |
| | 7,000 | | | 2.203%, 02/28/2019 | | | 6,924 | |
| | 81,000 | | | 1.999%, 03/28/2019 | | | 79,991 | |
| | 4,000,000 | | | 2.018%, 03/28/2019 | | | 3,950,174 | |
| | 18,000 | | | 2.126%, 03/28/2019 | | | 17,776 | |
| | 9,000 | | | 2.157%, 03/28/2019 | | | 8,888 | |
| | 9,000 | | | 2.160%, 03/28/2019 | | | 8,888 | |
| | 4,500,000 | | | 2.162%, 04/25/2019 | | | 4,434,250 | |
| | 10,000 | | | 2.185%, 04/25/2019 | | | 9,854 | |
| | 10,000 | | | 2.240%, 04/25/2019 | | | 9,854 | |
| | 4,000,000 | | | 2.149%, 05/23/2019 | | | 3,933,518 | |
| | 9,000 | | | 2.208%, 05/23/2019 | | | 8,850 | |
| | 9,000 | | | 2.269%, 05/23/2019 | | | 8,850 | |
| | 4,500,000 | | | 2.225%, 06/20/2019 | | | 4,416,506 | |
| | 10,000 | | | 2.300%, 06/20/2019 | | | 9,815 | |
| | 10,000 | | | 2.323%, 07/18/2019 | | | 9,794 | |
| | 4,400,000 | | | 2.338%, 07/18/2019 | | | 4,309,435 | |
| | 4,000,000 | | | 2.345%, 08/15/2019 | | | 3,908,949 | |
| | | | | | | | |
| | | | (Cost $266,337,261) | | | 266,328,314 | |
| | | | | | | | |
| | | | U.S. Treasury Notes—42.4% | | | | |
| | 4,650,000 | | | 0.875%, 10/15/2018 | | | 4,644,118 | |
| | 4,649,000 | | | 0.750%, 10/31/2018 | | | 4,639,774 | |
| | 6,210,000 | | | 1.250%, 10/31/2018 | | | 6,202,437 | |
| | 2,075,000 | | | 1.750%, 10/31/2018 | | | 2,074,064 | |
| | 4,540,000 | | | 1.250%, 11/15/2018 | | | 4,532,765 | |
| | 5,054,000 | | | 3.750%, 11/15/2018 | | | 5,070,412 | |
| | 4,854,000 | | | 1.000%, 11/30/2018 | | | 4,841,193 | |
See accompanying Notes to Financial Statements which are an integral part of the financial statements.
Invesco Treasury Collateral ETF (CLTL) (continued)
August 31, 2018
| | | | | | | | |
Principal
Amount | | | | | Value | |
| | | | Short-Term Investments (continued) | |
| | | | U.S. Treasury Securities (continued) | | | |
| | | | U.S. Treasury Notes (continued) | | | | |
| $ | 5,582,000 | | | 1.250%, 11/30/2018 | | $ | 5,570,555 | |
| | 2,584,000 | | | 1.375%, 11/30/2018 | | | 2,579,461 | |
| | 4,126,000 | | | 1.250%, 12/15/2018 | | | 4,115,759 | |
| | 4,640,000 | | | 1.250%, 12/31/2018 | | | 4,626,335 | |
| | 3,098,000 | | | 1.375%, 12/31/2018 | | | 3,090,104 | |
| | 5,982,000 | | | 1.500%, 12/31/2018 | | | 5,969,126 | |
| | 4,126,000 | | | 1.125%, 01/15/2019 | | | 4,110,366 | |
| | 4,393,200 | | | 1.125%, 01/31/2019 | | | 4,373,293 | |
| | 4,582,000 | | | 1.250%, 01/31/2019 | | | 4,563,744 | |
| | 5,218,200 | | | 1.500%, 01/31/2019 | | | 5,202,505 | |
| | 3,091,000 | | | 0.750%, 02/15/2019 | | | 3,070,595 | |
| | 4,093,000 | | | 2.750%, 02/15/2019 | | | 4,101,794 | |
| | 4,394,000 | | | 1.125%, 02/28/2019 | | | 4,370,314 | |
| | 3,091,000 | | | 1.375%, 02/28/2019 | | | 3,077,658 | |
| | 5,520,000 | | | 1.500%, 02/28/2019 | | | 5,499,623 | |
| | 4,117,000 | | | 1.000%, 03/15/2019 | | | 4,090,063 | |
| | 4,117,000 | | | 1.250%, 03/31/2019 | | | 4,092,636 | |
| | 2,065,000 | | | 1.500%, 03/31/2019 | | | 2,055,885 | |
| | 5,669,000 | | | 1.625%, 03/31/2019 | | | 5,647,630 | |
| | 4,018,000 | | | 0.875%, 04/15/2019 | | | 3,983,235 | |
| | 6,028,000 | | | 1.250%, 04/30/2019 | | | 5,985,380 | |
| | 5,224,000 | | | 1.625%, 04/30/2019 | | | 5,199,614 | |
| | 3,014,000 | | | 0.875%, 05/15/2019 | | | 2,983,212 | |
| | 5,221,000 | | | 3.125%, 05/15/2019 | | | 5,247,819 | |
| | 1,004,000 | | | 1.125%, 05/31/2019 | | | 994,842 | |
| | 4,018,000 | | | 1.250%, 05/31/2019 | | | 3,985,040 | |
| | 5,022,000 | | | 1.500%, 05/31/2019 | | | 4,989,828 | |
| | 4,009,000 | | | 0.875%, 06/15/2019 | | | 3,962,019 | |
| | 2,005,000 | | | 1.000%, 06/30/2019 | | | 1,982,444 | |
| | 4,510,000 | | | 1.250%, 06/30/2019 | | | 4,467,895 | |
| | 5,813,000 | | | 1.625%, 06/30/2019 | | | 5,775,420 | |
| | 4,009,000 | | | 0.750%, 07/15/2019 | | | 3,951,840 | |
| | 2,506,000 | | | 0.875%, 07/31/2019 | | | 2,471,200 | |
| | 4,410,000 | | | 1.375%, 07/31/2019 | | | 4,368,226 | |
| | 5,713,000 | | | 1.625%, 07/31/2019 | | | 5,671,045 | |
| | 3,900,000 | | | 0.750%, 08/15/2019 | | | 3,838,023 | |
| | 4,500,000 | | | 3.625%, 08/15/2019 | | | 4,548,023 | |
| | 2,400,000 | | | 1.000%, 08/31/2019 | | | 2,365,240 | |
| | 4,000,000 | | | 1.250%, 08/31/2019 | | | 3,952,068 | |
| | 5,700,000 | | | 1.625%, 08/31/2019 | | | 5,652,181 | |
| | | | | | | | |
| | | | (Cost $198,646,183) | | | 198,586,803 | |
| | | | | | | | |
| | | | U.S. Treasury Bonds—0.5% | | | | |
| | 614,000 | | | 9.000%, 11/15/2018 | | | 622,236 | |
| | 1,026,000 | | | 8.875%, 02/15/2019 | | | 1,055,698 | |
| | 930,000 | | | 8.125%, 08/15/2019 | | | 978,725 | |
| | | | | | | | |
| | | | (Cost $2,661,152) | | | 2,656,659 | |
| | | | | | | | |
| | | | Total Investments in Securities
(Cost $467,644,596)—99.8% | | | 467,571,776 | |
| | | | Other assets less liabilities—0.2% | | | 750,862 | |
| | | | | | | | |
| | | | Net Assets—100.0% | | $ | 468,322,638 | |
| | | | | | | | |
Notes to Schedule of Investments:
| (a) | Security traded on a discount basis. The interest rate shown represents the discount rate at the time of purchase by the Fund. |
See accompanying Notes to Financial Statements which are an integral part of the financial statements.
Schedule of Investments
Invesco Variable Rate Preferred ETF (VRP)
August 31, 2018
| | | | | | | | | | | | | | | | |
Principal
Amount | | | | | Interest
Rate | | | Maturity
Date | | | Value | |
| | | | Corporate Bonds—72.6% | | | | | | | | | |
| | | | Auto Manufacturers—0.6% | | | | | | | | | |
| $ | 13,350,000 | | | General Motors Financial Co., Inc., Series A(a) | | | 5.750 | % | | | 12/29/2049 | | | $ | 13,059,637 | |
| | | | | | | | | | | | | | | | |
| | | | Banks—46.1% | | | | | | | | | |
| | 24,375,000 | | | Bank of America Corp., Series AA(a) | | | 6.100 | | | | 12/29/2049 | | | | 25,715,625 | |
| | 12,850,000 | | | Bank of America Corp., Series DD | | | 6.300 | | | | 12/29/2049 | | | | 13,813,750 | |
| | 30,600,000 | | | Bank of America Corp., Series FF | | | 5.875 | | | | 09/15/2166 | | | | 30,600,000 | |
| | 12,850,000 | | | Bank of America Corp., Series U(a) | | | 5.200 | | | | 12/01/2165 | | | | 12,721,500 | |
| | 19,500,000 | | | Bank of America Corp., Series V | | | 5.125 | | | | 12/29/2049 | | | | 19,792,500 | |
| | 25,500,000 | | | Bank of America Corp., Series X | | | 6.250 | | | | 09/29/2049 | | | | 26,934,375 | |
| | 18,050,000 | | | Bank of America Corp., Series Z(a) | | | 6.500 | | | | 12/31/2049 | | | | 19,471,437 | |
| | 6,800,000 | | | Bank of New York Mellon Corp. (The), Series D | | | 4.500 | | | | 12/20/2165 | | | | 6,562,000 | |
| | 13,650,000 | | | Bank of New York Mellon Corp. (The), Series E | | | 4.950 | | | | 12/20/2165 | | | | 14,008,312 | |
| | 13,250,000 | | | Bank of New York Mellon Corp. (The), Series F | | | 4.625 | | | | 12/29/2049 | | | | 12,885,625 | |
| | 4,475,000 | | | CIT Group, Inc., Series A | | | 5.800 | | | | 12/15/2165 | | | | 4,475,000 | |
| | 19,500,000 | | | Citigroup, Inc. | | | 5.950 | | | | 07/30/2166 | | | | 20,085,000 | |
| | 16,200,000 | | | Citigroup, Inc., Series D(a) | | | 5.350 | | | | 04/29/2049 | | | | 16,078,500 | |
| | 22,700,000 | | | Citigroup, Inc., Series M | | | 6.300 | | | | 11/15/2165 | | | | 23,409,375 | |
| | 19,950,000 | | | Citigroup, Inc., Series N | | | 5.800 | | | | 11/29/2049 | | | | 20,498,625 | |
| | 19,600,000 | | | Citigroup, Inc., Series O | | | 5.875 | | | | 12/29/2049 | | | | 20,188,000 | |
| | 26,200,000 | | | Citigroup, Inc., Series P | | | 5.950 | | | | 12/29/2049 | | | | 26,986,000 | |
| | 16,100,000 | | | Citigroup, Inc., Series Q | | | 5.950 | | | | 12/29/2049 | | | | 16,583,000 | |
| | 19,400,000 | | | Citigroup, Inc., Series R | | | 6.125 | | | | 12/29/2049 | | | | 20,370,000 | |
| | 19,150,000 | | | Citigroup, Inc., Series T(a) | | | 6.250 | | | | 12/29/2049 | | | | 20,155,375 | |
| | 4,125,000 | | | Citizens Financial Group, Inc., Series B | | | 6.000 | | | | 01/06/2167 | | | | 4,202,344 | |
| | 8,100,000 | | | Fifth Third Bancorp | | | 5.100 | | | | 12/31/2165 | | | | 7,998,750 | |
| | 7,267,000 | | | Goldman Sachs Capital II | | | 4.000 | | | | 12/03/2165 | | | | 6,160,396 | |
| | 12,540,000 | | | Goldman Sachs Group, Inc. (The), Series L | | | 5.700 | | | | 12/29/2049 | | | | 12,759,450 | |
| | 19,450,000 | | | Goldman Sachs Group, Inc. (The), Series M | | | 5.375 | | | | 11/10/2166 | | | | 19,984,875 | |
| | 6,300,000 | | | Goldman Sachs Group, Inc. (The), Series O(a) | | | 5.300 | | | | 12/29/2049 | | | | 6,331,500 | |
| | 14,550,000 | | | Goldman Sachs Group, Inc. (The), Series P | | | 5.000 | | | | 05/10/2166 | | | | 13,822,500 | |
| | 6,750,000 | | | Huntington Bancshares, Inc., Series E | | | 5.700 | | | | 07/15/2166 | | | | 6,716,250 | |
| | 78,100,000 | | | JPMorgan Chase & Co., Series 1 (3 mo. USD LIBOR + 3.47%)(b) | | | 5.809 | | | | 04/29/2049 | | | | 78,591,132 | |
| | 16,300,000 | | | JPMorgan Chase & Co., Series CC | | | 4.625 | | | | 05/01/2166 | | | | 15,485,000 | |
| | 19,475,000 | | | JPMorgan Chase & Co., Series Q | | | 5.150 | | | | 12/29/2049 | | | | 19,523,687 | |
| | 19,350,000 | | | JPMorgan Chase & Co., Series R(a) | | | 6.000 | | | | 12/29/2049 | | | | 20,269,125 | |
| | 25,700,000 | | | JPMorgan Chase & Co., Series S | | | 6.750 | | | | 01/29/2049 | | | | 28,334,250 | |
| | 4,240,000 | | | JPMorgan Chase & Co., Series U (3 mo. USD LIBOR + 0.95%)(b) | | | 3.299 | | | | 02/02/2037 | | | | 3,781,158 | |
| | 12,900,000 | | | JPMorgan Chase & Co., Series U | | | 6.125 | | | | 12/29/2049 | | | | 13,496,625 | |
| | 32,450,000 | | | JPMorgan Chase & Co., Series V | | | 5.000 | | | | 12/31/2049 | | | | 32,922,147 | |
| | 7,901,000 | | | JPMorgan Chase & Co., Series W (3 mo. USD LIBOR + 1.00%)(b) | | | 3.314 | | | | 05/15/2047 | | | | 6,882,502 | |
| | 20,550,000 | | | JPMorgan Chase & Co., Series X | | | 6.100 | | | | 10/29/2049 | | | | 21,423,375 | |
| | 25,800,000 | | | JPMorgan Chase & Co., Series Z | | | 5.300 | | | | 12/29/2049 | | | | 26,541,750 | |
| | 7,200,000 | | | KeyCorp, Series D | | | 5.000 | | | | 12/15/2165 | | | | 7,128,000 | |
| | 4,700,000 | | | M&T Bank Corp., Series E | | | 6.450 | | | | 08/15/2166 | | | | 5,084,813 | |
| | 6,650,000 | | | M&T Bank Corp., Series F | | | 5.125 | | | | 05/01/2166 | | | | 6,683,250 | |
| | 6,700,000 | | | Mellon Capital IV, Series 1 | | | 4.000 | | | | 06/29/2049 | | | | 5,971,375 | |
| | 15,900,000 | | | Morgan Stanley, Series H | | | 5.450 | | | | 07/29/2049 | | | | 16,178,250 | |
| | 18,450,000 | | | Morgan Stanley, Series J | | | 5.550 | | | | 07/15/2166 | | | | 19,072,688 | |
| | 6,775,000 | | | Northern Trust Corp., Series D | | | 4.600 | | | | 04/01/2166 | | | | 6,690,313 | |
| | 13,475,000 | | | PNC Financial Services Group, Inc. (The), Series O | | | 6.750 | | | | 12/31/2049 | | | | 14,654,063 | |
| | 6,825,000 | | | PNC Financial Services Group, Inc. (The), Series R | | | 4.850 | | | | 12/31/2049 | | | | 6,859,125 | |
| | 6,850,000 | | | PNC Financial Services Group, Inc. (The), Series S(a) | | | 5.000 | | | | 05/01/2166 | | | | 6,884,250 | |
| | 10,821,000 | | | State Street Corp. (3 mo. USD LIBOR + 1.00%)(b) | | | 3.341 | | | | 06/01/2077 | | | | 9,885,979 | |
| | 10,170,000 | | | State Street Corp., Series F | | | 5.250 | | | | 12/29/2049 | | | | 10,525,950 | |
| | 10,275,000 | | | SunTrust Banks, Inc., Series G | | | 5.050 | | | | 12/30/2165 | | | | 10,185,094 | |
| | 6,750,000 | | | SunTrust Banks, Inc., Series H | | | 5.125 | | | | 06/15/2166 | | | | 6,412,500 | |
| | 9,750,000 | | | U.S. Bancorp, Series I | | | 5.125 | | | | 01/15/2166 | | | | 10,091,250 | |
| | 13,300,000 | | | U.S. Bancorp, Series J | | | 5.300 | | | | 12/29/2049 | | | | 13,399,750 | |
See accompanying Notes to Financial Statements which are an integral part of the financial statements.
Invesco Variable Rate Preferred ETF (VRP) (continued)
August 31, 2018
| | | | | | | | | | | | | | | | |
Principal
Amount | | | | | Interest
Rate | | | Maturity
Date | | | Value | |
| | | | Corporate Bonds (continued) | | | | | | | | | |
| | | | Banks (continued) | | | | | | | | | |
| $ | 9,060,000 | | | USB Capital IX | | | 3.500 | % | | | 10/29/2049 | | | $ | 8,346,525 | |
| | 32,453,000 | | | Wachovia Capital Trust III | | | 5.570 | | | | 03/29/2049 | | | | 32,331,301 | |
| | 43,800,000 | | | Wells Fargo & Co., Series K (3 mo. USD LIBOR + 3.77%)(b) | | | 6.111 | | | | 03/29/2049 | | | | 44,457,000 | |
| | 25,950,000 | | | Wells Fargo & Co., Series S | | | 5.900 | | | | 12/29/2049 | | | | 26,404,125 | |
| | 26,000,000 | | | Wells Fargo & Co., Series U | | | 5.875 | | | | 12/29/2049 | | | | 27,462,500 | |
| | | | | | | | | | | | | | | | |
| | | | | | | | | | | | | | | 1,011,268,916 | |
| | | | | | | | | | | | | | | | |
| | | | Diversified Financial Services—3.2% | | | | | | | | | |
| | 10,225,000 | | | American Express Co., Series B | | | 5.200 | | | | 05/29/2049 | | | | 10,429,500 | |
| | 11,275,000 | | | American Express Co., Series C | | | 4.900 | | | | 12/29/2049 | | | | 11,387,750 | |
| | 5,350,000 | | | Charles Schwab Corp. (The) | | | 7.000 | | | | 08/01/2166 | | | | 5,885,000 | |
| | 8,125,000 | | | Charles Schwab Corp. (The), Series E | | | 4.625 | | | | 03/01/2166 | | | | 8,206,250 | |
| | 6,650,000 | | | Charles Schwab Corp. (The), Series F | | | 5.000 | | | | 06/01/2166 | | | | 6,483,750 | |
| | 7,700,000 | | | Discover Financial Services, Series C | | | 5.500 | | | | 04/30/2166 | | | | 7,603,750 | |
| | 5,200,000 | | | E*Trade Financial Corp., Series A(a) | | | 5.875 | | | | 03/15/2166 | | | | 5,382,000 | |
| | 3,900,000 | | | E*Trade Financial Corp., Series B(a) | | | 5.300 | | | | 09/15/2166 | | | | 3,900,000 | |
| | 5,453,000 | | | National Rural Utilities Cooperative Finance Corp. | | | 4.750 | | | | 04/30/2043 | | | | 5,519,374 | |
| | 4,725,000 | | | National Rural Utilities Cooperative Finance Corp. | | | 5.250 | | | | 04/20/2046 | | | | 4,883,302 | |
| | | | | | | | | | | | | | | | |
| | | | | | | | | | | | | | | 69,680,676 | |
| | | | | | | | | | | | | | | | |
| | | | Electric—2.3% | | | | | | | | | |
| | 10,000,000 | | | CenterPoint Energy, Inc., Series A | | | 6.125 | | | | 03/01/2167 | | | | 10,200,000 | |
| | 9,260,000 | | | Dominion Energy, Inc. | | | 5.750 | | | | 10/01/2054 | | | | 9,638,748 | |
| | 4,397,000 | | | NextEra Energy Capital Holdings, Inc. (3 mo. USD LIBOR + 2.07%)(b) | | | 4.405 | | | | 10/01/2066 | | | | 4,254,097 | |
| | 7,500,000 | | | NextEra Energy Capital Holdings, Inc. | | | 4.800 | | | | 12/01/2077 | | | | 7,087,500 | |
| | 4,700,000 | | | Southern California Edison Co., Series E | | | 6.250 | | | | 08/01/2166 | | | | 4,993,750 | |
| | 7,301,000 | | | Southern Co. (The), Series B | | | 5.500 | | | | 03/15/2057 | | | | 7,456,146 | |
| | 6,976,000 | | | WEC Energy Group, Inc. (3 mo. USD LIBOR + 2.11%)(b) | | | 4.426 | | | | 05/15/2067 | | | | 6,827,760 | |
| | | | | | | | | | | | | | | | |
| | | | | | | | | | | | | | | 50,458,001 | |
| | | | | | | | | | | | | | | | |
| | | | Gas—0.3% | | | | | | | | | |
| | 5,500,000 | | | NiSource, Inc.(c) | | | 5.650 | | | | 12/15/2166 | | | | 5,527,500 | |
| | | | | | | | | | | | | | | | |
| | | | Hand/Machine Tools—0.2% | | | | | | | | | |
| | 5,313,000 | | | Stanley Black & Decker, Inc. | | | 5.750 | | | | 12/15/2053 | | | | 5,386,054 | |
| | | | | | | | | | | | | | | | |
| | | | Insurance—7.5% | | | | | | | | | |
| | 10,700,000 | | | Aegon NV (Netherlands) | | | 5.500 | | | | 04/11/2048 | | | | 10,392,375 | |
| | 10,684,000 | | | Allstate Corp. (The), Series B | | | 5.750 | | | | 08/15/2053 | | | | 11,271,620 | |
| | 10,050,000 | | | American International Group, Inc., Series A-9 | | | 5.750 | | | | 04/01/2048 | | | | 9,889,200 | |
| | 5,400,000 | | | Assurant, Inc. | | | 7.000 | | | | 03/27/2048 | | | | 5,512,398 | |
| | 3,324,000 | | | Everest Reinsurance Holdings, Inc. (3 mo. USD LIBOR + 2.39%)(a)(b) | | | 4.699 | | | | 05/01/2067 | | | | 3,282,450 | |
| | 9,800,000 | | | Lincoln National Corp. (3 mo. USD LIBOR + 2.36%)(b) | | | 4.669 | | | | 05/17/2066 | | | | 9,322,250 | |
| | 6,665,000 | | | Lincoln National Corp. (3 mo. USD LIBOR + 2.04%)(b) | | | 4.388 | | | | 04/20/2067 | | | | 6,223,444 | |
| | 20,200,000 | | | MetLife, Inc., Series C(a) | | | 5.250 | | | | 12/29/2049 | | | | 20,705,000 | |
| | 6,725,000 | | | MetLife, Inc., Series D | | | 5.875 | | | | 09/15/2166 | | | | 6,968,781 | |
| | 5,458,000 | | | Principal Financial Group, Inc. | | | 4.700 | | | | 05/15/2055 | | | | 5,512,580 | |
| | 6,600,000 | | | Progressive Corp. (The), Series B | | | 5.375 | | | | 09/15/2166 | | | | 6,576,035 | |
| | 13,436,000 | | | Prudential Financial, Inc. | | | 5.875 | | | | 09/15/2042 | | | | 14,366,551 | |
| | 20,098,000 | | | Prudential Financial, Inc. | | | 5.625 | | | | 06/15/2043 | | | | 21,102,900 | |
| | 6,745,000 | | | Prudential Financial, Inc. | | | 5.200 | | | | 03/15/2044 | | | | 6,820,881 | |
| | 13,561,000 | | | Prudential Financial, Inc. | | | 5.375 | | | | 05/15/2045 | | | | 13,692,020 | |
| | 10,120,000 | | | Prudential Financial, Inc. | | | 4.500 | | | | 09/15/2047 | | | | 9,407,522 | |
| | 4,430,000 | | | Reinsurance Group of America, Inc. (3 mo. USD LIBOR + 2.67%)(b) | | | 5.006 | | | | 12/15/2065 | | | | 4,396,775 | |
| | | | | | | | | | | | | | | | |
| | | | | | | | | | | | | | | 165,442,782 | |
| | | | | | | | | | | | | | | | |
| | | | Media—0.8% | | | | | | | | | |
| | 8,760,000 | | | Viacom, Inc. | | | 5.875 | | | | 02/28/2057 | | | | 8,639,550 | |
| | 8,650,000 | | | Viacom, Inc. | | | 6.250 | | | | 02/28/2057 | | | | 8,531,062 | |
| | | | | | | | | | | | | | | | |
| | | | | | | | | | | | | | | 17,170,612 | |
| | | | | | | | | | | | | | | | |
See accompanying Notes to Financial Statements which are an integral part of the financial statements.
Invesco Variable Rate Preferred ETF (VRP) (continued)
August 31, 2018
| | | | | | | | | | | | | | | | |
Principal
Amount | | | | | Interest
Rate | | | Maturity
Date | | | Value | |
| | | | Corporate Bonds (continued) | | | | | | | | | |
| | | | Miscellaneous Manufacturing—3.5% | | | | | | | | | |
| $ | 76,950,000 | | | General Electric Co., Series D | | | 5.000 | % | | | 06/15/2165 | | | $ | 76,036,219 | |
| | | | | | | | | | | | | | | | |
| | | | Pipelines—8.1% | | | | | | | | | |
| | 8,000,000 | | | Andeavor Logistics LP, Series A | | | 6.875 | | | | 02/15/2166 | | | | 8,080,000 | |
| | 5,175,000 | | | Buckeye Partners LP | | | 6.375 | | | | 01/22/2078 | | | | 4,924,807 | |
| | 6,850,000 | | | DCP Midstream LP, Series A | | | 7.375 | | | | 06/15/2166 | | | | 6,850,000 | |
| | 13,650,000 | | | Enbridge, Inc. (Canada) | | | 5.500 | | | | 07/15/2077 | | | | 12,762,750 | |
| | 11,300,000 | | | Enbridge, Inc. (Canada) | | | 6.250 | | | | 03/01/2078 | | | | 11,045,750 | |
| | 10,300,000 | | | Enbridge, Inc., Series 16-A (Canada) | | | 6.000 | | | | 01/15/2077 | | | | 10,094,000 | |
| | 12,900,000 | | | Energy Transfer Partners LP, Series A | | | 6.250 | | | | 02/15/2167 | | | | 12,477,364 | |
| | 7,100,000 | | | Energy Transfer Partners LP, Series B | | | 6.625 | | | | 02/15/2166 | | | | 6,906,940 | |
| | 5,550,000 | | | EnLink Midstream Partners LP, Series C | | | 6.000 | | | | 12/15/2165 | | | | 5,175,375 | |
| | 9,516,000 | | | Enterprise Products Operating LLC | | | 5.375 | | | | 02/15/2078 | | | | 8,918,157 | |
| | 9,450,000 | | | Enterprise Products Operating LLC, Series D | | | 4.875 | | | | 08/16/2077 | | | | 9,127,235 | |
| | 13,450,000 | | | Enterprise Products Operating LLC, Series E | | | 5.250 | | | | 08/16/2077 | | | | 12,667,768 | |
| | 11,100,000 | | | Plains All American Pipeline LP, Series B | | | 6.125 | | | | 11/15/2166 | | | | 10,933,500 | |
| | 13,510,000 | | | TransCanada PipeLines Ltd. (Canada) (3 mo. USD LIBOR + 2.21%)(b) | | | 4.524 | | | | 05/15/2067 | | | | 12,530,525 | |
| | 10,035,000 | | | TransCanada Trust (Canada) | | | 5.625 | | | | 05/20/2075 | | | | 9,947,194 | |
| | 19,950,000 | | | TransCanada Trust (Canada) | | | 5.300 | | | | 03/15/2077 | | | | 19,028,440 | |
| | 16,192,000 | | | TransCanada Trust, Series 16-A (Canada)(a) | | | 5.875 | | | | 08/15/2076 | | | | 16,556,320 | |
| | | | | | | | | | | | | | | | |
| | | | | | | | | | | | | | | 178,026,125 | |
| | | | | | | | | | | | | | | | |
| | | | Total Corporate Bonds
(Cost $1,627,437,319) | | | | | | | | | | | 1,592,056,522 | |
| | | | | | | | | | | | | | | | |
Number
of Shares | | | | | | | | | | | | |
| | | | Preferred Stocks & Other Equity Interests—26.4%(d) | | | | | | | | | |
| | | | Banks—10.4% | | | | | | | | | |
| | 190,667 | | | Banco Santander SA, 4.00%, Series 6 (Spain)(a) | | | | | | | | | | | 4,514,994 | |
| | 156,896 | | | Bank of America Corp., 3.00%, Series H | | | | | | | | | | | 3,483,091 | |
| | 110,308 | | | Bank of America Corp., 4.00%, Series 4(a) | | | | | | | | | | | 2,738,948 | |
| | 221,351 | | | Bank of America Corp., 4.00%, Series 5 | | | | | | | | | | | 5,334,559 | |
| | 165,893 | | | Bank of America Corp., 4.00%, Series E(a) | | | | | | | | | | | 4,031,200 | |
| | 1,180,643 | | | Citigroup Capital XIII, 8.71% (3 mo. USD LIBOR + 6.37%)(b) | | | | | | | | | | | 32,101,683 | |
| | 784,251 | | | Citigroup, Inc., 6.88%, Series K | | | | | | | | | | | 21,723,753 | |
| | 497,799 | | | Citigroup, Inc., 7.13%, Series J | | | | | | | | | | | 14,087,712 | |
| | 245,875 | | | Fifth Third Bancorp, 6.63%, Series I | | | | | | | | | | | 6,823,031 | |
| | 60,945 | | | FNB Corp., 7.25%(a) | | | | | | | | | | | 1,737,542 | |
| | 272,065 | | | KeyCorp, 6.13%, Series E | | | | | | | | | | | 7,530,759 | |
| | 549,739 | | | Merrill Lynch Capital Trust I, 6.45%, Series K | | | | | | | | | | | 14,320,701 | |
| | 136,679 | | | People’s United Financial, Inc., 5.63%, Series A | | | | | | | | | | | 3,565,955 | |
| | 814,457 | | | PNC Financial Services Group, Inc. (The), 6.13%, Series P(a) | | | | | | | | | | | 22,536,025 | |
| | 272,191 | | | Regions Financial Corp., 6.38%, Series B | | | | | | | | | | | 7,398,151 | |
| | 94,172 | | | SunTrust Banks, Inc., 4.00% | | | | | | | | | | | 2,193,266 | |
| | 108,955 | | | Synovus Financial Corp., 6.30%, Series D | | | | | | | | | | | 2,860,069 | |
| | 544,226 | | | U.S. Bancorp, 3.50%, Series B | | | | | | | | | | | 12,696,793 | |
| | 598,740 | | | U.S. Bancorp, 6.50%, Series F(a) | | | | | | | | | | | 16,752,745 | |
| | 54,669 | | | Valley National Bancorp, 5.50%, Series B | | | | | | | | | | | 1,432,328 | |
| | 62,964 | | | Valley National Bancorp, 6.25%, Series A | | | | | | | | | | | 1,681,139 | |
| | 907,959 | | | Wells Fargo & Co., 5.85%, Series Q | | | | | | | | | | | 23,370,865 | |
| | 441,646 | | | Wells Fargo & Co., 6.63%, Series R | | | | | | | | | | | 12,149,681 | |
| | 68,452 | | | Wintrust Financial Corp., 6.50%, Series D | | | | | | | | | | | 1,857,103 | |
| | 75,782 | | | Zions Bancorp, 6.30%, Series G | | | | | | | | | | | 2,053,692 | |
| | | | | | | | | | | | | | | | |
| | | | | | | | | | | | | | | 228,975,785 | |
| | | | | | | | | | | | | | | | |
| | | | Capital Markets—5.5% | | | | | | | | | |
| | 295,569 | | | Goldman Sachs Group, Inc. (The), 3.75%, Series A(a) | | | | | | | | | | | 6,966,561 | |
| | 79,454 | | | Goldman Sachs Group, Inc. (The), 4.00%, Series C(a) | | | | | | | | | | | 1,954,568 | |
See accompanying Notes to Financial Statements which are an integral part of the financial statements.
Invesco Variable Rate Preferred ETF (VRP) (continued)
August 31, 2018
| | | | | | | | | | | | | | | | |
Number
of Shares | | | | | | | | | | | Value | |
| | | | Preferred Stocks & Other Equity Interests (continued) | | | | | | | | | |
| | | | Capital Markets (continued) | | | | | | | | | |
| | 533,227 | | | Goldman Sachs Group, Inc. (The), 4.00%, Series D(a) | | | | | | | | | | $ | 12,493,509 | |
| | 396,450 | | | Goldman Sachs Group, Inc. (The), 5.50%, Series J | | | | | | | | | | | 10,359,238 | |
| | 276,579 | | | Goldman Sachs Group, Inc. (The), 6.38%, Series K | | | | | | | | | | | 7,531,246 | |
| | 545,857 | | | Morgan Stanley, 4.00%, Series A | | | | | | | | | | | 13,024,148 | |
| | 487,902 | | | Morgan Stanley, 5.85%, Series K | | | | | | | | | | | 12,690,331 | |
| | 494,260 | | | Morgan Stanley, 6.38%, Series I | | | | | | | | | | | 13,443,872 | |
| | 420,027 | | | Morgan Stanley, 6.88%, Series F(a) | | | | | | | | | | | 11,777,557 | |
| | 425,702 | | | Morgan Stanley, 7.13%, Series E(a) | | | | | | | | | | �� | 12,251,704 | |
| | 271,944 | | | State Street Corp., 5.35%, Series G(a) | | | | | | | | | | | 7,111,336 | |
| | 407,834 | | | State Street Corp., 5.90%, Series D | | | | | | | | | | | 11,019,675 | |
| | | | | | | | | | | | | | | | |
| | | | | | | | | | | | | | | 120,623,745 | |
| | | | | | | | | | | | | | | | |
| | | | Commercial Services & Supplies—0.3% | | | | | | | | | |
| | 218,113 | | | NuStar Logistics LP, 9.07% (3 mo. USD LIBOR + 6.73%)(a)(b) | | | | | | | | | | | 5,642,583 | |
| | | | | | | | | | | | | | | | |
| | | | Consumer Finance—1.8% | | | | | | | | | |
| | 1,461,042 | | | GMAC Capital Trust I, 8.10%, Series 2 (3 mo. USD LIBOR + 5.79%)(b) | | | | | | | | | | | 39,155,926 | |
| | | | | | | | | | | | | | | | |
| | | | Diversified Financial Services—0.1% | | | | | | | | | |
| | 54,688 | | | Compass Diversified Holdings, 7.88%, Series B | | | | | | | | | | | 1,279,152 | |
| | | | | | | | | | | | | | | | |
| | | | Electric Utilities—0.6% | | | | | | | | | |
| | 150,326 | | | SCE Trust III, 5.75%, Series H(a) | | | | | | | | | | | 4,009,194 | |
| | 177,684 | | | SCE Trust IV, 5.38%, Series J | | | | | | | | | | | 4,546,934 | |
| | 163,967 | | | SCE Trust V, 5.45%, Series K | | | | | | | | | | | 4,233,628 | |
| | | | | | | | | | | | | | | | |
| | | | | | | | | | | | | | | 12,789,756 | |
| | | | | | | | | | | | | | | | |
| | | | Food Products—0.6% | | | | | | | | | |
| | 268,906 | | | CHS, Inc., 6.75%, Series 3 | | | | | | | | | | | 7,370,713 | |
| | 229,093 | | | CHS, Inc., 7.10%, Series 2(a) | | | | | | | | | | | 6,611,624 | |
| | | | | | | | | | | | | | | | |
| | | | | | | | | | | | | | | 13,982,337 | |
| | | | | | | | | | | | | | | | |
| | | | Insurance—2.2% | | | | | | | | | |
| | 136,078 | | | Aegon NV, 4.00%, Series 1 (Netherlands)(a) | | | | | | | | | | | 3,406,032 | |
| | 272,380 | | | Allstate Corp. (The), 5.10% | | | | | | | | | | | 7,062,813 | |
| | 149,971 | | | Aspen Insurance Holdings Ltd., 5.95% (Bermuda) | | | | | | | | | | | 3,867,752 | |
| | 212,584 | | | Enstar Group Ltd., 7.00%, Series D (Bermuda) | | | | | | | | | | | 5,550,568 | |
| | 323,701 | | | Hartford Financial Services Group, Inc. (The), 7.88% | | | | | | | | | | | 9,199,583 | |
| | 326,703 | | | MetLife, Inc., 4.00%, Series A(a) | | | | | | | | | | | 8,245,984 | |
| | 218,082 | | | Reinsurance Group of America, Inc., 5.75% | | | | | | | | | | | 5,622,154 | |
| | 218,204 | | | Reinsurance Group of America, Inc., 6.20% | | | | | | | | | | | 5,919,875 | |
| | | | | | | | | | | | | | | | |
| | | | | | | | | | | | | | | 48,874,761 | |
| | | | | | | | | | | | | | | | |
| | | | Mortgage REITs—2.0% | | | | | | | | | |
| | 176,866 | | | AGNC Investment Corp., 7.00%, Series C | | | | | | | | | | | 4,644,501 | |
| | 231,822 | | | Annaly Capital Management, Inc., 6.50%, Series G | | | | | | | | | | | 5,663,412 | |
| | 391,486 | | | Annaly Capital Management, Inc., 6.95%, Series F | | | | | | | | | | | 10,041,616 | |
| | 177,319 | | | Chimera Investment Corp., 8.00%, Series B | | | | | | | | | | | 4,613,840 | |
| | 65,672 | | | Exantas Capital Corp., 8.63% | | | | | | | | | | | 1,696,965 | |
| | 73,636 | | | New York Mortgage Trust, Inc., 8.00%, Series D | | | | | | | | | | | 1,787,146 | |
| | 106,177 | | | PennyMac Mortgage Investment Trust, 8.00%, Series B(a) | | | | | | | | | | | 2,657,610 | |
| | 62,679 | | | PennyMac Mortgage Investment Trust, 8.13%, Series A | | | | | | | | | | | 1,575,123 | |
| | 160,954 | | | Two Harbors Investment Corp., 7.25%, Series C | | | | | | | | | | | 4,062,479 | |
| | 156,448 | | | Two Harbors Investment Corp., 7.63%, Series B | | | | | | | | | | | 4,075,470 | |
| | 78,340 | | | Two Harbors Investment Corp., 8.13%, Series A | | | | | | | | | | | 2,148,083 | |
| | | | | | | | | | | | | | | | |
| | | | | | | | | | | | | | | 42,966,245 | |
| | | | | | | | | | | | | | | | |
| | | | Multi-Utilities—0.3% | | | | | | | | | |
| | 220,745 | | | Integrys Holding, Inc., 6.00% | | | | | | | | | | | 5,695,221 | |
| | 54,129 | | | Just Energy Group, Inc., 8.50%, Series A (Canada) | | | | | | | | | | | 1,250,380 | |
| | | | | | | | | | | | | | | | |
| | | | | | | | | | | | | | | 6,945,601 | |
| | | | | | | | | | | | | | | | |
See accompanying Notes to Financial Statements which are an integral part of the financial statements.
Invesco Variable Rate Preferred ETF (VRP) (continued)
August 31, 2018
| | | | | | | | | | | | | | | | |
Number
of Shares | | | | | | | | | | | Value | |
| | | | Preferred Stocks & Other Equity Interests (continued) | | | | | | | | | |
| | | | Oil, Gas & Consumable Fuels—2.2% | | | | | | | | | |
| | 88,261 | | | DCP Midstream LP, 7.88%, Series B | | | | | | | | | | $ | 2,273,603 | |
| | 326,680 | | | Enbridge, Inc., 6.38%, Series B (Canada) | | | | | | | | | | | 8,372,808 | |
| | 246,052 | | | Energy Transfer Partners LP, 7.38%, Series C | | | | | | | | | | | 6,296,471 | |
| | 187,590 | | | Energy Transfer Partners LP, 7.63%, Series D | | | | | | | | | | | 4,924,238 | |
| | 62,836 | | | GasLog Partners LP, 8.20%, Series B (Monaco)(a) | | | | | | | | | | | 1,638,763 | |
| | 79,029 | | | GasLog Partners LP, 8.63%, Series A (Monaco) | | | | | | | | | | | 2,103,752 | |
| | 114,165 | | | NGL Energy Partners LP, 9.00%, Series B | | | | | | | | | | | 2,835,859 | |
| | 212,166 | | | NuStar Energy LP, 7.63%, Series B | | | | | | | | | | | 4,939,224 | |
| | 124,157 | | | NuStar Energy LP, 8.50%, Series A | | | | | | | | | | | 2,979,768 | |
| | 94,314 | | | NuStar Energy LP, 9.00%, Series C | | | | | | | | | | | 2,355,021 | |
| | 68,853 | | | Targa Resources Partners LP, 9.00%, Series A(a) | | | | | | | | | | | 1,870,047 | |
| | 92,812 | | | Teekay LNG Partners LP, 8.50%, Series B (Bermuda) | | | | | | | | | | | 2,284,103 | |
| | 65,437 | | | Teekay Offshore Partners LP, 8.88%, Series E | | | | | | | | | | | 1,611,059 | |
| | 62,831 | | | Tsakos Energy Navigation Ltd., 9.25%, Series E (Greece)(a) | | | | | | | | | | | 1,567,005 | |
| | 82,122 | | | Tsakos Energy Navigation Ltd., 9.50%, Series F (Greece) | | | | | | | | | | | 2,073,581 | |
| | | | | | | | | | | | | | | | |
| | | | | | | | | | | | | | | 48,125,302 | |
| | | | | | | | | | | | | | | | |
| | | | Thrifts & Mortgage Finance—0.4% | | | | | | | | | |
| | 280,226 | | | New York Community Bancorp, Inc., 6.38%, Series A | | | | | | | | | | | 7,815,503 | |
| | | | | | | | | | | | | | | | |
| | | | Total Preferred Stocks & Other Equity Interests
(Cost $587,657,764) | | | | | | | | | | | 577,176,696 | |
| | | | | | | | | | | | | | | | |
| | | | Total Investments in Securities
(excluding investments purchased with cash collateral from securities on loan)
(Cost $2,215,095,083)—99.0% | | | | | | | | | | | 2,169,233,218 | |
| | | | | | | | | | | | | | | | |
| | | | |
| | | | | | | | | | | | | | | | |
| | | | Investments Purchased with Cash Collateral from Securities on Loan | | | | | | | | | |
| | | | |
| | | | | | | | | | | | | | | | |
| | | | Money Market Fund—2.1% | | | | | | | | | |
| | 46,732,075 | | | Invesco Government & Agency Portfolio—Institutional Class, 1.85%(e)(f)
(Cost $46,732,075) | | | | | | | | | | | 46,732,075 | |
| | | | | | | | | | | | | | | | |
| | | | Total Investments in Securities
(Cost $2,261,827,158)—101.1% | | | | | | | | | | | 2,215,965,293 | |
| | | | Other assets less liabilities—(1.1)% | | | | | | | | | | | (23,850,962 | ) |
| | | | | | | | | | | | | | | | |
| | | | Net Assets—100.0% | | | | | | | | | | $ | 2,192,114,331 | |
| | | | | | | | | | | | | | | | |
Investment Abbreviations:
LIBOR—London Interbank Offered Rate
USD—U.S. Dollar
Notes to Schedule of Investments:
| (a) | All or a portion of this security was out on loan at August 31, 2018. |
| (b) | Variable rate coupon. Stated interest rate was in effect at August 31, 2018. |
| (c) | Security purchased or received in a transaction exempt from registration under the Securities Act of 1933, as amended (the “1933 Act”). The security may be resold pursuant to an exemption from registration under the 1933 Act, typically to qualified institutional buyers. The value of this security at August 31, 2018 represented less than 1% of the Fund’s Net Assets. |
| (d) | Industry and/or sector classifications used in this report are generally according to the Global Industry Classification Standard, which was developed by and is the exclusive property and a service mark of MSCI Inc. and Standard & Poor’s. |
| (e) | The security and the Fund are advised by wholly-owned subsidiaries of Invesco Ltd. and are therefore considered to be affiliated. The rate shown is the 7-day SEC standardized yield as of August 31, 2018. |
| (f) | The security has been segregated to satisfy the commitment to return the cash collateral received in securities lending transactions upon the borrower’s return of the securities loaned. See Note 2J. |
See accompanying Notes to Financial Statements which are an integral part of the financial statements.
Schedule of Investments
Invesco VRDO Tax-Free Weekly ETF (PVI)
August 31, 2018
| | | | | | | | | | | | | | | | |
Principal
Amount | | | | | Interest
Rate | | | Maturity
Date | | | Value | |
| | | | Municipal Bonds—97.5%(a) | | | | | | | | | |
| | | | Ad Valorem Property Tax—3.7% | | | | | | | | | |
| $ | 2,300,000 | | | Washington Maryland Suburban Sanitary District Ser. 15A | | | 1.520 | % | | | 06/01/2023 | | | $ | 2,300,000 | |
| | | | | | | | | | | | | | | | |
| | | | College & University Revenue—7.1% | | | | | | | | | |
| | 2,500,000 | | | Michigan State University (General Remarketed 2/25/15) Rev. Ser. 00A | | | 1.510 | | | | 08/15/2030 | | | | 2,500,000 | |
| | 1,900,000 | | | Washington State Higher Education Facilities Auth. (Whitman College Project) Ref. Ser. 04 | | | 1.550 | | | | 10/01/2029 | | | | 1,900,000 | |
| | | | | | | | | | | | | | | | |
| | | | | | | | | | | | | | | 4,400,000 | |
| | | | | | | | | | | | | | | | |
| | | | Electric Power Revenue—6.4% | | | | | | | | | |
| | 2,200,000 | | | Santa Clara California Electric Rev. Sub.-Ser. 08B (LOC-Bank Tokyo-Mitsubishi UFJ)(b) | | | 1.340 | | | | 07/01/2027 | | | | 2,200,000 | |
| | 1,780,000 | | | Sevier County Tennessee Public Building Auth. (Local Government Improvement Program) Ser. 10V-D-1 (LOC-Bank of America N.A.)(b) | | | 1.590 | | | | 06/01/2026 | | | | 1,780,000 | |
| | | | | | | | | | | | | | | | |
| | | | | | | | | | | | | | | 3,980,000 | |
| | | | | | | | | | | | | | | | |
| | | | Health, Hospital, Nursing Home Revenue—28.9% | | | | | | | | | |
| | 180,000 | | | Arizona State Health Facilities Auth. (Banner Health) Ser. 08F (LOC-JPMorgan Chase Bank N.A.)(b) | | | 1.580 | | | | 01/01/2029 | | | | 180,000 | |
| | 2,500,000 | | | Arizona State Health Facilities Auth. (Dignity Health) Ser. 05B (LOC-JPMorgan Chase Bank N.A.)(b) | | | 1.550 | | | | 07/01/2035 | | | | 2,500,000 | |
| | 2,500,000 | | | California State Statewide Community Development Auth. (Kaiser Permanente) Ser. 04M | | | 1.510 | | | | 04/01/2038 | | | | 2,500,000 | |
| | 2,200,000 | | | Cleveland-Cuyahoga County Ohio Port Auth. (Carnegie/89th Garage Project) Ser. 07 (LOC-JPMorgan Chase Bank N.A.)(b) | | | 1.510 | | | | 01/01/2037 | | | | 2,200,000 | |
| | 2,500,000 | | | Connecticut State Health & Educational Facilities Auth. (Yale New Heaven Hospital) Rev. Ser. 13O (LOC-Wells Fargo Bank N.A.)(b) | | | 1.510 | | | | 07/01/2053 | | | | 2,500,000 | |
| | 300,000 | | | Louisiana State Public Facilities Auth. (Christus Health) Rev. Ref. Ser. 09B2 (LOC-Bank of New York Mellon (The))(b) | | | 1.550 | | | | 07/01/2047 | | | | 300,000 | |
| | 2,700,000 | | | Maryland State Health & Higher Educational Facilities Auth. (University of Maryland Medical Systems) Rev. Ser. 07A (LOC-Wells Fargo Bank N.A.)(b) | | | 1.550 | | | | 07/01/2034 | | | | 2,700,000 | |
| | 2,500,000 | | | Massachusetts State Health & Educational Facilities Auth. (Partners Healthcare P-1—Remarketed 05/14/09) Rev. Ser. 97 | | | 1.500 | | | | 07/01/2027 | | | | 2,500,000 | |
| | 2,500,000 | | | Missouri State Health & Educational Facilities Auth. (BJC Health System) Ser. 08C | | | 1.530 | | | | 05/15/2038 | | | | 2,500,000 | |
| | 135,000 | | | University of North Carolina at Chapel Hill Rev. Ref. Ser. 03B | | | 1.520 | | | | 02/01/2029 | | | | 135,000 | |
| | | | | | | | | | | | | | | | |
| | | | | | | | | | | | | | | 18,015,000 | |
| | | | | | | | | | | | | | | | |
| | | | Highway Tolls Revenue—3.7% | | | | | | | | | |
| | 2,325,000 | | | Bay Area California Auth. Toll Bridge Rev. Ser. 07 (LOC-Sumitomo Mitsui Banking)(b) | | | 1.300 | | | | 04/01/2047 | | | | 2,325,000 | |
| | | | | | | | | | | | | | | | |
| | | | Hotel Occupancy Tax—0.5% | | | | | | | | | |
| | 300,000 | | | Kansas City Missouri Special Obligation (H. Roe Bartle) Ref. Ser. 08F (LOC-Sumitomo Mitsui Banking)(b) | | | 1.580 | | | | 04/15/2025 | | | | 300,000 | |
| | | | | | | | | | | | | | | | |
| | | | Lease Revenue—2.4% | | | | | | | | | |
| | 1,500,000 | | | Michigan State Building Auth. Variable (Facilities Program Remarketed 12/18/14) Rev. Ref. Ser. 07I (LOC-Citibank N.A.)(b) | | | 1.550 | | | | 10/15/2042 | | | | 1,500,000 | |
| | | | | | | | | | | | | | | | |
| | | | Local or GTD Housing—7.3% | | | | | | | | | |
| | 2,500,000 | | | Indianapolis Indiana Multifamily Housing (Capital Place-Convington) Rev. Ser. 08 (LOC-Fannie Mae)(b) | | | 1.540 | | | | 05/15/2038 | | | | 2,500,000 | |
| | 600,000 | | | Nebraska State Investment Finance Auth. Single Family Housing Rev. Ser. 10B GNMA | | | 1.530 | | | | 09/01/2038 | | | | 600,000 | |
| | 1,450,000 | | | New York State Housing Finance Agency (222 E 44th Street Housing) Rev. Ser. 15A (LOC-Bank of China Ltd.)(b) | | | 1.620 | | | | 05/01/2050 | | | | 1,450,000 | |
| | | | | | | | | | | | | | | | |
| | | | | | | | | | | | | | | 4,550,000 | |
| | | | | | | | | | | | | | | | |
| | | | Miscellaneous Revenue—5.3% | | | | | | | | | |
| | 1,495,000 | | | Clarksville Tennessee Public Building Auth. (Pooled Financing Tennessee Municipal Bond Fund) Rev. Ser. 99 (LOC-Bank of America N.A.)(b) | | | 1.570 | | | | 06/01/2029 | | | | 1,495,000 | |
| | 200,000 | | | New York State Housing Finance Agency Service Contract (Remarketed 10/08/08) Rev. Ref. Ser. 03L (LOC-Bank of America N.A.)(b) | | | 1.550 | | | | 09/15/2021 | | | | 200,000 | |
| | 1,600,000 | | | New York State Urban Development Corp. (CVS Contract) Rev. Ref. Ser. 08A-1 (LOC-Wells Fargo Bank N.A.)(b) | | | 1.530 | | | | 01/01/2030 | | | | 1,600,000 | |
| | | | | | | | | | | | | | | | |
| | | | | | | | | | | | | | | 3,295,000 | |
| | | | | | | | | | | | | | | | |
| | | | Multiple Utility Revenue—3.8% | | | | | | | | | |
| | 2,400,000 | | | Colorado Springs Colorado Utilities Improvement (Sub.-Lien) Rev. Ser. 06B | | | 1.580 | | | | 11/01/2036 | | | | 2,400,000 | |
| | | | | | | | | | | | | | | | |
See accompanying Notes to Financial Statements which are an integral part of the financial statements.
Invesco VRDO Tax-Free Weekly ETF (PVI) (continued)
August 31, 2018
| | | | | | | | | | | | | | | | |
Principal
Amount | | | | | Interest
Rate | | | Maturity
Date | | | Value | |
| | | | Municipal Bonds (continued) | | | | | | | | | |
| | | | Port, Airport & Marina Revenue—7.2% | | | | | | | | | |
| $ | 2,500,000 | | | Clark County Nevada Appropriation (Sub.-Lien) Rev. Ser. 08D-3 (LOC-Bank of America
N.A.)(b) | | | 1.570 | % | | | 07/01/2029 | | | $ | 2,500,000 | |
| | 2,000,000 | | | Louisiana State Offshore Terminal Auth. Deepwater Port (Loop LLC Project) Rev. Ref. Ser. 13B (LOC-JPMorgan Chase Bank N.A.)(b) | | | 1.550 | | | | 09/01/2033 | | | | 2,000,000 | |
| | | | | | | | | | | | | | | | |
| | | | | | | | | | | | | | | 4,500,000 | |
| | | | | | | | | | | | | | | | |
| | | | Sales Tax Revenue—7.4% | | | | | | | | | |
| | 2,630,000 | | | Florida State Department of Environmental Protection Preservation (Everglades Restoration) Rev. Ser. 07A AGC | | | 1.580 | | | | 07/01/2027 | | | | 2,630,000 | |
| | 2,000,000 | | | Nassau County Interim Finance Auth. (Sales Tax Secured) Ser. 08B | | | 1.570 | | | | 11/15/2021 | | | | 2,000,000 | |
| | | | | | | | | | | | | | | | |
| | | | | | | | | | | | | | | 4,630,000 | |
| | | | | | | | | | | | | | | | |
| | | | Water Revenue—13.8% | | | | | | | | | |
| | 100,000 | | | Charlotte North Carolina Water & Sewer System Rev. Ser. 06B | | | 1.490 | | | | 07/01/2036 | | | | 100,000 | |
| | 2,500,000 | | | Florida Keys Aqueduct Auth. Water Rev. Ref. Ser. 08 (LOC-TD Bank N.A.)(b) | | | 1.560 | | | | 09/01/2035 | | | | 2,500,000 | |
| | 2,500,000 | | | JEA Florida Water & Sewer System Rev. Ser. 08B | | | 1.550 | | | | 10/01/2041 | | | | 2,500,000 | |
| | 2,000,000 | | | Los Angeles California Department of Water & Power Waterworks (Remarketed 07/25/16) Rev. Sub.-Ser. 01B-4 | | | 1.270 | | | | 07/01/2035 | | | | 2,000,000 | |
| | 1,500,000 | | | West Palm Beach Florida Utility System Rev. Ser. 08C AGC | | | 1.580 | | | | 10/01/2038 | | | | 1,500,000 | |
| | | | | | | | | | | | | | | | |
| | | | | | | | | | | | | | | 8,600,000 | |
| | | | | | | | | | | | | | | | |
| | | | Total Investments in Securities
(Cost $60,795,000)(c)—97.5% | | | | | | | | | | | 60,795,000 | |
| | | | Other assets less liabilities—2.5% | | | | | | | | | | | 1,531,943 | |
| | | | | | | | | | | | | | | | |
| | | | Net Assets—100.0% | | | | | | | | | | $ | 62,326,943 | |
| | | | | | | | | | | | | | | | |
Investment Abbreviations:
AGC—Assured Guaranty Corp.
Auth.—Authority
GNMA—Government National Mortgage Association
GTD—Grant To Date
LOC—Letter of Credit
Ref.—Refunding
Rev.—Revenue
Ser.—Series
Sub.—Subordinated
Notes to Schedule of Investments:
| (a) | Demand security payable upon demand by the Fund at specified time intervals no greater than thirteen months. Interest rate is redetermined periodically by the issuer or agent based on current market conditions. Rate shown is the rate in effect on August 31, 2018. |
| (b) | Principal and interest payments are fully enhanced by a letter of credit from the bank listed or a predecessor bank, branch or subsidiary. |
| (c) | The following table provides a listing of those entities that have either guaranteed, backed or otherwise enhanced the credit quality of more than 5% of the value of securities held in the portfolio, as of August 31, 2018. In instances where the entity has guaranteed, backed or otherwise enhanced the credit quality of a security, it is not primarily responsible for the borrower’s obligations but may be called upon to satisfy the borrower’s obligations. |
| | | | |
Entities | | Percentage of
Total Investments | |
| JPMorgan Chase Bank N.A. | | | 11.3 | % |
| Wells Fargo Bank N.A. | | | 11.2 | |
| Bank of America N.A. | | | 9.8 | |
| Assured Guaranty Corp. | | | 6.8 | |
See accompanying Notes to Financial Statements which are an integral part of the financial statements.
(This Page Intentionally Left Blank)
Statements of Assets and Liabilities
August 31, 2018
| | | | | | | | | | | | | | | | | | | | |
| | | Invesco
1-30 Laddered
Treasury
ETF (PLW) | | | Invesco
California
AMT-Free
Municipal Bond
ETF (PWZ) | | | Invesco
CEF Income
Composite
ETF (PCEF) | | | Invesco
Fundamental
High Yield®
Corporate Bond
ETF (PHB) | | | Invesco
Fundamental
Investment Grade
Corporate Bond
ETF (PFIG) | |
| Assets: | | | | | | | | | | | | | | | | | | | | |
Unaffiliated investments in securities, at value(a) | | $ | 153,164,282 | | | $ | 246,497,548 | | | $ | 709,561,476 | | | $ | 935,318,862 | | | $ | 105,613,183 | |
Affiliated investments in securities, at value | | | 97,162 | | | | — | | | | 15,069,299 | | | | 55,638,500 | | | | 37,252 | |
Cash | | | — | | | | 1,652,707 | | | | — | | | | 117,158 | | | | — | |
Cash segregated as collateral | | | — | | | | — | | | | — | | | | — | | | | — | |
Receivables: | | | | | | | | | | | | | | | | | | | | |
Dividends and interest | | | 405,494 | | | | 2,705,219 | | | | 938,757 | | | | 14,214,107 | | | | 1,018,360 | |
Investments sold | | | — | | | | — | | | | — | | | | 5,535,608 | | | | 1,888,682 | |
Foreign tax reclaims | | | — | | | | — | | | | — | | | | — | | | | 96 | |
Securities lending | | | — | | | | — | | | | 13,928 | | | | 55,016 | | | | — | |
Shares sold | | | — | | | | — | | | | — | | | | — | | | | — | |
Other assets | | | — | | | | — | | | | — | | | | 1,499 | | | | — | |
| | | | | | | | | | | | | | | | | | | | |
Total Assets | | | 153,666,938 | | | | 250,855,474 | | | | 725,583,460 | | | | 1,010,880,750 | | | | 108,557,573 | |
| | | | | | | | | | | | | | | | | | | | |
| | | | | |
| Liabilities: | | | | | | | | | | | | | | | | | | | | |
Due to custodian | | | — | | | | — | | | | — | | | | — | | | | — | |
Payables: | | | | | | | | | | | | | | | | | | | | |
Shares repurchased | | | — | | | | — | | | | — | | | | 7,428,223 | | | | — | |
Collateral upon receipt of securities in-kind | | | — | | | | — | | | | — | | | | — | | | | — | |
Investments purchased | | | — | | | | — | | | | — | | | | 1,033,452 | | | | 1,917,661 | |
Collateral upon return of securities loaned | | | — | | | | — | | | | 2,101,525 | | | | 53,481,918 | | | | — | |
Accrued unitary management fees | | | 32,450 | | | | 59,611 | | | | 305,215 | | | | 407,311 | | | | 19,787 | |
| | | | | | | | | | | | | | | | | | | | |
Total Liabilities | | | 32,450 | | | | 59,611 | | | | 2,406,740 | | | | 62,350,904 | | | | 1,937,448 | |
| | | | | | | | | | | | | | | | | | | | |
| Net Assets | | $ | 153,634,488 | | | $ | 250,795,863 | | | $ | 723,176,720 | | | $ | 948,529,846 | | | $ | 106,620,125 | |
| | | | | | | | | | | | | | | | | | | | |
| | | | | |
| Net Assets Consist of: | | | | | | | | | | | | | | | | | | | | |
Shares of beneficial interest | | $ | 162,161,487 | | | $ | 250,951,268 | | | $ | 740,506,262 | | | $ | 991,451,899 | | | $ | 108,951,433 | |
Undistributed net investment income | | | — | | | | — | | | | — | | | | 108,311 | | | | — | |
Undistributed net realized gain (loss) | | | (518,352 | ) | | | (966,903 | ) | | | (30,334,989 | ) | | | (27,108,160 | ) | | | (451,540 | ) |
Net unrealized appreciation (depreciation) | | | (8,008,647 | ) | | | 811,498 | | | | 13,005,447 | | | | (15,922,204 | ) | | | (1,879,768 | ) |
| | | | | | | | | | | | | | | | | | | | |
| Net Assets | | $ | 153,634,488 | | | $ | 250,795,863 | | | $ | 723,176,720 | | | $ | 948,529,846 | | | $ | 106,620,125 | |
| | | | | | | | | | | | | | | | | | | | |
Shares outstanding (unlimited amount authorized, $0.01 par value) | | | 4,850,000 | | | | 9,700,000 | | | | 31,450,000 | | | | 51,100,000 | | | | 4,300,000 | |
Net asset value | | $ | 31.68 | | | $ | 25.86 | | | $ | 22.99 | | | $ | 18.56 | | | $ | 24.80 | |
| | | | | | | | | | | | | | | | | | | | |
Market price | | $ | 31.64 | | | $ | 25.83 | | | $ | 23.01 | | | $ | 18.55 | | | $ | 24.80 | |
| | | | | | | | | | | | | | | | | | | | |
Unaffiliated investments in securities, at cost | | $ | 161,172,929 | | | $ | 245,686,050 | | | $ | 696,233,836 | | | $ | 951,241,066 | | | $ | 107,492,951 | |
| | | | | | | | | | | | | | | | | | | | |
Affiliated investments in securities, at cost | | $ | 97,162 | | | $ | — | | | $ | 15,391,492 | | | $ | 55,638,500 | | | $ | 37,252 | |
| | | | | | | | | | | | | | | | | | | | |
(a) Includes securities on loan with an aggregate value of: | | $ | — | | | $ | — | | | $ | 1,982,656 | | | $ | 51,366,518 | | | $ | — | |
| | | | | | | | | | | | | | | | | | | | |
See accompanying Notes to Financial Statements which are an integral part of the financial statements.
| | | | | | | | | | | | | | | | | | | | | | | | | | | | | | |
Invesco
LadderRite
0-5 Year
Corporate Bond
ETF (LDRI) | | | Invesco
National
AMT-Free
Municipal Bond
ETF (PZA) | | | Invesco
New York
AMT-Free
Municipal Bond
ETF (PZT) | | | Invesco
Preferred ETF
(PGX) | | | Invesco
Taxable
Municipal Bond
ETF (BAB) | | | Invesco
Treasury
Collateral
ETF (CLTL) | | | Invesco
Variable Rate
Preferred
ETF (VRP) | | | Invesco
VRDO
Tax-Free
Weekly
ETF (PVI) | |
| | | | | | | | | | | | | | | | | | | | | | | | | | | | | | |
| $ | 12,200,763 | | | $ | 1,630,187,244 | | | $ | 62,677,877 | | | $ | 5,372,026,980 | | | $ | 924,270,242 | | | $ | 467,571,776 | | | $ | 2,169,233,218 | | | $ | 60,795,000 | |
| | 100,817 | | | | — | | | | — | | | | 84,114,534 | | | | 1,761,575 | | | | — | | | | 46,732,075 | | | | — | |
| | — | | | | 11,653,226 | | | | 176,907 | | | | — | | | | — | | | | — | | | | — | | | | 1,462,876 | |
| | — | | | | — | | | | — | | | | 6,639 | | | | — | | | | 1,023,067 | | | | 7,915,894 | | | | — | |
| | | | | | | | | | | | | | | | | | | | | | | | | | | | | | |
| | 108,743 | | | | 18,534,845 | | | | 737,160 | | | | 35,156,848 | | | | 13,061,695 | | | | 592,653 | | | | 23,907,485 | | | | 82,298 | |
| | 203,951 | | | | — | | | | — | | | | 1,604,140 | | | | — | | | | 81,530,160 | | | | 12,869,134 | | | | — | |
| | 370 | | | | — | | | | — | | | | — | | | | — | | | | — | | | | — | | | | — | |
| | — | | | | — | | | | — | | | | 453,563 | | | | — | | | | — | | | | 76,721 | | | | — | |
| | — | | | | — | | | | — | | | | 58,712 | | | | — | | | | 937,289 | | | | — | | | | — | |
| | — | | | | — | | | | — | | | | — | | | | — | | | | — | | | | 1,500 | | | | — | |
| | | | | | | | | | | | | | | | | | | | | | | | | | | | | | |
| | 12,614,644 | | | | 1,660,375,315 | | | | 63,591,944 | | | | 5,493,421,416 | | | | 939,093,512 | | | | 551,654,945 | | | | 2,260,736,027 | | | | 62,340,174 | |
| | | | | | | | | | | | | | | | | | | | | | | | | | | | | | |
| | | | | | | |
| | | | | | | | | | | | | | | | | | | | | | | | | | | | | | |
| | — | | | | — | | | | — | | | | 27,557,970 | | | | — | | | | 4,070,929 | | | | 313,148 | | | | — | |
| | | | | | | | | | | | | | | | | | | | | | | | | | | | | | |
| | — | | | | — | | | | — | | | | 1,460,410 | | | | — | | | | — | | | | 12,568,227 | | | | — | |
| | — | | | | — | | | | — | | | | 6,639 | | | | — | | | | 1,023,068 | | | | 7,915,894 | | | | — | |
| | 297,135 | | | | — | | | | — | | | | — | | | | — | | | | 78,206,432 | | | | 150,863 | | | | — | |
| | — | | | | — | | | | — | | | | 84,114,534 | | | | — | | | | — | | | | 46,732,075 | | | | — | |
| | 2,286 | | | | 394,792 | | | | 15,308 | | | | 2,270,955 | | | | 222,514 | | | | 31,878 | | | | 941,489 | | | | 13,231 | |
| | | | | | | | | | | | | | | | | | | | | | | | | | | | | | |
| | 299,421 | | | | 394,792 | | | | 15,308 | | | | 115,410,508 | | | | 222,514 | | | | 83,332,307 | | | | 68,621,696 | | | | 13,231 | |
| | | | | | | | | | | | | | | | | | | | | | | | | | | | | | |
| $ | 12,315,223 | | | $ | 1,659,980,523 | | | $ | 63,576,636 | | | $ | 5,378,010,908 | | | $ | 938,870,998 | | | $ | 468,322,638 | | | $ | 2,192,114,331 | | | $ | 62,326,943 | |
| | | | | | | | | | | | | | | | | | | | | | | | | | | | | | |
| | | | | | | |
| | | | | | | | | | | | | | | | | | | | | | | | | | | | | | |
| $ | 12,484,488 | | | $ | 1,634,527,295 | | | $ | 63,471,196 | | | $ | 5,469,550,703 | | | $ | 902,484,807 | | | $ | 468,082,746 | | | $ | 2,234,762,542 | | | $ | 62,326,565 | |
| | 5,337 | | | | — | | | | — | | | | 9,737,537 | | | | — | | | | 396,869 | | | | 7,752,813 | | | | 38 | |
| | (29,923 | ) | | | (1,147,821 | ) | | | (16,604 | ) | | | (86,882,833 | ) | | | (5,438,102 | ) | | | (84,157 | ) | | | (4,539,159 | ) | | | 340 | |
| | (144,679 | ) | | | 26,601,049 | | | | 122,044 | | | | (14,394,499 | ) | | | 41,824,293 | | | | (72,820 | ) | | | (45,861,865 | ) | | | — | |
| | | | | | | | | | | | | | | | | | | | | | | | | | | | | | |
| $ | 12,315,223 | | | $ | 1,659,980,523 | | | $ | 63,576,636 | | | $ | 5,378,010,908 | | | $ | 938,870,998 | | | $ | 468,322,638 | | | $ | 2,192,114,331 | | | $ | 62,326,943 | |
| | | | | | | | | | | | | | | | | | | | | | | | | | | | | | |
|
500,000 |
| | | 66,100,000 | | | | 2,650,000 | | | | 368,250,000 | | | | 31,650,000 | | | | 4,440,001 | | | | 87,200,000 | | | | 2,500,000 | |
| $ | 24.63 | | | $ | 25.11 | | | $ | 23.99 | | | $ | 14.60 | | | $ | 29.66 | | | $ | 105.48 | | | $ | 25.14 | | | $ | 24.93 | |
| | | | | | | | | | | | | | | | | | | | | | | | | | | | | | |
| $ | 24.63 | | | $ | 25.12 | | | $ | 23.92 | | | $ | 14.62 | | | $ | 29.51 | | | $ | 105.54 | | | $ | 25.11 | | | $ | 24.93 | |
| | | | | | | | | | | | | | | | | | | | | | | | | | | | | | |
| $ | 12,345,442 | | | $ | 1,603,586,195 | | | $ | 62,555,833 | | | $ | 5,386,421,479 | | | $ | 882,445,949 | | | $ | 467,644,596 | | | $ | 2,215,095,083 | | | $ | 60,795,000 | |
| | | | | | | | | | | | | | | | | | | | | | | | | | | | | | |
| $ | 100,817 | | | $ | — | | | $ | — | | | $ | 84,114,534 | | | $ | 1,761,575 | | | $ | — | | | $ | 46,732,075 | | | $ | — | |
| | | | | | | | | | | | | | | | | | | | | | | | | | | | | | |
| $ | — | | | $ | — | | | $ | — | | | $ | 80,756,583 | | | $ | — | | | $ | — | | | $ | 45,347,897 | | | $ | — | |
| | | | | | | | | | | | | | | | | | | | | | | | | | | | | | |
Statements of Operations
For the period November 1, 2017 through August 31, 2018 and year ended October 31, 2017
| | | | | | | | | | | | | | | | |
| | | Invesco 1-30 Laddered Treasury
ETF (PLW) | | | Invesco California AMT-Free Municipal
Bond ETF (PWZ) | |
| | | Ten Months Ended
August 31, 2018 | | | Year Ended
October 31, 2017 | | | Ten Months Ended
August 31, 2018 | | | Year Ended
October 31, 2017 | |
| Investment Income: | | | | | | | | | | | | | | | | |
Unaffiliated interest income | | $ | 3,500,138 | | | $ | 4,298,959 | | | $ | 5,734,999 | | | $ | 5,319,861 | |
Unaffiliated dividend income | | | — | | | | — | | | | — | | | | — | |
Affiliated dividend income | | | 2,898 | | | | 1,852 | | | | — | | | | — | |
Securities lending income | | | — | | | | — | | | | — | | | | — | |
| | | | | | | | | | | | | | | | |
Total Income | | | 3,503,036 | | | | 4,300,811 | | | | 5,734,999 | | | | 5,319,861 | |
| | | | | | | | | | | | | | | | |
| | | | |
| Expenses: | | | | | | | | | | | | | | | | |
Unitary management fees | | | 368,208 | | | | 473,283 | | | | 580,531 | | | | 531,954 | |
Tax expenses | | | — | | | | — | | | | — | | | | — | |
| | | | | | | | | | | | | | | | |
Total Expenses | | | 368,208 | | | | 473,283 | | | | 580,531 | | | | 531,954 | |
| | | | | | | | | | | | | | | | |
Less: Waivers | | | (530 | ) | | | (550 | ) | | | — | | | | — | |
| | | | | | | | | | | | | | | | |
Net Expenses | | | 367,678 | | | | 472,733 | | | | 580,531 | | | | 531,954 | |
| | | | | | | | | | | | | | | | |
Net Investment Income | | | 3,135,358 | | | | 3,828,078 | | | | 5,154,468 | | | | 4,787,907 | |
| | | | | | | | | | | | | | | | |
| | | | |
| Realized and Unrealized Gain (Loss): | | | | | | | | | | | | | | | | |
Net realized gain (loss) from: | | | | | | | | | | | | | | | | |
Unaffiliated investment securities | | | (274,593 | ) | | | (229,915 | ) | | | 199,203 | | | | 516,728 | |
Affiliated investment securities | | | — | | | | — | | | | — | | | | — | |
Unaffiliated in-kind redemptions | | | (1,626,468 | ) | | | (631,103 | ) | | | — | | | | — | |
Affiliated in-kind redemptions | | | — | | | | — | | | | — | | | | — | |
Distributions of underlying fund shares | | | — | | | | — | | | | — | | | | — | |
| | | | | | | | | | | | | | | | |
Net realized gain (loss) | | | (1,901,061 | ) | | | (861,018 | ) | | | 199,203 | | | | 516,728 | |
| | | | | | | | | | | | | | | | |
Change in net unrealized appreciation (depreciation) on: | | | | | | | | | | | | | | | | |
Unaffiliated investment securities | | | (3,808,896 | ) | | | (7,860,127 | ) | | | (2,516,166 | ) | | | (1,373,457 | ) |
Affiliated investment securities | | | — | | | | — | | | | — | | | | — | |
| | | | | | | | | | | | | | | | |
Net change in unrealized appreciation (depreciation) | | | (3,808,896 | ) | | | (7,860,127 | ) | | | (2,516,166 | ) | | | (1,373,457 | ) |
| | | | | | | | | | | | | | | | |
Net realized and unrealized gain (loss) | | | (5,709,957 | ) | | | (8,721,145 | ) | | | (2,316,963 | ) | | | (856,729 | ) |
| | | | | | | | | | | | | | | | |
Net increase (decrease) in net assets resulting from operations | | $ | (2,574,599 | ) | | $ | (4,893,067 | ) | | $ | 2,837,505 | | | $ | 3,931,178 | |
| | | | | | | | | | | | | | | | |
See accompanying Notes to Financial Statements which are an integral part of the financial statements.
| | | | | | | | | | | | | | | | | | | | | | | | | | | | | | |
Invesco CEF Income Composite
ETF (PCEF) | | | Invesco Fundamental High Yield®
Corporate Bond ETF (PHB) | | | Invesco Fundamental Investment
Grade Corporate Bond ETF (PFIG) | | | Invesco LadderRite 0-5 Year
Corporate Bond ETF (LDRI) | |
Ten Months Ended
August 31,��2018 | | | Year Ended
October 31, 2017 | | | Ten Months Ended
August 31, 2018 | | | Year Ended
October 31, 2017 | | | Ten Months Ended
August 31, 2018 | | | Year Ended
October 31, 2017 | | | Ten Months Ended
August 31, 2018 | | | Year Ended
October 31, 2017 | |
| | | | | | | | | | | | | | | | | | | | | | | | | | | | | | |
| $ | — | | | $ | — | | | $ | 39,921,468 | | | $ | 54,993,626 | | | $ | 2,318,599 | | | $ | 1,363,919 | | | $ | 381,138 | | | $ | 491,153 | |
| | 40,826,831 | | | | 35,481,076 | | | | — | | | | — | | | | — | | | | — | | | | — | | | | — | |
| | 512,933 | | | | 538,022 | | | | 44,969 | | | | 39,173 | | | | 3,613 | | | | 1,023 | | | | 2,230 | | | | 2,304 | |
| | 276,448 | | | | — | | | | 684,691 | | | | 6,044 | | | | — | | | | — | | | | — | | | | — | |
| | | | | | | | | | | | | | | | | | | | | | | | | | | | | | |
| | 41,616,212 | | | | 36,019,098 | | | | 40,651,128 | | | | 55,038,843 | | | | 2,322,212 | | | | 1,364,942 | | | | 383,368 | | | | 493,457 | |
| | | | | | | | | | | | | | | | | | | | | | | | | | | | | | |
| | | | | | | |
| | | | | | | | | | | | | | | | | | | | | | | | | | | | | | |
| | 2,958,459 | | | | 3,367,222 | | | | 4,398,919 | | | | 5,816,367 | | | | 170,693 | | | | 109,132 | | | | 36,368 | | | | 54,022 | |
| | — | | | | — | | | | — | | | | 2,355 | | | | — | | | | — | | | | — | | | | — | |
| | | | | | | | | | | | | | | | | | | | | | | | | | | | | | |
| | 2,958,459 | | | | 3,367,222 | | | | 4,398,919 | | | | 5,818,722 | | | | 170,693 | | | | 109,132 | | | | 36,368 | | | | 54,022 | |
| | | | | | | | | | | | | | | | | | | | | | | | | | | | | | |
| | (940 | ) | | | (1,971 | ) | | | (5,623 | ) | | | (10,599 | ) | | | (490 | ) | | | (343 | ) | | | (301 | ) | | | (676 | ) |
| | | | | | | | | | | | | | | | | | | | | | | | | | | | | | |
| | 2,957,519 | | | | 3,365,251 | | | | 4,393,296 | | | | 5,808,123 | | | | 170,203 | | | | 108,789 | | | | 36,067 | | | | 53,346 | |
| | | | | | | | | | | | | | | | | | | | | | | | | | | | | | |
| | 38,658,693 | | | | 32,653,847 | | | | 36,257,832 | | | | 49,230,720 | | | | 2,152,009 | | | | 1,256,153 | | | | 347,301 | | | | 440,111 | |
| | | | | | | | | | | | | | | | | | | | | | | | | | | | | | |
| | | | | | | |
| | | | | | | | | | | | | | | | | | | | | | | | | | | | | | |
| | | | | | | | | | | | | | | | | | | | | | | | | | | | | | |
| | (1,855,765 | ) | | | (4,066,541 | ) | | | (4,591,256 | ) | | | (314,105 | ) | | | (452,563 | ) | | | 54,123 | | | | (29,838 | ) | | | 25,584 | |
| | (38,399 | ) | | | (345,367 | ) | | | — | | | | — | | | | — | | | | — | | | | — | | | | — | |
| | 10,863,727 | | | | 11,188,421 | | | | 4,456,121 | | | | 33,878,647 | | | | (273,983 | ) | | | 39,556 | | | | (210,115 | ) | | | 26,106 | |
| | 37,553 | | | | 71,431 | | | | — | | | | — | | | | — | | | | — | | | | — | | | | — | |
| | 483,270 | | | | 329,149 | | | | — | | | | — | | | | — | | | | — | | | | — | | | | — | |
| | | | | | | | | | | | | | | | | | | | | | | | | | | | | | |
| | 9,490,386 | | | | 7,177,093 | | | | (135,135 | ) | | | 33,564,542 | | | | (726,546 | ) | | | 93,679 | | | | (239,953 | ) | | | 51,690 | |
| | | | | | | | | | | | | | | | | | | | | | | | | | | | | | |
| | | | | | | | | | | | | | | | | | | | | | | | | | | | | | |
| | (34,582,425 | ) | | | 57,681,448 | | | | (32,016,902 | ) | | | (15,558,589 | ) | | | (2,206,353 | ) | | | (782,957 | ) | | | (166,144 | ) | | | (120,959 | ) |
| | (368,656 | ) | | | 479,009 | | | | — | | | | — | | | | — | | | | — | | | | — | | | | — | |
| | | | | | | | | | | | | | | | | | | | | | | | | | | | | | |
| | (34,951,081 | ) | | | 58,160,457 | | | | (32,016,902 | ) | | | (15,558,589 | ) | | | (2,206,353 | ) | | | (782,957 | ) | | | (166,144 | ) | | | (120,959 | ) |
| | | | | | | | | | | | | | | | | | | | | | | | | | | | | | |
| | (25,460,695 | ) | | | 65,337,550 | | | | (32,152,037 | ) | | | 18,005,953 | | | | (2,932,899 | ) | | | (689,278 | ) | | | (406,097 | ) | | | (69,269 | ) |
| | | | | | | | | | | | | | | | | | | | | | | | | | | | | | |
| $ | 13,197,998 | | | $ | 97,991,397 | | | $ | 4,105,795 | | | $ | 67,236,673 | | | $ | (780,890 | ) | | $ | 566,875 | | | $ | (58,796 | ) | | $ | 370,842 | |
| | | | | | | | | | | | | | | | | | | | | | | | | | | | | | |
Statements of Operations (continued)
For the period November 1, 2017 through August 31, 2018 and year ended October 31, 2017
| | | | | | | | | | | | | | | | |
| | | Invesco National AMT-Free Municipal
Bond ETF (PZA) | | | Invesco New York AMT-Free
Municipal Bond ETF (PZT) | |
| | | Ten Months Ended
August 31, 2018 | | | Year Ended
October 31, 2017 | | | Ten Months Ended
August 31, 2018 | | | Year Ended
October 31, 2017 | |
| Investment Income: | | | | | | | | | | | | | | | | |
Unaffiliated interest income | | $ | 46,038,140 | | | $ | 48,161,578 | | | $ | 1,779,932 | | | $ | 2,105,703 | |
Unaffiliated dividend income | | | — | | | | — | | | | — | | | | — | |
Affiliated dividend income | | | — | | | | — | | | | — | | | | — | |
Securities lending income | | | — | | | | — | | | | — | | | | — | |
Foreign withholding tax | | | — | | | | — | | | | — | | | | — | |
| | | | | | | | | | | | | | | | |
Total Income | | | 46,038,140 | | | | 48,161,578 | | | | 1,779,932 | | | | 2,105,703 | |
| | | | | | | | | | | | | | | | |
| | | | |
| Expenses: | | | | | | | | | | | | | | | | |
Unitary management fees | | | 3,812,635 | | | | 4,041,215 | | | | 156,975 | | | | 179,389 | |
Tax expenses | | | — | | | | — | | | | — | | | | — | |
| | | | | | | | | | | | | | | | |
Total Expenses | | | 3,812,635 | | | | 4,041,215 | | | | 156,975 | | | | 179,389 | |
| | | | | | | | | | | | | | | | |
Less: Waivers | | | — | | | | — | | | | — | | | | — | |
| | | | | | | | | | | | | | | | |
Net Expenses | | | 3,812,635 | | | | 4,041,215 | | | | 156,975 | | | | 179,389 | |
| | | | | | | | | | | | | | | | |
Net Investment Income | | | 42,225,505 | | | | 44,120,363 | | | | 1,622,957 | | | | 1,926,314 | |
| | | | | | | | | | | | | | | | |
| | | | |
| Realized and Unrealized Gain (Loss): | | | | | | | | | | | | | | | | |
Net realized gain (loss) from: | | | | | | | | | | | | | | | | |
Unaffiliated investment securities(b) | | | (1,124,099 | ) | | | 1,280,896 | | | | 58,298 | | | | 485,614 | |
Affiliated investment securities | | | — | | | | — | | | | — | | | | — | |
Unaffiliated in-kind redemptions | | | 384,532 | | | | 285,250 | | | | 192,239 | | | | — | |
| | | | | | | | | | | | | | | | |
Net realized gain (loss) | | | (739,567 | ) | | | 1,566,146 | | | | 250,537 | | | | 485,614 | |
| | | | | | | | | | | | | | | | |
Net change in unrealized appreciation (depreciation) on investment securities | | | (28,566,818 | ) | | | (6,807,061 | ) | | | (1,557,451 | ) | | | (901,063 | ) |
| | | | | | | | | | | | | | | | |
Net realized and unrealized gain (loss) | | | (29,306,385 | ) | | | (5,240,915 | ) | | | (1,306,914 | ) | | | (415,449 | ) |
| | | | | | | | | | | | | | | | |
Net increase in net assets resulting from operations | | $ | 12,919,120 | | | $ | 38,879,448 | | | $ | 316,043 | | | $ | 1,510,865 | |
| | | | | | | | | | | | | | | | |
| (a) | For the period January 10, 2017 (commencement of investment operations) through October 31, 2017. |
| (b) | Includes net gains from securities sold to affiliates of $74,566 for Invesco Variable Rate Preferred ETF. |
See accompanying Notes to Financial Statements which are an integral part of the financial statements.
| | | | | | | | | | | | | | | | | | | | | | | | | | | | | | |
Invesco Preferred
ETF (PGX) | | | Invesco Taxable Municipal Bond
ETF (BAB) | | | Invesco Treasury Collateral
ETF (CLTL) | | | Invesco Variable Rate Preferred
ETF (VRP) | |
Ten Months Ended
August 31, 2018 | | | Year Ended
October 31, 2017 | | | Ten Months Ended
August 31, 2018 | | | Year Ended
October 31, 2017 | | | Ten Months Ended
August 31, 2018 | | | Year Ended
October 31, 2017(a) | | | Ten Months Ended
August 31, 2018 | | | Year Ended
October 31, 2017 | |
| | | | | | | | | | | | | | | | | | | | | | | | | | | | | | |
| $ | — | | | $ | — | | | $ | 34,124,613 | | | $ | 42,371,563 | | | $ | 5,883,709 | | | $ | 2,632,698 | | | $ | 52,852,832 | | | $ | 27,347,046 | |
| | 272,658,772 | | | | 294,171,972 | | | | — | | | | — | | | | — | | | | — | | | | 28,868,982 | | | | 44,003,971 | |
| | 141,712 | | | | 77,384 | | | | 144,232 | | | | 67,483 | | | | 5,626 | | | | 8,833 | | | | 60,030 | | | | 33,847 | |
| | 3,767,918 | | | | 3,397,632 | | | | — | | | | — | | | | — | | | | — | | | | 720,164 | | | | 4,556 | |
| | (34,253 | ) | | | — | | | | — | | | | — | | | | — | | | | — | | | | (13,277 | ) | | | (14,709 | ) |
| | | | | | | | | | | | | | | | | | | | | | | | | | | | | | |
| | 276,534,149 | | | | 297,646,988 | | | | 34,268,845 | | | | 42,439,046 | | | | 5,889,335 | | | | 2,641,531 | | | | 82,488,731 | | | | 71,374,711 | |
| | | | | | | | | | | | | | | | | | | | | | | | | | | | | | |
| | | | | | | |
| | | | | | | | | | | | | | | | | | | | | | | | | | | | | | |
| | 21,852,991 | | | | 24,179,803 | | | | 2,210,161 | | | | 2,742,635 | | | | 307,313 | | | | 246,371 | | | | 8,572,977 | | | | 6,841,613 | |
| | — | | | | — | | | | — | | | | — | | | | — | | | | — | | | | — | | | | 2,355 | |
| | | | | | | | | | | | | | | | | | | | | | | | | | | | | | |
| | 21,852,991 | | | | 24,179,803 | | | | 2,210,161 | | | | 2,742,635 | | | | 307,313 | | | | 246,371 | | | | 8,572,977 | | | | 6,843,968 | |
| | | | | | | | | | | | | | | | | | | | | | | | | | | | | | |
| | (18,348 | ) | | | (18,307 | ) | | | (17,750 | ) | | | (22,816 | ) | | | (750 | ) | | | (2,761 | ) | | | (7,964 | ) | | | (8,297 | ) |
| | | | | | | | | | | | | | | | | | | | | | | | | | | | | | |
| | 21,834,643 | | | | 24,161,496 | | | | 2,192,411 | | | | 2,719,819 | | | | 306,563 | | | | 243,610 | | | | 8,565,013 | | | | 6,835,671 | |
| | | | | | | | | | | | | | | | | | | | | | | | | | | | | | |
| | 254,699,506 | | | | 273,485,492 | | | | 32,076,434 | | | | 39,719,227 | | | | 5,582,772 | | | | 2,397,921 | | | | 73,923,718 | | | | 64,539,040 | |
| | | | | | | | | | | | | | | | | | | | | | | | | | | | | | |
| | | | | | | |
| | | | | | | | | | | | | | | | | | | | | | | | | | | | | | |
| | | | | | | | | | | | | | | | | | | | | | | | | | | | | | |
| | (44,869,976 | ) | | | (19,104,862 | ) | | | (1,529,776 | ) | | | (3,901,943 | ) | | | (49,581 | ) | | | (34,576 | ) | | | (1,923,809 | ) | | | (2,047,941 | ) |
| | — | | | | — | | | | — | | | | — | | | | — | | | | — | | | | — | | | | — | |
| | 4,616,990 | | | | 10,630,701 | | | | 678,824 | | | | 2,091,256 | | | | — | | | | (528 | ) | | | 18,827,387 | | | | 33,609,700 | |
| | | | | | | | | | | | | | | | | | | | | | | | | | | | | | |
| | (40,252,986 | ) | | | (8,474,161 | ) | | | (850,952 | ) | | | (1,810,687 | ) | | | (49,581 | ) | | | (35,104 | ) | | | 16,903,578 | | | | 31,561,759 | |
| | | | | | | | | | | | | | | | | | | | | | | | | | | | | | |
| | (99,837,343 | ) | | | (1,049,352 | ) | | | (22,250,818 | ) | | | (11,646,216 | ) | | | 88,653 | | | | (161,473 | ) | | | (67,581,280 | ) | | | (953,428 | ) |
| | | | | | | | | | | | | | | | | | | | | | | | | | | | | | |
| | (140,090,329 | ) | | | (9,523,513 | ) | | | (23,101,770 | ) | | | (13,456,903 | ) | | | 39,072 | | | | (196,577 | ) | | | (50,677,702 | ) | | | 30,608,331 | |
| | | | | | | | | | | | | | | | | | | | | | | | | | | | | | |
| $ | 114,609,177 | | | $ | 263,961,979 | | | $ | 8,974,664 | | | $ | 26,262,324 | | | $ | 5,621,844 | | | $ | 2,201,344 | | | $ | 23,246,016 | | | $ | 95,147,371 | |
| | | | | | | | | | | | | | | | | | | | | | | | | | | | | | |
Statements of Operations (continued)
For the period November 1, 2017 through August 31, 2018 and year ended October 31, 2017
| | | | | | | | |
| | | Invesco VRDO Tax-Free Weekly
ETF (PVI) | |
| | | Ten Months Ended
August 31, 2018 | | | Year Ended
October 31, 2017 | |
| Investment Income: | | | | | | | | |
Unaffiliated interest income | | $ | 708,275 | | | $ | 588,602 | |
| | | | | | | | |
| | |
| Expenses: | | | | | | | | |
Unitary management fees | | | 143,709 | | | | 192,631 | |
| | | | | | | | |
Net Investment Income | | | 564,566 | | | | 395,971 | |
| | | | | | | | |
| | |
| Realized and Unrealized Gain (Loss): | | | | | | | | |
Net realized gain (loss) from investment securities | | | 350 | | | | (10 | ) |
| | | | | | | | |
Net realized and unrealized gain (loss) | | | 350 | | | | (10 | ) |
| | | | | | | | |
Net increase in net assets resulting from operations | | $ | 564,916 | | | $ | 395,961 | |
| | | | | | | | |
See accompanying Notes to Financial Statements which are an integral part of the financial statements.
(This Page Intentionally Left Blank)
Statements of Changes in Net Assets
For the period November 1, 2017 through August 31, 2018 and years ended October 31, 2017 and 2016
| | | | | | | | | | | | | | | | | | | | | | | | |
| | | Invesco 1-30 Laddered Treasury
ETF (PLW) | | | Invesco California AMT-Free Municipal Bond
ETF (PWZ) | |
| | | Ten Months Ended
August 31, 2018 | | | Year Ended
October 31, 2017 | | | Year Ended
October 31, 2016 | | | Ten Months Ended
August 31, 2018 | | | Year Ended
October 31, 2017 | | | Year Ended
October 31, 2016 | |
| Operations: | | | | | | | | | | | | | | | | | | | | | | | | |
Net investment income | | $ | 3,135,358 | | | $ | 3,828,078 | | | $ | 4,569,492 | | | $ | 5,154,468 | | | $ | 4,787,907 | | | $ | 3,933,268 | |
Net realized gain (loss) | | | (1,901,061 | ) | | | (861,018 | ) | | | 10,080,039 | | | | 199,203 | | | | 516,728 | | | | 156,626 | |
Net change in unrealized appreciation (depreciation) | | | (3,808,896 | ) | | | (7,860,127 | ) | | | 683,766 | | | | (2,516,166 | ) | | | (1,373,457 | ) | | | 1,450,367 | |
| | | | | | | | | | | | | | | | | | | | | | | | |
Net increase (decrease) in net assets resulting from operations | | | (2,574,599 | ) | | | (4,893,067 | ) | | | 15,333,297 | | | | 2,837,505 | | | | 3,931,178 | | | | 5,540,261 | |
| | | | | | | | | | | | | | | | | | | | | | | | |
| | | | | | |
| Distributions to Shareholders from: | | | | | | | | | | | | | | | | | | | | | | | | |
Net investment income | | | (3,150,699 | ) | | | (3,839,339 | ) | | | (4,583,798 | ) | | | (5,154,468 | ) | | | (4,787,907 | ) | | | (3,933,268 | ) |
Return of capital | | | — | | | | — | | | | — | | | | (78,193 | ) | | | (47,626 | ) | | | (31,261 | ) |
| | | | | | | | | | | | | | | | | | | | | | | | |
Total distributions to shareholders | | | (3,150,699 | ) | | | (3,839,339 | ) | | | (4,583,798 | ) | | | (5,232,661 | ) | | | (4,835,533 | ) | | | (3,964,529 | ) |
| | | | | | | | | | | | | | | | | | | | | | | | |
| | | | | | |
| Shareholder Transactions: | | | | | | | | | | | | | | | | | | | | | | | | |
Proceeds from shares sold | | | 73,889,628 | | | | 24,396,719 | | | | 84,560,450 | | | | 20,897,090 | | | | 80,270,039 | | | | 88,924,511 | |
Value of shares repurchased | | | (101,922,955 | ) | | | (49,742,721 | ) | | | (141,116,828 | ) | | | (5,132,012 | ) | | | (31,699,168 | ) | | | (10,467,305 | ) |
Transaction fees | | | — | | | | — | | | | — | | | | 12,830 | | | | 126,543 | | | | 218,389 | |
| | | | | | | | | | | | | | | | | | | | | | | | |
Net increase (decrease) in net assets resulting from shares transactions | | | (28,033,327 | ) | | | (25,346,002 | ) | | | (56,556,378 | ) | | | 15,777,908 | | | | 48,697,414 | | | | 78,675,595 | |
| | | | | | | | | | | | | | | | | | | | | | | | |
Increase (Decrease) in Net Assets | | | (33,758,625 | ) | | | (34,078,408 | ) | | | (45,806,879 | ) | | | 13,382,752 | | | | 47,793,059 | | | | 80,251,327 | |
| | | | | | | | | | | | | | | | | | | | | | | | |
| | | | | | |
| Net Assets: | | | | | | | | | | | | | | | | | | | | | | | | |
Beginning of period | | | 187,393,113 | | | | 221,471,521 | | | | 267,278,400 | | | | 237,413,111 | | | | 189,620,052 | | | | 109,368,725 | |
| | | | | | | | | | | | | | | | | | | | | | | | |
End of period | | $ | 153,634,488 | | | $ | 187,393,113 | | | $ | 221,471,521 | | | $ | 250,795,863 | | | $ | 237,413,111 | | | $ | 189,620,052 | |
| | | | | | | | | | | | | | | | | | | | | | | | |
Undistributed net investment income at end of period | | $ | — | | | $ | — | | | $ | — | | | $ | — | | | $ | — | | | $ | — | |
| | | | | | | | | | | | | | | | | | | | | | | | |
| | | | | | |
| Changes in Shares Outstanding: | | | | | | | | | | | | | | | | | | | | | | | | |
Shares sold | | | 2,300,000 | | | | 750,000 | | | | 2,500,000 | | | | 800,000 | | | | 3,100,000 | | | | 3,350,000 | |
Shares repurchased | | | (3,200,000 | ) | | | (1,550,000 | ) | | | (4,150,000 | ) | | | (200,000 | ) | | | (1,250,000 | ) | | | (400,000 | ) |
Shares outstanding, beginning of period | | | 5,750,000 | | | | 6,550,000 | | | | 8,200,000 | | | | 9,100,000 | | | | 7,250,000 | | | | 4,300,000 | |
| | | | | | | | | | | | | | | | | | | | | | | | |
Shares outstanding, end of period | | | 4,850,000 | | | | 5,750,000 | | | | 6,550,000 | | | | 9,700,000 | | | | 9,100,000 | | | | 7,250,000 | |
| | | | | | | | | | | | | | | | | | | | | | | | |
See accompanying Notes to Financial Statements which are an integral part of the financial statements.
| | | | | | | | | | | | | | | | | | | | | | |
Invesco CEF Income Composite
ETF (PCEF) | | | Invesco Fundamental High Yield® Corporate Bond
ETF (PHB) | |
Ten Months Ended
August 31, 2018 | | | Year Ended
October 31, 2017 | | | Year Ended
October 31, 2016 | | | Ten Months Ended
August 31, 2018 | | | Year Ended
October 31, 2017 | | | Year Ended
October 31, 2016 | |
| | | | | | | | | | | | | | | | | | | | | | |
| $ | 38,658,693 | | | $ | 32,653,847 | | | $ | 37,094,240 | | | $ | 36,257,832 | | | $ | 49,230,720 | | | $ | 37,913,482 | |
| | 9,490,386 | | | | 7,177,093 | | | | (11,577,880 | ) | | | (135,135 | ) | | | 33,564,542 | | | | (16,764,677 | ) |
| | | | | |
| | (34,951,081 | ) | | | 58,160,457 | | | | 32,412,423 | | | | (32,016,902 | ) | | | (15,558,589 | ) | | | 48,202,775 | |
| | | | | | | | | | | | | | | | | | | | | | |
| | | | | |
| | 13,197,998 | | | | 97,991,397 | | | | 57,928,783 | | | | 4,105,795 | | | | 67,236,673 | | | | 69,351,580 | |
| | | | | | | | | | | | | | | | | | | | | | |
| | | | | |
| | | | | | | | | | | | | | | | | | | | | | |
| (42,434,762 | ) | | | (32,752,020 | ) | | | (38,325,657 | ) | | | (36,149,521 | ) | | | (49,423,066 | ) | | | (37,984,421 | ) |
| | — | | | | (15,880,681 | ) | | | (11,635,257 | ) | | | — | | | | — | | | | — | |
| | | | | | | | | | | | | | | | | | | | | | |
| | (42,434,762 | ) | | | (48,632,701 | ) | | | (49,960,914 | ) | | | (36,149,521 | ) | | | (49,423,066 | ) | | | (37,984,421 | ) |
| | | | | | | | | | | | | | | | | | | | | | |
| | | | | |
| | | | | | | | | | | | | | | | | | | | | | |
| | 100,554,411 | | | | 78,505,086 | | | | 51,120,858 | | | | 627,330,216 | | | | 991,546,556 | | | | 756,314,570 | |
| | (51,317,550 | ) | | | (67,160,223 | ) | | | (45,299,178 | ) | | | (844,678,481 | ) | | | (899,575,504 | ) | | | (365,845,423 | ) |
| | — | | | | — | | | | — | | | | — | | | | — | | | | — | |
| | | | | | | | | | | | | | | | | | | | | | |
| | | | | |
| | 49,236,861 | | | | 11,344,863 | | | | 5,821,680 | | | | (217,348,265 | ) | | | 91,971,052 | | | | 390,469,147 | |
| | | | | | | | | | | | | | | | | | | | | | |
| | 20,000,097 | | | | 60,703,559 | | | | 13,789,549 | | | | (249,391,991 | ) | | | 109,784,659 | | | | 421,836,306 | |
| | | | | | | | | | | | | | | | | | | | | | |
| | | | | |
| | | | | | | | | | | | | | | | | | | | | | |
| | 703,176,623 | | | | 642,473,064 | | | | 628,683,515 | | | | 1,197,921,837 | | | | 1,088,137,178 | | | | 666,300,872 | |
| | | | | | | | | | | | | | | | | | | | | | |
| $ | 723,176,720 | | | $ | 703,176,623 | | | $ | 642,473,064 | | | $ | 948,529,846 | | | $ | 1,197,921,837 | | | $ | 1,088,137,178 | |
| | | | | | | | | | | | | | | | | | | | | | |
| | | | | |
| $ | — | | | $ | — | | | $ | — | | | $ | 108,311 | | | $ | — | | | $ | — | |
| | | | | | | | | | | | | | | | | | | | | | |
| | | | | |
| | | | | | | | | | | | | | | | | | | | | | |
| | 4,300,000 | | | | 3,350,000 | | | | 2,350,000 | | | | 33,400,000 | | | | 52,500,000 | | | | 41,700,000 | |
| | (2,200,000 | ) | | | (2,900,000 | ) | | | (2,150,000 | ) | | | (45,100,000 | ) | | | (47,600,000 | ) | | | (20,300,000 | ) |
| | 29,350,000 | | | | 28,900,000 | | | | 28,700,000 | | | | 62,800,000 | | | | 57,900,000 | | | | 36,500,000 | |
| | | | | | | | | | | | | | | | | | | | | | |
| | 31,450,000 | | | | 29,350,000 | | | | 28,900,000 | | | | 51,100,000 | | | | 62,800,000 | | | | 57,900,000 | |
| | | | | | | | | | | | | | | | | | | | | | |
Statements of Changes in Net Assets (continued)
For the period November 1, 2017 through August 31, 2018 and years ended October 31, 2017 and 2016
| | | | | | | | | | | | | | | | | | | | | | | | |
| | | Invesco Fundamental
Investment Grade Corporate Bond ETF (PFIG) | | | Invesco LadderRite 0-5 Year
Corporate Bond ETF (LDRI) | |
| | | Ten Months Ended
August 31, 2018 | | | Year Ended
October 31, 2017 | | | Year Ended
October 31, 2016 | | | Ten Months Ended
August 31, 2018 | | | Year Ended
October 31, 2017 | | | Year Ended
October 31, 2016 | |
| Operations: | | | | | | | | | | | | | | | | | | | | | | | | |
Net investment income | | $ | 2,152,009 | | | $ | 1,256,153 | | | $ | 1,112,065 | | | $ | 347,301 | | | $ | 440,111 | | | $ | 236,488 | |
Net realized gain (loss) | | | (726,546 | ) | | | 93,679 | | | | (40,240 | ) | | | (239,953 | ) | | | 51,690 | | | | (29,417 | ) |
Net change in unrealized appreciation (depreciation) | | | (2,206,353 | ) | | | (782,957 | ) | | | 1,089,201 | | | | (166,144 | ) | | | (120,959 | ) | | | 149,321 | |
| | | | | | | | | | | | | | | | | | | | | | | | |
Net increase (decrease) in net assets resulting from operations | | | (780,890 | ) | | | 566,875 | | | | 2,161,026 | | | | (58,796 | ) | | | 370,842 | | | | 356,392 | |
| | | | | | | | | | | | | | | | | | | | | | | | |
| | | | | | |
| Distributions to Shareholders from: | | | | | | | | | | | | | | | | | | | | | | | | |
Net investment income | | | (2,152,009 | ) | | | (1,261,537 | ) | | | (1,112,065 | ) | | | (341,964 | ) | | | (442,061 | ) | | | (237,571 | ) |
Net realized gains | | | — | | | | — | | | | — | | | | — | | | | — | | | | (7,046 | ) |
Return of capital | | | (16,435 | ) | | | — | | | | (6,736 | ) | | | — | | | | — | | | | (1,098 | ) |
| | | | | | | | | | | | | | | | | | | | | | | | |
Total distributions to shareholders | | | (2,168,444 | ) | | | (1,261,537 | ) | | | (1,118,801 | ) | | | (341,964 | ) | | | (442,061 | ) | | | (245,715 | ) |
| | | | | | | | | | | | | | | | | | | | | | | | |
| | | | | | |
| Shareholder Transactions: | | | | | | | | | | | | | | | | | | | | | | | | |
Proceeds from shares sold | | | 75,624,449 | | | | 17,863,611 | | | | 23,044,431 | | | | 11,218,280 | | | | 6,249,120 | | | | 17,419,435 | |
Value of shares repurchased | | | (16,025,377 | ) | | | (25,352,592 | ) | | | — | | | | (22,236,829 | ) | | | (4,996,874 | ) | | | (1,246,709 | ) |
Transaction fees | | | — | | | | — | | | | — | | | | — | | | | — | | | | — | |
| | | | | | | | | | | | | | | | | | | | | | | | |
Net increase (decrease) in net assets resulting from shares transactions | | | 59,599,072 | | | | (7,488,981 | ) | | | 23,044,431 | | | | (11,018,549 | ) | | | 1,252,246 | | | | 16,172,726 | |
| | | | | | | | | | | | | | | | | | | | | | | | |
Increase (Decrease) in Net Assets | | | 56,649,738 | | | | (8,183,643 | ) | | | 24,086,656 | | | | (11,419,309 | ) | | | 1,181,027 | | | | 16,283,403 | |
| | | | | | | | | | | | | | | | | | | | | | | | |
| | | | | | |
| Net Assets: | | | | | | | | | | | | | | | | | | | | | | | | |
Beginning of period | | | 49,970,387 | | | | 58,154,030 | | | | 34,067,374 | | | | 23,734,532 | | | | 22,553,505 | | | | 6,270,102 | |
| | | | | | | | | | | | | | | | | | | | | | | | |
End of period | | $ | 106,620,125 | | | $ | 49,970,387 | | | $ | 58,154,030 | | | $ | 12,315,223 | | | $ | 23,734,532 | | | $ | 22,553,505 | |
| | | | | | | | | | | | | | | | | | | | | | | | |
Undistributed net investment income at end of period | | $ | — | | | $ | — | | | $ | — | | | $ | 5,337 | | | $ | — | | | $ | — | |
| | | | | | | | | | | | | | | | | | | | | | | | |
| | | | | | |
| Changes in Shares Outstanding: | | | | | | | | | | | | | | | | | | | | | | | | |
Shares sold | | | 3,000,000 | | | | 700,000 | | | | 900,000 | | | | 450,000 | | | | 250,000 | | | | 700,000 | |
Shares repurchased | | | (650,000 | ) | | | (1,000,000 | ) | | | — | | | | (900,000 | ) | | | (200,000 | ) | | | (50,000 | ) |
Shares outstanding, beginning of period | | | 1,950,000 | | | | 2,250,000 | | | | 1,350,000 | | | | 950,000 | �� | | | 900,000 | | | | 250,000 | |
| | | | | | | | | | | | | | | | | | | | | | | | |
Shares outstanding, end of period | | | 4,300,000 | | | | 1,950,000 | | | | 2,250,000 | | | | 500,000 | | | | 950,000 | | | | 900,000 | |
| | | | | | | | | | | | | | | | | | | | | | | | |
See accompanying Notes to Financial Statements which are an integral part of the financial statements.
| | | | | | | | | | | | | | | | | | | | | | |
Invesco National AMT-Free
Municipal Bond ETF (PZA) | | | Invesco New York AMT-Free
Municipal Bond ETF (PZT) | |
Ten Months Ended
August 31, 2018 | | | Year Ended
October 31, 2017 | | | Year Ended
October 31, 2016 | | | Ten Months Ended
August 31, 2018 | | | Year Ended
October 31, 2017 | | | Year Ended
October 31, 2016 | |
| | | | | | | | | | | | | | | | | | | | | | |
| $ | 42,225,505 | | | $ | 44,120,363 | | | $ | 38,124,263 | | | $ | 1,622,957 | | | $ | 1,926,314 | | | $ | 1,779,763 | |
| | (739,567 | ) | | | 1,566,146 | | | | 3,949,289 | | | | 250,537 | | | | 485,614 | | | | 491,670 | |
| | | | | |
| | (28,566,818 | ) | | | (6,807,061 | ) | | | 15,301,328 | | | | (1,557,451 | ) | | | (901,063 | ) | | | 329,137 | |
| | | | | | | | | | | | | | | | | | | | | | |
| | | | | |
| | 12,919,120 | | | | 38,879,448 | | | | 57,374,880 | | | | 316,043 | | | | 1,510,865 | | | | 2,600,570 | |
| | | | | | | | | | | | | | | | | | | | | | |
| | | | | |
| | | | | | | | | | | | | | | | | | | | | | |
| | (42,825,016 | ) | | | (44,434,318 | ) | | | (38,124,263 | ) | | | (1,645,145 | ) | | | (1,937,572 | ) | | | (1,779,763 | ) |
| | — | | | | — | | | | — | | | | — | | | | — | | | | — | |
| | — | | | | — | | | | (189,479 | ) | | | — | | | | — | | | | (12,981 | ) |
| | | | | | | | | | | | | | | | | | | | | | |
| | (42,825,016 | ) | | | (44,434,318 | ) | | | (38,313,742 | ) | | | (1,645,145 | ) | | | (1,937,572 | ) | | | (1,792,744 | ) |
| | | | | | | | | | | | | | | | | | | | | | |
| | | | | |
| | | | | | | | | | | | | | | | | | | | | | |
| | 155,166,789 | | | | 375,282,762 | | | | 469,907,438 | | | | 3,662,435 | | | | 2,424,444 | | | | 15,018,293 | |
| | (76,665,955 | ) | | | (138,711,374 | ) | | | (7,925,010 | ) | | | (4,817,324 | ) | | | — | | | | (2,455,728 | ) |
| | 127,313 | | | | 608,718 | | | | 1,194,581 | | | | — | | | | — | | | | — | |
| | | | | | | | | | | | | | | | | | | | | | |
| | | | | |
| | 78,628,147 | | | | 237,180,106 | | | | 463,177,009 | | | | (1,154,889 | ) | | | 2,424,444 | | | | 12,562,565 | |
| | | | | | | | | | | | | | | | | | | | | | |
| | 48,722,251 | | | | 231,625,236 | | | | 482,238,147 | | | | (2,483,991 | ) | | | 1,997,737 | | | | 13,370,391 | |
| | | | | | | | | | | | | | | | | | | | | | |
| | | | | |
| | | | | | | | | | | | | | | | | | | | | | |
| | 1,611,258,272 | | | | 1,379,633,036 | | | | 897,394,889 | | | | 66,060,627 | | | | 64,062,890 | | | | 50,692,499 | |
| | | | | | | | | | | | | | | | | | | | | | |
| $ | 1,659,980,523 | | | $ | 1,611,258,272 | | | $ | 1,379,633,036 | | | $ | 63,576,636 | | | $ | 66,060,627 | | | $ | 64,062,890 | |
| | | | | | | | | | | | | | | | | | | | | | |
| | | | | |
| $ | — | | | $ | — | | | $ | — | | | $ | — | | | $ | — | | | $ | — | |
| | | | | | | | | | | | | | | | | | | | | | |
| | | | | |
| | | | | | | | | | | | | | | | | | | | | | |
| | 6,100,000 | | | | 14,850,000 | | | | 18,250,000 | | | | 150,000 | | | | 100,000 | | | | 600,000 | |
| | (3,000,000 | ) | | | (5,550,000 | ) | | | (300,000 | ) | | | (200,000 | ) | | | — | | | | (100,000 | ) |
| | 63,000,000 | | | | 53,700,000 | | | | 35,750,000 | | | | 2,700,000 | | | | 2,600,000 | | | | 2,100,000 | |
| | | | | | | | | | | | | | | | | | | | | | |
| | 66,100,000 | | | | 63,000,000 | | | | 53,700,000 | | | | 2,650,000 | | | | 2,700,000 | | | | 2,600,000 | |
| | | | | | | | | | | | | | | | | | | | | | |
Statements of Changes in Net Assets (continued)
For the period November 1, 2017 through August 31, 2018 and years ended October 31, 2017 and 2016
| | | | | | | | | | | | | | | | | | | | | | | | |
| | | Invesco Preferred
ETF (PGX) | | | Invesco Taxable Municipal Bond
ETF (BAB) | |
| | | Ten Months Ended
August 31, 2018 | | | Year Ended
October 31, 2017 | | | Year Ended
October 31, 2016 | | | Ten Months Ended
August 31, 2018 | | | Year Ended
October 31, 2017 | | | Year Ended
October 31, 2016 | |
| Operations: | | | | | | | | | | | | | | | | | | | | | | | | |
Net investment income | | $ | 254,699,506 | | | $ | 273,485,492 | | | $ | 223,181,740 | | | $ | 32,076,434 | | | $ | 39,719,227 | | | $ | 35,952,968 | |
Net realized gain (loss) | | | (40,252,986 | ) | | | (8,474,161 | ) | | | 8,413,389 | | | | (850,952 | ) | | | (1,810,687 | ) | | | 4,593 | |
Net change in unrealized appreciation (depreciation) | | | (99,837,343 | ) | | | (1,049,352 | ) | | | 24,855,342 | | | | (22,250,818 | ) | | | (11,646,216 | ) | | | 36,415,568 | |
| | | | | | | | | | | | | | | | | | | | | | | | |
Net increase in net assets resulting from operations | | | 114,609,177 | | | | 263,961,979 | | | | 256,450,471 | | | | 8,974,664 | | | | 26,262,324 | | | | 72,373,129 | |
| | | | | | | | | | | | | | | | | | | | | | | | |
| | | | | | |
| Distributions to Shareholders from: | | | | | | | | | | | | | | | | | | | | | | | | |
Net investment income | | | (244,818,962 | ) | | | (276,488,848 | ) | | | (226,731,995 | ) | | | (32,279,031 | ) | | | (39,855,653 | ) | | | (36,098,186 | ) |
Return of capital | | | — | | | | — | | | | — | | | | — | | | | — | | | | — | |
| | | | | | | | | | | | | | | | | | | | | | | | |
Total distributions to shareholders | | | (244,818,962 | ) | | | (276,488,848 | ) | | | (226,731,995 | ) | | | (32,279,031 | ) | | | (39,855,653 | ) | | | (36,098,186 | ) |
| | | | | | | | | | | | | | | | | | | | | | | | |
| | | | | | |
| Shareholder Transactions: | | | | | | | | | | | | | | | | | | | | | | | | |
Proceeds from shares sold | | | 793,860,901 | | | | 1,107,127,988 | | | | 1,874,743,397 | | | | 49,320,084 | | | | 21,044,718 | | | | 366,831,325 | |
Value of shares repurchased | | | (619,175,651 | ) | | | (491,910,183 | ) | | | (290,708,764 | ) | | | (59,659,382 | ) | | | (106,639,740 | ) | | | (10,287,020 | ) |
Transaction fees | | | — | | | | — | | | | — | | | | 279,471 | | | | 744,256 | | | | 1,019,948 | |
| | | | | | | | | | | | | | | | | | | | | | | | |
Net increase (decrease) in net assets resulting from shares transactions | | | 174,685,250 | | | | 615,217,805 | | | | 1,584,034,633 | | | | (10,059,827 | ) | | | (84,850,766 | ) | | | 357,564,253 | |
| | | | | | | | | | | | | | | | | | | | | | | | |
Increase (Decrease) in Net Assets | | | 44,475,465 | | | | 602,690,936 | | | | 1,613,753,109 | | | | (33,364,194 | ) | | | (98,444,095 | ) | | | 393,839,196 | |
| | | | | | | | | | | | | | | | | | | | | | | | |
| | | | | | |
| Net Assets: | | | | | | | | | | | | | | | | | | | | | | | | |
Beginning of period | | | 5,333,535,443 | | | | 4,730,844,507 | | | | 3,117,091,398 | | | | 972,235,192 | | | | 1,070,679,287 | | | | 676,840,091 | |
| | | | | | | | | | | | | | | | | | | | | | | | |
End of period | | $ | 5,378,010,908 | | | $ | 5,333,535,443 | | | $ | 4,730,844,507 | | | $ | 938,870,998 | | | $ | 972,235,192 | | | $ | 1,070,679,287 | |
| | | | | | | | | | | | | | | | | | | | | | | | |
Undistributed net investment income at end of period | | $ | 9,737,537 | | | $ | — | | | $ | — | | | $ | — | | | $ | — | | | $ | — | |
| | | | | | | | | | | | | | | | | | | | | | | | |
| | | | | | |
| Changes in Shares Outstanding: | | | | | | | | | | | | | | | | | | | | | | | | |
Shares sold | | | 54,350,000 | | | | 74,100,000 | | | | 124,900,000 | | | | 1,650,000 | | | | 700,000 | | | | 12,000,000 | |
Shares repurchased | | | (42,500,000 | ) | | | (33,900,000 | ) | | | (19,550,000 | ) | | | (2,000,000 | ) | | | (3,600,000 | ) | | | (350,000 | ) |
Shares outstanding, beginning of period | | | 356,400,000 | | | | 316,200,000 | | | | 210,850,000 | | | | 32,000,000 | | | | 34,900,000 | | | | 23,250,000 | |
| | | | | | | | | | | | | | | | | | | | | | | | |
Shares outstanding, end of period | | | 368,250,000 | | | | 356,400,000 | | | | 316,200,000 | | | | 31,650,000 | | | | 32,000,000 | | | | 34,900,000 | |
| | | | | | | | | | | | | | | | | | | | | | | | |
| (a) | For the period January 10, 2017 (commencement of investment operations) through October 31, 2017. |
See accompanying Notes to Financial Statements which are an integral part of the financial statements.
| | | | | | | | | | | | | | | | | | | | | | | | | | | | | | |
Invesco Treasury Collateral
ETF (CLTL) | | | Invesco Variable Rate Preferred
ETF (VRP) | | | Invesco VRDO Tax-Free Weekly
ETF (PVI) | |
Ten Months Ended
August 31, 2018 | | | Year Ended
October 31, 2017(a) | | | Ten Months Ended
August 31, 2018 | | | Year Ended
October 31, 2017 | | | Year Ended
October 31, 2016 | | | Ten Months Ended
August 31, 2018 | | | Year Ended
October 31, 2017 | | | Year Ended
October 31, 2016 | |
| | | | | | | | | | | | | | | | | | | | | | | | | | | | | | |
| $ | 5,582,772 | | | $ | 2,397,921 | | | $ | 73,923,718 | | | $ | 64,539,040 | | | $ | 31,368,685 | | | $ | 564,566 | | | $ | 395,971 | | | $ | 43,358 | |
| | (49,581 | ) | | | (35,104 | ) | | | 16,903,578 | | | | 31,561,759 | | | | (111,445 | ) | | | 350 | | | | (10 | ) | | | 950 | |
| | | | | | | |
| | 88,653 | | | | (161,473 | ) | | | (67,581,280 | ) | | | (953,428 | ) | | | 29,032,847 | | | | — | | | | — | | | | — | |
| | | | | | | | | | | | | | | | | | | | | | | | | | | | | | |
| | | | | | | |
| | 5,621,844 | | | | 2,201,344 | | | | 23,246,016 | | | | 95,147,371 | | | | 60,290,087 | | | | 564,916 | | | | 395,961 | | | | 44,308 | |
| | | | | | | | | | | | | | | | | | | | | | | | | | | | | | |
| | | | | | | |
| | | | | | | | | | | | | | | | | | | | | | | | | | | | | | |
| | (7,583,824 | ) | | | — | | | | (79,508,012 | ) | | | (64,972,652 | ) | | | (31,532,782 | ) | | | (564,528 | ) | | | (395,971 | ) | | | (44,304 | ) |
| | — | | | | — | | | | — | | | | — | | | | — | | | | — | | | | (449 | ) | | | (2,604 | ) |
| | | | | | | | | | | | | | | | | | | | | | | | | | | | | | |
| | (7,583,824 | ) | | | — | | | | (79,508,012 | ) | | | (64,972,652 | ) | | | (31,532,782 | ) | | | (564,528 | ) | | | (396,420 | ) | | | (46,908 | ) |
| | | | | | | | | | | | | | | | | | | | | | | | | | | | | | |
| | | | | | | |
| | | | | | | | | | | | | | | | | | | | | | | | | | | | | | |
| | 15,855,831 | | | | 453,283,483 | | | | 923,347,552 | | | | 1,478,978,932 | | | | 491,717,702 | | | | 4,986,642 | | | | 26,174,420 | | | | 7,477,888 | |
| | — | | | | (1,056,040 | ) | | | (565,925,316 | ) | | | (517,259,238 | ) | | | (18,480,727 | ) | | | (26,172,286 | ) | | | (2,492,350 | ) | | | (28,654,688 | ) |
| | — | | | | — | | | | — | | | | | | | | — | | | | — | | | | — | | | | — | |
| | | | | | | | | | | | | | | | | | | | | | | | | | | | | | |
| | | | | | | |
| | 15,855,831 | | | | 452,227,443 | | | | 357,422,236 | | | | 961,719,694 | | | | 473,236,975 | | | | (21,185,644 | ) | | | 23,682,070 | | | | (21,176,800 | ) |
| | | | | | | | | | | | | | | | | | | | | | | | | | | | | | |
| | 13,893,851 | | | | 454,428,787 | | | | 301,160,240 | | | | 991,894,413 | | | | 501,994,280 | | | | (21,185,256 | ) | | | 23,681,611 | | | | (21,179,400 | ) |
| | | | | | | | | | | | | | | | | | | | | | | | | | | | | | |
| | | | | | | |
| | | | | | | | | | | | | | | | | | | | | | | | | | | | | | |
| | 454,428,787 | | | | — | | | | 1,890,954,091 | | | | 899,059,678 | | | | 397,065,398 | | | | 83,512,199 | | | | 59,830,588 | | | | 81,009,988 | |
| | | | | | | | | | | | | | | | | | | | | | | | | | | | | | |
| $ | 468,322,638 | | | $ | 454,428,787 | | | $ | 2,192,114,331 | | | $ | 1,890,954,091 | | | $ | 899,059,678 | | | $ | 62,326,943 | | | $ | 83,512,199 | | | $ | 59,830,588 | |
| | | | | | | | | | | | | | | | | | | | | | | | | | | | | | |
| | | | | | | |
| $ | 396,869 | | | $ | 2,397,921 | | | $ | 7,752,813 | | | $ | — | | | $ | — | | | $ | 38 | | | $ | — | | | $ | — | |
| | | | | | | | | | | | | | | | | | | | | | | | | | | | | | |
| | | | | | | |
| | | | | | | | | | | | | | | | | | | | | | | | | | | | | | |
| | 150,000 | | | | 4,300,001 | | | | 36,200,000 | | | | 57,600,000 | | | | 20,000,000 | | | | 200,000 | | | | 1,050,000 | | | | 300,000 | |
| | — | | | | (10,000 | ) | | | (22,100,000 | ) | | | (20,000,000 | ) | | | (800,000 | ) | | | (1,050,000 | ) | | | (100,000 | ) | | | (1,150,000 | ) |
| | | | | | | |
| | 4,290,001 | | | | — | | | | 73,100,000 | | | | 35,500,000 | | | | 16,300,000 | | | | 3,350,000 | | | | 2,400,000 | | | | 3,250,000 | |
| | | | | | | | | | | | | | | | | | | | | | | | | | | | | | |
| | 4,440,001 | | | | 4,290,001 | | | | 87,200,000 | | | | 73,100,000 | | | | 35,500,000 | | | | 2,500,000 | | | | 3,350,000 | | | | 2,400,000 | |
| | | | | | | | | | | | | | | | | | | | | | | | | | | | | | |
Financial Highlights
Invesco 1-30 Laddered Treasury ETF (PLW)
| | | | | | | | | | | | | | | | | | | | | | | | |
| | | Ten Months Ended
August 31, 2018 | | | Year Ended October 31, | |
| | | 2017 | | | 2016 | | | 2015 | | | 2014 | | | 2013 | |
| Per Share Operating Performance: | | | | | | | | | | | | | | | | | | | | | | | | |
Net asset value at beginning of period | | $ | 32.59 | | | $ | 33.81 | | | $ | 32.59 | | | $ | 31.96 | | | $ | 30.41 | | | $ | 32.96 | |
Net investment income(a) | | | 0.57 | | | | 0.66 | | | | 0.65 | | | | 0.70 | | | | 0.76 | | | | 0.74 | |
Net realized and unrealized gain (loss) on investments | | | (0.91 | ) | | | (1.22 | ) | | | 1.22 | | | | 0.63 | | | | 1.54 | | | | (2.55 | ) |
Total from investment operations | | | (0.34 | ) | | | (0.56 | ) | | | 1.87 | | | | 1.33 | | | | 2.30 | | | | (1.81 | ) |
Distributions to shareholders from: | | | | | | | | | | | | | | | | | | | | | | | | |
Net investment income | | | (0.57 | ) | | | (0.66 | ) | | | (0.65 | ) | | | (0.70 | ) | | | (0.75 | ) | | | (0.74 | ) |
Net realized gains | | | — | | | | — | | | | — | | | | — | | | | — | | | | (0.00 | )(b) |
Total distributions | | | (0.57 | ) | | | (0.66 | ) | | | (0.65 | ) | | | (0.70 | ) | | | (0.75 | ) | | | (0.74 | ) |
Net asset value at end of period | | $ | 31.68 | | | $ | 32.59 | | | $ | 33.81 | | | $ | 32.59 | | | $ | 31.96 | | | $ | 30.41 | |
Market price at end of period(c) | | $ | 31.64 | | | $ | 32.59 | | | $ | 33.84 | | | $ | 32.60 | | | $ | 31.97 | | | $ | 30.40 | |
| Net Asset Value Total Return(d) | | | (1.04 | )% | | | (1.63 | )% | | | 5.76 | % | | | 4.18 | % | | | 7.71 | % | | | (5.55 | )% |
| Market Price Total Return(d) | | | (1.17 | )% | | | (1.72 | )% | | | 5.82 | % | | | 4.18 | % | | | 7.77 | % | | | (5.47 | )% |
| Ratios/Supplemental Data: | | | | | | | | | | | | | | | | | | | | | | | | |
Net assets at end of period (000’s omitted) | | $ | 153,634 | | | $ | 187,393 | | | $ | 221,472 | | | $ | 267,278 | | | $ | 279,635 | | | $ | 150,540 | |
Ratio to average net assets of: | | | | | | | | | | | | | | | | | | | | | | | | |
Expenses | | | 0.25 | %(e) | | | 0.25 | % | | | 0.25 | % | | | 0.25 | % | | | 0.25 | % | | | 0.25 | % |
Net investment income | | | 2.13 | %(e) | | | 2.02 | % | | | 1.94 | % | | | 2.14 | % | | | 2.47 | % | | | 2.33 | % |
Portfolio turnover rate(f) | | | 5 | % | | | 5 | % | | | 6 | % | | | 7 | % | | | 5 | % | | | 5 | % |
| (a) | Based on average shares outstanding. |
| (b) | Amount represents less than $0.005. |
| (c) | The mean between the last bid and ask prices. |
| (d) | Net asset value total return is calculated assuming an initial investment made at the net asset value at the beginning of the period, reinvestment of all dividends and distributions at net asset value during the period, and redemption on the last day of the period. Net asset value total return includes adjustments in accordance with accounting principles generally accepted in the United States of America and as such, the net asset value for financial reporting purposes and the returns based upon those net asset values may differ from the net asset value and returns for shareholder transactions. Market price total return is calculated assuming an initial investment made at the market price at the beginning of the period, reinvestment of all dividends and distributions at market price during the period, and sale at the market price on the last day of the period. Total investment returns calculated for a period of less than one year are not annualized. |
| (f) | Portfolio turnover rate is not annualized for periods less than one year, if applicable, and does not include securities received or delivered from processing creations or redemptions. |
See accompanying Notes to Financial Statements which are an integral part of the financial statements.
Financial Highlights (continued)
Invesco California AMT-Free Municipal Bond ETF (PWZ)
| | | | | | | | | | | | | | | | | | | | | | | | |
| | | Ten Months Ended
August 31, 2018 | | | Year Ended October 31, | |
| | | 2017 | | | 2016 | | | 2015 | | | 2014 | | | 2013 | |
| Per Share Operating Performance: | | | | | | | | | | | | | | | | | | | | | | | | |
Net asset value at beginning of period | | $ | 26.09 | | | $ | 26.15 | | | $ | 25.43 | | | $ | 25.45 | | | $ | 23.50 | | | $ | 25.34 | |
Net investment income(a) | | | 0.54 | | | | 0.65 | | | | 0.74 | | | | 0.82 | | | | 0.97 | | | | 0.91 | |
Net realized and unrealized gain (loss) on investments | | | (0.23 | ) | | | (0.07 | ) | | | 0.70 | | | | (0.06 | ) | | | 1.91 | | | | (1.84 | ) |
Total from investment operations | | | 0.31 | | | | 0.58 | | | | 1.44 | | | | 0.76 | | | | 2.88 | | | | (0.93 | ) |
Distributions to shareholders from: | | | | | | | | | | | | | | | | | | | | | | | | |
Net investment income | | | (0.53 | ) | | | (0.65 | ) | | | (0.75 | ) | | | (0.83 | ) | | | (0.97 | ) | | | (0.91 | ) |
Return of capital | | | (0.01 | ) | | | (0.01 | ) | | | (0.01 | ) | | | (0.00 | )(b) | | | (0.02 | ) | | | (0.00 | )(b) |
Total distributions | | | (0.54 | ) | | | (0.66 | ) | | | (0.76 | ) | | | (0.83 | ) | | | (0.99 | ) | | | (0.91 | ) |
Transaction fees(a) | | | 0.00 | (b) | | | 0.02 | | | | 0.04 | | | | 0.05 | | | | 0.06 | | | | — | |
Net asset value at end of period | | $ | 25.86 | | | $ | 26.09 | | | $ | 26.15 | | | $ | 25.43 | | | $ | 25.45 | | | $ | 23.50 | |
Market price at end of period(c) | | $ | 25.83 | | | $ | 26.08 | | | $ | 26.21 | | | $ | 25.50 | | | $ | 25.61 | | | $ | 23.42 | |
| Net Asset Value Total Return(d) | | | 1.22 | % | | | 2.36 | % | | | 5.84 | % | | | 3.25 | % | | | 12.75 | % | | | (3.74 | )% |
| Market Price Total Return(d) | | | 1.15 | % | | | 2.08 | % | | | 5.79 | % | | | 2.87 | % | | | 13.84 | % | | | (4.06 | )% |
| Ratios/Supplemental Data: | | | | | | | | | | | | | | | | | | | | | | | | |
Net assets at end of period (000’s omitted) | | $ | 250,796 | | | $ | 237,413 | | | $ | 189,620 | | | $ | 109,369 | | | $ | 66,169 | | | $ | 61,108 | |
Ratio to average net assets of: | | | | | | | | | | | | | | | | | | | | | | | | |
Expenses | | | 0.28 | %(e) | | | 0.28 | % | | | 0.28 | % | | | 0.28 | % | | | 0.26 | % | | | 0.30 | % |
Net investment income | | | 2.49 | %(e) | | | 2.52 | % | | | 2.81 | % | | | 3.23 | % | | | 3.95 | % | | | 3.70 | % |
Portfolio turnover rate(f) | | | 6 | % | | | 24 | % | | | 6 | % | | | 3 | % | | | 28 | % | | | 1 | % |
| (a) | Based on average shares outstanding. |
| (b) | Amount represents less than $0.005. |
| (c) | The mean between the last bid and ask prices. |
| (d) | Net asset value total return is calculated assuming an initial investment made at the net asset value at the beginning of the period, reinvestment of all dividends and distributions at net asset value during the period, and redemption on the last day of the period. Net asset value total return includes adjustments in accordance with accounting principles generally accepted in the United States of America and as such, the net asset value for financial reporting purposes and the returns based upon those net asset values may differ from the net asset value and returns for shareholder transactions. Market price total return is calculated assuming an initial investment made at the market price at the beginning of the period, reinvestment of all dividends and distributions at market price during the period, and sale at the market price on the last day of the period. Total investment returns calculated for a period of less than one year are not annualized. |
| (f) | Portfolio turnover rate is not annualized for periods less than one year, if applicable, and does not include securities received or delivered from processing creations or redemptions. For the fiscal year ended October 31, 2014, the portfolio turnover calculation includes the value of securities purchased and sold in the effort to realign the Fund’s portfolio holdings due to the underlying index change. |
See accompanying Notes to Financial Statements which are an integral part of the financial statements.
Financial Highlights (continued)
Invesco CEF Income Composite ETF (PCEF)
| | | | | | | | | | | | | | | | | | | | | | | | |
| | | Ten Months Ended
August 31, 2018 | | | Year Ended October 31, | |
| | | 2017 | | | 2016 | | | 2015 | | | 2014 | | | 2013 | |
| Per Share Operating Performance: | | | | | | | | | | | | | | | | | | | | | | | | |
Net asset value at beginning of period | | $ | 23.96 | | | $ | 22.23 | | | $ | 21.91 | | | $ | 24.41 | | | $ | 24.40 | | | $ | 25.47 | |
Net investment income(a) | | | 1.26 | | | | 1.13 | | | | 1.30 | | | | 1.53 | | | | 1.36 | | | | 1.21 | |
Net realized and unrealized gain (loss) on investments | | | (0.84 | ) | | | 2.28 | | | | 0.77 | | | | (2.07 | ) | | | 0.58 | | | | (0.31 | ) |
Total from investment operations | | | 0.42 | | | | 3.41 | | | | 2.07 | | | | (0.54 | ) | | | 1.94 | | | | 0.90 | |
Distributions to shareholders from: | | | | | | | | | | | | | | | | | | | | | | | | |
Net investment income | | | (1.39 | ) | | | (1.13 | ) | | | (1.34 | ) | | | (1.49 | ) | | | (1.75 | ) | | | (1.49 | ) |
Net realized gains | | | — | | | | — | | | | — | | | | — | | | | (0.18 | ) | | | — | |
Return of capital | | | — | | | | (0.55 | ) | | | (0.41 | ) | | | (0.47 | ) | | | — | | | | (0.48 | ) |
Total distributions | | | (1.39 | ) | | | (1.68 | ) | | | (1.75 | ) | | | (1.96 | ) | | | (1.93 | ) | | | (1.97 | ) |
Net asset value at end of period | | $ | 22.99 | | | $ | 23.96 | | | $ | 22.23 | | | $ | 21.91 | | | $ | 24.41 | | | $ | 24.40 | |
Market price at end of period(b) | | $ | 23.01 | | | $ | 23.96 | | | $ | 22.23 | | | $ | 21.85 | | | $ | 24.42 | | | $ | 24.40 | |
| Net Asset Value Total Return(c) | | | 1.85 | % | | | 15.86 | % | | | 10.11 | % | | | (2.31 | )% | | | 8.23 | % | | | 3.64 | % |
| Market Price Total Return(c) | | | 1.94 | % | | | 15.86 | % | | | 10.41 | % | | | (2.62 | )% | | | 8.27 | % | | | 3.43 | % |
| Ratios/Supplemental Data: | | | | | | | | | | | | | | | | | | | | | | | | |
Net assets at end of period (000’s omitted) | | $ | 723,177 | | | $ | 703,177 | | | $ | 642,473 | | | $ | 628,684 | | | $ | 619,913 | | | $ | 469,789 | |
Ratio to average net assets of: | | | | | | | | | | | | | | | | | | | | | | | | |
Expenses(d) | | | 0.50 | %(e) | | | 0.50 | % | | | 0.50 | % | | | 0.50 | % | | | 0.50 | % | | | 0.50 | % |
Net investment income | | | 6.53 | %(e) | | | 4.85 | % | | | 5.99 | % | | | 6.61 | % | | | 5.54 | % | | | 4.82 | % |
Portfolio turnover rate(f) | | | 12 | % | | | 15 | % | | | 20 | % | | | 20 | % | | | 19 | % | | | 33 | % |
| (a) | Based on average shares outstanding. |
| (b) | The mean between the last bid and ask prices. |
| (c) | Net asset value total return is calculated assuming an initial investment made at the net asset value at the beginning of the period, reinvestment of all dividends and distributions at net asset value during the period, and redemption on the last day of the period. Net asset value total return includes adjustments in accordance with accounting principles generally accepted in the United States of America and as such, the net asset value for financial reporting purposes and the returns based upon those net asset values may differ from the net asset value and returns for shareholder transactions. Market price total return is calculated assuming an initial investment made at the market price at the beginning of the period, reinvestment of all dividends and distributions at market price during the period, and sale at the market price on the last day of the period. Total investment returns calculated for a period of less than one year are not annualized. |
| (d) | In addition to the fees and expenses which the Fund bears directly, the Fund indirectly bears a pro rata share of the fees and expenses of the investment companies in which the Fund invests. Estimated investment companies’ expenses are not expenses that are incurred directly by the Fund. They are expenses that are incurred directly by the investment companies and are deducted from the value of the investment companies the Fund invests in. The effect of the estimated investment companies’ expenses that the Fund bears indirectly is included in the Fund’s total return. |
| (f) | Portfolio turnover rate is not annualized for periods less than one year, if applicable, and does not include securities received or delivered from processing creations or redemptions. |
Invesco Fundamental High Yield® Corporate Bond ETF (PHB)
| | | | | | | | | | | | | | | | | | | | | | | | |
| | | Ten Months Ended
August 31, 2018 | | | Year Ended October 31, | |
| | | 2017 | | | 2016 | | | 2015 | | | 2014 | | | 2013 | |
| Per Share Operating Performance: | | | | | | | | | | | | | | | | | | | | | | | | |
Net asset value at beginning of period | | $ | 19.08 | | | $ | 18.79 | | | $ | 18.25 | | | $ | 19.24 | | | $ | 19.24 | | | $ | 19.19 | |
Net investment income(a) | | | 0.64 | | | | 0.80 | | | | 0.85 | | | | 0.81 | | | | 0.85 | | | | 0.90 | |
Net realized and unrealized gain (loss) on investments | | | (0.52 | ) | | | 0.29 | | | | 0.54 | | | | (0.98 | ) | | | (0.00 | )(b) | | | 0.05 | |
Total from investment operations | | | 0.12 | | | | 1.09 | | | | 1.39 | | | | (0.17 | ) | | | 0.85 | | | | 0.95 | |
Distributions to shareholders from: | | | | | | | | | | | | | | | | | | | | | | | | |
Net investment income | | | (0.64 | ) | | | (0.80 | ) | | | (0.85 | ) | | | (0.82 | ) | | | (0.85 | ) | | | (0.90 | ) |
Net asset value at end of period | | $ | 18.56 | | | $ | 19.08 | | | $ | 18.79 | | | $ | 18.25 | | | $ | 19.24 | | | $ | 19.24 | |
Market price at end of period(c) | | $ | 18.55 | | | $ | 19.07 | | | $ | 18.70 | | | $ | 18.23 | | | $ | 19.19 | | | $ | 19.26 | |
| Net Asset Value Total Return(d) | | | 0.70 | % | | | 5.96 | % | | | 7.97 | % | | | (0.90 | )% | | | 4.49 | % | | | 5.06 | % |
| Market Price Total Return(d) | | | 0.70 | % | | | 6.42 | % | | | 7.56 | % | | | (0.75 | )% | | | 4.12 | % | | | 5.29 | % |
| Ratios/Supplemental Data: | | | | | | | | | | | | | | | | | | | | | | | | |
Net assets at end of period (000’s omitted) | | $ | 948,530 | | | $ | 1,197,922 | | | $ | 1,088,137 | | | $ | 666,301 | | | $ | 565,770 | | | $ | 621,429 | |
Ratio to average net assets of: | | | | | | | | | | | | | | | | | | | | | | | | |
Expenses | | | 0.50 | %(e) | | | 0.50 | % | | | 0.50 | % | | | 0.50 | % | | | 0.50 | % | | | 0.50 | % |
Net investment income | | | 4.12 | %(e) | | | 4.23 | % | | | 4.69 | % | | | 4.34 | % | | | 4.37 | % | | | 4.66 | % |
Portfolio turnover rate(f) | | | 12 | % | | | 9 | % | | | 14 | % | | | 16 | % | | | 20 | % | | | 23 | % |
| (a) | Based on average shares outstanding. |
| (b) | Amount represents less than $0.005. |
| (c) | The mean between the last bid and ask prices. |
| (d) | Net asset value total return is calculated assuming an initial investment made at the net asset value at the beginning of the period, reinvestment of all dividends and distributions at net asset value during the period, and redemption on the last day of the period. Net asset value total return includes adjustments in accordance with accounting principles generally accepted in the United States of America and as such, the net asset value for financial reporting purposes and the returns based upon those net asset values may differ from the net asset value and returns for shareholder transactions. Market price total return is calculated assuming an initial investment made at the market price at the beginning of the period, reinvestment of all dividends and distributions at market price during the period, and sale at the market price on the last day of the period. Total investment returns calculated for a period of less than one year are not annualized. |
| (f) | Portfolio turnover rate is not annualized for periods less than one year, if applicable, and does not include securities received or delivered from processing creations or redemptions. |
See accompanying Notes to Financial Statements which are an integral part of the financial statements.
Financial Highlights (continued)
Invesco Fundamental Investment Grade Corporate Bond ETF (PFIG)
| | | | | | | | | | | | | | | | | | | | | | | | |
| | | Ten Months Ended
August 31, 2018 | | | Year Ended October 31, | |
| | 2017 | | | 2016 | | | 2015 | | | 2014 | | | 2013 | |
| Per Share Operating Performance: | | | | | | | | | | | | | | | | | | | | | | | | |
Net asset value at beginning of period | | $ | 25.63 | | | $ | 25.85 | | | $ | 25.24 | | | $ | 25.45 | | | $ | 25.13 | | | $ | 25.83 | |
Net investment income(a) | | | 0.57 | | | | 0.65 | | | | 0.65 | | | | 0.62 | | | | 0.62 | | | | 0.54 | |
Net realized and unrealized gain (loss) on investments | | | (0.83 | ) | | | (0.22 | ) | | | 0.62 | | | | (0.19 | ) | | | 0.31 | | | | (0.69 | ) |
Total from investment operations | | | (0.26 | ) | | | 0.43 | | | | 1.27 | | | | 0.43 | | | | 0.93 | | | | (0.15 | ) |
Distributions to shareholders from: | | | | | | | | | | | | | | | | | | | | | | | | |
Net investment income | | | (0.57 | ) | | | (0.65 | ) | | | (0.66 | ) | | | (0.64 | ) | | | (0.60 | ) | | | (0.55 | ) |
Net realized gains | | | — | | | | — | | | | — | | | | — | | | | (0.01 | ) | | | — | |
Return of capital | | | (0.00 | )(b) | | | — | | | | (0.00 | )(b) | | | — | | | | — | | | | — | |
Total distributions | | | (0.57 | ) | | | (0.65 | ) | | | (0.66 | ) | | | (0.64 | ) | | | (0.61 | ) | | | (0.55 | ) |
Net asset value at end of period | | $ | 24.80 | | | $ | 25.63 | | | $ | 25.85 | | | $ | 25.24 | | | $ | 25.45 | | | $ | 25.13 | |
Market price at end of period(c) | | $ | 24.80 | | | $ | 25.62 | | | $ | 25.87 | | | $ | 25.27 | | | $ | 25.47 | | | $ | 25.12 | |
| Net Asset Value Total Return(d) | | | (1.01 | )% | | | 1.73 | % | | | 5.08 | % | | | 1.69 | % | | | 3.75 | % | | | (0.57 | )% |
| Market Price Total Return(d) | | | (0.98 | )% | | | 1.61 | % | | | 5.03 | % | | | 1.72 | % | | | 3.88 | % | | | (0.68 | )% |
| Ratios/Supplemental Data: | | | | | | | | | | | | | | | | | | | | | | | | |
Net assets at end of period (000’s omitted) | | $ | 106,620 | | | $ | 49,970 | | | $ | 58,154 | | | $ | 34,067 | | | $ | 30,538 | | | $ | 33,925 | |
Ratio to average net assets of: | | | | | | | | | | | | | | | | | | | | | | | | |
Expenses | | | 0.22 | %(e) | | | 0.22 | % | | | 0.22 | % | | | 0.22 | % | | | 0.22 | % | | | 0.22 | % |
Net investment income | | | 2.77 | %(e) | | | 2.53 | % | | | 2.55 | % | | | 2.45 | % | | | 2.43 | % | | | 2.15 | % |
Portfolio turnover rate(f) | | | 24 | % | | | 42 | % | | | 20 | % | | | 16 | % | | | 9 | % | | | 20 | % |
| (a) | Based on average shares outstanding. |
| (b) | Amount represents less than $0.005. |
| (c) | The mean between the last bid and ask prices. |
| (d) | Net asset value total return is calculated assuming an initial investment made at the net asset value at the beginning of the period, reinvestment of all dividends and distributions at net asset value during the period, and redemption on the last day of the period. Net asset value total return includes adjustments in accordance with accounting principles generally accepted in the United States of America and as such, the net asset value for financial reporting purposes and the returns based upon those net asset values may differ from the net asset value and returns for shareholder transactions. Market price total return is calculated assuming an initial investment made at the market price at the beginning of the period, reinvestment of all dividends and distributions at market price during the period, and sale at the market price on the last day of the period. Total investment returns calculated for a period of less than one year are not annualized. |
| (f) | Portfolio turnover rate is not annualized for periods less than one year, if applicable, and does not include securities received or delivered from processing creations or redemptions. |
See accompanying Notes to Financial Statements which are an integral part of the financial statements.
Financial Highlights (continued)
Invesco LadderRite 0-5 Year Corporate Bond ETF (LDRI)
| | | | | | | | | | | | | | | | | | | | |
| | | Ten Months Ended
August 31, 2018 | | | Year Ended October 31, | | | For the Period
September 8, 2014(a)
Through
October 31, 2014 | |
| | | 2017 | | | 2016 | | | 2015 | |
| Per Share Operating Performance: | | | | | | | | | | | | | | | | | | | | |
Net asset value at beginning of period | | $ | 24.98 | | | $ | 25.06 | | | $ | 25.08 | | | $ | 25.03 | | | $ | 25.07 | |
Net investment income(b) | | | 0.43 | | | | 0.45 | | | | 0.43 | | | | 0.32 | | | | 0.03 | |
Net realized and unrealized gain (loss) on investments | | | (0.36 | ) | | | (0.08 | ) | | | 0.03 | | | | 0.05 | | | | (0.04 | ) |
Total from investment operations | | | 0.07 | | | | 0.37 | | | | 0.46 | | | | 0.37 | | | | (0.01 | ) |
Distribution to shareholders from: | | | | | | | | | | | | | | | | | | | | |
Net investment income | | | (0.42 | ) | | | (0.45 | ) | | | (0.44 | ) | | | (0.32 | ) | | | (0.03 | ) |
Net realized gains | | | — | | | | — | | | | (0.04 | ) | | | — | | | | — | |
Return of capital | | | — | | | | — | | | | (0.00 | )(c) | | | — | | | | — | |
Total distributions | | | (0.42 | ) | | | (0.45 | ) | | | (0.48 | ) | | | (0.32 | ) | | | (0.03 | ) |
Net asset value at end of period | | $ | 24.63 | | | $ | 24.98 | | | $ | 25.06 | | | $ | 25.08 | | | $ | 25.03 | |
Market price at end of period(d) | | $ | 24.63 | | | $ | 24.98 | | | $ | 25.14 | | | $ | 25.16 | | | $ | 25.04 | |
| Net Asset Value Total Return(e) | | | 0.30 | % | | | 1.49 | % | | | 1.84 | % | | | 1.48 | % | | | (0.06 | )%(f) |
| Market Price Total Return(e) | | | 0.30 | % | | | 1.16 | % | | | 1.84 | % | | | 1.76 | % | | | (0.02 | )%(f) |
| Ratios/Supplemental Data: | | | | | | | | | | | | | | | | | | | | |
Net assets at end of period (000’s omitted) | | $ | 12,315 | | | $ | 23,735 | | | $ | 22,554 | | | $ | 6,270 | | | $ | 6,256 | |
Ratio to average net assets of: | | | | | | | | | | | | | | | | | | | | |
Expenses | | | 0.22 | %(g) | | | 0.22 | % | | | 0.22 | % | | | 0.22 | % | | | 0.22 | %(g) |
Net investment income | | | 2.10 | %(g) | | | 1.79 | % | | | 1.74 | % | | | 1.26 | % | | | 0.96 | %(g) |
Portfolio turnover rate(h) | | | 27 | % | | | 19 | % | | | 11 | % | | | 9 | % | | | 0 | % |
| (a) | Commencement of investment operations. |
| (b) | Based on average shares outstanding. |
| (c) | Amount represents less than $0.005. |
| (d) | The mean between the last bid and ask prices. |
| (e) | Net asset value total return is calculated assuming an initial investment made at the net asset value at the beginning of the period, reinvestment of all dividends and distributions at net asset value during the period, and redemption on the last day of the period. Net asset value total return includes adjustments in accordance with accounting principles generally accepted in the United States of America and as such, the net asset value for financial reporting purposes and the returns based upon those net asset values may differ from the net asset value and returns for shareholder transactions. Market price total return is calculated assuming an initial investment made at the market price at the beginning of the period, reinvestment of all dividends and distributions at market price during the period, and sale at the market price on the last day of the period. Total investment returns calculated for a period of less than one year are not annualized. |
| (f) | The net asset value total return from Fund Inception (September 10, 2014, the first day trading on the exchange) to October 31, 2014 was 0.22%. The market price total return from Fund Inception to October 31, 2014 was 0.26%. |
| (h) | Portfolio turnover rate is not annualized for periods less than one year, if applicable, and does not include securities received or delivered from processing creations or redemptions. |
See accompanying Notes to Financial Statements which are an integral part of the financial statements.
Financial Highlights (continued)
Invesco National AMT-Free Municipal Bond ETF (PZA)
| | | | | | | | | | | | | | | | | | | | | | | | |
| | | Ten Months Ended
August 31, 2018 | | | Year Ended October 31, | |
| | 2017 | | | 2016 | | | 2015 | | | 2014 | | | 2013 | |
| Per Share Operating Performance: | | | | | | | | | | | | | | | | | | | | | | | | |
Net asset value at beginning of period | | $ | 25.58 | | | $ | 25.69 | | | $ | 25.10 | | | $ | 25.17 | | | $ | 23.28 | | | $ | 25.74 | |
Net investment income(a) | | | 0.65 | | | | 0.77 | | | | 0.82 | | | | 0.92 | | | | 1.00 | | | | 0.98 | |
Net realized and unrealized gain (loss) on investments | | | (0.46 | ) | | | (0.11 | ) | | | 0.57 | | | | (0.09 | ) | | | 1.87 | | | | (2.46 | ) |
Total from investment operations | | | 0.19 | | | | 0.66 | | | | 1.39 | | | | 0.83 | | | | 2.87 | | | | (1.48 | ) |
Distributions to shareholders from: | | | | | | | | | | | | | | | | | | | | | | | | |
Net investment income | | | (0.66 | ) | | | (0.78 | ) | | | (0.83 | ) | | | (0.92 | ) | | | (1.01 | ) | | | (0.98 | ) |
Return of capital | | | — | | | | — | | | | (0.00 | )(b) | | | (0.00 | )(b) | | | (0.01 | ) | | | (0.00 | )(b) |
Total distributions | | | (0.66 | ) | | | (0.78 | ) | | | (0.83 | ) | | | (0.92 | ) | | | (1.02 | ) | | | (0.98 | ) |
Transaction fees(a) | | | 0.00 | (b) | | | 0.01 | | | | 0.03 | | | | 0.02 | | | | 0.04 | | | | — | |
Net asset value at end of period | | $ | 25.11 | | | $ | 25.58 | | | $ | 25.69 | | | $ | 25.10 | | | $ | 25.17 | | | $ | 23.28 | |
Market price at end of period(c) | | $ | 25.12 | | | $ | 25.55 | | | $ | 25.77 | | | $ | 25.15 | | | $ | 25.25 | | | $ | 23.23 | |
| Net Asset Value Total Return(d) | | | 0.77 | % | | | 2.70 | % | | | 5.71 | % | | | 3.45 | % | | | 12.77 | % | | | (5.90 | )% |
| Market Price Total Return(d) | | | 0.93 | % | | | 2.25 | % | | | 5.82 | % | | | 3.32 | % | | | 13.35 | % | | | (6.27 | )% |
| Ratios/Supplemental Data: | | | | | | | | | | | | | | | | | | | | | | | | |
Net assets at end of period (000’s omitted) | | $ | 1,659,981 | | | $ | 1,611,258 | | | $ | 1,379,633 | | | $ | 897,395 | | | $ | 739,986 | | | $ | 564,598 | |
Ratio to average net assets of: | | | | | | | | | | | | | | | | | | | | | | | | |
Expenses | | | 0.28 | %(e) | | | 0.28 | % | | | 0.28 | % | | | 0.28 | % | | | 0.28 | % | | | 0.28 | % |
Net investment income | | | 3.10 | %(e) | | | 3.06 | % | | | 3.17 | % | | | 3.64 | % | | | 4.13 | % | | | 3.93 | % |
Portfolio turnover rate(f) | | | 8 | % | | | 23 | % | | | 6 | % | | | 4 | % | | | 15 | % | | | 12 | % |
| (a) | Based on average shares outstanding. |
| (b) | Amount represents less than $0.005. |
| (c) | The mean between the last bid and ask prices. |
| (d) | Net asset value total return is calculated assuming an initial investment made at the net asset value at the beginning of the period, reinvestment of all dividends and distributions at net asset value during the period, and redemption on the last day of the period. Net asset value total return includes adjustments in accordance with accounting principles generally accepted in the United States of America and as such, the net asset value for financial reporting purposes and the returns based upon those net asset values may differ from the net asset value and returns for shareholder transactions. Market price total return is calculated assuming an initial investment made at the market price at the beginning of the period, reinvestment of all dividends and distributions at market price during the period, and sale at the market price on the last day of the period. Total investment returns calculated for a period of less than one year are not annualized. |
| (f) | Portfolio turnover rate is not annualized for periods less than one year, if applicable, and does not include securities received or delivered from processing creations or redemptions. For the fiscal year ended October 31, 2014, the portfolio turnover calculation includes the value of securities purchased and sold in the effort to realign the Fund’s portfolio holdings due to the underlying index change. |
See accompanying Notes to Financial Statements which are an integral part of the financial statements.
Financial Highlights (continued)
Invesco New York AMT-Free Municipal Bond ETF (PZT)
| | | | | | | | | | | | | | | | | | | | | | | | |
| | | Ten Months Ended
August 31, 2018 | | | Year Ended October 31, | |
| | | 2017 | | | 2016 | | | 2015 | | | 2014 | | | 2013 | |
| Per Share Operating Performance: | | | | | | | | | | | | | | | | | | | | | | | | |
Net asset value at beginning of period | | $ | 24.47 | | | $ | 24.64 | | | $ | 24.14 | | | $ | 24.33 | | | $ | 22.37 | | | $ | 24.82 | |
Net investment income(a) | | | 0.58 | | | | 0.73 | | | | 0.81 | | | | 0.83 | | | | 0.92 | | | | 0.92 | |
Net realized and unrealized gain (loss) on investments | | | (0.47 | ) | | | (0.17 | ) | | | 0.51 | | | | (0.19 | ) | | | 1.96 | | | | (2.45 | ) |
Total from investment operations | | | 0.11 | | | | 0.56 | | | | 1.32 | | | | 0.64 | | | | 2.88 | | | | (1.53 | ) |
Distributions to shareholders from: | | | | | | | | | | | | | | | | | | | | | | | | |
Net investment income | | | (0.59 | ) | | | (0.73 | ) | | | (0.81 | ) | | | (0.83 | ) | | | (0.91 | ) | | | (0.92 | ) |
Return of capital | | | — | | | | — | | | | (0.01 | ) | | | (0.00 | )(b) | | | (0.01 | ) | | | (0.00 | )(b) |
Total distributions | | | (0.59 | ) | | | (0.73 | ) | | | (0.82 | ) | | | (0.83 | ) | | | (0.92 | ) | | | (0.92 | ) |
Net asset value at end of period | | $ | 23.99 | | | $ | 24.47 | | | $ | 24.64 | | | $ | 24.14 | | | $ | 24.33 | | | $ | 22.37 | |
Market price at end of period(c) | | $ | 23.92 | | | $ | 24.53 | | | $ | 24.67 | | | $ | 24.05 | | | $ | 24.22 | | | $ | 22.28 | |
| Net Asset Value Total Return(d) | | | 0.46 | % | | | 2.37 | % | | | 5.50 | % | | | 2.68 | % | | | 13.16 | % | | | (6.32 | )% |
| Market Price Total Return(d) | | | (0.08 | )% | | | 2.49 | % | | | 6.02 | % | | | 2.77 | % | | | 13.11 | % | | | (6.83 | )% |
| Ratios/Supplemental Data: | | | | | | | | | | | | | | | | | | | | | | | | |
Net assets at end of period (000’s omitted) | | $ | 63,577 | | | $ | 66,061 | | | $ | 64,063 | | | $ | 50,692 | | | $ | 47,450 | | | $ | 49,204 | |
Ratio to average net assets of: | | | | | | | | | | | | | | | | | | | | | | | | |
Expenses | | | 0.28 | %(e) | | | 0.28 | % | | | 0.28 | % | | | 0.28 | % | | | 0.26 | % | | | 0.30 | % |
Net investment income | | | 2.89 | %(e) | | | 3.01 | % | | | 3.26 | % | | | 3.42 | % | | | 3.92 | % | | | 3.84 | % |
Portfolio turnover rate(f) | | | 7 | % | | | 22 | % | | | 21 | % | | | 18 | % | | | 18 | % | | | 20 | % |
| (a) | Based on average shares outstanding. |
| (b) | Amount represents less than $0.005. |
| (c) | The mean between the last bid and ask prices. |
| (d) | Net asset value total return is calculated assuming an initial investment made at the net asset value at the beginning of the period, reinvestment of all dividends and distributions at net asset value during the period, and redemption on the last day of the period. Net asset value total return includes adjustments in accordance with accounting principles generally accepted in the United States of America and as such, the net asset value for financial reporting purposes and the returns based upon those net asset values may differ from the net asset value and returns for shareholder transactions. Market price total return is calculated assuming an initial investment made at the market price at the beginning of the period, reinvestment of all dividends and distributions at market price during the period, and sale at the market price on the last day of the period. Total investment returns calculated for a period of less than one year are not annualized. |
| (f) | Portfolio turnover rate is not annualized for periods less than one year, if applicable, and does not include securities received or delivered from processing creations or redemptions. For the fiscal year ended October 31, 2014, the portfolio turnover calculation includes the value of securities purchased and sold in the effort to realign the Fund’s portfolio holdings due to the underlying index change. |
Invesco Preferred ETF (PGX)
| | | | | | | | | | | | | | | | | | | | | | | | |
| | | Ten Months Ended
August 31, 2018 | | | Year Ended October 31, | |
| | | 2017 | | | 2016 | | | 2015 | | | 2014 | | | 2013 | |
| Per Share Operating Performance: | | | | | | | | | | | | | | | | | | | | | | | | |
Net asset value at beginning of period | | $ | 14.97 | | | $ | 14.96 | | | $ | 14.78 | | | $ | 14.57 | | | $ | 13.78 | | | $ | 14.82 | |
Net investment income(a) | | | 0.71 | | | | 0.84 | | | | 0.84 | | | | 0.87 | | | | 0.88 | | | | 0.91 | |
Net realized and unrealized gain (loss) on investments | | | (0.40 | ) | | | 0.02 | | | | 0.20 | | | | 0.21 | | | | 0.79 | | | | (1.03 | ) |
Total from investment operations | | | 0.31 | | | | 0.86 | | | | 1.04 | | | | 1.08 | | | | 1.67 | | | | (0.12 | ) |
Distributions to shareholders from: | | | | | | | | | | | | | | | | | | | | | | | | |
Net investment income | | | (0.68 | ) | | | (0.85 | ) | | | (0.86 | ) | | | (0.87 | ) | | | (0.88 | ) | | | (0.92 | ) |
Net asset value at end of period | | $ | 14.60 | | | $ | 14.97 | | | $ | 14.96 | | | $ | 14.78 | | | $ | 14.57 | | | $ | 13.78 | |
Market price at end of period(b) | | $ | 14.62 | | | $ | 14.96 | | | $ | 15.00 | | | $ | 14.80 | | | $ | 14.62 | | | $ | 13.79 | |
| Net Asset Value Total Return(c) | | | 2.18 | % | | | 5.97 | % | | | 7.22 | % | | | 7.66 | % | | | 12.51 | % | | | (0.88 | )% |
| Market Price Total Return(c) | | | 2.39 | % | | | 5.60 | % | | | 7.36 | % | | | 7.43 | % | | | 12.81 | % | | | (0.95 | )% |
| Ratios/Supplemental Data: | | | | | | | | | | | | | | | | | | | | | | | | |
Net assets at end of period (000’s omitted) | | $ | 5,378,011 | | | $ | 5,333,535 | | | $ | 4,730,845 | | | $ | 3,117,091 | | | $ | 2,264,758 | | | $ | 2,107,031 | |
Ratio to average net assets of: | | | | | | | | | | | | | | | | | | | | | | | | |
Expenses | | | 0.50 | %(d)(e) | | | 0.50 | % | | | 0.50 | % | | | 0.50 | % | | | 0.50 | % | | | 0.50 | % |
Net investment income | | | 5.83 | %(d)(e) | | | 5.66 | % | | | 5.63 | % | | | 5.95 | % | | | 6.21 | % | | | 6.27 | % |
Portfolio turnover rate(f) | | | 16 | % | | | 10 | % | | | 14 | % | | | 12 | % | | | 13 | % | | | 29 | % |
| (a) | Based on average shares outstanding. |
| (b) | The mean between the last bid and ask prices. |
| (c) | Net asset value total return is calculated assuming an initial investment made at the net asset value at the beginning of the period, reinvestment of all dividends and distributions at net asset value during the period, and redemption on the last day of the period. Net asset value total return includes adjustments in accordance with accounting principles generally accepted in the United States of America and as such, the net asset value for financial reporting purposes and the returns based upon those net asset values may differ from the net asset value and returns for shareholder transactions. Market price total return is calculated assuming an initial investment made at the market price at the beginning of the period, reinvestment of all dividends and distributions at market price during the period, and sale at the market price on the last day of the period. Total investment returns calculated for a period of less than one year are not annualized. |
| (e) | In addition to the fees and expenses which the Fund bears directly, the Fund indirectly bears a pro rata share of the fees and expenses of the investment companies in which the Fund invests. Estimated investment companies’ expenses are not expenses that are incurred directly by the Fund. They are expenses that are incurred directly by the investment companies and are deducted from the value of the investment companies the Fund invests in. The effect of the estimated investment companies’ expenses that the Fund bears indirectly is included in the Fund’s total return. |
| (f) | Portfolio turnover rate is not annualized for periods less than one year, if applicable, and does not include securities received or delivered from processing creations or redemptions. |
See accompanying Notes to Financial Statements which are an integral part of the financial statements.
Financial Highlights (continued)
Invesco Taxable Municipal Bond ETF (BAB)
| | | | | | | | | | | | | | | | | | | | | | | | |
| | | Ten Months Ended
August 31, 2018 | | | Year Ended October 31, | |
| | | 2017 | | | 2016 | | | 2015 | | | 2014 | | | 2013 | |
| Per Share Operating Performance: | | | | | | | | | | | | | | | | | | | | | | | | |
Net asset value at beginning of period | | $ | 30.38 | | | $ | 30.68 | | | $ | 29.11 | | | $ | 29.77 | | | $ | 27.90 | | | $ | 30.19 | |
Net investment income(a) | | | 1.01 | | | | 1.21 | | | | 1.26 | | | | 1.37 | | | | 1.40 | | | | 1.42 | |
Net realized and unrealized gain (loss) on investments | | | (0.72 | ) | | | (0.32 | ) | | | 1.54 | | | | (0.71 | ) | | | 1.87 | | | | (2.29 | ) |
Total from investment operations | | | 0.29 | | | | 0.89 | | | | 2.80 | | | | 0.66 | | | | 3.27 | | | | (0.87 | ) |
Distributions to shareholders from: | | | | | | | | | | | | | | | | | | | | | | | | |
Net investment income | | | (1.02 | ) | | | (1.21 | ) | | | (1.27 | ) | | | (1.37 | ) | | | (1.40 | ) | | | (1.42 | ) |
Transaction fees(a) | | | 0.01 | | | | 0.02 | | | | 0.04 | | | | 0.05 | | | | — | | | | — | |
Net asset value at end of period | | $ | 29.66 | | | $ | 30.38 | | | $ | 30.68 | | | $ | 29.11 | | | $ | 29.77 | | | $ | 27.90 | |
Market price at end of period(b) | | $ | 29.51 | | | $ | 30.45 | | | $ | 30.74 | | | $ | 29.17 | | | $ | 29.76 | | | $ | 27.79 | |
| Net Asset Value Total Return(c) | | | 1.02 | % | | | 3.14 | % | | | 9.93 | % | | | 2.40 | % | | | 12.03 | % | | | (3.00 | )% |
| Market Price Total Return(c) | | | 0.29 | % | | | 3.19 | % | | | 9.90 | % | | | 2.65 | % | | | 12.44 | % | | | (3.28 | )% |
| Ratios/Supplemental Data: | | | | | | | | | | | | | | | | | | | | | | | | |
Net assets at end of period (000’s omitted) | | $ | 938,871 | | | $ | 972,235 | | | $ | 1,070,679 | | | $ | 676,840 | | | $ | 695,156 | | | $ | 683,643 | |
Ratio to average net assets of: | | | | | | | | | | | | | | | | | | | | | | | | |
Expenses | | | 0.28 | %(d) | | | 0.28 | %(e) | | | 0.27 | % | | | 0.28 | % | | | 0.27 | % | | | 0.28 | % |
Net investment income | | | 4.06 | %(d) | | | 4.05 | % | | | 4.14 | % | | | 4.59 | % | | | 4.86 | % | | | 4.80 | % |
Portfolio turnover rate(f) | | | 4 | % | | | 6 | % | | | 0 | %(g) | | | 9 | % | | | 7 | % | | | 5 | % |
| (a) | Based on average shares outstanding. |
| (b) | The mean between the last bid and ask prices. |
| (c) | Net asset value total return is calculated assuming an initial investment made at the net asset value at the beginning of the period, reinvestment of all dividends and distributions at net asset value during the period, and redemption on the last day of the period. Net asset value total return includes adjustments in accordance with accounting principles generally accepted in the United States of America and as such, the net asset value for financial reporting purposes and the returns based upon those net asset values may differ from the net asset value and returns for shareholder transactions. Market price total return is calculated assuming an initial investment made at the market price at the beginning of the period, reinvestment of all dividends and distributions at market price during the period, and sale at the market price on the last day of the period. Total investment returns calculated for a period of less than one year are not annualized. |
| (e) | In addition to the fees and expenses which the Fund bears directly, the Fund indirectly bears a pro rata share of the fees and expenses of the investment companies in which the Fund invests. Estimated investment companies’ expenses are not expenses that are incurred directly by the Fund. They are expenses that are incurred directly by the investment companies and are deducted from the value of the investment companies the Fund invests in. The effect of the estimated investment companies’ expenses that the Fund bears indirectly is included in the Fund’s total return. |
| (f) | Portfolio turnover rate is not annualized for periods less than one year, if applicable, and does not include securities received or delivered from processing creations or redemptions. For the fiscal year ended October 31, 2017, the portfolio turnover calculation includes the value of securities purchased and sold in the effort to realign the Fund’s portfolio holdings due to the underlying index change. |
| (g) | Amount represents less than 0.5%. |
Invesco Treasury Collateral ETF (CLTL)
| | | | | | | | |
| | | Ten Months Ended
August 31, 2018 | | | For the Period
January 10, 2017(a)
Through
October 31, 2017 | |
| Per Share Operating Performance: | | | | | | | | |
Net asset value at beginning of period | | $ | 105.93 | | | $ | 105.35 | |
Net investment income(b) | | | 1.28 | | | | 0.66 | |
Net realized and unrealized gain (loss) on investments | | | 0.00 | (c) | | | (0.08 | ) |
Total from investment operations | | | 1.28 | | | | 0.58 | �� |
Distribution to shareholders from: | | | | | | | | |
Net investment income | | | (1.73 | ) | | | — | |
Net asset value at end of period | | $ | 105.48 | | | $ | 105.93 | |
Market price at end of period(d) | | $ | 105.54 | | | $ | 105.94 | |
| Net Asset Value Total Return(e) | | | 1.22 | % | | | 0.55 | %(f) |
| Market Price Total Return(e) | | | 1.27 | % | | | 0.56 | %(f) |
| Ratios/Supplemental Data: | | | | | | | | |
Net assets at end of period (000’s omitted) | | $ | 468,323 | | | $ | 454,429 | |
Ratio to average net assets of: | | | | | | | | |
Expenses | | | 0.08 | %(g) | | | 0.08 | %(g) |
Net investment income | | | 1.45 | %(g) | | | 0.77 | %(g) |
| (a) | Commencement of investment operations. |
| (b) | Based on average shares outstanding. |
| (c) | Amount represents less than $0.005. |
| (d) | The mean between the last bid and ask prices. |
| (e) | Net asset value total return is calculated assuming an initial investment made at the net asset value at the beginning of the period, reinvestment of all dividends and distributions at net asset value during the period, and redemption on the last day of the period. Net asset value total return includes adjustments in accordance with accounting principles generally accepted in the United States of America and as such, the net asset value for financial reporting purposes and the returns based upon those net asset values may differ from the net asset value and returns for shareholder transactions. Market price total return is calculated assuming an initial investment made at the market price at the beginning of the period, reinvestment of all dividends and distributions at market price during the period, and sale at the market price on the last day of the period. Total investment returns calculated for a period of less than one year are not annualized. |
| (f) | The net asset value total return from Fund Inception (January 12, 2017, the first day trading on the exchange) to October 31, 2017 was 0.55%. The market price total return from Fund Inception to October 31, 2017 was 0.54%. |
See accompanying Notes to Financial Statements which are an integral part of the financial statements.
Financial Highlights (continued)
Invesco Variable Rate Preferred ETF (VRP)
| | | | | | | | | | | | | | | | | | | | |
| | | Ten Months Ended
August 31, 2018 | | | Year Ended October 31, | | | For the Period
April 28, 2014(a)
Through
October 31, 2014 | |
| | | 2017 | | | 2016 | | | 2015 | |
| Per Share Operating Performance: | | | | | | | | | | | | | | | | | | | | |
Net asset value at beginning of period | | $ | 25.87 | | | $ | 25.33 | | | $ | 24.36 | | | $ | 24.85 | | | $ | 24.87 | |
Net investment income(b) | | | 0.91 | | | | 1.21 | | | | 1.23 | | | | 1.20 | | | | 0.60 | |
Net realized and unrealized gain (loss) on investments | | | (0.66 | ) | | | 0.56 | | | | 0.98 | | | | (0.47 | ) | | | (0.08 | ) |
Total from investment operations | | | 0.25 | | | | 1.77 | | | | 2.21 | | | | 0.73 | | | | 0.52 | |
Distributions to shareholders from: | | | | | | | | | | | | | | | | | | | | |
Net investment income | | | (0.98 | ) | | | (1.23 | ) | | | (1.24 | ) | | | (1.20 | ) | | | (0.51 | ) |
Return of capital | | | — | | | | — | | | | — | | | | (0.02 | ) | | | (0.03 | ) |
Total distributions | | | (0.98 | ) | | | (1.23 | ) | | | (1.24 | ) | | | (1.22 | ) | | | (0.54 | ) |
Net asset value at end of period | | $ | 25.14 | | | $ | 25.87 | | | $ | 25.33 | | | $ | 24.36 | | | $ | 24.85 | |
Market price at end of period(c) | | $ | 25.11 | | | $ | 25.94 | | | $ | 25.42 | | | $ | 24.40 | | | $ | 24.92 | |
| Net Asset Value Total Return(d) | | | 1.01 | % | | | 7.18 | % | | | 9.43 | % | | | 2.99 | % | | | 2.09 | %(e) |
| Market Price Total Return(d) | | | 0.62 | % | | | 7.08 | % | | | 9.63 | % | | | 2.85 | % | | | 2.38 | %(e) |
| Ratios/Supplemental Data: | | | | | | | | | | | | | | | | | | | | |
Net assets at end of period (000’s omitted) | | $ | 2,192,114 | | | $ | 1,890,954 | | | $ | 899,060 | | | $ | 397,065 | | | $ | 91,950 | |
Ratio to average net assets of: | | | | | | | | | | | | | | | | | | | | |
Expenses | | | 0.50 | %(f) | | | 0.50 | % | | | 0.50 | % | | | 0.50 | % | | | 0.50 | %(f) |
Net investment income | | | 4.31 | %(f) | | | 4.72 | % | | | 5.03 | % | | | 4.88 | % | | | 4.79 | %(f) |
Portfolio turnover rate(g) | | | 7 | % | | | 4 | % | | | 17 | % | | | 5 | % | | | 6 | % |
| (a) | Commencement of investment operations. |
| (b) | Based on average shares outstanding. |
| (c) | The mean between the last bid and ask prices. |
| (d) | Net asset value total return is calculated assuming an initial investment made at the net asset value at the beginning of the period, reinvestment of all dividends and distributions at net asset value during the period, and redemption on the last day of the period. Net asset value total return includes adjustments in accordance with accounting principles generally accepted in the United States of America and as such, the net asset value for financial reporting purposes and the returns based upon those net asset values may differ from the net asset value and returns for shareholder transactions. Market price total return is calculated assuming an initial investment made at the market price at the beginning of the period, reinvestment of all dividends and distributions at market price during the period, and sale at the market price on the last day of the period. Total investment returns calculated for a period of less than one year are not annualized. |
| (e) | The net asset value total return from Fund Inception (May 1, 2014, the first day of trading on the exchange) to October 31, 2014 was 1.93%. The market price total return from Fund Inception to October 31, 2014 was 2.01%. |
| (g) | Portfolio turnover rate is not annualized for periods less than one year, if applicable, and does not include securities received or delivered from processing creations or redemptions. |
Invesco VRDO Tax-Free Weekly ETF (PVI)
| | | | | | | | | | | | | | | | | | | | | | | | |
| | | Ten Months Ended
August 31, 2018 | | | Year Ended October 31, | |
| | | 2017 | | | 2016 | | | 2015 | | | 2014 | | | 2013 | |
| Per Share Operating Performance: | | | | | | | | | | | | | | | | | | | | | | | | |
Net asset value at beginning of period | | $ | 24.93 | | | $ | 24.93 | | | $ | 24.93 | | | $ | 24.96 | | | $ | 24.99 | | | $ | 25.00 | |
Net investment income (loss)(a) | | | 0.20 | | | | 0.13 | | | | 0.02 | | | | (0.03 | ) | | | (0.02 | ) | | | 0.01 | |
Net realized and unrealized gain (loss) on investments | | | — | | | | (0.00 | )(b) | | | — | | | | — | | | | (0.01 | ) | | | (0.01 | ) |
Total from investment operations | | | 0.20 | | | | 0.13 | | | | 0.02 | | | | (0.03 | ) | | | (0.03 | ) | | | — | |
Distributions to shareholders from: | | | | | | | | | | | | | | | | | | | | | | | | |
Net investment income | | | (0.20 | ) | | | (0.13 | ) | | | (0.02 | ) | | | — | | | | — | | | | (0.01 | ) |
Return of capital | | | — | | | | (0.00 | )(b) | | | (0.00 | )(b) | | | (0.00 | )(b) | | | (0.00 | )(b) | | | (0.00 | )(b) |
Total distributions | | | (0.20 | ) | | | (0.13 | ) | | | (0.02 | ) | | | (0.00 | )(b) | | | (0.00 | )(b) | | | (0.01 | ) |
Net asset value at end of period | | $ | 24.93 | | | $ | 24.93 | | | $ | 24.93 | | | $ | 24.93 | | | $ | 24.96 | | | $ | 24.99 | |
Market price at end of period(c) | | $ | 24.93 | | | $ | 24.93 | | | $ | 24.91 | | | $ | 24.93 | | | $ | 24.97 | | | $ | 24.99 | |
| Net Asset Value Total Return(d) | | | 0.82 | % | | | 0.51 | % | | | 0.07 | % | | | (0.12 | )% | | | (0.12 | )% | | | (0.00 | )%(e) |
| Market Price Total Return(d) | | | 0.82 | % | | | 0.59 | % | | | (0.01 | )% | | | (0.16 | )% | | | (0.08 | )% | | | 0.04 | % |
| Ratios/Supplemental Data: | | | | | | | | | | | | | | | | | | | | | | | | |
Net assets at end of period (000’s omitted) | | $ | 62,327 | | | $ | 83,512 | | | $ | 59,831 | | | $ | 81,010 | | | $ | 118,580 | | | $ | 193,700 | |
Ratio to average net assets of: | | | | | | | | | | | | | | | | | | | | | | | | |
Expenses | | | 0.25 | %(f) | | | 0.25 | % | | | 0.25 | % | | | 0.25 | % | | | 0.25 | % | | | 0.25 | % |
Net investment income (loss) | | | 0.98 | %(f) | | | 0.51 | % | | | 0.06 | % | | | (0.15 | )% | | | (0.11 | )% | | | 0.03 | % |
| (a) | Based on average shares outstanding. |
| (b) | Amount represents less than $0.005. |
| (c) | The mean between the last bid and ask prices. |
| (d) | Net asset value total return is calculated assuming an initial investment made at the net asset value at the beginning of the period, reinvestment of all dividends and distributions at net asset value during the period, and redemption on the last day of the period. Net asset value total return includes adjustments in accordance with accounting principles generally accepted in the United States of America and as such, the net asset value for financial reporting purposes and the returns based upon those net asset values may differ from the net asset value and returns for shareholder transactions. Market price total return is calculated assuming an initial investment made at the market price at the beginning of the period, reinvestment of all dividends and distributions at market price during the period, and sale at the market price on the last day of the period. Total investment returns calculated for a period of less than one year are not annualized. |
| (e) | Amount represents less than 0.005%. |
See accompanying Notes to Financial Statements which are an integral part of the financial statements.
Notes to Financial Statements
Invesco Exchange-Traded Fund Trust II
August 31, 2018
Note 1. Organization
Invesco Exchange-Traded Fund Trust II (the “Trust”), formerly PowerShares Exchange-Traded Fund Trust II, was organized as a Massachusetts business trust on October 10, 2006 and is authorized to have multiple series of portfolios. The Trust is an open-end management investment company registered under the Investment Company Act of 1940, as amended (the “1940 Act”). This report includes the following portfolios:
| | |
Full Name | | Short Name |
| Invesco 1-30 Laddered Treasury ETF (PLW) | | “1-30 Laddered Treasury ETF” |
| Invesco California AMT-Free Municipal Bond ETF (PWZ) | | “California AMT-Free Municipal Bond ETF” |
| Invesco CEF Income Composite ETF (PCEF) | | “CEF Income Composite ETF” |
| Invesco Fundamental High Yield® Corporate Bond ETF (PHB) | | “Fundamental High Yield® Corporate Bond ETF” |
| Invesco Fundamental Investment Grade Corporate Bond ETF (PFIG) | | “Fundamental Investment Grade Corporate Bond ETF” |
| Invesco LadderRite 0-5 Year Corporate Bond ETF (LDRI) | | “LadderRite 0-5 Year Corporate Bond ETF” |
| Invesco National AMT-Free Municipal Bond ETF (PZA) | | “National AMT-Free Municipal Bond ETF” |
| Invesco New York AMT-Free Municipal Bond ETF (PZT) | | “New York AMT-Free Municipal Bond ETF” |
| Invesco Preferred ETF (PGX) | | “Preferred ETF” |
| Invesco Taxable Municipal Bond ETF (BAB) | | “Taxable Municipal Bond ETF” |
| Invesco Treasury Collateral ETF (CLTL) | | “Treasury Collateral ETF” |
| Invesco Variable Rate Preferred ETF (VRP) | | “Variable Rate Preferred ETF” |
| Invesco VRDO Tax-Free Weekly ETF (PVI) | | “VRDO Tax-Free Weekly ETF” |
Each portfolio (each, a “Fund”, and collectively, the “Funds”) represents a separate series of the Trust. The shares of the Funds are referred to herein as “Shares” or “Fund’s Shares.” Each Fund’s Shares are listed and traded on NYSE Arca, Inc., except for Shares of 1-30 Laddered Treasury ETF and LadderRite 0-5 Year Corporate Bond ETF, which are listed and traded on The NASDAQ Stock Market LLC.
Effective June 4, 2018, the Funds’ names changed as part of an overall rebranding strategy whereby the PowerShares name was changed to the Invesco brand. This resulted in all references to the PowerShares name being changed to Invesco.
Effective August 31, 2018, each Fund’s fiscal year-end changed from October 31 to August 31.
The market price of each Share may differ to some degree from a Fund’s net asset value (“NAV”). Unlike conventional mutual funds, each Fund issues and redeems Shares on a continuous basis, at NAV, only in a large specified number of Shares, each called a “Creation Unit.” Creation Units of 1-30 Laddered Treasury ETF, CEF Income Composite ETF, Fundamental High Yield® Corporate Bond ETF, Fundamental Investment Grade Corporate Bond ETF, Preferred ETF, Treasury Collateral ETF and Variable Rate Preferred ETF are issued and redeemed principally in exchange for the deposit or delivery of a basket of securities (“Deposit Securities”). Creation Units of California AMT-Free Municipal Bond ETF, LadderRite 0-5 Year Corporate Bond ETF, National AMT-Free Municipal Bond ETF, New York AMT-Free Municipal Bond ETF, Taxable Municipal Bond ETF and VRDO Tax-Free Weekly ETF are issued and redeemed principally in exchange for the deposit or delivery of cash. Except when aggregated in Creation Units by Authorized Participants, the Shares are not individually redeemable securities of the Funds.
To provide enhanced daily liquidity, Treasury Collateral ETF determines its NAV twice each day, at 12:00 p.m. EST and 4:00 p.m. EST. The Fund provides same-day settlement for creation/redemption trades in the primary market for any trades placed before the initial daily NAV strike.
CEF Income Composite ETF is a “fund of funds,” in that it invests in other funds (“Underlying Funds”). Each Underlying Fund’s accounting policies are outlined in that Underlying Fund’s financial statements and are publicly available.
The investment objective of each Fund is to seek to track the investment results (before fees and expenses) of its respective index listed below (each, an “Underlying Index”):
| | |
Fund | | Underlying Index |
| 1-30 Laddered Treasury ETF | | Ryan/NASDAQ U.S. 1-30 Year Treasury Laddered Index |
| California AMT-Free Municipal Bond ETF | | ICE BofAML California Long-Term Core Plus Municipal Securities Index |
| CEF Income Composite ETF | | S-Network Composite Closed-End Fund IndexSM |
| Fundamental High Yield® Corporate Bond ETF | | RAFI® Bonds U.S. High Yield 1-10 Index |
| Fundamental Investment Grade Corporate Bond ETF | | RAFI® Bonds U.S. Investment Grade 1-10 Index |
| LadderRite 0-5 Year Corporate Bond ETF | | NASDAQ LadderRite® 0-5 Year USD Corporate Bond Index |
| National AMT-Free Municipal Bond ETF | | ICE BofAML National Long-Term Core Plus Municipal Securities Index |
| New York AMT-Free Municipal Bond ETF | | ICE BofAML New York Long-Term Core Plus Municipal Securities Index |
| Preferred ETF | | ICE BofAML Core Plus Fixed Rate Preferred Securities Index |
| Taxable Municipal Bond ETF | | ICE BofAML US Taxable Municipal Securities Plus Index |
| Treasury Collateral ETF | | ICE U.S. Treasury Short Bond Index |
| Variable Rate Preferred ETF | | Wells Fargo® Hybrid and Preferred Securities Floating and Variable Rate Index |
| VRDO Tax-Free Weekly ETF | | Bloomberg U.S. Municipal AMT-Free Weekly VRDO Index |
Note 2. Significant Accounting Policies
The following is a summary of the significant accounting policies followed by the Funds in preparation of their financial statements.
Each Fund is an investment company and accordingly follows the investment company accounting and reporting guidance in accordance with Financial Accounting Standards Board Accounting Standards Codification Topic 946, Financial Services—Investment Companies.
A. Security Valuation
Securities, including restricted securities, are valued according to the following policies:
Securities, including restricted securities in an Underlying Fund, if any, that are held as investments of a Fund, are valued in accordance with the Underlying Fund’s valuation policy. The policies of Underlying Funds affiliated with the Funds as a result of having the same investment adviser are the same as those set forth below.
A security listed or traded on an exchange (except convertible securities) is generally valued at its last sales price or official closing price as of the close of the customary trading session on the exchange where the security is principally traded or, lacking any sales or official closing price on a particular day, the security may be valued at the closing bid price on that day. Securities traded in the over-the-counter market are valued based on prices furnished by independent pricing services or market makers. When such securities are valued by an independent pricing service they may be considered fair valued. Futures contracts are valued at the final settlement price set by an exchange on which they are principally traded. Listed options are valued at the mean between the last bid and asked prices from the exchange on which they are principally traded, or at the final settlement price set by such exchange. Swaps and options not listed on an exchange are valued by an independent source. For purposes of determining NAV per Share, futures and option contracts generally are valued 15 minutes after the close of the customary trading session of the New York Stock Exchange (“NYSE”).
Investment companies are valued using such company’s NAV per share, unless the shares are exchange-traded, in which case they are valued at the last sales price or official closing price as of the close of the customary trading session on the exchange where the security is principally traded.
Debt obligations (including convertible securities) and unlisted equities are fair valued using an evaluated quote provided by an independent pricing service. Evaluated quotes provided by the pricing service may be determined without exclusive reliance on quoted prices, and may reflect appropriate factors such as institution-size trading in similar groups of securities, developments related to specific securities, dividend rate (for unlisted equities), yield (for debt obligations), quality, type of issue, coupon rate (for debt obligations), maturity (for debt obligations), individual trading characteristics and other market data. Securities with a demand feature exercisable within one to seven days are valued at par. Pricing services generally value debt obligations assuming orderly transactions of institutional round lot size, but a Fund may hold or transact in the same securities in smaller, odd lot sizes. Odd lots often trade at lower prices than institutional round lots. Debt obligations are subject to interest rate and credit risks. In addition, all debt obligations involve some risk of default with respect to interest and/or principal payments.
Foreign securities’ (including foreign exchange contracts’) prices are converted into U.S. dollar amounts using the applicable exchange rates as of the close of the London world markets. If market quotations are available and reliable for foreign exchange-traded equity securities, the securities will be valued at the market quotations. Because trading hours for certain foreign securities end before the
close of the NYSE, closing market quotations may become unreliable. If between the time trading ends on a particular security and the close of the customary trading session on the NYSE, events occur that Invesco Capital Management LLC (the “Adviser”), formerly Invesco PowerShares Capital Management LLC, determines are significant and make the closing price unreliable, a Fund may fair value the security. If the event is likely to have affected the closing price of the security, the security will be valued at fair value in good faith using procedures approved by the Board of Trustees. Adjustments to closing prices to reflect fair value may also be based on a screening process of an independent pricing service to indicate the degree of certainty, based on historical data, that the closing price in the principal market where a foreign security trades is not the current value as of the close of the NYSE. Foreign securities’ prices meeting the approved degree of certainty that the price is not reflective of current value will be priced at the indication of fair value from the independent pricing service. Multiple factors may be considered by the independent pricing service in determining adjustments to reflect fair value and may include information relating to sector indices, American Depositary Receipts and domestic and foreign index futures. Foreign securities may have additional risks including exchange rate changes, potential for sharply devalued currencies and high inflation, political and economic upheaval, the relative lack of issuer information, relatively low market liquidity and the potential lack of strict financial and accounting controls and standards.
Securities for which market prices are not provided by any of the above methods may be valued based upon quotes furnished by independent sources. The last bid price may be used to value exchange-traded equity securities. The mean between the last bid and asked prices may be used to value debt obligations, including corporate loans, and unlisted equity securities.
Securities for which market quotations are not readily available or became unreliable are valued at fair value as determined in good faith following procedures approved by the Board of Trustees. Issuer-specific events, market trends, bid/asked quotes of brokers and information providers and other market data may be reviewed in the course of making a good faith determination of a security’s fair value.
Each Fund may invest in securities that are subject to interest rate risk, meaning the risk that the prices will generally fall as interest rates rise and, conversely, the prices will generally rise as interest rates fall. Specific securities differ in their sensitivity to changes in interest rates depending on their individual characteristics. Changes in interest rates may result in increased market volatility, which may affect the value and/or liquidity of certain Fund investments.
Valuations change in response to many factors, including the historical and prospective earnings of the issuer, the value of the issuer’s assets, general economic conditions, interest rates, investor perceptions and market liquidity. Because of the inherent uncertainties of valuation, the values reflected in the financial statements may materially differ from the value received upon actual sale of those investments.
B. Other Risks
Index Risk. Unlike many investment companies, the Funds do not utilize investing strategies that seek returns in excess of their Underlying Indexes. Therefore, a Fund would not necessarily buy or sell a security unless that security is added or removed, respectively, from its respective Underlying Index, even if that security generally is underperforming.
Authorized Participant Concentration Risk. Only Authorized Participants (“APs”) may engage in creation or redemption transactions directly with each Fund. Each Fund has a limited number of institutions that may act as APs, and such APs have no obligation to submit creation or redemption orders. Consequently, there is no assurance that those APs will establish or maintain an active trading market for the Shares. This risk may be heightened to the extent that securities underlying each Fund are traded outside a collateralized settlement system. In that case, APs may be required to post collateral on certain trades on an agency basis (i.e., on behalf of other market participants), which only a limited number of APs may be able to do. In addition, to the extent that APs exit the business or are unable to proceed with creation and/or redemption orders with respect to each Fund and no other AP is able to step forward to create or redeem Creation Units, this may result in a significantly diminished trading market for Fund Shares, which may be more likely to trade at a premium or discount to each Fund’s net asset value (“NAV”) and to face trading halts and/or delisting.
Changing Fixed-Income Market Conditions. Each Fund, except for CEF Income Composite ETF and Variable Rate Preferred ETF, invests in fixed-income securities. The current historically low interest rate environment was created in part by the Federal Reserve Board (“FRB”) and certain foreign central banks keeping the federal funds and equivalent foreign rates near, at or below zero. The “tapering” in 2015 of the FRB’s quantitative easing program, combined with the FRB’s raising of the target range for the Federal Funds Rate (and possible continued fluctuations in equivalent foreign rates) may expose fixed-income markets to heightened volatility and reduced liquidity for certain fixed-income investments, particularly those with longer maturities, although it is difficult to predict the impact of this rate increase and any future rate increases on various markets. In addition, decreases in fixed-income dealer market-making capacity may also potentially lead to heightened volatility and reduced liquidity in the fixed-income markets. As a result, the value of the Fund’s investments and share price may decline. Changes in central bank policies could also result in higher than normal shareholder redemptions, which could potentially increase portfolio turnover and the Funds’ transaction costs.
Fixed-Income Securities Risk. Each Fund, except for CEF Income Composite ETF and Variable Rate Preferred ETF, invests in fixed-income securities. Fixed-income securities are subject to interest rate risk and credit risk. Interest rate risk refers to fluctuations in the
value of a fixed-income security resulting from changes in the general level of interest rates. When the general level of interest rates goes up, the prices of most fixed-income securities go down. When the general level of interest rates goes down, the prices of most fixed-income securities go up. Fixed-income securities with longer maturities typically are more sensitive to changes in interest rates, making them more volatile than securities with shorter maturities. Credit risk refers to the possibility that the issuer of a security will be unable and/or unwilling to make timely interest payments and/or repay the principal on its debt. Debt instruments are subject to varying degrees of credit risk, which may be reflected in credit ratings. There is a possibility that the credit rating of a fixed-income security may be downgraded after purchase, which may adversely affect the value of the security. Securities issued by the U.S. Government are subject to limited credit risk; however, securities issued by U.S. Government agencies are not necessarily backed by the full faith and credit of the U.S. Government.
Call Risk. If interest rates fall, it is possible that issuers of callable securities with high interest coupons will “call” (or prepay) their bonds before their maturity date. If an issuer exercised such a call during a period of declining interest rates, a Fund may have to replace such called security with a lower yielding security. If that were to happen, such Fund’s net investment income could fall.
Industry Concentration Risk. Each Fund’s Underlying Index from time to time may be concentrated to a significant degree in securities of issuers located in a single industry or sector. To the extent that each Underlying Index concentrates in the securities of issuers in a particular industry or sector, each Fund will also concentrate its investments to approximately the same extent. By concentrating its investments in an industry or sector, each Fund faces more risks than if it were diversified broadly over numerous industries or sectors. Such industry-based risks, any of which may adversely affect the companies in which each Fund invests, may include, but are not limited to, the following: general economic conditions or cyclical market patterns that could negatively affect supply and demand in a particular industry; competition for resources, adverse labor relations, political or world events; obsolescence of technologies; and increased competition or new product introductions that may affect the profitability or viability of companies in an industry. In addition, at times, such industry or sector may be out of favor and underperform other industries or the market as a whole.
Non-Diversified Fund Risk. California AMT-Free Municipal Bond ETF, New York AMT-Free Municipal Bond ETF, Preferred ETF, Treasury Collateral ETF and Variable Rate Preferred ETF are non-diversified and can invest a greater portion of its assets in securities of individual issuers than diversified funds. As a result, changes in the market value of a single investment could cause greater fluctuations in Share price than would occur in a diversified fund. This may increase a Fund’s volatility and cause the performance of a relatively small number of issuers to have a greater impact on a Fund’s performance.
Non-Correlation Risk. Each Fund’s return may not match the return of its Underlying Index for a number of reasons. For example, each Fund incurs operating expenses not applicable to its Underlying Index, and incurs costs in buying and selling securities, especially when rebalancing the Fund’s securities holdings to reflect changes in the composition of its Underlying Index. To the extent that a Fund issues and redeems Creation Units principally for cash, it will incur higher costs in buying and selling securities than if it issued and redeemed Creation Units principally in-kind. In addition, the performance of each Fund and its Underlying Index may vary due to asset valuation differences and differences between each Fund’s portfolio and its Underlying Index resulting from legal restrictions, cost or liquidity constraints.
Sampling Risk. Each Fund’s (except for 1-30 Laddered Treasury ETF and CEF Income Composite ETF) use of a representative sampling approach will result in the Fund holding a smaller number of securities than are in its respective Underlying Index. As a result, an adverse development with respect to an issuer of securities that a Fund holds could result in a greater decline in NAV than would be the case if a Fund held all of the securities in its Underlying Index. To the extent the assets in a Fund are smaller, these risks will be greater.
Cash Transaction Risk. Most ETFs generally make in-kind redemptions to avoid being taxed on gains on the distributed portfolio securities at the fund level. However, unlike most ETFs, the California AMT-Free Municipal Bond ETF, National AMT-Free Municipal Bond ETF, New York AMT-Free Municipal Bond ETF, Taxable Municipal Bond ETF and VRDO Tax-Free Weekly ETF currently intend to effect creations and redemptions principally for cash, rather than principally in-kind, due to the nature of each Fund’s investments. As such, each Fund may be required to sell portfolio securities to obtain the cash needed to distribute redemption proceeds. Therefore, each Fund may recognize a capital gain on these sales that might not have been incurred if the Fund had made a redemption in-kind. This may decrease the tax efficiency of each Fund compared to ETFs that utilize an in-kind redemption process and there may be a substantial difference in the after-tax rate of the return between each Fund and conventional ETFs.
Foreign Investment Risk. Investments in the securities of non-U.S issuers involve risks beyond those associated with investments in U.S. securities. Foreign securities may have relatively low market liquidity, greater market volatility, decreased publicly available information and less reliable financial information about issuers. Foreign securities also are subject to the risks of expropriation, nationalization, political instability, local taxation, potential currency transfer restrictions or other adverse political or economic developments and the difficulty of enforcing obligations in other countries. These risks may be exacerbated in emerging market countries. If a Fund invests in securities denominated in foreign currencies, fluctuations in the value of the U.S. dollar relative to the values of other currencies may adversely affect investments in foreign securities and may negatively impact the Fund’s returns. Such risks may be exacerbated in emerging markets, where securities laws are relatively new and unsettled.
Valuation Risk. Financial information related to securities of non-U.S. issuers may be less reliable than information related to securities of U.S. issuers, which may make it difficult to obtain a current price for a non-U.S. security held by a Fund. In certain circumstances, market quotations may not be readily available for some Fund securities, and those securities may be fair valued. The value established for a security through fair valuation may be different from what would be produced if the security had been valued using market quotations. Fund securities that are valued using techniques other than market quotations, including “fair valued” securities, may be subject to greater fluctuation in their value from one day to the next than would be the case if market quotations were used. In addition, there is no assurance that a Fund could sell a portfolio security for the value established for it at any time, and it is possible that a Fund would incur a loss because a security is sold at a discount to its established value.
Fund of Funds Risk. Because CEF Income Composite ETF is a fund of funds, its investment performance largely depends on the investment performance of the Underlying Funds in which it invests. An investment in the Fund is subject to the risks associated with the Underlying Funds that comprise its Underlying Index. The Fund will pay indirectly a proportional share of the fees and expenses of the Underlying Funds in which it invests, including their investment advisory and administration fees, while continuing to pay its own unitary management fee. As a result, shareholders will absorb duplicate levels of fees with respect to investments in the Underlying Funds. In addition, at times certain segments of the market represented by constituent Underlying Funds in its Underlying Index may be out of favor and underperform other segments.
Municipal Securities Risk. California AMT-Free Municipal Bond ETF, National AMT-Free Municipal Bond ETF, New York AMT-Free Municipal Bond ETF, Taxable Municipal Bond ETF and VRDO Tax-Free Weekly ETF invest in municipal securities. Municipal securities are subject to the risk that litigation, legislation or other political events, local business or economic conditions or the bankruptcy of the issuer could have a significant effect on an issuer’s ability to make payments of principal and/or interest.
Political changes and uncertainties in the municipal market related to taxation, legislative changes or the rights of municipal security holders can significantly affect municipal securities. Because many securities are issued to finance similar projects, especially those relating to education, health care, transportation and utilities, conditions in those sectors can affect the overall municipal market. In addition, changes in the financial condition of an individual municipal issuer can affect the overall municipal market. If the Internal Revenue Service (“IRS”) determines that an issuer of a municipal security has not complied with applicable tax requirements, interest from the security could become taxable and the security could decline significantly in value.
Municipal Insurance Risk. A portion of the municipal securities that California AMT-Free Municipal Bond ETF, National AMT-Free Municipal Bond ETF, New York AMT-Free Municipal Bond ETF and VRDO Tax-Free Weekly ETF hold may be covered by insurance that guarantees the bond’s scheduled payment of interest and repayment of principal. Municipal security insurance does not insure against market fluctuations or fluctuations in a Fund’s Share price. In addition, a municipal security insurance policy will not cover: (i) repayment of a municipal security before maturity (redemption), (ii) prepayment or payment of an acceleration premium (except for a mandatory sinking fund redemption) or any other provision of a bond indenture that advances the maturity of the bond, or (iii) nonpayment of principal or interest caused by negligence or bankruptcy of the paying agent. A mandatory sinking fund redemption may be a provision of a municipal security issue whereby part of the municipal security issue may be retired before maturity.
Tax Risk. There is no guarantee that the income from California AMT-Free Municipal Bond ETF, National AMT-Free Municipal Bond ETF, New York AMT-Free Municipal Bond ETF or VRDO Tax-Free Weekly ETF will be exempt from federal or state income taxes. Events occurring after the date of issuance of a municipal bond or after a Fund’s acquisition of a municipal bond may result in a determination that interest on that bond is includible in gross income for federal income tax purposes retroactively to its date of issuance. Such a determination may cause a portion of prior distributions by a Fund to its shareholders to be taxable to those shareholders in the year of receipt. Federal or state changes in income or alternative minimum tax rates or in the tax treatment of municipal bonds may make municipal bonds less attractive as investments and cause them to lose value.
Risks of Investing in Closed-End Funds. For CEF Income Composite ETF, the shares of closed-end funds may trade at a discount or premium to, or at, their NAV. To the extent that the Fund invests a portion of its assets in closed-end funds, those assets will be subject to the risks of the closed-end fund’s portfolio securities, and a shareholder in the Fund will bear not only his or her proportionate share of the expenses of the Fund, but also, indirectly, the expenses of the closed-end fund. The securities of closed-end funds in which the Fund may invest may be leveraged. As a result, the Fund may be exposed indirectly to leverage through an investment in such securities. An investment in securities of closed-end funds that use leverage may expose the Fund to higher volatility in the market value of such securities and the possibility that the Fund’s long-term returns on such securities (and, indirectly, the long-term returns of the Shares) will be diminished.
Preferred Stock Risk. With respect to Preferred ETF and Variable Rate Preferred ETF, preferred stock is subject to issuer-specific and overall market risks that are generally applicable to equity securities as a whole; however, there are special risks associated with investing in preferred stock. Preferred stock may be less liquid than many other types of securities, such as common stock, and generally provides no voting rights with respect to the issuer. Preferred stock also may be subordinated to bonds or other debt instruments in an issuer’s capital structure, meaning that an issuer’s preferred stock generally pays dividends only after the issuer makes required payments to holders of its bonds and other debt. This subjects preferred stock to a greater risk of non-payment than
more senior securities. Because of the subordinated position of preferred stock in an issuer’s capital structure, the ability to defer dividend or interest payments for extended periods of time without triggering an event of default for the issuer, and certain other features, its quality and value are heavily dependent on the profitability and cash flows of the issuer rather than on any legal claims to specific assets. Also, in certain circumstances, an issuer of a preferred stock may call or redeem it prior to a specified date or may convert it to common stock, all of which may negatively impact its return.
Not a Money Market Fund. Treasury Collateral ETF is not a money market fund and is not subject to the strict rules that govern the quality, maturity, liquidity and other features of securities that money market funds may purchase. Under normal circumstances, the Fund’s investments may be more susceptible than a money market fund’s to credit risk, interest rate risk, valuation risk and other risks relevant to the Fund’s investments. An investment in the Fund is not insured or guaranteed by the Federal Deposit Insurance Corporation or any other government agency, and it is possible for the Fund to lose money. The Fund does not seek to maintain a stable NAV of $1.00 per share.
U.S. Treasury Obligations Risk. Treasury Collateral ETF will invest in obligations issued or guaranteed by the U.S. Treasury. U.S. Treasury securities are backed by the “full faith and credit” of the United States; however, the U.S. Government does not guarantee the market value of their securities, and consequently, the value of such securities may fluctuate. Because U.S. Treasury securities trade actively outside the United States, their prices may rise and fall as changes in global economic conditions affect the demand for these securities. Although the Fund may hold securities that carry U.S. Government guarantees, these guarantees do not extend to Shares of the Fund.
C. Federal Income Taxes
Each Fund intends to comply with the provisions of the Internal Revenue Code of 1986, as amended (the “Internal Revenue Code”), applicable to regulated investment companies and to distribute substantially all of the Fund’s taxable earnings to its shareholders. As such, the Funds will not be subject to federal income taxes on otherwise taxable income (including net realized gains) that is distributed to the shareholders. Therefore, no provision for federal income taxes is recorded in the financial statements.
Each Fund recognizes the tax benefits of uncertain tax positions only when the position is more likely than not to be sustained. Management has analyzed each Fund’s uncertain tax positions and concluded that no liability for unrecognized tax benefits should be recorded related to uncertain tax positions. Management is not aware of any tax positions for which it is reasonably possible that the total amounts of unrecognized tax benefits will change materially in the next 12 months.
Income and capital gain distributions are determined in accordance with federal income tax regulations, which may differ from accounting principles generally accepted in the United States of America (“GAAP”). These differences are primarily due to differing book and tax treatments for in-kind transactions, losses deferred due to wash sales, and passive foreign investment company adjustments, if any.
The Funds file U.S. federal tax returns and tax returns in certain other jurisdictions. Generally, a Fund is subject to examinations by such taxing authorities for up to three years after the filing of the return for the tax period.
D. Investment Transactions and Investment Income
Investment transactions are accounted for on a trade date basis. Realized gains and losses from the sale or disposition of securities are computed on the specific identified cost basis. Interest income is recorded on the accrual basis from settlement date. Bond premiums and discounts are amortized and/or accreted over the lives of the respective securities. Pay-in-kind interest income and non-cash dividend income received in the form of securities in-lieu of cash are recorded at the fair value of the securities received. Dividend income (net of withholding tax, if any) is recorded on the ex-dividend date. Realized gains, dividends and interest received by a Fund may give rise to withholding and other taxes imposed by foreign countries. Tax conventions between certain countries and the United States may reduce or eliminate such taxes.
The Funds may periodically participate in litigation related to each Fund’s investments. As such, the Funds may receive proceeds from litigation settlements. Any proceeds received are included in the Statements of Operations as realized gain (loss) for investments no longer held and as unrealized gain (loss) for investments still held.
Brokerage commissions and mark ups are considered transaction costs and are recorded as an increase to the cost basis of securities purchased and/or a reduction of proceeds on a sale of securities. Such transaction costs are included in the determination of net realized and unrealized gain (loss) from investment securities reported in the Statements of Operations and the Statements of Changes in Net Assets and the net realized and unrealized gains (losses) on securities per share in the Financial Highlights. Transaction costs are included in the calculation of each Fund’s NAV and, accordingly, they reduce each Fund’s total returns. These transaction costs are not considered operating expenses and are not reflected in net investment income reported in the Statements of Operations and the Statements of Changes in Net Assets, or the net investment income per share and the ratios of expenses and net investment income reported in the Financial Highlights, nor are they limited by any expense limitation arrangements between each Fund and the Adviser.
E. Country Determination
For the purposes of presentation in the Schedules of Investments, the Adviser may determine the country in which an issuer is located and/or credit risk exposure based on various factors. These factors include whether each Fund’s Underlying Index has made a country determination and may include the laws of the country under which the issuer is organized, where the issuer maintains a principal office, the country in which the issuer derives 50% or more of its total revenues and the country that has the primary market for the issuer’s securities, as well as other criteria. Among the other criteria that may be evaluated for making this determination are the country in which the issuer maintains 50% or more of its assets, the type of security, financial guarantees and enhancements, the nature of the collateral and the sponsor organization. Country of issuer and/or credit risk exposure has been determined to be the United States of America, unless otherwise noted.
F. Expenses
Each Fund has agreed to pay an annual unitary management fee to the Adviser. Out of the unitary management fee, the Adviser has agreed to pay for substantially all expenses of the Funds, including payments to Invesco Advisers, Inc. (the “Sub-Adviser”) for Treasury Collateral ETF and, for each Fund, the cost of transfer agency, custody, fund administration, legal, audit and other services, except for advisory fees, distribution fees, if any, brokerage expenses, taxes, interest, acquired fund fees and expenses, if any, litigation expenses and other extraordinary expenses.
Expenses of the Trust that are excluded from a Fund’s unitary management fee and are directly identifiable to a specific Fund are applied to that Fund. Expenses of the Trust that are excluded from each Fund’s unitary management fee and that are not readily identifiable to a specific Fund are allocated in such a manner as deemed equitable, taking into consideration the nature and type of expense and the relative net assets of each Fund.
To the extent a Fund invests in other investment companies, the expenses shown in the accompanying financial statements reflect the expenses of the Fund and do not include any expenses of the investment companies in which it invests. The effects of such investment companies’ expenses are included in the realized and unrealized gain or loss on the investments in the investment companies.
G. Dividends and Distributions to Shareholders
Each Fund declares and pays dividends from net investment income, if any, to its shareholders monthly and records such dividends on ex-dividend date. Prior to August 1, 2018, Treasury Collateral ETF declared and paid dividends from net investment income, if any, to its shareholders annually and recorded such dividends on ex-dividend date. Generally, each Fund distributes net realized taxable capital gains, if any, annually in cash and records them on ex-dividend date. Such distributions on a tax basis are determined in conformity with federal income tax regulations, which may differ from GAAP. Distributions in excess of tax basis earnings and profits, if any, are reported in such Fund’s financial statements as a tax return of capital at fiscal year-end.
H. Accounting Estimates
The preparation of the financial statements in accordance with GAAP requires management to make estimates and assumptions that affect the reported amounts and disclosures in the financial statements, including estimates and assumptions related to taxation. Actual results could differ from these estimates. Certain prior year amounts have been reclassified to conform to the current year presentation. In addition, the Funds monitor for material events or transactions that may occur or become known after the period-end date and before the date the financial statements are released to print.
I. Foreign Currency Translations
Foreign currency is valued at the close of the NYSE based on quotations posted by banks and major currency dealers. Portfolio securities and other assets and liabilities denominated in foreign currencies are translated into U.S. dollar amounts at date of valuation. Purchases and sales of portfolio securities (net of foreign taxes withheld on disposition) and income items denominated in foreign currencies are translated into U.S. dollar amounts on the respective dates of such transactions. The Funds do not separately account for the portion of the results of operations resulting from changes in foreign exchange rates on investments and the fluctuations arising from changes in market prices of securities held. The combined results of changes in foreign exchange rates and the fluctuation of market prices on investments (net of estimated foreign tax withholding) are included with the net realized and unrealized gain or loss from investments in the Statements of Operations. Reported net realized foreign currency gains or losses arise from (1) sales of foreign currencies, (2) currency gains or losses realized between the trade and settlement dates on securities transactions, and (3) the difference between the amounts of dividends, interest, and foreign withholding taxes recorded on each Fund’s books and the U.S. dollar equivalent of the amounts actually received or paid. Net unrealized foreign currency gains and losses arise from changes in the fair values of assets and liabilities, other than investments in securities at fiscal period-end, resulting from changes in exchange rates.
The Funds may invest in foreign securities, which may be subject to foreign taxes on income, gains on investments or currency repatriation, a portion of which may be recoverable. Foreign taxes, if any, are recorded based on the tax regulations and rates that exist in the foreign markets in which each Fund invests.
J. Securities Lending
During the period November 1, 2017 to August 31, 2018, CEF Income Composite ETF, Fundamental High Yield® Corporate Bond ETF, Preferred ETF and Variable Rate Preferred ETF participated in securities lending. Each Fund loaned portfolio securities having a market value up to one-third of each Fund’s total assets. Such loans are secured by cash collateral equal to no less than 102% (105% for international securities) of the market value of the loaned securities determined daily by the securities lending provider. Cash collateral received in connection with these loans is generally invested in an affiliated money market fund and is shown as such on the Schedules of Investments. Each Fund bears the risk of loss with respect to the investment of collateral. It is the policy of these Funds to obtain additional collateral from or return excess collateral to the borrower by the end of the next business day, following the valuation date of the securities loaned. Therefore, the value of the collateral held may be temporarily less than the value of the securities on loan. When loaning securities, each Fund retains certain benefits of owning the securities, including the economic equivalent of dividends or interest generated by the security. Lending securities entails a risk of loss to each Fund if, and to the extent that, the market value of the securities loaned were to increase, and the borrower did not increase the collateral accordingly, and the borrower failed to return the securities. The securities loaned are subject to termination at the option of the borrower or each Fund. Upon termination, the borrower will return to each Fund the securities loaned and each Fund will return the collateral. Upon the failure of the borrower to return the securities, collateral may be liquidated and the securities may be purchased on the open market to replace the loaned securities. Each Fund could experience delays and costs in gaining access to the collateral and the securities may lose value during the delay which could result in potential losses to each Fund. Some of these losses may be indemnified by the lending agent. Each Fund bears the risk of any deficiency in the amount of the collateral available for return to the borrower due to any loss on the collateral invested. Dividends received on cash collateral investments for securities lending transactions, which are net of compensation to counterparties, are included in Securities lending income on the Statements of Operations. The aggregate value of securities out on loan, if any, is shown on the Statements of Assets and Liabilities.
Note 3. Investment Advisory Agreement and Other Agreements
The Trust has entered into an Investment Advisory Agreement with the Adviser on behalf of each Fund, pursuant to which the Adviser has overall responsibility for the selection and ongoing monitoring of the Funds’ investments, managing the Funds’ business affairs and providing certain clerical, bookkeeping and other administrative services, and for Treasury Collateral ETF, the oversight of the Sub-Adviser.
As compensation for its services, each Fund accrues daily and pays monthly to the Adviser an annual unitary management fee. Out of the unitary management fee, the Adviser has agreed to pay for substantially all expenses of the Funds, including payments to the Sub-Adviser for Treasury Collateral ETF and, for each Fund, the cost of transfer agency, custody, fund administration, legal, audit and other services, except for advisory fees, distribution fees, if any, brokerage expenses, taxes, interest, acquired fund fees and expenses, if any, litigation expenses and other extraordinary expenses. The unitary management fee is paid by each Fund to the Adviser at the following annual rates:
| | | | |
| | | % of Average
Daily Net Assets | |
| 1-30 Laddered Treasury ETF | | | 0.25 | % |
| California AMT-Free Municipal Bond ETF | | | 0.28 | % |
| CEF Income Composite ETF | | | 0.50 | % |
| Fundamental High Yield® Corporate Bond ETF | | | 0.50 | % |
| Fundamental Investment Grade Corporate Bond ETF | | | 0.22 | % |
| LadderRite 0-5 Year Corporate Bond ETF | | | 0.22 | % |
| National AMT-Free Municipal Bond ETF | | | 0.28 | % |
| New York AMT-Free Municipal Bond ETF | | | 0.28 | % |
| Preferred ETF | | | 0.50 | % |
| Taxable Municipal Bond ETF | | | 0.28 | % |
| Treasury Collateral ETF | | | 0.08 | % |
| Variable Rate Preferred ETF | | | 0.50 | % |
| VRDO Tax-Free Weekly ETF | | | 0.25 | % |
For Treasury Collateral ETF, the Adviser has entered into a sub-advisory agreement with the Sub-Adviser. The sub-advisory fee is paid by the Adviser to the Sub-Adviser at the annual rate of 40% of compensation paid to the Adviser from the Fund.
Further, through August 31, 2020, the Adviser has contractually agreed to waive a portion of each Fund’s management fee in an amount equal to 100% of the net advisory fees an affiliate of the Adviser receives that are attributable to certain of the Fund’s investments in money market funds managed by that affiliate (excluding investments of cash collateral from securities lending). The Adviser cannot discontinue this waiver prior to its expiration.
For the period November 1, 2017 to August 31, 2018 and the fiscal year ended October 31, 2017, the Adviser waived fees for each Fund in the following amounts:
| | | | | | | | |
| | | 2018 | | | 2017 | |
| 1-30 Laddered Treasury ETF | | $ | 530 | | | $ | 550 | |
| California AMT-Free Municipal Bond ETF | | | — | | | | — | |
| CEF Income Composite ETF | | | 940 | | | | 1,971 | |
| Fundamental High Yield® Corporate Bond ETF | | | 5,623 | | | | 10,599 | |
| Fundamental Investment Grade Corporate Bond ETF | | | 490 | | | | 343 | |
| LadderRite 0-5 Year Corporate Bond ETF | | | 301 | | | | 676 | |
| National AMT-Free Municipal Bond ETF | | | — | | | | — | |
| New York AMT-Free Municipal Bond ETF | | | — | | | | — | |
| Preferred ETF | | | 18,348 | | | | 18,307 | |
| Taxable Municipal Bond ETF | | | 17,750 | | | | 22,816 | |
| Treasury Collateral ETF | | | 750 | | | | 2,761 | |
| Variable Rate Preferred ETF | | | 7,964 | | | | 8,297 | |
| VRDO Tax-Free Weekly ETF | | | — | | | | — | |
The Trust has entered into a Distribution Agreement with Invesco Distributors, Inc. (the “Distributor”), which serves as the distributor of Creation Units for each Fund. The Distributor does not maintain a secondary market in the Shares. The Funds are not charged any fees pursuant to the Distribution Agreement. The Distributor is an affiliate of the Adviser.
The Adviser has entered into a licensing agreement for each Fund with the following entities (each, a “Licensor”):
| | |
Fund | | Licensor |
| 1-30 Laddered Treasury ETF | | Nasdaq, Inc. |
| California AMT-Free Municipal Bond ETF | | Merrill Lynch, Pierce, Fenner & Smith Inc. |
| CEF Income Composite ETF | | S-Network Global Indexes, LLC |
| Fundamental High Yield® Corporate Bond ETF | | Research Affiliates® |
| Fundamental Investment Grade Corporate Bond ETF | | Research Affiliates® |
| LadderRite 0-5 Year Corporate Bond ETF | | Nasdaq, Inc. |
| National AMT-Free Municipal Bond ETF | | Merrill Lynch, Pierce, Fenner & Smith Inc. |
| New York AMT-Free Municipal Bond ETF | | Merrill Lynch, Pierce, Fenner & Smith Inc. |
| Preferred ETF | | Merrill Lynch, Pierce, Fenner & Smith Inc. |
| Taxable Municipal Bond ETF | | Merrill Lynch, Pierce, Fenner & Smith Inc. |
| Treasury Collateral ETF | | Interactive Data Pricing and Reference Data LLC |
| Variable Rate Preferred ETF | | Wells Fargo & Company |
| VRDO Tax-Free Weekly ETF | | Bloomberg Finance L.P. |
Each Underlying Index name trademark is owned by its respective Licensor. These trademarks have been licensed to the Adviser for use by the Funds. Each Fund is entitled to use its Underlying Index pursuant to the Trust’s sub-licensing agreement with the Adviser. The Funds are not sponsored, endorsed, sold or promoted by the Licensors, and the Licensors make no representation regarding the advisability of investing in any of the Funds.
The Trust has entered into service agreements whereby The Bank of New York Mellon, a wholly-owned subsidiary of The Bank of New York Mellon Corporation, serves as the administrator, custodian, fund accountant and transfer agent for each Fund.
Note 4. Investments in Affiliates
The Adviser and the adviser for Invesco Bond Fund, Invesco High Income 2023 Target Term Fund and Invesco Senior Income Trust are wholly-owned subsidiaries of Invesco Ltd. and therefore, Invesco Bond Fund, Invesco High Income 2023 Target Term Fund and Invesco Senior Income Trust are considered to be affiliated with the Funds. The table below shows CEF Income Composite ETF’s transactions in, and earnings from, investments in affiliates (excluding affiliated money market funds) for the period November 1, 2017 to August 31, 2018.
CEF Income Composite ETF
| | | | | | | | | | | | | | | | | | | | | | | | | | | | |
| | | Value
October 31, 2017 | | | Purchases
at Cost | | | Proceeds
from Sales | | | Change in
Unrealized
Appreciation
(Depreciation) | | | Realized
Gain (Loss) | | | Value
August 31, 2018 | | | Dividend
Income | |
| Invesco Bond Fund | | $ | 2,181,131 | | | $ | 737,406 | | | $ | (614,674 | ) | | $ | (226,514 | ) | | $ | 24,194 | (a) | | $ | 2,101,543 | | | $ | 78,937 | |
| Invesco High Income 2023 Target Term Fund | | | 1,601,344 | | | | 226,195 | | | | (300,752 | ) | | | (14,558 | ) | | | (5,102 | ) | | | 1,507,127 | | | | 80,343 | |
| Invesco Senior Income Trust | | | 8,681,050 | | | | 1,629,894 | | | | (974,378 | ) | | | (127,584 | ) | | | (19,938 | ) | | | 9,189,044 | | | | 346,113 | |
| | | | | | | | | | | | | | | | | | | | | | | | | | | | |
| Total Investments in Affiliates | | $ | 12,463,525 | | | $ | 2,593,495 | | | $ | (1,889,804 | ) | | $ | (368,656 | ) | | $ | (846 | ) | | $ | 12,797,714 | | | $ | 505,393 | |
| | | | | | | | | | | | | | | | | | | | | | | | | | | | |
| (a) | Includes $9,325 of capital gains distributions from affiliated Underlying Funds. |
Note 5. Security Transactions with Affiliated Funds
Each Fund is permitted to purchase or sell securities from or to certain other affiliated funds under specified conditions outlined in procedures adopted by the Board of Trustees of the Trust. The procedures have been designed to ensure that any purchase or sale of securities by each Fund from or to another fund or portfolio that is or could be considered an affiliate by virtue of having a common investment adviser (or affiliated investment advisers), common Trustees and/or common officers complies with Rule 17a-7 of the 1940 Act. Further, as defined under the procedures, each transaction is effected at the current market price. For the period November 1, 2017 to August 31, 2018, the following Funds engaged in transactions with affiliates as listed below:
| | | | | | | | | | | | |
| | | Securities
Purchases | | | Securities
Sales | | | Net Realized
Gain | |
| Preferred ETF | | $ | 7,784,496 | | | $ | — | | | $ | — | |
| Variable Rate Preferred ETF | | | — | | | | 6,028,553 | | | | 74,566 | |
Note 6. Additional Valuation Information
GAAP defines fair value as the price that would be received to sell an asset or paid to transfer a liability in an orderly transaction between market participants at the measurement date, under current market conditions. GAAP establishes a hierarchy that prioritizes the inputs to valuation methods, giving the highest priority to readily available unadjusted quoted prices in an active market for identical assets (Level 1) and the lowest priority to significant unobservable inputs (Level 3), generally when market prices are not readily available or are unreliable. Based on the valuation inputs, the securities or other investments are tiered into one of three levels. Changes in valuation methods may result in transfers in or out of an investment’s assigned level:
| | Level 1 — | Prices are determined using quoted prices in an active market for identical assets. |
| | Level 2 — | Prices are determined using other significant observable inputs. Observable inputs are inputs that other market participants may use in pricing a security. These may include quoted prices for similar securities, interest rates, prepayment speeds, credit risk, yield curves, loss severities, default rates, discount rates, volatilities and others. |
| | Level 3 — | Prices are determined using significant unobservable inputs. In situations where quoted prices or observable inputs are unavailable (for example, when there is little or no market activity for an investment at the end of the period), unobservable inputs may be used. Unobservable inputs reflect a Fund’s own assumptions about the factors market participants would use in determining fair value of the securities or instruments and would be based on the best available information. |
Except for all of the securities in CEF Income Composite ETF, Preferred ETF and certain Funds listed below, as of August 31, 2018, all of the securities in each Fund were valued based on Level 2 inputs (see the Schedules of Investments for security categories). All of the securities in CEF Income Composite ETF and Preferred ETF were valued based on Level 1 inputs (see the Schedules of Investments for security categories). The level assigned to the securities valuations may not be an indication of the risk or liquidity associated with investing in those securities. Because of the inherent uncertainties of valuation, the values reflected in the financial statements may materially differ from the value received upon actual sale of those investments.
Each fund’s policy is to recognize transfers in and out of the valuation levels as of the end of the reporting period. During the period November 1, 2017 to August 31, 2018, there were no transfers between valuation levels.
| | | | | | | | | | | | | | | | |
| | | Level 1 | | | Level 2 | | | Level 3 | | | Total | |
| 1-30 Laddered Treasury ETF | | | | | | | | | | | | | | | | |
| Investments in Securities | | | | | | | | | | | | | | | | |
U.S. Treasury Securities | | $ | — | | | $ | 153,164,282 | | | $ | — | | | $ | 153,164,282 | |
Money Market Fund | | | 97,162 | | | | — | | | | — | | | | 97,162 | |
| | | | | | | | | | | | | | | | |
Total Investments | | $ | 97,162 | | | $ | 153,164,282 | | | $ | — | | | $ | 153,261,444 | |
| | | | | | | | | | | | | | | | |
| Fundamental High Yield® Corporate Bond ETF | | | | | | | | | | | | | | | | |
| Investments in Securities | | | | | | | | | | | | | | | | |
Corporate Bonds | | $ | — | | | $ | 935,318,862 | | | $ | — | | | $ | 935,318,862 | |
Money Market Funds | | | 55,638,500 | | | | — | | | | — | | | | 55,638,500 | |
| | | | | | | | | | | | | | | | |
Total Investments | | $ | 55,638,500 | | | $ | 935,318,862 | | | $ | — | | | $ | 990,957,362 | |
| | | | | | | | | | | | | | | | |
| Fundamental Investment Grade Corporate Bond ETF | | | | | | | | | | | | | | | | |
| Investments in Securities | | | | | | | | | | | | | | | | |
Corporate Bonds | | $ | — | | | $ | 105,613,183 | | | $ | — | | | $ | 105,613,183 | |
Money Market Fund | | | 37,252 | | | | — | | | | — | | | | 37,252 | |
| | | | | | | | | | | | | | | | |
Total Investments | | $ | 37,252 | | | $ | 105,613,183 | | | $ | — | | | $ | 105,650,435 | |
| | | | | | | | | | | | | | | | |
| LadderRite 0-5 Year Corporate Bond ETF | | | | | | | | | | | | | | | | |
| Investments in Securities | | | | | | | | | | | | | | | | |
Corporate Bonds | | $ | — | | | $ | 12,200,763 | | | $ | — | | | $ | 12,200,763 | |
Money Market Fund | | | 100,817 | | | | — | | | | — | | | | 100,817 | |
| | | | | | | | | | | | | | | | |
Total Investments | | $ | 100,817 | | | $ | 12,200,763 | | | $ | — | | | $ | 12,301,580 | |
| | | | | | | | | | | | | | | | |
| Taxable Municipal Bond ETF | | | | | | | | | | | | | | | | |
| Investments in Securities | | | | | | | | | | | | | | | | |
Municipal Bonds | | $ | — | | | $ | 916,147,555 | | | $ | — | | | $ | 916,147,555 | |
Corporate Bonds | | | — | | | | 8,122,687 | | | | — | | | | 8,122,687 | |
Money Market Fund | | | 1,761,575 | | | | — | | | | — | | | | 1,761,575 | |
| | | | | | | | | | | | | | | | |
Total Investments | | $ | 1,761,575 | | | $ | 924,270,242 | | | $ | — | | | $ | 926,031,817 | |
| | | | | | | | | | | | | | | | |
| Variable Rate Preferred ETF | | | | | | | | | | | | | | | | |
| Investments in Securities | | | | | | | | | | | | | | | | |
Corporate Bonds | | $ | — | | | $ | 1,592,056,522 | | | $ | — | | | $ | 1,592,056,522 | |
Preferred Stocks & Other Equity Interests | | | 577,176,696 | | | | — | | | | — | | | | 577,176,696 | |
Money Market Funds | | | 46,732,075 | | | | — | | | | — | | | | 46,732,075 | |
| | | | | | | | | | | | | | | | |
Total Investments | | $ | 623,908,771 | | | $ | 1,592,056,522 | | | $ | — | | | $ | 2,215,965,293 | |
| | | | | | | | | | | | | | | | |
Note 7. Distributions to Shareholders and Tax Components of Net Assets
Tax Character of Distributions to Shareholders Paid During the Period November 1, 2017 to August 31, 2018, Year Ended October 31, 2017 and Year Ended October 31, 2016:
| | | | | | | | | | | | | | | | | | | | | | | | | | | | | | | | | | | | | | | | | | | | | | | | |
| | | 8/31/2018 | | | 10/31/2017 | | | 10/31/2016 | |
| | | Ordinary
Income | | | Long-
Term
Capital
Gains | | | Return
of
Capital | | | Tax-Exempt
Income | | | Ordinary
Income | | | Long-
Term
Capital
Gains | | | Return of
Capital | | | Tax-Exempt
Income | | | Ordinary
Income | | | Long-
Term
Capital
Gains | | | Return of
Capital | | | Tax-Exempt
Income | |
| 1-30 Laddered Treasury ETF | | $ | 3,150,699 | | | $ | — | | | $ | — | | | $ | — | | | $ | 3,839,339 | | | $ | — | | | $ | — | | | $ | — | | | $ | 4,583,798 | | | $ | — | | | $ | — | | | $ | — | |
| California AMT-Free Municipal Bond ETF | | | — | | | | — | | | | 78,193 | | | | 5,154,468 | | | | — | | | | — | | | | 47,626 | | | | 4,787,907 | | | | — | | | | — | | | | 31,261 | | | | 3,933,268 | |
| CEF Income Composite ETF | | | 42,434,762 | | | | — | | | | — | | | | — | | | | 32,752,020 | | | | — | | | | 15,880,681 | | | | — | | | | 38,325,657 | | | | — | | | | 11,635,257 | | | | — | |
| Fundamental High Yield® Corporate Bond ETF | | | 36,149,521 | | | | — | | | | — | | | | — | | | | 49,423,066 | | | | — | | | | — | | | | — | | | | 37,984,421 | | | | — | | | | — | | | | — | |
| Fundamental Investment Grade Corporate Bond ETF | | | 2,152,009 | | | | — | | | | 16,435 | | | | — | | | | 1,261,537 | | | | — | | | | — | | | | — | | | | 1,112,065 | | | | — | | | | 6,736 | | | | — | |
| LadderRite 0-5 Year Corporate Bond ETF | | | 341,964 | | | | — | | | | — | | | | — | | | | 442,061 | | | | — | | | | — | | | | — | | | | 244,489 | | | | 128 | | | | 1,098 | | | | — | |
| National AMT-Free Municipal Bond ETF | | | 599,511 | | | | — | | | | — | | | | 42,225,505 | | | | 313,955 | | | | — | | | | — | | | | 44,120,363 | | | | — | | | | — | | | | 189,479 | | | | 38,124,263 | |
| New York AMT-Free Municipal Bond ETF | | | 22,188 | | | | — | | | | — | | | | 1,622,957 | | | | 11,258 | | | | — | | | | — | | | | 1,926,314 | | | | — | | | | — | | | | 12,981 | | | | 1,779,763 | |
| Preferred ETF | | | 244,818,962 | | | | — | | | | — | | | | — | | | | 276,488,848 | | | | — | | | | — | | | | — | | | | 226,731,995 | | | | — | | | | — | | | | — | |
| Taxable Municipal Bond ETF | | | 32,279,031 | | | | — | | | | — | | | | — | | | | 39,855,653 | | | | — | | | | — | | | | — | | | | 36,098,186 | | | | — | | | | — | | | | — | |
| Treasury Collateral ETF | | | 7,583,824 | | | | — | | | | — | | | | — | | | | — | | | | — | | | | — | | | | — | | | | — | | | | — | | | | — | | | | — | |
| Variable Rate Preferred ETF | | | 79,508,012 | | | | — | | | | — | | | | — | | | | 64,972,652 | | | | — | | | | — | | | | — | | | | 31,532,782 | | | | — | | | | — | | | | — | |
| VRDO Tax-Free Weekly ETF | | | — | | | | — | | | | — | | | | 564,528 | | | | — | | | | — | | | | 449 | | | | 395,971 | | | | 25 | | | | 921 | | | | 2,604 | | | | 43,358 | |
Tax Components of Net Assets at Fiscal Period-End:
| | | | | | | | | | | | | | | | | | | | | | | | |
| | | Undistributed
Ordinary
Income | | | Undistributed
Long-Term
Capital Gains | | | Net Unrealized
Appreciation
(Depreciation)—
Investments | | | Capital Loss
Carryforwards | | | Shares of
Beneficial
Interest | | | Total Net
Assets | |
| 1-30 Laddered Treasury ETF | | $ | — | | | $ | — | | | $ | (8,240,569 | ) | | $ | (286,430 | ) | | $ | 162,161,487 | | | $ | 153,634,488 | |
| California AMT-Free Municipal Bond ETF | | | — | | | | | | | | 727,731 | | | | (883,136 | ) | | | 250,951,268 | | | | 250,795,863 | |
| CEF Income Composite ETF | | | — | | | | | | | | (1,830,432 | ) | | | (15,499,110 | ) | | | 740,506,262 | | | | 723,176,720 | |
| Fundamental High Yield® Corporate Bond ETF | | | 108,311 | | | | | | | | (16,050,367 | ) | | | (26,979,997 | ) | | | 991,451,899 | | | | 948,529,846 | |
| Fundamental Investment Grade Corporate Bond ETF | | | — | | | | | | | | (1,915,606 | ) | | | (415,702 | ) | | | 108,951,433 | | | | 106,620,125 | |
| LadderRite 0-5 Year Corporate Bond ETF | | | 5,337 | | | | | | | | (144,679 | ) | | | (29,923 | ) | | | 12,484,488 | | | | 12,315,223 | |
| National AMT-Free Municipal Bond ETF | | | — | | | | | | | | 26,601,049 | | | | (1,147,821 | ) | | | 1,634,527,295 | | | | 1,659,980,523 | |
| New York AMT-Free Municipal Bond ETF | | | — | | | | | | | | 122,044 | | | | (16,604 | ) | | | 63,471,196 | | | | 63,576,636 | |
| Preferred ETF | | | 9,737,537 | | | | | | | | (21,456,433 | ) | | | (79,820,899 | ) | | | 5,469,550,703 | | | | 5,378,010,908 | |
| Taxable Municipal Bond ETF | | | — | | | | | | | | 41,824,293 | | | | (5,438,102 | ) | | | 902,484,807 | | | | 938,870,998 | |
| Treasury Collateral ETF | | | 396,869 | | | | | | | | (72,832 | ) | | | (84,145 | ) | | | 468,082,746 | | | | 468,322,638 | |
| Variable Rate Preferred ETF | | | — | | | | | | | | (40,461,054 | ) | | | (2,187,157 | ) | | | 2,234,762,542 | | | | 2,192,114,331 | |
| VRDO Tax-Free Weekly ETF | | | 378 | | | | | | | | — | | | | — | | | | 62,326,565 | | | | 62,326,943 | |
Capital loss carryforwards are calculated and reported as of a specific date. Results of transactions and other activity after that date may affect the amount of capital loss carryforwards actually available for the Funds to utilize. Capital losses generated in years beginning after December 22, 2010 can be carried forward for an unlimited period, whereas previous losses expire in eight tax years. Capital losses with an expiration period may not be used to offset capital gains until all net capital losses without an expiration date have been utilized. Capital loss carryforwards with no expiration date will retain their character as either short-term or long-term capital losses instead of as short-term capital losses as under prior law. The ability to utilize capital loss carryforwards in the future may be limited under the Internal Revenue Code and related regulations based on the results of future transactions.
The following table presents available capital loss carryforwards and expiration dates for each Fund as of August 31, 2018:
| | | | | | | | | | | | | | | | | | | | |
| | | | | | Post-effective/no expiration | | | | | | | |
| | | 2019 | | | Short-Term | | | Long-Term | | | Total* | | | Expired | |
| 1-30 Laddered Treasury ETF | | $ | — | | | $ | 286,430 | | | $ | — | | | $ | 286,430 | | | $ | — | |
| California AMT-Free Municipal Bond ETF | | | 438,783 | | | | 444,353 | | | | — | | | | 883,136 | | | | — | |
| CEF Income Composite ETF | | | — | | | | 990,558 | | | | 14,508,552 | | | | 15,499,110 | | | | — | |
| Fundamental High Yield® Corporate Bond ETF | | | — | | | | 16,082,676 | | | | 10,897,321 | | | | 26,979,997 | | | | — | |
| Fundamental Investment Grade Corporate Bond ETF | | | — | | | | 318,968 | | | | 96,734 | | | | 415,702 | | | | — | |
| LadderRite 0-5 Year Corporate Bond ETF | | | — | | | | 13,496 | | | | 16,427 | | | | 29,923 | | | | — | |
| National AMT-Free Municipal Bond ETF | | | 23,722 | | | | 412,636 | | | | 711,463 | | | | 1,147,821 | | | | — | |
| New York AMT-Free Municipal Bond ETF | | | 16,604 | | | | — | | | | — | | | | 16,604 | | | | — | |
| Preferred ETF | | | — | | | | 20,507,856 | | | | 59,313,043 | | | | 79,820,899 | | | | — | |
| Taxable Municipal Bond ETF | | | — | | | | 3,277,461 | | | | 2,160,641 | | | | 5,438,102 | | | | 6,399 | |
| Treasury Collateral ETF | | | — | | | | 84,145 | | | | — | | | | 84,145 | | | | | |
| Variable Rate Preferred ETF | | | — | | | | 769,184 | | | | 1,417,973 | | | | 2,187,157 | | | | — | |
| VRDO Tax-Free Weekly ETF | | | — | | | | — | | | | — | | | | — | | | | — | |
| * | Capital loss carryforwards as of the date listed above are reduced for limitations, if any, to the extent required by the Internal Revenue Code and may be further limited depending upon a variety of factors, including the realization of net unrealized gains or losses as of the date of any reorganization. |
Note 8. Investment Transactions
For the period November 1, 2017 to August 31, 2018, the cost of securities purchased and proceeds from sales of securities (other than short-term securities, U.S. Treasury obligations, money market funds and in-kind transactions, if any) were as follows:
| | | | | | | | |
| | | Purchases | | | Sales | |
| 1-30 Laddered Treasury ETF | | $ | — | | | $ | — | |
| California AMT-Free Municipal Bond ETF | | | 37,508,323 | | | | 15,513,484 | |
| CEF Income Composite ETF | | | 85,146,225 | | | | 84,814,532 | |
| Fundamental High Yield® Corporate Bond ETF | | | 127,816,344 | | | | 133,277,618 | |
| Fundamental Investment Grade Corporate Bond ETF | | | 36,963,988 | | | | 21,283,299 | |
| LadderRite 0-5 Year Corporate Bond ETF | | | 5,863,084 | | | | 4,876,764 | |
| National AMT-Free Municipal Bond ETF | | | 221,421,175 | | | | 125,811,267 | |
| New York AMT-Free Municipal Bond ETF | | | 7,741,005 | | | | 4,261,276 | |
| Preferred ETF | | | 851,507,126 | | | | 831,408,890 | |
| Taxable Municipal Bond ETF | | | 55,328,767 | | | | 34,611,209 | |
| Treasury Collateral ETF | | | — | | | | — | |
| Variable Rate Preferred ETF | | | 741,663,981 | | | | 153,253,661 | |
| VRDO Tax-Free Weekly ETF | | | — | | | | — | |
For the period November 1, 2017 to August 31, 2018, the cost of securities purchased and proceeds from sales of U.S. Treasury obligations (other than short-term securities, money market funds and in-kind transactions), for the 1-30 Laddered Treasury ETF amounted to $11,852,851 and $8,179,142, respectively and for the Treasury Collateral ETF amounted to $0 and $0, respectively.
For the period November 1, 2017 to August 31, 2018, in-kind transactions associated with creations and redemptions were as follows:
| | | | | | | | |
| | | Cost of
Securities
Received | | | Value of
Securities
Delivered | |
| 1-30 Laddered Treasury ETF | | $ | 70,541,087 | | | $ | 98,314,377 | |
| California AMT-Free Municipal Bond ETF | | | — | | | | — | |
| CEF Income Composite ETF | | | 99,922,758 | | | | 51,851,065 | |
| Fundamental High Yield® Corporate Bond ETF | | | 609,157,816 | | | | 813,635,657 | |
| Fundamental Investment Grade Corporate Bond ETF | | | 59,244,083 | | | | 15,481,386 | |
| LadderRite 0-5 Year Corporate Bond ETF | | | 8,648,531 | | | | 19,274,685 | |
| | | | | | | | |
| | | Cost of
Securities
Received | | | Value of
Securities
Delivered | |
| National AMT-Free Municipal Bond ETF | | $ | — | | | $ | 11,565,895 | |
| New York AMT-Free Municipal Bond ETF | | | — | | | | 3,891,334 | |
| Preferred ETF | | | 730,590,370 | | | | 559,120,545 | |
| Taxable Municipal Bond ETF | | | — | | | | 22,507,223 | |
| Treasury Collateral ETF | | | — | | | | — | |
| Variable Rate Preferred ETF | | | 365,407,434 | | | | 562,481,871 | |
| VRDO Tax-Free Weekly ETF | | | — | | | | — | |
Gains (losses) on in-kind transactions are generally not considered taxable gains (losses) for federal income tax purposes.
At August 31, 2018, the aggregate cost of investments, including any derivatives, on a tax basis includes adjustments for financial reporting purposes as of the most recently completed federal income tax reporting period-end:
| | | | | | | | | | | | | | | | |
| | | Gross
Unrealized
Appreciation | | | Gross
Unrealized
(Depreciation) | | | Net
Unrealized
Appreciation
(Depreciation) | | | Cost | |
| 1-30 Laddered Treasury ETF | | $ | 124,166 | | | $ | (8,364,735 | ) | | $ | (8,240,569 | ) | | $ | 161,502,013 | |
| California AMT-Free Municipal Bond ETF | | | 2,902,028 | | | | (2,174,297 | ) | | | 727,731 | | | | 245,769,817 | |
| CEF Income Composite ETF | | | 40,802,155 | | | | (42,632,587 | ) | | | (1,830,432 | ) | | | 726,461,207 | |
| Fundamental High Yield® Corporate Bond ETF | | | 2,624,927 | | | | (18,675,294 | ) | | | (16,050,367 | ) | | | 1,007,007,729 | |
| Fundamental Investment Grade Corporate Bond ETF | | | 61,958 | | | | (1,977,564 | ) | | | (1,915,606 | ) | | | 107,566,041 | |
| LadderRite 0-5 Year Corporate Bond ETF | | | 3,916 | | | | (148,595 | ) | | | (144,679 | ) | | | 12,446,259 | |
| National AMT-Free Municipal Bond ETF | | | 33,198,654 | | | | (6,597,605 | ) | | | 26,601,049 | | | | 1,603,586,195 | |
| New York AMT-Free Municipal Bond ETF | | | 825,930 | | | | (703,886 | ) | | | 122,044 | | | | 62,555,833 | |
| Preferred ETF | | | 45,064,137 | | | | (66,520,570 | ) | | | (21,456,433 | ) | | | 5,477,597,947 | |
| Taxable Municipal Bond ETF | | | 51,078,396 | | | | (9,254,103 | ) | | | 41,824,293 | | | | 884,207,524 | |
| Treasury Collateral ETF | | | 31,413 | | | | (104,245 | ) | | | (72,832 | ) | | | 467,644,608 | |
| Variable Rate Preferred ETF | | | 10,083,870 | | | | (50,544,924 | ) | | | (40,461,054 | ) | | | 2,256,426,347 | |
| VRDO Tax-Free Weekly ETF | | | — | | | | — | | | | — | | | | 60,795,000 | |
Note 9. Reclassification of Permanent Differences
Primarily as a result of differing book/tax treatment of in-kind transactions, amounts were reclassified between undistributed net investment income, undistributed net realized gain (loss) and Shares of beneficial interest. These reclassifications had no effect on the net assets of each Fund. For the period November 1, 2017 to August 31, 2018, the reclassifications were as follows:
| | | | | | | | | | | | |
| | | Undistributed
Net Investment
Income | | | Undistributed
Net Realized
Gain (Loss) | | | Shares of
Beneficial
Interest | |
| 1-30 Laddered Treasury ETF | | $ | 15,341 | | | $ | 2,102,322 | | | $ | (2,117,663 | ) |
| California AMT-Free Municipal Bond ETF | | | — | | | | — | | | | — | |
| CEF Income Composite ETF | | | 3,776,069 | | | | (9,458,190 | ) | | | 5,682,121 | |
| Fundamental High Yield® Corporate Bond ETF | | | — | | | | (4,384,074 | ) | | | 4,384,074 | |
| Fundamental Investment Grade Corporate Bond ETF | | | — | | | | 278,698 | | | | (278,698 | ) |
| LadderRite 0-5 Year Corporate Bond ETF | | | — | | | | 210,115 | | | | (210,115 | ) |
| National AMT-Free Municipal Bond ETF | | | 599,511 | | | | (384,532 | ) | | | (214,979 | ) |
| New York AMT-Free Municipal Bond ETF | | | 22,188 | | | | (192,239 | ) | | | 170,051 | |
| Preferred ETF | | | (143,007 | ) | | | (3,223,736 | ) | | | 3,366,743 | |
| Taxable Municipal Bond ETF | | | 202,597 | | | | (672,425 | ) | | | 469,828 | |
| Treasury Collateral ETF | | | — | | | | — | | | | — | |
| Variable Rate Preferred ETF | | | 13,337,107 | | | | (18,915,145 | ) | | | 5,578,038 | |
| VRDO Tax-Free Weekly ETF | | | — | | | | — | | | | — | |
Note 10. Trustees’ and Officer’s Fees
Trustees’ and Officer’s Fees include amounts accrued by the Funds to pay remuneration to each Trustee who is not an “interested person” as defined in the 1940 Act (an “Independent Trustee”), any Trustee who is not an affiliate of the Adviser or Distributor (or any of their affiliates) and who is otherwise an “interested person” of the Trust under the 1940 Act (an “Unaffiliated Trustee”) and an Officer of the Trust. The Adviser, as a result of each Fund’s unitary management fee, pays for such compensation. The Trustee who is an “interested person” of the Trust does not receive any Trustees’ fees.
The Trust has adopted a deferred compensation plan (the “Plan”). Under the Plan, each Independent Trustee or Unaffiliated Trustee who has executed a Deferred Fee Agreement (a “Participating Trustee”) may defer receipt of all or a portion of his compensation (“Deferral Fees”). Such Deferral Fees are deemed to be invested in select Invesco Funds. The Deferral Fees payable to the Participating Trustee are valued as of the date such Deferral Fees would have been paid to the Participating Trustee. The value increases with contributions or with increases in the value of the Shares selected, and the value decreases with distributions or with declines in the value of the Shares selected. Obligations under the Plan represent unsecured claims against the general assets of the Funds.
Note 11. Capital
Shares are created and redeemed by each Fund only in Creation Units of 50,000 Shares (100,000 Shares for Fundamental High Yield® Corporate Bond ETF and Variable Rate Preferred ETF and 10,000 for Treasury Collateral ETF). Only Authorized Participants are permitted to purchase or redeem Creation Units from the Funds. For 1-30 Laddered Treasury ETF, CEF Income Composite ETF, Fundamental High Yield® Corporate Bond ETF, Fundamental Investment Grade Corporate Bond ETF, Preferred ETF, Treasury Collateral ETF and Variable Rate Preferred ETF, such transactions are generally in exchange for the deposit or delivery of a basket of securities (“Deposit Securities”). However, for such Funds, cash in an amount equivalent to the value of certain securities may be substituted, generally when the securities are not available in sufficient quantity for delivery, not eligible for trading by the Authorized Participant or as a result of other market circumstances. For California AMT-Free Municipal Bond ETF, LadderRite 0-5 Year Corporate Bond ETF, National AMT-Free Municipal Bond ETF, New York AMT-Free Municipal Bond ETF, Taxable Municipal Bond ETF and VRDO Tax-Free Weekly ETF, such transactions are principally in exchange for the deposit or delivery of cash.
To the extent that the Funds permit transactions in exchange for Deposit Securities, each Fund may issue Shares in advance of receipt of Deposit Securities subject to various conditions, including a requirement to maintain on deposit with the Trust cash at least equal to 105% of the market value of the missing Deposit Securities. In accordance with the Trust’s Participant Agreement, Creation Units will be issued to an Authorized Participant, notwithstanding the fact that the corresponding Deposit Securities have not been received in part or in whole, in reliance on the undertaking of the Authorized Participant to deliver the missing Deposit Securities as soon as possible, which undertaking shall be secured by the Authorized Participant’s delivery and maintenance of collateral consisting of cash in the form of U.S. dollars in immediately available funds having a value (marked-to-market daily) at least equal to 105%, which the Adviser may change from time to time, of the value of the missing Deposit Securities.
Certain transaction fees may be charged by the Funds for creations and redemptions, which are treated as increases in capital.
Transactions in each Fund’s Shares are disclosed in detail in the Statements of Changes in Net Assets.
Note 12. Indemnifications
Under the Trust’s organizational documents, its Officers and Trustees are indemnified against certain liabilities arising out of the performance of their duties to the Trust. Each Independent Trustee and Unaffiliated Trustee is also indemnified against certain liabilities arising out of the performance of his duties to the Trust pursuant to an Indemnification Agreement between such trustee and the Trust. Additionally, in the normal course of business, the Trust enters into contracts with service providers that contain general indemnification clauses. The Trust’s maximum exposure under these arrangements is unknown, as this would involve future claims that may be made against the Trust that have not yet occurred. However, based on experience, the Trust believes the risk of loss to be remote.
Report of Independent Registered Public Accounting Firm
To the Board of Trustees of Invesco Exchange-Traded Fund Trust II and Shareholders of Invesco 1-30 Laddered Treasury ETF, Invesco California AMT-Free Municipal Bond ETF, Invesco CEF Income Composite ETF, Invesco Fundamental High Yield® Corporate Bond ETF, Invesco Fundamental Investment Grade Corporate Bond ETF, Invesco LadderRite 0-5 Year Corporate Bond ETF, Invesco National AMT-Free Municipal Bond ETF, Invesco New York AMT-Free Municipal Bond ETF, Invesco Preferred ETF, Invesco Taxable Municipal Bond ETF, Invesco Treasury Collateral ETF, Invesco Variable Rate Preferred ETF and Invesco VRDO Tax-Free Weekly ETF
Opinions on the Financial Statements
We have audited the accompanying statements of assets and liabilities, including the schedules of investments, of Invesco 1-30 Laddered Treasury ETF, Invesco California AMT-Free Municipal Bond ETF, Invesco CEF Income Composite ETF, Invesco Fundamental High Yield® Corporate Bond ETF, Invesco Fundamental Investment Grade Corporate Bond ETF, Invesco LadderRite 0-5 Year Corporate Bond ETF, Invesco National AMT-Free Municipal Bond ETF, Invesco New York AMT-Free Municipal Bond ETF, Invesco Preferred ETF, Invesco Taxable Municipal Bond ETF, Invesco Treasury Collateral ETF, Invesco Variable Rate Preferred ETF and Invesco VRDO Tax-Free Weekly ETF (thirteen of the funds constituting Invesco Exchange-Traded Fund Trust II, hereafter collectively referred to as the “Funds”) as of August 31, 2018, the related statements of operations for the period November 1, 2017 through August 31, 2018 and for the year ended October 31, 2017 (or for Invesco Treasury Collateral ETF, for the periods November 1, 2017 through August 31, 2018 and January 10, 2017 (commencement of investment operations) through October 31, 2017), the statements of changes in net assets for the period November 1, 2017 through August 31, 2018 and for each of the two years in the period ended October 31, 2017 (or for Invesco Treasury Collateral ETF, for the periods November 1, 2017 through August 31, 2018 and January 10, 2017 (commencement of investment operations) through October 31, 2017), including the related notes, and the financial highlights for each of the periods indicated therein (collectively referred to as the “financial statements”). In our opinion, the financial statements present fairly, in all material respects, the financial position of each of the Funds as of August 31, 2018, the results of each of their operations for the period November 1, 2017 through August 31, 2018 and for the year ended October 31, 2017 (or for Invesco Treasury Collateral ETF, for the periods November 1, 2017 through August 31, 2018 and January 10, 2017 (commencement of investment operations) through October 31, 2017), the changes in each of their net assets for the period November 1, 2017 through August 31, 2018 and for each of the two years in the period ended October 31, 2017 (or for Invesco Treasury Collateral ETF, for the periods November 1, 2017 through August 31, 2018 and January 10, 2017 (commencement of investment operations) through October 31, 2017) and each of the financial highlights for each of the periods indicated therein, in conformity with accounting principles generally accepted in the United States of America.
Basis for Opinions
These financial statements are the responsibility of the Funds’ management. Our responsibility is to express an opinion on the Funds’ financial statements based on our audits. We are a public accounting firm registered with the Public Company Accounting Oversight Board (United States) (“PCAOB”) and are required to be independent with respect to the Funds in accordance with the U.S. federal securities laws and the applicable rules and regulations of the Securities and Exchange Commission and the PCAOB.
We conducted our audits of these financial statements in accordance with the standards of the PCAOB. Those standards require that we plan and perform the audit to obtain reasonable assurance about whether the financial statements are free of material misstatement, whether due to error or fraud.
Our audits included performing procedures to assess the risks of material misstatement of the financial statements, whether due to error or fraud, and performing procedures that respond to those risks. Such procedures included examining, on a test basis, evidence regarding the amounts and disclosures in the financial statements. Our audits also included evaluating the accounting principles used and significant estimates made by management, as well as evaluating the overall presentation of the financial statements. Our procedures included confirmation of securities owned as of August 31, 2018 by correspondence with the custodian, transfer agent, and brokers; when replies were not received from brokers, we performed other auditing procedures. We believe that our audits provide a reasonable basis for our opinions.
PricewaterhouseCoopers LLP
Chicago, Illinois
October 26, 2018
We have served as the auditor of one or more of the investment companies in the Invesco group of investment companies since at least 1995. We have not been able to determine the specific year we began serving as auditor.
Fees and Expenses
As a shareholder of a Fund of the Invesco Exchange-Traded Fund Trust II, you incur a unitary management fee. In addition to the unitary management fee, a shareholder may pay distribution fees, if any, brokerage expenses, taxes, interest, acquired fund fees and expenses, if any, litigation expenses and other extraordinary expenses. The expense examples below are intended to help you understand your ongoing costs (in dollars) of investing in the Funds and to compare these costs with the ongoing costs of investing in other funds.
The example is based on an investment of $1,000 invested at the beginning of the period and held through the six-month period ended August 31, 2018.
In addition to the fees and expenses which the Invesco CEF Income Composite ETF and Invesco Preferred ETF (collectively the “Portfolios”) bear directly, the Portfolios indirectly bear a pro rata share of the fees and expenses of the investment companies in which the Portfolios invest. The amount of fees and expenses incurred indirectly by the Portfolios will vary because the investment companies have varied expenses and fee levels and the Portfolios may own different proportions of the investment companies at different times. Estimated investment companies’ expenses are not expenses that are incurred directly by the Portfolios. They are expenses that are incurred directly by the investment companies and are deducted from the value of the investment companies the Portfolios invest in. The effect of the estimated investment companies’ expenses that the Portfolios bear indirectly is included in each Portfolio’s total return.
Actual Expenses
The first line in the following table provides information about actual account values and actual expenses. You may use the information in this line, together with the amount you invested, to estimate the expenses that you paid over the period. Simply divide your account value by $1,000 (for example, an $8,600 account value divided by $1,000 = 8.6), then multiply the result by the number in the first line under the heading “Expenses Paid During the Six-Month Period” to estimate the expenses you paid on your account during this period.
Hypothetical Example for Comparison Purposes
The second line in the following table provides information about hypothetical account values and hypothetical expenses based on each Fund’s actual expense ratio and an assumed annualized rate of return of 5% per year before expenses, which is not the Fund’s actual return. The hypothetical account values and expenses may not be used to estimate the actual ending account balance or expenses you paid for the period. You may use this information to compare the ongoing costs of investing in the Funds and other funds. To do so, compare this 5% hypothetical example with the 5% hypothetical examples that appear in the shareholder reports of the other funds.
Please note that the expenses shown in the table are meant to highlight your ongoing costs only, and do not reflect any transactional costs, such as sales charges and brokerage commissions. Therefore, the second line in the table is useful in comparing ongoing costs only, and will not help you determine the relative total costs of owning different funds. In addition, expenses shown in the table do not include the expenses of the underlying funds, which are borne indirectly by a Fund. If transaction costs and indirect expenses were included, your costs would have been higher.
| | | | | | | | | | | | | | | | |
| | | Beginning
Account Value
March 1, 2018 | | | Ending
Account Value
August 31, 2018 | | | Annualized
Expense Ratio
Based on the
Six-Month Period | | | Expenses Paid
During the
Six-Month Period(1) | |
| Invesco 1-30 Laddered Treasury ETF (PLW) | | | | | | | | | | | | | | | | |
Actual | | $ | 1,000.00 | | | $ | 1,021.40 | | | | 0.25 | % | | $ | 1.27 | |
Hypothetical (5% return before expenses) | | | 1,000.00 | | | | 1,023.95 | | | | 0.25 | | | | 1.28 | |
| Invesco California AMT-Free Municipal Bond ETF (PWZ) | | | | | | | | | | | | | | | | |
Actual | | | 1,000.00 | | | | 1,021.20 | | | | 0.28 | | | | 1.43 | |
Hypothetical (5% return before expenses) | | | 1,000.00 | | | | 1,023.79 | | | | 0.28 | | | | 1.43 | |
| Invesco CEF Income Composite ETF (PCEF) | | | | | | | | | | | | | | | | |
Actual | | | 1,000.00 | | | | 1,030.70 | | | | 0.50 | | | | 2.56 | |
Hypothetical (5% return before expenses) | | | 1,000.00 | | | | 1,022.68 | | | | 0.50 | | | | 2.55 | |
| Invesco Fundamental High Yield® Corporate Bond ETF (PHB) | | | | | | | | | | | | | | | | |
Actual | | | 1,000.00 | | | | 1,015.30 | | | | 0.50 | | | | 2.54 | |
Hypothetical (5% return before expenses) | | | 1,000.00 | | | | 1,022.68 | | | | 0.50 | | | | 2.55 | |
Fees and Expenses (continued)
| | | | | | | | | | | | | | | | |
| | | Beginning
Account Value
March 1, 2018 | | | Ending
Account Value
August 31, 2018 | | | Annualized
Expense Ratio
Based on the
Six-Month Period | | | Expenses Paid
During the
Six-Month Period(1) | |
| Invesco Fundamental Investment Grade Corporate Bond ETF (PFIG) | | | | | | | | | | | | | | | | |
Actual | | $ | 1,000.00 | | | $ | 1,009.30 | | | | 0.22 | % | | $ | 1.11 | |
Hypothetical (5% return before expenses) | | | 1,000.00 | | | | 1,024.10 | | | | 0.22 | | | | 1.12 | |
| Invesco LadderRite 0-5 Year Corporate Bond ETF (LDRI) | | | | | | | | | | | | | | | | |
Actual | | | 1,000.00 | | | | 1,011.30 | | | | 0.22 | | | | 1.12 | |
Hypothetical (5% return before expenses) | | | 1,000.00 | | | | 1,024.10 | | | | 0.22 | | | | 1.12 | |
| Invesco National AMT-Free Municipal Bond ETF (PZA) | | | | | | | | | | | | | | | | |
Actual | | | 1,000.00 | | | | 1,016.40 | | | | 0.28 | | | | 1.42 | |
Hypothetical (5% return before expenses) | | | 1,000.00 | | | | 1,023.79 | | | | 0.28 | | | | 1.43 | |
| Invesco New York AMT-Free Municipal Bond ETF (PZT) | | | | | | | | | | | | | | | | |
Actual | | | 1,000.00 | | | | 1,015.70 | | | | 0.28 | | | | 1.42 | |
Hypothetical (5% return before expenses) | | | 1,000.00 | | | | 1,023.79 | | | | 0.28 | | | | 1.43 | |
| Invesco Preferred ETF (PGX) | | | | | | | | | | | | | | | | |
Actual | | | 1,000.00 | | | | 1,029.20 | | | | 0.50 | | | | 2.56 | |
Hypothetical (5% return before expenses) | | | 1,000.00 | | | | 1,022.68 | | | | 0.50 | | | | 2.55 | |
| Invesco Taxable Municipal Bond ETF (BAB) | | | | | | | | | | | | | | | | |
Actual | | | 1,000.00 | | | | 1,018.90 | | | | 0.28 | | | | 1.42 | |
Hypothetical (5% return before expenses) | | | 1,000.00 | | | | 1,023.79 | | | | 0.28 | | | | 1.43 | |
| Invesco Treasury Collateral ETF (CLTL) | | | | | | | | | | | | | | | | |
Actual | | | 1,000.00 | | | | 1,009.00 | | | | 0.08 | | | | 0.41 | |
Hypothetical (5% return before expenses) | | | 1,000.00 | | | | 1,024.80 | | | | 0.08 | | | | 0.41 | |
| Invesco Variable Rate Preferred ETF (VRP) | | | | | | | | | | | | | | | | |
Actual | | | 1,000.00 | | | | 1,020.30 | | | | 0.50 | | | | 2.55 | |
Hypothetical (5% return before expenses) | | | 1,000.00 | | | | 1,022.68 | | | | 0.50 | | | | 2.55 | |
| Invesco VRDO Tax-Free Weekly ETF (PVI) | | | | | | | | | | | | | | | | |
Actual | | | 1,000.00 | | | | 1,005.30 | | | | 0.25 | | | | 1.26 | |
Hypothetical (5% return before expenses) | | | 1,000.00 | | | | 1,023.95 | | | | 0.25 | | | | 1.28 | |
| (1) | Expenses are calculated using the annualized expense ratio, which represents the ongoing expenses as a percentage of net assets for the six-month period ended August 31, 2018. Expenses are calculated by multiplying the Fund’s annualized expense ratio by the average account value for the period, then multiplying the result by 184/365. Expense ratios for the most recent six-month period may differ from expense ratios based on the annualized data in the Financial Highlights. |
Tax Information
Form 1099-DIV, Form 1042-S and other year-end tax information provide shareholders with actual calendar year amounts that should be included in their tax returns. Shareholders should consult their tax advisers.
The following distribution information is being provided as required by the Internal Revenue Code or to meet a specific state’s requirement.
Each Fund designates the following amounts or, if subsequently determined to be different, the maximum amount allowable for its fiscal period ended August 31, 2018:
| | | | | | | | | | | | | | | | | | | | | | | | | |
| | | Qualified Interest
Income* | | Qualified Dividend
Income* | | Corporate
Dividends Received
Deduction* | | Tax Exempt
Income* | | Long-Term
Capital Gain |
| Invesco 1-30 Laddered Treasury ETF | | | | 100 | % | | | | 0 | % | | | | 0 | % | | | | 0 | % | | | $ | — | |
| Invesco California AMT-Free Municipal Bond ETF | | | | 0 | % | | | | 0 | % | | | | 0 | % | | | | 99 | % | | | | — | |
| Invesco CEF Income Composite ETF | | | | 0 | % | | | | 15 | % | | | | 15 | % | | | | 0 | % | | | | — | |
| Invesco Fundamental High Yield® Corporate Bond ETF | | | | 98 | % | | | | 0 | % | | | | 0 | % | | | | 0 | % | | | | — | |
| Invesco Fundamental Investment Grade Corporate Bond ETF | | | | 100 | % | | | | 0 | % | | | | 0 | % | | | | 0 | % | | | | — | |
| Invesco LadderRite 0-5 Year Corporate Bond ETF | | | | 78 | % | | | | 0 | % | | | | 0 | % | | | | 0 | % | | | | — | |
| Invesco National AMT-Free Municipal Bond ETF | | | | 0 | % | | | | 0 | % | | | | 0 | % | | | | 99 | % | | | | — | |
| Invesco New York AMT-Free Municipal Bond ETF | | | | 0 | % | | | | 0 | % | | | | 0 | % | | | | 99 | % | | | | — | |
| Invesco Preferred ETF | | | | 0 | % | | | | 70 | % | | | | 55 | % | | | | 0 | % | | | | — | |
| Invesco Taxable Municipal Bond ETF | | | | 100 | % | | | | 0 | % | | | | 0 | % | | | | 0 | % | | | | — | |
| Invesco Treasury Collateral ETF | | | | 100 | % | | | | 0 | % | | | | 0 | % | | | | 0 | % | | | | — | |
| Invesco Variable Rate Preferred ETF | | | | 0 | % | | | | 23 | % | | | | 21 | % | | | | 0 | % | | | | — | |
| Invesco VRDO Tax-Free Weekly ETF | | | | 0 | % | | | | 0 | % | | | | 0 | % | | | | 100 | % | | | | — | |
| * | The above percentages are based on ordinary income dividends paid to shareholders during the Fund’s fiscal period. |
Trustees and Officers
The Independent Trustees of the Trust, their term of office and length of time served, their principal business occupations during at least the past five years, the number of portfolios in the Fund Complex (as defined below) overseen by each Independent Trustee and the other directorships, if any, held by each Independent Trustee are shown below.
| | | | | | | | | | |
Name, Address and Year of
Birth of Independent Trustees | | Position(s)
Held
with Trust | | Term of
Office
and
Length of
Time
Served* | | Principal
Occupation(s)
During Past 5 Years | | Number of
Portfolios
in Fund
Complex**
Overseen by
Independent
Trustees | | Other
Directorships
Held by
Independent
Trustees During
the Past 5 Years |
Ronn R. Bagge—1958
c/o Invesco Capital Management LLC
3500 Lacey Road, Suite 700
Downers Grove, IL 60515 | | Chairman of the Nominating and Governance Committee and Trustee | | Chairman of the Nominating and Governance Committee and Trustee since 2007 | | Founder and Principal, YQA Capital Management LLC (1998-Present); formerly, Owner/CEO of Electronic Dynamic Balancing Co., Inc. (high-speed rotating equipment service provider). | | 221 | | Trustee and Investment Oversight Committee member, Mission Aviation Fellowship (2017–Present) |
| | | | | |
Todd J. Barre—1957
c/o Invesco Capital Management LLC
3500 Lacey Road, Suite 700
Downers Grove, IL 60515 | | Trustee | | Since 2010 | | Assistant Professor of Business, Trinity Christian College (2010-2016); formerly, Vice President and Senior Investment Strategist (2001-2008), Director of Open Architecture and Trading (2007-2008), Head of Fundamental Research (2004-2007) and Vice President and Senior Fixed Income Strategist (1994-2001), BMO Financial Group/Harris Private Bank. | | 221 | | None |
| | | | | |
Marc M. Kole—1960
c/o Invesco Capital Management LLC
3500 Lacey Road, Suite 700
Downers Grove, IL 60515 | | Chairman of the Audit Committee and Trustee | | Chairman of the Audit Committee since 2008; Trustee since 2007 | | Senior Director of Finance, By The Hand Club for Kids (2015-Present); formerly, Chief Financial Officer, Hope Network (social services) (2008-2012); Assistant Vice President and Controller, Priority Health (health insurance) (2005-2008); Senior Vice President of Finance, United Healthcare (2004-2005); Chief Accounting Officer, Senior Vice President of Finance, Oxford Health Plans (2000-2004); Audit Partner, Arthur Andersen LLP (1996-2000). | | 221 | | None |
| | | | | |
Yung Bong Lim—1964
c/o Invesco Capital Management LLC
3500 Lacey Road, Suite 700
Downers Grove, IL 60515 | | Chairman of the Investment Oversight Committee and Trustee | | Chairman of the Investment Oversight Committee since 2014; Trustee since 2013 | | Managing Partner, RDG Funds LLC (2008-Present); formerly, Managing Director, Citadel LLC (1999-2007). | | 221 | | None |
| * | This is the date the Independent Trustee began serving the Trust. Each Independent Trustee serves an indefinite term, until his successor is elected. |
| ** | Fund Complex includes all open- and closed-end funds (including all of their portfolios) advised by the Adviser and any affiliated person of the Adviser. |
Trustees and Officers (continued)
| | | | | | | | | | |
Name, Address and Year of
Birth of Independent Trustees | | Position(s)
Held
with Trust | | Term of
Office
and
Length of
Time
Served* | | Principal
Occupation(s)
During Past 5 Years | | Number of
Portfolios
in Fund
Complex**
Overseen by
Independent
Trustees | | Other
Directorships
Held by
Independent
Trustees During
the Past 5 Years |
Gary R. Wicker—1961
c/o Invesco Capital Management LLC
3500 Lacey Road, Suite 700
Downers Grove, IL 60515 | | Trustee | | Since 2013 | | Senior Vice President of Global Finance and Chief Financial Officer at RBC Ministries (publishing company) (2013-Present); formerly, Executive Vice President and Chief Financial Officer, Zondervan Publishing (a division of Harper Collins/NewsCorp) (2007-2012); Senior Vice President and Group Controller (2005-2006), Senior Vice President and Chief Financial Officer (2003-2004), Chief Financial Officer (2001-2003), Vice President, Finance and Controller (1999-2001) and Assistant Controller (1997-1999), divisions of The Thomson Corporation (information services provider). | | 221 | | None |
| | | | | |
Donald H. Wilson—1959
c/o Invesco Capital Management LLC
3500 Lacey Road, Suite 700
Downers Grove, IL 60515 | | Chairman of the Board and Trustee | | Chairman since 2012; Trustee since 2007 | | Chairman, President and Chief Executive Officer, McHenry Bancorp Inc. and McHenry Savings Bank (subsidiary) (2018-Present); Chairman and Chief Executive Officer, Stone Pillar Advisors, Ltd. (2010-Present); President and Chief Executive Officer, Stone Pillar Investments, Ltd. (2016-Present); formerly, Chairman, President and Chief Executive Officer, Community Financial Shares, Inc. and Community Bank—Wheaton/Glen Ellyn (subsidiary) (2013-2015); Chief Operating Officer, AMCORE Financial, Inc. (bank holding company) (2007-2009); Executive Vice President and Chief Financial Officer, AMCORE Financial, Inc. (2006-2007); Senior Vice President and Treasurer, Marshall & Ilsley Corp. (bank holding company) (1995-2006). | | 221 | | None |
| * | This is the date the Independent Trustee began serving the Trust. Each Independent Trustee serves an indefinite term, until his successor is elected. |
| ** | Fund Complex includes all open- and closed-end funds (including all of their portfolios) advised by the Adviser and any affiliated person of the Adviser. |
Trustees and Officers (continued)
The Unaffiliated Trustee, his term of office and length of time served, his principal business occupations during at least the past five years, the number of portfolios in the Fund Complex (as defined below) overseen by the Unaffiliated Trustee and the other directorships, if any, held by the Unaffiliated Trustee are shown below.
| | | | | | | | | | |
Name, Address and Year of
Birth of Unaffiliated Trustee | | Position(s)
Held
with Trust | | Term of
Office
and
Length of
Time
Served* | | Principal
Occupation(s)
During Past 5 Years | | Number of
Portfolios
in Fund
Complex**
Overseen by
Unaffiliated
Trustee | | Other
Directorships
Held by
Unaffiliated
Trustee During
the Past 5 Years |
Philip M. Nussbaum***—1961
c/o Invesco Capital Management LLC
3500 Lacey Road, Suite 700
Downers Grove, IL 60515 | | Trustee | | Since 2007 | | Chairman, Performance Trust Capital Partners (2004-Present). | | 221 | | None |
| | * | This is the date the Unaffiliated Trustee began serving the Trust. The Unaffiliated Trustee serves an indefinite term, until his successor is elected. |
| | ** | Fund Complex includes all open- and closed-end funds (including all of their portfolios) advised by the Adviser and any affiliated person of the Adviser. |
| | *** | Effective September 19, 2018, Mr. Nussbaum resigned from the Board of Trustees of the Trust. |
Trustees and Officers (continued)
The Interested Trustee and the executive officers of the Trust, their term of office and length of time served, their principal business occupations during at least the past five years, the number of portfolios in the Fund Complex (as defined below) overseen by the Interested Trustee and the other directorships, if any, held by the Interested Trustee are shown below.
| | | | | | | | | | |
Name, Address and Year of
Birth of Interested Trustee | | Position(s)
Held
with Trust | | Term of
Office
and
Length of
Time
Served* | | Principal
Occupation(s)
During Past 5 Years | | Number of
Portfolios
in Fund
Complex**
Overseen by
Interested
Trustee | | Other
Directorships
Held by
Interested
Trustee During
the Past 5 Years |
Kevin M. Carome—1956
Invesco Ltd.
Two Peachtree Pointe,
1555 Peachtree St., N.E.,
Suite 1800
Atlanta, GA 30309 | | Trustee | | Since 2010 | | Senior Managing Director, Secretary and General Counsel, Invesco Ltd. (2007-Present); Director, Invesco Advisers, Inc. (2009-Present); Director (2006-Present) and Executive Vice President (2008-Present), Invesco Group Services, Inc., Invesco Holding Company (US), Inc. and Invesco North American Holdings, Inc.; Director, Invesco Holding Company Limited (2007-Present); Executive Vice President (2008-Present), Invesco Investments (Bermuda) Ltd.; Manager, Horizon Flight Works LLC, Director and Executive Vice President, Invesco Finance, Inc. and Director, Invesco Finance PLC (2011-Present); Director and Secretary (2012–Present), Invesco Services (Bahamas) Private Limited; and Director and Executive Vice President (2014-Present), INVESCO Asset Management (Bermuda) Ltd.; formerly, Director and Chairman, INVESCO Funds Group, Inc., Senior Vice President, Secretary and General Counsel, Invesco Advisers, Inc. (2003-2006); Director, Invesco Investments (Bermuda) Ltd. (2008-2016); Senior Vice President and General Counsel, Liberty Financial Companies, Inc. (2000-2001); General Counsel of certain investment management subsidiaries of Liberty Financial Companies, Inc. (1998-2000); Associate General Counsel, Liberty Financial Companies, Inc. (1993-1998); Associate, Ropes & Gray LLP. | | 221 | | None |
| * | This is the date the Interested Trustee began serving the Trust. The Interested Trustee serves an indefinite term, until his successor is elected. |
| ** | Fund Complex includes all open- and closed-end funds (including all of their portfolios) advised by the Adviser and any affiliated person of the Adviser. |
Trustees and Officers (continued)
| | | | | | |
Name, Address and Year of
Birth of Executive Officers | | Position(s)
Held
with Trust | | Length of
Time
Served* | | Principal Occupation(s) During Past 5 Years |
Daniel E. Draper—1968 Invesco Capital
Management LLC 3500 Lacey Road, Suite 700 Downers Grove, IL 60515 | | President and Principal Executive Officer | | Since 2015 | | President and Principal Executive Officer, Invesco Exchange-Traded Fund Trust, Invesco Exchange-Traded Fund Trust II, Invesco India Exchange-Traded Fund Trust, Invesco Actively Managed Exchange-Traded Fund Trust and Invesco Actively Managed Exchange-Traded Commodity Fund Trust (2015-Present) and Invesco Exchange-Traded Self-Indexed Fund Trust (2016-Present); Chief Executive Officer and Principal Executive Officer (2016-Present) and Managing Director (2013-Present), Invesco Capital Management LLC; Senior Vice President, Invesco Distributors, Inc. (2014-Present); formerly, Vice President, Invesco Exchange-Traded Fund Trust, Invesco Exchange-Traded Fund Trust II, Invesco India Exchange-Traded Fund Trust, Invesco Actively Managed Exchange-Traded Fund Trust (2013-2015) and Invesco Actively Managed Exchange-Traded Commodity Fund Trust (2014-2015); Managing Director, Credit Suisse Asset Management (2010-2013) and Lyxor Asset Management/Societe Generale (2007-2010). |
| | | |
Kelli Gallegos—1970 Invesco Capital Management LLC 3500 Lacey Road, Suite 700 Downers Grove, IL 60515 | | Vice President
and Treasurer | | Since 2018 | | Vice President and Treasurer, Invesco Exchange-Traded Fund Trust, Invesco Exchange-Traded Fund Trust II, Invesco India Exchange-Traded Fund Trust, Invesco Actively Managed Exchange-Traded Fund Trust, Invesco Actively Managed Exchange-Traded Commodity Fund Trust and Invesco Exchange-Traded Self-Indexed Fund Trust (2018-Present); Principal Financial and Accounting Officer-Pooled Investments, Invesco Capital Management LLC (2018-Present); Vice President, Principal Financial Officer (2016-Present) and Assistant Treasurer (2008-Present), The Invesco Funds; formerly, Assistant Treasurer Invesco Exchange-Traded Fund Trust, Invesco Exchange-Traded Fund Trust II, Invesco India Exchange-Traded Fund Trust and Invesco Actively Managed Exchange-Traded Fund Trust (2012-2018), Invesco Actively Managed Exchange-Traded Commodity Fund Trust (2014-2018) and Invesco Exchange-Traded Self-Indexed Fund Trust (2016-2018); Assistant Treasurer, Invesco Capital Management LLC (2013-2018); and Assistant Vice President, The Invesco Funds (2008-2016). |
| | | |
Peter Hubbard—1981 Invesco Capital Management LLC 3500 Lacey Road, Suite 700 Downers Grove, IL 60515 | | Vice President | | Since 2009 | | Vice President, Invesco Exchange-Traded Fund Trust, Invesco Exchange-Traded Fund Trust II, Invesco India Exchange-Traded Fund Trust, Invesco Actively Managed Exchange-Traded Fund Trust (2009-Present), Invesco Actively Managed Exchange-Traded Commodity Fund Trust (2014-Present) and Invesco Exchange-Traded Self-Indexed Fund Trust (2016-Present); Vice President and Director of Portfolio Management, Invesco Capital Management LLC (2010-Present); formerly, Vice President of Portfolio Management, Invesco Capital Management LLC (2008-2010); Portfolio Manager, Invesco Capital Management LLC (2007-2008); Research Analyst, Invesco Capital Management LLC (2005-2007); Research Analyst and Trader, Ritchie Capital, a hedge fund operator (2003-2005). |
| | | |
Sheri Morris—1964 Invesco Capital Management LLC 3500 Lacey Road, Suite 700 Downers Grove, IL 60515 | | Vice President | | Since 2012 | | President and Principal Executive Officer, The Invesco Funds (2016-Present); Treasurer, The Invesco Funds (2008-Present); Vice President, Invesco Advisers, Inc. (formerly known as Invesco Institutional (N.A.), Inc.) (registered investment adviser) (2009-Present) and Vice President, Invesco Exchange-Traded Fund Trust, Invesco Exchange-Traded Fund Trust II, Invesco India Exchange-Traded Fund Trust, Invesco Actively Managed Exchange-Traded Fund Trust (2012-Present), Invesco Actively Managed Exchange-Traded Commodity Fund Trust (2014-Present) and Invesco Exchange-Traded Self-Indexed Fund Trust (2016-Present); formerly, Vice President and Principal Financial Officer, The Invesco Funds (2008-2016); Treasurer, Invesco Exchange-Traded Fund Trust, Invesco Exchange-Traded Fund Trust II, Invesco India Exchange-Traded Fund Trust and Invesco Actively Managed Exchange-Traded Fund Trust (2011-2013); Vice President, Invesco Aim Advisers, Inc., Invesco Aim Capital Management, Inc. and Invesco Aim Private Asset Management, Inc.; Assistant Vice President and Assistant Treasurer, The Invesco Funds and Assistant Vice President, Invesco Advisers, Inc., Invesco Aim Capital Management, Inc. and Invesco Aim Private Asset Management, Inc. |
* This is the date each Officer began serving the Trust. Each Officer serves an indefinite term, until his or her successor is elected.
Trustees and Officers (continued)
| | | | | | |
Name, Address and Year of
Birth of Executive Officers | | Position(s)
Held
with Trust | | Length of
Time
Served* | | Principal Occupation(s) During Past 5 Years |
Anna Paglia—1974 Invesco Capital Management LLC 3500 Lacey Road, Suite 700 Downers Grove, IL 60515 | | Secretary | | Since 2011 | | Secretary, Invesco Exchange-Traded Fund Trust, Invesco Exchange-Traded Fund Trust II, Invesco India Exchange-Traded Fund Trust, Invesco Actively Managed Exchange-Traded Fund Trust (2011-Present), Invesco Actively Managed Exchange-Traded Commodity Fund Trust (2014-Present) and Invesco Exchange-Traded Self-Indexed Fund Trust (2015-Present); Head of Legal (2010-Present) and Secretary (2015-Present), Invesco Capital Management LLC; Manager and Assistant Secretary, Invesco Indexing LLC (2017-Present); formerly, Partner, K&L Gates LLP (formerly, Bell Boyd & Lloyd LLP) (2007-2010); Associate Counsel at Barclays Global Investors Ltd. (2004-2006). |
| | | |
Rudolf E. Reitmann—1971 Invesco Capital Management LLC 3500 Lacey Road, Suite 700 Downers Grove, IL 60515 | | Vice President | | Since 2013 | | Vice President, Invesco Exchange-Traded Fund Trust, Invesco Exchange-Traded Fund Trust II, Invesco India Exchange-Traded Fund Trust, Invesco Actively Managed Exchange-Traded Fund Trust (2013-Present), Invesco Actively Managed Exchange-Traded Commodity Fund Trust (2014-Present) and Invesco Exchange-Traded Self-Indexed Fund Trust (2016-Present); Head of Global Exchange Traded Funds Services, Invesco Capital Management LLC (2013-Present); Vice President, Invesco Capital Markets, Inc. (2018-Present). |
| | | |
David Warren—1957 Invesco Canada Ltd. 5140 Yonge Street, Suite 800 Toronto, Ontario M2N 6X7 | | Vice President | | Since 2009 | | Vice President, Invesco Exchange-Traded Fund Trust, Invesco Exchange-Traded Fund Trust II, Invesco India Exchange-Traded Fund Trust, and Invesco Actively Managed Exchange-Traded Fund Trust (2009-Present), Invesco Actively Managed Exchange-Traded Commodity Fund Trust (2014-Present) and Invesco Exchange-Traded Self-Indexed Fund Trust (2016-Present); Managing Director—Chief Administrative Officer, Americas, Invesco Capital Management LLC; Senior Vice President, Invesco Advisers, Inc. (2009-Present); Director, Invesco Inc. (2009-Present); Director, Executive Vice President and Chief Financial Officer, Invesco Canada Ltd. (formerly, Invesco Trimark Ltd.) (2011-Present); Chief Administrative Officer, North American Retail, Invesco Ltd. (2007-Present); Director, Invesco Corporate Class Inc. (2014-Present); Director, Invesco Global Direct Real Estate Feeder GP Ltd. (2015-Present); Director, Invesco Canada Holdings Inc. (2002-Present); Director, Invesco Financial Services Ltd./ Services Financiers Invesco Ltée and Trimark Investments Ltd./Placements Trimark Ltée (2014-Present); Director, Invesco IP Holdings (Canada) Ltd. (2016-Present); Director, Invesco Global Direct Real Estate GP Ltd. (2015-Present); formerly, Senior Vice President, Invesco Management Group, Inc. (2007-2018); Executive Vice President and Chief Financial Officer, Invesco Inc. (2009-2015); Director, Executive Vice President and Chief Financial Officer, Invesco Canada Ltd. (formerly, Invesco Trimark Ltd.) (2000-2011). |
| | | |
Melanie Zimdars—1976 Invesco Capital Management LLC 3500 Lacey Road, Suite 700 Downers Grove, IL 60515 | | Chief Compliance
Officer | | Since 2017 | | Chief Compliance Officer of Invesco Capital Management LLC (2017-Present); Chief Compliance Officer of Invesco Exchange-Traded Fund Trust, Invesco Exchange-Traded Fund Trust II, Invesco India Exchange-Traded Fund Trust, Invesco Actively Managed Exchange-Traded Fund Trust, Invesco Actively Managed Exchange-Traded Commodity Fund Trust and Invesco Exchange-Traded Self-Indexed Fund Trust (2017-Present); formerly, Vice President and Deputy Chief Compliance Officer at ALPS Holding, Inc. (2009-2017); Mutual Fund Treasurer/Chief Financial Officer at Wasatch Advisors, Inc. (2005-2008); Compliance Officer, U.S. Bancorp Fund Services, LLC (2001-2005). |
Availability of Additional Information About the Trustees
The Statement of Additional Information includes additional information about the Trustees and is available, without charge, upon request at (800) 983-0903.
| * | This is the date each Officer began serving the Trust. Each Officer serves an indefinite term, until his or her successor is elected. |
(This Page Intentionally Left Blank)
(This Page Intentionally Left Blank)
(This Page Intentionally Left Blank)
Proxy Voting Policies and Procedures
A description of the Trust’s proxy voting policies and procedures that the Funds use to determine how to vote proxies relating to portfolio securities is available, without charge and upon request, by calling (800) 983-0903. This information is also available on the Securities and Exchange Commission’s (“Commission”) website at www.sec.gov.
Information regarding how each Fund voted proxies for portfolio securities, if applicable, during the most recent 12-month period ended June 30, is also available, without charge and upon request, by (i) calling (800) 983-0903; or (ii) accessing the Trust’s Form N-PX on the Commission’s website at www.sec.gov.
Quarterly Portfolios
The Trust files its complete schedule of portfolio holdings for the Funds with the Commission for the first and third quarters of each fiscal year on Form N-Q. The Trust’s Forms N-Q are available on the Commission’s website at www.sec.gov. The Trust’s Forms N-Q may also be reviewed and copied at the Commission’s Public Reference Room in Washington, DC; information on the operation of the Public Reference Room may be obtained by calling (800) SEC-0330.
Frequency Distribution of Discounts and Premiums
A table showing the number of days the market price of each Fund’s shares was greater than the Fund’s net asset value, and the number of days it was less than the Fund’s net asset value (i.e., premium or discount) for the most recently completed calendar year, and the calendar quarters since that year end (or the life of the Fund, if shorter) may be found at the Fund’s website at www.invesco.com/ETFs.
| | | | |
©2018 Invesco Capital Management LLC 3500 Lacey Road, Suite 700 Downers Grove, IL 60515 | | P-TRST2-FINC-AR-1 | | invesco.com/ETFs |

Invesco Annual Report to Shareholders
August 31, 2018
| | |
| USEQ | | Invesco Russell 1000 Enhanced Equal Weight ETF |
| EQAL | | Invesco Russell 1000 Equal Weight ETF |
| USLB | | Invesco Russell 1000 Low Beta Equal Weight ETF |
| SPVU | | Invesco S&P 500 Enhanced Value ETF |
| XRLV | | Invesco S&P 500® ex-Rate Sensitive Low Volatility ETF |
| SPHB | | Invesco S&P 500® High Beta ETF |
| SPHD | | Invesco S&P 500® High Dividend Low Volatility ETF |
| SPLV | | Invesco S&P 500® Low Volatility ETF |
| SPMV | | Invesco S&P 500 Minimum Variance ETF |
| SPMO | | Invesco S&P 500 Momentum ETF |
| SPVM | | Invesco S&P 500 Value with Momentum ETF |
| XMLV | | Invesco S&P MidCap Low Volatility ETF |
| XSHD | | Invesco S&P SmallCap High Dividend Low Volatility ETF |
| XSLV | | Invesco S&P SmallCap Low Volatility ETF |
| XSHQ | | Invesco S&P SmallCap Quality ETF |
Table of Contents
The Market Environment
Domestic Equity
The fiscal period proved to be another strong, albeit increasingly volatile, time for US equities. As the fiscal period unfolded in the later months of 2017, several major US stock market indexes repeatedly reached new highs amid improving economic data, strong corporate profits and the prospect of tax reform legislation. Stock market volatility remained exceedingly low—a hallmark of 2017.
At the outset of 2018, US equity markets continued to steadily move higher in January as investors remained enthused about the passage of the Tax Cuts and Jobs Act signed into law in late December 2017, which significantly cut corporate tax rates. However, in February 2018, volatility returned to the US stock and bond markets. Worries about how rising interest rates might affect economic growth, concerns about a potential trade war and heightened geopolitical tensions, caused the US stock market to pull back and volatility to increase. In addition, in April 2018, the yield on the 10-year US Treasury bond climbed above 3%—a psychologically important level—for the first time since December 2013.1
Despite a disappointing first quarter, US equity markets generally recovered in the second quarter of 2018. Strong US retail sales and low unemployment continued to buoy US equity markets. In the final months of the fiscal period, US equities moved higher, despite several potential headwinds including trade tensions, tariff announcements and contagion concerns over a Turkish currency crisis. Ultimately, the fiscal period ended the same way it began with several US equity indexes reaching new record highs.
Given signs of a strong economy, the US Federal Reserve raised interest rates three times during the fiscal period: in December 2017 and in March and June 2018.2 In contrast, the European Central Bank and central banks in several other countries maintained extraordinarily accommodative monetary policies.
| 2 | Source: US Federal Reserve |
| | |
| USEQ | | Manager’s Analysis |
| | Invesco Russell 1000 Enhanced Equal Weight ETF (USEQ) |
As an index fund, the Invesco Russell 1000 Enhanced Equal Weight ETF (the “Fund”) is passively managed and seeks to track the returns of an underlying index. The Fund seeks to track the investment results (before fees and expenses) of the Russell 1000® Enhanced Value Equal Weight Index (the “Index”). The Fund generally will invest at least 90% of its total assets in securities that comprise the Index.
Frank Russell Company (“Russell” or the “Index Provider”) compiles, maintains and calculates the Index, which is composed of securities in the Russell 1000® Index (the “Russell 1000” or “Benchmark Index”) exhibiting upward price momentum and fair valuations. The Index is a subset of the Russell 1000, which measures the performance of the large-cap segment of the U.S. equity universe.
Strictly in accordance with its guidelines and mandated procedures, the Index Provider selects constituent securities for the Index using a three-step screening process. First, Russell excludes securities with zero or negative earnings over the past 12 months. Second, Russell screens for value stocks. Russell excludes stocks with valuation scores in the bottom 10% of all eligible stocks. Third, Russell screens for securities with greater positive price “momentum.” Stocks are ranked from highest returns to lowest returns over that period within each of 10 industries, and stocks with returns ranking in the bottom 10% of each industry are excluded. The remaining securities are included in the Index. Constituent securities in the Index are equally weighted. The Index also may include securities of mid-cap issuers. Therefore, due to the equal weighting methodology of the Index, the Fund may have greater exposure to mid-cap issuers than would be the case if the Index used a traditional capitalization-weighted methodology. The Fund generally invests in all of the components of the Index in proportion to their weightings in the Index.
The Board of Trustees approved a change in the fiscal year end for the Fund from October 31 to August 31. For the fiscal period from November 1, 2017 to August 31, 2018, on a market price basis, the Fund returned 10.29%. On a net asset value (“NAV”) basis, the Fund returned 10.38%. During the same time period, the Index returned 10.61%. During the fiscal period, the Fund fully replicated the components of the Index; therefore, the Fund’s performance (NAV basis) differed from the return of the Index primarily due to fees and operating expenses that the Fund incurred during the period.
During this same time period, the Benchmark Index returned 14.69%. The Benchmark Index is an unmanaged index weighted by market capitalization based on the average performance of approximately 1,000 securities. The Benchmark Index was selected for its recognition in the marketplace, and its performance comparison is a useful measure for investors as a broad representation of the overall U.S. stock market.
The performance of the Fund differed from the Benchmark Index in part because the Fund seeks to track an index that employs an equal weighted methodology, whereas the Benchmark Index weights stocks based on market capitalization.
Relative to the Benchmark Index, the Fund was most overweight in the industrials sector and most underweight in the information technology sector during the fiscal period ended August 31, 2018. The majority of the Fund’s underperformance relative to the Benchmark Index during the period can be primarily attributed to its allocation to the information technology sector and stock selection within the consumer discretionary sector.
For the fiscal period ended August 31, 2018, the consumer discretionary sector contributed most significantly to the Fund’s return, followed by the industrials and information technology sectors, respectively. The materials sector was the only detracting sector.
Positions that contributed most significantly to the Fund’s return for the fiscal period ended August 31, 2018, included Lululemon Athletica, Inc., a consumer discretionary company (portfolio average weight of 0.21%), and NetApp, Inc., an information technology company (portfolio average weight of 0.18%). Positions that detracted most significantly from the Fund’s return included Akorn, Inc., a health care company (no longer held at fiscal period-end), and Coherent, Inc., an information technology company (no longer held at fiscal period-end).
| | | | |
Sector Breakdown
(% of the Fund’s Net Assets)
as of August 31, 2018 | |
| Financials | | | 17.7 | |
| Industrials | | | 16.6 | |
| Consumer Discretionary | | | 16.0 | |
| Information Technology | | | 11.6 | |
| Health Care | | | 9.5 | |
| Real Estate | | | 7.5 | |
| Consumer Staples | | | 5.9 | |
| Materials | | | 5.5 | |
| Utilities | | | 4.5 | |
| Energy | | | 4.3 | |
| Telecommunication Services | | | 0.9 | |
| Other Assets Less Liabilities | | | 0.0 | |
|
Top Ten Fund Holdings
(% of the Fund’s Net Assets)
as of August 31, 2018 | |
| Security | | | | |
| Concho Resources, Inc. | | | 0.2 | |
| Lululemon Athletica, Inc. | | | 0.2 | |
| Premier, Inc., Class A | | | 0.2 | |
| Fortinet, Inc. | | | 0.2 | |
| Manhattan Associates, Inc. | | | 0.2 | |
| First Data Corp., Class A | | | 0.2 | |
| WellCare Health Plans, Inc. | | | 0.2 | |
| Darden Restaurants, Inc. | | | 0.2 | |
| Nordstrom, Inc. | | | 0.2 | |
| Credit Acceptance Corp. | | | 0.2 | |
| Total | | | 2.0 | |
Invesco Russell 1000 Enhanced Equal Weight ETF (USEQ) (continued)
Growth of a $10,000 Investment Since Inception
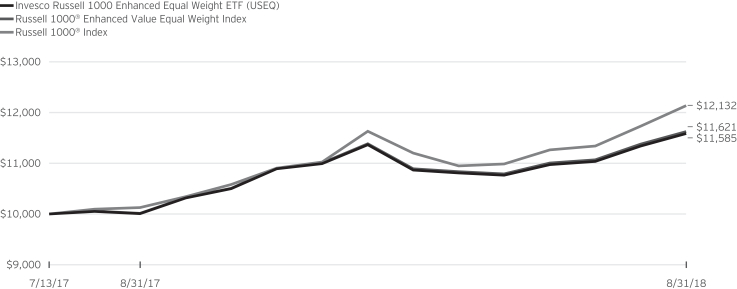
Fund Performance History as of August 31, 2018
| | | | | | | | | | | | | | | | |
| | | 1 Year | | | | | | Fund Inception | |
| Index | | | | | Average
Annualized | | | Cumulative | |
| Russell 1000® Enhanced Value Equal Weight Index | | | 16.09 | % | | | | | | | 14.20 | % | | | 16.21 | % |
| Russell 1000® Index | | | 19.82 | | | | | | | | 18.62 | | | | 21.32 | |
| Fund | | | | | | | | | | | | | | | | |
| NAV Return | | | 15.76 | | | | | | | | 13.88 | | | | 15.85 | |
| Market Price Return | | | 15.79 | | | | | | | | 13.91 | | | | 15.88 | |
Fund Inception: July 13, 2017
Performance quoted above represents past performance. Past performance is not a guarantee of future results and current performance may be higher or lower than performance quoted. Investment returns and principal value will fluctuate, and shares of the Fund (“Fund Shares”), when redeemed or sold, may be worth more or less than their original cost. Fund performance reflects any applicable fee waivers and/or expense reimbursements. Had the adviser not waived fees and/or reimbursed expenses currently or in the past, returns would have been lower. See current prospectus for more information. According to the Fund’s current prospectus, the Fund’s expense ratio of 0.29% is expressed as a unitary management fee to cover operating expenses and expenses incurred in connection with managing the portfolio. NAV and Market Price returns assume that dividends and capital gain distributions have been reinvested in the Fund at NAV and Market Price, respectively. The returns shown in the table above do not reflect the deduction of taxes that a shareholder would pay on Fund distributions or the redemption or sale of Fund Shares. See invesco.com/ETFs to find the most recent month-end performance numbers.
Index and Benchmark Index performance results are based upon a hypothetical investment in their respective constituent securities. Index and Benchmark Index returns do not represent Fund returns. An investor cannot invest directly in an index. The Index and Benchmark Index do not charge management fees or brokerage expenses, and no such fees or expenses were deducted from the hypothetical performance shown. In addition, the results actual investors might have achieved would have differed from those shown because of differences in the timing, amounts of their investments, and fees and expenses associated with an investment in the Fund.
Notes Regarding Indexes and Fund Performance History:
| - | Average Annualized and Cumulative Inception returns for the Fund, Index and Benchmark Index are based on the inception date of the Fund. |
| | |
| EQAL | | Manager’s Analysis |
| | Invesco Russell 1000 Equal Weight ETF (EQAL) |
As an index fund, the Invesco Russell 1000 Equal Weight ETF (the “Fund”) is passively managed and seeks to track the returns of an underlying index. The Fund seeks to track the investment results (before fees and expenses) of the Russell 1000® Equal Weight Index (the “Index”). The Fund generally will invest at least 90% of its total assets in common stocks that comprise the Index.
Frank Russell Company (“Russell” or the “Index Provider”) compiles, maintains and calculates the Index strictly in accordance with its existing guidelines and mandated procedures. The Index is composed of all the securities in the Russell 1000® Index (the “Russell 1000” or “Benchmark Index”). The Index Provider equally weights the Index by applying a two-step weighting process. First, the Index Provider separates the component securities of the Russell 1000 into different economic sector groups based on the Russell Global Sectors (the “RGS”) classification system. There are nine economic sectors within the RGS classification system. Next, the Index Provider equally weights those nine sector groups, and then equally weights the individual securities within each of those sector groups. The Index Provider re-weights the Index quarterly and reconstitutes it annually in accordance with this equally-weighted methodology. The Fund generally invests in all of the securities comprising the Index in proportion to their weightings in the Index.
The Board of Trustees approved a change in the fiscal year end for the Fund from October 31 to August 31. For the fiscal period from November 1, 2017 to August 31, 2018, on a market price basis, the Fund returned 12.49%. On a net asset value (“NAV”) basis, the Fund returned 12.50%. During the same time period, the Index returned 12.69%. During the fiscal period, the Fund fully replicated the components of the Index; therefore, the Fund’s performance, on a NAV basis, differed from the return of the Index primarily due to fees and operating expenses that the Fund incurred during the period, which were partially offset by revenue generated from the securities lending program in which the Fund participates.
During this same time period, the Benchmark Index returned 14.69%. The Benchmark Index is an unmanaged index weighted by market capitalization based on the average performance of approximately 1,000 securities. The Benchmark Index was selected for its recognition in the marketplace, and its performance comparison is a useful measure for investors as a broad representation of the overall U.S. stock market.
The performance of the Fund differed from the Benchmark Index in part because the Fund seeks to track an Index that employs an equal weighted methodology, whereas the Benchmark Index weights stocks based on market capitalization.
Relative to the Benchmark Index, the Fund was most overweight in the utilities sector and most underweight in the information technology sector during the fiscal period ended August 31, 2018. The majority of the Fund’s underperformance relative to
the Benchmark Index during the period can be attributed to the Fund’s allocations in the consumer discretionary sector.
For the fiscal period ended August 31, 2018, the information technology sector contributed most significantly to the Fund’s return, followed by the energy and health care sectors, respectively. The materials sector was the greatest detracting sector.
Positions that contributed most significantly to the Fund’s return for the fiscal period ended August 31, 2018, included Whiting Petroleum Corp., an energy company (portfolio average weight of 0.18%), and HollyFrontier Corp., an energy company (portfolio average weight of 0.19%). Positions that detracted most significantly from the Fund’s return included TESARO, Inc., a health care company (portfolio average weight of 0.08%), and Pilgrim’s Pride Corp., a consumer staples company (portfolio average weight of 0.21%).
| | | | |
Sector Breakdown
(% of the Fund’s Net Assets)
as of August 31, 2018 | |
| Information Technology | | | 13.5 | |
| Industrials | | | 12.8 | |
| Health Care | | | 11.9 | |
| Consumer Staples | | | 11.2 | |
| Energy | | | 10.5 | |
| Consumer Discretionary | | | 9.9 | |
| Utilities | | | 9.7 | |
| Materials | | | 8.5 | |
| Financials | | | 6.1 | |
| Real Estate | | | 3.7 | |
| Telecommunication Services | | | 2.1 | |
| Money Market Fund Plus Other Assets Less Liabilities | | | 0.1 | |
|
Top Ten Fund Holdings*
(% of the Fund’s Net Assets)
as of August 31, 2018 | |
| Security | | | | |
| Concho Resources, Inc. | | | 0.4 | |
| Sprouts Farmers Market, Inc. | | | 0.3 | |
| Kroger Co. (The) | | | 0.3 | |
| CenturyLink, Inc. | | | 0.3 | |
| McCormick & Co., Inc. | | | 0.3 | |
| United States Cellular Corp. | | | 0.3 | |
| PG&E Corp. | | | 0.3 | |
| Eversource Energy | | | 0.3 | |
| Casey’s General Stores, Inc. | | | 0.3 | |
| DTE Energy Co. | | | 0.3 | |
| Total | | | 3.1 | |
| * | Excluding money market fund holdings. |
Invesco Russell 1000 Equal Weight ETF (EQAL) (continued)
Growth of a $10,000 Investment Since Inception
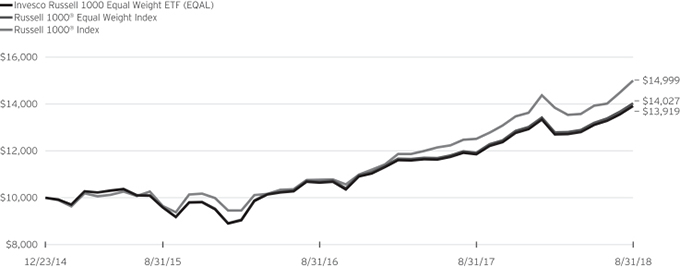
Fund Performance History as of August 31, 2018
| | | | | | | | | | | | | | | | | | | | | | | | |
| | | 1 Year | | | 3 Years Average
Annualized | | | 3 Years Cumulative | | | | | | Fund Inception | |
| Index | | | | | Average
Annualized | | | Cumulative | |
| Russell 1000® Equal Weight Index | | | 17.63 | % | | | 13.46 | % | | | 46.07 | % | | | | | | | 9.61 | % | | | 40.27 | % |
| Russell 1000® Index | | | 19.82 | | | | 15.84 | | | | 55.45 | | | | | | | | 11.62 | | | | 49.99 | |
| Fund | | | | | | | | | | | | | | | | | | | | | | | | |
| NAV Return | | | 17.37 | | | | 13.22 | | | | 45.14 | | | | | | | | 9.38 | | | | 39.19 | |
| Market Price Return | | | 17.44 | | | | 13.22 | | | | 45.12 | | | | | | | | 9.36 | | | | 39.12 | |
Fund Inception: December 23, 2014
Performance quoted above represents past performance. Past performance is not a guarantee of future results and current performance may be higher or lower than performance quoted. Investment returns and principal value will fluctuate, and shares of the Fund (“Fund Shares”), when redeemed or sold, may be worth more or less than their original cost. Fund performance reflects any applicable fee waivers and/or expense reimbursements. Had the adviser not waived fees and/or reimbursed expenses currently or in the past, returns would have been lower. See current prospectus for more information. According to the Fund’s current prospectus, the Fund’s expense ratio of 0.20% is expressed as a unitary management fee to cover operating expenses and expenses incurred in connection with managing the portfolio. NAV and Market Price returns assume that dividends and capital gain distributions have been reinvested in the Fund at NAV and Market Price, respectively. The returns shown in the table above do not reflect the deduction of taxes that a shareholder would pay on Fund
distributions or the redemption or sale of Fund Shares. See invesco.com/ETFs to find the most recent month-end performance numbers.
Index and Benchmark Index performance results are based upon a hypothetical investment in their respective constituent securities. Index and Benchmark Index returns do not represent Fund returns. An investor cannot invest directly in an index. The Index and Benchmark Index do not charge management fees or brokerage expenses, and no such fees or expenses were deducted from the hypothetical performance shown. In addition, the results actual investors might have achieved would have differed from those shown because of differences in the timing, amounts of their investments, and fees and expenses associated with an investment in the Fund.
Notes Regarding Indexes and Fund Performance History:
| - | Average Annualized and Cumulative Inception returns for the Fund, Index and Benchmark Index are based on the inception date of the Fund. |
| | |
| USLB | | Manager’s Analysis |
| | Invesco Russell 1000 Low Beta Equal Weight ETF (USLB) |
As an index fund, the Invesco Russell 1000 Low Beta Equal Weight ETF (the “Fund”) is passively managed and seeks to track the returns of an underlying index. The Fund seeks to track the investment results (before fees and expenses) of the Russell 1000® Low Beta Equal Weight Index (the “Index”). The Fund generally will invest at least 90% of its total assets in common stocks that comprise the Index.
Strictly in accordance with its guidelines and mandated procedures, Frank Russell Company (“Russell” or the “Index Provider”) compiles, maintains and calculates the Index, which is designed to provide exposure to constituents of the Russell 1000® Index (the “Russell 1000” or “Benchmark Index”) that exhibit low beta characteristics. The Russell 1000 is designed to measure the performance of the U.S. equity market, and consists of the stocks of the largest 1,000 companies by capitalization in the U.S.
Beta is a measure of a security’s price sensitivity (i.e., volatility); it reflects the rate of change in a security’s price that results from overall market movements. To calculate the beta score for each security in the Russell 1000, the Index Provider analyzes the security’s monthly returns over the past eighteen months to see the extent to which they correlate to overall market movements. Securities with a beta score of less than that of the overall U.S. equity market average (that is, securities whose price changes exhibit less volatility than the average amount of volatility in the market) are eligible for inclusion in the Index. The Index is equally weighted, meaning that the Index Provider assigns each component security the same weight in the Index. The Fund generally invests in all of the securities comprising the Index in proportion to their weighting in the Index.
The Board of Trustees approved a change in the fiscal year end for the Fund from October 31 to August 31. For the fiscal period from November 1, 2017 to August 31, 2018, on a market price basis, the Fund returned 13.04%. On a net asset value (“NAV”) basis, the Fund returned 13.04%. During the same time period, the Index returned 13.44%. During the fiscal period, the Fund fully replicated the components of the Index; therefore, the Fund’s performance (NAV basis) differed from the return of the Index primarily due to fees and operating expenses that the Fund incurred during the period.
During this same time period, the Benchmark Index returned 14.69%. The Benchmark Index is an unmanaged index weighted by market capitalization based on the average performance of approximately 1,000 securities. The Benchmark Index was selected for its recognition in the marketplace, and its performance comparison is a useful measure for investors as a broad representation of the overall U.S. stock market.
Relative to the Benchmark Index, the Fund was most overweight in the real estate sector and most underweight in the information technology sector during the fiscal period ended August 31,
2018. The majority of the Fund’s underperformance relative to the Benchmark Index during the period can be attributed to its allocation to the utilities sector.
For the fiscal period ended August 31, 2018, the information technology sector contributed most significantly to the Fund’s return, followed by the consumer discretionary sector. The utilities sector was the only detracting sector.
Positions that contributed most significantly to the Fund’s return for the fiscal period ended August 31, 2018, included Netflix, Inc., a consumer discretionary company (no longer held at fiscal period-end), and Under Armour, Inc., Class A, a consumer discretionary company (no longer held at fiscal period-end). Positions that detracted most significantly from the Fund’s return included RPC, Inc., an energy company (portfolio average weight of 0.15%), and Pilgrim’s Pride Corp., a consumer staples company (portfolio average weight of 0.17%).
| | | | |
Sector Breakdown
(% of the Fund’s Net Assets)
as of August 31, 2018 | |
| Financials | | | 16.1 | |
| Real Estate | | | 13.6 | |
| Information Technology | | | 13.3 | |
| Consumer Discretionary | | | 12.3 | |
| Industrials | | | 10.2 | |
| Health Care | | | 9.7 | |
| Materials | | | 6.7 | |
| Utilities | | | 6.4 | |
| Energy | | | 5.3 | |
| Consumer Staples | | | 4.9 | |
| Telecommunication Services | | | 1.4 | |
| Other Assets Less Liabilities | | | 0.1 | |
|
Top Ten Fund Holdings
(% of the Fund’s Net Assets)
as of August 31, 2018 | |
| Security | | | | |
| Prologis, Inc. REIT | | | 0.4 | |
| Concho Resources, Inc. | | | 0.4 | |
| Lululemon Athletica, Inc. | | | 0.3 | |
| Paycom Software, Inc. | | | 0.3 | |
| Fortinet, Inc. | | | 0.3 | |
| First Data Corp., Class A | | | 0.3 | |
| Veeva Systems, Inc., Class A | | | 0.3 | |
| Regeneron Pharmaceuticals, Inc. | | | 0.3 | |
| Premier, Inc., Class A | | | 0.3 | |
| GrubHub, Inc. | | | 0.2 | |
| Total | | | 3.1 | |
Invesco Russell 1000 Low Beta Equal Weight ETF (USLB) (continued)
Growth of a $10,000 Investment Since Inception
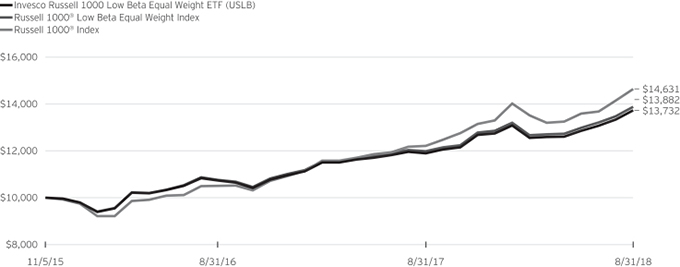
Fund Performance History as of August 31, 2018
| | | | | | | | | | | | | | | | |
| | | 1 Year | | | | | | Fund Inception | |
| Index | | | | | Average
Annualized | | | Cumulative | |
| Russell 1000® Low Beta Equal Weight Index | | | 15.88 | % | | | | | | | 12.34 | % | | | 38.82 | % |
| Russell 1000® Index | | | 19.82 | | | | | | | | 14.45 | | | | 46.31 | |
| Fund | | | | | | | | | | | | | | | | |
| NAV Return | | | 15.40 | | | | | | | | 11.91 | | | | 37.32 | |
| Market Price Return | | | 15.40 | | | | | | | | 11.86 | | | | 37.16 | |
Fund Inception: November 5, 2015
Performance quoted above represents past performance. Past performance is not a guarantee of future results and current performance may be higher or lower than performance quoted. Investment returns and principal value will fluctuate, and shares of the Fund (“Fund Shares”), when redeemed or sold, may be worth more or less than their original cost. Fund performance reflects any applicable fee waivers and/or expense reimbursements. Had the adviser not waived fees and/or reimbursed expenses currently or in the past, returns would have been lower. See current prospectus for more information. According to the Fund’s current prospectus, the Fund’s expense ratio of 0.35% is expressed as a unitary management fee to cover operating expenses and expenses incurred in connection with managing the portfolio. NAV and Market Price returns assume that dividends and capital gain distributions have been reinvested in the Fund at NAV and Market Price, respectively. The returns shown in the table above do not reflect the deduction of taxes that a shareholder would pay on Fund
distributions or the redemption or sale of Fund Shares. See invesco.com/ETFs to find the most recent month-end performance numbers.
Index and Benchmark Index performance results are based upon a hypothetical investment in their respective constituent securities. Index and Benchmark Index returns do not represent Fund returns. An investor cannot invest directly in an index. The Index and Benchmark Index do not charge management fees or brokerage expenses, and no such fees or expenses were deducted from the hypothetical performance shown. In addition, the results actual investors might have achieved would have differed from those shown because of differences in the timing, amounts of their investments, and fees and expenses associated with an investment in the Fund.
Notes Regarding Indexes and Fund Performance History:
| - | Average Annualized and Cumulative Inception returns for the Fund, Index and Benchmark Index are based on the inception date of the Fund. |
| | |
| SPVU | | Manager’s Analysis |
| | Invesco S&P 500 Enhanced Value ETF (SPVU) |
As an index fund, the Invesco S&P 500 Enhanced Value ETF (the “Fund”) is passively managed and seeks to track the returns of an underlying index. The Fund seeks to track the investment results (before fees and expenses) of the S&P 500 Enhanced Value Index (the “Index”). The Fund generally will invest at least 90% of its total assets in common stocks that comprise the Index.
Strictly in accordance with its existing guidelines and mandated procedures, S&P Dow Jones Indices LLC (“S&P DJI” or the “Index Provider”) compiles, maintains and calculates the Index, which is designed to track the performance of approximately 100 stocks in the S&P 500® Index (the “Benchmark Index”) that have the highest “value score.”
In selecting constituent securities for the Index, the Index Provider first calculates the value score of each stock in the Benchmark Index by evaluating each stock’s: (i) book value-to-price ratio, (ii) earnings-to-price ratio, and (iii) sales-to-price ratio. The Index Provider then calculates the value score of each security based on a composite of those three factors and selects the 100 stocks with the highest value score for inclusion in the Index. The Index uses a modified market capitalization-weighted strategy, as the Index Provider weights securities by multiplying their market capitalization and their value score. The Fund generally invests in all of the securities comprising the Index in proportion to their weightings in the Index.
The Board of Trustees approved a change in the fiscal year end for the Fund from October 31 to August 31. For the fiscal period from November 1, 2017 to August 31, 2018, on a market price basis, the Fund returned 11.60%. On a net asset value (“NAV”) basis, the Fund returned 11.61%. During the same time period, the Index returned 11.80%. During the fiscal period, the Fund fully replicated the components of the Index; therefore, the Fund’s performance (NAV basis) differed from the return of the Index primarily due to fees and operating expenses that the Fund incurred during the period.
During this same time period, the Benchmark Index returned 14.57%. The Benchmark Index is an unmanaged index weighted by market capitalization based on the average performance of approximately 500 securities. The Benchmark Index was selected for its recognition in the marketplace, and its performance comparison is a useful measure for investors as a broad representation of the overall U.S. stock market.
The performance of the Fund differed from the Benchmark Index primarily due to the Fund’s thematic objective and proprietary weighting methodology.
Relative to the Benchmark Index, the Fund was most overweight in the financials sector and most underweight in the information technology sector during the fiscal period ended August 31, 2018. The majority of the Fund’s underperformance relative to
the Benchmark Index during the period can be attributed to overweighting of the financials sector.
For the fiscal period ended August 31, 2018, the energy sector contributed most significantly to the Fund’s return, followed by the health care and consumer discretionary sectors, respectively. No sectors detracted from the Fund’s return.
Positions that contributed most significantly to the Fund’s return for the fiscal period ended August 31, 2018, included Valero Energy Corp., an energy company (portfolio average weight of 1.53%), and Verizon Communications, Inc., a telecommunication services company (portfolio average weight of 5.42%). Positions that detracted most significantly from the Fund’s return included Ford Motor Co., a consumer discretionary company (portfolio average weight of 1.73%), and Citigroup Inc., a financials company (no longer held at fiscal period-end).
| | | | |
Sector Breakdown
(% of the Fund’s Net Assets)
as of August 31, 2018 | |
| Financials | | | 35.5 | |
| Consumer Discretionary | | | 14.8 | |
| Telecommunication Services | | | 10.9 | |
| Health Care | | | 10.2 | |
| Consumer Staples | | | 9.8 | |
| Energy | | | 5.5 | |
| Industrials | | | 5.5 | |
| Materials | | | 2.7 | |
| Utilities | | | 2.4 | |
| Information Technology | | | 2.4 | |
| Real Estate | | | 0.2 | |
| Other Assets Less Liabilities | | | 0.1 | |
|
Top Ten Fund Holdings
(% of the Fund’s Net Assets)
as of August 31, 2018 | |
| Security | | | | |
| Verizon Communications, Inc. | | | 5.4 | |
| Berkshire Hathaway, Inc., Class B | | | 5.2 | |
| Wells Fargo & Co. | | | 5.1 | |
| Bank of America Corp. | | | 5.0 | |
| Comcast Corp., Class A | | | 4.7 | |
| AT&T, Inc. | | | 4.6 | |
| Walmart, Inc. | | | 3.5 | |
| CVS Health Corp. | | | 3.0 | |
| Prudential Financial, Inc. | | | 1.9 | |
| Express Scripts Holding Co. | | | 1.9 | |
| Total | | | 40.3 | |
Invesco S&P 500 Enhanced Value ETF (SPVU) (continued)
Growth of a $10,000 Investment Since Inception
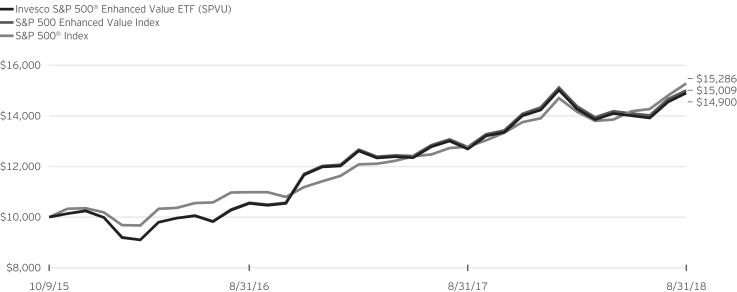
Fund Performance History as of August 31, 2018
| | | | | | | | | | | | | | | | |
| | | 1 Year | | | | | | Fund Inception | |
| Index | | | | | Average
Annualized | | | Cumulative | |
| S&P 500 Enhanced Value Index | | | 17.60 | % | | | | | | | 15.07 | % | | | 50.09 | % |
| S&P 500® Index | | | 19.66 | | | | | | | | 15.80 | | | | 52.86 | |
| Fund | | | | | | | | | | | | | | | | |
| NAV Return | | | 17.34 | | | | | | | | 14.78 | | | | 49.00 | |
| Market Price Return | | | 17.44 | | | | | | | | 14.76 | | | | 48.90 | |
Fund Inception: October 9, 2015
Performance quoted above represents past performance. Past performance is not a guarantee of future results and current performance may be higher or lower than performance quoted. Investment returns and principal value will fluctuate, and shares of the Fund (“Fund Shares”), when redeemed or sold, may be worth more or less than their original cost. Fund performance reflects any applicable fee waivers and/or expense reimbursements. Had the adviser not waived fees and/or reimbursed expenses currently or in the past, returns would have been lower. See current prospectus for more information. According to the Fund’s current prospectus, the Fund’s expense ratio of 0.13% is expressed as a unitary management fee to cover operating expenses and expenses incurred in connection with managing the portfolio. NAV and Market Price returns assume that dividends and capital gain distributions have been reinvested in the Fund at NAV and Market Price, respectively. The returns shown in the table above do not reflect the deduction of taxes that a shareholder would pay on Fund distributions or the redemption or sale of Fund Shares. See
invesco.com/ETFs to find the most recent month-end performance numbers.
Index and Benchmark Index performance results are based upon a hypothetical investment in their respective constituent securities. Index and Benchmark Index returns do not represent Fund returns. An investor cannot invest directly in an index. The Index and Benchmark Index do not charge management fees or brokerage expenses, and no such fees or expenses were deducted from the hypothetical performance shown. In addition, the results actual investors might have achieved would have differed from those shown because of differences in the timing, amounts of their investments, and fees and expenses associated with an investment in the Fund.
Notes Regarding Indexes and Fund Performance History:
| - | Average Annualized and Cumulative Inception returns for the Fund, Index and Benchmark Index are based on the inception date of the Fund. |
| | |
| XRLV | | Manager’s Analysis |
| | Invesco S&P 500® ex-Rate Sensitive Low Volatility ETF (XRLV) |
As an index fund, the Invesco S&P 500® ex-Rate Sensitive Low Volatility ETF (the “Fund”) is passively managed and seeks to track the returns of an underlying index. The Fund seeks to track the investment results (before fees and expenses) of the S&P 500® Low Volatility Rate Response Index (the “Index”). The Fund generally will invest at least 90% of its total assets in common stocks that comprise the Index.
Strictly in accordance with its guidelines and mandated procedures, S&P Dow Jones Indices LLC (“S&P DJI” or the “Index Provider”) compiles, maintains and calculates the Index, which is designed to provide exposure to the 100 constituents of the S&P 500® Index (the “Benchmark Index”) that exhibit both low volatility and low interest rate risk. The Index is designed to include stocks exhibiting low volatility characteristics, after removing stocks that historically have performed poorly in rising interest rate environments. Volatility is a statistical measurement of the magnitude of up and down asset price fluctuations (increases or decreases in a stock’s price) over time. The Index Provider determines a stock’s “rate sensitivity” by performing a regression of the stock’s returns over a five-year period to changes in interest rates over that same period. The Fund generally invests in all of the securities comprising the Index in proportion to their weightings in the Index.
The Board of Trustees approved a change in the fiscal year end for the Fund from October 31 to August 31. For the fiscal period from November 1, 2017 to August 31, 2018, on a market price basis, the Fund returned 12.96%. On a net asset value (“NAV”) basis, the Fund returned 12.92%. During the same time period, the Index returned 13.16%. During the fiscal period, the Fund fully replicated the components of the Index; therefore, the Fund’s performance (NAV basis) differed from the return of the Index primarily due to fees and operating expenses that the Fund incurred during the period.
During this same time period, the Benchmark Index returned 14.57%. The Benchmark Index is an unmanaged index weighted by market capitalization based on the average performance of approximately 500 securities. The Benchmark Index was selected for its recognition in the marketplace, and its performance comparison is a useful measure for investors as a broad representation of the overall U.S. stock market.
The performance of the Fund differed from the Benchmark Index in part because the Fund seeks to track an Index that is a subset of the Benchmark Index, consisting of the 100 securities within the Benchmark Index that historically have had the highest positive sensitivity to interest rates and the lowest volatility.
Relative to the Benchmark Index, the Fund was most overweight in the industrials sector and most underweight in the information technology sector during the fiscal period ended August 31, 2018. The majority of the Fund’s underperformance relative to the Benchmark Index during the period can be attributed to stock
selection within the consumer discretionary sector as well as fees and operating expenses incurred by the Fund.
For the fiscal period ended August 31, 2018, the information technology sector contributed most significantly to the Fund’s return, followed by the health care and financials sectors, respectively. The utilities sector was the only detracting sector.
Positions that contributed most significantly to the Fund’s return for the fiscal period ended August 31, 2018, included Progressive Corp. (The), a financials company (portfolio average weight of 1.02%), and Verisk Analytics, Inc., an industrials company (portfolio average weight of 1.06%). Positions that detracted most significantly from the Fund’s return included Mohawk Industries, Inc., a consumer discretionary company (no longer held at fiscal period-end), and Fortune Brands Home & Security, Inc., an industrials company (no longer held at fiscal period-end).
| | | | |
Sector Breakdown
(% of the Fund’s Net Assets)
as of August 31, 2018 | |
| Financials | | | 25.2 | |
| Information Technology | | | 17.1 | |
| Industrials | | | 13.7 | |
| Health Care | | | 11.7 | |
| Consumer Staples | | | 8.6 | |
| Materials | | | 7.1 | |
| Consumer Discretionary | | | 6.8 | |
| Real Estate | | | 5.1 | |
| Energy | | | 3.7 | |
| Telecommunication Services | | | 0.9 | |
| Other Assets Less Liabilities | | | 0.1 | |
|
Top Ten Fund Holdings
(% of the Fund’s Net Assets)
as of August 31, 2018 | |
| Security | | | | |
| Coca-Cola Co. (The) | | | 1.3 | |
| Ecolab, Inc. | | | 1.2 | |
| Procter & Gamble Co. (The) | | | 1.2 | |
| Marsh & McLennan Cos., Inc. | | | 1.2 | |
| Honeywell International, Inc. | | | 1.1 | |
| PepsiCo, Inc. | | | 1.1 | |
| Aon PLC | | | 1.1 | |
| Fidelity National Information Services, Inc. | | | 1.1 | |
| Republic Services, Inc. | | | 1.1 | |
| Willis Towers Watson PLC | | | 1.1 | |
| Total | | | 11.5 | |
Invesco S&P 500® ex-Rate Sensitive Low Volatility ETF (XRLV) (continued)
Growth of a $10,000 Investment Since Inception
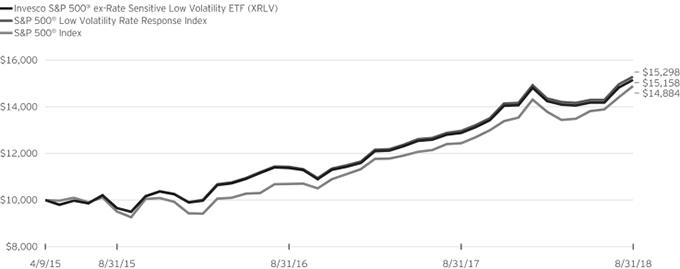
Fund Performance History as of August 31, 2018
| | | | | | | | | | | | | | | | | | | | | | | | |
| | | 1 Year | | | 3 Years Average
Annualized | | | 3 Years Cumulative | | | | | | Fund Inception | |
| Index | | | | | Average
Annualized | | | Cumulative | |
| S&P 500® Low Volatility Rate Response Index | | | 17.96 | % | | | 16.53 | % | | | 58.26 | % | | | | | | | 13.35 | % | | | 52.98 | % |
| S&P 500® Index | | | 19.66 | | | | 16.11 | | | | 56.55 | | | | | | | | 12.44 | | | | 48.84 | |
| Fund | | | | | | | | | | | | | | | | | | | | | | | | |
| NAV Return | | | 17.66 | | | | 16.22 | | | | 56.99 | | | | | | | | 13.05 | | | | 51.58 | |
| Market Price Return | | | 17.70 | | | | 16.17 | | | | 56.77 | | | | | | | | 13.03 | | | | 51.50 | |
Fund Inception: April 9, 2015
Performance quoted above represents past performance. Past performance is not a guarantee of future results and current performance may be higher or lower than performance quoted. Investment returns and principal value will fluctuate, and shares of the Fund (“Fund Shares”), when redeemed or sold, may be worth more or less than their original cost. Fund performance reflects any applicable fee waivers and/or expense reimbursements. Had the adviser not waived fees and/or reimbursed expenses currently or in the past, returns would have been lower. See current prospectus for more information. According to the Fund’s current prospectus, the Fund’s expense ratio of 0.25% is expressed as a unitary management fee to cover operating expenses and expenses incurred in connection with managing the portfolio. NAV and Market Price returns assume that dividends and capital gain distributions have been reinvested in the Fund at NAV and Market Price, respectively. The returns shown in the table above do not reflect the deduction of taxes that a shareholder would pay on Fund distributions or the redemption or sale of Fund Shares. See
invesco.com/ETFs to find the most recent month-end performance numbers.
Index and Benchmark Index performance results are based upon a hypothetical investment in their respective constituent securities. Index and Benchmark Index returns do not represent Fund returns. An investor cannot invest directly in an index. The Index and Benchmark Index do not charge management fees or brokerage expenses, and no such fees or expenses were deducted from the hypothetical performance shown. In addition, the results actual investors might have achieved would have differed from those shown because of differences in the timing, amounts of their investments, and fees and expenses associated with an investment in the Fund.
Notes Regarding Indexes and Fund Performance History:
| - | Average Annualized and Cumulative Inception returns for the Fund, Index and Benchmark Index are based on the inception date of the Fund. |
| | |
| SPHB | | Manager’s Analysis |
| | Invesco S&P 500® High Beta ETF (SPHB) |
As an index fund, the Invesco S&P 500® High Beta ETF (the “Fund”) is passively managed and seeks to track the returns of an underlying index. The Fund seeks to track the investment results (before fees and expenses) of the S&P 500® High Beta Index (the “Index”). The Fund generally will invest at least 90% of its total assets in securities that comprise the Index.
S&P Dow Jones Indices LLC (“S&P DJI” or the “Index Provider”) compiles, maintains and calculates the Index. Strictly in accordance with its existing guidelines and mandated procedures, S&P DJI selects 100 securities from the S&P 500® Index (the “Benchmark Index”) for inclusion in the Index that have the highest sensitivity to market movements, or “beta,” over the past 12 months as determined by the Index Provider. Beta is a measure of relative risk and is the rate of change of a security’s price. The Fund generally invests in all of the securities comprising the Index in proportion to their weightings in the Index.
The Board of Trustees approved a change in the fiscal year end for the Fund from October 31 to August 31. For the fiscal period from November 1, 2017 to August 31, 2018, on a market price basis, the Fund returned 14.22%. On a net asset value (“NAV”) basis, the Fund returned 14.12%. During the same time period, the Index returned 14.41%. During the fiscal period, the Fund fully replicated the components of the Index; therefore, the Fund’s performance (NAV basis) differed from the return of the Index primarily due to fees and operating expenses that the Fund incurred during the period, which were partially offset by revenue generated from the securities lending program in which the Funds participates.
During this same time period, the Benchmark Index returned 14.57%. The Benchmark Index is an unmanaged index weighted by market capitalization based on the average performance of approximately 500 securities. The Benchmark Index was selected for its recognition in the marketplace, and its performance comparison is a useful measure for investors as a broad representation of the overall U.S. stock market.
Relative to the Benchmark Index, the Fund was most overweight in the financials sector and most underweight in the health care sector during the fiscal period ended August 31, 2018. The majority of the Fund’s underperformance relative to the Benchmark Index during the period can be attributed to stock selection within the information technology sector and allocations within the consumer discretionary sector.
For the fiscal period ended August 31, 2018, the information technology sector contributed most significantly to the Fund’s return, followed by the financials sector, respectively. The real estate sector was the only detracting sector.
Positions that contributed most significantly to the Fund’s return for the fiscal period ended August 31, 2018, included Advanced Micro Devices, Inc., an information technology company (portfolio
average weight of 1.59%), and NetApp, Inc., an information technology company (portfolio average weight of 0.99%). Positions that detracted most significantly from the Fund’s return included Invesco Ltd., a financials company (portfolio average weight of 0.89%), and Western Digital Corp., an information technology company (portfolio average weight of 0.89%).
| | | | |
Sector Breakdown
(% of the Fund’s Net Assets)
as of August 31, 2018 | |
| Information Technology | | | 33.2 | |
| Financials | | | 24.4 | |
| Industrials | | | 12.7 | |
| Health Care | | | 12.7 | |
| Consumer Discretionary | | | 6.6 | |
| Materials | | | 5.6 | |
| Energy | | | 4.7 | |
| Other Assets Less Liabilities | | | 0.1 | |
|
Top Ten Fund Holdings
(% of the Fund’s Net Assets)
as of August 31, 2018 | |
| Security | | | | |
| Advanced Micro Devices, Inc. | | | 1.6 | |
| NVIDIA Corp. | | | 1.5 | |
| Micron Technology, Inc. | | | 1.4 | |
| Lam Research Corp. | | | 1.4 | |
| Align Technology, Inc. | | | 1.3 | |
| Netflix, Inc. | | | 1.3 | |
| Incyte Corp. | | | 1.2 | |
| KLA-Tencor Corp. | | | 1.2 | |
| United Rentals, Inc. | | | 1.2 | |
| Applied Materials, Inc. | | | 1.2 | |
| Total | | | 13.3 | |
Invesco S&P 500® High Beta ETF (SPHB) (continued)
Growth of a $10,000 Investment Since Inception
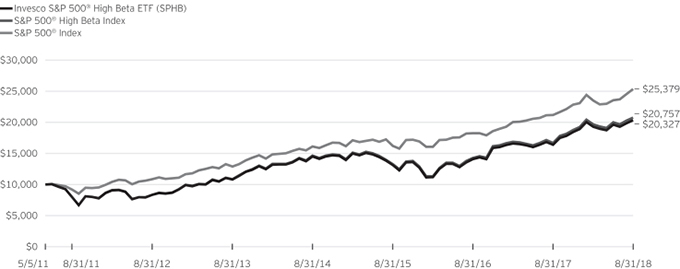
Fund Performance History as of August 31, 2018
| | | | | | | | | | | | | | | | | | | | | | | | | | | | | | | | |
| | | | | | 3 Years Average
Annualized | | | 3 Years Cumulative | | | 5 Years Average
Annualized | | | 5 Years Cumulative | | | | | | Fund Inception | |
| Index | | 1 Year | | | | | | Average
Annualized | | | Cumulative | |
| S&P 500® High Beta Index | | | 24.34 | % | | | 16.03 | % | | | 56.22 | % | | | 13.80 | % | | | 90.87 | % | | | | | | | 10.49 | % | | | 107.57 | % |
| S&P 500® Index | | | 19.66 | | | | 16.11 | | | | 56.55 | | | | 14.52 | | | | 97.01 | | | | | | | | 13.57 | | | | 153.79 | |
| Fund | | | | | | | | | | | | | | | | | | | | | | | | | | | | | | | | |
| NAV Return | | | 23.98 | | | | 15.70 | | | | 54.87 | | | | 13.48 | | | | 88.22 | | | | | | | | 10.18 | | | | 103.27 | |
| Market Price Return | | | 24.22 | | | | 15.71 | | | | 54.91 | | | | 13.50 | | | | 88.38 | | | | | | | | 10.20 | | | | 103.54 | |
Fund Inception: May 5, 2011
Performance quoted above represents past performance. Past performance is not a guarantee of future results and current performance may be higher or lower than performance quoted. Investment returns and principal value will fluctuate, and shares of the Fund (“Fund Shares”), when redeemed or sold, may be worth more or less than their original cost. Fund performance reflects any applicable fee waivers and/or expense reimbursements. Had the adviser not waived fees and/or reimbursed expenses currently or in the past, returns would have been lower. See current prospectus for more information. According to the Fund’s current prospectus, the Fund’s expense ratio of 0.25% is expressed as a unitary management fee to cover operating expenses and expenses incurred in connection with managing the portfolio. NAV and Market Price returns assume that dividends and capital gain distributions have been reinvested in the Fund at NAV and Market Price, respectively. The returns shown in the table above do not reflect the deduction of taxes that a shareholder would pay on Fund
distributions or the redemption or sale of Fund Shares. See invesco.com/ETFs to find the most recent month-end performance numbers.
Index and Benchmark Index performance results are based upon a hypothetical investment in their respective constituent securities. Index and Benchmark Index returns do not represent Fund returns. An investor cannot invest directly in an index. The Index and Benchmark Index do not charge management fees or brokerage expenses, and no such fees or expenses were deducted from the hypothetical performance shown. In addition, the results actual investors might have achieved would have differed from those shown because of differences in the timing, amounts of their investments, and fees and expenses associated with an investment in the Fund.
Notes Regarding Indexes and Fund Performance History:
| - | Average Annualized and Cumulative Inception returns for the Fund, Index and Benchmark Index are based on the inception date of the Fund. |
| | |
| SPHD | | Manager’s Analysis |
| | Invesco S&P 500® High Dividend Low Volatility ETF (SPHD) |
As an index fund, the Invesco S&P 500® High Dividend Low Volatility ETF (the “Fund”) is passively managed and seeks to track the returns of an underlying index. The Fund seeks to track the investment results (before fees and expenses) of the S&P 500® Low Volatility High Dividend Index (the “Index”). The Fund generally will invest at least 90% of its total assets in securities that comprise the Index.
S&P Dow Jones Indices LLC (“S&P DJI” or the “Index Provider”) compiles, maintains and calculates the Index, which is composed of 50 securities in the S&P 500® Index (the “Benchmark Index”) that historically have provided high dividend yields with lower volatility. Strictly in accordance with its guidelines and mandated procedures, S&P DJI identifies from the Benchmark Index the 75 securities with the highest dividend yields over the past 12 months, with no one sector within the Benchmark Index allowed to contribute more than 10 securities. From those securities, S&P DJI selects for inclusion in the Index the 50 securities with the lowest volatility over the past 12 months. Volatility is a statistical measurement of the magnitude of up and down asset price fluctuations (increases or decreases in a stock’s price) over time. The Index Provider weights each of the constituent securities in the Index by its dividend yield, with the highest dividend yielding securities receiving the highest weights. The Fund generally invests in all of the securities comprising the Index in proportion to their weightings in the Index.
The Board of Trustees approved a change in the fiscal year end for the Fund from October 31 to August 31. For the fiscal period from November 1, 2017 to August 31, 2018, on a market price basis, the Fund returned 4.45%. On a net asset value (“NAV”) basis, the Fund returned 4.48%. During the same time period, the Index returned 4.77%. During the fiscal period, the Fund fully replicated the components of the Index; therefore, the Fund’s performance (NAV basis) differed from the return of the Index primarily due to fees and operating expenses that the Fund incurred during that period.
During this same time period, the Benchmark Index returned 14.57%. The Benchmark Index is an unmanaged index weighted by market capitalization based on the average performance of approximately 500 securities. The Benchmark Index was selected for its recognition in the marketplace, and its performance comparison is a useful measure for investors as a broad representation of the overall U.S. stock market.
The performance of the Fund differed from the Benchmark Index in part because the Fund seeks to track an Index that is a subset of the Benchmark Index, consisting of the 50 securities within the Benchmark Index that historically have provided high dividend yields with lower volatility.
Relative to the Benchmark Index, the Fund was most overweight in the real estate sector and most underweight in the information
technology sector during the fiscal period ended August 31, 2018. The majority of the Fund’s underperformance relative to the Benchmark Index during the period can be attributed to the Fund’s allocation to the consumer discretionary and information technology sectors.
For the fiscal period ended August 31, 2018, the real estate sector contributed most significantly to the Fund’s return, followed by the energy and health care sectors, respectively. The consumer staples sector was the greatest detracting sector.
Positions that contributed most significantly to the Fund’s return for the fiscal period ended August 31, 2018, included Occidental Petroleum Corp., an energy company (portfolio average weight of 1.66%), and AbbVie, Inc., a health care company (no longer held at fiscal period-end). Positions that detracted most significantly from the Fund’s return included General Electric Co., an industrials company (no longer held at fiscal period-end), and Invesco Ltd., a financials company (portfolio average weight of 1.91%).
| | | | |
Sector Breakdown
(% of the Fund’s Net Assets)
as of August 31, 2018 | |
| Utilities | | | 19.0 | |
| Real Estate | | | 17.9 | |
| Consumer Staples | | | 15.5 | |
| Energy | | | 10.7 | |
| Financials | | | 10.5 | |
| Consumer Discretionary | | | 5.6 | |
| Telecommunication Services | | | 5.3 | |
| Industrials | | | 5.0 | |
| Information Technology | | | 3.6 | |
| Health Care | | | 3.5 | |
| Materials | | | 3.3 | |
| Other Assets Less Liabilities | | | 0.1 | |
|
Top Ten Fund Holdings
(% of the Fund’s Net Assets)
as of August 31, 2018 | |
| Security | | | | |
| Iron Mountain, Inc. | | | 3.0 | |
| AT&T, Inc. | | | 2.9 | |
| HCP, Inc. | | | 2.8 | |
| PPL Corp. | | | 2.8 | |
| Welltower, Inc. | | | 2.8 | |
| Ventas, Inc. | | | 2.7 | |
| Realty Income Corp. | | | 2.4 | |
| Philip Morris International, Inc. | | | 2.4 | |
| Verizon Communications, Inc. | | | 2.3 | |
| Ford Motor Co. | | | 2.3 | |
| Total | | | 26.4 | |
Invesco S&P 500® High Dividend Low Volatility ETF (SPHD) (continued)
Growth of a $10,000 Investment Since Inception
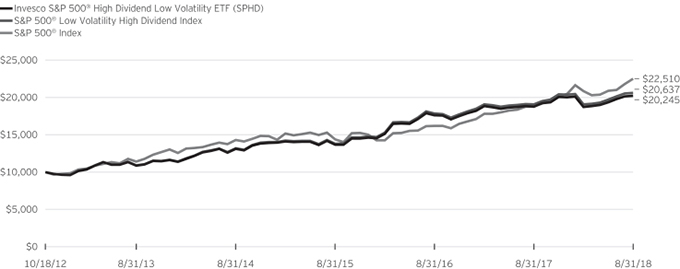
Fund Performance History as of August 31, 2018
| | | | | | | | | | | | | | | | | | | | | | | | | | | | | | | | |
| | | 1 Year | | | 3 Years Average
Annualized | | | 3 Years Cumulative | | | 5 Years Average
Annualized | | | 5 Years Cumulative | | | | | | Fund Inception | |
| Index | | | | | Average
Annualized | | | Cumulative | |
| S&P 500® Low Volatility High Dividend Index | | | 8.19 | % | | �� | 14.38 | % | | | 49.63 | % | | | 13.59 | % | | | 89.10 | % | | | | | | | 13.14 | % | | | 106.37 | % |
| S&P 500® Index | | | 19.66 | | | | 16.11 | | | | 56.55 | | | | 14.52 | | | | 97.01 | | | | | | | | 14.83 | | | | 125.10 | |
| Fund | | | | | | | | | | | | | | | | | | | | | | | | | | | | | | | | |
| NAV Return | | | 7.85 | | | | 14.00 | | | | 48.15 | | | | 13.21 | | | | 86.00 | | | | | | | | 12.77 | | | | 102.45 | |
| Market Price Return | | | 7.90 | | | | 13.98 | | | | 48.06 | | | | 13.24 | | | | 86.22 | | | | | | | | 12.76 | | | | 102.37 | |
Fund Inception: October 18, 2012
Performance quoted above represents past performance. Past performance is not a guarantee of future results and current performance may be higher or lower than performance quoted. Investment returns and principal value will fluctuate, and shares of the Fund (“Fund Shares”), when redeemed or sold, may be worth more or less than their original cost. Fund performance reflects any applicable fee waivers and/or expense reimbursements. Had the adviser not waived fees and/or reimbursed expenses currently or in the past, returns would have been lower. See current prospectus for more information. According to the Fund’s current prospectus, the Fund’s expense ratio of 0.30% is expressed as a unitary management fee to cover operating expenses and expenses incurred in connection with managing the portfolio. NAV and Market Price returns assume that dividends and capital gain distributions have been reinvested in the Fund at NAV and Market Price, respectively. The returns shown in the table above do not reflect the deduction of taxes that a shareholder would pay on Fund
distributions or the redemption or sale of Fund Shares. See invesco.com/ETFs to find the most recent month-end performance numbers.
Index and Benchmark Index performance results are based upon a hypothetical investment in their respective constituent securities. Index and Benchmark Index returns do not represent Fund returns. An investor cannot invest directly in an index. The Index and Benchmark Index do not charge management fees or brokerage expenses, and no such fees or expenses were deducted from the hypothetical performance shown. In addition, the results actual investors might have achieved would have differed from those shown because of differences in the timing, amounts of their investments, and fees and expenses associated with an investment in the Fund.
Notes Regarding Indexes and Fund Performance History:
| - | Average Annualized and Cumulative Inception returns for the Fund, Index and Benchmark Index are based on the inception date of the Fund. |
| | |
| SPLV | | Manager’s Analysis |
| | Invesco S&P 500® Low Volatility ETF (SPLV) |
As an index fund, the Invesco S&P 500® Low Volatility ETF (the “Fund”) is passively managed and seeks to track the returns of an underlying index. The Fund seeks to track the investment results (before fees and expenses) of the S&P 500® Low Volatility Index (the “Index”). The Fund generally will invest at least 90% of its total assets in common stocks that comprise the Index.
S&P Dow Jones Indices LLC (“S&P DJI” or the “Index Provider”) compiles, maintains and calculates the Index. Strictly in accordance with its existing guidelines and mandated procedures, S&P DJI selects 100 securities from the S&P 500® Index (the “Benchmark Index”) for inclusion in the Index that have the lowest realized volatility over the past 12 months as determined by the Index Provider. Volatility is a statistical measurement of the magnitude of up and down asset price fluctuations (increases or decreases in a stock’s price) over time. The Fund generally invests in all of the securities comprising the Index in proportion to their weightings in the Index.
The Board of Trustees approved a change in the fiscal year end for the Fund from October 31 to August 31. For the fiscal period from November 1, 2017 to August 31, 2018, on a market price basis, the Fund returned 8.76%. On a net asset value (“NAV”) basis, the Fund returned 8.77%. During the same time period, the Index returned 9.02%. During the fiscal period, the Fund fully replicated the components of the Index; therefore, the Fund’s performance (NAV basis) differed from the return of the Index primarily due to fees and operating expenses that the Fund incurred during the period.
During this same time period, the Benchmark Index returned 14.57%. The Benchmark Index is an unmanaged index weighted by market capitalization based on the average performance of approximately 500 securities. The Benchmark Index was selected for its recognition in the marketplace, and its performance comparison is a useful measure for investors as a broad representation of the overall U.S. stock market.
The performance of the Fund differed from the Benchmark Index in part because the Fund attempts to track an Index that is a subset of the Benchmark Index, consisting of the 100 securities within the Benchmark Index that have the lowest realized volatility over the past 12 months.
Relative to the Benchmark Index, the Fund was most overweight in the utilities sector and most underweight in the information technology sector during the fiscal period ended August 31, 2018. The majority of the Fund’s underperformance relative to the Benchmark Index during the period can be attributed to its allocation to the utilities, consumer discretionary, and information technology sectors.
For the fiscal period ended August 31, 2018, the information technology sector contributed most significantly to the Fund’s return, followed by the financials and industrials sectors,
respectively. The telecommunication services sector detracted most significantly from the Fund’s return, followed by the utilities sector.
Positions that contributed most significantly to the Fund’s return for the fiscal period ended August 31, 2018, included Nasdaq, Inc., a financials company (portfolio average weight of 1.00%), and Keurig Dr. Pepper Inc., a consumer staples company (no longer held at fiscal period-end). Positions that detracted most significantly from the Fund’s return included Edison International, a utilities company (no longer held at fiscal period-end), and PPL Corp., a utilities company (portfolio average weight of 0.92%).
| | | | |
Sector Breakdown
(% of the Fund’s Net Assets)
as of August 31, 2018 | |
| Utilities | | | 23.2 | |
| Real Estate | | | 18.0 | |
| Financials | | | 16.8 | |
| Information Technology | | | 10.7 | |
| Consumer Staples | | | 9.1 | |
| Industrials | | | 6.0 | |
| Health Care | | | 5.7 | |
| Materials | | | 4.9 | |
| Consumer Discretionary | | | 3.8 | |
| Energy | | | 1.8 | |
| Other Assets Less Liabilities | | | 0.0 | |
|
Top Ten Fund Holdings
(% of the Fund’s Net Assets)
as of August 31, 2018 | |
| Security | | | | |
| Coca-Cola Co. (The) | | | 1.2 | |
| Ecolab, Inc. | | | 1.2 | |
| Duke Energy Corp. | | | 1.2 | |
| CMS Energy Corp. | | | 1.1 | |
| AvalonBay Communities, Inc. | | | 1.1 | |
| Exelon Corp. | | | 1.1 | |
| Consolidated Edison, Inc. | | | 1.1 | |
| DTE Energy Co. | | | 1.1 | |
| Procter & Gamble Co. (The) | | | 1.1 | |
| WEC Energy Group, Inc. | | | 1.1 | |
| Total | | | 11.3 | |
Invesco S&P 500® Low Volatility ETF (SPLV) (continued)
Growth of a $10,000 Investment Since Inception
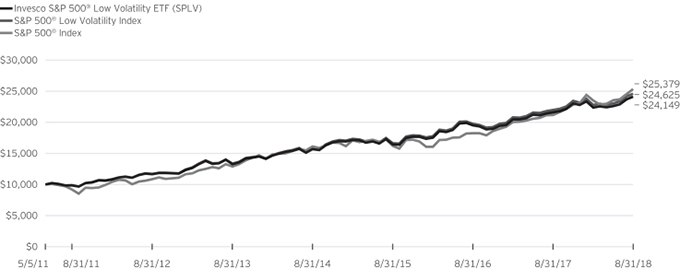
Fund Performance History as of August 31, 2018
| | | | | | | | | | | | | | | | | | | | | | | | | | | | | | | | |
| | | 1 Year | | | 3 Years Average
Annualized | | | 3 Years Cumulative | | | 5 Years Average
Annualized | | | 5 Years Cumulative | | | | | | Fund Inception | |
| Index | | | | | Average
Annualized | | | Cumulative | |
| S&P 500® Low Volatility Index | | | 11.98 | % | | | 13.91 | % | | | 47.79 | % | | | 12.98 | % | | | 84.05 | % | | | | | | | 13.10 | % | | | 146.25 | % |
| S&P 500® Index | | | 19.66 | | | | 16.11 | | | | 56.55 | | | | 14.52 | | | | 97.01 | | | | | | | | 13.57 | | | | 153.79 | |
| Fund | | | | | | | | | | | | | | | | | | | | | | | | | | | | | | | | |
| NAV Return | | | 11.65 | | | | 13.60 | | | | 46.60 | | | | 12.67 | | | | 81.61 | | | | | | | | 12.80 | | | | 141.49 | |
| Market Price Return | | | 11.73 | | | | 13.59 | | | | 46.55 | | | | 12.69 | | | | 81.71 | | | | | | | | 12.80 | | | | 141.53 | |
Fund Inception: May 5, 2011
Performance quoted above represents past performance. Past performance is not a guarantee of future results and current performance may be higher or lower than performance quoted. Investment returns and principal value will fluctuate, and shares of the Fund (“Fund Shares”), when redeemed or sold, may be worth more or less than their original cost. Fund performance reflects any applicable fee waivers and/or expense reimbursements. Had the adviser not waived fees and/or reimbursed expenses currently or in the past, returns would have been lower. See current prospectus for more information. According to the Fund’s current prospectus, the Fund’s expense ratio of 0.25% is expressed as a unitary management fee to cover operating expenses and expenses incurred in connection with managing the portfolio. NAV and Market Price returns assume that dividends and capital gain distributions have been reinvested in the Fund at NAV and Market Price, respectively. The returns shown in the table above do not reflect the deduction of taxes that a shareholder would pay on Fund
distributions or the redemption or sale of Fund Shares. See invesco.com/ETFs to find the most recent month-end performance numbers.
Index and Benchmark Index performance results are based upon a hypothetical investment in their respective constituent securities. Index and Benchmark Index returns do not represent Fund returns. An investor cannot invest directly in an index. The Index and Benchmark Index do not charge management fees or brokerage expenses, and no such fees or expenses were deducted from the hypothetical performance shown. In addition, the results actual investors might have achieved would have differed from those shown because of differences in the timing, amounts of their investments, and fees and expenses associated with an investment in the Fund.
Notes Regarding Indexes and Fund Performance History:
| - | Average Annualized and Cumulative Inception returns for the Fund, Index and Benchmark Index are based on the inception date of the Fund. |
| | |
| SPMV | | Manager’s Analysis |
| | Invesco S&P 500 Minimum Variance ETF (SPMV) |
As an index fund, the Invesco S&P 500 Minimum Variance ETF (the “Fund”) is passively managed and seeks to track the returns of an underlying index. The Fund seeks to track the investment results (before fees and expenses) of the S&P 500® Minimum Volatility Index (the “Index”). The Fund generally will invest at least 90% of its total assets in common stocks that comprise the Index.
S&P Dow Jones Indices LLC (“S&P DJI” or the “Index Provider”) compiles, maintains and calculates the Index, which is composed of a subset of constituent securities in the S&P 500® Index (the “Benchmark Index”). The Index measures the performance of a portfolio of equity securities using a managed volatility strategy that seeks to achieve lower total risk than the Benchmark Index, while maintaining other similar characteristics of the Benchmark Index. Volatility is a statistical measurement of the magnitude of up and down asset price fluctuations (increases or decreases in a stock’s price) over time. Unlike the Benchmark Index, which is a traditional market capitalization-weighted index (meaning that companies with larger market capitalizations receive proportionally greater weight in the index, without regard to the volatility of those stocks), the Index weights its constituents using a managed volatility methodology that is designed to minimize the overall forecasted volatility (i.e., to reduce the magnitude of price fluctuations) of the Index. The Fund generally invests in all of the components of the Index in proportion to their weightings in the Index.
The Board of Trustees approved a change in the fiscal year end for the Fund from October 31 to August 31. For the fiscal period from November 1, 2017 to August 31, 2018, on a market price basis, the Fund returned 13.45%. On a net asset value (“NAV”) basis, the Fund returned 13.50%. During the same time period, the Index returned 13.37%. During the fiscal period, the Fund fully replicated the components of the Index; therefore, the Fund’s performance (NAV basis) differed from the return of the Index primarily due to beneficial trade execution associated with portfolio rebalances, which was partially offset by fees and operating expenses that the Fund incurred during the period.
During this same time period, the Benchmark Index returned 14.57%. The Benchmark Index is an unmanaged index weighted by market capitalization based on the average performance of approximately 500 securities. The Benchmark Index was selected for its recognition in the marketplace, and its performance comparison is a useful measure for investors as a broad representation of the overall U.S. stock market.
Relative to the Benchmark Index, the Fund was most overweight in the consumer staples sector and most underweight in the energy sector during the fiscal period ended August 31, 2018. The majority of the Fund’s underperformance relative to the Benchmark Index during the period can be attributed to its allocation within the utilities and real estate sectors.
For the fiscal period ended August 31, 2018, the information technology sector contributed most significantly to the Fund’s return, followed by the financials and industrials sectors, respectively. The consumer staples sector detracted most significantly from the Fund’s return, followed by the consumer discretionary and health care sectors, respectively.
Positions that contributed most significantly to the Fund’s return for the fiscal period ended August 31, 2018, included Nike, Inc., Class B, a consumer discretionary company (portfolio average weight of 2.40%), and QUALCOMM, Inc., an information technology company (portfolio average weight of 1.92%). Positions that detracted most significantly from the Fund’s return included Mohawk Industries, Inc., a consumer discretionary company (portfolio average weight of 0.99%), and Southard Co., a utilities company (no longer held at fiscal period-end).
| | | | |
Sector Breakdown
(% of the Fund’s Net Assets)
as of August 31, 2018 | |
| Information Technology | | | 20.9 | |
| Health Care | | | 16.5 | |
| Consumer Discretionary | | | 14.2 | |
| Financials | | | 11.2 | |
| Consumer Staples | | | 11.2 | |
| Industrials | | | 9.9 | |
| Utilities | | | 8.0 | |
| Telecommunication Services | | | 4.2 | |
| Real Estate | | | 2.4 | |
| Materials | | | 1.1 | |
| Energy | | | 0.3 | |
| Other Assets Less Liabilities | | | 0.1 | |
|
Top Ten Fund Holdings
(% of the Fund’s Net Assets)
as of August 31, 2018 | |
| Security | | | | |
| VF Corp. | | | 2.4 | |
| NIKE, Inc., Class B | | | 2.4 | |
| UnitedHealth Group, Inc. | | | 2.3 | |
| Becton, Dickinson and Co. | | | 2.1 | |
| Microsoft Corp. | | | 2.1 | |
| Waste Management, Inc. | | | 2.0 | |
| Alphabet, Inc., Class C | | | 2.0 | |
| Stryker Corp. | | | 2.0 | |
| Johnson & Johnson | | | 1.9 | |
| Texas Instruments, Inc. | | | 1.9 | |
| Total | | | 21.1 | |
Invesco S&P 500 Minimum Variance ETF (SPMV) (continued)
Growth of a $10,000 Investment Since Inception
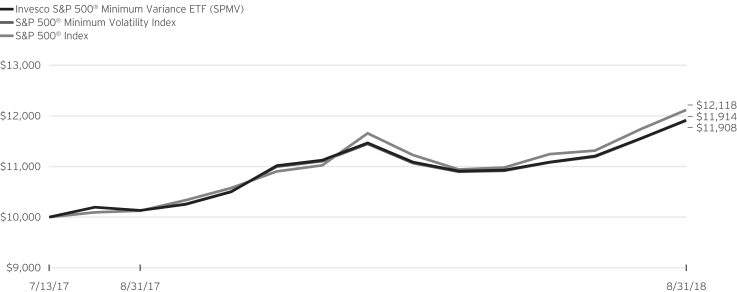
Fund Performance History as of August 31, 2018
| | | | | | | | | | | | | | | | |
| | | | | | | | | Fund Inception | |
| Index | | 1 Year | | | | | | Average
Annualized | | | Cumulative | |
| S&P 500® Minimum Volatility Index | | | 17.50 | % | | | | | | | 16.68 | % | | | 19.08 | % |
| S&P 500® Index | | | 19.66 | | | | | | | | 18.50 | | | | 21.18 | |
| Fund | | | | | | | | | | | | | | | | |
| NAV Return | | | 17.60 | | | | | | | | 16.74 | | | | 19.14 | |
| Market Price Return | | | 17.51 | | | | | | | | 16.65 | | | | 19.05 | |
Fund Inception: July 13, 2017
Performance quoted above represents past performance. Past performance is not a guarantee of future results and current performance may be higher or lower than performance quoted. Investment returns and principal value will fluctuate, and shares of the Fund (“Fund Shares”), when redeemed or sold, may be worth more or less than their original cost. Fund performance reflects any applicable fee waivers and/or expense reimbursements. Had the adviser not waived fees and/or reimbursed expenses currently or in the past, returns would have been lower. See current prospectus for more information. According to the Fund’s current prospectus, as supplemented to date, the Fund’s expense ratio of 0.10% is expressed as a unitary management fee to cover operating expenses and expenses incurred in connection with managing the portfolio. NAV and Market Price returns assume that dividends and capital gain distributions have been reinvested in the Fund at NAV and Market Price, respectively. The returns shown in the table above do not reflect the deduction of taxes that a shareholder would pay on Fund distributions or the redemption or
sale of Fund Shares. See invesco.com/ETFs to find the most recent month-end performance numbers.
Index and Benchmark Index performance results are based upon a hypothetical investment in their respective constituent securities. Index and Benchmark Index returns do not represent Fund returns. An investor cannot invest directly in an index. The Index and Benchmark Index do not charge management fees or brokerage expenses, and no such fees or expenses were deducted from the hypothetical performance shown. In addition, the results actual investors might have achieved would have differed from those shown because of differences in the timing, amounts of their investments, and fees and expenses associated with an investment in the Fund.
Notes Regarding Indexes and Fund Performance History:
| - | Average Annualized and Cumulative Inception returns for the Fund, Index and Benchmark Index are based on the inception date of the Fund. |
| | |
| SPMO | | Manager’s Analysis |
| | Invesco S&P 500 Momentum ETF (SPMO) |
As an index fund, the Invesco S&P 500 Momentum ETF (the “Fund”) is passively managed and seeks to track the returns of an underlying index. The Fund seeks to track the investment results (before fees and expenses) of the S&P 500® Momentum Index (the “Index”). The Fund generally will invest at least 90% of its total assets in common stocks that comprise the Index.
S&P Dow Jones Indices LLC (“S&P DJI” or the “Index Provider”) compiles, maintains and calculates the Index. Strictly in accordance with its existing guidelines and mandated procedures, the Index Provider selects approximately 100 stocks from the S&P 500® Index (the “Benchmark Index”) that have the highest “momentum score.” In general, momentum is the tendency of an investment to exhibit persistence in its relative performance; a “momentum style” of investing emphasizes investing in securities that have had better recent performance compared to other securities. The momentum score for each security included in the Index is based on upward price movements of the security as compared to other eligible securities within the Benchmark Index.
In selecting constituent securities for the Index, the Index Provider calculates the momentum score of each stock in the Benchmark Index by evaluating the percentage change in the stock’s price over the last 12 months, excluding the most recent month, and applying an adjustment based on the security’s volatility over that period. The Index Provider then selects the 100 stocks with the highest momentum score for inclusion in the Index using a modified market capitalization-weighted strategy, as the Index Provider weights securities by multiplying their market capitalization and their momentum score. The Fund generally invests in all of the securities comprising the Index in proportion to their weightings in the Index.
The Board of Trustees approved a change in the fiscal year end for the Fund from October 31 to August 31. For the fiscal period from November 1, 2017 to August 31, 2018, on a market price basis, the Fund returned 21.26%. On a net asset value (“NAV”) basis, the Fund returned 21.12%. During the same time period, the Index returned 21.30%. During the fiscal period, the Fund fully replicated the components of the Index; therefore, the Fund’s performance (NAV basis) differed from the return of the Index primarily due to fees and operating expenses that the Fund incurred during the period.
During this same time period, the Benchmark Index returned 14.57%. The Benchmark Index is an unmanaged index weighted by market capitalization based on the average performance of approximately 500 securities. The Benchmark Index was selected for its recognition in the marketplace, and its performance comparison is a useful measure for investors as a broad representation of the overall U.S. stock market.
The performance of the Fund differed from the Benchmark Index primarily due to the Fund’s thematic objective and the Index Provider’s proprietary weighting methodology.
Relative to the Benchmark Index, the Fund was most overweight in the information technology sector and most underweight in the energy sector during the fiscal period ended August 31, 2018.
For the fiscal period ended August 31, 2018, the information technology sector contributed most significantly to the Fund’s return, followed by the consumer discretionary and financials sectors, respectively. The real estate and materials sectors detracted most significantly from the Fund’s return.
Positions that contributed most significantly to the Fund’s return for the fiscal period ended August 31, 2018, included Microsoft Corp., an information technology company (portfolio average weight of 9.83%), and Amazon.com Inc., a consumer discretionary company (portfolio average weight of 9.97%). Positions that detracted most significantly from the Fund’s return included AbbVie, Inc., a health care company (portfolio average weight of 2.03%), and 3M Co., an industrials company (portfolio average weight of 1.53%).
| | | | |
Sector Breakdown
(% of the Fund’s Net Assets)
as of August 31, 2018 | |
| Information Technology | | | 39.6 | |
| Consumer Discretionary | | | 17.7 | |
| Financials | | | 13.2 | |
| Industrials | | | 13.1 | |
| Health Care | | | 11.5 | |
| Consumer Staples | | | 2.8 | |
| Real Estate | | | 1.0 | |
| Materials | | | 0.5 | |
| Energy | | | 0.5 | |
| Other Assets Less Liabilities | | | 0.1 | |
|
Top Ten Fund Holdings
(% of the Fund’s Net Assets)
as of August 31, 2018 | |
| Security | | | | |
| Amazon.com, Inc. | | | 10.0 | |
| Microsoft Corp. | | | 9.8 | |
| Alphabet, Inc., Class C | | | 3.9 | |
| Berkshire Hathaway, Inc., Class B | | | 3.8 | |
| Alphabet, Inc., Class A | | | 3.7 | |
| Visa, Inc., Class A | | | 3.6 | |
| Boeing Co. (The) | | | 3.6 | |
| Facebook, Inc., Class A | | | 3.5 | |
| JPMorgan Chase & Co. | | | 3.4 | |
| Home Depot, Inc. (The) | | | 2.9 | |
| Total | | | 48.2 | |
Invesco S&P 500 Momentum ETF (SPMO) (continued)
Growth of a $10,000 Investment Since Inception
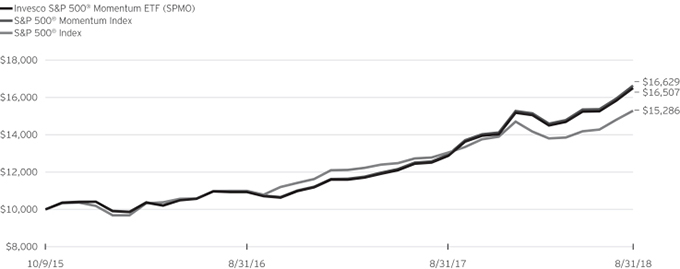
Fund Performance History as of August 31, 2018
| | | | | | | | | | | | | | | | |
| | | | | | | | | Fund Inception | |
| Index | | 1 Year | | | | | | Average
Annualized | | | Cumulative | |
| S&P 500® Momentum Index | | | 32.23 | % | | | | | | | 19.22 | % | | | 66.29 | % |
| S&P 500® Index | | | 19.66 | | | | | | | | 15.80 | | | | 52.86 | |
| Fund | | | | | | | | | | | | | | | | |
| NAV Return | | | 31.96 | | | | | | | | 18.92 | | | | 65.07 | |
| Market Price Return | | | 32.21 | | | | | | | | 18.90 | | | | 64.99 | |
Fund Inception: October 9, 2015
Performance quoted above represents past performance. Past performance is not a guarantee of future results and current performance may be higher or lower than performance quoted. Investment returns and principal value will fluctuate, and shares of the Fund (“Fund Shares”), when redeemed or sold, may be worth more or less than their original cost. Fund performance reflects any applicable fee waivers and/or expense reimbursements. Had the adviser not waived fees and/or reimbursed expenses currently or in the past, returns would have been lower. See current prospectus for more information. According to the Fund’s current prospectus, the Fund’s expense ratio of 0.13% is expressed as a unitary management fee to cover operating expenses and expenses incurred in connection with managing the portfolio. NAV and Market Price returns assume that dividends and capital gain distributions have been reinvested in the Fund at NAV and Market Price, respectively. The returns shown in the table above do not reflect the deduction of taxes that a shareholder would pay on Fund
distributions or the redemption or sale of Fund Shares. See invesco.com/ETFs to find the most recent month-end performance numbers.
Index and Benchmark Index performance results are based upon a hypothetical investment in their respective constituent securities. Index and Benchmark Index returns do not represent Fund returns. An investor cannot invest directly in an index. The Index and Benchmark Index do not charge management fees or brokerage expenses, and no such fees or expenses were deducted from the hypothetical performance shown. In addition, the results actual investors might have achieved would have differed from those shown because of differences in the timing, amounts of their investments, and fees and expenses associated with an investment in the Fund.
Notes Regarding Indexes and Fund Performance History:
| - | Average Annualized and Cumulative Inception returns for the Fund, Index and Benchmark Index are based on the inception date of the Fund. |
| | |
| SPVM | | Manager’s Analysis |
| | Invesco S&P 500 Value With Momentum ETF (SPVM) |
As an index fund, the Invesco S&P 500 Value With Momentum ETF (the “Fund”) is passively managed and seeks to track the returns of an underlying index. The Fund seeks to track the investment results (before fees and expenses) of the S&P 500® High Momentum Value Index (the “Index”). The Fund generally will invest at least 90% of its total assets in securities that comprise the Index.
Strictly in accordance with its guidelines and mandated procedures, S&P Dow Jones Indices LLC (“S&P DJI” or the “Index Provider”) compiles, maintains and calculates the Index, which is composed of the 100 securities in the S&P 500® Index (the “Benchmark Index”) having both the highest “value scores” and “momentum scores,” all as determined by the Index Provider using its methodology described below.
Strictly in accordance with its guidelines and mandated procedures, the Index Provider selects constituents for the Index using a two-step screening process: first, it identifies the 200 stocks from among the approximately 500 stocks in the Benchmark Index with the highest value scores (i.e., those stocks that the Index Provider has calculated as being undervalued by investors); second, from among those 200 stocks, it identifies the 100 stocks with the highest positive momentum scores (i.e., those stocks that the Index Provider has calculated as showing better recent performance than other stocks). The component stocks of the Index are weighted by their value score; stocks with higher value scores receive relatively greater weights. The Fund generally invests in all of the components of the Index in proportion to their weightings in the Index.
The Board of Trustees approved a change in the fiscal year end for the Fund from October 31 to August 31. For the fiscal period from November 1, 2017 to August 31, 2018, on a market price basis, the Fund returned 9.34%. On a net asset value (“NAV”) basis, the Fund returned 9.42%. During the same time period, the Index returned 9.75%. During the fiscal period, the Fund fully replicated the components of the Index; therefore, the Fund’s performance (NAV basis) differed from the return of the Index primarily due to fees and operating expenses that the Fund incurred during the period.
During this same time period, the Benchmark Index returned 14.57%. The Benchmark Index is an unmanaged index weighted by market capitalization based on the average performance of approximately 500 securities. The Benchmark Index was selected for its recognition in the marketplace, and its performance comparison is a useful measure for investors as a broad representation of the U.S. stock market.
The performance of the Fund differed from the Benchmark Index in part because the Fund attempts to track an Index that is a subset of the Benchmark Index, consisting of the 100 securities within the Benchmark Index that have high value and positive momentum scores.
Relative to the Benchmark Index, the Fund was most overweight in the financials sector and most underweight in the information
technology sector during the fiscal period ended August 31, 2018. The majority of the Fund’s underperformance relative to the Benchmark Index during the period can be attributed to fees and operating expenses incurred by the Fund during the period as well as its allocation to the financials sector.
For the fiscal period ended August 31, 2018, the health care sector contributed most significantly to the Fund’s return, followed by the financials and energy sectors, respectively. No sectors detracted from the Fund’s return.
Positions that contributed most significantly to the Fund’s return for the fiscal period ended August 31, 2018, included Centene Corp., a health care company (portfolio average weight 1.57%), and Valero Energy Corp., an energy company (portfolio average weight 1.31%). Positions that detracted most significantly from the Fund’s return included Unum Group, a financials company (portfolio average weight 1.77%), and McKesson Corp., a health care company (portfolio average weight 1.59%).
| | | | |
Sector Breakdown
(% of the Fund’s Net Assets)
as of August 31, 2018 | |
| Financials | | | 32.4 | |
| Consumer Discretionary | | | 14.8 | |
| Health Care | | | 11.5 | |
| Utilities | | | 10.9 | |
| Industrials | | | 10.0 | |
| Energy | | | 5.6 | |
| Information Technology | | | 5.6 | |
| Materials | | | 3.9 | |
| Consumer Staples | | | 3.3 | |
| Telecommunication Services | | | 1.2 | |
| Real Estate | | | 0.7 | |
| Other Assets Less Liabilities | | | 0.1 | |
|
Top Ten Fund Holdings*
(% of the Fund’s Net Assets)
as of August 31, 2018 | |
| Security | | | | |
| Unum Group | | | 1.8 | |
| Lincoln National Corp. | | | 1.7 | |
| MetLife, Inc. | | | 1.7 | |
| McKesson Corp. | | | 1.6 | |
| Centene Corp. | | | 1.6 | |
| Hewlett Packard Enterprise Co. | | | 1.5 | |
| Anthem, Inc. | | | 1.5 | |
| Allstate Corp. (The) | | | 1.5 | |
| Loews Corp. | | | 1.5 | |
| Marathon Petroleum Corp. | | | 1.5 | |
| Total | | | 15.9 | |
| * | Excluding money market fund holdings. |
Invesco S&P 500 Value with Momentum ETF (SPVM) (continued)
Growth of a $10,000 Investment Since Inception
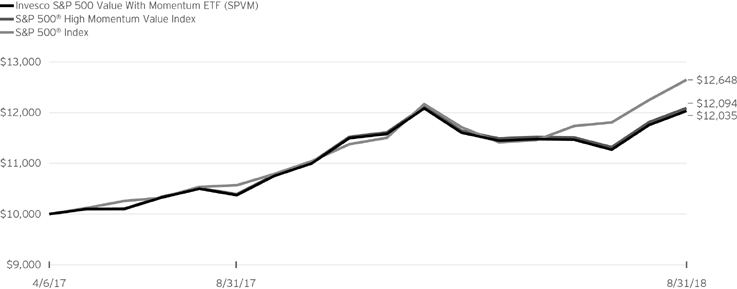
Fund Performance History as of August 31, 2018
| | | | | | | | | | | | | | | | |
| | | | | | | | | Fund Inception | |
| Index | | 1 Year | | | | | | Average
Annualized | | | Cumulative | |
| S&P 500® High Momentum Value Index | | | 16.37 | % | | | | | | | 14.54 | % | | | 20.94 | % |
| S&P 500® Index | | | 19.66 | | | | | | | | 18.27 | | | | 26.48 | |
| Fund | | | | | | | | | | | | | | | | |
| NAV Return | | | 15.99 | | | | | | | | 14.14 | | | | 20.35 | |
| Market Price Return | | | 15.99 | | | | | | | | 14.18 | | | | 20.40 | |
Fund Inception: April 6, 2017
Performance quoted above represents past performance. Past performance is not a guarantee of future results and current performance may be higher or lower than performance quoted. Investment returns and principal value will fluctuate, and shares of the Fund (“Fund Shares”), when redeemed or sold, may be worth more or less than their original cost. Fund performance reflects any applicable fee waivers and/or expense reimbursements. Had the adviser not waived fees and/or reimbursed expenses currently or in the past, returns would have been lower. See current prospectus for more information. According to the Fund’s current prospectus, as supplemented to date, the Fund’s expense ratio of 0.15% is expressed as a unitary management fee to cover operating expenses and expenses incurred in connection with managing the portfolio. NAV and Market Price returns assume that dividends and capital gain distributions have been reinvested in the Fund at NAV and Market Price, respectively. The returns shown in the table above do not reflect the deduction of taxes that a shareholder would pay on Fund distributions or the redemption or
sale of Fund Shares. See invesco.com/ETFs to find the most recent month-end performance numbers.
Index and Benchmark Index performance results are based upon a hypothetical investment in their respective constituent securities. Index and Benchmark Index returns do not represent Fund returns. An investor cannot invest directly in an index. The Index and Benchmark Index do not charge management fees or brokerage expenses, and no such fees or expenses were deducted from the hypothetical performance shown. In addition, the results actual investors might have achieved would have differed from those shown because of differences in the timing, amounts of their investments, and fees and expenses associated with an investment in the Fund.
Notes Regarding Indexes and Fund Performance History:
| - | Average Annualized and Cumulative Inception returns for the Fund, Index and Benchmark Index are based on the inception date of the Fund. |
| | |
| XMLV | | Manager’s Analysis |
| | Invesco S&P MidCap Low Volatility ETF (XMLV) |
As an index fund, the Invesco S&P MidCap Low Volatility ETF (the “Fund”) is passively managed and seeks to track the returns of an underlying index. The Fund seeks to track the investment results (before fees and expenses) of the S&P MidCap 400® Low Volatility Index (the “Index”). The Fund generally will invest at least 90% of its total assets in common stocks that comprise the Index.
S&P Dow Jones Indices LLC (“S&P DJI” or the “Index Provider”) compiles, maintains and calculates the Index. Strictly in accordance with its guidelines and mandated procedures, S&P DJI selects for inclusion in the Index the 80 securities that it has determined have the lowest volatility over the past 12 months out of the 400 medium capitalization securities that are contained in the S&P MidCap 400® Index (the “Benchmark Index”). Volatility is a statistical measurement of the magnitude of up and down asset price fluctuations (increases or decreases in a stock’s price) over time. S&P DJI weights the 80 securities within the Index based upon the inverse of each security’s volatility, with the least volatile securities receiving the highest weights in the Index. The Fund generally invests in all of the securities comprising the Index in proportion to their weightings in the Index.
The Board of Trustees approved a change in the fiscal year end for the Fund from October 31 to August 31. For the fiscal period from November 1, 2017 to August 31, 2018, on a market price basis, the Fund returned 11.04%. On a net asset value (“NAV”) basis, the Fund returned 11.00%. During the same time period, the Index returned 11.27%. During the fiscal period, the Fund fully replicated the components of the Index; therefore, the Fund’s performance (NAV basis) differed from the return of the Index primarily due to fees and operating expenses that the Fund incurred during the period.
During this same time period, the Benchmark Index returned 12.92%. The Benchmark Index is an unmanaged index weighted by market capitalization based on the average performance of approximately 400 mid-cap securities. The Benchmark Index was selected for its recognition in the marketplace, and its performance comparison is a useful measure for investors as a broad representation of the overall U.S. mid-cap equity market.
The performance of the Fund differed from the Benchmark Index in part because the Fund seeks to track an Index that is a subset of the Benchmark Index, consisting of the 80 securities within the Benchmark Index that have the lowest realized volatility over the past 12 months.
Relative to the Benchmark Index, the Fund was most overweight in the utilities and real estate sectors and most underweight in the information technology and consumer discretionary sectors during the fiscal period ended August 31, 2018. The majority of the Fund’s underperformance relative to the Benchmark Index during the period can be attributed to its allocation to the utilities sector.
For the fiscal period ended August 31, 2018, the financials sector contributed most significantly to the Fund’s return, followed by the real estate and industrials sectors, respectively. There were no detracting sectors.
Positions that contributed most significantly to the Fund’s return for the fiscal period ended August 31, 2018, included Jack Henry & Associates, Inc., an information technology company (portfolio average weight of 1.63%), and Churchill Downs Inc., a consumer discretionary company (no longer held at fiscal period-end). Positions that detracted most significantly from the Fund’s return included Owens & Minor, Inc., a health care company (no longer held at fiscal period-end), and Ingredion, Inc., a consumer staples company (portfolio average weight of 1.17%).
| | | | |
Sector Breakdown
(% of the Fund’s Net Assets)
as of August 31, 2018 | |
| Real Estate | | | 27.1 | |
| Utilities | | | 21.2 | |
| Financials | | | 16.1 | |
| Materials | | | 8.8 | |
| Industrials | | | 8.1 | |
| Information Technology | | | 6.4 | |
| Consumer Staples | | | 4.9 | |
| Consumer Discretionary | | | 3.9 | |
| Health Care | | | 3.6 | |
| Other Assets Less Liabilities | | | (0.1 | ) |
|
Top Ten Fund Holdings
(% of the Fund’s Net Assets)
as of August 31, 2018 | |
| Security | | | | |
| Jack Henry & Associates, Inc. | | | 1.6 | |
| Hawaiian Electric Industries, Inc. | | | 1.6 | |
| Brown & Brown, Inc. | | | 1.6 | |
| Atmos Energy Corp. | | | 1.6 | |
| Douglas Emmett, Inc. | | | 1.5 | |
| Highwoods Properties, Inc. | | | 1.5 | |
| W.R. Berkley Corp. | | | 1.5 | |
| UGI Corp. | | | 1.4 | |
| Camden Property Trust | | | 1.4 | |
| IDACORP, Inc. | | | 1.4 | |
| Total | | | 15.1 | |
Invesco S&P MidCap Low Volatility ETF (XMLV) (continued)
Growth of a $10,000 Investment Since Inception
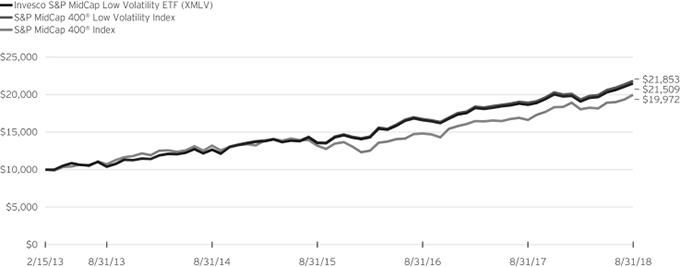
Fund Performance History as of August 31, 2018
| | | | | | | | | | | | | | | | | | | | | | | | | | | | | | | | |
| | | 1 Year | | | 3 Years Average
Annualized | | | 3 Years Cumulative | | | 5 Years Average
Annualized | | | 5 Years Cumulative | | | | | | Fund Inception | |
| Index | | | | | Average
Annualized | | | Cumulative | |
| S&P MidCap 400® Low Volatility Index | | | 15.57 | % | | | 17.00 | % | | | 60.17 | % | | | 15.96 | % | | | 109.65 | % | | | | | | | 15.16 | % | | | 118.53 | % |
| S&P MidCap 400® Index | | | 20.00 | | | | 14.84 | | | | 51.46 | | | | 13.30 | | | | 86.69 | | | | | | | | 13.30 | | | | 99.72 | |
| Fund | | | | | | | | | | | | | | | | | | | | | | | | | | | | | | | | |
| NAV Return | | | 15.24 | | | | 16.67 | | | | 58.80 | | | | 15.63 | | | | 106.67 | | | | | | | | 14.83 | | | | 115.09 | |
| Market Price Return | | | 15.31 | | | | 16.68 | | | | 58.87 | | | | 15.64 | | | | 106.75 | | | | | | | | 14.84 | | | | 115.17 | |
Fund Inception: February 15, 2013
Performance quoted above represents past performance. Past performance is not a guarantee of future results and current performance may be higher or lower than performance quoted. Investment returns and principal value will fluctuate, and shares of the Fund (“Fund Shares”), when redeemed or sold, may be worth more or less than their original cost. Fund performance reflects any applicable fee waivers and/or expense reimbursements. Had the adviser not waived fees and/or reimbursed expenses currently or in the past, returns would have been lower. See current prospectus for more information. According to the Fund’s current prospectus, the Fund’s expense ratio of 0.25% is expressed as a unitary management fee to cover operating expenses and expenses incurred in connection with managing the portfolio. NAV and Market Price returns assume that dividends and capital gain distributions have been reinvested in the Fund at NAV and Market Price, respectively. The returns shown in the table above do not reflect the deduction of taxes that a shareholder would pay on Fund distributions or the redemption or sale of Fund Shares. See
invesco.com/ETFs to find the most recent month-end performance numbers.
Index and Benchmark Index performance results are based upon a hypothetical investment in their respective constituent securities. Index and Benchmark Index returns do not represent Fund returns. An investor cannot invest directly in an index. The Index and Benchmark Index do not charge management fees or brokerage expenses, and no such fees or expenses were deducted from the hypothetical performance shown. In addition, the results actual investors might have achieved would have differed from those shown because of differences in the timing, amounts of their investments, and fees and expenses associated with an investment in the Fund.
Notes Regarding Indexes and Fund Performance History:
| - | Average Annualized and Cumulative Inception returns for the Fund, Index and Benchmark Index are based on the inception date of the Fund. |
| | |
| XSHD | | Manager’s Analysis |
| | Invesco S&P SmallCap High Dividend Low Volatility ETF (XSHD) |
As an index fund, the Invesco S&P SmallCap High Dividend Low Volatility ETF (the “Fund”) is passively managed and seeks to track the returns of an underlying index. The Fund seeks to track the investment results (before fees and expenses) of the S&P SmallCap 600® Low Volatility High Dividend Index (the “Index”). The Fund generally will invest at least 90% of its total assets in securities that comprise the Index.
S&P Dow Jones Indices LLC (“S&P DJI” or the “Index Provider”) compiles, maintains and calculates the Index, which is composed of 60 securities in the S&P SmallCap 600® Index (the “Benchmark Index”) that historically have provided high dividend yields with lower volatility. Strictly in accordance with its guidelines and mandated procedures, S&P DJI identifies from the Benchmark Index the 90 securities with the highest dividend yields over the past 12 months, with no one sector within the Benchmark Index allowed to contribute more than 10 securities. From those securities, S&P DJI selects for inclusion in the Index the 60 securities with the lowest realized volatility over the past 12 months. The Index Provider weights each of the constituent securities in the Index by its dividend yield, with the highest dividend-yielding securities receiving the highest weights. The Fund generally invests in all of the components of the Index in proportion to their weightings in the Index.
The Board of Trustees approved a change in the fiscal year end for the Fund from October 31 to August 31. For the fiscal period from November 1, 2017 to August 31, 2018, on a market price basis, the Fund returned 11.26%. On a net asset value basis, the Fund returned 11.39%. During the same time period, the Index returned 11.72%. During the fiscal period, the Fund fully replicated the components of the Index; therefore, the Fund’s performance (NAV basis) differed from the return of the Index primarily due to fees and operating expenses that the Fund incurred during the period.
During this same time period, the Benchmark Index returned 21.83%. The Benchmark Index is an unmanaged index weighted by market capitalization based on the average performance of approximately 600 small-cap securities. The Benchmark Index was selected for its recognition in the marketplace, and its performance comparison is a useful measure for investors as a broad representation of the overall U.S. small-cap equity market.
The performance of the Fund differed from the Benchmark Index in part because the Fund seeks to track an Index that is a subset of the Benchmark Index, consisting of the 60 securities within the Benchmark Index that historically have provided high dividend yields with lower volatility.
Relative to the Benchmark Index, the Fund was most overweight in the real estate sector and most underweight in the industrials sector during the fiscal period ended August 31, 2018. The majority of the Fund’s underperformance relative to the Benchmark Index during the period can be attributed to its allocation to the health care sector.
For the fiscal period ended August 31, 2018, the consumer staples sector contributed most significantly to the Fund’s return, followed by the consumer discretionary sector and financials sector, respectively. The materials sector was the only detractor from the Fund’s return.
Positions that contributed most significantly to the Fund’s return for the fiscal period ended August 31, 2018, included Medifast Inc., a consumer staples company (no longer held at fiscal period-end), and Dine Brands Global, Inc., a consumer discretionary company (no longer held at fiscal period-end). Positions that detracted most significantly from the Fund’s return included Consolidated Communications Holdings, Inc., a telecommunication services company (no longer held at fiscal period-end) and Franklin Street Properties Corp. REIT, a real estate company (portfolio average weight of 2.93%).
| | | | |
Sector Breakdown
(% of the Fund’s Net Assets)
as of August 31, 2018 | |
| Financials | | | 25.0 | |
| Real Estate | | | 21.8 | |
| Materials | | | 11.4 | |
| Information Technology | | | 10.3 | |
| Utilities | | | 8.7 | |
| Industrials | | | 8.1 | |
| Telecommunication Services | | | 4.3 | |
| Consumer Staples | | | 3.7 | |
| Health Care | | | 2.8 | |
| Consumer Discretionary | | | 2.5 | |
| Energy | | | 1.4 | |
| Other Assets Less Liabilities | | | 0.0 | |
|
Top Ten Fund Holdings
(% of the Fund’s Net Assets)
as of August 31, 2018 | |
| Security | | | | |
| Lexington Realty Trust | | | 3.2 | |
| Ramco-Gershenson Properties Trust | | | 3.2 | |
| Government Properties Income Trust | | | 3.2 | |
| Whitestone | | | 3.2 | |
| PennyMac Mortgage Investment Trust | | | 3.1 | |
| Kite Realty Group Trust | | | 3.1 | |
| New York Mortgage Trust, Inc. | | | 3.1 | |
| Global NET Lease, Inc. | | | 3.1 | |
| Apollo Commercial Real Estate Finance, Inc. | | | 3.0 | |
| Waddell & Reed Financial, Inc., Class A | | | 3.0 | |
| Total | | | 31.2 | |
Invesco S&P SmallCap High Dividend Low Volatility ETF (XSHD) (continued)
Growth of a $10,000 Investment Since Inception
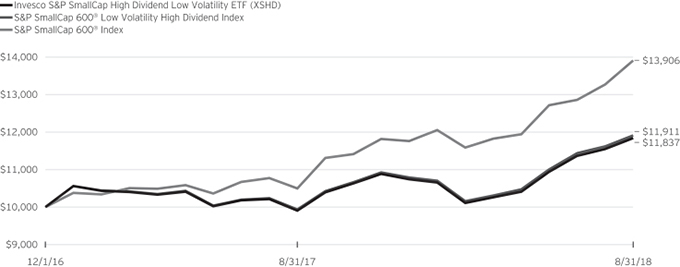
Fund Performance History as of August 31, 2018
| | | | | | | | | | | | | | | | |
| | | | | | | | | Fund Inception | |
| Index | | 1 Year | | | | | | Average
Annualized | | | Cumulative | |
| S&P SmallCap 600® Low Volatility High Dividend Index | | | 19.92 | % | | | | | | | 10.53 | % | | | 19.11 | % |
| S&P SmallCap 600® Index | | | 32.47 | | | | | | | | 20.77 | | | | 39.06 | |
| Fund | | | | | | | | | | | | | | | | |
| NAV Return | | | 19.55 | | | | | | | | 10.13 | | | | 18.37 | |
| Market Price Return | | | 19.51 | | | | | | | | 10.10 | | | | 18.32 | |
Fund Inception: December 1, 2016
Performance quoted above represents past performance. Past performance is not a guarantee of future results and current performance may be higher or lower than performance quoted. Investment returns and principal value will fluctuate, and shares of the Fund (“Fund Shares”), when redeemed or sold, may be worth more or less than their original cost. Fund performance reflects any applicable fee waivers and/or expense reimbursements. Had the adviser not waived fees and/or reimbursed expenses currently or in the past, returns would have been lower. See current prospectus for more information. According to the Fund’s current prospectus, the Fund’s expense ratio of 0.30% is expressed as a unitary management fee to cover operating expenses and expenses incurred in connection with managing the portfolio. NAV and Market Price returns assume that dividends and capital gain distributions have been reinvested in the Fund at NAV and Market Price, respectively. The returns shown in the table above do not reflect the deduction of taxes that a shareholder would pay on Fund distributions or the redemption or sale of Fund Shares. See
invesco.com/ETFs to find the most recent month-end performance numbers.
Index and Benchmark Index performance results are based upon a hypothetical investment in their respective constituent securities. Index and Benchmark Index returns do not represent Fund returns. An investor cannot invest directly in an index. The Index and Benchmark Index do not charge management fees or brokerage expenses, and no such fees or expenses were deducted from the hypothetical performance shown. In addition, the results actual investors might have achieved would have differed from those shown because of differences in the timing, amounts of their investments, and fees and expenses associated with an investment in the Fund.
Notes Regarding Indexes and Fund Performance History:
| - | Average Annualized and Cumulative Inception returns for the Fund, Index and Benchmark Index are based on the inception date of the Fund. |
| | |
| XSLV | | Manager’s Analysis |
| | Invesco S&P SmallCap Low Volatility ETF (XSLV) |
As an index fund, the Invesco S&P SmallCap Low Volatility ETF (the “Fund”) is passively managed and seeks to track the returns of an underlying index. The Fund seeks to track the investment results (before fees and expenses) of the S&P SmallCap 600® Low Volatility Index (the “Index”). The Fund generally will invest at least 90% of its total assets in common stocks that comprise the Index.
S&P Dow Jones Indices LLC (“S&P DJI” or the “Index Provider”) compiles, maintains and calculates the Index. Strictly in accordance with its guidelines and mandated procedures, the Index Provider selects for inclusion in the Index the 120 securities that it has determined have the lowest volatility over the past 12 months out of the 600 small capitalization securities that are contained in the S&P SmallCap 600® Index (the “Benchmark Index”). Volatility is a statistical measurement of the magnitude of up and down asset price fluctuations (increases or decreases in a stock’s price) over time. S&P DJI weights the 120 securities within the Index based upon the inverse of each security’s volatility, with the least volatile securities receiving the highest weights in the Index. The Fund generally invests in all of the securities comprising the Index in proportion to their weightings in the index.
The Board of Trustees approved a change in the fiscal year end for the Fund from October 31 to August 31. For the fiscal period from November 1, 2017 to August 31, 2018, on a market price basis, the Fund returned 11.71%. On a net asset value (“NAV”) basis, the Fund returned 11.81%. During the same time period, the Index returned 12.12%. During the fiscal period, the Fund fully replicated the component of the index; therefore, the fund’s performance (NAV basis) differed from the return of the Index primarily due to fees and operating expenses that the Fund incurred during the period.
During this same time period, the Benchmark Index returned 21.83%. The Benchmark Index is an unmanaged index weighted by market capitalization based on the average performance of approximately 600 small-cap securities. The Benchmark Index was selected for its recognition in the marketplace, and its performance comparison is a useful measure for investors as a broad representation of the overall U.S. small-cap equity market.
The performance of the Fund differed from the Benchmark Index in part because the Fund seeks to track an Index that is a subset of the Benchmark Index, consisting of the 120 securities within the Benchmark Index that have the lowest realized volatility over the past 12 months.
Relative to the Benchmark Index, the Fund was most overweight in the real estate and financials sectors and most underweight in the consumer discretionary sector during the fiscal period ended August 31, 2018. The majority of the Fund’s underperformance relative to the Benchmark Index during the period can be attributed to allocation to the health care, real estate, and financials sectors, respectively.
For the fiscal period ended August 31, 2018, the financials sector contributed most significantly to the Fund’s return, followed by the health care sector. The energy and utilities sectors were the only detracting sectors.
Positions that contributed most significantly to the Fund’s return for the fiscal period ended August 31, 2018, included Bottomline Technologies (DE), Inc., an information technology company (portfolio average weight of 0.78%) and WD-40 Co., a consumer staples company (portfolio average weight of 0.95%). Positions that detracted most significantly from the Fund’s return included OSI Systems, Inc., an information technology company (no longer held at fiscal period-end), and Multi-Color Corp., an industrials company (no longer held at fiscal period-end).
| | | | |
Sector Breakdown
(% of the Fund’s Net Assets)
as of August 31, 2018 | |
| Financials | | | 42.0 | |
| Real Estate | | | 22.5 | |
| Industrials | | | 11.1 | |
| Information Technology | | | 7.1 | |
| Utilities | | | 4.9 | |
| Materials | | | 4.2 | |
| Health Care | | | 3.3 | |
| Consumer Discretionary | | | 3.0 | |
| Consumer Staples | | | 1.8 | |
| Money Market Funds Plus Other Assets Less Liabilities | | | 0.1 | |
|
Top Ten Fund Holdings*
(% of the Fund’s Net Assets)
as of August 31, 2018 | |
| Security | | | | |
| Apollo Commercial Real Estate Finance, Inc. | | | 1.7 | |
| Granite Point Mortgage Trust, Inc. | | | 1.1 | |
| Redwood Trust, Inc. | | | 1.1 | |
| Easterly Government Properties, Inc. | | | 1.1 | |
| Invesco Mortgage Capital, Inc. | | | 1.1 | |
| ARMOUR Residential REIT, Inc. | | | 1.1 | |
| Agree Realty Corp. | | | 1.1 | |
| Four Corners Property Trust, Inc. | | | 1.0 | |
| Capstead Mortgage Corp. | | | 1.0 | |
| Lexington Realty Trust | | | 1.0 | |
| Total | | | 11.3 | |
| * | Excluding money market fund holdings. |
Invesco S&P SmallCap Low Volatility ETF (XSLV) (continued)
Growth of a $10,000 Investment Since Inception
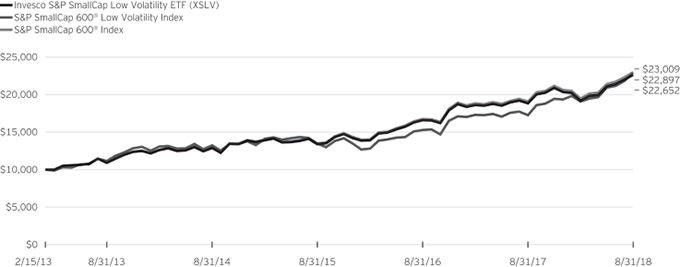
Fund Performance History as of August 31, 2018
| | | | | | | | | | | | | | | | | | | | | | | | | | | | | | | | |
| | | | | | 3 Years Average
Annualized | | | 3 Years Cumulative | | | 5 Years Average
Annualized | | | 5 Years Cumulative | | | | | | Fund Inception | |
| Index | | 1 Year | | | Average
Annualized | | | Cumulative | |
| S&P SmallCap 600® Low Volatility Index | | | 20.65 | % | | | 19.41 | % | | | 70.28 | % | | | 16.06 | % | | | 110.55 | % | | | | | | | 16.24 | % | | | 130.09 | % |
| S&P SmallCap 600® Index | | | 32.47 | | | | 19.28 | | | | 69.70 | | | | 15.45 | | | | 105.06 | | | | | | | | 16.13 | | | | 128.97 | |
| Fund | | | | | | | | | | | | | | | | | | | | | | | | | | | | | | | | |
| NAV Return | | | 20.27 | | | | 19.10 | | | | 68.95 | | | | 15.73 | | | | 107.62 | | | | | | | | 15.91 | | | | 126.52 | |
| Market Price Return | | | 20.36 | | | | 19.10 | | | | 68.95 | | | | 15.76 | | | | 107.84 | | | | | | | | 15.88 | | | | 126.21 | |
Fund Inception: February 15, 2013
Performance quoted above represents past performance. Past performance is not a guarantee of future results and current performance may be higher or lower than performance quoted. Investment returns and principal value will fluctuate, and shares of the Fund (“Fund Shares”), when redeemed or sold, may be worth more or less than their original cost. Fund performance reflects any applicable fee waivers and/or expense reimbursements. Had the adviser not waived fees and/or reimbursed expenses currently or in the past, returns would have been lower. See current prospectus for more information. According to the Fund’s current prospectus, the Fund’s expense ratio of 0.25% is expressed as a unitary management fee to cover operating expenses and expenses incurred in connection with managing the portfolio. NAV and Market Price returns assume that dividends and capital gain distributions have been reinvested in the Fund at NAV and Market Price, respectively. The returns shown in the table above do not reflect the deduction of taxes that a shareholder would pay on Fund
distributions or the redemption or sale of Fund Shares. See invesco.com/ETFs to find the most recent month-end performance numbers.
Index and Benchmark Index performance results are based upon a hypothetical investment in their respective constituent securities. Index and Benchmark Index returns do not represent Fund returns. An investor cannot invest directly in an index. The Index and Benchmark Index do not charge management fees or brokerage expenses, and no such fees or expenses were deducted from the hypothetical performance shown. In addition, the results actual investors might have achieved would have differed from those shown because of differences in the timing, amounts of their investments, and fees and expenses associated with an investment in the Fund.
Notes Regarding Indexes and Fund Performance History:
| - | Average Annualized and Cumulative Inception returns for the Fund, Index and Benchmark Index are based on the inception date of the Fund. |
| | |
| XSHQ | | Manager’s Analysis |
| | Invesco S&P SmallCap Quality ETF (XSHQ) |
As an index fund, the Invesco S&P SmallCap Quality ETF (the “Fund”) is passively managed and seeks to track the returns of an underlying index. The Fund seeks to track the investment results (before fees and expenses) of the S&P SmallCap 600® Quality Index (the “Index”). The Fund generally will invest at least 90% of its total assets in securities that comprise the Index.
S&P Dow Jones Indices LLC (“S&P DJI” or the “Index Provider”) compiles, maintains and calculates the Index, which is composed of 120 securities in the S&P SmallCap 600® Index (the “Benchmark Index”) that are of the highest quality—that is, stocks of companies that seek to generate higher revenue and cash flow than their counterparts through prudent use of assets and finances. The Benchmark Index is designed to measure the small-capitalization segment of the U.S. equity market.
Strictly in accordance with its guidelines and mandated procedures, S&P DJI first calculates the quality score of each security in the Benchmark Index. Based on its criteria, S&P DJI selects the 120 stocks with the highest quality score for inclusion in the Index. S&P DJI weights each component stock of the Index by the total of its quality score multiplied by its market capitalization; stocks with higher scores receive relatively greater weights. The Fund generally invests in all of the components of the Index in proportion to their weightings in the Index.
The Board of Trustees approved a change in the fiscal year end for the Fund from October 31 to August 31. For the fiscal period from November 1, 2017 to August 31, 2018, on a market price basis, the Fund returned 22.65%. On a net asset value (“NAV”) basis, the Fund returned 22.72%. During the same time period, the Index returned 23.14%. During the fiscal period, the Fund fully replicated the components of the Index; therefore, the Fund’s (NAV basis) differed from the return of the Index primarily due to fees and operating expenses that the Fund incurred during the period.
During this same time period, the Benchmark Index returned 21.83%. The Benchmark Index is an unmanaged index weighted by market capitalization based on the average performance of small-cap securities. The Benchmark Index was selected for its recognition in the marketplace, and its performance comparison is a useful measure for investors as a broad representation of the overall U.S. small-cap stock market.
The performance of the Fund differed from the Benchmark Index in part because the Fund seeks to track an Index that is a subset of the Benchmark Index, consisting of the 120 securities within the Benchmark Index that have the highest quality score.
Relative to the Benchmark Index, the Fund was most overweight in the consumer discretionary sector and most underweight in the real estate sector during the fiscal period ended August 31, 2018. The majority of the Fund’s outperformance relative to the Benchmark Index during the period can be attributed to stock selection within the consumer staples sector.
For the fiscal period ended August 31, 2018, the health care sector contributed most significantly to the Fund’s return, followed by the industrials and financials sectors, respectively. The telecommunication services sector was the only detracting sector.
Positions that contributed most significantly to the Fund’s return for the fiscal period ended August 31, 2018, included Medifast, Inc., a consumer staples company (portfolio average weight of 1.82%), and Insperity, Inc., an industrials company (no longer held at fiscal period-end). Positions that detracted most significantly from the Fund’s return included Advanced Energy Industries, Inc., an information technology company (portfolio average weight of 1.41%), and LCI Industries, a consumer discretionary company (no longer held at fiscal period-end).
| | | | |
Sector Breakdown
(% of the Fund’s Net Assets)
as of August 31, 2018 | |
| Financials | | | 21.2 | |
| Information Technology | | | 18.9 | |
| Consumer Discretionary | | | 18.5 | |
| Industrials | | | 15.6 | |
| Health Care | | | 12.1 | |
| Consumer Staples | | | 6.0 | |
| Materials | | | 5.1 | |
| Real Estate | | | 1.5 | |
| Energy | | | 1.0 | |
| Money Market Fund Plus Other Assets Less Liabilities | | | 0.1 | |
|
Top Ten Fund Holdings*
(% of the Fund’s Net Assets)
as of August 31, 2018 | |
| Security | | | | |
| Stamps.com, Inc. | | | 2.6 | |
| Inogen, Inc. | | | 2.5 | |
| CACI International, Inc., Class A | | | 2.5 | |
| First Financial Bankshares, Inc. | | | 2.3 | |
| Axon Enterprise, Inc. | | | 2.2 | |
| FirstCash, Inc. | | | 1.9 | |
| Korn/Ferry International | | | 1.8 | |
| Medifast, Inc. | | | 1.8 | |
| Balchem Corp. | | | 1.8 | |
| Amedisys, Inc. | | | 1.7 | |
| Total | | | 21.1 | |
| * | Excluding money market fund holdings. |
Invesco S&P SmallCap Quality ETF (XSHQ) (continued)
Growth of a $10,000 Investment Since Inception
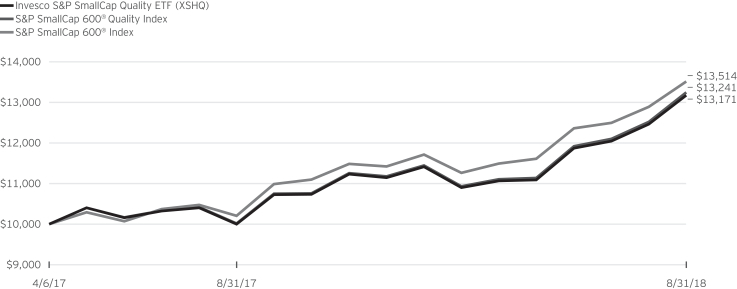
Fund Performance History as of August 31, 2018
| | | | | | | | | | | | | | | | |
| | | | | | | | | Fund Inception | |
| Index | | 1 Year | | | | | | Average
Annualized | | | Cumulative | |
| S&P SmallCap 600® Quality Index | | | 32.23 | % | | | | | | | 22.20 | % | | | 32.41 | % |
| S&P SmallCap 600® Index | | | 32.47 | | | | | | | | 24.00 | | | | 35.14 | |
| Fund | | | | | | | | | | | | | | | | |
| NAV Return | | | 31.73 | | | | | | | | 21.74 | | | | 31.71 | |
| Market Price Return | | | 31.87 | | | | | | | | 21.87 | | | | 31.90 | |
Fund Inception: April 6, 2017
Performance quoted above represents past performance. Past performance is not a guarantee of future results and current performance may be higher or lower than performance quoted. Investment returns and principal value will fluctuate, and shares of the Fund (“Fund Shares”), when redeemed or sold, may be worth more or less than their original cost. Fund performance reflects any applicable fee waivers and/or expense reimbursements. Had the adviser not waived fees and/or reimbursed expenses currently or in the past, returns would have been lower. See current prospectus for more information. According to the Fund’s current prospectus, the Fund’s expense ratio of 0.29% is expressed as a unitary management fee to cover operating expenses and expenses incurred in connection with managing the portfolio. NAV and Market Price returns assume that dividends and capital gain distributions have been reinvested in the Fund at NAV and Market Price, respectively. The returns shown in the table above do not reflect the deduction of taxes that a shareholder would pay on Fund distributions or the redemption or sale of Fund Shares. See
invesco.com/ETFs to find the most recent month-end performance numbers.
Index and Benchmark Index performance results are based upon a hypothetical investment in their respective constituent securities. Index and Benchmark Index returns do not represent Fund returns. An investor cannot invest directly in an index. The Index and Benchmark Index do not charge management fees or brokerage expenses, and no such fees or expenses were deducted from the hypothetical performance shown. In addition, the results actual investors might have achieved would have differed from those shown because of differences in the timing, amounts of their investments, and fees and expenses associated with an investment in the Fund.
Notes Regarding Indexes and Fund Performance History:
| - | Average Annualized and Cumulative Inception returns for the Fund, Index and Benchmark Index are based on the inception date of the Fund. |
Schedule of Investments(a)
Invesco Russell 1000 Enhanced Equal Weight ETF (USEQ)
August 31, 2018
| | | | | | | | |
Number
of Shares | | | | | Value | |
| | | | Common Stocks & Other Equity Interests—100.0% | |
| | | | Consumer Discretionary—16.0% | | | |
| | 3,794 | | | Adient PLC | | $ | 164,242 | |
| | 1,587 | | | Advance Auto Parts, Inc. | | | 260,316 | |
| | 3,411 | | | AMC Networks, Inc., Class A(b) | | | 214,245 | |
| | 2,088 | | | Aptiv PLC | | | 183,765 | |
| | 5,145 | | | Aramark | | | 211,357 | |
| | 4,324 | | | AutoNation, Inc.(b) | | | 196,093 | |
| | 312 | | | AutoZone, Inc.(b) | | | 239,267 | |
| | 2,891 | | | Best Buy Co., Inc. | | | 230,008 | |
| | 98 | | | Booking Holdings, Inc.(b) | | | 191,252 | |
| | 4,064 | | | BorgWarner, Inc. | | | 177,881 | |
| | 1,986 | | | Bright Horizons Family Solutions, Inc.(b) | | | 237,188 | |
| | 3,117 | | | Brunswick Corp. | | | 207,031 | |
| | 1,475 | | | Burlington Stores, Inc.(b) | | | 248,065 | |
| | 310 | | | Cable One, Inc. | | | 259,699 | |
| | 2,906 | | | CarMax, Inc.(b) | | | 226,813 | |
| | 3,201 | | | Carnival Corp. | | | 196,829 | |
| | 1,815 | | | Carter’s, Inc. | | | 192,263 | |
| | 3,927 | | | CBS Corp., Class B | | | 208,210 | |
| | 464 | | | Chipotle Mexican Grill, Inc.(b) | | | 220,484 | |
| | 2,488 | | | Choice Hotels International, Inc. | | | 194,188 | |
| | 5,952 | | | Cinemark Holdings, Inc. | | | 222,129 | |
| | 2,313 | | | Columbia Sportswear Co. | | | 209,789 | |
| | 4,745 | | | D.R. Horton, Inc. | | | 211,200 | |
| | 2,294 | | | Darden Restaurants, Inc. | | | 266,196 | |
| | 2,085 | | | Dollar General Corp. | | | 224,617 | |
| | 2,090 | | | Dollar Tree, Inc.(b) | | | 168,266 | |
| | 812 | | | Domino’s Pizza, Inc. | | | 242,431 | |
| | 3,189 | | | Dunkin’ Brands Group, Inc. | | | 232,446 | |
| | 10,145 | | | Extended Stay America, Inc. | | | 204,726 | |
| | 4,247 | | | Floor & Decor Holdings, Inc., Class A(b) | | | 156,120 | |
| | 3,691 | | | Foot Locker, Inc. | | | 181,966 | |
| | 17,411 | | | Ford Motor Co. | | | 165,056 | |
| | 6,965 | | | Gap, Inc. (The) | | | 211,388 | |
| | 3,305 | | | Garmin Ltd. | | | 225,203 | |
| | 8,552 | | | Gentex Corp. | | | 199,946 | |
| | 2,196 | | | Genuine Parts Co. | | | 219,271 | |
| | 8,174 | | | Goodyear Tire & Rubber Co. (The) | | | 185,468 | |
| | 344 | | | Graham Holdings Co., Class B | | | 193,552 | |
| | 1,823 | | | Grand Canyon Education, Inc.(b) | | | 217,192 | |
| | 7,159 | | | H&R Block, Inc. | | | 193,723 | |
| | 10,813 | | | Hanesbrands, Inc. | | | 189,660 | |
| | 4,787 | | | Harley-Davidson, Inc. | | | 204,022 | |
| | 2,317 | | | Hasbro, Inc. | | | 230,101 | |
| | 4,985 | | | Hilton Grand Vacations, Inc.(b) | | | 162,810 | |
| | 2,458 | | | Hilton Worldwide Holdings, Inc. | | | 190,790 | |
| | 1,077 | | | Home Depot, Inc. (The) | | | 216,229 | |
| | 2,497 | | | Hyatt Hotels Corp., Class A | | | 193,168 | |
| | 8,895 | | | Interpublic Group of Cos., Inc. (The) | | | 207,698 | |
| | 2,936 | | | John Wiley & Sons, Inc., Class A | | | 189,519 | |
| | 3,012 | | | Kohl’s Corp. | | | 238,279 | |
| | 2,506 | | | Las Vegas Sands Corp. | | | 163,943 | |
| | 1,031 | | | Lear Corp. | | | 167,228 | |
| | 4,784 | | | Leggett & Platt, Inc. | | | 217,385 | |
| | 3,666 | | | Lennar Corp., Class A | | | 189,422 | |
| | 202 | | | Lennar Corp., Class B | | | 8,520 | |
| | 1,451 | | | Liberty Media Corp.-Liberty SiriusXM, Class A(b) | | | 67,820 | |
| | 2,932 | | | Liberty Media Corp.-Liberty SiriusXM, Class C(b) | | | 137,921 | |
| | | | | | | | |
Number
of Shares | | | | | Value | |
| | | | Common Stocks & Other Equity Interests
(continued) | |
| | | | Consumer Discretionary (continued) | | | |
| | 8,473 | | | Lions Gate Entertainment Corp., Class A | | $ | 199,285 | |
| | 8,976 | | | Lions Gate Entertainment Corp., Class B | | | 201,511 | |
| | 6,446 | | | LKQ Corp.(b) | | | 222,516 | |
| | 2,101 | | | Lowe’s Cos., Inc. | | | 228,484 | |
| | 1,933 | | | Lululemon Athletica, Inc.(b) | | | 299,480 | |
| | 5,653 | | | Macy’s, Inc. | | | 206,617 | |
| | 1,479 | | | Marriott International, Inc., Class A | | | 187,049 | |
| | 1,267 | | | McDonald’s Corp. | | | 205,545 | |
| | 6,304 | | | MGM Resorts International | | | 182,753 | |
| | 3,379 | | | Michael Kors Holdings Ltd.(b) | | | 245,383 | |
| | 10,478 | | | Michaels Cos., Inc. (The)(b) | | | 178,021 | |
| | 967 | | | Mohawk Industries, Inc.(b) | | | 185,268 | |
| | 2,786 | | | NIKE, Inc., Class B | | | 229,009 | |
| | 4,169 | | | Nordstrom, Inc. | | | 262,022 | |
| | 3,814 | | | Norwegian Cruise Line Holdings Ltd.(b) | | | 204,469 | |
| | 69 | | | NVR, Inc.(b) | | | 184,123 | |
| | 2,823 | | | Omnicom Group, Inc. | | | 195,690 | |
| | 745 | | | O’Reilly Automotive, Inc.(b) | | | 249,888 | |
| | 4,152 | | | Penske Automotive Group, Inc. | | | 218,520 | |
| | 1,781 | | | Polaris Industries, Inc. | | | 193,149 | |
| | 1,395 | | | Pool Corp. | | | 229,143 | |
| | 6,651 | | | PulteGroup, Inc. | | | 185,895 | |
| | 1,295 | | | PVH Corp. | | | 185,392 | |
| | 1,478 | | | Ralph Lauren Corp., Class A | | | 196,293 | |
| | 2,589 | | | Ross Stores, Inc. | | | 247,974 | |
| | 1,898 | | | Royal Caribbean Cruises Ltd. | | | 232,657 | |
| | 5,483 | | | Service Corp. International | | | 230,067 | |
| | 3,502 | | | ServiceMaster Global Holdings, Inc.(b) | | | 211,066 | |
| | 28,224 | | | Sirius XM Holdings, Inc. | | | 200,390 | |
| | 3,101 | | | Six Flags Entertainment Corp. | | | 209,473 | |
| | 6,741 | | | Skechers U.S.A., Inc., Class A(b) | | | 198,725 | |
| | 3,502 | | | Starbucks Corp. | | | 187,182 | |
| | 4,652 | | | Tapestry, Inc. | | | 235,810 | |
| | 2,783 | | | Target Corp. | | | 243,512 | |
| | 4,247 | | | Tempur Sealy International, Inc.(b) | | | 235,241 | |
| | 2,103 | | | Thor Industries, Inc. | | | 200,710 | |
| | 1,562 | | | Tiffany & Co. | | | 191,579 | |
| | 2,279 | | | TJX Cos., Inc. (The) | | | 250,622 | |
| | 5,042 | | | Toll Brothers, Inc. | | | 182,672 | |
| | 2,715 | | | Tractor Supply Co. | | | 239,680 | |
| | 5,575 | | | Tribune Media Co., Class A | | | 205,662 | |
| | 3,555 | | | Twenty-First Century Fox, Inc., Class A | | | 161,397 | |
| | 1,662 | | | Twenty-First Century Fox, Inc., Class B | | | 74,624 | |
| | 794 | | | Ulta Beauty, Inc.(b) | | | 206,440 | |
| | 4,823 | | | Urban Outfitters, Inc.(b) | | | 224,173 | |
| | 837 | | | Vail Resorts, Inc. | | | 249,468 | |
| | 2,498 | | | VF Corp. | | | 230,141 | |
| | 6,356 | | | Viacom, Inc., Class A | | | 214,197 | |
| | 1,600 | | | Visteon Corp.(b) | | | 176,624 | |
| | 2,012 | | | Walt Disney Co. (The) | | | 225,384 | |
| | 12,095 | | | Wendy’s Co. (The) | | | 213,477 | |
| | 1,345 | | | Whirlpool Corp. | | | 168,098 | |
| | 3,680 | | | Williams-Sonoma, Inc. | | | 258,446 | |
| | 4,023 | | | Wyndham Destinations, Inc. | | | 177,817 | |
| | 1,027 | | | Wynn Resorts Ltd. | | | 152,345 | |
See accompanying Notes to Financial Statements which are an integral part of the financial statements.
Invesco Russell 1000 Enhanced Equal Weight ETF (USEQ) (continued)
August 31, 2018
| | | | | | | | |
Number
of Shares | | | | | Value | |
| | | | Common Stocks & Other Equity Interests
(continued) | |
| | | | Consumer Discretionary (continued) | | | |
| | 5,108 | | | Yum China Holdings, Inc. (China) | | $ | 197,577 | |
| | 2,437 | | | Yum! Brands, Inc. | | | 211,751 | |
| | | | | | | | |
| | | | | | | 23,284,882 | |
| | | | | | | | |
| | | | Consumer Staples—5.9% | | | |
| | 4,619 | | | Archer-Daniels-Midland Co. | | | 232,798 | |
| | 3,595 | | | Brown-Forman Corp., Class A | | | 189,241 | |
| | 2,857 | | | Bunge Ltd. | | | 185,648 | |
| | 2,064 | | | Casey’s General Stores, Inc. | | | 235,647 | |
| | 4,248 | | | Church & Dwight Co., Inc. | | | 240,352 | |
| | 1,597 | | | Clorox Co. (The) | | | 231,533 | |
| | 4,662 | | | Coca-Cola Co. (The) | | | 207,785 | |
| | 3,124 | | | Colgate-Palmolive Co. | | | 207,465 | |
| | 5,330 | | | Conagra Brands, Inc. | | | 195,877 | |
| | 895 | | | Constellation Brands, Inc., Class A | | | 186,339 | |
| | 1,024 | | | Costco Wholesale Corp. | | | 238,725 | |
| | 3,228 | | | Energizer Holdings, Inc. | | | 205,269 | |
| | 1,329 | | | Estee Lauder Cos., Inc. (The), Class A | | | 186,219 | |
| | 9,694 | | | Flowers Foods, Inc. | | | 195,334 | |
| | 7,696 | | | Hain Celestial Group, Inc. (The)(b) | | | 219,798 | |
| | 4,123 | | | Herbalife Nutrition Ltd.(b) | | | 233,321 | |
| | 2,198 | | | Hershey Co. (The) | | | 220,943 | |
| | 5,415 | | | Hormel Foods Corp. | | | 211,997 | |
| | 1,760 | | | Ingredion, Inc. | | | 177,883 | |
| | 1,885 | | | JM Smucker Co. (The) | | | 194,871 | |
| | 3,047 | | | Kellogg Co. | | | 218,744 | |
| | 1,662 | | | Keurig Dr Pepper, Inc. | | | 37,894 | |
| | 1,909 | | | Kimberly-Clark Corp. | | | 220,566 | |
| | 8,054 | | | Kroger Co. (The) | | | 253,701 | |
| | 3,095 | | | Lamb Weston Holdings, Inc. | | | 209,222 | |
| | 1,963 | | | McCormick & Co., Inc. | | | 245,139 | |
| | 5,068 | | | Mondelez International, Inc., Class A | | | 216,505 | |
| | 3,934 | | | Monster Beverage Corp.(b) | | | 239,541 | |
| | 2,439 | | | Nu Skin Enterprises, Inc., Class A | | | 194,144 | |
| | 1,977 | | | PepsiCo, Inc. | | | 221,444 | |
| | 9,894 | | | Pilgrim’s Pride Corp.(b) | | | 182,940 | |
| | 3,193 | | | Pinnacle Foods, Inc. | | | 212,079 | |
| | 2,600 | | | Post Holdings, Inc.(b) | | | 252,876 | |
| | 2,689 | | | Procter & Gamble Co. (The) | | | 223,053 | |
| | 48 | | | Seaboard Corp. | | | 176,869 | |
| | 9,189 | | | Sprouts Farmers Market, Inc.(b) | | | 243,233 | |
| | 3,095 | | | Sysco Corp. | | | 231,568 | |
| | 2,850 | | | Tyson Foods, Inc., Class A | | | 179,009 | |
| | 5,565 | | | US Foods Holding Corp.(b) | | | 181,363 | |
| | 3,163 | | | Walgreens Boots Alliance, Inc. | | | 216,855 | |
| | 2,394 | | | Walmart, Inc. | | | 229,489 | |
| | | | | | | | |
| | | | | | | 8,583,279 | |
| | | | | | | | |
| | | | Energy—4.3% | | | |
| | 1,381 | | | Andeavor | | | 211,003 | |
| | 4,941 | | | Apache Corp. | | | 216,564 | |
| | 8,867 | | | Cabot Oil & Gas Corp. | | | 211,301 | |
| | 10,824 | | | Centennial Resource Development, Inc., Class A(b) | | | 208,578 | |
| | 1,608 | | | Chevron Corp. | | | 190,484 | |
| | 2,120 | | | Cimarex Energy Co. | | | 179,098 | |
| | 12,338 | | | CNX Resources Corp.(b) | | | 196,668 | |
| | | | | | | | |
Number
of Shares | | | | | Value | |
| | | | Common Stocks & Other Equity Interests
(continued) | |
| | | | Energy (continued) | | | |
| | 2,893 | | | Concho Resources, Inc.(b) | | $ | 396,775 | |
| | 2,958 | | | Continental Resources, Inc.(b) | | | 195,080 | |
| | 4,793 | | | Devon Energy Corp. | | | 205,763 | |
| | 1,636 | | | Diamondback Energy, Inc. | | | 198,087 | |
| | 2,946 | | | Energen Corp.(b) | | | 228,462 | |
| | 1,682 | | | EOG Resources, Inc. | | | 198,863 | |
| | 2,515 | | | Exxon Mobil Corp. | | | 201,628 | |
| | 2,593 | | | HollyFrontier Corp. | | | 193,230 | |
| | 12,144 | | | Kinder Morgan, Inc. | | | 214,949 | |
| | 2,573 | | | Marathon Petroleum Corp. | | | 211,732 | |
| | 6,846 | | | Newfield Exploration Co.(b) | | | 186,759 | |
| | 2,393 | | | Occidental Petroleum Corp. | | | 191,129 | |
| | 2,946 | | | ONEOK, Inc. | | | 194,171 | |
| | 6,689 | | | Parsley Energy, Inc., Class A(b) | | | 185,754 | |
| | 4,220 | | | PBF Energy, Inc., Class A | | | 219,102 | |
| | 1,689 | | | Phillips 66 | | | 200,163 | |
| | 1,022 | | | Pioneer Natural Resources Co. | | | 178,543 | |
| | 16,065 | | | QEP Resources, Inc.(b) | | | 160,168 | |
| | 11,538 | | | RPC, Inc. | | | 157,840 | |
| | 7,563 | | | SM Energy Co. | | | 227,571 | |
| | 4,159 | | | Targa Resources Corp. | | | 229,036 | |
| | 1,680 | | | Valero Energy Corp. | | | 198,038 | |
| | 7,396 | | | Williams Cos., Inc. (The) | | | 218,848 | |
| | | | | | | | |
| | | | | | | 6,205,387 | |
| | | | | | | | |
| | | | Financials—17.7% | | | |
| | 1,275 | | | Affiliated Managers Group, Inc. | | | 186,265 | |
| | 4,417 | | | Aflac, Inc. | | | 204,242 | |
| | 10,440 | | | AGNC Investment Corp. REIT | | | 198,569 | |
| | 358 | | | Alleghany Corp. | | | 226,177 | |
| | 2,131 | | | Allstate Corp. (The) | | | 214,315 | |
| | 7,809 | | | Ally Financial, Inc. | | | 209,906 | |
| | 2,031 | | | American Express Co. | | | 215,245 | |
| | 1,801 | | | American Financial Group, Inc. | | | 200,559 | |
| | 1,681 | | | American National Insurance Co. | | | 215,740 | |
| | 1,440 | | | Ameriprise Financial, Inc. | | | 204,422 | |
| | 18,943 | | | Annaly Capital Management, Inc. REIT | | | 201,175 | |
| | 1,433 | | | Aon PLC | | | 208,587 | |
| | 3,005 | | | Arthur J. Gallagher & Co. | | | 216,781 | |
| | 7,213 | | | Associated Banc-Corp. | | | 196,554 | |
| | 2,108 | | | Assurant, Inc. | | | 216,745 | |
| | 5,632 | | | Assured Guaranty Ltd. | | | 229,448 | |
| | 4,430 | | | Athene Holding Ltd., Class A(b) | | | 219,994 | |
| | 6,824 | | | Bank of America Corp. | | | 211,066 | |
| | 2,342 | | | Bank of Hawaii Corp. | | | 194,690 | |
| | 3,631 | | | Bank of New York Mellon Corp. (The) | | | 189,357 | |
| | 4,184 | | | Bank OZK | | | 169,285 | |
| | 4,722 | | | BankUnited, Inc. | | | 183,166 | |
| | 3,793 | | | BB&T Corp. | | | 195,946 | |
| | 1,052 | | | Berkshire Hathaway, Inc., Class B(b) | | | 219,573 | |
| | 17,307 | | | BGC Partners, Inc., Class A | | | 214,953 | |
| | 378 | | | BlackRock, Inc. | | | 181,085 | |
| | 2,004 | | | BOK Financial Corp. | | | 205,510 | |
| | 7,232 | | | Brown & Brown, Inc. | | | 220,431 | |
| | 2,196 | | | Capital One Financial Corp. | | | 217,602 | |
| | 2,030 | | | Cboe Global Markets, Inc. | | | 204,624 | |
| | 10,924 | | | Chimera Investment Corp. REIT | | | 203,514 | |
See accompanying Notes to Financial Statements which are an integral part of the financial statements.
Invesco Russell 1000 Enhanced Equal Weight ETF (USEQ) (continued)
August 31, 2018
| | | | | | | | |
Number
of Shares | | | | | Value | |
| | | | Common Stocks & Other Equity Interests
(continued) | |
| | | | Financials (continued) | | | |
| | 1,520 | | | Chubb Ltd. | | $ | 205,565 | |
| | 2,919 | | | Cincinnati Financial Corp. | | | 223,800 | |
| | 4,060 | | | CIT Group, Inc. | | | 220,214 | |
| | 4,972 | | | Citizens Financial Group, Inc. | | | 204,648 | |
| | 4,220 | | | CNA Financial Corp. | | | 189,478 | |
| | 2,118 | | | Comerica, Inc. | | | 206,463 | |
| | 3,131 | | | Commerce Bancshares, Inc. | | | 222,489 | |
| | 572 | | | Credit Acceptance Corp.(b) | | | 261,238 | |
| | 1,774 | | | Cullen/Frost Bankers, Inc. | | | 196,719 | |
| | 2,719 | | | Discover Financial Services | | | 212,408 | |
| | 3,218 | | | E*TRADE Financial Corp.(b) | | | 189,411 | |
| | 2,850 | | | East West Bancorp, Inc. | | | 180,661 | |
| | 3,668 | | | Eaton Vance Corp. | | | 193,414 | |
| | 1,780 | | | Erie Indemnity Co., Class A | | | 219,883 | |
| | 1,904 | | | Evercore, Inc., Class A | | | 202,110 | |
| | 893 | | | Everest Re Group Ltd. | | | 199,157 | |
| | 14,903 | | | F.N.B. Corp. | | | 200,445 | |
| | 996 | | | FactSet Research Systems, Inc. | | | 228,472 | |
| | 5,295 | | | Fidelity National Financial, Inc. | | | 212,329 | |
| | 6,573 | | | Fifth Third Bancorp | | | 193,443 | |
| | 3,736 | | | First American Financial Corp. | | | 212,429 | |
| | 462 | | | First Citizens BancShares, Inc., Class A | | | 219,455 | |
| | 6,885 | | | First Hawaiian, Inc. | | | 199,596 | |
| | 10,771 | | | First Horizon National Corp. | | | 198,402 | |
| | 2,005 | | | First Republic Bank | | | 203,688 | |
| | 5,969 | | | Franklin Resources, Inc. | | | 189,456 | |
| | 880 | | | Goldman Sachs Group, Inc. (The) | | | 209,273 | |
| | 1,671 | | | Hanover Insurance Group, Inc. (The) | | | 204,681 | |
| | 13,535 | | | Huntington Bancshares, Inc. | | | 219,402 | |
| | 2,701 | | | Interactive Brokers Group, Inc., Class A | | | 167,894 | |
| | 2,809 | | | Intercontinental Exchange, Inc. | | | 214,130 | |
| | 7,316 | | | Invesco Ltd.(c) | | | 176,316 | |
| | 9,059 | | | Jefferies Financial Group, Inc. | | | 210,350 | |
| | 1,888 | | | JPMorgan Chase & Co. | | | 216,327 | |
| | 10,233 | | | KeyCorp | | | 215,609 | |
| | 3,879 | | | Lazard Ltd., Class A | | | 186,735 | |
| | 5,253 | | | Legg Mason, Inc. | | | 163,894 | |
| | 3,000 | | | Lincoln National Corp. | | | 196,740 | |
| | 4,125 | | | Loews Corp. | | | 207,529 | |
| | 2,914 | | | LPL Financial Holdings, Inc. | | | 193,023 | |
| | 1,176 | | | M&T Bank Corp. | | | 208,328 | |
| | 182 | | | Markel Corp.(b) | | | 220,002 | |
| | 2,493 | | | Marsh & McLennan Cos., Inc. | | | 210,983 | |
| | 4,260 | | | Mercury General Corp. | | | 229,614 | |
| | 4,348 | | | MetLife, Inc. | | | 199,530 | |
| | 25,724 | | | MFA Financial, Inc. REIT | | | 197,046 | |
| | 3,946 | | | Morgan Stanley | | | 192,683 | |
| | 1,678 | | | Morningstar, Inc. | | | 238,813 | |
| | 2,151 | | | Nasdaq, Inc. | | | 205,291 | |
| | 14,198 | | | Navient Corp. | | | 193,661 | |
| | 11,118 | | | New Residential Investment Corp. REIT | | | 206,461 | |
| | 17,225 | | | New York Community Bancorp, Inc. | | | 185,513 | |
| | 1,975 | | | Northern Trust Corp. | | | 212,233 | |
| | 9,488 | | | Old Republic International Corp. | | | 210,444 | |
| | 6,135 | | | OneMain Holdings, Inc.(b) | | | 225,154 | |
| | 3,732 | | | PacWest Bancorp | | | 188,429 | |
| | | | | | | | |
Number
of Shares | | | | | Value | |
| | | | Common Stocks & Other Equity Interests
(continued) | |
| | | | Financials (continued) | | | |
| | 10,808 | | | People’s United Financial, Inc. | | $ | 200,056 | |
| | 2,952 | | | Pinnacle Financial Partners, Inc. | | | 190,552 | |
| | 1,395 | | | PNC Financial Services Group, Inc. (The) | | | 200,238 | |
| | 4,402 | | | Popular, Inc. | | | 221,597 | |
| | 3,566 | | | Principal Financial Group, Inc. | | | 196,808 | |
| | 3,194 | | | Progressive Corp. (The) | | | 215,691 | |
| | 2,733 | | | Prosperity Bancshares, Inc. | | | 204,538 | |
| | 2,053 | | | Prudential Financial, Inc. | | | 201,707 | |
| | 2,055 | | | Raymond James Financial, Inc. | | | 191,197 | |
| | 10,919 | | | Regions Financial Corp. | | | 212,484 | |
| | 1,335 | | | Reinsurance Group of America, Inc. | | | 190,705 | |
| | 1,008 | | | S&P Global, Inc. | | | 208,706 | |
| | 11,446 | | | Santander Consumer USA Holdings, Inc. | | | 247,005 | |
| | 3,092 | | | SEI Investments Co. | | | 195,043 | |
| | 1,553 | | | Signature Bank/New York NY | | | 179,744 | |
| | 17,539 | | | SLM Corp.(b) | | | 205,557 | |
| | 9,197 | | | Starwood Property Trust, Inc. REIT | | | 202,610 | |
| | 2,061 | | | State Street Corp. | | | 179,122 | |
| | 8,048 | | | Sterling Bancorp | | | 183,897 | |
| | 3,026 | | | SunTrust Banks, Inc. | | | 222,593 | |
| | 648 | | | SVB Financial Group(b) | | | 209,142 | |
| | 5,745 | | | Synchrony Financial | | | 181,944 | |
| | 3,692 | | | Synovus Financial Corp. | | | 184,822 | |
| | 1,642 | | | T. Rowe Price Group, Inc. | | | 190,291 | |
| | 7,594 | | | TCF Financial Corp. | | | 192,508 | |
| | 2,062 | | | Texas Capital Bancshares, Inc.(b) | | | 183,312 | |
| | 2,407 | | | Torchmark Corp. | | | 211,623 | |
| | 1,575 | | | Travelers Cos., Inc. (The) | | | 207,270 | |
| | 12,828 | | | Two Harbors Investment Corp. REIT | | | 200,373 | |
| | 8,454 | | | Umpqua Holdings Corp. | | | 180,916 | |
| | 4,036 | | | US Bancorp | | | 218,388 | |
| | 2,615 | | | W.R. Berkley Corp. | | | 204,650 | |
| | 3,115 | | | Webster Financial Corp. | | | 203,659 | |
| | 3,711 | | | Wells Fargo & Co. | | | 217,019 | |
| | 3,308 | | | Western Alliance Bancorp(b) | | | 190,706 | |
| | 224 | | | White Mountains Insurance Group Ltd. | | | 207,861 | |
| | 1,315 | | | Willis Towers Watson PLC | | | 193,660 | |
| | 2,151 | | | Wintrust Financial Corp. | | | 190,471 | |
| | 3,624 | | | Zions Bancorporation | | | 193,123 | |
| | | | | | | | |
| | | | | | | 25,678,575 | |
| | | | | | | | |
| | | | Health Care—9.5% | | | |
| | 3,299 | | | Abbott Laboratories | | | 220,505 | |
| | 1,950 | | | AbbVie, Inc. | | | 187,161 | |
| | 4,924 | | | Acadia Healthcare Co., Inc.(b) | | | 204,494 | |
| | 1,148 | | | Aetna, Inc. | | | 229,910 | |
| | 3,210 | | | Agilent Technologies, Inc. | | | 216,803 | |
| | 1,726 | | | Alexion Pharmaceuticals, Inc.(b) | | | 210,986 | |
| | 2,393 | | | AmerisourceBergen Corp. | | | 215,298 | |
| | 1,116 | | | Amgen, Inc. | | | 222,988 | |
| | 871 | | | Anthem, Inc. | | | 230,580 | |
| | 2,799 | | | Baxter International, Inc. | | | 208,162 | |
| | 900 | | | Becton, Dickinson and Co. | | | 235,683 | |
| | 685 | | | Biogen, Inc.(b) | | | 242,141 | |
| | 6,590 | | | Boston Scientific Corp.(b) | | | 234,340 | |
| | 3,797 | | | Bristol-Myers Squibb Co. | | | 229,908 | |
| | 6,553 | | | Bruker Corp. | | | 233,156 | |
See accompanying Notes to Financial Statements which are an integral part of the financial statements.
Invesco Russell 1000 Enhanced Equal Weight ETF (USEQ) (continued)
August 31, 2018
| | | | | | | | |
Number
of Shares | | | | | Value | |
| | | | Common Stocks & Other Equity Interests
(continued) | |
| | | | Health Care (continued) | | | |
| | 5,030 | | | Catalent, Inc.(b) | | $ | 210,254 | |
| | 1,694 | | | Centene Corp.(b) | | | 248,137 | |
| | 3,342 | | | Cerner Corp.(b) | | | 217,598 | |
| | 1,899 | | | Charles River Laboratories International, Inc.(b) | | | 234,545 | |
| | 609 | | | Chemed Corp. | | | 197,036 | |
| | 1,179 | | | Cigna Corp. | | | 222,053 | |
| | 878 | | | Cooper Cos., Inc. (The) | | | 224,575 | |
| | 3,102 | | | CVS Health Corp. | | | 233,394 | |
| | 1,989 | | | Danaher Corp. | | | 205,941 | |
| | 2,941 | | | DaVita, Inc.(b) | | | 203,782 | |
| | 1,488 | | | Edwards Lifesciences Corp.(b) | | | 214,629 | |
| | 2,401 | | | Eli Lilly & Co. | | | 253,666 | |
| | 3,118 | | | Encompass Health Corp. | | | 254,398 | |
| | 2,686 | | | Express Scripts Holding Co.(b) | | | 236,422 | |
| | 3,019 | | | Gilead Sciences, Inc. | | | 228,629 | |
| | 1,945 | | | HCA Healthcare, Inc. | | | 260,844 | |
| | 2,179 | | | Hill-Rom Holdings, Inc. | | | 211,951 | |
| | 680 | | | Humana, Inc. | | | 226,617 | |
| | 2,003 | | | IQVIA Holdings, Inc.(b) | | | 254,561 | |
| | 1,195 | | | Jazz Pharmaceuticals PLC(b) | | | 204,249 | |
| | 1,690 | | | Johnson & Johnson | | | 227,626 | |
| | 1,099 | | | Laboratory Corp. of America Holdings(b) | | | 189,984 | |
| | 2,008 | | | Masimo Corp.(b) | | | 236,723 | |
| | 1,394 | | | McKesson Corp. | | | 179,477 | |
| | 4,349 | | | MEDNAX, Inc.(b) | | | 205,925 | |
| | 2,383 | | | Medtronic PLC | | | 229,745 | |
| | 3,424 | | | Merck & Co., Inc. | | | 234,852 | |
| | 367 | | | Mettler-Toledo International, Inc.(b) | | | 214,497 | |
| | 5,091 | | | Mylan NV(b) | | | 199,211 | |
| | 2,705 | | | PerkinElmer, Inc. | | | 250,023 | |
| | 2,647 | | | Perrigo Co. PLC | | | 202,522 | |
| | 5,578 | | | Pfizer, Inc. | | | 231,599 | |
| | 2,304 | | | PRA Health Sciences, Inc.(b) | | | 243,302 | |
| | 6,243 | | | Premier, Inc., Class A(b) | | | 276,128 | |
| | 1,890 | | | Quest Diagnostics, Inc. | | | 207,862 | |
| | 1,923 | | | STERIS PLC | | | 220,030 | |
| | 1,171 | | | Stryker Corp. | | | 198,403 | |
| | 768 | | | Teleflex, Inc. | | | 190,026 | |
| | 971 | | | Thermo Fisher Scientific, Inc. | | | 232,166 | |
| | 823 | | | UnitedHealth Group, Inc. | | | 220,943 | |
| | 1,719 | | | Universal Health Services, Inc., Class B | | | 223,745 | |
| | 1,694 | | | Varian Medical Systems, Inc.(b) | | | 189,762 | |
| | 1,056 | | | Waters Corp.(b) | | | 200,091 | |
| | 887 | | | WellCare Health Plans, Inc.(b) | | | 268,380 | |
| | 2,175 | | | West Pharmaceutical Services, Inc. | | | 254,584 | |
| | 1,818 | | | Zimmer Biomet Holdings, Inc. | | | 224,759 | |
| | 2,385 | | | Zoetis, Inc. | | | 216,081 | |
| | | | | | | | |
| | | | | | | 13,833,842 | |
| | | | | | | | |
| | | | Industrials—16.6% | | | |
| | 1,012 | | | 3M Co. | | | 213,451 | |
| | 3,122 | | | A.O. Smith Corp. | | | 181,326 | |
| | 6,017 | | | AECOM(b) | | | 202,412 | |
| | 3,096 | | | AGCO Corp. | | | 184,707 | |
| | 4,531 | | | Air Lease Corp. | | | 209,377 | |
| | 2,538 | | | Allegion PLC | | | 221,364 | |
| | 4,770 | | | Allison Transmission Holdings, Inc. | | | 236,878 | |
| | | | | | | | |
Number
of Shares | | | | | Value | |
| | | | Common Stocks & Other Equity Interests
(continued) | |
| | | | Industrials (continued) | | | |
| | 567 | | | AMERCO | | $ | 212,563 | |
| | 4,645 | | | American Airlines Group, Inc. | | | 188,030 | |
| | 2,695 | | | AMETEK, Inc. | | | 207,407 | |
| | 3,324 | | | Armstrong World Industries, Inc.(b) | | | 232,015 | |
| | 565 | | | Boeing Co. (The) | | | 193,676 | |
| | 2,984 | | | BWX Technologies, Inc. | | | 182,979 | |
| | 2,247 | | | C.H. Robinson Worldwide, Inc. | | | 215,892 | |
| | 1,883 | | | Carlisle Cos., Inc. | | | 238,783 | |
| | 1,295 | | | Caterpillar, Inc. | | | 179,811 | |
| | 1,099 | | | Cintas Corp. | | | 234,494 | |
| | 1,807 | | | Copa Holdings SA, Class A (Panama) | | | 144,452 | |
| | 3,640 | | | Copart, Inc.(b) | | | 234,088 | |
| | 2,404 | | | Crane Co. | | | 219,437 | |
| | 3,117 | | | CSX Corp. | | | 231,157 | |
| | 1,385 | | | Cummins, Inc. | | | 196,393 | |
| | 1,533 | | | Curtiss-Wright Corp. | | | 205,345 | |
| | 1,298 | | | Deere & Co. | | | 186,652 | |
| | 3,706 | | | Delta Air Lines, Inc. | | | 216,727 | |
| | 4,225 | | | Donaldson Co., Inc. | | | 213,785 | |
| | 2,552 | | | Dover Corp. | | | 219,140 | |
| | 1,620 | | | Dun & Bradstreet Corp. (The) | | | 231,530 | |
| | 2,585 | | | Eaton Corp. PLC | | | 214,917 | |
| | 2,809 | | | Emerson Electric Co. | | | 215,535 | |
| | 2,717 | | | Expeditors International of Washington, Inc. | | | 199,102 | |
| | 3,820 | | | Fastenal Co. | | | 222,935 | |
| | 795 | | | FedEx Corp. | | | 193,940 | |
| | 4,732 | | | Flowserve Corp. | | | 246,632 | |
| | 4,057 | | | Fluor Corp. | | | 232,912 | |
| | 2,712 | | | Fortive Corp. | | | 227,754 | |
| | 3,505 | | | Fortune Brands Home & Security, Inc. | | | 185,695 | |
| | 988 | | | General Dynamics Corp. | | | 191,079 | |
| | 2,570 | | | Genesee & Wyoming, Inc., Class A(b) | | | 225,877 | |
| | 4,330 | | | Graco, Inc. | | | 203,553 | |
| | 1,316 | | | Harris Corp. | | | 213,863 | |
| | 4,974 | | | HD Supply Holdings, Inc.(b) | | | 226,765 | |
| | 3,309 | | | HEICO Corp., Class A | | | 246,520 | |
| | 2,822 | | | Hexcel Corp. | | | 186,591 | |
| | 1,360 | | | Honeywell International, Inc. | | | 216,322 | |
| | 1,826 | | | Hubbell, Inc. | | | 230,733 | |
| | 903 | | | Huntington Ingalls Industries, Inc. | | | 220,756 | |
| | 1,454 | | | IDEX Corp. | | | 222,767 | |
| | 4,068 | | | IHS Markit Ltd.(b) | | | 223,740 | |
| | 1,383 | | | Illinois Tool Works, Inc. | | | 192,071 | |
| | 2,242 | | | Ingersoll-Rand PLC | | | 227,092 | |
| | 3,832 | | | ITT, Inc. | | | 226,509 | |
| | 1,584 | | | J.B. Hunt Transport Services, Inc. | | | 191,268 | |
| | 3,104 | | | Jacobs Engineering Group, Inc. | | | 225,630 | |
| | 1,849 | | | Kansas City Southern | | | 214,410 | |
| | 3,823 | | | KAR Auction Services, Inc. | | | 239,664 | |
| | 2,177 | | | Kirby Corp.(b) | | | 190,052 | |
| | 4,890 | | | Knight-Swift Transportation Holdings, Inc. | | | 166,896 | |
| | 1,011 | | | L3 Technologies, Inc. | | | 216,071 | |
| | 1,777 | | | Landstar System, Inc. | | | 205,777 | |
| | 971 | | | Lennox International, Inc. | | | 216,348 | |
| | 2,217 | | | Lincoln Electric Holdings, Inc. | | | 208,753 | |
| | 635 | | | Lockheed Martin Corp. | | | 203,460 | |
See accompanying Notes to Financial Statements which are an integral part of the financial statements.
Invesco Russell 1000 Enhanced Equal Weight ETF (USEQ) (continued)
August 31, 2018
| | | | | | | | |
Number
of Shares | | | | | Value | |
| | | | Common Stocks & Other Equity Interests
(continued) | |
| | | | Industrials (continued) | | | |
| | 5,269 | | | Masco Corp. | | $ | 200,064 | |
| | 1,983 | | | Middleby Corp. (The)(b) | | | 241,014 | |
| | 2,220 | | | MSC Industrial Direct Co., Inc., Class A | | | 189,766 | |
| | 1,570 | | | Nordson Corp. | | | 218,261 | |
| | 1,299 | | | Norfolk Southern Corp. | | | 225,818 | |
| | 606 | | | Northrop Grumman Corp. | | | 180,885 | |
| | 1,272 | | | Old Dominion Freight Line, Inc. | | | 193,853 | |
| | 2,632 | | | Oshkosh Corp. | | | 184,924 | |
| | 3,106 | | | Owens Corning | | | 175,862 | |
| | 3,130 | | | PACCAR, Inc. | | | 214,155 | |
| | 1,170 | | | Parker-Hannifin Corp. | | | 205,452 | |
| | 4,501 | | | Pentair PLC (United Kingdom) | | | 195,703 | |
| | 5,544 | | | Quanta Services, Inc.(b) | | | 191,767 | |
| | 965 | | | Raytheon Co. | | | 192,460 | |
| | 2,504 | | | Regal Beloit Corp. | | | 209,585 | |
| | 2,996 | | | Republic Services, Inc. | | | 219,787 | |
| | 3,190 | | | Robert Half International, Inc. | | | 249,394 | |
| | 1,129 | | | Rockwell Automation, Inc. | | | 204,304 | |
| | 1,484 | | | Rockwell Collins, Inc. | | | 201,750 | |
| | 732 | | | Roper Technologies, Inc. | | | 218,407 | |
| | 2,903 | | | Ryder System, Inc. | | | 223,067 | |
| | 6,653 | | | Schneider National, Inc., Class B | | | 179,964 | |
| | 3,905 | | | Sensata Technologies Holding PLC(b) | | | 206,770 | |
| | 1,358 | | | Snap-on, Inc. | | | 240,067 | |
| | 3,920 | | | Southwest Airlines Co. | | | 240,296 | |
| | 2,354 | | | Spirit AeroSystems Holdings, Inc., Class A | | | 201,267 | |
| | 1,398 | | | Stanley Black & Decker, Inc. | | | 196,461 | |
| | 987 | | | Teledyne Technologies, Inc.(b) | | | 234,176 | |
| | 4,904 | | | Terex Corp. | | | 190,030 | |
| | 3,006 | | | Textron, Inc. | | | 207,504 | |
| | 4,127 | | | Timken Co. (The) | | | 200,779 | |
| | 599 | | | TransDigm Group, Inc.(b) | | | 209,650 | |
| | 2,987 | | | TransUnion | | | 224,921 | |
| | 5,722 | | | Trinity Industries, Inc. | | | 205,076 | |
| | 1,379 | | | Union Pacific Corp. | | | 207,705 | |
| | 2,885 | | | United Continental Holdings, Inc.(b) | | | 252,207 | |
| | 1,723 | | | United Parcel Service, Inc., Class B | | | 211,722 | |
| | 1,237 | | | United Rentals, Inc.(b) | | | 192,811 | |
| | 1,594 | | | United Technologies Corp. | | | 209,930 | |
| | 7,299 | | | Univar, Inc.(b) | | | 203,058 | |
| | 4,842 | | | USG Corp.(b) | | | 208,690 | |
| | 1,343 | | | Valmont Industries, Inc. | | | 188,557 | |
| | 1,880 | | | Verisk Analytics, Inc.(b) | | | 223,889 | |
| | 667 | | | W.W. Grainger, Inc. | | | 236,165 | |
| | 1,635 | | | WABCO Holdings, Inc.(b) | | | 201,236 | |
| | 2,081 | | | Wabtec Corp. | | | 225,414 | |
| | 2,401 | | | Waste Management, Inc. | | | 218,251 | |
| | 1,083 | | | Watsco, Inc. | | | 189,514 | |
| | 10,098 | | | Welbilt, Inc.(b) | | | 223,469 | |
| | 3,335 | | | WESCO International, Inc.(b) | | | 203,935 | |
| | 1,876 | | | XPO Logistics, Inc.(b) | | | 199,794 | |
| | 2,815 | | | Xylem, Inc. | | | 213,687 | |
| | | | | | | | |
| | | | | | | 24,189,133 | |
| | | | | | | | |
| | | | Information Technology—11.6% | | | |
| | 1,291 | | | Accenture PLC, Class A | | | 218,269 | |
| | 2,642 | | | Akamai Technologies, Inc.(b) | | | 198,520 | |
| | | | | | | | |
Number
of Shares | | | | | Value | |
| | | | Common Stocks & Other Equity Interests
(continued) | |
| | | | Information Technology (continued) | | | |
| | 96 | | | Alphabet, Inc., Class A(b) | | $ | 118,253 | |
| | 95 | | | Alphabet, Inc., Class C(b) | | | 115,728 | |
| | 2,936 | | | Amdocs Ltd. | | | 191,662 | |
| | 2,299 | | | Amphenol Corp., Class A | | | 217,440 | |
| | 1,075 | | | Apple, Inc. | | | 244,702 | |
| | 3,902 | | | Applied Materials, Inc. | | | 167,864 | |
| | 2,666 | | | Arrow Electronics, Inc.(b) | | | 206,695 | |
| | 1,564 | | | Automatic Data Processing, Inc. | | | 229,517 | |
| | 4,539 | | | Booz Allen Hamilton Holding Corp. | | | 232,215 | |
| | 806 | | | Broadcom, Inc. | | | 176,538 | |
| | 1,758 | | | Broadridge Financial Solutions, Inc. | | | 237,576 | |
| | 5,740 | | | CA, Inc. | | | 251,412 | |
| | 3,104 | | | CDK Global, Inc. | | | 193,441 | |
| | 2,512 | | | CDW Corp. | | | 219,951 | |
| | 1,888 | | | Citrix Systems, Inc.(b) | | | 215,270 | |
| | 4,335 | | | Cognex Corp. | | | 233,223 | |
| | 2,655 | | | Cognizant Technology Solutions Corp., Class A | | | 208,232 | |
| | 10,529 | | | Conduent, Inc.(b) | | | 244,062 | |
| | 3,815 | | | CoreLogic, Inc.(b) | | | 193,955 | |
| | 2,484 | | | Dell Technologies, Inc., Class V(b) | | | 238,886 | |
| | 3,216 | | | Dolby Laboratories, Inc., Class A | | | 225,731 | |
| | 2,511 | | | DXC Technology Co. | | | 228,727 | |
| | 1,529 | | | Electronic Arts, Inc.(b) | | | 173,404 | |
| | 1,617 | | | EPAM Systems, Inc.(b) | | | 231,118 | |
| | 2,502 | | | Euronet Worldwide, Inc.(b) | | | 244,696 | |
| | 1,166 | | | F5 Networks, Inc.(b) | | | 220,514 | |
| | 1,074 | | | Facebook, Inc., Class A(b) | | | 188,734 | |
| | 1,093 | | | Fair Isaac Corp.(b) | | | 252,461 | |
| | 1,982 | | | Fidelity National Information Services, Inc. | | | 214,393 | |
| | 10,650 | | | First Data Corp., Class A(b) | | | 273,918 | |
| | 2,812 | | | Fiserv, Inc.(b) | | | 225,157 | |
| | 999 | | | FleetCor Technologies, Inc.(b) | | | 213,526 | |
| | 3,782 | | | FLIR Systems, Inc. | | | 237,283 | |
| | 3,292 | | | Fortinet, Inc.(b) | | | 275,738 | |
| | 6,608 | | | Genpact Ltd. | | | 202,469 | |
| | 12,919 | | | Hewlett Packard Enterprise Co. | | | 213,551 | |
| | 9,078 | | | HP, Inc. | | | 223,773 | |
| | 1,307 | | | IAC/InterActiveCorp.(b) | | | 257,740 | |
| | 3,612 | | | Intel Corp. | | | 174,929 | |
| | 1,411 | | | International Business Machines Corp. | | | 206,683 | |
| | 831 | | | IPG Photonics Corp.(b) | | | 145,824 | |
| | 7,059 | | | Jabil, Inc. | | | 208,664 | |
| | 1,648 | | | Jack Henry & Associates, Inc. | | | 261,109 | |
| | 7,452 | | | Juniper Networks, Inc. | | | 211,860 | |
| | 1,795 | | | KLA-Tencor Corp. | | | 208,597 | |
| | 998 | | | Lam Research Corp. | | | 172,744 | |
| | 3,321 | | | Leidos Holdings, Inc. | | | 235,027 | |
| | 908 | | | Littelfuse, Inc. | | | 202,993 | |
| | 4,745 | | | Manhattan Associates, Inc.(b) | | | 275,163 | |
| | 9,150 | | | Marvell Technology Group Ltd. | | | 189,222 | |
| | 3,427 | | | Maxim Integrated Products, Inc. | | | 207,231 | |
| | 2,101 | | | Microchip Technology, Inc. | | | 180,749 | |
| | 3,216 | | | Micron Technology, Inc.(b) | | | 168,904 | |
| | 2,064 | | | Microsoft Corp. | | | 231,849 | |
| | 1,749 | | | MKS Instruments, Inc. | | | 162,482 | |
| | 4,835 | | | National Instruments Corp. | | | 230,871 | |
See accompanying Notes to Financial Statements which are an integral part of the financial statements.
Invesco Russell 1000 Enhanced Equal Weight ETF (USEQ) (continued)
August 31, 2018
| | | | | | | | |
Number
of Shares | | | | | Value | |
| | | | Common Stocks & Other Equity Interests
(continued) | |
| | | | Information Technology (continued) | | | |
| | 2,994 | | | NetApp, Inc. | | $ | 259,909 | |
| | 1,738 | | | NXP Semiconductors NV (Netherlands)(b) | | | 161,877 | |
| | 7,859 | | | ON Semiconductor Corp.(b) | | | 167,711 | |
| | 4,272 | | | Oracle Corp. | | | 207,534 | |
| | 3,048 | | | Paychex, Inc. | | | 223,266 | |
| | 8,366 | | | Sabre Corp. | | | 218,436 | |
| | 2,016 | | | Skyworks Solutions, Inc. | | | 184,061 | |
| | 4,106 | | | SS&C Technologies Holdings, Inc. | | | 243,650 | |
| | 2,301 | | | Synopsys, Inc.(b) | | | 235,024 | |
| | 5,218 | | | Teradyne, Inc. | | | 214,929 | |
| | 1,799 | | | Texas Instruments, Inc. | | | 202,208 | |
| | 2,371 | | | Total System Services, Inc. | | | 230,319 | |
| | 5,978 | | | Trimble, Inc.(b) | | | 251,674 | |
| | 2,416 | | | Ubiquiti Networks, Inc. | | | 216,739 | |
| | 1,561 | | | VeriSign, Inc.(b) | | | 247,590 | |
| | 5,004 | | | Versum Materials, Inc. | | | 199,109 | |
| | 1,481 | | | VMware, Inc., Class A(b) | | | 226,978 | |
| | 2,324 | | | Western Digital Corp. | | | 146,970 | |
| | 7,243 | | | Xerox Corp. | | | 201,790 | |
| | 3,007 | | | Xilinx, Inc. | | | 234,035 | |
| | 1,289 | | | Zebra Technologies Corp., Class A(b) | | | 221,373 | |
| | | | | | | | |
| | | | | | | 16,826,427 | |
| | | | | | | | |
| | | | Materials—5.5% | | | |
| | 1,255 | | | Air Products & Chemicals, Inc. | | | 208,694 | |
| | 2,147 | | | Albemarle Corp. | | | 205,081 | |
| | 4,144 | | | Alcoa Corp.(b) | | | 185,113 | |
| | 2,179 | | | AptarGroup, Inc. | | | 228,163 | |
| | 1,883 | | | Avery Dennison Corp. | | | 198,054 | |
| | 5,341 | | | Ball Corp. | | | 223,681 | |
| | 4,768 | | | Bemis Co., Inc. | | | 234,967 | |
| | 1,783 | | | Celanese Corp., Series A | | | 208,308 | |
| | 4,843 | | | CF Industries Holdings, Inc. | | | 251,594 | |
| | 4,029 | | | Chemours Co. (The) | | | 175,664 | |
| | 3,104 | | | DowDuPont, Inc. | | | 217,684 | |
| | 1,856 | | | Eagle Materials, Inc. | | | 171,365 | |
| | 1,920 | | | Eastman Chemical Co. | | | 186,298 | |
| | 1,398 | | | Ecolab, Inc. | | | 210,371 | |
| | 2,280 | | | FMC Corp. | | | 194,826 | |
| | 11,746 | | | Freeport-McMoRan, Inc. | | | 165,031 | |
| | 13,552 | | | Graphic Packaging Holding Co. | | | 192,709 | |
| | 6,145 | | | Huntsman Corp. | | | 187,361 | |
| | 1,612 | | | International Flavors & Fragrances, Inc. | | | 210,027 | |
| | 3,733 | | | International Paper Co. | | | 190,906 | |
| | 1,798 | | | LyondellBasell Industries NV, Class A | | | 202,778 | |
| | 925 | | | Martin Marietta Materials, Inc. | | | 183,816 | |
| | 5,134 | | | Newmont Mining Corp. | | | 159,308 | |
| | 3,137 | | | Nucor Corp. | | | 196,063 | |
| | 6,094 | | | Olin Corp. | | | 187,269 | |
| | 1,700 | | | Packaging Corp. of America | | | 186,864 | |
| | 1,986 | | | PPG Industries, Inc. | | | 219,532 | |
| | 1,288 | | | Praxair, Inc. | | | 203,749 | |
| | 2,129 | | | Reliance Steel & Aluminum Co. | | | 187,118 | |
| | 2,316 | | | Scotts Miracle-Gro Co. (The) | | | 173,052 | |
| | 4,486 | | | Sealed Air Corp. | | | 179,933 | |
| | 528 | | | Sherwin-Williams Co. (The) | | | 240,546 | |
| | 3,868 | | | Sonoco Products Co. | | | 216,763 | |
| | | | | | | | |
Number
of Shares | | | | | Value | |
| | | | Common Stocks & Other Equity Interests
(continued) | |
| | | | Materials (continued) | | | |
| | 4,074 | | | Southern Copper Corp. (Peru) | | $ | 177,789 | |
| | 4,029 | | | Steel Dynamics, Inc. | | | 184,246 | |
| | 5,549 | | | United States Steel Corp. | | | 164,694 | |
| | 9,724 | | | Valvoline, Inc. | | | 209,260 | |
| | 1,577 | | | Vulcan Materials Co. | | | 174,732 | |
| | 2,837 | | | W.R. Grace & Co. | | | 200,462 | |
| | 1,693 | | | Westlake Chemical Corp. | | | 160,107 | |
| | 3,363 | | | WestRock Co. | | | 185,234 | |
| | | | | | | | |
| | | | | | | 8,039,212 | |
| | | | | | | | |
| | | | Real Estate—7.5% | | | |
| | 1,483 | | | American Tower Corp. REIT | | | 221,145 | |
| | 10,473 | | | Apple Hospitality REIT, Inc. REIT | | | 184,848 | |
| | 1,675 | | | Boston Properties, Inc. REIT | | | 218,504 | |
| | 12,304 | | | Brandywine Realty Trust REIT | | | 206,215 | |
| | 100 | | | Brookfield Property Partners LP (Bermuda) | | | 1,998 | |
| | 2,463 | | | Brookfield Property REIT, Inc., Class A REIT | | | 49,309 | |
| | 2,299 | | | Camden Property Trust REIT | | | 218,543 | |
| | 4,351 | | | CBRE Group, Inc., Class A(b) | | | 212,372 | |
| | 9,021 | | | Columbia Property Trust, Inc. REIT | | | 217,226 | |
| | 1,896 | | | CoreSite Realty Corp. REIT | | | 220,827 | |
| | 6,570 | | | CubeSmart REIT | | | 200,713 | |
| | 5,225 | | | Douglas Emmett, Inc. REIT | | | 204,088 | |
| | 7,100 | | | Duke Realty Corp. REIT | | | 202,279 | |
| | 2,220 | | | Equity LifeStyle Properties, Inc. REIT | | | 215,074 | |
| | 3,150 | | | Equity Residential REIT | | | 213,412 | |
| | 846 | | | Essex Property Trust, Inc. REIT | | | 208,353 | |
| | 2,077 | | | Extra Space Storage, Inc. REIT | | | 191,520 | |
| | 1,687 | | | Federal Realty Investment Trust REIT | | | 220,339 | |
| | 5,702 | | | Gaming and Leisure Properties, Inc. REIT | | | 204,075 | |
| | 4,234 | | | Highwoods Properties, Inc. REIT | | | 210,599 | |
| | 6,930 | | | Hospitality Properties Trust REIT | | | 200,901 | |
| | 9,209 | | | Host Hotels & Resorts, Inc. REIT | | | 198,270 | |
| | 1,595 | | | Howard Hughes Corp. (The)(b) | | | 207,940 | |
| | 5,718 | | | Hudson Pacific Properties, Inc. REIT | | | 193,497 | |
| | 6,001 | | | Iron Mountain, Inc. REIT | | | 216,636 | |
| | 1,223 | | | Jones Lang LaSalle, Inc. | | | 186,532 | |
| | 2,635 | | | Kilroy Realty Corp. REIT | | | 192,724 | |
| | 2,893 | | | Lamar Advertising Co., Class A REIT | | | 222,906 | |
| | 4,589 | | | Liberty Property Trust REIT | | | 200,769 | |
| | 2,203 | | | Life Storage, Inc. REIT | | | 215,013 | |
| | 3,647 | | | Macerich Co. (The) REIT | | | 214,225 | |
| | 14,844 | | | Medical Properties Trust, Inc. REIT | | | 223,402 | |
| | 4,865 | | | National Retail Properties, Inc. REIT | | | 224,228 | |
| | 6,535 | | | Omega Healthcare Investors, Inc. REIT | | | 215,982 | |
| | 10,135 | | | Outfront Media, Inc. REIT | | | 201,382 | |
| | 13,403 | | | Paramount Group, Inc. REIT | | | 212,840 | |
| | 6,282 | | | Park Hotels & Resorts, Inc. REIT | | | 210,133 | |
| | 3,106 | | | Prologis, Inc. REIT | | | 208,661 | |
| | 965 | | | Public Storage REIT | | | 205,140 | |
| | 5,153 | | | Rayonier, Inc. REIT | | | 179,479 | |
| | 3,743 | | | Realty Income Corp. REIT | | | 219,228 | |
| | 3,443 | | | Regency Centers Corp. REIT | | | 227,341 | |
| | 16,639 | | | Retail Properties of America, Inc., Class A REIT | | | 211,814 | |
| | 1,265 | | | Simon Property Group, Inc. REIT | | | 231,533 | |
| | 2,102 | | | SL Green Realty Corp. REIT | | | 219,449 | |
| | 25,714 | | | Spirit Realty Capital, Inc. REIT | | | 215,226 | |
See accompanying Notes to Financial Statements which are an integral part of the financial statements.
Invesco Russell 1000 Enhanced Equal Weight ETF (USEQ) (continued)
August 31, 2018
| | | | | | | | |
Number
of Shares | | | | | Value | |
| | | | Common Stocks & Other Equity Interests
(continued) | |
| | | | Real Estate (continued) | | | |
| | 7,444 | | | STORE Capital Corp. REIT | | $ | 214,462 | |
| | 3,734 | | | Taubman Centers, Inc. REIT | | | 241,254 | |
| | 9,676 | | | Uniti Group, Inc. REIT(b) | | | 201,454 | |
| | 28,135 | | | VEREIT, Inc. REIT | | | 220,016 | |
| | 2,899 | | | Vornado Realty Trust REIT | | | 223,223 | |
| | 6,852 | | | Weingarten Realty Investors REIT | | | 211,932 | |
| | 5,399 | | | Weyerhaeuser Co. REIT | | | 187,399 | |
| | 3,000 | | | WP Carey, Inc. REIT | | | 199,740 | |
| | | | | | | | |
| | | | | | | 10,976,170 | |
| | | | | | | | |
| | | | Telecommunication Services—0.9% | | | |
| | 6,174 | | | AT&T, Inc. | | | 197,198 | |
| | 7,767 | | | Telephone & Data Systems, Inc. | | | 233,321 | |
| | 3,630 | | | T-Mobile US, Inc.(b) | | | 239,725 | |
| | 5,523 | | | United States Cellular Corp.(b) | | | 236,163 | |
| | 4,139 | | | Verizon Communications, Inc. | | | 225,037 | |
| | 5,783 | | | Zayo Group Holdings, Inc.(b) | | | 200,439 | |
| | | | | | | | |
| | | | | | | 1,331,883 | |
| | | | | | | | |
| | | | Utilities—4.5% | | | |
| | 4,853 | | | Alliant Energy Corp. | | | 207,902 | |
| | 3,390 | | | Ameren Corp. | | | 214,350 | |
| | 2,956 | | | American Electric Power Co., Inc. | | | 212,034 | |
| | 2,391 | | | American Water Works Co., Inc. | | | 209,284 | |
| | 5,637 | | | Aqua America, Inc. | | | 209,584 | |
| | 2,234 | | | Atmos Energy Corp. | | | 206,042 | |
| | 3,792 | | | Avangrid, Inc. | | | 187,097 | |
| | 7,699 | | | CenterPoint Energy, Inc. | | | 213,955 | |
| | 4,357 | | | CMS Energy Corp. | | | 214,539 | |
| | 2,634 | | | Consolidated Edison, Inc. | | | 207,902 | |
| | 3,116 | | | Dominion Energy, Inc. | | | 220,519 | |
| | 1,998 | | | DTE Energy Co. | | | 222,058 | |
| | 2,614 | | | Duke Energy Corp. | | | 212,361 | |
| | 2,506 | | | Entergy Corp. | | | 209,476 | |
| | 3,527 | | | Evergy, Inc. | | | 201,215 | |
| | 3,521 | | | Eversource Energy | | | 219,816 | |
| | 4,877 | | | Exelon Corp. | | | 213,174 | |
| | 5,873 | | | Hawaiian Electric Industries, Inc. | | | 207,141 | |
| | 7,173 | | | MDU Resources Group, Inc. | | | 200,055 | |
| | 3,828 | | | National Fuel Gas Co. | | | 212,569 | |
| | 1,217 | | | NextEra Energy, Inc. | | | 207,012 | |
| | 7,950 | | | NiSource, Inc. | | | 215,206 | |
| | 5,734 | | | OGE Energy Corp. | | | 211,183 | |
| | 2,520 | | | Pinnacle West Capital Corp. | | | 197,946 | |
| | 3,816 | | | Public Service Enterprise Group, Inc. | | | 199,768 | |
| | 1,895 | | | Sempra Energy | | | 219,972 | |
| | 4,500 | | | Southern Co. (The) | | | 197,010 | |
| | 3,934 | | | UGI Corp. | | | 212,633 | |
| | 2,897 | | | Vectren Corp. | | | 206,266 | |
| | | | | | | | |
Number
of Shares | | | | | Value | |
| | | | Common Stocks & Other Equity Interests
(continued) | |
| | | | Utilities (continued) | | | |
| | 3,230 | | | WEC Energy Group, Inc. | | $ | 218,283 | |
| | 4,413 | | | Xcel Energy, Inc. | | | 212,045 | |
| | | | | | | | |
| | | | | | | 6,498,397 | |
| | | | | | | | |
| | | | Total Investments in Securities
(Cost $135,053,099)—100.0% | | | 145,447,187 | |
| | | | Other assets less liabilities—0.0% | | | 52,352 | |
| | | | | | | | |
| | | | Net Assets—100.0% | | $ | 145,499,539 | |
| | | | | | | | |
Investment Abbreviations:
REIT—Real Estate Investment Trust
Notes to Schedule of Investments:
| (a) | Industry and/or sector classifications used in this report are generally according to the Global Industry Classification Standard, which was developed by and is the exclusive property and a service mark of MSCI Inc. and Standard & Poor’s. |
| (b) | Non-income producing security. |
| (c) | Affiliated company. The Fund’s Adviser is a wholly-owned subsidiary of Invesco Ltd. and therefore, Invesco Ltd. is considered to be affiliated. See Note 4. |
See accompanying Notes to Financial Statements which are an integral part of the financial statements.
Schedule of Investments(a)
Invesco Russell 1000 Equal Weight ETF (EQAL)
August 31, 2018
| | | | | | | | |
Number
of Shares | | | | | Value | |
| | | | Common Stocks & Other Equity Interests—99.9% | |
| | | | Consumer Discretionary—9.9% | | | |
| | 7,212 | | | Adient PLC | | $ | 312,207 | |
| | 2,597 | | | Advance Auto Parts, Inc. | | | 425,986 | |
| | 208 | | | Amazon.com, Inc.(b) | | | 418,644 | |
| | 5,147 | | | AMC Networks, Inc., Class A(b) | | | 323,283 | |
| | 3,395 | | | Aptiv PLC | | | 298,794 | |
| | 8,732 | | | Aramark | | | 358,711 | |
| | 7,080 | | | AutoNation, Inc.(b) | | | 321,078 | |
| | 512 | | | AutoZone, Inc.(b) | | | 392,643 | |
| | 4,738 | | | Best Buy Co., Inc. | | | 376,955 | |
| | 170 | | | Booking Holdings, Inc.(b) | | | 331,763 | |
| | 7,108 | | | BorgWarner, Inc. | | | 311,117 | |
| | 3,288 | | | Bright Horizons Family Solutions, Inc.(b) | | | 392,686 | |
| | 5,110 | | | Brunswick Corp. | | | 339,406 | |
| | 2,257 | | | Burlington Stores, Inc.(b) | | | 379,582 | |
| | 503 | | | Cable One, Inc. | | | 421,383 | |
| | 29,910 | | | Caesars Entertainment Corp.(b) | | | 305,082 | |
| | 4,744 | | | CarMax, Inc.(b) | | | 370,269 | |
| | 5,405 | | | Carnival Corp. | | | 332,353 | |
| | 3,219 | | | Carter’s, Inc. | | | 340,989 | |
| | 6,293 | | | CBS Corp., Class B | | | 333,655 | |
| | 1,171 | | | Charter Communications, Inc., Class A(b) | | | 363,478 | |
| | 768 | | | Chipotle Mexican Grill, Inc.(b) | | | 364,938 | |
| | 4,246 | | | Choice Hotels International, Inc. | | | 331,400 | |
| | 9,763 | | | Cinemark Holdings, Inc. | | | 364,355 | |
| | 3,805 | | | Columbia Sportswear Co. | | | 345,113 | |
| | 10,258 | | | Comcast Corp., Class A | | | 379,443 | |
| | 8,049 | | | D.R. Horton, Inc. | | | 358,261 | |
| | 3,760 | | | Darden Restaurants, Inc. | | | 436,310 | |
| | 9,284 | | | Dick’s Sporting Goods, Inc. | | | 347,593 | |
| | 13,610 | | | Discovery, Inc., Class A(b)(c) | | | 378,766 | |
| | 10,184 | | | DISH Network Corp., Class A(b) | | | 360,004 | |
| | 3,607 | | | Dollar General Corp. | | | 388,582 | |
| | 3,931 | | | Dollar Tree, Inc.(b) | | | 316,485 | |
| | 1,267 | | | Domino’s Pizza, Inc. | | | 378,276 | |
| | 5,077 | | | Dunkin’ Brands Group, Inc. | | | 370,063 | |
| | 2,810 | | | Expedia Group, Inc. | | | 366,705 | |
| | 16,086 | | | Extended Stay America, Inc. | | | 324,615 | |
| | 6,307 | | | Floor & Decor Holdings, Inc., Class A(b) | | | 231,845 | |
| | 6,016 | | | Foot Locker, Inc. | | | 296,589 | |
| | 29,173 | | | Ford Motor Co. | | | 276,560 | |
| | 11,076 | | | Gap, Inc. (The) | | | 336,157 | |
| | 5,606 | | | Garmin Ltd. | | | 381,993 | |
| | 7,747 | | | GCI Liberty, Inc., Class A(b) | | | 380,223 | |
| | 7,963 | | | General Motors Co. | | | 287,066 | |
| | 13,758 | | | Gentex Corp. | | | 321,662 | |
| | 3,689 | | | Genuine Parts Co. | | | 368,347 | |
| | 13,814 | | | Goodyear Tire & Rubber Co. (The) | | | 313,440 | |
| | 580 | | | Graham Holdings Co., Class B | | | 326,337 | |
| | 3,040 | | | Grand Canyon Education, Inc.(b) | | | 362,186 | |
| | 14,592 | | | H&R Block, Inc. | | | 394,859 | |
| | 17,195 | | | Hanesbrands, Inc. | | | 301,600 | |
| | 7,856 | | | Harley-Davidson, Inc. | | | 334,823 | |
| | 3,782 | | | Hasbro, Inc. | | | 375,590 | |
| | 8,910 | | | Hilton Grand Vacations, Inc.(b) | | | 291,001 | |
| | 4,188 | | | Hilton Worldwide Holdings, Inc. | | | 325,073 | |
| | 1,736 | | | Home Depot, Inc. (The) | | | 348,537 | |
| | 4,185 | | | Hyatt Hotels Corp., Class A | | | 323,752 | |
| | | | | | | | |
Number
of Shares | | | | | Value | |
| | | | Common Stocks & Other Equity Interests
(continued) | |
| | | | Consumer Discretionary (continued) | | | |
| | 13,289 | | | International Game Technology PLC | | $ | 279,601 | |
| | 14,719 | | | Interpublic Group of Cos., Inc. (The) | | | 343,689 | |
| | 4,924 | | | John Wiley & Sons, Inc., Class A | | | 317,844 | |
| | 4,751 | | | Kohl’s Corp. | | | 375,852 | |
| | 9,643 | | | L Brands, Inc. | | | 254,864 | |
| | 4,303 | | | Las Vegas Sands Corp. | | | 281,502 | |
| | 1,711 | | | Lear Corp. | | | 277,524 | |
| | 7,848 | | | Leggett & Platt, Inc. | | | 356,613 | |
| | 6,538 | | | Lennar Corp., Class A | | | 337,818 | |
| | 4,537 | | | Liberty Broadband Corp., Class C(b) | | | 367,905 | |
| | 10,386 | | | Liberty Media Corp.-Liberty Formula One, Class C(b) | | | 383,867 | |
| | 7,446 | | | Liberty Media Corp.-Liberty SiriusXM, Class C(b) | | | 350,260 | |
| | 13,862 | | | Lions Gate Entertainment Corp., Class A | | | 326,034 | |
| | 7,451 | | | Live Nation Entertainment, Inc.(b) | | | 370,166 | |
| | 10,470 | | | LKQ Corp.(b) | | | 361,424 | |
| | 3,504 | | | Lowe’s Cos., Inc. | | | 381,060 | |
| | 2,773 | | | Lululemon Athletica, Inc.(b) | | | 429,621 | |
| | 9,241 | | | Macy’s, Inc. | | | 337,759 | |
| | 1,268 | | | Madison Square Garden Co. (The), Class A(b) | | | 382,860 | |
| | 2,504 | | | Marriott International, Inc., Class A | | | 316,681 | |
| | 19,361 | | | Mattel, Inc.(b)(c) | | | 298,740 | |
| | 2,072 | | | McDonald’s Corp. | | | 336,141 | |
| | 11,043 | | | MGM Resorts International | | | 320,137 | |
| | 5,261 | | | Michael Kors Holdings Ltd.(b) | | | 382,054 | |
| | 18,403 | | | Michaels Cos., Inc. (The)(b) | | | 312,667 | |
| | 1,625 | | | Mohawk Industries, Inc.(b) | | | 311,334 | |
| | 884 | | | Netflix, Inc.(b) | | | 325,029 | |
| | 13,144 | | | Newell Brands, Inc. | | | 285,488 | |
| | 21,656 | | | News Corp., Class A | | | 283,044 | |
| | 4,644 | | | NIKE, Inc., Class B | | | 381,737 | |
| | 6,950 | | | Nordstrom, Inc. | | | 436,807 | |
| | 6,366 | | | Norwegian Cruise Line Holdings Ltd.(b) | | | 341,281 | |
| | 115 | | | NVR, Inc.(b) | | | 306,872 | |
| | 4,601 | | | Omnicom Group, Inc. | | | 318,941 | |
| | 1,229 | | | O’Reilly Automotive, Inc.(b) | | | 412,231 | |
| | 6,880 | | | Penske Automotive Group, Inc. | | | 362,094 | |
| | 2,677 | | | Polaris Industries, Inc. | | | 290,321 | |
| | 2,292 | | | Pool Corp. | | | 376,484 | |
| | 11,272 | | | PulteGroup, Inc. | | | 315,052 | |
| | 2,172 | | | PVH Corp. | | | 310,944 | |
| | 16,178 | | | Qurate Retail, Inc., Class A(b) | | | 336,341 | |
| | 2,505 | | | Ralph Lauren Corp., Class A | | | 332,689 | |
| | 4,103 | | | Ross Stores, Inc. | | | 392,985 | |
| | 3,061 | | | Royal Caribbean Cruises Ltd. | | | 375,217 | |
| | 9,818 | | | Service Corp. International | | | 411,963 | |
| | 5,897 | | | ServiceMaster Global Holdings, Inc.(b) | | | 355,412 | |
| | 47,015 | | | Sirius XM Holdings, Inc.(c) | | | 333,806 | |
| | 4,802 | | | Six Flags Entertainment Corp. | | | 324,375 | |
| | 11,972 | | | Skechers U.S.A., Inc., Class A(b) | | | 352,935 | |
| | 6,079 | | | Starbucks Corp. | | | 324,923 | |
| | 7,625 | | | Tapestry, Inc. | | | 386,511 | |
| | 4,505 | | | Target Corp. | | | 394,187 | |
| | 6,907 | | | Tempur Sealy International, Inc.(b) | | | 382,579 | |
| | 976 | | | Tesla, Inc.(b)(c) | | | 294,420 | |
See accompanying Notes to Financial Statements which are an integral part of the financial statements.
Invesco Russell 1000 Equal Weight ETF (EQAL) (continued)
August 31, 2018
| | | | | | | | |
Number
of Shares | | | | | Value | |
| | | | Common Stocks & Other Equity Interests
(continued) | |
| | | | Consumer Discretionary (continued) | | | |
| | 3,516 | | | Thor Industries, Inc. | | $ | 335,567 | |
| | 2,565 | | | Tiffany & Co. | | | 314,597 | |
| | 3,678 | | | TJX Cos., Inc. (The) | | | 404,470 | |
| | 8,882 | | | Toll Brothers, Inc. | | | 321,795 | |
| | 4,662 | | | Tractor Supply Co. | | | 411,561 | |
| | 9,040 | | | Tribune Media Co., Class A | | | 333,486 | |
| | 6,013 | | | TripAdvisor, Inc.(b) | | | 326,566 | |
| | 7,777 | | | Twenty-First Century Fox, Inc., Class A | | | 353,076 | |
| | 1,408 | | | Ulta Beauty, Inc.(b) | | | 366,080 | |
| | 14,795 | | | Under Armour, Inc., Class A(b) | | | 302,558 | |
| | 7,561 | | | Urban Outfitters, Inc.(b) | | | 351,435 | |
| | 1,241 | | | Vail Resorts, Inc. | | | 369,880 | |
| | 4,148 | | | VF Corp. | | | 382,155 | |
| | 11,999 | | | Viacom, Inc., Class B | | | 351,331 | |
| | 2,615 | | | Visteon Corp.(b) | | | 288,670 | |
| | 3,188 | | | Walt Disney Co. (The) | | | 357,120 | |
| | 3,168 | | | Wayfair, Inc., Class A(b) | | | 428,219 | |
| | 19,699 | | | Wendy’s Co. (The) | | | 347,687 | |
| | 2,234 | | | Whirlpool Corp. | | | 279,205 | |
| | 5,703 | | | Williams-Sonoma, Inc. | | | 400,522 | |
| | 4,118 | | | Wyndham Destinations, Inc. | | | 182,016 | |
| | 5,728 | | | Wyndham Hotels & Resorts, Inc. | | | 325,064 | |
| | 1,970 | | | Wynn Resorts Ltd. | | | 292,230 | |
| | 8,465 | | | Yum China Holdings, Inc. (China) | | | 327,426 | |
| | 4,167 | | | Yum! Brands, Inc. | | | 362,071 | |
| | | | | | | | |
| | | | | | | 46,892,085 | |
| | | | | | | | |
| | | | Consumer Staples—11.2% | | | |
| | 19,372 | | | Altria Group, Inc. | | | 1,133,649 | |
| | 24,271 | | | Archer-Daniels-Midland Co. | | | 1,223,258 | |
| | 20,766 | | | Brown-Forman Corp., Class B | | | 1,084,401 | |
| | 15,581 | | | Bunge Ltd. | | | 1,012,453 | |
| | 30,042 | | | Campbell Soup Co. | | | 1,185,157 | |
| | 11,075 | | | Casey’s General Stores, Inc. | | | 1,264,433 | |
| | 22,038 | | | Church & Dwight Co., Inc. | | | 1,246,910 | |
| | 8,587 | | | Clorox Co. (The) | | | 1,244,943 | |
| | 25,199 | | | Coca-Cola Co. (The) | | | 1,123,119 | |
| | 17,350 | | | Colgate-Palmolive Co. | | | 1,152,214 | |
| | 28,781 | | | Conagra Brands, Inc. | | | 1,057,702 | |
| | 4,739 | | | Constellation Brands, Inc., Class A | | | 986,660 | |
| | 1,696 | | | Costco Wholesale Corp. | | | 395,388 | |
| | 24,323 | | | Coty, Inc., Class A | | | 300,632 | |
| | 18,417 | | | Energizer Holdings, Inc. | | | 1,171,137 | |
| | 2,230 | | | Estee Lauder Cos., Inc. (The), Class A | | | 312,468 | |
| | 54,168 | | | Flowers Foods, Inc. | | | 1,091,485 | |
| | 24,692 | | | General Mills, Inc. | | | 1,136,079 | |
| | 39,029 | | | Hain Celestial Group, Inc. (The)(b) | | | 1,114,668 | |
| | 20,343 | | | Herbalife Nutrition Ltd.(b) | | | 1,151,210 | |
| | 11,923 | | | Hershey Co. (The) | | | 1,198,500 | |
| | 30,417 | | | Hormel Foods Corp. | | | 1,190,826 | |
| | 9,714 | | | Ingredion, Inc. | | | 981,794 | |
| | 10,581 | | | JM Smucker Co. (The) | | | 1,093,864 | |
| | 16,487 | | | Kellogg Co. | | | 1,183,602 | |
| | 9,156 | | | Keurig Dr Pepper, Inc. | | | 208,757 | |
| | 10,765 | | | Kimberly-Clark Corp. | | | 1,243,788 | |
| | 18,105 | | | Kraft Heinz Co. (The) | | | 1,054,978 | |
| | 41,952 | | | Kroger Co. (The) | | | 1,321,488 | |
| | | | | | | | |
Number
of Shares | | | | | Value | |
| | | | Common Stocks & Other Equity Interests
(continued) | |
| | | | Consumer Staples (continued) | | | |
| | 16,761 | | | Lamb Weston Holdings, Inc. | | $ | 1,133,044 | |
| | 10,359 | | | McCormick & Co., Inc. | | | 1,293,632 | |
| | 16,462 | | | Molson Coors Brewing Co., Class B | | | 1,098,674 | |
| | 27,176 | | | Mondelez International, Inc., Class A | | | 1,160,959 | |
| | 19,594 | | | Monster Beverage Corp.(b) | | | 1,193,079 | |
| | 13,218 | | | Nu Skin Enterprises, Inc., Class A | | | 1,052,153 | |
| | 10,451 | | | PepsiCo, Inc. | | | 1,170,617 | |
| | 13,591 | | | Philip Morris International, Inc. | | | 1,058,603 | |
| | 53,200 | | | Pilgrim’s Pride Corp.(b) | | | 983,668 | |
| | 17,124 | | | Pinnacle Foods, Inc. | | | 1,137,376 | |
| | 12,927 | | | Post Holdings, Inc.(b) | | | 1,257,280 | |
| | 14,458 | | | Procter & Gamble Co. (The) | | | 1,199,291 | |
| | 276 | | | Seaboard Corp. | | | 1,016,999 | |
| | 13,888 | | | Spectrum Brands Holdings, Inc.(c) | | | 1,206,173 | |
| | 51,274 | | | Sprouts Farmers Market, Inc.(b) | | | 1,357,223 | |
| | 16,521 | | | Sysco Corp. | | | 1,236,101 | |
| | 21,024 | | | TreeHouse Foods, Inc.(b) | | | 1,095,350 | |
| | 15,487 | | | Tyson Foods, Inc., Class A | | | 972,738 | |
| | 29,468 | | | US Foods Holding Corp.(b) | | | 960,362 | |
| | 16,937 | | | Walgreens Boots Alliance, Inc. | | | 1,161,201 | |
| | 4,148 | | | Walmart, Inc. | | | 397,627 | |
| | | | | | | | |
| | | | | | | 53,007,713 | |
| | | | | | | | |
| | | | Energy—10.5% | | | |
| | 12,379 | | | Anadarko Petroleum Corp. | | | 797,208 | |
| | 6,452 | | | Andeavor | | | 985,801 | |
| | 45,102 | | | Antero Resources Corp.(b) | | | 834,838 | |
| | 20,785 | | | Apache Corp. | | | 911,007 | |
| | 23,519 | | | Apergy Corp.(b) | | | 1,063,529 | |
| | 26,114 | | | Baker Hughes a GE Co. | | | 860,979 | |
| | 37,942 | | | Cabot Oil & Gas Corp. | | | 904,158 | |
| | 53,480 | | | Centennial Resource Development, Inc., Class A(b) | | | 1,030,560 | |
| | 13,551 | | | Cheniere Energy, Inc.(b) | | | 906,968 | |
| | 188,422 | | | Chesapeake Energy Corp.(b) | | | 834,709 | |
| | 7,101 | | | Chevron Corp. | | | 841,184 | |
| | 10,293 | | | Cimarex Energy Co. | | | 869,553 | |
| | 51,790 | | | CNX Resources Corp.(b) | | | 825,533 | |
| | 14,041 | | | Concho Resources, Inc.(b) | | | 1,925,723 | |
| | 13,172 | | | ConocoPhillips | | | 967,220 | |
| | 13,969 | | | Continental Resources, Inc.(b) | | | 921,256 | |
| | 21,527 | | | Devon Energy Corp. | | | 924,154 | |
| | 7,735 | | | Diamondback Energy, Inc. | | | 936,554 | |
| | 13,963 | | | Energen Corp.(b) | | | 1,082,831 | |
| | 7,637 | | | EOG Resources, Inc. | | | 902,922 | |
| | 15,658 | | | EQT Corp. | | | 798,871 | |
| | 58,389 | | | Extraction Oil & Gas, Inc.(b) | | | 674,393 | |
| | 10,743 | | | Exxon Mobil Corp. | | | 861,266 | |
| | 18,428 | | | Halliburton Co. | | | 735,093 | |
| | 13,840 | | | Helmerich & Payne, Inc. | | | 907,489 | |
| | 14,743 | | | Hess Corp. | | | 992,794 | |
| | 12,060 | | | HollyFrontier Corp. | | | 898,711 | |
| | 52,968 | | | Kinder Morgan, Inc. | | | 937,534 | |
| | 111,501 | | | Kosmos Energy Ltd. (Ghana)(b) | | | 1,007,969 | |
| | 42,438 | | | Marathon Oil Corp. | | | 912,841 | |
| | 11,938 | | | Marathon Petroleum Corp. | | | 982,378 | |
| | 26,250 | | | Murphy Oil Corp. | | | 809,287 | |
See accompanying Notes to Financial Statements which are an integral part of the financial statements.
Invesco Russell 1000 Equal Weight ETF (EQAL) (continued)
August 31, 2018
| | | | | | | | |
Number
of Shares | | | | | Value | |
| | | | Common Stocks & Other Equity Interests
(continued) | |
| | | | Energy (continued) | | | |
| | 125,788 | | | Nabors Industries Ltd. | | $ | 776,112 | |
| | 21,272 | | | National Oilwell Varco, Inc. | | | 1,001,273 | |
| | 30,118 | | | Newfield Exploration Co.(b) | | | 821,619 | |
| | 25,432 | | | Noble Energy, Inc. | | | 755,839 | |
| | 10,433 | | | Occidental Petroleum Corp. | | | 833,284 | |
| | 12,698 | | | ONEOK, Inc. | | | 836,925 | |
| | 32,142 | | | Parsley Energy, Inc., Class A(b) | | | 892,583 | |
| | 48,195 | | | Patterson-UTI Energy, Inc. | | | 825,580 | |
| | 19,031 | | | PBF Energy, Inc., Class A | | | 988,089 | |
| | 7,615 | | | Phillips 66 | | | 902,454 | |
| | 4,694 | | | Pioneer Natural Resources Co. | | | 820,042 | |
| | 73,712 | | | QEP Resources, Inc.(b) | | | 734,909 | |
| | 55,729 | | | Range Resources Corp. | | | 915,070 | |
| | 62,829 | | | RPC, Inc. | | | 859,501 | |
| | 13,172 | | | Schlumberger Ltd. | | | 831,943 | |
| | 36,676 | | | SM Energy Co. | | | 1,103,581 | |
| | 18,519 | | | Targa Resources Corp. | | | 1,019,841 | |
| | 72,910 | | | Transocean Ltd.(b) | | | 882,940 | |
| | 7,691 | | | Valero Energy Corp. | | | 906,615 | |
| | 251,237 | | | Weatherford International PLC(b) | | | 607,994 | |
| | 17,032 | | | Whiting Petroleum Corp.(b) | | | 867,099 | |
| | 32,933 | | | Williams Cos., Inc. (The) | | | 974,487 | |
| | 50,528 | | | WPX Energy, Inc.(b) | | | 963,569 | |
| | | | | | | | |
| | | | | | | 49,966,662 | |
| | | | | | | | |
| | | | Financials—6.1% | | | |
| | 1,273 | | | Affiliated Managers Group, Inc. | | | 185,973 | |
| | 4,356 | | | Aflac, Inc. | | | 201,421 | |
| | 10,488 | | | AGNC Investment Corp. REIT | | | 199,482 | |
| | 339 | | | Alleghany Corp. | | | 214,173 | |
| | 2,154 | | | Allstate Corp. (The) | | | 216,628 | |
| | 7,571 | | | Ally Financial, Inc. | | | 203,509 | |
| | 1,997 | | | American Express Co. | | | 211,642 | |
| | 1,809 | | | American Financial Group, Inc. | | | 201,450 | |
| | 3,639 | | | American International Group, Inc. | | | 193,486 | |
| | 1,668 | | | American National Insurance Co. | | | 214,071 | |
| | 1,353 | | | Ameriprise Financial, Inc. | | | 192,072 | |
| | 18,929 | | | Annaly Capital Management, Inc. REIT | | | 201,026 | |
| | 1,421 | | | Aon PLC | | | 206,841 | |
| | 7,369 | | | Arch Capital Group Ltd.(b) | | | 225,270 | |
| | 3,026 | | | Arthur J. Gallagher & Co. | | | 218,296 | |
| | 4,686 | | | Aspen Insurance Holdings Ltd. (Bermuda) | | | 192,829 | |
| | 7,096 | | | Associated Banc-Corp. | | | 193,366 | |
| | 2,083 | | | Assurant, Inc. | | | 214,174 | |
| | 5,329 | | | Assured Guaranty Ltd. | | | 217,103 | |
| | 4,276 | | | Athene Holding Ltd., Class A(b) | | | 212,346 | |
| | 9,398 | | | AXA Equitable Holdings, Inc. | | | 215,684 | |
| | 3,511 | | | Axis Capital Holdings Ltd. | | | 201,953 | |
| | 6,758 | | | Bank of America Corp. | | | 209,025 | |
| | 2,328 | | | Bank of Hawaii Corp. | | | 193,527 | |
| | 3,502 | | | Bank of New York Mellon Corp. (The) | | | 182,629 | |
| | 4,083 | | | Bank OZK | | | 165,198 | |
| | 4,555 | | | BankUnited, Inc. | | | 176,688 | |
| | 3,793 | | | BB&T Corp. | | | 195,946 | |
| | 1,041 | | | Berkshire Hathaway, Inc., Class B(b) | | | 217,278 | |
| | 16,771 | | | BGC Partners, Inc., Class A | | | 208,296 | |
| | 375 | | | BlackRock, Inc. | | | 179,648 | |
| | | | | | | | |
Number
of Shares | | | | | Value | |
| | | | Common Stocks & Other Equity Interests
(continued) | |
| | | | Financials (continued) | | | |
| | 1,954 | | | BOK Financial Corp. | | $ | 200,383 | |
| | 4,394 | | | Brighthouse Financial, Inc.(b) | | | 182,395 | |
| | 7,044 | | | Brown & Brown, Inc. | | | 214,701 | |
| | 2,065 | | | Capital One Financial Corp. | | | 204,621 | |
| | 1,923 | | | Cboe Global Markets, Inc. | | | 193,838 | |
| | 3,513 | | | Charles Schwab Corp. (The) | | | 178,425 | |
| | 10,783 | | | Chimera Investment Corp. REIT | | | 200,887 | |
| | 1,525 | | | Chubb Ltd. | | | 206,241 | |
| | 2,889 | | | Cincinnati Financial Corp. | | | 221,500 | |
| | 3,886 | | | CIT Group, Inc. | | | 210,777 | |
| | 3,018 | | | Citigroup, Inc. | | | 215,002 | |
| | 4,814 | | | Citizens Financial Group, Inc. | | | 198,144 | |
| | 1,177 | | | CME Group, Inc. | | | 205,657 | |
| | 4,206 | | | CNA Financial Corp. | | | 188,849 | |
| | 2,087 | | | Comerica, Inc. | | | 203,441 | |
| | 3,050 | | | Commerce Bancshares, Inc. | | | 216,733 | |
| | 552 | | | Credit Acceptance Corp.(b) | | | 252,104 | |
| | 1,751 | | | Cullen/Frost Bankers, Inc. | | | 194,168 | |
| | 2,645 | | | Discover Financial Services | | | 206,627 | |
| | 3,086 | | | E*TRADE Financial Corp.(b) | | | 181,642 | |
| | 2,841 | | | East West Bancorp, Inc. | | | 180,091 | |
| | 3,633 | | | Eaton Vance Corp. | | | 191,568 | |
| | 1,697 | | | Erie Indemnity Co., Class A | | | 209,630 | |
| | 1,791 | | | Evercore, Inc., Class A | | | 190,115 | |
| | 880 | | | Everest Re Group Ltd. | | | 196,258 | |
| | 14,452 | | | F.N.B. Corp. | | | 194,379 | |
| | 933 | | | FactSet Research Systems, Inc. | | | 214,021 | |
| | 5,209 | | | Fidelity National Financial, Inc. | | | 208,881 | |
| | 6,465 | | | Fifth Third Bancorp | | | 190,265 | |
| | 3,831 | | | First American Financial Corp. | | | 217,831 | |
| | 464 | | | First Citizens BancShares, Inc., Class A | | | 220,405 | |
| | 6,531 | | | First Hawaiian, Inc. | | | 189,334 | |
| | 10,436 | | | First Horizon National Corp. | | | 192,231 | |
| | 1,992 | | | First Republic Bank | | | 202,367 | |
| | 6,008 | | | Franklin Resources, Inc. | | | 190,694 | |
| | 853 | | | Goldman Sachs Group, Inc. (The) | | | 202,852 | |
| | 1,660 | | | Hanover Insurance Group, Inc. (The) | | | 203,333 | |
| | 3,750 | | | Hartford Financial Services Group, Inc. (The) | | | 188,888 | |
| | 12,914 | | | Huntington Bancshares, Inc. | | | 209,336 | |
| | 2,841 | | | Interactive Brokers Group, Inc., Class A | | | 176,597 | |
| | 2,667 | | | Intercontinental Exchange, Inc. | | | 203,305 | |
| | 7,327 | | | Invesco Ltd.(d) | | | 176,581 | |
| | 8,849 | | | Jefferies Financial Group, Inc. | | | 205,474 | |
| | 1,836 | | | JPMorgan Chase & Co. | | | 210,369 | |
| | 9,703 | | | KeyCorp | | | 204,442 | |
| | 3,710 | | | Lazard Ltd., Class A | | | 178,599 | |
| | 5,548 | | | Legg Mason, Inc. | | | 173,098 | |
| | 2,923 | | | Lincoln National Corp. | | | 191,690 | |
| | 4,014 | | | Loews Corp. | | | 201,944 | |
| | 2,853 | | | LPL Financial Holdings, Inc. | | | 188,983 | |
| | 1,140 | | | M&T Bank Corp. | | | 201,951 | |
| | 187 | | | Markel Corp.(b) | | | 226,046 | |
| | 914 | | | MarketAxess Holdings, Inc. | | | 173,496 | |
| | 2,439 | | | Marsh & McLennan Cos., Inc. | | | 206,413 | |
| | 4,210 | | | Mercury General Corp. | | | 226,919 | |
| | 4,260 | | | MetLife, Inc. | | | 195,491 | |
See accompanying Notes to Financial Statements which are an integral part of the financial statements.
Invesco Russell 1000 Equal Weight ETF (EQAL) (continued)
August 31, 2018
| | | | | | | | |
Number
of Shares | | | | | Value | |
| | | | Common Stocks & Other Equity Interests
(continued) | |
| | | | Financials (continued) | | | |
| | 25,547 | | | MFA Financial, Inc. REIT | | $ | 195,690 | |
| | 1,134 | | | Moody’s Corp. | | | 201,875 | |
| | 3,888 | | | Morgan Stanley | | | 189,851 | |
| | 1,514 | | | Morningstar, Inc. | | | 215,472 | |
| | 1,158 | | | MSCI, Inc., Class A | | | 208,741 | |
| | 2,104 | | | Nasdaq, Inc. | | | 200,806 | |
| | 14,770 | | | Navient Corp. | | | 201,463 | |
| | 10,988 | | | New Residential Investment Corp. REIT | | | 204,047 | |
| | 17,270 | | | New York Community Bancorp, Inc. | | | 185,998 | |
| | 1,870 | | | Northern Trust Corp. | | | 200,950 | |
| | 9,486 | | | Old Republic International Corp. | | | 210,399 | |
| | 5,980 | | | OneMain Holdings, Inc.(b) | | | 219,466 | |
| | 3,674 | | | PacWest Bancorp | | | 185,500 | |
| | 10,599 | | | People’s United Financial, Inc. | | | 196,188 | |
| | 3,047 | | | Pinnacle Financial Partners, Inc. | | | 196,684 | |
| | 1,405 | | | PNC Financial Services Group, Inc. (The) | | | 201,674 | |
| | 4,285 | | | Popular, Inc. | | | 215,707 | |
| | 3,534 | | | Principal Financial Group, Inc. | | | 195,041 | |
| | 3,215 | | | Progressive Corp. (The) | | | 217,109 | |
| | 2,771 | | | Prosperity Bancshares, Inc. | | | 207,382 | |
| | 2,016 | | | Prudential Financial, Inc. | | | 198,072 | |
| | 2,022 | | | Raymond James Financial, Inc. | | | 188,127 | |
| | 10,706 | | | Regions Financial Corp. | | | 208,339 | |
| | 1,390 | | | Reinsurance Group of America, Inc. | | | 198,562 | |
| | 1,613 | | | RenaissanceRe Holdings Ltd. (Bermuda) | | | 214,464 | |
| | 957 | | | S&P Global, Inc. | | | 198,147 | |
| | 10,628 | | | Santander Consumer USA Holdings, Inc. | | | 229,352 | |
| | 3,038 | | | SEI Investments Co. | | | 191,637 | |
| | 1,587 | | | Signature Bank/New York NY | | | 183,679 | |
| | 17,156 | | | SLM Corp.(b) | | | 201,068 | |
| | 8,939 | | | Starwood Property Trust, Inc. REIT | | | 196,926 | |
| | 2,026 | | | State Street Corp. | | | 176,080 | |
| | 8,091 | | | Sterling Bancorp | | | 184,879 | |
| | 2,890 | | | SunTrust Banks, Inc. | | | 212,588 | |
| | 627 | | | SVB Financial Group(b) | | | 202,364 | |
| | 5,652 | | | Synchrony Financial | | | 178,999 | |
| | 3,591 | | | Synovus Financial Corp. | | | 179,765 | |
| | 1,626 | | | T. Rowe Price Group, Inc. | | | 188,437 | |
| | 7,575 | | | TCF Financial Corp. | | | 192,026 | |
| | 3,327 | | | TD Ameritrade Holding Corp. | | | 194,862 | |
| | 1,991 | | | Texas Capital Bancshares, Inc.(b) | | | 177,000 | |
| | 12,567 | | | TFS Financial Corp. | | | 194,034 | |
| | 2,361 | | | Torchmark Corp. | | | 207,579 | |
| | 1,539 | | | Travelers Cos., Inc. (The) | | | 202,532 | |
| | 12,537 | | | Two Harbors Investment Corp. REIT | | | 195,828 | |
| | 8,315 | | | Umpqua Holdings Corp. | | | 177,941 | |
| | 5,131 | | | Unum Group | | | 189,231 | |
| | 3,916 | | | US Bancorp | | | 211,895 | |
| | 6,574 | | | Virtu Financial, Inc., Class A | | | 143,313 | |
| | 3,861 | | | Voya Financial, Inc. | | | 193,320 | |
| | 2,642 | | | W.R. Berkley Corp. | | | 206,763 | |
| | 3,025 | | | Webster Financial Corp. | | | 197,775 | |
| | 3,643 | | | Wells Fargo & Co. | | | 213,043 | |
| | 3,215 | | | Western Alliance Bancorp(b) | | | 185,345 | |
| | 226 | | | White Mountains Insurance Group Ltd. | | | 209,717 | |
| | 1,269 | | | Willis Towers Watson PLC | | | 186,886 | |
| | | | | | | | |
Number
of Shares | | | | | Value | |
| | | | Common Stocks & Other Equity Interests
(continued) | |
| | | | Financials (continued) | | | |
| | 2,105 | | | Wintrust Financial Corp. | | $ | 186,398 | |
| | 3,537 | | | XL Group Ltd. (Bermuda) | | | 202,988 | |
| | 3,599 | | | Zions Bancorporation | | | 191,791 | |
| | | | | | | | |
| | | | | | | 29,112,837 | |
| | | | | | | | |
| | | | Health Care—11.9% | | | |
| | 7,943 | | | Abbott Laboratories | | | 530,910 | |
| | 5,067 | | | AbbVie, Inc. | | | 486,331 | |
| | 1,137 | | | ABIOMED, Inc.(b) | | | 462,281 | |
| | 12,154 | | | Acadia Healthcare Co., Inc.(b) | | | 504,756 | |
| | 2,663 | | | Aetna, Inc. | | | 533,319 | |
| | 7,533 | | | Agilent Technologies, Inc. | | | 508,779 | |
| | 5,349 | | | Agios Pharmaceuticals, Inc.(b) | | | 431,771 | |
| | 4,167 | | | Alexion Pharmaceuticals, Inc.(b) | | | 509,374 | |
| | 1,380 | | | Align Technology, Inc.(b) | | | 533,356 | |
| | 9,973 | | | Alkermes PLC(b) | | | 447,189 | |
| | 2,873 | | | Allergan PLC | | | 550,783 | |
| | 4,664 | | | Alnylam Pharmaceuticals, Inc.(b) | | | 572,133 | |
| | 5,360 | | | AmerisourceBergen Corp. | | | 482,239 | |
| | 2,684 | | | Amgen, Inc. | | | 536,290 | |
| | 2,074 | | | Anthem, Inc. | | | 549,050 | |
| | 3,181 | | | athenahealth, Inc.(b) | | | 489,556 | |
| | 6,636 | | | Baxter International, Inc. | | | 493,519 | |
| | 2,155 | | | Becton, Dickinson and Co. | | | 564,330 | |
| | 1,640 | | | Biogen, Inc.(b) | | | 579,724 | |
| | 5,549 | | | BioMarin Pharmaceutical, Inc.(b) | | | 554,789 | |
| | 1,655 | | | Bio-Rad Laboratories, Inc., Class A(b) | | | 538,372 | |
| | 3,059 | | | Bio-Techne Corp. | | | 587,848 | |
| | 2,540 | | | Bluebird Bio, Inc.(b) | | | 427,482 | |
| | 15,386 | | | Boston Scientific Corp.(b) | | | 547,126 | |
| | 9,328 | | | Bristol-Myers Squibb Co. | | | 564,810 | |
| | 15,470 | | | Bruker Corp. | | | 550,423 | |
| | 5,032 | | | Cantel Medical Corp. | | | 488,104 | |
| | 9,152 | | | Cardinal Health, Inc. | | | 477,643 | |
| | 12,033 | | | Catalent, Inc.(b) | | | 502,979 | |
| | 6,372 | | | Celgene Corp.(b) | | | 601,835 | |
| | 4,056 | | | Centene Corp.(b) | | | 594,123 | |
| | 8,190 | | | Cerner Corp.(b) | | | 533,251 | |
| | 4,373 | | | Charles River Laboratories International, Inc.(b) | | | 540,109 | |
| | 1,525 | | | Chemed Corp. | | | 493,399 | |
| | 2,852 | | | Cigna Corp. | | | 537,146 | |
| | 2,119 | | | Cooper Cos., Inc. (The) | | | 541,998 | |
| | 15,902 | | | CVS Health Corp. | | | 1,196,466 | |
| | 4,870 | | | Danaher Corp. | | | 504,240 | |
| | 7,043 | | | DaVita, Inc.(b) | | | 488,009 | |
| | 11,137 | | | DENTSPLY SIRONA, Inc. | | | 444,589 | |
| | 5,079 | | | DexCom, Inc.(b) | | | 733,306 | |
| | 3,312 | | | Edwards Lifesciences Corp.(b) | | | 477,723 | |
| | 5,785 | | | Eli Lilly & Co. | | | 611,185 | |
| | 7,412 | | | Encompass Health Corp. | | | 604,745 | |
| | 11,163 | | | Envision Healthcare Corp.(b) | | | 506,354 | |
| | 7,408 | | | Exact Sciences Corp.(b) | | | 554,785 | |
| | 25,766 | | | Exelixis, Inc.(b) | | | 484,143 | |
| | 6,086 | | | Express Scripts Holding Co.(b) | | | 535,690 | |
| | 7,033 | | | Gilead Sciences, Inc. | | | 532,609 | |
| | 4,733 | | | HCA Healthcare, Inc. | | | 634,743 | |
See accompanying Notes to Financial Statements which are an integral part of the financial statements.
Invesco Russell 1000 Equal Weight ETF (EQAL) (continued)
August 31, 2018
| | | | | | | | |
Number
of Shares | | | | | Value | |
| | | | Common Stocks & Other Equity Interests
(continued) | |
| | | | Health Care (continued) | | | |
| | 6,859 | | | Henry Schein, Inc.(b) | | $ | 532,807 | |
| | 5,399 | | | Hill-Rom Holdings, Inc. | | | 525,161 | |
| | 12,434 | | | Hologic, Inc.(b) | | | 494,376 | |
| | 1,655 | | | Humana, Inc. | | | 551,545 | |
| | 1,619 | | | ICU Medical, Inc.(b) | | | 495,414 | |
| | 2,219 | | | IDEXX Laboratories, Inc.(b) | | | 563,715 | |
| | 1,725 | | | Illumina, Inc.(b) | | | 612,082 | |
| | 6,793 | | | Incyte Corp.(b) | | | 502,071 | |
| | 5,050 | | | Insulet Corp.(b) | | | 526,564 | |
| | 7,456 | | | Integra LifeSciences Holdings Corp.(b) | | | 443,408 | |
| | 1,019 | | | Intuitive Surgical, Inc.(b) | | | 570,640 | |
| | 10,558 | | | Ionis Pharmaceuticals, Inc.(b) | | | 482,395 | |
| | 4,847 | | | IQVIA Holdings, Inc.(b) | | | 616,005 | |
| | 2,823 | | | Jazz Pharmaceuticals PLC(b) | | | 482,507 | |
| | 4,079 | | | Johnson & Johnson | | | 549,401 | |
| | 2,666 | | | Laboratory Corp. of America Holdings(b) | | | 460,871 | |
| | 4,920 | | | Masimo Corp.(b) | | | 580,019 | |
| | 3,339 | | | McKesson Corp. | | | 429,896 | |
| | 11,144 | | | MEDNAX, Inc.(b) | | | 527,668 | |
| | 5,771 | | | Medtronic PLC | | | 556,382 | |
| | 8,114 | | | Merck & Co., Inc. | | | 556,539 | |
| | 699 | | | Mettler-Toledo International, Inc.(b) | | | 408,538 | |
| | 5,192 | | | Molina Healthcare, Inc.(b) | | | 716,496 | |
| | 12,648 | | | Mylan NV(b) | | | 494,916 | |
| | 8,862 | | | Nektar Therapeutics, Class A(b) | | | 589,234 | |
| | 5,015 | | | Neurocrine Biosciences, Inc.(b) | | | 616,594 | |
| | 3,184 | | | Penumbra, Inc.(b) | | | 442,098 | |
| | 6,376 | | | PerkinElmer, Inc. | | | 589,334 | |
| | 6,675 | | | Perrigo Co. PLC | | | 510,704 | |
| | 13,835 | | | Pfizer, Inc. | | | 574,429 | |
| | 5,248 | | | PRA Health Sciences, Inc.(b) | | | 554,189 | |
| | 14,130 | | | Premier, Inc., Class A(b) | | | 624,970 | |
| | 13,382 | | | QIAGEN NV(b) | | | 521,497 | |
| | 4,510 | | | Quest Diagnostics, Inc. | | | 496,010 | |
| | 1,591 | | | Regeneron Pharmaceuticals, Inc.(b) | | | 647,139 | |
| | 4,687 | | | ResMed, Inc. | | | 522,179 | |
| | 3,039 | | | Sage Therapeutics, Inc.(b) | | | 499,186 | |
| | 5,066 | | | Sarepta Therapeutics, Inc.(b) | | | 699,311 | |
| | 7,645 | | | Seattle Genetics, Inc.(b) | | | 586,830 | |
| | 4,682 | | | STERIS PLC | | | 535,714 | |
| | 2,957 | | | Stryker Corp. | | | 501,005 | |
| | 1,764 | | | Teleflex, Inc. | | | 436,467 | |
| | 12,063 | | | TESARO, Inc.(b) | | | 391,444 | |
| | 2,307 | | | Thermo Fisher Scientific, Inc. | | | 551,604 | |
| | 4,373 | | | United Therapeutics Corp.(b) | | | 537,835 | |
| | 1,967 | | | UnitedHealth Group, Inc. | | | 528,061 | |
| | 4,358 | | | Universal Health Services, Inc., Class B | | | 567,237 | |
| | 4,051 | | | Varian Medical Systems, Inc.(b) | | | 453,793 | |
| | 6,020 | | | Veeva Systems, Inc., Class A(b) | | | 628,247 | |
| | 3,221 | | | Vertex Pharmaceuticals, Inc.(b) | | | 593,952 | |
| | 1,990 | | | Waters Corp.(b) | | | 377,065 | |
| | 2,084 | | | WellCare Health Plans, Inc.(b) | | | 630,556 | |
| | 5,013 | | | West Pharmaceutical Services, Inc. | | | 586,772 | |
| | 4,348 | | | Zimmer Biomet Holdings, Inc. | | | 537,543 | |
| | 5,681 | | | Zoetis, Inc. | | | 514,699 | |
| | | | | | | | |
| | | | | | | 56,680,828 | |
| | | | | | | | |
| | | | | | | | |
Number
of Shares | | | | | Value | |
| | | | Common Stocks & Other Equity Interests
(continued) | |
| | | | Industrials—12.8% | | | |
| | 1,959 | | | 3M Co. | | $ | 413,192 | |
| | 6,231 | | | A.O. Smith Corp. | | | 361,896 | |
| | 6,348 | | | Acuity Brands, Inc. | | | 970,228 | |
| | 49,253 | | | ADT, Inc.(c) | | | 440,814 | |
| | 11,855 | | | AECOM(b) | | | 398,802 | |
| | 6,464 | | | AGCO Corp. | | | 385,642 | |
| | 9,084 | | | Air Lease Corp. | | | 419,772 | |
| | 6,369 | | | Alaska Air Group, Inc. | | | 429,844 | |
| | 4,870 | | | Allegion PLC | | | 424,761 | |
| | 9,615 | | | Allison Transmission Holdings, Inc. | | | 477,481 | |
| | 978 | | | AMERCO | | | 366,642 | |
| | 9,242 | | | American Airlines Group, Inc. | | | 374,116 | |
| | 5,329 | | | AMETEK, Inc. | | | 410,120 | |
| | 22,141 | | | Arconic, Inc. | | | 495,516 | |
| | 11,814 | | | Armstrong World Industries, Inc.(b) | | | 824,617 | |
| | 1,102 | | | Boeing Co. (The) | | | 377,755 | |
| | 6,042 | | | BWX Technologies, Inc. | | | 370,495 | |
| | 4,399 | | | C.H. Robinson Worldwide, Inc. | | | 422,656 | |
| | 3,709 | | | Carlisle Cos., Inc. | | | 470,338 | |
| | 2,600 | | | Caterpillar, Inc. | | | 361,010 | |
| | 2,080 | | | Cintas Corp. | | | 443,810 | |
| | 7,446 | | | Clean Harbors, Inc.(b) | | | 510,721 | |
| | 12,882 | | | Colfax Corp.(b) | | | 449,839 | |
| | 3,942 | | | Copa Holdings SA, Class A (Panama) | | | 315,123 | |
| | 6,866 | | | Copart, Inc.(b) | | | 441,552 | |
| | 975 | | | CoStar Group, Inc.(b) | | | 431,106 | |
| | 4,732 | | | Crane Co. | | | 431,937 | |
| | 6,046 | | | CSX Corp. | | | 448,371 | |
| | 2,811 | | | Cummins, Inc. | | | 398,600 | |
| | 3,084 | | | Curtiss-Wright Corp. | | | 413,102 | |
| | 2,648 | | | Deere & Co. | | | 380,782 | |
| | 7,250 | | | Delta Air Lines, Inc. | | | 423,980 | |
| | 8,302 | | | Donaldson Co., Inc. | | | 420,081 | |
| | 5,233 | | | Dover Corp. | | | 449,358 | |
| | 1,497 | | | Dun & Bradstreet Corp. (The) | | | 213,951 | |
| | 5,032 | | | Eaton Corp. PLC | | | 418,360 | |
| | 5,463 | | | Emerson Electric Co. | | | 419,176 | |
| | 1,596 | | | Equifax, Inc. | | | 213,816 | |
| | 5,187 | | | Expeditors International of Washington, Inc. | | | 380,103 | |
| | 14,504 | | | Fastenal Co. | | | 846,453 | |
| | 1,507 | | | FedEx Corp. | | | 367,633 | |
| | 9,597 | | | Flowserve Corp. | | | 500,196 | |
| | 8,156 | | | Fluor Corp. | | | 468,236 | |
| | 4,965 | | | Fortive Corp. | | | 416,961 | |
| | 6,101 | | | Fortune Brands Home & Security, Inc. | | | 323,231 | |
| | 13,262 | | | Gardner Denver Holdings, Inc.(b) | | | 370,806 | |
| | 25,090 | | | Gates Industrial Corp PLC(b) | | | 457,391 | |
| | 2,032 | | | General Dynamics Corp. | | | 392,989 | |
| | 29,203 | | | General Electric Co. | | | 377,887 | |
| | 4,947 | | | Genesee & Wyoming, Inc., Class A(b) | | | 434,792 | |
| | 8,560 | | | Graco, Inc. | | | 402,406 | |
| | 36,529 | | | GrafTech International Ltd. | | | 675,056 | |
| | 2,813 | | | Harris Corp. | | | 457,141 | |
| | 9,201 | | | HD Supply Holdings, Inc.(b) | | | 419,474 | |
| | 5,382 | | | HEICO Corp. | | | 488,040 | |
| | 10,548 | | | Hexcel Corp. | | | 697,434 | |
See accompanying Notes to Financial Statements which are an integral part of the financial statements.
Invesco Russell 1000 Equal Weight ETF (EQAL) (continued)
August 31, 2018
| | | | | | | | |
Number
of Shares | | | | | Value | |
| | | | Common Stocks & Other Equity Interests
(continued) | |
| | | | Industrials (continued) | | | |
| | 2,631 | | | Honeywell International, Inc. | | $ | 418,487 | |
| | 3,523 | | | Hubbell, Inc. | | | 445,166 | |
| | 1,806 | | | Huntington Ingalls Industries, Inc. | | | 441,513 | |
| | 2,778 | | | IDEX Corp. | | | 425,617 | |
| | 8,301 | | | IHS Markit Ltd.(b) | | | 456,555 | |
| | 2,670 | | | Illinois Tool Works, Inc. | | | 370,810 | |
| | 8,166 | | | Ingersoll-Rand PLC | | | 827,134 | |
| | 7,249 | | | ITT, Inc. | | | 428,488 | |
| | 3,086 | | | J.B. Hunt Transport Services, Inc. | | | 372,634 | |
| | 6,090 | | | Jacobs Engineering Group, Inc. | | | 442,682 | |
| | 20,920 | | | JetBlue Airways Corp.(b) | | | 399,154 | |
| | 11,419 | | | Johnson Controls International PLC | | | 431,296 | |
| | 3,669 | | | Kansas City Southern | | | 425,457 | |
| | 6,291 | | | KAR Auction Services, Inc. | | | 394,383 | |
| | 4,647 | | | Kirby Corp.(b) | | | 405,683 | |
| | 9,523 | | | Knight-Swift Transportation Holdings, Inc. | | | 325,020 | |
| | 2,014 | | | L3 Technologies, Inc. | | | 430,432 | |
| | 3,509 | | | Landstar System, Inc. | | | 406,342 | |
| | 3,629 | | | Lennox International, Inc. | | | 808,577 | |
| | 4,271 | | | Lincoln Electric Holdings, Inc. | | | 402,157 | |
| | 1,337 | | | Lockheed Martin Corp. | | | 428,388 | |
| | 9,560 | | | Macquarie Infrastructure Corp. | | | 449,702 | |
| | 4,281 | | | ManpowerGroup, Inc. | | | 401,258 | |
| | 19,513 | | | Masco Corp. | | | 740,909 | |
| | 3,750 | | | Middleby Corp. (The)(b) | | | 455,775 | |
| | 4,259 | | | MSC Industrial Direct Co., Inc., Class A | | | 364,059 | |
| | 11,010 | | | Nielsen Holdings PLC | | | 286,260 | |
| | 3,079 | | | Nordson Corp. | | | 428,043 | |
| | 2,596 | | | Norfolk Southern Corp. | | | 451,289 | |
| | 1,229 | | | Northrop Grumman Corp. | | | 366,844 | |
| | 14,895 | | | nVent Electric PLC (United Kingdom) | | | 418,401 | |
| | 2,499 | | | Old Dominion Freight Line, Inc. | | | 380,848 | |
| | 5,485 | | | Oshkosh Corp. | | | 385,376 | |
| | 11,497 | | | Owens Corning | | | 650,960 | |
| | 6,250 | | | PACCAR, Inc. | | | 427,625 | |
| | 2,316 | | | Parker-Hannifin Corp. | | | 406,690 | |
| | 9,102 | | | Pentair PLC (United Kingdom) | | | 395,755 | |
| | 11,094 | | | Quanta Services, Inc.(b) | | | 383,741 | |
| | 1,967 | | | Raytheon Co. | | | 392,298 | |
| | 4,872 | | | Regal Beloit Corp. | | | 407,786 | |
| | 5,752 | | | Republic Services, Inc. | | | 421,967 | |
| | 5,697 | | | Robert Half International, Inc. | | | 445,391 | |
| | 2,230 | | | Rockwell Automation, Inc. | | | 403,541 | |
| | 2,888 | | | Rockwell Collins, Inc. | | | 392,624 | |
| | 7,627 | | | Rollins, Inc. | | | 458,230 | |
| | 1,407 | | | Roper Technologies, Inc. | | | 419,807 | |
| | 5,583 | | | Ryder System, Inc. | | | 428,998 | |
| | 13,892 | | | Schneider National, Inc., Class B | | | 375,779 | |
| | 7,404 | | | Sensata Technologies Holding PLC(b) | | | 392,042 | |
| | 2,502 | | | Snap-on, Inc. | | | 442,304 | |
| | 7,673 | | | Southwest Airlines Co. | | | 470,355 | |
| | 4,516 | | | Spirit AeroSystems Holdings, Inc., Class A | | | 386,118 | |
| | 2,803 | | | Stanley Black & Decker, Inc. | | | 393,906 | |
| | 6,209 | | | Stericycle, Inc.(b) | | | 383,033 | |
| | 1,931 | | | Teledyne Technologies, Inc.(b) | | | 458,149 | |
| | 9,964 | | | Terex Corp. | | | 386,105 | |
| | | | | | | | |
Number
of Shares | | | | | Value | |
| | | | Common Stocks & Other Equity Interests
(continued) | |
| | | | Industrials (continued) | | | |
| | 5,918 | | | Textron, Inc. | | $ | 408,520 | |
| | 15,597 | | | Timken Co. (The) | | | 758,794 | |
| | 6,399 | | | Toro Co. (The) | | | 388,995 | |
| | 1,167 | | | TransDigm Group, Inc.(b) | | | 408,450 | |
| | 2,807 | | | TransUnion | | | 211,367 | |
| | 11,506 | | | Trinity Industries, Inc. | | | 412,375 | |
| | 2,757 | | | Union Pacific Corp. | | | 415,259 | |
| | 5,457 | | | United Continental Holdings, Inc.(b) | | | 477,051 | |
| | 3,401 | | | United Parcel Service, Inc., Class B | | | 417,915 | |
| | 2,431 | | | United Rentals, Inc.(b) | | | 378,920 | |
| | 3,139 | | | United Technologies Corp. | | | 413,406 | |
| | 27,196 | | | Univar, Inc.(b) | | | 756,593 | |
| | 17,369 | | | USG Corp.(b) | | | 748,604 | |
| | 5,101 | | | Valmont Industries, Inc. | | | 716,180 | |
| | 3,637 | | | Verisk Analytics, Inc.(b) | | | 433,130 | |
| | 1,258 | | | W.W. Grainger, Inc. | | | 445,420 | |
| | 2,823 | | | WABCO Holdings, Inc.(b) | | | 347,455 | |
| | 3,918 | | | Wabtec Corp. | | | 424,398 | |
| | 4,772 | | | Waste Management, Inc. | | | 433,775 | |
| | 3,987 | | | Watsco, Inc. | | | 697,685 | |
| | 18,299 | | | Welbilt, Inc.(b) | | | 404,957 | |
| | 6,398 | | | WESCO International, Inc.(b) | | | 391,238 | |
| | 3,581 | | | XPO Logistics, Inc.(b) | | | 381,377 | |
| | 5,547 | | | Xylem, Inc. | | | 421,073 | |
| | | | | | | | |
| | | | | | | 60,526,471 | |
| | | | | | | | |
| | | | Information Technology—13.5% | | | |
| | 3,598 | | | 2U, Inc.(b) | | | 321,517 | |
| | 2,455 | | | Accenture PLC, Class A | | | 415,067 | |
| | 5,430 | | | Activision Blizzard, Inc. | | | 391,503 | |
| | 1,639 | | | Adobe Systems, Inc.(b) | | | 431,893 | |
| | 25,939 | | | Advanced Micro Devices, Inc.(b) | | | 652,885 | |
| | 5,211 | | | Akamai Technologies, Inc.(b) | | | 391,555 | |
| | 879 | | | Alliance Data Systems Corp. | | | 209,712 | |
| | 378 | | | Alphabet, Inc., Class C(b) | | | 460,476 | |
| | 6,033 | | | Amdocs Ltd. | | | 393,834 | |
| | 4,618 | | | Amphenol Corp., Class A | | | 436,770 | |
| | 4,153 | | | Analog Devices, Inc. | | | 410,524 | |
| | 2,387 | | | ANSYS, Inc.(b) | | | 443,934 | |
| | 2,213 | | | Apple, Inc. | | | 503,745 | |
| | 8,486 | | | Applied Materials, Inc. | | | 365,068 | |
| | 1,504 | | | Arista Networks, Inc.(b) | | | 449,666 | |
| | 16,119 | | | ARRIS International PLC(b) | | | 417,643 | |
| | 5,334 | | | Arrow Electronics, Inc.(b) | | | 413,545 | |
| | 4,226 | | | Aspen Technology, Inc.(b) | | | 487,511 | |
| | 6,340 | | | Atlassian Corp. PLC, Class A(b) | | | 570,663 | |
| | 3,053 | | | Autodesk, Inc.(b) | | | 471,231 | |
| | 2,854 | | | Automatic Data Processing, Inc. | | | 418,824 | |
| | 10,493 | | | Avnet, Inc. | | | 507,861 | |
| | 8,103 | | | Black Knight, Inc.(b) | | | 432,700 | |
| | 8,779 | | | Booz Allen Hamilton Holding Corp. | | | 449,134 | |
| | 1,578 | | | Broadcom, Inc. | | | 345,629 | |
| | 1,733 | | | Broadridge Financial Solutions, Inc. | | | 234,198 | |
| | 11,380 | | | CA, Inc. | | | 498,444 | |
| | 9,388 | | | Cadence Design Systems, Inc.(b) | | | 441,612 | |
| | 6,392 | | | CDK Global, Inc. | | | 398,349 | |
| | 5,042 | | | CDW Corp. | | | 441,478 | |
See accompanying Notes to Financial Statements which are an integral part of the financial statements.
Invesco Russell 1000 Equal Weight ETF (EQAL) (continued)
August 31, 2018
| | | | | | | | |
Number
of Shares | | | | | Value | |
| | | | Common Stocks & Other Equity Interests
(continued) | |
| | | | Information Technology (continued) | | | |
| | 11,041 | | | Ceridian HCM Holding, Inc.(b) | | $ | 425,078 | |
| | 9,430 | | | Cisco Systems, Inc. | | | 450,471 | |
| | 3,960 | | | Citrix Systems, Inc.(b) | | | 451,519 | |
| | 9,202 | | | Cognex Corp. | | | 495,068 | |
| | 5,369 | | | Cognizant Technology Solutions Corp., Class A | | | 421,091 | |
| | 2,574 | | | Coherent, Inc.(b) | | | 490,604 | |
| | 13,927 | | | CommScope Holding Co., Inc.(b) | | | 441,347 | |
| | 19,130 | | | Conduent, Inc.(b) | | | 443,433 | |
| | 3,675 | | | CoreLogic, Inc.(b) | | | 186,837 | |
| | 14,586 | | | Corning, Inc. | | | 488,777 | |
| | 23,832 | | | Cypress Semiconductor Corp. | | | 410,149 | |
| | 4,800 | | | Dell Technologies, Inc., Class V(b) | | | 461,616 | |
| | 6,630 | | | DocuSign Inc(b)(c) | | | 413,977 | |
| | 6,470 | | | Dolby Laboratories, Inc., Class A | | | 454,129 | |
| | 4,999 | | | DXC Technology Co. | | | 455,359 | |
| | 8,892 | | | eBay, Inc.(b) | | | 307,752 | |
| | 9,022 | | | EchoStar Corp., Class A(b) | | | 433,056 | |
| | 2,925 | | | Electronic Arts, Inc.(b) | | | 331,724 | |
| | 3,362 | | | EPAM Systems, Inc.(b) | | | 480,531 | |
| | 2,337 | | | Euronet Worldwide, Inc.(b) | | | 228,559 | |
| | 2,327 | | | F5 Networks, Inc.(b) | | | 440,082 | |
| | 2,161 | | | Facebook, Inc., Class A(b) | | | 379,753 | |
| | 985 | | | Fair Isaac Corp.(b) | | | 227,515 | |
| | 1,864 | | | Fidelity National Information Services, Inc. | | | 201,629 | |
| | 24,355 | | | FireEye, Inc.(b) | | | 404,293 | |
| | 9,224 | | | First Data Corp., Class A(b) | | | 237,241 | |
| | 16,731 | | | First Solar, Inc.(b) | | | 871,350 | |
| | 2,611 | | | Fiserv, Inc.(b) | | | 209,063 | |
| | 963 | | | FleetCor Technologies, Inc.(b) | | | 205,832 | |
| | 7,351 | | | FLIR Systems, Inc. | | | 461,202 | |
| | 6,425 | | | Fortinet, Inc.(b) | | | 538,158 | |
| | 3,074 | | | Gartner, Inc.(b) | | | 460,362 | |
| | 12,894 | | | Genpact Ltd. | | | 395,072 | |
| | 1,693 | | | Global Payments, Inc. | | | 210,914 | |
| | 5,732 | | | GoDaddy, Inc., Class A(b) | | | 466,929 | |
| | 3,511 | | | GrubHub, Inc.(b) | | | 505,970 | |
| | 4,575 | | | Guidewire Software, Inc.(b) | | | 460,108 | |
| | 26,635 | | | Hewlett Packard Enterprise Co. | | | 440,277 | |
| | 17,718 | | | HP, Inc. | | | 436,749 | |
| | 2,599 | | | IAC/InterActiveCorp.(b) | | | 512,523 | |
| | 7,595 | | | Intel Corp. | | | 367,826 | |
| | 2,900 | | | International Business Machines Corp. | | | 424,792 | |
| | 2,017 | | | Intuit, Inc. | | | 442,671 | |
| | 1,745 | | | IPG Photonics Corp.(b) | | | 306,213 | |
| | 14,213 | | | Jabil, Inc. | | | 420,136 | |
| | 1,515 | | | Jack Henry & Associates, Inc. | | | 240,037 | |
| | 15,148 | | | Juniper Networks, Inc. | | | 430,658 | |
| | 6,520 | | | Keysight Technologies, Inc.(b) | | | 423,083 | |
| | 3,724 | | | KLA-Tencor Corp. | | | 432,766 | |
| | 2,324 | | | Lam Research Corp. | | | 402,261 | |
| | 6,933 | | | Leidos Holdings, Inc. | | | 490,648 | |
| | 1,706 | | | Littelfuse, Inc. | | | 381,393 | |
| | 3,959 | | | LogMeIn, Inc. | | | 340,276 | |
| | 8,834 | | | Manhattan Associates, Inc.(b) | | | 512,284 | |
| | 30,206 | | | Marvell Technology Group Ltd. | | | 624,660 | |
| | | | | | | | |
Number
of Shares | | | | | Value | |
| | | | Common Stocks & Other Equity Interests
(continued) | |
| | | | Information Technology (continued) | | | |
| | 1,008 | | | Mastercard, Inc., Class A | | $ | 217,284 | |
| | 9,707 | | | Match Group, Inc.(b)(c) | | | 485,835 | |
| | 6,860 | | | Maxim Integrated Products, Inc. | | | 414,824 | |
| | 4,104 | | | Microchip Technology, Inc. | | | 353,067 | |
| | 7,126 | | | Micron Technology, Inc.(b) | | | 374,258 | |
| | 4,162 | | | Microsoft Corp. | | | 467,517 | |
| | 3,991 | | | MKS Instruments, Inc. | | | 370,764 | |
| | 3,024 | | | Monolithic Power Systems, Inc. | | | 453,207 | |
| | 3,701 | | | Motorola Solutions, Inc. | | | 475,060 | |
| | 9,126 | | | National Instruments Corp. | | | 435,766 | |
| | 13,290 | | | NCR Corp.(b) | | | 377,569 | |
| | 5,448 | | | NetApp, Inc. | | | 472,941 | |
| | 29,087 | | | Nuance Communications, Inc.(b) | | | 474,700 | |
| | 6,741 | | | Nutanix, Inc., Class A(b) | | | 379,653 | |
| | 1,596 | | | NVIDIA Corp. | | | 447,965 | |
| | 3,728 | | | NXP Semiconductors NV (Netherlands)(b) | | | 347,226 | |
| | 7,981 | | | Okta, Inc., Class A(b) | | | 493,465 | |
| | 16,278 | | | ON Semiconductor Corp.(b) | | | 347,373 | |
| | 9,179 | | | Oracle Corp. | | | 445,916 | |
| | 1,968 | | | Palo Alto Networks, Inc.(b) | | | 454,903 | |
| | 5,753 | | | Paychex, Inc. | | | 421,407 | |
| | 3,707 | | | Paycom Software, Inc.(b) | | | 575,030 | |
| | 2,327 | | | PayPal Holdings, Inc.(b) | | | 214,852 | |
| | 6,780 | | | Pegasystems, Inc. | | | 431,886 | |
| | 3,337 | | | Proofpoint, Inc.(b) | | | 395,935 | |
| | 4,438 | | | PTC, Inc.(b) | | | 443,534 | |
| | 16,597 | | | Pure Storage, Inc., Class A(b) | | | 445,463 | |
| | 5,050 | | | Qorvo, Inc.(b) | | | 404,454 | |
| | 7,091 | | | QUALCOMM, Inc. | | | 487,223 | |
| | 7,042 | | | RealPage, Inc.(b) | | | 439,421 | |
| | 2,402 | | | Red Hat, Inc.(b) | | | 354,847 | |
| | 5,411 | | | RingCentral, Inc., Class A(b) | | | 504,035 | |
| | 15,972 | | | Sabre Corp. | | | 417,029 | |
| | 3,059 | | | salesforce.com, Inc.(b) | | | 467,048 | |
| | 2,284 | | | ServiceNow, Inc.(b) | | | 448,486 | |
| | 4,141 | | | Skyworks Solutions, Inc. | | | 378,073 | |
| | 3,522 | | | Splunk, Inc.(b) | | | 451,344 | |
| | 3,132 | | | Square, Inc., Class A(b) | | | 277,620 | |
| | 7,953 | | | SS&C Technologies Holdings, Inc. | | | 471,931 | |
| | 32,269 | | | Switch, Inc., Class A(c) | | | 373,030 | |
| | 19,729 | | | Symantec Corp. | | | 397,737 | |
| | 4,634 | | | Synopsys, Inc.(b) | | | 473,317 | |
| | 4,147 | | | Tableau Software, Inc., Class A(b) | | | 463,883 | |
| | 3,459 | | | Take-Two Interactive Software, Inc.(b) | | | 461,984 | |
| | 9,986 | | | Teradata Corp.(b) | | | 414,119 | |
| | 10,795 | | | Teradyne, Inc. | | | 444,646 | |
| | 3,680 | | | Texas Instruments, Inc. | | | 413,632 | |
| | 2,286 | | | Total System Services, Inc. | | | 222,062 | |
| | 11,247 | | | Trimble, Inc.(b) | | | 473,499 | |
| | 7,143 | | | Twilio, Inc., Class A(b) | | | 576,154 | |
| | 9,021 | | | Twitter, Inc.(b) | | | 317,359 | |
| | 1,781 | | | Tyler Technologies, Inc.(b) | | | 439,818 | |
| | 4,815 | | | Ubiquiti Networks, Inc.(c) | | | 431,954 | |
| | 1,531 | | | Ultimate Software Group, Inc. (The)(b) | | | 474,105 | |
| | 4,275 | | | Universal Display Corp.(c) | | | 523,260 | |
| | 3,005 | | | VeriSign, Inc.(b) | | | 476,623 | |
See accompanying Notes to Financial Statements which are an integral part of the financial statements.
Invesco Russell 1000 Equal Weight ETF (EQAL) (continued)
August 31, 2018
| | | | | | | | |
Number
of Shares | | | | | Value | |
| | | | Common Stocks & Other Equity Interests
(continued) | |
| | | | Information Technology (continued) | | | |
| | 18,705 | | | Versum Materials, Inc. | | $ | 744,272 | |
| | 1,474 | | | Visa, Inc., Class A | | | 216,516 | |
| | 2,817 | | | VMware, Inc., Class A(b) | | | 431,733 | |
| | 5,107 | | | Western Digital Corp. | | | 322,967 | |
| | 9,646 | | | Western Union Co. (The) | | | 182,502 | |
| | 1,057 | | | WEX, Inc.(b) | | | 201,063 | |
| | 3,296 | | | Workday, Inc., Class A(b) | | | 509,364 | |
| | 2,358 | | | Worldpay, Inc., Class A(b) | | | 229,646 | |
| | 14,357 | | | Xerox Corp. | | | 399,986 | |
| | 5,984 | | | Xilinx, Inc. | | | 465,735 | |
| | 2,533 | | | Zebra Technologies Corp., Class A(b) | | | 435,017 | |
| | 7,094 | | | Zendesk, Inc.(b) | | | 488,706 | |
| | 3,072 | | | Zillow Group, Inc., Class C(b) | | | 149,453 | |
| | 96,449 | | | Zynga, Inc., Class A(b) | | | 401,228 | |
| | | | | | | | |
| | | | | | | 64,257,055 | |
| | | | | | | | |
| | | | Materials—8.5% | | | |
| | 4,528 | | | Air Products & Chemicals, Inc. | | | 752,961 | |
| | 8,006 | | | Albemarle Corp. | | | 764,733 | |
| | 15,677 | | | Alcoa Corp.(b) | | | 700,292 | |
| | 7,910 | | | AptarGroup, Inc. | | | 828,256 | |
| | 44,968 | | | Ardagh Group SA (Luxembourg) | | | 720,387 | |
| | 9,483 | | | Ashland Global Holdings, Inc. | | | 798,469 | |
| | 3,746 | | | Avery Dennison Corp. | | | 394,004 | |
| | 24,033 | | | Axalta Coating Systems Ltd.(b) | | | 733,007 | |
| | 20,740 | | | Ball Corp. | | | 868,591 | |
| | 17,884 | | | Bemis Co., Inc. | | | 881,324 | |
| | 16,244 | | | Berry Global Group, Inc.(b) | | | 775,326 | |
| | 11,606 | | | Cabot Corp. | | | 753,462 | |
| | 6,527 | | | Celanese Corp., Series A | | | 762,549 | |
| | 16,713 | | | CF Industries Holdings, Inc. | | | 868,240 | |
| | 15,068 | | | Chemours Co. (The) | | | 656,965 | |
| | 16,685 | | | Crown Holdings, Inc.(b) | | | 714,285 | |
| | 16,106 | | | Domtar Corp. | | | 819,795 | |
| | 11,234 | | | DowDuPont, Inc. | | | 787,841 | |
| | 6,674 | | | Eagle Materials, Inc. | | | 616,211 | |
| | 6,943 | | | Eastman Chemical Co. | | | 673,679 | |
| | 5,157 | | | Ecolab, Inc. | | | 776,025 | |
| | 8,303 | | | FMC Corp. | | | 709,491 | |
| | 42,667 | | | Freeport-McMoRan, Inc. | | | 599,471 | |
| | 51,833 | | | Graphic Packaging Holding Co. | | | 737,065 | |
| | 22,631 | | | Huntsman Corp. | | | 690,019 | |
| | 6,159 | | | International Flavors & Fragrances, Inc. | | | 802,456 | |
| | 13,190 | | | International Paper Co. | | | 674,537 | |
| | 6,569 | | | LyondellBasell Industries NV, Class A | | | 740,852 | |
| | 3,356 | | | Martin Marietta Materials, Inc. | | | 666,904 | |
| | 25,437 | | | Mosaic Co. (The) | | | 795,415 | |
| | 1,910 | | | NewMarket Corp. | | | 765,986 | |
| | 19,148 | | | Newmont Mining Corp. | | | 594,163 | |
| | 10,938 | | | Nucor Corp. | | | 683,625 | |
| | 24,670 | | | Olin Corp. | | | 758,109 | |
| | 41,408 | | | Owens-Illinois, Inc.(b) | | | 731,679 | |
| | 6,213 | | | Packaging Corp. of America | | | 682,933 | |
| | 65,927 | | | Platform Specialty Products Corp.(b) | | | 874,192 | |
| | 7,385 | | | PPG Industries, Inc. | | | 816,338 | |
| | 4,638 | | | Praxair, Inc. | | | 733,685 | |
| | 7,798 | | | Reliance Steel & Aluminum Co. | | | 685,366 | |
| | | | | | | | |
Number
of Shares | | | | | Value | |
| | | | Common Stocks & Other Equity Interests
(continued) | |
| | | | Materials (continued) | | | |
| | 8,037 | | | Royal Gold, Inc. | | $ | 612,902 | |
| | 15,051 | | | RPM International, Inc. | | | 1,015,943 | |
| | 8,742 | | | Scotts Miracle-Gro Co. (The) | | | 653,202 | |
| | 17,022 | | | Sealed Air Corp. | | | 682,753 | |
| | 1,876 | | | Sherwin-Williams Co. (The) | | | 854,668 | |
| | 27,597 | | | Silgan Holdings, Inc. | | | 752,018 | |
| | 14,137 | | | Sonoco Products Co. | | | 792,238 | |
| | 14,913 | | | Southern Copper Corp. (Peru) | | | 650,803 | |
| | 15,308 | | | Steel Dynamics, Inc. | | | 700,035 | |
| | 19,937 | | | United States Steel Corp. | | | 591,730 | |
| | 42,865 | | | Valvoline, Inc. | | | 922,455 | |
| | 5,688 | | | Vulcan Materials Co. | | | 630,230 | |
| | 10,242 | | | W.R. Grace & Co. | | | 723,700 | |
| | 6,672 | | | Westlake Chemical Corp. | | | 630,971 | |
| | 12,388 | | | WestRock Co. | | | 682,331 | |
| | | | | | | | |
| | | | | | | 40,284,667 | |
| | | | | | | | |
| | | | Real Estate—3.7% | | | |
| | 1,553 | | | Alexandria Real Estate Equities, Inc. REIT | | | 199,328 | |
| | 4,654 | | | American Campus Communities, Inc. REIT | | | 195,142 | |
| | 9,465 | | | American Homes 4 Rent, Class A REIT | | | 219,588 | |
| | 1,439 | | | American Tower Corp. REIT | | | 214,584 | |
| | 4,815 | | | Apartment Investment & Management Co., Class A REIT | | | 210,897 | |
| | 10,626 | | | Apple Hospitality REIT, Inc. REIT | | | 187,549 | |
| | 1,182 | | | AvalonBay Communities, Inc. REIT | | | 216,649 | |
| | 1,664 | | | Boston Properties, Inc. REIT | | | 217,069 | |
| | 12,359 | | | Brandywine Realty Trust REIT | | | 207,137 | |
| | 11,478 | | | Brixmor Property Group, Inc. REIT | | | 209,129 | |
| | 100 | | | Brookfield Property Partners LP (Bermuda) | | | 1,998 | |
| | 2,503 | | | Brookfield Property REIT, Inc., Class A REIT | | | 50,110 | |
| | 2,214 | | | Camden Property Trust REIT | | | 210,463 | |
| | 4,121 | | | CBRE Group, Inc., Class A(b) | | | 201,146 | |
| | 34,465 | | | Colony Capital, Inc. REIT | | | 211,270 | |
| | 8,935 | | | Columbia Property Trust, Inc. REIT | | | 215,155 | |
| | 1,840 | | | CoreSite Realty Corp. REIT | | | 214,305 | |
| | 7,281 | | | Corporate Office Properties Trust REIT | | | 224,109 | |
| | 1,970 | | | Crown Castle International Corp. REIT | | | 224,639 | |
| | 6,353 | | | CubeSmart REIT | | | 194,084 | |
| | 3,393 | | | CyrusOne, Inc. REIT | | | 227,195 | |
| | 11,557 | | | DDR Corp. REIT | | | 161,682 | |
| | 1,875 | | | Digital Realty Trust, Inc. REIT | | | 233,025 | |
| | 5,143 | | | Douglas Emmett, Inc. REIT | | | 200,886 | |
| | 6,970 | | | Duke Realty Corp. REIT | | | 198,575 | |
| | 11,776 | | | Empire State Realty Trust, Inc., Class A REIT | | | 207,140 | |
| | 3,132 | | | EPR Properties REIT | | | 219,804 | |
| | 506 | | | Equinix, Inc. REIT | | | 220,682 | |
| | 6,445 | | | Equity Commonwealth REIT(b) | | | 206,627 | |
| | 2,177 | | | Equity LifeStyle Properties, Inc. REIT | | | 210,908 | |
| | 3,126 | | | Equity Residential REIT | | | 211,786 | |
| | 849 | | | Essex Property Trust, Inc. REIT | | | 209,092 | |
| | 2,050 | | | Extra Space Storage, Inc. REIT | | | 189,030 | |
| | 1,649 | | | Federal Realty Investment Trust REIT | | | 215,376 | |
| | 9,864 | | | Forest City Realty Trust, Inc., Class A REIT | | | 248,080 | |
| | 5,655 | | | Gaming and Leisure Properties, Inc. REIT | | | 202,392 | |
| | 8,341 | | | HCP, Inc. REIT | | | 225,457 | |
See accompanying Notes to Financial Statements which are an integral part of the financial statements.
Invesco Russell 1000 Equal Weight ETF (EQAL) (continued)
August 31, 2018
| | | | | | | | |
Number
of Shares | | | | | Value | |
| | | | Common Stocks & Other Equity Interests
(continued) | |
| | | | Real Estate (continued) | | | |
| | 7,957 | | | Healthcare Trust of America, Inc., Class A REIT | | $ | 227,331 | |
| | 4,114 | | | Highwoods Properties, Inc. REIT | | | 204,630 | |
| | 7,012 | | | Hospitality Properties Trust REIT | | | 203,278 | |
| | 9,355 | | | Host Hotels & Resorts, Inc. REIT | | | 201,413 | |
| | 1,467 | | | Howard Hughes Corp. (The)(b) | | | 191,253 | |
| | 5,664 | | | Hudson Pacific Properties, Inc. REIT | | | 191,670 | |
| | 8,883 | | | Invitation Homes, Inc. REIT | | | 207,596 | |
| | 5,868 | | | Iron Mountain, Inc. REIT | | | 211,835 | |
| | 5,287 | | | JBG SMITH Properties REIT | | | 198,051 | |
| | 1,166 | | | Jones Lang LaSalle, Inc. | | | 177,838 | |
| | 2,627 | | | Kilroy Realty Corp. REIT | | | 192,139 | |
| | 12,048 | | | Kimco Realty Corp. REIT | | | 206,141 | |
| | 2,804 | | | Lamar Advertising Co., Class A REIT | | | 216,048 | |
| | 4,502 | | | Liberty Property Trust REIT | | | 196,963 | |
| | 2,153 | | | Life Storage, Inc. REIT | | | 210,133 | |
| | 3,542 | | | Macerich Co. (The) REIT | | | 208,057 | |
| | 14,427 | | | Medical Properties Trust, Inc. REIT | | | 217,126 | |
| | 2,053 | | | Mid-America Apartment Communities, Inc. REIT | | | 212,609 | |
| | 4,731 | | | National Retail Properties, Inc. REIT | | | 218,052 | |
| | 6,365 | | | Omega Healthcare Investors, Inc. REIT | | | 210,363 | |
| | 10,032 | | | Outfront Media, Inc. REIT | | | 199,336 | |
| | 13,197 | | | Paramount Group, Inc. REIT | | | 209,568 | |
| | 6,493 | | | Park Hotels & Resorts, Inc. REIT | | | 217,191 | |
| | 6,195 | | | Prologis, Inc. REIT | | | 416,180 | |
| | 925 | | | Public Storage REIT | | | 196,637 | |
| | 5,217 | | | Rayonier, Inc. REIT | | | 181,708 | |
| | 8,088 | | | Realogy Holdings Corp.(c) | | | 173,002 | |
| | 3,756 | | | Realty Income Corp. REIT | | | 219,989 | |
| | 3,326 | | | Regency Centers Corp. REIT | | | 219,616 | |
| | 15,339 | | | Retail Properties of America, Inc., Class A REIT | | | 195,265 | |
| | 1,154 | | | Retail Value, Inc. REIT(b) | | | 41,221 | |
| | 1,261 | | | SBA Communications Corp. REIT(b) | | | 195,745 | |
| | 11,397 | | | Senior Housing Properties Trust REIT | | | 217,797 | |
| | 1,210 | | | Simon Property Group, Inc. REIT | | | 221,466 | |
| | 2,034 | | | SL Green Realty Corp. REIT | | | 212,350 | |
| | 24,504 | | | Spirit Realty Capital, Inc. REIT | | | 205,098 | |
| | 7,412 | | | STORE Capital Corp. REIT | | | 213,540 | |
| | 2,068 | | | Sun Communities, Inc. REIT | | | 213,376 | |
| | 3,576 | | | Taubman Centers, Inc. REIT | | | 231,045 | |
| | 5,373 | | | UDR, Inc. REIT | | | 214,759 | |
| | 8,677 | | | Uniti Group, Inc. REIT(b) | | | 180,655 | |
| | 3,664 | | | Ventas, Inc. REIT | | | 219,364 | |
| | 27,524 | | | VEREIT, Inc. REIT | | | 215,238 | |
| | 9,714 | | | VICI Properties, Inc. REIT | | | 203,120 | |
| | 2,774 | | | Vornado Realty Trust REIT | | | 213,598 | |
| | 6,634 | | | Weingarten Realty Investors REIT | | | 205,190 | |
| | 3,454 | | | Welltower, Inc. REIT | | | 230,416 | |
| | 5,351 | | | Weyerhaeuser Co. REIT | | | 185,733 | |
| | 2,968 | | | WP Carey, Inc. REIT | | | 197,609 | |
| | | | | | | | |
| | | | | | | 17,560,426 | |
| | | | | | | | |
| | | | Telecommunication Services—2.1% | | | |
| | 38,836 | | | AT&T, Inc. | | | 1,240,422 | |
| | 60,935 | | | CenturyLink, Inc. | | | 1,301,572 | |
| | | | | | | | |
Number
of Shares | | | | | Value | |
| | | | Common Stocks & Other Equity Interests
(continued) | |
| | | | Telecommunication Services (continued) | | | |
| | 201,164 | | | Sprint Corp.(b) | | $ | 1,229,112 | |
| | 40,568 | | | Telephone & Data Systems, Inc. | | | 1,218,663 | |
| | 18,454 | | | T-Mobile US, Inc.(b) | | | 1,218,702 | |
| | 29,874 | | | United States Cellular Corp.(b) | | | 1,277,412 | |
| | 22,967 | | | Verizon Communications, Inc. | | | 1,248,716 | |
| | 30,028 | | | Zayo Group Holdings, Inc.(b) | | | 1,040,770 | |
| | | | | | | | |
| | | | | | | 9,775,369 | |
| | | | | | | | |
| | | | Utilities—9.7% | | | |
| | 83,415 | | | AES Corp. (The) | | | 1,122,766 | |
| | 27,707 | | | Alliant Energy Corp. | | | 1,186,968 | |
| | 19,475 | | | Ameren Corp. | | | 1,231,404 | |
| | 16,994 | | | American Electric Power Co., Inc. | | | 1,218,980 | |
| | 13,759 | | | American Water Works Co., Inc. | | | 1,204,325 | |
| | 32,990 | | | Aqua America, Inc. | | | 1,226,568 | |
| | 12,814 | | | Atmos Energy Corp. | | | 1,181,835 | |
| | 21,847 | | | Avangrid, Inc. | | | 1,077,931 | |
| | 41,949 | | | CenterPoint Energy, Inc. | | | 1,165,763 | |
| | 25,163 | | | CMS Energy Corp. | | | 1,239,026 | |
| | 14,996 | | | Consolidated Edison, Inc. | | | 1,183,634 | |
| | 16,764 | | | Dominion Energy, Inc. | | | 1,186,388 | |
| | 11,315 | | | DTE Energy Co. | | | 1,257,549 | |
| | 14,940 | | | Duke Energy Corp. | | | 1,213,726 | |
| | 18,235 | | | Edison International | | | 1,198,587 | |
| | 14,315 | | | Entergy Corp. | | | 1,196,591 | |
| | 21,133 | | | Evergy, Inc. | | | 1,205,638 | |
| | 20,329 | | | Eversource Energy | | | 1,269,139 | |
| | 26,886 | | | Exelon Corp. | | | 1,175,187 | |
| | 32,048 | | | FirstEnergy Corp. | | | 1,197,954 | |
| | 33,475 | | | Hawaiian Electric Industries, Inc. | | | 1,180,663 | |
| | 39,032 | | | MDU Resources Group, Inc. | | | 1,088,602 | |
| | 20,771 | | | National Fuel Gas Co. | | | 1,153,414 | |
| | 6,912 | | | NextEra Energy, Inc. | | | 1,175,731 | |
| | 45,761 | | | NiSource, Inc. | | | 1,238,750 | |
| | 32,826 | | | NRG Energy, Inc. | | | 1,161,712 | |
| | 31,799 | | | OGE Energy Corp. | | | 1,171,157 | |
| | 27,496 | | | PG&E Corp. | | | 1,269,765 | |
| | 14,558 | | | Pinnacle West Capital Corp. | | | 1,143,531 | |
| | 40,566 | | | PPL Corp. | | | 1,206,433 | |
| | 21,050 | | | Public Service Enterprise Group, Inc. | | | 1,101,968 | |
| | 29,746 | | | SCANA Corp. | | | 1,140,462 | |
| | 9,695 | | | Sempra Energy | | | 1,125,396 | |
| | 24,835 | | | Southern Co. (The) | | | 1,087,276 | |
| | 22,297 | | | UGI Corp. | | | 1,205,153 | |
| | 15,612 | | | Vectren Corp. | | | 1,111,574 | |
| | 45,803 | | | Vistra Energy Corp.(b) | | | 1,078,203 | |
| | 18,338 | | | WEC Energy Group, Inc. | | | 1,239,282 | |
| | 25,616 | | | Xcel Energy, Inc. | | | 1,230,849 | |
| | | | | | | | |
| | | | | | | 46,049,880 | |
| | | | | | | | |
| | | | Total Investments in Securities
(excluding investments purchased with cash collateral from securities on loan)
(Cost $436,003,616)-99.9% | | | 474,113,993 | |
| | | | | | | | |
| | |
| | | | | | | | |
See accompanying Notes to Financial Statements which are an integral part of the financial statements.
Invesco Russell 1000 Equal Weight ETF (EQAL) (continued)
August 31, 2018
| | | | | | | | |
Number
of Shares | | | | | Value | |
| | | | Investments Purchased with Cash Collateral from
Securities on Loan | |
| | |
| | | | | | | | |
| | | | Money Market Fund—0.9% | |
| | 4,208,824 | | | Invesco Government & Agency Portfolio—Institutional Class, 1.85%(e)(f)
(Cost $4,208,824) | | $ | 4,208,824 | |
| | | | | | | | |
| | |
| | | | | | | | |
| | | | Total Investments in Securities
(Cost $440,212,440)—100.8% | | | 478,322,817 | |
| | | | Other assets less liabilities—(0.8)% | | | (3,768,855 | ) |
| | | | | | | | |
| | | | Net Assets—100.0% | | $ | 474,553,962 | |
| | | | | | | | |
Investment Abbreviations:
REIT—Real Estate Investment Trust
Notes to Schedule of Investments:
| (a) | Industry and/or sector classifications used in this report are generally according to the Global Industry Classification Standard, which was developed by and is the exclusive property and a service mark of MSCI Inc. and Standard & Poor’s. |
| (b) | Non-income producing security. |
| (c) | All or a portion of this security was out on loan at August 31, 2018. |
| (d) | Affiliated company. The Fund’s Adviser is a wholly-owned subsidiary of Invesco Ltd. and therefore, Invesco Ltd. is considered to be affiliated. See Note 4. |
| (e) | The security and the Fund are advised by wholly-owned subsidiaries of Invesco Ltd. and are therefore considered to be affiliated. The rate shown is the 7-day SEC standardized yield as of August 31, 2018. |
| (f) | The security has been segregated to satisfy the commitment to return the cash collateral received in securities lending transactions upon the borrower’s return of the securities loaned. See Note 2J. |
See accompanying Notes to Financial Statements which are an integral part of the financial statements.
Schedule of Investments(a)
Invesco Russell 1000 Low Beta Equal Weight ETF (USLB)
August 31, 2018
| | | | | | | | |
Number
of Shares | | | | | Value | |
| | | | Common Stocks & Other Equity Interests—99.9% | |
| | | | Consumer Discretionary—12.3% | | | |
| | 5,761 | | | Adient PLC | | $ | 249,394 | |
| | 5,179 | | | AMC Networks, Inc., Class A(b) | | | 325,293 | |
| | 4,386 | | | Best Buy Co., Inc. | | | 348,950 | |
| | 146 | | | Booking Holdings, Inc.(b) | | | 284,926 | |
| | 3,012 | | | Bright Horizons Family Solutions, Inc.(b) | | | 359,723 | |
| | 2,239 | | | Burlington Stores, Inc.(b) | | | 376,555 | |
| | 464 | | | Cable One, Inc. | | | 388,711 | |
| | 4,855 | | | Carnival Corp. | | | 298,534 | |
| | 5,959 | | | CBS Corp., Class B | | | 315,946 | |
| | 700 | | | Chipotle Mexican Grill, Inc.(b) | | | 332,626 | |
| | 9,032 | | | Cinemark Holdings, Inc. | | | 337,074 | |
| | 3,453 | | | Columbia Sportswear Co. | | | 313,187 | |
| | 3,495 | | | Darden Restaurants, Inc. | | | 405,560 | |
| | 1,213 | | | Domino’s Pizza, Inc. | | | 362,153 | |
| | 4,764 | | | Dunkin’ Brands Group, Inc. | | | 347,248 | |
| | 15,403 | | | Extended Stay America, Inc. | | | 310,833 | |
| | 26,473 | | | Ford Motor Co. | | | 250,964 | |
| | 531 | | | Graham Holdings Co., Class B | | | 298,767 | |
| | 2,772 | | | Grand Canyon Education, Inc.(b) | | | 330,256 | |
| | 10,881 | | | H&R Block, Inc. | | | 294,440 | |
| | 16,413 | | | Hanesbrands, Inc. | | | 287,884 | |
| | 7,270 | | | Harley-Davidson, Inc. | | | 309,847 | |
| | 3,522 | | | Hasbro, Inc. | | | 349,770 | |
| | 13,502 | | | Interpublic Group of Cos., Inc. (The) | | | 315,272 | |
| | 4,464 | | | John Wiley & Sons, Inc., Class A | | | 288,151 | |
| | 8,451 | | | L Brands, Inc. | | | 223,360 | |
| | 7,276 | | | Leggett & Platt, Inc. | | | 330,621 | |
| | 2,945 | | | Lululemon Athletica, Inc.(b) | | | 456,269 | |
| | 8,580 | | | Macy’s, Inc. | | | 313,599 | |
| | 1,176 | | | Madison Square Garden Co. (The), Class A(b) | | | 355,081 | |
| | 1,887 | | | McDonald’s Corp. | | | 306,128 | |
| | 5,054 | | | Michael Kors Holdings Ltd.(b) | | | 367,021 | |
| | 12,339 | | | Newell Brands, Inc. | | | 268,003 | |
| | 6,230 | | | Nordstrom, Inc. | | | 391,556 | |
| | 100 | | | NVR, Inc.(b) | | | 266,845 | |
| | 4,291 | | | Omnicom Group, Inc. | | | 297,452 | |
| | 2,702 | | | Polaris Industries, Inc. | | | 293,032 | |
| | 10,108 | | | PulteGroup, Inc. | | | 282,519 | |
| | 1,966 | | | PVH Corp. | | | 281,453 | |
| | 14,835 | | | Qurate Retail, Inc., Class A(b) | | | 308,420 | |
| | 2,240 | | | Ralph Lauren Corp., Class A | | | 297,494 | |
| | 5,315 | | | ServiceMaster Global Holdings, Inc.(b) | | | 320,335 | |
| | 4,703 | | | Six Flags Entertainment Corp. | | | 317,688 | |
| | 5,319 | | | Starbucks Corp. | | | 284,301 | |
| | 6,955 | | | Tapestry, Inc. | | | 352,549 | |
| | 4,155 | | | Target Corp. | | | 363,563 | |
| | 6,446 | | | Tempur Sealy International, Inc.(b) | | | 357,044 | |
| | 3,136 | | | Thor Industries, Inc. | | | 299,300 | |
| | 3,400 | | | TJX Cos., Inc. (The) | | | 373,898 | |
| | 7,663 | | | Toll Brothers, Inc. | | | 277,631 | |
| | 8,477 | | | Tribune Media Co., Class A | | | 312,717 | |
| | 5,397 | | | Twenty-First Century Fox, Inc., Class A | | | 245,024 | |
| | 2,526 | | | Twenty-First Century Fox, Inc., Class B | | | 113,417 | |
| | 1,204 | | | Ulta Beauty, Inc.(b) | | | 313,040 | |
| | 7,323 | | | Urban Outfitters, Inc.(b) | | | 340,373 | |
| | 1,256 | | | Vail Resorts, Inc. | | | 374,351 | |
| | 3,808 | | | VF Corp. | | | 350,831 | |
| | 2,426 | | | Visteon Corp.(b) | | | 267,806 | |
| | | | | | | | |
Number
of Shares | | | | | Value | |
| | | | Common Stocks & Other Equity Interests
(continued) | |
| | | | Consumer Discretionary (continued) | | | |
| | 3,116 | | | Walt Disney Co. (The) | | $ | 349,054 | |
| | 18,368 | | | Wendy’s Co. (The) | | | 324,195 | |
| | 5,500 | | | Williams-Sonoma, Inc. | | | 386,265 | |
| | 1,560 | | | Wynn Resorts Ltd. | | | 231,410 | |
| | 7,758 | | | Yum China Holdings, Inc. (China) | | | 300,079 | |
| | 3,706 | | | Yum! Brands, Inc. | | | 322,014 | |
| | | | | | | | |
| | | | | | | 20,297,802 | |
| | | | | | | | |
| | | | Consumer Staples—4.9% | | | |
| | 6,894 | | | Archer-Daniels-Midland Co. | | | 347,458 | |
| | 819 | | | Brown-Forman Corp., Class A | | | 43,112 | |
| | 4,494 | | | Brown-Forman Corp., Class B | | | 234,677 | |
| | 9,012 | | | Campbell Soup Co. | | | 355,523 | |
| | 6,343 | | | Church & Dwight Co., Inc. | | | 358,887 | |
| | 7,089 | | | Coca-Cola Co. (The) | | | 315,957 | |
| | 1,358 | | | Constellation Brands, Inc., Class A | | | 282,736 | |
| | 2,019 | | | Estee Lauder Cos., Inc. (The), Class A | | | 282,902 | |
| | 14,712 | | | Flowers Foods, Inc. | | | 296,447 | |
| | 11,683 | | | Hain Celestial Group, Inc. (The)(b) | | | 333,666 | |
| | 6,159 | | | Herbalife Nutrition Ltd.(b) | | | 348,538 | |
| | 8,226 | | | Hormel Foods Corp. | | | 322,048 | |
| | 2,900 | | | Kimberly-Clark Corp. | | | 335,066 | |
| | 4,704 | | | Lamb Weston Holdings, Inc. | | | 317,990 | |
| | 2,935 | | | McCormick & Co., Inc. | | | 366,523 | |
| | 4,896 | | | Molson Coors Brewing Co., Class B | | | 326,759 | |
| | 7,706 | | | Mondelez International, Inc., Class A | | | 329,200 | |
| | 5,875 | | | Monster Beverage Corp.(b) | | | 357,729 | |
| | 3,707 | | | Nu Skin Enterprises, Inc., Class A | | | 295,077 | |
| | 15,040 | | | Pilgrim’s Pride Corp.(b) | | | 278,090 | |
| | 3,961 | | | Post Holdings, Inc.(b) | | | 385,247 | |
| | 75 | | | Seaboard Corp. | | | 276,358 | |
| | 4,629 | | | Sysco Corp. | | | 346,342 | |
| | 4,336 | | | Tyson Foods, Inc., Class A | | | 272,344 | |
| | 8,467 | | | US Foods Holding Corp.(b) | | | 275,939 | |
| | 4,812 | | | Walgreens Boots Alliance, Inc. | | | 329,911 | |
| | | | | | | | |
| | | | | | | 8,014,526 | |
| | | | | | | | |
| | | | Energy—5.3% | | | |
| | 2,093 | | | Andeavor | | | 319,789 | |
| | 16,034 | | | Antero Resources Corp.(b) | | | 296,789 | |
| | 8,567 | | | Baker Hughes a GE Co. | | | 282,454 | |
| | 13,475 | | | Cabot Oil & Gas Corp. | | | 321,109 | |
| | 16,456 | | | Centennial Resource Development, Inc., Class A(b) | | | 317,107 | |
| | 2,439 | | | Chevron Corp. | | | 288,924 | |
| | 3,223 | | | Cimarex Energy Co. | | | 272,279 | |
| | 18,729 | | | CNX Resources Corp.(b) | | | 298,540 | |
| | 4,356 | | | Concho Resources, Inc.(b) | | | 597,425 | |
| | 2,486 | | | Diamondback Energy, Inc. | | | 301,005 | |
| | 4,481 | | | Energen Corp.(b) | | | 347,502 | |
| | 2,553 | | | EOG Resources, Inc. | | | 301,841 | |
| | 3,941 | | | HollyFrontier Corp. | | | 293,683 | |
| | 18,435 | | | Kinder Morgan, Inc. | | | 326,299 | |
| | 10,403 | | | Newfield Exploration Co.(b) | | | 283,794 | |
| | 3,631 | | | Occidental Petroleum Corp. | | | 290,008 | |
| | 4,474 | | | ONEOK, Inc. | | | 294,881 | |
| | 10,156 | | | Parsley Energy, Inc., Class A(b) | | | 282,032 | |
See accompanying Notes to Financial Statements which are an integral part of the financial statements.
Invesco Russell 1000 Low Beta Equal Weight ETF (USLB) (continued)
August 31, 2018
| | | | | | | | |
Number
of Shares | | | | | Value | |
| | | | Common Stocks & Other Equity Interests
(continued) | |
| | | | Energy (continued) | | | |
| | 6,417 | | | PBF Energy, Inc., Class A | | $ | 333,171 | |
| | 2,562 | | | Phillips 66 | | | 303,623 | |
| | 1,555 | | | Pioneer Natural Resources Co. | | | 271,659 | |
| | 24,422 | | | QEP Resources, Inc.(b) | | | 243,487 | |
| | 19,457 | | | Range Resources Corp. | | | 319,484 | |
| | 17,542 | | | RPC, Inc. | | | 239,975 | |
| | 11,495 | | | SM Energy Co. | | | 345,885 | |
| | 6,324 | | | Targa Resources Corp. | | | 348,263 | |
| | 2,498 | | | Valero Energy Corp. | | | 294,464 | |
| | 11,245 | | | Williams Cos., Inc. (The) | | | 332,740 | |
| | | | | | | | |
| | | | | | | 8,748,212 | |
| | | | | | | | |
| | | | Financials—16.1% | | | |
| | 6,701 | | | Aflac, Inc. | | | 309,854 | |
| | 15,875 | | | AGNC Investment Corp. REIT | | | 301,942 | |
| | 3,240 | | | Allstate Corp. (The) | | | 325,847 | |
| | 3,089 | | | American Express Co. | | | 327,372 | |
| | 2,735 | | | American Financial Group, Inc. | | | 304,570 | |
| | 2,553 | | | American National Insurance Co. | | | 327,652 | |
| | 28,791 | | | Annaly Capital Management, Inc. REIT | | | 305,760 | |
| | 2,177 | | | Aon PLC | | | 316,884 | |
| | 11,580 | | | Arch Capital Group Ltd.(b) | | | 354,001 | |
| | 4,565 | | | Arthur J. Gallagher & Co. | | | 329,319 | |
| | 10,979 | | | Associated Banc-Corp. | | | 299,178 | |
| | 3,267 | | | Assurant, Inc. | | | 335,913 | |
| | 8,557 | | | Assured Guaranty Ltd. | | | 348,612 | |
| | 3,557 | | | Bank of Hawaii Corp. | | | 295,693 | |
| | 5,511 | | | Bank of New York Mellon Corp. (The) | | | 287,399 | |
| | 6,366 | | | Bank OZK | | | 257,568 | |
| | 7,181 | | | BankUnited, Inc. | | | 278,551 | |
| | 26,272 | | | BGC Partners, Inc., Class A | | | 326,298 | |
| | 2,990 | | | BOK Financial Corp. | | | 306,624 | |
| | 10,987 | | | Brown & Brown, Inc. | | | 334,884 | |
| | 5,459 | | | Charles Schwab Corp. (The) | | | 277,263 | |
| | 16,608 | | | Chimera Investment Corp. REIT | | | 309,407 | |
| | 4,362 | | | Cincinnati Financial Corp. | | | 334,435 | |
| | 6,064 | | | CIT Group, Inc. | | | 328,911 | |
| | 1,845 | | | CME Group, Inc. | | | 322,377 | |
| | 6,411 | | | CNA Financial Corp. | | | 287,854 | |
| | 4,683 | | | Commerce Bancshares, Inc. | | | 332,774 | |
| | 865 | | | Credit Acceptance Corp.(b) | | | 395,054 | |
| | 2,645 | | | Cullen/Frost Bankers, Inc. | | | 293,304 | |
| | 4,133 | | | Discover Financial Services | | | 322,870 | |
| | 4,805 | | | E*TRADE Financial Corp.(b) | | | 282,822 | |
| | 4,338 | | | East West Bancorp, Inc. | | | 274,986 | |
| | 2,699 | | | Erie Indemnity Co., Class A | | | 333,407 | |
| | 1,356 | | | Everest Re Group Ltd. | | | 302,415 | |
| | 8,042 | | | Fidelity National Financial, Inc. | | | 322,484 | |
| | 9,992 | | | Fifth Third Bancorp | | | 294,065 | |
| | 712 | | | First Citizens BancShares, Inc., Class A | | | 338,207 | |
| | 10,451 | | | First Hawaiian, Inc. | | | 302,974 | |
| | 16,368 | | | First Horizon National Corp. | | | 301,499 | |
| | 3,041 | | | First Republic Bank | | | 308,935 | |
| | 4,103 | | | Interactive Brokers Group, Inc., Class A | | | 255,042 | |
| | 4,260 | | | Intercontinental Exchange, Inc. | | | 324,740 | |
| | 2,822 | | | JPMorgan Chase & Co. | | | 323,345 | |
| | 15,560 | | | KeyCorp | | | 327,849 | |
| | | | | | | | |
Number
of Shares | | | | | Value | |
| | | | Common Stocks & Other Equity Interests
(continued) | |
| | | | Financials (continued) | | | |
| | 6,258 | | | Loews Corp. | | $ | 314,840 | |
| | 4,432 | | | LPL Financial Holdings, Inc. | | | 293,576 | |
| | 274 | | | Markel Corp.(b) | | | 331,211 | |
| | 1,412 | | | MarketAxess Holdings, Inc. | | | 268,026 | |
| | 3,786 | | | Marsh & McLennan Cos., Inc. | | | 320,409 | |
| | 6,367 | | | Mercury General Corp. | | | 343,181 | |
| | 6,611 | | | MetLife, Inc. | | | 303,379 | |
| | 39,099 | | | MFA Financial, Inc. REIT | | | 299,498 | |
| | 1,760 | | | Moody’s Corp. | | | 313,315 | |
| | 2,597 | | | Morningstar, Inc. | | | 369,605 | |
| | 3,272 | | | Nasdaq, Inc. | | | 312,280 | |
| | 16,902 | | | New Residential Investment Corp. REIT | | | 313,870 | |
| | 2,943 | | | Northern Trust Corp. | | | 316,255 | |
| | 5,673 | | | PacWest Bancorp | | | 286,430 | |
| | 4,490 | | | Pinnacle Financial Partners, Inc. | | | 289,830 | |
| | 6,686 | | | Popular, Inc. | | | 336,573 | |
| | 5,425 | | | Principal Financial Group, Inc. | | | 299,406 | |
| | 4,853 | | | Progressive Corp. (The) | | | 327,723 | |
| | 2,028 | | | Reinsurance Group of America, Inc. | | | 289,700 | |
| | 1,532 | | | S&P Global, Inc. | | | 317,201 | |
| | 17,129 | | | Santander Consumer USA Holdings, Inc. | | | 369,644 | |
| | 26,657 | | | SLM Corp.(b) | | | 312,420 | |
| | 13,959 | | | Starwood Property Trust, Inc. REIT | | | 307,517 | |
| | 12,230 | | | Sterling Bancorp | | | 279,456 | |
| | 969 | | | SVB Financial Group(b) | | | 312,745 | |
| | 5,610 | | | Synovus Financial Corp. | | | 280,837 | |
| | 2,500 | | | T. Rowe Price Group, Inc. | | | 289,725 | |
| | 11,555 | | | TCF Financial Corp. | | | 292,919 | |
| | 5,134 | | | TD Ameritrade Holding Corp. | | | 300,698 | |
| | 19,315 | | | TFS Financial Corp. | | | 298,224 | |
| | 3,587 | | | Torchmark Corp. | | | 315,369 | |
| | 19,500 | | | Two Harbors Investment Corp. REIT | | | 304,590 | |
| | 12,847 | | | Umpqua Holdings Corp. | | | 274,926 | |
| | 8,015 | | | Unum Group | | | 295,593 | |
| | 9,738 | | | Virtu Financial, Inc., Class A | | | 212,288 | |
| | 3,967 | | | W.R. Berkley Corp. | | | 310,457 | |
| | 4,729 | | | Webster Financial Corp. | | | 309,182 | |
| | 5,026 | | | Western Alliance Bancorp(b) | | | 289,749 | |
| | 336 | | | White Mountains Insurance Group Ltd. | | | 311,791 | |
| | 1,997 | | | Willis Towers Watson PLC | | | 294,098 | |
| | 3,274 | | | Wintrust Financial Corp. | | | 289,913 | |
| | 5,506 | | | Zions Bancorporation | | | 293,415 | |
| | | | | | | | |
| | | | | | | 26,562,804 | |
| | | | | | | | |
| | | | Health Care—9.7% | | | |
| | 2,968 | | | AbbVie, Inc. | | | 284,869 | |
| | 7,481 | | | Acadia Healthcare Co., Inc.(b) | | | 310,686 | |
| | 1,753 | | | Aetna, Inc. | | | 351,073 | |
| | 2,621 | | | Alexion Pharmaceuticals, Inc.(b) | | | 320,391 | |
| | 1,696 | | | Amgen, Inc. | | | 338,878 | |
| | 2,010 | | | athenahealth, Inc.(b) | | | 309,339 | |
| | 2,037 | | | Bio-Techne Corp. | | | 391,450 | |
| | 10,006 | | | Boston Scientific Corp.(b) | | | 355,813 | |
| | 2,356 | | | Cantel Medical Corp. | | | 228,532 | |
| | 3,921 | | | Celgene Corp.(b) | | | 370,338 | |
| | 5,082 | | | Cerner Corp.(b) | | | 330,889 | |
| | 2,892 | | | Charles River Laboratories International, Inc.(b) | | | 357,191 | |
See accompanying Notes to Financial Statements which are an integral part of the financial statements.
Invesco Russell 1000 Low Beta Equal Weight ETF (USLB) (continued)
August 31, 2018
| | | | | | | | |
Number
of Shares | | | | | Value | |
| | | | Common Stocks & Other Equity Interests
(continued) | |
| | | | Health Care (continued) | | | |
| | 925 | | | Chemed Corp. | | $ | 299,274 | |
| | 1,799 | | | Cigna Corp. | | | 338,824 | |
| | 3,015 | | | Danaher Corp. | | | 312,173 | |
| | 2,221 | | | Edwards Lifesciences Corp.(b) | | | 320,357 | |
| | 3,709 | | | Eli Lilly & Co. | | | 391,856 | |
| | 4,671 | | | Encompass Health Corp. | | | 381,107 | |
| | 7,021 | | | Envision Healthcare Corp.(b) | | | 318,472 | |
| | 4,012 | | | Express Scripts Holding Co.(b) | | | 353,136 | |
| | 4,270 | | | Henry Schein, Inc.(b) | | | 331,694 | |
| | 3,304 | | | Hill-Rom Holdings, Inc. | | | 321,380 | |
| | 1,030 | | | Humana, Inc. | | | 343,258 | |
| | 1,122 | | | Illumina, Inc.(b) | | | 398,119 | |
| | 4,742 | | | Integra LifeSciences Holdings Corp.(b) | | | 282,007 | |
| | 3,096 | | | IQVIA Holdings, Inc.(b) | | | 393,471 | |
| | 1,812 | | | Jazz Pharmaceuticals PLC(b) | | | 309,707 | |
| | 2,528 | | | Johnson & Johnson | | | 340,496 | |
| | 1,667 | | | Laboratory Corp. of America Holdings(b) | | | 288,174 | |
| | 6,612 | | | MEDNAX, Inc.(b) | | | 313,078 | |
| | 5,120 | | | Merck & Co., Inc. | | | 351,181 | |
| | 1,925 | | | Penumbra, Inc.(b) | | | 267,286 | |
| | 8,481 | | | Pfizer, Inc. | | | 352,131 | |
| | 3,443 | | | PRA Health Sciences, Inc.(b) | | | 363,581 | |
| | 9,330 | | | Premier, Inc., Class A(b) | | | 412,666 | |
| | 8,291 | | | QIAGEN NV(b) | | | 323,100 | |
| | 2,817 | | | Quest Diagnostics, Inc. | | | 309,814 | |
| | 1,016 | | | Regeneron Pharmaceuticals, Inc.(b) | | | 413,258 | |
| | 2,919 | | | STERIS PLC | | | 333,992 | |
| | 1,744 | | | Stryker Corp. | | | 295,486 | |
| | 2,822 | | | United Therapeutics Corp.(b) | | | 347,078 | |
| | 1,273 | | | UnitedHealth Group, Inc. | | | 341,750 | |
| | 3,973 | | | Veeva Systems, Inc., Class A(b) | | | 414,622 | |
| | 1,952 | | | Vertex Pharmaceuticals, Inc.(b) | | | 359,949 | |
| | 1,347 | | | WellCare Health Plans, Inc.(b) | | | 407,562 | |
| | 2,763 | | | Zimmer Biomet Holdings, Inc. | | | 341,590 | |
| | 3,615 | | | Zoetis, Inc. | | | 327,519 | |
| | | | | | | | |
| | | | | | | 15,948,597 | |
| | | | | | | | |
| | | | Industrials—10.2% | | | |
| | 2,516 | | | Acuity Brands, Inc. | | | 384,545 | |
| | 5,064 | | | Alaska Air Group, Inc. | | | 341,769 | |
| | 857 | | | AMERCO | | | 321,281 | |
| | 4,523 | | | BWX Technologies, Inc. | | | 277,350 | |
| | 3,419 | | | C.H. Robinson Worldwide, Inc. | | | 328,498 | |
| | 2,868 | | | Carlisle Cos., Inc. | | | 363,691 | |
| | 1,669 | | | Cintas Corp. | | | 356,115 | |
| | 5,444 | | | Copart, Inc.(b) | | | 350,104 | |
| | 4,658 | | | CSX Corp. | | | 345,437 | |
| | 2,333 | | | Curtiss-Wright Corp. | | | 312,505 | |
| | 2,460 | | | Dun & Bradstreet Corp. (The) | | | 351,583 | |
| | 4,267 | | | Emerson Electric Co. | | | 327,407 | |
| | 4,056 | | | Expeditors International of Washington, Inc. | | | 297,224 | |
| | 1,206 | | | FedEx Corp. | | | 294,204 | |
| | 7,191 | | | Flowserve Corp. | | | 374,795 | |
| | 4,121 | | | Fortive Corp. | | | 346,082 | |
| | 7,553 | | | HD Supply Holdings, Inc.(b) | | | 344,341 | |
| | 1,572 | | | HEICO Corp. | | | 142,549 | |
| | 3,098 | | | HEICO Corp., Class A | | | 230,801 | |
| | | | | | | | |
Number
of Shares | | | | | Value | |
| | | | Common Stocks & Other Equity Interests
(continued) | |
| | | | Industrials (continued) | | | |
| | 1,373 | | | Huntington Ingalls Industries, Inc. | | $ | 335,657 | |
| | 6,179 | | | IHS Markit Ltd.(b) | | | 339,845 | |
| | 3,405 | | | Ingersoll-Rand PLC | | | 344,892 | |
| | 2,359 | | | J.B. Hunt Transport Services, Inc. | | | 284,849 | |
| | 16,109 | | | JetBlue Airways Corp.(b) | | | 307,360 | |
| | 8,886 | | | Johnson Controls International PLC | | | 335,624 | |
| | 5,709 | | | KAR Auction Services, Inc. | | | 357,897 | |
| | 3,300 | | | Kirby Corp.(b) | | | 288,090 | |
| | 1,975 | | | Norfolk Southern Corp. | | | 343,334 | |
| | 4,757 | | | PACCAR, Inc. | | | 325,474 | |
| | 6,837 | | | Pentair PLC (United Kingdom) | | | 297,273 | |
| | 1,440 | | | Raytheon Co. | | | 287,194 | |
| | 4,467 | | | Republic Services, Inc. | | | 327,699 | |
| | 4,777 | | | Robert Half International, Inc. | | | 373,466 | |
| | 2,216 | | | Rockwell Collins, Inc. | | | 301,265 | |
| | 5,975 | | | Rollins, Inc. | | | 358,978 | |
| | 2,034 | | | Snap-on, Inc. | | | 359,571 | |
| | 2,123 | | | Stanley Black & Decker, Inc. | | | 298,345 | |
| | 7,448 | | | Terex Corp. | | | 288,610 | |
| | 4,570 | | | Textron, Inc. | | | 315,467 | |
| | 5,077 | | | Toro Co. (The) | | | 308,631 | |
| | 4,457 | | | TransUnion | | | 335,612 | |
| | 8,694 | | | Trinity Industries, Inc. | | | 311,593 | |
| | 2,092 | | | Union Pacific Corp. | | | 315,097 | |
| | 4,380 | | | United Continental Holdings, Inc.(b) | | | 382,900 | |
| | 2,419 | | | United Technologies Corp. | | | 318,582 | |
| | 11,098 | | | Univar, Inc.(b) | | | 308,746 | |
| | 2,855 | | | Verisk Analytics, Inc.(b) | | | 340,002 | |
| | 3,166 | | | Wabtec Corp. | | | 342,941 | |
| | 3,641 | | | Waste Management, Inc. | | | 330,967 | |
| | 15,326 | | | Welbilt, Inc.(b) | | | 339,164 | |
| | 2,797 | | | XPO Logistics, Inc.(b) | | | 297,881 | |
| | 4,277 | | | Xylem, Inc. | | | 324,667 | |
| | | | | | | | |
| | | | | | | 16,817,954 | |
| | | | | | | | |
| | | | Information Technology—13.3% | | | |
| | 1,960 | | | Accenture PLC, Class A | | | 331,377 | |
| | 1,234 | | | Adobe Systems, Inc.(b) | | | 325,171 | |
| | 4,013 | | | Akamai Technologies, Inc.(b) | | | 301,537 | |
| | 4,457 | | | Amdocs Ltd. | | | 290,953 | |
| | 3,486 | | | Amphenol Corp., Class A | | | 329,706 | |
| | 1,628 | | | Apple, Inc. | | | 370,582 | |
| | 5,927 | | | Applied Materials, Inc. | | | 254,980 | |
| | 11,976 | | | ARRIS International PLC(b) | | | 310,298 | |
| | 4,057 | | | Arrow Electronics, Inc.(b) | | | 314,539 | |
| | 3,266 | | | Aspen Technology, Inc.(b) | | | 376,766 | |
| | 1,224 | | | Broadcom, Inc. | | | 268,093 | |
| | 2,632 | | | Broadridge Financial Solutions, Inc. | | | 355,689 | |
| | 8,598 | | | CA, Inc. | | | 376,592 | |
| | 4,715 | | | CDK Global, Inc. | | | 293,839 | |
| | 2,868 | | | Citrix Systems, Inc.(b) | | | 327,009 | |
| | 4,033 | | | Cognizant Technology Solutions Corp., Class A | | | 316,308 | |
| | 10,396 | | | CommScope Holding Co., Inc.(b) | | | 329,449 | |
| | 5,792 | | | CoreLogic, Inc.(b) | | | 294,465 | |
| | 3,767 | | | Dell Technologies, Inc., Class V(b) | | | 362,272 | |
| | 4,887 | | | Dolby Laboratories, Inc., Class A | | | 343,019 | |
| | 3,815 | | | DXC Technology Co. | | | 347,508 | |
See accompanying Notes to Financial Statements which are an integral part of the financial statements.
Invesco Russell 1000 Low Beta Equal Weight ETF (USLB) (continued)
August 31, 2018
| | | | | | | | |
Number
of Shares | | | | | Value | |
| | | | Common Stocks & Other Equity Interests
(continued) | |
| | | | Information Technology (continued) | | | |
| | 6,425 | | | EchoStar Corp., Class A(b) | | $ | 308,400 | |
| | 1,763 | | | F5 Networks, Inc.(b) | | | 333,419 | |
| | 1,627 | | | Facebook, Inc., Class A(b) | | | 285,913 | |
| | 16,213 | | | First Data Corp., Class A(b) | | | 416,998 | |
| | 4,196 | | | Fiserv, Inc.(b) | | | 335,974 | |
| | 4,990 | | | Fortinet, Inc.(b) | | | 417,962 | |
| | 2,737 | | | Global Payments, Inc. | | | 340,975 | |
| | 4,232 | | | GoDaddy, Inc., Class A(b) | | | 344,739 | |
| | 2,843 | | | GrubHub, Inc.(b) | | | 409,705 | |
| | 19,607 | | | Hewlett Packard Enterprise Co. | | | 324,104 | |
| | 1,983 | | | IAC/InterActiveCorp.(b) | | | 391,048 | |
| | 5,491 | | | Intel Corp. | | | 265,929 | |
| | 1,520 | | | Intuit, Inc. | | | 333,594 | |
| | 10,728 | | | Jabil, Inc. | | | 317,120 | |
| | 11,324 | | | Juniper Networks, Inc. | | | 321,941 | |
| | 2,678 | | | KLA-Tencor Corp. | | | 311,210 | |
| | 1,515 | | | Lam Research Corp. | | | 262,231 | |
| | 5,046 | | | Leidos Holdings, Inc. | | | 357,105 | |
| | 2,789 | | | LogMeIn, Inc. | | | 239,715 | |
| | 1,594 | | | Mastercard, Inc., Class A | | | 343,603 | |
| | 7,309 | | | Match Group, Inc.(b) | | | 365,815 | |
| | 4,879 | | | Micron Technology, Inc.(b) | | | 256,245 | |
| | 3,085 | | | Microsoft Corp. | | | 346,538 | |
| | 2,663 | | | MKS Instruments, Inc. | | | 247,393 | |
| | 2,281 | | | Monolithic Power Systems, Inc. | | | 341,854 | |
| | 2,645 | | | NXP Semiconductors NV (Netherlands)(b) | | | 246,355 | |
| | 6,499 | | | Oracle Corp. | | | 315,721 | |
| | 2,911 | | | Paycom Software, Inc.(b) | | | 451,554 | |
| | 4,880 | | | Pegasystems, Inc. | | | 310,856 | |
| | 5,200 | | | RealPage, Inc.(b) | | | 324,480 | |
| | 1,857 | | | Red Hat, Inc.(b) | | | 274,335 | |
| | 12,491 | | | Sabre Corp. | | | 326,140 | |
| | 2,361 | | | salesforce.com, Inc.(b) | | | 360,478 | |
| | 3,060 | | | Skyworks Solutions, Inc. | | | 279,378 | |
| | 14,525 | | | Symantec Corp. | | | 292,824 | |
| | 2,729 | | | Texas Instruments, Inc. | | | 306,740 | |
| | 8,885 | | | Twitter, Inc.(b) | | | 312,574 | |
| | 1,322 | | | Tyler Technologies, Inc.(b) | | | 326,468 | |
| | 1,180 | | | Ultimate Software Group, Inc. (The)(b) | | | 365,411 | |
| | 2,335 | | | VeriSign, Inc.(b) | | | 370,354 | |
| | 7,600 | | | Versum Materials, Inc. | | | 302,404 | |
| | 2,337 | | | Visa, Inc., Class A | | | 343,282 | |
| | 2,215 | | | VMware, Inc., Class A(b) | | | 339,471 | |
| | 3,838 | | | Worldpay, Inc., Class A(b) | | | 373,783 | |
| | 1,958 | | | Zebra Technologies Corp., Class A(b) | | | 336,267 | |
| | 70,777 | | | Zynga, Inc., Class A(b) | | | 294,432 | |
| | | | | | | | |
| | | | | | | 21,892,989 | |
| | | | | | | | |
| | | | Materials—6.7% | | | |
| | 1,875 | | | Air Products & Chemicals, Inc. | | | 311,794 | |
| | 3,267 | | | Albemarle Corp. | | | 312,064 | |
| | 6,299 | | | Alcoa Corp.(b) | | | 281,376 | |
| | 3,249 | | | AptarGroup, Inc. | | | 340,203 | |
| | 9,803 | | | Axalta Coating Systems Ltd.(b) | | | 298,991 | |
| | 8,117 | | | Ball Corp. | | | 339,940 | |
| | 7,131 | | | Bemis Co., Inc. | | | 351,416 | |
| | 6,183 | | | Berry Global Group, Inc.(b) | | | 295,115 | |
| | | | | | | | |
Number
of Shares | | | | | Value | |
| | | | Common Stocks & Other Equity Interests
(continued) | |
| | | | Materials (continued) | | | |
| | 2,656 | | | Celanese Corp., Series A | | $ | 310,300 | |
| | 7,349 | | | CF Industries Holdings, Inc. | | | 381,781 | |
| | 2,914 | | | Eastman Chemical Co. | | | 282,745 | |
| | 2,120 | | | Ecolab, Inc. | | | 319,018 | |
| | 3,460 | | | FMC Corp. | | | 295,657 | |
| | 17,860 | | | Freeport-McMoRan, Inc. | | | 250,933 | |
| | 2,450 | | | International Flavors & Fragrances, Inc. | | | 319,210 | |
| | 5,674 | | | International Paper Co. | | | 290,168 | |
| | 808 | | | NewMarket Corp. | | | 324,040 | |
| | 7,790 | | | Newmont Mining Corp. | | | 241,724 | |
| | 4,770 | | | Nucor Corp. | | | 298,125 | |
| | 16,403 | | | Owens-Illinois, Inc.(b) | | | 289,841 | |
| | 2,578 | | | Packaging Corp. of America | | | 283,374 | |
| | 3,014 | | | PPG Industries, Inc. | | | 333,168 | |
| | 1,951 | | | Praxair, Inc. | | | 308,629 | |
| | 3,237 | | | Reliance Steel & Aluminum Co. | | | 284,500 | |
| | 6,002 | | | RPM International, Inc. | | | 405,135 | |
| | 3,520 | | | Scotts Miracle-Gro Co. (The) | | | 263,014 | |
| | 6,825 | | | Sealed Air Corp. | | | 273,751 | |
| | 808 | | | Sherwin-Williams Co. (The) | | | 368,109 | |
| | 11,082 | | | Silgan Holdings, Inc. | | | 301,984 | |
| | 5,883 | | | Sonoco Products Co. | | | 329,683 | |
| | 6,187 | | | Southern Copper Corp. (Peru) | | | 270,001 | |
| | 6,129 | | | Steel Dynamics, Inc. | | | 280,279 | |
| | 8,435 | | | United States Steel Corp. | | | 250,351 | |
| | 14,785 | | | Valvoline, Inc. | | | 318,173 | |
| | 4,307 | | | W.R. Grace & Co. | | | 304,333 | |
| | 5,116 | | | WestRock Co. | | | 281,789 | |
| | | | | | | | |
| | | | | | | 10,990,714 | |
| | | | | | | | |
| | | | Real Estate—13.6% | | | |
| | 2,436 | | | Alexandria Real Estate Equities, Inc. REIT | | | 312,661 | |
| | 7,581 | | | American Campus Communities, Inc. REIT | | | 317,871 | |
| | 15,272 | | | American Homes 4 Rent, Class A REIT | | | 354,310 | |
| | 7,490 | | | Apartment Investment & Management Co., Class A REIT | | | 328,062 | |
| | 1,843 | | | AvalonBay Communities, Inc. REIT | | | 337,803 | |
| | 2,500 | | | Boston Properties, Inc. REIT | | | 326,125 | |
| | 18,701 | | | Brandywine Realty Trust REIT | | | 313,429 | |
| | 19,470 | | | Brixmor Property Group, Inc. REIT | | | 354,743 | |
| | 3,487 | | | Camden Property Trust REIT | | | 331,474 | |
| | 13,717 | | | Columbia Property Trust, Inc. REIT | | | 330,305 | |
| | 2,834 | | | CoreSite Realty Corp. REIT | | | 330,076 | |
| | 10,912 | | | Corporate Office Properties Trust REIT | | | 335,871 | |
| | 2,935 | | | Crown Castle International Corp. REIT | | | 334,678 | |
| | 9,995 | | | CubeSmart REIT | | | 305,347 | |
| | 2,826 | | | Digital Realty Trust, Inc. REIT | | | 351,215 | |
| | 7,927 | | | Douglas Emmett, Inc. REIT | | | 309,629 | |
| | 10,780 | | | Duke Realty Corp. REIT | | | 307,122 | |
| | 18,018 | | | Empire State Realty Trust, Inc., Class A REIT | | | 316,937 | |
| | 4,969 | | | EPR Properties REIT | | | 348,724 | |
| | 762 | | | Equinix, Inc. REIT | | | 332,331 | |
| | 9,766 | | | Equity Commonwealth REIT(b) | | | 313,098 | |
| | 3,370 | | | Equity LifeStyle Properties, Inc. REIT | | | 326,486 | |
| | 4,791 | | | Equity Residential REIT | | | 324,590 | |
| | 1,267 | | | Essex Property Trust, Inc. REIT | | | 312,037 | |
| | 3,154 | | | Extra Space Storage, Inc. REIT | | | 290,830 | |
See accompanying Notes to Financial Statements which are an integral part of the financial statements.
Invesco Russell 1000 Low Beta Equal Weight ETF (USLB) (continued)
August 31, 2018
| | | | | | | | |
Number
of Shares | | | | | Value | |
| | | | Common Stocks & Other Equity Interests
(continued) | |
| | | | Real Estate (continued) | | | |
| | 2,557 | | | Federal Realty Investment Trust REIT | | $ | 333,970 | |
| | 15,390 | | | Forest City Realty Trust, Inc., Class A REIT | | | 387,058 | |
| | 8,674 | | | Gaming and Leisure Properties, Inc. REIT | | | 310,442 | |
| | 11,925 | | | Healthcare Trust of America, Inc., Class A REIT | | | 340,697 | |
| | 6,426 | | | Highwoods Properties, Inc. REIT | | | 319,629 | |
| | 2,418 | | | Howard Hughes Corp. (The)(b) | | | 315,235 | |
| | 8,686 | | | Hudson Pacific Properties, Inc. REIT | | | 293,934 | |
| | 9,127 | | | Iron Mountain, Inc. REIT | | | 329,485 | |
| | 4,001 | | | Kilroy Realty Corp. REIT | | | 292,633 | |
| | 19,837 | | | Kimco Realty Corp. REIT | | | 339,411 | |
| | 4,393 | | | Lamar Advertising Co., Class A REIT | | | 338,481 | |
| | 6,982 | | | Liberty Property Trust REIT | | | 305,463 | |
| | 3,295 | | | Life Storage, Inc. REIT | | | 321,592 | |
| | 5,445 | | | Macerich Co. (The) REIT | | | 319,839 | |
| | 22,530 | | | Medical Properties Trust, Inc. REIT | | | 339,077 | |
| | 3,253 | | | Mid-America Apartment Communities, Inc. REIT | | | 336,881 | |
| | 7,398 | | | National Retail Properties, Inc. REIT | | | 340,974 | |
| | 9,930 | | | Omega Healthcare Investors, Inc. REIT | | | 328,187 | |
| | 15,411 | | | Outfront Media, Inc. REIT | | | 306,217 | |
| | 20,370 | | | Paramount Group, Inc. REIT | | | 323,476 | |
| | 9,449 | | | Prologis, Inc. REIT | | | 634,784 | |
| | 1,471 | | | Public Storage REIT | | | 312,705 | |
| | 7,822 | | | Rayonier, Inc. REIT | | | 272,440 | |
| | 12,751 | | | Realogy Holdings Corp. | | | 272,744 | |
| | 5,691 | | | Realty Income Corp. REIT | | | 333,322 | |
| | 5,227 | | | Regency Centers Corp. REIT | | | 345,139 | |
| | 25,251 | | | Retail Properties of America, Inc., Class A REIT | | | 321,445 | |
| | 17,314 | | | Senior Housing Properties Trust REIT | | | 330,871 | |
| | 1,889 | | | Simon Property Group, Inc. REIT | | | 345,744 | |
| | 3,139 | | | SL Green Realty Corp. REIT | | | 327,712 | |
| | 39,023 | | | Spirit Realty Capital, Inc. REIT | | | 326,623 | |
| | 11,303 | | | STORE Capital Corp. REIT | | | 325,639 | |
| | 3,157 | | | Sun Communities, Inc. REIT | | | 325,739 | |
| | 5,576 | | | Taubman Centers, Inc. REIT | | | 360,265 | |
| | 8,391 | | | UDR, Inc. REIT | | | 335,388 | |
| | 14,684 | | | Uniti Group, Inc. REIT(b) | | | 305,721 | |
| | 5,570 | | | Ventas, Inc. REIT | | | 333,476 | |
| | 42,763 | | | VEREIT, Inc. REIT | | | 334,407 | |
| | 4,396 | | | Vornado Realty Trust REIT | | | 338,492 | |
| | 10,398 | | | Weingarten Realty Investors REIT | | | 321,610 | |
| | 5,314 | | | Welltower, Inc. REIT | | | 354,497 | |
| | 8,213 | | | Weyerhaeuser Co. REIT | | | 285,073 | |
| | 4,556 | | | WP Carey, Inc. REIT | | | 303,338 | |
| | | | | | | | |
| | | | | | | 22,415,609 | |
| | | | | | | | |
| | | | Telecommunication Services—1.4% | | | |
| | 9,388 | | | AT&T, Inc. | | | 299,853 | |
| | 16,699 | | | CenturyLink, Inc. | | | 356,691 | |
| | 58,574 | | | Sprint Corp.(b) | | | 357,887 | |
| | 11,805 | | | Telephone & Data Systems, Inc. | | | 354,622 | |
| | 5,428 | | | T-Mobile US, Inc.(b) | | | 358,465 | |
| | 8,391 | | | United States Cellular Corp.(b) | | | 358,799 | |
| | 8,780 | | | Zayo Group Holdings, Inc.(b) | | | 304,315 | |
| | | | | | | | |
| | | | | | | 2,390,632 | |
| | | | | | | | |
| | | | | | | | |
Number
of Shares | | | | | Value | |
| | | | Common Stocks & Other Equity Interests
(continued) | |
| | | | Utilities—6.4% | | | |
| | 7,378 | | | Alliant Energy Corp. | | $ | 316,074 | |
| | 5,140 | | | Ameren Corp. | | | 325,002 | |
| | 4,496 | | | American Electric Power Co., Inc. | | | 322,498 | |
| | 3,625 | | | American Water Works Co., Inc. | | | 317,296 | |
| | 8,567 | | | Aqua America, Inc. | | | 318,521 | |
| | 3,393 | | | Atmos Energy Corp. | | | 312,936 | |
| | 5,758 | | | Avangrid, Inc. | | | 284,100 | |
| | 11,706 | | | CenterPoint Energy, Inc. | | | 325,310 | |
| | 6,625 | | | CMS Energy Corp. | | | 326,215 | |
| | 4,006 | | | Consolidated Edison, Inc. | | | 316,194 | |
| | 4,739 | | | Dominion Energy, Inc. | | | 335,379 | |
| | 2,984 | | | DTE Energy Co. | | | 331,642 | |
| | 3,972 | | | Duke Energy Corp. | | | 322,685 | |
| | 4,910 | | | Edison International | | | 322,734 | |
| | 3,807 | | | Entergy Corp. | | | 318,227 | |
| | 5,360 | | | Evergy, Inc. | | | 305,788 | |
| | 5,351 | | | Eversource Energy | | | 334,063 | |
| | 7,406 | | | Exelon Corp. | | | 323,716 | |
| | 8,930 | | | Hawaiian Electric Industries, Inc. | | | 314,961 | |
| | 10,887 | | | MDU Resources Group, Inc. | | | 303,638 | |
| | 1,847 | | | NextEra Energy, Inc. | | | 314,175 | |
| | 12,081 | | | NiSource, Inc. | | | 327,033 | |
| | 8,700 | | | OGE Energy Corp. | | | 320,421 | |
| | 7,096 | | | PG&E Corp. | | | 327,693 | |
| | 3,831 | | | Pinnacle West Capital Corp. | | | 300,925 | |
| | 11,166 | | | PPL Corp. | | | 332,077 | |
| | 5,794 | | | Public Service Enterprise Group, Inc. | | | 303,316 | |
| | 2,878 | | | Sempra Energy | | | 334,078 | |
| | 6,834 | | | Southern Co. (The) | | | 299,193 | |
| | 5,974 | | | UGI Corp. | | | 322,895 | |
| | 4,319 | | | Vectren Corp. | | | 307,513 | |
| | 4,823 | | | WEC Energy Group, Inc. | | | 325,938 | |
| | 6,704 | | | Xcel Energy, Inc. | | | 322,127 | |
| | | | | | | | |
| | | | | | | 10,514,363 | |
| | | | | | | | |
| | | | Total Investments in Securities
(Cost $150,841,331)—99.9% | | | 164,594,202 | |
| | | | Other assets less liabilities—0.1% | | | 183,597 | |
| | | | | | | | |
| | | | Net Assets—100.0% | | $ | 164,777,799 | |
| | | | | | | | |
Investment Abbreviations:
REIT—Real Estate Investment Trust
Notes to Schedule of Investments:
| (a) | Industry and/or sector classifications used in this report are generally according to the Global Industry Classification Standard, which was developed by and is the exclusive property and a service mark of MSCI Inc. and Standard & Poor’s. |
| (b) | Non-income producing security. |
See accompanying Notes to Financial Statements which are an integral part of the financial statements.
Schedule of Investments(a)
Invesco S&P 500 Enhanced Value ETF (SPVU)
August 31, 2018
| | | | | | | | |
Number
of Shares | | | | | Value | |
| | | | Common Stocks & Other Equity Interests—99.9% | |
| | | | Consumer Discretionary—14.8% | | | |
| | 1,640 | | | Best Buy Co., Inc. | | $ | 130,478 | |
| | 1,422 | | | Charter Communications, Inc., Class A(b) | | | 441,389 | |
| | 33,957 | | | Comcast Corp., Class A | | | 1,256,069 | |
| | 2,144 | | | D.R. Horton, Inc. | | | 95,430 | |
| | 1,861 | | | DISH Network Corp., Class A(b) | | | 65,786 | |
| | 1,579 | | | Dollar Tree, Inc.(b) | | | 127,125 | |
| | 598 | | | Foot Locker, Inc. | | | 29,481 | |
| | 49,873 | | | Ford Motor Co. | | | 472,796 | |
| | 1,295 | | | Gap, Inc. (The) | | | 39,303 | |
| | 7,366 | | | General Motors Co. | | | 265,544 | |
| | 2,367 | | | Goodyear Tire & Rubber Co. (The) | | | 53,707 | |
| | 1,206 | | | Kohl’s Corp. | | | 95,407 | |
| | 2,107 | | | Lennar Corp., Class A | | | 108,869 | |
| | 3,199 | | | Macy’s, Inc. | | | 116,924 | |
| | 5,739 | | | Newell Brands, Inc. | | | 124,651 | |
| | 684 | | | Nordstrom, Inc. | | | 42,989 | |
| | 1,498 | | | PulteGroup, Inc. | | | 41,869 | |
| | 3,789 | | | Target Corp. | | | 331,538 | |
| | 3,341 | | | Viacom, Inc., Class B | | | 97,825 | |
| | 495 | | | Whirlpool Corp. | | | 61,865 | |
| | | | | | | | |
| | | | | | | 3,999,045 | |
| | | | | | | | |
| | | | Consumer Staples—9.8% | | | |
| | 5,826 | | | Archer-Daniels-Midland Co. | | | 293,630 | |
| | 805 | | | JM Smucker Co. (The) | | | 83,221 | |
| | 5,439 | | | Kraft Heinz Co. (The) | | | 316,931 | |
| | 7,336 | | | Kroger Co. (The) | | | 231,084 | |
| | 1,756 | | | Molson Coors Brewing Co., Class B | | | 117,195 | |
| | 2,681 | | | Tyson Foods, Inc., Class A | | | 168,394 | |
| | 6,843 | | | Walgreens Boots Alliance, Inc. | | | 469,156 | |
| | 9,976 | | | Walmart, Inc. | | | 956,299 | |
| | | | | | | | |
| | | | | | | 2,635,910 | |
| | | | | | | | |
| | | | Energy—5.5% | | | |
| | 1,144 | | | Andeavor | | | 174,792 | |
| | 3,055 | | | Baker Hughes a GE Co. | | | 100,724 | |
| | 3,977 | | | Marathon Petroleum Corp. | | | 327,267 | |
| | 3,265 | | | Phillips 66 | | | 386,935 | |
| | 2,811 | | | TechnipFMC PLC (United Kingdom) | | | 86,101 | |
| | 3,501 | | | Valero Energy Corp. | | | 412,698 | |
| | | | | | | | |
| | | | | | | 1,488,517 | |
| | | | | | | | |
| | | | Financials—35.5% | | | |
| | 6,342 | | | Aflac, Inc. | | | 293,254 | |
| | 2,927 | | | Allstate Corp. (The) | | | 294,368 | |
| | 496 | | | Assurant, Inc. | | | 50,999 | |
| | 43,339 | | | Bank of America Corp. | | | 1,340,475 | |
| | 5,389 | | | Bank of New York Mellon Corp. (The) | | | 281,036 | |
| | 6,711 | | | Berkshire Hathaway, Inc., Class B(b) | | | 1,400,720 | |
| | 695 | | | Brighthouse Financial, Inc.(b) | | | 28,849 | |
| | 3,328 | | | Capital One Financial Corp. | | | 329,771 | |
| | 3,006 | | | Chubb Ltd. | | | 406,531 | |
| | 3,399 | | | Citizens Financial Group, Inc. | | | 139,903 | |
| | 269 | | | Everest Re Group Ltd. | | | 59,992 | |
| | 4,653 | | | Fifth Third Bancorp | | | 136,938 | |
| | 1,946 | | | Goldman Sachs Group, Inc. (The) | | | 462,778 | |
| | 2,978 | | | Invesco Ltd.(c) | | | 71,770 | |
| | 2,472 | | | Jefferies Financial Group, Inc. | | | 57,400 | |
| | 2,353 | | | Lincoln National Corp. | | | 154,310 | |
| | | | | | | | |
Number
of Shares | | | | | Value | |
| | | | Common Stocks & Other Equity Interests
(continued) | |
| | | | Financials (continued) | | | |
| | 2,325 | | | Loews Corp. | | $ | 116,971 | |
| | 10,439 | | | MetLife, Inc. | | | 479,046 | |
| | 8,317 | | | Morgan Stanley | | | 406,119 | |
| | 1,942 | | | People’s United Financial, Inc. | | | 35,946 | |
| | 2,401 | | | PNC Financial Services Group, Inc. (The) | | | 344,640 | |
| | 2,514 | | | Principal Financial Group, Inc. | | | 138,748 | |
| | 5,194 | | | Prudential Financial, Inc. | | | 510,310 | |
| | 5,660 | | | Regions Financial Corp. | | | 110,144 | |
| | 2,466 | | | SunTrust Banks, Inc. | | | 181,399 | |
| | 814 | | | Torchmark Corp. | | | 71,567 | |
| | 1,706 | | | Travelers Cos., Inc. (The) | | | 224,510 | |
| | 2,507 | | | Unum Group | | | 92,458 | |
| | 23,424 | | | Wells Fargo & Co. | | | 1,369,836 | |
| | | | | | | | |
| | | | | | | 9,590,788 | |
| | | | | | | | |
| | | | Health Care—10.2% | | | |
| | 1,123 | | | AmerisourceBergen Corp. | | | 101,036 | |
| | 1,893 | | | Anthem, Inc. | | | 501,134 | |
| | 3,192 | | | Cardinal Health, Inc. | | | 166,590 | |
| | 1,610 | | | Centene Corp.(b) | | | 235,833 | |
| | 10,923 | | | CVS Health Corp. | | | 821,847 | |
| | 1,070 | | | Envision Healthcare Corp.(b) | | | 48,535 | |
| | 5,795 | | | Express Scripts Holding Co.(b) | | | 510,076 | |
| | 2,302 | | | McKesson Corp. | | | 296,383 | |
| | 526 | | | Universal Health Services, Inc., Class B | | | 68,464 | |
| | | | | | | | |
| | | | | | | 2,749,898 | |
| | | | | | | | |
| | | | Industrials—5.5% | | | |
| | 971 | | | Alaska Air Group, Inc. | | | 65,533 | |
| | 2,809 | | | American Airlines Group, Inc. | | | 113,708 | |
| | 4,180 | | | Delta Air Lines, Inc. | | | 244,446 | |
| | 2,537 | | | Eaton Corp. PLC | | | 210,926 | |
| | 1,040 | | | Fluor Corp. | | | 59,706 | |
| | 798 | | | Jacobs Engineering Group, Inc. | | | 58,007 | |
| | 6,258 | | | Johnson Controls International PLC | | | 236,365 | |
| | 1,039 | | | Pentair PLC (United Kingdom) | | | 45,176 | |
| | 1,245 | | | Quanta Services, Inc.(b) | | | 43,064 | |
| | 3,432 | | | Southwest Airlines Co. | | | 210,382 | |
| | 2,212 | | | United Continental Holdings, Inc.(b) | | | 193,373 | |
| | | | | | | | |
| | | | | | | 1,480,686 | |
| | | | | | | | |
| | | | Information Technology—2.4% | | | |
| | 13,122 | | | Hewlett Packard Enterprise Co. | | | 216,907 | |
| | 7,437 | | | Micron Technology, Inc.(b) | | | 390,591 | |
| | 1,555 | | | Xerox Corp. | | | 43,322 | |
| | | | | | | | |
| | | | | | | 650,820 | |
| | | | | | | | |
| | | | Materials—2.7% | | | |
| | 754 | | | Eastman Chemical Co. | | | 73,161 | |
| | 2,650 | | | International Paper Co. | | | 135,521 | |
| | 1,876 | | | LyondellBasell Industries NV, Class A | | | 211,575 | |
| | 1,859 | | | Mosaic Co. (The) | | | 58,131 | |
| | 1,787 | | | Nucor Corp. | | | 111,687 | |
| | 2,307 | | | WestRock Co. | | | 127,070 | |
| | | | | | | | |
| | | | | | | 717,145 | |
| | | | | | | | |
| | | | Real Estate—0.2% | | | |
| | 2,179 | | | Duke Realty Corp. REIT | | | 62,080 | |
| | | | | | | | |
See accompanying Notes to Financial Statements which are an integral part of the financial statements.
Invesco S&P 500 Enhanced Value ETF (SPVU) (continued)
August 31, 2018
| | | | | | | | |
Number
of Shares | | | | | Value | |
| | | | Common Stocks & Other Equity Interests
(continued) | |
| | | | Telecommunication Services—10.9% | | | |
| | 39,002 | | | AT&T, Inc. | | $ | 1,245,724 | |
| | 11,018 | | | CenturyLink, Inc. | | | 235,345 | |
| | 26,893 | | | Verizon Communications, Inc. | | | 1,462,172 | |
| | | | | | | | |
| | | | | | | 2,943,241 | |
| | | | | | | | |
| | | | Utilities—2.4% | | | |
| | 3,606 | | | CenterPoint Energy, Inc. | | | 100,211 | |
| | 7,688 | | | Exelon Corp. | | | 336,043 | |
| | 4,023 | | | PG&E Corp. | | | 185,782 | |
| | 792 | | | SCANA Corp. | | | 30,365 | |
| | | | | | | | |
| | | | | | | 652,401 | |
| | | | | | | | |
| | | | Total Investments in Securities
(Cost $25,744,394)—99.9% | | | 26,970,531 | |
| | | | Other assets less liabilities—0.1% | | | 25,042 | |
| | | | | | | | |
| | | | Net Assets—100.0% | | $ | 26,995,573 | |
| | | | | | | | |
Investment Abbreviations:
REIT—Real Estate Investment Trust
Notes to Schedule of Investments:
| (a) | Industry and/or sector classifications used in this report are generally according to the Global Industry Classification Standard, which was developed by and is the exclusive property and a service mark of MSCI Inc. and Standard & Poor’s. |
| (b) | Non-income producing security. |
| (c) | Affiliated company. The Fund’s Adviser is a wholly-owned subsidiary of Invesco Ltd. and therefore, Invesco Ltd. is considered to be affiliated. See Note 4. |
See accompanying Notes to Financial Statements which are an integral part of the financial statements.
Schedule of Investments(a)
Invesco S&P 500® ex-Rate Sensitive Low Volatility ETF (XRLV)
August 31, 2018
| | | | | | | | |
Number
of Shares | | | | | Value | |
| | | | Common Stocks & Other Equity Interests—99.9% | |
| | | | Consumer Discretionary—6.8% | | | |
| | 22,040 | | | Garmin Ltd. | | $ | 1,501,806 | |
| | 7,092 | | | Home Depot, Inc. (The) | | | 1,423,861 | |
| | 8,872 | | | McDonald’s Corp. | | | 1,439,304 | |
| | 25,282 | | | Starbucks Corp. | | | 1,351,323 | |
| | 13,561 | | | TJX Cos., Inc. (The) | | | 1,491,303 | |
| | 11,693 | | | Walt Disney Co. (The) | | | 1,309,850 | |
| | 16,749 | | | Yum! Brands, Inc. | | | 1,455,321 | |
| | | | | | | | |
| | | | | | | 9,972,768 | |
| | | | | | | | |
| | | | Consumer Staples—8.6% | | | |
| | 29,109 | | | Archer-Daniels-Midland Co. | | | 1,467,094 | |
| | 42,796 | | | Coca-Cola Co. (The) | | | 1,907,418 | |
| | 35,980 | | | Conagra Brands, Inc. | | | 1,322,265 | |
| | 6,200 | | | Costco Wholesale Corp. | | | 1,445,406 | |
| | 32,992 | | | Mondelez International, Inc., Class A | | | 1,409,418 | |
| | 14,900 | | | PepsiCo, Inc. | | | 1,668,949 | |
| | 21,032 | | | Procter & Gamble Co. (The) | | | 1,744,604 | |
| | 20,376 | | | Sysco Corp. | | | 1,524,532 | |
| | | | | | | | |
| | | | | | | 12,489,686 | |
| | | | | | | | |
| | | | Energy—3.7% | | | |
| | 18,355 | | | Exxon Mobil Corp. | | | 1,471,520 | |
| | 17,024 | | | Occidental Petroleum Corp. | | | 1,359,707 | |
| | 19,014 | | | ONEOK, Inc. | | | 1,253,213 | |
| | 11,231 | | | Phillips 66 | | | 1,330,986 | |
| | | | | | | | |
| | | | | | | 5,415,426 | |
| | | | | | | | |
| | | | Financials—25.2% | | | |
| | 34,734 | | | Aflac, Inc. | | | 1,606,100 | |
| | 14,528 | | | Allstate Corp. (The) | | | 1,461,081 | |
| | 12,664 | | | American Express Co. | | | 1,342,131 | |
| | 27,201 | | | American International Group, Inc. | | | 1,446,277 | |
| | 11,376 | | | Aon PLC | | | 1,655,891 | |
| | 21,900 | | | Arthur J. Gallagher & Co. | | | 1,579,866 | |
| | 6,741 | | | Berkshire Hathaway, Inc., Class B(b) | | | 1,406,982 | |
| | 10,780 | | | Chubb Ltd. | | | 1,457,887 | |
| | 17,659 | | | Cincinnati Financial Corp. | | | 1,353,916 | |
| | 8,417 | | | CME Group, Inc. | | | 1,470,702 | |
| | 26,294 | | | Hartford Financial Services Group, Inc. (The) | | | 1,324,429 | |
| | 18,488 | | | Intercontinental Exchange, Inc. | | | 1,409,340 | |
| | 11,168 | | | JPMorgan Chase & Co. | | | 1,279,629 | |
| | 32,243 | | | Loews Corp. | | | 1,622,145 | |
| | 20,258 | | | Marsh & McLennan Cos., Inc. | | | 1,714,435 | |
| | 8,062 | | | Moody’s Corp. | | | 1,435,197 | |
| | 16,310 | | | Nasdaq, Inc. | | | 1,556,626 | |
| | 78,768 | | | People’s United Financial, Inc. | | | 1,457,996 | |
| | 8,979 | | | PNC Financial Services Group, Inc. (The) | | | 1,288,846 | |
| | 22,028 | | | Progressive Corp. (The) | | | 1,487,551 | |
| | 6,465 | | | S&P Global, Inc. | | | 1,338,578 | |
| | 18,103 | | | Torchmark Corp. | | | 1,591,616 | |
| | 10,622 | | | Travelers Cos., Inc. (The) | | | 1,397,855 | |
| | 28,311 | | | US Bancorp | | | 1,531,908 | |
| | 11,071 | | | Willis Towers Watson PLC | | | 1,630,426 | |
| | | | | | | | |
| | | | | | | 36,847,410 | |
| | | | | | | | |
| | | | Health Care—11.7% | | | |
| | 21,425 | | | Abbott Laboratories | | | 1,432,047 | |
| | 19,236 | | | Baxter International, Inc. | | | 1,430,581 | |
| | 5,312 | | | Becton, Dickinson and Co. | | | 1,391,054 | |
| | | | | | | | |
Number
of Shares | | | | | Value | |
| | | | Common Stocks & Other Equity Interests
(continued) | |
| | | | Health Care (continued) | | | |
| | 14,502 | | | Danaher Corp. | | $ | 1,501,537 | |
| | 13,424 | | | Eli Lilly & Co. | | | 1,418,246 | |
| | 3,976 | | | Humana, Inc. | | | 1,325,042 | |
| | 11,131 | | | Johnson & Johnson | | | 1,499,234 | |
| | 7,924 | | | Laboratory Corp. of America Holdings(b) | | | 1,369,822 | |
| | 19,841 | | | Merck & Co., Inc. | | | 1,360,894 | |
| | 15,998 | | | PerkinElmer, Inc. | | | 1,478,695 | |
| | 38,856 | | | Pfizer, Inc. | | | 1,613,301 | |
| | 14,610 | | | Zoetis, Inc. | | | 1,323,666 | |
| | | | | | | | |
| | | | | | | 17,144,119 | |
| | | | | | | | |
| | | | Industrials—13.7% | | | |
| | 19,214 | | | AMETEK, Inc. | | | 1,478,709 | |
| | 6,278 | | | Cintas Corp. | | | 1,339,537 | |
| | 6,760 | | | General Dynamics Corp. | | | 1,307,384 | |
| | 10,513 | | | Honeywell International, Inc. | | | 1,672,198 | |
| | 6,410 | | | L3 Technologies, Inc. | | | 1,369,945 | |
| | 4,329 | | | Lockheed Martin Corp. | | | 1,387,055 | |
| | 30,627 | | | Pentair PLC (United Kingdom) | | | 1,331,662 | |
| | 6,892 | | | Raytheon Co. | | | 1,374,541 | |
| | 22,423 | | | Republic Services, Inc. | | | 1,644,951 | |
| | 4,544 | | | Roper Technologies, Inc. | | | 1,355,793 | |
| | 20,170 | | | Textron, Inc. | | | 1,392,335 | |
| | 10,125 | | | United Technologies Corp. | | | 1,333,463 | |
| | 13,059 | | | Verisk Analytics, Inc.(b) | | | 1,555,196 | |
| | 16,890 | | | Waste Management, Inc. | | | 1,535,301 | |
| | | | | | | | |
| | | | | | | 20,078,070 | |
| | | | | | | | |
| | | | Information Technology—17.1% | | | |
| | 8,313 | | | Accenture PLC, Class A | | | 1,405,479 | |
| | 16,417 | | | Amphenol Corp., Class A | | | 1,552,720 | |
| | 9,531 | | | Automatic Data Processing, Inc. | | | 1,398,674 | |
| | 11,470 | | | Broadridge Financial Solutions, Inc. | | | 1,550,056 | |
| | 13,415 | | | Citrix Systems, Inc.(b) | | | 1,529,578 | |
| | 19,249 | | | Cognizant Technology Solutions Corp., Class A | | | 1,509,699 | |
| | 15,265 | | | Fidelity National Information Services, Inc. | | | 1,651,215 | |
| | 19,913 | | | Fiserv, Inc.(b) | | | 1,594,434 | |
| | 6,110 | | | Intuit, Inc. | | | 1,340,962 | |
| | 11,671 | | | Motorola Solutions, Inc. | | | 1,498,090 | |
| | 20,211 | | | Paychex, Inc. | | | 1,480,456 | |
| | 14,918 | | | Synopsys, Inc.(b) | | | 1,523,724 | |
| | 14,922 | | | TE Connectivity Ltd. | | �� | 1,368,049 | |
| | 13,834 | | | Total System Services, Inc. | | | 1,343,835 | |
| | 8,651 | | | VeriSign, Inc.(b) | | | 1,372,135 | |
| | 9,844 | | | Visa, Inc., Class A | | | 1,445,985 | |
| | 71,308 | | | Western Union Co. (The) | | | 1,349,147 | |
| | | | | | | | |
| | | | | | | 24,914,238 | |
| | | | | | | | |
| | | | Materials—7.1% | | | |
| | 9,440 | | | Air Products & Chemicals, Inc. | | | 1,569,778 | |
| | 34,351 | | | Ball Corp. | | | 1,438,620 | |
| | 13,545 | | | Eastman Chemical Co. | | | 1,314,271 | |
| | 12,058 | | | Ecolab, Inc. | | | 1,814,488 | |
| | 12,785 | | | PPG Industries, Inc. | | | 1,413,254 | |
| | 35,859 | | | Sealed Air Corp. | | | 1,438,305 | |
| | 2,949 | | | Sherwin-Williams Co. (The) | | | 1,343,505 | |
| | | | | | | | |
| | | | | | | 10,332,221 | |
| | | | | | | | |
See accompanying Notes to Financial Statements which are an integral part of the financial statements.
Invesco S&P 500® ex-Rate Sensitive Low Volatility ETF (XRLV) (continued)
August 31, 2018
| | | | | | | | |
Number
of Shares | | | | | Value | |
| | | | Common Stocks & Other Equity Interests
(continued) | |
| | | | Real Estate—5.1% | | | |
| | 29,973 | | | CBRE Group, Inc., Class A(b) | | $ | 1,462,982 | |
| | 63,784 | | | Host Hotels & Resorts, Inc. REIT | | | 1,373,269 | |
| | 14,094 | | | SL Green Realty Corp. REIT | | | 1,471,414 | |
| | 20,340 | | | Vornado Realty Trust REIT | | | 1,566,180 | |
| | 46,665 | | | Weyerhaeuser Co. REIT | | | 1,619,742 | |
| | | | | | | | |
| | | | | | | 7,493,587 | |
| | | | | | | | |
| | | | Telecommunication Services—0.9% | | | |
| | 25,330 | | | Verizon Communications, Inc. | | | 1,377,192 | |
| | | | | | | | |
| | | | Total Investments in Securities
(Cost $132,999,353)—99.9% | | | 146,064,717 | |
| | | | Other assets less liabilities-0.1% | | | 124,236 | |
| | | | | | | | |
| | | | Net Assets—100.0% | | $ | 146,188,953 | |
| | | | | | | | |
Investment Abbreviations:
REIT—Real Estate Investment Trust
| Notes | to Schedule of Investments: |
| (a) | Industry and/or sector classifications used in this report are generally according to the Global Industry Classification Standard, which was developed by and is the exclusive property and a service mark of MSCI Inc. and Standard & Poor’s. |
| (b) | Non-income producing security. |
See accompanying Notes to Financial Statements which are an integral part of the financial statements.
Schedule of Investments(a)
Invesco S&P 500® High Beta ETF (SPHB)
August 31, 2018
| | | | | | | | |
Number
of Shares | | | | | Value | |
| | | | Common Stocks—99.9% | | | |
| | | | Consumer Discretionary—6.6% | | | |
| | 829 | | | Amazon.com, Inc.(b) | | $ | 1,668,537 | |
| | 16,006 | | | Aptiv PLC | | | 1,408,688 | |
| | 36,280 | | | BorgWarner, Inc. | | | 1,587,976 | |
| | 51,821 | | | MGM Resorts International | | | 1,502,291 | |
| | 5,929 | | | Netflix, Inc.(b) | | | 2,179,975 | |
| | 70,949 | | | Newell Brands, Inc. | | | 1,541,012 | |
| | 74,921 | | | Under Armour, Inc., Class A(b) | | | 1,532,134 | |
| | | | | | | | |
| | | | | | | 11,420,613 | |
| | | | | | | | |
| | | | Energy—4.7% | |
| | 32,934 | | | EQT Corp. | | | 1,680,293 | |
| | 25,908 | | | Hess Corp. | | | 1,744,645 | |
| | 78,546 | | | Marathon Oil Corp. | | | 1,689,524 | |
| | 56,908 | | | Newfield Exploration Co.(b) | | | 1,552,450 | |
| | 49,505 | | | Noble Energy, Inc. | | | 1,471,289 | |
| | | | | | | | |
| | | | | | | 8,138,201 | |
| | | | | | | | |
| | | | Financials—24.4% | |
| | 10,587 | | | Affiliated Managers Group, Inc. | | | 1,546,655 | |
| | 11,424 | | | Ameriprise Financial, Inc. | | | 1,621,751 | |
| | 50,129 | | | Bank of America Corp. | | | 1,550,490 | |
| | 7,141 | | | Berkshire Hathaway, Inc., Class B(b) | | | 1,490,469 | |
| | 3,503 | | | BlackRock, Inc. | | | 1,678,147 | |
| | 38,686 | | | Brighthouse Financial, Inc.(b) | | | 1,605,856 | |
| | 15,327 | | | Capital One Financial Corp. | | | 1,518,752 | |
| | 34,603 | | | Charles Schwab Corp. (The) | | | 1,757,486 | |
| | 38,351 | | | Citizens Financial Group, Inc. | | | 1,578,527 | |
| | 15,078 | | | Comerica, Inc. | | | 1,469,803 | |
| | 20,102 | | | Discover Financial Services | | | 1,570,368 | |
| | 27,310 | | | E*TRADE Financial Corp.(b) | | | 1,607,467 | |
| | 45,618 | | | Franklin Resources, Inc. | | | 1,447,915 | |
| | 6,705 | | | Goldman Sachs Group, Inc. (The) | | | 1,594,516 | |
| | 63,798 | | | Invesco Ltd.(c) | | | 1,537,532 | |
| | 24,972 | | | Lincoln National Corp. | | | 1,637,664 | |
| | 35,890 | | | Morgan Stanley | | | 1,752,509 | |
| | 13,993 | | | Northern Trust Corp. | | | 1,503,688 | |
| | 27,159 | | | Principal Financial Group, Inc. | | | 1,498,905 | |
| | 16,795 | | | Prudential Financial, Inc. | | | 1,650,109 | |
| | 19,473 | | | Raymond James Financial, Inc. | | | 1,811,768 | |
| | 18,970 | | | State Street Corp. | | | 1,648,683 | |
| | 5,957 | | | SVB Financial Group(b) | | | 1,922,622 | |
| | 54,022 | | | Synchrony Financial | | | 1,710,877 | |
| | 13,785 | | | T. Rowe Price Group, Inc. | | | 1,597,544 | |
| | 42,167 | | | Unum Group | | | 1,555,119 | |
| | | | | | | | |
| | | | | | | 41,865,222 | |
| | | | | | | | |
| | | | Health Care—12.7% | |
| | 18,343 | | | AbbVie, Inc. | | | 1,760,561 | |
| | 4,384 | | | ABIOMED, Inc.(b) | | | 1,782,447 | |
| | 23,205 | | | Agilent Technologies, Inc. | | | 1,567,266 | |
| | 15,423 | | | Alexion Pharmaceuticals, Inc.(b) | | | 1,885,307 | |
| | 5,966 | | | Align Technology, Inc.(b) | | | 2,305,799 | |
| | 6,447 | | | IDEXX Laboratories, Inc.(b) | | | 1,637,796 | |
| | 5,411 | | | Illumina, Inc.(b) | | | 1,919,985 | |
| | 28,777 | | | Incyte Corp.(b) | | | 2,126,908 | |
| | 3,125 | | | Intuitive Surgical, Inc.(b) | | | 1,750,000 | |
| | 2,611 | | | Mettler-Toledo International, Inc.(b) | | | 1,526,025 | |
| | 26,741 | | | Nektar Therapeutics, Class A(b) | | | 1,778,009 | |
| | | | | | | | |
Number
of Shares | | | | | Value | |
| | | | Common Stocks (continued) | | | |
| | | | Health Care (continued) | |
| | 9,622 | | | Vertex Pharmaceuticals, Inc.(b) | | $ | 1,774,297 | |
| | | | | | | | |
| | | | | | | 21,814,400 | |
| | | | | | | | |
| | | | Industrials—12.7% | |
| | 7,272 | | | 3M Co. | | | 1,533,810 | |
| | 26,717 | | | A.O. Smith Corp. | | | 1,551,723 | |
| | 40,330 | | | American Airlines Group, Inc. | | | 1,632,558 | |
| | 85,122 | | | Arconic, Inc. | | | 1,905,030 | |
| | 4,781 | | | Boeing Co. (The) | | | 1,638,879 | |
| | 13,120 | | | Caterpillar, Inc. | | | 1,821,712 | |
| | 20,640 | | | CSX Corp. | | | 1,530,662 | |
| | 12,372 | | | Deere & Co. | | | 1,779,094 | |
| | 21,848 | | | Jacobs Engineering Group, Inc. | | | 1,588,131 | |
| | 23,844 | | | PACCAR, Inc. | | | 1,631,407 | |
| | 9,116 | | | Parker-Hannifin Corp. | | | 1,600,770 | |
| | 9,248 | | | Rockwell Automation, Inc. | | | 1,673,518 | |
| | 12,989 | | | United Rentals, Inc.(b) | | | 2,024,596 | |
| | | | | | | | |
| | | | | | | 21,911,890 | |
| | | | | | | | |
| | | | Information Technology—33.2% | |
| | 25,924 | | | Activision Blizzard, Inc. | | | 1,869,120 | |
| | 6,698 | | | Adobe Systems, Inc.(b) | | | 1,764,990 | |
| | 108,413 | | | Advanced Micro Devices, Inc.(b) | | | 2,728,755 | |
| | 1,455 | | | Alphabet, Inc., Class C(b) | | | 1,772,466 | |
| | 16,018 | | | Analog Devices, Inc. | | | 1,583,379 | |
| | 47,017 | | | Applied Materials, Inc. | | | 2,022,671 | |
| | 12,855 | | | Autodesk, Inc.(b) | | | 1,984,169 | |
| | 38,414 | | | Cisco Systems, Inc. | | | 1,835,037 | |
| | 46,371 | | | Corning, Inc. | | | 1,553,892 | |
| | 11,604 | | | Electronic Arts, Inc.(b) | | | 1,316,010 | |
| | 9,329 | | | Facebook, Inc., Class A(b) | | | 1,639,385 | |
| | 70,539 | | | HP, Inc. | | | 1,738,786 | |
| | 39,896 | | | Intel Corp. | | | 1,932,163 | |
| | 11,010 | | | IPG Photonics Corp.(b) | | | 1,932,035 | |
| | 18,180 | | | KLA-Tencor Corp. | | | 2,112,698 | |
| | 13,418 | | | Lam Research Corp. | | | 2,322,522 | |
| | 7,299 | | | Mastercard, Inc., Class A | | | 1,573,372 | |
| | 19,836 | | | Microchip Technology, Inc. | | | 1,706,491 | |
| | 44,651 | | | Micron Technology, Inc.(b) | | | 2,345,071 | |
| | 16,560 | | | Microsoft Corp. | | | 1,860,185 | |
| | 19,648 | | | NetApp, Inc. | | | 1,705,643 | |
| | 9,452 | | | NVIDIA Corp. | | | 2,652,987 | |
| | 18,187 | | | PayPal Holdings, Inc.(b) | | | 1,679,206 | |
| | 18,591 | | | Qorvo, Inc.(b) | | | 1,488,953 | |
| | 25,283 | | | QUALCOMM, Inc. | | | 1,737,195 | |
| | 29,125 | | | Seagate Technology PLC | | | 1,559,353 | |
| | 18,622 | | | Skyworks Solutions, Inc. | | | 1,700,189 | |
| | 14,214 | | | Take-Two Interactive Software, Inc.(b) | | | 1,898,422 | |
| | 15,427 | | | Texas Instruments, Inc. | | | 1,733,995 | |
| | 24,155 | | | Western Digital Corp. | | | 1,527,562 | |
| | 23,203 | | | Xilinx, Inc. | | | 1,805,890 | |
| | | | | | | | |
| | | | | | | 57,082,592 | |
| | | | | | | | |
| | | | Materials—5.6% | |
| | 25,138 | | | DowDuPont, Inc. | | | 1,762,928 | |
| | 129,666 | | | Freeport-McMoRan, Inc. | | | 1,821,807 | |
| | 48,851 | | | Mosaic Co. (The) | | | 1,527,571 | |
| | 23,628 | | | Nucor Corp. | | | 1,476,750 | |
See accompanying Notes to Financial Statements which are an integral part of the financial statements.
Invesco S&P 500® High Beta ETF (SPHB) (continued)
August 31, 2018
| | | | | | | | |
Number
of Shares | | | | | Value | |
| | | | Common Stocks (continued) | | | |
| | | | Materials (continued) | |
| | 9,561 | | | Praxair, Inc. | | $ | 1,512,454 | |
| | 26,546 | | | WestRock Co. | | | 1,462,154 | |
| | | | | | | | |
| | | | | | | 9,563,664 | |
| | | | | | | | |
| | | | Total Investments in Securities
(Cost $172,760,814)—99.9% | | | 171,796,582 | |
| | | | Other assets less liabilities—0.1% | | | 137,322 | |
| | | | | | | | |
| | | | Net Assets—100.0% | | $ | 171,933,904 | |
| | | | | | | | |
Notes to Schedule of Investments:
| (a) | Industry and/or sector classifications used in this report are generally according to the Global Industry Classification Standard, which was developed by and is the exclusive property and a service mark of MSCI Inc. and Standard & Poor’s. |
| (b) | Non-income producing security. |
| (c) | Affiliated company. The Fund’s Adviser is a wholly-owned subsidiary of Invesco Ltd. and therefore, Invesco Ltd. is considered to be affiliated. See Note 4. |
See accompanying Notes to Financial Statements which are an integral part of the financial statements.
Schedule of Investments(a)
Invesco S&P 500® High Dividend Low Volatility ETF (SPHD)
August 31, 2018
| | | | | | | | |
Number
of Shares | | | | | Value | |
| | | | Common Stocks & Other Equity Interests—99.9% | |
| | | | Consumer Discretionary—5.6% | | | |
| | 6,428,204 | | | Ford Motor Co. | | $ | 60,939,374 | |
| | 666,901 | | | Garmin Ltd. | | | 45,442,634 | |
| | 919,709 | | | Leggett & Platt, Inc. | | | 41,791,577 | |
| | | | | | | | |
| | | | | | | 148,173,585 | |
| | | | | | | | |
| | | | Consumer Staples—15.5% | |
| | 1,035,393 | | | Altria Group, Inc. | | | 60,591,198 | |
| | 959,889 | | | Coca-Cola Co. (The) | | | 42,782,253 | |
| | 1,288,338 | | | General Mills, Inc. | | | 59,276,431 | |
| | 552,406 | | | Kellogg Co. | | | 39,657,227 | |
| | 441,677 | | | Kimberly-Clark Corp. | | | 51,031,361 | |
| | 836,078 | | | Kraft Heinz Co. (The) | | | 48,718,265 | |
| | 808,282 | | | Philip Morris International, Inc. | | | 62,957,085 | |
| | 566,425 | | | Procter & Gamble Co. (The) | | | 46,984,954 | |
| | | | | | | | |
| | | | | | | 411,998,774 | |
| | | | | | | | |
| | | | Energy—10.7% | |
| | 352,273 | | | Chevron Corp. | | | 41,730,259 | |
| | 571,363 | | | Exxon Mobil Corp. | | | 45,806,172 | |
| | 2,311,253 | | | Kinder Morgan, Inc. | | | 40,909,178 | |
| | 553,034 | | | Occidental Petroleum Corp. | | | 44,170,826 | |
| | 779,258 | | | ONEOK, Inc. | | | 51,360,895 | |
| | 2,028,412 | | | Williams Cos., Inc. (The) | | | 60,020,711 | |
| | | | | | | | |
| | | | | | | 283,998,041 | |
| | | | | | | | |
| | | | Financials—10.5% | |
| | 546,006 | | | Cincinnati Financial Corp. | | | 41,862,280 | |
| | 2,105,333 | | | Invesco Ltd.(b) | | | 50,738,525 | |
| | 1,037,164 | | | MetLife, Inc. | | | 47,595,456 | |
| | 2,603,857 | | | People’s United Financial, Inc. | | | 48,197,393 | |
| | 859,270 | | | Principal Financial Group, Inc. | | | 47,423,111 | |
| | 450,739 | | | Prudential Financial, Inc. | | | 44,285,107 | |
| | | | | | | | |
| | | | | | | 280,101,872 | |
| | | | | | | | |
| | | | Health Care—3.5% | |
| | 622,138 | | | Merck & Co., Inc. | | | 42,672,445 | |
| | 1,210,011 | | | Pfizer, Inc. | | | 50,239,657 | |
| | | | | | | | |
| | | | | | | 92,912,102 | |
| | | | | | | | |
| | | | Industrials—5.0% | |
| | 300,305 | | | Cummins, Inc. | | | 42,583,249 | |
| | 545,742 | | | Eaton Corp. PLC | | | 45,372,990 | |
| | 365,237 | | | United Parcel Service, Inc., Class B | | | 44,880,322 | |
| | | | | | | | |
| | | | | | | 132,836,561 | |
| | | | | | | | |
| | | | Information Technology—3.6% | | | |
| | 372,110 | | | International Business Machines Corp. | | | 54,506,673 | |
| | 2,226,213 | | | Western Union Co. (The) | | | 42,119,950 | |
| | | | | | | | |
| | | | | | | 96,626,623 | |
| | | | | | | | |
| | | | Materials—3.3% | |
| | 856,428 | | | International Paper Co. | | | 43,797,728 | |
| | 400,161 | | | LyondellBasell Industries NV, Class A | | | 45,130,158 | |
| | | | | | | | |
| | | | | | | 88,927,886 | |
| | | | | | | | |
| | | | Real Estate—17.9% | |
| | 441,431 | | | Crown Castle International Corp. REIT | | | 50,336,377 | |
| | 2,777,601 | | | HCP, Inc. REIT | | | 75,078,555 | |
| | 2,236,440 | | | Iron Mountain, Inc. REIT | | | 80,735,484 | |
| | 1,097,417 | | | Realty Income Corp. REIT | | | 64,275,714 | |
| | 327,583 | | | Simon Property Group, Inc. REIT | | | 59,957,516 | |
| | | | | | | | |
Number
of Shares | | | | | Value | |
| | | | Common Stocks & Other Equity Interests
(continued) | |
| | | | Real Estate (continued) | |
| | 1,199,809 | | | Ventas, Inc. REIT | | $ | 71,832,565 | |
| | 1,100,399 | | | Welltower, Inc. REIT | | | 73,407,617 | |
| | | | | | | | |
| | | | | | | 475,623,828 | |
| | | | | | | | |
| | | | Telecommunication Services—5.3% | |
| | 2,440,061 | | | AT&T, Inc. | | | 77,935,549 | |
| | 1,135,587 | | | Verizon Communications, Inc. | | | 61,741,865 | |
| | | | | | | | |
| | | | | | | 139,677,414 | |
| | | | | | | | |
| | | | Utilities—19.0% | |
| | 3,565,396 | | | AES Corp. (The) | | | 47,990,230 | |
| | 1,765,549 | | | CenterPoint Energy, Inc. | | | 49,064,607 | |
| | 828,451 | | | Dominion Energy, Inc. | | | 58,629,477 | |
| | 706,477 | | | Duke Energy Corp. | | | 57,394,192 | |
| | 707,288 | | | Edison International | | | 46,490,040 | |
| | 695,614 | | | Entergy Corp. | | | 58,146,374 | |
| | 1,455,016 | | | FirstEnergy Corp. | | | 54,388,498 | |
| | 2,484,840 | | | PPL Corp. | | | 73,899,142 | |
| | 1,332,426 | | | Southern Co. (The) | | | 58,333,610 | |
| | | | | | | | |
| | | | | | | 504,336,170 | |
| | | | | | | | |
| | | | Total Investments in Securities
(Cost $2,689,037,268)—99.9% | | | 2,655,212,856 | |
| | | | Other assets less liabilities—0.1% | | | 1,655,409 | |
| | | | | | | | |
| | | | Net Assets—100.0% | | $ | 2,656,868,265 | |
| | | | | | | | |
Investment Abbreviations:
REIT—Real Estate Investment Trust
Notes to Schedule of Investments:
| (a) | Industry and/or sector classifications used in this report are generally according to the Global Industry Classification Standard, which was developed by and is the exclusive property and a service mark of MSCI Inc. and Standard & Poor’s. |
| (b) | Affiliated company. The Fund’s Adviser is a wholly-owned subsidiary of Invesco Ltd. and therefore, Invesco Ltd. is considered to be affiliated. See Note 4. |
See accompanying Notes to Financial Statements which are an integral part of the financial statements.
Schedule of Investments(a)
Invesco S&P 500® Low Volatility ETF (SPLV)
August 31, 2018
| | | | | | | | |
Number
of Shares | | | | | Value | |
| | | | Common Stocks & Other Equity Interests—100.0% | |
| | | | Consumer Discretionary—3.8% | | | |
| | 1,044,874 | | | Garmin Ltd. | | $ | 71,197,714 | |
| | 336,460 | | | Home Depot, Inc. (The) | | | 67,551,074 | |
| | 420,394 | | | McDonald’s Corp. | | | 68,200,519 | |
| | 793,703 | | | Yum! Brands, Inc. | | | 68,964,854 | |
| | | | | | | | |
| | | | | | | 275,914,161 | |
| | | | | | | | |
| | | | Consumer Staples—9.1% | |
| | 1,379,877 | | | Archer-Daniels-Midland Co. | | | 69,545,801 | |
| | 2,028,767 | | | Coca-Cola Co. (The) | | | 90,422,145 | |
| | 1,130,865 | | | Colgate-Palmolive Co. | | | 75,100,745 | |
| | 352,081 | | | Constellation Brands, Inc., Class A | | | 73,303,264 | |
| | 1,105,329 | | | Kraft Heinz Co. (The) | | | 64,407,521 | |
| | 1,564,014 | | | Mondelez International, Inc., Class A | | | 66,814,678 | |
| | 706,427 | | | PepsiCo, Inc. | | | 79,126,888 | |
| | 997,291 | | | Procter & Gamble Co. (The) | | | 82,725,288 | |
| | 966,156 | | | Sysco Corp. | | | 72,287,792 | |
| | | | | | | | |
| | | | | | | 673,734,122 | |
| | | | | | | | |
| | | | Energy—1.8% | |
| | 870,397 | | | Exxon Mobil Corp. | | | 69,779,727 | |
| | 532,549 | | | Phillips 66 | | | 63,112,382 | |
| | | | | | | | |
| | | | | | | 132,892,109 | |
| | | | | | | | |
| | | | Financials—16.8% | |
| | 1,646,805 | | | Aflac, Inc. | | | 76,148,263 | |
| | 688,612 | | | Allstate Corp. (The) | | | 69,253,709 | |
| | 1,289,614 | | | American International Group, Inc. | | | 68,568,776 | |
| | 539,134 | | | Aon PLC | | | 78,476,345 | |
| | 1,038,105 | | | Arthur J. Gallagher & Co. | | | 74,888,895 | |
| | 319,363 | | | Berkshire Hathaway, Inc., Class B(b) | | | 66,657,445 | |
| | 511,064 | | | Chubb Ltd. | | | 69,116,295 | |
| | 399,056 | | | CME Group, Inc. | | | 69,727,055 | |
| | 1,528,587 | | | Loews Corp. | | | 76,903,212 | |
| | 960,334 | | | Marsh & McLennan Cos., Inc. | | | 81,273,067 | |
| | 382,032 | | | Moody’s Corp. | | | 68,009,337 | |
| | 773,052 | | | Nasdaq, Inc. | | | 73,780,083 | |
| | 3,734,121 | | | People’s United Financial, Inc. | | | 69,118,580 | |
| | 1,044,338 | | | Progressive Corp. (The) | | | 70,524,145 | |
| | 858,081 | | | Torchmark Corp. | | | 75,442,482 | |
| | 1,342,039 | | | US Bancorp | | | 72,617,730 | |
| | 525,012 | | | Willis Towers Watson PLC | | | 77,318,517 | |
| | | | | | | | |
| | | | | | | 1,237,823,936 | |
| | | | | | | | |
| | | | Health Care—5.7% | |
| | 912,104 | | | Baxter International, Inc. | | | 67,833,174 | |
| | 687,505 | | | Danaher Corp. | | | 71,184,268 | |
| | 636,501 | | | Eli Lilly & Co. | | | 67,246,331 | |
| | 527,512 | | | Johnson & Johnson | | | 71,050,591 | |
| | 375,723 | | | Laboratory Corp. of America Holdings(b) | | | 64,951,235 | |
| | 1,842,259 | | | Pfizer, Inc. | | | 76,490,594 | |
| | | | | | | | |
| | | | | | | 418,756,193 | |
| | | | | | | | |
| | | | Industrials—6.0% | |
| | 910,839 | | | AMETEK, Inc. | | | 70,098,169 | |
| | 498,496 | | | Honeywell International, Inc. | | | 79,290,774 | |
| | 1,247,820 | | | IHS Markit Ltd.(b) | | | 68,630,100 | |
| | 1,063,156 | | | Republic Services, Inc. | | | 77,993,124 | |
| | 618,882 | | | Verisk Analytics, Inc.(b) | | | 73,702,657 | |
| | 800,522 | | | Waste Management, Inc. | | | 72,767,450 | |
| | | | | | | | |
| | | | | | | 442,482,274 | |
| | | | | | | | |
| | | | | | | | |
Number
of Shares | | | | | Value | |
| | | | Common Stocks & Other Equity Interests
(continued) | |
| | | | Information Technology—10.7% | |
| | 778,486 | | | Amphenol Corp., Class A | | $ | 73,629,206 | |
| | 543,964 | | | Broadridge Financial Solutions, Inc. | | | 73,511,295 | |
| | 636,202 | | | Citrix Systems, Inc.(b) | | | 72,539,752 | |
| | 912,698 | | | Cognizant Technology Solutions Corp., Class A | | | 71,582,904 | |
| | 723,419 | | | Fidelity National Information Services, Inc. | | | 78,252,233 | |
| | 944,166 | | | Fiserv, Inc.(b) | | | 75,599,372 | |
| | 553,023 | | | Motorola Solutions, Inc. | | | 70,986,032 | |
| | 958,009 | | | Paychex, Inc. | | | 70,174,159 | |
| | 707,220 | | | Synopsys, Inc.(b) | | | 72,235,451 | |
| | 707,367 | | | TE Connectivity Ltd. | | | 64,851,407 | |
| | 466,946 | | | Visa, Inc., Class A | | | 68,589,698 | |
| | | | | | | | |
| | | | | | | 791,951,509 | |
| | | | | | | | |
| | | | Materials—4.9% | |
| | 447,745 | | | Air Products & Chemicals, Inc. | | | 74,455,516 | |
| | 1,628,533 | | | Ball Corp. | | | 68,202,962 | |
| | 571,703 | | | Ecolab, Inc. | | | 86,029,868 | |
| | 606,211 | | | PPG Industries, Inc. | | | 67,010,564 | |
| | 1,700,165 | | | Sealed Air Corp. | | | 68,193,618 | |
| | | | | | | | |
| | | | | | | 363,892,528 | |
| | | | | | | | |
| | | | Real Estate—18.0% | |
| | 571,151 | | | Alexandria Real Estate Equities, Inc. REIT | | | 73,307,231 | |
| | 1,804,509 | | | Apartment Investment & Management Co., Class A REIT | | | 79,037,494 | |
| | 454,906 | | | AvalonBay Communities, Inc. REIT | | | 83,379,721 | |
| | 530,865 | | | Boston Properties, Inc. REIT | | | 69,251,339 | |
| | 1,420,998 | | | CBRE Group, Inc., Class A(b) | | | 69,358,912 | |
| | 2,457,299 | | | Duke Realty Corp. REIT | | | 70,008,449 | |
| | 1,173,411 | | | Equity Residential REIT | | | 79,498,595 | |
| | 298,441 | | | Essex Property Trust, Inc. REIT | | | 73,500,049 | |
| | 530,410 | | | Federal Realty Investment Trust REIT | | | 69,276,850 | |
| | 712,294 | | | Mid-America Apartment Communities, Inc. REIT | | | 73,765,167 | |
| �� | 1,035,819 | | | Prologis, Inc. REIT | | | 69,586,320 | |
| | 331,210 | | | Public Storage REIT | | | 70,408,622 | |
| | 1,286,600 | | | Realty Income Corp. REIT | | | 75,356,162 | |
| | 1,044,951 | | | Regency Centers Corp. REIT | | | 68,998,115 | |
| | 668,212 | | | SL Green Realty Corp. REIT | | | 69,761,333 | |
| | 2,016,755 | | | UDR, Inc. REIT | | | 80,609,697 | |
| | 964,232 | | | Vornado Realty Trust REIT | | | 74,245,864 | |
| | 2,212,310 | | | Weyerhaeuser Co. REIT | | | 76,789,280 | |
| | | | | | | | |
| | | | | | | 1,326,139,200 | |
| | | | | | | | |
| | | | Utilities—23.2% | |
| | 1,809,872 | | | Alliant Energy Corp. | | | 77,534,917 | |
| | 1,178,710 | | | Ameren Corp. | | | 74,529,833 | |
| | 1,137,617 | | | American Electric Power Co., Inc. | | | 81,601,267 | |
| | 877,593 | | | American Water Works Co., Inc. | | | 76,815,715 | |
| | 2,545,099 | | | CenterPoint Energy, Inc. | | | 70,728,301 | |
| | 1,710,267 | | | CMS Energy Corp. | | | 84,213,547 | |
| | 1,054,373 | | | Consolidated Edison, Inc. | | | 83,221,661 | |
| | 1,097,663 | | | Dominion Energy, Inc. | | | 77,681,611 | |
| | 746,002 | | | DTE Energy Co. | | | 82,910,662 | |
| | 1,051,624 | | | Duke Energy Corp. | | | 85,433,934 | |
| | 867,975 | | | Entergy Corp. | | | 72,554,030 | |
See accompanying Notes to Financial Statements which are an integral part of the financial statements.
Invesco S&P 500® Low Volatility ETF (SPLV) (continued)
August 31, 2018
| | | | | | | | |
Number
of Shares | | | | | Value | |
| | | | Common Stocks & Other Equity Interests
(continued) | |
| | | | Utilities (continued) | |
| | 1,296,396 | | | Evergy, Inc. | | $ | 73,959,392 | |
| | 1,196,513 | | | Eversource Energy | | | 74,698,307 | |
| | 1,906,361 | | | Exelon Corp. | | | 83,327,039 | |
| | 470,094 | | | NextEra Energy, Inc. | | | 79,962,989 | |
| | 2,808,731 | | | NiSource, Inc. | | | 76,032,348 | |
| | 936,520 | | | Pinnacle West Capital Corp. | | | 73,563,646 | |
| | 2,274,622 | | | PPL Corp. | | | 67,647,258 | |
| | 1,556,956 | | | Public Service Enterprise Group, Inc. | | | 81,506,647 | |
| | 1,665,186 | | | Southern Co. (The) | | | 72,901,843 | |
| | 1,221,982 | | | WEC Energy Group, Inc. | | | 82,581,544 | |
| | 1,692,157 | | | Xcel Energy, Inc. | | | 81,308,144 | |
| | | | | | | | |
| | | | | | | 1,714,714,635 | |
| | | | | | | | |
| | | | Total Investments in Securities
(Cost $6,868,756,210)—100.0% | | | 7,378,300,667 | |
| | | | Other assets less liabilities—0.0% | | | 3,061,762 | |
| | | | | | | | |
| | | | Net Assets—100.0% | | $ | 7,381,362,429 | |
| | | | | | | | |
Investment Abbreviations:
REIT—Real Estate Investment Trust
Notes to Schedule of Investments:
| (a) | Industry and/or sector classifications used in this report are generally according to the Global Industry Classification Standard, which was developed by and is the exclusive property and a service mark of MSCI Inc. and Standard & Poor’s. |
| (b) | Non-income producing security. |
See accompanying Notes to Financial Statements which are an integral part of the financial statements.
Schedule of Investments(a)
Invesco S&P 500 Minimum Variance ETF (SPMV)
August 31, 2018
| | | | | | | | |
Number
of Shares | | | | | Value | |
| | | | Common Stocks & Other Equity Interests—99.9% | |
| | | | Consumer Discretionary—14.2% | | | |
| | 14 | | | Amazon.com, Inc.(b) | | $ | 28,178 | |
| | 26 | | | Home Depot, Inc. (The) | | | 5,220 | |
| | 91 | | | Michael Kors Holdings Ltd.(b) | | | 6,608 | |
| | 75 | | | Mohawk Industries, Inc.(b) | | | 14,369 | |
| | 425 | | | NIKE, Inc., Class B | | | 34,935 | |
| | 8 | | | PVH Corp. | | | 1,145 | |
| | 44 | | | Ralph Lauren Corp., Class A | | | 5,844 | |
| | 52 | | | Ross Stores, Inc. | | | 4,981 | |
| | 478 | | | Starbucks Corp. | | | 25,549 | |
| | 316 | | | Tapestry, Inc. | | | 16,018 | |
| | 122 | | | TJX Cos., Inc. (The) | | | 13,416 | |
| | 217 | | | Under Armour, Inc., Class A(b) | | | 4,438 | |
| | 383 | | | VF Corp. | | | 35,286 | |
| | 135 | | | Yum! Brands, Inc. | | | 11,730 | |
| | | | | | | | |
| | | | | | | 207,717 | |
| | | | | | | | |
| | | | Consumer Staples—11.2% | |
| | 225 | | | Campbell Soup Co. | | | 8,876 | |
| | 270 | | | Coca-Cola Co. (The) | | | 12,034 | |
| | 210 | | | Colgate-Palmolive Co. | | | 13,946 | |
| | 445 | | | Conagra Brands, Inc. | | | 16,354 | |
| | 463 | | | General Mills, Inc. | | | 21,303 | |
| | 311 | | | Hormel Foods Corp. | | | 12,176 | |
| | 134 | | | JM Smucker Co. (The) | | | 13,853 | |
| | 54 | | | Kellogg Co. | | | 3,877 | |
| | 132 | | | McCormick & Co., Inc. | | | 16,484 | |
| | 144 | | | Monster Beverage Corp.(b) | | | 8,768 | |
| | 219 | | | Procter & Gamble Co. (The) | | | 18,166 | |
| | 276 | | | Tyson Foods, Inc., Class A | | | 17,335 | |
| | | | | | | | |
| | | | | | | 163,172 | |
| | | | | | | | |
| | | | Energy—0.3% | |
| | 74 | | | EQT Corp. | | | 3,775 | |
| | 10 | | | Exxon Mobil Corp. | | | 802 | |
| | | | | | | | |
| | | | | | | 4,577 | |
| | | | | | | | |
| | | | Financials—11.2% | |
| | 100 | | | Aon PLC | | | 14,556 | |
| | 420 | | | Bank of America Corp. | | | 12,990 | |
| | 132 | | | Berkshire Hathaway, Inc., Class B(b) | | | 27,551 | |
| | 9 | | | Chubb Ltd. | | | 1,217 | |
| | 127 | | | Citigroup, Inc. | | | 9,047 | |
| | 158 | | | JPMorgan Chase & Co. | | | 18,104 | |
| | 308 | | | Marsh & McLennan Cos., Inc. | | | 26,066 | |
| | 143 | | | Progressive Corp. (The) | | | 9,657 | |
| | 198 | | | Travelers Cos., Inc. (The) | | | 26,057 | |
| | 314 | | | Wells Fargo & Co. | | | 18,363 | |
| | | | | | | | |
| | | | | | | 163,608 | |
| | | | | | | | |
| | | | Health Care—16.5% | |
| | 50 | | | Allergan PLC | | | 9,585 | |
| | 118 | | | Becton, Dickinson and Co. | | | 30,901 | |
| | 12 | | | Celgene Corp.(b) | | | 1,133 | |
| | 351 | | | Cerner Corp.(b) | | | 22,854 | |
| | 66 | | | Cigna Corp. | | | 12,430 | |
| | 52 | | | Edwards Lifesciences Corp.(b) | | | 7,500 | |
| | 132 | | | Envision Healthcare Corp.(b) | | | 5,987 | |
| | 191 | | | Express Scripts Holding Co.(b) | | | 16,812 | |
| | 27 | | | HCA Healthcare, Inc. | | | 3,621 | |
| | | | | | | | |
Number
of Shares | | | | | Value | |
| | | | Common Stocks & Other Equity Interests
(continued) | |
| | | | Health Care (continued) | |
| | 184 | | | Henry Schein, Inc.(b) | | $ | 14,293 | |
| | 6 | | | Humana, Inc. | | | 2,000 | |
| | 211 | | | Johnson & Johnson | | | 28,420 | |
| | 143 | | | Medtronic PLC | | | 13,787 | |
| | 169 | | | Stryker Corp. | | | 28,634 | |
| | 125 | | | UnitedHealth Group, Inc. | | | 33,557 | |
| | 66 | | | Universal Health Services, Inc., Class B | | | 8,591 | |
| | | | | | | | |
| | | | | | | 240,105 | |
| | | | | | | | |
| | | | Industrials—9.9% | |
| | 40 | | | Boeing Co. (The) | | | 13,711 | |
| | 56 | | | Cintas Corp. | | | 11,949 | |
| | 47 | | | General Electric Co. | | | 608 | |
| | 83 | | | Lockheed Martin Corp. | | | 26,594 | |
| | 269 | | | Republic Services, Inc. | | | 19,734 | |
| | 127 | | | Rockwell Collins, Inc. | | | 17,266 | |
| | 100 | | | Stericycle, Inc.(b) | | | 6,169 | |
| | 148 | | | United Technologies Corp. | | | 19,492 | |
| | 323 | | | Waste Management, Inc. | | | 29,361 | |
| | | | | | | | |
| | | | | | | 144,884 | |
| | | | | | | | |
| | | | Information Technology—20.9% | |
| | 62 | | | Accenture PLC, Class A | | | 10,482 | |
| | 88 | | | Adobe Systems, Inc.(b) | | | 23,189 | |
| | 24 | | | Alphabet, Inc., Class C(b) | | | 29,237 | |
| | 151 | | | Analog Devices, Inc. | | | 14,926 | |
| | 119 | | | Apple, Inc. | | | 27,088 | |
| | 23 | | | Applied Materials, Inc. | | | 989 | |
| | 55 | | | Automatic Data Processing, Inc. | | | 8,071 | |
| | 349 | | | Cisco Systems, Inc. | | | 16,672 | |
| | 121 | | | Facebook, Inc., Class A(b) | | | 21,263 | |
| | 19 | | | Global Payments, Inc. | | | 2,367 | |
| | 541 | | | Intel Corp. | | | 26,201 | |
| | 38 | | | International Business Machines Corp. | | | 5,566 | |
| | 95 | | | Intuit, Inc. | | | 20,850 | |
| | 55 | | | Micron Technology, Inc.(b) | | | 2,889 | |
| | 275 | | | Microsoft Corp. | | | 30,891 | |
| | 25 | | | NVIDIA Corp. | | | 7,017 | |
| | 13 | | | Oracle Corp. | | | 631 | |
| | 408 | | | QUALCOMM, Inc. | | | 28,034 | |
| | 252 | | | Texas Instruments, Inc. | | | 28,325 | |
| | 9 | | | Xilinx, Inc. | | | 700 | |
| | | | | | | | |
| | | | | | | 305,388 | |
| | | | | | | | |
| | | | Materials—1.1% | |
| | 508 | | | Newmont Mining Corp. | | | 15,763 | |
| | | | | | | | |
| | | | Real Estate—2.4% | | | |
| | 7 | | | AvalonBay Communities, Inc. REIT | | | 1,283 | |
| | 219 | | | Crown Castle International Corp. REIT | | | 24,973 | |
| | 44 | | | Public Storage REIT | | | 9,353 | |
| | | | | | | | |
| | | | | | | 35,609 | |
| | | | | | | | |
| | | | Telecommunication Services—4.2% | |
| | 762 | | | AT&T, Inc. | | | 24,338 | |
| | 708 | | | CenturyLink, Inc. | | | 15,123 | |
| | 405 | | | Verizon Communications, Inc. | | | 22,020 | |
| | | | | | | | |
| | | | | | | 61,481 | |
| | | | | | | | |
See accompanying Notes to Financial Statements which are an integral part of the financial statements.
Invesco S&P 500 Minimum Variance ETF (SPMV) (continued)
August 31, 2018
| | | | | | | | |
Number
of Shares | | | | | Value | |
| | | | Common Stocks & Other Equity Interests
(continued) | |
| | | | Utilities—8.0% | |
| | 294 | | | Ameren Corp. | | $ | 18,590 | |
| | 36 | | | American Electric Power Co., Inc. | | | 2,582 | |
| | 23 | | | Consolidated Edison, Inc. | | | 1,816 | |
| | 195 | | | Dominion Energy, Inc. | | | 13,800 | |
| | 14 | | | DTE Energy Co. | | | 1,556 | |
| | 34 | | | Edison International | | | 2,235 | |
| | 113 | | | Eversource Energy | | | 7,055 | |
| | 13 | | | NextEra Energy, Inc. | | | 2,211 | |
| | 302 | | | PG&E Corp. | | | 13,946 | |
| | 532 | | | Public Service Enterprise Group, Inc. | | | 27,850 | |
| | 17 | | | Sempra Energy | | | 1,973 | |
| | 475 | | | Southern Co. (The) | | | 20,796 | |
| | 28 | | | WEC Energy Group, Inc. | | | 1,892 | |
| | | | | | | | |
| | | | | | | 116,302 | |
| | | | | | | | |
| | | | Total Investments in Securities
(Cost $1,277,521)—99.9% | | | 1,458,606 | |
| | | | Other assets less liabilities—0.1% | | | 1,055 | |
| | | | | | | | |
| | | | Net Assets—100.0% | | $ | 1,459,661 | |
| | | | | | | | |
Investment Abbreviations:
REIT—Real Estate Investment Trust
Notes to Schedule of Investments:
| (a) | Industry and/or sector classifications used in this report are generally according to the Global Industry Classification Standard, which was developed by and is the exclusive property and a service mark of MSCI Inc. and Standard & Poor’s. |
| (b) | Non-income producing security. |
See accompanying Notes to Financial Statements which are an integral part of the financial statements.
Schedule of Investments(a)
Invesco S&P 500 Momentum ETF (SPMO)
August 31, 2018
| | | | | | | | |
Number
of Shares | | | | | Value | |
| | | | Common Stocks & Other Equity Interests—99.9% | |
| | | | Consumer Discretionary—17.7% | | | |
| | 2,479 | | | Amazon.com, Inc.(b) | | $ | 4,989,508 | |
| | 1,275 | | | Aptiv PLC | | | 112,213 | |
| | 2,079 | | | D.R. Horton, Inc. | | | 92,536 | |
| | 1,101 | | | Hilton Worldwide Holdings, Inc. | | | 85,459 | |
| | 7,357 | | | Home Depot, Inc. (The) | | | 1,477,065 | |
| | 2,293 | | | Marriott International, Inc., Class A | | | 289,996 | |
| | 4,443 | | | McDonald’s Corp. | | | 720,788 | |
| | 2,248 | | | Netflix, Inc.(b) | | | 826,545 | |
| | 1,231 | | | PulteGroup, Inc. | | | 34,406 | |
| | 399 | | | PVH Corp. | | | 57,121 | |
| | 1,845 | | | VF Corp. | | | 169,980 | |
| | | | | | | | |
| | | | | | | 8,855,617 | |
| | | | | | | | |
| | | | Consumer Staples—2.8% | |
| | 1,202 | | | Brown-Forman Corp., Class B | | | 62,768 | |
| | 885 | | | Constellation Brands, Inc., Class A | | | 184,257 | |
| | 1,423 | | | Estee Lauder Cos., Inc. (The), Class A | | | 199,391 | |
| | 2,072 | | | Monster Beverage Corp.(b) | | | 126,164 | |
| | 8,746 | | | Walmart, Inc. | | | 838,392 | |
| | | | | | | | |
| | | | | | | 1,410,972 | |
| | | | | | | | |
| | | | Energy—0.5% | |
| | 2,241 | | | Valero Energy Corp. | | | 264,169 | |
| | | | | | | | |
| | | | Financials—13.2% | | | |
| | 1,475 | | | Allstate Corp. (The) | | | 148,341 | |
| | 3,075 | | | American Express Co. | | | 325,889 | |
| | 674 | | | Ameriprise Financial, Inc. | | | 95,681 | |
| | 9,222 | | | Berkshire Hathaway, Inc., Class B(b) | | | 1,924,816 | |
| | 770 | | | BlackRock, Inc. | | | 368,876 | |
| | 1,001 | | | Cboe Global Markets, Inc. | | | 100,901 | |
| | 11,121 | | | Citigroup, Inc. | | | 792,260 | |
| | 14,983 | | | JPMorgan Chase & Co. | | | 1,716,752 | |
| | 1,193 | | | Moody’s Corp. | | | 212,378 | |
| | 3,234 | | | Progressive Corp. (The) | | | 218,392 | |
| | 1,684 | | | S&P Global, Inc. | | | 348,672 | |
| | 1,796 | | | State Street Corp. | | | 156,090 | |
| | 1,670 | | | T. Rowe Price Group, Inc. | | | 193,536 | |
| | | | | | | | |
| | | | | | | 6,602,584 | |
| | | | | | | | |
| | | | Health Care—11.5% | |
| | 10,699 | | | Abbott Laboratories | | | 715,121 | |
| | 10,603 | | | AbbVie, Inc. | | | 1,017,676 | |
| | 1,755 | | | Agilent Technologies, Inc. | | | 118,533 | |
| | 650 | | | Align Technology, Inc.(b) | | | 251,218 | |
| | 1,449 | | | Anthem, Inc. | | | 383,594 | |
| | 3,227 | | | Baxter International, Inc. | | | 239,992 | |
| | 772 | | | Centene Corp.(b) | | | 113,083 | |
| | 834 | | | Intuitive Surgical, Inc.(b) | | | 467,040 | |
| | 150 | | | Mettler-Toledo International, Inc.(b) | | | 87,669 | |
| | 1,501 | | | Nektar Therapeutics, Class A(b) | | | 99,801 | |
| | 600 | | | PerkinElmer, Inc. | | | 55,458 | |
| | 1,997 | | | Thermo Fisher Scientific, Inc. | | | 477,483 | |
| | 5,199 | | | UnitedHealth Group, Inc. | | | 1,395,723 | |
| | 504 | | | Varian Medical Systems, Inc.(b) | | | 56,458 | |
| | 427 | | | Waters Corp.(b) | | | 80,908 | |
| | 2,248 | | | Zoetis, Inc. | | | 203,669 | |
| | | | | | | | |
| | | | | | | 5,763,426 | |
| | | | | | | | |
| | | | | | | | |
Number
of Shares | | | | | Value | |
| | | | Common Stocks & Other Equity Interests
(continued) | |
| | | | Industrials—13.1% | |
| | 3,620 | | | 3M Co. | | $ | 763,530 | |
| | 1,528 | | | AMETEK, Inc. | | | 117,595 | |
| | 5,191 | | | Boeing Co. (The) | | | 1,779,423 | |
| | 3,747 | | | Caterpillar, Inc. | | | 520,271 | |
| | 395 | | | Cintas Corp. | | | 84,281 | |
| | 1,869 | | | Deere & Co. | | | 268,762 | |
| | 1,521 | | | Fortive Corp. | | | 127,734 | |
| | 795 | | | Harris Corp. | | | 129,195 | |
| | 4,543 | | | Honeywell International, Inc. | | | 722,610 | |
| | 1,517 | | | Illinois Tool Works, Inc. | | | 210,681 | |
| | 1,622 | | | Lockheed Martin Corp. | | | 519,705 | |
| | 1,170 | | | Northrop Grumman Corp. | | | 349,233 | |
| | 547 | | | Parker-Hannifin Corp. | | | 96,053 | |
| | 1,849 | | | Raytheon Co. | | | 368,765 | |
| | 623 | | | Roper Technologies, Inc. | | | 185,884 | |
| | 220 | | | TransDigm Group, Inc.(b) | | | 77,000 | |
| | 1,823 | | | Waste Management, Inc. | | | 165,711 | |
| | 924 | | | Xylem, Inc. | | | 70,141 | |
| | | | | | | | |
| | | | | | | 6,556,574 | |
| | | | | | | | |
| | | | Information Technology—39.6% | |
| | 3,620 | | | Accenture PLC, Class A | | | 612,033 | |
| | 3,522 | | | Activision Blizzard, Inc. | | | 253,936 | |
| | 2,907 | | | Adobe Systems, Inc.(b) | | | 766,024 | |
| | 1,502 | | | Alphabet, Inc., Class A(b) | | | 1,850,164 | |
| | 1,604 | | | Alphabet, Inc., Class C(b) | | | 1,953,977 | |
| | 1,700 | | | Amphenol Corp., Class A | | | 160,786 | |
| | 526 | | | ANSYS, Inc.(b) | | | 97,825 | |
| | 1,695 | | | Cadence Design Systems, Inc.(b) | | | 79,733 | |
| | 3,400 | | | Cognizant Technology Solutions Corp., Class A | | | 266,662 | |
| | 1,301 | | | DXC Technology Co. | | | 118,508 | |
| | 10,045 | | | Facebook, Inc., Class A(b) | | | 1,765,208 | |
| | 1,500 | | | Fidelity National Information Services, Inc. | | | 162,255 | |
| | 404 | | | Gartner, Inc.(b) | | | 60,503 | |
| | 8,273 | | | HP, Inc. | | | 203,929 | |
| | 276 | | | IPG Photonics Corp.(b) | | | 48,432 | |
| | 674 | | | Lam Research Corp. | | | 116,663 | |
| | 6,768 | | | Mastercard, Inc., Class A | | | 1,458,910 | |
| | 43,805 | | | Microsoft Corp. | | | 4,920,616 | |
| | 1,125 | | | NetApp, Inc. | | | 97,661 | |
| | 3,244 | | | NVIDIA Corp. | | | 910,526 | |
| | 9,884 | | | PayPal Holdings, Inc.(b) | | | 912,590 | |
| | 1,057 | | | Red Hat, Inc.(b) | | | 156,151 | |
| | 3,350 | | | salesforce.com, Inc.(b) | | | 511,478 | |
| | 754 | | | Synopsys, Inc.(b) | | | 77,013 | |
| | 849 | | | Take-Two Interactive Software, Inc.(b) | | | 113,392 | |
| | 1,675 | | | TE Connectivity Ltd. | | | 153,564 | |
| | 1,272 | | | Total System Services, Inc. | | | 123,562 | |
| | 447 | | | VeriSign, Inc.(b) | | | 70,899 | |
| | 12,181 | | | Visa, Inc., Class A | | | 1,789,267 | |
| | | | | | | | |
| | | | | | | 19,812,267 | |
| | | | | | | | |
| | | | Materials—0.5% | |
| | 626 | | | Avery Dennison Corp. | | | 65,843 | |
| | 1,349 | | | Praxair, Inc. | | | 213,398 | |
| | | | | | | | |
| | | | | | | 279,241 | |
| | | | | | | | |
See accompanying Notes to Financial Statements which are an integral part of the financial statements.
Invesco S&P 500 Momentum ETF (SPMO) (continued)
August 31, 2018
| | | | | | | | |
Number
of Shares | | | | | Value | |
| | | | Common Stocks & Other Equity Interests
(continued) | |
| | | | Real Estate—1.0% | |
| | 2,097 | | | American Tower Corp. REIT | | $ | 312,705 | |
| | 1,350 | | | CBRE Group, Inc., Class A(b) | | | 65,894 | |
| | 702 | | | SBA Communications Corp. REIT(b) | | | 108,971 | |
| | | | | | | | |
| | | | | | | 487,570 | |
| | | | | | | | |
| | | | Total Investments in Securities
(Cost $46,697,770)—99.9% | | | 50,032,420 | |
| | | | Other assets less liabilities—0.1% | | | 49,558 | |
| | | | | | | | |
| | | | Net Assets—100.0% | | $ | 50,081,978 | |
| | | | | | | | |
Investment Abbreviations:
REIT—Real Estate Investment Trust
Notes to Schedule of Investments:
| (a) | Industry and/or sector classifications used in this report are generally according to the Global Industry Classification Standard, which was developed by and is the exclusive property and a service mark of MSCI Inc. and Standard & Poor’s. |
| (b) | Non-income producing security. |
See accompanying Notes to Financial Statements which are an integral part of the financial statements.
Schedule of Investments(a)
Invesco S&P 500 Value with Momentum ETF (SPVM)
August 31, 2018
| | | | | | | | |
Number
of Shares | | | | | Value | |
| | | | Common Stocks—99.9% | | | |
| | | | Consumer Discretionary—14.8% | | | |
| | 469 | | | Best Buy Co., Inc. | | $ | 37,314 | |
| | 482 | | | BorgWarner, Inc. | | | 21,097 | |
| | 389 | | | CarMax, Inc.(b) | | | 30,362 | |
| | 368 | | | Carnival Corp. | | | 22,628 | |
| | 722 | | | D.R. Horton, Inc. | | | 32,136 | |
| | 257 | | | Dollar General Corp. | | | 27,687 | |
| | 392 | | | Dollar Tree, Inc.(b) | | | 31,560 | |
| | 607 | | | General Motors Co. | | | 21,882 | |
| | 527 | | | Kohl’s Corp. | | | 41,691 | |
| | 723 | | | Lennar Corp., Class A | | | 37,357 | |
| | 1,589 | | | News Corp., Class A | | | 20,768 | |
| | 919 | | | PulteGroup, Inc. | | | 25,686 | |
| | 133 | | | PVH Corp. | | | 19,040 | |
| | 220 | | | Royal Caribbean Cruises Ltd. | | | 26,968 | |
| | 470 | | | Target Corp. | | | 41,125 | |
| | | | | | | | |
| | | | | | | 437,301 | |
| | | | | | | | |
| | | | Consumer Staples—3.3% | |
| | 122 | | | Costco Wholesale Corp. | | | 28,442 | |
| | 377 | | | Sysco Corp. | | | 28,207 | |
| | 413 | | | Walmart, Inc. | | | 39,590 | |
| | | | | | | | |
| | | | | | | 96,239 | |
| | | | | | | | |
| | | | Energy—5.6% | |
| | 195 | | | Chevron Corp. | | | 23,099 | |
| | 360 | | | Helmerich & Payne, Inc. | | | 23,605 | |
| | 520 | | | Marathon Petroleum Corp. | | | 42,791 | |
| | 327 | | | Phillips 66 | | | 38,753 | |
| | 327 | | | Valero Energy Corp. | | | 38,547 | |
| | | | | | | | |
| | | | | | | 166,795 | |
| | | | | | | | |
| | | | Financials—32.4% | |
| | 868 | | | Aflac, Inc. | | | 40,136 | |
| | 429 | | | Allstate Corp. (The) | | | 43,145 | |
| | 155 | | | Ameriprise Financial, Inc. | | | 22,004 | |
| | 906 | | | Bank of America Corp. | | | 28,023 | |
| | 467 | | | Bank of New York Mellon Corp. (The) | | | 24,354 | |
| | 428 | | | BB&T Corp. | | | 22,110 | |
| | 163 | | | Berkshire Hathaway, Inc., Class B(b) | | | 34,021 | |
| | 351 | | | Capital One Financial Corp. | | | 34,781 | |
| | 816 | | | Citizens Financial Group, Inc. | | | 33,587 | |
| | 274 | | | Discover Financial Services | | | 21,405 | |
| | 1,050 | | | Fifth Third Bancorp | | | 30,901 | |
| | 117 | | | Goldman Sachs Group, Inc. (The) | | | 27,824 | |
| | 1,588 | | | Huntington Bancshares, Inc. | | | 25,741 | |
| | 215 | | | JPMorgan Chase & Co. | | | 24,635 | |
| | 1,211 | | | KeyCorp | | | 25,516 | |
| | 784 | | | Lincoln National Corp. | | | 51,415 | |
| | 852 | | | Loews Corp. | | | 42,864 | |
| | 110 | | | M&T Bank Corp. | | | 19,486 | |
| | 1,061 | | | MetLife, Inc. | | | 48,689 | |
| | 578 | | | Morgan Stanley | | | 28,224 | |
| | 1,459 | | | People’s United Financial, Inc. | | | 27,006 | |
| | 169 | | | PNC Financial Services Group, Inc. (The) | | | 24,258 | |
| | 318 | | | Progressive Corp. (The) | | | 21,475 | |
| | 196 | | | Raymond James Financial, Inc. | | | 18,236 | |
| | 1,325 | | | Regions Financial Corp. | | | 25,785 | |
| | 218 | | | State Street Corp. | | | 18,946 | |
| | 374 | | | SunTrust Banks, Inc. | | | 27,511 | |
| | | | | | | | |
Number
of Shares | | | | | Value | |
| | | | Common Stocks (continued) | | | |
| | | | Financials (continued) | |
| | 655 | | | Synchrony Financial | | $ | 20,744 | |
| | 433 | | | Torchmark Corp. | | | 38,069 | |
| | 236 | | | Travelers Cos., Inc. (The) | | | 31,058 | |
| | 1,413 | | | Unum Group | | | 52,111 | |
| | 394 | | | Zions Bancorporation | | | 20,996 | |
| | | | | | | | |
| | | | | | | 955,056 | |
| | | | | | | | |
| | | | Health Care—11.5% | |
| | 139 | | | Aetna, Inc. | | | 27,838 | |
| | 164 | | | Anthem, Inc. | | | 43,416 | |
| | 317 | | | Centene Corp.(b) | | | 46,434 | |
| | 148 | | | Cigna Corp. | | | 27,874 | |
| | 202 | | | HCA Healthcare, Inc. | | | 27,090 | |
| | 85 | | | Humana, Inc. | | | 28,327 | |
| | 185 | | | IQVIA Holdings, Inc.(b) | | | 23,512 | |
| | 120 | | | Laboratory Corp. of America Holdings(b) | | | 20,744 | |
| | 363 | | | McKesson Corp. | | | 46,736 | |
| | 609 | | | Pfizer, Inc. | | | 25,286 | |
| | 77 | | | UnitedHealth Group, Inc. | | | 20,672 | |
| | | | | | | | |
| | | | | | | 337,929 | |
| | | | | | | | |
| | | | Industrials—10.0% | |
| | 243 | | | C.H. Robinson Worldwide, Inc. | | | 23,347 | |
| | 299 | | | CSX Corp. | | | 22,174 | |
| | 144 | | | Cummins, Inc. | | | 20,419 | |
| | 579 | | | Delta Air Lines, Inc. | | | 33,860 | |
| | 287 | | | Dover Corp. | | | 24,645 | |
| | 96 | | | FedEx Corp. | | | 23,419 | |
| | 692 | | | Fluor Corp. | | | 39,728 | |
| | 203 | | | Kansas City Southern | | | 23,540 | |
| | 178 | | | Norfolk Southern Corp. | | | 30,944 | |
| | 696 | | | Pentair PLC (United Kingdom) | | | 30,262 | |
| | 144 | | | United Rentals, Inc.(b) | | | 22,445 | |
| | | | | | | | |
| | | | | | | 294,783 | |
| | | | | | | | |
| | | | Information Technology—5.6% | |
| | 298 | | | DXC Technology Co. | | | 27,145 | |
| | 2,667 | | | Hewlett Packard Enterprise Co. | | | 44,086 | |
| | 1,246 | | | HP, Inc. | | | 30,714 | |
| | 535 | | | Micron Technology, Inc.(b) | | | 28,098 | |
| | 1,313 | | | Xerox Corp. | | | 36,580 | |
| | | | | | | | |
| | | | | | | 166,623 | |
| | | | | | | | |
| | | | Materials—3.9% | |
| | 299 | | | DowDuPont, Inc. | | | 20,969 | |
| | 245 | | | Eastman Chemical Co. | | | 23,772 | |
| | 251 | | | LyondellBasell Industries NV, Class A | | | 28,308 | |
| | 743 | | | WestRock Co. | | | 40,924 | |
| | | | | | | | |
| | | | | | | 113,973 | |
| | | | | | | | |
| | | | Real Estate—0.7% | |
| | 441 | | | CBRE Group, Inc., Class A(b) | | | 21,525 | |
| | | | | | | | |
| | | | Telecommunication Services—1.2% | | | |
| | 667 | | | Verizon Communications, Inc. | | | 36,265 | |
| | | | | | | | |
| | | | Utilities—10.9% | | | |
| | 331 | | | Ameren Corp. | | | 20,929 | |
| | 352 | | | American Electric Power Co., Inc. | | | 25,249 | |
| | 378 | | | Consolidated Edison, Inc. | | | 29,836 | |
See accompanying Notes to Financial Statements which are an integral part of the financial statements.
Invesco S&P 500 Value with Momentum ETF (SPVM) (continued)
August 31, 2018
| | | | | | | | |
Number
of Shares | | | | | Value | |
| | | | Common Stocks (continued) | | | |
| | | | Utilities (continued) | | | |
| | 271 | | | DTE Energy Co. | | $ | 30,119 | |
| | 299 | | | Entergy Corp. | | | 24,993 | |
| | 449 | | | Eversource Energy | | | 28,031 | |
| | 930 | | | Exelon Corp. | | | 40,650 | |
| | 156 | | | NextEra Energy, Inc. | | | 26,536 | |
| | 813 | | | NiSource, Inc. | | | 22,008 | |
| | 470 | | | Public Service Enterprise Group, Inc. | | | 24,604 | |
| | 361 | | | WEC Energy Group, Inc. | | | 24,396 | |
| | 510 | | | Xcel Energy, Inc. | | | 24,506 | |
| | | | | | | | |
| | | | | | | 321,857 | |
| | | | | | | | |
| | | | Total Investments in Securities
(Cost $2,785,363)—99.9% | | | 2,948,346 | |
| | | | Other assets less liabilities—0.1% | | | 1,563 | |
| | | | | | | | |
| | | | Net Assets—100.0% | | $ | 2,949,909 | |
| | | | | | | | |
Notes to Schedule of Investments:
| (a) | Industry and/or sector classifications used in this report are generally according to the Global Industry Classification Standard, which was developed by and is the exclusive property and a service mark of MSCI Inc. and Standard & Poor’s. |
| (b) | Non-income producing security. |
See accompanying Notes to Financial Statements which are an integral part of the financial statements.
Schedule of Investments(a)
Invesco S&P MidCap Low Volatility ETF (XMLV)
August 31, 2018
| | | | | | | | |
Number
of Shares | | | | | Value | |
| | | | Common Stocks & Other Equity Interests—100.1% | |
| | | | Consumer Discretionary—3.9% | | | |
| | 32,137 | | | Graham Holdings Co., Class B | | $ | 18,081,883 | |
| | 291,442 | | | John Wiley & Sons, Inc., Class A | | | 18,812,581 | |
| | 442,173 | | | Service Corp. International | | | 18,553,579 | |
| | | | | | | | |
| | | | | | | 55,448,043 | |
| | | | | | | | |
| | | | Consumer Staples—4.9% | |
| | 166,574 | | | Ingredion, Inc. | | | 16,835,634 | |
| | 262,509 | | | Lamb Weston Holdings, Inc. | | | 17,745,608 | |
| | 106,455 | | | Lancaster Colony Corp. | | | 16,635,723 | |
| | 652,824 | | | Tootsie Roll Industries, Inc. | | | 18,801,331 | |
| | | | | | | | |
| | | | | | | 70,018,296 | |
| | | | | | | | |
| | | | Financials—16.1% | |
| | 25,880 | | | Alleghany Corp. | | | 16,350,466 | |
| | 156,599 | | | American Financial Group, Inc. | | | 17,438,865 | |
| | 219,369 | | | Bank of Hawaii Corp. | | | 18,236,145 | |
| | 738,051 | | | Brown & Brown, Inc. | | | 22,495,795 | |
| | 247,937 | | | Commerce Bancshares, Inc. | | | 17,618,403 | |
| | 317,599 | | | Eaton Vance Corp. | | | 16,746,995 | |
| | 309,745 | | | First American Financial Corp. | | | 17,612,101 | |
| | 136,689 | | | Hanover Insurance Group, Inc. (The) | | | 16,743,036 | |
| | 782,361 | | | Old Republic International Corp. | | | 17,352,767 | |
| | 118,388 | | | Reinsurance Group of America, Inc. | | | 16,911,726 | |
| | 269,804 | | | SEI Investments Co. | | | 17,019,236 | |
| | 272,231 | | | W.R. Berkley Corp. | | | 21,304,798 | |
| | 498,672 | | | Washington Federal, Inc. | | | 17,004,715 | |
| | | | | | | | |
| | | | | | | 232,835,048 | |
| | | | | | | | |
| | | | Health Care—3.6% | |
| | 89,021 | | | Bio-Techne Corp. | | | 17,107,165 | |
| | 167,054 | | | Hill-Rom Holdings, Inc. | | | 16,249,343 | |
| | 166,371 | | | STERIS PLC | | | 19,036,170 | |
| | | | | | | | |
| | | | | | | 52,392,678 | |
| | | | | | | | |
| | | | Industrials—8.1% | |
| | 365,033 | | | Donaldson Co., Inc. | | | 18,470,670 | |
| | 111,490 | | | Dun & Bradstreet Corp. (The) | | | 15,934,151 | |
| | 337,547 | | | Graco, Inc. | | | 15,868,084 | |
| | 114,217 | | | IDEX Corp. | | | 17,499,187 | |
| | 299,848 | | | Rollins, Inc. | | | 18,014,868 | |
| | 111,646 | | | Valmont Industries, Inc. | | | 15,675,098 | |
| | 91,309 | | | Watsco, Inc. | | | 15,978,162 | |
| | | | | | | | |
| | | | | | | 117,440,220 | |
| | | | | | | | |
| | | | Information Technology—6.4% | |
| | 210,743 | | | Arrow Electronics, Inc.(b) | | | 16,338,905 | |
| | 267,077 | | | CDK Global, Inc. | | | 16,644,239 | |
| | 149,062 | | | Jack Henry & Associates, Inc. | | | 23,617,383 | |
| | 278,145 | | | MAXIMUS, Inc. | | | 18,496,643 | |
| | 71,391 | | | Tyler Technologies, Inc.(b) | | | 17,630,007 | |
| | | | | | | | |
| | | | | | | 92,727,177 | |
| | | | | | | | |
| | | | Materials—8.8% | |
| | 175,955 | | | AptarGroup, Inc. | | | 18,424,248 | |
| | 312,404 | | | Bemis Co., Inc. | | | 15,395,269 | |
| | 47,827 | | | NewMarket Corp. | | | 19,180,540 | |
| | 261,661 | | | Sensient Technologies Corp. | | | 18,583,164 | |
| | 647,134 | | | Silgan Holdings, Inc. | | | 17,634,402 | |
| | 350,721 | | | Sonoco Products Co. | | | 19,654,405 | |
| | 849,104 | | | Valvoline, Inc. | | | 18,272,718 | |
| | | | | | | | |
| | | | | | | 127,144,746 | |
| | | | | | | | |
| | | | | | | | |
Number
of Shares | | | | | Value | |
| | | | Common Stocks & Other Equity Interests
(continued) | |
| | | | Real Estate—27.1% | |
| | 422,173 | | | American Campus Communities, Inc. REIT | | $ | 17,701,714 | |
| | 214,909 | | | Camden Property Trust REIT | | | 20,429,250 | |
| | 627,672 | | | Corporate Office Properties Trust REIT | | | 19,319,744 | |
| | 1,946,896 | | | Cousins Properties, Inc. REIT | | | 18,203,478 | |
| | 554,560 | | | Douglas Emmett, Inc. REIT | | | 21,661,114 | |
| | 418,103 | | | Education Realty Trust, Inc. REIT | | | 17,301,102 | |
| | 242,640 | | | EPR Properties REIT | | | 17,028,475 | |
| | 598,815 | | | First Industrial Realty Trust, Inc. REIT | | | 19,437,535 | |
| | 597,763 | | | Healthcare Realty Trust, Inc. REIT | | | 18,506,742 | |
| | 428,923 | | | Highwoods Properties, Inc. REIT | | | 21,334,630 | |
| | 626,184 | | | Hospitality Properties Trust REIT | | | 18,153,074 | |
| | 480,469 | | | JBG SMITH Properties REIT | | | 17,998,369 | |
| | 269,499 | | | Kilroy Realty Corp. REIT | | | 19,711,157 | |
| | 214,561 | | | Lamar Advertising Co., Class A REIT | | | 16,531,925 | |
| | 454,225 | | | Liberty Property Trust REIT | | | 19,872,344 | |
| | 181,515 | | | Life Storage, Inc. REIT | | | 17,715,864 | |
| | 1,255,996 | | | Medical Properties Trust, Inc. REIT | | | 18,902,740 | |
| | 402,927 | | | National Retail Properties, Inc. REIT | | | 18,570,905 | |
| | 579,546 | | | Rayonier, Inc. REIT | | | 20,185,587 | |
| | 873,602 | | | Senior Housing Properties Trust REIT | | | 16,694,534 | |
| | 518,297 | | | Weingarten Realty Investors REIT | | | 16,030,926 | |
| | | | | | | | |
| | | | | | | 391,291,209 | |
| | | | | | | | |
| | | | Utilities—21.2% | |
| | 253,657 | | | ALLETE, Inc. | | | 19,044,568 | |
| | 524,769 | | | Aqua America, Inc. | | | 19,510,911 | |
| | 242,141 | | | Atmos Energy Corp. | | | 22,332,665 | |
| | 293,270 | | | Black Hills Corp. | | | 17,258,940 | |
| | 662,497 | | | Hawaiian Electric Industries, Inc. | | | 23,366,269 | |
| | 206,732 | | | IDACORP, Inc. | | | 20,228,726 | |
| | 693,563 | | | MDU Resources Group, Inc. | | | 19,343,472 | |
| | 327,371 | | | National Fuel Gas Co. | | | 18,178,912 | |
| | 377,410 | | | New Jersey Resources Corp. | | | 17,209,896 | |
| | 336,566 | | | NorthWestern Corp. | | | 20,180,497 | |
| | 519,153 | | | OGE Energy Corp. | | | 19,120,405 | |
| | 249,034 | | | ONE Gas, Inc. | | | 19,556,640 | |
| | 396,517 | | | PNM Resources, Inc. | | | 15,444,337 | |
| | 199,872 | | | Southwest Gas Holdings, Inc. | | | 15,454,103 | |
| | 385,388 | | | UGI Corp. | | | 20,830,221 | |
| | 254,875 | | | Vectren Corp. | | | 18,147,100 | |
| | | | | | | | |
| | | | | | | 305,207,662 | |
| | | | | | | | |
| | | | Total Investments in Securities
(Cost $1,321,468,915)—100.1% | | | 1,444,505,079 | |
| | | | Other assets less liabilities—(0.1)% | | | (864,109 | ) |
| | | | | | | | |
| | | | Net Assets—100.0% | | $ | 1,443,640,970 | |
| | | | | | | | |
Investment Abbreviations:
REIT—Real Estate Investment Trust
Notes to Schedule of Investments:
| (a) | Industry and/or sector classifications used in this report are generally according to the Global Industry Classification Standard, which was developed by and is the exclusive property and a service mark of MSCI Inc. and Standard & Poor’s. |
| (b) | Non-income producing security. |
See accompanying Notes to Financial Statements which are an integral part of the financial statements.
Schedule of Investments(a)
Invesco S&P SmallCap High Dividend Low Volatility ETF (XSHD)
August 31, 2018
| | | | | | | | |
Number
of Shares | | | | | Value | |
| | | | Common Stocks & Other Equity Interests—100.0% | |
| | | | Consumer Discretionary—2.5% | | | |
| | 19,148 | | | New Media Investment Group, Inc. | | $ | 304,453 | |
| | | | | | | | |
| | | | Consumer Staples—3.7% | | | |
| | 3,141 | | | Andersons, Inc. (The) | | | 128,310 | |
| | 603 | | | Calavo Growers, Inc. | | | 63,828 | |
| | 1,503 | | | Inter Parfums, Inc. | | | 98,146 | |
| | 433 | | | J & J Snack Foods Corp. | | | 63,001 | |
| | 505 | | | WD-40 Co. | | | 89,612 | |
| | | | | | | | |
| | | | | | | 442,897 | |
| | | | | | | | |
| | | | Energy—1.4% | |
| | 9,577 | | | Green Plains, Inc. | | | 169,992 | |
| | | | | | | | |
| | | | Financials—25.0% | | | |
| | 18,794 | | | Apollo Commercial Real Estate Finance, Inc. REIT | | | 365,167 | |
| | 15,443 | | | ARMOUR Residential REIT, Inc. REIT | | | 363,219 | |
| | 41,289 | | | Capstead Mortgage Corp. REIT | | | 346,828 | |
| | 22,100 | | | Invesco Mortgage Capital, Inc. REIT(b) | | | 358,683 | |
| | 57,697 | | | New York Mortgage Trust, Inc. REIT | | | 369,261 | |
| | 10,993 | | | Northwest Bancshares, Inc. | | | 200,293 | |
| | 16,993 | | | Oritani Financial Corp. | | | 275,287 | |
| | 19,005 | | | PennyMac Mortgage Investment Trust REIT | | | 379,720 | |
| | 18,223 | | | Waddell & Reed Financial, Inc., Class A | | | 364,824 | |
| | | | | | | | |
| | | | | | | 3,023,282 | |
| | | | | | | | |
| | | | Health Care—2.8% | |
| | 3,076 | | | Computer Programs & Systems, Inc. | | | 83,975 | |
| | 848 | | | CONMED Corp. | | | 68,205 | |
| | 11,518 | | | Meridian Bioscience, Inc. | | | 180,832 | |
| | | | | | | | |
| | | | | | | 333,012 | |
| | | | | | | | |
| | | | Industrials—8.1% | |
| | 4,552 | | | ABM Industries, Inc. | | | 144,389 | |
| | 3,332 | | | Brady Corp., Class A | | | 134,779 | |
| | 11,023 | | | Briggs & Stratton Corp. | | | 222,224 | |
| | 2,508 | | | Mobile Mini, Inc. | | | 107,593 | |
| | 4,823 | | | Powell Industries, Inc. | | | 188,821 | |
| | 10,853 | | | Resources Connection, Inc. | | | 179,617 | |
| | | | | | | | |
| | | | | | | 977,423 | |
| | | | | | | | |
| | | | Information Technology—10.3% | |
| | 8,424 | | | ADTRAN, Inc. | | | 144,893 | |
| | 2,817 | | | CSG Systems International, Inc. | | | 105,215 | |
| | 22,445 | | | Daktronics, Inc. | | | 182,029 | |
| | 6,455 | | | Monotype Imaging Holdings, Inc. | | | 132,973 | |
| | 2,423 | | | MTS Systems Corp. | | | 131,084 | |
| | 7,283 | | | NIC, Inc. | | | 122,354 | |
| | 4,279 | | | Park Electrochemical Corp. | | | 91,485 | |
| | 24,927 | | | TiVo Corp. | | | 340,254 | |
| | | | | | | | |
| | | | | | | 1,250,287 | |
| | | | | | | | |
| | | | Materials—11.4% | |
| | 2,390 | | | A. Schulman, Inc.(c)(d) | | | 4,780 | |
| | 3,797 | | | Hawkins, Inc. | | | 156,816 | |
| | 3,369 | | | Haynes International, Inc. | | | 132,738 | |
| | 4,721 | | | Innophos Holdings, Inc. | | | 206,355 | |
| | 1,035 | | | Kaiser Aluminum Corp. | | | 113,426 | |
| | 8,911 | | | Myers Industries, Inc. | | | 198,270 | |
| | 1,208 | | | Neenah, Inc. | | | 110,230 | |
| | | | | | | | |
Number
of Shares | | | | | Value | |
| | | | Common Stocks & Other Equity Interests
(continued) | |
| | | | Materials (continued) | |
| | 7,479 | | | P.H. Glatfelter Co. | | $ | 143,821 | |
| | 5,258 | | | Schweitzer-Mauduit International, Inc. | | | 213,948 | |
| | 4,281 | | | Tredegar Corp. | | | 93,968 | |
| | | | | | | | |
| | | | | | | 1,374,352 | |
| | | | | | | | |
| | | | Real Estate—21.8% | |
| | 41,261 | | | Franklin Street Properties Corp. REIT | | | 353,607 | |
| | 17,007 | | | Global NET Lease, Inc. REIT | | | 368,882 | |
| | 22,619 | | | Government Properties Income Trust REIT | | | 382,487 | |
| | 21,262 | | | Kite Realty Group Trust REIT | | | 371,660 | |
| | 41,261 | | | Lexington Realty Trust REIT | | | 385,378 | |
| | 27,583 | | | Ramco-Gershenson Properties Trust REIT | | | 385,058 | |
| | 28,019 | | | Whitestone REIT | | | 382,179 | |
| | | | | | | | |
| | | | | | | 2,629,251 | |
| | | | | | | | |
| | | | Telecommunication Services—4.3% | |
| | 1,372 | | | ATN International, Inc. | | | 100,472 | |
| | 4,047 | | | Cogent Communications Holdings, Inc. | | | 221,371 | |
| | 13,086 | | | Spok Holdings, Inc. | | | 200,870 | |
| | | | | | | | |
| | | | | | | 522,713 | |
| | | | | | | | |
| | | | Utilities—8.7% | |
| | 1,705 | | | American States Water Co. | | | 103,033 | |
| | 3,171 | | | Avista Corp. | | | 162,704 | |
| | 2,634 | | | California Water Service Group | | | 108,389 | |
| | 2,177 | | | El Paso Electric Co. | | | 133,450 | |
| | 2,667 | | | Northwest Natural Gas Co. | | | 173,089 | |
| | 5,689 | | | South Jersey Industries, Inc. | | | 188,761 | |
| | 2,489 | | | Spire, Inc. | | | 185,555 | |
| | | | | | | | |
| | | | | | | 1,054,981 | |
| | | | | | | | |
| | | | Total Investments in Securities
(Cost $11,624,557)—100.0% | | | 12,082,643 | |
| | | | Other assets less liabilities—0.0% | | | 3,576 | |
| | | | | | | | |
| | | | Net Assets—100.0% | | $ | 12,086,219 | |
| | | | | | | | |
Investment Abbreviations:
REIT—Real Estate Investment Trust
Notes to Schedule of Investments:
| (a) | Industry and/or sector classifications used in this report are generally according to the Global Industry Classification Standard, which was developed by and is the exclusive property and a service mark of MSCI Inc. and Standard & Poor’s. |
| (b) | Affiliated company. The Fund’s Adviser and Invesco Mortgage Capital, Inc. REIT are wholly-owned subsidiaries of Invesco Ltd. and therefore, Invesco Ltd. And Invesco Mortgage Capital, Inc. REIT are considered to be affiliated. See Note 4. |
| (c) | Non-income producing security. |
| (d) | Security valued using significant unobservable inputs (Level 3). See Note 6. |
See accompanying Notes to Financial Statements which are an integral part of the financial statements.
Schedule of Investments(a)
Invesco S&P SmallCap Low Volatility ETF (XSLV)
August 31, 2018
| | | | | | | | |
Number
of Shares | | | | | Value | |
| | | | Common Stocks & Other Equity Interests—99.9% | |
| | | | Consumer Discretionary—3.0% | | | |
| | 72,593 | | | Cooper-Standard Holdings, Inc.(b) | | $ | 10,049,049 | |
| | 234,815 | | | Monarch Casino & Resort, Inc.(b) | | | 11,048,046 | |
| | 660,265 | | | New Media Investment Group, Inc. | | | 10,498,213 | |
| | 282,694 | | | Scholastic Corp. | | | 11,884,456 | |
| | | | | | | | |
| | | | | | | 43,479,764 | |
| | | | | | | | |
| | | | Consumer Staples—1.8% | |
| | 79,039 | | | J & J Snack Foods Corp. | | | 11,500,174 | |
| | 76,659 | | | WD-40 Co. | | | 13,603,140 | |
| | | | | | | | |
| | | | | | | 25,103,314 | |
| | | | | | | | |
| | | | Financials—42.0% | |
| | 1,277,722 | | | Apollo Commercial Real Estate Finance, Inc. REIT | | | 24,826,138 | |
| | 654,971 | | | ARMOUR Residential REIT, Inc. REIT | | | 15,404,918 | |
| | 176,899 | | | Banner Corp. | | | 11,379,913 | |
| | 284,140 | | | Berkshire Hills Bancorp, Inc. | | | 12,004,915 | |
| | 650,841 | | | Brookline Bancorp, Inc. | | | 11,812,764 | |
| | 1,719,696 | | | Capstead Mortgage Corp. REIT | | | 14,445,446 | |
| | 415,032 | | | Central Pacific Financial Corp. | | | 11,757,857 | |
| | 136,761 | | | City Holding Co. | | | 11,088,582 | |
| | 247,076 | | | Columbia Banking System, Inc. | | | 10,438,961 | |
| | 176,073 | | | Community Bank System, Inc. | | | 11,643,707 | |
| | 445,749 | | | CVB Financial Corp. | | | 10,720,263 | |
| | 239,760 | | | Employers Holdings, Inc. | | | 10,992,996 | |
| | 461,097 | | | Fidelity Southern Corp. | | | 11,204,657 | |
| | 662,873 | | | First Commonwealth Financial Corp. | | | 11,103,123 | |
| | 175,342 | | | First Financial Bankshares, Inc. | | | 10,590,657 | |
| | 401,503 | | | First Midwest Bancorp, Inc. | | | 10,912,852 | |
| | 141,895 | | | FirstCash, Inc. | | | 11,536,064 | |
| | 234,854 | | | Glacier Bancorp, Inc. | | | 10,728,131 | |
| | 832,927 | | | Granite Point Mortgage Trust, Inc. REIT | | | 15,942,223 | |
| | 286,384 | | | Heritage Financial Corp. | | | 10,395,739 | |
| | 577,105 | | | Hope Bancorp, Inc. | | | 10,105,109 | |
| | 233,839 | | | Horace Mann Educators Corp. | | | 10,826,746 | |
| | 117,468 | | | Independent Bank Corp./MA | | | 10,701,335 | |
| | 218,033 | | | INTL. FCStone, Inc.(b) | | | 12,157,520 | |
| | 958,456 | | | Invesco Mortgage Capital, Inc. REIT(c) | | | 15,555,741 | |
| | 290,676 | | | National Bank Holdings Corp., Class A | | | 11,670,641 | |
| | 285,504 | | | NBT Bancorp, Inc. | | | 11,557,202 | |
| | 2,224,721 | | | New York Mortgage Trust, Inc. REIT(d) | | | 14,238,214 | |
| | 696,631 | | | Northfield Bancorp, Inc. | | | 11,341,153 | |
| | 772,060 | | | Northwest Bancshares, Inc. | | | 14,066,933 | |
| | 556,043 | | | Old National Bancorp | | | 11,287,673 | |
| | 349,990 | | | Opus Bank | | | 9,922,217 | |
| | 846,478 | | | Oritani Financial Corp. | | | 13,712,944 | |
| | 664,119 | | | PennyMac Mortgage Investment Trust REIT | | | 13,269,098 | |
| | 456,310 | | | Provident Financial Services, Inc. | | | 11,512,701 | |
| | 929,667 | | | Redwood Trust, Inc. REIT | | | 15,785,746 | |
| | 161,954 | | | RLI Corp. | | | 12,465,599 | |
| | 240,682 | | | S&T Bancorp, Inc. | | | 11,230,222 | |
| | 133,755 | | | Safety Insurance Group, Inc. | | | 12,934,109 | |
| | 179,046 | | | Selective Insurance Group, Inc. | | | 11,494,753 | |
| | 344,485 | | | Simmons First National Corp., Class A | | | 10,885,726 | |
| | 335,717 | | | Southside Bancshares, Inc. | | | 11,951,525 | |
| | 258,671 | | | Stewart Information Services Corp. | | | 11,583,287 | |
| | 774,026 | | | Third Point Reinsurance Ltd. (Bermuda)(b) | | | 10,371,948 | |
| | | | | | | | |
Number
of Shares | | | | | Value | |
| | | | Common Stocks & Other Equity Interests
(continued) | |
| | | | Financials (continued) | |
| | 122,436 | | | Tompkins Financial Corp. | | $ | 10,758,451 | |
| | 1,091,411 | | | TrustCo Bank Corp. NY | | | 10,095,552 | |
| | 329,227 | | | United Community Banks, Inc. | | | 9,988,747 | |
| | 206,208 | | | United Fire Group, Inc. | | | 10,213,482 | |
| | 82,974 | | | Virtus Investment Partners, Inc. | | | 10,703,646 | |
| | 164,516 | | | Westamerica Bancorporation | | | 10,533,959 | |
| | | | | | | | |
| | | | | | | 601,851,885 | |
| | | | | | | | |
| | | | Health Care—3.3% | |
| | 410,505 | | | Computer Programs & Systems, Inc. | | | 11,206,787 | |
| | 143,949 | | | CONMED Corp. | | | 11,577,818 | |
| | 132,242 | | | Neogen Corp.(b) | | | 12,356,692 | |
| | 94,099 | | | US Physical Therapy, Inc. | | | 11,785,900 | |
| | | | | | | | |
| | | | | | | 46,927,197 | |
| | | | | | | | |
| | | | Industrials—11.1% | |
| | 137,054 | | | Albany International Corp., Class A | | | 10,573,716 | |
| | 145,368 | | | Applied Industrial Technologies, Inc. | | | 11,200,604 | |
| | 297,685 | | | Brady Corp., Class A | | | 12,041,358 | |
| | 228,227 | | | Exponent, Inc. | | | 11,947,684 | |
| | 220,986 | | | Forrester Research, Inc. | | | 10,872,511 | |
| | 167,882 | | | Forward Air Corp. | | | 10,788,097 | |
| | 203,141 | | | Hillenbrand, Inc. | | | 10,390,662 | |
| | 191,209 | | | Kaman Corp. | | | 12,468,739 | |
| | 121,026 | | | Lindsay Corp. | | | 11,590,660 | |
| | 193,684 | | | Matthews International Corp., Class A | | | 10,052,200 | |
| | 106,091 | | | Standex International Corp. | | | 11,447,219 | |
| | 59,359 | | | UniFirst Corp. | | | 10,993,287 | |
| | 216,005 | | | Viad Corp. | | | 13,305,908 | |
| | 138,129 | | | Watts Water Technologies, Inc., Class A | | | 11,388,736 | |
| | | | | | | | |
| | | | | | | 159,061,381 | |
| | | | | | | | |
| | | | Information Technology—7.1% | |
| | 168,935 | | | Bottomline Technologies (DE), Inc.(b) | | | 11,144,642 | |
| | 55,587 | | | CACI International, Inc., Class A(b) | | | 10,839,465 | |
| | 318,588 | | | CSG Systems International, Inc. | | | 11,899,262 | |
| | 219,698 | | | ExlService Holdings, Inc.(b) | | | 14,078,248 | |
| | 79,747 | | | MicroStrategy, Inc., Class A(b) | | | 11,882,303 | |
| | 196,731 | | | MTS Systems Corp. | | | 10,643,147 | |
| | 396,313 | | | Perficient, Inc.(b) | | | 11,386,072 | |
| | 164,641 | | | Plexus Corp.(b) | | | 10,420,129 | |
| | 809,874 | | | Rambus, Inc.(b) | | | 9,896,660 | |
| | | | | | | | |
| | | | | | | 102,189,928 | |
| | | | | | | | |
| | | | Materials—4.2% | |
| | 124,604 | | | Balchem Corp. | | | 13,817,338 | |
| | 194,587 | | | H.B. Fuller Co. | | | 11,089,513 | |
| | 93,612 | | | Kaiser Aluminum Corp. | | | 10,258,939 | |
| | 153,598 | | | Neenah, Inc. | | | 14,015,817 | |
| | 258,150 | | | Schweitzer-Mauduit International, Inc. | | | 10,504,124 | |
| | | | | | | | |
| | | | | | | 59,685,731 | |
| | | | | | | | |
| | | | Real Estate—22.5% | |
| | 405,205 | | | Acadia Realty Trust REIT | | | 11,556,447 | |
| | 267,914 | | | Agree Realty Corp. REIT | | | 15,289,852 | |
| | 336,174 | | | American Assets Trust, Inc. REIT | | | 13,278,873 | |
| | 821,320 | | | Armada Hoffler Properties, Inc. REIT | | | 12,804,379 | |
| | 606,372 | | | CareTrust REIT, Inc. REIT | | | 11,187,563 | |
See accompanying Notes to Financial Statements which are an integral part of the financial statements.
Invesco S&P SmallCap Low Volatility ETF (XSLV) (continued)
August 31, 2018
| | | | | | | | |
Number
of Shares | | | | | Value | |
| | | | Common Stocks & Other Equity Interests
(continued) | |
| | | | Real Estate (continued) | |
| | 565,499 | | | Chatham Lodging Trust REIT | | $ | 12,129,954 | |
| | 381,016 | | | Chesapeake Lodging Trust REIT | | | 12,539,237 | |
| | 334,777 | | | Community Healthcare Trust, Inc. REIT | | | 10,388,130 | |
| | 995,361 | | | DiamondRock Hospitality Co. REIT | | | 11,904,518 | |
| | 775,628 | | | Easterly Government Properties, Inc. REIT | | | 15,706,467 | |
| | 142,637 | | | EastGroup Properties, Inc. REIT | | | 13,874,301 | |
| | 546,631 | | | Four Corners Property Trust, Inc. REIT | | | 14,726,239 | |
| | 397,003 | | | Getty Realty Corp. REIT | | | 11,556,757 | |
| | 511,302 | | | Global NET Lease, Inc. REIT | | | 11,090,140 | |
| | 562,767 | | | Hersha Hospitality Trust REIT | | | 13,281,301 | |
| | 1,070,533 | | | Independence Realty Trust, Inc. REIT | | | 11,058,606 | |
| | 1,545,778 | | | Lexington Realty Trust REIT | | | 14,437,566 | |
| | 282,782 | | | LTC Properties, Inc. REIT | | | 13,135,224 | |
| | 393,958 | | | National Storage Affiliates Trust REIT | | | 11,172,649 | |
| | 100,610 | | | PS Business Parks, Inc. REIT | | | 13,122,562 | |
| | 785,599 | | | Ramco-Gershenson Properties Trust REIT | | | 10,966,962 | |
| | 659,390 | | | Retail Opportunity Investments Corp. REIT | | | 13,016,359 | |
| | 184,026 | | | Saul Centers, Inc. REIT | | | 11,041,560 | |
| | 751,865 | | | Summit Hotel Properties, Inc. REIT | | | 10,323,106 | |
| | 149,007 | | | Universal Health Realty Income Trust REIT | | | 11,361,784 | |
| | 537,459 | | | Urstadt Biddle Properties, Inc., Class A REIT | | | 12,227,192 | |
| | | | | | | | |
| | | | | | | 323,177,728 | |
| | | | | | | | |
| | | | Utilities—4.9% | |
| | 177,516 | | | American States Water Co. | | | 10,727,292 | |
| | 244,069 | | | California Water Service Group | | | 10,043,439 | |
| | 207,257 | | | El Paso Electric Co. | | | 12,704,854 | |
| | 204,085 | | | Northwest Natural Gas Co. | | | 13,245,117 | |
| | 314,638 | | | South Jersey Industries, Inc. | | | 10,439,689 | |
| | 174,604 | | | Spire, Inc. | | | 13,016,728 | |
| | | | | | | | |
| | | | | | | 70,177,119 | |
| | | | | | | | |
| | | | Total Common Stocks & Other Equity Interests
(Cost $1,276,051,157) | | | 1,431,654,047 | |
| | | | | | | | |
| | |
| | | | Money Market Fund—0.1% | | | |
| | 993,393 | | | Invesco Premier U.S. Government Money Portfolio—Institutional Class, 1.83%(e)
(Cost $993,393) | | | 993,393 | |
| | | | | | | | |
| | | | Total Investments in Securities
(excluding investments purchased with cash collateral from securities on loan)
(Cost $1,277,044,550)—100.0% | | | 1,432,647,440 | |
| | | | | | | | |
| | |
| | | | | | | | |
| | | | | | | | |
Number
of Shares | | | | | Value | |
| | | | Investments Purchased with Cash Collateral from
Securities on Loan | |
| | |
| | | | Money Market Fund—0.9% | | | |
| | 12,908,376 | | | Invesco Government & Agency Portfolio—Institutional Class, 1.85%(e)(f)
(Cost $12,908,376) | | $ | 12,908,376 | |
| | | | | | | | |
| | | | Total Investments in Securities
(Cost $1,289,952,926)—100.9% | | | 1,445,555,816 | |
| | | | Other assets less liabilities—(0.9)% | | | (12,200,078 | ) |
| | | | | | | | |
| | | | Net Assets—100.0% | | $ | 1,433,355,738 | |
| | | | | | | | |
Investment Abbreviations:
REIT—Real Estate Investment Trust
Notes to Schedule of Investments:
| (a) | Industry and/or sector classifications used in this report are generally according to the Global Industry Classification Standard, which was developed by and is the exclusive property and a service mark of MSCI Inc. and Standard & Poor’s. |
| (b) | Non-income producing security. |
| (c) | Affiliated company. The Fund’s Adviser and Invesco Mortgage Capital, Inc. REIT are wholly-owned subsidiaries of Invesco Ltd. and therefore, Invesco Ltd. And Invesco Mortgage Capital, Inc. REIT are considered to be affiliated. See Note 4. |
| (d) | All or a portion of this security was out on loan at August 31, 2018. |
| (e) | The security and the Fund are advised by wholly-owned subsidiaries of Invesco Ltd. and are therefore considered to be affiliated. The rate shown is the 7-day SEC standardized yield as of August 31, 2018. |
| (f) | The security has been segregated to satisfy the commitment to return the cash collateral received in securities lending transactions upon the borrower’s return of the securities loaned. See Note 2J. |
See accompanying Notes to Financial Statements which are an integral part of the financial statements.
Schedule of Investments(a)
Invesco S&P SmallCap Quality ETF (XSHQ)
August 31, 2018
| | | | | | | | |
Number
of Shares | | | | | Value | |
| | | | Common Stocks & Other Equity Interests—99.9% | |
| | | | Consumer Discretionary—18.5% | | | |
| | 14,281 | | | Abercrombie & Fitch Co., Class A | | $ | 309,469 | |
| | 3,699 | | | American Public Education, Inc.(b) | | | 128,540 | |
| | 3,888 | | | BJ’s Restaurants, Inc. | | | 294,322 | |
| | 7,236 | | | Buckle, Inc. (The) | | | 186,327 | |
| | 10,042 | | | Caleres, Inc. | | | 406,500 | |
| | 5,967 | | | Cato Corp. (The), Class A | | | 127,992 | |
| | 1,831 | | | Cavco Industries, Inc.(b) | | | 449,327 | |
| | 28,566 | | | Chico’s FAS, Inc. | | | 260,522 | |
| | 4,714 | | | Children’s Place, Inc. (The) | | | 663,495 | |
| | 16,767 | | | Crocs, Inc.(b) | | | 346,406 | |
| | 7,939 | | | Dave & Buster’s Entertainment, Inc.(b) | | | 461,812 | |
| | 16,525 | | | DSW, Inc., Class A | | | 549,622 | |
| | 5,805 | | | Ethan Allen Interiors, Inc. | | | 129,161 | |
| | 3,916 | | | Haverty Furniture Cos., Inc. | | | 86,544 | |
| | 5,346 | | | Hibbett Sports, Inc.(b) | | | 109,860 | |
| | 3,970 | | | Kirkland’s, Inc.(b) | | | 36,087 | |
| | 10,190 | | | La-Z-Boy, Inc. | | | 338,818 | |
| | 6,103 | | | Lumber Liquidators Holdings, Inc.(b) | | | 106,375 | |
| | 6,156 | | | Nautilus, Inc.(b) | | | 90,185 | |
| | 8,278 | | | Nutrisystem, Inc. | | | 306,286 | |
| | 3,645 | | | Oxford Industries, Inc. | | | 339,313 | |
| | 5,185 | | | PetMed Express, Inc. | | | 190,238 | |
| | 6,643 | | | Ruth’s Hospitality Group, Inc. | | | 204,604 | |
| | 2,296 | | | Shoe Carnival, Inc. | | | 102,080 | |
| | 9,958 | | | Sleep Number Corp.(b) | | | 335,585 | |
| | 12,551 | | | Steven Madden Ltd. | | | 729,841 | |
| | 2,569 | | | Strategic Education, Inc. | | | 356,500 | |
| | 4,770 | | | Sturm Ruger & Co., Inc. | | | 312,197 | |
| | | | | | | | |
| | | | | | | 7,958,008 | |
| | | | | | | | |
| | | | Consumer Staples—6.0% | |
| | 3,267 | | | Calavo Growers, Inc. | | | 345,812 | |
| | 6,823 | | | Cal-Maine Foods, Inc. | | | 337,397 | |
| | 3,618 | | | Inter Parfums, Inc. | | | 236,255 | |
| | 1,863 | | | John B. Sanfilippo & Son, Inc. | | | 136,130 | |
| | 3,423 | | | Medifast, Inc. | | | 783,011 | |
| | 3,058 | | | MGP Ingredients, Inc. | | | 235,802 | |
| | 2,859 | | | WD-40 Co. | | | 507,330 | |
| | | | | | | | |
| | | | | | | 2,581,737 | |
| | | | | | | | |
| | | | Energy—1.0% | |
| | 7,831 | | | Renewable Energy Group, Inc.(b) | | | 211,046 | |
| | 4,232 | | | SEACOR Holdings, Inc.(b) | | | 217,736 | |
| | | | | | | | |
| | | | | | | 428,782 | |
| | | | | | | | |
| | | | Financials—21.2% | |
| | 19,437 | | | American Equity Investment Life Holding Co. | | | 720,918 | |
| | 9,465 | | | Ameris Bancorp | | | 469,937 | |
| | 4,698 | | | AMERISAFE, Inc. | | | 299,732 | |
| | 6,921 | | | Banner Corp. | | | 445,228 | |
| | 10,697 | | | BofI Holding, Inc.(b) | | | 398,356 | |
| | 7,075 | | | Central Pacific Financial Corp. | | | 200,435 | |
| | 21,465 | | | CVB Financial Corp. | | | 516,233 | |
| | 16,279 | | | First Financial Bankshares, Inc. | | | 983,252 | |
| | 10,026 | | | FirstCash, Inc. | | | 815,114 | |
| | 12,118 | | | Great Western Bancorp, Inc. | | | 527,618 | |
| | 6,805 | | | Investment Technology Group, Inc. | | | 148,893 | |
| | 6,265 | | | James River Group Holdings Ltd. | | | 256,552 | |
| | 1,946 | | | Meta Financial Group, Inc. | | | 168,524 | |
| | | | | | | | |
Number
of Shares | | | | | Value | |
| | | | Common Stocks & Other Equity Interests
(continued) | |
| | | | Financials (continued) | | | |
| | 11,233 | | | OFG Bancorp | | $ | 181,975 | |
| | 12,400 | | | ProAssurance Corp. | | | 599,540 | |
| | 8,272 | | | RLI Corp. | | | 636,696 | |
| | 3,294 | | | Safety Insurance Group, Inc. | | | 318,530 | |
| | 4,427 | | | United Fire Group, Inc. | | | 219,269 | |
| | 8,882 | | | Universal Insurance Holdings, Inc. | | | 396,137 | |
| | 7,702 | | | Walker & Dunlop, Inc. | | | 419,759 | |
| | 5,605 | | | Westamerica Bancorporation | | | 358,888 | |
| | | | | | | | |
| | | | | | | 9,081,586 | |
| | | | | | | | |
| | | | Health Care—12.1% | |
| | 5,934 | | | Amedisys, Inc.(b) | | | 741,809 | |
| | 10,828 | | | AMN Healthcare Services, Inc.(b) | | | 631,273 | |
| | 7,674 | | | Cambrex Corp.(b) | | | 517,228 | |
| | 2,269 | | | CorVel Corp.(b) | | | 134,892 | |
| | 3,673 | | | Cutera, Inc.(b) | | | 124,882 | |
| | 3,505 | | | Enanta Pharmaceuticals, Inc.(b) | | | 318,710 | |
| | 6,399 | | | HealthStream, Inc. | | | 203,040 | |
| | 4,042 | | | Inogen, Inc.(b) | | | 1,070,766 | |
| | 8,667 | | | Luminex Corp. | | | 244,496 | |
| | 9,343 | | | Meridian Bioscience, Inc. | | | 146,685 | |
| | 23,383 | | | MiMedx Group, Inc.(b) | | | 123,930 | |
| | 3,888 | | | Orthofix Medical, Inc.(b) | | | 208,241 | |
| | 2,539 | | | Providence Service Corp. (The)(b) | | | 170,469 | |
| | 11,853 | | | Quality Systems, Inc.(b) | | | 271,315 | |
| | 8,613 | | | Tivity Health, Inc.(b) | | | 296,287 | |
| | | | | | | | |
| | | | | | | 5,204,023 | |
| | | | | | | | |
| | | | Industrials—15.6% | |
| | 8,562 | | | AAON, Inc. | | | 345,905 | |
| | 13,897 | | | Axon Enterprise, Inc.(b) | | | 948,609 | |
| | 10,777 | | | Brady Corp., Class A | | | 435,930 | |
| | 4,240 | | | Encore Wire Corp. | | | 213,060 | |
| | 4,757 | | | EnPro Industries, Inc. | | | 357,108 | |
| | 11,476 | | | Exponent, Inc. | | | 600,769 | |
| | 2,403 | | | Forrester Research, Inc. | | | 118,228 | |
| | 6,670 | | | Forward Air Corp. | | | 428,614 | |
| | 4,050 | | | Heidrick & Struggles International, Inc. | | | 179,010 | |
| | 11,715 | | | Korn/Ferry International | | | 786,428 | |
| | 8,721 | | | Marten Transport Ltd. | | | 192,298 | |
| | 1,107 | | | National Presto Industries, Inc. | | | 146,788 | |
| | 7,506 | | | Raven Industries, Inc. | | | 363,290 | |
| | 6,561 | | | Resources Connection, Inc. | | | 108,585 | |
| | 8,419 | | | Simpson Manufacturing Co., Inc. | | | 646,327 | |
| | 8,451 | | | TrueBlue, Inc.(b) | | | 247,614 | |
| | 10,799 | | | WageWorks, Inc.(b) | | | 577,746 | |
| | | | | | | | |
| | | | | | | 6,696,309 | |
| | | | | | | | |
| | | | Information Technology—18.9% | |
| | 10,186 | | | Advanced Energy Industries, Inc.(b) | | | 606,882 | |
| | 5,947 | | | Badger Meter, Inc. | | | 326,788 | |
| | 15,093 | | | Brooks Automation, Inc. | | | 594,815 | |
| | 5,832 | | | Cabot Microelectronics Corp. | | | 657,441 | |
| | 5,413 | | | CACI International, Inc., Class A(b) | | | 1,055,535 | |
| | 8,532 | | | Daktronics, Inc. | | | 69,194 | |
| | 2,965 | | | ePlus, Inc.(b) | | | 307,322 | |
| | 11,070 | | | KEMET Corp.(b) | | | 286,049 | |
See accompanying Notes to Financial Statements which are an integral part of the financial statements.
Invesco S&P SmallCap Quality ETF (XSHQ) (continued)
August 31, 2018
| | | | | | | | |
Number
of Shares | | | | | Value | |
| | | | Common Stocks & Other Equity Interests
(continued) | |
| | | | Information Technology (continued) | | | |
| | 18,505 | | | Knowles Corp.(b) | | $ | 335,496 | |
| | 8,151 | | | Methode Electronics, Inc. | | | 323,187 | |
| | 4,915 | | | Nanometrics, Inc.(b) | | | 215,326 | |
| | 6,532 | | | NETGEAR, Inc.(b) | | | 462,792 | |
| | 17,253 | | | NIC, Inc. | | | 289,850 | |
| | 6,777 | | | OneSpan, Inc.(b) | | | 127,069 | |
| | 5,967 | | | Park Electrochemical Corp. | | | 127,574 | |
| | 9,775 | | | QuinStreet, Inc.(b) | | | 148,287 | |
| | 6,967 | | | Rudolph Technologies, Inc.(b) | | | 193,683 | |
| | 4,316 | | | Shutterstock, Inc. | | | 237,553 | |
| | 8,291 | | | SolarEdge Technologies, Inc.(b) | | | 397,553 | |
| | 4,413 | | | Stamps.com, Inc.(b) | | | 1,096,410 | |
| | 7,830 | | | Ultra Clean Holdings, Inc.(b) | | | 119,486 | |
| | 5,049 | | | XO Group, Inc.(b) | | | 151,773 | |
| | | | | | | | |
| | | | | | | 8,130,065 | |
| | | | | | | | |
| | | | Materials—5.1% | |
| | 6,264 | | | AdvanSix, Inc.(b) | | | 211,974 | |
| | 6,834 | | | Balchem Corp. | | | 757,822 | |
| | 1,863 | | | Hawkins, Inc. | | | 76,942 | |
| | 4,232 | | | Materion Corp. | | | 270,001 | |
| | 2,727 | | | Quaker Chemical Corp. | | | 491,242 | |
| | 4,053 | | | Stepan Co. | | | 361,568 | |
| | | | | | | | |
| | | | | | | 2,169,549 | |
| | | | | | | | |
| | | | Real Estate—1.5% | |
| | 4,890 | | | PS Business Parks, Inc. REIT | | | 637,803 | |
| | | | | | | | |
| | | | Total Common Stocks & Other Equity Interests
(Cost $39,899,528) | | | 42,887,862 | |
| | | | | | | | |
| | |
| | | | Money Market Fund—0.1% | | | |
| | 29,941 | | | Invesco Premier U.S. Government Money Portfolio—Institutional Class, 1.83%(c)
(Cost $29,941) | | | 29,941 | |
| | | | | | | | |
| | | | Total Investments in Securities
(Cost $39,929,469)—100.0% | | | 42,917,803 | |
| | | | Other assets less liabilities—0.0% | | | 6,464 | |
| | | | | | | | |
| | | | Net Assets—100.0% | | $ | 42,924,267 | |
| | | | | | | | |
Investment Abbreviations:
REIT—Real Estate Investment Trust
Notes to Schedule of Investments:
| (a) | Industry and/or sector classifications used in this report are generally according to the Global Industry Classification Standard, which was developed by and is the exclusive property and a service mark of MSCI Inc. and Standard & Poor’s. |
| (b) | Non-income producing security. |
| (c) | The security and the Fund are advised by wholly-owned subsidiaries of Invesco Ltd. and are therefore considered to be affiliated. The rate shown is the 7-day SEC standardized yield as of August 31, 2018. |
See accompanying Notes to Financial Statements which are an integral part of the financial statements.
(This Page Intentionally Left Blank)
Statements of Assets and Liabilities
August 31, 2018
| | | | | | | | | | | | |
| | |
Invesco Russell
1000 Enhanced
Equal Weight
ETF (USEQ) | | | Invesco Russell
1000 Equal
Weight ETF
(EQAL) | | | Invesco Russell
1000 Low Beta
Equal Weight
ETF (USLB) | |
| Assets: | | | | | | | | | | | | |
Unaffiliated investments in securities, at value(a) | | $ | 145,270,871 | | | $ | 473,937,412 | | | $ | 164,594,202 | |
Affiliated investments in securities, at value | | | 176,316 | | | | 4,385,405 | | | | – | |
Receivables: | | | | | | | | | | | | |
Shares sold | | | 2,881,111 | | | | 1,679,891 | | | | – | |
Dividends | | | 211,152 | | | | 711,369 | | | | 231,960 | |
Investments sold | | | 31 | | | | 3,061 | | | | — | |
Securities lending | | | — | | | | 4,573 | | | | — | |
| | | | | | | | | | | | |
Total Assets | | | 148,539,481 | | | | 480,721,711 | | | | 164,826,162 | |
| | | | | | | | | | | | |
| | | |
| Liabilities: | | | | | | | | | | | | |
Due to custodian | | | 114,679 | | | | 217,683 | | | | 133 | |
Payables: | | | | | | | | | | | | |
Investments purchased | | | 2,890,713 | | | | 1,663,025 | | | | — | |
Shares repurchased | | | — | | | | — | | | | — | |
Collateral upon return of securities loaned | | | — | | | | 4,208,824 | | | | — | |
Accrued unitary management fees | | | 34,550 | | | | 78,217 | | | | 48,230 | |
| | | | | | | | | | | | |
Total Liabilities | | | 3,039,942 | | | | 6,167,749 | | | | 48,363 | |
| | | | | | | | | | | | |
| Net Assets | | $ | 145,499,539 | | | $ | 474,553,962 | | | $ | 164,777,799 | |
| | | | | | | | | | | | |
| | | |
| Net Assets Consist of: | | | | | | | | | | | | |
Shares of beneficial interest | | $ | 136,931,367 | | | $ | 450,685,892 | | | $ | 166,509,790 | |
Undistributed net investment income | | | 474,726 | | | | 1,734,607 | | | | 638,961 | |
Undistributed net realized gain (loss) | | | (2,300,642 | ) | | | (15,976,914 | ) | | | (16,123,823 | ) |
Net unrealized appreciation (depreciation) | | | 10,394,088 | | | | 38,110,377 | | | | 13,752,871 | |
| | | | | | | | | | | | |
| Net Assets | | $ | 145,499,539 | | | $ | 474,553,962 | | | $ | 164,777,799 | |
| | | | | | | | | | | | |
Shares outstanding (unlimited amount authorized, $0.01 par value) | | | 5,050,001 | | | | 14,250,001 | | | | 4,950,001 | |
Net asset value | | $ | 28.81 | | | $ | 33.30 | | | $ | 33.29 | |
| | | | | | | | | | | | |
Market price | | $ | 28.83 | | | $ | 33.31 | | | $ | 33.29 | |
| | | | | | | | | | | | |
Unaffiliated investments in securities, at cost | | $ | 134,815,598 | | | $ | 435,775,175 | | | $ | 150,841,331 | |
| | | | | | | | | | | | |
Affiliated investments in securities, at cost | | $ | 237,501 | | | $ | 4,437,265 | | | $ | — | |
| | | | | | | | | | | | |
(a) Includes securities on loan with an aggregate value of: | | $ | — | | | $ | 4,089,138 | | | $ | — | |
| | | | | | | | | | | | |
See accompanying Notes to Financial Statements which are an integral part of the financial statements.
| | | | | | | | | | | | | | | | | | | | | | |
| | | Invesco S&P
500 Enhanced
Value ETF
(SPVU) | | | Invesco S&P
500® ex-Rate
Sensitive Low
Volatility
ETF (XRLV) | | | Invesco S&P
500® High
Beta
ETF (SPHB) | | | Invesco S&P
500® High
Dividend Low
Volatility
ETF (SPHD) | | | Invesco S&P
500® Low
Volatility
ETF (SPLV) | |
| | | | | | | | | | | | | | | | | | | | | | |
| | | | $ | 26,898,761 | | | $ | 146,064,717 | | | $ | 170,259,050 | | | $ | 2,604,474,331 | | | $ | 7,378,300,667 | |
| | | | | 71,770 | | | | – | | | | 1,537,532 | | | | 50,738,525 | | | | — | |
| | | | | | | | | | | | | | | | | | | | | | |
| | | | | – | | | | – | | | | – | | | | – | | | | 12,445,253 | |
| | | | | 76,941 | | | | 209,376 | | | | 180,319 | | | | 9,442,348 | | | | 16,913,793 | |
| | | | | — | | | | — | | | | — | | | | — | | | | 4,975,389 | |
| | | | | — | | | | — | | | | 114 | | | | — | | | | — | |
| | | | | | | | | | | | | | | | | | | | | | |
| | | | | 27,047,472 | | | | 146,274,093 | | | | 171,977,015 | | | | 2,664,655,204 | | | | 7,412,635,102 | |
| | | | | | | | | | | | | | | | | | | | | | |
| | | | | |
| | | | | | | | | | | | | | | | | | | | | | |
| | | | | 48,956 | | | | 49,651 | | | | 6,816 | | | | 7,104,920 | | | | 12,267,682 | |
| | | | | | | | | | | | | | | | | | | | | | |
| | | | | — | | | | — | | | | — | | | | — | | | | 12,438,471 | |
| | | | | — | | | | — | | | | — | | | | 1,757 | | | | 4,977,216 | |
| | | | | — | | | | — | | | | — | | | | — | | | | — | |
| | | | | 2,943 | | | | 35,489 | | | | 36,295 | | | | 680,262 | | | | 1,589,304 | |
| | | | | | | | | | | | | | | | | | | | | | |
| | | | | 51,899 | | | | 85,140 | | | | 43,111 | | | | 7,786,939 | | | | 31,272,673 | |
| | | | | | | | | | | | | | | | | | | | | | |
| | | | $ | 26,995,573 | | | $ | 146,188,953 | | | $ | 171,933,904 | | | $ | 2,656,868,265 | | | $ | 7,381,362,429 | |
| | | | | | | | | | | | | | | | | | | | | | |
| | | | | |
| | | | | | | | | | | | | | | | | | | | | | |
| | | | $ | 26,379,170 | | | $ | 143,122,831 | | | $ | 228,648,891 | | | $ | 2,842,910,582 | | | $ | 7,330,131,003 | |
| | | | | 140,996 | | | | — | | | | 407,470 | | | | — | | | | — | |
| | | | | (750,730 | ) | | | (9,999,242 | ) | | | (56,158,225 | ) | | | (152,217,905 | ) | | | (458,313,031 | ) |
| | | | | 1,226,137 | | | | 13,065,364 | | | | (964,232 | ) | | | (33,824,412 | ) | | | 509,544,457 | |
| | | | | | | | | | | | | | | | | | | | | | |
| | | | $ | 26,995,573 | | | $ | 146,188,953 | | | $ | 171,933,904 | | | $ | 2,656,868,265 | | | $ | 7,381,362,429 | |
| | | | | | | | | | | | | | | | | | | | | | |
| | | | | 750,001 | | | | 4,050,001 | | | | 3,800,000 | | | | 63,750,000 | | | | 148,300,000 | |
| | | | $ | 35.99 | | | $ | 36.10 | | | $ | 45.25 | | | $ | 41.68 | | | $ | 49.77 | |
| | | | | | | | | | | | | | | | | | | | | | |
| | | | $ | 36.01 | | | $ | 36.11 | | | $ | 45.28 | | | $ | 41.68 | | | $ | 49.78 | |
| | | | | | | | | | | | | | | | | | | | | | |
| | | | $ | 25,662,467 | | | $ | 132,999,353 | | | $ | 170,577,586 | | | $ | 2,623,045,850 | | | $ | 6,868,756,210 | |
| | | | | | | | | | | | | | | | | | | | | | |
| | | | $ | 81,927 | | | $ | — | | | $ | 2,183,228 | | | $ | 65,991,418 | | | $ | — | |
| | | | | | | | | | | | | | | | | | | | | | |
| | | | $ | — | | | $ | — | | | $ | — | | | $ | — | | | $ | — | |
| | | | | | | | | | | | | | | | | | | | | | |
Statements of Assets and Liabilities (continued)
August 31, 2018
| | | | | | | | | | | | |
| | | Invesco
S&P 500
Minimum
Variance
ETF (SPMV) | | | Invesco S&P
500
Momentum
ETF (SPMO) | | | Invesco
S&P 500
Value with
Momentum
ETF (SPVM) | |
| Assets: | | | | | | | | | | | | |
Unaffiliated investments in securities, at value(a) | | $ | 1,458,606 | | | $ | 50,032,420 | | | $ | 2,948,346 | |
Affiliated investments in securities, at value | | | — | | | | — | | | | — | |
Receivables: | | | | | | | | | | | | |
Shares sold | | | — | | | | 6,015,408 | | | | — | |
Dividends | | | 2,354 | | | | 59,180 | | | | 6,274 | |
Investments sold | | | — | | | | — | | | | — | |
Securities lending | | | — | | | | — | | | | — | |
| | | | | | | | | | | | |
Total Assets | | | 1,460,960 | | | | 56,107,008 | | | | 2,954,620 | |
| | | | | | | | | | | | |
| | | |
| Liabilities: | | | | | | | | | | | | |
Due to custodian | | | 1,140 | | | | 10,209 | | | | 4,113 | |
Payables: | | | | | | | | | | | | |
Investments purchased | | | — | | | | 6,010,217 | | | | — | |
Shares repurchased | | | — | | | | — | | | | — | |
Collateral upon return of securities loaned | | | — | | | | — | | | | — | |
Accrued unitary management fees | | | 159 | | | | 4,604 | | | | 598 | |
| | | | | | | | | | | | |
Total Liabilities | | | 1,299 | | | | 6,025,030 | | | | 4,711 | |
| | | | | | | | | | | | |
| Net Assets | | $ | 1,459,661 | | | $ | 50,081,978 | | | $ | 2,949,909 | |
| | | | | | | | | | | | |
| | | |
| Net Assets Consist of: | | | | | | | | | | | | |
Shares of beneficial interest | | $ | 1,299,936 | | | $ | 46,864,331 | | | $ | 2,887,424 | |
Undistributed net investment income | | | 4,429 | | | | 89,914 | | | | 15,178 | |
Undistributed net realized gain (loss) | | | (25,789 | ) | | | (206,917 | ) | | | (115,676 | ) |
Net unrealized appreciation | | | 181,085 | | | | 3,334,650 | | | | 162,983 | |
| | | | | | | | | | | | |
| Net Assets | | $ | 1,459,661 | | | $ | 50,081,978 | | | $ | 2,949,909 | |
| | | | | | | | | | | | |
Shares outstanding (unlimited amount authorized, $0.01 par value) | | | 50,001 | | | | 1,250,001 | | | | 100,001 | |
Net asset value | | $ | 29.19 | | | $ | 40.07 | | | $ | 29.50 | |
| | | | | | | | | | | | |
Market price | | $ | 29.19 | | | $ | 40.08 | | | $ | 29.50 | |
| | | | | | | | | | | | |
Unaffiliated investments in securities, at cost | | $ | 1,277,521 | | | $ | 46,697,770 | | | $ | 2,785,363 | |
| | | | | | | | | | | | |
Affiliated investments in securities, at cost | | $ | — | | | $ | — | | | $ | — | |
| | | | | | | | | | | | |
(a) Includes securities on loan with an aggregate value of: | | $ | — | | | $ | — | | | $ | — | |
| | | | | | | | | | | | |
See accompanying Notes to Financial Statements which are an integral part of the financial statements.
| | | | | | | | | | | | | | |
Invesco S&P
MidCap Low
Volatility
ETF (XMLV) | | | Invesco S&P
SmallCap High
Dividend Low
Volatility ETF
(XSHD) | | | Invesco S&P
SmallCap Low
Volatility
ETF (XSLV) | | | Invesco S&P
SmallCap
Quality
ETF (XSHQ) | |
| | | | | | | | | | | | | | |
| $ | 1,444,505,079 | | | $ | 11,723,960 | | | $ | 1,416,098,306 | | | $ | 42,887,862 | |
| | — | | | | 358,683 | | | | 29,457,510 | | | | 29,941 | |
| | | | | | | | | | | | | | |
| | — | | | | — | | | | 2,558,973 | | | | — | |
| | 2,289,575 | | | | 15,235 | | | | 993,072 | | | | 16,546 | |
| | 270 | | | | 872 | | | | — | | | | — | |
| | — | | | | — | | | | 5,106 | | | | — | |
| | | | | | | | | | | | | | |
| | 1,446,794,924 | | | | 12,098,750 | | | | 1,449,112,967 | | | | 42,934,349 | |
| | | | | | | | | | | | | | |
| | | |
| | | | | | | | | | | | | | |
| | 2,847,352 | | | | 9,581 | | | | — | | | | — | |
| | | | | | | | | | | | | | |
| | — | | | | — | | | | 2,551,940 | | | | — | |
| | 2,539 | | | | — | | | | — | | | | — | |
| | — | | | | — | | | | 12,908,376 | | | | — | |
| | 304,063 | | | | 2,950 | | | | 296,913 | | | | 10,082 | |
| | | | | | | | | | | | | | |
| | 3,153,954 | | | | 12,531 | | | | 15,757,229 | | | | 10,082 | |
| | | | | | | | | | | | | | |
| $ | 1,443,640,970 | | | $ | 12,086,219 | | | $ | 1,433,355,738 | | | $ | 42,924,267 | |
| | | | | | | | | | | | | | |
| | | |
| | | | | | | | | | | | | | |
| $ | 1,363,336,355 | | | $ | 12,279,960 | | | $ | 1,296,299,488 | | | $ | 40,009,209 | |
| | 5,745,811 | | | | — | | | | 6,722,853 | | | | 68,667 | |
| | (48,477,360 | ) | | | (651,827 | ) | | | (25,269,493 | ) | | | (141,943 | ) |
| | 123,036,164 | | | | 458,086 | | | | 155,602,890 | | | | 2,988,334 | |
| | | | | | | | | | | | | | |
| $ | 1,443,640,970 | | | $ | 12,086,219 | | | $ | 1,433,355,738 | | | $ | 42,924,267 | |
| | | | | | | | | | | | | | |
| | 29,450,000 | | | | 450,001 | | | | 28,050,000 | | | | 1,350,001 | |
| $ | 49.02 | | | $ | 26.86 | | | $ | 51.10 | | | $ | 31.80 | |
| | | | | | | | | | | | | | |
| $ | 49.04 | | | $ | 26.85 | | | $ | 51.10 | | | $ | 31.81 | |
| | | | | | | | | | | | | | |
| $ | 1,321,468,915 | | | $ | 11,266,613 | | | $ | 1,260,423,883 | | | $ | 39,899,528 | |
| | | | | | | | | | | | | | |
| $ | — | | | $ | 357,944 | | | $ | 29,529,043 | | | $ | 29,941 | |
| | | | | | | | | | | | | | |
| $ | — | | | $ | — | | | $ | 12,239,053 | | | $ | — | |
| | | | | | | | | | | | | | |
Statements of Operations
For the period November 1, 2017 through August 31, 2018 and year ended October 31, 2017
| | | | | | | | | | | | | | | | |
| | | Invesco Russell 1000 Enhanced Equal
Weight ETF (USEQ) | | | Invesco Russell 1000 Equal Weight ETF
(EQAL) | |
| | | Ten Months Ended
August 31, 2018 | | | Period Ended
October 31, 2017(a) | | | Ten Months Ended
August 31, 2018 | | | Year Ended
October 31, 2017 | |
| Investment Income: | | | | | | | | | | | | | | | | |
Unaffiliated dividend income | | $ | 1,822,143 | | | $ | 256,872 | | | $ | 5,682,900 | | | $ | 4,118,890 | |
Affiliated dividend income | | | 6,625 | | | | 695 | | | | 8,838 | | | | 4,651 | |
Non-cash dividend income | | | 16,689 | | | | — | | | | 77,689 | | | | 5,901 | |
Securities lending income | | | — | | | | — | | | | 50,421 | | | | 86,902 | |
Foreign withholding tax | | | (658 | ) | | | (54 | ) | | | (5,659 | ) | | | (12,305 | ) |
| | | | | | | | | | | | | | | | |
Total Income | | | 1,844,799 | | | | 257,513 | | | | 5,814,189 | | | | 4,204,039 | |
| | | | | | | | | | | | | | | | |
| | | | |
| Expenses: | | | | | | | | | | | | | | | | |
Unitary management fees | | | 270,659 | | | | 45,478 | | | | 658,026 | | | | 501,811 | |
| | | | | | | | | | | | | | | | |
Less: Waivers | | | (101 | ) | | | (13 | ) | | | (313 | ) | | | (270 | ) |
| | | | | | | | | | | | | | | | |
Net Expenses | | | 270,558 | | | | 45,465 | | | | 657,713 | | | | 501,541 | |
| | | | | | | | | | | | | | | | |
Net Investment Income | | | 1,574,241 | | | | 212,048 | | | | 5,156,476 | | | | 3,702,498 | |
| | | | | | | | | | | | | | | | |
| | | | |
| Realized and Unrealized Gain (Loss): | | | | | | | | | | | | | | | | |
Net realized gain (loss) from: | | | | | | | | | | | | | | | | |
Unaffiliated investment securities | | | (2,336,066 | ) | | | (9,599 | ) | | | (6,852,911 | ) | | | (4,819,011 | ) |
Affiliated investment securities | | | (385 | ) | | | — | | | | 26 | | | | (2,740 | ) |
Unaffiliated in-kind redemptions | | | 3,894,448 | | | | — | | | | 27,739,445 | | | | 14,916,487 | |
Affiliated in-kind redemptions | | | — | | | | — | | | | 3,072 | | | | 5,567 | |
| | | | | | | | | | | | | | | | |
Net realized gain (loss) | | | 1,557,997 | | | | (9,599 | ) | | | 20,889,632 | | | | 10,100,303 | |
| | | | | | | | | | | | | | | | |
Change in net unrealized appreciation (depreciation) on: | | | | | | | | | | | | | | | | |
Unaffiliated investment securities | | | 7,930,903 | | | | 2,524,371 | | | | 19,119,872 | | | | 24,232,508 | |
Affiliated investment securities | | | (61,427 | ) | | | 241 | | | | (67,863 | ) | | | 24,477 | |
| | | | | | | | | | | | | | | | |
Net change in unrealized appreciation (depreciation) | | | 7,869,476 | | | | 2,524,612 | | | | 19,052,009 | | | | 24,256,985 | |
| | | | | | | | | | | | | | | | |
Net realized and unrealized gain | | | 9,427,473 | | | | 2,515,013 | | | | 39,941,641 | | | | 34,357,288 | |
| | | | | | | | | | | | | | | | |
Net increase in net assets resulting from operations | | $ | 11,001,714 | | | $ | 2,727,061 | | | $ | 45,098,117 | | | $ | 38,059,786 | |
| | | | | | | | | | | | | | | | |
| (a) | For the period July 11, 2017 (commencement of investment operations) through October 31, 2017. |
See accompanying Notes to Financial Statements which are an integral part of the financial statements.
| | | | | | | | | | | | | | | | | | | | | | |
Invesco Russell 1000 Low Beta Equal
Weight ETF (USLB) | | | Invesco S&P 500 Enhanced Value ETF
(SPVU) | | | Invesco S&P 500® ex-Rate Sensitive
Low Volatility ETF (XRLV) | |
Ten Months Ended
August 31, 2018 | | | Year Ended
October 31, 2017 | | | Ten Months Ended
August 31, 2018 | | | Year Ended
October 31, 2017 | | | Ten Months Ended
August 31, 2018 | | | Year Ended
October 31, 2017 | |
| | | | | | | | | | | | | | | | | | | | | | |
| $ | 2,444,736 | | | $ | 3,083,872 | | | $ | 550,022 | | | $ | 501,436 | | | $ | 2,423,052 | | | $ | 3,018,729 | |
| | 1,015 | | | | 592 | | | | 1,115 | | | | 106 | | | | 243 | | | | 241 | |
| | 117,253 | | | | — | | | | — | | | | — | | | | — | | | | — | |
| | — | | | | — | | | | — | | | | — | | | | — | | | | — | |
| | — | | | | (1,925 | ) | | | — | | | | — | | | | — | | | | — | |
| | | | | | | | | | | | | | | | | | | | | | |
| | 2,563,004 | | | | 3,082,539 | | | | 551,137 | | | | 501,542 | | | | 2,423,295 | | | | 3,018,970 | |
| | | | | | | | | | | | | | | | | | | | | | |
| | | | | |
| | | | | | | | | | | | | | | | | | | | | | |
| | 454,202 | | | | 552,808 | | | | 34,742 | | | | 61,011 | | | | 341,341 | | | | 377,706 | |
| | | | | | | | | | | | | | | | | | | | | | |
| | (144 | ) | | | (202 | ) | | | (32 | ) | | | (24 | ) | | | (31 | ) | | | (80 | ) |
| | | | | | | | | | | | | | | | | | | | | | |
| | 454,058 | | | | 552,606 | | | | 34,710 | | | | 60,987 | | | | 341,310 | | | | 377,626 | |
| | | | | | | | | | | | | | | | | | | | | | |
| | 2,108,946 | | | | 2,529,933 | | | | 516,427 | | | | 440,555 | | | | 2,081,985 | | | | 2,641,344 | |
| | | | | | | | | | | | | | | | | | | | | | |
| | | | | |
| | | | | | | | | | | | | | | | | | | | | | |
| | | | | | | | | | | | | | | | | | | | | | |
| | (7,515,777 | ) | | | (1,489,929 | ) | | | (613,029 | ) | | | (184,186 | ) | | | (4,153,607 | ) | | | (3,384,150 | ) |
| | — | | | | — | | | | — | | | | — | | | | — | | | | — | |
| | 23,729,739 | | | | 15,074,346 | | | | 3,756,901 | | | | 796,442 | | | | 21,894,382 | | | | 23,433,952 | |
| | — | | | | — | | | | — | | | | — | | | | — | | | | — | |
| | | | | | | | | | | | | | | | | | | | | | |
| | 16,213,962 | | | | 13,584,417 | | | | 3,143,872 | | | | 612,256 | | | | 17,740,775 | | | | 20,049,802 | |
| | | | | | | | | | | | | | | | | | | | | | |
| | | | | | | | | | | | | | | | | | | | | | |
| | 1,536,763 | | | | 7,973,509 | | | | (1,465,052 | ) | | | 2,679,062 | | | | (1,085,115 | ) | | | 10,253,938 | |
| | — | | | | — | | | | (10,157 | ) | | | — | | | | — | | | | — | |
| | | | | | | | | | | | | | | | | | | | | | |
| | 1,536,763 | | | | 7,973,509 | | | | (1,475,209 | ) | | | 2,679,062 | | | | (1,085,115 | ) | | | 10,253,938 | |
| | | | | | | | | | | | | | | | | | | | | | |
| 17,750,725
|
| | | 21,557,926 | | | | 1,668,663 | | | | 3,291,318 | | | | 16,655,660 | | | | 30,303,740 | |
| | | | | | | | | | | | | | | | | | | | | | |
| $ | 19,859,671 | | | $ | 24,087,859 | | | $ | 2,185,090 | | | $ | 3,731,873 | | | $ | 18,737,645 | | | $ | 32,945,084 | |
| | | | | | | | | | | | | | | | | | | | | | |
Statements of Operations (continued)
For the period November 1, 2017 through August 31, 2018 and year ended October 31, 2017
| | | | | | | | | | | | | | | | |
| | | Invesco S&P 500® High Beta ETF
(SPHB) | | | Invesco S&P 500® High Dividend Low
Volatility ETF (SPHD) | |
| | | Ten Months Ended
August 31, 2018 | | | Year Ended
October 31, 2017 | | | Ten Months Ended
August 31, 2018 | | | Year Ended
October 31, 2017 | |
| Investment Income: | | | | | | | | | | | | | | | | |
Unaffiliated dividend income | | $ | 4,345,728 | | | $ | 6,000,163 | | | $ | 96,641,671 | | | $ | 100,436,392 | |
Affiliated dividend income | | | 105,305 | | | | 186,158 | | | | 1,766,231 | | | | 400,870 | |
Non-cash dividend income | | | — | | | | — | | | | — | | | | 6,251,155 | |
Securities lending income | | | 51,630 | | | | — | | | | — | | | | — | |
| | | | | | | | | | | | | | | | |
Total Income | | | 4,502,663 | | | | 6,186,321 | | | | 98,407,902 | | | | 107,088,417 | |
| | | | | | | | | | | | | | | | |
| | | | |
| Expenses: | | | | | | | | | | | | | | | | |
Unitary management fees | | | 675,037 | | | | 1,084,368 | | | | 6,954,096 | | | | 8,891,306 | |
| | | | | | | | | | | | | | | | |
Less: Waivers | | | (221 | ) | | | (629 | ) | | | (1,180 | ) | | | (2,006 | ) |
| | | | | | | | | | | | | | | | |
Net Expenses | | | 674,816 | | | | 1,083,739 | | | | 6,952,916 | | | | 8,889,300 | |
| | | | | | | | | | | | | | | | |
Net Investment Income | | | 3,827,847 | | | | 5,102,582 | | | | 91,454,986 | | | | 98,199,117 | |
| | | | | | | | | | | | | | | | |
| | | | |
| Realized and Unrealized Gain (Loss): | | | | | | | | | | | | | | | | |
Net realized gain (loss) from: | | | | | | | | | | | | | | | | |
Unaffiliated investment securities(b) | | | (18,396,448 | ) | | | (25,644,835 | ) | | | (87,324,076 | ) | | | (65,137,188 | ) |
Affiliated investment securities | | | (131,616 | ) | | | (214,923 | ) | | | (143,843 | ) | | | (198 | ) |
Unaffiliated in-kind redemptions | | | 54,637,705 | | | | 107,360,158 | | | | 225,606,744 | | | | 249,819,487 | |
Affiliated in-kind redemptions | | | (490,946 | ) | | | 391,559 | | | | (391,661 | ) | | | (112,705 | ) |
| | | | | | | | | | | | | | | | |
Net realized gain (loss) | | | 35,618,695 | | | | 81,891,959 | | | | 137,747,164 | | | | 184,569,396 | |
| | | | | | | | | | | | | | | | |
Change in net unrealized appreciation (depreciation) on: | | | | | | | | | | | | | | | | |
Unaffiliated investment securities | | | (2,798,366 | ) | | | 11,368,611 | | | | (91,771,804 | ) | | | 72,250,941 | |
Affiliated investment securities | | | (736,306 | ) | | | 790,392 | | | | (16,531,856 | ) | | | 1,278,963 | |
| | | | | | | | | | | | | | | | |
Net change in unrealized appreciation (depreciation) | | | (3,534,672 | ) | | | 12,159,003 | | | | (108,303,660 | ) | | | 73,529,904 | |
| | | | | | | | | | | | | | | | |
Net realized and unrealized gain | | | 32,084,023 | | | | 94,050,962 | | | | 29,443,504 | | | | 258,099,300 | |
| | | | | | | | | | | | | | | | |
Net increase in net assets resulting from operations | | $ | 35,911,870 | | | $ | 99,153,544 | | | $ | 120,898,490 | | | $ | 356,298,417 | |
| | | | | | | | | | | | | | | | |
| (a) | For the period July 11, 2017 (commencement of investment operations) through October 31, 2017. |
| (b) | Includes net gains (losses) from securities sold to affiliates of $(5,808) for Invesco S&P 500® Low Volatility ETF. |
See accompanying Notes to Financial Statements which are an integral part of the financial statements.
| | | | | | | | | | | | | | | | | | | | | | |
Invesco S&P 500® Low Volatility ETF
(SPLV) | | | Invesco S&P 500 Minimum Variance ETF
(SPMV) | | | Invesco S&P 500 Momentum ETF
(SPMO) | |
Ten Months Ended
August 31, 2018 | | | Year Ended
October 31, 2017 | | | Ten Months Ended
August 31, 2018 | | | Period Ended
October 31, 2017(a) | | | Ten Months Ended
August 31, 2018 | | | Year Ended
October 31, 2017 | |
| | | | | | | | | | | | | | | | | | | | | | |
| $ | 138,414,273 | | | $ | 161,871,518 | | | $ | 29,016 | | | $ | 16,368 | | | $ | 241,534 | | | $ | 27,173 | |
| | 17,926 | | | | 11,291 | | | | 12 | | | | — | | | | 90 | | | | 3 | |
| | — | | | | — | | | | — | | | | — | | | | — | | | | — | |
| | — | | | | — | | | | — | | | | — | | | | — | | | | — | |
| | | | | | | | | | | | | | | | | | | | | | |
| | 138,432,199 | | | | 161,882,809 | | | | 29,028 | | | | 16,368 | | | | 241,624 | | | | 27,176 | |
| | | | | | | | | | | | | | | | | | | | | | |
| | | | | |
| | | | | | | | | | | | | | | | | | | | | | |
| | 14,966,480 | | | | 16,631,387 | | | | 1,708 | | | | 1,014 | | | | 26,418 | | | | 3,644 | |
| | | | | | | | | | | | | | | | | | | | | | |
| | (2,197 | ) | | | (2,748 | ) | | | (6 | ) | | | — | | | | (11 | ) | | | (1 | ) |
| | | | | | | | | | | | | | | | | | | | | | |
| | 14,964,283 | | | | 16,628,639 | | | | 1,702 | | | | 1,014 | | | | 26,407 | | | | 3,643 | |
| | | | | | | | | | | | | | | | | | | | | | |
| | 123,467,916 | | | | 145,254,170 | | | | 27,326 | | | | 15,354 | | | | 215,217 | | | | 23,533 | |
| | | | | | | | | | | | | | | | | | | | | | |
| | | | | |
| | | | | | | | | | | | | | | | | | | | | | |
| | | | | | | | | | | | | | | | | | | | | | |
| | (119,792,908 | ) | | | (142,583,651 | ) | | | (25,004 | ) | | | (817 | ) | | | (187,307 | ) | | | (28,024 | ) |
| | — | | | | — | | | | — | | | | — | | | | — | | | | — | |
| | 783,852,352 | | | | 586,674,256 | | | | 197,957 | | | | — | | | | 1,700,391 | | | | 232,447 | |
| | — | | | | — | | | | — | | | | — | | | | — | | | | — | |
| | | | | | | | | | | | | | | | | | | | | | |
| | 664,059,444 | | | | 444,090,605 | | | | 172,953 | | | | (817 | ) | | | 1,513,084 | | | | 204,423 | |
| | | | | | | | | | | | | | | | | | | | | | |
| | | | | | | | | | | | | | | | | | | | | | |
| | (175,481,341 | ) | | | 468,264,797 | | | | 50,344 | | | | 130,741 | | | | 3,135,412 | | | | 145,527 | |
| | — | | | | — | | | | — | | | | — | | | | — | | | | — | |
| | | | | | | | | | | | | | | | | | | | | | |
| | (175,481,341 | ) | | | 468,264,797 | | | | 50,344 | | | | 130,741 | | | | 3,135,412 | | | | 145,527 | |
| | | | | | | | | | | | | | | | | | | | | | |
| | 488,578,103 | | | | 912,355,402 | | | | 223,297 | | | | 129,924 | | | | 4,648,496 | | | | 349,950 | |
| | | | | | | | | | | | | | | | | | | | | | |
| $ | 612,046,019 | | | $ | 1,057,609,572 | | | $ | 250,623 | | | $ | 145,278 | | | $ | 4,863,713 | | | $ | 373,483 | |
| | | | | | | | | | | | | | | | | | | | | | |
Statements of Operations (continued)
For the period November 1, 2017 through August 31, 2018 and year ended October 31, 2017
| | | | | | | | | | | | | | | | |
| | | Invesco S&P 500 Value with Momentum
ETF (SPVM) | | | Invesco S&P MidCap Low Volatility ETF
(XMLV) | |
| | | Ten Months Ended
August 31, 2018 | | | Period Ended
October 31, 2017(a) | | | Ten Months Ended
August 31, 2018 | | | Year Ended
October 31, 2017 | |
| Investment Income: | | | | | | | | | | | | | | | | |
Unaffiliated dividend income | | $ | 47,142 | | | $ | 28,842 | | | $ | 29,630,061 | | | $ | 18,191,810 | |
Affiliated dividend income | | | 439 | | | | 6 | | | | 10,236 | | | | 2,849 | |
Non-cash dividend income | | | — | | | | — | | | | — | | | | — | |
Securities lending income | | | — | | | | — | | | | — | | | | — | |
Foreign withholding tax | | | — | | | | — | | | | — | | | | — | |
| | | | | | | | | | | | | | | | |
Total Income | | | 47,581 | | | | 28,848 | | | | 29,640,297 | | | | 18,194,659 | |
| | | | | | | | | | | | | | | | |
| | | | |
| Expenses: | | | | | | | | | | | | | | | | |
Unitary management fees | | | 6,838 | | | | 4,447 | | | | 2,679,770 | | | | 2,408,293 | |
| | | | | | | | | | | | | | | | |
Less: Waivers | | | (147 | ) | | | (1 | ) | | | (1,468 | ) | | | (900 | ) |
| | | | | | | | | | | | | | | | |
Net Expenses | | | 6,691 | | | | 4,446 | | | | 2,678,302 | | | | 2,407,393 | |
| | | | | | | | | | | | | | | | |
Net Investment Income | | | 40,890 | | | | 24,402 | | | | 26,961,995 | | | | 15,787,266 | |
| | | | | | | | | | | | | | | | |
| | | | |
| Realized and Unrealized Gain (Loss): | | | | | | | | | | | | | | | | |
Net realized gain (loss) from: | | | | | | | | | | | | | | | | |
Unaffiliated investment securities | | | (100,337 | ) | | | (17,714 | ) | | | (27,418,666 | ) | | | (26,111,311 | ) |
Affiliated investment securities | | | (6,604 | ) | | | — | | | | — | | | | — | |
Unaffiliated in-kind redemptions | | | 324,700 | | | | 42,862 | | | | 131,810,779 | | | | 77,788,846 | |
Affiliated in-kind redemptions | | | — | | | | — | | | | — | | | | — | |
| | | | | | | | | | | | | | | | |
Net realized gain (loss) | | | 217,759 | | | | 25,148 | | | | 104,392,113 | | | | 51,677,535 | |
| | | | | | | | | | | | | | | | |
Change in net unrealized appreciation (depreciation) on: | | | | | | | | | | | | | | | | |
Unaffiliated investment securities | | | (35,303 | ) | | | 198,286 | | | | 6,754,525 | | | | 92,875,997 | |
Affiliated investment securities | | | — | | | | — | | | | — | | | | — | |
| | | | | | | | | | | | | | | | |
Net change in unrealized appreciation (depreciation) | | | (35,303 | ) | | | 198,286 | | | | 6,754,525 | | | | 92,875,997 | |
| | | | | | | | | | | | | | | | |
Net realized and unrealized gain (loss) | | | 182,456 | | | | 223,434 | | | | 111,146,638 | | | | 144,553,532 | |
| | | | | | | | | | | | | | | | |
Net increase in net assets resulting from operations | | $ | 223,346 | | | $ | 247,836 | | | $ | 138,108,633 | | | $ | 160,340,798 | |
| | | | | | | | | | | | | | | | |
| (a) | For the period April 3, 2017 (commencement of investment operations) through October 31, 2017. |
| (b) | For the period November 29, 2016 (commencement of investment operations) through October 31, 2017. |
See accompanying Notes to Financial Statements which are an integral part of the financial statements.
| | | | | | | | | | | | | | | | | | | | | | |
Invesco S&P SmallCap High Dividend Low
Volatility ETF (XSHD) | | | Invesco S&P SmallCap Low Volatility
ETF (XSLV) | | | Invesco S&P SmallCap Quality
ETF (XSHQ) | |
Ten Months Ended
August 31, 2018 | | | Period Ended
October 31, 2017(b) | | | Ten Months Ended
August 31, 2018 | | | Year Ended
October 31, 2017 | | | Ten Months Ended
August 31, 2018 | | | Period Ended
October 31, 2017(a) | |
| | | | | | | | | | | | | | | | | | | | | | |
| $ | 258,576 | | | $ | 260,709 | | | $ | 24,273,111 | | | $ | 21,895,892 | | | $ | 105,476 | | | $ | 14,522 | |
| | 10,970 | | | | 42 | | | | 696,640 | | | | 3,679 | | | | 25 | | | | 5 | |
| | — | | | | — | | | | — | | | | 850,985 | | | | — | | | | — | |
| | — | | | | — | | | | 37,439 | | | | 51,958 | | | | — | | | | — | |
| | — | | | | — | | | | — | | | | — | | | | (13 | ) | | | (7 | ) |
| | | | | | | | | | | | | | | | | | | | | | |
| | 269,546 | | | | 260,751 | | | | 25,007,190 | | | | 22,802,514 | | | | 105,488 | | | | 14,520 | |
| | | | | | | | | | | | | | | | | | | | | | |
| | | | | |
| | | | | | | | | | | | | | | | | | | | | | |
| | 20,021 | | | | 20,169 | | | | 2,514,970 | | | | 2,277,156 | | | | 22,622 | | | | 3,003 | |
| | | | | | | | | | | | | | | | | | | | | | |
| | (13 | ) | | | (13 | ) | | | (1,109 | ) | | | (1,144 | ) | | | (3 | ) | | | (1 | ) |
| | | | | | | | | | | | | | | | | | | | | | |
| | 20,008 | | | | 20,156 | | | | 2,513,861 | | | | 2,276,012 | | | | 22,619 | | | | 3,002 | |
| | | | | | | | | | | | | | | | | | | | | | |
| | 249,538 | | | | 240,595 | | | | 22,493,329 | | | | 20,526,502 | | | | 82,869 | | | | 11,518 | |
| | | | | | | | | | | | | | | | | | | | | | |
| | | | | |
| | | | | | | | | | | | | | | | | | | | | | |
| | | | | | | | | | | | | | | | | | | | | | |
| | (427,774 | ) | | | (321,341 | ) | | | 3,724,895 | | | | (26,743,366 | ) | | | (116,286 | ) | | | (46,077 | ) |
| | 716 | | | | — | | | | (4,613 | ) | | | — | | | | — | | | | — | |
| | 540,053 | | | | 428,538 | | | | 95,024,038 | | | | 93,767,888 | | | | 285,343 | | | | 113,826 | |
| | — | | | | — | | | | 3,727 | | | | — | | | | — | | | | — | |
| | | | | | | | | | | | | | | | | | | | | | |
| | 112,995 | | | | 107,197 | | | | 98,748,047 | | | | 67,024,522 | | | | 169,057 | | | | 67,749 | |
| | | | | | | | | | | | | | | | | | | | | | |
| | | | | | | | | | | | | | | | | | | | | | |
| | 606,534 | | | | (149,187 | ) | | | 23,608,738 | | | | 95,413,872 | | | | 2,947,114 | | | | 41,220 | |
| | 739 | | | | — | | | | (71,533 | ) | | | — | | | | — | | | | — | |
| | | | | | | | | | | | | | | | | | | | | | |
| | 607,273 | | | | (149,187 | ) | | | 23,537,205 | | | | 95,413,872 | | | | 2,947,114 | | | | 41,220 | |
| | | | | | | | | | | | | | | | | | | | | | |
| | 720,268 | | | | (41,990 | ) | | | 122,285,252 | | | | 162,438,394 | | | | 3,116,171 | | | | 108,969 | |
| | | | | | | | | | | | | | | | | | | | | | |
| $ | 969,806 | | | $ | 198,605 | | | $ | 144,778,581 | | | $ | 182,964,896 | | | $ | 3,199,040 | | | $ | 120,487 | |
| | | | | | | | | | | | | | | | | | | | | | |
Statements of Changes in Net Assets
For the period November 1, 2017 through August 31, 2018 and years ended October 31, 2017 and 2016
| | | | | | | | | | | | | | | | | | | | |
| | | Invesco Russell 1000 Enhanced Equal
Weight ETF (USEQ) | | | Invesco Russell 1000 Equal Weight
ETF (EQAL) | |
| | | Ten Months Ended
August 31, 2018 | | | Period Ended
October 31, 2017(a) | | | Ten Months Ended
August 31, 2018 | | | Year Ended
October 31, 2017 | | | Year Ended
October 31, 2016 | |
| Operations: | | | | | | | | | | | | | | | | | | | | |
Net investment income | | $ | 1,574,241 | | | $ | 212,048 | | | $ | 5,156,476 | | | $ | 3,702,498 | | | $ | 1,613,776 | |
Net realized gain (loss) | | | 1,557,997 | | | | (9,599 | ) | | | 20,889,632 | | | | 10,100,303 | | | | (2,034,858 | ) |
Net change in unrealized appreciation (depreciation) | | | 7,869,476 | | | | 2,524,612 | | | | 19,052,009 | | | | 24,256,985 | | | | 4,409,245 | |
| | | | | | | | | | | | | | | | | | | | |
Net increase in net assets resulting from operations | | | 11,001,714 | | | | 2,727,061 | | | | 45,098,117 | | | | 38,059,786 | | | | 3,988,163 | |
| | | | | | | | | | | | | | | | | | | | |
| | | | | |
| Distributions to Shareholders from: | | | | | | | | | | | | | | | | | | | | |
Net investment income | | | (1,209,519 | ) | | | (100,835 | ) | | | (3,959,851 | ) | | | (3,397,369 | ) | | | (1,669,387 | ) |
| | | | | | | | | | | | | | | | | | | | |
| | | | | |
| Shareholder Transactions: | | | | | | | | | | | | | | | | | | | | |
Proceeds from shares sold | | | 89,214,658 | | | | 64,674,553 | | | | 237,551,147 | | | | 242,896,219 | | | | 98,849,289 | |
Value of shares repurchased | | | (20,808,093 | ) | | | — | | | | (119,630,244 | ) | | | (77,547,535 | ) | | | (134,768,145 | ) |
| | | | | | | | | | | | | | | | | | | | |
Net increase (decrease) in net assets resulting from shares transactions | | | 68,406,565 | | | | 64,674,553 | | | | 117,920,903 | | | | 165,348,684 | | | | (35,918,856 | ) |
| | | | | | | | | | | | | | | | | | | | |
Increase (Decrease) in Net Assets | | | 78,198,760 | | | | 67,300,779 | | | | 159,059,169 | | | | 200,011,101 | | | | (33,600,080 | ) |
| | | | | | | | | | | | | | | | | | | | |
| | | | | |
| Net Assets: | | | | | | | | | | | | | | | | | | | | |
Beginning of period | | | 67,300,779 | | | | — | | | | 315,494,793 | | | | 115,483,692 | | | | 149,083,772 | |
| | | | | | | | | | | | | | | | | | | | |
End of period | | $ | 145,499,539 | | | $ | 67,300,779 | | | $ | 474,553,962 | | | $ | 315,494,793 | | | $ | 115,483,692 | |
| | | | | | | | | | | | | | | | | | | | |
Undistributed net investment income at end of period | | $ | 474,726 | | | $ | 111,213 | | | $ | 1,734,607 | | | $ | 557,813 | | | $ | 251,668 | |
| | | | | | | | | | | | | | | | | | | | |
| | | | | |
| Changes in Shares Outstanding: | | | | | | | | | | | | | | | | | | | | |
Shares sold | | | 3,250,000 | | | | 2,550,001 | | | | 7,600,000 | | | | 8,700,000 | | | | 3,900,000 | |
Shares repurchased | | | (750,000 | ) | | | — | | | | (3,900,000 | ) | | | (2,700,000 | ) | | | (5,450,000 | ) |
Shares outstanding, beginning of period | | | 2,550,001 | | | | — | | | | 10,550,001 | | | | 4,550,001 | | | | 6,100,001 | |
| | | | | | | | | | | | | | | | | | | | |
Shares outstanding, end of period | | | 5,050,001 | | | | 2,550,001 | | | | 14,250,001 | | | | 10,550,001 | | | | 4,550,001 | |
| | | | | | | | | | | | | | | | | | | | |
| (a) | For the period July 11, 2017 (commencement of investment operations) through October 31, 2017. |
| (b) | For the period November 2, 2015 (commencement of investment operations) through October 31, 2016. |
See accompanying Notes to Financial Statements which are an integral part of the financial statements.
| | | | | | | | | | | | | | | | | | | | | | | | | | | | | | | | | | |
Invesco Russell 1000 Low Beta Equal Weight
ETF (USLB) | | | Invesco S&P 500 Enhanced Value
ETF (SPVU) | | | Invesco S&P 500® ex-Rate Sensitive Low Volatility
ETF (XRLV) | |
Ten Months Ended
August 31, 2018 | | | Year Ended
October 31, 2017 | | | Period Ended
October 31, 2016(b) | | | Ten Months Ended
August 31, 2018 | | | Year Ended
October 31, 2017 | | | Year Ended
October 31, 2016 | | | Ten Months Ended
August 31, 2018 | | | Year Ended
October 31, 2017 | | | Year Ended
October 31, 2016 | |
| | | | | | | | | | | | | | | | | | | | | | | | | | | | | | | | | | |
| $ | 2,108,946 | | | $ | 2,529,933 | | | $ | 1,967,030 | | | $ | 516,427 | | | $ | 440,555 | | | $ | 51,946 | | | $ | 2,081,985 | | | $ | 2,641,344 | | | $ | 2,177,683 | |
| | 16,213,962 | | | | 13,584,417 | | | | (2,936,395 | ) | | | 3,143,872 | | | | 612,256 | | | | 1,064 | | | | 17,740,775 | | | | 20,049,802 | | | | 2,243,144 | |
| | 1,536,763 | | | | 7,973,509 | | | | 4,242,599 | | | | (1,475,209 | ) | | | 2,679,062 | | | | (50,556 | ) | | | (1,085,115 | ) | | | 10,253,938 | | | | 2,922,337 | |
| | | | | | | | | | | | | | | | | | | | | | | | | | | | | | | | | | |
| | 19,859,671 | | | | 24,087,859 | | | | 3,273,234 | | | | 2,185,090 | | | | 3,731,873 | | | | 2,454 | | | | 18,737,645 | | | | 32,945,084 | | | | 7,343,164 | |
| | | | | | | | | | | | | | | | | | | | | | | | | | | | | | | | | | |
| | | | | | | | |
| | | | | | | | | | | | | | | | | | | | | | | | | | | | | | | | | | |
| | (1,895,751 | ) | | | (2,395,027 | ) | | | (1,664,363 | ) | | | (467,801 | ) | | | (348,743 | ) | | | (50,033 | ) | | | (2,103,003 | ) | | | (2,593,776 | ) | | | (2,230,409 | ) |
| | | | | | | | | | | | | | | | | | | | | | | | | | | | | | | | | | |
| | | | | | | | |
| | | | | | | | | | | | | | | | | | | | | | | | | | | | | | | | | | |
| | 103,983,202 | | | | 82,940,794 | | | | 186,748,265 | | | | 20,908,118 | | | | 59,262,427 | | | | 2,493,761 | | | | 145,540,212 | | | | 131,851,703 | | | | 107,507,979 | |
| | (110,683,953 | ) | | | (89,822,766 | ) | | | (49,653,366 | ) | | | (46,904,649 | ) | | | (12,692,825 | ) | | | (3,702,145 | ) | | | (147,139,160 | ) | | | (195,472,407 | ) | | | (55,983,273 | ) |
| | | | | | | | | | | | | | | | | | | | | | | | | | | | | | | | | | |
| | (6,700,751 | ) | |
|
(6,881,972) |
| | | 137,094,899 | | | | (25,996,531 | ) | | | 46,569,602 | | | | (1,208,384 | ) | | | (1,598,948 | ) | | | (63,620,704 | ) | | | 51,524,706 | |
| | | | | | | | | | | | | | | | | | | | | | | | | | | | | | | | | | |
| | 11,263,169 | | | | 14,810,860 | | | | 138,703,770 | | | | (24,279,242 | ) | | | 49,952,732 | | | | (1,255,963 | ) | | | 15,035,694 | | | | (33,269,396 | ) | | | 56,637,461 | |
| | | | | | | | | | | | | | | | | | | | | | | | | | | | | | | | | | |
| | | | | | | | |
| | | | | | | | | | | | | | | | | | | | | | | | | | | | | | | | | | |
| | 153,514,630 | | | | 138,703,770 | | | | — | | | | 51,274,815 | | | | 1,322,083 | | | | 2,578,046 | | | | 131,153,259 | | | | 164,422,655 | | | | 107,785,194 | |
| | | | | | | | | | | | | | | | | | | | | | | | | | | | | | | | | | |
| $ | 164,777,799 | | | $ | 153,514,630 | | | $ | 138,703,770 | | | $ | 26,995,573 | | | $ | 51,274,815 | | | $ | 1,322,083 | | | $ | 146,188,953 | | | $ | 131,153,259 | | | $ | 164,422,655 | |
| | | | | | | | | | | | | | | | | | | | | | | | | | | | | | | | | | |
| $ | 638,961 | | | $ | 437,573 | | | $ | 302,667 | | | $ | 140,996 | | | $ | 94,799 | | | $ | 2,987 | | | $ | – | | | $ | 25,677 | | | $ | — | |
| | | | | | | | | | | | | | | | | | | | | | | | | | | | | | | | | | |
| | | | | | | | |
| | | | | | | | | | | | | | | | | | | | | | | | | | | | | | | | | | |
| | 3,300,000 | | | | 2,950,000 | | | | 7,300,001 | | | | 600,000 | | | | 1,900,000 | | | | 100,000 | | | | 4,250,000 | | | | 4,550,000 | | | | 4,000,000 | |
| | (3,500,000 | ) | | | (3,150,000 | ) | | | (1,950,000 | ) | | | (1,400,000 | ) | | | (400,000 | ) | | | (150,000 | ) | | | (4,250,000 | ) | | | (6,650,000 | ) | | | (2,100,000 | ) |
| | 5,150,001 | | | | 5,350,001 | | | | — | | | | 1,550,001 | | | | 50,001 | | | | 100,001 | | | | 4,050,001 | | | | 6,150,001 | | | | 4,250,001 | |
| | | | | | | | | | | | | | | | | | | | | | | | | | | | | | | | | | |
| | 4,950,001 | | | | 5,150,001 | | | | 5,350,001 | | | | 750,001 | | | | 1,550,001 | | | | 50,001 | | | | 4,050,001 | | | | 4,050,001 | | | | 6,150,001 | |
| | | | | | | | | | | | | | | | | | | | | | | | | | | | | | | | | | |
Statements of Changes in Net Assets (continued)
For the period November 1, 2017 through August 31, 2018 and years ended October 31, 2017 and 2016
| | | | | | | | | | | | | | | | | | | | | | | | |
| | | Invesco S&P 500® High Beta
ETF (SPHB) | | | Invesco S&P 500® High Dividend Low Volatility
ETF (SPHD) | |
| | | Ten Months Ended
August 31, 2018 | | | Year Ended
October 31, 2017 | | | Year Ended
October 31, 2016 | | | Ten Months Ended
August 31, 2018 | | | Year Ended
October 31, 2017 | | | Year Ended
October 31, 2016 | |
| Operations: | | | | | | | | | | | | | | | | | | | | | | | | |
Net investment income | | $ | 3,827,847 | | | $ | 5,102,582 | | | $ | 1,488,279 | | | $ | 91,454,986 | | | $ | 98,199,117 | | | $ | 53,631,247 | |
Net realized gain (loss) | | | 35,618,695 | | | | 81,891,959 | | | | (9,684,548 | ) | | | 137,747,164 | | | | 184,569,396 | | | | 110,094,381 | |
Net change in unrealized appreciation (depreciation) | | | (3,534,672 | ) | | | 12,159,003 | | | | 3,338,974 | | | | (108,303,660 | ) | | | 73,529,904 | | | | 5,606,532 | |
| | | | | | | | | | | | | | | | | | | | | | | | |
Net increase (decrease) in net assets resulting from operations | | | 35,911,870 | | | | 99,153,544 | | | | (4,857,295 | ) | | | 120,898,490 | | | | 356,298,417 | | | | 169,332,160 | |
| | | | | | | | | | | | | | | | | | | | | | | | |
| | | | | | |
| Distributions to Shareholders from: | | | | | | | | | | | | | | | | | | | | | | | | |
Net investment income | | | (3,731,027 | ) | | | (5,358,690 | ) | | | (1,082,016 | ) | | | (92,276,850 | ) | | | (107,583,441 | ) | | | (55,786,559 | ) |
| | | | | | | | | | | | | | | | | | | | | | | | |
| | | | | | |
| Shareholder Transactions: | | | | | | | | | | | | | | | | | | | | | | | | |
Proceeds from shares sold | | | 537,521,730 | | | | 1,052,063,298 | | | | 558,099,509 | | | | 1,282,580,964 | | | | 2,107,138,978 | | | | 2,961,903,602 | |
Value of shares repurchased | | | (756,840,730 | ) | | | (1,275,990,516 | ) | | | (142,980,317 | ) | | | (1,627,935,128 | ) | | | (2,005,683,823 | ) | | | (990,198,392 | ) |
| | | | | | | | | | | | | | | | | | | | | | | | |
Net increase (decrease) in net assets resulting from shares transactions | | | (219,319,000 | ) | | | (223,927,218 | ) | | | 415,119,192 | | | | (345,354,164 | ) | | | 101,455,155 | | | | 1,971,705,210 | |
| | | | | | | | | | | | | | | | | | | | | | | | |
Increase (Decrease) in Net Assets | | | (187,138,157 | ) | | | (130,132,364 | ) | | | 409,179,881 | | | | (316,732,524 | ) | | | 350,170,131 | | | | 2,085,250,811 | |
| | | | | | | | | | | | | | | | | | | | | | | | |
| | | | | | |
| Net Assets: | | | | | | | | | | | | | | | | | | | | | | | | |
Beginning of period | | | 359,072,061 | | | | 489,204,425 | | | | 80,024,544 | | | | 2,973,600,789 | | | | 2,623,430,658 | | | | 538,179,847 | |
| | | | | | | | | | | | | | | | | | | | | | | | |
End of period | | $ | 171,933,904 | | | $ | 359,072,061 | | | $ | 489,204,425 | | | $ | 2,656,868,265 | | | $ | 2,973,600,789 | | | $ | 2,623,430,658 | |
| | | | | | | | | | | | | | | | | | | | | | | | |
Undistributed net investment income at end of period | | $ | 407,470 | | | $ | 310,650 | | | $ | 566,758 | | | $ | – | | | $ | — | | | $ | — | |
| | | | | | | | | | | | | | | | | | | | | | | | |
| | | | | | |
| Changes in Shares Outstanding: | | | | | | | | | | | | | | | | | | | | | | | | |
Shares sold | | | 12,500,000 | | | | 28,250,000 | | | | 17,450,000 | | | | 30,850,000 | | | | 52,700,000 | | | | 79,800,000 | |
Shares repurchased | | | (17,650,000 | ) | | | (34,450,000 | ) | | | (4,850,000 | ) | | | (39,200,000 | ) | | | (50,200,000 | ) | | | (26,400,000 | ) |
Shares outstanding, beginning of period | | | 8,950,000 | | | | 15,150,000 | | | | 2,550,000 | | | | 72,100,000 | | | | 69,600,000 | | | | 16,200,000 | |
| | | | | | | | | | | | | | | | | | | | | | | | |
Shares outstanding, end of period | | | 3,800,000 | | | | 8,950,000 | | | | 15,150,000 | | | | 63,750,000 | | | | 72,100,000 | | | | 69,600,000 | |
| | | | | | | | | | | | | | | | | | | | | | | | |
| (a) | For the period July 11, 2017 (commencement of investment operations) through October 31, 2017. |
See accompanying Notes to Financial Statements which are an integral part of the financial statements.
| | | | | | | | | | | | | | | | | | | | | | | | | | | | | | |
Invesco S&P 500® Low Volatility
ETF (SPLV) | | | Invesco S&P 500 Minimum Variance
ETF (SPMV) | | | Invesco S&P 500 Momentum
ETF (SPMO) | |
Ten Months Ended
August 31, 2018 | | | Year Ended
October 31, 2017 | | | Year Ended
October 31, 2016 | | | Ten Months Ended
August 31, 2018 | | | Period Ended
October 31, 2017(a) | | | Ten Months Ended
August 31, 2018 | | | Year Ended
October 31, 2017 | | | Year Ended
October 31, 2016 | |
| | | | | | | | | | | | | | | | | | | | | | | | | | | | | | |
| $ | 123,467,916 | | | $ | 145,254,170 | | | $ | 132,530,954 | | | $ | 27,326 | | | $ | 15,354 | | | $ | 215,217 | | | $ | 23,533 | | | $ | 34,054 | |
| | 664,059,444 | | | | 444,090,605 | | | | 402,101,928 | | | | 172,953 | | | | (817 | ) | | | 1,513,084 | | | | 204,423 | | | | 106,798 | |
| | (175,481,341 | ) | |
|
468,264,797 |
| | | (63,587,546 | ) | | | 50,344 | | | | 130,741 | | | | 3,135,412 | | | | 145,527 | | | | (87,049 | ) |
| | | | | | | | | | | | | | | | | | | | | | | | | | | | | | |
| | 612,046,019 | | |
|
1,057,609,572 |
| | | 471,045,336 | | | | 250,623 | | | | 145,278 | | | | 4,863,713 | | | | 373,483 | | | | 53,803 | |
| | | | | | | | | | | | | | | | | | | | | | | | | | | | | | |
| | | | | | | |
| | | | | | | | | | | | | | | | | | | | | | | | | | | | | | |
| | (124,946,206 | ) | | | (145,029,675 | ) | | | (136,098,330 | ) | | | (30,483 | ) | | | (7,768 | ) | | | (128,220 | ) | | | (24,884 | ) | | | (30,887 | ) |
| | | | | | | | | | | | | | | | | | | | | | | | | | | | | | |
| | | | | | | |
| | | | | | | | | | | | | | | | | | | | | | | | | | | | | | |
| | 4,931,352,695 | | | | 4,465,475,987 | | | | 5,898,583,249 | | | | 1,381,755 | | | | 2,491,823 | | | | 62,079,720 | | | | 2,991,006 | | | | 1,268,358 | |
| | (5,177,453,666 | ) | | | (4,688,707,093 | ) | | | (4,833,748,058 | ) | | | (2,771,567 | ) | | | — | | | | (18,396,137 | ) | | | (3,004,960 | ) | | | (2,569,412 | ) |
| | | | | | | | | | | | | | | | | | | | | | | | | | | | | | |
| | (246,100,971 | ) | |
|
(223,231,106) |
| | | 1,064,835,191 | | | | (1,389,812 | ) | | | 2,491,823 | | | | 43,683,583 | | | | (13,954 | ) | | | (1,301,054 | ) |
| | | | | | | | | | | | | | | | | | | | | | | | | | | | | | |
| | 240,998,842 | | | | 689,348,791 | | | | 1,399,782,197 | | | | (1,169,672 | ) | | | 2,629,333 | | | | 48,419,076 | | | | 334,645 | | | | (1,278,138 | ) |
| | | | | | | | | | | | | | | | | | | | | | | | | | | | | | |
| | | | | | | |
| | | | | | | | | | | | | | | | | | | | | | | | | | | | | | |
| | 7,140,363,587 | | | | 6,451,014,796 | | | | 5,051,232,599 | | | | 2,629,333 | | | | — | | | | 1,662,902 | | | | 1,328,257 | | | | 2,606,395 | |
| | | | | | | | | | | | | | | | | | | | | | | | | | | | | | |
| $ | 7,381,362,429 | | | $ | 7,140,363,587 | | | $ | 6,451,014,796 | | | $ | 1,459,661 | | | $ | 2,629,333 | | | $ | 50,081,978 | | | $ | 1,662,902 | | | $ | 1,328,257 | |
| | | | | | | | | | | | | | | | | | | | | | | | | | | | | | |
| $ | – | | |
$ |
— |
| | $ | — | | | $ | 4,429 | | | $ | 7,586 | | | $ | 89,914 | | | $ | 2,917 | | | $ | 4,268 | |
| | | | | | | | | | | | | | | | | | | | | | | | | | | | | | |
| | | | | | | |
| | | | | | | | | | | | | | | | | | | | | | | | | | | | | | |
| | 104,200,000 | | | | 102,100,000 | | | | 148,200,000 | | | | 50,000 | | | | 100,001 | | | | 1,700,000 | | | | 100,000 | | | | 50,000 | |
| | (109,250,000 | ) | | | (108,150,000 | ) | | | (120,550,000 | ) | | | (100,000 | ) | | | — | | | | (500,000 | ) | | | (100,000 | ) | | | (100,000 | ) |
| | 153,350,000 | | | | 159,400,000 | | | | 131,750,000 | | | | 100,001 | | | | — | | | | 50,001 | | | | 50,001 | | | | 100,001 | |
| | | | | | | | | | | | | | | | | | | | | | | | | | | | | | |
| | 148,300,000 | | | | 153,350,000 | | | | 159,400,000 | | | | 50,001 | | | | 100,001 | | | | 1,250,001 | | | | 50,001 | | | | 50,001 | |
| | | | | | | | | | | | | | | | | | | | | | | | | | | | | | |
Statements of Changes in Net Assets (continued)
For the period November 1, 2017 through August 31, 2018 and years ended October 31, 2017 and 2016
| | | | | | | | | | | | | | | | | | | | |
| | | Invesco S&P 500 Value with Momentum
ETF (SPVM) | | | Invesco S&P MidCap Low Volatility
ETF (XMLV) | |
| | | Ten Months Ended
August 31, 2018 | | | Period Ended
October 31, 2017(a) | | | Ten Months Ended
August 31, 2018 | | | Year Ended
October 31, 2017 | | | Year Ended
October 31, 2016 | |
| Operations: | | | | | | | | | | | | | | | | | | | | |
Net investment income | | $ | 40,890 | | | $ | 24,402 | | | $ | 26,961,995 | | | $ | 15,787,266 | | | $ | 7,286,438 | |
Net realized gain | | | 217,759 | | | | 25,148 | | | | 104,392,113 | | | | 51,677,535 | | | | 15,871,240 | |
Net change in unrealized appreciation (depreciation) | | | (35,303 | ) | | | 198,286 | | | | 6,754,525 | | | | 92,875,997 | | | | 17,799,553 | |
| | | | | | | | | | | | | | | | | | | | |
Net increase in net assets resulting from operations | | | 223,346 | | | | 247,836 | | | | 138,108,633 | | | | 160,340,798 | | | | 40,957,231 | |
| | | | | | | | | | | | | | | | | | | | |
| | | | | |
| Distributions to Shareholders from: | | | | | | | | | | | | | | | | | | | | |
Net investment income | | | (31,691 | ) | | | (18,152 | ) | | | (24,301,375 | ) | | | (14,587,225 | ) | | | (5,648,124 | ) |
| | | | | | | | | | | | | | | | | | | | |
| | | | | |
| Shareholder Transactions: | | | | | | | | | | | | | | | | | | | | |
Proceeds from shares sold | | | 4,330,121 | | | | 3,780,281 | | | | 846,187,776 | | | | 865,051,116 | | | | 690,631,478 | |
Value of shares repurchased | | | (4,297,442 | ) | | | (1,284,390 | ) | | | (711,572,371 | ) | | | (497,680,763 | ) | | | (150,411,608 | ) |
| | | | | | | | | | | | | | | | | | | | |
Net increase in net assets resulting from shares transactions | | | 32,679 | | | | 2,495,891 | | | | 134,615,405 | | | | 367,370,353 | | | | 540,219,870 | |
| | | | | | | | | | | | | | | | | | | | |
Increase in Net Assets | | | 224,334 | | | | 2,725,575 | | | | 248,422,663 | | | | 513,123,926 | | | | 575,528,977 | |
| | | | | | | | | | | | | | | | | | | | |
| | | | | |
| Net Assets: | | | | | | | | | | | | | | | | | | | | |
Beginning of period | | | 2,725,575 | | | | — | | | | 1,195,218,307 | | | | 682,094,381 | | | | 106,565,404 | |
| | | | | | | | | | | | | | | | | | | | |
End of period | | $ | 2,949,909 | | | $ | 2,725,575 | | | $ | 1,443,640,970 | | | $ | 1,195,218,307 | | | $ | 682,094,381 | |
| | | | | | | | | | | | | | | | | | | | |
Undistributed net investment income at end of period | | $ | 15,178 | | | $ | 6,250 | | | $ | 5,745,811 | | | $ | 3,085,191 | | | $ | 1,885,150 | |
| | | | | | | | | | | | | | | | | | | | |
| | | | | |
| Changes in Shares Outstanding: | | | | | | | | | | | | | | | | | | | | |
Shares sold | | | 150,000 | | | | 150,001 | | | | 18,400,000 | | | | 20,500,000 | | | | 18,800,000 | |
Shares repurchased | | | (150,000 | ) | | | (50,000 | ) | | | (15,500,000 | ) | | | (11,800,000 | ) | | | (4,050,000 | ) |
Shares outstanding, beginning of period | | | 100,001 | | | | — | | | | 26,550,000 | | | | 17,850,000 | | | | 3,100,000 | |
| | | | | | | | | | | | | | | | | | | | |
Shares outstanding, end of period | | | 100,001 | | | | 100,001 | | | | 29,450,000 | | | | 26,550,000 | | | | 17,850,000 | |
| | | | | | | | | | | | | | | | | | | | |
| (a) | For the period April 3, 2017 (commencement of investment operations) through October 31, 2017. |
| (b) | For the period November 29, 2016 (commencement of investment operations) through October 31, 2017. |
See accompanying Notes to Financial Statements which are an integral part of the financial statements.
| | | | | | | | | | | | | | | | | | | | | | | | | | |
Invesco S&P SmallCap High Dividend
Low Volatility ETF (XSHD) | | | Invesco S&P SmallCap Low Volatility
ETF (XSLV) | | | Invesco S&P SmallCap Quality
ETF (XSHQ) | |
Ten Months Ended
August 31, 2018 | | | Period Ended
October 31, 2017(b) | | | Ten Months Ended
August 31, 2018 | | | Year Ended
October 31, 2017 | | | Year Ended
October 31, 2016 | | | Ten Months Ended
August 31, 2018 | | | Period Ended
October 31, 2017(a) | |
| | | | | | | | | | | | | | | | | | | | | | | | | | |
| $ | 249,538 | | | $ | 240,595 | | | $ | 22,493,329 | | | $ | 20,526,502 | | | $ | 7,677,710 | | | $ | 82,869 | | | $ | 11,518 | |
| | 112,995 | | | | 107,197 | | | | 98,748,047 | | | | 67,024,522 | | | | 11,880,566 | | | | 169,057 | | | | 67,749 | |
| | 607,273 | | | | (149,187) | | | | 23,537,205 | | | | 95,413,872 | | | | 30,269,530 | | | | 2,947,114 | | | | 41,220 | |
| | | | | | | | | | | | | | | | | | | | | | | | | | |
| | 969,806 | | | | 198,605 | | | | 144,778,581 | | | | 182,964,896 | | | | 49,827,806 | | | | 3,199,040 | | | | 120,487 | |
| | | | | | | | | | | | | | | | | | | | | | | | | | |
| | | | | | |
| | | | | | | | | | | | | | | | | | | | | | | | | | |
| | (329,517 | ) | | | (276,845 | ) | | | (19,115,449 | ) | | | (18,420,981 | ) | | | (6,839,137 | ) | | | (16,059 | ) | | | (9,661 | ) |
| | | | | | | | | | | | | | | | | | | | | | | | | | |
| | | | | | |
| | | | | | | | | | | | | | | | | | | | | | | | | | |
| | 7,780,195 | | | | 13,849,536 | | | | 653,336,692 | | | | 716,336,132 | | | | 604,177,339 | | | | 41,298,366 | | | | 3,727,343 | |
| | (3,871,849 | ) | | | (6,233,712 | ) | | | (425,116,341 | ) | | | (453,228,874 | ) | | | (122,270,444 | ) | | | (2,862,484 | ) | | | (2,532,765 | ) |
| | | | | | | | | | | | | | | | | | | | | | | | | | |
| | 3,908,346 | | |
|
7,615,824 |
| | | 228,220,351 | | | | 263,107,258 | | | | 481,906,895 | | | | 38,435,882 | | | | 1,194,578 | |
| | | | | | | | | | | | | | | | | | | | | | | | | | |
| | 4,548,635 | | | | 7,537,584 | | | | 353,883,483 | | | | 427,651,173 | | | | 524,895,564 | | | | 41,618,863 | | | | 1,305,404 | |
| | | | | | | | | | | | | | | | | | | | | | | | | | |
| | | | | | |
| | | | | | | | | | | | | | | | | | | | | | | | | | |
| | 7,537,584 | | | | — | | | | 1,079,472,255 | | | | 651,821,082 | | | | 126,925,518 | | | | 1,305,404 | | | | — | |
| | | | | | | | | | | | | | | | | | | | | | | | | | |
| $ | 12,086,219 | | | $ | 7,537,584 | | | $ | 1,433,355,738 | | | $ | 1,079,472,255 | | | $ | 651,821,082 | | | $ | 42,924,267 | | | $ | 1,305,404 | |
| | | | | | | | | | | | | | | | | | | | | | | | | | |
| $ | – | | | $ | — | | | $ | 6,722,853 | | | $ | 3,344,973 | | | $ | 1,239,452 | | | $ | 68,667 | | | $ | 1,857 | |
| | | | | | | | | | | | | | | | | | | | | | | | | | |
| | | | | | |
| | | | | | | | | | | | | | | | | | | | | | | | | | |
| | 300,000 | | | | 550,001 | | | | 13,900,000 | | | | 16,700,000 | | | | 16,850,000 | | | | 1,400,000 | | | | 150,001 | |
| | (150,000 | ) | | | (250,000 | ) | | | (9,100,000 | ) | | | (10,650,000 | ) | | | (3,350,000 | ) | | | (100,000 | ) | | | (100,000 | ) |
| | 300,001 | | | | — | | | | 23,250,000 | | | | 17,200,000 | | | | 3,700,000 | | | | 50,001 | | | | — | |
| | | | | | | | | | | | | | | | | | | | | | | | | | |
| | 450,001 | | | | 300,001 | | | | 28,050,000 | | | | 23,250,000 | | | | 17,200,000 | | | | 1,350,001 | | | | 50,001 | |
| | | | | | | | | | | | | | | | | | | | | | | | | | |
Financial Highlights
Invesco Russell 1000 Enhanced Equal Weight ETF (USEQ)
| | | | | | | | |
| | | Ten Months Ended
August 31, 2018 | | | For the Period
July 11, 2017(a)
Through
October 31, 2017 | |
| |
| Per Share Operating Performance: | | | | | | | | |
Net asset value at beginning of period | | $ | 26.39 | | | $ | 24.98 | |
Net investment income(b) | | | 0.39 | | | | 0.11 | |
Net realized and unrealized gain on investments | | | 2.34 | | | | 1.35 | |
Total from investment operations | | | 2.73 | | | | 1.46 | |
Distributions to shareholders from: | | | | | | | | |
Net investment income | | | (0.31 | ) | | | (0.05 | ) |
Net asset value at end of period | | $ | 28.81 | | | $ | 26.39 | |
Market price at end of period(c) | | $ | 28.83 | | | $ | 26.43 | |
| Net Asset Value Total Return(d) | | | 10.38 | % | | | 5.84 | %(e) |
| Market Price Total Return(d) | | | 10.29 | % | | | 6.00 | %(e) |
| Ratios/Supplemental Data: | | | | | | | | |
Net assets at end of period (000’s omitted) | | $ | 145,500 | | | $ | 67,301 | |
Ratio to average net assets of: | | | | | | | | |
Expenses | | | 0.29 | %(f) | | | 0.29 | %(f) |
Net investment income | | | 1.69 | %(f) | | | 1.35 | %(f) |
Portfolio turnover rate(g) | | | 34 | % | | | 2 | % |
| (a) | Commencement of investment operations. |
| (b) | Based on average shares outstanding. |
| (c) | The mean between the last bid and ask prices. |
| (d) | Net asset value total return is calculated assuming an initial investment made at the net asset value at the beginning of the period, reinvestment of all dividends and distributions at net asset value during the period, and redemption on the last day of the period. Net asset value total return includes adjustments in accordance with accounting principles generally accepted in the United States of America and as such, the net asset value for financial reporting purposes and the returns based upon those net asset values may differ from the net asset value and returns for shareholder transactions. Market price total return is calculated assuming an initial investment made at the market price at the beginning of the period, reinvestment of all dividends and distributions at market price during the period, and the sale at the market price on the last day of the period. Total investment returns calculated for a period of less than one year are not annualized. |
| (e) | The net asset value total return from Fund Inception (July 13, 2017, the first day of trading on the exchange) to October 31, 2017 was 4.96%. The market price total return from Fund Inception to October 31, 2017 was 5.08%. |
| (g) | Portfolio turnover rate is not annualized for periods less than one year, if applicable, and does not include securities received or delivered from processing creations or redemptions. |
Invesco Russell 1000 Equal Weight ETF (EQAL)
| | | | | | | | | | | | | | | | |
| | | Ten Months Ended
August 31, 2018 | | | Year Ended October 31, | | | For the Period
December 22, 2014(a)
Through
October 31, 2015 | |
| | | 2017 | | | 2016 | |
| Per Share Operating Performance: | | | | | | | | | | | | | | | | |
Net asset value at beginning of period | | $ | 29.90 | | | $ | 25.38 | | | $ | 24.44 | | | $ | 25.05 | |
Net investment income(b) | | | 0.41 | | | | 0.42 | | | | 0.41 | | | | 0.32 | |
Net realized and unrealized gain (loss) on investments | | | 3.31 | | | | 4.50 | | | | 0.95 | | | | (0.71 | ) |
Total from investment operations | | | 3.72 | | | | 4.92 | | | | 1.36 | | | | (0.39 | ) |
Distributions to shareholders from: | | | | | | | | | | | | | | | | |
Net investment income | | | (0.32 | ) | | | (0.40 | ) | | | (0.42 | ) | | | (0.22 | ) |
Net asset value at end of period | | $ | 33.30 | | | $ | 29.90 | | | $ | 25.38 | | | $ | 24.44 | |
Market price at end of period(c) | | $ | 33.31 | | | $ | 29.91 | | | $ | 25.41 | | | $ | 24.48 | |
| Net Asset Value Total Return(d) | | | 12.50 | % | | | 19.48 | % | | | 5.67 | % | | | (1.58 | )%(e) |
| Market Price Total Return(d) | | | 12.49 | % | | | 19.38 | % | | | 5.62 | % | | | (1.42 | )%(e) |
| Ratios/Supplemental Data: | | | | | | | | | | | | | | | | |
Net assets at end of period (000’s omitted) | | $ | 474,554 | | | $ | 315,495 | | | $ | 115,484 | | | $ | 149,084 | |
Ratio to average net assets of: | | | | | | | | | | | | | | | | |
Expenses | | | 0.20 | %(f) | | | 0.20 | % | | | 0.20 | % | | | 0.20 | %(f) |
Net investment income | | | 1.57 | %(f) | | | 1.48 | % | | | 1.70 | % | | | 1.49 | %(f) |
Portfolio turnover rate(g) | | | 19 | % | | | 29 | % | | | 31 | % | | | 24 | % |
| (a) | Commencement of investment operations. |
| (b) | Based on average shares outstanding. |
| (c) | The mean between the last bid and ask prices. |
| (d) | Net asset value total return is calculated assuming an initial investment made at the net asset value at the beginning of the period, reinvestment of all dividends and distributions at net asset value during the period, and redemption on the last day of the period. Net asset value total return includes adjustments in accordance with accounting principles generally accepted in the United States of America and as such, the net asset value for financial reporting purposes and the returns based upon those net asset values may differ from the net asset value and returns for shareholder transactions. Market price total return is calculated assuming an initial investment made at the market price at the beginning of the period, reinvestment of all dividends and distributions at market price during the period, and sale at the market price on the last day of the period. Total investment returns calculated for a period of less than one year are not annualized. |
| (e) | The net asset value total return from Fund Inception (December 23, 2014, the first day of trading on the exchange) to October 31, 2015 was (2.01)%. The market price total return from Fund Inception to October 31, 2015 was (1.93)%. |
| (g) | Portfolio turnover rate is not annualized for periods less than one year, if applicable, and does not include securities received or delivered from processing creations or redemptions. |
See accompanying Notes to Financial Statements which are an integral part of the financial statements.
Financial Highlights (continued)
Invesco Russell 1000 Low Beta Equal Weight ETF (USLB)
| | | | | | | | | | | | |
| | | Ten Months Ended
August 31, 2018 | | | Year Ended
October 31,
2017 | | | For the Period
November 2, 2015(a)
Through
October 31, 2016 | |
| |
| Per Share Operating Performance: | | | | | | | | | | | | |
Net asset value at beginning of period | | $ | 29.81 | | | $ | 25.93 | | | $ | 25.31 | |
Net investment income(b) | | | 0.42 | | | | 0.45 | | | | 0.42 | |
Net realized and unrealized gain on investments | | | 3.44 | | | | 3.83 | | | | 0.53 | |
Total from investment operations | | | 3.86 | | | | 4.28 | | | | 0.95 | |
Distributions to shareholders from: | | | | | | | | | | | | |
Net investment income | | | (0.38 | ) | | | (0.40 | ) | | | (0.33 | ) |
Net asset value at end of period | | $ | 33.29 | | | $ | 29.81 | | | $ | 25.93 | |
Market price at end of period(c) | | $ | 33.29 | | | $ | 29.81 | | | $ | 25.95 | |
| Net Asset Value Total Return(d) | | | 13.04 | % | | | 16.60 | % | | | 3.78 | %(e) |
| Market Price Total Return(d) | | | 13.04 | % | | | 16.51 | % | | | 3.86 | %(e) |
| Ratios/Supplemental Data: | | | | | | | | | | | | |
Net assets at end of period (000’s omitted) | | $ | 164,778 | | | $ | 153,515 | | | $ | 138,704 | |
Ratio to average net assets of: | | | | | | | | | | | | |
Expenses | | | 0.35 | %(f) | | | 0.35 | % | | | 0.35 | %(f) |
Net investment income | | | 1.63 | %(f) | | | 1.60 | % | | | 1.66 | %(f) |
Portfolio turnover rate(g) | | | 91 | % | | | 40 | % | | | 118 | % |
| (a) | Commencement of investment operations. |
| (b) | Based on average shares outstanding. |
| (c) | The mean between the last bid and ask prices. |
| (d) | Net asset value total return is calculated assuming an initial investment made at the net asset value at the beginning of the period, reinvestment of all dividends and distributions at net asset value during the period, and redemption on the last day of the period. Net asset value total return includes adjustments in accordance with accounting principles generally accepted in the United States of America and as such, the net asset value for financial reporting purposes and the returns based upon those net asset values may differ from the net asset value and returns for shareholder transactions. Market price total return is calculated assuming an initial investment made at the market price at the beginning of the period, reinvestment of all dividends and distributions at market price during the period, and the sale at the market price on the last day of the period. Total investment returns calculated for a period of less than one year are not annualized. |
| (e) | The net asset value total return from Fund Inception (November 5, 2015, the first day of trading on the exchange) to October 31, 2016 was 4.19%. The market price total return from Fund Inception to October 31, 2016 was 4.15%. |
| (g) | Portfolio turnover rate is not annualized for periods less than one year, if applicable, and does not include securities received or delivered from processing creations or redemptions. |
Invesco S&P 500 Enhanced Value ETF (SPVU)
| | | | | | | | | | | | | | | | |
| | | Ten Months Ended
August 31, 2018 | | | Year Ended October 31, | | | For the Period
October 6, 2015(a)
Through
October 31, 2015 | |
| | | 2017 | | | 2016 | |
| Per Share Operating Performance: | | | | | | | | | | | | | | | | |
Net asset value at beginning of period | | $ | 33.08 | | | $ | 26.44 | | | $ | 25.78 | | | $ | 25.04 | |
Net investment income(b) | | | 0.68 | | | | 0.57 | | | | 0.63 | | | | 0.01 | |
Net realized and unrealized gain on investments | | | 3.12 | | | | 6.44 | | | | 0.38 | | | | 0.73 | |
Total from investment operations | | | 3.80 | | | | 7.01 | | | | 1.01 | | | | 0.74 | |
Distributions to shareholders from: | | | | | | | | | | | | | | | | |
Net investment income | | | (0.89 | ) | | | (0.37 | ) | | | (0.35 | ) | | | — | |
Net asset value at end of period | | $ | 35.99 | | | $ | 33.08 | | | $ | 26.44 | | | $ | 25.78 | |
Market price at end of period(c) | | $ | 36.01 | | | $ | 33.10 | | | $ | 26.45 | | | $ | 25.83 | |
| Net Asset Value Total Return(d) | | | 11.61 | % | | | 26.58 | % | | | 4.03 | % | | | 2.96 | %(e) |
| Market Price Total Return(d) | | | 11.60 | % | | | 26.61 | % | | | 3.86 | % | | | 3.15 | %(e) |
| Ratios/Supplemental Data: | | | | | | | | | | | | | | | | |
Net assets at end of period (000’s omitted) | | $ | 26,996 | | | $ | 51,275 | | | $ | 1,322 | | | $ | 2,578 | |
Ratio to average net assets of: | | | | | | | | | | | | | | | | |
Expenses | | | 0.16 | %(f) | | | 0.25 | % | | | 0.25 | % | | | 0.25 | %(f) |
Net investment income | | | 2.35 | %(f) | | | 1.81 | % | | | 2.53 | % | | | 0.63 | %(f) |
Portfolio turnover rate(g) | | | 34 | % | | | 36 | % | | | 42 | % | | | 0 | %(h) |
| (a) | Commencement of investment operations. |
| (b) | Based on average shares outstanding. |
| (c) | The mean between the last bid and ask prices. |
| (d) | Net asset value total return is calculated assuming an initial investment made at the net asset value at the beginning of the period, reinvestment of all dividends and distributions at net asset value during the period, and redemption on the last day of the period. Net asset value total return includes adjustments in accordance with accounting principles generally accepted in the United States of America and as such, the net asset value for financial reporting purposes and the returns based upon those net asset values may differ from the net asset value and returns for shareholder transactions. Market price total return is calculated assuming an initial investment made at the market price at the beginning of the period, reinvestment of all dividends and distributions at market price during the period, and the sale at the market price on the last day of the period. Total investment returns calculated for a period of less than one year are not annualized. |
| (e) | The net asset value total return from Fund Inception (October 9, 2015, the first day of trading on the exchange) to October 31, 2015 was 1.38%. The market price total return from Fund Inception to October 31, 2015 was 1.45%. |
| (g) | Portfolio turnover rate is not annualized for periods less than one year, if applicable, and does not include securities received or delivered from processing creations or redemptions. |
| (h) | Amount represents less than 0.5%. |
See accompanying Notes to Financial Statements which are an integral part of the financial statements.
Financial Highlights (continued)
Invesco S&P 500® ex-Rate Sensitive Low Volatility ETF (XRLV)
| | | | | | | | | | | | | | | | |
| | | Ten Months Ended
August 31, 2018 | | | Year Ended October 31, | | | For the Period
April 6, 2015(a)
Through
October 31, 2015
| |
| | | 2017 | | | 2016 | |
| Per Share Operating Performance: | | | | | | | | | | | | | | | | |
Net asset value at beginning of period | | $ | 32.38 | | | $ | 26.74 | | | $ | 25.36 | | | $ | 25.14 | |
Net investment income(b) | | | 0.43 | | | | 0.51 | | | | 0.44 | | | | 0.23 | |
Net realized and unrealized gain on investments | | | 3.73 | | | | 5.62 | | | | 1.39 | | | | 0.18 | |
Total from investment operations | | | 4.16 | | | | 6.13 | | | | 1.83 | | | | 0.41 | |
Distributions to shareholders from: | | | | | | | | | | | | | | | | |
Net investment income | | | (0.44 | ) | | | (0.49 | ) | | | (0.45 | ) | | | (0.19 | ) |
Return of capital | | | — | | | | — | | | | — | | | | (0.00 | )(c) |
Total distributions | | | (0.44 | ) | | | (0.49 | ) | | | (0.45 | ) | | | (0.19 | ) |
Net asset value at end of period | | $ | 36.10 | | | $ | 32.38 | | | $ | 26.74 | | | $ | 25.36 | |
Market price at end of period(d) | | $ | 36.11 | | | $ | 32.38 | | | $ | 26.75 | | | $ | 25.42 | |
| Net Asset Value Total Return(e) | | | 12.92 | % | | | 23.11 | % | | | 7.29 | % | | | 1.62 | %(f) |
| Market Price Total Return(e) | | | 12.96 | % | | | 23.06 | % | | | 7.08 | % | | | 1.86 | %(f) |
| Ratios/Supplemental Data: | | | | | | | | | | | | | | | | |
Net assets at end of period (000’s omitted) | | $ | 146,189 | | | $ | 131,153 | | | $ | 164,423 | | | $ | 107,785 | |
Ratio to average net assets of: | | | | | | | | | | | | | | | | |
Expenses | | | 0.25 | %(g) | | | 0.25 | % | | | 0.25 | % | | | 0.25 | %(g) |
Net investment income | | | 1.52 | %(g) | | | 1.75 | % | | | 1.65 | % | | | 1.65 | %(g) |
Portfolio turnover rate(h) | | | 68 | % | | | 61 | % | | | 52 | % | | | 32 | % |
| (a) | Commencement of investment operations. |
| (b) | Based on average shares outstanding. |
| (c) | Amount represents less than $(0.005). |
| (d) | The mean between the last bid and ask prices. |
| (e) | Net asset value total return is calculated assuming an initial investment made at the net asset value at the beginning of the period, reinvestment of all dividends and distributions at net asset value during the period, and redemption on the last day of the period. Net asset value total return includes adjustments in accordance with accounting principles generally accepted in the United States of America and as such, the net asset value for financial reporting purposes and the returns based upon those net asset values may differ from the net asset value and returns for shareholder transactions. Market price total return is calculated assuming an initial investment made at the market price at the beginning of the period, reinvestment of all dividends and distributions at market price during the period, and the sale at the market price on the last day of the period. Total investment returns calculated for a period of less than one year are not annualized. |
| (f) | The net asset value total return from Fund Inception (April 9, 2015, the first day of trading on the exchange) to October 31, 2015 was 1.62%. The market price total return from Fund Inception to October 31, 2015 was 1.78%. |
| (h) | Portfolio turnover rate is not annualized for periods less than one year, if applicable, and does not include securities received or delivered from processing creations or redemptions. |
Invesco S&P 500® High Beta ETF (SPHB)
| | | | | | | | | | | | | | | | | | | | | | | | |
| | | Ten Months Ended
August 31, 2018 | | | Year Ended October 31, | |
| | | 2017 | | | 2016 | | | 2015 | | | 2014 | | | 2013 | |
| Per Share Operating Performance: | | | | | | | | | | | | | | | | | | | | | | | | |
Net asset value at beginning of period | | $ | 40.12 | | | $ | 32.29 | | | $ | 31.38 | | | $ | 34.04 | | | $ | 28.51 | | | $ | 20.42 | |
Net investment income(a) | | | 0.51 | | | | 0.44 | | | | 0.39 | | | | 0.37 | | | | 0.29 | | | | 0.22 | |
Net realized and unrealized gain (loss) on investments | | | 5.15 | | | | 8.01 | | | | 0.84 | | | | (2.58 | ) | | | 5.54 | | | | 8.08 | |
Total from investment operations | | | 5.66 | | | | 8.45 | | | | 1.23 | | | | (2.21 | ) | | | 5.83 | | | | 8.30 | |
Distributions to shareholders from: | | | | | | | | | | | | | | | | | | | | | | | | |
Net investment income | | | (0.53 | ) | | | (0.62 | ) | | | (0.32 | ) | | | (0.45 | ) | | | (0.30 | ) | | | (0.21 | ) |
Net asset value at end of period | | $ | 45.25 | | | $ | 40.12 | | | $ | 32.29 | | | $ | 31.38 | | | $ | 34.04 | | | $ | 28.51 | |
Market price at end of period(b) | | $ | 45.28 | | | $ | 40.12 | | | $ | 32.32 | | | $ | 31.42 | | | $ | 34.05 | | | $ | 28.54 | |
| Net Asset Value Total Return(c) | | | 14.14 | % | | | 26.32 | % | | | 4.02 | % | | | (6.56 | )% | | | 20.55 | % | | | 40.88 | % |
| Market Price Total Return(c) | | | 14.22 | % | | | 26.20 | % | | | 3.98 | % | | | (6.47 | )% | | | 20.47 | % | | | 41.10 | % |
| Ratios/Supplemental Data: | | | | | | | | | | | | | | | | | | | | | | | | |
Net assets at end of period (000’s omitted) | | $ | 171,934 | | | $ | 359,072 | | | $ | 489,204 | | | $ | 80,025 | | | $ | 233,167 | | | $ | 530,209 | |
Ratio to average net assets of: | | | | | | | | | | | | | | | | | | | | | | | | |
Expenses | | | 0.25 | %(d) | | | 0.25 | % | | | 0.25 | % | | | 0.25 | % | | | 0.25 | % | | | 0.25 | % |
Net investment income | | | 1.42 | %(d) | | | 1.18 | % | | | 1.28 | % | | | 1.09 | % | | | 0.93 | % | | | 0.89 | % |
Portfolio turnover rate(e) | | | 76 | % | | | 80 | % | | | 55 | % | | | 90 | % | | | 78 | % | | | 65 | % |
| (a) | Based on average shares outstanding. |
| (b) | The mean between the last bid and ask prices. |
| (c) | Net asset value total return is calculated assuming an initial investment made at the net asset value at the beginning of the period, reinvestment of all dividends and distributions at net asset value during the period, and redemption on the last day of the period. Net asset value total return includes adjustments in accordance with accounting principles generally accepted in the United States of America and as such, the net asset value for financial reporting purposes and the returns based upon those net asset values may differ from the net asset value and returns for shareholder transactions. Market price total return is calculated assuming an initial investment made at the market price at the beginning of the period, reinvestment of all dividends and distributions at market price during the period, and the sale at the market price on the last day of the period. Total investment returns calculated for a period of less than one year are not annualized. |
| (e) | Portfolio turnover rate is not annualized for periods less than one year, if applicable, and does not include securities received or delivered from processing creations or redemptions. |
See accompanying Notes to Financial Statements which are an integral part of the financial statements.
Financial Highlights (continued)
Invesco S&P 500® High Dividend Low Volatility ETF (SPHD)
| | | | | | | | | | | | | | | | | | | | | | | | |
| | | Ten Months Ended
August 31, 2018 | | | Year Ended October 31, | |
| | | 2017 | | | 2016 | | | 2015 | | | 2014 | | | 2013 | |
| Per Share Operating Performance: | | | | | | | | | | | | | | | | | | | | | | | | |
Net asset value at beginning of period | | $ | 41.24 | | | $ | 37.69 | | | $ | 33.22 | | | $ | 32.14 | | | $ | 28.36 | | | $ | 25.03 | |
Net investment income(a) | | | 1.35 | | | | 1.33 | | | | 1.29 | | | | 1.10 | | | | 1.01 | | | | 0.98 | |
Net realized and unrealized gain on investments | | | 0.45 | | | | 3.68 | | | | 4.51 | | | | 1.13 | | | | 3.86 | | | | 3.41 | |
Total from investment operations | | | 1.80 | | | | 5.01 | | | | 5.80 | | | | 2.23 | | | | 4.87 | | | | 4.39 | |
Distributions to shareholders from: | | | | | | | | | | | | | | | | | | | | | | | | |
Net investment income | | | (1.36 | ) | | | (1.46 | ) | | | (1.33 | ) | | | (1.15 | ) | | | (1.07 | ) | | | (1.06 | ) |
Net realized gains | | | — | | | | — | | | | — | | | | — | | | | (0.02 | ) | | | — | |
Total distributions | | | (1.36 | ) | | | (1.46 | ) | | | (1.33 | ) | | | (1.15 | ) | | | (1.09 | ) | | | (1.06 | ) |
Net asset value at end of period | | $ | 41.68 | | | $ | 41.24 | | | $ | 37.69 | | | $ | 33.22 | | | $ | 32.14 | | | $ | 28.36 | |
Market price at end of period(b) | | $ | 41.68 | | | $ | 41.25 | | | $ | 37.72 | | | $ | 33.27 | | | $ | 32.15 | | | $ | 28.39 | |
| Net Asset Value Total Return(c) | | | 4.48 | % | | | 13.48 | % | | | 17.75 | % | | | 7.07 | % | | | 17.59 | % | | | 17.95 | % |
| Market Price Total Return(c) | | | 4.45 | % | | | 13.42 | % | | | 17.66 | % | | | 7.20 | % | | | 17.50 | % | | | 18.03 | % |
| Ratios/Supplemental Data: | | | | | | | | | | | | | | | | | | | | | | | | |
Net assets at end of period (000’s omitted) | | $ | 2,656,868 | | | $ | 2,973,601 | | | $ | 2,623,431 | | | $ | 538,180 | | | $ | 210,523 | | | $ | 138,965 | |
Ratio to average net assets of: | | | | | | | | | | | | | | | | | | | | | | | | |
Expenses | | | 0.30 | %(d) | | | 0.30 | % | | | 0.30 | % | | | 0.30 | % | | | 0.30 | % | | | 0.30 | % |
Net investment income | | | 3.95 | %(d) | | | 3.31 | % | | | 3.48 | % | | | 3.38 | % | | | 3.39 | % | | | 3.59 | % |
Portfolio turnover rate(e) | | | 46 | % | | | 56 | % | | | 50 | % | | | 48 | % | | | 53 | % | | | 47 | % |
| (a) | Based on average shares outstanding. |
| (b) | The mean between the last bid and ask prices. |
| (c) | Net asset value total return is calculated assuming an initial investment made at the net asset value at the beginning of the period, reinvestment of all dividends and distributions at net asset value during the period, and redemption on the last day of the period. Net asset value total return includes adjustments in accordance with accounting principles generally accepted in the United States of America and as such, the net asset value for financial reporting purposes and the returns based upon those net asset values may differ from the net asset value and returns for shareholder transactions. Market price total return is calculated assuming an initial investment made at the market price at the beginning of the period, reinvestment of all dividends and distributions at market price during the period, and the sale at the market price on the last day of the period. Total investment returns calculated for a period of less than one year are not annualized. |
| (e) | Portfolio turnover rate is not annualized for periods less than one year, if applicable, and does not include securities received or delivered from processing creations or redemptions. |
Invesco S&P 500® Low Volatility ETF (SPLV)
| | | | | | | | | | | | | | | | | | | | | | | | |
| | | Ten Months Ended
August 31, 2018 | | | Year Ended October 31, | |
| | | 2017 | | | 2016 | | | 2015 | | | 2014 | | | 2013 | |
| Per Share Operating Performance: | | | | | | | | | | | | | | | | | | | | | | | | |
Net asset value at beginning of period | | $ | 46.56 | | | $ | 40.47 | | | $ | 38.34 | | | $ | 36.60 | | | $ | 32.56 | | | $ | 28.07 | |
Net investment income(a) | | | 0.81 | | | | 0.95 | | | | 0.81 | | | | 0.85 | | | | 0.83 | | | | 0.88 | |
Net realized and unrealized gain on investments | | | 3.23 | | | | 6.09 | | | | 2.16 | | | | 1.78 | | | | 4.04 | | | | 4.51 | |
Total from investment operations | | | 4.04 | | | | 7.04 | | | | 2.97 | | | | 2.63 | | | | 4.87 | | | | 5.39 | |
Distributions to shareholders from: | | | | | | | | | | | | | | | | | | | | | | | | |
Net investment income | | | (0.83 | ) | | | (0.95 | ) | | | (0.84 | ) | | | (0.89 | ) | | | (0.83 | ) | | | (0.90 | ) |
Net asset value at end of period | | $ | 49.77 | | | $ | 46.56 | | | $ | 40.47 | | | $ | 38.34 | | | $ | 36.60 | | | $ | 32.56 | |
Market price at end of period(b) | | $ | 49.78 | | | $ | 46.57 | | | $ | 40.50 | | | $ | 38.40 | | | $ | 36.62 | | | $ | 32.59 | |
| Net Asset Value Total Return(c) | | | 8.77 | % | | | 17.57 | % | | | 7.80 | % | | | 7.28 | % | | | 15.18 | % | | | 19.51 | % |
| Market Price Total Return(c) | | | 8.76 | % | | | 17.51 | % | | | 7.72 | % | | | 7.39 | % | | | 15.14 | % | | | 19.58 | % |
| Ratios/Supplemental Data: | | | | | | | | | | | | | | | | | | | | | | | | |
Net assets at end of period (000’s omitted) | | $ | 7,381,362 | | | $ | 7,140,364 | | | $ | 6,451,015 | | | $ | 5,051,233 | | | $ | 4,498,516 | | | $ | 3,975,657 | |
Ratio to average net assets of: | | | | | | | | | | | | | | | | | | | | | | | | |
Expenses | | | 0.25 | %(d) | | | 0.25 | % | | | 0.25 | % | | | 0.25 | % | | | 0.25 | % | | | 0.25 | % |
Net investment income | | | 2.06 | %(d) | | | 2.18 | % | | | 2.02 | % | | | 2.26 | % | | | 2.44 | % | | | 2.87 | % |
Portfolio turnover rate(e) | | | 68 | % | | | 49 | % | | | 53 | % | | | 65 | % | | | 51 | % | | | 50 | % |
| (a) | Based on average shares outstanding. |
| (b) | The mean between the last bid and ask prices. |
| (c) | Net asset value total return is calculated assuming an initial investment made at the net asset value at the beginning of the period, reinvestment of all dividends and distributions at net asset value during the period, and redemption on the last day of the period. Net asset value total return includes adjustments in accordance with accounting principles generally accepted in the United States of America and as such, the net asset value for financial reporting purposes and the returns based upon those net asset values may differ from the net asset value and returns for shareholder transactions. Market price total return is calculated assuming an initial investment made at the market price at the beginning of the period, reinvestment of all dividends and distributions at market price during the period, and the sale at the market price on the last day of the period. Total investment returns calculated for a period of less than one year are not annualized. |
| (e) | Portfolio turnover rate is not annualized for periods less than one year, if applicable, and does not include securities received or delivered from processing creations or redemptions. |
See accompanying Notes to Financial Statements which are an integral part of the financial statements.
Financial Highlights (continued)
Invesco S&P 500 Minimum Variance ETF (SPMV)
| | | | | | | | |
| | | Ten Months Ended
August 31, 2018 | | | For the Period
July 11, 2017(a)
Through
October 31, 2017 | |
| |
| Per Share Operating Performance: | | | | | | | | |
Net asset value at beginning of period | | $ | 26.29 | | | $ | 24.92 | |
Net investment income(b) | | | 0.47 | | | | 0.15 | |
Net realized and unrealized gain on investments | | | 3.04 | | | | 1.30 | |
Total from investment operations | | | 3.51 | | | | 1.45 | |
Distributions to shareholders from: | | | | | | | | |
Net investment income | | | (0.61 | ) | | | (0.08 | ) |
Net asset value at end of period | | $ | 29.19 | | | $ | 26.29 | |
Market price at end of period(c) | | $ | 29.19 | | | $ | 26.30 | |
| Net Asset Value Total Return(d) | | | 13.50 | % | | | 5.81 | %(e) |
| Market Price Total Return(d) | | | 13.45 | % | | | 5.85 | %(e) |
| Ratios/Supplemental Data: | | | | | | | | |
Net assets at end of period (000’s omitted) | | $ | 1,460 | | | $ | 2,629 | |
Ratio to average net assets of: | | | | | | | | |
Expenses | | | 0.13 | %(f) | | | 0.13 | %(f) |
Net investment income | | | 2.08 | %(f) | | | 1.97 | %(f) |
Portfolio turnover rate(g) | | | 30 | % | | | 14 | % |
| (a) | Commencement of investment operations. |
| (b) | Based on average shares outstanding. |
| (c) | The mean between the last bid and ask prices. |
| (d) | Net asset value total return is calculated assuming an initial investment made at the net asset value at the beginning of the period, reinvestment of all dividends and distributions at net asset value during the period, and redemption on the last day of the period. Net asset value total return includes adjustments in accordance with accounting principles generally accepted in the United States of America and as such, the net asset value for financial reporting purposes and the returns based upon those net asset values may differ from the net asset value and returns for shareholder transactions. Market price total return is calculated assuming an initial investment made at the market price at the beginning of the period, reinvestment of all dividends and distributions at market price during the period, and the sale at the market price on the last day of the period. Total investment returns calculated for a period of less than one year are not annualized. |
| (e) | The net asset value total return from Fund Inception (July 13, 2017, the first day of trading on the exchange) to October 31, 2017 was 4.97%. The market price total return from Fund Inception to October 31, 2017 was 4.93%. |
| (g) | Portfolio turnover rate is not annualized for periods less than one year, if applicable, and does not include securities received or delivered from processing creations or redemptions. |
Invesco S&P 500 Momentum ETF (SPMO)
| | | | | | | | | | | | | | | | |
| | | Ten Months Ended
August 31, 2018 | | | Year Ended October 31, | | | For the Period
October 6, 2015(a)
Through
October 31, 2015
| |
| | | 2017 | | | 2016 | |
| Per Share Operating Performance: | | | | | | | | | | | | | | | | |
Net asset value at beginning of period | | $ | 33.26 | | | $ | 26.56 | | | $ | 26.06 | | | $ | 24.65 | |
Net investment income(b) | | | 0.34 | | | | 0.46 | | | | 0.41 | | | | 0.01 | |
Net realized and unrealized gain on investments | | | 6.67 | | | | 6.72 | | | | 0.44 | | | | 1.40 | |
Total from investment operations | | | 7.01 | | | | 7.18 | | | | 0.85 | | | | 1.41 | |
Distributions to shareholders from: | | | | | | | | | | | | | | | | |
Net investment income | | | (0.20 | ) | | | (0.48 | ) | | | (0.35 | ) | | | — | |
Net asset value at end of period | | $ | 40.07 | | | $ | 33.26 | | | $ | 26.56 | | | $ | 26.06 | |
Market price at end of period(c) | | $ | 40.08 | | | $ | 33.23 | | | $ | 26.58 | | | $ | 26.12 | |
| Net Asset Value Total Return(d) | | | 21.12 | % | | | 27.35 | % | | | 3.28 | % | | | 5.72 | %(e) |
| Market Price Total Return(d) | | | 21.26 | % | | | 27.14 | % | | | 3.12 | % | | | 5.96 | %(e) |
| Ratios/Supplemental Data: | | | | | | | | | | | | | | | | |
Net assets at end of period (000’s omitted) | | $ | 50,082 | | | $ | 1,663 | | | $ | 1,328 | | | $ | 2,606 | |
Ratio to average net assets of: | | | | | | | | | | | | | | | | |
Expenses | | | 0.13 | %(f) | | | 0.25 | % | | | 0.25 | % | | | 0.25 | %(f) |
Net investment income | | | 1.10 | %(f) | | | 1.61 | % | | | 1.60 | % | | | 0.69 | %(f) |
Portfolio turnover rate(g) | | | 41 | % | | | 140 | % | | | 105 | % | | | 1 | % |
| (a) | Commencement of investment operations. |
| (b) | Based on average shares outstanding. |
| (c) | The mean between the last bid and ask prices. |
| (d) | Net asset value total return is calculated assuming an initial investment made at the net asset value at the beginning of the period, reinvestment of all dividends and distributions at net asset value during the period, and redemption on the last day of the period. Net asset value total return includes adjustments in accordance with accounting principles generally accepted in the United States of America and as such, the net asset value for financial reporting purposes and the returns based upon those net asset values may differ from the net asset value and returns for shareholder transactions. Market price total return is calculated assuming an initial investment made at the market price at the beginning of the period, reinvestment of all dividends and distributions at market price during the period, and the sale at the market price on the last day of the period. Total investment returns calculated for a period of less than one year are not annualized. |
| (e) | The net asset value total return from Fund Inception (October 9, 2015, the first day of trading on the exchange) to October 31, 2015 was 3.62%. The market price total return from Fund Inception to October 31, 2015 was 3.77%. |
| (g) | Portfolio turnover rate is not annualized for periods less than one year, if applicable, and does not include securities received or delivered from processing creations or redemptions. |
See accompanying Notes to Financial Statements which are an integral part of the financial statements.
Financial Highlights (continued)
Invesco S&P 500 Value with Momentum ETF (SPVM)
| | | | | | | | |
| | | Ten Months Ended
August 31, 2018 | | | For the Period
April 3, 2017(a)
Through
October 31, 2017 | |
| Per Share Operating Performance: | | | | | | | | |
Net asset value at beginning of period | | $ | 27.26 | | | $ | 24.93 | |
Net investment income(b) | | | 0.42 | | | | 0.24 | |
Net realized and unrealized gain on investments | | | 2.14 | | | | 2.24 | |
Total from investment operations | | | 2.56 | | | | 2.48 | |
Distributions to shareholders from: | | | | | | | | |
Net investment income | | | (0.32 | ) | | | (0.15 | ) |
Net asset value at end of period | | $ | 29.50 | | | $ | 27.26 | |
Market price at end of period(c) | | $ | 29.50 | | | $ | 27.28 | |
| Net Asset Value Total Return(d) | | | 9.42 | % | | | 9.99 | %(e) |
| Market Price Total Return(d) | | | 9.34 | % | | | 10.07 | %(e) |
| Ratios/Supplemental Data: | | | | | | | | |
Net assets at end of period (000’s omitted) | | $ | 2,950 | | | $ | 2,726 | |
Ratio to average net assets of: | | | | | | | | |
Expenses, after Waivers | | | 0.29 | %(f) | | | 0.30 | %(f) |
Expenses, prior to Waivers | | | 0.30 | %(f) | | | 0.30 | %(f) |
Net investment income | | | 1.79 | %(f) | | | 1.65 | %(f) |
Portfolio turnover rate(g) | | | 61 | % | | | 37 | % |
| (a) | Commencement of investment operations. |
| (b) | Based on average shares outstanding. |
| (c) | The mean between the last bid and ask prices. |
| (d) | Net asset value total return is calculated assuming an initial investment made at the net asset value at the beginning of the period, reinvestment of all dividends and distributions at net asset value during the period, and redemption on the last day of the period. Net asset value total return includes adjustments in accordance with accounting principles generally accepted in the United States of America and as such, the net asset value for financial reporting purposes and the returns based upon those net asset values may differ from the net asset value and returns for shareholder transactions. Market price total return is calculated assuming an initial investment made at the market price at the beginning of the period, reinvestment of all dividends and distributions at market price during the period, and the sale at the market price on the last day of the period. Total investment returns calculated for a period of less than one year are not annualized. |
| (e) | The net asset value total return from Fund Inception (April 6, 2017, the first day of trading on the exchange) to October 31, 2017 was 9.99%. The market price total return from Fund Inception to October 31, 2017 was 10.12%. |
| (g) | Portfolio turnover rate is not annualized for periods less than one year, if applicable, and does not include securities received or delivered from processing creations or redemptions. |
Invesco S&P MidCap Low Volatility ETF (XMLV)
| | | | | | | | | | | | | | | | | | | | | | | | |
| | | Ten Months
Ended
August 31, 2018 | | | Year Ended October 31, | | | For the Period
February 12, 2013(a)
Through
October 31, 2013 | |
| | | 2017 | | | 2016 | | | 2015 | | | 2014 | |
| Per Share Operating Performance: | | | | | | | | | | | | | | | | | | | | | | | | |
Net asset value at beginning of period | | $ | 45.02 | | | $ | 38.21 | | | $ | 34.38 | | | $ | 31.82 | | | $ | 28.25 | | | $ | 25.12 | |
Net investment income(b) | | | 0.96 | | | | 0.69 | | | | 0.69 | | | | 0.66 | | | | 0.62 | | | | 0.38 | |
Net realized and unrealized gain on investments | | | 3.92 | | | | 6.80 | | | | 3.72 | | | | 2.55 | | | | 3.52 | | | | 3.02 | |
Total from investment operations | | | 4.88 | | | | 7.49 | | | | 4.41 | | | | 3.21 | | | | 4.14 | | | | 3.40 | |
Distributions to shareholders from: | | | | | | | | | | | | | | | | | | | | | | | | |
Net investment income | | | (0.88 | ) | | | (0.68 | ) | | | (0.58 | ) | | | (0.65 | ) | | | (0.57 | ) | | | (0.27 | ) |
Net asset value at end of period | | $ | 49.02 | | | $ | 45.02 | | | $ | 38.21 | | | $ | 34.38 | | | $ | 31.82 | | | $ | 28.25 | |
Market price at end of period(c) | | $ | 49.04 | | | $ | 45.02 | | | $ | 38.23 | | | $ | 34.42 | | | $ | 31.82 | | | $ | 28.28 | |
| Net Asset Value Total Return(d) | | | 11.00 | % | | | 19.76 | % | | | 12.96 | % | | | 10.18 | % | | | 14.84 | % | | | 13.62 | %(e) |
| Market Price Total Return(d) | | | 11.04 | % | | | 19.69 | % | | | 12.89 | % | | | 10.30 | % | | | 14.72 | % | | | 13.77 | %(e) |
| Ratios/Supplemental Data: | | | | | | | | | | | | | | | | | | | | | | | | |
Net assets at end of period (000’s omitted) | | $ | 1,443,641 | | | $ | 1,195,218 | | | $ | 682,094 | | | $ | 106,565 | | | $ | 44,546 | | | $ | 21,189 | |
Ratio to average net assets of: | | | | | | | | | | | | | | | | | | | | | | | | |
Expenses | | | 0.25 | %(f) | | | 0.25 | % | | | 0.25 | % | | | 0.25 | % | | | 0.25 | % | | | 0.26 | %(f) |
Net investment income | | | 2.52 | %(f) | | | 1.64 | % | | | 1.86 | % | | | 1.97 | % | | | 2.09 | % | | | 1.98 | %(f) |
Portfolio turnover rate(g) | | | 50 | % | | | 57 | % | | | 51 | % | | | 57 | % | | | 58 | % | | | 29 | % |
| (a) | Commencement of investment operations. |
| (b) | Based on average shares outstanding. |
| (c) | The mean between the last bid and ask prices. |
| (d) | Net asset value total return is calculated assuming an initial investment made at the net asset value at the beginning of the period, reinvestment of all dividends and distributions at net asset value during the period, and redemption on the last day of the period. Net asset value total return includes adjustments in accordance with accounting principles generally accepted in the United States of America and as such, the net asset value for financial reporting purposes and the returns based upon those net asset values may differ from the net asset value and returns for shareholder transactions. Market price total return is calculated assuming an initial investment made at the market price at the beginning of the period, reinvestment of all dividends and distributions at market price during the period, and the sale at the market price on the last day of the period. Total investment returns calculated for a period of less than one year are not annualized. |
| (e) | The net asset value total return from Fund Inception (February 15, 2013, the first day of trading on the exchange) to October 31, 2013 was 13.21%. The market price total return from Fund Inception to October 31, 2013 was 13.37%. |
| (g) | Portfolio turnover rate is not annualized for periods less than one year, if applicable, and does not include securities received or delivered from processing creations or redemptions. |
See accompanying Notes to Financial Statements which are an integral part of the financial statements.
Financial Highlights (continued)
Invesco S&P SmallCap High Dividend Low Volatility ETF (XSHD)
| | | | | | | | |
| | | Ten Months Ended
August 31, 2018 | | | For the Period
November 29, 2016(a)
Through
October 31, 2017 | |
| |
| Per Share Operating Performance: | | | | | | | | |
Net asset value at beginning of period | | $ | 25.13 | | | $ | 25.02 | |
Net investment income(b) | | | 0.78 | | | | 0.81 | |
Net realized and unrealized gain on investments | | | 1.98 | | | | 0.24 | |
Total from investment operations | | | 2.76 | | | | 1.05 | |
Distributions to shareholders from: | | | | | | | | |
Net investment income | | | (1.03 | ) | | | (0.94 | ) |
Net asset value at end of period | | $ | 26.86 | | | $ | 25.13 | |
Market price at end of period(c) | | $ | 26.85 | | | $ | 25.15 | |
| Net Asset Value Total Return(d) | | | 11.39 | % | | | 4.31 | %(e) |
| Market Price Total Return(d) | | | 11.26 | % | | | 4.39 | %(e) |
| Ratios/Supplemental Data: | | | | | | | | |
Net assets at end of period (000’s omitted) | | $ | 12,086 | | | $ | 7,538 | |
Ratio to average net assets of: | | | | | | | | |
Expenses | | | 0.30 | %(f) | | | 0.30 | %(f) |
Net investment income | | | 3.74 | %(f) | | | 3.58 | %(f) |
Portfolio turnover rate(g) | | | 61 | % | | | 86 | % |
| (a) | Commencement of investment operations. |
| (b) | Based on average shares outstanding. |
| (c) | The mean between the last bid and ask prices. |
| (d) | Net asset value total return is calculated assuming an initial investment made at the net asset value at the beginning of the period, reinvestment of all dividends and distributions at net asset value during the period, and redemption on the last day of the period. Net asset value total return includes adjustments in accordance with accounting principles generally accepted in the United States of America and as such, the net asset value for financial reporting purposes and the returns based upon those net asset values may differ from the net asset value and returns for shareholder transactions. Market price total return is calculated assuming an initial investment made at the market price at the beginning of the period, reinvestment of all dividends and distributions at market price during the period, and the sale at the market price on the last day of the period. Total investment returns calculated for a period of less than one year are not annualized. |
| (e) | The net asset value total return from Fund Inception (December 1, 2016, the first day of trading on the exchange) to October 31, 2017 was 6.26%. The market price total return from Fund Inception to October 31, 2017 was 6.34%. |
| (g) | Portfolio turnover rate is not annualized for periods less than one year, if applicable, and does not include securities received or delivered from processing creations or redemptions. |
See accompanying Notes to Financial Statements which are an integral part of the financial statements.
Financial Highlights (continued)
Invesco S&P SmallCap Low Volatility ETF (XSLV)
| | | | | | | | | | | | | | | | | | | | | | | | |
| | | Ten Months Ended
August 31, 2018 | | | Year Ended October 31, | | | For the Period
February 12, 2013(a)
Through
October 31, 2013 | |
| | | 2017 | | | 2016 | | | 2015 | | | 2014 | |
| Per Share Operating Performance: | | | | | | | | | | | | | | | | | | | | | | | | |
Net asset value at beginning of period | | $ | 46.43 | | | $ | 37.90 | | | $ | 34.30 | | | $ | 32.93 | | | $ | 29.92 | | | $ | 25.10 | |
Net investment income(b) | | | 0.87 | | | | 0.97 | | | | 0.78 | | | | 0.77 | | | | 0.75 | | | | 0.43 | |
Net realized and unrealized gain on investments | | | 4.55 | | | | 8.46 | | | | 3.58 | | | | 1.38 | | | | 2.95 | | | | 4.63 | |
Total from investment operations | | | 5.42 | | | | 9.43 | | | | 4.36 | | | | 2.15 | | | | 3.70 | | | | 5.06 | |
Distributions to shareholders from: | | | | | | | | | | | | | | | | | | | | | | | | |
Net investment income | | | (0.75 | ) | | | (0.90 | ) | | | (0.76 | ) | | | (0.78 | ) | | | (0.69 | ) | | | (0.24 | ) |
Net asset value at end of period | | $ | 51.10 | | | $ | 46.43 | | | $ | 37.90 | | | $ | 34.30 | | | $ | 32.93 | | | $ | 29.92 | |
Market price at end of period(c) | | $ | 51.10 | | | $ | 46.47 | | | $ | 37.93 | | | $ | 34.30 | | | $ | 32.91 | | | $ | 29.96 | |
| Net Asset Value Total Return(d) | | | 11.81 | % | | | 25.05 | % | | | 12.90 | % | | | 6.63 | % | | | 12.50 | % | | | 20.28 | %(e) |
| Market Price Total Return(d) | | | 11.71 | % | | | 25.06 | % | | | 12.99 | % | | | 6.70 | % | | | 12.29 | % | | | 20.45 | %(e) |
| Ratios/Supplemental Data: | | | | | | | | | | | | | | | | | | | | | | | | |
Net assets at end of period (000’s omitted) | | $ | 1,433,356 | | | $ | 1,079,472 | | | $ | 651,821 | | | $ | 126,926 | | | $ | 55,985 | | | $ | 31,411 | |
Ratio to average net assets of: | | | | | | | | | | | | | | | | | | | | | | | | |
Expenses | | | 0.25 | %(f) | | | 0.25 | % | | | 0.25 | % | | | 0.25 | %(g) | | | 0.25 | %(g) | | | 0.26 | %(f) |
Net investment income | | | 2.24 | %(f) | | | 2.25 | % | | | 2.15 | % | | | 2.33 | % | | | 2.41 | % | | | 2.17 | %(f) |
Portfolio turnover rate(h) | | | 66 | % | | | 59 | % | | | 48 | % | | | 57 | % | | | 68 | % | | | 35 | % |
| (a) | Commencement of investment operations. |
| (b) | Based on average shares outstanding. |
| (c) | The mean between the last bid and ask prices. |
| (d) | Net asset value total return is calculated assuming an initial investment made at the net asset value at the beginning of the period, reinvestment of all dividends and distributions at net asset value during the period, and redemption on the last day of the period. Net asset value total return includes adjustments in accordance with accounting principles generally accepted in the United States of America and as such, the net asset value for financial reporting purposes and the returns based upon those net asset values may differ from the net asset value and returns for shareholder transactions. Market price total return is calculated assuming an initial investment made at the market price at the beginning of the period, reinvestment of all dividends and distributions at market price during the period, and the sale at the market price on the last day of the period. Total investment returns calculated for a period of less than one year are not annualized. |
| (e) | The net asset value total return from Fund Inception (February 15, 2013, the first day of trading on the exchange) to October 31, 2013 was 19.62%. The market price total return from Fund Inception to October 31, 2013 was 19.63%. |
| (g) | In addition to the fees and expenses which the Fund bears directly, the Fund indirectly bears a pro rata share of the fees and expenses of the investment companies in which the Fund invests. Estimated investment companies’ expenses are not expenses that are incurred directly by the Fund. They are expenses that are incurred directly by the investment companies and are deducted from the value of the investment companies the Fund invests in. The effect of the estimated investment companies’ expenses that the Fund bears indirectly is included in the Fund’s total return. |
| (h) | Portfolio turnover rate is not annualized for periods less than one year, if applicable, and does not include securities received or delivered from processing creations or redemptions. |
See accompanying Notes to Financial Statements which are an integral part of the financial statements.
Financial Highlights (continued)
Invesco S&P SmallCap Quality ETF (XSHQ)
| | | | | | | | |
| | | Ten Months Ended
August 31, 2018 | | | For the Period
April 3, 2017(a)
Through
October 31, 2017 | |
| |
| Per Share Operating Performance: | | | | | | | | |
Net asset value at beginning of period | | $ | 26.11 | | | $ | 24.54 | |
Net investment income(b) | | | 0.26 | | | | 0.16 | |
Net realized and unrealized gain on investments | | | 5.65 | | | | 1.51 | |
Total from investment operations | | | 5.91 | | | | 1.67 | |
Distributions to shareholders from: | | | | | | | | |
Net investment income | | | (0.22 | ) | | | (0.10 | ) |
Net asset value at end of period | | $ | 31.80 | | | $ | 26.11 | |
Market price at end of period(c) | | $ | 31.81 | | | $ | 26.14 | |
| Net Asset Value Total Return(d) | | | 22.75 | % | | | 6.81 | %(e) |
| Market Price Total Return(d) | | | 22.65 | % | | | 6.93 | %(e) |
| Ratios/Supplemental Data: | | | | | | | | |
Net assets at end of period (000’s omitted) | | $ | 42,924 | | | $ | 1,305 | |
Ratio to average net assets of: | | | | | | | | |
Expenses | | | 0.29 | %(f) | | | 0.29 | %(f) |
Net investment income | | | 1.06 | %(f) | | | 1.11 | %(f) |
Portfolio turnover rate(g) | | | 23 | % | | | 65 | % |
| (a) | Commencement of investment operations. |
| (b) | Based on average shares outstanding. |
| (c) | The mean between the last bid and ask prices. |
| (d) | Net asset value total return is calculated assuming an initial investment made at the net asset value at the beginning of the period, reinvestment of all dividends and distributions at net asset value during the period, and redemption on the last day of the period. Net asset value total return includes adjustments in accordance with accounting principles generally accepted in the United States of America and as such, the net asset value for financial reporting purposes and the returns based upon those net asset values may differ from the net asset value and returns for shareholder transactions. Market price total return is calculated assuming an initial investment made at the market price at the beginning of the period, reinvestment of all dividends and distributions at market price during the period, and the sale at the market price on the last day of the period. Total investment returns calculated for a period of less than one year are not annualized. |
| (e) | The net asset value total return from Fund Inception (April 6, 2017, the first day of trading on the exchange) to October 31, 2017 was 7.33%. The market price total return from Fund Inception to October 31, 2017 was 7.54%. |
| (g) | Portfolio turnover rate is not annualized for periods less than one year, if applicable, and does not include securities received or delivered from processing creations or redemptions. |
See accompanying Notes to Financial Statements which are an integral part of the financial statements.
Notes to Financial Statements
Invesco Exchange-Traded Fund Trust II
August 31, 2018
Note 1. Organization
Invesco Exchange-Traded Fund Trust II (the “Trust”), formerly PowerShares Exchange-Traded Fund Trust II, was organized as a Massachusetts business trust on October 10, 2006 and is authorized to have multiple series of portfolios. The Trust is an open-end management investment company registered under the Investment Company Act of 1940, as amended (the “1940 Act”). This report includes the following portfolios:
| | |
Full Name | | Short Name |
| Invesco Russell 1000 Enhanced Equal Weight ETF (USEQ) | | “Russell 1000 Enhanced Equal Weight ETF” |
| Invesco Russell 1000 Equal Weight ETF (EQAL) | | “Russell 1000 Equal Weight ETF” |
| Invesco Russell 1000 Low Beta Equal Weight ETF (USLB) | | “Russell 1000 Low Beta Equal Weight ETF” |
| Invesco S&P 500 Enhanced Value ETF (SPVU) | | “S&P 500 Enhanced Value ETF” |
| Invesco S&P 500® ex-Rate Sensitive Low Volatility ETF (XRLV) | | “S&P 500® ex-Rate Sensitive Low Volatility ETF” |
| Invesco S&P 500® High Beta ETF (SPHB) | | “S&P 500® High Beta ETF” |
| Invesco S&P 500® High Dividend Low Volatility ETF (SPHD) | | “S&P 500® High Dividend Low Volatility ETF” |
| Invesco S&P 500® Low Volatility ETF (SPLV) | | “S&P 500® Low Volatility ETF” |
| Invesco S&P 500 Minimum Variance ETF (SPMV) | | “S&P 500 Minimum Variance ETF” |
| Invesco S&P 500 Momentum ETF (SPMO) | | “S&P 500 Momentum ETF” |
| Invesco S&P 500 Value with Momentum ETF (SPVM) | | “S&P 500 Value with Momentum ETF” |
| Invesco S&P MidCap Low Volatility ETF (XMLV) | | “S&P MidCap Low Volatility ETF” |
| Invesco S&P SmallCap High Dividend Low Volatility ETF (XSHD) | | “S&P SmallCap High Dividend Low Volatility ETF” |
| Invesco S&P SmallCap Low Volatility ETF (XSLV) | | “S&P SmallCap Low Volatility ETF” |
| Invesco S&P SmallCap Quality ETF (XSHQ) | | “S&P SmallCap Quality ETF” |
Each portfolio (each, a “Fund”, and collectively, the “Funds”) represents a separate series of the Trust. The shares of the Funds are referred to herein as “Shares” or “Fund’s Shares.” Each Fund’s Shares are listed and traded on NYSE Arca, Inc., except for Shares of Russell 1000 Low Beta Equal Weight ETF, which is listed and traded on The NASDAQ Stock Market LLC and Shares of Russell 1000 Enhanced Equal Weight ETF, S&P 500 Minimum Variance ETF, S&P 500 Value with Momentum ETF, S&P SmallCap High Dividend Low Volatility ETF and S&P SmallCap Quality ETF, which are listed and traded on Cboe BZX Exchange, Inc.
Effective June 4, 2018, the Funds’ names changed as part of an overall rebranding strategy whereby the PowerShares name was changed to the Invesco brand. This resulted in all references to the PowerShares name being changed to Invesco.
Effective August 31, 2018, each Fund’s fiscal year-end changed from October 31 to August 31.
The market price of each Share may differ to some degree from a Fund’s net asset value (“NAV”). Unlike conventional mutual funds, each Fund issues and redeems Shares on a continuous basis, at NAV, only in a large specified number of Shares, each called a “Creation Unit.” Creation Units are issued and redeemed principally in exchange for the deposit or delivery of a basket of securities (“Deposit Securities”). Except when aggregated in Creation Units by Authorized Participants, the Shares are not individually redeemable securities of the Funds.
The investment objective of each Fund is to seek to track the investment results (before fees and expenses) of its respective index listed below (each, an “Underlying Index”).
| | |
Fund | | Underlying Index |
| Russell 1000 Enhanced Equal Weight ETF | | Russell 1000® Enhanced Value Equal Weight Index |
| Russell 1000 Equal Weight ETF | | Russell 1000® Equal Weight Index |
| Russell 1000 Low Beta Equal Weight ETF | | Russell 1000® Low Beta Equal Weight Index |
| S&P 500 Enhanced Value ETF | | S&P 500 Enhanced Value Index |
| S&P 500® ex-Rate Sensitive Low Volatility ETF | | S&P 500® Low Volatility Rate Response Index |
| S&P 500® High Beta ETF | | S&P 500® High Beta Index |
| S&P 500® High Dividend Low Volatility ETF | | S&P 500® Low Volatility High Dividend Index |
| S&P 500® Low Volatility ETF | | S&P 500® Low Volatility Index |
| | |
Fund | | Underlying Index |
| S&P 500 Minimum Variance ETF | | S&P 500® Minimum Volatility Index |
| S&P 500 Momentum ETF | | S&P 500® Momentum Index |
| S&P 500 Value with Momentum ETF | | S&P 500® High Momentum Value Index |
| S&P MidCap Low Volatility ETF | | S&P MidCap 400® Low Volatility Index |
| S&P SmallCap High Dividend Low Volatility ETF | | S&P SmallCap 600® Low Volatility High Dividend Index |
| S&P SmallCap Low Volatility ETF | | S&P SmallCap 600® Low Volatility Index |
| S&P SmallCap Quality ETF | | S&P SmallCap 600® Quality Index |
Note 2. Significant Accounting Policies
The following is a summary of the significant accounting policies followed by the Funds in preparation of their financial statements.
Each Fund is an investment company and accordingly follows the investment company accounting and reporting guidance in accordance with Financial Accounting Standards Board Accounting Standards Codification Topic 946, Financial Services—Investment Companies.
A. Security Valuation
Securities, including restricted securities, are valued according to the following policies:
A security listed or traded on an exchange (except convertible securities) is generally valued at its last sales price or official closing price as of the close of the customary trading session on the exchange where the security is principally traded, or lacking any sales or official closing price on a particular day, the security may be valued at the closing bid price on that day. Securities traded in the over-the-counter market are valued based on prices furnished by independent pricing services or market makers. When such securities are valued by an independent pricing service they may be considered fair valued. Futures contracts are valued at the final settlement price set by an exchange on which they are principally traded. Listed options are valued at the mean between the last bid and asked prices from the exchange on which they are principally traded, or at the final settlement price set by such exchange. Swaps and options not listed on an exchange are valued by an independent source. For purposes of determining NAV per Share, futures and option contracts generally are valued 15 minutes after the close of the customary trading session of the New York Stock Exchange (“NYSE”).
Investment companies are valued using such company’s NAV per share, unless the shares are exchange-traded, in which case they are valued at the last sales price or official closing price as of the close of the customary trading session on the exchange where the security is principally traded.
Debt obligations (including convertible securities) and unlisted equities are fair valued using an evaluated quote provided by an independent pricing service. Evaluated quotes provided by the pricing service may be determined without exclusive reliance on quoted prices, and may reflect appropriate factors such as institution-size trading in similar groups of securities, developments related to specific securities, dividend rate (for unlisted equities), yield (for debt obligations), quality, type of issue, coupon rate (for debt obligations), maturity (for debt obligations), individual trading characteristics and other market data. Securities with a demand feature exercisable within one to seven days are valued at par. Pricing services generally value debt obligations assuming orderly transactions of institutional round lot size, but a Fund may hold or transact in the same securities in smaller, odd lot sizes. Odd lots often trade at lower prices than institutional round lots. Debt obligations are subject to interest rate and credit risks. In addition, all debt obligations involve some risk of default with respect to interest and/or principal payments.
Foreign securities’ (including foreign exchange contracts’) prices are converted into U.S. dollar amounts using the applicable exchange rates as of the close of the London world markets. If market quotations are available and reliable for foreign exchange-traded equity securities, the securities will be valued at the market quotations. Because trading hours for certain foreign securities end before the close of the NYSE, closing market quotations may become unreliable. If between the time trading ends on a particular security and the close of the customary trading session on the NYSE, events occur that Invesco Capital Management LLC (the “Adviser”), formerly Invesco PowerShares Capital Management LLC, determines are significant and make the closing price unreliable, a Fund may fair value the security. If the event is likely to have affected the closing price of the security, the security will be valued at fair value in good faith using procedures approved by the Board of Trustees. Adjustments to closing prices to reflect fair value may also be based on a screening process of an independent pricing service to indicate the degree of certainty, based on historical data, that the closing price in the principal market where a foreign security trades is not the current value as of the close of the NYSE. Foreign securities’ prices meeting the approved degree of certainty that the price is not reflective of current value will be priced at the indication of fair value from the independent pricing service. Multiple factors may be considered by the independent pricing service in determining adjustments to reflect fair value and may include information relating to sector indices, American Depositary Receipts and domestic and foreign index futures. Foreign securities may have additional risks including exchange rate changes, potential for sharply devalued currencies and high inflation, political and economic upheaval, the relative lack of issuer information, relatively low market liquidity and the potential lack of strict financial and accounting controls and standards.
Securities for which market prices are not provided by any of the above methods may be valued based upon quotes furnished by independent sources. The last bid price may be used to value exchange-traded equity securities. The mean between the last bid and asked prices may be used to value debt obligations, including corporate loans, and unlisted equity securities.
Securities for which market quotations are not readily available or became unreliable are valued at fair value as determined in good faith following procedures approved by the Board of Trustees. Issuer-specific events, market trends, bid/asked quotes of brokers and information providers and other market data may be reviewed in the course of making a good faith determination of a security’s fair value.
Each Fund may invest in securities that are subject to interest rate risk, meaning the risk that the prices will generally fall as interest rates rise and, conversely, the prices will generally rise as interest rates fall. Specific securities differ in their sensitivity to changes in interest rates depending on their individual characteristics. Changes in interest rates may result in increased market volatility, which may affect the value and/or liquidity of certain Fund investments.
Valuations change in response to many factors, including the historical and prospective earnings of the issuer, the value of the issuer’s assets, general economic conditions, interest rates, investor perceptions and market liquidity. Because of the inherent uncertainties of valuation, the values reflected in the financial statements may materially differ from the value received upon actual sale of those investments.
B. Other Risks
Index Risk. Unlike many investment companies, the Funds do not utilize investing strategies that seek returns in excess of their Underlying Indexes. Therefore, a Fund would not necessarily buy or sell a security unless that security is added or removed, respectively, from its respective Underlying Index, even if that security generally is underperforming.
Authorized Participant Concentration Risk. Only Authorized Participants (“APs”) may engage in creation or redemption transactions directly with each Fund. Each Fund has a limited number of institutions that may act as APs, and such APs have no obligation to submit creation or redemption orders. Consequently, there is no assurance that those APs will establish or maintain an active trading market for the Shares. This risk may be heightened to the extent that securities underlying each Fund are traded outside a collateralized settlement system. In that case, APs may be required to post collateral on certain trades on an agency basis (i.e., on behalf of other market participants), which only a limited number of APs may be able to do. In addition, to the extent that APs exit the business or are unable to proceed with creation and/or redemption orders with respect to each Fund and no other AP is able to step forward to create or redeem Creation Units, this may result in a significantly diminished trading market for Fund Shares, which may be more likely to trade at a premium or discount to each Fund’s net asset value (“NAV”) and to face trading halts and/or delisting.
Equity Risk. Equity risk is the risk that the value of the securities that each Fund holds will fall due to general market and economic conditions, perceptions regarding the industries in which the issuers of securities that a Fund holds participate or factors relating to specific companies in which the Fund invests. For example, an adverse event, such as an unfavorable earnings report, may depress the value of securities a Fund holds; the price of securities may be particularly sensitive to general movements in the stock market; or a drop in the stock market may depress the price of most or all of the securities a Fund holds. In addition, securities of an issuer in the Fund’s portfolio may decline in price if the issuer fails to make anticipated dividend payments because, among other reasons, the issuer of the security experiences a decline in its financial condition.
High Dividend Paying Securities Risk. S&P 500® High Dividend Low Volatility ETF and S&P SmallCap High Dividend Low Volatility ETF invest in securities that pay high dividends. As a group, these securities can fall out of favor with the market, causing such companies to underperform companies that do not pay high dividends. Also, changes in the dividend policies of the companies in an Underlying Index and the capital resources available for such companies’ dividend payments may affect a Fund.
Industry Concentration Risk. Each Fund’s Underlying Index from time to time may be concentrated to a significant degree in securities of issuers located in a single industry or sector. To the extent that each Underlying Index concentrates in the securities of issuers in a particular industry or sector, each Fund will also concentrate its investments to approximately the same extent. By concentrating its investments in an industry or sector, each Fund faces more risks than if it were diversified broadly over numerous industries or sectors. Such industry-based risks, any of which may adversely affect the companies in which each Fund invests, may include, but are not limited to, the following: general economic conditions or cyclical market patterns that could negatively affect supply and demand in a particular industry; competition for resources, adverse labor relations, political or world events; obsolescence of technologies; and increased competition or new product introductions that may affect the profitability or viability of companies in an industry. In addition, at times, such industry or sector may be out of favor and underperform other industries or the market as a whole.
Non-Diversified Fund Risk. Each Fund (except Russell 1000 Equal Weight ETF, Russell 1000 Low Beta Equal Weight ETF, S&P 500® High Beta ETF, S&P 500® High Dividend Low Volatility ETF, S&P 500® Low Volatility ETF, S&P MidCap Low Volatility ETF and S&P SmallCap Low Volatility ETF) is non-diversified and can invest a greater portion of its assets in securities of individual issuers than diversified funds. As a result, changes in the market value of a single investment could cause greater fluctuations in Share price than
would occur in a diversified fund. This may increase a Fund’s volatility and cause the performance of a relatively small number of issuers to have a greater impact on a Fund’s performance.
Non-Correlation Risk. Each Fund’s return may not match the return of its Underlying Index for a number of reasons. For example, each Fund incurs operating expenses not applicable to its Underlying Index, and incurs costs in buying and selling securities, especially when rebalancing the Fund’s securities holdings to reflect changes in the composition of its Underlying Index. In addition, the performance of each Fund and its Underlying Index may vary due to asset valuation differences and differences between each Fund’s portfolio and its Underlying Index resulting from legal restrictions, cost or liquidity constraints.
Portfolio Turnover Risk. Russell 1000 Low Beta Equal Weight ETF, S&P 500 Momentum ETF and S&P SmallCap Quality ETF may engage in frequent trading of its portfolio securities in connection with the rebalancing or adjustment of its Underlying Index. This may result in a high portfolio turnover rate. A portfolio turnover rate of 200%, for example, is equivalent to the Fund buying and selling all of its securities two times during the course of a year. A high portfolio turnover rate (such as 100% or more) could result in high brokerage costs for the Fund. A high portfolio turnover rate also can result in an increase in taxable capital gains distributions to shareholders and an increased likelihood that the capital gains will be taxable at ordinary rates.
Small- and Mid-Capitalization Company Risk. For Russell 1000 Equal Weight ETF, S&P MidCap Low Volatility ETF, S&P SmallCap High Dividend Low Volatility ETF, S&P SmallCap Low Volatility ETF and S&P SmallCap Quality ETF, investing in securities of small- and mid-capitalization companies involves greater risk than customarily is associated with investing in larger, more established companies. These companies’ securities may be more volatile and less liquid than those of more established companies. These securities may have returns that vary, sometimes significantly, from the overall securities market. Often small- and medium-capitalization companies and the industries in which they focus are still evolving and, as a result, they may be more sensitive to changing market conditions.
Momentum Investing Risk. For S&P 500 Momentum ETF and S&P 500 Value with Momentum ETF, the momentum style of investing is subject to the risk that the securities may be more volatile than the market as a whole, or that the returns on securities that previously have exhibited price momentum are less than returns on other styles of investing. Momentum can turn quickly, and stocks that previously have exhibited high momentum may not experience continued positive momentum. In addition, there may be periods when the momentum style of investing is out of favor and therefore, the investment performance of a Fund may suffer.
REIT Risk. Each Fund (except S&P 500® High Beta ETF and S&P 500 Value with Momentum ETF), in addition to the risks pertaining to real estate investments more generally, REITs are subject to additional risks. The value of a REIT can depend on the structure of and cash flow generated by the REIT. REITs whose investments are concentrated in a limited number or type of properties, investments or narrow geographic area are also subject to certain requirements under federal tax law. In addition, REITs may have expenses, including advisory and administration expenses, and each Fund and its shareholders will incur its pro rata share of the underlying expenses.
C. Federal Income Taxes
Each Fund intends to comply with the provisions of the Internal Revenue Code of 1986, as amended (the “Internal Revenue Code”), applicable to regulated investment companies and to distribute substantially all of the Fund’s taxable earnings to its shareholders. As such, the Funds will not be subject to federal income taxes on otherwise taxable income (including net realized gains) that is distributed to the shareholders. Therefore, no provision for federal income taxes is recorded in the financial statements.
Each Fund recognizes the tax benefits of uncertain tax positions only when the position is more likely than not to be sustained. Management has analyzed each Fund’s uncertain tax positions and concluded that no liability for unrecognized tax benefits should be recorded related to uncertain tax positions. Management is not aware of any tax positions for which it is reasonably possible that the total amounts of unrecognized tax benefits will change materially in the next 12 months.
Income and capital gain distributions are determined in accordance with federal income tax regulations, which may differ from accounting principles generally accepted in the United States of America (“GAAP”). These differences are primarily due to differing book and tax treatments for in-kind transactions, losses deferred due to wash sales, and passive foreign investment company adjustments, if any.
The Funds file U.S. federal tax returns and tax returns in certain other jurisdictions. Generally, a Fund is subject to examinations by such taxing authorities for up to three years after the filing of the return for the tax period.
D. Investment Transactions and Investment Income
Investment transactions are accounted for on a trade date basis. Realized gains and losses from the sale or disposition of securities are computed on the specific identified cost basis. Interest income is recorded on the accrual basis from settlement date. Pay-in-kind interest income and non-cash dividend income received in the form of securities in-lieu of cash are recorded at the fair value of the securities received. Dividend income (net of withholding tax, if any) is recorded on the ex-dividend date. Realized gains, dividends and interest received by a Fund may give rise to withholding and other taxes imposed by foreign countries. Tax conventions between certain countries and the United States may reduce or eliminate such taxes.
The Funds may periodically participate in litigation related to each Fund’s investments. As such, the Funds may receive proceeds from litigation settlements. Any proceeds received are included in the Statements of Operations as realized gain (loss) for investments no longer held and as unrealized gain (loss) for investments still held.
Brokerage commissions and mark ups are considered transaction costs and are recorded as an increase to the cost basis of securities purchased and/or a reduction of proceeds on a sale of securities. Such transaction costs are included in the determination of net realized and unrealized gain (loss) from investment securities reported in the Statements of Operations and the Statements of Changes in Net Assets and the net realized and unrealized gains (losses) on securities per share in the Financial Highlights. Transaction costs are included in the calculation of each Fund’s NAV and, accordingly, they reduce each Fund’s total returns. These transaction costs are not considered operating expenses and are not reflected in net investment income reported in the Statements of Operations and the Statements of Changes in Net Assets, or the net investment income per share and the ratios of expenses and net investment income reported in the Financial Highlights, nor are they limited by any expense limitation arrangements between each Fund and the Adviser.
E. Country Determination
For the purposes of presentation in the Schedules of Investments, the Adviser may determine the country in which an issuer is located and/or credit risk exposure based on various factors. These factors include whether each Fund’s Underlying Index has made a country determination and may include the laws of the country under which the issuer is organized, where the issuer maintains a principal office, the country in which the issuer derives 50% or more of its total revenues and the country that has the primary market for the issuer’s securities, as well as other criteria. Among the other criteria that may be evaluated for making this determination are the country in which the issuer maintains 50% or more of its assets, the type of security, financial guarantees and enhancements, the nature of the collateral and the sponsor organization. Country of issuer and/or credit risk exposure has been determined to be the United States of America, unless otherwise noted.
F. Expenses
Each Fund has agreed to pay an annual unitary management fee to the Adviser. Out of the unitary management fee, the Adviser has agreed to pay for substantially all expenses of the Funds, including the cost of transfer agency, custody, fund administration, legal, audit and other services, except for advisory fees, distribution fees, if any, brokerage expenses, taxes, interest, acquired fund fees and expenses, if any, litigation expenses and other extraordinary expenses.
Expenses of the Trust that are excluded from a Fund’s unitary management fee and are directly identifiable to a specific Fund are applied to that Fund. Expenses of the Trust that are excluded from each Fund’s unitary management fee and that are not readily identifiable to a specific Fund are allocated in such a manner as deemed equitable, taking into consideration the nature and type of expense and the relative net assets of each Fund.
To the extent a Fund invests in other investment companies, the expenses shown in the accompanying financial statements reflect the expenses of the Fund and do not include any expenses of the investment companies in which it invests. The effects of such investment companies’ expenses are included in the realized and unrealized gain or loss on the investments in the investment companies.
G. Dividends and Distributions to Shareholders
Each Fund (except for S&P 500® ex-Rate Sensitive Low Volatility ETF, S&P 500® High Dividend Low Volatility ETF, S&P 500® Low Volatility ETF and S&P SmallCap High Dividend Low Volatility ETF) declares and pays dividends from net investment income, if any, to its shareholders quarterly and records such dividends on ex-dividend date. S&P 500® ex-Rate Sensitive Low Volatility ETF, S&P 500® High Dividend Low Volatility ETF, S&P 500® Low Volatility ETF and S&P SmallCap High Dividend Low Volatility ETF each declares and pays dividends from net investment income, if any, to its shareholders monthly and records such dividends on ex-dividend date. Generally, each Fund distributes net realized taxable capital gains, if any, annually in cash and records them on ex-dividend date. Such distributions on a tax basis are determined in conformity with federal income tax regulations, which may differ from GAAP. Distributions in excess of tax basis earnings and profits, if any, are reported in such Fund’s financial statements as a tax return of capital at fiscal year-end.
H. Accounting Estimates
The preparation of the financial statements in accordance with GAAP requires management to make estimates and assumptions that affect the reported amounts and disclosures in the financial statements, including estimates and assumptions related to taxation. Actual results could differ from these estimates. In addition, the Funds monitor for material events or transactions that may occur or become known after the period-end date and before the date the financial statements are released to print.
I. Foreign Currency Translations
Foreign currency is valued at the close of the NYSE based on quotations posted by banks and major currency dealers. Portfolio securities and other assets and liabilities denominated in foreign currencies are translated into U.S. dollar amounts at date of valuation. Purchases and sales of portfolio securities (net of foreign taxes withheld on disposition) and income items denominated in foreign currencies are translated into U.S. dollar amounts on the respective dates of such transactions. The Funds do not separately account for the portion of the results of operations resulting from changes in foreign exchange rates on investments and the fluctuations arising from changes in market prices of securities held. The combined results of changes in foreign exchange rates and the fluctuation of market prices on investments (net of estimated foreign tax withholding) are included with the net realized and unrealized gain or loss from investments in the Statements of Operations. Reported net realized foreign currency gains or losses arise from (1) sales of foreign currencies, (2) currency gains or losses realized between the trade and settlement dates on securities transactions, and (3) the difference between the amounts of dividends, interest, and foreign withholding taxes recorded on each Fund’s books and the U.S. dollar
equivalent of the amounts actually received or paid. Net unrealized foreign currency gains and losses arise from changes in the fair values of assets and liabilities, other than investments in securities at fiscal period-end, resulting from changes in exchange rates.
The Funds may invest in foreign securities, which may be subject to foreign taxes on income, gains on investments or currency repatriation, a portion of which may be recoverable. Foreign taxes, if any, are recorded based on the tax regulations and rates that exist in the foreign markets in which each Fund invests.
J. Securities Lending
During the period November 1, 2017 to August 31, 2018, Russell 1000 Equal Weight ETF, S&P 500® High Beta ETF and S&P SmallCap Low Volatility ETF participated in securities lending. Each Fund loaned portfolio securities having a market value up to one-third of each Fund’s total assets. Such loans are secured by cash collateral equal to no less than 102% (105% for international securities) of the market value of the loaned securities determined daily by the securities lending provider. Cash collateral received in connection with these loans is generally invested in an affiliated money market fund and is shown as such on the Schedules of Investments. Each Fund bears the risk of loss with respect to the investment of collateral. It is the policy of these Funds to obtain additional collateral from or return excess collateral to the borrower by the end of the next business day, following the valuation date of the securities loaned. Therefore, the value of the collateral held may be temporarily less than the value of the securities on loan. When loaning securities, each Fund retains certain benefits of owning the securities, including the economic equivalent of dividends or interest generated by the security. Lending securities entails a risk of loss to each Fund if, and to the extent that, the market value of the securities loaned were to increase, and the borrower did not increase the collateral accordingly, and the borrower failed to return the securities. The securities loaned are subject to termination at the option of the borrower or each Fund. Upon termination, the borrower will return to each Fund the securities loaned and each Fund will return the collateral. Upon the failure of the borrower to return the securities, collateral may be liquidated and the securities may be purchased on the open market to replace the loaned securities. Each Fund could experience delays and costs in gaining access to the collateral and the securities may lose value during the delay which could result in potential losses to each Fund. Some of these losses may be indemnified by the lending agent. Each Fund bears the risk of any deficiency in the amount of the collateral available for return to the borrower due to any loss on the collateral invested. Dividends received on cash collateral investments for securities lending transactions, which are net of compensation to counterparties, are included in Securities lending income on the Statements of Operations. The aggregate value of securities out on loan, if any, is shown on the Statements of Assets and Liabilities.
Note 3. Investment Advisory Agreement and Other Agreements
The Trust has entered into an Investment Advisory Agreement with the Adviser on behalf of each Fund, pursuant to which the Adviser has overall responsibility for the selection and ongoing monitoring of the Funds’ investments, managing the Funds’ business affairs and providing certain clerical, bookkeeping and other administrative services.
As compensation for its services, each Fund accrues daily and pays monthly to the Adviser an annual unitary management fee. Out of the unitary management fee, the Adviser has agreed to pay for substantially all expenses of the Funds, including the cost of transfer agency, custody, fund administration, legal, audit and other services, except for advisory fees, distribution fees, if any, brokerage expenses, taxes, interest, acquired fund fees and expenses, if any, litigation expenses and other extraordinary expenses. The unitary management fee is paid by each Fund to the Adviser at the following annual rates:
| | | | |
| | | % of Average
Daily Net Assets | |
| Russell 1000 Enhanced Equal Weight ETF | | | 0.29 | % |
| Russell 1000 Equal Weight ETF | | | 0.20 | % |
| Russell 1000 Low Beta Equal Weight ETF | | | 0.35 | % |
| S&P 500 Enhanced Value ETF | | | 0.13 | %* |
| S&P 500® ex-Rate Sensitive Low Volatility ETF | | | 0.25 | % |
| S&P 500® High Beta ETF | | | 0.25 | % |
| S&P 500® High Dividend Low Volatility ETF | | | 0.30 | % |
| S&P 500® Low Volatility ETF | | | 0.25 | % |
| S&P 500 Minimum Variance ETF | | | 0.10 | %** |
| S&P 500 Momentum ETF | | | 0.13 | %* |
| S&P 500 Value with Momentum ETF | | | 0.15 | %*** |
| S&P MidCap Low Volatility ETF | | | 0.25 | % |
| S&P SmallCap High Dividend Low Volatility ETF | | | 0.30 | % |
| S&P SmallCap Low Volatility ETF | | | 0.25 | % |
| S&P SmallCap Quality ETF | | | 0.29 | % |
| * | Prior to January 1, 2018, the unitary management fee was 0.25% of average daily net assets. |
| ** | Prior to April 20, 2018, the unitary management fee was 0.13%. Effective April 9, 2018, the Adviser had agreed to waive permanently a portion of its unitary management fee. After giving effect to such waiver, the net unitary management fee was 0.10%. Effective April 20, 2018, the unitary management fee was reduced to 0.10%. |
| *** | Prior to August 20, 2018, the unitary management fee was 0.30%. Effective August 20, 2018, the Adviser had agreed to waive permanently a portion of its unitary management fee. After giving effect to such waiver, the net unitary management fee was 0.15%. |
Further, through August 31, 2020, the Adviser has contractually agreed to waive a portion of each Fund’s management fee in an amount equal to 100% of the net advisory fees an affiliate of the Adviser receives that are attributable to certain of the Fund’s investments in money market funds managed by that affiliate (excluding investments of cash collateral from securities lending). The Adviser cannot discontinue this waiver prior to its expiration.
For the period November 1, 2017 to August 31, 2018 and the fiscal year ended October 31, 2017, the Adviser waived fees for each Fund in the following amounts:
| | | | | | | | |
| | | Ten Months Ended
August 31, 2018 | | | Year Ended
October 31, 2017 | |
| Russell 1000 Enhanced Equal Weight ETF | | $ | 101 | | | $ | 13 | |
| Russell 1000 Equal Weight ETF | | | 313 | | | | 270 | |
| Russell 1000 Low Beta Equal Weight ETF | | | 144 | | | | 202 | |
| S&P 500 Enhanced Value ETF | | | 32 | | | | 24 | |
| S&P 500® ex-Rate Sensitive Low Volatility ETF | | | 31 | | | | 80 | |
| S&P 500® High Beta ETF | | | 221 | | | | 629 | |
| S&P 500® High Dividend Low Volatility ETF | | | 1,180 | | | | 2,006 | |
| S&P 500® Low Volatility ETF | | | 2,197 | | | | 2,748 | |
| S&P 500 Minimum Variance ETF | | | 6 | | | | — | |
| S&P 500 Momentum ETF | | | 11 | | | | 1 | |
| S&P 500 Value with Momentum ETF | | | 147 | | | | 1 | |
| S&P MidCap Low Volatility ETF | | | 1,468 | | | | 900 | |
| S&P SmallCap High Dividend Low Volatility ETF | | | 13 | | | | 13 | |
| S&P SmallCap Low Volatility ETF | | | 1,109 | | | | 1,144 | |
| S&P SmallCap Quality ETF | | | 3 | | | | 1 | |
The Trust has entered into a Distribution Agreement with Invesco Distributors, Inc. (the “Distributor”), which serves as the distributor of Creation Units for each Fund. The Distributor does not maintain a secondary market in the Shares. The Funds are not charged any fees pursuant to the Distribution Agreement. The Distributor is an affiliate of the Adviser.
The Adviser has entered into a licensing agreement for each Fund with the following entities (each, a “Licensor”):
| | |
Fund | | Licensor |
| Russell 1000 Enhanced Equal Weight ETF | | Frank Russell Company |
| Russell 1000 Equal Weight ETF | | Frank Russell Company |
| Russell 1000 Low Beta Equal Weight ETF | | Frank Russell Company |
| S&P 500 Enhanced Value ETF | | S&P Dow Jones Indices LLC |
| S&P 500® ex-Rate Sensitive Low Volatility ETF | | S&P Dow Jones Indices LLC |
| S&P 500® High Beta ETF | | S&P Dow Jones Indices LLC |
| S&P 500® High Dividend Low Volatility ETF | | S&P Dow Jones Indices LLC |
| S&P 500® Low Volatility ETF | | S&P Dow Jones Indices LLC |
| S&P 500 Minimum Variance ETF | | S&P Dow Jones Indices LLC |
| S&P 500 Momentum ETF | | S&P Dow Jones Indices LLC |
| S&P 500 Value with Momentum ETF | | S&P Dow Jones Indices LLC |
| S&P MidCap Low Volatility ETF | | S&P Dow Jones Indices LLC |
| S&P SmallCap High Dividend Low Volatility ETF | | S&P Dow Jones Indices LLC |
| S&P SmallCap Low Volatility ETF | | S&P Dow Jones Indices LLC |
| S&P SmallCap Quality ETF | | S&P Dow Jones Indices LLC |
Each Underlying Index name trademark is owned by its respective Licensor. These trademarks have been licensed to the Adviser for use by the Funds. Each Fund is entitled to use its Underlying Index pursuant to the Trust’s sub-licensing agreement with the Adviser. The Funds are not sponsored, endorsed, sold or promoted by the Licensors, and the Licensors make no representation regarding the advisability of investing in any of the Funds.
The Trust has entered into service agreements whereby The Bank of New York Mellon, a wholly-owned subsidiary of The Bank of New York Mellon Corporation, serves as the administrator, custodian, fund accountant and transfer agent for each Fund.
Note 4. Investments in Affiliates
The Adviser and Invesco Mortgage Capital, Inc. REIT are wholly-owned subsidiaries of Invesco Ltd. and therefore, Invesco Ltd. and Invesco Mortgage Capital, Inc. REIT are considered to be affiliated with the Funds. The tables below show certain Funds’ transactions in, and earnings from, investments in affiliates (excluding affiliated money market funds) for the period November 1, 2017 to August 31, 2018.
Russell 1000 Enhanced Equal Weight ETF
| | | | | | | | | | | | | | | | | | | | | | | | | | | | |
| | | Value
October 31, 2017 | | | Purchases
at Cost | | | Proceeds
from Sales | | | Change in
Unrealized
Appreciation
(Depreciation) | | | Realized
Gain (Loss) | | | Value
August 31, 2018 | | | Dividend
Income | |
| Invesco Ltd. | | $ | 106,583 | | | $ | 152,305 | | | $ | (20,760 | ) | | $ | (61,427 | ) | | $ | (385 | ) | | $ | 176,316 | | | $ | 5,828 | |
Russell 1000 Equal Weight ETF
| | | | | | | | | | | | | | | | | | | | | | | | | | | | |
| | | Value
October 31, 2017 | | | Purchases
at Cost | | | Proceeds
from Sales | | | Change in
Unrealized
Appreciation
(Depreciation) | | | Realized
Gain | | | Value
August 31, 2018 | | | Dividend
Income | |
| Invesco Ltd. | | $ | 151,177 | | | $ | 140,415 | | | $ | (50,246 | ) | | $ | (67,863 | ) | | $ | 3,098 | | | $ | 176,581 | | | $ | 6,364 | |
S&P 500 Enhanced Value ETF
| | | | | | | | | | | | | | | | | | | | | | | | | | | | |
| | | Value
October 31, 2017 | | | Purchases
at Cost | | | Proceeds
from Sales | | | Change in
Unrealized
Appreciation
(Depreciation) | | | Realized
Gain | | | Value
August 31, 2018 | | | Dividend
Income | |
| Invesco Ltd. | | $ | — | | | $ | 81,927 | | | $ | — | | | $ | (10,157 | ) | | $ | — | | | $ | 71,770 | | | $ | 891 | |
S&P 500® High Beta ETF
| | | | | | | | | | | | | | | | | | | | | | | | | | | | |
| | | Value
October 31, 2017 | | | Purchases
at Cost | | | Proceeds
from Sales | | | Change in
Unrealized
Appreciation
(Depreciation) | | | Realized
Gain (Loss) | | | Value
August 31, 2018 | | | Dividend
Income | |
| Invesco Ltd. | | $ | 3,946,313 | | | $ | 5,558,112 | | | $ | (6,608,025 | ) | | $ | (736,306 | ) | | $ | (622,562 | ) | | $ | 1,537,532 | | | $ | 103,728 | |
S&P 500® High Dividend Low Volatility ETF
| | | | | | | | | | | | | | | | | | | | | | | | | | | | |
| | | Value
October 31, 2017 | | | Purchases
at Cost | | | Proceeds
from Sales | | | Change in
Unrealized
Appreciation
(Depreciation) | | | Realized
Gain (Loss) | | | Value
August 31, 2018 | | | Dividend
Income | |
| Invesco Ltd. | | $ | 46,298,517 | | | $ | 38,048,551 | | | $ | (16,541,183 | ) | | $ | (16,531,856 | ) | | $ | (535,504 | ) | | $ | 50,738,525 | | | $ | 1,756,372 | |
S&P 500 Value with Momentum ETF
| | | | | | | | | | | | | | | | | | | | | | | | | | | | |
| | | Value
October 31, 2017 | | | Purchases
at Cost | | | Proceeds
from Sales | | | Change in
Unrealized
Appreciation
(Depreciation) | | | Realized
Gain (Loss) | | | Value
August 31, 2018 | | | Dividend
Income | |
| Invesco Ltd. | | $ | — | | | $ | 49,849 | | | $ | (43,245 | ) | | $ | — | | | $ | (6,604 | ) | | $ | — | | | $ | 426 | |
S&P SmallCap High Dividend Low Volatility ETF
| | | | | | | | | | | | | | | | | | | | | | | | | | | | |
| | | Value
October 31, 2017 | | | Purchases
at Cost | | | Proceeds
from Sales | | | Change in
Unrealized
Appreciation | | | Realized
Gain | | | Value
August 31, 2018 | | | Dividend
Income | |
| Invesco Mortgage Capital, Inc. REIT | | $ | — | | | $ | 396,847 | | | $ | (39,619 | ) | | $ | 739 | | | $ | 716 | | | $ | 358,683 | | | $ | 10,864 | |
S&P SmallCap Low Volatility ETF
| | | | | | | | | | | | | | | | | | | | | | | | | | | | |
| | | Value
October 31, 2017 | | | Purchases
at Cost | | | Proceeds
from Sales | | | Change in
Unrealized
Appreciation
(Depreciation) | | | Realized
Gain (Loss) | | | Value
August 31, 2018 | | | Dividend
Income | |
| Invesco Mortgage Capital, Inc. REIT | | $ | — | | | $ | 16,645,534 | | | $ | (1,017,374 | ) | | $ | (71,533 | ) | | $ | (886 | ) | | $ | 15,555,741 | | | $ | 688,550 | |
Note 5. Security Transactions with Affiliated Funds
Each Fund is permitted to purchase or sell securities from or to certain other affiliated funds under specified conditions outlined in procedures adopted by the Board of Trustees of the Trust. The procedures have been designed to ensure that any purchase or sale of securities by each Fund from or to another fund or portfolio that is or could be considered an affiliate by virtue of having a common investment adviser (or affiliated investment advisers), common Trustees and/or common officers complies with Rule 17a-7 of the 1940 Act. Further, as defined under the procedures, each transaction is effected at the current market price. For the period November 1, 2017 to August 31, 2018, the following Fund engaged in transactions with affiliates as listed below:
| | | | | | | | | | | | |
| | | Securities
Purchases | | | Securities
Sales | | | Net Realized
Gain (Loss) | |
| S&P 500® Low Volatility ETF | | $ | — | | | $ | 136,503 | | | $ | (5,808 | ) |
Note 6. Additional Valuation Information
GAAP defines fair value as the price that would be received to sell an asset or paid to transfer a liability in an orderly transaction between market participants at the measurement date, under current market conditions. GAAP establishes a hierarchy that prioritizes the inputs to valuation methods, giving the highest priority to readily available unadjusted quoted prices in an active market for identical assets (Level 1) and the lowest priority to significant unobservable inputs (Level 3), generally when market prices are not readily available or are unreliable. Based on the valuation inputs, the securities or other investments are tiered into one of three levels. Changes in valuation methods may result in transfers in or out of an investment’s assigned level:
| | Level 1 — | Prices are determined using quoted prices in an active market for identical assets. |
| | Level 2 — | Prices are determined using other significant observable inputs. Observable inputs are inputs that other market participants may use in pricing a security. These may include quoted prices for similar securities, interest rates, prepayment speeds, credit risk, yield curves, loss severities, default rates, discount rates, volatilities and others. |
| | Level 3 — | Prices are determined using significant unobservable inputs. In situations where quoted prices or observable inputs are unavailable (for example, when there is little or no market activity for an investment at the end of the period), unobservable inputs may be used. Unobservable inputs reflect a Fund’s own assumptions about the factors market participants would use in determining fair value of the securities or instruments and would be based on the best available information. |
Except for the Funds listed below, as of August 31, 2018, all of the securities in each Fund were valued based on Level 1 inputs (see the Schedules of Investments for security categories). The level assigned to the securities valuations may not be an indication of the risk or liquidity associated with investing in those securities. Because of the inherent uncertainties of valuation, the values reflected in the financial statements may materially differ from the value received upon actual sale of those investments.
Each Fund’s policy is to recognize transfers in and out of the valuation levels as of the end of the reporting period. During the period November 1, 2017 to August 31, 2018, there were no transfers between valuation levels.
| | | | | | | | | | | | | | | | |
| | | Level 1 | | | Level 2 | | | Level 3 | | | Total | |
| S&P SmallCap High Dividend Low Volatility ETF | | | | | | | | | | | | | | | | |
| Investments in Securities | | | | | | | | | | | | | | | | |
Common Stocks & Other Equity Interests | | $ | 12,077,863 | | | $ | — | | | $ | 4,780 | | | $ | 12,082,643 | |
| | | | | | | | | | | | | | | | |
Note 7. Distributions to Shareholders and Tax Components of Net Assets
Tax Character of Distributions to Shareholders Paid During the Period November 1, 2017 to August 31, 2018, Year Ended October 31, 2017 and Year Ended October 31, 2016:
| | | | | | | | | | | | |
| | | August 31, 2018 | | | October 31, 2017 | | | October 31, 2016 | |
| | | Ordinary
Income | | | Ordinary
Income | | | Ordinary
Income | |
| Russell 1000 Enhanced Equal Weight ETF | | $ | 1,209,519 | | | $ | 100,835 | | | $ | — | |
| Russell 1000 Equal Weight ETF | | | 3,959,851 | | | | 3,397,369 | | | | 1,669,387 | |
| Russell 1000 Low Beta Equal Weight ETF | | | 1,895,751 | | | | 2,395,027 | | | | 1,664,363 | |
| S&P 500 Enhanced Value ETF | | | 467,801 | | | | 348,743 | | | | 50,033 | |
| S&P 500® ex-Rate Sensitive Low Volatility ETF | | | 2,103,003 | | | | 2,593,776 | | | | 2,230,409 | |
| S&P 500® High Beta ETF | | | 3,731,027 | | | | 5,358,690 | | | | 1,082,016 | |
| S&P 500® High Dividend Low Volatility ETF | | | 92,276,850 | | | | 107,583,441 | | | | 55,786,559 | |
| S&P 500® Low Volatility ETF | | | 124,946,206 | | | | 145,029,675 | | | | 136,098,330 | |
| | | | | | | | | | | | |
| | | August 31, 2018 | | | October 31, 2017 | | | October 31, 2016 | |
| | | Ordinary
Income | | | Ordinary
Income | | | Ordinary
Income | |
| S&P 500 Minimum Variance ETF | | $ | 30,483 | | | $ | 7,768 | | | $ | — | |
| S&P 500 Momentum ETF | | | 128,220 | | | | 24,884 | | | | 30,887 | |
| S&P 500 Value with Momentum ETF | | | 31,691 | | | | 18,152 | | | | — | |
| S&P MidCap Low Volatility ETF | | | 24,301,375 | | | | 14,587,225 | | | | 5,648,124 | |
| S&P SmallCap High Dividend Low Volatility ETF | | | 329,517 | | | | 276,845 | | | | — | |
| S&P SmallCap Low Volatility ETF | | | 19,115,449 | | | | 18,420,981 | | | | 6,839,137 | |
| S&P SmallCap Quality ETF | | | 16,059 | | | | 9,661 | | | | — | |
Tax Components of Net Assets at Fiscal Period-End:
| | | | | | | | | | | | | | | | | | | | |
| | | Undistributed
Ordinary
Income | | | Net Unrealized
Appreciation
(Depreciation)—
Investments | | | Capital Loss
Carryforwards | | | Shares of
Beneficial
Interest | | | Total Net
Assets | |
| Russell 1000 Enhanced Equal Weight ETF | | $ | 474,726 | | | $ | 9,863,880 | | | $ | (1,770,434 | ) | | $ | 136,931,367 | | | $ | 145,499,539 | |
| Russell 1000 Equal Weight ETF | | | 1,734,607 | | | | 32,095,961 | | | | (9,962,498 | ) | | | 450,685,892 | | | | 474,553,962 | |
| Russell 1000 Low Beta Equal Weight ETF | | | 638,961 | | | | 11,968,179 | | | | (14,339,131 | ) | | | 166,509,790 | | | | 164,777,799 | |
| S&P 500 Enhanced Value ETF | | | 140,996 | | | | 1,018,216 | | | | (542,809 | ) | | | 26,379,170 | | | | 26,995,573 | |
| S&P 500® ex-Rate Sensitive Low Volatility ETF | | | — | | | | 12,303,414 | | | | (9,237,292 | ) | | | 143,122,831 | | | | 146,188,953 | |
| S&P 500® High Beta ETF | | | 407,470 | | | | (3,016,938 | ) | | | (54,105,519 | ) | | | 228,648,891 | | | | 171,933,904 | |
| S&P 500® High Dividend Low Volatility ETF | | | — | | | | (67,499,681 | ) | | | (118,542,636 | ) | | | 2,842,910,582 | | | | 2,656,868,265 | |
| S&P 500® Low Volatility ETF | | | — | | | | 457,986,101 | | | | (406,754,675 | ) | | | 7,330,131,003 | | | | 7,381,362,429 | |
| S&P 500 Minimum Variance ETF | | | 4,429 | | | | 160,289 | | | | (4,993 | ) | | | 1,299,936 | | | | 1,459,661 | |
| S&P 500 Momentum ETF | | | 89,914 | | | | 3,237,355 | | | | (109,622 | ) | | | 46,864,331 | | | | 50,081,978 | |
| S&P 500 Value with Momentum ETF | | | 15,178 | | | | 136,286 | | | | (88,979 | ) | | | 2,887,424 | | | | 2,949,909 | |
| S&P MidCap Low Volatility ETF | | | 5,745,811 | | | | 107,594,882 | | | | (33,036,078 | ) | | | 1,363,336,355 | | | | 1,443,640,970 | |
| S&P SmallCap High Dividend Low Volatility ETF | | | — | | | | 298,985 | | | | (492,726 | ) | | | 12,279,960 | | | | 12,086,219 | |
| S&P SmallCap Low Volatility ETF | | | 6,722,853 | | | | 141,157,805 | | | | (10,824,408 | ) | | | 1,296,299,488 | | | | 1,433,355,738 | |
| S&P SmallCap Quality ETF | | | 68,667 | | | | 2,924,833 | | | | (78,442 | ) | | | 40,009,209 | | | | 42,924,267 | |
Capital loss carryforwards are calculated and reported as of a specific date. Results of transactions and other activity after that date may affect the amount of capital loss carryforwards actually available for the Funds to utilize. Capital losses generated in years beginning after December 22, 2010 can be carried forward for an unlimited period, whereas previous losses expire in eight tax years. Capital losses with an expiration period may not be used to offset capital gains until all net capital losses without an expiration date have been utilized. Capital loss carryforwards with no expiration date will retain their character as either short-term or long-term capital losses instead of as short-term capital losses as under prior law. The ability to utilize capital loss carryforwards in the future may be limited under the Internal Revenue Code and related regulations based on the results of future transactions.
The following table presents available capital loss carryforwards and expiration dates for each Fund as of August 31, 2018:
| | | | | | | | | | | | |
| | | Post-effective/no expiration | | | | |
| | | Short-Term | | | Long-Term | | | Total* | |
| Russell 1000 Enhanced Equal Weight ETF | | $ | 1,770,434 | | | $ | — | | | $ | 1,770,434 | |
| Russell 1000 Equal Weight ETF | | | 2,761,715 | | | | 7,200,783 | | | | 9,962,498 | |
| Russell 1000 Low Beta Equal Weight ETF | | | 10,782,825 | | | | 3,556,306 | | | | 14,339,131 | |
| S&P 500 Enhanced Value ETF | | | 482,847 | | | | 59,962 | | | | 542,809 | |
| S&P 500® ex-Rate Sensitive Low Volatility ETF | | | 7,793,375 | | | | 1,443,917 | | | | 9,237,292 | |
| S&P 500® High Beta ETF | | | 42,157,070 | | | | 11,948,449 | | | | 54,105,519 | |
| S&P 500® High Dividend Low Volatility ETF | | | 87,155,526 | | | | 31,387,110 | | | | 118,542,636 | |
| S&P 500® Low Volatility ETF | | | 338,174,444 | | | | 68,580,231 | | | | 406,754,675 | |
| S&P 500 Minimum Variance ETF | | | 4,993 | | | | — | | | | 4,993 | |
| S&P 500 Momentum ETF | | | 109,571 | | | | 51 | | | | 109,622 | |
| | | | | | | | | | | | |
| | | Post-effective/no expiration | | | | |
| | | Short-Term | | | Long-Term | | | Total* | |
| S&P 500 Value with Momentum ETF | | $ | 81,526 | | | $ | 7,453 | | | $ | 88,979 | |
| S&P MidCap Low Volatility ETF | | | 29,993,864 | | | | 3,042,214 | | | | 33,036,078 | |
| S&P SmallCap High Dividend Low Volatility ETF | | | 324,665 | | | | 168,061 | | | | 492,726 | |
| S&P SmallCap Low Volatility ETF | | | 10,824,408 | | | | — | | | | 10,824,408 | |
| S&P SmallCap Quality ETF | | | 61,304 | | | | 17,138 | | | | 78,442 | |
| * | Capital loss carryforwards as of the date listed above are reduced for limitations, if any, to the extent required by the Internal Revenue Code and may be further limited depending upon a variety of factors, including the realization of net unrealized gains or losses as of the date of any reorganization. |
Note 8. Investment Transactions
For the period November 1, 2017 to August 31, 2018, the cost of securities purchased and proceeds from sales of securities (other than short-term securities, U.S. Treasury obligations, money market funds and in-kind transactions, if any) were as follows:
| | | | | | | | |
| | | Purchases | | | Sales | |
| Russell 1000 Enhanced Equal Weight ETF | | $ | 38,231,945 | | | $ | 37,937,350 | |
| Russell 1000 Equal Weight ETF | | | 73,552,712 | | | | 73,013,653 | |
| Russell 1000 Low Beta Equal Weight ETF | | | 141,662,778 | | | | 142,680,060 | |
| S&P 500 Enhanced Value ETF | | | 8,892,957 | | | | 8,702,562 | |
| S&P 500® ex-Rate Sensitive Low Volatility ETF | | | 110,164,932 | | | | 109,621,231 | |
| S&P 500® High Beta ETF | | | 247,875,772 | | | | 248,535,660 | |
| S&P 500® High Dividend Low Volatility ETF | | | 1,294,440,996 | | | | 1,295,390,339 | |
| S&P 500® Low Volatility ETF | | | 4,852,665,147 | | | | 4,859,914,492 | |
| S&P 500 Minimum Variance ETF | | | 480,661 | | | | 1,554,149 | |
| S&P 500 Momentum ETF | | | 11,182,626 | | | | 10,235,923 | |
| S&P 500 Value with Momentum ETF | | | 1,667,005 | | | | 3,355,119 | |
| S&P MidCap Low Volatility ETF | | | 644,034,916 | | | | 640,891,256 | |
| S&P SmallCap High Dividend Low Volatility ETF | | | 4,982,302 | | | | 5,288,385 | |
| S&P SmallCap Low Volatility ETF | | | 807,051,637 | | | | 801,994,578 | |
| S&P SmallCap Quality ETF | | | 2,223,802 | | | | 2,776,017 | |
For the period November 1, 2017 to August 31, 2018, in-kind transactions associated with creations and redemptions were as follows:
| | | | | | | | |
| | | Cost of
Securities
Received | | | Value of
Securities
Delivered | |
| Russell 1000 Enhanced Equal Weight ETF | | $ | 89,222,194 | | | $ | 20,545,196 | |
| Russell 1000 Equal Weight ETF | | | 237,074,921 | | | | 117,706,210 | |
| Russell 1000 Low Beta Equal Weight ETF | | | 103,785,462 | | | | 108,997,100 | |
| S&P 500 Enhanced Value ETF | | | 20,896,545 | | | | 47,023,053 | |
| S&P 500® ex-Rate Sensitive Low Volatility ETF | | | 145,252,333 | | | | 147,474,266 | |
| S&P 500® High Beta ETF | | | 536,765,707 | | | | 755,158,662 | |
| S&P 500® High Dividend Low Volatility ETF | | | 1,282,063,831 | | | | 1,622,397,433 | |
| S&P 500® Low Volatility ETF | | | 4,920,607,237 | | | | 5,158,687,400 | |
| S&P 500 Minimum Variance ETF | | | 1,379,640 | | | | 1,698,298 | |
| S&P 500 Momentum ETF | | | 62,049,452 | | | | 19,275,811 | |
| S&P 500 Value with Momentum ETF | | | 4,322,400 | | | | 2,593,565 | |
| S&P MidCap Low Volatility ETF | | | 844,913,572 | | | | 707,483,377 | |
| S&P SmallCap High Dividend Low Volatility ETF | | | 7,773,338 | | | | 3,527,940 | |
| S&P SmallCap Low Volatility ETF | | | 651,094,642 | | | | 421,429,687 | |
| S&P SmallCap Quality ETF | | | 41,233,997 | | | | 2,215,290 | |
Gains (losses) on in-kind transactions are generally not considered taxable gains (losses) for federal income tax purposes.
At August 31, 2018, the aggregate cost of investments, including any derivatives, on a tax basis includes adjustments for financial reporting purposes as of the most recently completed federal income tax reporting period-end:
| | | | | | | | | | | | | | | | |
| | | Gross
Unrealized
Appreciation | | | Gross
Unrealized
(Depreciation) | | | Net
Unrealized
Appreciation
(Depreciation) | | | Cost | |
| Russell 1000 Enhanced Equal Weight ETF | | $ | 13,114,995 | | | $ | (3,251,115 | ) | | $ | 9,863,880 | | | $ | 135,583,307 | |
| Russell 1000 Equal Weight ETF | | | 49,776,218 | | | | (17,680,257 | ) | | | 32,095,961 | | | | 446,226,856 | |
| Russell 1000 Low Beta Equal Weight ETF | | | 16,134,530 | | | | (4,166,351 | ) | | | 11,968,179 | | | | 152,626,023 | |
| S&P 500 Enhanced Value ETF | | | 1,874,294 | | | | (856,078 | ) | | | 1,018,216 | | | | 25,952,315 | |
| S&P 500® ex-Rate Sensitive Low Volatility ETF | | | 13,132,771 | | | | (829,357 | ) | | | 12,303,414 | | | | 133,761,303 | |
| S&P 500® High Beta ETF | | $ | 8,410,118 | | | $ | (11,427,056 | ) | | $ | (3,016,938 | ) | | $ | 174,813,520 | |
| S&P 500® High Dividend Low Volatility ETF | | | 82,814,801 | | | | (150,314,482 | ) | | | (67,499,681 | ) | | | 2,722,712,537 | |
| S&P 500® Low Volatility ETF | | | 521,845,134 | | | | (63,859,033 | ) | | | 457,986,101 | | | | 6,920,314,566 | |
| S&P 500 Minimum Variance ETF | | | 194,333 | | | | (34,044 | ) | | | 160,289 | | | | 1,298,317 | |
| S&P 500 Momentum ETF | | | 3,890,845 | | | | (653,490 | ) | | | 3,237,355 | | | | 46,795,065 | |
| S&P 500 Value with Momentum ETF | | | 217,021 | | | | (80,735 | ) | | | 136,286 | | | | 2,812,060 | |
| S&P MidCap Low Volatility ETF | | | 126,046,662 | | | | (18,451,780 | ) | | | 107,594,882 | | | | 1,336,910,197 | |
| S&P SmallCap High Dividend Low Volatility ETF | | | 587,005 | | | | (288,020 | ) | | | 298,985 | | | | 11,783,658 | |
| S&P SmallCap Low Volatility ETF | | | 152,786,266 | | | | (11,628,461 | ) | | | 141,157,805 | | | | 1,304,398,011 | |
| S&P SmallCap Quality ETF | | | 3,857,931 | | | | (933,098 | ) | | | 2,924,833 | | | | 39,992,970 | |
Note 9. Reclassification of Permanent Differences
Primarily as a result of differing book/tax treatment of in-kind transactions and expired capital loss carryforwards, amounts were reclassified between undistributed net investment income, undistributed net realized gain (loss) and Shares of beneficial interest. These reclassifications had no effect on the net assets of each Fund. For the period November 1, 2017 to August 31, 2018, the reclassifications were as follows:
| | | | | | | | | | | | |
| | | Undistributed
Net Investment
Income | | | Undistributed
Net Realized
Gain (Loss) | | | Shares of
Beneficial
Interest | |
| Russell 1000 Enhanced Equal Weight ETF | | $ | (1,209 | ) | | $ | (3,849,040 | ) | | | 3,850,249 | |
| Russell 1000 Equal Weight ETF | | | (19,831 | ) | | | (26,319,404 | ) | | | 26,339,235 | |
| Russell 1000 Low Beta Equal Weight ETF | | | (11,807 | ) | | | (23,276,678 | ) | | | 23,288,485 | |
| S&P 500 Enhanced Value ETF | | | (2,429 | ) | | | (3,685,435 | ) | | | 3,687,864 | |
| S&P 500® ex-Rate Sensitive Low Volatility ETF | | | (4,659 | ) | | | (20,886,810 | ) | | | 20,891,469 | |
| S&P 500® High Beta ETF | | | — | | | | (48,714,159 | ) | | | 48,714,159 | |
| S&P 500® High Dividend Low Volatility ETF | | | 821,864 | | | | (214,941,350 | ) | | | 214,119,486 | |
| S&P 500® Low Volatility ETF | | | 1,478,290 | | | | (743,707,954 | ) | | | 742,229,664 | |
| S&P 500 Minimum Variance ETF | | | — | | | | (197,925 | ) | | | 197,925 | |
| S&P 500 Momentum ETF | | | — | | | | (1,681,604 | ) | | | 1,681,604 | |
| S&P 500 Value with Momentum ETF | | | (271 | ) | | | (316,150 | ) | | | 316,421 | |
| S&P MidCap Low Volatility ETF | | | — | | | | (124,696,563 | ) | | | 124,696,563 | |
| S&P SmallCap High Dividend Low Volatility ETF | | | 79,979 | | | | (477,109 | ) | | | 397,130 | |
| S&P SmallCap Low Volatility ETF | | | — | | | | (92,976,792 | ) | | | 92,976,792 | |
| S&P SmallCap Quality ETF | | | — | | | | (283,723 | ) | | | 283,723 | |
Note 10. Trustees’ and Officer’s Fees
Trustees’ and Officer’s Fees include amounts accrued by the Funds to pay remuneration to each Trustee who is not an “interested person” as defined in the 1940 Act (an “Independent Trustee”), any Trustee who is not an affiliate of the Adviser or Distributor (or any of their affiliates) and who is otherwise an “interested person” of the Trust under the 1940 Act (an “Unaffiliated Trustee”) and an Officer of the Trust. The Adviser, as a result of each Fund’s unitary management fee, pays for such compensation. The Trustee who is an “interested person” of the Trust does not receive any Trustees’ fees.
The Trust has adopted a deferred compensation plan (the “Plan”). Under the Plan, each Independent Trustee or Unaffiliated Trustee who has executed a Deferred Fee Agreement (a “Participating Trustee”) may defer receipt of all or a portion of his compensation (“Deferral Fees”). Such Deferral Fees are deemed to be invested in select Invesco Funds. The Deferral Fees payable to the Participating Trustee are valued as of the date such Deferral Fees would have been paid to the Participating Trustee. The value increases with contributions or with increases in the value of the Shares selected, and the value decreases with distributions or with declines in the value of the Shares selected. Obligations under the Plan represent unsecured claims against the general assets of the Funds.
Note 11. Capital
Shares are created and redeemed by each Fund only in Creation Units of 50,000 Shares. Only Authorized Participants are permitted to purchase or redeem Creation Units from the Funds. Such transactions are principally permitted in exchange for Deposit Securities, with a balancing cash component to equate the transaction to the NAV per Share of a Fund of the Trust on the transaction date. However, for all Funds, cash in an amount equivalent to the value of certain securities may be substituted, generally when the securities are not available in sufficient quantity for delivery, not eligible for trading by the Authorized Participant or as a result of other market circumstances.
To the extent that the Funds permit transactions in exchange for Deposit Securities, each Fund may issue Shares in advance of receipt of Deposit Securities subject to various conditions, including a requirement to maintain on deposit with the Trust cash at least equal to 105% of the market value of the missing Deposit Securities. In accordance with the Trust’s Participant Agreement, Creation Units will be issued to an Authorized Participant, notwithstanding the fact that the corresponding Deposit Securities have not been received in part or in whole, in reliance on the undertaking of the Authorized Participant to deliver the missing Deposit Securities as soon as possible, which undertaking shall be secured by the Authorized Participant’s delivery and maintenance of collateral consisting of cash in the form of U.S. dollars in immediately available funds having a value (marked-to-market daily) at least equal to 105%, which the Adviser may change from time to time, of the value of the missing Deposit Securities.
Certain transaction fees may be charged by the Funds for creations and redemptions, which are treated as increases in capital.
Transactions in each Fund’s Shares are disclosed in detail in the Statements of Changes in Net Assets.
Note 12. Indemnifications
Under the Trust’s organizational documents, its Officers and Trustees are indemnified against certain liabilities arising out of the performance of their duties to the Trust. Each Independent Trustee and Unaffiliated Trustee is also indemnified against certain liabilities arising out of the performance of his duties to the Trust pursuant to an Indemnification Agreement between such trustee and the Trust. Additionally, in the normal course of business, the Trust enters into contracts with service providers that contain general indemnification clauses. The Trust’s maximum exposure under these arrangements is unknown, as this would involve future claims that may be made against the Trust that have not yet occurred. However, based on experience, the Trust believes the risk of loss to be remote.
Note 13. Subsequent Event
At a meeting held on September 21, 2018, the Board of Trustees approved reducing the annual unitary management fee of S&P 500 Value with Momentum ETF to 0.15% of the Fund’s average daily net assets, effective September 24, 2018.
Report of Independent Registered Public Accounting Firm
To the Board of Trustees of Invesco Exchange-Traded Fund Trust II and Shareholders of Invesco Russell 1000 Enhanced Equal Weight ETF, Invesco Russell 1000 Equal Weight ETF, Invesco Russell 1000 Low Beta Equal Weight ETF, Invesco S&P 500 Enhanced Value ETF, Invesco S&P 500® ex-Rate Sensitive Low Volatility ETF, Invesco S&P 500® High Beta ETF, Invesco S&P 500® High Dividend Low Volatility ETF, Invesco S&P 500® Low Volatility ETF, Invesco S&P 500 Minimum Variance ETF, Invesco S&P 500 Momentum ETF, Invesco S&P 500 Value with Momentum ETF, Invesco S&P MidCap Low Volatility ETF, Invesco S&P SmallCap High Dividend Low Volatility ETF, Invesco S&P SmallCap Low Volatility ETF and Invesco S&P SmallCap Quality ETF
Opinions on the Financial Statements
We have audited the accompanying statements of assets and liabilities, including the schedules of investments, of the funds listed in the table below (fifteen of the funds constituting Invesco Exchange-Traded Fund Trust II, hereafter collectively referred to as the “Funds”) as of August 31, 2018, the related statements of operations and changes in net assets for each of the periods indicated in the table below, including the related notes, and the financial highlights for each of the periods indicated therein (collectively referred to as the “financial statements”). In our opinion, the financial statements present fairly, in all material respects, the financial position of each of the Funds as of August 31, 2018, the results of each of their operations and the changes in each of their net assets for the periods indicated in the table below, and each of the financial highlights for each of the periods indicated therein, in conformity with accounting principles generally accepted in the United States of America.
Invesco Russell 1000 Enhanced Equal Weight ETF(1)
Invesco Russell 1000 Equal Weight ETF(2)
Invesco Russell 1000 Low Beta Equal Weight ETF(3)
Invesco S&P 500 Enhanced Value ETF(2)
Invesco S&P 500® ex-Rate Sensitive Low Volatility ETF(2)
Invesco S&P 500® High Beta ETF(2)
Invesco S&P 500® High Dividend Low Volatility ETF(2)
Invesco S&P 500® Low Volatility ETF(2)
Invesco S&P 500 Minimum Variance ETF(1)
Invesco S&P 500 Momentum ETF(2)
Invesco S&P 500 Value with Momentum ETF(4)
Invesco S&P MidCap Low Volatility ETF(2)
Invesco S&P SmallCap High Dividend Low Volatility ETF(5)
Invesco S&P SmallCap Low Volatility ETF(2)
Invesco S&P SmallCap Quality ETF(4)
| (1) | Statements of operations and changes in net assets for the periods November 1, 2017 through August 31, 2018 and July 11, 2017 (commencement of investment operations) through October 31, 2017 |
| (2) | Statement of operations for the period November 1, 2017 through August 31, 2018 and for the year ended October 31, 2017 and statement of changes in net assets for the period November 1, 2017 through August 31, 2018 and for each of the two years in the period ended October 31, 2017 |
| (3) | Statement of operations for the period November 1, 2017 through August 31, 2018 and for the year ended October 31, 2017 and statement of changes in net assets for the period November 1, 2017 through August 31, 2018, for the year ended October 31, 2017, and for the period November 2, 2015 (commencement of investment operations) through October 31, 2016 |
| (4) | Statements of operations and changes in net assets for the periods November 1, 2017 through August 31, 2018 and April 3, 2017 (commencement of investment operations) through October 31, 2017 |
| (5) | Statements of operations and changes in net assets for the periods November 1, 2017 through August 31, 2018 and November 29, 2016 (commencement of investment operations) through October 31, 2017 |
Basis for Opinions
These financial statements are the responsibility of the Funds’ management. Our responsibility is to express an opinion on the Funds’ financial statements based on our audits. We are a public accounting firm registered with the Public Company Accounting Oversight Board (United States) (“PCAOB”) and are required to be independent with respect to the Funds in accordance with the U.S. federal securities laws and the applicable rules and regulations of the Securities and Exchange Commission and the PCAOB.
We conducted our audits of these financial statements in accordance with the standards of the PCAOB. Those standards require that we plan and perform the audit to obtain reasonable assurance about whether the financial statements are free of material misstatement, whether due to error or fraud.
Report of Independent Registered Public Accounting Firm (continued)
Our audits included performing procedures to assess the risks of material misstatement of the financial statements, whether due to error or fraud, and performing procedures that respond to those risks. Such procedures included examining, on a test basis, evidence regarding the amounts and disclosures in the financial statements. Our audits also included evaluating the accounting principles used and significant estimates made by management, as well as evaluating the overall presentation of the financial statements. Our procedures included confirmation of securities owned as of August 31, 2018 by correspondence with the custodian, transfer agent, and brokers; when replies were not received from brokers, we performed other auditing procedures. We believe that our audits provide a reasonable basis for our opinions.
PricewaterhouseCoopers LLP
Chicago, Illinois
October 26, 2018
We have served as the auditor of one or more of the investment companies in the Invesco group of investment companies since at least 1995. We have not been able to determine the specific year we began serving as auditor.
Fees and Expenses
As a shareholder of a Fund of the Invesco Exchange-Traded Fund Trust II, you incur a unitary management fee. In addition to the unitary management fee, a shareholder may pay distribution fees, if any, brokerage expenses, taxes, interest, acquired fund fees and expenses, if any, litigation expenses and other extraordinary expenses. The expense examples below are intended to help you understand your ongoing costs (in dollars) of investing in the Funds and to compare these costs with the ongoing costs of investing in other funds.
The example is based on an investment of $1,000 invested at the beginning of the period and held through the six-month period ended August 31, 2018.
Actual Expenses
The first line in the following table provides information about actual account values and actual expenses. You may use the information in this line, together with the amount you invested, to estimate the expenses that you paid over the period. Simply divide your account value by $1,000 (for example, an $8,600 account value divided by $1,000 = 8.6), then multiply the result by the number in the first line under the heading “Expenses Paid During the Six-Month Period” to estimate the expenses you paid on your account during this period.
Hypothetical Example for Comparison Purposes
The second line in the following table provides information about hypothetical account values and hypothetical expenses based on each Fund’s actual expense ratio and an assumed annualized rate of return of 5% per year before expenses, which is not the Fund’s actual return. The hypothetical account values and expenses may not be used to estimate the actual ending account balance or expenses you paid for the period. You may use this information to compare the ongoing costs of investing in the Funds and other funds. To do so, compare this 5% hypothetical example with the 5% hypothetical examples that appear in the shareholder reports of the other funds.
Please note that the expenses shown in the table are meant to highlight your ongoing costs only, and do not reflect any transactional costs, such as sales charges and brokerage commissions. Therefore, the second line in the table is useful in comparing ongoing costs only, and will not help you determine the relative total costs of owning different funds. In addition, expenses shown in the table do not include the expenses of the underlying funds, which are borne indirectly by a Fund. If transaction costs and indirect expenses were included, your costs would have been higher.
| | | | | | | | | | | | | | | | |
| | | Beginning
Account Value
March 1, 2018 | | | Ending
Account Value
August 31, 2018 | | | Annualized
Expense Ratio
Based on the
Six-Month Period | | | Expenses Paid
During the
Six-Month Period(1) | |
| Invesco Russell 1000 Enhanced Equal Weight ETF (USEQ) | | | | | | | | | | | | | | | | |
Actual | | $ | 1,000.00 | | | $ | 1,069.10 | | | | 0.29 | % | | $ | 1.51 | |
Hypothetical (5% return before expenses) | | | 1,000.00 | | | | 1,023.74 | | | | 0.29 | | | | 1.48 | |
| Invesco Russell 1000 Equal Weight ETF (EQAL) | | | | | | | | | | | | | | | | |
Actual | | | 1,000.00 | | | | 1,091.80 | | | | 0.20 | | | | 1.05 | |
Hypothetical (5% return before expenses) | | | 1,000.00 | | | | 1,024.20 | | | | 0.20 | | | | 1.02 | |
| Invesco Russell 1000 Low Beta Equal Weight ETF (USLB) | | | | | | | | | | | | | | | | |
Actual | | | 1,000.00 | | | | 1,094.10 | | | | 0.35 | | | | 1.85 | |
Hypothetical (5% return before expenses) | | | 1,000.00 | | | | 1,023.44 | | | | 0.35 | | | | 1.79 | |
| Invesco S&P 500 Enhanced Value ETF (SPVU) | | | | | | | | | | | | | | | | |
Actual | | | 1,000.00 | | | | 1,051.30 | | | | 0.13 | | | | 0.67 | |
Hypothetical (5% return before expenses) | | | 1,000.00 | | | | 1,024.55 | | | | 0.13 | | | | 0.66 | |
| Invesco S&P 500® ex-Rate Sensitive Low Volatility ETF (XRLV) | | | | | | | | | | | | | | | | |
Actual | | | 1,000.00 | | | | 1,075.70 | | | | 0.25 | | | | 1.31 | |
Hypothetical (5% return before expenses) | | | 1,000.00 | | | | 1,023.95 | | | | 0.25 | | | | 1.28 | |
| Invesco S&P 500® High Beta ETF (SPHB) | | | | | | | | | | | | | | | | |
Actual | | | 1,000.00 | | | | 1,053.80 | | | | 0.25 | | | | 1.29 | |
Hypothetical (5% return before expenses) | | | 1,000.00 | | | | 1,023.95 | | | | 0.25 | | | | 1.28 | |
Fees and Expenses (continued)
| | | | | | | | | | | | | | | | |
| | | Beginning
Account Value
March 1, 2018 | | | Ending
Account Value
August 31, 2018 | | | Annualized
Expense Ratio
Based on the
Six-Month Period | | | Expenses Paid
During the
Six-Month Period(1) | |
| Invesco S&P 500® High Dividend Low Volatility ETF (SPHD) | | | | | | | | | | | | | | | | |
Actual | | $ | 1,000.00 | | | $ | 1,078.90 | | | | 0.30 | % | | $ | 1.57 | |
Hypothetical (5% return before expenses) | | | 1,000.00 | | | | 1,023.69 | | | | 0.30 | | | | 1.53 | |
| Invesco S&P 500® Low Volatility ETF (SPLV) | | | | | | | | | | | | | | | | |
Actual | | | 1,000.00 | | | | 1,078.30 | | | | 0.25 | | | | 1.31 | |
Hypothetical (5% return before expenses) | | | 1,000.00 | | | | 1,023.95 | | | | 0.25 | | | | 1.28 | |
| Invesco S&P 500 Minimum Variance ETF (SPMV) | | | | | | | | | | | | | | | | |
Actual | | | 1,000.00 | | | | 1,082.20 | | | | 0.13 | | | | 0.68 | |
Hypothetical (5% return before expenses) | | | 1,000.00 | | | | 1,024.55 | | | | 0.13 | | | | 0.66 | |
| Invesco S&P 500 Momentum ETF (SPMO) | | | | | | | | | | | | | | | | |
Actual | | | 1,000.00 | | | | 1,111.40 | | | | 0.13 | | | | 0.69 | |
Hypothetical (5% return before expenses) | | | 1,000.00 | | | | 1,024.55 | | | | 0.13 | | | | 0.66 | |
| Invesco S&P 500 Value with Momentum ETF (SPVM) | | | | | | | | | | | | | | | | |
Actual | | | 1,000.00 | | | | 1,045.80 | | | | 0.29 | | | | 1.50 | |
Hypothetical (5% return before expenses) | | | 1,000.00 | | | | 1,023.74 | | | | 0.29 | | | | 1.48 | |
| Invesco S&P MidCap Low Volatility ETF (XMLV) | | | | | | | | | | | | | | | | |
Actual | | | 1,000.00 | | | | 1,129.20 | | | | 0.25 | | | | 1.34 | |
Hypothetical (5% return before expenses) | | | 1,000.00 | | | | 1,023.95 | | | | 0.25 | | | | 1.28 | |
| Invesco S&P SmallCap High Dividend Low Volatility ETF (XSHD) | | | | | | | | | | | | | | | | |
Actual | | | 1,000.00 | | | | 1,162.40 | | | | 0.30 | | | | 1.64 | |
Hypothetical (5% return before expenses) | | | 1,000.00 | | | | 1,023.69 | | | | 0.30 | | | | 1.53 | |
| Invesco S&P SmallCap Low Volatility ETF (XSLV) | | | | | | | | | | | | | | | | |
Actual | | | 1,000.00 | | | | 1,170.30 | | | | 0.25 | | | | 1.37 | |
Hypothetical (5% return before expenses) | | | 1,000.00 | | | | 1,023.95 | | | | 0.25 | | | | 1.28 | |
| Invesco S&P SmallCap Quality ETF (XSHQ) | | | | | | | | | | | | | | | | |
Actual | | | 1,000.00 | | | | 1,199.80 | | | | 0.29 | | | | 1.61 | |
Hypothetical (5% return before expenses) | | | 1,000.00 | | | | 1,023.74 | | | | 0.29 | | | | 1.48 | |
| (1) | Expenses are calculated using the annualized expense ratio, which represents the ongoing expenses as a percentage of net assets for the six-month period ended August 31, 2018. Expenses are calculated by multiplying the Fund’s annualized expense ratio by the average account value for the period, then multiplying the result by 184/365. Expense ratios for the most recent six-month period may differ from expense ratios based on the annualized data in the Financial Highlights. |
Tax Information
Form 1099-DIV, Form 1042-S and other year-end tax information provide shareholders with actual calendar year amounts that should be included in their tax returns. Shareholders should consult their tax advisers.
The following distribution information is being provided as required by the Internal Revenue Code or to meet a specific state’s requirement.
Each Fund designates the following amounts or, if subsequently determined to be different, the maximum amount allowable for its fiscal period ended August 31, 2018:
| | | | | | | | | | |
| | | Qualified Dividend
Income* | | Dividends-Received
Deduction* |
| Invesco Russell 1000 Enhanced Equal Weight ETF | | | | 100 | % | | | | 100 | % |
| Invesco Russell 1000 Equal Weight ETF | | | | 100 | % | | | | 100 | % |
| Invesco Russell 1000 Low Beta Equal Weight ETF | | | | 100 | % | | | | 99 | % |
| Invesco S&P 500 Enhanced Value ETF | | | | 100 | % | | | | 100 | % |
| Invesco S&P 500® ex-Rate Sensitive Low Volatility ETF | | | | 100 | % | | | | 100 | % |
| Invesco S&P 500® High Beta ETF | | | | 100 | % | | | | 100 | % |
| Invesco S&P 500® High Dividend Low Volatility ETF | | | | 94 | % | | | | 92 | % |
| Invesco S&P 500® Low Volatility ETF | | | | 100 | % | | | | 100 | % |
| Invesco S&P 500 Minimum Variance ETF | | | | 100 | % | | | | 99 | % |
| Invesco S&P 500 Momentum ETF | | | | 100 | % | | | | 100 | % |
| Invesco S&P 500 Value with Momentum ETF | | | | 100 | % | | | | 100 | % |
| Invesco S&P MidCap Low Volatility ETF | | | | 85 | % | | | | 84 | % |
| Invesco S&P SmallCap High Dividend Low Volatility ETF | | | | 89 | % | | | | 89 | % |
| Invesco S&P SmallCap Low Volatility ETF | | | | 90 | % | | | | 90 | % |
| Invesco S&P SmallCap Quality ETF | | | | 100 | % | | | | 100 | % |
| * | The above percentages are based on ordinary income dividends paid to shareholders during the fiscal period. |
Trustees and Officers
The Independent Trustees of the Trust, their term of office and length of time served, their principal business occupations during at least the past five years, the number of portfolios in the Fund Complex (as defined below) overseen by each Independent Trustee and the other directorships, if any, held by each Independent Trustee are shown below.
| | | | | | | | | | |
Name, Address and Year of
Birth of Independent Trustees | | Position(s)
Held
with Trust | | Term of
Office
and
Length of
Time
Served* | | Principal
Occupation(s) During
Past 5 Years | | Number of
Portfolios
in Fund
Complex**
Overseen by
Independent
Trustees | | Other
Directorships
Held by
Independent
Trustees During
the Past 5 Years |
Ronn R. Bagge—1958
c/o Invesco Capital
Management LLC
3500 Lacey Road, Suite 700
Downers Grove, IL 60515 | | Chairman of the Nominating and Governance Committee and Trustee | | Chairman of the Nominating and Governance Committee and Trustee since 2007 | | Founder and Principal, YQA Capital Management LLC (1998-Present); formerly, Owner/CEO of Electronic Dynamic Balancing Co., Inc. (high-speed rotating equipment service provider). | | 221 | | Trustee and Investment Oversight Committee member, Mission Aviation Fellowship (2017–Present) |
| | | | | |
Todd J. Barre—1957
c/o Invesco Capital
Management LLC
3500 Lacey Road, Suite 700
Downers Grove, IL 60515 | | Trustee | | Since 2010 | | Assistant Professor of Business, Trinity Christian College (2010-2016); formerly, Vice President and Senior Investment Strategist (2001-2008), Director of Open Architecture and Trading (2007-2008), Head of Fundamental Research (2004-2007) and Vice President and Senior Fixed Income Strategist (1994-2001), BMO Financial Group/Harris Private Bank. | | 221 | | None |
| | | | | |
Marc M. Kole—1960
c/o Invesco Capital
Management LLC
3500 Lacey Road, Suite 700
Downers Grove, IL 60515 | | Chairman of the Audit Committee and Trustee | | Chairman of the Audit Committee since 2008; Trustee since 2007 | | Senior Director of Finance, By The Hand Club for Kids (2015-Present); formerly, Chief Financial Officer, Hope Network (social services) (2008-2012); Assistant Vice President and Controller, Priority Health (health insurance) (2005-2008); Senior Vice President of Finance, United Healthcare (2004-2005); Chief Accounting Officer, Senior Vice President of Finance, Oxford Health Plans (2000-2004); Audit Partner, Arthur Andersen LLP (1996-2000). | | 221 | | None |
| * | This is the date the Independent Trustee began serving the Trust. Each Independent Trustee serves an indefinite term, until his successor is elected. |
| ** | Fund Complex includes all open- and closed-end funds (including all of their portfolios) advised by the Adviser and any affiliated person of the Adviser. |
Trustees and Officers (continued)
| | | | | | | | | | |
Name, Address and Year of
Birth of Independent Trustees | | Position(s)
Held
with Trust | | Term of
Office
and
Length of
Time
Served* | | Principal
Occupation(s) During
Past 5 Years | | Number of
Portfolios
in Fund
Complex**
Overseen by
Independent
Trustees | | Other
Directorships
Held by
Independent
Trustees During
the Past 5 Years |
Yung Bong Lim—1964
c/o Invesco Capital
Management LLC
3500 Lacey Road, Suite 700
Downers Grove, IL 60515 | | Chairman of the Investment Oversight Committee and Trustee | | Chairman of the Investment Oversight Committee since 2014; Trustee since 2013 | | Managing Partner, RDG Funds LLC (2008-Present); formerly, Managing Director, Citadel LLC (1999-2007). | | 221 | | None |
| | | | | |
Gary R. Wicker—1961
c/o Invesco Capital
Management LLC
3500 Lacey Road, Suite 700
Downers Grove, IL 60515 | | Trustee | | Since 2013 | | Senior Vice President of Global Finance and Chief Financial Officer at RBC Ministries (publishing company) (2013-Present); formerly, Executive Vice President and Chief Financial Officer, Zondervan Publishing (a division of Harper Collins/NewsCorp) (2007-2012); Senior Vice President and Group Controller (2005-2006), Senior Vice President and Chief Financial Officer (2003-2004), Chief Financial Officer (2001-2003), Vice President, Finance and Controller (1999-2001) and Assistant Controller (1997-1999), divisions of The Thomson Corporation (information services provider). | | 221 | | None |
| | | | | |
Donald H. Wilson—1959
c/o Invesco Capital
Management LLC
3500 Lacey Road, Suite 700
Downers Grove, IL 60515 | | Chairman of the Board and Trustee | | Chairman since 2012; Trustee since 2007 | | Chairman, President and Chief Executive Officer, McHenry Bancorp Inc. and McHenry Savings Bank (subsidiary) (2018-Present); Chairman and Chief Executive Officer, Stone Pillar Advisors, Ltd. (2010-Present); President and Chief Executive Officer, Stone Pillar Investments, Ltd. (2016-Present); formerly, Chairman, President and Chief Executive Officer, Community Financial Shares, Inc. and Community Bank—Wheaton/Glen Ellyn (subsidiary) (2013-2015); Chief Operating Officer, AMCORE Financial, Inc. (bank holding company) (2007-2009); Executive Vice President and Chief Financial Officer, AMCORE Financial, Inc. (2006-2007); Senior Vice President and Treasurer, Marshall & Ilsley Corp. (bank holding company) (1995-2006). | | 221 | | None |
| * | This is the date the Independent Trustee began serving the Trust. Each Independent Trustee serves an indefinite term, until his successor is elected. |
| ** | Fund Complex includes all open- and closed-end funds (including all of their portfolios) advised by the Adviser and any affiliated person of the Adviser. |
Trustees and Officers (continued)
The Unaffiliated Trustee, his term of office and length of time served, his principal business occupations during at least the past five years, the number of portfolios in the Fund Complex (as defined below) overseen by the Unaffiliated Trustee and the other directorships, if any, held by the Unaffiliated Trustee are shown below.
| | | | | | | | | | |
Name, Address and Year of
Birth of Unaffiliated Trustee | | Position(s)
Held
with Trust | | Term of
Office
and
Length of
Time
Served* | | Principal
Occupation(s) During
Past 5 Years | | Number of
Portfolios in
Fund
Complex**
Overseen by
Unaffiliated
Trustee | | Other
Directorships
Held by
Unaffiliated
Trustee During
the Past 5 Years |
Philip M. Nussbaum***—1961
c/o Invesco Capital Management LLC
3500 Lacey Road, Suite 700
Downers Grove, IL 60515 | | Trustee | | Since 2007 | | Chairman, Performance Trust Capital Partners (2004-Present). | | 221 | | None |
| * | This is the date the Unaffiliated Trustee began serving the Trust. The Unaffiliated Trustee serves an indefinite term, until his successor is elected. |
| ** | Fund Complex includes all open- and closed-end funds (including all of their portfolios) advised by the Adviser and any affiliated person of the Adviser. |
| *** | Effective September 19, 2018, Mr. Nussbaum resigned from the Board of Trustees of the Trust. |
Trustees and Officers (continued)
The Interested Trustee and the executive officers of the Trust, their term of office and length of time served, their principal business occupations during at least the past five years, the number of portfolios in the Fund Complex (as defined below) overseen by the Interested Trustee and the other directorships, if any, held by the Interested Trustee are shown below.
| | | | | | | | | | |
Name, Address and Year of
Birth of Interested Trustee | | Position(s)
Held
with Trust | | Term of
Office
and
Length of
Time
Served* | | Principal
Occupation(s) During
Past 5 Years | | Number of
Portfolios in
Fund
Complex**
Overseen by
Interested
Trustee | | Other
Directorships
Held by
Interested
Trustee During
the Past 5 Years |
Kevin M. Carome—1956
Invesco Ltd.
Two Peachtree Pointe,
1555 Peachtree St., N.E.,
Suite 1800
Atlanta, GA 30309 | | Trustee | | Since 2010 | | Senior Managing Director, Secretary and General Counsel, Invesco Ltd. (2007-Present); Director, Invesco Advisers, Inc. (2009-Present); Director (2006-Present) and Executive Vice President (2008–Present), Invesco Group Services, Inc., Invesco Holding Company (US), Inc. and Invesco North American Holdings, Inc.; Director, Invesco Holding Company Limited (2007-Present); Executive Vice President (2008-Present), Invesco Investments (Bermuda) Ltd.; Manager, Horizon Flight Works LLC, Director and Executive Vice President, Invesco Finance, Inc. and Director, Invesco Finance PLC (2011-Present); Director and Secretary (2012-Present), Invesco Services (Bahamas) Private Limited; and Director and Executive Vice President (2014-Present), INVESCO Asset Management (Bermuda) Ltd.; formerly, Director and Chairman, INVESCO Funds Group, Inc., Senior Vice President, Secretary and General Counsel, Invesco Advisers, Inc. (2003-2006); Director, Invesco Investments (Bermuda) Ltd. (2008-2016); Senior Vice President and General Counsel, Liberty Financial Companies, Inc. (2000-2001); General Counsel of certain investment management subsidiaries of Liberty Financial Companies, Inc. (1998-2000); Associate General Counsel, Liberty Financial Companies, Inc. (1993-1998); Associate, Ropes & Gray LLP. | | 221 | | None |
| * | This is the date the Interested Trustee began serving the Trust. The Interested Trustee serves an indefinite term, until his successor is elected. |
| ** | Fund Complex includes all open- and closed-end funds (including all of their portfolios) advised by the Adviser and any affiliated person of the Adviser. |
Trustees and Officers (continued)
| | | | | | |
Name, Address and Year of
Birth of Executive Officers | | Position(s)
Held
with Trust | | Length of
Time
Served* | | Principal Occupation(s) During Past 5 Years |
Daniel E. Draper—1968 Invesco Capital Management LLC 3500 Lacey Road, Suite 700 Downers Grove, IL 60515 | | President and Principal Executive Officer | | Since 2015 | | President and Principal Executive Officer, Invesco Exchange-Traded Fund Trust, Invesco Exchange-Traded Fund Trust II, Invesco India Exchange-Traded Fund Trust, Invesco Actively Managed Exchange-Traded Fund Trust and Invesco Actively Managed Exchange-Traded Commodity Fund Trust (2015-Present) and Invesco Exchange-Traded Self-Indexed Fund Trust (2016-Present); Chief Executive Officer and Principal Executive Officer (2016-Present) and Managing Director (2013-Present), Invesco Capital Management LLC; Senior Vice President, Invesco Distributors, Inc. (2014-Present); formerly, Vice President, Invesco Exchange-Traded Fund Trust, Invesco Exchange-Traded Fund Trust II, Invesco India Exchange-Traded Fund Trust, Invesco Actively Managed Exchange-Traded Fund Trust (2013-2015) and Invesco Actively Managed Exchange-Traded Commodity Fund Trust (2014-2015); Managing Director, Credit Suisse Asset Management (2010-2013) and Lyxor Asset Management/Societe Generale (2007-2010). |
| | | |
Kelli Gallegos—1970 Invesco Capital Management LLC 3500 Lacey Road, Suite 700 Downers Grove, IL 60515 | | Vice President
and Treasurer | | Since 2018 | | Vice President and Treasurer, Invesco Exchange-Traded Fund Trust, Invesco Exchange-Traded Fund Trust II, Invesco India Exchange-Traded Fund Trust, Invesco Actively Managed Exchange-Traded Fund Trust, Invesco Actively Managed Exchange-Traded Commodity Fund Trust and Invesco Exchange-Traded Self-Indexed Fund Trust (2018-Present); Principal Financial and Accounting Officer-Pooled Investments, Invesco Capital Management LLC (2018-Present); Vice President, Principal Financial Officer (2016-Present) and Assistant Treasurer (2008-Present), The Invesco Funds; formerly, Assistant Treasurer Invesco Exchange-Traded Fund Trust, Invesco Exchange-Traded Fund Trust II, Invesco India Exchange-Traded Fund Trust and Invesco Actively Managed Exchange-Traded Fund Trust (2012-2018), Invesco Actively Managed Exchange-Traded Commodity Fund Trust (2014-2018) and Invesco Exchange-Traded Self-Indexed Fund Trust (2016-2018); Assistant Treasurer, Invesco Capital Management LLC (2013-2018); and Assistant Vice President, The Invesco Funds (2008-2016). |
| | | |
Peter Hubbard—1981 Invesco Capital Management LLC 3500 Lacey Road, Suite 700 Downers Grove, IL 60515 | | Vice President | | Since 2009 | | Vice President, Invesco Exchange-Traded Fund Trust, Invesco Exchange-Traded Fund Trust II, Invesco India Exchange-Traded Fund Trust, Invesco Actively Managed Exchange-Traded Fund Trust (2009-Present), Invesco Actively Managed Exchange-Traded Commodity Fund Trust (2014-Present) and Invesco Exchange-Traded Self-Indexed Fund Trust (2016-Present); Vice President and Director of Portfolio Management, Invesco Capital Management LLC (2010-Present); formerly, Vice President of Portfolio Management, Invesco Capital Management LLC (2008-2010); Portfolio Manager, Invesco Capital Management LLC (2007-2008); Research Analyst, Invesco Capital Management LLC (2005-2007); Research Analyst and Trader, Ritchie Capital, a hedge fund operator (2003-2005). |
| | | |
Sheri Morris—1964 Invesco Capital Management LLC 3500 Lacey Road, Suite 700 Downers Grove, IL 60515 | | Vice President | | Since 2012 | | President and Principal Executive Officer, The Invesco Funds (2016-Present); Treasurer, The Invesco Funds (2008-Present); Vice President, Invesco Advisers, Inc. (formerly known as Invesco Institutional (N.A.), Inc.) (registered investment adviser) (2009-Present) and Vice President, Invesco Exchange-Traded Fund Trust, Invesco Exchange-Traded Fund Trust II, Invesco India Exchange-Traded Fund Trust, Invesco Actively Managed Exchange-Traded Fund Trust (2012-Present), Invesco Actively Managed Exchange-Traded Commodity Fund Trust (2014-Present) and Invesco Exchange-Traded Self-Indexed Fund Trust (2016-Present); formerly, Vice President and Principal Financial Officer, The Invesco Funds (2008-2016); Treasurer, Invesco Exchange-Traded Fund Trust, Invesco Exchange-Traded Fund Trust II, Invesco India Exchange-Traded Fund Trust and Invesco Actively Managed Exchange-Traded Fund Trust (2011-2013); Vice President, Invesco Aim Advisers, Inc., Invesco Aim Capital Management, Inc. and Invesco Aim Private Asset Management, Inc.; Assistant Vice President and Assistant Treasurer, The Invesco Funds and Assistant Vice President, Invesco Advisers, Inc., Invesco Aim Capital Management, Inc. and Invesco Aim Private Asset Management, Inc. |
| * | This is the date each Officer began serving the Trust. Each Officer serves an indefinite term, until his or her successor is elected. |
Trustees and Officers (continued)
| | | | | | |
Name, Address and Year of
Birth of Executive Officers | | Position(s)
Held
with Trust | | Length of
Time
Served* | | Principal Occupation(s) During Past 5 Years |
Anna Paglia—1974 Invesco Capital Management LLC 3500 Lacey Road, Suite 700 Downers Grove, IL 60515 | | Secretary | | Since 2011 | | Secretary, Invesco Exchange-Traded Fund Trust, Invesco Exchange-Traded Fund Trust II, Invesco India Exchange-Traded Fund Trust, Invesco Actively Managed Exchange-Traded Fund Trust (2011-Present), Invesco Actively Managed Exchange-Traded Commodity Fund Trust (2014-Present) and Invesco Exchange-Traded Self-Indexed Fund Trust (2015-Present); Head of Legal (2010-Present) and Secretary (2015-Present), Invesco Capital Management LLC; Manager and Assistant Secretary, Invesco Indexing LLC (2017-Present); formerly, Partner, K&L Gates LLP (formerly, Bell Boyd & Lloyd LLP) (2007-2010); Associate Counsel at Barclays Global Investors Ltd. (2004-2006). |
| | | |
Rudolf E. Reitmann—1971 Invesco Capital Management LLC 3500 Lacey Road, Suite 700 Downers Grove, IL 60515 | | Vice President | | Since 2013 | | Vice President, Invesco Exchange-Traded Fund Trust, Invesco Exchange-Traded Fund Trust II, Invesco India Exchange-Traded Fund Trust, Invesco Actively Managed Exchange-Traded Fund Trust (2013-Present), Invesco Actively Managed Exchange-Traded Commodity Fund Trust (2014-Present) and Invesco Exchange-Traded Self-Indexed Fund Trust (2016-Present); Head of Global Exchange Traded Funds Services, Invesco Capital Management LLC (2013-Present); Vice President, Invesco Capital Markets, Inc. (2018-Present). |
| | | |
David Warren—1957 Invesco Canada Ltd. 5140 Yonge Street, Suite 800 Toronto, Ontario M2N 6X7 | | Vice President | | Since 2009 | | Vice President, Invesco Exchange-Traded Fund Trust, Invesco Exchange-Traded Fund Trust II, Invesco India Exchange-Traded Fund Trust, and Invesco Actively Managed Exchange-Traded Fund Trust (2009-Present), Invesco Actively Managed Exchange-Traded Commodity Fund Trust (2014-Present) and Invesco Exchange-Traded Self-Indexed Fund Trust (2016-Present); Managing Director—Chief Administrative Officer, Americas, Invesco Capital Management LLC; Senior Vice President, Invesco Advisers, Inc. (2009-Present); Director, Invesco Inc. (2009-Present); Director, Executive Vice President and Chief Financial Officer, Invesco Canada Ltd. (formerly, Invesco Trimark Ltd.) (2011-Present); Chief Administrative Officer, North American Retail, Invesco Ltd. (2007-Present); Director, Invesco Corporate Class Inc. (2014-Present); Director, Invesco Global Direct Real Estate Feeder GP Ltd. (2015-Present); Director, Invesco Canada Holdings Inc. (2002-Present); Director, Invesco Financial Services Ltd. / Services Financiers Invesco Ltée and Trimark Investments Ltd./Placements Trimark Ltée (2014-Present); Director, Invesco IP Holdings (Canada) Ltd. (2016-Present); Director, Invesco Global Direct Real Estate GP Ltd. (2015-Present); formerly, Senior Vice President, Invesco Management Group, Inc. (2007-2018); Executive Vice President and Chief Financial Officer, Invesco Inc. (2009-2015); Director, Executive Vice President and Chief Financial Officer, Invesco Canada Ltd. (formerly, Invesco Trimark Ltd.) (2000-2011). |
| | | |
Melanie Zimdars—1976 Invesco Capital Management LLC 3500 Lacey Road, Suite 700 Downers Grove, IL 60515 | | Chief Compliance Officer | | Since 2017 | | Chief Compliance Officer of Invesco Capital Management LLC (2017-Present); Chief Compliance Officer of Invesco Exchange-Traded Fund Trust, Invesco Exchange-Traded Fund Trust II, Invesco India Exchange-Traded Fund Trust, Invesco Actively Managed Exchange-Traded Fund Trust, Invesco Actively Managed Exchange-Traded Commodity Fund Trust and Invesco Exchange-Traded Self-Indexed Fund Trust (2017-Present); formerly, Vice President and Deputy Chief Compliance Officer at ALPS Holding, Inc. (2009-2017); Mutual Fund Treasurer/Chief Financial Officer at Wasatch Advisors, Inc. (2005-2008); Compliance Officer, U.S. Bancorp Fund Services, LLC (2001-2005). |
Availability of Additional Information About the Trustees
The Statement of Additional Information includes additional information about the Trustees and is available, without charge, upon request at (800) 983-0903.
| * | This is the date each Officer began serving the Trust. Each Officer serves an indefinite term, until his or her successor is elected. |
Proxy Voting Policies and Procedures
A description of the Trust’s proxy voting policies and procedures that the Funds use to determine how to vote proxies relating to portfolio securities is available, without charge and upon request, by calling (800) 983-0903. This information is also available on the Securities and Exchange Commission’s (the “Commission”) website at www.sec.gov.
Information regarding how each Fund voted proxies for portfolio securities, if applicable, during the most recent 12-month period ended June 30, is available, without charge and upon request, by (i) calling (800) 983-0903; or (ii) accessing the Trust’s Form N-PX on the Commission’s website at www.sec.gov.
Quarterly Portfolios
The Trust files its complete schedule of portfolio holdings for the Funds with the Commission for the first and third quarters of each fiscal year on Form N-Q. The Form N-Qs will be available on the Commission’s website at www.sec.gov. The Trust’s Form N-Qs may also be reviewed and copied at the Commission’s Public Reference Room in Washington, D.C. Information on the operation of the Public Reference Room may be obtained by calling (800) SEC-0330.
Frequency Distribution of Discounts and Premiums
A table showing the number of days the market price of each Fund’s shares was greater than the Fund’s net asset value, and the number of days it was less than the Fund’s net asset value (i.e., premium or discount) for the most recently completed calendar year, and the calendar quarters since that year end (or the life of the Fund, if shorter) may be found at the Fund’s website at www.invesco.com/ETFs.
| | | | |
©2018 Invesco Capital Management LLC 3500 Lacey Road, Suite 700 Downers Grove, IL 60515 | | P-TRST2-HBLV-AR-1 | | invesco.com/ETFs |

Invesco Annual Report to Shareholders
August 31, 2018
| | |
| KBWB | | Invesco KBW Bank ETF |
| KBWD | | Invesco KBW High Dividend Yield Financial ETF |
| KBWY | | Invesco KBW Premium Yield Equity REIT ETF |
| KBWP | | Invesco KBW Property & Casualty Insurance ETF |
| KBWR | | Invesco KBW Regional Banking ETF |
Table of Contents
The Market Environment
Domestic Equity
The fiscal period proved to be another strong, albeit increasingly volatile, time for US equities. As the fiscal period unfolded in the later months of 2017, several major US stock market indexes repeatedly reached new highs amid improving economic data, strong corporate profits and the prospect of tax reform legislation. Stock market volatility remained exceedingly low—a hallmark of 2017.
At the outset of 2018, US equity markets continued to steadily move higher in January as investors remained enthused about the passage of the Tax Cuts and Jobs Act signed into law in late December 2017, which significantly cut corporate tax rates. However, in February 2018, volatility returned to the US stock and bond markets. Worries about how rising interest rates might affect economic growth, concerns about a potential trade war and heightened geopolitical tensions, caused the US stock market to pull back and volatility to increase. In addition, in April 2018, the yield on the 10-year US Treasury bond climbed above 3%—a psychologically important level—for the first time since December 2013.1
Despite a disappointing first quarter, US equity markets generally recovered in the second quarter of 2018. Strong US retail sales and low unemployment continued to buoy US equity markets. In the final months of the fiscal period, US equities moved higher, despite several potential headwinds including trade tensions, tariff announcements and contagion concerns over a Turkish currency crisis. Ultimately, the fiscal period ended the same way it began with several US equity indexes reaching new record highs.
Given signs of a strong economy, the US Federal Reserve raised interest rates three times during the fiscal period: in December 2017 and in March and June 2018.2 In contrast, the European Central Bank and central banks in several other countries maintained extraordinarily accommodative monetary policies.
| 2 | Source: US Federal Reserve |
| | |
| KBWB | | Manager’s Analysis |
| | Invesco KBW Bank ETF (KBWB) |
As an index fund, the Invesco KBW Bank ETF (the “Fund”) is passively managed and seeks to track the returns of an underlying index. The Fund seeks to track the investment results (before fees and expenses) of the KBW Nasdaq Bank Index (the “Index”). The Fund generally will invest at least 90% of its total assets in securities of national money centers (which are banks with more than $50 billion in assets and that have a branch network across geographic regions), regional banks and thrift institutions that are listed on a U.S. national securities exchange and that comprise the Index.
Keefe, Bruyette & Woods, Inc. and Nasdaq, Inc. (“KBW Nasdaq” or the “Index Provider”), compile, calculate and maintain the Index, which is a modified-market capitalization-weighted index that seeks to reflect the performance of national money centers, regional banks and thrift institutions that are publicly traded in the U.S. The Fund generally invests in all of the securities comprising the Index in proportion to their weightings in the Index.
The Board of Trustees approved a change in the fiscal year end for the Fund from October 31 to August 31. For the fiscal period from November 1, 2017 to August 31, 2018, on a market price basis, the Fund returned 10.18%. On a net asset value (“NAV”) basis, the Fund returned 10.22%. During the same time period, the Index returned 10.56%. During the fiscal period, the Fund fully replicated the components of the Index; therefore, the Fund’s performance (NAV basis) differed from the return of the Index primarily due to fees and operating expenses incurred by the Fund during the period.
During this same time period, the S&P 500® Financials Index (the “Benchmark Index”) returned 8.03%. The Benchmark Index is an unmanaged index weighted by market capitalization and based on the average performance of approximately 70 securities. The Benchmark Index was selected for its recognition in the marketplace, and its performance comparison is a useful measure for investors as a broad representation of the United States financial sector equity market.
The performance of the Fund differed from the Benchmark Index in part because the Benchmark Index is broadly diversified across all financial sub-industries and is not concentrated just on the banking sub-industry.
Relative to the Benchmark Index, the Fund was most overweight in the regional banks sub-industry and most underweight in the multi-sector holdings sub-industry during the fiscal period ended August 31, 2018. The majority of the Fund’s outperformance relative to the Benchmark Index during the period can be attributed to the Fund’s underweight position in the multi-line and life & health insurance sub-industries.
For the fiscal period ended August 31, 2018, the regional banks sub-industry contributed most significantly to the Fund’s return, followed by the diversified banks and asset management &
custody banks sub-industries, respectively. The thrifts & mortgage finance sub-industry was the only detracting sub-industry.
Positions that contributed most significantly to the Fund’s return for the fiscal period ended August 31, 2018, included JPMorgan Chase & Co., a diversified bank & data company (portfolio average weight of 8.08%), and Bank of America Corp., a diversified bank & data company (portfolio average weight of 8.13%). State Street Corp., a diversified bank & data company (portfolio average weight of 3.87%), was the largest detracting position.
| | | | |
Sub-Industry Breakdown
(% of the Fund’s Net Assets)
as of August 31, 2018 | |
| Regional Banks | | | 42.8 | |
| Diversified Banks | | | 41.3 | |
| Asset Management & Custody Banks | | | 11.0 | |
| Consumer Finance | | | 4.1 | |
| Thrifts & Mortgage Finance | | | 0.8 | |
| Other Assets Less Liabilities | | | (0.0) | |
| | | | |
|
Top Ten Fund Holdings
(% of the Fund’s Net Assets)
as of August 31, 2018 | |
| Security | | | | |
| Wells Fargo & Co. | | | 8.3 | |
| US Bancorp | | | 8.3 | |
| JPMorgan Chase & Co. | | | 8.2 | |
| Citigroup, Inc. | | | 8.2 | |
| Bank of America Corp. | | | 8.2 | |
| SunTrust Banks, Inc. | | | 4.2 | |
| Capital One Financial Corp. | | | 4.1 | |
| M&T Bank Corp. | | | 4.0 | |
| Northern Trust Corp. | | | 3.9 | |
| PNC Financial Services Group, Inc. (The) | | | 3.8 | |
| Total | | | 61.2 | |
Invesco KBW Bank ETF (KBWB) (continued)
Growth of a $10,000 Investment Since Inception
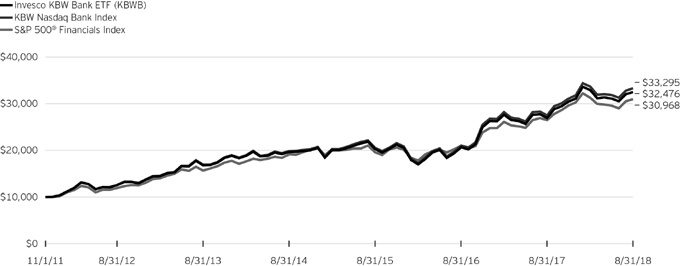
Fund Performance History as of August 31, 2018
| | | | | | | | | | | | | | | | | | | | | | | | | | | | | | | | |
| | | 1 Year | | | 3 Years
Average
Annualized | | | 3 Years
Cumulative | | | 5 Years
Average
Annualized | | | 5 Years
Cumulative | | | | | | Fund Inception | |
| Index | | | | | Average
Annualized | | | Cumulative | |
| KBW Nasdaq Bank Index | | | 20.93 | % | | | 17.41 | % | | | 61.86 | % | | | 14.46 | % | | | 96.42 | % | | | | | | | 19.26 | % | | | 232.95 | % |
| S&P 500® Financials Index | | | 16.92 | | | | 16.44 | | | | 57.89 | | | | 14.59 | | | | 97.56 | | | | | | | | 18.00 | | | | 209.68 | |
| Fund | | | | | | | | | | | | | | | | | | | | | | | | | | | | | | | | |
| NAV Return | | | 20.46 | | | | 16.98 | | | | 60.09 | | | | 14.04 | | | | 92.84 | | | | | | | | 18.82 | | | | 224.76 | |
| Market Price Return | | | 20.59 | | | | 16.94 | | | | 59.90 | | | | 14.05 | | | | 93.00 | | | | | | | | 18.84 | | | | 225.13 | |
Fund Inception: November 1, 2011
Performance quoted above represents past performance. Past performance is not a guarantee of future results and current performance may be higher or lower than performance quoted. Investment returns and principal value will fluctuate, and shares of the Fund (“Fund Shares”), when redeemed or sold, may be worth more or less than their original cost. Fund performance reflects any applicable fee waivers and/or expense reimbursements. Had the adviser not waived fees and/or reimbursed expenses currently or in the past, returns would have been lower. See current prospectus for more information. According to the Fund’s current prospectus, the Fund’s expense ratio of 0.35% is expressed as a unitary management fee to cover operating expenses and expenses incurred in connection with managing the portfolio. NAV and Market Price returns assume that dividends and capital gain distributions have been reinvested in the Fund at NAV and Market Price, respectively. The returns shown in the table above do not reflect the deduction of taxes that a shareholder would pay on Fund
distributions or the redemption or sale of Fund Shares. See invesco.com/ETFs to find the most recent month-end performance numbers.
Index and Benchmark Index performance results are based upon a hypothetical investment in their respective constituent securities. Index and Benchmark Index returns do not represent Fund returns. An investor cannot invest directly in an index. The Index and Benchmark Index do not charge management fees or brokerage expenses, and no such fees or expenses were deducted from the hypothetical performance shown. In addition, the results actual investors might have achieved would have differed from those shown because of differences in the timing, amounts of their investments, and fees and expenses associated with an investment in the Fund.
Notes Regarding Indexes and Fund Performance History:
| - | Average Annualized and Cumulative Inception returns for the Fund, Index and Benchmark Index are based on the inception date of the Fund. |
| | |
| KBWD | | Manager’s Analysis |
| | Invesco KBW High Dividend Yield Financial ETF (KBWD) |
As an index fund, the Invesco KBW High Dividend Yield Financial ETF (the “Fund”) is passively managed and seeks to track the returns of an underlying index. The Fund seeks to track the investment results (before fees and expenses) of the KBW Nasdaq Financial Sector Dividend Yield Index (the “Index”). The Fund generally will invest at least 90% of its total assets in the securities of financial companies that are listed on a U.S. national securities exchange and are principally engaged in the business of providing financial services and products, including banking, insurance and diversified financial services, in the United States and that comprise the Index.
Keefe, Bruyette & Woods, Inc. and Nasdaq, Inc. (“KBW Nasdaq” or the “Index Provider”) compile, maintain and calculate the Index, which is a modified-dividend yield-weighted index that seeks to reflect the performance of publicly-traded U.S. financial companies with competitive yields. The Fund generally invests in all of the securities comprising the Index in proportion to their weightings in the Index.
The Board of Trustees approved a change in the fiscal year end for the Fund from October 31 to August 31. For the fiscal period from November 1, 2017 to August 31, 2018, on a market price basis, the Fund returned 8.47%. On a net asset value (“NAV”) basis, the Fund returned 8.57%. During the same time period, the Index returned 8.29%. During the fiscal period, the Fund fully replicated the components of the Index; therefore, the Fund’s performance (NAV basis) differed from the return of the Index primarily due to fees and operating expenses incurred by the Fund during the period, which were offset by revenue generated from the securities lending program in which the Fund participates.
During this same time period, the S&P 500® Financials Index (the “Benchmark Index”) returned 8.03%. The Benchmark Index is an unmanaged index weighted by market capitalization and based on the average performance of approximately 70 securities. The Benchmark Index was selected for its recognition in the marketplace, and its performance comparison is a useful measure for investors as a broad representation of the United States financial services equity market.
The performance of the Fund differed from the Benchmark Index in part because of an overweight allocation to the mortgage REITs sub-industry relative to the Benchmark Index.
Relative to the Benchmark Index, the Fund was most overweight in the mortgage REITs sub-industry and most underweight in the diversified banks sub-industry during the fiscal period ended August 31, 2018. The majority of the Fund’s outperformance relative to the Benchmark Index during the period can be attributed to overweight allocations in the asset management & custody banks sub-industry as well as the mortgage REITs sub-industry.
For the fiscal period ended August 31, 2018, the mortgage REITs sub-industry contributed most significantly to the Fund’s return, followed by the asset management & custody banks and investment banking & brokerage sub-industries, respectively. The reinsurance sub-industry was the only detracting sub-industry.
Positions that contributed most significantly to the Fund’s return for the fiscal period ended August 31, 2018, included Virtu Financial, Inc., Class A, an investment banking and brokerage company (portfolio average weight of 1.66%), and PennyMac Mortgage Investment Trust REIT, a mortgage REITs company (portfolio average weight of 3.88%). Positions that detracted most significantly from the Fund’s return included Maiden Holdings LTD., a reinsurance company (portfolio average weight of 3.07%), and Medley Capital Corp., an asset management and custody bank company (portfolio average weight of 2.20%).
| | | | |
Sub-Industry Breakdown
(% of the Fund’s Net Assets)
as of August 31, 2018 | |
| Mortgage REITs | | | 43.7 | |
| Asset Management & Custody Banks | | | 29.6 | |
| Thrifts & Mortgage Finance | | | 6.0 | |
| Regional Banks | | | 5.8 | |
| Property & Casualty Insurance | | | 5.1 | |
| Investment Banking & Brokerage | | | 4.6 | |
| Trading Companies & Distributors | | | 2.4 | |
| Consumer Finance | | | 1.7 | |
| Reinsurance | | | 1.1 | |
| Money Market Fund Plus Other Assets Less Liabilities | | | (0.0) | |
|
Top Ten Fund Holdings*
(% of the Fund’s Net Assets)
as of August 31, 2018 | |
| Security | | | | |
| Orchid Island Capital, Inc. | | | 5.9 | |
| Western Asset Mortgage Capital Corp. | | | 4.7 | |
| Prospect Capital Corp. | | | 4.5 | |
| Annaly Capital Management, Inc. | | | 4.4 | |
| New Residential Investment Corp. | | | 4.4 | |
| AGNC Investment Corp. | | | 4.4 | |
| Chimera Investment Corp. | | | 4.1 | |
| Dynex Capital, Inc. | | | 4.1 | |
| PennyMac Mortgage Investment Trust | | | 4.0 | |
| BlackRock Capital Investment Corp. | | | 3.9 | |
| Total | | | 44.4 | |
| * | Excluding money market fund holdings. |
Invesco KBW High Dividend Yield Financial ETF (KBWD) (continued)
Growth of a $10,000 Investment Since Inception
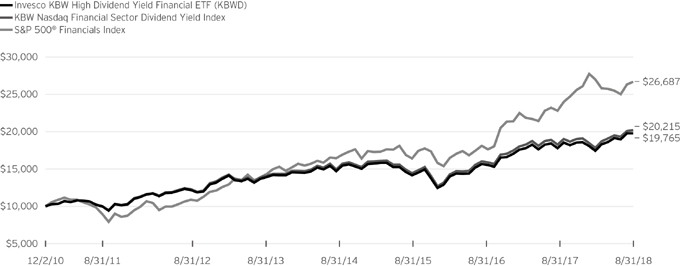
Fund Performance History as of August 31, 2018
| | | | | | | | | | | | | | | | | | | | | | | | | | | | | | | | |
| | | 1 Year | | | 3 Years Average
Annualized | | | 3 Years Cumulative | | | 5 Years Average
Annualized | | | 5 Years Cumulative | | | | | | Fund Inception | |
| Index | | | | | Average
Annualized | | | Cumulative | |
| KBW Nasdaq Financial Sector Dividend Yield Index | | | 10.65 | % | | | 10.69 | % | | | 35.61 | % | | | 8.65 | % | | | 51.42 | % | | | | | | | 9.51 | % | | | 102.15 | % |
| S&P 500® Financials Index | | | 16.92 | | | | 16.44 | | | | 57.89 | | | | 14.59 | | | | 97.56 | | | | | | | | 13.51 | | | | 166.87 | |
| Fund | | | | | | | | | | | | | | | | | | | | | | | | | | | | | | | | |
| NAV Return | | | 10.98 | | | | 10.61 | | | | 35.34 | | | | 8.43 | | | | 49.88 | | | | | | | | 9.20 | | | | 97.65 | |
| Market Price Return | | | 10.92 | | | | 10.61 | | | | 35.31 | | | | 8.44 | | | | 49.94 | | | | | | | | 9.22 | | | | 97.95 | |
Fund Inception: December 2, 2010
Performance quoted above represents past performance. Past performance is not a guarantee of future results and current performance may be higher or lower than performance quoted. Investment returns and principal value will fluctuate, and shares of the Fund (“Fund Shares”), when redeemed or sold, may be worth more or less than their original cost. Fund performance reflects any applicable fee waivers and/or expense reimbursements. Had the adviser not waived fees and/or reimbursed expenses currently or in the past, returns would have been lower. See current prospectus for more information. According to the Fund’s current prospectus, the Fund’s expense ratio of 2.40% includes the unitary management fee of 0.35% and acquired fund fees and expenses of 2.05%. NAV and Market Price returns assume that dividends and capital gain distributions have been reinvested in the Fund at NAV and Market Price, respectively. The returns shown in the table above do not reflect the deduction of taxes that a shareholder would pay on Fund distributions or the redemption or sale of Fund
Shares. See invesco.com/ETFs to find the most recent month-end performance numbers.
Index and Benchmark Index performance results are based upon a hypothetical investment in their respective constituent securities. Index and Benchmark Index returns do not represent Fund returns. An investor cannot invest directly in an index. The Index and Benchmark Index do not charge management fees or brokerage expenses, and no such fees or expenses were deducted from the hypothetical performance shown. In addition, the results actual investors might have achieved would have differed from those shown because of differences in the timing, amounts of their investments, and fees and expenses associated with an investment in the Fund.
Notes Regarding Indexes and Fund Performance History:
| - | Average Annualized and Cumulative Inception returns for the Fund, Index and Benchmark Index are based on the inception date of the Fund. |
| | |
| KBWY | | Manager’s Analysis |
| | Invesco KBW Premium Yield Equity REIT ETF (KBWY) |
As an index fund, the Invesco KBW Premium Yield Equity REIT ETF (the “Fund”) is passively managed and seeks to track the returns of an underlying index. The Fund seeks to track the investment results (before fees and expenses) of the KBW Nasdaq Premium Yield Equity REIT Index (the “Index”). The Fund generally will invest at least 90% of its total assets in the securities of small- and mid-cap equity real estate investment trusts (“REITs”) in the United States that comprise the Index.
Keefe, Bruyette & Woods, Inc. and Nasdaq, Inc. (“KBW Nasdaq” or the “Index Provider”) compile, maintain and calculate the Index, which is a modified-dividend yield-weighted index that seeks to reflect the performance of small- and mid-cap equity REITs in the U.S. The Fund generally invests in all of the securities comprising the Index in proportion to their weightings in the Index.
The Board of Trustees approved a change in the fiscal year end for the Fund from October 31 to August 31. For the fiscal period from November 1, 2017 to August 31, 2018, on a market price basis, the Fund returned 3.95%. On a net asset value (“NAV”) basis, the Fund returned 4.05%. During the same time period, the Index returned 4.35%. During the fiscal period, the Fund fully replicated the components of the Index; therefore, the Fund’s performance (NAV basis) differed from the return of the Index primarily due to fees and operating expenses incurred by the Fund during the period, which were partially offset by revenue generated from the securities lending program in which the Fund participates.
During this same time period, the Dow Jones U.S. Real Estate Index (the “Benchmark Index”) returned 7.36%. The Benchmark Index is an unmanaged index weighted by market capitalization and based on the average performance of approximately 120 securities. The Benchmark Index was selected for its recognition in the marketplace, and its performance comparison is a useful measure for investors as a broad representation of the United States REIT market.
The performance of the Fund differed from the Benchmark Index primarily due to a lower concentration and stock selection differences in the health care REITs sub-industry.
Relative to the Benchmark Index, the Fund was most overweight in the industrial REITs sub-industry and most underweight in the health care REITs sub-industry during the fiscal period ended August 31, 2018. The majority of the Fund’s underperformance relative to the Benchmark Index during the period can be attributed to the security selection differences in the health care and retail REITs sub-industries.
For the fiscal period ended August 31, 2018, the hotel & resorts REITs sub-industry contributed most significantly to the Fund’s return, followed by the health care REITs and diversified REITs sub-industries, respectively. The retail REITs sub-industry detracted most significantly from the Fund’s return.
Positions that contributed most significantly to the Fund’s return for the fiscal period ended August 31, 2018, included Sabra Health Care REIT, Inc., a health care company (portfolio average weight of 3.88%), and Washington Prime Group, Inc., a retail company (portfolio average weight of 5.83%). Positions that detracted most significantly from the Fund’s return included CBL & Associates Properties, Inc., a health care REITs company (no longer held at fiscal period-end), and New Senior Investment Group, Inc., a health care company (portfolio average weight of 5.11%).
| | | | |
REIT Sub-Industry Breakdown (% of the Fund’s Net
Assets) as of August 31, 2018 | |
| Retail | | | 26.9 | |
| Health Care | | | 19.4 | |
| Hotel & Resort | | | 18.5 | |
| Specialized | | | 12.4 | |
| Diversified | | | 11.9 | |
| Office | | | 7.7 | |
| Residential | | | 3.2 | |
| Money Market Funds Plus Other Assets Less Liabilities | | | (0.0) | |
|
Top Ten Fund Holdings*
(% of the Fund’s Net Assets)
as of August 31, 2018 | |
| Security | | | | |
| Washington Prime Group, Inc. | | | 6.0 | |
| Government Properties Income Trust | | | 5.6 | |
| Global NET Lease, Inc. | | | 4.9 | |
| New Senior Investment Group, Inc. | | | 4.8 | |
| Whitestone | | | 4.2 | |
| Sabra Health Care REIT, Inc. | | | 4.0 | |
| CoreCivic, Inc. | | | 3.9 | |
| Senior Housing Properties Trust | | | 3.9 | |
| DDR Corp. | | | 3.8 | |
| Kite Realty Group Trust | | | 3.7 | |
| Total | | | 44.8 | |
| * | Excluding money market fund holdings. |
Invesco KBW Premium Yield Equity REIT ETF (KBWY) (continued)
Growth of a $10,000 Investment Since Inception
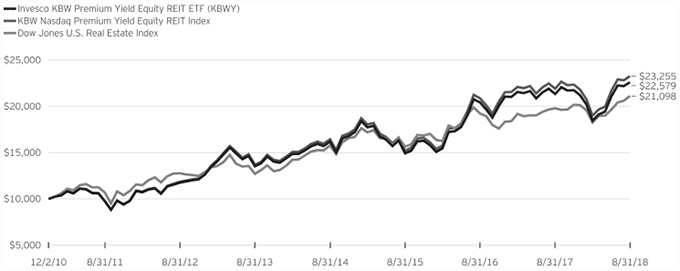
Fund Performance History as of August 31, 2018
| | | | | | | | | | | | | | | | | | | | | | | | | | | | | | | | |
| | | 1 Year | | | 3 Years
Average
Annualized | | | 3 Years
Cumulative | | | 5 Years
Average
Annualized | | | 5 Years
Cumulative | | | | | | Fund Inception | |
| Index | | | | | Average
Annualized | | | Cumulative | |
| KBW Nasdaq Premium Yield Equity REIT Index | | | 6.13 | % | | | 15.21 | % | | | 52.91 | % | | | 11.19 | % | | | 69.94 | % | | | | | | | 11.51 | % | | | 132.55 | % |
| Dow Jones U.S. Real Estate Index | | | 6.64 | | | | 10.50 | | | | 34.93 | | | | 10.68 | | | | 66.09 | | | | | | | | 10.12 | | | | 110.98 | |
| Fund | | | | | | | | | | | | | | | | | | | | | | | | | | | | | | | | |
| NAV Return | | | 5.81 | | | | 14.83 | | | | 51.41 | | | | 10.79 | | | | 66.94 | | | | | | | | 11.09 | | | | 125.79 | |
| Market Price Return | | | 5.75 | | | | 14.85 | | | | 51.50 | | | | 10.82 | | | | 67.16 | | | | | | | | 11.11 | | | | 126.19 | |
Fund Inception: December 2, 2010
Performance quoted above represents past performance. Past performance is not a guarantee of future results and current performance may be higher or lower than performance quoted. Investment returns and principal value will fluctuate, and shares of the Fund (“Fund Shares”), when redeemed or sold, may be worth more or less than their original cost. Fund performance reflects any applicable fee waivers and/or expense reimbursements. Had the adviser not waived fees and/or reimbursed expenses currently or in the past, returns would have been lower. See current prospectus for more information. According to the Fund’s current prospectus, the Fund’s expense ratio of 0.35% is expressed as a unitary management fee to cover operating expenses and expenses incurred in connection with managing the portfolio. NAV and Market Price returns assume that dividends and capital gain distributions have been reinvested in the Fund at NAV and Market Price, respectively. The returns shown in the table above do not reflect the deduction of taxes that a shareholder would pay on Fund
distributions or the redemption or sale of Fund Shares. See invesco.com/ETFs to find the most recent month-end performance numbers.
Index and Benchmark Index performance results are based upon a hypothetical investment in their respective constituent securities. Index and Benchmark Index returns do not represent Fund returns. An investor cannot invest directly in an index. The Index and Benchmark Index do not charge management fees or brokerage expenses, and no such fees or expenses were deducted from the hypothetical performance shown. In addition, the results actual investors might have achieved would have differed from those shown because of differences in the timing, amounts of their investments, and fees and expenses associated with an investment in the Fund.
Notes Regarding Indexes and Fund Performance History:
| - | Average Annualized and Cumulative Inception returns for the Fund, Index and Benchmark Index are based on the inception date of the Fund. |
| | |
| KBWP | | Manager’s Analysis |
| | Invesco KBW Property & Casualty Insurance ETF (KBWP) |
As an index fund, the Invesco KBW Property & Casualty Insurance ETF (the “Fund”) is passively managed and seeks to track the returns of an underlying index. The Fund seeks to track the investment results (before fees and expenses) of the KBW Nasdaq Property & Casualty Index (the “Index”). The Fund generally will invest at least 90% of its total assets in the securities of property and casualty insurance companies that comprise the Index.
Keefe, Bruyette & Woods, Inc. and Nasdaq, Inc. (“KBW Nasdaq” or the “Index Provider”) compile, maintain and calculate the Index using a modified market capitalization-weighted methodology that seeks to reflect the performance of property and casualty insurance companies. The Fund generally invests in all of the securities comprising the Index in proportion to their weightings in the Index.
The Board of Trustees approved a change in the fiscal year end for the Fund from October 31 to August 31. For the fiscal period from November 1, 2017 to August 31, 2018, on a market price basis, the Fund returned 9.09%. On a net asset value (“NAV”) basis, the Fund returned 8.99%. During the same time period, the Index returned 9.30%. During the fiscal period, the Fund fully replicated the components of the Index; therefore, the Fund’s performance (NAV basis) differed from the return of the Index primarily due to fees and operating expenses incurred by the Fund during the period.
During this same time period, the S&P 500® Property & Casualty Index (the “Benchmark Index”) returned 7.78%. The Benchmark Index is an unmanaged index weighted by market capitalization and based on the average performance of approximately 10 securities. The Benchmark Index was selected for its recognition in the marketplace, and its performance comparison is a useful measure for investors as a representation of the United States property and casualty market.
Relative to the Benchmark Index, the Fund included holdings within the multi-line insurance and reinsurance sub-industries during the fiscal period ended August 31, 2018. The majority of the Fund’s outperformance relative to the Benchmark Index during the period can be attributed to the Fund’s stock selection within the property & casualty insurance sub-industry.
For the fiscal period ended August 31, 2018, the property & casualty insurance sub-industry contributed most significantly to the Fund’s return, followed by the multi-line insurance sub-industry. The reinsurance sub-industry was the single detracting sub-industry.
Positions that contributed most significantly to the Fund’s return for the fiscal period ended August 31, 2018, included Progressive Corp. (The), a property & casualty insurance company (portfolio average weight of 8.29%), and XL Group Ltd., a property & casualty insurance company (no longer held at fiscal period-end). Positions that detracted most significantly from the Fund’s return
included Arch Capital Group Ltd., a property & casualty insurance company (portfolio average weight of 5.49%), and Chubb Ltd., a property & casualty insurance company (portfolio average weight of 7.77%).
| | | | |
Sub-Industry Breakdown
(% of the Fund’s Net Assets)
as of August 31, 2018 | |
| Property & Casualty Insurance | | | 71.5 | |
| Multi-line Insurance | | | 19.2 | |
| Reinsurance | | | 9.3 | |
| Other Assets Less Liabilities | | | (0.0) | |
|
Top Ten Fund Holdings
(% of the Fund’s Net Assets)
as of August 31, 2018 | |
| Security | | | | |
| Progressive Corp. (The) | | | 8.2 | |
| Allstate Corp. (The) | | | 8.1 | |
| Chubb Ltd. | | | 7.8 | |
| Travelers Cos., Inc. (The) | | | 7.7 | |
| American International Group, Inc. | | | 7.6 | |
| Kemper Corp. | | | 4.6 | |
| Arch Capital Group Ltd. | | | 4.4 | |
| Cincinnati Financial Corp. | | | 4.2 | |
| Assurant, Inc. | | | 4.1 | |
| RenaissanceRe Holdings Ltd. | | | 4.1 | |
| Total | | | 60.8 | |
Invesco KBW Property & Casualty Insurance ETF (KBWP) (continued)
Growth of a $10,000 Investment Since Inception
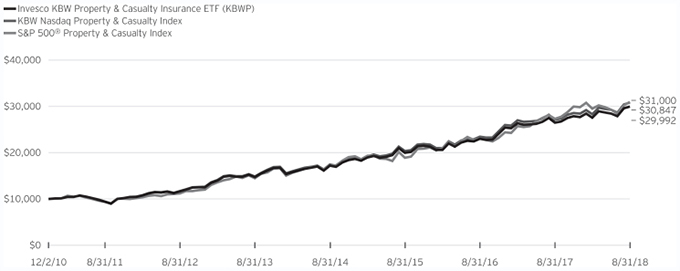
Fund Performance History as of August 31, 2018
| | | | | | | | | | | | | | | | | | | | | | | | | | | | | | | | |
| | | 1 Year | | | 3 Years
Average
Annualized | | | 3 Years
Cumulative | | | 5 Years
Average
Annualized | | | 5 Years
Cumulative | | | | | | Fund Inception | |
| Index | | | | | Average
Annualized | | | Cumulative | |
| KBW Nasdaq Property & Casualty Index | | | 13.69 | % | | | 14.87 | % | | | 51.58 | % | | | 15.70 | % | | | 107.33 | % | | | | | | | 15.66 | % | | | 208.47 | % |
| S&P 500® Property & Casualty Index | | | 13.46 | | | | 17.88 | | | | 63.79 | | | | 16.47 | | | | 114.33 | | | | | | | | 15.73 | | | | 210.00 | |
| Fund | | | | | | | | | | | | | | | | | | | | | | | | | | | | | | | | |
| NAV Return | | | 13.30 | | | | 14.46 | | | | 49.97 | | | | 15.28 | | | | 103.63 | | | | | | | | 15.24 | | | | 199.92 | |
| Market Price Return | | | 13.52 | | | | 14.45 | | | | 49.92 | | | | 15.33 | | | | 104.04 | | | | | | | | 15.26 | | | | 200.34 | |
Fund Inception: December 2, 2010
Performance quoted above represents past performance. Past performance is not a guarantee of future results and current performance may be higher or lower than performance quoted. Investment returns and principal value will fluctuate, and shares of the Fund (“Fund Shares”), when redeemed or sold, may be worth more or less than their original cost. Fund performance reflects any applicable fee waivers and/or expense reimbursements. Had the adviser not waived fees and/or reimbursed expenses currently or in the past, returns would have been lower. See current prospectus for more information. According to the Fund’s current prospectus, the Fund’s expense ratio of 0.35% is expressed as a unitary management fee to cover operating expenses and expenses incurred in connection with managing the portfolio. NAV and Market Price returns assume that dividends and capital gain distributions have been reinvested in the Fund at NAV and Market Price, respectively. The returns shown in the table above do not reflect the deduction of taxes that a shareholder would pay on Fund
distributions or the redemption or sale of Fund Shares. See invesco.com/ETFs to find the most recent month-end performance numbers.
Index and Benchmark Index performance results are based upon a hypothetical investment in their respective constituent securities. Index and Benchmark Index returns do not represent Fund returns. An investor cannot invest directly in an index. The Index and Benchmark Index do not charge management fees or brokerage expenses, and no such fees or expenses were deducted from the hypothetical performance shown. In addition, the results actual investors might have achieved would have differed from those shown because of differences in the timing, amounts of their investments, and fees and expenses associated with an investment in the Fund.
Notes Regarding Indexes and Fund Performance History:
| - | Average Annualized and Cumulative Inception returns for the Fund, Index and Benchmark Index are based on the inception date of the Fund. |
| | |
| KBWR | | Manager’s Analysis |
| | Invesco KBW Regional Banking ETF (KBWR) |
As an index fund, the Invesco KBW Regional Banking ETF (the “Fund”) is passively managed and seeks to track the returns of an underlying index. The Fund seeks to track the investment results (before fees and expenses) of the KBW Nasdaq Regional Banking Index (the “Index”). The Fund generally will invest at least 90% of its total assets in securities of publicly traded mid-capitalization companies that do business as regional banks and thrifts listed on U.S. stock markets and that comprise the Index.
Keefe, Bruyette & Woods, Inc. and Nasdaq, Inc. (“KBW Nasdaq” or the “Index Provider”) compile, maintain and calculate the Index, which is a modified-market capitalization-weighted index comprised of securities of 50 mid-cap banking companies that are publicly listed in the United States. The Fund generally invests in all of the securities comprising the Index in proportion to their weightings in the Index.
The Board of Trustees approved a change in the fiscal year end for the Fund from October 31 to August 31. For the fiscal period from November 1, 2017 to August 31, 2018, on a market price basis, the Fund returned 8.65%. On a net asset value (“NAV”) basis, the Fund returned 8.79%. During the same time period, the Index returned 9.14%. During the fiscal period, the Fund fully replicated the components of the Index; therefore, the Fund’s performance (NAV basis) differed from the return of the Index primarily due to slippage around rebalances and fees and operating expenses incurred by the Fund during the period.
During this same time period, the S&P Composite 1500® Commercial Banks Index (the “Benchmark Index”) returned 10.32%. The Benchmark Index is an unmanaged index weighted by market capitalization based on the average performance of approximately 90 securities. The Benchmark Index was selected for its recognition in the marketplace, and its performance comparison is a useful measure for investors as a broad representation of the United States commercial banking market.
Relative to the Benchmark Index, the Fund was most overweight in the regional banks sub-industry and most underweight in the diversified banks sub-industry during the fiscal period ended August 31, 2018. The majority of the Fund’s underperformance relative to the Benchmark Index during the period can be attributed to the fact that the Fund did not have an allocation to the diversified banks sub-industry.
For the fiscal period ended August 31, 2018, the regional banks sub-industry contributed most significantly to the Fund’s return, followed by the thrifts & mortgage finance sub-industry. The diversified banks sub-industry detracted most significantly.
Positions that contributed most significantly to the Fund’s return for the fiscal period ended August 31, 2018, included TCF Financial Corp., a regional banks company (portfolio average weight of 2.09%), and Popular, Inc., a regional banks company (portfolio average weight of 2.06%). Signature Bank/New York
NY, a regional banks company (portfolio average weight of 3.60%), was the largest detracting position.
| | | | |
Sub-Industry Breakdown
(% of the Fund’s Net Assets)
as of August 31, 2018 | |
| Regional Banks | | | 97.2 | |
| Thrifts & Mortgage Finance | | | 2.8 | |
| Other Assets Less Liabilities | | | (0.0) | |
|
Top Ten Fund Holdings
(% of the Fund’s Net Assets)
as of August 31, 2018 | |
| Security | | | | |
| East West Bancorp, Inc. | | | 3.7 | |
| Commerce Bancshares, Inc. | | | 3.6 | |
| Cullen/Frost Bankers, Inc. | | | 3.3 | |
| Signature Bank/New York NY | | | 3.0 | |
| PacWest Bancorp | | | 3.0 | |
| Glacier Bancorp, Inc. | | | 2.3 | |
| First Financial Bankshares, Inc. | | | 2.3 | |
| Popular, Inc. | | | 2.2 | |
| IBERIABANK Corp. | | | 2.2 | |
| United Bankshares, Inc. | | | 2.2 | |
| Total | | | 27.8 | |
Invesco KBW Regional Banking ETF (KBWR) (continued)
Growth of a $10,000 Investment Since Inception
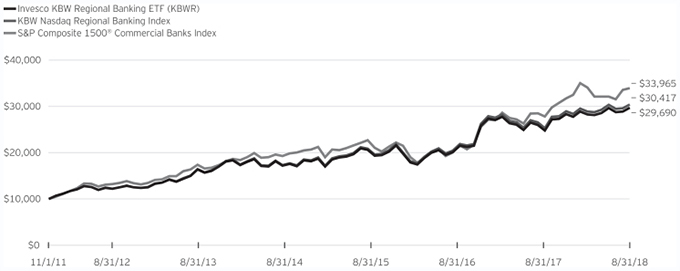
Fund Performance History as of August 31, 2018
| | | | | | | | | | | | | | | | | | | | | | | | | | | | | | | | |
| | | 1 Year | | | 3 Years
Average
Annualized | | | 3 Years
Cumulative | | | 5 Years
Average
Annualized | | | 5 Years
Cumulative | | | | | | Fund Inception | |
| Index | | | | | Average
Annualized | | | Cumulative | |
| KBW Nasdaq Regional Banking Index | | | 20.16 | % | | | 15.74 | % | | | 55.02 | % | | | 14.07 | % | | | 93.09 | % | | | | | | | 17.69 | % | | | 204.17 | % |
| S&P Composite 1500® Commercial Banks Index | | | 22.16 | | | | 17.29 | | | | 61.36 | | | | 15.40 | | | | 104.67 | | | | | | | | 19.60 | | | | 239.65 | |
| Fund | | | | | | | | | | | | | | | | | | | | | | | | | | | | | | | | |
| NAV Return | | | 19.67 | | | | 15.31 | | | | 53.31 | | | | 13.64 | | | | 89.52 | | | | | | | | 17.27 | | | | 196.90 | |
| Market Price Return | | | 19.84 | | | | 15.30 | | | | 53.27 | | | | 13.65 | | | | 89.63 | | | | | | | | 17.31 | | | | 197.54 | |
Fund Inception: November 1, 2011
Performance quoted above represents past performance. Past performance is not a guarantee of future results and current performance may be higher or lower than performance quoted. Investment returns and principal value will fluctuate, and shares of the Fund (“Fund Shares”), when redeemed or sold, may be worth more or less than their original cost. Fund performance reflects any applicable fee waivers and/or expense reimbursements. Had the adviser not waived fees and/or reimbursed expenses currently or in the past, returns would have been lower. See current prospectus for more information. According to the Fund’s current prospectus, the Fund’s expense ratio of 0.35% is expressed as a unitary management fee to cover operating expenses and expenses incurred in connection with managing the portfolio. NAV and Market Price returns assume that dividends and capital gain distributions have been reinvested in the Fund at NAV and Market Price, respectively. The returns shown in the table above do not reflect the deduction of taxes that a shareholder would pay on Fund
distributions or the redemption or sale of Fund Shares. See invesco.com/ETFs to find the most recent month-end performance numbers.
Index and Benchmark Index performance results are based upon a hypothetical investment in their respective constituent securities. Index and Benchmark Index returns do not represent Fund returns. An investor cannot invest directly in an index. The Index and Benchmark Index do not charge management fees or brokerage expenses, and no such fees or expenses were deducted from the hypothetical performance shown. In addition, the results actual investors might have achieved would have differed from those shown because of differences in the timing, amounts of their investments, and fees and expenses associated with an investment in the Fund.
Notes Regarding Indexes and Fund Performance History:
| - | Average Annualized and Cumulative Inception returns for the Fund, Index and Benchmark Index are based on the inception date of the Fund. |
Schedule of Investments(a)
Invesco KBW Bank ETF (KBWB)
August 31, 2018
| | | | | | | | |
Number
of Shares | | | | | Value | |
| | | | Common Stocks—100.0% | |
| | | | Asset Management & Custody Banks—11.0% | |
| | 718,983 | | | Bank of New York Mellon Corp. (The) | | $ | 37,494,963 | |
| | 366,945 | | | Northern Trust Corp. | | | 39,431,910 | |
| | 409,575 | | | State Street Corp. | | | 35,596,163 | |
| | | | | | | | |
| | | | | | | 112,523,036 | |
| | | | | | | | |
| | | | Consumer Finance—4.1% | |
| | 418,770 | | | Capital One Financial Corp. | | | 41,495,919 | |
| | | | | | | | |
| | | | Diversified Banks—41.3% | |
| | 2,711,039 | | | Bank of America Corp. | | | 83,852,436 | |
| | 1,180,515 | | | Citigroup, Inc. | | | 84,099,889 | |
| | 735,712 | | | JPMorgan Chase & Co. | | | 84,297,881 | |
| | 1,574,886 | | | US Bancorp | | | 85,217,082 | |
| | 1,458,207 | | | Wells Fargo & Co. | | | 85,275,945 | |
| | | | | | | | |
| | | | | | | 422,743,233 | |
| | | | | | | | |
| | | | Regional Banks—42.8% | |
| | 749,795 | | | BB&T Corp. | | | 38,734,410 | |
| | 790,554 | | | Citizens Financial Group, Inc. | | | 32,539,203 | |
| | 280,411 | | | Comerica, Inc. | | | 27,334,464 | |
| | 1,117,994 | | | Fifth Third Bancorp | | | 32,902,563 | |
| | 263,841 | | | First Republic Bank | | | 26,803,607 | |
| | 1,796,948 | | | Huntington Bancshares, Inc. | | | 29,128,527 | |
| | 1,731,495 | | | KeyCorp | | | 36,482,600 | |
| | 228,755 | | | M&T Bank Corp. | | | 40,523,948 | |
| | 567,363 | | | People’s United Financial, Inc. | | | 10,501,889 | |
| | 274,487 | | | PNC Financial Services Group, Inc. (The) | | | 39,399,864 | |
| | 1,831,773 | | | Regions Financial Corp. | | | 35,646,303 | |
| | 583,089 | | | SunTrust Banks, Inc. | | | 42,892,027 | |
| | 86,396 | | | SVB Financial Group(b) | | | 27,884,309 | |
| | 321,480 | | | Zions Bancorporation | | | 17,131,669 | |
| | | | | | | | |
| | | | | | | 437,905,383 | |
| | | | | | | | |
| | | | Thrifts & Mortgage Finance—0.8% | |
| | 799,797 | | | New York Community Bancorp, Inc. | | | 8,613,814 | |
| | | | | | | | |
| | | | Total Investments in Securities
(Cost $1,040,439,076)—100.0% | | | 1,023,281,385 | |
| | | | Other assets less liabilities—(0.0)% | | | (21,746 | ) |
| | | | | | | | |
| | | | Net Assets—100.0% | | $ | 1,023,259,639 | |
| | | | | | | | |
Notes to Schedule of Investments:
| (a) | Industry and/or sector classifications used in this report are generally according to the Global Industry Classification Standard, which was developed by and is the exclusive property and a service mark of MSCI Inc. and Standard & Poor’s. |
| (b) | Non-income producing security. |
See accompanying Notes to Financial Statements which are an integral part of the financial statements.
Schedule of Investments(a)
Invesco KBW High Dividend Yield Financial ETF (KBWD)
August 31, 2018
| | | | | | | | |
Number
of Shares | | | | | Value | |
| | | | Common Stocks & Other Equity
Interests—100.0% | |
| | | | Asset Management & Custody Banks—29.6% | |
| | 1,310,562 | | | Arlington Asset Investment Corp., Class A(b) | | $ | 13,328,416 | |
| | 298,058 | | | Artisan Partners Asset Management, Inc., Class A | | | 9,880,623 | |
| | 2,162,562 | | | BlackRock Capital Investment Corp. | | | 13,559,264 | |
| | 237,563 | | | Federated Investors, Inc., Class B | | | 5,501,959 | |
| | 208,314 | | | Invesco Ltd.(c) | | | 5,020,367 | |
| | 195,535 | | | Janus Henderson Group PLC (United Kingdom) | | | 5,523,864 | |
| | 1,622,611 | | | Medley Capital Corp.(b) | | | 6,539,122 | |
| | 535,050 | | | Newtek Business Services Corp.(b) | | | 12,391,758 | |
| | 2,041,441 | | | Prospect Capital Corp.(b) | | | 15,310,807 | |
| | 476,000 | | | Stellus Capital Investment Corp.(b) | | | 6,387,920 | |
| | 976,469 | | | THL Credit, Inc. | | | 8,348,810 | |
| | | | | | | | |
| | | | | | | 101,792,910 | |
| | | | | | | | |
| | | | Consumer Finance—1.7% | |
| | 434,798 | | | Navient Corp. | | | 5,930,645 | |
| | | | | | | | |
| | | | Investment Banking & Brokerage—4.6% | |
| | 710,328 | | | BGC Partners, Inc., Class A | | | 8,822,274 | |
| | 86,182 | | | Lazard Ltd., Class A | | | 4,148,801 | |
| | 129,017 | | | Virtu Financial, Inc., Class A(b) | | | 2,812,571 | |
| | | | | | | | |
| | | | | | | 15,783,646 | |
| | | | | | | | |
| | | | Mortgage REITs—43.7% | |
| | 690,635 | | | AG Mortgage Investment Trust, Inc. REIT | | | 12,983,938 | |
| | 790,157 | | | AGNC Investment Corp. REIT | | | 15,028,786 | |
| | 1,429,260 | | | Annaly Capital Management, Inc. REIT | | | 15,178,741 | |
| | 689,853 | | | Apollo Commercial Real Estate Finance, Inc. REIT | | | 13,403,844 | |
| | 764,576 | | | Chimera Investment Corp. REIT | | | 14,244,051 | |
| | 2,221,669 | | | Dynex Capital, Inc. REIT | | | 14,240,898 | |
| | 810,574 | | | New Residential Investment Corp. REIT | | | 15,052,359 | |
| | 2,576,238 | | | Orchid Island Capital, Inc. REIT(b) | | | 20,455,330 | |
| | 695,091 | | | PennyMac Mortgage Investment Trust REIT | | | 13,887,918 | |
| | 1,438,031 | | | Western Asset Mortgage Capital Corp. REIT | | | 16,005,285 | |
| | | | | | | | |
| | | | | | | 150,481,150 | |
| | | | | | | | |
| | | | Property & Casualty Insurance—5.1% | |
| | 113,064 | | | HCI Group, Inc. | | | 4,579,092 | |
| | 145,951 | | | Mercury General Corp. | | | 7,866,759 | |
| | 229,603 | | | Old Republic International Corp. | | | 5,092,594 | |
| | | | | | | | |
| | | | | | | 17,538,445 | |
| | | | | | | | |
| | | | Regional Banks—5.8% | |
| | 110,453 | | | PacWest Bancorp | | | 5,576,772 | |
| | 267,602 | | | People’s United Financial, Inc. | | | 4,953,313 | |
| | 132,628 | | | United Bankshares, Inc. | | | 5,225,543 | |
| | 352,902 | | | Valley National Bancorp | | | 4,252,469 | |
| | | | | | | | |
| | | | | | | 20,008,097 | |
| | | | | | | | |
| | | | Reinsurance—1.1% | |
| | 1,015,382 | | | Maiden Holdings Ltd. | | | 3,858,452 | |
| | | | | | | | |
| | | | | | | | |
Number
of Shares | | | | | Value | |
| | | | Common Stocks & Other Equity
Interests (continued) | |
| | | | Thrifts & Mortgage Finance—6.0% | |
| | 655,900 | | | New York Community Bancorp, Inc. | | $ | 7,064,043 | |
| | 296,435 | | | Northwest Bancshares, Inc. | | | 5,401,046 | |
| | 512,510 | | | Oritani Financial Corp. | | | 8,302,662 | |
| | | | | | | | |
| | | | | | | 20,767,751 | |
| | | | | | | | |
| | | | Trading Companies & Distributors—2.4% | |
| | 222,410 | | | Triton International Ltd. (Bermuda) | | | 8,402,650 | |
| | | | | | | | |
| | | | Total Investments in Securities
(excluding investments purchased with cash collateral from securities on loan)
(Cost $340,824,943)-100.0% | | | 344,563,746 | |
| | | | | | | | |
| | |
| | | | | | | | |
| | | | Investments Purchased with Cash Collateral from
Securities on Loan | |
| | |
| | | | | | | | |
| | | | Money Market Fund—15.9% | |
| | 54,741,081 | | | Invesco Government & Agency Portfolio—Institutional Class, 1.85%(d)(e)
(Cost $54,741,081) | | | 54,741,081 | |
| | | | | | | | |
| | | | Total Investments in Securities
(Cost $395,566,024)—115.9% | | | 399,304,827 | |
| | | | Other assets less liabilities—(15.9)% | | | (54,748,388 | ) |
| | | | | | | | |
| | | | Net Assets—100.0% | | $ | 344,556,439 | |
| | | | | | | | |
Investment Abbreviations:
REIT—Real Estate Investment Trust
Notes to Schedule of Investments:
| (a) | Industry and/or sector classifications used in this report are generally according to the Global Industry Classification Standard, which was developed by and is the exclusive property and a service mark of MSCI Inc. and Standard & Poor’s. |
| (b) | All or a portion of this security was out on loan at August 31, 2018. |
| (c) | Affiliated company. The Fund’s Adviser is a wholly-owned subsidiary of Invesco Ltd. and therefore, Invesco Ltd. is considered to be affiliated. See Note 4. |
| (d) | The security and the Fund are advised by wholly-owned subsidiaries of Invesco Ltd. and are therefore considered to be affiliated. The rate shown is the 7-day SEC standardized yield as of August 31, 2018. |
| (e) | The security has been segregated to satisfy the commitment to return the cash collateral received in securities lending transactions upon the borrower’s return of the securities loaned. See Note 2J. |
See accompanying Notes to Financial Statements which are an integral part of the financial statements.
Schedule of Investments(a)
Invesco KBW Premium Yield Equity REIT ETF (KBWY)
August 31, 2018
| | | | | | | | |
Number
of Shares | | | | | Value | |
| | | | Real Estate Investment Trusts—100.0% | |
| | | | Diversified—11.9% | |
| | 766,120 | | | Gladstone Commercial Corp. | | $ | 15,253,449 | |
| | 986,754 | | | Global NET Lease, Inc. | | | 21,402,694 | |
| | 1,720,911 | | | Lexington Realty Trust | | | 16,073,309 | |
| | | | | | | | |
| | | | | | | 52,729,452 | |
| | | | | | | | |
| | | | Health Care—19.4% | |
| | 1,380,641 | | | MedEquities Realty Trust, Inc. | | | 14,786,665 | |
| | 980,309 | | | Medical Properties Trust, Inc. | | | 14,753,650 | |
| | 3,355,453 | | | New Senior Investment Group, Inc. | | | 21,273,572 | |
| | 756,132 | | | Sabra Health Care REIT, Inc. | | | 17,829,593 | �� |
| | 902,952 | | | Senior Housing Properties Trust | | | 17,255,413 | |
| | | | | | | | |
| | | | | | | 85,898,893 | |
| | | | | | | | |
| | | | Hotel & Resort—18.5% | |
| | 598,169 | | | Apple Hospitality REIT, Inc. | | | 10,557,683 | |
| | 1,595,252 | | | Ashford Hospitality Trust, Inc. | | | 10,353,185 | |
| | 954,813 | | | Braemar Hotels & Resorts, Inc. | | | 11,028,090 | |
| | 551,299 | | | Chatham Lodging Trust | | | 11,825,364 | |
| | 278,048 | | | Chesapeake Lodging Trust | | | 9,150,560 | |
| | 446,892 | | | Hersha Hospitality Trust | | | 10,546,651 | |
| | 456,628 | | | Hospitality Properties Trust | | | 13,237,646 | |
| | 138,094 | | | LaSalle Hotel Properties | | | 4,848,480 | |
| | | | | | | | |
| | | | | | | 81,547,659 | |
| | | | | | | | |
| | | | Office—7.7% | |
| | 1,084,792 | | | Franklin Street Properties Corp. | | | 9,296,668 | |
| | 1,470,687 | | | Government Properties Income Trust | | | 24,869,317 | |
| | | | | | | | |
| | | | | | | 34,165,985 | |
| | | | | | | | |
| | | | Residential—3.2% | |
| | 1,381,378 | | | Independence Realty Trust, Inc. | | | 14,269,635 | |
| | | | | | | | |
| | | | Retail—26.9% | |
| | 1,189,190 | | | DDR Corp. | | | 16,636,768 | |
| | 931,277 | | | Kite Realty Group Trust | | | 16,278,722 | |
| | 1,250,908 | | | Pennsylvania Real Estate Investment Trust(b) | | | 12,759,262 | |
| | 1,050,017 | | | Ramco-Gershenson Properties Trust | | | 14,658,237 | |
| | 547,243 | | | Tanger Factory Outlet Centers, Inc.(b) | | | 13,166,666 | |
| | 3,415,504 | | | Washington Prime Group, Inc.(b) | | | 26,436,001 | |
| | 1,373,609 | | | Whitestone | | | 18,736,027 | |
| | | | | | | | |
| | | | | | | 118,671,683 | |
| | | | | | | | |
| | | | Specialized—12.4% | |
| | 670,453 | | | CoreCivic, Inc. | | | 17,358,028 | |
| | 206,925 | | | EPR Properties | | | 14,521,996 | |
| | 1,271,247 | | | Farmland Partners, Inc. | | | 8,975,004 | |
| | 551,791 | | | GEO Group, Inc. (The) | | | 13,998,938 | |
| | | | | | | | |
| | | | | | | 54,853,966 | |
| | | | | | | | |
| | | | Total Real Estate Investment Trusts
(Cost $430,169,924) | | | 442,137,273 | |
| | | | | | | | |
| | |
| | | | | | | | |
| | | | | | | | |
Number
of Shares | | | | | Value | |
| | | | Money Market Fund—0.0% | |
| | 85,758 | | | Invesco Premier U.S. Government Money Portfolio—Institutional Class, 1.83%(c) (Cost $85,758) | | $ | 85,758 | |
| | | | | | | | |
| | | | Total Investments in Securities
(excluding investments purchased with cash collateral from securities on loan) (Cost $430,255,682)—100.0% | | | 442,223,031 | |
| | | | | | | | |
| | | | Investments Purchased with Cash Collateral from
Securities on Loan | |
| | |
| | | | | | | | |
| | | | Money Market Fund—0.5% | |
| | 1,981,903 | | | Invesco Government & Agency Portfolio—Institutional Class, 1.85%(c)(d)
(Cost $1,981,903) | | | 1,981,903 | |
| | | | | | | | |
| | | | Total Investments in Securities
(Cost $432,237,585)—100.5% | | | 444,204,934 | |
| | | | Other assets less liabilities—(0.5)% | | | (2,078,484 | ) |
| | | | | | | | |
| | | | Net Assets—100.0% | | $ | 442,126,450 | |
| | | | | | | | |
Investment Abbreviations:
REIT—Real Estate Investment Trust
Notes to Schedule of Investments:
| (a) | Industry and/or sector classifications used in this report are generally according to the Global Industry Classification Standard, which was developed by and is the exclusive property and a service mark of MSCI Inc. and Standard & Poor’s. |
| (b) | All or a portion of this security was out on loan at August 31, 2018. |
| (c) | The security and the Fund are advised by wholly-owned subsidiaries of Invesco Ltd. and are therefore considered to be affiliated. The rate shown is the 7-day SEC standardized yield as of August 31, 2018. |
| (d) | The security has been segregated to satisfy the commitment to return the cash collateral received in securities lending transactions upon the borrower’s return of the securities loaned. See Note 2J. |
See accompanying Notes to Financial Statements which are an integral part of the financial statements.
Schedule of Investments(a)
Invesco KBW Property & Casualty Insurance ETF (KBWP)
August 31, 2018
| | | | | | | | |
Number
of Shares | | | | | Value | |
| | | | Common Stocks—100.0% | | | | |
| | | | Multi-line Insurance—19.2% | |
| | 22,983 | | | American Financial Group, Inc. | | $ | 2,559,387 | |
| | 95,677 | | | American International Group, Inc. | | | 5,087,146 | |
| | 27,053 | | | Assurant, Inc. | | | 2,781,589 | |
| | 48,259 | | | Hartford Financial Services Group, Inc. (The) | | | 2,430,806 | |
| | | | | | | | |
| | | | | | | 12,858,928 | |
| | | | | | | | |
| | | | Property & Casualty Insurance—71.5% | |
| | 54,031 | | | Allstate Corp. (The) | | | 5,433,898 | |
| | 96,573 | | | Arch Capital Group Ltd.(b) | | | 2,952,237 | |
| | 19,772 | | | Argo Group International Holdings Ltd. | | | 1,259,476 | |
| | 34,803 | | | Aspen Insurance Holdings Ltd. (Bermuda) | | | 1,432,144 | |
| | 44,422 | | | Axis Capital Holdings Ltd. | | | 2,555,153 | |
| | 38,647 | | | Chubb Ltd. | | | 5,226,620 | |
| | 36,405 | | | Cincinnati Financial Corp. | | | 2,791,171 | |
| | 20,830 | | | Hanover Insurance Group, Inc. (The) | | | 2,551,467 | |
| | 37,774 | | | Kemper Corp. | | | 3,072,915 | |
| | 32,283 | | | Mercury General Corp. | | | 1,740,054 | |
| | 31,268 | | | ProAssurance Corp. | | | 1,511,808 | |
| | 81,346 | | | Progressive Corp. (The) | | | 5,493,295 | |
| | 25,819 | | | RLI Corp. | | | 1,987,288 | |
| | 34,275 | | | Selective Insurance Group, Inc. | | | 2,200,455 | |
| | 39,300 | | | Travelers Cos., Inc. (The) | | | 5,171,880 | |
| | 33,025 | | | W.R. Berkley Corp. | | | 2,584,537 | |
| | | | | | | | |
| | | | | | | 47,964,398 | |
| | | | | | | | |
| | | | Reinsurance—9.3% | |
| | 11,210 | | | Everest Re Group Ltd. | | | 2,500,055 | |
| | 48,494 | | | Maiden Holdings Ltd. | | | 184,277 | |
| | 20,570 | | | RenaissanceRe Holdings Ltd. (Bermuda) | | | 2,734,987 | |
| | 59,653 | | | Third Point Reinsurance Ltd. (Bermuda)(b) | | | 799,350 | |
| | | | | | | | |
| | | | | | | 6,218,669 | |
| | | | | | | | |
| | | | Total Investments in Securities
(Cost $60,651,995)—100.0% | | | 67,041,995 | |
| | | | Other assets less liabilities—(0.0)% | | | (2,167 | ) |
| | | | | | | | |
| | | | Net Assets—100.0% | | $ | 67,039,828 | |
| | | | | | | | |
Notes to Schedule of Investments:
| (a) | Industry and/or sector classifications used in this report are generally according to the Global Industry Classification Standard, which was developed by and is the exclusive property and a service mark of MSCI Inc. and Standard & Poor’s. |
| (b) | Non-income producing security. |
See accompanying Notes to Financial Statements which are an integral part of the financial statements.
Schedule of Investments(a)
Invesco KBW Regional Banking ETF (KBWR)
August 31, 2018
| | | | | | | | |
Number
of Shares | | | | | Value | |
| | | | Common Stocks—100.0% | |
| | | | Regional Banks—97.2% | |
| | 141,852 | | | Associated Banc-Corp. | | $ | 3,865,467 | |
| | 116,869 | | | BancorpSouth Bank | | | 4,067,041 | |
| | 46,098 | | | Bank of Hawaii Corp. | | | 3,832,127 | |
| | 82,354 | | | Bank OZK | | | 3,332,043 | |
| | 92,841 | | | BankUnited, Inc. | | | 3,601,302 | |
| | 101,370 | | | Boston Private Financial Holdings, Inc. | | | 1,464,796 | |
| | 96,672 | | | Brookline Bancorp, Inc. | | | 1,754,597 | |
| | 92,797 | | | Cathay General Bancorp | | | 3,925,313 | |
| | 69,763 | | | Chemical Financial Corp. | | | 3,984,862 | |
| | 88,153 | | | Columbia Banking System, Inc. | | | 3,724,464 | |
| | 98,020 | | | Commerce Bancshares, Inc. | | | 6,965,301 | |
| | 61,355 | | | Community Bank System, Inc. | | | 4,057,406 | |
| | 58,664 | | | Cullen/Frost Bankers, Inc. | | | 6,505,251 | |
| | 132,717 | | | CVB Financial Corp. | | | 3,191,844 | |
| | 112,697 | | | East West Bancorp, Inc. | | | 7,143,863 | |
| | 295,479 | | | F.N.B. Corp. | | | 3,974,192 | |
| | 120,800 | | | First Commonwealth Financial Corp. | | | 2,023,400 | |
| | 117,729 | | | First Financial Bancorp | | | 3,696,691 | |
| | 74,432 | | | First Financial Bankshares, Inc. | | | 4,495,693 | |
| | 133,713 | | | First Hawaiian, Inc. | | | 3,876,340 | |
| | 211,171 | | | First Horizon National Corp. | | | 3,889,770 | |
| | 124,077 | | | First Midwest Bancorp, Inc. | | | 3,372,413 | |
| | 211,545 | | | Fulton Financial Corp. | | | 3,850,119 | |
| | 100,413 | | | Glacier Bancorp, Inc. | | | 4,586,866 | |
| | 77,912 | | | Hancock Whitney Corp. | | | 4,016,364 | |
| | 170,074 | | | Home BancShares, Inc. | | | 3,981,432 | |
| | 163,114 | | | Hope Bancorp, Inc. | | | 2,856,126 | |
| | 49,000 | | | IBERIABANK Corp. | | | 4,245,850 | |
| | 293,486 | | | Investors Bancorp, Inc. | | | 3,756,621 | |
| | 79,269 | | | MB Financial, Inc. | | | 3,841,376 | |
| | 183,161 | | | Old National Bancorp | | | 3,718,168 | |
| | 115,065 | | | PacWest Bancorp | | | 5,809,632 | |
| | 58,391 | | | Pinnacle Financial Partners, Inc. | | | 3,769,139 | |
| | 86,541 | | | Popular, Inc. | | | 4,356,474 | |
| | 54,054 | | | Prosperity Bancshares, Inc. | | | 4,045,401 | |
| | 50,896 | | | Signature Bank/New York NY | | | 5,890,703 | |
| | 159,475 | | | Sterling Bancorp | | | 3,644,004 | |
| | 72,355 | | | Synovus Financial Corp. | | | 3,622,091 | |
| | 148,807 | | | TCF Financial Corp. | | | 3,772,257 | |
| | 40,634 | | | Texas Capital Bancshares, Inc.(b) | | | 3,612,363 | |
| | 81,585 | | | Trustmark Corp. | | | 2,894,636 | |
| | 50,812 | | | UMB Financial Corp. | | | 3,823,095 | |
| | 166,317 | | | Umpqua Holdings Corp. | | | 3,559,184 | |
| | 107,410 | | | United Bankshares, Inc. | | | 4,231,954 | |
| | 308,033 | | | Valley National Bancorp | | | 3,711,798 | |
| | 61,078 | | | Webster Financial Corp. | | | 3,993,280 | |
| | 64,970 | | | Western Alliance Bancorp(b) | | | 3,745,520 | |
| | 42,505 | | | Wintrust Financial Corp. | | | 3,763,818 | |
| | | | | | | | |
| | | | | | | 189,842,447 | |
| | | | | | | | |
| | | | | | | | |
Number
of Shares | | | | | Value | |
| | | | Common Stocks (continued) | |
| | | | Thrifts & Mortgage Finance—2.8% | |
| | 80,658 | | | Provident Financial Services, Inc. | | $ | 2,035,001 | |
| | 101,677 | | | Washington Federal, Inc. | | | 3,467,186 | |
| | | | | | | | |
| | | | | | | 5,502,187 | |
| | | | | | | | |
| | | | Total Investments in Securities
(Cost $188,420,119)—100.0% | | | 195,344,634 | |
| | | | Other assets less liabilities—(0.0)% | | | (7,028 | ) |
| | | | | | | | |
| | | | Net Assets—100.0% | | $ | 195,337,606 | |
| | | | | | | | |
Notes to Schedule of Investments:
| (a) | Industry and/or sector classifications used in this report are generally according to the Global Industry Classification Standard, which was developed by and is the exclusive property and a service mark of MSCI Inc. and Standard & Poor’s. |
| (b) | Non-income producing security. |
See accompanying Notes to Financial Statements which are an integral part of the financial statements.
(This Page Intentionally Left Blank)
Statements of Assets and Liabilities
August 31, 2018
| | | | | | | | |
| | | Invesco KBW
Bank ETF (KBWB) | | |
Invesco KBW High
Dividend Yield
Financial ETF
(KBWD) | |
| Assets: | | | | | | | | |
Unaffiliated investments in securities, at value(a) | | $ | 1,023,281,385 | | | $ | 339,543,379 | |
Affiliated investments in securities, at value | | | — | | | | 59,761,448 | |
Receivables: | | | | | | | | |
Dividends | | | 1,742,874 | | | | 948,162 | |
Shares sold | | | 6,025 | | | | — | |
Securities lending | | | — | | | | 78,721 | |
| | | | | | | | |
Total Assets | | | 1,025,030,284 | | | | 400,331,710 | |
| | | | | | | | |
| Liabilities: | | | | | | | | |
Due to custodian | | | 1,465,740 | | | | 933,083 | |
Payables: | | | | | | | | |
Investments purchased | | | — | | | | — | |
Collateral upon return of securities loaned | | | — | | | | 54,741,081 | |
Accrued unitary management fees | | | 304,905 | | | | 101,107 | |
| | | | | | | | |
Total Liabilities | | | 1,770,645 | | | | 55,775,271 | |
| | | | | | | | |
| Net Assets | | $ | 1,023,259,639 | | | $ | 344,556,439 | |
| | | | | | | | |
| | |
| Net Assets Consist of: | | | | | | | | |
Shares of beneficial interest | | $ | 1,038,651,738 | | | $ | 407,763,029 | |
Undistributed net investment income | | | 4,417,021 | | | | — | |
Undistributed net realized gain (loss) | | | (2,651,429 | ) | | | (66,945,393 | ) |
Net unrealized appreciation (depreciation) | | | (17,157,691 | ) | | | 3,738,803 | |
| | | | | | | | |
| Net Assets | | $ | 1,023,259,639 | | | $ | 344,556,439 | |
| | | | | | | | |
Shares outstanding (unlimited amount authorized, $0.01 par value) | | | 17,950,000 | | | | 14,550,000 | |
Net asset value | | $ | 57.01 | | | $ | 23.68 | |
| | | | | | | | |
Market price | | $ | 57.01 | | | $ | 23.69 | |
| | | | | | | | |
Unaffiliated investments in securities, at cost | | $ | 1,040,439,076 | | | $ | 334,682,044 | |
| | | | | | | | |
Affiliated investments in securities, at cost | | $ | — | | | $ | 60,883,980 | |
| | | | | | | | |
(a) Includes securities on loan with an aggregate value of: | | $ | — | | | $ | 52,963,253 | |
| | | | | | | | |
See accompanying Notes to Financial Statements which are an integral part of the financial statements.
| | | | | | | | | | |
Invesco KBW
Premium Yield
Equity REIT ETF
(KBWY) | | | Invesco KBW
Property &
Casualty
Insurance ETF
(KBWP) | | | Invesco KBW
Regional Banking
ETF (KBWR) | |
| | | | | | | | | | |
| $ | 442,137,273 | | | $ | 67,041,995 | | | $ | 195,344,634 | |
| | 2,067,661 | | | | — | | | | — | |
| | | | | | | | | | |
| | 1,438,408 | | | | 80,020 | | | | 286,860 | |
| | — | | | | — | | | | — | |
| | 384 | | | | — | | | | — | |
| | | | | | | | | | |
| | 445,643,726 | | | | 67,122,015 | | | | 195,631,494 | |
| | | | | | | | | | |
| | | | | | | | | | |
| | — | | | | 62,512 | | | | 236,048 | |
| | | | | | | | | | |
| | 1,407,455 | | | | — | | | | — | |
| | 1,981,903 | | | | — | | | | — | |
| | 127,918 | | | | 19,675 | | | | 57,840 | |
| | | | | | | | | | |
| | 3,517,276 | | | | 82,187 | | | | 293,888 | |
| | | | | | | | | | |
| $ | 442,126,450 | | | $ | 67,039,828 | | | $ | 195,337,606 | |
| | | | | | | | | | |
| | |
| | | | | | | | | | |
| $ | 458,990,002 | | | $ | 63,652,258 | | | $ | 190,112,676 | |
| | — | | | | 210,388 | | | | 775,338 | |
| | (28,830,901 | ) | | | (3,212,818 | ) | | | (2,474,923 | ) |
| | 11,967,349 | | | | 6,390,000 | | | | 6,924,515 | |
| | | | | | | | | | |
| $ | 442,126,450 | | | $ | 67,039,828 | | | $ | 195,337,606 | |
| | | | | | | | | | |
| | 12,350,000 | | | | 1,050,000 | | | | 3,300,000 | |
| $ | 35.80 | | | $ | 63.85 | | | $ | 59.19 | |
| | | | | | | | | | |
| $ | 35.80 | | | $ | 63.92 | | | $ | 59.19 | |
| | | | | | | | | | |
| $ | 430,169,924 | | | $ | 60,651,995 | | | $ | 188,420,119 | |
| | | | | | | | | | |
| $ | 2,067,661 | | | $ | — | | | $ | — | |
| | | | | | | | | | |
| $ | 1,808,783 | | | $ | — | | | $ | — | |
| | | | | | | | | | |
Statements of Operations
For the period November 1, 2017 through August 31, 2018 and year ended October 31, 2017
| | | | | | | | | | | | | | | | |
| | | Invesco
KBW Bank
ETF (KBWB) | | | Invesco
KBW High Dividend Yield Financial
ETF (KBWD) | |
| | | Ten Months Ended
August 31, 2018 | | | Year Ended
October 31, 2017 | | | Ten Months Ended
August 31, 2018 | | | Year Ended
October 31, 2017 | |
| Investment Income: | | | | | | | | | | | | | | | | |
Unaffiliated dividend income | | $ | 19,541,453 | | | $ | 15,918,433 | | | $ | 17,062,236 | | | $ | 22,398,043 | |
Affiliated dividend income | | | 5,445 | | | | 1,905 | | | | 159,243 | | | | 89,736 | |
Non-cash dividend income | | | — | | | | — | | | | — | | | | — | |
Securities lending income | | | — | | | | — | | | | 731,197 | | | | 469,958 | |
Foreign withholding tax | | | — | | | | — | | | | — | | | | — | |
| | | | | | | | | | | | | | | | |
Total Income | | | 19,546,898 | | | | 15,920,338 | | | | 17,952,676 | | | | 22,957,737 | |
| | | | | | | | | | | | | | | | |
| | | | |
| Expenses: | | | | | | | | | | | | | | | | |
Unitary management fees | | | 3,204,795 | | | | 2,850,981 | | | | 936,114 | | | | 989,001 | |
| | | | | | | | | | | | | | | | |
Less: Waivers | | | (763 | ) | | | (586 | ) | | | (604 | ) | | | (564 | ) |
| | | | | | | | | | | | | | | | |
Net Expenses | | | 3,204,032 | | | | 2,850,395 | | | | 935,510 | | | | 988,437 | |
| | | | | | | | | | | | | | | | |
Net Investment Income | | | 16,342,866 | | | | 13,069,943 | | | | 17,017,166 | | | | 21,969,300 | |
| | | | | | | | | | | | | | | | |
| | | | |
| Realized and Unrealized Gain (Loss): | | | | | | | | | | | | | | | | |
Net realized gain (loss) from: | | | | | | | | | | | | | | | | |
Investment securities | | | (2,646,099 | ) | | | (1,809,708 | ) | | | 4,497 | | | | (8,112,383 | ) |
In-kind redemptions | | | 104,410,927 | | | | 156,185,417 | | | | 16,922,470 | | | | 19,981,184 | |
| | | | | | | | | | | | | | | | |
Net realized gain (loss) | | | 101,764,828 | | | | 154,375,709 | | | | 16,926,967 | | | | 11,868,801 | |
| | | | | | | | | | | | | | | | |
Net change in unrealized appreciation (depreciation) on investment securities | | | (34,013,957 | ) | | | 27,468,968 | | | | (6,479,260 | ) | | | 9,290,576 | |
| | | | | | | | | | | | | | | | |
Net realized and unrealized gain | | | 67,750,871 | | | | 181,844,677 | | | | 10,447,707 | | | | 21,159,377 | |
| | | | | | | | | | | | | | | | |
Net increase in net assets resulting from operations | | $ | 84,093,737 | | | $ | 194,914,620 | | | $ | 27,464,873 | | | $ | 43,128,677 | |
| | | | | | | | | | | | | | | | |
See accompanying Notes to Financial Statements which are an integral part of the financial statements.
| | | | | | | | | | | | | | | | | | | | | | |
Invesco
KBW Premium Yield Equity REIT
ETF (KBWY) | | | Invesco
KBW Property & Casualty Insurance
ETF (KBWP) | | | Invesco
KBW Regional Banking
ETF (KBWR) | |
Ten Months Ended
August 31, 2018 | | | Year Ended
October 31, 2017 | | | Ten Months Ended
August 31, 2018 | | | Year Ended
October 31, 2017 | | | Ten Months Ended
August 31, 2018 | | | Year Ended
October 31, 2017 | |
| | | | | | | | | | | | | | | | | | | | | | |
| $ | 14,210,379 | | | $ | 12,734,506 | | | $ | 1,756,629 | | | $ | 2,206,908 | | | $ | 3,081,037 | | | $ | 3,875,444 | |
| | 152,076 | | | | 3,576 | | | | 498 | | | | 221 | | | | 1,172 | | | | 548 | |
| | 3,364,193 | | | | — | | | | — | | | | — | | | | — | | | | — | |
| | 43,969 | | | | 39 | | | | — | | | | — | | | | — | | | | — | |
| | — | | | | — | | | | — | | | | — | | | | (6,019 | ) | | | (8,160 | ) |
| | | | | | | | | | | | | | | | | | | | | | |
| | 17,770,617 | | | | 12,738,121 | | | | 1,757,127 | | | | 2,207,129 | | | | 3,076,190 | | | | 3,867,832 | |
| | | | | | | | | | | | | | | | | | | | | | |
| | | | | |
| | | | | | | | | | | | | | | | | | | | | | |
| | 1,128,151 | | | | 1,016,568 | | | | 222,460 | | | | 333,314 | | | | 488,585 | | | | 643,464 | |
| | | | | | | | | | | | | | | | | | | | | | |
| | (768 | ) | | | (954 | ) | | | (71 | ) | | | (76 | ) | | | (159 | ) | | | (174 | ) |
| | | | | | | | | | | | | | | | | | | | | | |
| | 1,127,383 | | | | 1,015,614 | | | | 222,389 | | | | 333,238 | | | | 488,426 | | | | 643,290 | |
| | | | | | | | | | | | | | | | | | | | | | |
| | 16,643,234 | | | | 11,722,507 | | | | 1,534,738 | | | | 1,873,891 | | | | 2,587,764 | | | | 3,224,542 | |
| | | | | | | | | | | | | | | | | | | | | | |
| | | | | |
| | | | | | | | | | | | | | | | | | | | | | |
| | | | | | | �� | | | | | | | | | | | | | | | |
| | (14,943,287 | ) | | | (6,413,833 | ) | | | (3,388,940 | ) | | | (276,854 | ) | | | (1,167,652 | ) | | | (1,721,469 | ) |
| | 8,483,829 | | | | 18,214,590 | | | | 9,908,272 | | | | 5,496,375 | | | | 1,856,067 | | | | 42,728,837 | |
| | | | | | | | | | | | | | | | | | | | | | |
| | (6,459,458 | ) | | | 11,800,757 | | | | 6,519,332 | | | | 5,219,521 | | | | 688,415 | | | | 41,007,368 | |
| | | | | | | | | | | | | | | | | | | | | | |
| | 7,059,557 | | | | 8,428,010 | | | | (2,244,500 | ) | | | 7,305,099 | | | | 9,232,886 | | | | (12,499,936 | ) |
| | | | | | | | | | | | | | | | | | | | | | |
| | 600,099 | | | | 20,228,767 | | | | 4,274,832 | | | | 12,524,620 | | | | 9,921,301 | | | | 28,507,432 | |
| | | | | | | | | | | | | | | | | | | | | | |
| $ | 17,243,333 | | | $ | 31,951,274 | | | $ | 5,809,570 | | | $ | 14,398,511 | | | $ | 12,509,065 | | | $ | 31,731,974 | |
| | | | | | | | | | | | | | | | | | | | | | |
Statements of Changes in Net Assets
For the period November 1, 2017 through August 31, 2018 and years ended October 31, 2017 and 2016
| | | | | | | | | | | | | | | | | | | | | | | | |
| | | Invesco
KBW Bank
ETF (KBWB) | | | Invesco
KBW High Dividend Yield Financial
ETF (KBWD) | |
| | | Ten Months Ended
August 31, 2018 | | | Year Ended
October 31, 2017 | | | Year Ended
October 31, 2016 | | | Ten Months Ended
August 31, 2018 | | | Year Ended
October 31, 2017 | | | Year Ended
October 31, 2016 | |
| Operations: | | | | | | | | | | | | | | | | | | | | | | | | |
Net investment income | | $ | 16,342,866 | | | $ | 13,069,943 | | | $ | 7,791,054 | | | $ | 17,017,166 | | | $ | 21,969,300 | | | $ | 15,845,554 | |
Net realized gain (loss) | | | 101,764,828 | | | | 154,375,709 | | | | (12,624,177 | ) | | | 16,926,967 | | | | 11,868,801 | | | | (35,525,957 | ) |
Net change in unrealized appreciation (depreciation) | | | (34,013,957 | ) | | | 27,468,968 | | | | 10,087,559 | | | | (6,479,260 | ) | | | 9,290,576 | | | | 19,019,996 | |
| | | | | | | | | | | | | | | | | | | | | | | | |
Net increase (decrease) in net assets resulting from operations | | | 84,093,737 | | | | 194,914,620 | | | | 5,254,436 | | | | 27,464,873 | | | | 43,128,677 | | | | (660,407 | ) |
| | | | | | | | | | | | | | | | | | | | | | | | |
| | | | | | |
| Distributions to Shareholders from: | | | | | | | | | | | | | | | | | | | | | | | | |
Net investment income | | | (13,953,911 | ) | | | (11,970,916 | ) | | | (8,225,074 | ) | | | (22,966,897 | ) | | | (22,432,879 | ) | | | (18,056,090 | ) |
Net realized gains | | | — | | | | — | | | | — | | | | — | | | | — | | | | — | |
Return of capital | | | — | | | | — | | | | — | | | | — | | | | (2,226,939 | ) | | | (1,310,772 | ) |
| | | | | | | | | | | | | | | | | | | | | | | | |
Total distributions to shareholders | | | (13,953,911 | ) | | | (11,970,916 | ) | | | (8,225,074 | ) | | | (22,966,897 | ) | | | (24,659,818 | ) | | | (19,366,862 | ) |
| | | | | | | | | | | | | | | | | | | | | | | | |
| Shareholder Transactions: | | | | | | | | | | | | | | | | | | | | | | | | |
Proceeds from shares sold | | | 1,638,315,299 | | | | 2,366,524,964 | | | | 792,589,249 | | | | 108,478,207 | | | | 178,272,224 | | | | 98,967,320 | |
Value of shares repurchased | | | (1,617,247,032 | ) | | | (2,047,550,740 | ) | | | (919,116,603 | ) | | | (88,207,774 | ) | | | (98,332,179 | ) | | | (135,253,331 | ) |
| | | | | | | | | | | | | | | | | | | | | | | | |
Net increase (decrease) in net assets resulting from shares transactions | | | 21,068,267 | | | | 318,974,224 | | | | (126,527,354 | ) | | | 20,270,433 | | | | 79,940,045 | | | | (36,286,011 | ) |
| | | | | | | | | | | | | | | | | | | | | | | | |
Increase (Decrease) in Net Assets | | | 91,208,093 | | | | 501,917,928 | | | | (129,497,992 | ) | | | 24,768,409 | | | | 98,408,904 | | | | (56,313,280 | ) |
| | | | | | | | | | | | | | | | | | | | | | | | |
| Net Assets: | | | | | | | | | | | | | | | | | | | | | | | | |
Beginning of period | | | 932,051,546 | | | | 430,133,618 | | | | 559,631,610 | | | | 319,788,030 | | | | 221,379,126 | | | | 277,692,406 | |
| | | | | | | | | | | | | | | | | | | | | | | | |
End of period | | $ | 1,023,259,639 | | | $ | 932,051,546 | | | $ | 430,133,618 | | | $ | 344,556,439 | | | $ | 319,788,030 | | | $ | 221,379,126 | |
| | | | | | | | | | | | | | | | | | | | | | | | |
Undistributed net investment income at end of period | | $ | 4,417,021 | | | $ | 2,028,066 | | | $ | 929,039 | | | $ | — | | | $ | — | | | $ | — | |
| | | | | | | | | | | | | | | | | | | | | | | | |
| | | | | | |
| Changes in Shares Outstanding: | | | | | | | | | | | | | | | | | | | | | | | | |
Shares sold | | | 29,550,000 | | | | 49,150,000 | | | | 22,400,000 | | | | 4,650,000 | | | | 7,600,000 | | | | 4,550,000 | |
Shares repurchased | | | (29,400,000 | ) | | | (42,550,000 | ) | | | (26,150,000 | ) | | | (3,750,000 | ) | | | (4,250,000 | ) | | | (6,650,000 | ) |
Shares outstanding, beginning of period | | | 17,800,000 | | | | 11,200,000 | | | | 14,950,000 | | | | 13,650,000 | | | | 10,300,000 | | | | 12,400,000 | |
| | | | | | | | | | | | | | | | | | | | | | | | |
Shares outstanding, end of period | | | 17,950,000 | | | | 17,800,000 | | | | 11,200,000 | | | | 14,550,000 | | | | 13,650,000 | | | | 10,300,000 | |
| | | | | | | | | | | | | | | | | | | | | | | | |
See accompanying Notes to Financial Statements which are an integral part of the financial statements.
| | | | | | | | | | | | | | | | | | | | | | |
Invesco
KBW Premium Yield Equity REIT
ETF (KBWY) | | | Invesco
KBW Property & Casualty Insurance
ETF (KBWP) | |
Ten Months Ended
August 31, 2018 | | | Year Ended
October 31, 2017 | | | Year Ended
October 31, 2016 | | | Ten Months Ended
August 31, 2018 | | | Year Ended
October 31, 2017 | | | Year Ended
October 31, 2016 | |
| | | | | | | | | | | | | | | | | | | | | | |
| $ | 16,643,234 | | | $ | 11,722,507 | | | $ | 6,420,290 | | | $ | 1,534,738 | | | $ | 1,873,891 | | | $ | 1,721,055 | |
| | (6,459,458 | ) | | | 11,800,757 | | | | 1,367,377 | | | | 6,519,332 | | | | 5,219,521 | | | | 3,869,718 | |
| | 7,059,557 | | | | 8,428,010 | | | | 2,720,795 | | | | (2,244,500 | ) | | | 7,305,099 | | | | (1,722,440 | ) |
| | | | | | | | | | | | | | | | | | | | | | |
| | 17,243,333 | | |
|
31,951,274 |
| | | 10,508,462 | | | | 5,809,570 | | | | 14,398,511 | | | | 3,868,333 | |
| | | | | | | | | | | | | | | | | | | | | | |
| | | | | |
| | | | | | | | | | | | | | | | | | | | | | |
| | (24,220,997 | ) | | | (20,246,066 | ) | | | (10,877,502 | ) | | | (1,596,854 | ) | | | (1,799,966 | ) | | | (1,590,127 | ) |
| | — | | | | — | | | | — | | | | — | | | | — | | | | (84,880 | ) |
| | — | | | | — | | | | — | | | | — | | | | — | | | | — | |
| | | | | | | | | | | | | | | | | | | | | | |
| | (24,220,997 | ) | | | (20,246,066 | ) | | | (10,877,502 | ) | | | (1,596,854 | ) | | | (1,799,966 | ) | | | (1,675,007 | ) |
| | | | | | | | | | | | | | | | | | | | | | |
| | | | | | | | | | | | | | | | | | | | | | |
| | 141,589,335 | | | | 250,699,457 | | | | 201,750,993 | | | | 18,244,467 | | | | 58,787,740 | | | | 53,368,691 | |
| | (73,506,565 | ) | | | (69,808,620 | ) | | | (123,235,903 | ) | | | (53,879,098 | ) | | | (35,934,148 | ) | | | (79,380,432 | ) |
| | | | | | | | | | | | | | | | | | | | | | |
| | 68,082,770 | | |
|
180,890,837 |
| | | 78,515,090 | | | | (35,634,631 | ) | | | 22,853,592 | | | | (26,011,741 | ) |
| | | | | | | | | | | | | | | | | | | | | | |
| | 61,105,106 | | | | 192,596,045 | | | | 78,146,050 | | | | (31,421,915 | ) | | | 35,452,137 | | | | (23,818,415 | ) |
| | | | | | | | | | | | | | | | | | | | | | |
| | | | | | | | | | | | | | | | | | | | | | |
| | 381,021,344 | | | | 188,425,299 | | | | 110,279,249 | | | | 98,461,743 | | | | 63,009,606 | | | | 86,828,021 | |
| | | | | | | | | | | | | | | | | | | | | | |
| $ | 442,126,450 | | | $ | 381,021,344 | | | $ | 188,425,299 | | | $ | 67,039,828 | | | $ | 98,461,743 | | | $ | 63,009,606 | |
| | | | | | | | | | | | | | | | | | | | | | |
| $ | — | | |
$ |
— |
| | $ | — | | | $ | 210,388 | | | $ | 272,504 | | | $ | 198,579 | |
| | | | | | | | | | | | | | | | | | | | | | |
| | | | | |
| | | | | | | | | | | | | | | | | | | | | | |
| | 4,050,000 | | | | 6,750,000 | | | | 5,800,000 | | | | 300,000 | | | | 1,050,000 | | | | 1,100,000 | |
| | (2,100,000 | ) | | | (1,900,000 | ) | | | (3,750,000 | ) | | | (900,000 | ) | | | (650,000 | ) | | | (1,650,000 | ) |
| | 10,400,000 | | | | 5,550,000 | | | | 3,500,000 | | | | 1,650,000 | | | | 1,250,000 | | | | 1,800,000 | |
| | | | | | | | | | | | | | | | | | | | | | |
| | 12,350,000 | | | | 10,400,000 | | | | 5,550,000 | | | | 1,050,000 | | | | 1,650,000 | | | | 1,250,000 | |
| | | | | | | | | | | | | | | | | | | | | | |
Statements of Changes in Net Assets (continued)
For the period November 1, 2017 through August 31, 2018 and years ended October 31, 2017 and 2016
| | | | | | | | | | | | |
| | | Invesco
KBW Regional Banking
ETF (KBWR) | |
| | | Ten Months Ended
August 31, 2018 | | | Year Ended
October 31, 2017 | | | Year Ended
October 31, 2016 | |
| Operations: | | | | | | | | | | | | |
Net investment income | | $ | 2,587,764 | | | $ | 3,224,542 | | | $ | 2,001,469 | |
Net realized gain (loss) | | | 688,415 | | | | 41,007,368 | | | | (592,347 | ) |
Net change in unrealized appreciation (depreciation) | | | 9,232,886 | | | | (12,499,936 | ) | | | 9,554,208 | |
| | | | | | | | | | | | |
Net increase in net assets resulting from operations | | | 12,509,065 | | | | 31,731,974 | | | | 10,963,330 | |
| | | | | | | | | | | | |
| | | |
| Distributions to Shareholders from: | | | | | | | | | | | | |
Net investment income | | | (2,158,780 | ) | | | (3,136,776 | ) | | | (1,882,396 | ) |
| | | | | | | | | | | | |
| Shareholder Transactions: | | | | | | | | | | | | |
Proceeds from shares sold | | | 64,182,760 | | | | 301,117,371 | | | | 88,644,290 | |
Value of shares repurchased | | | (28,049,508 | ) | | | (317,540,491 | ) | | | (14,038,950 | ) |
| | | | | | | | | | | | |
Net increase (decrease) in net assets resulting from shares transactions | | | 36,133,252 | | | | (16,423,120 | ) | | | 74,605,340 | |
| | | | | | | | | | | | |
Increase in Net Assets | | | 46,483,537 | | | | 12,172,078 | | | | 83,686,274 | |
| | | | | | | | | | | | |
| Net Assets: | | | | | | | | | | | | |
Beginning of period | | | 148,854,069 | | | | 136,681,991 | | | | 52,995,717 | |
| | | | | | | | | | | | |
End of period | | $ | 195,337,606 | | | $ | 148,854,069 | | | $ | 136,681,991 | |
| | | | | | | | | | | | |
Undistributed net investment income at end of period | | $ | 775,338 | | | $ | 346,354 | | | $ | 258,588 | |
| | | | | | | | | | | | |
| | | |
| Changes in Shares Outstanding: | | | | | | | | | | | | |
Shares sold | | | 1,100,000 | | | | 5,500,000 | | | | 2,200,000 | |
Shares repurchased | | | (500,000 | ) | | | (5,900,000 | ) | | | (350,000 | ) |
Shares outstanding, beginning of period | | | 2,700,000 | | | | 3,100,000 | | | | 1,250,000 | |
| | | | | | | | | | | | |
Shares outstanding, end of period | | | 3,300,000 | | | | 2,700,000 | | | | 3,100,000 | |
| | | | | | | | | | | | |
See accompanying Notes to Financial Statements which are an integral part of the financial statements.
Financial Highlights
Invesco KBW Bank ETF (KBWB)
| | | | | | | | | | | | | | | | | | | | | | | | |
| | | Ten Months Ended
August 31, 2018 | | | Year Ended October 31, | |
| | | 2017 | | | 2016 | | | 2015 | | | 2014 | | | 2013 | |
| Per Share Operating Performance: | | | | | | | | | | | | | | | | | | | | | | | | |
Net asset value at beginning of period | | $ | 52.36 | | | $ | 38.40 | | | $ | 37.43 | | | $ | 37.12 | | | $ | 33.00 | | | $ | 25.44 | |
Net investment income(a) | | | 0.83 | | | | 0.77 | | | | 0.68 | | | | 0.66 | | | | 0.55 | | | | 0.45 | |
Net realized and unrealized gain on investments | | | 4.51 | | | | 13.92 | | | | 0.98 | | | | 0.22 | | | | 4.11 | | | | 7.52 | |
Total from investment operations | | | 5.34 | | | | 14.69 | | | | 1.66 | | | | 0.88 | | | | 4.66 | | | | 7.97 | |
Distributions to shareholders from: | | | | | | | | | | | | | | | | | | | | | | | | |
Net investment income | | | (0.69 | ) | | | (0.73 | ) | | | (0.69 | ) | | | (0.55 | ) | | | (0.54 | ) | | | (0.41 | ) |
Net realized gains | | | — | | | | — | | | | — | | | | (0.02 | ) | | | — | | | | — | |
Total distributions | | | (0.69 | ) | | | (0.73 | ) | | | (0.69 | ) | | | (0.57 | ) | | | (0.54 | ) | | | (0.41 | ) |
Net asset value at end of period | | $ | 57.01 | | | $ | 52.36 | | | $ | 38.40 | | | $ | 37.43 | | | $ | 37.12 | | | $ | 33.00 | |
Market price at end of period(b) | | $ | 57.01 | | | $ | 52.39 | | | $ | 38.44 | | | $ | 37.49 | | | $ | 37.13 | | | $ | 33.03 | |
| Net Asset Value Total Return(c) | | | 10.24 | % | | | 38.42 | % | | | 4.61 | % | | | 2.35 | % | | | 14.16 | % | | | 31.51 | % |
| Market Price Total Return(c) | | | 10.18 | % | | | 38.36 | % | | | 4.55 | % | | | 2.49 | % | | | 14.09 | % | | | 31.52 | % |
| Ratios/Supplemental Data: | | | | | | | | | | | | | | | | | | | | | | | | |
Net assets at end of period (000’s omitted) | | $ | 1,023,260 | | | $ | 932,052 | | | $ | 430,134 | | | $ | 559,632 | | | $ | 289,536 | | | $ | 150,169 | |
Ratio to average net assets of: | | | | | | | | | | | | | | | | | | | | | | | | |
Expenses | | | 0.35 | %(d) | | | 0.35 | % | | | 0.35 | % | | | 0.35 | % | | | 0.35 | % | | | 0.35 | % |
Net investment income | | | 1.78 | %(d) | | | 1.60 | % | | | 1.92 | % | | | 1.74 | % | | | 1.55 | % | | | 1.51 | % |
Portfolio turnover rate(e) | | | 7 | % | | | 9 | % | | | 12 | % | | | 17 | % | | | 5 | % | | | 8 | % |
| (a) | Based on average shares outstanding. |
| (b) | The mean between the last bid and ask prices. |
| (c) | Net asset value total return is calculated assuming an initial investment made at the net asset value at the beginning of the period, reinvestment of all dividends and distributions at net asset value during the period, and redemption on the last day of the period. Net asset value total return includes adjustments in accordance with accounting principles generally accepted in the United States of America and as such, the net asset value for financial reporting purposes and the returns based upon those net asset values may differ from the net asset value and returns for shareholder transactions. Market price total return is calculated assuming an initial investment made at the market price at the beginning of the period, reinvestment of all dividends and distributions at market price during the period, and sale at the market price on the last day of the period. Total investment returns calculated for a period of less than one year are not annualized. |
| (e) | Portfolio turnover rate is not annualized for periods less than one year, if applicable, and does not include securities received or delivered from processing creations or redemptions. |
Invesco KBW High Dividend Yield Financial ETF (KBWD)
| | | | | | | | | | | | | | | | | | | | | | | | |
| | | Ten Months Ended
August 31, 2018 | | | Year Ended October 31, | |
| | | 2017 | | | 2016 | | | 2015 | | | 2014 | | | 2013 | |
| Per Share Operating Performance: | | | | | | | | | | | | | | | | | | | | | | | | |
Net asset value at beginning of period | | $ | 23.43 | | | $ | 21.49 | | | $ | 22.39 | | | $ | 25.81 | | | $ | 25.20 | | | $ | 23.91 | |
Net investment income(a) | | | 1.23 | | | | 1.84 | | | | 1.57 | | | | 1.75 | | | | 2.04 | (b) | | | 1.90 | |
Net realized and unrealized gain (loss) on investments | | | 0.69 | | | | 2.16 | | | | (0.53 | ) | | | (3.22 | ) | | | 0.62 | | | | 1.37 | |
Total from investment operations | | | 1.92 | | | | 4.00 | | | | 1.04 | | | | (1.47 | ) | | | 2.66 | | | | 3.27 | |
Distributions to shareholders from: | | | | | | | | | | | | | | | | | | | | | | | | |
Net investment income | | | (1.67 | ) | | | (1.88 | ) | | | (1.81 | ) | | | (1.87 | ) | | | (2.05 | ) | | | (1.98 | ) |
Return of capital | | | — | | | | (0.18 | ) | | | (0.13 | ) | | | (0.08 | ) | | | — | | | | — | |
Total distributions | | | (1.67 | ) | | | (2.06 | ) | | | (1.94 | ) | | | (1.95 | ) | | | (2.05 | ) | | | (1.98 | ) |
Net asset value at end of period | | $ | 23.68 | | | $ | 23.43 | | | $ | 21.49 | | | $ | 22.39 | | | $ | 25.81 | | | $ | 25.20 | |
Market price at end of period(c) | | $ | 23.69 | | | $ | 23.46 | | | $ | 21.51 | | | $ | 22.39 | | | $ | 25.82 | | | $ | 25.24 | |
| Net Asset Value Total Return(d) | | | 8.57 | % | | | 18.95 | % | | | 5.46 | % | | | (6.08 | )% | | | 11.05 | % | | | 14.21 | % |
| Market Price Total Return(d) | | | 8.47 | % | | | 18.99 | % | | | 5.56 | % | | | (6.12 | )% | | | 10.91 | % | | | 14.62 | % |
| Ratios/Supplemental Data: | | | | | | | | | | | | | | | | | | | | | | | | |
Net assets at end of period (000’s omitted) | | $ | 344,556 | | | $ | 319,788 | | | $ | 221,379 | | | $ | 277,692 | | | $ | 272,257 | | | $ | 234,348 | |
Ratio to average net assets of: | | | | | | | | | | | | | | | | | | | | | | | | |
Expenses(e) | | | 0.35 | %(f) | | | 0.35 | % | | | 0.35 | % | | | 0.35 | % | | | 0.35 | % | | | 0.37 | % |
Net investment income | | | 6.36 | %(f) | | | 7.77 | % | | | 7.45 | % | | | 7.15 | % | | | 8.00 | %(b) | | | 7.64 | % |
Portfolio turnover rate(g) | | | 46 | % | | | 52 | % | | | 113 | % | | | 49 | % | | | 30 | % | | | 37 | % |
| (a) | Based on average shares outstanding. |
| (b) | Net investment income per share and the ratio of net investment income to average net assets include a significant dividend during the year. Net investment income per share and the ratio of net investment income to average net excluding the significant dividend are $1.90 and 7.47%, respectively. |
| (c) | The mean between the last bid and ask prices. |
| (d) | Net asset value total return is calculated assuming an initial investment made at the net asset value at the beginning of the period, reinvestment of all dividends and distributions at net asset value during the period, and redemption on the last day of the period. Net asset value total return includes adjustments in accordance with accounting principles generally accepted in the United States of America and as such, the net asset value for financial reporting purposes and the returns based upon those net asset values may differ from the net asset value and returns for shareholder transactions. Market price total return is calculated assuming an initial investment made at the market price at the beginning of the period, reinvestment of all dividends and distributions at market price during the period, and sale at the market price on the last day of the period. Total investment returns calculated for a period of less than one year are not annualized. |
| (e) | In addition to the fees and expenses which the Fund bears directly, the Fund indirectly bears a pro rata share of the fees and expenses of the investment companies in which the Fund invests. Estimated investment companies’ expenses are not expenses that are incurred directly by the Fund. They are expenses that are incurred directly by the investment companies and are deducted from the value of the investment companies the Fund invests in. The effect of the estimated investment companies’ expenses that the Fund bears indirectly is included in the Fund’s total return. |
| (g) | Portfolio turnover rate is not annualized for periods less than one year, if applicable, and does not include securities received or delivered from processing creations or redemptions. |
See accompanying Notes to Financial Statements which are an integral part of the financial statements.
Financial Highlights (continued)
Invesco KBW Premium Yield Equity REIT ETF (KBWY)
| | | | | | | | | | | | | | | | | | | | | | | | |
| | | Ten Months Ended
August 31, 2018 | | | Year Ended October 31, | |
| | | 2017 | | | 2016 | | | 2015 | | | 2014 | | | 2013 | |
| Per Share Operating Performance: | | | | | | | | | | | | | | | | | | | | | | | | |
Net asset value at beginning of period | | $ | 36.64 | | | $ | 33.95 | | | $ | 31.51 | | | $ | 33.83 | | | $ | 31.32 | | | $ | 27.13 | |
Net investment income(a) | | | 1.45 | | | | 1.49 | | | | 1.40 | | | | 1.19 | | | | 1.07 | | | | 0.89 | |
Net realized and unrealized gain (loss) on investments | | | (0.18 | ) | | | 3.78 | | | | 3.36 | | | | (1.80 | ) | | | 3.01 | | | | 4.76 | |
Total from investment operations | | | 1.27 | | | | 5.27 | | | | 4.76 | | | | (0.61 | ) | | | 4.08 | | | | 5.65 | |
Distributions to shareholders from: | | | | | | | | | | | | | | | | | | | | | | | | |
Net investment income | | | (2.11 | ) | | | (2.58 | ) | | | (2.32 | ) | | | (1.71 | ) | | | (1.57 | ) | | | (1.46 | ) |
Net asset value at end of period | | $ | 35.80 | | | $ | 36.64 | | | $ | 33.95 | | | $ | 31.51 | | | $ | 33.83 | | | $ | 31.32 | |
Market price at end of period(b) | | $ | 35.80 | | | $ | 36.67 | | | $ | 33.95 | | | $ | 31.52 | | | $ | 33.82 | | | $ | 31.38 | |
| Net Asset Value Total Return(c) | | | 4.05 | % | | | 15.71 | % | | | 15.68 | % | | | (1.94 | )% | | | 13.51 | % | | | 21.11 | % |
| Market Price Total Return(c) | | | 3.95 | % | | | 15.79 | % | | | 15.64 | % | | | (1.88 | )% | | | 13.27 | % | | | 21.42 | % |
| Ratios/Supplemental Data: | | | | | | | | | | | | | | | | | | | | | | | | |
Net assets at end of period (000’s omitted) | | $ | 442,126 | | | $ | 381,021 | | | $ | 188,425 | | | $ | 110,279 | | | $ | 98,103 | | | $ | 68,908 | |
Ratio to average net assets of: | | | | | | | | | | | | | | | | | | | | | | | | |
Expenses | | | 0.35 | %(d) | | | 0.35 | % | | | 0.35 | % | | | 0.35 | % | | | 0.35 | % | | | 0.36 | % |
Net investment income | | | 5.16 | %(d) | | | 4.04 | % | | | 4.18 | % | | | 3.58 | % | | | 3.39 | % | | | 2.85 | % |
Portfolio turnover rate(e) | | | 53 | % | | | 61 | % | | | 87 | % | | | 25 | % | | | 27 | % | | | 21 | % |
| (a) | Based on average shares outstanding. |
| (b) | The mean between the last bid and ask prices. |
| (c) | Net asset value total return is calculated assuming an initial investment made at the net asset value at the beginning of the period, reinvestment of all dividends and distributions at net asset value during the period, and redemption on the last day of the period. Net asset value total return includes adjustments in accordance with accounting principles generally accepted in the United States of America and as such, the net asset value for financial reporting purposes and the returns based upon those net asset values may differ from the net asset value and returns for shareholder transactions. Market price total return is calculated assuming an initial investment made at the market price at the beginning of the period, reinvestment of all dividends and distributions at market price during the period, and sale at the market price on the last day of the period. Total investment returns calculated for a period of less than one year are not annualized. |
| (e) | Portfolio turnover rate is not annualized for periods less than one year, if applicable, and does not include securities received or delivered from processing creations or redemptions. |
Invesco KBW Property & Casualty Insurance ETF (KBWP)
| | | | | | | | | | | | | | | | | | | | | | | | |
| | | Ten Months Ended
August 31, 2018 | | | Year Ended October 31, | |
| | | 2017 | | | 2016 | | | 2015 | | | 2014 | | | 2013 | |
| Per Share Operating Performance: | | | | | | | | | | | | | | | | | | | | | | | | |
Net asset value at beginning of period | | $ | 59.67 | | | $ | 50.41 | | | $ | 48.24 | | | $ | 41.27 | | | $ | 38.07 | | | $ | 30.25 | |
Net investment income(a) | | | 1.22 | | | | 1.12 | | | | 1.08 | | | | 0.75 | | | | 0.88 | | | | 0.59 | |
Net realized and unrealized gain on investments | | | 4.06 | | | | 9.23 | | | | 2.06 | | | | 7.10 | | | | 3.29 | | | | 8.09 | |
Total from investment operations | | | 5.28 | | | | 10.35 | | | | 3.14 | | | | 7.85 | | | | 4.17 | | | | 8.68 | |
Distributions to shareholders from: | | | | | | | | | | | | | | | | | | | | | | | | |
Net investment income | | | (1.10 | ) | | | (1.09 | ) | | | (0.93 | ) | | | (0.78 | ) | | | (0.92 | ) | | | (0.86 | ) |
Net realized gains | | | — | | | | — | | | | (0.04 | ) | | | (0.10 | ) | | | (0.05 | ) | | | — | |
Total distributions | | | (1.10 | ) | | | (1.09 | ) | | | (0.97 | ) | | | (0.88 | ) | | | (0.97 | ) | | | (0.86 | ) |
Net asset value at end of period | | $ | 63.85 | | | $ | 59.67 | | | $ | 50.41 | | | $ | 48.24 | | | $ | 41.27 | | | $ | 38.07 | |
Market price at end of period(b) | | $ | 63.92 | | | $ | 59.68 | | | $ | 50.44 | | | $ | 48.36 | | | $ | 41.27 | | | $ | 38.09 | |
| Net Asset Value Total Return(c) | | | 8.99 | % | | | 20.68 | % | | | 6.63 | % | | | 19.31 | % | | | 11.17 | % | | | 29.33 | % |
| Market Price Total Return(c) | | | 9.09 | % | | | 20.63 | % | | | 6.43 | % | | | 19.60 | % | | | 11.12 | % | | | 29.44 | % |
| Ratios/Supplemental Data: | | | | | | | | | | | | | | | | | | | | | | | | |
Net assets at end of period (000’s omitted) | | $ | 67,040 | | | $ | 98,462 | | | $ | 63,010 | | | $ | 86,828 | | | $ | 10,319 | | | $ | 20,937 | |
Ratio to average net assets of: | | | | | | | | | | | | | | | | | | | | | | | | |
Expenses | | | 0.35 | %(d) | | | 0.35 | % | | | 0.35 | % | | | 0.35 | % | | | 0.35 | % | | | 0.36 | % |
Net investment income | | | 2.41 | %(d) | | | 1.97 | % | | | 2.23 | % | | | 1.69 | % | | | 2.30 | % | | | 1.69 | % |
Portfolio turnover rate(e) | | | 22 | % | | | 16 | % | | | 20 | % | | | 35 | % | | | 4 | % | | | 12 | % |
| (a) | Based on average shares outstanding. |
| (b) | The mean between the last bid and ask prices. |
| (c) | Net asset value total return is calculated assuming an initial investment made at the net asset value at the beginning of the period, reinvestment of all dividends and distributions at net asset value during the period, and redemption on the last day of the period. Net asset value total return includes adjustments in accordance with accounting principles generally accepted in the United States of America and as such, the net asset value for financial reporting purposes and the returns based upon those net asset values may differ from the net asset value and returns for shareholder transactions. Market price total return is calculated assuming an initial investment made at the market price at the beginning of the period, reinvestment of all dividends and distributions at market price during the period, and sale at the market price on the last day of the period. Total investment returns calculated for a period of less than one year are not annualized. |
| (e) | Portfolio turnover rate is not annualized for periods less than one year, if applicable, and does not include securities received or delivered from processing creations or redemptions. |
See accompanying Notes to Financial Statements which are an integral part of the financial statements.
Financial Highlights (continued)
Invesco KBW Regional Banking ETF (KBWR)
| | | | | | | | | | | | | | | | | | | | | | | | |
| | | Ten Months Ended
August 31, 2018 | | | Year Ended October 31, | |
| | | 2017 | | | 2016 | | | 2015 | | | 2014 | | | 2013 | |
| Per Share Operating Performance: | | | | | | | | | | | | | | | | | | | | | | | | |
Net asset value at beginning of period | | $ | 55.13 | | | $ | 44.09 | | | $ | 42.40 | | | $ | 39.21 | | | $ | 36.92 | | | $ | 27.67 | |
Net investment income(a) | | | 0.89 | | | | 0.94 | | | | 0.87 | | | | 0.80 | | | | 0.68 | | | | 0.66 | |
Net realized and unrealized gain on investments | | | 3.94 | | | | 10.96 | | | | 1.63 | | | | 3.17 | | | | 2.28 | | | | 9.12 | |
Total from investment operations | | | 4.83 | | | | 11.90 | | | | 2.50 | | | | 3.97 | | | | 2.96 | | | | 9.78 | |
Distributions to shareholders from: | | | | | | | | | | | | | | | | | | | | | | | | |
Net investment income | | | (0.77 | ) | | | (0.86 | ) | | | (0.81 | ) | | | (0.78 | ) | | | (0.67 | ) | | | (0.53 | ) |
Net asset value at end of period | | $ | 59.19 | | | $ | 55.13 | | | $ | 44.09 | | | $ | 42.40 | | | $ | 39.21 | | | $ | 36.92 | |
Market price at end of period(b) | | $ | 59.19 | | | $ | 55.20 | | | $ | 44.15 | | | $ | 42.42 | | | $ | 39.21 | | | $ | 36.96 | |
| Net Asset Value Total Return(c) | | | 8.79 | % | | | 27.06 | % | | | 6.05 | % | | | 10.24 | % | | | 8.03 | % | | | 35.80 | % |
| Market Price Total Return(c) | | | 8.65 | % | | | 27.05 | % | | | 6.14 | % | | | 10.29 | % | | | 7.91 | % | | | 35.94 | % |
| Ratios/Supplemental Data: | | | | | | | | | | | | | | | | | | | | | | | | |
Net assets at end of period (000’s omitted) | | $ | 195,338 | | | $ | 148,854 | | | $ | 136,682 | | | $ | 52,996 | | | $ | 35,292 | | | $ | 33,225 | |
Ratio to average net assets of: | | | | | | | | | | | | | | | | | | | | | | | | |
Expenses | | | 0.35 | %(d) | | | 0.35 | % | | | 0.35 | % | | | 0.35 | % | | | 0.35 | % | | | 0.35 | % |
Net investment income | | | 1.85 | %(d) | | | 1.75 | % | | | 2.11 | % | | | 1.97 | % | | | 1.80 | % | | | 2.05 | % |
Portfolio turnover rate(e) | | | 14 | % | | | 21 | % | | | 23 | % | | | 25 | % | | | 13 | % | | | 7 | % |
| (a) | Based on average shares outstanding. |
| (b) | The mean between the last bid and ask prices. |
| (c) | Net asset value total return is calculated assuming an initial investment made at the net asset value at the beginning of the period, reinvestment of all dividends and distributions at net asset value during the period, and redemption on the last day of the period. Net asset value total return includes adjustments in accordance with accounting principles generally accepted in the United States of America and as such, the net asset value for financial reporting purposes and the returns based upon those net asset values may differ from the net asset value and returns for shareholder transactions. Market price total return is calculated assuming an initial investment made at the market price at the beginning of the period, reinvestment of all dividends and distributions at market price during the period, and sale at the market price on the last day of the period. Total investment returns calculated for a period of less than one year are not annualized. |
| (e) | Portfolio turnover rate is not annualized for periods less than one year, if applicable, and does not include securities received or delivered from processing creations or redemptions. |
See accompanying Notes to Financial Statements which are an integral part of the financial statements.
Notes to Financial Statements
Invesco Exchange-Traded Fund Trust II
August 31, 2018
Note 1. Organization
Invesco Exchange-Traded Fund Trust II (the “Trust”), formerly PowerShares Exchange-Traded Fund Trust II, was organized as a Massachusetts business trust on October 10, 2006 and is authorized to have multiple series of portfolios. The Trust is an open-end management investment company registered under the Investment Company Act of 1940, as amended (the “1940 Act”). This report includes the following portfolios:
| | |
Full Name | | Short Name |
| Invesco KBW Bank ETF (KBWB) | | “KBW Bank ETF” |
| Invesco KBW High Dividend Yield Financial ETF (KBWD) | | “KBW High Dividend Yield Financial ETF” |
| Invesco KBW Premium Yield Equity REIT ETF (KBWY) | | “KBW Premium Yield Equity REIT ETF” |
| Invesco KBW Property & Casualty Insurance ETF (KBWP) | | “KBW Property & Casualty Insurance ETF” |
| Invesco KBW Regional Banking ETF (KBWR) | | “KBW Regional Banking ETF” |
Each portfolio (each, a “Fund”, and collectively, the “Funds”) represents a separate series of the Trust. The shares of the Funds are referred to herein as “Shares” or “Fund’s Shares.” Each Fund’s Shares are listed and traded on The NASDAQ Stock Market LLC.
Effective June 4, 2018, the Funds’ names changed as part of an overall rebranding strategy whereby the PowerShares name was changed to the Invesco brand. This resulted in all references to the PowerShares name being changed to Invesco.
Effective August 31, 2018, each Fund’s fiscal year-end changed from October 31 to August 31.
The market price of each Share may differ to some degree from a Fund’s net asset value (“NAV”). Unlike conventional mutual funds, each Fund issues and redeems Shares on a continuous basis, at NAV, only in a large specified number of Shares, each called a “Creation Unit.” Creation Units are issued and redeemed principally in exchange for the deposit or delivery of a basket of securities (“Deposit Securities”). Except when aggregated in Creation Units by Authorized Participants, the Shares are not individually redeemable securities of the Funds.
The investment objective of each Fund is to seek to track the investment results (before fees and expenses) of its respective index listed below (each, an “Underlying Index”):
| | |
Fund | | Underlying Index |
| KBW Bank ETF | | KBW Nasdaq Bank Index |
| KBW High Dividend Yield Financial ETF | | KBW Nasdaq Financial Sector Dividend Yield Index |
| KBW Premium Yield Equity REIT ETF | | KBW Nasdaq Premium Yield Equity REIT Index |
| KBW Property & Casualty Insurance ETF | | KBW Nasdaq Property & Casualty Index |
| KBW Regional Banking ETF | | KBW Nasdaq Regional Banking Index |
Note 2. Significant Accounting Policies
The following is a summary of the significant accounting policies followed by the Funds in preparation of their financial statements.
Each Fund is an investment company and accordingly follows the investment company accounting and reporting guidance in accordance with Financial Accounting Standards Board Accounting Standards Codification Topic 946, Financial Services—Investment Companies.
A. Security Valuation
Securities, including restricted securities, are valued according to the following policies:
A security listed or traded on an exchange (except convertible securities) is generally valued at its last sales price or official closing price as of the close of the customary trading session on the exchange where the security is principally traded or, lacking any sales or official closing price on a particular day, the security may be valued at the closing bid price on that day. Securities traded in the over-the-counter market are valued based on prices furnished by independent pricing services or market makers. When such securities are valued by an independent pricing service they may be considered fair valued. Futures contracts are valued at the final settlement price set by an exchange on which they are principally traded. Listed options are valued at the mean between the last bid and asked prices from the exchange on which they are principally traded, or at the final settlement price set by such exchange. Swaps and options not listed on an exchange are valued by an independent source. For purposes of determining NAV per Share, futures and option contracts generally are valued 15 minutes after the close of the customary trading session of the New York Stock Exchange (“NYSE”).
Investment companies are valued using such company’s NAV per share, unless the shares are exchange-traded, in which case they are valued at the last sales price or official closing price as of the close of the customary trading session on the exchange where the security is principally traded.
Debt obligations (including convertible securities) and unlisted equities are fair valued using an evaluated quote provided by an independent pricing service. Evaluated quotes provided by the pricing service may be determined without exclusive reliance on quoted prices, and may reflect appropriate factors such as institution-size trading in similar groups of securities, developments related to specific securities, dividend rate (for unlisted equities), yield (for debt obligations), quality, type of issue, coupon rate (for debt obligations), maturity (for debt obligations), individual trading characteristics and other market data. Securities with a demand feature exercisable within one to seven days are valued at par. Pricing services generally value debt obligations assuming orderly transactions of institutional round lot size, but a Fund may hold or transact in the same securities in smaller, odd lot sizes. Odd lots often trade at lower prices than institutional round lots. Debt obligations are subject to interest rate and credit risks. In addition, all debt obligations involve some risk of default with respect to interest and/or principal payments.
Foreign securities’ (including foreign exchange contracts’) prices are converted into U.S. dollar amounts using the applicable exchange rates as of the close of the London world markets. If market quotations are available and reliable for foreign exchange-traded equity securities, the securities will be valued at the market quotations. Because trading hours for certain foreign securities end before the close of the NYSE, closing market quotations may become unreliable. If between the time trading ends on a particular security and the close of the customary trading session on the NYSE, events occur that Invesco Capital Management LLC (the “Adviser”), formerly Invesco PowerShares Capital Management LLC, determines are significant and make the closing price unreliable, a Fund may fair value the security. If the event is likely to have affected the closing price of the security, the security will be valued at fair value in good faith using procedures approved by the Board of Trustees. Adjustments to closing prices to reflect fair value may also be based on a screening process of an independent pricing service to indicate the degree of certainty, based on historical data, that the closing price in the principal market where a foreign security trades is not the current value as of the close of the NYSE. Foreign securities’ prices meeting the approved degree of certainty that the price is not reflective of current value will be priced at the indication of fair value from the independent pricing service. Multiple factors may be considered by the independent pricing service in determining adjustments to reflect fair value and may include information relating to sector indices, American Depositary Receipts and domestic and foreign index futures. Foreign securities may have additional risks including exchange rate changes, potential for sharply devalued currencies and high inflation, political and economic upheaval, the relative lack of issuer information, relatively low market liquidity and the potential lack of strict financial and accounting controls and standards.
Securities for which market prices are not provided by any of the above methods may be valued based upon quotes furnished by independent sources. The last bid price may be used to value exchange-traded equity securities. The mean between the last bid and asked prices may be used to value debt obligations, including corporate loans, and unlisted equity securities.
Securities for which market quotations are not readily available or became unreliable are valued at fair value as determined in good faith following procedures approved by the Board of Trustees. Issuer-specific events, market trends, bid/asked quotes of brokers and information providers and other market data may be reviewed in the course of making a good faith determination of a security’s fair value.
Each Fund may invest in securities that are subject to interest rate risk, meaning the risk that the prices will generally fall as interest rates rise and, conversely, the prices will generally rise as interest rates fall. Specific securities differ in their sensitivity to changes in interest rates depending on their individual characteristics. Changes in interest rates may result in increased market volatility, which may affect the value and/or liquidity of certain Fund investments.
Valuations change in response to many factors, including the historical and prospective earnings of the issuer, the value of the issuer’s assets, general economic conditions, interest rates, investor perceptions and market liquidity. Because of the inherent uncertainties of valuation, the values reflected in the financial statements may materially differ from the value received upon actual sale of those investments.
B. Other Risks
Index Risk. Unlike many investment companies, the Funds do not utilize investing strategies that seek returns in excess of their Underlying Indexes. Therefore, a Fund would not necessarily buy or sell a security unless that security is added or removed, respectively, from its respective Underlying Index, even if that security generally is underperforming.
Authorized Participant Concentration Risk. Only Authorized Participants (“APs”) may engage in creation or redemption transactions directly with each Fund. Each Fund has a limited number of institutions that may act as APs, and such APs have no obligation to submit creation or redemption orders. Consequently, there is no assurance that those APs will establish or maintain an active trading market for the Shares. This risk may be heightened to the extent that securities underlying each Fund are traded outside a collateralized settlement system. In that case, APs may be required to post collateral on certain trades on an agency basis (i.e., on behalf of other market participants), which only a limited number of APs may be able to do. In addition, to the extent that APs exit the business or are
unable to proceed with creation and/or redemption orders with respect to each Fund and no other AP is able to step forward to create or redeem Creation Units, this may result in a significantly diminished trading market for Fund Shares, which may be more likely to trade at a premium or discount to each Fund’s net asset value (“NAV”) and to face trading halts and/or delisting.
Equity Risk. Equity risk is the risk that the value of the securities that each Fund holds will fall due to general market and economic conditions, perceptions regarding the industries in which the issuers of securities that a Fund holds participate or factors relating to specific companies in which the Fund invests. For example, an adverse event, such as an unfavorable earnings report, may depress the value of securities a Fund holds; the price of securities may be particularly sensitive to general movements in the stock market; or a drop in the stock market may depress the price of most or all of the securities a Fund holds. In addition, securities of an issuer in the Fund’s portfolio may decline in price if the issuer fails to make anticipated dividend payments because, among other reasons, the issuer of the security experiences a decline in its financial condition.
Industry Concentration Risk. Each Fund’s Underlying Index from time to time may be concentrated to a significant degree in securities of issuers located in a single industry or sector. To the extent that each Underlying Index concentrates in the securities of issuers in a particular industry or sector, each Fund will also concentrate its investments to approximately the same extent. By concentrating its investments in an industry or sector, each Fund faces more risks than if it were diversified broadly over numerous industries or sectors. Such industry-based risks, any of which may adversely affect the companies in which each Fund invests, may include, but are not limited to, the following: general economic conditions or cyclical market patterns that could negatively affect supply and demand in a particular industry; competition for resources, adverse labor relations, political or world events; obsolescence of technologies; and increased competition or new product introductions that may affect the profitability or viability of companies in an industry. In addition, at times, such industry or sector may be out of favor and underperform other industries or the market as a whole.
Non-Diversified Fund Risk. KBW Bank ETF and KBW Property & Casualty Insurance ETF are non-diversified and each can invest a greater portion of its assets in securities of individual issuers than diversified funds. As a result, changes in the market value of a single investment could cause greater fluctuations in Share price than would occur in a diversified fund. This may increase a Fund’s volatility and cause the performance of a relatively small number of issuers to have a greater impact on a Fund’s performance.
Non-Correlation Risk. Each Fund’s return may not match the return of its Underlying Index for a number of reasons. For example, each Fund incurs operating expenses not applicable to its Underlying Index, and incurs costs in buying and selling securities, especially when rebalancing the Fund’s securities holdings to reflect changes in the composition of its Underlying Index. In addition, the performance of each Fund and its Underlying Index may vary due to asset valuation differences and differences between each Fund’s portfolio and its Underlying Index resulting from legal restrictions, cost or liquidity constraints.
High Dividend Paying Securities Risk. KBW High Dividend Yield Financial ETF and KBW Premium Yield Equity REIT ETF invest in securities that pay high dividends. As a group, these securities can fall out of favor with the market, causing such companies to underperform companies that do not pay high dividends. Also, changes in the dividend policies of the companies in an Underlying Index and the capital resources available for such companies’ dividend payments may affect a Fund.
Small- and Mid-Capitalization Company Risk. For KBW High Dividend Yield Financial ETF, KBW Premium Yield Equity REIT ETF and KBW Property & Casualty Insurance ETF, investing in securities of small- and mid-capitalization companies involves greater risk than customarily is associated with investing in larger, more established companies. These companies’ securities may be more volatile and less liquid than those of more established companies. These securities may have returns that vary, sometimes significantly, from the overall securities market. Often small- and mid-capitalization companies and the industries in which they focus are still evolving and, as a result, they may be more sensitive to changing market conditions.
REIT Risk. For KBW High Dividend Yield Financial ETF and KBW Premium Yield Equity REIT ETF, although the Funds will not invest in real estate directly, the REITs in which the Funds invest are subject to risks inherent in the direct ownership of real estate. These risks include, but are not limited to, a possible lack of mortgage funds and associated interest rate risks, overbuilding, property vacancies, increases in property taxes and operating expenses, changes in zoning laws, losses due to environmental damages and changes in neighborhood values and appeal to purchasers.
C. Federal Income Taxes
Each Fund intends to comply with the provisions of the Internal Revenue Code of 1986, as amended (the “Internal Revenue Code”), applicable to regulated investment companies and to distribute substantially all of the Fund’s taxable earnings to its shareholders. As such, the Funds will not be subject to federal income taxes on otherwise taxable income (including net realized gains) that is distributed to the shareholders. Therefore, no provision for federal income taxes is recorded in the financial statements.
Each Fund recognizes the tax benefits of uncertain tax positions only when the position is more likely than not to be sustained. Management has analyzed each Fund’s uncertain tax positions and concluded that no liability for unrecognized tax benefits should be recorded related to uncertain tax positions. Management is not aware of any tax positions for which it is reasonably possible that the total amounts of unrecognized tax benefits will change materially in the next 12 months.
Income and capital gain distributions are determined in accordance with federal income tax regulations, which may differ from accounting principles generally accepted in the United States of America (“GAAP”). These differences are primarily due to differing book and tax treatments for in-kind transactions, losses deferred due to wash sales, and passive foreign investment company adjustments, if any.
The Funds file U.S. federal tax returns and tax returns in certain other jurisdictions. Generally, a Fund is subject to examinations by such taxing authorities for up to three years after the filing of the return for the tax period.
D. Investment Transactions and Investment Income
Investment transactions are accounted for on a trade date basis. Realized gains and losses from the sale or disposition of securities are computed on the specific identified cost basis. Interest income is recorded on the accrual basis from settlement date. Pay-in-kind interest income and non-cash dividend income received in the form of securities in-lieu of cash are recorded at the fair value of the securities received. Dividend income (net of withholding tax, if any) is recorded on the ex-dividend date. Realized gains, dividends and interest received by a Fund may give rise to withholding and other taxes imposed by foreign countries. Tax conventions between certain countries and the United States may reduce or eliminate such taxes.
The Funds may periodically participate in litigation related to each Fund’s investments. As such, the Funds may receive proceeds from litigation settlements. Any proceeds received are included in the Statements of Operations as realized gain (loss) for investments no longer held and as unrealized gain (loss) for investments still held.
Brokerage commissions and mark ups are considered transaction costs and are recorded as an increase to the cost basis of securities purchased and/or a reduction of proceeds on a sale of securities. Such transaction costs are included in the determination of net realized and unrealized gain (loss) from investment securities reported in the Statements of Operations and the Statements of Changes in Net Assets and the net realized and unrealized gains (losses) on securities per share in the Financial Highlights. Transaction costs are included in the calculation of each Fund’s NAV and, accordingly, they reduce each Fund’s total returns. These transaction costs are not considered operating expenses and are not reflected in net investment income reported in the Statements of Operations and the Statements of Changes in Net Assets, or the net investment income per share and the ratios of expenses and net investment income reported in the Financial Highlights, nor are they limited by any expense limitation arrangements between each Fund and the Adviser.
E. Country Determination
For the purposes of presentation in the Schedules of Investments, the Adviser may determine the country in which an issuer is located and/or credit risk exposure based on various factors. These factors include whether each Fund’s Underlying Index has made a country determination and may include the laws of the country under which the issuer is organized, where the issuer maintains a principal office, the country in which the issuer derives 50% or more of its total revenues and the country that has the primary market for the issuer’s securities, as well as other criteria. Among the other criteria that may be evaluated for making this determination are the country in which the issuer maintains 50% or more of its assets, the type of security, financial guarantees and enhancements, the nature of the collateral and the sponsor organization. Country of issuer and/or credit risk exposure has been determined to be the United States of America, unless otherwise noted.
F. Expenses
Each Fund has agreed to pay an annual unitary management fee to the Adviser. Out of the unitary management fee, the Adviser has agreed to pay for substantially all expenses of the Funds, including the cost of transfer agency, custody, fund administration, legal, audit and other services, except for advisory fees, distribution fees, if any, brokerage expenses, taxes, interest, acquired fund fees and expenses, if any, litigation expenses and other extraordinary expenses.
Expenses of the Trust that are excluded from a Fund’s unitary management fee and are directly identifiable to a specific Fund are applied to that Fund. Expenses of the Trust that are excluded from each Fund’s unitary management fee and that are not readily identifiable to a specific Fund are allocated in such a manner as deemed equitable, taking into consideration the nature and type of expense and the relative net assets of each Fund.
To the extent a Fund invests in other investment companies, the expenses shown in the accompanying financial statements reflect the expenses of the Fund and do not include any expenses of the investment companies in which it invests. The effects of such investment companies’ expenses are included in the realized and unrealized gain or loss on the investments in the investment companies.
G. Dividends and Distributions to Shareholders
Each Fund (except for KBW High Dividend Yield Financial ETF and KBW Premium Yield Equity REIT ETF) declares and pays dividends from net investment income, if any, to its shareholders quarterly and records such dividends on ex-dividend date. KBW High Dividend Yield Financial ETF and KBW Premium Yield Equity REIT ETF each declares and pays dividends from net investment income, if any, to its shareholders monthly and records such dividends on ex-dividend date. Generally, each Fund distributes net realized taxable capital gains, if any, annually in cash and records them on ex-dividend date. Such distributions on a tax basis are determined in conformity with federal income tax regulations, which may differ from GAAP. Distributions in excess of tax basis earnings and profits, if any, are reported in such Fund’s financial statements as a tax return of capital at fiscal year-end.
H. Accounting Estimates
The preparation of the financial statements in accordance with GAAP requires management to make estimates and assumptions that affect the reported amounts and disclosures in the financial statements, including estimates and assumptions related to taxation. Actual results could differ from these estimates. In addition, the Funds monitor for material events or transactions that may occur or become known after the period-end date and before the date the financial statements are released to print.
I. Foreign Currency Translations
Foreign currency is valued at the close of the NYSE based on quotations posted by banks and major currency dealers. Portfolio securities and other assets and liabilities denominated in foreign currencies are translated into U.S. dollar amounts at date of valuation. Purchases and sales of portfolio securities (net of foreign taxes withheld on disposition) and income items denominated in foreign currencies are translated into U.S. dollar amounts on the respective dates of such transactions. The Funds do not separately account for the portion of the results of operations resulting from changes in foreign exchange rates on investments and the fluctuations arising from changes in market prices of securities held. The combined results of changes in foreign exchange rates and the fluctuation of market prices on investments (net of estimated foreign tax withholding) are included with the net realized and unrealized gain or loss from investments in the Statements of Operations. Reported net realized foreign currency gains or losses arise from (1) sales of foreign currencies, (2) currency gains or losses realized between the trade and settlement dates on securities transactions, and (3) the difference between the amounts of dividends, interest, and foreign withholding taxes recorded on each Fund’s books and the U.S. dollar equivalent of the amounts actually received or paid. Net unrealized foreign currency gains and losses arise from changes in the fair values of assets and liabilities, other than investments in securities at fiscal period-end, resulting from changes in exchange rates.
The Funds may invest in foreign securities, which may be subject to foreign taxes on income, gains on investments or currency repatriation, a portion of which may be recoverable. Foreign taxes, if any, are recorded based on the tax regulations and rates that exist in the foreign markets in which each Fund invests.
J. Securities Lending
During the period November 1, 2017 to August 31, 2018, KBW High Dividend Yield Financial ETF and KBW Premium Yield Equity REIT ETF participated in securities lending. Each Fund loaned portfolio securities having a market value up to one-third of each Fund’s total assets. Such loans are secured by cash collateral equal to no less than 102% (105% for international securities) of the market value of the loaned securities determined daily by the securities lending provider. Cash collateral received in connection with these loans is generally invested in an affiliated money market fund and is shown as such on the Schedules of Investments. Each Fund bears the risk of loss with respect to the investment of collateral. It is the policy of these Funds to obtain additional collateral from or return excess collateral to the borrower by the end of the next business day, following the valuation date of the securities loaned. Therefore, the value of the collateral held may be temporarily less than the value of the securities on loan. When loaning securities, each Fund retains certain benefits of owning the securities, including the economic equivalent of dividends or interest generated by the security. Lending securities entails a risk of loss to each Fund if, and to the extent that, the market value of the securities loaned were to increase, and the borrower did not increase the collateral accordingly, and the borrower failed to return the securities. The securities loaned are subject to termination at the option of the borrower or each Fund. Upon termination, the borrower will return to each Fund the securities loaned and each Fund will return the collateral. Upon the failure of the borrower to return the securities, collateral may be liquidated and the securities may be purchased on the open market to replace the loaned securities. Each Fund could experience delays and costs in gaining access to the collateral and the securities may lose value during the delay which could result in potential losses to each Fund. Some of these losses may be indemnified by the lending agent. Each Fund bears the risk of any deficiency in the amount of the collateral available for return to the borrower due to any loss on the collateral invested. Dividends received on cash collateral investments for securities lending transactions, which are net of compensation to counterparties, are included in Securities lending income on the Statements of Operations. The aggregate value of securities out on loan, if any, is shown on the Statements of Assets and Liabilities.
Note 3. Investment Advisory Agreement and Other Agreements
The Trust has entered into an Investment Advisory Agreement with the Adviser on behalf of each Fund, pursuant to which the Adviser has overall responsibility for the selection and ongoing monitoring of the Funds’ investments, managing the Funds’ business affairs and providing certain clerical, bookkeeping and other administrative services.
As compensation for its services, each Fund accrues daily and pays monthly to the Adviser an annual unitary management fee of 0.35% of each Fund’s average daily net assets. Out of the unitary management fee, the Adviser has agreed to pay for substantially all expenses of the Funds, including the cost of transfer agency, custody, fund administration, legal, audit and other services, except for advisory fees, distribution fees, if any, brokerage expenses, taxes, interest, acquired fund fees and expenses, if any, litigation expenses and other extraordinary expenses.
Further, through August 31, 2020, the Adviser has contractually agreed to waive a portion of each Fund’s management fee in an amount equal to 100% of the net advisory fees an affiliate of the Adviser receives that are attributable to certain of the Fund’s investments in money market funds managed by that affiliate (excluding investments of cash collateral from securities lending). The Adviser cannot discontinue this waiver prior to its expiration.
For the period November 1, 2017 to August 31, 2018 and the fiscal year ended October 31, 2017, the Adviser waived fees for each Fund in the following amounts:
| | | | | | | | |
| | | November 1, 2017 to
August 31, 2018 | | | Year Ended
October 31, 2017 | |
| KBW Bank ETF | | $ | 763 | | | $ | 586 | |
| KBW High Dividend Yield Financial ETF | | | 604 | | | | 564 | |
| KBW Premium Yield Equity REIT ETF | | | 768 | | | | 954 | |
| KBW Property & Casualty Insurance ETF | | | 71 | | | | 76 | |
| KBW Regional Banking ETF | | | 159 | | | | 174 | |
The Trust has entered into a Distribution Agreement with Invesco Distributors, Inc. (the “Distributor”), which serves as the distributor of Creation Units for each Fund. The Distributor does not maintain a secondary market in the Shares. The Funds are not charged any fees pursuant to the Distribution Agreement. The Distributor is an affiliate of the Adviser.
The Adviser has entered into a licensing agreement for each Fund with Keefe, Bruyette & Woods, Inc. (the “Licensor”). Each Underlying Index name trademark is owned by the Licensor. These trademarks have been licensed to the Adviser for use by the Funds. Each Fund is entitled to use its Underlying Index pursuant to the Trust’s sub-licensing agreement with the Adviser. The Funds are not sponsored, endorsed, sold or promoted by the Licensor, and the Licensor makes no representation regarding the advisability of investing in any of the Funds.
The Trust has entered into service agreements whereby The Bank of New York Mellon, a wholly-owned subsidiary of The Bank of New York Mellon Corporation, serves as the administrator, custodian, fund accountant and transfer agent for each Fund.
Note 4. Investments in Affiliates
The Adviser is a wholly-owned subsidiary of Invesco Ltd. and therefore, Invesco Ltd. is considered to be affiliated with the Funds. The table below shows KBW High Dividend Yield Financial ETF’s transactions in, and earnings from, investments in affiliates (excluding affiliated money market funds) for the period November 1, 2017 to August 31, 2018.
KBW High Dividend Yield Financial ETF
| | | | | | | | | | | | | | | | | | | | | | | | | | | | |
| | | Value
October 31, 2017 | | | Purchases
at Cost | | | Proceeds
from Sales | | | Change in
Unrealized
Appreciation
(Depreciation) | | | Realized
Gain | | | Value
August 31, 2018 | | | Dividend
Income | |
| Invesco Ltd. | | $ | 4,002,539 | | | $ | 3,998,038 | | | $ | (1,469,516 | ) | | $ | (1,599,635 | ) | | $ | 88,941 | | | $ | 5,020,367 | | | $ | 154,665 | |
The 1940 Act defines “affiliated person” to include an issuer of which a fund holds 5% or more of the outstanding voting securities. The Fund listed below has not owned enough of the outstanding voting securities of the issuer to have control (as defined in the 1940 Act) of that issuer. The table below shows KBW Premium Yield Equity REIT ETF’s transactions in, and earnings from, investment in affiliates (excluding affiliated money market funds) for the period November 1, 2017 to August 31, 2018.
KBW Premium Yield Equity REIT ETF
| | | | | | | | | | | | | | | | | | | | | | | | | | | | |
| | | Value
October 31, 2017 | | | Purchases
at Cost | | | Proceeds
from Sales | | | Change in
Unrealized
Appreciation | | | Realized
Gain (Loss) | | | Value
August 31, 2018 | | | Dividend
Income | |
| Global Medical REIT, Inc.* | | $ | 16,128,119 | | | $ | — | | | $ | (15,597,377 | ) | | $ | 743,993 | | | $ | (1,274,735 | ) | | $ | — | | | $ | 146,047 | |
| * | At August 31, 2018, this security was no longer held. |
Note 5. Security Transactions with Affiliated Funds
Each Fund is permitted to purchase or sell securities from or to certain other affiliated funds under specified conditions outlined in procedures adopted by the Board of Trustees of the Trust. The procedures have been designed to ensure that any purchase or sale of securities by each Fund from or to another fund or portfolio that is or could be considered an affiliate by virtue of having a common investment adviser (or affiliated investment advisers), common Trustees and/or common officers complies with Rule 17a-7 of the 1940 Act. Further, as defined under the procedures, each transaction is effected at the current market price. For the period November 1, 2017 to August 31, 2018, the following Funds engaged in transactions with affiliates as listed below:
| | | | | | | | | | | | |
| | | Securities
Purchases | | | Securities
Sales | | | Net Realized
Gain | |
| KBW High Dividend Yield Financial ETF | �� | $ | 16,152 | | | $ | — | | | $ | — | |
| KBW Premium Yield Equity REIT ETF | | | 51,800 | | | | — | | | | — | |
Note 6. Additional Valuation Information
GAAP defines fair value as the price that would be received to sell an asset or paid to transfer a liability in an orderly transaction between market participants at the measurement date, under current market conditions. GAAP establishes a hierarchy that prioritizes the inputs to valuation methods, giving the highest priority to readily available unadjusted quoted prices in an active market for identical assets (Level 1) and the lowest priority to significant unobservable inputs (Level 3), generally when market prices are not readily available or are unreliable. Based on the valuation inputs, the securities or other investments are tiered into one of three levels. Changes in valuation methods may result in transfers in or out of an investment’s assigned level:
| | Level 1 — | Prices are determined using quoted prices in an active market for identical assets. |
| | Level 2 — | Prices are determined using other significant observable inputs. Observable inputs are inputs that other market participants may use in pricing a security. These may include quoted prices for similar securities, interest rates, prepayment speeds, credit risk, yield curves, loss severities, default rates, discount rates, volatilities and others. |
| | Level 3 — | Prices are determined using significant unobservable inputs. In situations where quoted prices or observable inputs are unavailable (for example, when there is little or no market activity for an investment at the end of the period), unobservable inputs may be used. Unobservable inputs reflect a Fund’s own assumptions about the factors market participants would use in determining fair value of the securities or instruments and would be based on the best available information. |
As of August 31, 2018, all of the securities in each Fund were valued based on Level 1 inputs (see the Schedules of Investments for security categories). The level assigned to the securities valuations may not be an indication of the risk or liquidity associated with investing in those securities. Because of the inherent uncertainties of valuation, the values reflected in the financial statements may materially differ from the value received upon actual sale of those investments.
Each Fund’s policy is to recognize transfers in and out of the valuation levels as of the end of the reporting period. During the period November 1, 2017 to August 31, 2018, there were no transfers between valuation levels.
Note 7. Distributions to Shareholders and Tax Components of Net Assets
Tax Character of Distributions to Shareholders Paid During the Period November 1, 2017 to August 31, 2018, Year Ended October 31, 2017 and Year Ended October 31, 2016:
| | | | | | | | | | | | | | | | | | | | | | | | | | | | | | | | | | | | |
| | | August 31, 2018 | | | October 31, 2017 | | | October 31, 2016 | |
| | | Ordinary
Income | | | Long-Term
Capital Gains | | | Return
of
Capital | | | Ordinary
Income | | | Long-Term
Capital Gains | | | Return of
Capital | | | Ordinary
Income | | | Long-Term
Capital Gains | | | Return of
Capital | |
| KBW Bank ETF | | $ | 13,953,911 | | | $ | — | | | $ | — | | | $ | 11,970,916 | | | $ | — | | | $ | — | | | $ | 8,225,074 | | | $ | — | | | $ | — | |
| KBW High Dividend Yield Financial ETF | | | 22,966,897 | | | | — | | | | — | | | | 22,432,879 | | | | — | | | | 2,226,939 | | | | 18,056,090 | | | | — | | | | 1,310,772 | |
| KBW Premium Yield Equity REIT ETF | | | 24,220,997 | | | | — | | | | — | | | | 20,246,066 | | | | — | | | | — | | | | 10,877,502 | | | | — | | | | — | |
| KBW Property & Casualty Insurance ETF | | | 1,596,854 | | | | — | | | | — | | | | 1,799,966 | | | | — | | | | — | | | | 1,641,784 | | | | 33,223 | | | | — | |
| KBW Regional Banking ETF | | | 2,158,780 | | | | — | | | | — | | | | 3,136,776 | | | | — | | | | — | | | | 1,882,396 | | | | — | | | | — | |
Tax Components of Net Assets at Fiscal Period-End:
| | | | | | | | | | | | | | | | | | | | |
| | | Undistributed
Ordinary
Income | | | Net Unrealized
Appreciation
(Depreciation)-
Investments | | | Capital Loss
Carryforwards | | | Shares of
Beneficial
Interest | | | Total Net
Assets | |
| KBW Bank ETF | | $ | 4,417,021 | | | $ | (18,835,677 | ) | | $ | (973,443 | ) | | $ | 1,038,651,738 | | | $ | 1,023,259,639 | |
| KBW High Dividend Yield Financial ETF | | | — | | | | (4,162,535 | ) | | | (59,044,055 | ) | | | 407,763,029 | | | | 344,556,439 | |
| KBW Premium Yield Equity REIT ETF | | | — | | | | 2,559,724 | | | | (19,423,276 | ) | | | 458,990,002 | | | | 442,126,450 | |
| KBW Property & Casualty Insurance ETF | | | 210,388 | | | | 5,863,022 | | | | (2,685,840 | ) | | | 63,652,258 | | | | 67,039,828 | |
| KBW Regional Banking ETF | | | 775,338 | | | | 6,053,588 | | | | (1,603,996 | ) | | | 190,112,676 | | | | 195,337,606 | |
Capital loss carryforwards are calculated and reported as of a specific date. Results of transactions and other activity after that date may affect the amount of capital loss carryforwards actually available for the Funds to utilize. The ability to utilize capital loss carryforwards in the future may be limited under the Internal Revenue Code and related regulations based on the results of future transactions.
The following table presents available capital loss carryforwards for each Fund as of August 31, 2018:
| | | | | | | | | | | | |
| | | Post-effective/no expiration | | | | |
| | | Short-Term | | | Long-Term | | | Total* | |
| KBW Bank ETF | | $ | — | | | $ | 973,443 | | | $ | 973,443 | |
| KBW High Dividend Yield Financial ETF | | | 17,347,894 | | | | 41,696,161 | | | | 59,044,055 | |
| KBW Premium Yield Equity REIT ETF | | | 12,666,128 | | | | 6,757,148 | | | | 19,423,276 | |
| KBW Property & Casualty Insurance ETF | | | 758,863 | | | | 1,926,977 | | | | 2,685,840 | |
| KBW Regional Banking ETF | | | 1,108,730 | | | | 495,266 | | | | 1,603,996 | |
| * | Capital loss carryforwards as of the date listed above are reduced for limitations, if any, to the extent required by the Internal Revenue Code and may be further limited depending upon a variety of factors, including the realization of net unrealized gains or losses as of the date of any reorganization. |
Note 8. Investment Transactions
For the period November 1, 2017 to August 31, 2018, the cost of securities purchased and proceeds from sales of securities (other than short-term securities, U.S. Treasury obligations, money market funds and in-kind transactions, if any) were as follows:
| | | | | | | | |
| | | Purchases | | | Sales | |
| KBW Bank ETF | | $ | 85,116,281 | | | $ | 73,999,536 | |
| KBW High Dividend Yield Financial ETF | | | 159,567,341 | | | | 147,551,233 | |
| KBW Premium Yield Equity REIT ETF | | | 212,145,914 | | | | 205,235,260 | |
| KBW Property & Casualty Insurance ETF | | | 16,670,489 | | | | 19,224,034 | |
| KBW Regional Banking ETF | | | 24,388,060 | | | | 23,860,446 | |
For the period November 1, 2017 to August 31, 2018, in-kind transactions associated with creations and redemptions were as follows:
| | | | | | | | |
| | | Cost of
Securities
Received | | | Value of
Securities
Delivered | |
| KBW Bank ETF | | $ | 1,617,536,137 | | | $ | 1,604,747,549 | |
| KBW High Dividend Yield Financial ETF | | | 87,538,519 | | | | 77,263,945 | |
| KBW Premium Yield Equity REIT ETF | | | 138,058,100 | | | | 72,483,662 | |
| KBW Property & Casualty Insurance ETF | | | 18,223,201 | | | | 51,359,489 | |
| KBW Regional Banking ETF | | | 64,133,046 | | | | 28,099,312 | |
Gains (losses) on in-kind transactions are generally not considered taxable gains (losses) for federal income tax purposes.
At August 31, 2018, the aggregate cost of investments, including any derivatives, on a tax basis includes adjustments for financial reporting purposes as of the most recently completed federal income tax reporting period-end:
| | | | | | | | | | | | | | | | |
| | | Gross
Unrealized
Appreciation | | | Gross
Unrealized
(Depreciation) | | | Net
Unrealized
Appreciation
(Depreciation) | | | Cost | |
| KBW Bank ETF | | $ | 13,321,837 | | | $ | (32,157,514 | ) | | $ | (18,835,677 | ) | | $ | 1,042,117,062 | |
| KBW High Dividend Yield Financial ETF | | | 21,953,063 | | | | (26,115,598 | ) | | | (4,162,535 | ) | | | 403,467,362 | |
| KBW Premium Yield Equity REIT ETF | | | 20,847,253 | | | | (18,287,529 | ) | | | 2,559,724 | | | | 441,645,210 | |
| KBW Property & Casualty Insurance ETF | | | 7,824,135 | | | | (1,961,113 | ) | | | 5,863,022 | | | | 61,178,973 | |
| KBW Regional Banking ETF | | | 12,375,177 | | | | (6,321,589 | ) | | | 6,053,588 | | | | 189,291,046 | |
Note 9. Reclassification of Permanent Differences
Primarily as a result of differing book/tax treatment of in-kind transactions and taxable overdistributions, amounts were reclassified between undistributed net investment income, undistributed net realized gain (loss) and Shares of beneficial interest. These
reclassifications had no effect on the net assets of each Fund. For the period November 1, 2017 to August 31, 2018, the reclassifications were as follows:
| | | | | | | | | | | | |
| | | Undistributed
Net Investment
Income | | | Undistributed
Net Realized
Gain (Loss) | | | Shares of
Beneficial
Interest | |
| KBW Bank ETF | | $ | — | | | $ | (102,494,174 | ) | | $ | 102,494,174 | |
| KBW High Dividend Yield Financial ETF | | | 5,949,731 | | | | (15,508,769 | ) | | | 9,559,038 | |
| KBW Premium Yield Equity REIT ETF | | | 7,577,763 | | | | (6,245,149 | ) | | | (1,332,614 | ) |
| KBW Property & Casualty Insurance ETF | | | — | | | | (9,163,966 | ) | | | 9,163,966 | |
| KBW Regional Banking ETF | | | — | | | | (1,451,067 | ) | | | 1,451,067 | |
Note 10. Trustees’ and Officer’s Fees
Trustees’ and Officer’s Fees include amounts accrued by the Funds to pay remuneration to each Trustee who is not an “interested person” as defined in the 1940 Act (an “Independent Trustee”), any Trustee who is not an affiliate of the Adviser or Distributor (or any of their affiliates) and who is otherwise an “interested person” of the Trust under the 1940 Act (an “Unaffiliated Trustee”) and an Officer of the Trust. The Adviser, as a result of each Fund’s unitary management fee, pays for such compensation. The Trustee who is an “interested person” of the Trust does not receive any Trustees’ fees.
The Trust has adopted a deferred compensation plan (the “Plan”). Under the Plan, each Independent Trustee or Unaffiliated Trustee who has executed a Deferred Fee Agreement (a “Participating Trustee”) may defer receipt of all or a portion of his compensation (“Deferral Fees”). Such Deferral Fees are deemed to be invested in select Invesco Funds. The Deferral Fees payable to the Participating Trustee are valued as of the date such Deferral Fees would have been paid to the Participating Trustee. The value increases with contributions or with increases in the value of the Shares selected, and the value decreases with distributions or with declines in the value of the Shares selected. Obligations under the Plan represent unsecured claims against the general assets of the Funds.
Note 11. Capital
Shares are created and redeemed by each Fund only in Creation Units of 50,000 Shares. Only Authorized Participants are permitted to purchase or redeem Creation Units from the Funds. Such transactions are principally permitted in exchange for Deposit Securities, with a balancing cash component to equate the transaction to the NAV per Share of a Fund of the Trust on the transaction date. However, for all Funds, cash in an amount equivalent to the value of certain securities may be substituted, generally when the securities are not available in sufficient quantity for delivery, not eligible for trading by the Authorized Participant or as a result of other market circumstances.
To the extent that the Funds permit transactions in exchange for Deposit Securities, each Fund may issue Shares in advance of receipt of Deposit Securities subject to various conditions, including a requirement to maintain on deposit with the Trust cash at least equal to 105% of the market value of the missing Deposit Securities. In accordance with the Trust’s Participant Agreement, Creation Units will be issued to an Authorized Participant, notwithstanding the fact that the corresponding Deposit Securities have not been received in part or in whole, in reliance on the undertaking of the Authorized Participant to deliver the missing Deposit Securities as soon as possible, which undertaking shall be secured by the Authorized Participant’s delivery and maintenance of collateral consisting of cash in the form of U.S. dollars in immediately available funds having a value (marked-to-market daily) at least equal to 105%, which the Adviser may change from time to time, of the value of the missing Deposit Securities.
Certain transaction fees may be charged by the Funds for creations and redemptions, which are treated as increases in capital.
Transactions in each Fund’s Shares are disclosed in detail in the Statements of Changes in Net Assets.
Note 12. Indemnifications
Under the Trust’s organizational documents, its Officers and Trustees are indemnified against certain liabilities arising out of the performance of their duties to the Trust. Each Independent Trustee and Unaffiliated Trustee is also indemnified against certain liabilities arising out of the performance of his duties to the Trust pursuant to an Indemnification Agreement between such trustee and the Trust. Additionally, in the normal course of business, the Trust enters into contracts with service providers that contain general indemnification clauses. The Trust’s maximum exposure under these arrangements is unknown, as this would involve future claims that may be made against the Trust that have not yet occurred. However, based on experience, the Trust believes the risk of loss to be remote.
Report of Independent Registered Public Accounting Firm
To the Board of Trustees of Invesco Exchange-Traded Fund Trust II and Shareholders of Invesco KBW Bank ETF, Invesco KBW High Dividend Yield Financial ETF, Invesco KBW Premium Yield Equity REIT ETF, Invesco KBW Property & Casualty Insurance ETF and Invesco KBW Regional Banking ETF
Opinions on the Financial Statements
We have audited the accompanying statements of assets and liabilities, including the schedules of investments, of Invesco KBW Bank ETF, Invesco KBW High Dividend Yield Financial ETF, Invesco KBW Premium Yield Equity REIT ETF, Invesco KBW Property & Casualty Insurance ETF and Invesco KBW Regional Banking ETF (five of the funds constituting Invesco Exchange-Traded Fund Trust II, hereafter collectively referred to as the “Funds”) as of August 31, 2018, the related statements of operations for the period November 1, 2017 through August 31, 2018 and for the year ended October 31, 2017, the statements of changes in net assets for the period November 1, 2017 through August 31, 2018 and for each of the two years in the period ended October 31, 2017, including the related notes, and the financial highlights for each of the periods indicated therein (collectively referred to as the “financial statements”). In our opinion, the financial statements present fairly, in all material respects, the financial position of each of the Funds as of August 31, 2018, the results of each of their operations for the period November 1, 2017 through August 31, 2018 and for the year ended October 31, 2017, the changes in each of their net assets for the period November 1, 2017 through August 31, 2018 and for each of the two years in the period ended October 31, 2017 and each of the financial highlights for each of the periods indicated therein, in conformity with accounting principles generally accepted in the United States of America.
Basis for Opinions
These financial statements are the responsibility of the Funds’ management. Our responsibility is to express an opinion on the Funds’ financial statements based on our audits. We are a public accounting firm registered with the Public Company Accounting Oversight Board (United States) (“PCAOB”) and are required to be independent with respect to the Funds in accordance with the U.S. federal securities laws and the applicable rules and regulations of the Securities and Exchange Commission and the PCAOB.
We conducted our audits of these financial statements in accordance with the standards of the PCAOB. Those standards require that we plan and perform the audit to obtain reasonable assurance about whether the financial statements are free of material misstatement, whether due to error or fraud.
Our audits included performing procedures to assess the risks of material misstatement of the financial statements, whether due to error or fraud, and performing procedures that respond to those risks. Such procedures included examining, on a test basis, evidence regarding the amounts and disclosures in the financial statements. Our audits also included evaluating the accounting principles used and significant estimates made by management, as well as evaluating the overall presentation of the financial statements. Our procedures included confirmation of securities owned as of August 31, 2018 by correspondence with the custodian, transfer agent, and brokers; when replies were not received from brokers, we performed other auditing procedures. We believe that our audits provide a reasonable basis for our opinions.
PricewaterhouseCoopers LLP
Chicago, Illinois
October 26, 2018
We have served as the auditor of one or more of the investment companies in the Invesco group of investment companies since at least 1995. We have not been able to determine the specific year we began serving as auditor.
Fees and Expenses
As a shareholder of a Fund of the Invesco Exchange-Traded Fund Trust II, you incur a unitary management fee. In addition to the unitary management fee, a shareholder may pay distribution fees, if any, brokerage expenses, taxes, interest, acquired fund fees and expenses, if any, litigation expenses and other extraordinary expenses. The expense examples below are intended to help you understand your ongoing costs (in dollars) of investing in the Funds and to compare these costs with the ongoing costs of investing in other funds.
The example is based on an investment of $1,000 invested at the beginning of the period and held through the six-month period ended August 31, 2018.
In addition to the fees and expenses which the Invesco KBW High Dividend Yield Financial ETF (the “Portfolio”) bears directly, the Portfolio indirectly bears a pro rata share of the fees and expenses of the investment companies in which the Portfolio invests. The amount of fees and expenses incurred indirectly by the Portfolio will vary because the investment companies have varied expenses and fee levels and the Portfolio may own different proportions of the investment companies at different times. Estimated investment companies’ expenses are not expenses that are incurred directly by the Portfolio. They are expenses that are incurred directly by the investment companies and are deducted from the value of the investment companies the Portfolio invests in. The effect of the estimated investment companies’ expenses that the Portfolio bears indirectly are included in the Portfolio’s total returns.
Actual Expenses
The first line in the following table provides information about actual account values and actual expenses. You may use the information in this line, together with the amount you invested, to estimate the expenses that you paid over the period. Simply divide your account value by $1,000 (for example, an $8,600 account value divided by $1,000 = 8.6), then multiply the result by the number in the first line under the heading “Expenses Paid During the Six-Month Period” to estimate the expenses you paid on your account during this period.
Hypothetical Example for Comparison Purposes
The second line in the following table provides information about hypothetical account values and hypothetical expenses based on each Fund’s actual expense ratio and an assumed annualized rate of return of 5% per year before expenses, which is not the Fund’s actual return. The hypothetical account values and expenses may not be used to estimate the actual ending account balance or expenses you paid for the period. You may use this information to compare the ongoing costs of investing in the Funds and other funds. To do so, compare this 5% hypothetical example with the 5% hypothetical examples that appear in the shareholder reports of the other funds.
Please note that the expenses shown in the table are meant to highlight your ongoing costs only, and do not reflect any transactional costs, such as sales charges and brokerage commissions. Therefore, the second line in the table is useful in comparing ongoing costs only, and will not help you determine the relative total costs of owning different funds. In addition, expenses shown in the table do not include the expenses of the underlying funds, which are borne indirectly by a Fund. If transaction costs and indirect expenses were included, your costs would have been higher.
| | | | | | | | | | | | | | | | |
| | | Beginning Account Value March 1, 2018 | | | Ending Account Value August 31, 2018 | | | Annualized Expense Ratio Based on the Six-Month Period | | | Expenses Paid During the Six-Month Period(1) | |
| Invesco KBW Bank ETF (KBWB) | | | | | | | | | | | | | | | | |
Actual | | $ | 1,000.00 | | | $ | 993.10 | | | | 0.35 | % | | $ | 1.76 | |
Hypothetical (5% return before expenses) | | | 1,000.00 | | | | 1,023.44 | | | | 0.35 | | | | 1.79 | |
| Invesco KBW High Dividend Yield Financial ETF (KBWD) | | | | | | | | | | | | | | | | |
Actual | | | 1,000.00 | | | | 1,133.50 | | | | 0.35 | | | | 1.88 | |
Hypothetical (5% return before expenses) | | | 1,000.00 | | | | 1,023.44 | | | | 0.35 | | | | 1.79 | |
| Invesco KBW Premium Yield Equity REIT ETF (KBWY) | | | | | | | | | | | | | | | | |
Actual | | | 1,000.00 | | | | 1,222.60 | | | | 0.35 | | | | 1.96 | |
Hypothetical (5% return before expenses) | | | 1,000.00 | | | | 1,023.44 | | | | 0.35 | | | | 1.79 | |
| Invesco KBW Property & Casualty Insurance ETF (KBWP) | | | | | | | | | | | | | | | | |
Actual | | | 1,000.00 | | | | 1,087.40 | | | | 0.35 | | | | 1.84 | |
Hypothetical (5% return before expenses) | | | 1,000.00 | | | | 1,023.44 | | | | 0.35 | | | | 1.79 | |
Fees and Expenses (continued)
| | | | | | | | | | | | | | | | |
| | | Beginning Account Value March 1, 2018 | | | Ending Account Value August 31, 2018 | | | Annualized Expense Ratio Based on the Six-Month Period | | | Expenses Paid During the Six-Month Period(1) | |
| Invesco KBW Regional Banking ETF (KBWR) | | | | | | | | | | | | | | | | |
Actual | | $ | 1,000.00 | | | $ | 1,027.70 | | | | 0.35 | % | | $ | 1.79 | |
Hypothetical (5% return before expenses) | | | 1,000.00 | | | | 1,023.44 | | | | 0.35 | | | | 1.79 | |
| (1) | Expenses are calculated using the annualized expense ratio, which represents the ongoing expenses as a percentage of net assets for the six-month period ended August 31, 2018. Expenses are calculated by multiplying the Fund’s annualized expense ratio by the average account value for the period, then multiplying the result by 184/365. Expense ratios for the most recent six-month period may differ from expense ratios based on the annualized data in the Financial Highlights. |
Tax Information
Form 1099-DIV, Form 1042-S and other year-end tax information provide shareholders with actual calendar year amounts that should be included in their tax returns. Shareholders should consult their tax advisers.
The following distribution information is being provided as required by the Internal Revenue Code or to meet a specific state’s requirement.
Each Fund designates the following amounts or, if subsequently determined to be different, the maximum amount allowable for its fiscal period ended August 31, 2018:
| | | | | | | | | | |
| | | Qualified Dividend
Income* | | Corporate Dividends
Received Deduction* |
| Invesco KBW Bank ETF | | | | 100 | % | | | | 100 | % |
| Invesco KBW High Dividend Yield Financial ETF | | | | 69 | % | | | | 67 | % |
| Invesco KBW Premium Yield Equity REIT ETF | | | | 1 | % | | | | 1 | % |
| Invesco KBW Property & Casualty Insurance ETF | | | | 100 | % | | | | 88 | % |
| Invesco KBW Regional Banking ETF | | | | 100 | % | | | | 100 | % |
| * | The above percentages are based on ordinary income dividends paid to shareholders during the Fund’s fiscal period. |
Trustees and Officers
The Independent Trustees of the Trust, their term of office and length of time served, their principal business occupations during at least the past five years, the number of portfolios in the Fund Complex (as defined below) overseen by each Independent Trustee and the other directorships, if any, held by each Independent Trustee are shown below.
| | | | | | | | | | |
Name, Address and Year of
Birth of Independent Trustees | | Position(s)
Held
with Trust | | Term of
Office
and
Length of
Time
Served* | | Principal
Occupation(s) During
Past 5 Years | | Number of
Portfolios
in Fund
Complex**
Overseen by
Independent
Trustees | | Other
Directorships
Held by
Independent
Trustees During
the Past 5 Years |
Ronn R. Bagge—1958
c/o Invesco Capital Management LLC
3500 Lacey Road, Suite 700
Downers Grove, IL 60515 | | Chairman of the Nominating and Governance Committee and Trustee | | Chairman of the Nominating and Governance Committee and Trustee since 2007 | | Founder and Principal, YQA Capital Management LLC (1998-Present); formerly, Owner/CEO of Electronic Dynamic Balancing Co., Inc. (high-speed rotating equipment service provider). | | 221 | | Trustee and Investment Oversight Committee member, Mission Aviation Fellowship (2017-Present) |
| | | | | |
Todd J. Barre—1957
c/o Invesco Capital Management LLC
3500 Lacey Road, Suite 700
Downers Grove, IL 60515 | | Trustee | | Since 2010 | | Assistant Professor of Business, Trinity Christian College (2010-2016); formerly, Vice President and Senior Investment Strategist (2001-2008), Director of Open Architecture and Trading (2007-2008), Head of Fundamental Research (2004-2007) and Vice President and Senior Fixed Income Strategist (1994-2001), BMO Financial Group/Harris Private Bank. | | 221 | | None |
| | | | | |
Marc M. Kole—1960
c/o Invesco Capital Management LLC
3500 Lacey Road, Suite 700
Downers Grove, IL 60515 | | Chairman of the Audit Committee and Trustee | | Chairman of the Audit Committee since 2008; Trustee since 2007 | | Senior Director of Finance, By The Hand Club for Kids (2015-Present); formerly, Chief Financial Officer, Hope Network (social services) (2008-2012); Assistant Vice President and Controller, Priority Health (health insurance) (2005-2008); Senior Vice President of Finance, United Healthcare (2004-2005); Chief Accounting Officer, Senior Vice President of Finance, Oxford Health Plans (2000-2004); Audit Partner, Arthur Andersen LLP (1996-2000). | | 221 | | None |
| * | This is the date the Independent Trustee began serving the Trust. Each Independent Trustee serves an indefinite term, until his successor is elected. |
| ** | Fund Complex includes all open- and closed-end funds (including all of their portfolios) advised by the Adviser and any affiliated person of the Adviser. |
Trustees and Officers (continued)
| | | | | | | | | | |
Name, Address and Year of
Birth of Independent Trustees | | Position(s)
Held
with Trust | | Term of
Office
and
Length of
Time
Served* | | Principal
Occupation(s) During
Past 5 Years | | Number of
Portfolios
in Fund
Complex**
Overseen by
Independent
Trustees | | Other
Directorships
Held by
Independent
Trustees During
the Past 5 Years |
Yung Bong Lim—1964
c/o Invesco Capital Management LLC
3500 Lacey Road, Suite 700
Downers Grove, IL 60515 | | Chairman of the Investment Oversight Committee and Trustee | | Chairman of the Investment Oversight Committee since 2014; Trustee since 2013 | | Managing Partner, RDG Funds LLC (2008-Present); formerly, Managing Director, Citadel LLC (1999-2007). | | 221 | | None |
| | | | | |
Gary R. Wicker—1961
c/o Invesco Capital Management LLC
3500 Lacey Road, Suite 700
Downers Grove, IL 60515 | | Trustee | | Since 2013 | | Senior Vice President of Global Finance and Chief Financial Officer at RBC Ministries (publishing company) (2013-Present); formerly, Executive Vice President and Chief Financial Officer, Zondervan Publishing (a division of Harper Collins/NewsCorp) (2007-2012); Senior Vice President and Group Controller (2005-2006), Senior Vice President and Chief Financial Officer (2003-2004), Chief Financial Officer (2001-2003), Vice President, Finance and Controller (1999-2001) and Assistant Controller (1997-1999), divisions of The Thomson Corporation (information services provider). | | 221 | | None |
| | | | | |
Donald H. Wilson—1959
c/o Invesco Capital Management LLC
3500 Lacey Road, Suite 700
Downers Grove, IL 60515 | | Chairman of the Board and Trustee | | Chairman since 2012; Trustee since 2007 | | Chairman, President and Chief Executive Officer, McHenry Bancorp Inc. and McHenry Savings Bank (subsidiary) (2018-Present); Chairman and Chief Executive Officer, Stone Pillar Advisors, Ltd. (2010-Present); President and Chief Executive Officer, Stone Pillar Investments, Ltd. (2016-Present); formerly, Chairman, President and Chief Executive Officer, Community Financial Shares, Inc. and Community Bank—Wheaton/Glen Ellyn (subsidiary) (2013-2015); Chief Operating Officer, AMCORE Financial, Inc. (bank holding company) (2007-2009); Executive Vice President and Chief Financial Officer, AMCORE Financial, Inc. (2006-2007); Senior Vice President and Treasurer, Marshall & Ilsley Corp. (bank holding company) (1995-2006). | | 221 | | None |
| * | This is the date the Independent Trustee began serving the Trust. Each Independent Trustee serves an indefinite term, until his successor is elected. |
| ** | Fund Complex includes all open- and closed-end funds (including all of their portfolios) advised by the Adviser and any affiliated person of the Adviser. |
Trustees and Officers (continued)
The Unaffiliated Trustee, his term of office and length of time served, his principal business occupations during at least the past five years, the number of portfolios in the Fund Complex (as defined below) overseen by the Unaffiliated Trustee and the other directorships, if any, held by the Unaffiliated Trustee are shown below.
| | | | | | | | | | |
Name, Address and Year of
Birth of Unaffiliated Trustee | | Position(s)
Held
with Trust | | Term of
Office
and
Length of
Time
Served* | | Principal
Occupation(s) During
Past 5 Years | | Number of
Portfolios
in Fund
Complex**
Overseen by
Unaffiliated
Trustee | | Other
Directorships
Held by
Unaffiliated
Trustee During
the Past 5 Years |
Philip M. Nussbaum***—1961
c/o Invesco Capital Management LLC
3500 Lacey Road, Suite 700
Downers Grove, IL 60515 | | Trustee | | Since 2007 | | Chairman, Performance Trust Capital Partners (2004-Present). | | 221 | | None |
| * | This is the date the Unaffiliated Trustee began serving the Trust. The Unaffiliated Trustee serves an indefinite term, until his successor is elected. |
| ** | Fund Complex includes all open- and closed-end funds (including all of their portfolios) advised by the Adviser and any affiliated person of the Adviser. |
| *** | Effective September 19, 2018, Mr. Nussbaum resigned from the Board of Trustees of the Trust. |
Trustees and Officers (continued)
The Interested Trustee and the executive officers of the Trust, their term of office and length of time served, their principal business occupations during at least the past five years, the number of portfolios in the Fund Complex (as defined below) overseen by the Interested Trustee and the other directorships, if any, held by the Interested Trustee are shown below.
| | | | | | | | | | |
Name, Address and Year of
Birth of Interested Trustee | | Position(s)
Held
with Trust | | Term of
Office
and
Length of
Time
Served* | | Principal
Occupation(s) During
Past 5 Years | | Number of
Portfolios
in Fund
Complex**
Overseen by
Interested
Trustee | | Other
Directorships
Held by
Interested
Trustee During
the Past 5 Years |
Kevin M. Carome—1956
Invesco Ltd.
Two Peachtree Pointe,
1555 Peachtree St., N.E.,
Suite 1800
Atlanta, GA 30309 | | Trustee | | Since 2010 | | Senior Managing Director, Secretary and General Counsel, Invesco Ltd. (2007-Present); Director, Invesco Advisers, Inc. (2009-Present); Director (2006-Present) and Executive Vice President (2008–Present), Invesco Group Services, Inc., Invesco Holding Company (US), Inc. and Invesco North American Holdings, Inc.; Director, Invesco Holding Company Limited (2007-Present); Executive Vice President (2008–Present), Invesco Investments (Bermuda) Ltd.; Manager, Horizon Flight Works LLC, Director and Executive Vice President, Invesco Finance, Inc. and Director, Invesco Finance PLC (2011- Present); Director and Secretary (2012–Present), Invesco Services (Bahamas) Private Limited; and Director and Executive Vice President (2014–Present), INVESCO Asset Management (Bermuda) Ltd.; formerly, Director and Chairman, INVESCO Funds Group, Inc., Senior Vice President, Secretary and General Counsel, Invesco Advisers, Inc. (2003-2006); Director, Invesco Investments (Bermuda) Ltd. (2008-2016); Senior Vice President and General Counsel, Liberty Financial Companies, Inc. (2000-2001); General Counsel of certain investment management subsidiaries of Liberty Financial Companies, Inc. (1998-2000); Associate General Counsel, Liberty Financial Companies, Inc. (1993-1998); Associate, Ropes & Gray LLP. | | 221 | | None |
| * | This is the date the Interested Trustee began serving the Trust. The Interested Trustee serves an indefinite term, until his successor is elected. |
| ** | Fund Complex includes all open- and closed-end funds (including all of their portfolios) advised by the Adviser and any affiliated person of the Adviser. |
Trustees and Officers (continued)
| | | | | | |
Name, Address and Year of Birth
of Executive Officers | | Position(s)
Held
with Trust | | Length of
Time
Served* | | Principal Occupation(s) During Past 5 Years |
Daniel E. Draper—1968 Invesco Capital Management LLC 3500 Lacey Road, Suite 700 Downers Grove, IL 60515 | | President and Principal Executive Officer | | Since 2015 | | President and Principal Executive Officer, Invesco Exchange-Traded Fund Trust, Invesco Exchange-Traded Fund Trust II, Invesco India Exchange-Traded Fund Trust, Invesco Actively Managed Exchange-Traded Fund Trust and Invesco Actively Managed Exchange-Traded Commodity Fund Trust (2015-Present) and Invesco Exchange-Traded Self-Indexed Fund Trust (2016-Present); Chief Executive Officer and Principal Executive Officer (2016-Present) and Managing Director (2013-Present), Invesco Capital Management LLC; Senior Vice President, Invesco Distributors, Inc. (2014-Present); formerly, Vice President, Invesco Exchange-Traded Fund Trust, Invesco Exchange-Traded Fund Trust II, Invesco India Exchange-Traded Fund Trust, Invesco Actively Managed Exchange-Traded Fund Trust (2013-2015) and Invesco Actively Managed Exchange-Traded Commodity Fund Trust (2014-2015); Managing Director, Credit Suisse Asset Management (2010-2013) and Lyxor Asset Management/Societe Generale (2007-2010). |
| | | |
Kelli Gallegos—1970 Invesco Capital Management LLC 3500 Lacey Road, Suite 700 Downers Grove, IL 60515 | | Vice President
and Treasurer | | Since 2018 | | Vice President and Treasurer, Invesco Exchange-Traded Fund Trust, Invesco Exchange-Traded Fund Trust II, Invesco India Exchange-Traded Fund Trust, Invesco Actively Managed Exchange-Traded Fund Trust, Invesco Actively Managed Exchange-Traded Commodity Fund Trust and Invesco Exchange-Traded Self-Indexed Fund Trust (2018-Present); Principal Financial and Accounting Officer-Pooled Investments, Invesco Capital Management LLC (2018-Present); Vice President, Principal Financial Officer (2016-Present) and Assistant Treasurer (2008-Present), The Invesco Funds; formerly, Assistant Treasurer Invesco Exchange-Traded Fund Trust, Invesco Exchange-Traded Fund Trust II, Invesco India Exchange-Traded Fund Trust and Invesco Actively Managed Exchange-Traded Fund Trust (2012-2018), Invesco Actively Managed Exchange-Traded Commodity Fund Trust (2014-2018) and Invesco Exchange-Traded Self-Indexed Fund Trust (2016-2018); Assistant Treasurer, Invesco Capital Management LLC (2013-2018); and Assistant Vice President, The Invesco Funds (2008-2016). |
| | | |
Peter Hubbard—1981 Invesco Capital Management LLC 3500 Lacey Road, Suite 700 Downers Grove, IL 60515 | | Vice President | | Since
2009 | | Vice President, Invesco Exchange-Traded Fund Trust, Invesco Exchange-Traded Fund Trust II, Invesco India Exchange-Traded Fund Trust, Invesco Actively Managed Exchange-Traded Fund Trust (2009-Present), Invesco Actively Managed Exchange-Traded Commodity Fund Trust (2014-Present) and Invesco Exchange-Traded Self-Indexed Fund Trust (2016-Present); Vice President and Director of Portfolio Management, Invesco Capital Management LLC (2010-Present); formerly, Vice President of Portfolio Management, Invesco Capital Management LLC (2008-2010); Portfolio Manager, Invesco Capital Management LLC (2007-2008); Research Analyst, Invesco Capital Management LLC (2005-2007); Research Analyst and Trader, Ritchie Capital, a hedge fund operator (2003-2005). |
| | | |
Sheri Morris—1964 Invesco Capital Management LLC 3500 Lacey Road, Suite 700 Downers Grove, IL 60515 | | Vice President | | Since 2012 | | President and Principal Executive Officer, The Invesco Funds (2016-Present); Treasurer, The Invesco Funds (2008-Present); Vice President, Invesco Advisers, Inc. (formerly known as Invesco Institutional (N.A.), Inc.) (registered investment adviser) (2009-Present) and Vice President, Invesco Exchange-Traded Fund Trust, Invesco Exchange-Traded Fund Trust II, Invesco India Exchange-Traded Fund Trust, Invesco Actively Managed Exchange-Traded Fund Trust (2012-Present), Invesco Actively Managed Exchange-Traded Commodity Fund Trust (2014-Present) and Invesco Exchange-Traded Self-Indexed Fund Trust (2016-Present); formerly, Vice President and Principal Financial Officer, The Invesco Funds (2008-2016); Treasurer, Invesco Exchange-Traded Fund Trust, Invesco Exchange-Traded Fund Trust II, Invesco India Exchange-Traded Fund Trust and Invesco Actively Managed Exchange-Traded Fund Trust (2011-2013); Vice President, Invesco Aim Advisers, Inc., Invesco Aim Capital Management, Inc. and Invesco Aim Private Asset Management, Inc.; Assistant Vice President and Assistant Treasurer, The Invesco Funds and Assistant Vice President, Invesco Advisers, Inc., Invesco Aim Capital Management, Inc. and Invesco Aim Private Asset Management, Inc. |
| * | This is the date each Officer began serving the Trust. Each Officer serves an indefinite term, until his or her successor is elected. |
Trustees and Officers (continued)
| | | | | | |
Name, Address and Year of Birth
of Executive Officers | | Position(s)
Held
with Trust | | Length of
Time
Served* | | Principal Occupation(s) During Past 5 Years |
Anna Paglia—1974 Invesco Capital Management LLC 3500 Lacey Road, Suite 700 Downers Grove, IL 60515 | | Secretary | | Since 2011 | | Secretary, Invesco Exchange-Traded Fund Trust, Invesco Exchange-Traded Fund Trust II, Invesco India Exchange-Traded Fund Trust, Invesco Actively Managed Exchange-Traded Fund Trust (2011-Present), Invesco Actively Managed Exchange-Traded Commodity Fund Trust (2014-Present) and Invesco Exchange-Traded Self-Indexed Fund Trust (2015-Present); Head of Legal (2010-Present) and Secretary (2015-Present), Invesco Capital Management LLC; Manager and Assistant Secretary, Invesco Indexing LLC (2017-Present); formerly, Partner, K&L Gates LLP (formerly, Bell Boyd & Lloyd LLP) (2007-2010); Associate Counsel at Barclays Global Investors Ltd. (2004-2006). |
| | | |
Rudolf E. Reitmann—1971 Invesco Capital Management LLC 3500 Lacey Road, Suite 700 Downers Grove, IL 60515 | | Vice President | | Since 2013 | | Vice President, Invesco Exchange-Traded Fund Trust, Invesco Exchange-Traded Fund Trust II, Invesco India Exchange-Traded Fund Trust, Invesco Actively Managed Exchange-Traded Fund Trust (2013-Present), Invesco Actively Managed Exchange-Traded Commodity Fund Trust (2014-Present) and Invesco Exchange-Traded Self-Indexed Fund Trust (2016-Present); Head of Global Exchange Traded Funds Services, Invesco Capital Management LLC (2013-Present); Vice President, Invesco Capital Markets, Inc. (2018-Present). |
| | | |
David Warren—1957 Invesco Canada Ltd. 5140 Yonge Street, Suite 800 Toronto, Ontario M2N 6X7 | | Vice President | | Since 2009 | | Vice President, Invesco Exchange-Traded Fund Trust, Invesco Exchange-Traded Fund Trust II, Invesco India Exchange-Traded Fund Trust, and Invesco Actively Managed Exchange-Traded Fund Trust (2009-Present), Invesco Actively Managed Exchange-Traded Commodity Fund Trust (2014-Present) and Invesco Exchange-Traded Self-Indexed Fund Trust (2016-Present); Managing Director—Chief Administrative Officer, Americas, Invesco Capital Management LLC; Senior Vice President, Invesco Advisers, Inc. (2009-Present); Director, Invesco Inc. (2009-Present); Director, Executive Vice President and Chief Financial Officer, Invesco Canada Ltd. (formerly, Invesco Trimark Ltd.) (2011-Present); Chief Administrative Officer, North American Retail, Invesco Ltd. (2007-Present); Director, Invesco Corporate Class Inc. (2014-Present); Director, Invesco Global Direct Real Estate Feeder GP Ltd. (2015-Present); Director, Invesco Canada Holdings Inc. (2002-Present); Director, Invesco Financial Services Ltd. / Services Financiers Invesco Ltée and Trimark Investments Ltd./Placements Trimark Ltée (2014-Present); Director, Invesco IP Holdings (Canada) Ltd. (2016-Present); Director, Invesco Global Direct Real Estate GP Ltd. (2015-Present); formerly, Senior Vice President, Invesco Management Group, Inc. (2007-2018); Executive Vice President and Chief Financial Officer, Invesco Inc. (2009-2015); Director, Executive Vice President and Chief Financial Officer, Invesco Canada Ltd. (formerly, Invesco Trimark Ltd.) (2000-2011). |
| | | |
Melanie Zimdars—1976 Invesco Capital Management LLC 3500 Lacey Road, Suite 700 Downers Grove, IL 60515 | | Chief Compliance Officer | | Since 2017 | | Chief Compliance Officer of Invesco Capital Management LLC (2017-Present); Chief Compliance Officer of Invesco Exchange-Traded Fund Trust, Invesco Exchange-Traded Fund Trust II, Invesco India Exchange-Traded Fund Trust, Invesco Actively Managed Exchange-Traded Fund Trust, Invesco Actively Managed Exchange-Traded Commodity Fund Trust and Invesco Exchange-Traded Self-Indexed Fund Trust (2017-Present); formerly, Vice President and Deputy Chief Compliance Officer at ALPS Holding, Inc. (2009-2017); Mutual Fund Treasurer/Chief Financial Officer at Wasatch Advisors, Inc. (2005-2008); Compliance Officer, U.S. Bancorp Fund Services, LLC (2001-2005). |
Availability of Additional Information About the Trustees
The Statement of Additional Information includes additional information about the Trustees and is available, without charge, upon request at (800) 983-0903.
| * | This is the date each Officer began serving the Trust. Each Officer serves an indefinite term, until his or her successor is elected. |
(This Page Intentionally Left Blank)
(This Page Intentionally Left Blank)
Proxy Voting Policies and Procedures
A description of the Trust’s proxy voting policies and procedures that the Funds use to determine how to vote proxies relating to portfolio securities is available, without charge and upon request, by calling (800) 983-0903. This information is also available on the Securities and Exchange Commission’s (“Commission”) website at www.sec.gov.
Information regarding how each Fund voted proxies for portfolio securities, if applicable, during the most recent 12-month period ended June 30, is also available, without charge and upon request, by (i) calling (800) 983-0903; or (ii) accessing the Trust’s Form N-PX on the Commission’s website at www.sec.gov.
Quarterly Portfolios
The Trust files its complete schedule of portfolio holdings for the Funds with the Commission for the first and third quarters of each fiscal year on Form N-Q. The Trust’s Forms N-Q are available on the Commission’s website at www.sec.gov. The Trust’s Forms N-Q may also be reviewed and copied at the Commission’s Public Reference Room in Washington, DC; information on the operation of the Public Reference Room may be obtained by calling (800) SEC-0330.
Frequency Distribution of Discounts and Premiums
A table showing the number of days the market price of each Fund’s shares was greater than the Fund’s net asset value, and the number of days it was less than the Fund’s net asset value (i.e., premium or discount) for the most recently completed calendar year, and the calendar quarters since that year end (or the life of the Fund, if shorter) may be found at the Fund’s website at www.invesco.com/ETFs.
| | | | |
©2018 Invesco Capital Management LLC 3500 Lacey Road, Suite 700 Downers Grove, IL 60515 | | P-KBW-AR-1 | | invesco.com/ETFs |

Invesco Annual Report to Shareholders
August 31, 2018
| | |
| PBUS | | Invesco PureBetaSM MSCI USA ETF |
| PBSM | | Invesco PureBetaSM MSCI USA Small Cap ETF |
| PBND | | Invesco PureBetaSM US Aggregate Bond ETF |
Table of Contents
The Market Environment
Domestic Equity
The fiscal period proved to be another strong, albeit increasingly volatile, time for US equities. As the fiscal period unfolded in the later months of 2017, several major US stock market indexes repeatedly reached new highs amid improving economic data, strong corporate profits and the prospect of tax reform legislation. Stock market volatility remained exceedingly low—a hallmark of 2017.
At the outset of 2018, US equity markets continued to steadily move higher in January as investors remained enthused about the passage of the Tax Cuts and Jobs Act signed into law in late December 2017, which significantly cut corporate tax rates. However, in February 2018, volatility returned to the US stock and bond markets. Worries about how rising interest rates might affect economic growth, concerns about a potential trade war and heightened geopolitical tensions, caused the US stock market to pull back and volatility to increase. In addition, in April 2018, the yield on the 10-year US Treasury bond climbed above 3%—a psychologically important level—for the first time since December 2013.1
Despite a disappointing first quarter, US equity markets generally recovered in the second quarter of 2018. Strong US retail sales and low unemployment continued to buoy US equity markets. In the final months of the fiscal period, US equities moved higher, despite several potential headwinds including trade tensions, tariff announcements and contagion concerns over a Turkish currency crisis. Ultimately, the fiscal period ended the same way it began with several US equity indexes reaching new record highs.
Given signs of a strong economy, the US Federal Reserve raised interest rates three times during the fiscal period: in December 2017 and in March and June 2018.2 In contrast, the European Central Bank and central banks in several other countries maintained extraordinarily accommodative monetary policies.
| 2 | Source: US Federal Reserve |
Fixed Income
Throughout the fiscal period, US economic data remained positive; economic growth in the second quarter of 2018 was particularly strong. The US economy continued to add jobs, pushing the unemployment rate to 3.9% at the close of the fiscal period, while inflation remained subdued.1 Against this backdrop, the US Federal Reserve (the Fed) raised the federal funds target rate from a range of 1.00% to 1.25% at the start of the fiscal period to a range of 1.75% to 2.00% at the close of the fiscal period. This was accomplished with three 0.25% rate hikes in December 2017, and in March and June 2018.2 Working against these positive developments, however, were global macroeconomic headwinds in the form of geopolitical trade tension, sub-optimal inflation, and the lingering unknown of Brexit—the decision by UK voters to leave the European Union. These headwinds could limit future Fed rate hikes in the near-term. The Bank of Japan and the European Central Bank maintained their negative interest rates in a continued attempt to stimulate growth and inflation by encouraging investors to spend rather than save. These actions continued to drive overseas investments into higher yielding segments of the fixed income markets.
The 10-year US Treasury yield continued to move upward at the start of the fiscal period and spiked in early 2018 due to the continued strength in the global economy, the rising risks of inflation and the high probability of additional Fed rate hikes throughout the fiscal period. Due to these factors, the 10-year US Treasury note declined steadily throughout the first quarter of 2018, resulting in higher government yields and a brief move above 3.00% before normalizing near the end of the fiscal period.3 The 10-year US Treasury yield ended the fiscal period at 2.86%, 74 basis points higher than at the beginning of the fiscal period.3 (A basis point is one one-hundredth of a percentage point.)
The broader bond market, as represented by the Bloomberg Barclays U.S. Aggregate Bond Index, fell 1.05% for the fiscal period. Poor performance was largely attributable to the broad increase in US Treasury yields, a widening of credit spreads and reduced overseas bond purchase demand during the fiscal period. All four primary sectors of the Bloomberg Barclays U.S. Aggregate Bond Index—government-related, corporate, securitized and treasury—posted negative returns for the fiscal period.
| 1 | Bureau of Labor Statistics |
| | |
| PBUS | | Manager’s Analysis |
| | Invesco PureBetaSM MSCI USA ETF (PBUS) |
As an index fund, the Invesco PureBetaSM MSCI USA ETF (the “Fund”) is passively managed and seeks to track the investment results (before fees and expenses) of the MSCI USA Index (the “Index”). The Fund generally will invest at least 90% of its total assets in common stocks that comprise the Index.
Strictly in accordance with its guidelines and mandated procedures, MSCI Inc. (the “Index Provider”) compiles, maintains and calculates the Index, which is designed to measure the performance of the large- and mid-capitalization segments of the U.S. equity market. The Index Provider weights securities in the Index by their free float-adjusted market capitalization. The Fund generally invests in all of the securities comprising its Index in proportion to their weightings in the Index.
The Board of Trustees approved a change in the fiscal year end for the Fund from October 31 to August 31. For the fiscal period from November 1, 2017 to August 31, 2018, on a market price basis, the Fund returned 14.68%. On a net asset value (“NAV”) basis, the Fund returned 14.68%. During the same time period, the Index returned 14.71%. During the fiscal period, the Fund fully replicated the components of the Index; therefore, the Fund’s performance (NAV basis) differed from the return of the Index primarily due to fees and operating expenses incurred by the Fund during the period.
For the fiscal period ended August 31, 2018, the information technology sector contributed most significantly to the Fund’s return, followed by the consumer discretionary and health care sectors, respectively. The utilities sector detracted most significantly from the Fund’s return, followed by the materials sector.
Positions that contributed most significantly to the Fund’s return for the fiscal period ended August 31, 2018, included Amazon.com, Inc., a consumer discretionary company (portfolio average weight of 2.52%), Apple, Inc., an information technology company (portfolio average weight of 3.81%), and Microsoft Corp., an information technology company (portfolio average weight of 2.85%). Positions that detracted most significantly from the Fund’s return included General Electric Co., an industrials company (portfolio average weight of 0.54%), and Philip Morris International, Inc., a consumer staples company (portfolio average weight of 0.60%).
| | | | |
Sector Breakdown
(% of the Fund’s Net Assets)
as of August 31, 2018 | |
| Information Technology | | | 26.8 | |
| Health Care | | | 14.3 | |
| Financials | | | 13.5 | |
| Consumer Discretionary | | | 13.3 | |
| Industrials | | | 9.5 | |
| Consumer Staples | | | 6.5 | |
| Energy | | | 5.8 | |
| Real Estate | | | 2.8 | |
| Utilities | | | 2.7 | |
| Materials | | | 2.6 | |
| Telecommunication Services | | | 2.0 | |
| Other Assets Less Liabilities | | | 0.2 | |
|
Top Ten Fund Holdings
(% of the Fund’s Net Assets)
as of August 31, 2018 | |
| Security | | | | |
| Apple, Inc. | | | 4.3 | |
| Amazon.com, Inc. | | | 3.3 | |
| Microsoft Corp. | | | 3.2 | |
| Facebook, Inc., Class A | | | 1.6 | |
| JPMorgan Chase & Co. | | | 1.5 | |
| Alphabet, Inc., Class C | | | 1.5 | |
| Alphabet, Inc., Class A | | | 1.4 | |
| Johnson & Johnson | | | 1.4 | |
| Exxon Mobil Corp. | | | 1.3 | |
| Bank of America Corp. | | | 1.2 | |
| Total | | | 20.7 | |
Invesco PureBetaSM MSCI USA ETF (PBUS) (continued)
Growth of a $10,000 Investment Since Inception
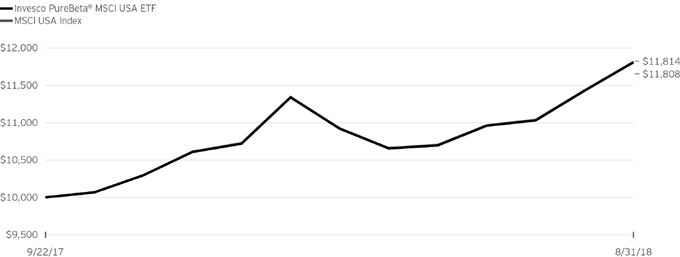
Fund Performance History as of August 31, 2018
| | | | |
| | | Fund Inception | |
| Index | | Cumulative | |
| MSCI USA Index | | | 18.14 | % |
| Fund | | | | |
| NAV Return | | | 18.08 | |
| Market Price Return | | | 18.22 | |
Fund Inception: September 22, 2017
Performance quoted above represents past performance. Past performance is not a guarantee of future results and current performance may be higher or lower than performance quoted. Investment returns and principal value will fluctuate, and shares of the Fund (“Fund Shares”), when redeemed or sold, may be worth more or less than their original cost. Fund performance reflects any applicable fee waivers and/or expense reimbursements. Had the adviser not waived fees and/or reimbursed expenses currently, returns would have been lower. See current prospectus for more information. According to the Fund’s current prospectus, the Fund’s expense ratio of 0.04% is expressed as a unitary management fee to cover operating expenses and expenses incurred in connection with managing the portfolio. NAV and Market Price returns assume that dividends and capital gain distributions have been reinvested in the Fund at NAV and Market Price, respectively.
See invesco.com/ETFs to find the most recent month-end performance numbers.
Index performance results are based upon a hypothetical investment in their respective constituent securities. Index returns do not represent Fund returns. An investor cannot invest directly in an index. The Index does not charge management fees or brokerage expenses, and no such fees or expenses were deducted from the hypothetical performance shown. In addition, the results actual investors might have achieved would have differed from those shown because of differences in the timing, amounts of their investments, and fees and expenses associated with an investment in the Fund.
Notes Regarding Index and Fund Performance History:
| - | Cumulative Inception returns for the Fund and Index are based on the inception date of the Fund. |
| | |
| PBSM | | Manager’s Analysis |
| | Invesco PureBetaSM MSCI USA Small Cap ETF (PBSM) |
As an index fund, the Invesco PureBetaSM MSCI USA Small Cap ETF (the “Fund”) is passively managed and seeks to track the investment results (before fees and expenses) of the MSCI USA Small Cap Index (the “Index”). The Fund generally will invest at least 90% of its total assets in common stocks that comprise the Index.
Strictly in accordance with its guidelines and mandated procedures, MSCI Inc. (the “Index Provider”) compiles, maintains and calculates the Index, which is designed to measure the performance of the small-capitalization segment of the U.S. equity market. The Index Provider weights securities in the Index by their free float-adjusted market capitalization. The Fund generally invests in all of the securities comprising its Index in proportion to their weightings in the Index.
The Board of Trustees approved a change in the fiscal year end for the Fund from October 31 to August 31. For the fiscal period from November 1, 2017 to August 31, 2018, on a market price basis, the Fund returned 16.57%. On a net asset value (“NAV”) basis, the Fund returned 16.66%. During the same time period, the Index returned 16.70%. During the fiscal period, the Fund fully replicated the components of the Index; therefore, the Fund’s performance (NAV basis) differed from the return of the Index primarily due to fees and operating expenses incurred by the Fund during the period.
For the fiscal period ended August 31, 2018, the health care sector contributed most significantly to the Fund’s return, followed by the information technology and consumer discretionary sectors, respectively. The telecommunications services sector detracted most significantly from the Fund’s return, followed by the materials and utilities sectors, respectively.
Positions that contributed most significantly to the Fund’s return for the fiscal period ended August 31, 2018, included Nektar Therapeutics, a consumer discretionary company (no longer held at fiscal period-end), and ABIOMED, Inc., a consumer discretionary company (no longer held at fiscal period-end). Positions that detracted most significantly from the Fund’s return included Adient PLC, a consumer discretionary company (portfolio average weight of 0.16%), and Acadia Healthcare Co., Inc., a health care company (portfolio average weight of 0.06%).
| | | | |
Sector Breakdown
(% of the Fund’s Net Assets)
as of August 31, 2018 | |
| Information Technology | | | 16.0 | |
| Financials | | | 15.9 | |
| Health Care | | | 14.8 | |
| Industrials | | | 13.9 | |
| Consumer Discretionary | | | 12.8 | |
| Real Estate | | | 10.0 | |
| Materials | | | 5.4 | |
| Energy | | | 4.6 | |
| Consumer Staples | | | 3.3 | |
| Utilities | | | 2.8 | |
| Telecommunication Services | | | 0.5 | |
| Other Assets Less Liabilities | | | 0.0 | |
|
Top Ten Fund Holdings
(% of the Fund’s Net Assets)
as of August 31, 2018 | |
| Security | | | | |
| WellCare Health Plans, Inc. | | | 0.4 | |
| GrubHub, Inc. | | | 0.3 | |
| DexCom, Inc. | | | 0.3 | |
| PTC Therapeutics, Inc. | | | 0.3 | |
| Burlington Stores, Inc. | | | 0.3 | |
| Neurocrine Biosciences, Inc. | | | 0.3 | |
| NRG Energy, Inc. | | | 0.3 | |
| PerkinElmer, Inc. | | | 0.3 | |
| Lamb Weston Holdings, Inc. | | | 0.3 | |
| STERIS PLC | | | 0.3 | |
| Total | | | 3.1 | |
Invesco PureBetaSM MSCI USA Small Cap ETF (PBSM) (continued)
Growth of a $10,000 Investment Since Inception
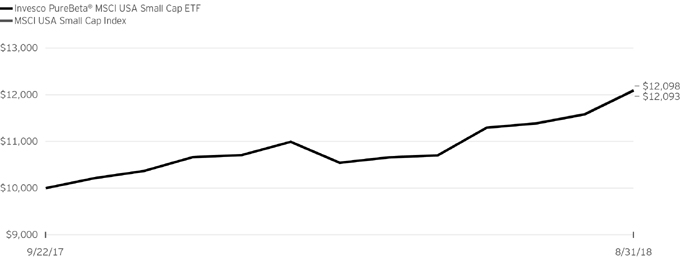
Fund Performance History as of August 31, 2018
| | | | |
| | | Fund Inception | |
| Index | | Cumulative | |
| MSCI USA Small Cap Index | | | 20.98 | % |
| Fund | | | | |
| NAV Return | | | 20.93 | |
| Market Price Return | | | 20.84 | |
Fund Inception: September 22, 2017
Performance quoted above represents past performance. Past performance is not a guarantee of future results and current performance may be higher or lower than performance quoted. Investment returns and principal value will fluctuate, and shares of the Fund (“Fund Shares”), when redeemed or sold, may be worth more or less than their original cost. Fund performance reflects any applicable fee waivers and/or expense reimbursements. Had the adviser not waived fees and/or reimbursed expenses currently, returns would have been lower. See current prospectus for more information. According to the Fund’s current prospectus, the Fund’s expense ratio of 0.06% is expressed as a unitary management fee to cover operating expenses and expenses incurred in connection with managing the portfolio. NAV and Market Price returns assume that dividends and capital gain distributions have been reinvested in the Fund at NAV and Market Price, respectively.
See invesco.com/ETFs to find the most recent month-end performance numbers.
Index performance results are based upon a hypothetical investment in their respective constituent securities. Index returns do not represent Fund returns. An investor cannot invest directly in an index. The Index does not charge management fees or brokerage expenses, and no such fees or expenses were deducted from the hypothetical performance shown. In addition, the results actual investors might have achieved would have differed from those shown because of differences in the timing, amounts of their investments, and fees and expenses associated with an investment in the Fund.
Notes Regarding Index and Fund Performance History:
| - | Cumulative Inception returns for the Fund and Index are based on the inception date of the Fund. |
| | |
| PBND | | Manager’s Analysis |
| | Invesco PureBetaSM US Aggregate Bond ETF (PBND) |
As an index fund, the Invesco PureBetaSM US Aggregate Bond ETF (the “Fund”) is passively managed and seeks to track the investment results (before fees and expenses) of the ICE BofAML US Broad Market IndexSM (the “Index”). The Fund generally will invest at least 80% of its total assets in the component securities that comprise the Index.
Strictly in accordance with its guidelines and mandated procedures, ICE Data Indices, LLC (the “Index Provider”) compiles, maintains and calculates the Index, which is designed to provide a broad measure of the performance of the domestic investment grade bond market, represented by U.S. dollar-denominated, investment grade debt securities that are publicly offered for sale in the United States. Constituent securities may include U.S. Treasury notes and bonds, quasi-government securities, corporate securities, residential and commercial mortgaged-backed securities and asset-backed securities. Transactions in U.S. government agency mortgage-backed securities may occur through standardized agreements for forward or future delivery in which the actual mortgage pools to be delivered are not specified until shortly prior to settlement (to be announced (“TBA”) transactions). The Fund may engage in such TBA transactions. Pending settlement of TBA transactions, the Fund will invest its assets in high-quality, liquid, short-term instruments, including affiliated money market funds. The Fund also may acquire interests in mortgage pools through means other than such standardized agreements for forward or future delivery.
To qualify for inclusion in the Index, securities must have: (i) at least one year to final maturity; (ii) at least 18 months to final maturity when issued; (iii) a fixed coupon schedule; and (iv) with the exception of U.S. Treasuries, an investment grade rating (based on an average of Moody’s Investors Services, Inc. (“Moody’s”), S&P Global Ratings, a division of S&P Global Inc. (“S&P”) and Fitch Ratings, Inc. (“Fitch”)). Original issue zero coupon bonds, Rule 144A securities, corporate pay-in-kind securities and “hybrid” securities (including those that may convert into preferred shares) are eligible for inclusion in the Index. Index constituents are capitalization-weighted, based on their current amount outstanding times the market price, plus accrued interest. The Fund does not purchase all of the securities in the Index; instead, the Fund utilizes a “sampling” methodology to seek to achieve its investment objective.
The Board of Trustees approved a change in the fiscal year end for the Fund from October 31 to August 31. For the fiscal period from November 1, 2017 to August 31, 2018, on a market price basis, the Fund returned (0.64)%. On a net asset value (“NAV”) basis, the Fund returned (0.68)%. During the same time period, the Index returned (0.60)%. During the fiscal period, the Fund’s performance (NAV basis) differed from the return of the Index primarily due to fees and operating expenses that the Fund incurred during the period as well as due to the sampling methodology utilized by the Fund.
For the fiscal period ended August 31, 2018, government securities contributed most significantly to the Fund’s return, followed by U.S. Treasuries. Corporate debt securities detracted most significantly from the Fund’s return.
Positions that contributed most significantly to the Fund’s return for the fiscal period ended August 31, 2018, included Anheuser-Busch InBev Finance, Inc. (Belgium), 4.90% coupon, due 02/01/2046, a beverages company (no longer held at fiscal period-end), Federal Home Loan Mortgage Corp. (FHLMC), 3.00% coupon, due 11/01/2028, a collateralized mortgage obligations security (portfolio average weight of 0.50%), and Verizon Communications, Inc., 5.012% coupon, due 04/15/2049, a telecommunications company (portfolio average weight of 0.42%). Positions that detracted most significantly from the Fund’s return included General Electric Co., Series A, GMTN, 6.75% coupon, due 03/15/2032, a miscellaneous manufacturing company (portfolio average weight of 0.53%), and Kraft Heinz Foods Co., 5.20% coupon, due 07/15/2045, a food company (portfolio average weight of 0.42%).
| | | | |
Asset Group (% of the Fund’s Net Assets)
as of August 31, 2018 | | | |
| U.S. Treasury Securities | | | 39.3 | |
| Corporate Bonds and Notes | | | 28.6 | |
| U.S. Government Sponsored Agency Mortgage-Backed Securities | | | 23.3 | |
| Sovereign Debt Obligations | | | 3.1 | |
| Commercial Mortgage-Backed Securities | | | 1.8 | |
| U.S. Government Sponsored Agency Securities | | | 1.7 | |
| Asset-Backed Securities | | | 1.2 | |
| Municipal Bonds | | | 0.6 | |
| Money Market Fund Plus Other Assets Less Liabilities | | | 0.4 | |
Invesco PureBetaSM US Aggregate Bond ETF (PBND) (continued)
| | | | |
Top Ten Fund Holdings*
(% of the Fund’s Net Assets)
as of August 31, 2018 | |
| Security | | | | |
| Government National Mortgage Association (GNMA), 3.500%, 08/20/2047 | | | 1.9 | |
| Government National Mortgage Association (GNMA), 3.000%, 11/20/2046 | | | 1.9 | |
| Federal Home Loan Mortgage Corp. (FHLMC), 3.000%, 06/01/2046 | | | 1.7 | |
| Federal National Mortgage Association (FNMA), 4.000%, 10/01/2047 | | | 1.5 | |
| Federal National Mortgage Association (FNMA), 3.500%, 08/01/2045 | | | 1.4 | |
| Federal National Mortgage Association (FNMA), 3.000%, 09/01/2046 | | | 1.4 | |
| Government National Mortgage Association (GNMA), 3.500%, 09/20/2047 | | | 1.4 | |
| Federal National Mortgage Association (FNMA), 3.000%, 12/01/2046 | | | 1.2 | |
| Federal National Mortgage Association (FNMA), 4.000%, 09/01/2047 | | | 1.1 | |
| U.S. Treasury Bond, 6.625%, 02/15/2027 | | | 1.1 | |
| Total | | | 14.6 | |
| * | Excluding money market fund holdings. |
Invesco PureBetaSM US Aggregate Bond ETF (PBND) (continued)
Growth of a $10,000 Investment Since Inception
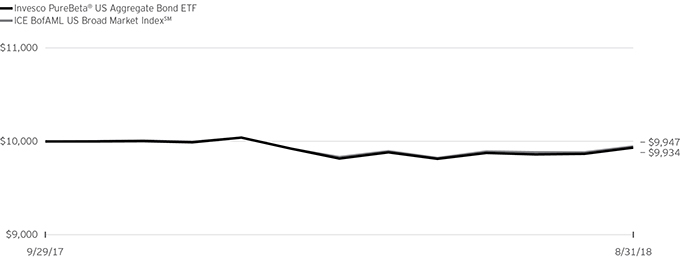
Fund Performance History as of August 31, 2018
| | | | |
| | | Fund Inception | |
| Index | | Cumulative | |
| ICE BofAML US Broad Market IndexSM | | | (0.53 | )% |
| Fund | | | | |
| NAV Return | | | (0.66 | ) |
| Market Price Return | | | (0.34 | ) |
Fund Inception: September 29, 2017
Performance quoted above represents past performance. Past performance is not a guarantee of future results and current performance may be higher or lower than performance quoted. Investment returns and principal value will fluctuate, and shares of the Fund (“Fund Shares”), when redeemed or sold, may be worth more or less than their original cost. Fund performance reflects any applicable fee waivers and/or expense reimbursements. Had the adviser not waived fees and/or reimbursed expenses currently, returns would have been lower. See current prospectus for more information. According to the Fund’s current prospectus, the Fund’s expense ratio of 0.05% is expressed as a unitary management fee to cover operating expenses and expenses incurred in connection with managing the portfolio. NAV and Market Price returns assume that dividends and capital gain distributions have been reinvested in the Fund at NAV and Market Price, respectively.
See invesco.com/ETFs to find the most recent month-end performance numbers.
Index performance results are based upon a hypothetical investment in their respective constituent securities. Index returns do not represent Fund returns. An investor cannot invest directly in an index. The Index does not charge management fees or brokerage expenses, and no such fees or expenses were deducted from the hypothetical performance shown. In addition, the results actual investors might have achieved would have differed from those shown because of differences in the timing, amounts of their investments, and fees and expenses associated with an investment in the Fund.
Notes Regarding Index and Fund Performance History:
| - | Cumulative Inception returns for the Fund and Index are based on the inception date of the Fund. |
Schedule of Investments(a)
Invesco PureBetaSM MSCI USA ETF (PBUS)
August 31, 2018
| | | | | | | | |
Number
of Shares | | | | | Value | |
| | | | Common Stocks & Other Equity Interests—99.8% | |
| | | | Consumer Discretionary—13.3% | | | |
| | 8 | | | Advance Auto Parts, Inc. | | $ | 1,312 | |
| | 47 | | | Amazon.com, Inc.(b) | | | 94,597 | |
| | 30 | | | Aptiv PLC | | | 2,640 | |
| | 27 | | | Aramark | | | 1,109 | |
| | 10 | | | Autoliv, Inc. (Sweden) | | | 891 | |
| | 3 | | | AutoZone, Inc.(b) | | | 2,301 | |
| | 29 | | | Best Buy Co., Inc. | | | 2,307 | |
| | 5 | | | Booking Holdings, Inc.(b) | | | 9,758 | |
| | 24 | | | BorgWarner, Inc. | | | 1,050 | |
| | 21 | | | CarMax, Inc.(b) | | | 1,639 | |
| | 48 | | | Carnival Corp. | | | 2,952 | |
| | 40 | | | CBS Corp., Class B | | | 2,121 | |
| | 19 | | | Charter Communications, Inc., Class A(b) | | | 5,898 | |
| | 3 | | | Chipotle Mexican Grill, Inc.(b) | | | 1,426 | |
| | 524 | | | Comcast Corp., Class A | | | 19,383 | |
| | 40 | | | D.R. Horton, Inc. | | | 1,780 | |
| | 14 | | | Darden Restaurants, Inc. | | | 1,625 | |
| | 17 | | | Discovery, Inc., Class A(b) | | | 473 | |
| | 34 | | | Discovery, Inc., Class C(b) | | | 872 | |
| | 25 | | | DISH Network Corp., Class A(b) | | | 884 | |
| | 31 | | | Dollar General Corp. | | | 3,340 | |
| | 26 | | | Dollar Tree, Inc.(b) | | | 2,093 | |
| | 5 | | | Domino’s Pizza, Inc. | | | 1,493 | |
| | 14 | | | Expedia Group, Inc. | | | 1,827 | |
| | 414 | | | Ford Motor Co. | | | 3,925 | |
| | 26 | | | Gap, Inc. (The) | | | 789 | |
| | 14 | | | Garmin Ltd. | | | 954 | |
| | 144 | | | General Motors Co. | | | 5,191 | |
| | 16 | | | Genuine Parts Co. | | | 1,598 | |
| | 28 | | | Goodyear Tire & Rubber Co. (The) | | | 635 | |
| | 23 | | | H&R Block, Inc. | | | 622 | |
| | 41 | | | Hanesbrands, Inc. | | | 719 | |
| | 19 | | | Harley-Davidson, Inc. | | | 810 | |
| | 13 | | | Hasbro, Inc. | | | 1,291 | |
| | 32 | | | Hilton Worldwide Holdings, Inc. | | | 2,484 | |
| | 131 | | | Home Depot, Inc. (The) | | | 26,301 | |
| | 44 | | | Interpublic Group of Cos., Inc. (The) | | | 1,027 | |
| | 19 | | | Kohl’s Corp. | | | 1,503 | |
| | 27 | | | L Brands, Inc. | | | 714 | |
| | 44 | | | Las Vegas Sands Corp. | | | 2,878 | |
| | 8 | | | Lear Corp. | | | 1,298 | |
| | 15 | | | Leggett & Platt, Inc. | | | 682 | |
| | 32 | | | Lennar Corp., Class A | | | 1,653 | |
| | 12 | | | Liberty Broadband Corp., Class C(b) | | | 973 | |
| | 24 | | | Liberty Global PLC, Series A (United Kingdom)(b) | | | 643 | |
| | 64 | | | Liberty Global PLC, Series C (United Kingdom)(b) | | | 1,657 | |
| | 23 | | | Liberty Media Corp.-Liberty Formula One, Class C(b) | | | 850 | |
| | 10 | | | Liberty Media Corp.-Liberty SiriusXM, Class A(b) | | | 467 | |
| | 20 | | | Liberty Media Corp.-Liberty SiriusXM, Class C(b) | | | 941 | |
| | 16 | | | Live Nation Entertainment, Inc.(b) | | | 795 | |
| | 34 | | | LKQ Corp.(b) | | | 1,174 | |
| | 93 | | | Lowe’s Cos., Inc. | | | 10,114 | |
| | 11 | | | Lululemon Athletica, Inc.(b) | | | 1,704 | |
| | 34 | | | Macy’s, Inc. | | | 1,243 | |
| | 35 | | | Marriott International, Inc., Class A | | | 4,426 | |
| | 38 | | | Mattel, Inc.(b) | | | 586 | |
| | | | | | | | |
Number
of Shares | | | | | Value | |
| | | | Common Stocks & Other Equity Interests
(continued) | |
| | | | Consumer Discretionary (continued) | | | |
| | 89 | | | McDonald’s Corp. | | $ | 14,438 | |
| | 60 | | | MGM Resorts International | | | 1,739 | |
| | 17 | | | Michael Kors Holdings Ltd.(b) | | | 1,235 | |
| | 7 | | | Mohawk Industries, Inc.(b) | | | 1,341 | |
| | 49 | | | Netflix, Inc.(b) | | | 18,016 | |
| | 54 | | | Newell Brands, Inc. | | | 1,173 | |
| | 43 | | | News Corp., Class A | | | 562 | |
| | 145 | | | NIKE, Inc., Class B | | | 11,919 | |
| | 14 | | | Nordstrom, Inc. | | | 880 | |
| | 24 | | | Norwegian Cruise Line Holdings Ltd.(b) | | | 1,287 | |
| | 26 | | | Omnicom Group, Inc. | | | 1,802 | |
| | 9 | | | O’Reilly Automotive, Inc.(b) | | | 3,019 | |
| | 7 | | | Polaris Industries, Inc. | | | 759 | |
| | 32 | | | PulteGroup, Inc. | | | 894 | |
| | 9 | | | PVH Corp. | | | 1,288 | |
| | 50 | | | Qurate Retail, Inc., Class A(b) | | | 1,040 | |
| | 6 | | | Ralph Lauren Corp., Class A | | | 797 | |
| | 43 | | | Ross Stores, Inc. | | | 4,119 | |
| | 19 | | | Royal Caribbean Cruises Ltd. | | | 2,329 | |
| | 182 | | | Sirius XM Holdings, Inc. | | | 1,292 | |
| | 159 | | | Starbucks Corp. | | | 8,499 | |
| | 31 | | | Tapestry, Inc. | | | 1,571 | |
| | 58 | | | Target Corp. | | | 5,075 | |
| | 14 | | | Tesla, Inc.(b) | | | 4,223 | |
| | 14 | | | Tiffany & Co. | | | 1,717 | |
| | 71 | | | TJX Cos., Inc. (The) | | | 7,808 | |
| | 17 | | | Toll Brothers, Inc. | | | 616 | |
| | 14 | | | Tractor Supply Co. | | | 1,236 | |
| | 13 | | | TripAdvisor, Inc.(b) | | | 706 | |
| | 117 | | | Twenty-First Century Fox, Inc., Class A | | | 5,312 | |
| | 49 | | | Twenty-First Century Fox, Inc., Class B | | | 2,200 | |
| | 6 | | | Ulta Beauty, Inc.(b) | | | 1,560 | |
| | 21 | | | Under Armour, Inc., Class C(b) | | | 398 | |
| | 21 | | | Under Armour, Inc., Class A(b) | | | 429 | |
| | 5 | | | Vail Resorts, Inc. | | | 1,490 | |
| | 38 | | | VF Corp. | | | 3,501 | |
| | 39 | | | Viacom, Inc., Class B | | | 1,142 | |
| | 169 | | | Walt Disney Co. (The) | | | 18,931 | |
| | 7 | | | Whirlpool Corp. | | | 875 | |
| | 11 | | | Wynn Resorts Ltd. | | | 1,632 | |
| | 38 | | | Yum! Brands, Inc. | | | 3,302 | |
| | | | | | | | |
| | | | | | | 386,570 | |
| | | | | | | | |
| | | | Consumer Staples—6.5% | |
| | 213 | | | Altria Group, Inc. | | | 12,465 | |
| | 63 | | | Archer-Daniels-Midland Co. | | | 3,175 | |
| | 30 | | | Brown-Forman Corp., Class B | | | 1,567 | |
| | 16 | | | Bunge Ltd. | | | 1,040 | |
| | 20 | | | Campbell Soup Co. | | | 789 | |
| | 28 | | | Church & Dwight Co., Inc. | | | 1,584 | |
| | 14 | | | Clorox Co. (The) | | | 2,030 | |
| | 458 | | | Coca-Cola Co. (The) | | | 20,413 | |
| | 94 | | | Colgate-Palmolive Co. | | | 6,242 | |
| | 47 | | | Conagra Brands, Inc. | | | 1,727 | |
| | 19 | | | Constellation Brands, Inc., Class A | | | 3,956 | |
| | 49 | | | Costco Wholesale Corp. | | | 11,423 | |
| | 54 | | | Coty, Inc., Class A | | | 667 | |
See accompanying Notes to Financial Statements which are an integral part of the financial statements.
Invesco PureBetaSM MSCI USA ETF (PBUS) (continued)
August 31, 2018
| | | | | | | | |
Number
of Shares | | | | | Value | |
| | | | Common Stocks & Other Equity Interests
(continued) | |
| | | | Consumer Staples (continued) | |
| | 25 | | | Estee Lauder Cos., Inc. (The), Class A | | $ | 3,503 | |
| | 64 | | | General Mills, Inc. | | | 2,945 | |
| | 16 | | | Hershey Co. (The) | | | 1,608 | |
| | 32 | | | Hormel Foods Corp. | | | 1,253 | |
| | 8 | | | Ingredion, Inc. | | | 809 | |
| | 13 | | | JM Smucker Co. (The) | | | 1,344 | |
| | 29 | | | Kellogg Co. | | | 2,082 | |
| | 39 | | | Kimberly-Clark Corp. | | | 4,506 | |
| | 68 | | | Kraft Heinz Co. (The) | | | 3,962 | |
| | 101 | | | Kroger Co. (The) | | | 3,181 | |
| | 14 | | | McCormick & Co., Inc. | | | 1,748 | |
| | 21 | | | Molson Coors Brewing Co., Class B | | | 1,401 | |
| | 167 | | | Mondelez International, Inc., Class A | | | 7,134 | |
| | 47 | | | Monster Beverage Corp.(b) | | | 2,862 | |
| | 159 | | | PepsiCo, Inc. | | | 17,810 | |
| | 174 | | | Philip Morris International, Inc. | | | 13,553 | |
| | 285 | | | Procter & Gamble Co. (The) | | | 23,641 | |
| | 55 | | | Sysco Corp. | | | 4,115 | |
| | 34 | | | Tyson Foods, Inc., Class A | | | 2,136 | |
| | 94 | | | Walgreens Boots Alliance, Inc. | | | 6,445 | |
| | 167 | | | Walmart, Inc. | | | 16,009 | |
| | | | | | | | |
| | | | | | | 189,125 | |
| | | | | | | | |
| | | | Energy—5.8% | |
| | 60 | | | Anadarko Petroleum Corp. | | | 3,864 | |
| | 16 | | | Andeavor | | | 2,445 | |
| | 25 | | | Antero Resources Corp.(b) | | | 463 | |
| | 42 | | | Apache Corp. | | | 1,841 | |
| | 49 | | | Baker Hughes a GE Co. | | | 1,616 | |
| | 52 | | | Cabot Oil & Gas Corp. | | | 1,239 | |
| | 23 | | | Cheniere Energy, Inc.(b) | | | 1,539 | |
| | 214 | | | Chevron Corp. | | | 25,350 | |
| | 11 | | | Cimarex Energy Co. | | | 929 | |
| | 22 | | | Concho Resources, Inc.(b) | | | 3,017 | |
| | 131 | | | ConocoPhillips | | | 9,619 | |
| | 10 | | | Continental Resources, Inc.(b) | | | 659 | |
| | 59 | | | Devon Energy Corp. | | | 2,533 | |
| | 11 | | | Diamondback Energy, Inc. | | | 1,332 | |
| | 65 | | | EOG Resources, Inc. | | | 7,685 | |
| | 30 | | | EQT Corp. | | | 1,531 | |
| | 477 | | | Exxon Mobil Corp. | | | 38,241 | |
| | 97 | | | Halliburton Co. | | | 3,869 | |
| | 12 | | | Helmerich & Payne, Inc. | | | 787 | |
| | 32 | | | Hess Corp. | | | 2,155 | |
| | 19 | | | HollyFrontier Corp. | | | 1,416 | |
| | 224 | | | Kinder Morgan, Inc. | | | 3,965 | |
| | 95 | | | Marathon Oil Corp. | | | 2,043 | |
| | 54 | | | Marathon Petroleum Corp. | | | 4,444 | |
| | 42 | | | National Oilwell Varco, Inc. | | | 1,977 | |
| | 22 | | | Newfield Exploration Co.(b) | | | 600 | |
| | 55 | | | Noble Energy, Inc. | | | 1,635 | |
| | 87 | | | Occidental Petroleum Corp. | | | 6,949 | |
| | 46 | | | ONEOK, Inc. | | | 3,032 | |
| | 25 | | | Parsley Energy, Inc., Class A(b) | | | 694 | |
| | 50 | | | Phillips 66 | | | 5,926 | |
| | 19 | | | Pioneer Natural Resources Co. | | | 3,319 | |
| | 16 | | | Plains GP Holdings LP, Class A | | | 412 | |
| | | | | | | | |
Number
of Shares | | | | | Value | |
| | | | Common Stocks & Other Equity Interests
(continued) | |
| | | | Energy (continued) | |
| | 155 | | | Schlumberger Ltd. | | $ | 9,790 | |
| | 24 | | | Targa Resources Corp. | | | 1,322 | |
| | 49 | | | TechnipFMC PLC (United Kingdom) | | | 1,501 | |
| | 49 | | | Valero Energy Corp. | | | 5,776 | |
| | 136 | | | Williams Cos., Inc. (The) | | | 4,024 | |
| | | | | | | | |
| | | | | | | 169,539 | |
| | | | | | | | |
| | | | Financials—13.5% | |
| | 6 | | | Affiliated Managers Group, Inc. | | | 877 | |
| | 88 | | | Aflac, Inc. | | | 4,069 | |
| | 50 | | | AGNC Investment Corp. REIT | | | 951 | |
| | 2 | | | Alleghany Corp. | | | 1,264 | |
| | 40 | | | Allstate Corp. (The) | | | 4,023 | |
| | 51 | | | Ally Financial, Inc. | | | 1,371 | |
| | 82 | | | American Express Co. | | | 8,690 | |
| | 8 | | | American Financial Group, Inc. | | | 891 | |
| | 100 | | | American International Group, Inc. | | | 5,317 | |
| | 16 | | | Ameriprise Financial, Inc. | | | 2,271 | |
| | 128 | | | Annaly Capital Management, Inc. REIT | | | 1,359 | |
| | 28 | | | Aon PLC | | | 4,076 | |
| | 45 | | | Arch Capital Group Ltd.(b) | | | 1,376 | |
| | 20 | | | Arthur J. Gallagher & Co. | | | 1,443 | |
| | 6 | | | Assurant, Inc. | | | 617 | |
| | 17 | | | Athene Holding Ltd., Class A(b) | | | 844 | |
| | 9 | | | Axis Capital Holdings Ltd. | | | 518 | |
| | 1,097 | | | Bank of America Corp. | | | 33,930 | |
| | 114 | | | Bank of New York Mellon Corp. (The) | | | 5,945 | |
| | 88 | | | BB&T Corp. | | | 4,546 | |
| | 143 | | | Berkshire Hathaway, Inc., Class B(b) | | | 29,847 | |
| | 14 | | | BlackRock, Inc. | | | 6,707 | |
| | 10 | | | Brighthouse Financial, Inc.(b) | | | 415 | |
| | 54 | | | Capital One Financial Corp. | | | 5,351 | |
| | 13 | | | Cboe Global Markets, Inc. | | | 1,310 | |
| | 136 | | | Charles Schwab Corp. (The) | | | 6,907 | |
| | 52 | | | Chubb Ltd. | | | 7,033 | |
| | 18 | | | Cincinnati Financial Corp. | | | 1,380 | |
| | 13 | | | CIT Group, Inc. | | | 705 | |
| | 288 | | | Citigroup, Inc. | | | 20,517 | |
| | 56 | | | Citizens Financial Group, Inc. | | | 2,305 | |
| | 38 | | | CME Group, Inc. | | | 6,640 | |
| | 19 | | | Comerica, Inc. | | | 1,852 | |
| | 41 | | | Discover Financial Services | | | 3,203 | |
| | 31 | | | E*TRADE Financial Corp.(b) | | | 1,825 | |
| | 16 | | | East West Bancorp, Inc. | | | 1,014 | |
| | 13 | | | Eaton Vance Corp. | | | 686 | |
| | 5 | | | Everest Re Group Ltd. | | | 1,115 | |
| | 29 | | | Fidelity National Financial, Inc. | | | 1,163 | |
| | 79 | | | Fifth Third Bancorp | | | 2,325 | |
| | 18 | | | First Republic Bank | | | 1,829 | |
| | 37 | | | Franklin Resources, Inc. | | | 1,174 | |
| | 40 | | | Goldman Sachs Group, Inc. (The) | | | 9,512 | |
| | 41 | | | Hartford Financial Services Group, Inc. (The) | | | 2,065 | |
| | 121 | | | Huntington Bancshares, Inc. | | | 1,961 | |
| | 66 | | | Intercontinental Exchange, Inc. | | | 5,031 | |
| | 45 | | | Invesco Ltd.(c) | | | 1,085 | |
| | 36 | | | Jefferies Financial Group, Inc. | | | 836 | |
| | 387 | | | JPMorgan Chase & Co. | | | 44,342 | |
See accompanying Notes to Financial Statements which are an integral part of the financial statements.
Invesco PureBetaSM MSCI USA ETF (PBUS) (continued)
August 31, 2018
| | | | | | | | |
Number
of Shares | | | | | Value | |
| | | | Common Stocks & Other Equity Interests
(continued) | |
| | | | Financials (continued) | |
| | 122 | | | KeyCorp | | $ | 2,571 | |
| | 24 | | | Lincoln National Corp. | | | 1,574 | |
| | 32 | | | Loews Corp. | | | 1,610 | |
| | 16 | | | M&T Bank Corp. | | | 2,834 | |
| | 2 | | | Markel Corp.(b) | | | 2,418 | |
| | 57 | | | Marsh & McLennan Cos., Inc. | | | 4,824 | |
| | 100 | | | MetLife, Inc. | | | 4,589 | |
| | 19 | | | Moody’s Corp. | | | 3,382 | |
| | 151 | | | Morgan Stanley | | | 7,373 | |
| | 10 | | | MSCI, Inc., Class A | | | 1,803 | |
| | 13 | | | Nasdaq, Inc. | | | 1,241 | |
| | 54 | | | New York Community Bancorp, Inc. | | | 582 | |
| | 24 | | | Northern Trust Corp. | | | 2,579 | |
| | 38 | | | People’s United Financial, Inc. | | | 703 | |
| | 53 | | | PNC Financial Services Group, Inc. (The) | | | 7,608 | |
| | 32 | | | Principal Financial Group, Inc. | | | 1,766 | |
| | 65 | | | Progressive Corp. (The) | | | 4,389 | |
| | 47 | | | Prudential Financial, Inc. | | | 4,618 | |
| | 15 | | | Raymond James Financial, Inc. | | | 1,396 | |
| | 130 | | | Regions Financial Corp. | | | 2,530 | |
| | 7 | | | Reinsurance Group of America, Inc. | | | 1,000 | |
| | 4 | | | RenaissanceRe Holdings Ltd. (Bermuda) | | | 532 | |
| | 28 | | | S&P Global, Inc. | | | 5,797 | |
| | 15 | | | SEI Investments Co. | | | 946 | |
| | 6 | | | Signature Bank/New York NY | | | 694 | |
| | 41 | | | State Street Corp. | | | 3,563 | |
| | 54 | | | SunTrust Banks, Inc. | | | 3,972 | |
| | 6 | | | SVB Financial Group(b) | | | 1,937 | |
| | 81 | | | Synchrony Financial | | | 2,565 | |
| | 27 | | | T. Rowe Price Group, Inc. | | | 3,129 | |
| | 32 | | | TD Ameritrade Holding Corp. | | | 1,874 | |
| | 12 | | | Torchmark Corp. | | | 1,055 | |
| | 31 | | | Travelers Cos., Inc. (The) | | | 4,080 | |
| | 25 | | | Unum Group | | | 922 | |
| | 176 | | | US Bancorp | | | 9,523 | |
| | 21 | | | Voya Financial, Inc. | | | 1,051 | |
| | 11 | | | W.R. Berkley Corp. | | | 861 | |
| | 525 | | | Wells Fargo & Co. | | | 30,702 | |
| | 15 | | | Willis Towers Watson PLC | | | 2,209 | |
| | 29 | | | XL Group Ltd. (Bermuda) | | | 1,664 | |
| | 23 | | | Zions Bancorporation | | | 1,226 | |
| | | | | | | | |
| | | | | | | 394,205 | |
| | | | | | | | |
| | | | Health Care—14.3% | |
| | 198 | | | Abbott Laboratories | | | 13,234 | |
| | 170 | | | AbbVie, Inc. | | | 16,317 | |
| | 5 | | | ABIOMED, Inc.(b) | | | 2,033 | |
| | 37 | | | Aetna, Inc. | | | 7,410 | |
| | 36 | | | Agilent Technologies, Inc. | | | 2,431 | |
| | 25 | | | Alexion Pharmaceuticals, Inc.(b) | | | 3,056 | |
| | 9 | | | Align Technology, Inc.(b) | | | 3,478 | |
| | 17 | | | Alkermes PLC(b) | | | 762 | |
| | 37 | | | Allergan PLC | | | 7,093 | |
| | 10 | | | Alnylam Pharmaceuticals, Inc.(b) | | | 1,227 | |
| | 18 | | | AmerisourceBergen Corp. | | | 1,619 | |
| | 76 | | | Amgen, Inc. | | | 15,186 | |
| | 29 | | | Anthem, Inc. | | | 7,677 | |
| | | | | | | | |
Number
of Shares | | | | | Value | |
| | | | Common Stocks & Other Equity Interests
(continued) | |
| | | | Health Care (continued) | |
| | 57 | | | Baxter International, Inc. | | $ | 4,239 | |
| | 30 | | | Becton, Dickinson and Co. | | | 7,856 | |
| | 24 | | | Biogen, Inc.(b) | | | 8,484 | |
| | 20 | | | BioMarin Pharmaceutical, Inc.(b) | | | 2,000 | |
| | 152 | | | Boston Scientific Corp.(b) | | | 5,405 | |
| | 183 | | | Bristol-Myers Squibb Co. | | | 11,081 | |
| | 35 | | | Cardinal Health, Inc. | | | 1,827 | |
| | 84 | | | Celgene Corp.(b) | | | 7,934 | |
| | 23 | | | Centene Corp.(b) | | | 3,369 | |
| | 33 | | | Cerner Corp.(b) | | | 2,149 | |
| | 27 | | | Cigna Corp. | | | 5,085 | |
| | 6 | | | Cooper Cos., Inc. (The) | | | 1,535 | |
| | 114 | | | CVS Health Corp. | | | 8,577 | |
| | 70 | | | Danaher Corp. | | | 7,248 | |
| | 17 | | | DaVita, Inc.(b) | | | 1,178 | |
| | 26 | | | DENTSPLY SIRONA, Inc. | | | 1,038 | |
| | 24 | | | Edwards Lifesciences Corp.(b) | | | 3,462 | |
| | 111 | | | Eli Lilly & Co. | | | 11,727 | |
| | 63 | | | Express Scripts Holding Co.(b) | | | 5,545 | |
| | 148 | | | Gilead Sciences, Inc. | | | 11,208 | |
| | 32 | | | HCA Healthcare, Inc. | | | 4,292 | |
| | 18 | | | Henry Schein, Inc.(b) | | | 1,398 | |
| | 31 | | | Hologic, Inc.(b) | | | 1,233 | |
| | 16 | | | Humana, Inc. | | | 5,332 | |
| | 10 | | | IDEXX Laboratories, Inc.(b) | | | 2,540 | |
| | 17 | | | Illumina, Inc.(b) | | | 6,032 | |
| | 20 | | | Incyte Corp.(b) | | | 1,478 | |
| | 13 | | | Intuitive Surgical, Inc.(b) | | | 7,280 | |
| | 17 | | | IQVIA Holdings, Inc.(b) | | | 2,161 | |
| | 7 | | | Jazz Pharmaceuticals PLC(b) | | | 1,196 | |
| | 301 | | | Johnson & Johnson | | | 40,542 | |
| | 11 | | | Laboratory Corp. of America Holdings(b) | | | 1,902 | |
| | 23 | | | McKesson Corp. | | | 2,961 | |
| | 153 | | | Medtronic PLC | | | 14,751 | |
| | 302 | | | Merck & Co., Inc. | | | 20,714 | |
| | 3 | | | Mettler-Toledo International, Inc.(b) | | | 1,753 | |
| | 58 | | | Mylan NV(b) | | | 2,270 | |
| | 18 | | | Nektar Therapeutics, Class A(b) | | | 1,197 | |
| | 16 | | | Perrigo Co. PLC | | | 1,224 | |
| | 667 | | | Pfizer, Inc. | | | 27,694 | |
| | 15 | | | Quest Diagnostics, Inc. | | | 1,650 | |
| | 9 | | | Regeneron Pharmaceuticals, Inc.(b) | | | 3,661 | |
| | 16 | | | ResMed, Inc. | | | 1,783 | |
| | 13 | | | Seattle Genetics, Inc.(b) | | | 998 | |
| | 38 | | | Stryker Corp. | | | 6,438 | |
| | 5 | | | Teleflex, Inc. | | | 1,237 | |
| | 45 | | | Thermo Fisher Scientific, Inc. | | | 10,759 | |
| | 5 | | | United Therapeutics Corp.(b) | | | 615 | |
| | 109 | | | UnitedHealth Group, Inc. | | | 29,262 | |
| | 10 | | | Universal Health Services, Inc., Class B | | | 1,302 | |
| | 10 | | | Varian Medical Systems, Inc.(b) | | | 1,120 | |
| | 13 | | | Veeva Systems, Inc., Class A(b) | | | 1,357 | |
| | 28 | | | Vertex Pharmaceuticals, Inc.(b) | | | 5,163 | |
| | 9 | | | Waters Corp.(b) | | | 1,705 | |
| | 23 | | | Zimmer Biomet Holdings, Inc. | | | 2,843 | |
| | 54 | | | Zoetis, Inc. | | | 4,892 | |
| | | | | | | | |
| | | | | | | 415,205 | |
| | | | | | | | |
See accompanying Notes to Financial Statements which are an integral part of the financial statements.
Invesco PureBetaSM MSCI USA ETF (PBUS) (continued)
August 31, 2018
| | | | | | | | |
Number
of Shares | | | | | Value | |
| | | | Common Stocks & Other Equity Interests
(continued) | |
| | | | Industrials—9.5% | |
| | 67 | | | 3M Co. | | $ | 14,132 | |
| | 16 | | | A.O. Smith Corp. | | | 929 | |
| | 5 | | | Acuity Brands, Inc. | | | 764 | |
| | 7 | | | AGCO Corp. | | | 418 | |
| | 11 | | | Allegion PLC | | | 959 | |
| | 1 | | | AMERCO | | | 375 | |
| | 14 | | | American Airlines Group, Inc. | | | 567 | |
| | 26 | | | AMETEK, Inc. | | | 2,001 | |
| | 49 | | | Arconic, Inc. | | | 1,097 | |
| | 63 | | | Boeing Co. (The) | | | 21,596 | |
| | 16 | | | C.H. Robinson Worldwide, Inc. | | | 1,537 | |
| | 67 | | | Caterpillar, Inc. | | | 9,303 | |
| | 10 | | | Cintas Corp. | | | 2,134 | |
| | 23 | | | Copart, Inc.(b) | | | 1,479 | |
| | 4 | | | CoStar Group, Inc.(b) | | | 1,769 | |
| | 95 | | | CSX Corp. | | | 7,045 | |
| | 18 | | | Cummins, Inc. | | | 2,552 | |
| | 35 | | | Deere & Co. | | | 5,033 | |
| | 20 | | | Delta Air Lines, Inc. | | | 1,170 | |
| | 17 | | | Dover Corp. | | | 1,460 | |
| | 49 | | | Eaton Corp. PLC | | | 4,074 | |
| | 72 | | | Emerson Electric Co. | | | 5,525 | |
| | 13 | | | Equifax, Inc. | | | 1,742 | |
| | 20 | | | Expeditors International of Washington, Inc. | | | 1,466 | |
| | 32 | | | Fastenal Co. | | | 1,867 | |
| | 29 | | | FedEx Corp. | | | 7,075 | |
| | 15 | | | Flowserve Corp. | | | 782 | |
| | 16 | | | Fluor Corp. | | | 919 | |
| | 35 | | | Fortive Corp. | | | 2,939 | |
| | 17 | | | Fortune Brands Home & Security, Inc. | | | 901 | |
| | 28 | | | General Dynamics Corp. | | | 5,415 | |
| | 971 | | | General Electric Co. | | | 12,565 | |
| | 13 | | | Harris Corp. | | | 2,113 | |
| | 20 | | | HD Supply Holdings, Inc.(b) | | | 912 | |
| | 84 | | | Honeywell International, Inc. | | | 13,361 | |
| | 5 | | | Huntington Ingalls Industries, Inc. | | | 1,222 | |
| | 9 | | | IDEX Corp. | | | 1,379 | |
| | 45 | | | IHS Markit Ltd.(b) | | | 2,475 | |
| | 35 | | | Illinois Tool Works, Inc. | | | 4,861 | |
| | 28 | | | Ingersoll-Rand PLC | | | 2,836 | |
| | 10 | | | J.B. Hunt Transport Services, Inc. | | | 1,207 | |
| | 15 | | | Jacobs Engineering Group, Inc. | | | 1,090 | |
| | 104 | | | Johnson Controls International PLC | | | 3,928 | |
| | 12 | | | Kansas City Southern | | | 1,392 | |
| | 15 | | | Knight-Swift Transportation Holdings, Inc. | | | 512 | |
| | 9 | | | L3 Technologies, Inc. | | | 1,923 | |
| | 4 | | | Lennox International, Inc. | | | 891 | |
| | 29 | | | Lockheed Martin Corp. | | | 9,292 | |
| | 7 | | | ManpowerGroup, Inc. | | | 656 | |
| | 36 | | | Masco Corp. | | | 1,367 | |
| | 6 | | | Middleby Corp. (The)(b) | | | 729 | |
| | 40 | | | Nielsen Holdings PLC | | | 1,040 | |
| | 32 | | | Norfolk Southern Corp. | | | 5,563 | |
| | 19 | | | Northrop Grumman Corp. | | | 5,671 | |
| | 7 | | | Old Dominion Freight Line, Inc. | | | 1,067 | |
| | 12 | | | Owens Corning | | | 679 | |
| | | | | | | | |
Number
of Shares | | | | | Value | |
| | | | Common Stocks & Other Equity Interests
(continued) | |
| | | | Industrials (continued) | |
| | 39 | | | PACCAR, Inc. | | $ | 2,668 | |
| | 15 | | | Parker-Hannifin Corp. | | | 2,634 | |
| | 19 | | | Pentair PLC (United Kingdom) | | | 826 | |
| | 32 | | | Raytheon Co. | | | 6,382 | |
| | 26 | | | Republic Services, Inc. | | | 1,907 | |
| | 14 | | | Robert Half International, Inc. | | | 1,095 | |
| | 14 | | | Rockwell Automation, Inc. | | | 2,533 | |
| | 18 | | | Rockwell Collins, Inc. | | | 2,447 | |
| | 11 | | | Rollins, Inc. | | | 661 | |
| | 12 | | | Roper Technologies, Inc. | | | 3,580 | |
| | 19 | | | Sensata Technologies Holding PLC(b) | | | 1,006 | |
| | 6 | | | Snap-on, Inc. | | | 1,061 | |
| | 17 | | | Southwest Airlines Co. | | | 1,042 | |
| | 13 | | | Spirit AeroSystems Holdings, Inc., Class A | | | 1,111 | |
| | 17 | | | Stanley Black & Decker, Inc. | | | 2,389 | |
| | 10 | | | Stericycle, Inc.(b) | | | 617 | |
| | 30 | | | Textron, Inc. | | | 2,071 | |
| | 5 | | | TransDigm Group, Inc.(b) | | | 1,750 | |
| | 20 | | | TransUnion | | | 1,506 | |
| | 88 | | | Union Pacific Corp. | | | 13,255 | |
| | 9 | | | United Continental Holdings, Inc.(b) | | | 787 | |
| | 77 | | | United Parcel Service, Inc., Class B | | | 9,462 | |
| | 10 | | | United Rentals, Inc.(b) | | | 1,559 | |
| | 85 | | | United Technologies Corp. | | | 11,194 | |
| | 18 | | | Verisk Analytics, Inc.(b) | | | 2,144 | |
| | 5 | | | W.W. Grainger, Inc. | | | 1,770 | |
| | 6 | | | WABCO Holdings, Inc.(b) | | | 738 | |
| | 10 | | | Wabtec Corp. | | | 1,083 | |
| | 30 | | | Waste Connections, Inc. | | | 2,382 | |
| | 48 | | | Waste Management, Inc. | | | 4,363 | |
| | 13 | | | XPO Logistics, Inc.(b) | | | 1,384 | |
| | 20 | | | Xylem, Inc. | | | 1,518 | |
| | | | | | | | |
| | | | | | | 276,681 | |
| | | | | | | | |
| | | | Information Technology—26.8% | |
| | 73 | | | Accenture PLC, Class A | | | 12,342 | |
| | 80 | | | Activision Blizzard, Inc. | | | 5,768 | |
| | 55 | | | Adobe Systems, Inc.(b) | | | 14,493 | |
| | 103 | | | Advanced Micro Devices, Inc.(b) | | | 2,593 | |
| | 19 | | | Akamai Technologies, Inc.(b) | | | 1,428 | |
| | 6 | | | Alliance Data Systems Corp. | | | 1,431 | |
| | 34 | | | Alphabet, Inc., Class A(b) | | | 41,881 | |
| | 35 | | | Alphabet, Inc., Class C(b) | | | 42,637 | |
| | 34 | | | Amphenol Corp., Class A | | | 3,216 | |
| | 41 | | | Analog Devices, Inc. | | | 4,053 | |
| | 9 | | | ANSYS, Inc.(b) | | | 1,674 | |
| | 555 | | | Apple, Inc. | | | 126,335 | |
| | 120 | | | Applied Materials, Inc. | | | 5,162 | |
| | 6 | | | Arista Networks, Inc.(b) | | | 1,794 | |
| | 10 | | | Arrow Electronics, Inc.(b) | | | 775 | |
| | 25 | | | Autodesk, Inc.(b) | | | 3,859 | |
| | 50 | | | Automatic Data Processing, Inc. | | | 7,337 | |
| | 14 | | | Avnet, Inc. | | | 678 | |
| | 46 | | | Broadcom, Inc. | | | 10,075 | |
| | 13 | | | Broadridge Financial Solutions, Inc. | | | 1,757 | |
| | 35 | | | CA, Inc. | | | 1,533 | |
| | 31 | | | Cadence Design Systems, Inc.(b) | | | 1,458 | |
See accompanying Notes to Financial Statements which are an integral part of the financial statements.
Invesco PureBetaSM MSCI USA ETF (PBUS) (continued)
August 31, 2018
| | | | | | | | |
Number
of Shares | | | | | Value | |
| | | | Common Stocks & Other Equity Interests
(continued) | |
| | | | Information Technology (continued) | |
| | 15 | | | CDK Global, Inc. | | $ | 935 | |
| | 17 | | | CDW Corp. | | | 1,489 | |
| | 531 | | | Cisco Systems, Inc. | | | 25,366 | |
| | 15 | | | Citrix Systems, Inc.(b) | | | 1,710 | |
| | 20 | | | Cognex Corp. | | | 1,076 | |
| | 66 | | | Cognizant Technology Solutions Corp., Class A | | | 5,176 | |
| | 21 | | | CommScope Holding Co., Inc.(b) | | | 665 | |
| | 97 | | | Corning, Inc. | | | 3,250 | |
| | 23 | | | Dell Technologies, Inc., Class V(b) | | | 2,212 | |
| | 32 | | | DXC Technology Co. | | | 2,915 | |
| | 111 | | | eBay, Inc.(b) | | | 3,842 | |
| | 34 | | | Electronic Arts, Inc.(b) | | | 3,856 | |
| | 7 | | | F5 Networks, Inc.(b) | | | 1,324 | |
| | 269 | | | Facebook, Inc., Class A(b) | | | 47,271 | |
| | 37 | | | Fidelity National Information Services, Inc. | | | 4,002 | |
| | 49 | | | First Data Corp., Class A(b) | | | 1,260 | |
| | 46 | | | Fiserv, Inc.(b) | | | 3,683 | |
| | 10 | | | FleetCor Technologies, Inc.(b) | | | 2,137 | |
| | 59 | | | Flex Ltd.(b) | | | 814 | |
| | 15 | | | FLIR Systems, Inc. | | | 941 | |
| | 17 | | | Fortinet, Inc.(b) | | | 1,424 | |
| | 10 | | | Gartner, Inc.(b) | | | 1,498 | |
| | 18 | | | Global Payments, Inc. | | | 2,242 | |
| | 17 | | | GoDaddy, Inc., Class A(b) | | | 1,385 | |
| | 178 | | | Hewlett Packard Enterprise Co. | | | 2,942 | |
| | 188 | | | HP, Inc. | | | 4,634 | |
| | 9 | | | IAC/InterActiveCorp.(b) | | | 1,775 | |
| | 528 | | | Intel Corp. | | | 25,571 | |
| | 103 | | | International Business Machines Corp. | | | 15,087 | |
| | 27 | | | Intuit, Inc. | | | 5,926 | |
| | 4 | | | IPG Photonics Corp.(b) | | | 702 | |
| | 9 | | | Jack Henry & Associates, Inc. | | | 1,426 | |
| | 42 | | | Juniper Networks, Inc. | | | 1,194 | |
| | 21 | | | Keysight Technologies, Inc.(b) | | | 1,363 | |
| | 18 | | | KLA-Tencor Corp. | | | 2,092 | |
| | 18 | | | Lam Research Corp. | | | 3,116 | |
| | 16 | | | Leidos Holdings, Inc. | | | 1,132 | |
| | 69 | | | Marvell Technology Group Ltd. | | | 1,427 | |
| | 105 | | | Mastercard, Inc., Class A | | | 22,634 | |
| | 32 | | | Maxim Integrated Products, Inc. | | | 1,935 | |
| | 5 | | | MercadoLibre, Inc. (Argentina) | | | 1,712 | |
| | 26 | | | Microchip Technology, Inc. | | | 2,237 | |
| | 129 | | | Micron Technology, Inc.(b) | | | 6,775 | |
| | 823 | | | Microsoft Corp. | | | 92,448 | |
| | 18 | | | Motorola Solutions, Inc. | | | 2,310 | |
| | 30 | | | NetApp, Inc. | | | 2,604 | |
| | 65 | | | NVIDIA Corp. | | | 18,244 | |
| | 48 | | | ON Semiconductor Corp.(b) | | | 1,024 | |
| | 350 | | | Oracle Corp. | | | 17,003 | |
| | 10 | | | Palo Alto Networks, Inc.(b) | | | 2,312 | |
| | 36 | | | Paychex, Inc. | | | 2,637 | |
| | 128 | | | PayPal Holdings, Inc.(b) | | | 11,818 | |
| | 14 | | | Qorvo, Inc.(b) | | | 1,121 | |
| | 159 | | | QUALCOMM, Inc. | | | 10,925 | |
| | 20 | | | Red Hat, Inc.(b) | | | 2,955 | |
| | 23 | | | Sabre Corp. | | | 601 | |
| | | | | | | | |
Number
of Shares | | | | | Value | |
| | | | Common Stocks & Other Equity Interests
(continued) | |
| | | | Information Technology (continued) | |
| | 79 | | | salesforce.com, Inc.(b) | | $ | 12,062 | |
| | 30 | | | Seagate Technology PLC | | | 1,606 | |
| | 20 | | | ServiceNow, Inc.(b) | | | 3,927 | |
| | 21 | | | Skyworks Solutions, Inc. | | | 1,917 | |
| | 16 | | | Splunk, Inc.(b) | | | 2,050 | |
| | 32 | | | Square, Inc., Class A(b) | | | 2,836 | |
| | 23 | | | SS&C Technologies Holdings, Inc. | | | 1,365 | |
| | 68 | | | Symantec Corp. | | | 1,371 | |
| | 17 | | | Synopsys, Inc.(b) | | | 1,736 | |
| | 13 | | | Take-Two Interactive Software, Inc.(b) | | | 1,736 | |
| | 39 | | | TE Connectivity Ltd. | | | 3,576 | |
| | 110 | | | Texas Instruments, Inc. | | | 12,364 | |
| | 18 | | | Total System Services, Inc. | | | 1,749 | |
| | 28 | | | Trimble, Inc.(b) | | | 1,179 | |
| | 76 | | | Twitter, Inc.(b) | | | 2,674 | |
| | 12 | | | VeriSign, Inc.(b) | | | 1,903 | |
| | 203 | | | Visa, Inc., Class A | | | 29,819 | |
| | 8 | | | VMware, Inc., Class A(b) | | | 1,226 | |
| | 33 | | | Western Digital Corp. | | | 2,087 | |
| | 52 | | | Western Union Co. (The) | | | 984 | |
| | 15 | | | Workday, Inc., Class A(b) | | | 2,318 | |
| | 33 | | | Worldpay, Inc., Class A(b) | | | 3,214 | |
| | 24 | | | Xerox Corp. | | | 669 | |
| | 28 | | | Xilinx, Inc. | | | 2,179 | |
| | 12 | | | Zillow Group, Inc., Class C(b) | | | 584 | |
| | | | | | | | |
| | | | | | | 779,565 | |
| | | | | | | | |
| | | | Materials—2.6% | |
| | 25 | | | Air Products & Chemicals, Inc. | | | 4,157 | |
| | 12 | | | Albemarle Corp. | | | 1,146 | |
| | 10 | | | Avery Dennison Corp. | | | 1,052 | |
| | 24 | | | Axalta Coating Systems Ltd.(b) | | | 732 | |
| | 37 | | | Ball Corp. | | | 1,550 | |
| | 15 | | | Celanese Corp., Series A | | | 1,752 | |
| | 26 | | | CF Industries Holdings, Inc. | | | 1,351 | |
| | 20 | | | Chemours Co. (The) | | | 872 | |
| | 15 | | | Crown Holdings, Inc.(b) | | | 642 | |
| | 262 | | | DowDuPont, Inc. | | | 18,374 | |
| | 16 | | | Eastman Chemical Co. | | | 1,552 | |
| | 29 | | | Ecolab, Inc. | | | 4,364 | |
| | 15 | | | FMC Corp. | | | 1,282 | |
| | 153 | | | Freeport-McMoRan, Inc. | | | 2,150 | |
| | 9 | | | International Flavors & Fragrances, Inc. | | | 1,173 | |
| | 44 | | | International Paper Co. | | | 2,250 | |
| | 38 | | | LyondellBasell Industries NV, Class A | | | 4,286 | |
| | 7 | | | Martin Marietta Materials, Inc. | | | 1,391 | |
| | 41 | | | Mosaic Co. (The) | | | 1,282 | |
| | 59 | | | Newmont Mining Corp. | | | 1,831 | |
| | 36 | | | Nucor Corp. | | | 2,250 | |
| | 11 | | | Packaging Corp. of America | | | 1,209 | |
| | 28 | | | PPG Industries, Inc. | | | 3,095 | |
| | 32 | | | Praxair, Inc. | | | 5,062 | |
| | 20 | | | Sealed Air Corp. | | | 802 | |
| | 10 | | | Sherwin-Williams Co. (The) | | | 4,556 | |
| | 27 | | | Steel Dynamics, Inc. | | | 1,235 | |
| | 15 | | | Vulcan Materials Co. | | | 1,662 | |
| | 4 | | | Westlake Chemical Corp. | | | 378 | |
See accompanying Notes to Financial Statements which are an integral part of the financial statements.
Invesco PureBetaSM MSCI USA ETF (PBUS) (continued)
August 31, 2018
| | | | | | | | |
Number
of Shares | | | | | Value | |
| | | | Common Stocks & Other Equity Interests
(continued) | |
| | | | Materials (continued) | |
| | 28 | | | WestRock Co. | | $ | 1,542 | |
| | | | | | | | |
| | | | | | | 74,980 | |
| | | | | | | | |
| | | | Real Estate—2.8% | |
| | 11 | | | Alexandria Real Estate Equities, Inc. REIT | | | 1,412 | |
| | 49 | | | American Tower Corp. REIT | | | 7,307 | |
| | 16 | | | AvalonBay Communities, Inc. REIT | | | 2,933 | |
| | 17 | | | Boston Properties, Inc. REIT | | | 2,218 | |
| | 5 | | | Brookfield Property Partners LP (Bermuda) | | | 100 | |
| | 27 | | | Brookfield Property REIT, Inc., Class A REIT | | | 540 | |
| | 10 | | | Camden Property Trust REIT | | | 951 | |
| | 38 | | | CBRE Group, Inc., Class A(b) | | | 1,855 | |
| | 46 | | | Crown Castle International Corp. REIT | | | 5,245 | |
| | 23 | | | Digital Realty Trust, Inc. REIT | | | 2,858 | |
| | 40 | | | Duke Realty Corp. REIT | | | 1,140 | |
| | 9 | | | Equinix, Inc. REIT | | | 3,925 | |
| | 41 | | | Equity Residential REIT | | | 2,778 | |
| | 7 | | | Essex Property Trust, Inc. REIT | | | 1,724 | |
| | 14 | | | Extra Space Storage, Inc. REIT | | | 1,291 | |
| | 8 | | | Federal Realty Investment Trust REIT | | | 1,045 | |
| | 52 | | | HCP, Inc. REIT | | | 1,406 | |
| | 82 | | | Host Hotels & Resorts, Inc. REIT | | | 1,765 | |
| | 35 | | | Invitation Homes, Inc. REIT | | | 818 | |
| | 31 | | | Iron Mountain, Inc. REIT | | | 1,119 | |
| | 5 | | | Jones Lang LaSalle, Inc. | | | 763 | |
| | 47 | | | Kimco Realty Corp. REIT | | | 804 | |
| | 16 | | | Liberty Property Trust REIT | | | 700 | |
| | 13 | | | Macerich Co. (The) REIT | | | 764 | |
| | 13 | | | Mid-America Apartment Communities, Inc. REIT | | | 1,346 | |
| | 17 | | | National Retail Properties, Inc. REIT | | | 783 | |
| | 67 | | | Prologis, Inc. REIT | | | 4,501 | |
| | 18 | | | Public Storage REIT | | | 3,826 | |
| | 33 | | | Realty Income Corp. REIT | | | 1,933 | |
| | 17 | | | Regency Centers Corp. REIT | | | 1,122 | |
| | 13 | | | SBA Communications Corp. REIT(b) | | | 2,018 | |
| | 36 | | | Simon Property Group, Inc. REIT | | | 6,589 | |
| | 11 | | | SL Green Realty Corp. REIT | | | 1,148 | |
| | 30 | | | UDR, Inc. REIT | | | 1,199 | |
| | 40 | | | Ventas, Inc. REIT | | | 2,395 | |
| | 108 | | | VEREIT, Inc. REIT | | | 845 | |
| | 19 | | | Vornado Realty Trust REIT | | | 1,463 | |
| | 41 | | | Welltower, Inc. REIT | | | 2,735 | |
| | 84 | | | Weyerhaeuser Co. REIT | | | 2,916 | |
| | | | | | | | |
| | | | | | | 80,280 | |
| | | | | | | | |
| | | | Telecommunication Services—2.0% | |
| | 816 | | | AT&T, Inc. | | | 26,063 | |
| | 109 | | | CenturyLink, Inc. | | | 2,328 | |
| | 89 | | | Sprint Corp.(b) | | | 544 | |
| | 38 | | | T-Mobile US, Inc.(b) | | | 2,510 | |
| | 466 | | | Verizon Communications, Inc. | | | 25,336 | |
| | 24 | | | Zayo Group Holdings, Inc.(b) | | | 832 | |
| | | | | | | | |
| | | | | | | 57,613 | |
| | | | | | | | |
| | | | Utilities—2.7% | |
| | 73 | | | AES Corp. (The) | | | 983 | |
| | 25 | | | Alliant Energy Corp. | | | 1,071 | |
| | | | | | | | |
Number
of Shares | | | | | Value | |
| | | | Common Stocks & Other Equity Interests
(continued) | |
| | | | Utilities (continued) | |
| | 27 | | | Ameren Corp. | | $ | 1,707 | |
| | 55 | | | American Electric Power Co., Inc. | | | 3,945 | |
| | 20 | | | American Water Works Co., Inc. | | | 1,751 | |
| | 12 | | | Atmos Energy Corp. | | | 1,107 | |
| | 46 | | | CenterPoint Energy, Inc. | | | 1,278 | |
| | 31 | | | CMS Energy Corp. | | | 1,526 | |
| | 35 | | | Consolidated Edison, Inc. | | | 2,763 | |
| | 72 | | | Dominion Energy, Inc. | | | 5,095 | |
| | 20 | | | DTE Energy Co. | | | 2,223 | |
| | 78 | | | Duke Energy Corp. | | | 6,337 | |
| | 36 | | | Edison International | | | 2,366 | |
| | 20 | | | Entergy Corp. | | | 1,672 | |
| | 30 | | | Evergy, Inc. | | | 1,711 | |
| | 35 | | | Eversource Energy | | | 2,185 | |
| | 108 | | | Exelon Corp. | | | 4,721 | |
| | 53 | | | FirstEnergy Corp. | | | 1,981 | |
| | 53 | | | NextEra Energy, Inc. | | | 9,015 | |
| | 36 | | | NiSource, Inc. | | | 975 | |
| | 22 | | | OGE Energy Corp. | | | 810 | |
| | 57 | | | PG&E Corp. | | | 2,632 | |
| | 12 | | | Pinnacle West Capital Corp. | | | 943 | |
| | 76 | | | PPL Corp. | | | 2,260 | |
| | 56 | | | Public Service Enterprise Group, Inc. | | | 2,932 | |
| | 15 | | | SCANA Corp. | | | 575 | |
| | 27 | | | Sempra Energy | | | 3,134 | |
| | 115 | | | Southern Co. (The) | | | 5,035 | |
| | 19 | | | UGI Corp. | | | 1,027 | |
| | 39 | | | Vistra Energy Corp.(b) | | | 918 | |
| | 35 | | | WEC Energy Group, Inc. | | | 2,365 | |
| | 57 | | | Xcel Energy, Inc. | | | 2,739 | |
| | | | | | | | |
| | | | | | | 79,782 | |
| | | | | | | | |
| | | | Total Investments in Securities
(Cost $2,509,756)—99.8% | | | 2,903,545 | |
| | | | Other assets less liabilities—0.2% | | | 5,456 | |
| | | | | | | | |
| | | | Net Assets—100.0% | | $ | 2,909,001 | |
| | | | | | | | |
Investment Abbreviations:
REIT—Real Estate Investment Trust
Notes to Schedule of Investments:
| (a) | Industry and/or sector classifications used in this report are generally according to the Global Industry Classification Standard, which was developed by and is the exclusive property and a service mark of MSCI Inc. and Standard & Poor’s. |
| (b) | Non-income producing security. |
| (c) | Affiliated company. The Fund’s Adviser is a wholly-owned subsidiary of Invesco Ltd. and therefore, Invesco Ltd. is considered to be affiliated. See Note 4. |
See accompanying Notes to Financial Statements which are an integral part of the financial statements.
Schedule of Investments(a)
Invesco PureBetaSM MSCI USA Small Cap ETF (PBSM)
August 31, 2018
| | | | | | | | |
Number
of Shares | | | | | Value | |
| | | | Common Stocks & Other Equity Interests—100.0% | |
| | | | Consumer Discretionary—12.8% | |
| | 19 | | | 1-800-Flowers.com, Inc., Class A(b) | | $ | 229 | |
| | 55 | | | Aaron’s, Inc. | | | 2,735 | |
| | 52 | | | Abercrombie & Fitch Co., Class A | | | 1,127 | |
| | 26 | | | Acushnet Holdings Corp. | | | 703 | |
| | 69 | | | Adient PLC | | | 2,987 | |
| | 46 | | | Adtalem Global Education, Inc.(b) | | | 2,201 | |
| | 40 | | | AMC Entertainment Holdings, Inc., Class A | | | 762 | |
| | 38 | | | AMC Networks, Inc., Class A(b) | | | 2,387 | |
| | 83 | | | American Axle & Manufacturing Holdings, Inc.(b) | | | 1,470 | |
| | 134 | | | American Eagle Outfitters, Inc. | | | 3,479 | |
| | 43 | | | American Outdoor Brands Corp.(b) | | | 603 | |
| | 12 | | | American Public Education, Inc.(b) | | | 417 | |
| | 17 | | | Asbury Automotive Group, Inc.(b) | | | 1,266 | |
| | 111 | | | Ascena Retail Group, Inc.(b) | | | 508 | |
| | 27 | | | At Home Group, Inc.(b) | | | 929 | |
| | 46 | | | AutoNation, Inc.(b) | | | 2,086 | |
| | 26 | | | Barnes & Noble Education, Inc.(b) | | | 155 | |
| | 44 | | | Barnes & Noble, Inc. | | | 231 | |
| | 54 | | | BBX Capital Corp., Class A | | | 401 | |
| | 24 | | | Beazer Homes USA, Inc.(b) | | | 307 | |
| | 111 | | | Bed Bath & Beyond, Inc. | | | 1,991 | |
| | 66 | | | Belmond Ltd., Class A (United Kingdom)(b) | | | 1,106 | |
| | 34 | | | Big Lots, Inc. | | | 1,464 | |
| | 1 | | | Biglari Holdings, Inc., Class B(b) | | | 198 | |
| | 18 | | | BJ’s Restaurants, Inc. | | | 1,363 | |
| | 61 | | | Bloomin’ Brands, Inc. | | | 1,177 | |
| | 14 | | | Bojangles’, Inc.(b) | | | 204 | |
| | 21 | | | Boot Barn Holdings, Inc.(b) | | | 629 | |
| | 65 | | | Boyd Gaming Corp. | | | 2,367 | |
| | 44 | | | Bright Horizons Family Solutions, Inc.(b) | | | 5,255 | |
| | 37 | | | Brinker International, Inc. | | | 1,638 | |
| | 68 | | | Brunswick Corp. | | | 4,517 | |
| | 22 | | | Buckle, Inc. (The) | | | 566 | |
| | 53 | | | Burlington Stores, Inc.(b) | | | 8,914 | |
| | 3 | | | Cable One, Inc. | | | 2,513 | |
| | 461 | | | Caesars Entertainment Corp.(b) | | | 4,702 | |
| | 33 | | | Caleres, Inc. | | | 1,336 | |
| | 71 | | | Callaway Golf Co. | | | 1,620 | |
| | 13 | | | Cambium Learning Group, Inc.(b) | | | 174 | |
| | 23 | | | Camping World Holdings, Inc., Class A | | | 476 | |
| | 50 | | | Career Education Corp.(b) | | | 797 | |
| | 11 | | | Carriage Services, Inc. | | | 250 | |
| | 26 | | | Carrols Restaurant Group, Inc.(b) | | | 411 | |
| | 37 | | | Carter’s, Inc. | | | 3,919 | |
| | 18 | | | Cato Corp. (The), Class A | | | 386 | |
| | 7 | | | Cavco Industries, Inc.(b) | | | 1,718 | |
| | 22 | | | Century Communities, Inc.(b) | | | 643 | |
| | 35 | | | Cheesecake Factory, Inc. (The) | | | 1,861 | |
| | 76 | | | Chegg, Inc.(b) | | | 2,461 | |
| | 98 | | | Chico’s FAS, Inc. | | | 894 | |
| | 13 | | | Children’s Place, Inc. (The) | | | 1,830 | |
| | 30 | | | Choice Hotels International, Inc. | | | 2,341 | |
| | 10 | | | Churchill Downs, Inc. | | | 2,826 | |
| | 13 | | | Chuy’s Holdings, Inc.(b) | | | 376 | |
| | 90 | | | Cinemark Holdings, Inc. | | | 3,359 | |
| | 11 | | | Citi Trends, Inc. | | | 340 | |
| | 23 | | | Clear Channel Outdoor Holdings, Inc., Class A | | | 105 | |
| | | | | | | | |
Number
of Shares | | | | | Value | |
| | | | Common Stocks & Other Equity Interests
(continued) | |
| | | | Consumer Discretionary (continued) | |
| | 25 | | | Columbia Sportswear Co. | | $ | 2,267 | |
| | 15 | | | Conn’s, Inc.(b) | | | 615 | |
| | 40 | | | Cooper Tire & Rubber Co. | | | 1,154 | |
| | 14 | | | Cooper-Standard Holdings, Inc.(b) | | | 1,938 | |
| | 35 | | | Core-Mark Holding Co., Inc. | | | 1,252 | |
| | 15 | | | Cracker Barrel Old Country Store, Inc. | | | 2,236 | |
| | 56 | | | Crocs, Inc.(b) | | | 1,157 | |
| | 116 | | | Dana, Inc. | | | 2,270 | |
| | 32 | | | Dave & Buster’s Entertainment, Inc.(b) | | | 1,861 | |
| | 22 | | | Deckers Outdoor Corp.(b) | | | 2,680 | |
| | 26 | | | Del Taco Restaurants, Inc.(b) | | | 336 | |
| | 71 | | | Delphi Technologies PLC | | | 2,501 | |
| | 53 | | | Denny’s Corp.(b) | | | 799 | |
| | 66 | | | Dick’s Sporting Goods, Inc. | | | 2,471 | |
| | 10 | | | Dillard’s, Inc., Class A | | | 786 | |
| | 13 | | | Dine Brands Global, Inc. | | | 1,084 | |
| | 23 | | | Dorman Products, Inc.(b) | | | 1,863 | |
| | 56 | | | DSW, Inc., Class A | | | 1,863 | |
| | 14 | | | Duluth Holdings, Inc., Class B(b) | | | 405 | |
| | 64 | | | Dunkin’ Brands Group, Inc. | | | 4,665 | |
| | 40 | | | E.W. Scripps Co. (The), Class A | | | 587 | |
| | 18 | | | El Pollo Loco Holdings, Inc.(b) | | | 214 | |
| | 41 | | | Eldorado Resorts, Inc.(b) | | | 1,970 | |
| | 14 | | | Emerald Expositions Events, Inc. | | | 219 | |
| | 94 | | | Entercom Communications Corp., Class A | | | 738 | |
| | 50 | | | Entravision Communications Corp., Class A | | | 262 | |
| | 20 | | | Ethan Allen Interiors, Inc. | | | 445 | |
| | 60 | | | Express, Inc.(b) | | | 673 | |
| | 154 | | | Extended Stay America, Inc. | | | 3,108 | |
| | 20 | | | Fiesta Restaurant Group, Inc.(b) | | | 575 | |
| | 44 | | | Five Below, Inc.(b) | | | 5,125 | |
| | 34 | | | Floor & Decor Holdings, Inc., Class A(b) | | | 1,250 | |
| | 92 | | | Foot Locker, Inc. | | | 4,536 | |
| | 33 | | | Fossil Group, Inc.(b) | | | 748 | |
| | 29 | | | Fox Factory Holding Corp.(b) | | | 1,915 | |
| | 77 | | | GameStop Corp., Class A | | | 1,022 | |
| | 82 | | | Gannett Co., Inc. | | | 843 | |
| | 73 | | | GCI Liberty, Inc., Class A(b) | | | 3,583 | |
| | 15 | | | Genesco, Inc.(b) | | | 763 | |
| | 213 | | | Gentex Corp. | | | 4,980 | |
| | 28 | | | Gentherm, Inc.(b) | | | 1,378 | |
| | 33 | | | G-III Apparel Group Ltd.(b) | | | 1,501 | |
| | 52 | | | GNC Holdings, Inc., Class A(b) | | | 161 | |
| | 18 | | | Golden Entertainment, Inc.(b) | | | 522 | |
| | 77 | | | GoPro, Inc., Class A(b) | | | 494 | |
| | 4 | | | Graham Holdings Co., Class B | | | 2,251 | |
| | 38 | | | Grand Canyon Education, Inc.(b) | | | 4,527 | |
| | 68 | | | Gray Television, Inc.(b) | | | 1,187 | |
| | 27 | | | Green Brick Partners, Inc.(b) | | | 282 | |
| | 16 | | | Group 1 Automotive, Inc. | | | 1,233 | |
| | 349 | | | Groupon, Inc., Class A(b) | | | 1,490 | |
| | 47 | | | Guess?, Inc. | | | 1,151 | |
| | 8 | | | Hamilton Beach Brands Holding Co., Class A | | | 185 | |
| | 14 | | | Haverty Furniture Cos., Inc. | | | 309 | |
| | 21 | | | Helen of Troy Ltd.(b) | | | 2,498 | |
| | 13 | | | Hemisphere Media Group, Inc., Class A(b) | | | 178 | |
See accompanying Notes to Financial Statements which are an integral part of the financial statements.
Invesco PureBetaSM MSCI USA Small Cap ETF (PBSM) (continued)
August 31, 2018
| | | | | | | | |
Number
of Shares | | | | | Value | |
| | | | Common Stocks & Other Equity Interests
(continued) | |
| | | | Consumer Discretionary (continued) | |
| | 16 | | | Hibbett Sports, Inc.(b) | | $ | 329 | |
| | 77 | | | Hilton Grand Vacations, Inc.(b) | | | 2,515 | |
| | 8 | | | Hooker Furniture Corp. | | | 336 | |
| | 79 | | | Houghton Mifflin Harcourt Co.(b) | | | 510 | |
| | 90 | | | Hovnanian Enterprises, Inc., Class A(b) | | | 140 | |
| | 45 | | | IMAX Corp.(b) | | | 1,057 | |
| | 17 | | | Installed Building Products, Inc.(b) | | | 791 | |
| | 19 | | | International Speedway Corp., Class A | | | 839 | |
| | 21 | | | iRobot Corp.(b) | | | 2,383 | |
| | 236 | | | J.C. Penney Co., Inc.(b) | | | 418 | |
| | 23 | | | Jack in the Box, Inc. | | | 2,085 | |
| | 35 | | | John Wiley & Sons, Inc., Class A | | | 2,259 | |
| | 26 | | | K12, Inc.(b) | | | 431 | |
| | 63 | | | KB Home | | | 1,566 | |
| | 10 | | | Lands’ End, Inc.(b) | | | 257 | |
| | 37 | | | Laureate Education, Inc., Class A(b) | | | 591 | |
| | 37 | | | La-Z-Boy, Inc. | | | 1,230 | |
| | 19 | | | LCI Industries | | | 1,766 | |
| | 14 | | | LGI Homes, Inc.(b) | | | 806 | |
| | 42 | | | Liberty Expedia Holdings, Inc., Class A(b) | | | 1,938 | |
| | 36 | | | Liberty Latin America Ltd., Class A (Chile)(b) | | | 710 | |
| | 92 | | | Liberty Latin America Ltd., Class C (Chile)(b) | | | 1,806 | |
| | 8 | | | Liberty Media Corp.-Liberty Braves, Class A(b) | | | 213 | |
| | 26 | | | Liberty Media Corp.-Liberty Braves, Class C(b) | | | 691 | |
| | 55 | | | Liberty TripAdvisor Holdings, Inc., Series A(b) | | | 872 | |
| | 17 | | | Lindblad Expeditions Holdings, Inc.(b) | | | 258 | |
| | 40 | | | Lions Gate Entertainment Corp., Class A | | | 941 | |
| | 82 | | | Lions Gate Entertainment Corp., Class B | | | 1,841 | |
| | 19 | | | Lithia Motors, Inc., Class A | | | 1,642 | |
| | 10 | | | Loral Space & Communications, Inc.(b) | | | 444 | |
| | 22 | | | Lumber Liquidators Holdings, Inc.(b) | | | 383 | |
| | 21 | | | M/I Homes, Inc.(b) | | | 544 | |
| | 15 | | | Madison Square Garden Co. (The), Class A(b) | | | 4,529 | |
| | 14 | | | Marcus Corp. (The) | | | 568 | |
| | 20 | | | MarineMax, Inc.(b) | | | 450 | |
| | 32 | | | Marriott Vacations Worldwide Corp. | | | 3,808 | |
| | 38 | | | MDC Holdings, Inc. | | | 1,205 | |
| | 43 | | | MDC Partners, Inc., Class A(b) | | | 209 | |
| | 30 | | | Meredith Corp. | | | 1,550 | |
| | 29 | | | Meritage Homes Corp.(b) | | | 1,251 | |
| | 84 | | | Michaels Cos., Inc. (The)(b) | | | 1,427 | |
| | 38 | | | Modine Manufacturing Co.(b) | | | 640 | |
| | 9 | | | Monarch Casino & Resort, Inc.(b) | | | 423 | |
| | 25 | | | Monro, Inc. | | | 1,774 | |
| | 14 | | | Motorcar Parts of America, Inc.(b) | | | 372 | |
| | 12 | | | Movado Group, Inc. | | | 511 | |
| | 47 | | | MSG Networks, Inc., Class A(b) | | | 1,142 | |
| | 25 | | | Murphy USA, Inc.(b) | | | 2,075 | |
| | 60 | | | National CineMedia, Inc. | | | 546 | |
| | 39 | | | National Vision Holdings, Inc.(b) | | | 1,726 | |
| | 23 | | | Nautilus, Inc.(b) | | | 337 | |
| | 41 | | | New Media Investment Group, Inc. | | | 652 | |
| | 103 | | | New York Times Co. (The), Class A | | | 2,400 | |
| | 37 | | | Nexstar Media Group, Inc., Class A | | | 3,034 | |
| | 23 | | | Nutrisystem, Inc. | | | 851 | |
| | 393 | | | Office Depot, Inc. | | | 1,317 | |
| | | | | | | | |
Number
of Shares | | | | | Value | |
| | | | Common Stocks & Other Equity Interests
(continued) | |
| | | | Consumer Discretionary (continued) | |
| | 42 | | | Ollie’s Bargain Outlet Holdings, Inc.(b) | | $ | 3,658 | |
| | 19 | | | Overstock.com, Inc.(b) | | | 555 | |
| | 14 | | | Oxford Industries, Inc. | | | 1,303 | |
| | 21 | | | Papa John’s International, Inc. | | | 969 | |
| | 52 | | | Party City Holdco, Inc.(b) | | | 798 | |
| | 66 | | | Penn National Gaming, Inc.(b) | | | 2,274 | |
| | 30 | | | Penske Automotive Group, Inc. | | | 1,579 | |
| | 16 | | | PetMed Express, Inc. | | | 587 | |
| | 41 | | | Pinnacle Entertainment, Inc.(b) | | | 1,404 | |
| | 69 | | | Planet Fitness, Inc., Class A(b) | | | 3,545 | |
| | 47 | | | Playa Hotels & Resorts NV(b) | | | 486 | |
| | 21 | | | PlayAGS, Inc.(b) | | | 673 | |
| | 32 | | | Pool Corp. | | | 5,256 | |
| | 18 | | | Potbelly Corp.(b) | | | 244 | |
| | 10 | | | Red Robin Gourmet Burgers, Inc.(b) | | | 413 | |
| | 56 | | | Red Rock Resorts, Inc., Class A | | | 1,828 | |
| | 26 | | | Regis Corp.(b) | | | 556 | |
| | 40 | | | Rent-A-Center, Inc.(b) | | | 590 | |
| | 15 | | | RH(b) | | | 2,385 | |
| | 22 | | | Ruth’s Hospitality Group, Inc. | | | 678 | |
| | 104 | | | Sally Beauty Holdings, Inc.(b) | | | 1,602 | |
| | 23 | | | Scholastic Corp. | | | 967 | |
| | 41 | | | Scientific Games Corp., Class A(b) | | | 1,242 | |
| | 42 | | | SeaWorld Entertainment, Inc.(b) | | | 1,231 | |
| | 144 | | | Service Corp. International | | | 6,042 | |
| | 106 | | | ServiceMaster Global Holdings, Inc.(b) | | | 6,389 | |
| | 19 | | | Shake Shack, Inc., Class A(b) | | | 1,149 | |
| | 9 | | | Shoe Carnival, Inc. | | | 400 | |
| | 25 | | | Shutterfly, Inc.(b) | | | 1,942 | |
| | 48 | | | Signet Jewelers Ltd. | | | 3,082 | |
| | 59 | | | Sinclair Broadcast Group, Inc., Class A | | | 1,708 | |
| | 56 | | | Six Flags Entertainment Corp. | | | 3,783 | |
| | 107 | | | Skechers U.S.A., Inc., Class A(b) | | | 3,154 | |
| | 32 | | | Sleep Number Corp.(b) | | | 1,078 | |
| | 20 | | | Sonic Automotive, Inc., Class A | | | 430 | |
| | 24 | | | Sonic Corp. | | | 861 | |
| | 31 | | | Sotheby’s(b) | | | 1,489 | |
| | 9 | | | Speedway Motorsports, Inc. | | | 161 | |
| | 16 | | | Standard Motor Products, Inc. | | | 812 | |
| | 44 | | | Steven Madden Ltd. | | | 2,559 | |
| | 20 | | | Stoneridge, Inc.(b) | | | 599 | |
| | 17 | | | Strategic Education, Inc. | | | 2,359 | |
| | 14 | | | Sturm Ruger & Co., Inc. | | | 916 | |
| | 17 | | | Superior Industries International, Inc. | | | 369 | |
| | 38 | | | Tailored Brands, Inc. | | | 895 | |
| | 90 | | | Taylor Morrison Home Corp., Class A(b) | | | 1,751 | |
| | 175 | | | TEGNA, Inc. | | | 2,037 | |
| | 35 | | | Tempur Sealy International, Inc.(b) | | | 1,939 | |
| | 41 | | | Tenneco, Inc. | | | 1,754 | |
| | 52 | | | Texas Roadhouse, Inc. | | | 3,585 | |
| | 41 | | | Thor Industries, Inc. | | | 3,913 | |
| | 26 | | | Tile Shop Holdings, Inc. | | | 199 | |
| | 28 | | | TopBuild Corp.(b) | | | 1,744 | |
| | 16 | | | Tower International, Inc. | | | 541 | |
| | 121 | | | TRI Pointe Group, Inc.(b) | | | 1,753 | |
| | 64 | | | Tribune Media Co., Class A | | | 2,361 | |
See accompanying Notes to Financial Statements which are an integral part of the financial statements.
Invesco PureBetaSM MSCI USA Small Cap ETF (PBSM) (continued)
August 31, 2018
| | | | | | | | |
Number
of Shares | | | | | Value | |
| | | | Common Stocks & Other Equity Interests
(continued) | |
| | | | Consumer Discretionary (continued) | |
| | 11 | | | tronc, Inc.(b) | | $ | 182 | |
| | 39 | | | Tupperware Brands Corp. | | | 1,268 | |
| | 12 | | | Unifi, Inc.(b) | | | 382 | |
| | 11 | | | Universal Electronics, Inc.(b) | | | 475 | |
| | 59 | | | Urban Outfitters, Inc.(b) | | | 2,742 | |
| | 64 | | | Veoneer, Inc. (Sweden)(b) | | | 3,196 | |
| | 15 | | | Vera Bradley, Inc.(b) | | | 220 | |
| | 43 | | | Vista Outdoor, Inc.(b) | | | 794 | |
| | 24 | | | Visteon Corp.(b) | | | 2,649 | |
| | 43 | | | Wayfair, Inc., Class A(b) | | | 5,812 | |
| | 31 | | | Weight Watchers International, Inc.(b) | | | 2,322 | |
| | 150 | | | Wendy’s Co. (The) | | | 2,648 | |
| | 21 | | | WideOpenWest, Inc.(b) | | | 245 | |
| | 27 | | | William Lyon Homes, Class A(b) | | | 528 | |
| | 64 | | | Williams-Sonoma, Inc. | | | 4,495 | |
| | 22 | | | Wingstop, Inc. | | | 1,473 | |
| | 2 | | | Winmark Corp. | | | 298 | |
| | 23 | | | Winnebago Industries, Inc. | | | 850 | |
| | 74 | | | Wolverine World Wide, Inc. | | | 2,899 | |
| | 31 | | | World Wrestling Entertainment, Inc., Class A | | | 2,710 | |
| | 77 | | | Wyndham Destinations, Inc. | | | 3,403 | |
| | 77 | | | Wyndham Hotels & Resorts, Inc. | | | 4,370 | |
| | 14 | | | Zumiez, Inc.(b) | | | 436 | |
| | | | | | | | |
| | | | | | | 385,179 | |
| | | | | | | | |
| | | | Consumer Staples—3.3% | | | |
| | 21 | | | Andersons, Inc. (The) | | | 858 | |
| | 335 | | | Avon Products, Inc. (United Kingdom)(b) | | | 670 | |
| | 51 | | | B&G Foods, Inc. | | | 1,629 | |
| | 7 | | | Boston Beer Co., Inc. (The), Class A(b) | | | 2,122 | |
| | 12 | | | Calavo Growers, Inc. | | | 1,270 | |
| | 23 | | | Cal-Maine Foods, Inc. | | | 1,137 | |
| | 30 | | | Casey’s General Stores, Inc. | | | 3,425 | |
| | 8 | | | Central Garden & Pet Co.(b) | | | 318 | |
| | 35 | | | Central Garden & Pet Co., Class A(b) | | | 1,272 | |
| | 16 | | | Chefs’ Warehouse, Inc. (The)(b) | | | 470 | |
| | 4 | | | Coca-Cola Bottling Co. Consolidated | | | 678 | |
| | 133 | | | Darling Ingredients, Inc.(b) | | | 2,631 | |
| | 69 | | | Dean Foods Co. | | | 526 | |
| | 42 | | | Edgewell Personal Care Co.(b) | | | 2,372 | |
| | 17 | | | elf Beauty, Inc.(b) | | | 236 | |
| | 47 | | | Energizer Holdings, Inc. | | | 2,989 | |
| | 8 | | | Farmer Brothers Co.(b) | | | 232 | |
| | 151 | | | Flowers Foods, Inc. | | | 3,043 | |
| | 25 | | | Fresh Del Monte Produce, Inc. | | | 936 | |
| | 22 | | | Freshpet, Inc.(b) | | | 817 | |
| | 77 | | | Hain Celestial Group, Inc. (The)(b) | | | 2,199 | |
| | 89 | | | Herbalife Nutrition Ltd.(b) | | | 5,036 | |
| | 81 | | | Hostess Brands, Inc.(b) | | | 953 | |
| | 9 | | | Ingles Markets, Inc., Class A | | | 324 | |
| | 13 | | | Inter Parfums, Inc. | | | 849 | |
| | 12 | | | J & J Snack Foods Corp. | | | 1,746 | |
| | 6 | | | John B. Sanfilippo & Son, Inc. | | | 438 | |
| | 116 | | | Lamb Weston Holdings, Inc. | | | 7,842 | |
| | 15 | | | Lancaster Colony Corp. | | | 2,344 | |
| | 19 | | | Landec Corp.(b) | | | 256 | |
| | 9 | | | Medifast, Inc. | | | 2,059 | |
| | | | | | | | |
Number
of Shares | | | | | Value | |
| | | | Common Stocks & Other Equity Interests
(continued) | |
| | | | Consumer Staples (continued) | | | |
| | 11 | | | MGP Ingredients, Inc. | | $ | 848 | |
| | 9 | | | National Beverage Corp.(b) | | | 1,061 | |
| | 42 | | | Nu Skin Enterprises, Inc., Class A | | | 3,343 | |
| | 82 | | | Performance Food Group Co.(b) | | | 2,714 | |
| | 92 | | | Pinnacle Foods, Inc. | | | 6,111 | |
| | 53 | | | Post Holdings, Inc.(b) | | | 5,155 | |
| | 17 | | | PriceSmart, Inc. | | | 1,476 | |
| | 811 | | | Rite Aid Corp.(b) | | | 1,111 | |
| | 16 | | | Sanderson Farms, Inc. | | | 1,692 | |
| | 49 | | | Simply Good Foods Co. (The)(b) | | | 882 | |
| | 22 | | | Smart & Final Stores, Inc.(b) | | | 154 | |
| | 29 | | | SpartanNash Co. | | | 619 | |
| | 32 | | | Spectrum Brands Holdings, Inc. | | | 2,779 | |
| | 99 | | | Sprouts Farmers Market, Inc.(b) | | | 2,620 | |
| | 29 | | | SUPERVALU, Inc.(b) | | | 936 | |
| | 15 | | | Tootsie Roll Industries, Inc. | | | 432 | |
| | 44 | | | TreeHouse Foods, Inc.(b) | | | 2,292 | |
| | 39 | | | United Natural Foods, Inc.(b) | | | 1,385 | |
| | 19 | | | Universal Corp. | | | 1,136 | |
| | 170 | | | US Foods Holding Corp.(b) | | | 5,540 | |
| | 9 | | | USANA Health Sciences, Inc.(b) | | | 1,188 | |
| | 77 | | | Vector Group Ltd. | | | 1,196 | |
| | 6 | | | Village Super Market, Inc., Class A | | | 175 | |
| | 11 | | | WD-40 Co. | | | 1,952 | |
| | 10 | | | Weis Markets, Inc. | | | 466 | |
| | | | | | | | |
| | | | | | | 98,940 | |
| | | | | | | | |
| | | | Energy—4.6% | | | |
| | 59 | | | Alta Mesa Resources, Inc.(b) | | | 280 | |
| | 57 | | | Antero Midstream GP LP | | | 963 | |
| | 61 | | | Apergy Corp.(b) | | | 2,758 | |
| | 15 | | | Arch Coal, Inc., Class A | | | 1,330 | |
| | 101 | | | Archrock, Inc. | | | 1,278 | |
| | 14 | | | Basic Energy Services, Inc.(b) | | | 124 | |
| | 13 | | | Bonanza Creek Energy, Inc.(b) | | | 403 | |
| | 49 | | | C&J Energy Services, Inc.(b) | | | 1,027 | |
| | 28 | | | Cactus, Inc., Class A(b) | | | 957 | |
| | 37 | | | California Resources Corp.(b) | | | 1,537 | |
| | 172 | | | Callon Petroleum Co.(b) | | | 1,944 | |
| | 75 | | | Carrizo Oil & Gas, Inc.(b) | | | 1,816 | |
| | 121 | | | Centennial Resource Development, Inc., Class A(b) | | | 2,332 | |
| | 708 | | | Chesapeake Energy Corp.(b) | | | 3,136 | |
| | 139 | | | CNX Resources Corp.(b) | | | 2,216 | |
| | 17 | | | CONSOL Energy, Inc.(b) | | | 729 | |
| | 35 | | | Core Laboratories NV | | | 4,009 | |
| | 23 | | | Covia Holdings Corp.(b) | | | 261 | |
| | 24 | | | CVR Energy, Inc. | | | 913 | |
| | 62 | | | Delek US Holdings, Inc. | | | 3,379 | |
| | 348 | | | Denbury Resources, Inc.(b) | | | 1,938 | |
| | 52 | | | Diamond Offshore Drilling, Inc.(b) | | | 906 | |
| | 29 | | | Dril-Quip, Inc.(b) | | | 1,527 | |
| | 70 | | | Eclipse Resources Corp.(b) | | | 100 | |
| | 57 | | | Enbridge Energy Management LLC(b) | | | 618 | |
| | 68 | | | Energen Corp.(b) | | | 5,273 | |
| | 48 | | | EnLink Midstream LLC | | | 782 | |
| | 354 | | | Ensco PLC, Class A | | | 2,421 | |
See accompanying Notes to Financial Statements which are an integral part of the financial statements.
Invesco PureBetaSM MSCI USA Small Cap ETF (PBSM) (continued)
August 31, 2018
| | | | | | | | |
Number
of Shares | | | | | Value | |
| | | | Common Stocks & Other Equity Interests
(continued) | |
| | | | Energy (continued) | | | |
| | 24 | | | Exterran Corp.(b) | | $ | 657 | |
| | 78 | | | Extraction Oil & Gas, Inc.(b) | | | 901 | |
| | 59 | | | Forum Energy Technologies, Inc.(b) | | | 705 | |
| | 61 | | | Frank’s International NV(b) | | | 539 | |
| | 17 | | | FTS International, Inc.(b) | | | 188 | |
| | 304 | | | Gran Tierra Energy, Inc. (Columbia)(b) | | | 1,049 | |
| | 29 | | | Green Plains, Inc. | | | 515 | |
| | 125 | | | Gulfport Energy Corp.(b) | | | 1,470 | |
| | 87 | | | Halcon Resources Corp.(b) | | | 398 | |
| | 106 | | | Helix Energy Solutions Group, Inc.(b) | | | 992 | |
| | 82 | | | HighPoint Resources Corp.(b) | | | 452 | |
| | 11 | | | International Seaways, Inc.(b) | | | 226 | |
| | 47 | | | Jagged Peak Energy, Inc.(b) | | | 621 | |
| | 41 | | | Keane Group, Inc.(b) | | | 503 | |
| | 176 | | | Kosmos Energy Ltd. (Ghana)(b) | | | 1,591 | |
| | 125 | | | Laredo Petroleum, Inc.(b) | | | 1,036 | |
| | 6 | | | Mammoth Energy Services, Inc. | | | 165 | |
| | 80 | | | Matador Resources Co.(b) | | | 2,619 | |
| | 20 | | | Matrix Service Co.(b) | | | 418 | |
| | 142 | | | McDermott International, Inc.(b) | | | 2,746 | |
| | 9 | | | Midstates Petroleum Co., Inc.(b) | | | 105 | |
| | 127 | | | Murphy Oil Corp. | | | 3,915 | |
| | 273 | | | Nabors Industries Ltd. | | | 1,684 | |
| | 10 | | | Natural Gas Services Group, Inc.(b) | | | 221 | |
| | 8 | | | NCS Multistage Holdings, Inc.(b) | | | 130 | |
| | 67 | | | Newpark Resources, Inc.(b) | | | 704 | |
| | 13 | | | Nine Energy Service, Inc.(b) | | | 390 | |
| | 186 | | | Noble Corp. PLC(b) | | | 1,135 | |
| | 217 | | | Oasis Petroleum, Inc.(b) | | | 2,921 | |
| | 75 | | | Oceaneering International, Inc.(b) | | | 2,120 | |
| | 44 | | | Oil States International, Inc.(b) | | | 1,489 | |
| | 22 | | | Par Pacific Holdings, Inc.(b) | | | 447 | |
| | 173 | | | Patterson-UTI Energy, Inc. | | | 2,963 | |
| | 82 | | | PBF Energy, Inc., Class A | | | 4,257 | |
| | 51 | | | PDC Energy, Inc.(b) | | | 2,687 | |
| | 65 | | | Peabody Energy Corp. | | | 2,685 | |
| | 8 | | | Penn Virginia Corp.(b) | | | 712 | |
| | 59 | | | ProPetro Holding Corp.(b) | | | 898 | |
| | 195 | | | QEP Resources, Inc.(b) | | | 1,944 | |
| | 193 | | | Range Resources Corp. | | | 3,169 | |
| | 26 | | | Renewable Energy Group, Inc.(b) | | | 701 | |
| | 14 | | | Resolute Energy Corp.(b) | | | 461 | |
| | 5 | | | REX American Resources Corp.(b) | | | 403 | |
| | 49 | | | Ring Energy, Inc.(b) | | | 578 | |
| | 91 | | | Rowan Cos. PLC, Class A(b) | | | 1,278 | |
| | 50 | | | RPC, Inc. | | | 684 | |
| | 24 | | | SandRidge Energy, Inc.(b) | | | 381 | |
| | 13 | | | SEACOR Holdings, Inc.(b) | | | 669 | |
| | 36 | | | Select Energy Services, Inc., Class A(b) | | | 491 | |
| | 50 | | | SemGroup Corp., Class A | | | 1,210 | |
| | 82 | | | SM Energy Co. | | | 2,467 | |
| | 456 | | | Southwestern Energy Co.(b) | | | 2,563 | |
| | 194 | | | SRC Energy, Inc.(b) | | | 1,806 | |
| | 116 | | | Superior Energy Services, Inc.(b) | | | 1,044 | |
| | 124 | | | Tallgrass Energy LP, Class A | | | 3,049 | |
| | 16 | | | Talos Energy, Inc.(b) | | | 552 | |
| | | | | | | | |
Number
of Shares | | | | | Value | |
| | | | Common Stocks & Other Equity Interests
(continued) | |
| | | | Energy (continued) | | | |
| | 61 | | | Tellurian, Inc.(b) | | $ | 590 | |
| | 88 | | | TETRA Technologies, Inc.(b) | | | 404 | |
| | 17 | | | Tidewater, Inc.(b) | | | 544 | |
| | 341 | | | Transocean Ltd.(b) | | | 4,130 | |
| | 153 | | | Ultra Petroleum Corp.(b) | | | 200 | |
| | 40 | | | Unit Corp.(b) | | | 1,052 | |
| | 62 | | | US Silica Holdings, Inc. | | | 1,314 | |
| | 76 | | | W&T Offshore, Inc.(b) | | | 515 | |
| | 769 | | | Weatherford International PLC(b) | | | 1,861 | |
| | 71 | | | Whiting Petroleum Corp.(b) | | | 3,615 | |
| | 18 | | | WildHorse Resource Development Corp.(b) | | | 391 | |
| | 53 | | | World Fuel Services Corp. | | | 1,486 | |
| | 309 | | | WPX Energy, Inc.(b) | | | 5,893 | |
| | | | | | | | |
| | | | | | | 137,656 | |
| | | | | | | | |
| | | | Financials—15.9% | | | |
| | 14 | | | 1st Source Corp. | | | 784 | |
| | 11 | | | Access National Corp. | | | 299 | |
| | 21 | | | AG Mortgage Investment Trust, Inc. REIT | | | 395 | |
| | 9 | | | Allegiance Bancshares, Inc.(b) | | | 401 | |
| | 34 | | | Ambac Financial Group, Inc.(b) | | | 718 | |
| | 69 | | | American Equity Investment Life Holding Co. | | | 2,559 | |
| | 6 | | | American National Insurance Co. | | | 770 | |
| | 34 | | | Ameris Bancorp | | | 1,688 | |
| | 15 | | | AMERISAFE, Inc. | | | 957 | |
| | 91 | | | AmTrust Financial Services, Inc. | | | 1,323 | |
| | 73 | | | Anworth Mortgage Asset Corp. REIT | | | 356 | |
| | 90 | | | Apollo Commercial Real Estate Finance, Inc. REIT | | | 1,749 | |
| | 37 | | | Arbor Realty Trust, Inc. REIT | | | 454 | |
| | 27 | | | Argo Group International Holdings Ltd. | | | 1,720 | |
| | 18 | | | Arlington Asset Investment Corp., Class A | | | 183 | |
| | 32 | | | ARMOUR Residential REIT, Inc. REIT | | | 753 | |
| | 9 | | | Arrow Financial Corp. | | | 354 | |
| | 41 | | | Artisan Partners Asset Management, Inc., Class A | | | 1,359 | |
| | 46 | | | Aspen Insurance Holdings Ltd. (Bermuda) | | | 1,893 | |
| | 132 | | | Associated Banc-Corp. | | | 3,597 | |
| | 4 | | | Associated Capital Group, Inc., Class A | | | 150 | |
| | 87 | | | Assured Guaranty Ltd. | | | 3,544 | |
| | 19 | | | Atlantic Capital Bancshares, Inc.(b) | | | 347 | |
| | 11 | | | B. Riley Financial, Inc. | | | 252 | |
| | 32 | | | Banc of California, Inc. | | | 645 | |
| | 13 | | | BancFirst Corp. | | | 829 | |
| | 42 | | | Bancorp, Inc. (The)(b) | | | 421 | |
| | 75 | | | BancorpSouth Bank | | | 2,610 | |
| | 33 | | | Bank of Hawaii Corp. | | | 2,743 | |
| | 5 | | | Bank of Marin Bancorp | | | 441 | |
| | 97 | | | Bank OZK | | | 3,925 | |
| | 83 | | | BankUnited, Inc. | | | 3,220 | |
| | 27 | | | Banner Corp. | | | 1,737 | |
| | 12 | | | Bar Harbor Bankshares | | | 353 | |
| | 52 | | | Beneficial Bancorp, Inc. | | | 915 | |
| | 32 | | | Berkshire Hills Bancorp, Inc. | | | 1,352 | |
| | 189 | | | BGC Partners, Inc., Class A | | | 2,347 | |
| | 80 | | | Blackstone Mortgage Trust, Inc., Class A REIT | | | 2,725 | |
| | 37 | | | Blucora, Inc.(b) | | | 1,339 | |
| | 18 | | | Blue Hills Bancorp, Inc. | | | 414 | |
See accompanying Notes to Financial Statements which are an integral part of the financial statements.
Invesco PureBetaSM MSCI USA Small Cap ETF (PBSM) (continued)
August 31, 2018
| | | | | | | | |
Number
of Shares | | | | | Value | |
| | | | Common Stocks & Other Equity Interests
(continued) | |
| | | | Financials (continued) | | | |
| | 46 | | | BofI Holding, Inc.(b) | | $ | 1,713 | |
| | 18 | | | BOK Financial Corp. | | | 1,846 | |
| | 64 | | | Boston Private Financial Holdings, Inc. | | | 925 | |
| | 12 | | | Bridge Bancorp, Inc. | | | 420 | |
| | 61 | | | BrightSphere Investment Group PLC | | | 774 | |
| | 58 | | | Brookline Bancorp, Inc. | | | 1,053 | |
| | 182 | | | Brown & Brown, Inc. | | | 5,547 | |
| | 15 | | | Bryn Mawr Bank Corp. | | | 732 | |
| | 13 | | | Byline Bancorp, Inc.(b) | | | 297 | |
| | 49 | | | Cadence BanCorp, Class A | | | 1,384 | |
| | 12 | | | Camden National Corp. | | | 549 | |
| | 52 | | | Cannae Holdings, Inc.(b) | | | 1,011 | |
| | 100 | | | Capitol Federal Financial, Inc. | | | 1,321 | |
| | 73 | | | Capstead Mortgage Corp. REIT | | | 613 | |
| | 15 | | | Carolina Financial Corp. | | | 617 | |
| | 62 | | | Cathay General Bancorp | | | 2,623 | |
| | 65 | | | CenterState Bank Corp. | | | 1,990 | |
| | 23 | | | Central Pacific Financial Corp. | | | 652 | |
| | 57 | | | Chemical Financial Corp. | | | 3,256 | |
| | 146 | | | Chimera Investment Corp. REIT | | | 2,720 | |
| | 35 | | | Citizens, Inc.(b) | | | 294 | |
| | 12 | | | City Holding Co. | | | 973 | |
| | 131 | | | CNO Financial Group, Inc. | | | 2,831 | |
| | 28 | | | CoBiz Financial, Inc. | | | 645 | |
| | 16 | | | Cohen & Steers, Inc. | | | 665 | |
| | 65 | | | Colony Credit Real Estate, Inc. REIT | | | 1,305 | |
| | 56 | | | Columbia Banking System, Inc. | | | 2,366 | |
| | 76 | | | Commerce Bancshares, Inc. | | | 5,401 | |
| | 39 | | | Community Bank System, Inc. | | | 2,579 | |
| | 12 | | | Community Trust Bancorp, Inc. | | | 593 | |
| | 23 | | | ConnectOne Bancorp, Inc. | | | 567 | |
| | 19 | | | Cowen, Inc., Class A(b) | | | 289 | |
| | 13 | | | Crawford & Co., Class A | | | 111 | |
| | 9 | | | Credit Acceptance Corp.(b) | | | 4,110 | |
| | 47 | | | Cullen/Frost Bankers, Inc. | | | 5,212 | |
| | 22 | | | Customers Bancorp, Inc.(b) | | | 543 | |
| | 91 | | | CVB Financial Corp. | | | 2,189 | |
| | 3 | | | Diamond Hill Investment Group, Inc. | | | 560 | |
| | 24 | | | Dime Community Bancshares, Inc. | | | 436 | |
| | 9 | | | Donegal Group, Inc., Class A | | | 130 | |
| | 25 | | | Donnelley Financial Solutions, Inc.(b) | | | 522 | |
| | 35 | | | Dynex Capital, Inc. REIT | | | 224 | |
| | 25 | | | Eagle Bancorp, Inc.(b) | | | 1,346 | |
| | 7 | | | EMC Insurance Group, Inc. | | | 180 | |
| | 25 | | | Employers Holdings, Inc. | | | 1,146 | |
| | 19 | | | Encore Capital Group, Inc.(b) | | | 736 | |
| | 26 | | | Enova International, Inc.(b) | | | 863 | |
| | 8 | | | Enstar Group Ltd. (Bermuda)(b) | | | 1,708 | |
| | 18 | | | Enterprise Financial Services Corp. | | | 1,013 | |
| | 20 | | | Erie Indemnity Co., Class A | | | 2,471 | |
| | 69 | | | Essent Group Ltd.(b) | | | 2,992 | |
| | 32 | | | Evercore, Inc., Class A | | | 3,397 | |
| | 23 | | | Exantas Capital Corp. REIT | | | 273 | |
| | 39 | | | EZCORP, Inc., Class A(b) | | | 433 | |
| | 259 | | | F.N.B. Corp. | | | 3,484 | |
| | 30 | | | FactSet Research Systems, Inc. | | | 6,882 | |
| | | | | | | | |
Number
of Shares | | | | | Value | |
| | | | Common Stocks & Other Equity Interests
(continued) | |
| | | | Financials (continued) | | | |
| | 13 | | | FB Financial Corp. | | $ | 572 | |
| | 9 | | | FBL Financial Group, Inc., Class A | | | 732 | |
| | 35 | | | FCB Financial Holdings, Inc., Class A(b) | | | 1,813 | |
| | 7 | | | Federal Agricultural Mortgage Corp., Class C | | | 539 | |
| | 74 | | | Federated Investors, Inc., Class B | | | 1,714 | |
| | 108 | | | FGL Holdings(b) | | | 941 | |
| | 17 | | | Fidelity Southern Corp. | | | 413 | |
| | 10 | | | Financial Institutions, Inc. | | | 323 | |
| | 87 | | | First American Financial Corp. | | | 4,947 | |
| | 174 | | | First BanCorp/Puerto Rico(b) | | | 1,522 | |
| | 25 | | | First Bancorp/Southern Pines NC | | | 1,043 | |
| | 33 | | | First Busey Corp. | | | 1,058 | |
| | 5 | | | First Citizens BancShares, Inc., Class A | | | 2,375 | |
| | 74 | | | First Commonwealth Financial Corp. | | | 1,239 | |
| | 11 | | | First Community Bancshares, Inc. | | | 369 | |
| | 16 | | | First Defiance Financial Corp. | | | 512 | |
| | 76 | | | First Financial Bancorp | | | 2,386 | |
| | 43 | | | First Financial Bankshares, Inc. | | | 2,597 | |
| | 7 | | | First Financial Corp. | | | 360 | |
| | 25 | | | First Foundation, Inc.(b) | | | 404 | |
| | 74 | | | First Hawaiian, Inc. | | | 2,145 | |
| | 241 | | | First Horizon National Corp. | | | 4,439 | |
| | 30 | | | First Interstate BancSystem, Inc., Class A | | | 1,393 | |
| | 38 | | | First Merchants Corp. | | | 1,829 | |
| | 11 | | | First Mid-Illinois Bancshares, Inc. | | | 452 | |
| | 78 | | | First Midwest Bancorp, Inc. | | | 2,120 | |
| | 16 | | | First of Long Island Corp. (The) | | | 349 | |
| | 37 | | | FirstCash, Inc. | | | 3,008 | |
| | 25 | | | Flagstar Bancorp, Inc.(b) | | | 826 | |
| | 21 | | | Flushing Financial Corp. | | | 544 | |
| | 9 | | | Franklin Financial Network, Inc.(b) | | | 348 | |
| | 140 | | | Fulton Financial Corp. | | | 2,548 | |
| | 3 | | | GAMCO Investors, Inc., Class A | | | 78 | |
| | 379 | | | Genworth Financial, Inc., Class A(b) | | | 1,762 | |
| | 17 | | | German American Bancorp, Inc. | | | 639 | |
| | 66 | | | Glacier Bancorp, Inc. | | | 3,015 | |
| | 4 | | | Global Indemnity Ltd., Class A (Cayman Islands) | | | 158 | |
| | 33 | | | Granite Point Mortgage Trust, Inc. REIT | | | 632 | |
| | 8 | | | Great Southern Bancorp, Inc. | | | 474 | |
| | 45 | | | Great Western Bancorp, Inc. | | | 1,959 | |
| | 17 | | | Green Bancorp, Inc. | | | 408 | |
| | 36 | | | Green Dot Corp., Class A(b) | | | 3,084 | |
| | 19 | | | Greenhill & Co., Inc. | | | 522 | |
| | 22 | | | Greenlight Capital Re Ltd., Class A(b) | | | 283 | |
| | 18 | | | Guaranty Bancorp | | | 562 | |
| | 68 | | | Hancock Whitney Corp. | | | 3,505 | |
| | 25 | | | Hanmi Financial Corp. | | | 652 | |
| | 39 | | | Hannon Armstrong Sustainable Infrastructure Capital, Inc. REIT | | | 841 | |
| | 33 | | | Hanover Insurance Group, Inc. (The) | | | 4,042 | |
| | 11 | | | HarborOne Bancorp, Inc.(b) | | | 217 | |
| | 6 | | | HCI Group, Inc. | | | 243 | |
| | 21 | | | Heartland Financial USA, Inc. | | | 1,277 | |
| | 27 | | | Heritage Commerce Corp. | | | 428 | |
| | 26 | | | Heritage Financial Corp. | | | 944 | |
| | 20 | | | Heritage Insurance Holdings, Inc. | | | 293 | |
See accompanying Notes to Financial Statements which are an integral part of the financial statements.
Invesco PureBetaSM MSCI USA Small Cap ETF (PBSM) (continued)
August 31, 2018
| | | | | | | | |
Number
of Shares | | | | | Value | |
| | | | Common Stocks & Other Equity Interests
(continued) | |
| | | | Financials (continued) | | | |
| | 60 | | | Hilltop Holdings, Inc. | | $ | 1,245 | |
| | 124 | | | Home BancShares, Inc. | | | 2,903 | |
| | 21 | | | HomeStreet, Inc.(b) | | | 618 | |
| | 14 | | | HomeTrust Bancshares, Inc.(b) | | | 403 | |
| | 105 | | | Hope Bancorp, Inc. | | | 1,839 | |
| | 31 | | | Horace Mann Educators Corp. | | | 1,435 | |
| | 27 | | | Horizon Bancorp, Inc. | | | 552 | |
| | 27 | | | Houlihan Lokey, Inc., Class A | | | 1,270 | |
| | 44 | | | IBERIABANK Corp. | | | 3,813 | |
| | 4 | | | Independence Holding Co. | | | 141 | |
| | 21 | | | Independent Bank Corp./MA | | | 1,913 | |
| | 16 | | | Independent Bank Corp./MI | | | 399 | |
| | 12 | | | Independent Bank Group, Inc. | | | 831 | |
| | 54 | | | Interactive Brokers Group, Inc., Class A | | | 3,357 | |
| | 43 | | | International Bancshares Corp. | | | 2,015 | |
| | 12 | | | INTL. FCStone, Inc.(b) | | | 669 | |
| | 85 | | | Invesco Mortgage Capital, Inc. REIT(c) | | | 1,380 | |
| | 24 | | | Investment Technology Group, Inc. | | | 525 | |
| | 201 | | | Investors Bancorp, Inc. | | | 2,573 | |
| | 22 | | | James River Group Holdings Ltd. | | | 901 | |
| | 149 | | | Janus Henderson Group PLC (United Kingdom) | | | 4,209 | |
| | 73 | | | Kearny Financial Corp. | | | 1,000 | |
| | 42 | | | Kemper Corp. | | | 3,417 | |
| | 14 | | | Kinsale Capital Group, Inc. | | | 851 | |
| | 19 | | | KKR Real Estate Finance Trust, Inc. | | | 403 | |
| | 58 | | | Ladder Capital Corp., Class A REIT | | | 1,007 | |
| | 82 | | | Ladenburg Thalmann Financial Services, Inc. | | | 283 | |
| | 34 | | | Lakeland Bancorp, Inc. | | | 656 | |
| | 18 | | | Lakeland Financial Corp. | | | 887 | |
| | 35 | | | LegacyTexas Financial Group, Inc. | | | 1,619 | |
| | 67 | | | Legg Mason, Inc. | | | 2,090 | |
| | 230 | | | LendingClub Corp.(b) | | | 830 | |
| | 6 | | | LendingTree, Inc.(b) | | | 1,520 | |
| | 19 | | | Live Oak Bancshares, Inc. | | | 575 | |
| | 70 | | | LPL Financial Holdings, Inc. | | | 4,637 | |
| | 13 | | | Luther Burbank Corp. | | | 148 | |
| | 56 | | | Maiden Holdings Ltd. | | | 213 | |
| | 30 | | | MarketAxess Holdings, Inc. | | | 5,695 | |
| | 65 | | | MB Financial, Inc. | | | 3,150 | |
| | 78 | | | MBIA, Inc.(b) | | | 801 | |
| | 12 | | | Mercantile Bank Corp. | | | 425 | |
| | 7 | | | Merchants Bancorp | | | 183 | |
| | 21 | | | Mercury General Corp. | | | 1,132 | |
| | 39 | | | Meridian Bancorp, Inc. | | | 698 | |
| | 7 | | | Meta Financial Group, Inc. | | | 606 | |
| | 358 | | | MFA Financial, Inc. REIT | | | 2,742 | |
| | 294 | | | MGIC Investment Corp.(b) | | | 3,740 | |
| | 17 | | | Midland States Bancorp, Inc. | | | 585 | |
| | 37 | | | Moelis & Co., Class A | | | 2,148 | |
| | 15 | | | Morningstar, Inc. | | | 2,135 | |
| | 35 | | | MTGE Investment Corp. REIT | | | 686 | |
| | 20 | | | National Bank Holdings Corp., Class A | | | 803 | |
| | 12 | | | National Commerce Corp.(b) | | | 528 | |
| | 50 | | | National General Holdings Corp. | | | 1,365 | |
| | 2 | | | National Western Life Group, Inc., Class A | | | 652 | |
| | 195 | | | Navient Corp. | | | 2,660 | |
| | | | | | | | |
Number
of Shares | | | | | Value | |
| | | | Common Stocks & Other Equity Interests
(continued) | |
| | | | Financials (continued) | | | |
| | 18 | | | Navigators Group, Inc. (The) | | $ | 1,260 | |
| | 33 | | | NBT Bancorp, Inc. | | | 1,336 | |
| | 17 | | | Nelnet, Inc., Class A | | | 980 | |
| | 267 | | | New Residential Investment Corp. REIT | | | 4,958 | |
| | 123 | | | New York Mortgage Trust, Inc. REIT | | | 787 | |
| | 7 | | | Nicolet Bankshares, Inc.(b) | | | 388 | |
| | 49 | | | NMI Holdings, Inc., Class A(b) | | | 1,058 | |
| | 33 | | | Northfield Bancorp, Inc. | | | 537 | |
| | 74 | | | Northwest Bancshares, Inc. | | | 1,348 | |
| | 33 | | | OceanFirst Financial Corp. | | | 964 | |
| | 76 | | | Ocwen Financial Corp.(b) | | | 318 | |
| | 33 | | | OFG Bancorp | | | 535 | |
| | 10 | | | Old Line Bancshares, Inc. | | | 342 | |
| | 103 | | | Old National Bancorp | | | 2,091 | |
| | 224 | | | Old Republic International Corp. | | | 4,968 | |
| | 30 | | | On Deck Capital, Inc.(b) | | | 247 | |
| | 66 | | | OneMain Holdings, Inc.(b) | | | 2,422 | |
| | 24 | | | Opus Bank | | | 680 | |
| | 30 | | | Oritani Financial Corp. | | | 486 | |
| | 42 | | | Pacific Premier Bancorp, Inc.(b) | | | 1,661 | |
| | 96 | | | PacWest Bancorp | | | 4,847 | |
| | 11 | | | Park National Corp. | | | 1,212 | |
| | 11 | | | Peapack-Gladstone Financial Corp. | | | 368 | |
| | 51 | | | PennyMac Mortgage Investment Trust REIT | | | 1,019 | |
| | 12 | | | Peoples Bancorp, Inc. | | | 430 | |
| | 11 | | | People’s Utah Bancorp | | | 398 | |
| | 25 | | | PHH Corp.(b) | | | 271 | |
| | 57 | | | Pinnacle Financial Partners, Inc. | | | 3,679 | |
| | 11 | | | Piper Jaffray Cos. | | | 847 | |
| | 16 | | | PJT Partners, Inc., Class A | | | 927 | |
| | 81 | | | Popular, Inc. | | | 4,078 | |
| | 35 | | | PRA Group, Inc.(b) | | | 1,279 | |
| | 10 | | | Preferred Bank | | | 612 | |
| | 35 | | | Primerica, Inc. | | | 4,279 | |
| | 41 | | | ProAssurance Corp. | | | 1,982 | |
| | 51 | | | Prosperity Bancshares, Inc. | | | 3,817 | |
| | 7 | | | Protective Insurance Corp., Class B | | | 164 | |
| | 48 | | | Provident Financial Services, Inc. | | | 1,211 | |
| | 12 | | | Pzena Investment Management, Inc., Class A | | | 109 | |
| | 10 | | | QCR Holdings, Inc. | | | 435 | |
| | 172 | | | Radian Group, Inc. | | | 3,497 | |
| | 58 | | | Redwood Trust, Inc. REIT | | | 985 | |
| | 40 | | | Renasant Corp. | | | 1,868 | |
| | 8 | | | Republic Bancorp, Inc., Class A | | | 389 | |
| | 35 | | | Republic First Bancorp, Inc.(b) | | | 273 | |
| | 29 | | | RLI Corp. | | | 2,232 | |
| | 27 | | | S&T Bancorp, Inc. | | | 1,260 | |
| | 11 | | | Safety Insurance Group, Inc. | | | 1,064 | |
| | 27 | | | Sandy Spring Bancorp, Inc. | | | 1,053 | |
| | 35 | | | Seacoast Banking Corp. of Florida(b) | | | 1,107 | |
| | 45 | | | Selective Insurance Group, Inc. | | | 2,889 | |
| | 34 | | | ServisFirst Bancshares, Inc. | | | 1,465 | |
| | 68 | | | Simmons First National Corp., Class A | | | 2,149 | |
| | 343 | | | SLM Corp.(b) | | | 4,020 | |
| | 29 | | | South State Corp. | | | 2,391 | |
| | 21 | | | Southside Bancshares, Inc. | | | 748 | |
See accompanying Notes to Financial Statements which are an integral part of the financial statements.
Invesco PureBetaSM MSCI USA Small Cap ETF (PBSM) (continued)
August 31, 2018
| | | | | | | | |
Number
of Shares | | | | | Value | |
| | | | Common Stocks & Other Equity Interests
(continued) | |
| | | | Financials (continued) | | | |
| | 203 | | | Starwood Property Trust, Inc. REIT | | $ | 4,472 | |
| | 13 | | | State Auto Financial Corp. | | | 408 | |
| | 28 | | | State Bank Financial Corp. | | | 912 | |
| | 165 | | | Sterling Bancorp | | | 3,770 | |
| | 14 | | | Sterling Bancorp, Inc./MI | | | 171 | |
| | 16 | | | Stewart Information Services Corp. | | | 716 | |
| | 55 | | | Stifel Financial Corp. | | | 3,073 | |
| | 16 | | | Stock Yards Bancorp, Inc. | | | 619 | |
| | 13 | | | Sutherland Asset Management Corp. REIT | | | 223 | |
| | 94 | | | Synovus Financial Corp. | | | 4,706 | |
| | 130 | | | TCF Financial Corp. | | | 3,295 | |
| | 39 | | | Texas Capital Bancshares, Inc.(b) | | | 3,467 | |
| | 5 | | | Texas Pacific Land Trust | | | 4,173 | |
| | 43 | | | TFS Financial Corp. | | | 664 | |
| | 72 | | | Third Point Reinsurance Ltd. (Bermuda)(b) | | | 965 | |
| | 11 | | | Tompkins Financial Corp. | | | 967 | |
| | 50 | | | Towne Bank | | | 1,630 | |
| | 30 | | | TPG RE Finance Trust, Inc. REIT | | | 620 | |
| | 22 | | | TriCo Bancshares | | | 855 | |
| | 17 | | | TriState Capital Holdings, Inc.(b) | | | 506 | |
| | 20 | | | Triumph Bancorp, Inc.(b) | | | 849 | |
| | 21 | | | Trupanion, Inc.(b) | | | 802 | |
| | 73 | | | TrustCo Bank Corp. NY | | | 675 | |
| | 52 | | | Trustmark Corp. | | | 1,845 | |
| | 199 | | | Two Harbors Investment Corp. REIT | | | 3,108 | |
| | 35 | | | UMB Financial Corp. | | | 2,633 | |
| | 175 | | | Umpqua Holdings Corp. | | | 3,745 | |
| | 48 | | | Union Bankshares Corp. | | | 1,997 | |
| | 85 | | | United Bankshares, Inc. | | | 3,349 | |
| | 62 | | | United Community Banks, Inc. | | | 1,881 | |
| | 39 | | | United Community Financial Corp. | | | 404 | |
| | 39 | | | United Financial Bancorp, Inc. | | | 693 | |
| | 16 | | | United Fire Group, Inc. | | | 792 | |
| | 19 | | | United Insurance Holdings Corp. | | | 396 | |
| | 25 | | | Universal Insurance Holdings, Inc. | | | 1,115 | |
| | 26 | | | Univest Corp. of Pennsylvania | | | 741 | |
| | 246 | | | Valley National Bancorp | | | 2,964 | |
| | 13 | | | Veritex Holdings, Inc.(b) | | | 398 | |
| | 21 | | | Virtu Financial, Inc., Class A | | | 458 | |
| | 6 | | | Virtus Investment Partners, Inc. | | | 774 | |
| | 63 | | | Waddell & Reed Financial, Inc., Class A | | | 1,261 | |
| | 23 | | | Walker & Dunlop, Inc. | | | 1,254 | |
| | 68 | | | Washington Federal, Inc. | | | 2,319 | |
| | 12 | | | Washington Trust Bancorp, Inc. | | | 720 | |
| | 19 | | | Waterstone Financial, Inc. | | | 321 | |
| | 71 | | | Webster Financial Corp. | | | 4,642 | |
| | 43 | | | WesBanco, Inc. | | | 2,122 | |
| | 20 | | | Westamerica Bancorporation | | | 1,281 | |
| | 79 | | | Western Alliance Bancorp(b) | | | 4,554 | |
| | 32 | | | Western Asset Mortgage Capital Corp. REIT | | | 356 | |
| | 6 | | | Westwood Holdings Group, Inc. | | | 345 | |
| | 2 | | | White Mountains Insurance Group Ltd. | | | 1,856 | |
| | 43 | | | Wintrust Financial Corp. | | | 3,808 | |
| | 107 | | | WisdomTree Investments, Inc. | | | 880 | |
| | | | | | | | |
Number
of Shares | | | | | Value | |
| | | | Common Stocks & Other Equity Interests
(continued) | |
| | | | Financials (continued) | | | |
| | 5 | | | World Acceptance Corp.(b) | | $ | 593 | |
| | 24 | | | WSFS Financial Corp. | | | 1,171 | |
| | | | | | | | |
| | | | | | | 477,906 | |
| | | | | | | | |
| | | | Health Care—14.8% | | | |
| | 23 | | | Abeona Therapeutics, Inc.(b) | | | 354 | |
| | 68 | | | Acadia Healthcare Co., Inc.(b) | | | 2,824 | |
| | 75 | | | ACADIA Pharmaceuticals, Inc.(b) | | | 1,066 | |
| | 25 | | | Accelerate Diagnostics, Inc.(b) | | | 615 | |
| | 29 | | | Acceleron Pharma, Inc.(b) | | | 1,567 | |
| | 63 | | | Accuray, Inc.(b) | | | 252 | |
| | 20 | | | Achaogen, Inc.(b) | | | 106 | |
| | 73 | | | Achillion Pharmaceuticals, Inc.(b) | | | 252 | |
| | 18 | | | Aclaris Therapeutics, Inc.(b) | | | 287 | |
| | 29 | | | Acorda Therapeutics, Inc.(b) | | | 835 | |
| | 17 | | | Adamas Pharmaceuticals, Inc.(b) | | | 392 | |
| | 6 | | | Addus HomeCare Corp.(b) | | | 389 | |
| | 24 | | | Aduro Biotech, Inc.(b) | | | 178 | |
| | 28 | | | Aerie Pharmaceuticals, Inc.(b) | | | 1,718 | |
| | 68 | | | Agenus, Inc.(b) | | | 150 | |
| | 42 | | | Agios Pharmaceuticals, Inc.(b) | | | 3,390 | |
| | 29 | | | Aimmune Therapeutics, Inc.(b) | | | 809 | |
| | 13 | | | Akcea Therapeutics, Inc.(b) | | | 343 | |
| | 30 | | | Akebia Therapeutics, Inc.(b) | | | 246 | |
| | 71 | | | Akorn, Inc.(b) | | | 1,114 | |
| | 45 | | | Alder Biopharmaceuticals, Inc.(b) | | | 814 | |
| | 148 | | | Allscripts Healthcare Solutions, Inc.(b) | | | 2,162 | |
| | 27 | | | AMAG Pharmaceuticals, Inc.(b) | | | 659 | |
| | 22 | | | Amedisys, Inc.(b) | | | 2,750 | |
| | 9 | | | American Renal Associates Holdings, Inc.(b) | | | 198 | |
| | 143 | | | Amicus Therapeutics, Inc.(b) | | | 1,928 | |
| | 37 | | | AMN Healthcare Services, Inc.(b) | | | 2,157 | |
| | 81 | | | Amneal Pharmaceuticals, Inc.(b) | | | 1,871 | |
| | 28 | | | Amphastar Pharmaceuticals, Inc.(b) | | | 531 | |
| | 13 | | | AnaptysBio, Inc.(b) | | | 1,152 | |
| | 27 | | | AngioDynamics, Inc.(b) | | | 605 | |
| | 6 | | | ANI Pharmaceuticals, Inc.(b) | | | 349 | |
| | 11 | | | Anika Therapeutics, Inc.(b) | | | 455 | |
| | 29 | | | Apellis Pharmaceuticals, Inc.(b) | | | 561 | |
| | 37 | | | Arena Pharmaceuticals, Inc.(b) | | | 1,437 | |
| | 159 | | | Array BioPharma, Inc.(b) | | | 2,476 | |
| | 61 | | | Arrowhead Pharmaceuticals, Inc.(b) | | | 900 | |
| | 16 | | | Assembly Biosciences, Inc.(b) | | | 640 | |
| | 43 | | | Assertio Therapeutics, Inc.(b) | | | 274 | |
| | 23 | | | Atara Biotherapeutics, Inc.(b) | | | 942 | |
| | 31 | | | athenahealth, Inc.(b) | | | 4,771 | |
| | 25 | | | Athenex, Inc.(b) | | | 411 | |
| | 24 | | | AtriCure, Inc.(b) | | | 829 | |
| | 1 | | | Atrion Corp. | | | 655 | |
| | 22 | | | Audentes Therapeutics, Inc.(b) | | | 801 | |
| | 36 | | | Avanos Medical, Inc.(b) | | | 2,596 | |
| | 26 | | | AxoGen, Inc.(b) | | | 1,140 | |
| | 19 | | | Bellicum Pharmaceuticals, Inc.(b) | | | 137 | |
| | 45 | | | BioCryst Pharmaceuticals, Inc.(b) | | | 322 | |
| | 14 | | | Biohaven Pharmaceutical Holding Co., Ltd.(b) | | | 530 | |
| | 16 | | | Bio-Rad Laboratories, Inc., Class A(b) | | | 5,205 | |
| | 29 | | | Bio-Techne Corp. | | | 5,573 | |
See accompanying Notes to Financial Statements which are an integral part of the financial statements.
Invesco PureBetaSM MSCI USA Small Cap ETF (PBSM) (continued)
August 31, 2018
| | | | | | | | |
Number
of Shares | | | | | Value | |
| | | | Common Stocks & Other Equity Interests
(continued) | |
| | | | Health Care (continued) | | | |
| | 27 | | | BioTelemetry, Inc.(b) | | $ | 1,669 | |
| | 69 | | | BioTime, Inc.(b) | | | 190 | |
| | 42 | | | Bluebird Bio, Inc.(b) | | | 7,069 | |
| | 30 | | | Blueprint Medicines Corp.(b) | | | 2,300 | |
| | 141 | | | Brookdale Senior Living, Inc.(b) | | | 1,399 | |
| | 78 | | | Bruker Corp. | | | 2,775 | |
| | 25 | | | Cambrex Corp.(b) | | | 1,685 | |
| | 29 | | | Cantel Medical Corp. | | | 2,813 | |
| | 18 | | | Capital Senior Living Corp.(b) | | | 160 | |
| | 30 | | | Cara Therapeutics, Inc.(b) | | | 605 | |
| | 25 | | | Cardiovascular Systems, Inc.(b) | | | 963 | |
| | 49 | | | Castlight Health, Inc., Class B(b) | | | 147 | |
| | 103 | | | Catalent, Inc.(b) | | | 4,305 | |
| | 100 | | | Cerus Corp.(b) | | | 778 | |
| | 37 | | | Charles River Laboratories International, Inc.(b) | | | 4,570 | |
| | 13 | | | Chemed Corp. | | | 4,206 | |
| | 17 | | | ChemoCentryx, Inc.(b) | | | 224 | |
| | 11 | | | Civitas Solutions, Inc.(b) | | | 176 | |
| | 37 | | | Clovis Oncology, Inc.(b) | | | 1,323 | |
| | 37 | | | Codexis, Inc.(b) | | | 636 | |
| | 35 | | | Coherus Biosciences, Inc.(b) | | | 705 | |
| | 15 | | | Collegium Pharmaceutical, Inc.(b) | | | 256 | |
| | 87 | | | Community Health Systems, Inc.(b) | | | 338 | |
| | 9 | | | Computer Programs & Systems, Inc. | | | 246 | |
| | 11 | | | Concert Pharmaceuticals, Inc.(b) | | | 173 | |
| | 19 | | | CONMED Corp. | | | 1,528 | |
| | 80 | | | Corcept Therapeutics, Inc.(b) | | | 1,202 | |
| | 8 | | | CorVel Corp.(b) | | | 476 | |
| | 15 | | | CRISPR Therapeutics AG (Switzerland)(b) | | | 850 | |
| | 28 | | | Cross Country Healthcare, Inc.(b) | | | 280 | |
| | 28 | | | CryoLife, Inc.(b) | | | 972 | |
| | 11 | | | Cutera, Inc.(b) | | | 374 | |
| | 43 | | | Cymabay Therapeutics, Inc.(b) | | | 586 | |
| | 30 | | | Cytokinetics, Inc.(b) | | | 237 | |
| | 31 | | | CytomX Therapeutics, Inc.(b) | | | 697 | |
| | 14 | | | Deciphera Pharmaceuticals, Inc.(b) | | | 518 | |
| | 48 | | �� | Denali Therapeutics, Inc.(b) | | | 942 | |
| | 24 | | | Dermira, Inc.(b) | | | 228 | |
| | 69 | | | DexCom, Inc.(b) | | | 9,962 | |
| | 24 | | | Dicerna Pharmaceuticals, Inc.(b) | | | 380 | |
| | 46 | | | Diplomat Pharmacy, Inc.(b) | | | 950 | |
| | 10 | | | Dova Pharmaceuticals, Inc.(b) | | | 254 | |
| | 45 | | | Dynavax Technologies Corp.(b) | | | 623 | |
| | 9 | | | Eagle Pharmaceuticals, Inc.(b) | | | 622 | |
| | 26 | | | Editas Medicine, Inc.(b) | | | 854 | |
| | 33 | | | Emergent BioSolutions, Inc.(b) | | | 2,046 | |
| | 11 | | | Enanta Pharmaceuticals, Inc.(b) | | | 1,000 | |
| | 76 | | | Encompass Health Corp. | | | 6,201 | |
| | 163 | | | Endo International PLC(b) | | | 2,795 | |
| | 43 | | | Endocyte, Inc.(b) | | | 848 | |
| | 60 | | | Endologix, Inc.(b) | | | 138 | |
| | 37 | | | Ensign Group, Inc. (The) | | | 1,446 | |
| | 94 | | | Envision Healthcare Corp.(b) | | | 4,264 | |
| | 36 | | | Epizyme, Inc.(b) | | | 425 | |
| | 18 | | | Esperion Therapeutics, Inc.(b) | | | 891 | |
| | 45 | | | Evolent Health, Inc., Class A(b) | | | 1,147 | |
| | | | | | | | |
Number
of Shares | | | | | Value | |
| | | | Common Stocks & Other Equity Interests
(continued) | |
| | | | Health Care (continued) | | | |
| | 94 | | | Exact Sciences Corp.(b) | | $ | 7,040 | |
| | 235 | | | Exelixis, Inc.(b) | | | 4,416 | |
| | 33 | | | Fate Therapeutics, Inc.(b) | | | 425 | |
| | 58 | | | FibroGen, Inc.(b) | | | 3,547 | |
| | 27 | | | Five Prime Therapeutics, Inc.(b) | | | 378 | |
| | 22 | | | Flexion Therapeutics, Inc.(b) | | | 504 | |
| | 16 | | | G1 Therapeutics, Inc.(b) | | | 971 | |
| | 39 | | | GenMark Diagnostics, Inc.(b) | | | 334 | |
| | 16 | | | Genomic Health, Inc.(b) | | | 979 | |
| | 121 | | | Geron Corp.(b) | | | 693 | |
| | 24 | | | Glaukos Corp.(b) | | | 1,641 | |
| | 39 | | | Global Blood Therapeutics, Inc.(b) | | | 1,909 | |
| | 58 | | | Globus Medical, Inc., Class A(b) | | | 3,090 | |
| | 26 | | | GlycoMimetics, Inc.(b) | | | 383 | |
| | 40 | | | Haemonetics Corp.(b) | | | 4,466 | |
| | 104 | | | Halozyme Therapeutics, Inc.(b) | | | 1,915 | |
| | 44 | | | HealthEquity, Inc.(b) | | | 4,145 | |
| | 21 | | | HealthStream, Inc. | | | 666 | |
| | 48 | | | Heron Therapeutics, Inc.(b) | | | 1,850 | |
| | 5 | | | Heska Corp.(b) | | | 535 | |
| | 51 | | | Hill-Rom Holdings, Inc. | | | 4,961 | |
| | 64 | | | HMS Holdings Corp.(b) | | | 2,051 | |
| | 133 | | | Horizon Pharma PLC(b) | | | 2,812 | |
| | 13 | | | ICU Medical, Inc.(b) | | | 3,978 | |
| | 122 | | | ImmunoGen, Inc.(b) | | | 1,243 | |
| | 93 | | | Immunomedics, Inc.(b) | | | 2,489 | |
| | 58 | | | Innoviva, Inc.(b) | | | 842 | |
| | 14 | | | Inogen, Inc.(b) | | | 3,709 | |
| | 56 | | | Inovalon Holdings, Inc., Class A(b) | | | 616 | |
| | 65 | | | Inovio Pharmaceuticals, Inc.(b) | | | 342 | |
| | 60 | | | Insmed, Inc.(b) | | | 1,196 | |
| | 45 | | | Insulet Corp.(b) | | | 4,692 | |
| | 16 | | | Insys Therapeutics, Inc.(b) | | | 150 | |
| | 22 | | | Integer Holdings Corp.(b) | | | 1,758 | |
| | 59 | | | Integra LifeSciences Holdings Corp.(b) | | | 3,509 | |
| | 17 | | | Intellia Therapeutics, Inc.(b) | | | 526 | |
| | 17 | | | Intercept Pharmaceuticals, Inc.(b) | | | 1,901 | |
| | 20 | | | Intersect ENT, Inc.(b) | | | 586 | |
| | 32 | | | Intra-Cellular Therapies, Inc.(b) | | | 702 | |
| | 54 | | | Intrexon Corp.(b) | | | 831 | |
| | 24 | | | Invacare Corp. | | | 365 | |
| | 42 | | | Invitae Corp.(b) | | | 622 | |
| | 98 | | | Ionis Pharmaceuticals, Inc.(b) | | | 4,478 | |
| | 60 | | | Iovance Biotherapeutics, Inc.(b) | | | 1,062 | |
| | 13 | | | iRhythm Technologies, Inc.(b) | | | 1,210 | |
| | 119 | | | Ironwood Pharmaceuticals, Inc., Class A(b) | | | 2,290 | |
| | 11 | | | Jounce Therapeutics, Inc.(b) | | | 86 | |
| | 32 | | | K2M Group Holdings, Inc.(b) | | | 875 | |
| | 37 | | | Karyopharm Therapeutics, Inc.(b) | | | 779 | |
| | 62 | | | Keryx Biopharmaceuticals, Inc.(b) | | | 211 | |
| | 17 | | | Kura Oncology, Inc.(b) | | | 348 | |
| | 13 | | | La Jolla Pharmaceutical Co.(b) | | | 300 | |
| | 21 | | | Lannett Co., Inc.(b) | | | 112 | |
| | 37 | | | Lantheus Holdings, Inc.(b) | | | 596 | |
| | 11 | | | LeMaitre Vascular, Inc. | | | 413 | |
| | 36 | | | Lexicon Pharmaceuticals, Inc.(b) | | | 417 | |
See accompanying Notes to Financial Statements which are an integral part of the financial statements.
Invesco PureBetaSM MSCI USA Small Cap ETF (PBSM) (continued)
August 31, 2018
| | | | | | | | |
Number
of Shares | | | | | Value | |
| | | | Common Stocks & Other Equity Interests
(continued) | |
| | | | Health Care (continued) | | | |
| | 23 | | | LHC Group, Inc.(b) | | $ | 2,275 | |
| | 31 | | | LifePoint Health, Inc.(b) | | | 1,996 | |
| | 17 | | | Ligand Pharmaceuticals, Inc.(b) | | | 4,415 | |
| | 38 | | | LivaNova PLC(b) | | | 4,771 | |
| | 18 | | | Loxo Oncology, Inc.(b) | | | 3,042 | |
| | 30 | | | Luminex Corp. | | | 846 | |
| | 29 | | | MacroGenics, Inc.(b) | | | 634 | |
| | 6 | | | Madrigal Pharmaceuticals, Inc.(b) | | | 1,435 | |
| | 19 | | | Magellan Health, Inc.(b) | | | 1,396 | |
| | 67 | | | Mallinckrodt PLC(b) | | | 2,309 | |
| | 38 | | | Masimo Corp.(b) | | | 4,480 | |
| | 59 | | | Medicines Co. (The)(b) | | | 2,337 | |
| | 45 | | | Medidata Solutions, Inc.(b) | | | 3,824 | |
| | 73 | | | MEDNAX, Inc.(b) | | | 3,457 | |
| | 21 | | | Medpace Holdings, Inc.(b) | | | 1,256 | |
| | 32 | | | Meridian Bioscience, Inc. | | | 502 | |
| | 41 | | | Merit Medical Systems, Inc.(b) | | | 2,413 | |
| | 80 | | | MiMedx Group, Inc.(b) | | | 424 | |
| | 24 | | | Minerva Neurosciences, Inc.(b) | | | 250 | |
| | 14 | | | Mirati Therapeutics, Inc.(b) | | | 792 | |
| | 46 | | | Molina Healthcare, Inc.(b) | | | 6,348 | |
| | 60 | | | Momenta Pharmaceuticals, Inc.(b) | | | 1,590 | |
| | 25 | | | MyoKardia, Inc.(b) | | | 1,541 | |
| | 11 | | | Myovant Sciences Ltd.(b) | | | 267 | |
| | 57 | | | Myriad Genetics, Inc.(b) | | | 2,838 | |
| | 31 | | | Natera, Inc.(b) | | | 857 | |
| | 8 | | | National HealthCare Corp. | | | 617 | |
| | 7 | | | National Research Corp., Class A | | | 274 | |
| | 25 | | | Natus Medical, Inc.(b) | | | 932 | |
| | 40 | | | Neogen Corp.(b) | | | 3,738 | |
| | 65 | | | NeoGenomics, Inc.(b) | | | 900 | |
| | 70 | | | Neurocrine Biosciences, Inc.(b) | | | 8,606 | |
| | 21 | | | Nevro Corp.(b) | | | 1,416 | |
| | 272 | | | Novavax, Inc.(b) | | | 424 | |
| | 49 | | | Novocure Ltd.(b) | | | 2,207 | |
| | 39 | | | NuVasive, Inc.(b) | | | 2,737 | |
| | 50 | | | NxStage Medical, Inc.(b) | | | 1,417 | |
| | 34 | | | Omeros Corp.(b) | | | 880 | |
| | 31 | | | Omnicell, Inc.(b) | | | 2,131 | |
| | 256 | | | OPKO Health, Inc.(b) | | | 1,516 | |
| | 9 | | | Optinose, Inc.(b) | | | 134 | |
| | 44 | | | OraSure Technologies, Inc.(b) | | | 704 | |
| | 14 | | | Orthofix Medical, Inc.(b) | | | 750 | |
| | 46 | | | Owens & Minor, Inc. | | | 781 | |
| | 74 | | | Pacific Biosciences of California, Inc.(b) | | | 369 | |
| | 31 | | | Pacira Pharmaceuticals, Inc.(b) | | | 1,462 | |
| | 26 | | | Paratek Pharmaceuticals, Inc.(b) | | | 266 | |
| | 67 | | | Patterson Cos., Inc. | | | 1,511 | |
| | 116 | | | PDL BioPharma, Inc.(b) | | | 281 | |
| | 24 | | | Penumbra, Inc.(b) | | | 3,332 | |
| | 86 | | | PerkinElmer, Inc. | | | 7,949 | |
| | 14 | | | Phibro Animal Health Corp., Class A | | | 661 | |
| | 48 | | | Portola Pharmaceuticals, Inc.(b) | | | 1,433 | |
| | 46 | | | PRA Health Sciences, Inc.(b) | | | 4,858 | |
| | 44 | | | Premier, Inc., Class A(b) | | | 1,946 | |
| | 40 | | | Prestige Consumer Healthcare, Inc.(b) | | | 1,540 | |
| | | | | | | | |
Number
of Shares | | | | | Value | |
| | | | Common Stocks & Other Equity Interests
(continued) | |
| | | | Health Care (continued) | | | |
| | 78 | | | Progenics Pharmaceuticals, Inc.(b) | | $ | 611 | |
| | 29 | | | Prothena Corp. PLC (Ireland)(b) | | | 441 | |
| | 9 | | | Providence Service Corp. (The)(b) | | | 604 | |
| | 30 | | | PTC Therapeutics, Inc.(b) | | | 1,252 | |
| | 23 | | | Puma Biotechnology, Inc.(b) | | | 1,011 | |
| | 36 | | | Quality Systems, Inc.(b) | | | 824 | |
| | 25 | | | Quidel Corp.(b) | | | 1,922 | |
| | 65 | | | R1 RCM, Inc.(b) | | | 648 | |
| | 33 | | | Radius Health, Inc.(b) | | | 679 | |
| | 29 | | | RadNet, Inc.(b) | | | 402 | |
| | 16 | | | Reata Pharmaceuticals, Inc., Class A(b) | | | 1,382 | |
| | 23 | | | REGENXBIO, Inc.(b) | | | 1,620 | |
| | 28 | | | Repligen Corp.(b) | | | 1,537 | |
| | 28 | | | Retrophin, Inc.(b) | | | 887 | |
| | 24 | | | Revance Therapeutics, Inc.(b) | | | 658 | |
| | 16 | | | Rhythm Pharmaceuticals, Inc.(b) | | | 504 | |
| | 107 | | | Rigel Pharmaceuticals, Inc.(b) | | | 365 | |
| | 17 | | | Rocket Pharmaceuticals, Inc.(b) | | | 405 | |
| | 38 | | | Rockwell Medical, Inc.(b) | | | 187 | |
| | 36 | | | Sage Therapeutics, Inc.(b) | | | 5,913 | |
| | 77 | | | Sangamo Therapeutics, Inc.(b) | | | 1,405 | |
| | 49 | | | Sarepta Therapeutics, Inc.(b) | | | 6,764 | |
| | 81 | | | Select Medical Holdings Corp.(b) | | | 1,604 | |
| | 15 | | | Seres Therapeutics, Inc.(b) | | | 132 | |
| | 53 | | | Sorrento Therapeutics, Inc.(b) | | | 294 | |
| | 25 | | | Spark Therapeutics, Inc.(b) | | | 1,540 | |
| | 70 | | | Spectrum Pharmaceuticals, Inc.(b) | | | 1,507 | |
| | 26 | | | STAAR Surgical Co.(b) | | | 1,240 | |
| | 67 | | | STERIS PLC | | | 7,666 | |
| | 43 | | | Supernus Pharmaceuticals, Inc.(b) | | | 1,905 | |
| | 15 | | | Surgery Partners, Inc.(b) | | | 260 | |
| | 10 | | | SurModics, Inc.(b) | | | 787 | |
| | 50 | | | Syneos Health, Inc., Class A(b) | | | 2,493 | |
| | 171 | | | Synergy Pharmaceuticals, Inc.(b) | | | 333 | |
| | 12 | | | Tabula Rasa HealthCare, Inc.(b) | | | 1,052 | |
| | 11 | | | Tactile Systems Technology, Inc.(b) | | | 744 | |
| | 45 | | | Teladoc Health, Inc.(b) | | | 3,490 | |
| | 81 | | | Tenet Healthcare Corp.(b) | | | 2,731 | |
| | 30 | | | TESARO, Inc.(b) | | | 974 | |
| | 41 | | | TG Therapeutics, Inc.(b) | | | 521 | |
| | 130 | | | TherapeuticsMD, Inc.(b) | | | 842 | |
| | 32 | | | Theravance Biopharma, Inc.(b) | | | 927 | |
| | 31 | | | Tivity Health, Inc.(b) | | | 1,066 | |
| | 18 | | | Triple-S Management Corp., Class B(b) | | | 392 | |
| | 36 | | | Ultragenyx Pharmaceutical, Inc.(b) | | | 3,050 | |
| | 18 | | | uniQure N.V. (Netherlands)(b) | | | 764 | |
| | 10 | | | US Physical Therapy, Inc. | | | 1,253 | |
| | 44 | | | Vanda Pharmaceuticals, Inc.(b) | | | 850 | |
| | 29 | | | Varex Imaging Corp.(b) | | | 911 | |
| | 49 | | | ViewRay, Inc.(b) | | | 494 | |
| | 24 | | | Vocera Communications, Inc.(b) | | | 796 | |
| | 13 | | | Voyager Therapeutics, Inc.(b) | | | 283 | |
| | 8 | | | WaVe Life Sciences Ltd.(b) | | | 426 | |
| | 38 | | | WellCare Health Plans, Inc.(b) | | | 11,498 | |
| | 57 | | | West Pharmaceutical Services, Inc. | | | 6,672 | |
| | 92 | | | Wright Medical Group NV(b) | | | 2,666 | |
See accompanying Notes to Financial Statements which are an integral part of the financial statements.
Invesco PureBetaSM MSCI USA Small Cap ETF (PBSM) (continued)
August 31, 2018
| | | | | | | | |
Number
of Shares | | | | | Value | |
| | | | Common Stocks & Other Equity Interests
(continued) | |
| | | | Health Care (continued) | | | |
| | 38 | | | Xencor, Inc.(b) | | $ | 1,588 | |
| | 97 | | | ZIOPHARM Oncology, Inc.(b) | | | 283 | |
| | 32 | | | Zogenix, Inc.(b) | | | 1,546 | |
| | | | | | | | |
| | | | | | | 446,778 | |
| | | | | | | | |
| | | | Industrials—13.9% | | | |
| | 33 | | | AAON, Inc. | | | 1,333 | |
| | 25 | | | AAR Corp. | | | 1,167 | |
| | 54 | | | ABM Industries, Inc. | | | 1,713 | |
| | 83 | | | ACCO Brands Corp. | | | 1,029 | |
| | 46 | | | Actuant Corp., Class A | | | 1,355 | |
| | 53 | | | Advanced Disposal Services, Inc.(b) | | | 1,414 | |
| | 29 | | | Advanced Drainage Systems, Inc. | | | 909 | |
| | 127 | | | AECOM(b) | | | 4,272 | |
| | 26 | | | Aegion Corp.(b) | | | 649 | |
| | 52 | | | Aerojet Rocketdyne Holdings, Inc.(b) | | | 1,826 | |
| | 16 | | | Aerovironment, Inc.(b) | | | 1,407 | |
| | 78 | | | Air Lease Corp. | | | 3,604 | |
| | 11 | | | Air Transport Services Group, Inc.(b) | | | 224 | |
| | 51 | | | Aircastle Ltd. | | | 1,067 | |
| | 8 | | | Alamo Group, Inc. | | | 762 | |
| | 22 | | | Albany International Corp., Class A | | | 1,697 | |
| | 3 | | | Allegiant Travel Co. | | | 409 | |
| | 99 | | | Allison Transmission Holdings, Inc. | | | 4,916 | |
| | 23 | | | Altra Industrial Motion Corp. | | | 898 | |
| | 6 | | | American Railcar Industries, Inc. | | | 275 | |
| | 11 | | | American Woodmark Corp.(b) | | | 934 | |
| | 22 | | | Apogee Enterprises, Inc. | | | 1,083 | |
| | 30 | | | Applied Industrial Technologies, Inc. | | | 2,311 | |
| | 19 | | | ArcBest Corp. | | | 914 | |
| | 11 | | | Argan, Inc. | | | 438 | |
| | 16 | | | Armstrong Flooring, Inc.(b) | | | 280 | |
| | 35 | | | Armstrong World Industries, Inc.(b) | | | 2,443 | |
| | 42 | | | ASGN, Inc.(b) | | | 3,889 | |
| | 15 | | | Astec Industries, Inc. | | | 730 | |
| | 16 | | | Astronics Corp.(b) | | | 696 | |
| | 36 | | | Atkore International Group, Inc.(b) | | | 986 | |
| | 5 | | | Atlas Air Worldwide Holdings, Inc.(b) | | | 304 | |
| | 53 | | | Avis Budget Group, Inc.(b) | | | 1,649 | |
| | 45 | | | Axon Enterprise, Inc.(b) | | | 3,072 | |
| | 20 | | | AZZ, Inc. | | | 1,075 | |
| | 39 | | | Barnes Group, Inc. | | | 2,654 | |
| | 6 | | | Barrett Business Services, Inc. | | | 450 | |
| | 53 | | | Beacon Roofing Supply, Inc.(b) | | | 1,965 | |
| | 9 | | | Blue Bird Corp.(b) | | | 207 | |
| | 54 | | | BMC Stock Holdings, Inc.(b) | | | 1,215 | |
| | 36 | | | Brady Corp., Class A | | | 1,456 | |
| | 32 | | | Briggs & Stratton Corp. | | | 645 | |
| | 39 | | | Brink’s Co. (The) | | | 2,929 | |
| | 92 | | | Builders FirstSource, Inc.(b) | | | 1,437 | |
| | 77 | | | BWX Technologies, Inc. | | | 4,722 | |
| | 12 | | | CAI International, Inc.(b) | | | 324 | |
| | 48 | | | Carlisle Cos., Inc. | | | 6,087 | |
| | 29 | | | Casella Waste Systems, Inc., Class A(b) | | | 823 | |
| | 39 | | | CBIZ, Inc.(b) | | | 932 | |
| | 22 | | | Chart Industries, Inc.(b) | | | 1,662 | |
| | 18 | | | Cimpress NV (Netherlands)(b) | | | 2,520 | |
| | | | | | | | |
Number
of Shares | | | | | Value | |
| | | | Common Stocks & Other Equity Interests
(continued) | |
| | | | Industrials (continued) | | | |
| | 16 | | | CIRCOR International, Inc. | | $ | 726 | |
| | 111 | | | Civeo Corp.(b) | | | 437 | |
| | 42 | | | Clean Harbors, Inc.(b) | | | 2,881 | |
| | 74 | | | Colfax Corp.(b) | | | 2,584 | |
| | 15 | | | Columbus McKinnon Corp. | | | 638 | |
| | 28 | | | Comfort Systems USA, Inc. | | | 1,607 | |
| | 30 | | | Continental Building Products, Inc.(b) | | | 1,119 | |
| | 90 | | | Covanta Holding Corp. | | | 1,588 | |
| | 9 | | | Covenant Transportation Group, Inc., Class A(b) | | | 269 | |
| | 37 | | | Crane Co. | | | 3,377 | |
| | 12 | | | CSW Industrials, Inc.(b) | | | 672 | |
| | 20 | | | Cubic Corp. | | | 1,514 | |
| | 33 | | | Curtiss-Wright Corp. | | | 4,420 | |
| | 31 | | | Daseke, Inc.(b) | | | 279 | |
| | 37 | | | Deluxe Corp. | | | 2,191 | |
| | 101 | | | Donaldson Co., Inc. | | | 5,111 | |
| | 17 | | | Douglas Dynamics, Inc. | | | 779 | |
| | 29 | | | Dun & Bradstreet Corp. (The) | | | 4,145 | |
| | 13 | | | DXP Enterprises, Inc.(b) | | | 597 | |
| | 24 | | | Dycom Industries, Inc.(b) | | | 2,014 | |
| | 20 | | | Echo Global Logistics, Inc.(b) | | | 664 | |
| | 46 | | | EMCOR Group, Inc. | | | 3,685 | |
| | 16 | | | Encore Wire Corp. | | | 804 | |
| | 27 | | | Energy Recovery, Inc.(b) | | | 262 | |
| | 33 | | | EnerSys | | | 2,739 | |
| | 15 | | | Engility Holdings, Inc.(b) | | | 521 | |
| | 19 | | | Ennis, Inc. | | | 414 | |
| | 17 | | | EnPro Industries, Inc. | | | 1,276 | |
| | 20 | | | ESCO Technologies, Inc. | | | 1,353 | |
| | 28 | | | Essendant, Inc. | | | 404 | |
| | 21 | | | Esterline Technologies Corp.(b) | | | 1,805 | |
| | 59 | | | Evoqua Water Technologies Corp.(b) | | | 1,143 | |
| | 40 | | | Exponent, Inc. | | | 2,094 | |
| | 45 | | | Federal Signal Corp. | | | 1,171 | |
| | 7 | | | Forrester Research, Inc. | | | 344 | |
| | 23 | | | Forward Air Corp. | | | 1,478 | |
| | 11 | | | Foundation Building Materials, Inc.(b) | | | 152 | |
| | 30 | | | Franklin Electric Co., Inc. | | | 1,467 | |
| | 29 | | | FTI Consulting, Inc.(b) | | | 2,210 | |
| | 85 | | | Gardner Denver Holdings, Inc.(b) | | | 2,377 | |
| | 45 | | | Gates Industrial Corp PLC(b) | | | 820 | |
| | 29 | | | GATX Corp. | | | 2,449 | |
| | 48 | | | Generac Holdings, Inc.(b) | | | 2,664 | |
| | 47 | | | Genesee & Wyoming, Inc., Class A(b) | | | 4,131 | |
| | 27 | | | Gibraltar Industries, Inc.(b) | | | 1,226 | |
| | 17 | | | Global Brass & Copper Holdings, Inc. | | | 655 | |
| | 25 | | | GMS, Inc.(b) | | | 621 | |
| | 14 | | | Gorman-Rupp Co. (The) | | | 513 | |
| | 10 | | | GP Strategies Corp.(b) | | | 190 | |
| | 133 | | | Graco, Inc. | | | 6,252 | |
| | 37 | | | Granite Construction, Inc. | | | 1,690 | |
| | 42 | | | Great Lakes Dredge & Dock Corp.(b) | | | 230 | |
| | 25 | | | Greenbrier Cos., Inc. (The) | | | 1,450 | |
| | 23 | | | Griffon Corp. | | | 420 | |
| | 24 | | | H&E Equipment Services, Inc. | | | 835 | |
| | 61 | | | Harsco Corp.(b) | | | 1,723 | |
See accompanying Notes to Financial Statements which are an integral part of the financial statements.
Invesco PureBetaSM MSCI USA Small Cap ETF (PBSM) (continued)
August 31, 2018
| | | | | | | | |
Number
of Shares | | | | | Value | |
| | | | Common Stocks & Other Equity Interests
(continued) | |
| | | | Industrials (continued) | | | |
| | 10 | | | Hawaiian Holdings, Inc. | | $ | 415 | |
| | 56 | | | Healthcare Services Group, Inc. | | | 2,308 | |
| | 35 | | | Heartland Express, Inc. | | | 716 | |
| | 32 | | | HEICO Corp. | | | 2,902 | |
| | 60 | | | HEICO Corp., Class A | | | 4,470 | |
| | 14 | | | Heidrick & Struggles International, Inc. | | | 619 | |
| | 16 | | | Herc Holdings, Inc.(b) | | | 841 | |
| | 11 | | | Heritage-Crystal Clean, Inc.(b) | | | 256 | |
| | 46 | | | Herman Miller, Inc. | | | 1,762 | |
| | 38 | | | Hertz Global Holdings, Inc.(b) | | | 669 | |
| | 70 | | | Hexcel Corp. | | | 4,628 | |
| | 51 | | | Hillenbrand, Inc. | | | 2,609 | |
| | 34 | | | HNI Corp. | | | 1,499 | |
| | 26 | | | Hub Group, Inc., Class A(b) | | | 1,374 | |
| | 43 | | | Hubbell, Inc. | | | 5,433 | |
| | 17 | | | Huron Consulting Group, Inc.(b) | | | 841 | |
| | 6 | | | Hyster-Yale Materials Handling, Inc. | | | 370 | |
| | 14 | | | ICF International, Inc. | | | 1,143 | |
| | 36 | | | InnerWorkings, Inc.(b) | | | 282 | |
| | 30 | | | Insperity, Inc. | | | 3,595 | |
| | 14 | | | Insteel Industries, Inc. | | | 537 | |
| | 48 | | | Interface, Inc. | | | 1,130 | |
| | 68 | | | ITT, Inc. | | | 4,019 | |
| | 57 | | | JELD-WEN Holding, Inc.(b) | | | 1,386 | |
| | 25 | | | John Bean Technologies Corp. | | | 2,957 | |
| | 9 | | | Kadant, Inc. | | | 909 | |
| | 18 | | | Kaman Corp. | | | 1,174 | |
| | 105 | | | KAR Auction Services, Inc. | | | 6,582 | |
| | 109 | | | KBR, Inc. | | | 2,287 | |
| | 24 | | | Kelly Services, Inc., Class A | | | 605 | |
| | 62 | | | Kennametal, Inc. | | | 2,532 | |
| | 34 | | | KeyW Holding Corp. (The)(b) | | | 289 | |
| | 18 | | | Kforce, Inc. | | | 757 | |
| | 28 | | | Kimball International, Inc., Class B | | | 489 | |
| | 12 | | | Kirby Corp.(b) | | | 1,048 | |
| | 40 | | | KLX, Inc.(b) | | | 2,954 | |
| | 37 | | | Knoll, Inc. | | | 871 | |
| | 42 | | | Korn/Ferry International | | | 2,819 | |
| | 65 | | | Kratos Defense & Security Solutions, Inc.(b) | | | 868 | |
| | 33 | | | Landstar System, Inc. | | | 3,821 | |
| | 48 | | | Lincoln Electric Holdings, Inc. | | | 4,520 | |
| | 8 | | | Lindsay Corp. | | | 766 | |
| | 26 | | | LSC Communications, Inc. | | | 318 | |
| | 13 | | | Lydall, Inc.(b) | | | 556 | |
| | 63 | | | Macquarie Infrastructure Corp. | | | 2,964 | |
| | 25 | | | Manitowoc Co., Inc. (The)(b) | | | 580 | |
| | 31 | | | Marten Transport Ltd. | | | 684 | |
| | 23 | | | Masonite International Corp.(b) | | | 1,540 | |
| | 51 | | | MasTec, Inc.(b) | | | 2,234 | |
| | 8 | | | Matson, Inc. | | | 299 | |
| | 25 | | | Matthews International Corp., Class A | | | 1,298 | |
| | 21 | | | McGrath RentCorp | | | 1,218 | |
| | 37 | | | Mercury Systems, Inc.(b) | | | 2,017 | |
| | 64 | | | Meritor, Inc.(b) | | | 1,386 | |
| | 54 | | | Milacron Holdings Corp.(b) | | | 1,145 | |
| | 13 | | | Mistras Group, Inc.(b) | | | 297 | |
| | | | | | | | |
Number
of Shares | | | | | Value | |
| | | | Common Stocks & Other Equity Interests
(continued) | |
| | | | Industrials (continued) | | | |
| | 34 | | | Mobile Mini, Inc. | | $ | 1,459 | |
| | 25 | | | Moog, Inc., Class A | | | 1,973 | |
| | 72 | | | MRC Global, Inc.(b) | | | 1,484 | |
| | 29 | | | MSA Safety, Inc. | | | 2,932 | |
| | 35 | | | MSC Industrial Direct Co., Inc., Class A | | | 2,992 | |
| | 42 | | | Mueller Industries, Inc. | | | 1,343 | |
| | 121 | | | Mueller Water Products, Inc., Class A | | | 1,400 | |
| | 11 | | | Multi-Color Corp. | | | 679 | |
| | 12 | | | MYR Group, Inc.(b) | | | 417 | |
| | 4 | | | National Presto Industries, Inc. | | | 530 | |
| | 36 | | | Navigant Consulting, Inc.(b) | | | 860 | |
| | 34 | | | Navistar International Corp.(b) | | | 1,481 | |
| | 32 | | | NCI Building Systems, Inc.(b) | | | 541 | |
| | 20 | | | Nexeo Solutions, Inc.(b) | | | 200 | |
| | 20 | | | NN, Inc. | | | 400 | |
| | 41 | | | Nordson Corp. | | | 5,700 | |
| | 82 | | | NOW, Inc.(b) | | | 1,410 | |
| | 9 | | | NV5 Global, Inc.(b) | | | 796 | |
| | 135 | | | nVent Electric PLC (United Kingdom) | | | 3,792 | |
| | 2 | | | Omega Flex, Inc. | | | 178 | |
| | 59 | | | Oshkosh Corp. | | | 4,145 | |
| | 6 | | | Park-Ohio Holdings Corp. | | | 249 | |
| | 18 | | | Patrick Industries, Inc.(b) | | | 1,152 | |
| | 37 | | | PGT Innovations, Inc.(b) | | | 899 | |
| | 142 | | | Pitney Bowes, Inc. | | | 1,031 | |
| | 170 | | | Plug Power, Inc.(b) | | | 335 | |
| | 7 | | | Powell Industries, Inc. | | | 274 | |
| | 31 | | | Primoris Services Corp. | | | 777 | |
| | 20 | | | Proto Labs, Inc.(b) | | | 3,109 | |
| | 23 | | | Quad/Graphics, Inc., Class A | | | 524 | |
| | 24 | | | Quanex Building Products Corp. | | | 394 | |
| | 120 | | | Quanta Services, Inc.(b) | | | 4,151 | |
| | 27 | | | Raven Industries, Inc. | | | 1,307 | |
| | 19 | | | RBC Bearings, Inc.(b) | | | 2,846 | |
| | 34 | | | Regal Beloit Corp. | | | 2,846 | |
| | 21 | | | Resources Connection, Inc. | | | 348 | |
| | 22 | | | REV Group, Inc. | | | 374 | |
| | 84 | | | Rexnord Corp.(b) | | | 2,439 | |
| | 53 | | | RR Donnelley & Sons Co. | | | 268 | |
| | 3 | | | Rush Enterprises, Inc., Class B | | | 133 | |
| | 26 | | | Rush Enterprises, Inc., Class A | | | 1,117 | |
| | 41 | | | Ryder System, Inc. | | | 3,150 | |
| | 20 | | | Saia, Inc.(b) | | | 1,585 | |
| | 33 | | | Simpson Manufacturing Co., Inc. | | | 2,533 | |
| | 31 | | | SiteOne Landscape Supply, Inc.(b) | | | 2,801 | |
| | 10 | | | SkyWest, Inc. | | | 653 | |
| | 17 | | | SP Plus Corp.(b) | | | 661 | |
| | 26 | | | Spartan Motors, Inc. | | | 376 | |
| | 13 | | | Spirit Airlines, Inc.(b) | | | 618 | |
| | 32 | | | SPX Corp.(b) | | | 1,088 | |
| | 32 | | | SPX FLOW, Inc.(b) | | | 1,534 | |
| | 10 | | | Standex International Corp. | | | 1,079 | |
| | 66 | | | Steelcase, Inc., Class A | | | 964 | |
| | 21 | | | Sun Hydraulics Corp. | | | 1,057 | |
| | 69 | | | Sunrun, Inc.(b) | | | 905 | |
| | 11 | | | Systemax, Inc. | | | 402 | |
See accompanying Notes to Financial Statements which are an integral part of the financial statements.
Invesco PureBetaSM MSCI USA Small Cap ETF (PBSM) (continued)
August 31, 2018
| | | | | | | | |
Number
of Shares | | | | | Value | |
| | | | Common Stocks & Other Equity Interests
(continued) | |
| | | | Industrials (continued) | | | |
| | 23 | | | Team, Inc.(b) | | $ | 536 | |
| | 28 | | | Teledyne Technologies, Inc.(b) | | | 6,643 | |
| | 14 | | | Tennant Co. | | | 1,072 | |
| | 57 | | | Terex Corp. | | | 2,209 | |
| | 44 | | | Tetra Tech, Inc. | | | 3,071 | |
| | 25 | | | Thermon Group Holdings, Inc.(b) | | | 670 | |
| | 54 | | | Timken Co. (The) | | | 2,627 | |
| | 38 | | | Titan International, Inc. | | | 284 | |
| | 14 | | | Titan Machinery, Inc.(b) | | | 253 | |
| | 84 | | | Toro Co. (The) | | | 5,106 | |
| | 12 | | | TPI Composites, Inc.(b) | | | 336 | |
| | 46 | | | Trex Co., Inc.(b) | | | 3,896 | |
| | 35 | | | TriMas Corp.(b) | | | 1,075 | |
| | 37 | | | TriNet Group, Inc.(b) | | | 2,186 | |
| | 105 | | | Trinity Industries, Inc. | | | 3,763 | |
| | 41 | | | Triton International Ltd. (Bermuda) | | | 1,549 | |
| | 38 | | | Triumph Group, Inc. | | | 790 | |
| | 32 | | | TrueBlue, Inc.(b) | | | 938 | |
| | 30 | | | Tutor Perini Corp.(b) | | | 611 | |
| | 12 | | | UniFirst Corp. | | | 2,222 | |
| | 90 | | | Univar, Inc.(b) | | | 2,504 | |
| | 48 | | | Universal Forest Products, Inc. | | | 1,798 | |
| | 6 | | | Universal Logistics Holdings, Inc. | | | 220 | |
| | 17 | | | US Ecology, Inc. | | | 1,237 | |
| | 72 | | | USG Corp.(b) | | | 3,103 | |
| | 18 | | | Valmont Industries, Inc. | | | 2,527 | |
| | 9 | | | Veritiv Corp.(b) | | | 430 | |
| | 16 | | | Viad Corp. | | | 986 | |
| | 13 | | | Vicor Corp.(b) | | | 812 | |
| | 7 | | | VSE Corp. | | | 270 | |
| | 46 | | | Wabash National Corp. | | | 839 | |
| | 30 | | | WageWorks, Inc.(b) | | | 1,605 | |
| | 25 | | | Watsco, Inc. | | | 4,375 | |
| | 23 | | | Watts Water Technologies, Inc., Class A | | | 1,896 | |
| | 106 | | | Welbilt, Inc.(b) | | | 2,346 | |
| | 36 | | | Werner Enterprises, Inc. | | | 1,334 | |
| | 42 | | | Wesco Aircraft Holdings, Inc.(b) | | | 510 | |
| | 37 | | | WESCO International, Inc.(b) | | | 2,263 | |
| | 26 | | | Willscot Corp., Class A(b) | | | 454 | |
| | 44 | | | Woodward, Inc. | | | 3,545 | |
| | 25 | | | YRC Worldwide, Inc.(b) | | | 239 | |
| | | | | | | | |
| | | | | | | 419,347 | |
| | | | | | | | |
| | | | Information Technology—16.0% | | | |
| | 44 | | | 2U, Inc.(b) | | | 3,932 | |
| | 95 | | | 3D Systems Corp.(b) | | | 1,933 | |
| | 70 | | | 8x8, Inc.(b) | | | 1,589 | |
| | 38 | | | A10 Networks, Inc.(b) | | | 265 | |
| | 19 | | | Acacia Communications, Inc.(b) | | | 775 | |
| | 90 | | | ACI Worldwide, Inc.(b) | | | 2,557 | |
| | 60 | | | Acxiom Corp.(b) | | | 2,741 | |
| | 37 | | | ADTRAN, Inc. | | | 636 | |
| | 31 | | | Advanced Energy Industries, Inc.(b) | | | 1,847 | |
| | 24 | | | Alarm.com Holdings, Inc.(b) | | | 1,351 | |
| | 14 | | | Alpha & Omega Semiconductor Ltd.(b) | | | 199 | |
| | 26 | | | Ambarella, Inc.(b) | | | 996 | |
| | 82 | | | Amkor Technology, Inc.(b) | | | 716 | |
| | | | | | | | |
Number
of Shares | | | | | Value | |
| | | | Common Stocks & Other Equity Interests
(continued) | |
| | | | Information Technology (continued) | | | |
| | 36 | | | ANGI Homeservices, Inc., Class A(b) | | $ | 780 | |
| | 25 | | | Anixter International, Inc.(b) | | | 1,802 | |
| | 14 | | | Applied Optoelectronics, Inc.(b) | | | 579 | |
| | 142 | | | ARRIS International PLC(b) | | | 3,679 | |
| | 55 | | | Aspen Technology, Inc.(b) | | | 6,345 | |
| | 85 | | | Avaya Holdings Corp.(b) | | | 1,986 | |
| | 38 | | | AVX Corp. | | | 804 | |
| | 23 | | | Axcelis Technologies, Inc.(b) | | | 465 | |
| | 22 | | | Badger Meter, Inc. | | | 1,209 | |
| | 33 | | | Belden, Inc. | | | 2,400 | |
| | 38 | | | Benchmark Electronics, Inc. | | | 982 | |
| | 12 | | | Benefitfocus, Inc.(b) | | | 529 | |
| | 112 | | | Black Knight, Inc.(b) | | | 5,981 | |
| | 38 | | | Blackbaud, Inc. | | | 3,974 | |
| | 27 | | | Blackline, Inc.(b) | | | 1,424 | |
| | 113 | | | Booz Allen Hamilton Holding Corp. | | | 5,781 | |
| | 31 | | | Bottomline Technologies (DE), Inc.(b) | | | 2,045 | |
| | 97 | | | Box, Inc., Class A(b) | | | 2,382 | |
| | 57 | | | Brooks Automation, Inc. | | | 2,246 | |
| | 20 | | | Cabot Microelectronics Corp. | | | 2,255 | |
| | 19 | | | CACI International, Inc., Class A(b) | | | 3,705 | |
| | 27 | | | CalAmp Corp.(b) | | | 634 | |
| | 24 | | | Carbonite, Inc.(b) | | | 997 | |
| | 35 | | | Cardtronics PLC, Class A(b) | | | 1,228 | |
| | 52 | | | Cars.com, Inc.(b) | | | 1,399 | |
| | 9 | | | Cass Information Systems, Inc. | | | 644 | |
| | 17 | | | CEVA, Inc.(b) | | | 520 | |
| | 18 | | | ChannelAdvisor Corp.(b) | | | 235 | |
| | 111 | | | Ciena Corp.(b) | | | 3,505 | |
| | 49 | | | Cirrus Logic, Inc.(b) | | | 2,154 | |
| | 27 | | | Cision Ltd.(b) | | | 489 | |
| | 80 | | | Cloudera, Inc.(b) | | | 1,201 | |
| | 19 | | | Coherent, Inc.(b) | | | 3,621 | |
| | 21 | | | Cohu, Inc. | | | 554 | |
| | 33 | | | CommVault Systems, Inc.(b) | | | 2,298 | |
| | 18 | | | Comtech Telecommunications Corp. | | | 645 | |
| | 144 | | | Conduent, Inc.(b) | | | 3,338 | |
| | 19 | | | Control4 Corp.(b) | | | 616 | |
| | 72 | | | Convergys Corp. | | | 1,781 | |
| | 65 | | | CoreLogic, Inc.(b) | | | 3,305 | |
| | 36 | | | Cornerstone OnDemand, Inc.(b) | | | 2,036 | |
| | 34 | | | Coupa Software, Inc.(b) | | | 2,438 | |
| | 31 | | | Cray, Inc.(b) | | | 673 | |
| | 79 | | | Cree, Inc.(b) | | | 3,801 | |
| | 26 | | | CSG Systems International, Inc. | | | 971 | |
| | 24 | | | CTS Corp. | | | 887 | |
| | 269 | | | Cypress Semiconductor Corp. | | | 4,629 | |
| | 28 | | | Daktronics, Inc. | | | 227 | |
| | 52 | | | Diebold Nixdorf, Inc. | | | 247 | |
| | 33 | | | Diodes, Inc.(b) | | | 1,251 | |
| | 49 | | | Dolby Laboratories, Inc., Class A | | | 3,439 | |
| | 18 | | | Ebix, Inc. | | | 1,434 | |
| | 37 | | | EchoStar Corp., Class A(b) | | | 1,776 | |
| | 23 | | | Electro Scientific Industries, Inc.(b) | | | 505 | |
| | 35 | | | Electronics For Imaging, Inc.(b) | | | 1,218 | |
| | 27 | | | Ellie Mae, Inc.(b) | | | 2,845 | |
See accompanying Notes to Financial Statements which are an integral part of the financial statements.
Invesco PureBetaSM MSCI USA Small Cap ETF (PBSM) (continued)
August 31, 2018
| | | | | | | | |
Number
of Shares | | | | | Value | |
| | | | Common Stocks & Other Equity Interests
(continued) | |
| | | | Information Technology (continued) | | | |
| | 49 | | | Endurance International Group Holdings, Inc.(b) | | $ | 473 | |
| | 112 | | | Entegris, Inc. | | | 3,797 | |
| | 34 | | | Envestnet, Inc.(b) | | | 2,149 | |
| | 39 | | | EPAM Systems, Inc.(b) | | | 5,574 | |
| | 11 | | | ePlus, Inc.(b) | | | 1,140 | |
| | 85 | | | Etsy, Inc.(b) | | | 4,139 | |
| | 40 | | | Euronet Worldwide, Inc.(b) | | | 3,912 | |
| | 21 | | | Everbridge, Inc.(b) | | | 1,264 | |
| | 52 | | | Everi Holdings, Inc.(b) | | | 451 | |
| | 47 | | | EVERTEC, Inc. | | | 1,130 | |
| | 26 | | | ExlService Holdings, Inc.(b) | | | 1,666 | |
| | 84 | | | Extreme Networks, Inc.(b) | | | 527 | |
| | 28 | | | Fabrinet (Thailand)(b) | | | 1,340 | |
| | 23 | | | Fair Isaac Corp.(b) | | | 5,312 | |
| | 13 | | | FARO Technologies, Inc.(b) | | | 887 | |
| | 92 | | | Finisar Corp.(b) | | | 1,877 | |
| | 141 | | | FireEye, Inc.(b) | | | 2,341 | |
| | 61 | | | First Solar, Inc.(b) | | | 3,177 | |
| | 140 | | | Fitbit, Inc., Class A(b) | | | 843 | |
| | 41 | | | Five9, Inc.(b) | | | 1,970 | |
| | 17 | | | ForeScout Technologies, Inc.(b) | | | 613 | |
| | 55 | | | FormFactor, Inc.(b) | | | 850 | |
| | 82 | | | Glu Mobile, Inc.(b) | | | 631 | |
| | 43 | | | Gogo, Inc.(b) | | | 193 | |
| | 70 | | | GrubHub, Inc.(b) | | | 10,088 | |
| | 27 | | | GTT Communications, Inc.(b) | | | 1,162 | |
| | 62 | | | Guidewire Software, Inc.(b) | | | 6,235 | |
| | 19 | | | Hackett Group, Inc. (The) | | | 389 | |
| | 40 | | | Hortonworks, Inc.(b) | | | 893 | |
| | 28 | | | HubSpot, Inc.(b) | | | 4,024 | |
| | 16 | | | Ichor Holdings Ltd.(b) | | | 415 | |
| | 46 | | | II-VI, Inc.(b) | | | 2,288 | |
| | 27 | | | Imperva, Inc.(b) | | | 1,273 | |
| | 124 | | | Infinera Corp.(b) | | | 1,110 | |
| | 29 | | | Inphi Corp.(b) | | | 1,075 | |
| | 27 | | | Insight Enterprises, Inc.(b) | | | 1,489 | |
| | 22 | | | Instructure, Inc.(b) | | | 901 | |
| | 102 | | | Integrated Device Technology, Inc.(b) | | | 4,334 | |
| | 27 | | | InterDigital, Inc. | | | 2,230 | |
| | 27 | | | Itron, Inc.(b) | | | 1,793 | |
| | 39 | | | j2 Global, Inc. | | | 3,220 | |
| | 119 | | | Jabil, Inc. | | | 3,518 | |
| | 38 | | | KEMET Corp.(b) | | | 982 | |
| | 21 | | | Kimball Electronics, Inc.(b) | | | 416 | |
| | 68 | | | Knowles Corp.(b) | | | 1,233 | |
| | 54 | | | Kulicke & Soffa Industries, Inc. (Singapore) | | | 1,393 | |
| | 88 | | | Lattice Semiconductor Corp.(b) | | | 721 | |
| | 107 | | | Limelight Networks, Inc.(b) | | | 542 | |
| | 20 | | | Littelfuse, Inc. | | | 4,471 | |
| | 48 | | | LivePerson, Inc.(b) | | | 1,291 | |
| | 41 | | | LogMeIn, Inc. | | | 3,524 | |
| | 50 | | | Lumentum Holdings, Inc.(b) | | | 3,395 | |
| | 32 | | | MACOM Technology Solutions Holdings, Inc.(b) | | | 738 | |
| | 53 | | | Manhattan Associates, Inc.(b) | | | 3,073 | |
| | 20 | | | ManTech International Corp., Class A | | | 1,326 | |
| | 52 | | | MAXIMUS, Inc. | | | 3,458 | |
| | | | | | | | |
Number
of Shares | | | | | Value | |
| | | | Common Stocks & Other Equity Interests
(continued) | |
| | | | Information Technology (continued) | | | |
| | 50 | | | MaxLinear, Inc., Class A(b) | | $ | 964 | |
| | 34 | | | Mellanox Technologies Ltd. (Israel)(b) | | | 2,829 | |
| | 3 | | | Mesa Laboratories, Inc. | | | 602 | |
| | 29 | | | Methode Electronics, Inc. | | | 1,150 | |
| | 7 | | | MicroStrategy, Inc., Class A(b) | | | 1,043 | |
| | 27 | | | MINDBODY, Inc., Class A(b) | | | 1,002 | |
| | 93 | | | Mitel Networks Corp.(b) | | | 1,023 | |
| | 42 | | | MKS Instruments, Inc. | | | 3,902 | |
| | 31 | | | MobileIron, Inc.(b) | | | 152 | |
| | 17 | | | Model N, Inc.(b) | | | 289 | |
| | 23 | | | MoneyGram International, Inc.(b) | | | 150 | |
| | 31 | | | Monolithic Power Systems, Inc. | | | 4,646 | |
| | 32 | | | Monotype Imaging Holdings, Inc. | | | 659 | |
| | 13 | | | MTS Systems Corp. | | | 703 | |
| | 18 | | | Nanometrics, Inc.(b) | | | 789 | |
| | 97 | | | National Instruments Corp. | | | 4,632 | |
| | 92 | | | NCR Corp.(b) | | | 2,614 | |
| | 44 | | | Net 1 UEPS Technologies, Inc. (South Africa)(b) | | | 319 | |
| | 25 | | | NETGEAR, Inc.(b) | | | 1,771 | |
| | 66 | | | NetScout Systems, Inc.(b) | | | 1,650 | |
| | 32 | | | New Relic, Inc.(b) | | | 3,288 | |
| | 48 | | | NIC, Inc. | | | 806 | |
| | 25 | | | Novanta, Inc.(b) | | | 1,915 | |
| | 235 | | | Nuance Communications, Inc.(b) | | | 3,835 | |
| | 89 | | | Nutanix, Inc., Class A(b) | | | 5,012 | |
| | 4 | | | NVE Corp. | | | 455 | |
| | 127 | | | Oclaro, Inc.(b) | | | 1,212 | |
| | 23 | | | OneSpan, Inc.(b) | | | 431 | |
| | 14 | | | OSI Systems, Inc.(b) | | | 1,090 | |
| | 210 | | | Pandora Media, Inc.(b) | | | 1,940 | |
| | 15 | | | Park Electrochemical Corp. | | | 321 | |
| | 39 | | | Paycom Software, Inc.(b) | | | 6,050 | |
| | 24 | | | Paylocity Holding Corp.(b) | | | 1,907 | |
| | 9 | | | PC Connection, Inc. | | | 357 | |
| | 21 | | | PDF Solutions, Inc.(b) | | | 183 | |
| | 30 | | | Pegasystems, Inc. | | | 1,911 | |
| | 27 | | | Perficient, Inc.(b) | | | 776 | |
| | 110 | | | Perspecta, Inc. | | | 2,559 | |
| | 52 | | | Photronics, Inc.(b) | | | 556 | |
| | 26 | | | Plantronics, Inc. | | | 1,748 | |
| | 26 | | | Plexus Corp.(b) | | | 1,645 | |
| | 23 | | | Power Integrations, Inc. | | | 1,687 | |
| | 25 | | | Presidio, Inc.(b) | | | 378 | |
| | 33 | | | Progress Software Corp. | | | 1,351 | |
| | 39 | | | Proofpoint, Inc.(b) | | | 4,627 | |
| | 28 | | | PROS Holdings, Inc.(b) | | | 1,033 | |
| | 90 | | | PTC, Inc.(b) | | | 8,995 | |
| | 115 | | | Pure Storage, Inc., Class A(b) | | | 3,087 | |
| | 30 | | | Q2 Holdings, Inc.(b) | | | 1,869 | |
| | 8 | | | QAD, Inc., Class A | | | 485 | |
| | 26 | | | Qualys, Inc.(b) | | | 2,367 | |
| | 24 | | | Quantenna Communications, Inc.(b) | | | 438 | |
| | 29 | | | QuinStreet, Inc.(b) | | | 440 | |
| | 70 | | | Quotient Technology, Inc.(b) | | | 1,046 | |
| | 85 | | | Rambus, Inc.(b) | | | 1,039 | |
| | 22 | | | Rapid7, Inc.(b) | | | 839 | |
See accompanying Notes to Financial Statements which are an integral part of the financial statements.
Invesco PureBetaSM MSCI USA Small Cap ETF (PBSM) (continued)
August 31, 2018
| | | | | | | | |
Number
of Shares | | | | | Value | |
| | | | Common Stocks & Other Equity Interests
(continued) | |
| | | | Information Technology (continued) | | | |
| | 57 | | | RealPage, Inc.(b) | | $ | 3,557 | |
| | 39 | | | Ribbon Communications, Inc.(b) | | | 270 | |
| | 52 | | | RingCentral, Inc., Class A(b) | | | 4,844 | |
| | 14 | | | Rogers Corp.(b) | | | 1,933 | |
| | 23 | | | Rudolph Technologies, Inc.(b) | | | 639 | |
| | 50 | | | SailPoint Technologies Holding, Inc.(b) | | | 1,546 | |
| | 52 | | | Sanmina Corp.(b) | | | 1,602 | |
| | 19 | | | ScanSource, Inc.(b) | | | 772 | |
| | 34 | | | Science Applications International Corp. | | | 3,067 | |
| | 53 | | | Semtech Corp.(b) | | | 3,167 | |
| | 20 | | | SendGrid, Inc.(b) | | | 725 | |
| | 54 | | | ServiceSource International, Inc.(b) | | | 172 | |
| | 14 | | | Shutterstock, Inc. | | | 771 | |
| | 33 | | | Silicon Laboratories, Inc.(b) | | | 3,234 | |
| | 8 | | | SMART Global Holdings, Inc.(b) | | | 264 | |
| | 27 | | | SolarEdge Technologies, Inc.(b) | | | 1,295 | |
| | 13 | | | SPS Commerce, Inc.(b) | | | 1,277 | |
| | 13 | | | Stamps.com, Inc.(b) | | | 3,230 | |
| | 48 | | | SunPower Corp.(b) | | | 323 | |
| | 35 | | | Sykes Enterprises, Inc.(b) | | | 1,058 | |
| | 26 | | | Synaptics, Inc.(b) | | | 1,255 | |
| | 23 | | | SYNNEX Corp. | | | 2,230 | |
| | 32 | | | Syntel, Inc.(b) | | | 1,304 | |
| | 53 | | | Tableau Software, Inc., Class A(b) | | | 5,929 | |
| | 28 | | | Tech Data Corp.(b) | | | 2,037 | |
| | 16 | | | TechTarget, Inc.(b) | | | 384 | |
| | 97 | | | Teradata Corp.(b) | | | 4,023 | |
| | 152 | | | Teradyne, Inc. | | | 6,261 | |
| | 92 | | | TiVo Corp. | | | 1,256 | |
| | 24 | | | Trade Desk, Inc. (The), Class A(b) | | | 3,405 | |
| | 103 | | | Travelport Worldwide Ltd. | | | 1,913 | |
| | 53 | | | TrueCar, Inc.(b) | | | 682 | |
| | 12 | | | TTEC Holdings, Inc. | | | 314 | |
| | 79 | | | TTM Technologies, Inc.(b) | | | 1,477 | |
| | 6 | | | Tucows, Inc., Class A(b) | | | 351 | |
| | 54 | | | Twilio, Inc., Class A(b) | | | 4,356 | |
| | 28 | | | Tyler Technologies, Inc.(b) | | | 6,915 | |
| | 18 | | | Ubiquiti Networks, Inc. | | | 1,615 | |
| | 23 | | | Ultimate Software Group, Inc. (The)(b) | | | 7,122 | |
| | 35 | | | Ultra Clean Holdings, Inc.(b) | | | 534 | |
| | 38 | | | Unisys Corp.(b) | | | 707 | |
| | 33 | | | Universal Display Corp. | | | 4,039 | |
| | 12 | | | Upland Software, Inc.(b) | | | 447 | |
| | 22 | | | Varonis Systems, Inc.(b) | | | 1,626 | |
| | 36 | | | Veeco Instruments, Inc.(b) | | | 432 | |
| | 51 | | | Verint Systems, Inc.(b) | | | 2,476 | |
| | 87 | | | Versum Materials, Inc. | | | 3,462 | |
| | 44 | | | ViaSat, Inc.(b) | | | 2,764 | |
| | 172 | | | Viavi Solutions, Inc.(b) | | | 1,926 | |
| | 22 | | | Virtusa Corp.(b) | | | 1,282 | |
| | 102 | | | Vishay Intertechnology, Inc. | | | 2,428 | |
| | 31 | | | Web.com Group, Inc.(b) | | | 866 | |
| | 34 | | | WEX, Inc.(b) | | | 6,467 | |
| | 17 | | | Workiva, Inc., Class A(b) | | | 626 | |
| | 41 | | | Xcerra Corp.(b) | | | 594 | |
| | 19 | | | XO Group, Inc.(b) | | | 571 | |
| | | | | | | | |
Number
of Shares | | | | | Value | |
| | | | Common Stocks & Other Equity Interests
(continued) | |
| | | | Information Technology (continued) | | | |
| | 38 | | | Xperi Corp. | | $ | 597 | |
| | 61 | | | Yelp, Inc., Class A(b) | | | 2,874 | |
| | 37 | | | Yext, Inc.(b) | | | 920 | |
| | 42 | | | Zebra Technologies Corp., Class A(b) | | | 7,213 | |
| | 81 | | | Zendesk, Inc.(b) | | | 5,580 | |
| | 609 | | | Zynga, Inc., Class A(b) | | | 2,533 | |
| | | | | | | | |
| | | | | | | 483,793 | |
| | | | | | | | |
| | | | Materials—5.4% | | | |
| | 23 | | | A. Schulman, Inc.(d) | | | 46 | |
| | 23 | | | AdvanSix, Inc.(b) | | | 778 | |
| | 17 | | | AgroFresh Solutions, Inc.(b) | | | 113 | |
| | 240 | | | AK Steel Holding Corp.(b) | | | 1,066 | |
| | 144 | | | Alcoa Corp.(b) | | | 6,432 | |
| | 97 | | | Allegheny Technologies, Inc.(b) | | | 2,622 | |
| | 20 | | | American Vanguard Corp. | | | 438 | |
| | 48 | | | AptarGroup, Inc. | | | 5,026 | |
| | 48 | | | Ashland Global Holdings, Inc. | | | 4,042 | |
| | 25 | | | Balchem Corp. | | | 2,772 | |
| | 70 | | | Bemis Co., Inc. | | | 3,450 | |
| | 102 | | | Berry Global Group, Inc.(b) | | | 4,868 | |
| | 29 | | | Boise Cascade Co. | | | 1,267 | |
| | 48 | | | Cabot Corp. | | | 3,116 | |
| | 36 | | | Carpenter Technology Corp. | | | 2,148 | |
| | 40 | | | Century Aluminum Co.(b) | | | 505 | |
| | 6 | | | Chase Corp. | | | 744 | |
| | 13 | | | Clearwater Paper Corp.(b) | | | 378 | |
| | 214 | | | Cleveland-Cliffs, Inc.(b) | | | 2,151 | |
| | 138 | | | Coeur Mining, Inc.(b) | | | 784 | |
| | 93 | | | Commercial Metals Co. | | | 2,009 | |
| | 26 | | | Compass Minerals International, Inc. | | | 1,626 | |
| | 48 | | | Domtar Corp. | | | 2,443 | |
| | 38 | | | Eagle Materials, Inc. | | | 3,509 | |
| | 60 | | | Ferro Corp.(b) | | | 1,317 | |
| | 15 | | | Forterra, Inc.(b) | | | 127 | |
| | 20 | | | FutureFuel Corp. | | | 297 | |
| | 53 | | | GCP Applied Technologies, Inc.(b) | | | 1,336 | |
| | 247 | | | Graphic Packaging Holding Co. | | | 3,512 | |
| | 20 | | | Greif, Inc., Class A | | | 1,104 | |
| | 4 | | | Greif, Inc., Class B | | | 227 | |
| | 39 | | | H.B. Fuller Co. | | | 2,223 | |
| | 7 | | | Hawkins, Inc. | | | 289 | |
| | 9 | | | Haynes International, Inc. | | | 355 | |
| | 391 | | | Hecla Mining Co. | | | 1,110 | |
| | 169 | | | Huntsman Corp. | | | 5,153 | |
| | 34 | | | Ingevity Corp.(b) | | | 3,434 | |
| | 15 | | | Innophos Holdings, Inc. | | | 656 | |
| | 19 | | | Innospec, Inc. | | | 1,474 | |
| | 76 | | | Intrepid Potash, Inc.(b) | | | 258 | |
| | 13 | | | Kaiser Aluminum Corp. | | | 1,425 | |
| | 71 | | | KapStone Paper and Packaging Corp. | | | 2,439 | |
| | 10 | | | KMG Chemicals, Inc. | | | 775 | |
| | 16 | | | Koppers Holdings, Inc.(b) | | | 567 | |
| | 24 | | | Kraton Corp.(b) | | | 1,129 | |
| | 18 | | | Kronos Worldwide, Inc. | | | 362 | |
| | 116 | | | Louisiana-Pacific Corp. | | | 3,383 | |
| | 15 | | | Materion Corp. | | | 957 | |
See accompanying Notes to Financial Statements which are an integral part of the financial statements.
Invesco PureBetaSM MSCI USA Small Cap ETF (PBSM) (continued)
August 31, 2018
| | | | | | | | |
Number
of Shares | | | | | Value | |
| | | | Common Stocks & Other Equity Interests
(continued) | |
| | | | Materials (continued) | | | |
| | 200 | | | McEwen Mining, Inc. | | $ | 394 | |
| | 35 | | | Mercer International, Inc. (Canada) | | | 619 | |
| | 27 | | | Minerals Technologies, Inc. | | | 1,813 | |
| | 18 | | | Myers Industries, Inc. | | | 401 | |
| | 13 | | | Neenah, Inc. | | | 1,186 | |
| | 7 | | | NewMarket Corp. | | | 2,807 | |
| | 133 | | | Olin Corp. | | | 4,087 | |
| | 34 | | | OMNOVA Solutions, Inc.(b) | | | 308 | �� |
| | 124 | | | Owens-Illinois, Inc.(b) | | | 2,191 | |
| | 33 | | | P.H. Glatfelter Co. | | | 635 | |
| | 186 | | | Platform Specialty Products Corp.(b) | | | 2,466 | |
| | 63 | | | PolyOne Corp. | | | 2,662 | |
| | 31 | | | PQ Group Holdings, Inc.(b) | | | 552 | |
| | 11 | | | Quaker Chemical Corp. | | | 1,982 | |
| | 45 | | | Rayonier Advanced Materials, Inc. | | | 941 | |
| | 57 | | | Reliance Steel & Aluminum Co. | | | 5,010 | |
| | 44 | | | Resolute Forest Products, Inc.(b) | | | 605 | |
| | 52 | | | Royal Gold, Inc. | | | 3,966 | |
| | 104 | | | RPM International, Inc. | | | 7,020 | |
| | 13 | | | Ryerson Holding Corp.(b) | | | 135 | |
| | 20 | | | Schnitzer Steel Industries, Inc., Class A | | | 527 | |
| | 23 | | | Schweitzer-Mauduit International, Inc. | | | 936 | |
| | 34 | | | Scotts Miracle-Gro Co. (The) | | | 2,540 | |
| | 34 | | | Sensient Technologies Corp. | | | 2,415 | |
| | 59 | | | Silgan Holdings, Inc. | | | 1,608 | |
| | 79 | | | Sonoco Products Co. | | | 4,427 | |
| | 16 | | | Stepan Co. | | | 1,427 | |
| | 85 | | | Summit Materials, Inc., Class A(b) | | | 1,808 | |
| | 44 | | | SunCoke Energy, Inc.(b) | | | 491 | |
| | 29 | | | TimkenSteel Corp.(b) | | | 406 | |
| | 19 | | | Tredegar Corp. | | | 417 | |
| | 34 | | | Trinseo SA | | | 2,623 | |
| | 81 | | | Tronox Ltd., Class A | | | 1,311 | |
| | 2 | | | United States Lime & Minerals, Inc. | | | 152 | |
| | 138 | | | United States Steel Corp. | | | 4,096 | |
| | 12 | | | US Concrete, Inc.(b) | | | 578 | |
| | 156 | | | Valvoline, Inc. | | | 3,357 | |
| | 43 | | | Venator Materials PLC(b) | | | 519 | |
| | 27 | | | Verso Corp., Class A(b) | | | 848 | |
| | 52 | | | W.R. Grace & Co. | | | 3,674 | |
| | 27 | | | Warrior Met Coal, Inc. | | | 649 | |
| | 37 | | | Worthington Industries, Inc. | | | 1,723 | |
| | | | | | | | |
| | | | | | | 162,554 | |
| | | | | | | | |
| | | | Real Estate—10.0% | | | |
| | 65 | | | Acadia Realty Trust REIT | | | 1,854 | |
| | 24 | | | Agree Realty Corp. REIT | | | 1,370 | |
| | 51 | | | Alexander & Baldwin, Inc. REIT | | | 1,197 | |
| | 2 | | | Alexander’s, Inc. REIT | | | 722 | |
| | 10 | | | Altisource Portfolio Solutions SA(b) | | | 362 | |
| | 27 | | | American Assets Trust, Inc. REIT | | | 1,066 | |
| | 106 | | | American Campus Communities, Inc. REIT | | | 4,445 | |
| | 208 | | | American Homes 4 Rent, Class A REIT | | | 4,826 | |
| | 44 | | | Americold Realty Trust REIT | | | 1,096 | |
| | 122 | | | Apartment Investment & Management Co., Class A REIT | | | 5,344 | |
| | 169 | | | Apple Hospitality REIT, Inc. REIT | | | 2,983 | |
| | | | | | | | |
Number
of Shares | | | | | Value | |
| | | | Common Stocks & Other Equity Interests
(continued) | |
| | | | Real Estate (continued) | | | |
| | 34 | | | Armada Hoffler Properties, Inc. REIT | | $ | 530 | |
| | 74 | | | Ashford Hospitality Trust, Inc. REIT | | | 480 | |
| | 19 | | | Braemar Hotels & Resorts, Inc. REIT | | | 219 | |
| | 141 | | | Brandywine Realty Trust REIT | | | 2,363 | |
| | 236 | | | Brixmor Property Group, Inc. REIT | | | 4,300 | |
| | 65 | | | CareTrust REIT, Inc. REIT | | | 1,199 | |
| | 43 | | | CatchMark Timber Trust, Inc., Class A REIT | | | 539 | |
| | 130 | | | CBL & Associates Properties, Inc. REIT | | | 580 | |
| | 65 | | | Cedar Realty Trust, Inc. REIT | | | 291 | |
| | 35 | | | Chatham Lodging Trust REIT | | | 751 | |
| | 46 | | | Chesapeake Lodging Trust REIT | | | 1,514 | |
| | 378 | | | Colony Capital, Inc. REIT | | | 2,317 | |
| | 93 | | | Columbia Property Trust, Inc. REIT | | | 2,239 | |
| | 13 | | | Community Healthcare Trust, Inc. REIT | | | 403 | |
| | 90 | | | CoreCivic, Inc. REIT | | | 2,330 | |
| | 31 | | | CorePoint Lodging, Inc. REIT | | | 646 | |
| | 27 | | | CoreSite Realty Corp. REIT | | | 3,145 | |
| | 82 | | | Corporate Office Properties Trust REIT | | | 2,524 | |
| | 326 | | | Cousins Properties, Inc. REIT | | | 3,048 | |
| | 143 | | | CubeSmart REIT | | | 4,369 | |
| | 78 | | | CyrusOne, Inc. REIT | | | 5,223 | |
| | 119 | | | DDR Corp. REIT | | | 1,665 | |
| | 152 | | | DiamondRock Hospitality Co. REIT | | | 1,818 | |
| | 127 | | | Douglas Emmett, Inc. REIT | | | 4,961 | |
| | 51 | | | Easterly Government Properties, Inc. REIT | | | 1,033 | |
| | 28 | | | EastGroup Properties, Inc. REIT | | | 2,724 | |
| | 60 | | | Education Realty Trust, Inc. REIT | | | 2,483 | |
| | 111 | | | Empire State Realty Trust, Inc., Class A REIT | | | 1,952 | |
| | 57 | | | EPR Properties REIT | | | 4,000 | |
| | 94 | | | Equity Commonwealth REIT(b) | | | 3,014 | |
| | 66 | | | Equity LifeStyle Properties, Inc. REIT | | | 6,394 | |
| | 95 | | | First Industrial Realty Trust, Inc. REIT | | | 3,084 | |
| | 44 | | | Five Point Holdings LLC, Class A(b) | | | 481 | |
| | 181 | | | Forest City Realty Trust, Inc., Class A REIT | | | 4,552 | |
| | 8 | | | Forestar Group, Inc.(b) | | | 206 | |
| | 46 | | | Four Corners Property Trust, Inc. REIT | | | 1,239 | |
| | 77 | | | Franklin Street Properties Corp. REIT | | | 660 | |
| | 39 | | | Front Yard Residential Corp. REIT | | | 477 | |
| | 5 | | | FRP Holdings, Inc.(b) | | | 326 | |
| | 157 | | | Gaming and Leisure Properties, Inc. REIT | | | 5,619 | |
| | 95 | | | GEO Group, Inc. (The) REIT | | | 2,410 | |
| | 25 | | | Getty Realty Corp. REIT | | | 728 | |
| | 19 | | | Gladstone Commercial Corp. REIT | | | 378 | |
| | 50 | | | Global NET Lease, Inc. REIT | | | 1,084 | |
| | 82 | | | Government Properties Income Trust REIT | | | 1,387 | |
| | 99 | | | Healthcare Realty Trust, Inc. REIT | | | 3,065 | |
| | 163 | | | Healthcare Trust of America, Inc., Class A REIT | | | 4,657 | |
| | 32 | | | Hersha Hospitality Trust REIT | | | 755 | |
| | 28 | | | HFF, Inc., Class A | | | 1,271 | |
| | 80 | | | Highwoods Properties, Inc. REIT | | | 3,979 | |
| | 131 | | | Hospitality Properties Trust REIT | | | 3,798 | |
| | 32 | | | Howard Hughes Corp. (The)(b) | | | 4,172 | |
| | 124 | | | Hudson Pacific Properties, Inc. REIT | | | 4,196 | |
| | 62 | | | Independence Realty Trust, Inc. REIT | | | 640 | |
| | 18 | | | Industrial Logistics Properties Trust REIT | | | 433 | |
| | 33 | | | InfraREIT, Inc. REIT(b) | | | 689 | |
See accompanying Notes to Financial Statements which are an integral part of the financial statements.
Invesco PureBetaSM MSCI USA Small Cap ETF (PBSM) (continued)
August 31, 2018
| | | | | | | | |
Number
of Shares | | | | | Value | |
| | | | Common Stocks & Other Equity Interests
(continued) | |
| | | | Real Estate (continued) | | | |
| | 92 | | | Investors Real Estate Trust REIT | | $ | 501 | |
| | 49 | | | iStar, Inc. REIT | | | 548 | |
| | 87 | | | JBG SMITH Properties REIT | | | 3,259 | |
| | 104 | | | Kennedy-Wilson Holdings, Inc. | | | 2,231 | |
| | 77 | | | Kilroy Realty Corp. REIT | | | 5,632 | |
| | 63 | | | Kite Realty Group Trust REIT | | | 1,101 | |
| | 65 | | | Lamar Advertising Co., Class A REIT | | | 5,008 | |
| | 85 | | | LaSalle Hotel Properties REIT | | | 2,984 | |
| | 165 | | | Lexington Realty Trust REIT | | | 1,541 | |
| | 36 | | | Life Storage, Inc. REIT | | | 3,514 | |
| | 30 | | | LTC Properties, Inc. REIT | | | 1,393 | |
| | 69 | | | Mack-Cali Realty Corp. REIT | | | 1,507 | |
| | 13 | | | Marcus & Millichap, Inc.(b) | | | 473 | |
| | 289 | | | Medical Properties Trust, Inc. REIT | | | 4,349 | |
| | 58 | | | MGM Growth Properties LLC, Class A REIT | | | 1,782 | |
| | 62 | | | Monmouth Real Estate Investment Corp. REIT | | | 1,078 | |
| | 32 | | | National Health Investors, Inc. REIT | | | 2,536 | |
| | 43 | | | National Storage Affiliates Trust REIT | | | 1,219 | |
| | 62 | | | New Senior Investment Group, Inc. REIT | | | 393 | |
| | 12 | | | New York REIT, Inc. REIT | | | 224 | |
| | 12 | | | NexPoint Residential Trust, Inc. REIT | | | 388 | |
| | 40 | | | NorthStar Realty Europe Corp. REIT | | | 549 | |
| | 153 | | | Omega Healthcare Investors, Inc. REIT | | | 5,057 | |
| | 10 | | | One Liberty Properties, Inc. REIT | | | 288 | |
| | 106 | | | Outfront Media, Inc. REIT | | | 2,106 | |
| | 168 | | | Paramount Group, Inc. REIT | | | 2,668 | |
| | 157 | | | Park Hotels & Resorts, Inc. REIT | | | 5,252 | |
| | 53 | | | Pebblebrook Hotel Trust REIT | | | 2,046 | |
| | 53 | | | Pennsylvania Real Estate Investment Trust REIT | | | 541 | |
| | 144 | | | Physicians Realty Trust REIT | | | 2,519 | |
| | 99 | | | Piedmont Office Realty Trust, Inc., Class A REIT | | | 1,964 | |
| | 47 | | | PotlatchDeltic Corp. REIT | | | 2,270 | |
| | 37 | | | Preferred Apartment Communities, Inc., Class A REIT | | | 659 | |
| | 16 | | | PS Business Parks, Inc. REIT | | | 2,087 | |
| | 41 | | | QTS Realty Trust, Inc., Class A REIT | | | 1,875 | |
| | 60 | | | Ramco-Gershenson Properties Trust REIT | | | 838 | |
| | 103 | | | Rayonier, Inc. REIT | | | 3,587 | |
| | 14 | | | RE/MAX Holdings, Inc., Class A | | | 690 | |
| | 105 | | | Realogy Holdings Corp. | | | 2,246 | |
| | 35 | | | Redfin Corp.(b) | | | 693 | |
| | 92 | | | Retail Opportunity Investments Corp. REIT | | | 1,816 | |
| | 169 | | | Retail Properties of America, Inc., Class A REIT | | | 2,151 | |
| | 11 | | | Retail Value, Inc. REIT(b) | | | 393 | |
| | 65 | | | Rexford Industrial Realty, Inc. REIT | | | 2,113 | |
| | 135 | | | RLJ Lodging Trust REIT | | | 2,958 | |
| | 5 | | | RMR Group, Inc. (The), Class A | | | 472 | |
| | 37 | | | Ryman Hospitality Properties, Inc. REIT | | | 3,283 | |
| | 138 | | | Sabra Health Care REIT, Inc. REIT | | | 3,254 | |
| | 10 | | | Saul Centers, Inc. REIT | | | 600 | |
| | 51 | | | Select Income REIT | | | 1,048 | |
| | 189 | | | Senior Housing Properties Trust REIT | | | 3,612 | |
| | 25 | | | Seritage Growth Properties, Class A REIT | | | 1,287 | |
| | 36 | | | Spirit MTA REIT(b) | | | 386 | |
| | 335 | | | Spirit Realty Capital, Inc. REIT | | | 2,804 | |
| | 31 | | | St. Joe Co. (The)(b) | | | 533 | |
| | | | | | | | |
Number
of Shares | | | | | Value | |
| | | | Common Stocks & Other Equity Interests
(continued) | |
| | | | Real Estate (continued) | | | |
| | 80 | | | STAG Industrial, Inc., Class A REIT | | $ | 2,310 | |
| | 136 | | | STORE Capital Corp. REIT | | | 3,918 | |
| | 79 | | | Summit Hotel Properties, Inc. REIT | | | 1,085 | |
| | 63 | | | Sun Communities, Inc. REIT | | | 6,500 | |
| | 181 | | | Sunstone Hotel Investors, Inc. REIT | | | 3,037 | |
| | 73 | | | Tanger Factory Outlet Centers, Inc. REIT | | | 1,756 | |
| | 49 | | | Taubman Centers, Inc. REIT | | | 3,166 | |
| | 16 | | | Tejon Ranch Co.(b) | | | 356 | |
| | 42 | | | Terreno Realty Corp. REIT | | | 1,613 | |
| | 36 | | | Tier REIT, Inc. REIT | | | 858 | |
| | 23 | | | UMH Properties, Inc. REIT | | | 367 | |
| | 134 | | | Uniti Group, Inc. REIT(b) | | | 2,790 | |
| | 10 | | | Universal Health Realty Income Trust REIT | | | 763 | |
| | 87 | | | Urban Edge Properties REIT | | | 1,989 | |
| | 23 | | | Urstadt Biddle Properties, Inc., Class A REIT | | | 523 | |
| | 215 | | | VICI Properties, Inc. REIT | | | 4,496 | |
| | 141 | | | Washington Prime Group, Inc. REIT | | | 1,091 | |
| | 64 | | | Washington Real Estate Investment Trust REIT | | | 2,020 | |
| | 98 | | | Weingarten Realty Investors REIT | | | 3,031 | |
| | 29 | | | Whitestone REIT | | | 396 | |
| | 84 | | | WP Carey, Inc. REIT | | | 5,593 | |
| | 81 | | | Xenia Hotels & Resorts, Inc. REIT | | | 1,965 | |
| | | | | | | | |
| | | | | | | 300,534 | |
| | | | | | | | |
| | | | Telecommunication Services—0.5% | | | |
| | 9 | | | ATN International, Inc. | | | 659 | |
| | 36 | | | Boingo Wireless, Inc.(b) | | | 1,191 | |
| | 29 | | | Cincinnati Bell, Inc.(b) | | | 377 | |
| | 33 | | | Cogent Communications Holdings, Inc. | | | 1,805 | |
| | 52 | | | Consolidated Communications Holdings, Inc. | | | 614 | |
| | 60 | | | Frontier Communications Corp. | | | 312 | |
| | 623 | | | Globalstar, Inc.(b) | | | 318 | |
| | 75 | | | Iridium Communications, Inc.(b) | | | 1,519 | |
| | 52 | | | ORBCOMM, Inc.(b) | | | 561 | |
| | 7 | | | pdvWireless, Inc.(b) | | | 210 | |
| | 36 | | | Shenandoah Telecommunications Co. | | | 1,373 | |
| | 16 | | | Spok Holdings, Inc. | | | 246 | |
| | 75 | | | Telephone & Data Systems, Inc. | | | 2,253 | |
| | 10 | | | United States Cellular Corp.(b) | | | 428 | |
| | 175 | | | Vonage Holdings Corp.(b) | | | 2,481 | |
| | 29 | | | Windstream Holdings, Inc.(b) | | | 137 | |
| | | | | | | | |
| | | | | | | 14,484 | |
| | | | | | | | |
| | | | Utilities—2.8% | | | |
| | 41 | | | ALLETE, Inc. | | | 3,078 | |
| | 28 | | | American States Water Co. | | | 1,692 | |
| | 141 | | | Aqua America, Inc. | | | 5,242 | |
| | 12 | | | AquaVenture Holdings Ltd.(b) | | | 218 | |
| | 51 | | | Avista Corp. | | | 2,617 | |
| | 41 | | | Black Hills Corp. | | | 2,413 | |
| | 37 | | | California Water Service Group | | | 1,523 | |
| | 12 | | | Chesapeake Utilities Corp. | | | 1,032 | |
| | 9 | | | Connecticut Water Service, Inc. | | | 617 | |
| | 31 | | | El Paso Electric Co. | | | 1,900 | |
| | 87 | | | Hawaiian Electric Industries, Inc. | | | 3,069 | |
| | 39 | | | IDACORP, Inc. | | | 3,816 | |
| | 148 | | | MDU Resources Group, Inc. | | | 4,128 | |
See accompanying Notes to Financial Statements which are an integral part of the financial statements.
Invesco PureBetaSM MSCI USA Small Cap ETF (PBSM) (continued)
August 31, 2018
| | | | | | | | |
Number
of Shares | | | | | Value | |
| | | | Common Stocks & Other Equity Interests
(continued) | |
| | | | Utilities (continued) | | | |
| | 27 | | | MGE Energy, Inc. | | $ | 1,767 | |
| | 12 | | | Middlesex Water Co. | | | 550 | |
| | 62 | | | National Fuel Gas Co. | | | 3,443 | |
| | 70 | | | New Jersey Resources Corp. | | | 3,192 | |
| | 44 | | | NextEra Energy Partners LP | | | 2,134 | |
| | 22 | | | Northwest Natural Gas Co. | | | 1,428 | |
| | 40 | | | NorthWestern Corp. | | | 2,398 | |
| | 234 | | | NRG Energy, Inc. | | | 8,281 | |
| | 26 | | | NRG Yield, Inc., Class A | | | 512 | |
| | 48 | | | NRG Yield, Inc., Class C | | | 953 | |
| | 42 | | | ONE Gas, Inc. | | | 3,298 | |
| | 29 | | | Ormat Technologies, Inc. | | | 1,527 | |
| | 27 | | | Otter Tail Corp. | | | 1,293 | |
| | 62 | | | Pattern Energy Group, Inc., Class A | | | 1,264 | |
| | 61 | | | PNM Resources, Inc. | | | 2,376 | |
| | 71 | | | Portland General Electric Co. | | | 3,294 | |
| | 12 | | | SJW Corp. | | | 695 | |
| | 67 | | | South Jersey Industries, Inc. | | | 2,223 | |
| | 37 | | | Southwest Gas Holdings, Inc. | | | 2,861 | |
| | 9 | | | Spark Energy, Inc., Class A | | | 79 | |
| | 40 | | | Spire, Inc. | | | 2,982 | |
| | 52 | | | TerraForm Power, Inc., Class A | | | 581 | |
| | 11 | | | Unitil Corp. | | | 556 | |
| | 66 | | | Vectren Corp. | | | 4,699 | |
| | 10 | | | York Water Co. (The) | | | 301 | |
| | | | | | | | |
| | | | | | | 84,032 | |
| | | | | | | | |
| | | | Total Investments in Securities
(Cost $2,585,017)-100.0% | | | 3,011,203 | |
| | | | Other assets less liabilities—0.0% | | | 94 | |
| | | | | | | | |
| | | | Net Assets—100.0% | | $ | 3,011,297 | |
| | | | | | | | |
Investment Abbreviations:
REIT—Real Estate Investment Trust
Notes to Schedule of Investments:
| (a) | Industry and/or sector classifications used in this report are generally according to the Global Industry Classification Standard, which was developed by and is the exclusive property and a service mark of MSCI Inc. and Standard & Poor’s. |
| (b) | Non-income producing security. |
| (c) | Affiliated company. The Fund’s Adviser and Invesco Mortgage Capital, Inc. REIT are wholly-owned subsidiaries of Invesco Ltd. and therefore, Invesco Ltd. and Invesco Mortgage Capital, Inc. REIT are considered to be affiliated. See Note 4. |
| (d) | Security valued using significant unobservable inputs (Level 3). See Note 5. |
See accompanying Notes to Financial Statements which are an integral part of the financial statements.
Schedule of Investments
Invesco PureBetaSM US Aggregate Bond ETF (PBND)
August 31, 2018
| | | | | | | | | | | | | | | | |
Principal
Amount | | | | | Interest
Rate | | | Maturity
Date | | | Value | |
| | | | U.S. Treasury Securities—39.3% | | | | | | | |
| | | | U.S. Treasury Bonds—11.5% | | | | | | | |
| $ | 200,000 | | | U.S. Treasury Bonds | | | 7.625 | % | | | 11/15/2022 | | | $ | 238,715 | |
| | 200,000 | | | U.S. Treasury Bonds | | | 6.250 | | | | 08/15/2023 | | | | 232,441 | |
| | 100,000 | | | U.S. Treasury Bonds | | | 7.500 | | | | 11/15/2024 | | | | 126,828 | |
| | 200,000 | | | U.S. Treasury Bonds | | | 6.625 | | | | 02/15/2027 | | | | 257,141 | |
| | 100,000 | | �� | U.S. Treasury Bonds | | | 5.250 | | | | 11/15/2028 | | | | 121,021 | |
| | 50,000 | | | U.S. Treasury Bonds | | | 4.500 | | | | 02/15/2036 | | | | 60,960 | |
| | 200,000 | | | U.S. Treasury Bonds | | | 4.250 | | | | 05/15/2039 | | | | 240,188 | |
| | 100,000 | | | U.S. Treasury Bonds | | | 4.500 | | | | 08/15/2039 | | | | 124,068 | |
| | 100,000 | | | U.S. Treasury Bonds | | | 4.375 | | | | 11/15/2039 | | | | 122,291 | |
| | 100,000 | | | U.S. Treasury Bonds | | | 4.750 | | | | 02/15/2041 | | | | 128,932 | |
| | 200,000 | | | U.S. Treasury Bonds | | | 2.750 | | | | 08/15/2042 | | | | 191,496 | |
| | 100,000 | | | U.S. Treasury Bonds | | | 2.875 | | | | 05/15/2043 | | | | 97,762 | |
| | 50,000 | | | U.S. Treasury Bonds | | | 3.750 | | | | 11/15/2043 | | | | 56,566 | |
| | 200,000 | | | U.S. Treasury Bonds | | | 3.625 | | | | 02/15/2044 | | | | 222,039 | |
| | 200,000 | | | U.S. Treasury Bonds | | | 2.875 | | | | 08/15/2045 | | | | 195,070 | |
| | 200,000 | | | U.S. Treasury Bonds | | | 2.250 | | | | 08/15/2046 | | | | 171,375 | |
| | 200,000 | | | U.S. Treasury Bonds | | | 3.000 | | | | 05/15/2047 | | | | 199,680 | |
| | | | | | | | | | | | | | | | |
| | | | | | | | | | | | | | | 2,786,573 | |
| | | | | | | | | | | | | | | | |
| | | | U.S. Treasury Notes—27.8% | | | | | | | | | |
| | 200,000 | | | U.S. Treasury Notes | | | 1.625 | | | | 08/31/2019 | | | | 198,340 | |
| | 200,000 | | | U.S. Treasury Notes | | | 0.875 | | | | 09/15/2019 | | | | 196,734 | |
| | 200,000 | | | U.S. Treasury Notes | | | 3.375 | | | | 11/15/2019 | | | | 201,969 | |
| | 200,000 | | | U.S. Treasury Notes | | | 1.625 | | | | 12/31/2019 | | | | 197,598 | |
| | 200,000 | | | U.S. Treasury Notes | | | 1.250 | | | | 02/29/2020 | | | | 196,176 | |
| | 200,000 | | | U.S. Treasury Notes | | | 1.375 | | | | 04/30/2020 | | | | 196,055 | |
| | 200,000 | | | U.S. Treasury Notes | | | 3.500 | | | | 05/15/2020 | | | | 202,926 | |
| | 200,000 | | | U.S. Treasury Notes | | | 1.500 | | | | 06/15/2020 | | | | 196,156 | |
| | 200,000 | | | U.S. Treasury Notes | | | 2.625 | | | | 08/15/2020 | | | | 200,000 | |
| | 200,000 | | | U.S. Treasury Notes | | | 1.375 | | | | 10/31/2020 | | | | 194,703 | |
| | 100,000 | | | U.S. Treasury Notes | | | 2.625 | | | | 11/15/2020 | | | | 99,924 | |
| | 250,000 | | | U.S. Treasury Notes | | | 1.625 | | | | 11/30/2020 | | | | 244,448 | |
| | 100,000 | | | U.S. Treasury Notes | | | 1.750 | | | | 12/31/2020 | | | | 97,971 | |
| | 200,000 | | | U.S. Treasury Notes | | | 1.250 | | | | 03/31/2021 | | | | 192,988 | |
| | 200,000 | | | U.S. Treasury Notes | | | 3.125 | | | | 05/15/2021 | | | | 202,301 | |
| | 200,000 | | | U.S. Treasury Notes | | | 1.125 | | | | 06/30/2021 | | | | 191,578 | |
| | 200,000 | | | U.S. Treasury Notes | | | 1.125 | | | | 09/30/2021 | | | | 190,750 | |
| | 200,000 | | | U.S. Treasury Notes | | | 1.750 | | | | 11/30/2021 | | | | 194,098 | |
| | 200,000 | | | U.S. Treasury Notes | | | 1.875 | | | | 11/30/2021 | | | | 194,863 | |
| | 200,000 | | | U.S. Treasury Notes | | | 2.000 | | | | 02/15/2022 | | | | 195,328 | |
| | 200,000 | | | U.S. Treasury Notes | | | 1.875 | | | | 03/31/2022 | | | | 194,281 | |
| | 200,000 | | | U.S. Treasury Notes | | | 1.750 | | | | 05/15/2022 | | | | 193,195 | |
| | 200,000 | | | U.S. Treasury Notes | | | 2.125 | | | | 06/30/2022 | | | | 195,680 | |
| | 100,000 | | | U.S. Treasury Notes | | | 2.000 | | | | 02/15/2023 | | | | 96,955 | |
| | 200,000 | | | U.S. Treasury Notes | | | 1.500 | | | | 02/28/2023 | | | | 189,633 | |
| | 100,000 | | | U.S. Treasury Notes | | | 1.750 | | | | 05/15/2023 | | | | 95,689 | |
| | 100,000 | | | U.S. Treasury Notes | | | 2.500 | | | | 08/15/2023 | | | | 98,904 | |
| | 200,000 | | | U.S. Treasury Notes | | | 2.750 | | | | 11/15/2023 | | | | 200,043 | |
| | 200,000 | | | U.S. Treasury Notes | | | 2.250 | | | | 01/31/2024 | | | | 194,902 | |
| | 200,000 | | | U.S. Treasury Notes | | | 2.000 | | | | 06/30/2024 | | | | 191,727 | |
| | 200,000 | | | U.S. Treasury Notes | | | 2.375 | | | | 08/15/2024 | | | | 195,543 | |
| | 150,000 | | | U.S. Treasury Notes | | | 2.250 | | | | 11/15/2024 | | | | 145,418 | |
| | 200,000 | | | U.S. Treasury Notes | | | 2.000 | | | | 02/15/2025 | | | | 190,605 | |
| | 200,000 | | | U.S. Treasury Notes | | | 2.250 | | | | 11/15/2025 | | | | 192,719 | |
| | 50,000 | | | U.S. Treasury Notes | | | 1.625 | | | | 05/15/2026 | | | | 45,887 | |
| | 100,000 | | | U.S. Treasury Notes | | | 1.500 | | | | 08/15/2026 | | | | 90,602 | |
| | 200,000 | | | U.S. Treasury Notes | | | 2.000 | | | | 11/15/2026 | | | | 187,871 | |
| | 150,000 | | | U.S. Treasury Notes | | | 2.250 | | | | 08/15/2027 | | | | 142,925 | |
See accompanying Notes to Financial Statements which are an integral part of the financial statements.
Invesco PureBetaSM US Aggregate Bond ETF (PBND) (continued)
August 31, 2018
| | | | | | | | | | | | | | | | |
Principal
Amount | | | | | Interest
Rate | | | Maturity
Date | | | Value | |
| | | | U.S. Treasury Securities (continued) | | | | | | | |
| | | | U.S. Treasury Notes (continued) | | | | | | | | | |
| $ | 100,000 | | | U.S. Treasury Notes | | | 2.750 | % | | | 02/15/2028 | | | $ | 99,121 | |
| | | | | | | | | | | | | | | | |
| | | | | | | | | | | | | | | 6,726,606 | |
| | | | | | | | | | | | | | | | |
| | | | Total U.S. Treasury Securities
(Cost $9,743,084) | | | | | | | | | | | 9,513,179 | |
| | | | | | | | | | | | | | | | |
| | | | Corporate Bonds and Notes—28.6% | | | | | | | | | |
| | | | Aerospace/Defense—0.4% | | | | | | | |
| | 100,000 | | | United Technologies Corp. | | | 4.500 | | | | 06/01/2042 | | | | 99,520 | |
| | | | | | | | | | | | | | | | |
| | | | Agriculture—0.4% | | | | | | | |
| | 100,000 | | | Philip Morris International, Inc. | | | 4.125 | | | | 03/04/2043 | | | | 94,757 | |
| | | | | | | | | | | | | | | | |
| | | | Airlines—0.4% | | | | | | | |
| | 100,000 | | | Delta Air Lines, Inc. | | | 2.875 | | | | 03/13/2020 | | | | 99,289 | |
| | | | | | | | | | | | | | | | |
| | | | Auto Manufacturers—0.4% | | | | | | | |
| | 100,000 | | | General Motors Financial Co., Inc. | | | 3.200 | | | | 07/06/2021 | | | | 98,749 | |
| | | | | | | | | | | | | | | | |
| | | | Banks—6.7% | | | | | | | |
| | 100,000 | | | Bank of America Corp., MTN | | | 3.875 | | | | 08/01/2025 | | | | 100,126 | |
| | 100,000 | | | Bank of New York Mellon Corp. (The), MTN | | | 2.200 | | | | 08/16/2023 | | | | 94,549 | |
| | 200,000 | | | Barclays PLC (United Kingdom) | | | 3.250 | | | | 01/12/2021 | | | | 198,014 | |
| | 100,000 | | | Citigroup, Inc. | | | 8.125 | | | | 07/15/2039 | | | | 144,341 | |
| | 100,000 | | | Goldman Sachs Group, Inc. (The) | | | 2.875 | | | | 02/25/2021 | | | | 99,251 | |
| | 200,000 | | | HSBC Holdings PLC (United Kingdom) | | | 3.900 | | | | 05/25/2026 | | | | 197,093 | |
| | 100,000 | | | JPMorgan Chase & Co. | | | 2.250 | | | | 01/23/2020 | | | | 99,015 | |
| | 100,000 | | | JPMorgan Chase & Co. | | | 3.964 | | | | 11/15/2048 | | | | 92,715 | |
| | 100,000 | | | Kreditanstalt Fuer Wiederaufbau (Germany) | | | 1.625 | | | | 05/29/2020 | | | | 98,117 | |
| | 100,000 | | | Morgan Stanley, Series F, GMTN | | | 3.875 | | | | 04/29/2024 | | | | 100,635 | |
| | 100,000 | | | Sumitomo Mitsui Financial Group, Inc. (Japan) | | | 2.934 | | | | 03/09/2021 | | | | 99,028 | |
| | 100,000 | | | Toronto-Dominion Bank (The) (Canada) | | | 3.625 | | | | 09/15/2031 | | | | 95,042 | |
| | 100,000 | | | Wells Fargo & Co. | | | 3.069 | | | | 01/24/2023 | | | | 97,929 | |
| | 100,000 | | | Westpac Banking Corp. (Australia) | | | 1.600 | | | | 08/19/2019 | | | | 98,976 | |
| | | | | | | | | | | | | | | | |
| | | | | | | | | | | | | | | 1,614,831 | |
| | | | | | | | | | | | | | | | |
| | | | Beverages—0.8% | | | | | | | |
| | 100,000 | | | Anheuser-Busch InBev Finance, Inc. (Belgium) | | | 3.650 | | | | 02/01/2026 | | | | 98,024 | |
| | 100,000 | | | PepsiCo, Inc. | | | 2.150 | | | | 10/14/2020 | | | | 98,622 | |
| | | | | | | | | | | | | | | | |
| | | | | | | | | | | | | | | 196,646 | |
| | | | | | | | | | | | | | | | |
| | | | Biotechnology—0.8% | | | | | | | |
| | 100,000 | | | Amgen, Inc. | | | 4.663 | | | | 06/15/2051 | | | | 100,400 | |
| | 100,000 | | | Gilead Sciences, Inc. | | | 2.550 | | | | 09/01/2020 | | | | 99,141 | |
| | | | | | | | | | | | | | | | |
| | | | | | | | | | | | | | | 199,541 | |
| | | | | | | | | | | | | | | | |
| | | | Chemicals—0.4% | | | | | | | |
| | 100,000 | | | Dow Chemical Co. (The) | | | 4.375 | | | | 11/15/2042 | | | | 95,051 | |
| | | | | | | | | | | | | | | | |
| | | | Computers—0.5% | | | | | | | |
| | 100,000 | | | International Business Machines Corp. | | | 6.500 | | | | 01/15/2028 | | | | 121,029 | |
| | | | | | | | | | | | | | | | |
| | | | Diversified Financial Services—0.8% | | | | | | | |
| | 100,000 | | | Air Lease Corp. | | | 3.625 | | | | 04/01/2027 | | | | 93,969 | |
| | 100,000 | | | American Express Credit Corp., MTN | | | 2.200 | | | | 03/03/2020 | | | | 98,805 | |
| | | | | | | | | | | | | | | | |
| | | | | | | | | | | | | | | 192,774 | |
| | | | | | | | | | | | | | | | |
| | | | Electric—2.1% | | | | | | | |
| | 100,000 | | | Dominion Energy, Inc. | | | 3.625 | | | | 12/01/2024 | | | | 98,457 | |
| | 100,000 | | | Duke Energy Corp. | | | 3.750 | | | | 09/01/2046 | | | | 90,070 | |
| | 100,000 | | | Exelon Corp. | | | 2.850 | | | | 06/15/2020 | | | | 99,384 | |
| | 100,000 | | | Georgia Power Co. | | | 4.300 | | | | 03/15/2043 | | | | 96,972 | |
See accompanying Notes to Financial Statements which are an integral part of the financial statements.
Invesco PureBetaSM US Aggregate Bond ETF (PBND) (continued)
August 31, 2018
| | | | | | | | | | | | | | | | |
Principal
Amount | | | | | Interest
Rate | | | Maturity
Date | | | Value | |
| | | | Corporate Bonds and Notes (continued) | | | | | | | | | |
| | | | Electric (continued) | | | | | | | |
| $ | 100,000 | | | Pacific Gas & Electric Co. | | | 6.050 | % | | | 03/01/2034 | | | $ | 112,660 | |
| | | | | | | | | | | | | | | | |
| | | | | | | | | | | | | | | 497,543 | |
| | | | | | | | | | | | | | | | |
| | | | Environmental Control—0.4% | | | | | | | |
| | 100,000 | | | Waste Management, Inc. | | | 3.900 | | | | 03/01/2035 | | | | 98,412 | |
| | | | | | | | | | | | | | | | |
| | | | Food—0.4% | | | | | | | |
| | 100,000 | | | Kraft Heinz Foods Co. | | | 5.200 | | | | 07/15/2045 | | | | 97,772 | |
| | | | | | | | | | | | | | | | |
| | | | Healthcare-Products—0.4% | | | | | | | |
| | 100,000 | | | Abbott Laboratories | | | 4.900 | | | | 11/30/2046 | | | | 109,362 | |
| | | | | | | | | | | | | | | | |
| | | | Healthcare-Services—0.4% | | | | | | | |
| | 100,000 | | | UnitedHealth Group, Inc. | | | 2.125 | | | | 03/15/2021 | | | | 97,750 | |
| | | | | | | | | | | | | | | | |
| | | | Housewares—0.4% | | | | | | | |
| | 100,000 | | | Newell Brands, Inc. | | | 2.875 | | | | 12/01/2019 | | | | 99,603 | |
| | | | | | | | | | | | | | | | |
| | | | Insurance—1.3% | | | | | | | |
| | 100,000 | | | Berkshire Hathaway Finance Corp. | | | 2.900 | | | | 10/15/2020 | | | | 100,272 | |
| | 100,000 | | | Chubb INA Holdings, Inc. | | | 2.300 | | | | 11/03/2020 | | | | 98,483 | |
| | 100,000 | | | MetLife, Inc. | | | 6.400 | | | | 12/15/2036 | | | | 107,625 | |
| | | | | | | | | | | | | | | | |
| | | | | | | | | | | | | | | 306,380 | |
| | | | | | | | | | | | | | | | |
| | | | Internet—0.4% | | | | | | | |
| | 100,000 | | | Amazon.com, Inc. | | | 2.500 | | | | 11/29/2022 | | | | 97,744 | |
| | | | | | | | | | | | | | | | |
| | | | Iron/Steel—0.5% | | | | | | | |
| | 100,000 | | | Vale Overseas Ltd. (Brazil) | | | 6.250 | | | | 08/10/2026 | | | | 110,138 | |
| | | | | | | | | | | | | | | | |
| | | | Machinery-Diversified—0.4% | | | | | | | |
| | 100,000 | | | John Deere Capital Corp., MTN | | | 1.250 | | | | 10/09/2019 | | | | 98,338 | |
| | | | | | | | | | | | | | | | |
| | | | Media—0.8% | | | | | | | |
| | 100,000 | | | Comcast Corp. | | | 2.750 | | | | 03/01/2023 | | | | 97,562 | |
| | 100,000 | | | Warner Media LLC | | | 4.875 | | | | 03/15/2020 | | | | 102,510 | |
| | | | | | | | | | | | | | | | |
| | | | | | | | | | | | | | | 200,072 | |
| | | | | | | | | | | | | | | | |
| | | | Miscellaneous Manufacturing—0.5% | | | | | | | |
| | 100,000 | | | General Electric Co., Series A, GMTN | | | 6.750 | | | | 03/15/2032 | | | | 124,160 | |
| | | | | | | | | | | | | | | | |
| | | | Multi-National—1.2% | | | | | | | |
| | 100,000 | | | African Development Bank (Supranational) | | | 1.125 | | | | 09/20/2019 | | | | 98,506 | |
| | 100,000 | | | Asian Development Bank (Supranational) | | | 1.875 | | | | 10/23/2018 | | | | 99,956 | |
| | 100,000 | | | Asian Development Bank, GMTN (Supranational) | | | 1.750 | | | | 01/10/2020 | | | | 98,820 | |
| | | | | | | | | | | | | | | | |
| | | | | | | | | | | | | | | 297,282 | |
| | | | | | | | | | | | | | | | |
| | | | Oil & Gas—1.6% | | | | | | | |
| | 100,000 | | | Anadarko Petroleum Corp. | | | 3.450 | | | | 07/15/2024 | | | | 97,140 | |
| | 100,000 | | | BP Capital Markets PLC (United Kingdom) | | | 3.119 | | | | 05/04/2026 | | | | 96,490 | |
| | 100,000 | | | Exxon Mobil Corp. | | | 2.726 | | | | 03/01/2023 | | | | 98,488 | |
| | 100,000 | | | Valero Energy Corp. | | | 3.400 | | | | 09/15/2026 | | | | 95,517 | |
| | | | | | | | | | | | | | | | |
| | | | | | | | | | | | | | | 387,635 | |
| | | | | | | | | | | | | | | | |
| | | | Pharmaceuticals—1.2% | | | | | | | |
| | 100,000 | | | AbbVie, Inc. | | | 3.600 | | | | 05/14/2025 | | | | 97,826 | |
| | 100,000 | | | Bayer US Finance II LLC (Germany)(a) | | | 2.750 | | | | 07/15/2021 | | | | 97,457 | |
| | 100,000 | | | CVS Health Corp. | | | 2.875 | | | | 06/01/2026 | | | | 92,028 | |
| | | | | | | | | | | | | | | | |
| | | | | | | | | | | | | | | 287,311 | |
| | | | | | | | | | | | | | | | |
| | | | Pipelines—1.3% | | | | | | | |
| | 100,000 | | | Energy Transfer Partners LP | | | 6.125 | | | | 12/15/2045 | | | | 106,289 | |
| | 100,000 | | | Kinder Morgan Energy Partners LP | | | 3.950 | | | | 09/01/2022 | | | | 101,183 | |
See accompanying Notes to Financial Statements which are an integral part of the financial statements.
Invesco PureBetaSM US Aggregate Bond ETF (PBND) (continued)
August 31, 2018
| | | | | | | | | | | | | | | | |
Principal
Amount | | | | | Interest
Rate | | | Maturity
Date | | | Value | |
| | | | Corporate Bonds and Notes (continued) | | | | | | | | | |
| | | | Pipelines (continued) | | | | | | | |
| $ | 100,000 | | | TransCanada PipeLines Ltd. (Canada) | | | 4.625 | % | | | 03/01/2034 | | | $ | 101,659 | |
| | | | | | | | | | | | | | | | |
| | | | | | | | | | | | | | | 309,131 | |
| | | | | | | | | | | | | | | | |
| | | | REITs—0.8% | | | | | | | |
| | 100,000 | | | American Tower Corp. | | | 3.500 | | | | 01/31/2023 | | | | 98,745 | |
| | 100,000 | | | Boston Properties LP | | | 3.800 | | | | 02/01/2024 | | | | 100,217 | |
| | | | | | | | | | | | | | | | |
| | | | | | | | | | | | | | | 198,962 | |
| | | | | | | | | | | | | | | | |
| | | | Retail—0.5% | | | | | | | |
| | 100,000 | | | Home Depot, Inc. (The) | | | 5.875 | | | | 12/16/2036 | | | | 123,246 | |
| | | | | | | | | | | | | | | | |
| | | | Semiconductors—0.4% | | | | | | | |
| | 100,000 | | | Intel Corp. | | | 2.700 | | | | 12/15/2022 | | | | 98,556 | |
| | | | | | | | | | | | | | | | |
| | | | Software—0.8% | | | | | | | |
| | 100,000 | | | Microsoft Corp. | | | 3.700 | | | | 08/08/2046 | | | | 96,876 | |
| | 100,000 | | | Oracle Corp. | | | 1.900 | | | | 09/15/2021 | | | | 96,841 | |
| | | | | | | | | | | | | | | | |
| | | | | | | | | | | | | | | 193,717 | |
| | | | | | | | | | | | | | | | |
| | | | Telecommunications—0.8% | | | | | | | |
| | 100,000 | | | AT&T, Inc. | | | 3.400 | | | | 05/15/2025 | | | | 95,216 | |
| | 100,000 | | | Verizon Communications, Inc. | | | 5.012 | | | | 04/15/2049 | | | | 100,949 | |
| | | | | | | | | | | | | | | | |
| | | | | | | | | | | | | | | 196,165 | |
| | | | | | | | | | | | | | | | |
| | | | Transportation—0.4% | | | | | | | |
| | 100,000 | | | Burlington Northern Santa Fe LLC | | | 3.050 | | | | 09/01/2022 | | | | 99,399 | |
| | | | | | | | | | | | | | | | |
| | | | Total Corporate Bonds and Notes
(Cost $7,177,111) | | | | | | | | | | | 6,940,865 | |
| | | | | | | | | | | | | | | | |
| | | | U.S. Government Sponsored Agency Mortgage-Backed Securities—23.3% | | | | | | | |
| | | | Collateralized Mortgage Obligations—23.3% | | | | | | | |
| | 216,016 | | | Federal Home Loan Mortgage Corp. (FHLMC) | | | 3.000 | | | | 11/01/2028 | | | | 215,955 | |
| | 104,249 | | | Federal Home Loan Mortgage Corp. (FHLMC) | | | 3.500 | | | | 02/01/2043 | | | | 104,518 | |
| | 205,507 | | | Federal Home Loan Mortgage Corp. (FHLMC) | | | 3.500 | | | | 05/01/2045 | | | | 205,292 | |
| | 72,170 | | | Federal Home Loan Mortgage Corp. (FHLMC) | | | 3.500 | | | | 03/01/2046 | | | | 72,195 | |
| | 414,910 | | | Federal Home Loan Mortgage Corp. (FHLMC) | | | 3.000 | | | | 06/01/2046 | | | | 402,309 | |
| | 222,911 | | | Federal Home Loan Mortgage Corp. (FHLMC) | | | 4.000 | | | | 08/01/2047 | | | | 227,395 | |
| | 236,243 | | | Federal Home Loan Mortgage Corp. (FHLMC) | | | 3.500 | | | | 10/01/2047 | | | | 235,217 | |
| | 150,000 | | | Federal Home Loan Mortgage Corp. (FHLMC) | | | 4.000 | | | | 09/01/2048 | | | | 152,947 | |
| | 88,904 | | | Federal National Mortgage Association (FNMA) | | | 3.500 | | | | 12/01/2028 | | | | 90,253 | |
| | 205,298 | | | Federal National Mortgage Association (FNMA) | | | 3.500 | | | | 10/01/2042 | | | | 205,880 | |
| | 348,234 | | | Federal National Mortgage Association (FNMA) | | | 3.500 | | | | 08/01/2045 | | | | 347,226 | |
| | 342,155 | | | Federal National Mortgage Association (FNMA) | | | 3.000 | | | | 09/01/2046 | | | | 331,583 | |
| | 176,389 | | | Federal National Mortgage Association (FNMA) | | | 3.000 | | | | 12/01/2046 | | | | 170,910 | |
| | 310,224 | | | Federal National Mortgage Association (FNMA) | | | 3.000 | | | | 12/01/2046 | | | | 301,889 | |
| | 225,947 | | | Federal National Mortgage Association (FNMA) | | | 3.500 | | | | 08/01/2047 | | | | 224,908 | |
| | 271,756 | | | Federal National Mortgage Association (FNMA) | | | 4.000 | | | | 09/01/2047 | | | | 276,949 | |
| | 362,933 | | | Federal National Mortgage Association (FNMA) | | | 4.000 | | | | 10/01/2047 | | | | 369,863 | |
| | 93,777 | | | Federal National Mortgage Association (FNMA) | | | 4.000 | | | | 12/01/2047 | | | | 95,651 | |
| | 75,565 | | | Government National Mortgage Association (GNMA) | | | 3.500 | | | | 04/20/2042 | | | | 76,483 | |
| | 90,735 | | | Government National Mortgage Association (GNMA) | | | 4.000 | | | | 11/15/2046 | | | | 93,247 | |
| | 464,744 | | | Government National Mortgage Association (GNMA) | | | 3.000 | | | | 11/20/2046 | | | | 455,025 | |
| | 189,333 | | | Government National Mortgage Association (GNMA) | | | 4.000 | | | | 05/20/2047 | | | | 194,692 | |
| | 463,777 | | | Government National Mortgage Association (GNMA) | | | 3.500 | | | | 08/20/2047 | | | | 466,046 | |
| | 328,643 | | | Government National Mortgage Association (GNMA) | | | 3.500 | | | | 09/20/2047 | | | | 330,251 | |
| | | | | | | | | | | | | | | | |
| | | | Total U.S. Government Sponsored Agency Mortgage-Backed Securities
(Cost $5,826,954) | | | | | | | | | | | 5,646,684 | |
| | | | | | | | | | | | | | | | |
| | | | Sovereign Debt Obligations—3.1% | | | | | | | |
| | | | Canada—0.4% | | | | | | | |
| | 100,000 | | | Province of Alberta Canada | | | 2.200 | | | | 07/26/2022 | | | | 96,646 | |
| | | | | | | | | | | | | | | | |
See accompanying Notes to Financial Statements which are an integral part of the financial statements.
Invesco PureBetaSM US Aggregate Bond ETF (PBND) (continued)
August 31, 2018
| | | | | | | | | | | | | | | | |
Principal
Amount | | | | | Interest
Rate | | | Maturity
Date | | | Value | |
| | | | Sovereign Debt Obligations (continued) | | | | | | | |
| | | | Hungary—0.9% | | | | | | | |
| $ | 200,000 | | | Hungary Government International Bond | | | 5.375 | % | | | 02/21/2023 | | | $ | 213,395 | |
| | | | | | | | | | | | | | | | |
| | | | Indonesia—0.6% | | | | | | | |
| | 100,000 | | | Indonesia Government International Bond(a) | | | 8.500 | | | | 10/12/2035 | | | | 139,552 | |
| | | | | | | | | | | | | | | | |
| | | | Japan—0.8% | | | | | | | |
| | 200,000 | | | Japan Bank For International Cooperation | | | 2.875 | | | | 06/01/2027 | | | | 194,250 | |
| | | | | | | | | | | | | | | | |
| | | | Mexico—0.4% | | | | | | | |
| | 100,000 | | | Mexico Government International Bond, GMTN | | | 4.750 | | | | 03/08/2044 | | | | 95,800 | |
| | | | | | | | | | | | | | | | |
| | | | Total Sovereign Debt Obligations
(Cost $773,510) | | | | | | | | | | | 739,643 | |
| | | | | | | | | | | | | | | | |
| | | | Commercial Mortgage-Backed Securities—1.8% | | | | | | | |
| | 100,000 | | | COMM Mortgage Trust, Class A5, Ser. 2015-CR22 | | | 3.309 | | | | 03/10/2048 | | | | 99,182 | |
| | 200,000 | | | Wells Fargo Commercial Mortgage Trust, Class A4, Ser. 2015-NXS2 | | | 3.498 | | | | 07/15/2058 | | | | 200,406 | |
| | 100,000 | | | Wells Fargo Commercial Mortgage Trust, Class B, Series 2015-LC20 | | | 3.719 | | | | 04/15/2050 | | | | 97,988 | |
| | 50,000 | | | WFRBS Commercial Mortgage Trust, Class C, Series 2012-C9 | | | 4.543 | | | | 11/15/2045 | | | | 50,029 | |
| | | | | | | | | | | | | | | | |
| | | | Total Commercial Mortgage-Backed Securities
(Cost $460,792) | | | | | | | | | | | 447,605 | |
| | | | | | | | | | | | | | | | |
| | | | U.S. Government Sponsored Agency Securities—1.7% | | | | | | | |
| | 100,000 | | | Federal Home Loan Banks (FHLB) | | | 2.625 | | | | 05/28/2020 | | | | 100,005 | |
| | 100,000 | | | Federal Home Loan Mortgage Corp. (FHLMC) | | | 2.375 | | | | 01/13/2022 | | | | 98,815 | |
| | 100,000 | | | Federal National Mortgage Association (FNMA) | | | 2.625 | | | | 09/06/2024 | | | | 98,633 | |
| | 100,000 | | | Resolution Funding Corp., Series A | | | 8.625 | | | | 01/15/2021 | | | | 113,300 | |
| | | | | | | | | | | | | | | | |
| | | | Total U.S. Government Sponsored Agency Securities
(Cost $415,878) | | | | | | | | | | | 410,753 | |
| | | | | | | | | | | | | | | | |
| | | | Asset-Backed Securities—1.2% | | | | | | | |
| | 200,000 | | | Capital One Multi-Asset Execution Trust, Class A4, Ser. 2016-A4 | | | 1.330 | | | | 06/15/2022 | | | | 197,485 | |
| | 100,000 | | | Ford Credit Auto Owner Trust 2018-Rev1, Class A, Series 2018-1(a) | | | 3.190 | | | | 07/15/2031 | | | | 98,477 | |
| | | | | | | | | | | | | | | | |
| | | | Total Asset-Backed Securities
(Cost $297,087) | | | | | | | | | | | 295,962 | |
| | | | | | | | | | | | | | | | |
| | | | Municipal Bonds—0.6% | | | | | | | |
| | | | Ad Valorem Property Tax—0.6% | | | | | | | |
| | 100,000 | | | California State Various Purpose Ser. 09 | | | 7.550 | | | | 04/01/2039 | | | | | |
| | | | (Cost $152,621) | | | | | | | | | | | 148,667 | |
| | | | | | | | | | | | | | | | |
| | | | |
| | | | | | | | | | | | | | | | |
Number
of Shares | | | | | | | | | | | | |
| | | | Money Market Fund—0.6% | | | | | | | |
| | 147,058 | | | Invesco Premier U.S. Government Money Portfolio—Institutional Class, 1.83%(b)
(Cost $147,058) | | | | | | | | | | | 147,058 | |
| | | | | | | | | | | | | | | | |
| | | | Total Investments in Securities
(Cost $24,994,095)—100.2% | | | | | | | | | | | 24,290,416 | |
| | | | Other assets less liabilities—(0.2)% | | | | | | | | | | | (57,224 | ) |
| | | | | | | | | | | | | | | | |
| | | | Net Assets—100.0% | | | | | | | | | | $ | 24,233,192 | |
| | | | | | | | | | | | | | | | |
Investment Abbreviations:
GMTN—Global Medium-Term Note
MTN—Medium-Term Note
REIT—Real Estate Investment Trust
Ser.—Series
See accompanying Notes to Financial Statements which are an integral part of the financial statements.
Invesco PureBetaSM US Aggregate Bond ETF (PBND) (continued)
August 31, 2018
Notes to Schedule of Investments:
| (a) | Security purchased or received in a transaction exempt from registration under the Securities Act of 1933, as amended (the “1933 Act”). The security may be resold pursuant to an exemption from registration under the 1933 Act, typically to qualified institutional buyers. The aggregate value of these securities at August 31, 2018 was $335,486, which represented 1.38% of the Fund’s Net Assets. |
| (b) | The security and the Fund are advised by wholly-owned subsidiaries of Invesco Ltd. and are therefore considered to be affiliated. The rate shown is the 7-day SEC standardized yield as of August 31, 2018. |
See accompanying Notes to Financial Statements which are an integral part of the financial statements.
Statements of Assets and Liabilities
August 31, 2018
| | | | | | | | | | | | |
| | | Invesco
PureBetaSM
MSCI USA ETF
(PBUS) | | | Invesco
PureBetaSM
MSCI USA
Small Cap ETF
(PBSM) | | | Invesco
PureBetaSM
US Aggregate
Bond ETF
(PBND) | |
| Assets: | | | | | | | | | | | | |
Unaffiliated investments in securities, at value | | $ | 2,902,460 | | | $ | 3,009,823 | | | $ | 24,143,358 | |
Affiliated investments in securities, at value | | | 1,085 | | | | 1,380 | | | | 147,058 | |
Receivables: | | | | | | | | | | | | |
Dividends and interest | | | 5,237 | | | | 2,269 | | | | 147,367 | |
Investments sold | | | 5,028 | | | | 14,341 | | | | 789,249 | |
| | | | | | | | | | | | |
Total Assets | | | 2,913,810 | | | | 3,027,813 | | | | 25,227,032 | |
| | | | | | | | | | | | |
| | | |
| Liabilities: | | | | | | | | | | | | |
Due to custodian | | | 1,400 | | | | 1,209 | | | | — | |
Payables: | | | | | | | | | | | | |
Investments purchased | | | 3,312 | | | | 15,157 | | | | 992,831 | |
Accrued unitary management fees | | | 97 | | | | 150 | | | | 1,009 | |
| | | | | | | | | | | | |
Total Liabilities | | | 4,809 | | | | 16,516 | | | | 993,840 | |
| | | | | | | | | | | | |
| Net Assets | | $ | 2,909,001 | | | $ | 3,011,297 | | | $ | 24,233,192 | |
| | | | | | | | | | | | |
| | | |
| Net Assets Consist of: | | | | | | | | | | | | |
Shares of beneficial interest | | $ | 2,500,025 | | | $ | 2,500,025 | | | $ | 24,991,283 | |
Undistributed net investment income | | | 11,137 | | | | 8,416 | | | | — | |
Undistributed net realized gain (loss) | | | 4,050 | | | | 76,670 | | | | (54,412 | ) |
Net unrealized appreciation (depreciation) | | | 393,789 | | | | 426,186 | | | | (703,679 | ) |
| | | | | | | | | | | | |
| Net Assets | | $ | 2,909,001 | | | $ | 3,011,297 | | | $ | 24,233,192 | |
| | | | | | | | | | | | |
Shares outstanding (unlimited amount authorized, $0.01 par value) | | | 100,001 | | | | 100,001 | | | | 1,000,001 | |
Net asset value | | $ | 29.09 | | | $ | 30.11 | | | $ | 24.23 | |
| | | | | | | | | | | | |
Market price | | $ | 29.09 | | | $ | 30.11 | | | $ | 24.25 | |
| | | | | | | | | | | | |
Unaffiliated investments in securities, at cost | | $ | 2,508,248 | | | $ | 2,583,561 | | | $ | 24,847,037 | |
| | | | | | | | | | | | |
Affiliated investments in securities, at cost | | $ | 1,508 | | | $ | 1,456 | | | $ | 147,058 | |
| | | | | | | | | | | | |
See accompanying Notes to Financial Statements which are an integral part of the financial statements.
(This Page Intentionally Left Blank)
Statements of Operations
For the period November 1, 2017 through August 31, 2018 and period ended October 31, 2017
| | | | | | | | | | | | | | | | |
| | | Invesco PureBetaSM
MSCI USA ETF (PBUS) | | | Invesco PureBetaSM
MSCI USA Small Cap ETF (PBSM) | |
| | | Ten Months Ended
August 31, 2018 | | | Period Ended
October 31, 2017(a) | | | Ten Months Ended
August 31, 2018 | | | Period Ended
October 31, 2017(a) | |
| Investment Income: | | | | | | | | | | | | | | | | |
Unaffiliated dividend income | | $ | 44,082 | | | $ | 3,754 | | | $ | 31,181 | | | $ | 3,558 | |
Affiliated dividend income | | | 68 | | | | — | | | | 125 | | | | 35 | |
Non-cash dividend income | | | — | | | | — | | | | 2,005 | | | | — | |
Unaffiliated interest income | | | — | | | | — | | | | — | | | | — | |
Foreign withholding tax | | | (3 | ) | | | (5 | ) | | | (19 | ) | | | — | |
| | | | | | | | | | | | | | | | |
Total Income | | | 44,147 | | | | 3,749 | | | | 33,292 | | | | 3,593 | |
| | | | | | | | | | | | | | | | |
| Expenses: | | | | | | | | | | | | | | | | |
Unitary management fees | | | 906 | | | | 111 | | | | 1,377 | | | | 170 | |
| | | | | | | | | | | | | | | | |
Less: Waivers | | | (2 | ) | | | — | | | | (2 | ) | | | — | |
| | | | | | | | | | | | | | | | |
Net Expenses | | | 904 | | | | 111 | | | | 1,375 | | | | 170 | |
| | | | | | | | | | | | | | | | |
Net Investment Income | | | 43,243 | | | | 3,638 | | | | 31,917 | | | | 3,423 | |
| | | | | | | | | | | | | | | | |
| | | | |
| Realized and Unrealized Gain (Loss): | | | | | | | | | | | | | | | | |
Net realized gain (loss) from: | | | | | | | | | | | | | | | | |
Investment securities | | | 4,577 | | | | (620 | ) | | | 76,656 | | | | (99 | ) |
| | | | | | | | | | | | | | | | |
Net realized gain (loss) | | | 4,577 | | | | (620 | ) | | | 76,656 | | | | (99 | ) |
| | | | | | | | | | | | | | | | |
Change in net unrealized appreciation (depreciation) on: | | | | | | | | | | | | | | | | |
Unaffiliated investment securities | | | 327,595 | | | | 66,618 | | | | 323,121 | | | | 103,141 | |
Affiliated investment securities | | | (526 | ) | | | 102 | | | | (84 | ) | | | 8 | |
| | | | | | | | | | | | | | | | |
Net change in unrealized appreciation (depreciation) | | | 327,069 | | | | 66,720 | | | | 323,037 | | | | 103,149 | |
| | | | | | | | | | | | | | | | |
Net realized and unrealized gain (loss) | | | 331,646 | | | | 66,100 | | | | 399,693 | | | | 103,050 | |
| | | | | | | | | | | | | | | | |
Net increase (decrease) in net assets resulting from operations | | $ | 374,889 | | | $ | 69,738 | | | $ | 431,610 | | | $ | 106,473 | |
| | | | | | | | | | | | | | | | |
| (a) | For the period September 19, 2017 (commencement of investment operations) through October 31, 2017. |
| (b) | For the period September 27, 2017 (commencement of investment operations) through October 31, 2017. |
See accompanying Notes to Financial Statements which are an integral part of the financial statements.
| | | | | | |
Invesco PureBetaSM
US Aggregate Bond ETF (PBND) | |
Ten Months Ended
August 31, 2018 | | | Period Ended
October 31, 2017(b) | |
| | | | | | |
| $ | 1 | | | $ | — | |
| | 1,614 | | | | 588 | |
| | — | | | | — | |
| | 527,944 | | | | 55,450 | |
| | (140 | ) | | | — | |
| | | | | | |
| | 529,419 | | | | 56,038 | |
| | | | | | |
| | | | | | |
| | 10,173 | | | | 1,130 | |
| | | | | | |
| | (218 | ) | | | (159 | ) |
| | | | | | |
| | 9,955 | | | | 971 | |
| | | | | | |
| | 519,464 | | | | 55,067 | |
| | | | | | |
| |
| | | | | | |
| | | | | | |
| | (35,744 | ) | | | — | |
| | | | | | |
| | (35,744 | ) | | | — | |
| | | | | | |
| | | | | | |
| | (665,580 | ) | | | (38,099 | ) |
| | — | | | | — | |
| | | | | | |
| | (665,580 | ) | | | (38,099 | ) |
| | | | | | |
| | (701,324 | ) | | | (38,099 | ) |
| | | | | | |
| $ | (181,860 | ) | | $ | 16,968 | |
| | | | | | |
Statements of Changes in Net Assets
For the period November 1, 2017 through August 31, 2018 and the period ended October 31, 2017
| | | | | | | | | | | | | | | | |
| | | Invesco PureBetaSM
MSCI USA ETF (PBUS) | | | Invesco PureBetaSM
MSCI USA Small Cap ETF (PBSM) | |
| | | Ten Months Ended
August 31, 2018 | | | Period Ended
October 31, 2017(a) | | | Ten Months Ended
August 31, 2018 | | | Period Ended
October 31, 2017(a) | |
| Operations: | | | | | | | | | | | | | | | | |
Net investment income | | $ | 43,243 | | | $ | 3,638 | | | $ | 31,917 | | | $ | 3,423 | |
Net realized gain (loss) | | | 4,577 | | | | (620 | ) | | | 76,656 | | | | (99 | ) |
Net change in unrealized appreciation (depreciation) | | | 327,069 | | | | 66,720 | | | | 323,037 | | | | 103,149 | |
| | | | | | | | | | | | | | | | |
Net increase (decrease) in net assets resulting from operations | | | 374,889 | | | | 69,738 | | | | 431,610 | | | | 106,473 | |
| | | | | | | | | | | | | | | | |
| | | | |
| Distributions to Shareholders from: | | | | | | | | | | | | | | | | |
Net investment income | | | (35,651 | ) | | | — | | | | (26,811 | ) | | | — | |
Return of capital | | | — | | | | — | | | | — | | | | — | |
| | | | | | | | | | | | | | | | |
Total distributions to shareholders | | | (35,651 | ) | | | — | | | | (26,811 | ) | | | — | |
| | | | | | | | | | | | | | | | |
| | | | |
| Shareholder Transactions: | | | | | | | | | | | | | | | | |
Proceeds from shares sold | | | — | | | | 2,500,025 | | | | — | | | | 2,500,025 | |
| | | | | | | | | | | | | | | | |
Net increase in net assets resulting from shares transactions | | | — | | | | 2,500,025 | | | | — | | | | 2,500,025 | |
| | | | | | | | | | | | | | | | |
Increase (Decrease) in Net Assets | | | 339,238 | | | | 2,569,763 | | | | 404,799 | | | | 2,606,498 | |
| | | | | | | | | | | | | | | | |
| | | | |
| Net Assets: | | | | | | | | | | | | | | | | |
Beginning of period | | | 2,569,763 | | | | — | | | | 2,606,498 | | | | — | |
| | | | | | | | | | | | | | | | |
End of period | | $ | 2,909,001 | | | $ | 2,569,763 | | | $ | 3,011,297 | | | $ | 2,606,498 | |
| | | | | | | | | | | | | | | | |
Undistributed net investment income at end of period | | $ | 11,137 | | | $ | 3,638 | | | $ | 8,416 | | | $ | 3,423 | |
| | | | | | | | | | | | | | | | |
| | | | |
| Changes in Shares Outstanding: | | | | | | | | | | | | | | | | |
Shares sold | | | — | | | | 100,001 | | | | — | | | | 100,001 | |
Shares repurchased | | | — | | | | — | | | | — | | | | — | |
Shares outstanding, beginning of period | | | 100,001 | | | | — | | | | 100,001 | | | | — | |
| | | | | | | | | | | | | | | | |
Shares outstanding, end of period | | | 100,001 | | | | 100,001 | | | | 100,001 | | | | 100,001 | |
| | | | | | | | | | | | | | | | |
| (a) | For the period September 19, 2017 (commencement of investment operations) through October 31, 2017. |
| (b) | For the period September 27, 2017 (commencement of investment operations) through October 31, 2017. |
See accompanying Notes to Financial Statements which are an integral part of the financial statements.
| | | | | | |
Invesco PureBetaSM
US Aggregate Bond ETF (PBND) | |
Ten Months Ended
August 31, 2018 | | | Period Ended
October 31, 2017(b) | |
| | | | | | |
| $ | 519,464 | | | $ | 55,067 | |
| | (35,744 | ) | | | — | |
| | (665,580 | ) | | | (38,099 | ) |
| | | | | | |
| | (181,860 | ) | | | 16,968 | |
| | | | | | |
| |
| | | | | | |
| | (540,479 | ) | | | (52,720 | ) |
| | (8,742 | ) | | | — | |
| | | | | | |
| | (549,221 | ) | | | (52,720 | ) |
| | | | | | |
| |
| | | | | | |
| | — | | | | 25,000,025 | |
| | | | | | |
| | — | | | | 25,000,025 | |
| | | | | | |
| | (731,081 | ) | | | 24,964,273 | |
| | | | | | |
| |
| | | | | | |
| | 24,964,273 | | | | — | |
| | | | | | |
| $ | 24,233,192 | | | $ | 24,964,273 | |
| | | | | | |
| $ | — | | | $ | 3,370 | |
| | | | | | |
| |
| | | | | | |
| | — | | | | 1,000,001 | |
| | — | | | | — | |
| | 1,000,001 | | | | — | |
| | | | | | |
| | 1,000,001 | | | | 1,000,001 | |
| | | | | | |
Financial Highlights
Invesco PureBetaSM MSCI USA ETF (PBUS)
| | | | | | | | |
| | | Ten Months Ended
August 31, 2018 | | | For the Period
September 19, 2017(a)
Through
October 31, 2017
| |
| |
| Per Share Operating Performance: | | | | | | | | |
Net asset value at beginning of period | | $ | 25.70 | | | $ | 25.00 | |
Net investment income(b) | | | 0.43 | | | | 0.04 | |
Net realized and unrealized gain on investments | | | 3.32 | | | | 0.66 | |
Total from investment operations | | | 3.75 | | | | 0.70 | |
Distributions to shareholders from: | | | | | | | | |
Net investment income | | | (0.36 | ) | | | — | |
Net asset value at end of period | | $ | 29.09 | | | $ | 25.70 | |
Market price at end of period(c) | | $ | 29.09 | | | $ | 25.70 | |
| Net Asset Value Total Return(d) | | | 14.68 | % | | | 2.80 | %(e) |
| Market Price Total Return(d) | | | 14.68 | % | | | 2.80 | %(e) |
| Ratios/Supplemental Data: | | | | | | | | |
Net assets at end of period (000’s omitted) | | $ | 2,909 | | | $ | 2,570 | |
Ratio to average net assets of: | | | | | | | | |
Expenses | | | 0.04 | %(f) | | | 0.04 | %(f) |
Net investment income | | | 1.91 | %(f) | | | 1.31 | %(f) |
Portfolio turnover rate(g) | | | 4 | % | | | 0 | %(h) |
| (a) | Commencement of investment operations. |
| (b) | Based on average shares outstanding. |
| (c) | The mean between the last bid and ask prices. |
| (d) | Net asset value total return is calculated assuming an initial investment made at the net asset value at the beginning of the period, reinvestment of all dividends and distributions at net asset value during the period, and redemption on the last day of the period. Net asset value total return includes adjustments in accordance with accounting principles generally accepted in the United States of America and as such, the net asset value for financial reporting purposes and the returns based upon those net asset values may differ from the net asset value and returns for shareholder transactions. Market price total return is calculated assuming an initial investment made at the market price at the beginning of the period, reinvestment of all dividends and distributions at market price during the period, and the sale at the market price on the last day of the period. Total investment returns calculated for a period of less than one year are not annualized. |
| (e) | The net asset value total return from Fund Inception (September 22, 2017, the first day of trading on the exchange) to October 31, 2017 was 2.96%. The market price total return from Fund Inception to October 31, 2017 was 3.09%. |
| (g) | Portfolio turnover rate is not annualized for periods less than one year, if applicable, and does not include securities received or delivered from processing creations or redemptions. |
| (h) | Amount represents less than 0.5%. |
Invesco PureBetaSM MSCI USA Small Cap ETF (PBSM)
| | | | | | | | |
| | | Ten Months Ended
August 31, 2018 | | | For the Period
September 19, 2017(a)
Through
October 31, 2017
| |
| |
| Per Share Operating Performance: | | | | | | | | |
Net asset value at beginning of period | | $ | 26.06 | | | $ | 25.00 | |
Net investment income(b) | | | 0.32 | | | | 0.04 | |
Net realized and unrealized gain on investments | | | 4.00 | | | | 1.02 | |
Total from investment operations | | | 4.32 | | | | 1.06 | |
Distributions to shareholders from: | | | | | | | | |
Net investment income | | | (0.27 | ) | | | — | |
Net asset value at end of period | | $ | 30.11 | | | $ | 26.06 | |
Market price at end of period(c) | | $ | 30.11 | | | $ | 26.08 | |
| Net Asset Value Total Return(d) | | | 16.66 | % | | | 4.24 | %(e) |
| Market Price Total Return(d) | | | 16.57 | % | | | 4.32 | %(e) |
| Ratios/Supplemental Data: | | | | | | | | |
Net assets at end of period (000’s omitted) | | $ | 3,011 | | | $ | 2,606 | |
Ratio to average net assets of: | | | | | | | | |
Expenses | | | 0.06 | %(f) | | | 0.06 | %(f) |
Net investment income | | | 1.39 | %(f) | | | 1.21 | %(f) |
Portfolio turnover rate(g) | | | 15 | % | | | 1 | % |
| (a) | Commencement of investment operations. |
| (b) | Based on average shares outstanding. |
| (c) | The mean between the last bid and ask prices. |
| (d) | Net asset value total return is calculated assuming an initial investment made at the net asset value at the beginning of the period, reinvestment of all dividends and distributions at net asset value during the period, and redemption on the last day of the period. Net asset value total return includes adjustments in accordance with accounting principles generally accepted in the United States of America and as such, the net asset value for financial reporting purposes and the returns based upon those net asset values may differ from the net asset value and returns for shareholder transactions. Market price total return is calculated assuming an initial investment made at the market price at the beginning of the period, reinvestment of all dividends and distributions at market price during the period, and the sale at the market price on the last day of the period. Total investment returns calculated for a period of less than one year are not annualized. |
| (e) | The net asset value total return from Fund Inception (September 22, 2017, the first day of trading on the exchange) to October 31, 2017 was 3.66%. The market price total return from Fund Inception to October 31, 2017 was 3.66%. |
| (g) | Portfolio turnover rate is not annualized for periods less than one year, if applicable, and does not include securities received or delivered from processing creations or redemptions. |
See accompanying Notes to Financial Statements which are an integral part of the financial statements.
Financial Highlights (continued)
Invesco PureBetaSM US Aggregate Bond ETF (PBND)
| | | | | | | | | | | | |
| | | | | | Ten Months Ended
August 31, 2018 | | | For the Period
September 27, 2017(a)
Through
October 31, 2017
| |
| |
| Per Share Operating Performance: | | | | | | | | | | | | |
Net asset value at beginning of period | | | | | | $ | 24.96 | | | $ | 25.00 | |
Net investment income(b) | | | | | | | 0.52 | | | | 0.06 | |
Net realized and unrealized gain (loss) on investments | | | | | | | (0.70 | ) | | | (0.05 | ) |
Total from investment operations | | | | | | | (0.18 | ) | | | 0.01 | |
Distributions to shareholders from: | | | | | | | | | | | | |
Net investment income | | | | | | | (0.54 | ) | | | (0.05 | ) |
Return of capital | | | | | | | (0.01 | ) | | | — | |
Total distributions to shareholders | | | | | | | (0.55 | ) | | | (0.05 | ) |
Net asset value at end of period | | | | | | $ | 24.23 | | | $ | 24.96 | |
Market price at end of period(c) | | | | | | $ | 24.25 | | | $ | 24.96 | |
| Net Asset Value Total Return(d) | | | | | | | (0.72 | )% | | | 0.05 | %(e) |
| Market Price Total Return(d) | | | | | | | (0.64 | )% | | | 0.05 | %(e) |
| Ratios/Supplemental Data: | | | | | | | | | | | | |
Net assets at end of period (000’s omitted) | | | | | | $ | 24,233 | | | $ | 24,964 | |
Ratio to average net assets of: | | | | | | | | | | | | |
Expenses, after Waivers | | | | | | | 0.05 | %(f) | | | 0.04 | %(f) |
Expenses, prior to Waivers | | | | | | | 0.05 | %(f) | | | 0.05 | %(f) |
Net investment income, after Waivers | | | | | | | 2.55 | %(f) | | | 2.44 | %(f) |
Portfolio turnover rate(g) | | | | | | | 20 | % | | | 0 | %(h) |
| (a) | Commencement of investment operations. |
| (b) | Based on average shares outstanding. |
| (c) | The mean between the last bid and ask prices. |
| (d) | Net asset value total return is calculated assuming an initial investment made at the net asset value at the beginning of the period, reinvestment of all dividends and distributions at net asset value during the period, and redemption on the last day of the period. Net asset value total return includes adjustments in accordance with accounting principles generally accepted in the United States of America and as such, the net asset value for financial reporting purposes and the returns based upon those net asset values may differ from the net asset value and returns for shareholder transactions. Market price total return is calculated assuming an initial investment made at the market price at the beginning of the period, reinvestment of all dividends and distributions at market price during the period, and the sale at the market price on the last day of the period. Total investment returns calculated for a period of less than one year are not annualized. |
| (e) | The net asset value total return from Fund Inception (September 29, 2017, the first day of trading on the exchange) to October 31, 2017 was 0.01%. The market price total return from Fund Inception to October 31, 2017 was 0.29%. |
| (g) | Portfolio turnover rate is not annualized for periods less than one year, if applicable, and does not include securities received or delivered from processing creations or redemptions. |
| (h) | Amount represents less than 0.5% |
See accompanying Notes to Financial Statements which are an integral part of the financial statements.
Notes to Financial Statements
Invesco Exchange-Traded Fund Trust II
August 31, 2018
Note 1. Organization
Invesco Exchange-Traded Fund Trust II (the “Trust”), formerly PowerShares Exchange-Traded Fund Trust II, was organized as a Massachusetts business trust on October 10, 2006 and is authorized to have multiple series of portfolios. The Trust is an open-end management investment company registered under the Investment Company Act of 1940, as amended (the “1940 Act”). This report includes the following portfolios:
| | |
Full Name | | Short Name |
| Invesco PureBetaSM MSCI USA ETF (PBUS) | | “PureBetaSM MSCI USA ETF” |
| Invesco PureBetaSM MSCI USA Small Cap ETF (PBSM) | | “PureBetaSM MSCI USA Small Cap ETF” |
| Invesco PureBetaSM US Aggregate Bond ETF (PBND) | | “PureBetaSM US Aggregate Bond ETF” |
Each portfolio (each, a “Fund”, and collectively, the “Funds”) represents a separate series of the Trust. The shares of the Funds are referred to herein as “Shares” or “Fund’s Shares.” Each Fund’s Shares are listed and traded on Cboe BZX Exchange, Inc.
Effective June 4, 2018, the Funds’ names changed as part of an overall rebranding strategy whereby the PowerShares name was changed to the Invesco brand. This resulted in all references to the PowerShares name being changed to Invesco.
Effective August 31, 2018, each Fund’s fiscal year-end changed from October 31 to August 31.
The market price of each Share may differ to some degree from a Fund’s net asset value (“NAV”). Unlike conventional mutual funds, each Fund issues and redeems Shares on a continuous basis, at NAV, only in a large specified number of Shares, each called a “Creation Unit.” Creation Units are issued and redeemed principally in exchange for the deposit or delivery of a basket of securities (“Deposit Securities”). Except when aggregated in Creation Units by Authorized Participants, the Shares are not individually redeemable securities of the Funds.
The investment objective of each Fund is to seek to track the investment results (before fees and expenses) of its respective index listed below (each, an “Underlying Index”):
| | |
Fund | | Underlying Index |
| PureBetaSM MSCI USA ETF | | MSCI USA Index |
| PureBetaSM MSCI USA Small Cap ETF | | MSCI USA Small Cap Index |
| PureBetaSM US Aggregate Bond ETF | | ICE BofAML US Broad Market IndexSM |
Note 2. Significant Accounting Policies
The following is a summary of the significant accounting policies followed by the Funds in preparation of their financial statements.
Each Fund is an investment company and accordingly follows the investment company accounting and reporting guidance in accordance with Financial Accounting Standards Board Accounting Standards Codification Topic 946, Financial Services—Investment Companies.
A. Security Valuation
Securities, including restricted securities, are valued according to the following policies:
A security listed or traded on an exchange (except convertible securities) is generally valued at its last sales price or official closing price as of the close of the customary trading session on the exchange where the security is principally traded or, lacking any sales or official closing price on a particular day, the security may be valued at the closing bid price on that day. Securities traded in the over-the-counter market are valued based on prices furnished by independent pricing services or market makers. When such securities are valued by an independent pricing service they may be considered fair valued. Futures contracts are valued at the final settlement price set by an exchange on which they are principally traded. Listed options are valued at the mean between the last bid and asked prices from the exchange on which they are principally traded, or at the final settlement price set by such exchange. Swaps and options not listed on an exchange are valued by an independent source. For purposes of determining NAV per Share, futures and option contracts generally are valued 15 minutes after the close of the customary trading session of the New York Stock Exchange (“NYSE”).
Investments companies are valued using such company’s NAV per share, unless the shares are exchanged-traded, in which case they are valued at the last sales price or official closing price as of the close of the customary trading session on the exchange where the security is principally traded.
Debt obligations (including convertible securities) and unlisted equities are fair valued using an evaluated quote provided by an independent pricing service. Evaluated quotes provided by the pricing service may be determined without exclusive reliance on quoted prices, and may reflect appropriate factors such as institution-size trading in similar groups of securities, developments related to specific securities, dividend rate (for unlisted equities), yield (for debt obligations), quality, type of issue, coupon rate (for debt obligations), maturity (for debt obligations), individual trading characteristics and other market data. Securities with a demand feature exercisable within one to seven days are valued at par. Pricing services generally value debt obligations assuming orderly transactions of institutional round lot size, but a Fund may hold or transact in the same securities in smaller, odd lot sizes. Odd lots often trade at lower prices than institutional round lots. Debt obligations are subject to interest rate and credit risks. In addition, all debt obligations involve some risk of default with respect to interest and/or principal payments.
Foreign securities’ (including foreign exchange contracts’) prices are converted into U.S. dollar amounts using the applicable exchange rates as of the close of the London world markets. If market quotations are available and reliable for foreign exchange-traded equity securities, the securities will be valued at the market quotations. Because trading hours for certain foreign securities end before the close of the NYSE, closing market quotations may become unreliable. If between the time trading ends on a particular security and the close of the customary trading session on the NYSE, events occur that Invesco Capital Management LLC (the “Adviser”), formerly Invesco PowerShares Capital Management LLC, determines are significant and make the closing price unreliable, a Fund may fair value the security. If the event is likely to have affected the closing price of the security, the security will be valued at fair value in good faith using procedures approved by the Board of Trustees. Adjustments to closing prices to reflect fair value may also be based on a screening process of an independent pricing service to indicate the degree of certainty, based on historical data, that the closing price in the principal market where a foreign security trades is not the current value as of the close of the NYSE. Foreign securities’ prices meeting the approved degree of certainty that the price is not reflective of current value will be priced at the indication of fair value from the independent pricing service. Multiple factors may be considered by the independent pricing service in determining adjustments to reflect fair value and may include information relating to sector indices, American Depositary Receipts and domestic and foreign index futures. Foreign securities may have additional risks including exchange rate changes, potential for sharply devalued currencies and high inflation, political and economic upheaval, the relative lack of issuer information, relatively low market liquidity and the potential lack of strict financial and accounting controls and standards.
Securities for which market prices are not provided by any of the above methods may be valued based upon quotes furnished by independent sources. The last bid price may be used to value exchange-traded equity securities. The mean between the last bid and asked prices may be used to value debt obligations, including corporate loans, and unlisted equity securities.
Securities for which market quotations are not readily available or became unreliable are valued at fair value as determined in good faith following procedures approved by the Board of Trustees. Issuer-specific events, market trends, bid/asked quotes of brokers and information providers and other market data may be reviewed in the course of making a good faith determination of a security’s fair value.
Each Fund may invest in securities that are subject to interest rate risk, meaning the risk that the prices will generally fall as interest rates rise and, conversely, the prices will generally rise as interest rates fall. Specific securities differ in their sensitivity to changes in interest rates depending on their individual characteristics. Changes in interest rates may result in increased market volatility, which may affect the value and/or liquidity of certain Fund investments.
Valuations change in response to many factors, including the historical and prospective earnings of the issuer, the value of the issuer’s assets, general economic conditions, interest rates, investor perceptions and market liquidity. Because of the inherent uncertainties of valuation, the values reflected in the financial statements may materially differ from the value received upon actual sale of those investments.
B. Other Risks
Index Risk. Unlike many investment companies, the Funds do not utilize investing strategies that seek returns in excess of their Underlying Indexes. Therefore, a Fund would not necessarily buy or sell a security unless that security is added or removed, respectively, from its respective Underlying Index, even if that security generally is underperforming.
Authorized Participant Concentration Risk. Only Authorized Participants (“APs”) may engage in creation or redemption transactions directly with each Fund. Each Fund has a limited number of institutions that may act as APs, and such APs have no obligation to submit creation or redemption orders. Consequently, there is no assurance that those APs will establish or maintain an active trading market for the Shares. This risk may be heightened to the extent that securities underlying each Fund are traded outside a collateralized settlement system. In that case, APs may be required to post collateral on certain trades on an agency basis (i.e., on behalf of other market participants), which only a limited number of APs may be able to do. In addition, to the extent that APs exit the business or are unable to proceed with creation and/or redemption orders with respect to each Fund and no other AP is able to step forward to create or redeem Creation Units, this may result in a significantly diminished trading market for Fund Shares, which may be more likely to trade at a premium or discount to each Fund’s net asset value (“NAV”) and to face trading halts and/or delisting.
Equity Risk. Equity risk is the risk that the value of the securities that each Fund (except PureBetaSM US Aggregate Bond ETF) holds will fall due to general market and economic conditions, perceptions regarding the industries in which the issuers of securities that a Fund holds participate or factors relating to specific companies in which the Fund invests. For example, an adverse event, such as an unfavorable earnings report, may depress the value of securities a Fund holds; the price of securities may be particularly sensitive to general movements in the stock market; or a drop in the stock market may depress the price of most or all of the securities a Fund holds. In addition, securities of an issuer in the Fund’s portfolio may decline in price if the issuer fails to make anticipated dividend payments because, among other reasons, the issuer of the security experiences a decline in its financial condition.
Industry or Geographic Concentration Risk. Each Fund’s Underlying Index from time to time may be concentrated to a significant degree in securities of issuers located in a single industry or sector. To the extent that each Underlying Index concentrates in the securities of issuers in a particular industry or sector, each Fund will also concentrate its investments to approximately the same extent. By concentrating its investments in an industry or sector, each Fund faces more risks than if it were diversified broadly over numerous industries or sectors. Such industry-based risks, any of which may adversely affect the companies in which each Fund invests, may include, but are not limited to, the following: general economic conditions or cyclical market patterns that could negatively affect supply and demand in a particular industry; competition for resources, adverse labor relations, political or world events; obsolescence of technologies; and increased competition or new product introductions that may affect the profitability or viability of companies in an industry. In addition, at times, such industry or sector may be out of favor and underperform other industries or the market as a whole.
Non-Diversified Fund Risk. Each Fund is non-diversified and can invest a greater portion of its assets in securities of individual issuers than diversified funds. As a result, changes in the market value of a single investment could cause greater fluctuations in Share price than would occur in a diversified fund. This may increase a Fund’s volatility and cause the performance of a relatively small number of issuers to have a greater impact on a Fund’s performance.
Non-Correlation Risk. Each Fund’s return may not match the return of its Underlying Index for a number of reasons. For example, each Fund incurs operating expenses not applicable to its Underlying Index, and incurs costs in buying and selling securities, especially when rebalancing the Fund’s securities holdings to reflect changes in the composition of its Underlying Index. In addition, the performance of each Fund and its Underlying Index may vary due to asset valuation differences and differences between each Fund’s portfolio and its Underlying Index resulting from legal restrictions, cost or liquidity constraints.
Portfolio Turnover Risk. PureBetaSM US Aggregate Bond ETF may engage in frequent trading of its portfolio securities in connection with the rebalancing or adjustment of the Underlying Index. A portfolio turnover rate of 200%, for example, is equivalent to the Fund buying and selling all of its securities two times during the course of a year. A high portfolio turnover rate (such as 100% or more) could result in high brokerage costs for the Fund. While a high portfolio turnover rate can result in an increase in taxable capital gains distributions to the Fund’s shareholders, the Fund will seek to utilize the in-kind creation and redemption mechanism (described below) to minimize realization of capital gains to the extent possible.
Small- and Mid-Capitalization Company Risk. For each Fund (except PureBetaSM US Aggregate Bond ETF), investing in securities of small- and mid-capitalization companies involves greater risk than customarily is associated with investing in larger, more established companies. These companies’ securities may be more volatile and less liquid than those of more established companies. These securities may have returns that vary, sometimes significantly, from the overall securities market. Often small- and mid-capitalization companies and the industries in which they focus are still evolving and, as a result, they may be more sensitive to changing market conditions.
Sampling Risk. For PureBetaSM US Aggregate Bond ETF, the use of a representative sampling approach will result in the Fund holding a smaller number of securities than are in its Underlying Index. As a result, an adverse development to an issuer of securities held by the Fund could result in a greater decline in NAV than would be the case if the Fund held all of the securities in their Underlying Index. To the extent the assets in the Fund are smaller, these risks will be greater.
Liquidity Risk. For PureBetaSM US Aggregate Bond ETF, liquidity risk exists when a particular investment is difficult to purchase or sell. If the Fund invests in illiquid securities or current portfolio securities become illiquid, it may reduce the returns of the Fund because the Fund may be unable to sell the illiquid securities at an advantageous time or price.
U.S. Government Obligations Risk. PureBetaSM US Aggregate Bond ETF may invest in U.S. government obligations issued or guaranteed by the U.S. Government, its agencies and instrumentalities, including bills, notes and bonds issued by the U.S. Treasury. U.S. Government securities include securities that are issued or guaranteed by the United States Treasury, by various agencies of the U.S. Government, or by various instrumentalities which have been established or sponsored by the U.S. Government. U.S. Treasury securities are backed by the “full faith and credit” of the United States. Securities issued or guaranteed by federal agencies and U.S. Government-sponsored instrumentalities may or may not be backed by the full faith and credit of the United States. In the case of those U.S. Government securities not backed by the full faith and credit of the United States, the investor must look principally to the agency or instrumentality issuing or guaranteeing the security for ultimate repayment, and may not be able to assert a claim against the United States itself in the event that the agency or instrumentality does not meet its commitment. The U.S. Government, its agencies and instrumentalities do not guarantee the market value of their securities, and consequently, the value of such securities may fluctuate.
Call Risk. For PureBetaSM US Aggregate Bond ETF, if interest rates fall, it is possible that issuers of callable securities with high interest coupons will “call” (or prepay) their bonds before their maturity date. If an issuer exercised such a call during a period of declining interest rates, the Fund may have to replace such called security with a lower yielding security. If that were to happen, the Fund’s net investment income could fall.
Mortgage-Backed and Asset-Backed Securities Risk. For PureBetaSM US Aggregate Bond ETF, investments in mortgage- and asset-backed securities are subject to prepayment or call risk, which is the risk that payments from the borrower may be received earlier than expected due to changes in the rate at which the underlying loans are prepaid. Securities may be prepaid at a price less than the original purchase value. In addition, TBA transactions involve the risk that the securities received may be less favorable than what was anticipated by the Fund when entering into the TBA transaction and counterparty risk. Default or bankruptcy of a counterparty to a TBA transaction would expose the Fund to potential loss and could affect the Fund’s returns.
C. Federal Income Taxes
Each Fund intends to comply with the provisions of the Internal Revenue Code of 1986, as amended (the “Internal Revenue Code”), applicable to regulated investment companies and to distribute substantially all of the Fund’s taxable earnings to its shareholders. As such, the Funds will not be subject to federal income taxes on otherwise taxable income (including net realized gains) that is distributed to the shareholders. Therefore, no provision for federal income taxes is recorded in the financial statements.
Each Fund recognizes the tax benefits of uncertain tax positions only when the position is more likely than not to be sustained. Management has analyzed each Fund’s uncertain tax positions and concluded that no liability for unrecognized tax benefits should be recorded related to uncertain tax positions. Management is not aware of any tax positions for which it is reasonably possible that the total amounts of unrecognized tax benefits will change materially in the next 12 months.
Income and capital gain distributions are determined in accordance with federal income tax regulations, which may differ from accounting principles generally accepted in the United States of America (“GAAP”). These differences are primarily due to differing book and tax treatments for in-kind transactions, losses deferred due to wash sales, and passive foreign investment company adjustments, if any.
The Funds file U.S. federal tax returns and tax returns in certain other jurisdictions. Generally, a Fund is subject to examinations by such taxing authorities for up to three years after the filing of the return for the tax period.
D. Investment Transactions and Investment Income
Investment transactions are accounted for on a trade date basis. Realized gains and losses from the sale or disposition of securities are computed on the specific identified cost basis. Interest income is recorded on the accrual basis from settlement date. Bond premiums and discounts are amortized and/or accreted over the lives of the respective securities. Pay-in-kind interest income and non-cash dividend income received in the form of securities in-lieu of cash are recorded at the fair value of the securities received. Dividend income (net of withholding tax, if any) is recorded on the ex-dividend date. Realized gains, dividends and interest received by a Fund may give rise to withholding and other taxes imposed by foreign countries. Tax conventions between certain countries and the United States may reduce or eliminate such taxes.
The Funds may periodically participate in litigation related to each Fund’s investments. As such, the Funds may receive proceeds from litigation settlements. Any proceeds received are included in the Statements of Operations as realized gain (loss) for investments no longer held and as unrealized gain (loss) for investments still held.
Brokerage commissions and mark ups are considered transaction costs and are recorded as an increase to the cost basis of securities purchased and/or a reduction of proceeds on a sale of securities. Such transaction costs are included in the determination of net realized and unrealized gain (loss) from investment securities reported in the Statements of Operations and the Statements of Changes in Net Assets and the net realized and unrealized gains (losses) on securities per share in the Financial Highlights. Transaction costs are included in the calculation of each Fund’s NAV and, accordingly, they reduce each Fund’s total returns. These transaction costs are not considered operating expenses and are not reflected in net investment income reported in the Statements of Operations and the Statements of Changes in Net Assets, or the net investment income per share and the ratios of expenses and net investment income reported in the Financial Highlights, nor are they limited by any expense limitation arrangements between each Fund and the Adviser.
E. Country Determination
For the purposes of presentation in the Schedules of Investments, the Adviser may determine the country in which an issuer is located and/or credit risk exposure based on various factors. These factors include whether each Fund’s Underlying Index has made a country determination and may include the laws of the country under which the issuer is organized, where the issuer maintains a principal office, the country in which the issuer derives 50% or more of its total revenues and the country that has the primary market for the issuer’s securities, as well as other criteria. Among the other criteria that may be evaluated for making this determination are the country in which the issuer maintains 50% or more of its assets, the type of security, financial guarantees and enhancements, the nature of the collateral and the sponsor organization. Country of issuer and/or credit risk exposure has been determined to be the United States of America, unless otherwise noted.
F. Expenses
Each Fund has agreed to pay an annual unitary management fee to the Adviser. Out of the unitary management fee, the Adviser has agreed to pay for substantially all expenses of the Funds, including the cost of transfer agency, custody, fund administration, legal, audit and other services, except for advisory fees, distribution fees, if any, brokerage expenses, taxes, interest, acquired fund fees and expenses, if any, litigation expenses and other extraordinary expenses.
Expenses of the Trust that are excluded from a Fund’s unitary management fee and are directly identifiable to a specific Fund are applied to that Fund. Expenses of the Trust that are excluded from each Fund’s unitary management fee and that are not readily identifiable to a specific Fund are allocated in such a manner as deemed equitable, taking into consideration the nature and type of expense and the relative net assets of each Fund.
To the extent a Fund invests in other investment companies, the expenses shown in the accompanying financial statements reflect the expenses of the Fund and do not include any expenses of the investment companies in which it invests. The effects of such investment companies’ expenses are included in the realized and unrealized gain or loss on the investments in the investment companies.
G. Dividends and Distributions to Shareholders
Each Fund (except for PureBetaSM US Aggregate Bond ETF) declares and pays dividends from net investment income, if any, to its shareholders quarterly and records such dividends on ex-dividend date. PureBetaSM US Aggregate Bond ETF declares and pays dividends from net investment income, if any, to its shareholders monthly and records such dividends on ex-dividend date. Generally, each Fund distributes net realized taxable capital gains, if any, annually in cash and records them on ex-dividend date. Such distributions on a tax basis are determined in conformity with federal income tax regulations, which may differ from GAAP. Distributions in excess of tax basis earnings and profits, if any, are reported in such Fund’s financial statements as a tax return of capital at fiscal year-end.
H. Accounting Estimates
The preparation of the financial statements in accordance with GAAP requires management to make estimates and assumptions that affect the reported amounts and disclosures in the financial statements, including estimates and assumptions related to taxation. Actual results could differ from these estimates. In addition, the Funds monitor for material events or transactions that may occur or become known after the period-end date and before the date the financial statements are released to print.
I. Foreign Currency Translations
Foreign currency is valued at the close of the NYSE based on quotations posted by banks and major currency dealers. Portfolio securities and other assets and liabilities denominated in foreign currencies are translated into U.S. dollar amounts at date of valuation. Purchases and sales of portfolio securities (net of foreign taxes withheld on disposition) and income items denominated in foreign currencies are translated into U.S. dollar amounts on the respective dates of such transactions. The Funds do not separately account for the portion of the results of operations resulting from changes in foreign exchange rates on investments and the fluctuations arising from changes in market prices of securities held. The combined results of changes in foreign exchange rates and the fluctuation of market prices on investments (net of estimated foreign tax withholding) are included with the net realized and unrealized gain or loss from investments in the Statements of Operations. Reported net realized foreign currency gains or losses arise from (1) sales of foreign currencies, (2) currency gains or losses realized between the trade and settlement dates on securities transactions, and (3) the difference between the amounts of dividends, interest, and foreign withholding taxes recorded on each Fund’s books and the U.S. dollar equivalent of the amounts actually received or paid. Net unrealized foreign currency gains and losses arise from changes in the fair values of assets and liabilities, other than investments in securities at fiscal period-end, resulting from changes in exchange rates.
The Funds may invest in foreign securities, which may be subject to foreign taxes on income, gains on investments or currency repatriation, a portion of which may be recoverable. Foreign taxes, if any, are recorded based on the tax regulations and rates that exist in the foreign markets in which each Fund invests.
Note 3. Investment Advisory Agreement and Other Agreements
The Trust has entered into an Investment Advisory Agreement with the Adviser on behalf of each Fund, pursuant to which the Adviser has overall responsibility for the selection and ongoing monitoring of the Funds’ investments, managing the Funds’ business affairs and providing certain clerical, bookkeeping and other administrative services.
As compensation for its services, each Fund accrues daily and pays monthly to the Adviser an annual unitary management fee. Out of the unitary management fee, the Adviser has agreed to pay for substantially all expenses of the Funds, including the cost of transfer agency, custody, fund administration, legal, audit and other services, except for advisory fees, distribution fees, if any, brokerage
expenses, taxes, interest, acquired fund fees and expenses, if any, litigation expenses and other extraordinary expenses. The unitary management fee is paid by each Fund to the Adviser at the following annual rates:
| | | | |
| | | % of Average
Daily Net Assets | |
| PureBetaSM MSCI USA ETF | | | 0.04 | % |
| PureBetaSM MSCI USA Small Cap ETF | | | 0.06 | % |
| PureBetaSM US Aggregate Bond ETF | | | 0.05 | % |
Further, through August 31, 2020, the Adviser has contractually agreed to waive a portion of each Fund’s management fee in an amount equal to 100% of the net advisory fees an affiliate of the Adviser receives that are attributable to certain of the Fund’s investments in money market funds managed by that affiliate (excluding investments of cash collateral from securities lending). The Adviser cannot discontinue this waiver prior to its expiration.
For the period November 1, 2017 to August 31, 2018 and the fiscal period ended October 31, 2017, the Adviser waived fees for each Fund in the following amounts:
| | | | | | | | |
| | | Ten Months Ended
August 31, 2018 | | | Period Ended
October 31, 2017 | |
| Invesco PureBetaSM MSCI USA ETF | | | 2 | | | | — | |
| Invesco PureBetaSM MSCI USA Small Cap ETF | | | 2 | | | | — | |
| Invesco PureBetaSM US Aggregate Bond ETF | | | 218 | | | | 159 | |
The Trust has entered into a Distribution Agreement with Invesco Distributors, Inc. (the “Distributor”), which serves as the distributor of Creation Units for each Fund. The Distributor does not maintain a secondary market in the Shares. The Funds are not charged any fees pursuant to the Distribution Agreement. The Distributor is an affiliate of the Adviser.
The Adviser has entered into a licensing agreement for each Fund with the following entities (each, a “Licensor”):
| | |
Fund | | Licensor |
| PureBetaSM MSCI USA ETF | | MSCI Inc. |
| PureBetaSM MSCI USA Small Cap ETF | | MSCI Inc. |
| PureBetaSM US Aggregate Bond ETF | | ICE Data Indices, LLC |
Each Underlying Index name trademark is owned by its respective Licensor. These trademarks have been licensed to the Adviser for use by the Funds. Each Fund is entitled to use its Underlying Index pursuant to the Trust’s sub-licensing agreement with the Adviser. The Funds are not sponsored, endorsed, sold or promoted by the Licensors, and the Licensors make no representation regarding the advisability of investing in any of the Funds.
The Trust has entered into service agreements whereby The Bank of New York Mellon, a wholly-owned subsidiary of The Bank of New York Mellon Corporation, serves as the administrator, custodian, fund accountant and transfer agent for each Fund.
Note 4. Investments in Affiliates
The Adviser and Invesco Mortgage Capital, Inc. REIT are wholly-owned subsidiaries of Invesco Ltd. and therefore, Invesco Ltd. and Invesco Mortgage Capital, Inc. REIT are considered to be affiliated with the Funds. The tables below show certain Funds’ transactions in, and earnings from, investments in affiliates (excluding affiliated money market funds) for the period November 1, 2017 to August 31, 2018.
PureBetaSM MSCI USA ETF
| | | | | | | | | | | | | | | | | | | | | | | | | | | | |
| | | Value
October 31, 2017 | | | Purchases
at Cost | | | Proceeds
from Sales | | | Change in
Unrealized
Appreciation
(Depreciation) | | | Realized
Gain | | | Value
August 31, 2018 | | | Dividend
Income | |
| Invesco Ltd. | | $ | 1,611 | | | $ | — | | | $ | — | | | $ | (526 | ) | | $ | — | | | $ | 1,085 | | | $ | 53 | |
PureBetaSM MSCI USA Small Cap ETF
| | | | | | | | | | | | | | | | | | | | | | | | | | | | |
| | | Value
October 31, 2017 | | | Purchases
at Cost | | | Proceeds
from Sales | | | Change in
Unrealized
Appreciation
(Depreciation) | | | Realized
Gain | | | Value
August 31, 2018 | | | Dividend
Income | |
| Invesco Mortgage Capital, Inc. REIT | | $ | 1,464 | | | $ | — | | | $ | — | | | $ | (84 | ) | | $ | — | | | $ | 1,380 | | | $ | 107 | |
Note 5. Additional Valuation Information
GAAP defines fair value as the price that would be received to sell an asset or paid to transfer a liability in an orderly transaction between market participants at the measurement date, under current market conditions. GAAP establishes a hierarchy that prioritizes the inputs to valuation methods, giving the highest priority to readily available unadjusted quoted prices in an active market for identical assets (Level 1) and the lowest priority to significant unobservable inputs (Level 3), generally when market prices are not readily available or are unreliable. Based on the valuation inputs, the securities or other investments are tiered into one of three levels. Changes in valuation methods may result in transfers in or out of an investment’s assigned level:
| | Level 1 — | Prices are determined using quoted prices in an active market for identical assets. |
| | Level 2 — | Prices are determined using other significant observable inputs. Observable inputs are inputs that other market participants may use in pricing a security. These may include quoted prices for similar securities, interest rates, prepayment speeds, credit risk, yield curves, loss severities, default rates, discount rates, volatilities and others. |
| | Level 3 — | Prices are determined using significant unobservable inputs. In situations where quoted prices or observable inputs are unavailable (for example, when there is little or no market activity for an investment at the end of the period), unobservable inputs may be used. Unobservable inputs reflect a Fund’s own assumptions about the factors market participants would use in determining fair value of the securities or instruments and would be based on the best available information. |
Except for the Funds listed below, as of August 31, 2018, all of the securities in each Fund were valued based on Level 1 inputs (see the Schedules of Investments for security categories). The level assigned to the securities valuations may not be an indication of the risk or liquidity associated with investing in those securities. Because of the inherent uncertainties of valuation, the values reflected in the financial statements may materially differ from the value received upon actual sale of those investments.
Each Fund’s policy is to recognize transfers in and out of the valuation levels as of the end of the reporting period. During the period November 1, 2017 to August 31, 2018, there were no transfers between valuation levels.
| | | | | | | | | | | | | | | | |
| | | Level 1 | | | Level 2 | | | Level 3 | | | Total | |
| Invesco PureBetaSM MSCI USA Small Cap ETF | | | | | | | | | | | | | | | | |
| Investments in Securities | | | | | | | | | | | | | | | | |
Common Stocks & Other Equity Interests | | $ | 3,011,157 | | | $ | — | | | $ | 46 | | | $ | 3,011,203 | |
| | | | | | | | | | | | | | | | |
| Invesco PureBetaSM US Aggregate Bond ETF | | | | | | | | | | | | | | | | |
| Investments in Securities | | | | | | | | | | | | | | | | |
U.S. Treasury Securities | | $ | — | | | $ | 9,513,179 | | | $ | — | | | $ | 9,513,179 | |
Corporate Bonds and Notes | | | — | | | | 6,940,865 | | | | — | | | | 6,940,865 | |
U.S. Government Sponsored Agency Mortage-Backed Securities | | | — | | | | 5,646,684 | | | | — | | | | 5,646,684 | |
Sovereign Debt Obligations | | | — | | | | 739,643 | | | | — | | | | 739,643 | |
Commercial Mortgage-Backed Securities | | | — | | | | 447,605 | | | | — | | | | 447,605 | |
U.S. Government Sponsored Agency Securities | | | — | | | | 410,753 | | | | — | | | | 410,753 | |
Asset-Backed Securities | | | — | | | | 295,962 | | | | — | | | | 295,962 | |
Municipal Bonds | | | — | | | | 148,667 | | | | — | | | | 148,667 | |
Money Market Fund | | | 147,058 | | | | — | | | | — | | | | 147,058 | |
| | | | | | | | | | | | | | | | |
Total Investments | | $ | 147,058 | | | $ | 24,143,358 | | | $ | — | | | $ | 24,290,416 | |
| | | | | | | | | | | | | | | | |
Note 6. Distributions to Shareholders and Tax Components of Net Assets
Tax Character of Distributions to Shareholders Paid During the Period November 1, 2017 to August 31, 2018 and Period Ended October 31, 2017:
| | | | | | | | | | | | |
| | | August 31, 2018 | | | October 31, 2017 | |
| | | Ordinary
Income | | | Return of
Capital | | | Ordinary
Income | |
| Invesco PureBetaSM MSCI USA ETF | | $ | 35,651 | | | $ | — | | | $ | — | |
| Invesco PureBetaSM MSCI USA Small Cap ETF | | | 26,811 | | | | — | | | | — | |
| Invesco PureBetaSM US Aggregate Bond ETF | | | 540,479 | | | | 8,742 | | | | 52,720 | |
Tax Components of Net Assets at Fiscal Period-End:
| | | | | | | | | | | | | | | | | | | | | | | | |
| | | Undistributed
Ordinary
Income | | | Undistributed
Capital Gains | | | Net
Unrealized
Appreciation
(Depreciation)—
Investments | | | Capital Loss
Carryforwards | | | Shares of
Beneficial
Interest | | | Total Net
Assets | |
| Invesco PureBetaSM MSCI USA ETF | | $ | 15,016 | | | $ | 405 | | | $ | 393,555 | | | $ | — | | | $ | 2,500,025 | | | $ | 2,909,001 | |
| Invesco PureBetaSM MSCI USA Small Cap ETF | | | 85,023 | | | | 1,290 | | | | 424,959 | | | | — | | | | 2,500,025 | | | | 3,011,297 | |
| Invesco PureBetaSM US Aggregate Bond ETF | | | — | | | | — | | | | (703,679 | ) | | | (54,412 | ) | | | 24,991,283 | | | | 24,233,192 | |
Capital loss carryforwards are calculated and reported as of a specific date. Results of transactions and other activity after that date may affect the amount of capital loss carryforwards actually available for the Funds to utilize. The ability to utilize capital loss carryforwards in the future may be limited under the Internal Revenue Code and related regulations based on the results of future transactions.
The following table presents available capital loss carryforwards and expiration dates for each Fund as of August 31, 2018:
| | | | | | | | | | | | |
| | | Post-effective/ no
expiration | | | Total* | |
| | | Short-term | | | Long-Term | |
| Invesco PureBetaSM MSCI USA ETF | | $ | — | | | $ | — | | | $ | — | |
| Invesco PureBetaSM MSCI USA Small Cap ETF | | | — | | | | — | | | | — | |
| Invesco PureBetaSM US Aggregate Bond ETF | | | 54,412 | | | | — | | | | 54,412 | |
| * | Capital loss carryforwards as of the date listed above are reduced for limitations, if any, to the extent required by the Internal Revenue Code and may be further limited depending upon a variety of factors, including the realization of net unrealized gains or losses as of the date of any reorganization. |
Note 7. Investment Transactions
For the period November 1, 2017 to August 31, 2018, the cost of securities purchased and proceeds from sales of securities (other than short-term securities, U.S. Treasury obligations, money market funds and in-kind transactions, if any) were as follows:
| | | | | | | | |
| | | Purchases | | | Sales | |
| PureBetaSM MSCI USA ETF | | $ | 100,442 | | | $ | 96,989 | |
| PureBetaSM MSCI USA Small Cap ETF | | | 419,989 | | | | 408,377 | |
| PureBetaSM US Aggregate Bond ETF | | | 5,322,480 | | | | 4,868,584 | |
For the period November 1, 2017 to August 31, 2018, the cost of securities purchased and proceeds from sales of U.S. Treasury obligations (other than short-term securities, money market funds and in-kind transactions), for PureBetaSM US Aggregate Bond ETF amounted to $2,422,830 and $2,447,661.
At August 31, 2018, the aggregate cost of investments, including any derivatives, on a tax basis includes adjustments for financial reporting purposes as of the most recently completed federal income tax reporting period-end:
| | | | | | | | | | | | | | | | |
| | | Gross
Unrealized
Appreciation | | | Gross
Unrealized
(Depreciation) | | | Net
Unrealized
Appreciation
(Depreciation) | | | Cost | |
| Invesco PureBetaSM MSCI USA ETF | | $ | 471,863 | | | $ | (78,308 | ) | | $ | 393,555 | | | $ | 2,509,990 | |
| Invesco PureBetaSM MSCI USA Small Cap ETF | | | 544,219 | | | | (119,260 | ) | | | 424,959 | | | | 2,586,244 | |
| Invesco PureBetaSM US Aggregate Bond ETF | | | 5,294 | | | | (708,973 | ) | | | (703,679 | ) | | | 24,994,095 | |
Note 8. Reclassification of Permanent Differences
Primarily as a result of differing book/tax treatment of in-kind transactions and expired capital loss carryforwards, amounts were reclassified between undistributed net investment income, undistributed net realized gain (loss) and Shares of beneficial interest. These reclassifications had no effect on the net assets of each Fund. For the period November 1, 2017 to August 31, 2018, the reclassifications were as follows:
| | | | | | | | | | | | |
| | | Undistributed
Net Investment
Income (Loss) | | | Undistributed
Net Realized
Gain (Loss) | | | Shares of
Beneficial
Interest | |
| Invesco PureBetaSM MSCI USA ETF | | $ | (93 | ) | | $ | 93 | | | $ | — | |
| Invesco PureBetaSM MSCI USA Small Cap ETF | | | (113 | ) | | | 113 | | | | — | |
| Invesco PureBetaSM US Aggregate Bond ETF | | | 17,645 | | | | (17,645 | ) | | | — | |
Note 9. Trustees’ and Officer’s Fees
Trustees’ and Officer’s Fees include amounts accrued by the Funds to pay remuneration to each Trustee who is not an “interested person” as defined in the 1940 Act (an “Independent Trustee”), any Trustee who is not an affiliate of the Adviser or Distributor (or any of their affiliates) and who is otherwise an “interested person” of the Trust under the 1940 Act (an “Unaffiliated Trustee”) and an Officer of the Trust. The Adviser, as a result of each Fund’s unitary management fee, pays for such compensation. The Trustee who is an “interested person” of the Trust does not receive any Trustees’ fees.
The Trust has adopted a deferred compensation plan (the “Plan”). Under the Plan, each Independent Trustee or Unaffiliated Trustee who has executed a Deferred Fee Agreement (a “Participating Trustee”) may defer receipt of all or a portion of his compensation (“Deferral Fees”). Such Deferral Fees are deemed to be invested in select Invesco Funds. The Deferral Fees payable to the Participating Trustee are valued as of the date such Deferral Fees would have been paid to the Participating Trustee. The value increases with contributions or with increases in the value of the Shares selected, and the value decreases with distributions or with declines in the value of the Shares selected. Obligations under the Plan represent unsecured claims against the general assets of the Funds.
Note 10. Capital
Shares are created and redeemed by each Fund only in Creation Units of 50,000 Shares (100,000 Shares for PureBetaSM US Aggregate Bond ETF). Only Authorized Participants are permitted to purchase or redeem Creation Units from the Funds. Such transactions are principally permitted in exchange for Deposit Securities, with a balancing cash component to equate the transaction to the NAV per Share of a Fund of the Trust on the transaction date. However, for all Funds, cash in an amount equivalent to the value of certain securities may be substituted, generally when the securities are not available in sufficient quantity for delivery, not eligible for trading by the Authorized Participant or as a result of other market circumstances.
To the extent that the Funds permit transactions in exchange for Deposit Securities, each Fund may issue Shares in advance of receipt of Deposit Securities subject to various conditions, including a requirement to maintain on deposit with the Trust cash at least equal to 105% of the market value of the missing Deposit Securities. In accordance with the Trust’s Participant Agreement, Creation Units will be issued to an Authorized Participant, notwithstanding the fact that the corresponding Deposit Securities have not been received in part or in whole, in reliance on the undertaking of the Authorized Participant to deliver the missing Deposit Securities as soon as possible, which undertaking shall be secured by the Authorized Participant’s delivery and maintenance of collateral consisting of cash in the form of U.S. dollars in immediately available funds having a value (marked-to-market daily) at least equal to 105%, which the Adviser may change from time to time, of the value of the missing Deposit Securities.
Certain transaction fees may be charged by the Funds for creations and redemptions, which are treated as increases in capital.
Transactions in each Fund’s Shares are disclosed in detail in the Statements of Changes in Net Assets.
Note 11. Indemnifications
Under the Trust’s organizational documents, its Officers and Trustees are indemnified against certain liabilities arising out of the performance of their duties to the Trust. Each Independent Trustee and Unaffiliated Trustee is also indemnified against certain liabilities arising out of the performance of his duties to the Trust pursuant to an Indemnification Agreement between such trustee and the Trust. Additionally, in the normal course of business, the Trust enters into contracts with service providers that contain general indemnification clauses. The Trust’s maximum exposure under these arrangements is unknown, as this would involve future claims that may be made against the Trust that have not yet occurred. However, based on experience, the Trust believes the risk of loss to be remote.
Report of Independent Registered Public Accounting Firm
To the Board of Trustees of Invesco Exchange-Traded Fund Trust II and Shareholders of Invesco PureBetaSM MSCI USA ETF, Invesco PureBetaSM MSCI USA Small Cap ETF and Invesco PureBetaSM US Aggregate Bond ETF
Opinions on the Financial Statements
We have audited the accompanying statements of assets and liabilities, including the schedules of investments, of Invesco PureBetaSM MSCI USA ETF, Invesco PureBetaSM MSCI USA Small Cap ETF and Invesco PureBetaSM US Aggregate Bond ETF (three of the funds constituting Invesco Exchange-Traded Fund Trust II, hereafter collectively referred to as the “Funds”) as of August 31, 2018, the related statements of operations and changes in net assets, including the related notes, and the financial highlights for the periods November 1, 2017 through August 31, 2018 and September 19, 2017 (commencement of investment operations) through October 31, 2017 (or for Invesco PureBetaSM US Aggregate Bond ETF, for the periods November 1, 2017 through August 31, 2018 and September 27, 2017 (commencement of investment operations) through October 31, 2017) (collectively referred to as the “financial statements”). In our opinion, the financial statements present fairly, in all material respects, the financial position of each of the Funds as of August 31, 2018, the results of each of their operations, the changes in each of their net assets, and each of the financial highlights for the periods November 1, 2017 through August 31, 2018 and September 19, 2017 (commencement of investment operations) through October 31, 2017 (or for Invesco PureBetaSM US Aggregate Bond ETF, for the periods November 1, 2017 through August 31, 2018 and September 27, 2017 (commencement of investment operations) through October 31, 2017), in conformity with accounting principles generally accepted in the United States of America.
Basis for Opinions
These financial statements are the responsibility of the Funds’ management. Our responsibility is to express an opinion on the Funds’ financial statements based on our audits. We are a public accounting firm registered with the Public Company Accounting Oversight Board (United States) (“PCAOB”) and are required to be independent with respect to the Funds in accordance with the U.S. federal securities laws and the applicable rules and regulations of the Securities and Exchange Commission and the PCAOB.
We conducted our audits of these financial statements in accordance with the standards of the PCAOB. Those standards require that we plan and perform the audit to obtain reasonable assurance about whether the financial statements are free of material misstatement, whether due to error or fraud.
Our audits included performing procedures to assess the risks of material misstatement of the financial statements, whether due to error or fraud, and performing procedures that respond to those risks. Such procedures included examining, on a test basis, evidence regarding the amounts and disclosures in the financial statements. Our audits also included evaluating the accounting principles used and significant estimates made by management, as well as evaluating the overall presentation of the financial statements. Our procedures included confirmation of securities owned as of August 31, 2018 by correspondence with the custodian, transfer agent, and brokers; when replies were not received from brokers, we performed other auditing procedures. We believe that our audits provide a reasonable basis for our opinions.
PricewaterhouseCoopers LLP
Chicago, Illinois
October 26, 2018
We have served as the auditor of one or more of the investment companies in the Invesco group of investment companies since at least 1995. We have not been able to determine the specific year we began serving as auditor.
Fees and Expenses
As a shareholder of a Fund of the Invesco Exchange-Traded Fund Trust II, you incur a unitary management fee. In addition to the unitary management fee, a shareholder may pay distribution fees, if any, brokerage expenses, taxes, interest, acquired fund fees and expenses, if any, litigation expenses and other extraordinary expenses. The expense examples below are intended to help you understand your ongoing costs (in dollars) of investing in the Funds and to compare these costs with the ongoing costs of investing in other funds.
The example is based on an investment of $1,000 invested at the beginning of the period and held through the six-month period ended August 31, 2018.
Actual Expenses
The first line in the following table provides information about actual account values and actual expenses. You may use the information in this line, together with the amount you invested, to estimate the expenses that you paid over the period. Simply divide your account value by $1,000 (for example, an $8,600 account value divided by $1,000 = 8.6), then multiply the result by the number in the first line under the heading “Expenses Paid During the Six-Month Period” to estimate the expenses you paid on your account during this period.
Hypothetical Example for Comparison Purposes
The second line in the following table provides information about hypothetical account values and hypothetical expenses based on each Fund’s actual expense ratio and an assumed annualized rate of return of 5% per year before expenses, which is not the Fund’s actual return. The hypothetical account values and expenses may not be used to estimate the actual ending account balance or expenses you paid for the period. You may use this information to compare the ongoing costs of investing in the Funds and other funds. To do so, compare this 5% hypothetical example with the 5% hypothetical examples that appear in the shareholder reports of the other funds.
Please note that the expenses shown in the table are meant to highlight your ongoing costs only, and do not reflect any transactional costs, such as sales charges and brokerage commissions. Therefore, the second line in the table is useful in comparing ongoing costs only, and will not help you determine the relative total costs of owning different funds. In addition, expenses shown in the table do not include the expenses of the underlying funds, which are borne indirectly by a Fund. If transaction costs and indirect expenses were included, your costs would have been higher.
| | | | | | | | | | | | | | | | |
| | | Beginning Account Value March 1, 2018 | | | Ending Account Value August 31, 2018 | | | Annualized Expense Ratio Based on the Six-Month Period | | | Expenses Paid During the Six-Month Period(1) | |
| Invesco PureBetaSM MSCI USA ETF (PBUS) | | | | | | | | | | | | | | | | |
Actual | | $ | 1,000.00 | | | $ | 1,089.00 | | | | 0.04 | % | | $ | 0.21 | |
Hypothetical (5% return before expenses) | | | 1,000.00 | | | | 1,025.00 | | | | 0.04 | | | | 0.20 | |
| Invesco PureBetaSM MSCI USA Small Cap ETF (PBSM) | | | | | | | | | | | | | | | | |
Actual | | | 1,000.00 | | | | 1,135.80 | | | | 0.06 | | | | 0.32 | |
Hypothetical (5% return before expenses) | | | 1,000.00 | | | | 1,024.90 | | | | 0.06 | | | | 0.31 | |
| Invesco PureBetaSM MSCI US Aggregate Bond ETF (PBND) | | | | | | | | | | | | | | | | |
Actual | | | 1,000.00 | | | | 1,011.90 | | | | 0.05 | | | | 0.25 | |
Hypothetical (5% return before expenses) | | | 1,000.00 | | | | 1,024.95 | | | | 0.05 | | | | 0.26 | |
| (1) | Expenses are calculated using the annualized expense ratio, which represents the ongoing expenses as a percentage of net assets for the six-month period ended August 31, 2018. Expenses are calculated by multiplying the Fund’s annualized expense ratio by the average account value for the period, then multiplying the result by 184/365. Expense ratios for the most recent six-month period may differ from expense ratios based on the annualized data in the Financial Highlights. |
Tax Information
Form 1099-DIV, Form 1042-S and other year-end tax information provide shareholders with actual calendar year amounts that should be included in their tax returns. Shareholders should consult their tax advisers. The following distribution information is being provided as required by the Internal Revenue Code or to meet a specific state’s requirement.
The following distribution information is being provided as required by the Internal Revenue Code or to meet a specific state’s requirement.
Each Fund designates the following amounts or, if subsequently determined to be different, the maximum amount allowable for its fiscal period ended August 31, 2018:
| | | | | | | | | | | | | | | |
| | | Qualified Dividend
Income* | | Dividends-Received
Deduction* | | Qualified
Interest Income* |
| Invesco PureBetaSM MSCI USA ETF | | | | 93 | % | | | | 89 | % | | | | 0 | % |
| Invesco PureBetaSM MSCI USA Small Cap ETF | | | | 33 | % | | | | 32 | % | | | | 0 | % |
| Invesco PureBetaSM US Aggregate Bond ETF | | | | 0 | % | | | | 0 | % | | | | 88 | % |
| * | The above percentages are based on ordinary income dividends paid to shareholders during the Fund’s fiscal period. |
Trustees and Officers
The Independent Trustees of the Trust, their term of office and length of time served, their principal business occupations during at least the past five years, the number of portfolios in the Fund Complex (as defined below) overseen by each Independent Trustee and the other directorships, if any, held by each Independent Trustee are shown below.
| | | | | | | | | | |
Name, Address and Year of Birth
of Independent Trustees | | Position(s)
Held
with Trust | | Term of
Office
and
Length of
Time
Served* | | Principal
Occupation(s) During
Past 5 Years | | Number of
Portfolios
in Fund
Complex**
Overseen by
Independent
Trustees | | Other
Directorships
Held by
Independent
Trustees During
the Past 5 Years |
Ronn R. Bagge—1958 c/o Invesco Capital Management LLC 3500 Lacey Road, Suite 700 Downers Grove, IL 60515 | | Chairman of the Nominating and Governance Committee and Trustee | | Chairman
of the Nominating and Governance Committee and Trustee since
2007 | | Founder and Principal, YQA Capital Management LLC (1998-Present); formerly, Owner/CEO of Electronic Dynamic Balancing Co., Inc. (high-speed rotating equipment service provider). | | 221 | | Trustee and Investment Oversight Committee member, Mission Aviation Fellowship (2017–Present) |
| | | | | |
Todd J. Barre—1957 c/o Invesco Capital Management LLC 3500 Lacey Road, Suite 700 Downers Grove, IL 60515 | | Trustee | | Since
2010 | | Assistant Professor of Business, Trinity Christian College (2010-2016); formerly, Vice President and Senior Investment Strategist (2001-2008), Director of Open Architecture and Trading (2007-2008), Head of Fundamental Research (2004-2007) and Vice President and Senior Fixed Income Strategist (1994-2001), BMO Financial Group/Harris Private Bank. | | 221 | | None |
| | | | | |
Marc M. Kole—1960 c/o Invesco Capital Management LLC 3500 Lacey Road, Suite 700 Downers Grove, IL 60515 | | Chairman of the
Audit Committee and
Trustee | | Chairman of the Audit Committee since
2008; Trustee since
2007 | | Senior Director of Finance, By The Hand Club for Kids (2015-Present); formerly, Chief Financial Officer, Hope Network (social services) (2008-2012); Assistant Vice President and Controller, Priority Health (health insurance) (2005-2008); Senior Vice President of Finance, United Healthcare (2004-2005); Chief Accounting Officer, Senior Vice President of Finance, Oxford Health Plans (2000-2004); Audit Partner, Arthur Andersen LLP (1996-2000). | | 221 | | None |
| * | This is the date the Independent Trustee began serving the Trust. Each Independent Trustee serves an indefinite term, until his successor is elected. |
| ** | Fund Complex includes all open- and closed-end funds (including all of their portfolios) advised by the Adviser and any affiliated person of the Adviser. |
Trustees and Officers (continued)
| | | | | | | | | | |
Name, Address and Year of Birth
of Independent Trustees | | Position(s)
Held
with Trust | | Term of
Office
and
Length of
Time
Served* | | Principal
Occupation(s) During
Past 5 Years | | Number of
Portfolios
in Fund
Complex**
Overseen by
Independent
Trustees | | Other
Directorships
Held by
Independent
Trustees During
the Past 5 Years |
Yung Bong Lim—1964 c/o Invesco Capital Management LLC 3500 Lacey Road, Suite 700 Downers Grove, IL 60515 | | Chairman of the Investment Oversight Committee and Trustee | | Chairman of the Investment Oversight Committee since
2014; Trustee since
2013 | | Managing Partner, RDG Funds LLC (2008-Present); formerly, Managing Director, Citadel LLC (1999-2007). | | 221 | | None |
| | | | | |
Gary R. Wicker—1961 c/o Invesco Capital Management LLC 3500 Lacey Road, Suite 700 Downers Grove, IL 60515 | | Trustee | | Since
2013 | | Senior Vice President of Global Finance and Chief Financial Officer at RBC Ministries (publishing company) (2013-Present); formerly, Executive Vice President and Chief Financial Officer, Zondervan Publishing (a division of Harper Collins/NewsCorp) (2007-2012); Senior Vice President and Group Controller (2005-2006), Senior Vice President and Chief Financial Officer (2003-2004), Chief Financial Officer (2001-2003), Vice President, Finance and Controller (1999-2001) and Assistant Controller (1997-1999), divisions of The Thomson Corporation (information services provider). | | 221 | | None |
| | | | | |
Donald H. Wilson—1959 c/o Invesco Capital Management LLC 3500 Lacey Road, Suite 700 Downers Grove, IL 60515 | | Chairman of the Board and Trustee | | Chairman since 2012; Trustee since 2007 | | Chairman, President and Chief Executive Officer, McHenry Bancorp Inc. and McHenry Savings Bank (subsidiary) (2018-Present); Chairman and Chief Executive Officer, Stone Pillar Advisors, Ltd. (2010-Present); President and Chief Executive Officer, Stone Pillar Investments, Ltd. (2016-Present); formerly, Chairman, President and Chief Executive Officer, Community Financial Shares, Inc. and Community Bank—Wheaton/Glen Ellyn (subsidiary) (2013-2015); Chief Operating Officer, AMCORE Financial, Inc. (bank holding company) (2007-2009); Executive Vice President and Chief Financial Officer, AMCORE Financial, Inc. (2006-2007); Senior Vice President and Treasurer, Marshall & Ilsley Corp. (bank holding company) (1995-2006). | | 221 | | None |
| * | This is the date the Independent Trustee began serving the Trust. Each Independent Trustee serves an indefinite term, until his successor is elected. |
| ** | Fund Complex includes all open- and closed-end funds (including all of their portfolios) advised by the Adviser and any affiliated person of the Adviser. |
Trustees and Officers (continued)
The Unaffiliated Trustee, his term of office and length of time served, his principal business occupations during at least the past five years, the number of portfolios in the Fund Complex (as defined below) overseen by the Unaffiliated Trustee and the other directorships, if any, held by the Unaffiliated Trustee are shown below.
| | | | | | | | | | |
Name, Address and Year of Birth
of Unaffiliated Trustee | | Position(s)
Held
with Trust | | Term of
Office
and
Length of
Time
Served* | | Principal
Occupation(s) During
Past 5 Years | | Number of
Portfolios
in Fund
Complex**
Overseen by
Unaffiliated
Trustee | | Other
Directorships
Held by
Unaffiliated
Trustee During
the Past 5 Years |
Philip M. Nussbaum***—1961 c/o Invesco Capital Management LLC 3500 Lacey Road, Suite 700 Downers Grove, IL 60515 | | Trustee | | Since 2007 | | Chairman, Performance Trust Capital Partners (2004-Present). | | 221 | | None |
| * | This is the date the Unaffiliated Trustee began serving the Trust. The Unaffiliated Trustee serves an indefinite term, until his successor is elected. |
| ** | Fund Complex includes all open- and closed-end funds (including all of their portfolios) advised by the Adviser and any affiliated person of the Adviser. |
| *** | Effective September 19, 2018, Mr. Nussbaum resigned from the Board of Trustees of the Trust. |
Trustees and Officers (continued)
The Interested Trustee and the executive officers of the Trust, their term of office and length of time served, their principal business occupations during at least the past five years, the number of portfolios in the Fund Complex (as defined below) overseen by the Interested Trustee and the other directorships, if any, held by the Interested Trustee are shown below.
| | | | | | | | | | |
Name, Address and Year of Birth
of Interested Trustee | | Position(s)
Held
with Trust | | Term of
Office
and
Length of
Time
Served* | | Principal
Occupation(s) During
Past 5 Years | | Number of
Portfolios
in Fund
Complex**
Overseen by
Interested
Trustee | | Other
Directorships
Held by
Interested
Trustee During
the Past 5 Years |
Kevin M. Carome—1956 Invesco Ltd. Two Peachtree Pointe, 1555 Peachtree St., N.E., Suite 1800 Atlanta, GA 30309 | | Trustee | | Since 2010 | | Senior Managing Director, Secretary and General Counsel, Invesco Ltd. (2007-Present); Director, Invesco Advisers, Inc. (2009-Present); Director (2006-Present) and Executive Vice President (2008– Present), Invesco Group Services, Inc., Invesco Holding Company (US), Inc. and Invesco North American Holdings, Inc.; Director, Invesco Holding Company Limited (2007-Present); Executive Vice President (2008–Present), Invesco Investments (Bermuda) Ltd.; Manager, Horizon Flight Works LLC, Director and Executive Vice President, Invesco Finance, Inc. and Director, Invesco Finance PLC (2011- Present); Director and Secretary (2012– Present), Invesco Services (Bahamas) Private Limited; and Director and Executive Vice President (2014 – Present), INVESCO Asset Management (Bermuda) Ltd.; formerly, Director and Chairman, INVESCO Funds Group, Inc., Senior Vice President, Secretary and General Counsel, Invesco Advisers, Inc. (2003-2006); Director, Invesco Investments (Bermuda) Ltd. (2008-2016); Senior Vice President and General Counsel, Liberty Financial Companies, Inc. (2000-2001); General Counsel of certain investment management subsidiaries of Liberty Financial Companies, Inc. (1998-2000); Associate General Counsel, Liberty Financial Companies, Inc. (1993-1998); Associate, Ropes & Gray LLP. | | 221 | | None |
| * | This is the date the Interested Trustee began serving the Trust. The Interested Trustee serves an indefinite term, until his successor is elected. |
| ** | Fund Complex includes all open- and closed-end funds (including all of their portfolios) advised by the Adviser and any affiliated person of the Adviser. |
Trustees and Officers (continued)
| | | | | | |
Name, Address and Year of Birth
of Executive Officers | | Position(s)
Held
with Trust | | Length of
Time
Served* | | Principal Occupation(s) During Past 5 Years |
Daniel E. Draper—1968 Invesco Capital Management LLC 3500 Lacey Road, Suite 700 Downers Grove, IL 60515 | | President and Principal Executive Officer | | Since 2015 | | President and Principal Executive Officer, Invesco Exchange-Traded Fund Trust, Invesco Exchange-Traded Fund Trust II, Invesco India Exchange-Traded Fund Trust, Invesco Actively Managed Exchange-Traded Fund Trust and Invesco Actively Managed Exchange-Traded Commodity Fund Trust (2015-Present) and Invesco Exchange-Traded Self-Indexed Fund Trust (2016-Present); Chief Executive Officer and Principal Executive Officer (2016-Present) and Managing Director (2013-Present), Invesco Capital Management LLC; Senior Vice President, Invesco Distributors, Inc. (2014-Present); formerly, Vice President, Invesco Exchange-Traded Fund Trust, Invesco Exchange-Traded Fund Trust II, Invesco India Exchange-Traded Fund Trust, Invesco Actively Managed Exchange-Traded Fund Trust (2013-2015) and Invesco Actively Managed Exchange-Traded Commodity Fund Trust (2014-2015); Managing Director, Credit Suisse Asset Management (2010-2013) and Lyxor Asset Management/Societe Generale (2007-2010). |
| | | |
Kelli Gallegos—1970 Invesco Capital Management LLC 3500 Lacey Road, Suite 700 Downers Grove, IL 60515 | | Vice President
and Treasurer | | Since 2018 | | Vice President and Treasurer, Invesco Exchange-Traded Fund Trust, Invesco Exchange-Traded Fund Trust II, Invesco India Exchange-Traded Fund Trust, Invesco Actively Managed Exchange-Traded Fund Trust, Invesco Actively Managed Exchange-Traded Commodity Fund Trust and Invesco Exchange-Traded Self-Indexed Fund Trust (2018-Present); Principal Financial and Accounting Officer-Pooled Investments, Invesco Capital Management LLC (2018-Present); Vice President, Principal Financial Officer (2016-Present) and Assistant Treasurer (2008-Present), The Invesco Funds; formerly, Assistant Treasurer Invesco Exchange-Traded Fund Trust, Invesco Exchange-Traded Fund Trust II, Invesco India Exchange-Traded Fund Trust and Invesco Actively Managed Exchange-Traded Fund Trust (2012-2018), Invesco Actively Managed Exchange-Traded Commodity Fund Trust (2014-2018) and Invesco Exchange-Traded Self-Indexed Fund Trust (2016-2018); Assistant Treasurer, Invesco Capital Management LLC (2013-2018); and Assistant Vice President, The Invesco Funds (2008-2016). |
| | | |
Peter Hubbard—1981 Invesco Capital Management LLC 3500 Lacey Road, Suite 700 Downers Grove, IL 60515 | | Vice
President | | Since
2009 | | Vice President, Invesco Exchange-Traded Fund Trust, Invesco Exchange-Traded Fund Trust II, Invesco India Exchange-Traded Fund Trust, Invesco Actively Managed Exchange-Traded Fund Trust (2009-Present), Invesco Actively Managed Exchange-Traded Commodity Fund Trust (2014-Present) and Invesco Exchange-Traded Self-Indexed Fund Trust (2016-Present); Vice President and Director of Portfolio Management, Invesco Capital Management LLC (2010-Present); formerly, Vice President of Portfolio Management, Invesco Capital Management LLC (2008-2010); Portfolio Manager, Invesco Capital Management LLC (2007-2008); Research Analyst, Invesco Capital Management LLC (2005-2007); Research Analyst and Trader, Ritchie Capital, a hedge fund operator (2003-2005). |
| | | |
Sheri Morris—1964 Invesco Capital Management LLC 3500 Lacey Road, Suite 700 Downers Grove, IL 60515 | | Vice President | | Since 2012 | | President and Principal Executive Officer, The Invesco Funds (2016-Present); Treasurer, The Invesco Funds (2008-Present); Vice President, Invesco Advisers, Inc. (formerly known as Invesco Institutional (N.A.), Inc.) (registered investment adviser) (2009-Present) and Vice President, Invesco Exchange-Traded Fund Trust, Invesco Exchange-Traded Fund Trust II, Invesco India Exchange-Traded Fund Trust, Invesco Actively Managed Exchange-Traded Fund Trust (2012-Present), Invesco Actively Managed Exchange-Traded Commodity Fund Trust (2014-Present) and Invesco Exchange-Traded Self-Indexed Fund Trust (2016-Present); formerly, Vice President and Principal Financial Officer, The Invesco Funds (2008-2016); Treasurer, Invesco Exchange-Traded Fund Trust, Invesco Exchange-Traded Fund Trust II, Invesco India Exchange-Traded Fund Trust and Invesco Actively Managed Exchange-Traded Fund Trust (2011-2013); Vice President, Invesco Aim Advisers, Inc., Invesco Aim Capital Management, Inc. and Invesco Aim Private Asset Management, Inc.; Assistant Vice President and Assistant Treasurer, The Invesco Funds and Assistant Vice President, Invesco Advisers, Inc., Invesco Aim Capital Management, Inc. and Invesco Aim Private Asset Management, Inc. |
| * | This is the date each Officer began serving the Trust. Each Officer serves an indefinite term, until his or her successor is elected. |
Trustees and Officers (continued)
| | | | | | |
Name, Address and Year of Birth
of Executive Officers | | Position(s)
Held
with Trust | | Length of
Time
Served* | | Principal Occupation(s) During Past 5 Years |
Anna Paglia—1974 Invesco Capital Management LLC 3500 Lacey Road, Suite 700 Downers Grove, IL 60515 | | Secretary | | Since 2011 | | Secretary, Invesco Exchange-Traded Fund Trust, Invesco Exchange-Traded Fund Trust II, Invesco India Exchange-Traded Fund Trust, Invesco Actively Managed Exchange-Traded Fund Trust (2011-Present), Invesco Actively Managed Exchange-Traded Commodity Fund Trust (2014-Present) and Invesco Exchange-Traded Self-Indexed Fund Trust (2015-Present); Head of Legal (2010-Present) and Secretary (2015-Present), Invesco Capital Management LLC; Manager and Assistant Secretary, Invesco Indexing LLC (2017-Present); formerly, Partner, K&L Gates LLP (formerly, Bell Boyd & Lloyd LLP) (2007-2010); Associate Counsel at Barclays Global Investors Ltd. (2004-2006). |
| | | |
Rudolf E. Reitmann—1971 Invesco Capital Management LLC 3500 Lacey Road, Suite 700 Downers Grove, IL 60515 | | Vice President | | Since 2013 | | Vice President, Invesco Exchange-Traded Fund Trust, Invesco Exchange-Traded Fund Trust II, Invesco India Exchange-Traded Fund Trust, Invesco Actively Managed Exchange-Traded Fund Trust (2013-Present), Invesco Actively Managed Exchange-Traded Commodity Fund Trust (2014-Present) and Invesco Exchange-Traded Self-Indexed Fund Trust (2016-Present); Head of Global Exchange Traded Funds Services, Invesco Capital Management LLC (2013-Present); Vice President, Invesco Capital Markets, Inc. (2018-Present). |
| | | |
David Warren—1957 Invesco Canada Ltd. 5140 Yonge Street, Suite 800 Toronto, Ontario M2N 6X7 | | Vice President | | Since 2009 | | Vice President, Invesco Exchange-Traded Fund Trust, Invesco Exchange-Traded Fund Trust II, Invesco India Exchange-Traded Fund Trust, and Invesco Actively Managed Exchange-Traded Fund Trust (2009-Present), Invesco Actively Managed Exchange-Traded Commodity Fund Trust (2014-Present) and Invesco Exchange-Traded Self-Indexed Fund Trust (2016-Present); Managing Director—Chief Administrative Officer, Americas, Invesco Capital Management LLC; Senior Vice President, Invesco Advisers, Inc. (2009-Present); Director, Invesco Inc. (2009-Present); Director, Executive Vice President and Chief Financial Officer, Invesco Canada Ltd. (formerly, Invesco Trimark Ltd.) (2011-Present); Chief Administrative Officer, North American Retail, Invesco Ltd. (2007-Present); Director, Invesco Corporate Class Inc. (2014-Present); Director, Invesco Global Direct Real Estate Feeder GP Ltd. (2015-Present); Director, Invesco Canada Holdings Inc. (2002-Present); Director, Invesco Financial Services Ltd. / Services Financiers Invesco Ltée and Trimark Investments Ltd./Placements Trimark Ltée (2014-Present); Director, Invesco IP Holdings (Canada) Ltd. (2016-Present); Director, Invesco Global Direct Real Estate GP Ltd. (2015-Present); formerly, Senior Vice President, Invesco Management Group, Inc. (2007-2018); Executive Vice President and Chief Financial Officer, Invesco Inc. (2009-2015); Director, Executive Vice President and Chief Financial Officer, Invesco Canada Ltd. (formerly, Invesco Trimark Ltd.) (2000-2011). |
| | | |
Melanie Zimdars—1976 Invesco Capital Management LLC 3500 Lacey Road, Suite 700 Downers Grove, IL 60515 | | Chief
Compliance
Officer | | Since 2017 | | Chief Compliance Officer of Invesco Capital Management LLC (2017-Present); Chief Compliance Officer of Invesco Exchange-Traded Fund Trust, Invesco Exchange-Traded Fund Trust II, Invesco India Exchange-Traded Fund Trust, Invesco Actively Managed Exchange-Traded Fund Trust, Invesco Actively Managed Exchange-Traded Commodity Fund Trust and Invesco Exchange-Traded Self-Indexed Fund Trust (2017-Present); formerly, Vice President and Deputy Chief Compliance Officer at ALPS Holding, Inc. (2009-2017); Mutual Fund Treasurer/Chief Financial Officer at Wasatch Advisors, Inc. (2005-2008); Compliance Officer, U.S. Bancorp Fund Services, LLC (2001-2005). |
Availability of Additional Information About the Trustees
The Statement of Additional Information includes additional information about the Trustees and is available, without charge, upon request at (800) 983-0903.
| * | This is the date each Officer began serving the Trust. Each Officer serves an indefinite term, until his or her successor is elected. |
(This Page Intentionally Left Blank)
Proxy Voting Policies and Procedures
A description of the Trust’s proxy voting policies and procedures that the Funds use to determine how to vote proxies relating to portfolio securities is available, without charge and upon request, by calling (800) 983-0903. This information is also available on the Securities and Exchange Commission’s (the “Commission”) website at www.sec.gov.
Information regarding how each Fund voted proxies for portfolio securities, if applicable, during the most recent 12-month period ended June 30, is available, without charge and upon request, by (i) calling (800) 983-0903; or (ii) accessing the Trust’s Form N-PX on the Commission’s website at www.sec.gov.
Quarterly Portfolios
The Trust files its complete schedule of portfolio holdings for the Funds with the Commission for the first and third quarters of each fiscal year on Form N-Q. The Form N-Qs will be available on the Commission’s website at www.sec.gov. The Trust’s Form N-Qs may also be reviewed and copied at the Commission’s Public Reference Room in Washington, D.C. Information on the operation of the Public Reference Room may be obtained by calling (800) SEC-0330.
Frequency Distribution of Discounts and Premiums
A table showing the number of days the market price of each Fund’s shares was greater than the Fund’s net asset value, and the number of days it was less than the Fund’s net asset value (i.e., premium or discount) for the most recently completed calendar year, and the calendar quarters since that year end (or the life of the Fund, if shorter) may be found at the Fund’s website at www.invesco.com/ETFs.
| | | | |
©2018 Invesco Capital Management LLC 3500 Lacey Road, Suite 700 Downers Grove, IL 60515 | | P-PBETA-AR-2 | | invesco.com/ETFs |

Invesco Annual Report to Shareholders
August 31, 2018
| | |
| BKLN | | Invesco Senior Loan ETF |
Table of Contents
The Market Environment
Bank Loans
The senior loan market was characterized by solid returns throughout the reporting period. In the latter part of 2017, loans delivered solid returns as fundamentals remained strong and a supportive technical environment remained in place. Loans provided investors a safe haven from the volatility caused by rising interest rates and mounting trade tension concerns. Loans continued to generate steady returns through the end of the reporting period.
Loan fundamentals remained supportive with a trailing 12-month default rate of 1.99%1 and slow but positive growth in the US economy could continue to support fundamentals. During the reporting period, corporate revenue and earnings growth remained robust.
During the latter part of 2017, strong technicals pushed loan prices higher as demand from institutional investors remained robust, outstripping supply. However, in 2018, particularly near the end of the reporting period, an influx in net new supply in the primary market reversed this trend, weighing on loan prices in the secondary market. This influx in net new supply was a positive development as it loosened a very tight technical dynamic in loans, alleviated the downward pressure on spreads, slowed the repricing and refinancing activity that was prevalent during 2017 and allowed for investors to better negotiate deal pricing and documentation.
The average price in the senior loan market was $98.322 as of August 31, 2018, with 47.8%2 of the market trading at or above par. Given the price of senior loans at the end of the Fund’s fiscal period, they were providing a 6.70% yield.3
| 3 | Source: S&P LCD and Invesco. Yield incorporates forward LIBOR curve. |
Fixed Income
Throughout the fiscal period, US economic data remained positive; economic growth in the second quarter of 2018 was particularly strong. The US economy continued to add jobs, pushing the unemployment rate to 3.9% at the close of the fiscal period, while inflation remained subdued.1 Against this backdrop, the US Federal Reserve (the Fed) raised the federal funds target rate from a range of 1.00% to 1.25% at the start of the fiscal period to a range of 1.75% to 2.00% at the close of the fiscal period. This was accomplished with three 0.25% rate hikes in December 2017, and in March and June 2018.2 Working against these positive developments, however, were global macroeconomic headwinds in the form of geopolitical trade tension, sub-optimal inflation, and the lingering unknown of Brexit—the decision by UK voters to leave the European Union. These headwinds could limit future Fed rate hikes in the near-term. The Bank of Japan and the
European Central Bank maintained their negative interest rates in a continued attempt to stimulate growth and inflation by encouraging investors to spend rather than save. These actions continued to drive overseas investments into higher yielding segments of the fixed income markets.
The 10-year US Treasury yield continued to move upward at the start of the fiscal period and spiked in early 2018 due to the continued strength in the global economy, the rising risks of inflation and the high probability of additional Fed rate hikes throughout the fiscal period. Due to these factors, the 10-year US Treasury note declined steadily throughout the first quarter of 2018, resulting in higher government yields and a brief move above 3.00% before normalizing near the end of the fiscal period.3 The 10-year US Treasury yield ended the fiscal period at 2.86%, 74 basis points higher than at the beginning of the fiscal period.3 (A basis point is one one-hundredth of a percentage point.)
The broader bond market, as represented by the Bloomberg Barclays U.S. Aggregate Bond Index, fell 1.05% for the fiscal period. Poor performance was largely attributable to the broad increase in US Treasury yields, a widening of credit spreads and reduced overseas bond purchase demand during the fiscal period. All four primary sectors of the Bloomberg Barclays U.S. Aggregate Bond Index—government-related, corporate, securitized and treasury—posted negative returns for the fiscal period.
| 1 | Bureau of Labor Statistics |
| | |
| BKLN | | Manager’s Analysis |
| | Invesco Senior Loan ETF (BKLN) |
As an index fund, the Invesco Senior Loan ETF (the “Fund”) is passively managed and attempts to track the returns of an underlying index. The Fund seeks to track the investment results (before fees and expenses) of the S&P/LSTA U.S. Leveraged Loan 100 Index (the “Index”). The Fund generally will invest at least 80% of its net assets (plus any borrowings for investment purposes) in senior loans that comprise the Index. The Fund’s adviser, Invesco Capital Management LLC (the “Adviser”) and the Fund’s sub-adviser, Invesco Senior Secured Management, Inc., define senior loans to include leveraged loans, bank loans and/or floating rate loans. Banks and other lending institutions generally issue senior loans to corporations, partnerships or other entities (“borrowers”). These borrowers operate in a variety of industries and geographic regions, including foreign countries.
S&P Dow Jones Indices LLC (the “Index Provider”) compiles, maintains and calculates the Index, which tracks the market weighted performance of the largest institutional leveraged loans based on market weightings, spreads and interest payments. A leveraged loan is rated below investment grade quality or is unrated but deemed to be of comparable quality. The Fund will invest in loans that are expected to be below investment grade quality and to bear interest at a floating rate that periodically resets. The Index may include, and the Fund may acquire and retain, loans of borrowers that have filed for bankruptcy protection. The Fund does not purchase all of the securities in the Index; instead, the Fund utilizes a “sampling” methodology to seek to achieve its investment objective.
The Board of Trustees approved a change in the fiscal year end for the Fund from October 31 to August 31. For the fiscal period from November 1, 2017 to August 31, 2018, on a market price basis, the Fund returned 2.93%. On a net asset value (“NAV”) basis, the Fund returned 2.98%. During the same time period, the Index returned 3.66%. The Fund’s performance (NAV basis) differed from the return of the Index primarily due to friction costs from rebalancing positions within the Fund and as a result of the Fund’s sampling methodology. Additionally, the Fund maintains a cash balance, which has been set aside as a liquidity tool, which further caused a reduction in performance. While those were the two largest drivers of return differential, other factors include fees and operating expenses incurred by the Fund during the period.
During this same time period, the Bloomberg Barclays U.S. Aggregate Bond Index (the “Benchmark Index”) returned (0.63)%. The Benchmark Index is an unmanaged index weighted by market capitalization based on the average performance of approximately 10,133 securities. The Benchmark Index was selected for its recognition in the marketplace, and its performance comparison is a useful measure for investors as a broad representation of the U.S investment-grade, fixed-rate bond market.
Relative to the Benchmark Index, the majority of the Fund’s outperformance relative to the Benchmark Index during
the period can be attributed to the Fund’s concentration in the bank loan sector in general, coupled with the Benchmark Index’s investment grade focus versus the Fund’s below investment grade focus.
For the fiscal period ended August 31, 2018, the retail industry contributed most significantly to the Fund’s return, followed by the electronics and business equipment & services industries. The home furnishings industry detracted most significantly from the Fund’s return.
Positions that contributed most significantly to the Fund’s return for the fiscal period ended August 31, 2018, included Seadrill Operating LP, Term Loan (United Kingdom), an oil & gas company (portfolio average weight of 0.84%), and Neiman Marcus Group, Inc., Term Loan, a retail company (portfolio average weight of 0.86%). Positions that detracted most significantly from the Fund’s return included Acosta, Inc., Term Loan B-1, an advertising company (portfolio average weight 0.57%), and Petco Animal Supplies, Inc., Term Loan, a retail company (portfolio average weight of 0.64%).
| | | | |
Credit Quality Rating Breakdown* (% of the Fund’s Net Assets) as of August 31, 2018 | |
Baa2 | | | 2.5 | |
Baa3 | | | 7.0 | |
Ba1 | | | 9.2 | |
Ba2 | | | 13.8 | |
Ba3 | | | 24.2 | |
B1 | | | 17.1 | |
B2 | | | 12.7 | |
B3 | | | 3.4 | |
Caa1 | | | 1.4 | |
Caa2 | | | 0.9 | |
NR | | | 1.3 | |
Money Market Fund Plus Other Assets
Less Liabilities | | | 6.5 | |
| * | Source: Moody’s. A credit rating is an assessment provided by a nationally recognized statistical rating organization (NRSRO) of the creditworthiness of an issuer with respect to debt obligations, including specific securities, money market instruments or other debts. Ratings are measured on a scale that generally ranges from Aaa (highest) to C (lowest); ratings are subject to change without notice. “Non-Rated” indicates the debtor was not rated, and should not be interpreted as indicating low quality. For more information on Moody’s rating methodology, please visit moodys.com and select “Rating Methodologies” under Research and Ratings on the homepage. |
Invesco Senior Loan ETF (BKLN) (continued)
| | | | |
Top Ten Fund Holdings* (% of the Fund’s Net Assets)
as of August 31, 2018 | |
| Security | | | | |
| CenturyLink, Inc., Term Loan B, 4.826%, 01/31/2025 | | | 1.8 | |
| Charter Communications Operating LLC, Term Loan B, 4.080%, 04/30/2025 | | | 1.8 | |
| New Red Finance, Inc., Term Loan B-3, 4.326%, 02/16/2024 | | | 1.8 | |
| Grifols Worldwide Operations USA, Inc., Term Loan B, 4.207%, 01/31/2025 | | | 1.7 | |
| Change Healthcare Holdings, Inc., Term Loan, 4.826%, 03/01/2024 | | | 1.6 | |
| Avolon TLB Borrower 1 US LLC, Term Loan B-3, 4.077%, 01/15/2025 | | | 1.5 | |
| Valeant Pharmaceuticals International, Inc., Term Loan, 5.081%, 06/01/2025 | | | 1.5 | |
| Caesars Resort Collection LLC, Term Loan B, 4.826%, 12/23/2024 | | | 1.5 | |
| Level 3 Financing, Inc., Term Loan B, 4.317%, 02/22/2024 | | | 1.4 | |
| Western Digital Corp., Term Loan A-1, 3.577%, 02/27/2023 | | | 1.4 | |
| Total | | | 16.0 | |
| * | Excluding money market fund holdings. |
Growth of a $10,000 Investment Since Inception
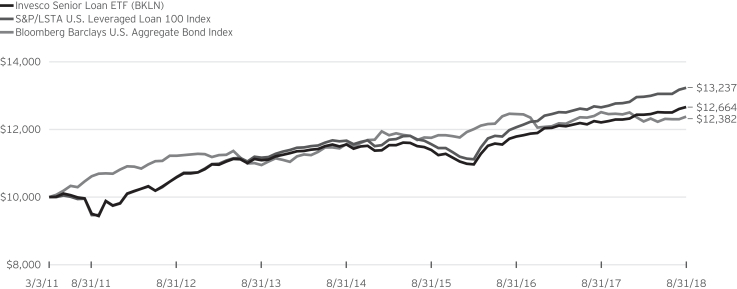
Fund Performance History as of August 31, 2018
| | | | | | | | | | | | | | | | | | | | | | | | | | | | | | | | |
| | | | | | 3 Years Average
Annualized | | | 3 Years Cumulative | | | 5 Years Average
Annualized | | | 5 Years Cumulative | | | | | | Fund Inception | |
| Index | | 1 Year | | | | | | Average
Annualized | | | Cumulative | |
| S&P/LSTA U.S. Leveraged Loan 100 Index | | | 4.59 | % | | | 4.62 | % | | | 14.50 | % | | | 3.45 | % | | | 18.47 | % | | | | | | | 3.81 | % | | | 32.37 | % |
| Bloomberg Barclays U.S. Aggregate Bond Index | | | (1.05 | ) | | | 1.76 | | | | 5.37 | | | | 2.49 | | | | 13.06 | | | | | | | | 2.89 | | | | 23.82 | |
| Fund | | | | | | | | | | | | | | | | | | | | | | | | | | | | | | | | |
| NAV Return | | | 3.69 | | | | 3.58 | | | | 11.14 | | | | 2.68 | | | | 14.16 | | | | | | | | 3.20 | | | | 26.64 | |
| Market Price Return | | | 3.43 | | | | 3.61 | | | | 11.23 | | | | 2.63 | | | | 13.88 | | | | | | | | 3.10 | | | | 25.67 | |
Invesco Senior Loan ETF (BKLN) (continued)
Fund Inception: March 3, 2011
Performance quoted above represents past performance. Past performance is not a guarantee of future results and current performance may be higher or lower than performance quoted. Investment returns and principal value will fluctuate, and shares of the Fund (“Fund Shares”), when redeemed or sold, may be worth more or less than their original cost. Fund performance reflects any applicable fee waivers and/or expense reimbursements. Had the adviser not waived fees and/or reimbursed expenses currently or in the past, returns would have been lower. See current prospectus for more information. The adviser has contractually agreed to waive fees and/or pay certain Fund expenses through August 31, 2019. According to the Fund’s current prospectus, the Fund’s expense ratio of 0.67% (0.65% after fee waiver) includes the unitary management fee of 0.65% and acquired fund fees and expenses of 0.02%. NAV and Market Price returns assume that dividends and capital gain distributions have been reinvested in the Fund at NAV and Market Price, respectively. The returns shown in the table above do not reflect the deduction of taxes that a shareholder would pay
on Fund distributions or the redemption or sale of Fund Shares. See invesco.com/ETFs to find the most recent month-end performance numbers.
Index and Benchmark Index performance results are based upon a hypothetical investment in their respective constituent securities. Index and Benchmark Index returns do not represent Fund returns. An investor cannot invest directly in an index. The Index and Benchmark Index do not charge management fees or brokerage expenses, and no such fees or expenses were deducted from the hypothetical performance shown. In addition, the results actual investors might have achieved would have differed from those shown because of differences in the timing, amounts of their investments, and fees and expenses associated with an investment in the Fund.
Notes Regarding Indexes and Fund Performance History:
| - | Average Annualized and Cumulative Inception returns for the Fund, Index and Benchmark Index are based on the inception date of the Fund. |
Schedule of Investments
Invesco Senior Loan ETF (BKLN)
August 31, 2018
| | | | | | | | | | | | | | | | |
Principal
Amount | | | | | Interest
Rate | | | Maturity
Date | | | Value | |
| | | | Variable Rate Senior Loan Interests—90.3%(a)(b) | | | | | | | | | |
| | | | Advertising—0.8% | | | | | | | | | |
| $ | 50,425,492 | | | Acosta, Inc., Term Loan B-1 (1 mo. USD LIBOR + 3.25%) | | | 5.326 | % | | | 09/26/2021 | | | $ | 39,277,928 | |
| | 18,744,522 | | | Red Ventures LLC, First Lien Term Loan (1 mo. USD LIBOR + 4.00%) | | | 6.076 | | | | 11/08/2024 | | | | 18,971,050 | |
| | | | | | | | | | | | | | | | |
| | | | | | | | | | | | | | | 58,248,978 | |
| | | | | | | | | | | | | | | | |
| | | | Aerospace/Defense—1.9% | | | | | | | | | |
| | | | TransDigm, Inc. | | | | | | | | | | | | |
| | 39,484,433 | | | Term Loan E (1 mo. USD LIBOR + 2.50%) | | | 4.576 | | | | 05/30/2025 | | | | 39,441,395 | |
| | 103,298,843 | | | Term Loan F (1 mo. USD LIBOR + 2.50%) | | | 4.576 | | | | 06/09/2023 | | | | 103,216,720 | |
| | | | | | | | | | | | | | | | |
| | | | | | | | | | | | | | | 142,658,115 | |
| | | | | | | | | | | | | | | | |
| | | | Building Materials—0.8% | | | | | | | | | |
| | 60,323,466 | | | Quikrete Holdings, Inc., First Lien Term Loan (1 mo. USD LIBOR + 2.75%) | | | 4.826 | | | | 11/15/2023 | | | | 60,345,484 | |
| | | | | | | | | | | | | | | | |
| | | | Chemicals—1.7% | | | | | | | | | |
| | 36,790,775 | | | Axalta Coating Systems U.S. Holdings, Inc., Term Loan B-3 (3 mo. USD LIBOR + 1.75%) | | | 4.084 | | | | 06/01/2024 | | | | 36,864,357 | |
| | 35,000,000 | | | GrafTech Finance, Inc., Term Loan (1 mo. USD LIBOR + 3.50%) | | | 5.576 | | | | 02/15/2025 | | | | 35,262,500 | |
| | 51,088,183 | | | H.B. Fuller Co., Term Loan (1 mo. USD LIBOR + 2.00%) | | | 4.077 | | | | 10/20/2024 | | | | 51,120,114 | |
| | | | | | | | | | | | | | | | |
| | | | | | | | | | | | | | | 123,246,971 | |
| | | | | | | | | | | | | | | | |
| | | | Commercial Services—3.6% | | | | | | | | | |
| | 49,754,724 | | | Allied Universal Holdco LLC, First Lien Term Loan (1 mo. USD LIBOR + 3.75%) | | | 5.826 | | | | 07/28/2022 | | | | 49,158,662 | |
| | 45,489,322 | | | PAREXEL International Corp., Term Loan (1 mo. USD LIBOR + 2.75%) | | | 4.826 | | | | 09/27/2024 | | | | 45,529,125 | |
| | 83,334,841 | | | Prime Security Services Borrower LLC, First Lien Term Loan B-1 (1 mo. USD LIBOR + 2.75%) | | | 4.826 | | | | 05/02/2022 | | | | 83,652,346 | |
| | 64,428,952 | | | Team Health Holdings, Inc., Term Loan (1 mo. USD LIBOR + 2.75%) | | | 4.826 | | | | 02/06/2024 | | | | 61,825,056 | |
| | 25,465,348 | | | Verscend Holding Corp., Term Loan B (3 mo. USD LIBOR + 4.50%) | | | 6.706 | | | | 08/27/2025 | | | | 25,672,382 | |
| | | | | | | | | | | | | | | | |
| | | | | | | | | | | | | | | 265,837,571 | |
| | | | | | | | | | | | | | | | |
| | | | Computers—7.1% | | | | | | | | | |
| | | | Dell International LLC | | | | | | | | | | | | |
| | 102,962,108 | | | Term Loan A-2 (1 mo. USD LIBOR + 1.75%) | | | 3.830 | | | | 09/07/2021 | | | | 103,019,253 | |
| | 96,465,973 | | | Term Loan B (1 mo. USD LIBOR + 2.00%) | | | 4.080 | | | | 09/07/2023 | | | | 96,546,039 | |
| | 66,739,067 | | | McAfee LLC, Term Loan (1 mo. USD LIBOR + 4.50%) | | | 6.573 | | | | 09/30/2024 | | | | 67,373,088 | |
| | 68,824,399 | | | Tempo Acquisition LLC, Term Loan (1 mo. USD LIBOR + 3.00%) | | | 5.076 | | | | 05/01/2024 | | | | 69,064,252 | |
| | | | Western Digital Corp. | | | | | | | | | | | | |
| | 104,536,751 | | | Term Loan A-1 (1 mo. USD LIBOR + 1.50%) | | | 3.577 | | | | 02/27/2023 | | | | 104,896,357 | |
| | 79,210,568 | | | Term Loan B-4 (1 mo. USD LIBOR + 1.75%) | | | 3.816 | | | | 04/29/2023 | | | | 79,345,227 | |
| | | | | | | | | | | | | | | | |
| | | | | | | | | | | | | | | 520,244,216 | |
| | | | | | | | | | | | | | | | |
| | | | Electric—1.6% | | | | | | | | | |
| | | | Vistra Operations Co. LLC | | | | | | | | | | | | |
| | 65,045,230 | | | Term Loan (1 mo. USD LIBOR + 2.00%) | | | 4.706 | | | | 08/04/2023 | | | | 65,018,237 | |
| | 49,580,427 | | | Term Loan (1 mo. USD LIBOR + 2.00%) | | | 4.060 | | | | 12/31/2025 | | | | 49,535,309 | |
| | | | | | | | | | | | | | | | |
| | | | | | | | | | | | | | | 114,553,546 | |
| | | | | | | | | | | | | | | | |
| | | | Engineering & Construction—0.9% | | | | | | | | | |
| | 64,687,651 | | | Brand Energy & Infrastructure Services, Inc., Term Loan (3 mo. USD LIBOR + 4.25%) | | | 6.600 | | | | 06/21/2024 | | | | 65,098,741 | |
| | | | | | | | | | | | | | | | |
| | | | Entertainment—4.9% | | | | | | | | | |
| | 70,170,051 | | | Alpha Topco Ltd., Term Loan B (United Kingdom) (1 mo. USD LIBOR + 2.50%) | | | 4.576 | | | | 02/01/2024 | | | | 69,749,031 | |
| | 47,268,636 | | | Aristocrat Technologies, Inc., Term Loan B-3 (Australia) (2 mo. USD LIBOR + 1.75%) | | | 4.098 | | | | 10/19/2024 | | | | 47,219,476 | |
| | 53,967,500 | | | Crown Finance US, Inc., Term Loan (1 mo. USD LIBOR + 2.50%) | | | 4.576 | | | | 02/28/2025 | | | | 53,859,565 | |
| | 97,843,097 | | | Scientific Games International, Inc., Term Loan B-5 (1 mo. USD LIBOR + 2.75%) | | | 4.826 | | | | 08/14/2024 | | | | 97,694,376 | |
| | 27,207,784 | | | Stars Group (US) Co-Borrower LLC, Term Loan (3 mo. USD LIBOR + 3.50%) | | | 5.831 | | | | 07/10/2025 | | | | 27,456,191 | |
| | 64,745,027 | | | William Morris Endeavor Entertainment LLC, Term Loan B-1 (1 mo. USD LIBOR + 2.75%) | | | 4.830 | | | | 05/18/2025 | | | | 64,522,628 | |
| | | | | | | | | | | | | | | | |
| | | | | | | | | | | | | | | 360,501,267 | |
| | | | | | | | | | | | | | | | |
| | | | Food—3.3% | | | | | | | | | |
| | 67,640,397 | | | Albertson’s LLC, Term Loan B-4 (1 mo. USD LIBOR + 2.75%) | | | 4.826 | | | | 08/25/2021 | | | | 67,594,740 | |
| | 76,324,103 | | | JBS USA Lux SA, Term Loan (3 mo. USD LIBOR + 2.50%) | | | 4.834 | | | | 10/30/2022 | | | | 76,387,834 | |
| | 51,375,898 | | | Post Holdings, Inc., Series A, Term Loan (1 mo. USD LIBOR + 2.00%) | | | 4.070 | | | | 05/24/2024 | | | | 51,409,035 | |
| | 46,919,959 | | | US Foods, Inc., Term Loan (1 mo. USD LIBOR + 2.00%) | | | 4.076 | | | | 06/27/2023 | | | | 46,917,612 | |
| | | | | | | | | | | | | | | | |
| | | | | | | | | | | | | | | 242,309,221 | |
| | | | | | | | | | | | | | | | |
See accompanying Notes to Financial Statements which are an integral part of the financial statements.
Invesco Senior Loan ETF (BKLN) (continued)
August 31, 2018
| | | | | | | | | | | | | | | | |
Principal
Amount | | | | | Interest
Rate | | | Maturity
Date | | | Value | |
| | | | Variable Rate Senior Loan Interests (continued) | | | | | | | | | |
| | | | Healthcare-Products—0.8% | | | | | | | | | |
| $ | 56,238,469 | | | Ortho-Clinical Diagnostics SA, Term Loan (Luxembourg) (1 mo. USD LIBOR + 3.25%) | | | 5.316 | % | | | 06/30/2025 | | | $ | 56,303,705 | |
| | | | | | | | | | | | | | | | |
| | | | Healthcare-Services—3.7% | | | | | | | | | |
| | 76,419,845 | | | DaVita HealthCare Partners, Inc., Term Loan B (1 mo. USD LIBOR + 2.75%) | | | 4.826 | | | | 06/24/2021 | | | | 76,883,713 | |
| | 54,161,664 | | | Envision Healthcare Corp., Term Loan (1 mo. USD LIBOR + 3.00%) | | | 5.080 | | | | 12/01/2023 | | | | 54,217,992 | |
| | 67,618,912 | | | MPH Acquisition Holdings LLC, Term Loan (3 mo. USD LIBOR + 2.75%) | | | 5.084 | | | | 06/07/2023 | | | | 67,647,312 | |
| | 76,834,862 | | | Pharmaceutical Product Development, Inc., Term Loan (1 mo. USD LIBOR + 2.50%) | | | 4.576 | | | | 08/18/2022 | | | | 76,874,432 | |
| | | | | | | | | | | | | | | | |
| | | | | | | | | | | | | | | 275,623,449 | |
| | | | | | | | | | | | | | | | |
| | | | Insurance—5.2% | | | | | | | | | |
| | 7,293,335 | | | Alliant Holdings Intermediate LLC, Term Loan (1 mo. USD LIBOR + 3.00%) | | | 5.067 | | | | 05/09/2025 | | | | 7,301,686 | |
| | | | Asurion LLC | | | | | | | | | | | | |
| | 28,039,439 | | | Term Loan B-2 (1 mo. USD LIBOR + 6.50%) | | | 8.576 | | | | 08/04/2025 | | | | 28,903,895 | |
| | 76,682,297 | | | Term Loan B-4 (1 mo. USD LIBOR + 3.00%) | | | 5.076 | | | | 08/04/2022 | | | | 77,145,458 | |
| | 84,885,779 | | | Term Loan B-6 (1 mo. USD LIBOR + 3.00%) | | | 5.076 | | | | 11/03/2023 | | | | 85,242,299 | |
| | 47,015,816 | | | Term Loan B-7 (1 mo. USD LIBOR + 3.00%) | | | 5.076 | | | | 11/03/2024 | | | | 47,192,126 | |
| | 77,186,934 | | | HUB International Ltd., Term Loan (2 mo. USD LIBOR + 3.00%) | | | 5.330 | | | | 04/25/2025 | | | | 77,191,951 | |
| | 61,815,063 | | | USI, Inc., Term Loan (3 mo. USD LIBOR + 3.00%) | | | 5.334 | | | | 05/16/2024 | | | | 61,744,285 | |
| | | | | | | | | | | | | | | | |
| | | | | | | | | | | | | | | 384,721,700 | |
| | | | | | | | | | | | | | | | |
| | | | Internet—0.8% | | | | | | | | | |
| | 58,749,704 | | | Go Daddy Operating Co. LLC, Term Loan B-1 (1 mo. USD LIBOR + 2.25%) | | | 4.326 | | | | 02/15/2024 | | | | 58,977,359 | |
| | | | | | | | | | | | | | | | |
| | | | Investment Companies—1.4% | | | | | | | | | |
| | 103,469,335 | | | RPI Finance Trust, Term Loan B-6 (3 mo. USD LIBOR + 2.00%) | | | 4.334 | | | | 03/27/2023 | | | | 103,857,345 | |
| | | | | | | | | | | | | | | | |
| | | | Lodging—4.3% | | | | | | | | | |
| | 108,818,099 | | | Caesars Resort Collection LLC, Term Loan B (1 mo. USD LIBOR + 2.75%) | | | 4.826 | | | | 12/23/2024 | | | | 109,285,473 | |
| | 50,655,536 | | | Golden Nugget, Inc., Term Loan B (1 mo. USD LIBOR + 2.75%) | | | 4.820 | | | | 10/04/2023 | | | | 50,877,154 | |
| | 82,557,765 | | | Hilton Worldwide Finance LLC, Series B-2 Term Loan (1 mo. USD LIBOR + 1.75%) | | | 3.815 | | | | 10/25/2023 | | | | 82,906,159 | |
| | 76,723,801 | | | Las Vegas Sands LLC, Term Loan (1 mo. USD LIBOR + 1.75%) | | | 3.826 | | | | 03/27/2025 | | | | 76,690,426 | |
| | | | | | | | | | | | | | | | |
| | | | | | | | | | | | 319,759,212 | |
| | | | | | | | | | | | | | | | |
| | | | Machinery-Construction & Mining—0.9% | | | | | | | | | |
| | 21,093,573 | | | Brookfield WEC Holdings, Inc., Term Loan (1 mo. USD LIBOR + 3.75%) | | | 5.956 | | | | 08/01/2025 | | | | 21,241,228 | |
| | 48,280,959 | | | Cortes NP Acquisition Corp., Term Loan B (3 mo. USD LIBOR + 4.00%) | | | 6.313 | | | | 11/30/2023 | | | | 48,361,347 | |
| | | | | | | | | | | | | | | | |
| | | | | | | | | | | | | | | 69,602,575 | |
| | | | | | | | | | | | | | | | |
| | | | Media—8.7% | | | | | | | | | |
| | 135,059,700 | | | Charter Communications Operating LLC, Term Loan B (1 mo. USD LIBOR + 2.00%) | | | 4.080 | | | | 04/30/2025 | | | | 135,228,525 | |
| | 67,014,491 | | | CSC Holdings LLC, Term Loan (1 mo. USD LIBOR + 2.25%) | | | 4.314 | | | | 07/17/2025 | | | | 66,883,142 | |
| | 102,174,940 | | | iHeartCommunications, Inc., Term Loan D (1 mo. USD LIBOR + 6.75%)(c)(d) | | | 8.956 | | | | 01/30/2019 | | | | 76,645,509 | |
| | 49,014,571 | | | Nielsen Finance LLC, Term Loan B-4 (1 mo. USD LIBOR + 2.00%) | | | 4.071 | | | | 10/04/2023 | | | | 48,844,490 | |
| | | | Numericable-SFR SA | | | | | | | | | | | | |
| | 43,952,162 | | | Term Loan B-12 (France) (1 mo. USD LIBOR + 3.00%) | | | 5.751 | | | | 01/31/2026 | | | | 42,404,606 | |
| | 17,594,476 | | | Term Loan B-13 (3 mo. USD LIBOR + 3.00%) | | | 6.206 | | | | 01/31/2026 | | | | 17,159,277 | |
| | 68,438,733 | | | Radiate Holdco LLC, Term Loan (1 mo. USD LIBOR + 3.00%) | | | 5.076 | | | | 02/01/2024 | | | | 68,130,759 | |
| | 48,580,912 | | | Univision Communications, Inc., First Lien Term Loan (1 mo. USD LIBOR + 2.75%) | | | 4.826 | | | | 03/15/2024 | | | | 46,746,983 | |
| | 45,328,193 | | | Virgin Media Bristol LLC, Term Loan K (1 mo. USD LIBOR + 2.50%) | | | 4.563 | | | | 01/15/2026 | | | | 45,356,523 | |
| | 55,076,255 | | | WideOpenWest Finance LLC, Term Loan B (1 mo. USD LIBOR + 3.25%) | | | 5.310 | | | | 08/18/2023 | | | | 53,837,039 | |
| | 41,900,818 | | | Ziggo Secured Finance Partnership, Term Loan E (Netherlands) (1 mo. USD LIBOR + 2.50%) | | | 4.563 | | | | 04/15/2025 | | | | 41,252,612 | |
| | | | | | | | | | | | | | | | |
| | | | | | | | | | | | | | | 642,489,465 | |
| | | | | | | | | | | | | | | | |
| | | | Oil & Gas—0.9% | | | | | | | | | |
| | 69,684,250 | | | Seadrill Operating LP, Term Loan (United Kingdom) (3 mo. USD LIBOR + 6.00%) | | | 8.334 | | | | 02/21/2021 | | | | 65,280,554 | |
| | | | | | | | | | | | | | | | |
| | | | Oil & Gas Services—0.8% | | | | | | | | | |
| | 55,168,617 | | | McDermott Technology (Americas), Inc., Term Loan B (1 mo. USD LIBOR + 5.00%) | | | 7.076 | | | | 05/12/2025 | | | | 55,819,331 | |
| | | | | | | | | | | | | | | | |
| | | | Packaging & Containers—0.6% | | | | | | | | | |
| | 46,667,653 | | | Reynolds Group Holdings, Inc., Term Loan (1 mo. USD LIBOR + 2.75%) | | | 4.826 | | | | 02/05/2023 | | | | 46,871,824 | |
| | | | | | | | | | | | | | | | |
| | | | Pharmaceuticals—6.8% | | | | | | | | | |
| | 63,980,350 | | | Amneal Pharmaceuticals LLC, Term Loan (1 mo. USD LIBOR + 3.50%) | | | 5.625 | | | | 05/04/2025 | | | | 64,526,742 | |
| | 119,283,834 | | | Change Healthcare Holdings, Inc., Term Loan (1 mo. USD LIBOR + 2.75%) | | | 4.826 | | | | 03/01/2024 | | | | 119,483,038 | |
See accompanying Notes to Financial Statements which are an integral part of the financial statements.
Invesco Senior Loan ETF (BKLN) (continued)
August 31, 2018
| | | | | | | | | | | | | | | | |
Principal
Amount | | | | | Interest
Rate | | | Maturity
Date | | | Value | |
| | | | Variable Rate Senior Loan Interests (continued) | | | | | | | | | |
| | | | Pharmaceuticals (continued) | | | | | | | | | |
| $ | 79,582,011 | | | Endo LLC, Term Loan (1 mo. USD LIBOR + 4.25%) | | | 6.375 | % | | | 04/29/2024 | | | $ | 80,178,876 | |
| | 124,995,588 | | | Grifols Worldwide Operations USA, Inc., Term Loan B (Spain) (1 mo. USD LIBOR + 2.25%) | | | 4.207 | | | | 01/31/2025 | | | | 125,634,940 | |
| | 108,985,535 | | | Valeant Pharmaceuticals International, Inc., Term Loan (Canada) (1 mo. USD LIBOR + 3.00%) | | | 5.081 | | | | 06/01/2025 | | | | 109,509,756 | |
| | | | | | | | | | | | | | | | |
| | | | | | | | | | | | 499,333,352 | |
| | | | | | | | | | | | | | | | |
| | | | Real Estate—1.1% | | | | | | | | | |
| | 20,000,000 | | | Brookfield Retail Holdings VII Sub 3 LLC, Term Loan B (3 mo. USD LIBOR + 3.75%) | | | 4.706 | | | | 05/07/2025 | | | | 19,895,900 | |
| | 64,421,913 | | | DTZ U.S. Borrower LLC, Term Loan (1 mo. USD LIBOR + 3.25%) | | | 5.319 | | | | 08/21/2025 | | | | 64,281,152 | |
| | | | | | | | | | | | | | | | |
| | | | | | | | | | | | | | | 84,177,052 | |
| | | | | | | | | | | | | | | | |
| | | | REITs—0.7% | | | | | | | | | |
| | 50,966,507 | | | Communications Sales & Leasing, Inc., Term Loan B (1 mo. USD LIBOR + 3.00%) | | | 5.076 | | | | 10/24/2022 | | | | 48,889,622 | |
| | 2,500,000 | | | VICI Properties 1 LLC, Term Loan B (1 mo. USD LIBOR + 2.00%) | | | 4.067 | | | | 12/20/2024 | | | | 2,502,187 | |
| | | | | | | | | | | | | | | | |
| | | | | | | | | | | | | | | 51,391,809 | |
| | | | | | | | | | | | | | | | |
| | | | Retail—7.8% | | | | | | | | | |
| | 70,762,387 | | | Bass Pro Group LLC, Term Loan (1 mo. USD LIBOR + 5.00%) | | | 7.076 | | | | 09/25/2024 | | | | 71,558,464 | |
| | 51,480,076 | | | Harbor Freight Tools USA, Inc., Term Loan (1 mo. USD LIBOR + 2.50%) | | | 4.576 | | | | 08/18/2023 | | | | 51,483,679 | |
| | 55,072,894 | | | Michaels Stores, Inc., Term Loan (1 mo. USD LIBOR + 2.50%) | | | 4.566 | | | | 01/30/2023 | | | | 54,976,516 | |
| | 70,097,863 | | | Neiman Marcus Group, Inc., Term Loan (1 mo. USD LIBOR + 3.25%) | | | 5.330 | | | | 10/25/2020 | | | | 65,278,635 | |
| | 132,724,524 | | | New Red Finance, Inc., Term Loan B-3 (Canada) (1 mo. USD LIBOR + 2.25%) | | | 4.326 | | | | 02/16/2024 | | | | 132,828,713 | |
| | 59,764,526 | | | Petco Animal Supplies, Inc., Term Loan (3 mo. USD LIBOR + 3.25%) | | | 5.592 | | | | 01/26/2023 | | | | 44,028,526 | |
| | 101,248,236 | | | PetSmart, Inc., Term Loan B-2 (1 mo. USD LIBOR + 3.00%) | | | 5.090 | | | | 03/11/2022 | | | | 87,495,182 | |
| | 70,558,083 | | | Staples, Inc., Term Loan (3 mo. USD LIBOR + 4.00%) | | | 6.343 | | | | 09/12/2024 | | | | 70,482,586 | |
| | | | | | | | | | | | | | | | |
| | | | | | | | | | | | | | | 578,132,301 | |
| | | | | | | | | | | | | | | | |
| | | | Semiconductors—0.4% | | | | | | | | | |
| | 30,307,941 | | | Microchip Technology, Inc., Term Loan (1 mo. USD LIBOR + 2.00%) | | | 4.080 | | | | 05/29/2025 | | | | 30,301,728 | |
| | | | | | | | | | | | | | | | |
| | | | Software—9.0% | | | | | | | | | |
| | 81,746,369 | | | Almonde, Inc., First Lien Term Loan (1 mo. USD LIBOR + 3.50%) | | | 5.706 | | | | 06/13/2024 | | | | 81,495,407 | |
| | | | Boxer Parent Co., Inc. | | | | | | | | | | | | |
| | 54,569,767 | | | Term Loan (1 mo. USD LIBOR + 3.25%) | | | 6.456 | | | | 06/28/2025 | | | | 54,689,275 | |
| | 37,912,193 | | | Term Loan B-2 (1 mo. USD LIBOR + 3.25%) | | | 5.326 | | | | 09/10/2022 | | | | 37,992,187 | |
| | | | First Data Corp. | | | | | | | | | | | | |
| | 54,854,308 | | | Term Loan (1 mo. USD LIBOR + 2.00%) | | | 4.066 | | | | 07/08/2022 | | | | 54,891,884 | |
| | 75,382,557 | | | Term Loan (1 mo. USD LIBOR + 2.00%) | | | 4.066 | | | | 04/26/2024 | | | | 75,358,811 | |
| | 49,901,103 | | | Infor (US), Inc., Term Loan B-6 (1 mo. USD LIBOR + 2.75%) | | | 4.826 | | | | 02/01/2022 | | | | 49,998,909 | |
| | 54,407,847 | | | Kronos, Inc., First Lien Term Loan (2 mo. USD LIBOR + 3.00%) | | | 5.340 | | | | 11/01/2023 | | | | 54,618,678 | |
| | 2,630,116 | | | MA Finance Co. LLC, Term Loan B-3 (United Kingdom) (1 mo. USD LIBOR + 2.50%) | | | 4.576 | | | | 06/21/2024 | | | | 2,630,116 | |
| | 60,724,461 | | | Micro Holding LP, First Lien Term Loan (1 mo. USD LIBOR + 3.75%) | | | 5.827 | | | | 09/13/2024 | | | | 61,066,036 | |
| | 67,406,767 | | | Rackspace Hosting, Inc., Term Loan B (2 mo. USD LIBOR + 3.00%) | | | 5.350 | | | | 11/03/2023 | | | | 67,112,199 | |
| | 17,760,079 | | | Seattle Spinco, Inc., Term Loan (1 mo. USD LIBOR + 2.50%) | | | 4.576 | | | | 06/21/2024 | | | | 17,760,079 | |
| | | | SS&C Technologies, Inc. | | | | | | | | | | | | |
| | 76,713,818 | | | Term Loan B-3 (1 mo. USD LIBOR + 2.25%) | | | 4.326 | | | | 04/16/2025 | | | | 76,857,656 | |
| | 29,725,504 | | | Term Loan B-4 (1 mo. USD LIBOR + 2.25%) | | | 4.326 | | | | 04/16/2025 | | | | 29,781,239 | |
| | | | | | | | | | | | | | | | |
| | | | | | | | | | | | | | | 664,252,476 | |
| | | | | | | | | | | | | | | | |
| | | | Telecommunications—8.3% | | | | | | | | | |
| | 68,341,250 | | �� | Avaya, Inc., Term Loan B (1 mo. USD LIBOR + 4.25%) | | | 6.313 | | | | 12/15/2024 | | | | 68,883,880 | |
| | 137,782,300 | | | CenturyLink, Inc., Term Loan B (1 mo. USD LIBOR + 2.75%) | | | 4.826 | | | | 01/31/2025 | | | | 136,352,809 | |
| | 22,000,000 | | | Intelsat Jackson Holdings SA, Term Loan B-3 (Luxembourg) (1 mo. USD LIBOR + 3.75%) | | | 5.815 | | | | 11/27/2023 | | | | 22,132,990 | |
| | 105,604,855 | | | Level 3 Financing, Inc., Term Loan B (1 mo. USD LIBOR + 2.25%) | | | 4.317 | | | | 02/22/2024 | | | | 105,854,082 | |
| | 40,138,820 | | | Maxar Technologies Ltd., Term Loan B (Canada) (1 mo. USD LIBOR + 2.75%) | | | 4.956 | | | | 10/04/2024 | | | | 39,328,819 | |
| | 49,776,820 | | | SBA Senior Finance II LLC, Term Loan (1 mo. USD LIBOR + 2.00%) | | | 4.080 | | | | 04/11/2025 | | | | 49,683,488 | |
| | 90,599,714 | | | Sprint Communications, Inc., Term Loan (1 mo. USD LIBOR + 2.50%) | | | 4.625 | | | | 02/02/2024 | | | | 90,750,562 | |
| | 42,208,870 | | | Telesat LLC, Term Loan B-4 (Canada) (3 mo. USD LIBOR + 2.50%) | | | 4.840 | | | | 11/17/2023 | | | | 42,340,983 | |
| | 58,234,679 | | | West Corp., Term Loan B (1 mo. USD LIBOR + 4.00%) | | | 6.076 | | | | 10/10/2024 | | | | 58,098,119 | |
| | | | | | | | | | | | | | | | |
| | | | | | | | | | | | | | | 613,425,732 | |
| | | | | | | | | | | | | | | | |
See accompanying Notes to Financial Statements which are an integral part of the financial statements.
Invesco Senior Loan ETF (BKLN) (continued)
August 31, 2018
| | | | | | | | | | | | | | | | |
Principal
Amount | | | | | Interest
Rate | | | Maturity
Date | | | Value | |
| | | | Variable Rate Senior Loan Interests (continued) | | | | | | | | | |
| | | | Trucking & Leasing—1.5% | | | | | | | | | |
| $ | 112,458,783 | | | Avolon TLB Borrower 1 US LLC, Term Loan B-3 (Ireland) (1 mo. USD LIBOR + 2.00%) | | | 4.077 | % | | | 01/15/2025 | | | $ | 112,508,264 | |
| | | | | | | | | | | | | | | | |
| | | | Total Variable Rate Senior Loan Interests
(Cost $6,700,709,709) | | | | | | | | | | | 6,665,873,343 | |
| | | | | | | | | | | | | | | | |
| | | | |
| | | | | | | | | | | | | | | | |
| | | | Corporate Bonds—3.2% | | | | | | | | | |
| | | | Computers—0.4% | | | | | | | | | |
| | 24,793,000 | | | Dell International LLC(e) | | | 5.450 | | | | 06/15/2023 | | | | 26,060,418 | |
| | | | | | | | | | | | | | | | |
| | | | Media—1.7% | | | | | | | | | |
| | 24,174,000 | | | iHeartCommunications, Inc.(c)(d) | | | 9.000 | | | | 12/15/2019 | | | | 17,949,195 | |
| | 1,874,000 | | | Univision Communications, Inc.(e) | | | 6.750 | | | | 09/15/2022 | | | | 1,918,508 | |
| | 57,098,000 | | | Univision Communications, Inc.(e) | | | 5.125 | | | | 05/15/2023 | | | | 54,385,845 | |
| | 30,600,000 | | | Virgin Media Secured Finance PLC (United Kingdom)(e) | | | 5.250 | | | | 01/15/2026 | | | | 29,879,370 | |
| | 5,000,000 | | | Virgin Media Secured Finance PLC (United Kingdom)(e) | | | 5.500 | | | | 08/15/2026 | | | | 4,925,000 | |
| | 20,650,000 | | | Ziggo BV (Netherlands)(e) | | | 5.500 | | | | 01/15/2027 | | | | 19,501,447 | |
| | | | | | | | | | | | | | | | |
| | | | | | | | | | | | | | | 128,559,365 | |
| | | | | | | | | | | | | | | | |
| | | | Packaging & Containers—0.5% | | | | | | | | | |
| | 5,000,000 | | | Reynolds Group Holdings, Inc. (3 mo. USD LIBOR + 3.50%)(e)(f) | | | 5.839 | | | | 07/15/2021 | | | | 5,068,750 | |
| | 28,588,678 | | | Reynolds Group Issuer, Inc./Reynolds Group Issuer LLC/Reynolds Group Issuer Lu | | | 5.750 | | | | 10/15/2020 | | | | 28,660,149 | |
| | | | | | | | | | | | | | | | |
| | | | | | | | | | | | | | | 33,728,899 | |
| | | | | | | | | | | | | | | | |
| | | | Software—0.6% | | | | | | | | | |
| | 46,000,000 | | | First Data Corp.(e) | | | 5.000 | | | | 01/15/2024 | | | | 46,266,800 | |
| | | | | | | | | | | | | | | | |
| | | | Total Corporate Bonds
(Cost $243,924,220) | | | | | | | | | | | 234,615,482 | |
| | | | | | | | | | | | | | | | |
Number
of Shares | | | | | | | | | | | | |
| | | | Money Market Fund—7.3% | | | | | | | | | |
| | 538,422,513 | | | Invesco Premier U.S. Government Money Portfolio—Institutional Class, 1.83%(g)
(Cost $538,422,513) | | | | | | | | | | | 538,422,513 | |
| | | | | | | | | | | | | | | | |
| | | | Total Investments in Securities (Cost $7,483,056,442)—100.8% | | | | | | | | | | | 7,438,911,338 | |
| | | | Other assets less liabilities—(0.8)% | | | | | | | | | | | (60,684,777 | ) |
| | | | | | | | | | | | | | | | |
| | | | Net Assets—100.0% | | | | | | | | | | $ | 7,378,226,561 | |
| | | | | | | | | | | | | | | | |
Investment Abbreviations:
LIBOR—London Interbank Offered Rate
REIT—Real Estate Investment Trust
USD—U.S. Dollar
Notes to Schedule of Investments:
| (a) | Variable rate senior loan interests often require prepayments from excess cash flow or permit the borrower to repay at its election. The degree to which borrowers repay, whether as a contractual requirement or at their election, cannot be predicted with any accuracy. As a result, the actual remaining maturity may be substantially less than the stated maturities shown. However, it is anticipated that the variable rate senior loan interests will have an expected average life of three to five years. |
| (b) | Variable rate senior loan interests are, at present, not readily marketable, not registered under the Securities Act of 1933, as amended (the “1933 Act”) and may be subject to contractual and legal restrictions on sale. Variable rate senior loan interests in the Fund’s portfolio generally have variable rates which adjust to a base, such as the London Interbank Offered Rate (“LIBOR”), on set dates, typically every 30 days, but not greater than one year, and/or have interest rates that float at margin above a widely recognized base lending rate such as the Prime Rate of a designated U.S. bank. |
| (c) | Defaulted security. Currently, the issuer is partially or fully in default with respect to interest payments. The aggregate value of these securities at August 31, 2018 was $94,594,704, which represented 1.28% of the Fund’s Net Assets. |
| (d) | The borrower has filed for protection in federal bankruptcy court. |
| (e) | Security purchased or received in a transaction exempt from registration under the 1933 Act. The security may be resold pursuant to an exemption from registration under the 1933 Act, typically to qualified institutional buyers. The aggregate value of these securities at August 31, 2018 was $188,006,138, which represented 2.55% of the Fund’s Net Assets. |
| (f) | Interest and dividend rate is redetermined periodically. Rate shown is the rate in effect on August 31, 2018. |
| (g) | The security and the Fund are advised by wholly-owned subsidiaries of Invesco Ltd. and are therefore considered to be affiliated. The rate shown is the 7-day SEC standardized yield as of August 31, 2018. |
See accompanying Notes to Financial Statements which are an integral part of the financial statements.
Statement of Assets and Liabilities
August 31, 2018
| | | | |
| | | Invesco Senior
Loan ETF
(BKLN) | |
| Assets: | | | | |
Unaffiliated investments in securities, at value | | $ | 6,900,488,825 | |
Affiliated investments in securities, at value | | | 538,422,513 | |
Cash | | | 8,515,006 | |
Receivables: | | | | |
Investments sold | | | 123,737,854 | |
Interest | | | 16,886,127 | |
| | | | |
Total Assets | | | 7,588,050,325 | |
| | | | |
| |
| Liabilities: | | | | |
Payables: | | | | |
Investments purchased | | | 205,750,775 | |
Accrued unitary management fees | | | 4,072,989 | |
| | | | |
Total Liabilities | | | 209,823,764 | |
| | | | |
| Net Assets | | $ | 7,378,226,561 | |
| | | | |
| |
| Net Assets Consist of: | | | | |
Shares of beneficial interest | | $ | 7,874,794,608 | |
Undistributed net investment income | | | 13,033,080 | |
Undistributed net realized gain (loss) | | | (465,456,023 | ) |
Net unrealized appreciation (depreciation) | | | (44,145,104 | ) |
| | | | |
| Net Assets | | $ | 7,378,226,561 | |
| | | | |
Shares outstanding (unlimited amount authorized, $0.01 par value) | | | 319,200,000 | |
Net asset value | | $ | 23.11 | |
| | | | |
Market price | | $ | 23.05 | |
| | | | |
Unaffiliated investments in securities, at cost | | $ | 6,944,633,929 | |
| | | | |
Affiliated investments in securities, at cost | | $ | 538,422,513 | |
| | | | |
See accompanying Notes to Financial Statements which are an integral part of the financial statements.
Statement of Operations
For the period November 1, 2017 through August 31, 2018 and the year ended October 31, 2017
| | | | | | | | |
| | | Invesco Senior Loan ETF (BKLN) | |
| | | Ten Months Ended
August 31, 2018 | | | Year Ended
October 31, 2017 | |
| Investment Income: | | | | | | | | |
Interest income | | $ | 299,734,430 | | | $ | 344,611,907 | |
Affiliated dividend income | | | 8,244,286 | | | | 6,201,467 | |
Other Income | | | 1,014,515 | | | | 5,405,741 | |
| | | | | | | | |
Total Income | | | 308,993,231 | | | | 356,219,115 | |
| | | | | | | | |
| | |
| Expenses: | | | | | | | | |
Unitary management fees | | | 43,391,848 | | | | 55,771,970 | |
Tax expenses | | | 4,140 | | | | — | |
| | | | | | | | |
Total Expenses | | | 43,395,988 | | | | 55,771,970 | |
| | | | | | | | |
Less: Waivers | | | (1,039,450 | ) | | | (1,548,362 | ) |
| | | | | | | | |
Net Expenses | | | 42,356,538 | | | | 54,223,608 | |
| | | | | | | | |
Net Investment Income | | | 266,636,693 | | | | 301,995,507 | |
| | | | | | | | |
| | |
| Realized and Unrealized Gain (Loss): | | | | | | | | |
Net realized gain (loss) from Investment securities | | | (36,002,170 | ) | | | 2,445,393 | |
Net change in unrealized appreciation (depreciation) on investment securities | | | 3,991,124 | | | | (26,652,918 | ) |
| | | | | | | | |
Net realized and unrealized gain (loss) | | | (32,011,046 | ) | | | (24,207,525 | ) |
| | | | | | | | |
Net increase in net assets resulting from operations | | $ | 234,625,647 | | | $ | 277,787,982 | |
| | | | | | | | |
See accompanying Notes to Financial Statements which are an integral part of the financial statements.
Statement of Changes in Net Assets
For the period November 1, 2017 through August 31, 2018 and the year ended October 31, 2017 and 2016
| | | | | | | | | | | | |
| | | Invesco Senior Loan ETF (BKLN) | |
| | | Ten Months Ended
August 31, 2018 | | | Year Ended
October 31, 2017 | | | Year Ended
October 31, 2016 | |
| Operations: | | | | | | | | | | | | |
Net investment income | | $ | 266,636,693 | | | $ | 301,995,507 | | | $ | 193,910,528 | |
Net realized gain (loss) | | | (36,002,170 | ) | | | 2,445,393 | | | | (333,584,745 | ) |
Net change in unrealized appreciation (depreciation) | | | 3,991,124 | | | | (26,652,918 | ) | | | 344,726,561 | |
| | | | | | | | | | | | |
Net increase in net assets resulting from operations | | | 234,625,647 | | | | 277,787,982 | | | | 205,052,344 | |
| | | | | | | | | | | | |
| | | |
| Distributions to Shareholders from: | | | | | | | | | | | | |
Net investment income | | | (254,162,486 | ) | | | (301,436,634 | ) | | | (193,910,528 | ) |
Return of capital | | | — | | | | — | | | | (16,890,704 | ) |
| | | | | | | | | | | | |
Total distributions to shareholders | | | (254,162,486 | ) | | | (301,436,634 | ) | | | (210,801,232 | ) |
| | | | | | | | | | | | |
| | | |
| Shareholder Transactions: | | | | | | | | | | | | |
Proceeds from shares sold | | | 1,435,514,951 | | | | 3,177,332,078 | | | | 3,101,232,402 | |
Value of shares repurchased | | | (2,804,958,662 | ) | | | (852,914,348 | ) | | | (1,453,713,841 | ) |
Transaction fees | | | 3,376,366 | | | | 4,314,451 | | | | 7,999,052 | |
| | | | | | | | | | | | |
Net increase (decrease) in net assets resulting from shares transactions | | | (1,366,067,345 | ) | | | 2,328,732,181 | | | | 1,655,517,613 | |
| | | | | | | | | | | | |
Increase (Decrease) in Net Assets | | | (1,385,604,184 | ) | | | 2,305,083,529 | | | | 1,649,768,725 | |
| | | | | | | | | | | | |
| | | |
| Net Assets: | | | | | | | | | | | | |
Beginning of period | | | 8,763,830,745 | | | | 6,458,747,216 | | | | 4,808,978,491 | |
| | | | | | | | | | | | |
End of period | | $ | 7,378,226,561 | | | $ | 8,763,830,745 | | | $ | 6,458,747,216 | |
| | | | | | | | | | | | |
Undistributed net investment income at end of period | | $ | 13,033,080 | | | $ | 558,873 | | | $ | — | |
| | | | | | | | | | | | |
| | | |
| Changes in Shares Outstanding: | | | | | | | | | | | | |
Shares sold | | | 62,100,000 | | | | 136,500,000 | | | | 134,900,000 | |
Shares repurchased | | | (121,500,000 | ) | | | (36,800,000 | ) | | | (64,600,000 | ) |
Shares outstanding, beginning of period | | | 378,600,000 | | | | 278,900,000 | | | | 208,600,000 | |
| | | | | | | | | | | | |
Shares outstanding, end of period | | | 319,200,000 | | | | 378,600,000 | | | | 278,900,000 | |
| | | | | | | | | | | | |
See accompanying Notes to Financial Statements which are an integral part of the financial statements.
Statement of Cash Flows
For the period November 1, 2017 through August 31, 2018 and the year ended October 31, 2017
| | | | | | | | |
| | | Invesco Senior Loan ETF (BKLN) | |
| | | Ten Months Ended
August 31, 2018 | | | Year Ended
October 31, 2017 | |
| Cash Provided By (Used In) Operating Activities: | | | | | | | | |
Net increase in net assets resulting from operations | | $ | 234,625,647 | | | $ | 277,787,982 | |
| | | | | | | | |
| | |
| Adjustments to Reconcile the Change in Net Assets from Operations to Net Cash Provided By (Used In) Operating Activities: | | | | | | | | |
Purchases of investments | | | (5,549,166,229 | ) | | | (7,857,998,115 | ) |
Proceeds from disposition of investments sold | | | 6,753,791,830 | | | | 5,588,734,212 | |
Amortization of premiums and accretion of discounts on investments | | | (5,561,467 | ) | | | (11,745,773 | ) |
Net cash paid for purchases, sales, and maturities of short-term investments | | | (8,039,575 | ) | | | 88,265,829 | |
(Increase) in receivable for investments sold | | | (6,797,594 | ) | | | (2,975,067 | ) |
(Increase) Decrease in interest receivable | | | 3,154,730 | | | | (1,234,507 | ) |
Increase (Decrease) in payable for investments purchased | | | 1,896,336 | | | | (643,573,934 | ) |
Increase (Decrease) in payable for accrued expenses | | | (665,261 | ) | | | 1,560,301 | |
Net realized (gain) loss on investments | | | 36,002,170 | | | | (2,445,393 | ) |
Net change in unrealized (appreciation) depreciation on investments | | | (3,991,124 | ) | | | 26,652,918 | |
| | | | | | | | |
Net cash provided by (used in) operating activities | | | 1,220,623,816 | | | | (2,814,759,529 | ) |
| | |
| Cash Provided By (Used In) Financing Activities: | | | | | | | | |
Distributions paid to shareholders | | | (254,162,486 | ) | | | (301,436,634 | ) |
Proceeds from shares of beneficial interest sold | | | 1,435,514,951 | | | | 3,200,522,497 | |
Disbursements for shares of beneficial interest repurchased | | | (2,804,958,662 | ) | | | (852,914,348 | ) |
Net proceeds from transaction fees | | | 3,376,366 | | | | 4,314,451 | |
| | | | | | | | |
Net cash provided by (used in) financing activities | | | (1,620,229,831 | ) | | | 2,050,485,966 | |
| | | | | | | | |
| Net decrease in cash and cash equivalents | | | (164,980,368 | ) | | | (486,485,581 | ) |
| | | | | | | | |
| Cash and cash equivalents at beginning of period | | | 711,917,887 | | | | 1,198,403,468 | |
| | | | | | | | |
| Cash and cash equivalents at end of period | | $ | 546,937,519 | | | $ | 711,917,887 | |
| | | | | | | | |
See accompanying Notes to Financial Statements which are an integral part of the financial statements.
Financial Highlights
Invesco Senior Loan ETF (BKLN)
| | | | | | | | | | | | | | | | | | | | | | | | |
| | | Ten Months Ended
August 31, 2018 | | | Year Ended October 31, | |
| | | 2017 | | | 2016 | | | 2015 | | | 2014 | | | 2013 | |
| Per Share Operating Performance: | | | | | | | | | | | | | | | | | | | | | | | | |
Net asset value at beginning of period | | $ | 23.15 | | | $ | 23.16 | | | $ | 23.05 | | | $ | 24.43 | | | $ | 24.78 | | | $ | 24.76 | |
Net investment income(a) | | | 0.77 | | | | 0.82 | | | | 0.99 | | | | 0.92 | | | | 1.00 | | | | 1.06 | |
Net realized and unrealized gain (loss) on investments | | | (0.08 | ) | | | (0.02 | ) | | | 0.15 | | | | (1.39 | ) | | | (0.36 | ) | | | 0.04 | |
Total from investment operations | | | 0.69 | | | | 0.80 | | | | 1.14 | | | | (0.47 | ) | | | 0.64 | | | | 1.10 | |
Distributions to shareholders from: | | | | | | | | | | | | | | | | | | | | | | | | |
Net investment income | | | (0.74 | ) | | | (0.82 | ) | | | (0.99 | ) | | | (0.92 | ) | | | (1.00 | ) | | | (1.10 | ) |
Return of capital | | | — | | | | — | | | | (0.08 | ) | | | (0.00 | )(b) | | | (0.00 | )(b) | | | (0.02 | ) |
Total distributions | | | (0.74 | ) | | | (0.82 | ) | | | (1.07 | ) | | | (0.92 | ) | | | (1.00 | ) | | | (1.12 | ) |
Transaction fees(a) | | | 0.01 | | | | 0.01 | | | | 0.04 | | | | 0.01 | | | | 0.01 | | | | 0.04 | |
Net asset value at end of period | | $ | 23.11 | | | $ | 23.15 | | | $ | 23.16 | | | $ | 23.05 | | | $ | 24.43 | | | $ | 24.78 | |
Market price at end of period(c) | | $ | 23.05 | | | $ | 23.12 | | | $ | 23.19 | | | $ | 23.01 | | | $ | 24.37 | | | $ | 24.83 | |
| Net Asset Value Total Return(d) | | | 3.07 | % | | | 3.54 | % | | | 5.32 | % | | | (1.96 | )% | | | 2.66 | % | | | 4.70 | % |
| Market Price Total Return(d) | | | 2.93 | % | | | 3.27 | % | | | 5.64 | % | | | (1.89 | )% | | | 2.21 | % | | | 4.61 | % |
| Ratios/Supplemental Data: | | | | | | | | | | | | | | | | | | | | | | | | |
Net assets at end of period (000’s omitted) | | $ | 7,378,227 | | | $ | 8,763,831 | | | $ | 6,458,747 | | | $ | 4,808,978 | | | $ | 6,270,919 | | | $ | 6,064,711 | |
Ratio to average net assets of: | | | | | | | | | | | | | | | | | | | | | | | | |
Expenses, after Waivers | | | 0.63 | %(e)(f) | | | 0.63 | %(f) | | | 0.64 | % | | | 0.65 | %(f) | | | 0.64 | % | | | 0.65 | %(f) |
Expenses, prior to Waivers | | | 0.65 | %(e)(f) | | | 0.65 | %(f) | | | 0.65 | % | | | 0.65 | %(f) | | | 0.65 | % | | | 0.65 | %(f) |
Net investment income, after Waivers and Interest Expenses | | | 3.99 | %(e) | | | 3.52 | % | | | 4.33 | % | | | 3.82 | % | | | 4.03 | % | | | 4.30 | % |
Portfolio turnover rate(g) | | | 74 | % | | | 71 | % | | | 81 | % | | | 43 | % | | | 61 | % | | | 47 | % |
| (a) | Based on average shares outstanding. |
| (b) | Amount represents less than $0.005. |
| (c) | The mean between the last bid and ask prices. |
| (d) | Net asset value total return is calculated assuming an initial investment made at the net asset value at the beginning of the period, reinvestment of all dividends and distributions at net asset value during the period, and redemption on the last day of the period. Net asset value total return includes adjustments in accordance with accounting principles generally accepted in the United States of America and as such, the net asset value for financial reporting purposes and the returns based upon those net asset values may differ from the net asset value and returns for shareholder transactions. Market price total return is calculated assuming an initial investment made at the market price at the beginning of the period, reinvestment of all dividends and distributions at market price during the period, and sale at the market price on the last day of the period. Total investment returns calculated for a period of less than one year are not annualized. |
| (f) | In addition to the fees and expenses which the Fund bears directly, the Fund indirectly bears a pro rata share of the fees and expenses of the investment companies in which the Fund invests. Estimated investment companies’ expenses are not expenses that are incurred directly by the Fund. They are expenses that are incurred directly by the investment companies and are deducted from the value of the investment companies the Fund invests in. The effect of the estimated investment companies’ expenses that the Fund bears indirectly is included in the Fund’s total return. |
| (g) | Portfolio turnover rate is not annualized for periods less than one year, if applicable, and does not include securities received or delivered from processing creations or redemptions. |
See accompanying Notes to Financial Statements which are an integral part of the financial statements.
Notes to Financial Statements
Invesco Exchange-Traded Fund Trust II
August 31, 2018
Note 1. Organization
Invesco Exchange-Traded Fund Trust II (the “Trust”), formerly PowerShares Exchange-Traded Fund Trust II, was organized as a Massachusetts business trust on October 10, 2006 and is authorized to have multiple series of portfolios. The Trust is an open-end management investment company registered under the Investment Company Act of 1940, as amended (the “1940 Act”). This report includes the following portfolio:
| | |
Full Name | | Short Name |
| Invesco Senior Loan ETF (BKLN) | | “Senior Loan ETF” |
The portfolio (the “Fund”) represents a separate series of the Trust. The shares of the Fund are referred to herein as “Shares” or “Fund’s Shares.” The Fund’s Shares are listed and traded on NYSE Arca, Inc.
Effective June 4, 2018, the Fund’s name changed as part of an overall rebranding strategy whereby the PowerShares name was changed to the Invesco brand. This resulted in all references to the PowerShares name being changed to Invesco.
Effective August 31, 2018, the Fund’s fiscal year-end changed from October 31 to August 31.
The market price of a Share may differ to some degree from the Fund’s net asset value (“NAV”). Unlike conventional mutual funds, the Fund issues and redeems Shares on a continuous basis, at NAV, only in a large specified number of Shares, each called a “Creation Unit.” Creation Units are issued and redeemed principally in exchange for the deposit or delivery of cash. Except when aggregated in Creation Units by Authorized Participants, the Shares are not individually redeemable securities of the Fund.
The investment objective of the Fund is to seek to track the investment results (before fees and expenses) of the S&P/LSTA U.S. Leveraged Loan 100 Index (the “Underlying Index”).
Note 2. Significant Accounting Policies
The following is a summary of the significant accounting policies followed by the Fund in preparation of its financial statements.
The Fund is an investment company and accordingly follows the investment company accounting and reporting guidance in accordance with Financial Accounting Standards Board Accounting Standards Codification Topic 946, Financial Services—Investment Companies.
A. Security Valuation
Securities, including restricted securities, are valued according to the following policies:
Variable rate senior loan interests are fair valued using quotes provided by an independent pricing service. Quotes provided by the pricing service may reflect appropriate factors such as ratings, tranche type, industry, company performance, spread, individual trading characteristics, institution-size trading in similar groups of securities and other market data.
A security listed or traded on an exchange (except convertible securities) is generally valued at its last sales price or official closing price as of the close of the customary trading session on the exchange where the security is principally traded or, lacking any sales or official closing price on a particular day, the security may be valued at the closing bid price on that day. Securities traded in the over-the-counter market are valued based on prices furnished by independent pricing services or market makers. When such securities are valued by an independent pricing service they may be considered fair valued. Futures contracts are valued at the final settlement price set by an exchange on which they are principally traded. Listed options are valued at the mean between the last bid and asked prices from the exchange on which they are principally traded, or at the final settlement price set by such exchange. Swaps and options not listed on an exchange are valued by an independent source. For purposes of determining NAV per Share, futures and option contracts generally are valued 15 minutes after the close of the customary trading session of the New York Stock Exchange (“NYSE”).
Investment companies are valued using such company’s NAV per share, unless the shares are exchange-traded, in which case they are valued at the last sales price or official closing price as of the close of the customary trading session on the exchange where the security is principally traded.
Debt obligations (including convertible securities) and unlisted equities are fair valued using an evaluated quote provided by an independent pricing service. Evaluated quotes provided by the pricing service may be determined without exclusive reliance on quoted prices, and may reflect appropriate factors such as institution-size trading in similar groups of securities, developments related to specific securities, dividend rate (for unlisted equities), yield (for debt obligations), quality, type of issue, coupon rate (for debt obligations), maturity (for debt obligations), individual trading characteristics and other market data. Securities with a demand feature
exercisable within one to seven days are valued at par. Pricing services generally value debt obligations assuming orderly transactions of institutional round lot size, but a Fund may hold or transact in the same securities in smaller, odd lot sizes. Odd lots often trade at lower prices than institutional round lots. Debt obligations are subject to interest rate and credit risks. In addition, all debt obligations involve some risk of default with respect to interest and/or principal payments.
Foreign securities’ (including foreign exchange contracts’) prices are converted into U.S. dollar amounts using the applicable exchange rates as of the close of the London world markets. If market quotations are available and reliable for foreign exchange-traded equity securities, the securities will be valued at the market quotations. Because trading hours for certain foreign securities end before the close of the NYSE, closing market quotations may become unreliable. If between the time trading ends on a particular security and the close of the customary trading session on the NYSE, events occur that Invesco Capital Management LLC (the “Adviser”), formerly Invesco PowerShares Capital Management LLC, determines are significant and make the closing price unreliable, the Fund may fair value the security. If the event is likely to have affected the closing price of the security, the security will be valued at fair value in good faith using procedures approved by the Board of Trustees. Adjustments to closing prices to reflect fair value may also be based on a screening process of an independent pricing service to indicate the degree of certainty, based on historical data, that the closing price in the principal market where a foreign security trades is not the current value as of the close of the NYSE. Foreign securities’ prices meeting the approved degree of certainty that the price is not reflective of current value will be priced at the indication of fair value from the independent pricing service. Multiple factors may be considered by the independent pricing service in determining adjustments to reflect fair value and may include information relating to sector indices, American Depositary Receipts and domestic and foreign index futures. Foreign securities may have additional risks including exchange rate changes, potential for sharply devalued currencies and high inflation, political and economic upheaval, the relative lack of issuer information, relatively low market liquidity and the potential lack of strict financial and accounting controls and standards.
Securities for which market prices are not provided by any of the above methods may be valued based upon quotes furnished by independent sources. The last bid price may be used to value exchange-traded equity securities. The mean between the last bid and asked prices may be used to value debt obligations, including corporate loans, and unlisted equity securities.
Securities for which market quotations are not readily available or became unreliable are valued at fair value as determined in good faith following procedures approved by the Board of Trustees. Issuer-specific events, market trends, bid/asked quotes of brokers and information providers and other market data may be reviewed in the course of making a good faith determination of a security’s fair value.
The Fund may invest in securities that are subject to interest rate risk, meaning the risk that the prices will generally fall as interest rates rise and, conversely, the prices will generally rise as interest rates fall. Specific securities differ in their sensitivity to changes in interest rates depending on their individual characteristics. Changes in interest rates may result in increased market volatility, which may affect the value and/or liquidity of certain Fund investments.
Valuations change in response to many factors, including the historical and prospective earnings of the issuer, the value of the issuer’s assets, general economic conditions, interest rates, investor perceptions and market liquidity. Because of the inherent uncertainties of valuation, the values reflected in the financial statements may materially differ from the value received upon actual sale of those investments.
B. Other Risks
Index Risk. Unlike many investment companies, the Fund does not utilize an investing strategy that seeks returns in excess of its Underlying Index. Therefore, the Fund would not necessarily buy or sell a security unless that security is added or removed, respectively, from its Underlying Index, even if that security generally is underperforming.
Authorized Participant Concentration Risk. Only Authorized Participants (“APs”) may engage in creation or redemption transactions directly with the Fund. The Fund has a limited number of institutions that may act as APs, and such APs have no obligation to submit creation or redemption orders. Consequently, there is no assurance that those APs will establish or maintain an active trading market for the Shares. This risk may be heightened to the extent that securities underlying the Fund are traded outside a collateralized settlement system. In that case, APs may be required to post collateral on certain trades on an agency basis (i.e., on behalf of other market participants), which only a limited number of APs may be able to do. In addition, to the extent that APs exit the business or are unable to proceed with creation and/or redemption orders with respect to the Fund and no other AP is able to step forward to create or redeem Creation Units, this may result in a significantly diminished trading market for Fund Shares, which may be more likely to trade at a premium or discount to the Fund’s net asset value (“NAV”) and to face trading halts and/or delisting.
Industry Concentration Risk. The Underlying Index from time to time may be concentrated to a significant degree in securities of issuers located in a single industry or sector. To the extent that the Underlying Index concentrates in the securities of issuers in a particular industry or sector, the Fund will also concentrate its investments to approximately the same extent. By concentrating its investments in an industry or sector, the Fund faces more risks than if it were diversified broadly over numerous industries or sectors. Such industry-based risks, any of which may adversely affect the companies in which the Fund invests, may include, but are not limited to, the
following: general economic conditions or cyclical market patterns that could negatively affect supply and demand in a particular industry; competition for resources, adverse labor relations, political or world events; obsolescence of technologies; and increased competition or new product introductions that may affect the profitability or viability of companies in an industry. In addition, at times, such industry or sector may be out of favor and underperform other industries or the market as a whole.
Fixed-Income Securities Risk. Fixed-income securities are subject to interest rate risk and credit risk. Interest rate risk refers to fluctuations in the value of a fixed-income security resulting from changes in the general level of interest rates. When the general level of interest rates goes up, the prices of most fixed-income securities go down. When the general level of interest rates goes down, the prices of most fixed-income securities go up. Fixed-income securities with longer maturities typically are more sensitive to changes in interest rates, making them more volatile than securities with shorter maturities. Credit risk refers to the possibility that the issuer of a security will be unable and/or unwilling to make timely interest payments and/or repay the principal on its debt. Debt instruments are subject to varying degrees of credit risk, which may be reflected in credit ratings. There is a possibility that the credit rating of a fixed-income security may be downgraded after purchase, which may adversely affect the value of the security.
Changing Fixed-Income Market Conditions Risk. The current historically low interest rate environment was created in part by the Federal Reserve Board (“FRB”) and certain foreign central banks keeping the federal funds and equivalent foreign rates near, at or below zero. The “tapering” in 2015 of the FRB’s quantitative easing program, combined with the FRB’s raising of the target range for the Federal Funds Rate (and possible continued fluctuations in equivalent foreign rates) may expose fixed-income markets to heightened volatility and reduced liquidity for certain fixed-income investments, particularly those with longer maturities, although it is difficult to predict the impact of this rate increase and any future rate increases on various markets. In addition, decreases in fixed-income dealer market-making capacity may persist in the future, potentially leading to heightened volatility and reduced liquidity in the fixed-income markets. As a result, the value of the Fund’s investments and share price may decline. In addition, because of changing central bank policies, the Fund may experience higher than normal shareholder redemptions, which could potentially increase portfolio turnover and the Fund’s transaction costs and potentially lower the Fund’s returns.
Non-Correlation Risk. The Fund’s return may not match the return of its Underlying Index for a number of reasons. For example, the Fund incurs operating expenses not applicable to its Underlying Index, and incurs costs in buying and selling securities, especially when rebalancing the Fund’s securities holdings to reflect changes in the composition of its Underlying Index. Because the Fund issues and redeems Creation Units principally for cash, it will incur higher costs in buying and selling securities than if it issued and redeemed Creation Units principally in-kind. In addition, the performance of the Fund and its Underlying Index may vary due to asset valuation differences and differences between the Fund’s portfolio and its Underlying Index resulting from legal restrictions, cost or liquidity constraints.
Liquidity Risk. A majority of the Fund’s assets are likely to be invested in loans that are less liquid than securities traded on national exchanges. Loans with reduced liquidity involve greater risk than securities with more liquid markets. Available market quotations for such loans may vary over time, and if the credit quality of a loan unexpectedly declines, secondary trading of that loan may decline for a period of time. In the event that the Fund voluntarily or involuntarily liquidates portfolio assets during periods of infrequent trading, it may not receive full value for those assets.
Sampling Risk. The Fund’s use of a representative sampling approach will result in the Fund holding a smaller number of securities than are in its Underlying Index. As a result, an adverse development respecting to an issuer of securities held by the Fund could result in a greater decline in NAV than would be the case if the Fund held all of the securities in its Underlying Index. To the extent the assets in the Fund are smaller, these risks will be greater.
Cash Transaction Risk. Most ETFs generally make in-kind redemptions to avoid being taxed on gains on the distributed portfolio securities at the fund level. However, unlike most ETFs, the Fund currently intends to effect creations and redemptions principally for cash, rather than principally in-kind, due to the nature of the Fund’s investments. As such, the Fund may be required to sell portfolio securities to obtain the cash needed to distribute redemption proceeds. Therefore, the Fund may recognize a capital gain on these sales that might not have been incurred if the Fund had made a redemption in-kind. This may decrease the tax efficiency of the Fund compared to ETFs that utilize an in-kind redemption process and there may be a substantial difference in the after-tax rate of return between the Fund and conventional ETFs.
Non-Investment Grade Securities Risk. All or a significant portion of the loans in which the Fund will invest may be determined to be non-investment grade loans that are considered speculative. The Fund also may invest in junk bonds. Non-investment grade loans and bonds, and unrated loans and bonds of comparable credit quality are subject to the increased risk of a borrower’s or issuer’s inability to meet principal and interest payment obligations. These securities may be subject to greater price volatility due to such factors as specific corporate developments, interest rate sensitivity, negative perceptions of the non-investment grade securities markets generally, real or perceived adverse economic and competitive industry conditions and less secondary market liquidity. If the borrower of lower-rated loans or issuer of lower-rated bonds defaults, the Fund may incur additional expenses to seek recovery.
Risk of Investing in Loans. Investments in loans are subject to interest rate risk and credit risk. Interest rate risk refers to fluctuations in the value of a loan resulting from changes in the general level of interest rates. Credit risk refers to the possibility that the borrower of a
loan will be unable and/or unwilling to make timely interest payments and/or repay the principal on its obligation. Default in the payment of interest or principal on a loan will result in a reduction in the value of the loan and consequently a reduction in the value of the Fund’s investments and a potential decrease in the NAV of the Fund. Although the loans in which the Fund will invest generally will be secured by specific collateral, there can be no assurance that such collateral would satisfy the borrower’s obligation in the event of non-payment of scheduled interest or principal or that such collateral could be readily liquidated. In the event of the bankruptcy of a borrower, the Fund’s access to the collateral may be limited by bankruptcy or other insolvency loans and, therefore, the Fund could experience delays or limitations with respect to its ability to realize the benefits of the collateral securing a loan.
There is no organized exchange on which loans are traded and reliable market quotations may not be readily available. Therefore, elements of judgment may play a greater role in valuation of loans than for securities with a more developed secondary market and the Fund may not realize full value in the event of the need to sell a loan. To the extent that a secondary market does exist for certain loans, the market may be subject to volatility, irregular trading activity, wide bid/asked spreads, decreased liquidity and extended trade settlement periods. Some loans are subject to the risk that a court, pursuant to fraudulent conveyance or other similar laws, could subordinate the loans to presently existing or future indebtedness of the borrower or take other action detrimental to lenders, including the Fund, such as invalidation of loans or causing interest previously paid to be refunded to the borrower. Investments in loans also are subject to the risk of changes in legislation or state or federal regulations. If such legislation or regulations impose additional requirements or restrictions on the ability of financial institutions to make loans, the availability of loans for investment by the Fund may be adversely affected. Many loans are not registered with the Securities and Exchange Commission (the “SEC”) or any state securities commission and often are not rated by any nationally recognized rating service. Generally, there is less readily available, reliable information about most loans than is the case for many other types of securities. Although a loan may be senior to equity and other debt securities in a borrower’s capital structure, such obligations may be structurally subordinated to obligations of the borrower’s subsidiaries.
Senior Loans Risk. The risks associated with senior loans are similar to the risks of junk bonds, although senior loans typically are senior and secured, whereas junk bonds often are subordinated and unsecured. Investments in senior loans typically are below investment grade and are considered speculative because of the credit risk of their issuers. Such companies are more likely to default on their payments of interest and principal owed, and such defaults could reduce the Fund’s NAV and income distributions. An economic downturn generally leads to a higher non-payment rate, and a senior loan may lose significant value before a default occurs. There is no assurance that the liquidation of the collateral would satisfy the claims of the borrower’s obligations in the event of the non-payment of scheduled interest or principal, or that the collateral could be readily liquidated. Economic and other events (whether real or perceived) can reduce the demand for certain senior loans or senior loans generally, which may reduce market prices. Senior loans and other debt securities also are subject to the risk of price declines and to increases in prevailing interest rates, although floating-rate debt instruments such as senior loans in which the Fund may be expected to invest are substantially less exposed to this risk than fixed-rate debt instruments. No active trading market may exist for certain senior loans, which may impair the ability of the Fund to realize full value in the event of the need to liquidate such assets. Adverse market conditions may impair the liquidity of some actively traded senior loans. Longer interest rate reset periods generally increase fluctuations in value as a result of changes in market interest rates.
Risks of Loan Assignments and Participations. As the purchaser of an assignment, the Fund typically succeeds to all the rights and obligations of the assigning institution and becomes a lender under the credit agreement with respect to the debt obligation; however, the Fund may not be able to unilaterally enforce all rights and remedies under the loan and with regard to any associated collateral. Because assignments may be arranged through private negotiations between potential assignees and potential assignors, the rights and obligations acquired by the Fund as the purchaser of an assignment may differ from, and be more limited than, those held by the assigning lender. In addition, if the loan is foreclosed, the Fund could become part owner of any collateral and could bear the costs and liabilities of owning and disposing of the collateral. The Fund may be required to pass along to a purchaser that buys a loan from the Fund by way of assignment, a portion of any fees to which the Fund is entitled under the loan. In connection with purchasing participations, the Fund generally will have no right to enforce compliance by the borrower with the terms of the loan agreement relating to the loan, nor any rights of set-off against the borrower, and the Fund may not directly benefit from any collateral supporting the loan in which it has purchased the participation. As a result, the Fund will be subject to the credit risk of both the borrower and the lender that is selling the participation. In the event of the insolvency of the lender selling a participation, the Fund may be treated as a general creditor of the lender and may not benefit from any set-off between the lender and the borrower.
C. Cash and Cash Equivalents
For the purposes of the Statement of Cash Flows, the Fund defines Cash and Cash Equivalents as cash (including foreign currency), money market funds and other investments held in lieu of cash and excludes investments made with cash collateral received.
D. Securities Purchased on a When-Issued and Delayed Delivery Basis
The Fund may purchase and sell interests in corporate loans and corporate debt securities and other portfolio securities on a when-issued and delayed delivery basis, with payment and delivery scheduled for a future date. No income accrues to the Fund on such interests or securities in connection with such transactions prior to the date the Fund actually takes delivery of such interests or securities. These transactions are subject to market fluctuations and are subject to the risk that the value of the interests or securities at
delivery may be more or less than the trade date purchase price. Although the Fund will generally purchase these securities with the intention of acquiring such securities, it may sell such securities prior to the settlement date.
E. Federal Income Taxes
The Fund intends to comply with the provisions of the Internal Revenue Code of 1986, as amended (the “Internal Revenue Code”), applicable to regulated investment companies and to distribute substantially all of the Fund’s taxable earnings to its shareholders. As such, the Fund will not be subject to federal income taxes on otherwise taxable income (including net realized gains) that is distributed to the shareholders. Therefore, no provision for federal income taxes is recorded in the financial statements.
The Fund recognizes the tax benefits of uncertain tax positions only when the position is more likely than not to be sustained. Management has analyzed the Fund’s uncertain tax positions and concluded that no liability for unrecognized tax benefits should be recorded related to uncertain tax positions. Management is not aware of any tax positions for which it is reasonably possible that the total amounts of unrecognized tax benefits will change materially in the next 12 months.
Income and capital gain distributions are determined in accordance with federal income tax regulations, which may differ from accounting principles generally accepted in the United States of America (“GAAP”). These differences are primarily due to differing book and tax treatments for losses deferred due to wash sales and passive foreign investment company adjustments, if any.
The Fund files U.S. federal tax returns and tax returns in certain other jurisdictions. Generally, the Fund is subject to examinations by such taxing authorities for up to three years after the filing of the return for the tax period.
F. Investment Transactions and Investment Income
Investment transactions are accounted for on a trade date basis. Realized gains and losses from the sale or disposition of securities are computed on the specific identified cost basis. Bond premiums and discounts are amortized and/or accreted over the lives of the respective securities. Pay-in-kind interest income and non-cash dividend income received in the form of securities in-lieu of cash are recorded at the fair value of the securities received. Interest income is recorded on the accrual basis from settlement date. Dividend income (net of withholding tax, if any) is recorded on the ex-dividend date. Realized gains, dividends and interest received by the Fund may give rise to withholding and other taxes imposed by foreign countries. Tax conventions between certain countries and the United States may reduce or eliminate such taxes.
The Fund may periodically participate in litigation related to the Fund’s investments. As such, the Fund may receive proceeds from litigation settlements. Any proceeds received are included in the Statement of Operations as realized gain (loss) for investments no longer held and as unrealized gain (loss) for investments still held.
Other income is comprised primarily of amendment fees which are recorded when received. Amendment fees are received in return for changes in the terms of a loan or note.
Brokerage commissions and mark ups are considered transaction costs and are recorded as an increase to the cost basis of securities purchased and/or a reduction of proceeds on a sale of securities. Such transaction costs are included in the determination of net realized and unrealized gain (loss) from investment securities reported in the Statement of Operations and the Statement of Changes in Net Assets and the net realized and unrealized gains (losses) on securities per share in the Financial Highlights. Transaction costs are included in the calculation of the Fund’s NAV and, accordingly, they reduce the Fund’s total returns. These transaction costs are not considered operating expenses and are not reflected in net investment income reported in the Statement of Operations and the Statement of Changes in Net Assets, or the net investment income per share and the ratios of expenses and net investment income reported in the Financial Highlights, nor are they limited by any expense limitation arrangements between the Fund and the Adviser.
G. Country Determination
For the purposes of presentation in the Schedule of Investments, the Adviser may determine the country in which an issuer is located and/or credit risk exposure based on various factors. These factors include whether the Fund’s Underlying Index has made a country determination and may include the laws of the country under which the issuer is organized, where the issuer maintains a principal office, the country in which the issuer derives 50% or more of its total revenues and the country that has the primary market for the issuer’s securities, as well as other criteria. Among the other criteria that may be evaluated for making this determination are the country in which the issuer maintains 50% or more of its assets, the type of security, financial guarantees and enhancements, the nature of the collateral and the sponsor organization. Country of issuer and/or credit risk exposure has been determined to be the United States of America, unless otherwise noted.
H. Expenses
The Fund has agreed to pay an annual unitary management fee to the Adviser. Out of the unitary management fee, the Adviser has agreed to pay for substantially all expenses of the Fund, including the payments to Invesco Senior Secured Management, Inc. (the “Sub-Adviser”), set-up fees and commitment fees associated with the line of credit and the cost of transfer agency, custody, fund administration, legal, audit and other services, except for advisory fees, distribution fees, if any, brokerage expenses, taxes, interest (including interest expenses associated with the line of credit), acquired fund fees and expenses, if any, litigation expenses and other extraordinary expenses.
Expenses of the Trust that are excluded from the Fund’s unitary management fee and are directly identifiable to the Fund are applied to the Fund. Expenses of the Trust that are excluded from the Fund’s unitary management fee and that are not readily identifiable to the Fund are allocated in such a manner as deemed equitable, taking into consideration the nature and type of expense and the relative net assets of the Fund.
To the extent the Fund invests in other investment companies, the expenses shown in the accompanying financial statements reflect the expenses of the Fund and do not include any expenses of the investment companies in which it invests. The effects of such investment companies’ expenses are included in the realized and unrealized gain or loss on the investments in the investment companies.
I. Dividends and Distributions to Shareholders
The Fund declares and pays dividends from net investment income, if any, to its shareholders monthly and records such dividends on ex-dividend date. Generally, the Fund distributes net realized taxable capital gains, if any, annually in cash and records them on ex-dividend date. Such distributions on a tax basis are determined in conformity with federal income tax regulations, which may differ from GAAP. Distributions in excess of tax basis earnings and profits, if any, are reported in the Fund’s financial statements as a tax return of capital at fiscal year-end.
J. Accounting Estimates
The preparation of the financial statements in accordance with GAAP requires management to make estimates and assumptions that affect the reported amounts and disclosures in the financial statements, including estimates and assumptions related to taxation. Actual results could differ from these estimates. In addition, the Fund monitors for material events or transactions that may occur or become known after the period-end date and before the date the financial statements are released to print.
Note 3. Investment Advisory Agreement and Other Agreements
The Trust has entered into an Investment Advisory Agreement with the Adviser on behalf of the Fund, pursuant to which the Adviser has overall responsibility for the selection and ongoing monitoring of the Fund’s investments, managing the Fund’s business affairs and providing certain clerical, bookkeeping and other administrative services, and oversight of the Sub-Adviser.
As compensation for its services, the Fund accrues daily and pays monthly to the Adviser an annual unitary management fee of 0.65% of the Fund’s average daily net assets. Out of the unitary management fee, the Adviser has agreed to pay for substantially all expenses of the Fund, including payments to the Sub-Adviser, set-up fees and commitment fees associated with the Fund’s line of credit and the cost of transfer agency, custody, fund administration, legal, audit and other services, except for advisory fees, distribution fees, if any, brokerage expenses, taxes, interest (including interest expenses associated with the line of credit), acquired fund fees and expenses, if any, litigation expenses and other extraordinary expenses.
The Adviser has entered into a sub-advisory agreement with the Sub-Adviser. The sub-advisory fee is paid by the Adviser to the Sub-Adviser at the annual rate of 40% of compensation paid to the Adviser from the Fund. Further, through August 31, 2020, the Adviser has contractually agreed to waive a portion of the Fund’s management fee in an amount equal to 100% of the net advisory fees an affiliate of the Adviser receives that are attributable to certain of the Fund’s investments in money market funds managed by that affiliate (excluding investments of cash collateral from securities lending). The Adviser cannot discontinue this waiver prior to its expiration.
For the period November 1, 2017 to August 31, 2018 and the fiscal year ended October 31, 2017, the Adviser waived fees of $1,039,450 and $1,548,362, respectively.
The Trust has entered into a Distribution Agreement with Invesco Distributors, Inc. (the “Distributor”), which serves as the distributor of Creation Units for the Fund. The Distributor does not maintain a secondary market in the Shares. The Fund is not charged any fees pursuant to the Distribution Agreement. The Distributor is an affiliate of the Adviser.
The Adviser has entered into a licensing agreement for the Fund with S&P Dow Jones Indices LLC (the “Licensor”). The Underlying Index name trademark is owned by the Licensor. This trademark has been licensed to the Adviser for use by the Fund. The Fund is entitled to use its Underlying Index pursuant to the Trust’s sub-licensing agreement with the Adviser. The Fund is not sponsored, endorsed, sold or promoted by the Licensor, and the Licensor makes no representation regarding the advisability of investing in the Fund.
The Trust has entered into service agreements whereby The Bank of New York Mellon, a wholly-owned subsidiary of The Bank of New York Mellon Corporation, serves as the administrator, custodian, fund accountant and transfer agent for the Fund.
Note 4. Additional Valuation Information
GAAP defines fair value as the price that would be received to sell an asset or paid to transfer a liability in an orderly transaction between market participants at the measurement date, under current market conditions. GAAP establishes a hierarchy that prioritizes the inputs to valuation methods, giving the highest priority to readily available unadjusted quoted prices in an active market for identical
assets (Level 1) and the lowest priority to significant unobservable inputs (Level 3), generally when market prices are not readily available or are unreliable. Based on the valuation inputs, the securities or other investments are tiered into one of three levels. Changes in valuation methods may result in transfers in or out of an investment’s assigned level:
| | Level 1 — | Prices are determined using quoted prices in an active market for identical assets. |
| | Level 2 — | Prices are determined using other significant observable inputs. Observable inputs are inputs that other market participants may use in pricing a security. These may include quoted prices for similar securities, interest rates, prepayment speeds, credit risk, yield curves, loss severities, default rates, discount rates, volatilities and others. |
| | Level 3 — | Prices are determined using significant unobservable inputs. In situations where quoted prices or observable inputs are unavailable (for example, when there is little or no market activity for an investment at the end of the period), unobservable inputs may be used. Unobservable inputs reflect the Fund’s own assumptions about the factors market participants would use in determining fair value of the securities or instruments and would be based on the best available information. |
The following is a summary of the tiered valuation input levels, as of August 31, 2018. The level assigned to the securities valuations may not be an indication of the risk or liquidity associated with investing in those securities. Because of the inherent uncertainties of valuation, the values reflected in the financial statements may materially differ from the value received upon actual sale of those investments.
The Fund’s policy is to recognize transfers in and out of the valuation levels as of the end of the reporting period. During the period November 1, 2017 to August 31, 2018, there were no transfers between valuation levels.
| | | | | | | | | | | | | | | | |
| | | Investments in Securities | |
| | | Level 1 | | | Level 2 | | | Level 3 | | | Total | |
| Investments in Securities | | | | | | | | | | | | | | | | |
Variable Rate Senior Loan Interests | | $ | — | | | $ | 6,665,873,343 | | | $ | — | | | $ | 6,665,873,343 | |
Corporate Bonds | | | — | | | | 234,615,482 | | | | — | | | | 234,615,482 | |
Money Market Fund | | | 538,422,513 | | | | — | | | | — | | | | 538,422,513 | |
| | | | | | | | | | | | | | | | |
Total Investments | | $ | 538,422,513 | | | $ | 6,900,488,825 | | | $ | — | | | $ | 7,438,911,338 | |
| | | | | | | | | | | | | | | | |
Note 5. Distributions to Shareholders and Tax Components of Net Assets
Tax Character of Distributions to Shareholders Paid During the Period November 1, 2017 to August 31, 2018, Fiscal Year Ended October 31, 2017 and Fiscal Year Ended October 31, 2016:
| | | | | | | | | | | | |
| | | August 31, 2018 | | | October 31, 2017 | | | October 31, 2016 | |
| Ordinary Income | | $ | 254,162,486 | | | $ | 301,436,634 | | | $ | 193,910,528 | |
| Return of Capital | | | — | | | | — | | | | 16,890,704 | |
Tax Components of Net Assets at Fiscal Period-End:
| | | | |
| Undistributed Ordinary Income | | $ | 13,033,080 | |
| Net Unrealized Appreciation (Depreciation) Investments | | | (44,145,104 | ) |
| Capital Loss Carryforward | | | (465,456,023 | ) |
| Shares of Beneficial Interest | | | 7,874,794,608 | |
| | | | |
| Total Net Assets | | $ | 7,378,226,561 | |
| | | | |
Capital loss carryforwards are calculated and reported as of a specific date. Results of transactions and other activity after that date may affect the amount of capital loss carryforwards actually available for the Fund to utilize. The ability to utilize capital loss carryforwards in the future may be limited under the Internal Revenue Code and related regulations based on the results of future transactions.
The following table presents available capital loss carryforwards for the Fund as of August 31, 2018:
| | | | | | | | | | | | |
| | | Post-effective/no expiration | | | | |
| | | Short-Term | | | Long-Term | | | Total* | |
| | $ | 102,383,972 | | | $ | 363,072,051 | | | $ | 465,456,023 | |
| * | Capital loss carryforwards as of the date listed above are reduced for limitations, if any, to the extent required by the Internal Revenue Code and may be further limited depending upon a variety of factors, including the realization of net unrealized gains or losses as of the date of any reorganization. |
Note 6. Investment Transactions
For the period November 1, 2017 to August 31, 2018, the cost of securities purchased and proceeds from sales of securities (other than short-term securities, U.S. Treasury obligations and money market funds, if any) were $5,549,166,229 and $6,753,791,830, respectively.
At August 31, 2018, the aggregate cost of investments, including any derivatives, on a tax basis includes adjustments for financial reporting purposes as of the most recently completed federal income tax reporting period-end:
| | | | |
| Aggregate unrealized appreciation of investments | | $ | 33,313,209 | |
| Aggregate unrealized depreciation of investments | | | (77,458,313 | ) |
| | | | |
| Net unrealized appreciation (depreciation) of investments | | $ | (44,145,104 | ) |
| | | | |
| Cost of investments for tax and financial reporting purposes is the same. | | | | |
Note 7. Trustees’ and Officer’s Fees
Trustees’ and Officer’s Fees include amounts accrued by the Fund to pay remuneration to each Trustee who is not an “interested person” as defined in the 1940 Act (an “Independent Trustee”), any Trustee who is not an affiliate of the Adviser or Distributor (or any of their affiliates) and who is otherwise an “interested person” of the Trust under the 1940 Act (an “Unaffiliated Trustee”) and an Officer of the Trust. The Adviser, as a result of the unitary management fee, pays for such compensation. The Trustee who is an “interested person” of the Trust does not receive any Trustees’ fees.
The Trust has adopted a deferred compensation plan (the “Plan”). Under the Plan, each Independent Trustee or Unaffiliated Trustee who has executed a Deferred Fee Agreement (a “Participating Trustee”) may defer receipt of all or a portion of his compensation (“Deferral Fees”). Such Deferral Fees are deemed to be invested in select Invesco Funds. The Deferral Fees payable to the Participating Trustee are valued as of the date such Deferral Fees would have been paid to the Participating Trustee. The value increases with contributions or with increases in the value of the Shares selected, and the value decreases with distributions or with declines in the value of the Shares selected. Obligations under the Plan represent unsecured claims against the general assets of the Fund.
Note 8. Senior Loan Participation Commitments
The Fund may invest in participations, assignments, or act as a party to the primary lending syndicate of a senior loan interest to corporations, partnerships, and other entities. When the Fund purchases a participation of a senior loan interest, the Fund typically enters into a contractual agreement with the lender or other third party selling the participation, but not with the borrower directly. As such, the Fund assumes the credit risk of the borrower, selling participant or other persons interpositioned between the Fund and the borrower.
During the period November 1, 2017 to August 31, 2018, there were no interests in senior loans purchased by the Fund on a participation basis.
Note 9. Borrowing
The Fund is a party to a committed line of credit facility with a syndicate administered by State Street Bank and Trust Company. The Fund may borrow up to the lesser of (1) $750,000,000 or (2) the limits set by its prospectus for borrowings. The Adviser, on behalf of the Fund, pays an upfront fee of 0.10% on the commitment amount and a commitment fee of 0.15% on the amount of the commitment that has not been utilized. In case of borrowings from the line of credit, the Fund pays the associated interest expenses.
During the period November 1, 2017 to August 31, 2018, there were no outstanding borrowings from the line of credit.
Note 10. Capital
Shares are created and redeemed by the Fund only in Creation Units of 100,000 Shares. Only Authorized Participants are permitted to purchase or redeem Creation Units from the Fund. Unlike most ETFs, the Fund currently effects creations and redemptions principally in exchange for the deposit or delivery of cash, rather than principally in exchange for the deposit or delivery of a basket of securities (“Deposit Securities”) because of the nature of the Fund’s investments.
To the extent that the Fund permits transactions in exchange for Deposit Securities, the Fund may issue Shares in advance of receipt of Deposit Securities subject to various conditions, including a requirement to maintain on deposit with the Trust cash at least equal to 105% of the market value of the missing Deposit Securities. In accordance with the Trust’s Participant Agreement, Creation Units will be issued to an Authorized Participant, notwithstanding the fact that the corresponding Deposit Securities have not been received in part or in whole, in reliance on the undertaking of the Authorized Participant to deliver the missing Deposit Securities as soon as possible, which undertaking shall be secured by the Authorized Participant’s delivery and maintenance of collateral consisting of cash in the form of U.S. dollars in immediately available funds having a value (marked-to-market daily) at least equal to 105%, which the Adviser may change from time to time, of the value of the missing Deposit Securities.
Certain transaction fees may be charged by the Fund for creations and redemptions, which are treated as increases in capital.
Transactions in the Fund’s Shares are disclosed in detail in the Statement of Changes in Net Assets.
Note 11. Indemnifications
Under the Trust’s organizational documents, its Officers and Trustees are indemnified against certain liabilities arising out of the performance of their duties to the Trust. Each Independent Trustee and Unaffiliated Trustee is also indemnified against certain liabilities arising out of the performance of his duties to the Trust pursuant to an Indemnification Agreement between such trustee and the Trust. Additionally, in the normal course of business, the Trust enters into contracts with service providers that contain general indemnification clauses. The Trust’s maximum exposure under these arrangements is unknown, as this would involve future claims that may be made against the Trust that have not yet occurred. However, based on experience, the Trust believes the risk of loss to be remote.
Report of Independent Registered Public Accounting Firm
To the Board of Trustees of Invesco Exchange-Traded Fund Trust II and Shareholders of Invesco Senior Loan ETF
Opinion on the Financial Statements
We have audited the accompanying statement of assets and liabilities, including the schedule of investments, of Invesco Senior Loan ETF (one of the funds constituting Invesco Exchange-Traded Fund Trust II, referred to hereafter as the “Fund”) as of August 31, 2018, the related statements of operations and cash flows for the period November 1, 2017 through August 31, 2018 and for the year ended October 31, 2017, the statement of changes in net assets for the period November 1, 2017 through August 31, 2018 and for each of the two years in the period ended October 31, 2017, including the related notes, and the financial highlights for each of the periods indicated therein (collectively referred to as the “financial statements”). In our opinion, the financial statements present fairly, in all material respects, the financial position of the Fund as of August 31, 2018, the results of its operations and its cash flows for the period November 1, 2017 through August 31, 2018 and for the year ended October 31, 2017, the changes in its net assets for the period November 1, 2017 through August 31, 2018 and for each of the two years in the period ended October 31, 2017 and the financial highlights for each of the periods indicated therein, in conformity with accounting principles generally accepted in the United States of America.
Basis for Opinion
These financial statements are the responsibility of the Fund’s management. Our responsibility is to express an opinion on the Fund’s financial statements based on our audits. We are a public accounting firm registered with the Public Company Accounting Oversight Board (United States) (“PCAOB”) and are required to be independent with respect to the Fund in accordance with the U.S. federal securities laws and the applicable rules and regulations of the Securities and Exchange Commission and the PCAOB.
We conducted our audits of these financial statements in accordance with the standards of the PCAOB. Those standards require that we plan and perform the audit to obtain reasonable assurance about whether the financial statements are free of material misstatement, whether due to error or fraud.
Our audits included performing procedures to assess the risks of material misstatement of the financial statements, whether due to error or fraud, and performing procedures that respond to those risks. Such procedures included examining, on a test basis, evidence regarding the amounts and disclosures in the financial statements. Our audits also included evaluating the accounting principles used and significant estimates made by management, as well as evaluating the overall presentation of the financial statements. Our procedures included confirmation of securities owned as of August 31, 2018 by correspondence with the custodian, transfer agent, and brokers; when replies were not received from brokers, we performed other auditing procedures. We believe that our audits provide a reasonable basis for our opinion.
PricewaterhouseCoopers LLP
Chicago, Illinois
October 26, 2018
We have served as the auditor of one or more of the investment companies in the Invesco group of investment companies since at least 1995. We have not been able to determine the specific year we began serving as auditor.
Fees and Expenses
As a shareholder of the Invesco Senior Loan ETF (the “Fund”), a series of the Invesco Exchange-Traded Fund Trust II, you incur a unitary management fee. In addition to the unitary management fee, a shareholder may pay distribution fees, if any, brokerage expenses, taxes, interest (including interest expenses associated with the line of credit), acquired fund fees and expenses, if any, litigation expenses and other extraordinary expenses. The expense examples below are intended to help you understand your ongoing costs (in dollars) of investing in the Fund and to compare these costs with the ongoing costs of investing in other funds.
The example is based on an investment of $1,000 invested at the beginning of the period and held through the six-month period ended August 31, 2018.
In addition to the fees and expenses which the Fund bears directly, the Fund indirectly bears a pro rata share of the fees and expenses of the investment companies in which the Fund invests. The amount of fees and expenses incurred indirectly by the Fund will vary because the investment companies have varied expenses and fee levels and the Fund may own different proportions of the investment companies at different times. Estimated investment companies’ expenses are not expenses that are incurred directly by the Fund. They are expenses that are incurred directly by the investment companies and are deducted from the value of the investment companies the Fund invests in. The effect of the estimated investment companies’ expenses that the Fund bears indirectly is included in the Fund’s total return.
Actual Expenses
The first line in the following table provides information about actual account values and actual expenses. You may use the information in this line, together with the amount you invested, to estimate the expenses that you paid over the period. Simply divide your account value by $1,000 (for example, an $8,600 account value divided by $1,000 = 8.6), then multiply the result by the number in the first line under the heading “Expenses Paid During the Six-Month Period” to estimate the expenses you paid on your account during this period.
Hypothetical Example for Comparison Purposes
The second line in the following table provides information about hypothetical account values and hypothetical expenses based on the Fund’s actual expense ratio and an assumed annualized rate of return of 5% per year before expenses, which is not the Fund’s actual return. The hypothetical account values and expenses may not be used to estimate the actual ending account balance or expenses you paid for the period. You may use this information to compare the ongoing costs of investing in the Fund and other funds. To do so, compare this 5% hypothetical example with the 5% hypothetical examples that appear in the shareholder reports of the other funds.
Please note that the expenses shown in the table are meant to highlight your ongoing costs only, and do not reflect any transactional costs, such as sales charges and brokerage commissions. Therefore, the second line in the table is useful in comparing ongoing costs only, and will not help you determine the relative total costs of owning different fund. In addition, expenses shown in the table do not include the expenses of the underlying funds, which are borne indirectly by the Fund. If transaction costs and indirect expenses were included, your costs would have been higher.
| | | | | | | | | | | | | | | | |
| | | Beginning
Account Value
March 1, 2018 | | | Ending
Account Value
August 31, 2018 | | | Annualized
Expense Ratio
Based on the
Six-Month Period | | | Expenses Paid
During the
Six-Month Period(1) | |
| Invesco Senior Loan ETF (BKLN) | | | | | | | | | | | | | | | | |
Actual | | $ | 1,000.00 | | | $ | 1,019.30 | | | | 0.63 | % | | $ | 3.21 | |
Hypothetical (5% return before expenses) | | | 1,000.00 | | | | 1,022.03 | | | | 0.63 | | | | 3.21 | |
| (1) | Expenses are calculated using the annualized expense ratio, which represents the ongoing expenses as a percentage of net assets for the six-month period ended August 31, 2018. Expenses are calculated by multiplying the Fund’s annualized expense ratio by the average account value for the period, then multiplying the result by 184/365. Expense ratios for the most recent six-month period may differ from expense ratios based on the annualized data in the Financial Highlights. |
Tax Information
Form 1099-DIV, Form 1042-S and other year-end tax information provide shareholders with actual calendar year amounts that should be included in their tax returns. Shareholders should consult their tax advisors.
The following distribution information is being provided as required by the Internal Revenue Code or to meet a specific state’s requirement.
The Fund designates the following amounts or, if subsequently determined to be different, the maximum amount allowable for the fiscal period ended August 31, 2018:
| | | | | |
| Qualified Dividend Income* | | | | 0 | % |
| Corporate Dividends Received Deduction* | | | | 0 | % |
| Qualified Interest Income* | | | | 100 | % |
| * | The above percentages are based on ordinary income dividends paid to shareholders during the Fund’s fiscal period. |
Trustees and Officers
The Independent Trustees of the Trust, their term of office and length of time served, their principal business occupations during at least the past five years, the number of portfolios in the Fund Complex (as defined below) overseen by each Independent Trustee and the other directorships, if any, held by each Independent Trustee are shown below.
| | | | | | | | | | |
Name, Address and Year of
Birth of Independent Trustees | | Position(s)
Held
with Trust | | Term of
Office
and
Length of
Time
Served* | | Principal
Occupation(s) During
Past 5 Years | | Number of
Portfolios
in Fund
Complex**
Overseen by
Independent
Trustees | | Other
Directorships
Held by
Independent
Trustees During
the Past 5 Years |
Ronn R. Bagge—1958
c/o Invesco Capital Management LLC
3500 Lacey Road, Suite 700
Downers Grove, IL 60515 | | Chairman of the Nominating and Governance Committee and Trustee | | Chairman of the Nominating and Governance Committee and Trustee since 2007 | | Founder and Principal, YQA Capital Management LLC (1998-Present); formerly, Owner/CEO of Electronic Dynamic Balancing Co., Inc. (high-speed rotating equipment service provider). | | 221 | | Trustee and Investment Oversight Committee member, Mission Aviation Fellowship (2017-Present) |
| | | | | |
Todd J. Barre—1957
c/o Invesco Capital Management LLC
3500 Lacey Road, Suite 700
Downers Grove, IL 60515 | | Trustee | | Since 2010 | | Assistant Professor of Business, Trinity Christian College (2010-2016); formerly, Vice President and Senior Investment Strategist (2001-2008), Director of Open Architecture and Trading (2007-2008), Head of Fundamental Research (2004-2007) and Vice President and Senior Fixed Income Strategist (1994-2001), BMO Financial Group/Harris Private Bank. | | 221 | | None |
| | | | | |
Marc M. Kole—1960
c/o Invesco Capital Management LLC
3500 Lacey Road, Suite 700
Downers Grove, IL 60515 | | Chairman of the Audit Committee and Trustee | | Chairman of the Audit Committee since 2008; Trustee since 2007 | | Senior Director of Finance, By The Hand Club for Kids (2015-Present); formerly, Chief Financial Officer, Hope Network (social services) (2008-2012); Assistant Vice President and Controller, Priority Health (health insurance) (2005-2008); Senior Vice President of Finance, United Healthcare (2004-2005); Chief Accounting Officer, Senior Vice President of Finance, Oxford Health Plans (2000-2004); Audit Partner, Arthur Andersen LLP (1996-2000). | | 221 | | None |
| | | | | |
Yung Bong Lim—1964
c/o Invesco Capital Management LLC
3500 Lacey Road, Suite 700
Downers Grove, IL 60515 | | Chairman of the Investment Oversight Committee and Trustee | | Chairman of the Investment Oversight Committee since 2014; Trustee since 2013 | | Managing Partner, RDG Funds LLC (2008-Present); formerly, Managing Director, Citadel LLC (1999-2007). | | 221 | | None |
| * | This is the date the Independent Trustee began serving the Trust. Each Independent Trustee serves an indefinite term, until his successor is elected. |
| ** | Fund Complex includes all open- and closed-end funds (including all of their portfolios) advised by the Adviser and any affiliated person of the Adviser. |
Trustees and Officers (continued)
| | | | | | | | | | |
Name, Address and Year of
Birth of Independent Trustees | | Position(s)
Held
with Trust | | Term of
Office
and
Length of
Time
Served* | | Principal
Occupation(s) During
Past 5 Years | | Number of
Portfolios
in Fund
Complex**
Overseen by
Independent
Trustees | | Other
Directorships
Held by
Independent
Trustees During
the Past 5 Years |
Gary R. Wicker—1961
c/o Invesco Capital Management LLC
3500 Lacey Road, Suite 700
Downers Grove, IL 60515 | | Trustee | | Since 2013 | | Senior Vice President of Global Finance and Chief Financial Officer at RBC Ministries (publishing company) (2013-Present); formerly, Executive Vice President and Chief Financial Officer, Zondervan Publishing (a division of Harper Collins/NewsCorp) (2007-2012); Senior Vice President and Group Controller (2005-2006), Senior Vice President and Chief Financial Officer (2003-2004), Chief Financial Officer (2001-2003), Vice President, Finance and Controller (1999-2001) and Assistant Controller (1997-1999), divisions of The Thomson Corporation (information services provider). | | 221 | | None |
| | | | | |
Donald H. Wilson—1959
c/o Invesco Capital Management LLC
3500 Lacey Road, Suite 700
Downers Grove, IL 60515 | | Chairman of the Board and Trustee | | Chairman since 2012; Trustee since 2007 | | Chairman, President and Chief Executive Officer, McHenry Bancorp Inc. and McHenry Savings Bank (subsidiary) (2018-Present); Chairman and Chief Executive Officer, Stone Pillar Advisors, Ltd. (2010-Present); President and Chief Executive Officer, Stone Pillar Investments, Ltd. (2016-Present); formerly, Chairman, President and Chief Executive Officer, Community Financial Shares, Inc. and Community Bank—Wheaton/Glen Ellyn (subsidiary) (2013-2015); Chief Operating Officer, AMCORE Financial, Inc. (bank holding company) (2007-2009); Executive Vice President and Chief Financial Officer, AMCORE Financial, Inc. (2006-2007); Senior Vice President and Treasurer, Marshall & Ilsley Corp. (bank holding company) (1995-2006). | | 221 | | None |
| * | This is the date the Independent Trustee began serving the Trust. Each Independent Trustee serves an indefinite term, until his successor is elected. |
| ** | Fund Complex includes all open- and closed-end funds (including all of their portfolios) advised by the Adviser and any affiliated person of the Adviser. |
Trustees and Officers (continued)
The Unaffiliated Trustee, his term of office and length of time served, his principal business occupations during at least the past five years, the number of portfolios in the Fund Complex (as defined below) overseen by the Unaffiliated Trustee and the other directorships, if any, held by the Unaffiliated Trustee are shown below.
| | | | | | | | | | |
Name, Address and Year of
Birth of Unaffiliated Trustee | | Position(s)
Held
with Trust | | Term of
Office
and
Length of
Time
Served* | | Principal
Occupation(s)
During Past 5 Years | | Number of
Portfolios
in Fund
Complex**
Overseen by
Unaffiliated
Trustee | | Other
Directorships
Held by
Unaffiliated
Trustee During
the Past 5 Years |
Philip M. Nussbaum***—1961
c/o Invesco Capital Management LLC
3500 Lacey Road, Suite 700
Downers Grove, IL 60515 | | Trustee | | Since 2007 | | Chairman, Performance Trust Capital Partners (2004-Present). | | 221 | | None |
| * | This is the date the Unaffiliated Trustee began serving the Trust. The Unaffiliated Trustee serves an indefinite term, until his successor is elected. |
| ** | Fund Complex includes all open- and closed-end funds (including all of their portfolios) advised by the Adviser and any affiliated person of the Adviser. |
| *** | Effective September 19, 2018, Mr. Nussbaum resigned from the Board of Trustees of the Trust. |
Trustees and Officers (continued)
The Interested Trustee and the executive officers of the Trust, their term of office and length of time served, their principal business occupations during at least the past five years, the number of portfolios in the Fund Complex (as defined below) overseen by the Interested Trustee and the other directorships, if any, held by the Interested Trustee are shown below.
| | | | | | | | | | |
Name, Address and Year of
Birth of Interested Trustee | | Position(s)
Held
with Trust | | Term of
Office
and
Length of
Time
Served* | | Principal
Occupation(s) During
Past 5 Years | | Number of
Portfolios
in Fund
Complex**
Overseen by
Interested
Trustee | | Other
Directorships
Held by
Interested
Trustee During
the Past 5 Years |
Kevin M. Carome—1956
Invesco Ltd.
Two Peachtree Pointe,
1555 Peachtree St., N.E.,
Suite 1800
Atlanta, GA 30309 | | Trustee | | Since 2010 | | Senior Managing Director, Secretary and General Counsel, Invesco Ltd. (2007-Present); Director, Invesco Advisers, Inc. (2009-Present); Director (2006-Present) and Executive Vice President (2008- Present), Invesco Group Services, Inc., Invesco Holding Company (US), Inc. and Invesco North American Holdings, Inc.; Director, Invesco Holding Company Limited (2007-Present); Executive Vice President (2008-Present), Invesco Investments (Bermuda) Ltd.; Manager, Horizon Flight Works LLC, Director and Executive Vice President, Invesco Finance, Inc. and Director, Invesco Finance PLC (2011- Present); Director and Secretary (2012-Present), Invesco Services (Bahamas) Private Limited; and Director and Executive Vice President (2014-Present), INVESCO Asset Management (Bermuda) Ltd.; formerly, Director and Chairman, INVESCO Funds Group, Inc., Senior Vice President, Secretary and General Counsel, Invesco Advisers, Inc. (2003-2006); Director, Invesco Investments (Bermuda) Ltd. (2008-2016); Senior Vice President and General Counsel, Liberty Financial Companies, Inc. (2000-2001); General Counsel of certain investment management subsidiaries of Liberty Financial Companies, Inc. (1998-2000); Associate General Counsel, Liberty Financial Companies, Inc. (1993-1998); Associate, Ropes & Gray LLP. | | 221 | | None |
| * | This is the date the Interested Trustee began serving the Trust. The Interested Trustee serves an indefinite term, until his successor is elected. |
| ** | Fund Complex includes all open- and closed-end funds (including all of their portfolios) advised by the Adviser and any affiliated person of the Adviser. |
Trustees and Officers (continued)
| | | | | | |
Name, Address and Year of
Birth of Executive Officers | | Position(s)
Held
with
Trust | | Length
of
Time
Served* | | Principal Occupation(s) During Past 5 Years |
Daniel E. Draper—1968 Invesco Capital Management LLC 3500 Lacey Road, Suite 700 Downers Grove, IL 60515 | | President and Principal Executive Officer | | Since 2015 | | President and Principal Executive Officer, Invesco Exchange-Traded Fund Trust, Invesco Exchange-Traded Fund Trust II, Invesco India Exchange-Traded Fund Trust, Invesco Actively Managed Exchange-Traded Fund Trust and Invesco Actively Managed Exchange-Traded Commodity Fund Trust (2015-Present) and Invesco Exchange-Traded Self-Indexed Fund Trust (2016-Present); Chief Executive Officer and Principal Executive Officer (2016-Present) and Managing Director (2013-Present), Invesco Capital Management LLC; Senior Vice President, Invesco Distributors, Inc. (2014-Present); formerly, Vice President, Invesco Exchange-Traded Fund Trust, Invesco Exchange-Traded Fund Trust II, Invesco India Exchange-Traded Fund Trust, Invesco Actively Managed Exchange-Traded Fund Trust (2013-2015) and Invesco Actively Managed Exchange-Traded Commodity Fund Trust (2014-2015); Managing Director, Credit Suisse Asset Management (2010-2013) and Lyxor Asset Management/Societe Generale (2007-2010). |
| | | |
Kelli Gallegos—1970 Invesco Capital Management LLC 3500 Lacey Road, Suite 700 Downers Grove, IL 60515 | | Vice President
and Treasurer | | Since 2018 | | Vice President and Treasurer, Invesco Exchange-Traded Fund Trust, Invesco Exchange-Traded Fund Trust II, Invesco India Exchange-Traded Fund Trust, Invesco Actively Managed Exchange-Traded Fund Trust, Invesco Actively Managed Exchange-Traded Commodity Fund Trust and Invesco Exchange-Traded Self-Indexed Fund Trust (2018-Present); Principal Financial and Accounting Officer-Pooled Investments, Invesco Capital Management LLC (2018-Present); Vice President, Principal Financial Officer (2016-Present) and Assistant Treasurer (2008-Present), The Invesco Funds; formerly, Assistant Treasurer Invesco Exchange-Traded Fund Trust, Invesco Exchange-Traded Fund Trust II, Invesco India Exchange-Traded Fund Trust and Invesco Actively Managed Exchange-Traded Fund Trust (2012-2018), Invesco Actively Managed Exchange-Traded Commodity Fund Trust (2014-2018) and Invesco Exchange-Traded Self-Indexed Fund Trust (2016-2018); Assistant Treasurer, Invesco Capital Management LLC (2013-2018); and Assistant Vice President, The Invesco Funds (2008-2016). |
| | | |
Peter Hubbard—1981 Invesco Capital Management LLC 3500 Lacey Road, Suite 700 Downers Grove, IL 60515 | | Vice President | | Since 2009 | | Vice President, Invesco Exchange-Traded Fund Trust, Invesco Exchange-Traded Fund Trust II, Invesco India Exchange-Traded Fund Trust, Invesco Actively Managed Exchange-Traded Fund Trust (2009-Present), Invesco Actively Managed Exchange-Traded Commodity Fund Trust (2014-Present) and Invesco Exchange-Traded Self-Indexed Fund Trust (2016-Present); Vice President and Director of Portfolio Management, Invesco Capital Management LLC (2010-Present); formerly, Vice President of Portfolio Management, Invesco Capital Management LLC (2008-2010); Portfolio Manager, Invesco Capital Management LLC (2007-2008); Research Analyst, Invesco Capital Management LLC (2005-2007); Research Analyst and Trader, Ritchie Capital, a hedge fund operator (2003-2005). |
| | | |
Sheri Morris—1964 Invesco Capital Management LLC 3500 Lacey Road, Suite 700 Downers Grove, IL 60515 | | Vice President | | Since 2012 | | President and Principal Executive Officer, The Invesco Funds (2016-Present); Treasurer, The Invesco Funds (2008-Present); Vice President, Invesco Advisers, Inc. (formerly known as Invesco Institutional (N.A.), Inc.) (registered investment adviser) (2009-Present) and Vice President, Invesco Exchange-Traded Fund Trust, Invesco Exchange-Traded Fund Trust II, Invesco India Exchange-Traded Fund Trust, Invesco Actively Managed Exchange-Traded Fund Trust (2012-Present), Invesco Actively Managed Exchange-Traded Commodity Fund Trust (2014-Present) and Invesco Exchange-Traded Self-Indexed Fund Trust (2016-Present); formerly, Vice President and Principal Financial Officer, The Invesco Funds (2008-2016); Treasurer, Invesco Exchange-Traded Fund Trust, Invesco Exchange-Traded Fund Trust II, Invesco India Exchange-Traded Fund Trust and Invesco Actively Managed Exchange-Traded Fund Trust (2011-2013); Vice President, Invesco Aim Advisers, Inc., Invesco Aim Capital Management, Inc. and Invesco Aim Private Asset Management, Inc.; Assistant Vice President and Assistant Treasurer, The Invesco Funds and Assistant Vice President, Invesco Advisers, Inc., Invesco Aim Capital Management, Inc. and Invesco Aim Private Asset Management, Inc. |
| * | This is the date each Officer began serving the Trust. Each Officer serves an indefinite term, until his or her successor is elected. |
Trustees and Officers (continued)
| | | | | | |
Name, Address and Year of
Birth of Executive Officers | | Position(s)
Held
with
Trust | | Length
of
Time
Served* | | Principal Occupation(s) During Past 5 Years |
Anna Paglia—1974 Invesco Capital Management LLC 3500 Lacey Road, Suite 700 Downers Grove, IL 60515 | | Secretary | | Since 2011 | | Secretary, Invesco Exchange-Traded Fund Trust, Invesco Exchange-Traded Fund Trust II, Invesco India Exchange-Traded Fund Trust, Invesco Actively Managed Exchange-Traded Fund Trust (2011-Present), Invesco Actively Managed Exchange-Traded Commodity Fund Trust (2014-Present) and Invesco Exchange-Traded Self-Indexed Fund Trust (2015-Present); Head of Legal (2010-Present) and Secretary (2015-Present), Invesco Capital Management LLC; Manager and Assistant Secretary, Invesco Indexing LLC (2017-Present); formerly, Partner, K&L Gates LLP (formerly, Bell Boyd & Lloyd LLP) (2007-2010); Associate Counsel at Barclays Global Investors Ltd. (2004-2006). |
| | | |
Rudolf E. Reitmann—1971 Invesco Capital Management LLC 3500 Lacey Road, Suite 700 Downers Grove, IL 60515 | | Vice President | | Since 2013 | | Vice President, Invesco Exchange-Traded Fund Trust, Invesco Exchange-Traded Fund Trust II, Invesco India Exchange-Traded Fund Trust, Invesco Actively Managed Exchange-Traded Fund Trust (2013-Present), Invesco Actively Managed Exchange-Traded Commodity Fund Trust (2014-Present) and Invesco Exchange-Traded Self-Indexed Fund Trust (2016-Present); Head of Global Exchange Traded Funds Services, Invesco Capital Management LLC (2013-Present); Vice President, Invesco Capital Markets, Inc. (2018-Present). |
| | | |
David Warren—1957 Invesco Canada Ltd. 5140 Yonge Street, Suite 800 Toronto, Ontario M2N 6X7 | | Vice President | | Since 2009 | | Vice President, Invesco Exchange-Traded Fund Trust, Invesco Exchange-Traded Fund Trust II, Invesco India Exchange-Traded Fund Trust, and Invesco Actively Managed Exchange-Traded Fund Trust (2009-Present), Invesco Actively Managed Exchange-Traded Commodity Fund Trust (2014-Present) and Invesco Exchange-Traded Self-Indexed Fund Trust (2016-Present); Managing Director—Chief Administrative Officer, Americas, Invesco Capital Management LLC; Senior Vice President, Invesco Advisers, Inc. (2009-Present); Director, Invesco Inc. (2009-Present); Director, Executive Vice President and Chief Financial Officer, Invesco Canada Ltd. (formerly, Invesco Trimark Ltd.) (2011-Present); Chief Administrative Officer, North American Retail, Invesco Ltd. (2007-Present); Director, Invesco Corporate Class Inc. (2014-Present); Director, Invesco Global Direct Real Estate Feeder GP Ltd. (2015-Present); Director, Invesco Canada Holdings Inc. (2002-Present); Director, Invesco Financial Services Ltd. / Services Financiers Invesco Ltée and Trimark Investments Ltd./Placements Trimark Ltée (2014-Present); Director, Invesco IP Holdings (Canada) Ltd. (2016-Present); Director, Invesco Global Direct Real Estate GP Ltd. (2015-Present); formerly, Senior Vice President, Invesco Management Group, Inc. (2007-2018); Executive Vice President and Chief Financial Officer, Invesco Inc. (2009-2015); Director, Executive Vice President and Chief Financial Officer, Invesco Canada Ltd. (formerly, Invesco Trimark Ltd.) (2000-2011). |
| | | |
Melanie Zimdars—1976 Invesco Capital Management LLC 3500 Lacey Road, Suite 700 Downers Grove, IL 60515 | | Chief Compliance
Officer | | Since 2017 | | Chief Compliance Officer of Invesco Capital Management LLC (2017-Present); Chief Compliance Officer of Invesco Exchange-Traded Fund Trust, Invesco Exchange-Traded Fund Trust II, Invesco India Exchange-Traded Fund Trust, Invesco Actively Managed Exchange-Traded Fund Trust, Invesco Actively Managed Exchange-Traded Commodity Fund Trust and Invesco Exchange-Traded Self-Indexed Fund Trust (2017-Present); formerly, Vice President and Deputy Chief Compliance Officer at ALPS Holding, Inc. (2009-2017); Mutual Fund Treasurer/Chief Financial Officer at Wasatch Advisors, Inc. (2005-2008); Compliance Officer, U.S. Bancorp Fund Services, LLC (2001-2005). |
Availability of Additional Information About the Trustees
The Statement of Additional Information includes additional information about the Trustees and is
available, without charge, upon request at (800) 983-0903.
| * | This is the date each Officer began serving the Trust. Each Officer serves an indefinite term, until his or her successor is elected. |
(This Page Intentionally Left Blank)
Proxy Voting Policies and Procedures
A description of the Trust’s proxy voting policies and procedures that the Fund uses to determine how to vote proxies relating to portfolio securities is available, without charge and upon request, by calling (800) 983-0903. This information is also available on the Securities and Exchange Commission’s (“Commission”) website at www.sec.gov.
Information regarding how the Fund voted proxies for portfolio securities, if applicable, during the most recent 12-month period ended June 30, is also available, without charge and upon request, by (i) calling (800) 983-0903; or (ii) accessing the Trust’s Form N-PX on the Commission’s website at www.sec.gov.
Quarterly Portfolios
The Trust files its complete schedule of portfolio holdings for the Fund with the Commission for the first and third quarters of each fiscal year on Form N-Q. The Trust’s Forms N-Q are available on the Commission’s website at www.sec.gov. The Trust’s Forms N-Q may also be reviewed and copied at the Commission’s Public Reference Room in Washington, DC; information on the operation of the Public Reference Room may be obtained by calling (800) SEC-0330.
Frequency Distribution of Discounts and Premiums
A table showing the number of days the market price of the Fund’s shares was greater than the Fund’s net asset value, and the number of days it was less than the Fund’s net asset value (i.e., premium or discount) for the most recently completed calendar year, and the calendar quarters since that year end (or the life of the Fund, if shorter) may be found at the Fund’s website at www.invesco.com/ETFs.
| | | | | | | | |
©2018 Invesco Capital Management LLC 3500 Lacey Road, Suite 700 Downers Grove, IL 60515 | | P-BKLN-AR-1 | | invesco.com/ETFs |

Invesco Annual Report to Shareholders
August 31, 2018
| | |
| DWLV | | Invesco DWA Momentum & Low Volatility Rotation ETF |
| DWAS | | Invesco DWA SmallCap Momentum ETF |
| DWIN | | Invesco DWA Tactical Multi-Asset Income ETF |
| DWTR | | Invesco DWA Tactical Sector Rotation ETF |
| PSCD | | Invesco S&P SmallCap Consumer Discretionary ETF |
| PSCC | | Invesco S&P SmallCap Consumer Staples ETF |
| PSCE | | Invesco S&P SmallCap Energy ETF |
| PSCF | | Invesco S&P SmallCap Financials ETF |
| PSCH | | Invesco S&P SmallCap Health Care ETF |
| PSCI | | Invesco S&P SmallCap Industrials ETF |
| PSCT | | Invesco S&P SmallCap Information Technology ETF |
| PSCM | | Invesco S&P SmallCap Materials ETF |
| PSCU | | Invesco S&P SmallCap Utilities & Communication Services ETF |
| | (Effective as of the open of markets on September 24, 2018, after the close of the reporting period, Invesco S&P SmallCap Utilities ETF was renamed Invesco S&P SmallCap Utilities & Communication Services ETF) |
Table of Contents
The Market Environment
Domestic Equity
The fiscal period proved to be another strong, albeit increasingly volatile, time for US equities. As the fiscal period unfolded in the later months of 2017, several major US stock market indexes repeatedly reached new highs amid improving economic data, strong corporate profits and the prospect of tax reform legislation. Stock market volatility remained exceedingly low—a hallmark of 2017.
At the outset of 2018, US equity markets continued to steadily move higher in January as investors remained enthused about the passage of the Tax Cuts and Jobs Act signed into law in late December 2017, which significantly cut corporate tax rates. However, in February 2018, volatility returned to the US stock and bond markets. Worries about how rising interest rates might affect economic growth, concerns about a potential trade war and heightened geopolitical tensions, caused the US stock market to pull back and volatility to increase. In addition, in April 2018, the yield on the 10-year US Treasury bond climbed above 3%—a psychologically important level—for the first time since December 2013.1
Despite a disappointing first quarter, US equity markets generally recovered in the second quarter of 2018. Strong US retail sales and low unemployment continued to buoy US equity markets. In the final months of the fiscal period, US equities moved higher, despite several potential headwinds including trade tensions, tariff announcements and contagion concerns over a Turkish currency crisis. Ultimately, the fiscal period ended the same way it began with several US equity indexes reaching new record highs.
Given signs of a strong economy, the US Federal Reserve raised interest rates three times during the fiscal period: in December 2017 and in March and June 2018.2 In contrast, the European Central Bank and central banks in several other countries maintained extraordinarily accommodative monetary policies.
| 2 | Source: US Federal Reserve |
| | |
| DWLV | | Manager’s Analysis |
| | Invesco DWA Momentum & Low Volatility Rotation ETF (DWLV) |
As an index fund, the Invesco DWA Momentum & Low Volatility Rotation ETF (the “Fund”) is passively managed and seeks to track the returns of an underlying index. The Fund seeks to track the investment results (before fees and expenses) of the Dorsey Wright® Multi- Factor Global Equity Index (the “Index”). The Fund generally will invest at least 90% of its total assets in securities that comprise the Index. The Fund is a “fund of funds,” meaning that it invests its assets in the shares of other exchange-traded funds (“ETFs”), rather than in securities of individual companies. The Index includes other ETFs that are advised by the Fund’s adviser or its affiliates (the “Invesco ETFs”), as well as 1- to 6-month U.S. Treasury Bills. The Fund and the Invesco ETFs are part of the same group of investment companies.
Strictly in accordance with its guidelines and mandated procedures, Dorsey, Wright & Associates, LLC (“Dorsey Wright” or the “Index Provider”) compiles, maintains and calculates the Index, which, at any given time, is composed of up to eight Invesco ETFs that invest in either domestic or international equity securities, and that employ either a “momentum” or a “low volatility” investment strategy. A “momentum” investment style emphasizes investing in securities that recently have had better relative performance compared to other securities. A low volatility investment style emphasizes investing in securities with the least asset price fluctuations (i.e., increases or decreases in a stock’s price) over time. The Fund generally invests in all of the components of the Index in proportion to their weightings in the Index.
The Board of Trustees approved a change in the fiscal year end for the Fund from October 31 to August 31. For the fiscal period from November 1, 2017 to August 31, 2018, on a market price basis, the Fund returned 13.01%. On a net asset value (“NAV”) basis, the Fund returned 13.12%. During the same time period, the Index returned 12.95%. During the fiscal period, the Fund fully replicated the components of the Index; therefore, the Fund’s performance, on a NAV basis, differed from the return of the Index primarily due to fees and operating expenses that the Fund incurred during the period, offset by performance associated with rebalance activity.
During this same time period, the MSCI All Country World Index (Net) (the “Benchmark Index”) returned 7.08%. The Benchmark Index is an unmanaged index weighted by market capitalization based on the average performance of approximately 2,700 securities. The Benchmark Index was selected for its recognition in the marketplace, and its performance comparison is a useful measure for investors as a broad representation of the overall stock market.
The performance of the Fund differed from the Benchmark Index primarily due to the Fund’s thematic objective and weighting methodology across the underlying Invesco ETFs.
The majority of the Fund’s outperformance relative to the Benchmark Index during the period can be attributed to the Fund’s weighting methodology and thematic objective which placed a heavier weight on small-capitalization companies included in the Invesco DWA SmallCap Momentum ETF. During the same period, the Benchmark Index placed a heavier weight on large-cap holdings.
For the fiscal period ended August 31, 2018, the Invesco DWA SmallCap Momentum ETF (portfolio average weight of 25.23%), contributed most significantly to the Fund’s return, followed by the Invesco DWA Momentum ETF (portfolio average weight of 25.02%), and the Invesco DWA Emerging Markets Momentum ETF (portfolio average weight of 11.28%), respectively. There were no detracting portfolios.
| | | | |
Market Capitalization & Style Allocation*
as of August 31, 2018 | |
| Large-Cap Value | | | 5.7 | |
| Large-Cap Blend | | | 10.6 | |
| Large-Cap Growth | | | 20.1 | |
| Mid-Cap Value | | | 4.9 | |
| Mid-Cap Blend | | | 5.8 | |
| Mid-Cap Growth | | | 22.1 | |
| Small-Cap Value | | | 5.4 | |
| Small-Cap Blend | | | 9.7 | |
| Small-Cap Growth | | | 15.7 | |
| * | Source: Morningstar. Reflects exposure achieved through investments in underlying funds. |
| | | | |
Top Ten Fund Holdings*
(% of the Fund’s Net Assets)
as of August 31, 2018 | |
| Security | | | | |
| Invesco DWA SmallCap Momentum ETF | | | 27.2 | |
| Invesco DWA Momentum ETF | | | 25.9 | |
| Invesco DWA Developed Markets Momentum ETF | | | 10.2 | |
| Invesco DWA Emerging Markets Momentum ETF | | | 9.7 | |
| Invesco S&P SmallCap Low Volatility ETF | | | 9.6 | |
| Invesco S&P 500 Low Volatility ETF | | | 9.6 | |
| Invesco S&P Emerging Markets Low Volatility ETF | | | 3.9 | |
| Invesco S&P International Developed Low Volatility ETF | | | 3.8 | |
| Total | | | 99.9 | |
| * | Excluding money market fund holdings. |
Invesco DWA Momentum & Low Volatility Rotation ETF (DWLV) (continued)
Growth of a $10,000 Investment Since Inception
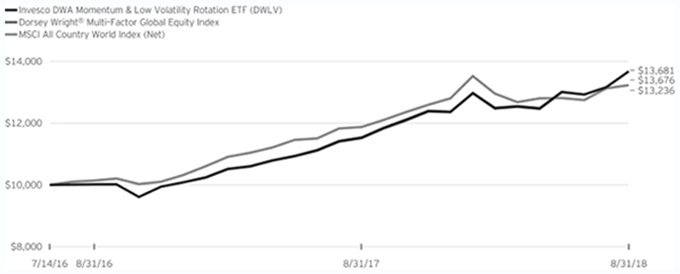
Fund Performance History as of August 31, 2018
| | | | | | | | | | | | | | | | |
| | | | | | | | | Fund Inception | |
| Index | | 1 Year | | | | | | Average
Annualized | | | Cumulative | |
| Dorsey Wright® Multi-Factor Global Equity Index | | | 18.61 | % | | | | | | | 15.86 | % | | | 36.81 | % |
| MSCI All Country World Index (Net) | | | 11.41 | | | | | | | | 14.08 | | | | 32.36 | |
| Fund | | | | | | | | | | | | | | | | |
| NAV Return | | | 18.74 | | | | | | | | 15.84 | | | | 36.76 | |
| Market Price Return | | | 18.87 | | | | | | | | 15.83 | | | | 36.72 | |
Fund Inception: July 14, 2016
Performance quoted above represents past performance. Past performance is not a guarantee of future results and current performance may be higher or lower than performance quoted. Investment returns and principal value will fluctuate, and shares of the Fund (“Fund Shares”), when redeemed or sold, may be worth more or less than their original cost. Fund performance reflects any applicable fee waivers and/or expense reimbursements. Had the adviser not waived fees and/or reimbursed expenses currently or in the past, returns would have been lower. See current prospectus for more information. According to the Fund’s current prospectus, the Fund’s expense ratio of 0.68% includes the unitary management fee of 0.15% and acquired fund fees and expenses of 0.53%. NAV and Market Price returns assume that dividends and capital gain distributions have been reinvested in the Fund at NAV and Market Price, respectively. The returns shown in the table above do not reflect the deduction of taxes that a shareholder would pay on Fund distributions or the redemption or sale of Fund Shares. See invesco.com/ETFs to find the most recent month-end performance numbers.
Index and Benchmark Index performance results are based upon a hypothetical investment in their respective constituent securities. Index and Benchmark Index returns do not represent Fund returns. An investor cannot invest directly in an index. The Index and Benchmark Index do not charge management fees or brokerage expenses, and no such fees or expenses were deducted from the hypothetical performance shown. In addition, the results actual investors might have achieved would have differed from those shown because of differences in the timing, amounts of their investments, and fees and expenses associated with an investment in the Fund.
Notes Regarding Indexes and Fund Performance History:
| - | Average Annualized and Cumulative Inception returns for the Fund, Index and Benchmark Index are based on the inception date of the Fund. |
| - | Net returns reflect reinvested dividends net of withholding taxes. |
| | |
| DWAS | | Manager’s Analysis |
| | Invesco DWA SmallCap Momentum ETF (DWAS) |
As an index fund, the Invesco DWA SmallCap Momentum ETF (the “Fund”) is passively managed and seeks to track the returns of an underlying index. The Fund seeks to track the investment results (before fees and expenses) of the Dorsey Wright® SmallCap Technical Leaders Index (the “Index”). The Fund generally will invest at least 90% of its total assets in equity securities of small capitalization companies that comprise the Index.
Strictly in accordance with its guidelines and mandated procedures, Dorsey, Wright & Associates (“Dorsey Wright” or the “Index Provider”) selects securities for inclusion in the Index pursuant to a proprietary selection methodology which is designed to identify securities that demonstrate powerful relative strength characteristics. “Relative strength” is an investing technique that seeks to determine the strongest performing securities by measuring certain factors, such as a security’s relative performance against the overall market or a security’s relative strength value, which is derived by comparing the rate of increase of the security’s price over a set period as compared to that of a benchmark index. The Index Provider selects securities for inclusion in the Index from an eligible universe of the smallest 2,000 constituents by market capitalization that trade on a U.S. exchange and that are included within the NASDAQ US Benchmark Index. The Index Provider assigns a relative strength score to each eligible security and selects approximately 200 securities with the greatest scores for inclusion in the Index. Component security weights are based on relative scores, with securities with higher scores receiving larger weights. The Fund generally invests in all of the securities comprising the Index in proportion to their weightings in the Index.
The Board of Trustees approved a change in the fiscal year end for the Fund from October 31 to August 31. For the fiscal period from November 1, 2017 to August 31, 2018, on a market price basis, the Fund returned 23.51%. On a net asset value (“NAV”) basis, the Fund returned 23.60%. During the same time period, the Index returned 24.24%. During the fiscal period, the Fund fully replicated the components of the Index; therefore, the Fund’s performance (NAV basis) differed from the return of the Index primarily due to fees and operating expenses that the Fund incurred during the period.
During this same time period, the Russell 2000® Index (the “Benchmark Index”) returned 17.08%. The Benchmark Index is an unmanaged index weighted by market capitalization based on the average performance of small-cap securities. The Benchmark Index was selected for its recognition in the marketplace, and its performance comparison is a useful measure for investors as a broad representation of the small-cap stock market.
Relative to the Benchmark Index, the Fund was most overweight in the health care sector and most underweight in the real estate sector during the fiscal period ended August 31, 2018. The majority of the Fund’s outperformance relative to the Benchmark
Index during the period can be attributed to the Fund being overweight in the health care sector.
For the fiscal period ended August 31, 2018, the health care sector contributed most significantly to the Fund’s return, followed by the consumer discretionary and information technology sectors, respectively. The utilities, energy and materials sectors detracted from the Fund’s return.
Positions that contributed most significantly to the Fund’s return for the fiscal period ended August 31, 2018, included AxoGen, Inc., a health care company (portfolio average weight of 1.58%), and Inogen, Inc., a health care company (portfolio average weight of 1.17%). Positions that detracted most significantly from the Fund’s return included KEMET Corp., an electronic manufacturing services company (no longer held at fiscal period-end), and Calithera Biosciences, Inc., a biotechnology company (no longer held at fiscal period-end).
| | | | |
Sector Breakdown
(% of the Fund’s Net Assets)
as of August 31, 2018 | |
| Health Care | | | 35.7 | |
| Information Technology | | | 14.8 | |
| Financials | | | 14.6 | |
| Industrials | | | 13.0 | |
| Consumer Discretionary | | | 12.1 | |
| Consumer Staples | | | 3.0 | |
| Materials | | | 2.9 | |
| Energy | | | 2.9 | |
| Real Estate | | | 0.6 | |
| Telecommunication Services | | | 0.4 | |
| Money Market Funds Plus Other Assets Less Liabilities | | | (0.0) | |
|
Top Ten Fund Holdings*
(% of the Fund’s Net Assets)
as of August 31, 2018 | |
| Security | | | | |
| CareDx, Inc. | | | 2.3 | |
| Endocyte, Inc. | | | 1.6 | |
| Inogen, Inc. | | | 1.6 | |
| Mirati Therapeutics, Inc. | | | 1.5 | |
| ePlus, Inc. | | | 1.4 | |
| Neogen Corp. | | | 1.4 | |
| Heska Corp. | | | 1.3 | |
| AxoGen, Inc. | | | 1.3 | |
| Arrowhead Pharmaceuticals, Inc. | | | 1.2 | |
| MGP Ingredients, Inc. | | | 1.2 | |
| Total | | | 14.8 | |
| * | Excluding money market fund holdings. |
Invesco DWA SmallCap Momentum ETF (DWAS) (continued)
Growth of a $10,000 Investment Since Inception
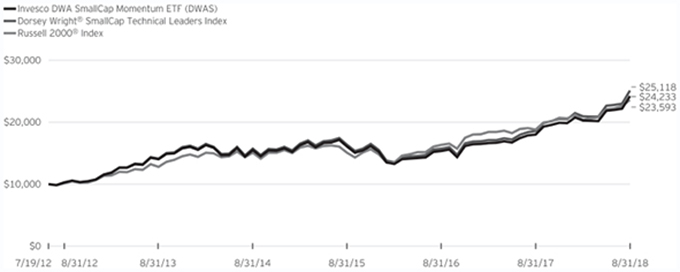
Fund Performance History as of August 31, 2018
| | | | | | | | | | | | | | | | | | | | | | | | | | | | | | | | |
| | | 1 Year | | | 3 Years Average
Annualized | | | 3 Years Cumulative | | | 5 Years Average
Annualized | | | 5 Years Cumulative | | | | | | Fund Inception | |
| Index | | | | | Average
Annualized | | | Cumulative | |
| Dorsey Wright® SmallCap Technical Leaders Index | | | 35.29 | % | | | 15.30 | % | | | 53.28 | % | | | 12.19 | % | | | 77.73 | % | | | | | | | 16.25 | % | | | 151.18 | % |
| Russell 2000® Index | | | 25.45 | | | | 16.11 | | | | 56.54 | | | | 13.00 | | | | 84.28 | | | | | | | | 15.07 | | | | 135.93 | |
| Fund | | | | | | | | | | | | | | | | | | | | | | | | | | | | | | | | |
| NAV Return | | | 34.48 | | | | 14.65 | | | | 50.69 | | | | 11.57 | | | | 72.86 | | | | | | | | 15.57 | | | | 142.33 | |
| Market Price Return | | | 34.56 | | | | 14.68 | | | | 50.81 | | | | 11.58 | | | | 72.92 | | | | | | | | 15.56 | | | | 142.12 | |
Fund Inception: July 19, 2012
Performance quoted above represents past performance. Past performance is not a guarantee of future results and current performance may be higher or lower than performance quoted. Investment returns and principal value will fluctuate, and shares of the Fund (“Fund Shares”), when redeemed or sold, may be worth more or less than their original cost. Fund performance reflects any applicable fee waivers and/or expense reimbursements. Had the adviser not waived fees and/or reimbursed expenses currently or in the past, returns would have been lower. See current prospectus for more information. According to the Fund’s current prospectus, the Fund’s expense ratio of 0.60% is expressed as a unitary management fee to cover operating expenses and expenses incurred in connection with managing the portfolio. NAV and Market Price returns assume that dividends and capital gain distributions have been reinvested in the Fund at NAV and Market Price, respectively. The returns shown in the table above do not reflect the deduction of taxes that a shareholder would pay on Fund distributions or the redemption or sale of Fund Shares.
See invesco.com/ETFs to find the most recent month-end performance numbers.
Index and Benchmark Index performance results are based upon a hypothetical investment in their respective constituent securities. Index and Benchmark Index returns do not represent Fund returns. An investor cannot invest directly in an index. The Index and Benchmark Index do not charge management fees or brokerage expenses, and no such fees or expenses were deducted from the hypothetical performance shown. In addition, the results actual investors might have achieved would have differed from those shown because of differences in the timing, amounts of their investments, and fees and expenses associated with an investment in the Fund.
Notes Regarding Indexes and Fund Performance History:
| - | Average Annualized and Cumulative Inception returns for the Fund, Index and Benchmark Index are based on the inception date of the Fund. |
| | |
| DWIN | | Manager’s Analysis |
| | Invesco DWA Tactical Multi-Asset Income ETF (DWIN) |
As an index fund, the Invesco DWA Tactical Multi-Asset Income ETF (the “Fund”) is passively managed and seeks to track the returns of an underlying index. The Fund seeks to track the investment results (before fees and expenses) of the Dorsey Wright® Multi-Asset Income Index (the “Index”). The Fund generally will invest at least 90% of its total assets in securities that comprise the Index. The Fund is a “fund of funds,” meaning that it invests substantially all of its assets in the shares of other exchange-traded funds (“ETFs”) eligible for inclusion in the Index, rather than in securities of individual companies. The Index is composed exclusively of other ETFs (the “Underlying ETFs”) and, under normal circumstances, most of the Underlying ETFs will be ETFs advised by the Fund’s adviser or its affiliates (the “Invesco ETFs”). The Fund and the Invesco ETFs are part of the same group of investment companies.
Strictly in accordance with its guidelines and mandated procedures, Dorsey, Wright & Associates, LLC (“Dorsey Wright” or the “Index Provider”) compiles, maintains and calculates the Index, which, at any given time, is composed of one to five Underlying ETFs selected from a universe of income-producing ETFs (the “Eligible ETFs”), each of which generally is designed to seek to provide high levels of current income. This universe, which the Index Provider may change from time to time, consists mostly of Invesco ETFs that employ income-oriented strategies. The Eligible ETFs invest their assets in different segments of the securities markets, such as: U.S. Treasuries, domestic and international bonds, dividend paying equities, preferred stock, real estate investment trusts (“REITs”) and master-limited partnerships (“MLPs”). The various Eligible ETFs may hold fixed income securities of any duration, maturity or quality, and certain Eligible ETFs may invest primarily in high-yield (or “junk”) bonds. The Fund generally invests in each Underlying ETF in proportion to its weighting in the Index.
The Board of Trustees approved a change in the fiscal year end for the Fund from October 31 to August 31. For the fiscal period from November 1, 2017 to August 31, 2018, on a market price basis, the Fund returned (1.87)%. On a net asset value (“NAV”) basis, the Fund returned (1.79)%. During the same time period, the Index returned (1.65)%. During the fiscal period, the Fund fully replicated the components of the Index; therefore, the Fund’s performance (NAV basis) differed from the return of the Index primarily due to fees and operating expenses that the Fund incurred during the period.
During this same time period, the Bloomberg Barclays U.S. Aggregate Bond Index returned (0.63)% and the S&P 500® Index returned 14.38% (each a “Benchmark Index” and together, the “Benchmark Indices”). The Benchmark Indices are unmanaged indices weighted by market capitalization and based on the average performance of approximately 9,980 securities and 500 securities, respectively. The Benchmark Indices were selected for their recognition in the marketplace and their performance comparison is a useful measure for investors as a broad representation of the U.S. fixed income and equity markets, respectively.
Relative to the Bloomberg Barclays U.S. Aggregate Bond Index, the Fund was most overweight in REITs and preferred securities and most underweight in U.S. Treasuries during the fiscal period ended August 31, 2018. The majority of the Fund’s underperformance relative to this Benchmark Index during the period can be attributed to the Fund’s thematic objective and weighting methodology across the Underlying ETFs.
Relative to the S&P 500® Index, the Fund was most overweight in the REIT sector and most underweight in the information technology and financials sectors during the fiscal period ended August 31, 2018. The majority of the Fund’s underperformance relative to this Benchmark Index during the period can be attributed to the Fund being overweight in the energy sector.
Positions that contributed most significantly to the Fund’s return for the fiscal period ended August 31, 2018, included the Invesco KBW Premium Yield Equity REIT ETF, an Invesco ETF holding positions in small- and mid-cap equity REITs (portfolio average weight of 21.58%), the Invesco Preferred ETF, an Invesco ETF holding positions in fixed rate U.S. dollar-denominated preferred securities (portfolio average weight of 20.71%) and Invesco Global Short Term High Yield Bond ETF, an Invesco ETF holding positions in U.S. and foreign short-term, non-investment grade bonds (portfolio average weight of 19.47%), respectively. The position that detracted most significantly from the Fund’s return was the Alerian MLP ETF, an ETF invested in MLPs (no longer held at fiscal period-end).
| | | | |
Market Segment Breakdown
(% of the Fund’s Net Assets)*
as of August 31, 2018 | |
| International Bond | | | 37.4 | |
| Real Estate | | | 23.1 | |
| Preferreds | | | 20.9 | |
| Domestic Fixed Income | | | 18.5 | |
| Money Market Funds Plus Other Assets Less Liabilities | | | 0.1 | |
| * | Reflects exposure achieved through investments in underlying funds. |
| | | | |
Top Ten Fund Holdings*
(% of the Fund’s Net Assets)
as of August 31, 2018 | |
| Security | | | | |
| Invesco KBW Premium Yield Equity REIT ETF | | | 23.1 | |
| Invesco Preferred ETF | | | 20.9 | |
| Invesco Global Short Term High Yield Bond ETF | | | 19.3 | |
| Invesco Taxable Municipal Bond ETF | | | 18.5 | |
| Invesco Emerging Markets Sovereign Debt ETF | | | 18.1 | |
| Total | | | 99.9 | |
| * | Excluding money market fund holdings. |
Invesco DWA Tactical Multi-Asset Income ETF (DWIN) (continued)
Growth of a $10,000 Investment Since Inception
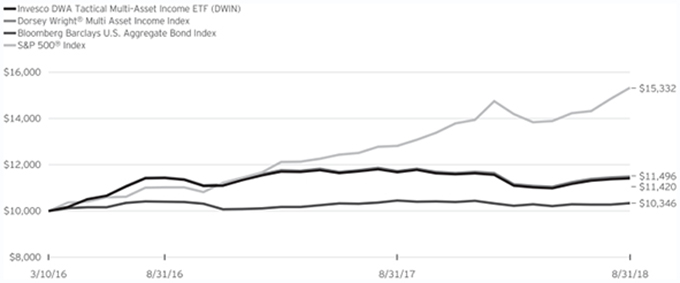
Fund Performance History as of August 31, 2018
| | | | | | | | | | | | | | | | |
| | | | | | | | | Fund Inception | |
| Index | | 1 Year | | | | | | Average
Annualized | | | Cumulative | |
| Dorsey Wright® Multi-Asset Income Index | | | (2.04 | )% | | | | | | | 5.80 | % | | | 14.96 | % |
| Bloomberg Barclays U.S. Aggregate Bond Index | | | (1.05 | ) | | | | | | | 1.38 | | | | 3.46 | |
| S&P 500® Index | | | 19.66 | | | | | | | | 18.86 | | | | 53.32 | |
| Fund | | | | | | | | | | | | | | | | |
| NAV Return | | | (2.20 | ) | | | | | | | 5.52 | | | | 14.20 | |
| Market Price Return | | | (2.27 | ) | | | | | | | 5.50 | | | | 14.15 | |
Fund Inception: March 10, 2016
Performance quoted above represents past performance. Past performance is not a guarantee of future results and current performance may be higher or lower than performance quoted. Investment returns and principal value will fluctuate, and shares of the Fund (“Fund Shares”), when redeemed or sold, may be worth more or less than their original cost. Fund performance reflects any applicable fee waivers and/or expense reimbursements. Had the adviser not waived fees and/or reimbursed expenses currently or in the past, returns would have been lower. See current prospectus for more information. According to the Fund’s current prospectus, the Fund’s expense ratio of 0.58% includes the unitary management fee of 0.25% and acquired fund fees and expenses of 0.33%. NAV and Market Price returns assume that dividends and capital gain distributions have been reinvested in the Fund at NAV and Market Price, respectively. The returns shown in the table above do not reflect the deduction of taxes that a shareholder would pay on Fund distributions or the redemption or sale of Fund
Shares. See invesco.com/ETFs to find the most recent month-end performance numbers.
Index and Benchmark Indices performance results are based upon a hypothetical investment in their respective constituent securities. Index and Benchmark Indices returns do not represent Fund returns. An investor cannot invest directly in an index. The Index and Benchmark Indices do not charge management fees or brokerage expenses, and no such fees or expenses were deducted from the hypothetical performance shown. In addition, the results actual investors might have achieved would have differed from those shown because of differences in the timing, amounts of their investments, and fees and expenses associated with an investment in the Fund.
Notes Regarding Indexes and Fund Performance History:
| - | Average Annualized and Cumulative Inception returns for the Fund, Index and Benchmark Indices are based on the inception date of the Fund. |
| | |
| DWTR | | Manager’s Analysis |
| | Invesco DWA Tactical Sector Rotation ETF (DWTR) |
As an index fund, the Invesco DWA Tactical Sector Rotation ETF (the “Fund”) is passively managed and seeks to track the returns of an underlying index. The Fund seeks to track the investment results (before fees and expenses) of the Dorsey Wright® Sector 4 Index (the “Index”). The Fund generally will invest at least 90% of its total assets in securities that comprise the Index. The Fund is a “fund of funds,” meaning that it invests its assets in the shares of other exchange-traded funds (“ETFs”) eligible for inclusion in the Index, rather than in securities of individual companies. The Fund also may invest in 1 to 6-month U.S. Treasury Bills included in the Index. The underlying funds included in the Index are ETFs advised by the Fund’s adviser or its affiliates (the “Invesco ETFs”). The Fund and the Invesco ETFs are part of the same group of investment companies.
Strictly in accordance with its guidelines and mandated procedures, Dorsey, Wright & Associates, LLC (“Dorsey Wright” or the “Index Provider”) compiles, maintains and calculates the Index which, at any given time, is composed of up to four Invesco ETFs from an eligible universe of nine Invesco ETFs, each of which is designed to seek to track separate sector-specific underlying indexes. Each Invesco ETF’s underlying index also is compiled and maintained by the Index Provider. The Index seeks to gain exposure to the sectors of the U.S. equity markets that display the strongest relative strength, as evaluated on a monthly basis. “Relative Strength” is the measurement of a security’s performance in a given universe as compared to the performance of all other securities in that universe. Therefore, at any given time, the components of the Index are those Invesco ETFs that the Index Provider believes offer the greatest potential to outperform each of the other eligible Invesco ETFs. The Fund generally invests in each constituent Invesco ETF comprising the Index in proportion to its weighting in the Index.
The Board of Trustees approved a change in the fiscal year end for the Fund from October 31 to August 31. For the fiscal period from November 1, 2017 to August 31, 2018, on a market price basis, the Fund returned 13.99%. On a net asset value (“NAV”) basis, the Fund returned 13.84%. During the same time period, the Index returned 13.95%. During the fiscal period, the Fund fully replicated the components of the Index; therefore, the Fund’s performance (NAV basis) differed from the return of the Index primarily due to fees and operating expenses that the Fund incurred.
During this same time period, the Russell 3000® Index (the “Benchmark Index”) returned 14.88%. The Benchmark Index is an unmanaged index weighted by market capitalization based on the average performance of approximately 2,950 securities. The Benchmark Index was selected for its recognition in the marketplace, and its performance comparison is a useful measure for investors as a broad representation of the overall U.S. stock market.
The performance of the Fund differed from the Benchmark Index primarily due to the Fund’s thematic objective and weighting methodology across the underlying Invesco ETFs.
Relative to the Benchmark Index, the Fund was most overweight in the industrials sector and most underweight in the health care sector during the fiscal period ended August 31, 2018. The majority of the Fund’s underperformance relative to the Benchmark Index during the period can be attributed to the Fund being underweight in the health care sector, as well as stock selection within the financials sector.
Positions that contributed most significantly to the Fund’s return for the fiscal period ended August 31, 2018, included the Invesco DWA Technology Momentum ETF, an Invesco ETF holding positions in common stock of technology sector companies (portfolio average weight of 26.34%), the Invesco DWA Consumer Cyclicals Momentum ETF, an Invesco ETF holding positions in common stock of consumer cyclicals sector companies (portfolio average weight of 16.29%), and Invesco DWA Industrials Momentum ETF, an Invesco ETF holding positions in common stock of industrials sector companies (portfolio average weight of 30.52%), respectively. The position that detracted most significantly from the Fund’s return was the Invesco DWA Healthcare Momentum ETF, an Invesco ETF holding positions in common stock of health care sector companies (no longer held at fiscal period-end).
| | | | |
Sector Breakdown
(% of the Fund’s Net Assets)*
as of August 31, 2018 | |
| Industrials | | | 29.7 | |
| Information Technology | | | 28.3 | |
| Consumer Discretionary | | | 22.7 | |
| Energy | | | 19.3 | |
| Money Market Funds Plus Other Assets Less Liabilities | | | 0.0 | |
| * | Reflects exposure achieved through investments in underlying funds. |
| | | | |
Top Ten Fund Holdings*
(% of the Fund’s Net Assets)
as of August 31, 2018 | |
| Security | | | | |
| Invesco DWA Industrials Momentum ETF | | | 29.7 | |
| Invesco DWA Technology Momentum ETF | | | 28.3 | |
| Invesco DWA Consumer Cyclicals Momentum ETF | | | 22.7 | |
| Invesco DWA Energy Momentum ETF | | | 19.3 | |
| Total | | | 100.0 | |
| * | Excluding money market fund holdings. |
Invesco DWA Tactical Sector Rotation ETF (DWTR) (continued)
Growth of a $10,000 Investment Since Inception
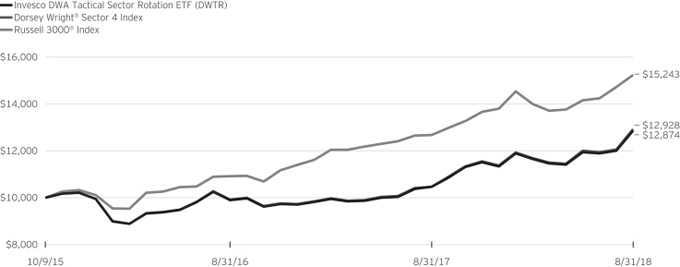
Fund Performance History as of August 31, 2018
| | | | | | | | | | | | | | | | |
| | | | | | | | | Fund Inception | |
| Index | | 1 Year | | | | | | Average
Annualized | | | Cumulative | |
| Dorsey Wright® Sector 4 Index | | | 23.47 | % | | | | | | | 9.28 | % | | | 29.28 | % |
| Russell 3000® Index | | | 20.25 | | | | | | | | 15.69 | | | | 52.43 | |
| Fund | | | | | | | | | | | | | | | | |
| NAV Return | | | 23.03 | | | | | | | | 9.13 | | | | 28.74 | |
| Market Price Return | | | 23.38 | | | | | | | | 9.16 | | | | 28.86 | |
Fund Inception: October 9, 2015
Performance quoted above represents past performance. Past performance is not a guarantee of future results and current performance may be higher or lower than performance quoted. Investment returns and principal value will fluctuate, and shares of the Fund (“Fund Shares”), when redeemed or sold, may be worth more or less than their original cost. Fund performance reflects any applicable fee waivers and/or expense reimbursements. Had the adviser not waived fees and/or reimbursed expenses currently or in the past, returns would have been lower. See current prospectus for more information. According to the Fund’s current prospectus, the Fund’s expense ratio of 0.75% includes the unitary management fee of 0.15% and acquired fund fees and expenses of 0.60%. NAV and Market Price returns assume that dividends and capital gain distributions have been reinvested in the Fund at NAV and Market Price, respectively. The returns shown in the table above do not reflect the deduction of taxes that a shareholder would pay on Fund distributions or the redemption or sale of Fund
Shares. See invesco.com/ETFs to find the most recent month-end performance numbers.
Index and Benchmark Index performance results are based upon a hypothetical investment in their respective constituent securities. Index and Benchmark Index returns do not represent Fund returns. An investor cannot invest directly in an index. The Index and Benchmark Index do not charge management fees or brokerage expenses, and no such fees or expenses were deducted from the hypothetical performance shown. In addition, the results actual investors might have achieved would have differed from those shown because of differences in the timing, amounts of their investments, and fees and expenses associated with an investment in the Fund.
Notes Regarding Indexes and Fund Performance History:
| - | Average Annualized and Cumulative Inception returns for the Fund, Index and Benchmark Index are based on the inception date of the Fund. |
| | |
| PSCD | | Manager’s Analysis |
| | Invesco S&P SmallCap Consumer Discretionary ETF (PSCD) |
As an index fund, the Invesco S&P SmallCap Consumer Discretionary ETF (the “Fund”) is passively managed and seeks to track the returns of an underlying index. The Fund seeks to track the investment results (before fees and expenses) of the S&P SmallCap 600® Capped Consumer Discretionary Index (the “Index”). The Fund generally will invest at least 90% of its total assets in common stocks of small capitalization U.S. consumer discretionary companies that comprise the Index. These companies are principally engaged in the business of providing consumer goods and services that are cyclical in nature, including, but not limited to, household durables, leisure products and services, apparel and luxury goods, computers and electronics, automobiles and auto components, hotel and restaurant services and television and other entertainment goods and services.
S&P Dow Jones Indices, LLC, the Index provider, defines sectors according to the Global Industry Classification Standard (“GICS”) and compiles, maintains and calculates the Index strictly in accordance with its guidelines and mandated procedures. The Fund generally invests in all of the securities comprising the Index in proportion to their weightings in the Index.
The Board of Trustees approved a change in the fiscal year end for the Fund from October 31 to August 31. For the fiscal period from November 1, 2017 to August 31, 2018, on a market price basis, the Fund returned 29.43%. On a net asset value (“NAV”) basis, the Fund returned 29.58%. During the same time period, the Index returned 29.72%. During the fiscal period, the Fund fully replicated the components of the Index; therefore, the Fund’s performance (NAV basis) differed from the return of the Index primarily due to fees and operating expenses that the Fund incurred during the period, which were partially offset by revenue generated from the securities lending program in which the Fund participates.
During this same time period, the S&P SmallCap 600® Index (the “Benchmark Index”) returned 21.83%. The Benchmark Index is an unmanaged index weighted by market capitalization based on the average performance of approximately 600 small-cap securities. The Benchmark Index was selected for its recognition in the marketplace, and its performance comparison is a useful measure for investors as a broad representation of the overall U.S. small-cap stock market.
Relative to the Benchmark Index, the Fund was most overweight in the specialty retail industry and most underweight in the banks industry during the fiscal period ended August 31, 2018. The majority of the Fund’s outperformance relative to the Benchmark Index during the period can be attributed to the Fund’s overweight allocation in the specialty retail industry.
For the fiscal period ended August 31, 2018, the specialty retail industry contributed most significantly to the Fund’s return, followed by the textiles, apparel & luxury goods and hotels,
restaurants & leisure industries, respectively. The automobiles industry was the only detracting industry.
Positions that contributed most significantly to the Fund’s return for the fiscal period ended August 31, 2018, included World Wrestling Entertainment, Inc., Class A, a movies & entertainment company (no longer held at fiscal period-end), and Ollie’s Bargain Outlet Holdings Inc., a general merchandise stores company (no longer held at fiscal period-end). Positions that detracted most significantly from the Fund’s return included LCI Industries, an auto components company (portfolio average weight of 2.24%), and Installed Building Products, Inc., a household durable company (portfolio average weight of 1.11%).
| | | | |
Industry Breakdown
(% of the Fund’s Net Assets)
as of August 31, 2018 | |
| Specialty Retail | | | 29.1 | |
| Hotels, Restaurants & Leisure | | | 14.1 | |
| Household Durables | | | 13.4 | |
| Auto Components | | | 13.4 | |
| Textiles, Apparel & Luxury Goods | | | 11.7 | |
| Diversified Consumer Services | | | 4.3 | |
| Media | | | 3.9 | |
| Leisure Products | | | 3.9 | |
| Internet & Direct Marketing Retail | | | 3.6 | |
| Distributors | | | 1.3 | |
| Automobiles | | | 0.9 | |
| Multi-line Retail | | | 0.5 | |
| Money Market Funds Plus Other Assets Less Liabilities | | | (0.1) | |
|
Top Ten Fund Holdings*
(% of the Fund’s Net Assets)
as of August 31, 2018 | |
| Security | | | | |
| Wolverine World Wide, Inc. | | | 3.0 | |
| iRobot Corp. | | | 2.5 | |
| Steven Madden Ltd. | | | 2.5 | |
| RH | | | 2.5 | |
| Penn National Gaming, Inc. | | | 2.4 | |
| Strategic Education, Inc. | | | 2.3 | |
| Shutterfly, Inc. | | | 2.1 | |
| Fox Factory Holding Corp. | | | 2.0 | |
| DSW, Inc., Class A | | | 1.9 | |
| Dorman Products, Inc. | | | 1.9 | |
| Total | | | 23.1 | |
* Excluding money market fund holdings.
Invesco S&P SmallCap Consumer Discretionary ETF (PSCD) (continued)
Growth of a $10,000 Investment Since Inception
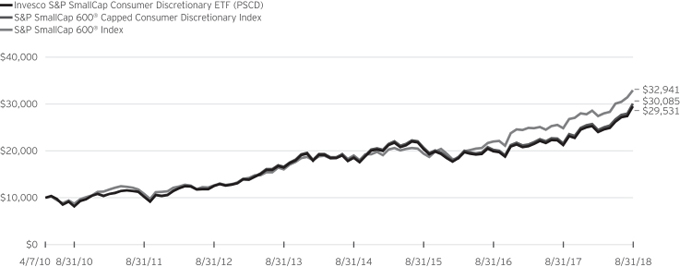
Fund Performance History as of August 31, 2018
| | | | | | | | | | | | | | | | | | | | | | | | | | | | | | | | |
| | | 1 Year | | | 3 Years
Average
Annualized | | | 3 Years
Cumulative | | | 5 Years
Average
Annualized | | | 5 Years
Cumulative | | | | | | Fund Inception | |
| Index | | | | | Average
Annualized | | | Cumulative | |
| S&P SmallCap 600® Capped Consumer Discretionary Index | | | 38.99 | % | | | 13.30 | % | | | 45.46 | % | | | 12.61 | % | | | 81.08 | % | | | | | | | 14.02 | % | | | 200.85 | % |
| S&P SmallCap 600® Index | | | 32.47 | | | | 19.28 | | | | 69.70 | | | | 15.45 | | | | 105.06 | | | | | | | | 15.25 | | | | 229.41 | |
| Fund | | | | | | | | | | | | | | | | | | | | | | | | | | | | | | | | |
| NAV Return | | | 38.82 | | | | 13.14 | | | | 44.83 | | | | 12.42 | | | | 79.54 | | | | | | | | 13.76 | | | | 195.31 | |
| Market Price Return | | | 38.93 | | | | 13.13 | | | | 44.79 | | | | 12.44 | | | | 79.74 | | | | | | | | 13.77 | | | | 195.52 | |
Fund Inception: April 7, 2010
Performance quoted above represents past performance. Past performance is not a guarantee of future results and current performance may be higher or lower than performance quoted. Investment returns and principal value will fluctuate, and shares of the Fund (“Fund Shares”), when redeemed or sold, may be worth more or less than their original cost. Fund performance reflects any applicable fee waivers and/or expense reimbursements. Had the adviser not waived fees and/or reimbursed expenses currently or in the past, returns would have been lower. See current prospectus for more information. According to the Fund’s current prospectus, the Fund’s expense ratio of 0.29% is expressed as a unitary management fee to cover operating expenses and expenses incurred in connection with managing the portfolio. NAV and Market Price returns assume that dividends and capital gain distributions have been reinvested in the Fund at NAV and Market Price, respectively. The returns shown in the table above do not reflect the deduction of taxes that a shareholder would pay on Fund distributions or the redemption or sale of Fund Shares.
See invesco.com/ETFs to find the most recent month-end performance numbers.
Index and Benchmark Index performance results are based upon a hypothetical investment in their respective constituent securities. Index and Benchmark Index returns do not represent Fund returns. An investor cannot invest directly in an index. The Index and Benchmark Index do not charge management fees or brokerage expenses, and no such fees or expenses were deducted from the hypothetical performance shown. In addition, the results actual investors might have achieved would have differed from those shown because of differences in the timing, amounts of their investments, and fees and expenses associated with an investment in the Fund.
Notes Regarding Indexes and Fund Performance History:
| - | Average Annualized and Cumulative Inception returns for the Fund, Index and Benchmark Index are based on the inception date of the Fund. |
| | |
| PSCC | | Manager’s Analysis |
| | Invesco S&P SmallCap Consumer Staples ETF (PSCC) |
As an index fund, the Invesco S&P SmallCap Consumer Staples ETF (the “Fund”) is passively managed and seeks to track the returns of an underlying index. The Fund seeks to track the investment results (before fees and expenses) of the S&P SmallCap 600® Capped Consumer Staples Index (the “Index”). The Fund generally will invest at least 90% of its total assets in common stocks of small capitalization U.S. consumer staples companies that comprise the Index. These companies are principally engaged in the business of providing consumer goods and services that have noncyclical characteristics, including, but not limited to, tobacco, food and beverage, and non-discretionary retail.
S&P Dow Jones Indices, LLC, the Index provider, defines sectors according to the Global Industry Classification Standard (“GICS”) and compiles, maintains and calculates the Index strictly in accordance with its guidelines and mandated procedures. The Fund generally invests in all of the securities comprising the Index in proportion to their weightings in the Index.
The Board of Trustees approved a change in the fiscal year end for the Fund from October 31 to August 31. For the fiscal period from November 1, 2017 to August 31, 2018, on a market price basis, the Fund returned 18.49%. On a net asset value (“NAV”) basis, the Fund returned 18.70%. During the same time period, the Index returned 18.91%. During the fiscal period, the Fund fully replicated the components of the Index; therefore, the Fund’s performance (NAV basis) differed from the return of the Index primarily due to fees and operating expenses that the Fund incurred during the period, which were partially offset by revenue generated from the securities lending program in which the Fund participates.
During this same time period, the S&P SmallCap 600® Index (the “Benchmark Index”) returned 21.83%. The Benchmark Index is an unmanaged index weighted by market capitalization based on the average performance of approximately 600 small-cap securities. The Benchmark Index was selected for its recognition in the marketplace, and its performance comparison is a useful measure for investors as a broad representation of the overall U.S. small-cap stock market.
Relative to the Benchmark Index, the Fund was most overweight in the food products industry and most underweight in the banks industry during the fiscal period ended August 31, 2018. The majority of the Fund’s underperformance relative to the Benchmark Index during the period can be attributed to the Fund’s overweight allocation in the food products industry.
For the fiscal period ended August 31, 2018, the personal products industry contributed most significantly to the Fund’s return, followed by the food products and household products industries, respectively. The beverages industry was the only detracting industry.
Positions that contributed most significantly to the Fund’s return for the fiscal period ended August 31, 2018, included Medifast, Inc., a personal products company (portfolio average weight of 5.09%), and WD-40 Co., a household products company (portfolio average weight of 6.83%). Positions that detracted most significantly from the Fund’s return included Avon Products, Inc. (United Kingdom), a personal products company (portfolio average weight of 2.01%), and Seneca Foods Corp., Class A, a food product company (portfolio average weight of 2.31%).
| | | | |
Industry Breakdown
(% of the Fund’s Net Assets)
as of August 31, 2018 | |
| Food Products | | | 43.7 | |
| Household Products | | | 15.8 | |
| Personal Products | | | 13.5 | |
| Food & Staples Retailing | | | 12.9 | |
| Beverages | | | 7.0 | |
| Tobacco | | | 3.8 | |
| Money Market Funds Plus Other Assets Less Liabilities | | | 3.3 | |
|
Top Ten Fund Holdings*
(% of the Fund’s Net Assets)
as of August 31, 2018 | |
| Security | | | | |
| Darling Ingredients, Inc. | | | 11.9 | |
| WD-40 Co. | | | 9.0 | |
| J & J Snack Foods Corp. | | | 8.0 | |
| B&G Foods, Inc. | | | 7.8 | |
| Central Garden & Pet Co., Class A | | | 5.3 | |
| Inter Parfums, Inc. | | | 4.8 | |
| Calavo Growers, Inc. | | | 4.7 | |
| SUPERVALU, Inc. | | | 4.7 | |
| Medifast, Inc. | | | 4.7 | |
| Andersons, Inc. (The) | | | 4.7 | |
| Total | | | 65.6 | |
| * | Excluding money market fund holdings. |
Invesco S&P SmallCap Consumer Staples ETF (PSCC) (continued)
Growth of a $10,000 Investment Since Inception
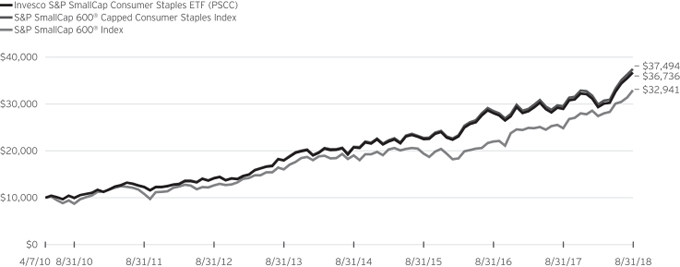
Fund Performance History as of August 31, 2018
| | | | | | | | | | | | | | | | | | | | | | | | | | | | | | | | |
| | | 1 Year | | | 3 Years
Average
Annualized | | | 3 Years
Cumulative | | | 5 Years
Average
Annualized | | | 5 Years
Cumulative | | | | | | Fund Inception | |
| Index | | | | | Average
Annualized | | | Cumulative | |
| S&P SmallCap 600® Capped Consumer Staples Index | | | 27.05 | % | | | 18.13 | % | | | 64.84 | % | | | 15.74 | % | | | 107.71 | % | | | | | | | 17.04 | % | | | 274.94 | % |
| S&P SmallCap 600® Index | | | 32.47 | | | | 19.28 | | | | 69.70 | | | | 15.45 | | | | 105.06 | | | | | | | | 15.25 | | | | 229.41 | |
| Fund | | | | | | | | | | | | | | | | | | | | | | | | | | | | | | | | |
| NAV Return | | | 26.82 | | | | 17.71 | | | | 63.09 | | | | 15.39 | | | | 104.60 | | | | | | | | 16.76 | | | | 267.36 | |
| Market Price Return | | | 26.94 | | | | 17.68 | | | | 62.98 | | | | 15.41 | | | | 104.75 | | | | | | | | 16.75 | | | | 266.97 | |
Fund Inception: April 7, 2010
Performance quoted above represents past performance. Past performance is not a guarantee of future results and current performance may be higher or lower than performance quoted. Investment returns and principal value will fluctuate, and shares of the Fund (“Fund Shares”), when redeemed or sold, may be worth more or less than their original cost. Fund performance reflects any applicable fee waivers and/or expense reimbursements. Had the adviser not waived fees and/or reimbursed expenses currently or in the past, returns would have been lower. See current prospectus for more information. According to the Fund’s current prospectus, the Fund’s expense ratio of 0.29% is expressed as a unitary management fee to cover operating expenses and expenses incurred in connection with managing the portfolio. NAV and Market Price returns assume that dividends and capital gain distributions have been reinvested in the Fund at NAV and Market Price, respectively. The returns shown in the table above do not reflect the deduction of taxes that a shareholder would pay on Fund distributions or the redemption or sale of Fund Shares.
See invesco.com/ETFs to find the most recent month-end performance numbers.
Index and Benchmark Index performance results are based upon a hypothetical investment in their respective constituent securities. Index and Benchmark Index returns do not represent Fund returns. An investor cannot invest directly in an index. The Index and Benchmark Index do not charge management fees or brokerage expenses, and no such fees or expenses were deducted from the hypothetical performance shown. In addition, the results actual investors might have achieved would have differed from those shown because of differences in the timing, amounts of their investments, and fees and expenses associated with an investment in the Fund.
Notes Regarding Indexes and Fund Performance History:
| - | Average Annualized and Cumulative Inception returns for the Fund, Index and Benchmark Index are based on the inception date of the Fund. |
| | |
| PSCE | | Manager’s Analysis |
| | Invesco S&P SmallCap Energy ETF (PSCE) |
As an index fund, the Invesco S&P SmallCap Energy ETF (the “Fund”) is passively managed and seeks to track the returns of an underlying index. The Fund seeks to track the investment results (before fees and expenses) of the S&P SmallCap 600® Capped Energy Index (the “Index”). The Fund generally will invest at least 90% of its total assets in common stocks of small capitalization U.S. energy companies that comprise the Index. These companies are principally engaged in the business of producing, distributing or servicing energy related products, including, but not limited to, oil and gas exploration and production, refining, oil services and pipelines.
S&P Dow Jones Indices, LLC, the Index provider, defines sectors according to the Global Industry Classification Standard (“GICS”) and compiles, maintains and calculates the Index strictly in accordance with its guidelines and mandated procedures. The Fund generally invests in all of the securities comprising the Index in proportion to their weightings in the Index.
The Board of Trustees approved a change in the fiscal year end for the Fund from October 31 to August 31. For the fiscal period from November 1, 2017 to August 31, 2018, on a market price basis, the Fund returned 14.25%. On a net asset value (“NAV”) basis, the Fund returned 14.64%. During the same time period, the Index returned 14.94%. During the fiscal period, the Fund fully replicated the components of the Index; therefore, the Fund’s performance (NAV basis) differed from the return of the Index primarily due to fees and operating expenses that the Fund incurred during the period, which were partially offset by revenue generated from the securities lending program in which the Fund participates.
During this same time period, the S&P SmallCap 600® Index (the “Benchmark Index”) returned 21.83%. The Benchmark Index is an unmanaged index weighted by market capitalization based on the average performance of approximately 600 small-cap securities. The Benchmark Index was selected for its recognition in the marketplace, and its performance comparison is a useful measure for investors as a broad representation of the overall U.S. small-cap stock market.
Relative to the Benchmark Index, the Fund was most overweight in the energy equipment & services industry and most underweight in the banks industry during the fiscal period ended August 31, 2018. The majority of the Fund’s underperformance relative to the Benchmark Index during the period can be attributed to the Fund’s single sector allocation.
For the fiscal period ended August 31, 2018, the oil, gas & consumable fuels industry contributed most significantly to the Fund’s return, followed by the energy equipment & services industry. There were no detracting industries.
Positions that contributed most significantly to the Fund’s return for the fiscal period ended August 31, 2018, included Denbury Resources, Inc., an oil, gas & consumable fuels company (portfolio average weight of 4.01%), and Carrizo Oil & Gas, Inc., an oil, gas & consumable fuels company (portfolio average weight of 5.29%). Positions that detracted most significantly from the Fund’s return included ProPetro Holding Corp., an energy equipment & services company (portfolio average weight of 1.58%), and C&J Energy Services, Inc., an energy equipment & services company (portfolio average weight of 2.47%).
| | | | |
Industry Breakdown
(% of the Fund’s Net Assets)
as of August 31, 2018 | |
| Energy Equipment & Services | | | 50.9 | |
| Oil, Gas & Consumable Fuels | | | 49.1 | |
| Money Market Funds Plus Other Assets Less Liabilities | | | 0.0 | |
|
Top Ten Fund Holdings*
(% of the Fund’s Net Assets)
as of August 31, 2018 | |
| Security | | | | |
| PDC Energy, Inc. | | | 10.2 | |
| SRC Energy, Inc. | | | 6.6 | |
| Carrizo Oil & Gas, Inc. | | | 6.2 | |
| Oil States International, Inc. | | | 6.0 | |
| Denbury Resources, Inc. | | | 5.6 | |
| US Silica Holdings, Inc. | | | 4.8 | |
| Archrock, Inc. | | | 4.8 | |
| Noble Corp. PLC | | | 4.5 | |
| Unit Corp. | | | 4.3 | |
| Helix Energy Solutions Group, Inc. | | | 3.9 | |
| Total | | | 56.9 | |
| * | Excluding money market fund holdings. |
Invesco S&P SmallCap Energy ETF (PSCE) (continued)
Growth of a $10,000 Investment Since Inception
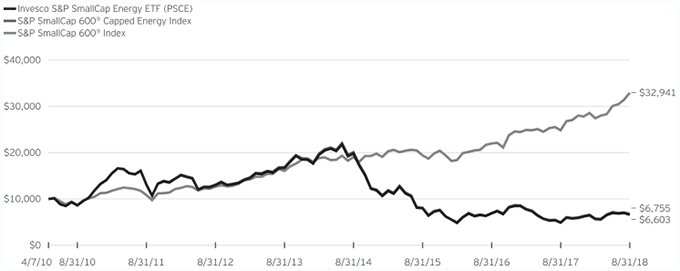
Fund Performance History as of August 31, 2018
| | | | | | | | | | | | | | | | | | | | | | | | | | | | | | | | |
| | | 1 Year | | | 3 Years
Average
Annualized | | | 3 Years
Cumulative | | | 5 Years
Average
Annualized | | | 5 Years
Cumulative | | | | | | Fund Inception | |
| Index | | | | | Average
Annualized | | | Cumulative | |
| S&P SmallCap 600® Capped Energy Index | | | 35.74 | % | | | (6.00 | )% | | | (16.93 | )% | | | (16.73 | )% | | | (59.96 | )% | | | | | | | (4.56 | )% | | | (32.45 | )% |
| S&P SmallCap 600® Index | | | 32.47 | | | | 19.28 | | | | 69.70 | | | | 15.45 | | | | 105.06 | | | | | | | | 15.25 | | | | 229.41 | |
| Fund | | | | | | | | | | | | | | | | | | | | | | | | | | | | | | | | |
| NAV Return | | | 35.33 | | | | (6.17 | ) | | | (17.40 | ) | | | (16.92 | ) | | | (60.42 | ) | | | | | | | (4.82 | ) | | | (33.97 | ) |
| Market Price Return | | | 35.13 | | | | (6.14 | ) | | | (17.32 | ) | | | (16.92 | ) | | | (60.41 | ) | | | | | | | (4.81 | ) | | | (33.91 | ) |
Fund Inception: April 7, 2010
Performance quoted above represents past performance. Past performance is not a guarantee of future results and current performance may be higher or lower than performance quoted. Investment returns and principal value will fluctuate, and shares of the Fund (“Fund Shares”), when redeemed or sold, may be worth more or less than their original cost. Fund performance reflects any applicable fee waivers and/or expense reimbursements. Had the adviser not waived fees and/or reimbursed expenses currently or in the past, returns would have been lower. See current prospectus for more information. According to the Fund’s current prospectus, the Fund’s expense ratio of 0.29% is expressed as a unitary management fee to cover operating expenses and expenses incurred in connection with managing the portfolio. NAV and Market Price returns assume that dividends and capital gain distributions have been reinvested in the Fund at NAV and Market Price, respectively. The returns shown in the table above do not reflect the deduction of taxes that a shareholder would pay on Fund distributions or the redemption or sale of Fund Shares.
See invesco.com/ETFs to find the most recent month-end performance numbers.
Index and Benchmark Index performance results are based upon a hypothetical investment in their respective constituent securities. Index and Benchmark Index returns do not represent Fund returns. An investor cannot invest directly in an index. The Index and Benchmark Index do not charge management fees or brokerage expenses, and no such fees or expenses were deducted from the hypothetical performance shown. In addition, the results actual investors might have achieved would have differed from those shown because of differences in the timing, amounts of their investments, and fees and expenses associated with an investment in the Fund.
Notes Regarding Indexes and Fund Performance History:
| - | Average Annualized and Cumulative Inception returns for the Fund, Index and Benchmark Index are based on the inception date of the Fund. |
| | |
| PSCF | | Manager’s Analysis |
| | Invesco S&P SmallCap Financials ETF (PSCF) |
As an index fund, the Invesco S&P SmallCap Financials ETF (the “Fund”) is passively managed and seeks to track the returns of an underlying index. The Fund seeks to track the investment results (before fees and expenses) of the S&P SmallCap 600® Capped Financials & Real Estate Index (the “Index”). The Fund generally will invest at least 90% of its total assets in common stocks of small capitalization U.S. financial service companies that comprise the Index. These companies are principally engaged in the business of providing financial services and products, including, but not limited to, banking, investment services, insurance and real estate finance services.
S&P Dow Jones Indices, LLC, the Index provider, defines sectors according to the Global Industry Classification Standard (“GICS”) and compiles, maintains and calculates the Index strictly in accordance with its guidelines and mandated procedures. The Fund generally invests in all of the securities comprising the Index in proportion to their weightings in the Index.
The Board of Trustees approved a change in the fiscal year end for the Fund from October 31 to August 31. For the fiscal period from November 1, 2017 to August 31, 2018, on a market price basis, the Fund returned 12.41%. On a net asset value (“NAV”) basis, the Fund returned 12.44%. During the same time period, the Index returned 12.63%. During the fiscal period, the Fund fully replicated the components of the Index; therefore, the Fund’s performance (NAV basis) differed from the return of the Index primarily due to fees and operating expenses that the Fund incurred during the period.
During this same time period, the S&P SmallCap 600® Index (the “Benchmark Index”) returned 21.83%. The Benchmark Index is an unmanaged index weighted by market capitalization based on the average performance of approximately 600 small-cap securities. The Benchmark Index was selected for its recognition in the marketplace, and its performance comparison is a useful measure for investors as a broad representation of the overall U.S. small-cap stock market.
Relative to the Benchmark Index, the Fund was most overweight in the banks industry and most underweight in the machinery industry during the fiscal period ended August 31, 2018. The majority of the Fund’s underperformance relative to the Benchmark Index during the period can be attributed to fees and operating expenses that the Fund incurred as well as the Fund’s single sector allocation. For the fiscal period ended August 31, 2018, the banks industry contributed most significantly to the Fund’s return, followed by the consumer finance and insurance industries, respectively. The real estate management & development industry was the only detracting industry.
Positions that contributed most significantly to the Fund’s return for the fiscal period ended August 31, 2018, included Green Dot Corp., Class A, a consumer finance company (portfolio average weight of 1.74%), and FirstCash, Inc., a consumer finance company (portfolio average weight of 2.06%). Positions that detracted most significantly from the Fund’s return included RE/MAX Holdings, Inc., Class A, a real estate management & development company (portfolio average weight of 0.53%), and Third Point Reinsurance Ltd. (Bermuda), an insurance company (portfolio average weight of 0.66%).
| | | | |
Industry Breakdown
(% of the Fund’s Net Assets)
as of August 31, 2018 | |
| Banks | | | 37.4 | |
| Equity REITs | | | 24.3 | |
| Insurance | | | 14.4 | |
| Consumer Finance | | | 6.4 | |
| Thrifts & Mortgage Finance | | | 6.4 | |
| Mortgage REITs | | | 5.1 | |
| Capital Markets | | | 4.6 | |
| Real Estate Management & Development | | | 1.3 | |
| Money Market Funds Plus Other Assets Less Liabilities | | | 0.1 | |
|
Top Ten Fund Holdings*
(% of the Fund’s Net Assets)
as of August 31, 2018 | |
| Security | | | | |
| First Financial Bankshares, Inc. | | | 2.0 | |
| Green Dot Corp., Class A | | | 2.0 | |
| Selective Insurance Group, Inc. | | | 1.9 | |
| FirstCash, Inc. | | | 1.9 | |
| Glacier Bancorp, Inc. | | | 1.8 | |
| EastGroup Properties, Inc. | | | 1.7 | |
| Community Bank System, Inc. | | | 1.7 | |
| American Equity Investment Life Holding Co. | | | 1.7 | |
| Columbia Banking System, Inc. | | | 1.6 | |
| First Financial Bancorp | | | 1.5 | |
| Total | | | 17.8 | |
| * | Excluding money market fund holdings. |
Invesco S&P SmallCap Financials ETF (PSCF) (continued)
Growth of a $10,000 Investment Since Inception
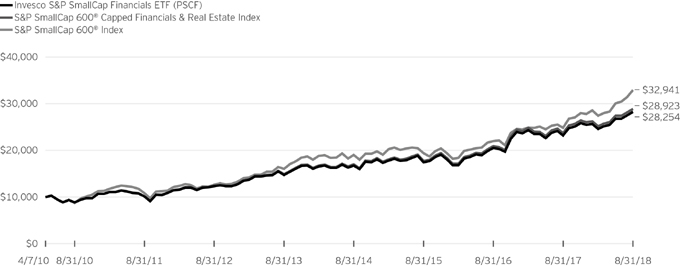
Fund Performance History as of August 31, 2018
| | | | | | | | | | | | | | | | | | | | | | | | | | | | | | | | |
| | | 1 Year | | | 3 Years
Average
Annualized | | | 3 Years
Cumulative | | | 5 Years
Average
Annualized | | | 5 Years
Cumulative | | | | | | Fund Inception | |
| Index | | | | | Average
Annualized | | | Cumulative | |
| S&P SmallCap 600® Capped Financials & Real Estate Index | | | 22.07 | % | | | 17.64 | % | | | 62.80 | % | | | 14.17 | % | | | 93.99 | % | | | | | | | 13.48 | % | | | 189.23 | % |
| S&P SmallCap 600® Index | | | 32.47 | | | | 19.28 | | | | 69.70 | | | | 15.45 | | | | 105.06 | | | | | | | | 15.25 | | | | 229.41 | |
| Fund | | | | | | | | | | | | | | | | | | | | | | | | | | | | | | | | |
| NAV Return | | | 21.80 | | | | 17.35 | | | | 61.60 | | | | 13.88 | | | | 91.50 | | | | | | | | 13.17 | | | | 182.54 | |
| Market Price Return | | | 21.95 | | | | 17.36 | | | | 61.64 | | | | 13.87 | | | | 91.47 | | | | | | | | 13.17 | | | | 182.65 | |
Fund Inception: April 7, 2010
Performance quoted above represents past performance. Past performance is not a guarantee of future results and current performance may be higher or lower than performance quoted. Investment returns and principal value will fluctuate, and shares of the Fund (“Fund Shares”), when redeemed or sold, may be worth more or less than their original cost. Fund performance reflects any applicable fee waivers and/or expense reimbursements. Had the adviser not waived fees and/or reimbursed expenses currently or in the past, returns would have been lower. See current prospectus for more information. According to the Fund’s current prospectus, the Fund’s expense ratio of 0.29% is expressed as a unitary management fee to cover operating expenses and expenses incurred in connection with managing the portfolio. NAV and Market Price returns assume that dividends and capital gain distributions have been reinvested in the Fund at NAV and Market Price, respectively. The returns shown in the table above do not reflect the deduction of taxes that a shareholder would pay on Fund distributions or the redemption or sale of Fund Shares.
See invesco.com/ETFs to find the most recent month-end performance numbers.
Index and Benchmark Index performance results are based upon a hypothetical investment in their respective constituent securities. Index and Benchmark Index returns do not represent Fund returns. An investor cannot invest directly in an index. The Index and Benchmark Index do not charge management fees or brokerage expenses, and no such fees or expenses were deducted from the hypothetical performance shown. In addition, the results actual investors might have achieved would have differed from those shown because of differences in the timing, amounts of their investments, and fees and expenses associated with an investment in the Fund.
Notes Regarding Indexes and Fund Performance History:
| - | Average Annualized and Cumulative Inception returns for the Fund, Index and Benchmark Index are based on the inception date of the Fund. |
| | |
| PSCH | | Manager’s Analysis |
| | Invesco S&P SmallCap Health Care ETF (PSCH) |
As an index fund, the Invesco S&P SmallCap Health Care ETF (the “Fund”) is passively managed and seeks to track the returns of an underlying index. The Fund seeks to track the investment results (before fees and expenses) of the S&P SmallCap 600® Capped Health Care Index (the “Index”). The Fund generally will invest at least 90% of its total assets in common stocks of small capitalization U.S. health care companies that comprise the Index. These companies are principally engaged in the business of providing health care-related products, facilities and services including, but not limited to, biotechnology, pharmaceuticals, medical technology and supplies.
S&P Dow Jones Indices, LLC, the Index provider, defines sectors according to the Global Industry Classification Standard (“GICS”) and compiles, maintains and calculates the Index strictly in accordance with its guidelines and mandated procedures. The Fund generally invests in all of the securities comprising the Index in proportion to their weightings in the Index.
The Board of Trustees approved a change in the fiscal year end for the Fund from October 31 to August 31. For the fiscal period from November 1, 2017 to August 31, 2018, on a market price basis, the Fund returned 58.31%. On a net asset value (“NAV”) basis, the Fund returned 58.32%. During the same time period, the Index returned 58.57%. During the fiscal period, the Fund fully replicated the components of the Index; therefore, the Fund’s performance (NAV basis) differed from the return of the Index primarily due to fees and operating expenses that the Fund incurred during the period, which were partially offset by revenue generated from the securities lending program in which the Fund participates.
During this same time period, the S&P SmallCap 600® Index (the “Benchmark Index”) returned 21.83%. The Benchmark Index is an unmanaged index weighted by market capitalization based on the average performance of approximately 600 small-cap securities. The Benchmark Index was selected for its recognition in the marketplace, and its performance comparison is a useful measure for investors as a broad representation of the overall U.S. small-cap stock market.
Relative to the Benchmark Index, the Fund was most overweight in the health care equipment & supplies industry and most underweight in the banks industry during the fiscal period ended August 31, 2018. The majority of the Fund’s outperformance relative to the Benchmark Index during the period can be attributed to the Fund’s overweight allocations in the health care equipment & supplies and pharmaceuticals industries, respectively.
For the fiscal period ended August 31, 2018, the pharmaceuticals industry contributed most significantly to the Fund’s return, followed by the health care equipment & supplies and health care providers & services industries, respectively. There were no detracting industries.
Positions that contributed most significantly to the Fund’s return for the fiscal period ended August 31, 2018, included Nektar Therapeutics, a life sciences tools & services company (no longer held at fiscal period-end), and Inogen, Inc., a health care equipment & supplies company (portfolio average weight of 2.56%). Positions that detracted most significantly from the Fund’s return included MiMedx Group, Inc., a biotechnology company (portfolio average weight of 0.86%), and Tivity Health, Inc., a health care providers & services company (portfolio average weight of 1.21%).
| | | | |
Industry Breakdown
(% of the Fund’s Net Assets)
as of August 31, 2018 | |
| Health Care Equipment & Supplies | | | 26.9 | |
| Health Care Providers & Services | | | 26.7 | |
| Biotechnology | | | 23.0 | |
| Pharmaceuticals | | | 12.3 | |
| Health Care Technology | | | 8.0 | |
| Life Sciences Tools & Services | | | 3.1 | |
| Money Market Funds Plus Other Assets Less Liabilities | | | (0.0) | |
|
Top Ten Fund Holdings*
(% of the Fund’s Net Assets)
as of August 31, 2018 | |
| Security | | | | |
| Ligand Pharmaceuticals, Inc. | | | 5.1 | |
| HealthEquity, Inc. | | | 4.5 | |
| Neogen Corp. | | | 4.4 | |
| Inogen, Inc. | | | 4.2 | |
| Amedisys, Inc. | | | 3.3 | |
| Myriad Genetics, Inc. | | | 3.2 | |
| Endo International PLC | | | 3.2 | |
| Merit Medical Systems, Inc. | | | 2.9 | |
| LHC Group, Inc. | | | 2.6 | |
| AMN Healthcare Services, Inc. | | | 2.6 | |
| Total | | | 36.0 | |
| * | Excluding money market fund holdings. |
Invesco S&P SmallCap Health Care ETF (PSCH) (continued)
Growth of a $10,000 Investment Since Inception
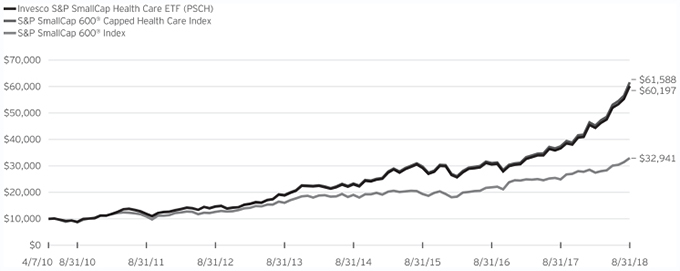
Fund Performance History as of August 31, 2018
| | | | | | | | | | | | | | | | | | | | | | | | | | | | | | | | |
| | | 1 Year | | | 3 Years Average
Annualized | | | 3 Years Cumulative | | | 5 Years Average
Annualized | | | 5 Years Cumulative | | | | | | Fund Inception | |
| Index | | | | | Average
Annualized | | | Cumulative | |
| S&P SmallCap 600® Capped Health Care Index | | | 64.70 | % | | | 27.44 | % | | | 106.97 | % | | | 26.42 | % | | | 222.93 | % | | | | | | | 24.17 | % | | | 515.88 | % |
| S&P SmallCap 600® Index | | | 32.47 | | | | 19.28 | | | | 69.70 | | | | 15.45 | | | | 105.06 | | | | | | | | 15.25 | | | | 229.41 | |
| Fund | | | | | | | | | | | | | | | | | | | | | | | | | | | | | | | | |
| NAV Return | | | 64.37 | | | | 27.15 | | | | 105.59 | | | | 26.10 | | | | 218.80 | | | | | | | | 23.83 | | | | 501.97 | |
| Market Price Return | | | 64.65 | | | | 27.24 | | | | 106.02 | | | | 26.12 | | | | 219.15 | | | | | | | | 23.87 | | | | 503.42 | |
Fund Inception: April 7, 2010
Performance quoted above represents past performance. Past performance is not a guarantee of future results and current performance may be higher or lower than performance quoted. Investment returns and principal value will fluctuate, and shares of the Fund (“Fund Shares”), when redeemed or sold, may be worth more or less than their original cost. Fund performance reflects any applicable fee waivers and/or expense reimbursements. Had the adviser not waived fees and/or reimbursed expenses currently or in the past, returns would have been lower. See current prospectus for more information. According to the Fund’s current prospectus, the Fund’s expense ratio of 0.29% is expressed as a unitary management fee to cover operating expenses and expenses incurred in connection with managing the portfolio. NAV and Market Price returns assume that dividends and capital gain distributions have been reinvested in the Fund at NAV and Market Price, respectively. The returns shown in the table above do not reflect the deduction of taxes that a shareholder would pay on Fund distributions or the redemption or sale of Fund Shares.
See invesco.com/ETFs to find the most recent month-end performance numbers.
Index and Benchmark Index performance results are based upon a hypothetical investment in their respective constituent securities. Index and Benchmark Index returns do not represent Fund returns. An investor cannot invest directly in an index. The Index and Benchmark Index do not charge management fees or brokerage expenses, and no such fees or expenses were deducted from the hypothetical performance shown. In addition, the results actual investors might have achieved would have differed from those shown because of differences in the timing, amounts of their investments, and fees and expenses associated with an investment in the Fund.
Notes Regarding Indexes and Fund Performance History:
| - | Average Annualized and Cumulative Inception returns for the Fund, Index and Benchmark Index are based on the inception date of the Fund. |
| | |
| PSCI | | Manager’s Analysis |
| | Invesco S&P SmallCap Industrials ETF (PSCI) |
As an index fund, the Invesco S&P SmallCap Industrials ETF (the “Fund”) is passively managed and seeks to track the returns of an underlying index. The Fund seeks to track the investment results (before fees and expenses) of the S&P SmallCap 600® Capped Industrials Index (the “Index”). The Fund generally will invest at least 90% of its total assets in common stocks of small capitalization U.S. industrial companies that comprise the Index. These companies are principally engaged in the business of providing industrial products and services including, but not limited to, engineering, heavy machinery, construction, electrical equipment, aerospace and defense, and general manufacturing.
S&P Dow Jones Indices, LLC, the Index provider, defines sectors according to the Global Industry Classification Standard (“GICS”) and compiles, maintains and calculates the Index strictly in accordance with its guidelines and mandated procedures. The Fund generally invests in all of the securities comprising the Index in proportion to their weightings in the Index.
The Board of Trustees approved a change in the fiscal year end for the Fund from October 31 to August 31. For the fiscal period from November 1, 2017 to August 31, 2018, on a market price basis, the Fund returned 21.59%. On a net asset value (“NAV”) basis, the Fund returned 21.69%. During the same time period, the Index returned 21.98%. During the fiscal period, the Fund fully replicated the components of the Index; therefore, the Fund’s performance (NAV basis) differed from the return of the Index primarily due to fees and operating expenses that the Fund incurred during the period.
During this same time period, the S&P SmallCap 600® Index (the “Benchmark Index”) returned 21.83%. The Benchmark Index is an unmanaged index weighted by market capitalization based on the average performance of approximately 600 small-cap securities. The Benchmark Index was selected for its recognition in the marketplace, and its performance comparison is a useful measure for investors as a broad representation of the overall U.S. small-cap stock market.
Relative to the Benchmark Index, the Fund was most overweight in the machinery industry and most underweight in the banks industry during the fiscal period ended August 31, 2018. The majority of the Fund’s slight underperformance relative to the Benchmark Index during the period can be attributed to fees and operating expenses that the Fund incurred during the period.
For the fiscal period ended August 31, 2018, the professional services industry contributed most significantly to the Fund’s return, followed by the machinery and aerospace & defense industries, respectively. There were no detracting industries.
Positions that contributed most significantly to the Fund’s return for the fiscal period ended August 31, 2018, included Insperity, Inc., a professional services company (portfolio average weight of 1.87%), and Axon Enterprise, Inc., an aerospace & defense company (portfolio average weight of 1.58%). Positions that detracted most significantly from the Fund’s return included ABM Industries, Inc., a commercial services & supplies company (portfolio average weight of 1.36%), and Matthews International Corp., Class A, a commercial services & supplies company (portfolio average weight of 1.15%).
| | | | |
Industry Breakdown
(% of the Fund’s Net Assets)
as of August 31, 2018 | |
| Machinery | | | 28.3 | |
| Professional Services | | | 14.9 | |
| Commercial Services & Supplies | | | 12.6 | |
| Building Products | | | 12.1 | |
| Aerospace & Defense | | | 11.3 | |
| Airlines | | | 4.2 | |
| Air Freight & Logistics | | | 3.6 | |
| Trading Companies & Distributors | | | 3.6 | |
| Road & Rail | | | 3.0 | |
| Electrical Equipment | | | 2.2 | |
| Construction & Engineering | | | 2.2 | |
| Industrial Conglomerates | | | 1.0 | |
| Marine | | | 1.0 | |
| Money Market Funds Plus Other Assets Less Liabilities | | | 0.0 | |
|
Top Ten Fund Holdings*
(% of the Fund’s Net Assets)
as of August 31, 2018 | |
| Security | | | | |
| Trex Co., Inc. | | | 2.9 | |
| ASGN, Inc. | | | 2.7 | |
| Insperity, Inc. | | | 2.6 | |
| Axon Enterprise, Inc. | | | 2.3 | |
| Proto Labs, Inc. | | | 2.3 | |
| Tetra Tech, Inc. | | | 2.3 | |
| Korn/Ferry International | | | 2.2 | |
| John Bean Technologies Corp. | | | 2.2 | |
| SkyWest, Inc. | | | 2.0 | |
| Barnes Group, Inc. | | | 1.9 | |
| Total | | | 23.4 | |
| * | Excluding money market fund holdings. |
Invesco S&P SmallCap Industrials ETF (PSCI) (continued)
Growth of a $10,000 Investment Since Inception
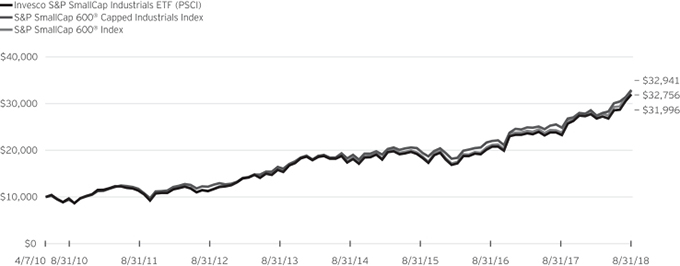
Fund Performance History as of August 31, 2018
| | | | | | | | | | | | | | | | | | | | | | | | | | | | | | | | |
| | | 1 Year | | | 3 Years
Average
Annualized | | | 3 Years
Cumulative | | | 5 Years
Average
Annualized | | | 5 Years
Cumulative | | | | | | Fund Inception | |
| Index | | | | | Average
Annualized | | | Cumulative | |
| S&P SmallCap 600® Capped Industrials Index | | | 37.90 | % | | | 20.70 | % | | | 75.83 | % | | | 16.04 | % | | | 110.36 | % | | | | | | | 15.18 | % | | | 227.56 | % |
| S&P SmallCap 600® Index | | | 32.47 | | | | 19.28 | | | | 69.70 | | | | 15.45 | | | | 105.06 | | | | | | | | 15.25 | | | | 229.41 | |
| Fund | | | | | | | | | | | | | | | | | | | | | | | | | | | | | | | | |
| NAV Return | | | 37.50 | | | | 20.43 | | | | 74.65 | | | | 15.75 | | | | 107.78 | | | | | | | | 14.86 | | | | 219.96 | |
| Market Price Return | | | 37.66 | | | | 20.48 | | | | 74.88 | | | | 15.74 | | | | 107.69 | | | | | | | | 14.87 | | | | 220.22 | |
Fund Inception: April 7, 2010
Performance quoted above represents past performance. Past performance is not a guarantee of future results and current performance may be higher or lower than performance quoted. Investment returns and principal value will fluctuate, and shares of the Fund (“Fund Shares”), when redeemed or sold, may be worth more or less than their original cost. Fund performance reflects any applicable fee waivers and/or expense reimbursements. Had the adviser not waived fees and/or reimbursed expenses currently or in the past, returns would have been lower. See current prospectus for more information. According to the Fund’s current prospectus, the Fund’s expense ratio of 0.29% is expressed as a unitary management fee to cover operating expenses and expenses incurred in connection with managing the portfolio. NAV and Market Price returns assume that dividends and capital gain distributions have been reinvested in the Fund at NAV and Market Price, respectively. The returns shown in the table above do not reflect the deduction of taxes that a shareholder would pay on Fund distributions or the redemption or sale of Fund Shares.
See invesco.com/ETFs to find the most recent month-end performance numbers.
Index and Benchmark Index performance results are based upon a hypothetical investment in their respective constituent securities. Index and Benchmark Index returns do not represent Fund returns. An investor cannot invest directly in an index. The Index and Benchmark Index do not charge management fees or brokerage expenses, and no such fees or expenses were deducted from the hypothetical performance shown. In addition, the results actual investors might have achieved would have differed from those shown because of differences in the timing, amounts of their investments, and fees and expenses associated with an investment in the Fund.
Notes Regarding Indexes and Fund Performance History:
| - | Average Annualized and Cumulative Inception returns for the Fund, Index and Benchmark Index are based on the inception date of the Fund. |
| | |
| PSCT | | Manager’s Analysis |
| | Invesco S&P SmallCap Information Technology ETF (PSCT) |
As an index fund, the Invesco S&P SmallCap Information Technology ETF (the “Fund”) is passively managed and seeks to track the returns of an underlying index. The Fund seeks to track the investment results (before fees and expenses) of the S&P SmallCap 600® Capped Information Technology Index (the “Index”). The Fund generally will invest at least 90% of its total assets in common stocks of small capitalization U.S. information technology companies that comprise the Index. These companies are principally engaged in the business of providing information technology-related products and services including, but not limited to, computer hardware and software, internet, electronics and semiconductors, and communication technologies.
S&P Dow Jones Indices, LLC, the Index provider, defines sectors according to the Global Industry Classification Standard (“GICS”) and compiles, maintains and calculates the Index strictly in accordance with its guidelines and mandated procedures. The Fund generally invests in all of the securities comprising the Index in proportion to their weightings in the Index.
The Board of Trustees approved a change in the fiscal year end for the Fund from October 31 to August 31. For the fiscal period from November 1, 2017 to August 31, 2018, on a market price basis, the Fund returned 10.85%. On a net asset value (“NAV”) basis, the Fund returned 11.09%. During the same time period, the Index returned 11.23%. During the fiscal period, the Fund fully replicated the components of the Index; therefore, the Fund’s performance (NAV basis) differed from the return of the Index primarily due to fees and operating expenses that the Fund incurred during the period, which were partially offset by revenue generated from the securities lending program in which the Fund participates.
During this same time period, the S&P SmallCap 600® Index (the “Benchmark Index”) returned 21.83%. The Benchmark Index is an unmanaged index weighted by market capitalization based on the average performance of approximately 600 small-cap securities. The Benchmark Index was selected for its recognition in the marketplace, and its performance comparison is a useful measure for investors as a broad representation of the overall U.S. small-cap stock market.
Relative to the Benchmark Index, the Fund was most overweight in the electronic equipment instruments & components industry and most underweight in the banks industry during the fiscal period ended August 31, 2018. The majority of the Fund’s underperformance relative to the Benchmark Index during the period can be attributed to the Fund’s single sector allocation. For the fiscal period ended August 31, 2018, the IT services industry contributed most significantly to the Fund’s return, followed by the internet software & services and software industries, respectively. There were no detracting industries.
Positions that contributed most significantly to the Fund’s return for the fiscal period ended August 31, 2018, included CACI International, Inc., Class A, an IT services company (portfolio average weight of 3.19%), and Qualys, Inc., a software company (portfolio average weight of 2.01%). Positions that detracted most significantly from the Fund’s return included Extreme Networks, Inc., a communications equipment company (portfolio average weight of 0.66%), and Diebold Nixdorf, Inc., a technology hardware, storage & peripherals company (portfolio average weight of 0.23%).
| | | | |
Industry Breakdown
(% of the Fund’s Net Assets)
as of August 31, 2018 | |
| Electronic Equipment, Instruments & Components | | | 26.8 | |
| Semiconductors & Semiconductor Equipment | | | 23.0 | |
| IT Services | | | 16.1 | |
| Software | | | 11.8 | |
| Communications Equipment | | | 10.1 | |
| Internet Software & Services | | | 8.4 | |
| Technology Hardware, Storage & Peripherals | | | 3.8 | |
| Money Market Fund Plus Other Assets Less Liabilities | | | (0.0) | |
|
Top Ten Fund Holdings*
(% of the Fund’s Net Assets)
as of August 31, 2018 | |
| Security | | | | |
| CACI International, Inc., Class A | | | 3.6 | |
| Stamps.com, Inc. | | | 3.1 | |
| Semtech Corp. | | | 2.9 | |
| Qualys, Inc. | | | 2.2 | |
| Cabot Microelectronics Corp. | | | 2.2 | |
| Brooks Automation, Inc. | | | 2.1 | |
| II-VI, Inc. | | | 2.0 | |
| Rogers Corp. | | | 1.9 | |
| Viavi Solutions, Inc. | | | 1.9 | |
| Advanced Energy Industries, Inc. | | | 1.7 | |
| Total | | | 23.6 | |
| * | Excluding money market fund holdings. |
Invesco S&P SmallCap Information Technology ETF (PSCT) (continued)
Growth of a $10,000 Investment Since Inception
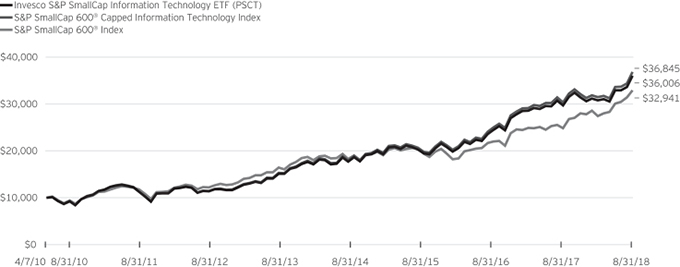
Fund Performance History as of August 31, 2018
| | | | | | | | | | | | | | | | | | | | | | | | | | | | | | | | |
| | | 1 Year | | | 3 Years
Average
Annualized | | | 3 Years
Cumulative | | | 5 Years
Average
Annualized | | | 5 Years
Cumulative | | | | | | Fund Inception | |
| Index | | | | | Average
Annualized | | | Cumulative | |
| S&P SmallCap 600® Capped Information Technology Index | | | 21.32 | % | | | 23.01 | % | | | 86.11 | % | | | 19.26 | % | | | 141.28 | % | | | | | | | 16.80 | % | | | 268.45 | % |
| S&P SmallCap 600® Index | | | 32.47 | | | | 19.28 | | | | 69.70 | | | | 15.45 | | | | 105.06 | | | | | | | | 15.25 | | | | 229.41 | |
| Fund | | | | | | | | | | | | | | | | | | | | | | | | | | | | | | | | |
| NAV Return | | | 21.16 | | | | 22.74 | | | | 84.91 | | | | 18.97 | | | | 138.30 | | | | | | | | 16.48 | | | | 260.06 | |
| Market Price Return | | | 21.18 | | | | 22.66 | | | | 84.57 | | | | 18.95 | | | | 138.13 | | | | | | | | 16.47 | | | | 259.84 | |
Fund Inception: April 7, 2010
Performance quoted above represents past performance. Past performance is not a guarantee of future results and current performance may be higher or lower than performance quoted. Investment returns and principal value will fluctuate, and shares of the Fund (“Fund Shares”), when redeemed or sold, may be worth more or less than their original cost. Fund performance reflects any applicable fee waivers and/or expense reimbursements. Had the adviser not waived fees and/or reimbursed expenses currently or in the past, returns would have been lower. See current prospectus for more information. According to the Fund’s current prospectus, the Fund’s expense ratio of 0.29% is expressed as a unitary management fee to cover operating expenses and expenses incurred in connection with managing the portfolio. NAV and Market Price returns assume that dividends and capital gain distributions have been reinvested in the Fund at NAV and Market Price, respectively. The returns shown in the table above do not reflect the deduction of taxes that a shareholder would pay on Fund distributions or the redemption or sale of Fund Shares.
See invesco.com/ETFs to find the most recent month-end performance numbers.
Index and Benchmark Index performance results are based upon a hypothetical investment in their respective constituent securities. Index and Benchmark Index returns do not represent Fund returns. An investor cannot invest directly in an index. The Index and Benchmark Index do not charge management fees or brokerage expenses, and no such fees or expenses were deducted from the hypothetical performance shown. In addition, the results actual investors might have achieved would have differed from those shown because of differences in the timing, amounts of their investments, and fees and expenses associated with an investment in the Fund.
Notes Regarding Indexes and Fund Performance History:
| - | Average Annualized and Cumulative Inception returns for the Fund, Index and Benchmark Index are based on the inception date of the Fund. |
| | |
| PSCM | | Manager’s Analysis |
| | Invesco S&P SmallCap Materials ETF (PSCM) |
As an index fund, the Invesco S&P SmallCap Materials ETF (the “Fund”) is passively managed and seeks to track the returns of an underlying index. The Fund seeks to track the investment results (before fees and expenses) of the S&P SmallCap 600® Capped Materials Index (the “Index”). The Fund generally will invest at least 90% of its total assets in common stocks of small capitalization U.S. basic materials companies that comprise the Index. These companies are principally engaged in the business of producing raw materials, including, but not limited to, paper or wood products, chemicals, construction materials, and mining and metals.
S&P Dow Jones Indices, LLC, the Index provider, defines sectors according to the Global Industry Classification Standard (“GICS”) and compiles, maintains and calculates the Index strictly in accordance with its guidelines and mandated procedures. The Fund generally invests in all of the securities comprising the Index in proportion to their weightings in the Index.
The Board of Trustees approved a change in the fiscal year end for the Fund from October 31 to August 31. For the fiscal period from November 1, 2017 to August 31, 2018, on a market price basis, the Fund returned 9.65%. On a net asset value (“NAV”) basis, the Fund returned 9.73%. During the same time period, the Index returned 9.86%. During the fiscal period, the Fund fully replicated the components of the Index; therefore, the Fund’s performance (NAV basis) differed from the return of the Index primarily due to fees and operating expenses that the Fund incurred during the period.
During this same time period, the S&P SmallCap 600® Index (the “Benchmark Index”) returned 21.83%. The Benchmark Index is an unmanaged index weighted by market capitalization based on the average performance of approximately 600 small-cap securities. The Benchmark Index was selected for its recognition in the marketplace, and its performance comparison is a useful measure for investors as a broad representation of the overall U.S. small-cap stock market.
Relative to the Benchmark Index, the Fund was most overweight in the chemicals industry and most underweight in the banks industry during the fiscal period ended August 31, 2018. The majority of the Fund’s underperformance relative to the Benchmark Index during the period can be attributed to the Fund’s single sector allocation.
For the fiscal period ended August 31, 2018, the chemicals industry contributed most significantly to the Fund’s return, followed by the paper & forest products and metals & mining industries, respectively. There were no detracting industries.
Positions that contributed most significantly to the Fund’s return for the fiscal period ended August 31, 2018, included Ingevity Corp., a chemicals company (portfolio average weight of 8.15%), and KapStone Paper and Packaging Corp., a paper & forest products company (portfolio average weight of 6.63%). Positions that detracted most significantly from the Fund’s return included U.S. Concrete, Inc., a construction materials company (portfolio average weight of 2.48%), and Clearwater Paper Corp., a paper & forest products company (portfolio average weight of 1.38%).
| | | | |
Industry Breakdown
(% of the Fund’s Net Assets)
as of August 31, 2018 | |
| Chemicals | | | 58.2 | |
| Paper & Forest Products | | | 21.2 | |
| Metals & Mining | | | 17.1 | |
| Construction Materials | | | 1.8 | |
| Containers & Packaging | | | 1.5 | |
| Specialty Chemicals | | | 0.1 | |
| Money Market Fund Plus Other Assets Less Liabilities | | | 0.1 | |
|
Top Ten Fund Holdings*
(% of the Fund’s Net Assets)
as of August 31, 2018 | |
| Security | | | | |
| Ingevity Corp. | | | 10.2 | |
| Balchem Corp. | | | 8.5 | |
| KapStone Paper and Packaging Corp. | | | 7.3 | |
| H.B. Fuller Co. | | | 6.9 | |
| Quaker Chemical Corp. | | | 5.8 | |
| Innospec, Inc. | | | 4.5 | |
| Kaiser Aluminum Corp. | | | 4.4 | |
| Stepan Co. | | | 4.3 | |
| Boise Cascade Co. | | | 4.1 | |
| Neenah, Inc. | | | 3.7 | |
| Total | | | 59.7 | |
| * | Excluding money market fund holdings. |
Invesco S&P SmallCap Materials ETF (PSCM) (continued)
Growth of a $10,000 Investment Since Inception
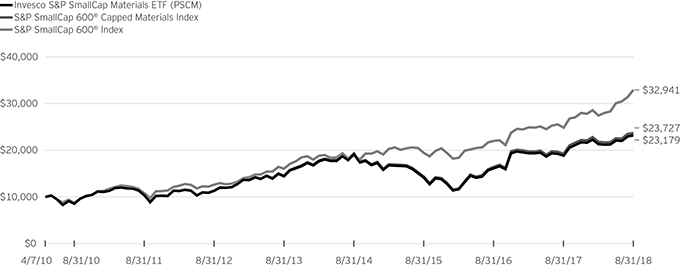
Fund Performance History as of August 31, 2018
| | | | | | | | | | | | | | | | | | | | | | | | | | | | | | | | |
| | | 1 Year | | | 3 Years
Average
Annualized | | | 3 Years
Cumulative | | | 5 Years
Average
Annualized | | | 5 Years
Cumulative | | | | | | Fund Inception | |
| Index | | | | | Average
Annualized | | | Cumulative | |
| S&P SmallCap 600® Capped Materials Index | | | 22.97 | % | | | 18.26 | % | | | 65.37 | % | | | 10.26 | % | | | 62.95 | % | | | | | | | 10.84 | % | | | 137.27 | % |
| S&P SmallCap 600® Index | | | 32.47 | | | | 19.28 | | | | 69.70 | | | | 15.45 | | | | 105.06 | | | | | | | | 15.25 | | | | 229.41 | |
| Fund | | | | | | | | | | | | | | | | | | | | | | | | | | | | | | | | |
| NAV Return | | | 22.77 | | | | 17.96 | | | | 64.14 | | | | 9.96 | | | | 60.77 | | | | | | | | 10.53 | | | | 131.79 | |
| Market Price Return | | | 23.09 | | | | 17.99 | | | | 64.28 | | | | 9.97 | | | | 60.81 | | | | | | | | 10.53 | | | | 131.80 | |
Fund Inception: April 7, 2010
Performance quoted above represents past performance. Past performance is not a guarantee of future results and current performance may be higher or lower than performance quoted. Investment returns and principal value will fluctuate, and shares of the Fund (“Fund Shares”), when redeemed or sold, may be worth more or less than their original cost. Fund performance reflects any applicable fee waivers and/or expense reimbursements. Had the adviser not waived fees and/or reimbursed expenses currently or in the past, returns would have been lower. See current prospectus for more information. According to the Fund’s current prospectus, the Fund’s expense ratio of 0.29% is expressed as a unitary management fee to cover operating expenses and expenses incurred in connection with managing the portfolio. NAV and Market Price returns assume that dividends and capital gain distributions have been reinvested in the Fund at NAV and Market Price, respectively. The returns shown in the table above do not reflect the deduction of taxes that a shareholder would pay on Fund distributions or the redemption or sale of Fund Shares.
See invesco.com/ETFs to find the most recent month-end performance numbers.
Index and Benchmark Index performance results are based upon a hypothetical investment in their respective constituent securities. Index and Benchmark Index returns do not represent Fund returns. An investor cannot invest directly in an index. The Index and Benchmark Index do not charge management fees or brokerage expenses, and no such fees or expenses were deducted from the hypothetical performance shown. In addition, the results actual investors might have achieved would have differed from those shown because of differences in the timing, amounts of their investments, and fees and expenses associated with an investment in the Fund.
Notes Regarding Indexes and Fund Performance History:
| - | Average Annualized and Cumulative Inception returns for the Fund, Index and Benchmark Index are based on the inception date of the Fund. |
| | |
| PSCU | | Manager’s Analysis |
| | Invesco S&P SmallCap Utilities ETF (PSCU) |
As an index fund, the Invesco S&P SmallCap Utilities ETF (the “Fund”) is passively managed and seeks to track the returns of an underlying index. The Fund seeks to track the investment results (before fees and expenses) of the S&P SmallCap 600® Capped Utilities & Telecommunication Services Index (the “Index”). The Fund generally will invest at least 90% of its total assets in common stocks of small capitalization U.S. utility companies that comprise the Index. These companies are principally engaged in providing either energy, water, electric or natural gas utilities or providing telecommunications services. These companies may include, but are not limited to, companies that generate and supply electricity, including electricity wholesalers; distribute natural gas to customers; provide water to customers, as well as deal with associated wastewater; and provide land line or wireless telephone services.
S&P Dow Jones Indices, LLC, the Index provider, defines sectors according to the Global Industry Classification Standard (“GICS”) and compiles, maintains and calculates the Index strictly in accordance with its guidelines and mandated procedures. The Fund generally invests in all of the securities comprising the Index in proportion to their weightings in the Index.
The Board of Trustees approved a change in the fiscal year end for the Fund from October 31 to August 31. For the fiscal period from November 1, 2017 to August 31, 2018, on a market price basis, the Fund returned 2.54%. On a net asset value (“NAV”) basis, the Fund returned 2.55%. During the same time period, the Index returned 2.39%. During the fiscal period, the Fund fully replicated the components of the Index; therefore, the Fund’s performance (NAV basis) differed from the return of the Index primarily due to fees and operating expenses incurred by the Fund during the period, which were partially offset by revenue generated from the securities lending program in which the Fund participates.
During this same time period, the S&P SmallCap 600® Index (the “Benchmark Index”) returned 21.83%. The Benchmark Index is an unmanaged index weighted by market capitalization based on the average performance of approximately 600 small-cap securities. The Benchmark Index was selected for its recognition in the marketplace, and its performance comparison is a useful measure for investors as a broad representation of the overall U.S. small-cap stock market.
Relative to the Benchmark Index, the Fund was most overweight in the diversified telecommunication services industry and most underweight in the banks industry during the fiscal period ended August 31, 2018. The majority of the Fund’s underperformance relative to the Benchmark Index during the period can be attributed to the Fund’s single sector allocation.
For the fiscal period ended August 31, 2018, the diversified telecommunication services industry contributed most significantly
to the Fund’s return, followed by the water utilities and gas utilities industries, respectively. There were no detracting industries.
Positions that contributed most significantly to the Fund’s return for the fiscal period ended August 31, 2018, included Vonage Holdings Corp., a diversified telecommunications services company (portfolio average weight of 7.11%), and Iridium Communications, Inc., a diversified telecommunications services company (portfolio average weight of 4.90%). Positions that detracted most significantly from the Fund’s return included Frontier Communications Corp., a diversified telecommunications services company (portfolio average weight of 3.48%), and ALLETE, Inc., an electric utilities company (no longer held at fiscal period-end).
| | | | |
Industry Breakdown
(% of the Fund’s Net Assets)
as of August 31, 2018 | |
| Gas Utilities | | | 34.5 | |
| Diversified Telecommunication Services | | | 30.3 | |
| Multi-Utilities | | | 15.3 | |
| Water Utilities | | | 8.9 | |
| Electric Utilities | | | 4.6 | |
| Wireless Telecommunication Services | | | 4.2 | |
| Money Market Fund Plus Other Assets Less Liabilities | | | 2.2 | |
|
Top Ten Fund Holdings*
(% of the Fund’s Net Assets)
as of August 31, 2018 | |
| Security | | | | |
| Spire, Inc. | | | 17.0 | |
| Avista Corp. | | | 15.3 | |
| South Jersey Industries, Inc. | | | 12.9 | |
| Vonage Holdings Corp. | | | 4.7 | |
| Cincinnati Bell, Inc. | | | 4.7 | |
| Iridium Communications, Inc. | | | 4.7 | |
| ATN International, Inc. | | | 4.7 | |
| Northwest Natural Gas Co. | | | 4.7 | |
| American States Water Co. | | | 4.6 | |
| El Paso Electric Co. | | | 4.6 | |
| Total | | | 77.9 | |
| * | Excluding money market fund holdings. |
Invesco S&P SmallCap Utilities ETF (PSCU) (continued)
Growth of a $10,000 Investment Since Inception
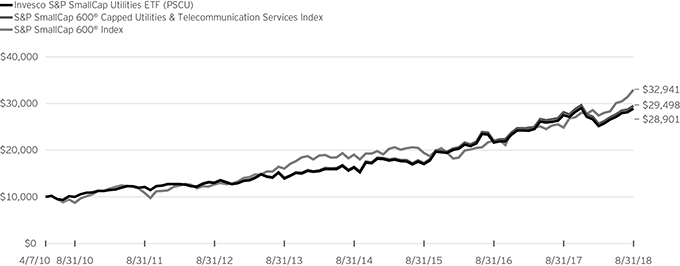
Fund Performance History as of August 31, 2018
| | | | | | | | | | | | | | | | | | | | | | | | | | | | | | | | |
| | | 1 Year | | | 3 Years
Average
Annualized | | | 3 Years
Cumulative | | | 5 Years
Average
Annualized | | | 5 Years
Cumulative | | | | | | Fund Inception | |
| Index | | | | | Average
Annualized | | | Cumulative | |
| S&P SmallCap 600® Capped Utilities & Telecommunication Services Index | | | 4.89 | % | | | 19.46 | % | | | 70.50 | % | | | 15.93 | % | | | 109.41 | % | | | | | | | 13.75 | % | | | 194.98 | % |
| S&P SmallCap 600® Index | | | 32.47 | | | | 19.28 | | | | 69.70 | | | | 15.45 | | | | 105.06 | | | | | | | | 15.25 | | | | 229.41 | |
| Fund | | | | | | | | | | | | | | | | | | | | | | | | | | | | | | | | |
| NAV Return | | | 5.00 | | | | 19.30 | | | | 69.79 | | | | 15.70 | | | | 107.31 | | | | | | | | 13.47 | | | | 189.01 | |
| Market Price Return | | | 5.03 | | | | 19.32 | | | | 69.89 | | | | 15.73 | | | | 107.59 | | | | | | | | 13.48 | | | | 189.13 | |
Fund Inception: April 7, 2010
Performance quoted above represents past performance. Past performance is not a guarantee of future results and current performance may be higher or lower than performance quoted. Investment returns and principal value will fluctuate, and shares of the Fund (“Fund Shares”), when redeemed or sold, may be worth more or less than their original cost. Fund performance reflects any applicable fee waivers and/or expense reimbursements. Had the adviser not waived fees and/or reimbursed expenses currently or in the past, returns would have been lower. See current prospectus for more information. According to the Fund’s current prospectus, the Fund’s expense ratio of 0.29% is expressed as a unitary management fee to cover operating expenses and expenses incurred in connection with managing the portfolio. NAV and Market Price returns assume that dividends and capital gain distributions have been reinvested in the Fund at NAV and Market Price, respectively. The returns shown in the table above do not reflect the deduction of taxes that a shareholder would pay on Fund distributions or the redemption or sale of Fund Shares.
See invesco.com/ETFs to find the most recent month-end performance numbers.
Index and Benchmark Index performance results are based upon a hypothetical investment in their respective constituent securities. Index and Benchmark Index returns do not represent Fund returns. An investor cannot invest directly in an index. The Index and Benchmark Index do not charge management fees or brokerage expenses, and no such fees or expenses were deducted from the hypothetical performance shown. In addition, the results actual investors might have achieved would have differed from those shown because of differences in the timing, amounts of their investments, and fees and expenses associated with an investment in the Fund.
Notes Regarding Indexes and Fund Performance History:
| - | Average Annualized and Cumulative Inception returns for the Fund, Index and Benchmark Index are based on the inception date of the Fund. |
Schedule of Investments
Invesco DWA Momentum & Low Volatility Rotation ETF (DWLV)
August 31, 2018
| | | | | | | | |
Number
of Shares | | | | | Value | |
| | | | Exchange-Traded Funds—99.9%(a) | |
| | 166,134 | | | Invesco DWA Developed Markets Momentum ETF | | $ | 4,696,608 | |
| | 236,663 | | | Invesco DWA Emerging Markets Momentum ETF | | | 4,508,430 | |
| | 200,032 | | | Invesco DWA Momentum ETF | | | 11,967,915 | |
| | 211,980 | | | Invesco DWA SmallCap Momentum ETF(b)(c) | | | 12,591,612 | |
| | 89,131 | | | Invesco S&P 500® Low Volatility ETF | | | 4,436,941 | |
| | 72,770 | | | Invesco S&P Emerging Markets Low Volatility ETF | | | 1,813,428 | |
| | 53,813 | | | Invesco S&P International Developed Low Volatility ETF | | | 1,759,685 | |
| | 87,352 | | | Invesco S&P SmallCap Low Volatility ETF | | | 4,464,561 | |
| | | | | | | | |
| | | | Total Exchange-Traded Funds
(Cost $42,425,588) | | | 46,239,180 | |
| | | | | | | | |
| | |
| | | | | | | | |
| | | | Money Market Fund—0.1% | | | | |
| | 42,612 | | | Invesco Premier U.S. Government Money Portfolio—Institutional Class, 1.83%(d)
(Cost $42,612) | | | 42,612 | |
| | | | | | | | |
| | | | Total Investments in Securities
(excluding investments purchased with cash collateral from securities on loan)
(Cost $42,468,200)—100.0% | | | 46,281,792 | |
| | | | | | | | |
| | |
| | | | | | | | |
| | | | Investments Purchased with Cash Collateral from Securities on Loan | |
| | |
| | | | | | | | |
| | | | Money Market Fund—1.1% | | | | |
| | 510,000 | | | Invesco Government & Agency Portfolio—Institutional Class, 1.85%(d)(e)
(Cost $510,000) | | | 510,000 | |
| | | | | | | | |
| | | | Total Investments in Securities
(Cost $42,978,200)—101.1% | | | 46,791,792 | |
| | | | Other assets less liabilities—(1.1)% | | | (513,447 | ) |
| | | | | | | | |
| | | | Net Assets—100.0% | | $ | 46,278,345 | |
| | | | | | | | |
Investment Abbreviations:
ETF—Exchange-Traded Fund
Notes to Schedule of Investments:
| (a) | Affiliated Company. The security and the Fund are affiliated by having the same investment adviser. See Note 4. |
| (b) | Non-income producing security. |
| (c) | All or a portion of this security was out on loan at August 31, 2018. |
| (d) | The security and the Fund are advised by wholly-owned subsidiaries of Invesco Ltd. and are therefore considered to be affiliated. The rate shown is the 7-day SEC standardized yield as of August 31, 2018. |
| (e) | The security has been segregated to satisfy the commitment to return the cash collateral received in securities lending transactions upon the borrower’s return of the securities loaned. See Note 2I. |
See accompanying Notes to Financial Statements which are an integral part of the financial statements.
Schedule of Investments(a)
Invesco DWA SmallCap Momentum ETF (DWAS)
August 31, 2018
| | | | | | | | |
Number
of Shares | | | | | Value | |
| | | | Common Stocks—100.0% | |
| | | | Consumer Discretionary—12.1% | |
| | 32,790 | | | Adtalem Global Education, Inc.(b) | | $ | 1,569,002 | |
| | 74,005 | | | Boot Barn Holdings, Inc.(b) | | | 2,214,970 | |
| | 117,595 | | | Career Education Corp.(b) | | | 1,875,640 | |
| | 41,948 | | | Carvana Co., Class A(b)(c) | | | 2,715,714 | |
| | 7,786 | | | Cavco Industries, Inc.(b) | | | 1,910,684 | |
| | 94,088 | | | Chegg, Inc.(b) | | | 3,046,569 | |
| | 49,283 | | | Conn’s, Inc.(b)(c) | | | 2,020,603 | |
| | 84,802 | | | Crocs, Inc.(b) | | | 1,752,009 | |
| | 13,280 | | | Deckers Outdoor Corp.(b) | | | 1,618,035 | |
| | 204,448 | | | Drive Shack, Inc.(b) | | | 1,267,578 | |
| | 102,509 | | | Eldorado Resorts, Inc.(b) | | | 4,925,557 | |
| | 16,572 | | | Five Below, Inc.(b) | | | 1,930,141 | |
| | 75,469 | | | Fossil Group, Inc.(b) | | | 1,710,882 | |
| | 19,729 | | | Johnson Outdoors, Inc., Class A | | | 1,998,153 | |
| | 36,376 | | | Malibu Boats, Inc., Class A(b) | | | 1,753,687 | |
| | 54,100 | | | MCBC Holdings, Inc.(b) | | | 1,491,537 | |
| | 34,753 | | | Monarch Casino & Resort, Inc.(b) | | | 1,635,129 | |
| | 16,726 | | | Nathan’s Famous, Inc. | | | 1,483,596 | |
| | 144,024 | | | Noodles & Co., Class A(b)(c) | | | 1,771,495 | |
| | 22,959 | | | Ollie’s Bargain Outlet Holdings, Inc.(b) | | | 1,999,729 | |
| | 47,688 | | | Penn National Gaming, Inc.(b) | | | 1,643,328 | |
| | 34,624 | | | Planet Fitness, Inc., Class A(b) | | | 1,778,635 | |
| | 18,653 | | | RH(b)(c) | | | 2,965,827 | |
| | 51,599 | | | Stoneridge, Inc.(b) | | | 1,544,358 | |
| | 19,601 | | | TopBuild Corp.(b) | | | 1,220,750 | |
| | 168,954 | | | Town Sports International Holdings, Inc.(b)(c) | | | 1,545,929 | |
| | 24,289 | | | World Wrestling Entertainment, Inc., Class A | | | 2,123,102 | |
| | 88,868 | | | ZAGG, Inc.(b) | | | 1,439,662 | |
| | | | | | | | |
| | | | | | | 54,952,301 | |
| | | | | | | | |
| | | | Consumer Staples—3.0% | |
| | 17,593 | | | Medifast, Inc. | | | 4,024,399 | |
| | 68,564 | | | MGP Ingredients, Inc.(c) | | | 5,286,970 | |
| | 131,725 | | | Natural Grocers by Vitamin Cottage, Inc.(b)(c) | | | 2,556,782 | |
| | 50,945 | | | Turning Point Brands, Inc. | | | 1,714,809 | |
| | | | | | | | |
| | | | | | | 13,582,960 | |
| | | | | | | | |
| | | | Energy—2.9% | |
| | 66,363 | | | California Resources Corp.(b) | | | 2,756,719 | |
| | 156,084 | | | Comstock Resources, Inc.(b) | | | 1,510,893 | |
| | 32,022 | | | Delek US Holdings, Inc. | | | 1,745,199 | |
| | 40,991 | | | Mammoth Energy Services, Inc. | | | 1,126,433 | |
| | 44,970 | | | Penn Virginia Corp.(b) | | | 3,999,632 | |
| | 70,402 | | | Unit Corp.(b) | | | 1,850,868 | |
| | | | | | | | |
| | | | | | | 12,989,744 | |
| | | | | | | | |
| | | | Financials—14.6% | |
| | 29,487 | | | Ameris Bancorp | | | 1,464,030 | |
| | 114,127 | | | B. Riley Financial, Inc. | | | 2,613,508 | |
| | 84,704 | | | Blucora, Inc.(b) | | | 3,066,285 | |
| | 55,133 | | | Carolina Financial Corp. | | | 2,268,723 | |
| | 37,487 | | | Cathay General Bancorp | | | 1,585,700 | |
| | 51,751 | | | CenterState Bank Corp. | | | 1,584,616 | |
| | 28,020 | | | Eagle Bancorp, Inc.(b) | | | 1,508,877 | |
| | 70,276 | | | eHealth, Inc.(b) | | | 2,051,356 | |
| | 57,046 | | | Enova International, Inc.(b) | | | 1,893,927 | |
| | 28,977 | | | Enterprise Financial Services Corp. | | | 1,631,405 | |
| | 17,185 | | | Federal Agricultural Mortgage Corp., Class C | | | 1,324,448 | |
| | 201,491 | | | First BanCorp/Puerto Rico(b) | | | 1,763,046 | |
| | | | | | | | |
Number
of Shares | | | | | Value | |
| | | | Common Stocks (continued) | |
| | | | Financials (continued) | |
| | 37,926 | | | First Bancorp/Southern Pines NC | | $ | 1,582,273 | |
| | 45,553 | | | First Bancshares, Inc. (The) | | | 1,869,951 | |
| | 50,265 | | | First Defiance Financial Corp. | | | 1,607,977 | |
| | 46,111 | | | First Financial Bankshares, Inc. | | | 2,785,104 | |
| | 36,576 | | | First Merchants Corp. | | | 1,760,037 | |
| | 70,177 | | | Green Bancorp, Inc. | | | 1,684,248 | |
| | 23,850 | | | Green Dot Corp., Class A(b) | | | 2,043,230 | |
| | 35,082 | | | Hamilton Lane, Inc., Class A | | | 1,711,300 | |
| | 75,169 | | | Horizon Bancorp, Inc. | | | 1,535,703 | |
| | 178,375 | | | Independent Bank Corp./MI | | | 4,450,456 | |
| | 30,865 | | | Kinsale Capital Group, Inc. | | | 1,875,666 | |
| | 81,531 | | | Meridian Bancorp, Inc. | | | 1,459,405 | |
| | 27,861 | | | Nicolet Bankshares, Inc.(b) | | | 1,542,385 | |
| | 92,575 | | | NMI Holdings, Inc., Class A(b) | | | 1,999,620 | |
| | 46,630 | | | Old Line Bancshares, Inc. | | | 1,594,746 | |
| | 32,879 | | | Preferred Bank | | | 2,012,524 | |
| | 43,641 | | | Regional Management Corp.(b) | | | 1,454,555 | |
| | 48,904 | | | Seacoast Banking Corp. of Florida(b) | | | 1,546,344 | |
| | 37,834 | | | Triumph Bancorp, Inc.(b) | | | 1,606,053 | |
| | 48,460 | | | United Community Banks, Inc. | | | 1,470,276 | |
| | 140,639 | | | United Community Financial Corp. | | | 1,455,614 | |
| | 27,536 | | | Walker & Dunlop, Inc. | | | 1,500,712 | |
| | 13,507 | | | World Acceptance Corp.(b) | | | 1,602,065 | |
| | 28,725 | | | WSFS Financial Corp. | | | 1,401,780 | |
| | | | | | | | |
| | | | | | | 66,307,945 | |
| | | | | | | | |
| | | | Health Care—35.7% | |
| | 27,856 | | | Addus HomeCare Corp.(b) | | | 1,807,854 | |
| | 35,615 | | | Arena Pharmaceuticals, Inc.(b) | | | 1,383,287 | |
| | 130,228 | | | Array BioPharma, Inc.(b) | | | 2,027,650 | |
| | 368,172 | | | Arrowhead Pharmaceuticals, Inc.(b) | | | 5,434,219 | |
| | 37,759 | | | Audentes Therapeutics, Inc.(b) | | | 1,374,428 | |
| | 133,204 | | | AxoGen, Inc.(b) | | | 5,840,995 | |
| | 49,523 | | | BioTelemetry, Inc.(b) | | | 3,060,521 | |
| | 438,810 | | | CareDx, Inc.(b) | | | 10,667,471 | |
| | 226,321 | | | Cerus Corp.(b) | | | 1,760,777 | |
| | 304,183 | | | Codexis, Inc.(b) | | | 5,231,948 | |
| | 57,795 | | | CryoLife, Inc.(b) | | | 2,005,487 | |
| | 294,626 | | | CryoPort, Inc.(b)(c) | | | 4,183,689 | |
| | 39,601 | | | Cutera, Inc.(b) | | | 1,346,434 | |
| | 294,628 | | | Cymabay Therapeutics, Inc.(b) | | | 4,015,780 | |
| | 149,490 | | | CytoSorbents Corp.(b) | | | 2,190,029 | |
| | 36,406 | | | Deciphera Pharmaceuticals, Inc.(b) | | | 1,346,658 | |
| | 16,374 | | | Enanta Pharmaceuticals, Inc.(b) | | | 1,488,888 | |
| | 366,802 | | | Endocyte, Inc.(b) | | | 7,233,335 | |
| | 179,502 | | | Fate Therapeutics, Inc.(b) | | | 2,313,781 | |
| | 34,260 | | | G1 Therapeutics, Inc.(b) | | | 2,078,897 | |
| | 202,893 | | | Galectin Therapeutics, Inc.(b)(c) | | | 1,312,718 | |
| | 29,642 | | | Globus Medical, Inc., Class A(b) | | | 1,579,029 | |
| | 17,581 | | | Haemonetics Corp.(b) | | | 1,962,743 | |
| | 20,709 | | | HealthEquity, Inc.(b) | | | 1,950,995 | |
| | 54,721 | | | Heska Corp.(b) | | | 5,855,147 | |
| | 63,842 | | | Immunomedics, Inc.(b) | | | 1,708,412 | |
| | 26,923 | | | Inogen, Inc.(b) | | | 7,132,172 | |
| | 24,688 | | | Integer Holdings Corp.(b) | | | 1,972,571 | |
| | 44,930 | | | Intersect ENT, Inc.(b) | | | 1,316,449 | |
| | 20,092 | | | iRhythm Technologies, Inc.(b) | | | 1,870,364 | |
| | 153,736 | | | Kindred Biosciences, Inc.(b) | | | 2,290,666 | |
See accompanying Notes to Financial Statements which are an integral part of the financial statements.
Invesco DWA SmallCap Momentum ETF (DWAS) (continued)
August 31, 2018
| | | | | | | | |
Number
of Shares | | | | | Value | |
| | | | Common Stocks (continued) | |
| | | | Health Care (continued) | |
| | 8,276 | | | Ligand Pharmaceuticals, Inc.(b) | | $ | 2,149,194 | |
| | 32,302 | | | Merit Medical Systems, Inc.(b) | | | 1,900,973 | |
| | 120,889 | | | Mirati Therapeutics, Inc.(b) | | | 6,836,273 | |
| | 66,586 | | | Neogen Corp.(b) | | | 6,221,796 | |
| | 62,169 | | | Novocure Ltd.(b) | | | 2,800,713 | |
| | 10,515 | | | Penumbra, Inc.(b) | | | 1,460,008 | |
| | 23,845 | | | Quidel Corp.(b) | | | 1,833,204 | |
| | 232,353 | | | R1 RCM, Inc.(b) | | | 2,316,559 | |
| | 24,194 | | | REGENXBIO, Inc.(b) | | | 1,704,467 | |
| | 137,216 | | | Rocket Pharmaceuticals, Inc.(b) | | | 3,272,602 | |
| | 117,335 | | | Savara, Inc.(b) | | | 1,379,860 | |
| | 107,695 | | | Sientra, Inc.(b) | | | 2,705,298 | |
| | 72,062 | | | Simulations Plus, Inc. | | | 1,502,493 | |
| | 271,467 | | | Sorrento Therapeutics, Inc.(b)(c) | | | 1,506,642 | |
| | 61,470 | | | STAAR Surgical Co.(b) | | | 2,932,119 | |
| | 91,522 | | | Stemline Therapeutics, Inc.(b) | | | 1,565,026 | |
| | 30,109 | | | Supernus Pharmaceuticals, Inc.(b) | | | 1,333,829 | |
| | 199,307 | | | T2 Biosystems, Inc.(b) | | | 1,301,475 | |
| | 35,932 | | | Tabula Rasa HealthCare, Inc.(b) | | | 3,150,158 | |
| | 33,024 | | | Tactile Systems Technology, Inc.(b) | | | 2,234,734 | |
| | 33,212 | | | Teladoc Health, Inc.(b) | | | 2,575,591 | |
| | 43,109 | | | Tenet Healthcare Corp.(b) | | | 1,453,635 | |
| | 38,724 | | | Triple-S Management Corp., Class B(b) | | | 843,021 | |
| | 88,689 | | | uniQure N.V. (Netherlands)(b)(c) | | | 3,763,074 | |
| | 16,228 | | | US Physical Therapy, Inc. | | | 2,032,557 | |
| | 13,928 | | | Utah Medical Products, Inc. | | | 1,265,359 | |
| | 192,292 | | | Verastem, Inc.(b) | | | 1,915,228 | |
| | 53,050 | | | Zogenix, Inc.(b) | | | 2,562,315 | |
| | | | | | | | |
| | | | | | | 162,261,597 | |
| | | | | | | | |
| | | | Industrials—13.0% | |
| | 33,979 | | | ArcBest Corp. | | | 1,634,390 | |
| | 23,856 | | | Axon Enterprise, Inc.(b) | | | 1,628,411 | |
| | 18,189 | | | Barrett Business Services, Inc. | | | 1,364,721 | |
| | 69,142 | | | CAI International, Inc.(b) | | | 1,866,143 | |
| | 104,553 | | | Casella Waste Systems, Inc., Class A(b) | | | 2,967,214 | |
| | 69,874 | | | CBIZ, Inc.(b) | | | 1,669,989 | |
| | 25,650 | | | Chart Industries, Inc.(b) | | | 1,937,857 | |
| | 33,972 | | | Comfort Systems USA, Inc. | | | 1,949,993 | |
| | 70,400 | | | DMC Global, Inc. | | | 2,763,200 | |
| | 33,078 | | | Douglas Dynamics, Inc. | | | 1,514,972 | |
| | 646,280 | | | Enphase Energy, Inc.(b)(c) | | | 3,160,309 | |
| | 78,532 | | | Harsco Corp.(b) | | | 2,218,529 | |
| | 29,382 | | | Insperity, Inc. | | | 3,521,433 | |
| | 24,841 | | | Korn/Ferry International | | | 1,667,576 | |
| | 49,227 | | | NV5 Global, Inc.(b) | | | 4,354,128 | |
| | 24,824 | | | Omega Flex, Inc. | | | 2,203,130 | |
| | 12,298 | | | RBC Bearings, Inc.(b) | | | 1,842,363 | |
| | 19,684 | | | Saia, Inc.(b) | | | 1,559,957 | |
| | 17,115 | | | SiteOne Landscape Supply, Inc.(b) | | | 1,546,683 | |
| | 55,338 | | | SkyWest, Inc. | | | 3,613,571 | |
| | 116,636 | | | Sunrun, Inc.(b) | | | 1,530,264 | |
| | 54,454 | | | Systemax, Inc. | | | 1,987,571 | |
| | 58,487 | | | Trex Co., Inc.(b) | | | 4,953,849 | |
| | 28,767 | | | TriNet Group, Inc.(b) | | | 1,699,267 | |
| | 42,473 | | | Universal Forest Products, Inc. | | | 1,591,039 | |
| | 39,512 | | | Vicor Corp.(b) | | | 2,467,524 | |
| | | | | | | | |
| | | | | | | 59,214,083 | |
| | | | | | | | |
| | | | | | | | |
Number
of Shares | | | | | Value | |
| | | | Common Stocks (continued) | |
| | | | Information Technology—14.8% | |
| | 27,287 | | | AppFolio, Inc., Class A(b) | | $ | 2,330,310 | |
| | 46,467 | | | Brooks Automation, Inc. | | | 1,831,264 | |
| | 14,593 | | | Cabot Microelectronics Corp. | | | 1,645,069 | |
| | 74,066 | | | Care.com, Inc.(b) | | | 1,439,102 | |
| | 25,093 | | | Coupa Software, Inc.(b) | | | 1,799,419 | |
| | 48,382 | | | CTS Corp. | | | 1,787,715 | |
| | 61,309 | | | ePlus, Inc.(b) | | | 6,354,678 | |
| | 32,391 | | | Everbridge, Inc.(b) | | | 1,950,262 | |
| | 286,661 | | | Everi Holdings, Inc.(b) | | | 2,485,351 | |
| | 105,889 | | | Five9, Inc.(b) | | | 5,087,966 | |
| | 11,808 | | | HubSpot, Inc.(b) | | | 1,696,810 | |
| | 99,088 | | | Immersion Corp.(b) | | | 1,151,403 | |
| | 71,616 | | | LivePerson, Inc.(b) | | | 1,926,470 | |
| | 15,318 | | | New Relic, Inc.(b) | | | 1,574,078 | |
| | 42,499 | | | PROS Holdings, Inc.(b) | | | 1,567,363 | |
| | 30,760 | | | Q2 Holdings, Inc.(b) | | | 1,916,348 | |
| | 30,632 | | | QAD, Inc., Class A | | | 1,857,831 | |
| | 17,416 | | | Qualys, Inc.(b) | | | 1,585,727 | |
| | 139,975 | | | QuinStreet, Inc.(b) | | | 2,123,421 | |
| | 49,225 | | | Rapid7, Inc.(b) | | | 1,877,934 | |
| | 30,352 | | | RingCentral, Inc., Class A(b) | | | 2,827,289 | |
| | 50,320 | | | Rudolph Technologies, Inc.(b) | | | 1,398,896 | |
| | 32,228 | | | Semtech Corp.(b) | | | 1,925,623 | |
| | 13,365 | | | Stamps.com, Inc.(b) | | | 3,320,534 | |
| | 54,815 | | | TechTarget, Inc.(b) | | | 1,315,012 | |
| | 83,368 | | | TTM Technologies, Inc.(b) | | | 1,558,982 | |
| | 57,679 | | | Upland Software, Inc.(b) | | | 2,146,812 | |
| | 117,225 | | | USA Technologies, Inc.(b) | | | 1,904,906 | |
| | 21,787 | | | Varonis Systems, Inc.(b) | | | 1,610,059 | |
| | 32,390 | | | Virtusa Corp.(b) | | | 1,887,041 | |
| | 42,936 | | | Vishay Precision Group, Inc.(b) | | | 1,859,129 | |
| | 47,762 | | | XO Group, Inc.(b) | | | 1,435,726 | |
| | | | | | | | |
| | | | | | | 67,178,530 | |
| | | | | | | | |
| | | | Materials—2.9% | |
| | 57,714 | | | Allegheny Technologies, Inc.(b) | | | 1,560,009 | |
| | 24,731 | | | Chase Corp. | | | 3,065,407 | |
| | 158,714 | | | Forterra, Inc.(b)(c) | | | 1,342,720 | |
| | 19,473 | | | Ingevity Corp.(b) | | | 1,966,968 | |
| | 23,251 | | | KMG Chemicals, Inc. | | | 1,801,488 | |
| | 10,611 | | | Quaker Chemical Corp. | | | 1,911,466 | |
| | 128,640 | | | SunCoke Energy, Inc.(b) | | | 1,435,622 | |
| | | | | | | | |
| | | | | | | 13,083,680 | |
| | | | | | | | |
| | | | Real Estate—0.6% | |
| | 26,675 | | | RMR Group, Inc. (The), Class A | | | 2,519,454 | |
| | | | | | | | |
| | | | Telecommunication Services—0.4% | |
| | 139,416 | | | Vonage Holdings Corp.(b) | | | 1,976,919 | |
| | | | | | | | |
| | | | Total Common Stocks
(Cost $366,921,798) | | | 454,067,213 | |
| | | | | | | | |
See accompanying Notes to Financial Statements which are an integral part of the financial statements.
Invesco DWA SmallCap Momentum ETF (DWAS) (continued)
August 31, 2018
| | | | | | | | |
Number
of Shares | | | | | Value | |
| | | | Money Market Fund—0.0% | | | | |
| | 35,680 | | | Invesco Premier U.S. Government Money
Portfolio—Institutional Class, 1.83%(d)
(Cost $35,680) | | $ | 35,680 | |
| | | | | | | | |
| | | | Total Investments in Securities
(excluding investments purchased with cash collateral from securities on loan)
(Cost $366,957,478)—100.0% | | | 454,102,893 | |
| | | | | | | | |
| | |
| | | | | | | | |
| | | | Investments Purchased with Cash Collateral from Securities on Loan | |
| | |
| | | | | | | | |
| | | | Money Market Fund—4.2% | | | | |
| | 18,771,075 | | | Invesco Government & Agency Portfolio—Institutional Class,
1.85%(d)(e)
(Cost $18,771,075) | | | 18,771,075 | |
| | | | | | | | |
| | | | Total Investments in Securities
(Cost $385,728,553)—104.2% | | | 472,873,968 | |
| | | | Other assets less liabilities—(4.2)% | | | (18,902,203 | ) |
| | | | | | | | |
| | | | Net Assets—100.0% | | $ | 453,971,765 | |
| | | | | | | | |
Notes to Schedule of Investments:
| (a) | Industry and/or sector classifications used in this report are generally according to the Global Industry Classification Standard, which was developed by and is the exclusive property and a service mark of MSCI Inc. and Standard & Poor’s. |
| (b) | Non-income producing security. |
| (c) | All or a portion of this security was out on loan at August 31, 2018. |
| (d) | The security and the Fund are advised by wholly-owned subsidiaries of Invesco Ltd. and are therefore considered to be affiliated. The rate shown is the 7-day SEC standardized yield as of August 31, 2018. |
| (e) | The security has been segregated to satisfy the commitment to return the cash collateral received in securities lending transactions upon the borrower’s return of the securities loaned. See Note 2I. |
See accompanying Notes to Financial Statements which are an integral part of the financial statements.
Schedule of Investments
Invesco DWA Tactical Multi-Asset Income ETF (DWIN)
August 31, 2018
| | | | | | | | |
Number
of Shares | | | | | Value | |
| | | | Exchange-Traded Funds—99.9%(a) | |
| | 426,079 | | | Invesco Emerging Markets Sovereign Debt ETF(b) | | $ | 11,346,484 | |
| | 518,618 | | | Invesco Global Short Term High Yield Bond ETF | | | 12,086,392 | |
| | 402,672 | | | Invesco KBW Premium Yield Equity REIT ETF(b) | | | 14,419,684 | |
| | 894,505 | | | Invesco Preferred ETF | | | 13,077,663 | |
| | 392,142 | | | Invesco Taxable Municipal Bond ETF | | | 11,568,189 | |
| | | | | | | | |
| | | | Total Exchange-Traded Funds
(Cost $65,343,991) | | | 62,498,412 | |
| | | | | | | | |
| | |
| | | | | | | | |
| | | | Money Market Fund—0.1% | | | | |
| | 55,619 | | | Invesco Premier U.S. Government Money Portfolio—Institutional Class, 1.83%(c)
(Cost $55,619) | | | 55,619 | |
| | | | | | | | |
| | | | Total Investments in Securities
(excluding investments purchased with cash collateral from securities on loan)
(Cost $65,399,610)-100.0% | | | 62,554,031 | |
| | | | | | | | |
| | |
| | | | | | | | |
| | | | Investments Purchased with Cash Collateral from Securities on Loan | |
| | |
| | | | | | | | |
| | | | Money Market Fund—15.4% | | | | |
| | 9,611,799 | | | Invesco Government & Agency Portfolio—Institutional Class, 1.85%(c)(d)
(Cost $9,611,799) | | | 9,611,799 | |
| | | | | | | | |
| | | | Total Investments in Securities
(Cost $75,011,409)—115.4% | | | 72,165,830 | |
| | | | Other assets less liabilities—(15.4)% | | | (9,616,877 | ) |
| | | | | | | | |
| | | | Net Assets—100.0% | | $ | 62,548,953 | |
| | | | | | | | |
Investment Abbreviations:
ETF—Exchange-Traded Fund
REIT—Real Estate Investment Trust
Notes to Schedule of Investments:
| (a) | Affiliated Company. The security and the Fund are affiliated by having the same investment adviser. See Note 4. |
| (b) | All or a portion of this security was out on loan at August 31, 2018. |
| (c) | The security and the Fund are advised by wholly-owned subsidiaries of Invesco Ltd. and are therefore considered to be affiliated. The rate shown is the 7-day SEC standardized yield as of August 31, 2018. |
| (d) | The security has been segregated to satisfy the commitment to return the cash collateral received in securities lending transactions upon the borrower’s return of the securities loaned. See Note 2I. |
See accompanying Notes to Financial Statements which are an integral part of the financial statements.
Schedule of Investments
Invesco DWA Tactical Sector Rotation ETF (DWTR)
August 31, 2018
| | | | | | | | |
Number
of Shares | | | | | Value | |
| | | | Exchange-Traded Funds—100.0%(a) | |
| | 334,063 | | | Invesco DWA Consumer Cyclicals Momentum ETF | | $ | 20,023,736 | |
| | 390,388 | | | Invesco DWA Energy Momentum ETF(b) | | | 17,083,379 | |
| | 404,856 | | | Invesco DWA Industrials Momentum ETF | | | 26,214,426 | |
| | 367,247 | | | Invesco DWA Technology Momentum ETF | | | 24,983,814 | |
| | | | | | | | |
| | | | Total Exchange-Traded Funds
(Cost $72,855,683) | | | 88,305,355 | |
| | | | | | | | |
| | |
| | | | | | | | |
| | | | Money Market Fund—0.0% | | | | |
| | 23,985 | | | Invesco Premier U.S. Government Money Portfolio—Institutional Class, 1.83%(c)
(Cost $23,985) | | | 23,985 | |
| | | | | | | | |
| | | | Total Investments in Securities
(excluding investments purchased with cash collateral from securities on loan)
(Cost $72,879,668)—100.0% | | | 88,329,340 | |
| | | | | | | | |
| | |
| | | | | | | | |
| | | | Investments Purchased with Cash Collateral from Securities on Loan | |
| | |
| | | | | | | | |
| | | | Money Market Fund—0.1% | | | | |
| | 120,825 | | | Invesco Government & Agency Portfolio—Institutional Class, 1.85%(c)(d)
(Cost $120,825) | | | 120,825 | |
| | | | | | | | |
| | | | Total Investments in Securities
(Cost $73,000,493)—100.1% | | | 88,450,165 | |
| | | | Other assets less liabilities—(0.1)% | | | (131,468 | ) |
| | | | | | | | |
| | | | Net Assets—100.0% | | $ | 88,318,697 | |
| | | | | | | | |
Investment Abbreviations:
ETF—Exchange-Traded Fund
Notes to Schedule of Investments:
| (a) | Affiliated Company. The security and the Fund are affiliated by having the same investment adviser. See Note 4. |
| (b) | All or a portion of this security was out on loan at August 31, 2018. |
| (c) | The security and the Fund are advised by wholly-owned subsidiaries of Invesco Ltd. and are therefore considered to be affiliated. The rate shown is the 7-day SEC standardized yield as of August 31, 2018. |
| (d) | The security has been segregated to satisfy the commitment to return the cash collateral received in securities lending transactions upon the borrower’s return of the securities loaned. See Note 2I. |
See accompanying Notes to Financial Statements which are an integral part of the financial statements.
Schedule of Investments(a)
Invesco S&P SmallCap Consumer Discretionary ETF (PSCD)
August 31, 2018
| | | | | | | | |
Number
of Shares | | | | | Value | |
| | | | Common Stocks—100.1% | |
| | | | Auto Components—13.4% | |
| | 74,509 | | | American Axle & Manufacturing Holdings, Inc.(b) | | $ | 1,319,554 | |
| | 37,904 | | | Cooper Tire & Rubber Co. | | | 1,093,531 | |
| | 12,191 | | | Cooper-Standard Holdings, Inc.(b) | | | 1,687,600 | |
| | 22,242 | | | Dorman Products, Inc.(b) | | | 1,801,157 | |
| | 28,246 | | | Fox Factory Holding Corp.(b) | | | 1,865,648 | |
| | 27,587 | | | Gentherm, Inc.(b) | | | 1,357,280 | |
| | 18,904 | | | LCI Industries | | | 1,757,127 | |
| | 14,301 | | | Motorcar Parts of America, Inc.(b) | | | 379,549 | |
| | 15,171 | | | Standard Motor Products, Inc. | | | 770,232 | |
| | 17,436 | | | Superior Industries International, Inc. | | | 378,361 | |
| | | | | | | | |
| | | | | | | 12,410,039 | |
| | | | | | | | |
| | | | Automobiles—0.9% | |
| | 21,601 | | | Winnebago Industries, Inc. | | | 798,157 | |
| | | | | | | | |
| | | | Distributors—1.3% | | | | |
| | 34,605 | | | Core-Mark Holding Co., Inc. | | | 1,237,821 | |
| | | | | | | | |
| | | | Diversified Consumer Services—4.3% | | | | |
| | 12,295 | | | American Public Education, Inc.(b) | | | 427,251 | |
| | 49,583 | | | Career Education Corp.(b) | | | 790,849 | |
| | 25,939 | | | Regis Corp.(b) | | | 554,835 | |
| | 15,643 | | | Strategic Education, Inc. | | | 2,170,779 | |
| | | | | | | | |
| | | | | | | 3,943,714 | |
| | | | | | | | |
| | | | Hotels, Restaurants & Leisure—14.1% | |
| | 62,954 | | | Belmond Ltd., Class A (United Kingdom)(b) | | | 1,054,479 | |
| | 13,557 | | | BJ’s Restaurants, Inc. | | | 1,026,265 | |
| | 12,691 | | | Chuy’s Holdings, Inc.(b) | | | 367,404 | |
| | 29,722 | | | Dave & Buster’s Entertainment, Inc.(b) | | | 1,728,929 | |
| | 13,369 | | | Dine Brands Global, Inc. | | | 1,115,242 | |
| | 16,222 | | | El Pollo Loco Holdings, Inc.(b) | | | 193,042 | |
| | 20,433 | | | Fiesta Restaurant Group, Inc.(b) | | | 587,449 | |
| | 8,538 | | | Monarch Casino & Resort, Inc.(b) | | | 401,713 | |
| | 63,363 | | | Penn National Gaming, Inc.(b) | | | 2,183,489 | |
| | 9,736 | | | Red Robin Gourmet Burgers, Inc.(b) | | | 402,097 | |
| | 21,573 | | | Ruth’s Hospitality Group, Inc. | | | 664,448 | |
| | 15,333 | | | Shake Shack, Inc., Class A(b) | | | 926,880 | |
| | 27,858 | | | Sonic Corp. | | | 998,988 | |
| | 21,899 | | | Wingstop, Inc. | | | 1,466,138 | |
| | | | | | | | |
| | | | | | | 13,116,563 | |
| | | | | | | | |
| | | | Household Durables—13.4% | |
| | 6,375 | | | Cavco Industries, Inc.(b) | | | 1,564,425 | |
| | 18,755 | | | Ethan Allen Interiors, Inc. | | | 417,299 | |
| | 15,638 | | | Installed Building Products, Inc.(b) | | | 727,949 | |
| | 20,847 | | | iRobot Corp.(b)(c) | | | 2,366,134 | |
| | 35,290 | | | La-Z-Boy, Inc. | | | 1,173,392 | |
| | 13,565 | | | LGI Homes, Inc.(b)(c) | | | 781,344 | |
| | 21,422 | | | M/I Homes, Inc.(b) | | | 555,044 | |
| | 33,724 | | | MDC Holdings, Inc. | | | 1,069,051 | |
| | 28,645 | | | Meritage Homes Corp.(b) | | | 1,236,032 | |
| | 26,734 | | | TopBuild Corp.(b) | | | 1,664,994 | |
| | 10,591 | | | Universal Electronics, Inc.(b) | | | 457,531 | |
| | 20,911 | | | William Lyon Homes, Class A(b) | | | 409,228 | |
| | | | | | | | |
| | | | | | | 12,422,423 | |
| | | | | | | | |
| | | | | | | | |
Number
of Shares | | | | | Value | |
| | | | Common Stocks (continued) | |
| | | | Internet & Direct Marketing Retail—3.6% | | | | |
| | 12,696 | | | FTD Cos., Inc.(b) | | $ | 45,452 | |
| | 22,275 | | | Nutrisystem, Inc. | | | 824,175 | |
| | 15,446 | | | PetMed Express, Inc.(c) | | | 566,714 | |
| | 24,862 | | | Shutterfly, Inc.(b) | | | 1,931,280 | |
| | | | | | | | |
| | | | | | | 3,367,621 | |
| | | | | | | | |
| | | | Leisure Products—3.9% | |
| | 70,794 | | | Callaway Golf Co. | | | 1,614,811 | |
| | 22,804 | | | Nautilus, Inc.(b) | | | 334,079 | |
| | 13,080 | | | Sturm Ruger & Co., Inc.(c) | | | 856,086 | |
| | 43,072 | | | Vista Outdoor, Inc.(b) | | | 795,540 | |
| | | | | | | | |
| | | | | | | 3,600,516 | |
| | | | | | | | |
| | | | Media—3.9% | |
| | 41,317 | | | E.W. Scripps Co. (The), Class A | | | 606,120 | |
| | 84,672 | | | Gannett Co., Inc. | | | 870,428 | |
| | 14,596 | | | Marcus Corp. (The) | | | 592,598 | |
| | 45,205 | | | New Media Investment Group, Inc. | | | 718,760 | |
| | 20,585 | | | Scholastic Corp. | | | 865,393 | |
| | | | | | | | |
| | | | | | | 3,653,299 | |
| | | | | | | | |
| | | | Multi-line Retail—0.5% | |
| | 235,646 | | | J.C. Penney Co., Inc.(b)(c) | | | 417,093 | |
| | | | | | | | |
| | | | Specialty Retail—29.1% | |
| | 50,888 | | | Abercrombie & Fitch Co., Class A | | | 1,102,743 | |
| | 13,767 | | | Asbury Automotive Group, Inc.(b) | | | 1,025,641 | |
| | 127,978 | | | Ascena Retail Group, Inc.(b) | | | 586,139 | |
| | 28,140 | | | Barnes & Noble Education, Inc.(b) | | | 168,277 | |
| | 42,571 | | | Barnes & Noble, Inc. | | | 223,498 | |
| | 15,094 | | | Big 5 Sporting Goods Corp.(c) | | | 86,036 | |
| | 21,328 | | | Buckle, Inc. (The)(c) | | | 549,196 | |
| | 32,383 | | | Caleres, Inc. | | | 1,310,864 | |
| | 17,280 | | | Cato Corp. (The), Class A | | | 370,656 | |
| | 96,843 | | | Chico’s FAS, Inc. | | | 883,208 | |
| | 12,476 | | | Children’s Place, Inc. (The) | | | 1,755,997 | |
| | 54,337 | | | DSW, Inc., Class A | | | 1,807,249 | |
| | 56,485 | | | Express, Inc.(b) | | | 633,762 | |
| | 26,019 | | | Francesca’s Holdings Corp.(b) | | | 163,399 | |
| | 76,380 | | | GameStop Corp., Class A(c) | | | 1,013,563 | |
| | 14,932 | | | Genesco, Inc.(b) | | | 759,292 | |
| | 14,750 | | | Group 1 Automotive, Inc. | | | 1,137,078 | |
| | 43,702 | | | Guess?, Inc. | | | 1,070,699 | |
| | 14,478 | | | Haverty Furniture Cos., Inc. | | | 319,964 | |
| | 14,238 | | | Hibbett Sports, Inc.(b) | | | 292,591 | |
| | 11,813 | | | Kirkland’s, Inc.(b) | | | 107,380 | |
| | 17,953 | | | Lithia Motors, Inc., Class A | | | 1,551,139 | |
| | 21,400 | | | Lumber Liquidators Holdings, Inc.(b) | | | 373,002 | |
| | 16,667 | | | MarineMax, Inc.(b) | | | 375,008 | |
| | 24,638 | | | Monro, Inc. | | | 1,748,066 | |
| | 384,797 | | | Office Depot, Inc. | | | 1,289,070 | |
| | 40,049 | | | Rent-A-Center, Inc.(b) | | | 590,322 | |
| | 14,360 | | | RH(b)(c) | | | 2,283,240 | |
| | 8,077 | | | Shoe Carnival, Inc. | | | 359,103 | |
| | 26,162 | | | Sleep Number Corp.(b) | | | 881,659 | |
| | 18,150 | | | Sonic Automotive, Inc., Class A | | | 390,225 | |
| | 37,288 | | | Tailored Brands, Inc. | | | 877,760 | |
| | 25,973 | | | Tile Shop Holdings, Inc. | | | 198,693 | |
| | 18,168 | | | Vitamin Shoppe, Inc.(b) | | | 232,550 | |
See accompanying Notes to Financial Statements which are an integral part of the financial statements.
Invesco S&P SmallCap Consumer Discretionary ETF (PSCD) (continued)
August 31, 2018
| | | | | | | | |
Number
of Shares | | | | | Value | |
| | | | Common Stocks (continued) | |
| | | | Specialty Retail (continued) | |
| | 13,732 | | | Zumiez, Inc.(b) | | $ | 427,752 | |
| | | | | | | | |
| | | | | | | 26,944,821 | |
| | | | | | | | |
| | | | Textiles, Apparel & Luxury Goods—11.7% | | | | |
| | 51,194 | | | Crocs, Inc.(b) | | | 1,057,668 | |
| | 32,857 | | | Fossil Group, Inc.(b) | | | 744,868 | |
| | 31,321 | | | G-III Apparel Group Ltd.(b) | | | 1,424,479 | |
| | 11,731 | | | Movado Group, Inc. | | | 499,741 | |
| | 12,699 | | | Oxford Industries, Inc. | | | 1,182,150 | |
| | 9,515 | | | Perry Ellis International, Inc.(b) | | | 261,948 | |
| | 39,452 | | | Steven Madden Ltd. | | | 2,294,134 | |
| | 12,785 | | | Unifi, Inc.(b) | | | 406,691 | |
| | 14,161 | | | Vera Bradley, Inc.(b) | | | 207,600 | |
| | 71,046 | | | Wolverine World Wide, Inc. | | | 2,783,582 | |
| | | | | | | | |
| | | | | | | 10,862,861 | |
| | | | | | | | |
| | | | Total Common Stocks
(Cost $84,181,890) | | | 92,774,928 | |
| | | | | | | | |
| | |
| | | | | | | | |
| | | | Money Market Fund—0.0% | | | | |
| | 8,202 | | | Invesco Premier U.S. Government Money Portfolio—Institutional Class, 1.83%(d)
(Cost $8,202) | | | 8,202 | |
| | | | | | | | |
| | | | Total Investments in Securities
(excluding investments purchased with cash collateral from securities on loan)
(Cost $84,190,092)—100.1% | | | 92,783,130 | |
| | | | | | | | |
| | |
| | | | | | | | |
| | | | Investments Purchased with Cash Collateral from Securities on Loan | |
| | |
| | | | | | | | |
| | | | Money Market Fund—9.4% | | | | |
| | 8,720,132 | | | Invesco Government & Agency Portfolio—Institutional Class, 1.85%(d)(e)
(Cost $8,720,132) | | | 8,720,132 | |
| | | | | | | | |
| | | | Total Investments in Securities
(Cost $92,910,224)—109.5% | | | 101,503,262 | |
| | | | Other assets less liabilities—(9.5)% | | | (8,785,341 | ) |
| | | | | | | | |
| | | | Net Assets—100.0% | | $ | 92,717,921 | |
| | | | | | | | |
Notes to Schedule of Investments:
| (a) | Industry and/or sector classifications used in this report are generally according to the Global Industry Classification Standard, which was developed by and is the exclusive property and a service mark of MSCI Inc. and Standard & Poor’s. |
| (b) | Non-income producing security. |
| (c) | All or a portion of this security was out on loan at August 31, 2018. |
| (d) | The security and the Fund are advised by wholly-owned subsidiaries of Invesco Ltd. and are therefore considered to be affiliated. The rate shown is the 7-day SEC standardized yield as of August 31, 2018. |
| (e) | The security has been segregated to satisfy the commitment to return the cash collateral received in securities lending transactions upon the borrower’s return of the securities loaned. See Note 2I. |
See accompanying Notes to Financial Statements which are an integral part of the financial statements.
Schedule of Investments(a)
Invesco S&P SmallCap Consumer Staples ETF (PSCC)
August 31, 2018
| | | | | | | | |
Number
of Shares | | | | | Value | |
| | | | Common Stocks—96.7% | |
| | | | Beverages—7.0% | |
| | 19,190 | | | Coca-Cola Bottling Co. Consolidated | | $ | 3,253,856 | |
| | 38,822 | | | MGP Ingredients, Inc. | | | 2,993,565 | |
| | | | | | | | |
| | | | | | | 6,247,421 | |
| | | | | | | | |
| | | | Food & Staples Retailing—12.9% | |
| | 103,460 | | | Andersons, Inc. (The) | | | 4,226,341 | |
| | 145,392 | | | SpartanNash Co. | | | 3,104,119 | |
| | 131,291 | | | SUPERVALU, Inc.(b) | | | 4,239,387 | |
| | | | | | | | |
| | | | | | | 11,569,847 | |
| | | | | | | | |
| | | | Food Products—43.7% | |
| | 218,430 | | | B&G Foods, Inc.(c) | | | 6,978,838 | |
| | 40,235 | | | Calavo Growers, Inc.(c) | | | 4,258,875 | |
| | 74,214 | | | Cal-Maine Foods, Inc. | | | 3,669,882 | |
| | 540,073 | | | Darling Ingredients, Inc.(b) | | | 10,682,644 | |
| | 377,182 | | | Dean Foods Co. | | | 2,874,127 | |
| | 49,075 | | | J & J Snack Foods Corp. | | | 7,140,412 | |
| | 36,165 | | | John B. Sanfilippo & Son, Inc. | | | 2,642,577 | |
| | 27,924 | | | Seneca Foods Corp., Class A(b) | | | 901,945 | |
| | | | | | | | |
| | | | | | | 39,149,300 | |
| | | | | | | | |
| | | | Household Products—15.8% | |
| | 33,860 | | | Central Garden & Pet Co., Class A(b)(c) | | | 1,344,242 | |
| | 130,449 | | | Central Garden & Pet Co., Class A(b) | | | 4,739,212 | |
| | 45,633 | | | WD-40 Co. | | | 8,097,576 | |
| | | | | | | | |
| | | | | | | 14,181,030 | |
| | | | | | | | |
| | | | Personal Products—13.5% | |
| | 1,825,969 | | | Avon Products, Inc. (United Kingdom)(b) | | | 3,651,938 | |
| | 65,301 | | | Inter Parfums, Inc. | | | 4,264,155 | |
| | 18,525 | | | Medifast, Inc. | | | 4,237,594 | |
| | | | | | | | |
| | | | | | | 12,153,687 | |
| | | | | | | | |
| | | | Tobacco—3.8% | |
| | 57,002 | | | Universal Corp. | | | 3,408,720 | |
| | | | | | | | |
| | | | Total Common Stocks | |
| | | | (Cost $78,046,150) | | | 86,710,005 | |
| | | | | | | | |
| | |
| | | | | | | | |
| | | | Money Market Fund—0.0% | |
| | 44,310 | | | Invesco Premier U.S. Government Money Portfolio—Institutional Class, 1.83%(d)
(Cost $44,310) | | | 44,310 | |
| | | | | | | | |
| | | | Total Investments in Securities
(excluding investments purchased with cash collateral from securities on loan)
(Cost $78,090,460)—96.7% | | | 86,754,315 | |
| | | | | | | | |
| | |
| | | | | | | | |
| | | | Investments Purchased with Cash Collateral from Securities on Loan | |
| | |
| | | | | | | | |
| | | | Money Market Fund—11.0% | |
| | 9,842,090 | | | Invesco Government & Agency Portfolio—Institutional Class, 1.85%(d)(e)
(Cost $9,842,090) | | | 9,842,090 | |
| | | | | | | | |
| | | | Total Investments in Securities
(Cost $87,932,550)—107.7% | | | 96,596,405 | |
| | | | Other assets less liabilities—(7.7)% | | | (6,915,813 | ) |
| | | | | | | | |
| | | | Net Assets—100.0% | | $ | 89,680,592 | |
| | | | | | | | |
Notes to Schedule of Investments:
| (a) | Industry and/or sector classifications used in this report are generally according to the Global Industry Classification Standard, which was developed by and is the exclusive property and a service mark of MSCI Inc. and Standard & Poor’s. |
| (b) | Non-income producing security. |
| (c) | All or a portion of this security was out on loan at August 31, 2018. |
| (d) | The security and the Fund are advised by wholly-owned subsidiaries of Invesco Ltd. and are therefore considered to be affiliated. The rate shown is the 7-day SEC standardized yield as of August 31, 2018. |
| (e) | The security has been segregated to satisfy the commitment to return the cash collateral received in securities lending transactions upon the borrower’s return of the securities loaned. See Note 2I. |
See accompanying Notes to Financial Statements which are an integral part of the financial statements.
Schedule of Investments(a)
Invesco S&P SmallCap Energy ETF (PSCE)
August 31, 2018
| | | | | | | | |
Number
of Shares | | | | | Value | |
| | | | | | | | |
| | | | Common Stocks—100.0% | | | | |
| | | | Energy Equipment & Services—50.9% | |
| | 231,180 | | | Archrock, Inc. | | $ | 2,924,427 | |
| | 58,763 | | | Bristow Group, Inc.(b) | | | 644,042 | |
| | 104,998 | | | C&J Energy Services, Inc.(b) | | | 2,199,708 | |
| | 40,361 | | | CARBO Ceramics, Inc.(b)(c) | | | 349,123 | |
| | 37,450 | | | Era Group, Inc.(b) | | | 447,153 | |
| | 58,453 | | | Exterran Corp.(b) | | | 1,601,028 | |
| | 24,679 | | | Geospace Technologies Corp.(b) | | | 348,714 | |
| | 24,883 | | | Gulf Island Fabrication, Inc.(b) | | | 235,144 | |
| | 253,024 | | | Helix Energy Solutions Group, Inc.(b) | | | 2,368,305 | |
| | 48,753 | | | Matrix Service Co.(b) | | | 1,018,938 | |
| | 162,331 | | | Newpark Resources, Inc.(b) | | | 1,704,476 | |
| | 448,553 | | | Noble Corp. PLC(b) | | | 2,736,173 | |
| | 106,378 | | | Oil States International, Inc.(b) | | | 3,600,895 | |
| | 142,013 | | | Pioneer Energy Services Corp.(b) | | | 454,442 | |
| | 130,386 | | | ProPetro Holding Corp.(b) | | | 1,984,475 | |
| | 31,052 | | | SEACOR Holdings, Inc.(b) | | | 1,597,625 | |
| | 228,240 | | | TETRA Technologies, Inc.(b) | | | 1,047,622 | |
| | 98,235 | | | Unit Corp.(b) | | | 2,582,598 | |
| | 138,280 | | | US Silica Holdings, Inc.(c) | | | 2,930,153 | |
| | | | | | | | |
| | | | | | | 30,775,041 | |
| | | | | | | | |
| | | | Oil, Gas & Consumable Fuels—49.1% | |
| | 37,258 | | | Bonanza Creek Energy, Inc.(b) | | | 1,154,998 | |
| | 154,341 | | | Carrizo Oil & Gas, Inc.(b) | | | 3,738,139 | |
| | 137,725 | | | Cloud Peak Energy, Inc.(b) | | | 325,031 | |
| | 45,850 | | | CONSOL Energy, Inc.(b) | | | 1,966,965 | |
| | 602,963 | | | Denbury Resources, Inc.(b) | | | 3,358,504 | |
| | 70,707 | | | Green Plains, Inc. | | | 1,255,049 | |
| | 181,115 | | | HighPoint Resources Corp.(b) | | | 997,943 | |
| | 45,867 | | | Par Pacific Holdings, Inc.(b) | | | 931,559 | |
| | 117,219 | | | PDC Energy, Inc.(b) | | | 6,176,269 | |
| | 24,632 | | | Penn Virginia Corp.(b) | | | 2,190,770 | |
| | 59,686 | | | Renewable Energy Group, Inc.(b) | | | 1,608,538 | |
| | 10,303 | | | REX American Resources Corp.(b) | | | 830,216 | |
| | 98,786 | | | Ring Energy, Inc.(b) | | | 1,165,675 | |
| | 429,471 | | | SRC Energy, Inc.(b) | | | 3,998,375 | |
| | | | | | | | |
| | | | | | | 29,698,031 | |
| | | | | | | | |
| | | | Total Common Stocks
(Cost $60,150,136) | | | 60,473,072 | |
| | | | | | | | |
| | |
| | | | | | | | |
| | | | Money Market Fund—0.0% | | | | |
| | 8,140 | | | Invesco Premier U.S. Government Money Portfolio—Institutional Class, 1.83%(d)
(Cost $8,140) | | | 8,140 | |
| | | | | | | | |
| | | | Total Investments in Securities
(excluding investments purchased with cash collateral from securities on loan)
(Cost $60,158,276)—100.0% | | | 60,481,212 | |
| | | | | | | | |
| | | | | | | | |
Number
of Shares | | | | | Value | |
| | | | Investments Purchased with Cash Collateral from Securities on Loan | |
| | |
| | | | | | | | |
| | | | Money Market Fund—5.1% | | | | |
| | 3,054,500 | | | Invesco Government & Agency Portfolio—Institutional Class, 1.85%(d)(e)
(Cost $3,054,500) | | $ | 3,054,500 | |
| | | | | | | | |
| | | | Total Investments in Securities
(Cost $63,212,776)—105.1% | | | 63,535,712 | |
| | | | Other assets less liabilities—(5.1)% | | | (3,060,333 | ) |
| | | | | | | | |
| | | | Net Assets—100.0% | | $ | 60,475,379 | |
| | | | | | | | |
Notes to Schedule of Investments:
| (a) | Industry and/or sector classifications used in this report are generally according to the Global Industry Classification Standard, which was developed by and is the exclusive property and a service mark of MSCI Inc. and Standard & Poor’s. |
| (b) | Non-income producing security. |
| (c) | All or a portion of this security was out on loan at August 31, 2018. |
| (d) | The security and the Fund are advised by wholly-owned subsidiaries of Invesco Ltd. and are therefore considered to be affiliated. The rate shown is the 7-day SEC standardized yield as of August 31, 2018. |
| (e) | The security has been segregated to satisfy the commitment to return the cash collateral received in securities lending transactions upon the borrower’s return of the securities loaned. See Note 2I. |
See accompanying Notes to Financial Statements which are an integral part of the financial statements.
Schedule of Investments(a)
Invesco S&P SmallCap Financials ETF (PSCF)
August 31, 2018
| | | | | | | | |
Number
of Shares | | | | | Value | |
| | | | Common Stocks & Other Equity Interests—99.9% | |
| | | | Banks—37.4% | |
| | 53,608 | | | Ameris Bancorp | | $ | 2,661,637 | |
| | 57,104 | | | Banc of California, Inc. | | | 1,150,646 | |
| | 43,450 | | | Banner Corp. | | | 2,795,139 | |
| | 49,423 | | | Berkshire Hills Bancorp, Inc. | | | 2,088,122 | |
| | 113,127 | | | Boston Private Financial Holdings, Inc. | | | 1,634,685 | |
| | 107,886 | | | Brookline Bancorp, Inc. | | | 1,958,131 | |
| | 39,760 | | | Central Pacific Financial Corp. | | | 1,126,401 | |
| | 20,733 | | | City Holding Co. | | | 1,681,032 | |
| | 98,378 | | | Columbia Banking System, Inc. | | | 4,156,471 | |
| | 68,472 | | | Community Bank System, Inc. | | | 4,528,053 | |
| | 39,771 | | | Customers Bancorp, Inc.(b) | | | 982,344 | |
| | 137,535 | | | CVB Financial Corp. | | | 3,307,717 | |
| | 29,780 | | | Fidelity Southern Corp. | | | 723,654 | |
| | 244,177 | | | First BanCorp/Puerto Rico(b) | | | 2,136,549 | |
| | 134,811 | | | First Commonwealth Financial Corp. | | | 2,258,084 | |
| | 131,384 | | | First Financial Bancorp | | | 4,125,458 | |
| | 90,834 | | | First Financial Bankshares, Inc. | | | 5,486,374 | |
| | 138,469 | | | First Midwest Bancorp, Inc. | | | 3,763,587 | |
| | 16,219 | | | Franklin Financial Network, Inc.(b) | | | 626,864 | |
| | 106,708 | | | Glacier Bancorp, Inc. | | | 4,874,421 | |
| | 79,112 | | | Great Western Bancorp, Inc. | | | 3,444,536 | |
| | 35,548 | | | Green Bancorp, Inc. | | | 853,152 | |
| | 43,650 | | | Hanmi Financial Corp. | | | 1,139,265 | |
| | 39,133 | | | Heritage Financial Corp. | | | 1,420,528 | |
| | 172,931 | | | Hope Bancorp, Inc. | | | 3,028,022 | |
| | 37,045 | | | Independent Bank Corp./MA | | | 3,374,800 | |
| | 57,052 | | | LegacyTexas Financial Group, Inc. | | | 2,639,796 | |
| | 36,500 | | | National Bank Holdings Corp., Class A | | | 1,465,475 | |
| | 58,609 | | | NBT Bancorp, Inc. | | | 2,372,492 | |
| | 59,060 | | | OFG Bancorp | | | 956,772 | |
| | 179,876 | | | Old National Bancorp | | | 3,651,483 | |
| | 23,215 | | | Opus Bank | | | 658,145 | |
| | 51,873 | | | Pacific Premier Bancorp, Inc.(b) | | | 2,051,577 | |
| | 18,519 | | | Preferred Bank | | | 1,133,548 | |
| | 47,015 | | | S&T Bancorp, Inc. | | | 2,193,720 | |
| | 63,110 | | | Seacoast Banking Corp. of Florida(b) | | | 1,995,538 | |
| | 60,681 | | | ServisFirst Bancshares, Inc. | | | 2,615,351 | |
| | 105,319 | | | Simmons First National Corp., Class A | | | 3,328,080 | |
| | 37,197 | | | Southside Bancshares, Inc. | | | 1,324,213 | |
| | 16,632 | | | Tompkins Financial Corp. | | | 1,461,454 | |
| | 31,020 | | | Triumph Bancorp, Inc.(b) | | | 1,316,799 | |
| | 98,845 | | | United Community Banks, Inc. | | | 2,998,957 | |
| | 35,767 | | | Westamerica Bancorporation | | | 2,290,161 | |
| | | | | | | | |
| | | | | | | 99,779,233 | |
| | | | | | | | |
| | | | Capital Markets—4.6% | |
| | 63,107 | | | Blucora, Inc.(b) | | | 2,284,473 | |
| | 45,536 | | | Donnelley Financial Solutions, Inc.(b) | | | 951,247 | |
| | 29,524 | | | Greenhill & Co., Inc. | | | 811,910 | |
| | 21,048 | | | INTL. FCStone, Inc.(b) | | | 1,173,636 | |
| | 44,362 | | | Investment Technology Group, Inc. | | | 970,641 | |
| | 19,190 | | | Piper Jaffray Cos. | | | 1,477,630 | |
| | 9,694 | | | Virtus Investment Partners, Inc. | | | 1,250,526 | |
| | 110,193 | | | Waddell & Reed Financial, Inc., Class A | | | 2,206,064 | |
| | 156,299 | | | WisdomTree Investments, Inc. | | | 1,284,778 | |
| | | | | | | | |
| | | | | | | 12,410,905 | |
| | | | | | | | |
| | | | | | | | |
Number
of Shares | | | | | Value | |
| | | | Common Stocks & Other Equity Interests
(continued) | |
| | | | Consumer Finance—6.4% | |
| | 34,364 | | | Encore Capital Group, Inc.(b) | | $ | 1,331,605 | |
| | 45,505 | | | Enova International, Inc.(b) | | | 1,510,766 | |
| | 69,169 | | | EZCORP, Inc., Class A(b) | | | 767,776 | |
| | 61,004 | | | FirstCash, Inc. | | | 4,959,625 | |
| | 62,773 | | | Green Dot Corp., Class A(b) | | | 5,377,763 | |
| | 60,816 | | | PRA Group, Inc.(b) | | | 2,222,825 | |
| | 8,173 | | | World Acceptance Corp.(b) | | | 969,399 | |
| | | | | | | | |
| | | | | | | 17,139,759 | |
| | | | | | | | |
| | | | Equity REITs—24.3% | |
| | 109,596 | | | Acadia Realty Trust REIT | | | 3,125,678 | |
| | 41,685 | | | Agree Realty Corp. REIT | | | 2,378,963 | |
| | 55,797 | | | American Assets Trust, Inc. REIT | | | 2,203,981 | |
| | 65,674 | | | Armada Hoffler Properties, Inc. REIT | | | 1,023,858 | |
| | 108,778 | | | CareTrust REIT, Inc. REIT | | | 2,006,954 | |
| | 231,929 | | | CBL & Associates Properties, Inc. REIT(c) | | | 1,034,403 | |
| | 105,600 | | | Cedar Realty Trust, Inc. REIT | | | 472,032 | |
| | 61,616 | | | Chatham Lodging Trust REIT | | | 1,321,663 | |
| | 81,107 | | | Chesapeake Lodging Trust REIT | | | 2,669,231 | |
| | 23,199 | | | Community Healthcare Trust, Inc. REIT | | | 719,865 | |
| | 269,406 | | | DiamondRock Hospitality Co. REIT | | | 3,222,096 | |
| | 81,100 | | | Easterly Government Properties, Inc. REIT | | | 1,642,275 | |
| | 46,938 | | | EastGroup Properties, Inc. REIT | | | 4,565,659 | |
| | 87,165 | | | Four Corners Property Trust, Inc. REIT | | | 2,348,225 | |
| | 144,038 | | | Franklin Street Properties Corp. REIT | | | 1,234,406 | |
| | 44,363 | | | Getty Realty Corp. REIT | | | 1,291,407 | |
| | 95,822 | | | Global NET Lease, Inc. REIT | | | 2,078,379 | |
| | 133,180 | | | Government Properties Income Trust REIT | | | 2,252,074 | |
| | 49,661 | | | Hersha Hospitality Trust REIT | | | 1,172,000 | |
| | 116,826 | | | Independence Realty Trust, Inc. REIT | | | 1,206,812 | |
| | 91,208 | | | iStar, Inc. REIT | | | 1,020,617 | |
| | 112,395 | | | Kite Realty Group Trust REIT | | | 1,964,665 | |
| | 290,121 | | | Lexington Realty Trust REIT | | | 2,709,730 | |
| | 53,232 | | | LTC Properties, Inc. REIT | | | 2,472,626 | |
| | 75,797 | | | National Storage Affiliates Trust REIT | | | 2,149,603 | |
| | 94,503 | | | Pennsylvania Real Estate Investment Trust REIT(c) | | | 963,931 | |
| | 26,786 | | | PS Business Parks, Inc. REIT | | | 3,493,698 | |
| | 107,500 | | | Ramco-Gershenson Properties Trust REIT | | | 1,500,700 | |
| | 151,411 | | | Retail Opportunity Investments Corp. REIT | | | 2,988,853 | |
| | 16,327 | | | Saul Centers, Inc. REIT | | | 979,620 | |
| | 140,642 | | | Summit Hotel Properties, Inc. REIT | | | 1,931,015 | |
| | 16,975 | | | Universal Health Realty Income Trust REIT | | | 1,294,344 | |
| | 40,045 | | | Urstadt Biddle Properties, Inc., Class A REIT | | | 911,024 | |
| | 249,832 | | | Washington Prime Group, Inc. REIT | | | 1,933,700 | |
| | 53,455 | | | Whitestone REIT | | | 729,126 | |
| | | | | | | | |
| | | | | | | 65,013,213 | |
| | | | | | | | |
| | | | Insurance—14.4% | |
| | 60,892 | | | Ambac Financial Group, Inc.(b) | | | 1,286,648 | |
| | 121,021 | | | American Equity Investment Life Holding Co. | | | 4,488,669 | |
| | 25,872 | | | AMERISAFE, Inc. | | | 1,650,633 | |
| | 22,451 | | | eHealth, Inc.(b) | | | 655,345 | |
| | 44,002 | | | Employers Holdings, Inc. | | | 2,017,492 | |
| | 10,161 | | | HCI Group, Inc. | | | 411,520 | |
| | 54,931 | | | Horace Mann Educators Corp. | | | 2,543,305 | |
| | 40,119 | | | James River Group Holdings Ltd. | | | 1,642,873 | |
See accompanying Notes to Financial Statements which are an integral part of the financial statements.
Invesco S&P SmallCap Financials ETF (PSCF) (continued)
August 31, 2018
| | | | | | | | |
Number
of Shares | | | | | Value | |
| | | | Common Stocks & Other Equity Interests
(continued) | |
| | | | Insurance (continued) | |
| | 91,551 | | | Maiden Holdings Ltd. | | $ | 347,894 | |
| | 30,342 | | | Navigators Group, Inc. (The) | | | 2,123,940 | |
| | 71,990 | | | ProAssurance Corp. | | | 3,480,716 | |
| | 52,355 | | | RLI Corp. | | | 4,029,764 | |
| | 20,534 | | | Safety Insurance Group, Inc. | | | 1,985,638 | |
| | 78,913 | | | Selective Insurance Group, Inc. | | | 5,066,215 | |
| | 31,878 | | | Stewart Information Services Corp. | | | 1,427,497 | |
| | 111,245 | | | Third Point Reinsurance Ltd. (Bermuda)(b) | | | 1,490,683 | |
| | 28,461 | | | United Fire Group, Inc. | | | 1,409,673 | |
| | 27,561 | | | United Insurance Holdings Corp. | | | 574,096 | |
| | 43,801 | | | Universal Insurance Holdings, Inc. | | | 1,953,525 | |
| | | | | | | | |
| | | | | | | 38,586,126 | |
| | | | | | | | |
| | | | Mortgage REITs—5.1% | |
| | 150,374 | | | Apollo Commercial Real Estate Finance, Inc. REIT | | | 2,921,767 | |
| | 56,286 | | | ARMOUR Residential REIT, Inc. REIT | | | 1,323,847 | |
| | 124,178 | | | Capstead Mortgage Corp. REIT | | | 1,043,095 | |
| | 58,347 | | | Granite Point Mortgage Trust, Inc. REIT | | | 1,116,761 | |
| | 149,956 | | | Invesco Mortgage Capital, Inc. REIT(d) | | | 2,433,786 | |
| | 183,774 | | | New York Mortgage Trust, Inc. REIT(c) | | | 1,176,154 | |
| | 81,781 | | | PennyMac Mortgage Investment Trust REIT | | | 1,633,984 | |
| | 111,396 | | | Redwood Trust, Inc. REIT | | | 1,891,504 | |
| | | | | | | | |
| | | | | | | 13,540,898 | |
| | | | | | | | |
| | | | Real Estate Management & Development—1.3% | |
| | 49,908 | | | HFF, Inc., Class A | | | 2,266,323 | |
| | 23,837 | | | RE/MAX Holdings, Inc., Class A | | | 1,173,972 | |
| | | | | | | | |
| | | | | | | 3,440,295 | |
| | | | | | | | |
| | | | Thrifts & Mortgage Finance—6.4% | |
| | 73,941 | | | BofI Holding, Inc.(b) | | | 2,753,563 | |
| | 41,383 | | | Dime Community Bancshares, Inc. | | | 751,101 | |
| | 36,237 | | | HomeStreet, Inc.(b) | | | 1,067,180 | |
| | 12,280 | | | Meta Financial Group, Inc. | | | 1,063,448 | |
| | 78,392 | | | NMI Holdings, Inc., Class A(b) | | | 1,693,267 | |
| | 62,697 | | | Northfield Bancorp, Inc. | | | 1,020,707 | |
| | 137,823 | | | Northwest Bancshares, Inc. | | | 2,511,135 | |
| | 53,225 | | | Oritani Financial Corp. | | | 862,245 | |
| | 81,912 | | | Provident Financial Services, Inc. | | | 2,066,640 | |
| | 129,528 | | | TrustCo Bank Corp. NY | | | 1,198,134 | |
| | 37,930 | | | Walker & Dunlop, Inc. | | | 2,067,185 | |
| | | | | | | | |
| | | | | | | 17,054,605 | |
| | | | | | | | |
| | | | Total Common Stocks & Other Equity Interests
(Cost $222,621,664) | | | 266,965,034 | |
| | | | | | | | |
| | |
| | | | | | | | |
| | | | Money Market Fund—0.0% | | | | |
| | 8,077 | | | Invesco Premier U.S. Government Money Portfolio—Institutional Class, 1.83%(e)
(Cost $8,077) | | | 8,077 | |
| | | | | | | | |
| | | | Total Investments in Securities
(excluding investments purchased with cash collateral from securities on loan)
(Cost $222,629,741)-99.9% | | | 266,973,111 | |
| | | | | | | | |
| | | | | | | | |
Number
of Shares | | | | | Value | |
| | | | Investments Purchased with Cash Collateral from Securities on Loan | |
| | |
| | | | | | | | |
| | | | Money Market Fund—1.2% | | | | |
| | 3,214,774 | | | Invesco Government & Agency Portfolio—Institutional Class, 1.85%(e)(f) (Cost $3,214,774) | | $ | 3,214,774 | |
| | | | | | | | |
| | | | Total Investments in Securities
(Cost $225,844,515)—101.1% | | | 270,187,885 | |
| | | | Other assets less liabilities—(1.1)% | | | (3,018,697 | ) |
| | | | | | | | |
| | | | Net Assets—100.0% | | $ | 267,169,188 | |
| | | | | | | | |
Investment Abbreviations:
REIT—Real Estate Investment Trust
Notes to Schedule of Investments:
| (a) | Industry and/or sector classifications used in this report are generally according to the Global Industry Classification Standard, which was developed by and is the exclusive property and a service mark of MSCI Inc. and Standard & Poor’s. |
| (b) | Non-income producing security. |
| (c) | All or a portion of this security was out on loan at August 31, 2018. |
| (d) | Affiliated company. The Fund’s Adviser and Invesco Mortgage Capital, Inc. REIT are wholly-owned subsidiaries of Invesco Ltd. and therefore, Invesco Ltd. and Invesco Mortgage Capital, Inc. REIT are considered to be affiliated. See Note 4. |
| (e) | The security and the Fund are advised by wholly-owned subsidiaries of Invesco Ltd. and are therefore considered to be affiliated. The rate shown is the 7-day SEC standardized yield as of August 31, 2018. |
| (f) | The security has been segregated to satisfy the commitment to return the cash collateral received in securities lending transactions upon the borrower’s return of the securities loaned. See Note 2I. |
See accompanying Notes to Financial Statements which are an integral part of the financial statements.
Schedule of Investments(a)
Invesco S&P SmallCap Health Care ETF (PSCH)
August 31, 2018
| | | | | | | | |
Number
of Shares | | | | | Value | |
| | | | Common Stocks—100.0% | |
| | | | Biotechnology—23.0% | |
| | 505,282 | | | Acorda Therapeutics, Inc.(b) | | $ | 14,552,122 | |
| | 368,673 | | | AMAG Pharmaceuticals, Inc.(b) | | | 8,995,621 | |
| | 548,372 | | | Cytokinetics, Inc.(b) | | | 4,332,139 | |
| | 89,314 | | | Eagle Pharmaceuticals, Inc.(b) | | | 6,174,277 | |
| | 379,779 | | | Emergent BioSolutions, Inc.(b) | | | 23,546,298 | |
| | 155,168 | | | Enanta Pharmaceuticals, Inc.(b) | | | 14,109,426 | |
| | 228,897 | | | Ligand Pharmaceuticals, Inc.(b) | | | 59,442,262 | |
| | 1,099,537 | | | MiMedx Group, Inc.(b)(c) | | | 5,827,546 | |
| | 833,106 | | | Momenta Pharmaceuticals, Inc.(b) | | | 22,077,309 | |
| | 750,475 | | | Myriad Genetics, Inc.(b) | | | 37,366,150 | |
| | 889,819 | | | Progenics Pharmaceuticals, Inc.(b)(c) | | | 6,967,283 | |
| | 312,463 | | | REGENXBIO, Inc.(b) | | | 22,013,019 | |
| | 403,381 | | | Repligen Corp.(b) | | | 22,137,549 | |
| | 1,005,593 | | | Spectrum Pharmaceuticals, Inc.(b) | | | 21,650,417 | |
| | | | | | | | |
| | | | | | | 269,191,418 | |
| | | | | | | | |
| | | | Health Care Equipment & Supplies—26.9% | |
| | 395,167 | | | AngioDynamics, Inc.(b) | | | 8,859,644 | |
| | 158,209 | | | Anika Therapeutics, Inc.(b) | | | 6,548,271 | |
| | 267,932 | | | CONMED Corp. | | | 21,549,771 | |
| | 361,674 | | | CryoLife, Inc.(b) | | | 12,550,088 | |
| | 146,755 | | | Cutera, Inc.(b) | | | 4,989,670 | |
| | 72,047 | | | Heska Corp.(b) | | | 7,709,029 | |
| | 186,831 | | | Inogen, Inc.(b) | | | 49,493,400 | |
| | 305,920 | | | Integer Holdings Corp.(b) | | | 24,443,008 | |
| | 356,903 | | | Invacare Corp. | | | 5,424,926 | |
| | 325,511 | | | Lantheus Holdings, Inc.(b) | | | 5,240,727 | |
| | 164,223 | | | LeMaitre Vascular, Inc. | | | 6,160,005 | |
| | 454,375 | | | Meridian Bioscience, Inc. | | | 7,133,687 | |
| | 578,760 | | | Merit Medical Systems, Inc.(b) | | | 34,060,026 | |
| | 359,243 | | | Natus Medical, Inc.(b) | | | 13,399,764 | |
| | 553,860 | | | Neogen Corp.(b) | | | 51,752,678 | |
| | 655,130 | | | OraSure Technologies, Inc.(b) | | | 10,488,631 | |
| | 202,372 | | | Orthofix Medical, Inc.(b) | | | 10,839,044 | |
| | 142,406 | | | SurModics, Inc.(b) | | | 11,214,473 | |
| | 159,151 | | | Tactile Systems Technology, Inc.(b) | | | 10,769,748 | |
| | 407,256 | | | Varex Imaging Corp.(b) | | | 12,787,838 | |
| | | | | | | | |
| | | | | | | 315,414,428 | |
| | | | | | | | |
| | | | Health Care Providers & Services—26.7% | |
| | 331,401 | | | Aceto Corp. | | | 1,100,251 | |
| | 311,075 | | | Amedisys, Inc.(b) | | | 38,887,486 | |
| | 513,594 | | | AMN Healthcare Services, Inc.(b) | | | 29,942,530 | |
| | 334,412 | | | BioTelemetry, Inc.(b) | | | 20,666,661 | |
| | 1,251,792 | | | Community Health Systems, Inc.(b)(c) | | | 4,856,953 | |
| | 103,646 | | | CorVel Corp.(b) | | | 6,161,755 | |
| | 391,810 | | | Cross Country Healthcare, Inc.(b) | | | 3,922,018 | |
| | 517,557 | | | Diplomat Pharmacy, Inc.(b) | | | 10,692,728 | |
| | 522,590 | | | Ensign Group, Inc. (The) | | | 20,417,591 | |
| | 563,923 | | | HealthEquity, Inc.(b) | | | 53,127,186 | |
| | 313,625 | | | LHC Group, Inc.(b) | | | 31,026,921 | |
| | 264,366 | | | Magellan Health, Inc.(b) | | | 19,430,901 | |
| | 663,612 | | | Owens & Minor, Inc. | | | 11,268,132 | |
| | 117,429 | | | Providence Service Corp. (The)(b) | | | 7,884,183 | |
| | 304,128 | | | Quorum Health Corp.(b) | | | 1,383,782 | |
| | 1,151,607 | | | Select Medical Holdings Corp.(b) | | | 22,801,819 | |
| | 368,062 | | | Tivity Health, Inc.(b) | | | 12,661,333 | |
| | | | | | | | |
Number
of Shares | | | | | Value | |
| | | | Common Stocks (continued) | |
| | | | Health Care Providers & Services (continued) | |
| | 135,911 | | | US Physical Therapy, Inc. | | $ | 17,022,853 | |
| | | | | | | | |
| | | | | | | 313,255,083 | |
| | | | | | | | |
| | | | Health Care Technology—8.0% | |
| | 122,809 | | | Computer Programs & Systems, Inc.(c) | | | 3,352,686 | |
| | 277,466 | | | HealthStream, Inc. | | | 8,803,996 | |
| | 893,479 | | | HMS Holdings Corp.(b) | | | 28,636,002 | |
| | 417,369 | | | Omnicell, Inc.(b) | | | 28,694,119 | |
| | 506,922 | | | Quality Systems, Inc.(b) | | | 11,603,444 | |
| | 146,116 | | | Tabula Rasa HealthCare, Inc.(b) | | | 12,809,990 | |
| | | | | | | | |
| | | | | | | 93,900,237 | |
| | | | | | | | |
| | | | Life Sciences Tools & Services—3.1% | |
| | 353,898 | | | Cambrex Corp.(b) | | | 23,852,725 | |
| | 443,609 | | | Luminex Corp. | | | 12,514,210 | |
| | | | | | | | |
| | | | | | | 36,366,935 | |
| | | | | | | | |
| | | | Pharmaceuticals—12.3% | |
| | 385,118 | | | Amphastar Pharmaceuticals, Inc.(b) | | | 7,309,540 | |
| | 97,684 | | | ANI Pharmaceuticals, Inc.(b) | | | 5,685,209 | |
| | 684,437 | | | Assertio Therapeutics, Inc.(b) | | | 4,366,708 | |
| | 1,026,766 | | | Corcept Therapeutics, Inc.(b) | | | 15,422,025 | |
| | 2,162,325 | | | Endo International PLC(b) | | | 37,083,874 | |
| | 741,167 | | | Innoviva, Inc.(b) | | | 10,761,745 | |
| | 327,346 | | | Lannett Co., Inc.(b)(c) | | | 1,751,301 | |
| | 695,489 | | | Medicines Co. (The)(b)(c) | | | 27,548,319 | |
| | 212,797 | | | Phibro Animal Health Corp., Class A | | | 10,044,018 | |
| | 556,109 | | | Supernus Pharmaceuticals, Inc.(b) | | | 24,635,629 | |
| | | | | | | | |
| | | | | | | 144,608,368 | |
| | | | | | | | |
| | | | Total Common Stocks
(Cost $967,304,132) | | | 1,172,736,469 | |
| | | | | | | | |
| | |
| | | | | | | | |
| | | | Money Market Fund—0.0% | | | | |
| | 2,361 | | | Invesco Premier U.S. Government Money Portfolio—Institutional Class, 1.83%(d)
(Cost $2,361) | | | 2,361 | |
| | | | | | | | |
| | | | Total Investments in Securities
(excluding investments purchased with cash collateral from securities on loan)
(Cost $967,306,493)—100.0% | | | 1,172,738,830 | |
| | | | | | | | |
| | |
| | | | | | | | |
| | | | Investments Purchased with Cash Collateral from Securities on Loan | |
| | |
| | | | | | | | |
| | | | Money Market Fund—1.4% | | | | |
| | 16,378,198 | | | Invesco Government & Agency Portfolio—Institutional Class, 1.85%(d)(e)
(Cost $16,378,198) | | | 16,378,198 | |
| | | | | | | | |
| | | | Total Investments in Securities
(Cost $983,684,691)—101.4% | | | 1,189,117,028 | |
| | | | Other assets less liabilities—(1.4)% | | | (16,547,751 | ) |
| | | | | | | | |
| | | | Net Assets—100.0% | | $ | 1,172,569,277 | |
| | | | | | | | |
See accompanying Notes to Financial Statements which are an integral part of the financial statements.
Invesco S&P SmallCap Health Care ETF (PSCH) (continued)
August 31, 2018
Notes to Schedule of Investments:
| (a) | Industry and/or sector classifications used in this report are generally according to the Global Industry Classification Standard, which was developed by and is the exclusive property and a service mark of MSCI Inc. and Standard & Poor’s. |
| (b) | Non-income producing security. |
| (c) | All or a portion of this security was out on loan at August 31, 2018. |
| (d) | The security and the Fund are advised by wholly-owned subsidiaries of Invesco Ltd. and are therefore considered to be affiliated. The rate shown is the 7-day SEC standardized yield as of August 31, 2018. |
| (e) | The security has been segregated to satisfy the commitment to return the cash collateral received in securities lending transactions upon the borrower’s return of the securities loaned. See Note 2I. |
See accompanying Notes to Financial Statements which are an integral part of the financial statements.
Schedule of Investments(a)
Invesco S&P SmallCap Industrials ETF (PSCI)
August 31, 2018
| | | | | | | | |
Number
of Shares | | | | | Value | |
| | | | Common Stocks—100.0% | |
| | | | Aerospace & Defense—11.3% | |
| | 29,100 | | | AAR Corp. | | $ | 1,358,097 | |
| | 68,049 | | | Aerojet Rocketdyne Holdings, Inc.(b) | | | 2,389,200 | |
| | 19,220 | | | Aerovironment, Inc.(b) | | | 1,690,591 | |
| | 51,821 | | | Axon Enterprise, Inc.(b) | | | 3,537,302 | |
| | 22,628 | | | Cubic Corp. | | | 1,712,940 | |
| | 16,024 | | | Engility Holdings, Inc.(b) | | | 556,193 | |
| | 43,488 | | | Mercury Systems, Inc.(b) | | | 2,370,531 | |
| | 29,277 | | | Moog, Inc., Class A | | | 2,310,248 | |
| | 4,540 | | | National Presto Industries, Inc.(c) | | | 602,004 | |
| | 44,908 | | | Triumph Group, Inc. | | | 934,086 | |
| | | | | | | | |
| | | | | | | 17,461,192 | |
| | | | | | | | |
| | | | Air Freight & Logistics—3.6% | |
| | 23,089 | | | Atlas Air Worldwide Holdings, Inc.(b) | | | 1,406,120 | |
| | 24,092 | | | Echo Global Logistics, Inc.(b) | | | 799,855 | |
| | 26,570 | | | Forward Air Corp. | | | 1,707,388 | |
| | 30,438 | | | Hub Group, Inc., Class A(b) | | | 1,608,648 | |
| | | | | | | | |
| | | | | | | 5,522,011 | |
| | | | | | | | |
| | | | Airlines—4.2% | |
| | 11,365 | | | Allegiant Travel Co. | | | 1,548,481 | |
| | 45,811 | | | Hawaiian Holdings, Inc. | | | 1,901,156 | |
| | 46,909 | | | SkyWest, Inc. | | | 3,063,158 | |
| | | | | | | | |
| | | | | | | 6,512,795 | |
| | | | | | | | |
| | | | Building Products—12.1% | |
| | 36,417 | | | AAON, Inc. | | | 1,471,247 | |
| | 12,804 | | | American Woodmark Corp.(b) | | | 1,087,700 | |
| | 25,492 | | | Apogee Enterprises, Inc. | | | 1,254,716 | |
| | 28,690 | | | Gibraltar Industries, Inc.(b) | | | 1,302,526 | |
| | 30,383 | | | Griffon Corp. | | | 554,490 | |
| | 16,358 | | | Insteel Industries, Inc. | | | 627,329 | |
| | 21,263 | | | Patrick Industries, Inc.(b) | | | 1,360,832 | |
| | 45,143 | | | PGT Innovations, Inc.(b) | | | 1,096,975 | |
| | 31,685 | | | Quanex Building Products Corp. | | | 519,634 | |
| | 37,160 | | | Simpson Manufacturing Co., Inc. | | | 2,852,773 | |
| | 53,088 | | | Trex Co., Inc.(b) | | | 4,496,554 | |
| | 55,531 | | | Universal Forest Products, Inc. | | | 2,080,191 | |
| | | | | | | | |
| | | | | | | 18,704,967 | |
| | | | | | | | |
| | | | Commercial Services & Supplies—12.6% | |
| | 59,343 | | | ABM Industries, Inc. | | | 1,882,360 | |
| | 43,539 | | | Brady Corp., Class A | | | 1,761,152 | |
| | 34,016 | | | Essendant, Inc. | | | 490,851 | |
| | 53,741 | | | Interface, Inc. | | | 1,265,601 | |
| | 30,151 | | | LSC Communications, Inc. | | | 368,747 | |
| | 29,026 | | | Matthews International Corp., Class A | | | 1,506,449 | |
| | 40,303 | | | Mobile Mini, Inc. | | | 1,728,999 | |
| | 12,561 | | | Multi-Color Corp. | | | 775,642 | |
| | 63,502 | | | RR Donnelley & Sons Co. | | | 321,320 | |
| | 27,089 | | | Team, Inc.(b)(c) | | | 631,174 | |
| | 50,139 | | | Tetra Tech, Inc. | | | 3,499,702 | |
| | 13,901 | | | UniFirst Corp. | | | 2,574,465 | |
| | 19,809 | | | US Ecology, Inc. | | | 1,441,105 | |
| | 18,497 | | | Viad Corp. | | | 1,139,415 | |
| | | | | | | | |
| | | | | | | 19,386,982 | |
| | | | | | | | |
| | | | Construction & Engineering—2.2% | |
| | 29,267 | | | Aegion Corp.(b) | | | 730,505 | |
| | 33,483 | | | Comfort Systems USA, Inc. | | | 1,921,924 | |
| | | | | | | | |
Number
of Shares | | | | | Value | |
| | | | Common Stocks (continued) | |
| | | | Construction & Engineering (continued) | |
| | 14,899 | | | MYR Group, Inc.(b) | | $ | 518,038 | |
| | 25,574 | | | Orion Group Holdings, Inc.(b) | | | 220,448 | |
| | | | | | | | |
| | | | | | | 3,390,915 | |
| | | | | | | | |
| | | | Electrical Equipment—2.2% | |
| | 23,505 | | | AZZ, Inc. | | | 1,263,394 | |
| | 18,827 | | | Encore Wire Corp. | | | 946,057 | |
| | 7,871 | | | Powell Industries, Inc. | | | 308,149 | |
| | 14,802 | | | Vicor Corp.(b) | | | 924,385 | |
| | | | | | | | |
| | | | | | | 3,441,985 | |
| | | | | | | | |
| | | | Industrial Conglomerates—1.0% | |
| | 32,417 | | | Raven Industries, Inc. | | | 1,568,983 | |
| | | | | | | | |
| | | | Machinery—28.3% | |
| | 54,817 | | | Actuant Corp., Class A | | | 1,614,361 | |
| | 8,635 | | | Alamo Group, Inc. | | | 822,916 | |
| | 26,167 | | | Albany International Corp., Class A | | | 2,018,784 | |
| | 17,308 | | | Astec Industries, Inc. | | | 842,034 | |
| | 43,609 | | | Barnes Group, Inc. | | | 2,968,029 | |
| | 38,539 | | | Briggs & Stratton Corp. | | | 776,946 | |
| | 27,976 | | | Chart Industries, Inc.(b) | | | 2,113,587 | |
| | 17,839 | | | CIRCOR International, Inc. | | | 809,177 | |
| | 18,976 | | | EnPro Industries, Inc. | | | 1,424,528 | |
| | 23,403 | | | ESCO Technologies, Inc. | | | 1,583,213 | |
| | 54,201 | | | Federal Signal Corp. | | | 1,410,852 | |
| | 34,878 | | | Franklin Electric Co., Inc. | | | 1,705,534 | |
| | 25,556 | | | Greenbrier Cos., Inc. (The) | | | 1,482,248 | |
| | 72,698 | | | Harsco Corp.(b) | | | 2,053,719 | |
| | 56,344 | | | Hillenbrand, Inc. | | | 2,881,996 | |
| | 28,607 | | | John Bean Technologies Corp. | | | 3,384,208 | |
| | 9,717 | | | Lindsay Corp. | | | 930,597 | |
| | 15,695 | | | Lydall, Inc.(b) | | | 671,746 | |
| | 51,996 | | | Mueller Industries, Inc. | | | 1,662,312 | |
| | 22,581 | | | Proto Labs, Inc.(b) | | | 3,510,216 | |
| | 38,817 | | | SPX Corp.(b) | | | 1,319,390 | |
| | 38,363 | | | SPX FLOW, Inc.(b) | | | 1,839,122 | |
| | 11,593 | | | Standex International Corp. | | | 1,250,885 | |
| | 16,242 | | | Tennant Co. | | | 1,243,325 | |
| | 44,851 | | | Titan International, Inc. | | | 335,485 | |
| | 52,429 | | | Wabash National Corp. | | | 956,305 | |
| | 25,103 | | | Watts Water Technologies, Inc., Class A | | | 2,069,742 | |
| | | | | | | | |
| | | | | | | 43,681,257 | |
| | | | | | | | |
| | | | Marine—1.0% | |
| | 38,530 | | | Matson, Inc. | | | 1,439,481 | |
| | | | | | | | |
| | | | Professional Services—14.9% | |
| | 44,333 | | | ASGN, Inc.(b) | | | 4,104,792 | |
| | 46,874 | | | Exponent, Inc. | | | 2,453,854 | |
| | 8,935 | | | Forrester Research, Inc. | | | 439,602 | |
| | 34,046 | | | FTI Consulting, Inc.(b) | | | 2,594,986 | |
| | 17,093 | | | Heidrick & Struggles International, Inc. | | | 755,511 | |
| | 33,710 | | | Insperity, Inc. | | | 4,040,143 | |
| | 27,783 | | | Kelly Services, Inc., Class A | | | 700,409 | |
| | 50,961 | | | Korn/Ferry International | | | 3,421,012 | |
| | 40,820 | | | Navigant Consulting, Inc.(b) | | | 975,190 | |
| | 26,761 | | | Resources Connection, Inc. | | | 442,895 | |
| | 36,609 | | | TrueBlue, Inc.(b) | | | 1,072,644 | |
See accompanying Notes to Financial Statements which are an integral part of the financial statements.
Invesco S&P SmallCap Industrials ETF (PSCI) (continued)
August 31, 2018
| | | | | | | | |
Number
of Shares | | | | | Value | |
| | | | Common Stocks (continued) | |
| | | | Professional Services (continued) | |
| | 35,802 | | | WageWorks, Inc.(b) | | $ | 1,915,407 | |
| | | | | | | | |
| | | | | | | 22,916,445 | |
| | | | | | | | |
| | | | Road & Rail—3.0% | |
| | 23,162 | | | ArcBest Corp. | | | 1,114,092 | |
| | 44,610 | | | Heartland Express, Inc. | | | 912,274 | |
| | 35,012 | | | Marten Transport Ltd. | | | 772,015 | |
| | 23,169 | | | Saia, Inc.(b) | | | 1,836,143 | |
| | | | | | | | |
| | | | | | | 4,634,524 | |
| | | | | | | | |
| | | | Trading Companies & Distributors—3.6% | |
| | 34,874 | | | Applied Industrial Technologies, Inc. | | | 2,687,042 | |
| | 14,268 | | | DXP Enterprises, Inc.(b) | | | 654,759 | |
| | 25,215 | | | Kaman Corp. | | | 1,644,270 | |
| | 10,159 | | | Veritiv Corp.(b) | | | 485,092 | |
| | | | | | | | |
| | | | | | | 5,471,163 | |
| | | | | | | | |
| | | | Total Common Stocks
(Cost $119,927,213) | | | 154,132,700 | |
| | | | | | | | |
| | |
| | | | | | | | |
| | | | Money Market Fund—0.0% | | | | |
| | 47,996 | | | Invesco Premier U.S. Government Money Portfolio—Institutional Class, 1.83%(d)
(Cost $47,996) | | | 47,996 | |
| | | | | | | | |
| | | | Total Investments in Securities (excluding investments purchased with cash collateral from securities on loan)
(Cost $119,975,209)—100.0% | | | 154,180,696 | |
| | | | | | | | |
| | |
| | | | | | | | |
| | | | Investments Purchased with Cash Collateral from Securities on Loan | |
| | |
| | | | | | | | |
| | | | Money Market Fund—0.6% | | | | |
| | 906,942 | | | Invesco Government & Agency Portfolio—Institutional Class, 1.85%(d)(e)
(Cost $906,942) | | | 906,942 | |
| | | | | | | | |
| | | | Total Investments in Securities
(Cost $120,882,151)—100.6% | | | 155,087,638 | |
| | | | Other assets less liabilities—(0.6)% | | | (882,955 | ) |
| | | | | | | | |
| | | | Net Assets—100.0% | | $ | 154,204,683 | |
| | | | | | | | |
Notes to Schedule of Investments:
| (a) | Industry and/or sector classifications used in this report are generally according to the Global Industry Classification Standard, which was developed by and is the exclusive property and a service mark of MSCI Inc. and Standard & Poor’s. |
| (b) | Non-income producing security. |
| (c) | All or a portion of this security was out on loan at August 31, 2018. |
| (d) | The security and the Fund are advised by wholly-owned subsidiaries of Invesco Ltd. and are therefore considered to be affiliated. The rate shown is the 7-day SEC standardized yield as of August 31, 2018. |
| (e) | The security has been segregated to satisfy the commitment to return the cash collateral received in securities lending transactions upon the borrower’s return of the securities loaned. See Note 2I. |
See accompanying Notes to Financial Statements which are an integral part of the financial statements.
Schedule of Investments(a)
Invesco S&P SmallCap Information Technology ETF (PSCT)
August 31, 2018
| | | | | | | | |
Number
of Shares | | | | | Value | |
| | | | Common Stocks—100.0% | |
| | | | Communications Equipment—10.1% | |
| | 169,711 | | | ADTRAN, Inc. | | $ | 2,919,029 | |
| | 69,349 | | | Applied Optoelectronics, Inc.(b)(c) | | | 2,868,275 | |
| | 126,662 | | | CalAmp Corp.(c) | | | 2,976,557 | |
| | 83,662 | | | Comtech Telecommunications Corp. | | | 2,999,283 | |
| | 96,169 | | | Digi International, Inc.(c) | | | 1,293,473 | |
| | 410,492 | | | Extreme Networks, Inc.(c) | | | 2,573,785 | |
| | 406,249 | | | Finisar Corp.(c) | | | 8,287,480 | |
| | 301,834 | | | Harmonic, Inc.(c) | | | 1,644,995 | |
| | 111,753 | | | NETGEAR, Inc.(c) | | | 7,917,700 | |
| | 604,476 | | | Oclaro, Inc.(c) | | | 5,766,701 | |
| | 801,606 | | | Viavi Solutions, Inc.(c) | | | 8,977,987 | |
| | | | | | | | |
| | | | | | | 48,225,265 | |
| | | | | | | | |
| | | | Electronic Equipment, Instruments & Components—26.8% | |
| | 103,031 | | | Anixter International, Inc.(c) | | | 7,428,535 | |
| | 103,122 | | | Badger Meter, Inc. | | | 5,666,554 | |
| | 34,878 | | | Bel Fuse, Inc., Class B | | | 999,255 | |
| | 168,181 | | | Benchmark Electronics, Inc. | | | 4,347,479 | |
| | 71,856 | | | Control4 Corp.(c) | | | 2,328,853 | |
| | 116,949 | | | CTS Corp. | | | 4,321,266 | |
| | 138,623 | | | Daktronics, Inc. | | | 1,124,233 | |
| | 121,798 | | | Electro Scientific Industries, Inc.(c) | | | 2,673,466 | |
| | 48,522 | | | ePlus, Inc.(c) | | | 5,029,305 | |
| | 130,707 | | | Fabrinet (Thailand)(c) | | | 6,256,944 | |
| | 60,058 | | | FARO Technologies, Inc.(c) | | | 4,095,956 | |
| | 194,950 | | | II-VI, Inc.(c) | | | 9,698,762 | |
| | 125,514 | | | Insight Enterprises, Inc.(c) | | | 6,920,842 | |
| | 122,191 | | | Itron, Inc.(c) | | | 8,113,482 | |
| | 175,475 | | | KEMET Corp.(c) | | | 4,534,274 | |
| | 318,623 | | | Knowles Corp.(c) | | | 5,776,635 | |
| | 130,512 | | | Methode Electronics, Inc. | | | 5,174,801 | |
| | 63,150 | | | MTS Systems Corp. | | | 3,416,415 | |
| | 60,174 | | | OSI Systems, Inc.(c) | | | 4,686,953 | |
| | 67,395 | | | Park Electrochemical Corp. | | | 1,440,905 | |
| | 116,808 | | | Plexus Corp.(c) | | | 7,392,778 | |
| | 65,052 | | | Rogers Corp.(c) | | | 8,981,730 | |
| | 242,988 | | | Sanmina Corp.(c) | | | 7,484,030 | |
| | 90,576 | | | ScanSource, Inc.(c) | | | 3,681,914 | |
| | 329,761 | | | TTM Technologies, Inc.(c) | | | 6,166,531 | |
| | | | | | | | |
| | | | | | | 127,741,898 | |
| | | | | | | | |
| | | | Internet Software & Services—8.4% | |
| | 88,783 | | | Alarm.com Holdings, Inc.(c) | | | 4,997,595 | |
| | 92,101 | | | Liquidity Services, Inc.(c) | | | 663,127 | |
| | 197,858 | | | LivePerson, Inc.(c) | | | 5,322,380 | |
| | 130,220 | | | QuinStreet, Inc.(c) | | | 1,975,438 | |
| | 65,452 | | | Shutterstock, Inc. | | | 3,602,478 | |
| | 61,500 | | | SPS Commerce, Inc.(c) | | | 6,043,605 | |
| | 59,043 | | | Stamps.com, Inc.(c) | | | 14,669,233 | |
| | 86,243 | | | XO Group, Inc.(c) | | | 2,592,465 | |
| | | | | | | | |
| | | | | | | 39,866,321 | |
| | | | | | | | |
| | | | IT Services—16.1% | |
| | 87,477 | | | CACI International, Inc., Class A(c) | | | 17,058,015 | |
| | 162,662 | | | Cardtronics PLC, Class A(c) | | | 5,707,809 | |
| | 119,199 | | | CSG Systems International, Inc. | | | 4,452,083 | |
| | 213,495 | | | EVERTEC, Inc. | | | 5,134,555 | |
| | 121,830 | | | ExlService Holdings, Inc.(c) | | | 7,806,866 | |
| | 93,339 | | | ManTech International Corp., Class A | | | 6,190,242 | |
| | | | | | | | |
Number
of Shares | | | | | Value | |
| | | | Common Stocks (continued) | |
| | | | IT Services (continued) | |
| | 235,592 | | | NIC, Inc. | | $ | 3,957,946 | |
| | 124,175 | | | Perficient, Inc.(c) | | | 3,567,548 | |
| | 140,982 | | | Sykes Enterprises, Inc.(c) | | | 4,263,296 | |
| | 446,404 | | | Travelport Worldwide Ltd. | | | 8,289,722 | |
| | 50,516 | | | TTEC Holdings, Inc. | | | 1,323,519 | |
| | 180,518 | | | Unisys Corp.(c) | | | 3,357,635 | |
| | 97,774 | | | Virtusa Corp.(c) | | | 5,696,313 | |
| | | | | | | | |
| | | | | | | 76,805,549 | |
| | | | | | | | |
| | | | Semiconductors & Semiconductor Equipment—23.0% | |
| | 139,303 | | | Advanced Energy Industries, Inc.(c) | | | 8,299,673 | |
| | 113,861 | | | Axcelis Technologies, Inc.(c) | | | 2,299,992 | |
| | 249,852 | | | Brooks Automation, Inc. | | | 9,846,667 | |
| | 90,969 | | | Cabot Microelectronics Corp. | | | 10,254,935 | |
| | 78,707 | | | CEVA, Inc.(c) | | | 2,408,434 | |
| | 102,002 | | | Cohu, Inc. | | | 2,690,813 | |
| | 137,005 | | | Diodes, Inc.(c) | | | 5,195,230 | |
| | 80,318 | | | DSP Group, Inc.(c) | | | 1,032,086 | |
| | 258,679 | | | FormFactor, Inc.(c) | | | 3,996,590 | |
| | 86,276 | | | Ichor Holdings Ltd.(b)(c) | | | 2,237,137 | |
| | 219,566 | | | Kopin Corp.(c) | | | 509,393 | |
| | 244,780 | | | Kulicke & Soffa Industries, Inc. (Singapore) | | | 6,312,876 | |
| | 219,568 | | | MaxLinear, Inc., Class A(c) | | | 4,233,271 | |
| | 84,622 | | | Nanometrics, Inc.(c) | | | 3,707,290 | |
| | 97,402 | | | PDF Solutions, Inc.(c) | | | 849,345 | |
| | 247,511 | | | Photronics, Inc.(c) | | | 2,648,368 | |
| | 104,776 | | | Power Integrations, Inc. | | | 7,685,320 | |
| | 380,711 | | | Rambus, Inc.(c) | | | 4,652,288 | |
| | 112,657 | | | Rudolph Technologies, Inc.(c) | | | 3,131,865 | |
| | 234,427 | | | Semtech Corp.(c) | | | 14,007,013 | |
| | 133,920 | | | SolarEdge Technologies, Inc.(c) | | | 6,421,464 | |
| | 137,160 | | | Ultra Clean Holdings, Inc.(c) | | | 2,093,062 | |
| | 172,467 | | | Veeco Instruments, Inc.(c) | | | 2,069,604 | |
| | 173,667 | | | Xperi Corp. | | | 2,726,572 | |
| | | | | | | | |
| | | | | | | 109,309,288 | |
| | | | | | | | |
| | | | Software—11.8% | |
| | 329,423 | | | 8x8, Inc.(c) | | | 7,477,902 | |
| | 54,317 | | | Agilysys, Inc.(c) | | | 872,874 | |
| | 124,044 | | | Bottomline Technologies (DE), Inc.(c) | | | 8,183,183 | |
| | 78,022 | | | Ebix, Inc.(b) | | | 6,214,452 | |
| | 33,337 | | | MicroStrategy, Inc., Class A(c) | | | 4,967,213 | |
| | 149,380 | | | Monotype Imaging Holdings, Inc. | | | 3,077,228 | |
| | 107,089 | | | OneSpan, Inc.(c) | | | 2,007,919 | |
| | 161,026 | | | Progress Software Corp. | | | 6,590,794 | |
| | 115,973 | | | Qualys, Inc.(c) | | | 10,559,342 | |
| | 435,534 | | | TiVo Corp. | | | 5,945,039 | |
| | | | | | | | |
| | | | | | | 55,895,946 | |
| | | | | | | | |
| | | | Technology Hardware, Storage & Peripherals—3.8% | |
| | 403,121 | | | 3D Systems Corp.(b)(c) | | | 8,203,512 | |
| | 143,978 | | | Cray, Inc.(c) | | | 3,124,323 | |
| | 269,043 | | | Diebold Nixdorf, Inc. | | | 1,277,954 | |
| | 158,401 | | | Electronics For Imaging, Inc.(c) | | | 5,510,771 | |
| | | | | | | | |
| | | | | | | 18,116,560 | |
| | | | | | | | |
| | | | Total Investments in Securities
(excluding investments purchased with cash collateral from securities on loan)
(Cost $381,896,085)-100.0% | | | 475,960,827 | |
| | | | | | | | |
See accompanying Notes to Financial Statements which are an integral part of the financial statements.
Invesco S&P SmallCap Information Technology ETF (PSCT) (continued)
August 31, 2018
| | | | | | | | |
Number
of Shares | | | | | Value | |
| | | | Investments Purchased with Cash Collateral from Securities on Loan | |
| | |
| | | | | | | | |
| | | | Money Market Fund—2.9% | |
| | 13,662,258 | | | Invesco Government & Agency Portfolio—Institutional Class, 1.85%(d)(e)
(Cost $13,662,258) | | $ | 13,662,258 | |
| | | | | | | | |
| | | | Total Investments in Securities
(Cost $395,558,343)—102.9% | | | 489,623,085 | |
| | | | Other assets less liabilities—(2.9)% | | | (13,664,703 | ) |
| | | | | | | | |
| | | | Net Assets—100.0% | | $ | 475,958,382 | |
| | | | | | | | |
Notes to Schedule of Investments:
| (a) | Industry and/or sector classifications used in this report are generally according to the Global Industry Classification Standard, which was developed by and is the exclusive property and a service mark of MSCI Inc. and Standard & Poor’s. |
| (b) | All or a portion of this security was out on loan at August 31, 2018. |
| (c) | Non-income producing security. |
| (d) | The security and the Fund are advised by wholly-owned subsidiaries of Invesco Ltd. and are therefore considered to be affiliated. The rate shown is the 7-day SEC standardized yield as of August 31, 2018. |
| (e) | The security has been segregated to satisfy the commitment to return the cash collateral received in securities lending transactions upon the borrower’s return of the securities loaned. See Note 2I. |
See accompanying Notes to Financial Statements which are an integral part of the financial statements.
Schedule of Investments(a)
Invesco S&P SmallCap Materials ETF (PSCM)
August 31, 2018
| | | | | | | | |
Number
of Shares | | | | | Value | |
| | | | Common Stocks—99.9% | |
| | | | Chemicals—58.2% | |
| | 22,404 | | | AdvanSix, Inc.(b) | | $ | 758,151 | |
| | 19,306 | | | American Vanguard Corp. | | | 422,801 | |
| | 23,586 | | | Balchem Corp. | | | 2,615,452 | |
| | 41,771 | | | Flotek Industries, Inc.(b) | | | 104,010 | |
| | 18,637 | | | FutureFuel Corp. | | | 276,387 | |
| | 37,135 | | | H.B. Fuller Co. | | | 2,116,324 | |
| | 6,985 | | | Hawkins, Inc. | | | 288,481 | |
| | 30,919 | | | Ingevity Corp.(b) | | | 3,123,128 | |
| | 14,355 | | | Innophos Holdings, Inc. | | | 627,457 | |
| | 17,926 | | | Innospec, Inc. | | | 1,391,058 | |
| | 15,512 | | | Koppers Holdings, Inc.(b) | | | 549,900 | |
| | 23,434 | | | Kraton Corp.(b) | | | 1,102,101 | |
| | 14,924 | | | LSB Industries, Inc.(b) | | | 130,137 | |
| | 9,787 | | | Quaker Chemical Corp. | | | 1,763,030 | |
| | 38,101 | | | Rayonier Advanced Materials, Inc. | | | 796,311 | |
| | 14,638 | | | Stepan Co. | | | 1,305,856 | |
| | 18,734 | | | Tredegar Corp. | | | 411,211 | |
| | | | | | | | |
| | | | | | | 17,781,795 | |
| | | | | | | | |
| | | | Construction Materials—1.8% | |
| | 11,607 | | | US Concrete, Inc.(b)(c) | | | 559,457 | |
| | | | | �� | | | |
| | | | Containers & Packaging—1.5% | |
| | 19,818 | | | Myers Industries, Inc. | | | 440,950 | |
| | | | | | | | |
| | | | Metals & Mining—17.1% | |
| | 231,618 | | | AK Steel Holding Corp.(b)(c) | | | 1,028,384 | |
| | 36,669 | | | Century Aluminum Co.(b) | | | 462,763 | |
| | 9,197 | | | Haynes International, Inc. | | | 362,362 | |
| | 12,312 | | | Kaiser Aluminum Corp. | | | 1,349,272 | |
| | 14,832 | | | Materion Corp. | | | 946,281 | |
| | 6,706 | | | Olympic Steel, Inc. | | | 147,800 | |
| | 47,498 | | | SunCoke Energy, Inc.(b) | | | 530,078 | |
| | 28,785 | | | TimkenSteel Corp.(b) | | | 403,278 | |
| | | | | | | | |
| | | | | | | 5,230,218 | |
| | | | | | | | |
| | | | Paper & Forest Products—21.2% | |
| | 28,556 | | | Boise Cascade Co. | | | 1,247,897 | |
| | 12,092 | | | Clearwater Paper Corp.(b) | | | 351,273 | |
| | 64,652 | | | KapStone Paper and Packaging Corp. | | | 2,220,796 | |
| | 12,351 | | | Neenah, Inc. | | | 1,127,029 | |
| | 32,100 | | | P.H. Glatfelter Co. | | | 617,283 | |
| | 22,591 | | | Schweitzer-Mauduit International, Inc. | | | 919,228 | |
| | | | | | | | |
| | | | | | | 6,483,506 | |
| | | | | | | | |
| | | | Specialty Chemicals—0.1% | |
| | 21,045 | | | A. Schulman, Inc.(b)(d) | | | 42,090 | |
| | | | | | | | |
| | | | Total Investments in Securities
(excluding investments purchased with cash collateral from securities on loan)
(Cost $30,108,496)-99.9% | | | 30,538,016 | |
| | | | | | | | |
| | | | | | | | |
Number
of Shares | | | | | Value | |
| | | | Investments Purchased with Cash Collateral from Securities on Loan | |
| | |
| | | | | | | | |
| | | | Money Market Fund—2.9% | |
| | 886,286 | | | Invesco Government & Agency Portfolio—Institutional Class, 1.85%(e)(f)
(Cost $886,286) | | $ | 886,286 | |
| | | | | | | | |
| | | | Total Investments in Securities
(Cost $30,994,782)—102.8% | | | 31,424,302 | |
| | | | Other assets less liabilities—(2.8)% | | | (858,559 | ) |
| | | | | | | | |
| | | | Net Assets—100.0% | | $ | 30,565,743 | |
| | | | | | | | |
Notes to Schedule of Investments:
| (a) | Industry and/or sector classifications used in this report are generally according to the Global Industry Classification Standard, which was developed by and is the exclusive property and a service mark of MSCI Inc. and Standard & Poor’s. |
| (b) | Non-income producing security. |
| (c) | All or a portion of this security was out on loan at August 31, 2018. |
| (d) | Security valued using significant unobservable inputs (Level 3). See Note 5. |
| (e) | The security and the Fund are advised by wholly-owned subsidiaries of Invesco Ltd. and are therefore considered to be affiliated. The rate shown is the 7-day SEC standardized yield as of August 31, 2018. |
| (f) | The security has been segregated to satisfy the commitment to return the cash collateral received in securities lending transactions upon the borrower’s return of the securities loaned. See Note 2I. |
See accompanying Notes to Financial Statements which are an integral part of the financial statements.
Schedule of Investments(a)
Invesco S&P SmallCap Utilities ETF (PSCU)
August 31, 2018
| | | | | | | | |
Number
of Shares | | | | | Value | |
| | | | Common Stocks—97.8% | | | | |
| | | | Diversified Telecommunication Services—30.3% | | | | |
| | 39,438 | | �� | ATN International, Inc. | | $ | 2,888,045 | |
| | 223,676 | | | Cincinnati Bell, Inc.(b) | | | 2,907,788 | |
| | 49,378 | | | Cogent Communications Holdings, Inc. | | | 2,700,977 | |
| | 211,007 | | | Consolidated Communications Holdings, Inc.(c) | | | 2,491,993 | |
| | 345,637 | | | Frontier Communications Corp.(c) | | | 1,797,312 | |
| | 142,889 | | | Iridium Communications, Inc.(b) | | | 2,893,502 | |
| | 205,135 | | | Vonage Holdings Corp.(b) | | | 2,908,814 | |
| | | | | | | | |
| | | | | | | 18,588,431 | |
| | | | | | | | |
| | | | Electric Utilities—4.6% | | | | |
| | 45,671 | | | El Paso Electric Co. | | | 2,799,632 | |
| | | | | | | | |
| | | | Gas Utilities—34.5% | | | | |
| | 44,133 | | | Northwest Natural Gas Co. | | | 2,864,232 | |
| | 238,014 | | | South Jersey Industries, Inc. | | | 7,897,304 | |
| | 140,173 | | | Spire, Inc. | | | 10,449,897 | |
| | | | | | | | |
| | | | | | | 21,211,433 | |
| | | | | | | | |
| | | | Multi-Utilities—15.3% | | | | |
| | 182,802 | | | Avista Corp. | | | 9,379,571 | |
| | | | | | | | |
| | | | Water Utilities—8.9% | | | | |
| | 46,342 | | | American States Water Co. | | | 2,800,447 | |
| | 65,437 | | | California Water Service Group | | | 2,692,733 | |
| | | | | | | | |
| | | | | | | 5,493,180 | |
| | | | | | | | |
| | | | Wireless Telecommunication Services—4.2% | | | | |
| | 168,667 | | | Spok Holdings, Inc. | | | 2,589,038 | |
| | | | | | | | |
| | | | Total Investments in Securities
(excluding investments purchased with cash collateral from securities on loan)
(Cost $55,864,903)—97.8% | | | 60,061,285 | |
| | | | | | | | |
| | |
| | | | | | | | |
| | | | Investments Purchased with Cash Collateral from Securities on Loan | |
| | |
| | | | | | | | |
| | | | Money Market Fund—5.2% | |
| | 3,166,088 | | | Invesco Government & Agency Portfolio—Institutional Class, 1.85%(d)(e)
(Cost $3,166,088) | | | 3,166,088 | |
| | | | | | | | |
| | | | Total Investments in Securities
(Cost $59,030,991)—103.0% | | | 63,227,373 | |
| | | | Other assets less liabilities—(3.0)% | | | (1,846,422 | ) |
| | | | | | | | |
| | | | Net Assets—100.0% | | $ | 61,380,951 | |
| | | | | | | | |
Notes to Schedule of Investments:
| (a) | Industry and/or sector classifications used in this report are generally according to the Global Industry Classification Standard, which was developed by and is the exclusive property and a service mark of MSCI Inc. and Standard & Poor’s. |
| (b) | Non-income producing security. |
| (c) | All or a portion of this security was out on loan at August 31, 2018. |
| (d) | The security and the Fund are advised by wholly-owned subsidiaries of Invesco Ltd. and are therefore considered to be affiliated. The rate shown is the 7-day SEC standardized yield as of August 31, 2018. |
| (e) | The security has been segregated to satisfy the commitment to return the cash collateral received in securities lending transactions upon the borrower’s return of the securities loaned. See Note 2I. |
See accompanying Notes to Financial Statements which are an integral part of the financial statements.
Statements of Assets and Liabilities
August 31, 2018
| | | | | | | | | | | | | | | | | | | | |
| | | Invesco
DWA Momentum &
Low Volatility Rotation
ETF (DWLV) | | | Invesco
DWA SmallCap
Momentum
ETF (DWAS) | | | Invesco
DWA Tactical
Multi-Asset Income
ETF (DWIN) | | | Invesco
DWA Tactical
Sector Rotation
ETF (DWTR) | | | Invesco
S&P SmallCap
Consumer
Discretionary
ETF (PSCD) | |
| Assets: | | | | | | | | | | | | | | | | | | | | |
Unaffiliated investments in securities, at value(a) | | $ | — | | | $ | 454,067,213 | | | $ | — | | | $ | — | | | $ | 92,774,928 | |
Affiliated investments in securities, at value(a) | | | 46,791,792 | | | | 18,806,755 | | | | 72,165,830 | | | | 88,450,165 | | | | 8,728,334 | |
Receivables: | | | | | | | | | | | | | | | | | | | | |
Securities lending | | | 2,077 | | | | 50,140 | | | | 9,908 | | | | 158 | | | | 13,937 | |
Dividends | | | 47 | | | | 34,216 | | | | 92 | | | | 46 | | | | 61,903 | |
Investments sold | | | — | | | | — | | | | — | | | | — | | | | 2,059,744 | |
Shares sold | | | — | | | | — | | | | — | | | | — | | | | — | |
| | | | | | | | | | | | | | | | | | | | |
Total Assets | | | 46,793,916 | | | | 472,958,324 | | | | 72,175,830 | | | | 88,450,369 | | | | 103,638,846 | |
| | | | | | | | | | | | | | | | | | | | |
| | | | | |
| Liabilities: | | | | | | | | | | | | | | | | | | | | |
Due to custodian | | | — | | | | 46 | | | | — | | | | — | | | | — | |
Payables: | | | | | | | | | | | | | | | | | | | | |
Collateral upon return of securities loaned | | | 510,000 | | | | 18,771,075 | | | | 9,611,799 | | | | 120,825 | | | | 8,720,132 | |
Shares repurchased | | | — | | | | — | | | | 1,034 | | | | — | | | | — | |
Investments purchased | | | — | | | | — | | | | — | | | | — | | | | 2,176,919 | |
Accrued unitary management fees | | | 5,571 | | | | 215,438 | | | | 14,044 | | | | 10,847 | | | | 23,874 | |
| | | | | | | | | | | | | | | | | | | | |
Total Liabilities | | | 515,571 | | | | 18,986,559 | | | | 9,626,877 | | | | 131,672 | | | | 10,920,925 | |
| | | | | | | | | | | | | | | | | | | | |
| Net Assets | | $ | 46,278,345 | | | $ | 453,971,765 | | | $ | 62,548,953 | | | $ | 88,318,697 | | | $ | 92,717,921 | |
| | | | | | | | | | | | | | | | | | | | |
| | | | | |
| Net Assets Consist of: | | | | | | | | | | | | | | | | | | | | |
Shares of beneficial interest | | $ | 42,376,197 | | | $ | 536,379,001 | | | $ | 67,847,139 | | | $ | 90,807,047 | | | $ | 90,449,221 | |
Undistributed net investment income (loss) | | | 161,592 | | | | (71,703 | ) | | | 400,654 | | | | — | | | | 224,967 | |
Undistributed net realized gain (loss) | | | (73,036 | ) | | | (169,480,948 | ) | | | (2,853,261 | ) | | | (17,938,022 | ) | | | (6,549,305 | ) |
Net unrealized appreciation (depreciation) | | | 3,813,592 | | | | 87,145,415 | | | | (2,845,579 | ) | | | 15,449,672 | | | | 8,593,038 | |
| | | | | | | | | | | | | | | | | | | | |
| Net Assets | | $ | 46,278,345 | | | $ | 453,971,765 | | | $ | 62,548,953 | | | $ | 88,318,697 | | | $ | 92,717,921 | |
| | | | | | | | | | | | | | | | | | | | |
Shares outstanding (unlimited amount authorized, $0.01 par value) | | | 1,350,001 | | | | 7,650,000 | | | | 2,450,001 | | | | 2,750,001 | | | | 1,300,000 | |
Net asset value | | $ | 34.28 | | | $ | 59.34 | | | $ | 25.53 | | | $ | 32.12 | | | $ | 71.32 | |
| | | | | | | | | | | | | | | | | | | | |
Market price | | $ | 34.27 | | | $ | 59.36 | | | $ | 25.51 | | | $ | 32.15 | | | $ | 71.31 | |
| | | | | | | | | | | | | | | | | | | | |
Unaffiliated investments in securities, at cost | | $ | — | | | $ | 366,921,798 | | | $ | — | | | $ | — | | | $ | 84,181,890 | |
| | | | | | | | | | | | | | | | | | | | |
Affiliated investments in securities, at cost | | $ | 42,978,200 | | | $ | 18,806,755 | | | $ | 75,011,409 | | | $ | 73,000,493 | | | $ | 8,728,334 | |
| | | | | | | | | | | | | | | | | | | | |
(a) Includes securities on loan with an aggregate value of: | | $ | 504,815 | | | $ | 18,814,911 | | | $ | 9,313,275 | | | $ | 117,585 | | | $ | 8,554,591 | |
| | | | | | | | | | | | | | | | | | | | |
See accompanying Notes to Financial Statements which are an integral part of the financial statements.
| | | | | | | | | | | | | | | | | | | | | | | | | | | | | | |
Invesco
S&P SmallCap
Consumer
Staples
ETF (PSCC) | | | Invesco
S&P SmallCap
Energy
ETF (PSCE) | | | Invesco
S&P SmallCap
Financials
ETF (PSCF) | | | Invesco
S&P SmallCap
Health Care
ETF (PSCH) | | | Invesco
S&P SmallCap
Industrials
ETF (PSCI) | | | Invesco
S&P SmallCap
Information
Technology
ETF (PSCT) | | | Invesco
S&P SmallCap
Materials
ETF (PSCM) | | | Invesco
S&P SmallCap
Utilities
ETF (PSCU) | |
| | | | | | | | | | | | | | | | | | | | | | | | | | | | | | |
| $ | 86,710,005 | | | $ | 60,473,072 | | | $ | 264,531,248 | | | $ | 1,172,736,469 | | | $ | 154,132,700 | | | $ | 475,960,827 | | | $ | 30,538,016 | | | $ | 60,061,285 | |
| | 9,886,400 | | | | 3,062,640 | | | | 5,656,637 | | | | 16,380,559 | | | | 954,938 | | | | 13,662,258 | | | | 886,286 | | | | 3,166,088 | |
| | | | | | | | | | | | | | | | | | | | | | | | | | | | | | |
| | 15,992 | | | | 1,461 | | | | 594 | | | | 43,298 | | | | 325 | | | | 21,052 | | | | 229 | | | | 4,058 | |
| | 46 | | | | 8,640 | | | | 260,400 | | | | 43,710 | | | | 59,108 | | | | 111,416 | | | | 61,866 | | | | 89,098 | |
| | 2,929,516 | | | | — | | | | — | | | | — | | | | — | | | | 3,612,904 | | | | — | | | | 1,320,361 | |
| | — | | | | — | | | | — | | | | 14,475,913 | | | | — | | | | — | | | | — | | | | — | |
| | | | | | | | | | | | | | | | | | | | | | | | | | | | | | |
| | 99,541,959 | | | | 63,545,813 | | | | 270,448,879 | | | | 1,203,679,949 | | | | 155,147,071 | | | | 493,368,457 | | | | 31,486,397 | | | | 64,640,890 | |
| | | | | | | | | | | | | | | | | | | | | | | | | | | | | | |
| | | | | | | |
| | | | | | | | | | | | | | | | | | | | | | | | | | | | | | |
| | — | | | | — | | | | — | | | | 2,860 | | | | — | | | | 278,774 | | | | 26,090 | | | | 17,190 | |
| | | | | | | | | | | | | | | | | | | | | | | | | | | | | | |
| | 9,842,090 | | | | 3,054,500 | | | | 3,214,774 | | | | 16,378,198 | | | | 906,942 | | | | 13,662,258 | | | | 886,286 | | | | 3,166,088 | |
| | — | | | | — | | | | — | | | | — | | | | — | | | | — | | | | — | | | | — | |
| | — | | | | — | | | | — | | | | 14,478,264 | | | | — | | | | 3,357,274 | | | | 917 | | | | 61,935 | |
| | 19,277 | | | | 15,934 | | | | 64,917 | | | | 251,350 | | | | 35,446 | | | | 111,769 | | | | 7,361 | | | | 14,726 | |
| | | | | | | | | | | | | | | | | | | | | | | | | | | | | | |
| | 9,861,367 | | | | 3,070,434 | | | | 3,279,691 | | | | 31,110,672 | | | | 942,388 | | | | 17,410,075 | | | | 920,654 | | | | 3,259,939 | |
| | | | | | | | | | | | | | | | | | | | | | | | | | | | | | |
| $ | 89,680,592 | | | $ | 60,475,379 | | | $ | 267,169,188 | | | $ | 1,172,569,277 | | | $ | 154,204,683 | | | $ | 475,958,382 | | | $ | 30,565,743 | | | $ | 61,380,951 | |
| | | | | | | | | | | | | | | | | | | | | | | | | | | | | | |
| | | | | | | |
| | | | | | | | | | | | | | | | | | | | | | | | | | | | | | |
| $ | 85,831,146 | | | $ | 105,517,086 | | | $ | 224,691,824 | | | $ | 979,735,127 | | | $ | 123,144,161 | | | $ | 401,476,817 | | | $ | 30,627,728 | | | $ | 59,699,427 | |
| | 245,675 | | | | 63,924 | | | | 2,275,159 | | | | (194,985 | ) | | | 132,201 | | | | 313,306 | | | | 82,972 | | | | 337,301 | |
| | (5,060,084 | ) | | | (45,428,567 | ) | | | (4,141,165 | ) | | | (12,403,202 | ) | | | (3,277,166 | ) | | | (19,896,483 | ) | | | (574,477 | ) | | | (2,852,159 | ) |
| | 8,663,855 | | | | 322,936 | | | | 44,343,370 | | | | 205,432,337 | | | | 34,205,487 | | | | 94,064,742 | | | | 429,520 | | | | 4,196,382 | |
| | | | | | | | | | | | | | | | | | | | | | | | | | | | | | |
| $ | 89,680,592 | | | $ | 60,475,379 | | | $ | 267,169,188 | | | $ | 1,172,569,277 | | | $ | 154,204,683 | | | $ | 475,958,382 | | | $ | 30,565,743 | | | $ | 61,380,951 | |
| | | | | | | | | | | | | | | | | | | | | | | | | | | | | | |
| 1,050,000 | | | | 3,700,000 | | | | 4,450,000 | | | | 8,100,000 | | | | 2,050,000 | | | | 5,300,000 | | | | 550,000 | | | | 1,100,000 | |
| $ | 85.41 | | | $ | 16.34 | | | $ | 60.04 | | | $ | 144.76 | | | $ | 75.22 | | | $ | 89.80 | | | $ | 55.57 | | | $ | 55.80 | |
| | | | | | | | | | | | | | | | | | | | | | | | | | | | | | |
| $ | 85.34 | | | $ | 16.33 | | | $ | 60.09 | | | $ | 144.99 | | | $ | 75.25 | | | $ | 89.71 | | | $ | 55.57 | | | $ | 55.82 | |
| | | | | | | | | | | | | | | | | | | | | | | | | | | | | | |
| $ | 78,046,150 | | | $ | 60,150,136 | | | $ | 219,938,444 | | | $ | 967,304,132 | | | $ | 119,927,213 | | | $ | 381,896,085 | | | $ | 30,108,496 | | | $ | 55,864,903 | |
| | | | | | | | | | | | | | | | | | | | | | | | | | | | | | |
| $ | 9,886,400 | | | $ | 3,062,640 | | | $ | 5,906,071 | | | $ | 16,380,559 | | | $ | 954,938 | | | $ | 13,662,258 | | | $ | 886,286 | | | $ | 3,166,088 | |
| | | | | | | | | | | | | | | | | | | | | | | | | | | | | | |
| $ | 9,831,229 | | | $ | 2,941,381 | | | $ | 3,098,857 | | | $ | 16,109,208 | | | $ | 887,652 | | | $ | 13,082,909 | | | $ | 871,660 | | | $ | 3,012,306 | |
| | | | | | | | | | | | | | | | | | | | | | | | | | | | | | |
Statements of Operations
For the period November 1, 2017 through August 31, 2018 and year ended October 31, 2017
| | | | | | | | | | | | | | | | | | | | | | | | |
| | | Invesco
DWA Momentum &
Low Volatility Rotation
ETF (DWLV) | | |
Invesco
DWA SmallCap
Momentum
ETF (DWAS) | | | Invesco
DWA Tactical
Multi-Asset Income
ETF (DWIN) | |
| | | Ten Months Ended
August 31, 2018 | | | Year Ended
October 31, 2017 | | | Ten Months Ended
August 31, 2018 | | | Year Ended
October 31, 2017 | | | Ten Months Ended
August 31, 2018 | | | Year Ended
October 31, 2017 | |
| Investment Income: | | | | | | | | | | | | | | | | | | | | | | | | |
Unaffiliated dividend income | | $ | — | | | $ | — | | | $ | 1,127,829 | | | $ | 1,319,218 | | | $ | (989,574 | ) | | $ | 1,366,477 | |
Affiliated dividend income | | | 182,608 | | | | 83,187 | | | | 732 | | | | 419 | | | | 3,478,690 | | | | 5,392,179 | |
Non-cash dividend income | | | — | | | | — | | | | — | | | | — | | | | — | | | | — | |
Securities lending income | | | 61,688 | | | | — | | | | 263,508 | | | | 437,587 | | | | 67,689 | | | | 176,130 | |
Foreign withholding tax | | | — | | | | — | | | | — | | | | (159 | ) | | | — | | | | — | |
| | | | | | | | | | | | | | | | | | | | | | | | |
Total Income | | | 244,296 | | | | 83,187 | | | | 1,392,069 | | | | 1,757,065 | | | | 2,556,805 | | | | 6,934,786 | |
| | | | | | | | | | | | | | | | | | | | | | | | |
| | | | | | |
| Expenses: | | | | | | | | | | | | | | | | | | | | | | | | |
Unitary management fees | | | 28,013 | | | | 7,878 | | | | 1,446,692 | | | | 1,121,338 | | | | 177,002 | | | | 292,560 | |
| | | | | | | | | | | | | | | | | | | | | | | | |
Less: Waivers | | | (10 | ) | | | (2 | ) | | | (96 | ) | | | (137 | ) | | | (67 | ) | | | (59 | ) |
| | | | | | | | | | | | | | | | | | | | | | | | |
Net Expenses | | | 28,003 | | | | 7,876 | | | | 1,446,596 | | | | 1,121,201 | | | | 176,935 | | | | 292,501 | |
| | | | | | | | | | | | | | | | | | | | | | | | |
Net Investment Income (Loss) | | | 216,293 | | | | 75,311 | | | | (54,527 | ) | | | 635,864 | | | | 2,379,870 | | | | 6,642,285 | |
| | | | | | | | | | | | | | | | | | | | | | | | |
| | | | | | |
| Realized and Unrealized Gain (Loss): | | | | | | | | | | | | | | | | | | | | | | | | |
Net realized gain (loss) from: | | | | | | | | | | | | | | | | | | | | | | | | |
Unaffiliated investment securities | | | — | | | | — | | | | (23,421,496 | ) | | | (21,092,000 | ) | | | (2,452,746 | ) | | | (24,263 | ) |
Affiliated investment securities | | | — | | | | (25,240 | ) | | | — | | | | — | | | | (69,062 | ) | | | (265,833 | ) |
Unaffiliated in-kind redemptions | | | — | | | | — | | | | 41,433,230 | | | | 44,368,016 | | | | (488,490 | ) | | | 548,102 | |
Affiliated in-kind redemptions | | | 282,345 | | | | 7,070 | | | | — | | | | — | | | | (383,560 | ) | | | 897,708 | |
| | | | | | | | | | | | | | | | | | | | | | | | |
Net realized gain (loss) | | | 282,345 | | | | (18,170 | ) | | | 18,011,734 | | | | 23,276,016 | | | | (3,393,858 | ) | | | 1,155,714 | |
| | | | | | | | | | | | | | | | | | | | | | | | |
Change in net unrealized appreciation (depreciation) on: | | | | | | | | | | | | | | | | | | | | | | | | |
Unaffiliated investment securities | | | — | | | | — | | | | 50,876,372 | | | | 31,038,733 | | | | 2,435,123 | | | | (3,323,105 | ) |
Affiliated investment securities | | | 3,097,196 | | | | 1,186,501 | | | | — | | | | — | | | | (4,159,009 | ) | | | 804,747 | |
| | | | | | | | | | | | | | | | | | | | | | | | |
Net change in unrealized appreciation (depreciation) | | | 3,097,196 | | | | 1,186,501 | | | | 50,876,372 | | | | 31,038,733 | | | | (1,723,886 | ) | | | (2,518,358 | ) |
| | | | | | | | | | | | | | | | | | | | | | | | |
Net realized and unrealized gain (loss) | | | 3,379,541 | | | | 1,168,331 | | | | 68,888,106 | | | | 54,314,749 | | | | (5,117,744 | ) | | | (1,362,644 | ) |
| | | | | | | | | | | | | | | | | | | | | | | | |
Net increase (decrease) in net assets resulting from operations | | $ | 3,595,834 | | | $ | 1,243,642 | | | $ | 68,833,579 | | | $ | 54,950,613 | | | $ | (2,737,874 | ) | | $ | 5,279,641 | |
| | | | | | | | | | | | | | | | | | | | | | | | |
See accompanying Notes to Financial Statements which are an integral part of the financial statements.
| | | | | | | | | | | | | | | | | | | | | | | | | | | | | | |
Invesco
DWA Tactical
Sector Rotation
ETF (DWTR) | | | Invesco
S&P SmallCap
Consumer
Discretionary
ETF (PSCD) | | | Invesco
S&P SmallCap
Consumer
Staples
ETF (PSCC) | | | Invesco
S&P SmallCap
Energy
ETF (PSCE) | |
Ten Months Ended
August 31, 2018 | | | Year Ended
October 31, 2017 | | | Ten Months Ended
August 31, 2018 | | | Year Ended
October 31, 2017 | | | Ten Months Ended
August 31, 2018 | | | Year Ended
October 31, 2017 | | | Ten Months Ended
August 31, 2018 | | | Year Ended
October 31, 2017 | |
| | | | | | | | | | | | | | | | | | | | | | | | | | | | | | |
| $ | — | | | $ | — | | | $ | 798,500 | | | $ | 863,642 | | | $ | 424,751 | | | $ | 878,782 | | | $ | 94,014 | | | $ | 120,730 | |
| | 208,482 | | | | 1,031,893 | | | | 296 | | | | 191 | | | | 456 | | | | 243 | | | | 146 | | | | 35 | |
| | — | | | | — | | | | — | | | | — | | | | — | | | | — | | | | 55,822 | | | | — | |
| | 15,438 | | | | 36,454 | | | | 107,414 | | | | 134,515 | | | | 98,427 | | | | 145,045 | | | | 20,650 | | | | 14,114 | |
| | — | | | | — | | | | — | | | | — | | | | — | | | | — | | | | — | | | | — | |
| | | | | | | | | | | | | | | | | | | | | | | | | | | | | | |
| | 223,920 | | | | 1,068,347 | | | | 906,210 | | | | 998,348 | | | | 523,634 | | | | 1,024,070 | | | | 170,632 | | | | 134,879 | |
| | | | | | | | | | | | | | | | | | | | | | | | | | | | | | |
| | | | | | | |
| | | | | | | | | | | | | | | | | | | | | | | | | | | | | | |
| | 86,749 | | | | 172,416 | | | | 193,109 | | | | 188,421 | | | | 128,396 | | | | 178,041 | | | | 150,930 | | | | 164,603 | |
| | | | | | | | | | | | | | | | | | | | | | | | | | | | | | |
| | (43 | ) | | | (55 | ) | | | (40 | ) | | | (63 | ) | | | (81 | ) | | | (102 | ) | | | (17 | ) | | | (18 | ) |
| | | | | | | | | | | | | | | | | | | | | | | | | | | | | | |
| | 86,706 | | | | 172,361 | | | | 193,069 | | | | 188,358 | | | | 128,315 | | | | 177,939 | | | | 150,913 | | | | 164,585 | |
| | | | | | | | | | | | | | | | | | | | | | | | | | | | | | |
| | 137,214 | | | | 895,986 | | | | 713,141 | | | | 809,990 | | | | 395,319 | | | | 846,131 | | | | 19,719 | | | | (29,706 | ) |
| | | | | | | | | | | | | | | | | | | | | | | | | | | | | | |
| | | | | | | |
| | | | | | | | | | | | | | | | | | | | | | | | | | | | | | |
| | | | | | | | | | | | | | | | | | | | | | | | | | | | | | |
| | — | | | | — | | | | (2,004,715 | ) | | | (3,135,343 | ) | | | (3,456,871 | ) | | | (1,943,369 | ) | | | (7,821,454 | ) | | | (13,639,731 | ) |
| | 101,650 | | | | (8,922,790 | ) | | | — | | | | — | | | | — | | | | — | | | | — | | | | — | |
| | — | | | | — | | | | 16,462,349 | | | | 6,179,920 | | | | 3,360,063 | | | | 7,320,055 | | | | 4,463,182 | | | | 6,423,044 | |
| | 6,140,676 | | | | 13,228,447 | | | | — | | | | — | | | | — | | | | — | | | | — | | | | — | |
| | | | | | | | | | | | | | | | | | | | | | | | | | | | | | |
| | 6,242,326 | | | | 4,305,657 | | | | 14,457,634 | | | | 3,044,577 | | | | (96,808 | ) | | | 5,376,686 | | | | (3,358,272 | ) | | | (7,216,687 | ) |
| | | | | | | | | | | | | | | | | | | | | | | | | | | | | | |
| | | | | | | | | | | | | | | | | | | | | | | | | | | | | | |
| | — | | | | — | | | | 4,541,379 | | | | 10,549,959 | | | | 8,564,790 | | | | 3,992,825 | | | | 8,803,738 | | | | (3,055,667 | ) |
| | 3,661,769 | | | | 9,481,303 | | | | — | | | | — | | | | — | | | | — | | | | — | | | | — | |
| | | | | | | | | | | | | | | | | | | | | | | | | | | | | | |
| 3,661,769 | | | | 9,481,303 | | | | 4,541,379 | | | | 10,549,959 | | | | 8,564,790 | | | | 3,992,825 | | | | 8,803,738 | | | | (3,055,667 | ) |
| | | | | | | | | | | | | | | | | | | | | | | | | | | | | | |
| | 9,904,095 | | | | 13,786,960 | | | | 18,999,013 | | | | 13,594,536 | | | | 8,467,982 | | | | 9,369,511 | | | | 5,445,466 | | | | (10,272,354 | ) |
| | | | | | | | | | | | | | | | | | | | | | | | | | | | | | |
$ | 10,041,309 | | | $ | 14,682,946 | | | $ | 19,712,154 | | | $ | 14,404,526 | | | $ | 8,863,301 | | | $ | 10,215,642 | | | $ | 5,465,185 | | | $ | (10,302,060 | ) |
| | | | | | | | | | | | | | | | | | | | | | | | | | | | | | |
Statements of Operations (continued)
For the period November 1, 2017 through August 31, 2018 and year ended October 31, 2017
| | | | | | | | | | | | | | | | | | | | | | | | |
| | |
Invesco
S&P SmallCap
Financials
ETF (PSCF) | | | Invesco
S&P SmallCap
Health Care
ETF (PSCH) | | | Invesco
S&P SmallCap
Industrials
ETF (PSCI) | |
| | | Ten Months Ended
August 31, 2018 | | | Year Ended
October 31, 2017 | | | Ten Months Ended
August 31, 2018 | | | Year Ended
October 31, 2017 | | | Ten Months Ended
August 31, 2018 | | | Year Ended
October 31, 2017 | |
| Investment Income: | | | | | | | | | | | | | | | | | | | | | | | | |
Unaffiliated dividend income | | $ | 4,796,697 | | | $ | 6,493,550 | | | $ | 672,377 | | | $ | 381,803 | | | $ | 891,501 | | | $ | 896,382 | |
Affiliated dividend income | | | 185,047 | | | | 709 | | | | 5,368 | | | | 1,056 | | | | 345 | | | | 301 | |
Non-cash dividend income | | | — | | | | — | | | | — | | | | — | | | | — | | | | 176,550 | |
Securities lending income | | | 25,549 | | | | 81,406 | | | | 381,498 | | | | 129,179 | | | | 5,577 | | | | 7,134 | |
Foreign withholding tax | | | (1,024 | ) | | | (1,501 | ) | | | — | | | | — | | | | — | | | | — | |
| | | | | | | | | | | | | | | | | | | | | | | | |
Total Income | | | 5,006,269 | | | | 6,574,164 | | | | 1,059,243 | | | | 512,038 | | | | 897,423 | | | | 1,080,367 | |
| | | | | | | | | | | | | | | | | | | | | | | | |
| | | | | | |
| Expenses: | | | | | | | | | | | | | | | | | | | | | | | | |
Unitary management fees | | | 568,489 | | | | 698,802 | | | | 1,232,585 | | | | 592,255 | | | | 275,190 | | | | 254,919 | |
| | | | | | | | | | | | | | | | | | | | | | | | |
Less: Waivers | | | (272 | ) | | | (263 | ) | | | (658 | ) | | | (283 | ) | | | (48 | ) | | | (87 | ) |
| | | | | | | | | | | | | | | | | | | | | | | | |
Net Expenses | | | 568,217 | | | | 698,539 | | | | 1,231,927 | | | | 591,972 | | | | 275,142 | | | | 254,832 | |
| | | | | | | | | | | | | | | | | | | | | | | | |
Net Investment Income (Loss) | | | 4,438,052 | | | | 5,875,625 | | | | (172,684 | ) | | | (79,934 | ) | | | 622,281 | | | | 825,535 | |
| | | | | | | | | | | | | | | | | | | | | | | | |
| | | | | | |
| Realized and Unrealized Gain (Loss): | | | | | | | | | | | | | | | | | | | | | | | | |
Net realized gain (loss) from: | | | | | | | | | | | | | | | | | | | | | | | | |
Unaffiliated investment securities | | | 324,358 | | | | (3,478,375 | ) | | | (5,531,592 | ) | | | (4,374,053 | ) | | | (348,637 | ) | | | (631,246 | ) |
Affiliated investment securities | | | (25,418 | ) | | | — | | | | — | | | | — | | | | — | | | | — | |
Unaffiliated in-kind redemptions | | | 20,007,864 | | | | 34,763,822 | | | | 75,949,086 | | | | 17,588,661 | | | | 6,881,244 | | | | 5,599,669 | |
Affiliated in-kind redemptions | | | 32 | | | | — | | | | — | | | | — | | | | — | | | | — | |
| | | | | | | | | | | | | | | | | | | | | | | | |
Net realized gain | | | 20,306,836 | | | | 31,285,447 | | | | 70,417,494 | | | | 13,214,608 | | | | 6,532,607 | | | | 4,968,423 | |
| | | | | | | | | | | | | | | | | | | | | | | | |
Change in net unrealized appreciation (depreciation) on: | | | | | | | | | | | | | | | | | | | | | | | | |
Unaffiliated investment securities | | | 3,219,770 | | | | 16,593,709 | | | | 174,671,274 | | | | 47,344,189 | | | | 16,602,277 | | | | 15,266,745 | |
Affiliated investment securities | | | (249,434 | ) | | | — | | | | — | | | | — | | | | — | | | | — | |
| | | | | | | | | | | | | | | | | | | | | | | | |
Net change in unrealized appreciation (depreciation) | | | 2,970,336 | | | | 16,593,709 | | | | 174,671,274 | | | | 47,344,189 | | | | 16,602,277 | | | | 15,266,745 | |
| | | | | | | | | | | | | | | | | | | | | | | | |
Net realized and unrealized gain (loss) | | | 23,277,172 | | | | 47,879,156 | | | | 245,088,768 | | | | 60,558,797 | | | | 23,134,884 | | | | 20,235,168 | |
| | | | | | | | | | | | | | | | | | | | | | | | |
Net increase in net assets resulting from operations | | $ | 27,715,224 | | | $ | 53,754,781 | | | $ | 244,916,084 | | | $ | 60,478,863 | | | $ | 23,757,165 | | | $ | 21,060,703 | |
| | | | | | | | | | | | | | | | | | | | | | | | |
See accompanying Notes to Financial Statements which are an integral part of the financial statements.
| | | | | | | | | | | | | | | | | | | | | | |
Invesco
S&P SmallCap
Information
Technology
ETF (PSCT) | | | Invesco
S&P SmallCap
Materials
ETF (PSCM) | | | Invesco
S&P SmallCap
Utilities
ETF (PSCU) | |
Ten Months Ended
August 31, 2018 | | | Year Ended
October 31, 2017 | | | Ten Months Ended
August 31, 2018 | | | Year Ended
October 31, 2017 | | | Ten Months Ended
August 31, 2018 | | | Year Ended
October 31, 2017 | |
| | | | | | | | | | | | | | | | | | | | | | |
| $ | 1,963,484 | | | $ | 2,491,400 | | | $ | 384,821 | | | $ | 706,382 | | | $ | 1,036,122 | | | $ | 948,396 | |
| | 2,729 | | | | 1,360 | | | | 572 | | | | 342 | | | | 853 | | | | 272 | |
| | — | | | | — | | | | — | | | | — | | | | — | | | | — | |
| | 600,316 | | | | 489,991 | | | | 3,647 | | | | 7,821 | | | | 186,238 | | | | 14,376 | |
| | (1,064 | ) | | | — | | | | — | | | | — | | | | — | | | | — | |
| | | | | | | | | | | | | | | | | | | | | | |
| | 2,565,465 | | | | 2,982,751 | | | | 389,040 | | | | 714,545 | | | | 1,223,213 | | | | 963,044 | |
| | | | | | | | | | | | | | | | | | | | | | |
| | | | | |
| | | | | | | | | | | | | | | | | | | | | | |
| | 1,084,315 | | | | 1,584,606 | | | | 94,382 | | | | 178,297 | | | | 123,452 | | | | 138,428 | |
| | | | | | | | | | | | | | | | | | | | | | |
| | (347 | ) | | | (567 | ) | | | (67 | ) | | | (124 | ) | | | (154 | ) | | | (207 | ) |
| | | | | | | | | | | | | | | | | | | | | | |
| | 1,083,968 | | | | 1,584,039 | | | | 94,315 | | | | 178,173 | | | | 123,298 | | | | 138,221 | |
| | | | | | | | | | | | | | | | | | | | | | |
| | 1,481,497 | | | | 1,398,712 | | | | 294,725 | | | | 536,372 | | | | 1,099,915 | | | | 824,823 | |
| | | | | | | | | | | | | | | | | | | | | | |
| | | | | |
| | | | | | | | | | | | | | | | | | | | | | |
| | | | | | | | | | | | | | | | | | | | | | |
| | (16,664,151 | ) | | | (4,203,312 | ) | | | 280,618 | | | | 328,573 | | | | (2,435,816 | ) | | | (496,422 | ) |
| | — | | | | — | | | | — | | | | — | | | | — | | | | — | |
| | 71,223,114 | | | | 98,632,813 | | | | 2,563,150 | | | | 7,187,172 | | | | 2,674,919 | | | | 5,028,692 | |
| | — | | | | — | | | | — | | | | — | | | | — | | | | — | |
| | | | | | | | | | | | | | | | | | | | | | |
| | 54,558,963 | | | | 94,429,501 | | | | 2,843,768 | | | | 7,515,745 | | | | 239,103 | | | | 4,532,270 | |
| | | | | | | | | | | | | | | | | | | | | | |
| | | | | | | | | | | | | | | | | | | | | | |
| | (15,469,273 | ) | | | 60,462,587 | | | | 442,622 | | | | 613,006 | | | | (318,630 | ) | | | 6,345,264 | |
| | — | | | | — | | | | — | | | | — | | | | — | | | | — | |
| | | | | | | | | | | | | | | | | | | | | | |
| (15,469,273 | ) | | | 60,462,587 | | | | 442,622 | | | | 613,006 | | | | (318,630 | ) | | | 6,345,264 | |
| | | | | | | | | | | | | | | | | | | | | | |
| | 39,089,690 | | | | 154,892,088 | | | | 3,286,390 | | | | 8,128,751 | | | | (79,527 | ) | | | 10,877,534 | |
| | | | | | | | | | | | | | | | | | | | | | |
$ | 40,571,187 | | | $ | 156,290,800 | | | $ | 3,581,115 | | | $ | 8,665,123 | | | $ | 1,020,388 | | | $ | 11,702,357 | |
| | | | | | | | | | | | | | | | | | | | | | |
Statements of Changes in Net Assets
For the period November 1, 2017 through August 31, 2018 and years ended October 31, 2017 and 2016
| | | | | | | | | | | | | | | | | | | | | | | | |
| | | Invesco DWA Momentum &
Low Volatility Rotation
ETF (DWLV) | | | Invesco DWA SmallCap
Momentum ETF (DWAS) | |
| | | Ten Months Ended
August 31, 2018 | | | Year Ended
October 31, 2017 | | | Year Ended
October 31, 2016(a) | | | Ten Months Ended
August 31, 2018 | | | Year Ended
October 31, 2017 | | | Year Ended
October 31, 2016 | |
| Operations: | | | | | | | | | | | | | | | | | | | | | | | | |
Net investment income (loss) | | $ | 216,293 | | | $ | 75,311 | | | $ | 20,112 | | | $ | (54,527 | ) | | $ | 635,864 | | | $ | 960,807 | |
Net realized gain (loss) | | | 282,345 | | | | (18,170 | ) | | | 37,835 | | | | 18,011,734 | | | | 23,276,016 | | | | (22,396,154 | ) |
Net change in unrealized appreciation (depreciation) | | | 3,097,196 | | | | 1,186,501 | | | | (470,105 | ) | | | 50,876,372 | | | | 31,038,733 | | | | (23,056,492 | ) |
| | | | | | | | | | | | | | | | | | | | | | | | |
Net increase (decrease) in net assets resulting from operations | | | 3,595,834 | | | | 1,243,642 | | | | (412,158 | ) | | | 68,833,579 | | | | 54,950,613 | | | | (44,491,839 | ) |
| | | | | | | | | | | | | | | | | | | | | | | | |
| | | | | | |
| Distributions to Shareholders from: | | | | | | | | | | | | | | | | | | | | | | | | |
Net investment income | | | (69,512 | ) | | | (75,347 | ) | | | (5,265 | ) | | | (495,961 | ) | | | (705,632 | ) | | | (825,119 | ) |
Return of capital | | | — | | | | — | | | | — | | | | — | | | | — | | | | — | |
| | | | | | | | | | | | | | | | | | | | | | | | |
Total distributions to shareholders | | | (69,512 | ) | | | (75,347 | ) | | | (5,265 | ) | | | (495,961 | ) | | | (705,632 | ) | | | (825,119 | ) |
| | | | | | | | | | | | | | | | | | | | | | | | |
| | | | | | |
| Shareholder Transactions: | | | | | | | | | | | | | | | | | | | | | | | | |
Proceeds from shares sold | | | 39,738,065 | | | | — | | | | 14,037,994 | | | | 340,693,590 | | | | 222,389,150 | | | | 67,039,578 | |
Value of shares repurchased | | | (1,562,899 | ) | | | (7,643,283 | ) | | | (2,568,726 | ) | | | (183,576,402 | ) | | | (203,974,345 | ) | | | (282,181,365 | ) |
| | | | | | | | | | | | | | | | | | | | | | | | |
Net increase (decrease) in net assets resulting from shares transactions | | | 38,175,166 | | | | (7,643,283 | ) | | | 11,469,268 | | | | 157,117,188 | | | | 18,414,805 | | | | (215,141,787 | ) |
| | | | | | | | | | | | | | | | | | | | | | | | |
Increase (Decrease) in Net Assets | | | 41,701,488 | | | | (6,474,988 | ) | | | 11,051,845 | | | | 225,454,806 | | | | 72,659,786 | | | | (260,458,745 | ) |
| | | | | | | | | | | | | | | | | | | | | | | | |
| | | | | | |
| Net Assets: | | | | | | | | | | | | | | | | | | | | | | | | |
Beginning of period | | | 4,576,857 | | | | 11,051,845 | | | | — | | | | 228,516,959 | | | | 155,857,173 | | | | 416,315,918 | |
| | | | | | | | | | | | | | | | | | | | | | | | |
End of period | | $ | 46,278,345 | | | $ | 4,576,857 | | | $ | 11,051,845 | | | $ | 453,971,765 | | | $ | 228,516,959 | | | $ | 155,857,173 | |
| | | | | | | | | | | | | | | | | | | | | | | | |
Undistributed net investment income (loss) at end of period | | $ | 161,592 | | | $ | 14,811 | | | $ | 14,847 | | | $ | (71,703 | ) | | $ | 398,919 | | | $ | 292,417 | |
| | | | | | | | | | | | | | | | | | | | | | | | |
| | | | | | |
| Changes in Shares Outstanding: | | | | | | | | | | | | | | | | | | | | | | | | |
Shares sold | | | 1,250,000 | | | | — | | | | 550,001 | | | | 6,500,000 | | | | 5,150,000 | | | | 1,750,000 | |
Shares repurchased | | | (50,000 | ) | | | (300,000 | ) | | | (100,000 | ) | | | (3,600,000 | ) | | | (4,800,000 | ) | | | (8,250,000 | ) |
Shares outstanding, beginning of period | | | 150,001 | | | | 450,001 | | | | — | | | | 4,750,000 | | | | 4,400,000 | | | | 10,900,000 | |
| | | | | | | | | | | | | | | | | | | | | | | | |
Shares outstanding, end of period | | | 1,350,001 | | | | 150,001 | | | | 450,001 | | | | 7,650,000 | | | | 4,750,000 | | | | 4,400,000 | |
| | | | | | | | | | | | | | | | | | | | | | | | |
| (a) | For the period July 11, 2016 (commencement of investment operations) through October 31, 2016. |
| (b) | For the period March 7, 2016 (commencement of investment operations) through October 31, 2016. |
See accompanying Notes to Financial Statements which are an integral part of the financial statements.
| | | | | | | | | | | | | | | | | | | | | | | | | | | | | | | | | | |
Invesco DWA Tactical
Multi-Asset Income
ETF (DWIN) | | | Invesco DWA Tactical
Sector Rotation
ETF (DWTR) | | | Invesco S&P SmallCap
Consumer Discretionary
ETF (PSCD) | |
Ten Months Ended
August 31, 2018 | | | Year Ended
October 31, 2017 | | | Year Ended
October 31, 2016(b) | | | Ten Months Ended
August 31, 2018 | | | Year Ended
October 31, 2017 | | | Year Ended
October 31, 2016 | | | Ten Months Ended
August 31, 2018 | | | Year Ended
October 31, 2017 | | | Year Ended
October 31, 2016 | |
| | | | | | | | | | | | | | | | | | | | | | | | | | | | | | | | | | |
| $ | 2,379,870 | | | $ | 6,642,285 | | | $ | 2,389,050 | | | $ | 137,214 | | | $ | 895,986 | | | $ | 1,084,164 | | | $ | 713,141 | | | $ | 809,990 | | | $ | 734,362 | |
| | (3,393,858 | ) | | | 1,155,714 | | | | 191,509 | | | | 6,242,326 | | | | 4,305,657 | | | | (9,869,144 | ) | | | 14,457,634 | | | | 3,044,577 | | | | 1,510,289 | |
| | | | | | | | |
| | (1,723,886 | ) | | | (2,518,358 | ) | | | 1,396,665 | | | | 3,661,769 | | | | 9,481,303 | | | | 1,527,655 | | | | 4,541,379 | | | | 10,549,959 | | | | (10,046,153 | ) |
| | | | | | | | | | | | | | | | | | | | | | | | | | | | | | | | | | |
| | | | | | | | |
| | (2,737,874 | ) | | | 5,279,641 | | | | 3,977,224 | | | | 10,041,309 | | | | 14,682,946 | | | | (7,257,325 | ) | | | 19,712,154 | | | | 14,404,526 | | | | (7,801,502 | ) |
| | | | | | | | | | | | | | | | | | | | | | | | | | | | | | | | | | |
| | | | | | | | |
| | | | | | | | | | | | | | | | | | | | | | | | | | | | | | | | | | |
| | (3,343,498 | ) | | | (5,282,805 | ) | | | (2,392,101 | ) | | | (179,329 | ) | | | (891,782 | ) | | | (1,081,384 | ) | | | (569,275 | ) | | | (893,766 | ) | | | (707,191 | ) |
| | — | | | | — | | | | — | | | | — | | | | — | | | | (2,439 | ) | | | — | | | | — | | | | — | |
| | | | | | | | | | | | | | | | | | | | | | | | | | | | | | | | | | |
| | (3,343,498 | ) | | | (5,282,805 | ) | | | (2,392,101 | ) | | | (179,329 | ) | | | (891,782 | ) | | | (1,083,823 | ) | | | (569,275 | ) | | | (893,766 | ) | | | (707,191 | ) |
| | | | | | | | | | | | | | | | | | | | | | | | | | | | | | | | | | |
| | | | | | | | |
| | | | | | | | | | | | | | | | | | | | | | | | | | | | | | | | | | |
| | — | | | | 16,651,048 | | | | 130,144,242 | | | | 63,575,125 | | | | 111,684,930 | | | | 166,921,314 | | | | 55,796,510 | | | | 10,583,736 | | | | 18,192,524 | |
| | (43,717,814 | ) | | | (23,145,887 | ) | | | (12,883,223 | ) | | | (53,014,995 | ) | | | (229,700,916 | ) | | | (29,062,791 | ) | | | (48,764,104 | ) | | | (31,787,168 | ) | | | (51,422,549 | ) |
| | | | | | | | | | | | | | | | | | | | | | | | | | | | | | | | | | |
| | | | | | | | |
| | (43,717,814 | ) | | | (6,494,839 | ) | | | 117,261,019 | | | | 10,560,130 | | | | (118,015,986 | ) | | | 137,858,523 | | | | 7,032,406 | | | | (21,203,432 | ) | | | (33,230,025 | ) |
| | | | | | | | | | | | | | | | | | | | | | | | | | | | | | | | | | |
| | (49,799,186 | ) | | | (6,498,003 | ) | | | 118,846,142 | | | | 20,422,110 | | | | (104,224,822 | ) | | | 129,517,375 | | | | 26,175,285 | | | | (7,692,672 | ) | | | (41,738,718 | ) |
| | | | | | | | | | | | | | | | | | | | | | | | | | | | | | | | | | |
| | | | | | | | |
| | | | | | | | | | | | | | | | | | | | | | | | | | | | | | | | | | |
| | 112,348,139 | | | | 118,846,142 | | | | — | | | | 67,896,587 | | | | 172,121,409 | | | | 42,604,034 | | | | 66,542,636 | | | | 74,235,308 | | | | 115,974,026 | |
| | | | | | | | | | | | | | | | | | | | | | | | | | | | | | | | | | |
| $ | 62,548,953 | | | $ | 112,348,139 | | | $ | 118,846,142 | | | $ | 88,318,697 | | | $ | 67,896,587 | | | $ | 172,121,409 | | | $ | 92,717,921 | | | $ | 66,542,636 | | | $ | 74,235,308 | |
| | | | | | | | | | | | | | | | | | | | | | | | | | | | | | | | | | |
| | | | | | | | |
| $ | 400,654 | | | $ | 1,361,509 | | | $ | — | | | $ | — | | | $ | 4,204 | | | $ | — | | | $ | 224,967 | | | $ | 81,101 | | | $ | 164,877 | |
| | | | | | | | | | | | | | | | | | | �� | | | | | | | | | | | | | | | |
| | | | | | | | |
| | | | | | | | | | | | | | | | | | | | | | | | | | | | | | | | | | |
| | — | | | | 600,000 | | | | 4,900,001 | | | | 2,150,000 | | | | 4,550,000 | | | | 6,700,000 | | | | 850,000 | | | | 200,000 | | | | 400,000 | |
| | (1,700,000 | ) | | | (850,000 | ) | | | (500,000 | ) | | | (1,800,000 | ) | | | (9,250,000 | ) | | | (1,250,000 | ) | | | (750,000 | ) | | | (600,000 | ) | | | (1,150,000 | ) |
| | 4,150,001 | | | | 4,400,001 | | | | — | | | | 2,400,001 | | | | 7,100,001 | | | | 1,650,001 | | | | 1,200,000 | | | | 1,600,000 | | | | 2,350,000 | |
| | | | | | | | | | | | | | | | | | | | | | | | | | | | | | | | | | |
| | 2,450,001 | | | | 4,150,001 | | | | 4,400,001 | | | | 2,750,001 | | | | 2,400,001 | | | | 7,100,001 | | | | 1,300,000 | | | | 1,200,000 | | | | 1,600,000 | |
| | | | | | | | | | | | | | | | | | | | | | | | | | | | | | | | | | |
Statements of Changes in Net Assets (continued)
For the period November 1, 2017 through August 31, 2018 and years ended October 31, 2017 and 2016
| | | | | | | | | | | | | | | | | | | | | | | | |
| | | Invesco S&P SmallCap
Consumer Staples
ETF (PSCC) | | | Invesco S&P SmallCap
Energy ETF (PSCE) | |
| | | Ten Months Ended
August 31, 2018 | | | Year Ended
October 31, 2017 | | | Year Ended
October 31, 2016 | | | Ten Months Ended
August 31, 2018 | | | Year Ended
October 31, 2017 | | | Year Ended
October 31, 2016 | |
| Operations: | | | | | | | | | | | | | | | | | | | | | | | | |
Net investment income (loss) | | $ | 395,319 | | | $ | 846,131 | | | $ | 914,426 | | | $ | 19,719 | | | $ | (29,706 | ) | | $ | 160,631 | |
Net realized gain (loss) | | | (96,808 | ) | | | 5,376,686 | | | | 8,052,288 | | | | (3,358,272 | ) | | | (7,216,687 | ) | | | (14,394,415 | ) |
Net change in unrealized appreciation (depreciation) | | | 8,564,790 | | | | 3,992,825 | | | | (4,262,072 | ) | | | 8,803,738 | | | | (3,055,667 | ) | | | 13,547,987 | |
| | | | | | | | | | | | | | | | | | | | | | | | |
Net increase (decrease) in net assets resulting from operations | | | 8,863,301 | | | | 10,215,642 | | | | 4,704,642 | | | | 5,465,185 | | | | (10,302,060 | ) | | | (685,797 | ) |
| | | | | | | | | | | | | | | | | | | | | | | | |
| | | | | | |
| Distributions to Shareholders from: | | | | | | | | | | | | | | | | | | | | | | | | |
Net investment income | | | (399,525 | ) | | | (1,101,515 | ) | | | (700,261 | ) | | | (24,419 | ) | | | (33,355 | ) | | | (204,998 | ) |
Net realized gains | | | — | | | | — | | | | — | | | | — | | | | — | | | | — | |
Return of capital | | | — | | | | — | | | | — | | | | — | | | | (44,284 | ) | | | — | |
| | | | | | | | | | | | | | | | | | | | | | | | |
Total distributions to shareholders | | | (399,525 | ) | | | (1,101,515 | ) | | | (700,261 | ) | | | (24,419 | ) | | | (77,639 | ) | | | (204,998 | ) |
| | | | | | | | | | | | | | | | | | | | | | | | |
| | | | | | |
| Shareholder Transactions: | | | | | | | | | | | | | | | | | | | | | | | | |
Proceeds from shares sold | | | 45,218,752 | | | | 30,925,031 | | | | 129,860,817 | | | | 38,175,819 | | | | 46,799,797 | | | | 30,659,258 | |
Value of shares repurchased | | | (18,351,655 | ) | | | (55,049,184 | ) | | | (95,999,049 | ) | | | (31,618,448 | ) | | | (40,629,050 | ) | | | (14,231,177 | ) |
| | | | | | | | | | | | | | | | | | | | | | | | |
Net increase (decrease) in net assets resulting from shares transactions | | | 26,867,097 | | | | (24,124,153 | ) | | | 33,861,768 | | | | 6,557,371 | | | | 6,170,747 | | | | 16,428,081 | |
| | | | | | | | | | | | | | | | | | | | | | | | |
Increase (Decrease) in Net Assets | | | 35,330,873 | | | | (15,010,026 | ) | | | 37,866,149 | | | | 11,998,137 | | | | (4,208,952 | ) | | | 15,537,286 | |
| | | | | | | | | | | | | | | | | | | | | | | | |
| | | | | | |
| Net Assets: | | | | | | | | | | | | | | | | | | | | | | | | |
Beginning of period | | | 54,349,719 | | | | 69,359,745 | | | | 31,493,596 | | | | 48,477,242 | | | | 52,686,194 | | | | 37,148,908 | |
| | | | | | | | | | | | | | | | | | | | | | | | |
End of period | | $ | 89,680,592 | | | $ | 54,349,719 | | | $ | 69,359,745 | | | $ | 60,475,379 | | | $ | 48,477,242 | | | $ | 52,686,194 | |
| | | | | | | | | | | | | | | | | | | | | | | | |
Undistributed net investment income (loss) at end of period | | $ | 245,675 | | | $ | 198,665 | | | $ | 454,049 | | | $ | 63,924 | | | $ | — | | | $ | 12,073 | |
| | | | | | | | | | | | | | | | | | | | | | | | |
| | | | | | |
| Changes in Shares Outstanding: | | | | | | | | | | | | | | | | | | | | | | | | |
Shares sold | | | 550,000 | | | | 450,000 | | | | 2,100,000 | | | | 2,350,000 | | | | 2,700,000 | | | | 2,000,000 | |
Shares repurchased | | | (250,000 | ) | | | (800,000 | ) | | | (1,550,000 | ) | | | (2,050,000 | ) | | | (2,450,000 | ) | | | (900,000 | ) |
Shares outstanding, beginning of period | | | 750,000 | | | | 1,100,000 | | | | 550,000 | | | | 3,400,000 | | | | 3,150,000 | | | | 2,050,000 | |
| | | | | | | | | | | | | | | | | | | | | | | | |
Shares outstanding, end of period | | | 1,050,000 | | | | 750,000 | | | | 1,100,000 | | | | 3,700,000 | | | | 3,400,000 | | | | 3,150,000 | |
| | | | | | | | | | | | | | | | | | | | | | | | |
See accompanying Notes to Financial Statements which are an integral part of the financial statements.
| | | | | | | | | | | | | | | | | | | | | | | | | | | | | | | | | | |
Invesco S&P SmallCap
Financials ETF (PSCF) | | | Invesco S&P SmallCap
Health Care ETF (PSCH) | | | Invesco S&P SmallCap
Industrials ETF (PSCI) | |
Ten Months Ended
August 31, 2018 | | | Year Ended
October 31, 2017 | | | Year Ended
October 31, 2016 | | | Ten Months Ended
August 31, 2018 | | | Year Ended
October 31, 2017 | | | Year Ended
October 31, 2016 | | | Ten Months Ended
August 31, 2018 | | | Year Ended
October 31, 2017 | | | Year Ended
October 31, 2016 | |
| | | | | | | | | | | | | | | | | | | | | | | | | | | | | | | | | | |
| $ | 4,438,052 | | | $ | 5,875,625 | | | $ | 5,111,044 | | | $ | (172,684 | ) | | $ | (79,934 | ) | | $ | 13,771 | | | $ | 622,281 | | | $ | 825,535 | | | $ | 460,257 | |
| | 20,306,836 | | | | 31,285,447 | | | | 10,100,019 | | | | 70,417,494 | | | | 13,214,608 | | | | 21,546,356 | | | | 6,532,607 | | | | 4,968,423 | | | | 3,950,099 | |
| | | | | | | | |
| | 2,970,336 | | | | 16,593,709 | | | | (2,235,856 | ) | | | 174,671,274 | | | | 47,344,189 | | | | (26,442,732 | ) | | | 16,602,277 | | | | 15,266,745 | | | | (1,722,069 | ) |
| | | | | | | | | | | | | | | | | | | | | | | | | | | | | | | | | | |
| | | | | | | | |
| | 27,715,224 | | | | 53,754,781 | | | | 12,975,207 | | | | 244,916,084 | | | | 60,478,863 | | | | (4,882,605 | ) | | | 23,757,165 | | | | 21,060,703 | | | | 2,688,287 | |
| | | | | | | | | | | | | | | | | | | | | | | | | | | | | | | | | | |
| | | | | | | | |
| | | | | | | | | | | | | | | | | | | | | | | | | | | | | | | | | | |
| | (3,619,319 | ) | | | (4,963,250 | ) | | | (5,304,095 | ) | | | — | | | | (47,751 | ) | | | — | | | | (571,956 | ) | | | (823,198 | ) | | | (476,137 | ) |
| | — | | | | (967,831 | ) | | | (338,778 | ) | | | — | | | | — | | | | — | | | | — | | | | — | | | | — | |
| | — | | | | — | | | | — | | | | — | | | | — | | | | — | | | | — | | | | — | | | | — | |
| | | | | | | | | | | | | | | | | | | | | | | | | | | | | | | | | | |
| | (3,619,319 | ) | | | (5,931,081 | ) | | | (5,642,873 | ) | | | — | | | | (47,751 | ) | | | — | | | | (571,956 | ) | | | (823,198 | ) | | | (476,137 | ) |
| | | | | | | | | | | | | | | | | | | | | | | | | | | | | | | | | | |
| | | | | | | | |
| | | | | | | | | | | | | | | | | | | | | | | | | | | | | | | | | | |
| | 52,796,123 | | | | 116,031,160 | | | | 61,415,237 | | | | 870,054,108 | | | | 62,939,784 | | | | 80,367,486 | | | | 51,182,877 | | | | 41,702,200 | | | | 24,256,729 | |
| | (64,697,993 | ) | | | (105,676,237 | ) | | | (54,297,695 | ) | | | (180,118,071 | ) | | | (53,239,975 | ) | | | (138,402,774 | ) | | | (19,577,737 | ) | | | (19,531,894 | ) | | | (40,070,787 | ) |
| | | | | | | | | | | | | | | | | | | | | | | | | | | | | | | | | | |
| | | | | | | | |
| | (11,901,870 | ) | | | 10,354,923 | | | | 7,117,542 | | | | 689,936,037 | | | | 9,699,809 | | | | (58,035,288 | ) | | | 31,605,140 | | | | 22,170,306 | | | | (15,814,058 | ) |
| | | | | | | | | | | | | | | | | | | | | | | | | | | | | | | | | | |
| | 12,194,035 | | | | 58,178,623 | | | | 14,449,876 | | | | 934,852,121 | | | | 70,130,921 | | | | (62,917,893 | ) | | | 54,790,349 | | | | 42,407,811 | | | | (13,601,908 | ) |
| | | | | | | | | | | | | | | | | | | | | | | | | | | | | | | | | | |
| | | | | | | | |
| | | | | | | | | | | | | | | | | | | | | | | | | | | | | | | | | | |
| | 254,975,153 | | | | 196,796,530 | | | | 182,346,654 | | | | 237,717,156 | | | | 167,586,235 | | | | 230,504,128 | | | | 99,414,334 | | | | 57,006,523 | | | | 70,608,431 | |
| | | | | | | | | | | | | | | | | | | | | | | | | | | | | | | | | | |
| $ | 267,169,188 | | | $ | 254,975,153 | | | $ | 196,796,530 | | | $ | 1,172,569,277 | | | $ | 237,717,156 | | | $ | 167,586,235 | | | $ | 154,204,683 | | | $ | 99,414,334 | | | $ | 57,006,523 | |
| | | | | | | | | | | | | | | | | | | | | | | | | | | | | | | | | | |
| | | | | | | | |
| $ | 2,275,159 | | | $ | 1,456,426 | | | $ | 545,760 | | | $ | (194,985 | ) | | $ | (110,134 | ) | | $ | (38,835 | ) | | $ | 132,201 | | | $ | 81,876 | | | $ | 79,539 | |
| | | | | | | | | | | | | | | | | | | | | | | | | | | | | | | | | | |
| | | | | | | | |
| | | | | | | | | | | | | | | | | | | | | | | | | | | | | | | | | | |
| | 950,000 | | | | 2,250,000 | | | | 1,500,000 | | | | 7,000,000 | | | | 750,000 | | | | 1,150,000 | | | | 750,000 | | | | 750,000 | | | | 550,000 | |
| | (1,200,000 | ) | | | (2,050,000 | ) | | | (1,300,000 | ) | | | (1,500,000 | ) | | | (650,000 | ) | | | (2,100,000 | ) | | | (300,000 | ) | | | (350,000 | ) | | | (900,000 | ) |
| | 4,700,000 | | | | 4,500,000 | | | | 4,300,000 | | | | 2,600,000 | | | | 2,500,000 | | | | 3,450,000 | | | | 1,600,000 | | | | 1,200,000 | | | | 1,550,000 | |
| | | | | | | | | | | | | | | | | | | | | | | | | | | | | | | | | | |
| | 4,450,000 | | | | 4,700,000 | | | | 4,500,000 | | | | 8,100,000 | | | | 2,600,000 | | | | 2,500,000 | | | | 2,050,000 | | | | 1,600,000 | | | | 1,200,000 | |
| | | | | | | | | | | | | | | | | | | | | | | | | | | | | | | | | | |
Statements of Changes in Net Assets (continued)
For the period November 1, 2017 through August 31, 2018 and years ended October 31, 2017 and 2016
| | | | | | | | | | | | | | | | | | | | | | | | |
| | | Invesco S&P SmallCap
Information Technology
ETF (PSCT) | | | Invesco S&P SmallCap
Materials ETF (PSCM) | |
| | | Ten Months Ended
August 31, 2018 | | | Year Ended
October 31, 2017 | | | Year Ended
October 31, 2016 | | | Ten Months Ended
August 31, 2018 | | | Year Ended
October 31, 2017 | | | Year Ended
October 31, 2016 | |
| Operations: | | | | | | | | | | | | | | | | | | | | | | | | |
Net investment income | | $ | 1,481,497 | | | $ | 1,398,712 | | | $ | 731,130 | | | $ | 294,725 | | | $ | 536,372 | | | $ | 123,842 | |
Net realized gain (loss) | | | 54,558,963 | | | | 94,429,501 | | | | 46,002,125 | | | | 2,843,768 | | | | 7,515,745 | | | | (1,484,386 | ) |
Net change in unrealized appreciation (depreciation) | | | (15,469,273 | ) | | | 60,462,587 | | | | 14,244,630 | | | | 442,622 | | | | 613,006 | | | | 2,856,477 | |
| | | | | | | | | | | | | | | | | | | | | | | | |
Net increase in net assets resulting from operations | | | 40,571,187 | | | | 156,290,800 | | | | 60,977,885 | | | | 3,581,115 | | | | 8,665,123 | | | | 1,495,933 | |
| | | | | | | | | | | | | | | | | | | | | | | | |
| | | | | | |
| Distributions to Shareholders from: | | | | | | | | | | | | | | | | | | | | | | | | |
Net investment income | | | (1,663,745 | ) | | | (1,151,080 | ) | | | (880,007 | ) | | | (272,639 | ) | | | (499,363 | ) | | | (122,745 | ) |
Net realized gains | | | — | | | | — | | | | — | | | | — | | | | — | | | | — | |
| | | | | | | | | | | | | | | | | | | | | | | | |
Total distributions to shareholders | | | (1,663,745 | ) | | | (1,151,080 | ) | | | (880,007 | ) | | | (272,639 | ) | | | (499,363 | ) | | | (122,745 | ) |
| | | | | | | | | | | | | | | | | | | | | | | | |
| | | | | | |
| Shareholder Transactions: | | | | | | | | | | | | | | | | | | | | | | | | |
Proceeds from shares sold | | | 88,536,701 | | | | 198,874,614 | | | | 249,989,678 | | | | 5,116,032 | | | | 84,882,052 | | | | 7,105,064 | |
Value of shares repurchased | | | (227,481,333 | ) | | | (286,466,093 | ) | | | (191,955,428 | ) | | | (26,269,680 | ) | | | (62,051,032 | ) | | | (1,372,670 | ) |
| | | | | | | | | | | | | | | | | | | | | | | | |
Net increase (decrease) in net assets resulting from shares transactions | | | (138,944,632 | ) | | | (87,591,479 | ) | | | 58,034,250 | | | | (21,153,648 | ) | | | 22,831,020 | | | | 5,732,394 | |
| | | | | | | | | | | | | | | | | | | | | | | | |
Increase (Decrease) in Net Assets | | | (100,037,190 | ) | | | 67,548,241 | | | | 118,132,128 | | | | (17,845,172 | ) | | | 30,996,780 | | | | 7,105,582 | |
| | | | | | | | | | | | | | | | | | | | | | | | |
| | | | | | |
| Net Assets: | | | | | | | | | | | | | | | | | | | | | | | | |
Beginning of period | | | 575,995,572 | | | | 508,447,331 | | | | 390,315,203 | | | | 48,410,915 | | | | 17,414,135 | | | | 10,308,553 | |
| | | | | | | | | | | | | | | | | | | | | | | | |
End of period | | $ | 475,958,382 | | | $ | 575,995,572 | | | $ | 508,447,331 | | | $ | 30,565,743 | | | $ | 48,410,915 | | | $ | 17,414,135 | |
| | | | | | | | | | | | | | | | | | | | | | | | |
Undistributed net investment income at end of period | | $ | 313,306 | | | $ | 495,554 | | | $ | 247,922 | | | $ | 82,972 | | | $ | 60,886 | | | $ | 23,877 | |
| | | | | | | | | | | | | | | | | | | | | | | | |
| | | | | | |
| Changes in Shares Outstanding: | | | | | | | | | | | | | | | | | | | | | | | | |
Shares sold | | | 1,100,000 | | | | 2,750,000 | | | | 4,300,000 | | | | 100,000 | | | | 1,800,000 | | | | 200,000 | |
Shares repurchased | | | (2,900,000 | ) | | | (3,950,000 | ) | | | (3,550,000 | ) | | | (500,000 | ) | | | (1,300,000 | ) | | | (50,000 | ) |
Shares outstanding, beginning of period | | | 7,100,000 | | | | 8,300,000 | | | | 7,550,000 | | | | 950,000 | | | | 450,000 | | | | 300,000 | |
| | | | | | | | | | | | | | | | | | | | | | | | |
Shares outstanding, end of period | | | 5,300,000 | | | | 7,100,000 | | | | 8,300,000 | | | | 550,000 | | | | 950,000 | | | | 450,000 | |
| | | | | | | | | | | | | | | | | | | | | | | | |
See accompanying Notes to Financial Statements which are an integral part of the financial statements.
| | | | | | | | | | |
Invesco S&P SmallCap
Utilities ETF (PSCU) | |
Ten Months Ended
August 31, 2018 | | | Year Ended
October 31, 2017 | | | Year Ended
October 31, 2016 | |
| | | | | | | | | | |
| $ | 1,099,915 | | | $ | 824,823 | | | $ | 2,295,765 | |
| | 239,103 | | | | 4,532,270 | | | | 13,648,376 | |
| | |
| | (318,630 | ) | | | 6,345,264 | | | | (4,788,469 | ) |
| | | | | | | | | | |
| | |
| | 1,020,388 | | | | 11,702,357 | | | | 11,155,672 | |
| | | | | | | | | | |
| | |
| | | | | | | | | | |
| | (1,199,988 | ) | | | (855,529 | ) | | | (2,016,277 | ) |
| | — | | | | (1,584,459 | ) | | | — | |
| | | | | | | | | | |
| | (1,199,988 | ) | | | (2,439,988 | ) | | | (2,016,277 | ) |
| | | | | | | | | | |
| | |
| | | | | | | | | | |
| | 31,729,169 | | | | 33,867,163 | | | | 130,908,237 | |
| | (23,055,601 | ) | | | (38,137,856 | ) | | | (132,039,699 | ) |
| | | | | | | | | | |
| | |
| | 8,673,568 | | | | (4,270,693 | ) | | | (1,131,462 | ) |
| | | | | | | | | | |
| | 8,493,968 | | | | 4,991,676 | | | | 8,007,933 | |
| | | | | | | | | | |
| | |
| | | | | | | | | | |
| | 52,886,983 | | | | 47,895,307 | | | | 39,887,374 | |
| | | | | | | | | | |
| $ | 61,380,951 | | | $ | 52,886,983 | | | $ | 47,895,307 | |
| | | | | | | | | | |
| | |
| $ | 337,301 | | | $ | 437,374 | | | $ | 371,420 | |
| | | | | | | | | | |
| | |
| | | | | | | | | | |
| | 600,000 | | | | 650,000 | | | | 3,000,000 | |
| | (450,000 | ) | | | (750,000 | ) | | | (2,900,000 | ) |
| | 950,000 | | | | 1,050,000 | | | | 950,000 | |
| | | | | | | | | | |
| | 1,100,000 | | | | 950,000 | | | | 1,050,000 | |
| | | | | | | | | | |
Financial Highlights
Invesco DWA Momentum & Low Volatility Rotation ETF (DWLV)
| | | | | | | | | | | | |
| | | Ten Months Ended
August 31, 2018 | | | Year Ended
October 31, 2017 | | | For the Period
July 11, 2016(a)
Through
October 31, 2016 | |
| Per Share Operating Performance: | | | | | | | | | | | | |
Net asset value at beginning of period | | $ | 30.51 | | | $ | 24.56 | | | $ | 25.47 | |
Net investment income(b) | | | 0.31 | | | | 0.39 | | | | 0.04 | |
Net realized and unrealized gain (loss) on investments | | | 3.67 | | | | 5.88 | | | | (0.94 | ) |
Total from investment operations | | | 3.98 | | | | 6.27 | | | | (0.90 | ) |
Distributions to shareholders from: | | | | | | | | | | | | |
Net investment income | | | (0.21 | ) | | | (0.32 | ) | | | (0.01 | ) |
Net asset value at end of period | | $ | 34.28 | | | $ | 30.51 | | | $ | 24.56 | |
Market price at end of period(c) | | $ | 34.27 | | | $ | 30.53 | | | $ | 24.57 | |
| Net Asset Value Total Return(d) | | | 13.12 | % | | | 25.73 | % | | | (3.53 | )%(e) |
| Market Price Total Return(d) | | | 13.01 | % | | | 25.76 | % | | | (3.49 | )%(e) |
| Ratios/Supplemental Data: | | | | | | | | | | | | |
Net assets at end of period (000’s omitted) | | $ | 46,278 | | | $ | 4,577 | | | $ | 11,052 | |
Ratio to average net assets of: | | | | | | | | | | | | |
Expenses(f) | | | 0.15 | %(g) | | | 0.15 | % | | | 0.15 | %(g) |
Net investment income | | | 1.16 | %(g) | | | 1.43 | % | | | 0.53 | %(g) |
Portfolio turnover rate(h) | | | 0 | % | | | 10 | % | | | 27 | % |
| (a) | Commencement of investment operations. |
| (b) | Based on average shares outstanding. |
| (c) | The mean between the last bid and ask prices. |
| (d) | Net asset value total return is calculated assuming an initial investment made at the net asset value at the beginning of the period, reinvestment of all dividends and distributions at net asset value during the period, and the redemption on the last day of the period. Net asset value total return includes adjustments in accordance with accounting principles generally accepted in the United States of America and as such, the net asset value for financial reporting purposes and the returns based upon those net asset values may differ from the net asset value and returns for shareholder transactions. Market price total return is calculated assuming an initial investment made at the market price at the beginning of the period, reinvestment of all dividends and distributions at market price during the period, and sale at the market price on the last day of the period. Total investment returns calculated for a period of less than one year are not annualized. |
| (e) | The net asset value total return from Fund Inception (July 14, 2016, the first day of trading on the Exchange) to October 31, 2016 was (3.84)%. The market price total return from Fund Inception to October 31, 2016 was (3.80)%. |
| (f) | In addition to the fees and expenses which the Fund bears directly, the Fund indirectly bears a pro rata share of the fees and expenses of the investment companies in which the Fund invests. Estimated investment companies’ expenses are not expenses that are incurred directly by the Fund. They are expenses that are incurred directly by the investment companies and are deducted from the value of the investment companies the Fund invests in. The effect of the estimated investment companies’ expenses that the Fund bears indirectly is included in the Fund’s total return. |
| (h) | Portfolio turnover rate is not annualized for periods less than one year, if applicable, and does not include securities received or delivered from processing creations or redemptions. |
See accompanying Notes to Financial Statements which are an integral part of the financial statements.
Financial Highlights (continued)
Invesco DWA SmallCap Momentum ETF (DWAS)
| | | | | | | | | | | | | | | | | | | | | | | | |
| | | Ten Months Ended
August 31, 2018 | | | Year Ended October 31, | |
| | | 2017 | | | 2016 | | | 2015 | | | 2014 | | | 2013 | |
| Per Share Operating Performance: | | | | | | | | | | | | | | | | | | | | | | | | |
Net asset value at beginning of period | | $ | 48.11 | | | $ | 35.42 | | | $ | 38.19 | | | $ | 38.24 | | | $ | 37.14 | | | $ | 25.87 | |
Net investment income (loss)(a) | | | (0.01 | ) | | | 0.14 | | | | 0.15 | | | | 0.02 | | | | 0.01 | | | | 0.04 | |
Net realized and unrealized gain (loss) on investments | | | 11.34 | | | | 12.71 | | | | (2.81 | ) | | | (0.04 | ) | | | 1.11 | | | | 11.50 | |
Total from investment operations | | | 11.33 | | | | 12.85 | | | | (2.66 | ) | | | (0.02 | ) | | | 1.12 | | | | 11.54 | |
Distributions to shareholders from: | | | | | | | | | | | | | | | | | | | | | | | | |
Net investment income | | | (0.10 | ) | | | (0.16 | ) | | | (0.11 | ) | | | (0.03 | ) | | | (0.01 | ) | | | (0.27 | ) |
Return of capital | | | — | | | | — | | | | — | | | | — | | | | (0.01 | ) | | | — | |
Total distributions | | | (0.10 | ) | | | (0.16 | ) | | | (0.11 | ) | | | (0.03 | ) | | | (0.02 | ) | | | (0.27 | ) |
Net asset value at end of period | | $ | 59.34 | | | $ | 48.11 | | | $ | 35.42 | | | $ | 38.19 | | | $ | 38.24 | | | $ | 37.14 | |
Market price at end of period(b) | | $ | 59.36 | | | $ | 48.16 | | | $ | 35.40 | | | $ | 38.18 | | | $ | 38.24 | | | $ | 37.22 | |
| Net Asset Value Total Return(c) | | | 23.60 | % | | | 36.38 | % | | | (6.97 | )% | | | (0.05 | )% | | | 3.03 | % | | | 44.98 | % |
| Market Price Total Return(c) | | | 23.51 | % | | | 36.60 | % | | | (7.00 | )% | | | (0.08 | )% | | | 2.80 | % | | | 45.69 | % |
| Ratios/Supplemental Data: | | | | | | | | | | | | | | | | | | | | | | | | |
Net assets at end of period (000’s omitted) | | $ | 453,972 | | | $ | 228,517 | | | $ | 155,857 | | | $ | 416,316 | | | $ | 292,517 | | | $ | 505,046 | |
Ratio to average net assets of: | | | | | | | | | | | | | | | | | | | | | | | | |
Expenses | | | 0.60 | %(e) | | | 0.60 | % | | | 0.60 | % | | | 0.60 | % | | | 0.60 | % | | | 0.60 | %(d) |
Net investment income (loss) | | | (0.02 | )%(e) | | | 0.34 | % | | | 0.41 | % | | | 0.06 | % | | | 0.04 | % | | | 0.10 | % |
Portfolio turnover rate(f) | | | 100 | % | | | 131 | % | | | 169 | % | | | 141 | % | | | 168 | % | | | 145 | % |
| (a) | Based on average shares outstanding. |
| (b) | The mean between the last bid and ask prices. |
| (c) | Net asset value total return is calculated assuming an initial investment made at the net asset value at the beginning of the period, reinvestment of all dividends and distributions at net asset value during the period, and the redemption on the last day of the period. Net asset value total return includes adjustments in accordance with accounting principles generally accepted in the United States of America and as such, the net asset value for financial reporting purposes and the returns based upon those net asset values may differ from the net asset value and returns for shareholder transactions. Market price total return is calculated assuming an initial investment made at the market price at the beginning of the period, reinvestment of all dividends and distributions at market price during the period, and sale at the market price on the last day of the period. Total investment returns calculated for a period of less than one year are not annualized. |
| (d) | In addition to the fees and expenses which the Fund bears directly, the Fund indirectly bears a pro rata share of the fees and expenses of the investment companies in which the Fund invests. Estimated investment companies’ expenses are not expenses that are incurred directly by the Fund. They are expenses that are incurred directly by the investment companies and are deducted from the value of the investment companies the Fund invests in. The effect of the estimated investment companies’ expenses that the Fund bears indirectly is included in the Fund’s total return. |
| (f) | Portfolio turnover rate is not annualized for periods less than one year, if applicable, and does not include securities received or delivered from processing creations or redemptions. |
See accompanying Notes to Financial Statements which are an integral part of the financial statements.
Financial Highlights (continued)
Invesco DWA Tactical Multi-Asset Income ETF (DWIN)
| | | | | | | | | | | | |
| | | Ten Months Ended
August 31, 2018 | | | Year Ended
October 31, 2017 | | | For the Period
March 7, 2016(a)
Through
October 31, 2016 | |
| Per Share Operating Performance: | | | | | | | | | | | | |
Net asset value at beginning of period | | $ | 27.07 | | | $ | 27.01 | | | $ | 25.09 | |
Net investment income(b) | | | 0.73 | (c) | | | 1.56 | | | | 0.84 | |
Net realized and unrealized gain (loss) on investments | | | (1.23 | ) | | | (0.25 | ) | | | 1.86 | |
Total from investment operations | | | (0.50 | ) | | | 1.31 | | | | 2.70 | |
Distributions to shareholders from: | | | | | | | | | | | | |
Net investment income | | | (1.04 | ) | | | (1.25 | ) | | | (0.78 | ) |
Net asset value at end of period | | $ | 25.53 | | | $ | 27.07 | | | $ | 27.01 | |
Market price at end of period(d) | | $ | 25.51 | | | $ | 27.07 | | | $ | 27.04 | |
| Net Asset Value Total Return(e) | | | (1.79 | )% | | | 4.87 | % | | | 10.80 | %(f) |
| Market Price Total Return(e) | | | (1.87 | )% | | | 4.74 | % | | | 10.92 | %(f) |
| Ratios/Supplemental Data: | | | | | | | | | | | | |
Net assets at end of period (000’s omitted) | | $ | 62,549 | | | $ | 112,348 | | | $ | 118,846 | |
Ratio to average net assets of: | | | | | | | | | | | | |
Expenses(g) | | | 0.25 | %(h) | | | 0.25 | % | | | 0.25 | %(h) |
Net investment income | | | 3.36 | %(c)(h) | | | 5.68 | % | | | 4.71 | %(h) |
Portfolio turnover rate(i) | | | 17 | % | | | 3 | % | | | 21 | % |
| (a) | Commencement of investment operations. |
| (b) | Based on average shares outstanding. |
| (c) | Net investment income per share and the ratio of net investment income to average net assets include a return of capital adjustment recorded during the period. Had this adjustment not been recorded, net investment income per share and the ratio of net investment income to average net assets would have been $1.28 and 5.88%, respectively. |
| (d) | The mean between the last bid and ask prices. |
| (e) | Net asset value total return is calculated assuming an initial investment made at the net asset value at the beginning of the period, reinvestment of all dividends and distributions at net asset value during the period, and the redemption on the last day of the period. Net asset value total return includes adjustments in accordance with accounting principles generally accepted in the United States of America and as such, the net asset value for financial reporting purposes and the returns based upon those net asset values may differ from the net asset value and returns for shareholder transactions. Market price total return is calculated assuming an initial investment made at the market price at the beginning of the period, reinvestment of all dividends and distributions at market price during the period, and sale at the market price on the last day of the period. Total investment returns calculated for a period of less than one year are not annualized. |
| (f) | The net asset value total return from Fund Inception (March 10, 2016, the first day of trading on the Exchange) to October 31, 2016 was 10.88%. The market price total return from Fund Inception to October 31, 2016 was 11.05%. |
| (g) | In addition to the fees and expenses which the Fund bears directly, the Fund indirectly bears a pro rata share of the fees and expenses of the investment companies in which the Fund invests. Estimated investment companies’ expenses are not expenses that are incurred directly by the Fund. They are expenses that are incurred directly by the investment companies and are deducted from the value of the investment companies the Fund invests in. The effect of the estimated investment companies’ expenses that the Fund bears indirectly is included in the Fund’s total return. |
| (i) | Portfolio turnover rate is not annualized for periods less than one year, if applicable, and does not include securities received or delivered from processing creations or redemptions. |
See accompanying Notes to Financial Statements which are an integral part of the financial statements.
Financial Highlights (continued)
Invesco DWA Tactical Sector Rotation ETF (DWTR)
| | | | | | | | | | | | | | | | |
| | | Ten Months Ended
August 31, 2018 | | | Year Ended October 31, | | | For the Period
October 7, 2015(a)
Through
October 31, 2015 | |
| | | 2017 | | | 2016 | |
| Per Share Operating Performance: | | | | | | | | | | | | | | | | |
Net asset value at beginning of period | | $ | 28.29 | | | $ | 24.24 | | | $ | 25.82 | | | $ | 25.17 | |
Net investment income (loss)(b) | | | 0.06 | | | | 0.20 | | | | 0.18 | | | | (0.00 | )(c) |
Net realized and unrealized gain (loss) on investments | | | 3.85 | | | | 4.02 | | | | (1.57 | ) | | | 0.65 | |
Total from investment operations | | | 3.91 | | | | 4.22 | | | | (1.39 | ) | | | 0.65 | |
Distributions to shareholders from: | | | | | | | | | | | | | | | | |
Net investment income | | | (0.08 | ) | | | (0.17 | ) | | | (0.19 | ) | | | — | |
Return of capital | | | — | | | | — | | | | (0.00 | )(c) | | | — | |
Total distributions | | | (0.08 | ) | | | (0.17 | ) | | | (0.19 | ) | | | — | |
Net asset value at end of period | | $ | 32.12 | | | $ | 28.29 | | | $ | 24.24 | | | $ | 25.82 | |
Market price at end of period(d) | | $ | 32.15 | | | $ | 28.28 | | | $ | 24.24 | | | $ | 25.84 | |
| Net Asset Value Total Return(e) | | | 13.84 | % | | | 17.50 | % | | | (5.40 | )% | | | 2.58 | %(f) |
| Market Price Total Return(e) | | | 13.99 | % | | | 17.46 | % | | | (5.47 | )% | | | 2.66 | %(f) |
| Ratios/Supplemental Data: | | | | | | | | | | | | | | | | |
Net assets at end of period (000’s omitted) | | $ | 88,319 | | | $ | 67,897 | | | $ | 172,121 | | | $ | 42,604 | |
Ratio to average net assets of: | | | | | | | | | | | | | | | | |
Expenses(g) | | | 0.15 | %(h) | | | 0.15 | % | | | 0.15 | % | | | 0.15 | %(h) |
Net investment income (loss) | | | 0.24 | %(h) | | | 0.78 | % | | | 0.75 | % | | | (0.15 | )%(h) |
Portfolio turnover rate(i) | | | 62 | % | | | 163 | % | | | 49 | % | | | 0 | %(j) |
| (a) | Commencement of investment operations |
| (b) | Based on average shares outstanding. |
| (c) | Amount represents less than $(0.005). |
| (d) | The mean between the last bid and ask prices. |
| (e) | Net asset value total return is calculated assuming an initial investment made at the net asset value at the beginning of the period, reinvestment of all dividends and distributions at net asset value during the period, and the redemption on the last day of the period. Net asset value total return includes adjustments in accordance with accounting principles generally accepted in the United States of America and as such, the net asset value for financial reporting purposes and the returns based upon those net asset values may differ from the net asset value and returns for shareholder transactions. Market price total return is calculated assuming an initial investment made at the market price at the beginning of the period, reinvestment of all dividends and distributions at market price during the period, and sale at the market price on the last day of the period. Total investment returns calculated for a period of less than one year are not annualized. |
| (f) | The net asset value total return from Fund Inception (October 9, 2015, the first day of trading on the exchange) to October 31, 2015 was 1.73%. The market price total return from Fund Inception to October 31, 2015 was 1.81%. |
| (g) | In addition to the fees and expenses which the Fund bears directly, the Fund indirectly bears a pro rata share of the fees and expenses of the investment companies in which the Fund invests. Estimated investment companies’ expenses are not expenses that are incurred directly by the Fund. They are expenses that are incurred directly by the investment companies and are deducted from the value of the investment companies the Fund invests in. The effect of the estimated investment companies’ expenses that the Fund bears indirectly is included in the Fund’s total return. |
| (i) | Portfolio turnover rate is not annualized for periods less than one year, if applicable, and does not include securities received or delivered from processing creations or redemptions. |
| (j) | Amount represents less than 0.5%. |
See accompanying Notes to Financial Statements which are an integral part of the financial statements.
Financial Highlights (continued)
Invesco S&P SmallCap Consumer Discretionary ETF (PSCD)
| | | | | | | | | | | | | | | | | | | | | | | | |
| | | Ten Months Ended
August 31, 2018 | | | Year Ended October 31, | |
| | | 2017 | | | 2016 | | | 2015 | | | 2014 | | | 2013 | |
| Per Share Operating Performance: | | | | | | | | | | | | | | | | | | | | | | | | |
Net asset value at beginning of period | | $ | 55.45 | | | $ | 46.40 | | | $ | 49.35 | | | $ | 47.26 | | | $ | 45.42 | | | $ | 32.18 | |
Net investment income(a) | | | 0.56 | | | | 0.66 | | | | 0.41 | | | | 0.50 | | | | 0.32 | | | | 0.40 | |
Net realized and unrealized gain (loss) on investments | | | 15.78 | | | | 9.12 | | | | (2.99 | ) | | | 2.10 | | | | 1.80 | | | | 13.25 | |
Total from investment operations | | | 16.34 | | | | 9.78 | | | | (2.58 | ) | | | 2.60 | | | | 2.12 | | | | 13.65 | |
Distributions to shareholders from: | | | | | | | | | | | | | | | | | | | | | | | | |
Net investment income | | | (0.47 | ) | | | (0.73 | ) | | | (0.37 | ) | | | (0.51 | ) | | | (0.28 | ) | | | (0.41 | ) |
Net asset value at end of period | | $ | 71.32 | | | $ | 55.45 | | | $ | 46.40 | | | $ | 49.35 | | | $ | 47.26 | | | $ | 45.42 | |
Market price at end of period(b) | | $ | 71.31 | | | $ | 55.51 | | | $ | 46.41 | | | $ | 49.37 | | | $ | 47.27 | | | $ | 45.52 | |
| Net Asset Value Total Return(c) | | | 29.58 | % | | | 21.15 | % | | | (5.23 | )% | | | 5.43 | % | | | 4.66 | % | | | 42.81 | % |
| Market Price Total Return(c) | | | 29.43 | % | | | 21.26 | % | | | (5.24 | )% | | | 5.45 | % | | | 4.45 | % | | | 43.13 | % |
| Ratios/Supplemental Data: | | | | | | | | | | | | | | | | | | | | | | | | |
Net assets at end of period (000’s omitted) | | $ | 92,718 | | | $ | 66,543 | | | $ | 74,235 | | | $ | 115,974 | | | $ | 92,148 | | | $ | 102,198 | |
Ratio to average net assets of: | | | | | | | | | | | | | | | | | | | | | | | | |
Expenses | | | 0.29 | %(d) | | | 0.29 | % | | | 0.29 | % | | | 0.29 | % | | | 0.29 | % | | | 0.30 | % |
Net investment income | | | 1.07 | %(d) | | | 1.25 | % | | | 0.86 | % | | | 0.96 | % | | | 0.69 | % | | | 1.04 | % |
Portfolio turnover rate(e) | | | 9 | % | | | 19 | % | | | 33 | % | | | 19 | % | | | 13 | % | | | 10 | % |
| (a) | Based on average shares outstanding. |
| (b) | The mean between the last bid and ask prices. |
| (c) | Net asset value total return is calculated assuming an initial investment made at the net asset value at the beginning of the period, reinvestment of all dividends and distributions at net asset value during the period, and the redemption on the last day of the period. Net asset value total return includes adjustments in accordance with accounting principles generally accepted in the United States of America and as such, the net asset value for financial reporting purposes and the returns based upon those net asset values may differ from the net asset value and returns for shareholder transactions. Market price total return is calculated assuming an initial investment made at the market price at the beginning of the period, reinvestment of all dividends and distributions at market price during the period, and sale at the market price on the last day of the period. Total investment returns calculated for a period of less than one year are not annualized. |
| (e) | Portfolio turnover rate is not annualized for periods less than one year, if applicable, and does not include securities received or delivered from processing creations or redemptions. |
Invesco S&P SmallCap Consumer Staples ETF (PSCC)
| | | | | | | | | | | | | | | | | | | | | | | | |
| | | Ten Months Ended
August 31, 2018 | | | Year Ended October 31, | |
| | | 2017 | | | 2016 | | | 2015 | | | 2014 | | | 2013 | |
| Per Share Operating Performance: | | | | | | | | | | | | | | | | | | | | | | | | |
Net asset value at beginning of period | | $ | 72.47 | | | $ | 63.05 | | | $ | 57.26 | | | $ | 53.83 | | | $ | 48.58 | | | $ | 34.23 | |
Net investment income(a) | | | 0.56 | | | | 0.94 | | | | 0.90 | | | | 0.61 | | | | 0.28 | | | | 0.28 | |
Net realized and unrealized gain on investments | | | 12.91 | | | | 9.64 | | | | 5.75 | | | | 3.88 | | | | 5.21 | | | | 14.31 | |
Total from investment operations | | | 13.47 | | | | 10.58 | | | | 6.65 | | | | 4.49 | | | | 5.49 | | | | 14.59 | |
Distributions to shareholders from: | | | | | | | | | | | | | | | | | | | | | | | | |
Net investment income | | | (0.53 | ) | | | (1.16 | ) | | | (0.86 | ) | | | (0.36 | ) | | | (0.24 | ) | | | (0.24 | ) |
Net realized gains | | | — | | | | — | | | | — | | | | (0.70 | ) | | | — | | | | — | |
Total distributions | | | (0.53 | ) | | | (1.16 | ) | | | (0.86 | ) | | | (1.06 | ) | | | (0.24 | ) | | | (0.24 | ) |
Net asset value at end of period | | $ | 85.41 | | | $ | 72.47 | | | $ | 63.05 | | | $ | 57.26 | | | $ | 53.83 | | | $ | 48.58 | |
Market price at end of period(b) | | $ | 85.34 | | | $ | 72.54 | | | $ | 62.99 | | | $ | 57.31 | | | $ | 53.82 | | | $ | 48.68 | |
| Net Asset Value Total Return(c) | | | 18.70 | % | | | 16.88 | % | | | 11.79 | % | | | 8.43 | % | | | 11.34 | % | | | 42.83 | % |
| Market Price Total Return(c) | | | 18.49 | % | | | 17.11 | % | | | 11.59 | % | | | 8.54 | % | | | 11.08 | % | | | 43.51 | % |
| Ratios/Supplemental Data: | | | | | | | | | | | | | | | | | | | | | | | | |
Net assets at end of period (000’s omitted) | | $ | 89,681 | | | $ | 54,350 | | | $ | 69,360 | | | $ | 31,494 | | | $ | 32,295 | | | $ | 46,151 | |
Ratio to average net assets of: | | | | | | | | | | | | | | | | | | | | | | | | |
Expenses | | | 0.29 | %(d) | | | 0.29 | % | | | 0.29 | % | | | 0.29 | % | | | 0.29 | % | | | 0.30 | % |
Net investment income | | | 0.89 | %(d) | | | 1.38 | % | | | 1.46 | % | | | 1.11 | % | | | 0.57 | % | | | 0.69 | % |
Portfolio turnover rate(e) | | | 42 | % | | | 62 | % | | | 68 | % | | | 39 | % | | | 33 | % | | | 23 | % |
| (a) | Based on average shares outstanding. |
| (b) | The mean between the last bid and ask price. |
| (c) | Net asset value total return is calculated assuming an initial investment made at the net asset value at the beginning of the period, reinvestment of all dividends and distributions at net asset value during the period, and the redemption on the last day of the period. Net asset value total return includes adjustments in accordance with accounting principles generally accepted in the United States of America and as such, the net asset value for financial reporting purposes and the returns based upon those net asset values may differ from the net asset value and returns for shareholder transactions. Market price total return is calculated assuming an initial investment made at the market price at the beginning of the period, reinvestment of all dividends and distributions at market price during the period, and sale at the market price on the last day of the period. Total investment returns calculated for a period of less than one year are not annualized. |
| (e) | Portfolio turnover rate is not annualized for periods less than one year, if applicable, and does not include securities received or delivered from processing creations or redemptions. |
See accompanying Notes to Financial Statements which are an integral part of the financial statements.
Financial Highlights (continued)
Invesco S&P SmallCap Energy ETF (PSCE)
| | | | | | | | | | | | | | | | | | | | | | | | |
| | | Ten Months Ended
August 31, 2018 | | | Year Ended October 31, | |
| | | 2017 | | | 2016 | | | 2015 | | | 2014 | | | 2013 | |
| Per Share Operating Performance: | | | | | | | | | | | | | | | | | | | | | | | | |
Net asset value at beginning of period | | $ | 14.26 | | | $ | 16.73 | | | $ | 18.12 | | | $ | 37.85 | | | $ | 48.28 | | | $ | 32.77 | |
Net investment income (loss)(a) | | | 0.00 | (b) | | | (0.01 | ) | | | 0.06 | | | | 0.14 | | | | 0.04 | | | | 0.29 | |
Net realized and unrealized gain (loss) on investments | | | 2.09 | | | | (2.44 | ) | | | (1.36 | ) | | | (19.74 | ) | | | (10.45 | ) | | | 15.47 | |
Total from investment operations | | | 2.09 | | | | (2.45 | ) | | | (1.30 | ) | | | (19.60 | ) | | | (10.41 | ) | | | 15.76 | |
Distributions to shareholders from: | | | | | | | | | | | | | | | | | | | | | | | | |
Net investment income | | | (0.01 | ) | | | (0.01 | ) | | | (0.09 | ) | | | (0.13 | ) | | | (0.02 | ) | | | (0.25 | ) |
Return of capital | | | — | | | | (0.01 | ) | | | — | | | | — | | | | (0.00 | )(b) | | | — | |
Total distributions | | | (0.01 | ) | | | (0.02 | ) | | | (0.09 | ) | | | (0.13 | ) | | | (0.02 | ) | | | (0.25 | ) |
Net asset value at end of period | | $ | 16.34 | | | $ | 14.26 | | | $ | 16.73 | | | $ | 18.12 | | | $ | 37.85 | | | $ | 48.28 | |
Market price at end of period(c) | | $ | 16.33 | | | $ | 14.30 | | | $ | 16.75 | | | $ | 18.13 | | | $ | 37.84 | | | $ | 48.42 | |
| Net Asset Value Total Return(d) | | | 14.64 | % | | | (14.69 | )% | | | (7.11 | )% | | | (51.89 | )% | | | (21.57 | )% | | | 48.41 | % |
| Market Price Total Return(d) | | | 14.25 | % | | | (14.55 | )% | | | (7.05 | )% | | | (51.85 | )% | | | (21.82 | )% | | | 49.07 | % |
| Ratios/Supplemental Data: | | | | | | | | | | | | | | | | | | | | | | | | |
Net assets at end of period (000’s omitted) | | $ | 60,475 | | | $ | 48,477 | | | $ | 52,686 | | | $ | 37,149 | | | $ | 30,281 | | | $ | 48,279 | |
Ratio to average net assets of: | | | | | | | | | | | | | | | | | | | | | | | | |
Expenses | | | 0.29 | %(e) | | | 0.29 | % | | | 0.29 | % | | | 0.29 | % | | | 0.29 | % | | | 0.29 | % |
Net investment income (loss) | | | 0.04 | %(e) | | | (0.05 | )% | | | 0.38 | % | | | 0.57 | % | | | 0.07 | % | | | 0.74 | % |
Portfolio turnover rate(f) | | | 40 | % | | | 39 | % | | | 21 | % | | | 38 | % | | | 27 | % | | | 38 | % |
| (a) | Based on average shares outstanding. |
| (b) | Amount represents less than $0.005. |
| (c) | The mean between the last bid and ask price. |
| (d) | Net asset value total return is calculated assuming an initial investment made at the net asset value at the beginning of the period, reinvestment of all dividends and distributions at net asset value during the period, and the redemption on the last day of the period. Net asset value total return includes adjustments in accordance with accounting principles generally accepted in the United States of America and as such, the net asset value for financial reporting purposes and the returns based upon those net asset values may differ from the net asset value and returns for shareholder transactions. Market price total return is calculated assuming an initial investment made at the market price at the beginning of the period, reinvestment of all dividends and distributions at market price during the period, and sale at the market price on the last day of the period. Total investment returns calculated for a period of less than one year are not annualized. |
| (f) | Portfolio turnover rate is not annualized for periods less than one year, if applicable, and does not include securities received or delivered from processing creations or redemptions. |
See accompanying Notes to Financial Statements which are an integral part of the financial statements.
Financial Highlights (continued)
Invesco S&P SmallCap Financials ETF (PSCF)
| | | | | | | | | | | | | | | | | | | | | | | | |
| | | Ten Months Ended
August 31, 2018 | | | Year Ended October 31, | |
| | | 2017 | | | 2016 | | | 2015 | | | 2014 | | | 2013 | |
| Per Share Operating Performance: | | | | | | | | | | | | | | | | | | | | | | | | |
Net asset value at beginning of period | | $ | 54.25 | | | $ | 43.73 | | | $ | 42.41 | | | $ | 40.98 | | | $ | 38.42 | | | $ | 30.41 | |
Net investment income(a) | | | 1.05 | | | | 1.25 | | | | 1.14 | | | | 0.98 | | | | 0.89 | | | | 0.88 | |
Net realized and unrealized gain on investments | | | 5.63 | | | | 10.58 | | | | 1.44 | | | | 1.32 | | | | 2.67 | | | | 8.14 | |
Total from investment operations | | | 6.68 | | | | 11.83 | | | | 2.58 | | | | 2.30 | | | | 3.56 | | | | 9.02 | |
Distributions to shareholders from: | | | | | | | | | | | | | | | | | | | | | | | | |
Net investment income | | | (0.89 | ) | | | (1.09 | ) | | | (1.18 | ) | | | (0.87 | ) | | | (0.97 | ) | | | (1.01 | ) |
Net realized gains | | | — | | | | (0.22 | ) | | | (0.08 | ) | | | — | | | | (0.03 | ) | | | — | |
Total distributions | | | (0.89 | ) | | | (1.31 | ) | | | (1.26 | ) | | | (0.87 | ) | | | (1.00 | ) | | | (1.01 | ) |
Net asset value at end of period | | $ | 60.04 | | | $ | 54.25 | | | $ | 43.73 | | | $ | 42.41 | | | $ | 40.98 | | | $ | 38.42 | |
Market price at end of period(b) | | $ | 60.09 | | | $ | 54.31 | | | $ | 43.73 | | | $ | 42.45 | | | $ | 40.97 | | | $ | 38.50 | |
| Net Asset Value Total Return(c) | | | 12.44 | % | | | 27.23 | % | | | 6.29 | % | | | 5.68 | % | | | 9.40 | % | | | 30.26 | % |
| Market Price Total Return(c) | | | 12.41 | % | | | 27.37 | % | | | 6.19 | % | | | 5.80 | % | | | 9.14 | % | | | 30.62 | % |
| Ratios/Supplemental Data: | | | | | | | | | | | | | | | | | | | | | | | | |
Net assets at end of period (000’s omitted) | | $ | 267,169 | | | $ | 254,975 | | | $ | 196,797 | | | $ | 182,347 | | | $ | 114,753 | | | $ | 97,969 | |
Ratio to average net assets of: | | | | | | | | | | | | | | | | | | | | | | | | |
Expenses | | | 0.29 | %(e) | | | 0.29 | % | | | 0.29 | % | | | 0.29 | %(d) | | | 0.29 | %(d) | | | 0.30 | %(d) |
Net investment income | | | 2.26 | %(e) | | | 2.44 | % | | | 2.73 | % | | | 2.38 | % | | | 2.31 | % | | | 2.56 | % |
Portfolio turnover rate(f) | | | 17 | % | | | 21 | % | | | 16 | % | | | 16 | % | | | 16 | % | | | 24 | % |
| (a) | Based on average shares outstanding. |
| (b) | The mean between the last bid and ask prices. |
| (c) | Net asset value total return is calculated assuming an initial investment made at the net asset value at the beginning of the period, reinvestment of all dividends and distributions at net asset value during the period, and the redemption on the last day of the period. Net asset value total return includes adjustments in accordance with accounting principles generally accepted in the United States of America and as such, the net asset value for financial reporting purposes and the returns based upon those net asset values may differ from the net asset value and returns for shareholder transactions. Market price total return is calculated assuming an initial investment made at the market price at the beginning of the period, reinvestment of all dividends and distributions at market price during the period, and sale at the market price on the last day of the period. Total investment returns calculated for a period of less than one year are not annualized. |
| (d) | In addition to the fees and expenses which the Fund bears directly, the Fund indirectly bears a pro rata share of the fees and expenses of the investment companies in which the Fund invests. Estimated investment companies’ expenses are not expenses that are incurred directly by the Fund. They are expenses that are incurred directly by the investment companies and are deducted from the value of the investment companies the Fund invests in. The effect of the estimated investment companies’ expenses that the Fund bears indirectly is included in the Fund’s total return. |
| (f) | Portfolio turnover rate is not annualized for periods less than one year, if applicable, and does not include securities received or delivered from processing creations or redemptions. |
See accompanying Notes to Financial Statements which are an integral part of the financial statements.
Financial Highlights (continued)
Invesco S&P SmallCap Health Care ETF (PSCH)
| | | | | | | | | | | | | | | | | | | | | | | | |
| | | Ten Months Ended
August 31, 2018 | | | Year Ended October 31, | |
| | | 2017 | | | 2016 | | | 2015 | | | 2014 | | | 2013 | |
| Per Share Operating Performance: | | | | | | | | | | | | | | | | | | | | | | | | |
Net asset value at beginning of period | | $ | 91.43 | | | $ | 67.03 | | | $ | 66.81 | | | $ | 60.07 | | | $ | 50.90 | | | $ | 34.33 | |
Net investment income (loss)(a) | | | (0.04 | ) | | | (0.03 | ) | | | 0.00 | (b) | | | (0.01 | ) | | | 0.04 | | | | 0.15 | |
Net realized and unrealized gain on investments | | | 53.37 | | | | 24.45 | | | | 0.22 | | | | 8.22 | | | | 9.17 | | | | 16.56 | |
Total from investment operations | | | 53.33 | | | | 24.42 | | | | 0.22 | | | | 8.21 | | | | 9.21 | | | | 16.71 | |
Distributions to shareholders from: | | | | | | | | | | | | | | | | | | | | | | | | |
Net investment income | | | — | | | | (0.02 | ) | | | — | | | | (0.03 | ) | | | (0.04 | ) | | | (0.14 | ) |
Net realized gains | | | — | | | | — | | | | — | | | | (1.44 | ) | | | — | | | | — | |
Total distributions | | | — | | | | (0.02 | ) | | | — | | | | (1.47 | ) | | | (0.04 | ) | | | (0.14 | ) |
Net asset value at end of period | | $ | 144.76 | | | $ | 91.43 | | | $ | 67.03 | | | $ | 66.81 | | | $ | 60.07 | | | $ | 50.90 | |
Market price at end of period(c) | | $ | 144.99 | | | $ | 91.58 | | | $ | 67.00 | | | $ | 66.86 | | | $ | 60.03 | | | $ | 50.99 | |
| Net Asset Value Total Return(d) | | | 58.32 | % | | | 36.44 | % | | | 0.33 | % | | | 13.96 | % | | | 18.10 | % | | | 48.85 | % |
| Market Price Total Return(d) | | | 58.31 | % | | | 36.72 | % | | | 0.21 | % | | | 14.12 | % | | | 17.81 | % | | | 49.25 | % |
| Ratios/Supplemental Data: | | | | | | | | | | | | | | | | | | | | | | | | |
Net assets at end of period (000’s omitted) | | $ | 1,172,569 | | | $ | 237,717 | | | $ | 167,586 | | | $ | 230,504 | | | $ | 165,200 | | �� | $ | 178,164 | |
Ratio to average net assets of: | | | | | | | | | | | | | | | | | | | | | | | | |
Expenses | | | 0.29 | %(e) | | | 0.29 | % | | | 0.29 | % | | | 0.29 | % | | | 0.29 | % | | | 0.30 | % |
Net investment income (loss) | | | (0.04 | )%(e) | | | (0.04 | )% | | | 0.01 | % | | | (0.02 | )% | | | 0.08 | % | | | 0.35 | % |
Portfolio turnover rate(f) | | | 20 | % | | | 19 | % | | | 23 | % | | | 22 | % | | | 27 | % | | | 16 | % |
| (a) | Based on average shares outstanding. |
| (b) | Amount represents less than $0.005. |
| (c) | The mean between the last bid and ask prices. |
| (d) | Net asset value total return is calculated assuming an initial investment made at the net asset value at the beginning of the period, reinvestment of all dividends and distributions at net asset value during the period, and the redemption on the last day of the period. Net asset value total return includes adjustments in accordance with accounting principles generally accepted in the United States of America and as such, the net asset value for financial reporting purposes and the returns based upon those net asset values may differ from the net asset value and returns for shareholder transactions. Market price total return is calculated assuming an initial investment made at the market price at the beginning of the period, reinvestment of all dividends and distributions at market price during the period, and sale at the market price on the last day of the period. Total investment returns calculated for a period of less than one year are not annualized. |
| (f) | Portfolio turnover rate is not annualized for periods less than one year, if applicable, and does not include securities received or delivered from processing creations or redemptions. |
Invesco S&P SmallCap Industrials ETF (PSCI)
| | | | | | | | | | | | | | | | | | | | | | | | |
| | | Ten Months Ended
August 31, 2018 | | | Year Ended October 31, | |
| | | 2017 | | | 2016 | | | 2015 | | | 2014 | | | 2013 | |
| Per Share Operating Performance: | | | | | | | | | | | | | | | | | | | | | | | | |
Net asset value at beginning of period | | $ | 62.13 | | | $ | 47.51 | | | $ | 45.55 | | | $ | 44.89 | | | $ | 42.30 | | | $ | 30.61 | |
Net investment income(a) | | | 0.36 | | | | 0.53 | | | | 0.34 | | | | 0.45 | | | | 0.34 | | | | 0.32 | |
Net realized and unrealized gain on investments | | | 13.07 | | | | 14.62 | | | | 1.96 | | | | 0.68 | | | | 2.57 | | | | 11.97 | |
Total from investment operations | | | 13.43 | | | | 15.15 | | | | 2.30 | | | | 1.13 | | | | 2.91 | | | | 12.29 | |
Distributions to shareholders from: | | | | | | | | | | | | | | | | | | | | | | | | |
Net investment income | | | (0.34 | ) | | | (0.53 | ) | | | (0.34 | ) | | | (0.47 | ) | | | (0.32 | ) | | | (0.60 | ) |
Net asset value at end of period | | $ | 75.22 | | | $ | 62.13 | | | $ | 47.51 | | | $ | 45.55 | | | $ | 44.89 | | | $ | 42.30 | |
Market price at end of period(b) | | $ | 75.25 | | | $ | 62.21 | | | $ | 47.42 | | | $ | 45.57 | | | $ | 44.83 | | | $ | 42.38 | |
| Net Asset Value Total Return(c) | | | 21.69 | % | | | 32.00 | % | | | 5.10 | % | | | 2.51 | % | | | 6.87 | % | | | 40.72 | % |
| Market Price Total Return(c) | | | 21.59 | % | | | 32.42 | % | | | 4.86 | % | | | 2.69 | % | | | 6.53 | % | | | 41.27 | % |
| Ratios/Supplemental Data: | | | | | | | | | | | | | | | | | | | | | | | | |
Net assets at end of period (000’s omitted) | | $ | 154,205 | | | $ | 99,414 | | | $ | 57,007 | | | $ | 70,608 | | | $ | 100,998 | | | $ | 74,027 | |
Ratio to average net assets of: | | | | | | | | | | | | | | | | | | | | | | | | |
Expenses | | | 0.29 | %(d) | | | 0.29 | % | | | 0.29 | % | | | 0.29 | % | | | 0.29 | % | | | 0.30 | % |
Net investment income | | | 0.66 | %(d) | | | 0.94 | % | | | 0.75 | % | | | 0.98 | % | | | 0.78 | % | | | 0.88 | % |
Portfolio turnover rate(e) | | | 2 | % | | | 7 | % | | | 16 | % | | | 11 | % | | | 15 | % | | | 30 | % |
| (a) | Based on average shares outstanding. |
| (b) | The mean between the last bid and ask price. |
| (c) | Net asset value total return is calculated assuming an initial investment made at the net asset value at the beginning of the period, reinvestment of all dividends and distributions at net asset value during the period, and the redemption on the last day of the period. Net asset value total return includes adjustments in accordance with accounting principles generally accepted in the United States of America and as such, the net asset value for financial reporting purposes and the returns based upon those net asset values may differ from the net asset value and returns for shareholder transactions. Market price total return is calculated assuming an initial investment made at the market price at the beginning of the period, reinvestment of all dividends and distributions at market price during the period, and sale at the market price on the last day of the period. Total investment returns calculated for a period of less than one year are not annualized. |
| (e) | Portfolio turnover rate is not annualized for periods less than one year, if applicable, and does not include securities received or delivered from processing creations or redemptions. |
See accompanying Notes to Financial Statements which are an integral part of the financial statements.
Financial Highlights (continued)
Invesco S&P SmallCap Information Technology ETF (PSCT)
| | | | | | | | | | | | | | | | | | | | | | | | |
| | | Ten Months Ended
August 31, 2018 | | | Year Ended October 31, | |
| | | 2017 | | | 2016 | | | 2015 | | | 2014 | | | 2013 | |
| Per Share Operating Performance: | | | | | | | | | | | | | | | | | | | | | | | | |
Net asset value at beginning of period | | $ | 81.13 | | | $ | 61.26 | | | $ | 51.70 | | | $ | 48.02 | | | $ | 41.59 | | | $ | 29.62 | |
Net investment income(a) | | | 0.27 | | | | 0.19 | | | | 0.10 | | | | 0.08 | | | | 0.09 | | | | 0.08 | |
Net realized and unrealized gain on investments | | | 8.69 | | | | 19.83 | | | | 9.58 | | | | 3.64 | | | | 6.43 | | | | 12.21 | |
Total from investment operations | | | 8.96 | | | | 20.02 | | | | 9.68 | | | | 3.72 | | | | 6.52 | | | | 12.29 | |
Distributions to shareholders from: | | | | | | | | | | | | | | | | | | | | | | | | |
Net investment income | | | (0.29 | ) | | | (0.15 | ) | | | (0.12 | ) | | | (0.04 | ) | | | (0.09 | ) | | | (0.32 | ) |
Net asset value at end of period | | $ | 89.80 | | | $ | 81.13 | | | $ | 61.26 | | | $ | 51.70 | | | $ | 48.02 | | | $ | 41.59 | |
Market price at end of
period(b) | | $ | 89.71 | | | $ | 81.23 | | | $ | 61.28 | | | $ | 51.77 | | | $ | 48.01 | | | $ | 41.67 | |
Net Asset Value Total
Return(c) | | | 11.09 | % | | | 32.71 | % | | | 18.75 | % | | | 7.75 | % | | | 15.69 | % | | | 41.86 | % |
| Market Price Total Return(c) | | | 10.85 | % | | | 32.84 | % | | | 18.63 | % | | | 7.92 | % | | | 15.44 | % | | | 42.28 | % |
| Ratios/Supplemental Data: | | | | | | | | | | | | | | | | | | | | | | | | |
Net assets at end of period (000’s omitted) | | $ | 475,958 | | | $ | 575,996 | | | $ | 508,447 | | | $ | 390,315 | | | $ | 225,700 | | | $ | 210,018 | |
Ratio to average net assets of: | | | | | | | | | | | | | | | | | | | | | | | | |
Expenses | | | 0.29 | %(d) | | | 0.29 | % | | | 0.29 | % | | | 0.29 | % | | | 0.29 | % | | | 0.29 | % |
Net investment income | | | 0.40 | %(d) | | | 0.26 | % | | | 0.18 | % | | | 0.16 | % | | | 0.21 | % | | | 0.23 | % |
Portfolio turnover rate(e) | | | 15 | % | | | 16 | % | | | 15 | % | | | 15 | % | | | 10 | % | | | 17 | % |
| (a) | Based on average shares outstanding. |
| (b) | The mean between the last bid and ask price. |
| (c) | Net asset value total return is calculated assuming an initial investment made at the net asset value at the beginning of the period, reinvestment of all dividends and distributions at net asset value during the period, and the redemption on the last day of the period. Net asset value total return includes adjustments in accordance with accounting principles generally accepted in the United States of America and as such, the net asset value for financial reporting purposes and the returns based upon those net asset values may differ from the net asset value and returns for shareholder transactions. Market price total return is calculated assuming an initial investment made at the market price at the beginning of the period, reinvestment of all dividends and distributions at market price during the period, and sale at the market price on the last day of the period. Total investment returns calculated for a period of less than one year are not annualized. |
| (e) | Portfolio turnover rate is not annualized for periods less than one year, if applicable, and does not include securities received or delivered from processing creations or redemptions. |
Invesco S&P SmallCap Materials ETF (PSCM)
| | | | | | | | | | | | | | | | | | | | | | | | |
| | | Ten Months Ended
August 31, 2018 | | | Year Ended October 31, | |
| | | 2017 | | | 2016 | | | 2015 | | | 2014 | | | 2013 | |
| Per Share Operating Performance: | | | | | | | | | | | | | | | | | | | | | | | | |
Net asset value at beginning of period | | $ | 50.96 | | | $ | 38.70 | | | $ | 34.36 | | | $ | 43.97 | | | $ | 40.34 | | | $ | 30.23 | |
Net investment income(a) | | | 0.40 | | | | 0.41 | | | | 0.35 | | | | 0.35 | | | | 0.28 | | | | 0.32 | |
Net realized and unrealized gain (loss) on investments | | | 4.54 | | | | 12.19 | | | | 4.36 | | | | (9.50 | ) | | | 3.58 | | | | 10.18 | |
Total from investment operations | | | 4.94 | | | | 12.60 | | | | 4.71 | | | | (9.15 | ) | | | 3.86 | | | | 10.50 | |
Distributions to shareholders from: | | | | | | | | | | | | | | | | | | | | | | | | |
Net investment income | | | (0.33 | ) | | | (0.34 | ) | | | (0.37 | ) | | | (0.46 | ) | | | (0.23 | ) | | | (0.39 | ) |
Net asset value at end of period | | $ | 55.57 | | | $ | 50.96 | | | $ | 38.70 | | | $ | 34.36 | | | $ | 43.97 | | | $ | 40.34 | |
Market price at end of period(b) | | $ | 55.57 | | | $ | 51.00 | | | $ | 38.77 | | | $ | 34.37 | | | $ | 43.95 | | | $ | 40.42 | |
| Net Asset Value Total Return(c) | | | 9.73 | % | | | 32.62 | % | | | 13.89 | % | | | (20.94 | )% | | | 9.56 | % | | | 35.00 | % |
| Market Price Total Return(c) | | | 9.65 | % | | | 32.48 | % | | | 14.07 | % | | | (20.88 | )% | | | 9.30 | % | | | 35.31 | % |
| Ratios/Supplemental Data: | | | | | | | | | | | | | | | | | | | | | | | | |
Net assets at end of period (000’s omitted) | | $ | 30,566 | | | $ | 48,411 | | | $ | 17,414 | | | $ | 10,309 | | | $ | 50,564 | | | $ | 18,154 | |
Ratio to average net assets of: | | | | | | | | | | | | | | | | | | | | | | | | |
Expenses | | | 0.29 | %(d) | | | 0.29 | % | | | 0.29 | % | | | 0.29 | % | | | 0.29 | % | | | 0.30 | % |
Net investment income | | | 0.91 | %(d) | | | 0.87 | % | | | 1.01 | % | | | 0.87 | % | | | 0.63 | % | | | 0.91 | % |
Portfolio turnover rate(e) | | | 9 | % | | | 21 | % | | | 16 | % | | | 17 | % | | | 12 | % | | | 15 | % |
| (a) | Based on average shares outstanding. |
| (b) | The mean between the last bid and ask price. |
| (c) | Net asset value total return is calculated assuming an initial investment made at the net asset value at the beginning of the period, reinvestment of all dividends and distributions at net asset value during the period, and the redemption on the last day of the period. Net asset value total return includes adjustments in accordance with accounting principles generally accepted in the United States of America and as such, the net asset value for financial reporting purposes and the returns based upon those net asset values may differ from the net asset value and returns for shareholder transactions. Market price total return is calculated assuming an initial investment made at the market price at the beginning of the period, reinvestment of all dividends and distributions at market price during the period, and sale at the market price on the last day of the period. Total investment returns calculated for a period of less than one year are not annualized. |
| (e) | Portfolio turnover rate is not annualized for periods less than one year, if applicable, and does not include securities received or delivered from processing creations or redemptions. |
See accompanying Notes to Financial Statements which are an integral part of the financial statements.
Financial Highlights (continued)
Invesco S&P SmallCap Utilities ETF (PSCU)
| | | | | | | | | | | | | | | | | | | | | | | | |
| | | Ten Months Ended
August 31, 2018 | | | Year Ended October 31, | |
| | | 2017 | | | 2016 | | | 2015 | | | 2014 | | | 2013 | |
| Per Share Operating Performance: | | | | | | | | | | | | | | | | | | | | | | | | |
Net asset value at beginning of period | | $ | 55.67 | | | $ | 45.61 | | | $ | 41.99 | | | $ | 38.34 | | | $ | 34.29 | | | $ | 31.10 | |
Net investment income(a) | | | 1.14 | | | | 0.87 | | | | 1.06 | | | | 1.02 | | | | 1.00 | | | | 1.00 | |
Net realized and unrealized gain on investments | | | 0.23 | | | | 11.81 | | | | 3.67 | | | | 3.96 | | | | 4.01 | | | | 3.53 | |
Total from investment operations | | | 1.37 | | | | 12.68 | | | | 4.73 | | | | 4.98 | | | | 5.01 | | | | 4.53 | |
Distributions to shareholders from: | | | | | | | | | | | | | | | | | | | | | | | | |
Net investment income | | | (1.24 | ) | | | (0.86 | ) | | | (1.11 | ) | | | (1.33 | ) | | | (0.96 | ) | | | (1.34 | ) |
Net realized gains | | | — | | | | (1.76 | ) | | | — | | | | — | | | | — | | | | — | |
Total distributions | | | (1.24 | ) | | | (2.62 | ) | | | (1.11 | ) | | | (1.33 | ) | | | (0.96 | ) | | | (1.34 | ) |
Net asset value at end of period | | $ | 55.80 | | | $ | 55.67 | | | $ | 45.61 | | | $ | 41.99 | | | $ | 38.34 | | | $ | 34.29 | |
Market price at end of period(b) | | $ | 55.82 | | | $ | 55.70 | | | $ | 45.57 | | | $ | 42.01 | | | $ | 38.33 | | | $ | 34.34 | |
| Net Asset Value Total Return(c) | | | 2.55 | % | | | 28.66 | % | | | 11.38 | % | | | 13.43 | % | | | 14.87 | % | | | 15.06 | % |
| Market Price Total Return(c) | | | 2.54 | % | | | 28.83 | % | | | 11.23 | % | | | 13.52 | % | | | 14.68 | % | | | 15.34 | % |
| Ratios/Supplemental Data: | | | | | | | | | | | | | | | | | | | | | | | | |
Net assets at end of period (000’s omitted) | | $ | 61,381 | | | $ | 52,887 | | | $ | 47,895 | | | $ | 39,887 | | | $ | 40,259 | | | $ | 32,573 | |
Ratio to average net assets of: | | | | | | | | | | | | | | | | | | | | | | | | |
Expenses | | | 0.29 | %(d) | | | 0.29 | % | | | 0.29 | % | | | 0.29 | % | | | 0.29 | % | | | 0.30 | % |
Net investment income | | | 2.58 | %(d) | | | 1.73 | % | | | 2.35 | % | | | 2.63 | % | | | 2.86 | % | | | 3.10 | % |
Portfolio turnover rate(e) | | | 48 | % | | | 48 | % | | | 69 | % | | | 18 | % | | | 34 | % | | | 17 | % |
| (a) | Based on average shares outstanding. |
| (b) | The mean between the last bid and ask price. |
| (c) | Net asset value total return is calculated assuming an initial investment made at the net asset value at the beginning of the period, reinvestment of all dividends and distributions at net asset value during the period, and the redemption on the last day of the period. Net asset value total return includes adjustments in accordance with accounting principles generally accepted in the United States of America and as such, the net asset value for financial reporting purposes and the returns based upon those net asset values may differ from the net asset value and returns for shareholder transactions. Market price total return is calculated assuming an initial investment made at the market price at the beginning of the period, reinvestment of all dividends and distributions at market price during the period, and sale at the market price on the last day of the period. Total investment returns calculated for a period of less than one year are not annualized. |
| (e) | Portfolio turnover rate is not annualized for periods less than one year, if applicable, and does not include securities received or delivered from processing creations or redemptions. |
See accompanying Notes to Financial Statements which are an integral part of the financial statements.
Notes to Financial Statements
Invesco Exchange-Traded Fund Trust II
August 31, 2018
Note 1. Organization
Invesco Exchange-Traded Fund Trust II (the “Trust”), formerly PowerShares Exchange-Traded Fund Trust II, was organized as a Massachusetts business trust on October 10, 2006 and is authorized to have multiple series of portfolios. The Trust is an open-end management investment company registered under the Investment Company Act of 1940, as amended (the “1940 Act”). This report includes the following portfolios:
| | |
Full Name | | Short Name |
| Invesco DWA Momentum & Low Volatility Rotation ETF (DWLV) | | “DWA Momentum & Low Volatility Rotation ETF” |
| Invesco DWA SmallCap Momentum ETF (DWAS) | | “DWA SmallCap Momentum ETF” |
| Invesco DWA Tactical Multi-Asset Income ETF (DWIN) | | “DWA Tactical Multi-Asset Income ETF” |
| Invesco DWA Tactical Sector Rotation ETF (DWTR) | | “DWA Tactical Sector Rotation ETF” |
| Invesco S&P SmallCap Consumer Discretionary ETF (PSCD) | | “S&P SmallCap Consumer Discretionary ETF” |
| Invesco S&P SmallCap Consumer Staples ETF (PSCC) | | “S&P SmallCap Consumer Staples ETF” |
| Invesco S&P SmallCap Energy ETF (PSCE) | | “S&P SmallCap Energy ETF” |
| Invesco S&P SmallCap Financials ETF (PSCF) | | “S&P SmallCap Financials ETF” |
| Invesco S&P SmallCap Health Care ETF (PSCH) | | “S&P SmallCap Health Care ETF” |
| Invesco S&P SmallCap Industrials ETF (PSCI) | | “S&P SmallCap Industrials ETF” |
| Invesco S&P SmallCap Information Technology ETF (PSCT) | | “S&P SmallCap Information Technology ETF” |
| Invesco S&P SmallCap Materials ETF (PSCM) | | “S&P SmallCap Materials ETF” |
| Invesco S&P SmallCap Utilities ETF (PSCU) | | “S&P SmallCap Utilities ETF” |
Each portfolio (each, a “Fund”, and collectively, the “Funds”) represents a separate series of the Trust. The shares of the Funds are referred to herein as “Shares” or “Fund’s Shares.” Each Fund’s Shares are listed and traded on The NASDAQ Stock Market LLC.
Effective June 4, 2018, the Funds’ names changed as part of an overall rebranding strategy whereby the PowerShares name was changed to the Invesco brand. This resulted in all references to the PowerShares name being changed to Invesco.
Effective August 31, 2018, each Fund’s fiscal year-end changed from October 31 to August 31.
The market price of each Share may differ to some degree from a Fund’s net asset value (“NAV”). Unlike conventional mutual funds, each Fund issues and redeems Shares on a continuous basis, at NAV, only in a large specified number of Shares, each called a “Creation Unit.” Creation Units are issued and redeemed principally in exchange for the deposit or delivery of a basket of securities (“Deposit Securities”). Except when aggregated in Creation Units by Authorized Participants, the Shares are not individually redeemable securities of the Funds.
DWA Momentum & Low Volatility Rotation ETF, DWA Tactical Multi-Asset Income ETF and DWA Tactical Sector Rotation ETF are each a “fund of funds,” in that each invests in other exchange-traded funds (“Underlying Funds”) advised by Invesco Capital Management LLC (the “Adviser”), formerly Invesco PowerShares Capital Management LLC, or other unaffiliated advisers. Each Underlying Fund’s accounting policies are outlined in that Underlying Fund’s financial statements and are publicly available.
The investment objective of each Fund is to seek to track the investment results (before fees and expenses) of its respective index listed below (each, an “Underlying Index”):
| | |
Fund | | Underlying Index |
| DWA Momentum & Low Volatility Rotation ETF | | Dorsey Wright® Multi-Factor Global Equity Index |
| DWA SmallCap Momentum ETF | | Dorsey Wright® SmallCap Technical Leaders Index |
| DWA Tactical Multi-Asset Income ETF | | Dorsey Wright® Multi-Asset Income Index |
| DWA Tactical Sector Rotation ETF | | Dorsey Wright® Sector 4 Index |
| S&P SmallCap Consumer Discretionary ETF | | S&P SmallCap 600® Capped Consumer Discretionary Index |
| S&P SmallCap Consumer Staples ETF | | S&P SmallCap 600® Capped Consumer Staples Index |
| S&P SmallCap Energy ETF | | S&P SmallCap 600® Capped Energy Index |
| S&P SmallCap Financials ETF | | S&P SmallCap 600® Capped Financials & Real Estate Index |
| | |
Fund | | Underlying Index |
| S&P SmallCap Health Care ETF | | S&P SmallCap 600® Capped Health Care Index |
| S&P SmallCap Industrials ETF | | S&P SmallCap 600® Capped Industrials Index |
| S&P SmallCap Information Technology ETF | | S&P SmallCap 600® Capped Information Technology Index |
| S&P SmallCap Materials ETF | | S&P SmallCap 600® Capped Materials Index |
| S&P SmallCap Utilities ETF | | S&P SmallCap 600® Capped Utilities & Telecommunication Services Index |
Note 2. Significant Accounting Policies
The following is a summary of the significant accounting policies followed by the Funds in preparation of their financial statements.
Each Fund is an investment company and accordingly follows the investment company accounting and reporting guidance in accordance with Financial Accounting Standards Board Accounting Standards Codification Topic 946, Financial Services—Investment Companies.
A. Security Valuation
Securities, including restricted securities, are valued according to the following policies:
Securities, including restricted securities in an Underlying Fund, if any, that are held as investments of a Fund, are valued in accordance with the Underlying Fund’s valuation policy. The policies of Underlying Funds affiliated with the Funds as a result of having the same investment adviser are the same as those set forth below.
A security listed or traded on an exchange (except convertible securities) is generally valued at its last sales price or official closing price as of the close of the customary trading session on the exchange where the security is principally traded or, lacking any sales or official closing price on a particular day, the security may be valued at the closing bid price on that day. Securities traded in the over-the-counter market are valued based on prices furnished by independent pricing services or market makers. When such securities are valued by an independent pricing service they may be considered fair valued. Futures contracts are valued at the final settlement price set by an exchange on which they are principally traded. Listed options are valued at the mean between the last bid and asked prices from the exchange on which they are principally traded, or at the final settlement price set by such exchange. Swaps and options not listed on an exchange are valued by an independent source. For purposes of determining NAV per Share, futures and option contracts generally are valued 15 minutes after the close of the customary trading session of the New York Stock Exchange (“NYSE”).
Investment companies are valued using such company’s NAV per share, unless the shares are exchange-traded, in which case they are valued at the last sales price or official closing price as of the close of the customary trading session on the exchange where the security is principally traded.
Debt obligations (including convertible securities) and unlisted equities are fair valued using an evaluated quote provided by an independent pricing service. Evaluated quotes provided by the pricing service may be determined without exclusive reliance on quoted prices, and may reflect appropriate factors such as institution-size trading in similar groups of securities, developments related to specific securities, dividend rate (for unlisted equities), yield (for debt obligations), quality, type of issue, coupon rate (for debt obligations), maturity (for debt obligations), individual trading characteristics and other market data. Securities with a demand feature exercisable within one to seven days are valued at par. Pricing services generally value debt obligations assuming orderly transactions of institutional round lot size, but a Fund may hold or transact in the same securities in smaller, odd lot sizes. Odd lots often trade at lower prices than institutional round lots. Debt obligations are subject to interest rate and credit risks. In addition, all debt obligations involve some risk of default with respect to interest and/or principal payments.
Foreign securities’ (including foreign exchange contracts’) prices are converted into U.S. dollar amounts using the applicable exchange rates as of the close of the London world markets. If market quotations are available and reliable for foreign exchange-traded equity securities, the securities will be valued at the market quotations. Because trading hours for certain foreign securities end before the close of the NYSE, closing market quotations may become unreliable. If between the time trading ends on a particular security and the close of the customary trading session on the NYSE, events occur that the Adviser determines are significant and make the closing price unreliable, a Fund may fair value the security. If the event is likely to have affected the closing price of the security, the security will be valued at fair value in good faith using procedures approved by the Board of Trustees. Adjustments to closing prices to reflect fair value may also be based on a screening process of an independent pricing service to indicate the degree of certainty, based on historical data, that the closing price in the principal market where a foreign security trades is not the current value as of the close of the NYSE. Foreign securities’ prices meeting the approved degree of certainty that the price is not reflective of current value will be priced at the indication of fair value from the independent pricing service. Multiple factors may be considered by the independent pricing service in determining adjustments to reflect fair value and may include information relating to sector indices, American Depositary Receipts and domestic and foreign index futures. Foreign securities may have additional risks including exchange rate changes, potential for sharply devalued currencies and high inflation, political and economic upheaval, the relative lack of issuer information, relatively low market liquidity and the potential lack of strict financial and accounting controls and standards.
Securities for which market prices are not provided by any of the above methods may be valued based upon quotes furnished by independent sources. The last bid price may be used to value exchange-traded equity securities. The mean between the last bid and asked prices may be used to value debt obligations, including corporate loans, and unlisted equity securities.
Securities for which market quotations are not readily available or became unreliable are valued at fair value as determined in good faith following procedures approved by the Board of Trustees. Issuer-specific events, market trends, bid/asked quotes of brokers and information providers and other market data may be reviewed in the course of making a good faith determination of a security’s fair value.
Each Fund may invest in securities that are subject to interest rate risk, meaning the risk that the prices will generally fall as interest rates rise and, conversely, the prices will generally rise as interest rates fall. Specific securities differ in their sensitivity to changes in interest rates depending on their individual characteristics. Changes in interest rates may result in increased market volatility, which may affect the value and/or liquidity of certain Fund investments.
Valuations change in response to many factors, including the historical and prospective earnings of the issuer, the value of the issuer’s assets, general economic conditions, interest rates, investor perceptions and market liquidity. Because of the inherent uncertainties of valuation, the values reflected in the financial statements may materially differ from the value received upon actual sale of those investments.
B. Other Risks
Index Risk. Unlike many investment companies, the Funds do not utilize investing strategies that seek returns in excess of their Underlying Indexes. Therefore, a Fund would not necessarily buy or sell a security unless that security is added or removed, respectively, from its respective Underlying Index, even if that security generally is underperforming.
Authorized Participant Concentration Risk. Only Authorized Participants (“APs”) may engage in creation or redemption transactions directly with each Fund. Each Fund has a limited number of institutions that may act as APs, and such APs have no obligation to submit creation or redemption orders. Consequently, there is no assurance that those APs will establish or maintain an active trading market for the Shares. This risk may be heightened to the extent that securities underlying each Fund are traded outside a collateralized settlement system. In that case, APs may be required to post collateral on certain trades on an agency basis (i.e., on behalf of other market participants), which only a limited number of APs may be able to do. In addition, to the extent that APs exit the business or are unable to proceed with creation and/or redemption orders with respect to each Fund and no other AP is able to step forward to create or redeem Creation Units , this may result in a significantly diminished trading market for Fund Shares, which may be more likely to trade at a premium or discount to each Fund’s net asset value (“NAV”) and to face trading halts and/or delisting.
Equity Risk. Equity risk is the risk that the value of the securities that each Fund holds will fall due to general market and economic conditions, perceptions regarding the industries in which the issuers of securities that a Fund holds participate or factors relating to specific companies in which the Fund invests. For example, an adverse event, such as an unfavorable earnings report, may depress the value of securities a Fund holds; the price of securities may be particularly sensitive to general movements in the stock market; or a drop in the stock market may depress the price of most or all of the securities a Fund holds. In addition, securities of an issuer in the Fund’s portfolio may decline in price if the issuer fails to make anticipated dividend payments because, among other reasons, the issuer of the security experiences a decline in its financial condition.
Industry Concentration Risk. Each Fund’s Underlying Index from time to time may be concentrated to a significant degree in securities of issuers located in a single industry or sector. To the extent that each Underlying Index concentrates in the securities of issuers in a particular industry or sector, each Fund will also concentrate its investments to approximately the same extent. By concentrating its investments in an industry or sector, each Fund faces more risks than if it were diversified broadly over numerous industries or sectors. Such industry-based risks, any of which may adversely affect the companies in which each Fund invests, may include, but are not limited to, the following: general economic conditions or cyclical market patterns that could negatively affect supply and demand in a particular industry; competition for resources, adverse labor relations, political or world events; obsolescence of technologies; and increased competition or new product introductions that may affect the profitability or viability of companies in an industry. In addition, at times, such industry or sector may be out of favor and underperform other industries or the market as a whole.
Non-Diversified Fund Risk. Each Fund (except DWA SmallCap Momentum ETF, S&P SmallCap Consumer Discretionary ETF, S&P SmallCap Financials ETF, S&P SmallCap Health Care ETF, S&P SmallCap Industrials ETF and S&P SmallCap Information Technology ETF) is non-diversified and can invest a greater portion of its assets in securities of individual issuers than diversified funds. As a result, changes in the market value of a single investment could cause greater fluctuations in Share price than would occur in a diversified fund. This may increase a Fund’s volatility and cause the performance of a relatively small number of issuers to have a greater impact on a Fund’s performance.
Non-Correlation Risk. Each Fund’s return may not match the return of its Underlying Index for a number of reasons. For example, each Fund incurs operating expenses not applicable to its Underlying Index, and incurs costs in buying and selling securities, especially when rebalancing the Fund’s securities holdings to reflect changes in the composition of its Underlying Index. In addition, the performance of
each Fund and its Underlying Index may vary due to asset valuation differences and differences between each Fund’s portfolio and its Underlying Index resulting from legal restrictions, cost or liquidity constraints.
Portfolio Turnover Risk. Each of DWA Momentum & Low Volatility Rotation ETF, DWA SmallCap Momentum ETF and DWA Tactical Sector Rotation ETF may engage in frequent trading of its portfolio securities in connection with the rebalancing or adjustment of its Underlying Index. A portfolio turnover rate of 200%, for example, is equivalent to a Fund buying and selling all of its securities two times during the course of a year. A high portfolio turnover rate (such as 100% or more) could result in high brokerage costs. While a high portfolio turnover rate can result in an increase in taxable capital gains distributions to a Fund’s shareholders, the Funds will seek to utilize an in-kind creation and redemption mechanism to minimize realization of capital gains to the extent possible.
Small- and Mid-Capitalization Company Risk. Investing in securities of small- and mid-capitalization companies involves greater risk than customarily is associated with investing in larger, more established companies. These companies’ securities may be more volatile and less liquid than those of more established companies. These securities may have returns that vary, sometimes significantly, from the overall securities market. Often small- and mid-capitalization companies and the industries in which they focus are still evolving and, as a result, they may be more sensitive to changing market conditions.
Fund of Funds Risk. Because DWA Momentum & Low Volatility Rotation ETF, DWA Tactical Multi-Asset Income ETF and DWA Tactical Sector Rotation ETF invest primarily in other funds, each Fund’s investment performance largely depends on the investment performance of those Underlying Funds. An investment in each Fund is subject to the risks associated with the Underlying Funds that comprise each Underlying Index. There is a risk that each index provider’s evaluations and assumptions regarding the asset classes represented by the Underlying Funds in each Underlying Index at any given time may be incorrect based on actual market conditions. In addition, at times, certain of the segments of the market represented by constituent Underlying Funds in each Underlying Index may be out of favor and underperform other segments. Each Fund indirectly pays a proportional share of the expense of the Underlying Funds in which it invests (including operating expenses and management fees), in addition to the fees and expenses it already pays to the Adviser.
C. Federal Income Taxes
Each Fund intends to comply with the provisions of the Internal Revenue Code of 1986, as amended (the “Internal Revenue Code”), applicable to regulated investment companies and to distribute substantially all of the Fund’s taxable earnings to its shareholders. As such, the Funds will not be subject to federal income taxes on otherwise taxable income (including net realized gains) that is distributed to the shareholders. Therefore, no provision for federal income taxes is recorded in the financial statements.
Each Fund recognizes the tax benefits of uncertain tax positions only when the position is more likely than not to be sustained. Management has analyzed each Fund’s uncertain tax positions and concluded that no liability for unrecognized tax benefits should be recorded related to uncertain tax positions. Management is not aware of any tax positions for which it is reasonably possible that the total amounts of unrecognized tax benefits will change materially in the next 12 months.
Income and capital gain distributions are determined in accordance with federal income tax regulations, which may differ from accounting principles generally accepted in the United States of America (“GAAP”). These differences are primarily due to differing book and tax treatments for in-kind transactions, losses deferred due to wash sales, and passive foreign investment company adjustments, if any.
The Funds file U.S. federal tax returns and tax returns in certain other jurisdictions. Generally, a Fund is subject to examinations by such taxing authorities for up to three years after the filing of the return for the tax period.
D. Investment Transactions and Investment Income
Investment transactions are accounted for on a trade date basis. Realized gains and losses from the sale or disposition of securities are computed on the specific identified cost basis. Interest income is recorded on the accrual basis from settlement date. Pay-in-kind interest income and non-cash dividend income received in the form of securities in-lieu of cash are recorded at the fair value of the securities received. Dividend income (net of withholding tax, if any) is recorded on the ex-dividend date. Realized gains, dividends and interest received by a Fund may give rise to withholding and other taxes imposed by foreign countries. Tax conventions between certain countries and the United States may reduce or eliminate such taxes.
The Funds may periodically participate in litigation related to each Fund’s investments. As such, the Funds may receive proceeds from litigation settlements. Any proceeds received are included in the Statements of Operations as realized gain (loss) for investments no longer held and as unrealized gain (loss) for investments still held.
Brokerage commissions and mark ups are considered transaction costs and are recorded as an increase to the cost basis of securities purchased and/or a reduction of proceeds on a sale of securities. Such transaction costs are included in the determination of net realized and unrealized gain (loss) from investment securities reported in the Statements of Operations and the Statements of Changes in Net Assets and the net realized and unrealized gains (losses) on securities per share in the Financial Highlights. Transaction costs are included in the calculation of each Fund’s NAV and, accordingly, they reduce each Fund’s total returns. These transaction costs are not considered operating expenses and are not reflected in net investment income reported in the Statements of Operations and the
Statements of Changes in Net Assets, or the net investment income per share and the ratios of expenses and net investment income reported in the Financial Highlights, nor are they limited by any expense limitation arrangements between each Fund and the Adviser.
E. Country Determination
For the purposes of presentation in the Schedules of Investments, the Adviser may determine the country in which an issuer is located and/or credit risk exposure based on various factors. These factors include whether each Fund’s Underlying Index has made a country determination and may include the laws of the country under which the issuer is organized, where the issuer maintains a principal office, the country in which the issuer derives 50% or more of its total revenues and the country that has the primary market for the issuer’s securities, as well as other criteria. Among the other criteria that may be evaluated for making this determination are the country in which the issuer maintains 50% or more of its assets, the type of security, financial guarantees and enhancements, the nature of the collateral and the sponsor organization. Country of issuer and/or credit risk exposure has been determined to be the United States of America, unless otherwise noted.
F. Expenses
Each Fund has agreed to pay an annual unitary management fee to the Adviser. Out of the unitary management fee, the Adviser has agreed to pay for substantially all expenses of the Funds, including the cost of transfer agency, custody, fund administration, legal, audit and other services, except for advisory fees, distribution fees, if any, brokerage expenses, taxes, interest, acquired fund fees and expenses, if any, litigation expenses and other extraordinary expenses.
Expenses of the Trust that are excluded from a Fund’s unitary management fee and are directly identifiable to a specific Fund are applied to that Fund. Expenses of the Trust that are excluded from each Fund’s unitary management fee and that are not readily identifiable to a specific Fund are allocated in such a manner as deemed equitable, taking into consideration the nature and type of expense and the relative net assets of each Fund.
To the extent a Fund invests in other investment companies, the expenses shown in the accompanying financial statements reflect the expenses of the Fund and do not include any expenses of the investment companies in which it invests. The effects of such investment companies’ expenses are included in the realized and unrealized gain or loss on the investments in the investment companies.
G. Dividends and Distributions to Shareholders
Each Fund (except DWA Tactical Multi-Asset Income ETF) declares and pays dividends from net investment income, if any, to its shareholders quarterly and records such dividends on ex-dividend date. DWA Tactical Multi-Asset Income ETF declares and pays dividends from net investment income, if any, to its shareholders monthly and records such dividends on ex-dividend date. Generally, each Fund distributes net realized taxable capital gains, if any, annually in cash and records them on ex-dividend date. Such distributions on a tax basis are determined in conformity with federal income tax regulations, which may differ from GAAP. Distributions in excess of tax basis earnings and profits, if any, are reported in such Fund’s financial statements as a tax return of capital at fiscal year-end.
H. Accounting Estimates
The preparation of the financial statements in accordance with GAAP requires management to make estimates and assumptions that affect the reported amounts and disclosures in the financial statements, including estimates and assumptions related to taxation. Actual results could differ from these estimates. In addition, the Funds monitor for material events or transactions that may occur or become known after the period-end date and before the date the financial statements are released to print.
I. Securities Lending
During the period November 1, 2017 to August 31, 2018, each Fund participated in securities lending. Each Fund loaned portfolio securities having a market value up to one-third of each Fund’s total assets. Such loans are secured by cash collateral equal to no less than 102% (105% for international securities) of the market value of the loaned securities determined daily by the securities lending provider. Cash collateral received in connection with these loans is generally invested in an affiliated money market fund and is shown as such on the Schedules of Investments. Each Fund bears the risk of loss with respect to the investment of collateral. It is the policy of these Funds to obtain additional collateral from or return excess collateral to the borrower by the end of the next business day, following the valuation date of the securities loaned. Therefore, the value of the collateral held may be temporarily less than the value of the securities on loan. When loaning securities, each Fund retains certain benefits of owning the securities, including the economic equivalent of dividends or interest generated by the security. Lending securities entails a risk of loss to each Fund if, and to the extent that, the market value of the securities loaned were to increase, and the borrower did not increase the collateral accordingly, and the borrower failed to return the securities. The securities loaned are subject to termination at the option of the borrower or each Fund. Upon termination, the borrower will return to each Fund the securities loaned and each Fund will return the collateral. Upon the failure of the borrower to return the securities, collateral may be liquidated and the securities may be purchased on the open market to replace the loaned securities. Each Fund could experience delays and costs in gaining access to the collateral and the securities may lose value during the delay which could result in potential losses to each Fund. Some of these losses may be indemnified by the lending agent. Each Fund bears the risk of any deficiency in the amount of the collateral available for return to the borrower due to any loss on the collateral invested. Dividends received on cash collateral investments for securities lending transactions, which are net of compensation
to counterparties, are included in Securities lending income on the Statements of Operations. The aggregate value of securities out on loan, if any, is shown on the Statements of Assets and Liabilities.
Note 3. Investment Advisory Agreement and Other Agreements
The Trust has entered into an Investment Advisory Agreement with the Adviser on behalf of each Fund, pursuant to which the Adviser has overall responsibility for the selection and ongoing monitoring of the Funds’ investments, managing the Funds’ business affairs and providing certain clerical, bookkeeping and other administrative services.
As compensation for its services, each Fund accrues daily and pays monthly to the Adviser an annual unitary management fee. Out of the unitary management fee, the Adviser has agreed to pay for substantially all expenses of the Funds, including the cost of transfer agency, custody, fund administration, legal, audit and other services, except for advisory fees, distribution fees, if any, brokerage expenses, taxes, interest, acquired fund fees and expenses, if any, litigation expenses and other extraordinary expenses. The unitary management fee is paid by each Fund to the Adviser at the following annual rates:
| | | | |
| | | % of Average
Daily Net Assets | |
| DWA Momentum & Low Volatility Rotation ETF | | | 0.15 | % |
| DWA SmallCap Momentum ETF | | | 0.60 | % |
| DWA Tactical Multi-Asset Income ETF | | | 0.25 | % |
| DWA Tactical Sector Rotation ETF | | | 0.15 | % |
| S&P SmallCap Consumer Discretionary ETF | | | 0.29 | % |
| S&P SmallCap Consumer Staples ETF | | | 0.29 | % |
| S&P SmallCap Energy ETF | | | 0.29 | % |
| S&P SmallCap Financials ETF | | | 0.29 | % |
| S&P SmallCap Health Care ETF | | | 0.29 | % |
| S&P SmallCap Industrials ETF | | | 0.29 | % |
| S&P SmallCap Information Technology ETF | | | 0.29 | % |
| S&P SmallCap Materials ETF | | | 0.29 | % |
| S&P SmallCap Utilities ETF | | | 0.29 | % |
Further, through August 31, 2020, the Adviser has contractually agreed to waive a portion of each Fund’s management fee in an amount equal to 100% of the net advisory fees an affiliate of the Adviser receives that are attributable to certain of the Fund’s investments in money market funds managed by that affiliate (excluding investments of cash collateral from securities lending). The Adviser cannot discontinue this waiver prior to its expiration. For the period November 1, 2017 to August 31, 2018 and the fiscal year ended October 31, 2017, the Adviser waived fees for each Fund in the following amounts:
| | | | | | | | |
| | | November 1, 2017 to
August 31, 2018 | | | Year Ended
October 31, 2017 | |
| DWA Momentum & Low Volatility Rotation ETF | | $ | 10 | | | $ | 2 | |
| DWA SmallCap Momentum ETF | | | 96 | | | | 137 | |
| DWA Tactical Multi-Asset Income ETF | | | 67 | | | | 59 | |
| DWA Tactical Sector Rotation ETF | | | 43 | | | | 55 | |
| S&P SmallCap Consumer Discretionary ETF | | | 40 | | | | 63 | |
| S&P SmallCap Consumer Staples ETF | | | 81 | | | | 102 | |
| S&P SmallCap Energy ETF | | | 17 | | | | 18 | |
| S&P SmallCap Financials ETF | | | 272 | | | | 263 | |
| S&P SmallCap Health Care ETF | | | 658 | | | | 283 | |
| S&P SmallCap Industrials ETF | | | 48 | | | | 87 | |
| S&P SmallCap Information Technology ETF | | | 347 | | | | 567 | |
| S&P SmallCap Materials ETF | | | 67 | | | | 124 | |
| S&P SmallCap Utilities ETF | | | 154 | | | | 207 | |
The Trust has entered into a Distribution Agreement with Invesco Distributors, Inc. (the “Distributor”), which serves as the distributor of Creation Units for each Fund. The Distributor does not maintain a secondary market in the Shares. The Funds are not charged any fees pursuant to the Distribution Agreement. The Distributor is an affiliate of the Adviser.
The Adviser has entered into a licensing agreement for each Fund with the following entities (each, a “Licensor”):
| | |
Fund | | Licensor |
| DWA Momentum & Low Volatility Rotation ETF | | Dorsey Wright & Associates, LLC |
| DWA SmallCap Momentum ETF | | Dorsey Wright & Associates, LLC |
| DWA Tactical Multi-Asset Income ETF | | Dorsey Wright & Associates, LLC |
| DWA Tactical Sector Rotation ETF | | Dorsey Wright & Associates, LLC |
| S&P SmallCap Consumer Discretionary ETF | | S&P Dow Jones Indices LLC |
| S&P SmallCap Consumer Staples ETF | | S&P Dow Jones Indices LLC |
| S&P SmallCap Energy ETF | | S&P Dow Jones Indices LLC |
| S&P SmallCap Financials ETF | | S&P Dow Jones Indices LLC |
| S&P SmallCap Health Care ETF | | S&P Dow Jones Indices LLC |
| S&P SmallCap Industrials ETF | | S&P Dow Jones Indices LLC |
| S&P SmallCap Information Technology ETF | | S&P Dow Jones Indices LLC |
| S&P SmallCap Materials ETF | | S&P Dow Jones Indices LLC |
| S&P SmallCap Utilities ETF | | S&P Dow Jones Indices LLC |
Each Underlying Index name trademark is owned by its respective Licensor. These trademarks have been licensed to the Adviser for use by the Funds. Each Fund is entitled to use its Underlying Index pursuant to the Trust’s sub-licensing agreement with the Adviser. The Funds are not sponsored, endorsed, sold or promoted by the Licensors, and the Licensors make no representation regarding the advisability of investing in any of the Funds.
The Trust has entered into service agreements whereby The Bank of New York Mellon, a wholly-owned subsidiary of The Bank of New York Mellon Corporation, serves as the administrator, custodian, fund accountant and transfer agent for each Fund.
Note 4. Investments in Affiliates
The Adviser also serves as the adviser for each Underlying Fund listed within the tables below, and therefore the following Underlying Funds are considered to be affiliated with the Funds. The tables below show certain Funds’ transactions in, and earnings from, investments in affiliates (excluding affiliated money market funds) for the period November 1, 2017 to August 31, 2018.
DWA Momentum & Low Volatility Rotation ETF
| | | | | | | | | | | | | | | | | | | | | | | | | | | | |
| | | Value
October 31, 2017 | | | Purchases
at Cost | | | Proceeds
from Sales | | | Change in
Unrealized
Appreciation
(Depreciation) | | | Realized
Gain | | | Value
August 31, 2018 | | | Dividend
Income | |
| Invesco DWA Developed Markets Momentum ETF | | $ | 503,036 | | | $ | 4,326,634 | | | $ | (168,651 | ) | | $ | 4,607 | | | $ | 30,982 | | | $ | 4,696,608 | | | $ | 33,157 | |
| Invesco DWA Emerging Markets Momentum ETF | | | 512,319 | | | | 4,584,063 | | | | (182,229 | ) | | | (450,210 | ) | | | 44,487 | | | | 4,508,430 | | | | 29,905 | |
| Invesco DWA Momentum ETF | | | 1,124,449 | | | | 9,933,518 | | | | (387,670 | ) | | | 1,227,146 | | | | 70,472 | | | | 11,967,915 | | | | 6,239 | |
| Invesco DWA SmallCap Momentum ETF | | | 1,129,159 | | | | 9,948,542 | | | | (387,877 | ) | | | 1,815,758 | | | | 86,030 | | | | 12,591,612 | | | | 3,791 | |
| Invesco S&P 500® Low Volatility ETF | | | 459,484 | | | | 3,900,706 | | | | (152,683 | ) | | | 218,732 | | | | 10,702 | | | | 4,436,941 | | | | 40,088 | |
| Invesco S&P Emerging Markets Low Volatility ETF | | | 198,325 | | | | 1,748,420 | | | | (70,104 | ) | | | (72,758 | ) | | | 9,545 | | | | 1,813,428 | | | | 13,100 | |
| Invesco S&P International Developed Low Volatility ETF | | | 198,475 | | | | 1,665,328 | | | | (66,048 | ) | | | (43,680 | ) | | | 5,610 | | | | 1,759,685 | | | | 28,156 | |
| Invesco S&P SmallCap Low Volatility ETF | | | 449,543 | | | | 3,740,393 | | | | (147,493 | ) | | | 397,601 | | | | 24,517 | | | | 4,464,561 | | | | 28,083 | |
| | | | | | | | | | | | | | | | | | | | | | | | | | | | |
| Total Investments in Affiliates | | $ | 4,574,790 | | | $ | 39,847,604 | | | $ | (1,562,755 | ) | | $ | 3,097,196 | | | $ | 282,345 | | | $ | 46,239,180 | | | $ | 182,519 | |
| | | | | | | | | | | | | | | | | | | | | | | | | | | | |
DWA Tactical Multi-Asset Income ETF
| | | | | | | | | | | | | | | | | | | | | | | | | | | | |
| | | Value
October 31, 2017 | | | Purchases
at Cost | | | Proceeds
from Sales | | | Change in
Unrealized
Appreciation
(Depreciation) | | | Realized
Gain (Loss) | | | Value
August 31, 2018 | | | Dividend
Income | |
| Invesco Emerging Markets Sovereign Debt ETF | | $ | 21,422,161 | | | $ | 154,156 | | | $ | (8,507,880 | ) | | $ | (1,607,687 | ) | | $ | (114,266 | ) | | $ | 11,346,484 | | | $ | 581,560 | |
| Invesco Global Short Term High Yield Bond ETF | | | 21,277,359 | | | | 155,244 | | | | (8,712,220 | ) | | | (671,469 | ) | | | 37,478 | | | | 12,086,392 | | | | 715,101 | |
| Invesco KBW Premium Yield Equity REIT ETF | | | 25,071,257 | | | | 170,787 | | | | (9,388,999 | ) | | | (1,307,487 | ) | | | (125,874 | ) | | | 14,419,684 | | | | 1,140,825 | |
| Invesco Preferred ETF | | | 22,714,681 | | | | 164,290 | | | | (9,274,144 | ) | | | (324,180 | ) | | | (202,984 | ) | | | 13,077,663 | | | | 813,168 | |
| Invesco Taxable Municipal Bond ETF | | | — | | | | 14,710,430 | | | | (2,847,079 | ) | | | (248,186 | ) | | | (46,976 | ) | | | 11,568,189 | | | | 227,407 | |
| | | | | | | | | | | | | | | | | | | | | | | | | | | | |
| Total Investments in Affiliates | | $ | 90,485,458 | | | $ | 15,354,907 | | | $ | (38,730,322 | ) | | $ | (4,159,009 | ) | | $ | (452,622 | ) | | $ | 62,498,412 | | | $ | 3,478,061 | |
| | | | | | | | | | | | | | | | | | | | | | | | | | | | |
DWA Tactical Sector Rotation ETF
| | | | | | | | | | | | | | | | | | | | | | | | | | | | |
| | | Value
October 31, 2017 | | | Purchases
at Cost | | | Proceeds
from Sales | | | Change in
Unrealized
Appreciation
(Depreciation) | | | Realized
Gain (Loss) | | | Value
August 31, 2018 | | | Dividend
Income | |
| Invesco DWA Consumer Cyclicals Momentum ETF | | $ | — | | | $ | 35,519,423 | | | $ | (18,744,952 | ) | | $ | 1,576,496 | | | $ | 1,672,769 | | | $ | 20,023,736 | | | $ | 16,592 | |
| Invesco DWA Energy Momentum ETF | | | — | | | | 20,432,669 | | | | (3,640,894 | ) | | | 346,856 | | | | (55,252 | ) | | | 17,083,379 | | | | 46,841 | |
| Invesco DWA Financial Momentum ETF* | | | 15,672,930 | | | | 11,862,073 | | | | (27,903,468 | ) | | | (1,421,346 | ) | | | 1,789,811 | | | | — | | | | 114,456 | |
| Invesco DWA Healthcare Momentum ETF* | | | 13,521,469 | | | | 2,734,525 | | | | (15,839,118 | ) | | | (1,502,696 | ) | | | 1,085,820 | | | | — | | | | — | |
| Invesco DWA Industrials Momentum ETF | | | 21,456,310 | | | | 19,211,212 | | | | (16,192,605 | ) | | | 910,610 | | | | 828,899 | | | | 26,214,426 | | | | 18,341 | |
| Invesco DWA Technology Momentum ETF | | | 17,230,598 | | | | 17,175,084 | | | | (14,093,996 | ) | | | 3,751,849 | | | | 920,279 | | | | 24,983,814 | | | | 11,880 | |
| | | | | | | | | | | | | | | | | | | | | | | | | | | | |
| Total Investments in Affiliates | | $ | 67,881,307 | | | $ | 106,934,986 | | | $ | (96,415,033 | ) | | $ | 3,661,769 | | | $ | 6,242,326 | | | $ | 88,305,355 | | | $ | 208,110 | |
| | | | | | | | | | | | | | | | | | | | | | | | | | | | |
| * | At August 31, 2018, this security was no longer held. |
The Adviser and Invesco Mortgage Capital, Inc. REIT are wholly-owned subsidiaries of Invesco Ltd. and therefore, Invesco Mortgage Capital, Inc. REIT is considered to be affiliated with the Funds. The table below shows S&P SmallCap Financials ETF’s transactions in, and earnings from, investments in affiliates (excluding affiliated money market funds) for the period November 1, 2017 to August 31, 2018.
S&P SmallCap Financials ETF
| | | | | | | | | | | | | | | | | | | | | | | | | | | | |
| | | Value
October 31, 2017 | | | Purchases
at Cost | | | Proceeds
from Sales | | | Change in
Unrealized
Appreciation
(Depreciation) | | | Realized
Gain (Loss) | | | Value
August 31, 2018 | | | Dividend
Income | |
| Invesco Mortgage Capital, Inc. REIT | | $ | — | | | $ | 3,135,961 | | | $ | (427,355 | ) | | $ | (249,434 | ) | | $ | (25,386 | ) | | $ | 2,433,786 | | | $ | 182,694 | |
Note 5. Additional Valuation Information
GAAP defines fair value as the price that would be received to sell an asset or paid to transfer a liability in an orderly transaction between market participants at the measurement date, under current market conditions. GAAP establishes a hierarchy that prioritizes the inputs to valuation methods, giving the highest priority to readily available unadjusted quoted prices in an active market for identical assets (Level 1) and the lowest priority to significant unobservable inputs (Level 3), generally when market prices are not readily available or are unreliable. Based on the valuation inputs, the securities or other investments are tiered into one of three levels. Changes in valuation methods may result in transfers in or out of an investment’s assigned level:
| | Level 1 — | Prices are determined using quoted prices in an active market for identical assets. |
| | Level 2 — | Prices are determined using other significant observable inputs. Observable inputs are inputs that other market participants may use in pricing a security. These may include quoted prices for similar securities, interest rates, prepayment speeds, credit risk, yield curves, loss severities, default rates, discount rates, volatilities and others. |
| | Level 3 — | Prices are determined using significant unobservable inputs. In situations where quoted prices or observable inputs are unavailable (for example, when there is little or no market activity for an investment at the end of the period), unobservable inputs may be used. Unobservable inputs reflect a Fund’s own assumptions about the factors market participants would use in determining fair value of the securities or instruments and would be based on the best available information. |
Except for the Fund listed below, as of August 31, 2018, all of the securities in each Fund were valued based on Level 1 inputs (see the Schedules of Investments for security categories). The level assigned to the securities valuations may not be an indication of the risk or liquidity associated with investing in those securities. Because of the inherent uncertainties of valuation, the values reflected in the financial statements may materially differ from the value received upon actual sale of those investments.
Each Fund’s policy is to recognize transfers in and out of the valuation levels as of the end of the reporting period. During the period November 1, 2017 to August 31, 2018, there were no transfers between valuation levels.
| | | | | | | | | | | | | | | | |
| | | Level 1 | | | Level 2 | | | Level 3 | | | Total | |
| S&P SmallCap Materials ETF | | | | | | | | | | | | | | | | |
| Investments in Securities | | | | | | | | | | | | | | | | |
Common Stocks & Other Equity Interests | | $ | 30,495,926 | | | $ | — | | | $ | 42,090 | | | $ | 30,538,016 | |
Money Market Funds | | | 886,286 | | | | — | | | | — | | | | 886,286 | |
| | | | | | | | | | | | | | | | |
Total Investments | | $ | 31,382,212 | | | $ | — | | | $ | 42,090 | | | $ | 31,424,302 | |
| | | | | | | | | | | | | | | | |
Note 6. Distributions to Shareholders and Tax Components of Net Assets
Tax Character of Distributions to Shareholders Paid During the Period November 1, 2017 to August 31, 2018, Year Ended October 31, 2017 and Year Ended October 31, 2016:
| | | | | | | | | | | | | | | | | | | | | | | | | | | | | | | | | | | | |
| | | August 31, 2018 | | | October 31, 2017 | | | October 31, 2016 | |
| | | Ordinary
Income | | | Long-Term
Capital Gains | | | Return of
Capital | | | Ordinary
Income | | | Long-Term
Capital Gains | | | Return of
Capital | | | Ordinary
Income | | | Long-Term
Capital Gains | | | Return of
Capital | |
| DWA Momentum & Low Volatility Rotation ETF | | $ | 69,512 | | | $ | — | | | $ | — | | | $ | 75,347 | | | $ | — | | | $ | — | | | $ | 5,265 | | | $ | — | | | $ | — | |
| DWA SmallCap Momentum ETF | | | 495,961 | | | | — | | | | — | | | | 705,632 | | | | — | | | | — | | | | 825,119 | | | | — | | | | — | |
| DWA Tactical Multi-Asset Income ETF | | | 3,343,498 | | | | — | | | | — | | | | 5,282,805 | | | | — | | | | — | | | | 2,392,101 | | | | — | | | | | |
| DWA Tactical Sector Rotation ETF | | | 179,329 | | | | — | | | | — | | | | 891,782 | | | | — | | | | — | | | | 1,081,384 | | | | — | | | | 2,439 | |
| S&P SmallCap Consumer Discretionary ETF | | | 569,275 | | | | — | | | | — | | | | 893,766 | | | | — | | | | — | | | | 707,191 | | | | — | | | | — | |
S&P SmallCap Consumer Staples
ETF(1) | | | 399,525 | | | | — | | | | — | | | | 1,101,515 | | | | — | | | | — | | | | 700,261 | | | | — | | | | — | |
| S&P SmallCap Energy ETF | | | 24,419 | | | | — | | | | — | | | | 33,355 | | | | — | | | | 44,284 | | | | 204,998 | | | | — | | | | — | |
| S&P SmallCap Financials ETF | | | 3,619,319 | | | | — | | | | — | | | | 5,205,722 | | | | 725,359 | | | | — | | | | 5,473,136 | | | | 169,737 | | | | — | |
| S&P SmallCap Health Care ETF | | | — | | | | — | | | | — | | | | 47,751 | | | | — | | | | — | | | | — | | | | — | | | | — | |
| S&P SmallCap Industrials ETF | | | 571,956 | | | | — | | | | — | | | | 823,198 | | | | — | | | | — | | | | 476,137 | | | | — | | | | — | |
| S&P SmallCap Information Technology ETF | | | 1,663,745 | | | | — | | | | — | | | | 1,151,080 | | | | — | | | | — | | | | 880,007 | | | | — | | | | — | |
| S&P SmallCap Materials ETF | | | 272,639 | | | | — | | | | — | | | | 499,363 | | | | — | | | | — | | | | 122,745 | | | | — | | | | — | |
| S&P SmallCap Utilities ETF(1) | | | 1,199,988 | | | | — | | | | — | | | | 2,439,988 | | | | — | | | | — | | | | 2,016,277 | | | | — | | | | — | |
| (1) | The tax year-end is October 31. The amounts presented reflect the character of distributions as of August 31, 2018. |
Tax Components of Net Assets at Fiscal Period-End:
| | | | | | | | | | | | | | | | | | | | | | | | | | | | |
| | | Undistributed
Ordinary
Income | | | Undistributed
Long-Term
Capital Gains | | | Late-year
Ordinary
Deferrals | | | Net
Unrealized
Appreciation
(Depreciation)—
Investments | | | Capital Loss
Carryforward | | | Shares of
Beneficial
Interest | | | Total Net
Assets | |
| DWA Momentum & Low Volatility Rotation ETF | | $ | 161,592 | | | $ | — | | | $ | — | | | $ | 3,813,592 | | | $ | (73,036 | ) | | $ | 42,376,197 | | | $ | 46,278,345 | |
| DWA SmallCap Momentum ETF | | | — | | | | — | | | | (71,703 | ) | | | 85,598,931 | | | | (167,934,464 | ) | | | 536,379,001 | | | | 453,971,765 | |
| DWA Tactical Multi-Asset Income ETF | | | 400,654 | | | | — | | | | — | | | | (3,112,903 | ) | | | (2,585,937 | ) | | | 67,847,139 | | | | 62,548,953 | |
| | | | | | | | | | | | | | | | | | | | | | | | | | | | |
| | | Undistributed
Ordinary
Income | | | Undistributed
Long-Term
Capital Gains | | | Late-year
Ordinary
Deferrals | | | Net
Unrealized
Appreciation
(Depreciation)—
Investments | | | Capital Loss
Carryforward | | | Shares of
Beneficial
Interest | | | Total Net
Assets | |
| DWA Tactical Sector Rotation ETF | | $ | — | | | $ | — | | | $ | — | | | $ | 15,349,294 | | | $ | (17,837,644 | ) | | $ | 90,807,047 | | | $ | 88,318,697 | |
| S&P SmallCap Consumer Discretionary ETF | | | 224,967 | | | | — | | | | — | | | | 6,561,007 | | | | (4,517,274 | ) | | | 90,449,221 | | | | 92,717,921 | |
| S&P SmallCap Consumer Staples ETF(1) | | | 245,675 | | | | — | | | | — | | | | 6,852,924 | | | | (3,249,153 | ) | | | 85,831,146 | | | | 89,680,592 | |
| S&P SmallCap Energy ETF | | | 63,924 | | | | — | | | | — | | | | (5,365,114 | ) | | | (39,740,517 | ) | | | 105,517,086 | | | | 60,475,379 | |
| S&P SmallCap Financials ETF | | | 2,923,144 | | | | 1,287,487 | | | | — | | | | 38,266,733 | | | | — | | | | 224,691,824 | | | | 267,169,188 | |
| S&P SmallCap Health Care ETF | | | — | | | | — | | | | (194,985 | ) | | | 197,385,881 | | | | (4,356,746 | ) | | | 979,735,127 | | | | 1,172,569,277 | |
| S&P SmallCap Industrials ETF | | | 132,201 | | | | — | | | | — | | | | 32,975,897 | | | | (2,047,576 | ) | | | 123,144,161 | | | | 154,204,683 | |
| S&P SmallCap Information Technology ETF | | | 313,306 | | | | — | | | | — | | | | 86,064,649 | | | | (11,896,390 | ) | | | 401,476,817 | | | | 475,958,382 | |
| S&P SmallCap Materials ETF | | | 82,972 | | | | — | | | | — | | | | 358,992 | | | | (503,949 | ) | | | 30,627,728 | | | | 30,565,743 | |
| S&P SmallCap Utilities ETF(1) | | | 337,301 | | | | — | | | | — | | | | 1,879,298 | | | | (535,075 | ) | | | 59,699,427 | | | | 61,380,951 | |
| (1) | The tax year-end is October 31. The tax components of net assets presented are estimates as of August 31, 2018. |
Capital loss carryforwards are calculated and reported as of a specific date. Results of transactions and other activity after that date may affect the amount of capital loss carryforwards actually available for the Funds to utilize. Capital losses generated in years beginning after December 22, 2010 can be carried forward for an unlimited period, whereas previous losses expire in eight tax years. Capital losses with an expiration period may not be used to offset capital gains until all net capital losses without an expiration date have been utilized. Capital loss carryforwards with no expiration date will retain their character as either short-term or long-term capital losses instead of as short-term capital losses as under prior law. The ability to utilize capital loss carryforwards in the future may be limited under the Internal Revenue Code and related regulations based on the results of future transactions.
The following table presents available capital loss carryforwards and expiration dates for each Fund as of August 31, 2018:
| | | | | | | | | | | | | | | | |
| | | | | | Post-effective no expiration | | | | |
| | | 2019 | | | Short-Term | | | Long-Term | | | Total* | |
| DWA Momentum & Low Volatility Rotation ETF | | $ | — | | | $ | 73,036 | | | $ | — | | | $ | 73,036 | |
| DWA SmallCap Momentum ETF | | | — | | | | 167,879,309 | | | | 55,155 | | | | 167,934,464 | |
| DWA Tactical Multi-Asset Income ETF | | | — | | | | 605,056 | | | | 1,980,881 | | | | 2,585,937 | |
| DWA Tactical Sector Rotation ETF | | | — | | | | 16,811,174 | | | | 1,026,470 | | | | 17,837,644 | |
| S&P SmallCap Consumer Discretionary ETF | | | 8,689 | | | | — | | | | 4,508,585 | | | | 4,517,274 | |
| S&P SmallCap Consumer Staples ETF(1) | | | — | | | | 421,775 | | | | 2,827,378 | | | | 3,249,153 | |
| S&P SmallCap Energy ETF | | | 2,406,357 | | | | 8,440,797 | | | | 28,893,363 | | | | 39,740,517 | |
| S&P SmallCap Financials ETF | | | — | | | | — | | | | — | | | | — | |
| S&P SmallCap Health Care ETF | | | — | | | | — | | | | 4,356,746 | | | | 4,356,746 | |
| S&P SmallCap Industrials ETF | | | 74,295 | | | | 763,705 | | | | 1,209,576 | | | | 2,047,576 | |
| S&P SmallCap Information Technology ETF | | | 567,102 | | | | 243,015 | | | | 11,086,273 | | | | 11,896,390 | |
| S&P SmallCap Materials ETF | | | 82,457 | | | | — | | | | 421,492 | | | | 503,949 | |
| S&P SmallCap Utilities ETF(1) | | | — | | | | 445,416 | | | | 89,659 | | | | 535,075 | |
| * | Capital loss carryforwards as of the date listed above are reduced for limitations, if any, to the extent required by the Internal Revenue Code and may be further limited depending upon a variety of factors, including the realization of net unrealized gains or losses as of the date of any reorganization. |
| (1) | Tax year-end and carryforward expiration is October 31. |
Note 7. Investment Transactions
For the period November 1, 2017 to August 31, 2018, the cost of securities purchased and proceeds from sales of securities (other than short-term securities, U.S. Treasury obligations, money market funds and in-kind transactions, if any) were as follows:
| | | | | | | | |
| | | Purchases | | | Sales | |
| DWA Momentum & Low Volatility Rotation ETF | | $ | 116,537 | | | $ | — | |
| DWA SmallCap Momentum ETF | | | 304,705,796 | | | | 305,011,912 | |
| DWA Tactical Multi-Asset Income ETF | | | 15,517,102 | | | | 14,754,515 | |
| DWA Tactical Sector Rotation ETF | | | 43,373,703 | | | | 43,626,330 | |
| S&P SmallCap Consumer Discretionary ETF | | | 7,099,432 | | | | 11,015,975 | |
| | | | | | | | |
| | | Purchases | | | Sales | |
| S&P SmallCap Consumer Staples ETF | | $ | 22,541,231 | | | $ | 26,815,439 | |
| S&P SmallCap Energy ETF | | | 24,677,587 | | | | 24,797,605 | |
| S&P SmallCap Financials ETF | | | 41,522,812 | | | | 40,078,287 | |
| S&P SmallCap Health Care ETF | | | 103,559,016 | | | | 107,603,344 | |
| S&P SmallCap Industrials ETF | | | 2,562,964 | | | | 2,867,514 | |
| S&P SmallCap Information Technology ETF | | | 66,121,774 | | | | 66,832,648 | |
| S&P SmallCap Materials ETF | | | 3,650,124 | | | | 3,626,600 | |
| S&P SmallCap Utilities ETF | | | 24,918,441 | | | | 26,675,881 | |
For the period November 1, 2017 to August 31, 2018, in-kind transactions associated with creations and redemptions were as follows:
| | | | | | | | |
| | | Cost of
Securities
Received | | | Value of
Securities
Delivered | |
| DWA Momentum & Low Volatility Rotation ETF | | $ | 39,731,062 | | | $ | 1,562,755 | |
| DWA SmallCap Momentum ETF | | | 340,621,513 | | | | 183,622,233 | |
| DWA Tactical Multi-Asset Income ETF | | | — | | | | 43,700,827 | |
| DWA Tactical Sector Rotation ETF | | | 63,561,283 | | | | 52,788,703 | |
| S&P SmallCap Consumer Discretionary ETF | | | 55,696,102 | | | | 44,521,192 | |
| S&P SmallCap Consumer Staples ETF | | | 44,919,829 | | | | 14,901,973 | |
| S&P SmallCap Energy ETF | | | 38,150,253 | | | | 31,396,166 | |
| S&P SmallCap Financials ETF | | | 52,410,347 | | | | 63,668,700 | |
| S&P SmallCap Health Care ETF | | | 869,574,640 | | | | 175,628,418 | |
| S&P SmallCap Industrials ETF | | | 51,161,475 | | | | 19,271,414 | |
| S&P SmallCap Information Technology ETF | | | 88,533,240 | | | | 226,979,792 | |
| S&P SmallCap Materials ETF | | | 5,113,629 | | | | 26,258,995 | |
| S&P SmallCap Utilities ETF | | | 31,424,256 | | | | 21,898,199 | |
Gains (losses) on in-kind transactions are generally not considered taxable gains (losses) for federal income tax purposes.
At August 31, 2018, the aggregate cost of investments, including any derivatives, on a tax basis includes adjustments for financial reporting purposes as of the most recently completed federal income tax reporting period-end:
| | | | | | | | | | | | | | | | |
| | | Gross
Unrealized
Appreciation | | | Gross
Unrealized
(Depreciation) | | | Net
Unrealized
Appreciation
(Depreciation) | | | Cost | |
| DWA Momentum & Low Volatility Rotation ETF | | $ | 4,254,102 | | | $ | (440,510 | ) | | $ | 3,813,592 | | | $ | 42,978,200 | |
| DWA SmallCap Momentum ETF | | | 93,784,500 | | | | (8,185,569 | ) | | | 85,598,931 | | | | 387,275,037 | |
| DWA Tactical Multi-Asset Income ETF | | | — | | | | (3,112,903 | ) | | | (3,112,903 | ) | | | 75,278,733 | |
| DWA Tactical Sector Rotation ETF | | | 15,349,294 | | | | — | | | | 15,349,294 | | | | 73,100,871 | |
| S&P SmallCap Consumer Discretionary ETF | | | 13,752,269 | | | | (7,191,262 | ) | | | 6,561,007 | | | | 94,942,255 | |
| S&P SmallCap Consumer Staples ETF(1) | | | 8,813,050 | | | | (1,960,126 | ) | | | 6,852,924 | | | | 89,743,481 | |
| S&P SmallCap Energy ETF | | | 4,954,765 | | | | (10,319,879 | ) | | | (5,365,114 | ) | | | 68,900,826 | |
| S&P SmallCap Financials ETF | | | 44,410,273 | | | | (6,143,540 | ) | | | 38,266,733 | | | | 231,921,152 | |
| S&P SmallCap Health Care ETF | | | 229,177,713 | | | | (31,791,832 | ) | | | 197,385,881 | | | | 991,731,147 | |
| S&P SmallCap Industrials ETF | | | 37,203,875 | | | | (4,227,978 | ) | | | 32,975,897 | | | | 122,111,741 | |
| S&P SmallCap Information Technology ETF | | | 119,681,766 | | | | (33,617,117 | ) | | | 86,064,649 | | | | 403,558,436 | |
| S&P SmallCap Materials ETF | | | 4,501,957 | | | | (4,142,965 | ) | | | 358,992 | | | | 31,065,310 | |
| S&P SmallCap Utilities ETF(1) | | | 5,163,173 | | | | (3,283,875 | ) | | | 1,879,298 | | | | 61,348,075 | |
| (1) | Tax year-end is October 31. |
Note 8. Reclassification of Permanent Differences
Primarily as a result of differing book/tax treatment of in-kind transactions amounts were reclassified between undistributed net investment income (loss), undistributed net realized gain (loss) and Shares of beneficial interest. These reclassifications had no effect on the net assets of each Fund. For the period November 1, 2017 to August 31, 2018, the reclassifications were as follows:
| | | | | | | | | | | | |
| | | Undistributed
Net Investment
Income (Loss) | | | Undistributed
Net Realized
Gain (Loss) | | | Shares of
Beneficial
Interest | |
| DWA Momentum & Low Volatility Rotation ETF | | $ | — | | | $ | (282,345 | ) | | $ | 282,345 | |
| DWA SmallCap Momentum ETF | | | 79,866 | | | | (38,850,395 | ) | | | 38,770,529 | |
| DWA Tactical Multi-Asset Income ETF | | | 2,773 | | | | 920,153 | | | | (922,926 | ) |
| DWA Tactical Sector Rotation ETF | | | 37,911 | | | | (6,084,181 | ) | | | 6,046,270 | |
| S&P SmallCap Consumer Discretionary ETF | | | — | | | | (14,843,402 | ) | | | 14,843,402 | |
| S&P SmallCap Consumer Staples ETF(1) | | | 51,216 | | | | (2,377,809 | ) | | | 2,326,593 | |
| S&P SmallCap Energy ETF | | | 68,624 | | | | 273,208 | | | | (341,832 | ) |
| S&P SmallCap Financials ETF | | | — | | | | (18,067,265 | ) | | | 18,067,265 | |
| S&P SmallCap Health Care ETF | | | 87,833 | | | | (74,218,622 | ) | | | 74,130,789 | |
| S&P SmallCap Industrials ETF | | | — | | | | (6,702,404 | ) | | | 6,702,404 | |
| S&P SmallCap Information Technology ETF | | | — | | | | (61,642,537 | ) | | | 61,642,537 | |
| S&P SmallCap Materials ETF | | | — | | | | (2,417,498 | ) | | | 2,417,498 | |
| S&P SmallCap Utilities ETF(1) | | | — | | | | (2,366,489 | ) | | | 2,366,489 | |
| (1) | The tax year-end is October 31. The reclassifications presented are estimates as of August 31, 2018. |
Note 9. Trustees’ and Officer’s Fees
Trustees’ and Officer’s Fees include amounts accrued by the Funds to pay remuneration to each Trustee who is not an “interested person” as defined in the 1940 Act (an “Independent Trustee”), any Trustee who is not an affiliate of the Adviser or Distributor (or any of their affiliates) and who is otherwise an “interested person” of the Trust under the 1940 Act (an “Unaffiliated Trustee”) and an Officer of the Trust. The Adviser, as a result of each Fund’s unitary management fee, pays for such compensation. The Trustee who is an “interested person” of the Trust does not receive any Trustees’ fees.
The Trust has adopted a deferred compensation plan (the “Plan”). Under the Plan, each Independent Trustee or Unaffiliated Trustee who has executed a Deferred Fee Agreement (a “Participating Trustee”) may defer receipt of all or a portion of his compensation (“Deferral Fees”). Such Deferral Fees are deemed to be invested in select Invesco Funds. The Deferral Fees payable to the Participating Trustee are valued as of the date such Deferral Fees would have been paid to the Participating Trustee. The value increases with contributions or with increases in the value of the Shares selected, and the value decreases with distributions or with declines in the value of the Shares selected. Obligations under the Plan represent unsecured claims against the general assets of the Funds.
Note 10. Capital
Shares are created and redeemed by each Fund only in Creation Units of 50,000 Shares. Only Authorized Participants are permitted to purchase or redeem Creation Units from the Funds. Such transactions are principally permitted in exchange for Deposit Securities, with a balancing cash component to equate the transaction to the NAV per Share of a Fund of the Trust on the transaction date. However, for all Funds, cash in an amount equivalent to the value of certain securities may be substituted, generally when the securities are not available in sufficient quantity for delivery, not eligible for trading by the Authorized Participant or as a result of other market circumstances.
To the extent that the Funds permit transactions in exchange for Deposit Securities, each Fund may issue Shares in advance of receipt of Deposit Securities subject to various conditions, including a requirement to maintain on deposit with the Trust cash at least equal to 105% of the market value of the missing Deposit Securities. In accordance with the Trust’s Participant Agreement, Creation Units will be issued to an Authorized Participant, notwithstanding the fact that the corresponding Deposit Securities have not been received in part or in whole, in reliance on the undertaking of the Authorized Participant to deliver the missing Deposit Securities as soon as possible, which undertaking shall be secured by the Authorized Participant’s delivery and maintenance of collateral consisting of cash in the form of U.S. dollars in immediately available funds having a value (marked-to-market daily) at least equal to 105%, which the Adviser may change from time to time, of the value of the missing Deposit Securities.
Certain transaction fees may be charged by the Funds for creations and redemptions, which are treated as increases in capital.
Transactions in each Fund’s Shares are disclosed in detail in the Statements of Changes in Net Assets.
Note 11. Indemnifications
Under the Trust’s organizational documents, its Officers and Trustees are indemnified against certain liabilities arising out of the performance of their duties to the Trust. Each Independent Trustee and Unaffiliated Trustee is also indemnified against certain liabilities arising out of the performance of his duties to the Trust pursuant to an Indemnification Agreement between such trustee and the Trust. Additionally, in the normal course of business, the Trust enters into contracts with service providers that contain general indemnification clauses. The Trust’s maximum exposure under these arrangements is unknown, as this would involve future claims that may be made against the Trust that have not yet occurred. However, based on experience, the Trust believes the risk of loss to be remote.
Note 12. Subsequent Event
Effective as of the open of markets on September 24, 2018, Invesco S&P SmallCap Utilities ETF changed its name, underlying index, investment objective and principal investment strategy. The new name and underlying index are Invesco S&P SmallCap Utilities & Communication Services ETF and S&P SmallCap 600® Capped Utilities & Communication Services Index, respectively.
Report of Independent Registered Public Accounting Firm
To the Board of Trustees of Invesco Exchange-Traded Fund Trust II and Shareholders of Invesco DWA Momentum & Low Volatility Rotation ETF, Invesco DWA SmallCap Momentum ETF, Invesco DWA Tactical Multi-Asset Income ETF, Invesco DWA Tactical Sector Rotation ETF, Invesco S&P SmallCap Consumer Discretionary ETF, Invesco S&P SmallCap Consumer Staples ETF, Invesco S&P SmallCap Energy ETF, Invesco S&P SmallCap Financials ETF, Invesco S&P SmallCap Health Care ETF, Invesco S&P SmallCap Industrials ETF, Invesco S&P SmallCap Information Technology ETF, Invesco S&P SmallCap Materials ETF and Invesco S&P SmallCap Utilities & Communication Services ETF
Opinions on the Financial Statements
We have audited the accompanying statements of assets and liabilities, including the schedules of investments, of each of the funds listed in the table below (thirteen of the funds constituting Invesco Exchange-Traded Fund Trust II, hereafter collectively referred to as the “Funds”) as of August 31, 2018, the related statements of operations and changes in net assets for each of the periods indicated in the table below, including the related notes, and the financial highlights for each of the periods indicated therein (collectively referred to as the “financial statements”). In our opinion, the financial statements present fairly, in all material respects, the financial position of each of the Funds as of August 31, 2018, the results of each of their operations and the changes in each of their net assets for the periods indicated in the table below, and each of the financial highlights for each of the periods indicated therein, in conformity with accounting principles generally accepted in the United States of America.
Invesco DWA Momentum & Low Volatility Rotation ETF(1)
Invesco DWA SmallCap Momentum ETF(2)
Invesco DWA Tactical Multi-Asset Income ETF(3)
Invesco DWA Tactical Sector Rotation ETF(2)
Invesco S&P SmallCap Consumer Discretionary ETF(2)
Invesco S&P SmallCap Consumer Staples ETF(2)
Invesco S&P SmallCap Energy ETF(2)
Invesco S&P SmallCap Financials ETF(2)
Invesco S&P SmallCap Health Care ETF(2)
Invesco S&P SmallCap Industrials ETF(2)
Invesco S&P SmallCap Information Technology ETF(2)
Invesco S&P SmallCap Materials ETF(2)
Invesco S&P SmallCap Utilities ETF(2)
| (1) | Statement of operations for the period November 1, 2017 through August 31, 2018 and for the year ended October 31, 2017 and statement of changes in net assets for the period November 1, 2017 through August 31, 2018, for the year ended October 31, 2017, and for the period July 11, 2016 (commencement of investment operations) through October 31, 2016 |
| (2) | Statement of operations for the period November 1, 2017 through August 31, 2018 and for the year ended October 31, 2017 and statement of changes in net assets for the period November 1, 2017 through August 31, 2018 and for each of the two years in the period ended October 31, 2017 |
| (3) | Statement of operations for the period November 1, 2017 through August 31, 2018 and for the year ended October 31, 2017 and statement of changes in net assets for the period November 1, 2017 through August 31, 2018, for the year ended October 31, 2017, and for the period March 7, 2016 (commencement of investment operations) through October 31, 2016 |
Basis for Opinions
These financial statements are the responsibility of the Funds’ management. Our responsibility is to express an opinion on the Funds’ financial statements based on our audits. We are a public accounting firm registered with the Public Company Accounting Oversight Board (United States) (“PCAOB”) and are required to be independent with respect to the Funds in accordance with the U.S. federal securities laws and the applicable rules and regulations of the Securities and Exchange Commission and the PCAOB.
We conducted our audits of these financial statements in accordance with the standards of the PCAOB. Those standards require that we plan and perform the audit to obtain reasonable assurance about whether the financial statements are free of material misstatement, whether due to error or fraud.
Our audits included performing procedures to assess the risks of material misstatement of the financial statements, whether due to error or fraud, and performing procedures that respond to those risks. Such procedures included examining, on a test basis, evidence regarding the amounts and disclosures in the financial statements. Our audits also included evaluating the accounting principles used and significant estimates made by management, as well as evaluating the overall presentation of the financial statements. Our
Report of Independent Registered Public Accounting Firm (continued)
procedures included confirmation of securities owned as of August 31, 2018 by correspondence with the custodian, transfer agent, and brokers; when replies were not received from brokers, we performed other auditing procedures. We believe that our audits provide a reasonable basis for our opinions.
PricewaterhouseCoopers LLP
Chicago, Illinois
October 26, 2018
We have served as the auditor of one or more of the investment companies in the Invesco group of investment companies since at least 1995. We have not been able to determine the specific year we began serving as auditor.
Fees and Expenses
As a shareholder of a Fund of the Invesco Exchange-Traded Fund Trust II, you incur a unitary management fee. In addition to the unitary management fee, a shareholder may pay distribution fees, if any, brokerage expenses, taxes, interest, acquired fund fees and expenses, if any, litigation expenses and other extraordinary expenses. The expense examples below are intended to help you understand your ongoing costs (in dollars) of investing in the Funds and to compare these costs with the ongoing costs of investing in other funds.
The example is based on an investment of $1,000 invested at the beginning of the period and held through the six-month period ended August 31, 2018.
In addition to the fees and expenses which the Invesco DWA Momentum & Low Volatility Rotation ETF, Invesco DWA Tactical Multi-Asset Income ETF and Invesco DWA Tactical Sector Rotation ETF (collectively, the “Portfolios”) bear directly, the Portfolios indirectly bear a pro rata share of the fees and expenses of the investment companies in which the Portfolios invest. The amount of fees and expenses incurred indirectly by the Portfolios will vary because the investment companies have varied expenses and fee levels and the Portfolios may own different proportions of the investment companies at different times. Estimated investment companies’ expenses are not expenses that are incurred directly by the Portfolios. They are expenses that are incurred directly by the investment companies and are deducted from the value of the investment companies the Portfolios invest in. The effect of the estimated investment companies’ expenses that the Portfolios bear indirectly is included in each Portfolio’s total return.
Actual Expenses
The first line in the following table provides information about actual account values and actual expenses. You may use the information in this line, together with the amount you invested, to estimate the expenses that you paid over the period. Simply divide your account value by $1,000 (for example, an $8,600 account value divided by $1,000 = 8.6), then multiply the result by the number in the first line under the heading “Expenses Paid During the Six-Month Period” to estimate the expenses you paid on your account during this period.
Hypothetical Example for Comparison Purposes
The second line in the following table provides information about hypothetical account values and hypothetical expenses based on each Fund’s actual expense ratio and an assumed annualized rate of return of 5% per year before expenses, which is not the Fund’s actual return. The hypothetical account values and expenses may not be used to estimate the actual ending account balance or expenses you paid for the period. You may use this information to compare the ongoing costs of investing in the Funds and other funds. To do so, compare this 5% hypothetical example with the 5% hypothetical examples that appear in the shareholder reports of the other funds.
Please note that the expenses shown in the table are meant to highlight your ongoing costs only, and do not reflect any transactional costs, such as sales charges and brokerage commissions. Therefore, the second line in the table is useful in comparing ongoing costs only, and will not help you determine the relative total costs of owning different funds. In addition, expenses shown in the table do not include the expenses of the underlying funds, which are borne indirectly by a Fund. If transaction costs and indirect expenses were included, your costs would have been higher.
| | | | | | | | | | | | | | | | |
| | | Beginning Account Value March 1, 2018 | | | Ending Account Value August 31, 2018 | | | Annualized Expense Ratio Based on the Six-Month Period | | | Expenses Paid During the Six-Month Period(1) | |
| Invesco DWA Momentum & Low Volatility Rotation ETF (DWLV) | | | | | | | | | | | | | | | | |
Actual | | $ | 1,000.00 | | | $ | 1,093.90 | | | | 0.15 | % | | $ | 0.79 | |
Hypothetical (5% return before expenses) | | | 1,000.00 | | | | 1,024.45 | | | | 0.15 | | | | 0.77 | |
| Invesco DWA SmallCap Momentum ETF (DWAS) | | | | | | | | | | | | | | | | |
Actual | | | 1,000.00 | | | | 1,176.20 | | | | 0.60 | | | | 3.29 | |
Hypothetical (5% return before expenses) | | | 1,000.00 | | | | 1,022.18 | | | | 0.60 | | | | 3.06 | |
| Invesco DWA Tactical Multi-Asset Income ETF (DWIN) | | | | | | | | | | | | | | | | |
Actual | | | 1,000.00 | | | | 1,025.30 | | | | 0.25 | | | | 1.28 | |
Hypothetical (5% return before expenses) | | | 1,000.00 | | | | 1,023.95 | | | | 0.25 | | | | 1.28 | |
| Invesco DWA Tactical Sector Rotation ETF (DWTR) | | | | | | | | | | | | | | | | |
Actual | | | 1,000.00 | | | | 1,129.00 | | | | 0.15 | | | | 0.80 | |
Hypothetical (5% return before expenses) | | | 1,000.00 | | | | 1,024.45 | | | | 0.15 | | | | 0.77 | |
Fees and Expenses (continued)
| | | | | | | | | | | | | | | | |
| | | Beginning Account Value March 1, 2018 | | | Ending Account Value August 31, 2018 | | | Annualized Expense Ratio Based on the Six-Month Period | | | Expenses Paid During the Six-Month Period(1) | |
| Invesco S&P SmallCap Consumer Discretionary ETF (PSCD) | | | | | | | | | | | | | | | | |
Actual | | $ | 1,000.00 | | | $ | 1,227.60 | | | | 0.29 | % | | $ | 1.63 | |
Hypothetical (5% return before expenses) | | | 1,000.00 | | | | 1,023.74 | | | | 0.29 | | | | 1.48 | |
| Invesco S&P SmallCap Consumer Staples ETF (PSCC) | | | | | | | | | | | | | | | | |
Actual | | | 1,000.00 | | | | 1,251.90 | | | | 0.29 | | | | 1.65 | |
Hypothetical (5% return before expenses) | | | 1,000.00 | | | | 1,023.74 | | | | 0.29 | | | | 1.48 | |
| Invesco S&P SmallCap Energy ETF (PSCE) | | | | | | | | | | | | | | | | |
Actual | | | 1,000.00 | | | | 1,171.30 | | | | 0.29 | | | | 1.59 | |
Hypothetical (5% return before expenses) | | | 1,000.00 | | | | 1,023.74 | | | | 0.29 | | | | 1.48 | |
| Invesco S&P SmallCap Financials ETF (PSCF) | | | | | | | | | | | | | | | | |
Actual | | | 1,000.00 | | | | 1,148.00 | | | | 0.29 | | | | 1.57 | |
Hypothetical (5% return before expenses) | | | 1,000.00 | | | | 1,023.74 | | | | 0.29 | | | | 1.48 | |
| Invesco S&P SmallCap Health Care ETF (PSCH) | | | | | | | | | | | | | | | | |
Actual | | | 1,000.00 | | | | 1,358.00 | | | | 0.29 | | | | 1.72 | |
Hypothetical (5% return before expenses) | | | 1,000.00 | | | | 1,023.74 | | | | 0.29 | | | | 1.48 | |
| Invesco S&P SmallCap Industrials ETF (PSCI) | | | | | | | | | | | | | | | | |
Actual | | | 1,000.00 | | | | 1,194.30 | | | | 0.29 | | | | 1.60 | |
Hypothetical (5% return before expenses) | | | 1,000.00 | | | | 1,023.74 | | | | 0.29 | | | | 1.48 | |
| Invesco S&P SmallCap Information Technology ETF (PSCT) | | | | | | | | | | | | | | | | |
Actual | | | 1,000.00 | | | | 1,169.60 | | | | 0.29 | | | | 1.59 | |
Hypothetical (5% return before expenses) | | | 1,000.00 | | | | 1,023.74 | | | | 0.29 | | | | 1.48 | |
| Invesco S&P SmallCap Materials ETF (PSCM) | | | | | | | | | | | | | | | | |
Actual | | | 1,000.00 | | | | 1,088.80 | | | | 0.29 | | | | 1.53 | |
Hypothetical (5% return before expenses) | | | 1,000.00 | | | | 1,023.74 | | | | 0.29 | | | | 1.48 | |
| Invesco S&P SmallCap Utilities ETF (PSCU) | | | | | | | | | | | | | | | | |
Actual | | | 1,000.00 | | | | 1,149.50 | | | | 0.29 | | | | 1.57 | |
Hypothetical (5% return before expenses) | | | 1,000.00 | | | | 1,023.74 | | | | 0.29 | | | | 1.48 | |
| (1) | Expenses are calculated using the annualized expense ratio, which represents the ongoing expenses as a percentage of net assets for the six-month period ended August 31, 2018. Expenses are calculated by multiplying the Fund’s annualized expense ratio by the average account value for the period, then multiplying the result by 184/365. Expense ratios for the most recent six-month period may differ from expense ratios based on the annualized data in the Financial Highlights. |
Tax Information
Form 1099-DIV, Form 1042-S and other year-end tax information provide shareholders with actual calendar year amounts that should be included in their tax returns. Shareholders should consult their tax advisers.
The following distribution information is being provided as required by the Internal Revenue Code or to meet a specific state’s requirement.
Each Fund designates the following amounts or, if subsequently determined to be different, the maximum amount allowable for its fiscal period ended August 31, 2018:
| | | | | | | | | | |
| | | Qualified Dividend
Income* | | Dividends-
Received Deduction* |
| Invesco DWA Momentum & Low Volatility Rotation ETF | | | | 76 | % | | | | 48 | % |
| Invesco DWA SmallCap Momentum ETF | | | | 100 | % | | | | 100 | % |
| Invesco DWA Tactical Multi-Asset Income ETF | | | | 12 | % | | | | 9 | % |
| Invesco DWA Tactical Sector Rotation ETF | | | | 100 | % | | | | 100 | % |
| Invesco S&P SmallCap Consumer Discretionary ETF | | | | 87 | % | | | | 87 | % |
| Invesco S&P SmallCap Consumer Staples ETF | | | | 64 | % | | | | 64 | % |
| Invesco S&P SmallCap Energy ETF | | | | 100 | % | | | | 100 | % |
| Invesco S&P SmallCap Financials ETF | | | | 75 | % | | | | 74 | % |
| Invesco S&P SmallCap Health Care ETF | | | | 0 | % | | | | 0 | % |
| Invesco S&P SmallCap Industrials ETF | | | | 100 | % | | | | 100 | % |
| Invesco S&P SmallCap Information Technology ETF | | | | 100 | % | | | | 100 | % |
| Invesco S&P SmallCap Materials ETF | | | | 100 | % | | | | 100 | % |
| Invesco S&P SmallCap Utilities ETF | | | | 77 | % | | | | 77 | % |
| * | The above percentages are based on ordinary income dividends paid to shareholders during the Fund’s fiscal period. |
Trustees and Officers
The Independent Trustees of the Trust, their term of office and length of time served, their principal business occupations during at least the past five years, the number of portfolios in the Fund Complex (as defined below) overseen by each Independent Trustee and the other directorships, if any, held by each Independent Trustee are shown below.
| | | | | | | | | | |
Name, Address and Year of
Birth of Independent Trustees | | Position(s)
Held
with Trust | | Term of
Office
and
Length of
Time
Served* | | Principal
Occupation(s) During
Past 5 Years | | Number of
Portfolios
in Fund
Complex**
Overseen by
Independent
Trustees | | Other
Directorships
Held by
Independent
Trustees During
the Past 5 Years |
Ronn R. Bagge—1958
c/o Invesco Capital Management LLC
3500 Lacey Road, Suite 700
Downers Grove, IL 60515 | | Chairman of the Nominating and Governance Committee and Trustee | | Chairman of the Nominating and Governance Committee and Trustee since 2007 | | Founder and Principal, YQA Capital Management LLC (1998-Present); formerly, Owner/CEO of Electronic Dynamic Balancing Co., Inc. (high-speed rotating equipment service provider). | | 221 | | Trustee and Investment Oversight Committee member, Mission Aviation Fellowship (2017–Present) |
| | | | | |
Todd J. Barre—1957
c/o Invesco Capital Management LLC
3500 Lacey Road, Suite 700
Downers Grove, IL 60515 | | Trustee | | Since 2010 | | Assistant Professor of Business, Trinity Christian College (2010-2016); formerly, Vice President and Senior Investment Strategist (2001-2008), Director of Open Architecture and Trading (2007-2008), Head of Fundamental Research (2004-2007) and Vice President and Senior Fixed Income Strategist (1994-2001), BMO Financial Group/Harris Private Bank. | | 221 | | None |
| | | | | |
Marc M. Kole—1960
c/o Invesco Capital Management LLC
3500 Lacey Road, Suite 700
Downers Grove, IL 60515 | | Chairman of the Audit Committee and Trustee | | Chairman of the Audit Committee since 2008; Trustee since 2007 | | Senior Director of Finance, By The Hand Club for Kids (2015-Present); formerly, Chief Financial Officer, Hope Network (social services) (2008-2012); Assistant Vice President and Controller, Priority Health (health insurance) (2005-2008); Senior Vice President of Finance, United Healthcare (2004-2005); Chief Accounting Officer, Senior Vice President of Finance, Oxford Health Plans (2000-2004); Audit Partner, Arthur Andersen LLP (1996-2000). | | 221 | | None |
| * | This is the date the Independent Trustee began serving the Trust. Each Independent Trustee serves an indefinite term, until his successor is elected. |
| ** | Fund Complex includes all open- and closed-end funds (including all of their portfolios) advised by the Adviser and any affiliated person of the Adviser. |
Trustees and Officers (continued)
| | | | | | | | | | |
Name, Address and Year of
Birth of Independent Trustees | | Position(s)
Held
with Trust | | Term of
Office
and
Length of
Time
Served* | | Principal
Occupation(s) During
Past 5 Years | | Number of
Portfolios
in Fund
Complex**
Overseen by
Independent
Trustees | | Other
Directorships
Held by
Independent
Trustees During
the Past 5 Years |
| | | | | |
Yung Bong Lim—1964
c/o Invesco Capital Management LLC
3500 Lacey Road, Suite 700
Downers Grove, IL 60515 | | Chairman of the Investment Oversight Committee and Trustee | | Chairman of the Investment Oversight Committee since 2014; Trustee since 2013 | | Managing Partner, RDG Funds LLC (2008-Present); formerly, Managing Director, Citadel LLC (1999-2007). | | 221 | | None |
| | | | | |
Gary R. Wicker—1961
c/o Invesco Capital Management LLC
3500 Lacey Road, Suite 700
Downers Grove, IL 60515 | | Trustee | | Since 2013 | | Senior Vice President of Global Finance and Chief Financial Officer at RBC Ministries (publishing company) (2013-Present); formerly, Executive Vice President and Chief Financial Officer, Zondervan Publishing (a division of Harper Collins/NewsCorp) (2007-2012); Senior Vice President and Group Controller (2005-2006), Senior Vice President and Chief Financial Officer (2003-2004), Chief Financial Officer (2001-2003), Vice President, Finance and Controller (1999-2001) and Assistant Controller (1997-1999), divisions of The Thomson Corporation (information services provider). | | 221 | | None |
| | | | | |
Donald H. Wilson—1959
c/o Invesco Capital Management LLC
3500 Lacey Road, Suite 700
Downers Grove, IL 60515 | | Chairman of the Board and Trustee | | Chairman since 2012; Trustee since 2007 | | Chairman, President and Chief Executive Officer, McHenry Bancorp Inc. and McHenry Savings Bank (subsidiary) (2018-Present); Chairman and Chief Executive Officer, Stone Pillar Advisors, Ltd. (2010-Present); President and Chief Executive Officer, Stone Pillar Investments, Ltd. (2016-Present); formerly, Chairman, President and Chief Executive Officer, Community Financial Shares, Inc. and Community Bank—Wheaton/Glen Ellyn (subsidiary) (2013-2015); Chief Operating Officer, AMCORE Financial, Inc. (bank holding company) (2007-2009); Executive Vice President and Chief Financial Officer, AMCORE Financial, Inc. (2006-2007); Senior Vice President and Treasurer, Marshall & Ilsley Corp. (bank holding company) (1995-2006). | | 221 | | None |
| * | This is the date the Independent Trustee began serving the Trust. Each Independent Trustee serves an indefinite term, until his successor is elected. |
| ** | Fund Complex includes all open- and closed-end funds (including all of their portfolios) advised by the Adviser and any affiliated person of the Adviser. |
Trustees and Officers (continued)
The Unaffiliated Trustee, his term of office and length of time served, his principal business occupations during at least the past five years, the number of portfolios in the Fund Complex (as defined below) overseen by the Unaffiliated Trustee and the other directorships, if any, held by the Unaffiliated Trustee are shown below.
| | | | | | | | | | |
Name, Address and Year of
Birth of Unaffiliated Trustee | | Position(s)
Held
with Trust | | Term of
Office
and
Length of
Time
Served* | | Principal
Occupation(s) During
Past 5 Years | | Number of
Portfolios
in Fund
Complex**
Overseen by
Unaffiliated
Trustee | | Other
Directorships
Held by
Unaffiliated
Trustee During
the Past 5 Years |
Philip M. Nussbaum***—1961
c/o Invesco Capital Management LLC
3500 Lacey Road, Suite 700
Downers Grove, IL 60515 | | Trustee | | Since 2007 | | Chairman, Performance Trust Capital Partners (2004-Present). | | 221 | | None |
| * | This is the date the Unaffiliated Trustee began serving the Trust. The Unaffiliated Trustee serves an indefinite term, until his successor is elected. |
| ** | Fund Complex includes all open- and closed-end funds (including all of their portfolios) advised by the Adviser and any affiliated person of the Adviser. |
| *** | Effective September 19, 2018, Mr. Nussbaum resigned from the Board of Trustees of the Trust. |
Trustees and Officers (continued)
The Interested Trustee and the executive officers of the Trust, their term of office and length of time served, their principal business occupations during at least the past five years, the number of portfolios in the Fund Complex (as defined below) overseen by the Interested Trustee and the other directorships, if any, held by the Interested Trustee are shown below.
| | | | | | | | | | |
Name, Address and Year of
Birth of Interested Trustee | | Position(s)
Held
with Trust | | Term of
Office
and
Length of
Time
Served* | | Principal
Occupation(s) During
Past 5 Years | | Number of
Portfolios
in Fund
Complex**
Overseen by
Interested
Trustee | | Other
Directorships
Held by
Interested
Trustee During
the Past 5 Years |
Kevin M. Carome—1956
Invesco Ltd.
Two Peachtree Pointe,
1555 Peachtree St., N.E.,
Suite 1800
Atlanta, GA 30309 | | Trustee | | Since 2010 | | Senior Managing Director, Secretary and General Counsel, Invesco Ltd. (2007-Present); Director, Invesco Advisers, Inc. (2009-Present); Director (2006-Present) and Executive Vice President (2008-Present), Invesco Group Services, Inc., Invesco Holding Company (US), Inc. and Invesco North American Holdings, Inc.; Director, Invesco Holding Company Limited (2007-Present); Executive Vice President (2008-Present), Invesco Investments (Bermuda) Ltd.; Manager, Horizon Flight Works LLC, Director and Executive Vice President, Invesco Finance, Inc. and Director, Invesco Finance PLC (2011- Present); Director and Secretary (2012-Present), Invesco Services (Bahamas) Private Limited; and Director and Executive Vice President (2014-Present), INVESCO Asset Management (Bermuda) Ltd.; formerly, Director and Chairman, INVESCO Funds Group, Inc., Senior Vice President, Secretary and General Counsel, Invesco Advisers, Inc. (2003-2006); Director, Invesco Investments (Bermuda) Ltd. (2008-2016); Senior Vice President and General Counsel, Liberty Financial Companies, Inc. (2000-2001); General Counsel of certain investment management subsidiaries of Liberty Financial Companies, Inc. (1998-2000); Associate General Counsel, Liberty Financial Companies, Inc. (1993-1998); Associate, Ropes & Gray LLP. | | 221 | | None |
| * | This is the date the Interested Trustee began serving the Trust. The Interested Trustee serves an indefinite term, until his successor is elected. |
| ** | Fund Complex includes all open- and closed-end funds (including all of their portfolios) advised by the Adviser and any affiliated person of the Adviser. |
Trustees and Officers (continued)
| | | | | | |
Name, Address and Year of
Birth of Executive Officers | | Position(s)
Held
with Trust | | Length of
Time
Served* | | Principal Occupation(s) During Past 5 Years |
Daniel E. Draper—1968 Invesco Capital Management LLC 3500 Lacey Road, Suite 700 Downers Grove, IL 60515 | | President and Principal Executive Officer | | Since 2015 | | President and Principal Executive Officer, Invesco Exchange-Traded Fund Trust, Invesco Exchange-Traded Fund Trust II, Invesco India Exchange-Traded Fund Trust, Invesco Actively Managed Exchange-Traded Fund Trust and Invesco Actively Managed Exchange-Traded Commodity Fund Trust (2015-Present) and Invesco Exchange-Traded Self-Indexed Fund Trust (2016-Present); Chief Executive Officer and Principal Executive Officer (2016-Present) and Managing Director (2013-Present), Invesco Capital Management LLC; Senior Vice President, Invesco Distributors, Inc. (2014-Present); formerly, Vice President, Invesco Exchange-Traded Fund Trust, Invesco Exchange-Traded Fund Trust II, Invesco India Exchange-Traded Fund Trust, Invesco Actively Managed Exchange-Traded Fund Trust (2013-2015) and Invesco Actively Managed Exchange-Traded Commodity Fund Trust (2014-2015); Managing Director, Credit Suisse Asset Management (2010-2013) and Lyxor Asset Management/Societe Generale (2007-2010). |
| | | |
Kelli Gallegos—1970 Invesco Capital Management LLC 3500 Lacey Road, Suite 700 Downers Grove, IL 60515 | | Vice President
and Treasurer | | Since 2018 | | Vice President and Treasurer, Invesco Exchange-Traded Fund Trust, Invesco Exchange-Traded Fund Trust II, Invesco India Exchange-Traded Fund Trust, Invesco Actively Managed Exchange-Traded Fund Trust, Invesco Actively Managed Exchange-Traded Commodity Fund Trust and Invesco Exchange-Traded Self-Indexed Fund Trust (2018-Present); Principal Financial and Accounting Officer-Pooled Investments, Invesco Capital Management LLC (2018-Present); Vice President, Principal Financial Officer (2016-Present) and Assistant Treasurer (2008-Present), The Invesco Funds; formerly, Assistant Treasurer Invesco Exchange-Traded Fund Trust, Invesco Exchange-Traded Fund Trust II, Invesco India Exchange-Traded Fund Trust and Invesco Actively Managed Exchange-Traded Fund Trust (2012-2018), Invesco Actively Managed Exchange-Traded Commodity Fund Trust (2014-2018) and Invesco Exchange-Traded Self-Indexed Fund Trust (2016-2018); Assistant Treasurer, Invesco Capital Management LLC (2013-2018); and Assistant Vice President, The Invesco Funds (2008-2016). |
| | | |
Peter Hubbard—1981 Invesco Capital Management LLC 3500 Lacey Road, Suite 700 Downers Grove, IL 60515 | | Vice President | | Since 2009 | | Vice President, Invesco Exchange-Traded Fund Trust, Invesco Exchange-Traded Fund Trust II, Invesco India Exchange-Traded Fund Trust, Invesco Actively Managed Exchange-Traded Fund Trust (2009-Present), Invesco Actively Managed Exchange-Traded Commodity Fund Trust (2014-Present) and Invesco Exchange-Traded Self-Indexed Fund Trust (2016-Present); Vice President and Director of Portfolio Management, Invesco Capital Management LLC (2010-Present); formerly, Vice President of Portfolio Management, Invesco Capital Management LLC (2008-2010); Portfolio Manager, Invesco Capital Management LLC (2007-2008); Research Analyst, Invesco Capital Management LLC (2005-2007); Research Analyst and Trader, Ritchie Capital, a hedge fund operator (2003-2005). |
| | | |
Sheri Morris—1964 Invesco Capital Management LLC 3500 Lacey Road, Suite 700 Downers Grove, IL 60515 | | Vice President | | Since 2012 | | President and Principal Executive Officer, The Invesco Funds (2016-Present); Treasurer, The Invesco Funds (2008-Present); Vice President, Invesco Advisers, Inc. (formerly known as Invesco Institutional (N.A.), Inc.) (registered investment adviser) (2009-Present) and Vice President, Invesco Exchange-Traded Fund Trust, Invesco Exchange-Traded Fund Trust II, Invesco India Exchange-Traded Fund Trust, Invesco Actively Managed Exchange-Traded Fund Trust (2012-Present), Invesco Actively Managed Exchange-Traded Commodity Fund Trust (2014-Present) and Invesco Exchange-Traded Self-Indexed Fund Trust (2016-Present); formerly, Vice President and Principal Financial Officer, The Invesco Funds (2008-2016); Treasurer, Invesco Exchange-Traded Fund Trust, Invesco Exchange-Traded Fund Trust II, Invesco India Exchange-Traded Fund Trust and Invesco Actively Managed Exchange-Traded Fund Trust (2011-2013); Vice President, Invesco Aim Advisers, Inc., Invesco Aim Capital Management, Inc. and Invesco Aim Private Asset Management, Inc.; Assistant Vice President and Assistant Treasurer, The Invesco Funds and Assistant Vice President, Invesco Advisers, Inc., Invesco Aim Capital Management, Inc. and Invesco Aim Private Asset Management, Inc. |
| * | This is the date each Officer began serving the Trust. Each Officer serves an indefinite term, until his or her successor is elected. |
Trustees and Officers (continued)
| | | | | | |
Name, Address and Year of
Birth of Executive Officers | | Position(s)
Held
with Trust | | Length of
Time
Served* | | Principal Occupation(s) During Past 5 Years |
Anna Paglia—1974 Invesco Capital Management LLC 3500 Lacey Road, Suite 700 Downers Grove, IL 60515 | | Secretary | | Since 2011 | | Secretary, Invesco Exchange-Traded Fund Trust, Invesco Exchange-Traded Fund Trust II, Invesco India Exchange-Traded Fund Trust, Invesco Actively Managed Exchange-Traded Fund Trust (2011-Present), Invesco Actively Managed Exchange-Traded Commodity Fund Trust (2014-Present) and Invesco Exchange-Traded Self-Indexed Fund Trust (2015-Present); Head of Legal (2010-Present) and Secretary (2015-Present), Invesco Capital Management LLC; Manager and Assistant Secretary, Invesco Indexing LLC (2017-Present); formerly, Partner, K&L Gates LLP (formerly, Bell Boyd & Lloyd LLP) (2007-2010); Associate Counsel at Barclays Global Investors Ltd. (2004-2006). |
| | | |
Rudolf E. Reitmann—1971 Invesco Capital Management LLC 3500 Lacey Road, Suite 700 Downers Grove, IL 60515 | | Vice President | | Since 2013 | | Vice President, Invesco Exchange-Traded Fund Trust, Invesco Exchange-Traded Fund Trust II, Invesco India Exchange-Traded Fund Trust, Invesco Actively Managed Exchange-Traded Fund Trust (2013-Present), Invesco Actively Managed Exchange-Traded Commodity Fund Trust (2014-Present) and Invesco Exchange-Traded Self-Indexed Fund Trust (2016-Present); Head of Global Exchange Traded Funds Services, Invesco Capital Management LLC (2013-Present); Vice President, Invesco Capital Markets, Inc. (2018-Present). |
| | | |
David Warren—1957 Invesco Canada Ltd. 5140 Yonge Street, Suite 800 Toronto, Ontario M2N 6X7 | | Vice President | | Since 2009 | | Vice President, Invesco Exchange-Traded Fund Trust, Invesco Exchange-Traded Fund Trust II, Invesco India Exchange-Traded Fund Trust, and Invesco Actively Managed Exchange-Traded Fund Trust (2009-Present), Invesco Actively Managed Exchange-Traded Commodity Fund Trust (2014-Present) and Invesco Exchange-Traded Self-Indexed Fund Trust (2016-Present); Managing Director—Chief Administrative Officer, Americas, Invesco Capital Management LLC; Senior Vice President, Invesco Advisers, Inc. (2009-Present); Director, Invesco Inc. (2009-Present); Director, Executive Vice President and Chief Financial Officer, Invesco Canada Ltd. (formerly, Invesco Trimark Ltd.) (2011-Present); Chief Administrative Officer, North American Retail, Invesco Ltd. (2007-Present); Director, Invesco Corporate Class Inc. (2014-Present); Director, Invesco Global Direct Real Estate Feeder GP Ltd. (2015-Present); Director, Invesco Canada Holdings Inc. (2002-Present); Director, Invesco Financial Services Ltd. / Services Financiers Invesco Ltée and Trimark Investments Ltd./Placements Trimark Ltée (2014-Present); Director, Invesco IP Holdings (Canada) Ltd. (2016-Present); Director, Invesco Global Direct Real Estate GP Ltd. (2015-Present); formerly, Senior Vice President, Invesco Management Group, Inc. (2007-2018); Executive Vice President and Chief Financial Officer, Invesco Inc. (2009-2015); Director, Executive Vice President and Chief Financial Officer, Invesco Canada Ltd. (formerly, Invesco Trimark Ltd.) (2000-2011). |
| | | |
Melanie Zimdars—1976 Invesco Capital Management LLC 3500 Lacey Road, Suite 700 Downers Grove, IL 60515 | | Chief Compliance
Officer | | Since 2017 | | Chief Compliance Officer of Invesco Capital Management LLC (2017-Present); Chief Compliance Officer of Invesco Exchange-Traded Fund Trust, Invesco Exchange-Traded Fund Trust II, Invesco India Exchange-Traded Fund Trust, Invesco Actively Managed Exchange-Traded Fund Trust, Invesco Actively Managed Exchange-Traded Commodity Fund Trust and Invesco Exchange-Traded Self-Indexed Fund Trust (2017-Present); formerly, Vice President and Deputy Chief Compliance Officer at ALPS Holding, Inc. (2009-2017); Mutual Fund Treasurer/Chief Financial Officer at Wasatch Advisors, Inc. (2005-2008); Compliance Officer, U.S. Bancorp Fund Services, LLC (2001-2005). |
Availability of Additional Information About the Trustees
The Statement of Additional Information includes additional information about the Trustees and is available, without charge, upon request at (800) 983-0903.
| * | This is the date each Officer began serving the Trust. Each Officer serves an indefinite term, until his or her successor is elected. |
(This Page Intentionally Left Blank)
(This Page Intentionally Left Blank)
(This Page Intentionally Left Blank)
Proxy Voting Policies and Procedures
A description of the Trust’s proxy voting policies and procedures that the Funds use to determine how to vote proxies relating to portfolio securities is available, without charge and upon request, by calling (800) 983-0903. This information is also available on the Securities and Exchange Commission’s (“Commission”) website at www.sec.gov.
Information regarding how each Fund voted proxies for portfolio securities, if applicable, during the most recent 12-month period ended June 30, is also available, without charge and upon request, by (i) calling (800) 983-0903; or (ii) accessing the Trust’s Form N-PX on the Commission’s website at www.sec.gov.
Quarterly Portfolios
The Trust files its complete schedule of portfolio holdings for the Funds with the Commission for the first and third quarters of each fiscal year on Form N-Q. The Trust’s Forms N-Q are available on the Commission’s website at www.sec.gov. The Trust’s Forms N-Q may also be reviewed and copied at the Commission’s Public Reference Room in Washington, DC; information on the operation of the Public Reference Room may be obtained by calling (800) SEC-0330.
Frequency Distribution of Discounts and Premiums
A table showing the number of days the market price of each Fund’s shares was greater than the Fund’s net asset value, and the number of days it was less than the Fund’s net asset value (i.e., premium or discount) for the most recently completed calendar year, and the calendar quarters since that year end (or the life of the Fund, if shorter) may be found at the Fund’s website at www.invesco.com/ETFs.
| | | | |
©2018 Invesco Capital Management LLC 3500 Lacey Road, Suite 700 Downers Grove, IL 60515 | | P-SCS-AR-1 | | invesco.com/ETFs |
Item 2. Code of Ethics.
The Registrant has adopted a Code of Ethics that applies to the Registrant’s principal executive officer and principal financial officer. This Code is filed as an exhibit to this report on Form N-CSR under Item 13(a)(1). No substantive amendments to this Code were made during the reporting period. There were no waivers for the fiscal year ended August 31, 2018.
Item 3. Audit Committee Financial Expert.
The Registrant’s Board of Trustees (the “Board”) has determined that the Registrant has three “audit committee financial experts” serving on its audit committee: Mr. Marc M. Kole, Mr. Gary R. Wicker, and Mr. Donald H. Wilson. Each of these audit committee members is “independent,” meaning that he is not an “interested person” of the Registrant (as that term is defined in Section 2(a)(19) of the Investment Company Act of 1940, as amended) and he does not accept any consulting, advisory, or other compensatory fee from the Registrant (except in his capacity as a Board or committee member).
An “audit committee financial expert” is not an “expert” for any purpose, including for purposes of Section 11 of the Securities Act of 1933, as a result of being designated as an “audit committee financial expert.” Further, the designation of a person as an “audit committee financial expert” does not mean that a person has any greater duties, obligations, or liability than those imposed on a person without the “audit committee financial expert” designation. Similarly, the designation of a person as an “audit committee financial expert” does not affect the duties, obligations, or liability of any other member of the audit committee or Board.
Item 4. Principal Accountant Fees and Services.
(a) to (d)
Fees Billed by PwC to the RegistrantPricewaterhouseCoopers LLP (“PwC”), the Registrant’s independent registered public accounting firm, billed the series of the Registrant with a fiscal year end of August 31, 2018 aggregate fees for pre-approved services rendered to these series as shown in the following table. The Audit Committee pre-approved all audit and non-audit services provided to the Registrant.
| | |
| | | Fees Billed by PwC for Services Rendered to the Registrant for fiscal Year End 2018 |
| |
Audit Fees | | $ 811,670 |
Audit-Related Fees | | $ 0 |
Tax Fees(1) | | $ 373,580 |
All Other Fees | | $ 0 |
Total Fees | | $ 1,185,250 |
(1) Tax fees for the fiscal year ended August 31, 2018 includes fees billed for reviewing tax returns, 2018 excise tax returns and excise tax distributions calculations and the 2017 State Source Income Analysis.
Fees Billed by PwC Related to Invesco and Invesco Affiliates
PwC billed Invesco Capital Management LLC (“Invesco” or “Adviser”), the Registrant’s adviser, and any entity controlling, controlled by or under common control with Invesco that provides ongoing services to the Registrant (“Affiliates”), aggregate fees for pre-approved non-audit services rendered to Invesco and Affiliates for the last fiscal year as shown in the following table. The Audit Committee pre-approved all non-audit services provided to Invesco and Affiliates that were required to be pre-approved.
| | |
| | | Fees Billed for Non-
Audit Services
Rendered to
Invesco and
Affiliates for Fiscal
Year End 2018 That
Were Required to be Pre-Approved by the Registrant’s Audit Committee |
| |
Audit-Related Fees(1) | | $ 662,000 |
Tax Fees | | $ 0 |
All Other Fees | | $ 0 |
Total Fees | | $ 662,000 |
(1) Audit-Related fees for the fiscal year end 2018 include fees billed related to reviewing controls at a service organization.
(e)(1) Audit Committee Pre Approval Policies and Procedures
Pre-Approval of Audit and Non-Audit Services Policies and Procedures
As Adopted by the Audit Committee of the Invesco ETFs
| | |
| Applicable to | | Invesco Exchange-Traded Fund Trust, Invesco Exchange-Traded Fund Trust II, Invesco India Exchange-Traded Fund Trust, Invesco Actively Managed Exchange-Traded Fund Trust, Invesco Actively Managed Exchange-Traded Commodity Fund Trust and Invesco Exchange-Traded Self-Indexed Fund Trust (collectively the “Funds”) |
| Risk Addressed by Policy | | Approval of Audit and Non-Audit Services |
| | |
Relevant Law and Other Sources | | Sarbanes-Oxley Act of 2002; Regulation S-X. |
Last Reviewed by Compliance for Accuracy | | June 15, 2018 |
Approved/Adopted Date | | June 2009 |
Statement of Principles
Under the Sarbanes-Oxley Act of 2002 and rules adopted by the Securities and Exchange Commission (“SEC”) (“Rules”), the Audit Committee of the Funds’ (the “Audit Committee”) Board of Trustees (the “Board”) is responsible for the appointment, compensation and oversight of the work of independent accountants (an “Auditor”). As part of this responsibility and to assure that the Auditor’s independence is not impaired, the Audit Committee pre-approves the audit and non-audit services provided to the Funds by each Auditor, as well as all non-audit services provided by the Auditor to the Funds’ investment adviser and to affiliates of the adviser that provide ongoing services to the Funds (“Service Affiliates”) if the services directly impact the Funds’ operations or financial reporting. The SEC Rules also specify the types of services that an Auditor may not provide to its audit client. The following policies and procedures comply with the requirements for pre-approval and provide a mechanism by which management of the Funds may request and secure pre-approval of audit and non-audit services in an orderly manner with minimal disruption to normal business operations.
Proposed services either may be pre-approved without consideration of specific case-by-case services by the Audit Committee (“general pre-approval”) or require the specific pre-approval of the Audit Committee (“specific pre-approval”). As set forth in these policies and procedures, unless a type of service has received general pre-approval, it will require specific pre-approval by the Audit Committee. Additionally, any fees exceeding 110% of estimated pre-approved fee levels provided at the time the service was pre-approved will also require specific approval by the Audit Committee before payment is made. The Audit Committee will also consider the impact of additional fees on the Auditor’s independence when determining whether to approve any additional fees for previously pre-approved services.
The Audit Committee will annually review and generally pre-approve the services that may be provided by each Auditor without obtaining specific pre-approval from the Audit Committee. The term of any general pre-approval runs from the date of such pre-approval through June 30th of the following year, unless the Audit Committee considers a different period and states otherwise. The Audit Committee will add to or subtract from the list of general pre-approved services from time to time, based on subsequent determinations.
The purpose of these policies and procedures is to set forth the guidelines to assist the Audit Committee in fulfilling its responsibilities.
Delegation
The Chairman of the Audit Committee (or, in his or her absence, any member of the Audit Committee) may grant specific pre-approval for non-prohibited services. All such delegated pre-approvals shall be presented to the Audit Committee no later than the next Audit Committee meeting.
Audit Services
The annual Audit services engagement terms will be subject to specific pre-approval of the Audit Committee. Audit services include the annual financial statement audit and other procedures such as tax provision work that is required to be performed by the independent auditor to be able to form an opinion on the Funds’ financial statements. The Audit Committee will obtain, review and consider sufficient information concerning the proposed Auditor to make a reasonable evaluation of the Auditor’s qualifications and independence.
In addition to the annual Audit services engagement, the Audit Committee may grant either general or specific pre-approval of other Audit services, which are those services that only the independent auditor reasonably can provide. Other Audit services may include services such as issuing consents for the inclusion of audited financial statements with SEC registration statements, periodic reports and other documents filed with the SEC or other documents issued in connection with securities offerings.
Non-Audit Services
The Audit Committee may provide either general or specific pre-approval of any non-audit services to the Funds and its Service Affiliates if the Audit Committee believes that the provision of the service will not impair the independence of the Auditor, is consistent with the SEC’s Rules on auditor independence, and otherwise conforms to the Audit Committee’s general principles and policies as set forth herein.
Audit-Related Services
“Audit-related services” are assurance and related services that are reasonably related to the performance of the audit or review of the Funds’ financial statements or that are traditionally performed by the independent auditor. Audit-related services include, among others, accounting consultations related to accounting, financial reporting or disclosure matters not classified as “Audit services”; and assistance with understanding and implementing new accounting and financial reporting guidance from rulemaking authorities.
Tax Services
“Tax services” include, but are not limited to, the review and signing of the Funds’ federal tax returns, the review of required distributions by the Funds and consultations regarding tax matters such as the tax treatment of new investments or the impact of new regulations. The Audit Committee will scrutinize carefully the retention of the Auditor in connection with a transaction initially recommended by the Auditor, the major business purpose of which may be tax avoidance or the tax treatment of which may not be supported in the Internal Revenue Code and related regulations. The Audit Committee will consult with the Funds’ Treasurer (or his or her designee) and may consult with outside counsel or advisors as necessary to ensure the consistency of Tax services rendered by the Auditor with the foregoing policy.
No Auditor shall represent any Fund or any Service Affiliate before a tax court, district court or federal court of claims.
Under rules adopted by the Public Company Accounting Oversight Board and approved by the SEC, in connection with seeking Audit Committee pre-approval of permissible Tax services, the Auditor shall:
| | 1. | Describe in writing to the Audit Committee, which writing may be in the form of the proposed engagement letter: |
| | a. | The scope of the service, the fee structure for the engagement, and any side letter or amendment to the engagement letter, or any other agreement between the Auditor and the Fund, relating to the service; and |
| | b. | Any compensation arrangement or other agreement, such as a referral agreement, a referral fee or |
fee-sharing arrangement, between the Auditor and any person (other than the Fund) with respect to the promoting, marketing, or recommending of a transaction covered by the service;
| | 2. | Discuss with the Audit Committee the potential effects of the services on the independence of the Auditor; and |
| | 3. | Document the substance of its discussion with the Audit Committee. |
All Other Auditor Services
The Audit Committee may pre-approve non-audit services classified as “All other services” that are not categorically prohibited by the SEC, as listed in Exhibit 1 to this policy.
Pre-Approval Fee Levels or Established Amounts
Pre-approval of estimated fees or established amounts for services to be provided by the Auditor under general or specific pre-approval policies will be set periodically by the Audit Committee. Any proposed fees exceeding 110% of the maximum estimated pre-approved fees or established amounts for pre-approved audit and non-audit services will be reported to the Audit Committee at the quarterly Audit Committee meeting and will require specific approval by the Audit Committee before payment is made. The Audit Committee will always factor in the overall relationship of fees for audit and non-audit services in determining whether to pre-approve any such services and in determining whether to approve any additional fees exceeding 110% of the maximum pre-approved fees or established amounts for previously pre-approved services.
Procedures
On an annual basis, the Auditor will submit to the Audit Committee for general pre-approval, a list of non-audit services that the Funds or Service Affiliates of the Funds may request from the Auditor. The list will describe the non-audit services in reasonable detail and will include an estimated range of fees and such other information as the Audit Committee may request.
Each request for services to be provided by the Auditor under the general pre-approval of the Audit Committee will be submitted to the Funds’ Treasurer (or his or her designee) and must include a detailed description of the services to be rendered. The Treasurer or his or her designee will ensure that such services are included within the list of services that have received the general pre-approval of the Audit Committee.
Each request to provide services that require specific approval by the Audit Committee shall be submitted to the Audit Committee jointly by the Funds’ Treasurer or his or her designee and the Auditor, and must include a joint statement that, in their view, such request is consistent with the pre-approval policies and procedures and the SEC Rules.
Each request to provide Tax services under either the general or specific pre-approval of the Audit Committee will describe in writing: (i) the scope of the service, the fee structure for the engagement, and any side letter or amendment to the engagement letter, or any other agreement between the Auditor and the audit client, relating to the service; and (ii) any compensation arrangement or other agreement between the Auditor and any person (other than the audit client) with respect to the promoting, marketing, or recommending of a transaction covered by the service. The Auditor will discuss with the Audit Committee the potential effects of the services on the Auditor’s independence and will document the substance of the discussion.
Non-audit services pursuant to the de minimis exception provided by the SEC Rules will be promptly brought to the attention of the Audit Committee for approval, including documentation that each of the conditions for this exception, as set forth in the SEC Rules, has been satisfied.
On at least an annual basis, the Auditor will prepare a summary of all the services provided to any entity in the investment company complex as defined in section 2-01(f)(14) of Regulation S-X in sufficient detail as to the nature of the engagement and the fees associated with those services.
The Audit Committee has designated the Funds’ Treasurer to monitor the performance of all services provided by the Auditor and to ensure such services are in compliance with these policies and procedures. The Funds’ Treasurer will report to the Audit Committee on a periodic basis as to the results of such monitoring. Both the Funds’ Treasurer and management will immediately report to the Chairman of the Audit Committee any breach of these policies and procedures that comes to the attention of the Funds’ Treasurer or senior management.
Adopted: June 26, 2009
Amended: June 15, 2018
Exhibit 1 to Pre-Approval of Audit and Non-Audit Services Policies and Procedures
Conditionally Prohibited Non-Audit Services (not prohibited if the Fund can reasonably conclude that the results of the service would not be subject to audit procedures in connection with the audit of the Fund’s financial statements)
| | • | | Bookkeeping or other services related to the accounting records or financial statements of the audit client |
| | • | | Financial information systems design and implementation |
| | • | | Appraisal or valuation services, fairness opinions, or contribution-in-kind reports |
| | • | | Internal audit outsourcing services |
Categorically Prohibited Non-Audit Services
| | • | | Broker-dealer, investment adviser, or investment banking services |
| | • | | Expert services unrelated to the audit |
| | • | | Any service or product provided for a contingent fee or a commission |
| | • | | Services related to marketing, planning, or opining in favor of the tax treatment of confidential transactions or aggressive tax position transactions, a significant purpose of which is tax avoidance |
| | • | | Tax services for persons in financial reporting oversight roles at the Fund |
| | • | | Any other service that the Public Company Oversight Board determines by regulation is impermissible. |
| (e)(2) | There were no amounts that were pre-approved by the Audit Committee pursuant to the de minimus exception under Rule 2-01 of Regulation S-X. |
| | (g) | PwC billed Invesco and Affiliates additional aggregate fees of $2,211,000 for the fiscal year ended August 31, 2018 for non-audit services not required to be pre-approved by the Registrant’s Audit Committee. In total, PwC billed the Registrant, Invesco and Affiliates aggregate non-audit fees of $3,247,000 for the fiscal year ended August 31, 2018. |
| | (h) | With respect to the non-audit services above billed to Invesco and Affiliates that were not required to be pre-approved by the Registrant’s Audit Committee, the Audit Committee received information from PwC about such services, including by way of comparison, that PwC provided audit services to entities within the Investment Company Complex, as defined by Rule#2-01(f)(14) of Regulation S-X, of approximately $25 million and non-audit services of approximately $16 million for the fiscal year ended 2018. The Audit Committee considered this information in evaluating PwC’s independence. |
PwC informed the Audit Committee of the Board of the Trust (the “Audit Committee”) that it has identified an issue related to its independence under Rule 2-01(c)(1)(ii)(A) of Regulation S-X (referred to as the “Loan Rule”). The Loan Rule prohibits accounting firms, such as PwC, from being deemed independent if they have certain financial relationships with their audit clients or certain affiliates of those clients. The Trust is required under various securities laws to have its financial statements audited by an independent accounting firm.
The Loan Rule specifically provides that an accounting firm would not be independent if it receives a loan from a lender that is a record or beneficial owner of more than ten percent of an audit client’s equity securities. For purposes of the Loan Rule, audit clients include the Funds as well as all registered investment companies advised by the Adviser and its affiliates, including other subsidiaries of the Adviser’s parent company, Invesco Ltd. (collectively, the Invesco Fund Complex). PwC informed the Audit Committee it has relationships with lenders who hold, as record owner, more than ten percent of the shares of certain funds within the Invesco Fund Complex. These relationships call into question PwC’s independence under the Loan Rule with respect to those funds, as well as all other funds in the Invesco Fund Complex.
On June 20, 2016, the SEC Staff issued a “no-action” letter to another mutual fund complex (see Fidelity Management & Research Company et al., No-Action Letter) related to the audit independence issue described above. In that letter, the SEC confirmed that it would not recommend enforcement action against a fund that relied on audit services performed by an audit firm that was not in compliance with the Loan Rule in certain specified circumstances.
In an August 18, 2016 letter, and in subsequent communications, PwC affirmed to the Audit Committee that, as of the date of the letter and the subsequent communications, respectively, PwC is an independent accountant with respect to the Trust, within the meaning of PCAOB Rule 3520. In its letter and in its subsequent communications , PwC also informed the Audit Committee that, after evaluating the facts and circumstances and the applicable independence rules, PwC has concluded that with regard to its compliance with the independence criteria set forth in the rules and regulations of the SEC related to the Loan Rule, it believes that it remains objective and impartial despite matters that may ultimately be determined to be inconsistent with these criteria and therefore it can continue to serve as the Trust’s registered public accounting firm. PWC has advised the Audit Committee that this conclusion is based in part on the following considerations: (1) the lenders to PwC have no influence over any Fund, or other entity within the Invesco Fund Complex, or its investment adviser; (2) none of the officers or trustees of the Invesco Fund Complex whose shares are owned by PwC lenders are associated with those lenders; (3) PwC understands that the shares held by PwC lenders are held for the benefit of and on behalf of its policy owners/end investors; (4) investments in funds such as the Invesco Fund Complex funds are passive; (5) the PwC lenders are part of various syndicates of unrelated lenders; (6) there have been no changes to the loans in question since the origination of each respective note; (7) the debts are in good standing and no lender has the right to take action against PwC, as borrower, in connection with the financings; (8) the debt balances with each lender are immaterial to PwC and to each lender; and (9) the PwC audit engagement team has no involvement in PwC’s treasury function and PwC’s treasury function has no oversight of or ability to influence the PwC audit engagement team. In addition, PwC has communicated that the lending relationships appear to be consistent with the lending relationships described in the no-action letter and that they are not aware of other relationships that would be implicated by the Loan Rule. In addition to relying on PwC’s August 18, 2016 letter and subsequent communications regarding its independence, the Trust intends to rely upon the no-action letter.
If in the future the independence of PwC is called into question under the Loan Rule by circumstances that are not addressed in the SEC’s no-action letter, the Fund may need to take other action in order for the Fund’s filings with the SEC containing financial statements to be deemed compliant with applicable securities laws. Such additional actions could result in additional costs, impair the ability of the Funds to issue new shares or have other material adverse effects on the Funds. The SEC no-action relief was initially set to expire 18 months from issuance, but has been extended by the SEC without an expiration date, except that the no-action letter will be withdrawn upon the effectiveness of any amendments to the Loan Rule designed to address the concerns expressed in the letter.
PwC advised the Registrant’s Audit Committee that PwC had identified two matters for consideration under the SEC’s auditor independence rules. PwC stated that a PwC manager and a PwC Senior Manager each held financial interests in investment companies within the Invesco Fund complex that were inconsistent with the requirements of Rule 2-01(c)(1) of Regulation S-X.
PwC advised the Audit Committee that it believes its objectivity and impartiality had not been adversely affected by these matters as they related to the audit of the Registrant. In reaching this conclusion, PwC noted, among other things, that during the time of its audit, the engagement team was not aware of the investments, neither individual was in the chain of command of the audit or the audit partners of Invesco or the Registrant, the services each individual provided were not relied upon by the audit engagement team with respect to the audit of the Registrant and the investments were not material to the net worth of either individual or their immediate family members.
Item 5. Audit Committee of Listed Registrants.
| | (a) | The Registrant has a separately designated Audit Committee established in accordance with Section 3(a)(58)(A) of the Securities Exchange Act of 1934, as amended, which consists solely of independent trustees. The Audit Committee members are Marc M. Kole, Gary R. Wicker, and Donald H. Wilson. |
Item 6. Schedule of Investments.
| | (a) | The Schedules of Investments are included as a part of the report to shareholders filed under Item 1 of this Form N-CSR. |
Item 7. Disclosure of Proxy Voting Policies and Procedures for Closed-End Management Investment Companies.
Not applicable.
Item 8. Portfolio Managers of Closed-End Management Investment Companies.
Not applicable.
| Item 9. | Purchases of Equity Securities by Closed-End Management Investment Company and Affiliated Purchasers. |
Not applicable.
Item 10. Submission of Matters to a Vote of Security Holders.
There have been no material changes to the procedures by which shareholders may recommend nominees to the Board that would require disclosure herein.
Item 11. Controls and Procedures.
| | (a) | Based on their evaluation of the Registrant’s disclosure controls and procedures (as defined in Rule 30a-3(c) under the Investment Company Act of 1940) as of a date within 90 days of the filing date of this report, the Registrant’s President (principal executive officer) and Treasurer (principal financial officer) have concluded that such disclosure controls and procedures are effective. |
| | (b) | There were no changes in the registrant’s internal control over financial reporting (as defined in Rule 30a-3(d) under the 1940 Act (17 CFR 270.30a-3(d))) that occurred during the registrant’s last fiscal quarter that has materially affected, or is reasonably likely to materially affect, the registrant’s internal control over financial reporting. |
Item 12. Disclosure of Securities Lending Activities for Closed-End Management Investment Companies.
Not applicable.
Item 13. Exhibits.
| | |
| (a)(1) | | Code of Ethics is attached as Exhibit 99.CODEETH. |
| |
| (a)(2) | | Certifications of the Registrant’s President and Treasurer pursuant to Rule 30a-2(a) under the Investment Company Act of 1940 and Section 302 of the Sarbanes-Oxley Act of 2002 are attached as Exhibit 99.CERT. |
| |
| (a)(3) | | Not applicable. |
| |
| (a)(4) | | Change in Registrant’s Independent Public Accountant -attached as Exhibit 99.ACCT |
| |
| (b) | | Certifications of the Registrant’s President and Treasurer pursuant to Rule 30a-2(b) under the Investment Company Act of 1940 and Section 906 of the Sarbanes-Oxley Act of 2002 are attached as Exhibit 99.906CERT. |
SIGNATURES
Pursuant to the requirements of the Securities Exchange Act of 1934 and the Investment Company Act of 1940, the Registrant has duly caused this report to be signed on its behalf by the undersigned, thereunto duly authorized.
(Registrant) Invesco Exchange-Traded Fund Trust II
|
| By: /s/ Daniel E. Draper |
|
| Name: Daniel E. Draper |
| Title: President |
Date: 11/07/2018
Pursuant to the requirements of the Securities Exchange Act of 1934 and the Investment Company Act of 1940, this report has been signed below by the following persons on behalf of the Registrant and in the capacities and on the dates indicated.
|
| By: /s/ Daniel E. Draper |
|
| Name: Daniel E. Draper |
| Title: President |
Date: 11/07/2018
|
| By: /s/ Kelli Gallegos |
|
| Name: Kelli Gallegos |
| Title: Treasurer |
Date: 11/07/2018