UNITED STATES
SECURITIES AND EXCHANGE COMMISSION
Washington, D.C. 20549
FORM N-CSR
CERTIFIED SHAREHOLDER REPORT OF REGISTERED MANAGEMENT
INVESTMENT COMPANIES
Investment Company Act file number 811-21977
Invesco Exchange-Traded Fund Trust II
(Exact name of registrant as specified in charter)
3500 Lacey Road
Downers Grove, IL 60515
(Address of principal executive offices) (Zip code)
Daniel E. Draper
President
3500 Lacey Road
Downers Grove, IL 60515
(Name and address of agent for service)
Registrant’s telephone number, including area code: 800-983-0903
Date of fiscal year end: October 31
Date of reporting period: October 31, 2018
Form N-CSR is to be used by management investment companies to file reports with the Commission not later than 10 days after the transmission to stockholders of any report that is required to be transmitted to stockholders under Rule 30e-1 under the Investment Company Act of 1940 (17 CFR 270.30e-1). The Commission may use the information provided on Form N-CSR in its regulatory, disclosure review, inspection, and policymaking roles.
A registrant is required to disclose the information specified by Form N-CSR, and the Commission will make this information public. A registrant is not required to respond to the collection of information contained in Form N-CSR unless the Form displays a currently valid Office of Management and Budget (“OMB”) control number. Please direct comments concerning the accuracy of the information collection burden estimate and any suggestions for reducing the burden to Secretary, Securities and Exchange Commission, 450 Fifth Street, NW, Washington, DC 20549-0609. The OMB has reviewed this collection of information under the clearance requirements of 44 U.S.C. § 3507.
Item 1. Reports to Stockholders.
The Registrant’s annual report transmitted to shareholders pursuant to Rule 30e-1 under the Investment Company Act of 1940 is as follows:

Invesco Annual Report to Shareholders
October 31, 2018
| | |
| YAO | | Invesco China All-Cap ETF |
| CQQQ | | Invesco China Technology ETF |
| CGW | | Invesco S&P Global Water Index ETF |
Table of Contents
The Market Environment
Domestic Equity
The fiscal year proved to be an increasingly volatile time for US equities. The fiscal year began in the final months of 2017 with several major US stock market indexes repeatedly reaching new highs amid strong corporate profits, the prospect of tax reform legislation and exceedingly low stock market volatility.
Stock market euphoria continued in January 2018 as US equity markets steadily moved higher. Investors remained enthused about the passage of the Tax Cuts and Jobs Act signed into law in late December 2017, which significantly cut corporate tax rates. However, in February 2018, volatility returned to the US stock and bond markets. Worries about how rising interest rates might affect economic growth, concerns about a potential trade war and heightened geopolitical tensions, caused the US stock markets to pull back and volatility to increase.
US equity markets generally recovered in the second quarter of 2018 as strong US retail sales and low unemployment buoyed markets. Throughout the summer, US equities moved higher as corporate profits surged. Several US equity indexes reached new highs despite potential headwinds including trade tensions, tariff announcements and contagion concerns over a Turkish currency crisis. After a relatively quiet summer, market volatility markedly rose in the final month of the fiscal year. US equity markets suffered a sharp sell-off in October 2018 amid rising interest rates and concerns that higher inflation could mean a more restrictive monetary policy. In this environment, there was a flight to safety, as investors fled to defensive areas of the market and U.S. treasuries.
Given signs of a strong economy, the US Federal Reserve raised interest rates four times during the fiscal year: in December 2017 and in March, June and September 2018.1 In contrast, the European Central Bank and central banks in several other countries maintained extraordinarily accommodative monetary policies.
| 1 | Source: US Federal Reserve |
Global Equity
The fiscal year proved to be an increasingly volatile time for global equities. The fiscal year began in the final months of 2017 with several US stock market indexes repeatedly reaching new highs amid strong corporate profits, the prospect of tax reform legislation and exceedingly low stock market volatility. Despite a sharp uptick in volatility, particularly in October 2018, US markets, in general, still produced positive returns for the fiscal year. International markets, however, were meaningfully less robust, many experiencing flat to negative results for the fiscal year. This divergence between the US and other markets could be attributed to the strength of the US economy and the widely-held belief that the US could win trade wars with other countries.
At the beginning of 2018, markets saw significant turbulence in late January and early February, when stocks were whipsawed—first by concerns about accelerated US Federal Reserve (the Fed) tightening and then, later in the year, by fears of brewing trade wars and geopolitical tensions. After a relatively quiet summer, market volatility markedly rose again in the final month of the fiscal year. Global equity markets (particularly the US) suffered a sharp sell-off in October 2018 amid rising interest rates and concerns that higher inflation could result in a more restrictive monetary policy.
Global economic growth, in general, was solid despite weakness in emerging markets. During the fiscal year, emerging markets were impacted by both country-specific issues, as well as, more generalized pressure resulting from the Fed’s tightening policy. In this environment, economic growth unsurprisingly slowed in emerging markets. Within the eurozone, economic growth accelerated, although there was divergence among countries. In Japan, economic growth improved over the latter part of the fiscal year. The US experienced strong growth during the fiscal year due to robust consumer and business spending. In addition, unemployment rates remained low, job creation was strong and inflation remained relatively controlled.
At the close of the fiscal year, equity valuations in developed and emerging markets appeared relatively full in absolute terms—but overseas equity markets were trading at a material discount to those of the US. In sum, while valuations were not cheap, recent earnings growth and upward earnings revisions improved in many non-US developed markets.
| | |
| YAO | | Manager’s Analysis |
| | Invesco China All-Cap ETF (YAO) |
As an index fund, the Invesco China All-Cap ETF (the “Fund”) is passively managed and seeks to track the returns of an underlying index. The Fund seeks to track the investment results (before fees and expenses) of the AlphaShares China All Cap Index (the “Index”). The Fund will invest at least 90% of its total assets in common stocks, American depositary receipts (“ADRs”), American depositary shares (“ADSs”), global depositary receipts (“GDRs”) and international depositary receipts (“IDRs”) that comprise the Index and depositary receipts or shares representing common stocks included in the Index (or underlying securities representing ADRs, ADSs, GDRs and IDRs included in the Index).
The Index is designed to measure and monitor the performance of the investable universe of publicly traded companies based in mainland China (as classified by the S&P BMI Country Code classification system). The Index was created by AlphaShares, LLC (the “Index Provider”) and is maintained by Standard & Poor’s. The Index includes equity securities of companies of all categories of market capitalizations, as defined by the Index Provider (subject to a minimum float-adjusted capitalization of U.S. $400 million). The Index may include Hong Kong listed securities, including China H-shares and Red Chip shares. China H-shares are issued by companies incorporated in mainland China and listed on the Hong Kong Stock Exchange. Red Chip shares are issued by companies with controlling Chinese shareholders that are incorporated outside mainland China and listed on the Hong Kong Stock Exchange. The Index may also include N-Shares, which are issued by companies based in mainland China and listed on the NYSE Arca, Inc. or The NASDAQ Stock Market. The Index does not include China A-Shares (which are subject to substantial restrictions on foreign investment) or China B-Shares (which offer a generally smaller market and limited liquidity), each of which trade on the Shanghai Stock Exchange and the Shenzhen Stock Exchange. The Fund generally will invest in all of the securities comprising the Index in proportion to their weightings in the Index.
The Board of Trustees approved a change in fiscal year end for the Fund from August 31 to October 31. For the fiscal period from September 1, 2018 to October 31, 2018, on a market price basis, the Fund returned (10.77)%. On a net asset value (“NAV”) basis, the Fund returned (10.97)%. During the same time period, the Index returned (11.05)%. During the fiscal period, the Fund’s performance, on a NAV basis, outperformed the Index primarily due to underweight allocation to the information technology sector.
During this same time period, the MSCI China Index (Net) (the “Benchmark Index”) returned (12.71)%. The Benchmark Index is an unmanaged index weighted by market capitalization based on the average performance of approximately 460 securities. The Benchmark Index was selected for its recognition in the marketplace, and its performance comparison is a useful measure for investors as a broad representation of the Chinese equity market.
The performance of the Fund differed from the Benchmark Index because the Fund seeks to track an Index that employs a proprietary stock selection and weighting methodology, whereas the Benchmark Index selects and weights stocks based on market capitalization.
Relative to the Benchmark Index, the Fund was most overweight in the financials sector and most underweight in the information technology sector during the fiscal period ended October 31, 2018. The majority of the Fund’s outperformance relative to the Benchmark Index during that period can be attributed to the Fund being underweight in the information technology sector.
For the fiscal period ended October 31, 2018, the information technology sector contributed most significantly to the Fund’s return. The consumer discretionary and real estate sectors were the greatest detracting sectors.
Positions that contributed most significantly to the Fund’s return for the fiscal period ended October 31, 2018, included Bank of Communications Co., Ltd. a financials company (portfolio average weight of 1.37%), and Netease, Inc., a communication services company (portfolio average weight of 1.30%). Positions that detracted most significantly from the Fund’s return during this period included Alibaba Group Holdings Ltd., a consumer discretionary company (portfolio average weight of 5.32%), and Tencent Holdings Ltd., a communication services company (portfolio average weight of 3.94%).
| | | | |
Sector Breakdown
(% of the Fund’s Net Assets)
as of October 31, 2018 | |
| Financials | | | 28.3 | |
| Communication Services | | | 18.0 | |
| Consumer Discretionary | | | 16.2 | |
| Industrials | | | 6.9 | |
| Energy | | | 6.8 | |
| Real Estate | | | 6.8 | |
| Health Care | | | 4.4 | |
| Consumer Staples | | | 3.7 | |
| Information Technology | | | 3.1 | |
| Utilities | | | 3.1 | |
| Materials | | | 2.7 | |
| Money Market Fund Plus Other Assets Less Liabilities | | | 0.0 | |
Invesco China All-Cap ETF (YAO) (continued)
| | | | |
Top Ten Fund Holdings*
(% of the Fund’s Net Assets)
as of October 31, 2018 | |
| Security | | | | |
| China Construction Bank Corp., H-Shares | | | 5.4 | |
| Alibaba Group Holding Ltd. ADR | | | 5.3 | |
| Baidu, Inc. ADR | | | 4.5 | |
| Industrial & Commercial Bank of China Ltd., H-Shares | | | 4.5 | |
| China Mobile Ltd. | | | 4.4 | |
| Ping An Insurance Group Co. of China Ltd., H-Shares | | | 4.1 | |
| Tencent Holdings Ltd. | | | 3.9 | |
| Bank of China Ltd., H-Shares | | | 2.8 | |
| CNOOC Ltd. | | | 2.4 | |
| China Petroleum & Chemical Corp. (Sinopec), H-Shares | | | 1.8 | |
| Total | | | 39.1 | |
| * | Excluding money market fund holdings. |
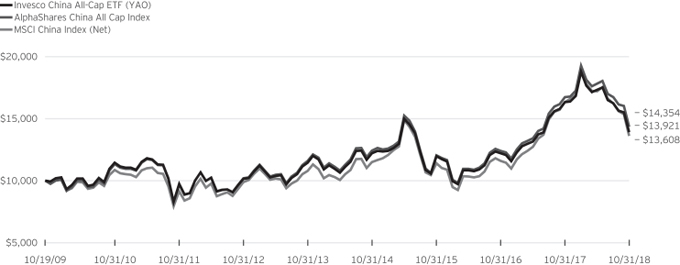
Growth of a $10,000 Investment Since Inception
Fund Performance History as of October 31, 2018
| | | | | | | | | | | | | | | | | | | | | | | | | | | | | | | | |
| | | 1 Year | | | 3 Years Average
Annualized | | | 3 Years Cumulative | | | 5 Years Average
Annualized | | | 5 Years Cumulative | | | | | | Fund Inception | |
| Index | | Average
Annualized | | | Cumulative | |
| AlphaShares China All Cap Index | | | (14.20 | )% | | | 6.00 | % | | | 19.11 | % | | | 4.38 | % | | | 23.92 | % | | | | | | | 4.08 | % | | | 43.54 | % |
| MSCI China Index (Net) | | | (16.73 | ) | | | 6.05 | | | | 19.27 | | | | 4.74 | | | | 26.03 | | | | | | | | 3.47 | | | | 36.08 | |
| Fund | | | | | | | | | | | | | | | | | | | | | | | | | | | | | | | | |
| NAV Return | | | (14.81 | ) | | | 5.17 | | | | 16.32 | | | | 3.98 | | | | 21.53 | | | | | | | | 3.73 | | | | 39.21 | |
| Market Price Return | | | (13.81 | ) | | | 5.19 | | | | 16.38 | | | | 3.98 | | | | 21.57 | | | | | | | | 3.72 | | | | 39.02 | |
Invesco China All-Cap ETF (YAO) (continued)
Guggenheim China All-Cap ETF (the “Predecessor Fund”) Inception: October 19, 2009
Performance quoted above represents past performance. Past performance is not a guarantee of future results and current performance may be higher or lower than performance quoted. Investment returns and principal value will fluctuate, and shares of the Fund (“Fund Shares”), when redeemed or sold, may be worth more or less than their original cost. Fund performance reflects any applicable fee waivers and/or expense reimbursements. Had the adviser not waived fees and/or reimbursed expenses currently or in the past, returns would have been lower. See current prospectus for more information. According to the Fund’s current prospectus, the Fund’s expense ratio of 0.70% is expressed as a unitary management fee to cover operating expenses and expenses incurred in connection with managing the portfolio. NAV and Market Price returns assume that dividends and capital gain distributions have been reinvested in the Fund at NAV and Market Price, respectively. The returns shown in the table above do not reflect the deduction of taxes that a shareholder would pay on Fund distributions or the redemption or sale of Fund Shares. See invesco.com/ETFs to find the most recent month-end performance numbers.
Index and Benchmark Index performance results are based upon a hypothetical investment in their respective constituent securities. Index and Benchmark Index returns do not represent Fund returns. An investor cannot invest directly in an index. The Index and Benchmark Index do not charge management fees or brokerage expenses, and no such fees or expenses were deducted from the hypothetical performance shown. In addition, the results actual investors might have achieved would have differed from those shown because of differences in the timing, amounts of their investments, and fees and expenses associated with an investment in the Fund.
Notes Regarding Indexes and Fund Performance History:
| - | Average Annualized and Cumulative Inception returns for the Fund, Index and Benchmark Index are based on the inception date of the Predecessor Fund. |
| - | Effective after the close of business on April 6, 2018, the Predecessor Fund was reorganized into the Fund. Fund returns shown are blended returns of the Predecessor Fund and the Fund. |
| - | Net returns reflect reinvested dividends net of withholding taxes. |
| | |
| CQQQ | | Manager’s Analysis |
| | Invesco China Technology ETF (CQQQ) |
As an index fund, the Invesco China Technology ETF (the “Fund”) is passively managed and seeks to track the returns of an underlying index. The Fund seeks to track the investment results (before fees and expenses) of an equity index called the AlphaShares China Technology Index (the “Index”). The Fund will invest at least 90% of its total assets in common stocks, American depositary receipts (“ADRs”), American depositary shares (“ADSs”), global depositary receipts (“GDRs”) and international depositary receipts (“IDRs”) that comprise the Index and depositary receipts or shares representing common stocks included in the Index (or underlying securities representing ADRs, ADSs, GDRs and IDRs included in the Index).
The Index is designed to measure and monitor the performance of the universe of publicly traded companies which are based in mainland China, Hong Kong or Macau (as classified by the S&P BMI Country Code classification system), are in the Information Technology Sector, as defined by S&P Global Industry Classification Standard (“GICS”) and are open to foreign investment. The Index was created by AlphaShares, LLC (the “Index Provider”) and is maintained by Standard & Poor’s. The Index includes equity securities of companies of all categories of market capitalizations, as defined by the Index Provider (subject to a minimum float-adjusted capitalization of U.S. $150 million). The Index may include Hong Kong listed securities, including China H-shares and Red Chip shares. China H-shares are issued by companies incorporated in mainland China and listed on the Hong Kong Stock Exchange. Red Chip shares are issued by companies with controlling Chinese shareholders that are incorporated outside mainland China and listed on the Hong Kong Stock Exchange. The Index may also include N-Shares, which are issued by companies based in mainland China and listed on the NYSE Arca, Inc. or The NASDAQ Stock Market. The Index does not include China A-Shares (which are subject to substantial restrictions on foreign investment) or China B-Shares (which offer a generally smaller market and limited liquidity), each of which trade on the Shanghai Stock Exchange and the Shenzhen Stock Exchange. The Fund generally will invest in all of the securities comprising the Index in proportion to their weightings in the Index.
The Board of Trustees approved a change in fiscal year end for the Fund from August 31 to October 31. For the fiscal period from September 1, 2018 to October 31, 2018, on a market price basis, the Fund returned (17.32)%. On a net asset value (“NAV”) basis, the Fund returned (17.78)%. During the same time period, the Index returned (17.68)%. During the fiscal period, the Fund’s performance, on a NAV basis, differed from the return of the Index primarily due to fees and operating expenses that the Fund incurred partially offset by income received from the securities lending program in which the Fund participates.
During this same time period, the MSCI China Index (Net) (the “Benchmark Index”) returned (12.71)%. The Benchmark Index is an unmanaged index weighted by market capitalization based on the average performance of approximately 460 securities. The
Benchmark Index was selected for its recognition in the marketplace, and its performance comparison is a useful measure for investors as a broad representation of the Chinese equity market.
The performance of the Fund differed from the Benchmark Index because the Fund seeks to track an Index that employs a proprietary stock selection and weighting methodology, whereas the Benchmark Index selects and weights stocks based on market capitalization.
Relative to the Benchmark Index, the Fund was most overweight in the internet software & services sub-industry and most underweight in the diversified banks sub-industry during the fiscal period ended October 31, 2018. The majority of the Fund’s underperformance relative to the Benchmark Index during that period can be attributed to the Fund being overweight in the internet software & services and electronic components sub-industries.
For the fiscal period ended October 31, 2018, the internet software & services sub-industry detracted most significantly from the Fund’s return, followed by the electronic components sub-industry. There were no contributing sub-industries during the period.
Positions that contributed most significantly to the Fund’s return for the fiscal period ended October 31, 2018, included NetEase, Inc. ADR, an entertainment company (portfolio average weight of 7.71%), and 21Vianet Group, Inc. ADR Class A, an IT services company (portfolio average weight of 0.54%). Positions that detracted most significantly from the Fund’s return during this period included Tencent Holdings Ltd., an interactive media & services company (portfolio average weight of 9.89%), and Alibaba Group Holding Ltd. ADR, an internet & direct marketing retail company (portfolio average weight of 9.77%).
| | | | |
Industry Breakdown
(% of the Fund’s Net Assets)
as of October 31, 2018 | |
| Interactive Media & Services | | | 41.6 | |
| Electronic Equipment, Instruments & Components | | | 12.9 | |
| Internet & Direct Marketing Retail | | | 11.1 | |
| Entertainment | | | 9.3 | |
| Semiconductors & Semiconductor Equipment | | | 6.8 | |
| IT Services | | | 6.2 | |
| Technology Hardware, Storage & Peripherals | | | 5.5 | |
| Software | | | 3.1 | |
| Industry Types Each Less Than 3% | | | 3.4 | |
| Money Market Funds Plus Other Assets Less Liabilities | | | 0.1 | |
Invesco China Technology ETF (CQQQ) (continued)
| | | | |
Top Ten Fund Holdings*
(% of the Fund’s Net Assets)
as of October 31, 2018 | |
| Security | | | | |
| Alibaba Group Holding Ltd. ADR | | | 10.1 | |
| Tencent Holdings Ltd. | | | 9.5 | |
| Baidu, Inc. ADR | | | 8.4 | |
| NetEase, Inc. ADR | | | 8.3 | |
| 58.com, Inc., Class A ADR | | | 4.7 | |
| Momo, Inc., Class A ADR | | | 4.2 | |
| Autohome, Inc., Class A ADR | | | 3.5 | |
| SINA Corp. | | | 3.5 | |
| Lenovo Group Ltd. | | | 3.5 | |
| Sunny Optical Technology Group Co. Ltd. | | | 3.4 | |
| Total | | | 59.1 | |
| * | Excluding money market fund holdings. |
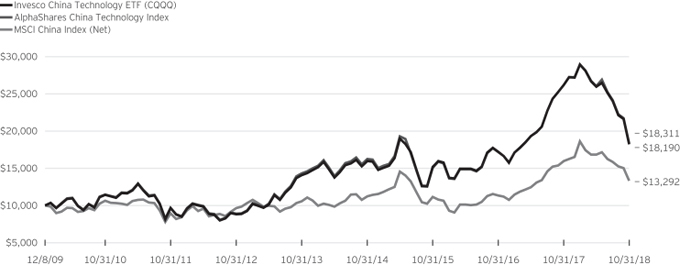
Growth of a $10,000 Investment Since Inception
Fund Performance History as of October 31, 2018
| | | | | | | | | | | | | | | | | | | | | | | | | | | | | | | | |
| | | 1 Year | | | 3 Years Average
Annualized | | | 3 Years Cumulative | | | 5 Years Average
Annualized | | | 5 Years Cumulative | | | | | | Fund Inception | |
| Index | | | | | Average
Annualized | | | Cumulative | |
| AlphaShares China Technology Index | | | (30.06 | )% | | | 6.73 | % | | | 21.59 | % | | | 5.09 | % | | | 28.15 | % | | | | | | | 7.04 | % | | | 83.11 | % |
| MSCI China Index (Net) | | | (16.73 | ) | | | 6.05 | | | | 19.27 | | | | 4.74 | | | | 26.03 | | | | | | | | 3.25 | | | | 32.92 | |
| Fund | | | | | | | | | | | | | | | | | | | | | | | | | | | | | | | | |
| NAV Return | | | (30.46 | ) | | | 6.22 | | | | 19.85 | | | | 5.31 | | | | 29.52 | | | | | | | | 6.96 | | | | 81.90 | |
| Market Price Return | | | (30.03 | ) | | | 6.57 | | | | 21.02 | | | | 5.59 | | | | 31.23 | | | | | | | | 7.03 | | | | 83.06 | |
Invesco China Technology ETF (CQQQ) (continued)
Guggenheim China Technology ETF (the “Predecessor Fund”) Inception: December 08, 2009
Performance quoted above represents past performance. Past performance is not a guarantee of future results and current performance may be higher or lower than performance quoted. Investment returns and principal value will fluctuate, and shares of the Fund (“Fund Shares”), when redeemed or sold, may be worth more or less than their original cost. Fund performance reflects any applicable fee waivers and/or expense reimbursements. Had the adviser not waived fees and/or reimbursed expenses currently or in the past, returns would have been lower. See current prospectus for more information. According to the Fund’s current prospectus, the Fund’s expense ratio of 0.70% is expressed as a unitary management fee to cover operating expenses and expenses incurred in connection with managing the portfolio. NAV and Market Price returns assume that dividends and capital gain distributions have been reinvested in the Fund at NAV and Market Price, respectively. The returns shown in the table above do not reflect the deduction of taxes that a shareholder would pay on Fund distributions or the redemption or sale of Fund Shares. See invesco.com/ETFs to find the most recent month-end performance numbers.
Index and Benchmark Index performance results are based upon a hypothetical investment in their respective constituent securities. Index and Benchmark Index returns do not represent Fund returns. An investor cannot invest directly in an index. The Index and Benchmark Index do not charge management fees or brokerage expenses, and no such fees or expenses were deducted from the hypothetical performance shown. In addition, the results actual investors might have achieved would have differed from those shown because of differences in the timing, amounts of their investments, and fees and expenses associated with an investment in the Fund.
Notes Regarding Indexes and Fund Performance History:
| - | Effective after the close of business on May 18, 2018, the Predecessor Fund was reorganized into the Fund. Fund returns shown are blended returns of the Predecessor Fund and the Fund. |
| - | Average Annualized and Cumulative Inception returns for the Fund, Index and Benchmark Index are based on the inception date of the Predecessor Fund. |
| - | Net returns reflect reinvested dividends net of withholding taxes. |
| | |
| CGW | | Manager’s Analysis |
| | Invesco S&P Global Water Index ETF (CGW) |
As an index fund, the Invesco S&P Global Water Index ETF (the “Fund”) is passively managed and seeks to track the returns of an underlying index. The Fund seeks to track the investment results (before fees and expenses) of the S&P Global Water Index (the “Index”). The Fund will invest at least 90% of its total assets in common stock and American depositary receipts (“ADRs”) that comprise the Index and depositary receipts representing common stocks included in the Index (or underlying securities representing ADRs included in the Index). The depositary receipts included in the Index may be sponsored or unsponsored.
The Index is comprised of 50 equity securities selected, based on investment and other criteria, from a universe of companies listed on global developed market exchanges. Standard & Poor’s Financial Services LLC, a subsidiary of The McGraw-Hill Companies (“S&P”), generally defines “developed markets” as the capital markets of those countries with high levels of per capita income and strict market regulation resulting in greater transparency. Specifically, all or any subset of the following countries/regions are currently considered to be developed markets—Australia, Austria, Belgium, Canada, Denmark, Finland, France, Germany, Hong Kong, Ireland, Israel, Italy, Japan, Luxembourg, the Netherlands, New Zealand, Norway, Portugal, Singapore, South Korea, Spain, Sweden, Switzerland, the United Kingdom and the United States. The universe of companies includes all companies classified by Standard & Poor’s Global Industry Classifications as being associated (in a manner representing a major component of such companies’ business) with the global demand for water, including water utilities, infrastructure, equipment, instruments and materials. Total market capitalization and float-adjusted market capitalization of securities in the Index must be at least $250 million and $100 million, respectively, at the time of each reconstitution, which includes small-, mid-, and large-capitalization securities as defined by S&P. The companies in the universe are selected using criteria as identified by S&P. The Fund generally will invest in all of the securities comprising the Index in proportion to their weightings in the Index.
The Board of Trustees approved a change in fiscal year end for the Fund from August 31 to October 31. For the fiscal period from September 1, 2018 to October 31, 2018, on a market price basis, the Fund returned (8.40)%. On a net asset value (“NAV”) basis, the Fund returned (8.39)%. During the same time period, the Index returned (8.34)%. During the fiscal period, the Fund’s performance, on a NAV basis, differed from the return of the Index primarily due to fees and operating expenses that the Fund incurred during the period.
During this same time period, the MSCI EAFE® Index (Net) (the “Benchmark Index”) returned (7.16)%. The Benchmark Index is an unmanaged index weighted by market capitalization based on the average performance of approximately 920 securities. The Benchmark Index was selected for its recognition in the marketplace, and its performance comparison is a useful measure
for investors as a broad representation of the equities market in developed countries outside the U.S.
The performance of the Fund differed from the Benchmark Index because the Fund seeks to track an Index that employs a proprietary stock selection and weighting methodology, whereas the Benchmark Index selects and weights stocks based on market capitalization.
Relative to the Benchmark Index, the Fund was most overweight in the water utilities sub-industry and most underweight in the diversified banks sub-industry during the fiscal period ended October 31, 2018. The majority of the Fund’s underperformance relative to the Benchmark Index during that period can be attributed to the Fund being overweight in the industrial machinery sub-industry.
For the fiscal period ended October 31, 2018, the construction materials sub-industry detracted most significantly from the Fund’s return, followed by the commodity chemicals and oil & gas equipment & services sub-industries, respectively. There were no contributing sub-industries during the period.
Positions that contributed most significantly to the Fund’s return for the fiscal period ended October 31, 2018, included Companhia de Saneamento Basico do Estado de Sao Paulo SABESP ADR, a water utilities company (portfolio average weight of 1.35%), and American Water Works Company, a water utilities company (portfolio average weight of 9.49%). Positions that detracted most significantly from the Fund’s return during this period included IDEX Corp., an industrial machinery company (portfolio average weight of 5.11%), and Xylem Inc., an industrial machinery company (portfolio average weight of 6.37%).
| | | | |
Industry Breakdown
(% of the Fund’s Net Assets)
as of October 31, 2018 | |
| Water Utilities | | | 34.4 | |
| Machinery | | | 29.5 | |
| Multi-Utilities | | | 12.2 | |
| Building Products | | | 6.6 | |
| Health Care Equipment & Supplies | | | 5.0 | |
| Electronic Equipment, Instruments & Components | | | 4.2 | |
| Industry Types Each Less Than 3% | | | 7.9 | |
| Money Market Fund Plus Other Assets Less Liabilities | | | 0.2 | |
Invesco S&P Global Water Index ETF (CGW) (continued)
| | | | |
Top Ten Fund Holdings*
(% of the Fund’s Net Assets)
as of October 31, 2018 | |
| Security | | | | |
| American Water Works Co., Inc. | | | 9.7 | |
| Xylem, Inc. | | | 6.3 | |
| Veolia Environnement SA | | | 5.2 | |
| Danaher Corp. | | | 5.0 | |
| IDEX Corp. | | | 4.7 | |
| Geberit AG | | | 4.7 | |
| Alfa Laval AB | | | 4.1 | |
| United Utilities Group PLC | | | 3.9 | |
| Suez | | | 3.7 | |
| Aqua America, Inc. | | | 3.5 | |
| Total | | | 50.8 | |
| * | Excluding money market fund holdings. |
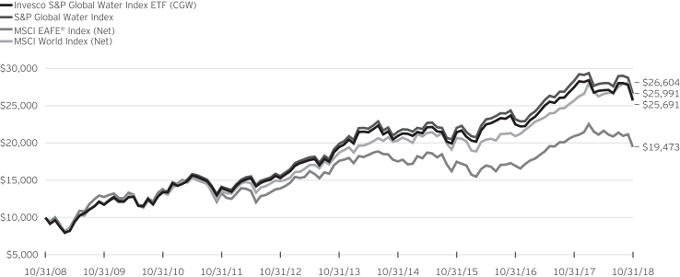
Growth of a $10,000 Investment
Fund Performance History as of October 31, 2018
| | | | | | | | | | | | | | | | | | | | | | | | | | | | | | | | | | | | | | | | |
| | | 1 Year | | | 3 Years Average
Annualized | | | 3 Years Cumulative | | | 5 Years Average
Annualized | | | 5 Years Cumulative | | | 10 Years Average
Annualized | | | 10 Years Cumulative | | | | | | Fund Inception | |
| Index | | | | | Average
Annualized | | | Cumulative | |
| S&P Global Water Index | | | (6.20 | )% | | | 6.47 | % | | | 20.68 | % | | | 5.98 | % | | | 33.67 | % | | | 10.28 | % | | | 166.04 | % | | | | | | | 5.00 | % | | | 74.98 | % |
| MSCI EAFE® Index (Net) | | | (6.85 | ) | | | 3.62 | | | | 11.27 | | | | 2.02 | | | | 10.52 | | | | 6.89 | | | | 94.73 | | | | | | | | 0.98 | | | | 11.82 | |
| MSCI World Index (Net) | | | 1.16 | | | | 7.91 | | | | 25.67 | | | | 6.81 | | | | 38.98 | | | | 10.02 | | | | 159.91 | | | | | | | | 4.23 | | | | 60.84 | |
| Fund | | | | | | | | | | | | | | | | | | | | | | | | | | | | | | | | | | | | | | | | |
| NAV Return | | | (6.50 | ) | | | 6.22 | | | | 19.84 | | | | 5.70 | | | | 31.93 | | | | 9.90 | | | | 156.91 | | | | | | | | 4.54 | | | | 66.38 | |
| Market Price Return | | | (6.57 | ) | | | 6.20 | | | | 19.79 | | | | 5.66 | | | | 31.72 | | | | 10.05 | | | | 160.56 | | | | | | | | 4.53 | | | | 66.09 | |
Invesco S&P Global Water Index ETF (CGW) (continued)
Guggenheim S&P Global Water Index ETF (the “Predecessor Fund”) Inception: May 14, 2007
Performance quoted above represents past performance. Past performance is not a guarantee of future results and current performance may be higher or lower than performance quoted. Investment returns and principal value will fluctuate, and shares of the Fund (“Fund Shares”), when redeemed or sold, may be worth more or less than their original cost. Fund performance reflects any applicable fee waivers and/or expense reimbursements. Had the adviser not waived fees and/or reimbursed expenses currently or in the past, returns would have been lower. See current prospectus for more information. According to the Fund’s current prospectus, the total annual operating expense ratio was indicated as 0.61%. The Financial Highlights section of the Shareholder Report presents the expense ratios based on expenses incurred during the period covered by this report. NAV and Market Price returns assume that dividends and capital gain distributions have been reinvested in the Fund at NAV and Market Price, respectively. The returns shown in the table above do not reflect the deduction of taxes that a shareholder would pay on Fund distributions or the redemption or sale of Fund Shares. See invesco.com/ETFs to find the most recent month-end performance numbers.
Index and Benchmark Indexes performance results are based upon a hypothetical investment in their respective constituent securities. Index
and Benchmark Indexes returns do not represent Fund returns. An investor cannot invest directly in an index. The Index and Benchmark Indexes do not charge management fees or brokerage expenses, and no such fees or expenses were deducted from the hypothetical performance shown. In addition, the results actual investors might have achieved would have differed from those shown because of differences in the timing, amounts of their investments, and fees and expenses associated with an investment in the Fund.
Notes Regarding Indexes and Fund Performance History:
| - | Average Annualized and Cumulative Inception returns for the Fund, Index and Benchmark Indexes are based on the inception date of the Predecessor Fund. |
| - | Effective after the close of business on April 6, 2018, the Predecessor Fund was reorganized into the Fund. Fund returns shown are blended returns of the Predecessor Fund and the Fund. |
| - | The Fund has elected to use the MSCI EAFE® Index to represent its broad-based index rather than the MSCI World Index because the MSCI EAFE® Index more closely reflects the performance of the types of securities in which the Fund invests. |
| - | Net returns reflect reinvested dividends net of withholding taxes. |
Schedule of Investments(a)
Invesco China All-Cap ETF (YAO)
October 31, 2018
| | | | | | | | |
Number
of Shares | | | | | Value | |
| | | | Common Stocks & Other Equity Interests—100.0% | |
| | | | Communication Services—18.0% | |
| | 1,553 | | | 58.com, Inc., Class A ADR (China)(b) | | $ | 101,861 | |
| | 220,000 | | | Alibaba Pictures Group Ltd. (Hong Kong)(b) | | | 30,308 | |
| | 966 | | | Autohome, Inc., Class A ADR (China)(c) | | | 69,919 | |
| | 4,827 | | | Baidu, Inc. ADR (China)(b) | | | 917,420 | |
| | 642 | | | Bitauto Holdings Ltd. ADR (China)(b)(c) | | | 12,262 | |
| | 273 | | | Changyou.com Ltd., Class A ADR (China) | | | 3,653 | |
| | 41,993 | | | China Communications Services Corp. Ltd., H-Shares (China) | | | 33,961 | |
| | 95,951 | | | China Mobile Ltd. (China) | | | 897,162 | |
| | 239,981 | | | China Telecom Corp. Ltd., H-Shares (China) | | | 113,265 | |
| | 101,995 | | | China Unicom Hong Kong Ltd. (China) | | | 105,906 | |
| | 3,131 | | | Fang Holdings Ltd. ADR (China)(b) | | | 6,356 | |
| | 2,450 | | | Momo, Inc., Class A ADR (China)(b) | | | 82,246 | |
| | 4,500 | | | NetDragon Websoft Holdings Ltd. (Hong Kong) | | | 7,956 | |
| | 1,273 | | | NetEase, Inc. ADR (China) | | | 264,593 | |
| | 1,088 | | | SINA Corp. (China)(b) | | | 68,881 | |
| | 536 | | | Sohu.com Ltd. ADR (China)(b) | | | 9,686 | |
| | 23,442 | | | Tencent Holdings Ltd. (China) | | | 798,405 | |
| | 1,092 | | | Weibo Corp., Class A ADR (China)(b) | | | 64,439 | |
| | 836 | | | YY, Inc., Class A ADR (China)(b) | | | 53,420 | |
| | | | | | | | |
| | | | | | | 3,641,699 | |
| | | | | | | | |
| | | | Consumer Discretionary—16.2% | |
| | 7,582 | | | Alibaba Group Holding Ltd. ADR (China)(b) | | | 1,078,767 | |
| | 15,000 | | | ANTA Sports Products Ltd. (China) | | | 61,612 | |
| | 27,453 | | | BAIC Motor Corp. Ltd., H-Shares (China)(d) | | | 15,408 | |
| | 508 | | | Baozun, Inc. ADR (China)(b)(c) | | | 20,223 | |
| | 49,996 | | | Brilliance China Automotive Holdings Ltd. (China) | | | 43,622 | |
| | 10,500 | | | BYD Co. Ltd., H-Shares (China)(c) | | | 68,041 | |
| | 58,000 | | | China Dongxiang Group Co. Ltd. (China) | | | 8,952 | |
| | 54,000 | | | China First Capital Group Ltd.
(Hong Kong)(b) | | | 21,767 | |
| | 24,000 | | | China Maple Leaf Educational Systems Ltd. (China) | | | 10,348 | |
| | 35,999 | | | China Travel International Investment Hong Kong Ltd. (China) | | | 9,643 | |
| | 21,000 | | | China Yongda Automobiles Services Holdings Ltd. (China) | | | 11,224 | |
| | 19,500 | | | China ZhengTong Auto Services Holdings Ltd. (China) | | | 9,303 | |
| | 6,604 | | | Ctrip.com International Ltd. ADR (China)(b) | | | 219,781 | |
| | 46,000 | | | Dongfeng Motor Group Co. Ltd., H-Shares (China) | | | 45,299 | |
| | 18,000 | | | Fu Shou Yuan International Group Ltd. (China) | | | 13,800 | |
| | 8,863 | | | Fuyao Glass Industry Group Co. Ltd., H-Shares (China)(d) | | | 26,173 | |
| | 96,993 | | | Geely Automobile Holdings Ltd. (China) | | | 185,588 | |
| | 8,000 | | | Golden Eagle Retail Group Ltd. (China) | | | 8,286 | |
| | 198,991 | | | GOME Retail Holdings Ltd. (China)(b) | | | 19,799 | |
| | 54,000 | | | Great Wall Motor Co. Ltd., H-Shares (China) | | | 31,962 | |
| | 48,398 | | | Guangzhou Automobile Group Co. Ltd., H-Shares (China) | | | 48,957 | |
| | 22,000 | | | Haier Electronics Group Co. Ltd. (Hong Kong)(b) | | | 45,968 | |
| | 1,815 | | | Huazhu Group Ltd. ADR (China) | | | 47,480 | |
| | 860,000 | | | Imperial Pacific International Holdings Ltd. (Hong Kong)(b) | | | 6,692 | |
| | 14,238 | | | JD.com, Inc., Class A ADR (China)(b) | | | 334,878 | |
| | 29,500 | | | Li Ning Co. Ltd. (China)(b) | | | 27,621 | |
| | | | | | | | |
Number
of Shares | | | | | Value | |
| | | | Common Stocks & Other Equity Interests
(continued) | |
| | | | Consumer Discretionary (continued) | |
| | 12,000 | | | Minth Group Ltd. (China) | | $ | 38,881 | |
| | 2,025 | | | New Oriental Education & Technology Group, Inc. ADR (China)(b) | | | 118,483 | |
| | 8,000 | | | Q Technology Group Co. Ltd. (China) | | | 3,786 | |
| | 12,999 | | | Shenzhou International Group Holdings Ltd. (China) | | | 143,597 | |
| | 33,999 | | | Skyworth Digital Holdings Ltd. (Hong Kong) | | | 7,850 | |
| | 6,146 | | | TAL Education Group ADR (China)(b) | | | 178,111 | |
| | 12,000 | | | Tianneng Power International Ltd. (China) | | | 9,598 | |
| | 1,393 | | | Tuniu Corp., Class A ADR (China)(b) | | | 8,859 | |
| | 7,182 | | | Vipshop Holdings Ltd., Class A ADR (China)(b) | | | 34,905 | |
| | 28,000 | | | Virscend Education Co. Ltd. (China)(d) | | | 15,966 | |
| | 43,999 | | | Xinyi Glass Holdings Ltd. (Hong Kong) | | | 43,553 | |
| | 6,631 | | | Yum China Holdings, Inc. (China) | | | 239,246 | |
| | 8,500 | | | Zhongsheng Group Holdings Ltd. (China) | | | 15,505 | |
| | | | | | | | |
| | | | | | | 3,279,534 | |
| | | | | | | | |
| | | | Consumer Staples—3.7% | |
| | 105,993 | | | C.P. Pokphand Co. Ltd. (Hong Kong) | | | 9,194 | |
| | 37,999 | | | China Agri-Industries Holdings Ltd. (China) | | | 12,700 | |
| | 59,000 | | | China Huishan Dairy Holdings Co. Ltd. (China)(b)(e) | | | 0 | |
| | 46,998 | | | China Mengniu Dairy Co. Ltd. (China)(b) | | | 138,487 | |
| | 45,989 | | | China Modern Dairy Holdings Ltd.
(China)(b) | | | 5,749 | |
| | 24,000 | | | China Resources Beer Holdings Co. Ltd. (China) | | | 83,425 | |
| | 68,000 | | | China Shengmu Organic Milk Ltd.
(China)(b)(d) | | | 2,732 | |
| | 35,500 | | | Dali Foods Group Co. Ltd. (China)(d) | | | 25,359 | |
| | 3,500 | | | Health and Happiness H&H International Holdings Ltd. (China)(b) | | | 19,912 | |
| | 13,001 | | | Hengan International Group Co. Ltd. (China) | | | 102,988 | |
| | 37,999 | | | Sun Art Retail Group Ltd. (Hong Kong) | | | 41,540 | |
| | 30,000 | | | Tibet Water Resources Ltd. (Hong Kong)(b) | | | 8,457 | |
| | 31,999 | | | Tingyi Cayman Islands Holding Corp. (China) | | | 47,349 | |
| | 5,928 | | | Tsingtao Brewery Co. Ltd., H-Shares (China) | | | 23,404 | |
| | 23,000 | | | Uni-President China Holdings Ltd. (China) | | | 22,327 | |
| | 5,000 | | | Vinda International Holdings Ltd. (Hong Kong) | | | 7,131 | |
| | 109,993 | | | Want Want China Holdings Ltd. (China) | | | 78,572 | |
| | 162,500 | | | WH Group Ltd. (Hong Kong)(d) | | | 113,800 | |
| | 10,500 | | | Zhou Hei Ya International Holdings Co. Ltd. (China)(b)(d) | | | 5,398 | |
| | | | | | | | |
| | | | | | | 748,524 | |
| | | | | | | | |
| | | | Energy—6.8% | |
| | 35,993 | | | China Coal Energy Co. Ltd., H-Shares (China) | | | 16,115 | |
| | 31,999 | | | China Oilfield Services Ltd., H-Shares (China) | | | 30,001 | |
| | 443,183 | | | China Petroleum & Chemical Corp. (Sinopec), H-Shares (China) | | | 359,548 | |
| | 58,996 | | | China Shenhua Energy Co. Ltd., H-Shares (China) | | | 133,654 | |
| | 278,990 | | | CNOOC Ltd. (China) | | | 479,017 | |
| | 59,994 | | | Kunlun Energy Co. Ltd. (China) | | | 68,111 | |
| | 365,986 | | | PetroChina Co. Ltd., H-Shares (China) | | | 267,975 | |
| | 18,000 | | | Sinopec Kantons Holdings Ltd. (China) | | | 7,325 | |
| | 29,999 | | | Yanzhou Coal Mining Co. Ltd., H-Shares (China) | | | 28,356 | |
| | | | | | | | |
| | | | | | | 1,390,102 | |
| | | | | | | | |
See accompanying Notes to Financial Statements which are an integral part of the financial statements.
Invesco China All-Cap ETF (YAO) (continued)
October 31, 2018
| | | | | | | | |
Number
of Shares | | | | | Value | |
| | | | Common Stocks & Other Equity Interests
(continued) | |
| | | | Financials—28.3% | |
| | 488,982 | | | Agricultural Bank of China Ltd., H-Shares (China) | | $ | 214,570 | |
| | 1,322,466 | | | Bank of China Ltd., H-Shares (China) | | | 563,441 | |
| | 369,993 | | | Bank of Communications Co. Ltd., H-Shares (China) | | | 277,516 | |
| | 20,000 | | | Central China Securities Co. Ltd.,
H-Shares (China)(d) | | | 4,796 | |
| | 153,000 | | | China Cinda Asset Management Co. Ltd., H-Shares (China) | | | 37,472 | |
| | 200,993 | | | China CITIC Bank Corp. Ltd., H-Shares (China) | | | 124,348 | |
| | 1,384,219 | | | China Construction Bank Corp., H-Shares (China) | | | 1,098,278 | |
| | 14,000 | | | China Everbright Ltd. (China) | | | 24,752 | |
| | 61,000 | | | China Galaxy Securities Co. Ltd., H-Shares (China) | | | 30,658 | |
| | 156,000 | | | China Huarong Asset Management Co. Ltd., H-Shares (China)(d) | | | 28,257 | |
| | 17,200 | | | China International Capital Corp. Ltd., H-Shares (China)(d) | | | 28,259 | |
| | 128,995 | | | China Life Insurance Co. Ltd., H-Shares (China) | | | 257,022 | |
| | 65,493 | | | China Merchants Bank Co. Ltd., H-Shares (China) | | | 252,301 | |
| | 14,800 | | | China Merchants Securities Co. Ltd., H-Shares (China)(d) | | | 16,783 | |
| | 117,888 | | | China Minsheng Banking Corp. Ltd., H-Shares (China) | | | 86,919 | |
| | 170,000 | | | China Minsheng Financial Holding Corp. Ltd. (Hong Kong)(b) | | | 5,183 | |
| | 44,600 | | | China Pacific Insurance (Group) Co. Ltd., H-Shares (China) | | | 166,125 | |
| | 105,000 | | | China Reinsurance Group Corp., H-Shares (China) | | | 20,091 | |
| | 24,800 | | | China Taiping Insurance Holdings Co. Ltd. (China) | | | 82,884 | |
| | 238,515 | | | Chong Sing Holdings Fintech GR
(China)(b) | | | 10,801 | |
| | 43,994 | | | Chongqing Rural Commercial Bank Co. Ltd., H-Shares (China) | | | 24,243 | |
| | 40,001 | | | CITIC Securities Co. Ltd., H-Shares (China) | | | 70,415 | |
| | 13,500 | | | CSC Financial Co. Ltd., H-Shares
(China)(d) | | | 7,646 | |
| | 4,800 | | | Everbright Securities Co. Ltd., H-Shares (China)(d) | | | 4,206 | |
| | 716 | | | Fanhua, Inc. ADR (China) | | | 19,174 | |
| | 38,000 | | | Far East Horizon Ltd. (China) | | | 36,840 | |
| | 23,272 | | | GF Securities Co. Ltd., H-Shares (China) | | | 30,102 | |
| | 55,000 | | | Guotai Junan International Holdings Ltd. (China) | | | 9,963 | |
| | 9,400 | | | Guotai Junan Securities Co. Ltd., H-Shares, Class H (China)(d) | | | 19,809 | |
| | 55,200 | | | Haitong Securities Co. Ltd., H-Shares (China) | | | 55,556 | |
| | 27,927 | | | Huatai Securities Co. Ltd., H-Shares (China)(d) | | | 44,886 | |
| | 14,700 | | | Huishang Bank Corp. Ltd., H-Shares (China) | | | 6,338 | |
| | 1,356,126 | | | Industrial & Commercial Bank of China Ltd., H-Shares (China) | | | 916,839 | |
| | 13,800 | | | New China Life Insurance Co. Ltd., H-Shares (China) | | | 64,516 | |
| | 105 | | | Noah Holdings Ltd. ADR (China)(b) | | | 3,960 | |
| | 14,000 | | | Orient Securities Co. Ltd., H-Shares (China)(d) | | | 9,197 | |
| | 121,000 | | | People’s Insurance Co. Group of China Ltd. (The), H-Shares (China) | | | 49,392 | |
| | | | | | | | |
Number
of Shares | | | | | Value | |
| | | | Common Stocks & Other Equity Interests
(continued) | |
| | | | Financials (continued) | |
| | 119,992 | | | PICC Property & Casualty Co. Ltd., H-Shares (China) | | $ | 116,328 | |
| | 87,652 | | | Ping An Insurance Group Co. of China Ltd., H-Shares (China) | | | 825,714 | |
| | 141,000 | | | Postal Savings Bank of China Co. Ltd., H-Shares (China)(d) | | | 84,175 | |
| | 10,318 | | | Shengjing Bank Co. Ltd., H-Shares
(China)(d) | | | 4,541 | |
| | | | | | | | |
| | | | | | | 5,734,296 | |
| | | | | | | | |
| | | | Health Care—4.4% | |
| | 11,454 | | | 3SBio, Inc. (China)(d) | | | 16,627 | |
| | 860 | | | BeiGene Ltd. ADR (China)(b) | | | 108,308 | |
| | 36,000 | | | China Animal Healthcare Ltd. (China)(b)(e) | | | 0 | |
| | 501 | | | China Biologic Products Holdings, Inc. (China)(b) | | | 33,287 | |
| | 23,495 | | | China Medical System Holdings Ltd. (China) | | | 27,962 | |
| | 11,000 | | | China Resources Medical Holdings Co. Ltd. (China) | | | 7,563 | |
| | 28,000 | | | China Resources Pharmaceutical Group Ltd. (China)(d) | | | 41,075 | |
| | 82,000 | | | CSPC Pharmaceutical Group Ltd. (China) | | | 173,008 | |
| | 15,636 | | | Genertec Universal Medical Group Co. Ltd. (China)(d) | | | 12,147 | |
| | 16,000 | | | Genscript Biotech Corp. (China)(b) | | | 24,410 | |
| | 3,827 | | | Guangzhou Baiyunshan Pharmaceutical Holdings Co. Ltd., H-Shares (China) | | | 13,937 | |
| | 91,200 | | | Hua Han Health Industry Holdings Ltd. (Hong Kong)(b)(e) | | | 0 | |
| | 2,080 | | | Livzon Pharmaceutical Group, Inc., H-Shares (China) | | | 6,036 | |
| | 27,000 | | | Luye Pharma Group Ltd. (China)(d) | | | 20,837 | |
| | 8,000 | | | Microport Scientific Corp. (China) | | | 9,552 | |
| | 40,001 | | | Shandong Weigao Group Medical Polymer Co. Ltd., H-Shares (China) | | | 35,769 | |
| | 8,000 | | | Shanghai Fosun Pharmaceutical Group Co. Ltd., H-Shares (China) | | | 23,981 | |
| | 14,500 | | | Shanghai Pharmaceuticals Holding Co. Ltd., H-Shares (China) | | | 32,036 | |
| | 82,000 | | | Sihuan Pharmaceutical Holdings Group Ltd. (China) | | | 16,631 | |
| | 111,988 | | | Sino Biopharmaceutical Ltd. (China) | | | 100,426 | |
| | 20,801 | | | Sinopharm Group Co. Ltd., H-Shares (China) | | | 100,298 | |
| | 30,000 | | | SSY Group Ltd. (Hong Kong) | | | 25,219 | |
| | 10,000 | | | Tong Ren Tang Technologies Co. Ltd., H-Shares (China) | | | 14,312 | |
| | 7,500 | | | Wuxi Biologics Cayman, Inc. (China)(b)(d) | | | 53,432 | |
| | | | | | | | |
| | | | | | | 896,853 | |
| | | | | | | | |
| | | | Industrials—6.9% | |
| | 395 | | | 51job, Inc. ADR (China)(b) | | | 24,257 | |
| | 33,999 | | | Air China Ltd., H-Shares (China) | | | 27,366 | |
| | 46,999 | | | AviChina Industry & Technology Co. Ltd., H-Shares (China) | | | 31,295 | |
| | 24,000 | | | Beijing Capital International Airport Co. Ltd., H-Shares (China) | | | 25,992 | |
| | 6,818 | | | CAR, Inc. (China)(b) | | | 5,410 | |
| | 76,993 | | | China Communications Construction Co. Ltd., H-Shares (China) | | | 70,419 | |
| | 31,500 | | | China Conch Venture Holdings Ltd. (China) | | | 88,400 | |
See accompanying Notes to Financial Statements which are an integral part of the financial statements.
Invesco China All-Cap ETF (YAO) (continued)
October 31, 2018
| | | | | | | | |
Number
of Shares | | | | | Value | |
| | | | Common Stocks & Other Equity Interests
(continued) | |
| | | | Industrials (continued) | |
| | 28,000 | | | China Eastern Airlines Corp. Ltd., H-Shares (China) | | $ | 15,465 | |
| | 108,000 | | | China Energy Engineering Corp. Ltd., H-Shares (China) | | | 10,470 | |
| | 63,999 | | | China Everbright International Ltd. (China) | | | 51,023 | |
| | 7,000 | | | China High Speed Transmission Equipment Group Co. Ltd. (Hong Kong) | | | 6,527 | |
| | 8,900 | | | China International Marine Containers Group Co. Ltd., H-Shares (China) | | | 7,856 | |
| | 17,000 | | | China Lesso Group Holdings Ltd. (China) | | | 8,956 | |
| | 13,000 | | | China Machinery Engineering Corp., H-Shares (China) | | | 5,920 | |
| | 21,320 | | | China Merchants Port Holdings Co. Ltd. (China) | | | 36,279 | |
| | 32,499 | | | China Railway Construction Corp. Ltd., H-Shares (China) | | | 41,124 | |
| | 66,993 | | | China Railway Group Ltd., H-Shares (China) | | | 59,820 | |
| | 34,000 | | | China Southern Airlines Co. Ltd., H-Shares (China) | | | 18,389 | |
| | 29,999 | | | China State Construction International Holdings Ltd. (China) | | | 21,391 | |
| | 111,000 | | | CITIC Ltd. (China) | | | 166,513 | |
| | 65,990 | | | COSCO SHIPPING Development Co. Ltd., H-Shares (China)(b) | | | 6,734 | |
| | 22,000 | | | COSCO SHIPPING Energy Transportation Co. Ltd., H-Shares (China) | | | 12,039 | |
| | 45,000 | | | COSCO SHIPPING Holdings Co. Ltd., H-Shares (China)(b) | | | 16,073 | |
| | 30,000 | | | COSCO SHIPPING Ports Ltd. (China) | | | 30,615 | |
| | 71,000 | | | CRRC Corp. Ltd., H-Shares (China) | | | 62,311 | |
| | 126,884 | | | Fullshare Holdings Ltd. (Hong Kong)(b)(c) | | | 49,366 | |
| | 20,000 | | | Greentown Service Group Co. Ltd. (China) | | | 13,215 | |
| | 24,000 | | | Guangshen Railway Co. Ltd., H-Shares (China) | | | 8,970 | |
| | 11,000 | | | Haitian International Holdings Ltd. (China) | | | 21,468 | |
| | 22,000 | | | Jiangsu Expressway Co. Ltd., H-Shares (China) | | | 29,523 | |
| | 28,000 | | | Lonking Holdings Ltd. (China) | | | 6,286 | |
| | 49,000 | | | Metallurgical Corp. of China Ltd., H-Shares (China) | | | 11,876 | |
| | 19,000 | | | Qingdao Port International Co. Ltd., H-Shares (China)(b)(d) | | | 11,149 | |
| | 41,998 | | | Shanghai Electric Group Co. Ltd., H-Shares (China) | | | 13,661 | |
| | 8,000 | | | Shanghai Industrial Holdings Ltd. (China) | | | 16,818 | |
| | 12,000 | | | Shenzhen Expressway Co. Ltd., H-Shares (China) | | | 11,037 | |
| | 17,407 | | | Shenzhen International Holdings Ltd. (China) | | | 33,307 | |
| | 20,500 | | | Sinopec Engineering Group Co. Ltd., H-Shares (China) | | | 19,063 | |
| | 37,000 | | | Sinotrans Ltd., H-Shares (China) | | | 12,885 | |
| | 11,500 | | | Sinotruk Hong Kong Ltd. (China) | | | 16,518 | |
| | 22,000 | | | SITC International Holdings Co. Ltd. (China) | | | 16,164 | |
| | 33,600 | | | Weichai Power Co. Ltd., H-Shares (China) | | | 33,217 | |
| | 11,280 | | | Xinjiang Goldwind Science & Technology Co. Ltd., H-Shares (China) | | | 8,403 | |
| | 38,700 | | | Yangzijiang Shipbuilding Holdings Ltd. (China) | | | 34,653 | |
| | 23,999 | | | Zhejiang Expressway Co. Ltd. H-Shares (China) | | | 20,113 | |
| | | | | | | | |
Number
of Shares | | | | | Value | |
| | | | Common Stocks & Other Equity Interests
(continued) | |
| | | | Industrials (continued) | |
| | 9,500 | | | Zhuzhou CRRC Times Electric Co. Ltd., H-Shares (China) | | $ | 50,776 | |
| | 22,599 | | | Zoomlion Heavy Industry Science and Technology Co. Ltd., H-Shares (China) | | | 7,236 | |
| | 6,503 | | | ZTO Express Cayman, Inc. ADR (China) | | | 105,479 | |
| | | | | | | | |
| | | | | | | 1,401,827 | |
| | | | | | | | |
| | | | Information Technology—3.1% | |
| | 12,482 | | | AAC Technologies Holdings, Inc. (China) | | | 94,976 | |
| | 48,000 | | | AGTech Holdings Ltd. (Hong Kong)(b) | | | 2,480 | |
| | 11,000 | | | BYD Electronic International Co. Ltd. (China) | | | 12,895 | |
| | 25,077 | | | China Railway Signal & Communication Corp. Ltd., H-Shares (China)(d) | | | 16,826 | |
| | 36,000 | | | Chinasoft International Ltd. (China)(b) | | | 21,124 | |
| | 18,000 | | | Digital China Holdings Ltd. (Hong Kong)(b) | | | 8,633 | |
| | 26,000 | | | FIT Hon Teng Ltd. (Taiwan)(d) | | | 10,746 | |
| | 214,995 | | | GCL-Poly Energy Holdings Ltd. (China)(b) | | | 12,753 | |
| | 950 | | | Hollysys Automation Technologies Ltd. (China) | | | 18,259 | |
| | 6,000 | | | Hua Hong Semiconductor Ltd. (China)(d) | | | 10,440 | |
| | 385 | | | JinkoSolar Holding Co. Ltd. ADR
(China)(b)(c) | | | 3,103 | |
| | 11,300 | | | Kingboard Holdings Ltd. (China) | | | 30,270 | |
| | 13,500 | | | Kingboard Laminates Holdings Ltd. (Hong Kong) | | | 10,332 | |
| | 32,000 | | | Kingdee International Software Group Co. Ltd. (China) | | | 26,124 | |
| | 17,000 | | | Kingsoft Corp. Ltd. (China) | | | 24,071 | |
| | 9,550 | | | Legend Holdings Corp., H-Shares (China)(d) | | | 25,948 | |
| | 107,995 | | | Lenovo Group Ltd. (China) | | | 68,742 | |
| | 27,500 | | | Meitu, Inc. (China)(b)(d) | | | 14,347 | |
| | 53,692 | | | Semiconductor Manufacturing International Corp. (China)(b) | | | 44,313 | |
| | 11,570 | | | Sunny Optical Technology Group Co. Ltd. (China) | | | 100,360 | |
| | 16,000 | | | TravelSky Technology Ltd., H-Shares (China) | | | 38,778 | |
| | 48,000 | | | Xinyi Solar Holdings Ltd. (China) | | | 15,001 | |
| | 3,000 | | | Yangtze Optical Fibre and Cable Joint Stock Ltd. Co., H-Shares (China)(d) | | | 7,309 | |
| | 13,248 | | | ZTE Corp. H-Shares (China)(b) | | | 20,212 | |
| | | | | | | | |
| | | | | | | 638,042 | |
| | | | | | | | |
| | | | Materials—2.7% | |
| | 67,994 | | | Aluminum Corp. of China Ltd., H-Shares (China)(b) | | | 24,632 | |
| | 18,000 | | | Angang Steel Co. Ltd., H-Shares (China) | | | 15,315 | |
| | 20,500 | | | Anhui Conch Cement Co. Ltd., H-Shares (China) | | | 105,907 | |
| | 41,000 | | | BBMG Corp., H-Shares (China) | | | 11,297 | |
| | 579,031 | | | Beijing Enterprises Clean Energy Group Ltd. (China)(b) | | | 7,312 | |
| | 27,999 | | | China BlueChemical Ltd., H-Shares (China) | | | 9,572 | |
| | 63,000 | | | China Molybdenum Co. Ltd., H-Shares (China) | | | 23,386 | |
| | 67,998 | | | China National Building Material Co. Ltd., H-Shares (China) | | | 48,574 | |
| | 38,000 | | | China Resources Cement Holdings Ltd. (China) | | | 33,495 | |
| | 105,999 | | | China Shanshui Cement Group Ltd. (China)(b) | | | 44,485 | |
| | 24,799 | | | China Zhongwang Holdings Ltd. (China) | | | 11,009 | |
| | 22,000 | | | Fufeng Group Ltd. (China) | | | 9,317 | |
See accompanying Notes to Financial Statements which are an integral part of the financial statements.
Invesco China All-Cap ETF (YAO) (continued)
October 31, 2018
| | | | | | | | |
Number
of Shares | | | | | Value | |
| | | | Common Stocks & Other Equity Interests
(continued) | |
| | | | Materials (continued) | |
| | 13,000 | | | Greatview Aseptic Packaging Co. Ltd. (China) | | $ | 8,623 | |
| | 14,999 | | | Huabao International Holdings Ltd. (Hong Kong) | | | 6,983 | |
| | 20,999 | | | Jiangxi Copper Co. Ltd., H-Shares (China) | | | 23,143 | |
| | 23,999 | | | Lee & Man Paper Manufacturing Ltd. (China) | | | 20,541 | |
| | 30,000 | | | Maanshan Iron & Steel Co. Ltd., H-Shares (China) | | | 16,073 | |
| | 36,000 | | | MMG Ltd. (China)(b) | | | 13,501 | |
| | 28,999 | | | Nine Dragons Paper Holdings Ltd. (Hong Kong) | | | 27,670 | |
| | 58,000 | | | Shougang Fushan Resources Group Ltd. (China) | | | 11,690 | |
| | 53,998 | | | Sinopec Shanghai Petrochemical Co. Ltd., H-Shares (China) | | | 23,695 | |
| | 17,500 | | | Zhaojin Mining Industry Co. Ltd., H-Shares (China) | | | 15,448 | |
| | 99,992 | | | Zijin Mining Group Co. Ltd., H-Shares (China) | | | 37,117 | |
| | | | | | | | |
| | | | | | | 548,785 | |
| | | | | | | | |
| | | | Real Estate—6.8% | |
| | 26,000 | | | Agile Group Holdings Ltd. (China) | | | 29,650 | |
| | 140,000 | | | Carnival Group International Holdings Ltd. (Hong Kong)(b) | | | 2,536 | |
| | 22,000 | | | China Aoyuan Property Group Ltd. (China) | | | 12,853 | |
| | 51,994 | | | China Evergrande Group (China) | | | 124,026 | |
| | 71,998 | | | China Jinmao Holdings Group Ltd. (China) | | | 30,216 | |
| | 28,000 | | | China Logistics Property Holdings Co. Ltd. (China)(b)(d) | | | 9,286 | |
| | 63,995 | | | China Overseas Land & Investment Ltd. (China) | | | 200,408 | |
| | 45,999 | | | China Resources Land Ltd. (China) | | | 156,080 | |
| | 32,000 | | | China SCE Group Holdings Ltd. (China) | | | 10,899 | |
| | 74,000 | | | China South City Holdings Ltd. (China) | | | 10,855 | |
| | 22,796 | | | China Vanke Co. Ltd., H-Shares (China) | | | 70,225 | |
| | 62,000 | | | CIFI Holdings Group Co. Ltd. (China) | | | 25,941 | |
| | 123,873 | | | Country Garden Holdings Co. Ltd. (China) | | | 132,573 | |
| | 30,000 | | | Future Land Development Holdings Ltd. (China) | | | 17,221 | |
| | 11,000 | | | Greentown China Holdings Ltd. (China) | | | 7,633 | |
| | 17,600 | | | Guangzhou R&F Properties Co. Ltd., H-Shares (China) | | | 27,614 | |
| | 12,000 | | | Hopson Development Holdings Ltd. (China) | | | 9,200 | |
| | 18,000 | | | Jiayuan International Group Ltd. (China) | | | 31,594 | |
| | 66,000 | | | Joy City Property Ltd. (China) | | | 6,988 | |
| | 41,000 | | | Kaisa Group Holdings Ltd. (China) | | | 9,989 | |
| | 20,815 | | | KWG Group Holdings Ltd. (China) | | | 15,905 | |
| | 22,000 | | | Logan Property Holdings Co. Ltd. (China) | | | 20,318 | |
| | 25,499 | | | Longfor Group Holdings Ltd. (China) | | | 61,931 | |
| | 31,999 | | | Poly Property Group Co. Ltd. (China) | | | 9,551 | |
| | 29,000 | | | Powerlong Real Estate Holdings Ltd. (China) | | | 9,914 | |
| | 11,837 | | | Red Star Macalline Group Corp. Ltd., H-Shares (China)(d) | | | 10,449 | |
| | 371,930 | | | Renhe Commercial Holdings Co. Ltd. (China)(b) | | | 12,573 | |
| | 10,000 | | | Ronshine China Holdings Ltd. (China)(b) | | | 11,264 | |
| | 53,999 | | | Shenzhen Investment Ltd. (China) | | | 15,498 | |
| | 18,499 | | | Shimao Property Holdings Ltd. (China) | | | 36,199 | |
| | 58,493 | | | Shui On Land Ltd. (China) | | | 11,789 | |
| | 52,493 | | | Sino-Ocean Group Holding Ltd. (China) | | | 20,557 | |
| | 32,499 | | | SOHO China Ltd. (China) | | | 11,027 | |
| | | | | | | | |
Number
of Shares | | | | | Value | |
| | | | Common Stocks & Other Equity Interests
(continued) | |
| | | | Real Estate (continued) | |
| | 40,000 | | | Sunac China Holdings Ltd. (China) | | $ | 108,682 | |
| | 10,000 | | | Times China Holdings Ltd. (China) | | | 8,712 | |
| | 11,500 | | | Yanlord Land Group Ltd. (China) | | | 10,464 | |
| | 105,992 | | | Yuexiu Property Co. Ltd. (China) | | | 16,765 | |
| | 32,000 | | | Yuzhou Properties Co. Ltd. (China) | | | 11,429 | |
| | 71,000 | | | Zall Smart Commerce Group Ltd. (China)(b) | | | 50,718 | |
| | | | | | | | |
| | | | | | | 1,379,532 | |
| | | | | | | | |
| | | | Utilities—3.1% | |
| | 8,500 | | | Beijing Enterprises Holdings Ltd. (China) | | | 45,973 | |
| | 95,986 | | | Beijing Enterprises Water Group Ltd. (China) | | | 48,854 | |
| | 34,000 | | | Beijing Jingneng Clean Energy Co. Ltd., H-Shares (China) | | | 6,375 | |
| | 178,271 | | | CGN Power Co. Ltd., H-Shares (China)(d) | | | 40,933 | |
| | 38,599 | | | China Gas Holdings Ltd. (Hong Kong) | | | 122,108 | |
| | 53,998 | | | China Longyuan Power Group Corp., H-Shares (China) | | | 41,053 | |
| | 74,999 | | | China Power International Development Ltd. (China) | | | 14,829 | |
| | 14,000 | | | China Resources Gas Group Ltd. (China) | | | 53,575 | |
| | 29,999 | | | China Resources Power Holdings Co. Ltd. (China) | | | 52,732 | |
| | 14,000 | | | China Water Affairs Group Ltd. (Hong Kong) | | | 12,626 | |
| | 50,000 | | | CT Environmental Group Ltd. (China) | | | 2,264 | |
| | 47,996 | | | Datang International Power Generation Co. Ltd., H-Shares (China) | | | 10,714 | |
| | 49,998 | | | Guangdong Investment Ltd. (China) | | | 89,289 | |
| | 36,000 | | | Huadian Fuxin Energy Corp. Ltd., H-Shares (China) | | | 6,475 | |
| | 28,000 | | | Huadian Power International Corp. Ltd., H-Shares (China) | | | 10,608 | |
| | 73,994 | | | Huaneng Power International, Inc., H-Shares (China) | | | 41,247 | |
| | 83,456 | | | Huaneng Renewables Corp. Ltd., H-Shares (China) | | | 21,398 | |
| | | | | | | | |
| | | | | | | 621,053 | |
| | | | | | | | |
| | | | Total Investments in Securities
(excluding investments purchased with cash collateral from securities on loan)
(Cost $20,818,282)—100.0% | | | 20,280,247 | |
| | | | | | | | |
| | |
| | | | | | | | |
| | | | Investments Purchased with Cash Collateral from
Securities on Loan | |
| | |
| | | | | | | | |
| | | | Money Market Fund—0.7% | | | |
| | 151,462 | | | Invesco Government & Agency Portfolio—Institutional Class, 2.08%(f)(g)
(Cost $151,462) | | | 151,462 | |
| | | | | | | | |
| | | | Total Investments in Securities
(Cost $20,969,744)—100.7% | | | 20,431,709 | |
| | | | Other assets less liabilities—(0.7)% | | | (150,008 | ) |
| | | | | | | | |
| | | | Net Assets—100.0% | | $ | 20,281,701 | |
| | | | | | | | |
See accompanying Notes to Financial Statements which are an integral part of the financial statements.
Invesco China All-Cap ETF (YAO) (continued)
October 31, 2018
Investment Abbreviations:
ADR—American Depositary Receipt
Notes to Schedule of Investments:
| (a) | Industry and/or sector classifications used in this report are generally according to the Global Industry Classification Standard, which was developed by and is the exclusive property and a service mark of MSCI Inc. and Standard & Poor’s. |
| (b) | Non-income producing security. |
| (c) | All or a portion of this security was out on loan at October 31, 2018. |
| (d) | Security purchased or received in a transaction exempt from registration under the Securities Act of 1933, as amended (the “1933 Act”). The security may be resold pursuant to an exemption from registration under the 1933 Act, typically to qualified institutional buyers. The aggregate value of these securities at October 31, 2018 was $758,942, which represented 3.74% of the Fund’s Net Assets. |
| (e) | Security valued using significant unobservable inputs (Level 3). See Note 4. |
| (f) | The security and the Fund are advised by wholly-owned subsidiaries of Invesco Ltd. and are therefore considered to be affiliated. The rate shown is the 7-day SEC standardized yield as of October 31, 2018. |
| (g) | The security has been segregated to satisfy the commitment to return the cash collateral received in securities lending transactions upon the borrower’s return of the securities loaned. See Note 2J. |
This Fund has holdings greater than 10% of net assets in the following country:
See accompanying Notes to Financial Statements which are an integral part of the financial statements.
Schedule of Investments(a)
Invesco China Technology ETF (CQQQ)
October 31, 2018
| | | | | | | | |
Number
of Shares | | | | | Value | |
| | | | Common Stocks & Other Equity Interests—99.9% | |
| | | | Communications Equipment—2.5% | | | |
| | 2,252,500 | | | BYD Electronic International Co. Ltd. (China) | | $ | 2,640,569 | |
| | 3,948,424 | | | China All Access Holdings Ltd. (Hong Kong) | | | 183,838 | |
| | 4,923,737 | | | Comba Telecom Systems Holdings Ltd. (Hong Kong)(b) | | | 690,883 | |
| | 1,429,666 | | | O-Net Technologies Group Ltd. (China)(b) | | | 618,232 | |
| | 1,107,097 | | | Xi’an Haitiantian Holdings Co. Ltd. (China)(b) | | | 283,857 | |
| | 615,306 | | | Yangtze Optical Fibre and Cable Joint Stock Ltd. Co., H-Shares (China)(c) | | | 1,499,138 | |
| | 2,697,480 | | | ZTE Corp. H-Shares (China)(b) | | | 4,115,348 | |
| | | | | | | | |
| | | | | | | 10,031,865 | |
| | | | | | | | |
| | | | Consumer Finance—0.2% | |
| | 39,008 | | | Yirendai Ltd. ADR (China)(d) | | | 606,964 | |
| | | | | | | | |
| | | | Electronic Equipment, Instruments & Components—12.9% | |
| | 1,456,871 | | | AAC Technologies Holdings, Inc. (China) | | | 11,085,332 | |
| | 2,144,054 | | | Anxin-China Holdings Ltd. (China)(b)(e) | | | 0 | |
| | 1,423,052 | | | Camsing International Holding Ltd. (Hong Kong)(b)(d) | | | 1,118,198 | |
| | 6,829,399 | | | China Aerospace International Holdings Ltd. (China) | | | 461,717 | |
| | 5,061,520 | | | China Railway Signal & Communication Corp. Ltd., H-Shares (China)(c) | | | 3,396,127 | |
| | 29,918,307 | | | China Youzan Ltd. (Hong Kong)(b)(d) | | | 2,099,021 | |
| | 5,537,560 | | | FIT Hon Teng Ltd. (Taiwan)(c) | | | 2,288,657 | |
| | 196,065 | | | Hollysys Automation Technologies Ltd. (China) | | | 3,768,369 | |
| | 3,031,369 | | | Ju Teng International Holdings Ltd. (Hong Kong) | | | 765,634 | |
| | 2,360,954 | | | Kingboard Holdings Ltd. (China) | | | 6,324,468 | |
| | 2,750,305 | | | Kingboard Laminates Holdings Ltd. (Hong Kong) | | | 2,104,986 | |
| | 2,632,048 | | | PAX Global Technology Ltd. (Hong Kong) | | | 1,295,980 | |
| | 1,602,653 | | | Sunny Optical Technology Group Co. Ltd. (China) | | | 13,901,626 | |
| | 14,834,361 | | | Tongda Group Holdings Ltd. (Hong Kong) | | | 1,911,206 | |
| | 6,350,997 | | | Truly International Holdings Ltd. (Hong Kong)(b) | | | 923,557 | |
| | 1,686,342 | | | Wasion Holdings Ltd. (China) | | | 828,178 | |
| | | | | | | | |
| | | | | | | 52,273,056 | |
| | | | | | | | |
| | | | Entertainment—9.3% | |
| | 1,719,074 | | | Boyaa Interactive International Ltd. (China)(b) | | | 401,294 | |
| | 57,217 | | | Changyou.com Ltd., Class A ADR (China) | | | 765,564 | |
| | 4,602,754 | | | Leyou Technologies Holdings Ltd. (China)(b) | | | 1,050,964 | |
| | 929,060 | | | NetDragon Websoft Holdings Ltd. (Hong Kong) | | | 1,642,571 | |
| | 162,742 | | | NetEase, Inc. ADR (China) | | | 33,825,925 | |
| | | | | | | | |
| | | | | | | 37,686,318 | |
| | | | | | | | |
| | | | Interactive Media & Services—41.6% | |
| | 292,601 | | | 58.com, Inc., Class A ADR (China)(b) | | | 19,191,699 | |
| | 197,044 | | | Autohome, Inc., Class A ADR
(China)(d) | | | 14,262,045 | |
| | 179,936 | | | Baidu, Inc. ADR (China)(b) | | | 34,198,636 | |
| | 132,468 | | | Bitauto Holdings Ltd. ADR (China)(b)(d) | | | 2,530,139 | |
| | 607,911 | | | Fang Holdings Ltd. ADR (China)(b) | | | 1,234,059 | |
| | 505,517 | | | Momo, Inc., Class A ADR (China)(b) | | | 16,970,206 | |
| | 106,161 | | | Phoenix New Media Ltd. ADR
(China)(b) | | | 341,838 | |
| | 224,580 | | | SINA Corp. (China)(b) | | | 14,218,160 | |
| | | | | | | | |
Number
of Shares | | | | | Value | |
| | | | Common Stocks & Other Equity Interests
(continued) | |
| | | | Interactive Media & Services (continued) | |
| | 109,766 | | | Sohu.com Ltd. ADR (China)(b) | | $ | 1,983,472 | |
| | 1,127,442 | | | Tencent Holdings Ltd. (China) | | | 38,399,241 | |
| | 2,043,973 | | | Tian Ge Interactive Holdings Ltd. (China)(c) | | | 1,076,818 | |
| | 225,372 | | | Weibo Corp., Class A ADR (China)(b) | | | 13,299,202 | |
| | 172,451 | | | YY, Inc., Class A ADR (China)(b) | | | 11,019,619 | |
| | | | | | | | |
| | | | | | | 168,725,134 | |
| | | | | | | | |
| | | | Internet & Direct Marketing Retail—11.1% | |
| | 288,810 | | | Alibaba Group Holding Ltd. ADR (China)(b) | | | 41,091,887 | |
| | 100,805 | | | Baozun, Inc. ADR (China)(b)(d) | | | 4,013,047 | |
| | | | | | | | |
| | | | | | | 45,104,934 | |
| | | | | | | | |
| | | | IT Services—6.2% | |
| | 279,635 | | | 21Vianet Group, Inc., Class A ADR (China)(b) | | | 3,041,031 | |
| | 11,289,090 | | | AGTech Holdings Ltd. (Hong Kong)(b) | | | 583,218 | |
| | 7,633,978 | | | Chinasoft International Ltd. (China)(b) | | | 4,479,463 | |
| | 3,653,396 | | | Digital China Holdings Ltd. (Hong Kong)(b) | | | 1,752,273 | |
| | 205,462 | | | GDS Holdings Ltd. ADR (China)(b)(d) | | | 4,822,193 | |
| | 17,231,265 | | | Green Leader Holdings Group Ltd. (Hong Kong)(b) | | | 147,268 | |
| | 6,545,276 | | | Hi Sun Technology China Ltd. (Hong Kong)(b) | | | 759,778 | |
| | 2,158,514 | | | SUNeVision Holdings Ltd. (Hong Kong) | | | 1,161,942 | |
| | 3,330,081 | | | TravelSky Technology Ltd., H-Shares (China) | | | 8,070,967 | |
| | 9,525,182 | | | Vision Values Holdings Ltd. (Hong Kong)(b) | | | 370,587 | |
| | | | | | | | |
| | | | | | | 25,188,720 | |
| | | | | | | | |
| | | | Real Estate Management & Development—0.3% | |
| | 5,239,972 | | | Landing International Development Ltd. (Hong Kong)(b) | | | 1,089,516 | |
| | | | | | | | |
| | | | Semiconductors & Semiconductor Equipment—6.8% | |
| | 909,787 | | | ASM Pacific Technology Ltd. (Hong Kong) | | | 7,856,798 | |
| | 2,972,387 | | | China Electronics Huada Technology Co. Ltd. (China) | | | 261,620 | |
| | 33,412 | | | Daqo New Energy Corp.
ADR (China)(b) | | | 713,346 | |
| | 43,267,118 | | | GCL-Poly Energy Holdings Ltd.
(China)(b) | | | 2,566,422 | |
| | 1,300,972 | | | Hua Hong Semiconductor Ltd.
(China)(c) | | | 2,263,599 | |
| | 96,380 | | | JinkoSolar Holding Co. Ltd. ADR
(China)(b)(d) | | | 776,823 | |
| | 11,055,497 | | | Semiconductor Manufacturing International Corp. (China)(b)(d) | | | 9,124,304 | |
| | 954,307 | | | Shanghai Fudan Microelectronics Group Co. Ltd., H-Shares (China)(b) | | | 1,044,462 | |
| | 9,812,373 | | | Xinyi Solar Holdings Ltd. (China) | | | 3,066,601 | |
| | | | | | | | |
| | | | | | | 27,673,975 | |
| | | | | | | | |
| | | | Software—3.1% | |
| | 139,002 | | | Cheetah Mobile, Inc., Class A ADR (China)(b) | | | 1,324,689 | |
| | 6,465,770 | | | Kingdee International Software Group Co. Ltd. (China) | | | 5,278,584 | |
| | 3,531,129 | | | Kingsoft Corp. Ltd. (China) | | | 4,999,813 | |
| | 313,924 | | | Link Motion, Inc. ADR (China)(b) | | | 168,263 | |
| | 534,446 | | | National Agricultural Holdings Ltd. (China)(b)(e) | | | 0 | |
| | 10,752,957 | | | Rentian Technology Holdings Ltd. (Hong Kong)(b) | | | 197,518 | |
| | 114,945 | | | Xunlei Ltd. ADR (China)(b) | | | 695,417 | |
| | | | | | | | |
| | | | | | | 12,664,284 | |
| | | | | | | | |
See accompanying Notes to Financial Statements which are an integral part of the financial statements.
Invesco China Technology ETF (CQQQ) (continued)
October 31, 2018
| | | | | | | | |
Number
of Shares | | | | | Value | |
| | | | Common Stocks & Other Equity Interests
(continued) | |
| | | | Specialty Retail—0.1% | |
| | 95,516 | | | Renren, Inc., Class A ADR (China)(d) | | $ | 136,588 | |
| | | | | | | | |
| | | | Technology Hardware, Storage & Peripherals—5.5% | |
| | 1,977,868 | | | Coolpad Group Ltd. (China)(b)(e) | | | 0 | |
| | 1,952,734 | | | Legend Holdings Corp., H-Shares (China)(c) | | | 5,305,666 | |
| | 22,308,498 | | | Lenovo Group Ltd. (China) | | | 14,199,990 | |
| | 5,545,032 | | | Meitu, Inc. (China)(b)(c) | | | 2,892,974 | |
| | | | | | | | |
| | | | | | | 22,398,630 | |
| | | | | | | | |
| | | | Trading Companies & Distributors—0.3% | |
| | 1,961,620 | | | HC Group, Inc. (China)(b) | | | 1,273,649 | |
| | | | | | | | |
| | | | Total Common Stocks & Other Equity Interests
(Cost $535,540,191) | | | 404,853,633 | |
| | | | | | | | |
| | |
| | | | | | | | |
| | | | Money Market Fund—0.1% | |
| | 590,245 | | | Invesco Premier U.S. Government Money Portfolio—Institutional Class, 2.08%(f)
(Cost $590,245) | | | 590,245 | |
| | | | | | | | |
| | | | Total Investments in Securities
(excluding investments purchased with cash collateral from securities on loan)
(Cost $536,130,436)—100.0% | | | 405,443,878 | |
| | | | | | | | |
| | |
| | | | | | | | |
| | | | Investments Purchased with Cash Collateral from
Securities on Loan | |
| | |
| | | | | | | | |
| | | | Money Market Fund—5.0% | |
| | 20,265,911 | | | Invesco Government & Agency Portfolio—Institutional Class,
2.08%(f)(g)
(Cost $20,265,911) | | | 20,265,911 | |
| | | | | | | | |
| | | | Total Investments in Securities
(Cost $556,396,347)—105.0% | | | 425,709,789 | |
| | | | Other assets less liabilities—(5.0)% | | | (20,168,672 | ) |
| | | | | | | | |
| | | | Net Assets—100.0% | | $ | 405,541,117 | |
| | | | | | | | |
Investment Abbreviations:
ADR—American Depositary Receipt
Notes to Schedule of Investments:
| (a) | Industry and/or sector classifications used in this report are generally according to the Global Industry Classification Standard, which was developed by and is the exclusive property and a service mark of MSCI Inc. and Standard & Poor’s. |
| (b) | Non-income producing security. |
| (c) | Security purchased or received in a transaction exempt from registration under the Securities Act of 1933, as amended (the “1933 Act”). The security may be resold pursuant to an exemption from registration under the 1933 Act, typically to qualified institutional buyers. The aggregate value of these securities at October 31, 2018 was $18,722,979, which represented 4.62% of the Fund’s Net Assets. |
| (d) | All or a portion of this security was out on loan at October 31, 2018. |
| (e) | Security valued using significant unobservable inputs (Level 3). See Note 4. |
| (f) | The security and the Fund are advised by wholly-owned subsidiaries of Invesco Ltd. and are therefore considered to be affiliated. The rate shown is the 7-day SEC standardized yield as of October 31, 2018. |
| (g) | The security has been segregated to satisfy the commitment to return the cash collateral received in securities lending transactions upon the borrower’s return of the securities loaned. See Note 2J. |
This Fund has holdings greater than 10% of net assets in the following country:
See accompanying Notes to Financial Statements which are an integral part of the financial statements.
Schedule of Investments
Invesco S&P Global Water Index ETF (CGW)
October 31, 2018
| | | | | | | | |
Number
of Shares | | | | | Value | |
| | | | Common Stocks & Other Equity Interests—99.8% | |
| | | | Austria—2.0% | | | |
| | 202,665 | | | ANDRITZ AG | | $ | 10,507,845 | |
| | | | | | | | |
| | | | Brazil—1.5% | | | |
| | 1,107,370 | | | Cia de Saneamento Basico do Estado de Sao Paulo ADR | | | 8,216,686 | |
| | | | | | | | |
| | | | Canada—2.9% | | | |
| | 1,524,983 | | | Algonquin Power & Utilities Corp. | | | 15,258,539 | |
| | | | | | | | |
| | | | China—4.8% | | | |
| | 17,994,431 | | | Beijing Enterprises Water Group Ltd. | | | 9,158,581 | |
| | 9,321,866 | | | Guangdong Investment Ltd. | | | 16,647,463 | |
| | | | | | | | |
| | | | | | | 25,806,044 | |
| | | | | | | | |
| | | | France—9.0% | | | |
| | 1,373,497 | | | Suez | | | 19,896,529 | |
| | 1,395,920 | | | Veolia Environnement SA | | | 27,868,610 | |
| | | | | | | | |
| | | | | | | 47,765,139 | |
| | | | | | | | |
| | | | Hong Kong—0.5% | | | |
| | 2,762,200 | | | China Water Affairs Group Ltd. | | | 2,491,103 | |
| | | | | | | | |
| | | | Italy—0.4% | | | |
| | 144,913 | | | ACEA SpA | | | 1,906,288 | |
| | | | | | | | |
| | | | Japan—3.0% | | | |
| | 267,671 | | | Ebara Corp. | | | 7,826,984 | |
| | 301,947 | | | Kurita Water Industries Ltd. | | | 7,446,002 | |
| | 30,725 | | | METAWATER Co. Ltd. | | | 787,897 | |
| | | | | | | | |
| | | | | | | 16,060,883 | |
| | | | | | | | |
| | | | Netherlands—1.9% | | | |
| | 271,702 | | | Aalberts Industries NV | | | 9,989,791 | |
| | | | | | | | |
| | | | Singapore—1.1% | | | |
| | 2,952,407 | | | Sembcorp Industries Ltd. | | | 6,012,267 | |
| | | | | | | | |
| | | | South Korea—1.8% | | | |
| | 152,151 | | | Coway Co. Ltd. | | | 9,386,350 | |
| | | | | | | | |
| | | | Sweden—4.1% | | | |
| | 846,269 | | | Alfa Laval AB | | | 21,638,901 | |
| | | | | | | | |
| | | | Switzerland—4.7% | | | |
| | 63,649 | | | Geberit AG | | | 24,949,598 | |
| | | | | | | | |
| | | | United Kingdom—16.6% | | | |
| | 1,067,212 | | | Halma PLC | | | 18,109,001 | |
| | 1,349,400 | | | Pennon Group PLC | | | 12,865,945 | |
| | 455,747 | | | Pentair PLC | | | 18,298,242 | |
| | 778,229 | | | Severn Trent PLC | | | 18,525,332 | |
| | 2,209,475 | | | United Utilities Group PLC | | | 20,513,049 | |
| | | | | | | | |
| | | | | | | 88,311,569 | |
| | | | | | | | |
| | | | United States—45.5% | | | |
| | 115,762 | | | Advanced Drainage Systems, Inc. | | | 3,217,026 | |
| | 104,696 | | | Aegion Corp.(a) | | | 2,026,915 | |
| | 119,030 | | | American States Water Co. | | | 7,287,017 | |
| | 584,840 | | | American Water Works Co., Inc. | | | 51,775,885 | |
| | 576,485 | | | Aqua America, Inc. | | | 18,753,057 | |
| | 42,203 | | | AquaVenture Holdings Ltd.(a) | | | 706,900 | |
| | 82,224 | | | Badger Meter, Inc. | | | 4,038,021 | |
| | 155,759 | | | California Water Service Group | | | 6,541,878 | |
| | | | | | | | |
Number
of Shares | | | | | Value | |
| | | | Common Stocks & Other Equity Interests
(continued) | |
| | | | United States (continued) | | | |
| | 39,034 | | | Connecticut Water Service, Inc. | | $ | 2,698,030 | |
| | 267,739 | | | Danaher Corp. | | | 26,613,257 | |
| | 87,766 | | | Energy Recovery, Inc.(a)(b) | | | 658,245 | |
| | 164,042 | | | Evoqua Water Technologies Corp.(a) | | | 1,574,803 | |
| | 52,593 | | | Forterra, Inc.(a) | | | 237,194 | |
| | 109,507 | | | Franklin Electric Co., Inc. | | | 4,645,287 | |
| | 53,845 | | | Gorman-Rupp Co. (The) | | | 1,857,652 | |
| | 198,416 | | | IDEX Corp. | | | 25,163,117 | |
| | 30,380 | | | Lindsay Corp. | | | 2,904,936 | |
| | 53,114 | | | Middlesex Water Co. | | | 2,390,130 | |
| | 446,702 | | | Mueller Water Products, Inc., Class A | | | 4,583,162 | |
| | 471,643 | | | Olin Corp. | | | 9,527,189 | |
| | 70,984 | | | PICO Holdings, Inc.(a) | | | 810,637 | |
| | 2,008,400 | | | Reliance Worldwide Corp. Ltd. | | | 7,131,501 | |
| | 190,233 | | | Select Energy Services, Inc., Class A(a) | | | 1,818,627 | |
| | 51,441 | | | SJW Corp. | | | 3,124,012 | |
| | 179,299 | | | Tetra Tech, Inc. | | | 11,840,906 | |
| | 78,527 | | | Watts Water Technologies, Inc., Class A | | | 5,500,816 | |
| | 507,279 | | | Xylem, Inc. | | | 33,267,357 | |
| | 41,848 | | | York Water Co. (The) | | | 1,303,147 | |
| | | | | | | | |
| | | | | | | 241,996,704 | |
| | | | | | | | |
| | | | Total Investments in Securities
(excluding investments purchased with cash collateral from securities on loan)
(Cost $472,775,682)—99.8% | | | 530,297,707 | |
| | | | | | | | |
| | |
| | | | | | | | |
| | | | Investments Purchased with Cash Collateral from
Securities on Loan | |
| | |
| | | | | | | | |
| | | | Money Market Fund—0.1% | |
| | 636,549 | | | Invesco Government & Agency Portfolio—Institutional Class, 2.08%(c)(d)
(Cost $636,549) | | | 636,549 | |
| | | | | | | | |
| | | | Total Investments in Securities
(Cost $473,412,231)—99.9% | | | 530,934,256 | |
| | | | Other assets less liabilities—0.1% | | | 363,953 | |
| | | | | | | | |
| | | | Net Assets—100.0% | | $ | 531,298,209 | |
| | | | | | | | |
Investment Abbreviations:
ADR—American Depositary Receipt
Notes to Schedule of Investments:
| (a) | Non-income producing security. |
| (b) | All or a portion of this security was out on loan at October 31, 2018. |
| (c) | The security and the Fund are advised by wholly-owned subsidiaries of Invesco Ltd. and are therefore considered to be affiliated. The rate shown is the 7-day SEC standardized yield as of October 31, 2018. |
| (d) | The security has been segregated to satisfy the commitment to return the cash collateral received in securities lending transactions upon the borrower’s return of the securities loaned. See Note 2J. |
See accompanying Notes to Financial Statements which are an integral part of the financial statements.
Statements of Assets and Liabilities
October 31, 2018
| | | | | | | | | | | | |
| | | Invesco
China All-Cap
ETF (YAO) | | | Invesco China
Technology ETF
(CQQQ) | | | Invesco S&P
Global Water Index
ETF (CGW) | |
| Assets: | | | | | | | | | | | | |
Unaffiliated investments in securities, at value(a) | | $ | 20,280,247 | | | $ | 404,853,633 | | | $ | 530,297,707 | |
Affiliated investments in securities, at value | | | 151,462 | | | | 20,856,156 | | | | 636,549 | |
Foreign currencies, at value | | | 7,187 | | | | — | | | | 46,780 | |
Cash segregated as collateral | | | — | | | | 25,110 | | | | — | |
Receivables: | | | | | | | | | | | | |
Dividends | | | 16,855 | | | | 532,418 | | | | 415,221 | |
Securities lending | | | 431 | | | | 26,514 | | | | 898 | |
Investments sold | | | — | | | | — | | | | 103,847 | |
Foreign tax reclaims | | | — | | | | — | | | | 1,343,784 | |
Shares sold | | | — | | | | 14,473 | | | | — | |
| | | | | | | | | | | | |
Total Assets | | | 20,456,182 | | | | 426,308,304 | | | | 532,844,786 | |
| | | | | | | | | | | | |
| | | |
| Liabilities: | | | | | | | | | | | | |
Due to custodian | | | 10,688 | | | | 9,681 | | | | 142,493 | |
Due to foreign custodian | | | — | | | | 107,741 | | | | — | |
Payables: | | | | | | | | | | | | |
Collateral upon return of securities loaned | | | 151,462 | | | | 20,265,911 | | | | 636,549 | |
Collateral upon receipt of securities in-kind | | | — | | | | 25,110 | | | | | |
Investments purchased | | | 8 | | | | 14,473 | | | | — | |
Shares repurchased | | | — | | | | — | | | | 103,847 | |
Accrued unitary management fees | | | 12,323 | | | | 344,271 | | | | — | |
Accrued advisory fees | | | — | | | | — | | | | 238,982 | |
Accrued trustees’ and officer’s fees | | | — | | | | — | | | | 9,841 | |
Accrued expenses | | | — | | | | — | | | | 414,865 | |
| | | | | | | | | | | | |
Total Liabilities | | | 174,481 | | | | 20,767,187 | | | | 1,546,577 | |
| | | | | | | | | | | | |
| Net Assets | | $ | 20,281,701 | | | $ | 405,541,117 | | | $ | 531,298,209 | |
| | | | | | | | | | | | |
| | | |
| Net Assets Consist of: | | | | | | | | | | | | |
Shares of beneficial interest | | $ | 29,538,989 | | | $ | 576,681,660 | | | $ | 493,012,775 | |
Distributable earnings | | | (9,257,288 | ) | | | (171,140,543 | ) | | | 38,285,434 | |
| | | | | | | | | | | | |
| Net Assets | | $ | 20,281,701 | | | $ | 405,541,117 | | | $ | 531,298,209 | |
| | | | | | | | | | | | |
Shares outstanding (unlimited amount authorized, $0.01 par value) | | | 700,000 | | | | 10,000,000 | | | | 16,440,000 | |
Net asset value | | $ | 28.97 | | | $ | 40.55 | | | $ | 32.32 | |
| | | | | | | | | | | | |
Market price | | $ | 28.93 | | | $ | 40.81 | | | $ | 32.27 | |
| | | | | | | | | | | | |
Unaffiliated investments in securities, at cost | | $ | 20,818,282 | | | $ | 535,540,191 | | | $ | 472,775,682 | |
| | | | | | | | | | | | |
Affiliated investments in securities, at cost | | $ | 151,462 | | | $ | 20,856,156 | | | $ | 636,549 | |
| | | | | | | | | | | | |
Foreign currencies (due to foreign custodian), at cost | | $ | 7,187 | | | $ | (107,742 | ) | | $ | 46,930 | |
| | | | | | | | | | | | |
(a) Includes securities on loan with an aggregate value of: | | $ | 152,743 | | | $ | 20,570,066 | | | $ | 648,219 | |
| | | | | | | | | | | | |
See accompanying Notes to Financial Statements which are an integral part of the financial statements.
Statements of Operations
Period September 1, 2018 through October 31, 2018 and the year ended August 31, 2018.
| | | | | | | | | | | | | | | | |
| | | Invesco China
All-Cap ETF (YAO) | | | Invesco China
Technology ETF (CQQQ) | |
| | | Two Months
Ended
October 31, 2018 | | | Year Ended
August 31, 2018 | | | Two Months
Ended
October 31, 2018 | | | Year Ended
August 31, 2018 | |
| Investment Income: | | | | | | | | | | | | | | | | |
Unaffiliated dividend income | | $ | 87,706 | | | $ | 648,753 | | | $ | 634,382 | | | $ | 3,912,736 | |
Affiliated dividend income | | | 58 | | | | 48 | | | | 1,052 | | | | 772 | |
Securities lending income | | | 910 | | | | 14,710 | | | | 64,397 | | | | 767,847 | |
Foreign withholding tax | | | (4,027 | ) | | | (44,924 | ) | | | (4,427 | ) | | | (22,645 | ) |
| | | | | | | | | | | | | | | | |
Total Income | | | 84,647 | | | | 618,587 | | | | 695,404 | | | | 4,658,710 | |
| | | | | | | | | | | | | | | | |
| | | | |
| Expenses: | | | | | | | | | | | | | | | | |
Unitary management fees | | | 25,095 | | | | 180,499 | | | | 445,000 | | | | 2,571,332 | |
| | | | | | | | | | | | | | | | |
Total Expenses | | | 25,095 | | | | 180,499 | | | | 445,000 | | | | 2,571,332 | |
| | | | | | | | | | | | | | | | |
Less: Waivers | | | (5 | ) | | | (4 | ) | | | (88 | ) | | | (150 | ) |
| | | | | | | | | | | | | | | | |
Net Expenses | | | 25,090 | | | | 180,495 | | | | 444,912 | | | | 2,571,182 | |
| | | | | | | | | | | | | | | | |
Net Investment Income | | | 59,557 | | | | 438,092 | | | | 250,492 | | | | 2,087,528 | |
| | | | | | | | | | | | | | | | |
| | | | |
| Realized and Unrealized Gain (Loss): | | | | | | | | | | | | | | | | |
Net realized gain (loss) from: | | | | | | | | | | | | | | | | |
Investment securities | | | (58,893 | ) | | | 545,967 | | | | (9,567,131 | ) | | | (16,550,736 | ) |
In-kind redemptions | | | — | | | | 1,340,951 | | | | — | | | | 54,723,140 | |
Foreign currencies | | | (208 | ) | | | 321 | | | | (12,867 | ) | | | (7,336 | ) |
| | | | | | | | | | | | | | | | |
Net realized gain (loss) | | | (59,101 | ) | | | 1,887,239 | | | | (9,579,998 | ) | | | 38,165,068 | |
| | | | | | | | | | | | | | | | |
Change in net unrealized appreciation (depreciation) on: | | | | | | | | | | | | | | | | |
Investment securities | | | (2,496,303 | ) | | | (2,069,467 | ) | | | (64,668,639 | ) | | | (102,225,582 | ) |
Foreign currencies | | | 15 | | | | (38 | ) | | | (79 | ) | | | 1,088 | |
| | | | | | | | | | | | | | | | |
Net change in unrealized appreciation (depreciation) | | | (2,496,288 | ) | | | (2,069,505 | ) | | | (64,668,718 | ) | | | (102,224,494 | ) |
| | | | | | | | | | | | | | | | |
Net realized and unrealized gain (loss) | | | (2,555,389 | ) | | | (182,266 | ) | | | (74,248,716 | ) | | | (64,059,426 | ) |
| | | | | | | | | | | | | | | | |
Net increase (decrease) in net assets resulting from operations | | $ | (2,495,832 | ) | | $ | 255,826 | | | $ | (73,998,224 | ) | | $ | (61,971,898 | ) |
| | | | | | | | | | | | | | | | |
See accompanying Notes to Financial Statements which are an integral part of the financial statements.
Statements of Operations (continued)
Period September 1, 2018 through October 31, 2018 and the year ended August 31, 2018.
| | | | | | | | |
| | | Invesco S&P Global Water Index
ETF (CGW) | |
| | | Two Months
Ended
October 31, 2018 | | | Year Ended
August 31, 2018 | |
| Investment Income: | | | | | | | | |
Unaffiliated dividend income | | $ | 1,276,912 | | | $ | 15,150,679 | |
Affiliated dividend income | | | 1,647 | | | | 2,210 | |
Securities lending income | | | 6,008 | | | | 37,378 | |
Foreign withholding tax | | | (58,833 | ) | | | (917,915 | ) |
| | | | | | | | |
Total Income | | | 1,225,734 | | | | 14,272,352 | |
| | | | | | | | |
| | |
| Expenses: | | | | | | | | |
Advisory fees | | | 479,163 | | | | 3,066,586 | |
Professional fees | | | 23,654 | | | | 62,542 | |
Accounting & administration fees | | | 18,741 | | | | 130,093 | |
Sub-licensing fees | | | 42,167 | | | | 269,861 | |
Printing fees | | | 8,563 | | | | 85,496 | |
Custodian & transfer agent fees | | | 2,778 | | | | 131,298 | |
Listing fee and expenses | | | 837 | | | | 5,110 | |
Trustees’ and officer’s fees | | | 1,430 | | | | 26,198 | |
Intraday valuation fees | | | 339 | | | | 2,570 | |
Insurance | | | 785 | | | | 4,104 | |
Other expenses | | | 1,420 | | | | 1,911 | |
| | | | | | | | |
Total Expenses | | | 579,877 | | | | 3,785,769 | |
| | | | | | | | |
Less: Waivers | | | (157 | ) | | | (2,586 | ) |
| | | | | | | | |
Net Expenses | | | 579,720 | | | | 3,783,183 | |
| | | | | | | | |
Net Investment Income | | | 646,014 | | | | 10,489,169 | |
| | | | | | | | |
| | |
| Realized and Unrealized Gain (Loss): | | | | | | | | |
Net realized gain (loss) from: | | | | | | | | |
Investment securities | | | (5,169,665 | ) | | | 1,469,612 | |
In-kind redemptions | | | 11,269,625 | | | | 69,513,361 | |
Foreign currencies | | | (12,929 | ) | | | (74,692 | ) |
| | | | | | | | |
Net realized gain | | | 6,087,031 | | | | 70,908,281 | |
| | | | | | | | |
Change in net unrealized appreciation (depreciation) on: | | | | | | | | |
Investment securities | | | (56,170,858 | ) | | | (37,428,408 | ) |
Foreign currencies | | | (39,397 | ) | | | (11,753 | ) |
| | | | | | | | |
Net change in unrealized appreciation (depreciation) | | | (56,210,255 | ) | | | (37,440,161 | ) |
| | | | | | | | |
Net realized and unrealized gain (loss) | | | (50,123,224 | ) | | | 33,468,120 | |
| | | | | | | | |
Net increase (decrease) in net assets resulting from operations | | $ | (49,477,210 | ) | | $ | 43,957,289 | |
| | | | | | | | |
See accompanying Notes to Financial Statements which are an integral part of the financial statements.
Statements of Changes in Net Assets
Period September 1, 2018 through October 31, 2018 and the years ended August 31, 2018 and 2017.
| | | | | | | | | | | | |
| | | Invesco China
All-Cap ETF (YAO) | |
| | | Two Months
Ended
October 31, 2018 | | | Year Ended
August 31, 2018 | | | Year Ended
August 31, 2017 | |
| Operations: | | | | | | | | | | | | |
Net investment income | | $ | 59,557 | | | $ | 438,092 | | | $ | 400,762 | |
Net realized gain (loss) | | | (59,101 | ) | | | 1,887,239 | | | | 620,333 | |
Net change in unrealized appreciation (depreciation) | | | (2,496,288 | ) | | | (2,069,505 | ) | | | 4,766,854 | |
| | | | | | | | | | | | |
Net increase (decrease) in net assets resulting from operations | | | (2,495,832 | ) | | | 255,826 | | | | 5,787,949 | |
| | | | | | | | | | | | |
| | | |
| Distributions to Shareholders from: | | | | | | | | | | | | |
Distributable earnings | | | — | | | | (500,080 | ) | | | (433,200 | ) |
| | | | | | | | | | | | |
| | | |
| Shareholder Transactions: | | | | | | | | | | | | |
Proceeds from shares sold | | | — | | | | — | | | | 2,958,308 | |
Value of shares repurchased | | | — | | | | (3,488,455 | ) | | | (5,376,934 | ) |
Transaction fees | | | — | | | | — | | | | — | |
| | | | | | | | | | | | |
Net increase (decrease) in net assets resulting from shares transactions | | | — | | | | (3,488,455 | ) | | | (2,418,626 | ) |
| | | | | | | | | | | | |
Increase (Decrease) in Net Assets | | | (2,495,832 | ) | | | (3,732,709 | ) | | | 2,936,123 | |
| | | | | | | | | | | | |
| | | |
| Net Assets: | | | | | | | | | | | | |
Beginning of period | | | 22,777,533 | | | | 26,510,242 | | | | 23,574,119 | |
| | | | | | | | | | | | |
End of period | | $ | 20,281,701 | | | $ | 22,777,533 | | | $ | 26,510,242 | |
| | | | | | | | | | | | |
| | | |
| Changes in Shares Outstanding: | | | | | | | | | | | | |
Shares sold | | | — | | | | — | | | | 100,000 | |
Shares repurchased | | | — | | | | (100,000 | ) | | | (200,000 | ) |
Shares outstanding, beginning of period | | | 700,000 | | | | 800,000 | | | | 900,000 | |
| | | | | | | | | | | | |
Shares outstanding, end of period | | | 700,000 | | | | 700,000 | | | | 800,000 | |
| | | | | | | | | | | | |
See accompanying Notes to Financial Statements which are an integral part of the financial statements.
| | | | | | | | | | | | | | | | | | | | | | |
Invesco China
Technology ETF (CQQQ) | | | Invesco S&P Global
Water Index ETF (CGW) | |
Two Months
Ended
October 31, 2018 | | | Year Ended
August 31, 2018 | | | Year Ended
August 31, 2017 | | | Two Months
Ended
October 31, 2018 | | | Year Ended
August 31, 2018 | | | Year Ended
August 31, 2017 | |
| | | | | | | | | | | | | | | | | | | | | | |
| $ | 250,492 | | | $ | 2,087,528 | | | $ | 932,753 | | | $ | 646,014 | | | $ | 10,489,169 | | | $ | 9,845,065 | |
| | (9,579,998 | ) | | | 38,165,068 | | | | (471,513 | ) | | | 6,087,031 | | | | 70,908,281 | | | | (7,735,767 | ) |
| | (64,668,718 | ) | | | (102,224,494 | ) | | | 35,523,479 | | | | (56,210,255 | ) | | | (37,440,161 | ) | | | 58,531,503 | |
| | | | | | | | | | | | | | | | | | | | | | |
| | (73,998,224 | ) | | | (61,971,898 | ) | | | 35,984,719 | | | | (49,477,210 | ) | | | 43,957,289 | | | | 60,640,801 | |
| | | | | | | | | | | | | | | | | | | | | | |
| | | | | |
| | | | | | | | | | | | | | | | | | | | | | |
| | — | | | | (5,489,280 | ) | | | (773,890 | ) | | | — | | | | (10,492,264 | ) | | | (7,164,324 | ) |
| | | | | | | | | | | | | | | | | | | | | | |
| | | | | |
| | | | | | | | | | | | | | | | | | | | | | |
| | 94,850,663 | | | | 398,909,634 | | | | 137,778,697 | | | | 16,098,469 | | | | 98,720,757 | | | | 126,926,729 | |
| | — | | | | (155,778,516 | ) | | | (9,123,754 | ) | | | (29,428,527 | ) | | | (148,333,764 | ) | | | (2,394,469 | ) |
| | — | | | | — | | | | — | | | | 565 | | | | — | | | | — | |
| | | | | | | | | | | | | | | | | | | | | | |
| | 94,850,663 | | | | 243,131,118 | | | | 128,654,943 | | | | (13,329,493 | ) | | | (49,613,007 | ) | | | 124,532,260 | |
| | | | | | | | | | | | | | | | | | | | | | |
| | 20,852,439 | | | | 175,669,940 | | | | 163,865,772 | | | | (62,806,703 | ) | | | (16,147,982 | ) | | | 178,008,737 | |
| | | | | | | | | | | | | | | | | | | | | | |
| | | | | |
| | | | | | | | | | | | | | | | | | | | | | |
| | 384,688,678 | | | | 209,018,738 | | | | 45,152,966 | | | | 594,104,912 | | | | 610,252,894 | | | | 432,244,157 | |
| | | | | | | | | | | | | | | | | | | | | | |
| $ | 405,541,117 | | | $ | 384,688,678 | | | $ | 209,018,738 | | | $ | 531,298,209 | | | $ | 594,104,912 | | | $ | 610,252,894 | |
| | | | | | | | | | | | | | | | | | | | | | |
| | | | | |
| | | | | | | | | | | | | | | | | | | | | | |
| | 2,200,000 | | | | 6,650,000 | | | | 2,900,000 | | | | 480,000 | | | | 2,800,000 | | | | 4,080,000 | |
| | — | | | | (2,650,000 | ) | | | (250,000 | ) | | | (880,000 | ) | | | (4,240,000 | ) | | | (80,000 | ) |
| | 7,800,000 | | | | 3,800,000 | | | | 1,150,000 | | | | 16,840,000 | | | | 18,280,000 | | | | 14,280,000 | |
| | | | | | | | | | | | | | | | | | | | | | |
| | 10,000,000 | | | | 7,800,000 | | | | 3,800,000 | | | | 16,440,000 | | | | 16,840,000 | | | | 18,280,000 | |
| | | | | | | | | | | | | | | | | | | | | | |
Financial Highlights
Invesco China All-Cap ETF (YAO)
| | | | | | | | | | | | | | | | | | | | | | | | |
| | | Two Months Ended
October 31, 2018 | | | Year Ended August 31, | |
| | | 2018 | | | 2017 | | | 2016 | | | 2015 | | | 2014 | |
| Per Share Operating Performance: | | | | | | | | | | | | | | | | | | | | | | | | |
Net asset value at beginning of period | | $ | 32.54 | | | $ | 33.14 | | | $ | 26.19 | | | $ | 24.42 | | | $ | 28.56 | | | $ | 24.63 | |
Net investment income(a) | | | 0.09 | | | | 0.60 | | | | 0.50 | | | | 0.52 | | | | 0.53 | | | | 0.62 | |
Net realized and unrealized gain (loss) on investments | | | (3.66 | ) | | | (0.49 | ) | | | 6.99 | | | | 2.12 | | | | (4.02 | ) | | | 3.80 | |
Total from investment operations | | | (3.57 | ) | | | 0.11 | | | | 7.49 | | | | 2.64 | | | | (3.49 | ) | | | 4.42 | |
Distributions to shareholders from: | | | | | | | | | | | | | | | | | | | | | | | | |
Net investment income | | | — | | | | (0.71 | ) | | | (0.54 | ) | | | (0.87 | ) | | | (0.65 | ) | | | (0.49 | ) |
Net asset value at end of period | | $ | 28.97 | | | $ | 32.54 | | | $ | 33.14 | | | $ | 26.19 | | | $ | 24.42 | | | $ | 28.56 | |
Market value at end of period | | $ | 28.93 | (b) | | $ | 32.42 | (b) | | $ | 33.23 | | | $ | 26.23 | | | $ | 24.13 | | | $ | 28.52 | |
| Net Asset Value Total Return(c) | | | (10.97 | )% | | | 0.19 | % | | | 29.33 | % | | | 10.99 | % | | | (12.51 | )% | | | 18.05 | % |
| Market Price Total Return(c) | | | (10.77 | )% | | | (0.44 | )% | | | | | | | | | | | | | | | | |
| Ratios/Supplemental Data: | | | | | | | | | | | | | | | | | | | | | | | | |
Net assets at end of period (000’s omitted) | | $ | 20,282 | | | $ | 22,778 | | | $ | 26,510 | | | $ | 23,574 | | | $ | 29,308 | | | $ | 54,262 | |
Ratio to average net assets of: | | | | | | | | | | | | | | | | | | | | | | | | |
Expenses | | | 0.70 | %(d) | | | 0.70 | % | | | 0.70 | % | | | 0.70 | % | | | 0.70 | % | | | 0.71 | % |
Net investment income | | | 1.66 | %(d) | | | 1.70 | % | | | 1.81 | % | | | 2.17 | % | | | 1.84 | % | | | 2.35 | % |
Portfolio turnover rate(e) | | | 2 | % | | | 10 | % | | | 10 | % | | | 26 | % | | | 17 | % | | | 12 | % |
| (a) | Based on average shares outstanding. |
| (b) | The mean between the last bid and ask prices. |
| (c) | Net asset value total return is calculated assuming an initial investment made at the net asset value at the beginning of the period, reinvestment of all dividends and distributions at net asset value during the period, and redemption on the last day of the period. Net asset value total return includes adjustments in accordance with accounting principles generally accepted in the United States of America and as such, the net asset value for financial reporting purposes and the returns based upon those net asset values may differ from the net asset value and returns for shareholder transactions. Market price total return is calculated assuming an initial investment made at the market price at the beginning of the period, reinvestment of all dividends and distributions at market price during the period, and sale at the market price on the last day of the period. Total investment returns calculated for a period of less than one year are not annualized. |
| (e) | Portfolio turnover rate is not annualized for periods less than one year, if applicable, and does not include securities received or delivered from processing creations or redemptions. |
Invesco China Technology ETF (CQQQ)
| | | | | | | | | | | | | | | | | | | | | | | | |
| | | Two Months Ended
October 31, 2018 | | | Year Ended August 31, | |
| | | 2018 | | | 2017 | | | 2016 | | | 2015 | | | 2014 | |
| Per Share Operating Performance: | | | | | | | | | | | | | | | | | | | | | | | | |
Net asset value at beginning of period | | $ | 49.32 | | | $ | 55.00 | | | $ | 39.26 | | | $ | 29.55 | | | $ | 38.09 | | | $ | 29.55 | |
Net investment income(a) | | | 0.03 | | | | 0.31 | | | | 0.52 | | | | 0.32 | | | | 0.46 | | | | 0.43 | |
Net realized and unrealized gain (loss) on investments | | | (8.80 | ) | | | (5.13 | ) | | | 15.82 | | | | 10.03 | | | | (8.65 | ) | | | 8.39 | |
Total from investment operations | | | (8.77 | ) | | | (4.82 | ) | | | 16.34 | | | | 10.35 | | | | (8.19 | ) | | | 8.82 | |
Distributions to shareholders from: | | | | | | | | | | | | | | | | | | | | | | | | |
Net investment income | | | — | | | | (0.86 | ) | | | (0.60 | ) | | | (0.64 | ) | | | (0.35 | ) | | | (0.28 | ) |
Net asset value at end of period | | $ | 40.55 | | | $ | 49.32 | | | $ | 55.00 | | | $ | 39.26 | | | $ | 29.55 | | | $ | 38.09 | |
Market value at end of period | | $ | 40.81 | (b) | | $ | 49.36 | (b) | | $ | 55.21 | | | $ | 39.08 | | | $ | 29.31 | | | $ | 37.88 | |
| Net Asset Value Total Return(c) | | | (17.78 | )% | | | (9.05 | )% | | | 42.43 | % | | | 35.19 | % | | | (21.62 | )% | | | 29.89 | % |
| Market Price Total Return(c) | | | (17.32 | )% | | | (9.33 | )% | | | | | | | | | | | | | | | | |
| Ratios/Supplemental Data: | | | | | | | | | | | | | | | | | | | | | | | | |
Net assets at end of period (000’s omitted) | | $ | 405,541 | | | $ | 384,689 | | | $ | 209,019 | | | $ | 45,153 | | | $ | 45,804 | | | $ | 78,077 | |
Ratio to average net assets of: | | | | | | | | | | | | | | | | | | | | | | | | |
Expenses | | | 0.70 | %(d) | | | 0.65 | % | | | 0.70 | % | | | 0.70 | % | | | 0.70 | % | | | 0.71 | % |
Net investment income | | | 0.39 | %(d) | | | 0.52 | % | | | 1.20 | % | | | 0.94 | % | | | 1.20 | % | | | 1.22 | % |
Portfolio turnover rate(e) | | | 4 | % | | | 21 | % | | | 10 | % | | | 48 | % | | | 32 | % | | | 39 | % |
| (a) | Based on average shares outstanding. |
| (b) | The mean between the last bid and ask prices. |
| (c) | Net asset value total return is calculated assuming an initial investment made at the net asset value at the beginning of the period, reinvestment of all dividends and distributions at net asset value during the period, and redemption on the last day of the period. Net asset value total return includes adjustments in accordance with accounting principles generally accepted in the United States of America and as such, the net asset value for financial reporting purposes and the returns based upon those net asset values may differ from the net asset value and returns for shareholder transactions. Market price total return is calculated assuming an initial investment made at the market price at the beginning of the period, reinvestment of all dividends and distributions at market price during the period, and sale at the market price on the last day of the period. Total investment returns calculated for a period of less than one year are not annualized. |
| (e) | Portfolio turnover rate is not annualized for periods less than one year, if applicable, and does not include securities received or delivered from processing creations or redemptions. |
See accompanying Notes to Financial Statements which are an integral part of the financial statements.
Financial Highlights (continued)
Invesco S&P Global Water Index ETF (CGW)
| | | | | | | | | | | | | | | | | | | | | | | | |
| | | Two Months Ended
October 31, 2018 | | | Year Ended August 31, | |
| | | 2018 | | | 2017 | | | 2016 | | | 2015 | | | 2014 | |
| Per Share Operating Performance: | | | | | | | | | | | | | | | | | | | | | | | | |
Net asset value at beginning of period | | $ | 35.28 | | | $ | 33.38 | | | $ | 30.27 | | | $ | 26.67 | | | $ | 29.02 | | | $ | 23.90 | |
Net investment income(a) | | | 0.04 | | | | 0.59 | | | | 0.61 | | | | 0.54 | | | | 0.48 | | | | 0.51 | |
Net realized and unrealized gain (loss) on investments | | | (3.00 | ) | | | 1.92 | | | | 2.97 | | | | 3.51 | | | | (2.33 | ) | | | 5.03 | |
Total from investment operations | | | (2.96 | ) | | | 2.51 | | | | 3.58 | | | | 4.05 | | | | (1.85 | ) | | | 5.54 | |
Distributions to shareholders from: | | | | | | | | | | | | | | | | | | | | | | | | |
Net investment income | | | — | | | | (0.61 | ) | | | (0.47 | ) | | | (0.45 | ) | | | (0.50 | ) | | | (0.42 | ) |
Transaction fees(a) | | | 0.00 | (b) | | | — | | | | — | | | | — | | | | — | | | | — | |
Net asset value at end of period | | $ | 32.32 | | | $ | 35.28 | | | $ | 33.38 | | | $ | 30.27 | | | $ | 26.67 | | | $ | 29.02 | |
Market value at end of period | | $ | 32.27 | (c) | | $ | 35.23 | (c) | | $ | 33.46 | | | $ | 30.32 | | | $ | 26.64 | | | $ | 29.08 | |
| Net Asset Value Total Return(d) | | | (8.39 | )% | | | 7.51 | % | | | 12.09 | % | | | 15.40 | % | | | (6.47 | )% | | | 23.27 | % |
| Market Price Total Return(d) | | | (8.40 | )% | | | 7.09 | % | | | | | | | | | | | | | | | | |
| Ratios/Supplemental Data: | | | | | | | | | | | | | | | | | | | | | | | | |
Net assets at end of period (000’s omitted) | | $ | 531,298 | | | $ | 594,105 | | | $ | 610,253 | | | $ | 432,244 | | | $ | 346,709 | | | $ | 367,914 | |
Ratio to average net assets of: | | | | | | | | | | | | | | | | | | | | | | | | |
Net expenses | | | 0.60 | %(e) | | | 0.62 | % | | | 0.63 | % | | | 0.64 | % | | | 0.64 | % | | | 0.65 | % |
Net investment income | | | 0.67 | %(e) | | | 1.71 | % | | | 1.98 | % | | | 1.93 | % | | | 1.69 | % | | | 1.83 | % |
Portfolio turnover rate(f) | | | 5 | % | | | 13 | % | | | 8 | % | | | 6 | % | | | 9 | % | | | 7 | % |
| (a) | Based on average shares outstanding. |
| (b) | Amount represents less than $0.005. |
| (c) | The mean between the last bid and ask prices. |
| (d) | Net asset value total return is calculated assuming an initial investment made at the net asset value at the beginning of the period, reinvestment of all dividends and distributions at net asset value during the period, and redemption on the last day of the period. Net asset value total return includes adjustments in accordance with accounting principles generally accepted in the United States of America and as such, the net asset value for financial reporting purposes and the returns based upon those net asset values may differ from the net asset value and returns for shareholder transactions. Market price total return is calculated assuming an initial investment made at the market price at the beginning of the period, reinvestment of all dividends and distributions at market price during the period, and sale at the market price on the last day of the period. Total investment returns calculated for a period of less than one year are not annualized. |
| (f) | Portfolio turnover rate is not annualized for periods less than one year, if applicable, and does not include securities received or delivered from processing creations or redemptions. |
See accompanying Notes to Financial Statements which are an integral part of the financial statements.
Notes to Financial Statements
Invesco Exchange-Traded Fund Trust II
October 31, 2018
Note 1. Organization
Invesco Exchange-Traded Fund Trust II (the “Trust”), formerly PowerShares Exchange-Traded Fund Trust II, was organized as a Massachusetts business trust on October 10, 2006 and is authorized to have multiple series of portfolios. The Trust is an open-end management investment company registered under the Investment Company Act of 1940, as amended (the “1940 Act”). This report includes the following portfolios:
| | |
Full Name | | Short Name |
| Invesco China All-Cap ETF (YAO) | | “China All-Cap ETF” |
| Invesco China Technology ETF (CQQQ) | | “China Technology ETF” |
| Invesco S&P Global Water Index ETF (CGW) | | “S&P Global Water Index ETF” |
Each portfolio (each, a “Fund”, and collectively, the “Funds”) represents a separate series of the Trust. The shares of the Funds are referred to herein as “Shares” or “Fund’s Shares.” Each Fund’s Shares are listed and traded on the following exchanges:
| | |
Fund | | Exchange |
| China All-Cap ETF | | NYSE Arca, Inc. |
| China Technology ETF | | NYSE Arca, Inc. |
| S&P Global Water Index ETF | | NYSE Arca, Inc. |
Effective June 4, 2018, the Funds’ names changed as part of an overall rebranding strategy whereby the PowerShares name was changed to the Invesco brand. This resulted in all references to the PowerShares name being changed to Invesco.
Each Fund acquired all or substantially all of the assets and all of the stated liabilities included in the financial statements of a corresponding fund of the Claymore Exchange-Traded Fund Trust 2 (each a “Predecessor Fund”) after the close of business on April 6, 2018 for China All-Cap ETF and S&P Global Water Index ETF, or May 18, 2018 for China Technology ETF (each a “Reorganization”). Each Fund adopted the performance and financial information of its corresponding Predecessor Fund. Information presented prior to the close of business on April 6, 2018 or May 18, 2018, as applicable, is that of its Predecessor Fund.
Effective October 31, 2018, the fiscal year-end changed for China All-Cap ETF, China Technology ETF and S&P Global Water Index ETF from August 31 to October 31.
The market price of each Share may differ to some degree from a Fund’s net asset value (“NAV”). Unlike conventional mutual funds, each Fund issues and redeems Shares on a continuous basis, at NAV, only in a large specified number of Shares, each called a “Creation Unit.” Creation Units are issued and redeemed principally in exchange for the deposit or delivery of a basket of securities (“Deposit Securities”). Except when aggregated in Creation Units by Authorized Participants, the Shares are not individually redeemable securities of the Funds.
The investment objective of each Fund is to seek investment results that correspond generally to the performance, before the Fund’s fees and expenses, of its respective Underlying Index.
| | |
Fund | | Underlying Index |
| China All-Cap ETF | | AlphaShares China All Cap Index |
| China Technology ETF | | AlphaShares China Technology Index |
| S&P Global Water Index ETF | | S&P Global Water Index |
Note 2. Significant Accounting Policies
The following is a summary of the significant accounting policies followed by the Funds in preparation of their financial statements.
Each Fund is an investment company and accordingly follows the investment company accounting and reporting guidance in accordance with Financial Accounting Standards Board Accounting Standards Codification Topic 946, Financial Services—Investment Companies.
A. Security Valuation
Securities, including restricted securities, are valued according to the following policies:
A security listed or traded on an exchange (except convertible securities) is generally valued at its last sales price or official closing price as of the close of the customary trading session on the exchange where the security is principally traded or, lacking any sales or official closing price on a particular day, the security may be valued at the closing bid price on that day. Securities traded in the over-the-counter market are valued based on prices furnished by independent pricing services or market makers. When such securities are valued by an independent pricing service they may be considered fair valued. Futures contracts are valued at the final settlement price set by an exchange on which they are principally traded. Listed options are valued at the mean between the last bid and asked prices from the exchange on which they are principally traded, or at the final settlement price set by such exchange. Swaps and options not listed on an exchange are valued by an independent source. For purposes of determining NAV per Share, futures and option contracts generally are valued 15 minutes after the close of the customary trading session of the New York Stock Exchange (“NYSE”).
Investment companies are valued using such company’s NAV per share, unless the shares are exchange-traded, in which case they are valued at the last sales price or official closing price as of the close of the customary trading session on the exchange where the security is principally traded.
Debt obligations (including convertible securities) and unlisted equities are fair valued using an evaluated quote provided by an independent pricing service. Evaluated quotes provided by the pricing service may be determined without exclusive reliance on quoted prices, and may reflect appropriate factors such as institution-size trading in similar groups of securities, developments related to specific securities, dividend rate (for unlisted equities), yield (for debt obligations), quality, type of issue, coupon rate (for debt obligations), maturity (for debt obligations), individual trading characteristics and other market data. Securities with a demand feature exercisable within one to seven days are valued at par. Pricing services generally value debt obligations assuming orderly transactions of institutional round lot size, but a Fund may hold or transact in the same securities in smaller, odd lot sizes. Odd lots often trade at lower prices than institutional round lots. Debt obligations are subject to interest rate and credit risks. In addition, all debt obligations involve some risk of default with respect to interest and/or principal payments.
Foreign securities’ (including foreign exchange contracts’) prices are converted into U.S. dollar amounts using the applicable exchange rates as of the close of the London world markets. If market quotations are available and reliable for foreign exchange-traded equity securities, the securities will be valued at the market quotations. Because trading hours for certain foreign securities end before the close of the NYSE, closing market quotations may become unreliable. If between the time trading ends on a particular security and the close of the customary trading session on the NYSE, events occur that Invesco Capital Management LLC (the “Adviser”), formerly Invesco PowerShares Capital Management LLC, determines are significant and make the closing price unreliable, a Fund may fair value the security. If the event is likely to have affected the closing price of the security, the security will be valued at fair value in good faith using procedures approved by the Board of Trustees. Adjustments to closing prices to reflect fair value may also be based on a screening process of an independent pricing service to indicate the degree of certainty, based on historical data, that the closing price in the principal market where a foreign security trades is not the current value as of the close of the NYSE. Foreign securities’ prices meeting the approved degree of certainty that the price is not reflective of current value will be priced at the indication of fair value from the independent pricing service. Multiple factors may be considered by the independent pricing service in determining adjustments to reflect fair value and may include information relating to sector indices, American Depositary Receipts and domestic and foreign index futures. Foreign securities may have additional risks including exchange rate changes, the potential for sharply devalued currencies and high inflation, political and economic upheaval, the relative lack of issuer information, relatively low market liquidity and the potential lack of strict financial and accounting controls and standards.
Securities for which market prices are not provided by any of the above methods may be valued based upon quotes furnished by independent sources. The last bid price may be used to value exchange-traded equity securities. The mean between the last bid and asked prices may be used to value debt obligations, including corporate loans, and unlisted equity securities.
Securities for which market quotations are not readily available or became unreliable are valued at fair value as determined in good faith following procedures approved by the Board of Trustees. Issuer-specific events, market trends, bid/asked quotes of brokers and information providers and other market data may be reviewed in the course of making a good faith determination of a security’s fair value.
Each Fund may invest in securities that are subject to interest rate risk, meaning the risk that the prices will generally fall as interest rates rise and, conversely, the prices will generally rise as interest rates fall. Specific securities differ in their sensitivity to changes in interest rates depending on their individual characteristics. Changes in interest rates may result in increased market volatility, which may affect the value and/or liquidity of certain Fund investments.
Valuations change in response to many factors, including the historical and prospective earnings of the issuer, the value of the issuer’s assets, general economic conditions, interest rates, investor perceptions and market liquidity. Because of the inherent uncertainties of
valuation, the values reflected in the financial statements may materially differ from the value received upon actual sale of those investments.
B. Other Risks
Index Risk. Unlike many investment companies, the Funds do not utilize investing strategies that seek returns in excess of their Underlying Indexes. Therefore, a Fund would not necessarily buy or sell a security unless that security is added or removed, respectively, from its respective Underlying Index, even if that security generally is underperforming.
Authorized Participant Concentration Risk. Only Authorized Participants (“APs”) may engage in creation or redemption transactions directly with each Fund. Each Fund has a limited number of institutions that may act as APs, and such APs have no obligation to submit creation or redemption orders. Consequently, there is no assurance that those APs will establish or maintain an active trading market for the Shares. This risk may be heightened to the extent that securities underlying each Fund are traded outside a collateralized settlement system. In that case, APs may be required to post collateral on certain trades on an agency basis (i.e., on behalf of other market participants), which only a limited number of APs may be able to do. In addition, to the extent that APs exit the business or are unable to proceed with creation and/or redemption orders with respect to each Fund and no other AP is able to step forward to create or redeem Creation Units, this may result in a significantly diminished trading market for Fund Shares, which may be more likely to trade at a premium or discount to each Fund’s net asset value (“NAV”) and to face trading halts and/or delisting. This risk may be heightened for the Funds because the Funds invest in non-U.S. securities, which may have lower trading volumes.
Equity Risk. Equity risk is the risk that the value of the securities that each Fund holds will fall due to general market and economic conditions, perceptions regarding the industries in which the issuers of securities that a Fund holds participate or factors relating to specific companies in which the Fund invests. For example, an adverse event, such as an unfavorable earnings report, may depress the value of securities a Fund holds; the price of securities may be particularly sensitive to general movements in the stock market; or a drop in the stock market may depress the price of most or all of the securities a Fund holds. In addition, securities of an issuer in the Fund’s portfolio may decline in price if the issuer fails to make anticipated dividend payments because, among other reasons, the issuer of the security experiences a decline in its financial condition.
Industry or Geographic Concentration Risk. Each Fund’s Underlying Index from time to time may be concentrated to a significant degree in securities of issuers located in a single industry or sector, or, in a specific country or geographic region. To the extent that an Underlying Index concentrates in the securities of issuers in a particular industry, sector, country or region, the corresponding Fund will also concentrate its investments to approximately the same extent. By so concentrating its investments in an industry, sector, country or region, a Fund faces more risks than if it were diversified broadly over numerous industries, sectors, countries or geographic regions. Such industry-based risks, any of which may adversely affect the companies in which the Fund invests, may include, but are not limited to, the following: general economic conditions or cyclical market patterns that could negatively affect supply and demand in a particular industry; competition for resources, adverse labor relations, political or world events; obsolescence of technologies; and increased competition or new product introductions that may affect the profitability or viability of companies in an industry. In addition, at times, such industry or sector may be out of favor and underperform other industries or the market as a whole. Also, a natural or other disaster could occur in a country or geographic region in which a Fund invests, which could affect the economy or particular business operations of companies in that specific country or geographic region and adversely impact a Fund’s investments in the affected country or region.
Non-Diversified Fund Risk. The Funds are non-diversified and can invest a greater portion of their assets in securities of individual issuers than diversified funds. As a result, changes in the market value of a single investment could cause greater fluctuations in Share price than would occur in a diversified fund. This may increase a Fund’s volatility and cause the performance of a relatively small number of issuers to have a greater impact on a Fund’s performance.
Issuer-Specific Changes Risk. The value of an individual security or particular type of security can be more volatile than the market as a whole and can perform differently from the value of the market as a whole. The value of securities of smaller issuers can be more volatile than that of larger issuers.
Micro-Capitalization Company Risk. For China All-Cap ETF and China Technology ETF, investing in the securities of micro-capitalization companies involve substantially greater risks of loss and price fluctuations because their earnings and revenues tend to be less predictable (and some companies may be experiencing significant losses), and their share prices tend to be more volatile and their markets less liquid than companies with larger market capitalizations.
Non-Correlation Risk. Each Fund’s return may not match the return of its Underlying Index for a number of reasons. For example, each Fund incurs operating expenses not applicable to its Underlying Index, and incurs costs in buying and selling securities, especially when rebalancing the Fund’s securities holdings to reflect changes in the composition of its Underlying Index. In addition, the performance of each Fund and its Underlying Index may vary due to asset valuation differences and differences between each Fund’s portfolio and its Underlying Index resulting from legal restrictions, cost or liquidity constraints.
Foreign Investment Risk. Investments in the securities of non-U.S. issuers involve risks beyond those associated with investments in U.S. securities. Foreign securities may have relatively low market liquidity, greater market volatility, decreased publicly available information and less reliable financial information about issuers, and inconsistent and potentially less stringent accounting, auditing and financial reporting requirements and standards of practice comparable to those applicable to domestic issuers. Foreign securities also are subject to the risks of expropriation, nationalization, political instability or other adverse political or economic developments and the difficulty of enforcing obligations in other countries. As the Funds may invest in securities denominated in foreign currencies, fluctuations in the value of the U.S. dollar relative to the values of other currencies may adversely affect investments in foreign securities and may negatively impact the Funds’ returns. Such risks may be exacerbated in emerging markets, where securities laws are relatively new and unsettled.
Small- and Mid-Capitalization Company Risk. For each Fund, investing in securities of small- and mid-capitalization companies involves greater risk than customarily is associated with investing in larger, more established companies. These companies’ securities may be more volatile and less liquid than those of more established companies. These securities may have returns that vary, sometimes significantly, from the overall securities market. Often small- and mid-capitalization companies and the industries in which they focus are still evolving and, as a result, they may be more sensitive to changing market conditions.
Emerging Markets Risk. The risks of foreign investments are usually much greater for emerging markets. Emerging markets are riskier because they develop unevenly and may never fully develop. They are more likely to experience hyperinflation and currency devaluations, which adversely affect returns to U.S. investors. In addition, the securities markets in many of these countries have far lower trading volumes and less liquidity then developed markets. Because these markets are so small, they may be more likely to suffer sharp and frequent price changes or long term price depression due to adverse publicity, investor perceptions or the transactions of a few large investors. Traditional measures of investment value used in the U.S., such as price to earnings ratios, may not apply to certain small markets, making it more difficult to value their securities.
Depositary Receipt Risk. Each Fund may hold the securities of non-U.S. companies in the form of depositary receipts. The underlying securities of the depositary receipts in each Fund’s portfolio are subject to fluctuations in foreign currency exchange rates that may affect the value of each Fund’s portfolio. In addition, the value of the securities underlying the depositary receipts may change materially when U.S. markets are not open for trading. Investments in the underlying foreign securities
Currency Risk. The Funds may invest in non-U.S. dollar denominated equity securities of foreign issuers. Because a Fund’s NAV is determined in U.S. dollars, the Fund’s NAV could decline if the currency of the non-U.S. market in which the Fund invests depreciates against the U.S. dollar, even if the value of the Fund’s holdings, measured in the foreign currency, increases.
C. Federal Income Taxes
Each Fund intends to comply with the provisions of the Internal Revenue Code of 1986, as amended (the “Internal Revenue Code”), applicable to regulated investment companies and to distribute substantially all of the Fund’s taxable earnings to its shareholders. As such, the Funds will not be subject to federal income taxes on otherwise taxable income (including net realized gains) that is distributed to the shareholders. Therefore, no provision for federal income taxes is recorded in the financial statements.
Each Fund recognizes the tax benefits of uncertain tax positions only when the position is more likely than not to be sustained. Management has analyzed each Fund’s uncertain tax positions and concluded that no liability for unrecognized tax benefits should be recorded related to uncertain tax positions. Management is not aware of any tax positions for which it is reasonably possible that the total amounts of unrecognized tax benefits will change materially in the next 12 months.
Income and capital gain distributions are determined in accordance with federal income tax regulations, which may differ from accounting principles generally accepted in the United States of America (“GAAP”). These differences are primarily due to differing book and tax treatments for in-kind transactions, losses deferred due to wash sales, and passive foreign investment company adjustments, if any.
The Funds file U.S. federal tax returns and tax returns in certain other jurisdictions. Generally, a Fund is subject to examinations by such taxing authorities for up to three years after the filing of the return for the tax period.
D. Investment Transactions and Investment Income
Investment transactions are accounted for on a trade date basis. Realized gains and losses from the sale or disposition of securities are computed on the specific identified cost basis. Interest income is recorded on the accrual basis from settlement date. Pay-in-kind interest income and non-cash dividend income received in the form of securities in-lieu of cash are recorded at the fair value of the securities received. Dividend income (net of withholding tax, if any) is recorded on the ex-dividend date. Dividend income from REITs is recorded based on the income included in the distributions received from the REIT investments using published REIT classifications, including some management estimates when actual amounts are not available. Distributions received in excess of this estimated amount are recorded as a reduction of the cost of investments or reclassified to capital gains. The actual amounts of income, return of capital, and capital gains are only determined by each REIT after its fiscal year-end, and may differ from the estimated amounts.
Realized gains, dividends and interest received by a Fund may give rise to withholding and other taxes imposed by foreign countries. Tax conventions between certain countries and the United States may reduce or eliminate such taxes.
The Funds may periodically participate in litigation related to each Fund’s investments. As such, the Funds may receive proceeds from litigation settlements. Any proceeds received are included in the Statements of Operations as realized gain (loss) for investments no longer held and as unrealized gain (loss) for investments still held.
Brokerage commissions and mark ups are considered transaction costs and are recorded as an increase to the cost basis of securities purchased and/or a reduction of proceeds on a sale of securities. Such transaction costs are included in the determination of net realized and unrealized gain (loss) from investment securities reported in the Statements of Operations and the Statements of Changes in Net Assets and the net realized and unrealized gains (losses) on securities per share in the Financial Highlights. Transaction costs are included in the calculation of each Fund’s NAV and, accordingly, they reduce each Fund’s total returns. These transaction costs are not considered operating expenses and are not reflected in net investment income reported in the Statements of Operations and the Statements of Changes in Net Assets, or the net investment income per share and the ratios of expenses and net investment income reported in the Financial Highlights, nor are they limited by any expense limitation arrangements between each Fund and the Adviser.
E. Country Determination
For the purposes of presentation in the Schedules of Investments, the Adviser may determine the country in which an issuer is located and/or credit risk exposure based on various factors. These factors include whether each Fund’s Underlying Index has made a country determination and may include the laws of the country under which the issuer is organized, where the issuer maintains a principal office, the country in which the issuer derives 50% or more of its total revenues and the country that has the primary market for the issuer’s securities, as well as other criteria. Among the other criteria that may be evaluated for making this determination are the country in which the issuer maintains 50% or more of its assets, the type of security, financial guarantees and enhancements, the nature of the collateral and the sponsor organization. Country of issuer and/or credit risk exposure has been determined to be the United States of America, unless otherwise noted.
F. Expenses
Expenses of the Trust directly identifiable to a specific Fund are applied to that Fund. Expenses of the Trust that are not readily identifiable to a specific Fund are allocated in such a manner as deemed equitable, taking into consideration the nature and type of expense and the relative net assets of each Fund.
S&P Global Water Index ETF is responsible for all of its expenses, including the investment advisory fees, cost of transfer agency, custody, fund administration, legal, audit and other services, interest, taxes, brokerage commissions and other expenses connected with executions of portfolio transactions, licensing fees related to its respective Underlying Index, any distribution fees or expenses, litigation expenses, fees payable to the Trust’s Board members and officers who are not “interested persons” (as defined in the 1940 Act) of the Trust (the “Independent Trustees”) expenses incurred in connection with the Board members’ services, including travel expenses and legal fees of counsel for the Independent Trustees, acquired fund fees and expenses, if any, and extraordinary expenses.
Each of China All-Cap ETF and China Technology ETF has agreed to pay an annual unitary management fee to the Adviser. Out of the unitary management fee, the Adviser has agreed to pay for substantially all expenses of the Funds, including the cost of transfer agency, custody, fund administration, legal, audit and other services, except for advisory fees, distribution fees, if any, brokerage expenses, taxes, interest, acquired fund fees and expenses, if any, litigation expenses and other extraordinary expenses.
To the extent a Fund invests in other investment companies, the expenses shown in the accompanying financial statements reflect the expenses of the Fund and do not include any expenses of the investment companies in which it invests. The effects of such investment companies’ expenses are included in the realized and unrealized gain or loss on the investments in the investment companies.
G. Dividends and Distributions to Shareholders
Each Fund declares and pays dividends from net investment income, if any, to its shareholders annually and records such dividends on ex-dividend date. Generally, each Fund distributes net realized taxable capital gains, if any, annually in cash and records them on ex-dividend date. Such distributions on a tax basis are determined in conformity with federal income tax regulations, which may differ from GAAP. Distributions in excess of tax basis earnings and profits, if any, are reported in such Fund’s financial statements as a tax return of capital at fiscal year-end.
H. Accounting Estimates
The preparation of the financial statements in accordance with GAAP requires management to make estimates and assumptions that affect the reported amounts and disclosures in the financial statements, including estimates and assumptions related to taxation. Actual results could differ from these estimates. In addition, the Funds monitor for material events or transactions that may occur or become known after the period-end date and before the date the financial statements are released to print.
I. Foreign Currency Translations
Foreign currency is valued at the close of the NYSE based on quotations posted by banks and major currency dealers. Portfolio securities and other assets and liabilities denominated in foreign currencies are translated into U.S. dollar amounts at date of valuation. Purchases and sales of portfolio securities (net of foreign taxes withheld on disposition) and income items denominated in foreign currencies are translated into U.S. dollar amounts on the respective dates of such transactions. The Funds do not separately account for the portion of the results of operations resulting from changes in foreign exchange rates on investments and the fluctuations arising from changes in market prices of securities held. The combined results of changes in foreign exchange rates and the fluctuation of market prices on investments (net of estimated foreign tax withholding) are included with the net realized and unrealized gain or loss from investments in the Statements of Operations. Reported net realized foreign currency gains or losses arise from (1) sales of foreign currencies, (2) currency gains or losses realized between the trade and settlement dates on securities transactions, and (3) the difference between the amounts of dividends, interest, and foreign withholding taxes recorded on each Fund’s books and the U.S. dollar equivalent of the amounts actually received or paid. Net unrealized foreign currency gains and losses arise from changes in the fair values of assets and liabilities, other than investments in securities at fiscal period-end, resulting from changes in exchange rates.
The Funds may invest in foreign securities, which may be subject to foreign taxes on income, gains on investments or currency repatriation, a portion of which may be recoverable. Foreign taxes, if any, are recorded based on the tax regulations and rates that exist in the foreign markets in which each Fund invests.
J. Securities Lending
During the period ended October 31, 2018, each Fund participated in securities lending. Each Fund loaned portfolio securities having a market value up to one-third of each Fund’s total assets. Such loans are secured by cash collateral equal to no less than 102% (105% for international securities) of the market value of the loaned securities determined daily by the securities lending provider. Cash collateral received in connection with these loans is generally invested in an affiliated money market fund and is shown as such on the Schedules of Investments. Each Fund bears the risk of loss with respect to the investment of collateral. It is the policy of these Funds to obtain additional collateral from or return excess collateral to the borrower by the end of the next business day, following the valuation date of the securities loaned. Therefore, the value of the collateral held may be temporarily less than the value of the securities on loan. When loaning securities, each Fund retains certain benefits of owning the securities, including the economic equivalent of dividends or interest generated by the security. Lending securities entails a risk of loss to each Fund if, and to the extent that, the market value of the securities loaned were to increase, and the borrower did not increase the collateral accordingly, and the borrower failed to return the securities. The securities loaned are subject to termination at the option of the borrower or each Fund. Upon termination, the borrower will return to each Fund the securities loaned and each Fund will return the collateral. Upon the failure of the borrower to return the securities, collateral may be liquidated and the securities may be purchased on the open market to replace the loaned securities. Each Fund could experience delays and costs in gaining access to the collateral and the securities may lose value during the delay which could result in potential losses to each Fund. Some of these losses may be indemnified by the lending agent. Each Fund bears the risk of any deficiency in the amount of the collateral available for return to the borrower due to any loss on the collateral invested. Dividends received on cash collateral investments for securities lending transactions, which are net of compensation to counterparties, are included in Securities lending income on the Statements of Operations. The aggregate value of securities out on loan, if any, is shown on the Statements of Assets and Liabilities.
K. Distributions from Distributable Earnings
In accordance with the Securities and Exchange Commission’s issuance of Disclosure Update and Simplification, the Fund has presented the total, rather than the components of distributions to shareholders, except for tax return of capital distributions, if any, in the Statements of Changes in Net Assets.
For the years ended August 31, 2018 and August 31, 2017, distributions from distributable earnings consisted of distributions from net investment income.
Note 3. Investment Advisory Agreement and Other Agreements
The Trust has entered into an Investment Advisory Agreement with the Adviser on behalf of the Fund listed below, pursuant to which the Adviser has overall responsibility for the selection and ongoing monitoring of the Fund’s investments, managing the Fund’s business affairs and providing certain clerical, bookkeeping and other administrative services. Pursuant to the Investment Advisory Agreement, the following Fund accrues daily and pays monthly to the Adviser an annual fee equal to a percentage of its average daily net assets as follows:
| | | | |
| | | Management Fees
(as a % of Net Assets) | |
| S&P Global Water Index ETF | | | 0.50 | % |
Pursuant to another Investment Advisory Agreement, each Fund listed below accrues daily and pays monthly to the Adviser an annual unitary management fee. Out of the unitary management fee, the Adviser has agreed to pay for substantially all expenses of the Funds, including the cost of transfer agency, custody, fund administration, legal, audit and other services, except for advisory fees, distribution
fees, if any, brokerage expenses, taxes, interest, acquired fund fees and expenses, if any, litigation expenses and other extraordinary expenses. The unitary management fee is paid by each Fund to the Adviser at the following annual rates:
| | | | |
| | | Unitary Management Fees
(as a % of Net Assets) | |
| China All-Cap ETF | | | 0.70 | % |
| China Technology ETF | | | 0.70 | % |
Prior to the Reorganization, the Predecessor Funds were managed by Guggenheim Funds Investment Advisors LLC (“GFIA”) and each Predecessor Fund paid GFIA an investment advisory fee calculated at the same annualized rates as disclosed above for each respective Fund.
During the period April 6, 2018 through the Reorganization, pursuant to an Interim Investment Advisory Agreement, GFIA did not receive any advisory fee from China Technology ETF.
Effective as of the Reorganization, the Adviser has agreed to waive fees and/or pay Fund expenses to the extent necessary to prevent the operating expenses of S&P Global Water Index ETF (excluding interest expenses, brokerage commissions and other trading expenses, sub-licensing fees, offering costs, taxes, acquired fund fees and expenses, if any, and extraordinary expenses) from exceeding the percentage of the Fund’s average daily net assets per year (the “Expense Cap”) shown in the table below through at least April 6, 2020 for S&P Global Water Index ETF. The Adviser also has agreed to waive a portion of its unitary management fee to prevent the expenses of the China All-Cap ETF and China Technology ETF (excluding interest expenses, brokerage commissions and other trading expenses, acquired fund fees and expenses, if any, taxes, and litigation expenses and other extraordinary expenses) from exceeding such Fund’s unitary management fee through at least April 6, 2020 for China All-Cap ETF, and May 18, 2020 for China Technology ETF. Neither the Adviser nor the Funds can discontinue the agreement prior to its expiration.
Prior to the Reorganization, GFIA limited expenses for the Predecessor Funds (except for S&P Global Water Index ETF) shown above in the table to the same expense caps, and for the S&P Global Water Index ETF’s Predecessor Fund to 0.65%.
Further, the Adviser agrees to reimburse S&P Global Water Index ETF in the amount equal to the licensing fees that the Fund pays that cause the Fund’s operating expenses (excluding interest expenses, offering costs, brokerage commissions and other trading expenses, taxes, acquired fund fees and expenses and extraordinary expenses) to exceed the following percentages:
| | | | | | | | |
Fund | | Limit | | | Contract End Date | |
| S&P Global Water Index ETF | | | 0.63 | % | | | 4/6/20 | |
Additionally, through August 31, 2020, the Adviser has contractually agreed to waive a portion of each Fund’s management fee in an amount equal to 100% of the net advisory fees an affiliate of the Adviser receives that are attributable to certain of the Fund’s investments in money market funds managed by that affiliate (excluding investments of cash collateral from securities lending). There is no guarantee that the Adviser will extend the waiver of these fees past that date.
For the period ended October 31, 2018, the Adviser waived fees for each Fund in the following amounts:
| | | | |
| China All-Cap ETF | | $ | 5 | * |
| China Technology ETF | | | 88 | * |
| S&P Global Water Index ETF | | | 157 | * |
| * | For the period September 1, 2018 to October 31, 2018 |
For the period September 1, 2017 to April 6, 2018 (or as otherwise indicated), GFIA waived fees and/or paid Fund expenses for each of the Predecessor Funds and for the period after the close of business on April 6, 2018 (or as otherwise indicated) to August 31, 2018 the Adviser waived Fund fees the following amounts:
| | | | | | | | |
| | | Period after the close
of business
April 6, 2018 to
August 31, 2018 | | | Period
September 1, 2017
to April 6, 2018 | |
| China All-Cap ETF | | $ | 4 | | | $ | — | |
| China Technology ETF | | | 150 | * | | | — | ** |
| S&P Global Water Index ETF | | | 224 | | | | 2,362 | |
| * | For the period after the close of business May 18, 2018 to August 31, 2018 |
| ** | For the period September 1, 2017 to May 18, 2018 |
The fees waived and/or expenses borne by the Adviser for S&P Global Water Index ETF are subject to recapture by the Adviser up to three years from the date the fees were waived or the expense were incurred, but no recapture payment will be made by the Funds if it would result in the Funds exceeding (i) the Expense Cap or (ii) the expense cap in effect at the time the fees and/or expenses subject to recapture were waived and/or borne by the Adviser. Amounts waived by GFIA prior to the Reorganization are not subject to recapture.
For the period ended October 31, 2018, there were no amounts available for potential recapture by the Adviser under the Expense Agreement for S&P Global Water Index ETF.
The Trust has entered into a Distribution Agreement with Invesco Distributors, Inc. (the “Distributor”), which serves as the distributor of Creation Units for each Fund. The Distributor does not maintain a secondary market in the Shares. The Funds are not charged any fees pursuant to the Distribution Agreement. The Distributor is an affiliate of the Adviser. Prior to the Reorganization, the Board of Trustees for each Predecessor Fund adopted a distribution and service plan pursuant to Rule 12b-1 under the 1940 Act. No 12b-1 fees were paid by the Predecessor Funds under this plan.
The Adviser has entered into a licensing agreement for each Fund with the following entities (each, a “Licensor”):
| | |
Fund | | Licensor |
| China All-Cap ETF | | AlphaShares |
| China Technology ETF | | AlphaShares |
| S&P Global Water Index ETF | | S&P Dow Jones Indices LLC |
Each Underlying Index name trademark is owned by its respective Licensor. These trademarks have been licensed to the Adviser for use by the Funds. Each Fund is entitled to use its Underlying Index pursuant to the Trust’s sub-licensing agreement with the Adviser. Prior to the Reorganization, each Underlying Index name trademark had been licensed to GFIA for use by the corresponding Predecessor Fund. The Funds are not sponsored, endorsed, sold or promoted by the Licensors, and the Licensors make no representation regarding the advisability of investing in any of the Funds.
The Trust has entered into service agreements whereby The Bank of New York Mellon, a wholly-owned subsidiary of The Bank of New York Mellon Corporation, serves as the administrator, custodian, fund accountant and transfer agent for each Fund. Prior to the Reorganization, GFIA engaged external service providers to perform these services for the Predecessor Funds.
Note 4. Additional Valuation Information
GAAP defines fair value as the price that would be received to sell an asset or paid to transfer a liability in an orderly transaction between market participants at the measurement date, under current market conditions. GAAP establishes a hierarchy that prioritizes the inputs to valuation methods, giving the highest priority to readily available unadjusted quoted prices in an active market for identical assets (Level 1) and the lowest priority to significant unobservable inputs (Level 3), generally when market prices are not readily available or are unreliable. Based on the valuation inputs, the securities or other investments are tiered into one of three levels. Changes in valuation methods may result in transfers in or out of an investment’s assigned level:
| | Level 1 — | Prices are determined using quoted prices in an active market for identical assets. |
| | Level 2 — | Prices are determined using other significant observable inputs. Observable inputs are inputs that other market participants may use in pricing a security. These may include quoted prices for similar securities, interest rates, prepayment speeds, credit risk, yield curves, loss severities, default rates, discount rates, volatilities and others. |
| | Level 3 — | Prices are determined using significant unobservable inputs. In situations where quoted prices or observable inputs are unavailable (for example, when there is little or no market activity for an investment at the end of the period), unobservable inputs may be used. Unobservable inputs reflect a Fund’s own assumptions about the factors market participants would use in determining fair value of the securities or instruments and would be based on the best available information. |
Except for the Funds listed below, as of October 31, 2018, all of the securities in each Fund were valued based on Level 1 inputs (see the Schedules of Investments for security categories). The level assigned to the securities valuations may not be an indication of the risk or liquidity associated with investing in those securities. Because of the inherent uncertainties of valuation, the values reflected in the financial statements may materially differ from the value received upon actual sale of those investments.
Each Fund’s policy is to recognize transfers in and out of the valuation levels as of the end of the reporting period. During the fiscal year ended October 31, 2018, there were no material transfers in and out of Level 3.
| | | | | | | | | | | | | | | | |
| | | Level 1 | | | Level 2 | | | Level 3 | | | Total | |
| China All-Cap ETF | | | | | | | | | | | | | | | | |
| Investments in Securities | | | | | | | | | | | | | | | | |
Common Stocks & Other Equity Interests | | $ | 20,224,354 | | | $ | 55,893 | | | $ | 0 | | | $ | 20,280,247 | |
Money Market Funds | | | 151,462 | | | | — | | | | — | | | | 151,462 | |
| | | | | | | | | | | | | | | | |
Total Investments | | $ | 20,375,816 | | | $ | 55,893 | | | $ | 0 | | | $ | 20,431,709 | |
| | | | | | | | | | | | | | | | |
| China Technology ETF | | | | | | | | | | | | | | | | |
| Investments in Securities | | | | | | | | | | | | | | | | |
Common Stocks & Other Equity Interests | | $ | 404,853,633 | | | $ | — | | | $ | 0 | | | $ | 404,853,633 | |
Money Market Funds | | | 20,856,156 | | | | — | | | | — | | | | 20,856,156 | |
| | | | | | | | | | | | | | | | |
Total Investments | | $ | 425,709,789 | | | $ | — | | | $ | 0 | | | $ | 425,709,789 | |
| | | | | | | | | | | | | | | | |
Note 5. Distributions to Shareholders and Tax Components of Net Assets
Tax Character of Distributions to Shareholder Paid during the Period September 1, 2018 to October 31, 2018, Fiscal Year ended August 31, 2018 and Fiscal Year ended August 31, 2017:
| | | | | | | | | | | | |
| | | October 31,
2018 | | | August 31,
2018 | | | August 31,
2017 | |
| | | Ordinary
Income | | | Ordinary
Income | | | Ordinary
Income | |
| China All-Cap ETF | | $ | — | | | $ | 500,080 | | | $ | 433,200 | |
| China Technology ETF | | | — | | | | 5,489,280 | | | | 773,890 | |
| S&P Global Water Index ETF | | | — | | | | 10,492,264 | | | | 7,164,324 | |
Tax Components of Net Assets at Fiscal Year-End:
| | | | | | | | | | | | | | | | | | | | | | | | |
| | | Undistributed
Ordinary
Income | | | Net
Unrealized
Appreciation
(Depreciation)—
Investment
Securities | | | Net
Unrealized
Appreciation
(Depreciation)—
Other
Investments | | | Capital Loss
Carryforwards | | | Shares of
Beneficial
Interest | | | Total Net
Assets | |
| China All-Cap ETF | | $ | 403,224 | | | $ | (722,892 | ) | | $ | 2 | | | $ | (8,937,622 | ) | | $ | 29,538,989 | | | $ | 20,281,701 | |
| China Technology ETF | | | — | | | | (149,317,853 | ) | | | (97 | ) | | | (21,822,593 | ) | | | 576,681,660 | | | | 405,541,117 | |
| S&P Global Water Index ETF | | | 9,386,628 | | | | 51,292,720 | | | | (41,138 | ) | | | (22,352,776 | ) | | | 493,012,775 | | | | 531,298,209 | |
Capital loss carryforwards are calculated and reported as of a specific date. Results of transactions and other activity after that date may affect the amount of capital loss carryforwards actually available for the Funds to utilize. Capital losses generated in years beginning after December 22, 2010 can be carried forward for an unlimited period, whereas previous losses expire in eight tax years. Capital losses with an expiration period may not be used to offset capital gains until all net capital losses without an expiration date have been utilized. Capital loss carryforwards with no expiration date will retain their character as either short-term or long-term capital losses instead of as short-term capital losses as under prior law. The ability to utilize capital loss carryforwards in the future may be limited under the Internal Revenue Code and related regulations based on the results of future transactions.
The Funds had capital loss carryforwards as of October 31, 2018, which expire as follows:
| | | | | | | | | | | | | | | | |
| | | | | | Post-effective/
no expiration | | | | |
| | | 2019 | | | Short-Term | | | Long-Term | | | Total* | |
| China All-Cap ETF | | $ | — | | | $ | 1,237,897 | | | $ | 7,699,725 | | | $ | 8,937,622 | |
| China Technology ETF | | | — | | | | 10,736,447 | | | | 11,086,146 | | | | 21,822,593 | |
| S&P Global Water Index ETF | | | — | | | | 2,164,644 | | | | 20,188,132 | | | | 22,352,776 | |
| * | Capital loss carryforwards as of the date listed above are reduced for limitations, if any, to the extent required by the Internal Revenue Code and may be further limited depending upon a variety of factors, including the realization of net unrealized gains or losses as of the date of any reorganization. |
Note 6. Investment Transactions
For the period ended October 31, 2018, the cost of securities purchased and proceeds from sales of securities (other than short-term securities, U.S. Treasury obligations, money market funds and in-kind transactions, if any) were as follows:
| | | | | | | | |
| | | Purchases | | | Sales | |
| China All-Cap ETF | | $ | 603,575 | | | $ | 495,425 | |
| China Technology ETF | | | 17,065,242 | | | | 17,522,545 | |
| S&P Global Water Index ETF | | | 29,469,563 | | | | 27,236,835 | |
For the period ended October 31, 2018, in-kind transactions associated with creations and redemptions were as follows:
| | | | | | | | |
| | | Cost of
Securities
Received | | | Value of
Securities
Delivered | |
| China All-Cap ETF | | $ | — | | | $ | — | |
| China Technology ETF | | | 94,838,306 | | | | — | |
| S&P Global Water Index ETF | | | 14,960,971 | | | | 27,847,768 | |
Gains (losses) on in-kind transactions are generally not considered taxable gains (losses) for federal income tax purposes.
At October 31, 2018, the aggregate cost of investments, including any derivatives, on a tax basis includes adjustments for financial reporting purposes as of the most recently completed federal income tax reporting period-end:
| | | | | | | | | | | | | | | | |
| | | Gross
Unrealized
Appreciation | | | Gross
Unrealized
(Depreciation) | | | Net
Unrealized
Appreciation
(Depreciation) | | | Cost | |
| China All-Cap ETF | | $ | 3,798,670 | | | $ | (4,521,562 | ) | | $ | (722,892 | ) | | $ | 21,154,601 | |
| China Technology ETF | | | 6,633,695 | | | | (155,951,548 | ) | | | (149,317,853 | ) | | | 575,027,642 | |
| S&P Global Water Index ETF | | | 86,554,197 | | | | (35,261,477 | ) | | | 51,292,720 | | | | 479,641,536 | |
Note 7. Reclassification of Permanent Differences
Primarily as a result of differing book/tax treatment of in-kind transactions and expired capital loss carryforwards, amounts were reclassified between undistributed net investment income, undistributed net realized gain (loss) and Shares of beneficial interest. These reclassifications had no effect on the net asset of each Fund. For the period ended October 31, 2018, the reclassifications were as follows:
| | | | | | | | | | | | |
| | | Undistributed
Net Investment
Income | | | Undistributed
Net Realized
Gain (Loss) | | | Shares of
Beneficial
Interest | |
| China All-Cap ETF | | $ | (208 | ) | | $ | 853,257 | | | $ | (853,049 | ) |
| China Technology ETF | | | 608,805 | | | | 200,964 | | | | (809,769 | ) |
| S&P Global Water Index ETF | | | (12,929 | ) | | | 5,563,415 | | | | (5,550,486 | ) |
Note 8. Trustees’ and Officer’s Fees
Trustees’ and Officer’s Fees include amounts accrued by the Funds to pay remuneration to each Independent Trustee and an Officer of the Trust. The Adviser, as a result of each Fund’s unitary management fee, pays for such compensation for each Fund except S&P Global Water Index ETF. The Trustee who is an “interested person” of the Trust does not receive any Trustees’ fees.
The Trust has adopted a deferred compensation plan (the “Plan”). Under the Plan, each Independent Trustee who has executed a Deferred Fee Agreement (a “Participating Trustee”) may defer receipt of all or a portion of his compensation (“Deferral Fees”). Such Deferral Fees are deemed to be invested in select Invesco Funds. The Deferral Fees payable to the Participating Trustee are valued as of the date such Deferral Fees would have been paid to the Participating Trustee. The value increases with contributions or with increases in the value of the Shares selected, and the value decreases with distributions or with declines in the value of the Shares selected. Obligations under the Plan represent unsecured claims against the general assets of the Funds.
Note 9. Capital
Shares are created and redeemed by the Funds only in Creation Units of 50,000 Shares for China Technology ETF, 80,000 Shares for S&P Global Water Index ETF and 100,000 Shares for China All-Cap ETF. Only Authorized Participants are permitted to purchase or redeem Creation Units from the Funds. Such transactions are principally permitted in exchange for Deposit Securities, with a balancing cash component to equate the transaction to the NAV per Share of a Fund of the Trust on the transaction date. However, for all Funds,
cash in an amount equivalent to the value of certain securities may be substituted, generally when the securities are not available in sufficient quantity for delivery, not eligible for trading by the Authorized Participant or as a result of other market circumstances.
To the extent that the Funds permit transactions in exchange for Deposit Securities, each Fund may issue Shares in advance of receipt of Deposit Securities subject to various conditions, including a requirement to maintain on deposit with the Trust cash at least equal to 105% of the market value of the missing Deposit Securities. In accordance with the Trust’s Participant Agreement, Creation Units will be issued to an Authorized Participant, notwithstanding the fact that the corresponding Deposit Securities have not been received in part or in whole, in reliance on the undertaking of the Authorized Participant to deliver the missing Deposit Securities as soon as possible, which undertaking shall be secured by the Authorized Participant’s delivery and maintenance of collateral consisting of cash in the form of U.S. dollars in immediately available funds having a value (marked-to-market daily) at least equal to 105%, which the Adviser may change from time to time, of the value of the missing Deposit Securities.
Certain transaction fees may be charged by the Funds for creations and redemptions, which are treated as increases in capital.
Transactions in each Fund’s Shares are disclosed in detail in the Statements of Changes in Net Assets.
Note 10. Indemnifications
Under the Trust’s organizational documents, its Officers and Trustees are indemnified against certain liabilities arising out of the performance of their duties to the Trust. Each Independent Trustee is also indemnified against certain liabilities arising out of the performance of his duties to the Trust pursuant to an Indemnification Agreement between such trustee and the Trust. Additionally, in the normal course of business, the Trust enters into contracts with service providers that contain general indemnification clauses. The Trust’s maximum exposure under these arrangements is unknown, as this would involve future claims that may be made against the Trust that have not yet occurred. However, based on experience, the Trust believes the risk of loss to be remote.
Note 11. Subsequent Event
At a meeting held on December 13, 2018, the Board of Trustees of the Trust approved the termination and winding down of China All-Cap ETF, with the liquidation payment to shareholders expected to take place on or about February 27, 2019. Investors, who have elected not to sell their shares before market close on February 20, 2019 will receive cash equal to the amount of the net asset value of their shares, which will include any capital gains and dividends, on or about February 27, 2019.
Report of Independent Registered Public Accounting Firm
To the Board of Trustees of Invesco Exchange-Traded Fund Trust II and Shareholders of Invesco China All-Cap ETF, Invesco China Technology ETF and Invesco S&P Global Water Index ETF
Opinions on the Financial Statements
We have audited the accompanying statements of assets and liabilities, including the schedules of investments, of Invesco China All-Cap ETF, Invesco China Technology ETF, and Invesco S&P Global Water Index ETF (three of the funds constituting Invesco Exchange-Traded Fund Trust II, hereafter collectively referred to as the “Funds”) as of October 31, 2018, the related statements of operations and changes in net assets, including the related notes, and the financial highlights for the period September 1, 2018 through October 31, 2018 and for year ended August 31, 2018 (collectively referred to as the “financial statements”). In our opinion, the financial statements present fairly, in all material respects, the financial position of each of the Funds as of October 31, 2018, the results of each of their operations, the changes in each of their net assets, and each of the financial highlights for the period September 1, 2018 through October 31, 2018 and for the year ended August 31, 2018 in conformity with accounting principles generally accepted in the United States of America.
The financial statements of Invesco China All-Cap ETF (Predecessor Fund Guggenheim China All-Cap ETF), Invesco China Technology ETF (Predecessor Fund Guggenheim China Technology ETF) and Invesco S&P Global Water Index ETF (Predecessor Fund Guggenheim S&P Global Water Index ETF) as of and for the year ended August 31, 2017 and the financial highlights for each of the periods ended on or prior to August 31, 2017 (not presented herein, other than the statements of changes in net assets and the financial highlights) were audited by other auditors whose report dated October 30, 2017 expressed an unqualified opinion on those financial statements and financial highlights.
Basis for Opinions
These financial statements are the responsibility of the Funds’ management. Our responsibility is to express an opinion on the Funds’ financial statements based on our audits. We are a public accounting firm registered with the Public Company Accounting Oversight Board (United States) (“PCAOB”) and are required to be independent with respect to the Funds in accordance with the U.S. federal securities laws and the applicable rules and regulations of the Securities and Exchange Commission and the PCAOB.
We conducted our audits of these financial statements in accordance with the standards of the PCAOB. Those standards require that we plan and perform the audit to obtain reasonable assurance about whether the financial statements are free of material misstatement, whether due to error or fraud.
Our audits included performing procedures to assess the risks of material misstatement of the financial statements, whether due to error or fraud, and performing procedures that respond to those risks. Such procedures included examining, on a test basis, evidence regarding the amounts and disclosures in the financial statements. Our audits also included evaluating the accounting principles used and significant estimates made by management, as well as evaluating the overall presentation of the financial statements. Our procedures included confirmation of securities owned as of October 31, 2018 by correspondence with the custodian, transfer agent, and brokers; when replies were not received from brokers, we performed other auditing procedures. We believe that our audits provide a reasonable basis for our opinions.
Subsequent Event
As discussed in Note 11 to the financial statements, the Board of Trustees approved a plan of liquidation for the Invesco China All-Cap ETF on December 13, 2018.
PricewaterhouseCoopers LLP
Chicago, Illinois
December 26, 2018
We have served as the auditor of one or more of the investment companies in the Invesco group of investment companies since at least 1995. We have not been able to determine the specific year we began serving as auditor.
Fees and Expenses
As a shareholder of a Fund of the Invesco Exchange-Traded Fund Trust II (excluding Invesco S&P Global Water Index ETF), you incur a unitary management fee. In addition to the unitary management fee, a shareholder may pay distribution fees, if any, brokerage expenses, taxes, interest, acquired fund fees and expenses, if any, litigation expenses and other extraordinary expenses. As a shareholder of Invesco S&P Global Water Index ETF, you incur advisory fees and other Fund expenses. The expense examples below are intended to help you understand your ongoing costs (in dollars) of investing in the Funds and to compare these costs with the ongoing costs of investing in other funds.
The example is based on an investment of $1,000 invested at the beginning of the period and held through the six-month period ended October 31, 2018.
Actual Expenses
The first line in the following table provides information about actual account values and actual expenses. You may use the information in this line, together with the amount you invested, to estimate the expenses that you paid over the period. Simply divide your account value by $1,000 (for example, an $8,600 account value divided by $1,000 = 8.6), then multiply the result by the number in the first line under the heading “Expenses Paid During the Six-Month Period” to estimate the expenses you paid on your account during this period.
Hypothetical Example for Comparison Purposes
The second line in the following table provides information about hypothetical account values and hypothetical expenses based on each Fund’s actual expense ratio and an assumed annualized rate of return of 5% per year before expenses, which is not the Fund’s actual return. The hypothetical account values and expenses may not be used to estimate the actual ending account balance or expenses you paid for the period. You may use this information to compare the ongoing costs of investing in the Funds and other funds. To do so, compare this 5% hypothetical example with the 5% hypothetical examples that appear in the shareholder reports of the other funds.
Please note that the expenses shown in the table are meant to highlight your ongoing costs only, and do not reflect any transactional costs such as sales charges and brokerage commissions. Therefore the second line in the table is useful in comparing ongoing costs only, and will not help you determine the relative total costs of owning different funds. In addition, expenses shown in the table do not include the expenses of the underlying funds, which are borne indirectly by a Fund. If transaction costs and indirect expenses were included, your costs would have been higher.
| | | | | | | | | | | | | | | | |
| | | Beginning
Account Value
May 1, 2018 | | | Ending
Account Value
October 31, 2018 | | | Annualized
Expense Ratio
Based on the
Six-Month Period | | | Expenses Paid
During the
Six-Month Period(1) | |
| Invesco China All-Cap ETF (YAO) | | | | | | | | | | | | | | | | |
Actual | | $ | 1,000.00 | | | $ | 802.90 | | | | 0.70 | % | | $ | 3.18 | |
Hypothetical (5% return before expenses) | | | 1,000.00 | | | | 1,021.68 | | | | 0.70 | | | | 3.57 | |
| Invesco China Technology ETF (CQQQ) | | | | | | | | | | | | | | | | |
Actual | | | 1,000.00 | | | | 701.19 | | | | 0.65 | | | | 2.79 | |
Hypothetical (5% return before expenses) | | | 1,000.00 | | | | 1,021.93 | | | | 0.65 | | | | 3.31 | |
| Invesco S&P Global Water Index ETF (CGW) | | | | | | | | | | | | | | | | |
Actual | | | 1,000.00 | | | | 948.37 | | | | 0.62 | | | | 3.04 | |
Hypothetical (5% return before expenses) | | | 1,000.00 | | | | 1,022.08 | | | | 0.62 | | | | 3.16 | |
| (1) | Expenses are calculated using the annualized expense ratio, which represents the ongoing expenses as a percentage of net assets for the six-month period ended October 31, 2018. Expenses are calculated by multiplying the Fund’s annualized expense ratio by the average account value for the period, then multiplying the result by 184/365. Expense ratios for the most recent six-month period may differ from expense ratios based on the annualized data in the Financial Highlights. |
Tax Information
Form 1099-DIV, Form 1042-S and other year-end tax information provide shareholders with actual calendar year amounts that should be included in their tax returns. Shareholders should consult their tax advisers.
The following distribution information is being provided as required by the Internal Revenue Code or to meet a specific state’s requirement.
Each Fund designates the following amounts or, if subsequently determined to be different, the maximum amount allowable for its fiscal year ended October 31, 2018:
| | | | | | | | | | |
| | | Qualified Dividend
Income* | | Dividends-Received
Deduction* |
| Invesco China All-Cap ETF | | | | 0 | % | | | | 0 | % |
| Invesco China Technology ETF | | | | 0 | % | | | | 0 | % |
| Invesco S&P Global Water Index ETF | | | | 0 | % | | | | 0 | % |
| * | The above percentages are based on ordinary income dividends paid to shareholders during the fiscal year. |
The Funds intend to elect to pass through to shareholders the credit for taxes paid to foreign countries. The gross foreign source income and foreign taxes paid are as follows:
| | | | | | | | | | |
| | | Gross Foreign
Income | | Foreign Taxes
Paid |
| Invesco China All-Cap ETF | | | $ | 70,977 | | | | $ | 4,027 | |
| Invesco China Technology ETF | | | | — | | | | | — | |
| Invesco S&P Global Water Index ETF | | | | 1,278,223 | | | | | 58,833 | |
Trustees and Officers
The Independent Trustees of the Trust, their term of office and length of time served, their principal business occupations during at least the past five years, the number of portfolios in the Fund Complex (as defined below) overseen by each Independent Trustee and the other directorships, if any, held by each Independent Trustee are shown below.
As of October 31, 2018
| | | | | | | | | | |
Name, Address and Year of Birth of Independent Trustees | | Position(s)
Held
with Trust | | Term of
Office and
Length of
Time
Served* | | Principal
Occupation(s) During
Past 5 Years | | Number of
Portfolios in
Fund
Complex**
Overseen by
Independent
Trustees | | Other
Directorships
Held by
Independent
Trustees During
the Past 5 Years |
Ronn R. Bagge—1958
c/o Invesco Capital Management LLC
3500 Lacey Road, Suite 700 Downers Grove, IL 60515 | | Chairman of the Nominating and Governance Committee and Trustee | | Chairman of the Nominating and Governance Committee and Trustee since 2007 | | Founder and Principal, YQA Capital Management LLC (1998-Present); formerly Owner/CEO of Electronic Dynamic Balancing Co., Inc. (high-speed rotating equipment service provider). | | 234 | | Trustee and Investment Oversight Committee member, Mission Aviation Fellowship (2017–Present) |
| | | | | |
Todd J. Barre—1957
c/o Invesco Capital Management LLC
3500 Lacey Road, Suite 700 Downers Grove, IL 60515 | | Trustee | | Since 2010 | | Assistant Professor of Business, Trinity Christian College (2010-2016); formerly, Vice President and Senior Investment Strategist (2001-2008), Director of Open Architecture and Trading (2007-2008), Head of Fundamental Research (2004-2007) and Vice President and Senior Fixed Income Strategist (1994-2001), BMO Financial Group/Harris Private Bank. | | 234 | | None |
| | | | | |
Marc M. Kole—1960
c/o Invesco Capital Management LLC
3500 Lacey Road, Suite 700 Downers Grove, IL 60515 | | Chairman of the Audit Committee and Trustee | | Chairman of the Audit Committee since 2008; Trustee since 2007 | | Senior Director of Finance, By The Hand Club for Kids (2015-Present); formerly, Chief Financial Officer, Hope Network (social services) (2008-2012); Assistant Vice President and Controller, Priority Health (health insurance) (2005-2008); Senior Vice President of Finance, United Healthcare (2004-2005); Chief Accounting Officer, Senior Vice President of Finance, Oxford Health Plans (2000-2004); Audit Partner, Arthur Andersen LLP (1996-2000). | | 234 | | None |
| | | | | |
Yung Bong Lim—1964
c/o Invesco Capital Management LLC
3500 Lacey Road, Suite 700 Downers Grove, IL 60515 | | Chairman of the Investment Oversight Committee and Trustee | | Chairman of the Investment Oversight Committee since 2014; Trustee since 2013 | | Managing Partner, RDG Funds LLC (2008-Present); formerly, Managing Director, Citadel LLC (1999-2007). | | 234 | | None |
| * | This is the date the Independent Trustee began serving the Trust. Each Independent Trustee serves an indefinite term, until his successor is elected. |
| ** | Fund Complex includes all open- and closed-end funds (including all of their portfolios) advised by the Adviser and any affiliated person of the Adviser. |
Trustees and Officers (continued)
| | | | | | | | | | |
Name, Address and Year of Birth of Independent Trustees | | Position(s)
Held
with Trust | | Term of
Office and
Length of
Time
Served* | | Principal
Occupation(s) During
Past 5 Years | | Number of
Portfolios in
Fund
Complex**
Overseen by
Independent
Trustees | | Other
Directorships
Held by
Independent
Trustees During
the Past 5 Years |
Gary R. Wicker—1961
c/o Invesco Capital Management LLC
3500 Lacey Road, Suite 700 Downers Grove, IL 60515 | | Trustee | | Since 2013 | | Senior Vice President of Global Finance and Chief Financial Officer at RBC Ministries (publishing company) (2013-Present); formerly, Executive Vice President and Chief Financial Officer, Zondervan Publishing (a division of Harper Collins/NewsCorp) (2007-2012); Senior Vice President and Group Controller (2005-2006), Senior Vice President and Chief Financial Officer (2003-2004), Chief Financial Officer (2001-2003), Vice President, Finance and Controller (1999-2001) and Assistant Controller (1997-1999), divisions of The Thomson Corporation (information services provider). | | 234 | | None |
| | | | | |
Donald H. Wilson—1959
c/o Invesco Capital Management LLC
3500 Lacey Road, Suite 700 Downers Grove, IL 60515 | | Chairman of the Board and Trustee | | Chairman since 2012; Trustee since 2007 | | Chairman, President and Chief Executive Officer, McHenry Bancorp Inc. and McHenry Savings Bank (subsidiary) (2018-Present); Chairman and Chief Executive Officer, Stone Pillar Advisors, Ltd. (2010-Present); President and Chief Executive Officer, Stone Pillar Investments, Ltd. (2016-Present); formerly, Chairman, President and Chief Executive Officer, Community Financial Shares, Inc. and Community Bank—Wheaton/Glen Ellyn (subsidiary) (2013-2015); Chief Operating Officer, AMCORE Financial, Inc. (bank holding company) (2007-2009); Executive Vice President and Chief Financial Officer, AMCORE Financial, Inc. (2006-2007); Senior Vice President and Treasurer, Marshall & Ilsley Corp. (bank holding company) (1995-2006). | | 234 | | None |
| * | This is the date the Independent Trustee began serving the Trust. Each Independent Trustee serves an indefinite term, until his successor is elected. |
| ** | Fund Complex includes all open- and closed-end funds (including all of their portfolios) advised by the Adviser and any affiliated person of the Adviser. |
Trustees and Officers (continued)
The Interested Trustee and the executive officers of the Trust, their term of office and length of time served, their principal business occupations during at least the past five years, the number of portfolios in the Fund Complex (as defined below) overseen by the Interested Trustee and the other directorships, if any, held by the Interested Trustee are shown below.
| | | | | | | | | | |
Name, Address and Year of
Birth of Interested Trustee | | Position(s)
Held
with Trust | | Term of
Office
and
Length of
Time
Served* | | Principal Occupation(s)
During Past 5 Years | | Number of
Portfolios in
Fund
Complex**
Overseen by
Interested
Trustee | | Other
Directorships
Held by
Interested
Trustee During the Past 5 Years |
Kevin M. Carome—1956 Invesco Ltd.
Two Peachtree Pointe,
1555 Peachtree St., N.E., Suite 1800
Atlanta, GA 30309 | | Trustee | | Since 2010 | | Senior Managing Director, Secretary and General Counsel, Invesco Ltd. (2007-Present); Director, Invesco Advisers, Inc. (2009-Present); Director (2006-Present) and Executive Vice President (2008 – Present), Invesco Group Services, Inc., Invesco Holding Company (US), Inc. and Invesco North American Holdings, Inc.; Director, Invesco Holding Company Limited (2007-Present); Executive Vice President (2008 – Present), Invesco Investments (Bermuda) Ltd.; Manager, Horizon Flight Works LLC, Director and Executive Vice President, Invesco Finance, Inc. and Director, Invesco Finance PLC (2011- Present); Director and Secretary (2012 – Present), Invesco Services (Bahamas) Private Limited; and Director and Executive Vice President (2014 – Present), INVESCO Asset Management (Bermuda) Ltd.; formerly, Director and Chairman, INVESCO Funds Group, Inc., Senior Vice President, Secretary and General Counsel, Invesco Advisers, Inc. (2003-2006); Director, Invesco Investments (Bermuda) Ltd. (2008-2016); Senior Vice President and General Counsel, Liberty Financial Companies, Inc. (2000-2001); General Counsel of certain investment management subsidiaries of Liberty Financial Companies, Inc. (1998-2000); Associate General Counsel, Liberty Financial Companies, Inc. (1993-1998); Associate, Ropes & Gray LLP. | | 234 | | None |
| * | This is the date the Interested Trustee began serving the Trust. The Interested Trustee serves an indefinite term, until his successor is elected. |
| ** | Fund Complex includes all open- and closed-end funds (including all of their portfolios) advised by the Adviser and any affiliated person of the Adviser. |
Trustees and Officers (Continued)
| | | | | | |
Name, Address and Year of
Birth of Executive Officers | | Position(s)
Held
with Trust | | Length of
Time
Served* | | Principal Occupation(s) During Past 5 Years |
Daniel E. Draper—1968 Invesco Capital
Management LLC 3500 Lacey Road, Suite 700 Downers Grove, IL
60515 | | President and Principal Executive Officer | | Since 2015 | | President and Principal Executive Officer, Invesco Exchange-Traded Fund Trust, Invesco Exchange-Traded Fund Trust II, Invesco India Exchange-Traded Fund Trust, Invesco Actively Managed Exchange-Traded Fund Trust and Invesco Actively Managed Exchange-Traded Commodity Fund Trust (2015-Present) and Invesco Exchange-Traded Self-Indexed Fund Trust (2016-Present); Chief Executive Officer and Principal Executive Officer (2016-Present) and Managing Director (2013-Present), Invesco Capital Management LLC; Senior Vice President, Invesco Distributors, Inc. (2014-Present); formerly, Vice President, Invesco Exchange-Traded Fund Trust, Invesco Exchange-Traded Fund Trust II, Invesco India Exchange-Traded Fund Trust, Invesco Actively Managed Exchange-Traded Fund Trust (2013-2015) and Invesco Actively Managed Exchange-Traded Commodity Fund Trust (2014-2015); Managing Director, Credit Suisse Asset Management (2010-2013) and Lyxor Asset Management/Societe Generale (2007-2010). |
| | | |
Kelli Gallegos—1970 Invesco Capital Management LLC 3500 Lacey Road, Suite 700 Downers Grove, IL
60515 | | Vice President
and Treasurer | | Since 2018 | | Vice President and Treasurer, Invesco Exchange-Traded Fund Trust, Invesco Exchange-Traded Fund Trust II, Invesco India Exchange-Traded Fund Trust, Invesco Actively Managed Exchange-Traded Fund Trust, Invesco Actively Managed Exchange-Traded Commodity Fund Trust and Invesco Exchange-Traded Self-Indexed Fund Trust (2018-Present); Principal Financial and Accounting Officer-Pooled Investments, Invesco Capital Management LLC (2018-Present); Vice President, Principal Financial Officer (2016-Present) and Assistant Treasurer (2008-Present), The Invesco Funds; formerly, Assistant Treasurer Invesco Exchange-Traded Fund Trust, Invesco Exchange-Traded Fund Trust II, Invesco India Exchange-Traded Fund Trust and Invesco Actively Managed Exchange-Traded Fund Trust (2012-2018), Invesco Actively Managed Exchange-Traded Commodity Fund Trust (2014-2018) and Invesco Exchange-Traded Self-Indexed Fund Trust (2016-2018); Assistant Treasurer, Invesco Capital Management LLC (2013-2018); and Assistant Vice President, The Invesco Funds (2008-2016). |
| | | |
Peter Hubbard—1981 Invesco Capital Management LLC 3500 Lacey Road, Suite 700 Downers Grove, IL
60515 | | Vice
President | | Since
2009 | | Vice President, Invesco Exchange-Traded Fund Trust, Invesco Exchange-Traded Fund Trust II, Invesco India Exchange-Traded Fund Trust, Invesco Actively Managed Exchange-Traded Fund Trust (2009-Present), Invesco Actively Managed Exchange-Traded Commodity Fund Trust (2014-Present) and Invesco Exchange-Traded Self-Indexed Fund Trust (2016-Present); Vice President and Director of Portfolio Management, Invesco Capital Management LLC (2010-Present); formerly, Vice President of Portfolio Management, Invesco Capital Management LLC (2008-2010); Portfolio Manager, Invesco Capital Management LLC (2007-2008); Research Analyst, Invesco Capital Management LLC (2005-2007); Research Analyst and Trader, Ritchie Capital, a hedge fund operator (2003-2005). |
| | | |
Sheri Morris—1964 Invesco Capital Management LLC 3500 Lacey Road, Suite 700 Downers Grove, IL
60515 | | Vice President | | Since 2012 | | President and Principal Executive Officer, The Invesco Funds (2016-Present); Treasurer, The Invesco Funds (2008-Present); Vice President, Invesco Advisers, Inc. (formerly known as Invesco Institutional (N.A.), Inc.) (registered investment adviser) (2009-Present) and Vice President, Invesco Exchange-Traded Fund Trust, Invesco Exchange-Traded Fund Trust II, Invesco India Exchange-Traded Fund Trust, Invesco Actively Managed Exchange-Traded Fund Trust (2012-Present), Invesco Actively Managed Exchange-Traded Commodity Fund Trust (2014-Present) and Invesco Exchange-Traded Self-Indexed Fund Trust (2016-Present); formerly, Vice President and Principal Financial Officer, The Invesco Funds (2008-2016); Treasurer, Invesco Exchange-Traded Fund Trust, Invesco Exchange-Traded Fund Trust II, Invesco India Exchange-Traded Fund Trust and Invesco Actively Managed Exchange-Traded Fund Trust (2011-2013); Vice President, Invesco Aim Advisers, Inc., Invesco Aim Capital Management, Inc. and Invesco Aim Private Asset Management, Inc.; Assistant Vice President and Assistant Treasurer, The Invesco Funds and Assistant Vice President, Invesco Advisers, Inc., Invesco Aim Capital Management, Inc. and Invesco Aim Private Asset Management, Inc. |
| * | This is the date each Officer began serving the Trust. Each Officer serves an indefinite term, until his or her successor is elected. |
Trustees and Officers (Continued)
| | | | | | |
Name, Address and Year of
Birth of Executive Officers | | Position(s)
Held
with Trust | | Length of
Time
Served* | | Principal Occupation(s) During Past 5 Years |
Anna Paglia—1974 Invesco Capital Management LLC 3500 Lacey Road, Suite 700 Downers Grove, IL
60515 | | Secretary | | Since 2011 | | Secretary, Invesco Exchange-Traded Fund Trust, Invesco Exchange-Traded Fund Trust II, Invesco India Exchange-Traded Fund Trust, Invesco Actively Managed Exchange-Traded Fund Trust (2011-Present), Invesco Actively Managed Exchange-Traded Commodity Fund Trust (2014-Present) and Invesco Exchange-Traded Self-Indexed Fund Trust (2015-Present); Head of Legal (2010-Present) and Secretary (2015-Present), Invesco Capital Management LLC; Manager and Assistant Secretary, Invesco Indexing LLC (2017-Present); formerly, Partner, K&L Gates LLP (formerly, Bell Boyd & Lloyd LLP) (2007-2010); Associate Counsel at Barclays Global Investors Ltd. (2004-2006). |
| | | |
Rudolf E. Reitmann—1971 Invesco Capital Management LLC 3500 Lacey Road, Suite 700 Downers Grove, IL
60515 | | Vice President | | Since 2013 | | Vice President, Invesco Exchange-Traded Fund Trust, Invesco Exchange-Traded Fund Trust II, Invesco India Exchange-Traded Fund Trust, Invesco Actively Managed Exchange-Traded Fund Trust (2013-Present), Invesco Actively Managed Exchange-Traded Commodity Fund Trust (2014-Present) and Invesco Exchange-Traded Self-Indexed Fund Trust (2016-Present); Head of Global Exchange Traded Funds Services, Invesco Capital Management LLC (2013-Present); Vice President, Invesco Capital Markets, Inc. (2018-Present). |
| | | |
David Warren—1957 Invesco Canada Ltd. 5140 Yonge Street, Suite 800 Toronto, Ontario M2N 6X7 | | Vice President | | Since 2009 | | Vice President, Invesco Exchange-Traded Fund Trust, Invesco Exchange-Traded Fund Trust II, Invesco India Exchange-Traded Fund Trust, and Invesco Actively Managed Exchange-Traded Fund Trust (2009-Present), Invesco Actively Managed Exchange-Traded Commodity Fund Trust (2014-Present) and Invesco Exchange-Traded Self-Indexed Fund Trust (2016-Present); Managing Director—Chief Administrative Officer, Americas, Invesco Capital Management LLC; Senior Vice President, Invesco Advisers, Inc. (2009-Present); Director, Invesco Inc. (2009-Present); Director, Executive Vice President and Chief Financial Officer, Invesco Canada Ltd. (formerly, Invesco Trimark Ltd.) (2011-Present); Chief Administrative Officer, North American Retail, Invesco Ltd. (2007-Present); Director, Invesco Corporate Class Inc. (2014-Present); Director, Invesco Global Direct Real Estate Feeder GP Ltd. (2015-Present); Director, Invesco Canada Holdings Inc. (2002-Present); Director, Invesco Financial Services Ltd. / Services Financiers Invesco Ltée and Trimark Investments Ltd./Placements Trimark Ltée (2014-Present); Director, Invesco IP Holdings (Canada) Ltd. (2016-Present); Director, Invesco Global Direct Real Estate GP Ltd. (2015-Present); formerly, Senior Vice President, Invesco Management Group, Inc. (2007-2018); Executive Vice President and Chief Financial Officer, Invesco Inc. (2009-2015); Director, Executive Vice President and Chief Financial Officer, Invesco Canada Ltd. (formerly, Invesco Trimark Ltd.) (2000-2011). |
| | | |
Melanie Zimdars—1976 Invesco Capital Management LLC 3500 Lacey Road, Suite 700 Downers Grove, IL
60515 | | Chief Compliance
Officer | | Since 2017 | | Chief Compliance Officer of Invesco Capital Management LLC (2017-Present); Chief Compliance Officer of Invesco Exchange-Traded Fund Trust, Invesco Exchange-Traded Fund Trust II, Invesco India Exchange-Traded Fund Trust, Invesco Actively Managed Exchange-Traded Fund Trust, Invesco Actively Managed Exchange-Traded Commodity Fund Trust and Invesco Exchange-Traded Self-Indexed Fund Trust (2017-Present); formerly, Vice President and Deputy Chief Compliance Officer at ALPS Holding, Inc. (2009-2017); Mutual Fund Treasurer/Chief Financial Officer at Wasatch Advisors, Inc. (2005-2008); Compliance Officer, U.S. Bancorp Fund Services, LLC (2001-2005). |
Availability of Additional Information About the Trustees
The Statement of Additional Information includes additional information about the Trustees and is available, without charge, upon request at (800) 983-0903.
| * | This is the date each Officer began serving the Trust. Each Officer serves an indefinite term, until his or her successor is elected. |
Proxy Voting Policies and Procedures
A description of the Trust’s proxy voting policies and procedures that the Funds use to determine how to vote proxies relating to portfolio securities is available, without charge and upon request, by calling (800) 983-0903. This information is also available on the Securities and Exchange Commission’s (the “Commission”) website at www.sec.gov.
Information regarding how each Fund voted proxies for portfolio securities, if applicable, during the most recent 12-month period ended June 30, is available, without charge and upon request, by (i) calling (800) 983-0903; or (ii) accessing the Trust’s Form N-PX on the Commission’s website at www.sec.gov.
Quarterly Portfolios
The Trust files its complete schedule of portfolio holdings for the Funds with the Commission for the first and third quarters of each fiscal year on Form N-Q (or any successor Form). The Form N-Qs (or any successor Form) will be available on the Commission’s website at www.sec.gov.
Frequency Distribution of Discounts and Premiums
A table showing the number of days the market price of each Fund’s shares was greater than the Fund’s net asset value, and the number of days it was less than the Fund’s net asset value (i.e., premium or discount) for the most recently completed calendar year, and the calendar quarters since that year end (or the life of the Fund, if shorter) may be found at the Fund’s website at www.invesco.com/ETFs.
| | | | |
©2018 Invesco Capital Management LLC 3500 Lacey Road, Suite 700 Downers Grove, IL 60515 | | P-TRST2-AR-3 | | invesco.com/ETFs |
Item 2. Code of Ethics.
The Registrant has adopted a Code of Ethics that applies to the Registrant’s principal executive officer and principal financial officer. This Code is filed as an exhibit to this report on Form N-CSR under Item 12(a)(1). No substantive amendments to this Code were made during the reporting period. There were no waivers for the fiscal year ended October 31, 2018.
Item 3. Audit Committee Financial Expert.
The Registrant’s Board of Trustees (the “Board”) has determined that the Registrant has three “audit committee financial experts” serving on its audit committee: Mr. Marc M. Kole, Mr. Gary R. Wicker, and Mr. Donald H. Wilson. Each of these audit committee members is “independent,” meaning that he is not an “interested person” of the Registrant (as that term is defined in Section 2(a)(19) of the Investment Company Act of 1940, as amended) and he does not accept any consulting, advisory, or other compensatory fee from the Registrant (except in his capacity as a Board or committee member).
An “audit committee financial expert” is not an “expert” for any purpose, including for purposes of Section 11 of the Securities Act of 1933, as a result of being designated as an “audit committee financial expert.” Further, the designation of a person as an “audit committee financial expert” does not mean that a person has any greater duties, obligations, or liability than those imposed on a person without the “audit committee financial expert” designation. Similarly, the designation of a person as an “audit committee financial expert” does not affect the duties, obligations, or liability of any other member of the audit committee or Board of Trustees.
Item 4. Principal Accountant Fees and Services.
(a) to (d)
Fees Billed by PwC to the Registrant
PricewaterhouseCoopers LLP (“PwC”), the Registrant’s independent registered public accounting firm, billed the Registrant aggregate fees for services rendered to the Registrant for the last two fiscal years as shown in the following table. The Audit Committee pre-approved all audit and non-audit services provided to the Registrant.
| | | | |
| | | Fees Billed by PwC for Services
Rendered to the Registrant for
Fiscal Year End 2018 | | Fees Billed by PwC for Services
Rendered to the Registrant for Fiscal
Year End 2017 |
| | |
Audit Fees | | $ 564,150 | | $ 1,352,977 |
Audit-Related Fees | | $ 0 | | $ 0 |
Tax Fees(1) | | $ 218,790 | | $ 609,290 |
All Other Fees | | $ 0 | | $ 0 |
Total Fees | | $ 782,940 | | $ 1,962,267 |
(1) Tax fees for the fiscal year ended October 31, 2018 include fees billed for reviewing tax returns, 2018 excise tax returns and excise tax distributions calculations. Tax fees for the fiscal year ended October 31, 2017 included fees billed for reviewing tax returns, 2017 excise tax returns and excise tax distribution calculations, 2016 State Source Income Analysis and filing tax dissolution forms for the Registrant’s four upcoming liquidations.
Fees Billed by PwC Related to Invesco and Invesco Affiliates
|
| PwC billed Invesco Capital Management LLC (“Invesco” or “Adviser”), the Registrant’s adviser, and any entity controlling, controlled by or under common control with Invesco that provides ongoing services to the Registrant (“Affiliates”), aggregate fees for pre-approved non-audit services rendered to Invesco and Affiliates for the last two fiscal years as shown in the following table. The Audit Committee pre-approved all non-audit services provided to Invesco and Affiliates that were required to be pre-approved. |
| | | | |
| | | Fees Billed for Non-
Audit Services
Rendered to
Invesco and
Affiliates for Fiscal
Year End 2018 That
Were Required to be Pre-Approved by the Registrant’s Audit Committee | | Fees Billed for Non-
Audit Services
Rendered to
Invesco and
Affiliates for Fiscal
Year End 2017 That
Were Required to be Pre-Approved by the Registrant’s Audit Committee |
| | |
Audit-Related Fees(1) | | $ 662,000 | | $ 662,000 |
Tax Fees | | $ 0 | | $ 0 |
All Other Fees(2) | | $ 0 | | $ 689,000 |
Total Fees | | $ 662,000 | | $ 1,351,000 |
(1) Audit-Related Fees for the fiscal year end 2018 include fees billed related to reviewing controls at a service organization. Audit-Related Fees for the fiscal year end 2017 include fees billed related to reviewing controls at a service organization
(2) All Other Fees for the fiscal year end 2017 include fees billed related to the assessments of the company’s current state of analysis against regulatory requirements and identification of structural and organizational alternatives, informed by industry practices, for certain of the company’s administrative activities and functions
(e)(1) Audit Committee Pre Approval Policies and Procedures
Pre-Approval of Audit and Non-Audit Services Policies and Procedures
As Adopted by the Audit Committee of the Invesco ETFs
| | |
| Applicable to | | Invesco Exchange-Traded Fund Trust, Invesco Exchange-Traded Fund Trust II, Invesco India Exchange-Traded Fund Trust, Invesco Actively Managed Exchange-Traded Fund Trust, Invesco Actively Managed Exchange-Traded Commodity Fund Trust and Invesco Exchange-Traded Self-Indexed Fund Trust (collectively the “Funds”) |
Risk Addressed by Policy | | Approval of Audit and Non-Audit Services |
Relevant Law and Other Sources | | Sarbanes-Oxley Act of 2002; Regulation S-X. |
Last Reviewed by Compliance for Accuracy | | June 15, 2018 |
Approved/Adopted Date | | June 2009 |
Statement of Principles
Under the Sarbanes-Oxley Act of 2002 and rules adopted by the Securities and Exchange Commission (“SEC”) (“Rules”), the Audit Committee of the Funds’ (the “Audit Committee”) Board of Trustees (the “Board”) is responsible for the appointment, compensation and oversight of the work of independent accountants (an “Auditor”). As part of this responsibility and to assure that the Auditor’s independence is not impaired, the Audit Committee pre-approves the audit and non-audit services provided to the Funds by each Auditor, as well as all non-audit services provided by the Auditor to the Funds’ investment adviser and to affiliates of the adviser that provide ongoing services to the Funds (“Service Affiliates”) if the services directly impact the Funds’ operations or financial reporting. The SEC Rules also specify the types of services that an Auditor may not provide to its audit client. The following policies and procedures comply with the requirements for pre-approval and provide a mechanism by which management of the Funds may request and secure pre-approval of audit and non-audit services in an orderly manner with minimal disruption to normal business operations.
Proposed services either may be pre-approved without consideration of specific case-by-case services by the Audit Committee (“general pre-approval”) or require the specific pre-approval of the Audit Committee (“specific pre-approval”). As set forth in these policies and procedures, unless a type of service has received general pre-approval, it will require specific pre-approval by the Audit Committee. Additionally, any fees exceeding 110% of estimated pre-approved fee levels provided at the time the service was pre-approved will also require specific approval by the Audit Committee before payment
is made. The Audit Committee will also consider the impact of additional fees on the Auditor’s independence when determining whether to approve any additional fees for previously pre-approved services.
The Audit Committee will annually review and generally pre-approve the services that may be provided by each Auditor without obtaining specific pre-approval from the Audit Committee. The term of any general pre-approval runs from the date of such pre-approval through June 30th of the following year, unless the Audit Committee considers a different period and states otherwise. The Audit Committee will add to or subtract from the list of general pre-approved services from time to time, based on subsequent determinations.
The purpose of these policies and procedures is to set forth the guidelines to assist the Audit Committee in fulfilling its responsibilities.
Delegation
The Chairman of the Audit Committee (or, in his or her absence, any member of the Audit Committee) may grant specific pre-approval for non-prohibited services. All such delegated pre-approvals shall be presented to the Audit Committee no later than the next Audit Committee meeting.
Audit Services
The annual Audit services engagement terms will be subject to specific pre-approval of the Audit Committee. Audit services include the annual financial statement audit and other procedures such as tax provision work that is required to be performed by the independent auditor to be able to form an opinion on the Funds’ financial statements. The Audit Committee will obtain, review and consider sufficient information concerning the proposed Auditor to make a reasonable evaluation of the Auditor’s qualifications and independence.
In addition to the annual Audit services engagement, the Audit Committee may grant either general or specific pre-approval of other Audit services, which are those services that only the independent auditor reasonably can provide. Other Audit services may include services such as issuing consents for the inclusion of audited financial statements with SEC registration statements, periodic reports and other documents filed with the SEC or other documents issued in connection with securities offerings.
Non-Audit Services
The Audit Committee may provide either general or specific pre-approval of any non-audit services to the Funds and its Service Affiliates if the Audit Committee believes that the provision of the service will not impair the independence of the Auditor, is consistent with the SEC’s Rules on auditor independence, and otherwise conforms to the Audit Committee’s general principles and policies as set forth herein.
Audit-Related Services
“Audit-related services” are assurance and related services that are reasonably related to the performance of the audit or review of the Funds’ financial statements or that are traditionally performed by the independent auditor. Audit-related services include, among others, accounting consultations related to accounting, financial reporting or disclosure matters not classified as “Audit services”; and assistance with understanding and implementing new accounting and financial reporting guidance from rulemaking authorities.
Tax Services
“Tax services” include, but are not limited to, the review and signing of the Funds’ federal tax returns, the review of required distributions by the Funds and consultations regarding tax matters such as the tax treatment of new investments or the impact of new regulations. The Audit Committee will scrutinize carefully the retention of the Auditor in connection with a transaction initially recommended by the Auditor, the major business purpose of which may be tax avoidance or the tax treatment of which may not be supported in the Internal Revenue Code and related regulations. The Audit Committee will consult with the Funds’ Treasurer (or his or her designee) and may consult with outside counsel or advisors as necessary to ensure the consistency of Tax services rendered by the Auditor with the foregoing policy.
No Auditor shall represent any Fund or any Service Affiliate before a tax court, district court or federal court of claims.
Under rules adopted by the Public Company Accounting Oversight Board and approved by the SEC, in connection with seeking Audit Committee pre-approval of permissible Tax services, the Auditor shall:
| | 1. | Describe in writing to the Audit Committee, which writing may be in the form of the proposed engagement letter: |
| | a. | The scope of the service, the fee structure for the engagement, and any side letter or amendment to the engagement letter, or any other agreement between the Auditor and the Fund, relating to the service; and |
| | b. | Any compensation arrangement or other agreement, such as a referral agreement, a referral fee or fee-sharing arrangement, between the Auditor and any person (other than the Fund) with respect to the promoting, marketing, or recommending of a transaction covered by the service; |
| | 2. | Discuss with the Audit Committee the potential effects of the services on the independence of the Auditor; and |
| | 3. | Document the substance of its discussion with the Audit Committee. |
All Other Auditor Services
The Audit Committee may pre-approve non-audit services classified as “All other services” that are not categorically prohibited by the SEC, as listed in Exhibit 1 to this policy.
Pre-Approval Fee Levels or Established Amounts
Pre-approval of estimated fees or established amounts for services to be provided by the Auditor under general or specific pre-approval policies will be set periodically by the Audit Committee. Any proposed fees exceeding 110% of the maximum estimated pre-approved fees or established amounts for pre-approved audit and non-audit services will be reported to the Audit Committee at the quarterly Audit Committee meeting and will require specific approval by the Audit Committee before payment is made. The Audit Committee will always factor in the overall relationship of fees for audit and non-audit services in determining whether to pre-approve any such services and in determining whether to approve any additional fees exceeding 110% of the maximum pre-approved fees or established amounts for previously pre-approved services.
Procedures
On an annual basis, the Auditor will submit to the Audit Committee for general pre-approval, a list of non-audit services that the Funds or Service Affiliates of the Funds may request from the Auditor. The list will describe the non-audit services in reasonable detail and will include an estimated range of fees and such other information as the Audit Committee may request.
Each request for services to be provided by the Auditor under the general pre-approval of the Audit Committee will be submitted to the Funds’ Treasurer (or his or her designee) and must include a detailed description of the services to be rendered. The Treasurer or his or her designee will ensure that such services are included within the list of services that have received the general pre-approval of the Audit Committee.
Each request to provide services that require specific approval by the Audit Committee shall be submitted to the Audit Committee jointly by the Funds’ Treasurer or his or her designee and the Auditor, and must include a joint statement that, in their view, such request is consistent with the pre-approval policies and procedures and the SEC Rules.
Each request to provide Tax services under either the general or specific pre-approval of the Audit Committee will describe in writing: (i) the scope of the service, the fee structure for the engagement, and any side letter or amendment to the engagement letter, or any other agreement between the Auditor and the audit client, relating to the service; and (ii) any compensation arrangement or other agreement between the Auditor and any person (other than the audit client) with respect to the promoting, marketing, or recommending of a transaction covered by the service. The Auditor will discuss with the Audit Committee the potential effects of the services on the Auditor’s independence and will document the substance of the discussion.
Non-audit services pursuant to the de minimis exception provided by the SEC Rules will be promptly brought to the attention of the Audit Committee for approval, including documentation that each of the conditions for this exception, as set forth in the SEC Rules, has been satisfied.
On at least an annual basis, the Auditor will prepare a summary of all the services provided to any entity in the investment company complex as defined in section 2-01(f)(14) of Regulation S-X in sufficient detail as to the nature of the engagement and the fees associated with those services.
The Audit Committee has designated the Funds’ Treasurer to monitor the performance of all services provided by the Auditor and to ensure such services are in compliance with these policies and procedures. The Funds’ Treasurer will report to the Audit Committee on a periodic basis as to the results of such monitoring. Both the Funds’ Treasurer and management will immediately report to the Chairman of the Audit Committee any breach of these policies and procedures that comes to the attention of the Funds’ Treasurer or senior management.
Adopted: June 26, 2009
Amended: June 15, 2018
Exhibit 1 to Pre-Approval of Audit and Non-Audit Services Policies and Procedures
Conditionally Prohibited Non-Audit Services (not prohibited if the Fund can reasonably conclude that the results of the service would not be subject to audit procedures in connection with the audit of the Fund’s financial statements)
| | • | | Bookkeeping or other services related to the accounting records or financial statements of the audit client |
| | • | | Financial information systems design and implementation |
| | • | | Appraisal or valuation services, fairness opinions, or contribution-in-kind reports |
| | • | | Internal audit outsourcing services |
Categorically Prohibited Non-Audit Services
| | • | | Broker-dealer, investment adviser, or investment banking services |
| | • | | Expert services unrelated to the audit |
| | • | | Any service or product provided for a contingent fee or a commission |
| | • | | Services related to marketing, planning, or opining in favor of the tax treatment of confidential transactions or |
| | aggressive tax position transactions, a significant purpose of which is tax avoidance |
| | • | | Tax services for persons in financial reporting oversight roles at the Fund |
| | • | | Any other service that the Public Company Oversight Board determines by regulation is impermissible. |
| | (e)(2) | There were no amounts that were pre-approved by the Audit Committee pursuant to the de minimus exception under Rule 2-01 of Regulation S-X. |
| (g) | In addition to the amounts shown in the tables above, PwC billed Invesco and Affiliates additional aggregate fees of $2,977,000 for the fiscal year ended October 31, 2018 and $3,068,000 for the fiscal year ended October 31, 2017 for non-audit services not required to be pre-approved by the Registrant’s Audit Committee. In total, PwC billed the Registrant, Invesco and Affiliates aggregate non-audit fees of $3,858,000 for the fiscal year ended 2018, and $5,028,000 for the fiscal year ended 2017. |
| | (h) | With respect to the non-audit services above billed to Invesco and Affiliates that were not required to be pre-approved by the Registrant’s Audit Committee, the Audit Committee received information from PwC about such services, including by way of comparison, that PwC provided audit services to entities within the Investment Company Complex, as defined by Rule 2-01(f)(14) of Regulation S-X, of approximately $25 million and non-audit services of approximately $18 million for the fiscal year ended 2018. The Audit Committee considered this information in evaluating PwC’s independence. |
PwC informed the Audit Committee of the Board (the “Audit Committee”) that it has identified an issue related to its independence under Rule 2-01(c)(1)(ii)(A) of Regulation S-X (referred to as the “Loan Rule”). The Loan Rule prohibits accounting firms, such as PwC, from being deemed independent if they have certain financial relationships with their audit clients or certain affiliates of those clients. The Registrant is required under various securities laws to have its financial statements audited by an independent accounting firm.
The Loan Rule specifically provides that an accounting firm would not be independent if it receives a loan from a lender that is a record or beneficial owner of more than ten percent of an audit client’s equity securities. For purposes of the Loan Rule, audit clients include the Registrant as well as all registered investment companies advised by the Adviser and its affiliates, including other subsidiaries of the Adviser’s parent company, Invesco Ltd. (collectively, the “Invesco Fund Complex”). PwC informed the Audit Committee it has relationships with lenders who hold, as record owner, more than ten percent of the shares of certain funds within the Invesco Fund Complex. These relationships call into question PwC’s independence under the Loan Rule with respect to those funds, as well as all other funds in the Invesco Fund Complex.
On June 20, 2016, the SEC Staff issued a “no-action” letter to another mutual fund complex (see Fidelity Management & Research Company et al., No-Action Letter) related to the audit independence issue described above. In that letter, the SEC confirmed that it would not recommend enforcement action against a fund that relied on audit services performed by an audit firm that was not in compliance with the Loan Rule in certain specified circumstances. On May 2, 2018, the SEC proposed amendments to the Loan Rule that, if adopted as proposed, would address many of the issues that led to the issuance of the no-action letter.
In an August 18, 2016 letter, and in subsequent communications, PwC affirmed to the Audit Committee that, as of the date of the letter and the subsequent communications, respectively, PwC is an independent accountant with respect to the Registrant within the meaning of PCAOB Rule 3520. In its letter and in its subsequent communications , PwC also informed the Audit Committee that, after evaluating the facts and circumstances and the applicable independence rules, PwC has concluded that with regard to its compliance with the independence criteria set forth in the rules and regulations of the SEC related to the Loan Rule, it believes that it remains objective and impartial despite matters that may ultimately be determined to be inconsistent with these criteria and therefore it can continue to serve as the Registrant’s registered public accounting firm. PwC has advised the Audit Committee that this conclusion is based in part on the following considerations: (1) the lenders to PwC have no influence over any fund, or other entity within the Invesco Fund Complex, or its investment adviser; (2) none of the officers or trustees of the Invesco Fund Complex whose shares are owned by PwC lenders are associated with those lenders; (3) PwC understands that the shares held by PwC lenders are held for the benefit of and on behalf of its policy owners/end investors; (4) investments in funds such as the Invesco Fund Complex funds are passive; (5) the PwC lenders are part of various syndicates of unrelated lenders; (6) there have been no changes to the loans in question since the origination of each respective note; (7) the debts are in good standing and no lender has the right to take action against PwC, as borrower, in connection with the financings; (8) the debt balances with each lender are immaterial to PwC and to each lender; and (9) the PwC audit engagement team has no involvement in PwC’s treasury function and PwC’s treasury function has no oversight of or ability to influence the PwC audit engagement team. In addition, PwC has communicated that the lending relationships appear to be consistent with the lending relationships described in the no-action letter and that they are not aware of other relationships that would be implicated by the Loan Rule. In addition to relying on PwC’s August 18, 2016 letter and subsequent communications regarding its independence, the Registrant intends to rely upon the no-action letter.
If in the future the independence of PwC is called into question under the Loan Rule by circumstances that are not addressed in the SEC’s no-action letter, the Registant may need to take other action in order for the Registrant’s filings with the SEC containing financial statements to be deemed compliant with applicable securities laws. Such additional actions could result in additional costs, impair the ability of the Registrant to issue new shares or have other material adverse effects on the Registrant. The SEC no-action relief was initially set to expire 18 months from issuance, but has been extended by the SEC without an expiration date, except that the no-action letter will be withdrawn upon the effectiveness of any amendments to the Loan Rule designed to address the concerns expressed in the letter.
PwC advised the Registrant’s Audit Committee that PwC had identified two matters for consideration under the SEC’s auditor independence rules. PwC stated that a PwC manager and a PwC Senior Manager each held financial interests in investment companies within the Invesco Fund complex that were inconsistent with the requirements of Rule 2-01(c)(1) of Regulation S-X.
PwC advised the Audit Committee that it believes its objectivity and impartiality had not been adversely affected by these matters as they related to the audit of the Registrant. In reaching this conclusion, PwC noted, among other things, that during the time of its audit, the engagement team was not aware of the investments, neither individual was in the chain of command of the audit or the audit partners of Invesco or the Registrant, the services each individual provided were not relied upon by the audit engagement team with respect to the audit of the Registrant and the investments were not material to the net worth of either individual or their immediate family members.
Item 5. Audit Committee of Listed Registrants.
| | (a) | The Registrant has a separately designated Audit Committee established in accordance with Section 3(a)(58)(A) of the Securities Exchange Act of 1934, as amended, which consists solely of independent trustees. The Audit Committee members are Marc M. Kole, Gary R. Wicker, and Donald H. Wilson. |
Item 6. Schedule of Investments.
| (a) | The Schedules of Investments are included as a part of the report to shareholders filed under Item 1 of this Form N-CSR. |
Item 7. Disclosure of Proxy Voting Policies and Procedures for Closed-End Management Investment Companies.
Not applicable.
Item 8. Portfolio Managers of Closed-End Management Investment Companies.
Not applicable.
| Item 9. | Purchases of Equity Securities by Closed-End Management Investment Company and Affiliated Purchasers. |
Not applicable.
Item 10. Submission of Matters to a Vote of Security Holders.
There have been no material changes to the procedures by which shareholders may recommend nominees to the Board that would require disclosure herein.
Item 11. Controls and Procedures.
| | (a) | Based on their evaluation of the Registrant’s disclosure controls and procedures (as defined in Rule 30a-3(c) under the Investment Company Act of 1940) as of a date within 90 days of the filing date of this report, the Registrant’s President (principal executive officer) and Treasurer (principal financial officer) have concluded that such disclosure controls and procedures are effective. |
| | (b) | There were no changes in the Registrant’s internal control over financial reporting (as defined in Rule 30a-3(d) under the 1940 Act (17 CFR 270.30a-3(d))) that occurred during the Registrant’s last fiscal quarter that has materially affected, or is reasonably likely to materially affect, the Registrant’s internal control over financial reporting. |
| Item 12. | Disclosure of Securities Lending Activities for Closed-End Management Investment Companies. |
Not applicable.
Item 13. Exhibits.
| | (a)(1) | Code of Ethics is attached as Exhibit 99.CODEETH. |
| | (a)(2) | Certifications of the Registrant’s President and Treasurer pursuant to Rule 30a-2(a) under the Investment Company Act of 1940 and Section 302 of the Sarbanes-Oxley Act of 2002 are attached as Exhibit 99.CERT. |
| | (b) | Certifications of the Registrant’s President and Treasurer pursuant to Rule 30a-2(b) under the Investment Company Act of 1940 and Section 906 of the Sarbanes-Oxley Act of 2002 are attached as Exhibit 99.906CERT |
SIGNATURES
Pursuant to the requirements of the Securities Exchange Act of 1934 and the Investment Company Act of 1940, the Registrant has duly caused this report to be signed on its behalf by the undersigned, thereunto duly authorized.
(Registrant) Invesco Exchange-Traded Fund Trust II
| | |
| |
| Name: | | Daniel E. Draper |
| Title: | | President |
| |
| Date: | | 12/27/2018 |
Pursuant to the requirements of the Securities Exchange Act of 1934 and the Investment Company Act of 1940, this report has been signed below by the following persons on behalf of the Registrant and in the capacities and on the dates indicated.
| | |
| |
| Name: | | Daniel E. Draper |
| Title: | | President |
| |
| Date: | | 12/27/2018 |
| | |
| |
| Name: | | Kelli Gallegos |
| Title: | | Treasurer |
| |
| Date: | | 12/27/2018 |