UNITED STATES
SECURITIES AND EXCHANGE COMMISSION
Washington, D.C. 20549
FORMN-CSR
CERTIFIED SHAREHOLDER REPORT OF REGISTERED
MANAGEMENT INVESTMENT COMPANIES
Investment Company Act file number811-21977
Invesco Exchange-Traded Fund Trust II
(Exact name of registrant as specified in charter)
3500 Lacey Road
Downers Grove, IL 60515
(Address of principal executive offices) (Zip code)
Daniel E. Draper
President
3500 Lacey Road
Downers Grove, IL 60515
(Name and address of agent for service)
Registrant’s telephone number, including area code:800-983-0903
Date of fiscal year end: June 30
Date of reporting period: June 30, 2019
FormN-CSR is to be used by management investment companies to file reports with the Commission not later than 10 days after the transmission to stockholders of any report that is required to be transmitted to stockholders under Rule30e-1 under the Investment Company Act of 1940 (17 CFR270.30e-1). The Commission may use the information provided on FormN-CSR in its regulatory, disclosure review, inspection, and policymaking roles.
A registrant is required to disclose the information specified by FormN-CSR, and the Commission will make this information public. A registrant is not required to respond to the collection of information contained in FormN-CSR unless the Form displays a currently valid Office of Management and Budget (“OMB”) control number. Please direct comments concerning the accuracy of the information collection burden estimate and any suggestions for reducing the burden to Secretary, Securities and Exchange Commission, 450 Fifth Street, NW, Washington, DC 20549-0609. The OMB has reviewed this collection of information under the clearance requirements of 44 U.S.C. § 3507.
Item 1. Reports to Stockholders.
The Registrant’s annual report transmitted to shareholders pursuant to Rule30e-1 under the Investment Company Act of 1940 is as follows:

Invesco Annual Report to Shareholders
June 30, 2019
| | |
| |
| OMOM | | Invesco Russell 1000® Momentum Factor ETF |
| |
| OVLU | | Invesco Russell 1000® Value Factor ETF |
| |
| OVOL | | Invesco Russell 1000® Low Volatility Factor ETF |
| |
| OSIZ | | Invesco Russell 1000® Size Factor ETF |
| |
| OQAL | | Invesco Russell 1000® Quality Factor ETF |
| |
| OYLD | | Invesco Russell 1000® Yield Factor ETF |
Beginning on January 1, 2021, as permitted by regulations adopted by the Securities and Exchange Commission, paper copies of the Funds’ shareholder reports will no longer be sent by mail, unless you specifically request paper copies of the reports from your financial intermediary, such as a broker-dealer or bank. Instead, the reports will be made available on a website, and you will be notified by mail each time a report is posted and provided with a website link to access the report.
If you already elected to receive shareholder reports electronically, you will not be affected by this change and you need not take any action. If you hold accounts through a financial intermediary, you may contact your financial intermediary to enroll in electronic delivery. Please note that not all financial intermediaries may offer this service.
You may elect to receive all future reports in paper free of charge. If you hold accounts through a financial intermediary, you can follow the instructions included with this disclosure, if applicable, or contact your financial intermediary to request that you continue to receive paper copies of your shareholder reports. Please note that not all financial intermediaries may offer this service. Your election to receive reports in paper will apply to all funds held with your financial intermediary.
Table of Contents
The Market Environment
Domestic Equity
Though the S&P 500 Index posted a modest gain of 4.30% for the second quarter, the US stock market experienced increased volatility. After four consecutive months of rising prices, stocks sold off in May, with the S&P 500 Index falling 6.58%. Bond yields and oil prices also fell as investors weighed the impact of the ongoing US/China trade war and the potential for new tariffs on Mexican imports. Additionally, data showed slowing in the US and global economies. Equity markets recovered in June as the S&P 500 Index returned 7.05%, its best June performance since 1955. The Federal Reserve left interest rates unchanged at its June Federal Open Market Committee meeting, but signaled a less restrictive stance, leading some investors to anticipate a future rate cut. US large andmid-cap stocks outperformedsmall-cap stocks and growth outperformed value for the quarter.
Important Update
On October 18, 2018, Massachusetts Mutual Life Insurance Company, an indirect corporate parent of OppenheimerFunds, Inc. and its subsidiaries OFI Global Asset Management, Inc., OFI SteelPath, Inc. and OFI Advisors, LLC, announced that it had entered into an agreement whereby Invesco Ltd., a global investment management company would acquire OppenheimerFunds and its subsidiaries (together “OppenheimerFunds”). After the close of business on May 24, 2019 Invesco Ltd. completed the acquisition of OppenheimerFunds. These Funds were included in that acquisition and as of that date, became part of the Invesco family of funds.
| | |
| OMOM | | Manager’s Analysis |
| | Invesco Russell 1000® Momentum Factor ETF (OMOM) |
As an index fund, the Invesco Russell 1000® Momentum Factor ETF (the “Fund”) seeks to track the investment results (before fees and expenses) of the Russell 1000® Momentum Factor Index (the “Index”). The Fund generally will invest at least 90% of its total assets in the securities that comprise the Index.
Strictly in accordance with its guidelines and mandated procedures, Frank Russell Company (“Frank Russell” or the “Index Provider”) compiles, maintains, and calculates the Index, which is constructed using a rules-based methodology that selects a subset of the equity securities from the Russell 1000 Index (the “Parent Index” or “Benchmark Index”), which is comprised of the 1,000 largest-capitalization companies in the United States. A company’s momentum factor score is based on historical total return over the 11 months ending on the last business day of the prior month. An initial weight for each security is determined from the product of the security’s factor score and its weight in the Parent Index. These weights are adjusted to ensure that each constituent and the Index as a whole satisfy certain constraints with respect to industry exposure, maximum security and minimum security weights, as compared to the Parent Index. Securities in the Parent Index are excluded from the Index if their relevant factor characteristics fall below an algorithmically determined threshold, or if their adjusted weights fall below a certain de minimis amount. The Fund generally invests in all of the securities comprising the Index in proportion to their weightings in the Index.
For the fiscal year ended June 30, 2019, on a market price basis, the Fund returned 7.85%. On a net asset value (“NAV”) basis, the Fund returned 8.09%. During the same time period, the Index returned 8.29%. During the fiscal year, the Fund fully replicated the components of the Index; therefore, the Fund’s performance, on a NAV basis, differed from the return of the Index primarily due to fees and operating expenses that the Fund incurred during the period.
During this same time period, (the Benchmark Index) returned 10.02%. The Benchmark Index is an unmanaged index weighted by market capitalization based on the average performance of approximately 1,000 securities. The Benchmark Index was selected for its recognition in the marketplace, and its performance comparison is a useful measure for investors as a broad representation of the overall U.S. stock market.
The performance of the Fund differed from the Benchmark Index in part because the Fund seeks to track an Index that employs a factor weighted methodology, whereas the Benchmark Index weights stocks based primarily on market capitalization.
Relative to the Benchmark Index, the Fund was most overweight in the information technology sector and most underweight in the consumer staples sector during the fiscal year ended June 30, 2019. The majority of the Fund’s underperformance relative to the Benchmark Index during that period can be attributed to the Fund being underweight in the financial sector.
For the fiscal year ended June 30, 2019, the information technology sector contributed most significantly from the Fund’s return, followed by the healthcare and consumer discretionary sectors, respectively. The energy sector detracted most significantly from the Fund’s return, followed by the communication services and materials sectors, respectively.
Positions that contributed most significantly to the Fund’s return for the fiscal year ended June 30, 2019, included Microsoft Corp., an information technology company (portfolio average weight of 5.10%) and Visa Inc. Class A, an information technology company (portfolio average weight of 1.51%). Positions that detracted most significantly from the Fund’s return during this period included Facebook, Inc. Class A, a communications services company (portfolio average weight of 1.02%) and NIVIDIA Corporation, an information technology company (portfolio average weight of 0.54%).
Invesco Russell 1000® Momentum Factor ETF (OMOM)(continued)
| | | | |
Sector Breakdown
(% of the Fund’s Net Assets)
as of June 30, 2019 | |
Software & Services | | | 17.1 | |
Pharmaceuticals, Biotechnology & Life Sciences | | | 8.3 | |
Media & Entertainment | | | 7.1 | |
Retailing | | | 6.1 | |
Capital Goods | | | 5.8 | |
Health Care Equipment & Services | | | 5.7 | |
Technology Hardware & Equipment | | | 5.2 | |
Real Estate | | | 4.6 | |
Utilities | | | 4.5 | |
Diversified Financials | | | 4.2 | |
Food, Beverage & Tobacco | | | 4.0 | |
Banks | | | 3.6 | |
Insurance | | | 3.0 | |
Energy | | | 2.9 | |
Semiconductors & Semiconductor Equipment | | | 2.7 | |
Consumer Services | | | 2.6 | |
Household & Personal Products | | | 2.6 | |
Materials | | | 2.2 | |
Telecommunication Services | | | 2.2 | |
Transportation | | | 1.8 | |
Food & Staples Retailing | | | 1.7 | |
Commercial & Professional Services | | | 1.0 | |
Consumer Durables & Apparel | | | 1.0 | |
Money Market Fund | | | 0.4 | |
Automobiles & Components | | | 0.2 | |
Liabilities in Excess of Other Assets | | | (0.5) | |
Net Assets | | | 100.0 | |
| | | | |
Top Ten Fund Holdings*
(% of the Fund’s Net Assets)
as of June 30, 2019 | |
| Security | | | | |
| Microsoft Corp. | | | 5.77 | |
| Amazon.com, Inc. | | | 3.06 | |
| Apple, Inc. | | | 2.88 | |
| Procter & Gamble Co. (The) | | | 1.70 | |
| Johnson & Johnson | | | 1.69 | |
| Visa, Inc., Class A | | | 1.56 | |
| Berkshire Hathaway, Inc., Class B | | | 1.51 | |
| Cisco Systems, Inc. | | | 1.39 | |
| Walt Disney Co. (The) | | | 1.33 | |
| Mastercard, Inc., Class A | | | 1.31 | |
| * | Excluding money market fund holdings. |
Invesco Russell 1000® Momentum Factor ETF (OMOM)(continued)
Growth of a $10,000 Investment Since Inception
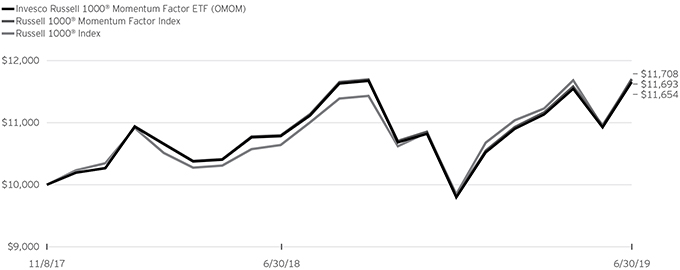
Fund Performance History as of June 30, 2019
| | | | | | | | | | | | | | | | |
| | | | | | | | | Fund Inception | |
| Index | | 1 Year | | | | | | Average
Annualized | | | Cumulative | |
| Russell 1000® Momentum Factor Index | | | 8.29 | % | | | | | | | 9.98 | % | | | 16.93 | % |
| Russell 1000® Index | | | 10.02 | | | | | | | | 10.06 | | | | 17.08 | |
| Fund | | | | | | | | | | | | | | | | |
| NAV Return | | | 8.09 | | | | | | | | 9.75 | | | | 16.54 | |
| Market Price Return | | | 7.85 | | | | | | | | 9.68 | | | | 16.41 | |
Oppenheimer Russell 1000® Momentum Factor ETF (the “Predecessor Fund”) Inception: November 8, 2017
Performance quoted above represents past performance. Past performance is not a guarantee of future results and current performance may be higher or lower than performance quoted. Investment returns and principal value will fluctuate, and shares of the Fund (“Fund Shares”), when redeemed or sold, may be worth more or less than their original cost. Fund performance reflects any applicable fee waivers and/or expense reimbursements. Had the adviser not waived fees and/or reimbursed expenses currently or in the past, returns would have been lower. See current prospectus for more information. According to the Fund’s current prospectus, the Fund’s expense ratio of 0.19% is expressed as a unitary management fee to cover operating expenses and expenses incurred in connection with managing the portfolio. NAV and Market Price returns assume that dividends and capital gain distributions have been reinvested in the Fund at NAV and Market Price, respectively. The returns shown in the table above do not reflect the deduction of taxes that a shareholder would pay on Fund distributions or the redemption or sale of Fund Shares. See invesco.com/ETFs to find the most recentmonth-end performance numbers.
Index and Benchmark Index performance results are based upon a hypothetical investment in their respective constituent securities. Index and Benchmark Index returns do not represent Fund returns. An investor cannot invest directly in an index. The Index and Benchmark Index do not charge management fees or brokerage expenses, and no such fees or expenses were deducted from the hypothetical performance shown. In addition, the results actual investors might have achieved would have differed from those shown because of differences in the timing, amounts of their investments, and fees and expenses associated with an investment in the Fund.
Notes Regarding Indexes and Fund Performance History:
| - | Average Annualized and Cumulative Inception returns for the Fund, Index and Benchmark Index are based on the inception date of the Predecessor Fund. |
| - | Effective after the close of business on May 24, 2019, the Predecessor Fund was reorganized into the Fund. Fund returns shown are blended returns of the Predecessor Fund and the Fund. |
| | |
| OVLU | | Manager’s Analysis |
| | Invesco Russell 1000® Value Factor ETF (OVLU) |
As an index fund, the Invesco Russell 1000® Value Factor ETF (the “Fund”) seeks to track the investment results (before fees and expenses) of the Russell 1000® Value Factor Index (the “Index”). The Fund generally will invest at least 90% of its total assets in the securities that comprise the Index.
Strictly in accordance with its guidelines and mandated procedures, Frank Russell Company (“Frank Russell” or the “Index Provider”) compiles, maintains, and calculates the Index, which is constructed using a rules-based methodology that selects a subset of the equity securities from the Russell 1000 Index (the “Parent Index” or “Benchmark Index”), which is comprised of the 1,000 largest-capitalization companies in the United States. To construct the Index, each constituent in the Parent Index is assigned a factor score based on the extent to which the constituent exhibits greater value characteristics relative to the other constituents in the Parent Index. A company’s value factor score is based on an equally-weighted composite of cash flow yield, earnings yield, and sales to price ratio, calculated based on the company’s total market capitalization and information reported in the company’s most recent annual financial statement as of the last business day of the prior month. An initial weight for each security is determined from the product of the security’s factor score and its weight in the Parent Index. These weights are adjusted to ensure that each constituent and the Index as a whole satisfy certain constraints with respect to factor exposure, diversification, liquidity, industry exposure, maximum security and minimum security weights, as compared to the Parent Index. Securities in the Parent Index are excluded from the Index if their relevant factor characteristics fall below an algorithmically-determined threshold, or if their adjusted weights fall below a certain de minimis amount. The Fund generally invests in all of the securities comprising the Index in proportion to their weightings in the Index.
For the fiscal year ended June 30, 2019, on a market price basis, the Fund returned 6.27%. On a net asset value (“NAV”) basis, the Fund returned 6.15%. During the same time period, the Index returned 6.35%. During the fiscal year, the Fund fully replicated the components of the Index; therefore, the Fund’s performance, on a NAV basis, differed from the return of the Index primarily due to fees and operating expenses that the Fund incurred during the period.
During this same time period, (the Benchmark Index) returned 10.02%. The Benchmark Index is an unmanaged index weighted by market capitalization based on the average performance of approximately 1,000 securities. The Benchmark Index was selected for its recognition in the marketplace, and its performance comparison is a useful measure for investors as a broad representation of the overall U.S. stock market.
The performance of the Fund differed from the Benchmark Index in part because the Fund seeks to track an Index that employs a factor weighted methodology, whereas the Benchmark Index weights stocks based primarily on market capitalization.
Relative to the Benchmark Index, the Fund was most overweight in the consumer staples sector and most underweight in the information technology sector during the fiscal year ended June 30, 2019. The majority of the Fund’s underperformance relative to the Benchmark Index during that period can be attributed to the Fund being underweight in the information technology sector.
For the fiscal year ended June 30, 2019, the communications services sector contributed most significantly from the Fund’s return, followed by the consumer staples and financials sectors, respectively. The energy sector detracted most significantly from the Fund’s return, followed by the materials and information technology sectors, respectively.
Positions that contributed most significantly to the Fund’s return for the fiscal year ended June 30, 2019, included Proctor & Gamble Company., a consumer staples company (portfolio average weight of 1.99%) and Comcast Corporation Class A, a communications services company (portfolio average weight of 1.96%). Positions that detracted most significantly from the Fund’s return during this period included Micron Technology, Inc., an information technology company (portfolio average weight of 0.76%) and Wells Fargo & Company, a financials company (portfolio average weight of 1.74%).
Invesco Russell 1000® Value Factor ETF (OVLU)(continued)
| | | | |
Sector Breakdown
(% of the Fund’s Net Assets)
as of June 30, 2019 | |
| Energy | | | 11.0 | |
| Banks | | | 10.2 | |
| Technology Hardware & Equipment | | | 8.1 | |
| Capital Goods | | | 6.9 | |
| Diversified Financials | | | 6.2 | |
| Health Care Equipment & Services | | | 6.1 | |
| Insurance | | | 5.0 | |
| Telecommunication Services | | | 5.0 | |
| Materials | | | 4.2 | |
| Utilities | | | 4.2 | |
| Semiconductors & Semiconductor Equipment | | | 3.8 | |
| Food & Staples Retailing | | | 3.5 | |
| Retailing | | | 3.5 | |
| Pharmaceuticals, Biotechnology & Life Sciences | | | 3.3 | |
| Media & Entertainment | | | 3.2 | |
| Software & Services | | | 3.0 | |
| Transportation | | | 3.0 | |
| Food, Beverage & Tobacco | | | 2.2 | |
| Consumer Services | | | 2.1 | |
| Automobiles & Components | | | 1.7 | |
| Real Estate | | | 1.7 | |
| Consumer Durables & Apparel | | | 1.5 | |
| Commercial & Professional Services | | | 0.5 | |
| Money Market Fund | | | 0.3 | |
| Household & Personal Products | | | 0.2 | |
| Liabilities in Excess of Other Assets | | | (0.4) | |
| Net Assets | | | 100.0 | |
| | | | |
Top Ten Fund Holdings*
(% of the Fund’s Net Assets)
as of June 30, 2019 | |
| Security | | | | |
| Apple, Inc. | | | 6.07 | |
| Exxon Mobil Corp. | | | 2.91 | |
| AT&T, Inc. | | | 2.58 | |
| Bank of America Corp. | | | 2.41 | |
| Chevron Corp. | | | 2.10 | |
| Verizon Communications, Inc. | | | 2.06 | |
| Intel Corp. | | | 1.99 | |
| Wells Fargo & Co. | | | 1.97 | |
| Citigroup, Inc. | | | 1.91 | |
| UnitedHealth Group, Inc. | | | 1.64 | |
| * | Excluding money market fund holdings. |
Invesco Russell 1000® Value Factor ETF (OVLU)(continued)
Growth of a $10,000 Investment Since Inception
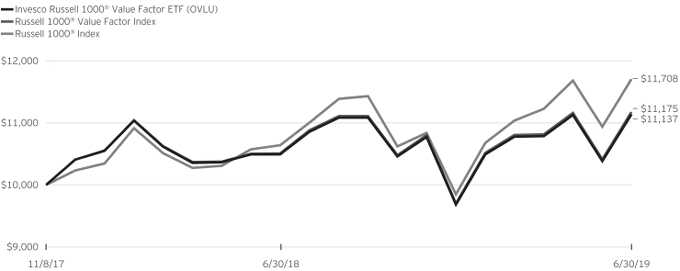
Fund Performance History as of June 30, 2019
| | | | | | | | | | | | | | | | |
| | | | | | | | | Fund Inception | |
| Index | | 1 Year | | | | | | Average
Annualized | | | Cumulative | |
| Russell 1000® Value Factor Index | | | 6.35 | % | | | | | | | 6.99 | % | | | 11.75 | % |
| Russell 1000® Index | | | 10.02 | | | | | | | | 10.06 | | | | 17.08 | |
| Fund | | | | | | | | | | | | | | | | |
| NAV Return | | | 6.15 | | | | | | | | 6.77 | | | | 11.37 | |
| Market Price Return | | | 6.27 | | | | | | | | 6.77 | | | | 11.37 | |
Oppenheimer Russell 1000® Value Factor ETF (the “Predecessor Fund”) Inception: November 8, 2017
Performance quoted above represents past performance. Past performance is not a guarantee of future results and current performance may be higher or lower than performance quoted. Investment returns and principal value will fluctuate, and shares of the Fund (“Fund Shares”), when redeemed or sold, may be worth more or less than their original cost. Fund performance reflects any applicable fee waivers and/or expense reimbursements. Had the adviser not waived fees and/or reimbursed expenses currently or in the past, returns would have been lower. See current prospectus for more information. According to the Fund’s current prospectus, the Fund’s expense ratio of 0.19% is expressed as a unitary management fee to cover operating expenses and expenses incurred in connection with managing the portfolio. NAV and Market Price returns assume that dividends and capital gain distributions have been reinvested in the Fund at NAV and Market Price, respectively. The returns shown in the table above do not reflect the deduction of taxes that a shareholder would pay on Fund distributions or the redemption or sale of Fund Shares. See invesco.com/ETFs to find the most recentmonth-end performance numbers.
Index and Benchmark Index performance results are based upon a hypothetical investment in their respective constituent securities. Index and Benchmark Index returns do not represent Fund returns. An investor cannot invest directly in an index. The Index and Benchmark Index do not charge management fees or brokerage expenses, and no such fees or expenses were deducted from the hypothetical performance shown. In addition, the results actual investors might have achieved would have differed from those shown because of differences in the timing, amounts of their investments, and fees and expenses associated with an investment in the Fund.
Notes Regarding Indexes and Fund Performance History:
| - | Average Annualized and Cumulative Inception returns for the Fund, Index and Benchmark Index are based on the inception date of the Predecessor Fund. |
| - | Effective after the close of business on May 24, 2019, the Predecessor Fund was reorganized into the Fund. Fund returns shown are blended returns of the Predecessor Fund and the Fund. |
| | |
| OVOL | | Manager’s Analysis |
| | Invesco Russell 1000®Low Volatility Factor ETF (OVOL) |
As an index fund, the Invesco Russell 1000® Low Volatility Factor ETF (the “Fund”) seeks to track the investment results (before fees and expenses) of the Russell 1000® Volatility Factor Index (the “Index”). The Fund generally will invest at least 90% of its total assets in the securities that comprise the Index.
Strictly in accordance with its guidelines and mandated procedures, Frank Russell Company (“Frank Russell” or the “Index Provider”) compiles, maintains, and calculates the Index, which is constructed using a rules-based methodology that selects a subset of the equity securities from the Russell 1000 Index (the “Parent Index” or “Benchmark Index”), which is comprised of the 1,000 largest-capitalization companies in the United States. To construct the Index, each constituent in the Parent Index is assigned a factor score based on the extent to which the constituent exhibits lower volatility characteristics relative to the other constituents in the Parent Index. A company’s volatility factor score is based on the standard deviation of weekly total returns to a company’s stock price over the trailing five years ending on the last business day of the prior month. An initial weight for each security is determined from the product of the security’s factor score and its weight in the Parent Index. These weights are adjusted to ensure that each constituent and the Index as a whole satisfy certain constraints with respect to factor exposure, diversification, liquidity, industry exposure, maximum security and minimum security weights, as compared to the Parent Index. Securities in the Parent Index are excluded from the Index if their relevant factor characteristics fall below an algorithmically-determined threshold, or if their adjusted weights fall below a certain de minimis amount. The Fund generally invests in all of the securities comprising the Index in proportion to their weightings in the Index.
For the fiscal year ended June 30, 2019, on a market price basis, the Fund returned 15.05%. On a net asset value (“NAV”) basis, the Fund returned 14.98%. During the same time period, the Index returned 15.25%. During the fiscal year, the Fund fully replicated the components of the Index; therefore, the Fund’s performance, on a NAV basis, differed from the return of the Index primarily due to fees and operating expenses that the Fund incurred as well as trading costs associated with portfolio rebalances during the period.
During this same time period, (the Benchmark Index) returned 10.02%. The Benchmark Index is an unmanaged index weighted by market capitalization based on the average performance of approximately 1000 securities. The Benchmark Index was selected for its recognition in the market place, and because its performance comparison is a useful measure for investors as a broad representation of the overall U.S. stock market.
The performance of the Fund differed from the Benchmark Index in part because the Fund seeks to track an Index that selects stocks based upon the factor scores and their weights in the Parent index as computed by the Index Provider, whereas the
Benchmark Index weights stocks based primarily on market capitalization.
Relative to the Benchmark Index, the Fund was most overweight in the financials sector and most underweight in the consumer discretionary sector during the fiscal year ended June 30, 2019. The majority of the Fund’s overperformed relative to the Benchmark Index during that period can be attributed to overweight exposure to and security selection in the health care sector and underweight exposure to and security selection in the energy sector.
For the fiscal year ended June 30, 2019, the information technology sector contributed most significantly from the Fund’s return, followed by the health care and consumer staples sectors, respectively. The energy sector detracted most significantly from the Fund’s return, followed by the materials and real estate sectors.
Positions that contributed most significantly to the Fund’s return for the fiscal year ended June 30, 2019, included Microsoft Corporation, an information technology company (portfolio average weight of 4.33%) and Procter & Gamble Company, a consumer staples company (portfolio average weight of 1.60%). Positions that detracted most significantly from the Fund’s return during this period included Schlumberger NV, an energy company (no longer held at year-end)) and Wells Fargo & Company, a financials company (portfolio average weight of 1.26%).
Invesco Russell 1000®Low Volatility Factor ETF (OVOL)(continued)
| | | | |
Sector Breakdown
(% of the Fund’s Net Assets)
as of June 30, 2019 | |
| Software & Services | | | 13.2 | |
| Pharmaceuticals, Biotechnology & Life Sciences | | | 8.2 | |
| Capital Goods | | | 6.8 | |
| Health Care Equipment & Services | | | 6.4 | |
| Diversified Financials | | | 6.2 | |
| Technology Hardware & Equipment | | | 6.2 | |
| Banks | | | 6.1 | |
| Media & Entertainment | | | 5.7 | |
| Food, Beverage & Tobacco | | | 5.3 | |
| Utilities | | | 5.0 | |
| Real Estate | | | 4.4 | |
| Insurance | | | 3.9 | |
| Energy | | | 3.3 | |
| Household & Personal Products | | | 2.9 | |
| Telecommunication Services | | | 2.9 | |
| Retailing | | | 2.8 | |
| Consumer Services | | | 2.2 | |
| Food & Staples Retailing | | | 2.0 | |
| Materials | | | 2.0 | |
| Semiconductors & Semiconductor Equipment | | | 1.6 | |
| Transportation | | | 1.6 | |
| Commercial & Professional Services | | | 0.8 | |
| Consumer Durables & Apparel | | | 0.5 | |
| Money Market Fund | | | 0.1 | |
| Net Assets | | | 100.0 | |
| | | | |
Top Ten Fund Holdings*
(% of the Fund’s Net Assets)
as of June 30, 2019 | |
| Security | | | | |
| Microsoft Corp. | | | 5.24 | |
| Apple, Inc. | | | 4.64 | |
| Berkshire Hathaway, Inc., Class B | | | 2.68 | |
| Johnson & Johnson | | | 2.37 | |
| JPMorgan Chase & Co. | | | 1.98 | |
| Exxon Mobil Corp. | | | 1.94 | |
| Procter & Gamble Co. (The) | | | 1.77 | |
| Visa, Inc., Class A | | | 1.73 | |
| Alphabet, Inc., Class C | | | 1.60 | |
| Alphabet, Inc., Class A | | | 1.56 | |
| * | Excluding money market fund holdings. |
Invesco Russell 1000®Low Volatility Factor ETF (OVOL)(continued)
Growth of a $10,000 Investment Since Inception
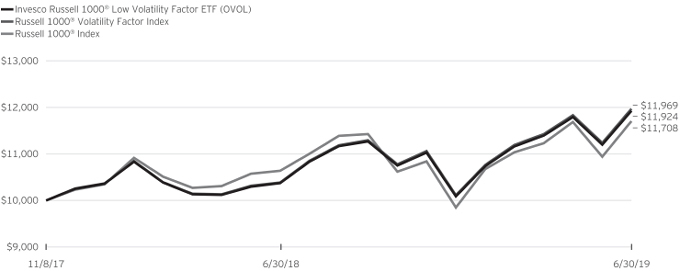
Fund Performance History as of June 30, 2019
| | | | | | | | | | | | | | | | |
| | | | | | | | | Fund Inception | |
| Index | | 1 Year | | | | | | Average
Annualized | | | Cumulative | |
| Russell 1000® Volatility Factor Index | | | 15.25 | % | | | | | | | 11.55 | % | | | 19.69 | % |
| Russell 1000® Index | | | 10.02 | | | | | | | | 10.06 | | | | 17.08 | |
| Fund | | | | | | | | | | | | | | | | |
| NAV Return | | | 14.98 | | | | | | | | 11.30 | | | | 19.24 | |
| Market Price Return | | | 15.05 | | | | | | | | 11.39 | | | | 19.41 | |
Oppenheimer Russell 1000® Low Volatility Factor ETF (the “Predecessor Fund”) Inception: November 8, 2017
Performance quoted above represents past performance. Past performance is not a guarantee of future results and current performance may be higher or lower than performance quoted. Investment returns and principal value will fluctuate, and shares of the Fund (“Fund Shares”), when redeemed or sold, may be worth more or less than their original cost. Fund performance reflects any applicable fee waivers and/or expense reimbursements. Had the adviser not waived fees and/or reimbursed expenses currently or in the past, returns would have been lower. See current prospectus for more information. According to the Fund’s current prospectus, the Fund’s expense ratio of 0.19% is expressed as a unitary management fee to cover operating expenses and expenses incurred in connection with managing the portfolio. NAV and Market Price returns assume that dividends and capital gain distributions have been reinvested in the Fund at NAV and Market Price, respectively. The returns shown in the table above do not reflect the deduction of taxes that a shareholder would pay on Fund distributions or the redemption or sale of Fund Shares. See invesco.com/ ETFs to find the most recentmonth-end performance numbers.
Index and Benchmark Index performance results are based upon a hypothetical investment in their respective constituent securities. Index and Benchmark Index returns do not represent Fund returns. An investor cannot invest directly in an index. The Index and Benchmark Index do not charge management fees or brokerage expenses, and no such fees or expenses were deducted from the hypothetical performance shown. In addition, the results actual investors might have achieved would have differed from those shown because of differences in the timing, amounts of their investments, and fees and expenses associated with an investment in the Fund.
Notes Regarding Indexes and Fund Performance History:
| - | Average Annualized and Cumulative Inception returns for the Fund, Index and Benchmark Index are based on the inception date of the Predecessor Fund. |
| - | Effective after the close of business on May 24, 2019, the Predecessor Fund was reorganized into the Fund. Fund returns shown are blended returns of the Predecessor Fund and the Fund. |
| | |
| OSIZ | | Manager’s Analysis |
| | Invesco Russell 1000® Size Factor ETF (OSIZ) |
As an index fund, the Invesco Russell 1000® Size Factor ETF (the “Fund”) seeks to track the investment results (before fees and expenses) of the Russell 1000 Size Factor Index (the “Index”). The Fund generally will invest at least 90% of its total assets in the securities that comprise the Index.
Strictly in accordance with its guidelines and mandated procedures, Frank Russell Company (“Frank Russell” or the “Index Provider”) compiles, maintains, and calculates the Index, which is constructed using a rules-based methodology that selects a subset of the equity securities from the Russell 1000 Index (the “Parent Index” or “Benchmark Index”), which is comprised of the 1,000 largest-capitalization companies in the United States. To construct the Index, each constituent in the Parent Index is assigned a factor score based on the extent to which the constituent exhibits characteristics of smaller-capitalization companies relative to the other constituents in the Parent Index. A company’s size factor score is based on total market capitalization as of the last business day of the prior month. An initial weight for each security is determined from the product of the security’s factor score and its weight in the Parent Index. These weights are adjusted to ensure that each constituent and the Index as a whole satisfy certain constraints with respect to factor exposure, diversification, liquidity, industry exposure, maximum security and minimum security weights, as compared to the Parent Index. Securities in the Parent Index are excluded from the Index if their relevant factor characteristics fall below an algorithmically-determined threshold, or if their adjusted weights fall below a certain de minimis amount. The Fund generally invests in all of the securities comprising the Index in proportion to their weightings in the Index.
For the fiscal year ended June 30, 2019, on a market price basis, the Fund returned 6.31%. On a net asset value (“NAV”) basis, the Fund returned 6.42%. During the same time period, the Index returned 6.58%. During the fiscal year, the Fund fully replicated the components of the Index; therefore, the Fund’s performance, on a NAV basis, differed from the return of the Index primarily due to fees and operating expenses that the Fund incurred partial offset by securities lending revenue during the period.
During this same time period, (the Benchmark Index) returned 10.02%. The Benchmark Index is an unmanaged index weighted by market capitalization based on the average performance of approximately 1,000 securities. The Benchmark Index was selected for its recognition in the marketplace, and its performance comparison is a useful measure for investors as a broad representation of the overall U.S. stock market.
The performance of the Fund differed from the Benchmark Index in part because the Fund seeks to track an Index that employs a factor weighted methodology, whereas the Benchmark Index weights stocks based primarily on market capitalization.
Relative to the Benchmark Index, the Fund was most overweight in the real estate sector and most underweight in the communication services sector during the fiscal year ended June 30, 2019. The majority of the Fund’s underperformance relative to the Benchmark Index during that period can be attributed to the Fund being overweight in the consumer discretionary sector.
For the fiscal year ended June 30, 2019, the information technology sector contributed most significantly from the Fund’s return, followed by the healthcare and industrials sectors, respectively. The energy detracted most significantly from the Fund’s return, followed by the consumer discretionary and materials sectors, respectively
Positions that contributed most significantly to the Fund’s return for the fiscal year ended June 30, 2019, included Veeva Systems Inc. Class A, a healthcare company (portfolio average weight of 0.34%) and Advanced Micro Devices, Inc. an information technology company (portfolio average weight of 0.43%). Positions that detracted most significantly from the Fund’s return during this period included Apache Corporation, an energy company (portfolio average weight of 0.21%) and Antero Resources Corporation, an energy company (portfolio average weight of 0.08%).
Invesco Russell 1000® Size Factor ETF (OSIZ)(continued)
| | | | |
Sector Breakdown
(% of the Fund’s Net Assets)
as of June 30, 2019 | |
| Software & Services | | | 10.2 | |
| Capital Goods | | | 9.9 | |
| Real Estate | | | 9.6 | |
| Materials | | | 6.6 | |
| Health Care Equipment & Services | | | 5.4 | |
| Diversified Financials | | | 5.0 | |
| Pharmaceuticals, Biotechnology & Life Sciences | | | 5.0 | |
| Banks | | | 4.9 | |
| Insurance | | | 4.6 | |
| Technology Hardware & Equipment | | | 4.5 | |
| Media & Entertainment | | | 4.4 | |
| Consumer Services | | | 4.2 | |
| Retailing | | | 4.0 | |
| Consumer Durables & Apparel | | | 3.7 | |
| Energy | | | 3.6 | |
| Utilities | | | 3.3 | |
| Transportation | | | 2.7 | |
| Semiconductors & Semiconductor Equipment | | | 2.6 | |
| Food, Beverage & Tobacco | | | 1.9 | |
| Commercial & Professional Services | | | 1.5 | |
| Automobiles & Components | | | 1.0 | |
| Money Market Fund | | | 1.0 | |
| Telecommunication Services | | | 0.6 | |
| Food & Staples Retailing | | | 0.4 | |
| Household & Personal Products | | | 0.4 | |
| Liabilities in Excess of Other Assets | | | (1.0) | |
| Net Assets | | | 100.0 | |
| | | | |
Top Ten Fund Holdings*
(% of the Fund’s Net Assets)
as of June 30, 2019 | |
| Security | | | | |
| Tableau Software, Inc., Class A | | | 0.28 | |
| Western Digital Corp. | | | 0.26 | |
| Keysight Technologies, Inc. | | | 0.26 | |
| Freeport-McMoRan, Inc. | | | 0.26 | |
| PG&E Corp. | | | 0.26 | |
| DexCom, Inc. | | | 0.26 | |
| Nucor Corp. | | | 0.25 | |
| DXC Technology Co. | | | 0.25 | |
| Maxim Integrated Products, Inc. | | | 0.25 | |
| Equifax, Inc. | | | 0.25 | |
| * | Excluding money market fund holdings. |
Invesco Russell 1000® Size Factor ETF (OSIZ)(continued)
Growth of a $10,000 Investment Since Inception
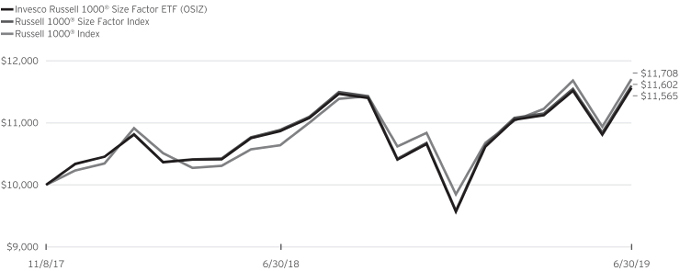
Fund Performance History as of June 30, 2019
| | | | | | | | | | | | | | | | |
| | | | | | | | | Fund Inception | |
| Index | | 1 Year | | | | | | Average
Annualized | | | Cumulative | |
| Russell 1000® Size Factor Index | | | 6.58 | % | | | | | | | 9.46 | % | | | 16.02 | % |
| Russell 1000® Index | | | 10.02 | | | | | | | | 10.06 | | | | 17.08 | |
| Fund | | | | | | | | | | | | | | | | |
| NAV Return | | | 6.42 | | | | | | | | 9.25 | | | | 15.65 | |
| Market Price Return | | | 6.31 | | | | | | | | 9.20 | | | | 15.57 | |
Oppenheimer Russell 1000® Size Factor ETF (the “Predecessor Fund”) Inception: November 8, 2017
Performance quoted above represents past performance. Past performance is not a guarantee of future results and current performance may be higher or lower than performance quoted. Investment returns and principal value will fluctuate, and shares of the Fund (“Fund Shares”), when redeemed or sold, may be worth more or less than their original cost. Fund performance reflects any applicable fee waivers and/or expense reimbursements. Had the adviser not waived fees and/or reimbursed expenses currently or in the past, returns would have been lower. See current prospectus for more information. According to the Fund’s current prospectus, the Fund’s expense ratio of 0.19% is expressed as a unitary management fee to cover operating expenses and expenses incurred in connection with managing the portfolio. NAV and Market Price returns assume that dividends and capital gain distributions have been reinvested in the Fund at NAV and Market Price, respectively. The returns shown in the table above do not reflect the deduction of taxes that a shareholder would pay on Fund distributions or the redemption or sale of Fund Shares. See invesco.com/ ETFs to find the most recentmonth-end performance numbers.
Index and Benchmark Index performance results are based upon a hypothetical investment in their respective constituent securities. Index and Benchmark Index returns do not represent Fund returns. An investor cannot invest directly in an index. The Index and Benchmark Index do not charge management fees or brokerage expenses, and no such fees or expenses were deducted from the hypothetical performance shown. In addition, the results actual investors might have achieved would have differed from those shown because of differences in the timing, amounts of their investments, and fees and expenses associated with an investment in the Fund.
Notes Regarding Indexes and Fund Performance History:
| - | Average Annualized and Cumulative Inception returns for the Fund, Index and Benchmark Index are based on the inception date of the Predecessor Fund. |
| - | Effective after the close of business on May 24, 2019, the Predecessor Fund was reorganized into the Fund. Fund returns shown are blended returns of the Predecessor Fund and the Fund. |
| | |
| OQAL | | Manager’s Analysis |
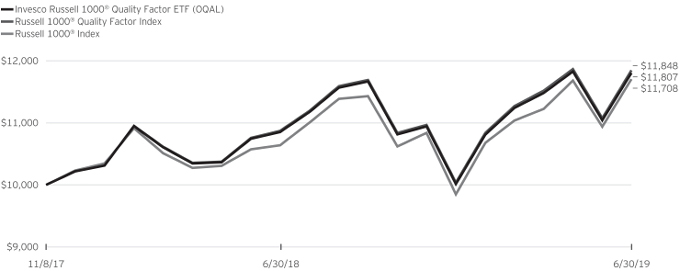
| | Invesco Russell 1000® Quality Factor ETF (OQAL) |
As an index fund, the Invesco Russell 1000® Quality Factor ETF (the “Fund”) seeks to track the investment results (before fees and expenses) of the Russell 1000® Quality Factor Index (the “Index”). The Fund generally will invest at least 90% of its total assets in the securities that comprise the Index.
Strictly in accordance with its guidelines and mandated procedures, Frank Russell Company (“Frank Russell” or the “Index Provider”) compiles, maintains, and calculates the Index, which is constructed using a rules-based methodology that selects a subset of the equity securities from the Russell 1000 Index (the “Parent Index” or “Benchmark Index”), which is comprised of the 1,000 largest-capitalization companies in the United States. To construct the Index, each constituent in the Parent Index is assigned a factor score based on the extent to which the constituent exhibits greater quality characteristics relative to the other constituents in the Parent Index. A company’s quality factor score is based on an equally-weighted composite of return on assets, change in asset turnover, accruals, and leverage, calculated based on information reported in the company’s most recent annual financial statement as of the last business day of the prior month. An initial weight for each security is determined from the product of the security’s factor score and its weight in the Parent Index. These weights are adjusted to ensure that each constituent and the Index as a whole satisfy certain constraints with respect to factor exposure, diversification, liquidity, industry exposure, maximum security and minimum security weights, as compared to the Parent Index. Securities in the Parent Index are excluded from the Index if their relevant factor characteristics fall below an algorithmically-determined threshold, or if their adjusted weights fall below a certain de minimis amount. The Fund generally invests in all of the securities comprising the Index in proportion to their weightings in the Index.
For the fiscal year ended June 30, 2019, on a market price basis, the Fund returned 8.07%. On a net asset value (“NAV”) basis, the Fund returned 8.76%. During the same time period, the Index returned 8.97%. During the fiscal year, the Fund fully replicated the components of the Index; therefore, the Fund’s performance, on a NAV basis, differed from the return of the Index primarily due to fees and operating expenses that the Fund incurred as well as trading costs associated with portfolio rebalances during the period.
During this same time period, (the Benchmark Index) returned 10.02%. The Benchmark Index is an unmanaged index weighted by market capitalization based on the average performance of approximately 1000 securities. The Benchmark Index was selected for its recognition in the market place, and because its performance comparison is a useful measure for investors as a broad representation of the overall U.S. stock market.
The performance of the Fund differed from the Benchmark Index in part because the Fund seeks to track an Index that selects
stocks based upon quality scores and their weights in the Parent Index as computed by the Index Provider, whereas the Benchmark Index weights stocks based primarily on market capitalization.
Relative to the Benchmark Index, the Fund was most overweight in the information technology sector and most underweight in the financials sector during the fiscal year ended June 30, 2019. The majority of the Fund’s underperformance relative to the Benchmark Index during that period can be attributed to an overweight to and security selection in communication services and security selection in the information technology sector.
For the fiscal year ended June 30, 2019, the information technology sector contributed most significantly from the Fund’s return, followed by the health care and consumer discretionary
sectors, respectively. The energy sector detracted most significantly from the Fund’s return, followed by the materials and communication services sectors.
Positions that contributed most significantly to the Fund’s return for the fiscal year ended June 30, 2019, included Visa Inc. Class A, an information technology company (portfolio average weight of 3.05%) and Mastercard, Inc., Class A, an information technology company (portfolio average weight of 2.48%). Positions that detracted most significantly from the Fund’s return during this period included NVIDIA Corporation, an information technology company (portfolio average weight of 0.99%) and Schlumberger NV, an energy company (no longer held atyear-end).
Invesco Russell 1000® Quality Factor ETF (OQAL)(continued)
| | | | |
Sector Breakdown
(% of the Fund’s Net Assets)
as of June 30, 2019 | |
| Software & Services | | | 17.1 | |
| Retailing | | | 9.9 | |
| Media & Entertainment | | | 9.8 | |
| Pharmaceuticals, Biotechnology & Life Sciences | | | 9.4 | |
| Technology Hardware & Equipment | | | 8.5 | |
| Capital Goods | | | 6.7 | |
| Energy | | | 6.1 | |
| Semiconductors & Semiconductor Equipment | | | 4.9 | |
| Health Care Equipment & Services | | | 4.7 | |
| Consumer Services | | | 2.7 | |
| Household & Personal Products | | | 2.6 | |
| Transportation | | | 2.5 | |
| Food, Beverage & Tobacco | | | 2.4 | |
| Materials | | | 2.1 | |
| Diversified Financials | | | 2.0 | |
| Real Estate | | | 2.0 | |
| Consumer Durables & Apparel | | | 1.7 | |
| Food & Staples Retailing | | | 1.6 | |
| Telecommunication Services | | | 0.9 | |
| Commercial & Professional Services | | | 0.8 | |
| Insurance | | | 0.8 | |
| Automobiles & Components | | | 0.4 | |
| Money Market Fund | | | 0.2 | |
| Utilities | | | 0.2 | |
| Banks | | | 0.1 | |
| Liabilities in Excess of Other Assets | | | (0.1) | |
| Net Assets | | | 100.0 | |
| | | | |
Top Ten Fund Holdings*
(% of the Fund’s Net Assets)
as of June 30, 2019 | |
| Security | | | | |
| Apple, Inc. | | | 6.17 | |
| Microsoft Corp. | | | 4.98 | |
| Amazon.com, Inc. | | | 4.37 | |
| Facebook, Inc., Class A | | | 3.32 | |
| Visa, Inc., Class A | | | 2.91 | |
| Johnson & Johnson | | | 2.39 | |
| Mastercard, Inc., Class A | | | 2.36 | |
| Exxon Mobil Corp. | | | 2.23 | |
| Alphabet, Inc., Class C | | | 2.12 | |
| Alphabet, Inc., Class A | | | 2.11 | |
| * | Excluding money market fund holdings. |
Invesco Russell 1000® Quality Factor ETF (OQAL)(continued)
Growth of a $10,000 Investment Since Inception
Fund Performance History as of June 30, 2019
| | | | | | | | | | | | | | | | |
| | | | | | | | | Fund Inception | |
| Index | | 1 Year | | | | | | Average
Annualized | | | Cumulative | |
| Russell 1000® Quality Factor Index | | | 8.97 | % | | | | | | | 10.86 | % | | | 18.48 | % |
| Russell 1000® Index | | | 10.02 | | | | | | | | 10.06 | | | | 17.08 | |
| Fund | | | | | | | | | | | | | | | | |
| NAV Return | | | 8.76 | | | | | | | | 10.63 | | | | 18.07 | |
| Market Price Return | | | 8.07 | | | | | | | | 10.28 | | | | 17.46 | |
Oppenheimer Russell 1000® Quality Factor ETF (the “Predecessor Fund”) Inception: November 8, 2017
Performance quoted above represents past performance. Past performance is not a guarantee of future results and current performance may be higher or lower than performance quoted. Investment returns and principal value will fluctuate, and shares of the Fund (“Fund Shares”), when redeemed or sold, may be worth more or less than their original cost. Fund performance reflects any applicable fee waivers and/or expense reimbursements. Had the adviser not waived fees and/or reimbursed expenses currently or in the past, returns would have been lower. See current prospectus for more information. According to the Fund’s current prospectus, the Fund’s expense ratio of 0.19% is expressed as a unitary management fee to cover operating expenses and expenses incurred in connection with managing the portfolio. NAV and Market Price returns assume that dividends and capital gain distributions have been reinvested in the Fund at NAV and Market Price, respectively. The returns shown in the table above do not reflect the deduction of taxes that a shareholder would pay on Fund distributions or the redemption or sale of Fund Shares. See invesco.com/ ETFs to find the most recentmonth-end performance numbers.
Index and Benchmark Index performance results are based upon a hypothetical investment in their respective constituent securities. Index and Benchmark Index returns do not represent Fund returns. An investor cannot invest directly in an index. The Index and Benchmark Index do not charge management fees or brokerage expenses, and no such fees or expenses were deducted from the hypothetical performance shown. In addition, the results actual investors might have achieved would have differed from those shown because of differences in the timing, amounts of their investments, and fees and expenses associated with an investment in the Fund.
Notes Regarding Indexes and Fund Performance History:
| - | Average Annualized and Cumulative Inception returns for the Fund, Index and Benchmark Index are based on the inception date of the Predecessor Fund. |
| - | Effective after the close of business on May 24, 2019, the Predecessor Fund was reorganized into the Fund. Fund returns shown are blended returns of the Predecessor Fund and the Fund. |
| | |
| OYLD | | Manager’s Analysis |
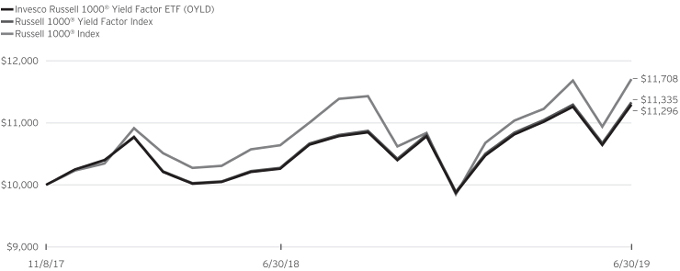
| | Invesco Russell 1000® Yield Factor ETF (OYLD) |
As an index fund, the Invesco Russell 1000® Yield Factor ETF (the “Fund”) seeks to track the investment results (before fees and expenses) of the Russell 1000 Yield Factor Index (the “Index”). The Fund generally will invest at least 90% of its total assets in the securities that comprise the Index.
Strictly in accordance with its guidelines and mandated procedures, Frank Russell Company (“Frank Russell” or the “Index Provider”) compiles, maintains, and calculates the Index, which is constructed using a rules-based methodology that selects a subset of the equity securities from the Russell 1000 Index (the “Parent Index” or “Benchmark Index”), which is comprised of the 1,000 largest-capitalization companies in the United States. To construct the Index, each constituent in the Parent Index is assigned a factor score based on the extent to which the constituent exhibits greater yield characteristics relative to the other constituents in the Parent Index. A company’s yield factor score is based on the12-month trailing dividend yield as of the last business day of the prior month. An initial weight for each security is determined from the product of the security’s factor score and its weight in the Parent Index. These weights are adjusted to ensure that each constituent and the Index as a whole satisfy certain constraints with respect to factor exposure, diversification, liquidity, industry exposure, maximum security and minimum security weights, as compared to the Parent Index. Securities in the Parent Index are excluded from the Index if their relevant factor characteristics fall below an algorithmically-determined threshold, or if their adjusted weights fall below a certain de minimis amount. The Fund generally invests in all of the securities comprising the Index in proportion to their weightings in the Index.
For the fiscal year ended June 30, 2019, on a market price basis, the Fund returned 9.79%. On a net asset value (“NAV”) basis, the Fund returned 10.10%. During the same time period, the Index returned 10.32%. During the fiscal year, the Fund fully replicated the components of the Index; therefore, the Fund’s performance, on a NAV basis, differed from the return of the Index primarily due to fees and operating expenses that the Fund incurred as well as trading costs associated with portfolio rebalances during the period.
During this same time period, (the Benchmark Index) returned 10.02%. The Benchmark Index is an unmanaged index weighted by market capitalization based on the average performance of approximately 1,000 securities. The Benchmark Index was selected for its recognition in the market place, and because its performance comparison is a useful measure for investors as a broad representation of the overall U.S. stock market.
The performance of the Fund differed from the Benchmark Index in part because the Fund seeks to track an Index that selects stocks based upon yield and their weights in the Parent index as computed by the Index Provider, whereas the Benchmark Index weights stocks based primarily on market capitalization.
Relative to the Benchmark Index, the Fund was most overweight in the consumer staples sector and most underweight in the information technology sector during the fiscal year ended June 30, 2019. The majority of the Fund’s outperformance (on a NAV bases) relative to the Benchmark Index during that period can be attributed to the Fund’s underweight exposure to and security selection in the communication services and consumer staples sectors.
For the fiscal year ended June 30, 2019, the consumer staples sector contributed most significantly from the Fund’s return, followed by the health care and information technology sectors, respectively. The energy sector detracted most significantly from the Fund’s return.
Positions that contributed most significantly to the Fund’s return for the fiscal year ended June 30, 2019, included Procter & Gamble Company, a consumer staples company (portfolio average weight of 2.51%) and Cisco Systems, Inc., an information technology company (portfolio average weight of 2.89%). Positions that detracted most significantly from the Fund’s return during this period included Schlumberger NV, an energy company (portfolio average weight of 0.65%) and General Electric Company, an industrials company (portfolio average weight of 1.05%).
Invesco Russell 1000® Yield Factor ETF (OYLD)(continued)
| | | | |
Sector Breakdown
(% of the Fund’s Net Assets)
as of June 30, 2019 | |
| Pharmaceuticals, Biotechnology & Life Sciences | | | 11.4 | |
| Banks | | | 11.0 | |
| Energy | | | 10.1 | |
| Capital Goods | | | 7.7 | |
| Food, Beverage & Tobacco | | | 7.2 | |
| Real Estate | | | 7.2 | |
| Utilities | | | 7.1 | |
| Semiconductors & Semiconductor Equipment | | | 6.6 | |
| Telecommunication Services | | | 5.6 | |
| Technology Hardware & Equipment | | | 3.8 | |
| Household & Personal Products | | | 3.3 | |
| Diversified Financials | | | 3.2 | |
| Retailing | | | 2.7 | |
| Insurance | | | 2.0 | |
| Software & Services | | | 2.0 | |
| Consumer Services | | | 1.9 | |
| Health Care Equipment & Services | | | 1.8 | |
| Materials | | | 1.7 | |
| Automobiles & Components | | | 1.1 | |
| Transportation | | | 1.1 | |
| Consumer Durables & Apparel | | | 0.8 | |
| Food & Staples Retailing | | | 0.4 | |
| Media & Entertainment | | | 0.3 | |
| Commercial & Professional Services | | | 0.1 | |
| Net Assets | | | 100.0 | |
| | | | |
Top Ten Fund Holdings*
(% of the Fund’s Net Assets)
as of June 30, 2019 | |
| Security | | | | |
| Exxon Mobil Corp. | | | 3.54 | |
| Johnson & Johnson | | | 3.09 | |
| JPMorgan Chase & Co. | | | 3.05 | |
| AT&T, Inc. | | | 2.93 | |
| Verizon Communications, Inc. | | | 2.54 | |
| Cisco Systems, Inc. | | | 2.46 | |
| Chevron Corp. | | | 2.45 | |
| Intel Corp. | | | 2.31 | |
| Procter & Gamble Co. (The) | | | 2.29 | |
| Pfizer, Inc. | | | 2.27 | |
| * | Excluding money market fund holdings. |
Invesco Russell 1000® Yield Factor ETF (OYLD)(continued)
Growth of a $10,000 Investment Since Inception
Fund Performance History as of June 30, 2019
| | | | | | | | | | | | | | | | |
| | | | | | | | | Fund Inception | |
| Index | | 1 Year | | | | | | Average
Annualized | | | Cumulative | |
| Russell 1000® Yield Factor Index | | | 10.32 | % | | | | | | | 7.92 | % | | | 13.35 | % |
| Russell 1000® Index | | | 10.02 | | | | | | | | 10.06 | | | | 17.08 | |
| Fund | | | | | | | | | | | | | | | | |
| NAV Return | | | 10.10 | | | | | | | | 7.69 | | | | 12.96 | |
| Market Price Return | | | 9.79 | | | | | | | | 7.68 | | | | 12.94 | |
Oppenheimer Russell 1000® Yield Factor ETF (the “Predecessor Fund”) Inception: November 8, 2017
Performance quoted above represents past performance. Past performance is not a guarantee of future results and current performance may be higher or lower than performance quoted. Investment returns and principal value will fluctuate, and shares of the Fund (“Fund Shares”), when redeemed or sold, may be worth more or less than their original cost. Fund performance reflects any applicable fee waivers and/or expense reimbursements. Had the adviser not waived fees and/or reimbursed expenses currently or in the past, returns would have been lower. See current prospectus for more information. According to the Fund’s current prospectus, the Fund’s expense ratio of 0.19% is expressed as a unitary management fee to cover operating expenses and expenses incurred in connection with managing the portfolio. NAV and Market Price returns assume that dividends and capital gain distributions have been reinvested in the Fund at NAV and Market Price, respectively. The returns shown in the table above do not reflect the deduction of taxes that a shareholder would pay on Fund distributions or the redemption or sale of Fund Shares. See invesco.com/ETFs to find the most recentmonth-end performance numbers.
Index and Benchmark Index performance results are based upon a hypothetical investment in their respective constituent securities. Index and Benchmark Index returns do not represent Fund returns. An investor cannot invest directly in an index. The Index and Benchmark Index do not charge management fees or brokerage expenses, and no such fees or expenses were deducted from the hypothetical performance shown. In addition, the results actual investors might have achieved would have differed from those shown because of differences in the timing, amounts of their investments, and fees and expenses associated with an investment in the Fund.
Notes Regarding Indexes and Fund Performance History:
| - | Average Annualized and Cumulative Inception returns for the Fund, Index and Benchmark Index are based on the inception date of the Predecessor Fund. |
| - | Effective after the close of business on May 24, 2019, the Predecessor Fund was reorganized into the Fund. Fund returns shown are blended returns of the Predecessor Fund and the Fund. |
Schedule of Investments
Invesco Russell 1000® Momentum Factor ETF (OMOM)
June 30, 2019
| | | | | | | | |
| Shares | | | | | Value | |
| | | | Common Stocks—100.1% | | | |
| | | | Automobiles & Components—0.2% | | | |
| | 492 | | | Ford Motor Co. | | $ | 5,033 | |
| | 121 | | | General Motors Co. | | | 4,662 | |
| | | | | | | | |
| | | | Total Automobiles & Components | | | 9,695 | |
| | | | | | | | |
| | | | Banks—3.6% | | | |
| | 1,387 | | | Bank of America Corp. | | | 40,223 | |
| | 105 | | | BB&T Corp. | | | 5,159 | |
| | 403 | | | Citigroup, Inc. | | | 28,222 | |
| | 43 | | | Citizens Financial Group, Inc. | | | 1,520 | |
| | 90 | | | Fifth Third Bancorp | | | 2,511 | |
| | 29 | | | First Republic Bank | | | 2,832 | |
| | 112 | | | Huntington Bancshares, Inc. | | | 1,548 | |
| | 657 | | | JPMorgan Chase & Co. | | | 73,453 | |
| | 86 | | | KeyCorp | | | 1,526 | |
| | 19 | | | M&T Bank Corp. | | | 3,231 | |
| | 107 | | | MGIC Investment Corp.1 | | | 1,406 | |
| | 59 | | | PNC Financial Services Group, Inc. (The) | | | 8,100 | |
| | 27 | | | Popular, Inc. | | | 1,464 | |
| | 55 | | | SunTrust Banks, Inc. | | | 3,457 | |
| | 274 | | | U.S. Bancorp | | | 14,358 | |
| | 376 | | | Wells Fargo & Co. | | | 17,792 | |
| | | | | | | | |
| | | | Total Banks | | | 206,802 | |
| | | | | | | | |
| | | | Capital Goods—5.8% | |
| | 47 | | | 3M Co. | | | 8,147 | |
| | 9 | | | Acuity Brands, Inc. | | | 1,241 | |
| | 28 | | | Allegion PLC | | | 3,095 | |
| | 59 | | | AMETEK, Inc. | | | 5,360 | |
| | 124 | | | Arconic, Inc. | | | 3,202 | |
| | 17 | | | Armstrong World Industries, Inc. | | | 1,652 | |
| | 94 | | | Boeing Co. (The) | | | 34,217 | |
| | 18 | | | Carlisle Cos., Inc. | | | 2,527 | |
| | 46 | | | Caterpillar, Inc. | | | 6,269 | |
| | 39 | | | Cummins, Inc. | | | 6,682 | |
| | 40 | | | Deere & Co. | | | 6,628 | |
| | 25 | | | Donaldson Co., Inc. | | | 1,272 | |
| | 44 | | | Dover Corp. | | | 4,409 | |
| | 79 | | | Eaton Corp. PLC | | | 6,579 | |
| | 77 | | | Emerson Electric Co. | | | 5,137 | |
| | 175 | | | Fastenal Co. | | | 5,703 | |
| | 39 | | | Flowserve Corp. | | | 2,055 | |
| | 49 | | | Fortive Corp. | | | 3,995 | |
| | 25 | | | General Dynamics Corp. | | | 4,546 | |
| | 549 | | | General Electric Co. | | | 5,765 | |
| | 33 | | | Graco, Inc. | | | 1,656 | |
| | 45 | | | Harris Corp.1 | | | 8,511 | |
| | 14 | | | HEICO Corp.2 | | | 1,873 | |
| | 27 | | | HEICO Corp., Class A | | | 2,791 | |
| | 206 | | | Honeywell International, Inc. | | | 35,966 | |
| | 12 | | | Hubbell, Inc. | | | 1,565 | |
| | 6 | | | Huntington Ingalls Industries, Inc. | | | 1,348 | |
| | 16 | | | IDEX Corp. | | | 2,754 | |
| | 63 | | | Illinois Tool Works, Inc. | | | 9,501 | |
| | 80 | | | Ingersoll-Rand PLC | | | 10,134 | |
| | 21 | | | ITT, Inc. | | | 1,375 | |
| | 37 | | | Jacobs Engineering Group, Inc. | | | 3,122 | |
| | 229 | | | Johnson Controls International PLC | | | 9,460 | |
| | 16 | | | L3 Technologies, Inc. | | | 3,923 | |
| | 12 | | | Lennox International, Inc. | | | 3,300 | |
| | | | | | | | |
| Shares | | | | | Value | |
| | | | Common Stocks (continued) | |
| | | | Capital Goods (continued) | |
| | 59 | | | Lockheed Martin Corp. | | $ | 21,449 | |
| | 49 | | | Masco Corp. | | | 1,923 | |
| | 18 | | | Middleby Corp. (The)1 | | | 2,443 | |
| | 11 | | | Nordson Corp. | | | 1,554 | |
| | 24 | | | Northrop Grumman Corp. | | | 7,755 | |
| | 86 | | | PACCAR, Inc. | | | 6,163 | |
| | 20 | | | Parker-Hannifin Corp. | | | 3,400 | |
| | 31 | | | Raytheon Co. | | | 5,390 | |
| | 15 | | | Rockwell Automation, Inc. | | | 2,457 | |
| | 32 | | | Roper Technologies, Inc. | | | 11,720 | |
| | 10 | | | Snap-on, Inc. | | | 1,656 | |
| | 14 | | | Spirit AeroSystems Holdings, Inc., Class A | | | 1,139 | |
| | 23 | | | Stanley Black & Decker, Inc. | | | 3,326 | |
| | 10 | | | Teledyne Technologies, Inc.1 | | | 2,739 | |
| | 28 | | | Toro Co. (The) | | | 1,873 | |
| | 17 | | | TransDigm Group, Inc.1 | | | 8,225 | |
| | 176 | | | United Technologies Corp. | | | 22,915 | |
| | 11 | | | WABCO Holdings, Inc.1 | | | 1,459 | |
| | 19 | | | Woodward, Inc. | | | 2,150 | |
| | 37 | | | Xylem, Inc. | | | 3,095 | |
| | | | | | | | |
| | | | Total Capital Goods | | | 328,591 | |
| | | | | | | | |
| | | | Commercial & Professional Services—1.0% | |
| | 24 | | | Cintas Corp. | | | 5,695 | |
| | 48 | | | Copart, Inc.1 | | | 3,587 | |
| | 11 | | | CoStar Group, Inc.1 | | | 6,095 | |
| | 19 | | | Equifax, Inc. | | | 2,570 | |
| | 25 | | | IAA, Inc.1 | | | 969 | |
| | 98 | | | IHS Markit Ltd.1 | | | 6,245 | |
| | 25 | | | KAR Auction Services, Inc. | | | 625 | |
| | 64 | | | Republic Services, Inc. | | | 5,545 | |
| | 22 | | | TransUnion | | | 1,617 | |
| | 51 | | | Verisk Analytics, Inc. | | | 7,469 | |
| | 138 | | | Waste Management, Inc. | | | 15,921 | |
| | | | | | | | |
| | | | Total Commercial & Professional Services | | | 56,338 | |
| | | | | | | | |
| | | | Consumer Durables & Apparel—1.0% | |
| | 69 | | | D.R. Horton, Inc. | | | 2,976 | |
| | 47 | | | Garmin Ltd. | | | 3,751 | |
| | 26 | | | Hasbro, Inc. | | | 2,748 | |
| | 49 | | | Lennar Corp., Class A | | | 2,375 | |
| | 40 | | | Lululemon Athletica, Inc.1 | | | 7,208 | |
| | 300 | | | NIKE, Inc., Class B | | | 25,185 | |
| | 1 | | | NVR, Inc.1 | | | 3,370 | |
| | 56 | | | PulteGroup, Inc. | | | 1,771 | |
| | 31 | | | Roku, Inc.1 | | | 2,808 | |
| | 70 | | | VF Corp. | | | 6,114 | |
| | | | | | | | |
| | | | Total Consumer Durables & Apparel | | | 58,306 | |
| | | | | | | | |
| | | | Consumer Services—2.6% | |
| | 18 | | | Bright Horizons Family Solutions, Inc.1 | | | 2,716 | |
| | 34 | | | Carnival Corp. | | | 1,583 | |
| | 9 | | | Chipotle Mexican Grill, Inc.1 | | | 6,596 | |
| | 40 | | | Darden Restaurants, Inc. | | | 4,869 | |
| | 7 | | | Domino’s Pizza, Inc. | | | 1,948 | |
| | 20 | | | Dunkin’ Brands Group, Inc. | | | 1,593 | |
| | 56 | | | H&R Block, Inc. | | | 1,641 | |
| | 69 | | | Hilton Worldwide Holdings, Inc. | | | 6,744 | |
| | 21 | | | Las Vegas Sands Corp. | | | 1,241 | |
| | 39 | | | Marriott International, Inc., Class A | | | 5,471 | |
The accompanying notes are an integral part of these financial statements.
Invesco Russell 1000® Momentum Factor ETF (OMOM)(continued)
June 30, 2019
| | | | | | | | |
| Shares | | | | | Value | |
| | | | Common Stocks (continued) | |
| | | | Consumer Services (continued) | |
| | 224 | | | McDonald’s Corp. | | $ | 46,516 | |
| | 44 | | | MGM Resorts International | | | 1,257 | |
| | 41 | | | Norwegian Cruise Line Holdings Ltd.1 | | | 2,199 | |
| | 32 | | | Planet Fitness, Inc., Class A1 | | | 2,318 | |
| | 40 | | | Royal Caribbean Cruises Ltd. | | | 4,848 | |
| | 51 | | | Service Corp. International | | | 2,386 | |
| | 47 | | | ServiceMaster Global Holdings, Inc.1 | | | 2,448 | |
| | 427 | | | Starbucks Corp. | | | 35,796 | |
| | 67 | | | Yum China Holdings, Inc. | | | 3,095 | |
| | 93 | | | Yum! Brands, Inc. | | | 10,292 | |
| | | | | | | | |
| | | | Total Consumer Services | | | 145,557 | |
| | | | | | | | |
| | | | Diversified Financials—4.2% | |
| | 99 | | | AGNC Investment Corp. | | | 1,665 | |
| | 100 | | | Ally Financial, Inc. | | | 3,099 | |
| | 202 | | | American Express Co. | | | 24,935 | |
| | 23 | | | Ameriprise Financial, Inc. | | | 3,339 | |
| | 250 | | | Annaly Capital Management, Inc. | | | 2,283 | |
| | 56 | | | AXA Equitable Holdings, Inc. | | | 1,170 | |
| | 67 | | | Bank of New York Mellon Corp. (The) | | | 2,958 | |
| | 403 | | | Berkshire Hathaway, Inc., Class B1 | | | 85,908 | |
| | 11 | | | BlackRock, Inc. | | | 5,162 | |
| | 65 | | | Capital One Financial Corp. | | | 5,898 | |
| | 21 | | | Cboe Global Markets, Inc. | | | 2,176 | |
| | 71 | | | Charles Schwab Corp. (The) | | | 2,853 | |
| | 83 | | | CME Group, Inc. | | | 16,111 | |
| | 3 | | | Credit Acceptance Corp.1 | | | 1,452 | |
| | 65 | | | Discover Financial Services | | | 5,043 | |
| | 12 | | | FactSet Research Systems, Inc. | | | 3,439 | |
| | 49 | | | Franklin Resources, Inc. | | | 1,705 | |
| | 31 | | | Goldman Sachs Group, Inc. (The) | | | 6,343 | |
| | 129 | | | Intercontinental Exchange, Inc. | | | 11,086 | |
| | 23 | | | LPL Financial Holdings, Inc. | | | 1,876 | |
| | 13 | | | MarketAxess Holdings, Inc. | | | 4,178 | |
| | 34 | | | Moody’s Corp. | | | 6,641 | |
| | 124 | | | Morgan Stanley | | | 5,432 | |
| | 27 | | | MSCI, Inc. | | | 6,447 | |
| | 17 | | | Nasdaq, Inc. | | | 1,635 | |
| | 78 | | | New Residential Investment Corp. | | | 1,200 | |
| | 22 | | | Northern Trust Corp. | | | 1,980 | |
| | 46 | | | S&P Global, Inc. | | | 10,478 | |
| | 66 | | | Starwood Property Trust, Inc. | | | 1,500 | |
| | 125 | | | Synchrony Financial | | | 4,334 | |
| | 21 | | | T. Rowe Price Group, Inc. | | | 2,304 | |
| | 31 | | | TD Ameritrade Holding Corp. | | | 1,548 | |
| | 27 | | | Voya Financial, Inc. | | | 1,493 | |
| | | | | | | | |
| | | | Total Diversified Financials | | | 237,671 | |
| | | | | | | | |
| | | | Energy—2.9% | |
| | 109 | | | Anadarko Petroleum Corp. | | | 7,691 | |
| | 102 | | | Cabot Oil & Gas Corp. | | | 2,342 | |
| | 46 | | | Cheniere Energy, Inc.1 | | | 3,149 | |
| | 336 | | | Chevron Corp. | | | 41,812 | |
| | 22 | | | Concho Resources, Inc. | | | 2,270 | |
| | 170 | | | ConocoPhillips | | | 10,370 | |
| | 24 | | | Diamondback Energy, Inc. | | | 2,615 | |
| | 44 | | | EOG Resources, Inc. | | | 4,099 | |
| | 675 | | | Exxon Mobil Corp. | | | 51,725 | |
| | 63 | | | Hess Corp. | | | 4,005 | |
| | | | | | | | |
| Shares | | | | | Value | |
| | | | Common Stocks (continued) | |
| | | | Energy (continued) | |
| | 605 | | | Kinder Morgan, Inc. | | $ | 12,632 | |
| | 28 | | | Marathon Petroleum Corp. | | | 1,565 | |
| | 85 | | | ONEOK, Inc. | | | 5,849 | |
| | 25 | | | Phillips 66 | | | 2,339 | |
| | 14 | | | Pioneer Natural Resources Co. | | | 2,154 | |
| | 36 | | | Targa Resources Corp. | | | 1,413 | |
| | 21 | | | Valero Energy Corp. | | | 1,798 | |
| | 260 | | | Williams Cos., Inc. (The) | | | 7,290 | |
| | | | | | | | |
| | | | Total Energy | | | 165,118 | |
| | | | | | | | |
| | | | Food & Staples Retailing—1.7% | | | |
| | 12 | | | Casey’s General Stores, Inc. | | | 1,872 | |
| | 127 | | | Costco Wholesale Corp. | | | 33,561 | |
| | 114 | | | Kroger Co. (The) | | | 2,475 | |
| | 122 | | | Sysco Corp. | | | 8,628 | |
| | 39 | | | US Foods Holding Corp.1 | | | 1,395 | |
| | 56 | | | Walgreens Boots Alliance, Inc. | | | 3,061 | |
| | 418 | | | Walmart, Inc. | | | 46,185 | |
| | | | | | | | |
| | | | Total Food & Staples Retailing | | | 97,177 | |
| | | | | | | | |
| | | | Food, Beverage & Tobacco—4.0% | | | |
| | 259 | | | Altria Group, Inc. | | | 12,264 | |
| | 66 | | | Archer-Daniels-Midland Co. | | | 2,693 | |
| | 28 | | | Brown-Forman Corp., Class B | | | 1,552 | |
| | 38 | | | Campbell Soup Co. | | | 1,523 | |
| | 975 | | | Coca-Cola Co. (The) | | | 49,647 | |
| | 17 | | | Constellation Brands, Inc., Class A | | | 3,348 | |
| | 171 | | | General Mills, Inc. | | | 8,981 | |
| | 51 | | | Hershey Co. (The) | | | 6,836 | |
| | 66 | | | Hormel Foods Corp.2 | | | 2,676 | |
| | 33 | | | JM Smucker Co. (The) | | | 3,801 | |
| | 24 | | | Kellogg Co. | | | 1,286 | |
| | 29 | | | Lamb Weston Holdings, Inc. | | | 1,837 | |
| | 44 | | | McCormick & Co., Inc. | | | 6,820 | |
| | 465 | | | Mondelez International, Inc., Class A | | | 25,063 | |
| | 95 | | | Monster Beverage Corp.1 | | | 6,064 | |
| | 423 | | | PepsiCo, Inc. | | | 55,468 | |
| | 377 | | | Philip Morris International, Inc. | | | 29,606 | |
| | 21 | | | Post Holdings, Inc.1 | | | 2,183 | |
| | 77 | | | Tyson Foods, Inc., Class A | | | 6,217 | |
| | | | | | | | |
| | | | Total Food, Beverage & Tobacco | | | 227,865 | |
| | | | | | | | |
| | | | Health Care Equipment & Services—5.7% | | | |
| | 510 | | | Abbott Laboratories | | | 42,891 | |
| | 9 | | | Align Technology, Inc.1 | | | 2,463 | |
| | 58 | | | Anthem, Inc. | | | 16,368 | |
| | 87 | | | Baxter International, Inc. | | | 7,125 | |
| | 44 | | | Becton Dickinson and Co. | | | 11,088 | |
| | 345 | | | Boston Scientific Corp.1 | | | 14,828 | |
| | 27 | | | Cardinal Health, Inc. | | | 1,272 | |
| | 47 | | | Centene Corp.1 | | | 2,465 | |
| | 76 | | | Cerner Corp. | | | 5,571 | |
| | 39 | | | Cigna Corp. | | | 6,145 | |
| | 15 | | | Cooper Cos., Inc. (The) | | | 5,053 | |
| | 76 | | | CVS Health Corp. | | | 4,141 | |
| | 204 | | | Danaher Corp. | | | 29,156 | |
| | 65 | | | DENTSPLY SIRONA, Inc. | | | 3,793 | |
| | 25 | | | DexCom, Inc.1 | | | 3,746 | |
| | 52 | | | Edwards Lifesciences Corp.1 | | | 9,607 | |
| | 72 | | | HCA Healthcare, Inc. | | | 9,732 | |
The accompanying notes are an integral part of these financial statements.
Invesco Russell 1000® Momentum Factor ETF (OMOM)(continued)
June 30, 2019
| | | | | | | | |
| Shares | | | | | Value | |
| | | | Common Stocks (continued) | |
| | | | Health Care Equipment & Services (continued) | | | |
| | 41 | | | Henry Schein, Inc.1 | | $ | 2,866 | |
| | 14 | | | Hill-Rom Holdings, Inc. | | | 1,465 | |
| | 63 | | | Hologic, Inc.1 | | | 3,025 | |
| | 10 | | | Humana, Inc. | | | 2,653 | |
| | 19 | | | IDEXX Laboratories, Inc.1 | | | 5,231 | |
| | 12 | | | Insulet Corp.1 | | | 1,433 | |
| | 19 | | | Intuitive Surgical, Inc.1 | | | 9,967 | |
| | 9 | | | Laboratory Corp. of America Holdings1 | | | 1,556 | |
| | 16 | | | Masimo Corp.1 | | | 2,381 | |
| | 16 | | | McKesson Corp. | | | 2,150 | |
| | 14 | | | Medidata Solutions, Inc.1 | | | 1,267 | |
| | 255 | | | Medtronic PLC | | | 24,834 | |
| | 21 | | | Molina Healthcare, Inc.1 | | | 3,006 | |
| | 15 | | | Quest Diagnostics, Inc. | | | 1,527 | |
| | 31 | | | ResMed, Inc. | | | 3,783 | |
| | 26 | | | STERIS PLC | | | 3,871 | |
| | 80 | | | Stryker Corp. | | | 16,446 | |
| | 9 | | | Teleflex, Inc. | | | 2,980 | |
| | 134 | | | UnitedHealth Group, Inc. | | | 32,697 | |
| | 17 | | | Universal Health Services, Inc., Class B | | | 2,217 | |
| | 19 | | | Varian Medical Systems, Inc.1 | | | 2,587 | |
| | 48 | | | Veeva Systems, Inc., Class A1 | | | 7,781 | |
| | 13 | | | WellCare Health Plans, Inc.1 | | | 3,706 | |
| | 19 | | | West Pharmaceutical Services, Inc. | | | 2,378 | |
| | 39 | | | Zimmer Biomet Holdings, Inc. | | | 4,592 | |
| | | | | | | | |
| | | | Total Health Care Equipment & Services | | | 321,843 | |
| | | | | | | | |
| | | | Household & Personal Products—2.6% | | | |
| | 89 | | | Church & Dwight Co., Inc. | | | 6,502 | |
| | 34 | | | Clorox Co. (The) | | | 5,206 | |
| | 213 | | | Colgate-Palmolive Co. | | | 15,266 | |
| | 46 | | | Estee Lauder Cos., Inc., (The), Class A | | | 8,423 | |
| | 108 | | | Kimberly-Clark Corp. | | | 14,394 | |
| | 882 | | | Procter & Gamble Co. (The) | | | 96,711 | |
| | | | | | | | |
| | | | Total Household & Personal Products | | | 146,502 | |
| | | | | | | | |
| | | | Insurance—3.0% | | | |
| | 194 | | | Aflac, Inc. | | | 10,633 | |
| | 4 | | | Alleghany Corp.1 | | | 2,725 | |
| | 64 | | | Allstate Corp. (The) | | | 6,508 | |
| | 132 | | | American International Group, Inc. | | | 7,033 | |
| | 78 | | | Aon PLC | | | 15,052 | |
| | 118 | | | Arch Capital Group Ltd.1 | | | 4,375 | |
| | 59 | | | Arthur J. Gallagher & Co. | | | 5,168 | |
| | 59 | | | Brown & Brown, Inc. | | | 1,977 | |
| | 113 | | | Chubb Ltd. | | | 16,644 | |
| | 55 | | | Cincinnati Financial Corp. | | | 5,702 | |
| | 9 | | | Erie Indemnity Co., Class A | | | 2,289 | |
| | 10 | | | Everest Re Group Ltd. | | | 2,472 | |
| | 54 | | | Fidelity National Financial, Inc. | | | 2,176 | |
| | 24 | | | First American Financial Corp. | | | 1,289 | |
| | 65 | | | Hartford Financial Services Group, Inc. (The) | | | 3,622 | |
| | 16 | | | Kemper Corp. | | | 1,381 | |
| | 31 | | | Lincoln National Corp. | | | 1,998 | |
| | 51 | | | Loews Corp. | | | 2,788 | |
| | 2 | | | Markel Corp.1 | | | 2,179 | |
| | 140 | | | Marsh & McLennan Cos., Inc. | | | 13,965 | |
| | 166 | | | MetLife, Inc. | | | 8,245 | |
| | 63 | | | Old Republic International Corp. | | | 1,410 | |
| | | | | | | | |
| Shares | | | | | Value | |
| | | | Common Stocks (continued) | |
| | | | Insurance (continued) | | | |
| | 12 | | | Primerica, Inc. | | $ | 1,439 | |
| | 47 | | | Principal Financial Group, Inc. | | | 2,722 | |
| | 188 | | | Progressive Corp. (The) | | | 15,027 | |
| | 77 | | | Prudential Financial, Inc. | | | 7,777 | |
| | 13 | | | Reinsurance Group of America, Inc. | | | 2,028 | |
| | 15 | | | RenaissanceRe Holdings Ltd. | | | 2,670 | |
| | 21 | | | Torchmark Corp. | | | 1,879 | |
| | 69 | | | Travelers Cos., Inc. (The) | | | 10,317 | |
| | 44 | | | W.R. Berkley Corp. | | | 2,901 | |
| | 34 | | | Willis Towers Watson PLC | | | 6,512 | |
| | | | | | | | |
| | | | Total Insurance | | | 172,903 | |
| | | | | | | | |
| | | | Materials—2.2% | | | |
| | 72 | | | Air Products & Chemicals, Inc. | | | 16,299 | |
| | 18 | | | AptarGroup, Inc. | | | 2,238 | |
| | 13 | | | Avery Dennison Corp. | | | 1,504 | |
| | 124 | | | Ball Corp. | | | 8,679 | |
| | 26 | | | Berry Global Group, Inc.1 | | | 1,367 | |
| | 13 | | | Celanese Corp. | | | 1,401 | |
| | 35 | | | CF Industries Holdings, Inc. | | | 1,635 | |
| | 141 | | | Corteva, Inc.1 | | | 4,169 | |
| | 43 | | | Crown Holdings, Inc.1 | | | 2,627 | |
| | 141 | | | Dow, Inc. | | | 6,953 | |
| | 25 | | | DuPont de Nemours, Inc. | | | 1,877 | |
| | 77 | | | Ecolab, Inc. | | | 15,203 | |
| | 21 | | | FMC Corp. | | | 1,742 | |
| | 25 | | | International Flavors & Fragrances, Inc. | | | 3,627 | |
| | 33 | | | International Paper Co. | | | 1,430 | |
| | 153 | | | Linde PLC | | | 30,722 | |
| | 9 | | | Martin Marietta Materials, Inc. | | | 2,071 | |
| | 67 | | | Newmont Goldcorp Corp. | | | 2,577 | |
| | 51 | | | PPG Industries, Inc. | | | 5,952 | |
| | 32 | | | RPM International, Inc. | | | 1,956 | |
| | 19 | | | Sherwin-Williams Co. (The) | | | 8,708 | |
| | 29 | | | Sonoco Products Co. | | | 1,895 | |
| | 22 | | | Vulcan Materials Co. | | | 3,021 | |
| | | | | | | | |
| | | | Total Materials | | | 127,653 | |
| | | | | | | | |
| | | | Media & Entertainment—7.1% | | | |
| | 52 | | | Alphabet, Inc., Class A1 | | | 56,306 | |
| | 53 | | | Alphabet, Inc., Class C1 | | | 57,288 | |
| | 114 | | | Altice USA, Inc., Class A1 | | | 2,776 | |
| | 2 | | | Cable One, Inc. | | | 2,342 | |
| | 33 | | | CBS Corp., Class B | | | 1,647 | |
| | 52 | | | Charter Communications, Inc., Class A1 | | | 20,549 | |
| | 1,479 | | | Comcast Corp., Class A | | | 62,532 | |
| | 67 | | | Discovery, Inc., Class C1 | | | 1,906 | |
| | 41 | | | DISH Network Corp., Class A1 | | | 1,575 | |
| | 331 | | | Facebook, Inc., Class A1 | | | 63,883 | |
| | 66 | | | Fox Corp., Class A | | | 2,418 | |
| | 33 | | | GCI Liberty, Inc., Class A1 | | | 2,028 | |
| | 27 | | | IAC/InterActiveCorp1 | | | 5,873 | |
| | 62 | | | Interpublic Group of Cos., Inc. (The) | | | 1,401 | |
| | 35 | | | Liberty Broadband Corp., Class C1 | | | 3,648 | |
| | 45 | | | Liberty Media Corp.-Liberty Formula One, Class C1 | | | 1,683 | |
| | 44 | | | Live Nation Entertainment, Inc.1 | | | 2,915 | |
| | 4 | | | Madison Square Garden Co. (The), Class A1 | | | 1,120 | |
| | 21 | | | Match Group, Inc. | | | 1,413 | |
| | 49 | | | Netflix, Inc.1 | | | 17,999 | |
The accompanying notes are an integral part of these financial statements.
Invesco Russell 1000® Momentum Factor ETF (OMOM)(continued)
June 30, 2019
| | | | | | | | |
| Shares | | | | | Value | |
| | | | Common Stocks (continued) | |
| | | | Media & Entertainment (continued) | | | |
| | 55 | | | New York Times Co., (The), Class A | | $ | 1,794 | |
| | 16 | | | Nexstar Media Group, Inc., Class A | | | 1,616 | |
| | 48 | | | Omnicom Group, Inc. | | | 3,934 | |
| | 11 | | | Take-Two Interactive Software, Inc.1 | | | 1,249 | |
| | 26 | | | Tribune Media Co., Class A | | | 1,202 | |
| | 56 | | | Twitter, Inc.1 | | | 1,954 | |
| | 58 | | | Viacom, Inc., Class B | | | 1,732 | |
| | 541 | | | Walt Disney Co. (The) | | | 75,545 | |
| | 301 | | | Zynga, Inc., Class A1 | | | 1,845 | |
| | | | | | | | |
| | | | Total Media & Entertainment | | | 402,173 | |
| | | | | | | | |
| | | | Pharmaceuticals, Biotechnology & Life Sciences—8.3% | | | |
| | 121 | | | AbbVie, Inc. | | | 8,799 | |
| | 64 | | | Agilent Technologies, Inc. | | | 4,779 | |
| | 47 | | | Alexion Pharmaceuticals, Inc.1 | | | 6,156 | |
| | 25 | | | Allergan PLC | | | 4,186 | |
| | 84 | | | Amgen, Inc. | | | 15,479 | |
| | 10 | | | Biogen, Inc.1 | | | 2,339 | |
| | 21 | | | BioMarin Pharmaceutical, Inc.1 | | | 1,799 | |
| | 11 | | | Bio-Techne Corp. | | | 2,293 | |
| | 170 | | | Bristol-Myers Squibb Co. | | | 7,709 | |
| | 33 | | | Bruker Corp. | | | 1,648 | |
| | 33 | | | Catalent, Inc.1 | | | 1,789 | |
| | 206 | | | Celgene Corp.1 | | | 19,043 | |
| | 11 | | | Charles River Laboratories International, Inc.1 | | | 1,561 | |
| | 69 | | | Elanco Animal Health, Inc.1 | | | 2,332 | |
| | 295 | | | Eli Lilly & Co. | | | 32,683 | |
| | 45 | | | Exact Sciences Corp.1 | | | 5,312 | |
| | 194 | | | Gilead Sciences, Inc. | | | 13,107 | |
| | 66 | | | Horizon Therapeutics PLC1 | | | 1,588 | |
| | 31 | | | Illumina, Inc.1 | | | 11,413 | |
| | 35 | | | Incyte Corp.1 | | | 2,974 | |
| | 46 | | | Ionis Pharmaceuticals, Inc.1 | | | 2,956 | |
| | 58 | | | IQVIA Holdings, Inc.1 | | | 9,332 | |
| | 689 | | | Johnson & Johnson | | | 95,964 | |
| | 831 | | | Merck & Co., Inc. | | | 69,679 | |
| | 7 | | | Mettler-Toledo International, Inc.1 | | | 5,880 | |
| | 26 | | | PerkinElmer, Inc. | | | 2,505 | |
| | 1,520 | | | Pfizer, Inc. | | | 65,846 | |
| | 37 | | | QIAGEN NV1 | | | 1,500 | |
| | 12 | | | Regeneron Pharmaceuticals, Inc.1 | | | 3,756 | |
| | 9 | | | Sage Therapeutics, Inc.1 | | | 1,648 | |
| | 20 | | | Sarepta Therapeutics, Inc.1 | | | 3,039 | |
| | 20 | | | Seattle Genetics, Inc.1 | | | 1,384 | |
| | 116 | | | Thermo Fisher Scientific, Inc. | | | 34,067 | |
| | 57 | | | Vertex Pharmaceuticals, Inc.1 | | | 10,453 | |
| | 13 | | | Waters Corp.1 | | | 2,798 | |
| | 124 | | | Zoetis, Inc. | | | 14,073 | |
| | | | | | | | |
| | | | Total Pharmaceuticals, Biotechnology & Life Sciences | | | 471,869 | |
| | | | | | | | |
| | | | Real Estate—4.6% | | | |
| | 30 | | | Alexandria Real Estate Equities, Inc. | | | 4,233 | |
| | 34 | | | American Campus Communities, Inc. | | | 1,569 | |
| | 66 | | | American Homes 4 Rent, Class A | | | 1,604 | |
| | 160 | | | American Tower Corp. | | | 32,712 | |
| | 70 | | | Americold Realty Trust | | | 2,269 | |
| | 46 | | | Apartment Investment & Management Co., Class A | | | 2,305 | |
| | 42 | | | AvalonBay Communities, Inc. | | | 8,534 | |
| | | | | | | | |
| Shares | | | | | Value | |
| | | | Common Stocks (continued) | |
| | | | Real Estate (continued) | | | |
| | 40 | | | Boston Properties, Inc. | | $ | 5,160 | |
| | 72 | | | Brixmor Property Group, Inc. | | | 1,287 | |
| | 25 | | | Camden Property Trust | | | 2,610 | |
| | 51 | | | CBRE Group, Inc., Class A1 | | | 2,616 | |
| | 134 | | | Crown Castle International Corp. | | | 17,467 | |
| | 43 | | | CubeSmart | | | 1,438 | |
| | 28 | | | CyrusOne, Inc. | | | 1,616 | |
| | 52 | | | Digital Realty Trust, Inc. | | | 6,125 | |
| | 36 | | | Douglas Emmett, Inc. | | | 1,434 | |
| | 85 | | | Duke Realty Corp. | | | 2,687 | |
| | 24 | | | EPR Properties | | | 1,790 | |
| | 26 | | | Equinix, Inc. | | | 13,112 | |
| | 28 | | | Equity LifeStyle Properties, Inc. | | | 3,397 | |
| | 111 | | | Equity Residential | | | 8,427 | |
| | 20 | | | Essex Property Trust, Inc. | | | 5,839 | |
| | 30 | | | Extra Space Storage, Inc. | | | 3,183 | |
| | 18 | | | Federal Realty Investment Trust | | | 2,318 | |
| | 57 | | | Gaming and Leisure Properties, Inc. | | | 2,222 | |
| | 166 | | | HCP, Inc. | | | 5,309 | |
| | 54 | | | Healthcare Trust of America, Inc., Class A | | | 1,481 | |
| | 100 | | | Host Hotels & Resorts, Inc. | | | 1,822 | |
| | 110 | | | Invitation Homes, Inc. | | | 2,940 | |
| | 51 | | | Iron Mountain, Inc. | | | 1,596 | |
| | 19 | | | Kilroy Realty Corp. | | | 1,402 | |
| | 109 | | | Kimco Realty Corp. | | | 2,014 | |
| | 24 | | | Lamar Advertising Co., Class A | | | 1,937 | |
| | 36 | | | Liberty Property Trust | | | 1,801 | |
| | 134 | | | Medical Properties Trust, Inc. | | | 2,337 | |
| | 34 | | | Mid-America Apartment Communities, Inc. | | | 4,004 | |
| | 53 | | | National Retail Properties, Inc. | | | 2,810 | |
| | 69 | | | Omega Healthcare Investors, Inc. | | | 2,536 | |
| | 48 | | | Outfront Media, Inc. | | | 1,238 | |
| | 44 | | | Park Hotels & Resorts, Inc. | | | 1,213 | |
| | 185 | | | Prologis, Inc. | | | 14,818 | |
| | 34 | | | Public Storage | | | 8,098 | |
| | 107 | | | Realty Income Corp. | | | 7,380 | |
| | 44 | | | Regency Centers Corp. | | | 2,937 | |
| | 38 | | | SBA Communications Corp.1 | | | 8,544 | |
| | 72 | | | Simon Property Group, Inc. | | | 11,503 | |
| | 69 | | | STORE Capital Corp. | | | 2,290 | |
| | 28 | | | Sun Communities, Inc. | | | 3,589 | |
| | 86 | | | UDR, Inc. | | | 3,861 | |
| | 111 | | | Ventas, Inc. | | | 7,587 | |
| | 307 | | | VEREIT, Inc. | | | 2,766 | |
| | 109 | | | VICI Properties, Inc. | | | 2,402 | |
| | 26 | | | Vornado Realty Trust | | | 1,667 | |
| | 146 | | | Welltower, Inc. | | | 11,903 | |
| | 53 | | | WP Carey, Inc. | | | 4,303 | |
| | | | | | | | |
| | | | Total Real Estate | | | 264,042 | |
| | | | | | | | |
| | | | Retailing—6.1% | | | |
| | 18 | | | Advance Auto Parts, Inc. | | | 2,775 | |
| | 92 | | | Amazon.com, Inc.1 | | | 174,214 | |
| | 9 | | | AutoZone, Inc.1 | | | 9,895 | |
| | 31 | | | Best Buy Co., Inc. | | | 2,162 | |
| | 4 | | | Booking Holdings, Inc.1 | | | 7,499 | |
| | 14 | | | Burlington Stores, Inc.1 | | | 2,382 | |
| | 34 | | | CarMax, Inc.1 | | | 2,952 | |
| | 79 | | | Dollar General Corp. | | | 10,678 | |
The accompanying notes are an integral part of these financial statements.
Invesco Russell 1000® Momentum Factor ETF (OMOM)(continued)
June 30, 2019
| | | | | | | | |
| Shares | | | | | Value | |
| | | | Common Stocks (continued) | |
| | | | Retailing (continued) | | | |
| | 60 | | | Dollar Tree, Inc.1 | | $ | 6,443 | |
| | 117 | | | eBay, Inc. | | | 4,621 | |
| | 43 | | | Etsy, Inc.1 | | | 2,639 | |
| | 16 | | | Expedia Group, Inc. | | | 2,128 | |
| | 17 | | | Five Below, Inc.1 | | | 2,040 | |
| | 28 | | | Genuine Parts Co. | | | 2,900 | |
| | 173 | | | Home Depot, Inc. (The) | | | 35,979 | |
| | 193 | | | Lowe’s Cos., Inc. | | | 19,476 | |
| | 17 | | | Ollie’s Bargain Outlet Holdings, Inc.1 | | | 1,481 | |
| | 23 | | | O’Reilly Automotive, Inc.1 | | | 8,494 | |
| | 11 | | | Pool Corp. | | | 2,101 | |
| | 93 | | | Ross Stores, Inc. | | | 9,218 | |
| | 70 | | | Target Corp. | | | 6,063 | |
| | 301 | | | TJX Cos., Inc. (The) | | | 15,917 | |
| | 41 | | | Tractor Supply Co. | | | 4,461 | |
| | 20 | | | Ulta Beauty, Inc.1 | | | 6,938 | |
| | 21 | | | Wayfair, Inc., Class A1 | | | 3,066 | |
| | | | | | | | |
| | | | Total Retailing | | | 346,522 | |
| | | | | | | | |
| | | | Semiconductors & Semiconductor Equipment—2.7% | | | |
| | 375 | | | Advanced Micro Devices, Inc.1 | | | 11,389 | |
| | 64 | | | Analog Devices, Inc. | | | 7,224 | |
| | 97 | | | Applied Materials, Inc. | | | 4,356 | |
| | 91 | | | Broadcom, Inc. | | | 26,195 | |
| | 33 | | | Cree, Inc.1 | | | 1,854 | |
| | 21 | | | First Solar, Inc.1 | | | 1,379 | |
| | 365 | | | Intel Corp. | | | 17,472 | |
| | 26 | | | KLA-Tencor Corp. | | | 3,073 | |
| | 35 | | | Lam Research Corp. | | | 6,574 | |
| | 129 | | | Marvell Technology Group Ltd. | | | 3,079 | |
| | 29 | | | Maxim Integrated Products, Inc. | | | 1,735 | |
| | 18 | | | Microchip Technology, Inc. | | | 1,561 | |
| | 9 | | | NVIDIA Corp. | | | 1,478 | |
| | 427 | | | QUALCOMM, Inc. | | | 32,482 | |
| | 46 | | | Teradyne, Inc. | | | 2,204 | |
| | 131 | | | Texas Instruments, Inc. | | | 15,034 | |
| | 16 | | | Universal Display Corp. | | | 3,009 | |
| | 35 | | | Versum Materials, Inc. | | | 1,805 | |
| | 93 | | | Xilinx, Inc. | | | 10,967 | |
| | | | | | | | |
| | | | Total Semiconductors & Semiconductor Equipment | | | 152,870 | |
| | | | | | | | |
| | | | Software & Services—17.1% | | | |
| | 150 | | | Accenture PLC, Class A | | | 27,715 | |
| | 115 | | | Adobe, Inc.1 | | | 33,885 | |
| | 22 | | | Akamai Technologies, Inc.1 | | | 1,763 | |
| | 17 | | | Alteryx, Inc., Class A1 | | | 1,855 | |
| | 17 | | | ANSYS, Inc.1 | | | 3,482 | |
| | 19 | | | Aspen Technology, Inc.1 | | | 2,361 | |
| | 39 | | | Atlassian Corp. PLC, Class A1 | | | 5,103 | |
| | 68 | | | Autodesk, Inc.1 | | | 11,077 | |
| | 118 | | | Automatic Data Processing, Inc. | | | 19,509 | |
| | 31 | | | Black Knight, Inc.1 | | | 1,865 | |
| | 47 | | | Booz Allen Hamilton Holding Corp. | | | 3,112 | |
| | 25 | | | Broadridge Financial Solutions, Inc. | | | 3,192 | |
| | 7 | | | CACI International, Inc., Class A1 | | | 1,432 | |
| | 102 | | | Cadence Design Systems, Inc.1 | | | 7,223 | |
| | 14 | | | Citrix Systems, Inc. | | | 1,374 | |
| | 26 | | | Cognizant Technology Solutions Corp., Class A | | | 1,648 | |
| | 23 | | | Coupa Software, Inc.1 | | | 2,912 | |
| | | | | | | | |
| Shares | | | | | Value | |
| | | | Common Stocks (continued) | |
| | | | Software & Services (continued) | | | |
| | 18 | | | EPAM Systems, Inc.1 | | $ | 3,116 | |
| | 19 | | | Euronet Worldwide, Inc.1 | | | 3,197 | |
| | 10 | | | Fair Isaac Corp.1 | | | 3,140 | |
| | 77 | | | Fidelity National Information Services, Inc. | | | 9,446 | |
| | 161 | | | First Data Corp., Class A1 | | | 4,358 | |
| | 99 | | | Fiserv, Inc.1 | | | 9,025 | |
| | 28 | | | FleetCor Technologies, Inc.1 | | | 7,864 | |
| | 45 | | | Fortinet, Inc.1 | | | 3,457 | |
| | 21 | | | Gartner, Inc.1 | | | 3,380 | |
| | 45 | | | Genpact Ltd. | | | 1,714 | |
| | 49 | | | Global Payments, Inc. | | | 7,846 | |
| | 32 | | | GoDaddy, Inc., Class A1 | | | 2,245 | |
| | 21 | | | Guidewire Software, Inc.1 | | | 2,129 | |
| | 14 | | | HubSpot, Inc.1 | | | 2,387 | |
| | 134 | | | International Business Machines Corp. | | | 18,479 | |
| | 69 | | | Intuit, Inc. | | | 18,032 | |
| | 15 | | | Jack Henry & Associates, Inc. | | | 2,009 | |
| | 43 | | | Leidos Holdings, Inc. | | | 3,434 | |
| | 21 | | | Manhattan Associates, Inc.1 | | | 1,456 | |
| | 282 | | | Mastercard, Inc., Class A | | | 74,597 | |
| | 2,451 | | | Microsoft Corp. | | | 328,336 | |
| | 9 | | | MongoDB, Inc.1 | | | 1,369 | |
| | 88 | | | Nuance Communications, Inc.1 | | | 1,405 | |
| | 38 | | | Okta, Inc.1 | | | 4,693 | |
| | 647 | | | Oracle Corp. | | | 36,860 | |
| | 18 | | | Palo Alto Networks, Inc.1 | | | 3,668 | |
| | 101 | | | Paychex, Inc. | | | 8,311 | |
| | 18 | | | Paycom Software, Inc.1 | | | 4,081 | |
| | 389 | | | PayPal Holdings, Inc.1 | | | 44,525 | |
| | 36 | | | Red Hat, Inc.1 | | | 6,759 | |
| | 26 | | | RingCentral, Inc., Class A1 | | | 2,988 | |
| | 176 | | | salesforce.com, Inc.1 | | | 26,704 | |
| | 66 | | | ServiceNow, Inc.1 | | | 18,122 | |
| | 29 | | | Smartsheet, Inc., Class A1 | | | 1,404 | |
| | 41 | | | Splunk, Inc.1 | | | 5,156 | |
| | 59 | | | Square, Inc., Class A1 | | | 4,279 | |
| | 52 | | | SS&C Technologies Holdings, Inc. | | | 2,996 | |
| | 82 | | | Symantec Corp. | | | 1,784 | |
| | 50 | | | Synopsys, Inc.1 | | | 6,434 | |
| | 21 | | | Tableau Software, Inc., Class A1 | | | 3,486 | |
| | 48 | | | Total System Services, Inc. | | | 6,157 | |
| | 14 | | | Trade Desk, Inc. (The), Class A1 | | | 3,189 | |
| | 43 | | | Twilio, Inc., Class A1 | | | 5,863 | |
| | 36 | | | VeriSign, Inc.1 | | | 7,530 | |
| | 511 | | | Visa, Inc., Class A | | | 88,684 | |
| | 29 | | | VMware, Inc., Class A | | | 4,849 | |
| | 64 | | | Western Union Co. (The) | | | 1,273 | |
| | 9 | | | WEX, Inc.1 | | | 1,873 | |
| | 60 | | | Workday, Inc., Class A1 | | | 12,335 | |
| | 109 | | | Worldpay, Inc., Class A1 | | | 13,358 | |
| | 39 | | | Zendesk, Inc.1 | | | 3,472 | |
| | 23 | | | Zscaler, Inc.1 | | | 1,763 | |
| | | | | | | | |
| | | | Total Software & Services | | | 974,525 | |
| | | | | | | | |
| | | | Technology Hardware & Equipment—5.2% | | | |
| | 51 | | | Amphenol Corp., Class A | | | 4,893 | |
| | 828 | | | Apple, Inc. | | | 163,878 | |
| | 6 | | | Arista Networks, Inc.1 | | | 1,558 | |
| | 43 | | | CDW Corp. | | | 4,773 | |
The accompanying notes are an integral part of these financial statements.
Invesco Russell 1000® Momentum Factor ETF (OMOM)(continued)
June 30, 2019
| | | | | | | | |
| Shares | | | | | Value | |
| | | | Common Stocks (continued) | |
| | | | Technology Hardware & Equipment (continued) | | | |
| | 54 | | | Ciena Corp.1 | | $ | 2,221 | |
| | 1,443 | | | Cisco Systems, Inc. | | | 78,975 | |
| | 152 | | | Corning, Inc. | | | 5,051 | |
| | 54 | | | Dell Technologies, Inc., Class C1 | | | 2,743 | |
| | 182 | | | Hewlett Packard Enterprise Co. | | | 2,721 | |
| | 117 | | | HP, Inc. | | | 2,432 | |
| | 46 | | | Juniper Networks, Inc. | | | 1,225 | |
| | 63 | | | Keysight Technologies, Inc.1 | | | 5,658 | |
| | 53 | | | Motorola Solutions, Inc. | | | 8,837 | |
| | 29 | | | NetApp, Inc. | | | 1,789 | |
| | 62 | | | Trimble, Inc.1 | | | 2,797 | |
| | 19 | | | ViaSat, Inc.1 | | | 1,536 | |
| | 55 | | | Xerox Corp. | | | 1,947 | |
| | 14 | | | Zebra Technologies Corp., Class A1 | | | 2,933 | |
| | | | | | | | |
| | | | Total Technology Hardware & Equipment | | | 295,967 | |
| | | | | | | | |
| | | | Telecommunication Services—2.2% | | | |
| | 1,337 | | | AT&T, Inc. | | | 44,803 | |
| | 96 | | | T-Mobile US, Inc.1 | | | 7,117 | |
| | 1,284 | | | Verizon Communications, Inc. | | | 73,355 | |
| | | | | | | | |
| | | | Total Telecommunication Services | | | 125,275 | |
| | | | | | | | |
| | | | Transportation—1.8% | | | |
| | 21 | | | Alaska Air Group, Inc. | | | 1,342 | |
| | 17 | | | C.H. Robinson Worldwide, Inc. | | | 1,434 | |
| | 214 | | | CSX Corp. | | | 16,557 | |
| | 106 | | | Delta Air Lines, Inc. | | | 6,016 | |
| | 27 | | | Expeditors International of Washington, Inc. | | | 2,048 | |
| | 24 | | | Kansas City Southern | | | 2,924 | |
| | 89 | | | Norfolk Southern Corp. | | | 17,740 | |
| | 86 | | | Southwest Airlines Co. | | | 4,367 | |
| | 34 | | | Uber Technologies, Inc.1 | | | 1,577 | |
| | 203 | | | Union Pacific Corp. | | | 34,329 | |
| | 56 | | | United Continental Holdings, Inc.1 | | | 4,903 | |
| | 72 | | | United Parcel Service, Inc., Class B | | | 7,436 | |
| | | | | | | | |
| | | | Total Transportation | | | 100,673 | |
| | | | | | | | |
| | | | Utilities—4.5% | | | |
| | 213 | | | AES Corp. | | | 3,570 | |
| | 72 | | | Alliant Energy Corp. | | | 3,534 | |
| | 82 | | | Ameren Corp. | | | 6,159 | |
| | 169 | | | American Electric Power Co., Inc. | | | 14,874 | |
| | 64 | | | American Water Works Co., Inc. | | | 7,424 | |
| | 61 | | | Aqua America, Inc. | | | 2,524 | |
| | 33 | | | Atmos Energy Corp. | | | 3,483 | |
| | 141 | | | CenterPoint Energy, Inc. | | | 4,037 | |
| | 93 | | | CMS Energy Corp. | | | 5,386 | |
| | 96 | | | Consolidated Edison, Inc. | | | 8,417 | |
| | 219 | | | Dominion Energy, Inc. | | | 16,933 | |
| | 62 | | | DTE Energy Co. | | | 7,928 | |
| | 215 | | | Duke Energy Corp. | | | 18,972 | |
| | 60 | | | Edison International | | | 4,045 | |
| | 62 | | | Entergy Corp. | | | 6,382 | |
| | 61 | | | Evergy, Inc. | | | 3,669 | |
| | 110 | | | Eversource Energy | | | 8,334 | |
| | 282 | | | Exelon Corp. | | | 13,519 | |
| | 167 | | | FirstEnergy Corp. | | | 7,149 | |
| | 35 | | | Hawaiian Electric Industries, Inc. | | | 1,524 | |
| | 14 | | | IDACORP, Inc. | | | 1,406 | |
| | 150 | | | NextEra Energy, Inc. | | | 30,729 | |
| | | | | | | | |
| Shares | | | | | Value | |
| | | | Common Stocks (continued) | |
| | | | Utilities (continued) | | | |
| | 106 | | | NiSource, Inc. | | $ | 3,053 | |
| | 56 | | | NRG Energy, Inc. | | | 1,967 | |
| | 63 | | | OGE Energy Corp. | | | 2,681 | |
| | 36 | | | Pinnacle West Capital Corp. | | | 3,387 | |
| | 184 | | | PPL Corp. | | | 5,706 | |
| | 138 | | | Public Service Enterprise Group, Inc. | | | 8,117 | |
| | 78 | | | Sempra Energy | | | 10,720 | |
| | 327 | | | Southern Co. (The) | | | 18,077 | |
| | 40 | | | UGI Corp. | | | 2,136 | |
| | 83 | | | Vistra Energy Corp. | | | 1,879 | |
| | 109 | | | WEC Energy Group, Inc. | | | 9,087 | |
| | 177 | | | Xcel Energy, Inc. | | | 10,530 | |
| | | | | | | | |
| | | | Total Utilities | | | 257,338 | |
| | | | | | | | |
| | | | Total Common Stocks
(Cost $4,779,238) | | | 5,693,275 | |
| | | | | | | | |
| | |
| | | | | | | | |
| | | | Money Market Fund—0.1% | | | |
| | 8,502 | | | Premier U.S. Government Money Portfolio, 2.26%3
(Cost $8,502) | | | 8,502 | |
| | | | | | | | |
| | |
| | | | | | | | |
| | | | Investment of Cash Collateral for Securities
Loaned—0.3% | |
| | 14,488 | | | Invesco Government & Agency Portfolio—Institutional Class, 2.27%3,4 | | | 14,488 | |
| | 4,212 | | | Invesco Liquid Assets Portfolio—Institutional Class, 2.41%3,4 | | | 4,213 | |
| | | | | | | | |
| | | | Total Investment of Cash Collateral for Securities Loaned
(Cost $18,701) | | | 18,701 | |
| | | | | | | | |
| | |
| | | | Total Investments—100.5%
(Cost $4,806,441) | | | 5,720,478 | |
| | |
| | | | Liabilities in Excess of Other Assets—(0.5)% | | | (30,169 | ) |
| | | | | | | | |
| | |
| | | | Net Assets—100.0% | | $ | 5,690,309 | |
| | | | | | | | |
| 1 | Non-income producing security. |
| 2 | All or a portion of the security was on loan. The aggregate value of the securities on loan was $2,417; total value of the collateral held by the Fund was $18,701. |
| 3 | The security and the Fund are advised by wholly-owned subsidiaries of Invesco Ltd. and are therefore considered to be affiliated. The rate shown is the 7-day SEC standardized yield as of June 30, 2019. |
| 4 | The security has been segregated to satisfy the commitment to return the cash collateral received in securities lending transactions upon the borrower’s return of the securities loaned. See Note 6. |
The accompanying notes are an integral part of these financial statements.
Schedule of Investments
Invesco Russell 1000® Value Factor ETF (OVLU)
June 30, 2019
| | | | | | | | |
| Shares | | | | | Value | |
| | | | Common Stocks—100.1% | | | |
| | | | Automobiles & Components—1.7% | | | |
| | 113 | | | Aptiv PLC | | $ | 9,134 | |
| | 131 | | | BorgWarner, Inc. | | | 5,499 | |
| | 2,645 | | | Ford Motor Co. | | | 27,058 | |
| | 839 | | | General Motors Co. | | | 32,327 | |
| | 96 | | | Gentex Corp. | | | 2,363 | |
| | 157 | | | Goodyear Tire & Rubber Co. (The) | | | 2,402 | |
| | 101 | | | Harley-Davidson, Inc. | | | 3,619 | |
| | 42 | | | Lear Corp. | | | 5,849 | |
| | 36 | | | Thor Industries, Inc. | | | 2,104 | |
| | | | | | | | |
| | | | Total Automobiles & Components | | | 90,355 | |
| | | | | | | | |
| | | | Banks—10.2% | |
| | 81 | | | Associated Banc-Corp. | | | 1,712 | |
| | 4,472 | | | Bank of America Corp. | | | 129,688 | |
| | 14 | | | Bank of Hawaii Corp. | | | 1,161 | |
| | 67 | | | Bank OZK | | | 2,016 | |
| | 59 | | | BankUnited, Inc. | | | 1,991 | |
| | 322 | | | BB&T Corp. | | | 15,820 | |
| | 57 | | | CIT Group, Inc. | | | 2,995 | |
| | 1,468 | | | Citigroup, Inc. | | | 102,804 | |
| | 226 | | | Citizens Financial Group, Inc. | | | 7,991 | |
| | 79 | | | Comerica, Inc. | | | 5,739 | |
| | 30 | | | Commerce Bancshares, Inc. | | | 1,790 | |
| | 20 | | | Cullen/Frost Bankers, Inc. | | | 1,873 | |
| | 72 | | | East West Bancorp, Inc. | | | 3,367 | |
| | 170 | | | F.N.B. Corp. | | | 2,001 | |
| | 369 | | | Fifth Third Bancorp | | | 10,295 | |
| | 3 | | | First Citizens BancShares, Inc., Class A | | | 1,351 | |
| | 49 | | | First Hawaiian, Inc. | | | 1,268 | |
| | 138 | | | First Horizon National Corp. | | | 2,060 | |
| | 39 | | | First Republic Bank | | | 3,808 | |
| | 490 | | | Huntington Bancshares, Inc. | | | 6,772 | |
| | 534 | | | KeyCorp | | | 9,479 | |
| | 50 | | | M&T Bank Corp. | | | 8,504 | |
| | 179 | | | MGIC Investment Corp.1 | | | 2,352 | |
| | 187 | | | New York Community Bancorp, Inc. | | | 1,866 | |
| | 57 | | | PacWest Bancorp | | | 2,213 | |
| | 138 | | | People’s United Financial, Inc. | | | 2,316 | |
| | 30 | | | Pinnacle Financial Partners, Inc. | | | 1,724 | |
| | 201 | | | PNC Financial Services Group, Inc. (The) | | | 27,593 | |
| | 55 | | | Popular, Inc. | | | 2,983 | |
| | 19 | | | Prosperity Bancshares, Inc. | | | 1,255 | |
| | 557 | | | Regions Financial Corp. | | | 8,322 | |
| | 20 | | | Signature Bank | | | 2,417 | |
| | 89 | | | Sterling Bancorp | | | 1,894 | |
| | 186 | | | SunTrust Banks, Inc. | | | 11,690 | |
| | 19 | | | SVB Financial Group1 | | | 4,267 | |
| | 57 | | | Synovus Financial Corp. | | | 1,995 | |
| | 85 | | | TCF Financial Corp. | | | 1,767 | |
| | 621 | | | U.S. Bancorp | | | 32,540 | |
| | 102 | | | Umpqua Holdings Corp. | | | 1,692 | |
| | 37 | | | Webster Financial Corp. | | | 1,767 | |
| | 2,243 | | | Wells Fargo & Co. | | | 106,139 | |
| | 43 | | | Western Alliance Bancorp1 | | | 1,923 | |
| | 22 | | | Wintrust Financial Corp. | | | 1,610 | |
| | 91 | | | Zions Bancorp NA | | | 4,184 | |
| | | | | | | | |
| | | | Total Banks | | | 548,994 | |
| | | | | | | | |
| | | | | | | | |
| Shares | | | | | Value | |
| | | | Common Stocks (continued) | | | |
| | | | Capital Goods—6.9% | | | |
| | 52 | | | A.O. Smith Corp. | | $ | 2,452 | |
| | 15 | | | Acuity Brands, Inc. | | | 2,069 | |
| | 97 | | | AECOM1 | | | 3,671 | |
| | 36 | | | AGCO Corp. | | | 2,793 | |
| | 68 | | | Air Lease Corp. | | | 2,811 | |
| | 20 | | | Allegion PLC | | | 2,211 | |
| | 59 | | | Allison Transmission Holdings, Inc. | | | 2,735 | |
| | 46 | | | AMETEK, Inc. | | | 4,179 | |
| | 175 | | | Arconic, Inc. | | | 4,518 | |
| | 19 | | | Carlisle Cos., Inc. | | | 2,668 | |
| | 259 | | | Caterpillar, Inc. | | | 35,299 | |
| | 21 | | | Crane Co. | | | 1,752 | |
| | 78 | | | Cummins, Inc. | | | 13,365 | |
| | 13 | | | Curtiss-Wright Corp. | | | 1,653 | |
| | 112 | | | Deere & Co. | | | 18,560 | |
| | 26 | | | Donaldson Co., Inc. | | | 1,322 | |
| | 39 | | | Dover Corp. | | | 3,908 | |
| | 164 | | | Eaton Corp. PLC | | | 13,658 | |
| | 188 | | | Emerson Electric Co. | | | 12,543 | |
| | 111 | | | Fastenal Co. | | | 3,617 | |
| | 25 | | | Flowserve Corp. | | | 1,317 | |
| | 82 | | | Fluor Corp. | | | 2,763 | |
| | 107 | | | Fortive Corp. | | | 8,723 | |
| | 56 | | | Fortune Brands Home & Security, Inc. | | | 3,199 | |
| | 99 | | | General Dynamics Corp. | | | 18,000 | |
| | 32 | | | Graco, Inc. | | | 1,606 | |
| | 66 | | | HD Supply Holdings, Inc.1 | | | 2,658 | |
| | 21 | | | Hexcel Corp. | | | 1,698 | |
| | 20 | | | Hubbell, Inc. | | | 2,608 | |
| | 21 | | | Huntington Ingalls Industries, Inc. | | | 4,720 | |
| | 13 | | | IDEX Corp. | | | 2,238 | |
| | 60 | | | Ingersoll-Rand PLC | | | 7,600 | |
| | 29 | | | ITT, Inc. | | | 1,899 | |
| | 54 | | | Jacobs Engineering Group, Inc. | | | 4,557 | |
| | 365 | | | Johnson Controls International PLC | | | 15,078 | |
| | 36 | | | L3 Technologies, Inc. | | | 8,826 | |
| | 7 | | | Lennox International, Inc. | | | 1,925 | |
| | 20 | | | Lincoln Electric Holdings, Inc. | | | 1,646 | |
| | 129 | | | Masco Corp. | | | 5,062 | |
| | 13 | | | Middleby Corp. (The)1 | | | 1,764 | |
| | 18 | | | MSC Industrial Direct Co., Inc., Class A | | | 1,337 | |
| | 15 | | | Nordson Corp. | | | 2,120 | |
| | 54 | | | Northrop Grumman Corp. | | | 17,448 | |
| | 53 | | | nVent Electric PLC | | | 1,314 | |
| | 40 | | | Oshkosh Corp. | | | 3,340 | |
| | 66 | | | Owens Corning | | | 3,841 | |
| | 188 | | | PACCAR, Inc. | | | 13,472 | |
| | 52 | | | Parker-Hannifin Corp. | | | 8,841 | |
| | 56 | | | Pentair PLC | | | 2,083 | |
| | 83 | | | Quanta Services, Inc. | | | 3,170 | |
| | 90 | | | Raytheon Co. | | | 15,649 | |
| | 22 | | | Regal Beloit Corp. | | | 1,798 | |
| | 76 | | | Resideo Technologies, Inc.1 | | | 1,666 | |
| | 35 | | | Rockwell Automation, Inc. | | | 5,734 | |
| | 61 | | | Sensata Technologies Holding PLC1 | | | 2,989 | |
| | 21 | | | Snap-on, Inc. | | | 3,478 | |
| | 45 | | | Spirit AeroSystems Holdings, Inc., Class A | | | 3,662 | |
| | 46 | | | Stanley Black & Decker, Inc. | | | 6,652 | |
The accompanying notes are an integral part of these financial statements.
Invesco Russell 1000® Value Factor ETF (OVLU)(continued)
June 30, 2019
| | | | | | | | |
| Shares | | | | | Value | |
| | | | Common Stocks (continued) | | | |
| | | | Capital Goods (continued) | | | |
| | 8 | | | Teledyne Technologies, Inc.1 | | $ | 2,191 | |
| | 137 | | | Textron, Inc. | | | 7,266 | |
| | 35 | | | Timken Co. (The) | | | 1,797 | |
| | 25 | | | Toro Co. (The) | | | 1,672 | |
| | 55 | | | Trinity Industries, Inc. | | | 1,141 | |
| | 52 | | | United Rentals, Inc.1 | | | 6,897 | |
| | 97 | | | Univar, Inc.1 | | | 2,138 | |
| | 16 | | | W.W. Grainger, Inc. | | | 4,292 | |
| | 17 | | | WABCO Holdings, Inc.1 | | | 2,254 | |
| | 25 | | | Wabtec Corp.2 | | | 1,794 | |
| | 8 | | | Watsco, Inc. | | | 1,308 | |
| | 30 | | | WESCO International, Inc.1 | | | 1,519 | |
| | 10 | | | Woodward, Inc. | | | 1,132 | |
| | 39 | | | Xylem, Inc. | | | 3,262 | |
| | | | | | | | |
| | | | Total Capital Goods | | | 370,928 | |
| | | | | | | | |
| | | | Commercial & Professional Services—0.5% | |
| | 14 | | | Cintas Corp. | | | 3,322 | |
| | 18 | | | Clean Harbors, Inc.1 | | | 1,280 | |
| | 26 | | | Copart, Inc.1 | | | 1,943 | |
| | 3 | | | CoStar Group, Inc.1 | | | 1,662 | |
| | 19 | | | Equifax, Inc. | | | 2,570 | |
| | 43 | | | IAA, Inc.1 | | | 1,668 | |
| | 43 | | | KAR Auction Services, Inc. | | | 1,075 | |
| | 39 | | | ManpowerGroup, Inc. | | | 3,767 | |
| | 55 | | | Republic Services, Inc. | | | 4,765 | |
| | 51 | | | Robert Half International, Inc. | | | 2,908 | |
| | 28 | | | TransUnion | | | 2,058 | |
| | | | | | | | |
| | | | Total Commercial & Professional Services | | | 27,018 | |
| | | | | | | | |
| | | | Consumer Durables & Apparel—1.5% | |
| | 46 | | | Brunswick Corp. | | | 2,111 | |
| | 84 | | | Capri Holdings Ltd.1 | | | 2,913 | |
| | 20 | | | Carter’s, Inc. | | | 1,951 | |
| | 149 | | | D.R. Horton, Inc. | | | 6,426 | |
| | 33 | | | Garmin Ltd. | | | 2,633 | |
| | 209 | | | Hanesbrands, Inc. | | | 3,599 | |
| | 22 | | | Hasbro, Inc. | | | 2,325 | |
| | 57 | | | Leggett & Platt, Inc. | | | 2,187 | |
| | 163 | | | Lennar Corp., Class A | | | 7,899 | |
| | 15 | | | Lululemon Athletica, Inc.1 | | | 2,703 | |
| | 32 | | | Mohawk Industries, Inc.1 | | | 4,719 | |
| | 76 | | | Newell Brands, Inc. | | | 1,172 | |
| | 1 | | | NVR, Inc.1 | | | 3,370 | |
| | 29 | | | Polaris Industries, Inc. | | | 2,646 | |
| | 161 | | | PulteGroup, Inc. | | | 5,091 | |
| | 46 | | | PVH Corp. | | | 4,354 | |
| | 21 | | | Ralph Lauren Corp. | | | 2,385 | |
| | 66 | | | Skechers U.S.A., Inc., Class A1 | | | 2,078 | |
| | 129 | | | Tapestry, Inc. | | | 4,093 | |
| | 85 | | | Toll Brothers, Inc. | | | 3,113 | |
| | 71 | | | VF Corp. | | | 6,202 | |
| | 36 | | | Whirlpool Corp. | | | 5,125 | |
| | | | | | | | |
| | | | Total Consumer Durables & Apparel | | | 79,095 | |
| | | | | | | | |
| | | | Consumer Services—2.1% | |
| | 136 | | | Aramark | | | 4,904 | |
| | 8 | | | Bright Horizons Family Solutions, Inc.1 | | | 1,207 | |
| | 291 | | | Caesars Entertainment Corp.1 | | | 3,440 | |
| | 195 | | | Carnival Corp. | | | 9,077 | |
| | | | | | | | |
| Shares | | | | | Value | |
| | | | Common Stocks (continued) | | | |
| | | | Consumer Services (continued) | |
| | 3 | | | Chipotle Mexican Grill, Inc.1 | | $ | 2,199 | |
| | 33 | | | Darden Restaurants, Inc. | | | 4,017 | |
| | 7 | | | Domino’s Pizza, Inc. | | | 1,948 | |
| | 15 | | | Dunkin’ Brands Group, Inc. | | | 1,195 | |
| | 64 | | | Extended Stay America, Inc. | | | 1,081 | |
| | 2 | | | Graham Holdings Co., Class B | | | 1,380 | |
| | 113 | | | H&R Block, Inc. | | | 3,311 | |
| | 115 | | | Las Vegas Sands Corp. | | | 6,795 | |
| | 210 | | | MGM Resorts International | | | 6,000 | |
| | 109 | | | Norwegian Cruise Line Holdings Ltd.1 | | | 5,846 | |
| | 71 | | | Royal Caribbean Cruises Ltd. | | | 8,606 | |
| | 52 | | | Service Corp. International | | | 2,432 | |
| | 27 | | | Six Flags Entertainment Corp. | | | 1,341 | |
| | 410 | | | Starbucks Corp. | | | 34,370 | |
| | 8 | | | Vail Resorts, Inc. | | | 1,785 | |
| | 70 | | | Wendy’s Co. (The) | | | 1,371 | |
| | 44 | | | Wyndham Destinations, Inc. | | | 1,932 | |
| | 24 | | | Wynn Resorts Ltd. | | | 2,976 | |
| | 114 | | | Yum China Holdings, Inc. | | | 5,267 | |
| | | | | | | | |
| | | | Total Consumer Services | | | 112,480 | |
| | | | | | | | |
| | | | Diversified Financials—6.2% | |
| | 29 | | | Affiliated Managers Group, Inc. | | | 2,672 | |
| | 124 | | | AGNC Investment Corp. | | | 2,086 | |
| | 263 | | | Ally Financial, Inc. | | | 8,150 | |
| | 241 | | | American Express Co. | | | 29,749 | |
| | 74 | | | Ameriprise Financial, Inc. | | | 10,742 | |
| | 436 | | | Annaly Capital Management, Inc. | | | 3,981 | |
| | 168 | | | AXA Equitable Holdings, Inc. | | | 3,511 | |
| | 424 | | | Bank of New York Mellon Corp. (The) | | | 18,720 | |
| | 312 | | | Capital One Financial Corp. | | | 28,311 | |
| | 20 | | | Cboe Global Markets, Inc. | | | 2,073 | |
| | 575 | | | Charles Schwab Corp. (The) | | | 23,109 | |
| | 79 | | | Chimera Investment Corp. | | | 1,491 | |
| | 3 | | | Credit Acceptance Corp.1 | | | 1,451 | |
| | 192 | | | Discover Financial Services | | | 14,897 | |
| | 114 | | | E*TRADE Financial Corp. | | | 5,084 | |
| | 34 | | | Eaton Vance Corp. | | | 1,466 | |
| | 26 | | | Evercore, Inc., Class A | | | 2,303 | |
| | 5 | | | FactSet Research Systems, Inc. | | | 1,433 | |
| | 138 | | | Franklin Resources, Inc. | | | 4,802 | |
| | 219 | | | Goldman Sachs Group, Inc. (The) | | | 44,807 | |
| | 44 | | | Interactive Brokers Group, Inc., Class A | | | 2,385 | |
| | 191 | | | Invesco Ltd.3 | | | 3,908 | |
| | 92 | | | Janus Henderson Group PLC | | | 1,969 | |
| | 133 | | | Jefferies Financial Group, Inc. | | | 2,557 | |
| | 69 | | | Lazard Ltd., Class A | | | 2,373 | |
| | 34 | | | Legg Mason, Inc. | | | 1,301 | |
| | 33 | | | LPL Financial Holdings, Inc. | | | 2,692 | |
| | 4 | | | MarketAxess Holdings, Inc. | | | 1,286 | |
| | 642 | | | Morgan Stanley | | | 28,126 | |
| | 11 | | | MSCI, Inc. | | | 2,627 | |
| | 29 | | | Nasdaq, Inc. | | | 2,789 | |
| | 142 | | | Navient Corp. | | | 1,938 | |
| | 81 | | | New Residential Investment Corp. | | | 1,247 | |
| | 74 | | | Northern Trust Corp. | | | 6,660 | |
| | 43 | | | OneMain Holdings, Inc. | | | 1,454 | |
| | 65 | | | Raymond James Financial, Inc. | | | 5,496 | |
| | 70 | | | Santander Consumer USA Holdings, Inc. | | | 1,677 | |
The accompanying notes are an integral part of these financial statements.
Invesco Russell 1000® Value Factor ETF (OVLU)(continued)
June 30, 2019
| | | | | | | | |
| Shares | | | | | Value | |
| | | | Common Stocks (continued) | | | |
| | | | Diversified Financials (continued) | |
| | 37 | | | SEI Investments Co. | | $ | 2,076 | |
| | 85 | | | Starwood Property Trust, Inc. | | | 1,931 | |
| | 245 | | | State Street Corp. | | | 13,735 | |
| | 457 | | | Synchrony Financial | | | 15,844 | |
| | 68 | | | T. Rowe Price Group, Inc. | | | 7,460 | |
| | 65 | | | TD Ameritrade Holding Corp. | | | 3,245 | |
| | 94 | | | Voya Financial, Inc. | | | 5,198 | |
| | | | | | | | |
| | | | Total Diversified Financials | | | 330,812 | |
| | | | | | | | |
| | | | Energy—11.0% | |
| | 172 | | | Anadarko Petroleum Corp. | | | 12,136 | |
| | 228 | | | Apache Corp. | | | 6,605 | |
| | 153 | | | Baker Hughes a GE Co. | | | 3,768 | |
| | 121 | | | Cabot Oil & Gas Corp. | | | 2,778 | |
| | 74 | | | Cheniere Energy, Inc.1 | | | 5,065 | |
| | 880 | | | Chesapeake Energy Corp.1,2 | | | 1,716 | |
| | 907 | | | Chevron Corp. | | | 112,867 | |
| | 64 | | | Cimarex Energy Co. | | | 3,797 | |
| | 94 | | | Concho Resources, Inc. | | | 9,699 | |
| | 628 | | | ConocoPhillips | | | 38,308 | |
| | 49 | | | Continental Resources, Inc.1 | | | 2,063 | |
| | 278 | | | Devon Energy Corp. | | | 7,929 | |
| | 44 | | | Diamondback Energy, Inc. | | | 4,795 | |
| | 261 | | | EOG Resources, Inc. | | | 24,315 | |
| | 104 | | | EQT Corp. | | | 1,644 | |
| | 71 | | | Equitrans Midstream Corp. | | | 1,399 | |
| | 2,039 | | | Exxon Mobil Corp. | | | 156,249 | |
| | 524 | | | Halliburton Co. | | | 11,916 | |
| | 23 | | | Helmerich & Payne, Inc. | | | 1,164 | |
| | 49 | | | Hess Corp. | | | 3,115 | |
| | 107 | | | HollyFrontier Corp. | | | 4,952 | |
| | 546 | | | Kinder Morgan, Inc. | | | 11,401 | |
| | 521 | | | Marathon Oil Corp. | | | 7,403 | |
| | 440 | | | Marathon Petroleum Corp. | | | 24,587 | |
| | 98 | | | Murphy Oil Corp. | | | 2,416 | |
| | 101 | | | National Oilwell Varco, Inc. | | | 2,245 | |
| | 166 | | | Noble Energy, Inc. | | | 3,718 | |
| | 434 | | | Occidental Petroleum Corp. | | | 21,822 | |
| | 120 | | | ONEOK, Inc. | | | 8,257 | |
| | 131 | | | Parsley Energy, Inc., Class A1 | | | 2,490 | |
| | 80 | | | PBF Energy, Inc., Class A | | | 2,504 | |
| | 307 | | | Phillips 66 | | | 28,717 | |
| | 58 | | | Pioneer Natural Resources Co. | | | 8,924 | |
| | 533 | | | Schlumberger Ltd. | | | 21,182 | |
| | 82 | | | Targa Resources Corp. | | | 3,219 | |
| | 277 | | | Valero Energy Corp. | | | 23,714 | |
| | 180 | | | WPX Energy, Inc.1 | | | 2,072 | |
| | | | | | | | |
| | | | Total Energy | | | 590,951 | |
| | | | | | | | |
| | | | Food & Staples Retailing—3.5% | |
| | 23 | | | Casey’s General Stores, Inc. | | | 3,588 | |
| | 166 | | | Costco Wholesale Corp. | | | 43,867 | |
| | 537 | | | Kroger Co. (The) | | | 11,658 | |
| | 73 | | | Sprouts Farmers Market, Inc.1 | | | 1,379 | |
| | 220 | | | Sysco Corp. | | | 15,558 | |
| | 133 | | | US Foods Holding Corp.1 | | | 4,756 | |
| | 518 | | | Walgreens Boots Alliance, Inc. | | | 28,319 | |
| | 695 | | | Walmart, Inc. | | | 76,791 | |
| | | | | | | | |
| | | | Total Food & Staples Retailing | | | 185,916 | |
| | | | | | | | |
| | | | | | | | |
| Shares | | | | | Value | |
| | | | Common Stocks (continued) | | | |
| | | | Food, Beverage & Tobacco—2.2% | |
| | 625 | | | Altria Group, Inc. | | $ | 29,594 | |
| | 236 | | | Archer-Daniels-Midland Co. | | | 9,629 | |
| | 26 | | | Brown-Forman Corp., Class B | | | 1,441 | |
| | 41 | | | Bunge Ltd. | | | 2,284 | |
| | 56 | | | Campbell Soup Co. | | | 2,244 | |
| | 146 | | | Conagra Brands, Inc. | | | 3,872 | |
| | 57 | | | Constellation Brands, Inc., Class A | | | 11,225 | |
| | 58 | | | Flowers Foods, Inc. | | | 1,350 | |
| | 207 | | | General Mills, Inc. | | | 10,872 | |
| | 33 | | | Hershey Co. (The) | | | 4,423 | |
| | 70 | | | Hormel Foods Corp.2 | | | 2,838 | |
| | 38 | | | Ingredion, Inc. | | | 3,134 | |
| | 32 | | | JM Smucker Co. (The) | | | 3,686 | |
| | 102 | | | Kellogg Co. | | | 5,464 | |
| | 42 | | | Kraft Heinz Co. (The) | | | 1,304 | |
| | 33 | | | Lamb Weston Holdings, Inc. | | | 2,091 | |
| | 20 | | | McCormick & Co., Inc. | | | 3,100 | |
| | 103 | | | Molson Coors Brewing Co., Class B | | | 5,768 | |
| | 21 | | | Post Holdings, Inc.1 | | | 2,183 | |
| | 30 | | | TreeHouse Foods, Inc.1 | | | 1,623 | |
| | 158 | | | Tyson Foods, Inc., Class A | | | 12,757 | |
| | | | | | | | |
| | | | Total Food, Beverage & Tobacco | | | 120,882 | |
| | | | | | | | |
| | | | Health Care Equipment & Services—6.1% | |
| | 5 | | | ABIOMED, Inc.1 | | | 1,302 | |
| | 95 | | | AmerisourceBergen Corp. | | | 8,100 | |
| | 107 | | | Anthem, Inc. | | | 30,197 | |
| | 178 | | | Cardinal Health, Inc. | | | 8,384 | |
| | 233 | | | Centene Corp.1 | | | 12,219 | |
| | 61 | | | Cerner Corp. | | | 4,471 | |
| | 3 | | | Chemed Corp. | | | 1,083 | |
| | 129 | | | Cigna Corp. | | | 20,324 | |
| | 7 | | | Cooper Cos., Inc. (The) | | | 2,358 | |
| | 746 | | | CVS Health Corp. | | | 40,650 | |
| | 75 | | | DaVita, Inc.1 | | | 4,220 | |
| | 41 | | | Encompass Health Corp. | | | 2,598 | |
| | 154 | | | HCA Healthcare, Inc. | | | 20,816 | |
| | 68 | | | Henry Schein, Inc.1 | | | 4,753 | |
| | 15 | | | Hill-Rom Holdings, Inc. | | | 1,569 | |
| | 23 | | | Hologic, Inc.1 | | | 1,104 | |
| | 68 | | | Humana, Inc. | | | 18,040 | |
| | 9 | | | IDEXX Laboratories, Inc.1 | | | 2,478 | |
| | 36 | | | Laboratory Corp. of America Holdings1 | | | 6,224 | |
| | 118 | | | McKesson Corp. | | | 15,858 | |
| | 54 | | | MEDNAX, Inc.1 | | | 1,362 | |
| | 31 | | | Molina Healthcare, Inc.1 | | | 4,437 | |
| | 48 | | | Quest Diagnostics, Inc. | | | 4,887 | |
| | 20 | | | ResMed, Inc. | | | 2,441 | |
| | 14 | | | STERIS PLC | | | 2,084 | |
| | 6 | | | Teleflex, Inc. | | | 1,987 | |
| | 362 | | | UnitedHealth Group, Inc. | | | 88,332 | |
| | 41 | | | Universal Health Services, Inc., Class B | | | 5,346 | |
| | 15 | | | Varian Medical Systems, Inc.1 | | | 2,042 | |
| | 11 | | | Veeva Systems, Inc., Class A1 | | | 1,783 | |
| | 18 | | | WellCare Health Plans, Inc.1 | | | 5,131 | |
| | 11 | | | West Pharmaceutical Services, Inc. | | | 1,377 | |
| | | | | | | | |
| | | | Total Health Care Equipment & Services | | | 327,957 | |
| | | | | | | | |
The accompanying notes are an integral part of these financial statements.
Invesco Russell 1000® Value Factor ETF (OVLU)(continued)
June 30, 2019
| | | | | | | | |
| Shares | | | | | Value | |
| | | | Common Stocks (continued) | | | |
| | | | Household & Personal Products—0.2% | |
| | 41 | | | Church & Dwight Co., Inc. | | $ | 2,995 | |
| | 27 | | | Clorox Co. (The) | | | 4,134 | |
| | 43 | | | Herbalife Nutrition Ltd.1 | | | 1,839 | |
| | 22 | | | Nu Skin Enterprises, Inc., Class A | | | 1,085 | |
| | 23 | | | Spectrum Brands Holdings, Inc. | | | 1,237 | |
| | | | | | | | |
| | | | Total Household & Personal Products | | | 11,290 | |
| | | | | | | | |
| | | | Insurance—5.0% | |
| | 360 | | | Aflac, Inc. | | | 19,732 | |
| | 3 | | | Alleghany Corp.1 | | | 2,043 | |
| | 188 | | | Allstate Corp. (The) | | | 19,118 | |
| | 42 | | | American Financial Group, Inc. | | | 4,304 | |
| | 129 | | | Arch Capital Group Ltd.1 | | | 4,783 | |
| | 42 | | | Arthur J. Gallagher & Co. | | | 3,679 | |
| | 29 | | | Assurant, Inc. | | | 3,085 | |
| | 47 | | | Assured Guaranty Ltd. | | | 1,978 | |
| | 103 | | | Athene Holding Ltd., Class A1 | | | 4,435 | |
| | 78 | | | Brighthouse Financial, Inc.1 | | | 2,862 | |
| | 49 | | | Brown & Brown, Inc. | | | 1,641 | |
| | 149 | | | Chubb Ltd. | | | 21,946 | |
| | 30 | | | Cincinnati Financial Corp. | | | 3,110 | |
| | 9 | | | Everest Re Group Ltd. | | | 2,225 | |
| | 100 | | | Fidelity National Financial, Inc. | | | 4,030 | |
| | 58 | | | First American Financial Corp. | | | 3,115 | |
| | 20 | | | Hanover Insurance Group, Inc. (The) | | | 2,566 | |
| | 207 | | | Hartford Financial Services Group, Inc. (The) | | | 11,534 | |
| | 21 | | | Kemper Corp. | | | 1,812 | |
| | 130 | | | Lincoln National Corp. | | | 8,378 | |
| | 153 | | | Loews Corp. | | | 8,365 | |
| | 2 | | | Markel Corp.1 | | | 2,179 | |
| | 536 | | | MetLife, Inc. | | | 26,623 | |
| | 126 | | | Old Republic International Corp. | | | 2,820 | |
| | 15 | | | Primerica, Inc. | | | 1,799 | |
| | 183 | | | Principal Financial Group, Inc. | | | 10,599 | |
| | 254 | | | Progressive Corp. (The) | | | 20,302 | |
| | 273 | | | Prudential Financial, Inc. | | | 27,573 | |
| | 37 | | | Reinsurance Group of America, Inc. | | | 5,773 | |
| | 14 | | | RenaissanceRe Holdings Ltd. | | | 2,492 | |
| | 47 | | | Torchmark Corp. | | | 4,205 | |
| | 117 | | | Travelers Cos., Inc. (The) | | | 17,494 | |
| | 138 | | | Unum Group | | | 4,630 | |
| | 45 | | | W.R. Berkley Corp. | | | 2,967 | |
| | 27 | | | Willis Towers Watson PLC | | | 5,172 | |
| | | | | | | | |
| | | | Total Insurance | | | 269,369 | |
| | | | | | | | |
| | | | Materials—4.2% | |
| | 44 | | | Albemarle Corp. | | | 3,098 | |
| | 118 | | | Alcoa Corp.1 | | | 2,762 | |
| | 12 | | | AptarGroup, Inc. | | | 1,492 | |
| | 17 | | | Ashland Global Holdings, Inc. | | | 1,360 | |
| | 28 | | | Avery Dennison Corp. | | | 3,239 | |
| | 73 | | | Axalta Coating Systems Ltd.1 | | | 2,173 | |
| | 84 | | | Ball Corp. | | | 5,879 | |
| | 74 | | | Berry Global Group, Inc.1 | | | 3,892 | |
| | 27 | | | Cabot Corp. | | | 1,288 | |
| | 63 | | | Celanese Corp. | | | 6,791 | |
| | 88 | | | CF Industries Holdings, Inc. | | | 4,111 | |
| | 110 | | | Chemours Co. (The) | | | 2,640 | |
| | 64 | | | Crown Holdings, Inc.1 | | | 3,910 | |
| | | | | | | | |
| Shares | | | | | Value | |
| | | | Common Stocks (continued) | | | |
| | | | Materials (continued) | |
| | 41 | | | Domtar Corp. | | $ | 1,826 | |
| | 500 | | | Dow, Inc. | | | 24,655 | |
| | 437 | | | DuPont de Nemours, Inc. | | | 32,806 | |
| | 86 | | | Eastman Chemical Co. | | | 6,693 | |
| | 33 | | | FMC Corp. | | | 2,737 | |
| | 976 | | | Freeport-McMoRan, Inc. | | | 11,331 | |
| | 151 | | | Huntsman Corp. | | | 3,087 | |
| | 16 | | | International Flavors & Fragrances, Inc. | | | 2,321 | |
| | 258 | | | International Paper Co. | | | 11,177 | |
| | 194 | | | LyondellBasell Industries NV, Class A | | | 16,709 | |
| | 13 | | | Martin Marietta Materials, Inc. | | | 2,991 | |
| | 193 | | | Mosaic Co. (The) | | | 4,831 | |
| | 203 | | | Nucor Corp. | | | 11,185 | |
| | 111 | | | Olin Corp. | | | 2,432 | |
| | 105 | | | Owens-Illinois, Inc. | | | 1,813 | |
| | 49 | | | Packaging Corp. of America | | | 4,671 | |
| | 72 | | | PPG Industries, Inc. | | | 8,403 | |
| | 42 | | | Reliance Steel & Aluminum Co. | | | 3,974 | |
| | 41 | | | RPM International, Inc. | | | 2,506 | |
| | 53 | | | Sealed Air Corp. | | | 2,267 | |
| | 45 | | | Silgan Holdings, Inc. | | | 1,377 | |
| | 40 | | | Sonoco Products Co. | | | 2,614 | |
| | 143 | | | Steel Dynamics, Inc. | | | 4,319 | |
| | 116 | | | United States Steel Corp. | | | 1,776 | |
| | 79 | | | Valvoline, Inc. | | | 1,543 | |
| | 24 | | | Vulcan Materials Co. | | | 3,295 | |
| | 23 | | | Westlake Chemical Corp. | | | 1,598 | |
| | 170 | | | WestRock Co. | | | 6,200 | |
| | | | | | | | |
| | | | Total Materials | | | 223,772 | |
| | | | | | | | |
| | | | Media & Entertainment—3.2% | |
| | 105 | | | Altice USA, Inc., Class A1 | | | 2,557 | |
| | 28 | | | AMC Networks, Inc., Class A1 | | | 1,526 | |
| | 154 | | | CBS Corp., Class B | | | 7,685 | |
| | 51 | | | Charter Communications, Inc., Class A1 | | | 20,154 | |
| | 45 | | | Cinemark Holdings, Inc. | | | 1,624 | |
| | 1,853 | | | Comcast Corp., Class A | | | 78,345 | |
| | 74 | | | Discovery, Inc., Class A1,2 | | | 2,272 | |
| | 174 | | | Discovery, Inc., Class C1 | | | 4,950 | |
| | 120 | | | DISH Network Corp., Class A1 | | | 4,609 | |
| | 113 | | | Fox Corp., Class A | | | 4,140 | |
| | 53 | | | Fox Corp., Class B | | | 1,936 | |
| | 14 | | | IAC/InterActiveCorp1 | | | 3,045 | |
| | 180 | | | Interpublic Group of Cos., Inc. (The) | | | 4,066 | |
| | 23 | | | John Wiley & Sons, Inc., Class A | | | 1,055 | |
| | 35 | | | Liberty Media Corp.-Liberty SiriusXM, Class A1 | | | 1,323 | |
| | 70 | | | Liberty Media Corp.-Liberty SiriusXM, Class C1 | | | 2,659 | |
| | 31 | | | Live Nation Entertainment, Inc.1 | | | 2,054 | |
| | 23 | | | Nexstar Media Group, Inc., Class A | | | 2,323 | |
| | 103 | | | Omnicom Group, Inc. | | | 8,441 | |
| | 27 | | | Sinclair Broadcast Group, Inc., Class A | | | 1,448 | |
| | 353 | | | Sirius XM Holdings, Inc.2 | | | 1,970 | |
| | 11 | | | Spotify Technology S.A.1 | | | 1,608 | |
| | 22 | | | Take-Two Interactive Software, Inc.1 | | | 2,498 | |
| | 40 | | | Tribune Media Co., Class A | | | 1,849 | |
| | 221 | | | Viacom, Inc., Class B | | | 6,601 | |
| | | | | | | | |
| | | | Total Media & Entertainment | | | 170,738 | |
| | | | | | | | |
The accompanying notes are an integral part of these financial statements.
Invesco Russell 1000® Value Factor ETF (OVLU)(continued)
June 30, 2019
| | | | | | | | |
| Shares | | | | | Value | |
| | | | Common Stocks (continued) | | | |
| | | | Pharmaceuticals, Biotechnology & Life Sciences—3.3% | |
| | 482 | | | AbbVie, Inc. | | $ | 35,051 | |
| | 63 | | | Agilent Technologies, Inc. | | | 4,704 | |
| | 230 | | | Amgen, Inc. | | | 42,384 | |
| | 94 | | | Biogen, Inc.1 | | | 21,984 | |
| | 4 | | | Bio-Rad Laboratories, Inc., Class A1 | | | 1,250 | |
| | 27 | | | Catalent, Inc.1 | | | 1,464 | |
| | 12 | | | Charles River Laboratories International, Inc.1 | | | 1,703 | |
| | 49 | | | Elanco Animal Health, Inc.1 | | | 1,656 | |
| | 113 | | | Exelixis, Inc.1 | | | 2,415 | |
| | 442 | | | Gilead Sciences, Inc. | | | 29,861 | |
| | 17 | | | Incyte Corp.1 | | | 1,444 | |
| | 22 | | | Ionis Pharmaceuticals, Inc.1 | | | 1,414 | |
| | 18 | | | Jazz Pharmaceuticals PLC1 | | | 2,566 | |
| | 4 | | | Mettler-Toledo International, Inc.1 | | | 3,360 | |
| | 320 | | | Mylan NV1 | | | 6,093 | |
| | 83 | | | Nektar Therapeutics1 | | | 2,953 | |
| | 17 | | | PerkinElmer, Inc. | | | 1,638 | |
| | 43 | | | Perrigo Co. PLC | | | 2,048 | |
| | 13 | | | PRA Health Sciences, Inc.1 | | | 1,289 | |
| | 31 | | | QIAGEN NV1 | | | 1,257 | |
| | 23 | | | Regeneron Pharmaceuticals, Inc.1 | | | 7,199 | |
| | 27 | | | United Therapeutics Corp.1 | | | 2,108 | |
| | 13 | | | Waters Corp.1 | | | 2,798 | |
| | | | | | | | |
| | | | Total Pharmaceuticals, Biotechnology & Life Sciences | | | 178,639 | |
| | | | | | | | |
| | | | Real Estate—1.7% | |
| | 14 | | | Alexandria Real Estate Equities, Inc. | | | 1,975 | |
| | 45 | | | Apartment Investment & Management Co., Class A | | | 2,255 | |
| | 75 | | | Apple Hospitality REIT, Inc. | | | 1,190 | |
| | 26 | | | Boston Properties, Inc. | | | 3,354 | |
| | 105 | | | Brixmor Property Group, Inc. | | | 1,877 | |
| | 64 | | | Brookfield Property REIT, Inc., Class A | | | 1,209 | |
| | 12 | | | Camden Property Trust | | | 1,253 | |
| | 168 | | | CBRE Group, Inc., Class A1 | | | 8,618 | |
| | 49 | | | Cousins Properties, Inc. | | | 1,772 | |
| | 58 | | | Duke Realty Corp. | | | 1,833 | |
| | 17 | | | EPR Properties | | | 1,268 | |
| | 11 | | | Equity LifeStyle Properties, Inc. | | | 1,335 | |
| | 9 | | | Essex Property Trust, Inc. | | | 2,627 | |
| | 19 | | | Extra Space Storage, Inc. | | | 2,016 | |
| | 11 | | | Federal Realty Investment Trust | | | 1,416 | |
| | 43 | | | Gaming and Leisure Properties, Inc. | | | 1,676 | |
| | 124 | | | HCP, Inc. | | | 3,966 | |
| | 65 | | | Hospitality Properties Trust | | | 1,625 | |
| | 283 | | | Host Hotels & Resorts, Inc. | | | 5,156 | |
| | 44 | | | Invitation Homes, Inc. | | | 1,176 | |
| | 92 | | | Iron Mountain, Inc. | | | 2,880 | |
| | 30 | | | Jones Lang LaSalle, Inc. | | | 4,221 | |
| | 17 | | | Kilroy Realty Corp. | | | 1,255 | |
| | 83 | | | Kimco Realty Corp. | | | 1,534 | |
| | 18 | | | Lamar Advertising Co., Class A | | | 1,453 | |
| | 23 | | | Liberty Property Trust | | | 1,151 | |
| | 173 | | | Medical Properties Trust, Inc. | | | 3,017 | |
| | 16 | | | Mid-America Apartment Communities, Inc. | | | 1,884 | |
| | 26 | | | National Retail Properties, Inc. | | | 1,378 | |
| | 41 | | | Omega Healthcare Investors, Inc. | | | 1,507 | |
| | 78 | | | Park Hotels & Resorts, Inc. | | | 2,150 | |
| | 39 | | | Realty Income Corp. | | | 2,690 | |
| | 25 | | | Regency Centers Corp. | | | 1,669 | |
| | | | | | | | |
| Shares | | | | | Value | |
| | | | Common Stocks (continued) | | | |
| | | | Real Estate (continued) | |
| | 16 | | | SL Green Realty Corp. | | $ | 1,286 | |
| | 9 | | | Sun Communities, Inc. | | | 1,154 | |
| | 35 | | | UDR, Inc. | | | 1,571 | |
| | 89 | | | VICI Properties, Inc. | | | 1,962 | |
| | 32 | | | Vornado Realty Trust | | | 2,051 | |
| | 41 | | | Weingarten Realty Investors | | | 1,124 | |
| | 194 | | | Weyerhaeuser Co. | | | 5,110 | |
| | 23 | | | WP Carey, Inc. | | | 1,867 | |
| | | | | | | | |
| | | | Total Real Estate | | | 90,511 | |
| | | | | | | | |
| | | | Retailing—3.5% | |
| | 23 | | | Advance Auto Parts, Inc. | | | 3,545 | |
| | 36 | | | AutoNation, Inc.1 | | | 1,510 | |
| | 7 | | | AutoZone, Inc.1 | | | 7,696 | |
| | 151 | | | Best Buy Co., Inc. | | | 10,529 | |
| | 18 | | | Burlington Stores, Inc.1 | | | 3,063 | |
| | 67 | | | CarMax, Inc.1 | | | 5,818 | |
| | 46 | | | Dick’s Sporting Goods, Inc. | | | 1,593 | |
| | 85 | | | Dollar General Corp. | | | 11,489 | |
| | 265 | | | eBay, Inc. | | | 10,467 | |
| | 39 | | | Expedia Group, Inc. | | | 5,188 | |
| | 73 | | | Foot Locker, Inc. | | | 3,060 | |
| | 146 | | | Gap, Inc. (The) | | | 2,624 | |
| | 65 | | | Genuine Parts Co. | | | 6,733 | |
| | 110 | | | Kohl’s Corp. | | | 5,230 | |
| | 152 | | | L Brands, Inc. | | | 3,967 | |
| | 159 | | | LKQ Corp.1 | | | 4,231 | |
| | 281 | | | Lowe’s Cos., Inc. | | | 28,356 | |
| | 209 | | | Macy’s, Inc. | | | 4,485 | |
| | 73 | | | Nordstrom, Inc.2 | | | 2,326 | |
| | 7 | | | Pool Corp. | | | 1,337 | |
| | 266 | | | Qurate Retail, Inc.1 | | | 3,296 | |
| | 305 | | | Target Corp. | | | 26,416 | |
| | 30 | | | Tiffany & Co. | | | 2,809 | |
| | 379 | | | TJX Cos., Inc. (The) | | | 20,041 | |
| | 34 | | | Tractor Supply Co. | | | 3,699 | |
| | 11 | | | Ulta Beauty, Inc.1 | | | 3,816 | |
| | 48 | | | Urban Outfitters, Inc.1 | | | 1,092 | |
| | 42 | | | Williams-Sonoma, Inc. | | | 2,730 | |
| | | | | | | | |
| | | | Total Retailing | | | 187,146 | |
| | | | | | | | |
| | | | Semiconductors & Semiconductor Equipment—3.8% | |
| | 463 | | | Applied Materials, Inc. | | | 20,793 | |
| | 103 | | | Cypress Semiconductor Corp. | | | 2,291 | |
| | 35 | | | Entegris, Inc. | | | 1,306 | |
| | 2,239 | | | Intel Corp. | | | 107,181 | |
| | 48 | | | KLA-Tencor Corp. | | | 5,674 | |
| | 70 | | | Lam Research Corp. | | | 13,149 | |
| | 62 | | | Marvell Technology Group Ltd. | | | 1,480 | |
| | 59 | | | Maxim Integrated Products, Inc. | | | 3,529 | |
| | 49 | | | Microchip Technology, Inc. | | | 4,248 | |
| | 747 | | | Micron Technology, Inc.1 | | | 28,827 | |
| | 25 | | | MKS Instruments, Inc. | | | 1,947 | |
| | 221 | | | ON Semiconductor Corp.1 | | | 4,467 | |
| | 31 | | | Qorvo, Inc.1 | | | 2,065 | |
| | 75 | | | Skyworks Solutions, Inc. | | | 5,795 | |
| | 44 | | | Teradyne, Inc. | | | 2,108 | |
| | 22 | | | Versum Materials, Inc. | | | 1,135 | |
| | | | | | | | |
| | | | Total Semiconductors & Semiconductor Equipment | | | 205,995 | |
| | | | | | | | |
The accompanying notes are an integral part of these financial statements.
Invesco Russell 1000® Value Factor ETF (OVLU)(continued)
June 30, 2019
| | | | | | | | |
| Shares | | | | | Value | |
| | | | Common Stocks (continued) | | | |
| | | | Software & Services—3.0% | |
| | 33 | | | Akamai Technologies, Inc.1 | | $ | 2,645 | |
| | 30 | | | Alliance Data Systems Corp. | | | 4,204 | |
| | 37 | | | Amdocs Ltd. | | | 2,297 | |
| | 11 | | | ANSYS, Inc.1 | | | 2,253 | |
| | 21 | | | Black Knight, Inc.1 | | | 1,263 | |
| | 41 | | | Booz Allen Hamilton Holding Corp. | | | 2,715 | |
| | 21 | | | Broadridge Financial Solutions, Inc. | | | 2,681 | |
| | 8 | | | CACI International, Inc., Class A1 | | | 1,637 | |
| | 35 | | | Cadence Design Systems, Inc.1 | | | 2,478 | |
| | 38 | | | CDK Global, Inc. | | | 1,879 | |
| | 32 | | | Citrix Systems, Inc. | | | 3,140 | |
| | 176 | | | Cognizant Technology Solutions Corp., Class A | | | 11,157 | |
| | 27 | | | CoreLogic, Inc.1 | | | 1,129 | |
| | 166 | | | DXC Technology Co. | | | 9,155 | |
| | 7 | | | EPAM Systems, Inc.1 | | | 1,212 | |
| | 9 | | | Euronet Worldwide, Inc.1 | | | 1,514 | |
| | 271 | | | First Data Corp., Class A1 | | | 7,336 | |
| | 24 | | | Fortinet, Inc.1 | | | 1,844 | |
| | 11 | | | Gartner, Inc.1 | | | 1,770 | |
| | 38 | | | Genpact Ltd. | | | 1,447 | |
| | 21 | | | GoDaddy, Inc., Class A1 | | | 1,473 | |
| | 458 | | | International Business Machines Corp. | | | 63,158 | |
| | 11 | | | Jack Henry & Associates, Inc. | | | 1,473 | |
| | 52 | | | Leidos Holdings, Inc. | | | 4,152 | |
| | 10 | | | Palo Alto Networks, Inc.1 | | | 2,038 | |
| | 117 | | | Sabre Corp. | | | 2,597 | |
| | 10 | | | Splunk, Inc.1 | | | 1,258 | |
| | 26 | | | Square, Inc., Class A1 | | | 1,886 | |
| | 30 | | | SS&C Technologies Holdings, Inc. | | | 1,728 | |
| | 141 | | | Symantec Corp. | | | 3,068 | |
| | 21 | | | Synopsys, Inc.1 | | | 2,703 | |
| | 28 | | | Total System Services, Inc. | | | 3,592 | |
| | 13 | | | VeriSign, Inc.1 | | | 2,719 | |
| | 13 | | | VMware, Inc., Class A | | | 2,174 | |
| | 207 | | | Western Union Co. (The) | | | 4,117 | |
| | 7 | | | WEX, Inc.1 | | | 1,457 | |
| | | | | | | | |
| | | | Total Software & Services | | | 163,349 | |
| | | | | | | | |
| | | | Technology Hardware & Equipment—8.1% | |
| | 1,648 | | | Apple, Inc. | | | 326,172 | |
| | 7 | | | Arista Networks, Inc.1 | | | 1,817 | |
| | 55 | | | Arrow Electronics, Inc.1 | | | 3,920 | |
| | 47 | | | Avnet, Inc. | | | 2,128 | |
| | 56 | | | CDW Corp. | | | 6,216 | |
| | 32 | | | Ciena Corp.1 | | | 1,316 | |
| | 11 | | | Coherent, Inc.1 | | | 1,500 | |
| | 105 | | | CommScope Holding Co., Inc.1 | | | 1,652 | |
| | 287 | | | Corning, Inc. | | | 9,537 | |
| | 64 | | | Dell Technologies, Inc., Class C1 | | | 3,251 | |
| | 19 | | | F5 Networks, Inc.1 | | | 2,767 | |
| | 29 | | | FLIR Systems, Inc. | | | 1,569 | |
| | 876 | | | Hewlett Packard Enterprise Co. | | | 13,096 | |
| | 1,003 | | | HP, Inc. | | | 20,852 | |
| | 9 | | | IPG Photonics Corp.1 | | | 1,388 | |
| | 100 | | | Jabil, Inc. | | | 3,160 | |
| | 132 | | | Juniper Networks, Inc. | | | 3,515 | |
| | 20 | | | Keysight Technologies, Inc.1 | | | 1,796 | |
| | 7 | | | Littelfuse, Inc. | | | 1,238 | |
| | 54 | | | NCR Corp.1 | | | 1,680 | |
| | | | | | | | |
| Shares | | | | | Value | |
| | | | Common Stocks (continued) | | | |
| | | | Technology Hardware & Equipment (continued) | |
| | 93 | | | NetApp, Inc. | | $ | 5,738 | |
| | 24 | | | SYNNEX Corp. | | | 2,362 | |
| | 47 | | | Trimble, Inc.1 | | | 2,120 | |
| | 198 | | | Western Digital Corp. | | | 9,415 | |
| | 109 | | | Xerox Corp. | | | 3,860 | |
| | 16 | | | Zebra Technologies Corp., Class A1 | | | 3,352 | |
| | | | | | | | |
| | | | Total Technology Hardware & Equipment | | | 435,417 | |
| | | | | | | | |
| | | | Telecommunication Services—5.0% | |
| | 4,143 | | | AT&T, Inc. | | | 138,832 | |
| | 616 | | | CenturyLink, Inc. | | | 7,244 | |
| | 292 | | | Sprint Corp.1 | | | 1,918 | |
| | 65 | | | Telephone & Data Systems, Inc. | | | 1,976 | |
| | 96 | | | T-Mobile US, Inc.1 | | | 7,117 | |
| | 1,938 | | | Verizon Communications, Inc. | | | 110,718 | |
| | 61 | | | Zayo Group Holdings, Inc.1 | | | 2,008 | |
| | | | | | | | |
| | | | Total Telecommunication Services | | | 269,813 | |
| | | | | | | | |
| | | | Transportation—3.0% | |
| | 66 | | | Alaska Air Group, Inc. | | | 4,218 | |
| | 3 | | | AMERCO | | | 1,136 | |
| | 269 | | | American Airlines Group, Inc. | | | 8,772 | |
| | 67 | | | C.H. Robinson Worldwide, Inc. | | | 5,651 | |
| | 14 | | | Copa Holdings SA, Class A | | | 1,366 | |
| | 377 | | | Delta Air Lines, Inc. | | | 21,395 | |
| | 51 | | | Expeditors International of Washington, Inc. | | | 3,869 | |
| | 139 | | | FedEx Corp. | | | 22,822 | |
| | 17 | | | Genesee & Wyoming, Inc., Class A1 | | | 1,700 | |
| | 39 | | | JB Hunt Transport Services, Inc. | | | 3,565 | |
| | 181 | | | JetBlue Airways Corp.1 | | | 3,347 | |
| | 27 | | | Kansas City Southern | | | 3,289 | |
| | 15 | | | Kirby Corp.1 | | | 1,185 | |
| | 75 | | | Knight-Swift Transportation Holdings, Inc. | | | 2,463 | |
| | 17 | | | Landstar System, Inc. | | | 1,836 | |
| | 29 | | | Macquarie Infrastructure Corp. | | | 1,176 | |
| | 20 | | | Old Dominion Freight Line, Inc. | | | 2,985 | |
| | 35 | | | Ryder System, Inc. | | | 2,041 | |
| | 286 | | | Southwest Airlines Co. | | | 14,523 | |
| | 162 | | | United Continental Holdings, Inc.1 | | | 14,183 | |
| | 348 | | | United Parcel Service, Inc., Class B | | | 35,938 | |
| | 61 | | | XPO Logistics, Inc.1,2 | | | 3,526 | |
| | | | | | | | |
| | | | Total Transportation | | | 160,986 | |
| | | | | | | | |
| | | | Utilities—4.2% | |
| | 417 | | | AES Corp. | | | 6,989 | |
| | 51 | | | Alliant Energy Corp. | | | 2,503 | |
| | 80 | | | Ameren Corp. | | | 6,009 | |
| | 166 | | | American Electric Power Co., Inc. | | | 14,610 | |
| | 34 | | | American Water Works Co., Inc. | | | 3,944 | |
| | 30 | | | Aqua America, Inc. | | | 1,241 | |
| | 30 | | | Atmos Energy Corp. | | | 3,167 | |
| | 198 | | | CenterPoint Energy, Inc. | | | 5,669 | |
| | 87 | | | CMS Energy Corp. | | | 5,038 | |
| | 103 | | | Consolidated Edison, Inc. | | | 9,031 | |
| | 70 | | | DTE Energy Co. | | | 8,952 | |
| | 235 | | | Duke Energy Corp. | | | 20,736 | |
| | 94 | | | Edison International | | | 6,337 | |
| | 74 | | | Entergy Corp. | | | 7,617 | |
| | 68 | | | Evergy, Inc. | | | 4,090 | |
| | 83 | | | Eversource Energy | | | 6,288 | |
The accompanying notes are an integral part of these financial statements.
Invesco Russell 1000® Value Factor ETF (OVLU)(continued)
June 30, 2019
| | | | | | | | |
| Shares | | | | | Value | |
| | | | Common Stocks (continued) | | | |
| | | | Utilities (continued) | |
| | 474 | | | Exelon Corp. | | $ | 22,724 | |
| | 124 | | | FirstEnergy Corp. | | | 5,309 | |
| | 39 | | | Hawaiian Electric Industries, Inc. | | | 1,699 | |
| | 14 | | | IDACORP, Inc. | | | 1,406 | |
| | 84 | | | MDU Resources Group, Inc. | | | 2,167 | |
| | 32 | | | National Fuel Gas Co. | | | 1,688 | |
| | 56 | | | NiSource, Inc. | | | 1,613 | |
| | 137 | | | NRG Energy, Inc. | | | 4,811 | |
| | 63 | | | OGE Energy Corp. | | | 2,681 | |
| | 287 | | | PG&E Corp.1 | | | 6,578 | |
| | 37 | | | Pinnacle West Capital Corp. | | | 3,481 | |
| | 315 | | | PPL Corp. | | | 9,768 | |
| | 150 | | | Public Service Enterprise Group, Inc. | | | 8,823 | |
| | 348 | | | Southern Co. (The) | | | 19,237 | |
| | 79 | | | UGI Corp. | | | 4,219 | |
| | 129 | | | Vistra Energy Corp. | | | 2,921 | |
| | 87 | | | WEC Energy Group, Inc. | | | 7,253 | |
| | 158 | | | Xcel Energy, Inc. | | | 9,399 | |
| | | | | | | | |
| | | | Total Utilities | | | 227,998 | |
| | | | | | | | |
| | | | Total Common Stocks
(Cost $5,272,056) | | | 5,380,411 | |
| | | | | | | | |
| | |
| | | | | | | | |
| | | | Money Market Fund—0.1% | | | |
| | 5,604 | | | Premier U.S. Government Money Portfolio, 2.26%4
(Cost $5,604) | | | 5,604 | |
| | | | | | | | |
| | | | Investment of Cash Collateral for Securities
Loaned—0.2% | |
| | 9,195 | | | Invesco Government & Agency Portfolio—Institutional Class, 2.27%4,5 | | | 9,195 | |
| | 3,064 | | | Invesco Liquid Assets Portfolio—Institutional Class, 2.41%4,5 | | | 3,065 | |
| | | | | | | | |
| | | | Total Investment of Cash Collateral for Securities Loaned
(Cost $12,260) | | | 12,260 | |
| | | | | | | | |
| | |
| | | | Total Investments—100.4%
(Cost $5,289,920) | | | 5,398,275 | |
| | |
| | | | Liabilities in Excess of Other Assets—(0.4)% | | | (22,017 | ) |
| | | | | | | | |
| | |
| | | | Net Assets—100.0% | | $ | 5,376,258 | |
| | | | | | | | |
REIT—Real Estate Investment Trust
| 1 | Non-income producing security. |
| 2 | All or a portion of the security was on loan. The aggregate value of the securities on loan was $12,274; total value of the collateral held by the Fund was $12,260. |
| 3 | Affiliated security (Note 4). |
| 4 | The security and the Fund are advised by wholly-owned subsidiaries of Invesco Ltd. and are therefore considered to be affiliated. The rate shown is the 7-day SEC standardized yield as of June 30, 2019. |
| 5 | The security has been segregated to satisfy the commitment to return the cash collateral received in securities lending transactions upon the borrower’s return of the securities loaned. See Note 6. |
The accompanying notes are an integral part of these financial statements.
Schedule of Investments
Invesco Russell 1000® Low Volatility Factor ETF (OVOL)
June 30, 2019
| | | | | | | | |
| Shares | | | | | Value | |
| | | | Common Stocks—100.0% | | | |
| | | | Banks—6.1% | |
| | 2,090 | | | Bank of America Corp. | | $ | 60,610 | |
| | 247 | | | BB&T Corp. | | | 12,135 | |
| | 589 | | | Citigroup, Inc. | | | 41,248 | |
| | 1,021 | | | JPMorgan Chase & Co. | | | 114,148 | |
| | 42 | | | M&T Bank Corp. | | | 7,143 | |
| | 144 | | | PNC Financial Services Group, Inc. (The) | | | 19,768 | |
| | 116 | | | SunTrust Banks, Inc. | | | 7,291 | |
| | 506 | | | U.S. Bancorp | | | 26,514 | |
| | 1,260 | | | Wells Fargo & Co. | | | 59,623 | |
| | | | | | | | |
| | | | Total Banks | | | 348,480 | |
| | | | | | | | |
| | | | Capital Goods—6.8% | |
| | 184 | | | 3M Co. | | | 31,895 | |
| | 73 | | | AMETEK, Inc. | | | 6,631 | |
| | 140 | | | Boeing Co. (The) | | | 50,961 | |
| | 42 | | | Cummins, Inc. | | | 7,196 | |
| | 85 | | | Deere & Co. | | | 14,085 | |
| | 120 | | | Eaton Corp. PLC | | | 9,994 | |
| | 181 | | | Emerson Electric Co. | | | 12,076 | |
| | 97 | | | Fortive Corp. | | | 7,908 | |
| | 85 | | | General Dynamics Corp. | | | 15,455 | |
| | 34 | | | Harris Corp.1 | | | 6,430 | |
| | 262 | | | Honeywell International, Inc. | | | 45,743 | |
| | 25 | | | IDEX Corp. | | | 4,304 | |
| | 107 | | | Illinois Tool Works, Inc. | | | 16,137 | |
| | 72 | | | Ingersoll-Rand PLC | | | 9,120 | |
| | 261 | | | Johnson Controls International PLC | | | 10,782 | |
| | 22 | | | L3 Technologies, Inc. | | | 5,394 | |
| | 86 | | | Lockheed Martin Corp. | | | 31,264 | |
| | 49 | | | Northrop Grumman Corp. | | | 15,832 | |
| | 96 | | | PACCAR, Inc. | | | 6,879 | |
| | 92 | | | Raytheon Co. | | | 15,997 | |
| | 33 | | | Rockwell Automation, Inc. | | | 5,406 | |
| | 35 | | | Roper Technologies, Inc. | | | 12,819 | |
| | 46 | | | Stanley Black & Decker, Inc. | | | 6,652 | |
| | 35 | | | Toro Co. (The) | | | 2,342 | |
| | 278 | | | United Technologies Corp. | | | 36,196 | |
| | 55 | | | Xylem, Inc. | | | 4,600 | |
| | | | | | | | |
| | | | Total Capital Goods | | | 392,098 | |
| | | | | | | | |
| | | | Commercial & Professional Services—0.8% | |
| | 28 | | | Cintas Corp. | | | 6,644 | |
| | 131 | | | IHS Markit Ltd.1 | | | 8,347 | |
| | 81 | | | Republic Services, Inc. | | | 7,018 | |
| | 55 | | | Verisk Analytics, Inc. | | | 8,055 | |
| | 159 | | | Waste Management, Inc. | | | 18,344 | |
| | | | | | | | |
| | | | Total Commercial & Professional Services | | | 48,408 | |
| | | | | | | | |
| | | | Consumer Durables & Apparel—0.5% | |
| | 372 | | | NIKE, Inc., Class B | | | 31,229 | |
| | | | | | | | |
| | |
| | | | Consumer Services—2.2% | | | |
| | 20 | | | Bright Horizons Family Solutions, Inc.1 | | | 3,017 | |
| | 75 | | | Hilton Worldwide Holdings, Inc. | | | 7,331 | |
| | 78 | | | Marriott International, Inc., Class A | | | 10,943 | |
| | 282 | | | McDonald’s Corp. | | | 58,560 | |
| | 58 | | | Service Corp. International | | | 2,713 | |
| | 403 | | | Starbucks Corp. | | | 33,784 | |
| | 96 | | | Yum! Brands, Inc. | | | 10,624 | |
| | | | | | | | |
| | | | Total Consumer Services | | | 126,972 | |
| | | | | | | | |
| | | | | | | | |
| Shares | | | | | Value | |
| | | | Common Stocks (continued) | | | |
| | | | Diversified Financials—6.2% | | | |
| | 202 | | | AGNC Investment Corp. | | $ | 3,398 | |
| | 217 | | | American Express Co. | | | 26,786 | |
| | 545 | | | Annaly Capital Management, Inc. | | | 4,976 | |
| | 264 | | | Bank of New York Mellon Corp. (The) | | | 11,656 | |
| | 725 | | | Berkshire Hathaway, Inc., Class B1 | | | 154,548 | |
| | 35 | | | BlackRock, Inc. | | | 16,425 | |
| | 130 | | | Capital One Financial Corp. | | | 11,796 | |
| | 35 | | | Cboe Global Markets, Inc. | | | 3,627 | |
| | 121 | | | CME Group, Inc. | | | 23,487 | |
| | 100 | | | Discover Financial Services | | | 7,759 | |
| | 12 | | | FactSet Research Systems, Inc. | | | 3,439 | |
| | 89 | | | Goldman Sachs Group, Inc. (The) | | | 18,209 | |
| | 189 | | | Intercontinental Exchange, Inc. | | | 16,243 | |
| | 51 | | | Moody’s Corp. | | | 9,961 | |
| | 25 | | | MSCI, Inc. | | | 5,970 | |
| | 40 | | | Nasdaq, Inc. | | | 3,847 | |
| | 58 | | | Northern Trust Corp. | | | 5,220 | |
| | 79 | | | S&P Global, Inc. | | | 17,995 | |
| | 102 | | | Starwood Property Trust, Inc. | | | 2,317 | |
| | 70 | | | T. Rowe Price Group, Inc. | | | 7,680 | |
| | | | | | | | |
| | | | Total Diversified Financials | | | 355,339 | |
| | | | | | | | |
| | | | Energy—3.3% | |
| | 560 | | | Chevron Corp. | | | 69,686 | |
| | 1,463 | | | Exxon Mobil Corp. | | | 112,110 | |
| | 189 | | | Occidental Petroleum Corp. | | | 9,503 | |
| | | | | | | | |
| | | | Total Energy | | | 191,299 | |
| | | | | | | | |
| | | | Food & Staples Retailing—2.0% | |
| | 146 | | | Costco Wholesale Corp. | | | 38,582 | |
| | 167 | | | Sysco Corp. | | | 11,810 | |
| | 203 | | | Walgreens Boots Alliance, Inc. | | | 11,098 | |
| | 483 | | | Walmart, Inc. | | | 53,367 | |
| | | | | | | | |
| | | | Total Food & Staples Retailing | | | 114,857 | |
| | | | | | | | |
| | | | Food, Beverage & Tobacco—5.3% | |
| | 628 | | | Altria Group, Inc. | | | 29,736 | |
| | 162 | | | Archer-Daniels-Midland Co. | | | 6,610 | |
| | 56 | | | Brown-Forman Corp., Class B | | | 3,104 | |
| | 1,444 | | | Coca-Cola Co. (The) | | | 73,528 | |
| | 50 | | | Constellation Brands, Inc., Class A | | | 9,847 | |
| | 202 | | | General Mills, Inc. | | | 10,609 | |
| | 51 | | | Hershey Co. (The) | | | 6,836 | |
| | 91 | | | Hormel Foods Corp. | | | 3,689 | |
| | 36 | | | JM Smucker Co. (The) | | | 4,147 | |
| | 85 | | | Kellogg Co. | | | 4,553 | |
| | 47 | | | Lamb Weston Holdings, Inc. | | | 2,978 | |
| | 42 | | | McCormick & Co., Inc. | | | 6,510 | |
| | 497 | | | Mondelez International, Inc., Class A | | | 26,788 | |
| | 531 | | | PepsiCo, Inc. | | | 69,630 | |
| | 483 | | | Philip Morris International, Inc. | | | 37,930 | |
| | 75 | | | Tyson Foods, Inc., Class A | | | 6,056 | |
| | | | | | | | |
| | | | Total Food, Beverage & Tobacco | | | 302,551 | |
| | | | | | | | |
| | | | Health Care Equipment & Services—6.4% | |
| | 563 | | | Abbott Laboratories | | | 47,348 | |
| | 70 | | | Anthem, Inc. | | | 19,755 | |
| | 161 | | | Baxter International, Inc. | | | 13,186 | |
| | 89 | | | Becton Dickinson and Co. | | | 22,429 | |
| | 419 | | | Boston Scientific Corp.1 | | | 18,009 | |
The accompanying notes are an integral part of these financial statements.
Invesco Russell 1000® Low Volatility Factor ETF (OVOL)(continued)
June 30, 2019
| | | | | | | | |
| Shares | | | | | Value | |
| | | | Common Stocks (continued) | | | |
| | | | Health Care Equipment & Services (continued) | | | |
| | 95 | | | Cerner Corp. | | $ | 6,963 | |
| | 94 | | | Cigna Corp. | | | 14,810 | |
| | 15 | | | Cooper Cos., Inc. (The) | | | 5,053 | |
| | 362 | | | CVS Health Corp. | | | 19,725 | |
| | 224 | | | Danaher Corp. | | | 32,014 | |
| | 48 | | | Henry Schein, Inc.1 | | | 3,355 | |
| | 30 | | | Laboratory Corp. of America Holdings1 | | | 5,187 | |
| | 484 | | | Medtronic PLC | | | 47,137 | |
| | 43 | | | Quest Diagnostics, Inc. | | | 4,378 | |
| | 27 | | | STERIS PLC | | | 4,020 | |
| | 118 | | | Stryker Corp. | | | 24,258 | |
| | 289 | | | UnitedHealth Group, Inc. | | | 70,519 | |
| | 29 | | | Varian Medical Systems, Inc.1 | | | 3,948 | |
| | 60 | | | Zimmer Biomet Holdings, Inc. | | | 7,064 | |
| | | | | | | | |
| | | | Total Health Care Equipment & Services | | | 369,158 | |
| | | | | | | | |
| | | | Household & Personal Products—2.9% | |
| | 87 | | | Church & Dwight Co., Inc. | | | 6,356 | |
| | 46 | | | Clorox Co. (The) | | | 7,043 | |
| | 308 | | | Colgate-Palmolive Co. | | | 22,074 | |
| | 68 | | | Estee Lauder Cos., Inc., (The), Class A | | | 12,452 | |
| | 123 | | | Kimberly-Clark Corp. | | | 16,393 | |
| | 930 | | | Procter & Gamble Co. (The) | | | 101,975 | |
| | | | | | | | |
| | | | Total Household & Personal Products | | | 166,293 | |
| | | | | | | | |
| | | | Insurance—3.9% | |
| | 270 | | | Aflac, Inc. | | | 14,799 | |
| | 5 | | | Alleghany Corp.1 | | | 3,406 | |
| | 120 | | | Allstate Corp. (The) | | | 12,203 | |
| | 27 | | | American Financial Group, Inc. | | | 2,767 | |
| | 277 | | | American International Group, Inc. | | | 14,759 | |
| | 85 | | | Aon PLC | | | 16,403 | |
| | 138 | | | Arch Capital Group Ltd.1 | | | 5,117 | |
| | 68 | | | Arthur J. Gallagher & Co. | | | 5,956 | |
| | 88 | | | Brown & Brown, Inc. | | | 2,948 | |
| | 168 | | | Chubb Ltd. | | | 24,745 | |
| | 53 | | | Cincinnati Financial Corp. | | | 5,494 | |
| | 9 | | | Erie Indemnity Co., Class A | | | 2,288 | |
| | 14 | | | Everest Re Group Ltd. | | | 3,460 | |
| | 84 | | | Fidelity National Financial, Inc. | | | 3,385 | |
| | 128 | | | Hartford Financial Services Group, Inc. (The) | | | 7,132 | |
| | 95 | | | Loews Corp. | | | 5,194 | |
| | 5 | | | Markel Corp.1 | | | 5,448 | |
| | 187 | | | Marsh & McLennan Cos., Inc. | | | 18,653 | |
| | 204 | | | MetLife, Inc. | | | 10,133 | |
| | 204 | | | Progressive Corp. (The) | | | 16,306 | |
| | 111 | | | Prudential Financial, Inc. | | | 11,211 | |
| | 21 | | | Reinsurance Group of America, Inc. | | | 3,277 | |
| | 15 | | | RenaissanceRe Holdings Ltd. | | | 2,670 | |
| | 39 | | | Torchmark Corp. | | | 3,489 | |
| | 94 | | | Travelers Cos., Inc. (The) | | | 14,055 | |
| | 53 | | | W.R. Berkley Corp. | | | 3,494 | |
| | 45 | | | Willis Towers Watson PLC | | | 8,619 | |
| | | | | | | | |
| | | | Total Insurance | | | 227,411 | |
| | | | | | | | |
| | | | Materials—2.0% | |
| | 73 | | | Air Products & Chemicals, Inc. | | | 16,525 | |
| | 23 | | | AptarGroup, Inc. | | | 2,860 | |
| | 27 | | | Avery Dennison Corp. | | | 3,123 | |
| | 104 | | | Ball Corp. | | | 7,279 | |
| | | | | | | | |
| Shares | | | | | Value | |
| | | | Common Stocks (continued) | | | |
| | | | Materials (continued) | | | |
| | 91 | | | Ecolab, Inc. | | $ | 17,967 | |
| | 35 | | | International Flavors & Fragrances, Inc.2 | | | 5,078 | |
| | 185 | | | Linde PLC | | | 37,148 | |
| | 77 | | | PPG Industries, Inc. | | | 8,987 | |
| | 27 | | | Sherwin-Williams Co. (The) | | | 12,374 | |
| | 35 | | | Sonoco Products Co. | | | 2,287 | |
| | | | | | | | |
| | | | Total Materials | | | 113,628 | |
| | | | | | | | |
| | | | Media & Entertainment—5.7% | |
| | 83 | | | Alphabet, Inc., Class A1 | | | 89,873 | |
| | 85 | | | Alphabet, Inc., Class C1 | | | 91,877 | |
| | 1,420 | | | Comcast Corp., Class A | | | 60,038 | |
| | 73 | | | Omnicom Group, Inc. | | | 5,982 | |
| | 589 | | | Walt Disney Co. (The) | | | 82,248 | |
| | | | | | | | |
| | | | Total Media & Entertainment | | | 330,018 | |
| | | | | | | | |
| | | | Pharmaceuticals, Biotechnology & Life Sciences—8.2% | |
| | 90 | | | Agilent Technologies, Inc. | | | 6,720 | |
| | 171 | | | Amgen, Inc. | | | 31,512 | |
| | 398 | | | Bristol-Myers Squibb Co. | | | 18,049 | |
| | 284 | | | Eli Lilly & Co. | | | 31,464 | |
| | 294 | | | Gilead Sciences, Inc. | | | 19,863 | |
| | 50 | | | IQVIA Holdings, Inc.1 | | | 8,045 | |
| | 980 | | | Johnson & Johnson | | | 136,495 | |
| | 845 | | | Merck & Co., Inc. | | | 70,853 | |
| | 8 | | | Mettler-Toledo International, Inc.1 | | | 6,720 | |
| | 1,981 | | | Pfizer, Inc. | | | 85,817 | |
| | 127 | | | Thermo Fisher Scientific, Inc. | | | 37,297 | |
| | 20 | | | Waters Corp.1 | | | 4,305 | |
| | 146 | | | Zoetis, Inc. | | | 16,570 | |
| | | | | | | | |
| | | | Total Pharmaceuticals, Biotechnology & Life Sciences | | | 473,710 | |
| | | | | | | | |
| | | | Real Estate—4.4% | |
| | 37 | | | Alexandria Real Estate Equities, Inc. | | | 5,220 | |
| | 152 | | | American Tower Corp. | | | 31,076 | |
| | 49 | | | Apartment Investment & Management Co., Class A | | | 2,456 | |
| | 50 | | | AvalonBay Communities, Inc. | | | 10,159 | |
| | 52 | | | Boston Properties, Inc. | | | 6,708 | |
| | 32 | | | Camden Property Trust | | | 3,340 | |
| | 146 | | | Crown Castle International Corp. | | | 19,031 | |
| | 63 | | | Digital Realty Trust, Inc. | | | 7,421 | |
| | 121 | | | Duke Realty Corp. | | | 3,825 | |
| | 25 | | | Equinix, Inc. | | | 12,607 | |
| | 31 | | | Equity LifeStyle Properties, Inc. | | | 3,762 | |
| | 129 | | | Equity Residential | | | 9,794 | |
| | 23 | | | Essex Property Trust, Inc. | | | 6,714 | |
| | 38 | | | Extra Space Storage, Inc. | | | 4,032 | |
| | 26 | | | Federal Realty Investment Trust | | | 3,348 | |
| | 72 | | | Gaming and Leisure Properties, Inc. | | | 2,807 | |
| | 139 | | | Invitation Homes, Inc. | | | 3,715 | |
| | 50 | | | Liberty Property Trust | | | 2,502 | |
| | 38 | | | Mid-America Apartment Communities, Inc. | | | 4,475 | |
| | 53 | | | National Retail Properties, Inc. | | | 2,809 | |
| | 208 | | | Prologis, Inc. | | | 16,661 | |
| | 51 | | | Public Storage | | | 12,147 | |
| | 104 | | | Realty Income Corp. | | | 7,173 | |
| | 56 | | | Regency Centers Corp. | | | 3,737 | |
| | 33 | | | SBA Communications Corp.1 | | | 7,420 | |
| | 104 | | | Simon Property Group, Inc. | | | 16,615 | |
The accompanying notes are an integral part of these financial statements.
Invesco Russell 1000® Low Volatility Factor ETF (OVOL)(continued)
June 30, 2019
| | | | | | | | |
| Shares | | | | | Value | |
| | | | Common Stocks (continued) | | | |
| | | | Real Estate (continued) | | | |
| | 30 | | | Sun Communities, Inc. | | $ | 3,846 | |
| | 97 | | | UDR, Inc. | | | 4,354 | |
| | 107 | | | Ventas, Inc. | | | 7,313 | |
| | 143 | | | VICI Properties, Inc. | | | 3,152 | |
| | 57 | | | Vornado Realty Trust | | | 3,654 | |
| | 126 | | | Welltower, Inc. | | | 10,273 | |
| | 207 | | | Weyerhaeuser Co. | | | 5,452 | |
| | 61 | | | WP Carey, Inc. | | | 4,952 | |
| | | | | | | | |
| | | | Total Real Estate | | | 252,550 | |
| | | | | | | | |
| | | | Retailing—2.8% | |
| | 8 | | | AutoZone, Inc.1 | | | 8,796 | |
| | 70 | | | Dollar General Corp. | | | 9,461 | |
| | 47 | | | Genuine Parts Co. | | | 4,868 | |
| | 374 | | | Home Depot, Inc. (The) | | | 77,781 | |
| | 229 | | | Lowe’s Cos., Inc. | | | 23,108 | |
| | 21 | | | O’Reilly Automotive, Inc.1 | | | 7,756 | |
| | 99 | | | Ross Stores, Inc. | | | 9,813 | |
| | 407 | | | TJX Cos., Inc. (The) | | | 21,522 | |
| | | | | | | | |
| | | | Total Retailing | | | 163,105 | |
| | | | | | | | |
| | | | Semiconductors & Semiconductor Equipment—1.6% | |
| | 97 | | | Analog Devices, Inc. | | | 10,949 | |
| | 1,098 | | | Intel Corp. | | | 52,561 | |
| | 262 | | | Texas Instruments, Inc. | | | 30,067 | |
| | | | | | | | |
| | | | Total Semiconductors & Semiconductor Equipment | | | 93,577 | |
| | | | | | | | |
| | | | Software & Services—13.2% | |
| | 217 | | | Accenture PLC, Class A | | | 40,095 | |
| | 120 | | | Adobe, Inc.1 | | | 35,358 | |
| | 49 | | | Amdocs Ltd. | | | 3,042 | |
| | 25 | | | ANSYS, Inc.1 | | | 5,121 | |
| | 147 | | | Automatic Data Processing, Inc. | | | 24,304 | |
| | 38 | | | Broadridge Financial Solutions, Inc. | | | 4,852 | |
| | 112 | | | Fidelity National Information Services, Inc. | | | 13,740 | |
| | 138 | | | Fiserv, Inc.1 | | | 12,580 | |
| | 57 | | | Genpact Ltd. | | | 2,171 | |
| | 288 | | | International Business Machines Corp. | | | 39,715 | |
| | 68 | | | Intuit, Inc. | | | 17,770 | |
| | 28 | | | Jack Henry & Associates, Inc. | | | 3,750 | |
| | 290 | | | Mastercard, Inc., Class A | | | 76,714 | |
| | 2,254 | | | Microsoft Corp. | | | 301,946 | |
| | 728 | | | Oracle Corp. | | | 41,474 | |
| | 113 | | | Paychex, Inc. | | | 9,299 | |
| | 48 | | | Synopsys, Inc.1 | | | 6,177 | |
| | 48 | | | Total System Services, Inc. | | | 6,157 | |
| | 31 | | | VeriSign, Inc.1 | | | 6,484 | |
| | 575 | | | Visa, Inc., Class A | | | 99,791 | |
| | 139 | | | Western Union Co. (The) | | | 2,765 | |
| | 82 | | | Worldpay, Inc., Class A1 | | | 10,049 | |
| | | | | | | | |
| | | | Total Software & Services | | | 763,354 | |
| | | | | | | | |
| | | | Technology Hardware & Equipment—6.2% | |
| | 100 | | | Amphenol Corp., Class A | | | 9,594 | |
| | 1,351 | | | Apple, Inc. | | | 267,390 | |
| | 1,309 | | | Cisco Systems, Inc. | | | 71,641 | |
| | 49 | | | Motorola Solutions, Inc. | | | 8,170 | |
| | | | | | | | |
| | | | Total Technology Hardware & Equipment | | | 356,795 | |
| | | | | | | | |
| | | | | | | | |
| Shares | | | | | Value | |
| | | | Common Stocks (continued) | | | |
| | | | Telecommunication Services—2.9% | | | |
| | 2,560 | | | AT&T, Inc. | | $ | 85,786 | |
| | 1,427 | | | Verizon Communications, Inc. | | | 81,524 | |
| | | | | | | | |
| | | | Total Telecommunication Services | | | 167,310 | |
| | | | | | | | |
| | | | Transportation—1.6% | |
| | 42 | | | C.H. Robinson Worldwide, Inc. | | | 3,543 | |
| | 56 | | | Expeditors International of Washington, Inc. | | | 4,248 | |
| | 65 | | | FedEx Corp. | | | 10,673 | |
| | 67 | | | Norfolk Southern Corp. | | | 13,355 | |
| | 203 | | | Union Pacific Corp. | | | 34,329 | |
| | 226 | | | United Parcel Service, Inc., Class B | | | 23,339 | |
| | | | | | | | |
| | | | Total Transportation | | | 89,487 | |
| | | | | | | | |
| | | | Utilities—5.0% | |
| | 85 | | | Alliant Energy Corp. | | | 4,172 | |
| | 87 | | | Ameren Corp. | | | 6,535 | |
| | 177 | | | American Electric Power Co., Inc. | | | 15,578 | |
| | 66 | | | American Water Works Co., Inc. | | | 7,656 | |
| | 75 | | | Aqua America, Inc. | | | 3,103 | |
| | 42 | | | Atmos Energy Corp. | | | 4,433 | |
| | 167 | | | CenterPoint Energy, Inc. | | | 4,781 | |
| | 101 | | | CMS Energy Corp. | | | 5,849 | |
| | 119 | | | Consolidated Edison, Inc. | | | 10,434 | |
| | 284 | | | Dominion Energy, Inc. | | | 21,959 | |
| | 66 | | | DTE Energy Co. | | | 8,440 | |
| | 265 | | | Duke Energy Corp. | | | 23,384 | |
| | 94 | | | Edison International | | | 6,337 | |
| | 67 | | | Entergy Corp. | | | 6,896 | |
| | 85 | | | Evergy, Inc. | | | 5,113 | |
| | 113 | | | Eversource Energy | | | 8,561 | |
| | 327 | | | Exelon Corp. | | | 15,676 | |
| | 175 | | | FirstEnergy Corp. | | | 7,492 | |
| | 172 | | | NextEra Energy, Inc. | | | 35,236 | |
| | 122 | | | NiSource, Inc. | | | 3,514 | |
| | 67 | | | OGE Energy Corp. | | | 2,852 | |
| | 39 | | | Pinnacle West Capital Corp. | | | 3,669 | |
| | 246 | | | PPL Corp. | | | 7,628 | |
| | 176 | | | Public Service Enterprise Group, Inc. | | | 10,352 | |
| | 94 | | | Sempra Energy | | | 12,919 | |
| | 385 | | | Southern Co. (The) | | | 21,283 | |
| | 59 | | | UGI Corp. | | | 3,151 | |
| | 112 | | | WEC Energy Group, Inc. | | | 9,337 | |
| | 186 | | | Xcel Energy, Inc. | | | 11,065 | |
| | | | | | | | |
| | | | Total Utilities | | | 287,405 | |
| | | | | | | | |
| | |
| | | | Total Common Stocks
(Cost $4,934,641) | | | 5,765,034 | |
| | | | | | | | |
The accompanying notes are an integral part of these financial statements.
Invesco Russell 1000® Low Volatility Factor ETF (OVOL)(continued)
June 30, 2019
| | | | | | | | |
| Shares | | | | | Value | |
| | | | Investment of Cash Collateral for Securities
Loaned—0.1% | |
| | 2,417 | | | Invesco Government & Agency Portfolio—Institutional Class, 2.27%3,4 | | $ | 2,417 | |
| | 805 | | | Invesco Liquid Assets Portfolio—Institutional Class, 2.41%3,4 | | | 806 | |
| | | | | | | | |
| | | | Total Investment of Cash Collateral for Securities Loaned
(Cost $3,223) | | | 3,223 | |
| | | | | | | | |
| | |
| | | | Total Investments—100.1%
(Cost $4,937,864) | | | 5,768,257 | |
| | |
| | | | Liabilities in Excess of Other Assets—(0.1)% | | | (3,556 | ) |
| | | | | | | | |
| | |
| | | | Net Assets—100.0% | | $ | 5,764,701 | |
| | | | | | | | |
| 1 | Non-income producing security. |
| 2 | All or a portion of the security was on loan. The aggregate value of the security on loan was $3,192; total value of the collateral held by the Fund was $3,223. |
| 3 | The security and the Fund are advised by wholly-owned subsidiaries of Invesco Ltd. and are therefore considered to be affiliated. The rate shown is the 7-day SEC standardized yield as of June 30, 2019. |
| 4 | The security has been segregated to satisfy the commitment to return the cash collateral received in securities lending transactions upon the borrower’s return of the securities loaned. See Note 6. |
The accompanying notes are an integral part of these financial statements.
Schedule of Investments
Invesco Russell 1000® Size Factor ETF (OSIZ)
June 30, 2019
| | | | | | | | |
| Shares | | | | | Value | |
| | | | Common Stocks—100.0% | | | |
| | | | Automobiles & Components—1.0% | |
| | 277 | | | BorgWarner, Inc. | | $ | 11,629 | |
| | 390 | | | Gentex Corp. | | | 9,598 | |
| | 414 | | | Goodyear Tire & Rubber Co. (The) | | | 6,334 | |
| | 245 | | | Harley-Davidson, Inc. | | | 8,778 | |
| | 83 | | | Lear Corp. | | | 11,560 | |
| | 96 | | | Thor Industries, Inc. | | | 5,611 | |
| | | | | | | | |
| | | | Total Automobiles & Components | | | 53,510 | |
| | | | | | | | |
| | | | Banks—4.9% | | | |
| | 286 | | | Associated Banc-Corp. | | | 6,046 | |
| | 72 | | | Bank of Hawaii Corp. | | | 5,970 | |
| | 208 | | | Bank OZK | | | 6,259 | |
| | 172 | | | BankUnited, Inc. | | | 5,803 | |
| | 50 | | | BOK Financial Corp. | | | 3,774 | |
| | 156 | | | CIT Group, Inc. | | | 8,196 | |
| | 167 | | | Comerica, Inc. | | | 12,131 | |
| | 143 | | | Commerce Bancshares, Inc. | | | 8,531 | |
| | 84 | | | Cullen/Frost Bankers, Inc. | | | 7,867 | |
| | 210 | | | East West Bancorp, Inc. | | | 9,822 | |
| | 561 | | | F.N.B. Corp. | | | 6,603 | |
| | 12 | | | First Citizens BancShares, Inc., Class A | | | 5,403 | |
| | 237 | | | First Hawaiian, Inc. | | | 6,131 | |
| | 517 | | | First Horizon National Corp. | | | 7,719 | |
| | 963 | | | Huntington Bancshares, Inc. | | | 13,309 | |
| | 12 | | | LendingTree, Inc.1 | | | 5,040 | |
| | 564 | | | MGIC Investment Corp.1 | | | 7,411 | |
| | 731 | | | New York Community Bancorp, Inc. | | | 7,295 | |
| | 194 | | | PacWest Bancorp | | | 7,533 | |
| | 578 | | | People’s United Financial, Inc. | | | 9,699 | |
| | 125 | | | Pinnacle Financial Partners, Inc. | | | 7,185 | |
| | 149 | | | Popular, Inc. | | | 8,082 | |
| | 108 | | | Prosperity Bancshares, Inc. | | | 7,133 | |
| | 895 | | | Regions Financial Corp. | | | 13,371 | |
| | 78 | | | Signature Bank | | | 9,426 | |
| | 347 | | | Sterling Bancorp | | | 7,384 | |
| | 57 | | | SVB Financial Group1 | | | 12,802 | |
| | 236 | | | Synovus Financial Corp. | | | 8,260 | |
| | 286 | | | TCF Financial Corp. | | | 5,946 | |
| | 91 | | | Texas Capital Bancshares, Inc.1 | | | 5,585 | |
| | 78 | | | TFS Financial Corp. | | | 1,410 | |
| | 383 | | | Umpqua Holdings Corp. | | | 6,354 | |
| | 153 | | | Webster Financial Corp. | | | 7,309 | |
| | 160 | | | Western Alliance Bancorp1 | | | 7,155 | |
| | 96 | | | Wintrust Financial Corp. | | | 7,023 | |
| | 233 | | | Zions Bancorp NA | | | 10,713 | |
| | | | | | | | |
| | | | Total Banks | | | 275,680 | |
| | | | | | | | |
| | | | Capital Goods—9.9% | | | |
| | 208 | | | A.O. Smith Corp. | | | 9,809 | |
| | 63 | | | Acuity Brands, Inc. | | | 8,688 | |
| | 245 | | | AECOM1 | | | 9,273 | |
| | 99 | | | AGCO Corp. | | | 7,679 | |
| | 175 | | | Air Lease Corp. | | | 7,235 | |
| | 112 | | | Allegion PLC | | | 12,382 | |
| | 178 | | | Allison Transmission Holdings, Inc. | | | 8,250 | |
| | 455 | | | Arconic, Inc. | | | 11,748 | |
| | 80 | | | Armstrong World Industries, Inc. | | | 7,776 | |
| | 155 | | | BWX Technologies, Inc. | | | 8,076 | |
| | 74 | | | Carlisle Cos., Inc. | | | 10,390 | |
| | | | | | | | |
| Shares | | | | | Value | |
| | | | Common Stocks (continued) | | | |
| | | | Capital Goods (continued) | | | |
| | 167 | | | Colfax Corp.1 | | $ | 4,681 | |
| | 81 | | | Crane Co. | | | 6,759 | |
| | 68 | | | Curtiss-Wright Corp. | | | 8,645 | |
| | 187 | | | Donaldson Co., Inc. | | | 9,511 | |
| | 136 | | | Dover Corp. | | | 13,627 | |
| | 191 | | | Flowserve Corp. | | | 10,064 | |
| | 237 | | | Fluor Corp. | | | 7,985 | |
| | 195 | | | Fortune Brands Home & Security, Inc. | | | 11,140 | |
| | 181 | | | Gardner Denver Holdings, Inc.1 | | | 6,263 | |
| | 214 | | | Graco, Inc. | | | 10,739 | |
| | 111 | | | GrafTech International Ltd. | | | 1,277 | |
| | 233 | | | HD Supply Holdings, Inc.1 | | | 9,385 | |
| | 34 | | | HEICO Corp.2 | | | 4,550 | |
| | 66 | | | HEICO Corp., Class A | | | 6,822 | |
| | 123 | | | Hexcel Corp. | | | 9,948 | |
| | 78 | | | Hubbell, Inc. | | | 10,171 | |
| | 50 | | | Huntington Ingalls Industries, Inc. | | | 11,237 | |
| | 77 | | | IDEX Corp. | | | 13,255 | |
| | 137 | | | ITT, Inc. | | | 8,971 | |
| | 146 | | | Jacobs Engineering Group, Inc. | | | 12,321 | |
| | 39 | | | Lennox International, Inc. | | | 10,725 | |
| | 96 | | | Lincoln Electric Holdings, Inc. | | | 7,903 | |
| | 325 | | | Masco Corp. | | | 12,753 | |
| | 75 | | | Middleby Corp. (The)1 | | | 10,178 | |
| | 78 | | | MSC Industrial Direct Co., Inc., Class A | | | 5,792 | |
| | 78 | | | Nordson Corp. | | | 11,022 | |
| | 263 | | | nVent Electric PLC | | | 6,520 | |
| | 109 | | | Oshkosh Corp. | | | 9,100 | |
| | 166 | | | Owens Corning | | | 9,661 | |
| | 252 | | | Pentair PLC | | | 9,374 | |
| | 223 | | | Quanta Services, Inc. | | | 8,516 | |
| | 76 | | | Regal Beloit Corp. | | | 6,210 | |
| | 229 | | | Resideo Technologies, Inc.1 | | | 5,020 | |
| | 220 | | | Sensata Technologies Holding PLC1 | | | 10,780 | |
| | 68 | | | Snap-on, Inc. | | | 11,264 | |
| | 129 | | | Spirit AeroSystems Holdings, Inc., Class A | | | 10,497 | |
| | 44 | | | Teledyne Technologies, Inc.1 | | | 12,050 | |
| | 254 | | | Textron, Inc. | | | 13,472 | |
| | 118 | | | Timken Co. (The) | | | 6,058 | |
| | 146 | | | Toro Co. (The) | | | 9,767 | |
| | 197 | | | Trinity Industries, Inc. | | | 4,088 | |
| | 97 | | | United Rentals, Inc.1 | | | 12,865 | |
| | 276 | | | Univar, Inc.1 | | | 6,083 | |
| | 40 | | | Valmont Industries, Inc. | | | 5,072 | |
| | 38 | | | W.W. Grainger, Inc. | | | 10,193 | |
| | 72 | | | WABCO Holdings, Inc.1 | | | 9,547 | |
| | 161 | | | Wabtec Corp.2 | | | 11,553 | |
| | 50 | | | Watsco, Inc. | | | 8,177 | |
| | 85 | | | WESCO International, Inc.1 | | | 4,305 | |
| | 77 | | | Woodward, Inc. | | | 8,713 | |
| | 164 | | | Xylem, Inc. | | | 13,717 | |
| | | | | | | | |
| | | | Total Capital Goods | | | 559,632 | |
| | | | | | | | |
| | | | Commercial & Professional Services—1.5% | | | |
| | 185 | | | ADT, Inc.2 | | | 1,132 | |
| | 89 | | | Clean Harbors, Inc.1 | | | 6,328 | |
| | 103 | | | Equifax, Inc. | | | 13,930 | |
| | 176 | | | IAA, Inc.1 | | | 6,825 | |
| | 176 | | | KAR Auction Services, Inc. | | | 4,400 | |
The accompanying notes are an integral part of these financial statements.
Invesco Russell 1000® Size Factor ETF (OSIZ)(continued)
June 30, 2019
| | | | | | | | |
| Shares | | | | | Value | |
| | | | Common Stocks (continued) | | | |
| | | | Commercial & Professional Services (continued) | | | |
| | 93 | | | ManpowerGroup, Inc. | | $ | 8,984 | |
| | 454 | | | Nielsen Holdings PLC | | | 10,260 | |
| | 166 | | | Robert Half International, Inc. | | | 9,464 | |
| | 138 | | | Rollins, Inc. | | | 4,950 | |
| | 148 | | | Stericycle, Inc.1 | | | 7,067 | |
| | 183 | | | TransUnion | | | 13,452 | |
| | | | | | | | |
| | | | Total Commercial & Professional Services | | | 86,792 | |
| | | | | | | | |
| | | | Consumer Durables & Apparel—3.7% | | | |
| | 149 | | | Brunswick Corp. | | | 6,838 | |
| | 226 | | | Capri Holdings Ltd.1 | | | 7,838 | |
| | 76 | | | Carter’s, Inc. | | | 7,413 | |
| | 43 | | | Columbia Sportswear Co. | | | 4,307 | |
| | 124 | | | Garmin Ltd. | | | 9,895 | |
| | 552 | | | Hanesbrands, Inc. | | | 9,505 | |
| | 116 | | | Hasbro, Inc. | | | 12,259 | |
| | 211 | | | Leggett & Platt, Inc. | | | 8,096 | |
| | 601 | | | Mattel, Inc.1,2 | | | 6,737 | |
| | 68 | | | Mohawk Industries, Inc.1 | | | 10,028 | |
| | 570 | | | Newell Brands, Inc. | | | 8,789 | |
| | 3 | | | NVR, Inc.1 | | | 10,111 | |
| | 91 | | | Polaris Industries, Inc. | | | 8,302 | |
| | 318 | | | PulteGroup, Inc. | | | 10,055 | |
| | 107 | | | PVH Corp. | | | 10,126 | |
| | 79 | | | Ralph Lauren Corp. | | | 8,974 | |
| | 109 | | | Roku, Inc.1 | | | 9,873 | |
| | 225 | | | Skechers U.S.A., Inc., Class A1 | | | 7,085 | |
| | 366 | | | Tapestry, Inc. | | | 11,613 | |
| | 80 | | | Tempur Sealy International, Inc.1 | | | 5,870 | |
| | 211 | | | Toll Brothers, Inc. | | | 7,727 | |
| | 310 | | | Under Armour, Inc., Class A1 | | | 7,859 | |
| | 313 | | | Under Armour, Inc., Class C1 | | | 6,949 | |
| | 84 | | | Whirlpool Corp. | | | 11,958 | |
| | | | | | | | |
| | | | Total Consumer Durables & Apparel | | | 208,207 | |
| | | | | | | | |
| | | | Consumer Services—4.2% | | | |
| | 303 | | | Aramark | | | 10,926 | |
| | 74 | | | Bright Horizons Family Solutions, Inc.1 | | | 11,164 | |
| | 841 | | | Caesars Entertainment Corp.1 | | | 9,941 | |
| | 54 | | | Choice Hotels International, Inc. | | | 4,699 | |
| | 107 | | | Darden Restaurants, Inc. | | | 13,025 | |
| | 42 | | | Domino’s Pizza, Inc. | | | 11,688 | |
| | 120 | | | Dunkin’ Brands Group, Inc. | | | 9,559 | |
| | 332 | | | Extended Stay America, Inc. | | | 5,608 | |
| | 149 | | | frontdoor, Inc.1 | | | 6,489 | |
| | 8 | | | Graham Holdings Co., Class B | | | 5,520 | |
| | 71 | | | Grand Canyon Education, Inc.1 | | | 8,308 | |
| | 313 | | | H&R Block, Inc. | | | 9,171 | |
| | 169 | | | Hilton Grand Vacations, Inc.1 | | | 5,378 | |
| | 69 | | | Hyatt Hotels Corp., Class A | | | 5,253 | |
| | 180 | | | International Game Technology PLC | | | 2,335 | |
| | 478 | | | MGM Resorts International | | | 13,656 | |
| | 216 | | | Norwegian Cruise Line Holdings Ltd.1 | | | 11,584 | |
| | 121 | | | Planet Fitness, Inc., Class A1 | | | 8,765 | |
| | 228 | | | Service Corp. International | | | 10,666 | |
| | 183 | | | ServiceMaster Global Holdings, Inc.1 | | | 9,532 | |
| | 132 | | | Six Flags Entertainment Corp. | | | 6,558 | |
| | 49 | | | Vail Resorts, Inc. | | | 10,936 | |
| | 307 | | | Wendy’s Co. (The) | | | 6,011 | |
| | | | | | | | |
| Shares | | | | | Value | |
| | | | Common Stocks (continued) | | | |
| | | | Consumer Services (continued) | | | |
| | 158 | | | Wyndham Destinations, Inc. | | $ | 6,936 | |
| | 149 | | | Wyndham Hotels & Resorts, Inc. | | | 8,305 | |
| | 100 | | | Wynn Resorts Ltd. | | | 12,399 | |
| | 300 | | | Yum China Holdings, Inc. | | | 13,860 | |
| | | | | | | | |
| | | | Total Consumer Services | | | 238,272 | |
| | | | | | | | |
| | | | Diversified Financials—5.0% | | | |
| | 84 | | | Affiliated Managers Group, Inc. | | | 7,740 | |
| | 654 | | | AGNC Investment Corp. | | | 11,000 | |
| | 409 | | | Ally Financial, Inc. | | | 12,675 | |
| | 1,378 | | | Annaly Capital Management, Inc. | | | 12,581 | |
| | 330 | | | AXA Equitable Holdings, Inc. | | | 6,897 | |
| | 561 | | | BGC Partners, Inc., Class A | | | 2,934 | |
| | 109 | | | Cboe Global Markets, Inc. | | | 11,296 | |
| | 326 | | | Chimera Investment Corp. | | | 6,152 | |
| | 13 | | | Credit Acceptance Corp.1 | | | 6,290 | |
| | 260 | | | E*TRADE Financial Corp. | | | 11,596 | |
| | 183 | | | Eaton Vance Corp. | | | 7,893 | |
| | 72 | | | Evercore, Inc., Class A | | | 6,377 | |
| | 41 | | | FactSet Research Systems, Inc. | | | 11,749 | |
| | 220 | | | Franklin Resources, Inc. | | | 7,656 | |
| | 124 | | | Interactive Brokers Group, Inc., Class A | | | 6,721 | |
| | 512 | | | Invesco Ltd.3 | | | 10,475 | |
| | 276 | | | Janus Henderson Group PLC | | | 5,906 | |
| | 400 | | | Jefferies Financial Group, Inc. | | | 7,692 | |
| | 187 | | | Lazard Ltd., Class A | | | 6,431 | |
| | 151 | | | Legg Mason, Inc. | | | 5,780 | |
| | 116 | | | LPL Financial Holdings, Inc. | | | 9,462 | |
| | 38 | | | MarketAxess Holdings, Inc. | | | 12,214 | |
| | 797 | | | MFA Financial, Inc. | | | 5,722 | |
| | 29 | | | Morningstar, Inc. | | | 4,195 | |
| | 97 | | | Nasdaq, Inc. | | | 9,328 | |
| | 375 | | | Navient Corp. | | | 5,119 | |
| | 596 | | | New Residential Investment Corp. | | | 9,172 | |
| | 109 | | | OneMain Holdings, Inc. | | | 3,685 | |
| | 128 | | | Raymond James Financial, Inc. | | | 10,822 | |
| | 137 | | | Santander Consumer USA Holdings, Inc. | | | 3,283 | |
| | 170 | | | SEI Investments Co. | | | 9,537 | |
| | 721 | | | SLM Corp. | | | 7,008 | |
| | 395 | | | Starwood Property Trust, Inc. | | | 8,974 | |
| | 477 | | | Two Harbors Investment Corp. | | | 6,044 | |
| | 87 | | | Virtu Financial, Inc., Class A | | | 1,895 | |
| | 193 | | | Voya Financial, Inc. | | | 10,673 | |
| | | | | | | | |
| | | | Total Diversified Financials | | | 282,974 | |
| | | | | | | | |
| | | | Energy—3.6% | | | |
| | 327 | | | Antero Midstream Corp. | | | 3,747 | |
| | 501 | | | Antero Resources Corp.1 | | | 2,771 | |
| | 429 | | | Apache Corp. | | | 12,428 | |
| | 144 | | | Apergy Corp.1 | | | 4,830 | |
| | 545 | | | Baker Hughes a GE Co. | | | 13,423 | |
| | 453 | | | Cabot Oil & Gas Corp. | | | 10,401 | |
| | 346 | | | Centennial Resource Development, Inc., Class A1 | | | 2,626 | |
| | 2,321 | | | Chesapeake Energy Corp.1,2 | | | 4,526 | |
| | 149 | | | Cimarex Energy Co. | | | 8,840 | |
| | 81 | | | Continental Resources, Inc.1 | | | 3,409 | |
| | 454 | | | Devon Energy Corp. | | | 12,948 | |
| | 409 | | | EQT Corp. | | | 6,466 | |
| | 319 | | | Equitrans Midstream Corp. | | | 6,288 | |
The accompanying notes are an integral part of these financial statements.
Invesco Russell 1000® Size Factor ETF (OSIZ)(continued)
June 30, 2019
| | | | | | | | |
| Shares | | | | | Value | |
| | | | Common Stocks (continued) | | | |
| | | | Energy (continued) | | | |
| | 164 | | | Helmerich & Payne, Inc. | | $ | 8,302 | |
| | 225 | | | HollyFrontier Corp. | | | 10,413 | |
| | 671 | | | Kosmos Energy Ltd. | | | 4,207 | |
| | 877 | | | Marathon Oil Corp. | | | 12,462 | |
| | 272 | | | Murphy Oil Corp. | | | 6,705 | |
| | 494 | | | National Oilwell Varco, Inc. | | | 10,982 | |
| | 526 | | | Noble Energy, Inc. | | | 11,782 | |
| | 423 | | | Parsley Energy, Inc., Class A1 | | | 8,041 | |
| | 385 | | | Patterson-UTI Energy, Inc. | | | 4,431 | |
| | 212 | | | PBF Energy, Inc., Class A | | | 6,636 | |
| | 395 | | | Range Resources Corp. | | | 2,757 | |
| | 276 | | | Targa Resources Corp. | | | 10,836 | |
| | 988 | | | Transocean Ltd.1 | | | 6,333 | |
| | 680 | | | WPX Energy, Inc.1 | | | 7,827 | |
| | | | | | | | |
| | | | Total Energy | | | 204,417 | |
| | | | | | | | |
| | | | Food & Staples Retailing—0.4% | | | |
| | 59 | | | Casey’s General Stores, Inc. | | | 9,203 | |
| | 219 | | | Sprouts Farmers Market, Inc.1 | | | 4,137 | |
| | 289 | | | US Foods Holding Corp.1 | | | 10,335 | |
| | | | | | | | |
| | | | Total Food & Staples Retailing | | | 23,675 | |
| | | | | | | | |
| | | | Food, Beverage & Tobacco—1.9% | | | |
| | 14 | | | Beyond Meat, Inc.1 | | | 2,250 | |
| | 27 | | | Brown-Forman Corp., Class A | | | 1,485 | |
| | 184 | | | Bunge Ltd. | | | 10,251 | |
| | 178 | | | Campbell Soup Co. | | | 7,132 | |
| | 452 | | | Conagra Brands, Inc. | | | 11,987 | |
| | 312 | | | Flowers Foods, Inc. | | | 7,260 | |
| | 172 | | | Hain Celestial Group, Inc. (The)1 | | | 3,767 | |
| | 105 | | | Ingredion, Inc. | | | 8,661 | |
| | 98 | | | JM Smucker Co. (The) | | | 11,289 | |
| | 56 | | | Keurig Dr Pepper, Inc. | | | 1,618 | |
| | 180 | | | Lamb Weston Holdings, Inc. | | | 11,405 | |
| | 187 | | | Molson Coors Brewing Co., Class B | | | 10,472 | |
| | 76 | | | Pilgrim’s Pride Corp.1 | | | 1,930 | |
| | 85 | | | Post Holdings, Inc.1 | | | 8,837 | |
| | 100 | | | TreeHouse Foods, Inc.1 | | | 5,410 | |
| | | | | | | | |
| | | | Total Food, Beverage & Tobacco | | | 103,754 | |
| | | | | | | | |
| | | | Health Care Equipment & Services—5.4% | | | |
| | 45 | | | ABIOMED, Inc.1 | | | 11,722 | |
| | 157 | | | Acadia Healthcare Co., Inc.1 | | | 5,487 | |
| | 67 | | | Cantel Medical Corp. | | | 5,403 | |
| | 287 | | | Cardinal Health, Inc. | | | 13,518 | |
| | 24 | | | Chemed Corp. | | | 8,660 | |
| | 41 | | | Cooper Cos., Inc. (The) | | | 13,812 | |
| | 177 | | | Covetrus, Inc.1 | | | 4,329 | |
| | 172 | | | DaVita, Inc.1 | | | 9,677 | |
| | 214 | | | DENTSPLY SIRONA, Inc. | | | 12,489 | |
| | 96 | | | DexCom, Inc.1 | | | 14,385 | |
| | 146 | | | Encompass Health Corp. | | | 9,250 | |
| | 48 | | | Guardant Health, Inc.1 | | | 4,144 | |
| | 172 | | | Henry Schein, Inc.1 | | | 12,023 | |
| | 95 | | | Hill-Rom Holdings, Inc. | | | 9,939 | |
| | 268 | | | Hologic, Inc.1 | | | 12,869 | |
| | 32 | | | ICU Medical, Inc.1 | | | 8,061 | |
| | 84 | | | Insulet Corp.1 | | | 10,028 | |
| | 119 | | | Integra LifeSciences Holdings Corp.1 | | | 6,646 | |
| | 65 | | | Masimo Corp.1 | | | 9,673 | |
| | | | | | | | |
| Shares | | | | | Value | |
| | | | Common Stocks (continued) | | | |
| | | | Health Care Equipment & Services (continued) | | | |
| | 90 | | | Medidata Solutions, Inc.1 | | $ | 8,146 | |
| | 159 | | | MEDNAX, Inc.1 | | | 4,012 | |
| | 75 | | | Molina Healthcare, Inc.1 | | | 10,735 | |
| | 50 | | | Penumbra, Inc.1 | | | 8,000 | |
| | 97 | | | Premier, Inc., Class A1 | | | 3,794 | |
| | 127 | | | Quest Diagnostics, Inc. | | | 12,930 | |
| | 87 | | | STERIS PLC | | | 12,953 | |
| | 42 | | | Teleflex, Inc. | | | 13,908 | |
| | 92 | | | Universal Health Services, Inc., Class B | | | 11,996 | |
| | 93 | | | Varian Medical Systems, Inc.1 | | | 12,660 | |
| | 45 | | | WellCare Health Plans, Inc.1 | | | 12,828 | |
| | 91 | | | West Pharmaceutical Services, Inc. | | | 11,389 | |
| | | | | | | | |
| | | | Total Health Care Equipment & Services | | | 305,466 | |
| | | | | | | | |
| | | | Household & Personal Products—0.4% | | | |
| | 341 | | | Coty, Inc., Class A | | | 4,569 | |
| | 115 | | | Energizer Holdings, Inc. | | | 4,444 | |
| | 151 | | | Herbalife Nutrition Ltd.1 | | | 6,457 | |
| | 101 | | | Nu Skin Enterprises, Inc., Class A | | | 4,981 | |
| | 65 | | | Spectrum Brands Holdings, Inc. | | | 3,495 | |
| | | | | | | | |
| | | | Total Household & Personal Products | | | 23,946 | |
| | | | | | | | |
| | | | Insurance—4.6% | | | |
| | 16 | | | Alleghany Corp.1 | | | 10,898 | |
| | 90 | | | American Financial Group, Inc. | | | 9,222 | |
| | 13 | | | American National Insurance Co. | | | 1,514 | |
| | 341 | | | Arch Capital Group Ltd.1 | | | 12,644 | |
| | 89 | | | Assurant, Inc. | | | 9,468 | |
| | 165 | | | Assured Guaranty Ltd. | | | 6,943 | |
| | 219 | | | Athene Holding Ltd., Class A1 | | | 9,430 | |
| | 130 | | | Axis Capital Holdings Ltd. | | | 7,755 | |
| | 194 | | | Brighthouse Financial, Inc.1 | | | 7,118 | |
| | 285 | | | Brown & Brown, Inc. | | | 9,548 | |
| | 28 | | | CNA Financial Corp. | | | 1,318 | |
| | 28 | | | Erie Indemnity Co., Class A | | | 7,120 | |
| | 45 | | | Everest Re Group Ltd. | | | 11,123 | |
| | 287 | | | Fidelity National Financial, Inc. | | | 11,566 | |
| | 163 | | | First American Financial Corp. | | | 8,753 | |
| | 64 | | | Hanover Insurance Group, Inc. (The) | | | 8,211 | |
| | 94 | | | Kemper Corp. | | | 8,111 | |
| | 200 | | | Lincoln National Corp. | | | 12,890 | |
| | 12 | | | Markel Corp.1 | | | 13,075 | |
| | 48 | | | Mercury General Corp. | | | 3,000 | |
| | 396 | | | Old Republic International Corp. | | | 8,862 | |
| | 67 | | | Primerica, Inc. | | | 8,037 | |
| | 239 | | | Principal Financial Group, Inc. | | | 13,843 | |
| | 74 | | | Reinsurance Group of America, Inc. | | | 11,546 | |
| | 57 | | | RenaissanceRe Holdings Ltd. | | | 10,147 | |
| | 127 | | | Torchmark Corp. | | | 11,361 | |
| | 297 | | | Unum Group | | | 9,964 | |
| | 149 | | | W.R. Berkley Corp. | | | 9,824 | |
| | 6 | | | White Mountains Insurance Group Ltd. | | | 6,129 | |
| | | | | | | | |
| | | | Total Insurance | | | 259,420 | |
| | | | | | | | |
| | | | Materials—6.6% | | | |
| | 147 | | | Albemarle Corp. | | | 10,350 | |
| | 314 | | | Alcoa Corp.1 | | | 7,351 | |
| | 86 | | | AptarGroup, Inc. | | | 10,693 | |
| | 100 | | | Ashland Global Holdings, Inc. | | | 7,997 | |
| | 103 | | | Avery Dennison Corp. | | | 11,915 | |
The accompanying notes are an integral part of these financial statements.
Invesco Russell 1000® Size Factor ETF (OSIZ)(continued)
June 30, 2019
| | | | | | | | |
| Shares | | | | | Value | |
| | | | Common Stocks (continued) | | | |
| | | | Materials (continued) | | | |
| | 314 | | | Axalta Coating Systems Ltd.1 | | $ | 9,348 | |
| | 191 | | | Berry Global Group, Inc.1 | | | 10,045 | |
| | 108 | | | Cabot Corp. | | | 5,153 | |
| | 126 | | | Celanese Corp. | | | 13,583 | |
| | 267 | | | CF Industries Holdings, Inc. | | | 12,472 | |
| | 285 | | | Chemours Co. (The) | | | 6,840 | |
| | 173 | | | Crown Holdings, Inc.1 | | | 10,570 | |
| | 115 | | | Domtar Corp. | | | 5,121 | |
| | 77 | | | Eagle Materials, Inc. | | | 7,138 | |
| | 166 | | | Eastman Chemical Co. | | | 12,920 | |
| | 420 | | | Element Solutions, Inc.1 | | | 4,343 | |
| | 151 | | | FMC Corp. | | | 12,525 | |
| | 1,274 | | | Freeport-McMoRan, Inc. | | | 14,791 | |
| | 500 | | | Graphic Packaging Holding Co. | | | 6,990 | |
| | 374 | | | Huntsman Corp. | | | 7,645 | |
| | 92 | | | International Flavors & Fragrances, Inc. | | | 13,348 | |
| | 58 | | | Martin Marietta Materials, Inc. | | | 13,346 | |
| | 444 | | | Mosaic Co. (The) | | | 11,113 | |
| | 11 | | | NewMarket Corp. | | | 4,410 | |
| | 260 | | | Nucor Corp. | | | 14,326 | |
| | 291 | | | Olin Corp. | | | 6,376 | |
| | 287 | | | Owens-Illinois, Inc. | | | 4,956 | |
| | 117 | | | Packaging Corp. of America | | | 11,152 | |
| | 98 | | | Reliance Steel & Aluminum Co. | | | 9,273 | |
| | 98 | | | Royal Gold, Inc. | | | 10,044 | |
| | 177 | | | RPM International, Inc. | | | 10,816 | |
| | 62 | | | Scotts Miracle-Gro Co., (The) | | | 6,107 | |
| | 220 | | | Sealed Air Corp. | | | 9,412 | |
| | 138 | | | Silgan Holdings, Inc. | | | 4,223 | |
| | 144 | | | Sonoco Products Co. | | | 9,409 | |
| | 39 | | | Southern Copper Corp. | | | 1,515 | |
| | 321 | | | Steel Dynamics, Inc. | | | 9,694 | |
| | 326 | | | United States Steel Corp. | | | 4,991 | |
| | 332 | | | Valvoline, Inc. | | | 6,484 | |
| | 47 | | | Westlake Chemical Corp. | | | 3,265 | |
| | 319 | | | WestRock Co. | | | 11,634 | |
| | 92 | | | WR Grace & Co. | | | 7,002 | |
| | | | | | | | |
| | | | Total Materials | | | 370,686 | |
| | | | | | | | |
| | | | Media & Entertainment—4.4% | | | |
| | 337 | | | Altice USA, Inc., Class A1 | | | 8,206 | |
| | 81 | | | AMC Networks, Inc., Class A1 | | | 4,414 | |
| | 6 | | | Cable One, Inc. | | | 7,026 | |
| | 175 | | | Cinemark Holdings, Inc. | | | 6,317 | |
| | 141 | | | Discovery, Inc., Class A1,2 | | | 4,329 | |
| | 317 | | | Discovery, Inc., Class C1 | | | 9,019 | |
| | 280 | | | DISH Network Corp., Class A1 | | | 10,755 | |
| | 339 | | | Fox Corp., Class A | | | 12,421 | |
| | 193 | | | Fox Corp., Class B | | | 7,050 | |
| | 146 | | | GCI Liberty, Inc., Class A1 | | | 8,973 | |
| | 488 | | | Interpublic Group of Cos., Inc. (The) | | | 11,024 | |
| | 84 | | | John Wiley & Sons, Inc., Class A | | | 3,852 | |
| | 18 | | | Liberty Broadband Corp., Class A1 | | | 1,851 | |
| | 76 | | | Liberty Broadband Corp., Class C1 | | | 7,921 | |
| | 31 | | | Liberty Media Corp.-Liberty Formula One, Class A1 | | | 1,112 | |
| | 245 | | | Liberty Media Corp.-Liberty Formula One, Class C1 | | | 9,165 | |
| | 88 | | | Liberty Media Corp.-Liberty SiriusXM, Class A1 | | | 3,327 | |
| | 163 | | | Liberty Media Corp.-Liberty SiriusXM, Class C1 | | | 6,191 | |
| | 99 | | | Lions Gate Entertainment Corp., Class A | | | 1,213 | |
| | | | | | | | |
| Shares | | | | | Value | |
| | | | Common Stocks (continued) | | | |
| | | | Media & Entertainment (continued) | | | |
| | 196 | | | Lions Gate Entertainment Corp., Class B | | $ | 2,276 | |
| | 122 | | | Live Nation Entertainment, Inc.1 | | | 8,082 | |
| | 28 | | | Madison Square Garden Co. (The), Class A1 | | | 7,838 | |
| | 87 | | | Match Group, Inc. | | | 5,852 | |
| | 250 | | | New York Times Co., (The), Class A | | | 8,155 | |
| | 538 | | | News Corp., Class A | | | 7,258 | |
| | 170 | | | News Corp., Class B | | | 2,373 | |
| | 72 | | | Nexstar Media Group, Inc., Class A | | | 7,272 | |
| | 104 | | | Sinclair Broadcast Group, Inc., Class A | | | 5,578 | |
| | 727 | | | Sirius XM Holdings, Inc. | | | 4,057 | |
| | 110 | | | Take-Two Interactive Software, Inc.1 | | | 12,488 | |
| | 147 | | | Tribune Media Co., Class A | | | 6,794 | |
| | 162 | | | TripAdvisor, Inc.1 | | | 7,499 | |
| | 353 | | | Viacom, Inc., Class B | | | 10,544 | |
| | 76 | | | World Wrestling Entertainment, Inc., Class A | | | 5,488 | |
| | 104 | | | Zillow Group, Inc., Class A1 | | | 4,759 | |
| | 181 | | | Zillow Group, Inc., Class C1,2 | | | 8,397 | |
| | 1,256 | | | Zynga, Inc., Class A1 | | | 7,699 | |
| | | | | | | | |
| | | | Total Media & Entertainment | | | 246,575 | |
| | | | | | | | |
| | | | Pharmaceuticals, Biotechnology & Life Sciences—5.0% | | | |
| | 94 | | | Agios Pharmaceuticals, Inc.1,2 | | | 4,689 | |
| | 273 | | | Alkermes PLC1 | | | 6,153 | |
| | 144 | | | Alnylam Pharmaceuticals, Inc.1 | | | 10,449 | |
| | 151 | | | BioMarin Pharmaceutical, Inc.1 | | | 12,933 | |
| | 29 | | | Bio-Rad Laboratories, Inc., Class A1 | | | 9,065 | |
| | 50 | | | Bio-Techne Corp. | | | 10,424 | |
| | 78 | | | Bluebird Bio, Inc.1 | | | 9,922 | |
| | 147 | | | Bruker Corp. | | | 7,343 | |
| | 204 | | | Catalent, Inc.1 | | | 11,059 | |
| | 70 | | | Charles River Laboratories International, Inc.1 | | | 9,933 | |
| | 378 | | | Elanco Animal Health, Inc.1 | | | 12,776 | |
| | 117 | | | Exact Sciences Corp.1 | | | 13,811 | |
| | 441 | | | Exelixis, Inc.1 | | | 9,424 | |
| | 301 | | | Horizon Therapeutics PLC1 | | | 7,242 | |
| | 152 | | | Ionis Pharmaceuticals, Inc.1 | | | 9,769 | |
| | 75 | | | Jazz Pharmaceuticals PLC1 | | | 10,692 | |
| | 633 | | | Mylan NV1 | | | 12,052 | |
| | 256 | | | Nektar Therapeutics1 | | | 9,108 | |
| | 118 | | | Neurocrine Biosciences, Inc.1 | | | 9,963 | |
| | 128 | | | PerkinElmer, Inc. | | | 12,332 | |
| | 189 | | | Perrigo Co. PLC | | | 9,000 | |
| | 88 | | | PRA Health Sciences, Inc.1 | | | 8,725 | |
| | 272 | | | QIAGEN NV1 | | | 11,030 | |
| | 61 | | | Sage Therapeutics, Inc.1,2 | | | 11,168 | |
| | 88 | | | Sarepta Therapeutics, Inc.1 | | | 13,372 | |
| | 119 | | | Seattle Genetics, Inc.1 | | | 8,236 | |
| | 74 | | | United Therapeutics Corp.1 | | | 5,776 | |
| | 61 | | | Waters Corp.1 | | | 13,130 | |
| | | | | | | | |
| | | | Total Pharmaceuticals, Biotechnology & Life Sciences | | | 279,576 | |
| | | | | | | | |
| | | | Real Estate—9.6% | | | |
| | 196 | | | American Campus Communities, Inc. | | | 9,047 | |
| | 346 | | | American Homes 4 Rent, Class A | | | 8,411 | |
| | 282 | | | Americold Realty Trust | | | 9,142 | |
| | 197 | | | Apartment Investment & Management Co., Class A | | | 9,874 | |
| | 366 | | | Apple Hospitality REIT, Inc. | | | 5,805 | |
| | 319 | | | Brandywine Realty Trust | | | 4,568 | |
The accompanying notes are an integral part of these financial statements.
Invesco Russell 1000® Size Factor ETF (OSIZ)(continued)
June 30, 2019
| | | | | | | | |
| Shares | | | | | Value | |
| | | | Common Stocks (continued) | | | |
| | | | Real Estate (continued) | | | |
| | 463 | | | Brixmor Property Group, Inc. | | $ | 8,278 | |
| | 182 | | | Brookfield Property REIT, Inc., Class A | | | 3,438 | |
| | 105 | | | Camden Property Trust | | | 10,961 | |
| | 883 | | | Colony Capital, Inc. | | | 4,415 | |
| | 215 | | | Columbia Property Trust, Inc. | | | 4,459 | |
| | 60 | | | CoreSite Realty Corp. | | | 6,910 | |
| | 200 | | | Corporate Office Properties Trust | | | 5,274 | |
| | 146 | | | Cousins Properties, Inc. | | | 5,281 | |
| | 270 | | | CubeSmart | | | 9,029 | |
| | 157 | | | CyrusOne, Inc. | | | 9,062 | |
| | 223 | | | Douglas Emmett, Inc. | | | 8,884 | |
| | 385 | | | Duke Realty Corp. | | | 12,170 | |
| | 268 | | | Empire State Realty Trust, Inc., Class A | | | 3,969 | |
| | 111 | | | EPR Properties | | | 8,279 | |
| | 203 | | | Equity Commonwealth | | | 6,602 | |
| | 91 | | | Equity LifeStyle Properties, Inc. | | | 11,042 | |
| | 111 | | | Extra Space Storage, Inc. | | | 11,777 | |
| | 85 | | | Federal Realty Investment Trust | | | 10,945 | |
| | 252 | | | Gaming and Leisure Properties, Inc. | | | 9,823 | |
| | 396 | | | HCP, Inc. | | | 12,664 | |
| | 301 | | | Healthcare Trust of America, Inc., Class A | | | 8,256 | |
| | 166 | | | Highwoods Properties, Inc. | | | 6,856 | |
| | 272 | | | Hospitality Properties Trust | | | 6,800 | |
| | 671 | | | Host Hotels & Resorts, Inc. | | | 12,226 | |
| | 65 | | | Howard Hughes Corp. (The)1 | | | 8,050 | |
| | 236 | | | Hudson Pacific Properties, Inc. | | | 7,852 | |
| | 351 | | | Invitation Homes, Inc. | | | 9,382 | |
| | 347 | | | Iron Mountain, Inc. | | | 10,861 | |
| | 188 | | | JBG SMITH Properties | | | 7,396 | |
| | 68 | | | Jones Lang LaSalle, Inc. | | | 9,567 | |
| | 132 | | | Kilroy Realty Corp. | | | 9,743 | |
| | 542 | | | Kimco Realty Corp. | | | 10,016 | |
| | 119 | | | Lamar Advertising Co., Class A | | | 9,604 | |
| | 202 | | | Liberty Property Trust | | | 10,108 | |
| | 76 | | | Life Storage, Inc. | | | 7,226 | |
| | 220 | | | Macerich Co. (The) | | | 7,368 | |
| | 537 | | | Medical Properties Trust, Inc. | | | 9,365 | |
| | 106 | | | Mid-America Apartment Communities, Inc. | | | 12,483 | |
| | 199 | | | National Retail Properties, Inc. | | | 10,549 | |
| | 281 | | | Omega Healthcare Investors, Inc. | | | 10,327 | |
| | 246 | | | Outfront Media, Inc. | | | 6,344 | |
| | 354 | | | Paramount Group, Inc. | | | 4,960 | |
| | 304 | | | Park Hotels & Resorts, Inc. | | | 8,378 | |
| | 223 | | | Rayonier, Inc. | | | 6,757 | |
| | 175 | | | Regency Centers Corp. | | | 11,679 | |
| | 393 | | | Retail Properties of America, Inc., Class A | | | 4,622 | |
| | 261 | | | SITE Centers Corp. | | | 3,456 | |
| | 113 | | | SL Green Realty Corp. | | | 9,082 | |
| | 149 | | | Spirit Realty Capital, Inc. | | | 6,356 | |
| | 270 | | | STORE Capital Corp. | | | 8,961 | |
| | 90 | | | Sun Communities, Inc. | | | 11,537 | |
| | 107 | | | Taubman Centers, Inc. | | | 4,369 | |
| | 268 | | | UDR, Inc. | | | 12,030 | |
| | 1,199 | | | VEREIT, Inc. | | | 10,803 | |
| | 491 | | | VICI Properties, Inc. | | | 10,822 | |
| | 166 | | | Vornado Realty Trust | | | 10,641 | |
| | 209 | | | Weingarten Realty Investors | | | 5,731 | |
| | 148 | | | WP Carey, Inc. | | | 12,015 | |
| | | | | | | | |
| | | | Total Real Estate | | | 542,687 | |
| | | | | | | | |
| | | | | | | | |
| Shares | | | | | Value | |
| | | | Common Stocks (continued) | | | |
| | | | Retailing—4.0% | | | |
| | 72 | | | Advance Auto Parts, Inc. | | $ | 11,098 | |
| | 93 | | | AutoNation, Inc.1 | | | 3,901 | |
| | 72 | | | Burlington Stores, Inc.1 | | | 12,251 | |
| | 156 | | | CarMax, Inc.1 | | | 13,546 | |
| | 73 | | | Carvana Co.1 | | | 4,569 | |
| | 127 | | | Dick’s Sporting Goods, Inc. | | | 4,398 | |
| | 159 | | | Etsy, Inc.1 | | | 9,758 | |
| | 74 | | | Five Below, Inc.1 | | | 8,882 | |
| | 116 | | | Floor & Decor Holdings, Inc., Class A1,2 | | | 4,860 | |
| | 183 | | | Foot Locker, Inc. | | | 7,671 | |
| | 296 | | | Gap, Inc. (The) | | | 5,319 | |
| | 121 | | | Genuine Parts Co. | | | 12,533 | |
| | 135 | | | GrubHub, Inc.1 | | | 10,529 | |
| | 208 | | | Kohl’s Corp. | | | 9,890 | |
| | 331 | | | L Brands, Inc. | | | 8,639 | |
| | 400 | | | LKQ Corp.1 | | | 10,644 | |
| | 444 | | | Macy’s, Inc. | | | 9,528 | |
| | 172 | | | Nordstrom, Inc.2 | | | 5,480 | |
| | 76 | | | Ollie’s Bargain Outlet Holdings, Inc.1 | | | 6,620 | |
| | 60 | | | Penske Automotive Group, Inc. | | | 2,838 | |
| | 52 | | | Pool Corp. | | | 9,932 | |
| | 620 | | | Qurate Retail, Inc.1 | | | 7,682 | |
| | 129 | | | Tiffany & Co. | | | 12,080 | |
| | 119 | | | Tractor Supply Co. | | | 12,947 | |
| | 136 | | | Urban Outfitters, Inc.1 | | | 3,094 | |
| | 73 | | | Wayfair, Inc., Class A1 | | | 10,658 | |
| | 126 | | | Williams-Sonoma, Inc. | | | 8,190 | |
| | | | | | | | |
| | | | Total Retailing | | | 227,537 | |
| | | | | | | | |
| | | | Semiconductors & Semiconductor Equipment—2.6% | | | |
| | 157 | | | Cree, Inc.1 | | | 8,820 | |
| | 518 | | | Cypress Semiconductor Corp. | | | 11,520 | |
| | 217 | | | Entegris, Inc. | | | 8,098 | |
| | 120 | | | First Solar, Inc.1 | | | 7,882 | |
| | 557 | | | Marvell Technology Group Ltd. | | | 13,296 | |
| | 235 | | | Maxim Integrated Products, Inc. | | | 14,058 | |
| | 92 | | | MKS Instruments, Inc. | | | 7,166 | |
| | 66 | | | Monolithic Power Systems, Inc. | | | 8,961 | |
| | 548 | | | ON Semiconductor Corp.1 | | | 11,075 | |
| | 163 | | | Qorvo, Inc.1 | | | 10,857 | |
| | 177 | | | Skyworks Solutions, Inc. | | | 13,677 | |
| | 231 | | | Teradyne, Inc. | | | 11,067 | |
| | 59 | | | Universal Display Corp. | | | 11,096 | |
| | 165 | | | Versum Materials, Inc. | | | 8,511 | |
| | | | | | | | |
| | | | Total Semiconductors & Semiconductor Equipment | | | 146,084 | |
| | | | | | | | |
| | | | Software & Services—10.2% | | | |
| | 105 | | | 2U, Inc.1 | | | 3,952 | |
| | 156 | | | Akamai Technologies, Inc.1 | | | 12,502 | |
| | 61 | | | Alliance Data Systems Corp. | | | 8,548 | |
| | 76 | | | Alteryx, Inc., Class A1 | | | 8,293 | |
| | 173 | | | Amdocs Ltd. | | | 10,742 | |
| | 125 | | | Anaplan, Inc.1 | | | 6,309 | |
| | 90 | | | Aspen Technology, Inc.1 | | | 11,185 | |
| | 90 | | | Atlassian Corp. PLC, Class A1 | | | 11,776 | |
| | 68 | | | Avalara, Inc.1 | | | 4,910 | |
| | 179 | | | Black Knight, Inc.1 | | | 10,767 | |
| | 166 | | | Booz Allen Hamilton Holding Corp. | | | 10,991 | |
| | 99 | | | Broadridge Financial Solutions, Inc. | | | 12,640 | |
The accompanying notes are an integral part of these financial statements.
Invesco Russell 1000® Size Factor ETF (OSIZ)(continued)
June 30, 2019
| | | | | | | | |
| Shares | | | | | Value | |
| | | | Common Stocks (continued) | | | |
| | | | Software & Services (continued) | | | |
| | 38 | | | CACI International, Inc., Class A1 | | $ | 7,774 | |
| | 180 | | | CDK Global, Inc. | | | 8,899 | |
| | 86 | | | Ceridian HCM Holding, Inc.1 | | | 4,317 | |
| | 122 | | | Citrix Systems, Inc. | | | 11,973 | |
| | 143 | | | CoreLogic, Inc.1 | | | 5,982 | |
| | 86 | | | Coupa Software, Inc.1 | | | 10,888 | |
| | 175 | | | DocuSign, Inc.1 | | | 8,699 | |
| | 330 | | | Dropbox, Inc., Class A1 | | | 8,266 | |
| | 255 | | | DXC Technology Co. | | | 14,063 | |
| | 55 | | | Elastic NV1 | | | 4,106 | |
| | 61 | | | EPAM Systems, Inc.1 | | | 10,559 | |
| | 64 | | | Euronet Worldwide, Inc.1 | | | 10,767 | |
| | 35 | | | Fair Isaac Corp.1 | | | 10,991 | |
| | 359 | | | FireEye, Inc.1 | | | 5,317 | |
| | 486 | | | First Data Corp., Class A1 | | | 13,156 | |
| | 139 | | | Fortinet, Inc.1 | | | 10,679 | |
| | 79 | | | Gartner, Inc.1 | | | 12,714 | |
| | 226 | | | Genpact Ltd. | | | 8,608 | |
| | 164 | | | GoDaddy, Inc., Class A1 | | | 11,505 | |
| | 104 | | | Guidewire Software, Inc.1 | | | 10,544 | |
| | 54 | | | HubSpot, Inc.1 | | | 9,208 | |
| | 86 | | | Jack Henry & Associates, Inc. | | | 11,517 | |
| | 145 | | | Leidos Holdings, Inc. | | | 11,578 | |
| | 85 | | | LogMeIn, Inc. | | | 6,263 | |
| | 107 | | | Manhattan Associates, Inc.1 | | | 7,418 | |
| | 37 | | | MongoDB, Inc.1 | | | 5,627 | |
| | 70 | | | New Relic, Inc.1 | | | 6,056 | |
| | 457 | | | Nuance Communications, Inc.1 | | | 7,298 | |
| | 233 | | | Nutanix, Inc., Class A1 | | | 6,044 | |
| | 103 | | | Okta, Inc.1 | | | 12,722 | |
| | 48 | | | Paycom Software, Inc.1 | | | 10,883 | |
| | 50 | | | Paylocity Holding Corp.1 | | | 4,691 | |
| | 57 | | | Pegasystems, Inc. | | | 4,059 | |
| | 112 | | | Pluralsight, Inc., Class A1 | | | 3,396 | |
| | 79 | | | Proofpoint, Inc.1 | | | 9,500 | |
| | 120 | | | PTC, Inc.1 | | | 10,771 | |
| | 121 | | | RealPage, Inc.1 | | | 7,121 | |
| | 87 | | | RingCentral, Inc., Class A1 | | | 9,998 | |
| | 416 | | | Sabre Corp. | | | 9,235 | |
| | 146 | | | Smartsheet, Inc., Class A1 | | | 7,066 | |
| | 69 | | | SolarWinds Corp.1 | | | 1,265 | |
| | 195 | | | SS&C Technologies Holdings, Inc. | | | 11,234 | |
| | 117 | | | Switch, Inc., Class A | | | 1,532 | |
| | 597 | | | Symantec Corp. | | | 12,991 | |
| | 94 | | | Tableau Software, Inc., Class A1 | | | 15,606 | |
| | 196 | | | Teradata Corp.1 | | | 7,027 | |
| | 50 | | | Trade Desk, Inc. (The), Class A1 | | | 11,389 | |
| | 48 | | | Tyler Technologies, Inc.1 | | | 10,369 | |
| | 540 | | | Western Union Co. (The) | | | 10,741 | |
| | 55 | | | WEX, Inc.1 | | | 11,445 | |
| | 128 | | | Zendesk, Inc.1 | | | 11,396 | |
| | 76 | | | Zscaler, Inc.1 | | | 5,825 | |
| | | | | | | | |
| | | | Total Software & Services | | | 573,693 | |
| | | | | | | | |
| | | | Technology Hardware & Equipment—4.5% | | | |
| | 130 | | | Arrow Electronics, Inc.1 | | | 9,265 | |
| | 173 | | | Avnet, Inc. | | | 7,832 | |
| | 125 | | | CDW Corp. | | | 13,875 | |
| | 236 | | | Ciena Corp.1 | | | 9,707 | |
| | | | | | | | |
| Shares | | | | | Value | |
| | | | Common Stocks (continued) | | | |
| | | | Technology Hardware & Equipment (continued) | | | |
| | 226 | | | Cognex Corp. | | $ | 10,843 | |
| | 44 | | | Coherent, Inc.1 | | | 6,000 | |
| | 340 | | | CommScope Holding Co., Inc.1 | | | 5,348 | |
| | 168 | | | Dell Technologies, Inc., Class C1 | | | 8,534 | |
| | 106 | | | Dolby Laboratories, Inc., Class A | | | 6,848 | |
| | 90 | | | EchoStar Corp., Class A1 | | | 3,989 | |
| | 77 | | | F5 Networks, Inc.1 | | | 11,213 | |
| | 191 | | | FLIR Systems, Inc. | | | 10,333 | |
| | 50 | | | IPG Photonics Corp.1 | | | 7,712 | |
| | 255 | | | Jabil, Inc. | | | 8,058 | |
| | 425 | | | Juniper Networks, Inc. | | | 11,318 | |
| | 165 | | | Keysight Technologies, Inc.1 | | | 14,819 | |
| | 40 | | | Littelfuse, Inc. | | | 7,076 | |
| | 203 | | | National Instruments Corp. | | | 8,524 | |
| | 206 | | | NCR Corp.1 | | | 6,407 | |
| | 211 | | | NetApp, Inc. | | | 13,019 | |
| | 385 | | | Pure Storage, Inc., Class A1 | | | 5,879 | |
| | 67 | | | SYNNEX Corp. | | | 6,593 | |
| | 283 | | | Trimble, Inc.1 | | | 12,766 | |
| | 19 | | | Ubiquiti Networks, Inc. | | | 2,498 | |
| | 86 | | | ViaSat, Inc.1 | | | 6,951 | |
| | 312 | | | Western Digital Corp. | | | 14,836 | |
| | 258 | | | Xerox Corp. | | | 9,136 | |
| | 63 | | | Zebra Technologies Corp., Class A1 | | | 13,198 | |
| | | | | | | | |
| | | | Total Technology Hardware & Equipment | | | 252,577 | |
| | | | | | | | |
| | | | Telecommunication Services—0.6% | | | |
| | 1,125 | | | CenturyLink, Inc. | | | 13,230 | |
| | 247 | | | Sprint Corp.1 | | | 1,623 | |
| | 179 | | | Telephone & Data Systems, Inc. | | | 5,442 | |
| | 28 | | | United States Cellular Corp.1 | | | 1,251 | |
| | 296 | | | Zayo Group Holdings, Inc.1 | | | 9,741 | |
| | | | | | | | |
| | | | Total Telecommunication Services | | | 31,287 | |
| | | | | | | | |
| | | | Transportation—2.7% | | | |
| | 164 | | | Alaska Air Group, Inc. | | | 10,481 | |
| | 12 | | | AMERCO | | | 4,543 | |
| | 394 | | | American Airlines Group, Inc. | | | 12,848 | |
| | 144 | | | C.H. Robinson Worldwide, Inc. | | | 12,146 | |
| | 57 | | | Copa Holdings SA, Class A | | | 5,562 | |
| | 171 | | | Expeditors International of Washington, Inc. | | | 12,972 | |
| | 86 | | | Genesee & Wyoming, Inc., Class A1 | | | 8,600 | |
| | 103 | | | JB Hunt Transport Services, Inc. | | | 9,415 | |
| | 467 | | | JetBlue Airways Corp.1 | | | 8,635 | |
| | 104 | | | Kansas City Southern | | | 12,669 | |
| | 96 | | | Kirby Corp.1 | | | 7,584 | |
| | 200 | | | Knight-Swift Transportation Holdings, Inc. | | | 6,568 | |
| | 68 | | | Landstar System, Inc. | | | 7,343 | |
| | 26 | | | Lyft, Inc., Class A1 | | | 1,709 | |
| | 128 | | | Macquarie Infrastructure Corp. | | | 5,189 | |
| | 71 | | | Old Dominion Freight Line, Inc. | | | 10,598 | |
| | 95 | | | Ryder System, Inc. | | | 5,539 | |
| | 108 | | | Schneider National, Inc., Class B | | | 1,970 | |
| | 146 | | | XPO Logistics, Inc.1,2 | | | 8,440 | |
| | | | | | | | |
| | | | Total Transportation | | | 152,811 | |
| | | | | | | | |
| | | | Utilities—3.3% | |
| | 725 | | | AES Corp. | | | 12,151 | |
| | 247 | | | Alliant Energy Corp. | | | 12,123 | |
| | 268 | | | Aqua America, Inc. | | | 11,087 | |
The accompanying notes are an integral part of these financial statements.
Invesco Russell 1000® Size Factor ETF (OSIZ)(continued)
June 30, 2019
| | | | | | | | |
| Shares | | | | | Value | |
| | | | Common Stocks (continued) | | | |
| | | | Utilities (continued) | |
| | 116 | | | Atmos Energy Corp. | | $ | 12,245 | |
| | 46 | | | Avangrid, Inc. | | | 2,323 | |
| | 437 | | | CenterPoint Energy, Inc. | | | 12,511 | |
| | 213 | | | Evergy, Inc. | | | 12,812 | |
| | 176 | | | Hawaiian Electric Industries, Inc. | | | 7,665 | |
| | 79 | | | IDACORP, Inc. | | | 7,934 | |
| | 312 | | | MDU Resources Group, Inc. | | | 8,050 | |
| | 132 | | | National Fuel Gas Co. | | | 6,963 | |
| | 410 | | | NiSource, Inc. | | | 11,808 | |
| | 318 | | | NRG Energy, Inc. | | | 11,168 | |
| | 251 | | | OGE Energy Corp. | | | 10,682 | |
| | 635 | | | PG&E Corp.1 | | | 14,554 | |
| | 122 | | | Pinnacle West Capital Corp. | | | 11,479 | |
| | 209 | | | UGI Corp. | | | 11,163 | |
| | 430 | | | Vistra Energy Corp. | | | 9,735 | |
| | | | | | | | |
| | | | Total Utilities | | | 186,453 | |
| | | | | | | | |
| | | | Total Common Stocks
(Cost $5,414,607) | | | 5,635,711 | |
| | | | | | | | |
| | |
| | | | | | | | |
| | | | Money Market Fund—0.0%4 | | | |
| | 322 | | | Premier U.S. Government Money Portfolio, 2.26%5 (Cost $322) | | | 322 | |
| | | | | | | | |
| | |
| | | | | | | | |
| | | | Investment of Cash Collateral for Securities
Loaned—1.0% | |
| | 41,491 | | | Invesco Government & Agency Portfolio—Institutional Class, 2.27%5,6 | | | 41,491 | |
| | 14,577 | | | Invesco Liquid Assets Portfolio—Institutional Class, 2.41%5,6 | | | 14,583 | |
| | | | | | | | |
| | | | Total Investment of Cash Collateral for Securities Loaned (Cost $56,073) | | | 56,074 | |
| | | | | | | | |
| | |
| | | | Total Investments—101.0%
(Cost $5,471,002) | | | 5,692,107 | |
| | |
| | | | Liabilities in Excess of Other Assets—(1.0)% | | | (53,538 | ) |
| | | | | | | | |
| | |
| | | | Net Assets—100.0% | | $ | 5,638,569 | |
| | | | | | | | |
REIT—Real Estate Investment Trust
| 1 | Non-income producing security. |
| 2 | All or a portion of the security was on loan. The aggregate value of the securities on loan was $51,652; total value of the collateral held by the Fund was $56,074. |
| 3 | Affiliated security (Note 4). |
| 5 | The security and the Fund are advised by wholly-owned subsidiaries of Invesco Ltd. and are therefore considered to be affiliated. The rate shown is the 7-day SEC standardized yield as of June 30, 2019. |
| 6 | The security has been segregated to satisfy the commitment to return the cash collateral received in securities lending transactions upon the borrower’s return of the securities loaned. See Note 6. |
The accompanying notes are an integral part of these financial statements.
Schedule of Investments
Invesco Russell 1000® Quality Factor ETF (OQAL)
June 30, 2019
| | | | | | | | |
| Shares | | | | | Value | |
| | | | Common Stocks—99.9% | |
| | | | Automobiles & Components—0.4% | |
| | 70 | | | Aptiv PLC | | $ | 5,658 | |
| | 67 | | | BorgWarner, Inc. | | | 2,813 | |
| | 109 | | | Gentex Corp. | | | 2,682 | |
| | 25 | | | Lear Corp. | | | 3,482 | |
| | 37 | | | Tesla, Inc.1 | | | 8,268 | |
| | 22 | | | Thor Industries, Inc. | | | 1,286 | |
| | | | | | | | |
| | | | Total Automobiles & Components | | | 24,189 | |
| | | | | | | | |
| | | | Banks—0.1% | | | |
| | 4 | | | LendingTree, Inc.1 | | | 1,680 | |
| | 193 | | | MGIC Investment Corp.1 | | | 2,536 | |
| | | | | | | | |
| | | | Total Banks | | | 4,216 | |
| | | | | | | | |
| | | | Capital Goods—6.7% | | | |
| | 194 | | | 3M Co. | | | 33,628 | |
| | 58 | | | A.O. Smith Corp. | | | 2,735 | |
| | 15 | | | Acuity Brands, Inc. | | | 2,069 | |
| | 20 | | | AGCO Corp. | | | 1,551 | |
| | 22 | | | Allegion PLC | | | 2,432 | |
| | 35 | | | Allison Transmission Holdings, Inc. | | | 1,622 | |
| | 51 | | | AMETEK, Inc. | | | 4,633 | |
| | 15 | | | Armstrong World Industries, Inc. | | | 1,458 | |
| | 190 | | | Boeing Co. (The) | | | 69,162 | |
| | 23 | | | BWX Technologies, Inc. | | | 1,198 | |
| | 16 | | | Carlisle Cos., Inc. | | | 2,247 | |
| | 128 | | | Caterpillar, Inc. | | | 17,445 | |
| | 64 | | | Cummins, Inc. | | | 10,966 | |
| | 11 | | | Curtiss-Wright Corp. | | | 1,398 | |
| | 44 | | | Donaldson Co., Inc. | | | 2,238 | |
| | 43 | | | Dover Corp. | | | 4,309 | |
| | 116 | | | Eaton Corp. PLC | | | 9,660 | |
| | 193 | | | Emerson Electric Co. | | | 12,877 | |
| | 239 | | | Fastenal Co. | | | 7,789 | |
| | 32 | | | Fortune Brands Home & Security, Inc. | | | 1,828 | |
| | 70 | | | Graco, Inc. | | | 3,513 | |
| | 49 | | | HD Supply Holdings, Inc.1 | | | 1,974 | |
| | 12 | | | HEICO Corp. | | | 1,606 | |
| | 24 | | | HEICO Corp., Class A | | | 2,481 | |
| | 27 | | | Hexcel Corp. | | | 2,184 | |
| | 234 | | | Honeywell International, Inc. | | | 40,854 | |
| | 16 | | | Huntington Ingalls Industries, Inc. | | | 3,596 | |
| | 25 | | | IDEX Corp. | | | 4,304 | |
| | 115 | | | Illinois Tool Works, Inc. | | | 17,343 | |
| | 54 | | | Ingersoll-Rand PLC | | | 6,840 | |
| | 35 | | | ITT, Inc. | | | 2,292 | |
| | 14 | | | Lennox International, Inc. | | | 3,850 | |
| | 23 | | | Lincoln Electric Holdings, Inc. | | | 1,893 | |
| | 59 | | | Lockheed Martin Corp. | | | 21,449 | |
| | 89 | | | Masco Corp. | | | 3,492 | |
| | 14 | | | Nordson Corp. | | | 1,978 | |
| | 54 | | | nVent Electric PLC | | | 1,339 | |
| | 23 | | | Oshkosh Corp. | | | 1,920 | |
| | 95 | | | PACCAR, Inc. | | | 6,808 | |
| | 37 | | | Parker-Hannifin Corp. | | | 6,290 | |
| | 70 | | | Pentair PLC | | | 2,604 | |
| | 38 | | | Quanta Services, Inc. | | | 1,451 | |
| | 94 | | | Raytheon Co. | | | 16,345 | |
| | 49 | | | Rockwell Automation, Inc. | | | 8,028 | |
| | 19 | | | Snap-on, Inc. | | | 3,147 | |
| | | | | | | | |
| Shares | | | | | Value | |
| | | | Common Stocks (continued) | |
| | | | Capital Goods (continued) | | | |
| | 34 | | | Spirit AeroSystems Holdings, Inc., Class A | | $ | 2,767 | |
| | 34 | | | Stanley Black & Decker, Inc. | | | 4,917 | |
| | 12 | | | Teledyne Technologies, Inc.1 | | | 3,286 | |
| | 59 | | | Textron, Inc. | | | 3,129 | |
| | 43 | | | Toro Co. (The) | | | 2,877 | |
| | 15 | | | W.W. Grainger, Inc. | | | 4,023 | |
| | 19 | | | WABCO Holdings, Inc.1 | | | 2,519 | |
| | 13 | | | Watsco, Inc. | | | 2,126 | |
| | | | | | | | |
| | | | Total Capital Goods | | | 384,470 | |
| | | | | | | | |
| | | | Commercial & Professional Services—0.8% | | | |
| | 24 | | | Cintas Corp. | | | 5,695 | |
| | 79 | | | Copart, Inc.1 | | | 5,904 | |
| | 13 | | | CoStar Group, Inc.1 | | | 7,203 | |
| | 21 | | | ManpowerGroup, Inc. | | | 2,029 | |
| | 50 | | | Robert Half International, Inc. | | | 2,851 | |
| | 59 | | | Rollins, Inc. | | | 2,116 | |
| | 42 | | | Verisk Analytics, Inc. | | | 6,151 | |
| | 101 | | | Waste Management, Inc. | | | 11,652 | |
| | | | | | | | |
| | | | Total Commercial & Professional Services | | | 43,601 | |
| | | | | | | | |
| | | | Consumer Durables & Apparel—1.7% | | | |
| | 16 | | | Carter’s, Inc. | | | 1,561 | |
| | 12 | | | Columbia Sportswear Co. | | | 1,202 | |
| | 60 | | | Garmin Ltd. | | | 4,788 | |
| | 40 | | | Leggett & Platt, Inc. | | | 1,535 | |
| | 51 | | | Lululemon Athletica, Inc.1 | | | 9,191 | |
| | 14 | | | Mohawk Industries, Inc.1 | | | 2,065 | |
| | 536 | | | NIKE, Inc., Class B | | | 44,997 | |
| | 1 | | | NVR, Inc.1 | | | 3,370 | |
| | 86 | | | PulteGroup, Inc. | | | 2,719 | |
| | 18 | | | PVH Corp. | | | 1,703 | |
| | 19 | | | Ralph Lauren Corp. | | | 2,158 | |
| | 27 | | | Roku, Inc.1 | | | 2,446 | |
| | 50 | | | Skechers U.S.A., Inc., Class A1 | | | 1,574 | |
| | 79 | | | Tapestry, Inc. | | | 2,507 | |
| | 32 | | | Toll Brothers, Inc. | | | 1,172 | |
| | 67 | | | Under Armour, Inc., Class A1 | | | 1,698 | |
| | 69 | | | Under Armour, Inc., Class C1 | | | 1,532 | |
| | 111 | | | VF Corp. | | | 9,696 | |
| | 16 | | | Whirlpool Corp. | | | 2,278 | |
| | | | | | | | |
| | | | Total Consumer Durables & Apparel | | | 98,192 | |
| | | | | | | | |
| | | | Consumer Services—2.7% | | | |
| | 117 | | | Carnival Corp. | | | 5,446 | |
| | 10 | | | Chipotle Mexican Grill, Inc.1 | | | 7,329 | |
| | 51 | | | Darden Restaurants, Inc. | | | 6,208 | |
| | 16 | | | Domino’s Pizza, Inc. | | | 4,452 | |
| | 19 | | | Dunkin’ Brands Group, Inc. | | | 1,514 | |
| | 34 | | | frontdoor, Inc.1 | | | 1,481 | |
| | 16 | | | Grand Canyon Education, Inc.1 | | | 1,872 | |
| | 67 | | | H&R Block, Inc. | | | 1,963 | |
| | 108 | | | Las Vegas Sands Corp. | | | 6,382 | |
| | 63 | | | Marriott International, Inc., Class A | | | 8,838 | |
| | 201 | | | McDonald’s Corp. | | | 41,740 | |
| | 28 | | | Planet Fitness, Inc., Class A1 | | | 2,028 | |
| | 513 | | | Starbucks Corp. | | | 43,005 | |
| | 11 | | | Vail Resorts, Inc. | | | 2,455 | |
| | 154 | | | Yum China Holdings, Inc. | | | 7,115 | |
The accompanying notes are an integral part of these financial statements.
Invesco Russell 1000® Quality Factor ETF (OQAL)(continued)
June 30, 2019
| | | | | | | | |
| Shares | | | | | Value | |
| | | | Common Stocks (continued) | |
| | | | Consumer Services (continued) | | | |
| | 121 | | | Yum! Brands, Inc. | | $ | 13,391 | |
| | | | | | | | |
| | | | Total Consumer Services | | | 155,219 | |
| | | | | | | | |
| | | | Diversified Financials—2.0% | | | |
| | 48 | | | Cboe Global Markets, Inc. | | | 4,974 | |
| | 5 | | | Credit Acceptance Corp.1 | | | 2,419 | |
| | 63 | | | Eaton Vance Corp. | | | 2,717 | |
| | 23 | | | Evercore, Inc., Class A | | | 2,037 | |
| | 15 | | | FactSet Research Systems, Inc. | | | 4,298 | |
| | 147 | | | Franklin Resources, Inc. | | | 5,116 | |
| | 64 | | | Janus Henderson Group PLC | | | 1,370 | |
| | 58 | | | Lazard Ltd., Class A | | | 1,995 | |
| | 36 | | | LPL Financial Holdings, Inc. | | | 2,937 | |
| | 21 | | | MarketAxess Holdings, Inc. | | | 6,750 | |
| | 93 | | | Moody’s Corp. | | | 18,164 | |
| | 8 | | | Morningstar, Inc. | | | 1,157 | |
| | 47 | | | MSCI, Inc. | | | 11,223 | |
| | 141 | | | S&P Global, Inc. | | | 32,118 | |
| | 74 | | | SEI Investments Co. | | | 4,151 | |
| | 132 | | | T. Rowe Price Group, Inc. | | | 14,482 | |
| | | | | | | | |
| | | | Total Diversified Financials | | | 115,908 | |
| | | | | | | | |
| | | | Energy—6.1% | | | |
| | 84 | | | Apache Corp. | | | 2,433 | |
| | 170 | | | Cabot Oil & Gas Corp. | | | 3,903 | |
| | 725 | | | Chevron Corp. | | | 90,219 | |
| | 39 | | | Cimarex Energy Co. | | | 2,314 | |
| | 439 | | | ConocoPhillips | | | 26,779 | |
| | 155 | | | Devon Energy Corp. | | | 4,421 | |
| | 235 | | | EOG Resources, Inc. | | | 21,893 | |
| | 85 | | | EQT Corp. | | | 1,344 | |
| | 1,676 | | | Exxon Mobil Corp. | | | 128,432 | |
| | 193 | | | Halliburton Co. | | | 4,389 | |
| | 39 | | | Helmerich & Payne, Inc. | | | 1,974 | |
| | 63 | | | HollyFrontier Corp. | | | 2,916 | |
| | 258 | | | Marathon Oil Corp. | | | 3,666 | |
| | 282 | | | Occidental Petroleum Corp. | | | 14,179 | |
| | 69 | | | Parsley Energy, Inc., Class A1 | | | 1,312 | |
| | 173 | | | Phillips 66 | | | 16,182 | |
| | 68 | | | Pioneer Natural Resources Co. | | | 10,462 | |
| | 156 | | | Valero Energy Corp. | | | 13,355 | |
| | | | | | | | |
| | | | Total Energy | | | 350,173 | |
| | | | | | | | |
| | | | Food & Staples Retailing—1.6% | | | |
| | 144 | | | Costco Wholesale Corp. | | | 38,054 | |
| | 121 | | | Sysco Corp. | | | 8,557 | |
| | 254 | | | Walgreens Boots Alliance, Inc. | | | 13,886 | |
| | 307 | | | Walmart, Inc. | | | 33,920 | |
| | | | | | | | |
| | | | Total Food & Staples Retailing | | | 94,417 | |
| | | | | | | | |
| | | | Food, Beverage & Tobacco—2.4% | | | |
| | 471 | | | Altria Group, Inc. | | | 22,302 | |
| | 48 | | | Brown-Forman Corp., Class B | | | 2,661 | |
| | 100 | | | Hormel Foods Corp.2 | | | 4,054 | |
| | 19 | | | Ingredion, Inc. | | | 1,567 | |
| | 168 | | | Monster Beverage Corp.1 | | | 10,723 | |
| | 435 | | | PepsiCo, Inc. | | | 57,042 | |
| | 517 | | | Philip Morris International, Inc. | | | 40,600 | |
| | | | | | | | |
| | | | Total Food, Beverage & Tobacco | | | 138,949 | |
| | | | | | | | |
| | | | | | | | |
| Shares | | | | | Value | |
| | | | Common Stocks (continued) | |
| | | | Health Care Equipment & Services—4.7% | | | |
| | 377 | | | Abbott Laboratories | | $ | 31,706 | |
| | 18 | | | ABIOMED, Inc.1 | | | 4,689 | |
| | 34 | | | Align Technology, Inc.1 | | | 9,306 | |
| | 34 | | | AmerisourceBergen Corp. | | | 2,899 | |
| | 170 | | | Baxter International, Inc. | | | 13,923 | |
| | 119 | | | Cerner Corp. | | | 8,723 | |
| | 7 | | | Chemed Corp. | | | 2,526 | |
| | 151 | | | Danaher Corp. | | | 21,581 | |
| | 86 | | | Edwards Lifesciences Corp.1 | | | 15,888 | |
| | 21 | | | Encompass Health Corp. | | | 1,330 | |
| | 50 | | | Humana, Inc. | | | 13,265 | |
| | 7 | | | ICU Medical, Inc.1 | | | 1,763 | |
| | 35 | | | IDEXX Laboratories, Inc.1 | | | 9,636 | |
| | 41 | | | Intuitive Surgical, Inc.1 | | | 21,506 | |
| | 22 | | | Laboratory Corp. of America Holdings1 | | | 3,804 | |
| | 19 | | | Masimo Corp.1 | | | 2,827 | |
| | 59 | | | McKesson Corp. | | | 7,929 | |
| | 19 | | | Medidata Solutions, Inc.1 | | | 1,720 | |
| | 13 | | | Penumbra, Inc.1 | | | 2,080 | |
| | 57 | | | ResMed, Inc. | | | 6,956 | |
| | 24 | | | STERIS PLC | | | 3,573 | |
| | 270 | | | UnitedHealth Group, Inc. | | | 65,883 | |
| | 17 | | | Universal Health Services, Inc., Class B | | | 2,217 | |
| | 36 | | | Varian Medical Systems, Inc.1 | | | 4,901 | |
| | 45 | | | Veeva Systems, Inc., Class A1 | | | 7,295 | |
| | 29 | | | West Pharmaceutical Services, Inc. | | | 3,629 | |
| | | | | | | | |
| | | | Total Health Care Equipment & Services | | | 271,555 | |
| | | | | | | | |
| | | | Household & Personal Products—2.6% | | | |
| | 68 | | | Church & Dwight Co., Inc. | | | 4,968 | |
| | 30 | | | Clorox Co. (The) | | | 4,593 | |
| | 302 | | | Colgate-Palmolive Co. | | | 21,644 | |
| | 86 | | | Estee Lauder Cos., Inc., (The), Class A | | | 15,748 | |
| | 38 | | | Herbalife Nutrition Ltd.1 | | | 1,625 | |
| | 113 | | | Kimberly-Clark Corp. | | | 15,061 | |
| | 755 | | | Procter & Gamble Co. (The) | | | 82,786 | |
| | | | | | | | |
| | | | Total Household & Personal Products | | | 146,425 | |
| | | | | | | | |
| | | | Insurance—0.8% | | | |
| | 71 | | | Brown & Brown, Inc. | | | 2,378 | |
| | 14 | | | Erie Indemnity Co., Class A | | | 3,560 | |
| | 100 | | | Fidelity National Financial, Inc. | | | 4,030 | |
| | 222 | | | Marsh & McLennan Cos., Inc. | | | 22,145 | |
| | 200 | | | Progressive Corp. (The) | | | 15,986 | |
| | | | | | | | |
| | | | Total Insurance | | | 48,099 | |
| | | | | | | | |
| | | | Materials—2.1% | | | |
| | 71 | | | Air Products & Chemicals, Inc. | | | 16,072 | |
| | 25 | | | Albemarle Corp. | | | 1,760 | |
| | 23 | | | Avery Dennison Corp. | | | 2,661 | |
| | 71 | | | Ball Corp. | | | 4,969 | |
| | 43 | | | Celanese Corp. | | | 4,635 | |
| | 54 | | | CF Industries Holdings, Inc. | | | 2,522 | |
| | 164 | | | Corteva, Inc.1 | | | 4,850 | |
| | 164 | | | Dow, Inc. | | | 8,087 | |
| | 14 | | | Eagle Materials, Inc. | | | 1,298 | |
| | 30 | | | Eastman Chemical Co. | | | 2,335 | |
| | 61 | | | Ecolab, Inc. | | | 12,044 | |
| | 91 | | | Huntsman Corp. | | | 1,860 | |
| | 89 | | | International Paper Co. | | | 3,856 | |
The accompanying notes are an integral part of these financial statements.
Invesco Russell 1000® Quality Factor ETF (OQAL)(continued)
June 30, 2019
| | | | | | | | |
| Shares | | | | | Value | |
| | | | Common Stocks (continued) | |
| | | | Materials (continued) | | | |
| | 90 | | | LyondellBasell Industries NV, Class A | | $ | 7,752 | |
| | 187 | | | Newmont Goldcorp Corp. | | | 7,194 | |
| | 111 | | | Nucor Corp. | | | 6,116 | |
| | 27 | | | Packaging Corp. of America | | | 2,574 | |
| | 64 | | | PPG Industries, Inc. | | | 7,469 | |
| | 20 | | | Reliance Steel & Aluminum Co. | | | 1,892 | |
| | 24 | | | Royal Gold, Inc. | | | 2,460 | |
| | 35 | | | Sealed Air Corp. | | | 1,497 | |
| | 21 | | | Sherwin-Williams Co. (The) | | | 9,624 | |
| | 27 | | | Sonoco Products Co. | | | 1,764 | |
| | 80 | | | Steel Dynamics, Inc. | | | 2,416 | |
| | 60 | | | Valvoline, Inc. | | | 1,172 | |
| | 56 | | | WestRock Co. | | | 2,042 | |
| | | | | | | | |
| | | | Total Materials | | | 120,921 | |
| | | | | | | | |
| | | | Media & Entertainment—9.8% | | | |
| | 240 | | | Activision Blizzard, Inc. | | | 11,328 | |
| | 112 | | | Alphabet, Inc., Class A1 | | | 121,274 | |
| | 113 | | | Alphabet, Inc., Class C1 | | | 122,143 | |
| | 1 | | | Cable One, Inc. | | | 1,171 | |
| | 116 | | | Electronic Arts, Inc.1 | | | 11,746 | |
| | 992 | | | Facebook, Inc., Class A1 | | | 191,456 | |
| | 116 | | | Fox Corp., Class A | | | 4,250 | |
| | 54 | | | Fox Corp., Class B | | | 1,973 | |
| | 18 | | | IAC/InterActiveCorp1 | | | 3,915 | |
| | 7 | | | Madison Square Garden Co. (The), Class A1 | | | 1,960 | |
| | 22 | | | Match Group, Inc. | | | 1,480 | |
| | 44 | | | New York Times Co., (The), Class A | | | 1,435 | |
| | 405 | | | Sirius XM Holdings, Inc.2 | | | 2,260 | |
| | 46 | | | Take-Two Interactive Software, Inc.1 | | | 5,222 | |
| | 40 | | | TripAdvisor, Inc.1 | | | 1,852 | |
| | 571 | | | Walt Disney Co. (The) | | | 79,734 | |
| | 17 | | | World Wrestling Entertainment, Inc., Class A | | | 1,227 | |
| | 336 | | | Zynga, Inc., Class A1 | | | 2,060 | |
| | | | | | | | |
| | | | Total Media & Entertainment | | | 566,486 | |
| | | | | | | | |
| | | | Pharmaceuticals, Biotechnology & Life Sciences—9.4% | |
| | 543 | | | AbbVie, Inc. | | | 39,487 | |
| | 106 | | | Agilent Technologies, Inc. | | | 7,915 | |
| | 223 | | | Amgen, Inc. | | | 41,094 | |
| | 82 | | | Biogen, Inc.1 | | | 19,177 | |
| | 10 | | | Bio-Techne Corp. | | | 2,085 | |
| | 638 | | | Bristol-Myers Squibb Co. | | | 28,933 | |
| | 31 | | | Bruker Corp. | | | 1,549 | |
| | 108 | | | Elanco Animal Health, Inc.1 | | | 3,650 | |
| | 278 | | | Eli Lilly & Co. | | | 30,800 | |
| | 116 | | | Exelixis, Inc.1 | | | 2,479 | |
| | 355 | | | Gilead Sciences, Inc. | | | 23,984 | |
| | 38 | | | Illumina, Inc.1 | | | 13,990 | |
| | 69 | | | Incyte Corp.1 | | | 5,862 | |
| | 34 | | | Ionis Pharmaceuticals, Inc.1 | | | 2,185 | |
| | 15 | | | Jazz Pharmaceuticals PLC1 | | | 2,138 | |
| | 987 | | | Johnson & Johnson | | | 137,469 | |
| | 855 | | | Merck & Co., Inc. | | | 71,692 | |
| | 9 | | | Mettler-Toledo International, Inc.1 | | | 7,560 | |
| | 61 | | | Nektar Therapeutics1 | | | 2,170 | |
| | 1,528 | | | Pfizer, Inc. | | | 66,193 | |
| | 17 | | | PRA Health Sciences, Inc.1 | | | 1,686 | |
| | 32 | | | Regeneron Pharmaceuticals, Inc.1 | | | 10,016 | |
| | | | | | | | |
| Shares | | | | | Value | |
| | | | Common Stocks (continued) | |
| | | | Pharmaceuticals, Biotechnology & Life Sciences (continued) | |
| | 15 | | | United Therapeutics Corp.1 | | $ | 1,171 | |
| | 78 | | | Vertex Pharmaceuticals, Inc.1 | | | 14,304 | |
| | 29 | | | Waters Corp.1 | | | 6,242 | |
| | | | | | | | |
| | | | Total Pharmaceuticals, Biotechnology & Life Sciences | | | 543,831 | |
| | | | | | | | |
| | | | Real Estate—2.0% | | | |
| | 78 | | | Apartment Investment & Management Co., Class A | | | 3,909 | |
| | 41 | | | AvalonBay Communities, Inc. | | | 8,330 | |
| | 154 | | | CBRE Group, Inc., Class A1 | | | 7,900 | |
| | 42 | | | Cousins Properties, Inc. | | | 1,519 | |
| | 101 | | | Duke Realty Corp. | | | 3,193 | |
| | 47 | | | Equity Commonwealth | | | 1,529 | |
| | 27 | | | Equity LifeStyle Properties, Inc. | | | 3,276 | |
| | 38 | | | Extra Space Storage, Inc. | | | 4,032 | |
| | 205 | | | HCP, Inc. | | | 6,556 | |
| | 350 | | | Host Hotels & Resorts, Inc. | | | 6,377 | |
| | 15 | | | Jones Lang LaSalle, Inc. | | | 2,110 | |
| | 33 | | | Lamar Advertising Co., Class A | | | 2,664 | |
| | 14 | | | Life Storage, Inc. | | | 1,331 | |
| | 209 | | | Medical Properties Trust, Inc. | | | 3,645 | |
| | 57 | | | Park Hotels & Resorts, Inc. | | | 1,571 | |
| | 183 | | | Prologis, Inc. | | | 14,658 | |
| | 84 | | | Public Storage | | | 20,006 | |
| | 130 | | | Simon Property Group, Inc. | | | 20,769 | |
| | 115 | | | VICI Properties, Inc. | | | 2,535 | |
| | 53 | | | Weingarten Realty Investors | | | 1,453 | |
| | | | | | | | |
| | | | Total Real Estate | | | 117,363 | |
| | | | | | | | |
| | | | Retailing—9.9% | | | |
| | 22 | | | Advance Auto Parts, Inc. | | | 3,391 | |
| | 133 | | | Amazon.com, Inc.1 | | | 251,853 | |
| | 7 | | | AutoZone, Inc.1 | | | 7,696 | |
| | 96 | | | Best Buy Co., Inc. | | | 6,694 | |
| | 18 | | | Booking Holdings, Inc.1 | | | 33,745 | |
| | 22 | | | Burlington Stores, Inc.1 | | | 3,743 | |
| | 97 | | | Dollar General Corp. | | | 13,111 | |
| | 69 | | | Dollar Tree, Inc.1 | | | 7,410 | |
| | 269 | | | eBay, Inc. | | | 10,626 | |
| | 42 | | | Etsy, Inc.1 | | | 2,578 | |
| | 34 | | | Expedia Group, Inc. | | | 4,523 | |
| | 20 | | | Five Below, Inc.1 | | | 2,400 | |
| | 47 | | | Foot Locker, Inc. | | | 1,970 | |
| | 85 | | | Gap, Inc. (The) | | | 1,527 | |
| | 45 | | | Genuine Parts Co. | | | 4,661 | |
| | 22 | | | GrubHub, Inc.1 | | | 1,716 | |
| | 451 | | | Home Depot, Inc. (The) | | | 93,795 | |
| | 57 | | | Kohl’s Corp. | | | 2,710 | |
| | 55 | | | L Brands, Inc. | | | 1,436 | |
| | 251 | | | Lowe’s Cos., Inc. | | | 25,328 | |
| | 69 | | | Macy’s, Inc. | | | 1,481 | |
| | 20 | | | Ollie’s Bargain Outlet Holdings, Inc.1 | | | 1,742 | |
| | 27 | | | O’Reilly Automotive, Inc.1 | | | 9,972 | |
| | 9 | | | Pool Corp. | | | 1,719 | |
| | 110 | | | Qurate Retail, Inc.1 | | | 1,363 | |
| | 153 | | | Ross Stores, Inc. | | | 15,165 | |
| | 138 | | | Target Corp. | | | 11,952 | |
| | 40 | | | Tiffany & Co.2 | | | 3,746 | |
| | 525 | | | TJX Cos., Inc. (The) | | | 27,762 | |
| | 49 | | | Tractor Supply Co. | | | 5,331 | |
The accompanying notes are an integral part of these financial statements.
Invesco Russell 1000® Quality Factor ETF (OQAL)(continued)
June 30, 2019
| | | | | | | | |
| Shares | | | | | Value | |
| | | | Common Stocks (continued) | |
| | | | Retailing (continued) | | | |
| | 24 | | | Ulta Beauty, Inc.1 | | $ | 8,325 | |
| | 32 | | | Williams-Sonoma, Inc. | | | 2,080 | |
| | | | | | | | |
| | | | Total Retailing | | | 571,551 | |
| | | | | | | | |
| | | | Semiconductors & Semiconductor Equipment—4.9% | | | |
| | 400 | | | Applied Materials, Inc. | | | 17,964 | |
| | 99 | | | Cypress Semiconductor Corp. | | | 2,202 | |
| | 1,769 | | | Intel Corp. | | | 84,682 | |
| | 58 | | | KLA-Tencor Corp. | | | 6,856 | |
| | 65 | | | Lam Research Corp. | | | 12,210 | |
| | 77 | | | Maxim Integrated Products, Inc. | | | 4,606 | |
| | 442 | | | Micron Technology, Inc.1 | | | 17,057 | |
| | 21 | | | MKS Instruments, Inc. | | | 1,636 | |
| | 16 | | | Monolithic Power Systems, Inc. | | | 2,172 | |
| | 204 | | | NVIDIA Corp. | | | 33,503 | |
| | 40 | | | Qorvo, Inc.1 | | | 2,664 | |
| | 309 | | | QUALCOMM, Inc. | | | 23,506 | |
| | 66 | | | Skyworks Solutions, Inc. | | | 5,100 | |
| | 74 | | | Teradyne, Inc. | | | 3,545 | |
| | 406 | | | Texas Instruments, Inc. | | | 46,592 | |
| | 15 | | | Universal Display Corp. | | | 2,821 | |
| | 30 | | | Versum Materials, Inc. | | | 1,547 | |
| | 87 | | | Xilinx, Inc. | | | 10,259 | |
| | | | | | | | |
| | | | Total Semiconductors & Semiconductor Equipment | | | 278,922 | |
| | | | | | | | |
| | | | Software & Services—17.1% | | | |
| | 271 | | | Accenture PLC, Class A | | | 50,073 | |
| | 177 | | | Adobe, Inc.1 | | | 52,153 | |
| | 49 | | | Akamai Technologies, Inc.1 | | | 3,927 | |
| | 48 | | | Amdocs Ltd. | | | 2,980 | |
| | 29 | | | ANSYS, Inc.1 | | | 5,940 | |
| | 29 | | | Aspen Technology, Inc.1 | | | 3,604 | |
| | 168 | | | Automatic Data Processing, Inc. | | | 27,775 | |
| | 32 | | | Booz Allen Hamilton Holding Corp. | | | 2,119 | |
| | 40 | | | Broadridge Financial Solutions, Inc. | | | 5,107 | |
| | 100 | | | Cadence Design Systems, Inc.1 | | | 7,081 | |
| | 37 | | | Citrix Systems, Inc. | | | 3,631 | |
| | 211 | | | Cognizant Technology Solutions Corp., Class A | | | 13,375 | |
| | 20 | | | EPAM Systems, Inc.1 | | | 3,462 | |
| | 17 | | | Euronet Worldwide, Inc.1 | | | 2,860 | |
| | 9 | | | Fair Isaac Corp.1 | | | 2,826 | |
| | 92 | | | Fiserv, Inc.1 | | | 8,387 | |
| | 51 | | | Fortinet, Inc.1 | | | 3,918 | |
| | 37 | | | Genpact Ltd. | | | 1,409 | |
| | 99 | | | Intuit, Inc. | | | 25,872 | |
| | 29 | | | Jack Henry & Associates, Inc. | | | 3,884 | |
| | 17 | | | LogMeIn, Inc. | | | 1,253 | |
| | 27 | | | Manhattan Associates, Inc.1 | | | 1,872 | |
| | 513 | | | Mastercard, Inc., Class A | | | 135,704 | |
| | 2,142 | | | Microsoft Corp. | | | 286,942 | |
| | 23 | | | Palo Alto Networks, Inc.1 | | | 4,687 | |
| | 129 | | | Paychex, Inc. | | | 10,615 | |
| | 17 | | | Paycom Software, Inc.1 | | | 3,854 | |
| | 483 | | | PayPal Holdings, Inc.1 | | | 55,284 | |
| | 68 | | | Red Hat, Inc.1 | | | 12,768 | |
| | 167 | | | salesforce.com, Inc.1 | | | 25,339 | |
| | 53 | | | ServiceNow, Inc.1 | | | 14,552 | |
| | 48 | | | Synopsys, Inc.1 | | | 6,177 | |
| | 20 | | | Tableau Software, Inc., Class A1 | | | 3,320 | |
| | | | | | | | |
| Shares | | | | | Value | |
| | | | Common Stocks (continued) | |
| | | | Software & Services (continued) | | | |
| | 14 | | | Trade Desk, Inc. (The), Class A1 | | $ | 3,189 | |
| | 12 | | | Tyler Technologies, Inc.1 | | | 2,592 | |
| | 41 | | | VeriSign, Inc.1 | | | 8,576 | |
| | 965 | | | Visa, Inc., Class A | | | 167,476 | |
| | 33 | | | VMware, Inc., Class A | | | 5,518 | |
| | 212 | | | Western Union Co. (The) | | | 4,217 | |
| | | | | | | | |
| | | | Total Software & Services | | | 984,318 | |
| | | | | | | | |
| | | | Technology Hardware & Equipment—8.5% | | | |
| | 85 | | | Amphenol Corp., Class A | | | 8,155 | |
| | 1,795 | | | Apple, Inc. | | | 355,266 | |
| | 19 | | | Arista Networks, Inc.1 | | | 4,933 | |
| | 1,529 | | | Cisco Systems, Inc. | | | 83,682 | |
| | 69 | | | Cognex Corp. | | | 3,311 | |
| | 25 | | | Dolby Laboratories, Inc., Class A | | | 1,615 | |
| | 22 | | | F5 Networks, Inc.1 | | | 3,204 | |
| | 52 | | | FLIR Systems, Inc. | | | 2,813 | |
| | 528 | | | HP, Inc. | | | 10,977 | |
| | 13 | | | IPG Photonics Corp.1 | | | 2,005 | |
| | 47 | | | Keysight Technologies, Inc.1 | | | 4,221 | |
| | 49 | | | National Instruments Corp. | | | 2,058 | |
| | 100 | | | NetApp, Inc. | | | 6,170 | |
| | 15 | | | Zebra Technologies Corp., Class A1 | | | 3,142 | |
| | | | | | | | |
| | | | Total Technology Hardware & Equipment | | | 491,552 | |
| | | | | | | | |
| | | | Telecommunication Services—0.9% | | | |
| | 903 | | | Verizon Communications, Inc. | | | 51,588 | |
| | | | | | | | |
| | |
| | | | Transportation—2.5% | | | |
| | 33 | | | Alaska Air Group, Inc. | | | 2,109 | |
| | 54 | | | C.H. Robinson Worldwide, Inc. | | | 4,555 | |
| | 210 | | | CSX Corp. | | | 16,248 | |
| | 181 | | | Delta Air Lines, Inc. | | | 10,272 | |
| | 74 | | | Expeditors International of Washington, Inc. | | | 5,613 | |
| | 34 | | | JB Hunt Transport Services, Inc. | | | 3,108 | |
| | 96 | | | JetBlue Airways Corp.1 | | | 1,775 | |
| | 22 | | | Kansas City Southern | | | 2,680 | |
| | 53 | | | Knight-Swift Transportation Holdings, Inc. | | | 1,740 | |
| | 17 | | | Landstar System, Inc. | | | 1,836 | |
| | 66 | | | Norfolk Southern Corp. | | | 13,156 | |
| | 27 | | | Old Dominion Freight Line, Inc. | | | 4,030 | |
| | 195 | | | Southwest Airlines Co. | | | 9,902 | |
| | 215 | | | Union Pacific Corp. | | | 36,359 | |
| | 56 | | | United Continental Holdings, Inc.1 | | | 4,903 | |
| | 207 | | | United Parcel Service, Inc., Class B | | | 21,377 | |
| | 25 | | | XPO Logistics, Inc.1 | | | 1,445 | |
| | | | | | | | |
| | | | Total Transportation | | | 141,108 | |
| | | | | | | | |
| | | | Utilities—0.2% | | | |
| | 114 | | | CenterPoint Energy, Inc. | | | 3,264 | |
| | 11 | | | IDACORP, Inc. | | | 1,105 | |
| | 105 | | | NRG Energy, Inc. | | | 3,688 | |
| | 45 | | | UGI Corp. | | | 2,403 | |
| | | | | | | | |
| | | | Total Utilities | | | 10,460 | |
| | | | | | | | |
| | | | Total Common Stocks
(Cost $5,180,777) | | | 5,753,513 | |
| | | | | | | | |
The accompanying notes are an integral part of these financial statements.
Invesco Russell 1000® Quality Factor ETF (OQAL)(continued)
June 30, 2019
| | | | | | | | |
| Shares | | | | | Value | |
| | | | Investment of Cash Collateral for Securities
Loaned—0.2% | |
| | 8,948 | | | Invesco Government & Agency Portfolio—Institutional Class, 2.27%3,4 | | $ | 8,948 | |
| | 2,982 | | | Invesco Liquid Assets Portfolio—Institutional Class, 2.41%3,4 | | | 2,983 | |
| | | | | | | | |
| | | | Total Investment of Cash Collateral for Securities Loaned
(Cost $11,931) | | | 11,931 | |
| | | | | | | | |
| | |
| | | | Total Investments—100.1%
(Cost $5,192,708) | | | 5,765,444 | |
| | |
| | | | Liabilities in Excess of Other Assets—(0.1)% | | | (4,987 | ) |
| | | | | | | | |
| | |
| | | | Net Assets—100.0% | | $ | 5,760,457 | |
| | | | | | | | |
| 1 | Non-income producing security. |
| 2 | All or a portion of the security was on loan. The aggregate value of the securities on loan was $8,233; total value of the collateral held by the Fund was $11,931. |
| 3 | The security and the Fund are advised by wholly-owned subsidiaries of Invesco Ltd. and are therefore considered to be affiliated. The rate shown is the 7-day SEC standardized yield as of June 30, 2019. |
| 4 | The security has been segregated to satisfy the commitment to return the cash collateral received in securities lending transactions upon the borrower’s return of the securities loaned. See Note 6. |
The accompanying notes are an integral part of these financial statements.
Schedule of Investments
Invesco Russell 1000® Yield Factor ETF (OYLD)
June 30, 2019
| | | | | | | | |
| Shares | | | | | Value | |
| | | | Common Stocks—100.1% | | | |
| | | | Automobiles & Components—1.1% | | | |
| | 3,109 | | | Ford Motor Co. | | $ | 31,805 | |
| | 904 | | | General Motors Co. | | | 34,831 | |
| | 115 | | | Harley-Davidson, Inc. | | | 4,121 | |
| | | | | | | | |
| | | | Total Automobiles & Components | | | 70,757 | |
| | | | | | | | |
| | | | Banks—11.0% | |
| | 3,936 | | | Bank of America Corp. | | | 114,144 | |
| | 489 | | | BB&T Corp. | | | 24,025 | |
| | 1,275 | | | Citigroup, Inc. | | | 89,288 | |
| | 289 | | | Citizens Financial Group, Inc. | | | 10,219 | |
| | 95 | | | Comerica, Inc. | | | 6,901 | |
| | 232 | | | F.N.B. Corp. | | | 2,731 | |
| | 437 | | | Fifth Third Bancorp | | | 12,192 | |
| | 734 | | | Huntington Bancshares, Inc. | | | 10,144 | |
| | 1,830 | | | JPMorgan Chase & Co. | | | 204,594 | |
| | 690 | | | KeyCorp | | | 12,247 | |
| | 365 | | | New York Community Bancorp, Inc. | | | 3,643 | |
| | 94 | | | PacWest Bancorp | | | 3,650 | |
| | 288 | | | People’s United Financial, Inc. | | | 4,833 | |
| | 258 | | | PNC Financial Services Group, Inc. (The) | | | 35,418 | |
| | 675 | | | Regions Financial Corp. | | | 10,084 | |
| | 272 | | | SunTrust Banks, Inc. | | | 17,095 | |
| | 823 | | | U.S. Bancorp | | | 43,125 | |
| | 167 | | | Umpqua Holdings Corp. | | | 2,771 | |
| | 2,752 | | | Wells Fargo & Co. | | | 130,225 | |
| | | | | | | | |
| | | | Total Banks | | | 737,329 | |
| | | | | | | | |
| | | | Capital Goods—7.7% | |
| | 361 | | | 3M Co. | | | 62,576 | |
| | 238 | | | Boeing Co. (The) | | | 86,635 | |
| | 321 | | | Caterpillar, Inc. | | | 43,749 | |
| | 91 | | | Cummins, Inc. | | | 15,592 | |
| | 279 | | | Eaton Corp. PLC | | | 23,235 | |
| | 381 | | | Emerson Electric Co. | | | 25,420 | |
| | 309 | | | Fastenal Co. | | | 10,070 | |
| | 127 | | | General Dynamics Corp. | | | 23,091 | |
| | 4,860 | | | General Electric Co. | | | 51,030 | |
| | 180 | | | Illinois Tool Works, Inc. | | | 27,146 | |
| | 497 | | | Johnson Controls International PLC | | | 20,531 | |
| | 128 | | | Lockheed Martin Corp. | | | 46,533 | |
| | 252 | | | PACCAR, Inc. | | | 18,058 | |
| | 62 | | | Rockwell Automation, Inc. | | | 10,158 | |
| | 391 | | | United Technologies Corp. | | | 50,908 | |
| | 22 | | | Watsco, Inc. | | | 3,598 | |
| | | | | | | | |
| | | | Total Capital Goods | | | 518,330 | |
| | | | | | | | |
| | | | Commercial & Professional Services—0.1% | |
| | 295 | | | Nielsen Holdings PLC | | | 6,667 | |
| | | | | | | | |
| | | | Consumer Durables & Apparel—0.8% | | | |
| | 82 | | | Garmin Ltd. | | | 6,544 | |
| | 250 | | | Hanesbrands, Inc. | | | 4,305 | |
| | 64 | | | Hasbro, Inc. | | | 6,764 | |
| | 93 | | | Leggett & Platt, Inc. | | | 3,568 | |
| | 306 | | | Newell Brands, Inc. | | | 4,719 | |
| | 214 | | | Tapestry, Inc. | | | 6,790 | |
| | 154 | | | VF Corp. | | | 13,452 | |
| | 43 | | | Whirlpool Corp. | | | 6,121 | |
| | | | | | | | |
| | | | Total Consumer Durables & Apparel | | | 52,263 | |
| | | | | | | | |
| | | | | | | | |
| Shares | | | | | Value | |
| | | | Common Stocks (continued) | | | |
| | | | Consumer Services—1.9% | |
| | 286 | | | Carnival Corp. | | $ | 13,313 | |
| | 149 | | | Extended Stay America, Inc. | | | 2,517 | |
| | 144 | | | H&R Block, Inc. | | | 4,219 | |
| | 275 | | | Las Vegas Sands Corp. | | | 16,250 | |
| | 375 | | | McDonald’s Corp. | | | 77,872 | |
| | 67 | | | Six Flags Entertainment Corp. | | | 3,329 | |
| | 68 | | | Wyndham Destinations, Inc. | | | 2,985 | |
| | 58 | | | Wynn Resorts Ltd. | | | 7,191 | |
| | | | | | | | |
| | | | Total Consumer Services | | | 127,676 | |
| | | | | | | | |
| | | | Diversified Financials—3.2% | |
| | 458 | | | AGNC Investment Corp. | | | 7,704 | |
| | 72 | | | Ameriprise Financial, Inc. | | | 10,451 | |
| | 1,243 | | | Annaly Capital Management, Inc. | | | 11,349 | |
| | 449 | | | Bank of New York Mellon Corp. (The) | | | 19,823 | |
| | 70 | | | BlackRock, Inc. | | | 32,851 | |
| | 158 | | | Chimera Investment Corp. | | | 2,981 | |
| | 179 | | | CME Group, Inc. | | | 34,746 | |
| | 170 | | | Franklin Resources, Inc. | | | 5,916 | |
| | 312 | | | Invesco Ltd.1 | | | 6,383 | |
| | 132 | | | Janus Henderson Group PLC | | | 2,825 | |
| | 87 | | | Lazard Ltd., Class A | | | 2,992 | |
| | 380 | | | MFA Financial, Inc. | | | 2,728 | |
| | 691 | | | Morgan Stanley | | | 30,273 | |
| | 354 | | | New Residential Investment Corp. | | | 5,448 | |
| | 226 | | | Starwood Property Trust, Inc. | | | 5,135 | |
| | 235 | | | State Street Corp. | | | 13,174 | |
| | 132 | | | T. Rowe Price Group, Inc. | | | 14,482 | |
| | 232 | | | Two Harbors Investment Corp. | | | 2,939 | |
| | | | | | | | |
| | | | Total Diversified Financials | | | 212,200 | |
| | | | | | | | |
| | | | Energy—10.1% | |
| | 255 | | | Apache Corp. | | | 7,387 | |
| | 328 | | | Baker Hughes a GE Co. | | | 8,079 | |
| | 1,320 | | | Chevron Corp. | | | 164,261 | |
| | 3,104 | | | Exxon Mobil Corp. | | | 237,859 | |
| | 555 | | | Halliburton Co. | | | 12,621 | |
| | 83 | | | Helmerich & Payne, Inc. | | | 4,201 | |
| | 102 | | | HollyFrontier Corp. | | | 4,721 | |
| | 1,386 | | | Kinder Morgan, Inc. | | | 28,940 | |
| | 462 | | | Marathon Petroleum Corp. | | | 25,817 | |
| | 594 | | | Occidental Petroleum Corp. | | | 29,866 | |
| | 313 | | | ONEOK, Inc. | | | 21,537 | |
| | 313 | | | Phillips 66 | | | 29,278 | |
| | 1,080 | | | Schlumberger Ltd. | | | 42,919 | |
| | 192 | | | Targa Resources Corp. | | | 7,538 | |
| | 306 | | | Valero Energy Corp. | | | 26,197 | |
| | 926 | | | Williams Cos., Inc. (The) | | | 25,965 | |
| | | | | | | | |
| | | | Total Energy | | | 677,186 | |
| | | | | | | | |
| | | | Food & Staples Retailing—0.4% | |
| | 525 | | | Walgreens Boots Alliance, Inc. | | | 28,702 | |
| | | | | | | | |
| | |
| | | | Food, Beverage & Tobacco—7.2% | | | |
| | 1,489 | | | Altria Group, Inc. | | | 70,504 | |
| | 364 | | | Archer-Daniels-Midland Co. | | | 14,851 | |
| | 92 | | | Bunge Ltd. | | | 5,125 | |
| | 114 | | | Campbell Soup Co. | | | 4,568 | |
| | 2,370 | | | Coca-Cola Co. (The) | | | 120,680 | |
| | 297 | | | Conagra Brands, Inc. | | | 7,877 | |
The accompanying notes are an integral part of these financial statements.
Invesco Russell 1000® Yield Factor ETF (OYLD)(continued)
June 30, 2019
| | | | | | | | |
| Shares | | | | | Value | |
| | | | Common Stocks (continued) | | | |
| | | | Food, Beverage & Tobacco (continued) | | | |
| | 413 | | | General Mills, Inc. | | $ | 21,691 | |
| | 62 | | | JM Smucker Co. (The) | | | 7,142 | |
| | 174 | | | Kellogg Co. | | | 9,321 | |
| | 521 | | | Kraft Heinz Co. (The) | | | 16,172 | |
| | 103 | | | Molson Coors Brewing Co., Class B | | | 5,768 | |
| | 815 | | | PepsiCo, Inc. | | | 106,871 | |
| | 1,220 | | | Philip Morris International, Inc. | | | 95,807 | |
| | | | | | | | |
| | | | Total Food, Beverage & Tobacco | | | 486,377 | |
| | | | | | | | |
| | | | Health Care Equipment & Services—1.8% | |
| | 217 | | | Cardinal Health, Inc. | | | 10,221 | |
| | 923 | | | CVS Health Corp. | | | 50,294 | |
| | 619 | | | Medtronic PLC | | | 60,284 | |
| | | | | | | | |
| | | | Total Health Care Equipment & Services | | | 120,799 | |
| | | | | | | | |
| | | | Household & Personal Products—3.3% | |
| | 68 | | | Clorox Co. (The) | | | 10,411 | |
| | 427 | | | Colgate-Palmolive Co. | | | 30,603 | |
| | 209 | | | Kimberly-Clark Corp. | | | 27,856 | |
| | 1,400 | | | Procter & Gamble Co. (The) | | | 153,510 | |
| | | | | | | | |
| | | | Total Household & Personal Products | | | 222,380 | |
| | | | | | | | |
| | | | Insurance—2.0% | |
| | 54 | | | American Financial Group, Inc. | | | 5,533 | |
| | 455 | | | American International Group, Inc. | | | 24,242 | |
| | 161 | | | Fidelity National Financial, Inc. | | | 6,488 | |
| | 529 | | | MetLife, Inc. | | | 26,276 | |
| | 185 | | | Old Republic International Corp. | | | 4,140 | |
| | 194 | | | Principal Financial Group, Inc. | | | 11,237 | |
| | 305 | | | Progressive Corp. (The) | | | 24,379 | |
| | 281 | | | Prudential Financial, Inc. | | | 28,381 | |
| | 131 | | | Unum Group | | | 4,395 | |
| | | | | | | | |
| | | | Total Insurance | | | 135,071 | |
| | | | | | | | |
| | | | Materials—1.7% | |
| | 131 | | | CF Industries Holdings, Inc. | | | 6,119 | |
| | 117 | | | Chemours Co. (The) | | | 2,808 | |
| | 562 | | | DuPont de Nemours, Inc. | | | 42,189 | |
| | 92 | | | Eastman Chemical Co. | | | 7,160 | |
| | 292 | | | International Paper Co. | | | 12,650 | |
| | 225 | | | LyondellBasell Industries NV, Class A | | | 19,379 | |
| | 190 | | | Nucor Corp. | | | 10,469 | |
| | 61 | | | Packaging Corp. of America | | | 5,815 | |
| | 195 | | | WestRock Co. | | | 7,112 | |
| | | | | | | | |
| | | | Total Materials | | | 113,701 | |
| | | | | | | | |
| | | | Media & Entertainment—0.3% | |
| | 282 | | | Interpublic Group of Cos., Inc. (The) | | | 6,370 | |
| | 140 | | | Omnicom Group, Inc. | | | 11,473 | |
| | | | | | | | |
| | | | Total Media & Entertainment | | | 17,843 | |
| | | | | | | | |
| | | | Pharmaceuticals, Biotechnology & Life Sciences—11.4% | |
| | 1,121 | | | AbbVie, Inc. | | | 81,519 | |
| | 165 | | | Allergan PLC | | | 27,626 | |
| | 380 | | | Amgen, Inc. | | | 70,026 | |
| | 1,074 | | | Bristol-Myers Squibb Co. | | | 48,706 | |
| | 859 | | | Gilead Sciences, Inc. | | | 58,034 | |
| | 1,489 | | | Johnson & Johnson | | | 207,388 | |
| | 1,387 | | | Merck & Co., Inc. | | | 116,300 | |
| | 3,518 | | | Pfizer, Inc. | | | 152,400 | |
| | | | | | | | |
| | | | Total Pharmaceuticals, Biotechnology & Life Sciences | | | 761,999 | |
| | | | | | | | |
| | | | | | | | |
| Shares | | | | | Value | |
| | | | Common Stocks (continued) | | | |
| | | | Real Estate—7.2% | |
| | 60 | | | Alexandria Real Estate Equities, Inc. | | $ | 8,465 | |
| | 94 | | | American Campus Communities, Inc. | | | 4,339 | |
| | 172 | | | Apple Hospitality REIT, Inc. | | | 2,728 | |
| | 81 | | | AvalonBay Communities, Inc. | | | 16,458 | |
| | 88 | | | Boston Properties, Inc. | | | 11,352 | |
| | 237 | | | Brixmor Property Group, Inc. | | | 4,238 | |
| | 56 | | | Camden Property Trust | | | 5,846 | |
| | 396 | | | Colony Capital, Inc. | | | 1,980 | |
| | 263 | | | Crown Castle International Corp. | | | 34,282 | |
| | 125 | | | CubeSmart | | | 4,180 | |
| | 135 | | | Digital Realty Trust, Inc. | | | 15,902 | |
| | 202 | | | Duke Realty Corp. | | | 6,385 | |
| | 58 | | | EPR Properties | | | 4,326 | |
| | 210 | | | Equity Residential | | | 15,943 | |
| | 35 | | | Essex Property Trust, Inc. | | | 10,217 | |
| | 76 | | | Extra Space Storage, Inc. | | | 8,064 | |
| | 45 | | | Federal Realty Investment Trust | | | 5,794 | |
| | 162 | | | Gaming and Leisure Properties, Inc. | | | 6,315 | |
| | 351 | | | HCP, Inc. | | | 11,225 | |
| | 145 | | | Healthcare Trust of America, Inc., Class A | | | 3,977 | |
| | 72 | | | Highwoods Properties, Inc. | | | 2,974 | |
| | 135 | | | Hospitality Properties Trust | | | 3,375 | |
| | 540 | | | Host Hotels & Resorts, Inc. | | | 9,839 | |
| | 234 | | | Iron Mountain, Inc. | | | 7,324 | |
| | 322 | | | Kimco Realty Corp. | | | 5,951 | |
| | 63 | | | Lamar Advertising Co., Class A | | | 5,085 | |
| | 94 | | | Liberty Property Trust | | | 4,704 | |
| | 33 | | | Life Storage, Inc. | | | 3,138 | |
| | 117 | | | Macerich Co. (The) | | | 3,918 | |
| | 303 | | | Medical Properties Trust, Inc. | | | 5,284 | |
| | 71 | | | Mid-America Apartment Communities, Inc. | | | 8,361 | |
| | 108 | | | National Retail Properties, Inc. | | | 5,725 | |
| | 174 | | | Omega Healthcare Investors, Inc. | | | 6,394 | |
| | 110 | | | Outfront Media, Inc. | | | 2,837 | |
| | 164 | | | Park Hotels & Resorts, Inc. | | | 4,520 | |
| | 345 | | | Prologis, Inc. | | | 27,634 | |
| | 94 | | | Public Storage | | | 22,388 | |
| | 213 | | | Realty Income Corp. | | | 14,691 | |
| | 106 | | | Regency Centers Corp. | | | 7,074 | |
| | 164 | | | Retail Properties of America, Inc., Class A | | | 1,929 | |
| | 230 | | | Simon Property Group, Inc. | | | 36,745 | |
| | 57 | | | SL Green Realty Corp. | | | 4,581 | |
| | 69 | | | Spirit Realty Capital, Inc. | | | 2,943 | |
| | 140 | | | STORE Capital Corp. | | | 4,647 | |
| | 46 | | | Taubman Centers, Inc. | | | 1,878 | |
| | 163 | | | UDR, Inc. | | | 7,317 | |
| | 267 | | | Ventas, Inc. | | | 18,249 | |
| | 771 | | | VEREIT, Inc. | | | 6,947 | |
| | 310 | | | VICI Properties, Inc. | | | 6,832 | |
| | 117 | | | Vornado Realty Trust | | | 7,500 | |
| | 94 | | | Weingarten Realty Investors | | | 2,577 | |
| | 288 | | | Welltower, Inc. | | | 23,481 | |
| | 583 | | | Weyerhaeuser Co. | | | 15,356 | |
| | 126 | | | WP Carey, Inc. | | | 10,229 | |
| | | | | | | | |
| | | | Total Real Estate | | | 484,443 | |
| | | | | | | | |
| | | | Retailing—2.7% | |
| | 172 | | | Gap, Inc. (The) | | | 3,091 | |
| | 83 | | | Genuine Parts Co. | | | 8,597 | |
The accompanying notes are an integral part of these financial statements.
Invesco Russell 1000® Yield Factor ETF (OYLD)(continued)
June 30, 2019
| | | | | | | | |
| Shares | | | | | Value | |
| | | | Common Stocks (continued) | | | |
| | | | Retailing (continued) | |
| | 573 | | | Home Depot, Inc. (The) | | $ | 119,167 | |
| | 128 | | | Kohl’s Corp. | | | 6,086 | |
| | 200 | | | L Brands, Inc. | | | 5,220 | |
| | 264 | | | Macy’s, Inc. | | | 5,666 | |
| | 84 | | | Nordstrom, Inc. | | | 2,676 | |
| | 321 | | | Target Corp. | | | 27,802 | |
| | | | | | | | |
| | | | Total Retailing | | | 178,305 | |
| | | | | | | | |
| | | | Semiconductors & Semiconductor Equipment—6.6% | |
| | 303 | | | Broadcom, Inc. | | | 87,221 | |
| | 3,231 | | | Intel Corp. | | | 154,668 | |
| | 121 | | | KLA-Tencor Corp. | | | 14,302 | |
| | 101 | | | Lam Research Corp. | | | 18,972 | |
| | 223 | | | Maxim Integrated Products, Inc. | | | 13,340 | |
| | 1,044 | | | QUALCOMM, Inc. | | | 79,417 | |
| | 659 | | | Texas Instruments, Inc. | | | 75,627 | |
| | | | | | | | |
| | | | Total Semiconductors & Semiconductor Equipment | | | 443,547 | |
| | | | | | | | |
| | | | Software & Services—2.0% | |
| | 851 | | | International Business Machines Corp. | | | 117,353 | |
| | 173 | | | Paychex, Inc. | | | 14,236 | |
| | 297 | | | Western Union Co. (The) | | | 5,907 | |
| | | | | | | | |
| | | | Total Software & Services | | | 137,496 | |
| | | | | | | | |
| | | | Technology Hardware & Equipment—3.8% | |
| | 3,020 | | | Cisco Systems, Inc. | | | 165,285 | |
| | 527 | | | Corning, Inc. | | | 17,512 | |
| | 1,103 | | | Hewlett Packard Enterprise Co. | | | 16,490 | |
| | 1,222 | | | HP, Inc. | | | 25,405 | |
| | 258 | | | Juniper Networks, Inc. | | | 6,871 | |
| | 175 | | | NetApp, Inc. | | | 10,797 | |
| | 288 | | | Western Digital Corp. | | | 13,694 | |
| | | | | | | | |
| | | | Total Technology Hardware & Equipment | | | 256,054 | |
| | | | | | | | |
| | | | Telecommunication Services—5.6% | |
| | 5,859 | | | AT&T, Inc. | | | 196,335 | |
| | 936 | | | CenturyLink, Inc. | | | 11,007 | |
| | 2,981 | | | Verizon Communications, Inc. | | | 170,305 | |
| | | | | | | | |
| | | | Total Telecommunication Services | | | 377,647 | |
| | | | | | | | |
| | | | Transportation—1.1% | |
| | 332 | | | Delta Air Lines, Inc. | | | 18,841 | |
| | 62 | | | Macquarie Infrastructure Corp. | | | 2,514 | |
| | 482 | | | United Parcel Service, Inc., Class B | | | 49,776 | |
| | | | | | | | |
| | | | Total Transportation | | | 71,131 | |
| | | | | | | | |
| | | | Utilities—7.1% | |
| | 419 | | | AES Corp. | | | 7,023 | |
| | 137 | | | Alliant Energy Corp. | | | 6,724 | |
| | 129 | | | Ameren Corp. | | | 9,689 | |
| | 293 | | | American Electric Power Co., Inc. | | | 25,787 | |
| | 345 | | | CenterPoint Energy, Inc. | | | 9,877 | |
| | 152 | | | CMS Energy Corp. | | | 8,802 | |
| | 208 | | | Consolidated Edison, Inc. | | | 18,238 | |
| | 584 | | | Dominion Energy, Inc. | | | 45,155 | |
| | 106 | | | DTE Energy Co. | | | 13,555 | |
| | 519 | | | Duke Energy Corp. | | | 45,797 | |
| | 223 | | | Edison International | | | 15,032 | |
| | 127 | | | Entergy Corp. | | | 13,072 | |
| | 148 | | | Evergy, Inc. | | | 8,902 | |
| | 179 | | | Eversource Energy | | | 13,561 | |
| | | | | | | | |
| Shares | | | | | Value | |
| | | | Common Stocks (continued) | | | |
| | | | Utilities (continued) | |
| | 565 | | | Exelon Corp. | | $ | 27,086 | |
| | 347 | | | FirstEnergy Corp. | | | 14,855 | |
| | 234 | | | NextEra Energy, Inc. | | | 47,937 | |
| | 212 | | | NiSource, Inc. | | | 6,106 | |
| | 128 | | | OGE Energy Corp. | | | 5,448 | |
| | 67 | | | Pinnacle West Capital Corp. | | | 6,304 | |
| | 558 | | | PPL Corp. | | | 17,304 | |
| | 306 | | | Public Service Enterprise Group, Inc. | | | 17,999 | |
| | 155 | | | Sempra Energy | | | 21,303 | |
| | 754 | | | Southern Co. (The) | | | 41,681 | |
| | 179 | | | WEC Energy Group, Inc. | | | 14,923 | |
| | 284 | | | Xcel Energy, Inc. | | | 16,895 | |
| | | | | | | | |
| | | | Total Utilities | | | 479,055 | |
| | | | | | | | |
| | |
| | | | Total Investments—100.1%
(Cost $6,537,064) | | | 6,716,958 | |
| | |
| | | | Liabilities in Excess of Other Assets—(0.1)% | | | (6,352 | ) |
| | | | | | | | |
| | |
| | | | Net Assets—100.0% | | $ | 6,710,606 | |
| | | | | | | | |
REIT—Real Estate Investment Trust
| 1 | Affiliated security (Note 4). |
The accompanying notes are an integral part of these financial statements.
Statements of Assets and Liabilities
June 30, 2019
| | | | | | | | | | | | |
| | | Invesco Russell
1000® Momentum
Factor ETF (OMOM) | | | Invesco Russell
1000® Value
Factor ETF (OVLU) | | | Invesco Russell
1000® Low
Volatility Factor
ETF (OVOL) | |
| Assets: | | | | | | | | | | | | |
Unaffiliated investments in securities, at value (including securities on loan)1 | | $ | 5,693,275 | | | $ | 5,376,503 | | | $ | 5,765,034 | |
Affiliated investments in securities, at value | | | 27,203 | | | | 21,772 | | | | 3,223 | |
Cash | | | — | | | | — | | | | — | |
Receivables and other assets: | | | | | | | | | | | | |
Dividends | | | 4,234 | | | | 5,638 | | | | 5,395 | |
Investments sold | | | 2,092,833 | | | | 2,819,445 | | | | 294,421 | |
Securities lending | | | 3 | | | | 2 | | | | 1 | |
| | | | | | | | | | | | |
Total Assets | | | 7,817,548 | | | | 8,223,360 | | | | 6,068,074 | |
| | | | | | | | | | | | |
| | | |
| Liabilities: | | | | | | | | | | | | |
Payables and other liabilities: | | | | | | | | | | | | |
Investment of cash collateral of securities on loan | | | 18,701 | | | | 12,260 | | | | 3,223 | |
Due to custodian | | | 56 | | | | — | | | | 3,279 | |
Investments purchased | | | 684,941 | | | | 1,489,805 | | | | 295,984 | |
Shares Repurchsed | | | 1,422,645 | | | | 1,344,192 | | | | — | |
Accrued unitary management fees | | | 896 | | | | 845 | | | | 887 | |
| | | | | | | | | | | | |
Total Liabilities | | | 2,127,239 | | | | 2,847,102 | | | | 303,373 | |
| | | | | | | | | | | | |
| Net Assets | | $ | 5,690,309 | | | $ | 5,376,258 | | | $ | 5,764,701 | |
| | | | | | | | | | | | |
| | | |
| Net Assets Consist of: | | | | | | | | | | | | |
Shares of beneficial interest | | $ | 5,239,670 | | | $ | 5,405,267 | | | $ | 5,015,162 | |
Total distributable earnings | | | 450,639 | | | | (29,009 | ) | | | 749,539 | |
| | | | | | | | | | | | |
| Net Assets | | $ | 5,690,309 | | | $ | 5,376,258 | | | $ | 5,764,701 | |
| | | | | | | | | | | | |
Shares outstanding (unlimited number of shares of beneficial interest authorized, without par value) | | | 200,000 | | | | 200,000 | | | | 200,000 | |
Net asset value, offering and redemption price per share | | $ | 28.45 | | | $ | 26.88 | | | $ | 28.82 | |
| | | | | | | | | | | | |
Market price | | $ | 28.42 | | | $ | 26.88 | | | $ | 28.86 | |
| | | | | | | | | | | | |
Unaffiliated investments in securities, at cost | | $ | 4,779,238 | | | $ | 5,267,227 | | | $ | 4,934,641 | |
| | | | | | | | | | | | |
Affiliated investments in securities, at cost | | $ | 27,203 | | | $ | 22,693 | | | $ | 3,223 | |
| | | | | | | | | | | | |
1. Includes securities on loan with an aggregate value of: | | $ | 2,417 | | | $ | 12,274 | | | $ | 3,192 | |
| | | | | | | | | | | | |
The accompanying notes are an integral part of these financial statements.
| | | | | | | | | | |
Invesco Russell
1000® Size
Factor ETF (OSIZ) | | | Invesco Russell
1000® Quality
Factor ETF (OQAL) | | | Invesco Russell
1000® Yield
Factor ETF (OYLD) | |
| | | | | | | | | | |
| $ | 5,625,236 | | | $ | 5,753,513 | | | $ | 6,710,575 | |
| | 66,871 | | | | 11,931 | | | | 6,383 | |
| | 11 | | | | — | | | | — | |
| | | | | | | | | | |
| | 7,511 | | | | 4,302 | | | | 12,383 | |
| | 2,242,059 | | | | 2,575,005 | | | | 2,132,209 | |
| | 11 | | | | 1 | | | | 1 | |
| | | | | | | | | | |
| | 7,941,699 | | | | 8,344,752 | | | | 8,861,551 | |
| | | | | | | | | | |
| | |
| | | | | | | | | | |
| | | | | | | | | | |
| | 56,074 | | | | 11,931 | | | | — | |
| | — | | | | 1,726 | | | | 25,691 | |
| | 836,413 | | | | 1,129,543 | | | | 782,008 | |
| | 1,409,759 | | | | 1,440,191 | | | | 1,342,188 | |
| | 884 | | | | 904 | | | | 1,058 | |
| | | | | | | | | | |
| | 2,303,130 | | | | 2,584,295 | | | | 2,150,945 | |
| | | | | | | | | | |
| $ | 5,638,569 | | | $ | 5,760,457 | | | $ | 6,710,606 | |
| | | | | | | | | | |
| | |
| | | | | | | | | | |
| $ | 5,502,735 | | | $ | 5,347,459 | | | $ | 6,618,253 | |
| | 135,834 | | | | 412,998 | | | | 92,353 | |
| | | | | | | | | | |
| $ | 5,638,569 | | | $ | 5,760,457 | | | $ | 6,710,606 | |
| | | | | | | | | | |
| | | | | | | | | | |
| | 200,000 | | | | 200,000 | | | | 250,000 | |
| $ | 28.19 | | | $ | 28.80 | | | $ | 26.84 | |
| | | | | | | | | | |
| $ | 28.18 | | | $ | 28.80 | | | $ | 26.84 | |
| | | | | | | | | | |
| $ | 5,399,759 | | | $ | 5,180,777 | | | $ | 6,528,213 | |
| | | | | | | | | | |
| $ | 71,243 | | | $ | 11,931 | | | $ | 8,851 | |
| | | | | | | | | | |
| $ | 51,652 | | | $ | 8,233 | | | $ | — | |
| | | | | | | | | | |
Statements of Operations
For the year ended June 30, 2019
| | | | | | | | | | | | |
| | | Invesco Russell
1000® Momentum
Factor ETF (OMOM) | | | Invesco Russell
1000® Value
Factor ETF (OVLU) | | | Invesco Russell
1000® Low
Volatility Factor
ETF (OVOL) | |
| Investment Income: | | | | | | | | | | | | |
Unaffiliated dividend income | | $ | 91,180 | | | $ | 131,338 | | | $ | 124,078 | |
Affiliated dividend income | | | 6 | | | | 288 | | | | 19 | |
Foreign withholding tax | | | (7 | ) | | | (7 | ) | | | — | |
Securities lending income | | | 1,172 | | | | 242 | | | | 204 | |
| | | | | | | | | | | | |
Total Income | | | 92,351 | | | | 131,861 | | | | 124,301 | |
| | | | | | | | | | | | |
| | | |
| Expenses: | | | | | | | | | | | | |
Unitary management fees | | | 10,297 | | | | 9,966 | | | | 10,254 | |
| | | | | | | | | | | | |
Less fees waived | | | (1 | ) | | | (1 | ) | | | (2 | ) |
| | | | | | | | | | | | |
Net Expenses | | | 10,296 | | | | 9,965 | | | | 10,252 | |
| | | | | | | | | | | | |
Net Investment Income | | | 82,055 | | | | 121,896 | | | | 114,049 | |
| | | | | | | | | | | | |
| | | |
| Realized and Unrealized Gain (Loss) from: | | | | | | | | | | | | |
Net realized loss on investments | | | (350,011 | ) | | | (108,564 | ) | | | (30,619 | ) |
Net realized loss on affiliated investments | | | — | | | | (1,381 | ) | | | — | |
Net realized gain onin-kind redemptions | | | 196,577 | | | | 281,413 | | | | — | |
| | | | | | | | | | | | |
Total net realized gain (loss) | | | (153,434 | ) | | | 171,468 | | | | (30,619 | ) |
| | | | | | | | | | | | |
Net change in unrealized appreciation on unaffiliated investments | | | 511,130 | | | | 36,401 | | | | 675,708 | |
Net change in unrealized depreciation on affiliated investments | | | — | | | | (8 | ) | | | — | |
| | | | | | | | | | | | |
Net change in unrealized appreciation | | | 511,130 | | | | 36,393 | | | | 675,708 | |
| | | | | | | | | | | | |
Net realized and unrealized gain on investments | | | 357,696 | | | | 207,861 | | | | 645,089 | |
| | | | | | | | | | | | |
Net Increase in Net Assets Resulting From Operations | | $ | 439,751 | | | $ | 329,757 | | | $ | 759,138 | |
| | | | | | | | | | | | |
The accompanying notes are an integral part of these financial statements.
| | | | | | | | | | |
Invesco Russell
1000® Size
Factor ETF (OSIZ) | | | Invesco Russell
1000® Quality
Factor ETF (OQAL) | | | Invesco Russell
1000® Yield
Factor ETF (OYLD) | |
| | | | | | | | | | |
| $ | 84,236 | | | $ | 95,788 | | | $ | 189,794 | |
| | 552 | | | | 13 | | | | 328 | |
| | (29 | ) | | | (13 | ) | | | — | |
| | 1,028 | | | | 289 | | | | 268 | |
| | | | | | | | | | |
| | 85,787 | | | | 96,077 | | | | 190,390 | |
| | | | | | | | | | |
| | |
| | | | | | | | | | |
| | 10,211 | | | | 10,446 | | | | 10,488 | |
| | | | | | | | | | |
| | (1 | ) | | | (1 | ) | | | (3 | ) |
| | | | | | | | | | |
| | 10,210 | | | | 10,445 | | | | 10,485 | |
| | | | | | | | | | |
| | 75,577 | | | | 85,632 | | | | 179,905 | |
| | | | | | | | | | |
| | |
| | | | | | | | | | |
| | (53,891 | ) | | | (118,169 | ) | | | (80,204 | ) |
| | (960 | ) | | | — | | | | (549 | ) |
| | 330,024 | | | | 177,354 | | | | 201,926 | |
| | | | | | | | | | |
| | 275,173 | | | | 59,185 | | | | 121,173 | |
| | | | | | | | | | |
| | 17,273 | | | | 333,964 | | | | 249,241 | |
| | (1,589 | ) | | | — | | | | (783 | ) |
| | | | | | | | | | |
| | 15,684 | | | | 333,964 | | | | 248,458 | |
| | | | | | | | | | |
| | 290,857 | | | | 393,149 | | | | 369,631 | |
| | | | | | | | | | |
| $ | 366,434 | | | $ | 478,781 | | | $ | 549,536 | |
| | | | | | | | | | |
Statements of Changes in Net Assets
For the years ended June 30, 2019 and for the period November 8, 2017 through June 30, 2018
| | | | | | | | | | | | | | | | |
| | | Invesco Russell 1000®
Momentum
Factor ETF (OMOM) | | | Invesco Russell 1000® Value
Factor ETF (OVLU) | |
| | | Year Ended
June 30, 2019 | | | For the Period
November 8,
20171 to
June 30, 2018 | | | Year Ended
June 30, 2019 | | | For the Period
November 8,
20171 to
June 30, 2018 | |
| Operations | | | | | | | | | | | | | | | | |
Net investment income | | $ | 82,055 | | | $ | 49,809 | | | $ | 121,896 | | | $ | 67,244 | |
Net realized gain (loss) on investments andin-kind redemptions | | | (153,434 | ) | | | (50,892 | ) | | | 171,468 | | | | 109,446 | |
Net change in unrealized appreciation (depreciation) on investments | | | 511,130 | | | | 402,907 | | | | 36,393 | | | | 71,962 | |
| | | | | | | | | | | | | | | | |
Net increase in net assets resulting from operations | | | 439,751 | | | | 401,824 | | | | 329,757 | | | | 248,652 | |
| | | | | | | | | | | | | | | | |
| | | | |
| Distributions to Shareholders from: | | | | | | | | | | | | | | | | |
Distributable earnings | | | (81,006 | ) | | | (46,812 | ) | | | (120,297 | ) | | | (63,100 | ) |
| | | | | | | | | | | | | | | | |
| | | | |
| Shareholder Transactions: | | | | | | | | | | | | | | | | |
Proceeds from shares sold | | | 1,410,536 | | | | 7,633,804 | | | | 1,327,251 | | | | 6,314,889 | |
Value of shares repurchased | | | (1,422,645 | ) | | | (2,645,143 | ) | | | (1,344,192 | ) | | | (1,316,702 | ) |
| | | | | | | | | | | | | | | | |
Net increase (decrease) in net assets resulting from shareholder transactions | | | (12,109 | ) | | | 4,988,661 | | | | (16,941 | ) | | | 4,998,187 | |
| | | | | | | | | | | | | | | | |
Increase in net assets | | | 346,636 | | | | 5,343,673 | | | | 192,519 | | | | 5,183,739 | |
| | | | | | | | | | | | | | | | |
| | | | |
| Net Assets: | | | | | | | | | | | | | | | | |
Beginning of period or year | | | 5,343,673 | | | | — | | | | 5,183,739 | | | | — | |
| | | | | | | | | | | | | | | | |
End of period or year | | $ | 5,690,309 | | | $ | 5,343,673 | | | $ | 5,376,258 | | | $ | 5,183,739 | |
| | | | | | | | | | | | | | | | |
| | | | |
| Changes in Shares Outstanding: | | | | | | | | | | | | | | | | |
Shares outstanding, beginning of period or year | | | 200,000 | | | | — | | | | 200,000 | | | | — | |
Shares sold | | | 50,000 | | | | 300,000 | | | | 50,000 | | | | 250,000 | |
Shares repurchased | | | (50,000 | ) | | | (100,000 | ) | | | (50,000 | ) | | | (50,000 | ) |
| | | | | | | | | | | | | | | | |
Shares outstanding, end of period or year | | | 200,000 | | | | 200,000 | | | | 200,000 | | | | 200,000 | |
| | | | | | | | | | | | | | | | |
| 1. | Commencement of operations. |
The accompanying notes are an integral part of these financial statements.
| | | | | | | | | | | | | | | | | | | | | | | | | | | | | | |
Invesco Russell 1000® Low
Volatility Factor ETF (OVOL) | | | Invesco Russell 1000® Size
Factor ETF (OSIZ) | | | Invesco Russell 1000® Quality
Factor ETF (OQAL) | | | Invesco Russell 1000® Yield
Factor ETF (OYLD) | |
Year Ended
June 30, 2019 | | | For the Period
November 8,
20171 to
June 30, 2018 | | | Year Ended
June 30, 2019 | | | For the Period
November 8,
20171 to
June 30, 2018 | | | Year Ended
June 30, 2019 | | | For the Period
November 8,
20171 to
June 30, 2018 | | | Year Ended
June 30, 2019 | | | For the Period
November 8,
20171 to
June 30, 2018 | |
| | | | | | | | | | | | | | | | | | | | | | | | | | | | | | |
| $ | 114,049 | | | $ | 70,946 | | | $ | 75,577 | | | $ | 49,846 | | | $ | 85,632 | | | $ | 52,590 | | | $ | 179,905 | | | $ | 100,829 | |
| | (30,619 | ) | | | (35,265 | ) | | | 275,173 | | | | 180,317 | | | | 59,185 | | | | 137,210 | | | | 121,173 | | | | 104,583 | |
| | 675,708 | | | | 154,685 | | | | 15,684 | | | | 205,421 | | | | 333,964 | | | | 238,772 | | | | 248,458 | | | | (68,564 | ) |
| | | | | | | | | | | | | | | | | | | | | | | | | | | | | | |
| | 759,138 | | | | 190,366 | | | | 366,434 | | | | 435,584 | | | | 478,781 | | | | 428,572 | | | | 549,536 | | | | 136,848 | |
| | | | | | | | | | | | | | | | | | | | | | | | | | | | | | |
| | | | | | | |
| | | | | | | | | | | | | | | | | | | | | | | | | | | | | | |
| | (113,823 | ) | | | (66,067 | ) | | | (87,570 | ) | | | (43,194 | ) | | | (83,646 | ) | | | (49,684 | ) | | | (178,262 | ) | | | (92,937 | ) |
| | | | | | | | | | | | | | | | | | | | | | | | | | | | | | |
| | | | | | | |
| | | | | | | | | | | | | | | | | | | | | | | | | | | | | | |
| | — | | | | 6,286,539 | | | | 1,378,861 | | | | 6,367,861 | | | | 1,427,141 | | | | 6,364,054 | | | | 2,643,962 | | | | 6,260,772 | |
| | — | | | | (1,291,452 | ) | | | (1,409,759 | ) | | | (1,369,648 | ) | | | (1,440,191 | ) | | | (1,364,570 | ) | | | (1,342,188 | ) | | | (1,267,125 | ) |
| | | | | | | | | | | | | | | | | | | | | | | | | | | | | | |
| | — | | | | 4,995,087 | | | | (30,898 | ) | | | 4,998,213 | | | | (13,050 | ) | | | 4,999,484 | | | | 1,301,774 | | | | 4,993,647 | |
| | | | | | | | | | | | | | | | | | | | | | | | | | | | | | |
| | 645,315 | | | | 5,119,386 | | | | 247,966 | | | | 5,390,603 | | | | 382,085 | | | | 5,378,372 | | | | 1,673,048 | | | | 5,037,558 | |
| | | | | | | | | | | | | | | | | | | | | | | | | | | | | | |
| | | | | | | |
| | | | | | | | | | | | | | | | | | | | | | | | | | | | | | |
| | 5,119,386 | | | | — | | | | 5,390,603 | | | | — | | | | 5,378,372 | | | | — | | | | 5,037,558 | | | | — | |
| | | | | | | | | | | | | | | | | | | | | | | | | | | | | | |
| $ | 5,764,701 | | | $ | 5,119,386 | | | $ | 5,638,569 | | | $ | 5,390,603 | | | $ | 5,760,457 | | | $ | 5,378,372 | | | $ | 6,710,606 | | | $ | 5,037,558 | |
| | | | | | | | | | | | | | | | | | | | | | | | | | | | | | |
| | | | | | | |
| | | | | | | | | | | | | | | | | | | | | | | | | | | | | | |
| | 200,000 | | | | — | | | | 200,000 | | | | — | | | | 200,000 | | | | — | | | | 200,000 | | | | — | |
| | — | | | | 250,000 | | | | 50,000 | | | | 250,000 | | | | 50,000 | | | | 250,000 | | | | 100,000 | | | | 250,000 | |
| | — | | | | (50,000 | ) | | | (50,000 | ) | | | (50,000 | ) | | | (50,000 | ) | | | (50,000 | ) | | | (50,000 | ) | | | (50,000 | ) |
| | | | | | | | | | | | | | | | | | | | | | | | | | | | | | |
| | 200,000 | | | | 200,000 | | | | 200,000 | | | | 200,000 | | | | 200,000 | | | | 200,000 | | | | 250,000 | | | | 200,000 | |
| | | | | | | | | | | | | | | | | | | | | | | | | | | | | | |
Financial Highlights
Invesco Russell 1000® Momentum Factor ETF (OMOM)
| | | | | | | | |
| | | Year Ended
June 30, 2019 | | | For the Period
November 08, 20171
Through
June 30, 2018 | |
| Per Share Operating Performance: | | | | | | | | |
Net asset value, beginning of period | | $ | 26.72 | | | $ | 25.00 | |
Net investment income2 | | | 0.41 | | | | 0.25 | |
Net realized and unrealized gain on investments | | | 1.73 | | | | 1.70 | |
Total gain from investment operations | | | 2.14 | | | | 1.95 | |
Less Distributions from: | |
Net investment income | | | (0.41 | ) | | | (0.23 | ) |
Net asset value, end of period | | $ | 28.45 | | | $ | 26.72 | |
Market price, end of period | | $ | 28.42 | 3 | | | | |
| Total Return at Net Asset Value4 | | | 8.09 | % | | | 7.81 | % |
| Total Return at Market Value4 | | | 7.85 | % | | | 7.94 | % |
| Ratios/Supplemental Data: | | | | | | | | |
Net assets, end of period (000’s omitted) | | $ | 5,690 | | | $ | 5,344 | |
Ratio to average net assets of: | |
Expenses, net of waivers | | | 0.19 | % | | | 0.19 | %5 |
Expenses, prior to waivers | | | 0.19 | % | | | 0.19 | %5 |
Net investment income, net of waivers | | | 1.51 | % | | | 1.48 | %5 |
Portfolio turnover rate6 | | | 33 | % | | | 22 | % |
| 1. | Commencement of operations. |
| 2. | Based on average daily shares outstanding. |
| 3. | The mean between the last bid and ask prices. |
| 4. | Net asset value total return is calculated assuming an initial investment made at the net asset value at the beginning of the period, reinvestment of all dividends and distributions at net asset value during the period and redemption on the last day of the period at net asset value. Market value total return is calculated assuming an initial investment made at the market value at the beginning of the period, reinvestment of all dividends and distributions at market value during the period, and sale at the market value on the last day of the period. Market value is determined by trading that occurs on the Cboe BZX Exchange, and may be greater or less than net asset value, depending on the 4 p.m. mean of the bid and offer prices for a share of the Fund. Total return calculated for a period of less than one year is not annualized. The total return would have been lower if certain expenses had not been waived by the Advisor. |
| 5. | Annualized for periods less than one full year. |
| 6. | Portfolio turnover rate is not annualized and excludes the value of portfolio securities received or delivered as a result ofin-kind creations or redemptions of the Fund’s capital shares. |
Invesco Russell 1000® Value Factor ETF (OVLU)
| | | | | | | | |
| | | Year Ended
June 30, 2019 | | | For the Period
November 08, 20171
Through
June 30, 2018 | |
| Per Share Operating Performance: | | | | | | | | |
Net asset value, beginning of period | | $ | 25.92 | | | $ | 25.00 | |
Net investment income2 | | | 0.61 | | | | 0.34 | |
Net realized and unrealized gain on investments | | | 0.95 | | | | 0.90 | |
Total gain from investment operations | | | 1.56 | | | | 1.24 | |
Less Distributions from: | |
Net investment income | | | (0.60 | ) | | | (0.32 | ) |
Net asset value, end of period | | $ | 26.88 | | | $ | 25.92 | |
Market price, end of period | | $ | 26.88 | 3 | | | | |
| Total Return at Net Asset Value4 | | | 6.15 | % | | | 4.92 | % |
| Total Return at Market Value4 | | | 6.27 | % | | | 4.80 | % |
| Ratios/Supplemental Data: | | | | | | | | |
Net assets, end of period (000’s omitted) | | $ | 5,376 | | | $ | 5,184 | |
Ratio to average net assets of: | |
Expenses, net of waivers | | | 0.19 | % | | | 0.19 | %5 |
Expenses, prior to waivers | | | 0.19 | % | | | 0.19 | %5 |
Net investment income, net of waivers | | | 2.32 | % | | | 2.00 | %5 |
Portfolio turnover rate6 | | | 28 | % | | | 25 | % |
| 1. | Commencement of operations. |
| 2. | Based on average daily shares outstanding. |
| 3. | The mean between the last bid and ask prices. |
| 4. | Net asset value total return is calculated assuming an initial investment made at the net asset value at the beginning of the period, reinvestment of all dividends and distributions at net asset value during the period and redemption on the last day of the period at net asset value. Market value total return is calculated assuming an initial investment made at the market value at the beginning of the period, reinvestment of all dividends and distributions at market value during the period, and sale at the market value on the last day of the period. Market value is determined by trading that occurs on the Cboe BZX Exchange, and may be greater or less than net asset value, depending on the 4 p.m. mean of the bid and offer prices for a share of the Fund. Total return calculated for a period of less than one year is not annualized. The total return would have been lower if certain expenses had not been waived by the Advisor. |
| 5. | Annualized for periods less than one full year. |
| 6. | Portfolio turnover rate is not annualized and excludes the value of portfolio securities received or delivered as a result ofin-kind creations or redemptions of the Fund’s capital shares. |
The accompanying notes are an integral part of these financial statements.
Financial Highlights(continued)
Invesco Russell 1000® Low Volatility Factor ETF (OVOL)
| | | | | | | | |
| | | Year Ended
June 30, 2019 | | | For the Period
November 08, 20171
Through
June 30, 2018 | |
| Per Share Operating Performance: | | | | | | | | |
Net asset value, beginning of period | | $ | 25.60 | | | $ | 25.00 | |
Net investment income2 | | | 0.57 | | | | 0.35 | |
Net realized and unrealized gain on investments | | | 3.22 | | | | 0.58 | |
Total gain from investment operations | | | 3.79 | | | | 0.93 | |
Less Distributions from: | |
Net investment income | | | (0.57 | ) | | | (0.33 | ) |
Net asset value, end of period | | $ | 28.82 | | | $ | 25.60 | |
Market price, end of period | | $ | 28.86 | 3 | | | | |
| Total Return at Net Asset Value4 | | | 14.98 | % | | | 3.69 | % |
| Total Return at Market Value4 | | | 15.05 | % | | | 3.79 | % |
| Ratios/Supplemental Data: | | | | | | | | |
Net assets, end of period (000’s omitted) | | $ | 5,765 | | | $ | 5,119 | |
Ratio to average net assets of: | |
Expenses, net of waivers | | | 0.19 | % | | | 0.19 | %5 |
Expenses, prior to waivers | | | 0.19 | % | | | 0.19 | %5 |
Net investment income, net of waivers | | | 2.11 | % | | | 2.16 | %5 |
Portfolio turnover rate6 | | | 8 | % | | | 7 | % |
| 1. | Commencement of operations. |
| 2. | Based on average daily shares outstanding. |
| 3. | The mean between the last bid and ask prices. |
| 4. | Net asset value total return is calculated assuming an initial investment made at the net asset value at the beginning of the period, reinvestment of all dividends and distributions at net asset value during the period and redemption on the last day of the period at net asset value. Market value total return is calculated assuming an initial investment made at the market value at the beginning of the period, reinvestment of all dividends and distributions at market value during the period, and sale at the market value on the last day of the period. Market value is determined by trading that occurs on the Cboe BZX Exchange, and may be greater or less than net asset value, depending on the 4 p.m. mean of the bid and offer prices for a share of the Fund. Total return calculated for a period of less than one year is not annualized. The total return would have been lower if certain expenses had not been waived by the Advisor. |
| 5. | Annualized for periods less than one full year. |
| 6. | Portfolio turnover rate is not annualized and excludes the value of portfolio securities received or delivered as a result ofin-kind creations or redemptions of the Fund’s capital shares. |
Invesco Russell 1000® Size Factor ETF (OSIZ)
| | | | | | | | |
| | | Year Ended
June 30, 2019 | | | For the Period
November 08, 20171
Through
June 30, 2018 | |
| Per Share Operating Performance: | | | | | | | | |
Net asset value, beginning of period | | $ | 26.95 | | | $ | 25.00 | |
Net investment income2 | | | 0.38 | | | | 0.25 | |
Net realized and unrealized gain on investments | | | 1.29 | | | | 1.92 | |
Total gain from investment operations | | | 1.67 | | | | 2.17 | |
Less Distributions from: | |
Net investment income | | | (0.38 | ) | | | (0.22 | ) |
Realized gains | | | (0.05 | ) | | | — | |
Total distributions | | | (0.43 | ) | | | (0.22 | ) |
Net asset value, end of period | | $ | 28.19 | | | $ | 26.95 | |
Market price, end of period | | $ | 28.18 | 3 | | | | |
| Total Return at Net Asset Value4 | | | 6.42 | % | | | 8.68 | % |
| Total Return at Market Value4 | | | 6.31 | % | | | 8.71 | % |
| Ratios/Supplemental Data: | | | | | | | | |
Net assets, end of period (000’s omitted) | | $ | 5,639 | | | $ | 5,391 | |
Ratio to average net assets of: | |
Expenses, net of waivers | | | 0.19 | % | | | 0.19 | %5 |
Expenses, prior to waivers | | | 0.19 | % | | | 0.19 | %5 |
Net investment income, net of waivers | | | 1.41 | % | | | 1.48 | %5 |
Portfolio turnover rate6 | | | 21 | % | | | 18 | % |
| 1. | Commencement of operations. |
| 2. | Based on average daily shares outstanding. |
| 3. | The mean between the last bid and ask prices. |
| 4. | Net asset value total return is calculated assuming an initial investment made at the net asset value at the beginning of the period, reinvestment of all dividends and distributions at net asset value during the period and redemption on the last day of the period at net asset value. Market value total return is calculated assuming an initial investment made at the market value at the beginning of the period, reinvestment of all dividends and distributions at market value during the period, and sale at the market value on the last day of the period. Market value is determined by trading that occurs on the Cboe BZX Exchange, and may be greater or less than net asset value, depending on the 4 p.m. mean of the bid and offer prices for a share of the Fund. Total return calculated for a period of less than one year is not annualized. The total return would have been lower if certain expenses had not been waived by the Advisor. |
| 5. | Annualized for periods less than one full year. |
| 6. | Portfolio turnover rate is not annualized and excludes the value of portfolio securities received or delivered as a result ofin-kind creations or redemptions of the Fund’s capital shares. |
The accompanying notes are an integral part of these financial statements.
Financial Highlights(continued)
Invesco Russell 1000® Quality Factor ETF (OQAL)
| | | | | | | | |
| | | Year Ended
June 30, 2019 | | | For the Period
November 08, 20171
Through
June 30, 2018 | |
| Per Share Operating Performance: | | | | | | | | |
Net asset value, beginning of period | | $ | 26.89 | | | $ | 25.00 | |
Net investment income2 | | | 0.43 | | | | 0.26 | |
Net realized and unrealized gain on investments | | | 1.90 | | | | 1.88 | |
Total gain from investment operations | | | 2.33 | | | | 2.14 | |
Less Distributions from: | |
Net investment income | | | (0.42 | ) | | | (0.25 | ) |
Net asset value, end of period | | $ | 28.80 | | | $ | 26.89 | |
Market price, end of period | | $ | 28.80 | 3 | | | | |
| Total Return at Net Asset Value4 | | | 8.76 | % | | | 8.57 | % |
| Total Return at Market Value4 | | | 8.62 | % | | | 8.68 | % |
| Ratios/Supplemental Data: | | | | | | | | |
Net assets, end of period (000’s omitted) | | $ | 5,760 | | | $ | 5,378 | |
Ratio to average net assets of: | |
Expenses, net of waivers | | | 0.19 | % | | | 0.19 | %5 |
Expenses, prior to waivers | | | 0.19 | % | | | 0.19 | %5 |
Net investment income, net of waivers | | | 1.56 | % | | | 1.56 | %5 |
Portfolio turnover rate6 | | | 22 | % | | | 22 | % |
| 1. | Commencement of operations. |
| 2. | Based on average daily shares outstanding. |
| 3. | The mean between the last bid and ask prices. |
| 4 | Net asset value total return is calculated assuming an initial investment made at the net asset value at the beginning of the period, reinvestment of all dividends and distributions at net asset value during the period and redemption on the last day of the period at net asset value. Market value total return is calculated assuming an initial investment made at the market value at the beginning of the period, reinvestment of all dividends and distributions at market value during the period, and sale at the market value on the last day of the period. Market value is determined by trading that occurs on the Cboe BZX Exchange, and may be greater or less than net asset value, depending on the 4 p.m. mean of the bid and offer prices for a share of the Fund. Total return calculated for a period of less than one year is not annualized. The total return would have been lower if certain expenses had not been waived by the Advisor. |
| 5. | Annualized for periods less than one full year. |
| 6. | Portfolio turnover rate is not annualized and excludes the value of portfolio securities received or delivered as a result ofin-kind creations or redemptions of the Fund’s capital shares. |
Invesco Russell 1000® Yield Factor ETF (OYLD)
| | | | | | | | |
| | | Year Ended
June 30, 2019 | | | For the Period
November 08, 20171
Through
June 30, 2018 | |
| Per Share Operating Performance: | | | | | | | | |
Net asset value, beginning of period | | $ | 25.19 | | | $ | 25.00 | |
Net investment income2 | | | 0.84 | | | | 0.50 | |
Net realized and unrealized gain on investments | | | 1.65 | | | | 0.15 | |
Total gain from investment operations | | | 2.49 | | | | 0.65 | |
Less Distributions from: | |
Net investment income | | | (0.84 | ) | | | (0.46 | ) |
Net asset value, end of period | | $ | 26.84 | | | $ | 25.19 | |
Market price, end of period | | $ | 26.84 | 3 | | | | |
| Total Return at Net Asset Value4 | | | 10.10 | % | | | 2.59 | % |
| Total Return at Market Value4 | | | 9.79 | % | | | 2.87 | % |
| Ratios/Supplemental Data: | | | | | | | | |
Net assets, end of period (000’s omitted) | | $ | 6,711 | | | $ | 5,038 | |
Ratio to average net assets of: | |
Expenses, net of waivers | | | 0.19 | % | | | 0.19 | %5 |
Expenses, prior to waivers | | | 0.19 | % | | | 0.19 | %5 |
Net investment income, net of waivers | | | 3.26 | % | | | 3.10 | %5 |
Portfolio turnover rate6 | | | 17 | % | | | 10 | % |
| 1. | Commencement of operations. |
| 2. | Based on average daily shares outstanding. |
| 3. | The mean between the last bid and ask prices. |
| 4. | Net asset value total return is calculated assuming an initial investment made at the net asset value at the beginning of the period, reinvestment of all dividends and distributions at net asset value during the period and redemption on the last day of the period at net asset value. Market value total return is calculated assuming an initial investment made at the market value at the beginning of the period, reinvestment of all dividends and distributions at market value during the period, and sale at the market value on the last day of the period. Market value is determined by trading that occurs on the Cboe BZX Exchange, and may be greater or less than net asset value, depending on the 4 p.m. mean of the bid and offer prices for a share of the Fund. Total return calculated for a period of less than one year is not annualized. The total return would have been lower if certain expenses had not been waived by the Advisor. |
| 5. | Annualized for periods less than one full year. |
| 6. | Portfolio turnover rate is not annualized and excludes the value of portfolio securities received or delivered as a result ofin-kind creations or redemptions of the Fund’s capital shares. |
The accompanying notes are an integral part of these financial statements.
Notes to Financial Statements
Invesco Exchange-Traded Fund Trust II
June 30, 2019
Note 1—Organization
Invesco Exchange-Traded Fund Trust II (the “Trust”) was organized as a Massachusetts business trust on October 10, 2006 and is authorized to have multiple series of portfolios. The Trust is anopen-end management investment company, registered under the Investment Company Act of 1940, as amended (the “1940 Act”). This report includes the following portfolios:
| | | | |
Full Name | | Predecessor Fund (as defined below) | | Short Name |
| Invesco Russell 1000® Momentum Factor ETF | | Oppenheimer Russell 1000® Momentum Factor ETF | | Russell 1000® Momentum Factor ETF |
| Invesco Russell 1000® Value Factor ETF | | Oppenheimer Russell 1000® Value Factor ETF | | Russell 1000® Value Factor ETF |
| Invesco Russell 1000® Low Volatility Factor ETF | | Oppenheimer Russell 1000® Low Volatility Factor ETF | | Russell 1000® Low Volatility Factor ETF |
| Invesco Russell 1000® Size Factor ETF | | Oppenheimer Russell 1000® Size Factor ETF | | Russell 1000® Size Factor ETF |
| Invesco Russell 1000® Quality Factor ETF | | Oppenheimer Russell 1000® Quality Factor ETF | | Russell 1000® Quality Factor ETF |
| Invesco Russell 1000® Yield Factor ETF | | Oppenheimer Russell 1000® Yield Factor ETF | | Russell 1000® Yield Factor ETF |
Each portfolio (each, a “Fund”, and collectively, the “Funds”) represents a separate series of the Trust. The shares of the Funds are referred to herein as “Shares” or “Fund Shares”. Each Fund’s shares are listed and traded on Cboe BZX Exchange, Inc.
Each Fund acquired all or substantially all of the assets and all of the stated liabilities included in the financial statements of a corresponding fund of the Oppenheimer ETF Trust (a “Predecessor Fund”) after the close of business on May 24, 2019 (each, a “Reorganization”). Each Fund adopted the performance and financial information of its corresponding Predecessor Fund. Information presented prior to the close of business on May 24, 2019 is that of the Predecessor Fund.
The market price of each Share may differ to some degree from a Fund’s net asset value (“NAV”). Unlike conventional mutual funds, each Fund issues and redeems shares on a continuous basis, at NAV, only in a large specified number of Shares, each called a “Creation Unit.” Creation Units are issued and redeemed principally in exchange for the deposit or delivery of a basket of securities (“Deposit Securities”). Except when aggregated in Creation Units by Authorized Participants, the Shares are not individually redeemable securities of the Funds.
The investment objective for each Fund is to track the investment results (before fees and expenses) of its respective index listed below (each, an “Underlying Index”):
| | |
Fund | | Underlying Index |
| Russell 1000® Momentum Factor ETF | | Russell 1000® Momentum Factor Index |
| Russell 1000® Value Factor ETF | | Russell 1000® Value Factor Index |
| Russell 1000® Low Volatility Factor ETF | | Russell 1000® Volatility Factor Index |
| Russell 1000® Size Factor ETF | | Russell 1000® Size Factor Index |
| Russell 1000® Quality Factor ETF | | Russell 1000® Quality Factor Index |
| Russell 1000® Yield Factor ETF | | Russell 1000® Yield Factor Index |
Note 2—Significant Accounting Policies
The following is a summary of the significant accounting policies followed by the Funds in preparation of their financial statements.
Each Fund is an investment company and accordingly follows the investment company accounting and reporting guidance in accordance with Financial Accounting Standards Board Accounting Standards Codification Topic 946,Financial Services—Investment Companies.
| A. | Security Valuation — Securities, including restricted securities, are valued according to the following policies: |
A security listed or traded on an exchange (except convertible securities) is generally valued at its last sales price or official closing price as of the close of the customary trading session on the exchange where the security is principally traded or, lacking any sales or official closing price on a particular day, the security may be valued at the closing bid price on that day. Securities traded in theover-the-counter (“OTC”) market are valued based on prices furnished by independent pricing services or market makers. When such securities are valued by an independent pricing service they may be considered fair valued. Futures contracts are valued at the final settlement price set by an exchange on which they are principally traded. Listed options are valued at the mean between the last bid and asked prices from the exchange on which they are principally traded, or at the final settlement price set by such exchange. Swaps and options not listed on an exchange are valued by an independent source. For purposes of determining NAV per Share, futures and option contracts generally are valued 15 minutes after the close of the customary trading session of the New York Stock Exchange (“NYSE”).
Investment companies are valued using such company’s NAV per share, unless the shares are exchange-traded, in which case they are valued at the last sales price or official closing price as of the close of the customary trading session on the exchange where the security is principally traded.
Debt obligations (including convertible securities) and unlisted equities are fair valued using an evaluated quote provided by an independent pricing service. Evaluated quotes provided by the pricing service may be determined without exclusive reliance on quoted prices, and may reflect appropriate factors such asinstitution-size trading in similar groups of securities, developments related to specific securities, dividend rate (for unlisted equities), yield (for debt obligations), quality, type of issue, coupon rate (for debt obligations), maturity (for debt obligations), individual trading characteristics and other market data. Securities with a demand feature exercisable within one to seven days are valued at par. Pricing services generally value debt obligations assuming orderly transactions of institutional round lot size, but a Fund may hold or transact in the same securities in smaller, odd lot sizes. Odd lots often trade at lower prices than institutional round lots. Debt obligations are subject to interest rate and credit risks. In addition, all debt obligations involve some risk of default with respect to interest and/or principal payments.
Foreign securities’ (including foreign exchange contracts’) prices are converted into U.S. dollar amounts using the applicable exchange rates as of the close of the London world markets. If market quotations are available and reliable for foreign exchange-traded equity securities, the securities will be valued at the market quotations. Because trading hours for certain foreign securities end before the close of the NYSE, closing market quotations may become unreliable. If between the time trading ends on a particular security and the close of the customary trading session on the NYSE, events occur that Invesco Capital Management LLC (the “Adviser”), determines are significant and make the closing price unreliable, the Fund may fair value the security. If the event is likely to have affected the closing price of the security, the security will be valued at fair value in good faith using procedures approved by the Board of Trustees. Adjustments to closing prices to reflect fair value may also be based on a screening process of an independent pricing service to indicate the degree of certainty, based on historical data, that the closing price in the principal market where a foreign security trades is not the current value as of the close of the NYSE. Foreign securities’ prices meeting the approved degree of certainty that the price is not reflective of current value will be priced at the indication of fair value from the independent pricing service. Multiple factors may be considered by the independent pricing service in determining adjustments to reflect fair value and may include information relating to sector indices, American Depositary Receipts (“ADRs”) and domestic and foreign index futures. Foreign securities may have additional risks including exchange rate changes, potential for sharply devalued currencies and high inflation, political and economic upheaval, the relative lack of issuer information, relatively low market liquidity and the potential lack of strict financial and accounting controls and standards.
Securities for which market prices are not provided by any of the above methods may be valued based upon quotes furnished by independent sources. The last bid price may be used to value exchange-traded equity securities. The mean between the last bid and asked prices may be used to value debt obligations, including corporate loans, and unlisted equity securities.
Securities for which market quotations are not readily available or became unreliable are valued at fair value as determined in good faith following procedures approved by the Board of Trustees. Issuer-specific events, market trends, bid/asked quotes of brokers and information providers and other market data may be reviewed in the course of making a good faith determination of a security’s fair value.
Each Fund may invest in securities that are subject to interest rate risk, meaning the risk that the prices will generally fall as interest rates rise and, conversely, the prices will generally rise as interest rates fall. Specific securities differ in their sensitivity to changes in interest rates depending on their individual characteristics. Changes in interest rates may result in increased market volatility, which may affect the value and/or liquidity of certain Fund investments.
Valuations change in response to many factors, including the historical and prospective earnings of the issuer, the value of the issuer’s assets, general economic conditions, interest rates, investor perceptions and market liquidity. Because of the inherent uncertainties of valuation, the values reflected in the financial statements may materially differ from the value received upon actual sale of those investments.
Authorized Participant Concentration Risk. Only authorized participants (“APs”) may engage in creation or redemption transactions directly with each Fund. Each Fund has a limited number of institutions that may act as APs, and such APs have no obligation to submit creation or redemption orders. Consequently, there is no assurance that those APs will establish or maintain an active trading market for the Shares. This risk may be heightened to the extent that securities held by each Fund are traded outside a collateralized settlement system. In that case, APs may be required to post collateral on certain trades on an agency basis (i.e., on behalf of other market participants), which only a limited number of APs may be able to do. In addition, to the extent that APs exit the business or are unable to proceed with processing creation and/or redemption orders with respect to each Fund and no other AP is able to step forward to create or redeem Creation Units (as defined below), this may result in a significantly diminished trading market for Shares, which may be more likely to trade at a premium or discount to each Fund’s net asset value (“NAV”) and to face trading halts and/or delisting.
Equity Risk. Equity risk is the risk that the value of equity securities, including common stocks, may fall due to both changes in general economic conditions that impact the market as a whole, as well as factors that directly relate to a specific company or its industry. Such general economic conditions include changes in interest rates, periods of market turbulence or instability, or general and prolonged periods of economic decline and cyclical change. It is possible that a drop in the stock market may depress the price of most or all of the common stocks that each Fund holds. In addition, equity risk includes the risk that investor sentiment toward
particular industries will become negative. The value of a company’s common stock may fall solely because of factors, such as an increase in production costs, that negatively impact other companies in the same region, industry or sector of the market. A company’s common stock also may decline significantly in price over a short period of time due to factors specific to that company, including decisions made by its management or lower demand for the company’s products or services. For example, an adverse event, such as an unfavorable earnings report or the failure to make anticipated dividend payments, may depress the value of common stock.
Index Risk. Unlike many investment companies, each Fund does not utilize an investing strategy that seeks returns in excess of its Underlying Index. Therefore, it would not necessarily buy or sell a security unless that security is added or removed, respectively, from the Underlying Index, even if that security generally is underperforming.
Industry Concentration Risk. In following its methodology, each Underlying Index from time to time may be concentrated to a significant degree in securities of issuers operating in a single industry or industry group. To the extent that each Underlying Index concentrates in the securities of issuers in a particular industry or industry group, each corresponding Fund will also concentrate its investments to approximately the same extent. By concentrating its investments in an industry or industry group, each Fund may face more risks than if it were diversified broadly over numerous industries or industry groups. Such industry-based risks, any of which may adversely affect the companies in which each Fund invests, may include, but are not limited to, legislative or regulatory changes, adverse market conditions and/or increased competition within the industry or industry group. In addition, at times, such industry or industry group may be out of favor and underperform other industries, industry groups or the market as a whole.
Non-Correlation Risk. Each Fund’s return may not match the return of the Underlying Index for a number of reasons. For example, each Fund incurs operating expenses not applicable to the Underlying Index, and incurs costs in buying and selling securities, especially when rebalancing each Fund’s securities holdings to reflect changes in the composition of its Underlying Index. In addition, the performance of each Fund and its Underlying Index may vary due to asset valuation differences and differences between each Fund’s portfolio and its Underlying Index resulting from legal restrictions, costs or liquidity constraints.
Non-Diversified Fund Risk. Because each Fund isnon-diversified and can invest a greater portion of its assets in securities of individual issuers than a diversified fund, changes in the market value of a single investment could cause greater fluctuations in Share price than would occur in a diversified fund. This may increase the Fund’s volatility and cause the performance of a relatively small number of issuers to have a greater impact on the Fund’s performance.
Portfolio Turnover Risk. Each Fund may engage in frequent trading of its portfolio securities in connection with the rebalancing or adjustment of the Underlying Index. A portfolio turnover rate of 200%, for example, is equivalent to each Fund buying and selling all of its securities two times during the course of a year. A high portfolio turnover rate (such as 100% or more) could result in high brokerage costs for the Fund. While a high portfolio turnover rate can result in an increase in taxable capital gains distributions to each Fund’s shareholders, the Fund will seek to utilize thein-kind creation and redemption mechanism (described below) to minimize realization of capital gains to the extent possible.
| C. | Country Determination — For the purposes of presentation in the Schedules of Investments, the Adviser may determine the country in which an issuer is located and/or credit risk exposure based on various factors. These factors include whether the Fund’s Underlying Index has made a country determination and may include the laws of the country under which the issuer is organized, where the issuer maintains a principal office, the country in which the issuer derives 50% or more of its total revenues and the country that has the primary market for the issuer’s securities, as well as other criteria. Among the other criteria that may be evaluated for making this determination are the country in which the issuer maintains 50% or more of its assets, the type of security, financial guarantees and enhancements, the nature of the collateral and the sponsor organization. Country of issuer and/or credit risk exposure has been determined to be the United States of America, unless otherwise noted. |
| D. | Foreign Currency Translations — The accounting records of the Funds are maintained in U.S. dollars. All assets and liabilities initially expressed in foreign currencies are converted into U.S. dollars at prevailing exchange rates. Purchases and sales of investment securities, dividend and interest income, and certain expenses are translated at the rates of exchange prevailing on the respective dates of such transactions. Changes in the relationship of these foreign currencies to the U.S. dollar can significantly affect the value of the investments and earnings of the Funds. Foreign investments may also subject the Funds to foreign government exchange restrictions, expropriation, taxation, or other political, social or economic developments, all of which could affect the market and/or credit risk of the investments. |
The Funds do not isolate that portion of the results of operations resulting from changes in the foreign exchange rates on investments from the fluctuations arising from changes in the market prices of securities held. Such fluctuations are included with the net realized and unrealized gain or loss on investments.
Reported net realized foreign exchange gains and losses arise from sales of foreign currencies and currency gains or losses realized between the trade and settlement dates on investment transactions. Net unrealized exchange gains and losses arise from changes in the fair values of assets and liabilities other than investments in securities at the fiscal period end, resulting from changes in exchange rates.
| E. | Investment Transactions and Investment Income — Investment transactions are accounted for on a trade date basis. Realized gains and losses from the sale or disposition of securities are computed on the specific identified cost basis. Interest income is recorded on the accrual basis from settlement date.Pay-in-kind interest income andnon-cash dividend income received in the form of securitiesin-lieu of cash are recorded at the fair value of the securities received. Dividend income (net of withholding tax, if any) is recorded on theex-dividend date. Dividend income from REITs is recorded based on the income included in the distributions |
| | received from the REIT investments using published REIT classifications, including some management estimates when actual amounts are not available. Distributions received in excess of this estimated amount are recorded as a reduction of the cost of investments or reclassified to capital gains. The actual amounts of income, return of capital, and capital gains are only determined by each REIT after its fiscalyear-end, and may differ from the estimated amounts. Realized gains, dividends and interest received by a Fund may give rise to withholding and other taxes imposed by foreign countries. Tax conventions between certain countries and the United States may reduce or eliminate such taxes. |
The Funds may periodically participate in litigation related to each Fund’s investments. As such, the Funds may receive proceeds from litigation settlements. Any proceeds received are included in the Statements of Operations as realized gain (loss) for investments no longer held and as unrealized gain (loss) for investments still held.
Brokerage commissions and mark ups are considered transaction costs and are recorded as an increase to the cost basis of securities purchased and/or a reduction of proceeds on a sale of securities. Such transaction costs are included in the determination of net realized and unrealized gain (loss) from investment securities reported in the Statements of Operations and the Statements of Changes in Net Assets and the net realized and unrealized gains (losses) on securities per share in the Financial Highlights. Transaction costs are included in the calculation of each Fund’s NAV and, accordingly, they reduce each Fund’s total returns. These transaction costs are not considered operating expenses and are not reflected in net investment income reported in the Statements of Operations and the Statements of Changes in Net Assets, or the net investment income per share and the ratios of expenses and net investment income reported in the Financial Highlights, or are they limited by any expense limitation arrangements between each Fund and the Adviser.
| F. | Accounting Estimates — The preparation of the financial statements in accordance with Generally Accepted Accounting Principles (“GAAP”) requires management to make estimates and assumptions that affect the reported amounts and disclosures in the financial statements, including estimates and assumptions related to taxation. Actual results could differ from these estimates. In addition, the Funds monitor for material events or transactions that may occur or become known after the period-end date and before the date the financial statements are released to print. |
| G. | Dividends and Distributions to Shareholders — Each Fund declares and pays dividends from net investment income, if any, to its shareholders quarterly and records such dividends onex-dividend date. Generally, each Fund distributes net realized taxable capital gains, if any, annually in cash and records them onex-dividend date. Such distributions on a tax basis are determined in conformity with federal income tax regulations, which may differ from GAAP. Distributions in excess of tax basis earnings and profits, if any, are reported in such Fund’s financial statements as a tax return of capital at fiscalyear-end. |
| H. | Expenses — Expenses of the Trust which are directly identifiable to a specific Fund are applied to that Fund. Expenses which are not readily identifiable to a specific Fund are allocated in such a manner as deemed equitable, taking into consideration the nature and type of expense and the relative net assets of each Fund. |
Each Fund has agreed to pay an annual unitary management fee to the Adviser. Out of the unitary management fee, the Adviser has agreed to pay for substantially all expenses of the Funds, including the cost of transfer agency, custody, fund administration, legal, audit and other services, except for advisory fees, distribution fees, if any, brokerage expenses, taxes, interest, acquired fund fees and expenses, if any, litigation expenses and other extraordinary expenses.
| I. | Federal Income Taxes — The Funds intend to comply with provisions of the Internal Revenue Code applicable to regulated investment companies and to distribute substantially all of their investment company taxable income, including any net realized gain on investments not offset by capital loss carryforwards, if any, to shareholders. Therefore, no federal income or excise tax provision is required. The Funds file income tax returns in U.S. federal and applicable state jurisdictions. The statute of limitations on the Funds’ tax return filings generally remains open for the three preceding fiscal reporting period ends. The Funds have analyzed their tax positions for the fiscal year ended June 30, 2019, including open tax years and do not believe there are any uncertain tax positions requiring recognition in the Funds’ financial statements. |
The tax components of capital shown in the following table represent distribution requirements the Funds must satisfy under the income tax regulations, losses the Funds may be able to offset against income and gains realized in future years and unrealized appreciation or depreciation of securities and other investments for federal income tax purposes.
| | | | | | | | | | | | | | | | | | | | |
Fund | | Undistributed
Net Investment
Income | | | Undistributed
Long-Term Gain | | | Capital Loss
Carryforwards | | | Post-October
Capital Losses | | | Net Unrealized Appreciation
(Depreciation) Based on Cost of
Securities and Other Investments for
Federal Income Tax Purposes | |
| Russell 1000® Momentum Factor ETF | | $ | 4,066 | | | $ | — | | | $ | (439,405 | ) | | $ | — | | | $ | 885,978 | |
| Russell 1000® Value Factor ETF | | | 5,787 | | | | — | | | | (134,023 | ) | | | — | | | | 99,227 | |
| Russell 1000® Low Volatility Factor ETF | | | 5,105 | | | | — | | | | (45,393 | ) | | | — | | | | 789,827 | |
| Russell 1000® Size Factor ETF | | | 6,601 | | | | — | | | | — | | | | (64,354 | ) | | | 193,587 | |
| Russell 1000® Quality Factor ETF | | | 4,949 | | | | — | | | | (149,714 | ) | | | — | | | | 557,763 | |
| Russell 1000® Yield Factor ETF | | | 9,585 | | | | — | | | | (79,714 | ) | | | — | | | | 162,482 | |
At June 30, 2019, the Funds have capital loss carryforwards available to offset future realized capital gains, if any, and thereby reduce future taxable gain distributions. Details of the capital loss carryforwards are included in the table below. Capital loss carryforwards can be carried forward indefinitely.
| | | | | | | | | | | | |
Fund | | Short Term
Post-Effective
No Expiration | | | Long Term Post-
Effective No
Expiration | | | Total | |
| Russell 1000® Momentum Factor ETF | | $ | 211,503 | | | $ | 227,902 | | | $ | 439,405 | |
| Russell 1000® Value Factor ETF | | | 15,977 | | | | 118,046 | | | $ | 134,023 | |
| Russell 1000® Low Volatility Factor ETF | | | 5,874 | | | | 39,519 | | | $ | 45,393 | |
| Russell 1000® Size Factor ETF | | | — | | | | — | | | $ | — | |
| Russell 1000® Quality Factor ETF | | | 20,833 | | | | 128,881 | | | $ | 149,714 | |
| Russell 1000® Yield Factor ETF | | | 1,792 | | | | 77,922 | | | $ | 79,714 | |
Net investment income (loss) and net realized gain (loss) may differ for financial statement and tax purposes. The character of dividends and distributions made during the fiscal year from net investment income or net realized gains are determined in accordance with federal income tax requirements, which may differ from the character of net investment income or net realized gains presented in these financial statements in accordance with U.S. GAAP. Also, due to timing of dividend and distributions, the fiscal year in which amounts are distributed may differ from the fiscal year in which the income or net realized gain was recorded by the Funds.
Accordingly, the following amounts have been reclassified for the reporting periods. Net assets of each Fund were unaffected by the reclassifications.
| | | | | | | | | | | | |
Fund | | Increase (Decrease) to
Accumulated Net
Investment Income | | | Increase (Decrease) to
Accumulated Net Realized
Gain on Investments | | | Increase (Decrease) to
Paid-in-Capital | |
| Russell 1000® Momentum Factor ETF | | $ | 20 | | | $ | (195,918 | ) | | $ | 195,898 | |
| Russell 1000® Value Factor ETF | | | — | | | | (278,282 | ) | | | 278,282 | |
| Russell 1000® Low Volatility Factor ETF | | | — | | | | — | | | | — | |
| Russell 1000® Size Factor ETF | | | (2,452 | ) | | | (323,602 | ) | | | 326,054 | |
| Russell 1000® Quality Factor ETF | | | — | | | | (173,619 | ) | | | 173,619 | |
| Russell 1000® Yield Factor ETF | | | — | | | | (197,222 | ) | | | 197,222 | |
The tax character of distributions paid during the reporting periods:
| | | | | | | | | | | | | | | | | | | | | | | | |
| | | Year Ended June 30, 2019 | | | Year Ended June 30, 2018 | |
Fund | | Distributions Paid
from Ordinary
Income | | | Distributions
Paid from
Long-Term
Capital Gains | | | Total | | | Distributions Paid
from Ordinary
Income | | | Distributions
Paid from
Long-Term
Capital Gains | | | Total | |
| Russell 1000® Momentum Factor ETF | | $ | 81,006 | | | $ | — | | | $ | 81,006 | | | $ | 46,812 | | | $ | — | | | $ | 46,812 | |
| Russell 1000® Value Factor ETF | | | 120,297 | | | | — | | | | 120,297 | | | | 63,100 | | | | — | | | | 63,100 | |
| Russell 1000® Low Volatility Factor ETF | | | 113,823 | | | | — | | | | 113,823 | | | | 66,067 | | | | — | | | | 66,067 | |
| Russell 1000® Size Factor ETF | | | 84,064 | | | | 3,506 | | | | 87,570 | | | | 43,194 | | | | — | | | | 43,194 | |
| Russell 1000® Quality Factor ETF | | | 83,646 | | | | — | | | | 83,646 | | | | 49,684 | | | | — | | | | 49,684 | |
| Russell 1000® Yield Factor ETF | | | 178,262 | | | | — | | | | 178,262 | | | | 92,937 | | | | — | | | | 92,937 | |
At June 30, 2019, the aggregate cost of securities and other investments and the composition of unrealized appreciation and depreciation of securities and other investments for federal income tax purposes are noted in the following table. The primary difference between book and tax appreciation or depreciation of securities and other investments, if applicable, is attributable to the tax deferral of losses on wash sales.
| | | | | | | | | | | | | | | | |
Fund | | Federal Tax
Cost of
Securities | | | Gross
Unrealized
Appreciation | | | Gross
Unrealized
(Depreciation) | | | Net
Unrealized
Appreciation
(Depreciation) | |
| Russell 1000® Momentum Factor ETF | | $ | 4,834,500 | | | $ | 929,613 | | | $ | (43,635 | ) | | $ | 885,978 | |
| Russell 1000® Value Factor ETF | | | 5,299,048 | | | | 303,064 | | | | (203,837 | ) | | | 99,227 | |
| Russell 1000® Low Volatility Factor ETF | | | 4,978,430 | | | | 922,956 | | | | (133,129 | ) | | | 789,827 | |
| Russell 1000® Size Factor ETF | | | 5,498,520 | | | | 559,049 | | | | (365,462 | ) | | | 193,587 | |
| Russell 1000® Quality Factor ETF | | | 5,207,681 | | | | 685,926 | | | | (128,163 | ) | | | 557,763 | |
| Russell 1000® Yield Factor ETF | | | 6,554,476 | | | | 427,242 | | | | (264,760 | ) | | | 162,482 | |
| J. | Distributions from Distributable Earnings — In accordance with the Securities and Exchange Commission’s issuance of Disclosure Update and Simplification, the Funds have presented the total, rather than the components of distributions to shareholders, except for tax return of capital distributions, if any, in the Statements of Changes in Net Assets. |
For the period ended June 30, 2018, distributions from distributable earnings for each Fund consisted of distributions from net investment income.
Note 3—Investment Advisory Agreement and Other Agreements
The Trust has entered into an Investment Advisory Agreement with the Adviser on behalf of each Fund, pursuant to which the Adviser has overall responsibility for the selection and ongoing monitoring of each Fund’s investments, managing each Fund’s business affairs and providing certain clerical, bookkeeping and other administrative services. Pursuant to the Investment Advisory Agreement, each Fund accrues daily and pays monthly to the Adviser an annual unitary management fee equal to a percentage of its average daily net assets as follows:
| | | | |
| | | Unitary Management Fees
(as a % of Average daily
Net Assets | |
| Russell 1000® Momentum Factor ETF | | | 0.19 | % |
| Russell 1000® Value Factor ETF | | | 0.19 | % |
| Russell 1000® Low Volatility Factor ETF | | | 0.19 | % |
| Russell 1000® Size Factor ETF | | | 0.19 | % |
| Russell 1000® Quality Factor ETF | | | 0.19 | % |
| Russell 1000® Yield Factor ETF | | | 0.19 | % |
Prior to the Reorganization, the Predecessor Funds were managed by OFI Advisors, LLC (OFI) and the Predecessor Funds paid OFI an investment advisory fee calculated at the same annualized rate as disclosed above for each Fund.
Effective as of the Reorganization, the Adviser has agreed to waive a portion of each Fund’s unitary management fee to the extent necessary to prevent the operating expenses of the Fund (excluding interest expenses, brokerage expenses, acquired fund fees and expenses, any, distribution fees, if any, taxes and litigation expenses, and extraordinary expenses) from exceeding the Fund’s unitary management fee through at least May 24, 2021.
Further, effective as of the Reorganization, through August 31, 2021, the Adviser has contractually agreed to waive a portion of each Fund’s management fee in an amount equal to 100% of the net advisory fees an affiliate of the Adviser receives that are attributable to certain of the Fund’s investments in money market funds managed by that affiliate (excluding investments of cash collateral from securities lending). The Adviser cannot discontinue this waiver prior to its expiration.
For the fiscal year ended June 30, 2019, the Adviser waived fees and/or paid Fund expenses for each Fund in the following amounts:
| | | | |
| Russell 1000® Momentum Factor ETF | | $ | 1 | |
| Russell 1000® Value Factor ETF | | | 1 | |
| Russell 1000® Low Volatility Factor ETF | | | 2 | |
| Russell 1000® Size Factor ETF | | | 1 | |
| Russell 1000® Quality Factor ETF | | | 1 | |
| Russell 1000® Yield Factor ETF | | | 3 | |
The Trust has entered into a Distribution Agreement with Invesco Distributors, Inc. (the “Distributor”), which serves as the distributor of Creation Units for each Fund. The Distributor does not maintain a secondary market in the Shares. The Funds are not charged any fees pursuant to the Distribution Agreement. The Distributor is an affiliate of the Adviser. Prior to the Reorganization, the Board of Trustees for each Predecessor Fund adopted a distribution and service plan pursuant to Rule12b-1 under the 1940 Act. Prior to the Reorganization, the Predecessor Funds paid no distribution fees to OppenheimerFunds Distributor, Inc.
The Trust has entered into service agreements whereby The Bank of New York Mellon (BNYM), a wholly-owned subsidiary of The Bank of New York Mellon Corporation, serves as the administrator, custodian, fund accountant and transfer agent for each Fund. Prior to the Reorganization, BNYM served as administrator, custodian, fund accountant and transfer agent for each Predecessor Fund.
The Adviser has licensed each Fund to use certain trademarks that are owned by the Adviser. No fees were charged to the Funds for this license.
Each Underlying Index name trademark is owned by its respective Licensor. Each Fund is entitled to use its Underlying Index pursuant to the Trust’ssub-licensing agreement with the Adviser. Prior to the Reorganization, each Underlying Index name trademark had been licensed to OFI for use by the corresponding Predecessor Fund. The Funds are not sponsored, endorsed, sold or promoted by the Licensor, and the Licensor makes no representation regarding the advisability of investing in any of the Funds.
Note 4—Investments in Affiliates
The Adviser is wholly-owned subsidiary of Invesco Ltd. and therefore, Invesco Ltd. is considered to be affiliated with the Funds. The tables below show certain Funds’ transactions in, and earnings from, investments in affiliates (excluding affiliated money market funds) for the fiscal year ended June 30, 2019.
Russell 1000® Value Factor ETF
| | | | | | | | | | | | | | | | | | | | | | | | | | | | |
| | | Value
June 30, 2018 | | | Purchases
at cost | | | Proceeds
from Sales | | | Change in
Unrealized
Appreciation
(Depreciation) | | | Realized
Gain (Loss) | | | Value
June 30, 2019 | | | Dividend
Income | |
| Invesco Ltd. | | $ | 6,135 | | | $ | 1,166 | | | $ | (2,004 | ) | | $ | (8 | ) | | $ | (1,381 | ) | | $ | 3,908 | | | $ | 280 | |
Russell 1000® Size Factor ETF
| | | | | | | | | | | | | | | | | | | | | | | | | | | | |
| | | Value
June 30, 2018 | | | Purchases
at cost | | | Proceeds
from Sales | | | Change in
Unrealized
Appreciation
(Depreciation) | | | Realized
Gain (Loss) | | | Value
June 30, 2019 | | | Dividend
Income | |
| Invesco Ltd. | | $ | 11,076 | | | $ | 3,238 | | | $ | (1,288 | ) | | $ | (1,591 | ) | | $ | (960 | ) | | $ | 10,475 | | | $ | 544 | |
Russell 1000® Yield Factor ETF
| | | | | | | | | | | | | | | | | | | | | | | | | | | | |
| | | Value
June 30, 2018 | | | Purchases
at cost | | | Proceeds
from Sales | | | Change in
Unrealized
Appreciation
(Depreciation) | | | Realized
Gain (Loss) | | | Value
June 30, 2019 | | | Dividend
Income | |
| Invesco Ltd. | | $ | 6,162 | | | $ | 2,289 | | | $ | (736 | ) | | $ | (783 | ) | | $ | (549 | ) | | $ | 6,383 | | | $ | 299 | |
Note 5—Additional Valuation Information
GAAP defines fair value as the price that would be received to sell an asset or paid to transfer a liability in an orderly transaction between market participants at the measurement date, under current market conditions. GAAP establishes a hierarchy that prioritizes the inputs to valuation methods, giving the highest priority to readily available unadjusted quoted prices in an active market for identical assets (Level 1) and the lowest priority to significant unobservable inputs (Level 3), generally when market prices are not readily available or are unreliable. Based on the valuation inputs, the securities or other investments are tiered into one of three levels. Changes in valuation methods may result in transfers in or out of an investment’s assigned level:
| | Level 1 — | Prices are determined using quoted prices in an active market for identical assets. |
| | Level 2 — | Prices are determined using other significant observable inputs. Observable inputs are inputs that other market participants may use in pricing a security. These may include quoted prices for similar securities, interest rates, prepayment speeds, credit risk, yield curves, loss severities, default rates, discount rates, volatilities and others. |
| | Level 3 — | Prices are determined using significant unobservable inputs. In situations where quoted prices or observable inputs are unavailable (for example, when there is little or no market activity for an investment at the end of the period), unobservable inputs may be used. Unobservable inputs reflect the Fund’s own assumptions about the factors market participants would use in determining fair value of the securities or instruments and would be based on the best available information. |
As of June 30, 2019, all of the securities in each Fund were valued based on Level 1 inputs (see the Schedules of Investments for security categories). The level assigned to the securities valuations may not be an indication of the risk or liquidity associated with investing in those securities. Because of the inherent uncertainties of valuation, the values reflected in the financial statements may materially differ from the value received upon actual sale of those investments.
Note 6—Securities Lending
For the year ended June 30, 2019, each Fund participated in securities lending. Each Fund loaned portfolio securities having a market value up toone-third of each Fund’s total assets. Such loans are secured by cash collateral equal to no less than 102% (105% for international securities) of the market value of the loaned securities determined daily by the securities lending provider. Cash collateral received in connection with these loans is generally invested in an affiliated money market fund and is shown as such on the Schedules of Investments. Each Fund bears the risk of loss with respect to the investment of collateral. It is the policy of these Funds to obtain additional collateral from or return excess collateral to the borrower by the end of the next business day, following the valuation date of the securities loaned. Therefore, the value of the collateral held may be temporarily less than the value of the securities on loan. When loaning securities, each Fund retains certain benefits of owning the securities, including the economic equivalent of dividends or interest generated by the security. Lending securities entails a risk of loss to each Fund if, and to the extent that, the market value of the securities loaned were to increase, and the borrower did not increase the collateral accordingly, and the borrower failed to return the securities. The securities loaned are subject to termination at the option of the borrower or each Fund. Upon termination, the borrower will return to each Fund the securities loaned and each Fund will return the collateral. Upon the failure of the borrower to return the securities, collateral may be liquidated and the securities may be purchased on the open market to replace the loaned securities. Each Fund could experience delays and costs in gaining access to the collateral and the securities may lose value during the delay which could result in potential losses to each Fund. Some of these losses may be indemnified by the lending agent. Each Fund bears the risk of any deficiency in the amount of the collateral available for return to the borrower due to any loss on the collateral invested. Dividends received on cash collateral investments for securities lending transactions, which are net of compensation to Counterparties, are included in Securities lending income on the Statements of Operations. The aggregate value of securities out on loan, if any, is shown on the Statements of Assets and Liabilities.
Note 7—Capital
Shares are issued and redeemed by the Funds only in creation unit size aggregations of 50,000 shares. Transactions are permitted on anin-kind basis, with a separate cash payment, which is balancing each component to equate the transaction to the net asset value per share of the Fund on the transaction date.
To the extent that the Funds permit transactions in exchange for Deposit Securities, each Fund may issue Shares in advance of receipt of Deposit Securities subject to various conditions, including a requirement to maintain on deposit with the Trust cash at least equal to 105% of the market value of the missing Deposit Securities. In accordance with the Trust’s Participant Agreement, Creation Units will be issued to an Authorized Participant, notwithstanding the fact that the corresponding Deposit Securities have not been received in part or in whole, in reliance on the undertaking of the Authorized Participant to deliver the missing Deposit Securities as soon as possible, which undertaking shall be secured by the Authorized Participant’s delivery and maintenance of collateral consisting of cash in the form of U.S. dollars in immediately available funds having a value(marked-to-market daily) at least equal to 105%, which the Adviser may change from time to time, of the value of the missing Deposit Securities. Certain transaction fees may be charged by the Funds for creations and redemptions, which are treated as increases in capital. Transactions in each Fund’s Shares are disclosed in detail in the Statements of Changes in Net Assets.
Note 8—Purchases & Sales of Securities
For the fiscal year ended June 30, 2019, the cost of securities purchased and proceeds from sales of securities, (other than short-term securities, U.S. Treasury obligations, money market funds andin-kind transactions, if any), were as follows:
| | | | | | | | |
Fund | | Purchases | | | Sales | |
| Russell 1000® Momentum Factor ETF | | $ | 1,793,106 | | | $ | 2,349,635 | |
| Russell 1000® Value Factor ETF | | | 1,627,882 | | | | 1,473,223 | |
| Russell 1000® Low Volatility Factor ETF | | | 433,105 | | | | 412,593 | |
| Russell 1000® Size Factor ETF | | | 1,104,988 | | | | 1,356,840 | |
| Russell 1000® Quality Factor ETF | | | 1,219,164 | | | | 1,778,376 | |
| Russell 1000® Yield Factor ETF | | | 940,049 | | | | 1,183,393 | |
For the fiscal year ended June 30, 2019, the cost ofin-kind purchases and the proceeds fromin-kind sales were as follows:
| | | | | | | | |
Fund | | Purchases | | | Sales | |
| Russell 1000® Momentum Factor ETF | | $ | 1,400,614 | | | $ | 836,836 | |
| Russell 1000® Value Factor ETF | | | 1,319,071 | | | | 1,475,097 | |
| Russell 1000® Low Volatility Factor ETF | | | — | | | | — | |
| Russell 1000® Size Factor ETF | | | 1,373,468 | | | | 1,136,751 | |
| Russell 1000® Quality Factor ETF | | | 1,420,386 | | | | 866,491 | |
| Russell 1000® Yield Factor ETF | | | 2,645,425 | | | | 1,073,809 | |
Note 9—Trustees’ and Officer’s Fees
Trustees’ and Officer’s Fees include amounts accrued by the Funds to pay remuneration to the Independent Trustees and an Officer of the Trust. The Trustee who is an “interested person” of the Trust does not receive any Trustees’ fees.
The Trust has adopted a deferred compensation plan (the “Plan”). Under the Plan, each Independent Trustee who has executed a Deferred Fee Agreement (a “Participating Trustee”) may defer receipt of all or a portion of his compensation (“Deferral Fees”). Such Deferral Fees are deemed to be invested in select Invesco Funds. The Deferral Fees payable to the Participating Trustee are valued as of the date such Deferral Fees would have been paid to the Participating Trustee. The value increases with contributions or with increases in the value of the Shares selected, and the value decreases with distributions or with declines in the value of the Shares selected. Obligations under the Plan represent unsecured claims against the general assets of the Funds.
Note 10—Indemnifications
Under the Trust’s organizational documents, its Officers and Trustees are indemnified against certain liabilities arising out of the performance of their duties to the Trust. Each Independent Trustee is also indemnified against certain liabilities arising out of the performance of their duties to the Trust pursuant to an Indemnification Agreement between such trustee and the Trust. Additionally, in the normal course of business, the Trust enters into contracts with service providers that contain general indemnification clauses. The Trust’s maximum exposure under these arrangements is unknown, as this would involve future claims that may be made against the Trust that have not yet occurred. However, based on experience, the Trust believes the risk of loss to be remote.
Report of Independent Registered Public Accounting Firm
To the Board of Trustees of Invesco Exchange-Traded Fund Trust II and Shareholders of Invesco Russell 1000® Momentum Factor ETF, Invesco Russell 1000® Value Factor ETF, Invesco Russell 1000® Low Volatility Factor ETF, Invesco Russell 1000® Size Factor ETF, Invesco Russell 1000® Quality Factor ETF and Invesco Russell 1000® Yield Factor ETF
Opinions on the Financial Statements
We have audited the accompanying statements of assets and liabilities, including the schedules of investments, of each of the funds listed in the table below (six of the funds constituting Invesco Exchange-Traded Fund Trust II, hereafter collectively referred to as the “Funds”) as of June 30, 2019, the related statements of operations and changes in net assets, including the related notes, and the financial highlights for the year ended June 30, 2019 (collectively referred to as the “financial statements”). In our opinion, the financial statements present fairly, in all material respects, the financial position of each of the Funds as of June 30, 2019, the results of each of their operations, changes in each of their net assets and each of the financial highlights for the year ended June 30, 2019 in conformity with accounting principles generally accepted in the United States of America.
| | |
Fund Name | | Predecessor Fund |
| Invesco Russell 1000® Momentum Factor ETF | | Oppenheimer Russell 1000® Momentum Factor ETF |
| Invesco Russell 1000® Value Factor ETF | | Oppenheimer Russell 1000® Value Factor ETF |
| Invesco Russell 1000® Low Volatility Factor ETF | | Oppenheimer Russell 1000® Low Volatility Factor ETF |
| Invesco Russell 1000® Size Factor ETF | | Oppenheimer Russell 1000® Size Factor ETF |
| Invesco Russell 1000® Quality Factor ETF | | Oppenheimer Russell 1000® Quality Factor ETF |
| Invesco Russell 1000® Yield Factor ETF | | Oppenheimer Russell 1000® Yield Factor ETF |
The financial statements of the Predecessor Funds as of and for the year or period ended June 30, 2018 and the financial highlights for each of the periods ended on or prior to June 30, 2018 (not presented herein, other than the statements of changes in net assets and the financial highlights) were audited by other auditors whose report dated August 28, 2018 expressed an unqualified opinion on those financial statements and financial highlights.
Basis for Opinions
These financial statements are the responsibility of the Funds’ management. Our responsibility is to express an opinion on the Funds’ financial statements based on our audits. We are a public accounting firm registered with the Public Company Accounting Oversight Board (United States) (“PCAOB”) and are required to be independent with respect to the Funds in accordance with the U.S. federal securities laws and the applicable rules and regulations of the Securities and Exchange Commission and the PCAOB.
We conducted our audits of these financial statements in accordance with the standards of the PCAOB. Those standards require that we plan and perform the audit to obtain reasonable assurance about whether the financial statements are free of material misstatement, whether due to error or fraud.
Our audits included performing procedures to assess the risks of material misstatement of the financial statements, whether due to error or fraud, and performing procedures that respond to those risks. Such procedures included examining, on a test basis, evidence regarding the amounts and disclosures in the financial statements. Our audits also included evaluating the accounting principles used and significant estimates made by management, as well as evaluating the overall presentation of the financial statements. Our procedures included confirmation of securities owned as of June 30, 2019 by correspondence with the custodian, transfer agent and brokers; when replies were not received from brokers, we performed other auditing procedures. We believe that our audits provide a reasonable basis for our opinions.
PricewaterhouseCoopers LLP
Chicago, Illinois
August 23, 2019
We have served as the auditor of one or more of the investment companies in the Invesco group of investment companies since at least 1995. We have not determined the specific year we began serving as auditor.
Independent Registered Public Accounting Firm
Independent Registered Public Accounting Firm
The Audit Committee of the Board of Trustees appointed, and the Board of Trustees ratified and approved, PricewaterhouseCoopers LLP (“PWC”) as the independent registered public accounting firm of the Fund for the fiscal periods ending after May 24, 2019. Prior to the close of business on May 24, 2019, the Predecessor Fund was a separate series of an unaffiliated investment company and its financial statements were audited by a different independent registered public accounting firm (the “Prior Auditor”).
Effective after the close of business on May 24, 2019, the Prior Auditor resigned as the independent registered public accounting firm of the Fund. The Prior Auditor’s report on the financial statements of the Predecessor Fund for the past two fiscal years did not contain an adverse or disclaimer of opinion, and was not qualified or modified as to uncertainty, audit scope or accounting principles. During the Predecessor Fund’s two most recent fiscal years and through the close of business on May 24, 2019, there were no (1) disagreements with the Prior Auditor on any matter of accounting principles or practices, financial statement disclosure, or auditing scope or procedure, which disagreements, if not resolved to the Prior Auditor’s satisfaction, would have caused it to make reference to that matter in connection with its report; or (2) “reportable events,” as that term is defined in Item 304(a)(1)(v) of Regulation S-K under the Securities Exchange Act of 1934.
Calculating your ongoing Fund expenses
Example
As a shareholder of a Fund of the Invesco Exchange-Traded Fund Trust II, you incur a unitary management fee. In addition to the unitary management fee, a shareholder may pay distribution fees, if any, brokerage expenses, taxes, interest, including acquired fund fees and expenses, if any, litigation expenses and other extraordinary expenses. The expense examples below are intended to help you understand your ongoing costs (in dollars) of investing in the Funds and to compare these costs with the ongoing costs of investing in other funds.
The example is based on an investment of $1,000 invested at the beginning of the period and held through thesix-month period ended June 30, 2019.
Actual Expenses
The first line in the following table provides information about actual account values and actual expenses. You may use the information in this line, together with the amount you invested, to estimate the expenses that you paid over the period. Simply divide your account value by $1,000 (for example, an $8,600 account value divided by $1,000 = 8.6), then multiply the result by the number in the first line under the heading “Expenses Paid During theSix-Month Period” to estimate the expenses you paid on your account during this period.
Hypothetical Example for Comparison Purposes
The second line in the following table provides information about hypothetical account values and hypothetical expenses based on each Fund’s actual expense ratio and an assumed annualized rate of return of 5% per year before expenses, which is not the Fund’s actual return. The hypothetical account values and expenses may not be used to estimate the actual ending account balance or expenses you paid for the period. You may use this information to compare the ongoing costs of investing in the Funds and other funds. To do so, compare this 5% hypothetical example with the 5% hypothetical examples that appear in the shareholder reports of the other funds.
Please note that the expenses shown in the table are meant to highlight your ongoing costs only, and do not reflect any transactional costs, such as sales charges and brokerage commissions. Therefore, the second line in the table is useful in comparing ongoing costs only, and will not help you determine the relative total costs of owning different funds. In addition, expenses shown in the table do not include the expenses of the underlying funds, which are borne indirectly by the Fund. If transaction costs and indirect expenses were included, your costs would have been higher.
| | | | | | | | | | | | | | | | |
| | | Beginning
Account Value
January 1, 2019 | | | Ending
Account Value
June 30, 2019 | | | Annualized
Expense Ratio
Based on the
Six-Month Period | | | Expenses Paid
During the
Six-Month Period(1) | |
| Invesco Russell 1000® Momentum Factor ETF | | | | | | | | | | | | | | | | |
Actual | | $ | 1,000.00 | | | $ | 1,189.31 | | | | 0.19 | % | | $ | 1.03 | |
Hypothetical (5% return before expenses) | | | 1,000.00 | | | | 1,023.85 | | | | 0.19 | | | | 0.95 | |
| Invesco Russell 1000® Value Factor ETF | | | | | | | | | | | | | | | | |
Actual | | | 1,000.00 | | | | 1,150.35 | | | | 0.19 | | | | 1.01 | |
Hypothetical (5% return before expenses) | | | 1,000.00 | | | | 1,023.85 | | | | 0.19 | | | | 0.95 | |
| Invesco Russell 1000® Low Volatility Factor ETF | | | | | | | | | | | | | | | | |
Actual | | | 1,000.00 | | | | 1,181.80 | | | | 0.19 | | | | 1.03 | |
Hypothetical (5% return before expenses) | | | 1,000.00 | | | | 1,023.85 | | | | 0.19 | | | | 0.95 | |
| Invesco Russell 1000® Size Factor ETF | | | | | | | | | | | | | | | | |
Actual | | | 1,000.00 | | | | 1,208.62 | | | | 0.19 | | | | 1.04 | |
Hypothetical (5% return before expenses) | | | 1,000.00 | | | | 1,023.85 | | | | 0.19 | | | | 0.95 | |
| Invesco Russell 1000® Quality Factor ETF | | | | | | | | | | | | | | | | |
Actual | | | 1,000.00 | | | | 1,178.76 | | | | 0.19 | | | | 1.03 | |
Hypothetical (5% return before expenses) | | | 1,000.00 | | | | 1,023.85 | | | | 0.19 | | | | 0.95 | |
| Invesco Russell 1000® Yield Factor ETF | | | | | | | | | | | | | | | | |
Actual | | | 1,000.00 | | | | 1,143.91 | | | | 0.19 | | | | 1.01 | |
Hypothetical (5% return before expenses) | | | 1,000.00 | | | | 1,023.85 | | | | 0.19 | | | | 0.95 | |
| (1) | Expenses are calculated using the annualized expense ratio, which represents the ongoing expenses as a percentage of net assets for thesix-month period ended June 30, 2019. Expenses are calculated by multiplying the Fund’s annualized expense ratio by the average account value for the period, then multiplying the result by 181/365. Expense ratios for the most recentsix-month period may differ from expense ratios based on the annualized data in the Financial Highlights. |
Tax Information
Form 1099-DIV, Form 1042-S and other year-end tax information provide shareholders with actual calendar year amounts that should be included in their tax returns. Shareholders should consult their tax advisers.
The following distribution information is being provided as required by the Internal Revenue Code or to meet a specific state’s requirement.
Each Fund designates the following amounts or, if subsequently determined to be different, the maximum amount allowable for its fiscal year ended June 30, 2019:
| | | | | | | | | | | | | | | |
Fund | | Qualified Business
Income* | | Qualified Dividend
Income* | | Corporate
Dividends-Received
Deduction* |
| Invesco Russell 1000® Momentum Factor ETF | | | | 0 | % | | | | 100 | % | | | | 100 | % |
| Invesco Russell 1000® Value Factor ETF | | | | 0 | % | | | | 100 | % | | | | 100 | % |
| Invesco Russell 1000® Low Volatility Factor ETF | | | | 0 | % | | | | 100 | % | | | | 100 | % |
| Invesco Russell 1000® Size Factor ETF | | | | 24 | % | | | | 76 | % | | | | 71 | % |
| Invesco Russell 1000® Quality Factor ETF | | | | 0 | % | | | | 100 | % | | | | 100 | % |
| Invesco Russell 1000® Yield Factor ETF | | | | 0 | % | | | | 100 | % | | | | 92 | % |
| * | The above percentages are based on ordinary income dividends paid to shareholders during the Fund’s fiscal year. |
Proxy Results
A Special Meeting (“Meeting”) of Shareholders of Invesco Russell 1000® Momentum Factor ETF was held on April 12, 2019. The Meeting was held for the following purpose:
| (1) | Approval of an Agreement and Plan of Reorganization that provides for the reorganization of Oppenheimer Russell 1000® Momentum Factor ETF into Invesco Russell 1000® Momentum Factor ETF. |
The results of the voting on the above matter was as follows:
| | | | | | | | | | | | | | |
Matter | | Votes For | | | Votes
Against | | | Votes
Abstain | | | Broker
Non-Votes |
(1) Approval of an Agreement and Plan of Reorganization. | | | 191,075 | | | | 0 | | | | 0 | | | 0 |
A Special Meeting (“Meeting”) of Shareholders of Invesco Russell 1000® Value Factor ETF was held on April 12, 2019. The Meeting was held for the following purpose:
| (1) | Approval of an Agreement and Plan of Reorganization that provides for the reorganization of Oppenheimer Russell 1000® Value Factor ETF into Invesco Russell 1000® Value Factor ETF. |
The results of the voting on the above matter was as follows:
| | | | | | | | | | | | | | |
Matter | | Votes For | | | Votes
Against | | | Votes
Abstain | | | Broker
Non-Votes |
(1) Approval of an Agreement and Plan of Reorganization. | | | 190,399 | | | | 0 | | | | 0 | | | 0 |
A Special Meeting (“Meeting”) of Shareholders of Invesco Russell 1000® Low Volatility Factor ETF was held on April 12, 2019. The Meeting was held for the following purpose:
| (1) | Approval of an Agreement and Plan of Reorganization that provides for the reorganization of Oppenheimer Russell 1000® Low Volatility Factor ETF into Invesco Russell 1000® Low Volatility Factor ETF. |
The results of the voting on the above matter was as follows:
| | | | | | | | | | | | | | |
Matter | | Votes For | | | Votes
Against | | | Votes
Abstain | | | Broker
Non-Votes |
(1) Approval of an Agreement and Plan of Reorganization. | | | 192,049 | | | | 50 | | | | 0 | | | 0 |
A Special Meeting (“Meeting”) of Shareholders of Invesco Russell 1000® Size Factor ETF was held on April 12, 2019. The Meeting was held for the following purpose:
| (1) | Approval of an Agreement and Plan of Reorganization that provides for the reorganization of Oppenheimer Russell 1000® Size Factor ETF into Invesco Russell 1000® Size Factor ETF. |
The results of the voting on the above matter was as follows:
| | | | | | | | | | | | | | |
Matter | | Votes For | | | Votes
Against | | | Votes
Abstain | | | Broker
Non-Votes |
(1) Approval of an Agreement and Plan of Reorganization. | | | 190,347 | | | | 80 | | | | 0 | | | 0 |
Proxy Results(continued)
A Special Meeting (“Meeting”) of Shareholders of Invesco Russell 1000® Quality Factor ETF was held on April 12, 2019. The Meeting was held for the following purpose:
| (1) | Approval of an Agreement and Plan of Reorganization that provides for the reorganization of Oppenheimer Russell 1000® Quality Factor ETF into Invesco Russell 1000® Quality Factor ETF. |
The results of the voting on the above matter was as follows:
| | | | | | | | | | | | | | |
Matter | | Votes For | | | Votes
Against | | | Votes
Abstain | | | Broker
Non-Votes |
(1) Approval of an Agreement and Plan of Reorganization. | | | 174,344 | | | | 0 | | | | 0 | | | 0 |
A Special Meeting (“Meeting”) of Shareholders of Invesco Russell 1000® Yield Factor ETF was held on April 12, 2019. The Meeting was held for the following purpose:
| (1) | Approval of an Agreement and Plan of Reorganization that provides for the reorganization of Oppenheimer Russell 1000® Yield Factor ETF into Invesco Russell 1000® Yield Factor ETF. |
The results of the voting on the above matter was as follows:
| | | | | | | | | | | | | | |
Matter | | Votes For | | | Votes
Against | | | Votes
Abstain | | | Broker
Non-Votes |
(1) Approval of an Agreement and Plan of Reorganization. | | | 190,001 | | | | 0 | | | | 0 | | | 0 |
Trustees and Officers
The Independent Trustees of the Trust, their term of office and length of time served, their principal business occupations during at least the past five years, the number of portfolios in the Fund Complex (as defined below) overseen by each Independent Trustee and the other directorships, if any, held by each Independent Trustee are shown below.
As of June 30, 2019
| | | | | | | | | | |
Name, Address and Year of
Birth of Independent Trustees | | Position(s)
Held
with Trust | | Term of
Office
and
Length of
Time
Served* | | Principal
Occupation(s) During
Past 5 Years | | Number of
Portfolios
in Fund
Complex**
Overseen by
Independent
Trustees | | Other
Directorships
Held by
Independent
Trustees During
the Past 5 Years |
Ronn R. Bagge—1958
c/o Invesco Capital Management LLC
3500 Lacey Road, Suite 700
Downers Grove, IL 60515 | | Chairman of the Nominating and Governance Committee and Trustee | | Chairman of the Nominating and Governance Committee and Trustee since 2007 | | Founder and Principal, YQA Capital Management LLC (1998-Present); formerly, Owner/CEO of Electronic Dynamic Balancing Co., Inc. (high-speed rotating equipment service provider). | | 246 | | Trustee and Investment Oversight Committee member, Mission Aviation Fellowship (2017-Present) |
| | | | | |
Todd J. Barre—1957
c/o Invesco Capital Management LLC
3500 Lacey Road, Suite 700
Downers Grove, IL 60515 | | Trustee | | Since 2010 | | Assistant Professor of Business, Trinity Christian College (2010-2016); formerly, Vice President and Senior Investment Strategist (2001-2008), Director of Open Architecture and Trading (2007-2008), Head of Fundamental Research (2004-2007) and Vice President and Senior Fixed Income Strategist (1994-2001), BMO Financial Group/Harris Private Bank. | | 246 | | None |
| | | | | |
Edmund P. Giambastiani, Jr.—1948 c/o Invesco Capital Management LLC 3500 Lacey Road, Suite 700, Downers Grove, IL 60515 | | Trustee | | Since 2019 | | President of Giambastiani Group LLC (national security and energy consulting) (2007-Present); Director of The Boeing Company (2009-Present); Trustee of MITRE Corporation (federally-funded research development) (2008-Present); Director of THL Credit, Inc. (2016-Present) (alternative credit investment manager); Trustee of the U.S. Naval Academy Foundation Athletic & Scholarship Program (2010-Present); Advisory Board Member of the Massachusetts Institute of Technology Lincoln Laboratory (federally-funded research development) (2010-Present); Defense Advisory Board Member Lawrence Livermore National Laboratory (2013-present); formerly, Chairman of Monster | | 153 | | Trustee, certain funds in the Oppenheimer Funds complex (2013-2019); Director of Mercury Defense Systems Inc. (information technology) (2011-2013); Independent Director of QinetiQ Group Plc (defense technology and security)(2008-2011); Chairman of Alenia North America, Inc. (military and defense products) (2008-2009); Director of SRA International, Inc. (information technology and services)(2008-2011). |
| * | This is the date the Interested Trustee began serving the Trust. The Interested Trustee serves an indefinite term, until his successor is elected. |
| ** | Fund Complex includes all open- andclosed-end funds (including all of their portfolios) advised by the Adviser and any affiliated person of the Adviser. |
Trustees and Officers(Continued)
| | | | | | | | | | |
Name, Address and Year of
Birth of Independent Trustees | | Position(s)
Held
with Trust | | Term of
Office
and
Length of
Time
Served* | | Principal
Occupation(s) During
Past 5 Years | | Number of
Portfolios
in Fund
Complex**
Overseen by
Independent
Trustees | | Other
Directorships
Held by
Independent
Trustees During
the Past 5 Years |
| | | | | | Worldwide, Inc. (career services) (2015-2016), Director of Monster Worldwide, Inc. (2008-2011); Lead Director (2011-2015); Advisory Board Member of the Maxwell School of Citizenship and Public Affairs of Syracuse University (2012-2016); United States Navy, career nuclear submarine officer (1970-2007); Seventh Vice Chairman of the Joint Chiefs of Staff (2005-2007); first NATO Supreme Allied Commander Transformation (2003-2005) and Commander, U.S. Joint Forces Command (2002-2005). | | | | |
| | | | | |
Victoria J. Herget—1951 c/o Invesco Capital Management LLC 3500 Lacey Road, Suite 700, Downers Grove, IL 60515 | | Trustee | | Since 2019 | | Formerly, Managing Director (1993-2001), Principal (1985-1993), Vice President (1978-1985) and Assistant Vice President (1973-1978) of Zurich Scudder Investments (investment adviser) (and its predecessor firms). | | 153 | | Trustee (2000-Present) and Chair(2010-2017) of Newberry Library; Trustee, Mather LifeWays (2001-Present); formerly, Board Chair (2008-2015) and Director (2004-2018) of United Educators; Trustee, certain funds in the Oppenheimer Funds complex(2012-2019); Independent Director of the First American Funds(2003-2011); Trustee, Chikaming Open Lands (2014-present); Trustee (1992-2007), Chair of the Board of Trustees (1999-2007), Investment Committee Chair (1994-1999) and Investment Committee member(2007-2010) of Wellesley College; Trustee, BoardSource (2006-2009) and Chicago City Day School (1994-2005). |
| * | This is the date the Interested Trustee began serving the Trust. The Interested Trustee serves an indefinite term, until his successor is elected. |
| ** | Fund Complex includes all open- andclosed-end funds (including all of their portfolios) advised by the Adviser and any affiliated person of the Adviser. |
Trustees and Officers(Continued)
| | | | | | | | | | |
Name, Address and Year of
Birth of Independent Trustees | | Position(s)
Held
with Trust | | Term of
Office
and
Length of
Time
Served* | | Principal
Occupation(s) During
Past 5 Years | | Number of
Portfolios
in Fund
Complex**
Overseen by
Independent
Trustees | | Other
Directorships
Held by
Independent
Trustees During
the Past 5 Years |
Marc M. Kole—1960
c/o Invesco Capital Management LLC
3500 Lacey Road, Suite 700
Downers Grove, IL 60515 | | Chairman of the Audit Committee and Trustee | | Chairman of the Audit Committee since 2008; Trustee since 2007 | | Senior Director of Finance, By The Hand Club for Kids(not-for-profit) (2015-Present); formerly, Chief Financial Officer, Hope Network (social services) (2008-2012); Assistant Vice President and Controller, Priority Health (health insurance) (2005-2008); Regional Chief Financial Officer, United Healthcare (2005); Chief Accounting Officer, Senior Vice President of Finance, Oxford Health Plans (2000-2004); Audit Partner, Arthur Andersen LLP (1996-2000). | | 246 | | Treasurer (2018-Present), Finance Committee Member (2015-Present) and Audit Committee Member (2015), Thornapple Evangelical Covenant Church; formerly, Board and Finance Committee Member (2009-2017) and Treasurer (2010-2015, 2017), NorthPointe Christian Schools. |
| | | | | |
Yung Bong Lim—1964
c/o Invesco Capital Management LLC
3500 Lacey Road, Suite 700
Downers Grove, IL 60515 | | Chairman of the Investment Oversight Committee and Trustee | | Chairman of the Investment Oversight Committee since 2014; Trustee since 2013 | | Managing Partner, RDG Funds LLC (real estate) (2008-Present); formerly, Managing Director, Citadel LLC (1999-2007). | | 246 | | Advisory Board Member of Performance Trust Capital Partners (2008-Present); Board Director of Beacon Power Services (2019-Present). |
| | | | | |
Joanne Pace—1958 c/o Invesco Capital Management LLC 3500 Lacey Road, Suite 700, Downers Grove, IL 60515 | | Trustee | | Since 2019 | | Senior Advisor of SECOR Asset Management, LP (2010-2011); Managing Director and Chief Operating Officer of Morgan Stanley Investment Management (2006-2010); Partner and Chief Operating Officer of FrontPoint Partners, LLC (alternative investments) (2005-2006); Credit Suisse (investment banking), Managing Director (2003-2005), Global Head of Human Resources and member of Executive Board and Operating Committee (2004-2005), Global Head of Operations and Product Control (2003-2004); Morgan Stanley, Managing Director (1997-2003), Controller and Principal Accounting Officer (1999-2003); Chief Financial Officer (temporary assignment) for the Oversight Committee, Long Term Capital Management (1998-1999). | | 153 | | Board Director of Horizon Blue Cross Blue Shield of New Jersey (2012-Present); Advisory Board Director of The Alberleen Group LLC (2012-Present); Governing Council Member (2016-Present) and Chair of Education Committee (2017-Present) of Independent Directors Council (IDC); Board Member of 100 Women in Finance (2015-Present); Advisory Council Member of Morgan Stanley Children’s Hospital (2012-Present); formerly, Trustee, certain funds in the |
| * | This is the date the Interested Trustee began serving the Trust. The Interested Trustee serves an indefinite term, until his successor is elected. |
| ** | Fund Complex includes all open- andclosed-end funds (including all of their portfolios) advised by the Adviser and any affiliated person of the Adviser. |
Trustees and Officers(Continued)
| | | | | | | | | | |
Name, Address and Year of
Birth of Independent Trustees | | Position(s)
Held
with Trust | | Term of
Office
and
Length of
Time
Served* | | Principal
Occupation(s) During
Past 5 Years | | Number of
Portfolios
in Fund
Complex**
Overseen by
Independent
Trustees | | Other
Directorships
Held by
Independent
Trustees During
the Past 5 Years |
| | | | | | | | | | Oppenheimer Funds complex (2012-2019); Lead Independent Director and Chair of the Audit and Nominating Committee of The Global Chartist Fund, LLC of Oppenheimer Asset Management (2011-2012); Board Director of Managed Funds Association (2008-2010); Board Director of Morgan Stanley Foundation (2007-2010) and Investment Committee Chair (2008-2010). |
| | | | | |
Gary R. Wicker—1961
c/o Invesco Capital Management LLC
3500 Lacey Road, Suite 700
Downers Grove, IL 60515 | | Trustee | | Since 2013 | | Senior Vice President of Global Finance and Chief Financial Officer at RBC Ministries (publishing company) (2013-Present); formerly, Executive Vice President and Chief Financial Officer, Zondervan Publishing (a division of Harper Collins/NewsCorp) (2007-2012); Senior Vice President and Group Controller (2005-2006), Senior Vice President and Chief Financial Officer (2003-2004), Chief Financial Officer (2001-2003), Vice President, Finance and Controller (1999-2001) and Assistant Controller (1997-1999), divisions of The Thomson Corporation (information services provider); Senior Audit Manager (1994-1997), PricewaterhouseCoopers LLP. | | 246 | | Board Member and Treasurer, Our Daily Bread Ministries Canada (2015-Present); Board and Finance Committee Member, West Michigan Youth For Christ (2010-Present). |
| | | | | |
Donald H. Wilson—1959
c/o Invesco Capital Management LLC
3500 Lacey Road, Suite 700
Downers Grove, IL 60515 | | Chairman of the Board and Trustee | | Chairman since 2012; Trustee since 2007 | | Chairman, President and Chief Executive Officer, McHenry Bancorp Inc. and McHenry Savings Bank (subsidiary) (2018-Present); Chairman and Chief Executive Officer, Stone Pillar Advisors, Ltd. (advisory services to the financial sector) (2010-Present); formerly, President and Chief Executive | | 246 | | Director, Penfield Children’s Center (2004-present); Board Chairman, Gracebridge Alliance, Inc.(2015-present). |
| * | This is the date the Interested Trustee began serving the Trust. The Interested Trustee serves an indefinite term, until his successor is elected. |
| ** | Fund Complex includes all open- andclosed-end funds (including all of their portfolios) advised by the Adviser and any affiliated person of the Adviser. |
Trustees and Officers(Continued)
| | | | | | | | | | |
Name, Address and Year of
Birth of Independent Trustees | | Position(s)
Held
with Trust | | Term of
Office
and
Length of
Time
Served* | | Principal
Occupation(s) During
Past 5 Years | | Number of
Portfolios
in Fund
Complex**
Overseen by
Independent
Trustees | | Other
Directorships
Held by
Independent
Trustees During
the Past 5 Years |
| | | | | | Officer, Stone Pillar Investments, Ltd. (2016- 2018); Chairman, President and Chief Executive Officer, Community Financial Shares, Inc. and Community Bank—Wheaton/Glen Ellyn (subsidiary) (2013-2015); Chief Operating Officer, AMCORE Financial, Inc. (bank holding company) (2007-2009); Executive Vice President and Chief Financial Officer, AMCORE Financial, Inc. (2006-2007); Senior Vice President and Treasurer, Marshall & Ilsley Corp. (bank holding company)(1995-2006). | | | | |
| * | This is the date the Interested Trustee began serving the Trust. The Interested Trustee serves an indefinite term, until his successor is elected. |
| ** | Fund Complex includes all open- andclosed-end funds (including all of their portfolios) advised by the Adviser and any affiliated person of the Adviser. |
Trustees and Officers(Continued)
The Interested Trustee and the executive officers of the Trust, their term of office and length of time served, their principal business occupations during at least the past five years, the number of portfolios in the Fund Complex (as defined below) overseen by the Interested Trustee and the other directorships, if any, held by the Interested Trustee are shown below.
| | | | | | | | | | |
Name, Address and Year of
Birth of Interested Trustee | | Position(s)
Held
with Trust | | Term of
Office
and
Length of
Time
Served* | | Principal Occupation(s) During Past 5 Years | | Number of
Portfolios in
Fund
Complex**
Overseen by
Interested
Trustee | | Other
Directorships
Held by
Interested
Trustee
During the Past
5 Years |
Kevin M. Carome—1956
Invesco Ltd.
Two Peachtree Pointe,
1555 Peachtree St., N.E.,
Suite 1800
Atlanta, GA 30309 | | Trustee | | Since 2010 | | Senior Managing Director, Secretary and General Counsel, Invesco Ltd. (2007-Present); Director, Invesco Advisers, Inc. (2009-Present); Director (2006-Present) and Executive Vice President (2008-Present), Invesco North American Holdings, Inc.; Executive Vice President (2008-Present), Invesco Investments (Bermuda) Ltd.; Manager, Horizon Flight Works LLC; Director, Invesco Finance PLC (2011-Present); Director and Secretary (2012-Present), Invesco Services (Bahamas) Private Limited; and Executive Vice President (2014-Present), INVESCO Asset Management (Bermuda) Ltd.; formerly, Director, INVESCO Asset Management (Bermuda) Ltd. (2014-2019); Director and Executive Vice President, Invesco Finance, Inc. (2011-2018); Director (2006-2018) and Executive Vice President (2008-2018), Invesco Group Services, Inc., Invesco Holding Company (US), Inc.; Director, Invesco Holding Company Limited (2007-2019); Director and Chairman, INVESCO Funds Group, Inc., Senior Vice President, Secretary and General Counsel, Invesco Advisers, Inc. (2003-2006); Director, Invesco Investments (Bermuda) Ltd. (2008-2016); Senior Vice President and General Counsel, Liberty Financial Companies, Inc. (2000-2001); General Counsel of certain investment management subsidiaries of Liberty Financial Companies, Inc. (1998-2000); Associate General Counsel, Liberty Financial Companies, Inc. (1993-1998); Associate, Ropes & Gray LLP. | | 246 | | None |
| * | This is the date the Interested Trustee began serving the Trust. The Interested Trustee serves an indefinite term, until his successor is elected. |
| ** | Fund Complex includes all open- andclosed-end funds (including all of their portfolios) advised by the Adviser and any affiliated person of the Adviser. |
Trustees and Officers(Continued)
| | | | | | |
Name, Address and Year of Birth
of Executive Officers | | Position(s) Held
with Trust | | Length of
Time
Served* | | Principal Occupation(s) During Past 5 Years |
Daniel E. Draper—1968 Invesco Capital Management LLC 3500 Lacey Road, Suite 700 Downers Grove, IL 60515 | | President and Principal Executive Officer | | Since 2015 | | Chief Executive Officer, Manager and Principal Executive Officer, Invesco Specialized Products, LLC (2018-Present); President and Principal Executive Officer, Invesco Exchange-Traded Fund Trust, Invesco Exchange-Traded Fund Trust II, Invesco India Exchange-Traded Fund Trust, Invesco Actively Managed Exchange-Traded Fund Trust and Invesco Actively Managed Exchange-Traded Commodity Fund Trust (2015-Present) and Invesco Exchange-Traded Self-Indexed Fund Trust (2016-Present); Chief Executive Officer and Principal Executive Officer (2016-Present) and Managing Director (2013-Present), Invesco Capital Management LLC; Senior Vice President, Invesco Distributors, Inc. (2014-Present); formerly, Vice President, Invesco Exchange-Traded Fund Trust, Invesco Exchange-Traded Fund Trust II, Invesco India Exchange-Traded Fund Trust, Invesco Actively Managed Exchange-Traded Fund Trust (2013-2015) and Invesco Actively Managed Exchange-Traded Commodity Fund Trust (2014-2015); Managing Director, Credit Suisse Asset Management (2010-2013) and Lyxor Asset Management/Societe Generale (2007-2010). |
| | | |
Kelli Gallegos—1970 Invesco Capital Management LLC 3500 Lacey Road, Suite 700 Downers Grove, IL 60515 | | Vice President
and Treasurer | | Since 2018 | | Assistant Treasurer, Invesco Specialized Products, LLC (2018-Present); Vice President and Treasurer, Invesco Exchange-Traded Fund Trust, Invesco Exchange-Traded Fund Trust II, Invesco India Exchange-Traded Fund Trust, Invesco Actively Managed Exchange-Traded Fund Trust, Invesco Actively Managed Exchange-Traded Commodity Fund Trust and Invesco Exchange-Traded Self-Indexed Fund Trust (2018-Present); Principal Financial and Accounting Officer-Pooled Investments, Invesco Capital Management LLC (2018-Present); Vice President, Principal Financial Officer (2016-Present) and Assistant Treasurer (2008-Present), The Invesco Funds; formerly, Assistant Treasurer, Invesco Exchange-Traded Fund Trust, Invesco Exchange-Traded Fund Trust II, Invesco India Exchange-Traded Fund Trust and Invesco Actively Managed Exchange-Traded Fund Trust (2012-2018), Invesco Actively Managed Exchange-Traded Commodity Fund Trust (2014-2018) and Invesco Exchange-Traded Self-Indexed Fund Trust (2016-2018); Assistant Treasurer, Invesco Capital Management LLC (2013-2018); and Assistant Vice President, The Invesco Funds (2008-2016). |
| | | |
Peter Hubbard—1981 Invesco Capital Management LLC 3500 Lacey Road, Suite 700 Downers Grove, IL 60515 | | Vice President | | Since 2009 | | Vice President, Invesco Specialized Products, LLC (2018-Present); Vice President, Invesco Exchange-Traded Fund Trust, Invesco Exchange-Traded Fund Trust II, Invesco India Exchange-Traded Fund Trust, Invesco Actively Managed Exchange-Traded Fund Trust (2009-Present), Invesco Actively Managed Exchange-Traded Commodity Fund Trust (2014-Present) and Invesco Exchange-Traded Self-Indexed Fund Trust (2016-Present); Vice President and Director of Portfolio Management, Invesco Capital Management LLC (2010-Present); formerly, Vice President of Portfolio Management, Invesco Capital Management LLC (2008-2010); Portfolio Manager, Invesco Capital Management LLC (2007-2008); Research Analyst, Invesco Capital Management LLC (2005-2007); Research Analyst and Trader, Ritchie Capital, a hedge fund operator (2003-2005). |
| | | |
Sheri Morris—1964 Invesco Capital Management LLC 3500 Lacey Road, Suite 700 Downers Grove, IL 60515 | | Vice President | | Since 2012 | | President and Principal Executive Officer, The Invesco Funds (2016-Present); Treasurer, The Invesco Funds (2008-Present); Vice President, Invesco Advisers, Inc. (formerly known as Invesco Institutional (N.A.), Inc.) (registered investment adviser) (2009-Present) and Vice President, Invesco Exchange-Traded Fund Trust, Invesco Exchange-Traded Fund Trust II, Invesco India Exchange-Traded Fund Trust, Invesco Actively Managed Exchange-Traded Fund Trust (2012-Present), Invesco Actively Managed Exchange-Traded |
| * | This is the date each Officer began serving the Trust. Each Officer serves an indefinite term, until his or her successor is elected. |
Trustees and Officers(Continued)
| | | | | | |
Name, Address and Year of Birth
of Executive Officers | | Position(s) Held
with Trust | | Length of
Time
Served* | | Principal Occupation(s) During Past 5 Years |
| | | | | | Commodity Fund Trust (2014-Present) and Invesco Exchange-Traded Self- Indexed Fund Trust (2016-Present); formerly, Vice President and Principal Financial Officer, The Invesco Funds (2008-2016); Treasurer, Invesco Exchange-Traded Fund Trust, Invesco Exchange-Traded Fund Trust II, Invesco India Exchange-Traded Fund Trust and Invesco Actively Managed Exchange-Traded Fund Trust (2011-2013); Vice President, Invesco Aim Advisers, Inc., Invesco Aim Capital Management, Inc. and Invesco Aim Private Asset Management, Inc.; Assistant Vice President and Assistant Treasurer, The Invesco Funds and Assistant Vice President, Invesco Advisers, Inc., Invesco Aim Capital Management, Inc. and Invesco Aim Private Asset Management, Inc. |
| | | |
Anna Paglia—1974 Invesco Capital Management LLC 3500 Lacey Road, Suite 700 Downers Grove, IL 60515 | | Secretary | | Since 2011 | | Secretary, Invesco Specialized Products, LLC (2018-Present); Secretary, Invesco Exchange-Traded Fund Trust, Invesco Exchange-Traded Fund Trust II, Invesco India Exchange-Traded Fund Trust, Invesco Actively Managed Exchange-Traded Fund Trust (2011-Present), Invesco Actively Managed Exchange-Traded Commodity Fund Trust (2014-Present) and Invesco Exchange-Traded Self-Indexed Fund Trust (2015-Present); Head of Legal (2010-Present) and Secretary (2015-Present), Invesco Capital Management LLC; Manager and Assistant Secretary, Invesco Indexing LLC (2017-Present); formerly, Partner, K&L Gates LLP (formerly, Bell Boyd & Lloyd LLP) (2007-2010); Associate Counsel at Barclays Global Investors Ltd. (2004-2006). |
| | | |
Rudolf E. Reitmann—1971 Invesco Capital Management LLC 3500 Lacey Road, Suite 700 Downers Grove, IL 60515 | | Vice President | | Since 2013 | | Head of Global Exchange Traded Funds Services, Invesco Specialized Products, LLC (2018-Present); Vice President, Invesco Exchange-Traded Fund Trust, Invesco Exchange-Traded Fund Trust II, Invesco India Exchange-Traded Fund Trust, Invesco Actively Managed Exchange-Traded Fund Trust (2013-Present), Invesco Actively Managed Exchange-Traded Commodity Fund Trust (2014-Present) and Invesco Exchange-Traded Self-Indexed Fund Trust (2016-Present); Head of Global Exchange Traded Funds Services, Invesco Capital Management LLC (2013-Present); Vice President, Invesco Capital Markets, Inc. (2018-Present). |
| | | |
David Warren—1957 Invesco Canada Ltd. 5140 Yonge Street, Suite 800 Toronto, Ontario M2N 6X7 | | Vice President | | Since 2009 | | Manager, Invesco Specialized Products, LLC (2018-Present); Vice President, Invesco Exchange-Traded Fund Trust, Invesco Exchange-Traded Fund Trust II, Invesco India Exchange-Traded Fund Trust, and Invesco Actively Managed Exchange-Traded Fund Trust (2009-Present), Invesco Actively Managed Exchange-Traded Commodity Fund Trust (2014-Present) and Invesco Exchange-Traded Self-Indexed Fund Trust (2016-Present); Senior Vice President, Invesco Advisers, Inc. (2009-Present); Director, Invesco Inc. (2009-Present); Director, Executive Vice President and Chief Financial Officer, Invesco Canada Ltd. (formerly, Invesco Trimark Ltd.) (2011-Present); Chief Administrative Officer, North American Retail, Invesco Ltd. (2007-Present); Director, Invesco Corporate Class Inc. (2014-Present); Director, Invesco Global Direct Real Estate Feeder GP Ltd. (2015-Present); Director, Invesco Canada Holdings Inc. (2002-Present); Director, Invesco Financial Services Ltd. / Services Financiers Invesco Ltée and Trimark Investments Ltd./Placements Trimark Ltée (2014-Present); Director, Invesco IP Holdings (Canada) Ltd. (2016-Present); Director, Invesco Global Direct Real Estate GP Ltd. (2015-Present); formerly, Managing Director—Chief Administrative Officer, Americas, Invesco Capital Management LLC (2013-2019); Senior Vice President, Invesco Management Group, Inc. (2007-2018); Executive Vice President and Chief Financial Officer, Invesco Inc. (2009-2015); Director, Executive Vice President and Chief Financial Officer, Invesco Canada Ltd. (formerly, Invesco Trimark Ltd.) (2000-2011). |
| * | This is the date each Officer began serving the Trust. Each Officer serves an indefinite term, until his or her successor is elected. |
Trustees and Officers(Continued)
| | | | | | |
Name, Address and Year of Birth
of Executive Officers | | Position(s) Held
with Trust | | Length of
Time
Served* | | Principal Occupation(s) During Past 5 Years |
Melanie Zimdars—1976 Invesco Capital Management LLC 3500 Lacey Road, Suite 700 Downers Grove, IL 60515 | | Chief Compliance
Officer | | Since 2017 | | Chief Compliance Officer, Invesco Specialized Products, LLC (2018-Present); Chief Compliance Officer, Invesco Capital Management LLC (2017-Present); Chief Compliance Officer, Invesco Exchange-Traded Fund Trust, Invesco Exchange-Traded Fund Trust II, Invesco India Exchange-Traded Fund Trust, Invesco Actively Managed Exchange-Traded Fund Trust, Invesco Actively Managed Exchange-Traded Commodity Fund Trust and Invesco Exchange-Traded Self-Indexed Fund Trust (2017-Present); formerly, Vice President and Deputy Chief Compliance Officer at ALPS Holding, Inc. (2009-2017); Mutual Fund Treasurer/Chief Financial Officer at Wasatch Advisors, Inc. (2005-2008); Compliance Officer, U.S. Bancorp Fund Services, LLC (2001-2005). |
Availability of Additional Information About the Trustees
The Statement of Additional Information includes additional information about the Trustees and is available, without charge, upon request at (800)983-0903.
| * | This is the date each Officer began serving the Trust. Each Officer serves an indefinite term, until his or her successor is elected. |
Board Considerations Regarding Approval of Investment Advisory Agreement
Board Considerations Regarding Approval of Investment Advisory Agreement for
Invesco Emerging Markets Revenue ETF
Invesco Emerging Markets Ultra Dividend Revenue ETF
Invesco Global ESG Revenue ETF
Invesco Global Revenue ETF
Invesco International Revenue ETF
Invesco International Ultra Dividend Revenue ETF
Invesco Russell 1000® Low Volatility Factor ETF
Invesco Russell 1000® Momentum Factor ETF
Invesco Russell 1000® Quality Factor ETF
Invesco Russell 1000® Size Factor ETF
Invesco Russell 1000® Value Factor ETF
Invesco Russell 1000® Yield Factor ETF
Invesco S&P 500 Revenue ETF
Invesco S&P Financials Revenue ETF
Invesco S&P MidCap 400 Revenue ETF
Invesco S&P SmallCap 600 Revenue ETF
Invesco S&P Ultra Dividend Revenue ETF
At a meeting held on December 12, 2018, the Board of Trustees of the Invesco Exchange-Traded Fund Trust II (the “Trust”), including the Independent Trustees, approved the Investment Advisory Agreement (the “Agreement”) between Invesco Capital Management LLC (the “Adviser”) and the Trust for the funds listed above (each, a “Fund” and collectively, the “Funds”).
The Trustees reviewed information provided by the Adviser describing: (i) the nature, extent and quality of services to be provided, (ii) the proposed unitary advisory fee for each Fund and comparisons to amounts paid by other comparable registered investment companies, (iii) the extent to which economies of scale may be realized as each Fund grows, (iv) whether the fee levels reflect any possible economies of scale for the benefit of Fund shareholders, and (v) any benefits to be realized by the Adviser from its relationship with each Fund.
The Trustees noted that each Fund was created in connection with the purchase by Invesco Ltd. of OppenheimerFunds, Inc. and its subsidiaries, from Massachusetts Mutual Life Insurance Company (the “Transaction”) and that each Fund was structured substantially similar to a corresponding Oppenheimer ETF, including the unitary advisory fee, that would be reorganized into the Fund in connection with the Transaction.
Nature, Extent and Quality of Services. In evaluating the nature, extent and quality of the Adviser’s services, the Trustees reviewed information concerning the functions to be performed by the Adviser for each Fund, information describing the Adviser’s current organization and staffing, including operational support that would be provided by the Adviser’s parent organization, Invesco Ltd., and the background and experience of the persons who will be responsible for theday-to-day management of the Funds, and they considered the quality of services provided by the Adviser to other exchange-traded funds (“ETFs”). The Trustees also reviewed information related to the Adviser’s portfolio transaction policies and procedures, as well as reports on the correlation and tracking error between the underlying indexes and the performance of other ETFs for which the Adviser serves as investment adviser.
The Trustees also considered the services to be provided by the Adviser in its oversight of the Funds’ administrator, custodian and transfer agent. They noted the significant amount of time, effort and resources that had been devoted to this oversight function for the other ETFs and that was expected to be provided for each Fund.
The Trustees also considered information provided by the Adviser regarding the resources added in recent years to maintain and enhance the services provided to the Funds and all other Invesco ETFs.
Based on their review, the Trustees concluded that the nature, extent and quality of the services to be provided by the Adviser to each Fund under the Agreement were expected to be appropriate and reasonable.
Fees, Expenses and Profitability. The Trustees reviewed and discussed the information provided by the Adviser on each Fund’s proposed unitary advisory fee, as compared to information compiled by the Adviser from Lipper Inc. (“Lipper”) databases on the median net expense ratios of comparable passive ETFs,open-end(non-ETF) index funds andopen-end(non-ETF) actively managed funds. The Trustees noted that the fee data provided by the Adviser included only oneopen-end index fund peer for Invesco S&P Financials Revenue ETF. The Trustees also considered fee and expense data on Adviser-identified selected peers for each Fund other than Invesco Russell 1000® Momentum Factor ETF. The Trustees noted that the fee data provided by the Adviser included one Adviser-identified selected peer for Invesco Russell 1000® Low Volatility Factor ETF, Invesco Russell 1000® Quality Factor ETF, Invesco Russell 1000® Size Factor ETF and Invesco Russell 1000® Value Factor ETF and two Adviser-identified selected peers for Invesco S&P 500 Revenue ETF and Invesco S&P SmallCap 600 Revenue ETF.
Board Considerations Regarding Approval of Investment Advisory Agreement(continued)
The Trustees noted that the proposed annual advisory fee to be charged to each Fund was a unitary fee, and that the Adviser has agreed to pay all other expenses of each Fund except for the fee payment under the Agreement, payments under the Fund’s12b-1 plan, if any, brokerage expenses, taxes, interest, acquired fund fees and expenses, if any, litigation expenses and other extraordinary expenses. The Trustees noted each Fund’s proposed unitary advisory fee as compared to the median net expense ratio of its peer groups and select peer group, as applicable, as shown below:
| | | | | | | | |
Fund | | ETF Peer Group
(Number of Peers)1 | | Open-End
Index Fund
Peer Group
(Number of Peers)2 | | Open-End Active
Fund Peer Group
(Number of Peers) | | Select Peer Group
(Number of Peers)3 |
| Invesco Emerging Markets Revenue ETF | | Lower than
median (57) | | Higher than
median (10) | | Lower than
median (209) | | Lower than
median (3) |
| Invesco Emerging Markets Ultra Dividend Revenue ETF | | Lower than
median (44) | | Higher than
median (3) | | Lower than
median (20) | | Lower than
median (4) |
| Invesco Global ESG Revenue ETF | | N/A | | N/A | | Lower than
median (38) | | Lower than
median (3) |
| Invesco Global Revenue ETF | | N/A | | N/A | | Lower than
median (38) | | Lower than
median (3) |
| Invesco International Revenue ETF | | Lower than
median (8) | | Lower than
median (5) | | Lower than
median (41) | | Lower than
median (3) |
| Invesco International Ultra Dividend Revenue ETF | | Lower than
median (44) | | Higher than
median (3) | | Lower than
median (20) | | Lower than
median (4) |
| Invesco Russell 1000® Low Volatility Factor ETF | | Lower than
median (36) | | Lower than
median (24) | | Lower than
median (182) | | Lower than
median (1) |
| Invesco Russell 1000® Momentum Factor ETF | | Lower than
median (36) | | Lower than
median (24) | | Lower than
median (182) | | N/A |
| Invesco Russell 1000® Quality Factor ETF | | Higher than
median (14) | | Lower than
median (15) | | Lower than
median (155) | | Lower than
median (1) |
| Invesco Russell 1000® Size Factor ETF | | Lower than
median (36) | | Lower than
median (24) | | Lower than
median (182) | | Lower than
median (1) |
| Invesco Russell 1000® Value Factor ETF | | Higher than
median (12) | | Lower than
median (10) | | Lower than
median (105) | | Lower than
median (1) |
| Invesco Russell 1000® Yield Factor ETF | | Lower than
median (36) | | Lower than
median (24) | | Lower than
median (182) | | Lower than
median (3) |
| Invesco S&P 500 Revenue ETF | | Higher than
median (12) | | Lower than
median (10) | | Lower than
median (105) | | Higher than
median (2) |
| Invesco S&P Financials Revenue ETF | | Higher than
median (19) | | Higher than
median (1) | | Lower than
median (22) | | Lower than
median (3) |
| Invesco S&P MidCap 400 Revenue ETF | | Higher than
median (32) | | Higher than
median (31) | | Lower than
median (257) | | Higher than
median (4) |
| Invesco S&P SmallCap 600 Revenue ETF | | Higher than
median (14) | | Lower than
median (10) | | Lower than
median (81) | | Lower than
median (2) |
| Invesco S&P Ultra Dividend Revenue ETF | | Higher than
median (29) | | Lower than
median (4) | | Lower than
median (131) | | Lower than
median (4) |
| 1 | The information provided by the Adviser indicated that certain Funds did not have any comparable ETF peers. Those Funds have been designated with an “N/A” for not available. |
| 2 | The information provided by the Adviser indicated that certain Funds did not have any comparableopen-end index fund peers. Those Funds have been designated with an “N/A” for not available. |
| 3 | The information provided by the Adviser did not include a select peer group for Invesco Russell 1000® Momentum Factor ETF. The Fund has been designated with an “N/A” for not available. |
Board Considerations Regarding Approval of Investment Advisory Agreement(continued)
The Trustees considered each Fund’s proposed unitary advisory fee in light of the administrative, operational and management oversight services to be provided by the Adviser. The Board concluded that the unitary advisory fee to be charged to each Fund is reasonable and appropriate in light of the services expected to be provided by the Adviser.
In conjunction with their review of the unitary advisory fee, the Trustees considered that the Adviser did not provide a profitability analysis for the Adviser in managing the Funds because the Funds had not yet commenced operations. However, the Trustees noted other information the Board received at its April 2018 meeting on the Adviser’s overall profitability from its relationship with other ETFs for which it serves as investment adviser.
Economies of Scale and Whether Fee Levels Reflect These Economies of Scale. The Trustees reviewed the information provided by the Adviser as to the extent to which economies of scale may be realized as each Fund grows and whether fee levels reflect economies of scale for the benefit of shareholders. The Trustees noted that any reduction in fixed costs associated with the management of each Fund would be enjoyed by the Adviser, but that a unitary advisory fee provides a level of certainty in expenses for each Fund. The Trustees considered whether the proposed unitary advisory fee rate for each Fund is reasonable in relation to the proposed services and product strategy of each Fund, and they concluded that the unitary advisory fee was reasonable and appropriate.
Fall-Out Benefits. The Trustees noted that the Adviser had not identified any further benefits that it would derive from its relationships with each Fund, and had noted that it does not have any soft-dollar arrangements.
Based on all of the information considered and the conclusions reached, the Board, including the Independent Trustees, determined to approve the Agreement for each Fund. No single factor was determinative in the Board’s analysis.
Proxy Voting Policies and Procedures
A description of the Trust’s proxy voting policies and procedures that the Funds use to determine how to vote proxies relating to portfolio securities is available, without charge and upon request, by calling (800)983-0903. This information is also available on the Securities and Exchange Commission’s (the “Commission”) website atwww.sec.gov.
Information regarding how each Fund voted proxies for portfolio securities, if applicable, during the most recent12-month period ended June 30, is available, without charge and upon request, by (i) calling (800)983-0903; or (ii) accessing the Trust’s FormN-PX on the Commission’s website atwww.sec.gov.
Quarterly Portfolios
The Trust files its complete schedule of portfolio holdings for the Funds with the Commission for the first and third quarters of each fiscal year on FormN-Q (or any successor Form). The Trust’s FormsN-Q (or any successor Form) are available on the Commission’s website atwww.sec.gov.
Frequency Distribution of Discounts and Premiums
A table showing the number of days the market price of each Fund’s shares was greater than the Fund’s net asset value, and the number of days it was less than the Fund’s net asset value (i.e., premium or discount) for the most recently completed calendar year, and the calendar quarters since that year end (or the life of the Fund, if shorter) may be found at the Fund’s website atwww.invesco.com/ETFs.
| | | | |
©2019 Invesco Capital Management LLC 3500 Lacey Road, Suite 700 Downers Grove, IL 60515 | | O-FAC-AR-1 | | invesco.com/ETFs |

Invesco Annual Report to Shareholders
June 30, 2019
| | |
| |
| RWL | | Invesco S&P 500 Revenue ETF |
| |
| RWK | | Invesco S&P MidCap 400 Revenue ETF |
| |
| RWJ | | Invesco S&P SmallCap 600 Revenue ETF |
| |
| RWW | | Invesco S&P Financials Revenue ETF |
| |
| RDIV | | Invesco S&P Ultra Dividend Revenue ETF |
| |
| REDV | | Invesco Emerging Markets Ultra Dividend Revenue ETF |
| |
| RIDV | | Invesco International Ultra Dividend Revenue ETF |
| |
| REEM | | Invesco Emerging Markets Revenue ETF |
| |
| REFA | | Invesco International Revenue ETF |
| |
| RGLB | | Invesco Global Revenue ETF |
| |
| ESGF | | Invesco Global ESG Revenue ETF |
Beginning on January 1, 2021, as permitted by regulations adopted by the Securities and Exchange Commission, paper copies of the Funds’ shareholder reports will no longer be sent by mail, unless you specifically request paper copies of the reports from your financial intermediary, such as a broker-dealer or bank. Instead, the reports will be made available on a website, and you will be notified by mail each time a report is posted and provided with a website link to access the report.
If you already elected to receive shareholder reports electronically, you will not be affected by this change and you need not take any action. If you hold accounts through a financial intermediary, you may contact your financial intermediary to enroll in electronic delivery. Please note that not all financial intermediaries may offer this service.
You may elect to receive all future reports in paper free of charge. If you hold accounts through a financial intermediary, you can follow the instructions included with this disclosure, if applicable, or contact your financial intermediary to request that you continue to receive paper copies of your shareholder reports. Please note that not all financial intermediaries may offer this service. Your election to receive reports in paper will apply to all funds held with your financial intermediary.
Table of Contents
The Market Environment
Global Equity
After a relatively calm start to 2019, global equity markets faced greater volatility in the second quarter, hampered by lingering US/China trade issues, potential for new tariffs and slowing global growth. Global equity markets, particularly China, declined sharply in May, ending a four-month rally. Trade and tariff issues, which were not limited to the US and China, clouded the outlook for many global economies. In response, the European Central Bank maintained its accommodative stance, strongly implying the possibility of future interest rate cuts or further bond purchases. Similarly, the US Federal Reserve held rates steady and opened the door to rate cuts if conditions deteriorate. Disagreement within the UK about its withdrawal from the European Union increased uncertainty for the UK and Eurozone economies. Following better performance in June, most global equity markets managed modest positive returns for the second quarter, with developed markets generally outperforming emerging markets. China was an exception, declining approximately 4%. In this environment, the MSCI AC World Index returned 3.61% for the quarter.
Important Update
On October 18, 2018, Massachusetts Mutual Life Insurance Company, an indirect corporate parent of OppenheimerFunds, Inc. and its subsidiaries OFI Global Asset Management, Inc., OFI SteelPath, Inc. and OFI Advisors, LLC, announced that it had entered into an agreement whereby Invesco Ltd., a global investment management company would acquire OppenheimerFunds and its subsidiaries (together “OppenheimerFunds”). After the close of business on May 24, 2019 Invesco Ltd. completed the acquisition of OppenheimerFunds. These Funds were included in that acquisition and as of that date, became part of the Invesco family of funds.
| | |
| RWL | | Manager’s Analysis |
| | Invesco S&P 500 Revenue ETF (RWL) |
As an index fund, the Invesco S&P 500 Revenue ETF (the “Fund”) seeks to track the investment results (before fees and expenses) of the S&P 500 Revenue-Weighted Index (the “Index”). The Fund generally will invest at least 90% of its total assets in the securities that comprise the Index.
Strictly in accordance with its guidelines and mandated procedures, S&P Dow Jones Indices (“S&P DJI” or the “Index Provider”) compiles, maintains, and calculates the Index, which is constructed using a rules-based methodology thatre-weights the constituent securities of the S&P 500® Index (“the “Parent Index” or “Benchmark Index”) according to the revenue earned by the companies in the Parent Index, subject to a maximum 5% per company weighting. The Index thus contains the same securities as the Parent Index, but in different proportions. The Fund generally invests in all of the securities comprising the Index in proportion to their weightings in the Index.
For the fiscal year ended June 30, 2019, on a market price basis, the Fund returned 7.41%. On a net asset value (“NAV”) basis, the Fund returned 7.51%. During the same time period, the Index returned 7.92%. During the fiscal year, the Fund fully replicated the components of the Index; therefore, the Fund’s performance, on a NAV basis, differed from the return of the Index primarily due to fees and operating expenses that the Fund incurred during the period.
During this same time period, the Benchmark Index returned 10.42%. The Benchmark Index is an unmanaged index weighted by market capitalization based on the average performance of approximately 500 equity securities. The Benchmark Index was selected for its recognition in the market place, and because its performance comparison is a useful measure for investors as a broad representation of U.S.large-cap stocks.
The performance of the Fund differed from the Benchmark Index in part because the Fund seeks to track an Index that employs a revenue weighted methodology, whereas the Benchmark Index weights stocks based primarily on market capitalization.
Relative to the Benchmark Index, the Fund was most overweight in the consumer staples sector and most underweight in the information technology sector during the fiscal year ended June 30, 2019. The majority of the Fund’s underperformance relative to the Benchmark Index during that period can be attributed to the Fund being underweight to and security selection in the information technology sector.
For the fiscal year ended June 30, 2019, the consumer staples sector contributed most significantly to the Fund’s return, followed by the information technology and financials sectors, respectively. The energy sector detracted most significantly from the Fund’s return, followed by the materials and real estate sectors, respectively.
Positions that contributed most significantly to the Fund’s return for the fiscal year ended June 30, 2019, included Walmart Inc., a consumer staples company (portfolio average weight of 4.51%) and Costco Wholesale Corporation, a consumer staples company (portfolio average weight of 1.24%).
Positions that detracted most significantly from the Fund’s return during this period included Kroger Co., a consumer staples company (portfolio average weight of 1.09%) and CVS Health Corporation, a health care company (portfolio average weight of 1.58%).
| | | | |
Sector Breakdown
(% of the Fund’s Net Assets)
as of June 30, 2019 | |
| Health Care Equipment & Services | | | 12.8 | |
| Energy | | | 9.2 | |
| Capital Goods | | | 8.0 | |
| Food & Staples Retailing | | | 7.9 | |
| Retailing | | | 7.2 | |
| Diversified Financials | | | 5.0 | |
| Banks | | | 4.8 | |
| Media & Entertainment | | | 4.4 | |
| Technology Hardware & Equipment | | | 4.2 | |
| Software & Services | | | 4.1 | |
| Insurance | | | 3.9 | |
| Pharmaceuticals, Biotechnology & Life Sciences | | | 3.6 | |
| Food, Beverage & Tobacco | | | 3.3 | |
| Materials | | | 3.2 | |
| Transportation | | | 3.1 | |
| Automobiles & Components | | | 2.8 | |
| Telecommunication Services | | | 2.7 | |
| Utilities | | | 2.5 | |
| Semiconductors & Semiconductor Equipment | | | 2.0 | |
| Consumer Durables & Apparel | | | 1.6 | |
| Consumer Services | | | 1.2 | |
| Household & Personal Products | | | 1.1 | |
| Real Estate | | | 0.9 | |
| Commercial & Professional Services | | | 0.5 | |
| Money Market Fund | | | 0.3 | |
| Liabilities in Excess of Other Assets | | | (0.3 | ) |
| Net Assets | | | 100.0 | |
Invesco S&P 500 Revenue ETF (RWL)(continued)
| | | | |
Top Ten Fund Holdings*
(% of the Fund’s Net Assets)
as of June 30, 2019 | |
| Security | | | | |
| Walmart, Inc. | | | 4.21 | |
| Exxon Mobil Corp. | | | 2.29 | |
| Apple, Inc. | | | 2.14 | |
| Berkshire Hathaway, Inc., Class B | | | 2.09 | |
| Amazon.com, Inc. | | | 1.97 | |
| UnitedHealth Group, Inc. | | | 1.85 | |
| McKesson Corp. | | | 1.74 | |
| CVS Health Corp. | | | 1.70 | |
| AT&T, Inc. | | | 1.48 | |
| AmerisourceBergen Corp. | | | 1.41 | |
| * | Excluding money market fund holdings. |
Growth of a $10,000 Investment
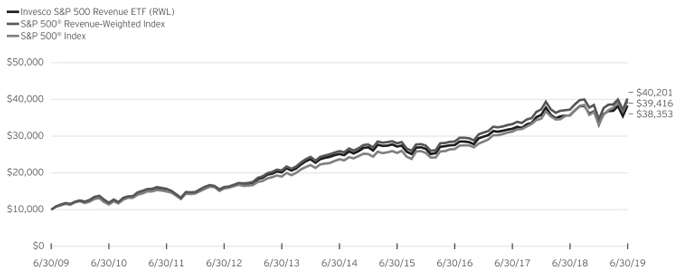
Fund Performance History as of June 30, 2019
| | | | | | | | | | | | | | | | | | | | | | | | | | | | | | | | | | | | | | | | |
| | | | | | 3 Years Average
Annualized | | | 3 Years Cumulative | | | 5 Years Average
Annualized | | | 5 Years Cumulative | | | 10 Years Average
Annualized | | | 10 Years Cumulative | | | | | | Fund Inception | |
| Index | | 1 Year | | | | | | Average
Annualized | | | Cumulative | |
| S&P 500® Revenue-Weighted Index | | | 7.92 | % | | | 12.07 | % | | | 40.76 | % | | | 9.19 | % | | | 55.21 | % | | | 14.93 | % | | | 302.01 | % | | | | | | | 9.25 | % | | | 173.33 | % |
| S&P 500® Index | | | 10.42 | | | | 14.19 | | | | 48.89 | | | | 10.71 | | | | 66.33 | | | | 14.70 | | | | 294.16 | | | | | | | | 9.42 | | | | 178.15 | |
| Fund | | | | | | | | | | | | | | | | | | | | | | | | | | | | | | | | | | | | | | | | |
| NAV Return | | | 7.51 | | | | 11.60 | | | | 38.98 | | | | 8.78 | | | | 52.32 | | | | 14.39 | | | | 283.53 | | | | | | | | 8.74 | | | | 158.96 | |
| Market Price Return | | | 7.41 | | | | 11.56 | | | | 38.83 | | | | 8.76 | | | | 52.15 | | | | 14.37 | | | | 282.90 | | | | | | | | 8.73 | | | | 158.86 | |
Invesco S&P 500 Revenue ETF (RWL)(continued)
Oppenheimer S&P 500 Revenue ETF (the “Predecessor Fund”) Predecessor Fund Inception: February 19, 2008
Performance quoted above represents past performance. Past performance is not a guarantee of future results and current performance may be higher or lower than performance quoted. Investment returns and principal value will fluctuate, and shares of the Fund (“Fund Shares”), when redeemed or sold, may be worth more or less than their original cost. Fund performance reflects any applicable fee waivers and/or expense reimbursements. Had the adviser not waived fees and/or reimbursed expenses currently or in the past, returns would have been lower. See current prospectus for more information. According to the Fund’s current prospectus, the Fund’s expense ratio of 0.39% is expressed as a unitary management fee to cover operating expenses and expenses incurred in connection with managing the portfolio. NAV and Market Price returns assume that dividends and capital gain distributions have been reinvested in the Fund at NAV and Market Price, respectively. The returns shown in the table above do not reflect the deduction of taxes that a shareholder would pay on Fund distributions or the redemption or sale of Fund Shares. See invesco.com/ETFs to find the most recentmonth-end performance numbers.
Index and Benchmark Index performance results are based upon a hypothetical investment in their respective constituent securities. Index and Benchmark Index returns do not represent Fund returns. An investor cannot invest directly in an index. The Index and Benchmark Index do not charge management fees or brokerage expenses, and no such fees or expenses were deducted from the hypothetical performance shown. In addition, the results actual investors might have achieved would have differed from those shown because of differences in the timing, amounts of their investments, and fees and expenses associated with an investment in the Fund.
Notes Regarding Indexes and Fund Performance History:
| - | Average Annualized and Cumulative Inception returns for the Fund, Index and Benchmark Index are based on the inception date of the Predecessor Fund. |
| - | Effective after the close of business on May 24, 2019, the Predecessor Fund was reorganized into the Fund. Fund returns shown are blended returns of the Predecessor Fund and the Fund. |
| | |
| RWK | | Manager’s Analysis |
| | Invesco S&P MidCap 400Revenue ETF (RWK) |
As an index fund, the Invesco S&P 400 MidCap 400 Revenue ETF (the “Fund”) seeks to track the investment results (before fees and expenses) of the S&P MidCap 400® Revenue-Weighted Index (the “Index”). The Fund generally will invest at least 90% of its total assets in the securities that comprise the Index.
Strictly in accordance with its guidelines and mandated procedures, S&P Dow Jones Indices (“S&P DJI” or the “Index Provider”) compiles, maintains, and calculates the Index, which is constructed using a rules-based methodology thatre-weights the constituent securities of the S&P MidCap 400® Index (the “Parent Index” or “Benchmark Index”), an index comprised of common stocks of 400mid-cap companies that generally represents themid-cap universe of the U.S. equity market, according to the revenue earned by the companies in the Parent Index, subject to a maximum 5% per company weighting. The Index thus contains the same securities as the Parent Index, but in different proportions. The Fund generally invests in all of the securities comprising the Index in proportion to their weightings in the Index.
For the fiscal year ended June 30, 2019, on a market price basis, the Fund returned 0.90%. On a net asset value (“NAV”) basis, the Fund returned 1.05%. During the same time period, the Index returned 1.37%. During the fiscal year, the Fund fully replicated the components of the Index; therefore, the Fund’s performance, on a NAV basis, differed from the return of the Index primarily due to fees and operating expenses that the Fund incurred during the period.
During this same time period, the Benchmark Index returned 1.36%. The Benchmark Index is an unmanaged index weighted by market capitalization based on the average performance of approximately 400 equity securities. The Benchmark Index was selected for its recognition in the market place, and because its performance comparison is a useful measure for investors as a broad representation of U.S.mid-cap stocks.
The performance of the Fund differed from the Benchmark Index in part because the Fund seeks to track an Index that employs a revenue weighted methodology, whereas the Benchmark Index weights stocks based primarily on market capitalization.
Relative to the Benchmark Index, the Fund was most overweight in the consumer discretionary sector and most underweight in the real estate sector during the fiscal year ended June 30, 2019.
The majority of the Fund’s underperformance relative to the Benchmark Index during that period can be attributed to the Fund being underweight to and security selection in the consumer discretionary sector.
For the fiscal year ended June 30, 2019, the information technology sector contributed most significantly to the Fund’s
return, followed by the industrials and financials sectors, respectively. The consumer discretionary sector detracted most significantly from the Fund’s return, followed by the materials and energy sectors, respectively.
Positions that contributed most significantly to the Fund’s return for the fiscal year ended June 30, 2019, included World Fuel Services Corporation., an energy company (portfolio average weight of 2.91%) and Tech Data Corporation, an information technology company (portfolio average weight of 2.81%). Positions that detracted most significantly from the Fund’s return during this period included United States Steel Corporation, a materials company (portfolio average weight of 0.89%) and Chesapeake Energy Corporation, an energy company (portfolio average weight of 0.70%).
| | | | |
Sector Breakdown
(% of the Fund’s Net Assets)
as of June 30, 2019 | |
| Capital Goods | | | 12.0 | |
| Technology Hardware & Equipment | | | 11.5 | |
| Energy | | | 9.1 | |
| Materials | | | 8.8 | |
| Retailing | | | 6.5 | |
| Insurance | | | 5.8 | |
| Health Care Equipment & Services | | | 5.2 | |
| Transportation | | | 4.3 | |
| Consumer Services | | | 4.2 | |
| Automobiles & Components | | | 4.1 | |
| Money Market Fund | | | 3.8 | |
| Consumer Durables & Apparel | | | 3.5 | |
| Software & Services | | | 3.5 | |
| Commercial & Professional Services | | | 3.3 | |
| Real Estate | | | 3.1 | |
| Banks | | | 2.8 | |
| Utilities | | | 2.4 | |
| Media & Entertainment | | | 2.0 | |
| Food, Beverage & Tobacco | | | 1.9 | |
| Diversified Financials | | | 1.8 | |
| Pharmaceuticals, Biotechnology & Life Sciences | | | 1.5 | |
| Semiconductors & Semiconductor Equipment | | | 1.1 | |
| Food & Staples Retailing | | | 0.9 | |
| Household & Personal Products | | | 0.4 | |
| Telecommunication Services | | | 0.3 | |
| Liabilities in Excess of Other Assets | | | (3.8 | ) |
| Net Assets | | | 100.0 | |
Invesco S&P MidCap 400Revenue ETF (RWK)(continued)
| | | | |
Top Ten Fund Holdings*
(% of the Fund’s Net Assets)
as of June 30, 2019 | |
| Security | | | | |
| World Fuel Services Corp. | | | 2.70 | |
| Tech Data Corp. | | | 2.56 | |
| PBF Energy, Inc., Class A | | | 2.25 | |
| Arrow Electronics, Inc. | | | 2.05 | |
| Jabil, Inc. | | | 1.83 | |
| AECOM | | | 1.50 | |
| ManpowerGroup, Inc. | | | 1.48 | |
| SYNNEX Corp. | | | 1.42 | |
| AutoNation, Inc. | | | 1.39 | |
| Fluor Corp. | | | 1.37 | |
| * | Excluding money market fund holdings. |
Growth of a $10,000 Investment
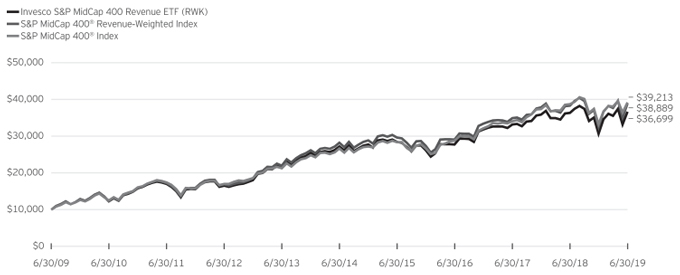
Fund Performance History as of June 30, 2019
| | | | | | | | | | | | | | | | | | | | | | | | | | | | | | | | | | | | | | | | |
| | | | | | 3 Years Average
Annualized | | | 3 Years Cumulative | | | 5 Years Average
Annualized | | | 5 Years Cumulative | | | 10 Years Average
Annualized | | | 10 Years Cumulative | | | | | | Fund Inception | |
| Index | | 1 Year | | | Average
Annualized | | | Cumulative | |
| S&P MidCap 400® Revenue-Weighted Index | | | 1.37 | % | | | 10.16 | % | | | 33.67 | % | | | 6.64 | % | | | 37.93 | % | | | 14.55 | % | | | 288.89 | % | | | | | | | 10.01 | % | | | 195.52 | % |
| S&P MidCap 400® Index | | | 1.36 | | | | 10.90 | | | | 36.41 | | | | 8.02 | | | | 47.07 | | | | 14.64 | | | | 292.13 | | | | | | | | 9.75 | | | | 187.82 | |
| Fund | | | | | | | | | | | | | | | | | | | | | | | | | | | | | | | | | | | | | | | | |
| NAV Return | | | 1.05 | | | | 9.74 | | | | 32.15 | | | | 6.18 | | | | 34.97 | | | | 13.88 | | | | 266.99 | | | | | | | | 9.35 | | | | 175.97 | |
| Market Price Return | | | 0.90 | | | | 9.65 | | | | 31.85 | | | | 6.12 | | | | 34.61 | | | | 13.85 | | | | 265.81 | | | | | | | | 9.33 | | | | 175.51 | |
Invesco S&P MidCap 400Revenue ETF (RWK)(continued)
Oppenheimer S&P MidCap 400 ETF (the “Predecessor Fund”) Predecessor Fund Inception: February 20, 2008
Performance quoted above represents past performance. Past performance is not a guarantee of future results and current performance may be higher or lower than performance quoted. Investment returns and principal value will fluctuate, and shares of the Fund (“Fund Shares”), when redeemed or sold, may be worth more or less than their original cost. Fund performance reflects any applicable fee waivers and/or expense reimbursements. Had the adviser not waived fees and/or reimbursed expenses currently or in the past, returns would have been lower. See current prospectus for more information. According to the Fund’s current prospectus, the Fund’s expense ratio of 0.39% is expressed as a unitary management fee to cover operating expenses and expenses incurred in connection with managing the portfolio. NAV and Market Price returns assume that dividends and capital gain distributions have been reinvested in the Fund at NAV and Market Price, respectively. The returns shown in the table above do not reflect the deduction of taxes that a shareholder would pay on Fund distributions or the redemption or sale of Fund Shares. See invesco.com/ETFs to find the most recentmonth-end performance numbers.
Index and Benchmark Index performance results are based upon a hypothetical investment in their respective constituent securities. Index and Benchmark Index returns do not represent Fund returns. An investor cannot invest directly in an index. The Index and Benchmark Index does not charge management fees or brokerage expenses, and no such fees or expenses were deducted from the hypothetical performance shown. In addition, the results actual investors might have achieved would have differed from those shown because of differences in the timing, amounts of their investments, and fees and expenses associated with an investment in the Fund.
Notes Regarding Indexes and Fund Performance History:
| - | Average Annualized and Cumulative Inception returns for the Fund, Index and Benchmark Index are based on the inception date of the Predecessor Fund. |
| - | Effective after the close of business on May 24, 2019, the Predecessor Fund was reorganized into the Fund. Fund returns shown are blended returns of the Predecessor Fund and the Fund. |
| | |
| RWJ | | Manager’s Analysis |
| | Invesco S&P SmallCap 600 Revenue ETF (RWJ) |
As an index fund, the Invesco S&P SmallCap 600 Revenue ETF (the “Fund”) seeks to track the investment results (before fees and expenses) of the S&P SmallCap 600® Revenue-Weighted Index (the “Index”). The Fund generally will invest at least 90% of its total assets in the securities that comprise the Index.
Strictly in accordance with its guidelines and mandated procedures, S&P Dow Jones Indices (“S&P DJI” or the “Index Provider”) compiles, maintains, and calculates the Index, which is constructed using a rules-based methodology thatre-weights the constituent securities of the S&P SmallCap 600® Index (the “Parent Index” or “Benchmark Index”), an index comprised of common stocks of 600small-cap companies that generally represents thesmall-cap universe of the U.S. equity market, according to the revenue earned by the companies in the Parent Index, subject to a maximum 5% per company weighting. The Index thus contains the same securities as the Parent Index, but in different proportions. The Fund generally invests in all of the securities comprising the Index in proportion to their weightings in the Index.
For the fiscal year ended June 30, 2019, on a market price basis, the Fund returned (12.57)%. On a net asset value (“NAV”) basis, the Fund returned (12.45)%. During the same time period, the Index returned (12.29)%. During the fiscal year, the Fund fully replicated the components of the Index; therefore, the Fund’s performance, on a NAV basis, differed from the return of the Index primarily due to fees and operating expenses that the Fund incurred during the period.
During this same time period, the Benchmark Index returned (4.88)%. The Benchmark Index is an unmanaged index weighted by market capitalization based on the average performance of approximately 600 equity securities. The Benchmark Index was selected for its recognition in the market place, and because its performance comparison is a useful measure for investors as a broad representation of U.S.small-cap stocks.
The performance of the Fund differed from the Benchmark Index in part because the Fund seeks to track an Index that employs a revenue weighted methodology, whereas the Benchmark Index weights stocks based primarily on market capitalization.
Relative to the Benchmark Index, the Fund was most overweight in the consumer discretionary sector and most underweight in the financials sector during the fiscal year ended June 30, 2019.
The majority of the Fund’s underperformance relative to the Benchmark Index during that period can be attributed to the Fund being underweight to and security selection in the health care sector.
For the fiscal year ended June 30, 2019, the information technology sector contributed most significantly to the Fund’s
return. The health care sector detracted most significantly from the Fund’s return, followed by the consumer discretionary and energy sectors, respectively.
Positions that contributed most significantly to the Fund’s return for the fiscal year ended June 30, 2019, included Core-Mark Holding Company, Inc., a consumer discretionary company (portfolio average weight of 2.24%) and SUPERVALU INC., a consumer staples company (no longer held at year-end). Positions that detracted most significantly from the Fund’s return during this period included Dean Foods Company, a consumer staples company (portfolio average weight of 0.80%) and Owens & Minor, Inc., a health care company (portfolio average weight of 1.05%).
| | | | |
Sector Breakdown
(% of the Fund’s Net Assets)
as of June 30, 2019 | |
| Retailing | | | 17.6 | |
| Capital Goods | | | 11.5 | |
| Health Care Equipment & Services | | | 7.9 | |
| Technology Hardware & Equipment | | | 7.8 | |
| Money Market Fund | | | 6.8 | |
| Materials | | | 6.2 | |
| Energy | | | 5.8 | |
| Commercial & Professional Services | | | 5.5 | |
| Consumer Durables & Apparel | | | 5.1 | |
| Food & Staples Retailing | | | 3.3 | |
| Automobiles & Components | | | 3.2 | |
| Transportation | | | 3.1 | |
| Banks | | | 2.8 | |
| Food, Beverage & Tobacco | | | 2.8 | |
| Real Estate | | | 2.3 | |
| Software & Services | | | 2.1 | |
| Insurance | | | 2.0 | |
| Telecommunication Services | | | 1.8 | |
| Diversified Financials | | | 1.7 | |
| Consumer Services | | | 1.6 | |
| Pharmaceuticals, Biotechnology & Life Sciences | | | 1.6 | |
| Semiconductors & Semiconductor Equipment | | | 1.6 | |
| Household & Personal Products | | | 1.0 | |
| Media & Entertainment | | | 1.0 | |
| Utilities | | | 0.7 | |
| Liabilities in Excess of Other Assets | | | (6.8 | ) |
| Net Assets | | | 100.0 | |
Invesco S&P SmallCap 600 Revenue ETF (RWJ) (continued)
| | | | |
Top Ten Fund Holdings*
(% of the Fund’s Net Assets)
as of June 30, 2019 | |
| Security | | | | |
| Core-Mark Holding Co., Inc. | | | 1.93 | |
| United Natural Foods, Inc. | | | 1.73 | |
| Community Health Systems, Inc. | | | 1.61 | |
| Lithia Motors, Inc., Class A | | | 1.39 | |
| Group 1 Automotive, Inc. | | | 1.38 | |
| JC Penney Co., Inc. | | | 1.37 | |
| Office Depot, Inc. | | | 1.34 | |
| Owens & Minor, Inc. | | | 1.28 | |
| Frontier Communications Corp. | | | 1.15 | |
| Sonic Automotive Inc. Class A | | | 1.12 | |
| * | Excluding money market fund holdings. |
Growth of a $10,000 Investment
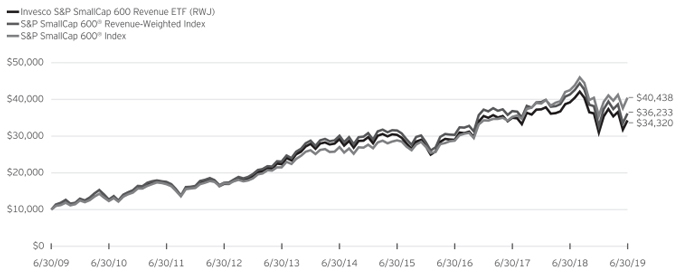
Fund Performance History as of June 30, 2019
| | | | | | | | | | | | | | | | | | | | | | | | | | | | | | | | | | | | | | | | |
| | | | | | 3 Years Average
Annualized | | | 3 Years Cumulative | | | 5 Years Average
Annualized | | | 5 Years Cumulative | | | 10 Years Average
Annualized | | | 10 Years Cumulative | | | | | | Fund Inception | |
| Index | | 1 Year | | | | | | Average
Annualized | | | Cumulative | |
| S&P SmallCap 600® Revenue-Weighted Index | | | (12.29 | )% | | | 6.10 | % | | | 19.45 | % | | | 3.75 | % | | | 20.21 | % | | | 13.74 | % | | | 262.33 | % | | | | | | | 10.08 | % | | | 197.85 | % |
| S&P SmallCap 600® Index | | | (4.88 | ) | | | 11.97 | | | | 40.36 | | | | 8.41 | | | | 49.76 | | | | 14.99 | | | | 304.38 | | | | | | | | 10.11 | | | | 198.85 | |
| Fund | | | | | | | | | | | | | | | | | | | | | | | | | | | | | | | | | | | | | | | | |
| NAV Return | | | (12.45 | ) | | | 5.81 | | | | 18.47 | | | | 3.32 | | | | 17.77 | | | | 13.12 | | | | 243.20 | | | | | | | | 9.38 | | | | 176.96 | |
| Market Price Return | | | (12.57 | ) | | | 5.77 | | | | 18.34 | | | | 3.28 | | | | 17.53 | | | | 13.09 | | | | 242.30 | | | | | | | | 9.37 | | | | 176.64 | |
Invesco S&P SmallCap 600 Revenue ETF (RWJ) (continued)
Oppenheimer S&P SmallCap 600 Revenue ETF (the ‘‘Predecessor Fund’’) Predecessor Fund Inception: February 19, 2008
Performance quoted above represents past performance. Past performance is not a guarantee of future results and current performance may be higher or lower than performance quoted. Investment returns and principal value will fluctuate, and shares of the Fund (“Fund Shares”), when redeemed or sold, may be worth more or less than their original cost. Fund performance reflects any applicable fee waivers and/or expense reimbursements. Had the adviser not waived fees and/or reimbursed expenses currently or in the past, returns would have been lower. See current prospectus for more information. According to the Fund’s current prospectus, the Fund’s expense ratio of 0.39% is expressed as a unitary management fee to cover operating expenses and expenses incurred in connection with managing the portfolio. NAV and Market Price returns assume that dividends and capital gain distributions have been reinvested in the Fund at NAV and Market Price, respectively. The returns shown in the table above do not reflect the deduction of taxes that a shareholder would pay on Fund distributions or the redemption or sale of Fund Shares. See invesco.com/ETFs to find the most recentmonth-end performance numbers.
Index and Benchmark Index performance results are based upon a hypothetical investment in their respective constituent securities. Index and Benchmark Index returns do not represent Fund returns. An investor cannot invest directly in an index. The Index and Benchmark Index does not charge management fees or brokerage expenses, and no such fees or expenses were deducted from the hypothetical performance shown. In addition, the results actual investors might have achieved would have differed from those shown because of differences in the timing, amounts of their investments, and fees and expenses associated with an investment in the Fund.
Notes Regarding Indexes and Fund Performance History:
| - | Average Annualized and Cumulative Inception returns for the Fund, Index and Benchmark Index are based on the inception date of the Predecessor Fund. |
| - | Effective after the close of business on May 24, 2019, the Predecessor Fund was reorganized into the Fund. Fund returns shown are blended returns of the Predecessor Fund and the Fund. |
| | |
| RWW | | Manager’s Analysis |
| | Invesco S&P Financials Revenue ETF (RWW) |
As an index fund, the Invesco S&P Financial Revenue ETF (the “Fund”) seeks to track the investment results (before fees and expenses) of the S&P 500® Financials Sector Revenue-Weighted Index (the “Index”). The Fund generally will invest at least 90% of its total assets in the securities that comprise the Index.
Strictly in accordance with its guidelines and mandated procedures, S&P Dow Jones Indices LLC (“S&P DJI” or the “Index Provider”) compiles, maintains, and calculates the Index, which is constructed using a rules-based methodology thatre-weights the constituent securities of the S&P 500® Financials Index (the “Parent Index” or ‘‘Benchmark Index’’) according to the revenue earned by the companies in the Parent Index. The Index thus contains the same securities as the Parent Index, but in different proportions. The Parent Index includes securities of companies in the S&P 500® Index that are classified in the financials sector. Such companies include those involved in activities such as: banking; mortgage finance; consumer finance; specialized finance; investment banking and brokerage; asset management and custody; corporate lending; insurance; financial investment; and real estate, including real estate investment trusts. The Fund generally invests in all of the securities comprising the Index in proportion to their weightings in the Index.
For the fiscal year ended June 30, 2019, on a market price basis, the Fund returned 7.68%. On a net asset value (“NAV”) basis, the Fund returned 7.83%. During the same time period, the Index returned 8.23%. During the fiscal year, the Fund fully replicated the components of the Index; therefore, the Fund’s performance, on a NAV basis, differed from the return of the Index primarily due to fees and operating expenses that the Fund incurred during the period.
During this same time period, the Benchmark Index returned 6.31%. The Benchmark Index is an unmanaged index weighted by market capitalization based on the average performance of approximately 67 equity securities. The Benchmark Index was selected for its recognition in the marketplace, and its performance comparison is a useful measure for investors as a broad representation of the U.S. stock market.
The performance of the Fund differed from the Benchmark Index in part because the Fund seeks to track an Index that employs revenue weighted methodology, whereas the Benchmark Index weights stocks based primarily on market capitalization.
Relative to the Benchmark Index, the Fund was most overweight in the life & health insurancesub-industry and most underweight in the diversified banksub-industry during the fiscal year ended June 30, 2019. The majority of the Fund’s outperformance relative to the Benchmark Index during that period can be attributed to the Fund being overweight in the life & health insurancesub-industry.
For the fiscal year ended June 30, 2019, the property & casualty insurancesub-industry contributed most significantly from the Fund’s return, followed by the multi-sector holdings and life & health insurancesub-industries, respectively. The asset management & custody bankssub-industry detracted most significantly to the Fund’s return, followed by investment banking & brokerage and regional bankssub-industries, respectively.
Positions that contributed most significantly to the Fund’s return for the fiscal year ended June 30, 2019, included Berkshire Hathaway Inc. Class B, a multi-sector holdings company (portfolio average weight of 15.04%) and MetLife, Inc., an life & health insurance company (portfolio average weight of 4.19%). Positions that detracted most significantly from the Fund’s return during this period included Wells Fargo & Company, a diversified banks company (portfolio average weight of 6.23%) and State Street Corp., an asset management & custody banks company (portfolio average weight of 0.71%).
| | | | |
Sector Breakdown
(% of the Fund’s Net Assets)
as of June 30, 2019 | |
| Banks | | | 34.8 | |
| Insurance | | | 28.7 | |
| Diversified Financial Services | | | 15.8 | |
| Capital Markets | | | 14.4 | |
| Consumer Finance | | | 6.3 | |
| Money Market Fund | | | 0.3 | |
| Liabilities in Excess of Other Assets | | | (0.3 | ) |
| Net Assets | | | 100.0 | |
| | | | |
Top Ten Fund Holdings*
(% of the Fund’s Net Assets)
as of June 30, 2019 | |
| Security | | | | |
| Berkshire Hathaway, Inc., Class B | | | 15.31 | |
| JPMorgan Chase & Co. | | | 8.18 | |
| Bank of America Corp. | | | 6.79 | |
| Wells Fargo & Co. | | | 6.27 | |
| Citigroup, Inc. | | | 6.12 | |
| MetLife, Inc. | | | 4.12 | |
| Prudential Financial, Inc. | | | 3.77 | |
| Goldman Sachs Group, Inc. (The) | | | 3.27 | |
| Morgan Stanley | | | 3.06 | |
| American International Group, Inc. | | | 2.85 | |
| * | Excluding money market fund holdings. |
Invesco S&P Financials Revenue ETF (RWW) (continued)
Growth of a $10,000 Investment
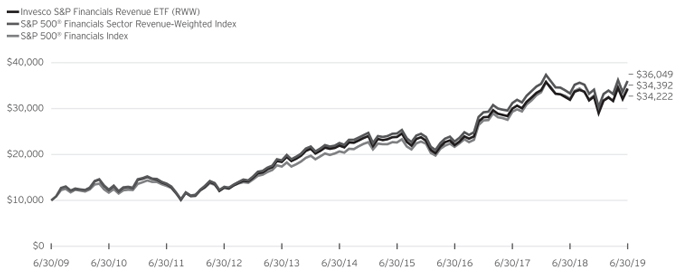
Fund Performance History as of June 30, 2019
| | | | | | | | | | | | | | | | | | | | | | | | | | | | | | | | | | | | | | | | |
| | | | | | 3 Years Average
Annualized | | | 3 Years Cumulative | | | 5 Years Average
Annualized | | | 5 Years Cumulative | | | 10 Years Average
Annualized | | | 10 Years Cumulative | | | | | | Fund Inception | |
| Index | | 1 Year | | | | | | Average
Annualized | | | Cumulative | |
| S&P 500® Financials Sector Revenue-Weighted Index | | | 8.23 | % | | | 16.43 | % | | | 57.82 | % | | | 9.87 | % | | | 60.10 | % | | | 13.68 | % | | | 260.49 | % | | | | | | | 12.28 | % | | | 242.77 | % |
| S&P 500® Financials Index | | | 6.31 | | | | 16.42 | | | | 57.79 | | | | 10.58 | | | | 65.34 | | | | 13.09 | | | | 242.22 | | | | | | | | 11.06 | | | | 205.39 | |
| Fund | | | | | | | | | | | | | | | | | | | | | | | | | | | | | | | | | | | | | | | | |
| NAV Return | | | 7.83 | | | | 15.96 | | | | 55.94 | | | | 9.39 | | | | 56.65 | | | | 13.15 | | | | 243.92 | | | | | | | | 11.71 | | | | 224.91 | |
| Market Price Return | | | 7.68 | | | | 15.94 | | | | 55.85 | | | | 9.37 | | | | 56.52 | | | | 13.15 | | | | 244.03 | | | | | | | | 11.70 | | | | 224.57 | |
Oppenheimer S&P Financials Revenue ETF (‘‘the Predecessor Funds’’) Predecessor Fund Inception: November 10, 2008
Performance quoted above represents past performance. Past performance is not a guarantee of future results and current performance may be higher or lower than performance quoted. Investment returns and principal value will fluctuate, and shares of the Fund (“Fund Shares”), when redeemed or sold, may be worth more or less than their original cost. Fund performance reflects any applicable fee waivers and/or expense reimbursements. Had the adviser not waived fees and/or reimbursed expenses currently or in the past, returns would have been lower. See current prospectus for more information. According to the Fund’s current prospectus, the Fund’s expense ratio of 0.45% is expressed as a unitary management fee to cover operating expenses and expenses incurred in connection with managing the portfolio. NAV and Market Price returns assume that dividends and capital gain distributions have been reinvested in the Fund at NAV and Market Price, respectively. The returns shown in the table above do not reflect the deduction of taxes that a shareholder would pay on Fund distributions or the redemption or sale of Fund Shares. See invesco.com/ETFs to find the most recentmonth-end performance numbers.
Index and Benchmark Index performance results are based upon a hypothetical investment in their respective constituent securities. Index and Benchmark Index returns do not represent Fund returns. An investor cannot invest directly in an index. The Index and Benchmark Index does not charge management fees or brokerage expenses, and no such fees or expenses were deducted from the hypothetical performance shown. In addition, the results actual investors might have achieved would have differed from those shown because of differences in the timing, amounts of their investments, and fees and expenses associated with an investment in the Fund.
Notes Regarding Indexes and Fund Performance History:
| - | Average Annualized and Cumulative Inception returns for the Fund, Index and Benchmark Index are based on the inception date of the Predecessor Fund. |
| - | Effective after the close of business on May 24, 2019, the Predecessor Fund was reorganized into the Fund. Fund returns shown are blended returns of the Predecessor Fund and the Fund. |
| | |
| RDIV | | Manager’s Analysis |
| | Invesco S&P Ultra Dividend Revenue ETF (RDIV) |
As an index fund, the Invesco S&P Ultra Dividend Revenue ETF (the “Fund”) seeks to track the investment results (before fees and expenses) of the S&P 900® Dividend Revenue-Weighted Index (the “Index”). The Fund generally will invest at least 90% of its total assets in the securities that comprise the Index.
Strictly in accordance with its guidelines and mandated procedures, S&P Dow Jones Indices (“S&P DJI” or the “Index Provider”) compiles, maintains, and calculates the Index, which is constructed using a rules-based methodology that selects components from the S&P 900® Index (the “Parent Index” or ‘‘Benchmark Index’’), which combines the S&P 500® Index and S&P MidCap® 400 Index to form an investable benchmark for the large- andmid-cap universe of the U.S. equity market. From the Parent Index, the Index Provider (1) excludes the top 5% of securities by dividend yield, (2) excludes the top 5% of securities within each sector by dividend payout ratio, (3) selects the top sixty securities by dividend yield and(4) re-weights those securities according to the revenue earned by the companies, subject to a maximum 5% per company weighting. The Index thus contains a subset of the securities in the Parent Index, in different proportions. The Fund generally invests in all of the securities comprising the Index in proportion to their weightings in the Index.
For the fiscal year ended June 30, 2019, on a market price basis, the Fund returned 2.26%. On a net asset value (“NAV”) basis, the Fund returned 2.26%. During the same time period, the Index returned 2.60%. During the fiscal year, the Fund fully replicated the components of the Index; therefore, the Fund’s performance, on a NAV basis, differed from the return of the Index primarily due to fees and operating expenses that the Fund incurred during the period.
During this same time period, the Benchmark Index returned 9.78%. The Benchmark Index is an unmanaged index weighted by market capitalization based on the average performance of approximately 900 equity securities. The Benchmark Index was selected for its recognition in the market place, and because its performance comparison is a useful measure for investors as a broad representation of the overall U.S. stock market.
The performance of the Fund differed from the Benchmark Index in part because the Fund seeks to track an Index that employs a revenue weighted methodology, whereas the Benchmark Index weights stocks based primarily on market capitalization.
Relative to the Benchmark Index, the Fund was most overweight in the utilities sector and most underweight in the health care sector during the fiscal year ended June 30, 2019. The majority of the Fund’s underperformance relative to the Benchmark Index during that period can be attributed to the Fund being overweight to and security selection in the consumer staples sector.
For the fiscal year ended June 30, 2019, the utilities sector contributed most significantly to the Fund’s return, followed by the information technology and communication services sectors, respectively. The consumer staples sector detracted most significantly from the Fund’s return, followed by the energy and industrials sectors, respectively.
Positions that contributed most significantly to the Fund’s return for the fiscal year ended June 30, 2019, included QUALCOMM Incorporated, an information technology company (portfolio average weight of 3.67%) and Coty Inc. Class A, a consumer staples company (portfolio average weight of 0.84%). Positions that detracted most significantly from the Fund’s return during this period included Kraft Heinz Company, a consumer staples company (no longer held at fiscalyear-end) and Occidental Petroleum Corporation, an energy company (portfolio average weight of 0.18%).
| | | | |
Sector Breakdown
(% of the Fund’s Net Assets)
as of June 30, 2019 | |
| Energy | | | 17.0 | |
| Materials | | | 14.3 | |
| Utilities | | | 13.5 | |
| Health Care Equipment & Services | | | 6.2 | |
| Software & Services | | | 5.9 | |
| Telecommunication Services | | | 5.2 | |
| Automobiles & Components | | | 5.0 | |
| Retailing | | | 4.7 | |
| Pharmaceuticals, Biotechnology & Life Sciences | | | 4.6 | |
| Real Estate | | | 4.2 | |
| Technology Hardware & Equipment | | | 4.1 | |
| Insurance | | | 2.9 | |
| Semiconductors & Semiconductor Equipment | | | 2.9 | |
| Food, Beverage & Tobacco | | | 2.6 | |
| Consumer Durables & Apparel | | | 1.6 | |
| Household & Personal Products | | | 1.6 | |
| Consumer Services | | | 1.4 | |
| Money Market Fund | | | 1.2 | |
| Banks | | | 1.0 | |
| Diversified Financials | | | 0.7 | |
| Media & Entertainment | | | 0.4 | |
| Liabilities in Excess of Other Assets | | | (1.0) | |
| Net Assets | | | 100.0 | |
Invesco S&P Ultra Dividend Revenue ETF (RDIV)(continued)
| | | | |
Top Ten Fund Holdings*
(% of the Fund’s Net Assets)
as of June 30, 2019 | |
| Security | | | | |
| Cardinal Health, Inc. | | | 5.28 | |
| Verizon Communications, Inc. | | | 5.16 | |
| International Business Machines Corp. | | | 5.07 | |
| General Motors Co. | | | 4.99 | |
| LyondellBasell Industries NV, Class A | | | 4.83 | |
| Exxon Mobil Corp. | | | 4.74 | |
| AbbVie, Inc. | | | 4.59 | |
| Schlumberger Ltd. | | | 4.30 | |
| Southern Co. (The) | | | 3.81 | |
| Duke Energy Corp. | | | 3.68 | |
| * | Excluding money market fund holdings. |
Growth of a $10,000 Investment
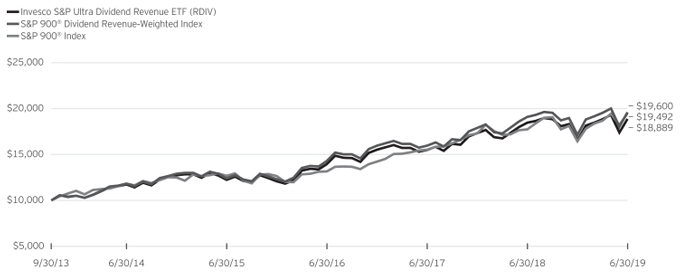
Fund Performance History as of June 30, 2019
| | | | | | | | | | | | | | | | | | | | | | | | | | | | | | | | |
| | | | | | 3 Years Average
Annualized | | | 3 Years Cumulative | | | 5 Years Average
Annualized | | | 5 Years Cumulative | | | | | | Fund Inception | |
| Index | | 1 Year | | | | | | Average
Annualized | | | Cumulative | |
| S&P 900® Dividend Revenue-Weighted Index | | | 2.60 | % | | | 11.11 | % | | | 37.18 | % | | | 10.60 | % | | | 65.46 | % | | | | | | | 12.42 | % | | | 96.00 | % |
| S&P 900® Index | | | 9.78 | | | | 13.96 | | | | 48.01 | | | | 10.52 | | | | 64.86 | | | | | | | | 12.31 | | | | 94.92 | |
| Fund | | | | | | | | | | | | | | | | | | | | | | | | | | | | | | | | |
| NAV Return | | | 2.26 | | | | 10.62 | | | | 35.37 | | | | 9.97 | | | | 60.81 | | | | | | | | 11.70 | | | | 88.89 | |
| Market Price Return | | | 2.26 | | | | 10.64 | | | | 35.44 | | | | 9.96 | | | | 60.73 | | | | | | | | 11.70 | | | | 88.98 | |
Invesco S&P Ultra Dividend Revenue ETF (RDIV)(continued)
Oppenheimer S&P Ultra Dividend Revenue ETF (‘‘the Predecessor Fund’’) Predecessor Fund Inception: September 30, 2013
Performance quoted above represents past performance. Past performance is not a guarantee of future results and current performance may be higher or lower than performance quoted. Investment returns and principal value will fluctuate, and shares of the Fund (“Fund Shares”), when redeemed or sold, may be worth more or less than their original cost. Fund performance reflects any applicable fee waivers and/or expense reimbursements. Had the adviser not waived fees and/or reimbursed expenses currently or in the past, returns would have been lower. See current prospectus for more information. According to the Fund’s current prospectus, the Fund’s expense ratio of 0.39% is expressed as a unitary management fee to cover operating expenses and expenses incurred in connection with managing the portfolio. NAV and Market Price returns assume that dividends and capital gain distributions have been reinvested in the Fund at NAV and Market Price, respectively. The returns shown in the table above do not reflect the deduction of taxes that a shareholder would pay on Fund distributions or the redemption or sale of Fund Shares. See invesco.com/ETFs to find the most recentmonth-end performance numbers.
Index and Benchmark Index performance results are based upon a hypothetical investment in their respective constituent securities. Index and Benchmark Index returns do not represent Fund returns. An investor cannot invest directly in an index. The Index or Benchmark Index does not charge management fees or brokerage expenses, and no such fees or expenses were deducted from the hypothetical performance shown. In addition, the results actual investors might have achieved would have differed from those shown because of differences in the timing, amounts of their investments, and fees and expenses associated with an investment in the Fund.
Notes Regarding Indexes and Fund Performance History:
| - | Average Annualized and Cumulative Inception returns for the Fund, Index and Benchmark Index are based on the inception date of the Predecessor Fund. |
| - | Effective after the close of business on May 24, 2019, the Predecessor Fund was reorganized into the Fund. Fund returns shown are blended returns of the Predecessor Fund and the Fund. |
| | |
| REDV | | Manager’s Analysis |
| | Invesco Emerging Markets Ultra Dividend Revenue ETF (REDV) |
As an index fund, the Invesco Emerging Market Ultra Dividend Revenue ETF (the “Fund”) seeks to track the investment results (before fees and expenses) of the FSTE Custom Emerging Ultra Dividend Revenue Index (the “Index”). The Fund generally will invest at least 90% of its total assets in the securities that comprise the Index, as well as American depositary receipts (“ADRs”) and global depositary receipts (“GDRs”) that represent securities in the Index.
Strictly in accordance with its guidelines and mandated procedures, FTSE Russell (“FTSE” or the “Index Provider”) compiles, maintains, and calculates the Index, which is constructed using a rules-based methodology that selects a subset of constituent securities of the FTSE Emerging Index (the “Parent Index” or ‘‘Benchmark Index’’), an index designed to represent the performance of securities of the most liquid large- andmid-capitalization companies in emerging market countries. The Index includes the top 100 constituent securities of the Parent Index according to the highest average of the1-year trailing dividend yields over the past two years, and thenre-weights those securities according to the revenue earned by those companies, subject to a maximum 5% per company weighting and a maximum 10% variation on the Index’s allocation to a single country versus the Parent Index. The Index thus contains a subset of the securities included in the Parent Index, in different proportions. The Fund generally invests in all of the securities comprising the Index in proportion to their weightings in the Index. The Fund does not purchase all of the securities in the Index; instead, the Fund utilizes a “sampling” methodology to seek to achieve its investment objective.
Since the Fund inception on August 7, 2018 through fiscal year ended June 30, 2019, on a market price basis, the Fund returned 0.54%. On a net asset value (“NAV”) basis, the Fund returned 0.08%. During the same time period, the Index returned 1.08%. During the fiscal period, the Fund utilized a sampling methodology to achieve exposure to the Thailand securities included in the Index; therefore, the Fund’s performance, on a NAV basis, differed from the return of the Index primarily due to fees and operating expenses that the Fund incurred and from the impact of the sampling methodology with respect to the securities previously mentioned during the period.
During this same time period, the Benchmark Index returned 1.21%. The Benchmark Index is an unmanaged index weighted by market capitalization based on the average performance of approximately 1750 equity securities. The Benchmark Index was selected for its recognition in the marketplace, and its performance comparison is a useful measure for investors as a broad representation of the markets of emerging market countries.
The performance of the Fund differed from the Benchmark Index in part because the Fund seeks to track an Index that employs a
revenue weighted methodology, whereas the Benchmark Index weights stocks based primarily on market capitalization.
Relative to the Benchmark Index, the Fund was most overweight in the utilities sector and most underweight in the consumer discretionary sector during the fiscal period ended June 30, 2019. The majority of the Fund’s underperformance relative to the Benchmark Index during that period can be attributed to the Fund being underweight to and security selection in the real estate sector.
For the fiscal period ended June 30, 2019, the utilities sector contributed most significantly to the Fund’s return, followed by the financials and communication services sectors, respectively. The real estate sector detracted most significantly to the Fund’s return, followed by the industrials and consumer discretionary sectors respectively.
Positions that contributed most significantly to the Fund’s return for the fiscal period ended June 30, 2019, included Companhia Paranaense de Energia—COPEL Pfd Registered B, a utilities company (portfolio average weight of 1.15%) and Companhia Energetica de Minas Gerais SA Pfd, a utilities company (no longer held at year-end). Positions that detracted most significantly from the Fund’s return during this period included Chongqing Changan Automobile Company Limited Class B, a consumer discretionary company (no longer held at fiscalyear-end) and Sinopec Shanghai Petrochemical Co. Ltd. Class H, a materials company (no longer held at fiscalyear-end).
Invesco Emerging Markets Ultra Dividend Revenue ETF (REDV)(continued)
| | | | |
Sector Breakdown
(% of the Fund’s Net Assets)
as of June 30, 2019 | |
| Energy | | | 16.5 | |
| Materials | | | 15.5 | |
| Diversified Financials | | | 10.7 | |
| Real Estate | | | 10.2 | |
| Telecommunication Services | | | 9.7 | |
| Utilities | | | 9.4 | |
| Banks | | | 8.4 | |
| Technology Hardware & Equipment | | | 5.8 | |
| Retailing | | | 5.1 | |
| Transportation | | | 2.1 | |
| Automobiles & Components | | | 1.7 | |
| Insurance | | | 1.3 | |
| Software & Services | | | 0.9 | |
| Capital Goods | | | 0.6 | |
| Consumer Services | | | 0.5 | |
| Food, Beverage & Tobacco | | | 0.4 | |
| Media & Entertainment | | | 0.4 | |
| Food & Staples Retailing | | | 0.2 | |
| Consumer Durables & Apparel | | | 0.1 | |
| Pharmaceuticals, Biotechnology & Life Sciences | | | 0.0 | |
| Telecommunications Hardware | | | 0.0 | |
| Other Assets in Excess of Liabilities | | | 0.5 | |
| Net Assets | | | 100.0 | |
| | | | |
Top Ten Fund Holdings*
(% of the Fund’s Net Assets)
as of June 30, 2019 | |
| Security | | | | |
| Indian Oil Corp. Ltd. | | | 4.55 | |
| Petrobras Distribuidora SA | | | 4.50 | |
| Tupras Turkiye Petrol Rafinerileri AS | | | 4.17 | |
| Vedanta Ltd. | | | 4.15 | |
| Coal India Ltd. | | | 4.13 | |
| China Cinda Asset Management Co. Ltd., Class H | | | 4.12 | |
| Guangzhou R&F Properties Co. Ltd., Class H | | | 4.05 | |
| China Huarong Asset Management Co. Ltd., Class H | | | 3.96 | |
| China Resources Power Holdings Co. Ltd. | | | 3.54 | |
| Telefonica Brasil SA | | | 3.39 | |
| * | Excluding money market fund holdings. |
Invesco Emerging Markets Ultra Dividend Revenue ETF (REDV)(continued)
Growth of a $10,000 Investment
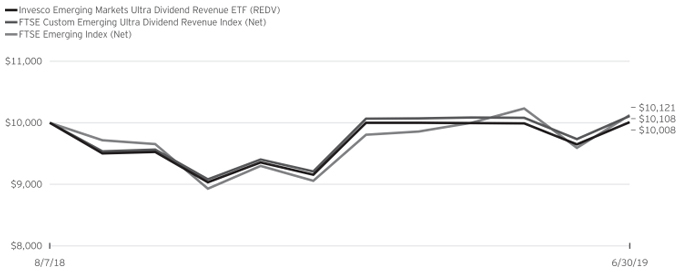
Fund Performance History as of June 30, 2019
| | | | | | | | | | | | |
| | | | | | | | | Fund Inception | |
| Index | | | | | | | | Cumulative | |
| FTSE Custom Emerging Ultra Dividend Revenue Index (Net) | | | | | | | | | | | 1.08 | % |
| FTSE Emerging Index (Net) | | | | | | | | | | | 1.21 | |
| Fund | | | | | | | | | | | | |
| NAV Return | | | | | | | | | | | 0.08 | |
| Market Price Return | | | | | | | | | | | 0.54 | |
Oppenheimer Emerging Markets Ultra Dividend Revenue ETF (‘‘the Predecessor Fund’’) Predecessor Fund Inception: August 7, 2018
Performance quoted above represents past performance. Past performance is not a guarantee of future results and current performance may be higher or lower than performance quoted. Investment returns and principal value will fluctuate, and shares of the Fund (“Fund Shares”), when redeemed or sold, may be worth more or less than their original cost. Fund performance reflects any applicable fee waivers and/or expense reimbursements. Had the adviser not waived fees and/or reimbursed expenses currently or in the past, returns would have been lower. See current prospectus for more information. According to the Fund’s current prospectus, the Fund’s expense ratio of 0.46% is expressed as a unitary management fee to cover operating expenses and expenses incurred in connection with managing the portfolio. NAV and Market Price returns assume that dividends and capital gain distributions have been reinvested in the Fund at NAV and Market Price, respectively. The returns shown in the table above do not reflect the deduction of taxes that a shareholder would pay on Fund distributions or the redemption or sale of Fund Shares. See invesco.com/ETFs to find the most recentmonth-end performance numbers.
Index and Benchmark Index performance results are based upon a hypothetical investment in their respective constituent securities. Index and Benchmark Index returns do not represent Fund returns. An investor cannot invest directly in an index. The Index or Benchmark Index does not charge management fees or brokerage expenses, and no such fees or expenses were deducted from the hypothetical performance shown. In addition, the results actual investors might have achieved would have differed from those shown because of differences in the timing, amounts of their investments, and fees and expenses associated with an investment in the Fund.
Notes Regarding Indexes and Fund Performance History:
| - | Average Annualized and Cumulative Inception returns for the Fund, Index and Benchmark Index are based on the inception date of the Predecessor Fund. |
| - | Net returns reflect reinvested dividends net of withholding taxes. |
| - | Effective after the close of business on May 24, 2019, the Predecessor Fund was reorganized into the Fund. Fund returns shown are blended returns of the Predecessor Fund and the Fund. |
| | |
| RIDV | | Manager’s Analysis |
| | Invesco International Ultra Dividend Revenue ETF (RIDV) |
As an index fund, the Invesco International Ultra Dividend Revenue ETF (the “Fund”) seeks to track the investment results (before fees and expenses) of the FSTE Custom Developed ex US Ultra Dividend Revenue Index (the “Index”). The Fund generally will invest at least 90% of its total assets in the securities that comprise the Index, as well as American depositary receipts (“ADRs”) and global depositary receipts (“GDRs”) that represent securities in the Index.
Strictly in accordance with its guidelines and mandated procedures, FTSE Russell (“FTSE” or the “Index Provider”) compiles, maintains, and calculates the Index, which is constructed using a rules-based methodology that starts with the FTSE Developed ex US Index (the “Parent Index” or ‘‘Benchmark Index’’), an index designed to represent the performance of large- andmid-cap securities from 24 developed market countries, excluding the United States. From a universe of components of the Parent Index, the Index (1) excludes the top 5% of securities within each country by yield, (2) excludes the top 5% of securities within each sector by dividend payout ratio, (3) selects the top 200 securities according to the highest average of the1-year trailing dividend yields over the past two years and(4) re-weights those securities according to the revenue earned by those companies, subject to a maximum 5% per company weighting and a maximum 10% variation on the Index’s allocation to a single country versus the Parent Index. The Index thus contains a subset of the securities included in the Parent Index, in different proportions. The Fund generally invests in all of the securities comprising the Index in proportion to their weightings in the Index.
Since the Fund’s inception on August 7, 2018 through fiscal year ended June 30, 2019, on a market price basis, the Fund returned (1.96)%. On a net asset value (“NAV”) basis, the Fund returned (1.82)%. During the same time period, the Index returned (2.12)%. During the fiscal year, the Fund did not fully replicate the components of the Index; therefore, the Fund’s performance, on a NAV basis, differed from the return of the Index primarily due to performance differential of the securities that were sampled during the period.
During this same time period, the Benchmark Index returned (1.05)%. The Benchmark Index is an unmanaged index weighted by market capitalization based on the average performance of approximately 1555 equity securities. The Benchmark Index was selected for its recognition in the marketplace, and its performance comparison is a useful measure for investors as a broad representation of the international equity markets
The performance of the Fund differed from the Benchmark Index in part because the Fund seeks to track an Index that employs a revenue weighted methodology, whereas the Benchmark Index weights stocks based primarily on market capitalization.
Relative to the Benchmark Index, the Fund was most overweight in the financials sector and most underweight in the industrials sector during the fiscal period ended June 30, 2019. The majority of the Fund’s underperformance relative to the Benchmark Index during that period can be attributed to the Fund being overweight to and security selection in the utilities sector.
During the fiscal period ended June 30, 2019, the utilities sector contributed most significantly to the Fund’s return, followed by materials and communication services sectors, respectively. The financials sector detracted most significantly from the Fund’s return, followed by the energy and industrials sectors, respectively.
Positions that contributed most significantly to the Fund’s return during the fiscal period ended June 30, 2019, included Enel SpA., a utilities company (portfolio average weight of 2.31%) and Allianz SE, a financials company (portfolio average weight of 3.47%). Positions that detracted most significantly from the Fund’s return during this period included Bayerische Motoren Werke AG, a consumer discretionary company (portfolio average weight of 2.71%) and Societe Generale S.A. Class A, a financials company (no longer held at year-end).
Invesco International Ultra Dividend Revenue ETF (RIDV)(continued)
| | | | |
Sector Breakdown
(% of the Fund’s Net Assets)
as of June 30, 2019 | |
Energy | | | 18.6 | |
Insurance | | | 18.4 | |
Banks | | | 17.4 | |
Materials | | | 8.9 | |
Telecommunication Services | | | 8.6 | |
Utilities | | | 5.7 | |
Automobiles & Components | | | 3.0 | |
Consumer Services | | | 2.9 | |
Capital Goods | | | 2.3 | |
Retailing | | | 2.1 | |
Transportation | | | 2.0 | |
Commercial & Professional Services | | | 1.6 | |
Diversified Financials | | | 1.6 | |
Technology Hardware & Equipment | | | 1.4 | |
Consumer Durables & Apparel | | | 1.0 | |
Pharmaceuticals, Biotechnology & Life Sciences | | | 1.0 | |
Food, Beverage & Tobacco | | | 0.9 | |
Real Estate | | | 0.9 | |
Food & Staples Retailing | | | 0.8 | |
Money Market Fund | | | 0.8 | |
Media & Entertainment | | | 0.7 | |
Liabilities in Excess of Other Assets | | | (0.6 | ) |
Net Assets | | | 100.0 | |
| | | | |
Top Ten Fund Holdings*
(% of the Fund’s Net Assets)
as of June 30, 2019 | |
| Security | | | | |
| Royal Dutch Shell PLC, Class A | | | 4.96 | |
| BP PLC | | | 4.82 | |
| TOTAL SA | | | 4.75 | |
| Allianz SE | | | 3.20 | |
| Bayerische Motoren Werke AG | | | 2.85 | |
| Credit Agricole SA | | | 2.33 | |
| Enel SpA | | | 2.31 | |
| Banco Santander SA | | | 2.24 | |
| Deutsche Telekom AG | | | 2.17 | |
| Assicurazioni Generali SpA | | | 2.16 | |
| * | Excluding money market fund holdings. |
Invesco International Ultra Dividend Revenue ETF (RIDV)(continued)
Growth of a $10,000 Investment
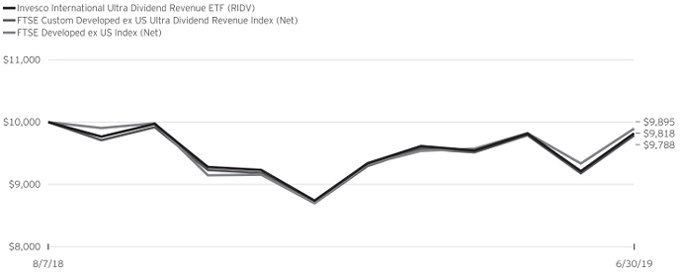
Fund Performance History as of June 30, 2019
| | | | | | | | | | | | |
| | | | | | | | | Fund Inception | |
| Index | | | | | | | | Cumulative | |
| FTSE Custom Developed ex US Ultra Dividend Revenue Index (Net) | | | | | | | | | | | (2.12 | )% |
| FTSE Developed ex US Index (Net) | | | | | | | | | | | (1.05 | ) |
| Fund | | | | | | | | | | | | |
| NAV Return | | | | | | | | | | | (1.82 | ) |
| Market Price Return | | | | | | | | | | | (1.96 | ) |
Oppenheimer International Ultra Dividend Revenue ETF (the ‘‘Predecessor Fund’’) Predecessor Fund Inception: August 7, 2018
Performance quoted above represents past performance. Past performance is not a guarantee of future results and current performance may be higher or lower than performance quoted. Investment returns and principal value will fluctuate, and shares of the Fund (“Fund Shares”), when redeemed or sold, may be worth more or less than their original cost. Fund performance reflects any applicable fee waivers and/or expense reimbursements. Had the adviser not waived fees and/or reimbursed expenses currently or in the past, returns would have been lower. See current prospectus for more information. According to the Fund’s current prospectus, the Fund’s expense ratio of 0.42% is expressed as a unitary management fee to cover operating expenses and expenses incurred in connection with managing the portfolio. NAV and Market Price returns assume that dividends and capital gain distributions have been reinvested in the Fund at NAV and Market Price, respectively. The returns shown in the table above do not reflect the deduction of taxes that a shareholder would pay on Fund distributions or the redemption or sale of Fund Shares. See invesco.com/ETFs to find the most recentmonth-end performance numbers.
Index and Benchmark Index performance results are based upon a hypothetical investment in their respective constituent securities. Index and Benchmark Index returns do not represent Fund returns. An investor cannot invest directly in an index. The Index and Benchmark Index does not charge management fees or brokerage expenses, and no such fees or expenses were deducted from the hypothetical performance shown. In addition, the results actual investors might have achieved would have differed from those shown because of differences in the timing, amounts of their investments, and fees and expenses associated with an investment in the Fund.
Notes Regarding Indexes and Fund Performance History:
| - | Average Annualized and Cumulative Inception returns for the Fund, Index and Benchmark Index are based on the inception date of the Predecessor Fund. |
| - | Net returns reflect reinvested dividends net of withholding taxes. |
| - | Effective after the close of business on May 24, 2019, the Predecessor Fund was reorganized into the Fund. Fund returns shown are blended returns of the Predecessor Fund and the Fund. |
| | |
| REEM | | Manager’s Analysis |
| | Invesco Emerging Markets Revenue ETF (REEM) |
As an index fund, the Invesco Emerging Markets Revenue ETF (the “Fund”) seeks to track the investment results (before fees and expenses) of the Invesco Revenue Emerging Markets Index (the “Index”). The Fund generally will invest at least 90% of its total assets in the securities that comprise the Index, as well as American depositary receipts (“ADRs”) and global depositary receipts (“GDRs”) that represent securities in the Index.
Strictly in accordance with its guidelines and mandated procedures, MSCI, Inc. (“MSCI” or the “Index Provider”) compiles, maintains, and calculates the Index, which is constructed using a rules-based methodology thatre-weights the constituent securities of the MSCI Emerging Markets Index (the “Parent Index” or ‘‘Benchmark Index’’), an index designed to represent the performance of large- andmid-capitalization securities in emerging market countries, according to the revenue earned by the companies in the Parent Index, subject to a maximum 5% per company weighting. The Fund does not purchase all of the securities in the Index; instead, the Fund utilizes a “sampling” methodology to seek to achieve its investment objective.
For the fiscal year ended June 30, 2019, on a market price basis, the Fund returned 3.57%. On a net asset value (“NAV”) basis, the Fund returned 3.77%. During the same time period, the Index returned 4.63%. During the fiscal year, the Fund utilized a sampling methodology to achieve exposure to the Thailand, Chinese and various other Middle East and Asian securities included in the Index; therefore, the Fund’s performance, on a NAV basis, differed from the return of the Index primarily due to fees and operating expenses that the Fund incurred and from the impact of the sampling methodology with respect to the securities previously mentioned during the period.
During this same time period, the Benchmark Index returned 1.21%. The Benchmark Index is an unmanaged index weighted by market capitalization based on the average performance of approximately 1195 equity securities. The Benchmark Index was selected for its recognition in the market place, and because its performance comparison is a useful measure for investors as a broad representation of emerging market equities.
The performance of the Fund differed from the Benchmark Index in part because the Fund seeks to track an Index that employs a revenue weighted methodology, whereas the Benchmark Index weights stocks based primarily on market capitalization.
Relative to the Benchmark Index, the Fund was most overweight in the energy sector and most underweight in the communication services sector during the fiscal year ended June 30, 2019. The majority of the Fund’s outperformance relative to the Benchmark Index during that period can be attributed to the Fund being underweight to and security selection in the communication services sector.
For the fiscal year ended June 30, 2019, the communication services sector contributed most significantly to the Fund’s return, followed by the energy and consumer discretionary sectors, respectively. The financials sector detracted most significantly from the Fund’s return, followed by the information technology and industrials sectors, respectively.
Positions that contributed most significantly to the Fund’s return for the fiscal year ended June 30, 2019, included Gazprom PJSC Sponsored ADR. an energy company (no longer held at year-end) and JBS S.A., a consumer staples company (portfolio average weight of 0.67%). Positions that detracted most significantly from the Fund’s return during this period included Hon Hai Precision Industry Co., Ltd., an information technology company (portfolio average weight of 2.00%) and Tata Motors Limited, a consumer discretionary company (portfolio average weight of 0.45%).
| | | | |
Sector Breakdown
(% of the Fund’s Net Assets)
as of June 30, 2019 | |
Energy | | | 17.8 | |
Banks | | | 13.8 | |
Technology Hardware & Equipment | | | 9.9 | |
Capital Goods | | | 9.3 | |
Materials | | | 8.7 | |
Telecommunication Services | | | 4.7 | |
Automobiles & Components | | | 4.4 | |
Utilities | | | 4.1 | |
Real Estate | | | 3.9 | |
Insurance | | | 3.8 | |
Food, Beverage & Tobacco | | | 3.4 | |
Retailing | | | 3.2 | |
Food & Staples Retailing | | | 2.8 | |
Transportation | | | 1.8 | |
Consumer Durables & Apparel | | | 1.5 | |
Semiconductors & Semiconductor Equipment | | | 1.3 | |
Media & Entertainment | | | 1.2 | |
Diversified Financials | | | 1.1 | |
Software & Services | | | 0.8 | |
Money Market Fund | | | 0.7 | |
Pharmaceuticals, Biotechnology & Life Sciences | | | 0.7 | |
Health Care Equipment & Services | | | 0.5 | |
Consumer Services | | | 0.4 | |
Household & Personal Products | | | 0.4 | |
Commercial & Professional Services | | | 0.1 | |
Liabilities in Excess of Other Assets | | | (0.3 | ) |
Net Assets | | | 100.0 | |
Invesco Emerging Markets Revenue ETF (REEM)(continued)
| | | | |
Top Ten Fund Holdings*
(% of the Fund’s Net Assets)
as of June 30, 2019 | |
| Security | | | | |
| Samsung Electronics Co. Ltd. | | | 2.45 | |
| Hon Hai Precision Industry Co. Ltd. | | | 2.00 | |
| Gazprom PJSC | | | 1.74 | |
| China Construction Bank Corp., Class H | | | 1.69 | |
| LUKOIL PJSC | | | 1.60 | |
| Rosneft Oil Co PJSC | | | 1.43 | |
| China Mobile Ltd. | | | 1.25 | |
| SK Holdings Co. Ltd. | | | 1.23 | |
| CITIC Ltd. | | | 1.08 | |
| Reliance Industries Ltd. | | | 0.94 | |
| * | Excluding money market fund holdings. |
Growth of a $10,000 Investment
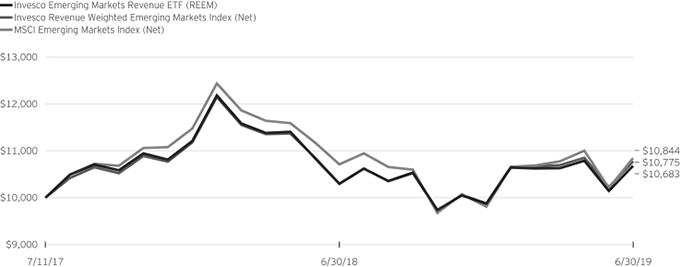
Fund Performance History as of June 30, 2019
| | | | | | | | | | | | | | | | |
| | | 1 Year | | | | | | Fund Inception | |
| Index | | | | | Average
Annualized | | | Cumulative | |
| Invesco Revenue Weighted Emerging Markets Index (Net) | | | 4.63 | % | | | | | | | 3.86 | % | | | 7.75 | % |
| MSCI Emerging Markets Index (Net) | | | 1.21 | | | | | | | | 4.20 | | | | 8.44 | |
| Fund | | | | | | | | | | | | | | | | |
| NAV Return | | | 3.77 | | | | | | | | 3.41 | | | | 6.83 | |
| Market Price Return | | | 3.57 | | | | | | | | 3.49 | | | | 7.00 | |
Invesco Emerging Markets Revenue ETF (REEM)(continued)
Oppenheimer Emerging Markets Revenue ETF (the ‘‘Predecessor Fund”) Predecessor Fund Inception: July 11, 2017
Performance quoted above represents past performance. Past performance is not a guarantee of future results and current performance may be higher or lower than performance quoted. Investment returns and principal value will fluctuate, and shares of the Fund (“Fund Shares”), when redeemed or sold, may be worth more or less than their original cost. Fund performance reflects any applicable fee waivers and/or expense reimbursements. Had the adviser not waived fees and/or reimbursed expenses currently or in the past, returns would have been lower. See current prospectus for more information. According to the Fund’s current prospectus, the Fund’s expense ratio of 0.46% is expressed as a unitary management fee to cover operating expenses and expenses incurred in connection with managing the portfolio. NAV and Market Price returns assume that dividends and capital gain distributions have been reinvested in the Fund at NAV and Market Price, respectively. The returns shown in the table above do not reflect the deduction of taxes that a shareholder would pay on Fund distributions or the redemption or sale of Fund Shares. See invesco.com/ETFs to find the most recentmonth-end performance numbers.
Index and Benchmark Index performance results are based upon a hypothetical investment in their respective constituent securities. Index and Benchmark Index returns do not represent Fund returns. An investor cannot invest directly in an index. The Index and Benchmark Index does not charge management fees or brokerage expenses, and no such fees or expenses were deducted from the hypothetical performance shown. In addition, the results actual investors might have achieved would have differed from those shown because of differences in the timing, amounts of their investments, and fees and expenses associated with an investment in the Fund.
Notes Regarding Indexes and Fund Performance History:
| - | Average Annualized and Cumulative Inception returns for the Fund, Index and Benchmark Index are based on the inception date of the Predecessor Fund. |
| - | Net returns reflect reinvested dividends net of withholding taxes. |
| - | Effective after the close of business on May 24, 2019, the Predecessor Fund was reorganized into the Fund. Fund returns shown are blended returns of the Predecessor Fund and the Fund. |
| | |
| REFA | | Manager’s Analysis |
| | Invesco International Revenue ETF (REFA) |
As an index fund, the Invesco International Revenue ETF (the “Fund”) seeks to track the investment results (before fees and expenses) of the Invesco Revenue Weighted International Index (the “Index”). The Fund generally will invest at least 90% of its total assets in the securities that comprise the Index, as well as American depositary receipts (“ADRs”) and global depositary receipts (“GDRs”) that represent securities in the Index.
Strictly in accordance with its guidelines and mandated procedures, MSCI, Inc. (“MSCI” or the “Index Provider”) compiles, maintains, and calculates the Index, which is constructed using a rules-based methodology thatre-weights the constituent securities of the MSCI EAFE Index (the “Parent Index” or “Benchmark Index’’) according to the revenue earned by the companies in the Parent Index, subject to a maximum 5% per company weighting. Thus, the Index contains the same securities as the Parent Index, but in different proportions. Since the Index is constructed based on securities in the Parent Index, it will primarily consist of securities from developed markets around the world, excluding the United States and Canada. It may include securities of foreign companies other than developed markets around the world and companies of any market capitalization, including medium capitalization companies. The Parent Index includes stocks from Europe, Australasia and the Far East. Consistent with the attributes of the Parent Index, the Fund invests in issuers that maintain their principal place of business or conduct their business activities outside the U.S., issuers that have their securities traded onnon-U.S. exchanges or issuers that have been formed under the laws ofnon-U.S. countries. The Fund does not purchase all of the securities in the Index; instead, the Fund utilizes a “sampling” methodology to seek to achieve its investment objective.
For the fiscal year ended June 30, 2019, on a market price basis, the Fund returned (2.80)%. On a net asset value (“NAV”) basis, the Fund returned (3.03)%. During the same time period, the Index returned (2.76)%. During the fiscal year, the Fund did not fully replicate the components of the Index; therefore, the Fund’s performance, on a NAV basis, differed from the return of the Index primarily due to fees and operating expenses that the Fund incurred and from the impact of the sampling methodology during the period.
During this same time period, the Benchmark Index returned 1.08%. The Benchmark Index is an unmanaged index weighted by market capitalization based on the average performance of approximately 920 equity securities. The Benchmark Index was selected for its recognition in the marketplace, and its performance comparison is a useful measure for investors as a broad representation of the markets of economically developed countries outside the U.S.
The performance of the Fund differed from the Benchmark Index in part because the Fund seeks to track an Index that employs a revenue weighted methodology, whereas the Benchmark Index weights stocks based primarily on market capitalization.
Relative to the Benchmark Index, the Fund was most overweight in the consumer discretionary sector and most underweight in the health care sector during the fiscal year ended June 30, 2019. The majority of the Fund’s underperformance relative to the Benchmark Index during that period can be attributed to the Fund being overweight to and security selection in the consumer discretionary sector.
For the fiscal year ended June 30, 2019, the utilities sector contributed most significantly to the Fund’s return, followed by the communication services and consumer staples sectors, respectively. The consumer discretionary sector detracted most significantly from the Fund’s return, followed by the materials and financials sectors respectively.
Positions that contributed most significantly to the Fund’s return for the fiscal year ended June 30, 2019, included Nestle S.A., a consumer staples company (portfolio average weight of 0.60%) and Enel SpA, a utilities company (portfolio average weight of 0.57%). Positions that detracted most significantly from the Fund’s return during this period included Glencore plc, a materials company (portfolio average weight of 1.33%) and Panasonic Corporation, a consumer discretionary company (portfolio average weight of 0.48%).
Invesco International Revenue ETF (REFA)(continued)
| | | | |
Sector Breakdown
(% of the Fund’s Net Assets)
as of June 30, 2019 | |
Capital Goods | | | 13.0 | |
Automobiles & Components | | | 11.9 | |
Energy | | | 8.6 | |
Materials | | | 8.6 | |
Banks | | | 7.4 | |
Insurance | | | 6.7 | |
Utilities | | | 5.8 | |
Telecommunication Services | | | 4.8 | |
Food & Staples Retailing | | | 4.0 | |
Food, Beverage & Tobacco | | | 3.9 | |
Consumer Durables & Apparel | | | 3.1 | |
Transportation | | | 3.1 | |
Diversified Financials | | | 3.0 | |
Money Market Fund | | | 2.8 | |
Pharmaceuticals, Biotechnology & Life Sciences | | | 2.7 | |
Technology Hardware & Equipment | | | 2.5 | |
Retailing | | | 1.6 | |
Health Care Equipment & Services | | | 1.5 | |
Commercial & Professional Services | | | 1.4 | |
Real Estate | | | 1.4 | |
Household & Personal Products | | | 1.3 | |
Software & Services | | | 1.1 | |
Consumer Services | | | 1.0 | |
Media & Entertainment | | | 0.9 | |
Semiconductors & Semiconductor Equipment | | | 0.5 | |
Liabilities in Excess of Other Assets | | | (2.6 | ) |
Net Assets | | | 100.0 | |
| | | | |
Top Ten Fund Holdings*
(% of the Fund’s Net Assets)
as of June 30, 2019 | |
| Security | | | | |
| Toyota Motor Corp. | | | 2.07 | |
| BP PLC | | | 1.83 | |
| Royal Dutch Shell PLC, Class A | | | 1.33 | |
| Glencore PLC | | | 1.30 | |
| TOTAL SA | | | 1.17 | |
| EXOR NV | | | 1.11 | |
| Royal Dutch Shell PLC, Class B | | | 1.11 | |
| Daimler AG | | | 1.08 | |
| Volkswagen AG | | | 1.00 | |
| Honda Motor Co., Ltd. | | | 0.92 | |
| * | Excluding money market fund holdings. |
Invesco International Revenue ETF (REFA)(continued)
Growth of a $10,000 Investment
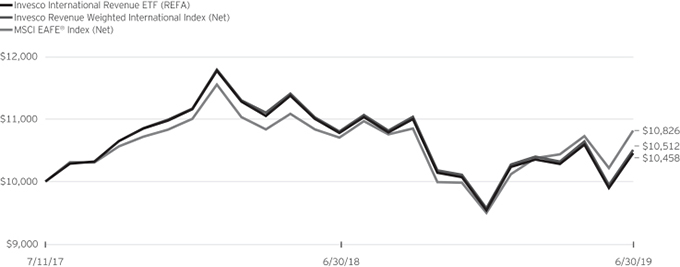
Fund Performance History as of June 30, 2019
| | | | | | | | | | | | | | | | |
| | | | | | | | | Fund Inception | |
| Index | | 1 Year | | | | | | Average
Annualized | | | Cumulative | |
| Invesco Revenue Weighted International Index (Net) | | | (2.76 | )% | | | | | | | 2.57 | % | | | 5.12 | % |
| MSCI EAFE® Index (Net) | | | 1.08 | | | | | | | | 4.11 | | | | 8.26 | |
| Fund | | | | | | | | | | | | | | | | |
| NAV Return | | | (3.03 | ) | | | | | | | 2.30 | | | | 4.58 | |
| Market Price Return | | | (2.80 | ) | | | | | | | 2.39 | | | | 4.77 | |
Oppenheimer International Revenue ETF (the ‘‘Predecessor Fund’’) Predecessor Fund Inception: July 11, 2017
Performance quoted above represents past performance. Past performance is not a guarantee of future results and current performance may be higher or lower than performance quoted. Investment returns and principal value will fluctuate, and shares of the Fund (“Fund Shares”), when redeemed or sold, may be worth more or less than their original cost. Fund performance reflects any applicable fee waivers and/or expense reimbursements. Had the adviser not waived fees and/or reimbursed expenses currently or in the past, returns would have been lower. See current prospectus for more information. According to the Fund’s current prospectus, the Fund’s expense ratio of 0.42% is expressed as a unitary management fee to cover operating expenses and expenses incurred in connection with managing the portfolio. NAV and Market Price returns assume that dividends and capital gain distributions have been reinvested in the Fund at NAV and Market Price, respectively. The returns shown in the table above do not reflect the deduction of taxes that a shareholder would pay on Fund distributions or the redemption or sale of Fund Shares. See invesco.com/ETFs to find the most recentmonth-end performance numbers.
Index and Benchmark Index performance results are based upon a hypothetical investment in their respective constituent securities. Index and Benchmark Index returns do not represent Fund returns. An investor cannot invest directly in an index. The Index and Benchmark Index does not charge management fees or brokerage expenses, and no such fees or expenses were deducted from the hypothetical performance shown. In addition, the results actual investors might have achieved would have differed from those shown because of differences in the timing, amounts of their investments, and fees and expenses associated with an investment in the Fund.
Notes Regarding Indexes and Fund Performance History:
| - | Average Annualized and Cumulative Inception returns for the Fund, Index and Benchmark Index are based on the inception date of the Predecessor Fund. |
| - | Net returns reflect reinvested dividends net of withholding taxes. |
| - | Effective after the close of business on May 24, 2019, the Predecessor Fund was reorganized into the Fund. Fund returns shown are blended returns of the Predecessor Fund and the Fund. |
| | |
| RGLB | | Manager’s Analysis |
| | Invesco Global Revenue ETF (RGLB) |
As an index fund, the Invesco Global Revenue ETF (the “Fund”) seeks to track the investment results (before fees and expenses) of the Invesco Revenue Weighted Global Index (the “Index”). The Fund generally will invest at least 90% of its total assets in the securities that comprise the Index, as well as American depositary receipts (“ADRs”) and global depositary receipts (“GDRs”) that represent securities in the Underlying Index.
Strictly in accordance with its guidelines and mandated procedures, MSCI, Inc. (“MSCI” or the “Index Provider”) compiles, maintains, and calculates the Index, which is constructed using a rules-based methodology thatre-weights the MSCI All Country World Index (the “Parent Index” or ‘‘Benchmark Index’’), an index designed to measure the equity market performance of developed and emerging markets, according to the revenue earned, subject to a maximum 5% per company weighting. Thus, the Index contains the same securities as the Parent Index, but in different proportions. The Fund does not purchase all of the securities in the Index; instead, the Fund utilizes a “sampling” methodology to seek to achieve its investment objective.
For the fiscal year ended June 30, 2019, on a market price basis, the Fund returned 1.45%. On a net asset value (“NAV”) basis, the Fund returned 1.26%. During the same time period, the Index returned 1.88%. During the fiscal year, the Fund utilized a sampling methodology to achieve exposure to the securities included in the Index; therefore, the Fund’s performance, on a NAV basis, differed from the return of the Index primarily due to fees and operating expenses that the Fund incurred and from the impact of the sampling methodology during the period.
During this same time period, the Benchmark Index returned 5.74%. The Benchmark Index is an unmanaged index weighted by market capitalization based on the average performance of approximately 2850 equity securities. The Benchmark Index was selected for its recognition in the market place, and because its performance comparison is a useful measure for investors as a broad representation of the overall global stock market.
The performance of the Fund differed from the Benchmark Index in part because the Fund seeks to track an Index that employs a revenue weighted methodology, whereas the Benchmark Index weights stocks based primarily on market capitalization.
Relative to the Benchmark Index, the Fund was most overweight in the energy sector and most underweight in the industrials sector during the fiscal year ended June 30, 2019. The majority of the Fund’s underperformance relative to the Benchmark Index during that period can be attributed to the Fund’s security selection in the industrials sector.
For the fiscal year ended June 30, 2019, the consumer staples sector contributed most significantly to the Fund’s return, followed by the financials and information technology sectors, respectively. The materials sector detracted most significantly from the Fund’s
return, followed by the consumer discretionary and industrials sectors, respectively.
Positions that contributed most significantly to the Fund’s return for the fiscal year ended June 30, 2019, included Walmart Inc., a consumer staples company (portfolio average weight of 1.47%) and Gazprom PJSC Sponsored ADR, an energy company (portfolio average weight of 0.35%). Positions that detracted most significantly from the Fund’s return during this period included Glencore plc, a materials company (portfolio average weight of 0.59%) and Hon Hai Precision Industry Co., Ltd., a materials company (portfolio average weight of 0.45%).
| | | | |
Sector Breakdown
(% of the Fund’s Net Assets)
as of June 30, 2019 | |
| Energy | | | 11.0 | |
| Capital Goods | | | 10.4 | |
| Banks | | | 8.0 | |
| Automobiles & Components | | | 7.1 | |
| Materials | | | 6.7 | |
| Food & Staples Retailing | | | 5.3 | |
| Insurance | | | 5.2 | |
| Health Care Equipment & Services | | | 5.1 | |
| Technology Hardware & Equipment | | | 5.1 | |
| Telecommunication Services | | | 4.2 | |
| Utilities | | | 4.1 | |
| Retailing | | | 3.7 | |
| Food, Beverage & Tobacco | | | 3.6 | |
| Diversified Financials | | | 3.2 | |
| Transportation | | | 2.7 | |
| Pharmaceuticals, Biotechnology & Life Sciences | | | 2.6 | |
| Software & Services | | | 2.4 | |
| Consumer Durables & Apparel | | | 2.0 | |
| Real Estate | | | 1.9 | |
| Media & Entertainment | | | 1.8 | |
| Money Market Fund | | | 1.5 | |
| Semiconductors & Semiconductor Equipment | | | 1.1 | |
| Consumer Services | | | 0.9 | |
| Household & Personal Products | | | 0.9 | |
| Commercial & Professional Services | | | 0.8 | |
| Liabilities in Excess of Other Assets | | | (1.3 | ) |
| Net Assets | | | 100.0 | |
Invesco Global Revenue ETF (RGLB)(continued)
| | | | |
Top Ten Fund Holdings*
(% of the Fund’s Net Assets)
as of June 30, 2019 | |
| Security | | | | |
| Walmart, Inc. | | | 1.49 | |
| Royal Dutch Shell PLC, Class A | | | 1.07 | |
| Toyota Motor Corp. | | | 0.91 | |
| BP PLC | | | 0.81 | |
| Exxon Mobil Corp. | | | 0.78 | |
| Apple, Inc. | | | 0.72 | |
| CVS Health Corp. | | | 0.67 | |
| Volkswagen AG | | | 0.65 | |
| Amazon.com, Inc. | | | 0.64 | |
| UnitedHealth Group, Inc. | | | 0.64 | |
| * | Excluding money market fund holdings. |
Growth of a $10,000 Investment
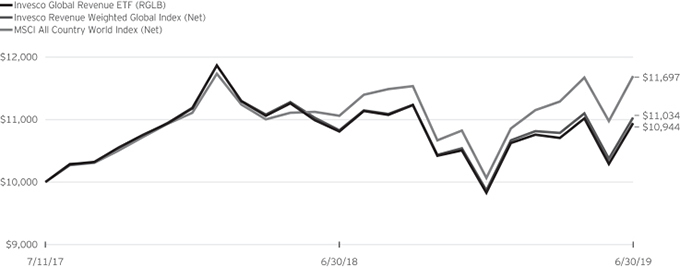
Fund Performance History as of June 30, 2019
| | | | | | | | | | | | | | | | |
| | | | | | | | | Fund Inception | |
| Index | | 1 Year | | | | | | Average
Annualized | | | Cumulative | |
| Invesco Revenue Weighted Global Index (Net) | | | 1.88 | % | | | | | | | 5.12 | % | | | 10.34 | % |
| MSCI All Country World Index (Net) | | | 5.74 | | | | | | | | 8.28 | | | | 16.97 | |
| Fund | | | | | | | | | | | | | | | | |
| NAV Return | | | 1.26 | | | | | | | | 4.69 | | | | 9.44 | |
| Market Price Return | | | 1.45 | | | | | | | | 4.72 | | | | 9.51 | |
Invesco Global Revenue ETF (RGLB)(continued)
Oppenheimer Global Revenue ETF (the ‘‘Predecessor Fund’’) Predecessor Fund Inception: July 11, 2017
Performance quoted above represents past performance. Past performance is not a guarantee of future results and current performance may be higher or lower than performance quoted. Investment returns and principal value will fluctuate, and shares of the Fund (“Fund Shares”), when redeemed or sold, may be worth more or less than their original cost. Fund performance reflects any applicable fee waivers and/or expense reimbursements. Had the adviser not waived fees and/or reimbursed expenses currently or in the past, returns would have been lower. See current prospectus for more information. According to the Fund’s current prospectus, the Fund’s expense ratio of 0.43% is expressed as a unitary management fee to cover operating expenses and expenses incurred in connection with managing the portfolio. NAV and Market Price returns assume that dividends and capital gain distributions have been reinvested in the Fund at NAV and Market Price, respectively. The returns shown in the table above do not reflect the deduction of taxes that a shareholder would pay on Fund distributions or the redemption or sale of Fund Shares. See invesco.com/ETFs to find the most recentmonth-end performance numbers.
Index and Benchmark Index performance results are based upon a hypothetical investment in their respective constituent securities. Index and Benchmark Index returns do not represent Fund returns. An investor cannot invest directly in an index. The Index and Benchmark Index does not charge management fees or brokerage expenses, and no such fees or expenses were deducted from the hypothetical performance shown. In addition, the results actual investors might have achieved would have differed from those shown because of differences in the timing, amounts of their investments, and fees and expenses associated with an investment in the Fund.
Notes Regarding Indexes and Fund Performance History:
| - | Average Annualized and Cumulative Inception returns for the Fund, Index and Benchmark Index are based on the inception date of the Predecessor Fund. |
| - | Net returns reflect reinvested dividends net of withholding taxes. |
| - | Effective after the close of business on May 24, 2019, the Predecessor Fund was reorganized into the Fund. Fund returns shown are blended returns of the Predecessor Fund and the Fund. |
| | |
| ESGF | | Manager’s Analysis |
| | Invesco Global ESG Revenue ETF (ESGF) |
As an index fund, the Invesco Global ESG Revenue ETF (the “Fund”) seeks to track the investment results (before fees and expenses) of the Invesco Revenue Weighted Global ESG Index (the “Index”). The Fund generally will invest at least 90% of its total assets in the securities that comprise the Index, as well as American depositary receipts (“ADRs”) and global depositary receipts (“GDRs”) that represent securities in the Index.
Strictly in accordance with its guidelines and mandated procedures, MSCI, Inc. (“MSCI” or the “Index Provider”) compiles, maintains, and calculates the Index, which is constructed using a rules-based methodology to select companies from within the MSCI All Country World Index (the “Parent Index” or ‘‘Benchmark Index”), an index designed to measure the equity market performance of developed and emerging markets, that have strong environmental, social and governance (“ESG”) practices, as identified by MSCI ESG Research, Inc., and thenre-weight those companies according to the revenue earned, subject to a maximum 5% per company weighting. The Index is constructed by using a scoring system established by MSCI ESG Research, Inc. to measure the strength of each pillar of environmental, social, and governance practices for each company within the Parent Index. Based on that scoring, the top half of companies with ESG score are selected for inclusion in the Index, and those that are selected are thenre-weighted according to revenue earned. Thus, the Index contains a subset of the securities in the Parent Index, in different proportions. The Fund generally invests in all of the securities comprising the Index in proportion to their weightings in the Index.
For the fiscal year ended June 30, 2019, on a market price basis, the Fund returned 1.47%. On a net asset value (“NAV”) basis, the Fund returned 1.37%. During the same time period, the Index returned 1.44%. During the fiscal year, the Fund fully replicated the components of the Index; therefore, the Fund’s performance, on a NAV basis, differed from the return of the Index primarily due to fees and operating expenses that the Fund incurred during the period.
During this same time period, the Benchmark Index returned 5.74%. The Benchmark Index is an unmanaged index weighted by market capitalization based on the average performance of approximately 1,636 securities. The Benchmark Index was selected for its recognition in the market place, and because its performance comparison is a useful measure for investors as a broad representation of the global developed equity markets.
The performance of the Fund differed from the Benchmark Index in part because the Fund seeks to track an Index that employs a revenue weighted methodology, whereas the Benchmark Index weights stocks based primarily on market capitalization.
Relative to the Benchmark Index, the Fund was most overweight in the industrials sector and most underweight in the information technology sector during the fiscal year ended June 30, 2019. The majority of the Fund’s underperformance relative to the Benchmark Index during that period can be attributed to the Fund being underweight in the information technology sector.
For the fiscal year ended June 30, 2019, the information technology sector contributed most significantly to the Fund’s return, followed by the utilities and industrials sectors, respectively. The energy sector detracted most significantly from the Fund’s return, followed by the consumer discretionary and materials sectors, respectively.
Positions that contributed most significantly to the Fund’s return for the fiscal year ended June 30, 2019, included Advanced Microsoft Corporation, an information technology company (portfolio average weight of 0.58%) and Nestle S.A., a consumer staples company (portfolio average weight of 0.44%). Positions that detracted most significantly from the Fund’s return during this period included Panasonic Corporation, a consumer discretionary company (portfolio average weight of 0.40%) and JXTG Holdings, Inc., an energy company (portfolio average weight of 0.56%).
Invesco Global ESG Revenue ETF (ESGF)(continued)
| | | | |
Sector Breakdown
(% of the Fund’s Net Assets)
as of June 30, 2019 | |
| Capital Goods | | | 11.2 | |
| Energy | | | 9.4 | |
| Banks | | | 8.1 | |
| Materials | | | 6.4 | |
| Technology Hardware & Equipment | | | 5.9 | |
| Automobiles & Components | | | 5.8 | |
| Insurance | | | 4.9 | |
| Health Care Equipment & Services | | | 4.8 | |
| Utilities | | | 4.7 | |
| Food, Beverage & Tobacco | | | 4.2 | |
| Food & Staples Retailing | | | 4.1 | |
| Telecommunication Services | | | 4.1 | |
| Diversified Financials | | | 3.7 | |
| Pharmaceuticals, Biotechnology & Life Sciences | | | 3.3 | |
| Retailing | | | 3.2 | |
| Software & Services | | | 3.1 | |
| Consumer Durables & Apparel | | | 2.8 | |
| Transportation | | | 2.8 | |
| Money Market Fund | | | 2.1 | |
| Media & Entertainment | | | 1.7 | |
| Household & Personal Products | | | 1.5 | |
| Real Estate | | | 1.2 | |
| Semiconductors & Semiconductor Equipment | | | 1.2 | |
| Commercial & Professional Services | | | 1.0 | |
| Consumer Services | | | 0.8 | |
| Liabilities in Excess of Other Assets | | | (2.0 | ) |
| Net Assets | | | 100.0 | |
| | | | |
Top Ten Fund Holdings*
(% of the Fund’s Net Assets)
as of June 30, 2019 | |
| Security | | | | |
| Toyota Motor Corp. | | | 1.43 | |
| BP PLC | | | 1.29 | |
| Apple, Inc. | | | 1.20 | |
| CVS Health Corp. | | | 1.11 | |
| Samsung Electronics Co. Ltd. | | | 0.95 | |
| Royal Dutch Shell PLC, Class A | | | 0.94 | |
| AmerisourceBergen Corp. | | | 0.84 | |
| TOTAL SA | | | 0.82 | |
| Exor NV | | | 0.78 | |
| Royal Dutch Shell PLC, Class B | | | 0.78 | |
| * | Excluding money market fund holdings. |
Invesco Global ESG Revenue ETF (ESGF)(continued)
Growth of a $10,000 Investment
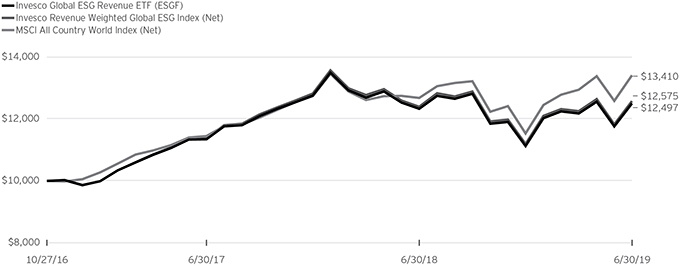
Fund Performance History as of June 30, 2019
| | | | | | | | | | | | | | | | |
| | | | | | | | | Fund Inception | |
| Index | | 1 Year | | | | | | Average
Annualized | | | Cumulative | |
| Invesco Revenue Weighted Global ESG Index (Net) | | | 1.44 | % | | | | | | | 8.94 | % | | | 25.75 | % |
| MSCI All Country World Index (Net) | | | 5.74 | | | | | | | | 11.58 | | | | 34.10 | |
| Fund | | | | | | | | | | | | | | | | |
| NAV Return | | | 1.37 | | | | | | | | 8.68 | | | | 24.97 | |
| Market Price Return | | | 1.47 | | | | | | | | 8.86 | | | | 25.51 | |
Oppenheimer Global EGS Revenue ETF (the “Predecessor Fund”) Predecessor Fund Inception: October 27, 2016
Performance quoted above represents past performance. Past performance is not a guarantee of future results and current performance may be higher or lower than performance quoted. Investment returns and principal value will fluctuate, and shares of the Fund (“Fund Shares”), when redeemed or sold, may be worth more or less than their original cost. Fund performance reflects any applicable fee waivers and/or expense reimbursements. Had the adviser not waived fees and/or reimbursed expenses currently or in the past, returns would have been lower. See current prospectus for more information. According to the Fund’s current prospectus, the Fund’s expense ratio of 0.45% is expressed as a unitary management fee to cover operating expenses and expenses incurred in connection with managing the portfolio. NAV and Market Price returns assume that dividends and capital gain distributions have been reinvested in the Fund at NAV and Market Price, respectively. The returns shown in the table above do not reflect the deduction of taxes that a shareholder would pay on Fund distributions or the redemption or sale of Fund Shares. See invesco.com/ETFs to find the most recentmonth-end performance numbers.
Index and Benchmark Index performance results are based upon a hypothetical investment in their respective constituent securities. Index and Benchmark Index returns do not represent Fund returns. An investor cannot invest directly in an index. The Index and Benchmark Index does not charge management fees or brokerage expenses, and no such fees or expenses were deducted from the hypothetical performance shown. In addition, the results actual investors might have achieved would have differed from those shown because of differences in the timing, amounts of their investments, and fees and expenses associated with an investment in the Fund.
Notes Regarding Indexes and Fund Performance History:
| - | Average Annualized and Cumulative Inception returns for the Fund, Index and Benchmark Index are based on the inception date of the Predecessor Fund. |
| - | Net returns reflect reinvested dividends net of withholding taxes. |
| - | Effective after the close of business on May 24, 2019, the Predecessor Fund was reorganized into the Fund. Fund returns shown are blended returns of the Predecessor Fund and the Fund. |
Schedule of Investments
Invesco S&P 500 Revenue ETF (RWL)
June 30, 2019
| | | | | | | | |
| Shares | | | | | Value | |
| | | | Common Stocks—100.0% | | | |
| | | | Automobiles & Components—2.8% | | | |
| | 14,754 | | | Aptiv PLC | | $ | 1,192,566 | |
| | 19,464 | | | BorgWarner, Inc. | | | 817,099 | |
| | 1,224,620 | | | Ford Motor Co. | | | 12,527,862 | |
| | 314,845 | | | General Motors Co. | | | 12,130,978 | |
| | 12,402 | | | Harley-Davidson, Inc. | | | 444,364 | |
| | | | | | | | |
| | | | Total Automobiles & Components | | | 27,112,869 | |
| | | | | | | | |
| | | | Banks—4.8% | | | |
| | 305,821 | | | Bank of America Corp. | | | 8,868,809 | |
| | 20,338 | | | BB&T Corp. | | | 999,206 | |
| | 114,025 | | | Citigroup, Inc. | | | 7,985,171 | |
| | 16,317 | | | Citizens Financial Group, Inc. | | | 576,969 | |
| | 4,039 | | | Comerica, Inc. | | | 293,393 | |
| | 23,022 | | | Fifth Third Bancorp | | | 642,314 | |
| | 2,994 | | | First Republic Bank | | | 292,364 | |
| | 30,992 | | | Huntington Bancshares, Inc. | | | 428,309 | |
| | 95,642 | | | JPMorgan Chase & Co. | | | 10,692,776 | |
| | 33,510 | | | KeyCorp | | | 594,802 | |
| | 3,018 | | | M&T Bank Corp. | | | 513,271 | |
| | 9,425 | | | People’s United Financial, Inc. | | | 158,152 | |
| | 11,545 | | | PNC Financial Services Group, Inc. (The) | | | 1,584,898 | |
| | 34,369 | | | Regions Financial Corp. | | | 513,473 | |
| | 12,584 | | | SunTrust Banks, Inc. | | | 790,904 | |
| | 1,031 | | | SVB Financial Group1 | | | 231,552 | |
| | 36,970 | | | U.S. Bancorp | | | 1,937,228 | |
| | 172,997 | | | Wells Fargo & Co. | | | 8,186,218 | |
| | 5,362 | | | Zions Bancorp NA | | | 246,545 | |
| | | | | | | | |
| | | | Total Banks | | | 45,536,354 | |
| | | | | | | | |
| | | | Capital Goods—8.0% | | | |
| | 14,997 | | | 3M Co. | | | 2,599,580 | |
| | 5,343 | | | A.O. Smith Corp. | | | 251,976 | |
| | 2,031 | | | Allegion PLC | | | 224,527 | |
| | 4,511 | | | AMETEK, Inc. | | | 409,779 | |
| | 47,449 | | | Arconic, Inc. | | | 1,225,133 | |
| | 22,310 | | | Boeing Co. (The) | | | 8,121,063 | |
| | 33,605 | | | Caterpillar, Inc. | | | 4,580,026 | |
| | 11,421 | | | Cummins, Inc. | | | 1,956,874 | |
| | 19,926 | | | Deere & Co. | | | 3,301,938 | |
| | 5,700 | | | Dover Corp. | | | 571,140 | |
| | 21,361 | | | Eaton Corp. PLC | | | 1,778,944 | |
| | 22,235 | | | Emerson Electric Co. | | | 1,483,519 | |
| | 12,424 | | | Fastenal Co. | | | 404,898 | |
| | 6,031 | | | Flowserve Corp. | | | 317,773 | |
| | 7,042 | | | Fortive Corp. | | | 574,064 | |
| | 7,953 | | | Fortune Brands Home & Security, Inc. | | | 454,355 | |
| | 17,111 | | | General Dynamics Corp. | | | 3,111,122 | |
| | 904,442 | | | General Electric Co. | | | 9,496,641 | |
| | 2,680 | | | Harris Corp.1 | | | 506,868 | |
| | 18,022 | | | Honeywell International, Inc. | | | 3,146,461 | |
| | 3,016 | | | Huntington Ingalls Industries, Inc. | | | 677,816 | |
| | 7,557 | | | Illinois Tool Works, Inc. | | | 1,139,671 | |
| | 9,835 | | | Ingersoll-Rand PLC | | | 1,245,800 | |
| | 14,269 | | | Jacobs Engineering Group, Inc. | | | 1,204,161 | |
| | 53,645 | | | Johnson Controls International PLC | | | 2,216,075 | |
| | 12,463 | | | Lockheed Martin Corp. | | | 4,530,799 | |
| | 16,846 | | | Masco Corp. | | | 661,037 | |
| | 7,879 | | | Northrop Grumman Corp. | | | 2,545,784 | |
| | | | | | | | |
| Shares | | | | | Value | |
| | | | Common Stocks (continued) | | | |
| | | | Capital Goods (continued) | | | |
| | 26,862 | | | PACCAR, Inc. | | $ | 1,924,931 | |
| | 6,803 | | | Parker-Hannifin Corp. | | | 1,156,578 | |
| | 6,338 | | | Pentair PLC | | | 235,774 | |
| | 23,655 | | | Quanta Services, Inc. | | | 903,385 | |
| | 11,991 | | | Raytheon Co. | | | 2,084,995 | |
| | 3,321 | | | Rockwell Automation, Inc. | | | 544,079 | |
| | 1,120 | | | Roper Technologies, Inc. | | | 410,211 | |
| | 1,912 | | | Snap-on, Inc. | | | 316,704 | |
| | 7,703 | | | Stanley Black & Decker, Inc. | | | 1,113,931 | |
| | 21,542 | | | Textron, Inc. | | | 1,142,588 | |
| | 854 | | | TransDigm Group, Inc.1 | | | 413,165 | |
| | 5,302 | | | United Rentals, Inc.1 | | | 703,204 | |
| | 42,716 | | | United Technologies Corp. | | | 5,561,623 | |
| | 3,193 | | | W.W. Grainger, Inc. | | | 856,458 | |
| | 5,570 | | | Wabtec Corp.2 | | | 399,703 | |
| | 4,985 | | | Xylem, Inc. | | | 416,945 | |
| | | | | | | | |
| | | | Total Capital Goods | | | 76,922,098 | |
| | | | | | | | |
| | | | Commercial & Professional Services—0.5% | | | |
| | 2,219 | | | Cintas Corp. | | | 526,547 | |
| | 2,046 | | | Copart, Inc.1 | | | 152,918 | |
| | 1,988 | | | Equifax, Inc. | | | 268,857 | |
| | 5,377 | | | IHS Markit Ltd.1 | | | 342,622 | |
| | 21,675 | | | Nielsen Holdings PLC | | | 489,855 | |
| | 8,966 | | | Republic Services, Inc. | | | 776,814 | |
| | 8,069 | | | Robert Half International, Inc. | | | 460,014 | |
| | 3,780 | | | Rollins, Inc. | | | 135,589 | |
| | 1,301 | | | Verisk Analytics, Inc. | | | 190,544 | |
| | 10,190 | | | Waste Management, Inc. | | | 1,175,620 | |
| | | | | | | | |
| | | | Total Commercial & Professional Services | | | 4,519,380 | |
| | | | | | | | |
| | | | Consumer Durables & Apparel—1.6% | | | |
| | 12,079 | | | Capri Holdings Ltd.1 | | | 418,900 | |
| | 27,900 | | | D.R. Horton, Inc. | | | 1,203,327 | |
| | 3,295 | | | Garmin Ltd. | | | 262,941 | |
| | 32,236 | | | Hanesbrands, Inc. | | | 555,104 | |
| | 3,303 | | | Hasbro, Inc. | | | 349,061 | |
| | 9,085 | | | Leggett & Platt, Inc. | | | 348,591 | |
| | 30,949 | | | Lennar Corp., Class A | | | 1,499,788 | |
| | 5,081 | | | Mohawk Industries, Inc.1 | | | 749,295 | |
| | 45,476 | | | Newell Brands, Inc. | | | 701,240 | |
| | 35,844 | | | NIKE, Inc., Class B | | | 3,009,104 | |
| | 24,035 | | | PulteGroup, Inc. | | | 759,987 | |
| | 8,512 | | | PVH Corp. | | | 805,576 | |
| | 4,351 | | | Ralph Lauren Corp. | | | 494,230 | |
| | 15,688 | | | Tapestry, Inc. | | | 497,780 | |
| | 7,439 | | | Under Armour, Inc., Class A1 | | | 188,579 | |
| | 8,438 | | | Under Armour, Inc., Class C1 | | | 187,324 | |
| | 12,126 | | | VF Corp. | | | 1,059,206 | |
| | 11,896 | | | Whirlpool Corp. | | | 1,693,514 | |
| | | | | | | | |
| | | | Total Consumer Durables & Apparel | | | 14,783,547 | |
| | | | | | | | |
| | | | Consumer Services—1.2% | | | |
| | 28,109 | | | Carnival Corp. | | | 1,308,474 | |
| | 529 | | | Chipotle Mexican Grill, Inc.1 | | | 387,694 | |
| | 5,442 | | | Darden Restaurants, Inc. | | | 662,455 | |
| | 8,505 | | | H&R Block, Inc. | | | 249,196 | |
| | 7,477 | | | Hilton Worldwide Holdings, Inc. | | | 730,802 | |
| | 12,004 | | | Marriott International, Inc., Class A | | | 1,684,041 | |
The accompanying notes are an integral part of these financial statements.
Invesco S&P 500 Revenue ETF (RWL)(continued)
June 30, 2019
| | | | | | | | |
| Shares | | | | | Value | |
| | | | Common Stocks (continued) | | | |
| | | | Consumer Services (continued) | | | |
| | 7,855 | | | McDonald’s Corp. | | $ | 1,631,169 | |
| | 33,855 | | | MGM Resorts International | | | 967,237 | |
| | 8,777 | | | Norwegian Cruise Line Holdings Ltd.1 | | | 470,711 | |
| | 6,167 | | | Royal Caribbean Cruises Ltd. | | | 747,502 | |
| | 23,436 | | | Starbucks Corp. | | | 1,964,640 | |
| | 4,447 | | | Wynn Resorts Ltd. | | | 551,384 | |
| | 3,923 | | | Yum! Brands, Inc. | | | 434,158 | |
| | | | | | | | |
| | | | Total Consumer Services | | | 11,789,463 | |
| | | | | | | | |
| | | | Diversified Financials—5.0% | | | |
| | 2,023 | | | Affiliated Managers Group, Inc. | | | 186,399 | |
| | 28,003 | | | American Express Co. | | | 3,456,690 | |
| | 6,349 | | | Ameriprise Financial, Inc. | | | 921,621 | |
| | 33,945 | | | Bank of New York Mellon Corp. (The) | | | 1,498,672 | |
| | 93,896 | | | Berkshire Hathaway, Inc., Class B1 | | | 20,015,810 | |
| | 2,436 | | | BlackRock, Inc. | | | 1,143,215 | |
| | 28,439 | | | Capital One Financial Corp. | | | 2,580,555 | |
| | 1,860 | | | Cboe Global Markets, Inc. | | | 192,752 | |
| | 21,619 | | | Charles Schwab Corp. (The) | | | 868,868 | |
| | 1,732 | | | CME Group, Inc. | | | 336,198 | |
| | 13,173 | | | Discover Financial Services | | | 1,022,093 | |
| | 5,319 | | | E*TRADE Financial Corp. | | | 237,227 | |
| | 13,407 | | | Franklin Resources, Inc.2 | | | 466,564 | |
| | 20,973 | | | Goldman Sachs Group, Inc. (The) | | | 4,291,076 | |
| | 5,713 | | | Intercontinental Exchange, Inc. | | | 490,975 | |
| | 19,135 | | | Invesco Ltd.3 | | | 391,502 | |
| | 29,905 | | | Jefferies Financial Group, Inc. | | | 575,073 | |
| | 1,801 | | | Moody’s Corp. | | | 351,753 | |
| | 91,705 | | | Morgan Stanley | | | 4,017,596 | |
| | 486 | | | MSCI, Inc. | | | 116,052 | |
| | 3,466 | | | Nasdaq, Inc. | | | 333,325 | |
| | 6,031 | | | Northern Trust Corp. | | | 542,790 | |
| | 7,258 | | | Raymond James Financial, Inc. | | | 613,664 | |
| | 2,159 | | | S&P Global, Inc. | | | 491,799 | |
| | 17,214 | | | State Street Corp. | | | 965,017 | |
| | 35,233 | | | Synchrony Financial | | | 1,221,528 | |
| | 3,918 | | | T. Rowe Price Group, Inc. | | | 429,844 | |
| | | | | | | | |
| | | | Total Diversified Financials | | | 47,758,658 | |
| | | | | | | | |
| | | | Energy—9.2% | | | |
| | 14,593 | | | Anadarko Petroleum Corp. | | | 1,029,682 | |
| | 20,434 | | | Apache Corp. | | | 591,973 | |
| | 80,563 | | | Baker Hughes a GE Co. | | | 1,984,267 | |
| | 7,508 | | | Cabot Oil & Gas Corp. | | | 172,384 | |
| | 100,183 | | | Chevron Corp. | | | 12,466,772 | |
| | 3,324 | | | Cimarex Energy Co. | | | 197,213 | |
| | 3,385 | | | Concho Resources, Inc. | | | 349,264 | |
| | 48,279 | | | ConocoPhillips | | | 2,945,019 | |
| | 30,278 | | | Devon Energy Corp. | | | 863,529 | |
| | 2,000 | | | Diamondback Energy, Inc. | | | 217,940 | |
| | 15,963 | | | EOG Resources, Inc. | | | 1,487,113 | |
| | 285,745 | | | Exxon Mobil Corp. | | | 21,896,639 | |
| | 86,717 | | | Halliburton Co. | | | 1,971,945 | |
| | 4,482 | | | Helmerich & Payne, Inc. | | | 226,879 | |
| | 8,898 | | | Hess Corp. | | | 565,646 | |
| | 33,541 | | | HollyFrontier Corp. | | | 1,552,277 | |
| | 53,508 | | | Kinder Morgan, Inc. | | | 1,117,247 | |
| | 33,131 | | | Marathon Oil Corp. | | | 470,791 | |
| | 169,216 | | | Marathon Petroleum Corp. | | | 9,455,790 | |
| | | | | | | | |
| Shares | | | | | Value | |
| | | | Common Stocks (continued) | | | |
| | | | Energy (continued) | | | |
| | 33,233 | | | National Oilwell Varco, Inc. | | $ | 738,770 | |
| | 16,932 | | | Noble Energy, Inc. | | | 379,277 | |
| | 28,079 | | | Occidental Petroleum Corp. | | | 1,411,812 | |
| | 14,710 | | | ONEOK, Inc. | | | 1,012,195 | |
| | 99,750 | | | Phillips 66 | | | 9,330,615 | |
| | 5,069 | | | Pioneer Natural Resources Co. | | | 779,916 | |
| | 70,686 | | | Schlumberger Ltd. | | | 2,809,062 | |
| | 41,972 | | | TechnipFMC PLC | | | 1,088,754 | |
| | 115,155 | | | Valero Energy Corp. | | | 9,858,419 | |
| | 24,772 | | | Williams Cos., Inc. (The) | | | 694,607 | |
| | | | | | | | |
| | | | Total Energy | | | 87,665,797 | |
| | | | | | | | |
| | | | Food & Staples Retailing—7.9% | | | |
| | 44,278 | | | Costco Wholesale Corp. | | | 11,700,904 | |
| | 384,322 | | | Kroger Co. (The) | | | 8,343,631 | |
| | 64,130 | | | Sysco Corp. | | | 4,535,274 | |
| | 199,323 | | | Walgreens Boots Alliance, Inc. | | | 10,896,988 | |
| | 364,440 | | | Walmart, Inc. | | | 40,266,976 | |
| | | | | | | | |
| | | | Total Food & Staples Retailing | | | 75,743,773 | |
| | | | | | | | |
| | | | Food, Beverage & Tobacco—3.3% | | | |
| | 29,394 | | | Altria Group, Inc. | | | 1,391,806 | |
| | 120,668 | | | Archer-Daniels-Midland Co. | | | 4,923,254 | |
| | 4,557 | | | Brown-Forman Corp., Class B | | | 252,595 | |
| | 17,928 | | | Campbell Soup Co. | | | 718,375 | |
| | 48,352 | | | Coca-Cola Co. (The) | | | 2,462,084 | |
| | 22,995 | | | Conagra Brands, Inc. | | | 609,827 | |
| | 3,342 | | | Constellation Brands, Inc., Class A | | | 658,173 | |
| | 24,009 | | | General Mills, Inc. | | | 1,260,953 | |
| | 4,383 | | | Hershey Co. (The) | | | 587,453 | |
| | 17,886 | | | Hormel Foods Corp.2 | | | 725,098 | |
| | 4,912 | | | JM Smucker Co. (The) | | | 565,813 | |
| | 18,651 | | | Kellogg Co. | | | 999,134 | |
| | 66,948 | | | Kraft Heinz Co. (The) | | | 2,078,066 | |
| | 4,597 | | | Lamb Weston Holdings, Inc. | | | 291,266 | |
| | 2,674 | | | McCormick & Co., Inc. | | | 414,497 | |
| | 15,371 | | | Molson Coors Brewing Co., Class B | | | 860,776 | |
| | 36,101 | | | Mondelez International, Inc., Class A | | | 1,945,844 | |
| | 4,917 | | | Monster Beverage Corp.1 | | | 313,852 | |
| | 37,612 | | | PepsiCo, Inc. | | | 4,932,062 | |
| | 29,472 | | | Philip Morris International, Inc. | | | 2,314,436 | |
| | 38,336 | | | Tyson Foods, Inc., Class A | | | 3,095,249 | |
| | | | | | | | |
| | | | Total Food, Beverage & Tobacco | | | 31,400,613 | |
| | | | | | | | |
| | | | Health Care Equipment & Services—12.8% | | | |
| | 28,876 | | | Abbott Laboratories | | | 2,428,472 | |
| | 237 | | | ABIOMED, Inc.1 | | | 61,736 | |
| | 526 | | | Align Technology, Inc.1 | | | 143,966 | |
| | 158,619 | | | AmerisourceBergen Corp. | | | 13,523,856 | |
| | 25,395 | | | Anthem, Inc. | | | 7,166,723 | |
| | 10,991 | | | Baxter International, Inc. | | | 900,163 | |
| | 5,622 | | | Becton Dickinson and Co. | | | 1,416,800 | |
| | 18,998 | | | Boston Scientific Corp.1 | | | 816,534 | |
| | 250,196 | | | Cardinal Health, Inc. | | | 11,784,232 | |
| | 94,328 | | | Centene Corp.1 | | | 4,946,560 | |
| | 5,855 | | | Cerner Corp. | | | 429,171 | |
| | 36,480 | | | Cigna Corp. | | | 5,747,424 | |
| | 622 | | | Cooper Cos., Inc. (The) | | | 209,546 | |
| | 298,737 | | | CVS Health Corp. | | | 16,278,179 | |
| | 11,113 | | | Danaher Corp. | | | 1,588,270 | |
The accompanying notes are an integral part of these financial statements.
Invesco S&P 500 Revenue ETF (RWL)(continued)
June 30, 2019
| | | | | | | | |
| Shares | | | | | Value | |
| | | | Common Stocks (continued) | | | |
| | | | Health Care Equipment & Services (continued) | |
| | 17,862 | | | DaVita, Inc.1 | | $ | 1,004,916 | |
| | 5,419 | | | DENTSPLY SIRONA, Inc. | | | 316,253 | |
| | 1,613 | | | Edwards Lifesciences Corp.1 | | | 297,986 | |
| | 29,152 | | | HCA Healthcare, Inc. | | | 3,940,476 | |
| | 13,383 | | | Henry Schein, Inc.1 | | | 935,472 | |
| | 5,309 | | | Hologic, Inc.1 | | | 254,938 | |
| | 18,025 | | | Humana, Inc. | | | 4,782,033 | |
| | 655 | | | IDEXX Laboratories, Inc.1 | | | 180,341 | |
| | 599 | | | Intuitive Surgical, Inc.1 | | | 314,205 | |
| | 5,237 | | | Laboratory Corp. of America Holdings1 | | | 905,477 | |
| | 124,027 | | | McKesson Corp. | | | 16,667,989 | |
| | 24,217 | | | Medtronic PLC | | | 2,358,494 | |
| | 5,766 | | | Quest Diagnostics, Inc. | | | 587,036 | |
| | 1,657 | | | ResMed, Inc. | | | 202,204 | |
| | 5,486 | | | Stryker Corp. | | | 1,127,812 | |
| | 603 | | | Teleflex, Inc. | | | 199,683 | |
| | 72,637 | | | UnitedHealth Group, Inc. | | | 17,724,154 | |
| | 6,855 | | | Universal Health Services, Inc., Class B | | | 893,823 | |
| | 1,790 | | | Varian Medical Systems, Inc.1 | | | 243,673 | |
| | 6,064 | | | WellCare Health Plans, Inc.1 | | | 1,728,664 | |
| | 5,192 | | | Zimmer Biomet Holdings, Inc. | | | 611,306 | |
| | | | | | | | |
| | | | Total Health Care Equipment & Services | | | 122,718,567 | |
| | | | | | | | |
| | | | Household & Personal Products—1.1% | | | |
| | 4,197 | | | Church & Dwight Co., Inc. | | | 306,633 | |
| | 3,092 | | | Clorox Co. (The) | | | 473,416 | |
| | 16,261 | | | Colgate-Palmolive Co. | | | 1,165,426 | |
| | 50,269 | | | Coty, Inc., Class A | | | 673,605 | |
| | 6,362 | | | Estee Lauder Cos., Inc., (The), Class A | | | 1,164,946 | |
| | 10,327 | | | Kimberly-Clark Corp. | | | 1,376,382 | |
| | 46,356 | | | Procter & Gamble Co. (The) | | | 5,082,935 | |
| | | | | | | | |
| | | | Total Household & Personal Products | | | 10,243,343 | |
| | | | | | | | |
| | | | Insurance—3.9% | | | |
| | 31,498 | | | Aflac, Inc. | | | 1,726,405 | |
| | 30,668 | | | Allstate Corp. (The) | | | 3,118,629 | |
| | 70,163 | | | American International Group, Inc. | | | 3,738,285 | |
| | 4,388 | | | Aon PLC | | | 846,796 | |
| | 6,070 | | | Arthur J. Gallagher & Co. | | | 531,671 | |
| | 6,415 | | | Assurant, Inc. | | | 682,428 | |
| | 16,769 | | | Chubb Ltd. | | | 2,469,906 | |
| | 4,738 | | | Cincinnati Financial Corp. | | | 491,188 | |
| | 2,309 | | | Everest Re Group Ltd. | | | 570,739 | |
| | 26,751 | | | Hartford Financial Services Group, Inc. (The) | | | 1,490,566 | |
| | 20,203 | | | Lincoln National Corp. | | | 1,302,083 | |
| | 20,527 | | | Loews Corp. | | | 1,122,211 | |
| | 11,795 | | | Marsh & McLennan Cos., Inc. | | | 1,176,551 | |
| | 108,247 | | | MetLife, Inc. | | | 5,376,629 | |
| | 20,818 | | | Principal Financial Group, Inc. | | | 1,205,779 | |
| | 31,985 | | | Progressive Corp. (The) | | | 2,556,561 | |
| | 48,962 | | | Prudential Financial, Inc. | | | 4,945,162 | |
| | 3,780 | | | Torchmark Corp. | | | 338,159 | |
| | 15,790 | | | Travelers Cos., Inc. (The) | | | 2,360,921 | |
| | 27,366 | | | Unum Group | | | 918,129 | |
| | 3,460 | | | Willis Towers Watson PLC | | | 662,728 | |
| | | | | | | | |
| | | | Total Insurance | | | 37,631,526 | |
| | | | | | | | |
| | | | Materials—3.2% | | | |
| | 3,171 | | | Air Products & Chemicals, Inc. | | | 717,819 | |
| | 3,691 | | | Albemarle Corp.2 | | | 259,883 | |
| | | | | | | | |
| Shares | | | | | Value | |
| | | | Common Stocks (continued) | | | |
| | | | Materials (continued) | | | |
| | 94,740 | | | Amcor PLC1 | | $ | 1,088,563 | |
| | 4,986 | | | Avery Dennison Corp. | | | 576,781 | |
| | 13,741 | | | Ball Corp. | | | 961,733 | |
| | 5,193 | | | Celanese Corp. | | | 559,805 | |
| | 7,514 | | | CF Industries Holdings, Inc. | | | 350,979 | |
| | 70,448 | | | Corteva, Inc.1 | | | 2,083,147 | |
| | 72,258 | | | Dow, Inc. | | | 3,563,042 | |
| | 8,032 | | | DuPont de Nemours, Inc. | | | 602,962 | |
| | 10,604 | | | Eastman Chemical Co. | | | 825,309 | |
| | 5,720 | | | Ecolab, Inc. | | | 1,129,357 | |
| | 4,554 | | | FMC Corp. | | | 377,754 | |
| | 128,097 | | | Freeport-McMoRan, Inc. | | | 1,487,206 | |
| | 2,266 | | | International Flavors & Fragrances, Inc.2 | | | 328,774 | |
| | 41,933 | | | International Paper Co. | | | 1,816,538 | |
| | 7,184 | | | Linde PLC | | | 1,442,547 | |
| | 33,962 | | | LyondellBasell Industries NV, Class A | | | 2,925,147 | |
| | 1,512 | | | Martin Marietta Materials, Inc. | | | 347,926 | |
| | 33,016 | | | Mosaic Co. (The) | | | 826,391 | |
| | 15,578 | | | Newmont Goldcorp Corp. | | | 599,286 | |
| | 38,258 | | | Nucor Corp. | | | 2,108,016 | |
| | 5,722 | | | Packaging Corp. of America | | | 545,421 | |
| | 10,089 | | | PPG Industries, Inc. | | | 1,177,487 | |
| | 8,220 | | | Sealed Air Corp. | | | 351,652 | |
| | 2,880 | | | Sherwin-Williams Co. (The) | | | 1,319,875 | |
| | 2,638 | | | Vulcan Materials Co. | | | 362,224 | |
| | 37,130 | | | WestRock Co. | | | 1,354,131 | |
| | | | | | | | |
| | | | Total Materials | | | 30,089,755 | |
| | | | | | | | |
| | | | Media & Entertainment—4.4% | | | |
| | 12,418 | | | Activision Blizzard, Inc. | | | 586,130 | |
| | 5,014 | | | Alphabet, Inc., Class A1 | | | 5,429,159 | |
| | 5,019 | | | Alphabet, Inc., Class C1 | | | 5,425,087 | |
| | 23,535 | | | CBS Corp., Class B | | | 1,174,396 | |
| | 8,709 | | | Charter Communications, Inc., Class A1 | | | 3,441,623 | |
| | 179,213 | | | Comcast Corp., Class A | | | 7,577,126 | |
| | 14,567 | | | Discovery, Inc., Class A1,2 | | | 447,207 | |
| | 15,750 | | | Discovery, Inc., Class C1 | | | 448,088 | |
| | 27,481 | | | DISH Network Corp., Class A1 | | | 1,055,545 | |
| | 4,110 | | | Electronic Arts, Inc.1 | | | 416,179 | |
| | 25,122 | | | Facebook, Inc., Class A1 | | | 4,848,546 | |
| | 12,432 | | | Fox Corp., Class A | | | 455,508 | |
| | 12,532 | | | Fox Corp., Class B | | | 457,794 | |
| | 34,687 | | | Interpublic Group of Cos., Inc. (The) | | | 783,579 | |
| | 3,779 | | | Netflix, Inc.1 | | | 1,388,102 | |
| | 33,644 | | | News Corp., Class A | | | 453,858 | |
| | 32,597 | | | News Corp., Class B | | | 455,054 | |
| | 14,735 | | | Omnicom Group, Inc. | | | 1,207,533 | |
| | 1,868 | | | Take-Two Interactive Software, Inc.1 | | | 212,074 | |
| | 2,736 | | | TripAdvisor, Inc.1 | | | 126,649 | |
| | 6,764 | | | Twitter, Inc.1 | | | 236,064 | |
| | 33,577 | | | Viacom, Inc., Class B | | | 1,002,945 | |
| | 32,435 | | | Walt Disney Co. (The) | | | 4,529,223 | |
| | | | | | | | |
| | | | Total Media & Entertainment | | | 42,157,469 | |
| | | | | | | | |
| | | | Pharmaceuticals, Biotechnology & Life Sciences—3.6% | |
| | 32,061 | | | AbbVie, Inc. | | | 2,331,476 | |
| | 5,543 | | | Agilent Technologies, Inc. | | | 413,896 | |
| | 2,832 | | | Alexion Pharmaceuticals, Inc.1 | | | 370,935 | |
| | 10,474 | | | Allergan PLC | | | 1,753,662 | |
The accompanying notes are an integral part of these financial statements.
Invesco S&P 500 Revenue ETF (RWL)(continued)
June 30, 2019
| | | | | | | | |
| Shares | | | | | Value | |
| | | | Common Stocks (continued) | | | |
| | | | Pharmaceuticals, Biotechnology & Life Sciences (continued) | |
| | 10,411 | | | Amgen, Inc. | | $ | 1,918,539 | |
| | 4,181 | | | Biogen, Inc.1 | | | 977,810 | |
| | 37,839 | | | Bristol-Myers Squibb Co. | | | 1,715,999 | |
| | 12,591 | | | Celgene Corp.1 | | | 1,163,912 | |
| | 16,562 | | | Eli Lilly & Co. | | | 1,834,904 | |
| | 26,003 | | | Gilead Sciences, Inc. | | | 1,756,763 | |
| | 766 | | | Illumina, Inc.1 | | | 282,003 | |
| | 1,986 | | | Incyte Corp.1 | | | 168,731 | |
| | 5,762 | | | IQVIA Holdings, Inc.1 | | | 927,106 | |
| | 44,759 | | | Johnson & Johnson | | | 6,234,033 | |
| | 40,055 | | | Merck & Co., Inc. | | | 3,358,612 | |
| | 289 | | | Mettler-Toledo International, Inc.1 | | | 242,760 | |
| | 51,048 | | | Mylan NV1 | | | 971,954 | |
| | 2,738 | | | Nektar Therapeutics1 | | | 97,418 | |
| | 2,314 | | | PerkinElmer, Inc. | | | 222,931 | |
| | 8,387 | | | Perrigo Co. PLC | | | 399,389 | |
| | 97,333 | | | Pfizer, Inc. | | | 4,216,466 | |
| | 1,750 | | | Regeneron Pharmaceuticals, Inc.1 | | | 547,750 | |
| | 6,674 | | | Thermo Fisher Scientific, Inc. | | | 1,960,020 | |
| | 1,477 | | | Vertex Pharmaceuticals, Inc.1 | | | 270,852 | |
| | 914 | | | Waters Corp.1 | | | 196,729 | |
| | 4,131 | | | Zoetis, Inc. | | | 468,827 | |
| | | | | | | | |
| | | | Total Pharmaceuticals, Biotechnology & Life Sciences | | | 34,803,477 | |
| | | | | | | | |
| | | | Real Estate—0.9% | | | |
| | 701 | | | Alexandria Real Estate Equities, Inc. | | | 98,904 | |
| | 2,758 | | | American Tower Corp. | | | 563,873 | |
| | 1,447 | | | Apartment Investment & Management Co., Class A | | | 72,524 | |
| | 850 | | | AvalonBay Communities, Inc. | | | 172,703 | |
| | 1,588 | | | Boston Properties, Inc. | | | 204,852 | |
| | 33,994 | | | CBRE Group, Inc., Class A1 | | | 1,743,892 | |
| | 3,220 | | | Crown Castle International Corp. | | | 419,727 | |
| | 2,004 | | | Digital Realty Trust, Inc. | | | 236,051 | |
| | 2,381 | | | Duke Realty Corp. | | | 75,263 | |
| | 793 | | | Equinix, Inc. | | | 399,902 | |
| | 2,562 | | | Equity Residential | | | 194,507 | |
| | 375 | | | Essex Property Trust, Inc. | | | 109,474 | |
| | 889 | | | Extra Space Storage, Inc. | | | 94,323 | |
| | 538 | | | Federal Realty Investment Trust | | | 69,273 | |
| | 4,342 | | | HCP, Inc. | | | 138,857 | |
| | 23,499 | | | Host Hotels & Resorts, Inc. | | | 428,152 | |
| | 10,319 | | | Iron Mountain, Inc. | | | 322,985 | |
| | 4,768 | | | Kimco Realty Corp. | | | 88,113 | |
| | 2,116 | | | Macerich Co. (The) | | | 70,865 | |
| | 1,043 | | | Mid-America Apartment Communities, Inc. | | | 122,824 | |
| | 2,786 | | | Prologis, Inc. | | | 223,158 | |
| | 933 | | | Public Storage | | | 222,213 | |
| | 1,456 | | | Realty Income Corp. | | | 100,420 | |
| | 1,254 | | | Regency Centers Corp. | | | 83,692 | |
| | 656 | | | SBA Communications Corp.1 | | | 147,495 | |
| | 2,673 | | | Simon Property Group, Inc. | | | 427,038 | |
| | 1,306 | | | SL Green Realty Corp. | | | 104,963 | |
| | 1,885 | | | UDR, Inc. | | | 84,618 | |
| | 4,341 | | | Ventas, Inc. | | | 296,707 | |
| | 3,028 | | | Vornado Realty Trust | | | 194,095 | |
| | 4,584 | | | Welltower, Inc. | | | 373,733 | |
| | 21,803 | | | Weyerhaeuser Co. | | | 574,291 | |
| | | | | | | | |
| | | | Total Real Estate | | | 8,459,487 | |
| | | | | | | | |
| | | | | | | | |
| Shares | | | | | Value | |
| | | | Common Stocks (continued) | | | |
| | | | Retailing—7.2% | |
| | 4,917 | | | Advance Auto Parts, Inc. | | $ | 757,906 | |
| | 9,956 | | | Amazon.com, Inc.1 | | | 18,852,980 | |
| | 796 | | | AutoZone, Inc.1 | | | 875,178 | |
| | 50,221 | | | Best Buy Co., Inc. | | | 3,501,910 | |
| | 628 | | | Booking Holdings, Inc.1 | | | 1,177,318 | |
| | 16,821 | | | CarMax, Inc.1 | | | 1,460,567 | |
| | 14,883 | | | Dollar General Corp. | | | 2,011,586 | |
| | 16,174 | | | Dollar Tree, Inc.1 | | | 1,736,926 | |
| | 21,393 | | | eBay, Inc. | | | 845,024 | |
| | 6,901 | | | Expedia Group, Inc. | | | 918,040 | |
| | 14,323 | | | Foot Locker, Inc. | | | 600,420 | |
| | 70,148 | | | Gap, Inc. (The) | | | 1,260,560 | |
| | 14,179 | | | Genuine Parts Co. | | | 1,468,661 | |
| | 40,982 | | | Home Depot, Inc. (The) | | | 8,523,027 | |
| | 32,528 | | | Kohl’s Corp. | | | 1,546,706 | |
| | 45,454 | | | L Brands, Inc. | | | 1,186,349 | |
| | 36,094 | | | LKQ Corp.1 | | | 960,461 | |
| | 55,306 | | | Lowe’s Cos., Inc. | | | 5,580,929 | |
| | 92,180 | | | Macy’s, Inc. | | | 1,978,183 | |
| | 37,304 | | | Nordstrom, Inc.2 | | | 1,188,506 | |
| | 1,925 | | | O’Reilly Automotive, Inc.1 | | | 710,941 | |
| | 11,635 | | | Ross Stores, Inc. | | | 1,153,261 | |
| | 66,731 | | | Target Corp. | | | 5,779,572 | |
| | 3,746 | | | Tiffany & Co. | | | 350,776 | |
| | 57,315 | | | TJX Cos., Inc. (The) | | | 3,030,817 | |
| | 5,870 | | | Tractor Supply Co. | | | 638,656 | |
| | 1,511 | | | Ulta Beauty, Inc.1 | | | 524,151 | |
| | | | | | | | |
| | | | Total Retailing | | | 68,619,411 | |
| | | | | | | | |
| | | | Semiconductors & Semiconductor Equipment—2.0% | |
| | 15,534 | | | Advanced Micro Devices, Inc.1,2 | | | 471,768 | |
| | 4,633 | | | Analog Devices, Inc. | | | 522,927 | |
| | 29,565 | | | Applied Materials, Inc. | | | 1,327,764 | |
| | 6,192 | | | Broadcom, Inc. | | | 1,782,429 | |
| | 117,897 | | | Intel Corp. | | | 5,643,729 | |
| | 3,084 | | | KLA-Tencor Corp. | | | 364,529 | |
| | 4,556 | | | Lam Research Corp. | | | 855,799 | |
| | 3,303 | | | Maxim Integrated Products, Inc. | | | 197,585 | |
| | 4,969 | | | Microchip Technology, Inc.2 | | | 430,812 | |
| | 70,947 | | | Micron Technology, Inc.1 | | | 2,737,845 | |
| | 5,732 | | | NVIDIA Corp. | | | 941,366 | |
| | 3,883 | | | Qorvo, Inc.1 | | | 258,647 | |
| | 23,876 | | | QUALCOMM, Inc. | | | 1,816,247 | |
| | 3,966 | | | Skyworks Solutions, Inc. | | | 306,453 | |
| | 11,226 | | | Texas Instruments, Inc. | | | 1,288,296 | |
| | 2,242 | | | Xilinx, Inc. | | | 264,377 | |
| | | | | | | | |
| | | | Total Semiconductors & Semiconductor Equipment | | | 19,210,573 | |
| | | | | | | | |
| | | | Software & Services—4.1% | |
| | 17,777 | | | Accenture PLC, Class A | | | 3,284,656 | |
| | 2,675 | | | Adobe, Inc.1 | | | 788,189 | |
| | 2,714 | | | Akamai Technologies, Inc.1 | | | 217,500 | |
| | 4,003 | | | Alliance Data Systems Corp. | | | 560,940 | |
| | 521 | | | ANSYS, Inc.1 | | | 106,711 | |
| | 1,343 | | | Autodesk, Inc.1 | | | 218,775 | |
| | 6,539 | | | Automatic Data Processing, Inc. | | | 1,081,093 | |
| | 2,712 | | | Broadridge Financial Solutions, Inc. | | | 346,268 | |
| | 2,508 | | | Cadence Design Systems, Inc.1 | | | 177,591 | |
The accompanying notes are an integral part of these financial statements.
Invesco S&P 500 Revenue ETF (RWL)(continued)
June 30, 2019
| | | | | | | | |
| Shares | | | | | Value | |
| | | | Common Stocks (continued) | | | |
| | | | Software & Services (continued) | |
| | 2,392 | | | Citrix Systems, Inc. | | $ | 234,751 | |
| | 20,464 | | | Cognizant Technology Solutions Corp., Class A | | | 1,297,213 | |
| | 31,008 | | | DXC Technology Co. | | | 1,710,091 | |
| | 5,364 | | | Fidelity National Information Services, Inc. | | | 658,055 | |
| | 5,101 | | | Fiserv, Inc.1 | | | 465,007 | |
| | 706 | | | FleetCor Technologies, Inc.1 | | | 198,280 | |
| | 1,914 | | | Fortinet, Inc.1 | | | 147,053 | |
| | 1,941 | | | Gartner, Inc.1 | | | 312,385 | |
| | 1,691 | | | Global Payments, Inc. | | | 270,780 | |
| | 44,748 | | | International Business Machines Corp. | | | 6,170,749 | |
| | 2,061 | | | Intuit, Inc. | | | 538,601 | |
| | 889 | | | Jack Henry & Associates, Inc. | | | 119,055 | |
| | 4,535 | | | Mastercard, Inc., Class A | | | 1,199,644 | |
| | 70,834 | | | Microsoft Corp. | | | 9,488,923 | |
| | 57,464 | | | Oracle Corp. | | | 3,273,724 | |
| | 3,269 | | | Paychex, Inc. | | | 269,006 | |
| | 10,564 | | | PayPal Holdings, Inc.1 | | | 1,209,155 | |
| | 1,403 | | | Red Hat, Inc.1 | | | 263,427 | |
| | 7,219 | | | salesforce.com, Inc.1 | | | 1,095,339 | |
| | 18,884 | | | Symantec Corp. | | | 410,916 | |
| | 2,004 | | | Synopsys, Inc.1 | | | 257,895 | |
| | 2,478 | | | Total System Services, Inc. | | | 317,853 | |
| | 465 | | | VeriSign, Inc.1 | | | 97,259 | |
| | 9,872 | | | Visa, Inc., Class A | | | 1,713,286 | |
| | 21,228 | | | Western Union Co. (The) | | | 422,225 | |
| | | | | | | | |
| | | | Total Software & Services | | | 38,922,395 | |
| | | | | | | | |
| | | | Technology Hardware & Equipment—4.2% | |
| | 6,796 | | | Amphenol Corp., Class A | | | 652,008 | |
| | 103,300 | | | Apple, Inc. | | | 20,445,136 | |
| | 744 | | | Arista Networks, Inc.1 | | | 193,157 | |
| | 72,441 | | | Cisco Systems, Inc. | | | 3,964,696 | |
| | 29,006 | | | Corning, Inc. | | | 963,869 | |
| | 1,238 | | | F5 Networks, Inc.1 | | | 180,290 | |
| | 2,692 | | | FLIR Systems, Inc. | | | 145,637 | |
| | 164,929 | | | Hewlett Packard Enterprise Co. | | | 2,465,689 | |
| | 226,733 | | | HP, Inc. | | | 4,713,779 | |
| | 829 | | | IPG Photonics Corp.1 | | | 127,873 | |
| | 13,247 | | | Juniper Networks, Inc. | | | 352,768 | |
| | 3,823 | | | Keysight Technologies, Inc.1 | | | 343,344 | |
| | 3,640 | | | Motorola Solutions, Inc. | | | 606,897 | |
| | 7,788 | | | NetApp, Inc. | | | 480,520 | |
| | 18,951 | | | Seagate Technology PLC | | | 892,971 | |
| | 11,961 | | | TE Connectivity Ltd. | | | 1,145,625 | |
| | 38,398 | | | Western Digital Corp. | | | 1,825,825 | |
| | 21,557 | | | Xerox Corp. | | | 763,333 | |
| | | | | | | | |
| | | | Total Technology Hardware & Equipment | | | 40,263,417 | |
| | | | | | | | |
| | | | Telecommunication Services—2.7% | |
| | 422,711 | | | AT&T, Inc. | | | 14,165,046 | |
| | 161,132 | | | CenturyLink, Inc. | | | 1,894,912 | |
| | 173,291 | | | Verizon Communications, Inc. | | | 9,900,115 | |
| | | | | | | | |
| | | | Total Telecommunication Services | | | 25,960,073 | |
| | | | | | | | |
| | | | Transportation—3.1% | |
| | 10,171 | | | Alaska Air Group, Inc. | | | 650,029 | |
| | 105,756 | | | American Airlines Group, Inc. | | | 3,448,703 | |
| | 15,194 | | | C.H. Robinson Worldwide, Inc. | | | 1,281,614 | |
| | 12,407 | | | CSX Corp. | | | 959,930 | |
| | | | | | | | |
| Shares | | | | | Value | |
| | | | Common Stocks (continued) | | | |
| | | | Transportation (continued) | |
| | 62,025 | | | Delta Air Lines, Inc. | | $ | 3,519,919 | |
| | 8,675 | | | Expeditors International of Washington, Inc. | | | 658,085 | |
| | 32,317 | | | FedEx Corp. | | | 5,306,128 | |
| | 7,448 | | | JB Hunt Transport Services, Inc. | | | 680,822 | |
| | 1,839 | | | Kansas City Southern | | | 224,027 | |
| | 4,596 | | | Norfolk Southern Corp. | | | 916,121 | |
| | 33,061 | | | Southwest Airlines Co. | | | 1,678,837 | |
| | 10,524 | | | Union Pacific Corp. | | | 1,779,714 | |
| | 37,130 | | | United Continental Holdings, Inc.1 | | | 3,250,731 | |
| | 54,379 | | | United Parcel Service, Inc., Class B | | | 5,615,719 | |
| | | | | | | | |
| | | | Total Transportation | | | 29,970,379 | |
| | | | | | | | |
| | | | Utilities—2.5% | |
| | 48,147 | | | AES Corp. | | | 806,944 | |
| | 5,572 | | | Alliant Energy Corp. | | | 273,474 | |
| | 6,311 | | | Ameren Corp. | | | 474,019 | |
| | 13,784 | | | American Electric Power Co., Inc. | | | 1,213,130 | |
| | 2,283 | | | American Water Works Co., Inc. | | | 264,828 | |
| | 2,201 | | | Atmos Energy Corp. | | | 232,338 | |
| | 28,492 | | | CenterPoint Energy, Inc. | | | 815,726 | |
| | 9,180 | | | CMS Energy Corp. | | | 531,614 | |
| | 10,890 | | | Consolidated Edison, Inc. | | | 954,835 | |
| | 13,892 | | | Dominion Energy, Inc. | | | 1,074,129 | |
| | 8,372 | | | DTE Energy Co. | | | 1,070,611 | |
| | 21,589 | | | Duke Energy Corp. | | | 1,905,013 | |
| | 16,793 | | | Edison International | | | 1,132,016 | |
| | 8,242 | | | Entergy Corp. | | | 848,349 | |
| | 6,232 | | | Evergy, Inc. | | | 374,855 | |
| | 8,564 | | | Eversource Energy | | | 648,809 | |
| | 55,820 | | | Exelon Corp. | | | 2,676,011 | |
| | 19,975 | | | FirstEnergy Corp. | | | 855,130 | |
| | 6,162 | | | NextEra Energy, Inc. | | | 1,262,347 | |
| | 14,067 | | | NiSource, Inc. | | | 405,130 | |
| | 21,639 | | | NRG Energy, Inc. | | | 759,962 | |
| | 2,944 | | | Pinnacle West Capital Corp. | | | 277,001 | |
| | 19,013 | | | PPL Corp. | | | 589,593 | |
| | 12,604 | | | Public Service Enterprise Group, Inc. | | | 741,367 | |
| | 6,506 | | | Sempra Energy | | | 894,185 | |
| | 31,401 | | | Southern Co. (The) | | | 1,735,847 | |
| | 7,122 | | | WEC Energy Group, Inc. | | | 593,761 | |
| | 15,088 | | | Xcel Energy, Inc. | | | 897,585 | |
| | | | | | | | |
| | | | Total Utilities | | | 24,308,609 | |
| | | | | | | | |
| | | | Total Common Stocks
(Cost $863,659,309) | | | 956,591,033 | |
| | | | | | | | |
The accompanying notes are an integral part of these financial statements.
Invesco S&P 500 Revenue ETF (RWL)(continued)
June 30, 2019
| | | | | | | | |
| Shares | | | | | Value | |
| | | | Investment of Cash Collateral for Securities
Loaned—0.3% | |
| | 2,423,407 | | | Invesco Government & Agency Portfolio—Institutional Class, 2.27%4,5 | | $ | 2,423,407 | |
| | 807,480 | | | Invesco Liquid Assets Portfolio—Institutional Class, 2.41%4,5 | | | 807,803 | |
| | | | | | | | |
| | | | Total Investment of Cash Collateral for Securities Loaned
(Cost $3,231,210) | | | 3,231,210 | |
| | | | | | | | |
| | |
| | | | Total Investments—100.3%
(Cost $866,890,519) | | | 959,822,243 | |
| | |
| | | | Liabilities in Excess of Other
Assets—(0.3)% | | | (3,273,636 | ) |
| | | | | | | | |
| | |
| | | | Net Assets—100.0% | | $ | 956,548,607 | |
| | | | | | | | |
| 1 | Non-income producing security. |
| 2 | All or a portion of the security was on loan. The aggregate value of the securities on loan was $3,198,532; total value of the collateral held by the Fund was $3,231,210. |
| 3 | Affiliated security (Note 4). |
| 4 | The security and the Fund are advised by wholly-owned subsidiaries of Invesco Ltd. and are therefore considered to be affiliated. The rate shown is the 7-day SEC standardized yield as of June 30, 2019. |
| 5 | The security has been segregated to satisfy the commitment to return the cash collateral received in securities lending transactions upon the borrower’s return of the securities loaned. See Note 6. |
The accompanying notes are an integral part of these financial statements.
Schedule of Investments
Invesco S&P MidCap 400 Revenue ETF (RWK)
June 30, 2019
| | | | | | | | |
| Shares | | | | | Value | |
| | | | Common Stocks—100.0% | | | |
| | | | Automobiles & Components—4.1% | |
| | 192,058 | | | Adient PLC | | $ | 4,661,248 | |
| | 113,758 | | | Dana, Inc. | | | 2,268,334 | |
| | 60,890 | | | Delphi Technologies PLC | | | 1,217,800 | |
| | 18,002 | | | Gentex Corp. | | | 443,029 | |
| | 236,772 | | | Goodyear Tire & Rubber Co. (The) | | | 3,622,612 | |
| | 30,460 | | | Thor Industries, Inc. | | | 1,780,387 | |
| | 12,816 | | | Visteon Corp.1 | | | 750,761 | |
| | | | | | | | |
| | | | Total Automobiles & Components | | | 14,744,171 | |
| | | | | | | | |
| | | | Banks—2.8% | |
| | 17,134 | | | Associated Banc-Corp. | | | 362,213 | |
| | 7,785 | | | BancorpSouth Bank | | | 226,076 | |
| | 2,069 | | | Bank of Hawaii Corp. | | | 171,541 | |
| | 9,387 | | | Bank OZK | | | 282,455 | |
| | 4,999 | | | Cathay General Bancorp | | | 179,514 | |
| | 5,570 | | | Chemical Financial Corp. | | | 228,983 | |
| | 5,457 | | | Commerce Bancshares, Inc. | | | 325,565 | |
| | 3,591 | | | Cullen/Frost Bankers, Inc. | | | 336,333 | |
| | 9,884 | | | East West Bancorp, Inc. | | | 462,275 | |
| | 29,761 | | | F.N.B. Corp. | | | 350,287 | |
| | 3,120 | | | First Financial Bankshares, Inc.2 | | | 96,065 | |
| | 36,594 | | | First Horizon National Corp. | | | 546,348 | |
| | 14,188 | | | Fulton Financial Corp. | | | 232,258 | |
| | 7,840 | | | Hancock Whitney Corp. | | | 314,070 | |
| | 9,902 | | | Home BancShares, Inc. | | | 190,713 | |
| | 3,973 | | | International Bancshares Corp. | | | 149,822 | |
| | 509 | | | LendingTree, Inc.1 | | | 213,795 | |
| | 44,045 | | | New York Community Bancorp, Inc. | | | 439,569 | |
| | 7,980 | | | PacWest Bancorp | | | 309,863 | |
| | 4,688 | | | Pinnacle Financial Partners, Inc. | | | 269,466 | |
| | 2,944 | | | Prosperity Bancshares, Inc. | | | 194,451 | |
| | 3,622 | | | Signature Bank | | | 437,683 | |
| | 15,062 | | | Sterling Bancorp | | | 320,519 | |
| | 12,777 | | | Synovus Financial Corp. | | | 447,195 | |
| | 19,098 | | | TCF Financial Corp. | | | 397,047 | |
| | 5,057 | | | Texas Capital Bancshares, Inc.1 | | | 310,348 | |
| | 4,745 | | | Trustmark Corp. | | | 157,771 | |
| | 4,281 | | | UMB Financial Corp. | | | 281,775 | |
| | 18,911 | | | Umpqua Holdings Corp. | | | 313,734 | |
| | 5,457 | | | United Bankshares, Inc. | | | 202,400 | |
| | 29,705 | | | Valley National Bancorp | | | 320,220 | |
| | 4,876 | | | Washington Federal, Inc. | | | 170,319 | |
| | 6,770 | | | Webster Financial Corp. | | | 323,403 | |
| | 5,093 | | | Wintrust Financial Corp. | | | 372,604 | |
| | | | | | | | |
| | | | Total Banks | | | 9,936,680 | |
| | | | | | | | |
| | | | Capital Goods—12.0% | |
| | 6,544 | | | Acuity Brands, Inc. | | | 902,483 | |
| | 141,604 | | | AECOM1 | | | 5,359,711 | |
| | 29,729 | | | AGCO Corp. | | | 2,306,079 | |
| | 7,672 | | | Carlisle Cos., Inc. | | | 1,077,226 | |
| | 34,404 | | | Colfax Corp.1,2 | | | 964,344 | |
| | 9,770 | | | Crane Co. | | | 815,209 | |
| | 4,787 | | | Curtiss-Wright Corp. | | | 608,571 | |
| | 13,413 | | | Donaldson Co., Inc. | | | 682,185 | |
| | 13,756 | | | Dycom Industries, Inc.1 | | | 809,816 | |
| | 23,114 | | | EMCOR Group, Inc. | | | 2,036,343 | |
| | 10,428 | | | EnerSys | | | 714,318 | |
| | 145,676 | | | Fluor Corp. | | | 4,907,824 | |
| | | | | | | | |
| Shares | | | | | Value | |
| | | | Common Stocks (continued) | | | |
| | | | Capital Goods (continued) | |
| | 4,272 | | | GATX Corp. | | $ | 338,727 | |
| | 7,693 | | | Graco, Inc. | | | 386,035 | |
| | 18,147 | | | Granite Construction, Inc. | | | 874,322 | |
| | 8,593 | | | Hubbell, Inc. | | | 1,120,527 | |
| | 3,597 | | | IDEX Corp. | | | 619,188 | |
| | 10,169 | | | ITT, Inc. | | | 665,866 | |
| | 17,332 | | | Kennametal, Inc. | | | 641,111 | |
| | 3,208 | | | Lennox International, Inc. | | | 882,200 | |
| | 8,992 | | | Lincoln Electric Holdings, Inc. | | | 740,221 | |
| | 33,449 | | | MasTec, Inc.1 | | | 1,723,627 | |
| | 10,698 | | | MSC Industrial Direct Co., Inc., Class A | | | 794,434 | |
| | 3,894 | | | Nordson Corp. | | | 550,261 | |
| | 55,229 | | | NOW, Inc.1 | | | 815,180 | |
| | 21,327 | | | nVent Electric PLC | | | 528,696 | |
| | 23,209 | | | Oshkosh Corp. | | | 1,937,719 | |
| | 10,491 | | | Regal Beloit Corp. | | | 857,220 | |
| | 54,733 | | | Resideo Technologies, Inc.1 | | | 1,199,747 | |
| | 2,670 | | | Teledyne Technologies, Inc.1 | | | 731,233 | |
| | 40,662 | | | Terex Corp. | | | 1,276,787 | |
| | 17,528 | | | Timken Co. (The) | | | 899,888 | |
| | 9,318 | | | Toro Co. (The) | | | 623,374 | |
| | 2,235 | | | Trex Co., Inc.1 | | | 160,250 | |
| | 38,270 | | | Trinity Industries, Inc. | | | 794,103 | |
| | 5,374 | | | Valmont Industries, Inc. | | | 681,477 | |
| | 6,419 | | | Watsco, Inc. | | | 1,049,699 | |
| | 5,609 | | | Woodward, Inc. | | | 634,714 | |
| | | | | | | | |
| | | | Total Capital Goods | | | 42,710,715 | |
| | | | | | | | |
| | | | Commercial & Professional Services—3.3% | |
| | 14,815 | | | ASGN, Inc.1 | | | 897,789 | |
| | 9,801 | | | Brink’s Co. (The) | | | 795,645 | |
| | 11,557 | | | Clean Harbors, Inc.1 | | | 821,703 | |
| | 11,011 | | | Deluxe Corp. | | | 447,707 | |
| | 13,835 | | | Healthcare Services Group, Inc. | | | 419,477 | |
| | 15,234 | | | Herman Miller, Inc. | | | 680,960 | |
| | 14,584 | | | HNI Corp. | | | 515,982 | |
| | 7,486 | | | Insperity, Inc. | | | 914,340 | |
| | 54,581 | | | ManpowerGroup, Inc. | | | 5,272,525 | |
| | 3,071 | | | MSA Safety, Inc. | | | 323,653 | |
| | 17,419 | | | Stericycle, Inc.1 | | | 831,757 | |
| | | | | | | | |
| | | | Total Commercial & Professional Services | | | 11,921,538 | |
| | | | | | | | |
| | | | Consumer Durables & Apparel—3.5% | |
| | 26,890 | | | Brunswick Corp. | | | 1,233,982 | |
| | 8,280 | | | Carter’s, Inc. | | | 807,631 | |
| | 2,660 | | | Deckers Outdoor Corp.1 | | | 468,080 | |
| | 2,639 | | | Helen of Troy Ltd.1 | | | 344,627 | |
| | 39,062 | | | KB Home | | | 1,005,065 | |
| | 87,317 | | | Mattel, Inc.1 | | | 978,824 | |
| | 480 | | | NVR, Inc.1 | | | 1,617,720 | |
| | 16,137 | | | Polaris Industries, Inc. | | | 1,472,179 | |
| | 34,805 | | | Skechers U.S.A., Inc., Class A1 | | | 1,096,009 | |
| | 9,350 | | | Tempur Sealy International, Inc.1 | | | 686,010 | |
| | 44,819 | | | Toll Brothers, Inc. | | | 1,641,272 | |
| | 57,976 | | | TRI Pointe Group, Inc.1 | | | 693,973 | |
| | 22,983 | | | Tupperware Brands Corp. | | | 437,366 | |
| | | | | | | | |
| | | | Total Consumer Durables & Apparel | | | 12,482,738 | |
| | | | | | | | |
The accompanying notes are an integral part of these financial statements.
Invesco S&P MidCap 400 Revenue ETF (RWK)(continued)
June 30, 2019
| | | | | | | | |
| Shares | | | | | Value | |
| | | | Common Stocks (continued) | | | |
| | | | Consumer Services—4.2% | |
| | 6,337 | | | Adtalem Global Education, Inc.1 | | $ | 285,482 | |
| | 24,887 | | | Boyd Gaming Corp. | | | 670,456 | |
| | 18,648 | | | Brinker International, Inc. | | | 733,799 | |
| | 200,190 | | | Caesars Entertainment Corp.1 | | | 2,366,246 | |
| | 11,976 | | | Cheesecake Factory, Inc. (The) | | | 523,591 | |
| | 2,187 | | | Churchill Downs, Inc. | | | 251,658 | |
| | 4,237 | | | Cracker Barrel Old Country Store, Inc.2 | | | 723,383 | |
| | 2,864 | | | Domino’s Pizza, Inc. | | | 796,994 | |
| | 3,851 | | | Dunkin’ Brands Group, Inc. | | | 306,771 | |
| | 10,032 | | | Eldorado Resorts, Inc.1,2 | | | 462,174 | |
| | 892 | | | Graham Holdings Co., Class B | | | 615,507 | |
| | 3,456 | | | International Speedway Corp., Class A | | | 155,140 | |
| | 2,349 | | | Jack in the Box, Inc. | | | 191,185 | |
| | 8,146 | | | Marriott Vacations Worldwide Corp. | | | 785,274 | |
| | 7,011 | | | Papa John’s International, Inc.2 | | | 313,532 | |
| | 47,675 | | | Penn National Gaming, Inc.1 | | | 918,220 | |
| | 37,744 | | | Scientific Games Corp.1 | | | 748,086 | |
| | 15,995 | | | Service Corp. International | | | 748,246 | |
| | 6,542 | | | Six Flags Entertainment Corp. | | | 325,006 | |
| | 6,596 | | | Sotheby’s1 | | | 383,425 | |
| | 10,716 | | | Texas Roadhouse, Inc. | | | 575,128 | |
| | 16,436 | | | Weight Watchers International, Inc.1 | | | 313,928 | |
| | 19,217 | | | Wendy’s Co. (The)2 | | | 376,269 | |
| | 21,196 | | | Wyndham Destinations, Inc. | | | 930,504 | |
| | 8,293 | | | Wyndham Hotels & Resorts, Inc. | | | 462,252 | |
| | | | | | | | |
| | | | Total Consumer Services | | | 14,962,256 | |
| | | | | | | | |
| | | | Diversified Financials—1.8% | |
| | 9,375 | | | Eaton Vance Corp. | | | 404,344 | |
| | 5,379 | | | Evercore, Inc., Class A | | | 476,418 | |
| | 1,083 | | | FactSet Research Systems, Inc. | | | 310,345 | |
| | 8,372 | | | Federated Investors, Inc., Class B | | | 272,090 | |
| | 5,014 | | | Green Dot Corp., Class A1 | | | 245,185 | |
| | 10,621 | | | Interactive Brokers Group, Inc., Class A | | | 575,658 | |
| | 23,906 | | | Janus Henderson Group PLC | | | 511,588 | |
| | 18,234 | | | Legg Mason, Inc. | | | 697,998 | |
| | 98,623 | | | Navient Corp. | | | 1,346,204 | |
| | 6,924 | | | SEI Investments Co. | | | 388,436 | |
| | 48,395 | | | SLM Corp. | | | 470,399 | |
| | 13,202 | | | Stifel Financial Corp. | | | 779,710 | |
| | | | | | | | |
| | | | Total Diversified Financials | | | 6,478,375 | |
| | | | | | | | |
| | | | Energy—9.1% | |
| | 9,164 | | | Apergy Corp.1 | | | 307,361 | |
| | 23,504 | | | Callon Petroleum Co.1 | | | 154,891 | |
| | 1,321,751 | | | Chesapeake Energy Corp.1,2 | | | 2,577,415 | |
| | 57,169 | | | CNX Resources Corp.1 | | | 417,905 | |
| | 3,360 | | | Core Laboratories NV | | | 175,661 | |
| | 58,957 | | | Ensco Rowan PLC, Class A2 | | | 502,903 | |
| | 70,854 | | | EQT Corp. | | | 1,120,202 | |
| | 18,185 | | | Equitrans Midstream Corp. | | | 358,426 | |
| | 11,805 | | | Matador Resources Co.1 | | | 234,683 | |
| | 251,816 | | | McDermott International, Inc.1 | | | 2,432,543 | |
| | 25,699 | | | Murphy Oil Corp. | | | 633,480 | |
| | 109,902 | | | Oasis Petroleum, Inc.1 | | | 624,243 | |
| | 27,523 | | | Oceaneering International, Inc.1 | | | 561,194 | |
| | 66,926 | | | Patterson-UTI Energy, Inc. | | | 770,318 | |
| | 256,375 | | | PBF Energy, Inc., Class A | | | 8,024,538 | |
| | 69,547 | | | QEP Resources, Inc.1 | | | 502,825 | |
| | | | | | | | |
| Shares | | | | | Value | |
| | | | Common Stocks (continued) | | | |
| | | | Energy (continued) | |
| | 119,485 | | | Range Resources Corp. | | $ | 834,005 | |
| | 35,437 | | | SM Energy Co. | | | 443,671 | |
| | 284,831 | | | Southwestern Energy Co.1 | | | 900,066 | |
| | 129,799 | | | Transocean Ltd.1 | | | 832,012 | |
| | 268,265 | | | World Fuel Services Corp. | | | 9,646,809 | |
| | 43,050 | | | WPX Energy, Inc.1 | | | 495,506 | |
| | | | | | | | |
| | | | Total Energy | | | 32,550,657 | |
| | | | | | | | |
| | | | Food & Staples Retailing—0.9% | |
| | 14,042 | | | Casey’s General Stores, Inc. | | | 2,190,411 | |
| | 58,539 | | | Sprouts Farmers Market, Inc.1 | | | 1,105,802 | |
| | | | | | | | |
| | | | Total Food & Staples Retailing | | | 3,296,213 | |
| | | | | | | | |
| | | | Food, Beverage & Tobacco—1.9% | |
| | 718 | | | Boston Beer Co., Inc. (The), Class A1 | | | 271,232 | |
| | 39,830 | | | Flowers Foods, Inc. | | | 926,844 | |
| | 25,727 | | | Hain Celestial Group, Inc. (The)1 | | | 563,421 | |
| | 16,359 | | | Ingredion, Inc. | | | 1,349,454 | |
| | 1,982 | | | Lancaster Colony Corp. | | | 294,525 | |
| | 13,465 | | | Post Holdings, Inc.1 | | | 1,399,956 | |
| | 5,173 | | | Sanderson Farms, Inc. | | | 706,425 | |
| | 3,132 | | | Tootsie Roll Industries, Inc. | | | 115,665 | |
| | 23,217 | | | TreeHouse Foods, Inc.1 | | | 1,256,040 | |
| | | | | | | | |
| | | | Total Food, Beverage & Tobacco | | | 6,883,562 | |
| | | | | | | | |
| | | | Health Care Equipment & Services—5.2% | |
| | 21,137 | | | Acadia Healthcare Co., Inc.1 | | | 738,738 | |
| | 43,157 | | | Allscripts Healthcare Solutions, Inc.1 | | | 501,916 | |
| | 3,365 | | | Amedisys, Inc.1 | | | 408,545 | |
| | 3,517 | | | Avanos Medical, Inc.1 | | | 153,376 | |
| | 2,740 | | | Cantel Medical Corp. | | | 220,954 | |
| | 1,200 | | | Chemed Corp. | | | 433,008 | |
| | 34,742 | | | Covetrus, Inc.1 | | | 849,789 | |
| | 16,755 | | | Encompass Health Corp. | | | 1,061,597 | |
| | 4,034 | | | Globus Medical, Inc., Class A1 | | | 170,638 | |
| | 1,993 | | | Haemonetics Corp.1 | | | 239,838 | |
| | 1,002 | | | HealthEquity, Inc.1 | | | 65,531 | |
| | 6,322 | | | Hill-Rom Holdings, Inc. | | | 661,408 | |
| | 1,295 | | | ICU Medical, Inc.1 | | | 326,223 | |
| | 1,251 | | | Inogen, Inc.1 | | | 83,517 | |
| | 6,678 | | | Integra LifeSciences Holdings Corp.1 | | | 372,966 | |
| | 3,546 | | | LivaNova PLC1 | | | 255,170 | |
| | 1,435 | | | Masimo Corp.1 | | | 213,557 | |
| | 1,665 | | | Medidata Solutions, Inc.1 | | | 150,699 | |
| | 32,236 | | | MEDNAX, Inc.1 | | | 813,314 | |
| | 29,188 | | | Molina Healthcare, Inc.1 | | | 4,177,970 | |
| | 4,438 | | | NuVasive, Inc.1 | | | 259,801 | |
| | 56,956 | | | Patterson Cos., Inc. | | | 1,304,292 | |
| | 4,567 | | | STERIS PLC | | | 679,935 | |
| | 199,287 | | | Tenet Healthcare Corp.1 | | | 4,117,269 | |
| | 3,332 | | | West Pharmaceutical Services, Inc. | | | 417,000 | |
| | | | | | | | |
| | | | Total Health Care Equipment & Services | | | 18,677,051 | |
| | | | | | | | |
| | | | Household & Personal Products—0.4% | |
| | 16,269 | | | Edgewell Personal Care Co.1 | | | 438,450 | |
| | 10,827 | | | Energizer Holdings, Inc. | | | 418,355 | |
| | 12,160 | | | Nu Skin Enterprises, Inc., Class A | | | 599,731 | |
| | | | | | | | |
| | | | Total Household & Personal Products | | | 1,456,536 | |
| | | | | | | | |
The accompanying notes are an integral part of these financial statements.
Invesco S&P MidCap 400 Revenue ETF (RWK)(continued)
June 30, 2019
| | | | | | | | |
| Shares | | | | | Value | |
| | | | Common Stocks (continued) | | | |
| | | | Insurance—5.8% | |
| | 2,476 | | | Alleghany Corp.1 | | $ | 1,686,428 | |
| | 15,966 | | | American Financial Group, Inc. | | | 1,636,036 | |
| | 47,377 | | | Brighthouse Financial, Inc.1 | | | 1,738,262 | |
| | 14,967 | | | Brown & Brown, Inc. | | | 501,395 | |
| | 61,323 | | | CNO Financial Group, Inc. | | | 1,022,868 | |
| | 24,893 | | | First American Financial Corp. | | | 1,336,754 | |
| | 652,426 | | | Genworth Financial, Inc., Class A1 | | | 2,420,500 | |
| | 8,699 | | | Hanover Insurance Group, Inc. (The) | | | 1,116,082 | |
| | 11,276 | | | Kemper Corp. | | | 973,006 | |
| | 13,609 | | | Mercury General Corp. | | | 850,563 | |
| | 64,088 | | | Old Republic International Corp. | | | 1,434,289 | |
| | 3,769 | | | Primerica, Inc. | | | 452,092 | |
| | 19,744 | | | Reinsurance Group of America, Inc. | | | 3,080,656 | |
| | 3,181 | | | RenaissanceRe Holdings Ltd. | | | 566,250 | |
| | 27,322 | | | W.R. Berkley Corp. | | | 1,801,339 | |
| | | | | | | | |
| | | | Total Insurance | | | 20,616,520 | |
| | | | | | | | |
| | | | Materials—8.8% | |
| | 39,549 | | | Allegheny Technologies, Inc.1 | | | 996,635 | |
| | 5,382 | | | AptarGroup, Inc. | | | 669,198 | |
| | 9,336 | | | Ashland Global Holdings, Inc. | | | 746,600 | |
| | 17,068 | | | Cabot Corp. | | | 814,314 | |
| | 12,483 | | | Carpenter Technology Corp. | | | 598,934 | |
| | 60,720 | | | Chemours Co. (The) | | | 1,457,280 | |
| | 79,117 | | | Commercial Metals Co. | | | 1,412,239 | |
| | 6,054 | | | Compass Minerals International, Inc. | | | 332,667 | |
| | 29,045 | | | Domtar Corp. | | | 1,293,374 | |
| | 3,657 | | | Eagle Materials, Inc. | | | 339,004 | |
| | 26,814 | | | Greif, Inc., Class A | | | 872,796 | |
| | 3,000 | | | Ingevity Corp.1 | | | 315,510 | |
| | 24,384 | | | Louisiana-Pacific Corp. | | | 639,349 | |
| | 7,323 | | | Minerals Technologies, Inc. | | | 391,854 | |
| | 1,277 | | | NewMarket Corp. | | | 512,000 | |
| | 71,478 | | | Olin Corp. | | | 1,566,083 | |
| | 91,642 | | | Owens-Illinois, Inc. | | | 1,582,657 | |
| | 28,366 | | | PolyOne Corp. | | | 890,409 | |
| | 30,391 | | | Reliance Steel & Aluminum Co. | | | 2,875,596 | |
| | 1,028 | | | Royal Gold, Inc. | | | 105,360 | |
| | 21,009 | | | RPM International, Inc. | | | 1,283,860 | |
| | 6,958 | | | Scotts Miracle-Gro Co., (The)2 | | | 685,363 | |
| | 4,267 | | | Sensient Technologies Corp. | | | 313,539 | |
| | 35,010 | | | Silgan Holdings, Inc. | | | 1,071,306 | |
| | 19,137 | | | Sonoco Products Co. | | | 1,250,412 | |
| | 104,897 | | | Steel Dynamics, Inc. | | | 3,167,889 | |
| | 243,111 | | | United States Steel Corp.2 | | | 3,722,029 | |
| | 27,881 | | | Valvoline, Inc. | | | 544,516 | |
| | 24,423 | | | Worthington Industries, Inc. | | | 983,270 | |
| | | | | | | | |
| | | | Total Materials | | | 31,434,043 | |
| | | | | | | | |
| | | | Media & Entertainment—2.0% | |
| | 12,680 | | | AMC Networks, Inc., Class A1 | | | 690,933 | |
| | 219 | | | Cable One, Inc. | | | 256,447 | |
| | 7,145 | | | Cars.com, Inc.1 | | | 140,900 | |
| | 19,064 | | | Cinemark Holdings, Inc. | | | 688,210 | |
| | 9,027 | | | John Wiley & Sons, Inc., Class A | | | 413,978 | |
| | 39,720 | | | Live Nation Entertainment, Inc.1 | | | 2,631,450 | |
| | 14,059 | | | Meredith Corp. | | | 774,089 | |
| | 12,526 | | | New York Times Co., (The), Class A | | | 408,598 | |
| | 35,397 | | | TEGNA, Inc. | | | 536,265 | |
| | | | | | | | |
| Shares | | | | | Value | |
| | | | Common Stocks (continued) | | | |
| | | | Media & Entertainment (continued) | |
| | 2,858 | | | World Wrestling Entertainment, Inc., Class A | | $ | 206,376 | |
| | 6,940 | | | Yelp, Inc.1 | | | 237,209 | |
| | | | | | | | |
| | | | Total Media & Entertainment | | | 6,984,455 | |
| | | | | | | | |
| | | | Pharmaceuticals, Biotechnology & Life Sciences—1.5% | |
| | 1,770 | | | Bio-Rad Laboratories, Inc., Class A1 | | | 553,284 | |
| | 779 | | | Bio-Techne Corp. | | | 162,414 | |
| | 11,491 | | | Catalent, Inc.1 | | | 622,927 | |
| | 4,231 | | | Charles River Laboratories International, Inc.1 | | | 600,379 | |
| | 9,968 | | | Exelixis, Inc.1 | | | 213,016 | |
| | 512 | | | Ligand Pharmaceuticals, Inc.1 | | | 58,445 | |
| | 71,917 | | | Mallinckrodt PLC1 | | | 660,198 | |
| | 6,945 | | | PRA Health Sciences, Inc.1 | | | 688,597 | |
| | 7,392 | | | Prestige Consumer Healthcare, Inc.1 | | | 234,178 | |
| | 21,709 | | | Syneos Health, Inc.1 | | | 1,109,113 | |
| | 4,715 | | | United Therapeutics Corp.1 | | | 368,053 | |
| | | | | | | | |
| | | | Total Pharmaceuticals, Biotechnology & Life Sciences | | | 5,270,604 | |
| | | | | | | | |
| | | | Real Estate—3.1% | |
| | 6,436 | | | Alexander & Baldwin, Inc. | | | 148,672 | |
| | 4,436 | | | American Campus Communities, Inc. | | | 204,766 | |
| | 14,819 | | | Brixmor Property Group, Inc. | | | 264,964 | |
| | 2,139 | | | Camden Property Trust | | | 223,290 | |
| | 18,186 | | | CoreCivic, Inc. | | | 377,541 | |
| | 1,112 | | | CoreSite Realty Corp. | | | 128,069 | |
| | 4,622 | | | Corporate Office Properties Trust | | | 121,882 | |
| | 2,902 | | | Cousins Properties, Inc. | | | 104,965 | |
| | 3,328 | | | CyrusOne, Inc. | | | 192,092 | |
| | 4,985 | | | Douglas Emmett, Inc. | | | 198,602 | |
| | 612 | | | EastGroup Properties, Inc. | | | 70,980 | |
| | 2,118 | | | EPR Properties | | | 157,982 | |
| | 2,572 | | | First Industrial Realty Trust, Inc. | | | 94,495 | |
| | 23,562 | | | GEO Group, Inc. (The) | | | 495,038 | |
| | 3,186 | | | Healthcare Realty Trust, Inc. | | | 99,785 | |
| | 3,729 | | | Highwoods Properties, Inc. | | | 154,008 | |
| | 21,504 | | | Hospitality Properties Trust | | | 537,600 | |
| | 3,602 | | | JBG SMITH Properties | | | 141,703 | |
| | 28,695 | | | Jones Lang LaSalle, Inc. | | | 4,037,099 | |
| | 2,274 | | | Kilroy Realty Corp. | | | 167,844 | |
| | 4,766 | | | Lamar Advertising Co., Class A | | | 384,664 | |
| | 3,149 | | | Liberty Property Trust | | | 157,576 | |
| | 1,302 | | | Life Storage, Inc. | | | 123,794 | |
| | 5,083 | | | Mack-Cali Realty Corp. | | | 118,383 | |
| | 9,704 | | | Medical Properties Trust, Inc. | | | 169,238 | |
| | 2,617 | | | National Retail Properties, Inc. | | | 138,727 | |
| | 5,523 | | | Omega Healthcare Investors, Inc. | | | 202,970 | |
| | 8,182 | | | Pebblebrook Hotel Trust | | | 230,569 | |
| | 5,891 | | | PotlatchDeltic, Corp. | | | 229,631 | |
| | 565 | | | PS Business Parks, Inc. | | | 95,219 | |
| | 6,079 | | | Rayonier, Inc. | | | 184,194 | |
| | 7,154 | | | Sabra Health Care REIT, Inc. | | | 140,862 | |
| | 31,647 | | | Senior Housing Properties Trust | | | 261,721 | |
| | 7,052 | | | Tanger Factory Outlet Centers, Inc.2 | | | 114,313 | |
| | 3,377 | | | Taubman Centers, Inc. | | | 137,883 | |
| | 22,156 | | | Uniti Group, Inc.2 | | | 210,482 | |
| | 4,824 | | | Urban Edge Properties | | | 83,600 | |
| | 4,217 | | | Weingarten Realty Investors | | | 115,630 | |
| | | | | | | | |
| | | | Total Real Estate | | | 11,020,833 | |
| | | | | | | | |
The accompanying notes are an integral part of these financial statements.
Invesco S&P MidCap 400 Revenue ETF (RWK)(continued)
June 30, 2019
| | | | | | | | |
| Shares | | | | | Value | |
| | | | Common Stocks (continued) | | | |
| | | | Retailing—6.5% | |
| | 14,780 | | | Aaron’s, Inc. | | $ | 907,640 | |
| | 53,742 | | | American Eagle Outfitters, Inc. | | | 908,240 | |
| | 118,025 | | | AutoNation, Inc.1 | | | 4,949,968 | |
| | 229,190 | | | Bed Bath & Beyond, Inc.2 | | | 2,663,188 | |
| | 57,369 | | | Dick’s Sporting Goods, Inc. | | | 1,986,688 | |
| | 26,198 | | | Dillard’s, Inc., Class A2 | | | 1,631,611 | |
| | 2,845 | | | Five Below, Inc.1 | | | 341,457 | |
| | 136,452 | | | Michaels Cos., Inc. (The)1 | | | 1,187,132 | |
| | 38,921 | | | Murphy USA, Inc.1 | | | 3,270,532 | |
| | 3,118 | | | Ollie’s Bargain Outlet Holdings, Inc.1 | | | 271,609 | |
| | 3,660 | | | Pool Corp. | | | 699,060 | |
| | 60,829 | | | Sally Beauty Holdings, Inc.1 | | | 811,459 | |
| | 79,454 | | | Signet Jewelers Ltd. | | | 1,420,638 | |
| | 38,242 | | | Urban Outfitters, Inc.1 | | | 870,006 | |
| | 21,467 | | | Williams-Sonoma, Inc.2 | | | 1,395,355 | |
| | | | | | | | |
| | | | Total Retailing | | | 23,314,583 | |
| | | | | | | | |
| | | | Semiconductors & Semiconductor Equipment—1.1% | |
| | 6,851 | | | Cirrus Logic, Inc.1 | | | 299,389 | |
| | 6,351 | | | Cree, Inc.1 | | | 356,799 | |
| | 25,489 | | | Cypress Semiconductor Corp. | | | 566,875 | |
| | 8,309 | | | First Solar, Inc.1 | | | 545,735 | |
| | 6,361 | | | MKS Instruments, Inc. | | | 495,458 | |
| | 1,084 | | | Monolithic Power Systems, Inc. | | | 147,186 | |
| | 3,340 | | | Semtech Corp.1 | | | 160,487 | |
| | 2,058 | | | Silicon Laboratories, Inc.1 | | | 212,797 | |
| | 12,931 | | | Synaptics, Inc.1 | | | 376,809 | |
| | 11,030 | | | Teradyne, Inc. | | | 528,447 | |
| | 390 | | | Universal Display Corp. | | | 73,344 | |
| | 6,124 | | | Versum Materials, Inc. | | | 315,876 | |
| | | | | | | | |
| | | | Total Semiconductors & Semiconductor Equipment | | | 4,079,202 | |
| | | | | | | | |
| | | | Software & Services—3.5% | |
| | 7,153 | | | ACI Worldwide, Inc.1 | | | 245,634 | |
| | 2,491 | | | Blackbaud, Inc. | | | 207,998 | |
| | 5,439 | | | CACI International, Inc., Class A1 | | | 1,112,765 | |
| | 10,981 | | | CDK Global, Inc. | | | 542,901 | |
| | 3,435 | | | CommVault Systems, Inc.1 | | | 170,445 | |
| | 9,584 | | | CoreLogic, Inc.1 | | | 400,899 | |
| | 815 | | | Fair Isaac Corp.1 | | | 255,926 | |
| | 3,262 | | | j2 Global, Inc. | | | 289,959 | |
| | 50,583 | | | KBR, Inc. | | | 1,261,540 | |
| | 30,179 | | | Leidos Holdings, Inc. | | | 2,409,793 | |
| | 2,038 | | | LiveRamp Holdings, Inc.1 | | | 98,802 | |
| | 4,120 | | | LogMeIn, Inc. | | | 303,562 | |
| | 1,948 | | | Manhattan Associates, Inc.1 | | | 135,055 | |
| | 7,764 | | | MAXIMUS, Inc. | | | 563,200 | |
| | 36,839 | | | Perspecta, Inc. | | | 862,401 | |
| | 3,432 | | | PTC, Inc.1 | | | 308,056 | |
| | 40,593 | | | Sabre Corp. | | | 901,165 | |
| | 13,791 | | | Science Applications International Corp. | | | 1,193,749 | |
| | 13,866 | | | Teradata Corp.1 | | | 497,096 | |
| | 1,010 | | | Tyler Technologies, Inc.1 | | | 218,180 | |
| | 1,729 | | | WEX, Inc.1 | | | 359,805 | |
| | | | | | | | |
| | | | Total Software & Services | | | 12,338,931 | |
| | | | | | | | |
| | | | Technology Hardware & Equipment—11.5% | |
| | 102,844 | | | Arrow Electronics, Inc.1 | | | 7,329,692 | |
| | 105,754 | | | Avnet, Inc. | | | 4,787,483 | |
| | | | | | | | |
| Shares | | | | | Value | |
| | | | Common Stocks (continued) | | | |
| | | | Technology Hardware & Equipment (continued) | |
| | 10,118 | | | Belden, Inc. | | $ | 602,729 | |
| | 18,114 | | | Ciena Corp.1 | | | 745,029 | |
| | 4,272 | | | Cognex Corp. | | | 204,970 | |
| | 3,291 | | | Coherent, Inc.1 | | | 448,794 | |
| | 1,040 | | | InterDigital, Inc. | | | 66,976 | |
| | 206,964 | | | Jabil, Inc. | | | 6,540,062 | |
| | 2,347 | | | Littelfuse, Inc. | | | 415,208 | |
| | 7,300 | | | Lumentum Holdings, Inc.1 | | | 389,893 | |
| | 7,820 | | | National Instruments Corp. | | | 328,362 | |
| | 47,218 | | | NCR Corp.1 | | | 1,468,480 | |
| | 8,159 | | | NetScout Systems, Inc.1 | | | 207,157 | |
| | 8,646 | | | Plantronics, Inc. | | | 320,248 | |
| | 51,688 | | | SYNNEX Corp. | | | 5,086,099 | |
| | 87,360 | | | Tech Data Corp.1 | | | 9,137,856 | |
| | 17,083 | | | Trimble, Inc.1 | | | 770,614 | |
| | 5,432 | | | ViaSat, Inc.1 | | | 439,014 | |
| | 45,788 | | | Vishay Intertechnology, Inc. | | | 756,418 | |
| | 5,165 | | | Zebra Technologies Corp., Class A1 | | | 1,082,016 | |
| | | | | | | | |
| | | | Total Technology Hardware & Equipment | | | 41,127,100 | |
| | | | | | | | |
| | | | Telecommunication Services—0.3% | |
| | 40,405 | | | Telephone & Data Systems, Inc. | | | 1,228,312 | |
| | | | | | | | |
| | | | Transportation—4.3% | |
| | 62,898 | | | Avis Budget Group, Inc.1 | | | 2,211,494 | |
| | 5,597 | | | Genesee & Wyoming, Inc., Class A1 | | | 559,700 | |
| | 92,559 | | | JetBlue Airways Corp.1 | | | 1,711,416 | |
| | 8,636 | | | Kirby Corp.1 | | | 682,244 | |
| | 37,731 | | | Knight-Swift Transportation Holdings, Inc. | | | 1,239,086 | |
| | 10,165 | | | Landstar System, Inc. | | | 1,097,718 | |
| | 6,665 | | | Old Dominion Freight Line, Inc. | | | 994,818 | |
| | 35,470 | | | Ryder System, Inc. | | | 2,067,901 | |
| | 18,792 | | | Werner Enterprises, Inc. | | | 584,055 | |
| | 69,864 | | | XPO Logistics, Inc.1,2 | | | 4,038,838 | |
| | | | | | | | |
| | | | Total Transportation | | | 15,187,270 | |
| | | | | | | | |
| | | | Utilities—2.4% | |
| | 4,062 | | | ALLETE, Inc. | | | 337,999 | |
| | 4,683 | | | Aqua America, Inc. | | | 193,736 | |
| | 5,239 | | | Black Hills Corp. | | | 409,533 | |
| | 15,252 | | | Hawaiian Electric Industries, Inc. | | | 664,225 | |
| | 3,142 | | | IDACORP, Inc. | | | 315,551 | |
| | 41,390 | | | MDU Resources Group, Inc. | | | 1,067,862 | |
| | 7,624 | | | National Fuel Gas Co. | | | 402,166 | |
| | 13,254 | | | New Jersey Resources Corp. | | | 659,651 | |
| | 3,899 | | | NorthWestern Corp. | | | 281,313 | |
| | 12,036 | | | OGE Energy Corp. | | | 512,252 | |
| | 4,197 | | | ONE Gas, Inc. | | | 378,989 | |
| | 6,674 | | | PNM Resources, Inc. | | | 339,773 | |
| | 7,751 | | | Southwest Gas Holdings, Inc. | | | 694,645 | |
| | 5,427 | | | Spire, Inc. | | | 455,434 | |
| | 32,664 | | | UGI Corp. | | | 1,744,584 | |
| | | | | | | | |
| | | | Total Utilities | | | 8,457,713 | |
| | | | | | | | |
| | | | Total Common Stocks
(Cost $329,491,573) | | | 357,160,058 | |
| | | | | | | | |
The accompanying notes are an integral part of these financial statements.
Invesco S&P MidCap 400 Revenue ETF (RWK)(continued)
June 30, 2019
| | | | | | | | |
| Shares | | | | | Value | |
| | | | Investment of Cash Collateral for Securities
Loaned—3.8% | |
| | 10,217,640 | | | Invesco Government & Agency Portfolio—Institutional Class, 2.27%3,4 | | $ | 10,217,640 | |
| | 3,432,957 | | | Invesco Liquid Assets Portfolio—Institutional Class, 2.41%3,4 | | | 3,434,330 | |
| | | | | | | | |
| | | | Total Investment of Cash Collateral for Securities Loaned | | | | |
| | | | Investment of Cash Collateral for Securities Loaned
(Cost $13,651,591) | | | 13,651,970 | |
| | | | | | | | |
| | |
| | | | Total Investments—103.8%
(Cost $343,143,164) | | | 370,812,028 | |
| | |
| | | | Liabilities in Excess of Other
Assets—(3.8)% | | | (13,815,986 | ) |
| | | | | | | | |
| | |
| | | | Net Assets—100.0% | | $ | 356,996,042 | |
| | | | | | | | |
REIT—Real Estate Investment Trust
| 1 | Non-income producing security. |
| 2 | All or a portion of the security was on loan. The aggregate value of the securities on loan was $13,620,798; total value of the collateral held by the Fund was $13,651,970. |
| 3 | The security and the Fund are advised by wholly-owned subsidiaries of Invesco Ltd. and are therefore considered to be affiliated. The rate shown is the 7-day SEC standardized yield as of June 30, 2019. |
| 4 | The security has been segregated to satisfy the commitment to return the cash collateral received in securities lending transactions upon the borrower’s return of the securities loaned. See Note 6. |
The accompanying notes are an integral part of these financial statements.
Schedule of Investments
Invesco S&P SmallCap 600 Revenue ETF (RWJ)
June 30, 2019
| | | | | | | | |
| Shares | | | | | Value | |
| | | | Common Stocks—100.0% | | | |
| | | | Automobiles & Components—3.2% | | | |
| | 287,142 | | | American Axle & Manufacturing Holdings, Inc.1 | | $ | 3,663,932 | |
| | 41,748 | | | Cooper Tire & Rubber Co. | | | 1,317,149 | |
| | 40,729 | | | Cooper-Standard Holdings, Inc.1 | | | 1,866,203 | |
| | 5,252 | | | Dorman Products, Inc.1 | | | 457,659 | |
| | 4,092 | | | Fox Factory Holding Corp.1 | | | 337,631 | |
| | 93,334 | | | Garrett Motion, Inc.1 | | | 1,432,677 | |
| | 12,137 | | | Gentherm, Inc.1 | | | 507,691 | |
| | 12,313 | | | LCI Industries | | | 1,108,170 | |
| | 12,459 | | | Motorcar Parts of America, Inc.1,2 | | | 266,747 | |
| | 11,579 | | | Standard Motor Products, Inc. | | | 524,992 | |
| | 190,344 | | | Superior Industries International, Inc. | | | 658,590 | |
| | 24,992 | | | Winnebago Industries, Inc. | | | 965,941 | |
| | | | | | | | |
| | | | Total Automobiles & Components | | | 13,107,382 | |
| | | | | | | | |
| | | | Banks—2.8% | | | |
| | 6,949 | | | Ameris Bancorp | | | 272,331 | |
| | 10,112 | | | Axos Financial, Inc.1 | | | 275,552 | |
| | 15,166 | | | Banc of California, Inc. | | | 211,869 | |
| | 4,997 | | | Banner Corp. | | | 270,587 | |
| | 9,275 | | | Berkshire Hills Bancorp, Inc. | | | 291,142 | |
| | 17,198 | | | Boston Private Financial Holdings, Inc. | | | 207,580 | |
| | 10,774 | | | Brookline Bancorp, Inc. | | | 165,704 | |
| | 3,889 | | | Central Pacific Financial Corp. | | | 116,514 | |
| | 1,448 | | | City Holding Co. | | | 110,424 | |
| | 7,688 | | | Columbia Banking System, Inc. | | | 278,152 | |
| | 4,190 | | | Community Bank System, Inc. | | | 275,870 | |
| | 10,626 | | | Customers Bancorp, Inc.1 | | | 223,146 | |
| | 9,609 | | | CVB Financial Corp. | | | 202,077 | |
| | 5,803 | | | Dime Community Bancshares, Inc. | | | 110,199 | |
| | 3,583 | | | Eagle Bancorp, Inc. | | | 193,948 | |
| | 33,515 | | | First BanCorp | | | 370,006 | |
| | 13,865 | | | First Commonwealth Financial Corp. | | | 186,762 | |
| | 14,480 | | | First Financial Bancorp | | | 350,706 | |
| | 16,896 | | | First Midwest Bancorp, Inc. | | | 345,861 | |
| | 16,738 | | | Flagstar Bancorp, Inc. | | | 554,697 | |
| | 3,216 | | | Franklin Financial Network, Inc. | | | 89,598 | |
| | 7,031 | | | Glacier Bancorp, Inc. | | | 285,107 | |
| | 7,802 | | | Great Western Bancorp, Inc. | | | 278,687 | |
| | 5,675 | | | Hanmi Financial Corp. | | | 126,382 | |
| | 3,754 | | | Heritage Financial Corp. | | | 110,893 | |
| | 6,814 | | | HomeStreet, Inc.1 | | | 201,967 | |
| | 24,873 | | | Hope Bancorp, Inc. | | | 342,750 | |
| | 2,728 | | | Independent Bank Corp. | | | 207,737 | |
| | 5,636 | | | LegacyTexas Financial Group, Inc. | | | 229,442 | |
| | 7,336 | | | Meta Financial Group, Inc. | | | 205,775 | |
| | 3,751 | | | National Bank Holdings Corp., Class A | | | 136,161 | |
| | 5,996 | | | NBT Bancorp, Inc. | | | 224,910 | |
| | 4,705 | | | NMI Holdings, Inc., Class A1 | | | 133,575 | |
| | 4,852 | | | Northfield Bancorp, Inc. | | | 75,740 | |
| | 12,767 | | | Northwest Bancshares, Inc. | | | 224,827 | |
| | 10,293 | | | OFG Bancorp | | | 244,665 | |
| | 23,520 | | | Old National Bancorp | | | 390,197 | |
| | 6,431 | | | Opus Bank | | | 135,758 | |
| | 4,505 | | | Oritani Financial Corp. | | | 79,919 | |
| | 7,823 | | | Pacific Premier Bancorp, Inc. | | | 241,574 | |
| | 2,108 | | | Preferred Bank | | | 99,603 | |
| | 8,227 | | | Provident Financial Services, Inc. | | | 199,505 | |
| | 4,227 | | | S&T Bancorp, Inc. | | | 158,428 | |
| | 5,894 | | | Seacoast Banking Corp. of Florida1 | | | 149,943 | |
| | | | | | | | |
| Shares | | | | | Value | |
| | | | Common Stocks (continued) | | | |
| | | | Banks (continued) | | | |
| | 5,115 | | | ServisFirst Bancshares, Inc. | | $ | 175,240 | |
| | 16,496 | | | Simmons First National Corp., Class A | | | 383,697 | |
| | 3,803 | | | Southside Bancshares, Inc. | | | 123,141 | |
| | 1,872 | | | Tompkins Financial Corp. | | | 152,755 | |
| | 4,766 | | | Triumph Bancorp, Inc.1 | | | 138,452 | |
| | 12,146 | | | TrustCo Bank Corp. NY | | | 96,196 | |
| | 10,076 | | | United Community Banks, Inc. | | | 287,771 | |
| | 3,889 | | | Veritex Holdings, Inc. | | | 100,920 | |
| | 6,923 | | | Walker & Dunlop, Inc. | | | 368,373 | |
| | 1,484 | | | Westamerica Bancorporation | | | 91,429 | |
| | | | | | | | |
| | | | Total Banks | | | 11,504,244 | |
| | | | | | | | |
| | | | Capital Goods—11.5% | | | |
| | 4,274 | | | AAON, Inc. | | | 214,469 | |
| | 26,903 | | | AAR Corp. | | | 989,761 | |
| | 22,698 | | | Actuant Corp., Class A | | | 563,137 | |
| | 36,078 | | | Aegion Corp.1 | | | 663,835 | |
| | 21,339 | | | Aerojet Rocketdyne Holdings, Inc.1,2 | | | 955,347 | |
| | 2,513 | | | AeroVironment, Inc.1 | | | 142,663 | |
| | 4,842 | | | Alamo Group, Inc. | | | 483,861 | |
| | 6,243 | | | Albany International Corp., Class A | | | 517,607 | |
| | 9,424 | | | American Woodmark Corp.1 | | | 797,459 | |
| | 16,536 | | | Apogee Enterprises, Inc. | | | 718,324 | |
| | 27,858 | | | Applied Industrial Technologies, Inc. | | | 1,714,103 | |
| | 19,101 | | | Arcosa, Inc. | | | 718,771 | |
| | 17,887 | | | Astec Industries, Inc. | | | 582,401 | |
| | 9,733 | | | AZZ, Inc. | | | 447,913 | |
| | 12,995 | | | Barnes Group, Inc. | | | 732,138 | |
| | 84,080 | | | Briggs & Stratton Corp. | | | 860,979 | |
| | 7,116 | | | Chart Industries, Inc.1 | | | 547,078 | |
| | 11,956 | | | CIRCOR International, Inc.1 | | | 549,976 | |
| | 21,073 | | | Comfort Systems USA, Inc. | | | 1,074,512 | |
| | 9,873 | | | Cubic Corp. | | | 636,611 | |
| | 16,787 | | | DXP Enterprises, Inc.1 | | | 636,059 | |
| | 11,138 | | | Encore Wire Corp. | | | 652,464 | |
| | 11,264 | | | EnPro Industries, Inc. | | | 719,094 | |
| | 4,869 | | | ESCO Technologies, Inc. | | | 402,277 | |
| | 19,913 | | | Federal Signal Corp. | | | 532,673 | |
| | 12,868 | | | Franklin Electric Co., Inc. | | | 611,230 | |
| | 12,116 | | | Gibraltar Industries, Inc.1 | | | 489,002 | |
| | 72,307 | | | GMS, Inc.1 | | | 1,590,754 | |
| | 42,763 | | | Greenbrier Cos., Inc. (The) | | | 1,299,995 | |
| | 58,269 | | | Griffon Corp. | | | 985,911 | |
| | 30,337 | | | Harsco Corp.1 | | | 832,447 | |
| | 21,385 | | | Hillenbrand, Inc. | | | 846,204 | |
| | 11,317 | | | Insteel Industries, Inc. | | | 235,620 | |
| | 7,734 | | | John Bean Technologies Corp. | | | 936,819 | |
| | 14,336 | | | Kaman Corp. | | | 913,060 | |
| | 3,006 | | | Lindsay Corp. | | | 247,123 | |
| | 19,182 | | | Lydall, Inc.1 | | | 387,476 | |
| | 4,331 | | | Mercury Systems, Inc.1 | | | 304,686 | |
| | 14,569 | | | Moog, Inc., Class A | | | 1,363,804 | |
| | 40,436 | | | Mueller Industries, Inc. | | | 1,183,562 | |
| | 22,453 | | | MYR Group, Inc.1 | | | 838,620 | |
| | 1,504 | | | National Presto Industries, Inc.2 | | | 140,308 | |
| | 22,671 | | | Patrick Industries, Inc.1 | | | 1,115,187 | |
| | 20,901 | | | PGT Innovations, Inc.1 | | | 349,465 | |
| | 6,100 | | | Powell Industries, Inc. | | | 231,800 | |
| | 2,028 | | | Proto Labs, Inc.1 | | | 235,289 | |
The accompanying notes are an integral part of these financial statements.
Invesco S&P SmallCap 600 Revenue ETF (RWJ)(continued)
June 30, 2019
| | | | | | | | |
| Shares | | | | | Value | |
| | | | Common Stocks (continued) | | | |
| | | | Capital Goods (continued) | | | |
| | 22,869 | | | Quanex Building Products Corp. | | $ | 431,995 | |
| | 5,153 | | | Raven Industries, Inc. | | | 184,890 | |
| | 7,592 | | | Simpson Manufacturing Co., Inc. | | | 504,564 | |
| | 22,343 | | | SPX Corp.1 | | | 737,766 | |
| | 24,959 | | | SPX FLOW, Inc.1 | | | 1,044,784 | |
| | 5,436 | | | Standex International Corp. | | | 397,589 | |
| | 8,516 | | | Tennant Co. | | | 521,179 | |
| | 171,256 | | | Titan International, Inc. | | | 837,442 | |
| | 74,555 | | | Triumph Group, Inc. | | | 1,707,310 | |
| | 55,263 | | | Universal Forest Products, Inc. | | | 2,103,310 | |
| | 205,690 | | | Veritiv Corp.1 | | | 3,994,500 | |
| | 4,240 | | | Vicor Corp.1 | | | 131,652 | |
| | 71,758 | | | Wabash National Corp. | | | 1,167,503 | |
| | 8,167 | | | Watts Water Technologies, Inc., Class A | | | 761,001 | |
| | | | | | | | |
| | | | Total Capital Goods | | | 46,517,359 | |
| | | | | | | | |
| | | | Commercial & Professional Services—5.5% | | | |
| | 74,124 | | | ABM Industries, Inc. | | | 2,964,960 | |
| | 11,035 | | | Brady Corp., Class A | | | 544,246 | |
| | 3,017 | | | Exponent, Inc. | | | 176,615 | |
| | 3,827 | | | Forrester Research, Inc. | | | 179,984 | |
| | 11,368 | | | FTI Consulting, Inc.1 | | | 953,093 | |
| | 10,314 | | | Heidrick & Struggles International, Inc. | | | 309,111 | |
| | 37,071 | | | Interface, Inc. | | | 568,298 | |
| | 99,487 | | | Kelly Services, Inc., Class A | | | 2,605,565 | |
| | 19,020 | | | Korn Ferry | | | 762,131 | |
| | 325,000 | | | LSC Communications, Inc. | | | 1,192,750 | |
| | 19,788 | | | Matthews International Corp., Class A | | | 689,612 | |
| | 8,965 | | | Mobile Mini, Inc. | | | 272,805 | |
| | 15,799 | | | Multi-Color Corp. | | | 789,476 | |
| | 15,223 | | | Navigant Consulting, Inc. | | | 353,021 | |
| | 368,431 | | | Pitney Bowes, Inc. | | | 1,576,885 | |
| | 20,759 | | | Resources Connection, Inc. | | | 332,352 | |
| | 1,419,509 | | | RR Donnelley & Sons Co. | | | 2,796,433 | |
| | 38,014 | | | Team, Inc.1,2 | | | 582,375 | |
| | 18,747 | | | Tetra Tech, Inc. | | | 1,472,577 | |
| | 52,591 | | | TrueBlue, Inc.1 | | | 1,160,157 | |
| | 4,744 | | | UniFirst Corp. | | | 894,576 | |
| | 4,343 | | | US Ecology, Inc. | | | 258,582 | |
| | 9,097 | | | Viad Corp. | | | 602,585 | |
| | 4,095 | | | WageWorks, Inc.1 | | | 207,985 | |
| | | | | | | | |
| | | | Total Commercial & Professional Services | | | 22,246,174 | |
| | | | | | | | |
| | | | Consumer Durables & Apparel—5.1% | | | |
| | 34,342 | | | Callaway Golf Co. | | | 589,309 | |
| | 2,823 | | | Cavco Industries, Inc.1 | | | 444,735 | |
| | 37,215 | | | Century Communities, Inc.1 | | | 989,175 | |
| | 26,804 | | | Crocs, Inc.1 | | | 529,379 | |
| | 16,752 | | | Ethan Allen Interiors, Inc. | | | 352,797 | |
| | 109,316 | | | Fossil Group, Inc.1,2 | | | 1,257,134 | |
| | 54,678 | | | G-III Apparel Group Ltd.1 | | | 1,608,627 | |
| | 11,646 | | | Installed Building Products, Inc.1 | | | 689,676 | |
| | 5,749 | | | iRobot Corp.1,2 | | | 526,838 | |
| | 44,211 | | | Kontoor Brands, Inc.1 | | | 1,238,792 | |
| | 25,629 | | | La-Z-Boy, Inc. | | | 785,785 | |
| | 9,474 | | | LGI Homes, Inc.1 | | | 676,728 | |
| | 41,344 | | | M.D.C. Holdings, Inc. | | | 1,355,256 | |
| | 36,994 | | | M/I Homes, Inc.1 | | | 1,055,809 | |
| | 30,089 | | | Meritage Homes Corp.1 | | | 1,544,769 | |
| | | | | | | | |
| Shares | | | | | Value | |
| | | | Common Stocks (continued) | | | |
| | | | Consumer Durables & Apparel (continued) | | | |
| | 12,176 | | | Movado Group, Inc. | | $ | 328,752 | |
| | 72,231 | | | Nautilus, Inc.1 | | | 159,631 | |
| | 6,710 | | | Oxford Industries, Inc. | | | 508,618 | |
| | 23,065 | | | Steven Madden Ltd. | | | 783,057 | |
| | 4,159 | | | Sturm Ruger & Co., Inc. | | | 226,582 | |
| | 14,163 | | | TopBuild Corp.1 | | | 1,172,130 | |
| | 17,505 | | | Unifi, Inc.1 | | | 318,066 | |
| | 7,789 | | | Universal Electronics, Inc.1 | | | 319,505 | |
| | 15,626 | | | Vera Bradley, Inc.1 | | | 187,512 | |
| | 115,965 | | | Vista Outdoor, Inc.1 | | | 1,029,769 | |
| | 51,158 | | | William Lyon Homes, Class A1 | | | 932,610 | |
| | 36,576 | | | Wolverine World Wide, Inc. | | | 1,007,303 | |
| | | | | | | | |
| | | | Total Consumer Durables & Apparel | | | 20,618,344 | |
| | | | | | | | |
| | | | Consumer Services—1.6% | | | |
| | 4,659 | | | American Public Education, Inc.1 | | | 137,813 | |
| | 12,189 | | | BJ’s Restaurants, Inc. | | | 535,585 | |
| | 94,386 | | | Bloomin’ Brands, Inc. | | | 1,784,839 | |
| | 13,815 | | | Career Education Corp.1 | | | 263,452 | |
| | 8,845 | | | Chuy’s Holdings, Inc.1 | | | 202,727 | |
| | 14,623 | | | Dave & Buster’s Entertainment, Inc. | | | 591,793 | |
| | 3,922 | | | Dine Brands Global, Inc. | | | 374,433 | |
| | 17,980 | | | El Pollo Loco Holdings, Inc.1 | | | 191,667 | |
| | 22,190 | | | Fiesta Restaurant Group, Inc.1 | | | 291,577 | |
| | 2,656 | | | Monarch Casino & Resort, Inc.1 | | | 113,517 | |
| | 18,338 | | | Red Robin Gourmet Burgers, Inc.1 | | | 560,593 | |
| | 26,392 | | | Regis Corp.1 | | | 438,107 | |
| | 9,192 | | | Ruth’s Hospitality Group, Inc. | | | 208,750 | |
| | 3,364 | | | Shake Shack, Inc., Class A1 | | | 242,881 | |
| | 1,931 | | | Strategic Education, Inc. | | | 343,718 | |
| | 817 | | | Wingstop, Inc. | | | 77,411 | |
| | | | | | | | |
| | | | Total Consumer Services | | | 6,358,863 | |
| | | | | | | | |
| | | | Diversified Financials—1.7% | | | |
| | 11,130 | | | Apollo Commercial Real Estate Finance, Inc. | | | 204,681 | |
| | 2,882 | | | ARMOUR Residential REIT, Inc. | | | 53,721 | |
| | 8,360 | | | Blucora, Inc.1 | | | 253,893 | |
| | 16,590 | | | Capstead Mortgage Corp. | | | 138,527 | |
| | 35,263 | | | Donnelley Financial Solutions, Inc.1 | | | 470,408 | |
| | 17,732 | | | Encore Capital Group, Inc.1,2 | | | 600,583 | |
| | 22,366 | | | Enova International, Inc.1 | | | 515,536 | |
| | 41,294 | | | EZCORP, Inc., Class A1 | | | 391,054 | |
| | 8,321 | | | FirstCash, Inc. | | | 832,266 | |
| | 4,913 | | | Granite Point Mortgage Trust, Inc. | | | 94,281 | |
| | 10,313 | | | Greenhill & Co., Inc. | | | 140,154 | |
| | 10,919 | | | INTL. FCStone, Inc.1 | | | 432,283 | |
| | 3,433 | | | Invesco Mortgage Capital, Inc.3 | | | 55,340 | |
| | 40,721 | | | New York Mortgage Trust, Inc. | | | 252,470 | |
| | 16,574 | | | PennyMac Mortgage Investment Trust | | | 361,810 | |
| | 5,157 | | | Piper Jaffray Cos. | | | 383,010 | |
| | 14,261 | | | PRA Group, Inc.1 | | | 401,305 | |
| | 14,462 | | | Redwood Trust, Inc. | | | 239,057 | |
| | 2,285 | | | Virtus Investment Partners, Inc. | | | 245,409 | |
| | 30,583 | | | Waddell & Reed Financial, Inc., Class A2 | | | 509,819 | |
| | 20,472 | | | WisdomTree Investments, Inc. | | | 126,312 | |
| | 1,594 | | | World Acceptance Corp.1 | | | 261,591 | |
| | | | | | | | |
| | | | Total Diversified Financials | | | 6,963,510 | |
| | | | | | | | |
| | | | Energy—5.8% | | | |
| | 46,573 | | | Archrock, Inc. | | | 493,674 | |
The accompanying notes are an integral part of these financial statements.
Invesco S&P SmallCap 600 Revenue ETF (RWJ)(continued)
June 30, 2019
| | | | | | | | |
| Shares | | | | | Value | |
| | | | Common Stocks (continued) | | | |
| | | | Energy (continued) | | | |
| | 7,317 | | | Bonanza Creek Energy, Inc.1 | | $ | 152,779 | |
| | 93,016 | | | C&J Energy Services, Inc.1 | | | 1,095,728 | |
| | 53,853 | | | Carrizo Oil & Gas, Inc.1 | | | 539,607 | |
| | 27,141 | | | CONSOL Energy, Inc.1 | | | 722,222 | |
| | 532,778 | | | Denbury Resources, Inc.1,2 | | | 660,645 | |
| | 63,214 | | | Diamond Offshore Drilling, Inc.1,2 | | | 560,708 | |
| | 2,689 | | | DMC Global, Inc. | | | 170,348 | |
| | 4,327 | | | Dril-Quip, Inc.1 | | | 207,696 | |
| | 13,083 | | | Era Group, Inc.1 | | | 109,112 | |
| | 49,799 | | | Exterran Corp.1 | | | 708,142 | |
| | 3,059 | | | Geospace Technologies Corp.1 | | | 46,222 | |
| | 130,657 | | | Green Plains, Inc. | | | 1,408,482 | |
| | 14,392 | | | Gulf Island Fabrication, Inc.1 | | | 102,183 | |
| | 141,071 | | | Gulfport Energy Corp.1 | | | 692,659 | |
| | 46,582 | | | Helix Energy Solutions Group, Inc.1 | | | 402,003 | |
| | 133,073 | | | HighPoint Resources Corp.1 | | | 242,193 | |
| | 12,719 | | | KLX Energy Services Holdings, Inc.1 | | | 259,849 | |
| | 196,980 | | | Laredo Petroleum, Inc.1 | | | 571,242 | |
| | 31,235 | | | Matrix Service Co.1 | | | 632,821 | |
| | 694,854 | | | Nabors Industries Ltd. | | | 2,015,077 | |
| | 66,836 | | | Newpark Resources, Inc.1 | | | 495,923 | |
| | 327,311 | | | Noble Corp. PLC1 | | | 612,071 | |
| | 30,268 | | | Oil States International, Inc.1 | | | 553,904 | |
| | 91,041 | | | Par Pacific Holdings, Inc.1 | | | 1,868,161 | |
| | 20,244 | | | PDC Energy, Inc.1 | | | 729,999 | |
| | 7,956 | | | Penn Virginia Corp.1 | | | 244,090 | |
| | 48,038 | | | ProPetro Holding Corp.1 | | | 994,387 | |
| | 70,740 | | | Renewable Energy Group, Inc.1 | | | 1,121,936 | |
| | 3,165 | | | REX American Resources Corp.1 | | | 230,729 | |
| | 18,239 | | | Ring Energy, Inc.1 | | | 59,277 | |
| | 9,185 | | | SEACOR Holdings, Inc.1 | | | 436,379 | |
| | 69,459 | | | SRC Energy, Inc.1 | | | 344,517 | |
| | 744,249 | | | Superior Energy Services, Inc.1 | | | 967,524 | |
| | 313,919 | | | TETRA Technologies, Inc.1 | | | 511,688 | |
| | 72,655 | | | U.S. Silica Holdings, Inc.2 | | | 929,257 | |
| | 45,734 | | | Unit Corp.1 | | | 406,575 | |
| | 56,303 | | | Whiting Petroleum Corp.1,2 | | | 1,051,740 | |
| | | | | | | | |
| | | | Total Energy | | | 23,351,549 | |
| | | | | | | | |
| | | | Food & Staples Retailing—3.3% | | | |
| | 72,528 | | | Andersons, Inc. (The) | | | 1,975,663 | |
| | 20,281 | | | Chefs’ Warehouse, Inc. (The)1 | | | 711,254 | |
| | 330,912 | | | SpartanNash Co. | | | 3,861,743 | |
| | 782,867 | | | United Natural Foods, Inc.1 | | | 7,022,317 | |
| | | | | | | | |
| | | | Total Food & Staples Retailing | | | 13,570,977 | |
| | | | | | | | |
| | | | Food, Beverage & Tobacco—2.8% | | | |
| | 33,506 | | | B&G Foods, Inc.2 | | | 696,925 | |
| | 5,186 | | | Calavo Growers, Inc. | | | 501,694 | |
| | 17,104 | | | Cal-Maine Foods, Inc. | | | 713,579 | |
| | 6,921 | | | Coca-Cola Consolidated | | | 2,071,109 | |
| | 78,032 | | | Darling Ingredients, Inc.1 | | | 1,552,056 | |
| | 3,251,428 | | | Dean Foods Co.2 | | | 3,003,669 | |
| | 3,228 | | | J&J Snack Foods Corp. | | | 519,547 | |
| | 5,021 | | | John B. Sanfilippo & Son, Inc. | | | 400,123 | |
| | 2,794 | | | MGP Ingredients, Inc.2 | | | 185,270 | |
| | 22,471 | | | Seneca Foods Corp., Class A1 | | | 625,368 | |
| | 17,258 | | | Universal Corp. | | | 1,048,769 | |
| | | | | | | | |
| | | | Total Food, Beverage & Tobacco | | | 11,318,109 | |
| | | | | | | | |
| | | | | | | | |
| Shares | | | | | Value | |
| | | | Common Stocks (continued) | | | |
| | | | Health Care Equipment & Services—7.9% | | | |
| | 3,479 | | | Addus HomeCare Corp.1 | | $ | 260,751 | |
| | 19,031 | | | AMN Healthcare Services, Inc.1 | | | 1,032,432 | |
| | 8,246 | | | AngioDynamics, Inc.1 | | | 162,364 | |
| | 3,758 | | | BioTelemetry, Inc.1 | | | 180,948 | |
| | 2,743 | | | Cardiovascular Systems, Inc.1 | | | 117,757 | |
| | 2,436,475 | | | Community Health Systems, Inc.1,2 | | | 6,505,388 | |
| | 4,817 | | | Computer Programs & Systems, Inc. | | | 133,864 | |
| | 4,845 | | | CONMED Corp. | | | 414,587 | |
| | 3,345 | | | CorVel Corp.1 | | | 291,048 | |
| | 45,536 | | | Cross Country Healthcare, Inc.1 | | | 427,128 | |
| | 4,216 | | | CryoLife, Inc.1 | | | 126,185 | |
| | 4,207 | | | Cutera, Inc.1 | | | 87,421 | |
| | 575,164 | | | Diplomat Pharmacy, Inc.1 | | | 3,502,749 | |
| | 16,951 | | | Ensign Group, Inc. (The) | | | 964,851 | |
| | 4,337 | | | HealthStream, Inc.1 | | | 112,155 | |
| | 714 | | | Heska Corp.1 | | | 60,811 | |
| | 9,149 | | | HMS Holdings Corp.1 | | | 296,336 | |
| | 7,246 | | | Integer Holdings Corp.1 | | | 608,084 | |
| | 80,270 | | | Invacare Corp. | | | 416,601 | |
| | 6,015 | | | Lantheus Holdings, Inc.1 | | | 170,225 | |
| | 1,896 | | | LeMaitre Vascular, Inc. | | | 53,050 | |
| | 8,066 | | | LHC Group, Inc.1 | | | 964,532 | |
| | 50,727 | | | Magellan Health, Inc.1 | | | 3,765,465 | |
| | 8,083 | | | Meridian Bioscience, Inc. | | | 96,026 | |
| | 7,265 | | | Merit Medical Systems, Inc.1 | | | 432,703 | |
| | 9,867 | | | Natus Medical, Inc.1 | | | 253,483 | |
| | 3,052 | | | Neogen Corp.1 | | | 189,560 | |
| | 12,932 | | | NextGen Healthcare, Inc.1 | | | 257,347 | |
| | 4,556 | | | Omnicell, Inc.1 | | | 391,953 | |
| | 9,099 | | | OraSure Technologies, Inc.1 | | | 84,439 | |
| | 4,040 | | | Orthofix Medical, Inc.1 | | | 213,635 | |
| | 1,617,619 | | | Owens & Minor, Inc. | | | 5,176,381 | |
| | 11,035 | | | Providence Service Corp. (The)1 | | | 632,747 | |
| | 153,707 | | | Select Medical Holdings Corp.1 | | | 2,439,330 | |
| | 998 | | | Surmodics, Inc.1 | | | 43,084 | |
| | 2,129 | | | Tabula Rasa HealthCare, Inc.1,2 | | | 106,301 | |
| | 1,327 | | | Tactile Systems Technology, Inc.1,2 | | | 75,533 | |
| | 16,796 | | | Tivity Health, Inc.1,2 | | | 276,126 | |
| | 1,805 | | | US Physical Therapy, Inc. | | | 221,239 | |
| | 12,505 | | | Varex Imaging Corp.1 | | | 383,278 | |
| | | | | | | | |
| | | | Total Health Care Equipment & Services | | | 31,927,897 | |
| | | | | | | | |
| | | | Household & Personal Products—1.0% | | | |
| | 638,643 | | | Avon Products, Inc.1 | | | 2,477,935 | |
| | 18,801 | | | Central Garden & Pet Co., Class A11,2 | | | 506,687 | |
| | 20,674 | | | Central Garden & Pet Co., Class A21 | | | 509,407 | |
| | 4,668 | | | Inter Parfums, Inc. | | | 310,375 | |
| | 1,893 | | | Medifast, Inc. | | | 242,872 | |
| | 1,168 | | | WD-40 Co. | | | 185,759 | |
| | | | | | | | |
| | | | Total Household & Personal Products | | | 4,233,035 | |
| | | | | | | | |
| | | | Insurance—2.0% | | | |
| | 12,297 | | | Ambac Financial Group, Inc.1 | | | 207,204 | |
| | 40,206 | | | American Equity Investment Life Holding Co. | | | 1,091,995 | |
| | 2,824 | | | AMERISAFE, Inc. | | | 180,086 | |
| | 1,717 | | | eHealth, Inc.1 | | | 147,834 | |
| | 9,049 | | | Employers Holdings, Inc. | | | 382,501 | |
| | 2,576 | | | HCI Group, Inc. | | | 104,251 | |
| | 13,431 | | | Horace Mann Educators Corp. | | | 541,135 | |
The accompanying notes are an integral part of these financial statements.
Invesco S&P SmallCap 600 Revenue ETF (RWJ)(continued)
June 30, 2019
| | | | | | | | |
| Shares | | | | | Value | |
| | | | Common Stocks (continued) | | | |
| | | | Insurance (continued) | | | |
| | 8,652 | | | James River Group Holdings Ltd. | | $ | 405,779 | |
| | 11,341 | | | ProAssurance Corp. | | | 409,523 | |
| | 4,832 | | | RLI Corp. | | | 414,151 | |
| | 4,059 | | | Safety Insurance Group, Inc. | | | 386,133 | |
| | 15,929 | | | Selective Insurance Group, Inc. | | | 1,192,923 | |
| | 20,700 | | | Stewart Information Services Corp. | | | 838,143 | |
| | 39,053 | | | Third Point Reinsurance Ltd.1 | | | 403,027 | |
| | 10,561 | | | United Fire Group, Inc. | | | 511,786 | |
| | 23,919 | | | United Insurance Holdings Corp. | | | 341,085 | |
| | 13,629 | | | Universal Insurance Holdings, Inc. | | | 380,249 | |
| | | | | | | | |
| | | | Total Insurance | | | 7,937,805 | |
| | | | | | | | |
| | | | Materials—6.2% | | | |
| | 25,414 | | | AdvanSix, Inc.1 | | | 620,864 | |
| | 1,525,957 | | | AK Steel Holding Corp.1,2 | | | 3,616,518 | |
| | 14,625 | | | American Vanguard Corp. | | | 225,371 | |
| | 3,032 | | | Balchem Corp. | | | 303,109 | |
| | 86,730 | | | Boise Cascade Co. | | | 2,437,980 | |
| | 141,840 | | | Century Aluminum Co.1 | | | 980,114 | |
| | 42,000 | | | Clearwater Paper Corp.1 | | | 776,580 | |
| | 48,204 | | | Ferro Corp.1 | | | 761,623 | |
| | 12,212 | | | FutureFuel Corp. | | | 142,758 | |
| | 31,174 | | | H.B. Fuller Co. | | | 1,446,474 | |
| | 6,331 | | | Hawkins, Inc. | | | 274,829 | |
| | 7,042 | | | Haynes International, Inc. | | | 224,006 | |
| | 13,033 | | | Innophos Holdings, Inc. | | | 379,391 | |
| | 8,044 | | | Innospec, Inc. | | | 733,935 | |
| | 7,903 | | | Kaiser Aluminum Corp. | | | 771,412 | |
| | 29,299 | | | Koppers Holdings, Inc.1 | | | 860,219 | |
| | 34,570 | | | Kraton Corp.1 | | | 1,074,090 | |
| | 30,038 | | | Livent Corp.1 | | | 207,863 | |
| | 50,626 | | | LSB Industries, Inc.1 | | | 197,441 | |
| | 8,800 | | | Materion Corp. | | | 596,728 | |
| | 46,996 | | | Mercer International, Inc. | | | 727,028 | |
| | 13,891 | | | Myers Industries, Inc. | | | 267,680 | |
| | 7,628 | | | Neenah, Inc. | | | 515,271 | |
| | 66,022 | | | Olympic Steel, Inc. | | | 901,200 | |
| | 30,720 | | | PH Glatfelter Co. | | | 518,554 | |
| | 2,001 | | | Quaker Chemical Corp. | | | 405,963 | |
| | 147,650 | | | Rayonier Advanced Materials, Inc.2 | | | 958,248 | |
| | 14,610 | | | Schweitzer-Mauduit International, Inc. | | | 484,760 | |
| | 9,889 | | | Stepan Co. | | | 908,898 | |
| | 89,665 | | | SunCoke Energy, Inc.1 | | | 796,225 | |
| | 104,161 | | | TimkenSteel Corp.1 | | | 846,829 | |
| | 30,225 | | | Tredegar Corp. | | | 502,340 | |
| | 14,665 | | | U.S. Concrete, Inc.1 | | | 728,704 | |
| | | | | | | | |
| | | | Total Materials | | | 25,193,005 | |
| | | | | | | | |
| | | | Media & Entertainment—1.0% | | | |
| | 6,483 | | | Care.com, Inc.1 | | | 71,183 | |
| | 38,162 | | | E.W. Scripps Co., (The), Class A | | | 583,497 | |
| | 154,953 | | | Gannett Co., Inc. | | | 1,264,417 | |
| | 9,530 | | | Marcus Corp. (The) | | | 314,109 | |
| | 77,197 | | | New Media Investment Group, Inc. | | | 728,740 | |
| | 12,491 | | | QuinStreet, Inc.1 | | | 197,982 | |
| | 23,652 | | | Scholastic Corp. | | | 786,192 | |
| | 2,824 | | | TechTarget, Inc.1 | | | 60,010 | |
| | | | | | | | |
| | | | Total Media & Entertainment | | | 4,006,130 | |
| | | | | | | | |
| | | | | | | | |
| Shares | | | | | Value | |
| | | | Common Stocks (continued) | | | |
| | | | Pharmaceuticals, Biotechnology & Life Sciences—1.6% | |
| | 24,871 | | | Acorda Therapeutics, Inc.1 | | $ | 190,761 | |
| | 72,743 | | | Akorn, Inc.1 | | | 374,626 | |
| | 22,002 | | | AMAG Pharmaceuticals, Inc.1 | | | 219,800 | |
| | 7,294 | | | Amphastar Pharmaceuticals, Inc.1 | | | 153,976 | |
| | 1,349 | | | ANI Pharmaceuticals, Inc.1 | | | 110,888 | |
| | 1,254 | | | Anika Therapeutics, Inc.1,2 | | | 50,937 | |
| | 1,679 | | | Arrowhead Pharmaceuticals, Inc.1,2 | | | 44,494 | |
| | 35,953 | | | Assertio Therapeutics, Inc.1 | | | 124,038 | |
| | 5,873 | | | Cambrex Corp.1 | | | 274,915 | |
| | 11,410 | | | Corcept Therapeutics, Inc.1 | | | 127,222 | |
| | 1,664 | | | Cytokinetics, Inc.1 | | | 18,720 | |
| | 1,904 | | | Eagle Pharmaceuticals, Inc.1 | | | 106,015 | |
| | 9,022 | | | Emergent BioSolutions, Inc.1 | | | 435,853 | |
| | 1,247 | | | Enanta Pharmaceuticals, Inc.1 | | | 105,222 | |
| | 335,107 | | | Endo International PLC1 | | | 1,380,641 | |
| | 9,001 | | | Innoviva, Inc.1 | | | 131,055 | |
| | 60,682 | | | Lannett Co., Inc.1,2 | | | 367,733 | |
| | 6,774 | | | Luminex Corp. | | | 139,815 | |
| | 106 | | | Medicines Co. (The)1 | | | 3,866 | |
| | 6,130 | | | Medpace Holdings, Inc.1 | | | 401,025 | |
| | 2,858 | | | Momenta Pharmaceuticals, Inc.1 | | | 35,582 | |
| | 15,939 | | | Myriad Genetics, Inc.1 | | | 442,785 | |
| | 6,126 | | | NeoGenomics, Inc.1 | | | 134,404 | |
| | 13,181 | | | Phibro Animal Health Corp., Class A | | | 418,760 | |
| | 1,869 | | | Progenics Pharmaceuticals, Inc.1 | | | 11,532 | |
| | 825 | | | REGENXBIO, Inc.1 | | | 42,380 | |
| | 1,302 | | | Repligen Corp.1 | | | 111,907 | |
| | 6,455 | | | Spectrum Pharmaceuticals, Inc.1 | | | 55,578 | |
| | 5,883 | | | Supernus Pharmaceuticals, Inc.1 | | | 194,668 | |
| | 6,180 | | | Vanda Pharmaceuticals, Inc.1 | | | 87,076 | |
| | | | | | | | |
| | | | Total Pharmaceuticals, Biotechnology & Life Sciences | | | 6,296,274 | |
| | | | | | | | |
| | | | Real Estate—2.3% | | | |
| | 4,445 | | | Acadia Realty Trust | | | 121,660 | |
| | 1,086 | | | Agree Realty Corp. | | | 69,558 | |
| | 3,211 | | | American Assets Trust, Inc. | | | 151,302 | |
| | 5,094 | | | Armada Hoffler Properties, Inc. | | | 84,306 | |
| | 2,977 | | | CareTrust REIT, Inc. | | | 70,793 | |
| | 347,567 | | | CBL & Associates Properties, Inc. | | | 361,470 | |
| | 24,510 | | | Cedar Realty Trust, Inc. | | | 64,951 | |
| | 7,868 | | | Chatham Lodging Trust | | | 148,469 | |
| | 9,447 | | | Chesapeake Lodging Trust | | | 268,484 | |
| | 614 | | | Community Healthcare Trust, Inc. | | | 24,198 | |
| | 40,543 | | | DiamondRock Hospitality Co. | | | 419,215 | |
| | 4,135 | | | Easterly Government Properties, Inc. | | | 74,885 | |
| | 2,423 | | | Four Corners Property Trust, Inc. | | | 66,221 | |
| | 16,086 | | | Franklin Street Properties Corp. | | | 118,715 | |
| | 1,993 | | | Getty Realty Corp. | | | 61,305 | |
| | 6,811 | | | Global Net Lease, Inc. | | | 133,632 | |
| | 13,750 | | | Hersha Hospitality Trust | | | 227,425 | |
| | 7,087 | | | HFF, Inc., Class A | | | 322,317 | |
| | 7,545 | | | Independence Realty Trust, Inc. | | | 87,296 | |
| | 79 | | | Innovative Industrial Properties, Inc., Class A2 | | | 9,761 | |
| | 21,192 | | | iStar, Inc.2 | | | 263,205 | |
| | 10,016 | | | Kite Realty Group Trust | | | 151,542 | |
| | 18,266 | | | Lexington Realty Trust | | | 171,883 | |
| | 1,643 | | | LTC Properties, Inc. | | | 75,019 | |
| | 12,085 | | | Marcus & Millichap, Inc.1 | | | 372,822 | |
The accompanying notes are an integral part of these financial statements.
Invesco S&P SmallCap 600 Revenue ETF (RWJ)(continued)
June 30, 2019
| | | | | | | | |
| Shares | | | | | Value | |
| | | | Common Stocks (continued) | | | |
| | | | Real Estate (continued) | | | |
| | 5,004 | | | National Storage Affiliates Trust | | $ | 144,816 | |
| | 10,335 | | | NorthStar Realty Europe Corp. | | | 169,804 | |
| | 9,354 | | | Office Properties Income Trust | | | 245,729 | |
| | 25,115 | | | Pennsylvania Real Estate Investment Trust2 | | | 163,247 | |
| | 3,342 | | | RE/MAX Holdings, Inc., Class A | | | 102,800 | |
| | 388,231 | | | Realogy Holdings Corp.2 | | | 2,810,792 | |
| | 7,465 | | | Retail Opportunity Investments Corp. | | | 127,875 | |
| | 9,312 | | | RPT Realty | | | 112,768 | |
| | 1,859 | | | Saul Centers, Inc. | | | 104,346 | |
| | 22,229 | | | Summit Hotel Properties, Inc. | | | 254,967 | |
| | 407 | | | Universal Health Realty Income Trust | | | 34,566 | |
| | 2,960 | | | Urstadt Biddle Properties, Inc., Class A | | | 62,160 | |
| | 81,921 | | | Washington Prime Group, Inc.2 | | | 312,938 | |
| | 5,494 | | | Washington Real Estate Investment Trust | | | 146,855 | |
| | 4,213 | | | Whitestone REIT | | | 53,463 | |
| | 23,490 | | | Xenia Hotels & Resorts, Inc. | | | 489,766 | |
| | | | | | | | |
| | | | Total Real Estate | | | 9,257,326 | |
| | | | | | | | |
| | | | Retailing—17.6% | | | |
| | 105,306 | | | Abercrombie & Fitch Co., Class A | | | 1,689,108 | |
| | 39,845 | | | Asbury Automotive Group, Inc.1 | | | 3,360,527 | |
| | 3,852,905 | | | Ascena Retail Group, Inc.1 | | | 2,350,272 | |
| | 277,181 | | | Barnes & Noble Education, Inc.1 | | | 931,328 | |
| | 241,299 | | | Barnes & Noble, Inc. | | | 1,614,290 | |
| | 82,488 | | | Big Lots, Inc. | | | 2,359,982 | |
| | 10,672 | | | Boot Barn Holdings, Inc.1 | | | 380,350 | |
| | 24,287 | | | Buckle, Inc. (The)2 | | | 420,408 | |
| | 65,434 | | | Caleres, Inc. | | | 1,303,445 | |
| | 30,313 | | | Cato Corp., (The), Class A | | | 373,456 | |
| | 289,273 | | | Chico’s FAS, Inc. | | | 974,850 | |
| | 9,034 | | | Children’s Place, Inc. (The)2 | | | 861,663 | |
| | 39,972 | | | Conn’s, Inc.1 | | | 712,301 | |
| | 197,122 | | | Core-Mark Holding Co., Inc. | | | 7,829,686 | |
| | 83,831 | | | Designer Brands, Inc., Class A | | | 1,607,040 | |
| | 352,486 | | | Express, Inc.1 | | | 962,287 | |
| | 674,426 | | | GameStop Corp., Class A2 | | | 3,689,110 | |
| | 25,875 | | | Genesco, Inc.1 | | | 1,094,254 | |
| | 68,376 | | | Group 1 Automotive, Inc. | | | 5,599,311 | |
| | 83,036 | | | Guess?, Inc. | | | 1,341,032 | |
| | 22,145 | | | Haverty Furniture Cos., Inc. | | | 377,129 | |
| | 22,378 | | | Hibbett Sports, Inc.1 | | | 407,280 | |
| | 4,864,705 | | | JC Penney Co., Inc.1,2 | | | 5,545,764 | |
| | 119,890 | | | Kirkland’s, Inc.1,2 | | | 270,951 | |
| | 16,772 | | | Liquidity Services, Inc.1 | | | 102,142 | |
| | 47,258 | | | Lithia Motors, Inc., Class A | | | 5,613,305 | |
| | 47,491 | | | Lumber Liquidators Holdings, Inc.1,2 | | | 548,521 | |
| | 33,715 | | | MarineMax, Inc.1 | | | 554,275 | |
| | 6,388 | | | Monro, Inc. | | | 544,896 | |
| | 2,639,738 | | | Office Depot, Inc. | | | 5,437,860 | |
| | 7,366 | | | PetMed Express, Inc.2 | | | 115,425 | |
| | 46,968 | | | Rent-A-Center, Inc.1 | | | 1,250,758 | |
| | 10,292 | | | RH1 | | | 1,189,755 | |
| | 17,664 | | | Shoe Carnival, Inc.2 | | | 487,526 | |
| | 18,884 | | | Shutterfly, Inc.1 | | | 954,586 | |
| | 7,435 | | | Shutterstock, Inc. | | | 291,378 | |
| | 18,729 | | | Sleep Number Corp.1 | | | 756,464 | |
| | 194,175 | | | Sonic Automotive, Inc., Class A | | | 4,533,986 | |
| | 6,672 | | | Stamps.com, Inc.1 | | | 302,042 | |
| | 267,745 | | | Tailored Brands, Inc.2 | | | 1,544,889 | |
| | | | | | | | |
| Shares | | | | | Value | |
| | | | Common Stocks (continued) | | | |
| | | | Retailing (continued) | | | |
| | 39,580 | | | Tile Shop Holdings, Inc. | | $ | 158,320 | |
| | 122,003 | | | Vitamin Shoppe, Inc.1,2 | | | 480,692 | |
| | 19,221 | | | Zumiez, Inc.1 | | | 501,668 | |
| | | | | | | | |
| | | | Total Retailing | | | 71,424,312 | |
| | | | | | | | |
| | | | Semiconductors & Semiconductor Equipment—1.6% | |
| | 5,910 | | | Advanced Energy Industries, Inc.1 | | | 332,556 | |
| | 12,913 | | | Axcelis Technologies, Inc.1 | | | 194,341 | |
| | 9,055 | | | Brooks Automation, Inc. | | | 350,881 | |
| | 3,446 | | | Cabot Microelectronics Corp. | | | 379,336 | |
| | 1,466 | | | CEVA, Inc.1 | | | 35,697 | |
| | 14,706 | | | Cohu, Inc. | | | 226,914 | |
| | 17,177 | | | Diodes, Inc.1 | | | 624,727 | |
| | 3,848 | | | DSP Group, Inc.1 | | | 55,257 | |
| | 17,137 | | | FormFactor, Inc.1 | | | 268,537 | |
| | 14,749 | | | Ichor Holdings Ltd.1 | | | 348,666 | |
| | 9,687 | | | Kopin Corp.1 | | | 10,559 | |
| | 15,571 | | | Kulicke & Soffa Industries, Inc. | | | 351,126 | |
| | 7,400 | | | MaxLinear, Inc.1 | | | 173,456 | |
| | 4,313 | | | Nanometrics, Inc.1 | | | 149,704 | |
| | 2,958 | | | PDF Solutions, Inc.1 | | | 38,809 | |
| | 30,012 | | | Photronics, Inc.1 | | | 246,098 | |
| | 2,652 | | | Power Integrations, Inc. | | | 212,637 | |
| | 9,298 | | | Rambus, Inc.1 | | | 111,948 | |
| | 5,004 | | | Rudolph Technologies, Inc.1 | | | 138,261 | |
| | 34,519 | | | SMART Global Holdings, Inc.1 | | | 793,592 | |
| | 8,095 | | | SolarEdge Technologies, Inc.1 | | | 505,614 | |
| | 37,058 | | | Ultra Clean Holdings, Inc.1 | | | 515,847 | |
| | 20,172 | | | Veeco Instruments, Inc.1 | | | 246,502 | |
| | 9,222 | | | Xperi Corp. | | | 189,881 | |
| | | | | | | | |
| | | | Total Semiconductors & Semiconductor Equipment | | | 6,500,946 | |
| | | | | | | | |
| | | | Software & Services—2.1% | | | |
| | 6,515 | | | 8x8, Inc.1 | | | 157,012 | |
| | 2,847 | | | Agilysys, Inc.1 | | | 61,125 | |
| | 3,779 | | | Alarm.com Holdings, Inc.1 | | | 202,176 | |
| | 4,258 | | | Bottomline Technologies (DE), Inc.1 | | | 188,374 | |
| | 21,591 | | | Cardtronics PLC, Class A1 | | | 589,866 | |
| | 8,905 | | | CSG Systems International, Inc. | | | 434,831 | |
| | 4,566 | | | Ebix, Inc.2 | | | 229,305 | |
| | 7,063 | | | EVERTEC, Inc. | | | 230,960 | |
| | 6,839 | | | ExlService Holdings, Inc.1 | | | 452,263 | |
| | 4,386 | | | LivePerson, Inc.1 | | | 122,983 | |
| | 14,361 | | | ManTech International Corp., Class A | | | 945,672 | |
| | 1,677 | | | MicroStrategy, Inc., Class A1 | | | 240,331 | |
| | 6,762 | | | Monotype Imaging Holdings, Inc. | | | 113,872 | |
| | 9,786 | | | NIC, Inc. | | | 156,967 | |
| | 6,943 | | | OneSpan, Inc.1 | | | 98,382 | |
| | 7,161 | | | Perficient, Inc.1 | | | 245,766 | |
| | 4,363 | | | Progress Software Corp. | | | 190,314 | |
| | 1,550 | | | Qualys, Inc.1 | | | 134,974 | |
| | 1,115 | | | SPS Commerce, Inc.1 | | | 113,964 | |
| | 27,291 | | | Sykes Enterprises, Inc.1 | | | 749,411 | |
| | 45,419 | | | TiVo Corp. | | | 334,738 | |
| | 15,974 | | | TTEC Holdings, Inc. | | | 744,229 | |
| | 141,182 | | | Unisys Corp.1 | | | 1,372,289 | |
| | 13,220 | | | Virtusa Corp.1 | | | 587,365 | |
| | | | | | | | |
| | | | Total Software & Services | | | 8,697,169 | |
| | | | | | | | |
The accompanying notes are an integral part of these financial statements.
Invesco S&P SmallCap 600 Revenue ETF (RWJ)(continued)
June 30, 2019
| | | | | | | | |
| Shares | | | | | Value | |
| | | | Common Stocks (continued) | | | |
| | | | Technology Hardware & Equipment—7.8% | |
| | 38,286 | | | 3D Systems Corp.1,2 | | $ | 348,403 | |
| | 15,594 | | | ADTRAN, Inc. | | | 237,808 | |
| | 68,266 | | | Anixter International, Inc.1 | | | 4,076,163 | |
| | 13,119 | | | Applied Optoelectronics, Inc.1,2 | | | 134,863 | |
| | 52,875 | | | Arlo Technologies, Inc.1 | | | 212,029 | |
| | 3,492 | | | Badger Meter, Inc. | | | 208,437 | |
| | 14,624 | | | Bel Fuse, Inc., Class B | | | 251,094 | |
| | 50,088 | | | Benchmark Electronics, Inc. | | | 1,258,211 | |
| | 16,347 | | | CalAmp Corp.1 | | | 190,933 | |
| | 11,268 | | | Comtech Telecommunications Corp. | | | 316,743 | |
| | 5,279 | | | Control4 Corp.1 | | | 125,376 | |
| | 5,911 | | | Cray, Inc.1 | | | 205,821 | |
| | 7,885 | | | CTS Corp. | | | 217,468 | |
| | 41,563 | | | Daktronics, Inc. | | | 256,444 | |
| | 235,755 | | | Diebold Nixdorf, Inc.1 | | | 2,159,516 | |
| | 9,917 | | | Digi International, Inc.1 | | | 125,748 | |
| | 12,406 | | | Electronics For Imaging, Inc.1 | | | 457,905 | |
| | 8,722 | | | ePlus, Inc.1 | | | 601,295 | |
| | 83,758 | | | Extreme Networks, Inc.1 | | | 541,914 | |
| | 14,639 | | | Fabrinet1 | | | 727,119 | |
| | 3,934 | | | FARO Technologies, Inc.1 | | | 206,850 | |
| | 26,893 | | | Finisar Corp.1 | | | 615,043 | |
| | 32,436 | | | Harmonic, Inc.1 | | | 180,020 | |
| | 17,956 | | | II-VI, Inc.1,2 | | | 656,471 | |
| | 58,439 | | | Insight Enterprises, Inc.1 | | | 3,401,150 | |
| | 18,293 | | | Itron, Inc.1 | | | 1,144,593 | |
| | 38,197 | | | KEMET Corp. | | | 718,486 | |
| | 22,285 | | | Knowles Corp.1 | | | 408,038 | |
| | 17,246 | | | Methode Electronics, Inc. | | | 492,718 | |
| | 6,850 | | | MTS Systems Corp. | | | 400,930 | |
| | 23,780 | | | NETGEAR, Inc.1 | | | 601,396 | |
| | 4,714 | | | OSI Systems, Inc.1 | | | 530,938 | |
| | 2,111 | | | Park Electrochemical Corp. | | | 35,233 | |
| | 26,076 | | | Plexus Corp.1 | | | 1,522,056 | |
| | 2,710 | | | Rogers Corp.1 | | | 467,692 | |
| | 129,931 | | | Sanmina Corp.1 | | | 3,934,311 | |
| | 57,270 | | | ScanSource, Inc.1 | | | 1,864,711 | |
| | 134,989 | | | TTM Technologies, Inc.1 | | | 1,376,888 | |
| | 39,109 | | | Viavi Solutions, Inc.1 | | | 519,759 | |
| | | | | | | | |
| | | | Total Technology Hardware & Equipment | | | 31,730,573 | |
| | | | | | | | |
| | | | Telecommunication Services—1.8% | | | |
| | 3,300 | | | ATN International, Inc. | | | 190,509 | |
| | 123,396 | | | Cincinnati Bell, Inc.1 | | | 610,810 | |
| | 4,045 | | | Cogent Communications Holdings, Inc. | | | 240,111 | |
| | 141,710 | | | Consolidated Communications Holdings, Inc. | | | 698,630 | |
| | 2,671,009 | | | Frontier Communications Corp.1,2 | | | 4,674,266 | |
| | 10,714 | | | Iridium Communications, Inc.1 | | | 249,208 | |
| | 5,290 | | | Spok Holdings, Inc. | | | 79,562 | |
| | 42,567 | | | Vonage Holdings Corp.1 | | | 482,284 | |
| | | | | | | | |
| | | | Total Telecommunication Services | | | 7,225,380 | |
| | | | | | | | |
| | | | Transportation—3.1% | | | |
| | 5,456 | | | Allegiant Travel Co. | | | 782,936 | |
| | 52,445 | | | ArcBest Corp. | | | 1,474,229 | |
| | 30,688 | | | Atlas Air Worldwide Holdings, Inc.1 | | | 1,369,912 | |
| | 53,490 | | | Echo Global Logistics, Inc.1 | | | 1,116,336 | |
| | 10,326 | | | Forward Air Corp. | | | 610,783 | |
| | 48,446 | | | Hawaiian Holdings, Inc. | | | 1,328,874 | |
| | | | | | | | |
| Shares | | | | | Value | |
| | | | Common Stocks (continued) | | | |
| | | | Transportation (continued) | | | |
| | 14,232 | | | Heartland Express, Inc.2 | | $ | 257,172 | |
| | 44,204 | | | Hub Group, Inc., Class A1 | | | 1,855,684 | |
| | 19,923 | | | Marten Transport Ltd. | | | 361,602 | |
| | 28,043 | | | Matson, Inc. | | | 1,089,471 | |
| | 12,294 | | | Saia, Inc.1 | | | 795,053 | |
| | 23,891 | | | SkyWest, Inc. | | | 1,449,467 | |
| | | | | | | | |
| | | | Total Transportation | | | 12,491,519 | |
| | | | | | | | |
| | | | Utilities—0.7% | | | |
| | 2,716 | | | American States Water Co. | | | 204,352 | |
| | 14,356 | | | Avista Corp. | | | 640,278 | |
| | 6,149 | | | California Water Service Group | | | 311,324 | |
| | 6,336 | | | El Paso Electric Co. | | | 414,374 | |
| | 4,817 | | | Northwest Natural Holding Co. | | | 334,782 | |
| | 23,732 | | | South Jersey Industries, Inc. | | | 800,480 | |
| | | | | | | | |
| | | | Total Utilities | | | 2,705,590 | |
| | | | | | | | |
| | | | Total Common Stocks
(Cost $448,662,148) | | | 405,183,472 | |
| | | | | | | | |
| | |
| | | | | | | | |
| | | | Right—0.0%4 | | | |
| | | | Materials—0.0%4 | | | |
| | | | A. Schulman, Inc. CVR1,5 | | | | |
| | 37,522 | | | (Cost $19,624) | | | 19,624 | |
| | | | | | | | |
| | |
| | | | | | | | |
| | | | Investment of Cash Collateral for Securities
Loaned—6.8% | |
| | 20,414,810 | | | Invesco Government & Agency Portfolio—Institutional Class, 2.27%6,7 | | | 20,414,810 | |
| | 7,015,694 | | | Invesco Liquid Assets Portfolio—Institutional Class, 2.41%6,7 | | | 7,018,501 | |
| | | | | | | | |
| | |
| | | | Total Investment of Cash Collateral for Securities Loaned | | | | |
| | | | (Cost $27,432,417) | | | 27,433,311 | |
| | | | | | | | |
| | |
| | | | Total Investments—106.8%
(Cost $476,114,189) | | | 432,636,407 | |
| | |
| | | | Liabilities in Excess of Other
Assets—(6.8)% | | | (27,437,226 | ) |
| | | | | | | | |
| | |
| | | | Net Assets—100.0% | | $ | 405,199,181 | |
| | | | | | | | |
CVR—Contigent Value Rights
REIT—Real Estate Investment Trust
| 1 | Non-income producing security. |
| 2 | All or a portion of the security was on loan. The aggregate value of the securities on loan was $26,542,878; total value of the collateral held by the Fund was $27,433,311. |
| 3 | Affiliated security (Note 4). |
| 5 | The value of this security was determined using significant unobservable inputs. See Note 5 of the accompanying Notes. |
| 6 | The security and the Fund are advised by wholly-owned subsidiaries of Invesco Ltd. and are therefore considered to be affiliated. The rate shown is the 7-day SEC standardized yield as of June 30, 2019. |
| 7 | The security has been segregated to satisfy the commitment to return the cash collateral received in securities lending transactions upon the borrower’s return of the securities loaned. See Note 6. |
The accompanying notes are an integral part of these financial statements.
Schedule of Investments
Invesco S&P Financials Revenue ETF (RWW)
June 30, 2019
| | | | | | | | |
| Shares | | | | | Value | |
| | | | Common Stocks—100.0% | |
| | | | Banks—34.8% | |
| | 79,527 | | | Bank of America Corp. | | $ | 2,306,283 | |
| | 5,265 | | | BB&T Corp. | | | 258,670 | |
| | 29,648 | | | Citigroup, Inc. | | | 2,076,249 | |
| | 4,224 | | | Citizens Financial Group, Inc. | | | 149,361 | |
| | 1,046 | | | Comerica, Inc. | | | 75,981 | |
| | 5,960 | | | Fifth Third Bancorp | | | 166,284 | |
| | 775 | | | First Republic Bank | | | 75,679 | |
| | 8,023 | | | Huntington Bancshares, Inc. | | | 110,878 | |
| | 24,852 | | | JPMorgan Chase & Co. | | | 2,778,454 | |
| | 8,675 | | | KeyCorp | | | 153,981 | |
| | 781 | | | M&T Bank Corp. | | | 132,825 | |
| | 2,440 | | | People’s United Financial, Inc. | | | 40,943 | |
| | 2,989 | | | PNC Financial Services Group, Inc. (The) | | | 410,330 | |
| | 8,897 | | | Regions Financial Corp. | | | 132,921 | |
| | 3,258 | | | SunTrust Banks, Inc. | | | 204,765 | |
| | 267 | | | SVB Financial Group1 | | | 59,966 | |
| | 9,570 | | | U.S. Bancorp | | | 501,468 | |
| | 44,976 | | | Wells Fargo & Co. | | | 2,128,264 | |
| | 1,388 | | | Zions Bancorp NA | | | 63,820 | |
| | | | | | | | |
| | | | Total Banks | | | 11,827,122 | |
| | | | | | | | |
| | | | Capital Markets—14.4% | | | |
| | 524 | | | Affiliated Managers Group, Inc. | | | 48,281 | |
| | 1,642 | | | Ameriprise Financial, Inc. | | | 238,353 | |
| | 8,787 | | | Bank of New York Mellon Corp. (The) | | | 387,946 | |
| | 631 | | | BlackRock, Inc. | | | 296,128 | |
| | 482 | | | Cboe Global Markets, Inc. | | | 49,950 | |
| | 5,597 | | | Charles Schwab Corp. (The) | | | 224,944 | |
| | 446 | | | CME Group, Inc. | | | 86,573 | |
| | 1,377 | | | E*TRADE Financial Corp. | | | 61,414 | |
| | 3,471 | | | Franklin Resources, Inc.2 | | | 120,791 | |
| | 5,429 | | | Goldman Sachs Group, Inc. (The) | | | 1,110,774 | |
| | 1,479 | | | Intercontinental Exchange, Inc. | | | 127,105 | |
| | 4,953 | | | Invesco Ltd.3 | | | 101,338 | |
| | 464 | | | Moody’s Corp. | | | 90,624 | |
| | 23,740 | | | Morgan Stanley | | | 1,040,049 | |
| | 123 | | | MSCI, Inc. | | | 29,371 | |
| | 895 | | | Nasdaq, Inc. | | | 86,072 | |
| | 1,561 | | | Northern Trust Corp. | | | 140,490 | |
| | 1,879 | | | Raymond James Financial, Inc. | | | 158,870 | |
| | 557 | | | S&P Global, Inc. | | | 126,879 | |
| | 4,456 | | | State Street Corp. | | | 249,803 | |
| | 1,014 | | | T. Rowe Price Group, Inc. | | | 111,246 | |
| | | | | | | | |
| | | | Total Capital Markets | | | 4,887,001 | |
| | | | | | | | |
| | | | Consumer Finance—6.3% | | | |
| | 7,248 | | | American Express Co. | | | 894,693 | |
| | 7,362 | | | Capital One Financial Corp. | | | 668,028 | |
| | 3,409 | | | Discover Financial Services | | | 264,504 | |
| | 9,121 | | | Synchrony Financial | | | 316,225 | |
| | | | | | | | |
| | | | Total Consumer Finance | | | 2,143,450 | |
| | | | | | | | |
| | | | Diversified Financial Services—15.8% | | | |
| | 24,381 | | | Berkshire Hathaway, Inc., Class B1 | | | 5,197,298 | |
| | 7,741 | | | Jefferies Financial Group, Inc. | | | 148,859 | |
| | | | | | | | |
| | | | Total Diversified Financial Services | | | 5,346,157 | |
| | | | | | | | |
| | | | Insurance—28.7% | | | |
| | 8,151 | | | Aflac, Inc. | | | 446,756 | |
| | 7,938 | | | Allstate Corp. (The) | | | 807,215 | |
| | | | | | | | |
| Shares | | | | | Value | |
| | | | Common Stocks (continued) | |
| | | | Insurance (continued) | | | |
| | 18,163 | | | American International Group, Inc. | | $ | 967,725 | |
| | 1,134 | | | Aon PLC | | | 218,839 | |
| | 1,571 | | | Arthur J. Gallagher & Co. | | | 137,604 | |
| | 1,661 | | | Assurant, Inc. | | | 176,697 | |
| | 4,340 | | | Chubb Ltd. | | | 639,239 | |
| | 1,225 | | | Cincinnati Financial Corp. | | | 126,996 | |
| | 598 | | | Everest Re Group Ltd. | | | 147,814 | |
| | 6,924 | | | Hartford Financial Services Group, Inc. (The) | | | 385,805 | |
| | 5,230 | | | Lincoln National Corp. | | | 337,073 | |
| | 5,312 | | | Loews Corp. | | | 290,407 | |
| | 3,053 | | | Marsh & McLennan Cos., Inc. | | | 304,537 | |
| | 28,177 | | | MetLife, Inc. | | | 1,399,552 | |
| | 5,389 | | | Principal Financial Group, Inc. | | | 312,131 | |
| | 8,278 | | | Progressive Corp. (The) | | | 661,661 | |
| | 12,675 | | | Prudential Financial, Inc. | | | 1,280,175 | |
| | 976 | | | Torchmark Corp. | | | 87,313 | |
| | 4,087 | | | Travelers Cos., Inc. (The) | | | 611,088 | |
| | 7,084 | | | Unum Group | | | 237,668 | |
| | 895 | | | Willis Towers Watson PLC | | | 171,428 | |
| | | | | | | | |
| | | | Total Insurance | | | 9,747,723 | |
| | | | | | | | |
| | | | Total Common Stocks
(Cost $33,594,192) | | | 33,951,453 | |
| | | | | | | | |
| | |
| | | | | | | | |
| | | | Investment of Cash Collateral for Securities
Loaned—0.3% | |
| | 83,931 | | | Invesco Government & Agency Portfolio—Institutional Class, 2.27%4,5 | | | 83,931 | |
| | 26,925 | | | Invesco Liquid Assets Portfolio—Institutional Class, 2.41%4,5 | | | 26,936 | |
| | | | | | | | |
| | |
| | | | Total Investment of Cash Collateral for Securities Loaned
(Cost $110,867) | | | 110,867 | |
| | | | | | | | |
| | |
| | | | Total Investments—100.3%
(Cost $33,705,059) | | | 34,062,320 | |
| | |
| | | | Liabilities in Excess of Other
Assets—(0.3)% | | | (111,424 | ) |
| | | | | | | | |
| | |
| | | | Net Assets—100.0% | | $ | 33,950,896 | |
| | | | | | | | |
| 1 | Non-income producing security. |
| 2 | All or a portion of the security was on loan. The aggregate value of the security on loan was $108,680; total value of the collateral held by the Fund was $110,867. |
| 3 | Affiliated security (Note 4). |
| 4 | The security and the Fund are advised by wholly-owned subsidiaries of Invesco Ltd. and are therefore considered to be affiliated. The rate shown is the 7-day SEC standardized yield as of June 30, 2019. |
| 5 | The security has been segregated to satisfy the commitment to return the cash collateral received in securities lending transactions upon the borrower’s return of the securities loaned. See Note 6. |
The accompanying notes are an integral part of these financial statements.
Schedule of Investments
Invesco S&P Ultra Dividend Revenue ETF (RDIV)
June 30, 2019
| | | | | | | | |
| Shares | | | | | Value | |
| | | | Common Stocks—99.8% | | | |
| | | | Automobiles & Components—5.0% | | | |
| | 2,309,863 | | | General Motors Co. | | $ | 88,999,021 | |
| | | | | | | | |
| | | | Banks—1.0% | | | |
| | 326,247 | | | F.N.B. Corp. | | | 3,839,927 | |
| | 300,676 | | | People’s United Financial, Inc. | | | 5,045,343 | |
| | 210,786 | | | Umpqua Holdings Corp. | | | 3,496,940 | |
| | 59,530 | | | United Bankshares, Inc. | | | 2,207,968 | |
| | 335,952 | | | Valley National Bancorp | | | 3,621,563 | |
| | | | | | | | |
| | | | Total Banks | | | 18,211,741 | |
| | | | | | | | |
| | | | Consumer Durables & Apparel—1.6% | |
| | 1,879,729 | | | Newell Brands, Inc. | | | 28,985,421 | |
| | | | | | | | |
| | | | Consumer Services—1.4% | |
| | 324,685 | | | H&R Block, Inc. | | | 9,513,270 | |
| | 75,669 | | | Six Flags Entertainment Corp. | | | 3,759,236 | |
| | 261,972 | | | Wyndham Destinations, Inc. | | | 11,500,571 | |
| | | | | | | | |
| | | | Total Consumer Services | | | 24,773,077 | |
| | | | | | | | |
| | | | Diversified Financials—0.7% | |
| | 94,081 | | | Federated Investors, Inc., Class B | | | 3,057,632 | |
| | 241,595 | | | Legg Mason, Inc. | | | 9,248,257 | |
| | | | | | | | |
| | | | Total Diversified Financials | | | 12,305,889 | |
| | | | | | | | |
| | | | Energy—17.0% | |
| | 1,103,313 | | | Exxon Mobil Corp. | | | 84,546,875 | |
| | 114,455 | | | Helmerich & Payne, Inc. | | | 5,793,712 | |
| | 1,918,281 | | | Kinder Morgan, Inc. | | | 40,053,707 | |
| | 762,912 | | | Occidental Petroleum Corp. | | | 38,359,215 | |
| | 492,409 | | | ONEOK, Inc. | | | 33,882,663 | |
| | 1,930,687 | | | Schlumberger Ltd. | | | 76,725,502 | |
| | 815,961 | | | Williams Cos., Inc. (The) | | | 22,879,547 | |
| | | | | | | | |
| | | | Total Energy | | | 302,241,221 | |
| | | | | | | | |
| | | | Food, Beverage & Tobacco—2.6% | | | |
| | 877,722 | | | General Mills, Inc. | | | 46,097,960 | |
| | | | | | | | |
| | | | Health Care Equipment & Services—6.2% | | | |
| | 1,996,839 | | | Cardinal Health, Inc. | | | 94,051,117 | |
| | 695,797 | | | Patterson Cos., Inc. | | | 15,933,751 | |
| | | | | | | | |
| | | | Total Health Care Equipment & Services | | | 109,984,868 | |
| | | | | | | | |
| | | | Household & Personal Products—1.6% | | | |
| | 2,187,551 | | | Coty, Inc., Class A | | | 29,313,183 | |
| | | | | | | | |
| | | | Insurance—2.9% | | | |
| | 185,213 | | | Mercury General Corp. | | | 11,575,813 | |
| | 692,224 | | | Principal Financial Group, Inc. | | | 40,093,614 | |
| | | | | | | | |
| | | | Total Insurance | | | 51,669,427 | |
| | | | | | | | |
| | | | Materials—14.3% | | | |
| | 605,850 | | | Corteva, Inc.1 | | | 17,914,984 | |
| | 603,858 | | | DuPont de Nemours, Inc. | | | 45,331,620 | |
| | 1,407,609 | | | International Paper Co. | | | 60,977,622 | |
| | 999,906 | | | LyondellBasell Industries NV, Class A | | | 86,121,904 | |
| | 1,235,802 | | | WestRock Co. | | | 45,069,699 | |
| | | | | | | | |
| | | | Total Materials | | | 255,415,829 | |
| | | | | | | | |
| | | | Media & Entertainment—0.4% | | | |
| | 141,770 | | | Meredith Corp. | | | 7,805,856 | |
| | | | | | | | |
| | | | Pharmaceuticals, Biotechnology & Life Sciences—4.6% | |
| | 1,124,118 | | | AbbVie, Inc. | | | 81,745,861 | |
| | | | | | | | |
| | | | | | | | |
| Shares | | | | | Value | |
| | | | Common Stocks (continued) | | | |
| | | | Real Estate—4.2% | | | |
| | 51,173 | | | American Campus Communities, Inc. | | $ | 2,362,146 | |
| | 13,569 | | | CoreSite Realty Corp. | | | 1,562,742 | |
| | 56,954 | | | Corporate Office Properties Trust | | | 1,501,877 | |
| | 39,902 | | | Healthcare Realty Trust, Inc. | | | 1,249,731 | |
| | 43,501 | | | Highwoods Properties, Inc. | | | 1,796,591 | |
| | 790,453 | | | Host Hotels & Resorts, Inc. | | | 14,402,054 | |
| | 54,672 | | | Lamar Advertising Co., Class A | | | 4,412,577 | |
| | 16,023 | | | Life Storage, Inc. | | | 1,523,467 | |
| | 32,464 | | | National Retail Properties, Inc. | | | 1,720,917 | |
| | 70,892 | | | Pebblebrook Hotel Trust | | | 1,997,736 | |
| | 68,474 | | | PotlatchDeltic, Corp. | | | 2,669,116 | |
| | 52,718 | | | Realty Income Corp. | | | 3,635,960 | |
| | 86,684 | | | Simon Property Group, Inc. | | | 13,848,636 | |
| | 33,948 | | | Taubman Centers, Inc. | | | 1,386,097 | |
| | 53,410 | | | Urban Edge Properties | | | 925,595 | |
| | 780,268 | | | Weyerhaeuser Co. | | | 20,552,259 | |
| | | | | | | | |
| | | | Total Real Estate | | | 75,547,501 | |
| | | | | | | | |
| | | | Retailing—4.7% | | | |
| | 1,954,754 | | | Bed Bath & Beyond, Inc.2 | | | 22,714,242 | |
| | 2,818,227 | | | Macy’s, Inc. | | | 60,479,151 | |
| | | | | | | | |
| | | | Total Retailing | | | 83,193,393 | |
| | | | | | | | |
| | | | Semiconductors & Semiconductor Equipment—2.9% | |
| | 669,081 | | | QUALCOMM, Inc. | | | 50,896,992 | |
| | | | | | | | |
| | | | Software & Services—5.9% | | | |
| | 655,121 | | | International Business Machines Corp. | | | 90,341,186 | |
| | 777,334 | | | Western Union Co. (The) | | | 15,461,173 | |
| | | | | | | | |
| | | | Total Software & Services | | | 105,802,359 | |
| | | | | | | | |
| | | | Technology Hardware & Equipment—4.1% | | | |
| | 964,159 | | | Western Digital Corp. | | | 45,845,761 | |
| | 778,393 | | | Xerox Corp. | | | 27,562,896 | |
| | | | | | | | |
| | | | Total Technology Hardware & Equipment | | | 73,408,657 | |
| | | | | | | | |
| | | | Telecommunication Services—5.2% | | | |
| | 1,609,992 | | | Verizon Communications, Inc. | | | 91,978,843 | |
| | | | | | | | |
| | | | Utilities—13.5% | | | |
| | 482,802 | | | Dominion Energy, Inc. | | | 37,330,251 | |
| | 743,681 | | | Duke Energy Corp. | | | 65,622,411 | |
| | 538,618 | | | Edison International | | | 36,308,239 | |
| | 317,802 | | | Entergy Corp. | | | 32,711,360 | |
| | 1,229,636 | | | Southern Co. (The) | | | 67,974,278 | |
| | | | | | | | |
| | | | Total Utilities | | | 239,946,539 | |
| | | | | | | | |
| | | | Total Common Stocks
(Cost $1,769,346,772) | | | 1,778,323,638 | |
| | | | | | | | |
| | |
| | | | | | | | |
The accompanying notes are an integral part of these financial statements.
Invesco S&P Ultra Dividend Revenue ETF (RDIV)(continued)
June 30, 2019
| | | | | | | | |
| Shares | | | | | Value | |
| | | | Investment of Cash Collateral for Securities
Loaned—1.2% | |
| | 15,355,765 | | | Invesco Government & Agency Portfolio—Institutional Class, 2.27%3,4 | | $ | 15,355,765 | |
| | 5,155,466 | | | Invesco Liquid Assets Portfolio—Institutional Class, 2.41%3,4 | | | 5,157,528 | |
| | | | | | | | |
| | |
| | | | Total Investment of Cash Collateral for Securities Loaned
(Cost $20,512,450) | | | 20,513,293 | |
| | | | | | | | |
| | |
| | | | Total Investments—101.0%
(Cost $1,789,859,222) | | | 1,798,836,931 | |
| | |
| | | | Liabilities in Excess of Other
Assets—(1.0)% | | | (16,237,838 | ) |
| | | | | | | | |
| | |
| | | | Net Assets—100.0% | | $ | 1,782,599,093 | |
| | | | | | | | |
| 1 | Non-income producing security. |
| 2 | All or a portion of the security was on loan. The aggregate value of the security on loan was $20,274,820; total value of the collateral held by the Fund was $20,513,293. |
| 3 | The security and the Fund are advised by wholly-owned subsidiaries of Invesco Ltd. and are therefore considered to be affiliated. The rate shown is the 7-day SEC standardized yield as of June 30, 2019. |
| 4 | The security has been segregated to satisfy the commitment to return the cash collateral received in securities lending transactions upon the borrower’s return of the securities loaned. See Note 6. |
The accompanying notes are an integral part of these financial statements.
Schedule of Investments
Invesco Emerging Markets Ultra Dividend Revenue ETF (REDV)
June 30, 2019
| | | | | | | | |
| Shares | | | | | Value | |
| | | | Common Stocks—93.6% | | | |
| | | | Automobiles & Components—1.7% | |
| | 2,200 | | | Loncin Motor Co. Ltd., Class A | | $ | 1,342 | |
| | 44,137 | | | Nemak SAB de CV1 | | | 20,677 | |
| | 9,062 | | | Tofas Turk Otomobil Fabrikasi AS | | | 30,238 | |
| | 1,209 | | | Yulon Nissan Motor Co. Ltd. | | | 10,704 | |
| | | | | | | | |
| | | | Total Automobiles & Components | | | 62,961 | |
| | | | | | | | |
| | | | Banks—7.9% | |
| | 17,022 | | | Abu Dhabi Commercial Bank PJSC | | | 38,464 | |
| | 16,561 | | | Abu Dhabi Islamic Bank PJSC | | | 20,965 | |
| | 51,550 | | | Banco Santander Mexico SA Institucion de Banca Multiple Grupo Financiero Santand | | | 78,808 | |
| | 20,670 | | | Doha Bank QPSC | | | 15,213 | |
| | 25,044 | | | Dubai Islamic Bank PJSC | | | 34,977 | |
| | 39,900 | | | Malayan Banking Bhd | | | 85,738 | |
| | 1,518 | | | Moneta Money Bank AS1 | | | 5,204 | |
| | 3,134 | | | Qatar International Islamic Bank QSC | | | 6,455 | |
| | | | | | | | |
| | | | Total Banks | | | 285,824 | |
| | | | | | | | |
| | | | Capital Goods—0.6% | |
| | 22,144 | | | Dubai Investments PJSC | | | 7,415 | |
| | 2,831 | | | Fangda Carbon New Material Co. Ltd., Class A2 | | | 5,066 | |
| | 1,640 | | | Reunert Ltd. | | | 7,854 | |
| | | | | | | | |
| | | | Total Capital Goods | | | 20,335 | |
| | | | | | | | |
| | | | Consumer Durables & Apparel—0.1% | |
| | 26,344 | | | China Dongxiang Group Co. Ltd. | | | 3,237 | |
| | | | | | | | |
| | | | Consumer Services—0.5% | |
| | 1,704 | | | OPAP SA | | | 19,114 | |
| | | | | | | | |
| | | | Diversified Financials—10.7% | |
| | 645,651 | | | China Cinda Asset Management Co. Ltd., Class H | | | 148,758 | |
| | 820,164 | | | China Huarong Asset Management Co. Ltd., Class H1 | | | 142,774 | |
| | 752 | | | Coronation Fund Managers Ltd. | | | 2,384 | |
| | 2,713 | | | Moscow ExchangeMICEX-RTS PJSC | | | 3,877 | |
| | 22,415 | | | Power Finance Corp. Ltd.2 | | | 43,578 | |
| | 18,133 | | | REC Ltd. | | | 43,292 | |
| | | | | | | | |
| | | | Total Diversified Financials | | | 384,663 | |
| | | | | | | | |
| | | | Energy—15.9% | |
| | 70,100 | | | Bukit Asam Tbk PT | | | 14,687 | |
| | 40,556 | | | Coal India Ltd. | | | 149,116 | |
| | 72,654 | | | Indian Oil Corp. Ltd. | | | 164,091 | |
| | 1,512 | | | Qatar Gas Transport Co. Ltd. | | | 9,592 | |
| | 6,999 | | | Tatneft PJSC | | | 85,985 | |
| | 7,556 | | | Tupras Turkiye Petrol Rafinerileri AS | | | 150,232 | |
| | | | | | | | |
| | | | Total Energy | | | 573,703 | |
| | | | | | | | |
| | | | Food & Staples Retailing—0.2% | |
| | 2,189 | | | Al Meera Consumer Goods Co. QSC | | | 8,699 | |
| | | | | | | | |
| | | | Food, Beverage & Tobacco—0.4% | |
| | 9,210 | | | Eastern Co. SAE | | | 8,518 | |
| | 11 | | | Philip Morris CR AS | | | 6,695 | |
| | | | | | | | |
| | | | Total Food, Beverage & Tobacco | | | 15,213 | |
| | | | | | | | |
| | | | Insurance—1.3% | |
| | 3,400 | | | Porto Seguro SA | | | 45,846 | |
| | | | | | | | |
| | | | Materials—15.5% | |
| | 17,456 | | | Alrosa PJSC | | | 23,812 | |
| | 40,694 | | | Eregli Demir ve Celik Fabrikalari TAS | | | 55,370 | |
| | | | | | | | |
| Shares | | | | | Value | |
| | | | Common Stocks (continued) | | | |
| | | | Materials (continued) | |
| | 12,021 | | | Fauji Fertilizer Co. Ltd. | | $ | 6,562 | |
| | 8,873 | | | Hindustan Zinc Ltd. | | | 31,377 | |
| | 200 | | | Huabao Flavours & Fragrances Co. Ltd., Class A | | | 923 | |
| | 11,049 | | | Iskenderun Demir ve Celik As | | | 13,181 | |
| | 1,068 | | | Kumba Iron Ore Ltd. | | | 37,822 | |
| | 1,400 | | | Liuzhou Iron & Steel Co. Ltd., Class A | | | 1,180 | |
| | 2,100 | | | Lomon Billions Group Co. Ltd., Class A | | | 4,534 | |
| | 65,308 | | | Magnitogorsk Iron & Steel Works PJSC | | | 46,578 | |
| | 298 | | | MMC Norilsk Nickel PJSC | | | 67,599 | |
| | 25,586 | | | Novolipetsk Steel PJSC | | | 64,781 | |
| | 2,600 | | | Sansteel Minguang Co. Ltd., Fujian, Class A | | | 3,521 | |
| | 2,972 | | | Severstal PJSC | | | 50,304 | |
| | 59,213 | | | Vedanta Ltd. | | | 149,560 | |
| | | | | | | | |
| | | | Total Materials | | | 557,104 | |
| | | | | | | | |
| | | | Media & Entertainment—0.4% | |
| | 40,700 | | | Astro Malaysia Holdings Bhd | | | 14,281 | |
| | | | | | | | |
| | | | Pharmaceuticals, Biotechnology & Life Sciences—0.0%3 | |
| | 2,700 | | | Harbin Pharmaceutical Group Co. Ltd., Class A2 | | | 1,628 | |
| | | | | | | | |
| | | | Real Estate—10.2% | |
| | 82,923 | | | Agile Group Holdings Ltd. | | | 111,024 | |
| | 37,350 | | | Aldar Properties PJSC | | | 19,218 | |
| | 565 | | | Barwa Real Estate Co. | | | 5,307 | |
| | 2,311 | | | Concentradora Fibra Danhos SA de CV | | | 3,057 | |
| | 61,693 | | | DAMAC Properties Dubai Co. PJSC2 | | | 15,435 | |
| | 7,287 | | | Fibra Uno Administracion SA de CV | | | 9,642 | |
| | 3,281 | | | Fortress REIT Ltd., Class B | | | 2,811 | |
| | 4,723 | | | Growthpoint Properties Ltd. | | | 8,132 | |
| | 75,915 | | | Guangzhou R&F Properties Co. Ltd., Class H | | | 145,951 | |
| | 469 | | | Hyprop Investments Ltd. | | | 2,324 | |
| | 13,807 | | | KWG Group Holdings Ltd.2 | | | 14,015 | |
| | 32,200 | | | Land & Houses PCL | | | 11,655 | |
| | 10,138 | | | Redefine Properties Ltd. | | | 6,499 | |
| | 486 | | | Resilient REIT Ltd. | | | 2,135 | |
| | 10,162 | | | SOHO China Ltd. | | | 3,590 | |
| | 1,234 | | | United Development Co. QSC | | | 4,694 | |
| | 1,168 | | | Vukile Property Fund Ltd. | | | 1,589 | |
| | | | | | | | |
| | | | Total Real Estate | | | 367,078 | |
| | | | | | | | |
| | | | Retailing—5.1% | |
| | 28,100 | | | Matahari Department Store Tbk PT | | | 6,862 | |
| | 24,900 | | | Petrobras Distribuidora SA | | | 162,420 | |
| | 22,246 | | | Xinhua Winshare Publishing and Media Co. Ltd., Class H | | | 15,747 | |
| | | | | | | | |
| | | | Total Retailing | | | 185,029 | |
| | | | | | | | |
| | | | Software & Services—0.9% | |
| | 18,013 | | | Cielo SA | | | 31,583 | |
| | | | | | | | |
| | | | Technology Hardware & Equipment—5.8% | |
| | 332,549 | | | AU Optronics Corp. | | | 99,574 | |
| | 700 | | | Guangdong Ellington Electronics Technology Co. Ltd., Class A | | | 1,047 | |
| | 37,608 | | | Kingboard Laminates Holdings Ltd. | | | 34,467 | |
| | 45,694 | | | Lite-On Technology Corp. | | | 66,938 | |
| | 2,501 | | | Transcend Information, Inc. | | | 5,765 | |
| | | | | | | | |
| | | | Total Technology Hardware & Equipment | | | 207,791 | |
| | | | | | | | |
| | | | Telecommunication Services—6.3% | |
| | 2,621 | | | Bharti Infratel Ltd. | | | 10,140 | |
| | 16,481 | | | Magyar Telekom Telecommunications PLC | | | 24,480 | |
The accompanying notes are an integral part of these financial statements.
Invesco Emerging Markets Ultra Dividend Revenue ETF (REDV)(continued)
June 30, 2019
| | | | | | | | |
| Shares | | | | | Value | |
| | | | Common Stocks (continued) | | | |
| | | | Telecommunication Services (continued) | |
| | 28,904 | | | Mobile Telecommunications Co. KSC | | $ | 50,491 | |
| | 10,761 | | | Mobile TeleSystems PJSC | | | 48,606 | |
| | 23,527 | | | Rostelecom PJSC | | | 30,269 | |
| | 127,055 | | | Sistema PJSFC | | | 19,888 | |
| | 19,703 | | | Turkcell Iletisim Hizmetleri AS | | | 43,603 | |
| | | | | | | | |
| | | | Total Telecommunication Services | | | 227,477 | |
| | | | | | | | |
| | | | Transportation—2.1% | |
| | 23,475 | | | Aeroflot PJSC | | | 37,873 | |
| | 42,861 | | | Air Arabia PJSC2 | | | 12,135 | |
| | 38,800 | | | AirAsia Group Bhd | | | 25,632 | |
| | | | | | | | |
| | | | Total Transportation | | | 75,640 | |
| | | | | | | | |
| | | | Utilities—8.0% | |
| | 102,346 | | | AES Gener SA | | | 28,077 | |
| | 87,473 | | | China Resources Power Holdings Co. Ltd. | | | 127,641 | |
| | 79,263 | | | Colbun SA | | | 16,344 | |
| | 213,692 | | | Datang International Power Generation Co. Ltd., Class H | | | 53,611 | |
| | 2,025 | | | Engie Brasil Energia SA | | | 22,968 | |
| | 8,160,583 | | | Federal Grid Co. Unified Energy System PJSC | | | 26,199 | |
| | 652 | | | Transmissora Alianca de Energia Eletrica SA | | | 4,620 | |
| | 181,021 | | | Unipro PJSC | | | 7,534 | |
| | | | | | | | |
| | | | Total Utilities | | | 286,994 | |
| | | | | | | | |
| | | | Total Common Stocks
(Cost $3,434,616) | | | 3,374,200 | |
| | | | | | | | |
| | |
| | | | | | | | |
| | | | Preferred Stocks—5.9% | | | |
| | | | Banks—0.5% | | | |
| | 4,850 | | | Itausa—Investimentos Itau SA, 3.16% | | | 16,311 | |
| | | | | | | | |
| | | | Energy—0.6% | | | |
| | 864 | | | Bashneft PJSC, 9.68% | | | 22,561 | |
| | | | | | | | |
| | | | Telecommunication Services—3.4% | | | |
| | 9,400 | | | Telefonica Brasil SA, 11.06% | | | 122,410 | |
| | | | | | | | |
| | | | Utilities—1.4% | |
| | 3,312 | | | Cia Paranaense de Energia, 3.01% | | | 41,998 | |
| | 1,552 | | | Cia de Transmissao de Energia Eletrica Paulista, 7.57% | | | 10,018 | |
| | | | | | | | |
| | | | Total Utilities | | | 52,016 | |
| | | | | | | | |
| | | | Total Preferred Stocks
(Cost $188,910) | | | 213,298 | |
| | | | | | | | |
| | |
| | | | | | | | |
| | | | Investment Company—0.0%3 | |
| | | | Telecommunications Hardware—0.0%3 | |
| | 2,109 | | | Digital Telecommunications Infrastructure Fund, Class F
(Cost $1,027) | | | 1,148 | |
| | | | | | | | |
| | |
| | | | Total Investments—99.5%
(Cost $3,624,553) | | | 3,588,646 | |
| | |
| | | | Other Assets in Excess of
Liabilities—0.5% | | | 17,537 | |
| | | | | | | | |
| | |
| | | | Net Assets—100.0% | | $ | 3,606,183 | |
| | | | | | | | |
PCL—Public Company Limited
REIT—Real Estate Investment Trust
| 1 | Represents securities sold under Rule 144A, which are exempt from registration under the Securities Act of 1933, as amended. These securities have been determined to be liquid under guidelines established by the Board of Trustees. These securities amount to $168,655 or 4.68% of the Fund’s net assets at period end. |
| 2 | Non-income producing security. |
Geographical Holdings
| | | | | | | | |
Country | | Value | | | % of Net
Assets | |
| China | | $ | 785,587 | | | | 21.8 | % |
| India | | | 591,154 | | | | 16.4 | |
| Russia | | | 535,864 | | | | 14.9 | |
| Brazil | | | 458,175 | | | | 12.7 | |
| Turkey | | | 292,624 | | | | 8.1 | |
| Taiwan | | | 182,982 | | | | 5.1 | |
| United Arab Emirates | | | 148,610 | | | | 4.1 | |
| Malaysia | | | 125,651 | | | | 3.5 | |
| Mexico | | | 112,183 | | | | 3.1 | |
| South Africa | | | 71,551 | | | | 2.0 | |
| Kuwait | | | 50,491 | | | | 1.4 | |
| Qatar | | | 49,960 | | | | 1.4 | |
| Chile | | | 44,421 | | | | 1.2 | |
| Hong Kong | | | 34,467 | | | | 1.0 | |
| Hungary | | | 24,480 | | | | 0.7 | |
| Indonesia | | | 21,549 | | | | 0.6 | |
| Greece | | | 19,114 | | | | 0.5 | |
| Thailand | | | 12,803 | | | | 0.3 | |
| Czech Republic | | | 11,900 | | | | 0.3 | |
| Egypt | | | 8,518 | | | | 0.2 | |
| Pakistan | | | 6,562 | | | | 0.2 | |
| | | | | | | | |
| Total Investments | | | 3,588,646 | | | | 99.5 | |
| Other Assets in Excess of Liabilities | | | 17,537 | | | | 0.5 | |
| | | | | | | | |
| Net Assets | | $ | 3,606,183 | | | | 100.0 | % |
| | | | | | | | |
The accompanying notes are an integral part of these financial statements.
Schedule of Investments
Invesco International Ultra Dividend Revenue ETF (RIDV)
June 30, 2019
| | | | | | | | |
| Shares | | | | | Value | |
| | | | Common Stocks—99.8% | | | |
| | | | Automobiles & Components—3.0% | | | |
| | 912 | | | Bayerische Motoren Werke AG | | $ | 67,601 | |
| | 36 | | | Nokian Renkaat OYJ | | | 1,126 | |
| | 1,092 | | | Xinyi Glass Holdings Ltd. | | | 1,146 | |
| | | | | | | | |
| | | | Total Automobiles & Components | | | 69,873 | |
| | | | | | | | |
| | | | Banks—17.4% | |
| | 488 | | | ABN AMRO Bank NV1 | | | 10,456 | |
| | 770 | | | Australia & New Zealand Banking Group Ltd. | | | 15,243 | |
| | 4,836 | | | Banco Bilbao Vizcaya Argentaria SA | | | 27,079 | |
| | 11,428 | | | Banco Santander SA | | | 53,105 | |
| | 356 | | | Bank of Nova Scotia (The) | | | 19,163 | |
| | 54 | | | Bank Polska Kasa Opieki SA | | | 1,619 | |
| | 153 | | | Bendigo & Adelaide Bank Ltd. | | | 1,243 | |
| | 870 | | | BNP Paribas SA | | | 41,379 | |
| | 155 | | | Canadian Imperial Bank of Commerce | | | 12,215 | |
| | 310 | | | Commonwealth Bank of Australia | | | 18,008 | |
| | 4,603 | | | Credit Agricole SA | | | 55,276 | |
| | 668 | | | Danske Bank A/S | | | 10,574 | |
| | 297 | | | DNB ASA | | | 5,528 | |
| | 29 | | | First International Bank of Israel Ltd. | | | 734 | |
| | 5,998 | | | HSBC Holdings PLC | | | 50,146 | |
| | 1,933 | | | ING Groep NV | | | 22,444 | |
| | 118 | | | KBC Group NV | | | 7,746 | |
| | 26,602 | | | Lloyds Banking Group PLC | | | 19,159 | |
| | 206 | | | Mediobanca Banca di Credito Finanziario SpA | | | 2,127 | |
| | 1,094 | | | Nordea Bank Abp | | | 7,958 | |
| | 488 | | | Skandinaviska Enskilda Banken AB, Class A | | | 4,519 | |
| | 1,061 | | | Unione di Banche Italiane SpA | | | 2,900 | |
| | 809 | | | Westpac Banking Corp. | | | 16,100 | |
| | 516 | | | Woori Financial Group, Inc. | | | 6,279 | |
| | | | | | | | |
| | | | Total Banks | | | 411,000 | |
| | | | | | | | |
| | | | Capital Goods—2.3% | |
| | 2,163 | | | BAE Systems PLC | | | 13,638 | |
| | 681 | | | Bouygues SA | | | 25,259 | |
| | 1,198 | | | NWS Holdings Ltd. | | | 2,463 | |
| | 129 | | | OC Oerlikon Corp. AG | | | 1,577 | |
| | 649 | | | Skanska AB, Class B | | | 11,730 | |
| | | | | | | | |
| | | | Total Capital Goods | | | 54,667 | |
| | | | | | | | |
| | | | Commercial & Professional Services—1.6% | |
| | 294 | | | Adecco Group AG | | | 17,688 | |
| | 581 | | | Babcock International Group PLC | | | 3,388 | |
| | 300 | | | Randstad NV | | | 16,501 | |
| | 15 | | | Societe BIC SA | | | 1,146 | |
| | | | | | | | |
| | | | Total Commercial & Professional Services | | | 38,723 | |
| | | | | | | | |
| | | | Consumer Durables & Apparel—1.0% | | | |
| | 532 | | | Barratt Developments PLC | | | 3,877 | |
| | 63 | | | Bellway PLC | | | 2,233 | |
| | 31 | | | HUGO BOSS AG | | | 2,065 | |
| | 50,000 | | | Li & Fung Ltd. | | | 8,704 | |
| | 53 | | | Pandora A/S | | | 1,888 | |
| | 2,000 | | | Yue Yuen Industrial Holdings Ltd. | | | 5,479 | |
| | | | | | | | |
| | | | Total Consumer Durables & Apparel | | | 24,246 | |
| | | | | | | | |
| | | | Consumer Services—2.9% | | | |
| | 216 | | | Cafe de Coral Holdings Ltd. | | | 643 | |
| | 148 | | | Crown Resorts Ltd. | | | 1,293 | |
| | 38,000 | | | NagaCorp Ltd. | | | 46,743 | |
| | 1,200 | | | Sands China Ltd. | | | 5,737 | |
| | | | | | | | |
| Shares | | | | | Value | |
| | | | Common Stocks (continued) | | | |
| | | | Consumer Services (continued) | | | |
| | 349 | | | Star Entertainment Grp Ltd. (The) | | $ | 1,009 | |
| | 1,366 | | | TUI AG | | | 13,428 | |
| | | | | | | | |
| | | | Total Consumer Services | | | 68,853 | |
| | | | | | | | |
| | | | Diversified Financials—1.6% | | | |
| | 48 | | | Amundi SA1 | | | 3,356 | |
| | 1,539 | | | Guotai Junan International Holdings Ltd. | | | 266 | |
| | 2,000 | | | Haitong International Securities Group Ltd. | | | 653 | |
| | 49 | | | IGM Financial, Inc. | | | 1,402 | |
| | 79 | | | Macquarie Group Ltd. | | | 6,951 | |
| | 8 | | | Perpetual Ltd. | | | 237 | |
| | 49 | | | Samsung Card Co. Ltd. | | | 1,621 | |
| | 104 | | | Singapore Exchange Ltd. | | | 609 | |
| | 467 | | | Standard Life Aberdeen PLC | | | 1,751 | |
| | 1,814 | | | UBS Group AG2 | | | 21,582 | |
| | | | | | | | |
| | | | Total Diversified Financials | | | 38,428 | |
| | | | | | | | |
| | | | Energy—18.6% | | | |
| | 76 | | | Aker BP ASA | | | 2,180 | |
| | 16,355 | | | BP PLC | | | 114,191 | |
| | 479 | | | Caltex Australia Ltd. | | | 8,320 | |
| | 7 | | | Delek Group Ltd. | | | 1,202 | |
| | 2,176 | | | Equinor ASA | | | 42,992 | |
| | 16 | | | Paz Oil Co. Ltd. | | | 2,249 | |
| | 90 | | | Pembina Pipeline Corp. | | | 3,358 | |
| | 3,589 | | | Royal Dutch Shell PLC, Class A | | | 117,505 | |
| | 195 | | | SK Innovation Co. Ltd. | | | 26,852 | |
| | 121 | | | TC Energy Corp. | | | 6,011 | |
| | 2,006 | | | TOTAL SA | | | 112,566 | |
| | 361 | | | Whitehaven Coal Ltd. | | | 927 | |
| | 123 | | | Woodside Petroleum Ltd. | | | 3,138 | |
| | | | | | | | |
| | | | Total Energy | | | 441,491 | |
| | | | | | | | |
| | | | Food & Staples Retailing—0.8% | | | |
| | 1,059 | | | METRO AG3 | | | 19,386 | |
| | | | | | | | |
| | | | Food, Beverage & Tobacco—0.9% | | | |
| | 516 | | | British American Tobacco PLC | | | 18,053 | |
| | 295 | | | Coca-Cola Amatil Ltd. | | | 2,116 | |
| | | | | | | | |
| | | | Total Food, Beverage & Tobacco | | | 20,169 | |
| | | | | | | | |
| | | | Insurance—18.4% | | | |
| | 36 | | | Admiral Group PLC | | | 1,012 | |
| | 4,626 | | | Aegon NV | | | 23,064 | |
| | 149 | | | Ageas | | | 7,756 | |
| | 314 | | | Allianz SE | | | 75,808 | |
| | 2,720 | | | Assicurazioni Generali SpA | | | 51,295 | |
| | 2,528 | | | Aviva PLC | | | 13,400 | |
| | 1,221 | | | CNP Assurances | | | 27,754 | |
| | 631 | | | Direct Line Insurance Group PLC | | | 2,665 | |
| | 98 | | | Gjensidige Forsikring ASA | | | 1,975 | |
| | 974 | | | Great-West Lifeco, Inc. | | | 22,473 | |
| | 371 | | | Harel Insurance Investments & Financial Services Ltd. | | | 2,780 | |
| | 1,255 | | | Insurance Australia Group Ltd. | | | 7,274 | |
| | 287 | | | Legal & General Group PLC | | | 984 | |
| | 4,822 | | | Mapfre SA | | | 14,118 | |
| | 157 | | | Muenchener Rueckversicherungs-Gesellschaft AG in Muenchen | | | 39,459 | |
| | 367 | | | NN Group NV | | | 14,795 | |
| | 510 | | | Phoenix Group Holdings PLC | | | 4,602 | |
| | 377 | | | Phoenix Holdings Ltd. (The) | | | 2,281 | |
The accompanying notes are an integral part of these financial statements.
Invesco International Ultra Dividend Revenue ETF (RIDV)(continued)
June 30, 2019
| | | | | | | | |
| Shares | | | | | Value | |
| | | | Common Stocks (continued) | | | |
| | | | Insurance (continued) | | | |
| | 1,988 | | | Poste Italiane SpA1 | | $ | 20,964 | |
| | 1,119 | | | Power Corp. of Canada | | | 24,157 | |
| | 1,057 | | | Power Financial Corp. | | | 24,363 | |
| | 146 | | | Sampo OYJ, Class A | | | 6,900 | |
| | 253 | | | SCOR SE | | | 11,110 | |
| | 571 | | | Talanx AG | | | 24,775 | |
| | 3,673 | | | UnipolSai Assicurazioni SpA | | | 9,449 | |
| | | | | | | | |
| | | | Total Insurance | | | 435,213 | |
| | | | | | | | |
| | | | Materials—8.9% | | | |
| | 233 | | | Adelaide Brighton Ltd. | | | 660 | |
| | 637 | | | Anglo American PLC | | | 18,196 | |
| | 622 | | | BASF SE | | | 45,277 | |
| | 882 | | | BHP Group Ltd. | | | 25,476 | |
| | 1,044 | | | BHP Group PLC | | | 26,773 | |
| | 613 | | | Boral Ltd. | | | 2,202 | |
| | 208 | | | Covestro AG1 | | | 10,590 | |
| | 362 | | | Evonik Industries AG | | | 10,558 | |
| | 657 | | | Fortescue Metals Group Ltd. | | | 4,159 | |
| | 67 | | | Imerys SA | | | 3,557 | |
| | 89 | | | Polymetal International PLC | | | 1,129 | |
| | 316 | | | Rio Tinto Ltd. | | | 23,009 | |
| | 391 | | | Rio Tinto PLC | | | 24,287 | |
| | 418 | | | Sims Metal Management Ltd. | | | 3,186 | |
| | 1,851 | | | South32 Ltd. | | | 4,131 | |
| | 276 | | | UPM-Kymmene OYJ | | | 7,345 | |
| | | | | | | | |
| | | | Total Materials | | | 210,535 | |
| | | | | | | | |
| | | | Media & Entertainment—0.7% | |
| | 1,726 | | | ITV PLC | | | 2,373 | |
| | 87 | | | SES SA | | | 1,362 | |
| | 300 | | | Singapore Press Holdings Ltd. | | | 541 | |
| | 966 | | | WPP PLC | | | 12,174 | |
| | | | | | | | |
| | | | Total Media & Entertainment | | | 16,450 | |
| | | | | | | | |
| | | | Pharmaceuticals, Biotechnology & Life Sciences—1.0% | |
| | 1,191 | | | GlaxoSmithKline PLC | | | 23,898 | |
| | 19 | | | Orion OYJ, Class B | | | 697 | |
| | | | | | | | |
| | | | Total Pharmaceuticals, Biotechnology & Life Sciences | | | 24,595 | |
| | | | | | | | |
| | | | Real Estate—0.9% | |
| | 18 | | | Amot Investments Ltd. | | | 120 | |
| | 200 | | | Ascendas Real Estate Investment Trust | | | 461 | |
| | 100 | | | CapitaLand Commercial Trust | | | 160 | |
| | 200 | | | CapitaLand Mall Trust | | | 389 | |
| | 346 | | | Champion REIT | | | 288 | |
| | 300 | | | City Developments Ltd. | | | 2,100 | |
| | 6 | | | Covivio | | | 629 | |
| | 46 | | | Dexus | | | 419 | |
| | 1,500 | | | Frasers Property Ltd. | | | 2,073 | |
| | 82 | | | GPT Group (The) | | | 354 | |
| | 414 | | | Hang Lung Properties Ltd. | | | 985 | |
| | 100 | | | Keppel REIT | | | 93 | |
| | 72 | | | Kiwi Property Group Ltd. | | | 77 | |
| | 23 | | | Klepierre SA | | | 772 | |
| | 200 | | | Mapletree Commercial Trust | | | 309 | |
| | 100 | | | Mapletree Industrial Trust | | | 166 | |
| | 200 | | | Mapletree Logistics Trust | | | 235 | |
| | 200 | | | Mapletree North Asia Commercial Trust | | | 216 | |
| | | | | | | | |
| Shares | | | | | Value | |
| | | | Common Stocks (continued) | | | |
| | | | Real Estate (continued) | |
| | 35 | | | RioCan Real Estate Investment Trust | | $ | 696 | |
| | 416 | | | Scentre Group | | | 1,121 | |
| | 61 | | | Shopping Centres Australasia Property Group | | | 102 | |
| | 9,456 | | | Shui On Land Ltd. | | | 2,191 | |
| | 337 | | | Stockland | | | 986 | |
| | 100 | | | Suntec Real Estate Investment Trust | | | 143 | |
| | 9 | | | Swiss Prime Site AG2 | | | 787 | |
| | 13 | | | Unibail-Rodamco-Westfield | | | 1,951 | |
| | 344 | | | Vicinity Centres | | | 591 | |
| | 1,000 | | | Wharf Holdings Ltd. (The) | | | 2,650 | |
| | | | | | | | |
| | | | Total Real Estate | | | 21,064 | |
| | | | | | | | |
| | | | Retailing—2.1% | |
| | 5,442 | | | Chow Tai Fook Jewellery Group Ltd. | | | 5,921 | |
| | 457 | | | Harvey Norman Holdings Ltd. | | | 1,305 | |
| | 878 | | | Hennes & Mauritz AB, Class B | | | 15,648 | |
| | 3,178 | | | Kingfisher PLC | | | 8,692 | |
| | 156 | | | Lifestyle International Holdings Ltd. | | | 228 | |
| | 1,624 | | | Sa Sa International Holdings Ltd. | | | 466 | |
| | 712 | | | Wesfarmers Ltd. | | | 18,067 | |
| | | | | | | | |
| | | | Total Retailing | | | 50,327 | |
| | | | | | | | |
| | | | Technology Hardware & Equipment—1.4% | |
| | 42,000 | | | Lenovo Group Ltd. | | | 32,525 | |
| | | | | | | | |
| | | | Telecommunication Services—8.6% | |
| | 226 | | | BCE, Inc. | | | 10,304 | |
| | 7,057 | | | BT Group PLC | | | 17,645 | |
| | 2,973 | | | Deutsche Telekom AG | | | 51,503 | |
| | 26 | | | Elisa OYJ | | | 1,271 | |
| | 1,719 | | | Orange SA | | | 27,142 | |
| | 5,000 | | | PCCW Ltd. | | | 2,886 | |
| | 129 | | | Proximus SADP | | | 3,808 | |
| | 3,200 | | | Singapore Telecommunications Ltd. | | | 8,278 | |
| | 40 | | | SK Telecom Co. Ltd. | | | 8,972 | |
| | 598 | | | Spark New Zealand Ltd. | | | 1,607 | |
| | 14 | | | Swisscom AG | | | 7,037 | |
| | 3,929 | | | Telefonica SA | | | 32,309 | |
| | 358 | | | Telenor ASA | | | 7,604 | |
| | 1,233 | | | Telia Co. AB | | | 5,481 | |
| | 4,094 | | | Telstra Corp. Ltd. | | | 11,061 | |
| | 166 | | | TELUS Corp. | | | 6,150 | |
| | | | | | | | |
| | | | Total Telecommunication Services | | | 203,058 | |
| | | | | | | | |
| | | | Transportation—2.0% | |
| | 1,271 | | | Air New Zealand Ltd. | | | 2,262 | |
| | 228 | | | Atlantia SpA | | | 5,948 | |
| | 337 | | | Aurizon Holdings Ltd. | | | 1,277 | |
| | 1,000 | | | ComfortDelGro Corp. Ltd. | | | 1,966 | |
| | 404 | | | easyJet PLC | | | 4,901 | |
| | 2,816 | | | International Consolidated Airlines Group SA | | | 17,092 | |
| | 92 | | | Kuehne + Nagel International AG | | | 13,673 | |
| | 300 | | | SIA Engineering Co. Ltd. | | | 557 | |
| | | | | | | | |
| | | | Total Transportation | | | 47,676 | |
| | | | | | | | |
| | | | Utilities—5.7% | |
| | 360 | | | AGL Energy Ltd. | | | 5,055 | |
| | 138 | | | APA Group | | | 1,046 | |
| | 673 | | | AusNet Services | | | 886 | |
| | 64 | | | Canadian Utilities Ltd., Class A | | | 1,810 | |
| | 2,676 | | | EDP—Energias de Portugal SA | | | 10,185 | |
The accompanying notes are an integral part of these financial statements.
Invesco International Ultra Dividend Revenue ETF (RIDV)(continued)
June 30, 2019
| | | | | | | | |
| Shares | | | | | Value | |
| | | | Common Stocks (continued) | | | |
| | | | Utilities (continued) | |
| | 7,841 | | | Enel SpA | | $ | 54,826 | |
| | 162 | | | Fortum OYJ | | | 3,585 | |
| | 163 | | | Hydro One Ltd.1 | | | 2,849 | |
| | 318 | | | Mercury NZ Ltd. | | | 993 | |
| | 1,096 | | | National Grid PLC | | | 11,658 | |
| | 110 | | | Pennon Group PLC | | | 1,040 | |
| | 16 | | | Power Assets Holdings Ltd. | | | 115 | |
| | 54 | | | Severn Trent PLC | | | 1,408 | |
| | 337 | | | Snam SpA | | | 1,678 | |
| | 395 | | | SSE PLC | | | 5,640 | |
| | 849 | | | Suez | | | 12,269 | |
| | 254 | | | Terna Rete Elettrica Nazionale SpA | | | 1,620 | |
| | 134 | | | United Utilities Group PLC | | | 1,335 | |
| | 738 | | | Veolia Environnement SA | | | 18,002 | |
| | | | | | | | |
| | | | Total Utilities | | | 136,000 | |
| | | | | | | | |
| | | | Total Common Stocks
(Cost $2,429,914) | | | 2,364,279 | |
| | | | | | | | |
| | |
| | | | | | | | |
| | | | Investment of Cash Collateral for Securities
Loaned—0.8% | |
| | 13,734 | | | Invesco Government & Agency Portfolio—Institutional Class, 2.27%4,5 | | | 13,734 | |
| | 4,470 | | | Invesco Liquid Assets Portfolio—Institutional Class, 2.41%4,5 | | | 4,472 | |
| | | | | | | | |
| | | | Total Investment of Cash Collateral
for Securities Loaned
(Cost $18,206) | | | 18,206 | |
| | | | | | | | |
| | |
| | | | Total Investments—100.6%
(Cost $2,448,120) | | | 2,382,485 | |
| | |
| | | | Liabilities in Excess of Other
Assets—(0.6)% | | | (13,708 | ) |
| | | | | | | | |
| | |
| | | | Net Assets—100.0% | | $ | 2,368,777 | |
| | | | | | | | |
REIT—Real Estate Investment Trust
| 1 | Represents securities sold under Rule 144A, which are exempt from registration under the Securities Act of 1933, as amended. These securities have been determined to be liquid under guidelines established by the Board of Trustees. These securities amount to $48,215 or 2.04% of the Fund’s net assets at period end. |
| 2 | Non-income producing security. |
| 3 | All or a portion of the security was on loan. The aggregate value of the security on loan was $17,446; total value of the collateral held by the Fund was $18,206. |
| 4 | The security and the Fund are advised by wholly-owned subsidiaries of Invesco Ltd. and are therefore considered to be affiliated. The rate shown is the 7-day SEC standardized yield as of June 30, 2019. |
| 5 | The security has been segregated to satisfy the commitment to return the cash collateral received in securities lending transactions upon the borrower’s return of the securities loaned. See Note 6. |
Geographical Holdings
| | | | | | | | |
Country | | Value | | | % of Net
Assets | |
| Germany | | $ | 360,450 | | | | 15.2 | % |
| United Kingdom | | | 356,954 | | | | 15.1 | |
| France | | | 342,166 | | | | 14.4 | |
| Australia | | | 234,829 | | | | 9.9 | |
| Netherlands | | | 204,765 | | | | 8.6 | |
| Italy | | | 150,807 | | | | 6.4 | |
| Canada | | | 134,951 | | | | 5.7 | |
| Spain | | | 126,611 | | | | 5.3 | |
| Switzerland | | | 62,344 | | | | 2.6 | |
| Norway | | | 60,279 | | | | 2.5 | |
| Cambodia | | | 46,743 | | | | 2.0 | |
| South Korea | | | 43,725 | | | | 1.9 | |
| Sweden | | | 37,378 | | | | 1.6 | |
| China | | | 34,982 | | | | 1.5 | |
| Hong Kong | | | 32,625 | | | | 1.4 | |
| Finland | | | 28,883 | | | | 1.2 | |
| United States | | | 21,392 | | | | 0.9 | |
| Belgium | | | 19,309 | | | | 0.8 | |
| Singapore | | | 18,296 | | | | 0.8 | |
| South Africa | | | 18,196 | | | | 0.8 | |
| Denmark | | | 12,463 | | | | 0.5 | |
| Portugal | | | 10,185 | | | | 0.4 | |
| Israel | | | 9,366 | | | | 0.4 | |
| Macau | | | 5,737 | | | | 0.2 | |
| New Zealand | | | 4,939 | | | | 0.2 | |
| Poland | | | 1,619 | | | | 0.1 | |
| Luxembourg | | | 1,362 | | | | 0.1 | |
| Russia | | | 1,129 | | | | 0.1 | |
| | | | | | | | |
| Total Investments | | | 2,382,485 | | | | 100.6 | |
| Liabilities in Excess of Other Assets | | | (13,708 | ) | | | (0.6 | ) |
| | | | | | | | |
| Net Assets | | $ | 2,368,777 | | | | 100.0 | % |
| | | | | | | | |
The accompanying notes are an integral part of these financial statements.
Schedule of Investments
Invesco Emerging Markets Revenue ETF (REEM)
June 30, 2019
| | | | | | | | |
| Shares | | | | | Value | |
| | | | Common Stocks—97.1% | | | |
| | | | Automobiles & Components—4.1% | |
| | 62,598 | | | Astra International Tbk PT | | $ | 33,010 | |
| | 20,798 | | | BAIC Motor Corp. Ltd., Class H1 | | | 13,045 | |
| | 177 | | | Bajaj Auto Ltd. | | | 7,249 | |
| | 368 | | | Bharat Forge Ltd. | | | 2,399 | |
| | 13 | | | Bosch Ltd.2 | | | 3,077 | |
| | 784 | | | Brilliance China Automotive Holdings Ltd. | | | 867 | |
| | 300 | | | BYD Co. Ltd., Class A | | | 2,215 | |
| | 1,724 | | | BYD Co. Ltd., Class H3 | | | 10,405 | |
| | 5,290 | | | Cheng Shin Rubber Industry Co. Ltd. | | | 6,830 | |
| | 2,000 | | | China First Capital Group Ltd.2 | | | 596 | |
| | 200 | | | China Shipbuilding Industry Group Power Co. Ltd., Class A | | | 688 | |
| | 1,400 | | | Chongqing Changan Automobile Co. Ltd., Class A | | | 1,351 | |
| | 10,033 | | | Dongfeng Motor Group Co. Ltd., Class H | | | 8,219 | |
| | 8 | | | Eicher Motors Ltd. | | | 2,218 | |
| | 1,158 | | | Ford Otomotiv Sanayi AS | | | 12,513 | |
| | 100 | | | Fuyao Glass Industry Group Co. Ltd., Class A | | | 331 | |
| | 373 | | | Fuyao Glass Industry Group Co. Ltd., Class H1 | | | 1,158 | |
| | 16,004 | | | Geely Automobile Holdings Ltd. | | | 27,368 | |
| | 11,096 | | | Great Wall Motor Co. Ltd., Class H | | | 7,939 | |
| | 700 | | | Guangzhou Automobile Group Co. Ltd., Class A | | | 1,114 | |
| | 5,209 | | | Guangzhou Automobile Group Co. Ltd., Class H | | | 5,561 | |
| | 329 | | | Hankook Tire & Technology Co. Ltd. | | | 10,001 | |
| | 929 | | | Hanon Systems | | | 9,373 | |
| | 242 | | | Hero MotoCorp Ltd. | | | 9,050 | |
| | 1,300 | | | Huayu Automotive Systems Co. Ltd., Class A | | | 4,088 | |
| | 299 | | | Hyundai Mobis Co. Ltd. | | | 60,983 | |
| | 1,083 | | | Hyundai Motor Co. | | | 131,313 | |
| | 2,276 | | | Kia Motors Corp. | | | 86,731 | |
| | 2,973 | | | Mahindra & Mahindra Ltd. | | | 28,226 | |
| | 233 | | | Maruti Suzuki India Ltd. | | | 22,058 | |
| | 8,870 | | | Motherson Sumi Systems Ltd. | | | 15,671 | |
| | 5,355 | | | Nexteer Automotive Group Ltd. | | | 6,663 | |
| | 200 | | | NIO, Inc.2,3,4 | | | 510 | |
| | 6,172 | | | SAIC Motor Corp. Ltd., Class A | | | 22,915 | |
| | 200 | | | Shandong Linglong Tyre Co. Ltd., Class A | | | 495 | |
| | 25,624 | | | Tata Motors Ltd.2 | | | 60,341 | |
| | 300 | | | Wanxiang Qianchao Co. Ltd., Class A | | | 261 | |
| | 100 | | | Weifu High-Technology Group Co. Ltd., Class A | | | 270 | |
| | | | | | | | |
| | | | Total Automobiles & Components | | | 617,102 | |
| | | | | | | | |
| | | | Banks—13.0% | |
| | 1,313 | | | Absa Group Ltd. | | | 16,388 | |
| | 2,877 | | | Abu Dhabi Commercial Bank PJSC | | | 6,501 | |
| | 41,718 | | | Agricultural Bank of China Ltd., Class A | | | 21,866 | |
| | 48,799 | | | Agricultural Bank of China Ltd., Class H | | | 20,425 | |
| | 11,753 | | | Akbank T.A.S.2 | | | 13,818 | |
| | 233 | | | Al Rajhi Bank | | | 4,324 | |
| | 215 | | | Alinma Bank | | | 1,397 | |
| | 172 | | | Alior Bank SA2 | | | 2,298 | |
| | 1,238 | | | Alliance Bank Malaysia Bhd | | | 1,126 | |
| | 3,886 | | | Alpha Bank AE2 | | | 7,789 | |
| | 3,201 | | | AMMB Holdings Bhd | | | 3,277 | |
| | 1,410 | | | Axis Bank Ltd.2 | | | 16,516 | |
| | 99 | | | Banco BBVA Argentina SA4 | | | 1,121 | |
| | | | | | | | |
| Shares | | | | | Value | |
| | | | Common Stocks (continued) | | | |
| | | | Banks (continued) | |
| | 6,887 | | | Banco Bradesco SA | | $ | 60,107 | |
| | 48,692 | | | Banco de Chile | | | 7,164 | |
| | 98 | | | Banco de Credito e Inversiones | | | 6,748 | |
| | 6,783 | | | Banco do Brasil SA | | | 95,463 | |
| | 7 | | | Banco Macro SA4 | | | 510 | |
| | 3,316 | | | Banco Santander Brasil SA | | | 39,332 | |
| | 101,255 | | | Banco Santander Chile | | | 7,531 | |
| | 4,000 | | | Banco Santander Mexico SA Institucion de Banca Multiple Grupo Financiero Santand | | | 6,115 | |
| | 546 | | | Bancolombia SA | | | 6,579 | |
| | 1,400 | | | Bangkok Bank PCL | | | 8,993 | |
| | 147 | | | Bank AlBilad2 | | | 1,066 | |
| | 225 | | | BankAl-Jazira | | | 911 | |
| | 5,000 | | | Bank Central Asia Tbk PT | | | 10,609 | |
| | 28,885 | | | Bank Mandiri Persero Tbk PT | | | 16,408 | |
| | 756 | | | Bank Millennium SA2 | | | 1,898 | |
| | 15,100 | | | Bank Negara Indonesia Persero Tbk PT | | | 9,833 | |
| | 3,400 | | | Bank of Beijing Co. Ltd., Class A | | | 2,926 | |
| | 400 | | | Bank of Chengdu Co. Ltd., Class A2 | | | 514 | |
| | 28,660 | | | Bank of China Ltd., Class A | | | 15,606 | |
| | 137,472 | | | Bank of China Ltd., Class H | | | 58,068 | |
| | 6,900 | | | Bank of Communications Co. Ltd., Class A | | | 6,148 | |
| | 67,194 | | | Bank of Communications Co. Ltd., Class H | | | 51,003 | |
| | 420 | | | Bank of Guiyang Co. Ltd., Class A | | | 529 | |
| | 900 | | | Bank of Hangzhou Co. Ltd., Class A | | | 1,092 | |
| | 2,200 | | | Bank of Jiangsu Co. Ltd., Class A | | | 2,325 | |
| | 1,300 | | | Bank of Nanjing Co. Ltd., Class A | | | 1,563 | |
| | 400 | | | Bank of Ningbo Co. Ltd., Class A | | | 1,412 | |
| | 1,400 | | | Bank of Shanghai Co. Ltd., Class A | | | 2,415 | |
| | 2,210 | | | Bank of the Philippine Islands | | | 3,386 | |
| | 153 | | | Bank Polska Kasa Opieki SA | | | 4,587 | |
| | 60,166 | | | Bank Rakyat Indonesia Persero Tbk PT | | | 18,568 | |
| | 19,000 | | | Bank Tabungan Negara Persero Tbk PT | | | 3,308 | |
| | 194 | | | Banque Saudi Fransi | | | 2,193 | |
| | 2,430 | | | BDO Unibank, Inc. | | | 6,640 | |
| | 1,065 | | | BNK Financial Group, Inc. | | | 6,908 | |
| | 33 | | | Capitec Bank Holdings Ltd. | | | 3,039 | |
| | 5,000 | | | Chang Hwa Commercial Bank Ltd. | | | 3,373 | |
| | 40,307 | | | China CITIC Bank Corp Ltd., Class H | | | 22,959 | |
| | 6,400 | | | China CITIC Bank Corp. Ltd., Class A | | | 5,563 | |
| | 1,000 | | | China Construction Bank Corp., Class A | | | 1,083 | |
| | 298,729 | | | China Construction Bank Corp., Class H | | | 257,337 | |
| | 76,000 | | | China Development Financial Holding Corp. | | | 23,172 | |
| | 7,700 | | | China Everbright Bank Co. Ltd., Class A | | | 4,271 | |
| | 30,323 | | | China Everbright Bank Co. Ltd., Class H | | | 13,895 | |
| | 1,600 | | | China Merchants Bank Co. Ltd., Class A | | | 8,382 | |
| | 3,576 | | | China Merchants Bank Co. Ltd., Class H | | | 17,829 | |
| | 7,500 | | | China Minsheng Banking Corp. Ltd., Class A | | | 6,934 | |
| | 21,602 | | | China Minsheng Banking Corp. Ltd., Class H | | | 14,959 | |
| | 5,314 | | | Chongqing Rural Commercial Bank Co. Ltd., Class H | | | 2,891 | |
| | 9,121 | | | CIMB Group Holdings Bhd | | | 11,874 | |
| | 2,920 | | | Commercial Bank PQSC (The) | | | 3,681 | |
| | 1,041 | | | Commercial International Bank Egypt SAE | | | 4,601 | |
| | 44 | | | Credicorp Ltd. | | | 10,072 | |
| | 39,797 | | | CTBC Financial Holding Co. Ltd. | | | 27,356 | |
| | 4,029 | | | Dubai Islamic Bank PJSC | | | 5,627 | |
| | 5,000 | | | E.Sun Financial Holding Co. Ltd. | | | 4,186 | |
The accompanying notes are an integral part of these financial statements.
Invesco Emerging Markets Revenue ETF (REEM)(continued)
June 30, 2019
| | | | | | | | |
| Shares | | | | | Value | |
| | | | Common Stocks (continued) | | | |
| | | | Banks (continued) | |
| | 7,515 | | | Eurobank Ergasias SA2 | | $ | 7,403 | |
| | 3,716 | | | First Abu Dhabi Bank PJSC | | | 15,033 | |
| | 7,000 | | | First Financial Holding Co. Ltd. | | | 5,139 | |
| | 3,013 | | | Grupo Financiero Banorte SAB de CV, Class O | | | 17,465 | |
| | 13 | | | Grupo Financiero Galicia SA4 | | | 462 | |
| | 4,900 | | | Grupo Financiero Inbursa SAB de CV, Class O | | | 7,080 | |
| | 2,767 | | | Habib Bank Ltd. | | | 1,962 | |
| | 708 | | | Hana Financial Group, Inc. | | | 22,933 | |
| | 800 | | | Hong Leong Bank Bhd | | | 3,678 | |
| | 800 | | | Hong Leong Financial Group Bhd | | | 3,589 | |
| | 478 | | | Housing Development Finance Corp. Ltd. | | | 15,180 | |
| | 7,000 | | | Hua Nan Financial Holdings Co. Ltd. | | | 4,699 | |
| | 3,800 | | | Huaxia Bank Co. Ltd., Class A2 | | | 4,260 | |
| | 5,359 | | | ICICI Bank Ltd. | | | 33,935 | |
| | 398 | | | Indiabulls Housing Finance Ltd. | | | 3,504 | |
| | 27,132 | | | Industrial & Commercial Bank of China Ltd., Class A | | | 23,267 | |
| | 99,063 | | | Industrial & Commercial Bank of China Ltd., Class H | | | 72,276 | |
| | 3,200 | | | Industrial Bank Co. Ltd., Class A | | | 8,521 | |
| | 1,294 | | | Industrial Bank of Korea | | | 15,746 | |
| | 673,572 | | | Itau CorpBanca | | | 5,613 | |
| | 5,248 | | | Kasikornbank PCL | | | 32,172 | |
| | 1,209 | | | KB Financial Group, Inc. | | | 48,008 | |
| | 92 | | | Komercni banka as | | | 3,669 | |
| | 14,523 | | | Krung Thai Bank PCL | | | 9,234 | |
| | 598 | | | LIC Housing Finance Ltd. | | | 4,810 | |
| | 6,600 | | | Malayan Banking Bhd | | | 14,182 | |
| | 2,460 | | | Masraf Al Rayan QSC | | | 2,574 | |
| | 27 | | | mBank SA2 | | | 3,113 | |
| | 1,033 | | | MCB Bank Ltd. | | | 1,128 | |
| | 6,000 | | | Mega Financial Holding Co. Ltd. | | | 5,969 | |
| | 2,995 | | | Metropolitan Bank & Trust Co. | | | 4,165 | |
| | 262 | | | Moneta Money Bank AS1 | | | 898 | |
| | 1,472 | | | National Bank of Greece SA2 | | | 4,040 | |
| | 351 | | | National Commercial Bank | | | 5,185 | |
| | 686 | | | Nedbank Group Ltd. | | | 12,318 | |
| | 171 | | | OTP Bank Nyrt | | | 6,817 | |
| | 3,000 | | | Ping An Bank Co. Ltd., Class A | | | 6,019 | |
| | 44,995 | | | Postal Savings Bank of China Co. Ltd., Class H1,3 | | | 26,723 | |
| | 773 | | | Powszechna Kasa Oszczednosci Bank Polski SA | | | 8,876 | |
| | 1,620 | | | Public Bank Bhd | | | 9,016 | |
| | 810 | | | Qatar Islamic Bank SAQ | | | 3,695 | |
| | 5,840 | | | Qatar National Bank QPSC | | | 30,521 | |
| | 3,444 | | | RHB Bank Bhd | | | 4,659 | |
| | 390 | | | Riyad Bank | | | 2,787 | |
| | 245 | | | Samba Financial Group | | | 2,313 | |
| | 48 | | | Santander Bank Polska SA | | | 4,773 | |
| | 207 | | | Saudi British Bank (The) | | | 2,285 | |
| | 31,020 | | | Sberbank of Russia PJSC | | | 117,318 | |
| | 420 | | | Security Bank Corp. | | | 1,394 | |
| | 2,200 | | | Shanghai Commercial & Savings Bank Ltd. (The) | | | 3,981 | |
| | 5,300 | | | Shanghai Pudong Development Bank Co. Ltd., Class A | | | 9,013 | |
| | 880 | | | Shinhan Financial Group Co. Ltd. | | | 34,220 | |
| | | | | | | | |
| Shares | | | | | Value | |
| | | | Common Stocks (continued) | | | |
| | | | Banks (continued) | |
| | 3,205 | | | Siam Commercial Bank PCL (The) | | $ | 14,579 | |
| | 7,000 | | | SinoPac Financial Holdings Co. Ltd. | | | 2,941 | |
| | 2,005 | | | Standard Bank Group Ltd. | | | 27,964 | |
| | 17,754 | | | State Bank of India2 | | | 92,914 | |
| | 7,000 | | | Taishin Financial Holding Co. Ltd. | | | 3,223 | |
| | 5,000 | | | Taiwan Business Bank | | | 2,197 | |
| | 7,000 | | | Taiwan Cooperative Financial Holding Co. Ltd. | | | 4,688 | |
| | 55,400 | | | TMB Bank PCL | | | 3,541 | |
| | 11,526 | | | Turkiye Garanti Bankasi AS2 | | | 18,134 | |
| | 19,650 | | | Turkiye Is Bankasi AS, Class C2 | | | 20,554 | |
| | 23,660,000 | | | VTB Bank PJSC | | | 14,959 | |
| | 1,582 | | | Woori Financial Group, Inc. | | | 19,250 | |
| | 3,282 | | | Yes Bank Ltd. | | | 5,171 | |
| | | | | | | | |
| | | | Total Banks | | | 1,966,123 | |
| | | | | | | | |
| | | | Capital Goods—9.3% | |
| | 6,530 | | | Aboitiz Equity Ventures, Inc. | | | 7,010 | |
| | 200 | | | AECC Aviation Power Co. Ltd., Class A | | | 661 | |
| | 85 | | | Airtac International Group | | | 952 | |
| | 34,734 | | | Alfa SAB de CV, Class A | | | 34,098 | |
| | 19,208 | | | Alliance Global Group, Inc. | | | 5,788 | |
| | 900 | | | Aselsan Elektronik Sanayi Ve Ticaret AS | | | 2,801 | |
| | 6,891 | | | Ashok Leyland Ltd. | | | 8,710 | |
| | 400 | | | AVIC Aircraft Co. Ltd., Class A | | | 917 | |
| | 100 | | | AVIC Shenyang Aircraft Co. Ltd., Class A2 | | | 423 | |
| | 15,118 | | | AviChina Industry & Technology Co. Ltd., Class H | | | 8,263 | |
| | 550 | | | Ayala Corp. | | | 9,597 | |
| | 642 | | | Bidvest Group Ltd. (The) | | | 8,621 | |
| | 300 | | | BOC Aviation Ltd.1 | | | 2,519 | |
| | 100 | | | China Avionics Systems Co. Ltd., Class A2 | | | 216 | |
| | 5,600 | | | China Communications Construction Co. Ltd., Class A | | | 9,230 | |
| | 37,377 | | | China Communications Construction Co. Ltd., Class H | | | 33,442 | |
| | 12,397 | | | China Communications Services Corp. Ltd., Class H | | | 9,616 | |
| | 2,800 | | | China Gezhouba Group Co. Ltd., Class A2 | | | 2,540 | |
| | 600 | | | China International Marine Containers Group Co. Ltd., Class A | | | 933 | |
| | 2,400 | | | China National Chemical Engineering Co. Ltd., Class A | | | 2,104 | |
| | 10,944 | | | China Railway Construction Corp. Ltd., Class A | | | 15,854 | |
| | 23,944 | | | China Railway Construction Corp. Ltd., Class H | | | 29,361 | |
| | 47,184 | | | China Railway Group Ltd., Class H | | | 35,875 | |
| | 1,500 | | | China Shipbuilding Industry Co. Ltd., Class A | | | 1,214 | |
| | 100 | | | China Spacesat Co. Ltd., Class A | | | 328 | |
| | 37,222 | | | China State Construction Engineering Corp. Ltd., Class A | | | 31,161 | |
| | 12,638 | | | China State Construction International Holdings Ltd. | | | 12,974 | |
| | 113,556 | | | CITIC Ltd. | | | 163,666 | |
| | 556 | | | CJ Corp. | | | 48,635 | |
| | 100 | | | Contemporary Amperex Technology Co. Ltd., Class A2 | | | 1,003 | |
| | 4,000 | | | CRRC Corp Ltd., Class A | | | 4,711 | |
| | 9,703 | | | CRRC Corp. Ltd., Class H | | | 8,110 | |
The accompanying notes are an integral part of these financial statements.
Invesco Emerging Markets Revenue ETF (REEM)(continued)
June 30, 2019
| | | | | | | | |
| Shares | | | | | Value | |
| | | | Common Stocks (continued) | | | |
| | | | Capital Goods (continued) | |
| | 193 | | | Daelim Industrial Co. Ltd. | | $ | 19,222 | |
| | 3,931 | | | Daewoo Engineering & Construction Co. Ltd.2 | | | 16,818 | |
| | 620 | | | Daewoo Shipbuilding & Marine Engineering Co. Ltd.2 | | | 17,559 | |
| | 14,943 | | | DMCI Holdings, Inc. | | | 3,004 | |
| | 400 | | | Dongfang Electric Corp. Ltd., Class A2 | | | 618 | |
| | 219 | | | Doosan Bobcat, Inc. | | | 6,904 | |
| | 5,340 | | | ElSewedy Electric Co. | | | 4,571 | |
| | 1,893 | | | Embraer SA | | | 9,587 | |
| | 149 | | | Fangda Carbon New Material Co. Ltd., Class A2 | | | 267 | |
| | 12,864 | | | Far Eastern New Century Corp. | | | 13,875 | |
| | 20,496 | | | Fosun International Ltd. | | | 27,232 | |
| | 27,500 | | | Fullshare Holdings Ltd.2 | | | 1,707 | |
| | 2,500 | | | Gamuda Bhd | | | 2,275 | |
| | 2,400 | | | Grupo Carso SAB de CV, Series A1 | | | 8,940 | |
| | 607 | | | GS Engineering & Construction Corp. | | | 21,212 | |
| | 1,451 | | | Haitian International Holdings Ltd. | | | 3,012 | |
| | 2,533 | | | Hanwha Corp. | | | 58,573 | |
| | 1,100 | | | HAP Seng Consolidated Bhd | | | 2,649 | |
| | 239 | | | Havells India Ltd. | | | 2,722 | |
| | 118 | | | HDC Hyundai DevelopmentCo-Engineering & Construction, Class E | | | 4,445 | |
| | 210 | | | Hiwin Technologies Corp. | | | 1,758 | |
| | 612 | | | Hyundai Engineering & Construction Co. Ltd. | | | 28,410 | |
| | 173 | | | Hyundai Heavy Industries Holdings Co. Ltd. | | | 48,545 | |
| | 4,900 | | | IJM Corp. Bhd | | | 2,846 | |
| | 930 | | | Industries Qatar QSC | | | 2,937 | |
| | 8,634 | | | JG Summit Holdings, Inc. | | | 11,358 | |
| | 26 | | | KCC Corp. | | | 6,204 | |
| | 16,365 | | | KOC Holding AS | | | 49,627 | |
| | 159 | | | Korea Aerospace Industries Ltd. | | | 4,950 | |
| | 210 | | | Korea Shipbuilding & Offshore Engineering Co. Ltd.2 | | | 21,552 | |
| | 1,762 | | | Larsen & Toubro Ltd. | | | 39,647 | |
| | 267 | | | LG Corp. | | | 17,782 | |
| | 461 | | | Lotte Corp. | | | 17,567 | |
| | 14,400 | | | Metallurgical Corp of China Ltd., Class A | | | 6,374 | |
| | 39,795 | | | Metallurgical Corp. of China., Ltd., Class H | | | 10,646 | |
| | 300 | | | NARI Technology Co. Ltd., Class A2 | | | 814 | |
| | 2,601 | | | Posco International Corp. | | | 41,336 | |
| | 9,700 | | | Power Construction Corp of China Ltd., Class A2 | | | 7,471 | |
| | 638 | | | Samsung C&T Corp. | | | 52,879 | |
| | 594 | | | Samsung Engineering Co. Ltd.2 | | | 8,823 | |
| | 1,261 | | | Samsung Heavy Industries Co. Ltd.2 | | | 8,912 | |
| | 800 | | | Sany Heavy Industry Co. Ltd., Class A | | | 1,524 | |
| | 2,600 | | | Shanghai Electric Group Co. Ltd., Class A | | | 2,037 | |
| | 15,749 | | | Shanghai Electric Group Co. Ltd., Class H | | | 5,705 | |
| | 2,955 | | | Shanghai Industrial Holdings Ltd. | | | 6,407 | |
| | 1,000 | | | Shanghai Tunnel Engineering Co. Ltd., Class A | | | 919 | |
| | 28,125 | | | Sime Darby Bhd | | | 15,381 | |
| | 4,800 | | | Sinopec Engineering Group Co. Ltd., Class H | | | 4,067 | |
| | 7,997 | | | Sinotruk Hong Kong Ltd. | | | 13,839 | |
| | 926 | | | SK Holdings Co. Ltd. | | | 186,058 | |
| | 833 | | | SM Investments Corp. | | | 15,754 | |
| | 400 | | | Suzhou Gold Mantis Construction Decoration Co. Ltd., Class A | | | 600 | |
| | | | | | | | |
| Shares | | | | | Value | |
| | | | Common Stocks (continued) | | | |
| | | | Capital Goods (continued) | |
| | 1,000 | | | TBEA Co. Ltd., Class A | | $ | 1,056 | |
| | 5,179 | | | Turkiye Sise ve Cam Fabrikalari AS | | | 4,647 | |
| | 1,200 | | | WEG SA | | | 6,688 | |
| | 1,800 | | | Weichai Power Co. Ltd., Class A | | | 3,221 | |
| | 6,983 | | | Weichai Power Co. Ltd., Class H | | | 11,798 | |
| | 1,600 | | | XCMG Construction Machinery Co. Ltd., Class A | | | 1,039 | |
| | 5,100 | | | Xiamen C & D, Inc., Class A | | | 6,594 | |
| | 400 | | | Xinjiang Goldwind Science & Technology Co. Ltd., Class A | | | 724 | |
| | 1,400 | | | Xinjiang Goldwind Science & Technology Co. Ltd., Class H | | | 1,530 | |
| | 200 | | | Zhejiang Chint Electrics Co. Ltd., Class A | | | 672 | |
| | 400 | | | Zhengzhou Yutong Bus Co. Ltd., Class A | | | 758 | |
| | 372 | | | Zhuzhou CRRC Times Electric Co. Ltd., Class H | | | 1,959 | |
| | 800 | | | Zoomlion Heavy Industry Science and Technology Co. Ltd., Class A | | | 700 | |
| | | | | | | | |
| | | | Total Capital Goods | | | 1,410,640 | |
| | | | | | | | |
| | | | Commercial & Professional Services—0.1% | |
| | 13 | | | 51job, Inc.2,4 | | | 982 | |
| | 7,000 | | | China Everbright International Ltd. | | | 6,460 | |
| | 983 | | | Country Garden Services Holdings Co. Ltd. | | | 2,272 | |
| | 2,000 | | | Greentown Service Group Co. Ltd. | | | 1,615 | |
| | 43 | | | S-1 Corp. | | | 3,635 | |
| | 200 | | | Tus-Sound Environmental Resources Co. Ltd., Class A2 | | | 343 | |
| | | | | | | | |
| | | | Total Commercial & Professional Services | | | 15,307 | |
| | | | | | | | |
| | | | Consumer Durables & Apparel—1.5% | |
| | 939 | | | ANTA Sports Products Ltd.3 | | | 6,448 | |
| | 2,991 | | | Arcelik AS2 | | | 10,058 | |
| | 50 | | | CCC SA | | | 2,260 | |
| | 118 | | | Eclat Textile Co. Ltd. | | | 1,512 | |
| | 492 | | | Feng TAY Enterprise Co. Ltd. | | | 3,833 | |
| | 235 | | | FF Group2,5 | | | 0 | |
| | 65 | | | Fila Korea Ltd. | | | 4,318 | |
| | 2,000 | | | Formosa Taffeta Co. Ltd. | | | 2,518 | |
| | 469 | | | Giant Manufacturing Co. Ltd. | | | 3,669 | |
| | 600 | | | Gree Electric Appliances Inc of Zhuhai, Class A | | | 4,805 | |
| | 8,566 | | | Haier Electronics Group Co. Ltd.2 | | | 23,683 | |
| | 2,000 | | | Haier Smart Home Co. Ltd., Class A2 | | | 5,035 | |
| | 400 | | | HLA Corp Ltd., Class A | | | 528 | |
| | 1 | | | HLB, Inc.2 | | | 31 | |
| | 1,386 | | | LG Electronics, Inc. | | | 95,189 | |
| | 1,500 | | | Li Ning Co. Ltd. | | | 3,537 | |
| | 2 | | | LPP SA | | | 4,097 | |
| | 900 | | | Midea Group Co. Ltd., Class A | | | 6,796 | |
| | 276 | | | Nien Made Enterprise Co. Ltd. | | | 2,075 | |
| | 100 | | | Oppein Home Group, Inc., Class A | | | 1,567 | |
| | 2 | | | Page Industries Ltd. | | | 596 | |
| | 14,267 | | | Pou Chen Corp. | | | 17,685 | |
| | 290 | | | Ruentex Industries Ltd. | | | 705 | |
| | 400 | | | Shenzhou International Group Holdings Ltd. | | | 5,499 | |
| | 6,000 | | | Tatung Co. Ltd.2 | | | 3,622 | |
| | 5,800 | | | TCL Corp., Class A | | | 2,812 | |
| | 286 | | | Titan Co. Ltd. | | | 5,530 | |
The accompanying notes are an integral part of these financial statements.
Invesco Emerging Markets Revenue ETF (REEM)(continued)
June 30, 2019
| | | | | | | | |
| Shares | | | | | Value | |
| | | | Common Stocks (continued) | | | |
| | | | Consumer Durables & Apparel (continued) | |
| | 64 | | | Woongjin Coway Co. Ltd. | | $ | 4,290 | |
| | 200 | | | Zhejiang Semir Garment Co. Ltd., Class A | | | 322 | |
| | | | | | | | |
| | | | Total Consumer Durables & Apparel | | | 223,020 | |
| | | | | | | | |
| | | | Consumer Services—0.4% | |
| | 1,959 | | | Alsea SAB de CV2 | | | 3,852 | |
| | 100 | | | China International Travel Service Corp Ltd, Class A | | | 1,291 | |
| | 5,700 | | | Genting Bhd | | | 9,338 | |
| | 5,856 | | | Genting Malaysia Bhd | | | 4,591 | |
| | 76 | | | Huazhu Group Ltd.4 | | | 2,755 | |
| | 997 | | | Jollibee Foods Corp. | | | 5,484 | |
| | 87 | | | Kangwon Land, Inc. | | | 2,279 | |
| | 1,200 | | | Kroton Educacional SA | | | 3,435 | |
| | 3,500 | | | Minor International PCL | | | 4,679 | |
| | 56 | | | New Oriental Education & Technology Group, Inc.2,4 | | | 5,409 | |
| | 327 | | | OPAP SA | | | 3,668 | |
| | 21 | | | Saudi Airlines Catering Co. | | | 478 | |
| | 900 | | | Shenzhen Overseas Chinese Town Co. Ltd., Class A | | | 911 | |
| | 70 | | | TAL Education Group2,4 | | | 2,667 | |
| | 351 | | | Yum China Holdings, Inc. | | | 16,216 | |
| | | | | | | | |
| | | | Total Consumer Services | | | 67,053 | |
| | | | | | | | |
| | | | Diversified Financials—1.1% | |
| | 100 | | | Anxin Trust Co. Ltd., Class A2 | | | 74 | |
| | 500 | | | Avic Capital Co. Ltd., Class A | | | 395 | |
| | 300 | | | B3 SA—Brasil Bolsa Balcao | | | 2,932 | |
| | 90 | | | Bajaj Finance Ltd. | | | 4,800 | |
| | 200 | | | Banco BTG Pactual SA | | | 2,655 | |
| | 100 | | | Caitong Securities Co. Ltd., Class A | | | 160 | |
| | 745 | | | Chailease Holding Co. Ltd. | | | 3,082 | |
| | 200 | | | Changjiang Securities Co. Ltd., Class A | | | 227 | |
| | 29,150 | | | China Cinda Asset Management Co. Ltd., Class H | | | 6,716 | |
| | 448 | | | China Everbright Ltd. | | | 662 | |
| | 2,500 | | | China Galaxy Securities Co. Ltd., Class H | | | 1,482 | |
| | 86,404 | | | China Huarong Asset Management Co. Ltd., Class H1 | | | 15,041 | |
| | 800 | | | China International Capital Corp. Ltd., Class H1 | | | 1,614 | |
| | 200 | | | China Merchants Securities Co. Ltd., Class A | | | 498 | |
| | 400 | | | CITIC Securities Co. Ltd., Class A | | | 1,387 | |
| | 1,334 | | | CITIC Securities Co. Ltd., Class H2 | | | 2,780 | |
| | 100 | | | Dongxing Securities Co. Ltd., Class A | | | 173 | |
| | 200 | | | Everbright Securities Co. Ltd., Class A | | | 333 | |
| | 6,063 | | | Far East Horizon Ltd. | | | 6,201 | |
| | 100 | | | First Capital Securities Co. Ltd., Class A | | | 92 | |
| | 3,527 | | | FirstRand Ltd. | | | 17,146 | |
| | 300 | | | Founder Securities Co. Ltd., Class A | | | 311 | |
| | 200 | | | GF Securities Co. Ltd., Class A | | | 400 | |
| | 896 | | | GF Securities Co. Ltd., Class H | | | 1,065 | |
| | 788 | | | Grupo de Inversiones Suramericana SA | | | 8,379 | |
| | 442 | | | GT Capital Holdings, Inc. | | | 8,109 | |
| | 200 | | | Guosen Securities Co. Ltd., Class A | | | 383 | |
| | 300 | | | Guotai Junan Securities Co. Ltd., Class A2 | | | 801 | |
| | 600 | | | Guotai Junan Securities Co. Ltd., Class H1,2 | | | 1,069 | |
| | 100 | | | Guoyuan Securities Co. Ltd., Class A | | | 133 | |
| | | | | | | | |
| Shares | | | | | Value | |
| | | | Common Stocks (continued) | | | |
| | | | Diversified Financials (continued) | |
| | 3,972 | | | Haci Omer Sabanci Holding AS | | $ | 5,899 | |
| | 400 | | | Haitong Securities Co. Ltd., Class A | | | 826 | |
| | 2,499 | | | Haitong Securities Co. Ltd., Class H | | | 2,802 | |
| | 100 | | | Huaan Securities Co. Ltd., Class A | | | 95 | |
| | 200 | | | Huatai Securities Co. Ltd., Class A | | | 650 | |
| | 800 | | | Huatai Securities Co. Ltd., Class H1 | | | 1,376 | |
| | 100 | | | Huaxi Securities Co., Ltd., Class A | | | 153 | |
| | 400 | | | Industrial Securities Co. Ltd., Class A | | | 393 | |
| | 494 | | | Investec Ltd. | | | 3,218 | |
| | 67 | | | Korea Investment Holdings Co. Ltd. | | | 4,683 | |
| | 414 | | | Mahindra & Mahindra Financial Services Ltd. | | | 2,329 | |
| | 671 | | | Meritz Securities Co. Ltd. | | | 3,115 | |
| | 34,916 | | | Metro Pacific Investments Corp. | | | 3,271 | |
| | 1,135 | | | Mirae Asset Daewoo Co. Ltd. | | | 8,041 | |
| | 830 | | | Moscow ExchangeMICEX-RTS PJSC | | | 1,186 | |
| | 400 | | | Muangthai Capital PCL | | | 737 | |
| | 227 | | | NH Investment & Securities Co. Ltd. | | | 2,851 | |
| | 13 | | | Noah Holdings Ltd.2,4 | | | 553 | |
| | 200 | | | Orient Securities Co. Ltd., Class A | | | 311 | |
| | 170 | | | PSG Group Ltd. | | | 2,881 | |
| | 3,266 | | | REC Ltd. | | | 7,797 | |
| | 22 | | | Reinet Investments SCA | | | 354 | |
| | 404 | | | Remgro Ltd. | | | 5,383 | |
| | 180 | | | Samsung Card Co. Ltd. | | | 5,955 | |
| | 76 | | | Samsung Securities Co. Ltd. | | | 2,574 | |
| | 200 | | | SDIC Capital Co., Ltd., Class A | | | 408 | |
| | 100 | | | Shanxi Securities Co. Ltd., Class A2 | | | 118 | |
| | 900 | | | Shenwan Hongyuan Group Co. Ltd., Class A | | | 656 | |
| | 263 | | | Shriram Transport Finance Co. Ltd. | | | 4,117 | |
| | 100 | | | Sinolink Securities Co. Ltd., Class A | | | 142 | |
| | 100 | | | SooChow Securities Co. Ltd., Class A2 | | | 149 | |
| | 100 | | | Western Securities Co. Ltd., Class A2 | | | 147 | |
| | 13,345 | | | Yuanta Financial Holding Co. Ltd. | | | 8,013 | |
| | | | | | | | |
| | | | Total Diversified Financials | | | 170,283 | |
| | | | | | | | |
| | | | Energy—17.2% | |
| | 78,784 | | | Adaro Energy Tbk PT | | | 7,584 | |
| | 13,474 | | | Banpu PCL | | | 6,590 | |
| | 13,353 | | | Bharat Petroleum Corp. Ltd. | | | 75,917 | |
| | 14,575 | | | Bukit Asam Tbk PT | | | 3,054 | |
| | 20,198 | | | China Coal Energy Co. Ltd., Class H2 | | | 8,402 | |
| | 2,000 | | | China Oilfield Services Ltd., Class H | | | 1,979 | |
| | 70,055 | | | China Petroleum & Chemical Corp., Class A | | | 55,793 | |
| | 199,246 | | | China Petroleum & Chemical Corp., Class H | | | 135,424 | |
| | 2,100 | | | China Shenhua Energy Co. Ltd., Class A | | | 6,231 | |
| | 5,466 | | | China Shenhua Energy Co. Ltd., Class H | | | 11,446 | |
| | 33,407 | | | CNOOC Ltd. | | | 57,129 | |
| | 7,157 | | | Coal India Ltd. | | | 26,315 | |
| | 400 | | | Cosan SA | | | 4,817 | |
| | 1,548 | | | Dialog Group Bhd | | | 1,221 | |
| | 39,206 | | | Ecopetrol SA | | | 35,697 | |
| | 3,591 | | | Empresas COPEC SA | | | 39,266 | |
| | 280 | | | Exxaro Resources Ltd. | | | 3,415 | |
| | 12,168 | | | Formosa Petrochemical Corp. | | | 43,290 | |
| | 71,420 | | | Gazprom PJSC | | | 263,634 | |
| | 647 | | | Grupa Lotos SA | | | 14,695 | |
| | 619 | | | GS Holdings Corp. | | | 27,448 | |
| | 600 | | | Guanghui Energy Co., Ltd., Class A | | | 311 | |
| | 16,621 | | | Hindustan Petroleum Corp. Ltd. | | | 69,841 | |
The accompanying notes are an integral part of these financial statements.
Invesco Emerging Markets Revenue ETF (REEM)(continued)
June 30, 2019
| | | | | | | | |
| Shares | | | | | Value | |
| | | | Common Stocks (continued) | | | |
| | | | Energy (continued) | |
| | 58,146 | | | Indian Oil Corp. Ltd. | | $ | 131,324 | |
| | 3,500 | | | Inner Mongolia Yitai Coal Co. Ltd., Class B | | | 3,794 | |
| | 99,307 | | | IRPC PCL | | | 16,191 | |
| | 2,880 | | | LUKOIL PJSC | | | 242,226 | |
| | 2,820 | | | MOL Hungarian Oil & Gas PLC | | | 31,360 | |
| | 836 | | | Motor Oil Hellas Corinth Refineries SA | | | 21,421 | |
| | 122 | | | Novatek PJSC | | | 25,864 | |
| | 400 | | | Offshore Oil Engineering Co. Ltd., Class A | | | 326 | |
| | 3,200 | | | Oil & Gas Development Co. Ltd. | | | 2,634 | |
| | 38,058 | | | Oil & Natural Gas Corp. Ltd. | | | 92,488 | |
| | 51,281 | | | PetroChina Co. Ltd., Class A | | | 51,368 | |
| | 120,199 | | | PetroChina Co. Ltd., Class H | | | 66,311 | |
| | 12,634 | | | Petroleo Brasileiro SA | | | 98,958 | |
| | 2,108 | | | Petronas Dagangan Bhd | | | 12,957 | |
| | 3,037 | | | Petronet LNG Ltd. | | | 10,784 | |
| | 2,107 | | | Polski Koncern Naftowy ORLEN SA | | | 50,839 | |
| | 12,209 | | | Polskie Gornictwo Naftowe i Gazownictwo SA | | | 17,384 | |
| | 2,327 | | | PTT Exploration & Production PCL | | | 10,244 | |
| | 85,368 | | | PTT PCL | | | 135,704 | |
| | 1,880 | | | Qatar Fuel QSC | | | 11,080 | |
| | 1,847 | | | Rabigh Refining & Petrochemical Co.2 | | | 10,175 | |
| | 7,827 | | | Reliance Industries Ltd.2 | | | 142,088 | |
| | 33,140 | | | Rosneft Oil Co PJSC | | | 217,781 | |
| | 1,100 | | | Shaanxi Coal Industry Co. Ltd., Class A | | | 1,480 | |
| | 500 | | | Shanxi Lu’an Environmental Energy Development Co. Ltd., Class A | | | 578 | |
| | 800 | | | Shanxi Xishan Coal & Electricity Power Co. Ltd., Class A | | | 706 | |
| | 608 | | | SK Innovation Co. Ltd. | | | 83,724 | |
| | 535 | | | S-Oil Corp. | | | 38,782 | |
| | 80,700 | | | Surgutneftegas PJSC | | | 33,700 | |
| | 2,340 | | | Tatneft PJSC | | | 28,748 | |
| | 10,534 | | | Thai Oil PCL | | | 22,842 | |
| | 40 | | | Transportadora de Gas del Sur SA4 | | | 578 | |
| | 1,294 | | | Tupras Turkiye Petrol Rafinerileri AS | | | 25,728 | |
| | 8,148 | | | Ultrapar Participacoes SA | | | 42,731 | |
| | 6,006 | | | United Tractors Tbk PT | | | 11,989 | |
| | 700 | | | Yanzhou Coal Mining Co. Ltd., Class A | | | 1,108 | |
| | 6,438 | | | Yanzhou Coal Mining Co. Ltd., Class H | | | 6,016 | |
| | 921 | | | YPF SA4 | | | 16,771 | |
| | | | | | | | |
| | | | Total Energy | | | 2,618,281 | |
| | | | | | | | |
| | | | Food & Staples Retailing—2.7% | |
| | 4,872 | | | Atacadao SA | | | 27,966 | |
| | 263 | | | Avenue Supermarts Ltd.1,2 | | | 5,326 | |
| | 5,587 | | | Berli Jucker PCL | | | 9,200 | |
| | 51 | | | BGF retail Co. Ltd. | | | 9,320 | |
| | 752 | | | Bid Corp. Ltd. | | | 16,371 | |
| | 799 | | | BIM Birlesik Magazalar AS | | | 11,003 | |
| | 13,591 | | | Cencosud SA | | | 26,623 | |
| | 262 | | | Clicks Group Ltd. | | | 3,814 | |
| | 11,583 | | | CP ALL PCL | | | 32,482 | |
| | 90 | | | Dino Polska SA1,2 | | | 3,159 | |
| | 208 | | | E-MART, Inc. | | | 25,220 | |
| | 435 | | | GS Retail Co. Ltd. | | | 14,806 | |
| | 2,465 | | | Magnit PJSC | | | 35,927 | |
| | 2,118 | | | Pick n Pay Stores Ltd. | | | 10,364 | |
| | 1,200 | | | President Chain Store Corp. | | | 11,610 | |
| | 375 | | | Raia Drogasil SA | | | 7,446 | |
| | | | | | | | |
| Shares | | | | | Value | |
| | | | Common Stocks (continued) | | | |
| | | | Food & Staples Retailing (continued) | |
| | 1,527 | | | Shoprite Holdings Ltd. | | $ | 17,073 | |
| | 877 | | | SPAR Group Ltd. (The) | | | 11,619 | |
| | 28,181 | | | Sun Art Retail Group Ltd. | | | 26,693 | |
| | 19,742 | | | Wal-Mart de Mexico SAB de CV | | | 53,847 | |
| | 1,323 | | | X5 Retail Group NV | | | 45,673 | |
| | 1,200 | | | Yonghui Superstores Co. Ltd., Class A | | | 1,784 | |
| | | | | | | | |
| | | | Total Food & Staples Retailing | | | 407,326 | |
| | | | | | | | |
| | | | Food, Beverage & Tobacco—3.4% | |
| | 214 | | | Almarai Co. JSC | | | 3,007 | |
| | 5,397 | | | Ambev SA | | | 25,192 | |
| | 1,862 | | | Anadolu Efes Biracilik Ve Malt Sanayii AS | | | 6,403 | |
| | 2,516 | | | Arca Continental SAB de CV | | | 13,600 | |
| | 500 | | | Beijing Dabeinong Technology Group Co. Ltd., Class A | | | 385 | |
| | 1,641 | | | BRF SA2 | | | 12,639 | |
| | 68 | | | Britannia Industries Ltd. | | | 2,703 | |
| | 100 | | | British American Tobacco Malaysia Bhd | | | 697 | |
| | 37,222 | | | Charoen Pokphand Foods PCL | | | 34,288 | |
| | 22,031 | | | Charoen Pokphand Indonesia Tbk PT | | | 7,376 | |
| | 81,793 | | | China Agri-Industries Holdings Ltd. | | | 26,278 | |
| | 4,534 | | | China Mengniu Dairy Co. Ltd.2 | | | 17,556 | |
| | 1,786 | | | China Resources Beer Holdings Co. Ltd. | | | 8,481 | |
| | 344 | | | Cia Cervecerias Unidas SA | | | 4,839 | |
| | 109 | | | CJ CheilJedang Corp. | | | 28,037 | |
| | 609 | | | Coca-Cola Femsa SAB de CV | | | 3,776 | |
| | 7,597 | | | Dali Foods Group Co. Ltd.1 | | | 5,047 | |
| | 1,480 | | | Eastern Co. SAE | | | 1,369 | |
| | 2,618 | | | Fomento Economico Mexicano SAB de CV | | | 25,341 | |
| | 237 | | | Fraser & Neave Holdings Bhd | | | 1,982 | |
| | 300 | | | Genting Plantations Bhd | | | 726 | |
| | 671 | | | Gruma SAB de CV, Class B | | | 6,292 | |
| | 12,208 | | | Grupo Bimbo SAB de CV, Series A | | | 25,437 | |
| | 763 | | | Gudang Garam Tbk PT | | | 4,152 | |
| | 28,052 | | | Hanjaya Mandala Sampoerna Tbk PT | | | 6,235 | |
| | 300 | | | Henan Shuanghui Investment & Development Co. Ltd., Class A | | | 1,087 | |
| | 7,200 | | | Indofood CBP Sukses Makmur Tbk PT | | | 5,173 | |
| | 21,300 | | | Indofood Sukses Makmur Tbk PT | | | 10,592 | |
| | 500 | | | Inner Mongolia Yili Industrial Group Co. Ltd., Class A | | | 2,432 | |
| | 2,800 | | | IOI Corp. Bhd | | | 2,880 | |
| | 2,773 | | | ITC Ltd. | | | 11,001 | |
| | 14,526 | | | JBS SA | | | 80,425 | |
| | 87 | | | KT&G Corp. | | | 7,422 | |
| | 1,273 | | | Kuala Lumpur Kepong Bhd | | | 7,566 | |
| | 313 | | | M Dias Branco SA | | | 3,182 | |
| | 19 | | | Nestle India Ltd. | | | 3,279 | |
| | 100 | | | Nestle Malaysia Bhd | | | 3,608 | |
| | 700 | | | New Hope Liuhe Co. Ltd., Class A | | | 1,770 | |
| | 39 | | | Orion Corp./Republic of Korea | | | 3,124 | |
| | 6 | | | Ottogi Corp. | | | 3,559 | |
| | 400 | | | PPB Group Bhd | | | 1,810 | |
| | 900 | | | QL Resources Bhd | | | 1,490 | |
| | 596 | | | Savola Group (The)2 | | | 5,197 | |
| | 5,500 | | | Sime Darby Plantation Bhd | | | 6,548 | |
| | 1,000 | | | Standard Foods Corp. | | | 1,954 | |
| | 13,200 | | | Thai Union Group PCL | | | 7,877 | |
| | 193 | | | Tiger Brands Ltd. | | | 3,062 | |
The accompanying notes are an integral part of these financial statements.
Invesco Emerging Markets Revenue ETF (REEM)(continued)
June 30, 2019
| | | | | | | | |
| Shares | | | | | Value | |
| | | | Common Stocks (continued) | | | |
| | | | Food, Beverage & Tobacco (continued) | |
| | 9,674 | | | Tingyi Cayman Islands Holding Corp. | | $ | 16,147 | |
| | 300 | | | Tongwei Co. Ltd., Class A | | | 614 | |
| | 474 | | | Tsingtao Brewery Co. Ltd., Class H | | | 3,018 | |
| | 5,200 | | | Uni-President China Holdings Ltd. | | | 5,791 | |
| | 9,728 | | | Uni-President Enterprises Corp. | | | 25,902 | |
| | 314 | | | United Spirits Ltd.2 | | | 2,661 | |
| | 1,470 | | | Universal Robina Corp. | | | 4,763 | |
| | 6,694 | | | Want Want China Holdings Ltd. | | | 5,441 | |
| | 300 | | | Wens Foodstuffs Group Co. Ltd., Class A | | | 1,566 | |
| | 100 | | | Wuliangye Yibin Co. Ltd., Class A | | | 1,717 | |
| | | | | | | | |
| | | | Total Food, Beverage & Tobacco | | | 514,496 | |
| | | | | | | | |
| | | | Health Care Equipment & Services—0.5% | |
| | 5,446 | | | Bangkok Dusit Medical Services PCL | | | 4,617 | |
| | 200 | | | Bumrungrad Hospital PCL | | | 1,102 | |
| | 19 | | | Celltrion Healthcare Co. Ltd.2 | | | 930 | |
| | 1,000 | | | Hartalega Holdings Bhd | | | 1,268 | |
| | 120 | | | Huadong Medicine Co. Ltd., Class A | | | 453 | |
| | 3,700 | | | IHH Healthcare Bhd | | | 5,193 | |
| | 1,000 | | | Jointown Pharmaceutical Group Co. Ltd., Class A | | | 1,800 | |
| | 1,654 | | | Life Healthcare Group Holdings Ltd. | | | 2,632 | |
| | 100 | | | Meinian Onehealth Healthcare Holdings Co. Ltd., Class A2 | | | 181 | |
| | 1,863 | | | Netcare Ltd. | | | 2,375 | |
| | 300 | | | Notre Dame Intermedica Participacoes SA | | | 3,156 | |
| | 2,512 | | | Shandong Weigao Group Medical Polymer Co. Ltd., Class H | | | 2,276 | |
| | 1,000 | | | Shanghai Pharmaceuticals Holding Co. Ltd., Class A | | | 2,643 | |
| | 6,733 | | | Shanghai Pharmaceuticals Holding Co. Ltd., Class H | | | 13,238 | |
| | 8,456 | | | Sinopharm Group Co. Ltd., Class H | | | 29,765 | |
| | 1,700 | | | Top Glove Corp. Bhd | | | 2,020 | |
| | | | | | | | |
| | | | Total Health Care Equipment & Services | | | 73,649 | |
| | | | | | | | |
| | | | Household & Personal Products—0.4% | |
| | 40 | | | Amorepacific Corp. | | | 5,699 | |
| | 164 | | | AMOREPACIFIC Group | | | 8,849 | |
| | 410 | | | Dabur India Ltd. | | | 2,379 | |
| | 287 | | | Godrej Consumer Products Ltd. | | | 2,757 | |
| | 645 | | | Hengan International Group Co. Ltd. | | | 4,743 | |
| | 401 | | | Hindustan Unilever Ltd. | | | 10,385 | |
| | 1,096 | | | Kimberly-Clark de Mexico SAB de CV, Class A2 | | | 2,036 | |
| | 8 | | | LG Household & Health Care Ltd. | | | 9,097 | |
| | 349 | | | Marico Ltd. | | | 1,873 | |
| | 400 | | | Natura Cosmeticos SA | | | 5,896 | |
| | 1,800 | | | Unilever Indonesia Tbk PT | | | 5,733 | |
| | | | | | | | |
| | | | Total Household & Personal Products | | | 59,447 | |
| | | | | | | | |
| | | | Insurance—3.8% | |
| | 33 | | | Bajaj Finserv Ltd. | | | 4,075 | |
| | 300 | | | BB Seguridade Participacoes SA | | | 2,535 | |
| | 79 | | | Bupa Arabia For Cooperative Insurance Co.2 | | | 2,029 | |
| | 9,673 | | | Cathay Financial Holding Co. Ltd.2 | | | 13,392 | |
| | 2,700 | | | China Life Insurance Co. Ltd., Class A | | | 11,133 | |
| | 14,274 | | | China Life Insurance Co. Ltd., Class H | | | 35,153 | |
| | 22,673 | | | China Life Insurance Co. Ltd./Taiwan | | | 18,140 | |
| | | | | | | | |
| Shares | | | | | Value | |
| | | | Common Stocks (continued) | | | |
| | | | Insurance (continued) | |
| | 1,100 | | | China Pacific Insurance Group Co. Ltd., Class A | | $ | 5,847 | |
| | 6,311 | | | China Pacific Insurance Group Co. Ltd., Class H | | | 24,678 | |
| | 24,000 | | | China Reinsurance Group Corp., Class H | | | 4,270 | |
| | 16,142 | | | China Taiping Insurance Holdings Co. Ltd.2 | | | 43,183 | |
| | 91 | | | Co. for Cooperative Insurance (The)2 | | | 1,699 | |
| | 461 | | | DB Insurance Co. Ltd. | | | 23,676 | |
| | 412 | | | Discovery Ltd. | | | 4,357 | |
| | 22,574 | | | Fubon Financial Holding Co. Ltd.2 | | | 33,324 | |
| | 9,540 | | | Hanwha Life Insurance Co. Ltd. | | | 27,059 | |
| | 1,300 | | | Hubei Biocause Pharmaceutical Co. Ltd., Class A | | | 1,228 | |
| | 886 | | | Hyundai Marine & Fire Insurance Co. Ltd. | | | 21,831 | |
| | 112 | | | ICICI Lombard General Insurance Co. Ltd.1 | | | 1,805 | |
| | 140 | | | IRB Brasil Resseguros SA | | | 3,598 | |
| | 694 | | | Liberty Holdings Ltd. | | | 5,200 | |
| | 3,534 | | | MMI Holdings Ltd. | | | 4,754 | |
| | 300 | | | New China Life Insurance Co. Ltd., Class A | | | 2,404 | |
| | 2,179 | | | New China Life Insurance Co. Ltd., Class H | | | 10,599 | |
| | 3,028 | | | Old Mutual Ltd. | | | 4,552 | |
| | 204 | | | Orange Life Insurance Ltd.1 | | | 5,592 | |
| | 61,425 | | | People’s Insurance Co. Group of China Ltd. (The), Class H | | | 23,980 | |
| | 27,485 | | | PICC Property & Casualty Co. Ltd., Class H | | | 29,657 | |
| | 900 | | | Ping An Insurance Group Co of China Ltd., Class A | | | 11,611 | |
| | 6,290 | | | Ping An Insurance Group Co. of China Ltd., Class H | | | 75,520 | |
| | 570 | | | Porto Seguro SA | | | 7,686 | |
| | 976 | | | Powszechny Zaklad Ubezpieczen SA | | | 11,427 | |
| | 563 | | | Qatar Insurance Co. SAQ | | | 5,421 | |
| | 721 | | | Rand Merchant Investment Holdings Ltd. | | | 1,737 | |
| | 135 | | | Samsung Fire & Marine Insurance Co. Ltd. | | | 31,334 | |
| | 408 | | | Samsung Life Insurance Co. Ltd. | | | 29,540 | |
| | 625 | | | Sanlam Ltd. | | | 3,464 | |
| | 64,000 | | | Shin Kong Financial Holding Co. Ltd. | | | 19,431 | |
| | 816 | | | Sul America SA | | | 7,988 | |
| | 200 | | | ZhongAn Online P&C Insurance Co. Ltd., Class H1,2,3 | | | 549 | |
| | | | | | | | |
| | | | Total Insurance | | | 575,458 | |
| | | | | | | | |
| | | | Materials—8.5% | |
| | 42 | | | Advanced Petrochemical Co. | | | 672 | |
| | 5,780 | | | Alrosa PJSC | | | 7,884 | |
| | 5,500 | | | Aluminum Corp of China Ltd., Class A2 | | | 3,139 | |
| | 32,126 | | | Aluminum Corp. of China Ltd., Class H2 | | | 11,391 | |
| | 2,131 | | | Ambuja Cements Ltd. | | | 6,571 | |
| | 4,030 | | | Angang Steel Co. Ltd., Class A | | | 2,224 | |
| | 7,800 | | | Angang Steel Co. Ltd., Class H | | | 3,554 | |
| | 181 | | | Anglo American Platinum Ltd. | | | 10,743 | |
| | 553 | | | AngloGold Ashanti Ltd. | | | 9,961 | |
| | 400 | | | Anhui Conch Cement Co. Ltd., Class A | | | 2,417 | |
| | 1,259 | | | Anhui Conch Cement Co. Ltd., Class H | | | 7,888 | |
| | 3,110 | | | Asia Cement Corp. | | | 4,761 | |
| | 240 | | | Asian Paints Ltd. | | | 4,722 | |
| | 6,900 | | | Baoshan Iron & Steel Co. Ltd., Class A | | | 6,530 | |
| | 21,400 | | | Barito Pacific Tbk PT | | | 4,862 | |
| | 2,800 | | | BBMG Corp., Class A | | | 1,533 | |
The accompanying notes are an integral part of these financial statements.
Invesco Emerging Markets Revenue ETF (REEM)(continued)
June 30, 2019
| | | | | | | | |
| Shares | | | | | Value | |
| | | | Common Stocks (continued) | | | |
| | | | Materials (continued) | |
| | 13,116 | | | BBMG Corp., Class H | | $ | 4,214 | |
| | 2,041 | | | Cementos Argos SA | | | 4,773 | |
| | 58,298 | | | Cemex SAB de CV | | | 24,549 | |
| | 32,997 | | | China Hongqiao Group Ltd. | | | 23,272 | |
| | 900 | | | China Molybdenum Co. Ltd., Class A | | | 519 | |
| | 3,000 | | | China Molybdenum Co. Ltd., Class H3 | | | 948 | |
| | 31,323 | | | China National Building Material Co. Ltd., Class H | | | 27,464 | |
| | 200 | | | China Northern Rare Earth Group High-Tech Co. Ltd., Class A | | | 374 | |
| | 17,198 | | | China Oriental Group Co. Ltd. | | | 10,060 | |
| | 9,597 | | | China Resources Cement Holdings Ltd. | | | 9,299 | |
| | 30,354 | | | China Steel Corp. | | | 24,383 | |
| | 13,437 | | | China Zhongwang Holdings Ltd. | | | 6,777 | |
| | 134 | | | Cia de Minas Buenaventura SAA4 | | | 2,234 | |
| | 2,738 | | | Cia Siderurgica Nacional SA | | | 11,937 | |
| | 3,515 | | | Empresas CMPC SA | | | 9,629 | |
| | 6,243 | | | Eregli Demir ve Celik Fabrikalari TAS | | | 8,495 | |
| | 6,758 | | | Formosa Chemicals & Fibre Corp. | | | 22,411 | |
| | 3,800 | | | Formosa Plastics Corp. | | | 14,009 | |
| | 1,121 | | | Gold Fields Ltd. | | | 6,101 | |
| | 1,420 | | | Grasim Industries Ltd. | | | 18,804 | |
| | 1,145 | | | Grupo Argos SA | | | 6,177 | |
| | 7,011 | | | Grupo Mexico SAB de CV, Series B | | | 18,601 | |
| | 760 | | | Hanwha Chemical Corp. | | | 14,941 | |
| | 840 | | | Hengli Petrochemical Co. Ltd., Class A | | | 1,487 | |
| | 1,000 | | | Hengyi Petrochemical Co. Ltd., Class A | | | 1,989 | |
| | 6,700 | | | Hesteel Co. Ltd., Class A2 | | | 2,917 | |
| | 10,318 | | | Hindalco Industries Ltd. | | | 30,949 | |
| | 885 | | | Hyundai Steel Co. | | | 32,038 | |
| | 14,745 | | | Indah Kiat Pulp & Paper Corp. Tbk PT | | | 9,785 | |
| | 1,400 | | | Indocement Tunggal Prakarsa Tbk PT | | | 1,982 | |
| | 12,826 | | | Indorama Ventures PCL | | | 19,657 | |
| | 683 | | | Industrias Penoles SAB de CV | | | 8,827 | |
| | 6,800 | | | Inner Mongolia BaoTou Steel Union Co. Ltd., Class A | | | 1,673 | |
| | 400 | | | Inner Mongolia Junzheng Energy & Chemical Industry Group Co. Ltd., Class A | | | 192 | |
| | 348 | | | Jastrzebska Spolka Weglowa SA2 | | | 4,405 | |
| | 1,600 | | | Jiangxi Copper Co. Ltd., Class A | | | 3,667 | |
| | 18,121 | | | Jiangxi Copper Co. Ltd., Class H | | | 24,123 | |
| | 200 | | | Jinduicheng Molybdenum Co. Ltd., Class A | | | 195 | |
| | 5,180 | | | JSW Steel Ltd. | | | 20,757 | |
| | 349 | | | KGHM Polska Miedz SA2 | | | 9,686 | |
| | 900 | | | Klabin SA | | | 3,839 | |
| | 31 | | | Korea Zinc Co. Ltd. | | | 12,780 | |
| | 190 | | | Kumba Iron Ore Ltd. | | | 6,729 | |
| | 134 | | | Kumho Petrochemical Co. Ltd. | | | 11,304 | |
| | 11,000 | | | Lee & Man Paper Manufacturing Ltd. | | | 7,702 | |
| | 136 | | | LG Chem Ltd. | | | 41,755 | |
| | 112 | | | Lotte Chemical Corp. | | | 24,492 | |
| | 3,300 | | | Maanshan Iron & Steel Co. Ltd., Class A | | | 1,638 | |
| | 9,999 | | | Maanshan Iron & Steel Co. Ltd., Class H | | | 3,968 | |
| | 20,700 | | | Magnitogorsk Iron & Steel Works PJSC | | | 14,763 | |
| | 5,730 | | | Mexichem SAB de CV | | | 12,017 | |
| | 94 | | | MMC Norilsk Nickel PJSC | | | 21,323 | |
| | 18,141 | | | MMG Ltd.2 | | | 6,339 | |
| | 154 | | | Mondi Ltd. | | | 3,462 | |
| | | | | | | | |
| Shares | | | | | Value | |
| | | | Common Stocks (continued) | | | |
| | | | Materials (continued) | |
| | 7,400 | | | Nan Ya Plastics Corp. | | $ | 18,727 | |
| | 610 | | | National Industrialization Co.2 | | | 2,755 | |
| | 16,016 | | | Nine Dragons Paper Holdings Ltd.2 | | | 14,207 | |
| | 8,320 | | | Novolipetsk Steel PJSC | | | 21,065 | |
| | 63 | | | OCI Co. Ltd. | | | 5,091 | |
| | 4,688 | | | Pabrik Kertas Tjiwi Kimia Tbk PT | | | 4,173 | |
| | 3,885 | | | Petronas Chemicals Group Bhd | | | 7,897 | |
| | 497 | | | PhosAgro PJSC | | | 6,521 | |
| | 101 | | | Pidilite Industries Ltd. | | | 1,777 | |
| | 271 | | | Polymetal International PLC | | | 3,449 | |
| | 66 | | | Polyus PJSC | | | 6,098 | |
| | 532 | | | POSCO | | | 112,652 | |
| | 47 | | | POSCO Chemical Co., Ltd. | | | 2,182 | |
| | 3,800 | | | Press Metal Aluminium Holdings Bhd | | | 4,046 | |
| | 14,000 | | | PTT Global Chemical PCL | | | 29,217 | |
| | 1,400 | | | Rongsheng Petro Chemical Co. Ltd., Class A | | | 2,458 | |
| | 2,364 | | | Sappi Ltd. | | | 9,202 | |
| | 779 | | | Sasol Ltd. | | | 19,347 | |
| | 44 | | | Saudi Arabian Fertilizer Co. | | | 995 | |
| | 234 | | | Saudi Arabian Mining Co.2 | | | 3,032 | |
| | 1,296 | | | Saudi Basic Industries Corp. | | | 39,465 | |
| | 14 | | | Saudi Cement Co. | | | 262 | |
| | 297 | | | Saudi Industrial Investment Group | | | 1,951 | |
| | 881 | | | Saudi Kayan Petrochemical Co.2 | | | 2,871 | |
| | 5,134 | | | Semen Indonesia Persero Tbk PT | | | 4,206 | |
| | 990 | | | Severstal PJSC | | | 16,757 | |
| | 300 | | | Shandong Gold Mining Co. Ltd., Class A2 | | | 1,798 | |
| | 800 | | | Shenzhen Zhongjin Lingnan Nonfemet Co. Ltd., Class A | | | 546 | |
| | 10 | | | Shree Cement Ltd. | | | 3,161 | |
| | 1,800 | | | Siam Cement PCL (The) | | | 27,704 | |
| | 2,300 | | | Sinopec Shanghai Petrochemical Co. Ltd., Class A | | | 1,728 | |
| | 17,323 | | | Sinopec Shanghai Petrochemical Co. Ltd., Class H | | | 6,874 | |
| | 361 | | | Southern Copper Corp. | | | 14,025 | |
| | 806 | | | Suzano SA | | | 6,908 | |
| | 5,186 | | | Taiwan Cement Corp. | | | 7,689 | |
| | 5,467 | | | Tata Steel Ltd. | | | 39,949 | |
| | 144 | | | Titan Cement Co. SA | | | 2,814 | |
| | 6,200 | | | Tongling Nonferrous Metals Group Co. Ltd., Class A | | | 2,221 | |
| | 500 | | | Transfar Zhilian Co. Ltd., Class A | | | 548 | |
| | 134 | | | UltraTech Cement Ltd. | | | 8,844 | |
| | 345 | | | UPL Ltd. | | | 4,685 | |
| | 5,219 | | | Vale SA | | | 70,564 | |
| | 10,432 | | | Vedanta Ltd. | | | 26,349 | |
| | 103 | | | Yanbu National Petrochemical Co. | | | 1,730 | |
| | 500 | | | Zhaojin Mining Industry Co. Ltd., Class H | | | 560 | |
| | 130 | | | Zhejiang Huayou Cobalt Co. Ltd., Class A | | | 403 | |
| | 200 | | | Zhejiang Longsheng Group Co. Ltd., Class A | | | 459 | |
| | 700 | | | Zhongjin Gold Corp Ltd., Class A | | | 1,047 | |
| | 4,300 | | | Zijin Mining Group Co. Ltd., Class A2 | | | 2,360 | |
| | 18,457 | | | Zijin Mining Group Co. Ltd., Class H | | | 7,489 | |
| | | | | | | | |
| | | | Total Materials | | | 1,286,121 | |
| | | | | | | | |
| | | | Media & Entertainment—1.2% | |
| | 44 | | | 58.Com, Inc.2,4 | | | 2,736 | |
| | 16 | | | Autohome, Inc.2,3,4 | | | 1,370 | |
The accompanying notes are an integral part of these financial statements.
Invesco Emerging Markets Revenue ETF (REEM)(continued)
June 30, 2019
| | | | | | | | |
| Shares | | | | | Value | |
| | | | Common Stocks (continued) | | | |
| | | | Media & Entertainment (continued) | |
| | 137 | | | Baidu, Inc.2,4 | | $ | 16,078 | |
| | 3 | | | CD Projekt SA | | | 173 | |
| | 272 | | | Cheil Worldwide, Inc. | | | 6,926 | |
| | 100 | | | China Film Co. Ltd., Class A | | | 228 | |
| | 200 | | | China Literature Ltd.1,2 | | | 942 | |
| | 100 | | | China South Publishing & Media Group Co. Ltd., Class A | | | 184 | |
| | 200 | | | Chinese Universe Publishing and Media Group Co. Ltd., Class A | | | 366 | |
| | 200 | | | CITIC Guoan Information Industry Co. Ltd., Class A | | | 117 | |
| | 782 | | | Cyfrowy Polsat SA | | | 6,241 | |
| | 4,362 | | | Grupo Televisa SAB, Series CPO | | | 7,368 | |
| | 137 | | | iQIYI, Inc.2,3,4 | | | 2,829 | |
| | 34 | | | Kakao Corp. | | | 3,872 | |
| | 126 | | | Megacable Holdings SAB de CV | | | 535 | |
| | 87 | | | Momo, Inc.4 | | | 3,115 | |
| | 660 | | | MultiChoice Group Ltd.2 | | | 6,270 | |
| | 94 | | | NAVER Corp. | | | 9,281 | |
| | 6 | | | NCSoft Corp. | | | 2,479 | |
| | 59 | | | NetEase Inc.4 | | | 15,090 | |
| | 31 | | | Netmarble Corp.1,2 | | | 3,034 | |
| | 4 | | | Pearl Abyss Corp.2 | | | 735 | |
| | 100 | | | Perfect World Co. Ltd., Class A | | | 376 | |
| | 200 | | | Shanghai Oriental Pearl Group Co. Ltd., Class A | | | 307 | |
| | 65 | | | SINA Corp.2 | | | 2,803 | |
| | 5,900 | | | Surya Citra Media Tbk PT | | | 672 | |
| | 1,734 | | | Tencent Holdings Ltd. | | | 78,260 | |
| | 346 | | | Tencent Music Entertainment Group2,3,4 | | | 5,187 | |
| | 26 | | | Weibo Corp.2,3,4 | | | 1,132 | |
| | 100 | | | Wuhu Sanqi Interactive Entertainment Network Technology Group Co. Ltd., Class A | | | 197 | |
| | 43 | | | YY, Inc.2,4 | | | 2,997 | |
| | 373 | | | Zee Entertainment Enterprises Ltd. | | | 1,830 | |
| | | | | | | | |
| | | | Total Media & Entertainment | | | 183,730 | |
| | | | | | | | |
| | | | Pharmaceuticals, Biotechnology & Life Sciences—0.7% | |
| | 838 | | | 3SBio, Inc.1,2,3 | | | 1,439 | |
| | 710 | | | Aspen Pharmacare Holdings Ltd. | | | 5,058 | |
| | 421 | | | Aurobindo Pharma Ltd. | | | 3,708 | |
| | 100 | | | Beijing Tongrentang Co. Ltd., Class A | | | 422 | |
| | 5 | | | Celltrion Pharm, Inc.2 | | | 208 | |
| | 9 | | | Celltrion, Inc.2 | | | 1,602 | |
| | 2,000 | | | China Medical System Holdings Ltd. | | | 1,833 | |
| | 32,097 | | | China Resources Pharmaceutical Group Ltd.1 | | | 36,195 | |
| | 100 | | | China Resources Sanjiu Medical & Pharmaceutical Co. Ltd., Class A2 | | | 427 | |
| | 5,200 | | | China Traditional Chinese Medicine Holdings Co. Ltd. | | | 2,529 | |
| | 496 | | | Cipla Ltd. | | | 3,977 | |
| | 1,824 | | | CSPC Pharmaceutical Group Ltd. | | | 2,942 | |
| | 51 | | | Divi’s Laboratories Ltd. | | | 1,180 | |
| | 94 | | | Dr Reddy’s Laboratories Ltd. | | | 3,473 | |
| | 282 | | | Glenmark Pharmaceuticals Ltd. | | | 1,811 | |
| | 100 | | | Guangzhou Baiyunshan Pharmaceutical Holdings Co. Ltd., Class A | | | 597 | |
| | 5 | | | Hanmi Pharm Co. Ltd. | | | 1,749 | |
| | 19 | | | Hanmi Science Co. Ltd. | | | 1,122 | |
| | | | | | | | |
| Shares | | | | | Value | |
| | | | Common Stocks (continued) | | | |
| | | | Pharmaceuticals, Biotechnology & Life
Sciences (continued) | |
| | 14 | | | Hutchison China MediTech Ltd.2,4 | | $ | 308 | |
| | 240 | | | Hypera SA | | | 1,878 | |
| | 28,891 | | | Kalbe Farma Tbk PT | | | 2,986 | |
| | 355 | | | Lupin Ltd. | | | 3,882 | |
| | 1,500 | | | Luye Pharma Group Ltd.1 | | | 1,087 | |
| | 1 | | | Medy-Tox, Inc. | | | 390 | |
| | 104 | | | Piramal Enterprises Ltd. | | | 2,933 | |
| | 155 | | | Richter Gedeon Nyrt | | | 2,863 | |
| | 3 | | | Samsung Biologics Co. Ltd.1,2 | | | 831 | |
| | 100 | | | Shandong Buchang Pharmaceuticals Co. Ltd., Class A | | | 375 | |
| | 100 | | | Shanghai Fosun Pharmaceutical Group Co. Ltd., Class A | | | 368 | |
| | 500 | | | Shanghai Fosun Pharmaceutical Group Co. Ltd., Class H | | | 1,514 | |
| | 100 | | | Sichuan Kelun Pharmaceutical Co. Ltd., Class A | | | 433 | |
| | 3,000 | | | Sihuan Pharmaceutical Holdings Group Ltd. | | | 676 | |
| | 5,341 | | | Sino Biopharmaceutical Ltd. | | | 5,462 | |
| | 2,000 | | | SSY Group Ltd. | | | 1,807 | |
| | 1,187 | | | Sun Pharmaceutical Industries Ltd. | | | 6,895 | |
| | 200 | | | Tasly Pharmaceutical Group Co. Ltd., Class A | | | 482 | |
| | 13 | | | Yuhan Corp. | | | 2,753 | |
| | 100 | | | Yunnan Baiyao Group Co. Ltd., Class A | | | 1,215 | |
| | | | | | | | |
| | | | Total Pharmaceuticals, Biotechnology & Life Sciences | | | 109,410 | |
| | | | | | | | |
| | | | Real Estate—3.9% | |
| | 11,581 | | | Agile Group Holdings Ltd. | | | 15,506 | |
| | 6,586 | | | Aldar Properties PJSC | | | 3,389 | |
| | 5,978 | | | Ayala Land, Inc. | | | 5,927 | |
| | 104 | | | Barwa Real Estate Co. | | | 977 | |
| | 200 | | | BR Malls Participacoes SA | | | 748 | |
| | 9,900 | | | Bumi Serpong Damai Tbk PT2 | | | 1,076 | |
| | 800 | | | Central Pattana PCL | | | 1,956 | |
| | 7,000 | | | China Aoyuan Group Ltd. | | | 9,838 | |
| | 37,783 | | | China Evergrande Group3 | | | 105,913 | |
| | 400 | | | China Fortune Land Development Co. Ltd., Class A2 | | | 1,897 | |
| | 16,682 | | | China Jinmao Holdings Group Ltd. | | | 10,143 | |
| | 700 | | | China Merchants Shekou Industrial Zone Holdings Co. Ltd., Class A2 | | | 2,130 | |
| | 10,189 | | | China Overseas Land & Investment Ltd. | | | 37,561 | |
| | 7,535 | | | China Resources Land Ltd. | | | 33,178 | |
| | 1,700 | | | China Vanke Co. Ltd., Class A | | | 6,883 | |
| | 2,430 | | | China Vanke Co. Ltd., Class H | | | 9,113 | |
| | 16,000 | | | CIFI Holdings Group Co. Ltd. | | | 10,547 | |
| | 64,144 | | | Country Garden Holdings Co. Ltd. | | | 97,540 | |
| | 584 | | | Dar Al Arkan Real Estate Development Co.2 | | | 1,828 | |
| | 7,459 | | | Emaar Development PJSC | | | 8,143 | |
| | 95 | | | Emaar Economic City2 | | | 252 | |
| | 4,321 | | | Emaar Malls PJSC | | | 2,388 | |
| | 10,298 | | | Emaar Properties PJSC | | | 12,392 | |
| | 1,200 | | | Fibra Uno Administracion SA de CV | | | 1,588 | |
| | 500 | | | Financial Street Holdings Co. Ltd., Class A | | | 571 | |
| | 175 | | | Fortress REIT Ltd., Class A | | | 266 | |
| | 12,146 | | | Future Land Development Holdings Ltd. | | | 15,982 | |
| | 700 | | | Gemdale Corp., Class A | | | 1,216 | |
| | 8,400 | | | Greendland Holdings Corp. Ltd., Class A | | | 8,353 | |
The accompanying notes are an integral part of these financial statements.
Invesco Emerging Markets Revenue ETF (REEM)(continued)
June 30, 2019
| | | | | | | | |
| Shares | | | | | Value | |
| | | | Common Stocks (continued) | | | |
| | | | Real Estate (continued) | |
| | 797 | | | Growthpoint Properties Ltd. | | $ | 1,372 | |
| | 3,374 | | | Guangzhou R&F Properties Co. Ltd., Class H | | | 6,487 | |
| | 2,000 | | | Highwealth Construction Corp. | | | 3,184 | |
| | 1,100 | | | Jinke Properties Group Co. Ltd., Class A | | | 966 | |
| | 22,797 | | | Kaisa Group Holdings Ltd.2 | | | 11,264 | |
| | 2,000 | | | KWG Group Holdings Ltd.2 | | | 2,030 | |
| | 5,694 | | | Land & Houses PCL | | | 2,061 | |
| | 7,602 | | | Logan Property Holdings Co. Ltd. | | | 12,299 | |
| | 8,471 | | | Longfor Group Holdings Ltd | | | 31,932 | |
| | 19,100 | | | Megaworld Corp.2 | | | 2,274 | |
| | 100 | | | Multiplan Empreendimentos Imobiliarios SA | | | 724 | |
| | 114 | | | NEPI Rockcastle PLC | | | 1,046 | |
| | 300 | | | Oceanwide Holdings Co. Ltd., Class A | | | 244 | |
| | 19,800 | | | Pakuwon Jati Tbk PT | | | 1,023 | |
| | 2,500 | | | Poly Developments and Holdings Group Co. Ltd., Class A | | | 4,644 | |
| | 1,597 | | | Redefine Properties Ltd. | | | 1,024 | |
| | 1,000 | | | RiseSun Real Estate Development Co. Ltd., Class A | | | 1,367 | |
| | 2,080 | | | Robinsons Land Corp. | | | 1,070 | |
| | 1,000 | | | Ruentex Development Co. Ltd. | | | 1,429 | |
| | 200 | | | Seazen Holdings Co. Ltd., Class A | | | 1,159 | |
| | 720 | | | Shanghai Lujiazui Finance & Trade Zone Development Co. Ltd., Class B | | | 871 | |
| | 10,000 | | | Shenzhen Investment Ltd. | | | 3,686 | |
| | 7,535 | | | Shimao Property Holdings Ltd. | | | 22,955 | |
| | 28,596 | | | Shui On Land Ltd. | | | 6,625 | |
| | 4,400 | | | Sime Darby Property Bhd | | | 1,097 | |
| | 25,705 | | | Sino-Ocean Group Holding Ltd. | | | 10,924 | |
| | 4,800 | | | SM Prime Holdings, Inc. | | | 3,476 | |
| | 1,500 | | | SOHO China Ltd. | | | 530 | |
| | 3,000 | | | SP Setia Bhd Group | | | 1,568 | |
| | 6,974 | | | Sunac China Holdings Ltd. | | | 34,279 | |
| | 700 | | | Xinhu Zhongbao Co. Ltd., Class A | | | 320 | |
| | 37,194 | | | Yuexiu Property Co. Ltd. | | | 8,427 | |
| | 12,998 | | | Yuzhou Properties Co. Ltd. | | | 6,106 | |
| | 200 | | | Zhejiang China Commodities City Group Co. Ltd., Class A | | | 120 | |
| | | | | | | | |
| | | | Total Real Estate | | | 595,884 | |
| | | | | | | | |
| | | | Retailing—3.2% | |
| | 505 | | | Alibaba Group Holding Ltd.2,4 | | | 85,572 | |
| | 360 | | | B2W Cia Digital2 | | | 3,073 | |
| | 25 | | | Baozun, Inc.2,3,4 | | | 1,247 | |
| | 6,600 | | | China Grand Automotive Services Group Co. Ltd., Class A2 | | | 4,286 | |
| | 36 | | | CJ ENM Co. Ltd. | | | 5,519 | |
| | 209 | | | Ctrip.Com International Ltd.2,4 | | | 7,714 | |
| | 300 | | | El Puerto de Liverpool SAB de CV, Series C1 | | | 1,669 | |
| | 308 | | | Foschini Group Ltd. (The) | | | 3,938 | |
| | 167,701 | | | GOME Retail Holdings Ltd.2 | | | 18,031 | |
| | 4,000 | | | HengTen Networks Group Ltd.2 | | | 95 | |
| | 6,900 | | | Home Product Center PCL | | | 3,937 | |
| | 700 | | | Hotai Motor Co. Ltd. | | | 11,449 | |
| | 90 | | | Hotel Shilla Co. Ltd. | | | 7,561 | |
| | 40 | | | Hyundai Department Store Co. Ltd. | | | 2,865 | |
| | 36 | | | Jarir Marketing Co. | | | 1,586 | |
| | 3,272 | | | JD.com, Inc.2,4 | | | 99,109 | |
| | 91 | | | JUMBO SA | | | 1,762 | |
| | | | | | | | |
| Shares | | | | | Value | |
| | | | Common Stocks (continued) | | | |
| | | | Retailing (continued) | |
| | 200 | | | Liaoning Cheng Da Co. Ltd., Class A | | $ | 423 | |
| | 362 | | | Lojas Renner SA | | | 4,454 | |
| | 192 | | | Lotte Shopping Co. Ltd. | | | 26,689 | |
| | 140 | | | Magazine Luiza SA | | | 7,712 | |
| | 1,860 | | | Meituan Dianping, Class B2 | | | 16,309 | |
| | 180 | | | Mr Price Group Ltd. | | | 2,534 | |
| | 45 | | | Naspers Ltd., Class N | | | 10,912 | |
| | 7,880 | | | Petrobras Distribuidora SA | | | 51,400 | |
| | 92 | | | Pinduoduo, Inc.2,4 | | | 1,898 | |
| | 900 | | | Robinson PCL | | | 1,651 | |
| | 3,569 | | | S.A.C.I. Falabella | | | 23,260 | |
| | 31 | | | Shinsegae, Inc. | | | 8,081 | |
| | 3,800 | | | Suning.com Co. Ltd., Class A | | | 6,352 | |
| | 442 | | | Truworths International Ltd. | | | 2,194 | |
| | 2,267 | | | Vipshop Holdings Ltd.2,4 | | | 19,564 | |
| | 2,803 | | | Woolworths Holdings Ltd. | | | 9,716 | |
| | 10,670 | | | Zhongsheng Group Holdings Ltd. | | | 29,705 | |
| | | | | | | | |
| | | | Total Retailing | | | 482,267 | |
| | | | | | | | |
| | | | Semiconductors & Semiconductor Equipment—1.3% | |
| | 9,587 | | | ASE Technology Holding Co. Ltd.2 | | | 18,983 | |
| | 384 | | | Globalwafers Co. Ltd. | | | 3,888 | |
| | 1,000 | | | Hua Hong Semiconductor Ltd.1 | | | 1,935 | |
| | 200 | | | LONGi Green Energy Technology Co. Ltd., Class A | | | 673 | |
| | 1,196 | | | MediaTek, Inc. | | | 12,091 | |
| | 2,380 | | | Nanya Technology Corp.2 | | | 4,943 | |
| | 499 | | | Novatek Microelectronics Corp. | | | 2,779 | |
| | 265 | | | Phison Electronics Corp. | | | 2,415 | |
| | 1,579 | | | Powertech Technology, Inc. | | | 3,864 | |
| | 384 | | | Realtek Semiconductor Corp. | | | 2,825 | |
| | 100 | | | Sanan Optoelectronics Co. Ltd., Class A2 | | | 164 | |
| | 5,446 | | | Semiconductor Manufacturing International Corp.2 | | | 6,065 | |
| | 1,049 | | | SK Hynix, Inc. | | | 63,141 | |
| | 7,286 | | | Taiwan Semiconductor Manufacturing Co. Ltd. | | | 56,065 | |
| | 21,598 | | | United Microelectronics Corp. | | | 9,701 | |
| | 1,000 | | | Vanguard International Semiconductor Corp. | | | 2,099 | |
| | 173 | | | Win Semiconductors Corp. | | | 1,108 | |
| | 6,000 | | | Winbond Electronics Corp. | | | 2,936 | |
| | 2,000 | | | Xinyi Solar Holdings Ltd. | | | 986 | |
| | | | | | | | |
| | | | Total Semiconductors & Semiconductor Equipment | | | 196,661 | |
| | | | | | | | |
| | | | Software & Services—0.8% | |
| | 100 | | | 360 Security Technology, Inc., Class A2 | | | 311 | |
| | 200 | | | Aisino Corp, Class A | | | 671 | |
| | 2,930 | | | Cielo SA | | | 5,137 | |
| | 200 | | | DHC Software Co. Ltd., Class A | | | 204 | |
| | 21 | | | GDS Holdings Ltd.2,3,4 | | | 789 | |
| | 8 | | | Globant SA2 | | | 808 | |
| | 946 | | | HCL Technologies Ltd. | | | 14,591 | |
| | 2,001 | | | Infosys Ltd. | | | 21,220 | |
| | 1,000 | | | Kingdee International Software Group Co. Ltd. | | | 1,082 | |
| | 597 | | | Kingsoft Corp. Ltd.2 | | | 1,291 | |
| | 87 | | | Samsung SDS Co. Ltd. | | | 16,200 | |
| | 130 | | | Shanghai 2345 Network Holding Group Co. Ltd., Class A | | | 74 | |
The accompanying notes are an integral part of these financial statements.
Invesco Emerging Markets Revenue ETF (REEM)(continued)
June 30, 2019
| | | | | | | | |
| Shares | | | | | Value | |
| | | | Common Stocks (continued) | | | |
| | | | Software & Services (continued) | |
| | 1,146 | | | Tata Consultancy Services Ltd. | | $ | 36,976 | |
| | 757 | | | Tech Mahindra Ltd. | | | 7,749 | |
| | 100 | | | Wangsu Science & Technology Co. Ltd., Class A | | | 157 | |
| | 3,556 | | | Wipro Ltd. | | | 14,450 | |
| | 100 | | | Yonyou Network Technology Co. Ltd., Class A | | | 391 | |
| | | | | | | | |
| | | | Total Software & Services | | | 122,101 | |
| | | | | | | | |
| | | | Technology Hardware & Equipment—9.6% | |
| | 830 | | | AAC Technologies Holdings, Inc. | | | 4,712 | |
| | 23,520 | | | Acer, Inc.2 | | | 14,577 | |
| | 340 | | | Advantech Co. Ltd. | | | 2,890 | |
| | 2,894 | | | Asustek Computer, Inc. | | | 20,778 | |
| | 55,252 | | | AU Optronics Corp. | | | 16,544 | |
| | 5,000 | | | BOE Technology Group Co. Ltd., Class A | | | 2,504 | |
| | 6,239 | | | BYD Electronic International Co. Ltd. | | | 8,912 | |
| | 732 | | | Catcher Technology Co. Ltd. | | | 5,244 | |
| | 2,000 | | | Chicony Electronics Co. Ltd. | | | 4,920 | |
| | 3,000 | | | China Railway Signal & Communication Corp. Ltd., Class H1 | | | 2,181 | |
| | 91,930 | | | Compal Electronics, Inc. | | | 60,232 | |
| | 2,600 | | | Delta Electronics, Inc. | | | 13,184 | |
| | 400 | | | Focus Media Information Technology Co. Ltd., Class A2 | | | 308 | |
| | 5,400 | | | Foxconn Industrial Internet Co., Ltd., Class A | | | 9,474 | |
| | 3,600 | | | Foxconn Technology Co. Ltd. | | | 7,314 | |
| | 500 | | | GoerTek, Inc., Class A | | | 647 | |
| | 100 | | | Guangzhou Haige Communications Group, Inc. Co., Class A | | | 139 | |
| | 300 | | | Hangzhou Hikvision Digital Technology Co. Ltd., Class A | | | 1,205 | |
| | 300 | | | Hengtong Optic-electric Co. Ltd., Class A | | | 732 | |
| | 122,009 | | | Hon Hai Precision Industry Co. Ltd. | | | 304,045 | |
| | 61,313 | | | Innolux Corp. | | | 14,470 | |
| | 37,610 | | | Inventec Corp. | | | 29,909 | |
| | 3,412 | | | Kingboard Holdings Ltd. | | | 9,499 | |
| | 4,600 | | | Kingboard Laminates Holdings Ltd. | | | 4,216 | |
| | 20 | | | Largan Precision Co. Ltd. | | | 2,482 | |
| | 20,578 | | | Legend Holdings Corp., Class H1 | | | 48,413 | |
| | 103,952 | | | Lenovo Group Ltd. | | | 80,500 | |
| | 600 | | | Lens Technology Co. Ltd., Class A | | | 609 | |
| | 2,490 | | | LG Display Co. Ltd.2 | | | 38,493 | |
| | 132 | | | LG Innotek Co. Ltd. | | | 12,461 | |
| | 8,433 | | | Lite-On Technology Corp. | | | 12,354 | |
| | 300 | | | Luxshare Precision Industry Co. Ltd., Class A | | | 1,083 | |
| | 2,000 | | | Meitu, Inc.1,2,3 | | | 645 | |
| | 2,784 | | | Micro-Star International Co. Ltd. | | | 7,888 | |
| | 100 | | | Ninestar Corp., Class A | | | 329 | |
| | 900 | | | OFILM Group Co. Ltd., Class A | | | 1,027 | |
| | 46,864 | | | Pegatron Corp. | | | 81,025 | |
| | 31,210 | | | Quanta Computer, Inc. | | | 60,693 | |
| | 153 | | | Samsung Electro-Mechanics Co. Ltd. | | | 12,959 | |
| | 9,120 | | | Samsung Electronics Co. Ltd. | | | 371,229 | |
| | 80 | | | Samsung SDI Co. Ltd. | | | 16,386 | |
| | 588 | | | Sunny Optical Technology Group Co. Ltd. | | | 6,074 | |
| | 200 | | | Suzhou Dongshan Precision Manufacturing Co. Ltd., Class A | | | 424 | |
| | 18,599 | | | Synnex Technology International Corp. | | | 23,354 | |
| | | | | | | | |
| Shares | | | | | Value | |
| | | | Common Stocks (continued) | | | |
| | | | Technology Hardware & Equipment (continued) | |
| | 400 | | | Tianma Microelectronics Co. Ltd., Class A | | $ | 783 | |
| | 500 | | | Tunghsu Optoelectronic Technology Co. Ltd., Class A | | | 374 | |
| | 300 | | | Unisplendour Corp Ltd., Class A | | | 1,190 | |
| | 502 | | | Walsin Technology Corp. | | | 2,651 | |
| | 68,660 | | | Wistron Corp. | | | 53,496 | |
| | 24,644 | | | WPG Holdings Ltd. | | | 32,016 | |
| | 25,159 | | | Xiaomi Corp., Class B1,2 | | | 32,204 | |
| | 555 | | | Yageo Corp. | | | 4,717 | |
| | 300 | | | Zhejiang Dahua Technology Co. Ltd., Class A | | | 634 | |
| | 2,175 | | | Zhen Ding Technology Holding Ltd. | | | 6,961 | |
| | 400 | | | ZTE Corp., Class A2 | | | 1,895 | |
| | 1,561 | | | ZTE Corp., Class H2 | | | 4,506 | |
| | | | | | | | |
| | | | Total Technology Hardware & Equipment | | | 1,458,491 | |
| | | | | | | | |
| | | | Telecommunication Services—4.6% | |
| | 1,563 | | | Advanced Info Service PCL | | | 11,111 | |
| | 89,532 | | | America Movil SAB de CV, Series L | | | 65,104 | |
| | 9,565 | | | Axiata Group Bhd | | | 11,527 | |
| | 5,162 | | | Bharti Airtel Ltd. | | | 25,923 | |
| | 448 | | | Bharti Infratel Ltd. | | | 1,733 | |
| | 20,868 | | | China Mobile Ltd. | | | 190,049 | |
| | 32,821 | | | China Telecom Corp. Ltd., Class H | | | 16,510 | |
| | 19,998 | | | China Tower Corp. Ltd., Class H1 | | | 5,247 | |
| | 69,070 | | | China Unicom Hong Kong Ltd. | | | 75,767 | |
| | 8,700 | | | China United Network Communications Ltd., Class A | | | 7,803 | |
| | 3,000 | | | Chunghwa Telecom Co. Ltd. | | | 10,915 | |
| | 2,500 | | | DiGi.Com Bhd | | | 3,055 | |
| | 5,907 | | | Emirates Telecommunications Group Co. PJSC | | | 26,824 | |
| | 502 | | | Empresa Nacional de Telecomunicaciones SA2 | | | 5,102 | |
| | 493 | | | Etihad Etisalat Co.2 | | | 3,158 | |
| | 2,000 | | | Far EasTone Telecommunications Co. Ltd. | | | 5,042 | |
| | 137 | | | Globe Telecom, Inc. | | | 6,048 | |
| | 601 | | | Hellenic Telecommunications Organization SA2 | | | 8,897 | |
| | 300 | | | Intouch Holdings PCL | | | 614 | |
| | 1,400 | | | LG Uplus Corp. | | | 17,581 | |
| | 3,100 | | | Maxis Bhd | | | 4,178 | |
| | 1,845 | | | Mobile TeleSystems PJSC4 | | | 17,177 | |
| | 2,433 | | | MTN Group Ltd. | | | 18,418 | |
| | 844 | | | Ooredoo Q.P.S.C. | | | 15,161 | |
| | 4,224 | | | Orange Polska SA2 | | | 7,572 | |
| | 239 | | | PLDT, Inc. | | | 6,018 | |
| | 429 | | | Saudi Telecom Co. | | | 11,920 | |
| | 131 | | | SK Telecom Co. Ltd. | | | 29,385 | |
| | 2,000 | | | Taiwan Mobile Co. Ltd. | | | 7,888 | |
| | 126 | | | Telecom Argentina SA4 | | | 2,226 | |
| | 7,562 | | | Telekom Malaysia Bhd | | | 7,320 | |
| | 64,299 | | | Telekomunikasi Indonesia Persero Tbk PT | | | 18,843 | |
| | 852 | | | Telkom SA SOC Ltd. | | | 5,570 | |
| | 2,855 | | | TIM Participacoes SA | | | 8,663 | |
| | 2,700 | | | Total Access Communication PCL | | | 4,666 | |
| | 57,441 | | | True Corp. PCL | | | 10,957 | |
| | 3,351 | | | Turkcell Iletisim Hizmetleri AS | | | 7,416 | |
| | 1,309 | | | Vodacom Group Ltd. | | | 11,109 | |
| | 45,416 | | | Vodafone Idea Ltd2 | | | 7,994 | |
| | | | | | | | |
| | | | Total Telecommunication Services | | | 700,491 | |
| | | | | | | | |
The accompanying notes are an integral part of these financial statements.
Invesco Emerging Markets Revenue ETF (REEM)(continued)
June 30, 2019
| | | | | | | | |
| Shares | | | | | Value | |
| | | | Common Stocks (continued) | | | |
| | | | Transportation—1.8% | |
| | 516 | | | Adani Ports & Special Economic Zone Ltd. | | $ | 3,066 | |
| | 1,900 | | | Air China Ltd., Class A | | | 2,647 | |
| | 11,575 | | | Air China Ltd., Class H | | | 11,675 | |
| | 7,373 | | | AirAsia Group Bhd | | | 4,871 | |
| | 1,600 | | | Airports of Thailand PCL | | | 3,835 | |
| | 2,500 | | | Bangkok Expressway & Metro PCL | | | 929 | |
| | 2,000 | | | Beijing Capital International Airport Co. Ltd., Class H | | | 1,754 | |
| | 5,922 | | | BTS Group Holdings PCL | | | 2,317 | |
| | 1,500 | | | CCR SA | | | 5,346 | |
| | 32,259 | | | China Airlines Ltd. | | | 10,220 | |
| | 2,300 | | | China Eastern Airlines Corp. Ltd., Class A | | | 2,100 | |
| | 14,798 | | | China Eastern Airlines Corp. Ltd., Class H2 | | | 8,732 | |
| | 1,192 | | | China Merchants Port Holdings Co. Ltd. | | | 2,026 | |
| | 2,400 | | | China Southern Airlines Co. Ltd., Class A | | | 2,698 | |
| | 15,139 | | | China Southern Airlines Co. Ltd., Class H | | | 10,542 | |
| | 136 | | | CJ Logistics Corp.2 | | | 15,842 | |
| | 268 | | | Container Corp. of India Ltd. | | | 2,213 | |
| | 600 | | | COSCO SHIPPING Development Co. Ltd., Class A2 | | | 238 | |
| | 2,000 | | | COSCO SHIPPING Energy Transportation Co. Ltd., Class H | | | 1,183 | |
| | 3,800 | | | COSCO SHIPPING Holdings Co. Ltd., Class A2 | | | 2,777 | |
| | 19,999 | | | COSCO SHIPPING Holdings Co. Ltd., Class H2 | | | 7,808 | |
| | 2,000 | | | COSCO SHIPPING Ports Ltd. | | | 1,974 | |
| | 1,500 | | | Daqin Railway Co. Ltd., Class A | | | 1,767 | |
| | 576 | | | DP World PLC | | | 9,158 | |
| | 22,459 | | | Eva Airways Corp. | | | 10,810 | |
| | 24,665 | | | Evergreen Marine Corp. Taiwan Ltd. | | | 9,887 | |
| | 100 | | | Grupo Aeroportuario del Pacifico SAB de CV, Class B | | | 1,040 | |
| | 80 | | | Grupo Aeroportuario del Sureste SAB de CV, Class B | | | 1,295 | |
| | 900 | | | Guangshen Railway Co. Ltd., Class A | | | 423 | |
| | 196 | | | Hyundai Glovis Co. Ltd. | | | 27,329 | |
| | 318 | | | InterGlobe Aviation Ltd.1 | | | 7,177 | |
| | 960 | | | International Container Terminal Services, Inc. | | | 2,743 | |
| | 12,824 | | | Jasa Marga Persero Tbk PT | | | 5,197 | |
| | 708 | | | Korean Air Lines Co. Ltd. | | | 17,751 | |
| | 1,845 | | | Latam Airlines Group SA | | | 17,324 | |
| | 400 | | | Localiza Rent a Car SA | | | 4,277 | |
| | 1,200 | | | Malaysia Airports Holdings Bhd | | | 2,477 | |
| | 2,322 | | | MISC Bhd | | | 4,017 | |
| | 1,064 | | | Pan Ocean Co. Ltd.2 | | | 4,276 | |
| | 95 | | | Promotora y Operadora de Infraestructura SAB de CV | | | 943 | |
| | 700 | | | Rumo SA2 | | | 3,786 | |
| | 500 | | | SF Holding Co. Ltd., Class A | | | 2,472 | |
| | 900 | | | Shanghai International Port Group Co. Ltd., Class A | | | 894 | |
| | 1,400 | | | Shenzhen International Holdings Ltd. | | | 2,778 | |
| | 18,199 | | | Sinotrans Ltd., Class H | | | 6,616 | |
| | 100 | | | Spring Airlines Co. Ltd., Class A | | | 655 | |
| | 2,000 | | | Taiwan High Speed Rail Corp. | | | 2,943 | |
| | 495 | | | TAV Havalimanlari Holding AS | | | 2,311 | |
| | 7,952 | | | Turk Hava Yollari AO2 | | | 17,722 | |
| | 800 | | | Westports Holdings Bhd | | | 763 | |
| | | | | | | | |
| Shares | | | | | Value | |
| | | | Common Stocks (continued) | | | |
| | | | Transportation (continued) | |
| | 202 | | | ZTO Express Cayman, Inc.4 | | $ | 3,862 | |
| | | | | | | | |
| | | | Total Transportation | | | 277,486 | |
| | | | | | | | |
| | | | Utilities—4.0% | |
| | 6,800 | | | Aboitiz Power Corp. | | | 4,619 | |
| | 2,274 | | | Aguas Andinas SA, Class A | | | 1,340 | |
| | 3,014 | | | Beijing Enterprises Holdings Ltd. | | | 15,316 | |
| | 12,000 | | | Beijing Enterprises Water Group Ltd.2 | | | 7,127 | |
| | 1,136 | | | Centrais Eletricas Brasileiras SA | | | 10,448 | |
| | 607 | | | CEZ AS2 | | | 14,670 | |
| | 12,000 | | | CGN Power Co. Ltd., Class H1 | | | 3,302 | |
| | 4,388 | | | China Gas Holdings Ltd. | | | 16,316 | |
| | 4,000 | | | China Longyuan Power Group Corp. Ltd., Class H | | | 2,565 | |
| | 1,100 | | | China National Nuclear Power Co. Ltd., Class A | | | 890 | |
| | 23,996 | | | China Power International Development Ltd. | | | 5,867 | |
| | 2,547 | | | China Resources Gas Group Ltd. | | | 12,633 | |
| | 13,207 | | | China Resources Power Holdings Co. Ltd. | | | 19,272 | |
| | 600 | | | China Yangtze Power Co. Ltd., Class A2 | | | 1,564 | |
| | 748 | | | Cia de Saneamento Basico do Estado de Sao Paulo | | | 9,225 | |
| | 13,958 | | | Colbun SA | | | 2,878 | |
| | 33,597 | | | Datang International Power Generation Co. Ltd., Class H | | | 8,429 | |
| | 200 | | | Electricity Generating PCL | | | 2,120 | |
| | 137,546 | | | Enel Americas SA | | | 24,211 | |
| | 72,701 | | | Enel Chile SA | | | 6,896 | |
| | 100 | | | Energisa SA | | | 1,202 | |
| | 400 | | | Energy Absolute PCL | | | 727 | |
| | 409 | | | Engie Brasil Energia SA | | | 4,639 | |
| | 1,820 | | | ENN Energy Holdings Ltd. | | | 17,705 | |
| | 269 | | | Equatorial Energia SA | | | 6,443 | |
| | 3,886 | | | GAIL India Ltd. | | | 17,562 | |
| | 4,600 | | | GD Power Development Co. Ltd., Class A | | | 1,701 | |
| | 2,000 | | | Guangdong Investment Ltd. | | | 3,958 | |
| | 338 | | | Gulf Energy Development PCL | | | 1,356 | |
| | 3,300 | | | Huadian Power International Corp. Ltd., Class A | | | 1,811 | |
| | 10,398 | | | Huadian Power International Corp. Ltd., Class H | | | 4,113 | |
| | 3,300 | | | Huaneng Power International, Inc., Class A | | | 2,993 | |
| | 22,121 | | | Huaneng Power International, Inc., Class H | | | 13,025 | |
| | 6,000 | | | Huaneng Renewables Corp. Ltd., Class H2 | | | 1,651 | |
| | 500 | | | Hubei Energy Group Co. Ltd., Class A | | | 316 | |
| | 540 | | | Infraestructura Energetica Nova SAB de CV | | | 2,119 | |
| | 593,000 | | | Inter RAO UES PJSC | | | 42,579 | |
| | 811 | | | Interconexion Electrica SA ESP | | | 4,517 | |
| | 4,154 | | | Korea Electric Power Corp.2 | | | 91,919 | |
| | 1,160 | | | Korea Gas Corp. | | | 42,396 | |
| | 28,731 | | | Kunlun Energy Co. Ltd.3 | | | 25,044 | |
| | 1,504 | | | Manila Electric Co. | | | 11,360 | |
| | 13,562 | | | NTPC Ltd. | | | 27,771 | |
| | 119 | | | Pampa Energia SA2,4 | | | 4,126 | |
| | 51,354 | | | Perusahaan Gas Negara Tbk PT | | | 7,670 | |
| | 600 | | | Petronas Gas Bhd | | | 2,521 | |
| | 4,864 | | | PGE Polska Grupa Energetyczna SA2 | | | 12,511 | |
| | 3,185 | | | Power Grid Corp. of India Ltd. | | | 9,547 | |
| | 270 | | | Qatar Electricity & Water Co. QSC | | | 1,235 | |
The accompanying notes are an integral part of these financial statements.
Invesco Emerging Markets Revenue ETF (REEM)(continued)
June 30, 2019
| | | | | | | | |
| Shares | | | | | Value | |
| | | | Common Stocks (continued) | | | |
| | | | Utilities (continued) | |
| | 1,100 | | | Ratch Group PCL | | $ | 2,394 | |
| | 3,415 | | | Saudi Electricity Co. | | | 17,028 | |
| | 1,000 | | | SDIC Power Holdings Co. Ltd., Class A | | | 1,131 | |
| | 1,100 | | | Shenergy Co. Ltd., Class A | | | 963 | |
| | 500 | | | Shenzhen Energy Group Co. Ltd., Class A | | | 451 | |
| | 8,427 | | | Tata Power Co. Ltd. (The) | | | 8,424 | |
| | 7,630 | | | Tenaga Nasional Bhd | | | 25,553 | |
| | 4,000 | | | Towngas China Co. Ltd.2 | | | 2,883 | |
| | 29,000 | | | YTL Corp. Bhd | | | 7,860 | |
| | | | | | | | |
| | | | Total Utilities | | | 600,892 | |
| | | | | | | | |
| | | | Total Common Stocks
(Cost $14,848,920) | | | 14,731,719 | |
| | | | | | | | |
| | |
| | | | | | | | |
| | | | Preferred Stocks—2.5% | | | |
| | | | Automobiles & Components—0.3% | |
| | 218 | | | Hyundai Motor Co., 3.77% | | | 14,934 | |
| | 299 | | | Hyundai MotorCo.-2nd Preferred, 3.51% | | | 22,348 | |
| | | | | | | | |
| | | | Total Automobiles & Components | | | 37,282 | |
| | | | | | | | |
| | | | Banks—0.8% | |
| | 5,860 | | | Banco Bradesco SA, 2.56% | | | 57,703 | |
| | 456 | | | Bancolombia SA, 2.59% | | | 5,801 | |
| | 13,720 | | | Grupo Aval Acciones y Valores SA, 3.98% | | | 5,497 | |
| | 600 | | | Itausa—Investimentos Itau SA, 3.16% | | | 2,018 | |
| | 4,925 | | | Itau Unibanco Holding SA, 3.89% | | | 46,595 | |
| | | | | | | | |
| | | | Total Banks | | | 117,614 | |
| | | | | | | | |
| | | | Capital Goods—0.0%6 | |
| | 53 | | | CJ Corp.2,5 | | | 2,270 | |
| | | | | | | | |
| | | | Diversified Financials—0.0%6 | |
| | 208 | | | Grupo de Inversiones Suramericana SA, 1.67% | | | 2,052 | |
| | | | | | | | |
| | | | Energy—0.6% | |
| | 10,459 | | | Petroleo Brasileiro SA, 3.60% | | | 74,800 | |
| | 11,000 | | | Surgutneftegas PJSC, 3.17% | | | 7,431 | |
| | 2 | | | Transneft PJSC, 4.49% | | | 5,246 | |
| | | | | | | | |
| | | | Total Energy | | | 87,477 | |
| | | | | | | | |
| | | | Food & Staples Retailing—0.1% | |
| | 677 | | | Cia Brasileira de Distribuicao, 1.74% | | | 16,724 | |
| | | | | | | | |
| | | | Food, Beverage & Tobacco—0.0%6 | |
| | 622 | | | Embotelladora Andina SA, Class B, 3.90% | | | 2,242 | |
| | | | | | | | |
| | | | Household & Personal Products—0.0%6 | |
| | 14 | | | Amorepacific Corp., 1.34% | | | 1,045 | |
| | 2 | | | LG Household & Health Care Ltd., 1.21% | | | 1,396 | |
| | | | | | | | |
| | | | Total Household & Personal Products | | | 2,441 | |
| | | | | | | | |
| | | | Materials—0.2% | |
| | 1,187 | | | Braskem SA, Class A2 | | | 10,849 | |
| | 4,017 | | | Gerdau SA, 2.03% | | | 15,931 | |
| | 27 | | | LG Chem Ltd., 3.07% | | | 4,572 | |
| | 51 | | | Sociedad Quimica y Minera de Chile SA, Class B, 3.59% | | | 1,581 | |
| | | | | | | | |
| | | | Total Materials | | | 32,933 | |
| | | | | | | | |
| | | | Retailing—0.0%6 | |
| | 1,396 | | | Lojas Americanas SA, 0.46% | | | 5,999 | |
| | | | | | | | |
| | | | | | | | |
| Shares | | | | | Value | |
| | | | Preferred Stocks (continued) | | | |
| | | | Technology Hardware & Equipment—0.3% | |
| | 1,545 | | | Samsung Electronics Co. Ltd., 2.85% | | $ | 51,181 | |
| | | | | | | | |
| | | | Telecommunication Services—0.1% | |
| | 1,116 | | | Telefonica Brasil SA, 11.06% | | | 14,533 | |
| | | | | | | | |
| | | | Utilities—0.1% | |
| | 300 | | | Centrais Eletricas Brasileiras SA, Class B, 3.79% | | | 2,818 | |
| | 2,100 | | | Cia Energetica de Minas Gerais, 3.97% | | | 8,137 | |
| | | | | | | | |
| | | | Total Utilities | | | 10,955 | |
| | | | | | | | |
| | | | Total Preferred Stocks
(Cost $326,725) | | | 383,703 | |
| | | | | | | | |
| | |
| | | | | | | | |
| | | | Right—0.0%6 | |
| | | | Diversified Financials—0.0%6 | |
| | 1,375 | | | Zhengqi Financial Holding Corp.2,5
(Cost $0) | | | 0 | |
| | | | | | | | |
| | |
| | | | | | | | |
| | | | Investment of Cash Collateral for Securities
Loaned—0.7% | |
| | 80,058 | | | Invesco Government & Agency Portfolio—Institutional Class, 2.27%7,8 | | | 80,058 | |
| | 26,675 | | | Invesco Liquid Assets Portfolio—Institutional Class, 2.41%7,8 | | | 26,686 | |
| | | | | | | | |
| | |
| | | | Total Investment of Cash Collateral for Securities Loaned
(Cost $106,743) | | | 106,744 | |
| | | | | | | | |
| | |
| | | | Total Investments—100.3%
(Cost $15,282,388) | | | 15,222,166 | |
| | |
| | | | Liabilities in Excess of Other
Assets—(0.3)% | | | (39,349 | ) |
| | | | | | | | |
| | |
| | | | Net Assets—100.0% | | $ | 15,182,817 | |
| | | | | | | | |
PCL—Public Company Limited
REIT—Real Estate Investment Trust
| 1 | Represents securities sold under Rule 144A, which are exempt from registration under the Securities Act of 1933, as amended. These securities have been determined to be liquid under guidelines established by the Board of Trustees. These securities amount to $229,553 or 1.51% of the Fund’s net assets at period end. |
| 2 | Non-income producing security. |
| 3 | All or a portion of the security was on loan. The aggregate value of the securities on loan was $100,687; total value of the collateral held by the Fund was $106,744. |
| 4 | American Depositary Receipt. |
| 5 | The value of this security was determined using significant unobservable inputs. See Note 5 of the accompanying Notes. |
| 7 | The security and the Fund are advised by wholly-owned subsidiaries of Invesco Ltd. and are therefore considered to be affiliated. The rate shown is the 7-day SEC standardized yield as of June 30, 2019. |
| 8 | The security has been segregated to satisfy the commitment to return the cash collateral received in securities lending transactions upon the borrower’s return of the securities loaned. See Note 6. |
The accompanying notes are an integral part of these financial statements.
Invesco Emerging Markets Revenue ETF (REEM)(continued)
June 30, 2019
Geographical Holdings
| | | | | | | | |
Country | | Value | | | % of Net
Assets | |
| China | | $ | 4,243,743 | | | | 28.0 | % |
| South Korea | | | 2,841,882 | | | | 18.7 | |
| Taiwan | | | 1,399,283 | | | | 9.2 | |
| India | | | 1,398,221 | | | | 9.2 | |
| Russia | | | 1,197,311 | | | | 7.9 | |
| Brazil | | | 952,502 | | | | 6.3 | |
| Thailand | | | 482,279 | | | | 3.2 | |
| Mexico | | | 353,534 | | | | 2.3 | |
| South Africa | | | 332,213 | | | | 2.2 | |
| Malaysia | | | 227,194 | | | | 1.5 | |
| Turkey | | | 217,126 | | | | 1.4 | |
| Indonesia | | | 216,099 | | | | 1.4 | |
| Chile | | | 192,248 | | | | 1.3 | |
| United States | | | 187,169 | | | | 1.2 | |
| Poland | | | 169,993 | | | | 1.1 | |
| Saudi Arabia | | | 134,551 | | | | 0.9 | |
| Philippines | | | 133,258 | | | | 0.9 | |
| Hong Kong | | | 102,698 | | | | 0.7 | |
| United Arab Emirates | | | 89,456 | | | | 0.6 | |
| Colombia | | | 79,472 | | | | 0.5 | |
| Qatar | | | 77,282 | | | | 0.5 | |
| Greece | | | 57,793 | | | | 0.4 | |
| Hungary | | | 41,041 | | | | 0.3 | |
| Argentina | | | 26,603 | | | | 0.2 | |
| Peru | | | 26,331 | | | | 0.2 | |
| Czech Republic | | | 19,238 | | | | 0.1 | |
| Egypt | | | 10,541 | | | | 0.1 | |
| Pakistan | | | 5,724 | | | | 0.0 | 1 |
| United Kingdom | | | 3,462 | | | | 0.0 | 1 |
| Singapore | | | 2,519 | | | | 0.0 | 1 |
| Romania | | | 1,046 | | | | 0.0 | 1 |
| Luxembourg | | | 354 | | | | 0.0 | 1 |
| | | | | | | | |
| Total Investments | | | 15,222,166 | | | | 100.3 | |
| Liabilities in Excess of Other Assets | | | (39,349 | ) | | | (0.3 | ) |
| | | | | | | | |
| Net Assets | | $ | 15,182,817 | | | | 100.0 | % |
| | | | | | | | |
The accompanying notes are an integral part of these financial statements.
Schedule of Investments
Invesco International Revenue ETF (REFA)
June 30, 2019
| | | | | | | | |
| Shares | | | | | Value | |
| | | | Common Stocks—99.0% | | | |
| | | | Automobiles & Components—11.2% | |
| | 918 | | | Aisin Seiki Co. Ltd. | | $ | 31,611 | |
| | 985 | | | Bayerische Motoren Werke AG | | | 73,013 | |
| | 710 | | | Bridgestone Corp.1 | | | 27,955 | |
| | 156 | | | Cie Generale des Etablissements Michelin | | | 19,817 | |
| | 264 | | | Continental AG | | | 38,549 | |
| | 2,405 | | | Daimler AG | | | 133,997 | |
| | 978 | | | Denso Corp. | | | 41,148 | |
| | 366 | | | Faurecia SA | | | 17,010 | |
| | 16 | | | Ferrari NV | | | 2,602 | |
| | 5,654 | | | Fiat Chrysler Automobiles NV | | | 78,978 | |
| | 4,412 | | | Honda Motor Co. Ltd. | | | 114,047 | |
| | 1,627 | | | Isuzu Motors Ltd. | | | 18,529 | |
| | 110 | | | Koito Manufacturing Co. Ltd. | | | 5,871 | |
| | 2,270 | | | Mazda Motor Corp. | | | 23,692 | |
| | 3,961 | | | Mitsubishi Motors Corp. | | | 18,970 | |
| | 170 | | | NGK Spark Plug Co. Ltd. | | | 3,190 | |
| | 12,558 | | | Nissan Motor Co. Ltd. | | | 89,936 | |
| | 49 | | | Nokian Renkaat OYJ | | | 1,532 | |
| | 2,703 | | | Peugeot SA | | | 66,704 | |
| | 707 | | | Pirelli & C SpA2 | | | 4,185 | |
| | 861 | | | Renault SA1 | | | 54,212 | |
| | 137 | | | Stanley Electric Co. Ltd. | | | 3,367 | |
| | 976 | | | Subaru Corp. | | | 23,725 | |
| | 1,831 | | | Sumitomo Electric Industries Ltd. | | | 24,039 | |
| | 561 | | | Sumitomo Rubber Industries Ltd. | | | 6,488 | |
| | 636 | | | Suzuki Motor Corp. | | | 29,893 | |
| | 316 | | | Toyoda Gosei Co. Ltd. | | | 6,162 | |
| | 310 | | | Toyota Industries Corp. | | | 17,062 | |
| | 4,110 | | | Toyota Motor Corp. | | | 255,130 | |
| | 552 | | | Valeo SA | | | 17,979 | |
| | 721 | | | Volkswagen AG | | | 124,106 | |
| | 680 | | | Yamaha Motor Co. Ltd. | | | 12,087 | |
| | 274 | | | Yokohama Rubber Co. Ltd. (The)1 | | | 5,035 | |
| | | | | | | | |
| | | | Total Automobiles & Components | | | 1,390,621 | |
| | | | | | | | |
| | | | Banks—7.4% | |
| | 653 | | | ABN AMRO Bank NV2 | | | 13,992 | |
| | 619 | | | AIB Group PLC | | | 2,535 | |
| | 47 | | | Aozora Bank Ltd. | | | 1,128 | |
| | 1,092 | | | Australia & New Zealand Banking Group Ltd. | | | 21,618 | |
| | 5,996 | | | Banco Bilbao Vizcaya Argentaria SA | | | 33,574 | |
| | 5,141 | | | Banco de Sabadell SA | | | 5,333 | |
| | 13,908 | | | Banco Santander SA | | | 64,629 | |
| | 488 | | | Bank Hapoalim B.M.3 | | | 3,620 | |
| | 514 | | | Bank LeumiLe-Israel B.M. | | | 3,712 | |
| | 986 | | | Bank of East Asia Ltd. (The) | | | 2,758 | |
| | 670 | | | Bank of Ireland Group PLC | | | 3,507 | |
| | 20 | | | Bank of Kyoto Ltd. (The) | | | 773 | |
| | 205 | | | Bank of Queensland Ltd. | | | 1,371 | |
| | 1,363 | | | Bankia SA | | | 3,225 | |
| | 325 | | | Bankinter SA | | | 2,242 | |
| | 13,778 | | | Barclays PLC | | | 26,268 | |
| | 224 | | | Bendigo & Adelaide Bank Ltd. | | | 1,820 | |
| | 1,029 | | | BNP Paribas SA | | | 48,941 | |
| | 2,624 | | | BOC Hong Kong Holdings Ltd. | | | 10,328 | |
| | 3,283 | | | CaixaBank SA | | | 9,414 | |
| | 391 | | | Chiba Bank Ltd. (The) | | | 1,909 | |
| | 1,289 | | | Commerzbank AG | | | 9,276 | |
| | 458 | | | Commonwealth Bank of Australia | | | 26,606 | |
| | | | | | | | |
| Shares | | | | | Value | |
| | | | Common Stocks (continued) | | | |
| | | | Banks (continued) | |
| | 601 | | | Concordia Financial Group Ltd. | | $ | 2,237 | |
| | 5,515 | | | Credit Agricole SA | | | 66,228 | |
| | 743 | | | Danske Bank A/S | | | 11,762 | |
| | 549 | | | DBS Group Holdings Ltd. | | | 10,534 | |
| | 372 | | | DNB ASA | | | 6,924 | |
| | 237 | | | Erste Group Bank AG3 | | | 8,809 | |
| | 72 | | | FinecoBank Banca Fineco SpA | | | 804 | |
| | 104 | | | Fukuoka Financial Group, Inc. | | | 1,899 | |
| | 197 | | | Hang Seng Bank Ltd. | | | 4,904 | |
| | 7,569 | | | HSBC Holdings PLC | | | 63,280 | |
| | 2,476 | | | ING Groep NV | | | 28,749 | |
| | 8,509 | | | Intesa Sanpaolo SpA | | | 18,237 | |
| | 586 | | | Israel Discount Bank Ltd., Class A | | | 2,394 | |
| | 1,540 | | | Japan Post Bank Co. Ltd. | | | 15,637 | |
| | 152 | | | KBC Group NV | | | 9,977 | |
| | 33,863 | | | Lloyds Banking Group PLC | | | 24,389 | |
| | 793 | | | Mebuki Financial Group, Inc. | | | 2,068 | |
| | 255 | | | Mediobanca Banca di Credito Finanziario SpA | | | 2,633 | |
| | 9,958 | | | Mitsubishi UFJ Financial Group, Inc. | | | 47,322 | |
| | 90 | | | Mizrahi Tefahot Bank Ltd.3 | | | 2,076 | |
| | 17,858 | | | Mizuho Financial Group, Inc. | | | 25,874 | |
| | 1,126 | | | National Australia Bank Ltd. | | | 21,113 | |
| | 1,334 | | | Nordea Bank Abp | | | 9,694 | |
| | 1,844 | | | Oversea-Chinese Banking Corp. Ltd. | | | 15,538 | |
| | 269 | | | Raiffeisen Bank International AG | | | 6,320 | |
| | 1,310 | | | Resona Holdings, Inc. | | | 5,454 | |
| | 5,543 | | | Royal Bank of Scotland Group PLC | | | 15,506 | |
| | 399 | | | Seven Bank Ltd. | | | 1,044 | |
| | 198 | | | Shinsei Bank Ltd. | | | 3,075 | |
| | 224 | | | Shizuoka Bank Ltd. (The) | | | 1,651 | |
| | 619 | | | Skandinaviska Enskilda Banken AB, Class A | | | 5,732 | |
| | 1,493 | | | Societe Generale SA | | | 37,779 | |
| | 2,062 | | | Standard Chartered PLC | | | 18,743 | |
| | 1,200 | | | Sumitomo Mitsui Financial Group, Inc. | | | 42,391 | |
| | 287 | | | Sumitomo Mitsui Trust Holdings, Inc. | | | 10,405 | |
| | 501 | | | Svenska Handelsbanken AB, Class A | | | 4,961 | |
| | 327 | | | Swedbank AB, Class A | | | 4,915 | |
| | 1,949 | | | UniCredit SpA | | | 24,029 | |
| | 455 | | | United Overseas Bank Ltd. | | | 8,788 | |
| | 1,186 | | | Westpac Banking Corp. | | | 23,603 | |
| | | | | | | | |
| | | | Total Banks | | | 916,057 | |
| | | | | | | | |
| | | | Capital Goods—13.0% | |
| | 1,049 | | | ABB Ltd. | | | 21,077 | |
| | 801 | | | ACS Actividades de Construccion y Servicios SA | | | 32,027 | |
| | 70 | | | AerCap Holdings NV3 | | | 3,641 | |
| | 337 | | | AGC, Inc. | | | 11,651 | |
| | 399 | | | Airbus SE | | | 56,652 | |
| | 152 | | | Alfa Laval AB | | | 3,319 | |
| | 164 | | | Alstom SA | | | 7,620 | |
| | 240 | | | Amada Holdings Co. Ltd. | | | 2,702 | |
| | 144 | | | ANDRITZ AG | | | 5,428 | |
| | 156 | | | Ashtead Group PLC | | | 4,475 | |
| | 320 | | | Assa Abloy AB, Class B | | | 7,239 | |
| | 186 | | | Atlas Copco AB, Class A | | | 5,950 | |
| | 95 | | | Atlas Copco AB, Class B | | | 2,728 | |
| | 2,903 | | | BAE Systems PLC | | | 18,303 | |
| | 799 | | | Bouygues SA | | | 29,635 | |
| | 216 | | | Brenntag AG | | | 10,653 | |
The accompanying notes are an integral part of these financial statements.
Invesco International Revenue ETF (REFA)(continued)
June 30, 2019
| | | | | | | | |
| Shares | | | | | Value | |
| | | | Common Stocks (continued) | | | |
| | | | Capital Goods (continued) | |
| | 358 | | | Bunzl PLC | | $ | 9,463 | |
| | 944 | | | Cie de Saint-Gobain | | | 36,847 | |
| | 254 | | | CIMIC Group Ltd. | | | 7,980 | |
| | 2,776 | | | CK Hutchison Holdings Ltd. | | | 27,360 | |
| | 2,402 | | | CNH Industrial NV | | | 24,668 | |
| | 60 | | | Daifuku Co. Ltd. | | | 3,369 | |
| | 140 | | | Daikin Industries Ltd. | | | 18,276 | |
| | 3 | | | Dassault Aviation SA | | | 4,318 | |
| | 191 | | | DCC PLC | | | 17,065 | |
| | 146 | | | Eiffage SA | | | 14,455 | |
| | 21 | | | Elbit Systems Ltd. | | | 3,127 | |
| | 218 | | | Epiroc AB, Class A | | | 2,272 | |
| | 107 | | | Epiroc AB, Class B | | | 1,061 | |
| | 30 | | | FANUC Corp. | | | 5,549 | |
| | 191 | | | Ferguson PLC | | | 13,613 | |
| | 222 | | | Ferrovial SA | | | 5,691 | |
| | 202 | | | Fuji Electric Co. Ltd. | | | 6,965 | |
| | 151 | | | GEA Group AG | | | 4,299 | |
| | 5 | | | Geberit AG | | | 2,338 | |
| | 1,675 | | | Hino Motors Ltd. | | | 14,101 | |
| | 319 | | | Hitachi Construction Machinery Co. Ltd. | | | 8,296 | |
| | 163 | | | HOCHTIEF AG | | | 19,880 | |
| | 29 | | | Hoshizaki Corp. | | | 2,159 | |
| | 497 | | | IHI Corp. | | | 11,980 | |
| | 3,930 | | | ITOCHU Corp. | | | 75,160 | |
| | 1,049 | | | Jardine Matheson Holdings Ltd. | | | 66,108 | |
| | 736 | | | Jardine Strategic Holdings Ltd. | | | 28,064 | |
| | 337 | | | JGC Corp. | | | 4,623 | |
| | 969 | | | JTEKT Corp. | | | 11,746 | |
| | 939 | | | Kajima Corp. | | | 12,881 | |
| | 500 | | | Kawasaki Heavy Industries Ltd. | | | 11,755 | |
| | 55 | | | Keihan Holdings Co. Ltd. | | | 2,397 | |
| | 736 | | | Keppel Corp. Ltd. | | | 3,623 | |
| | 76 | | | Kingspan Group PLC | | | 4,134 | |
| | 114 | | | KION Group AG | | | 7,197 | |
| | 55 | | | Knorr-Bremse AG | | | 6,138 | |
| | 918 | | | Komatsu Ltd. | | | 22,153 | |
| | 122 | | | Kone OYJ, Class B | | | 7,211 | |
| | 890 | | | Kubota Corp. | | | 14,811 | |
| | 83 | | | Kurita Water Industries Ltd. | | | 2,061 | |
| | 77 | | | Legrand SA | | | 5,638 | |
| | 967 | | | Leonardo SpA | | | 12,273 | |
| | 1,146 | | | LIXIL Group Corp. | | | 18,125 | |
| | 104 | | | Makita Corp. | | | 3,533 | |
| | 8,109 | | | Marubeni Corp. | | | 53,664 | |
| | 315 | | | Meggitt PLC | | | 2,101 | |
| | 2,784 | | | Melrose Industries PLC | | | 6,408 | |
| | 79 | | | Metso OYJ | | | 3,108 | |
| | 433 | | | MINEBEA MITSUMI, Inc. | | | 7,335 | |
| | 99 | | | MISUMI Group, Inc. | | | 2,483 | |
| | 3,680 | | | Mitsubishi Corp. | | | 97,004 | |
| | 2,382 | | | Mitsubishi Electric Corp. | | | 31,372 | |
| | 684 | | | Mitsubishi Heavy Industries Ltd. | | | 29,781 | |
| | 2,821 | | | Mitsui & Co. Ltd. | | | 45,926 | |
| | 38 | | | MonotaRO Co. Ltd. | | | 926 | |
| | 17 | | | MTU Aero Engines AG | | | 4,056 | |
| | 83 | | | Nabtesco Corp.1 | | | 2,307 | |
| | 236 | | | NGK Insulators Ltd. | | | 3,441 | |
| | | | | | | | |
| Shares | | | | | Value | |
| | | | Common Stocks (continued) | | | |
| | | | Capital Goods (continued) | |
| | 83 | | | Nidec Corp. | | $ | 11,344 | |
| | 926 | | | NSK Ltd. | | | 8,251 | |
| | 1,528 | | | NWS Holdings Ltd. | | | 3,141 | |
| | 1,492 | | | Obayashi Corp. | | | 14,693 | |
| | 472 | | | Prysmian SpA | | | 9,756 | |
| | 1,367 | | | Rolls-Royce Holdings PLC3 | | | 14,621 | |
| | 126 | | | Safran SA | | | 18,489 | |
| | 468 | | | Sandvik AB | | | 8,605 | |
| | 15 | | | Schindler Holding AG | | | 3,343 | |
| | 25 | | | Schindler Holding AG | | | 5,467 | |
| | 291 | | | Schneider Electric SE | | | 26,432 | |
| | 3,633 | | | Sembcorp Industries Ltd. | | | 6,471 | |
| | 1,293 | | | Shimizu Corp. | | | 10,741 | |
| | 622 | | | Siemens AG | | | 74,092 | |
| | 489 | | | Siemens Gamesa Renewable Energy SA | | | 8,141 | |
| | 1,326 | | | Singapore Technologies Engineering Ltd. | | | 4,058 | |
| | 802 | | | Skanska AB, Class B | | | 14,496 | |
| | 394 | | | SKF AB, Class B | | | 7,251 | |
| | 12 | | | SMC Corp./Japan | | | 4,474 | |
| | 172 | | | Smiths Group PLC | | | 3,426 | |
| | 11 | | | Spirax-Sarco Engineering PLC | | | 1,286 | |
| | 2,441 | | | Sumitomo Corp. | | | 36,987 | |
| | 204 | | | Sumitomo Heavy Industries Ltd. | | | 7,015 | |
| | 282 | | | Taisei Corp. | | | 10,247 | |
| | 844 | | | Techtronic Industries Co. Ltd. | | | 6,460 | |
| | 122 | | | Thales SA | | | 15,095 | |
| | 118 | | | THK Co. Ltd. | | | 2,820 | |
| | 929 | | | Toshiba Corp. | | | 28,929 | |
| | 125 | | | TOTO Ltd. | | | 4,937 | |
| | 1,604 | | | Toyota Tsusho Corp. | | | 48,608 | |
| | 111 | | | Vestas Wind Systems A/S | | | 9,603 | |
| | 410 | | | Vinci SA | | | 42,050 | |
| | 1,733 | | | Volvo AB, Class B | | | 27,522 | |
| | 294 | | | Wartsila OYJ Abp | | | 4,270 | |
| | 130 | | | Weir Group PLC (The) | | | 2,559 | |
| | 2,467 | | | Yangzijiang Shipbuilding Holdings Ltd. | | | 2,790 | |
| | | | | | | | |
| | | | Total Capital Goods | | | 1,606,245 | |
| | | | | | | | |
| | | | Commercial & Professional Services—1.4% | |
| | 377 | | | Adecco Group AG | | | 22,682 | |
| | 491 | | | Brambles Ltd. | | | 4,438 | |
| | 174 | | | Bureau Veritas SA | | | 4,304 | |
| | 472 | | | Dai Nippon Printing Co. Ltd. | | | 10,059 | |
| | 26 | | | Edenred | | | 1,328 | |
| | 124 | | | Experian PLC | | | 3,762 | |
| �� | 2,788 | | | G4S PLC | | | 7,380 | |
| | 44 | | | Intertek Group PLC | | | 3,081 | |
| | 267 | | | ISS A/S | | | 8,070 | |
| | 109 | | | Park24 Co. Ltd. | | | 2,538 | |
| | 318 | | | Persol Holdings Co. Ltd. | | | 7,470 | |
| | 386 | | | Randstad NV | | | 21,232 | |
| | 528 | | | Recruit Holdings Co. Ltd. | | | 17,613 | |
| | 332 | | | RELX PLC | | | 8,068 | |
| | 507 | | | Rentokil Initial PLC | | | 2,565 | |
| | 93 | | | Secom Co. Ltd. | | | 8,005 | |
| | 465 | | | Securitas AB, Class B | | | 8,164 | |
| | 58 | | | SEEK Ltd. | | | 861 | |
| | 2 | | | SGS SA | | | 5,102 | |
| | 21 | | | Societe BIC SA | | | 1,604 | |
The accompanying notes are an integral part of these financial statements.
Invesco International Revenue ETF (REFA)(continued)
June 30, 2019
| | | | | | | | |
| Shares | | | | | Value | |
| | | | Common Stocks (continued) | | | |
| | | | Commercial & Professional Services (continued) | |
| | 66 | | | Sohgo Security Services Co. Ltd. | | $ | 3,045 | |
| | 20 | | | Teleperformance | | | 4,013 | |
| | 695 | | | Toppan Printing Co. Ltd. | | | 10,547 | |
| | 56 | | | Wolters Kluwer NV | | | 4,083 | |
| | | | | | | | |
| | | | Total Commercial & Professional Services | | | 170,014 | |
| | | | | | | | |
| | | | Consumer Durables & Apparel—3.1% | |
| | 72 | | | adidas AG | | | 22,261 | |
| | 107 | | | Bandai Namco Holdings, Inc. | | | 5,194 | |
| | 651 | | | Barratt Developments PLC | | | 4,744 | |
| | 57 | | | Berkeley Group Holdings PLC | | | 2,707 | |
| | 118 | | | Burberry Group PLC | | | 2,796 | |
| | 194 | | | Casio Computer Co. Ltd. | | | 2,409 | |
| | 155 | | | Cie Financiere Richemont SA | | | 13,169 | |
| | 448 | | | Electrolux AB, Series B | | | 11,458 | |
| | 121 | | | EssilorLuxottica SA | | | 15,812 | |
| | 8 | | | Hermes International | | | 5,778 | |
| | 39 | | | HUGO BOSS AG | | | 2,598 | |
| | 308 | | | Husqvarna AB, Class B | | | 2,883 | |
| | 584 | | | Iida Group Holdings Co. Ltd. | | | 9,432 | |
| | 19 | | | Kering | | | 11,254 | |
| | 105 | | | LVMH Moet Hennessy Louis Vuitton SE | | | 44,757 | |
| | 33 | | | Moncler SpA | | | 1,413 | |
| | 399 | | | Nikon Corp. | | | 5,644 | |
| | 7,275 | | | Panasonic Corp. | | | 60,609 | |
| | 74 | | | Pandora A/S | | | 2,636 | |
| | 143 | | | Persimmon PLC | | | 3,635 | |
| | 70 | | | Puma SE | | | 4,675 | |
| | 37 | | | Rinnai Corp. | | | 2,352 | |
| | 19 | | | Sankyo Co. Ltd. | | | 688 | |
| | 35 | | | SEB SA | | | 6,302 | |
| | 200 | | | Sega Sammy Holdings, Inc. | | | 2,430 | |
| | 567 | | | Sekisui Chemical Co. Ltd. | | | 8,515 | |
| | 957 | | | Sekisui House Ltd. | | | 15,771 | |
| | 1,767 | | | Sharp Corp. | | | 19,386 | |
| | 17 | | | Shimano, Inc. | | | 2,529 | |
| | 1,227 | | | Sony Corp. | | | 64,322 | |
| | 13 | | | Swatch Group AG (The) | | | 3,727 | |
| | 55 | | | Swatch Group AG (The) | | | 2,981 | |
| | 1,838 | | | Taylor Wimpey PLC | | | 3,690 | |
| | 66 | | | Yamaha Corp. | | | 3,136 | |
| | 2,728 | | | Yue Yuen Industrial Holdings Ltd. | | | 7,473 | |
| | | | | | | | |
| | | | Total Consumer Durables & Apparel | | | 379,166 | |
| | | | | | | | |
| | | | Consumer Services—1.0% | |
| | 84 | | | Accor SA | | | 3,611 | |
| | 106 | | | Aristocrat Leisure Ltd. | | | 2,285 | |
| | 142 | | | Benesse Holdings, Inc. | | | 3,306 | |
| | 66 | | | Carnival PLC | | | 2,922 | |
| | 1,050 | | | Compass Group PLC | | | 25,217 | |
| | 197 | | | Crown Resorts Ltd. | | | 1,721 | |
| | 26 | | | Domino’s Pizza Enterprises Ltd.1 | | | 687 | |
| | 61 | | | Flight Centre Travel Group Ltd. | | | 1,779 | |
| | 22 | | | Flutter Entertainment PLC | | | 1,657 | |
| | 850 | | | Galaxy Entertainment Group Ltd. | | | 5,728 | |
| | 2,240 | | | Genting Singapore Ltd. | | | 1,523 | |
| | 204 | | | GVC Holdings PLC | | | 1,692 | |
| | 52 | | | InterContinental Hotels Group PLC | | | 3,423 | |
| | 43 | | | McDonald’s Holdings Co. Japan Ltd.1 | | | 1,896 | |
| | | | | | | | |
| Shares | | | | | Value | |
| | | | Common Stocks (continued) | | | |
| | | | Consumer Services (continued) | |
| | 191 | | | Melco Resorts & Entertainment Ltd.4 | | $ | 4,149 | |
| | 362 | | | Merlin Entertainments PLC2 | | | 2,069 | |
| | 1,115 | | | MGM China Holdings Ltd. | | | 1,895 | |
| | 34 | | | Oriental Land Co. Ltd. | | | 4,210 | |
| | 1,333 | | | Sands China Ltd. | | | 6,373 | |
| | 1,461 | | | Shangri-La Asia Ltd. | | | 1,842 | |
| | 2,974 | | | SJM Holdings Ltd. | | | 3,384 | |
| | 162 | | | Sodexo SA | | | 18,965 | |
| | 662 | | | Tabcorp Holdings Ltd. | | | 2,067 | |
| | 1,744 | | | TUI AG | | | 17,144 | |
| | 48 | | | Whitbread PLC | | | 2,828 | |
| | 1,714 | | | Wynn Macau Ltd. | | | 3,839 | |
| | | | | | | | |
| | | | Total Consumer Services | | | 126,212 | |
| | | | | | | | |
| | | | Diversified Financials—3.0% | |
| | 79 | | | 3i Group PLC | | | 1,120 | |
| | 593 | | | Acom Co. Ltd. | | | 2,136 | |
| | 190 | | | AEON Financial Service Co. Ltd. | | | 3,060 | |
| | 2,982 | | | AMP Ltd. | | | 4,436 | |
| | 61 | | | Amundi SA2 | | | 4,265 | |
| | 11 | | | ASX Ltd. | | | 636 | |
| | 200 | | | Challenger Ltd. | | | 932 | |
| | 271 | | | Credit Saison Co. Ltd. | | | 3,172 | |
| | 2,146 | | | Credit Suisse Group AG3 | | | 25,763 | |
| | 1,293 | | | Daiwa Securities Group, Inc. | | | 5,666 | |
| | 4,359 | | | Deutsche Bank AG | | | 33,656 | |
| | 21 | | | Deutsche Boerse AG | | | 2,975 | |
| | 56 | | | Eurazeo SE | | | 3,909 | |
| | 1,958 | | | EXOR NV | | | 137,354 | |
| | 54 | | | Groupe Bruxelles Lambert SA | | | 5,306 | |
| | 15 | | | Hargreaves Lansdown PLC | | | 366 | |
| | 46 | | | Hong Kong Exchanges & Clearing Ltd. | | | 1,624 | |
| | 6 | | | Industrivarden AB, Class C | | | 133 | |
| | 511 | | | Investec PLC | | | 3,323 | |
| | 59 | | | Investor AB, Class B | | | 2,837 | |
| | 55 | | | Japan Exchange Group, Inc. | | | 874 | |
| | 74 | | | Julius Baer Group Ltd.3 | | | 3,298 | |
| | 5 | | | Kinnevik AB, Class B | | | 130 | |
| | 31 | | | L E Lundbergforetagen AB, Class B | | | 1,161 | |
| | 32 | | | London Stock Exchange Group PLC | | | 2,234 | |
| | 105 | | | Macquarie Group Ltd. | | | 9,239 | |
| | 1,219 | | | Mitsubishi UFJ Lease & Finance Co. Ltd. | | | 6,460 | |
| | 2,337 | | | Natixis SA | | | 9,419 | |
| | 4,413 | | | Nomura Holdings, Inc. | | | 15,540 | |
| | 1,280 | | | ORIX Corp. | | | 19,104 | |
| | 56 | | | Pargesa Holding SA | | | 4,322 | |
| | 1 | | | Partners Group Holding AG | | | 787 | |
| | 109 | | | SBI Holdings, Inc. | | | 2,698 | |
| | 56 | | | Schroders PLC | | | 2,174 | |
| | 93 | | | Singapore Exchange Ltd. | | | 544 | |
| | 1 | | | St James’s Place PLC | | | 14 | |
| | 564 | | | Standard Life Aberdeen PLC | | | 2,115 | |
| | 176 | | | Tokyo Century Corp. | | | 7,424 | |
| | 2,400 | | | UBS Group AG3 | | | 28,554 | |
| | 55 | | | Wendel SA | | | 7,510 | |
| | | | | | | | |
| | | | Total Diversified Financials | | | 366,270 | |
| | | | | | | | |
| | | | Energy—8.6% | |
| | 90 | | | Aker BP ASA | | | 2,582 | |
| | 32,429 | | | BP PLC | | | 226,420 | |
The accompanying notes are an integral part of these financial statements.
Invesco International Revenue ETF (REFA)(continued)
June 30, 2019
| | | | | | | | |
| Shares | | | | | Value | |
| | | | Common Stocks (continued) | | | |
| | | | Energy (continued) | |
| | 630 | | | Caltex Australia Ltd. | | $ | 10,942 | |
| | 3,994 | | | Eni SpA | | | 66,433 | |
| | 2,701 | | | Equinor ASA | | | 53,364 | |
| | 898 | | | Galp Energia SGPS SA | | | 13,831 | |
| | 1,638 | | | Idemitsu Kosan Co. Ltd. | | | 49,259 | |
| | 726 | | | Inpex Corp. | | | 6,545 | |
| | 1,119 | | | John Wood Group PLC | | | 6,437 | |
| | 15,792 | | | JXTG Holdings, Inc. | | | 78,330 | |
| | 26 | | | Koninklijke Vopak NV | | | 1,201 | |
| | 60 | | | Lundin Petroleum AB | | | 1,862 | |
| | 374 | | | Neste OYJ | | | 12,709 | |
| | 216 | | | Oil Search Ltd. | | | 1,072 | |
| | 400 | | | OMV AG | | | 19,519 | |
| | 1,553 | | | Origin Energy Ltd. | | | 7,966 | |
| | 2,962 | | | Repsol SA | | | 46,498 | |
| | 5,036 | | | Royal Dutch Shell PLC, Class A | | | 164,880 | |
| | 4,171 | | | Royal Dutch Shell PLC, Class B | | | 137,011 | |
| | 541 | | | Santos Ltd. | | | 2,688 | |
| | 411 | | | Tenaris SA | | | 5,387 | |
| | 2,569 | | | TOTAL SA | | | 144,158 | |
| | 46 | | | Washington H Soul Pattinson & Co. Ltd. | | | 710 | |
| | 153 | | | Woodside Petroleum Ltd. | | | 3,904 | |
| | 291 | | | WorleyParsons Ltd. | | | 3,004 | |
| | | | | | | | |
| | | | Total Energy | | | 1,066,712 | |
| | | | | | | | |
| | | | Food & Staples Retailing—4.0% | |
| | 3,341 | | | Aeon Co. Ltd. | | | 57,399 | |
| | 3,461 | | | Carrefour SA | | | 66,925 | |
| | 925 | | | Casino Guichard Perrachon SA1 | | | 31,602 | |
| | 120 | | | Colruyt SA | | | 6,969 | |
| | 1,201 | | | Dairy Farm International Holdings Ltd. | | | 8,587 | |
| | 174 | | | FamilyMart UNY Holdings Co. Ltd. | | | 4,154 | |
| | 235 | | | ICA Gruppen AB | | | 10,111 | |
| | 11,401 | | | J Sainsbury PLC | | | 28,432 | |
| | 1,023 | | | Jeronimo Martins SGPS SA | | | 16,502 | |
| | 2,421 | | | Koninklijke Ahold Delhaize NV | | | 54,529 | |
| | 108 | | | Lawson, Inc. | | | 5,183 | |
| | 1,787 | | | METRO AG1 | | | 32,713 | |
| | 1,430 | | | Seven & i Holdings Co. Ltd. | | | 48,419 | |
| | 162 | | | Sundrug Co. Ltd. | | | 4,385 | |
| | 20,080 | | | Tesco PLC | | | 57,935 | |
| | 69 | | | Tsuruha Holdings, Inc. | | | 6,379 | |
| | 157 | | | Welcia Holdings Co. Ltd. | | | 6,390 | |
| | 6,813 | | | Wm Morrison Supermarkets PLC1 | | | 17,463 | |
| | 1,336 | | | Woolworths Group Ltd. | | | 31,154 | |
| | | | | | | | |
| | | | Total Food & Staples Retailing | | | 495,231 | |
| | | | | | | | |
| | | | Food, Beverage & Tobacco—3.9% | |
| | 54 | | | a2 Milk Co. Ltd.3 | | | 532 | |
| | 454 | | | Ajinomoto Co., Inc. | | | 7,871 | |
| | 408 | | | Anheuser-Busch InBev SA | | | 36,167 | |
| | 369 | | | Asahi Group Holdings Ltd. | | | 16,594 | |
| | 488 | | | Associated British Foods PLC | | | 15,297 | |
| | 3 | | | Barry Callebaut AG | | | 6,025 | |
| | 673 | | | British American Tobacco PLC | | | 23,546 | |
| | 65 | | | Calbee, Inc. | | | 1,754 | |
| | 44 | | | Carlsberg A/S, Class B | | | 5,842 | |
| | 1 | | | Chocoladefabriken Lindt & Spruengli AG | | | 7,287 | |
| | 421 | | | Coca-Cola Amatil Ltd. | | | 3,019 | |
| | | | | | | | |
| Shares | | | | | Value | |
| | | | Common Stocks (continued) | | | |
| | | | Food, Beverage & Tobacco (continued) | |
| | 300 | | | Coca-Cola Bottlers Japan Holdings, Inc. | | $ | 7,599 | |
| | 182 | | | Coca-Cola European Partners PLC | | | 10,283 | |
| | 168 | | | Coca-Cola HBC AG3 | | | 6,355 | |
| | 289 | | | Danone SA | | | 24,519 | |
| | 150 | | | Davide Campari-Milano SpA | | | 1,472 | |
| | 298 | | | Diageo PLC | | | 12,834 | |
| | 28,565 | | | Golden Agri-Resources Ltd. | | | 6,123 | |
| | 193 | | | Heineken Holding NV | | | 20,287 | |
| | 182 | | | Heineken NV | | | 20,341 | |
| | 580 | | | Imperial Brands PLC | | | 13,632 | |
| | 784 | | | Japan Tobacco, Inc. | | | 17,315 | |
| | 49 | | | Kerry Group PLC, Class A | | | 5,859 | |
| | 68 | | | Kikkoman Corp. | | | 2,960 | |
| | 698 | | | Kirin Holdings Co. Ltd. | | | 15,053 | |
| | 127 | | | MEIJI Holdings Co. Ltd. | | | 9,077 | |
| | 144 | | | Mowi ASA | | | 3,369 | |
| | 716 | | | Nestle SA | | | 74,214 | |
| | 212 | | | NH Foods Ltd. | | | 9,081 | |
| | 176 | | | Nisshin Seifun Group, Inc. | | | 4,017 | |
| | 54 | | | Nissin Foods Holdings Co. Ltd. | | | 3,478 | |
| | 441 | | | Orkla ASA | | | 3,914 | |
| | 45 | | | Pernod Ricard SA | | | 8,304 | |
| | 7 | | | Remy Cointreau SA1 | | | 1,011 | |
| | 212 | | | Suntory Beverage & Food Ltd. | | | 9,219 | |
| | 23 | | | Swedish Match AB | | | 972 | |
| | 77 | | | Toyo Suisan Kaisha Ltd. | | | 3,173 | |
| | 139 | | | Treasury Wine Estates Ltd. | | | 1,455 | |
| | 139 | | | Vitasoy International Holdings Ltd. | | | 668 | |
| | 17,859 | | | WH Group Ltd.2 | | | 18,105 | |
| | 13,142 | | | Wilmar International Ltd. | | | 35,940 | |
| | 50 | | | Yakult Honsha Co. Ltd. | | | 2,947 | |
| | 478 | | | Yamazaki Baking Co. Ltd. | | | 7,227 | |
| | | | | | | | |
| | | | Total Food, Beverage & Tobacco | | | 484,737 | |
| | | | | | | | |
| | | | Health Care Equipment & Services—1.5% | |
| | 91 | | | Alcon, Inc.3 | | | 5,626 | |
| | 789 | | | Alfresa Holdings Corp. | | | 19,465 | |
| | 14 | | | Asahi Intecc Co. Ltd. | | | 345 | |
| | 26 | | | BioMerieux | | | 2,157 | |
| | 11 | | | Carl Zeiss Meditec AG | | | 1,087 | |
| | 6 | | | Cochlear Ltd. | | | 871 | |
| | 17 | | | Coloplast A/S, Class B | | | 1,924 | |
| | 50 | | | Demant A/S3 | | | 1,557 | |
| | 51 | | | Fisher & Paykel Healthcare Corp. Ltd. | | | 529 | |
| | 186 | | | Fresenius Medical Care AG & Co. KGaA | | | 14,624 | |
| | 539 | | | Fresenius SE & Co. KGaA | | | 29,267 | |
| | 55 | | | Hoya Corp. | | | 4,213 | |
| | 392 | | | Koninklijke Philips NV | | | 17,046 | |
| | 40 | | | M3, Inc. | | | 731 | |
| | 1,148 | | | Medipal Holdings Corp. | | | 25,349 | |
| | 41 | | | NMC Health PLC | | | 1,254 | |
| | 482 | | | Olympus Corp. | | | 5,351 | |
| | 124 | | | Ramsay Health Care Ltd. | | | 6,286 | |
| | 25 | | | Ryman Healthcare Ltd. | | | 197 | |
| | 288 | | | Siemens Healthineers AG2 | | | 12,171 | |
| | 180 | | | Smith & Nephew PLC | | | 3,906 | |
| | 175 | | | Sonic Healthcare Ltd. | | | 3,328 | |
| | 10 | | | Sonova Holding AG | | | 2,275 | |
| | 1 | | | Straumann Holding AG | | | 883 | |
The accompanying notes are an integral part of these financial statements.
Invesco International Revenue ETF (REFA)(continued)
June 30, 2019
| | | | | | | | |
| Shares | | | | | Value | |
| | | | Common Stocks (continued) | | | |
| | | | Health Care Equipment & Services (continued) | |
| | 286 | | | Suzuken Co. Ltd. | | $ | 16,777 | |
| | 30 | | | Sysmex Corp. | | | 1,957 | |
| | 155 | | | Terumo Corp. | | | 4,618 | |
| | | | | | | | |
| | | | Total Health Care Equipment & Services | | | 183,794 | |
| | | | | | | | |
| | | | Household & Personal Products—1.2% | |
| | 62 | | | Beiersdorf AG1 | | | 7,452 | |
| | 286 | | | Essity AB, Class B | | | 8,798 | |
| | 115 | | | Henkel AG & Co KGaA1 | | | 10,575 | |
| | 135 | | | Kao Corp. | | | 10,287 | |
| | 16 | | | Kobayashi Pharmaceutical Co. Ltd. | | | 1,145 | |
| | 15 | | | Kose Corp. | | | 2,516 | |
| | 137 | | | Lion Corp. | | | 2,552 | |
| | 87 | | | L’Oreal SA | | | 24,819 | |
| | 18 | | | Pigeon Corp. | | | 724 | |
| | 64 | | | Pola Orbis Holdings, Inc. | | | 1,788 | |
| | 161 | | | Reckitt Benckiser Group PLC | | | 12,733 | |
| | 104 | | | Shiseido Co. Ltd. | | | 7,839 | |
| | 167 | | | Unicharm Corp. | | | 5,028 | |
| | 471 | | | Unilever NV | | | 28,728 | |
| | 330 | | | Unilever PLC | | | 20,557 | |
| | | | | | | | |
| | | | Total Household & Personal Products | | | 145,541 | |
| | | | | | | | |
| | | | Insurance—6.7% | |
| | 26 | | | Admiral Group PLC | | | 731 | |
| | 4,326 | | | Aegon NV | | | 21,568 | |
| | 156 | | | Ageas | | | 8,120 | |
| | 2,215 | | | AIA Group Ltd. | | | 23,886 | |
| | 267 | | | Allianz SE | | | 64,461 | |
| | 2,863 | | | Assicurazioni Generali SpA | | | 53,992 | |
| | 4,866 | | | Aviva PLC | | | 25,794 | |
| | 3,333 | | | AXA SA | | | 87,679 | |
| | 31 | | | Baloise Holding AG | | | 5,494 | |
| | 1,228 | | | CNP Assurances | | | 27,913 | |
| | 2,674 | | | Dai-ichi Life Holdings, Inc. | | | 40,331 | |
| | 765 | | | Direct Line Insurance Group PLC | | | 3,230 | |
| | 118 | | | Gjensidige Forsikring ASA | | | 2,378 | |
| | 100 | | | Hannover Rueck SE | | | 16,194 | |
| | 1,638 | | | Insurance Australia Group Ltd. | | | 9,495 | |
| | 5,567 | | | Japan Post Holdings Co. Ltd. | | | 63,038 | |
| | 3,197 | | | Legal & General Group PLC | | | 10,965 | |
| | 5,621 | | | Mapfre SA1 | | | 16,457 | |
| | 1,954 | | | Medibank Pvt Ltd. | | | 4,786 | |
| | 1,151 | | | MS&AD Insurance Group Holdings, Inc. | | | 36,536 | |
| | 164 | | | Muenchener Rueckversicherungs-Gesellschaft AG in Muenchen | | | 41,219 | |
| | 285 | | | NN Group NV | | | 11,489 | |
| | 1,427 | | | Poste Italiane SpA2 | | | 15,048 | |
| | 1,577 | | | Prudential PLC | | | 34,441 | |
| | 1,145 | | | QBE Insurance Group Ltd. | | | 9,505 | |
| | 919 | | | RSA Insurance Group PLC | | | 6,746 | |
| | 156 | | | Sampo OYJ, Class A | | | 7,373 | |
| | 334 | | | SCOR SE | | | 14,667 | |
| | 685 | | | Sompo Holdings, Inc. | | | 26,455 | |
| | 412 | | | Sony Financial Holdings, Inc. | | | 9,897 | |
| | 667 | | | Suncorp Group Ltd. | | | 6,305 | |
| | 22 | | | Swiss Life Holding AG | | | 10,916 | |
| | 297 | | | Swiss Re AG | | | 30,230 | |
| | 1,258 | | | T&D Holdings, Inc. | | | 13,655 | |
| | 662 | | | Tokio Marine Holdings, Inc. | | | 33,174 | |
| | | | | | | | |
| Shares | | | | | Value | |
| | | | Common Stocks (continued) | | | |
| | | | Insurance (continued) | |
| | 69 | | | Tryg A/S | | $ | 2,247 | |
| | 89 | | | Zurich Insurance Group AG | | | 31,027 | |
| | | | | | | | |
| | | | Total Insurance | | | 827,442 | |
| | | | | | | | |
| | | | Materials—8.6% | |
| | 141 | | | Air Liquide SA | | | 19,758 | |
| | 364 | | | Air Water, Inc. | | | 6,230 | |
| | 84 | | | Akzo Nobel NV | | | 7,905 | |
| | 933 | | | Anglo American PLC | | | 26,652 | |
| | 340 | | | Antofagasta PLC | | | 4,023 | |
| | 3,284 | | | ArcelorMittal | | | 58,850 | |
| | 86 | | | Arkema SA | | | 8,009 | |
| | 1,447 | | | Asahi Kasei Corp. | | | 15,425 | |
| | 750 | | | BASF SE | | | 54,594 | |
| | 676 | | | BHP Group Ltd. | | | 19,526 | |
| | 571 | | | BHP Group PLC | | | 14,643 | |
| | 782 | | | BlueScope Steel Ltd. | | | 6,613 | |
| | 176 | | | Boliden AB | | | 4,504 | |
| | 990 | | | Boral Ltd. | | | 3,557 | |
| | 9 | | | Chr Hansen Holding A/S | | | 846 | |
| | 270 | | | Clariant AG3 | | | 5,496 | |
| | 284 | | | Covestro AG2 | | | 14,460 | |
| | 715 | | | CRH PLC | | | 23,361 | |
| | 22 | | | Croda International PLC | | | 1,434 | |
| | 403 | | | Daicel Corp. | | | 3,583 | |
| | 3 | | | EMS-Chemie Holding AG | | | 1,949 | |
| | 448 | | | Evonik Industries AG | | | 13,066 | |
| | 1,237 | | | Evraz PLC | | | 10,472 | |
| | 1,466 | | | Fletcher Building Ltd. | | | 4,775 | |
| | 876 | | | Fortescue Metals Group Ltd. | | | 5,545 | |
| | 165 | | | Fresnillo PLC1 | | | 1,827 | |
| | 1 | | | Givaudan SA | | | 2,827 | |
| | 46,280 | | | Glencore PLC3 | | | 161,005 | |
| | 202 | | | HeidelbergCement AG | | | 16,369 | |
| | 180 | | | Hitachi Chemical Co. Ltd. | | | 4,888 | |
| | 729 | | | Hitachi Metals Ltd. | | | 8,235 | |
| | 86 | | | Imerys SA | | | 4,566 | |
| | 937 | | | Incitec Pivot Ltd. | | | 2,242 | |
| | 808 | | | Israel Chemicals Ltd. | | | 4,234 | |
| | 149 | | | James Hardie Industries PLC | | | 1,955 | |
| | 1,979 | | | JFE Holdings, Inc. | | | 29,068 | |
| | 372 | | | Johnson Matthey PLC | | | 15,761 | |
| | 252 | | | JSR Corp. | | | 3,979 | |
| | 133 | | | Kaneka Corp. | | | 5,000 | |
| | 189 | | | Kansai Paint Co. Ltd. | | | 3,963 | |
| | 2,260 | | | Kobe Steel Ltd. | | | 14,788 | |
| | 73 | | | Koninklijke DSM NV | | | 9,036 | |
| | 380 | | | Kuraray Co. Ltd.1 | | | 4,539 | |
| | 406 | | | LafargeHolcim Ltd.3 | | | 19,850 | |
| | 115 | | | LANXESS AG | | | 6,844 | |
| | 52 | | | Maruichi Steel Tube Ltd. | | | 1,445 | |
| | 4,291 | | | Mitsubishi Chemical Holdings Corp. | | | 29,974 | |
| | 410 | | | Mitsubishi Gas Chemical Co., Inc. | | | 5,465 | |
| | 492 | | | Mitsubishi Materials Corp. | | | 13,996 | |
| | 493 | | | Mitsui Chemicals, Inc. | | | 12,204 | |
| | 239 | | | Mondi PLC | | | 5,445 | |
| | 144 | | | Newcrest Mining Ltd. | | | 3,229 | |
| | 119 | | | Nippon Paint Holdings Co. Ltd. | | | 4,617 | |
| | 2,672 | | | Nippon Steel Corp. | | | 45,856 | |
The accompanying notes are an integral part of these financial statements.
Invesco International Revenue ETF (REFA)(continued)
June 30, 2019
| | | | | | | | |
| Shares | | | | | Value | |
| | | | Common Stocks (continued) | | | |
| | | | Materials (continued) | |
| | 34 | | | Nissan Chemical Corp. | | $ | 1,532 | |
| | 141 | | | Nitto Denko Corp. | | | 6,958 | |
| | 3,806 | | | Norsk Hydro ASA | | | 13,615 | |
| | 30 | | | Novozymes A/S, Class B | | | 1,401 | |
| | 2,048 | | | Oji Holdings Corp. | | | 11,823 | |
| | 212 | | | Orica Ltd. | | | 3,016 | |
| | 99 | | | Rio Tinto Ltd. | | | 7,209 | |
| | 395 | | | Rio Tinto PLC | | | 24,535 | |
| | 129 | | | Shin-Etsu Chemical Co. Ltd. | | | 12,015 | |
| | 255 | | | Showa Denko KK1 | | | 7,503 | |
| | 30 | | | Sika AG | | | 5,126 | |
| | 280 | | | Smurfit Kappa Group PLC | | | 8,485 | |
| | 101 | | | Solvay SA | | | 10,478 | |
| | 2,414 | | | South32 Ltd. | | | 5,387 | |
| | 590 | | | Stora Enso OYJ, Class R | | | 6,944 | |
| | 3,558 | | | Sumitomo Chemical Co. Ltd. | | | 16,512 | |
| | 276 | | | Sumitomo Metal Mining Co. Ltd. | | | 8,246 | |
| | 28 | | | Symrise AG | | | 2,699 | |
| | 223 | | | Taiheiyo Cement Corp. | | | 6,748 | |
| | 254 | | | Taiyo Nippon Sanso Corp. | | | 5,394 | |
| | 393 | | | Teijin Ltd. | | | 6,701 | |
| | 2,358 | | | thyssenkrupp AG | | | 34,439 | |
| | 2,488 | | | Toray Industries, Inc. | | | 18,917 | |
| | 454 | | | Tosoh Corp. | | | 6,384 | |
| | 298 | | | Toyo Seikan Group Holdings Ltd. | | | 5,913 | |
| | 375 | | | Umicore SA | | | 12,043 | |
| | 336 | | | UPM-Kymmene OYJ | | | 8,942 | |
| | 394 | | | voestalpine AG | | | 12,191 | |
| | 228 | | | Yara International ASA | | | 11,066 | |
| | | | | | | | |
| | | | Total Materials | | | 1,060,705 | |
| | | | | | | | |
| | | | Media & Entertainment—0.9% | |
| | 46 | | | Auto Trader Group PLC2 | | | 321 | |
| | 51 | | | Axel Springer SE1 | | | 3,598 | |
| | 73 | | | CyberAgent, Inc. | | | 2,646 | |
| | 203 | | | Dentsu, Inc. | | | 7,085 | |
| | 68 | | | Eutelsat Communications SA | | | 1,273 | |
| | 682 | | | Hakuhodo DY Holdings, Inc | | | 11,483 | |
| | 287 | | | Informa PLC | | | 3,050 | |
| | 2,255 | | | ITV PLC | | | 3,100 | |
| | 91 | | | JCDecaux SA | | | 2,761 | |
| | 18 | | | Kakaku.Com, Inc. | | | 348 | |
| | 44 | | | Konami Holdings Corp. | | | 2,062 | |
| | 51 | | | LINE Corp.3 | | | 1,427 | |
| | 119 | | | Nexon Co. Ltd.3 | | | 1,725 | |
| | 30 | | | Nintendo Co. Ltd. | | | 10,996 | |
| | 409 | | | Pearson PLC | | | 4,265 | |
| | 157 | | | Publicis Groupe SA | | | 8,301 | |
| | 8 | | | REA Group Ltd. | | | 539 | |
| | 110 | | | RTL Group SA | | | 5,642 | |
| | 28 | | | Schibsted ASA, Class B | | | 730 | |
| | 71 | | | SES SA | | | 1,112 | |
| | 319 | | | Singapore Press Holdings Ltd. | | | 575 | |
| | 43 | | | Telenet Group Holding NV | | | 2,399 | |
| | 43 | | | Toho Co. Ltd. | | | 1,828 | |
| | 22 | | | Ubisoft Entertainment SA3 | | | 1,725 | |
| | 452 | | | Vivendi SA | | | 12,462 | |
| | 1,314 | | | WPP PLC | | | 16,559 | |
| | | | | | | | |
| Shares | | | | | Value | |
| | | | Common Stocks (continued) | | | |
| | | | Media & Entertainment (continued) | |
| | 2,353 | | | Yahoo Japan Corp. | | $ | 6,901 | |
| | | | | | | | |
| | | | Total Media & Entertainment | | | 114,913 | |
| | | | | | | | |
| | | | Pharmaceuticals, Biotechnology & Life Sciences—2.7% | |
| | 707 | | | Astellas Pharma, Inc. | | | 10,073 | |
| | 226 | | | AstraZeneca PLC | | | 18,518 | |
| | 528 | | | Bayer AG | | | 36,642 | |
| | 1 | | | BeiGene Ltd.3,4 | | | 124 | |
| | 65 | | | Chugai Pharmaceutical Co. Ltd. | | | 4,247 | |
| | 44 | | | CSL Ltd. | | | 6,639 | |
| | 143 | | | Daiichi Sankyo Co. Ltd. | | | 7,479 | |
| | 80 | | | Eisai Co. Ltd. | | | 4,523 | |
| | 7 | | | Eurofins Scientific SE1,3 | | | 3,101 | |
| | 2 | | | Genmab A/S3 | | | 368 | |
| | 1,559 | | | GlaxoSmithKline PLC | | | 31,282 | |
| | 149 | | | Grifols SA | | | 4,412 | |
| | 53 | | | H Lundbeck A/S | | | 2,097 | |
| | 29 | | | Hisamitsu Pharmaceutical Co., Inc. | | | 1,145 | |
| | 17 | | | Ipsen SA | | | 2,323 | |
| | 142 | | | Kyowa Hakko Kirin Co. Ltd. | | | 2,556 | |
| | 14 | | | Lonza Group AG3 | | | 4,730 | |
| | 38 | | | Merck KGaA | | | 3,980 | |
| | 266 | | | Mitsubishi Tanabe Pharma Corp. | | | 2,963 | |
| | 457 | | | Novartis AG | | | 41,810 | |
| | 225 | | | Novo Nordisk A/S, Class B | | | 11,483 | |
| | 125 | | | Ono Pharmaceutical Co. Ltd. | | | 2,241 | |
| | 19 | | | Orion OYJ, Class B | | | 697 | |
| | 265 | | | Otsuka Holdings Co. Ltd. | | | 8,648 | |
| | 30 | | | QIAGEN NV3 | | | 1,219 | |
| | 30 | | | Recordati SpA | | | 1,252 | |
| | 134 | | | Roche Holding AG | | | 37,747 | |
| | 376 | | | Sanofi | | | 32,504 | |
| | 110 | | | Santen Pharmaceutical Co. Ltd. | | | 1,822 | |
| | 7 | | | Sartorius Stedim Biotech | | | 1,106 | |
| | 44 | | | Shionogi & Co. Ltd. | | | 2,536 | |
| | 146 | | | Sumitomo Dainippon Pharma Co. Ltd. | | | 2,768 | |
| | 24 | | | Taisho Pharmaceutical Holdings Co. Ltd. | | | 1,842 | |
| | 698 | | | Takeda Pharmaceutical Co. Ltd. | | | 24,768 | |
| | 1,296 | | | Teva Pharmaceutical Industries Ltd.3,4 | | | 11,962 | |
| | 54 | | | UCB SA | | | 4,484 | |
| | 9 | | | Vifor Pharma AG | | | 1,302 | |
| | | | | | | | |
| | | | Total Pharmaceuticals, Biotechnology & Life Sciences | | | 337,393 | |
| | | | | | | | |
| | | | Real Estate—1.4% | |
| | 147 | | | Aeon Mall Co. Ltd. | | | 2,213 | |
| | 77 | | | Aroundtown SA | | | 635 | |
| | 238 | | | Ascendas Real Estate Investment Trust | | | 549 | |
| | 11 | | | Azrieli Group Ltd. | | | 737 | |
| | 111 | | | British Land Co. PLC (The) | | | 761 | |
| | 161 | | | CapitaLand Commercial Trust | | | 258 | |
| | 1,396 | | | CapitaLand Ltd. | | | 3,642 | |
| | 266 | | | CapitaLand Mall Trust | | | 517 | |
| | 388 | | | City Developments Ltd. | | | 2,716 | |
| | 642 | | | CK Asset Holdings Ltd. | | | 5,025 | |
| | 9 | | | Covivio | | | 944 | |
| | 94 | | | Daito Trust Construction Co. Ltd. | | | 11,984 | |
| | 1,000 | | | Daiwa House Industry Co. Ltd. | | | 29,154 | |
| | 27 | | | Deutsche Wohnen SE | | | 992 | |
The accompanying notes are an integral part of these financial statements.
Invesco International Revenue ETF (REFA)(continued)
June 30, 2019
| | | | | | | | |
| Shares | | | | | Value | |
| | | | Common Stocks (continued) | | | |
| | | | Real Estate (continued) | |
| | 54 | | | Dexus | | $ | 492 | |
| | 4 | | | Gecina SA | | | 600 | |
| | 110 | | | Goodman Group | | | 1,160 | |
| | 102 | | | GPT Group (The) | | | 440 | |
| | 417 | | | Hang Lung Properties Ltd. | | | 992 | |
| | 391 | | | Henderson Land Development Co. Ltd. | | | 2,155 | |
| | 305 | | | Hongkong Land Holdings Ltd. | | | 1,964 | |
| | 246 | | | Hulic Co. Ltd.1 | | | 1,977 | |
| | 72 | | | Hysan Development Co. Ltd. | | | 372 | |
| | 19 | | | ICADE1 | | | 1,744 | |
| | 521 | | | Kerry Properties Ltd. | | | 2,187 | |
| | 33 | | | Klepierre SA | | | 1,108 | |
| | 69 | | | Land Securities Group PLC | | | 732 | |
| | 896 | | | Lendlease Group | | | 8,174 | |
| | 141 | | | Link REIT | | | 1,733 | |
| | 709 | | | Mirvac Group | | | 1,557 | |
| | 485 | | | Mitsubishi Estate Co. Ltd. | | | 9,026 | |
| | 581 | | | Mitsui Fudosan Co. Ltd. | | | 14,088 | |
| | 5,105 | | | New World Development Co. Ltd. | | | 7,985 | |
| | 204 | | | Nomura Real Estate Holdings, Inc. | | | 4,385 | |
| | 559 | | | Scentre Group | | | 1,506 | |
| | 52 | | | Segro PLC | | | 483 | |
| | 662 | | | Sino Land Co. Ltd. | | | 1,110 | |
| | 530 | | | Stockland | | | 1,551 | |
| | 193 | | | Sumitomo Realty & Development Co. Ltd. | | | 6,893 | |
| | 394 | | | Sun Hung Kai Properties Ltd. | | | 6,682 | |
| | 159 | | | Suntec Real Estate Investment Trust | | | 228 | |
| | 417 | | | Swire Pacific Ltd., Class A | | | 5,124 | |
| | 364 | | | Swire Properties Ltd. | | | 1,470 | |
| | 12 | | | Swiss Prime Site AG3 | | | 1,049 | |
| | 1,018 | | | Tokyu Fudosan Holdings Corp. | | | 5,622 | |
| | 18 | | | Unibail—Rodamco-Westfield | | | 2,701 | |
| | 267 | | | UOL Group Ltd. | | | 1,490 | |
| | 415 | | | Vicinity Centres | | | 714 | |
| | 47 | | | Vonovia SE | | | 2,248 | |
| | 721 | | | Wharf Holdings Ltd. (The) | | | 1,910 | |
| | 224 | | | Wharf Real Estate Investment Co. Ltd. | | | 1,578 | |
| | 698 | | | Wheelock & Co. Ltd. | | | 5,003 | |
| | | | | | | | |
| | | | Total Real Estate | | | 170,360 | |
| | | | | | | | |
| | | | Retailing—1.6% | |
| | 31 | | | ABC-Mart, Inc. | | | 2,020 | |
| | 12 | | | Delivery Hero SE2,3 | | | 545 | |
| | 84 | | | Dufry AG3 | | | 7,123 | |
| | 28 | | | Fast Retailing Co. Ltd. | | | 16,926 | |
| | 694 | | | Harvey Norman Holdings Ltd. | | | 1,982 | |
| | 920 | | | Hennes & Mauritz AB, Class B | | | 16,397 | |
| | 18 | | | Hikari Tsushin, Inc. | | | 3,925 | |
| | 800 | | | Industria de Diseno Textil SA | | | 24,097 | |
| | 1,059 | | | Isetan Mitsukoshi Holdings Ltd. | | | 8,591 | |
| | 309 | | | J Front Retailing Co. Ltd. | | | 3,542 | |
| | 610 | | | Jardine Cycle & Carriage Ltd. | | | 16,335 | |
| | 4,078 | | | Kingfisher PLC | | | 11,154 | |
| | 2,913 | | | Marks & Spencer Group PLC1 | | | 7,811 | |
| | 88 | | | Marui Group Co. Ltd. | | | 1,792 | |
| | 10 | | | Mercari, Inc.3 | | | 265 | |
| | 59 | | | Next PLC | | | 4,149 | |
| | 37 | | | Nitori Holdings Co. Ltd. | | | 4,904 | |
| | 108 | | | Ocado Group PLC3 | | | 1,604 | |
| | | | | | | | |
| Shares | | | | | Value | |
| | | | Common Stocks (continued) | | | |
| | | | Retailing (continued) | |
| | 113 | | | Pan Pacific International Holdings Corp. | | $ | 7,174 | |
| | 819 | | | Rakuten, Inc. | | | 9,730 | |
| | 17 | | | Ryohin Keikaku Co. Ltd. | | | 3,071 | |
| | 55 | | | Shimamura Co. Ltd. | | | 4,109 | |
| | 38 | | | USS Co. Ltd. | | | 749 | |
| | 611 | | | Wesfarmers Ltd. | | | 15,504 | |
| | 2,923 | | | Yamada Denki Co. Ltd. | | | 12,941 | |
| | 108 | | | Zalando SE2,3 | | | 4,799 | |
| | 44 | | | ZOZO, Inc. | | | 825 | |
| | | | | | | | |
| | | | Total Retailing | | | 192,064 | |
| | | | | | | | |
| | | | Semiconductors & Semiconductor Equipment—0.5% | |
| | 79 | | | Advantest Corp. | | | 2,174 | |
| | 186 | | | ASM Pacific Technology Ltd. | | | 1,905 | |
| | 49 | | | ASML Holding NV | | | 10,253 | |
| | 7 | | | Disco Corp. | | | 1,149 | |
| | 339 | | | Infineon Technologies AG | | | 6,003 | |
| | 84 | | | NXP Semiconductors NV | | | 8,199 | |
| | 1,037 | | | Renesas Electronics Corp.3 | | | 5,149 | |
| | 47 | | | Rohm Co. Ltd. | | | 3,158 | |
| | 388 | | | STMicroelectronics NV | | | 6,893 | |
| | 192 | | | SUMCO Corp.1 | | | 2,285 | |
| | 64 | | | Tokyo Electron Ltd. | | | 8,982 | |
| | | | | | | | |
| | | | Total Semiconductors & Semiconductor Equipment | | | 56,150 | |
| | | | | | | | |
| | | | Software & Services—1.1% | |
| | 2 | | | Adyen NV2,3 | | | 1,546 | |
| | 56 | | | Amadeus IT Group SA | | | 4,442 | |
| | 136 | | | Atos SE | | | 11,387 | |
| | 95 | | | Capgemini SE | | | 11,830 | |
| | 12 | | | Check Point Software Technologies Ltd.3 | | | 1,387 | |
| | 139 | | | Computershare Ltd. | | | 1,581 | |
| | 2 | | | CyberArk Software Ltd.3 | | | 256 | |
| | 20 | | | Dassault Systemes SE | | | 3,195 | |
| | 426 | | | Fujitsu Ltd. | | | 29,702 | |
| | 3 | | | GMO Payment Gateway, Inc. | | | 206 | |
| | 132 | | | Itochu Techno-Solutions Corp. | | | 3,384 | |
| | 91 | | | Micro Focus International PLC | | | 2,390 | |
| | 8 | | | Nice Ltd.3 | | | 1,088 | |
| | 231 | | | Nomura Research Institute Ltd. | | | 3,703 | |
| | 1,346 | | | NTT Data Corp. | | | 17,928 | |
| | 5 | | | Obic Co. Ltd. | | | 566 | |
| | 20 | | | Oracle Corp. Japan | | | 1,461 | |
| | 139 | | | Otsuka Corp. | | | 5,593 | |
| | 201 | | | Sage Group PLC (The) | | | 2,053 | |
| | 173 | | | SAP SE | | | 23,791 | |
| | 4 | | | Temenos AG3 | | | 717 | |
| | 25 | | | Trend Micro, Inc./Japan | | | 1,115 | |
| | 11 | | | Wirecard AG | | | 1,855 | |
| | 4 | | | Wix.com Ltd.3 | | | 568 | |
| | 19 | | | Worldline SA/France2,3 | | | 1,385 | |
| | | | | | | | |
| | | | Total Software & Services | | | 133,129 | |
| | | | | | | | |
| | | | Technology Hardware & Equipment—2.5% | |
| | 387 | | | Alps Alpine Co. Ltd. | | | 6,523 | |
| | 287 | | | Brother Industries Ltd. | | | 5,421 | |
| | 1,227 | | | Canon, Inc.1 | | | 35,828 | |
| | 456 | | | FUJIFILM Holdings Corp. | | | 23,122 | |
| | 51 | | | Halma PLC | | | 1,311 | |
The accompanying notes are an integral part of these financial statements.
Invesco International Revenue ETF (REFA)(continued)
June 30, 2019
| | | | | | | | |
| Shares | | | | | Value | |
| | | | Common Stocks (continued) | | | |
| | | | Technology Hardware & Equipment (continued) | |
| | 30 | | | Hamamatsu Photonics KK | | $ | 1,168 | |
| | 61 | | | Hexagon AB, Class B | | | 3,390 | |
| | 8 | | | Hirose Electric Co. Ltd. | | | 893 | |
| | 114 | | | Hitachi High-Technologies Corp. | | | 5,862 | |
| | 1,950 | | | Hitachi Ltd. | | | 71,473 | |
| | 29 | | | Ingenico Group SA | | | 2,569 | |
| | 7 | | | Keyence Corp. | | | 4,297 | |
| | 856 | | | Konica Minolta, Inc. | | | 8,334 | |
| | 197 | | | Kyocera Corp. | | | 12,863 | |
| | 262 | | | Murata Manufacturing Co. Ltd. | | | 11,770 | |
| | 591 | | | NEC Corp. | | | 23,258 | |
| | 89 | | | Nippon Electric Glass Co. Ltd. | | | 2,254 | |
| | 3,983 | | | Nokia OYJ | | | 19,804 | |
| | 130 | | | Omron Corp. | | | 6,781 | |
| | 1,600 | | | Ricoh Co. Ltd. | | | 15,979 | |
| | 594 | | | Seiko Epson Corp. | | | 9,400 | |
| | 109 | | | Shimadzu Corp. | | | 2,673 | |
| | 129 | | | TDK Corp. | | | 9,986 | |
| | 1,692 | | | Telefonaktiebolaget LM Ericsson, Class B | | | 16,066 | |
| | 176 | | | Venture Corp. Ltd. | | | 2,119 | |
| | 100 | | | Yaskawa Electric Corp. | | | 3,397 | |
| | 153 | | | Yokogawa Electric Corp. | | | 2,999 | |
| | | | | | | | |
| | | | Total Technology Hardware & Equipment | | | 309,540 | |
| | | | | | | | |
| | | | Telecommunication Services—4.8% | |
| | 102 | | | 1&1 Drillisch AG | | | 3,406 | |
| | 9,212 | | | BT Group PLC | | | 23,033 | |
| | 28 | | | Cellnex Telecom SA2,3 | | | 1,038 | |
| | 3,849 | | | Deutsche Telekom AG | | | 66,678 | |
| | 38 | | | Elisa OYJ | | | 1,857 | |
| | 2,305 | | | HKT Trust & HKT Ltd. | | | 3,658 | |
| | 36 | | | Iliad SA1 | | | 4,049 | |
| | 1,528 | | | KDDI Corp. | | | 38,909 | |
| | 1,663 | | | Koninklijke KPN NV | | | 5,113 | |
| | 49 | | | Millicom International Cellular SA | | | 2,759 | |
| | 1,948 | | | Nippon Telegraph & Telephone Corp. | | | 90,710 | |
| | 1,419 | | | NTT DOCOMO, Inc. | | | 33,091 | |
| | 2,367 | | | Orange SA | | | 37,374 | |
| | 6,640 | | | PCCW Ltd. | | | 3,833 | |
| | 186 | | | Proximus SADP | | | 5,490 | |
| | 4,375 | | | Singapore Telecommunications Ltd. | | | 11,318 | |
| | 2,016 | | | Softbank Corp. | | | 26,187 | |
| | 1,482 | | | SoftBank Group Corp. | | | 71,046 | |
| | 764 | | | Spark New Zealand Ltd. | | | 2,053 | |
| | 19 | | | Swisscom AG | | | 9,551 | |
| | 143 | | | Tele2 AB, Class B | | | 2,088 | |
| | 23,156 | | | Telecom Italia SpA3 | | | 12,663 | |
| | 9,726 | | | Telecom Italia SpA-RSP1 | | | 5,052 | |
| | 2,005 | | | Telefonica Deutschland Holding AG | | | 5,610 | |
| | 5,262 | | | Telefonica SA | | | 43,271 | |
| | 502 | | | Telenor ASA | | | 10,663 | |
| | 1,672 | | | Telia Co. AB | | | 7,432 | |
| | 5,862 | | | Telstra Corp. Ltd. | | | 15,838 | |
| | 317 | | | TPG Telecom Ltd. | | | 1,433 | |
| | 128 | | | United Internet AG | | | 4,221 | |
| | 24,351 | | | Vodafone Group PLC | | | 40,078 | |
| | | | | | | | |
| | | | Total Telecommunication Services | | | 589,502 | |
| | | | | | | | |
| | | | | | | | |
| Shares | | | | | Value | |
| | | | Common Stocks (continued) | | | |
| | | | Transportation—3.1% | |
| | 11 | | | A.P. Moeller—Maersk A/S, Class A | | $ | 12,789 | |
| | 10 | | | A.P. Moeller—Maersk A/S, Class B | | | 12,423 | |
| | 20 | | | Aena SME SA2 | | | 3,970 | |
| | 23 | | | Aeroports de Paris | | | 4,065 | |
| | 441 | | | ANA Holdings, Inc. | | | 14,605 | |
| | 258 | | | Atlantia SpA | | | 6,731 | |
| | 68 | | | Auckland International Airport Ltd. | | | 450 | |
| | 472 | | | Aurizon Holdings Ltd. | | | 1,789 | |
| | 3,510 | | | Bollore SA | | | 15,509 | |
| | 68 | | | Central Japan Railway Co. | | | 13,620 | |
| | 1,185 | | | ComfortDelGro Corp. Ltd. | | | 2,330 | |
| | 1,560 | | | Deutsche Lufthansa AG | | | 26,772 | |
| | 1,665 | | | Deutsche Post AG | | | 54,797 | |
| | 111 | | | DSV A/S | | | 10,917 | |
| | 229 | | | East Japan Railway Co. | | | 21,425 | |
| | 489 | | | easyJet PLC | | | 5,932 | |
| | 38 | | | Fraport AG Frankfurt Airport Services Worldwide | | | 3,272 | |
| | 61 | | | Getlink SE | | | 979 | |
| | 162 | | | Hankyu Hanshin Holdings, Inc. | | | 5,804 | |
| | 316 | | | Japan Airlines Co. Ltd. | | | 10,098 | |
| | 50 | | | Japan Airport Terminal Co. Ltd. | | | 2,132 | |
| | 93 | | | Kamigumi Co. Ltd. | | | 2,201 | |
| | 141 | | | Keikyu Corp. | | | 2,428 | |
| | 49 | | | Keio Corp. | | | 3,225 | |
| | 52 | | | Keisei Electric Railway Co. Ltd. | | | 1,894 | |
| | 180 | | | Kintetsu Group Holdings Co. Ltd. | | | 8,621 | |
| | 121 | | | Kuehne + Nagel International AG | | | 17,983 | |
| | 100 | | | Kyushu Railway Co. | | | 2,914 | |
| | 419 | | | Mitsui OSK Lines Ltd. | | | 10,030 | |
| | 892 | | | MTR Corp. Ltd. | | | 6,006 | |
| | 158 | | | Nagoya Railroad Co. Ltd. | | | 4,372 | |
| | 298 | | | Nippon Express Co. Ltd. | | | 15,849 | |
| | 898 | | | Nippon Yusen KK | | | 14,411 | |
| | 154 | | | Odakyu Electric Railway Co. Ltd. | | | 3,769 | |
| | 272 | | | SATS Ltd. | | | 1,049 | |
| | 258 | | | Seibu Holdings, Inc. | | | 4,301 | |
| | 299 | | | SG Holdings Co. Ltd. | | | 8,478 | |
| | 1,388 | | | Singapore Airlines Ltd. | | | 9,510 | |
| | 164 | | | Sydney Airport | | | 925 | |
| | 146 | | | Tobu Railway Co. Ltd. | | | 4,255 | |
| | 471 | | | Tokyu Corp. | | | 8,354 | |
| | 219 | | | Transurban Group | | | 2,265 | |
| | 138 | | | West Japan Railway Co. | | | 11,164 | |
| | 578 | | | Yamato Holdings Co. Ltd. | | | 11,754 | |
| | | | | | | | |
| | | | Total Transportation | | | 386,167 | |
| | | | | | | | |
| | | | Utilities—5.8% | |
| | 454 | | | AGL Energy Ltd. | | | 6,375 | |
| | 187 | | | APA Group | | | 1,417 | |
| | 797 | | | AusNet Services | | | 1,049 | |
| | 25,626 | | | Centrica PLC | | | 28,629 | |
| | 1,488 | | | Chubu Electric Power Co., Inc. | | | 20,875 | |
| | 840 | | | Chugoku Electric Power Co., Inc. (The) | | | 10,588 | |
| | 88 | | | CK Infrastructure Holdings Ltd. | | | 718 | |
| | 820 | | | CLP Holdings Ltd. | | | 9,048 | |
| | 2,554 | | | E.ON SE | | | 27,779 | |
| | 3,795 | | | EDP—Energias de Portugal SA | | | 14,443 | |
| | 295 | | | Electric Power Development Co. Ltd. | | | 6,703 | |
The accompanying notes are an integral part of these financial statements.
Invesco International Revenue ETF (REFA)(continued)
June 30, 2019
| | | | | | | | |
| Shares | | | | | Value | |
| | | | Common Stocks (continued) | | | |
| | | | Utilities (continued) | |
| | 4,161 | | | Electricite de France SA | | $ | 52,527 | |
| | 40 | | | Enagas SA1 | | | 1,069 | |
| | 690 | | | Endesa SA1 | | | 17,766 | |
| | 10,091 | | | Enel SpA | | | 70,559 | |
| | 3,422 | | | Engie SA | | | 51,986 | |
| | 214 | | | Fortum OYJ | | | 4,736 | |
| | 1,198 | | | HK Electric Investments & HK Electric Investments Ltd. | | | 1,227 | |
| | 1,768 | | | Hong Kong & China Gas Co. Ltd. | | | 3,920 | |
| | 3,274 | | | Iberdrola SA | | | 32,683 | |
| | 659 | | | Innogy SE2 | | | 31,295 | |
| | 2,076 | | | Kansai Electric Power Co., Inc. (The) | | | 23,787 | |
| | 1,525 | | | Kyushu Electric Power Co., Inc. | | | 14,975 | |
| | 563 | | | Meridian Energy Ltd. | | | 1,796 | |
| | 1,480 | | | National Grid PLC | | | 15,743 | |
| | 712 | | | Naturgy Energy Group SA | | | 19,646 | |
| | 114 | | | Orsted A/S2 | | | 9,873 | |
| | 528 | | | Osaka Gas Co. Ltd. | | | 9,199 | |
| | 22 | | | Power Assets Holdings Ltd. | | | 158 | |
| | 79 | | | Red Electrica Corp. SA1 | | | 1,648 | |
| | 418 | | | RWE AG | | | 10,315 | |
| | 73 | | | Severn Trent PLC | | | 1,903 | |
| | 464 | | | Snam SpA | | | 2,310 | |
| | 1,704 | | | SSE PLC | | | 24,333 | |
| | 1,111 | | | Suez | | | 16,055 | |
| | 320 | | | Terna Rete Elettrica Nazionale SpA | | | 2,041 | |
| | 80 | | | Toho Gas Co. Ltd. | | | 2,944 | |
| | 1,459 | | | Tohoku Electric Power Co., Inc. | | | 14,747 | |
| | 7,876 | | | Tokyo Electric Power Co. Holdings, Inc.3 | | | 41,083 | |
| | 535 | | | Tokyo Gas Co. Ltd. | | | 12,600 | |
| | 2,299 | | | Uniper SE1 | | | 69,720 | |
| | 183 | | | United Utilities Group PLC | | | 1,823 | |
| | 1,043 | | | Veolia Environnement SA | | | 25,442 | |
| | 24 | | | Verbund AG | | | 1,257 | |
| | | | | | | | |
| | | | Total Utilities | | | 718,790 | |
| | | | | | | | |
| | |
| | | | | | | | |
| | | | Total Common Stocks
(Cost $12,465,082) | | | 12,226,755 | |
| | | | | | | | |
| | |
| | | | | | | | |
| | | | Preferred Stocks—0.8% | | | |
| | | | Automobiles & Components—0.7% | |
| | 107 | | | Bayerische Motoren Werke AG, 6.20% | | | 6,653 | |
| | 1 | | | Porsche Automobil Holding SE, 3.72% | | | 65 | |
| | 507 | | | Volkswagen AG, 3.14% | | | 85,578 | |
| | | | | | | | |
| | | | Total Automobiles & Components | | | 92,296 | |
| | | | | | | | |
| | | | Capital Goods—0.0%5 | |
| | 105,932 | | | Rolls-Royce Holdings PLC3 | | | 135 | |
| | 279,201 | | | Rolls-Royce Holdings PLC, Class C3 | | | 355 | |
| | | | | | | | |
| | | | Total Capital Goods | | | 490 | |
| | | | | | | | |
| | | | Health Care Equipment & Services—0.0%5 | |
| | 4 | | | Sartorius AG, 0.34% | | | 822 | |
| | | | | | | | |
| | | | Household & Personal Products—0.1% | |
| | 74 | | | Henkel AG & Co KGaA, 2.03% | | | 7,249 | |
| | | | | | | | |
| | | | | | | | |
| Shares | | | | | Value | |
| | | | Preferred Stocks (continued) | | | |
| | | | Materials—0.0%5 | |
| | 28 | | | FUCHS PETROLUB SE, 2.60%1 | | $ | 1,103 | |
| | | | | | | | |
| | | | Total Preferred Stocks
(Cost $99,744) | | | 101,960 | |
| | | | | | | | |
| | |
| | | | | | | | |
| | | | Money Market Fund—0.0%5 | | | |
| | 4,624 | | | Premier U.S. Government Money Portfolio, 2.26%6,7
(Cost $4,624) | | | 4,624 | |
| | | | | | | | |
| | |
| | | | | | | | |
| | | | Investment of Cash Collateral for Securities
Loaned—2.8% | |
| | 257,104 | | | Invesco Government & Agency Portfolio—Institutional Class, 2.27%6,7 | | | 257,104 | |
| | 85,667 | | | Invesco Liquid Assets Portfolio—Institutional Class, 2.41%6,7 | | | 85,701 | |
| | | | | | | | |
| | | | Total Investment of Cash Collateral for Securities Loaned
(Cost $342,802) | | | 342,805 | |
| | | | | | | | |
| | |
| | | | Total Investments—102.6%
(Cost $12,912,252) | | | 12,676,144 | |
| | |
| | | | Liabilities in Excess of Other
Assets—(2.6)% | | | (318,495 | ) |
| | | | | | | | |
| | |
| | | | Net Assets—100.0% | | $ | 12,357,649 | |
| | | | | | | | |
REIT—Real Estate Investment Trust
| 1 | All or a portion of the security was on loan. The aggregate value of the securities on loan was $324,914; total value of the collateral held by the Fund was $342,805. |
| 2 | Represents securities sold under Rule 144A, which are exempt from registration under the Securities Act of 1933, as amended. These securities have been determined to be liquid under guidelines established by the Board of Trustees. These securities amount to $139,067 or 1.13% of the Fund’s net assets at period end. |
| 3 | Non-income producing security. |
| 4 | American Depositary Receipt. |
| 6 | The security and the Fund are advised by wholly-owned subsidiaries of Invesco Ltd. and are therefore considered to be affiliated. The rate shown is the 7-day SEC standardized yield as of June 30, 2019. |
| 7 | The security has been segregated to satisfy the commitment to return the cash collateral received in securities lending transactions upon the borrower’s return of the securities loaned. See Note 6. |
The accompanying notes are an integral part of these financial statements.
Invesco International Revenue ETF (REFA)(continued)
June 30, 2019
Geographical Holdings
| | | | | | | | |
Country | | Value | | | % of Net
Assets | |
| Japan | | $ | 4,275,106 | | | | 34.6 | % |
| France | | | 1,502,717 | | | | 12.2 | |
| Germany | | | 1,451,221 | | | | 11.7 | |
| United Kingdom | | | 1,251,475 | | | | 10.1 | |
| Netherlands | | | 695,812 | | | | 5.6 | |
| Switzerland | | | 648,098 | | | | 5.2 | |
| Australia | | | 408,114 | | | | 3.3 | |
| Spain | | | 381,276 | | | | 3.1 | |
| United States | | | 365,184 | | | | 3.0 | |
| Italy | | | 313,484 | | | | 2.5 | |
| Hong Kong | | | 280,891 | | | | 2.3 | |
| Sweden | | | 194,437 | | | | 1.6 | |
| Singapore | | | 145,779 | | | | 1.2 | |
| Norway | | | 108,605 | | | | 0.9 | |
| Denmark | | | 105,839 | | | | 0.9 | |
| Belgium | | | 101,435 | | | | 0.8 | |
| Finland | | | 88,877 | | | | 0.7 | |
| Luxembourg | | | 74,092 | | | | 0.6 | |
| Ireland | | | 55,133 | | | | 0.5 | |
| Austria | | | 53,524 | | | | 0.4 | |
| Portugal | | | 44,777 | | | | 0.4 | |
| Israel | | | 35,162 | | | | 0.3 | |
| South Africa | | | 29,975 | | | | 0.2 | |
| Macau | | | 21,220 | | | | 0.2 | |
| China | | | 13,242 | | | | 0.1 | |
| Russia | | | 10,473 | | | | 0.1 | |
| New Zealand | | | 10,333 | | | | 0.1 | |
| Chile | | | 4,023 | | | | 0.0 | 1 |
| Colombia | | | 2,759 | | | | 0.0 | 1 |
| Mexico | | | 1,827 | | | | 0.0 | 1 |
| United Arab Emirates | | | 1,254 | | | | 0.0 | 1 |
| | | | | | | | |
| Total Investments | | | 12,676,144 | | | | 102.6 | |
| Liabilities in Excess of Other Assets | | | (318,495 | ) | | | (2.6 | ) |
| | | | | | | | |
| Net Assets | | $ | 12,357,649 | | | | 100.0 | % |
| | | | | | | | |
The accompanying notes are an integral part of these financial statements.
Schedule of Investments
Invesco Global Revenue ETF (RGLB)
June 30, 2019
| | | | | | | | |
| Shares | | | | | Value | |
| | | | Common Stocks—98.9% | | | |
| | | | Automobiles & Components—6.4% | |
| | 503 | | | Aisin Seiki Co. Ltd. | | $ | 17,321 | |
| | 134 | | | Aptiv PLC | | | 10,831 | |
| | 5,000 | | | BAIC Motor Corp. Ltd., Class H1 | | | 3,136 | |
| | 533 | | | Bayerische Motoren Werke AG | | | 39,508 | |
| | 551 | | | Bridgestone Corp.2 | | | 21,694 | |
| | 1,095 | | | Daimler AG | | | 61,009 | |
| | 588 | | | Denso Corp. | | | 24,739 | |
| | 2,796 | | | Fiat Chrysler Automobiles NV | | | 39,056 | |
| | 5,343 | | | Ford Motor Co. | | | 54,659 | |
| | 4,515 | | | Geely Automobile Holdings Ltd. | | | 7,721 | |
| | 1,413 | | | General Motors Co. | | | 54,443 | |
| | 2,113 | | | Honda Motor Co. Ltd. | | | 54,620 | |
| | 73 | | | Hyundai Mobis Co. Ltd. | | | 14,889 | |
| | 281 | | | Hyundai Motor Co. | | | 34,071 | |
| | 1,006 | | | Isuzu Motors Ltd. | | | 11,457 | |
| | 515 | | | Kia Motors Corp. | | | 19,625 | |
| | 87 | | | Lear Corp. | | | 12,116 | |
| | 356 | | | Magna International, Inc. | | | 17,752 | |
| | 1,409 | | | Mazda Motor Corp. | | | 14,706 | |
| | 2,350 | | | Mitsubishi Motors Corp. | | | 11,255 | |
| | 201 | | | NIO, Inc.2,3,4 | | | 513 | |
| | 6,075 | | | Nissan Motor Co. Ltd. | | | 43,507 | |
| | 1,386 | | | Peugeot SA | | | 34,203 | |
| | 695 | | | Pirelli & C SpA1 | | | 4,114 | |
| | 459 | | | Renault SA | | | 28,901 | |
| | 604 | | | Subaru Corp. | | | 14,682 | |
| | 1,409 | | | Sumitomo Electric Industries Ltd. | | | 18,499 | |
| | 375 | | | Suzuki Motor Corp. | | | 17,626 | |
| | 5,569 | | | Tata Motors Ltd.3 | | | 13,114 | |
| | 38 | | | Tesla, Inc.2,3 | | | 8,491 | |
| | 1,907 | | | Toyota Motor Corp. | | | 118,378 | |
| | 503 | | | Yamaha Motor Co. Ltd. | | | 8,940 | |
| | | | | | | | |
| | | | Total Automobiles & Components | | | 835,576 | |
| | | | | | | | |
| | | | Banks—7.9% | |
| | 16,100 | | | Agricultural Bank of China Ltd., Class A | | | 8,439 | |
| | 51 | | | Al Rajhi Bank | | | 947 | |
| | 285 | | | Alior Bank SA3 | | | 3,807 | |
| | 746 | | | Australia & New Zealand Banking Group Ltd. | | | 14,768 | |
| | 689 | | | Axis Bank Ltd.3 | | | 8,071 | |
| | 112 | | | Banco BBVA Argentina SA4 | | | 1,268 | |
| | 3,423 | | | Banco Bilbao Vizcaya Argentaria SA | | | 19,167 | |
| | 3,343 | | | Banco Bradesco SA | | | 29,177 | |
| | 55,418 | | | Banco de Chile | | | 8,154 | |
| | 1,619 | | | Banco do Brasil SA | | | 22,786 | |
| | 1,211 | | | Banco Santander Brasil SA | | | 14,364 | |
| | 7,353 | | | Banco Santander SA | | | 34,168 | |
| | 8,013 | | | Bank Central Asia Tbk PT | | | 17,002 | |
| | 2,276 | | | Bank Millennium SA3 | | | 5,713 | |
| | 1,581 | | | Bank of America Corp. | | | 45,849 | |
| | 1,200 | | | Bank of Chengdu Co. Ltd., Class A3 | | | 1,543 | |
| | 51,183 | | | Bank of China Ltd., Class H | | | 21,620 | |
| | 8,900 | | | Bank of Communications Co. Ltd., Class A | | | 7,930 | |
| | 2,317 | | | BDO Unibank, Inc. | | | 6,331 | |
| | 677 | | | BNP Paribas SA | | | 32,199 | |
| | 2,463 | | | CaixaBank SA | | | 7,063 | |
| | 6,500 | | | China CITIC Bank Corp. Ltd., Class A | | | 5,650 | |
| | 68,627 | | | China Construction Bank Corp., Class H | | | 59,118 | |
| | 1,200 | | | China Merchants Bank Co. Ltd., Class A | | | 6,286 | |
| | | | | | | | |
| Shares | | | | | Value | |
| | | | Common Stocks (continued) | | | |
| | | | Banks (continued) | |
| | 6,320 | | | China Minsheng Banking Corp. Ltd., Class A | | $ | 5,843 | |
| | 629 | | | Citigroup, Inc. | | | 44,049 | |
| | 473 | | | Commercial International Bank Egypt SAE | | | 2,091 | |
| | 763 | | | Commerzbank AG | | | 5,491 | |
| | 3,058 | | | Credit Agricole SA | | | 36,722 | |
| | 501 | | | DNB ASA | | | 9,325 | |
| | 9,644 | | | Dubai Islamic Bank PJSC | | | 13,469 | |
| | 183 | | | Erste Group Bank AG3 | | | 6,802 | |
| | 6,035 | | | Eurobank Ergasias SA3 | | | 5,945 | |
| | 313 | | | FinecoBank Banca Fineco SpA | | | 3,497 | |
| | 836 | | | Grupo Financiero Banorte SAB de CV, Class O | | | 4,846 | |
| | 4,678 | | | HSBC Holdings PLC | | | 39,110 | |
| | 1,770 | | | ICICI Bank Ltd. | | | 11,208 | |
| | 34,481 | | | Industrial & Commercial Bank of China Ltd., Class H | | | 25,157 | |
| | 1,651 | | | ING Groep NV | | | 19,170 | |
| | 1,402 | | | Israel Discount Bank Ltd., Class A | | | 5,727 | |
| | 526 | | | JPMorgan Chase & Co. | | | 58,807 | |
| | 2,527 | | | Kasikornbank PCL | | | 15,491 | |
| | 24,717 | | | Lloyds Banking Group PLC | | | 17,802 | |
| | 11,230 | | | Masraf Al Rayan QSC | | | 11,750 | |
| | 1,088 | | | MCB Bank Ltd. | | | 1,188 | |
| | 6,110 | | | Mitsubishi UFJ Financial Group, Inc. | | | 29,036 | |
| | 1,133 | | | Moneta Money Bank AS1 | | | 3,884 | |
| | 1,762 | | | National Bank of Greece SA3 | | | 4,836 | |
| | 78 | | | National Commercial Bank | | | 1,152 | |
| | 189 | | | OTP Bank Nyrt | | | 7,535 | |
| | 16,101 | | | Postal Savings Bank of China Co. Ltd., Class H1,2 | | | 9,563 | |
| | 488 | | | Royal Bank of Canada | | | 38,864 | |
| | 3,680 | | | Royal Bank of Scotland Group PLC | | | 10,294 | |
| | 96 | | | Saudi British Bank (The) | | | 1,060 | |
| | 1,632 | | | Sberbank of Russia PJSC4 | | | 25,100 | |
| | 912 | | | Security Bank Corp. | | | 3,026 | |
| | 5,031 | | | Shanghai Commercial & Savings Bank Ltd. (The) | | | 9,103 | |
| | 891 | | | Societe Generale SA | | | 22,546 | |
| | 1,459 | | | Standard Chartered PLC | | | 13,262 | |
| | 4,277 | | | State Bank of India3 | | | 22,383 | |
| | 805 | | | Sumitomo Mitsui Financial Group, Inc. | | | 28,437 | |
| | 18 | | | SVB Financial Group3 | | | 4,043 | |
| | 984 | | | UniCredit SpA | | | 12,131 | |
| | 8,409 | | | VTB Bank PJSC | | | 10,579 | |
| | 953 | | | Wells Fargo & Co. | | | 45,096 | |
| | | | | | | | |
| | | | Total Banks | | | 1,026,840 | |
| | | | | | | | |
| | | | Capital Goods—10.4% | |
| | 1,167 | | | ABB Ltd. | | | 23,448 | |
| | 396 | | | ACS Actividades de Construccion y Servicios SA | | | 15,833 | |
| | 302 | | | AGC, Inc. | | | 10,441 | |
| | 222 | | | Airbus SE | | | 31,521 | |
| | 7,125 | | | Alfa SAB de CV, Class A | | | 6,995 | |
| | 9,246 | | | Alliance Global Group, Inc. | | | 2,786 | |
| | 112 | | | ANDRITZ AG | | | 4,222 | |
| | 284 | | | Arconic, Inc. | | | 7,333 | |
| | 1,952 | | | BAE Systems PLC | | | 12,307 | |
| | 243 | | | BOC Aviation Ltd.1 | | | 2,040 | |
| | 99 | | | Boeing Co. (The) | | | 36,037 | |
| | 3,120 | | | Bombardier, Inc., Class B3 | | | 5,253 | |
| | 531 | | | Bouygues SA | | | 19,695 | |
| | 152 | | | CAE, Inc. | | | 4,096 | |
| | 172 | | | Caterpillar, Inc. | | | 23,442 | |
The accompanying notes are an integral part of these financial statements.
Invesco Global Revenue ETF (RGLB)(continued)
June 30, 2019
| | | | | | | | |
| Shares | | | | | Value | |
| | | | Common Stocks (continued) | | | |
| | | | Capital Goods (continued) | |
| | 10,528 | | | China Communications Construction Co. Ltd., Class H | | $ | 9,420 | |
| | 3,907 | | | China Communications Services Corp. Ltd., Class H | | | 3,031 | |
| | 6,969 | | | China Railway Construction Corp. Ltd., Class H | | | 8,546 | |
| | 10,603 | | | China Railway Group Ltd., Class H | | | 8,062 | |
| | 2,900 | | | China Shipbuilding Industry Co. Ltd., Class A | | | 2,348 | |
| | 3,814 | | | China State Construction International Holdings Ltd. | | | 3,915 | |
| | 199 | | | CIMIC Group Ltd. | | | 6,252 | |
| | 24,222 | | | CITIC Ltd. | | | 34,911 | |
| | 133 | | | CJ Corp. | | | 11,634 | |
| | 1,073 | | | CNH Industrial NV | | | 11,019 | |
| | 100 | | | Contemporary Amperex Technology Co. Ltd., Class A3 | | | 1,003 | |
| | 76 | | | Cummins, Inc. | | | 13,022 | |
| | 1,128 | | | Daewoo Engineering & Construction Co. Ltd.3 | | | 4,826 | |
| | 170 | | | Daewoo Shipbuilding & Marine Engineering Co. Ltd.3 | | | 4,814 | |
| | 124 | | | DCC PLC | | | 11,079 | |
| | 108 | | | Deere & Co. | | | 17,897 | |
| | 500 | | | Dongfang Electric Corp. Ltd., Class A3 | | | 773 | |
| | 802 | | | Embraer SA | | | 4,062 | |
| | 147 | | | Ferguson PLC | | | 10,477 | |
| | 286 | | | Fluor Corp. | | | 9,635 | |
| | 5,540 | | | Fosun International Ltd. | | | 7,361 | |
| | 101 | | | Fuji Electric Co. Ltd. | | | 3,483 | |
| | 104 | | | General Dynamics Corp. | | | 18,909 | |
| | 4,189 | | | General Electric Co. | | | 43,984 | |
| | 172 | | | GS Engineering & Construction Corp. | | | 6,011 | |
| | 622 | | | Hanwha Corp. | | | 14,383 | |
| | 161 | | | HD Supply Holdings, Inc.3 | | | 6,485 | |
| | 48 | | | HEICO Corp.2 | | | 6,423 | |
| | 1,107 | | | Hino Motors Ltd. | | | 9,319 | |
| | 200 | | | Hitachi Construction Machinery Co. Ltd. | | | 5,201 | |
| | 101 | | | HOCHTIEF AG | | | 12,319 | |
| | 29 | | | Huntington Ingalls Industries, Inc. | | | 6,517 | |
| | 146 | | | Hyundai Engineering & Construction Co. Ltd. | | | 6,777 | |
| | 43 | | | Hyundai Heavy Industries Holdings Co. Ltd. | | | 12,066 | |
| | 302 | | | IHI Corp. | | | 7,280 | |
| | 88 | | | Ingersoll-Rand PLC | | | 11,147 | |
| | 1,934 | | | ITOCHU Corp. | | | 36,987 | |
| | 103 | | | Jacobs Engineering Group, Inc. | | | 8,692 | |
| | 692 | | | Jardine Matheson Holdings Ltd. | | | 43,610 | |
| | 678 | | | Jardine Strategic Holdings Ltd. | | | 25,852 | |
| | 201 | | | JGC Corp. | | | 2,757 | |
| | 378 | | | Johnson Controls International PLC | | | 15,615 | |
| | 600 | | | JTEKT Corp. | | | 7,273 | |
| | 632 | | | Kajima Corp. | | | 8,670 | |
| | 300 | | | Kawasaki Heavy Industries Ltd. | | | 7,053 | |
| | 404 | | | Kingspan Group PLC | | | 21,973 | |
| | 54 | | | Knorr-Bremse AG | | | 6,027 | |
| | 5,591 | | | KOC Holding AS | | | 16,955 | |
| | 479 | | | Komatsu Ltd. | | | 11,559 | |
| | 56 | | | Korea Shipbuilding & Offshore Engineering Co. Ltd.3 | | | 5,747 | |
| | 604 | | | Kubota Corp. | | | 10,052 | |
| | 491 | | | Leonardo SpA | | | 6,232 | |
| | 604 | | | LIXIL Group Corp. | | | 9,553 | |
| | | | | | | | |
| Shares | | | | | Value | |
| | | | Common Stocks (continued) | | | |
| | | | Capital Goods (continued) | |
| | 65 | | | Lockheed Martin Corp. | | $ | 23,630 | |
| | 3,825 | | | Marubeni Corp. | | | 25,313 | |
| | 17,998 | | | Metallurgical Corp. of China., Ltd., Class H | | | 4,815 | |
| | 300 | | | MINEBEA MITSUMI, Inc. | | | 5,082 | |
| | 127 | | | MISUMI Group, Inc. | | | 3,185 | |
| | 1,771 | | | Mitsubishi Corp. | | | 46,683 | |
| | 1,363 | | | Mitsubishi Electric Corp. | | | 17,952 | |
| | 403 | | | Mitsubishi Heavy Industries Ltd. | | | 17,547 | |
| | 1,447 | | | Mitsui & Co. Ltd. | | | 23,557 | |
| | 100 | | | MonotaRO Co. Ltd. | | | 2,437 | |
| | 63 | | | Nabtesco Corp.2 | | | 1,751 | |
| | 42 | | | Northrop Grumman Corp. | | | 13,571 | |
| | 704 | | | NSK Ltd. | | | 6,273 | |
| | 1,000 | | | Obayashi Corp. | | | 9,848 | |
| | 645 | | | Posco International Corp. | | | 10,251 | |
| | 73 | | | Raytheon Co. | | | 12,693 | |
| | 791 | | | Rolls-Royce Holdings PLC3 | | | 8,460 | |
| | 183 | | | Samsung C&T Corp. | | | 15,167 | |
| | 226 | | | Samsung Engineering Co. Ltd.3 | | | 3,357 | |
| | 577 | | | Samsung Heavy Industries Co. Ltd.3 | | | 4,078 | |
| | 64 | | | Schindler Holding AG | | | 14,264 | |
| | 600 | | | Shenzhen Inovance Technology Co. Ltd., Class A3 | | | 2,001 | |
| | 316 | | | Siemens AG | | | 37,641 | |
| | 247 | | | Siemens Gamesa Renewable Energy SA | | | 4,112 | |
| | 2,000 | | | Sinotruk Hong Kong Ltd. | | | 3,461 | |
| | 198 | | | SK Holdings Co. Ltd. | | | 39,783 | |
| | 231 | | | SNC-Lavalin Group, Inc. | | | 4,681 | |
| | 42 | | | Spirax-Sarco Engineering PLC | | | 4,910 | |
| | 64 | | | Spirit AeroSystems Holdings, Inc., Class A | | | 5,208 | |
| | 1,409 | | | Sumitomo Corp. | | | 21,349 | |
| | 200 | | | Taisei Corp. | | | 7,267 | |
| | 185 | | | Textron, Inc. | | | 9,812 | |
| | 457 | | | Toshiba Corp. | | | 14,231 | |
| | 100 | | | TOTO Ltd. | | | 3,949 | |
| | 805 | | | Toyota Tsusho Corp. | | | 24,395 | |
| | 230 | | | United Technologies Corp. | | | 29,946 | |
| | 54 | | | Vestas Wind Systems A/S | | | 4,672 | |
| | 331 | | | Vinci SA | | | 33,947 | |
| | 1,285 | | | Volvo AB, Class B | | | 20,407 | |
| | 25 | | | W.W. Grainger, Inc. | | | 6,706 | |
| | 59 | | | Wabtec Corp.2 | | | 4,234 | |
| | 1,752 | | | Weichai Power Co. Ltd., Class H | | | 2,960 | |
| | | | | | | | |
| | | | Total Capital Goods | | | 1,360,033 | |
| | | | | | | | |
| | | | Commercial & Professional Services—0.8% | |
| | 81 | | | Copart, Inc.3 | | | 6,054 | |
| | 788 | | | Country Garden Services Holdings Co. Ltd. | | | 1,822 | |
| | 500 | | | Dai Nippon Printing Co. Ltd. | | | 10,655 | |
| | 2,457 | | | G4S PLC | | | 6,504 | |
| | 194 | | | ISS A/S | | | 5,864 | |
| | 129 | | | ManpowerGroup, Inc. | | | 12,461 | |
| | 201 | | | Persol Holdings Co. Ltd. | | | 4,722 | |
| | 275 | | | Randstad NV | | | 15,126 | |
| | 302 | | | Recruit Holdings Co. Ltd. | | | 10,074 | |
| | 1,233 | | | Rentokil Initial PLC | | | 6,238 | |
| | 9 | | | SGS SA | | | 22,957 | |
| | | | | | | | |
| | | | Total Commercial & Professional Services | | | 102,477 | |
| | | | | | | | |
The accompanying notes are an integral part of these financial statements.
Invesco Global Revenue ETF (RGLB)(continued)
June 30, 2019
| | | | | | | | |
| Shares | | | | | Value | |
| | | | Common Stocks (continued) | | | |
| | | | Consumer Durables & Apparel—2.0% | |
| | 42 | | | adidas AG | | $ | 12,986 | |
| | 89 | | | Capri Holdings Ltd.3 | | | 3,087 | |
| | 197 | | | D.R. Horton, Inc. | | | 8,497 | |
| | 483 | | | Electrolux AB, Series B | | | 12,353 | |
| | 26 | | | Fila Korea Ltd. | | | 1,727 | |
| | 3,123 | | | Haier Electronics Group Co. Ltd.3 | | | 8,634 | |
| | 777 | | | Husqvarna AB, Class B | | | 7,274 | |
| | 604 | | | Iida Group Holdings Co. Ltd. | | | 9,755 | |
| | 312 | | | LG Electronics, Inc. | | | 21,428 | |
| | 1,006 | | | Li Ning Co. Ltd. | | | 2,372 | |
| | 71 | | | LVMH Moet Hennessy Louis Vuitton SE | | | 30,264 | |
| | 288 | | | Newell Brands, Inc. | | | 4,441 | |
| | 218 | | | NIKE, Inc., Class B | | | 18,301 | |
| | 100 | | | Oppein Home Group, Inc., Class A | | | 1,567 | |
| | 3,694 | | | Panasonic Corp. | | | 30,775 | |
| | 58 | | | Polaris Industries, Inc. | | | 5,291 | |
| | 185 | | | PulteGroup, Inc. | | | 5,850 | |
| | 56 | | | PVH Corp. | | | 5,300 | |
| | 201 | | | Sega Sammy Holdings, Inc. | | | 2,442 | |
| | 906 | | | Sharp Corp. | | | 9,940 | |
| | 539 | | | Sony Corp. | | | 28,256 | |
| | 2,000 | | | Tatung Co. Ltd.3 | | | 1,207 | |
| | 141 | | | Under Armour, Inc., Class A3 | | | 3,574 | |
| | 101 | | | VF Corp. | | | 8,822 | |
| | 78 | | | Whirlpool Corp. | | | 11,104 | |
| | 2,724 | | | Yue Yuen Industrial Holdings Ltd. | | | 7,462 | |
| | 1,300 | | | Zhejiang Semir Garment Co. Ltd., Class A | | | 2,093 | |
| | | | | | | | |
| | | | Total Consumer Durables & Apparel | | | 264,802 | |
| | | | | | | | |
| | | | Consumer Services—0.9% | |
| | 1,378 | | | Alsea SAB de CV3 | | | 2,710 | |
| | 386 | | | Aramark | | | 13,919 | |
| | 300 | | | Benesse Holdings, Inc. | | | 6,984 | |
| | 1,006 | | | China Education Group Holdings Ltd. | | | 1,571 | |
| | 6 | | | Chipotle Mexican Grill, Inc.3 | | | 4,397 | |
| | 102 | | | Flight Centre Travel Group Ltd. | | | 2,974 | |
| | 110 | | | Hilton Worldwide Holdings, Inc. | | | 10,752 | |
| | 87 | | | Marriott International, Inc., Class A | | | 12,205 | |
| | 368 | | | Melco Resorts & Entertainment Ltd.4 | | | 7,993 | |
| | 345 | | | MGM Resorts International | | | 9,857 | |
| | 7,666 | | | Minor International PCL | | | 10,249 | |
| | 174 | | | Saudi Airlines Catering Co. | | | 3,962 | |
| | 5,788 | | | SJM Holdings Ltd. | | | 6,586 | |
| | 1,100 | | | Songcheng Performance Development Co. Ltd., Class A | | | 3,706 | |
| | 128 | | | Stars Group, Inc. (The)3 | | | 2,189 | |
| | 2,183 | | | Tabcorp Holdings Ltd. | | | 6,817 | |
| | 1,107 | | | TUI AG | | | 10,882 | |
| | 142 | | | Yum China Holdings, Inc. | | | 6,560 | |
| | | | | | | | |
| | | | Total Consumer Services | | | 124,313 | |
| | | | | | | | |
| | | | Diversified Financials—3.2% | |
| | 234 | | | Ally Financial, Inc. | | | 7,252 | |
| | 62 | | | Ameriprise Financial, Inc. | | | 9,000 | |
| | 129 | | | ASX Ltd. | | | 7,457 | |
| | 258 | | | AXA Equitable Holdings, Inc. | | | 5,392 | |
| | 201 | | | Banco BTG Pactual SA | | | 2,668 | |
| | 259 | | | Berkshire Hathaway, Inc., Class B3 | | | 55,211 | |
| | 511 | | | Brookfield Asset Management, Inc., Class A | | | 24,499 | |
| | 700 | | | Caitong Securities Co. Ltd., Class A | | | 1,119 | |
| | | | | | | | |
| Shares | | | | | Value | |
| | | | Common Stocks (continued) | | | |
| | | | Diversified Financials (continued) | |
| | 160 | | | Capital One Financial Corp. | | $ | 14,518 | |
| | 34 | | | Cboe Global Markets, Inc. | | | 3,523 | |
| | 166 | | | Challenger Ltd. | | | 773 | |
| | 308 | | | CI Financial Corp. | | | 5,030 | |
| | 1,485 | | | Credit Suisse Group AG3 | | | 17,828 | |
| | 2,093 | | | Deutsche Bank AG | | | 16,160 | |
| | 400 | | | East Money Information Co. Ltd., Class A | | | 789 | |
| | 864 | | | EXOR NV | | | 60,610 | |
| | 23 | | | FactSet Research Systems, Inc. | | | 6,591 | |
| | 96 | | | Goldman Sachs Group, Inc. (The) | | | 19,642 | |
| | 135 | | | GT Capital Holdings, Inc. | | | 2,477 | |
| | 5,810 | | | Haci Omer Sabanci Holding AS | | | 8,629 | |
| | 101 | | | Hargreaves Lansdown PLC | | | 2,467 | |
| | 100 | | | Hithink RoyalFlush Information Network Co. Ltd., Class A | | | 1,432 | |
| | 900 | | | Huaxi Securities Co., Ltd., Class A | | | 1,376 | |
| | 312 | | | Jefferies Financial Group, Inc. | | | 6,000 | |
| | 134 | | | KKR & Co., Inc., Class A | | | 3,386 | |
| | 9 | | | MarketAxess Holdings, Inc. | | | 2,893 | |
| | 761 | | | Meritz Securities Co. Ltd. | | | 3,533 | |
| | 475 | | | Morgan Stanley | | | 20,810 | |
| | 1,500 | | | Muangthai Capital PCL | | | 2,764 | |
| | 216 | | | Onex Corp. | | | 13,057 | |
| | 726 | | | ORIX Corp. | | | 10,835 | |
| | 180 | | | Reinet Investments SCA | | | 2,900 | |
| | 46 | | | S&P Global, Inc. | | | 10,478 | |
| | 700 | | | SDIC Capital Co., Ltd., Class A | | | 1,428 | |
| | 4,031 | | | Singapore Exchange Ltd. | | | 23,597 | |
| | 1,116 | | | Standard Life Aberdeen PLC | | | 4,184 | |
| | 245 | | | Synchrony Financial | | | 8,494 | |
| | 100 | | | Tokyo Century Corp. | | | 4,218 | |
| | 1,849 | | | UBS Group AG3 | | | 21,998 | |
| | 121 | | | Voya Financial, Inc. | | | 6,691 | |
| | | | | | | | |
| | | | Total Diversified Financials | | | 421,709 | |
| | | | | | | | |
| | | | Energy—11.0% | |
| | 634 | | | Baker Hughes a GE Co. | | | 15,615 | |
| | 11,737 | | | Banpu PCL | | | 5,741 | |
| | 2,878 | | | Bharat Petroleum Corp. Ltd. | | | 16,363 | |
| | 15,122 | | | BP PLC | | | 105,582 | |
| | 13,236 | | | Bukit Asam Tbk PT | | | 2,773 | |
| | 426 | | | Caltex Australia Ltd. | | | 7,399 | |
| | 650 | | | Cenovus Energy, Inc. | | | 5,745 | |
| | 497 | | | Chevron Corp. | | | 61,847 | |
| | 3,332 | | | China Oilfield Services Ltd., Class H | | | 3,297 | |
| | 54,325 | | | China Petroleum & Chemical Corp., Class H | | | 36,924 | |
| | 11,281 | | | CNOOC Ltd. | | | 19,291 | |
| | 507 | | | ConocoPhillips | | | 30,927 | |
| | 796 | | | Empresas COPEC SA | | | 8,704 | |
| | 459 | | | Enbridge, Inc. | | | 16,614 | |
| | 2,170 | | | Eni SpA | | | 36,094 | |
| | 224 | | | EOG Resources, Inc. | | | 20,868 | |
| | 1,486 | | | Equinor ASA | | | 29,359 | |
| | 1,329 | | | Exxon Mobil Corp. | | | 101,841 | |
| | 7,234 | | | Gazprom PJSC4 | | | 52,996 | |
| | 202 | | | Grupa Lotos SA | | | 4,588 | |
| | 4,800 | | | Guanghui Energy Co., Ltd., Class A | | | 2,488 | |
| | 3,533 | | | Hindustan Petroleum Corp. Ltd. | | | 14,845 | |
| | 187 | | | HollyFrontier Corp. | | | 8,654 | |
| | 688 | | | Idemitsu Kosan Co. Ltd. | | | 20,690 | |
The accompanying notes are an integral part of these financial statements.
Invesco Global Revenue ETF (RGLB)(continued)
June 30, 2019
| | | | | | | | |
| Shares | | | | | Value | |
| | | | Common Stocks (continued) | | | |
| | | | Energy (continued) | |
| | 12,010 | | | Indian Oil Corp. Ltd. | | $ | 27,125 | |
| | 1,113 | | | John Wood Group PLC | | | 6,403 | |
| | 7,246 | | | JXTG Holdings, Inc. | | | 35,941 | |
| | 626 | | | LUKOIL PJSC4 | | | 52,847 | |
| | 669 | | | Marathon Petroleum Corp. | | | 37,384 | |
| | 258 | | | Neste OYJ | | | 8,767 | |
| | 8,377 | | | Oil & Natural Gas Corp. Ltd. | | | 20,358 | |
| | 209 | | | OMV AG | | | 10,199 | |
| | 831 | | | Origin Energy Ltd. | | | 4,263 | |
| | 18,300 | | | PetroChina Co. Ltd., Class A | | | 18,331 | |
| | 4,448 | | | Petroleo Brasileiro SA | | | 34,840 | |
| | 473 | | | Phillips 66 | | | 44,244 | |
| | 583 | | | Plains GP Holdings LP, Class A3 | | | 14,557 | |
| | 451 | | | Polski Koncern Naftowy ORLEN SA | | | 10,882 | |
| | 552 | | | PrairieSky Royalty Ltd. | | | 7,773 | |
| | 21,065 | | | PTT PCL | | | 33,486 | |
| | 620 | | | Qatar Fuel QSC | | | 3,654 | |
| | 209 | | | Rabigh Refining & Petrochemical Co.3 | | | 1,151 | |
| | 1,627 | | | Reliance Industries Ltd.3 | | | 29,536 | |
| | 1,474 | | | Repsol SA | | | 23,139 | |
| | 6,825 | | | Rosneft Oil Co. PJSC3 | | | 44,704 | |
| | 4,287 | | | Royal Dutch Shell PLC, Class A | | | 140,357 | |
| | 143 | | | SK Innovation Co. Ltd. | | | 19,692 | |
| | 147 | | | S-Oil Corp. | | | 10,656 | |
| | 565 | | | TechnipFMC PLC | | | 14,656 | |
| | 1,366 | | | TOTAL SA | | | 76,652 | |
| | 452 | | | Tupras Turkiye Petrol Rafinerileri AS | | | 8,987 | |
| | 2,109 | | | Ultrapar Participacoes SA | | | 11,060 | |
| | 493 | | | Valero Energy Corp. | | | 42,206 | |
| | 101 | | | Washington H Soul Pattinson & Co. Ltd. | | | 1,559 | |
| | 512 | | | WorleyParsons Ltd. | | | 5,285 | |
| | 1,200 | | | Yanzhou Coal Mining Co. Ltd., Class A | | | 1,899 | |
| | 112 | | | YPF SA4 | | | 2,040 | |
| | | | | | | | |
| | | | Total Energy | | | 1,433,878 | |
| | | | | | | | |
| | | | Food & Staples Retailing—5.3% | |
| | 1,711 | | | Aeon Co. Ltd. | | | 29,395 | |
| | 300 | | | Alimentation Couche-Tard, Inc., Class B | | | 18,919 | |
| | 5,134 | | | Berli Jucker PCL | | | 8,454 | |
| | 529 | | | Bid Corp. Ltd. | | | 11,517 | |
| | 1,745 | | | Carrefour SA | | | 33,743 | |
| | 450 | | | Casino Guichard Perrachon SA2 | | | 15,374 | |
| | 433 | | | Clicks Group Ltd. | | | 6,304 | |
| | 225 | | | Costco Wholesale Corp. | | | 59,459 | |
| | 298 | | | Empire Co. Ltd., Class A | | | 7,521 | |
| | 294 | | | George Weston Ltd. | | | 22,357 | |
| | 6,176 | | | J Sainsbury PLC | | | 15,402 | |
| | 1,258 | | | Koninklijke Ahold Delhaize NV | | | 28,334 | |
| | 1,720 | | | Kroger Co. (The) | | | 37,341 | |
| | 743 | | | Magnit PJSC | | | 10,829 | |
| | 886 | | | METRO AG2 | | | 16,219 | |
| | 191 | | | Raia Drogasil SA | | | 3,792 | |
| | 805 | | | Seven & i Holdings Co. Ltd. | | | 27,257 | |
| | 7,064 | | | Sun Art Retail Group Ltd. | | | 6,691 | |
| | 389 | | | Sysco Corp. | | | 27,510 | |
| | 10,064 | | | Tesco PLC | | | 29,037 | |
| | 944 | | | Walgreens Boots Alliance, Inc. | | | 51,609 | |
| | 4,338 | | | Wal-Mart de Mexico SAB de CV | | | 11,832 | |
| | 1,761 | | | Walmart, Inc. | | | 194,573 | |
| | 100 | | | Welcia Holdings Co. Ltd. | | | 4,070 | |
| | | | | | | | |
| Shares | | | | | Value | |
| | | | Common Stocks (continued) | | | |
| | | | Food & Staples Retailing (continued) | |
| | 859 | | | Woolworths Group Ltd. | | $ | 20,031 | |
| | | | | | | | |
| | | | Total Food & Staples Retailing | | | 697,570 | |
| | | | | | | | |
| | | | Food, Beverage & Tobacco—3.6% | |
| | 302 | | | Ajinomoto Co., Inc. | | | 5,236 | |
| | 1,757 | | | Anadolu Efes Biracilik Ve Malt Sanayii AS | | | 6,042 | |
| | 352 | | | Anheuser-Busch InBev SA | | | 31,203 | |
| | 504 | | | Arca Continental SAB de CV | | | 2,724 | |
| | 624 | | | Archer-Daniels-Midland Co. | | | 25,459 | |
| | 180 | | | Asahi Group Holdings Ltd. | | | 8,094 | |
| | 289 | | | Associated British Foods PLC | | | 9,059 | |
| | 419 | | | BRF SA3 | | | 3,227 | |
| | 314 | | | British American Tobacco PLC | | | 10,986 | |
| | 334 | | | Bunge Ltd. | | | 18,607 | |
| | 101 | | | Calbee, Inc. | | | 2,726 | |
| | 11,316 | | | Charoen Pokphand Foods PCL | | | 10,424 | |
| | 20,125 | | | China Agri-Industries Holdings Ltd. | | | 6,466 | |
| | 845 | | | China Mengniu Dairy Co. Ltd.3 | | | 3,272 | |
| | 1,073 | | | China Resources Beer Holdings Co. Ltd. | | | 5,095 | |
| | 34 | | | CJ CheilJedang Corp. | | | 8,746 | |
| | 388 | | | Coca-Cola Amatil Ltd. | | | 2,783 | |
| | 184 | | | Coca-Cola Bottlers Japan Holdings, Inc. | | | 4,661 | |
| | 449 | | | Fomento Economico Mexicano SAB de CV | | | 4,346 | |
| | 5,153 | | | Genting Plantations Bhd | | | 12,469 | |
| | 2,266 | | | Grupo Bimbo SAB de CV, Series A | | | 4,721 | |
| | 205 | | | Hormel Foods Corp.2 | | | 8,311 | |
| | 12,130 | | | Indofood Sukses Makmur Tbk PT | | | 6,032 | |
| | 59 | | | Ingredion, Inc. | | | 4,867 | |
| | 490 | | | Japan Tobacco, Inc. | | | 10,822 | |
| | 2,914 | | | JBS SA | | | 16,134 | |
| | 100 | | | Kikkoman Corp. | | | 4,353 | |
| | 346 | | | Kirin Holdings Co. Ltd. | | | 7,462 | |
| | 40 | | | Lamb Weston Holdings, Inc. | | | 2,534 | |
| | 101 | | | MEIJI Holdings Co. Ltd. | | | 7,218 | |
| | 93 | | | Molson Coors Brewing Co., Class B | | | 5,208 | |
| | 276 | | | Mondelez International, Inc., Class A | | | 14,876 | |
| | 466 | | | Nestle SA | | | 48,301 | |
| | 201 | | | Nisshin Seifun Group, Inc. | | | 4,588 | |
| | 6 | | | Ottogi Corp. | | | 3,560 | |
| | 212 | | | PepsiCo, Inc. | | | 27,800 | |
| | 145 | | | Philip Morris International, Inc. | | | 11,387 | |
| | 4,000 | | | QL Resources Bhd | | | 6,621 | |
| | 215 | | | Saputo, Inc. | | | 6,450 | |
| | 7,522 | | | Sime Darby Plantation Bhd | | | 8,955 | |
| | 2,456 | | | Standard Foods Corp. | | | 4,800 | |
| | 289 | | | Tiger Brands Ltd. | | | 4,585 | |
| | 2,617 | | | Tingyi Cayman Islands Holding Corp. | | | 4,368 | |
| | 101 | | | Toyo Suisan Kaisha Ltd. | | | 4,162 | |
| | 158 | | | Tyson Foods, Inc., Class A | | | 12,757 | |
| | 200 | | | Wens Foodstuffs Group Co. Ltd., Class A | | | 1,044 | |
| | 10,844 | | | WH Group Ltd.1 | | | 10,993 | |
| | 12,343 | | | Wilmar International Ltd. | | | 33,755 | |
| | 302 | | | Yamazaki Baking Co. Ltd. | | | 4,566 | |
| | | | | | | | |
| | | | Total Food, Beverage & Tobacco | | | 472,855 | |
| | | | | | | | |
| | | | Health Care Equipment & Services—5.1% | |
| | 450 | | | Aier Eye Hospital Group Co. Ltd., Class A | | | 2,029 | |
| | 604 | | | Alfresa Holdings Corp. | | | 14,901 | |
| | 815 | | | AmerisourceBergen Corp. | | | 69,487 | |
| | 131 | | | Anthem, Inc. | | | 36,970 | |
The accompanying notes are an integral part of these financial statements.
Invesco Global Revenue ETF (RGLB)(continued)
June 30, 2019
| | | | | | | | |
| Shares | | | | | Value | |
| | | | Common Stocks (continued) | | | |
| | | | Health Care Equipment & Services (continued) | |
| | 200 | | | Asahi Intecc Co. Ltd. | | $ | 4,927 | |
| | 1,133 | | | Cardinal Health, Inc. | | | 53,364 | |
| | 33 | | | Carl Zeiss Meditec AG | | | 3,260 | |
| | 451 | | | Centene Corp.3 | | | 23,650 | |
| | 335 | | | Cigna Corp. | | | 52,779 | |
| | 1,612 | | | CVS Health Corp. | | | 87,838 | |
| | 154 | | | DaVita, Inc.3 | | | 8,664 | |
| | 20 | | | DexCom, Inc.3 | | | 2,997 | |
| | 421 | | | Fisher & Paykel Healthcare Corp. Ltd. | | | 4,372 | |
| | 135 | | | Fresenius Medical Care AG & Co. KGaA | | | 10,614 | |
| | 289 | | | Fresenius SE & Co. KGaA | | | 15,692 | |
| | 159 | | | HCA Healthcare, Inc. | | | 21,492 | |
| | 7,754 | | | IHH Healthcare Bhd | | | 10,883 | |
| | 500 | | | Lepu Medical Technology Beijing Co. Ltd., Class A | | | 1,676 | |
| | 599 | | | McKesson Corp. | | | 80,500 | |
| | 805 | | | Medipal Holdings Corp. | | | 17,775 | |
| | 302 | | | Notre Dame Intermedica Participacoes SA | | | 3,177 | |
| | 100 | | | Shenzhen MindrayBio-Medical Electronics Co. Ltd., Class A | | | 2,376 | |
| | 272 | | | Siemens Healthineers AG1 | | | 11,495 | |
| | 88 | | | STERIS PLC | | | 13,101 | |
| | 224 | | | Suzuken Co. Ltd. | | | 13,140 | |
| | 341 | | | UnitedHealth Group, Inc. | | | 83,207 | |
| | 37 | | | WellCare Health Plans, Inc.3 | | | 10,548 | |
| | | | | | | | |
| | | | Total Health Care Equipment & Services | | | 660,914 | |
| | | | | | | | |
| | | | Household & Personal Products—0.9% | |
| | 20 | | | Amorepacific Corp. | | | 2,849 | |
| | 78 | | | AMOREPACIFIC Group | | | 4,208 | |
| | 349 | | | Coty, Inc., Class A | | | 4,677 | |
| | 491 | | | Essity AB, Class B | | | 15,103 | |
| | 610 | | | Hengan International Group Co. Ltd. | | | 4,486 | |
| | 315 | | | Natura Cosmeticos SA | | | 4,643 | |
| | 100 | | | Pigeon Corp. | | | 4,024 | |
| | 312 | | | Procter & Gamble Co. (The) | | | 34,211 | |
| | 101 | | | Shiseido Co. Ltd. | | | 7,613 | |
| | 2,911 | | | Unilever Indonesia Tbk PT | | | 9,272 | |
| | 482 | | | Unilever NV | | | 29,399 | |
| | | | | | | | |
| | | | Total Household & Personal Products | | | 120,485 | |
| | | | | | | | |
| | | | Insurance—5.2% | |
| | 1,829 | | | Aegon NV | | | 9,119 | |
| | 189 | | | Aflac, Inc. | | | 10,359 | |
| | 2,429 | | | AIA Group Ltd. | | | 26,194 | |
| | 7 | | | Alleghany Corp.3 | | | 4,768 | |
| | 116 | | | Allianz SE | | | 28,005 | |
| | 155 | | | Allstate Corp. (The) | | | 15,762 | |
| | 205 | | | American International Group, Inc. | | | 10,922 | |
| | 38 | | | Aon PLC | | | 7,333 | |
| | 84 | | | Arthur J. Gallagher & Co. | | | 7,358 | |
| | 1,229 | | | Assicurazioni Generali SpA | | | 23,177 | |
| | 44 | | | Assurant, Inc. | | | 4,681 | |
| | 2,408 | | | Aviva PLC | | | 12,764 | |
| | 1,671 | | | AXA SA | | | 43,958 | |
| | 3,796 | | | China Life Insurance Co. Ltd., Class H | | | 9,349 | |
| | 1,512 | | | China Pacific Insurance Group Co. Ltd., Class H | | | 5,913 | |
| | 3,094 | | | China Taiping Insurance Holdings Co. Ltd.3 | | | 8,277 | |
| | 90 | | | Chubb Ltd. | | | 13,256 | |
| | 52 | | | Cincinnati Financial Corp. | | | 5,391 | |
| | | | | | | | |
| Shares | | | | | Value | |
| | | | Common Stocks (continued) | | | |
| | | | Insurance (continued) | |
| | 796 | | | CNP Assurances | | $ | 18,093 | |
| | 1,308 | | | Dai-ichi Life Holdings, Inc. | | | 19,728 | |
| | 113 | | | DB Insurance Co. Ltd. | | | 5,803 | |
| | 1,147 | | | Direct Line Insurance Group PLC | | | 4,844 | |
| | 16 | | | Erie Indemnity Co., Class A | | | 4,068 | |
| | 10 | | | Everest Re Group Ltd. | | | 2,472 | |
| | 11 | | | Fairfax Financial Holdings Ltd. | | | 5,411 | |
| | 94 | | | Fidelity National Financial, Inc. | | | 3,788 | |
| | 477 | | | Great-West Lifeco, Inc. | | | 11,006 | |
| | 2,719 | | | Hanwha Life Insurance Co. Ltd. | | | 7,712 | |
| | 197 | | | Hyundai Marine & Fire Insurance Co. Ltd. | | | 4,854 | |
| | 85 | | | iA Financial Corp., Inc. | | | 3,470 | |
| | 102 | | | ICICI Lombard General Insurance Co. Ltd.1 | | | 1,644 | |
| | 792 | | | Insurance Australia Group Ltd. | | | 4,591 | |
| | 58 | | | Intact Financial Corp. | | | 5,371 | |
| | 2,415 | | | Japan Post Holdings Co. Ltd. | | | 27,346 | |
| | 855 | | | Liberty Holdings Ltd. | | | 6,406 | |
| | 78 | | | Loews Corp. | | | 4,264 | |
| | 360 | | | Manulife Financial Corp. | | | 6,557 | |
| | 2,171 | | | Mapfre SA2 | | | 6,356 | |
| | 5 | | | Markel Corp.3 | | | 5,448 | |
| | 1,197 | | | Medibank Pvt Ltd. | | | 2,932 | |
| | 330 | | | MetLife, Inc. | | | 16,391 | |
| | 604 | | | MS&AD Insurance Group Holdings, Inc. | | | 19,173 | |
| | 75 | | | Muenchener Rueckversicherungs-Gesellschaft AG in Muenchen | | | 18,850 | |
| | 12,547 | | | People’s Insurance Co. Group of China Ltd. (The), Class H | | | 4,898 | |
| | 4,887 | | | PICC Property & Casualty Co. Ltd., Class H | | | 5,273 | |
| | 1,340 | | | Ping An Insurance Group Co. of China Ltd., Class H | | | 16,089 | |
| | 566 | | | Poste Italiane SpA1 | | | 5,969 | |
| | 375 | | | Power Corp. of Canada | | | 8,095 | |
| | 464 | | | Power Financial Corp. | | | 10,695 | |
| | 223 | | | Powszechny Zaklad Ubezpieczen SA | | | 2,611 | |
| | 135 | | | Prudential Financial, Inc. | | | 13,635 | |
| | 765 | | | Prudential PLC | | | 16,707 | |
| | 371 | | | QBE Insurance Group Ltd. | | | 3,080 | |
| | 39 | | | Reinsurance Group of America, Inc. | | | 6,085 | |
| | 11 | | | RenaissanceRe Holdings Ltd. | | | 1,958 | |
| | 774 | | | RSA Insurance Group PLC | | | 5,682 | |
| | 36 | | | Samsung Fire & Marine Insurance Co. Ltd. | | | 8,356 | |
| | 125 | | | Samsung Life Insurance Co. Ltd. | | | 9,050 | |
| | 228 | | | SCOR SE | | | 10,012 | |
| | 302 | | | Sompo Holdings, Inc. | | | 11,663 | |
| | 201 | | | Sony Financial Holdings, Inc. | | | 4,828 | |
| | 255 | | | Sul America SA | | | 2,496 | |
| | 159 | | | Sun Life Financial, Inc. | | | 6,599 | |
| | 227 | | | Suncorp Group Ltd. | | | 2,146 | |
| | 600 | | | T&D Holdings, Inc. | | | 6,513 | |
| | 302 | | | Tokio Marine Holdings, Inc. | | | 15,134 | |
| | 54 | | | Torchmark Corp. | | | 4,831 | |
| | 84 | | | Travelers Cos., Inc. (The) | | | 12,560 | |
| | 110 | | | Unum Group | | | 3,691 | |
| | 108 | | | W.R. Berkley Corp. | | | 7,120 | |
| | 30 | | | Willis Towers Watson PLC | | | 5,746 | |
| | | | | | | | |
| | | | Total Insurance | | | 674,686 | |
| | | | | | | | |
The accompanying notes are an integral part of these financial statements.
Invesco Global Revenue ETF (RGLB)(continued)
June 30, 2019
| | | | | | | | |
| Shares | | | | | Value | |
| | | | Common Stocks (continued) | | | |
| | | | Materials—6.7% | |
| | 64 | | | Advanced Petrochemical Co. | | $ | 1,024 | |
| | 135 | | | Akzo Nobel NV | | | 12,705 | |
| | 1,700 | | | Aluminum Corp of China Ltd., Class A3 | | | 970 | |
| | 10,775 | | | Aluminum Corp. of China Ltd., Class H3 | | | 3,820 | |
| | 1,905 | | | Ambuja Cements Ltd. | | | 5,874 | |
| | 652 | | | Amcor PLC3 | | | 7,491 | |
| | 89 | | | Anglo American Platinum Ltd. | | | 5,282 | |
| | 534 | | | AngloGold Ashanti Ltd. | | | 9,619 | |
| | 1,765 | | | ArcelorMittal | | | 31,629 | |
| | 1,003 | | | Asahi Kasei Corp. | | | 10,692 | |
| | 86 | | | Avery Dennison Corp. | | | 9,949 | |
| | 127 | | | Ball Corp. | | | 8,889 | |
| | 12,027 | | | Barito Pacific Tbk PT | | | 2,733 | |
| | 463 | | | BASF SE | | | 33,703 | |
| | 481 | | | BlueScope Steel Ltd. | | | 4,067 | |
| | 320 | | | Boliden AB | | | 8,190 | |
| | 102 | | | CCL Industries, Inc., Class B | | | 5,013 | |
| | 11,953 | | | Cemex SAB de CV | | | 5,033 | |
| | 181 | | | Chemours Co. (The) | | | 4,344 | |
| | 8,000 | | | China Hongqiao Group Ltd. | | | 5,642 | |
| | 6,260 | | | China National Building Material Co. Ltd., Class H | | | 5,489 | |
| | 6,000 | | | China Oriental Group Co. Ltd. | | | 3,510 | |
| | 253 | | | Corteva, Inc.3 | | | 7,481 | |
| | 186 | | | Covestro AG1 | | | 9,470 | |
| | 104 | | | Crown Holdings, Inc.3 | | | 6,354 | |
| | 448 | | | Dow, Inc. | | | 22,091 | |
| | 253 | | | DuPont de Nemours, Inc. | | | 18,993 | |
| | 765 | | | Evraz PLC | | | 6,477 | |
| | 4,025 | | | Formosa Chemicals & Fibre Corp. | | | 13,348 | |
| | 807 | | | Freeport-McMoRan, Inc. | | | 9,369 | |
| | 21,274 | | | Glencore PLC3 | | | 74,011 | |
| | 573 | | | Grasim Industries Ltd. | | | 7,588 | |
| | 1,715 | | | Grupo Mexico SAB de CV, Series B | | | 4,550 | |
| | 134 | | | HeidelbergCement AG | | | 10,859 | |
| | 900 | | | Hengyi Petrochemical Co. Ltd., Class A | | | 1,790 | |
| | 3,052 | | | Hindalco Industries Ltd. | | | 9,155 | |
| | 6,400 | | | Inner Mongolia Junzheng Energy & Chemical Industry Group Co. Ltd., Class A | | | 3,066 | |
| | 254 | | | International Paper Co. | | | 11,003 | |
| | 153 | | | Jastrzebska Spolka Weglowa SA3 | | | 1,937 | |
| | 1,100 | | | JFE Holdings, Inc. | | | 16,157 | |
| | 7,836 | | | Jiangxi Copper Co. Ltd., Class H | | | 10,431 | |
| | 317 | | | Johnson Matthey PLC | | | 13,431 | |
| | 1,132 | | | Kinross Gold Corp.3 | | | 4,383 | |
| | 51 | | | Kirkland Lake Gold Ltd. | | | 2,202 | |
| | 1,409 | | | Kobe Steel Ltd. | | | 9,220 | |
| | 131 | | | Kumba Iron Ore Ltd. | | | 4,639 | |
| | 333 | | | LafargeHolcim Ltd.3 | | | 16,281 | |
| | 42 | | | LG Chem Ltd. | | | 12,895 | |
| | 34 | | | Lotte Chemical Corp. | | | 7,435 | |
| | 256 | | | LyondellBasell Industries NV, Class A | | | 22,049 | |
| | 6,000 | | | Maanshan Iron & Steel Co. Ltd., Class H | | | 2,381 | |
| | 302 | | | Maruichi Steel Tube Ltd. | | | 8,390 | |
| | 1,659 | | | Mexichem SAB de CV | | | 3,479 | |
| | 2,486 | | | Mitsubishi Chemical Holdings Corp. | | | 17,366 | |
| | 300 | | | Mitsubishi Materials Corp. | | | 8,534 | |
| | 678 | | | MMC Norilsk Nickel PJSC4 | | | 15,397 | |
| | 8,050 | | | Nan Ya Plastics Corp. | | | 20,372 | |
| | 4,807 | | | Nine Dragons Paper Holdings Ltd.3 | | | 4,264 | |
| | 100 | | | Nippon Paint Holdings Co. Ltd. | | | 3,880 | |
| | | | | | | | |
| Shares | | | | | Value | |
| | | | Common Stocks (continued) | | | |
| | | | Materials (continued) | |
| | 1,691 | | | Nippon Steel Corp. | | $ | 29,020 | |
| | 1,200 | | | Oji Holdings Corp. | | | 6,928 | |
| | 406 | | | Orica Ltd. | | | 5,775 | |
| | 3,491 | | | Pabrik Kertas Tjiwi Kimia Tbk PT | | | 3,107 | |
| | 335 | | | Pidilite Industries Ltd. | | | 5,894 | |
| | 131 | | | POSCO | | | 27,740 | |
| | 47 | | | POSCO Chemical Co., Ltd. | | | 2,182 | |
| | 1,450 | | | Sappi Ltd. | | | 5,644 | |
| | 360 | | | Sasol Ltd. | | | 8,941 | |
| | 46 | | | Saudi Arabian Fertilizer Co. | | | 1,040 | |
| | 70 | | | Saudi Arabian Mining Co.3 | | | 907 | |
| | 262 | | | Saudi Basic Industries Corp. | | | 7,978 | |
| | 1,624 | | | South32 Ltd. | | | 3,624 | |
| | 140 | | | Southern Copper Corp. | | | 5,439 | |
| | 2,683 | | | Sumitomo Chemical Co. Ltd. | | | 12,451 | |
| | 200 | | | Sumitomo Metal Mining Co. Ltd. | | | 5,976 | |
| | 200 | | | Taiheiyo Cement Corp. | | | 6,052 | |
| | 1,593 | | | Tata Steel Ltd. | | | 11,640 | |
| | 246 | | | Teck Resources Ltd., Class B | | | 5,689 | |
| | 1,239 | | | thyssenkrupp AG | | | 18,096 | |
| | 13,600 | | | Tongling Nonferrous Metals Group Co. Ltd., Class A | | | 4,871 | |
| | 1,777 | | | Toray Industries, Inc. | | | 13,511 | |
| | 201 | | | Toyo Seikan Group Holdings Ltd. | | | 3,989 | |
| | 2,100 | | | Transfar Zhilian Co. Ltd., Class A | | | 2,302 | |
| | 411 | | | Umicore SA | | | 13,199 | |
| | 1,282 | | | Vale SA | | | 17,334 | |
| | 2,861 | | | Vedanta Ltd. | | | 7,226 | |
| | 54 | | | West Fraser Timber Co. Ltd. | | | 2,467 | |
| | 88 | | | Westlake Chemical Corp. | | | 6,112 | |
| | 226 | | | WestRock Co. | | | 8,242 | |
| | 228 | | | Wheaton Precious Metals Corp. | | | 5,526 | |
| | 74 | | | Yanbu National Petrochemical Co. | | | 1,243 | |
| | 184 | | | Yara International ASA | | | 8,930 | |
| | 3,185 | | | Zhaojin Mining Industry Co. Ltd., Class H | | | 3,567 | |
| | | | | | | | |
| | | | Total Materials | | | 879,038 | |
| | | | | | | | |
| | | | Media & Entertainment—1.8% | |
| | 42 | | | Alphabet, Inc., Class A3 | | | 45,478 | |
| | 132 | | | Altice USA, Inc., Class A3 | | | 3,214 | |
| | 46 | | | Charter Communications, Inc., Class A3 | | | 18,178 | |
| | 400 | | | China Literature Ltd.1,3 | | | 1,884 | |
| | 858 | | | Comcast Corp., Class A | | | 36,276 | |
| | 100 | | | CyberAgent, Inc. | | | 3,624 | |
| | 188 | | | Fox Corp., Class A | | | 6,888 | |
| | 1,402 | | | Grupo Televisa SAB, Series CPO | | | 2,368 | |
| | 503 | | | Hakuhodo DY Holdings, Inc | | | 8,469 | |
| | 245 | | | Liberty Global PLC, Class A3 | | | 6,613 | |
| | 114 | | | Live Nation Entertainment, Inc.3 | | | 7,553 | |
| | 300 | | | Mango Excellent Media Co. Ltd., Class A3 | | | 1,793 | |
| | 295 | | | Megacable Holdings SAB de CV | | | 1,252 | |
| | 20 | | | Netflix, Inc.3 | | | 7,346 | |
| | 672 | | | News Corp., Class A | | | 9,065 | |
| | 453 | | | Pearson PLC | | | 4,724 | |
| | 254 | | | Quebecor, Inc., Class B | | | 6,063 | |
| | 63 | | | Schibsted ASA, Class B | | | 1,643 | |
| | 142 | | | Snap, Inc., Class A3 | | | 2,031 | |
| | 448 | | | Tencent Holdings Ltd. | | | 20,220 | |
| | 100 | | | Tencent Music Entertainment Group2,3,4 | | | 1,499 | |
| | 221 | | | Viacom, Inc., Class B | | | 6,601 | |
The accompanying notes are an integral part of these financial statements.
Invesco Global Revenue ETF (RGLB)(continued)
June 30, 2019
| | | | | | | | |
| Shares | | | | | Value | |
| | | | Common Stocks (continued) | | | |
| | | | Media & Entertainment (continued) | |
| | 225 | | | Walt Disney Co. (The) | | $ | 31,419 | |
| | 1,912 | | | Yahoo Japan Corp. | | | 5,608 | |
| | | | | | | | |
| | | | Total Media & Entertainment | | | 239,809 | |
| | | | | | | | |
| | | | Pharmaceuticals, Biotechnology & Life Sciences—2.6% | |
| | 157 | | | AbbVie, Inc. | | | 11,417 | |
| | 49 | | | Allergan PLC | | | 8,204 | |
| | 79 | | | Amgen, Inc. | | | 14,558 | |
| | 148 | | | AstraZeneca PLC | | | 12,127 | |
| | 138 | | | Bausch Health Cos., Inc.3 | | | 3,489 | |
| | 253 | | | Bayer AG | | | 17,558 | |
| | 231 | | | Bristol-Myers Squibb Co. | | | 10,476 | |
| | 7 | | | Canopy Growth Corp.3 | | | 283 | |
| | 69 | | | Celgene Corp.3 | | | 6,378 | |
| | 7,612 | | | China Resources Pharmaceutical Group Ltd.1 | | | 8,584 | |
| | 200 | | | Chongqing Zhifei Biological Products Co. Ltd., Class A | | | 1,255 | |
| | 88 | | | Divi’s Laboratories Ltd. | | | 2,036 | |
| | 121 | | | Elanco Animal Health, Inc.3 | | | 4,090 | |
| | 10 | | | Exact Sciences Corp.3 | | | 1,180 | |
| | 171 | | | Gilead Sciences, Inc. | | | 11,553 | |
| | 936 | | | GlaxoSmithKline PLC | | | 18,781 | |
| | 100 | | | Hangzhou Tigermed Consulting Co. Ltd., Class A3 | | | 1,123 | |
| | 14 | | | Ionis Pharmaceuticals, Inc.3 | | | 900 | |
| | 52 | | | IQVIA Holdings, Inc.3 | | | 8,367 | |
| | 249 | | | Johnson & Johnson | | | 34,681 | |
| | 243 | | | Merck & Co., Inc. | | | 20,376 | |
| | 262 | | | Mylan NV3 | | | 4,988 | |
| | 139 | | | Novo Nordisk A/S, Class B | | | 7,094 | |
| | 56 | | | PerkinElmer, Inc. | | | 5,395 | |
| | 70 | | | Perrigo Co. PLC | | | 3,333 | |
| | 577 | | | Pfizer, Inc. | | | 24,996 | |
| | 101 | | | Roche Holding AG | | | 28,451 | |
| | 261 | | | Sanofi | | | 22,562 | |
| | 26 | | | Sartorius Stedim Biotech | | | 4,107 | |
| | 100 | | | Shenzhen Kangtai Biological Products Co. Ltd., Class A3 | | | 764 | |
| | 406 | | | Takeda Pharmaceutical Co. Ltd. | | | 14,406 | |
| | 585 | | | Teva Pharmaceutical Industries Ltd.3,4 | | | 5,400 | |
| | 50 | | | Thermo Fisher Scientific, Inc. | | | 14,684 | |
| | 141 | | | WuXi AppTec Co. Ltd., Class H1 | | | 1,236 | |
| | | | | | | | |
| | | | Total Pharmaceuticals, Biotechnology & Life Sciences | | | 334,832 | |
| | | | | | | | |
| | | | Real Estate—1.9% | | | |
| | 2,366 | | | Agile Group Holdings Ltd. | | | 3,168 | |
| | 278 | | | Aroundtown SA | | | 2,294 | |
| | 97 | | | Camden Property Trust | | | 10,126 | |
| | 245 | | | CBRE Group, Inc., Class A3 | | | 12,568 | |
| | 1,006 | | | China Aoyuan Group Ltd. | | | 1,414 | |
| | 7,206 | | | China Evergrande Group2 | | | 20,200 | |
| | 4,348 | | | China Jinmao Holdings Group Ltd. | | | 2,644 | |
| | 1,729 | | | China Overseas Land & Investment Ltd. | | | 6,374 | |
| | 2,293 | | | China Resources Land Ltd. | | | 10,096 | |
| | 12,939 | | | Country Garden Holdings Co. Ltd. | | | 19,675 | |
| | 101 | | | Daito Trust Construction Co. Ltd. | | | 12,876 | |
| | 448 | | | Daiwa House Industry Co. Ltd. | | | 13,061 | |
| | 3,305 | | | Emaar Development PJSC | | | 3,608 | |
| | 81 | | | Equity LifeStyle Properties, Inc. | | | 9,828 | |
| | 394 | | | First Capital Realty, Inc.2 | | | 6,591 | |
| | | | | | | | |
| Shares | | | | | Value | |
| | | | Common Stocks (continued) | | | |
| | | | Real Estate (continued) | | | |
| | 2,000 | | | Future Land Development Holdings Ltd. | | $ | 2,632 | |
| | 449 | | | H&R Real Estate Investment Trust | | | 7,848 | |
| | 59 | | | Jones Lang LaSalle, Inc. | | | 8,301 | |
| | 5,031 | | | Kaisa Group Holdings Ltd.3 | | | 2,486 | |
| | 31 | | | Land & Houses PCL | | | 11 | |
| | 439 | | | Lendlease Group | | | 4,005 | |
| | 1,902 | | | Longfor Group Holdings Ltd | | | 7,170 | |
| | 18,192 | | | Megaworld Corp.3 | | | 2,166 | |
| | 696 | | | Mirvac Group | | | 1,529 | |
| | 403 | | | Mitsui Fudosan Co. Ltd. | | | 9,772 | |
| | 201 | | | Nomura Real Estate Holdings, Inc. | | | 4,321 | |
| | 1,100 | | | Oceanwide Holdings Co. Ltd., Class A | | | 894 | |
| | 35 | | | Public Storage | | | 8,336 | |
| | 481 | | | RioCan Real Estate Investment Trust | | | 9,567 | |
| | 4,959 | | | Robinsons Land Corp. | | | 2,550 | |
| | 8,050 | | | Shenzhen Investment Ltd. | | | 2,967 | |
| | 1,731 | | | Shimao Property Holdings Ltd. | | | 5,273 | |
| | 10,300 | | | Sime Darby Property Bhd | | | 2,567 | |
| | 5,818 | | | Sino-Ocean Group Holding Ltd. | | | 2,472 | |
| | 323 | | | SmartCentres Real Estate Investment Trust2 | | | 8,209 | |
| | 74 | | | Sun Communities, Inc. | | | 9,486 | |
| | 704 | | | Tokyu Fudosan Holdings Corp. | | | 3,888 | |
| | 117 | | | WP Carey, Inc. | | | 9,498 | |
| | | | | | | | |
| | | | Total Real Estate | | | 250,471 | |
| | | | | | | | |
| | | | Retailing—3.7% | | | |
| | 41 | | | Advance Auto Parts, Inc. | | | 6,320 | |
| | 98 | | | Alibaba Group Holding Ltd.3,4 | | | 16,606 | |
| | 44 | | | Amazon.com, Inc.3 | | | 83,320 | |
| | 200 | | | B2W Cia Digital3 | | | 1,707 | |
| | 266 | | | Best Buy Co., Inc. | | | 18,548 | |
| | 27 | | | Burlington Stores, Inc.3 | | | 4,594 | |
| | 89 | | | Canadian Tire Corp. Ltd., Class A | | | 9,718 | |
| | 120 | | | CarMax, Inc.3 | | | 10,420 | |
| | 118 | | | Dollar General Corp. | | | 15,949 | |
| | 105 | | | Dollar Tree, Inc.3 | | | 11,276 | |
| | 370 | | | Gap, Inc. (The) | | | 6,649 | |
| | 145 | | | Genuine Parts Co. | | | 15,019 | |
| | 49,531 | | | GOME Retail Holdings Ltd.3 | | | 5,325 | |
| | 28 | | | GrubHub, Inc.3 | | | 2,184 | |
| | 588 | | | Hennes & Mauritz AB, Class B | | | 10,480 | |
| | 231 | | | Home Depot, Inc. (The) | | | 48,041 | |
| | 906 | | | Isetan Mitsukoshi Holdings Ltd. | | | 7,350 | |
| | 20 | | | Jarir Marketing Co. | | | 881 | |
| | 723 | | | JD.com, Inc.3,4 | | | 21,900 | |
| | 2,853 | | | Kingfisher PLC | | | 7,803 | |
| | 151 | | | Kohl’s Corp. | | | 7,180 | |
| | 265 | | | L Brands, Inc. | | | 6,916 | |
| | 59 | | | Lotte Shopping Co. Ltd. | | | 8,201 | |
| | 254 | | | Lowe’s Cos., Inc. | | | 25,631 | |
| | 486 | | | Macy’s, Inc. | | | 10,429 | |
| | 100 | | | Magazine Luiza SA | | | 5,508 | |
| | 3,169 | | | Marks & Spencer Group PLC2 | | | 8,498 | |
| | 500 | | | Meituan Dianping, Class B3 | | | 4,384 | |
| | 217 | | | Nordstrom, Inc.2 | | | 6,914 | |
| | 124 | | | Ocado Group PLC3 | | | 1,842 | |
| | 2,013 | | | Petrobras Distribuidora SA | | | 13,131 | |
| | 500 | | | Qurate Retail, Inc.3 | | | 6,195 | |
| | 399 | | | Target Corp. | | | 34,557 | |
| | 495 | | | Vipshop Holdings Ltd.3,4 | | | 4,272 | |
The accompanying notes are an integral part of these financial statements.
Invesco Global Revenue ETF (RGLB)(continued)
June 30, 2019
| | | | | | | | |
| Shares | | | | | Value | |
| | | | Common Stocks (continued) | | | |
| | | | Retailing (continued) | | | |
| | 14 | | | Wayfair, Inc., Class A3 | | $ | 2,044 | |
| | 568 | | | Wesfarmers Ltd. | | | 14,413 | |
| | 2,200 | | | Yamada Denki Co. Ltd. | | | 9,740 | |
| | 2,516 | | | Zhongsheng Group Holdings Ltd. | | | 7,004 | |
| | 100 | | | ZOZO, Inc. | | | 1,874 | |
| | | | | | | | |
| | | | Total Retailing | | | 482,823 | |
| | | | | | | | |
| | | | Semiconductors & Semiconductor Equipment—1.1% | |
| | 201 | | | Advantest Corp. | | | 5,531 | |
| | 716 | | | Intel Corp. | | | 34,275 | |
| | 473 | | | Micron Technology, Inc.3 | | | 18,253 | |
| | 126 | | | NXP Semiconductors NV | | | 12,299 | |
| | 156 | | | QUALCOMM, Inc. | | | 11,867 | |
| | 1,409 | | | Renesas Electronics Corp.3 | | | 6,997 | |
| | 319 | | | SK Hynix, Inc. | | | 19,201 | |
| | 3,968 | | | Taiwan Semiconductor Manufacturing Co. Ltd. | | | 30,533 | |
| | 6,000 | | | Xinyi Solar Holdings Ltd. | | | 2,957 | |
| | | | | | | | |
| | | | Total Semiconductors & Semiconductor Equipment | | | 141,913 | |
| | | | | | | | |
| | | | Software & Services—2.4% | | | |
| | 300 | | | 360 Security Technology, Inc., Class A3 | | | 934 | |
| | 114 | | | Accenture PLC, Class A | | | 21,064 | |
| | 2 | | | Adyen NV1,3 | | | 1,546 | |
| | 30 | | | Alliance Data Systems Corp. | | | 4,204 | |
| | 75 | | | Atos SE | | | 6,279 | |
| | 72 | | | Automatic Data Processing, Inc. | | | 11,904 | |
| | 48 | | | Cadence Design Systems, Inc.3 | | | 3,399 | |
| | 108 | | | CGI, Inc.3 | | | 8,321 | |
| | 21 | | | Check Point Software Technologies Ltd.3 | | | 2,428 | |
| | 146 | | | Cognizant Technology Solutions Corp., Class A | | | 9,255 | |
| | 174 | | | Computershare Ltd. | | | 1,979 | |
| | 3 | | | Constellation Software, Inc. | | | 2,834 | |
| | 23 | | | DocuSign, Inc.3 | | | 1,143 | |
| | 55 | | | Dropbox, Inc., Class A3 | | | 1,378 | |
| | 173 | | | DXC Technology Co. | | | 9,541 | |
| | 26 | | | EPAM Systems, Inc.3 | | | 4,501 | |
| | 26 | | | Fortinet, Inc.3 | | | 1,998 | |
| | 191 | | | Fujitsu Ltd. | | | 13,317 | |
| | 83 | | | GoDaddy, Inc., Class A3 | | | 5,822 | |
| | 301 | | | HCL Technologies Ltd. | | | 4,642 | |
| | 671 | | | Infosys Ltd. | | | 7,116 | |
| | 235 | | | International Business Machines Corp. | | | 32,406 | |
| | 101 | | | Itochu Techno-Solutions Corp. | | | 2,589 | |
| | 43 | | | Jack Henry & Associates, Inc. | | | 5,759 | |
| | 87 | | | Leidos Holdings, Inc. | | | 6,947 | |
| | 354 | | | Microsoft Corp. | | | 47,422 | |
| | 6 | | | MongoDB, Inc.3 | | | 912 | |
| | 16 | | | Okta, Inc.3 | | | 1,976 | |
| | 354 | | | Oracle Corp. | | | 20,167 | |
| | 100 | | | Otsuka Corp. | | | 4,024 | |
| | 14 | | | Palo Alto Networks, Inc.3 | | | 2,853 | |
| | 7 | | | Paycom Software, Inc.3 | | | 1,587 | |
| | 32 | | | PTC, Inc.3 | | | 2,872 | |
| | 34 | | | Samsung SDS Co. Ltd. | | | 6,331 | |
| | 47 | | | Synopsys, Inc.3 | | | 6,048 | |
| | 13 | | | Tableau Software, Inc., Class A3 | | | 2,158 | |
| | 294 | | | Tata Consultancy Services Ltd. | | | 9,486 | |
| | 368 | | | Tech Mahindra Ltd. | | | 3,767 | |
| | 81 | | | Total System Services, Inc. | | | 10,390 | |
| | | | | | | | |
| Shares | | | | | Value | |
| | | | Common Stocks (continued) | | | |
| | | | Software & Services (continued) | | | |
| | 12 | | | Twilio, Inc., Class A3 | | $ | 1,636 | |
| | 800 | | | Wangsu Science & Technology Co. Ltd., Class A | | | 1,256 | |
| | 1,132 | | | Wipro Ltd. | | | 4,600 | |
| | 13 | | | Wix.com Ltd.3 | | | 1,847 | |
| | 52 | | | Worldline SA/France1,3 | | | 3,790 | |
| | 26 | | | Worldpay, Inc., Class A3 | | | 3,186 | |
| | | | | | | | |
| | | | Total Software & Services | | | 307,614 | |
| | | | | | | | |
| | | | Technology Hardware & Equipment—5.0% | | | |
| | 9,000 | | | Acer, Inc.3 | | | 5,578 | |
| | 300 | | | Alps Alpine Co. Ltd. | | | 5,057 | |
| | 478 | | | Apple, Inc. | | | 94,606 | |
| | 11 | | | Arista Networks, Inc.3 | | | 2,856 | |
| | 195 | | | Arrow Electronics, Inc.3 | | | 13,898 | |
| | 25,806 | | | AU Optronics Corp. | | | 7,727 | |
| | 300 | | | Brother Industries Ltd. | | | 5,666 | |
| | 1,899 | | | BYD Electronic International Co. Ltd. | | | 2,713 | |
| | 98 | | | CDW Corp. | | | 10,878 | |
| | 800 | | | Chaozhou Three-Circle Group Co. Ltd., Class A3 | | | 2,265 | |
| | 32,634 | | | Compal Electronics, Inc. | | | 21,382 | |
| | 54 | | | F5 Networks, Inc.3 | | | 7,864 | |
| | 1,007 | | | Flex Ltd.3 | | | 9,637 | |
| | 1,700 | | | Foxconn Industrial Internet Co., Ltd., Class A | | | 2,982 | |
| | 302 | | | FUJIFILM Holdings Corp. | | | 15,313 | |
| | 244 | | | Halma PLC | | | 6,273 | |
| | 929 | | | Hewlett Packard Enterprise Co. | | | 13,888 | |
| | 100 | | | Hitachi High-Technologies Corp. | | | 5,142 | |
| | 926 | | | Hitachi Ltd. | | | 33,941 | |
| | 24,848 | | | Hon Hai Precision Industry Co. Ltd. | | | 61,921 | |
| | 1,216 | | | HP, Inc. | | | 25,281 | |
| | 26,000 | | | Innolux Corp. | | | 6,136 | |
| | 13,082 | | | Inventec Corp. | | | 10,403 | |
| | 604 | | | Konica Minolta, Inc. | | | 5,881 | |
| | 4,528 | | | Legend Holdings Corp., Class H1 | | | 10,653 | |
| | 21,159 | | | Lenovo Group Ltd. | | | 16,385 | |
| | 1,400 | | | Lens Technology Co. Ltd., Class A | | | 1,421 | |
| | 587 | | | LG Display Co. Ltd.3 | | | 9,075 | |
| | 38 | | | LG Innotek Co. Ltd. | | | 3,587 | |
| | 302 | | | NEC Corp. | | | 11,885 | |
| | 2,951 | | | Nokia OYJ | | | 14,672 | |
| | 10,769 | | | Pegatron Corp. | | | 18,619 | |
| | 10,382 | | | Quanta Computer, Inc. | | | 20,189 | |
| | 855 | | | Ricoh Co. Ltd. | | | 8,539 | |
| | 1,891 | | | Samsung Electronics Co. Ltd. | | | 76,973 | |
| | 122 | | | Seagate Technology PLC | | | 5,749 | |
| | 500 | | | Seiko Epson Corp. | | | 7,913 | |
| | 500 | | | Suzhou Dongshan Precision Manufacturing Co. Ltd., Class A | | | 1,061 | |
| | 101 | | | TDK Corp. | | | 7,818 | |
| | 1,496 | | | Telefonaktiebolaget LM Ericsson, Class B | | | 14,205 | |
| | 403 | | | Venture Corp. Ltd. | | | 4,852 | |
| | 162 | | | Western Digital Corp. | | | 7,703 | |
| | 18,069 | | | Wistron Corp. | | | 14,078 | |
| | 300 | | | Wuxi Lead Intelligent Equipment Co. Ltd., Class A | | | 1,468 | |
| | 139 | | | Xerox Corp. | | | 4,922 | |
| | 5,635 | | | Xiaomi Corp., Class B1,2,3 | | | 7,213 | |
| | 15 | | | Zebra Technologies Corp., Class A3 | | | 3,142 | |
| | | | | | | | |
| | | | Total Technology Hardware & Equipment | | | 649,410 | |
| | | | | | | | |
The accompanying notes are an integral part of these financial statements.
Invesco Global Revenue ETF (RGLB)(continued)
June 30, 2019
| | | | | | | | |
| Shares | | | | | Value | |
| | | | Common Stocks (continued) | | | |
| | | | Telecommunication Services—4.2% | | | |
| | 19,501 | | | America Movil SAB de CV, Series L | | $ | 14,180 | |
| | 2,142 | | | AT&T, Inc. | | | 71,778 | |
| | 1,677 | | | Bharti Airtel Ltd. | | | 8,422 | |
| | 5,215 | | | BT Group PLC | | | 13,039 | |
| | 73 | | | Cellnex Telecom SA1,3 | | | 2,705 | |
| | 954 | | | CenturyLink, Inc. | | | 11,219 | |
| | 4,742 | | | China Mobile Ltd. | | | 43,186 | |
| | 7,999 | | | China Tower Corp. Ltd., Class H1 | | | 2,099 | |
| | 17,637 | | | China Unicom Hong Kong Ltd. | | | 19,347 | |
| | 4,113 | | | Chunghwa Telecom Co. Ltd. | | | 14,964 | |
| | 2,230 | | | Deutsche Telekom AG | | | 38,631 | |
| | 150 | | | Empresa Nacional de Telecomunicaciones SA3 | | | 1,524 | |
| | 172 | | | Etihad Etisalat Co.3 | | | 1,102 | |
| | 805 | | | KDDI Corp. | | | 20,499 | |
| | 1,039 | | | Mobile TeleSystems PJSC4 | | | 9,673 | |
| | 906 | | | Nippon Telegraph & Telephone Corp. | | | 42,189 | |
| | 1,727 | | | Orange SA | | | 27,268 | |
| | 61 | | | Saudi Telecom Co. | | | 1,695 | |
| | 48 | | | SK Telecom Co. Ltd. | | | 10,767 | |
| | 1,107 | | | Softbank Corp. | | | 14,380 | |
| | 604 | | | SoftBank Group Corp. | | | 28,955 | |
| | 2,055 | | | Sprint Corp.3 | | | 13,501 | |
| | 14,937 | | | Telecom Italia SpA3 | | | 8,168 | |
| | 2,883 | | | Telefonica SA | | | 23,708 | |
| | 3,499 | | | Telstra Corp. Ltd. | | | 9,453 | |
| | 261 | | | T-Mobile US, Inc.3 | | | 19,351 | |
| | 907 | | | Verizon Communications, Inc. | | | 51,817 | |
| | 12,948 | | | Vodafone Group PLC | | | 21,311 | |
| | 18,564 | | | Vodafone Idea Ltd3 | | | 3,268 | |
| | | | | | | | |
| | | | Total Telecommunication Services | | | 548,199 | |
| | | | | | | | |
| | | | Transportation—2.7% | | | |
| | 11 | | | A.P. Moeller—Maersk A/S, Class B | | | 13,665 | |
| | 599 | | | American Airlines Group, Inc. | | | 19,533 | |
| | 3,445 | | | Bollore SA | | | 15,222 | |
| | 177 | | | C.H. Robinson Worldwide, Inc. | | | 14,930 | |
| | 8,050 | | | China Eastern Airlines Corp. Ltd., Class H3 | | | 4,750 | |
| | 4,000 | | | COSCO SHIPPING Energy Transportation Co. Ltd., Class H | | | 2,366 | |
| | 13,082 | | | COSCO SHIPPING Holdings Co. Ltd., Class H3 | | | 5,107 | |
| | 424 | | | Delta Air Lines, Inc. | | | 24,062 | |
| | 874 | | | Deutsche Lufthansa AG | | | 14,999 | |
| | 983 | | | Deutsche Post AG | | | 32,352 | |
| | 99 | | | DSV A/S | | | 9,737 | |
| | 178 | | | FedEx Corp. | | | 29,226 | |
| | 62 | | | Hyundai Glovis Co. Ltd. | | | 8,645 | |
| | 160 | | | Knight-Swift Transportation Holdings, Inc. | | | 5,254 | |
| | 662 | | | Latam Airlines Group SA | | | 6,216 | |
| | 300 | | | Mitsui OSK Lines Ltd. | | | 7,181 | |
| | 200 | | | Nippon Express Co. Ltd. | | | 10,637 | |
| | 805 | | | Nippon Yusen KK | | | 12,919 | |
| | 1,400 | | | SF Holding Co. Ltd., Class A | | | 6,922 | |
| | 302 | | | SG Holdings Co. Ltd. | | | 8,563 | |
| | 13,082 | | | Sinotrans Ltd., Class H | | | 4,756 | |
| | 257 | | | Southwest Airlines Co. | | | 13,051 | |
| | 1,252 | | | Transurban Group | | | 12,951 | |
| | 239 | | | United Continental Holdings, Inc.3 | | | 20,925 | |
| | 264 | | | United Parcel Service, Inc., Class B | | | 27,263 | |
| | 140 | | | XPO Logistics, Inc.2,3 | | | 8,093 | |
| | 403 | | | Yamato Holdings Co. Ltd. | | | 8,195 | |
| | | | | | | | |
| Shares | | | | | Value | |
| | | | Common Stocks (continued) | | | |
| | | | Transportation (continued) | | | |
| | 201 | | | ZTO Express Cayman, Inc.4 | | $ | 3,843 | |
| | | | | | | | |
| | | | Total Transportation | | | 351,363 | |
| | | | | | | | |
| | | | Utilities—4.1% | | | |
| | 460 | | | AGL Energy Ltd. | | | 6,459 | |
| | 6,633 | | | Aguas Andinas SA, Class A | | | 3,908 | |
| | 14,525 | | | Centrica PLC | | | 16,227 | |
| | 18,999 | | | China Power International Development Ltd. | | | 4,645 | |
| | 1,204 | | | China Resources Gas Group Ltd. | | | 5,972 | |
| | 8,374 | | | Colbun SA | | | 1,727 | |
| | 20,125 | | | Datang International Power Generation Co. Ltd., Class H | | | 5,049 | |
| | 1,705 | | | E.ON SE | | | 18,545 | |
| | 5,017 | | | EDP—Energias de Portugal SA | | | 19,094 | |
| | 2,145 | | | Electricite de France SA | | | 27,078 | |
| | 655 | | | Endesa SA2 | | | 16,865 | |
| | 30,641 | | | Enel Americas SA | | | 5,393 | |
| | 35,382 | | | Enel Chile SA | | | 3,356 | |
| | 5,833 | | | Enel SpA | | | 40,786 | |
| | 503 | | | Energisa SA | | | 6,048 | |
| | 2,141 | | | Engie SA | | | 32,525 | |
| | 527 | | | ENN Energy Holdings Ltd. | | | 5,127 | |
| | 585 | | | Exelon Corp. | | | 28,045 | |
| | 342 | | | FirstEnergy Corp. | | | 14,641 | |
| | 428 | | | Fortum OYJ | | | 9,473 | |
| | 1,752 | | | GAIL India Ltd. | | | 7,918 | |
| | 1,500 | | | Gulf Energy Development PCL | | | 6,016 | |
| | 6,000 | | | Huadian Power International Corp. Ltd., Class H | | | 2,373 | |
| | 487 | | | Innogy SE1 | | | 23,127 | |
| | 1,107 | | | Kansai Electric Power Co., Inc. (The) | | | 12,684 | |
| | 925 | | | Korea Electric Power Corp.3 | | | 20,468 | |
| | 296 | | | Korea Gas Corp. | | | 10,818 | |
| | 973 | | | Manila Electric Co. | | | 7,349 | |
| | 530 | | | Naturgy Energy Group SA | | | 14,624 | |
| | 177 | | | NRG Energy, Inc. | | | 6,216 | |
| | 90 | | | Orsted A/S1 | | | 7,794 | |
| | 69 | | | Pampa Energia SA3,4 | | | 2,392 | |
| | 1,616 | | | PGE Polska Grupa Energetyczna SA3 | | | 4,157 | |
| | 2,842 | | | Power Grid Corp. of India Ltd. | | | 8,518 | |
| | 282 | | | RWE AG | | | 6,959 | |
| | 577 | | | Saudi Electricity Co. | | | 2,877 | |
| | 1,224 | | | SSE PLC | | | 17,478 | |
| | 1,107 | | | Tohoku Electric Power Co., Inc. | | | 11,189 | |
| | 3,623 | | | Tokyo Electric Power Co. Holdings, Inc.3 | | | 18,899 | |
| | 455 | | | Tokyo Gas Co. Ltd. | | | 10,716 | |
| | 1,167 | | | Uniper SE2 | | | 35,391 | |
| | 1,001 | | | Veolia Environnement SA | | | 24,418 | |
| | 41 | | | Verbund AG | | | 2,148 | |
| | 260 | | | Vistra Energy Corp. | | | 5,886 | |
| | | | | | | | |
| | | | Total Utilities | | | 541,378 | |
| | | | | | | | |
| | |
| | | | Total Common Stocks
(Cost $12,694,458) | | | 12,922,988 | |
| | | | | | | | |
| | |
| | | | | | | | |
| | | | Preferred Stocks—0.9% | | | |
| | | | Automobiles & Components—0.7% | | | |
| | 505 | | | Volkswagen AG, 3.16% | | | 85,241 | |
| | | | | | | | |
| | | | Banks—0.1% | |
| | 40,834 | | | Grupo Aval Acciones y Valores SA, 3.98% | | | 16,362 | |
| | | | | | | | |
The accompanying notes are an integral part of these financial statements.
Invesco Global Revenue ETF (RGLB)(continued)
June 30, 2019
| | | | | | | | |
| Shares | | | | | Value | |
| | | | Preferred Stocks (continued) | | | |
| | | | Capital Goods—0.0%5 | |
| | 16 | | | CJ Corp.3,6 | | $ | 685 | |
| | 61,770 | | | Rolls-Royce Holdings PLC3 | | | 79 | |
| | 148,849 | | | Rolls-Royce Holdings PLC, Class C3 | | | 189 | |
| | | | | | | | |
| | | | Total Capital Goods | | | 953 | |
| | | | | | | | |
| | | | Technology Hardware & Equipment—0.1% | |
| | 277 | | | Samsung Electronics Co. Ltd., 2.85% | | | 9,176 | |
| | | | | | | | |
| | | | Utilities—0.0%5 | |
| | 415 | | | Centrais Eletricas Brasileiras SA, Class B, 3.79% | | | 3,898 | |
| | | | | | | | |
| | | | Total Preferred Stocks
(Cost $109,018) | | | 115,630 | |
| | | | | | | | |
| | |
| | | | | | | | |
| | | | Right—0.0%5 | | | |
| | | | Diversified Financials—0.0%5 | |
| | 276 | | | Zhengqi Financial Holding Corp.3,6
(Cost $0) | | | 0 | |
| | | | | | | | |
| | |
| | | | | | | | |
| | | | Investment of Cash Collateral for Securities
Loaned—1.5% | |
| | 142,979 | | | Invesco Government & Agency Portfolio—Institutional Class, 2.27%7,8 | | | 142,979 | |
| | 47,641 | | | Invesco Liquid Assets Portfolio—Institutional Class, 2.41%7,8 | | | 47,660 | |
| | | | | | | | |
| | |
| | | | Total Investment of Cash Collateral for Securities Loaned
(Cost $190,637) | | | 190,639 | |
| | | | | | | | |
| | |
| | | | Total Investments—101.3%
(Cost $12,994,113) | | | 13,229,257 | |
| | |
| | | | Liabilities in Excess of Other
Assets—(1.3)% | | | (165,202 | ) |
| | | | | | | | |
| | |
| | | | Net Assets—100.0% | | $ | 13,064,055 | |
| | | | | | | | |
LP—Limited Partnership
PCL—Public Company Limited
| 1 | Represents securities sold under Rule 144A, which are exempt from registration under the Securities Act of 1933, as amended. These securities have been determined to be liquid under guidelines established by the Board of Trustees. These securities amount to $132,939 or 1.02% of the Fund’s net assets at period end. |
| 2 | All or a portion of the security was on loan. The aggregate value of the securities on loan was $182,081; total value of the collateral held by the Fund was $190,639. |
| 3 | Non-income producing security. |
| 4 | American Depositary Receipt. |
| 6 | The value of this security was determined using significant unobservable inputs. See Note 3 of the accompanying Notes. |
| 7 | The security and the Fund are advised by wholly-owned subsidiaries of Invesco Ltd. and are therefore considered to be affiliated. The rate shown is the 7-day SEC standardized yield as of June 30, 2019. |
| 8 | The security has been segregated to satisfy the commitment to return the cash collateral received in securities lending transactions upon the borrower’s return of the securities loaned. See Note 6. |
Geographical Holdings
| | | | | | | | |
Country | | Value | | | % of Net
Assets | |
| United States | | $ | 4,602,682 | | | | 35.3 | % |
| Japan | | | 1,865,776 | | | | 14.3 | |
| China | | | 843,802 | | | | 6.5 | |
| Germany | | | 653,382 | | | | 5.0 | |
| France | | | 631,081 | | | | 4.8 | |
| United Kingdom | | | 603,118 | | | | 4.6 | |
| South Korea | | | 553,832 | | | | 4.2 | |
| Canada | | | 342,714 | | | | 2.6 | |
| Netherlands | | | 299,266 | | | | 2.3 | |
| India | | | 271,797 | | | | 2.1 | |
| Switzerland | | | 267,539 | | | | 2.0 | |
| Taiwan | | | 260,361 | | | | 2.0 | |
| Russia | | | 228,602 | | | | 1.8 | |
| Brazil | | | 183,918 | | | | 1.4 | |
| Spain | | | 167,742 | | | | 1.3 | |
| Australia | | | 157,365 | | | | 1.2 | |
| Hong Kong | | | 141,694 | | | | 1.1 | |
| Italy | | | 140,168 | | | | 1.1 | |
| Thailand | | | 92,635 | | | | 0.7 | |
| Sweden | | | 88,012 | | | | 0.7 | |
| Mexico | | | 69,038 | | | | 0.5 | |
| Singapore | | | 64,245 | | | | 0.5 | |
| South Africa | | | 62,937 | | | | 0.5 | |
| Norway | | | 49,258 | | | | 0.4 | |
| Denmark | | | 48,826 | | | | 0.4 | |
| Belgium | | | 44,402 | | | | 0.3 | |
| Malaysia | | | 41,496 | | | | 0.3 | |
| Indonesia | | | 40,919 | | | | 0.3 | |
| Turkey | | | 40,612 | | | | 0.3 | |
| Chile | | | 38,982 | | | | 0.3 | |
| Luxembourg | | | 34,529 | | | | 0.3 | |
| Poland | | | 33,694 | | | | 0.3 | |
| Finland | | | 32,912 | | | | 0.3 | |
| Saudi Arabia | | | 27,019 | | | | 0.2 | |
| Philippines | | | 26,686 | | | | 0.2 | |
| Austria | | | 23,370 | | | | 0.2 | |
| Ireland | | | 21,973 | | | | 0.2 | |
| Portugal | | | 19,094 | | | | 0.1 | |
| United Arab Emirates | | | 17,077 | | | | 0.1 | |
| Colombia | | | 16,362 | | | | 0.1 | |
| Qatar | | | 15,404 | | | | 0.1 | |
| Israel | | | 15,402 | | | | 0.1 | |
| Greece | | | 10,781 | | | | 0.1 | |
| Hungary | | | 7,535 | | | | 0.1 | |
| Macau | | | 6,586 | | | | 0.1 | |
| Argentina | | | 5,700 | | | | 0.0 | 1 |
| Peru | | | 5,439 | | | | 0.0 | 1 |
| New Zealand | | | 4,372 | | | | 0.0 | 1 |
| Czech Republic | | | 3,884 | | | | 0.0 | 1 |
| Egypt | | | 2,091 | | | | 0.0 | 1 |
| Bermuda | | | 1,958 | | | | 0.0 | 1 |
| Pakistan | | | 1,188 | | | | 0.0 | 1 |
| | | | | | | | |
| Total Investments | | | 13,229,257 | | | | 101.3 | |
| Liabilities in Excess of Other Assets | | | (165,202 | ) | | | (1.3 | ) |
| | | | | | | | |
| Net Assets | | $ | 13,064,055 | | | | 100.0 | % |
| | | | | | | | |
The accompanying notes are an integral part of these financial statements.
Schedule of Investments
Invesco Global ESG Revenue ETF (ESGF)
June 30, 2019
| | | | | | | | |
| Shares | | | | | Value | |
| | | | Common Stocks—99.3% | | | |
| | | | Automobiles & Components—5.8% | | | |
| | 203 | | | Aptiv PLC | | $ | 16,409 | |
| | 37,273 | | | Astra International Tbk PT | | | 19,656 | |
| | 1,326 | | | Bayerische Motoren Werke AG | | | 98,289 | |
| | 299 | | | BorgWarner, Inc. | | | 12,552 | |
| | 940 | | | Bridgestone Corp.1 | | | 37,010 | |
| | 200 | | | BYD Co. Ltd., Class A | | | 1,477 | |
| | 1,026 | | | BYD Co. Ltd., Class H1 | | | 6,192 | |
| | 841 | | | China First Capital Group Ltd.2 | | | 251 | |
| | 206 | | | Cie Generale des Etablissements Michelin | | | 26,169 | |
| | 355 | | | Continental AG | | | 51,836 | |
| | 3,217 | | | Daimler AG | | | 179,238 | |
| | 1,284 | | | Denso Corp. | | | 54,022 | |
| | 5 | | | Eicher Motors Ltd. | | | 1,386 | |
| | 9,612 | | | Geely Automobile Holdings Ltd. | | | 16,437 | |
| | 196 | | | Hankook Tire & Technology Co. Ltd. | | | 5,958 | |
| | 167 | | | Harley-Davidson, Inc. | | | 5,984 | |
| | 144 | | | Hero MotoCorp Ltd. | | | 5,385 | |
| | 5,939 | | | Honda Motor Co. Ltd. | | | 153,519 | |
| | 878 | | | Magna International, Inc. | | | 43,781 | |
| | 1,769 | | | Mahindra & Mahindra Ltd. | | | 16,795 | |
| | 226 | | | NGK Spark Plug Co. Ltd. | | | 4,241 | |
| | 65 | | | Nokian Renkaat OYJ | | | 2,033 | |
| | 3,643 | | | Peugeot SA | | | 89,901 | |
| | 937 | | | Pirelli & C SpA3 | | | 5,547 | |
| | 1,165 | | | Renault SA1 | | | 73,353 | |
| | 182 | | | Stanley Electric Co. Ltd. | | | 4,473 | |
| | 743 | | | Sumitomo Rubber Industries Ltd. | | | 8,593 | |
| | 97 | | | Tesla, Inc.1,2 | | | 21,676 | |
| | 418 | | | Toyoda Gosei Co. Ltd. | | | 8,151 | |
| | 5,413 | | | Toyota Motor Corp. | | | 336,014 | |
| | 732 | | | Valeo SA | | | 23,841 | |
| | 902 | | | Yamaha Motor Co. Ltd. | | | 16,032 | |
| | | | | | | | |
| | | | Total Automobiles & Components | | | 1,346,201 | |
| | | | | | | | |
| | | | Banks—7.8% | |
| | 865 | | | ABN AMRO Bank NV3 | | | 18,534 | |
| | 781 | | | Absa Group Ltd. | | | 9,748 | |
| | 1,717 | | | Abu Dhabi Commercial Bank PJSC | | | 3,880 | |
| | 820 | | | AIB Group PLC | | | 3,358 | |
| | 1,934 | | | AMMB Holdings Bhd | | | 1,980 | |
| | 1,422 | | | Australia & New Zealand Banking Group Ltd. | | | 28,150 | |
| | 839 | | | Axis Bank Ltd.2 | | | 9,828 | |
| | 59 | | | Banco BBVA Argentina SA4 | | | 668 | |
| | 8,095 | | | Banco Bilbao Vizcaya Argentaria SA | | | 45,328 | |
| | 4,052 | | | Banco Bradesco SA | | | 35,364 | |
| | 58 | | | Banco de Credito e Inversiones | | | 3,994 | |
| | 6,811 | | | Banco de Sabadell SA | | | 7,066 | |
| | 4,070 | | | Banco do Brasil SA | | | 57,280 | |
| | 1,990 | | | Banco Santander Brasil SA | | | 23,604 | |
| | 60,254 | | | Banco Santander Chile | | | 4,482 | |
| | 2,352 | | | Banco Santander Mexico SA Institucion de Banca Multiple Grupo Financiero Santand | | | 3,596 | |
| | 18,759 | | | Banco Santander SA | | | 87,171 | |
| | 325 | | | Bancolombia SA | | | 3,916 | |
| | 2,980 | | | Bank Central Asia Tbk PT | | | 6,323 | |
| | 646 | | | Bank Hapoalim B.M.2 | | | 4,793 | |
| | 681 | | | Bank LeumiLe-Israel B.M. | | | 4,919 | |
| | 17,190 | | | Bank Mandiri Persero Tbk PT | | | 9,765 | |
| | 450 | | | Bank Millennium SA2 | | | 1,129 | |
| | | | | | | | |
| Shares | | | | | Value | |
| | | | Common Stocks (continued) | | | |
| | | | Banks (continued) | |
| | 9,007 | | | Bank Negara Indonesia Persero Tbk PT | | $ | 5,865 | |
| | 342 | | | Bank of Montreal | | | 25,889 | |
| | 577 | | | Bank of Nova Scotia (The) | | | 31,059 | |
| | 800 | | | Bank of Shanghai Co. Ltd., Class A | | | 1,380 | |
| | 1,316 | | | Bank of the Philippine Islands | | | 2,016 | |
| | 91 | | | Bank Polska Kasa Opieki SA | | | 2,728 | |
| | 35,806 | | | Bank Rakyat Indonesia Persero Tbk PT | | | 11,050 | |
| | 1,806 | | | Bankia SA | | | 4,274 | |
| | 431 | | | Bankinter SA | | | 2,973 | |
| | 116 | | | Banque Saudi Fransi | | | 1,311 | |
| | 18,255 | | | Barclays PLC | | | 34,803 | |
| | 289 | | | BB&T Corp. | | | 14,199 | |
| | 1,449 | | | BDO Unibank, Inc. | | | 3,959 | |
| | 297 | | | Bendigo & Adelaide Bank Ltd. | | | 2,413 | |
| | 629 | | | BNK Financial Group, Inc. | | | 4,080 | |
| | 1,380 | | | BNP Paribas SA | | | 65,636 | |
| | 3,477 | | | BOC Hong Kong Holdings Ltd. | | | 13,685 | |
| | 4,350 | | | CaixaBank SA | | | 12,474 | |
| | 247 | | | Canadian Imperial Bank of Commerce1 | | | 19,465 | |
| | 23,816 | | | China CITIC Bank Corp Ltd., Class H | | | 13,566 | |
| | 4,500 | | | China Everbright Bank Co. Ltd., Class A | | | 2,496 | |
| | 18,092 | | | China Everbright Bank Co. Ltd., Class H | | | 8,290 | |
| | 900 | | | China Merchants Bank Co. Ltd., Class A | | | 4,715 | |
| | 2,155 | | | China Merchants Bank Co. Ltd., Class H | | | 10,744 | |
| | 4,500 | | | China Minsheng Banking Corp. Ltd., Class A | | | 4,160 | |
| | 12,895 | | | China Minsheng Banking Corp. Ltd., Class H | | | 8,930 | |
| | 5,427 | | | CIMB Group Holdings Bhd | | | 7,065 | |
| | 233 | | | Citizens Financial Group, Inc. | | | 8,239 | |
| | 49 | | | Comerica, Inc. | | | 3,559 | |
| | 1,740 | | | Commercial Bank PQSC (The) | | | 2,193 | |
| | 619 | | | Commercial International Bank Egypt SAE | | | 2,736 | |
| | 1,708 | | | Commerzbank AG | | | 12,291 | |
| | 598 | | | Commonwealth Bank of Australia | | | 34,738 | |
| | 26 | | | Credicorp Ltd. | | | 5,952 | |
| | 7,433 | | | Credit Agricole SA | | | 89,260 | |
| | 23,556 | | | CTBC Financial Holding Co. Ltd. | | | 16,192 | |
| | 727 | | | DBS Group Holdings Ltd. | | | 13,949 | |
| | 493 | | | DNB ASA | | | 9,176 | |
| | 2,397 | | | Dubai Islamic Bank PJSC | | | 3,348 | |
| | 2,867 | | | E.Sun Financial Holding Co. Ltd. | | | 2,400 | |
| | 314 | | | Erste Group Bank AG2 | | | 11,672 | |
| | 2,256 | | | First Abu Dhabi Bank PJSC | | | 9,127 | |
| | 4,183 | | | First Financial Holding Co. Ltd. | | | 3,071 | |
| | 1,832 | | | Grupo Financiero Banorte SAB de CV, Class O | | | 10,619 | |
| | 421 | | | Hana Financial Group, Inc. | | | 13,637 | |
| | 261 | | | Hang Seng Bank Ltd. | | | 6,498 | |
| | 479 | | | Hong Leong Bank Bhd | | | 2,202 | |
| | 284 | | | Housing Development Finance Corp. Ltd. | | | 9,019 | |
| | 2,200 | | | Huaxia Bank Co. Ltd., Class A2 | | | 2,466 | |
| | 237 | | | Indiabulls Housing Finance Ltd. | | | 2,086 | |
| | 1,900 | | | Industrial Bank Co. Ltd., Class A | | | 5,060 | |
| | 3,280 | | | ING Groep NV | | | 38,085 | |
| | 11,273 | | | Intesa Sanpaolo SpA | | | 24,161 | |
| | 3,110 | | | Kasikornbank PCL | | | 19,065 | |
| | 716 | | | KB Financial Group, Inc. | | | 28,432 | |
| | 202 | | | KBC Group NV | | | 13,259 | |
| | 478 | | | KeyCorp | | | 8,484 | |
| | 55 | | | Komercni banka as | | | 2,193 | |
The accompanying notes are an integral part of these financial statements.
Invesco Global ESG Revenue ETF (ESGF)(continued)
June 30, 2019
| | | | | | | | |
| Shares | | | | | Value | |
| | | | Common Stocks (continued) | | | |
| | | | Banks (continued) | |
| | 44,865 | | | Lloyds Banking Group PLC | | $ | 32,313 | |
| | 43 | | | M&T Bank Corp. | | | 7,313 | |
| | 4,079 | | | Malayan Banking Bhd | | | 8,765 | |
| | 16 | | | mBank SA2 | | | 1,845 | |
| | 643 | | | MCB Bank Ltd. | | | 702 | |
| | 3,354 | | | Mega Financial Holding Co. Ltd. | | | 3,337 | |
| | 13,353 | | | Mitsubishi UFJ Financial Group, Inc. | | | 63,456 | |
| | 120 | | | Mizrahi Tefahot Bank Ltd.2 | | | 2,768 | |
| | 23,660 | | | Mizuho Financial Group, Inc. | | | 34,280 | |
| | 1,464 | | | National Australia Bank Ltd. | | | 27,451 | |
| | 178 | | | National Bank of Canada1 | | | 8,474 | |
| | 408 | | | Nedbank Group Ltd. | | | 7,326 | |
| | 1,835 | | | Nordea Bank Abp | | | 13,334 | |
| | 101 | | | OTP Bank Nyrt | | | 4,027 | |
| | 2,443 | | | Oversea-Chinese Banking Corp. Ltd. | | | 20,585 | |
| | 139 | | | People’s United Financial, Inc. | | | 2,332 | |
| | 164 | | | PNC Financial Services Group, Inc. (The) | | | 22,514 | |
| | 958 | | | Public Bank Bhd | | | 5,332 | |
| | 3,480 | | | Qatar National Bank QPSC | | | 18,187 | |
| | 357 | | | Raiffeisen Bank International AG | | | 8,387 | |
| | 476 | | | Regions Financial Corp. | | | 7,111 | |
| | 1,736 | | | Resona Holdings, Inc. | | | 7,228 | |
| | 2,043 | | | RHB Bank Bhd | | | 2,764 | |
| | 590 | | | Royal Bank of Canada | | | 46,988 | |
| | 7,344 | | | Royal Bank of Scotland Group PLC | | | 20,544 | |
| | 29 | | | Santander Bank Polska SA | | | 2,884 | |
| | 3,100 | | | Shanghai Pudong Development Bank Co. Ltd., Class A | | | 5,272 | |
| | 515 | | | Shinhan Financial Group Co. Ltd. | | | 20,026 | |
| | 1,938 | | | Siam Commercial Bank PCL (The) | | | 8,816 | |
| | 817 | | | Skandinaviska Enskilda Banken AB, Class A | | | 7,566 | |
| | 2,012 | | | Societe Generale SA | | | 50,912 | |
| | 1,193 | | | Standard Bank Group Ltd. | | | 16,639 | |
| | 2,731 | | | Standard Chartered PLC | | | 24,824 | |
| | 1,573 | | | Sumitomo Mitsui Financial Group, Inc. | | | 55,567 | |
| | 380 | | | Sumitomo Mitsui Trust Holdings, Inc. | | | 13,777 | |
| | 12 | | | SVB Financial Group2 | | | 2,695 | |
| | 664 | | | Svenska Handelsbanken AB, Class A | | | 6,575 | |
| | 433 | | | Swedbank AB, Class A | | | 6,508 | |
| | 4,261 | | | Taishin Financial Holding Co. Ltd. | | | 1,962 | |
| | 2,918 | | | Taiwan Business Bank | | | 1,282 | |
| | 32,955 | | | TMB Bank PCL | | | 2,106 | |
| | 756 | | | Toronto-Dominion Bank (The) | | | 44,269 | |
| | 2,582 | | | UniCredit SpA | | | 31,833 | |
| | 603 | | | United Overseas Bank Ltd. | | | 11,646 | |
| | 1,546 | | | Westpac Banking Corp. | | | 30,768 | |
| | 1,953 | | | Yes Bank Ltd. | | | 3,077 | |
| | 69 | | | Zions Bancorp NA | | | 3,173 | |
| | | | | | | | |
| | | | Total Banks | | | 1,836,810 | |
| | | | | | | | |
| | | | Capital Goods—11.2% | |
| | 196 | | | 3M Co. | | | 33,975 | |
| | 1,364 | | | ABB Ltd. | | | 27,406 | |
| | 1,062 | | | ACS Actividades de Construccion y Servicios SA | | | 42,462 | |
| | 29 | | | Acuity Brands, Inc. | | | 3,999 | |
| | 539 | | | Airbus SE | | | 76,530 | |
| | 201 | | | Alfa Laval AB | | | 4,389 | |
| | 28 | | | Allegion PLC | | | 3,095 | |
| | 218 | | | Alstom SA1 | | | 10,129 | |
| | | | | | | | |
| Shares | | | | | Value | |
| | | | Common Stocks (continued) | | | |
| | | | Capital Goods (continued) | |
| | 317 | | | Amada Holdings Co. Ltd. | | $ | 3,569 | |
| | 191 | | | ANDRITZ AG | | | 7,200 | |
| | 660 | | | Arconic, Inc. | | | 17,041 | |
| | 536 | | | Aselsan Elektronik Sanayi Ve Ticaret AS | | | 1,668 | |
| | 207 | | | Ashtead Group PLC | | | 5,938 | |
| | 424 | | | Assa Abloy AB, Class B | | | 9,592 | |
| | 246 | | | Atlas Copco AB, Class A | | | 7,869 | |
| | 125 | | | Atlas Copco AB, Class B | | | 3,589 | |
| | 3,846 | | | BAE Systems PLC | | | 24,249 | |
| | 382 | | | Bidvest Group Ltd. (The) | | | 5,129 | |
| | 200 | | | BOC Aviation Ltd.3 | | | 1,679 | |
| | 1,094 | | | Bouygues SA | | | 40,577 | |
| | 287 | | | Brenntag AG | | | 14,155 | |
| | 474 | | | Bunzl PLC | | | 12,530 | |
| | 99 | | | CAE, Inc. | | | 2,668 | |
| | 444 | | | Caterpillar, Inc. | | | 60,513 | |
| | 360 | | | China International Marine Containers Group Co. Ltd., Class A | | | 560 | |
| | 1,272 | | | Cie de Saint-Gobain | | | 49,649 | |
| | 3,182 | | | CNH Industrial NV | | | 32,678 | |
| | 151 | | | Cummins, Inc. | | | 25,872 | |
| | 80 | | | Daifuku Co. Ltd. | | | 4,492 | |
| | 185 | | | Daikin Industries Ltd. | | | 24,151 | |
| | 254 | | | DCC PLC | | | 22,693 | |
| | 273 | | | Deere & Co. | | | 45,239 | |
| | 281 | | | Eaton Corp. PLC | | | 23,402 | |
| | 193 | | | Eiffage SA | | | 19,108 | |
| | 28 | | | Elbit Systems Ltd. | | | 4,169 | |
| | 289 | | | Epiroc AB, Class A | | | 3,011 | |
| | 142 | | | Epiroc AB, Class B | | | 1,408 | |
| | 7,559 | | | Far Eastern New Century Corp. | | | 8,153 | |
| | 165 | | | Fastenal Co. | | | 5,377 | |
| | 253 | | | Ferguson PLC | | | 18,032 | |
| | 294 | | | Ferrovial SA | | | 7,537 | |
| | 78 | | | Flowserve Corp. | | | 4,110 | |
| | 678 | | | Fluor Corp. | | | 22,842 | |
| | 80 | | | Fortive Corp. | | | 6,522 | |
| | 104 | | | Fortune Brands Home & Security, Inc. | | | 5,942 | |
| | 12,207 | | | Fosun International Ltd. | | | 16,219 | |
| | 268 | | | Fuji Electric Co. Ltd. | | | 9,241 | |
| | 199 | | | GEA Group AG | | | 5,666 | |
| | 7 | | | Geberit AG | | | 3,274 | |
| | 12,393 | | | General Electric Co. | | | 130,127 | |
| | 361 | | | GS Engineering & Construction Corp. | | | 12,615 | |
| | 673 | | | HAP Seng Consolidated Bhd | | | 1,620 | |
| | 36 | | | Harris Corp.2 | | | 6,809 | |
| | 139 | | | HD Supply Holdings, Inc.2 | | | 5,599 | |
| | 2,219 | | | Hino Motors Ltd. | | | 18,681 | |
| | 422 | | | Hitachi Construction Machinery Co. Ltd. | | | 10,975 | |
| | 127 | | | Hiwin Technologies Corp. | | | 1,063 | |
| | 216 | | | HOCHTIEF AG | | | 26,345 | |
| | 246 | | | Honeywell International, Inc. | | | 42,949 | |
| | 39 | | | Hoshizaki Corp. | | | 2,903 | |
| | 40 | | | Huntington Ingalls Industries, Inc. | | | 8,990 | |
| | 17 | | | IDEX Corp. | | | 2,926 | |
| | 658 | | | IHI Corp. | | | 15,861 | |
| | 100 | | | Illinois Tool Works, Inc. | | | 15,081 | |
| | 131 | | | Ingersoll-Rand PLC | | | 16,594 | |
| | 5,287 | | | ITOCHU Corp. | | | 101,113 | |
The accompanying notes are an integral part of these financial statements.
Invesco Global ESG Revenue ETF (ESGF)(continued)
June 30, 2019
| | | | | | | | |
| Shares | | | | | Value | |
| | | | Common Stocks (continued) | | | |
| | | | Capital Goods (continued) | |
| | 192 | | | Jacobs Engineering Group, Inc. | | $ | 16,203 | |
| | 784 | | | Johnson Controls International PLC | | | 32,387 | |
| | 1,244 | | | Kajima Corp. | | | 17,065 | |
| | 667 | | | Kawasaki Heavy Industries Ltd. | | | 15,681 | |
| | 72 | | | Keihan Holdings Co. Ltd. | | | 3,138 | |
| | 975 | | | Keppel Corp. Ltd. | | | 4,800 | |
| | 101 | | | Kingspan Group PLC | | | 5,493 | |
| | 151 | | | KION Group AG | | | 9,533 | |
| | 72 | | | Knorr-Bremse AG | | | 8,035 | |
| | 9,739 | | | KOC Holding AS | | | 29,534 | |
| | 1,217 | | | Komatsu Ltd. | | | 29,369 | |
| | 162 | | | Kone OYJ, Class B | | | 9,575 | |
| | 1,180 | | | Kubota Corp. | | | 19,637 | |
| | 110 | | | Kurita Water Industries Ltd. | | | 2,731 | |
| | 45 | | | L3 Technologies, Inc. | | | 11,033 | |
| | 102 | | | Legrand SA | | | 7,469 | |
| | 15 | | | Lennox International, Inc. | | | 4,125 | |
| | 1,281 | | | Leonardo SpA | | | 16,258 | |
| | 159 | | | LG Corp. | | | 10,589 | |
| | 1,518 | | | LIXIL Group Corp. | | | 24,008 | |
| | 163 | | | Lockheed Martin Corp. | | | 59,257 | |
| | 228 | | | Masco Corp. | | | 8,947 | |
| | 417 | | | Meggitt PLC | | | 2,781 | |
| | 105 | | | Metso OYJ | | | 4,131 | |
| | 21 | | | Middleby Corp. (The)2 | | | 2,850 | |
| | 4,971 | | | Mitsubishi Corp. | | | 131,034 | |
| | 3,249 | | | Mitsubishi Electric Corp. | | | 42,791 | |
| | 894 | | | Mitsubishi Heavy Industries Ltd. | | | 38,925 | |
| | 23 | | | MTU Aero Engines AG | | | 5,487 | |
| | 110 | | | Nabtesco Corp.1 | | | 3,057 | |
| | 313 | | | NGK Insulators Ltd. | | | 4,564 | |
| | 101 | | | Northrop Grumman Corp. | | | 32,634 | |
| | 1,227 | | | NSK Ltd. | | | 10,933 | |
| | 1,976 | | | Obayashi Corp. | | | 19,459 | |
| | 148 | | | Owens Corning | | | 8,614 | |
| | 348 | | | PACCAR, Inc. | | | 24,938 | |
| | 90 | | | Parker-Hannifin Corp. | | | 15,301 | |
| | 625 | | | Prysmian SpA | | | 12,918 | |
| | 156 | | | Raytheon Co. | | | 27,125 | |
| | 43 | | | Rockwell Automation, Inc. | | | 7,045 | |
| | 1,811 | | | Rolls-Royce Holdings PLC2 | | | 19,370 | |
| | 15 | | | Roper Technologies, Inc. | | | 5,494 | |
| | 167 | | | Safran SA | | | 24,505 | |
| | 648 | | | Sandvik AB | | | 11,915 | |
| | 386 | | | Schneider Electric SE | | | 35,061 | |
| | 4,813 | | | Sembcorp Industries Ltd. | | | 8,573 | |
| | 1,713 | | | Shimizu Corp. | | | 14,230 | |
| | 836 | | | Siemens AG | | | 99,583 | |
| | 16,748 | | | Sime Darby Bhd | | | 9,159 | |
| | 1,757 | | | Singapore Technologies Engineering Ltd. | | | 5,376 | |
| | 551 | | | SK Holdings Co. Ltd. | | | 110,711 | |
| | 1,056 | | | Skanska AB, Class B | | | 19,087 | |
| | 522 | | | SKF AB, Class B | | | 9,607 | |
| | 228 | | | Smiths Group PLC | | | 4,541 | |
| | 26 | | | Snap-on, Inc. | | | 4,307 | |
| | 392 | | | SNC-Lavalin Group, Inc. | | | 7,944 | |
| | 14 | | | Spirax-Sarco Engineering PLC | | | 1,637 | |
| | 89 | | | Spirit AeroSystems Holdings, Inc., Class A | | | 7,242 | |
| | 374 | | | Taisei Corp. | | | 13,590 | |
| | | | | | | | |
| Shares | | | | | Value | |
| | | | Common Stocks (continued) | | | |
| | | | Capital Goods (continued) | |
| | 1,119 | | | Techtronic Industries Co. Ltd. | | $ | 8,565 | |
| | 162 | | | Thales SA | | | 20,044 | |
| | 156 | | | THK Co. Ltd. | | | 3,728 | |
| | 165 | | | TOTO Ltd. | | | 6,516 | |
| | 70 | | | United Rentals, Inc.2 | | | 9,284 | |
| | 547 | | | United Technologies Corp. | | | 71,219 | |
| | 147 | | | Vestas Wind Systems A/S | | | 12,717 | |
| | 551 | | | Vinci SA | | | 56,511 | |
| | 2,296 | | | Volvo AB, Class B | | | 36,464 | |
| | 44 | | | W.W. Grainger, Inc. | | | 11,802 | |
| | 30 | | | WABCO Holdings, Inc.2 | | | 3,978 | |
| | 389 | | | Wartsila OYJ Abp | | | 5,650 | |
| | 710 | | | WEG SA | | | 3,957 | |
| | 173 | | | Weir Group PLC (The) | | | 3,405 | |
| | 112 | | | WSP Global, Inc. | | | 6,179 | |
| | 200 | | | Xinjiang Goldwind Science & Technology Co. Ltd., Class A | | | 362 | |
| | 787 | | | Xinjiang Goldwind Science & Technology Co. Ltd., Class H | | | 860 | |
| | 71 | | | Xylem, Inc. | | | 5,938 | |
| | 200 | | | Zhengzhou Yutong Bus Co. Ltd., Class A | | | 379 | |
| | | | | | | | |
| | | | Total Capital Goods | | | 2,628,493 | |
| | | | | | | | |
| | | | Commercial & Professional Services—1.0% | |
| | 491 | | | Adecco Group AG | | | 29,541 | |
| | 651 | | | Brambles Ltd. | | | 5,884 | |
| | 231 | | | Bureau Veritas SA | | | 5,714 | |
| | 3,976 | | | China Everbright International Ltd. | | | 3,669 | |
| | 29 | | | Copart, Inc.2 | | | 2,168 | |
| | 409 | | | Country Garden Services Holdings Co. Ltd. | | | 946 | |
| | 625 | | | Dai Nippon Printing Co. Ltd. | | | 13,319 | |
| | 34 | | | Edenred | | | 1,737 | |
| | 165 | | | Experian PLC | | | 5,006 | |
| | 1,331 | | | Greentown Service Group Co. Ltd. | | | 1,075 | |
| | 74 | | | IHS Markit Ltd.2 | | | 4,715 | |
| | 58 | | | Intertek Group PLC | | | 4,061 | |
| | 354 | | | ISS A/S | | | 10,700 | |
| | 237 | | | ManpowerGroup, Inc. | | | 22,894 | |
| | 144 | | | Park24 Co. Ltd. | | | 3,353 | |
| | 511 | | | Randstad NV | | | 28,107 | |
| | 699 | | | Recruit Holdings Co. Ltd. | | | 23,317 | |
| | 441 | | | RELX PLC | | | 10,717 | |
| | 671 | | | Rentokil Initial PLC | | | 3,395 | |
| | 108 | | | Robert Half International, Inc. | | | 6,157 | |
| | 123 | | | Secom Co. Ltd. | | | 10,588 | |
| | 77 | | | SEEK Ltd. | | | 1,143 | |
| | 3 | | | SGS SA | | | 7,652 | |
| | 28 | | | Societe BIC SA | | | 2,138 | |
| | 88 | | | Sohgo Security Services Co. Ltd. | | | 4,059 | |
| | 27 | | | Teleperformance | | | 5,418 | |
| | 64 | | | Thomson Reuters Corp. | | | 4,138 | |
| | 921 | | | Toppan Printing Co. Ltd. | | | 13,977 | |
| | 37 | | | TransUnion | | | 2,720 | |
| | 74 | | | Wolters Kluwer NV | | | 5,395 | |
| | | | | | | | |
| | | | Total Commercial & Professional Services | | | 243,703 | |
| | | | | | | | |
| | | | Consumer Durables & Apparel—2.8% | |
| | 95 | | | adidas AG | | | 29,373 | |
| | 1,780 | | | Arcelik AS2 | | | 5,986 | |
| | 862 | | | Barratt Developments PLC | | | 6,282 | |
The accompanying notes are an integral part of these financial statements.
Invesco Global ESG Revenue ETF (ESGF)(continued)
June 30, 2019
| | | | | | | | |
| Shares | | | | | Value | |
| | | | Common Stocks (continued) | | | |
| | | | Consumer Durables & Apparel (continued) | |
| | 76 | | | Berkeley Group Holdings PLC | | $ | 3,609 | |
| | 157 | | | Burberry Group PLC | | | 3,721 | |
| | 257 | | | Casio Computer Co. Ltd. | | | 3,192 | |
| | 30 | | | CCC SA | | | 1,356 | |
| | 205 | | | Cie Financiere Richemont SA | | | 17,418 | |
| | 614 | | | Electrolux AB, Series B | | | 15,704 | |
| | 160 | | | EssilorLuxottica SA | | | 20,908 | |
| | 44 | | | Garmin Ltd. | | | 3,511 | |
| | 76 | | | Gildan Activewear, Inc. | | | 2,948 | |
| | 418 | | | Hanesbrands, Inc. | | | 7,198 | |
| | 100 | | | Hangzhou Robam Appliances Co. Ltd. | | | 395 | |
| | 49 | | | Hasbro, Inc. | | | 5,178 | |
| | 52 | | | HUGO BOSS AG | | | 3,464 | |
| | 408 | | | Husqvarna AB, Class B | | | 3,820 | |
| | 27 | | | Kering | | | 15,992 | |
| | 825 | | | LG Electronics, Inc. | | | 56,660 | |
| | 1 | | | LPP SA | | | 2,049 | |
| | 143 | | | LVMH Moet Hennessy Louis Vuitton SE | | | 60,954 | |
| | 74 | | | Mohawk Industries, Inc.2 | | | 10,913 | |
| | 43 | | | Moncler SpA | | | 1,841 | |
| | 570 | | | Newell Brands, Inc. | | | 8,789 | |
| | 379 | | | NIKE, Inc., Class B | | | 31,817 | |
| | 529 | | | Nikon Corp. | | | 7,483 | |
| | 9,783 | | | Panasonic Corp. | | | 81,504 | |
| | 99 | | | Pandora A/S | | | 3,527 | |
| | 189 | | | Persimmon PLC | | | 4,804 | |
| | 90 | | | Puma SE | | | 6,011 | |
| | 91 | | | PVH Corp. | | | 8,612 | |
| | 46 | | | SEB SA | | | 8,282 | |
| | 265 | | | Sega Sammy Holdings, Inc. | | | 3,220 | |
| | 751 | | | Sekisui Chemical Co. Ltd. | | | 11,278 | |
| | 1,269 | | | Sekisui House Ltd. | | | 20,912 | |
| | 2,341 | | | Sharp Corp. | | | 25,683 | |
| | 252 | | | Shenzhou International Group Holdings Ltd. | | | 3,464 | |
| | 1,608 | | | Sony Corp. | | | 84,295 | |
| | 17 | | | Swatch Group AG (The) | | | 4,873 | |
| | 72 | | | Swatch Group AG (The) | | | 3,903 | |
| | 3,376 | | | Tatung Co. Ltd.2 | | | 2,038 | |
| | 2,435 | | | Taylor Wimpey PLC | | | 4,889 | |
| | 3,400 | | | TCL Corp., Class A | | | 1,648 | |
| | 170 | | | Titan Co. Ltd. | | | 3,287 | |
| | 104 | | | Under Armour, Inc., Class A2 | | | 2,636 | |
| | 142 | | | Under Armour, Inc., Class C2 | | | 3,152 | |
| | 141 | | | VF Corp. | | | 12,316 | |
| | 160 | | | Whirlpool Corp. | | | 22,778 | |
| | 88 | | | Yamaha Corp. | | | 4,182 | |
| | | | | | | | |
| | | | Total Consumer Durables & Apparel | | | 657,855 | |
| | | | | | | | |
| | | | Consumer Services—0.8% | |
| | 112 | | | Accor SA | | | 4,815 | |
| | 997 | | | Alsea SAB de CV2 | | | 1,961 | |
| | 140 | | | Aristocrat Leisure Ltd. | | | 3,018 | |
| | 188 | | | Benesse Holdings, Inc. | | | 4,376 | |
| | 1,392 | | | Compass Group PLC | | | 33,430 | |
| | 261 | | | Crown Resorts Ltd. | | | 2,280 | |
| | 81 | | | Flight Centre Travel Group Ltd. | | | 2,362 | |
| | 30 | | | Flutter Entertainment PLC | | | 2,259 | |
| | 270 | | | GVC Holdings PLC | | | 2,240 | |
| | 40 | | | Hilton Worldwide Holdings, Inc. | | | 3,909 | |
| | | | | | | | |
| Shares | | | | | Value | |
| | | | Common Stocks (continued) | | | |
| | | | Consumer Services (continued) | |
| | 69 | | | InterContinental Hotels Group PLC | | $ | 4,542 | |
| | 52 | | | Kangwon Land, Inc. | | | 1,362 | |
| | 253 | | | Melco Resorts & Entertainment Ltd.4 | | | 5,495 | |
| | 479 | | | Merlin Entertainments PLC3 | | | 2,738 | |
| | 1,477 | | | MGM China Holdings Ltd. | | | 2,511 | |
| | 2,101 | | | Minor International PCL | | | 2,809 | |
| | 193 | | | OPAP SA | | | 2,165 | |
| | 45 | | | Oriental Land Co. Ltd. | | | 5,572 | |
| | 1,767 | | | Sands China Ltd. | | | 8,448 | |
| | 1,936 | | | Shangri-La Asia Ltd. | | | 2,441 | |
| | 215 | | | Sodexo SA | | | 25,170 | |
| | 330 | | | Starbucks Corp. | | | 27,664 | |
| | 877 | | | Tabcorp Holdings Ltd. | | | 2,739 | |
| | 2,311 | | | TUI AG | | | 22,718 | |
| | 10 | | | Vail Resorts, Inc. | | | 2,232 | |
| | 63 | | | Whitbread PLC1 | | | 3,711 | |
| | | | | | | | |
| | | | Total Consumer Services | | | 182,967 | |
| | | | | | | | |
| | | | Diversified Financials—3.7% | |
| | 105 | | | 3i Group PLC | | | 1,488 | |
| | 251 | | | AEON Financial Service Co. Ltd. | | | 4,042 | |
| | 389 | | | Ally Financial, Inc. | | | 12,055 | |
| | 385 | | | American Express Co. | | | 47,524 | |
| | 89 | | | Ameriprise Financial, Inc. | | | 12,919 | |
| | 3,951 | | | AMP Ltd. | | | 5,878 | |
| | 81 | | | Amundi SA3 | | | 5,664 | |
| | 15 | | | ASX Ltd. | | | 867 | |
| | 526 | | | AXA Equitable Holdings, Inc. | | | 10,993 | |
| | 162 | | | B3 SA—Brasil Bolsa Balcao | | | 1,583 | |
| | 53 | | | Bajaj Finance Ltd. | | | 2,826 | |
| | 448 | | | Bank of New York Mellon Corp. (The) | | | 19,779 | |
| | 32 | | | BlackRock, Inc. | | | 15,018 | |
| | 1,228 | | | Brookfield Asset Management, Inc., Class A | | | 58,875 | |
| | 457 | | | Chailease Holding Co. Ltd. | | | 1,891 | |
| | 265 | | | Challenger Ltd. | | | 1,235 | |
| | 587 | | | China International Capital Corp. Ltd., Class H3 | | | 1,184 | |
| | 109 | | | CI Financial Corp. | | | 1,780 | |
| | 26 | | | CME Group, Inc. | | | 5,047 | |
| | 2,801 | | | Credit Suisse Group AG2 | | | 33,626 | |
| | 1,713 | | | Daiwa Securities Group, Inc. | | | 7,506 | |
| | 5,892 | | | Deutsche Bank AG | | | 45,493 | |
| | 28 | | | Deutsche Boerse AG | | | 3,967 | |
| | 74 | | | Eurazeo SE | | | 5,166 | |
| | 2,617 | | | EXOR NV | | | 183,583 | |
| | 5 | | | FactSet Research Systems, Inc. | | | 1,433 | |
| | 2,099 | | | FirstRand Ltd. | | | 10,204 | |
| | 186 | | | Franklin Resources, Inc. | | | 6,473 | |
| | 268 | | | Goldman Sachs Group, Inc. (The) | | | 54,833 | |
| | 71 | | | Groupe Bruxelles Lambert SA | | | 6,976 | |
| | 60 | | | Hong Kong Exchanges & Clearing Ltd. | | | 2,118 | |
| | 87 | | | IGM Financial, Inc.1 | | | 2,489 | |
| | 8 | | | Industrivarden AB, Class C | | | 177 | |
| | 63 | | | Intercontinental Exchange, Inc. | | | 5,414 | |
| | 267 | | | Invesco Ltd.5 | | | 5,463 | |
| | 294 | | | Investec Ltd. | | | 1,915 | |
| | 677 | | | Investec PLC | | | 4,403 | |
| | 79 | | | Investor AB, Class B | | | 3,798 | |
| | 73 | | | Japan Exchange Group, Inc. | | | 1,160 | |
| | 97 | | | Julius Baer Group Ltd.2 | | | 4,324 | |
The accompanying notes are an integral part of these financial statements.
Invesco Global ESG Revenue ETF (ESGF)(continued)
June 30, 2019
| | | | | | | | |
| Shares | | | | | Value | |
| | | | Common Stocks (continued) | | | |
| | | | Diversified Financials (continued) | |
| | 8 | | | Kinnevik AB, Class B | | $ | 208 | |
| | 41 | | | L E Lundbergforetagen AB, Class B | | | 1,536 | |
| | 43 | | | London Stock Exchange Group PLC | | | 3,002 | |
| | 139 | | | Macquarie Group Ltd. | | | 12,231 | |
| | 1,615 | | | Mitsubishi UFJ Lease & Finance Co. Ltd. | | | 8,559 | |
| | 24 | | | Moody’s Corp. | | | 4,687 | |
| | 1,173 | | | Morgan Stanley | | | 51,389 | |
| | 225 | | | Muangthai Capital PCL | | | 415 | |
| | 3,096 | | | Natixis SA | | | 12,478 | |
| | 5,847 | | | Nomura Holdings, Inc. | | | 20,590 | |
| | 73 | | | Northern Trust Corp. | | | 6,570 | |
| | 409 | | | Onex Corp. | | | 24,723 | |
| | 1,696 | | | ORIX Corp. | | | 25,313 | |
| | 101 | | | PSG Group Ltd. | | | 1,712 | |
| | 1,944 | | | REC Ltd. | | | 4,641 | |
| | 240 | | | Remgro Ltd. | | | 3,198 | |
| | 30 | | | S&P Global, Inc. | | | 6,834 | |
| | 107 | | | Samsung Card Co. Ltd. | | | 3,540 | |
| | 74 | | | Schroders PLC | | | 2,873 | |
| | 123 | | | Singapore Exchange Ltd. | | | 720 | |
| | 747 | | | Standard Life Aberdeen PLC | | | 2,801 | |
| | 220 | | | State Street Corp. | | | 12,333 | |
| | 53 | | | T. Rowe Price Group, Inc. | | | 5,815 | |
| | 3,138 | | | UBS Group AG2 | | | 37,334 | |
| | 158 | | | Voya Financial, Inc. | | | 8,737 | |
| | 72 | | | Wendel SA | | | 9,831 | |
| | 7,923 | | | Yuanta Financial Holding Co. Ltd. | | | 4,757 | |
| | | | | | | | |
| | | | Total Diversified Financials | | | 877,996 | |
| | | | | | | | |
| | | | Energy—9.4% | |
| | 119 | | | Aker BP ASA | | | 3,414 | |
| | 1,255 | | | Baker Hughes a GE Co. | | | 30,911 | |
| | 8,040 | | | Banpu PCL | | | 3,932 | |
| | 43,313 | | | BP PLC | | | 302,413 | |
| | 834 | | | Caltex Australia Ltd. | | | 14,485 | |
| | 158 | | | Cameco Corp. | | | 1,698 | |
| | 1,836 | | | Cenovus Energy, Inc. | | | 16,228 | |
| | 129 | | | Cheniere Energy, Inc.2 | | | 8,830 | |
| | 592 | | | ConocoPhillips | | | 36,112 | |
| | 260 | | | Cosan SA | | | 3,131 | |
| | 335 | | | Devon Energy Corp. | | | 9,554 | |
| | 2,166 | | | Empresas COPEC SA | | | 23,684 | |
| | 1,118 | | | Enbridge, Inc. | | | 40,468 | |
| | 1,265 | | | Encana Corp. | | | 6,505 | |
| | 3,678 | | | Equinor ASA | | | 72,667 | |
| | 167 | | | Exxaro Resources Ltd. | | | 2,037 | |
| | 1,190 | | | Galp Energia SGPS SA | | | 18,329 | |
| | 368 | | | GS Holdings Corp. | | | 16,318 | |
| | 966 | | | Halliburton Co. | | | 21,967 | |
| | 100 | | | Hess Corp. | | | 6,357 | |
| | 1,698 | | | Husky Energy, Inc. | | | 16,126 | |
| | 2,154 | | | Idemitsu Kosan Co. Ltd. | | | 64,776 | |
| | 938 | | | Imperial Oil Ltd. | | | 26,028 | |
| | 34,892 | | | Indian Oil Corp. Ltd. | | | 78,804 | |
| | 962 | | | Inpex Corp. | | | 8,673 | |
| | 50,602 | | | IRPC PCL | | | 8,250 | |
| | 2,700 | | | IRPC PCL | | | 440 | |
| | 1,483 | | | John Wood Group PLC | | | 8,531 | |
| | 21,112 | | | JXTG Holdings, Inc. | | | 104,717 | |
| | | | | | | | |
| Shares | | | | | Value | |
| | | | Common Stocks (continued) | | | |
| | | | Energy (continued) | |
| | 35 | | | Koninklijke Vopak NV | | $ | 1,616 | |
| | 80 | | | Lundin Petroleum AB | | | 2,482 | |
| | 394 | | | Marathon Oil Corp. | | | 5,599 | |
| | 1,678 | | | MOL Hungarian Oil & Gas PLC | | | 18,661 | |
| | 361 | | | National Oilwell Varco, Inc. | | | 8,025 | |
| | 494 | | | Neste OYJ | | | 16,787 | |
| | 188 | | | Noble Energy, Inc. | | | 4,211 | |
| | 73 | | | Novatek PJSC | | | 15,476 | |
| | 200 | | | Offshore Oil Engineering Co. Ltd., Class A | | | 163 | |
| | 287 | | | Oil Search Ltd. | | | 1,424 | |
| | 530 | | | OMV AG | | | 25,863 | |
| | 192 | | | ONEOK, Inc. | | | 13,211 | |
| | 2,057 | | | Origin Energy Ltd. | | | 10,552 | |
| | 156 | | | Pembina Pipeline Corp.1 | | | 5,820 | |
| | 1,286 | | | Petronas Dagangan Bhd | | | 7,904 | |
| | 1,271 | | | Phillips 66 | | | 118,889 | |
| | 1,268 | | | Polski Koncern Naftowy ORLEN SA | | | 30,595 | |
| | 15 | | | PrairieSky Royalty Ltd. | | | 211 | |
| | 1,378 | | | PTT Exploration & Production PCL | | | 6,066 | |
| | 51,224 | | | PTT PCL | | | 81,427 | |
| | 3,983 | | | Repsol SA | | | 62,527 | |
| | 6,727 | | | Royal Dutch Shell PLC, Class A | | | 220,243 | |
| | 5,561 | | | Royal Dutch Shell PLC, Class B | | | 182,670 | |
| | 717 | | | Santos Ltd. | | | 3,562 | |
| | 857 | | | Schlumberger Ltd. | | | 34,057 | |
| | 361 | | | SK Innovation Co. Ltd. | | | 49,711 | |
| | 314 | | | S-Oil Corp. | | | 22,762 | |
| | 889 | | | Suncor Energy, Inc. | | | 27,791 | |
| | 222 | | | TC Energy Corp. | | | 11,029 | |
| | 562 | | | TechnipFMC PLC | | | 14,578 | |
| | 6,245 | | | Thai Oil PCL | | | 13,542 | |
| | 3,430 | | | TOTAL SA | | | 192,472 | |
| | 24 | | | Transportadora de Gas del Sur SA4 | | | 347 | |
| | 4,863 | | | Ultrapar Participacoes SA | | | 25,504 | |
| | 3,595 | | | United Tractors Tbk PT | | | 7,176 | |
| | 55 | | | Vermilion Energy, Inc.1 | | | 1,197 | |
| | 203 | | | Woodside Petroleum Ltd. | | | 5,180 | |
| | 386 | | | WorleyParsons Ltd. | | | 3,985 | |
| | | | | | | | |
| | | | Total Energy | | | 2,208,700 | |
| | | | | | | | |
| | | | Food & Staples Retailing—4.0% | |
| | 4,503 | | | Aeon Co. Ltd. | | | 77,363 | |
| | 2,887 | | | Atacadao SA | | | 16,572 | |
| | 448 | | | Bid Corp. Ltd. | | | 9,753 | |
| | 4,664 | | | Carrefour SA | | | 90,187 | |
| | 1,211 | | | Casino Guichard Perrachon SA1 | | | 41,373 | |
| | 156 | | | Clicks Group Ltd. | | | 2,271 | |
| | 159 | | | Colruyt SA | | | 9,234 | |
| | 525 | | | Empire Co. Ltd., Class A | | | 13,250 | |
| | 567 | | | George Weston Ltd. | | | 43,117 | |
| | 323 | | | ICA Gruppen AB1 | | | 13,897 | |
| | 15,106 | | | J Sainsbury PLC | | | 37,672 | |
| | 1,355 | | | Jeronimo Martins SGPS SA | | | 21,858 | |
| | 3,292 | | | Koninklijke Ahold Delhaize NV | | | 74,146 | |
| | 4,983 | | | Kroger Co. (The) | | | 108,181 | |
| | 143 | | | Lawson, Inc. | | | 6,862 | |
| | 679 | | | Loblaw Cos. Ltd. | | | 34,840 | |
| | 2,416 | | | METRO AG1 | | | 44,228 | |
| | 322 | | | Metro, Inc. | | | 12,109 | |
The accompanying notes are an integral part of these financial statements.
Invesco Global ESG Revenue ETF (ESGF)(continued)
June 30, 2019
| | | | | | | | |
| Shares | | | | | Value | |
| | | | Common Stocks (continued) | | | |
| | | | Food & Staples Retailing (continued) | |
| | 1,260 | | | Pick n Pay Stores Ltd. | | $ | 6,165 | |
| | 861 | | | President Chain Store Corp. | | | 8,330 | |
| | 1,867 | | | Seven & i Holdings Co. Ltd. | | | 63,215 | |
| | 522 | | | SPAR Group Ltd. (The) | | | 6,916 | |
| | 824 | | | Sysco Corp. | | | 58,273 | |
| | 26,932 | | | Tesco PLC | | | 77,704 | |
| | 9,026 | | | Wm Morrison Supermarkets PLC1 | | | 23,136 | |
| | 1,807 | | | Woolworths Group Ltd. | | | 42,138 | |
| | | | | | | | |
| | | | Total Food & Staples Retailing | | | 942,790 | |
| | | | | | | | |
| | | | Food, Beverage & Tobacco—4.2% | |
| | 602 | | | Ajinomoto Co., Inc. | | | 10,438 | |
| | 3,192 | | | Ambev SA | | | 14,900 | |
| | 1,108 | | | Anadolu Efes Biracilik Ve Malt Sanayii AS | | | 3,810 | |
| | 555 | | | Anheuser-Busch InBev SA | | | 49,198 | |
| | 1,535 | | | Arca Continental SAB de CV | | | 8,298 | |
| | 1,588 | | | Archer-Daniels-Midland Co. | | | 64,790 | |
| | 647 | | | Associated British Foods PLC | | | 20,281 | |
| | 4 | | | Barry Callebaut AG | | | 8,033 | |
| | 89 | | | British American Tobacco Malaysia Bhd | | | 620 | |
| | 891 | | | British American Tobacco PLC | | | 31,173 | |
| | 43 | | | Brown-Forman Corp., Class B | | | 2,384 | |
| | 877 | | | Bunge Ltd. | | | 48,858 | |
| | 260 | | | Campbell Soup Co. | | | 10,418 | |
| | 58 | | | Carlsberg A/S, Class B | | | 7,701 | |
| | 205 | | | Cia Cervecerias Unidas SA | | | 2,883 | |
| | 65 | | | CJ CheilJedang Corp. | | | 16,719 | |
| | 558 | | | Coca-Cola Amatil Ltd. | | | 4,002 | |
| | 658 | | | Coca-Cola Co. (The) | | | 33,505 | |
| | 242 | | | Coca-Cola European Partners PLC | | | 13,673 | |
| | 394 | | | Coca-Cola Femsa SAB de CV | | | 2,443 | |
| | 222 | | | Coca-Cola HBC AG2 | | | 8,397 | |
| | 349 | | | Conagra Brands, Inc. | | | 9,255 | |
| | 383 | | | Danone SA | | | 32,494 | |
| | 198 | | | Davide Campari-Milano SpA | | | 1,943 | |
| | 395 | | | Diageo PLC | | | 17,012 | |
| | 1,570 | | | Fomento Economico Mexicano SAB de CV | | | 15,197 | |
| | 128 | | | Fraser & Neave Holdings Bhd | | | 1,070 | |
| | 330 | | | General Mills, Inc. | | | 17,332 | |
| | 7,268 | | | Grupo Bimbo SAB de CV, Series A | | | 15,144 | |
| | 256 | | | Heineken Holding NV | | | 26,908 | |
| | 241 | | | Heineken NV | | | 26,935 | |
| | 45 | | | Hershey Co. (The) | | | 6,031 | |
| | 250 | | | Hormel Foods Corp. | | | 10,135 | |
| | 768 | | | Imperial Brands PLC | | | 18,051 | |
| | 72 | | | Ingredion, Inc. | | | 5,939 | |
| | 1,650 | | | ITC Ltd. | | | 6,546 | |
| | 64 | | | JM Smucker Co. (The) | | | 7,372 | |
| | 246 | | | Kellogg Co. | | | 13,178 | |
| | 65 | | | Kerry Group PLC, Class A | | | 7,772 | |
| | 91 | | | Kikkoman Corp. | | | 3,961 | |
| | 925 | | | Kirin Holdings Co. Ltd. | | | 19,948 | |
| | 842 | | | Kraft Heinz Co. (The) | | | 26,136 | |
| | 52 | | | KT&G Corp. | | | 4,436 | |
| | 57 | | | Lamb Weston Holdings, Inc. | | | 3,612 | |
| | 166 | | | M Dias Branco SA | | | 1,687 | |
| | 33 | | | McCormick & Co., Inc. | | | 5,115 | |
| | 187 | | | Molson Coors Brewing Co., Class B | | | 10,472 | |
| | 505 | | | Mondelez International, Inc., Class A | | | 27,220 | |
| | | | | | | | |
| Shares | | | | | Value | |
| | | | Common Stocks (continued) | | | |
| | | | Food, Beverage & Tobacco (continued) | |
| | 191 | | | Mowi ASA | | $ | 4,468 | |
| | 12 | | | Nestle India Ltd. | | | 2,071 | |
| | 39 | | | Nestle Malaysia Bhd | | | 1,407 | |
| | 962 | | | Nestle SA | | | 99,713 | |
| | 72 | | | Nissin Foods Holdings Co. Ltd. | | | 4,638 | |
| | 584 | | | Orkla ASA | | | 5,184 | |
| | 516 | | | PepsiCo, Inc. | | | 67,663 | |
| | 60 | | | Pernod Ricard SA | | | 11,073 | |
| | 10 | | | Remy Cointreau SA1 | | | 1,444 | |
| | 3,247 | | | Sime Darby Plantation Bhd | | | 3,866 | |
| | 531 | | | Standard Foods Corp. | | | 1,038 | |
| | 281 | | | Suntory Beverage & Food Ltd. | | | 12,219 | |
| | 31 | | | Swedish Match AB | | | 1,310 | |
| | 102 | | | Toyo Suisan Kaisha Ltd. | | | 4,203 | |
| | 188 | | | Treasury Wine Estates Ltd. | | | 1,968 | |
| | 17,941 | | | Wilmar International Ltd. | | | 49,064 | |
| | 66 | | | Yakult Honsha Co. Ltd. | | | 3,890 | |
| | | | | | | | |
| | | | Total Food, Beverage & Tobacco | | | 978,644 | |
| | | | | | | | |
| | | | Health Care Equipment & Services—4.8% | |
| | 3 | | | ABIOMED, Inc.2 | | | 781 | |
| | 120 | | | Alcon, Inc.2 | | | 7,419 | |
| | 1,045 | | | Alfresa Holdings Corp. | | | 25,781 | |
| | 6 | | | Align Technology, Inc.2 | | | 1,642 | |
| | 2,295 | | | AmerisourceBergen Corp. | | | 195,672 | |
| | 3,245 | | | Bangkok Dusit Medical Services PCL | | | 2,751 | |
| | 78 | | | Becton Dickinson and Co. | | | 19,657 | |
| | 3,196 | | | Cardinal Health, Inc. | | | 150,532 | |
| | 952 | | | Cigna Corp. | | | 149,988 | |
| | 8 | | | Cochlear Ltd. | | | 1,161 | |
| | 23 | | | Coloplast A/S, Class B | | | 2,603 | |
| | 9 | | | Cooper Cos., Inc. (The) | | | 3,032 | |
| | 4,761 | | | CVS Health Corp. | | | 259,427 | |
| | 231 | | | DaVita, Inc.2 | | | 12,996 | |
| | 66 | | | Demant A/S2 | | | 2,055 | |
| | 75 | | | DENTSPLY SIRONA, Inc. | | | 4,377 | |
| | 22 | | | Edwards Lifesciences Corp.2 | | | 4,064 | |
| | 68 | | | Fisher & Paykel Healthcare Corp. Ltd. | | | 706 | |
| | 246 | | | Fresenius Medical Care AG & Co. KGaA | | | 19,341 | |
| | 556 | | | Hartalega Holdings Bhd | | | 705 | |
| | 379 | | | HCA Healthcare, Inc. | | | 51,229 | |
| | 160 | | | Henry Schein, Inc.2 | | | 11,184 | |
| | 120 | | | Huadong Medicine Co. Ltd., Class A | | | 454 | |
| | 241 | | | Humana, Inc. | | | 63,937 | |
| | 9 | | | IDEXX Laboratories, Inc.2 | | | 2,478 | |
| | 2,201 | | | IHH Healthcare Bhd | | | 3,089 | |
| | 519 | | | Koninklijke Philips NV | | | 22,569 | |
| | 71 | | | Laboratory Corp. of America Holdings2 | | | 12,276 | |
| | 984 | | | Life Healthcare Group Holdings Ltd. | | | 1,566 | |
| | 1,108 | | | Netcare Ltd. | | | 1,413 | |
| | 54 | | | NMC Health PLC | | | 1,651 | |
| | 81 | | | Quest Diagnostics, Inc. | | | 8,247 | |
| | 165 | | | Ramsay Health Care Ltd. | | | 8,365 | |
| | 22 | | | ResMed, Inc. | | | 2,685 | |
| | 33 | | | Ryman Healthcare Ltd. | | | 260 | |
| | 600 | | | Shanghai Pharmaceuticals Holding Co. Ltd., Class A | | | 1,586 | |
| | 3,977 | | | Shanghai Pharmaceuticals Holding Co. Ltd., Class H | | | 7,819 | |
The accompanying notes are an integral part of these financial statements.
Invesco Global ESG Revenue ETF (ESGF)(continued)
June 30, 2019
| | | | | | | | |
| Shares | | | | | Value | |
| | | | Common Stocks (continued) | | | |
| | | | Health Care Equipment & Services (continued) | |
| | 239 | | | Smith & Nephew PLC | | $ | 5,186 | |
| | 232 | | | Sonic Healthcare Ltd. | | | 4,412 | |
| | 13 | | | Sonova Holding AG | | | 2,957 | |
| | 21 | | | STERIS PLC | | | 3,126 | |
| | 1 | | | Straumann Holding AG | | | 884 | |
| | 379 | | | Suzuken Co. Ltd. | | | 22,232 | |
| | 40 | | | Sysmex Corp. | | | 2,609 | |
| | 205 | | | Terumo Corp. | | | 6,108 | |
| | 24 | | | Varian Medical Systems, Inc.2 | | | 3,267 | |
| | | | | | | | |
| | | | Total Health Care Equipment & Services | | | 1,116,279 | |
| | | | | | | | |
| | | | Household & Personal Products—1.4% | |
| | 24 | | | Amorepacific Corp. | | | 3,419 | |
| | 98 | | | AMOREPACIFIC Group | | | 5,288 | |
| | 82 | | | Beiersdorf AG1 | | | 9,856 | |
| | 58 | | | Church & Dwight Co., Inc. | | | 4,237 | |
| | 44 | | | Clorox Co. (The) | | | 6,737 | |
| | 222 | | | Colgate-Palmolive Co. | | | 15,911 | |
| | 244 | | | Dabur India Ltd. | | | 1,416 | |
| | 395 | | | Essity AB, Class B | | | 12,150 | |
| | 52 | | | Estee Lauder Cos., Inc., (The), Class A | | | 9,522 | |
| | 152 | | | Henkel AG & Co KGaA1 | | | 13,978 | |
| | 238 | | | Hindustan Unilever Ltd. | | | 6,163 | |
| | 179 | | | Kao Corp. | | | 13,640 | |
| | 149 | | | Kimberly-Clark Corp. | | | 19,859 | |
| | 634 | | | Kimberly-Clark de Mexico SAB de CV, Class A2 | | | 1,178 | |
| | 5 | | | LG Household & Health Care Ltd. | | | 5,686 | |
| | 115 | | | L’Oreal SA | | | 32,806 | |
| | 207 | | | Marico Ltd. | | | 1,111 | |
| | 272 | | | Natura Cosmeticos SA | | | 4,009 | |
| | 633 | | | Procter & Gamble Co. (The) | | | 69,408 | |
| | 214 | | | Reckitt Benckiser Group PLC | | | 16,924 | |
| | 221 | | | Unicharm Corp. | | | 6,654 | |
| | 1,056 | | | Unilever Indonesia Tbk PT | | | 3,364 | |
| | 645 | | | Unilever NV | | | 39,341 | |
| | 437 | | | Unilever PLC | | | 27,222 | |
| | | | | | | | |
| | | | Total Household & Personal Products | | | 329,879 | |
| | | | | | | | |
| | | | Insurance—4.9% | |
| | 5,731 | | | Aegon NV | | | 28,573 | |
| | 360 | | | Allianz SE | | | 86,913 | |
| | 386 | | | Allstate Corp. (The) | | | 39,252 | |
| | 3,810 | | | Assicurazioni Generali SpA | | | 71,851 | |
| | 6,448 | | | Aviva PLC | | | 34,180 | |
| | 4,473 | | | AXA SA | | | 117,668 | |
| | 5,461 | | | Cathay Financial Holding Co. Ltd.2 | | | 7,560 | |
| | 1,628 | | | CNP Assurances | | | 37,005 | |
| | 13,449 | | | Fubon Financial Holding Co. Ltd.2 | | | 19,853 | |
| | 157 | | | Gjensidige Forsikring ASA | | | 3,164 | |
| | 1,118 | | | Great-West Lifeco, Inc. | | | 25,795 | |
| | 527 | | | Hyundai Marine & Fire Insurance Co. Ltd. | | | 12,985 | |
| | 2,170 | | | Insurance Australia Group Ltd. | | | 12,578 | |
| | 87 | | | Intact Financial Corp. | | | 8,057 | |
| | 4,236 | | | Legal & General Group PLC | | | 14,529 | |
| | 73 | | | Lincoln National Corp. | | | 4,705 | |
| | 1,056 | | | Manulife Financial Corp. | | | 19,233 | |
| | 7,489 | | | Mapfre SA1 | | | 21,927 | |
| | 163 | | | Marsh & McLennan Cos., Inc. | | | 16,259 | |
| | 1,509 | | | MS&AD Insurance Group Holdings, Inc. | | | 47,900 | |
| | | | | | | | |
| Shares | | | | | Value | |
| | | | Common Stocks (continued) | | | |
| | | | Insurance (continued) | |
| | 221 | | | Muenchener Rueckversicherungs-Gesellschaft AG in Muenchen | | $ | 55,545 | |
| | 377 | | | NN Group NV | | | 15,198 | |
| | 1,802 | | | Old Mutual Ltd. | | | 2,709 | |
| | 1,129 | | | Power Financial Corp. | | | 26,023 | |
| | 581 | | | Powszechny Zaklad Ubezpieczen SA | | | 6,802 | |
| | 118 | | | Principal Financial Group, Inc. | | | 6,835 | |
| | 425 | | | Progressive Corp. (The) | | | 33,970 | |
| | 366 | | | Prudential Financial, Inc. | | | 36,966 | |
| | 2,152 | | | Prudential PLC | | | 46,999 | |
| | 1,517 | | | QBE Insurance Group Ltd. | | | 12,594 | |
| | 1,218 | | | RSA Insurance Group PLC | | | 8,941 | |
| | 78 | | | Samsung Fire & Marine Insurance Co. Ltd. | | | 18,104 | |
| | 365 | | | Sanlam Ltd. | | | 2,023 | |
| | 895 | | | Sompo Holdings, Inc. | | | 34,566 | |
| | 360 | | | Sun Life Financial, Inc. | | | 14,940 | |
| | 884 | | | Suncorp Group Ltd. | | | 8,356 | |
| | 401 | | | Swiss Re AG | | | 40,816 | |
| | 1,667 | | | T&D Holdings, Inc. | | | 18,095 | |
| | 867 | | | Tokio Marine Holdings, Inc. | | | 43,447 | |
| | 192 | | | Travelers Cos., Inc. (The) | | | 28,708 | |
| | 92 | | | Tryg A/S | | | 2,996 | |
| | 49 | | | Willis Towers Watson PLC | | | 9,385 | |
| | 121 | | | Zurich Insurance Group AG | | | 42,182 | |
| | | | | | | | |
| | | | Total Insurance | | | 1,146,187 | |
| | | | | | | | |
| | | | Materials—6.4% | |
| | 54 | | | Agnico Eagle Mines Ltd. | | | 2,774 | |
| | 186 | | | Air Liquide SA | | | 26,064 | |
| | 111 | | | Akzo Nobel NV | | | 10,446 | |
| | 810 | | | Amcor PLC2 | | | 9,307 | |
| | 1,236 | | | Anglo American PLC | | | 35,307 | |
| | 451 | | | Antofagasta PLC | | | 5,336 | |
| | 114 | | | Arkema SA | | | 10,617 | |
| | 1,917 | | | Asahi Kasei Corp. | | | 20,435 | |
| | 143 | | | Asian Paints Ltd. | | | 2,814 | |
| | 71 | | | Avery Dennison Corp. | | | 8,213 | |
| | 191 | | | Axalta Coating Systems Ltd.2 | | | 5,686 | |
| | 190 | | | Ball Corp. | | | 13,298 | |
| | 1,006 | | | BASF SE | | | 73,229 | |
| | 877 | | | BHP Group Ltd. | | | 25,331 | |
| | 756 | | | BHP Group PLC | | | 19,388 | |
| | 1,037 | | | BlueScope Steel Ltd. | | | 8,769 | |
| | 233 | | | Boliden AB | | | 5,963 | |
| | 1,312 | | | Boral Ltd. | | | 4,714 | |
| | 85 | | | CCL Industries, Inc., Class B | | | 4,177 | |
| | 1,210 | | | Cementos Argos SA | | | 2,830 | |
| | 34,709 | | | Cemex SAB de CV | | | 14,616 | |
| | 600 | | | China Molybdenum Co. Ltd., Class A | | | 346 | |
| | 2,179 | | | China Molybdenum Co. Ltd., Class H1 | | | 689 | |
| | 17,884 | | | China Steel Corp. | | | 14,366 | |
| | 12 | | | Chr Hansen Holding A/S | | | 1,129 | |
| | 357 | | | Clariant AG2 | | | 7,266 | |
| | 638 | | | Corteva, Inc.2 | | | 18,866 | |
| | 376 | | | Covestro AG3 | | | 19,144 | |
| | 948 | | | CRH PLC | | | 30,973 | |
| | 29 | | | Croda International PLC | | | 1,890 | |
| | 535 | | | Daicel Corp. | | | 4,757 | |
| | 986 | | | Dow, Inc. | | | 48,620 | |
The accompanying notes are an integral part of these financial statements.
Invesco Global ESG Revenue ETF (ESGF)(continued)
June 30, 2019
| | | | | | | | |
| Shares | | | | | Value | |
| | | | Common Stocks (continued) | | | |
| | | | Materials (continued) | |
| | 629 | | | DuPont de Nemours, Inc. | | $ | 47,219 | |
| | 84 | | | Ecolab, Inc. | | | 16,585 | |
| | 2,091 | | | Empresas CMPC SA | | | 5,728 | |
| | 594 | | | Evonik Industries AG | | | 17,324 | |
| | 1,943 | | | Fletcher Building Ltd. | | | 6,329 | |
| | 1,161 | | | Fortescue Metals Group Ltd. | | | 7,349 | |
| | 9 | | | Franco-Nevada Corp. | | | 766 | |
| | 2 | | | Givaudan SA | | | 5,653 | |
| | 682 | | | Grupo Argos SA | | | 3,679 | |
| | 267 | | | HeidelbergCement AG | | | 21,637 | |
| | 238 | | | Hitachi Chemical Co. Ltd. | | | 6,464 | |
| | 966 | | | Hitachi Metals Ltd. | | | 10,912 | |
| | 114 | | | Imerys SA | | | 6,052 | |
| | 37 | | | International Flavors & Fragrances, Inc. | | | 5,368 | |
| | 197 | | | James Hardie Industries PLC | | | 2,585 | |
| | 2,585 | | | JFE Holdings, Inc. | | | 37,969 | |
| | 493 | | | Johnson Matthey PLC | | | 20,888 | |
| | 334 | | | JSR Corp. | | | 5,273 | |
| | 176 | | | Kaneka Corp. | | | 6,616 | |
| | 251 | | | Kansai Paint Co. Ltd. | | | 5,263 | |
| | 222 | | | KGHM Polska Miedz SA2 | | | 6,161 | |
| | 1,026 | | | Kinross Gold Corp.2 | | | 3,973 | |
| | 546 | | | Klabin SA | | | 2,329 | |
| | 97 | | | Koninklijke DSM NV | | | 12,007 | |
| | 113 | | | Kumba Iron Ore Ltd. | | | 4,002 | |
| | 504 | | | Kuraray Co. Ltd.1 | | | 6,020 | |
| | 528 | | | LafargeHolcim Ltd.2 | | | 25,815 | |
| | 152 | | | LANXESS AG | | | 9,046 | |
| | 82 | | | LG Chem Ltd. | | | 25,176 | |
| | 63 | | | Linde PLC | | | 12,650 | |
| | 64 | | | Lotte Chemical Corp. | | | 13,996 | |
| | 357 | | | Lundin Mining Corp. | | | 1,970 | |
| | 5,743 | | | Mitsubishi Chemical Holdings Corp. | | | 40,117 | |
| | 652 | | | Mitsubishi Materials Corp. | | | 18,548 | |
| | 654 | | | Mitsui Chemicals, Inc. | | | 16,189 | |
| | 10,730 | | | MMG Ltd.2 | | | 3,749 | |
| | 92 | | | Mondi Ltd. | | | 2,068 | |
| | 316 | | | Mondi PLC | | | 7,199 | |
| | 430 | | | Mosaic Co. (The) | | | 10,763 | |
| | 191 | | | Newcrest Mining Ltd. | | | 4,282 | |
| | 379 | | | Newmont Goldcorp Corp. | | | 14,580 | |
| | 157 | | | Nippon Paint Holdings Co. Ltd. | | | 6,091 | |
| | 3,643 | | | Nippon Steel Corp. | | | 62,520 | |
| | 187 | | | Nitto Denko Corp. | | | 9,229 | |
| | 5,043 | | | Norsk Hydro ASA | | | 18,040 | |
| | 39 | | | Novozymes A/S, Class B | | | 1,821 | |
| | 472 | | | Nucor Corp. | | | 26,007 | |
| | 387 | | | Nutrien Ltd. | | | 20,746 | |
| | 281 | | | Orica Ltd. | | | 3,997 | |
| | 2,782 | | | Pabrik Kertas Tjiwi Kimia Tbk PT | | | 2,476 | |
| | 60 | | | Pidilite Industries Ltd. | | | 1,056 | |
| | 161 | | | Polymetal International PLC | | | 2,049 | |
| | 39 | | | Polyus PJSC | | | 3,604 | |
| | 139 | | | PPG Industries, Inc. | | | 16,223 | |
| | 8,352 | | | PTT Global Chemical PCL | | | 17,430 | |
| | 131 | | | Rio Tinto Ltd. | | | 9,539 | |
| | 524 | | | Rio Tinto PLC | | | 32,548 | |
| | 778 | | | Saudi Basic Industries Corp. | | | 23,691 | |
| | 42 | | | Sherwin-Williams Co. (The) | | | 19,248 | |
| | | | | | | | |
| Shares | | | | | Value | |
| | | | Common Stocks (continued) | | | |
| | | | Materials (continued) | |
| | 171 | | | Shin-Etsu Chemical Co. Ltd. | | $ | 15,927 | |
| | 338 | | | Showa Denko KK1 | | | 9,945 | |
| | 1,072 | | | Siam Cement PCL (The) | | | 16,499 | |
| | 40 | | | Sika AG | | | 6,835 | |
| | 371 | | | Smurfit Kappa Group PLC | | | 11,243 | |
| | 133 | | | Solvay SA | | | 13,798 | |
| | 3,203 | | | South32 Ltd. | | | 7,148 | |
| | 817 | | | Stora Enso OYJ, Class R | | | 9,616 | |
| | 4,714 | | | Sumitomo Chemical Co. Ltd. | | | 21,877 | |
| | 366 | | | Sumitomo Metal Mining Co. Ltd. | | | 10,935 | |
| | 38 | | | Symrise AG | | | 3,663 | |
| | 295 | | | Taiheiyo Cement Corp. | | | 8,926 | |
| | 454 | | | Teck Resources Ltd., Class B | | | 10,499 | |
| | 521 | | | Teijin Ltd. | | | 8,883 | |
| | 3,185 | | | thyssenkrupp AG1 | | | 46,517 | |
| | 85 | | | Titan Cement Co. SA | | | 1,661 | |
| | 3,296 | | | Toray Industries, Inc. | | | 25,061 | |
| | 496 | | | Umicore SA | | | 15,929 | |
| | 443 | | | UPM-Kymmene OYJ | | | 11,790 | |
| | 521 | | | voestalpine AG1 | | | 16,120 | |
| | 101 | | | West Fraser Timber Co. Ltd. | | | 4,614 | |
| | 42 | | | Wheaton Precious Metals Corp. | | | 1,018 | |
| | | | | | | | |
| | | | Total Materials | | | 1,492,478 | |
| | | | | | | | |
| | | | Media & Entertainment—1.7% | |
| | 2,045 | | | Alibaba Pictures Group Ltd.2 | | | 440 | |
| | 51 | | | Alphabet, Inc., Class A2 | | | 55,223 | |
| | 60 | | | Alphabet, Inc., Class C2 | | | 64,855 | |
| | 61 | | | Auto Trader Group PLC3 | | | 425 | |
| | 68 | | | Axel Springer SE1 | | | 4,797 | |
| | 97 | | | CyberAgent, Inc. | | | 3,516 | |
| | 89 | | | Eutelsat Communications SA | | | 1,666 | |
| | 380 | | | Informa PLC | | | 4,038 | |
| | 2,987 | | | ITV PLC | | | 4,106 | |
| | 120 | | | JCDecaux SA | | | 3,640 | |
| | 58 | | | Konami Holdings Corp. | | | 2,719 | |
| | 128 | | | Liberty Global PLC, Class A2 | | | 3,455 | |
| | 344 | | | Liberty Global PLC, Class C2 | | | 9,126 | |
| | 393 | | | MultiChoice Group Ltd.2 | | | 3,734 | |
| | 4 | | | NCSoft Corp. | | | 1,652 | |
| | 39 | | | Nintendo Co. Ltd. | | | 14,295 | |
| | 200 | | | Omnicom Group, Inc. | | | 16,390 | |
| | 542 | | | Pearson PLC | | | 5,652 | |
| | 208 | | | Publicis Groupe SA1 | | | 10,998 | |
| | 38 | | | Schibsted ASA, Class B | | | 991 | |
| | 94 | | | SES SA | | | 1,472 | |
| | 412 | | | Singapore Press Holdings Ltd. | | | 743 | |
| | 25 | | | Take-Two Interactive Software, Inc.2 | | | 2,838 | |
| | 57 | | | Telenet Group Holding NV | | | 3,181 | |
| | 1,037 | | | Tencent Holdings Ltd. | | | 46,803 | |
| | 58 | | | Toho Co. Ltd. | | | 2,466 | |
| | 29 | | | Ubisoft Entertainment SA2 | | | 2,273 | |
| | 599 | | | Vivendi SA | | | 16,515 | |
| | 543 | | | Walt Disney Co. (The) | | | 75,824 | |
| | 1,741 | | | WPP PLC | | | 21,940 | |
| | 3,117 | | | Yahoo Japan Corp. | | | 9,142 | |
| | | | | | | | |
| | | | Total Media & Entertainment | | | 394,915 | |
| | | | | | | | |
The accompanying notes are an integral part of these financial statements.
Invesco Global ESG Revenue ETF (ESGF)(continued)
June 30, 2019
| | | | | | | | |
| Shares | | | | | Value | |
| | | | Common Stocks (continued) | | | |
| | | | Pharmaceuticals, Biotechnology & Life Sciences—3.3% | |
| | 417 | | | AbbVie, Inc. | | $ | 30,324 | |
| | 75 | | | Agilent Technologies, Inc. | | | 5,600 | |
| | 140 | | | Amgen, Inc. | | | 25,799 | |
| | 423 | | | Aspen Pharmacare Holdings Ltd. | | | 3,013 | |
| | 937 | | | Astellas Pharma, Inc. | | | 13,350 | |
| | 300 | | | AstraZeneca PLC | | | 24,581 | |
| | 713 | | | Bayer AG | | | 49,481 | |
| | 60 | | | Biogen, Inc.2 | | | 14,032 | |
| | 498 | | | Bristol-Myers Squibb Co. | | | 22,584 | |
| | 163 | | | Celgene Corp.2 | | | 15,068 | |
| | 86 | | | Chugai Pharmaceutical Co. Ltd. | | | 5,620 | |
| | 2 | | | Cronos Group, Inc.2 | | | 32 | |
| | 58 | | | CSL Ltd. | | | 8,751 | |
| | 190 | | | Daiichi Sankyo Co. Ltd. | | | 9,937 | |
| | 106 | | | Eisai Co. Ltd. | | | 5,993 | |
| | 113 | | | Elanco Animal Health, Inc.2 | | | 3,819 | |
| | 210 | | | Eli Lilly & Co. | | | 23,266 | |
| | 3 | | | Genmab A/S2 | | | 553 | |
| | 100 | | | Genscript Biotech Corp.2 | | | 251 | |
| | 349 | | | Gilead Sciences, Inc. | | | 23,578 | |
| | 2,130 | | | GlaxoSmithKline PLC | | | 42,739 | |
| | 168 | | | Glenmark Pharmaceuticals Ltd. | | | 1,079 | |
| | 197 | | | Grifols SA | | | 5,833 | |
| | 71 | | | H Lundbeck A/S | | | 2,809 | |
| | 38 | | | Hisamitsu Pharmaceutical Co., Inc. | | | 1,501 | |
| | 8 | | | Hutchison China MediTech Ltd.2,4 | | | 176 | |
| | 23 | | | Ipsen SA | | | 3,143 | |
| | 79 | | | IQVIA Holdings, Inc.2 | | | 12,711 | |
| | 14 | | | Jazz Pharmaceuticals PLC2 | | | 1,996 | |
| | 596 | | | Johnson & Johnson | | | 83,011 | |
| | 17,180 | | | Kalbe Farma Tbk PT | | | 1,776 | |
| | 188 | | | Kyowa Hakko Kirin Co. Ltd. | | | 3,383 | |
| | 18 | | | Lonza Group AG2 | | | 6,081 | |
| | 534 | | | Merck & Co., Inc. | | | 44,776 | |
| | 50 | | | Merck KGaA | | | 5,236 | |
| | 4 | | | Mettler-Toledo International, Inc.2 | | | 3,360 | |
| | 352 | | | Mitsubishi Tanabe Pharma Corp. | | | 3,921 | |
| | 615 | | | Novartis AG | | | 56,265 | |
| | 298 | | | Novo Nordisk A/S, Class B | | | 15,209 | |
| | 165 | | | Ono Pharmaceutical Co. Ltd. | | | 2,959 | |
| | 26 | | | Orion OYJ, Class B | | | 954 | |
| | 351 | | | Otsuka Holdings Co. Ltd. | | | 11,455 | |
| | 33 | | | PerkinElmer, Inc. | | | 3,179 | |
| | 97 | | | Perrigo Co. PLC | | | 4,619 | |
| | 63 | | | Piramal Enterprises Ltd. | | | 1,776 | |
| | 40 | | | QIAGEN NV2 | | | 1,626 | |
| | 40 | | | Recordati SpA | | | 1,670 | |
| | 180 | | | Roche Holding AG | | | 50,705 | |
| | 493 | | | Sanofi | | | 42,618 | |
| | 146 | | | Santen Pharmaceutical Co. Ltd. | | | 2,419 | |
| | 10 | | | Sartorius Stedim Biotech | | | 1,580 | |
| | 59 | | | Shionogi & Co. Ltd. | | | 3,400 | |
| | 193 | | | Sumitomo Dainippon Pharma Co. Ltd. | | | 3,660 | |
| | 925 | | | Takeda Pharmaceutical Co. Ltd. | | | 32,822 | |
| | 297 | | | Tong Ren Tang Technologies Co. Ltd., Class H1 | | | 354 | |
| | 72 | | | UCB SA | | | 5,979 | |
| | 19 | | | Vertex Pharmaceuticals, Inc.2 | | | 3,484 | |
| | 12 | | | Vifor Pharma AG | | | 1,736 | |
| | 12 | | | Waters Corp.2 | | | 2,583 | |
| | | | | | | | |
| Shares | | | | | Value | |
| | | | Common Stocks (continued) | | | |
| | | | Pharmaceuticals, Biotechnology & Life Sciences (continued) | |
| | 40 | | | Wuxi Biologics Cayman, Inc.2,3 | | $ | 359 | |
| | 59 | | | Zoetis, Inc. | | | 6,696 | |
| | | | | | | | |
| | | | Total Pharmaceuticals, Biotechnology & Life Sciences | | | 767,270 | |
| | | | | | | | |
| | | | Real Estate—1.2% | |
| | 195 | | | Aeon Mall Co. Ltd. | | | 2,936 | |
| | 38 | | | American Tower Corp. | | | 7,769 | |
| | 319 | | | Ascendas Real Estate Investment Trust | | | 736 | |
| | 14 | | | Azrieli Group Ltd. | | | 938 | |
| | 22 | | | Boston Properties, Inc. | | | 2,838 | |
| | 147 | | | British Land Co. PLC (The) | | | 1,007 | |
| | 207 | | | CapitaLand Commercial Trust | | | 332 | |
| | 1,850 | | | CapitaLand Ltd. | | | 4,827 | |
| | 353 | | | CapitaLand Mall Trust | | | 686 | |
| | 468 | | | CBRE Group, Inc., Class A2 | | | 24,008 | |
| | 485 | | | Central Pattana PCL | | | 1,186 | |
| | 514 | | | City Developments Ltd. | | | 3,598 | |
| | 12 | | | Covivio | | | 1,258 | |
| | 1,307 | | | Daiwa House Industry Co. Ltd. | | | 38,104 | |
| | 35 | | | Deutsche Wohnen SE | | | 1,286 | |
| | 71 | | | Dexus | | | 647 | |
| | 28 | | | Digital Realty Trust, Inc. | | | 3,298 | |
| | 39 | | | Duke Realty Corp. | | | 1,233 | |
| | 11 | | | Equinix, Inc. | | | 5,547 | |
| | 38 | | | Equity Residential | | | 2,885 | |
| | 31 | | | First Capital Realty, Inc.1 | | | 519 | |
| | 5 | | | Gecina SA | | | 749 | |
| | 149 | | | Goodman Group | | | 1,572 | |
| | 137 | | | GPT Group (The) | | | 591 | |
| | 474 | | | Growthpoint Properties Ltd. | | | 816 | |
| | 553 | | | Hang Lung Properties Ltd. | | | 1,315 | |
| | 91 | | | HCP, Inc. | | | 2,910 | |
| | 298 | | | Host Hotels & Resorts, Inc. | | | 5,430 | |
| | 326 | | | Hulic Co. Ltd.1 | | | 2,620 | |
| | 92 | | | Hysan Development Co. Ltd. | | | 475 | |
| | 25 | | | ICADE | | | 2,295 | |
| | 136 | | | Iron Mountain, Inc. | | | 4,257 | |
| | 125 | | | Jones Lang LaSalle, Inc. | | | 17,586 | |
| | 690 | | | Kerry Properties Ltd. | | | 2,897 | |
| | 67 | | | Kimco Realty Corp. | | | 1,238 | |
| | 43 | | | Klepierre SA | | | 1,444 | |
| | 91 | | | Land Securities Group PLC | | | 965 | |
| | 1,187 | | | Lendlease Group | | | 10,829 | |
| | 17 | | | Liberty Property Trust | | | 851 | |
| | 187 | | | Link REIT | | | 2,298 | |
| | 24 | | | Macerich Co. (The) | | | 804 | |
| | 14 | | | Mid-America Apartment Communities, Inc. | | | 1,649 | |
| | 939 | | | Mirvac Group | | | 2,062 | |
| | 643 | | | Mitsubishi Estate Co. Ltd. | | | 11,966 | |
| | 770 | | | Mitsui Fudosan Co. Ltd. | | | 18,671 | |
| | 68 | | | NEPI Rockcastle PLC | | | 624 | |
| | 270 | | | Nomura Real Estate Holdings, Inc. | | | 5,804 | |
| | 53 | | | Prologis, Inc. | | | 4,245 | |
| | 950 | | | Redefine Properties Ltd. | | | 609 | |
| | 9 | | | SBA Communications Corp.2 | | | 2,024 | |
| | 741 | | | Scentre Group | | | 1,997 | |
| | 68 | | | Segro PLC | | | 632 | |
| | 16,918 | | | Shui On Land Ltd. | | | 3,920 | |
| | 2,602 | | | Sime Darby Property Bhd | | | 648 | |
The accompanying notes are an integral part of these financial statements.
Invesco Global ESG Revenue ETF (ESGF)(continued)
June 30, 2019
| | | | | | | | |
| Shares | | | | | Value | |
| | | | Common Stocks (continued) | | | |
| | | | Real Estate (continued) | |
| | 34 | | | Simon Property Group, Inc. | | $ | 5,432 | |
| | 877 | | | Sino Land Co. Ltd. | | | 1,471 | |
| | 2,876 | | | SM Prime Holdings, Inc. | | | 2,083 | |
| | 794 | | | SOHO China Ltd. | | | 280 | |
| | 702 | | | Stockland | | | 2,054 | |
| | 522 | | | Sun Hung Kai Properties Ltd. | | | 8,853 | |
| | 553 | | | Swire Pacific Ltd., Class A | | | 6,795 | |
| | 482 | | | Swire Properties Ltd. | | | 1,946 | |
| | 15 | | | Swiss Prime Site AG2 | | | 1,311 | |
| | 1,349 | | | Tokyu Fudosan Holdings Corp. | | | 7,450 | |
| | 27 | | | UDR, Inc. | | | 1,212 | |
| | 23 | | | Unibail—Rodamco-Westfield | | | 3,451 | |
| | 354 | | | UOL Group Ltd. | | | 1,975 | |
| | 311 | | | Weyerhaeuser Co. | | | 8,192 | |
| | 297 | | | Wharf Real Estate Investment Co. Ltd. | | | 2,093 | |
| | 925 | | | Wheelock & Co. Ltd. | | | 6,630 | |
| | 100 | | | Zhejiang China Commodities City Group Co. Ltd., Class A | | | 60 | |
| | | | | | | | |
| | | | Total Real Estate | | | 283,719 | |
| | | | | | | | |
| | | | Retailing—3.2% | |
| | 15 | | | Baozun, Inc.1,2,4 | | | 748 | |
| | 638 | | | Best Buy Co., Inc. | | | 44,488 | |
| | 8 | | | Booking Holdings, Inc.2 | | | 14,998 | |
| | 98 | | | Canadian Tire Corp. Ltd., Class A | | | 10,700 | |
| | 111 | | | Dufry AG2 | | | 9,413 | |
| | 37 | | | Fast Retailing Co. Ltd. | | | 22,367 | |
| | 183 | | | Foschini Group Ltd. (The) | | | 2,340 | |
| | 768 | | | Gap, Inc. (The) | | | 13,801 | |
| | 919 | | | Harvey Norman Holdings Ltd. | | | 2,625 | |
| | 3,058 | | | HengTen Networks Group Ltd.2 | | | 73 | |
| | 1,212 | | | Hennes & Mauritz AB, Class B | | | 21,601 | |
| | 576 | | | Home Depot, Inc. (The) | | | 119,791 | |
| | 4,094 | | | Home Product Center PCL | | | 2,336 | |
| | 409 | | | Hotai Motor Co. Ltd. | | | 6,690 | |
| | 1,045 | | | Industria de Diseno Textil SA | | | 31,477 | |
| | 410 | | | J Front Retailing Co. Ltd. | | | 4,700 | |
| | 809 | | | Jardine Cycle & Carriage Ltd. | | | 21,664 | |
| | 5,403 | | | Kingfisher PLC | | | 14,777 | |
| | 456 | | | LKQ Corp.2 | | | 12,134 | |
| | 225 | | | Lojas Renner SA | | | 2,769 | |
| | 673 | | | Lowe’s Cos., Inc. | | | 67,912 | |
| | 1,244 | | | Macy’s, Inc. | | | 26,696 | |
| | 4,342 | | | Marks & Spencer Group PLC1 | | | 11,643 | |
| | 116 | | | Marui Group Co. Ltd. | | | 2,362 | |
| | 1,141 | | | Meituan Dianping, Class B2 | | | 10,004 | |
| | 107 | | | Mr Price Group Ltd. | | | 1,506 | |
| | 27 | | | Naspers Ltd., Class N | | | 6,547 | |
| | 78 | | | Next PLC | | | 5,486 | |
| | 50 | | | Nitori Holdings Co. Ltd. | | | 6,627 | |
| | 451 | | | Nordstrom, Inc.1 | | | 14,369 | |
| | 143 | | | Ocado Group PLC2 | | | 2,124 | |
| | 4,650 | | | Petrobras Distribuidora SA | | | 30,332 | |
| | 54 | | | Pinduoduo, Inc.2,4 | | | 1,114 | |
| | 1,085 | | | Rakuten, Inc. | | | 12,890 | |
| | 2,173 | | | S.A.C.I. Falabella | | | 14,162 | |
| | 2,300 | | | Suning.com Co. Ltd., Class A | | | 3,844 | |
| | 1,081 | | | Target Corp. | | | 93,625 | |
| | 46 | | | Tiffany & Co.1 | | | 4,307 | |
| | | | | | | | |
| Shares | | | | | Value | |
| | | | Common Stocks (continued) | | | |
| | | | Retailing (continued) | |
| | 81 | | | Tractor Supply Co. | | $ | 8,813 | |
| | 50 | | | USS Co. Ltd. | | | 985 | |
| | 33 | | | Wayfair, Inc., Class A2 | | | 4,818 | |
| | 809 | | | Wesfarmers Ltd. | | | 20,529 | |
| | 1,668 | | | Woolworths Holdings Ltd. | | | 5,782 | |
| | 3,873 | | | Yamada Denki Co. Ltd. | | | 17,147 | |
| | 143 | | | Zalando SE1,2,3 | | | 6,354 | |
| | 6,395 | | | Zhongsheng Group Holdings Ltd. | | | 17,804 | |
| | | | | | | | |
| | | | Total Retailing | | | 757,274 | |
| | | | | | | | |
| | | | Semiconductors & Semiconductor Equipment—1.2% | |
| | 245 | | | Advanced Micro Devices, Inc.2 | | | 7,441 | |
| | 105 | | | Advantest Corp. | | | 2,890 | |
| | 62 | | | Analog Devices, Inc. | | | 6,998 | |
| | 431 | | | Applied Materials, Inc. | | | 19,356 | |
| | 5,781 | | | ASE Technology Holding Co. Ltd.2 | | | 11,447 | |
| | 246 | | | ASM Pacific Technology Ltd. | | | 2,519 | |
| | 64 | | | ASML Holding NV | | | 13,391 | |
| | 9 | | | Disco Corp. | | | 1,477 | |
| | 449 | | | Infineon Technologies AG | | | 7,951 | |
| | 1,579 | | | Intel Corp. | | | 75,587 | |
| | 58 | | | Lam Research Corp. | | | 10,895 | |
| | 144 | | | Marvell Technology Group Ltd. | | | 3,437 | |
| | 48 | | | Maxim Integrated Products, Inc. | | | 2,871 | |
| | 872 | | | MediaTek, Inc. | | | 8,816 | |
| | 76 | | | NVIDIA Corp. | | | 12,481 | |
| | 308 | | | ON Semiconductor Corp.2 | | | 6,225 | |
| | 62 | | | Rohm Co. Ltd. | | | 4,166 | |
| | 54 | | | Skyworks Solutions, Inc. | | | 4,173 | |
| | 514 | | | STMicroelectronics NV | | | 9,131 | |
| | 4,383 | | | Taiwan Semiconductor Manufacturing Co. Ltd. | | | 33,727 | |
| | 149 | | | Texas Instruments, Inc. | | | 17,099 | |
| | 84 | | | Tokyo Electron Ltd. | | | 11,788 | |
| | 12,767 | | | United Microelectronics Corp. | | | 5,734 | |
| | 100 | | | Win Semiconductors Corp. | | | 641 | |
| | 29 | | | Xilinx, Inc. | | | 3,420 | |
| | 1,892 | | | Xinyi Solar Holdings Ltd. | | | 932 | |
| | | | | | | | |
| | | | Total Semiconductors & Semiconductor Equipment | | | 284,593 | |
| | | | | | | | |
| | | | Software & Services—3.1% | |
| | 100 | | | 360 Security Technology, Inc., Class A2 | | | 311 | |
| | 242 | | | Accenture PLC, Class A | | | 44,714 | |
| | 35 | | | Adobe, Inc.2 | | | 10,313 | |
| | 100 | | | Aisino Corp, Class A | | | 336 | |
| | 35 | | | Akamai Technologies, Inc.2 | | | 2,805 | |
| | 75 | | | Amadeus IT Group SA | | | 5,950 | |
| | 7 | | | ANSYS, Inc.2 | | | 1,434 | |
| | 180 | | | Atos SE | | | 15,070 | |
| | 15 | | | Autodesk, Inc.2 | | | 2,444 | |
| | 90 | | | Automatic Data Processing, Inc. | | | 14,880 | |
| | 37 | | | Broadridge Financial Solutions, Inc. | | | 4,724 | |
| | 33 | | | Cadence Design Systems, Inc.2 | | | 2,337 | |
| | 125 | | | Capgemini SE | | | 15,566 | |
| | 112 | | | CGI, Inc.2 | | | 8,629 | |
| | 1,733 | | | Cielo SA | | | 3,039 | |
| | 32 | | | Citrix Systems, Inc. | | | 3,140 | |
| | 285 | | | Cognizant Technology Solutions Corp., Class A | | | 18,066 | |
| | 184 | | | Computershare Ltd. | | | 2,093 | |
| | 26 | | | Dassault Systemes SE | | | 4,154 | |
The accompanying notes are an integral part of these financial statements.
Invesco Global ESG Revenue ETF (ESGF)(continued)
June 30, 2019
| | | | | | | | |
| Shares | | | | | Value | |
| | | | Common Stocks (continued) | | | |
| | | | Software & Services (continued) | |
| | 393 | | | DXC Technology Co. | | $ | 21,674 | |
| | 23 | | | Fortinet, Inc.2 | | | 1,767 | |
| | 557 | | | Fujitsu Ltd. | | | 38,836 | |
| | 563 | | | HCL Technologies Ltd. | | | 8,683 | |
| | 1,191 | | | Infosys Ltd. | | | 12,630 | |
| | 600 | | | International Business Machines Corp. | | | 82,740 | |
| | 27 | | | Intuit, Inc. | | | 7,056 | |
| | 12 | | | Jack Henry & Associates, Inc. | | | 1,607 | |
| | 397 | | | Kingdee International Software Group Co. Ltd. | | | 429 | |
| | 60 | | | Mastercard, Inc., Class A | | | 15,872 | |
| | 121 | | | Micro Focus International PLC | | | 3,179 | |
| | 947 | | | Microsoft Corp. | | | 126,860 | |
| | 11 | | | Nice Ltd.2 | | | 1,496 | |
| | 306 | | | Nomura Research Institute Ltd. | | | 4,905 | |
| | 1,784 | | | NTT Data Corp. | | | 23,761 | |
| | 71 | | | Open Text Corp. | | | 2,936 | |
| | 799 | | | Oracle Corp. | | | 45,519 | |
| | 26 | | | Oracle Corp. Japan | | | 1,899 | |
| | 184 | | | Otsuka Corp. | | | 7,403 | |
| | 3 | | | Paycom Software, Inc.2 | | | 680 | |
| | 141 | | | PayPal Holdings, Inc.2 | | | 16,139 | |
| | 15 | | | PTC, Inc.2 | | | 1,346 | |
| | 19 | | | Red Hat, Inc.2 | | | 3,567 | |
| | 201 | | | Sabre Corp. | | | 4,462 | |
| | 266 | | | Sage Group PLC (The) | | | 2,716 | |
| | 89 | | | salesforce.com, Inc.2 | | | 13,504 | |
| | 225 | | | SAP SE | | | 30,942 | |
| | 10 | | | ServiceNow, Inc.2 | | | 2,746 | |
| | 3 | | | Shopify, Inc., Class A2 | | | 904 | |
| | 254 | | | Symantec Corp. | | | 5,527 | |
| | 699 | | | Tata Consultancy Services Ltd. | | | 22,554 | |
| | 450 | | | Tech Mahindra Ltd. | | | 4,606 | |
| | 5 | | | Temenos AG2 | | | 896 | |
| | 5 | | | Twilio, Inc., Class A2 | | | 682 | |
| | 117 | | | Visa, Inc., Class A | | | 20,305 | |
| | 12 | | | VMware, Inc., Class A | | | 2,007 | |
| | 291 | | | Western Union Co. (The) | | | 5,788 | |
| | 2,116 | | | Wipro Ltd. | | | 8,599 | |
| | 5 | | | Wix.Com Ltd.2 | | | 711 | |
| | 10 | | | Workday, Inc., Class A2 | | | 2,056 | |
| | 25 | | | Worldline SA/France2,3 | | | 1,822 | |
| | | | | | | | |
| | | | Total Software & Services | | | 721,816 | |
| | | | | | | | |
| | | | Technology Hardware & Equipment—5.8% | |
| | 492 | | | AAC Technologies Holdings, Inc. | | | 2,793 | |
| | 13,956 | | | Acer, Inc.2 | | | 8,650 | |
| | 207 | | | Advantech Co. Ltd. | | | 1,759 | |
| | 92 | | | Amphenol Corp., Class A | | | 8,826 | |
| | 1,426 | | | Apple, Inc. | | | 282,234 | |
| | 9 | | | Arista Networks, Inc.2 | | | 2,337 | |
| | 32,744 | | | AU Optronics Corp. | | | 9,804 | |
| | 3,851 | | | BYD Electronic International Co. Ltd. | | | 5,501 | |
| | 467 | | | Catcher Technology Co. Ltd. | | | 3,345 | |
| | 1,372 | | | Chicony Electronics Co. Ltd. | | | 3,375 | |
| | 931 | | | Cisco Systems, Inc. | | | 50,954 | |
| | 19 | | | Cognex Corp. | | | 912 | |
| | 254 | | | CommScope Holding Co., Inc.2 | | | 3,995 | |
| | 378 | | | Corning, Inc. | | | 12,561 | |
| | 306 | | | Dell Technologies, Inc., Class C2 | | | 15,545 | |
| | | | | | | | |
| Shares | | | | | Value | |
| | | | Common Stocks (continued) | | | |
| | | | Technology Hardware & Equipment (continued) | |
| | 1,727 | | | Delta Electronics, Inc. | | $ | 8,757 | |
| | 16 | | | F5 Networks, Inc.2 | | | 2,330 | |
| | 2,593 | | | Flex Ltd.2 | | | 24,815 | |
| | 37 | | | FLIR Systems, Inc. | | | 2,002 | |
| | 604 | | | FUJIFILM Holdings Corp. | | | 30,626 | |
| | 2,279 | | | Hewlett Packard Enterprise Co. | | | 34,071 | |
| | 81 | | | Hexagon AB, Class B | | | 4,501 | |
| | 11 | | | Hirose Electric Co. Ltd. | | | 1,227 | |
| | 150 | | | Hitachi High-Technologies Corp. | | | 7,713 | |
| | 2,558 | | | Hitachi Ltd. | | | 93,759 | |
| | 3,248 | | | HP, Inc. | | | 67,526 | |
| | 38 | | | Ingenico Group SA | | | 3,366 | |
| | 36,558 | | | Innolux Corp. | | | 8,628 | |
| | 22,304 | | | Inventec Corp. | | | 17,737 | |
| | 9 | | | Keyence Corp. | | | 5,524 | |
| | 50 | | | Keysight Technologies, Inc.2 | | | 4,491 | |
| | 2,829 | | | Kingboard Laminates Holdings Ltd. | | | 2,593 | |
| | 1,134 | | | Konica Minolta, Inc. | | | 11,041 | |
| | 261 | | | Kyocera Corp. | | | 17,042 | |
| | 12,420 | | | Legend Holdings Corp., Class H3 | | | 29,220 | |
| | 62,357 | | | Lenovo Group Ltd. | | | 48,289 | |
| | 1,462 | | | LG Display Co. Ltd.2 | | | 22,601 | |
| | 78 | | | LG Innotek Co. Ltd. | | | 7,363 | |
| | 5,107 | | | Lite-On Technology Corp. | | | 7,481 | |
| | 1,615 | | | Micro-Star International Co. Ltd. | | | 4,576 | |
| | 52 | | | Motorola Solutions, Inc. | | | 8,670 | |
| | 348 | | | Murata Manufacturing Co. Ltd. | | | 15,633 | |
| | 783 | | | NEC Corp. | | | 30,814 | |
| | 5,275 | | | Nokia OYJ | | | 26,227 | |
| | 172 | | | Omron Corp. | | | 8,972 | |
| | 91 | | | Samsung Electro-Mechanics Co. Ltd. | | | 7,708 | |
| | 5,450 | | | Samsung Electronics Co. Ltd. | | | 221,842 | |
| | 47 | | | Samsung SDI Co. Ltd. | | | 9,627 | |
| | 259 | | | Seagate Technology PLC | | | 12,204 | |
| | 787 | | | Seiko Epson Corp. | | | 12,454 | |
| | 145 | | | Shimadzu Corp. | | | 3,556 | |
| | 171 | | | TDK Corp. | | | 13,237 | |
| | 160 | | | TE Connectivity Ltd. | �� | | 15,325 | |
| | 2,231 | | | Telefonaktiebolaget LM Ericsson, Class B | | | 21,184 | |
| | 79 | | | Trimble, Inc.2 | | | 3,564 | |
| | 200 | | | Unisplendour Corp Ltd., Class A | | | 794 | |
| | 40,939 | | | Wistron Corp. | | | 31,898 | |
| | 302 | | | Xerox Corp. | | | 10,694 | |
| | 133 | | | Yaskawa Electric Corp. | | | 4,518 | |
| | 203 | | | Yokogawa Electric Corp. | | | 3,979 | |
| | 23 | | | Zebra Technologies Corp., Class A2 | | | 4,818 | |
| | | | | | | | |
| | | | Total Technology Hardware & Equipment | | | 1,347,588 | |
| | | | | | | | |
| | | | Telecommunication Services—4.1% | |
| | 939 | | | Advanced Info Service PCL | | | 6,675 | |
| | 5,693 | | | Axiata Group Bhd | | | 6,861 | |
| | 3,072 | | | Bharti Airtel Ltd. | | | 15,427 | |
| | 267 | | | Bharti Infratel Ltd. | | | 1,033 | |
| | 12,205 | | | BT Group PLC | | | 30,517 | |
| | 2,323 | | | CenturyLink, Inc. | | | 27,318 | |
| | 11,458 | | | China Tower Corp. Ltd., Class H3 | | | 3,007 | |
| | 2,047 | | | Chunghwa Telecom Co. Ltd. | | | 7,447 | |
| | 5,185 | | | Deutsche Telekom AG | | | 89,822 | |
| | 1,472 | | | DiGi.Com Bhd | | | 1,799 | |
The accompanying notes are an integral part of these financial statements.
Invesco Global ESG Revenue ETF (ESGF)(continued)
June 30, 2019
| | | | | | | | |
| Shares | | | | | Value | |
| | | | Common Stocks (continued) | | | |
| | | | Telecommunication Services (continued) | |
| | 51 | | | Elisa OYJ | | $ | 2,492 | |
| | 1,204 | | | Far EasTone Telecommunications Co. Ltd. | | | 3,035 | |
| | 81 | | | Globe Telecom, Inc. | | | 3,576 | |
| | 357 | | | Hellenic Telecommunications Organization SA2 | | | 5,285 | |
| | 3,054 | | | HKT Trust & HKT Ltd. | | | 4,847 | |
| | 2,006 | | | KDDI Corp. | | | 51,081 | |
| | 2,203 | | | Koninklijke KPN NV | | | 6,774 | |
| | 1,840 | | | Maxis Bhd | | | 2,480 | |
| | 66 | | | Millicom International Cellular SA | | | 3,717 | |
| | 1,448 | | | MTN Group Ltd. | | | 10,962 | |
| | 2,560 | | | Nippon Telegraph & Telephone Corp. | | | 119,208 | |
| | 1,858 | | | NTT DOCOMO, Inc. | | | 43,329 | |
| | 503 | | | Ooredoo Q.P.S.C. | | | 9,036 | |
| | 2,513 | | | Orange Polska SA2 | | | 4,505 | |
| | 3,111 | | | Orange SA | | | 49,121 | |
| | 8,797 | | | PCCW Ltd. | | | 5,078 | |
| | 247 | | | Proximus SADP | | | 7,291 | |
| | 178 | | | Rogers Communications, Inc., Class B | | | 9,549 | |
| | 5,796 | | | Singapore Telecommunications Ltd. | | | 14,994 | |
| | 78 | | | SK Telecom Co. Ltd. | | | 17,496 | |
| | 2,632 | | | Softbank Corp. | | | 34,189 | |
| | 1,940 | | | SoftBank Group Corp. | | | 93,003 | |
| | 1,024 | | | Spark New Zealand Ltd. | | | 2,751 | |
| | 25 | | | Swisscom AG | | | 12,567 | |
| | 1,374 | | | Taiwan Mobile Co. Ltd. | | | 5,419 | |
| | 190 | | | Tele2 AB, Class B | | | 2,775 | |
| | 30,680 | | | Telecom Italia SpA2 | | | 16,777 | |
| | 12,886 | | | Telecom Italia SpA-RSP | | | 6,693 | |
| | 2,657 | | | Telefonica Deutschland Holding AG | | | 7,434 | |
| | 7,074 | | | Telefonica SA | | | 58,171 | |
| | 4,507 | | | Telekom Malaysia Bhd | | | 4,362 | |
| | 38,256 | | | Telekomunikasi Indonesia Persero Tbk PT | | | 11,211 | |
| | 661 | | | Telenor ASA | | | 14,040 | |
| | 2,215 | | | Telia Co. AB | | | 9,845 | |
| | 507 | | | Telkom SA SOC Ltd. | | | 3,315 | |
| | 7,767 | | | Telstra Corp. Ltd. | | | 20,984 | |
| | 297 | | | TELUS Corp. | | | 11,003 | |
| | 34,173 | | | True Corp. PCL | | | 6,519 | |
| | 1,994 | | | Turkcell Iletisim Hizmetleri AS | | | 4,413 | |
| | 779 | | | Vodacom Group Ltd. | | | 6,611 | |
| | 32,461 | | | Vodafone Group PLC | | | 53,426 | |
| | | | | | | | |
| | | | Total Telecommunication Services | | | 949,270 | |
| | | | | | | | |
| | | | Transportation—2.8% | |
| | 15 | | | A.P. Moeller—Maersk A/S, Class A | | | 17,440 | |
| | 14 | | | A.P. Moeller—Maersk A/S, Class B | | | 17,392 | |
| | 26 | | | Aena SME SA3 | | | 5,161 | |
| | 30 | | | Aeroports de Paris | | | 5,302 | |
| | 4,412 | | | AirAsia Group Bhd | | | 2,915 | |
| | 929 | | | Airports of Thailand PCL | | | 2,227 | |
| | 10 | | | AMERCO | | | 3,786 | |
| | 585 | | | ANA Holdings, Inc. | | | 19,373 | |
| | 90 | | | Auckland International Airport Ltd. | | | 595 | |
| | 625 | | | Aurizon Holdings Ltd. | | | 2,368 | |
| | 3,536 | | | BTS Group Holdings PCL | | | 1,384 | |
| | 207 | | | C.H. Robinson Worldwide, Inc. | | | 17,460 | |
| | 116 | | | Canadian National Railway Co. | | | 10,759 | |
| | 25 | | | Canadian Pacific Railway Ltd. | | | 5,901 | |
| | 90 | | | Central Japan Railway Co. | | | 18,027 | |
| | | | | | | | |
| Shares | | | | | Value | |
| | | | Common Stocks (continued) | | | |
| | | | Transportation (continued) | |
| | 1,570 | | | ComfortDelGro Corp. Ltd. | | $ | 3,087 | |
| | 170 | | | CSX Corp. | | | 13,153 | |
| | 859 | | | Delta Air Lines, Inc. | | | 48,748 | |
| | 2,253 | | | Deutsche Post AG | | | 74,149 | |
| | 146 | | | DSV A/S | | | 14,359 | |
| | 303 | | | East Japan Railway Co. | | | 28,348 | |
| | 648 | | | easyJet PLC | | | 7,861 | |
| | 13,494 | | | Eva Airways Corp. | | | 6,495 | |
| | 113 | | | Expeditors International of Washington, Inc. | | | 8,572 | |
| | 50 | | | Fraport AG Frankfurt Airport Services Worldwide | | | 4,305 | |
| | 81 | | | Getlink SE | | | 1,300 | |
| | 215 | | | Hankyu Hanshin Holdings, Inc. | | | 7,703 | |
| | 123 | | | Kamigumi Co. Ltd. | | | 2,911 | |
| | 24 | | | Kansas City Southern | | | 2,924 | |
| | 64 | | | Keio Corp. | | | 4,212 | |
| | 69 | | | Keisei Electric Railway Co. Ltd. | | | 2,514 | |
| | 239 | | | Kintetsu Group Holdings Co. Ltd. | | | 11,446 | |
| | 157 | | | Kuehne + Nagel International AG | | | 23,333 | |
| | 132 | | | Kyushu Railway Co. | | | 3,847 | |
| | 1,098 | | | Latam Airlines Group SA | | | 10,310 | |
| | 256 | | | Localiza Rent a Car SA | | | 2,737 | |
| | 1,410 | | | MISC Bhd | | | 2,440 | |
| | 1,181 | | | MTR Corp. Ltd. | | | 7,951 | |
| | 209 | | | Nagoya Railroad Co. Ltd. | | | 5,783 | |
| | 394 | | | Nippon Express Co. Ltd. | | | 20,954 | |
| | 1,190 | | | Nippon Yusen KK | | | 19,097 | |
| | 56 | | | Norfolk Southern Corp. | | | 11,162 | |
| | 204 | | | Odakyu Electric Railway Co. Ltd. | | | 4,993 | |
| | 362 | | | SATS Ltd. | | | 1,397 | |
| | 342 | | | Seibu Holdings, Inc. | | | 5,701 | |
| | 397 | | | SG Holdings Co. Ltd. | | | 11,257 | |
| | 1,838 | | | Singapore Airlines Ltd. | | | 12,593 | |
| | 10,968 | | | Sinotrans Ltd., Class H | | | 3,987 | |
| | 427 | | | Southwest Airlines Co. | | | 21,683 | |
| | 217 | | | Sydney Airport | | | 1,224 | |
| | 295 | | | TAV Havalimanlari Holding AS | | | 1,377 | |
| | 194 | | | Tobu Railway Co. Ltd. | | | 5,654 | |
| | 625 | | | Tokyu Corp. | | | 11,086 | |
| | 290 | | | Transurban Group | | | 3,000 | |
| | 139 | | | Union Pacific Corp. | | | 23,506 | |
| | 587 | | | United Parcel Service, Inc., Class B | | | 60,620 | |
| | 183 | | | West Japan Railway Co. | | | 14,804 | |
| | | | | | | | |
| | | | Total Transportation | | | 662,673 | |
| | | | | | | | |
| | | | Utilities—4.7% | |
| | 684 | | | AES Corp. | | | 11,464 | |
| | 1,353 | | | Aguas Andinas SA, Class A | | | 797 | |
| | 78 | | | Alliant Energy Corp. | | | 3,828 | |
| | 280 | | | AltaGas Ltd.1 | | | 4,245 | |
| | 88 | | | Ameren Corp. | | | 6,610 | |
| | 197 | | | American Electric Power Co., Inc. | | | 17,338 | |
| | 32 | | | American Water Works Co., Inc. | | | 3,712 | |
| | 247 | | | APA Group | | | 1,872 | |
| | 98 | | | Atco Ltd., Class I | | | 3,310 | |
| | 1,056 | | | AusNet Services | | | 1,389 | |
| | 90 | | | Canadian Utilities Ltd., Class A | | | 2,545 | |
| | 33,952 | | | Centrica PLC | | | 37,930 | |
| | 361 | | | CEZ AS2 | | | 8,725 | |
| | 2,670 | | | China Longyuan Power Group Corp. Ltd., Class H | | | 1,712 | |
The accompanying notes are an integral part of these financial statements.
Invesco Global ESG Revenue ETF (ESGF)(continued)
June 30, 2019
| | | | | | | | |
| Shares | | | | | Value | |
| | | | Common Stocks (continued) | | | |
| | | | Utilities (continued) | |
| | 1,086 | | | CLP Holdings Ltd. | | $ | 11,982 | |
| | 128 | | | CMS Energy Corp. | | | 7,412 | |
| | 8,306 | | | Colbun SA | | | 1,713 | |
| | 149 | | | Consolidated Edison, Inc. | | | 13,064 | |
| | 212 | | | Dominion Energy, Inc. | | | 16,392 | |
| | 117 | | | DTE Energy Co. | | | 14,962 | |
| | 298 | | | Duke Energy Corp. | | | 26,295 | |
| | 3,341 | | | E.ON SE | | | 36,339 | |
| | 220 | | | Edison International | | | 14,830 | |
| | 5,029 | | | EDP—Energias de Portugal SA | | | 19,140 | |
| | 390 | | | Electric Power Development Co. Ltd. | | | 8,861 | |
| | 5,626 | | | Electricite de France SA | | | 71,020 | |
| | 132 | | | Emera, Inc. | | | 5,405 | |
| | 53 | | | Enagas SA | | | 1,417 | |
| | 915 | | | Endesa SA1 | | | 23,560 | |
| | 83,699 | | | Enel Americas SA | | | 14,733 | |
| | 13,512 | | | Enel SpA | | | 94,479 | |
| | 58 | | | Energisa SA | | | 697 | |
| | 232 | | | Energy Absolute PCL | | | 422 | |
| | 224 | | | Engie Brasil Energia SA | | | 2,541 | |
| | 4,589 | | | Engie SA | | | 69,714 | |
| | 118 | | | Entergy Corp. | | | 12,146 | |
| | 120 | | | Eversource Energy | | | 9,091 | |
| | 756 | | | Exelon Corp. | | | 36,243 | |
| | 175 | | | Fortis, Inc. | | | 6,925 | |
| | 284 | | | Fortum OYJ | | | 6,286 | |
| | 1,587 | | | HK Electric Investments & HK Electric Investments Ltd. | | | 1,625 | |
| | 2,344 | | | Hong Kong & China Gas Co. Ltd. | | | 5,196 | |
| | 3,346 | | | Huaneng Renewables Corp. Ltd., Class H2 | | | 921 | |
| | 288 | | | Hydro One Ltd.3 | | | 5,034 | |
| | 4,421 | | | Iberdrola SA | | | 44,134 | |
| | 333 | | | Infraestructura Energetica Nova SAB de CV | | | 1,307 | |
| | 891 | | | Innogy SE3 | | | 42,312 | |
| | 352,727 | | | Inter RAO UES PJSC | | | 25,327 | |
| | 483 | | | Interconexion Electrica SA ESP | | | 2,690 | |
| | 2,020 | | | Kyushu Electric Power Co., Inc. | | | 19,836 | |
| | 746 | | | Meridian Energy Ltd. | | | 2,380 | |
| | 1,961 | | | National Grid PLC | | | 20,860 | |
| | 943 | | | Naturgy Energy Group SA | | | 26,020 | |
| | 87 | | | NextEra Energy, Inc. | | | 17,823 | |
| | 197 | | | NiSource, Inc. | | | 5,674 | |
| | 151 | | | Orsted A/S3 | | | 13,077 | |
| | 699 | | | Osaka Gas Co. Ltd. | | | 12,178 | |
| | 40 | | | Pinnacle West Capital Corp. | | | 3,764 | |
| | 29 | | | Power Assets Holdings Ltd. | | | 209 | |
| | 1,895 | | | Power Grid Corp. of India Ltd. | | | 5,680 | |
| | 277 | | | PPL Corp. | | | 8,590 | |
| | 169 | | | Public Service Enterprise Group, Inc. | | | 9,941 | |
| | 105 | | | Red Electrica Corp. SA | | | 2,190 | |
| | 554 | | | RWE AG | | | 13,671 | |
| | 95 | | | Sempra Energy | | | 13,057 | |
| | 96 | | | Severn Trent PLC | | | 2,502 | |
| | 615 | | | Snam SpA | | | 3,061 | |
| | 456 | | | Southern Co. (The) | | | 25,208 | |
| | 2,257 | | | SSE PLC | | | 32,229 | |
| | 1,472 | | | Suez | | | 21,272 | |
| | 424 | | | Terna Rete Elettrica Nazionale SpA | | | 2,704 | |
| | 106 | | | Toho Gas Co. Ltd. | | | 3,901 | |
| | | | | | | | |
| Shares | | | | | Value | |
| | | | Common Stocks (continued) | | | |
| | | | Utilities (continued) | |
| | 709 | | | Tokyo Gas Co. Ltd. | | $ | 16,698 | |
| | 2,135 | | | Towngas China Co. Ltd.2 | | | 1,539 | |
| | 148 | | | UGI Corp. | | | 7,905 | |
| | 245 | | | United Utilities Group PLC | | | 2,441 | |
| | 1,382 | | | Veolia Environnement SA | | | 33,711 | |
| | 31 | | | Verbund AG | | | 1,624 | |
| | 100 | | | WEC Energy Group, Inc. | | | 8,337 | |
| | 209 | | | Xcel Energy, Inc. | | | 12,433 | |
| | | | | | | | |
| | | | Total Utilities | | | 1,110,207 | |
| | | | | | | | |
| | | | Total Common Stocks
(Cost $23,024,391) | | | 23,268,307 | |
| | | | | | | | |
| | |
| | | | | | | | |
| | | | Preferred Stocks—0.6% | | | |
| | | | Automobiles & Components—0.0%6 | |
| | 142 | | | Bayerische Motoren Werke AG, 6.20% | | | 8,829 | |
| | | | | | | | |
| | | | Banks—0.3% | |
| | 3,473 | | | Banco Bradesco SA, 2.56% | | | 34,198 | |
| | 271 | | | Bancolombia SA, 2.59% | | | 3,448 | |
| | 2,936 | | | Itau Unibanco Holding SA, 3.89% | | | 27,777 | |
| | 364 | | | Itausa—Investimentos Itau SA, 3.11% | | | 1,224 | |
| | | | | | | | |
| | | | Total Banks | | | 66,647 | |
| | | | | | | | |
| | | | Capital Goods—0.0%6 | |
| | 138,521 | | | Rolls-Royce Holdings PLC2 | | | 177 | |
| | 358,453 | | | Rolls-Royce Holdings PLC, Class C2 | | | 456 | |
| | | | | | | | |
| | | | Total Capital Goods | | | 633 | |
| | | | | | | | |
| | | | Food & Staples Retailing—0.1% | |
| | 410 | | | Cia Brasileira de Distribuicao, 1.74% | | | 10,128 | |
| | | | | | | | |
| | | | Food, Beverage & Tobacco—0.0%6 | |
| | 370 | | | Embotelladora Andina SA, Class B, 3.90% | | | 1,334 | |
| | | | | | | | |
| | | | Health Care Equipment & Services—0.0%6 | |
| | 5 | | | Sartorius AG, 0.34% | | | 1,027 | |
| | | | | | | | |
| | | | Household & Personal Products—0.1% | |
| | 8 | | | Amorepacific Corp., 1.34% | | | 597 | |
| | 99 | | | Henkel AG & Co KGaA, 2.03% | | | 9,698 | |
| | 1 | | | LG Household & Health Care Ltd., 1.21% | | | 698 | |
| | | | | | | | |
| | | | Total Household & Personal Products | | | 10,993 | |
| | | | | | | | |
| | | | Materials—0.0%6 | |
| | 16 | | | LG Chem Ltd., 3.07% | | | 2,709 | |
| | 30 | | | Sociedad Quimica y Minera de Chile SA, Class B, 3.59% | | | 930 | |
| | | | | | | | |
| | | | Total Materials | | | 3,639 | |
| | | | | | | | |
| | | | Technology Hardware & Equipment—0.1% | |
| | 916 | | | Samsung Electronics Co. Ltd., 2.85% | | | 30,344 | |
| | | | | | | | |
| | | | Telecommunication Services—0.0%6 | |
| | 684 | | | Telefonica Brasil SA, 10.57% | | | 8,907 | |
| | | | | | | | |
| | | | Utilities—0.0%6 | |
| | 1,240 | | | Cia Energetica de Minas Gerais, 3.97% | | | 4,805 | |
| | | | | | | | |
| | | | Total Preferred Stocks
(Cost $123,193) | | | 147,286 | |
| | | | | | | | |
| | |
| | | | | | | | |
The accompanying notes are an integral part of these financial statements.
Invesco Global ESG Revenue ETF (ESGF)(continued)
June 30, 2019
| | | | | | | | |
| Shares | | | | | Value | |
| | | | Warrant—0.0%6 | | | |
| | | | Consumer Services—0.0%6 | |
| | 91 | | | Minor International PCL, expiring 9/30/212
(Cost $0) | | $ | 16 | |
| | | | | | | | |
| | |
| | | | | | | | |
| | | | Right—0.0%6 | | | |
| | | | Diversified Financials—0.0%6 | |
| | 838 | | | Zhengqi Financial Holding Corp.2,7
(Cost $0) | | | 0 | |
| | | | | | | | |
| | |
| | | | | | | | |
| | | | Investment of Cash Collateral for Securities
Loaned—2.1% | |
| | 370,108 | | | Invesco Government & Agency Portfolio—Institutional Class, 2.27%8,9 | | | 370,108 | |
| | 123,320 | | | Invesco Liquid Assets Portfolio—Institutional Class, 2.41%8,9 | | | 123,369 | |
| | | | | | | | |
| | | | Total Investment of Cash Collateral for Securities Loaned
(Cost $493,469) | | | 493,477 | |
| | | | | | | | |
| | |
| | | | Total Investments—102.0%
(Cost $23,641,053) | | | 23,909,086 | |
| | |
| | | | Liabilities in Excess of Other Assets—(2.0)% | | | (477,792 | ) |
| | | | | | | | |
| | |
| | | | Net Assets—100.0% | | $ | 23,431,294 | |
| | | | | | | | |
PCL—Public Company Limited
REIT—Real Estate Investment Trust
| 1 | All or a portion of the security was on loan. The aggregate value of the securities on loan was $472,384; total value of the collateral held by the Fund was $493,477. |
| 2 | Non-income producing security. |
| 3 | Represents securities sold under Rule 144A, which are exempt from registration under the Securities Act of 1933, as amended. These securities have been determined to be liquid under guidelines established by the Board of Trustees. These securities amount to $161,261 or 0.69% of the Fund’s net assets at period end. |
| 4 | American Depositary Receipt. |
| 5 | Affiliated security (Note 4). |
| 7 | The value of this security was determined using significant unobservable inputs. See Note 3 of the accompanying Notes. |
| 8 | The security and the Fund are advised by wholly-owned subsidiaries of Invesco Ltd. and are therefore considered to be affiliated. The rate shown is the 7-day SEC standardized yield as of June 30, 2019. |
| 9 | The security has been segregated to satisfy the commitment to return the cash collateral received in securities lending transactions upon the borrower’s return of the securities loaned. See Note 6. |
Geographical Holdings
| | | | | | | | |
Country | | Value | | | % of Net
Assets | |
| United States | | $ | 7,179,839 | | | | 30.6 | % |
| Japan | | | 3,983,579 | | | | 17.0 | |
| France | | | 1,925,226 | | | | 8.2 | |
| United Kingdom | | | 1,504,154 | | | | 6.4 | |
| Germany | | | 1,435,540 | | | | 6.1 | |
| Netherlands | | | 915,182 | | | | 3.9 | |
| Canada | | | 819,094 | | | | 3.5 | |
| South Korea | | | 784,848 | | | | 3.4 | |
| Switzerland | | | 596,758 | | | | 2.5 | |
| Australia | | | 503,571 | | | | 2.2 | |
| Spain | | | 497,649 | | | | 2.1 | |
| China | | | 335,823 | | | | 1.4 | |
| Brazil | | | 319,074 | | | | 1.4 | |
| Taiwan | | | 292,755 | | | | 1.3 | |
| Italy | | | 291,736 | | | | 1.2 | |
| Sweden | | | 248,532 | | | | 1.1 | |
| India | | | 240,380 | | | | 1.0 | |
| Thailand | | | 204,312 | | | | 0.9 | |
| Singapore | | | 183,025 | | | | 0.8 | |
| South Africa | | | 179,671 | | | | 0.8 | |
| Norway | | | 131,144 | | | | 0.6 | |
| Denmark | | | 126,088 | | | | 0.5 | |
| Belgium | | | 124,845 | | | | 0.5 | |
| Finland | | | 108,875 | | | | 0.5 | |
| Hong Kong | | | 102,759 | | | | 0.4 | |
| Chile | | | 92,055 | | | | 0.4 | |
| Malaysia | | | 79,054 | | | | 0.3 | |
| Indonesia | | | 78,661 | | | | 0.3 | |
| Mexico | | | 74,357 | | | | 0.3 | |
| Austria | | | 70,865 | | | | 0.3 | |
| Ireland | | | 63,684 | | | | 0.3 | |
| Poland | | | 60,054 | | | | 0.3 | |
| Portugal | | | 59,326 | | | | 0.3 | |
| Turkey | | | 46,787 | | | | 0.2 | |
| Russia | | | 46,456 | | | | 0.2 | |
| Qatar | | | 29,416 | | | | 0.1 | |
| Saudi Arabia | | | 25,003 | | | | 0.1 | |
| Hungary | | | 22,687 | | | | 0.1 | |
| Colombia | | | 20,279 | | | | 0.1 | |
| Israel | | | 19,793 | | | | 0.1 | |
| United Arab Emirates | | | 18,006 | | | | 0.1 | |
| New Zealand | | | 13,022 | | | | 0.1 | |
| Philippines | | | 11,634 | | | | 0.1 | |
| Macau | | | 10,958 | | | | 0.0 | 1 |
| Czech Republic | | | 10,918 | | | | 0.0 | 1 |
| Greece | | | 9,111 | | | | 0.0 | 1 |
| Peru | | | 5,952 | | | | 0.0 | 1 |
| Egypt | | | 2,736 | | | | 0.0 | 1 |
| Luxembourg | | | 1,472 | | | | 0.0 | 1 |
| Argentina | | | 1,015 | | | | 0.0 | 1 |
| Pakistan | | | 702 | | | | 0.0 | 1 |
| Romania | | | 624 | | | | 0.0 | 1 |
| | | | | | | | |
| Total Investments | | | 23,909,086 | | | | 102.0 | |
| Liabilities in Excess of Other Assets | | | (477,792 | ) | | | (2.0 | ) |
| | | | | | | | |
| Net Assets | | $ | 23,431,294 | | | | 100.0 | % |
| | | | | | | | |
The accompanying notes are an integral part of these financial statements.
Statements of Assets and Liabilities
June 30, 2019
| | | | | | | | | | | | | | | | |
| | | Invesco
S&P 500
Revenue ETF
(RWL) | | | Invesco S&P
MidCap 400
Revenue ETF
(RWK) | | |
Invesco S&P
SmallCap 600
Revenue ETF
(RWJ) | | | Invesco S&P
Financials
Revenue ETF
(RWW) | |
| Assets: | | | | | | | | | | | | | | | | |
Unaffiliated investments in securities, at value (including securities on loan)1 | | $ | 956,199,531 | | | $ | 357,160,058 | | | $ | 405,147,756 | | | $ | 33,850,115 | |
Affiliated investments in securities, at value | | | 3,622,712 | | | | 13,651,970 | | | | 27,488,651 | | | | 212,205 | |
Foreign currency, at value | | | — | | | | — | | | | — | | | | — | |
Receivables and other assets: | | | | | | | | | | | | | | | | |
Dividends | | | 871,252 | | | | 284,863 | | | | 270,074 | | | | 24,144 | |
Capital shares sold | | | 7,313 | | | | 19,653 | | | | 43,624 | | | | 368 | |
Investments sold | | | 5,408,796 | | | | 105,420 | | | | 3,486,757 | | | | – | |
Securities lending | | | 233 | | | | 4,173 | | | | 87,441 | | | | 2 | |
Reclaims | | | — | | | | — | | | | — | | | | — | |
| | | | | | | | | | | | | | | | |
Total Assets | | | 966,109,837 | | | | 371,226,137 | | | | 436,524,303 | | | | 34,086,834 | |
| | | | | | | | | | | | | | | | |
| | | | |
| Liabilities: | | | | | | | | | | | | | | | | |
Payables and other liabilities: | | | | | | | | | | | | | | | | |
Investment of cash collateral for securities on loan | | | 3,231,210 | | | | 13,651,591 | | | | 27,432,417 | | | | 110,867 | |
Due to custodian | | | 684,106 | | | | 467,411 | | | | 175,056 | | | | 12,386 | |
Investments purchased | | | – | | | | – | | | | 423,252 | | | | – | |
Shares Repurchased | | | 5,343,430 | | | | – | | | | 3,164,928 | | | | – | |
Accrued unitary management fees | | | 302,484 | | | | 111,093 | | | | 129,469 | | | | 12,685 | |
Deferred foreign tax payable | | | — | | | | — | | | | — | | | | — | |
| | | | | | | | | | | | | | | | |
Total Liabilities | | | 9,561,230 | | | | 14,230,095 | | | | 31,325,122 | | | | 135,938 | |
| | | | | | | | | | | | | | | | |
| Net Assets | | $ | 956,548,607 | | | $ | 356,996,042 | | | $ | 405,199,181 | | | $ | 33,950,896 | |
| | | | | | | | | | | | | | | | |
| | | | |
| Net Assets Consist of: | | | | | | | | | | | | | | | | |
Shares of beneficial interest | | $ | 895,280,765 | | | $ | 358,256,351 | | | $ | 501,984,592 | | | $ | 34,336,381 | |
Total distributable earnings (accumulated loss) | | | 61,267,842 | | | | (1,260,309 | ) | | | (96,785,411 | ) | | | (385,485 | ) |
| | | | | | | | | | | | | | | | |
| Net Assets | | $ | 956,548,607 | | | $ | 356,996,042 | | | $ | 405,199,181 | | | $ | 33,950,896 | |
| | | | | | | | | | | | | | | | |
Shares outstanding (unlimited number of shares of beneficial interest authorized, without par value) | | | 17,901,400 | | | | 5,851,400 | | | | 6,401,400 | | | | 500,000 | |
Net asset value, offering and redemption price per share | | $ | 53.43 | | | $ | 61.01 | | | $ | 63.30 | | | $ | 67.90 | |
| | | | | | | | | | | | | | | | |
Market price | | $ | 53.41 | | | $ | 60.91 | | | $ | 63.23 | | | $ | 67.83 | |
| | | | | | | | | | | | | | | | |
Unaffiliated investments in securities, at cost | | $ | 863,163,113 | | | $ | 329,491,573 | | | $ | 448,627,380 | | | $ | 33,430,984 | |
| | | | | | | | | | | | | | | | |
Affiliated investments in securities, at cost | | $ | 3,727,406 | | | $ | 13,651,591 | | | $ | 27,486,809 | | | $ | 274,075 | |
| | | | | | | | | | | | | | | | |
Foreign currency, at cost | | | — | | | | — | | | | — | | | | — | |
| | | | | | | | | | | | | | | | |
1. Includes securities on loan with an aggregate value of: | | $ | 3,198,532 | | | $ | 13,620,798 | | | $ | 26,542,878 | | | $ | 108,680 | |
| | | | | | | | | | | | | | | | |
2. Net of foreign taxes of $1,626. | | | | | | | | | | | | | | | | |
3. Net of foreign taxes of $1,414. | | | | | | | | | | | | | | | | |
4. Net of foreign taxes of $1,581. | | | | | | | | | | | | | | | | |
The accompanying notes are an integral part of these financial statements.
| | | | | | | | | | | | | | | | | | | | | | | | | | |
Invesco S&P
Ultra Dividend
Revenue ETF
(RDIV) | | | Invesco
Emerging Markets
Ultra Dividend
Revenue ETF
(REDV) | | | Invesco
International
Ultra Dividend
Revenue ETF
(RIDV) | | | Invesco
Emerging
Markets
Revenue ETF
(REEM) | | | Invesco
International
Revenue ETF
(REFA) | | | Invesco
Global
Revenue ETF
(RGLB) | | | Invesco
Global ESG
Revenue ETF
(ESGF) | |
| | | | | | | | | | | | | | | | | | | | | | | | | | |
| $ | 1,778,323,638 | | | $ | 3,588,646 | | | $ | 2,364,279 | | | $ | 15,115,422 | | | $ | 12,328,715 | | | $ | 13,038,618 | | | $ | 23,410,146 | |
| | 20,513,293 | | | | — | | | | 18,206 | | | | 106,744 | | | | 347,429 | | | | 190,639 | | | | 498,940 | |
| | — | | | | 29,473 | | | | 26,900 | | | | 14,824 | | | | 6,092 | | | | 4,270 | | | | 9,699 | |
| | | | | | | | | | | | | | | | | | | | | | | | | | |
| | 5,032,082 | | | | 25,442 | | | | 5,340 | | | | 78,062 | | | | 17,927 | | | | 27,019 | | | | 41,645 | |
| | 3,833,989 | | | | — | | | | — | | | | — | | | | — | | | | — | | | | 284 | |
| | — | | | | — | | | | 270 | | | | 660 | | | | 1,248 | | | | 3,867 | | | | 2,087 | |
| | 13,494 | | | | — | | | | 97 | | | | 32 | | | | 683 | | | | 276 | | | | 952 | |
| | — | | | | 90 | | | | 2,233 | | | | 8 | | | | 2,572 | | | | 1,306 | | | | 3,974 | |
| | | | | | | | | | | | | | | | | | | | | | | | | | |
| | 1,807,716,496 | | | | 3,643,651 | | | | 2,417,325 | | | | 15,315,752 | | | | 12,704,666 | | | | 13,265,995 | | | | 23,967,727 | |
| | | | | | | | | | | | | | | | | | | | | | | | | | |
| | | | | | |
| | | | | | | | | | | | | | | | | | | | | | | | | | |
| | | | | | | | | | | | | | | | | | | | | | | | | | |
| | 20,512,450 | | | | — | | | | 18,206 | | | | 106,743 | | | | 342,802 | | | | 190,637 | | | | 493,469 | |
| | 289,899 | | | | 36,112 | | | | 2,447 | | | | 18,950 | | | | — | | | | 5,378 | | | | 34,067 | |
| | 3,756,370 | | | | — | | | | 27,090 | | | | — | | | | — | | | | — | | | | — | |
| | — | | | | — | | | | — | | | | — | | | | — | | | | — | | | | — | |
| | 558,684 | | | | 1,356 | | | | 805 | | | | 5,616 | | | | 4,215 | | | | 4,533 | | | | 8,526 | |
| | — | | | | — | | | | — | | | | 1,626 | | | | — | | | | 1,392 | | | | 371 | |
| | | | | | | | | | | | | | | | | | | | | | | | | | |
| | 25,117,403 | | | | 37,468 | | | | 48,548 | | | | 132,935 | | | | 347,017 | | | | 201,940 | | | | 536,433 | |
| | | | | | | | | | | | | | | | | | | | | | | | | | |
| $ | 1,782,599,093 | | | $ | 3,606,183 | | | $ | 2,368,777 | | | $ | 15,182,817 | | | $ | 12,357,649 | | | $ | 13,064,055 | | | $ | 23,431,294 | |
| | | | | | | | | | | | | | | | | | | | | | | | | | |
| | | | | | |
| | | | | | | | | | | | | | | | | | | | | | | | | | |
| $ | 1,907,205,231 | | | $ | 3,714,922 | | | $ | 2,516,075 | | | $ | 15,771,258 | | | $ | 13,193,691 | | | $ | 13,371,811 | | | $ | 23,893,717 | |
| | (124,606,138 | ) | | | (108,739 | ) | | | (147,298 | ) | | | (588,441 | )2 | | | (836,042 | ) | | | (307,756 | )3 | | | (462,423 | )4 |
| | | | | | | | | | | | | | | | | | | | | | | | | | |
| $ | 1,782,599,093 | | | $ | 3,606,183 | | | $ | 2,368,777 | | | $ | 15,182,817 | | | $ | 12,357,649 | | | $ | 13,064,055 | | | $ | 23,431,294 | |
| | | | | | | | | | | | | | | | | | | | | | | | | | |
|
47,350,000 |
| | | 150,000 | | | | 100,000 | | | | 600,000 | | | | 500,000 | | | | 500,000 | | | | 800,000 | |
| $ | 37.65 | | | $ | 24.04 | | | $ | 23.69 | | | $ | 25.30 | | | $ | 24.72 | | | $ | 26.13 | | | $ | 29.29 | |
| | | | | | | | | | | | | | | | | | | | | | | | | | |
| $ | 37.67 | | | $ | 24.16 | | | $ | 23.66 | | | $ | 25.35 | | | $ | 24.77 | | | $ | 26.15 | | | $ | 29.43 | |
| | | | | | | | | | | | | | | | | | | | | | | | | | |
| $ | 1,769,346,772 | | | $ | 3,624,553 | | | $ | 2,429,914 | | | $ | 15,175,645 | | | $ | 12,564,826 | | | $ | 12,803,476 | | | $ | 23,142,212 | |
| | | | | | | | | | | | | | | | | | | | | | | | | | |
| $ | 20,512,450 | | | $ | — | | | $ | 18,206 | | | $ | 106,743 | | | $ | 347,426 | | | $ | 190,637 | | | $ | 498,841 | |
| | | | | | | | | | | | | | | | | | | | | | | | | | |
| $ | — | | | $ | 29,481 | | | $ | 26,886 | | | $ | 14,624 | | | $ | 6,106 | | | $ | 4,220 | | | $ | 9,638 | |
| | | | | | | | | | | | | | | | | | | | | | | | | | |
| $ | 20,274,820 | | | $ | — | | | $ | 17,446 | | | $ | 100,687 | | | $ | 324,914 | | | $ | 182,081 | | | $ | 472,384 | |
| | | | | | | | | | | | | | | | | | | | | | | | | | |
| | | | | | | | | | | | | | | | | | | | | | | | | | |
| | | | | | | | | | | | | | | | | | | | | | | | | | |
| | | | | | | | | | | | | | | | | | | | | | | | | | |
Statements of Operations
For the year ended June 30, 2019
| | | | | | | | | | | | | | | | |
| | | Invesco
S&P 500
Revenue ETF
(RWL) | | | Invesco S&P
MidCap 400
Revenue ETF
(RWK) | | | Invesco S&P
SmallCap 600
Revenue ETF
(RWJ) | | |
Invesco S&P
Financials
Revenue ETF
(RWW) | |
| Investment Income: | | | | | | | | | | | | | | | | |
Unaffiliated dividend income | | $ | 22,624,133 | | | $ | 5,164,979 | | | $ | 6,180,689 | | | $ | 993,123 | |
Affiliated dividend income | | | 26,267 | | | | 127 | | | | 30,336 | | | | 8,469 | |
Non-cash dividend income | | | 553,348 | | | | 83,329 | | | | — | | | | — | |
Foreign withholding tax | | | — | | | | (679 | ) | | | (730 | ) | | | — | |
Securities lending income | | | 40,833 | | | | 98,178 | | | | 1,028,805 | | | | 253 | |
| | | | | | | | | | | | | | | | |
Total Income | | | 23,244,581 | | | | 5,345,934 | | | | 7,239,100 | | | | 1,001,845 | |
| | | | | | | | | | | | | | | | |
| | | | |
| Expenses: | | | | | | | | | | | | | | | | |
Unitary management fees | | | 3,807,861 | | | | 1,410,841 | | | | 1,830,117 | | | | 207,112 | |
| | | | | | | | | | | | | | | | |
Less fees waived | | | (118 | ) | | | (14 | ) | | | (39 | ) | | | (4 | ) |
| | | | | | | | | | | | | | | | |
Net Expenses | | | 3,807,743 | | | | 1,410,827 | | | | 1,830,078 | | | | 207,108 | |
| | | | | | | | | | | | | | | | |
Net Investment Income | | | 19,436,838 | | | | 3,935,107 | | | | 5,409,022 | | | | 794,737 | |
| | | | | | | | | | | | | | | | |
| | | | |
| Net Realized and Unrealized Gain (Loss) on Investments from: | | | | | | | | | | | | | | | | |
Net realized loss on investments | | | (23,162,701 | ) | | | (14,184,249 | ) | | | (32,599,939 | ) | | | (577,953 | ) |
Net realized loss on affiliated investments | | | (74,141 | ) | | | — | | | | (46,233 | ) | | | (15,709 | ) |
Net realized gain onin-kind redemptions | | | 75,711,617 | | | | 32,863,128 | | | | 58,051,466 | | | | 6,942,240 | |
Net realized gain (loss) onin-kind redemptions on affiliates | | | 8,964 | | | | — | | | | 1,682 | | | | (12,099 | ) |
Net realized loss on foreign currency transactions | | | — | | | | — | | | | — | | | | — | |
| | | | | | | | | | | | | | | | |
Total net realized gain (loss) | | | 52,483,739 | | | | 18,678,879 | | | | 25,406,976 | | | | 6,336,479 | |
| | | | | | | | | | | | | | | | |
Net change in unrealized appreciation (depreciation) on unaffiliated investments | | | (6,578,379 | ) | | | (20,423,994 | ) | | | (98,717,001 | ) | | | (4,954,212 | ) |
Net change in unrealized appreciation (depreciation) on affiliated investments | | | (28,945 | ) | | | 379 | | | | 41,012 | | | | (19,160 | ) |
Net change in unrealized appreciation (depreciation) on foreign currency translations | | | — | | | | — | | | | — | | | | — | |
| | | | | | | | | | | | | | | | |
Net change in unrealized appreciation (depreciation) | | | (6,607,324 | ) | | | (20,423,615 | ) | | | (98,675,989 | ) | | | (4,973,372 | ) |
| | | | | | | | | | | | | | | | |
Net realized and unrealized gain (loss) on investments | | | 45,876,415 | | | | (1,744,736 | ) | | | (73,269,013 | ) | | | 1,363,107 | |
| | | | | | | | | | | | | | | | |
Net Increase (Decrease) in Net Assets Resulting From Operations | | $ | 65,313,253 | | | $ | 2,190,371 | | | $ | (67,859,991 | ) | | $ | 2,157,844 | |
| | | | | | | | | | | | | | | | |
| 1. | For the period from August 7, 2018 (commencement of operations) to June 30, 2019. |
| 2. | Net of foreign taxes of $65 and $476. |
| 3. | Net of change in deferred foreign taxes of $1,626, $1,414 and $1,581. |
The accompanying notes are an integral part of these financial statements.
| | | | | | | | | | | | | | | | | | | | | | | | | | |
Invesco S&P
Ultra Dividend
Revenue ETF
(RDIV) | | | Invesco
Emerging Markets
Ultra Dividend
Revenue ETF1
(REDV) | | | Invesco
International
Ultra Dividend
Revenue ETF1
(RIDV) | | | Invesco
Emerging Markets
Revenue ETF
(REEM) | | | Invesco
International
Revenue ETF
(REFA) | | | Invesco
Global
Revenue ETF
(RGLB) | | | Invesco
Global ESG
Revenue ETF
(ESGF) | |
| | | | | | | | | | | | | | | | | | | | | | | | | | |
| $ | 55,067,686 | | | $ | 152,220 | | | $ | 114,838 | | | $ | 474,804 | | | $ | 469,509 | | | $ | 416,863 | | | $ | 757,012 | |
| | 247,824 | | | | 5 | | | | 11 | | | | 87 | | | | 78 | | | | 59 | | | | 96 | |
| | — | | | | — | | | | 432 | | | | 17,464 | | | | 25,855 | | | | 21,126 | | | | 37,608 | |
| | — | | | | (12,692 | ) | | | (13,582 | ) | | | (54,753 | ) | | | (42,748 | ) | | | (32,734 | ) | | | (64,475 | ) |
| | 497,967 | | | | 54 | | | | 379 | | | | 1,056 | | | | 2,138 | | | | 1,364 | | | | 5,702 | |
| | | | | | | | | | | | | | | | | | | | | | | | | | |
| | 55,813,477 | | | | 139,587 | | | | 102,078 | | | | 438,658 | | | | 454,832 | | | | 406,678 | | | | 735,943 | |
| | | | | | | | | | | | | | | | | | | | | | | | | | |
| | | | | | |
| | | | | | | | | | | | | | | | | | | | | | | | | | |
| | 5,037,398 | | | | 11,112 | | | | 8,797 | | | | 59,994 | | | | 52,571 | | | | 55,755 | | | | 103,611 | |
| | | | | | | | | | | | | | | | | | | | | | | | | | |
| | (731 | ) | | | (1 | ) | | | (1 | ) | | | (8 | ) | | | (9 | ) | | | (6 | ) | | | (13 | ) |
| | | | | | | | | | | | | | | | | | | | | | | | | | |
| | 5,036,667 | | | | 11,111 | | | | 8,796 | | | | 59,986 | | | | 52,562 | | | | 55,749 | | | | 103,598 | |
| | | | | | | | | | | | | | | | | | | | | | | | | | |
| | 50,776,810 | | | | 128,476 | | | | 93,282 | | | | 378,672 | | | | 402,270 | | | | 350,929 | | | | 632,345 | |
| | | | | | | | | | | | | | | | | | | | | | | | | | |
| | | | | | |
| | | | | | | | | | | | | | | | | | | | | | | | | | |
| | (102,327,468 | ) | | | (81,187 | )2 | | | (90,384 | ) | | | (479,264 | ) | | | (566,909 | ) | | | (453,658 | )2 | | | (623,276 | ) |
| | (3,391,378 | ) | | | — | | | | — | | | | — | | | | — | | | | — | | | | — | |
| | 112,785,346 | | | | — | | | | — | | | | 177,846 | | | | 350,074 | | | | 473,326 | | | | 421,578 | |
| | 4,971 | | | | — | | | | — | | | | — | | | | — | | | | — | | | | — | |
| | — | | | | (3,829 | ) | | | (1,503 | ) | | | (18,220 | ) | | | (7,034 | ) | | | (6,372 | ) | | | (6,521 | ) |
| | | | | | | | | | | | | | | | | | | | | | | | | | |
| | 7,071,471 | | | | (85,016 | ) | | | (91,887 | ) | | | (319,638 | ) | | | (223,869 | ) | | | 13,296 | | | | (208,219 | ) |
| | | | | | | | | | | | | | | | | | | | | | | | | | |
| | (9,147,556 | ) | | | (35,907 | ) | | | (65,635 | ) | | | 351,703 | 3 | | | (612,556 | ) | | | (235,189 | )3 | | | (182,084 | )3 |
| | 843 | | | | — | | | | — | | | | 1 | | | | 3 | | | | 2 | | | | 99 | |
| | — | | | | (26 | ) | | | (96 | ) | | | 1,082 | | | | 86 | | | | 39 | | | | 519 | |
| | | | | | | | | | | | | | | | | | | | | | | | | | |
| | (9,146,713 | ) | | | (35,933 | ) | | | (65,731 | ) | | | 352,786 | | | | (612,467 | ) | | | (235,148 | ) | | | (181,466 | ) |
| | | | | | | | | | | | | | | | | | | | | | | | | | |
| | (2,075,242 | ) | | | (120,949 | ) | | | (157,618 | ) | | | 33,148 | | | | (836,336 | ) | | | (221,852 | ) | | | (389,685 | ) |
| | | | | | | | | | | | | | | | | | | | | | | | | | |
| $ | 48,701,568 | | | $ | 7,527 | | | $ | (64,336 | ) | | $ | 411,820 | | | $ | (434,066 | ) | | $ | 129,077 | | | $ | 242,660 | |
| | | | | | | | | | | | | | | | | | | | | | | | | | |
Statements of Changes in Net Assets
For the year ended June 30, 2019 and June 30, 2018
| | | | | | | | | | | | | | | | |
| | | Invesco S&P 500
Revenue ETF (RWL) | | |
Invesco S&P MidCap 400
Revenue ETF (RWK) | |
| | | Year Ended
June 30, 2019 | | | Year Ended
June 30, 2018 | | | Year Ended
June 30, 2019 | | | Year Ended
June 30, 2018 | |
| Operations | | | | | | | | | | | | | | | | |
Net investment income | | $ | 19,436,838 | | | $ | 15,300,273 | | | $ | 3,935,107 | | | $ | 3,913,591 | |
Net realized gain (loss) on investments andin-kind redemptions and foreign currency transactions | | | 52,483,739 | | | | 60,903,503 | | | | 18,678,879 | | | | 19,377,220 | |
Net change in unrealized appreciation (depreciation) on investments foreign currency translations | | | (6,607,324 | ) | | | 8,339,902 | | | | (20,423,615 | ) | | | 8,688,904 | |
| | | | | | | | | | | | | | | | |
Net increase (decrease) in net assets resulting from operations | | | 65,313,253 | | | | 84,543,678 | | | | 2,190,371 | | | | 31,979,715 | |
| | | | | | | | | | | | | | | | |
| | | | |
| Distributions to Shareholders from: | | | | | | | | | | | | | | | | |
Distributable earnings | | | (19,138,436 | ) | | | (17,723,983 | ) | | | (3,846,048 | ) | | | (3,676,937 | ) |
| | | | | | | | | | | | | | | | |
| | | | |
| Shareholder Transactions: | | | | | | | | | | | | | | | | |
Proceeds from shares sold | | | 243,025,931 | | | | 313,392,923 | | | | 80,869,707 | | | | 90,878,997 | |
Value of shares repurchased | | | (250,146,076 | ) | | | (152,222,803 | ) | | | (100,828,754 | ) | | | (70,072,549 | ) |
| | | | | | | | | | | | | | | | |
Net increase (decrease) in net assets resulting from shareholder transactions | | | (7,120,145 | ) | | | 161,170,120 | | | | (19,959,047 | ) | | | 20,806,448 | |
| | | | | | | | | | | | | | | | |
Increase (Decrease) in net assets | | | 39,054,672 | | | | 227,989,815 | | | | (21,614,724 | ) | | | 49,109,226 | |
| | | | | | | | | | | | | | | | |
| | | | |
| Net Assets: | | | | | | | | | | | | | | | | |
Beginning of period or year | | | 917,493,935 | | | | 689,504,120 | | | | 378,610,766 | | | | 329,501,540 | |
| | | | | | | | | | | | | | | | |
End of period or year | | $ | 956,548,607 | | | $ | 917,493,935 | | | $ | 356,996,042 | | | $ | 378,610,766 | |
| | | | | | | | | | | | | | | | |
| | | | |
| Changes in Shares Outstanding: | | | | | | | | | | | | | | | | |
Shares outstanding, beginning of period or year | | | 18,101,400 | | | | 14,851,400 | | | | 6,201,400 | | | | 5,851,400 | |
Shares sold | | | 4,750,000 | | | | 6,200,000 | | | | 1,400,000 | | | | 1,500,000 | |
Shares repurchased | | | (4,950,000 | ) | | | (2,950,000 | ) | | | (1,750,000 | ) | | | (1,150,000 | ) |
| | | | | | | | | | | | | | | | |
Shares outstanding, end of period or year | | | 17,901,400 | | | | 18,101,400 | | | | 5,851,400 | | | | 6,201,400 | |
| | | | | | | | | | | | | | | | |
The accompanying notes are an integral part of these financial statements.
| | | | | | | | | | | | | | | | | | | | | | |
Invesco S&P SmallCap 600
Revenue ETF (RWJ) | | | Invesco S&P Financials
Revenue ETF (RWW) | | |
Invesco S&P Ultra Dividend
Revenue ETF (RDIV) | |
Year Ended
June 30, 2019 | | | Year Ended
June 30, 2018 | | | Year Ended
June 30, 2019 | | | Year Ended
June 30, 2018 | | | Year Ended
June 30, 2019 | | | Year Ended
June 30, 2018 | |
| | | | | | | | | | | | | | | | | | | | | | |
| $ | 5,409,022 | | | $ | 5,174,190 | | | $ | 794,737 | | | $ | 620,297 | | | $ | 50,776,810 | | | $ | 25,549,754 | |
| | | | | |
| | 25,406,976 | | | | 52,865,569 | | | | 6,336,479 | | | | 1,474,077 | | | | 7,071,471 | | | | 28,487,131 | |
| | | | | |
| | (98,675,989 | ) | | | 358,776 | | | | (4,973,372 | ) | | | (1,328,352 | ) | | | (9,146,713 | ) | | | 37,354,744 | |
| | | | | | | | | | | | | | | | | | | | | | |
| | (67,859,991 | ) | | | 58,398,535 | | | | 2,157,844 | | | | 766,022 | | | | 48,701,568 | | | | 91,391,629 | |
| | | | | | | | | | | | | | | | | | | | | | |
| | | | | |
| | (5,443,557 | ) | | | (5,715,052 | ) | | | (788,763 | ) | | | (685,442 | ) | | | (48,980,283 | ) | | | (29,379,796 | ) |
| | | | | | | | | | | | | | | | | | | | | | |
| | | | | |
| | | | | | | | | | | | | | | | | | | | | | |
| | 175,782,312 | | | | 83,311,618 | | | | 6,364,575 | | | | 31,019,019 | | | | 2,425,047,339 | | | | 439,228,941 | |
| | (206,177,006 | ) | | | (181,849,009 | ) | | | (28,303,291 | ) | | | (10,277,825 | ) | | | (1,253,156,914 | ) | | | (400,883,719 | ) |
| | | | | | | | | | | | | | | | | | | | | | |
| | (30,394,694 | ) | | | (98,537,391 | ) | | | (21,938,716 | ) | | | 20,741,194 | | | | 1,171,890,425 | | | | 38,345,222 | |
| | | | | | | | | | | | | | | | | | | | | | |
| | (103,698,242 | ) | | | (45,853,908 | ) | | | (20,569,635 | ) | | | 20,821,774 | | | | 1,171,611,710 | | | | 100,357,055 | |
| | | | | | | | | | | | | | | | | | | | | | |
| | | | | |
| | | | | | | | | | | | | | | | | | | | | | |
| | 508,897,423 | | | | 554,751,331 | | | | 54,520,531 | | | | 33,698,757 | | | | 610,987,383 | | | | 510,630,328 | |
| | | | | | | | | | | | | | | | | | | | | | |
| $ | 405,199,181 | | | $ | 508,897,423 | | | $ | 33,950,896 | | | $ | 54,520,531 | | | $ | 1,782,599,093 | | | $ | 610,987,383 | |
| | | | | | | | | | | | | | | | | | | | | | |
| | | | | |
| | | | | | | | | | | | | | | | | | | | | | |
| | 6,951,400 | | | | 8,401,400 | | | | 850,000 | | | | 550,000 | | | | 16,000,000 | | | | 15,100,000 | |
| | 2,600,000 | | | | 1,150,000 | | | | 100,000 | | | | 450,000 | | | | 64,100,000 | | | | 12,150,000 | |
| | (3,150,000 | ) | | | (2,600,000 | ) | | | (450,000 | ) | | | (150,000 | ) | | | (32,750,000 | ) | | | (11,250,000 | ) |
| | | | | | | | | | | | | | | | | | | | | | |
| | 6,401,400 | | | | 6,951,400 | | | | 500,000 | | | | 850,000 | | | | 47,350,000 | | | | 16,000,000 | |
| | | | | | | | | | | | | | | | | | | | | | |
Statements of Changes in Net Assets(continued)
For the year or period ended June 30, 2019 and for the period ended June 30, 2018
| | | | | | | | | | | | | | | | |
| | | Invesco
Emerging Markets
Ultra Dividend
Revenue ETF (REDV) | | | Invesco
International Ultra
Dividend
Revenue ETF (RIDV) | | | Invesco Emerging Markets
Revenue ETF (REEM) | |
| | | For the Period
August 7,
20181 to
June 30, 2019 | | | For the Period
August 7,
20181 to
June 30, 2019 | | | Year Ended
June 30, 2019 | | | For the Period
July 11,
20171 to
June 30, 2018 | |
| Operations | | | | | | | | | | | | | | | | |
Net investment income | | $ | 128,476 | | | $ | 93,282 | | | $ | 378,672 | | | $ | 308,088 | |
Net realized gain on investments andin-kind redemptions | | | (85,016 | ) | | | (91,887 | ) | | | (319,638 | ) | | | 300,786 | |
Net change in unrealized appreciation (depreciation) on investments | | | (35,933 | ) | | | (65,731 | ) | | | 352,786 | | | | (413,901 | ) |
| | | | | | | | | | | | | | | | |
Net increase in net assets resulting from operations | | | 7,527 | | | | (64,336 | ) | | | 411,820 | | | | 194,973 | |
| | | | | | | | | | | | | | | | |
| | | | |
| Distributions to Shareholders from: | | | | | | | | | | | | | | | | |
Distributable earnings | | | (116,266 | ) | | | (82,962 | ) | | | (495,307 | ) | | | (218,650 | ) |
| | | | | | | | | | | | | | | | |
| | | | |
| Shareholder Transactions: | | | | | | | | | | | | | | | | |
Proceeds from shares sold | | | 3,714,922 | | | | 2,516,075 | | | | 7,689,891 | | | | 20,892,428 | |
Value of shares repurchased | | | — | | | | — | | | | (5,087,260 | ) | | | (8,205,078 | ) |
| | | | | | | | | | | | | | | | |
Net increase (decrease) in net assets resulting from shareholder transactions | | | 3,714,922 | | | | 2,516,075 | | | | 2,602,631 | | | | 12,687,350 | |
| | | | | | | | | | | | | | | | |
Increase (Decrease) in net assets | | | 3,606,183 | | | | 2,368,777 | | | | 2,519,144 | | | | 12,663,673 | |
| | | | | | | | | | | | | | | | |
| | | | |
| Net Assets: | | | | | | | | | | | | | | | | |
Beginning of period or year | | | — | | | | — | | | | 12,663,673 | | | | — | |
| | | | | | | | | | | | | | | | |
End of period or year | | $ | 3,606,183 | | | $ | 2,368,777 | | | $ | 15,182,817 | | | $ | 12,663,673 | |
| | | | �� | | | | | | | | | | | | |
| | | | |
| Changes in Shares Outstanding: | | | | | | | | | | | | | | | | |
Shares outstanding, beginning of period or year | | | — | | | | — | | | | 500,000 | | | | — | |
Shares sold | | | 150,000 | | | | 100,000 | | | | 300,000 | | | | 800,000 | |
Shares repurchased | | | — | | | | — | | | | (200,000 | ) | | | (300,000 | ) |
| | | | | | | | | | | | | | | | |
Shares outstanding, end of period or year | | | 150,000 | | | | 100,000 | | | | 600,000 | | | | 500,000 | |
| | | | | | | | | | | | | | | | |
| 1. | Commencement of operations. |
The accompanying notes are an integral part of these financial statements.
| | | | | | | | | | | | | | | | | | | | | | |
Invesco International Revenue ETF
(REFA) | | | Invesco Global Revenue ETF
(RGLB) | | | Invesco Global ESG Revenue ETF
(ESGF) | |
Year Ended
June 30, 2019 | | | For the Period
July 11,
20171 to
June 30, 2018 | | | Year Ended
June 30, 2019 | | | For the Period
July 11,
20171 to
June 30, 2018 | | | Year Ended
June 30, 2019 | | | Year Ended
June 30, 2018 | |
| | | | | | | | | | | | | | | | | | | | | | |
| $ | 402,270 | | | $ | 387,759 | | | $ | 350,929 | | | $ | 324,285 | | | $ | 632,345 | | | $ | 523,421 | |
| | (223,869 | ) | | | 188,104 | | | | 13,296 | | | | 197,759 | | | | (208,219 | ) | | | 1,700,456 | |
| | (612,467 | ) | | | 376,289 | | | | (235,148 | ) | | | 468,923 | | | | (181,466 | ) | | | (471,523 | ) |
| | | | | | | | | | | | | | | | | | | | | | |
| | (434,066 | ) | | | 952,152 | | | | 129,077 | | | | 990,967 | | | | 242,660 | | | | 1,752,354 | |
| | | | | | | | | | | | | | | | | | | | | | |
| | | | | |
| | (362,641 | ) | | | (358,426 | ) | | | (326,861 | ) | | | (278,541 | ) | | | (570,657 | ) | | | (702,508 | ) |
| | | | | | | | | | | | | | | | | | | | | | |
| | | | | |
| | | | | | | | | | | | | | | | | | | | | | |
| | 5,151,267 | | | | 20,634,014 | | | | 5,333,627 | | | | 23,265,502 | | | | 4,519,271 | | | | 16,371,671 | |
| | (5,119,876 | ) | | | (8,104,775 | ) | | | (5,309,136 | ) | | | (10,740,580 | ) | | | (2,974,163 | ) | | | (14,904,746 | ) |
| | | | | | | | | | | | | | | | | | | | | | |
| | | | | |
| | 31,391 | | | | 12,529,239 | | | | 24,491 | | | | 12,524,922 | | | | 1,545,108 | | | | 1,466,925 | |
| | | | | | | | | | | | | | | | | | | | | | |
| | (765,316 | ) | | | 13,122,965 | | | | (173,293 | ) | | | 13,237,348 | | | | 1,217,111 | | | | 2,516,771 | |
| | | | | | | | | | | | | | | | | | | | | | |
| | | | | |
| | | | | | | | | | | | | | | | | | | | | | |
| | 13,122,965 | | | | — | | | | 13,237,348 | | | | — | | | | 22,214,183 | | | | 19,697,412 | |
| | | | | | | | | | | | | | | | | | | | | | |
| $ | 12,357,649 | | | $ | 13,122,965 | | | $ | 13,064,055 | | | $ | 13,237,348 | | | $ | 23,431,294 | | | $ | 22,214,183 | |
| | | | | | | | | | | | | | | | | | | | | | |
| | | | | |
| | | | | | | | | | | | | | | | | | | | | | |
| | 500,000 | | | | — | | | | 500,000 | | | | — | | | | 750,000 | | | | 700,000 | |
| | 200,000 | | | | 800,000 | | | | 200,000 | | | | 900,000 | | | | 150,000 | | | | 550,000 | |
| | (200,000 | ) | | | (300,000 | ) | | | (200,000 | ) | | | (400,000 | ) | | | (100,000 | ) | | | (500,000 | ) |
| | | | | | | | | | | | | | | | | | | | | | |
| | 500,000 | | | | 500,000 | | | | 500,000 | | | | 500,000 | | | | 800,000 | | | | 750,000 | |
| | | | | | | | | | | | | | | | | | | | | | |
Financial Highlights
Invesco S&P 500 Revenue ETF (RWL)
| | | | | | | | | | | | | | | | | | | | |
| | | Years Ended June 30, | |
| | | 2019 | | | 2018 | | | 2017 | | | 2016 | | | 2015 | |
| Per Share Operating Performance: | | | | | | | | | | | | | | | | | | | | |
Net asset value, beginning of year | | $ | 50.69 | | | $ | 46.43 | | | $ | 40.74 | | | $ | 40.91 | | | $ | 38.56 | |
Net investment income1 | | | 1.03 | | | | 0.90 | | | | 0.83 | | | | 0.76 | | | | 0.68 | |
Net realized and unrealized gain (loss) on investments | | | 2.72 | | | | 4.41 | | | | 5.60 | | | | (0.14 | ) | | | 2.35 | |
Total gain from investment operations | | | 3.75 | | | | 5.31 | | | | 6.43 | | | | 0.62 | | | | 3.03 | |
Less Distributions from: | | | | | | | | | | | | | | | | | | | | |
Net investment income | | | (1.01 | ) | | | (1.05 | ) | | | (0.74 | ) | | | (0.76 | ) | | | (0.64 | ) |
Realized gains | | | — | | | | — | | | | — | | | | (0.03 | ) | | | (0.04 | ) |
Total distributions | | | (1.01 | ) | | | (1.05 | ) | | | (0.74 | ) | | | (0.79 | ) | | | (0.68 | ) |
Net asset value, end of year | | $ | 53.43 | | | $ | 50.69 | | | $ | 46.43 | | | $ | 40.74 | | | $ | 40.91 | |
Market price, end of year | | $ | 53.41 | 2 | | | | | | | | | | | | | | | | |
| Total Return at Net Asset Value3 | | | 7.51 | % | | | 11.49 | % | | | 15.96 | % | | | 1.55 | % | | | 7.91 | % |
| Total Return at Market Value3 | | | 7.41 | % | | | 11.46 | % | | | 15.98 | % | | | 1.61 | % | | | 7.85 | % |
| Ratios/Supplemental Data: | | | | | | | | | | | | | | | | | | | | |
Net assets, end of year (000’s omitted) | | $ | 956,549 | | | $ | 917,494 | | | $ | 689,504 | | | $ | 366,679 | | | $ | 343,682 | |
Ratio to average net assets of: | | | | | | | | | | | | | | | | | | | | |
Expenses, net of expense waivers and reimbursements | | | 0.39 | % | | | 0.39 | % | | | 0.42 | % | | | 0.49 | % | | | 0.49 | % |
Expenses, prior to expense waivers and reimbursements | | | 0.39 | % | | | 0.41 | % | | | 0.52 | % | | | 0.62 | % | | | 0.61 | % |
Net investment income, net of waivers and reimbursements | | | 1.99 | % | | | 1.81 | % | | | 1.89 | % | | | 1.92 | % | | | 1.70 | % |
Portfolio turnover rate4 | | | 19 | % | | | 15 | % | | | 15 | % | | | 14 | % | | | 19 | % |
| 1. | Based on average daily shares outstanding. |
| 2. | The mean between the last bid and ask prices. |
| 3. | Net asset value total return is calculated assuming an initial investment made at the net asset value at the beginning of the year, reinvestment of all dividends and distributions at net asset value during the year and redemption on the last day of the year at net asset value. Market value total return is calculated assuming an initial investment made at the market value at the beginning of the year, reinvestment of all dividends and distributions at market value during the year, and sale at the market value on the last day of the year. Market value is determined by trading that occurs on the NYSE Arca, and may be greater or less than net asset value, depending on the 4 p.m. mean of the bid and offer prices for a share of the Fund. Total return calculated for a period of less than one year is not annualized. The total return would have been lower if certain expenses had not been waived by the Adviser. |
| 4. | Portfolio turnover rate is not annualized and excludes the value of portfolio securities received or delivered as a result ofin-kind creations or redemptions of the Fund’s capital shares. |
Invesco S&P MidCap 400 Revenue ETF (RWK)
| | | | | | | | | | | | | | | | | | | | |
| | | Years Ended June 30, | |
| | | 2019 | | | 2018 | | | 2017 | | | 2016 | | | 2015 | |
| Per Share Operating Performance: | | | | | | | | | | | | | | | | | | | | |
Net asset value, beginning of year | | $ | 61.05 | | | $ | 56.31 | | | $ | 47.74 | | | $ | 49.39 | | | $ | 47.75 | |
Net investment income1 | | | 0.65 | | | | 0.63 | | | | 0.56 | | | | 0.44 | | | | 0.41 | |
Net realized and unrealized gain (loss) on investments | | | (0.06 | ) | | | 4.70 | | | | 8.68 | | | | (1.63 | ) | | | 1.79 | |
Total gain (loss) from investment operations | | | 0.59 | | | | 5.33 | | | | 9.24 | | | | (1.19 | ) | | | 2.20 | |
Less Distributions from: | | | | | | | | | | | | | | | | | | | | |
Net investment income | | | (0.63 | ) | | | (0.59 | ) | | | (0.67 | ) | | | (0.46 | ) | | | (0.39 | ) |
Realized gains | | | — | | | | — | | | | — | | | | — | | | | (0.17 | ) |
Total distributions | | | (0.63 | ) | | | (0.59 | ) | | | (0.67 | ) | | | (0.46 | ) | | | (0.56 | ) |
Net asset value, end of year | | $ | 61.01 | | | $ | 61.05 | | | $ | 56.31 | | | $ | 47.74 | | | $ | 49.39 | |
Market price, end of year | | $ | 60.91 | 2 | | | | | | | | | | | | | | | | |
| Total Return at Net Asset Value3 | | | 1.05 | % | | | 9.48 | % | | | 19.46 | % | | | (2.39 | )% | | | 4.63 | % |
| Total Return at Market Value3 | | | 0.90 | % | | | 9.40 | % | | | 19.45 | % | | | (2.38 | )% | | | 5.05 | % |
| Ratios/Supplemental Data: | | | | | | | | | | | | | | | | | | | | |
Net assets, end of year (000’s omitted) | | $ | 356,996 | | | $ | 378,611 | | | $ | 329,502 | | | $ | 186,252 | | | $ | 242,092 | |
Ratio to average net assets of: | | | | | | | | | | | | | | | | | | | | |
Expenses, net of expense waivers and reimbursements | | | 0.39 | % | | | 0.39 | % | | | 0.43 | % | | | 0.54 | % | | | 0.54 | % |
Expenses, prior to expense waivers and reimbursements | | | 0.39 | % | | | 0.42 | % | | | 0.56 | % | | | 0.72 | % | | | 0.68 | % |
Net investment income, net of waivers and reimbursements | | | 1.09 | % | | | 1.08 | % | | | 1.05 | % | | | 0.94 | % | | | 0.84 | % |
Portfolio turnover rate4 | | | 33 | % | | | 34 | % | | | 46 | % | | | 22 | % | | | 14 | % |
| 1. | Based on average daily shares outstanding. |
| 2. | The mean between the last bid and ask prices. |
| 3. | Net asset value total return is calculated assuming an initial investment made at the net asset value at the beginning of the year, reinvestment of all dividends and distributions at net asset value during the year and redemption on the last day of the year at net asset value. Market value total return is calculated assuming an initial investment made at the market value at the beginning of the year, reinvestment of all dividends and distributions at market value during the year, and sale at the market value on the last day of the year. Market value is determined by trading that occurs on the NYSE Arca, and may be greater or less than net asset value, depending on the 4 p.m. mean of the bid and offer prices for a share of the Fund. Total return calculated for a period of less than one year is not annualized. The total return would have been lower if certain expenses had not been waived by the Adviser. |
| 4. | Portfolio turnover rate is not annualized and excludes the value of portfolio securities received or delivered as a result of in-kind creations or redemptions of the Fund’s capital shares. |
The accompanying notes are an integral part of these financial statements.
Financial Highlights(continued)
Invesco S&P SmallCap 600 Revenue ETF (RWJ)
| | | | | | | | | | | | | | | | | | | | |
| | | Years Ended June 30, | |
| | | 2019 | | | 2018 | | | 2017 | | | 2016 | | | 2015 | |
| Per Share Operating Performance: | | | | | | | | | | | | | | | | | | | | |
Net asset value, beginning of year | | $ | 73.21 | | | $ | 66.03 | | | $ | 55.06 | | | $ | 58.05 | | | $ | 56.25 | |
Net investment income1 | | | 0.79 | | | | 0.69 | | | | 0.55 | | | | 0.36 | | | | 0.39 | |
Net realized and unrealized gain (loss) on investments | | | (9.90 | ) | | | 7.24 | | | | 10.85 | | | | (2.97 | ) | | | 1.89 | |
Total gain (loss) from investment operations | | | (9.11 | ) | | | 7.93 | | | | 11.40 | | | | (2.61 | ) | | | 2.28 | |
Less Distributions from: | | | | | | | | | | | | | | | | | | | | |
Net investment income | | | (0.80 | ) | | | (0.75 | ) | | | (0.43 | ) | | | (0.38 | ) | | | (0.38 | ) |
Realized gains | | | — | | | | — | | | | — | | | | — | | | | (0.10 | ) |
Total distributions | | | (0.80 | ) | | | (0.75 | ) | | | (0.43 | ) | | | (0.38 | ) | | | (0.48 | ) |
Net asset value, end of year | | $ | 63.30 | | | $ | 73.21 | | | $ | 66.03 | | | $ | 55.06 | | | $ | 58.05 | |
Market price, end of year | | $ | 63.23 | 2 | | | | | | | | | | | | | | | | |
| Total Return at Net Asset Value3 | | | (12.45 | )% | | | 12.07 | %4 | | | 20.75 | % | | | (4.46 | )% | | | 4.06 | % |
| Total Return at Market Value3 | | | (12.57 | )% | | | 12.10 | %4 | | | 20.76 | % | | | (4.51 | )% | | | 4.24 | % |
| Ratios/Supplemental Data: | | | | | | | | | | | | | | | | | | | | |
Net assets, end of year (000’s omitted) | | $ | 405,199 | | | $ | 508,897 | | | $ | 554,751 | | | $ | 297,421 | | | $ | 374,516 | |
Ratio to average net assets of: | | | | | | | | | | | | | | | | | | | | |
Expenses, net of expense waivers and reimbursements | | | 0.39 | % | | | 0.39 | % | | | 0.43 | % | | | 0.54 | % | | | 0.54 | % |
Expenses, prior to expense waivers and reimbursements | | | 0.39 | % | | | 0.42 | % | | | 0.54 | % | | | 0.68 | % | | | 0.67 | % |
Net investment income, net of waivers and reimbursements | | | 1.15 | % | | | 1.01 | % | | | 0.86 | % | | | 0.68 | % | | | 0.69 | % |
Portfolio turnover rate5 | | | 39 | % | | | 38 | % | | | 46 | % | | | 44 | % | | | 21 | % |
| 1. | Based on average daily shares outstanding. |
| 2. | The mean between the last bid and ask prices. |
| 3. | Net asset value total return is calculated assuming an initial investment made at the net asset value at the beginning of the year, reinvestment of all dividends and distributions at net asset value during the period and redemption on the last day of the year at net asset value. Market value total return is calculated assuming an initial investment made at the market value at the beginning of the year, reinvestment of all dividends and distributions at market value during the year, and sale at the market value on the last day of the year. Market value is determined by trading that occurs on the NYSE Arca, and may be greater or less than net asset value, depending on the 4 p.m. mean of the bid and offer prices for a share of the Fund. Total return calculated for a period of less than one year is not annualized. The total return would have been lower if certain expenses had not been waived by the Adviser. |
| 4. | Total Return at Net Asset Value and Total Return at Market Value include payments by affiliate, without which Total Return at Net Asset Value and Total Return at Market Value would have been lower. Such payments positively impacted Total Return at Net Asset Value by 0.10% and Total Return at Market Value by 0.09%. |
| 5. | Portfolio turnover rate is not annualized and excludes the value of portfolio securities received or delivered as a result ofin-kind creations or redemptions of the Fund’s capital shares. |
Invesco S&P Financials Revenue ETF (RWW)
| | | | | | | | | | | | | | | | | | | | |
| | | Years Ended June 30, | |
| | | 2019 | | | 2018 | | | 2017 | | | 2016 | | | 2015 | |
| Per Share Operating Performance: | | | | | | | | | | | | | | | | | | | | |
Net asset value, beginning of year | | $ | 64.14 | | | $ | 61.27 | | | $ | 45.61 | | | $ | 50.02 | | | $ | 46.54 | |
Net investment income1 | | | 1.12 | | | | 0.90 | | | | 0.70 | | | | 0.66 | | | | 0.54 | |
Net realized and unrealized gain (loss) on investments | | | 3.82 | | | | 2.95 | | | | 15.65 | | | | (4.38 | ) | | | 3.44 | |
Total gain (loss) from investment operations | | | 4.94 | | | | 3.85 | | | | 16.35 | | | | (3.72 | ) | | | 3.98 | |
Less Distributions from: | | | | | | | | | | | | | | | | | | | | |
Net investment income | | | (1.18 | ) | | | (0.98 | ) | | | (0.69 | ) | | | (0.69 | ) | | | (0.50 | ) |
Net asset value, end of year | | $ | 67.90 | | | $ | 64.14 | | | $ | 61.27 | | | $ | 45.61 | | | $ | 50.02 | |
Market price, end of year | | $ | 67.83 | 2 | | | | | | | | | | | | | | | | |
| Total Return at Net Asset Value3 | | | 7.83 | % | | | 6.24 | % | | | 36.14 | % | | | (7.49 | )% | | | 8.57 | % |
| Total Return at Market Value3 | | | 7.68 | % | | | 6.27 | % | | | 36.20 | % | | | (7.58 | )% | | | 8.66 | % |
| Ratios/Supplemental Data: | | | | | | | | | | | | | | | | | | | | |
Net assets, end of year (000’s omitted) | | $ | 33,951 | | | $ | 54,521 | | | $ | 33,699 | | | $ | 20,524 | | | $ | 32,513 | |
Ratio to average net assets of: | | | | | | | | | | | | | | | | | | | | |
Expenses, net of expense waivers and reimbursements | | | 0.45 | % | | | 0.46 | % | | | 0.49 | % | | | 0.49 | % | | | 0.49 | % |
Expenses, prior to expense waivers and reimbursements | | | 0.45 | % | | | 0.49 | % | | | 0.81 | % | | | 0.91 | % | | | 0.77 | % |
Net investment income, net of waivers and reimbursements | | | 1.73 | % | | | 1.35 | % | | | 1.28 | % | | | 1.40 | % | | | 1.11 | % |
Portfolio turnover rate4 | | | 12 | % | | | 8 | % | | | 18 | % | | | 20 | % | | | 13 | % |
| 1. | Based on average daily shares outstanding. |
| 2. | The mean between the last bid and ask prices. |
| 3. | Net asset value total return is calculated assuming an initial investment made at the net asset value at the beginning of the year, reinvestment of all dividends and distributions at net asset value during the year and redemption on the last day of the year at net asset value. Market value total return is calculated assuming an initial investment made at the market value at the beginning of the year, reinvestment of all dividends and distributions at market value during the year, and sale at the market value on the last day of the year. Market value is determined by trading that occurs on the NYSE Arca, and may be greater or less than net asset value, depending on the 4 p.m. mean of the bid and offer prices for a share of the Fund. Total return calculated for a period of less than one year is not annualized. The total return would have been lower if certain expenses had not been waived by the Adviser. |
| 4. | Portfolio turnover rate is not annualized and excludes the value of portfolio securities received or delivered as a result ofin-kind creations or redemptions of the Fund’s capital shares. |
The accompanying notes are an integral part of these financial statements.
Financial Highlights(continued)
Invesco S&P Ultra Dividend Revenue ETF (RDIV)
| | | | | | | | | | | | | | | | | | | | |
| | | Years Ended June 30, | |
| | | 2019 | | | 2018 | | | 2017 | | | 2016 | | | 2015 | |
| Per Share Operating Performance: | | | | | | | | | | | | | | | | | | | | |
Net asset value, beginning of year | | $ | 38.19 | | | $ | 33.82 | | | $ | 31.52 | | | $ | 28.81 | | | $ | 28.72 | |
Net investment income1 | | | 1.46 | | | | 1.73 | | | | 1.50 | | | | 1.21 | | | | 1.20 | |
Net realized and unrealized gain (loss) on investments | | | (0.66 | ) | | | 4.56 | | | | 1.96 | | | | 2.66 | | | | 0.03 | 2 |
Total gain from investment operations | | | 0.80 | | | | 6.29 | | | | 3.46 | | | | 3.87 | | | | 1.23 | |
Less Distributions from: | | | | | | | | | | | | | | | | | | | | |
Net investment income | | | (1.34 | ) | | | (1.92 | ) | | | (1.14 | ) | | | (1.16 | ) | | | (1.11 | ) |
Realized gains | | | — | | | | — | | | | (0.02 | ) | | | — | | | | (0.03 | ) |
Total distributions | | | (1.34 | ) | | | (1.92 | ) | | | (1.16 | ) | | | (1.16 | ) | | | (1.14 | ) |
Net asset value, end of year | | $ | 37.65 | | | $ | 38.19 | | | $ | 33.82 | | | $ | 31.52 | | | $ | 28.81 | |
Market price, end of year | | $ | 37.67 | 3 | | | | | | | | | | | | | | | | |
| Total Return at Net Asset Value4 | | | 2.26 | % | | | 19.13 | % | | | 11.10 | % | | | 13.91 | % | | | 4.30 | % |
| Total Return at Market Value4 | | | 2.26 | % | | | 19.12 | % | | | 11.18 | % | | | 13.90 | % | | | 4.19 | % |
| Ratios/Supplemental Data: | | | | | | | | | | | | | | | | | | | | |
Net assets, end of year (000’s omitted) | | $ | 1,782,599 | | | $ | 610,987 | | | $ | 510,630 | | | $ | 110,330 | | | $ | 66,254 | |
Ratio to average net assets of: | | | | | | | | | | | | | | | | | | | | |
Expenses, net of expense waivers and reimbursements | | | 0.39 | % | | | 0.39 | % | | | 0.41 | % | | | 0.49 | % | | | 0.49 | % |
Expenses, prior to expense waivers and reimbursements | | | 0.39 | % | | | 0.41 | % | | | 0.52 | % | | | 0.75 | % | | | 0.72 | % |
Net investment income, net of waivers and reimbursements | | | 3.93 | % | | | 4.90 | % | | | 4.48 | % | | | 4.19 | % | | | 4.06 | % |
Portfolio turnover rate5 | | | 122 | % | | | 74 | % | | | 81 | % | | | 208 | % | | | 52 | % |
| 1. | Based on average daily shares outstanding. |
| 2. | The amount shown for a share outstanding throughout the period may not correlate with the Statements of Operations for the period due to timing of sales and repurchase of creation unit Fund shares in relation to income earned and/or fluctuating value of the investments of the Fund. |
| 3. | The mean between the last bid and ask prices. |
| 4. | Net asset value total return is calculated assuming an initial investment made at the net asset value at the beginning of the year, reinvestment of all dividends and distributions at net asset value during the year and redemption on the last day of the year at net asset value. Market value total return is calculated assuming an initial investment made at the market value at the beginning of the year, reinvestment of all dividends and distributions at market value during the year, and sale at the market value on the last day of the year. Market value is determined by trading that occurs on the NYSE Arca, and may be greater or less than net asset value, depending on the 4 p.m. mean of the bid and offer prices for a share of the Fund. Total return calculated for a period of less than one year is not annualized. The total return would have been lower if certain expenses had not been waived by the Adviser. |
| 5. | Portfolio turnover rate is not annualized and excludes the value of portfolio securities received or delivered as a result ofin-kind creations or redemptions of the Fund’s capital shares. |
Invesco Emerging Markets Ultra Dividend Revenue ETF (REDV)
| | | | |
| | | For the Period
August 07, 20181
Through
June 30, 2019 | |
| Per Share Operating Performance: | | | | |
Net asset value, beginning of period | | $ | 25.00 | |
Net investment income2 | | | 1.12 | |
Net realized and unrealized loss on investments | | | (1.14 | ) |
Total loss from investment operations | | | (0.02 | ) |
Less Distributions from: | | | | |
Net investment income | | | (0.94 | ) |
Net asset value, end of period | | $ | 24.04 | |
Market price, end of period3 | | $ | 24.16 | |
| Total Return at Net Asset Value4 | | | 0.08 | % |
| Total Return at Market Value4 | | | 0.54 | % |
| Ratios/Supplemental Data: | | | | |
Net assets, end of period (000’s omitted) | | $ | 3,606 | |
Ratio to average net assets of: | | | | |
Expenses, net of expense waivers and reimbursements | | | 0.46 | %5 |
Expenses, prior to expense waivers and reimbursements | | | 0.46 | %5 |
Net investment income, net of waivers and reimbursements | | | 5.32 | %5 |
Portfolio turnover rate6 | | | 88 | % |
| 1. | Commencement of operations. |
| 2. | Based on average daily shares outstanding. |
| 3. | The mean between the last bid and ask prices. |
| 4. | Net asset value total return is calculated assuming an initial investment made at the net asset value at the beginning of the period, reinvestment of all dividends and distributions at net asset value during the period and redemption on the last day of the period at net asset value. Market value total return is calculated assuming an initial investment made at the market value at the beginning of the period, reinvestment of all dividends, and distributions at market value during the period, and sale at the market value on the last day of the period. Market value is determined by trading that occurs on the NYSE Arca, and may be greater or less than net asset value, depending on the 4 p.m. mean of the bid and offer prices for a share of the Fund. Total return calculated for a period of less than one year is not annualized. The total return would have been lower if certain expenses had not been waived by the Adviser. |
| 5. | Annualized for periods less than one full year. |
| 6. | Portfolio turnover rate is not annualized and excludes the value of portfolio securities received or delivered as a result ofin-kind creations or redemptions of the Fund’s capital shares. |
The accompanying notes are an integral part of these financial statements.
Financial Highlights(continued)
Invesco International Ultra Dividend Revenue ETF (RIDV)
| | | | |
| | | For the Period
August 07, 20181
Through
June 30, 2019 | |
| Per Share Operating Performance: | | | | |
Net asset value, beginning of period | | $ | 25.00 | |
Net investment income2 | | | 0.93 | |
Net realized and unrealized loss on investments | | | (1.41 | ) |
Total loss from investment operations | | | (0.48 | ) |
Less Distributions from: | | | | |
Net investment income | | | (0.83 | ) |
Net asset value, end of period | | $ | 23.69 | |
Market price, end of period3 | | $ | 23.66 | |
| Total Return at Net Asset Value4 | | | (1.82 | )% |
| Total Return at Market Value4 | | | (1.96 | )% |
| Ratios/Supplemental Data: | | | | |
Net assets, end of period (000’s omitted) | | $ | 2,369 | |
Ratio to average net assets of: | | | | |
Expenses, net of expense waivers and reimbursements | | | 0.42 | %5 |
Expenses, prior to expense waivers and reimbursements | | | 0.42 | %5 |
Net investment income, net of waivers and reimbursements | | | 4.45 | %5 |
Portfolio turnover rate6 | | | 81 | % |
| 1. | Commencement of operations. |
| 2. | Based on average daily shares outstanding. |
| 3. | The mean between the last bid and ask prices. |
| 4. | Net asset value total return is calculated assuming an initial investment made at the net asset value at the beginning of the period, reinvestment of all dividends and distributions at net asset value during the period and redemption on the last day of the period at net asset value. Market value total return is calculated assuming an initial investment made at the market value at the beginning of the period, reinvestment of all dividends and distributions at market value during the period, and sale at the market value on the last day of the period. Market value is determined by trading that occurs on the NYSE Arca, and may be greater or less than net asset value, depending on the 4 p.m. mean of the bid and offer prices for a share of the Fund. Total return calculated for a period of less than one year is not annualized. The total return would have been lower if certain expenses had not been waived by the Adviser. |
| 5. | Annualized for periods less than one full year. |
| 6. | Portfolio turnover rate is not annualized and excludes the value of portfolio securities received or delivered as a result ofin-kind creations or redemptions of the Fund’s capital shares. |
Invesco Emerging Markets Revenue ETF (REEM)
| | | | | | | | |
| | | Years Ended
June 30, 2019 | | | For the Period
July 11, 20171
Through
June 30, 2018 | |
| Per Share Operating Performance: | | | | | | | | |
Net asset value, beginning of period | | $ | 25.33 | | | $ | 25.00 | |
Net investment income2 | | | 0.72 | | | | 0.62 | |
Net realized and unrealized gain (loss) on investments | | | 0.20 | | | | 0.15 | |
Total gain from investment operations | | | 0.92 | | | | 0.77 | |
Less Distributions from: | |
Net investment income | | | (0.90 | ) | | | (0.36 | ) |
Realized gains | | | (0.05 | ) | | | (0.08 | ) |
Total distributions | | | (0.95 | ) | | | (0.44 | ) |
Net asset value, end of period | | $ | 25.30 | | | $ | 25.33 | |
Market price, end of period | | $ | 25.35 | 3 | | | | |
| Total Return at Net Asset Value4 | | | 3.77 | % | | | 2.95 | % |
| Total Return at Market Value4 | | | 3.57 | % | | | 3.31 | % |
| Ratios/Supplemental Data: | | | | | | | | |
Net assets, end of period/year (000’s omitted) | | $ | 15,183 | | | $ | 12,664 | |
Ratio to average net assets of: | |
Expenses, net of expense waivers and reimbursements | | | 0.46 | % | | | 0.46 | %5 |
Expenses, prior to expense waivers and reimbursements | | | 0.46 | % | | | 0.61 | %5 |
Net investment income, net of waivers and reimbursements | | | 2.90 | % | | | 2.32 | %5 |
Portfolio turnover rate6 | | | 67 | % | | | 85 | % |
| 1. | Commencement of operations. |
| 2. | Based on average daily shares outstanding. |
| 3. | The mean between the last bid and ask prices. |
| 4. | Net asset value total return is calculated assuming an initial investment made at the net asset value at the beginning of the year, reinvestment of all dividends and distributions at net asset value during the period and redemption on the last day of the period at net asset value. Market value total return is calculated assuming an initial investment made at the market value at the beginning of the year, reinvestment of all dividends and distributions at market value during the period, and sale at the market value on the last day of the period. Market value is determined by trading that occurs on the Cboe BZX Exchange, and may be greater or less than net asset value, depending on the 4 p.m. mean of the bid and offer prices for a share of the Fund. Total return calculated for a period of less than one year is not annualized. The total return would have been lower if certain expenses had not been waived by the Adviser. |
| 5. | Annualized for periods less than one full year. |
| 6. | Portfolio turnover rate is not annualized and excludes the value of portfolio securities received or delivered as a result ofin-kind creations or redemptions of the Fund’s capital shares. |
The accompanying notes are an integral part of these financial statements.
Financial Highlights(continued)
Invesco International Revenue ETF (REFA)
| | | | | | | | |
| | | Years Ended
June 30, 2019 | | | For the Period
July 11, 20171
Through
June 30, 2018 | |
| Per Share Operating Performance: | | | | | | | | |
Net asset value, beginning of period | | $ | 26.25 | | | $ | 25.00 | |
Net investment income2 | | | 0.80 | | | | 0.78 | |
Net realized and unrealized gain (loss) on investments | | | (1.60 | ) | | | 1.19 | |
Total gain (loss) from investment operations | | | (0.80 | ) | | | 1.97 | |
Less Distributions from: | |
Net investment income | | | (0.73 | ) | | | (0.72 | ) |
Net asset value, end of period | | $ | 24.72 | | | $ | 26.25 | |
Market price, end of period | | $ | 24.77 | 3 | | | | |
| Total Return at Net Asset Value4 | | | (3.03 | )% | | | 7.83 | %5 |
| Total Return at Market Value4 | | | (2.80 | )% | | | 7.79 | %5 |
| Ratios/Supplemental Data: | | | | | | | | |
Net assets, end of period/year (000’s omitted) | | $ | 12,358 | | | $ | 13,123 | |
Ratio to average net assets of: | | | | | | | | |
Expenses, net of expense waivers and reimbursements | | | 0.42 | % | | | 0.42 | %6 |
Expenses, prior to expense waivers and reimbursements | | | 0.42 | % | | | 0.57 | %6 |
Net investment income, net of waivers and reimbursements | | | 3.21 | % | | | 2.94 | %6 |
Portfolio turnover rate7 | | | 21 | % | | | 29 | % |
| 1. | Commencement of operations. |
| 2. | Based on average daily shares outstanding. |
| 3. | The mean between the last bid and ask prices. |
| 4. | Net asset value total return is calculated assuming an initial investment made at the net asset value at the beginning of the year, reinvestment of all dividends and distributions at net asset value during the year and redemption on the last day of the year at net asset value. Market value total return is calculated assuming an initial investment made at the market value at the beginning of the year, reinvestment of all dividends and distributions at market value during the year, and sale at the market value on the last day of the year. Market value is determined by trading that occurs on the Cboe BZX Exchange, and may be greater or less than net asset value, depending on the 4 p.m. mean of the bid and offer prices for a share of the Fund. Total return calculated for a period of less than one year is not annualized.The total return would have been lower if certain expenses had not been waived by the Adviser. |
| 5. | Total Return at Net Asset Value and Total Return at Market Value include payments by affiliate, without which Total Return at Net Asset Value and Total Return at Market Value would have been lower. Such payments positively impacted Total Return at Net Asset Value by 0.20% and Total Return at Market Value by 0.18%. |
| 6. | Annualized for periods less than one full year. |
| 7. | Portfolio turnover rate is not annualized and excludes the value of portfolio securities received or delivered as a result ofin-kind creations or redemptions of the Fund’s capital shares. |
Invesco Global Revenue ETF (RGLB)
| | | | | | | | |
| | | Years Ended
June 30, 2019 | | | For the Period
July 11, 20171
Through
June 30, 2018 | |
| Per Share Operating Performance: | | | | | | | | |
Net asset value, beginning of period | | $ | 26.47 | | | $ | 25.00 | |
Net investment income2 | | | 0.70 | | | | 0.65 | |
Net realized and unrealized gain (loss) on investments | | | (0.39 | ) | | | 1.38 | |
Total gain from investment operations | | | 0.31 | | | | 2.03 | |
Less Distributions from: | |
Net investment income | | | (0.65 | ) | | | (0.56 | ) |
Net asset value, end of period | | $ | 26.13 | | | $ | 26.47 | |
Market price, end of period | | $ | 26.15 | 3 | | | | |
| Total Return at Net Asset Value4 | | | 1.26 | % | | | 8.10 | %5 |
| Total Return at Market Value4 | | | 1.45 | % | | | 7.95 | %5 |
| Ratios/Supplemental Data: | | | | | | | | |
Net assets, end of period/year (000’s omitted) | | $ | 13,064 | | | $ | 13,237 | |
Ratio to average net assets of: | | | | | | | | |
Expenses, net of expense waivers and reimbursements | | | 0.43 | % | | | 0.43 | %6 |
Expenses, prior to expense waivers and reimbursements | | | 0.43 | % | | | 0.58 | %6 |
Net investment income, net of waivers and reimbursements | | | 2.71 | % | | | 2.47 | %6 |
Portfolio turnover rate7 | | | 24 | % | | | 64 | % |
| 1. | Commencement of operations. |
| 2. | Based on average daily shares outstanding. |
| 3. | The mean between the last bid and ask prices. |
| 4. | Net asset value total return is calculated assuming an initial investment made at the net asset value at the beginning of the year, reinvestment of all dividends and distributions at net asset value during the year and redemption on the last day of the year at net asset value. Market value total return is calculated assuming an initial investment made at the market value at the beginning of the year, reinvestment of all dividends and distributions at market value during the year, and sale at the market value on the last day of the year. Market value is determined by trading that occurs on the Cboe BZX Exchange, and may be greater or less than net asset value, depending on the 4 p.m. mean of the bid and offer prices for a share of the Fund. Total return calculated for a period of less than one year is not annualized.The total return would have been lower if certain expenses had not been waived by the Adviser. |
| 5. | Total Return at Net Asset Value and Total Return at Market Value include payments by affiliate, without which Total Return at Net Asset Value and Total Return at Market Value would have been lower. Such payments positively impacted Total Return at Net Asset Value by 0.16% and Total Return at Market Value by 0.15 %. |
| 6. | Annualized for periods less than one full year. |
| 7. | Portfolio turnover rate is not annualized and excludes the value of portfolio securities received or delivered as a result ofin-kind creations or redemptions of the Fund’s capital shares. |
The accompanying notes are an integral part of these financial statements.
Financial Highlights(continued)
Invesco Global ESG Revenue ETF (ESGF)
| | | | | | | | | | | | |
| | | Years Ended June 30, | | | For the Period
October 31, 20161
Through
June 30, 2017 | |
| | 2019 | | | 2018 | |
| Per Share Operating Performance: | | | | | | | | | | | | |
Net asset value, beginning of period | | $ | 29.62 | | | $ | 28.14 | | | $ | 25.00 | |
Net investment income2 | | | 0.80 | | | | 0.71 | | | | 0.38 | |
Net realized and unrealized gain (loss) on investments | | | (0.42 | ) | | | 1.71 | | | | 2.97 | |
Total gain from investment operations | | | 0.38 | | | | 2.42 | | | | 3.35 | |
Less Distributions from: | |
Net investment income | | | (0.71 | ) | | | (0.83 | ) | | | (0.21 | ) |
Realized gains | | | — | | | | (0.11 | ) | | | — | |
Total distributions | | | (0.71 | ) | | | (0.94 | ) | | | (0.21 | ) |
Net asset value, end of period | | $ | 29.29 | | | $ | 29.62 | | | $ | 28.14 | |
Market price, end of period | | $ | 29.43 | 3 | | | | | | | | |
| Total Return at Net Asset Value4 | | | 1.37 | % | | | 8.62 | % | | | 13.49 | % |
| Total Return at Market Value4 | | | 1.47 | % | | | 7.58 | % | | | 14.97 | % |
| Ratios/Supplemental Data: | | | | | | | | | | | | |
Net assets, end of period/year (000’s omitted) | | $ | 23,431 | | | $ | 22,214 | | | $ | 19,697 | |
Ratio to average net assets of: | | | | | | | | | | | | |
Expenses, net of expense waivers and reimbursements | | | 0.45 | % | | | 0.45 | % | | | 0.45 | %5 |
Expenses, prior to expense waivers and reimbursements | | | 0.45 | % | | | 0.58 | % | | | 1.18 | %5 |
Net investment income, net of waivers and reimbursements | | | 2.75 | % | | | 2.32 | % | | | 2.15 | %5 |
Portfolio turnover rate6 | | | 28 | % | | | 73 | % | | | 78 | % |
| 1. | Commencement of operations. |
| 2. | Based on average daily shares outstanding. |
| 3. | The mean between the last bid and ask prices. |
| 4. | Net asset value total return is calculated assuming an initial investment made at the net asset value at the beginning of the year, reinvestment of all dividends and distributions at net asset value during the year and redemption on the last day of the year at net asset value. Market value total return is calculated assuming an initial investment made at the market value at the beginning of the year, reinvestment of all dividends and distributions at market value during the year, and sale at the market value on the last day of the year. Market value is determined by trading that occurs on the NYSE Arca, and may be greater or less than net asset value, depending on the 4 p.m. mean of the bid and offer prices for a share of the Fund. Total return calculated for a period of less than one year is not annualized. The total return would have been lower if certain expenses had not been waived by the Adviser. |
| 5. | Annualized for periods less than one full year. |
| 6. | Portfolio turnover rate is not annualized and excludes the value of portfolio securities received or delivered as a result ofin-kind creations or redemptions of the Fund’s capital shares. |
The accompanying notes are an integral part of these financial statements.
Notes to Financial Statements
Invesco Exchange-Traded Fund Trust II
June 30, 2019
Note 1—Organization
Invesco Exchange-Traded Fund Trust II Trust (the “Trust”) was organized as a Massachusetts business trust on October 10, 2006 and is authorized to have multiple series of portfolios. The Trust is anopen-end management investment company, registered under the Investment Company Act of 1940, as amended (the “1940 Act”). This report includes the following portfolios:
| | | | |
Full Name | | Predecessor Fund (as defined below) | | Short Name |
| Invesco S&P 500 Revenue ETF | | Oppenheimer S&P 500 Revenue ETF | | S&P 500 Revenue ETF |
| Invesco S&P MidCap 400 Revenue ETF | | Oppenheimer S&P MidCap 400 Revenue ETF | | S&P MidCap 400 Revenue ETF |
| Invesco S&P SmallCap 600 Revenue ETF | | Oppenheimer S&P SmallCap 600 Revenue ETF | | S&P SmallCap 600 Revenue ETF |
| Invesco S&P Financials Revenue ETF | | Oppenheimer S&P Financials Revenue ETF | | S&P Financials Revenue ETF |
| Invesco S&P Ultra Dividend Revenue ETF | | Oppenheimer S&P Ultra Dividend Revenue ETF | | S&P Ultra Dividend Revenue ETF |
| Invesco Emerging Markets Ultra Dividend Revenue ETF | | Oppenheimer Emerging Markets Ultra Dividend Revenue ETF | | Emerging Markets Ultra Dividend Revenue ETF |
| Invesco International Ultra Dividend Revenue ETF | | Oppenheimer International Ultra Dividend Revenue ETF | | International Ultra Dividend Revenue ETF |
| Invesco Emerging Markets Revenue ETF | | Oppenheimer Emerging Markets Revenue ETF | | Emerging Markets Revenue ETF |
| Invesco International Revenue ETF | | Oppenheimer International Revenue ETF | | International Revenue ETF |
| Invesco Global Revenue ETF | | Oppenheimer Global Revenue ETF | | Global Revenue ETF |
| Invesco Global ESG Revenue ETF | | Oppenheimer Global ESG Revenue ETF | | Global ESG Revenue ETF |
Each portfolio (each, a ”Fund”, and collectively, the “Funds”) represents a separate series of the Trust. The shares of the Funds are referred to herein as “Shares” or “Fund Shares.” Each Fund’s shares are listed and traded on NYSE Arca, Inc., except for Emerging Markets Revenue ETF, Global Revenue ETF and International Revenue ETF, which are listed and traded on Cboe BZX Exchange, Inc.
Each Fund acquired all or substantially all of the assets and all of the stated liabilities included in the financial statements of a corresponding fund of the Oppenheimer ETF Trust (a “Predecessor Fund”) after the close of business on May 24, 2019 (each, a “Reorganization”). Each Fund adopted the performance and financial information of its corresponding Predecessor Fund. Information presented prior to the close of business on May 24, 2019 is that of the Predecessor Fund.
The market price of each Share may differ to some degree from a Fund’s net asset value (“NAV”). Unlike conventional mutual funds, each Fund issues and redeems shares on a continuous basis, at NAV, only in a large specified number of Shares, each called a “Creation Unit.” Creation Units are issued and redeemed principally in exchange for the deposit or delivery of a basket of securities (“Deposit Securities”). Except when aggregated in Creation Units by Authorized Participants, the Shares are not individually redeemable securities of the Funds.
The investment objective for each Fund is to track the investment results (before fees and expenses) of its respective index listed below (each, an “Underlying Index”):
| | |
Fund | | Underlying Index |
| S&P 500 Revenue ETF | | S&P 500 Revenue-Weighted Index |
| S&P MidCap 400 Revenue ETF | | S&P MidCap 400 Revenue-Weighted Index |
| S&P SmallCap 600 Revenue ETF | | S&P SmallCap 600 Revenue-Weighted Index |
| S&P Financials Revenue ETF | | S&P 500 Financials Sector Revenue-Weighted Index |
| S&P Ultra Dividend Revenue ETF | | S&P 900 Dividend Revenue-Weighted Index |
| Emerging Markets Ultra Dividend Revenue ETF | | FTSE Custom Emerging Ultra Dividend Revenue Index |
| International Ultra Dividend Revenue ETF | | FTSE Custom Developed ex US Ultra Dividend Revenue Index |
| Emerging Markets Revenue ETF | | Invesco Revenue Weighted Emerging Markets Index |
| International Revenue ETF | | Invesco Revenue Weighted International Index |
| Global Revenue ETF | | Invesco Revenue Weighted Global Index |
| Global ESG Revenue ETF | | Invesco Revenue Weighted Global ESG Index |
Note 2—Significant Accounting Policies
The following is a summary of the significant accounting policies followed by the Funds in preparation of their financial statements.
Each Fund is an investment company and accordingly follows the investment company accounting and reporting guidance in accordance with Financial Accounting Standards Board Accounting Standards Codification Topic 946,Financial Services—Investment Companies.
| A. | Security Valuation — Securities, including restricted securities, are valued according to the following policies: |
A security listed or traded on an exchange (except convertible securities) is generally valued at its last sales price or official closing price as of the close of the customary trading session on the exchange where the security is principally traded or, lacking any sales or official closing price on a particular day, the security may be valued at the closing bid price on that day. Securities traded in theover-the-counter (“OTC”) market are valued based on prices furnished by independent pricing services or market makers. When such securities are valued by an independent pricing service they may be considered fair valued. Futures contracts are valued at the final settlement price set by an exchange on which they are principally traded. Listed options are valued at the mean between the last bid and asked prices from the exchange on which they are principally traded, or at the final settlement price set by such exchange. Swaps and options not listed on an exchange are valued by an independent source. For purposes of determining NAV per Share, futures and option contracts generally are valued 15 minutes after the close of the customary trading session of the New York Stock Exchange (“NYSE”).
Investment companies are valued using such company’s NAV per share, unless the shares are exchange-traded, in which case they are valued at the last sales price or official closing price as of the close of the customary trading session on the exchange where the security is principally traded.
Debt obligations (including convertible securities) and unlisted equities are fair valued using an evaluated quote provided by an independent pricing service. Evaluated quotes provided by the pricing service may be determined without exclusive reliance on quoted prices, and may reflect appropriate factors such asinstitution-size trading in similar groups of securities, developments related to specific securities, dividend rate (for unlisted equities), yield (for debt obligations), quality, type of issue, coupon rate (for debt obligations), maturity (for debt obligations), individual trading characteristics and other market data. Securities with a demand feature exercisable within one to seven days are valued at par. Pricing services generally value debt obligations assuming orderly transactions of institutional round lot size, but a Fund may hold or transact in the same securities in smaller, odd lot sizes. Odd lots often trade at lower prices than institutional round lots. Debt obligations are subject to interest rate and credit risks. In addition, all debt obligations involve some risk of default with respect to interest and/or principal payments.
Foreign securities’ (including foreign exchange contracts’) prices are converted into U.S. dollar amounts using the applicable exchange rates as of the close of the London world markets. If market quotations are available and reliable for foreign exchange-traded equity securities, the securities will be valued at the market quotations. Because trading hours for certain foreign securities end before the close of the NYSE, closing market quotations may become unreliable. If between the time trading ends on a particular security and the close of the customary trading session on the NYSE, events occur that Invesco Capital Management LLC (the “Adviser”), determines are significant and make the closing price unreliable, the Fund may fair value the security. If the event is likely to have affected the closing price of the security, the security will be valued at fair value in good faith using procedures approved by the Board of Trustees. Adjustments to closing prices to reflect fair value may also be based on a screening process of an independent pricing service to indicate the degree of certainty, based on historical data, that the closing price in the principal market where a foreign security trades is not the current value as of the close of the NYSE. Foreign securities’ prices meeting the approved degree of certainty that the price is not reflective of current value will be priced at the indication of fair value from the independent pricing service. Multiple factors may be considered by the independent pricing service in determining adjustments to reflect fair value and may include information relating to sector indices, American Depositary Receipts (“ADRs”) and domestic and foreign index futures. Foreign securities may have additional risks including exchange rate changes, potential for sharply devalued currencies and high inflation, political and economic upheaval, the relative lack of issuer information, relatively low market liquidity and the potential lack of strict financial and accounting controls and standards.
Securities for which market prices are not provided by any of the above methods may be valued based upon quotes furnished by independent sources. The last bid price may be used to value exchange-traded equity securities. The mean between the last bid and asked prices may be used to value debt obligations, including corporate loans, and unlisted equity securities.
Securities for which market quotations are not readily available or became unreliable are valued at fair value as determined in good faith following procedures approved by the Board of Trustees. Issuer-specific events, market trends, bid/asked quotes of brokers and information providers and other market data may be reviewed in the course of making a good faith determination of a security’s fair value.
Each Fund may invest in securities that are subject to interest rate risk, meaning the risk that the prices will generally fall as interest rates rise and, conversely, the prices will generally rise as interest rates fall. Specific securities differ in their sensitivity to changes in interest rates depending on their individual characteristics. Changes in interest rates may result in increased market volatility, which may affect the value and/or liquidity of certain Fund investments.
Valuations change in response to many factors, including the historical and prospective earnings of the issuer, the value of the issuer’s assets, general economic conditions, interest rates, investor perceptions and market liquidity. Because of the inherent uncertainties of valuation, the values reflected in the financial statements may materially differ from the value received upon actual sale of those investments.
Authorized Participant Concentration Risk.Only authorized participants (“APs”) may engage in creation or redemption transactions directly with each Fund. Each Fund has a limited number of institutions that may act as APs, and such APs have no obligation to submit creation or redemption orders. Consequently, there is no assurance that those APs will establish or maintain an active trading market for the Shares. This risk may be heightened to the extent that securities held by each Fund are traded outside a collateralized settlement system. In that case, APs may be required to post collateral on certain trades on an agency basis (i.e., on behalf of other market participants), which only a limited number of APs may be able to do. In addition, to the extent that APs exit the business or are unable to proceed with processing creation and/or redemption orders with respect to each Fund and no other AP is able to step forward to create or redeem Creation Units (as defined below), this may result in a significantly diminished trading market for Shares, which may be more likely to trade at a premium or discount to each Fund’s NAV and to face trading halts and/or delisting. This risk may be heightened for each Fund because it invests innon-U.S. securities, which may have lower trading volumes.
Equity Risk.Equity risk is the risk that the value of equity securities, including common stocks, may fall due to both changes in general economic conditions that impact the market as a whole, as well as factors that directly relate to a specific company or its industry. Such general economic conditions include changes in interest rates, periods of market turbulence or instability, or general and prolonged periods of economic decline and cyclical change. It is possible that a drop in the stock market may depress the price of most or all of the common stocks that each Fund holds. In addition, equity risk includes the risk that investor sentiment toward particular industries will become negative. The value of a company’s common stock may fall solely because of factors, such as an increase in production costs, that negatively impact other companies in the same region, industry or sector of the market. A company’s common stock also may decline significantly in price over a short period of time due to factors specific to that company, including decisions made by its management or lower demand for the company’s products or services. For example, an adverse event, such as an unfavorable earnings report or the failure to make anticipated dividend payments, may depress the value of common stock
Foreign Investment Risk. Investments in the securities ofnon-U.S. issuers involve risks beyond those associated with investments in U.S. securities. Foreign securities may have relatively low market liquidity, greater market volatility, decreased publicly available information, and less reliable financial information about issuers, and inconsistent and potentially less stringent accounting, auditing and financial reporting requirements and standards of practice comparable to those applicable to domestic issuers. Foreign securities also are subject to the risks of expropriation, nationalization, political instability or other adverse political or economic developments and the difficulty of enforcing obligations in other countries. Investments in foreign securities also may be subject to dividend withholding or confiscatory taxes, currency blockage and/or transfer restrictions and higher transactional costs. As each Fund will invest in securities denominated in foreign currencies, fluctuations in the value of the U.S. dollar relative to the values of other currencies may adversely affect investments in foreign securities and may negatively impact each Fund’s returns.
Index Risk.Unlike many investment companies, each Fund does not utilize an investing strategy that seeks returns in excess of its Underlying Index. Therefore, it would not necessarily buy or sell a security unless that security is added or removed, respectively, from the Underlying Index, even if that security generally is underperforming.
Industry Concentration Risk.In following its methodology, each Underlying Index from time to time may be concentrated to a significant degree in securities of issuers operating in a single industry or industry group. To the extent that each Underlying Index concentrates in the securities of issuers in a particular industry or industry group, each Fund will also concentrate its investments to approximately the same extent. By concentrating its investments in an industry or industry group, each Fund may face more risks than if it were diversified broadly over numerous industries or industry groups. Such industry-based risks, any of which may adversely affect the companies in which each Fund invests, may include, but are not limited to, legislative or regulatory changes, adverse market conditions and/or increased competition within the industry or industry group. In addition, at times, such industry or industry group may be out of favor and underperform other industries, industry groups or the market as a whole.
Non-Diversified Fund Risk.Because each Fund isnon-diversified and can invest a greater portion of its assets in securities of individual issuers than a diversified fund, changes in the market value of a single investment could cause greater fluctuations in Share price than would occur in a diversified fund. This may increase the Fund’s volatility and cause the performance of a relatively small number of issuers to have a greater impact on the Fund’s performance.
Non-Correlation Risk.Each Fund’s return may not match the return of the Underlying Index for a number of reasons. For example, the Fund incurs operating expenses not applicable to the Underlying Index, and incurs costs in buying and selling securities, especially when rebalancing the Fund’s securities holdings to reflect changes in the composition of its Underlying Index. The Fund’s use of a representative sampling approach may cause the Fund not to be as well-correlated with the return of the Underlying Index as would be the case if the Fund purchased all of the securities in the Underlying Index in the proportions represented in the Underlying Index. In addition, the performance of the Fund and the Underlying Index may vary due to asset valuation differences and differences between the Fund’s portfolio and its Underlying Index resulting from legal restrictions, costs or liquidity constraints.
Sampling Risk.Certain Fund’s use of a representative sampling approach may result in it holding a smaller number of securities than are in the Underlying Index. As a result, an adverse development to an issuer of securities that the Fund holds could result in a greater decline in NAV than would be the case if the Fund held all of the securities in the Underlying Index. To the extent the assets in the Fund are smaller, these risks will be greater.
Portfolio Turnover Risk.Each Fund may engage in frequent trading of its portfolio securities in connection with the rebalancing or adjustment of the Underlying Index. A portfolio turnover rate of 200%, for example, is equivalent to the Fund buying and selling all of its securities two times during the course of a year. A high portfolio turnover rate (such as 100% or more) could result in high brokerage costs for the Fund. While a high portfolio turnover rate can result in an increase in taxable capital gains distributions to the Fund’s shareholders, the Fund will seek to utilize thein-kind creation and redemption mechanism (described below) to minimize realization of capital gains to the extent possible.
Small-and-Mid-Capitalization Company Risk.Investing in securities of small- andmid-capitalization companies involves greater risk than customarily is associated with investing in larger, more established companies. These companies’ securities may be more volatile and less liquid than those of more established companies. These securities may have returns that vary, sometimes significantly, from the overall securities market. Often small- andmid-capitalization companies and the industries in which they focus are still evolving and, as a result, they may be more sensitive to changing market conditions.
ADR and GDR Risk. ADRs are certificates that evidence ownership of shares of a foreign issuer and are alternatives to purchasing directly underlying foreign securities in their national markets and currencies. GDRs are certificates issued by an international bank that generally are traded and denominated in the currencies of countries other than the home country of the issuer of the underlying shares. ADRs and GDRs may be subject to certain of the risks associated with direct investments in the securities of foreign companies, such as currency, political, economic and market risks, because their values depend on the performance of thenon-dollar denominated underlying foreign securities. Moreover, ADRs and GDRs may not track the price of the underlying foreign securities on which they are based, and their value may change materially at times when U.S. markets are not open for trading.
Currency Risk.Because each Fund’s NAV is determined in U.S. dollars, the Fund’s NAV could decline if the currency of anon-U.S. market in which the Fund invests depreciates against the U.S. dollar. Generally, an increase in the value of the U.S. dollar against a foreign currency will reduce the value of a security denominated in that foreign currency, thereby decreasing the Fund’s overall NAV. Exchange rates may be volatile and may change quickly and unpredictably in response to both global economic developments and economic conditions, causing an adverse impact on the Fund. As a result, investors have the potential for losses regardless of the length of time they intend to hold Shares.
| C. | Country Determination— For the purposes of presentation in the Schedules of Investments, the Adviser may determine the country in which an issuer is located and/or credit risk exposure based on various factors. These factors include whether the Fund’s Underlying Index has made a country determination and may include the laws of the country under which the issuer is organized, where the issuer maintains a principal office, the country in which the issuer derives 50% or more of its total revenues and the country that has the primary market for the issuer’s securities, as well as other criteria. Among the other criteria that may be evaluated for making this determination are the country in which the issuer maintains 50% or more of its assets, the type of security, financial guarantees and enhancements, the nature of the collateral and the sponsor organization. Country of issuer and/or credit risk exposure has been determined to be the United States of America, unless otherwise noted. |
| D. | Foreign Currency Translations— The accounting records of the Funds are maintained in U.S. dollars. All assets and liabilities initially expressed in foreign currencies are converted into U.S. dollars at prevailing exchange rates. Purchases and sales of investment securities, dividend and interest income, and certain expenses are translated at the rates of exchange prevailing on the respective dates of such transactions. Changes in the relationship of these foreign currencies to the U.S. dollar can significantly affect the value of the investments and earnings of the Funds. Foreign investments may also subject the Funds to foreign government exchange restrictions, expropriation, taxation, or other political, social or economic developments, all of which could affect the market and/or credit risk of the investments. |
The Funds do not isolate that portion of the results of operations resulting from changes in the foreign exchange rates on investments from the fluctuations arising from changes in the market prices of securities held. Such fluctuations are included with the net realized and unrealized gain or loss on investments.
Reported net realized foreign exchange gains and losses arise from sales of foreign currencies and currency gains or losses realized between the trade and settlement dates on investment transactions. Net unrealized exchange gains and losses arise from changes in the fair values of assets and liabilities other than investments in securities at the fiscal period end, resulting from changes in exchange rates.
| E. | Investment Transactions and Investment Income— Investment transactions are accounted for on a trade date basis. Realized gains and losses from the sale or disposition of securities are computed on the specific identified cost basis. Interest income is recorded on the accrual basis from settlement date.Pay-in-kind interest income andnon-cash dividend income received in the form of securitiesin-lieu of cash are recorded at the fair value of the securities received. Dividend income (net of withholding tax, if any) is recorded on theex-dividend date. Dividend income from REITs is recorded based on the income included in the distributions received from the REIT investments using published REIT classifications, including some management estimates when actual amounts are not available. Distributions received in excess of this estimated amount are recorded as a reduction of the cost of investments or reclassified to capital gains. The actual amounts of income, return of capital, and capital gains are only determined by each REIT after its fiscalyear-end, and may differ from the estimated amounts. Realized gains, dividends and interest received by a Fund may give rise to withholding and other taxes imposed by foreign countries. Tax conventions between certain countries and the United States may reduce or eliminate such taxes. |
The Funds may periodically participate in litigation related to each Fund’s investments. As such, the Funds may receive proceeds from litigation settlements. Any proceeds received are included in the Statements of Operations as realized gain (loss) for investments no longer held and as unrealized gain (loss) for investments still held.
Brokerage commissions and mark ups are considered transaction costs and are recorded as an increase to the cost basis of securities purchased and/or a reduction of proceeds on a sale of securities. Such transaction costs are included in the determination of net realized and unrealized gain (loss) from investment securities reported in the Statements of Operations and the Statements of Changes in Net Assets and the net realized and unrealized gains (losses) on securities per share in the Financial Highlights. Transaction costs are included in the calculation of each Fund’s NAV and, accordingly, they reduce each Fund’s total returns. These transaction costs are not considered operating expenses and are not reflected in net investment income reported in the Statements of Operations and the Statements of Changes in Net Assets, or the net investment income per share and the ratios of expenses and net investment income reported in the Financial Highlights, nor are they limited by any expense limitation arrangements between each Fund and the Adviser.
| F. | Accounting Estimates— The preparation of the financial statements in accordance with GAAP requires management to make estimates and assumptions that affect the reported amounts and disclosures in the financial statements, including estimates and assumptions related to taxation. Actual results could differ from these estimates. In addition, the Funds monitor for material events or transactions that may occur or become known after the period-end date and before the date the financial statements are released to print. |
| G. | Dividends and Distributions to Shareholders — Each Fund declares and pays dividends from net investment income, if any, to its shareholders quarterly and records such dividends onex-dividend date. Generally, each Fund distributes net realized taxable capital gains, if any, annually in cash and records them onex-dividend date. Such distributions on a tax basis are determined in conformity with federal income tax regulations, which may differ from GAAP. Distributions in excess of tax basis earnings and profits, if any, are reported in such Fund’s financial statements as a tax return of capital at fiscalyear-end. |
| H. | Expenses — Expenses of the Trust which are directly identifiable to a specific Fund are applied to that Fund. Expenses which are not readily identifiable to a specific Fund are allocated in such a manner as deemed equitable, taking into consideration the nature and type of expense and the relative net assets of each Fund. |
Each Fund has agreed to pay an annual unitary management fee to the Adviser. Out of the unitary management fee, the Adviser has agreed to pay for substantially all expenses of the Funds, including the cost of transfer agency, custody, fund administration, legal, audit and other services, except for advisory fees, distribution fees, if any, brokerage expenses, taxes, interest, acquired fund fees and expenses, if any, litigation expenses and other extraordinary expenses.
| I. | Federal Taxes — The Funds intend to comply with provisions of the Internal Revenue Code applicable to regulated investment companies and to distribute substantially all of their investment company taxable income, including any net realized gain on investments not offset by capital loss carryforwards, if any, to shareholders. Therefore, no federal income or excise tax provision is required. The Funds file income tax returns in U.S. federal and applicable state jurisdictions. The statute of limitations on the Funds’ tax return filings generally remains open for the three preceding fiscal reporting period ends. The Funds have analyzed their tax positions for the fiscal year ended June 30, 2019, including open tax years, and do not believe there are any uncertain tax positions requiring recognition in the Funds’ financial statements. |
The tax components of capital shown in the following table represent distribution requirements the Funds must satisfy under the income tax regulations, losses the Funds may be able to offset against income and gains realized in future years and unrealized appreciation or depreciation of securities and other investments for federal income tax purposes.
| | | | | | | | | | | | | | | | | | | | |
Fund | | Undistributed
Net Investment
Income | | | Undistributed
Long-Term Gain | | | Capital Loss
Carryforwards | | | Post-October
Capital Losses | | | Net Unrealized Appreciation
(Depreciation) Based on Cost of
Securities and Other Investments for
Federal Income Tax Purposes | |
| S&P 500 Revenue ETF | | $ | 946,872 | | | $ | — | | | $ | (22,415,389 | ) | | $ | — | | | $ | 82,736,359 | |
| S&P MidCap 400 Revenue ETF | | | 325,713 | | | | — | | | | (24,037,658 | ) | | | — | | | | 22,451,636 | |
| S&P SmallCap 600 Revenue ETF | | | 476,527 | | | | — | | | | (42,828,303 | ) | | | — | | | | (54,433,635 | ) |
| S&P Financials Revenue ETF | | | 32,148 | | | | — | | | | (548,331 | ) | | | — | | | | 130,698 | |
| S&P Ultra Dividend Revenue ETF | | | 3,269,073 | | | | — | | | | (135,058,682 | ) | | | — | | | | 7,183,471 | |
| Emerging Markets Ultra Dividend Revenue ETF | | | 16,154 | | | | — | | | | (86,133 | ) | | | — | | | | (38,760 | ) |
| International Ultra Dividend Revenue ETF | | | 10,552 | | | | — | | | | (90,440 | ) | | | — | | | | (67,410 | ) |
| Emerging Markets Revenue ETF | | | 32,817 | | | | — | | | | (449,975 | ) | | | — | | | | (171,283 | ) |
| International Revenue ETF | | | 73,605 | | | | — | | | | (566,883 | ) | | | — | | | | (342,764 | ) |
| Global Revenue ETF | | | 48,805 | | | | — | | | | (466,223 | ) | | | — | | | | 109,662 | |
| Global ESG Revenue ETF | | | 98,525 | | | | — | | | | (665,243 | ) | | | — | | | | 104,295 | |
At June 30, 2019, the Funds have capital loss carryforwards available to offset future realized capital gains, if any, and thereby reduce future taxable gain distributions. Details of the capital loss carryforwards are included in the table below. Capital loss carryovers with no expiration, if any, must be utilized prior to those with expiration dates.
| | | | | | | | | | | | |
Fund | | Short Term
Post-Effective
No Expiration | | | Long Term
Post-Effective
No Expiration | | | Total | |
| S&P 500 Revenue ETF | | $ | 4,598,516 | | | $ | 17,816,873 | | | $ | 22,415,389 | |
| S&P MidCap 400 Revenue ETF | | | 13,340,457 | | | | 10,697,201 | | | | 24,037,658 | |
| S&P SmallCap 600 Revenue ETF | | | 11,666,748 | | | | 31,161,555 | | | | 42,828,303 | |
| S&P Financials Revenue ETF | | | 239,619 | | | | 308,712 | | | | 548,331 | |
| S&P Ultra Dividend Revenue ETF | | | 106,612,470 | | | | 28,446,212 | | | | 135,058,682 | |
| Emerging Markets Ultra Dividend Revenue ETF | | | 86,133 | | | | — | | | | 86,133 | |
| International Ultra Dividend Revenue ETF | | | 90,440 | | | | — | | | | 90,440 | |
| Emerging Markets Revenue ETF | | | 167,682 | | | | 282,293 | | | | 449,975 | |
| International Revenue ETF | | | 134,186 | | | | 432,697 | | | | 566,883 | |
| Global Revenue ETF | | | 141,612 | | | | 324,611 | | | | 466,223 | |
| Global ESG Revenue ETF | | | 191,525 | | | | 473,718 | | | | 665,243 | |
Net investment income (loss) and net realized gain (loss) may differ for financial statement and tax purposes. The character of dividends and distributions made during the fiscal year from net investment income or net realized gains are determined in accordance with federal income tax requirements, which may differ from the character of net investment income or net realized gains presented in these financial statements in accordance with U.S. GAAP. Also, due to timing of dividend and distributions, the fiscal year in which amounts are distributed may differ from the fiscal year in which the income or net realized gain was recorded by the Funds.
Accordingly, the following amounts have been reclassified for the reporting periods. Net assets of each Fund were unaffected by the reclassifications.
| | | | | | | | | | | | |
Fund | | Increase (Decrease) to
Accumulated Net
Investment Income | | | Increase (Decrease) to
Accumulated Undistributed
Net Realized
Gain/Loss on Investments | | | Increase (Decrease)
toPaid-in-Capital | |
| S&P 500 Revenue ETF | | $ | (4,136 | ) | | $ | (73,607,494 | ) | | $ | 73,611,630 | |
| S&P MidCap 400 Revenue ETF | | | — | | | | (32,067,550 | ) | | | 32,067,550 | |
| S&P SmallCap 600 Revenue ETF | | | (475 | ) | | | (51,148,423 | ) | | | 51,148,898 | |
| S&P Financials Revenue ETF | | | — | | | | (6,792,656 | ) | | | 6,792,656 | |
| S&P Ultra Dividend Revenue ETF | | | — | | | | (102,973,350 | ) | | | 102,973,350 | |
| Emerging Markets Ultra Dividend Revenue ETF | | | 3,182 | | | | (3,182 | ) | | | — | |
| International Ultra Dividend Revenue ETF | | | (252 | ) | | | 252 | | | | — | |
| Emerging Markets Revenue ETF | | | (9,729 | ) | | | (144,837 | ) | | | 154,566 | |
| International Revenue ETF | | | (1,809 | ) | | | (301,825 | ) | | | 303,634 | |
| Global Revenue ETF | | | (4,822 | ) | | | (406,613 | ) | | | 411,435 | |
| Global ESG Revenue ETF | | | (5,742 | ) | | | (395,920 | ) | | | 401,662 | |
The tax character of distributions paid during the reporting periods:
| | | | | | | | | | | | | | | | | | | | | | | | |
| | | Year Ended June 30, 2019 | | | Year Ended June 30, 2018 | |
Fund | | Distributions Paid
from Ordinary
Income | | | Distributions
Paid from
Long-Term
Capital Gains | | | Total | | | Distributions Paid
from Ordinary
Income | | | Distributions
Paid from
Long-Term
Capital Gains | | | Total | |
| S&P 500 Revenue ETF | | $ | 19,138,436 | | | $ | — | | | $ | 19,138,436 | | | $ | 17,723,983 | | | $ | — | | | $ | 17,723,983 | |
| S&P MidCap 400 Revenue ETF | | | 3,846,048 | | | | — | | | | 3,846,048 | | | | 3,676,937 | | | | — | | | | 3,676,937 | |
| S&P SmallCap 600 Revenue ETF | | | 5,443,557 | | | | — | | | | 5,443,557 | | | | 5,715,052 | | | | — | | | | 5,715,052 | |
| S&P Financials Revenue ETF | | | 788,763 | | | | — | | | | 788,763 | | | | 685,442 | | | | — | | | | 685,442 | |
| S&P Ultra Dividend Revenue ETF | | | 48,980,283 | | | | — | | | | 48,980,283 | | | | 29,379,796 | | | | — | | | | 29,379,796 | |
| Emerging Markets Ultra Dividend Revenue ETF | | | 116,266 | | | | — | | | | 116,266 | | | | NA | | | | NA | | | | NA | |
| International Ultra Dividend Revenue ETF | | | 82,962 | | | | — | | | | 82,962 | | | | NA | | | | NA | | | | NA | |
| Emerging Markets Revenue ETF | | | 495,307 | | | | — | | | | 495,307 | | | | 218,650 | | | | — | | | | 218,650 | |
| International Revenue ETF | | | 362,641 | | | | — | | | | 362,641 | | | | 358,426 | | | | — | | | | 358,426 | |
| Global Revenue ETF | | | 326,861 | | | | — | | | | 326,861 | | | | 278,541 | | | | — | | | | 278,541 | |
| Global ESG Revenue ETF | | | 570,657 | | | | — | | | | 570,657 | | | | 702,508 | | | | — | | | | 702,508 | |
At June 30, 2019, the aggregate cost of securities and other investments and the composition of unrealized appreciation and depreciation of securities and other investments for federal income tax purposes are noted in the following table. The primary difference between book and tax appreciation or depreciation of securities and other investments, if applicable, is attributable to the tax deferral of losses on wash sales.
| | | | | | | | | | | | | | | | |
Fund | | Federal Tax
Cost of
Securities | | | Gross
Unrealized
Appreciation | | | Gross
Unrealized
(Depreciation) | | | Net Unrealized
Appreciation
(Depreciation) | |
| S&P 500 Revenue ETF | | $ | 877,085,884 | | | $ | 134,156,234 | | | $ | (51,419,875 | ) | | $ | 82,736,359 | |
| S&P MidCap 400 Revenue ETF | | | 348,360,392 | | | | 47,351,136 | | | | (24,899,500 | ) | | | 22,451,636 | |
| S&P SmallCap 600 Revenue ETF | | | 487,070,042 | | | | 46,563,136 | | | | (100,996,771 | ) | | | (54,433,635 | ) |
| S&P Financials Revenue ETF | | | 33,931,622 | | | | 1,905,803 | | | | (1,775,105 | ) | | | 130,698 | |
| S&P Ultra Dividend Revenue ETF | | | 1,791,653,460 | | | | 77,189,205 | | | | (70,005,734 | ) | | | 7,183,471 | |
| Emerging Markets Ultra Dividend Revenue ETF | | | 3,627,380 | | | | 136,381 | | | | (175,115 | ) | | | (38,734 | ) |
| International Ultra Dividend Revenue ETF | | | 2,449,799 | | | | 81,489 | | | | (148,803 | ) | | | (67,314 | ) |
| Emerging Markets Revenue ETF | | | 15,392,556 | | | | 1,165,351 | | | | (1,335,741 | ) | | | (170,390 | ) |
| International Revenue ETF | | | 13,018,838 | | | | 788,907 | | | | (1,131,601 | ) | | | (342,694 | ) |
| Global Revenue ETF | | | 13,118,226 | | | | 1,163,171 | | | | (1,052,140 | ) | | | 111,031 | |
| Global ESG Revenue ETF | | | 23,804,645 | | | | 2,103,976 | | | | (1,999,535 | ) | | | 104,441 | |
| J. | Distributions from Distributable Earnings — In accordance with the Securities and Exchange Commission’s issuance of Disclosure Update and Simplification, the Funds have presented the total, rather than the components of distributions to shareholders, except for tax return of capital distributions, if any, in the Statements of Changes in Net Assets. |
For the year ended June 30, 2018, distributions from distributable earnings for each Fund (except Emerging Markets Revenue ETF and Global ESG Revenue ETF) consisted of distributions from net investment income. For the year ended June 30, 2018, distributions from distributable earnings for Emerging Markets Revenue ETF consisted of distributions from net investment income of $179,845 and distributions from net realized gains of $38,805. For the year ended June 30, 2018, distributions from distributable earning for Global Revenue ESG consisted of distributions from net investment income of $617,833 and distributions from net realized gains of $84,675.
Note 3—Investment Advisory Agreement and Other Agreements
The Trust has entered into an Investment Advisory Agreement with the Adviser on behalf of each Fund, pursuant to which the Adviser has overall responsibility for the selection and ongoing monitoring of each Fund’s investments, managing each Fund’s business affairs and providing certain clerical, bookkeeping and other administrative services. Pursuant to the Investment Advisory Agreement, each
Fund accrues daily and pays monthly to the Adviser an annual unitary management fee equal to a percentage of its average daily net assets as follows:
| | | | |
| | | Unitary Management Fees
(as a % of Average daily
Net Assets | |
| S&P 500 Revenue ETF | | | 0.39 | % |
| S&P MidCap 400 Revenue ETF | | | 0.39 | % |
| S&P SmallCap 600 Revenue ETF | | | 0.39 | % |
| S&P Financials Revenue ETF | | | 0.45 | % |
| S&P Ultra Dividend Revenue ETF | | | 0.39 | % |
| Emerging Markets Ultra Dividend Revenue ETF | | | 0.46 | % |
| International Ultra Dividend Revenue ETF | | | 0.42 | % |
| Emerging Markets Revenue ETF | | | 0.46 | % |
| International Revenue ETF | | | 0.42 | % |
| Global Revenue ETF | | | 0.43 | % |
| Global ESG Revenue ETF | | | 0.45 | % |
Prior to the Reorganization, the Predecessor Funds were managed by OFI Advisors, LLC (OFI) and the Predecessor Funds paid OFI an investment advisory fee calculated at the same annualized rate as disclosed above for each Fund.
Effective as of the Reorganization, the Adviser has agreed to waive a portion of each Fund unitary management fee to the extent necessary to prevent the operating expenses of the Fund (excluding distribution fees, if any, interest expenses, brokerage expenses, acquired fund fees and expenses, if any, taxes and litigation expenses, and extraordinary expenses) from exceeding the Fund’s unitary management fee through at least May 24, 2021.
Further, effective as of the Reorganization, through August 31, 2021, the Adviser has contractually agreed to waive a portion of each Fund’s management fee in an amount equal to 100% of the net advisory fees an affiliate of the Adviser receives that are attributable to certain of the Fund’s investments in money market funds managed by that affiliate (excluding investments of cash collateral from securities lending). The Adviser cannot discontinue this waiver prior to its expiration.
For the fiscal year ended June 30, 2019, the Adviser waived fees and/or paid Fund expenses for each Fund in the following amounts:
| | | | |
| S&P 500 Revenue ETF | | $ | 118 | |
| S&P MidCap 400 Revenue ETF | | | 14 | |
| S&P SmallCap 600 Revenue ETF | | | 39 | |
| S&P Financials Revenue ETF | | | 4 | |
| S&P Ultra Dividend Revenue ETF | | | 731 | |
| Emerging Markets Ultra Dividend Revenue ETF | | | 1 | |
| International Ultra Dividend Revenue ETF | | | 1 | |
| Emerging Markets Revenue ETF | | | 8 | |
| International Revenue ETF | | | 9 | |
| Global Revenue ETF | | | 6 | |
| Global ESG Revenue ETF | | | 13 | |
The Trust has entered into a Distribution Agreement with Invesco Distributors, Inc. (the “Distributor”), which serves as the distributor of Creation Units for each Fund. The Distributor does not maintain a secondary market in the Shares. The Funds are not charged any fees pursuant to the Distribution Agreement. The Distributor is an affiliate of the Adviser. Prior to the Reorganization, the Board of Trustees for each Predecessor Fund adopted a distribution and service plan pursuant to Rule12b-1 under the 1940 Act. Prior to the Reorganization, the Predecessor Funds paid no distribution fees to OppenheimerFunds Distributor, Inc.
The Trust has entered into service agreements whereby The Bank of New York Mellon (“BNYM”), a wholly-owned subsidiary of The Bank of New York Mellon Corporation, serves as the administrator, custodian, fund accountant and transfer agent for each Fund. Prior to the Reorganization, BNYM served as administrator, custodian, fund accountant and transfer agent for each Predecessor Fund.
Each Underlying Index name trademark is owned by its respective Licensor. These trademarks have been licensed to the Adviser for use by the Funds. Each Fund is entitled to use its Underlying Index pursuant to the Trust’ssub-licensing agreement with the Adviser. Prior to the Reorganization, each Underlying Index name trademark had been licensed to OFI for use by the corresponding Predecessor Fund. The Funds are not sponsored, endorsed, sold or promoted by the Licensor, and the Licensor makes no representation regarding the advisability of investing in any of the Funds.
Note 4—Investments in Affiliates
The Adviser and Invesco Mortgage Capital, Inc. are wholly-owned subsidiaries of Invesco Ltd. and therefore, Invesco Ltd. and Invesco Mortgage Capital, Inc. are considered to be affiliated with the Funds. The tables below show certain Funds’ transactions in, and earnings from, investments in affiliate (excluding affiliated money market funds) for the fiscal year ended June 30, 2019.
Invesco S&P 500 Revenue ETF
| | | | | | | | | | | | | | | | | | | | | | | | | | | | |
| | | Value
June 30, 2018 | | | Purchases
at cost | | | Proceeds
from Sales | | | Change in
Unrealized
Appreciation
(Depreciation) | | | Realized
Gain (Loss) | | | Value
June 30, 2019 | | | Dividend
Income | |
| Invesco Ltd. | | $ | 416,886 | | | $ | 233,185 | | | $ | (164,447 | ) | | $ | (28,945 | ) | | $ | (65,177 | ) | | $ | 391,502 | | | $ | 25,188 | |
S&P SmallCap 600 Revenue ETF
| | | | | | | | | | | | | | | | | | | | | | | | | | | | |
| | | Value
June 30, 2018 | | | Purchases
at cost | | | Proceeds
from Sales | | | Change in
Unrealized
Appreciation
(Depreciation) | | | Realized
Gain (Loss) | | | Value
June 30, 2019 | | | Dividend
Income | |
| Invesco Mortgage Capital, Inc. | | $ | 370,820 | | | $ | 187,019 | | | $ | (498,066 | ) | | $ | 40,118 | | | $ | (44,551 | ) | | $ | 55,340 | | | $ | 29,749 | |
S&P Financials Revenue ETF
| | | | | | | | | | | | | | | | | | | | | | | | | | | | |
| | | Value
June 30, 2018 | | | Purchases
at cost | | | Proceeds
from Sales | | | Change in
Unrealized
Appreciation
(Depreciation) | | | Realized
Gain (Loss) | | | Value
June 30, 2019 | | | Dividend
Income | |
| Invesco Ltd. | | $ | 187,593 | | | $ | 54,295 | | | $ | (93,580 | ) | | $ | (19,161 | ) | | $ | (27,809 | ) | | $ | 101,338 | | | $ | 8,440 | |
Global ESG Revenue ETF
| | | | | | | | | | | | | | | | | | | | | | | | | | | | |
| | | Value
June 30, 2018 | | | Purchases
at cost | | | Proceeds
from Sales | | | Change in
Unrealized
Appreciation
(Depreciation) | | | Realized
Gain (Loss) | | | Value
June 30, 2019 | | | Dividend
Income | |
| Invesco Ltd. | | $ | — | | | $ | 5,372 | | | $ | — | | | $ | 91 | | | $ | — | | | $ | 5,463 | | | $ | — | |
Note 5—Additional Valuation Information
GAAP defines fair value as the price that would be received to sell an asset or paid to transfer a liability in an orderly transaction between market participants at the measurement date, under current market conditions. GAAP establishes a hierarchy that prioritizes the inputs to valuation methods, giving the highest priority to readily available unadjusted quoted prices in an active market for identical assets (Level 1) and the lowest priority to significant unobservable inputs (Level 3), generally when market prices are not readily available or are unreliable. Based on the valuation inputs, the securities or other investments are tiered into one of three levels. Changes in valuation methods may result in transfers in or out of an investment’s assigned level:
| | Level 1 — | Prices are determined using quoted prices in an active market for identical assets. |
| | Level 2 — | Prices are determined using other significant observable inputs. Observable inputs are inputs that other market participants may use in pricing a security. These may include quoted prices for similar securities, interest rates, prepayment speeds, credit risk, yield curves, loss severities, default rates, discount rates, volatilities and others. |
| | Level 3 — | Prices are determined using significant unobservable inputs. In situations where quoted prices or observable inputs are unavailable (for example, when there is little or no market activity for an investment at the end of the period), unobservable inputs may be used. Unobservable inputs reflect the Fund’s own assumptions about the factors market participants would use in determining fair value of the securities or instruments and would be based on the best available information. |
The following is a summary of the tiered valuation input levels, as of June 30, 2019. The level assigned to the securities valuations may not be an indication of the risk or liquidity associated with investing in those securities. Because of the inherent uncertainties of
valuation, the values reflected in the financial statements may materially differ from the value received upon actual sale of those investments.
| | | | | | | | | | | | | | | | | | | | | | | | | | | | | | | | | | | | | | | | |
| | | (Level 1) | | | (Level 2) | | | (Level 3) | | | | |
Fund | | Common
Stocks | | | Investment
Company | | | Investment of
Cash Collateral
for Securities
Loaned | | | Preferred
Stocks | | | Warrants | | | Money Market
Funds | | | Preferred
Stocks | | | Preferred
Stocks | | | Rights | | | Total | |
| S&P 500 Revenue ETF | | $ | 956,591,033 | | | $ | — | | | $ | 3,231,210 | | | $ | — | | | $ | — | | | $ | — | | | $ | — | | | $ | — | | | $ | — | | | $ | 959,822,243 | |
| S&P MidCap 400 Revenue ETF | | | 357,160,058 | | | | — | | | | 13,651,970 | | | | — | | | | — | | | | — | | | | — | | | | — | | | | — | | | | 370,812,028 | |
| S&P SmallCap 600 Revenue ETF | | | 405,183,472 | | | | — | | | | 27,433,311 | | | | — | | | | — | | | | — | | | | — | | | | — | | | | 19,624 | | | | 432,636,407 | |
| S&P Financials Revenue ETF | | | 33,951,453 | | | | — | | | | 110,867 | | | | — | | | | — | | | | — | | | | — | | | | — | | | | — | | | | 34,062,320 | |
| S&P Ultra Dividend Revenue ETF | | | 1,778,323,638 | | | | — | | | | 20,513,293 | | | | — | | | | — | | | | — | | | | — | | | | — | | | | — | | | | 1,798,836,931 | |
| Emerging Markets Ultra Dividend Revenue ETF | | | 3,374,200 | | | | 1,148 | | | | — | | | | 213,298 | | | | — | | | | — | | | | — | | | | — | | | | — | | | | 3,588,646 | |
| International Ultra Dividend Revenue ETF | | | 2,364,279 | | | | — | | | | 18,206 | | | | — | | | | — | | | | — | | | | — | | | | — | | | | — | | | | 2,382,485 | |
| Emerging Markets Revenue ETF | | | 14,731,719 | | | | — | | | | 106,744 | | | | 381,433 | | | | — | | | | — | | | | — | | | | 2,270 | | | | — | | | | 15,222,166 | |
| International Revenue ETF | | | 12,226,755 | | | | — | | | | 342,805 | | | | 101,470 | | | | — | | | | 4,624 | | | | 490 | | | | — | | | | — | | | | 12,676,144 | |
| Global Revenue ETF | | | 12,922,988 | | | | — | | | | 190,639 | | | | 114,677 | | | | — | | | | — | | | | 268 | | | | 685 | | | | — | | | | 13,229,257 | |
| Global ESG Revenue ETF | | | 23,268,307 | | | | — | | | | 493,477 | | | | 146,653 | | | | 16 | | | | — | | | | 633 | | | | — | | | | — | | | | 23,909,086 | |
Note 6—Securities Lending
For the year ended June 30, 2019, each Fund participated in securities lending. Each Fund loaned portfolio securities having a market value up toone-third of each Fund’s total assets. Such loans are secured by cash collateral equal to no less than 102% (105% for international securities) of the market value of the loaned securities determined daily by the securities lending provider. Cash collateral received in connection with these loans is generally invested in an affiliated money market fund and is shown as such on the Schedules of Investments. Each Fund bears the risk of loss with respect to the investment of collateral. It is the policy of these Funds to obtain additional collateral from or return excess collateral to the borrower by the end of the next business day, following the valuation date of the securities loaned. Therefore, the value of the collateral held may be temporarily less than the value of the securities on loan. When loaning securities, each Fund retains certain benefits of owning the securities, including the economic equivalent of dividends or interest generated by the security. Lending securities entails a risk of loss to each Fund if, and to the extent that, the market value of the securities loaned were to increase, and the borrower did not increase the collateral accordingly, and the borrower failed to return the securities. The securities loaned are subject to termination at the option of the borrower or each Fund. Upon termination, the borrower will return to each Fund the securities loaned and each Fund will return the collateral. Upon the failure of the borrower to return the securities, collateral may be liquidated and the securities may be purchased on the open market to replace the loaned securities. Each Fund could experience delays and costs in gaining access to the collateral and the securities may lose value during the delay which could result in potential losses to each Fund. Some of these losses may be indemnified by the lending agent. Each Fund bears the risk of any deficiency in the amount of the collateral available for return to the borrower due to any loss on the collateral invested. Dividends received on cash collateral investments for securities lending transactions, which are net of compensation to Counterparties, are included inSecurities lending incomeon the Statements of Operations. The aggregate value of securities out on loan, if any, is shown on the Statements of Assets and Liabilities.
Note 7—Capital
Shares are issued and redeemed by the Funds only in Creation Units for each Fund, of 50,000 shares, except Invesco Emerging Markets Revenue ETF, Invesco Global Revenue ETF, and Invesco International Revenue ETF. Invesco Emerging Markets Revenue ETF, Invesco Global Revenue ETF, and Invesco International Revenue ETF issue and redeem shares in Creation Units of 100,000 shares. Transactions are permitted on anin-kind basis, with a separate cash payment, which is balancing each component to equate the transaction to the net asset value per share of the Fund on the transaction date.
To the extent that the Funds permit transactions in exchange for Deposit Securities, each Fund may issue Shares in advance of receipt of Deposit Securities subject to various conditions, including a requirement to maintain on deposit with the Trust cash at least equal to 105% of the market value of the missing Deposit Securities. In accordance with the Trust’s Participant Agreement, Creation Units will be issued to an Authorized Participant, notwithstanding the fact that the corresponding Deposit Securities have not been received in part or in whole, in reliance on the undertaking of the Authorized Participant to deliver the missing Deposit Securities as soon as possible, which undertaking shall be secured by the Authorized Participant’s delivery and maintenance of collateral consisting of cash in the form of U.S. dollars in immediately available funds having a value(marked-to-market daily) at least equal to 105%, which the Adviser may change from time to time, of the value of the missing Deposit Securities.
Certain transaction fees may be charged by the Funds for creations and redemptions, which are treated as increases in capital.
Transactions in each Fund’s Shares are disclosed in detail in the Statements of Changes in Net Assets.
Note 8—Purchases & Sales of Securities
The aggregate cost of purchases and the proceeds from sales of investment securities (excludingin-kind purchases and sales and short-term investments) for the year ended June 30, 2019, were as follows:
| | | | | | | | |
Fund | | Purchases | | | Sales | |
| S&P 500 Revenue ETF | | $ | 180,930,169 | | | $ | 182,782,370 | |
| S&P MidCap 400 Revenue ETF | | | 119,879,299 | | | | 119,193,883 | |
| S&P SmallCap 600 Revenue ETF | | | 180,311,787 | | | | 189,857,543 | |
| S&P Financials Revenue ETF | | | 5,275,008 | | | | 5,457,838 | |
| S&P Ultra Dividend Revenue ETF | | | 1,650,988,237 | | | | 1,635,505,035 | |
| Emerging Markets Ultra Dividend Revenue ETF | | | 3,946,423 | | | | 2,436,219 | |
| International Ultra Dividend Revenue ETF | | | 1,939,546 | | | | 1,903,390 | |
| Emerging Markets Revenue ETF | | | 9,354,253 | | | | 8,822,350 | |
| International Revenue ETF | | | 2,682,785 | | | | 4,698,726 | |
| Global Revenue ETF | | | 3,129,017 | | | | 4,786,226 | |
| Global ESG Revenue ETF | | | 6,528,549 | | | | 6,739,599 | |
For the year ended June 30, 2019, the cost ofin-kind purchases and the proceeds fromin-kind sales were as follows:
| | | | | | | | |
Fund | | Purchases | | | Sales | |
| S&P 500 Revenue ETF | | $ | 242,307,376 | | | $ | 245,538,678 | |
| S&P MidCap 400 Revenue ETF | | | 80,643,576 | | | | 100,329,323 | |
| S&P SmallCap 600 Revenue ETF | | | 174,750,169 | | | | 194,174,777 | |
| S&P Financials Revenue ETF | | | 6,341,897 | | | | 28,015,404 | |
| S&P Ultra Dividend Revenue ETF | | | 2,413,317,409 | | | | 1,255,122,003 | |
| Emerging Markets Ultra Dividend Revenue ETF | | | 2,195,471 | | | | — | |
| International Ultra Dividend Revenue ETF | | | 2,484,118 | | | | — | |
| Emerging Markets Revenue ETF | | | 3,281,022 | | | | 1,358,238 | |
| International Revenue ETF | | | 5,025,135 | | | | 2,934,372 | |
| Global Revenue ETF | | | 4,632,419 | | | | 2,922,281 | |
| Global ESG Revenue ETF | | | 3,934,203 | | | | 2,060,583 | |
Note 9—Trustees’ and Officer’s Fees
Trustees’ and Officer’s Fees include amounts accrued by the Funds to pay remuneration to the Independent Trustees and an Officer of the Trust. The Adviser, as a result of the unitary management fee, pays for such compensation for the Funds. The Trustee who is an “interested person” of the Trust does not receive any Trustees’ Fees.
The Trust has adopted a deferred compensation plan (the “Plan”). Under the Plan, each Independent Trustee who has executed a Deferred Fee Agreement (a “Participating Trustee”) may defer receipt of all or a portion of his compensation (“Deferral Fees”). Such Deferral Fees are deemed to be invested in select Invesco Funds. The Deferral Fees payable to the Participating Trustee are valued as of the date such Deferral Fees would have been paid to the Participating Trustee. The value increases with contributions or with increases in the value of the Shares selected, and the value decreases with distributions or with declines in the value of the Shares selected.
Obligations under the Plan represent unsecured claims against the general assets of the Funds.
Note 10—Indemnifications
Under the Trust’s organizational documents, its Officers and Trustees are indemnified against certain liabilities arising out of the performance of their duties to the Trust. Each Independent Trustee is also indemnified against certain liabilities arising out of the performance of his duties to the Trust pursuant to an Indemnification Agreement between such trustee and the Trust. Additionally, in the normal course of business, the Trust enters into contracts with service providers that contain general indemnification clauses. The Trust’s maximum exposure under these arrangements is unknown, as this would involve future claims that may be made against the Trust that have not yet occurred. However, based on experience, the Trust believes the risk of loss to be remote.
Report of Independent Registered Public Accounting Firm
To the Board of Trustees of Invesco Exchange-Traded Fund Trust II and Shareholders of Invesco S&P 500 Revenue ETF, Invesco S&P MidCap 400 Revenue ETF, Invesco S&P SmallCap 600 Revenue ETF, Invesco S&P Financials Revenue ETF, Invesco S&P Ultra Dividend Revenue ETF, Invesco Emerging Markets Ultra Dividend Revenue ETF, Invesco International Ultra Dividend Revenue ETF, Invesco Emerging Markets Revenue ETF, Invesco International Revenue ETF, Invesco Global Revenue ETF and Invesco Global ESG Revenue ETF
Opinions on the Financial Statements
We have audited the accompanying statements of assets and liabilities, including the schedules of investments, of each of the funds listed in the table below (eleven of the funds constituting Invesco Exchange-Traded Fund Trust II, hereafter collectively referred to as the “Funds”) as of June 30, 2019, the related statements of operations and changes in net assets, including the related notes, and the financial highlights for the year ended June 30, 2019 (or for Invesco Emerging Markets Ultra Dividend Revenue ETF and Invesco International Ultra Dividend Revenue ETF, for the period August 7, 2018 (commencement of operations) through June 30, 2019) (collectively referred to as the “financial statements”). In our opinion, the financial statements present fairly, in all material respects, the financial position of each of the Funds as of June 30, 2019, the results of each of their operations, changes in each of their net assets and each of the financial highlights for the year ended June 30, 2019 (or for Invesco Emerging Markets Ultra Dividend Revenue ETF and Invesco International Ultra Dividend Revenue ETF, for the period August 7, 2018 (commencement of operations) through June 30, 2019) in conformity with accounting principles generally accepted in the United States of America.
| | |
Fund Name | | Predecessor Fund |
| Invesco S&P 500 Revenue ETF | | Oppenheimer S&P 500 Revenue ETF |
| Invesco S&P MidCap 400 Revenue ETF | | Oppenheimer S&P MidCap 400 Revenue ETF |
| Invesco S&P SmallCap 600 Revenue ETF | | Oppenheimer S&P SmallCap 600 Revenue ETF |
| Invesco S&P Financials Revenue ETF | | Oppenheimer S&P Financials Revenue ETF |
| Invesco S&P Ultra Dividend Revenue ETF | | Oppenheimer S&P Ultra Dividend Revenue ETF |
| Invesco Emerging Markets Ultra Dividend Revenue ETF | | — |
| Invesco International Ultra Dividend Revenue ETF | | — |
| Invesco Emerging Markets Revenue ETF | | Oppenheimer Emerging Markets Revenue ETF |
| Invesco International Revenue ETF | | Oppenheimer International Revenue ETF |
| Invesco Global Revenue ETF | | Oppenheimer Global Revenue ETF |
| Invesco Global ESG Revenue ETF | | Oppenheimer Global ESG Revenue ETF |
The financial statements of the Predecessor Funds as of and for the year or period ended June 30, 2018 and the financial highlights for each of the periods ended on or prior to June 30, 2018 (not presented herein, other than the statements of changes in net assets and the financial highlights) were audited by other auditors whose report dated August 28, 2018 expressed an unqualified opinion on those financial statements and financial highlights.
Basis for Opinions
These financial statements are the responsibility of the Funds’ management. Our responsibility is to express an opinion on the Funds’ financial statements based on our audits. We are a public accounting firm registered with the Public Company Accounting Oversight Board (United States) (“PCAOB”) and are required to be independent with respect to the Funds in accordance with the U.S. federal securities laws and the applicable rules and regulations of the Securities and Exchange Commission and the PCAOB.
We conducted our audits of these financial statements in accordance with the standards of the PCAOB. Those standards require that we plan and perform the audit to obtain reasonable assurance about whether the financial statements are free of material misstatement, whether due to error or fraud.
Our audits included performing procedures to assess the risks of material misstatement of the financial statements, whether due to error or fraud, and performing procedures that respond to those risks. Such procedures included examining, on a test basis, evidence regarding the amounts and disclosures in the financial statements. Our audits also included evaluating the accounting principles used and significant estimates made by management, as well as evaluating the overall presentation of the financial statements. Our procedures included confirmation of securities owned as of June 30, 2019 by correspondence with the custodian, transfer agent and brokers; when replies were not received from brokers, we performed other auditing procedures. We believe that our audits provide a reasonable basis for our opinions.
PricewaterhouseCoopers LLP
Chicago, Illinois
August 23, 2019
We have served as the auditor of one or more of the investment companies in the Invesco group of investment companies since at least 1995. We have not determined the specific year we began serving as auditor.
Independent Registered Public Accounting Firm
Independent Registered Public Accounting Firm
The Audit Committee of the Board of Trustees appointed, and the Board of Trustees ratified and approved, PricewaterhouseCoopers LLP (“PWC”) as the independent registered public accounting firm of the Fund for the fiscal periods ending after May 24, 2019. Prior to the close of business on May 24, 2019, the Predecessor Fund was a separate series of an unaffiliated investment company and its financial statements were audited by a different independent registered public accounting firm (the “Prior Auditor”).
Effective after the close of business on May 24, 2019, the Prior Auditor resigned as the independent registered public accounting firm of the Fund. The Prior Auditor’s report on the financial statements of the Predecessor Fund for the past two fiscal years did not contain an adverse or disclaimer of opinion, and was not qualified or modified as to uncertainty, audit scope or accounting principles. During the Predecessor Fund’s two most recent fiscal years and through the close of business on May 24, 2019, there were no (1) disagreements with the Prior Auditor on any matter of accounting principles or practices, financial statement disclosure, or auditing scope or procedure, which disagreements, if not resolved to the Prior Auditor’s satisfaction, would have caused it to make reference to that matter in connection with its report; or (2) “reportable events,” as that term is defined in Item 304(a)(1)(v) of RegulationS-K under the Securities Exchange Act of 1934.
Calculating your ongoing Fund expenses
Example
As a shareholder of a Fund of the Invesco Exchange-Traded Fund Trust II, you incur a unitary management fee. In addition to the unitary management fee, a shareholder may pay distribution fees, if any, brokerage expenses, taxes, interest, including acquired fund fees and expenses, if any, litigation expenses and other extraordinary expenses. The expense examples below are intended to help you understand your ongoing costs (in dollars) of investing in the Funds and to compare these costs with the ongoing costs of investing in other funds.
The example is based on an investment of $1,000 invested at the beginning of the period and held through the six-month period ended June 30, 2019.
Actual Expenses
The first line in the following table provides information about actual account values and actual expenses. You may use the information in this line, together with the amount you invested, to estimate the expenses that you paid over the period. Simply divide your account value by $1,000 (for example, an $8,600 account value divided by $1,000 = 8.6), then multiply the result by the number in the first line under the heading “Expenses Paid During the Six-Month Period” to estimate the expenses you paid on your account during this period.
Hypothetical Example for Comparison Purposes
The second line in the following table provides information about hypothetical account values and hypothetical expenses based on each Fund’s actual expense ratio and an assumed annualized rate of return of 5% per year before expenses, which is not the Fund’s actual return. The hypothetical account values and expenses may not be used to estimate the actual ending account balance or expenses you paid for the period. You may use this information to compare the ongoing costs of investing in the Funds and other funds. To do so, compare this 5% hypothetical example with the 5% hypothetical examples that appear in the shareholder reports of the other funds.
Please note that the expenses shown in the table are meant to highlight your ongoing costs only, and do not reflect any transactional costs, such as sales charges and brokerage commissions. Therefore, the second line in the table is useful in comparing ongoing costs only, and will not help you determine the relative total costs of owning different funds. In addition, expenses shown in the table do not include the expenses of the underlying funds, which are borne indirectly by the Fund. If transaction costs and indirect expenses were included, your costs would have been higher.
| | | | | | | | | | | | | | | | |
| | | Beginning
Account Value
January 1, 2019 | | | Ending
Account Value
June 30, 2019 | | | Annualized
Expense Ratio
Based on the
Six-Month Period | | | Expenses Paid
During the
Six-Month Period(1) | |
| Invesco S&P 500 Revenue ETF | | | | | | | | | | | | | | | | |
Actual | | $ | 1,000.00 | | | $ | 1,159.43 | | | | 0.39 | % | | $ | 2.09 | |
Hypothetical (5% return before expenses) | | | 1,000.00 | | | | 1,022.86 | | | | 0.39 | | | | 1.96 | |
| Invesco S&P MidCap 400 Revenue ETF | | | | | | | | | | | | | | | | |
Actual | | | 1,000.00 | | | | 1,195.23 | | | | 0.39 | | | | 2.12 | |
Hypothetical (5% return before expenses) | | | 1,000.00 | | | | 1,022.86 | | | | 0.39 | | | | 1.96 | |
| Invesco S&P SmallCap 600 Revenue ETF | | | | | | | | | | | | | | | | |
Actual | | | 1,000.00 | | | | 1,106.53 | | | | 0.39 | | | | 2.04 | |
Hypothetical (5% return before expenses) | | | 1,000.00 | | | | 1,022.86 | | | | 0.39 | | | | 1.96 | |
| Invesco S&P Financials Revenue ETF | | | | | | | | | | | | | | | | |
Actual | | | 1,000.00 | | | | 1,186.36 | | | | 0.45 | | | | 2.44 | |
Hypothetical (5% return before expenses) | | | 1,000.00 | | | | 1,022.56 | | | | 0.45 | | | | 2.26 | |
| Invesco S&P Ultra Dividend Revenue ETF | | | | | | | | | | | | | | | | |
Actual | | | 1,000.00 | | | | 1,141.16 | | | | 0.39 | | | | 2.07 | |
Hypothetical (5% return before expenses) | | | 1,000.00 | | | | 1,022.86 | | | | 0.39 | | | | 1.96 | |
| Invesco Emerging Markets Ultra Dividend Revenue ETF | | | | | | | | | | | | | | | | |
Actual | | | 1,000.00 | | | | 1,092.93 | | | | 0.46 | | | | 2.39 | |
Hypothetical (5% return before expenses) | | | 1,000.00 | | | | 1,022.51 | | | | 0.46 | | | | 2.31 | |
| Invesco International Ultra Dividend Revenue ETF | | | | | | | | | | | | | | | | |
Actual | | | 1,000.00 | | | | 1,123.53 | | | | 0.42 | | | | 2.21 | |
Hypothetical (5% return before expenses) | | | 1,000.00 | | | | 1,022.71 | | | | 0.42 | | | | 2.11 | |
Calculating your ongoing Fund expenses(continued)
| | | | | | | | | | | | | | | | |
| | | Beginning
Account Value
January 1, 2019 | | | Ending
Account Value
June 30, 2019 | | | Annualized
Expense Ratio
Based on the
Six-Month Period | | | Expenses Paid
During the
Six-Month Period(1) | |
| Invesco Emerging Markets Revenue ETF | | | | | | | | | | | | | | | | |
Actual | | $ | 1,000.00 | | | $ | 1,081.98 | | | | 0.46 | % | | $ | 2.37 | |
Hypothetical (5% return before expenses) | | | 1,000.00 | | | | 1,022.51 | | | | 0.46 | | | | 2.31 | |
| Invesco International Revenue ETF | | | | | | | | | | | | | | | | |
Actual | | | 1,000.00 | | | | 1,096.59 | | | | 0.42 | | | | 2.18 | |
Hypothetical (5% return before expenses) | | | 1,000.00 | | | | 1,022.71 | | | | 0.42 | | | | 2.11 | |
| Invesco Global Revenue ETF | | | | | | | | | | | | | | | | |
Actual | | | 1,000.00 | | | | 1,113.60 | | | | 0.43 | | | | 2.25 | |
Hypothetical (5% return before expenses) | | | 1,000.00 | | | | 1,022.66 | | | | 0.43 | | | | 2.16 | |
| Invesco Global ESG Revenue ETF | | | | | | | | | | | | | | | | |
Actual | | | 1,000.00 | | | | 1,123.40 | | | | 0.45 | | | | 2.37 | |
Hypothetical (5% return before expenses) | | | 1,000.00 | | | | 1,022.56 | | | | 0.45 | | | | 2.26 | |
| (1) | Expenses are calculated using the annualized expense ratio, which represents the ongoing expenses as a percentage of net assets for the six-month period ended June 30, 2019. Expenses are calculated by multiplying the Fund’s annualized expense ratio by the average account value for the period, then multiplying the result by 181/365. Expense ratios for the most recent six-month period may differ from expense ratios based on the annualized data in the Financial Highlights. |
Tax Information
Form1099-DIV, Form1042-S and otheryear-end tax information provide shareholders with actual calendar year amounts that should be included in their tax returns. Shareholders should consult their tax advisers.
The following distribution information is being provided as required by the Internal Revenue Code or to meet a specific state’s requirement.
Each Fund designates the following amounts or, if subsequently determined to be different, the maximum amount allowable for its fiscal year ended June 30, 2019:
| | | | | | | | | | |
Fund | | Qualified Dividend
Income* | | Corporate
Dividends-Received
Deduction* |
| Invesco S&P 500 Revenue ETF | | | | 100 | % | | | | 100 | % |
| Invesco S&P MidCap 400 Revenue ETF | | | | 100 | % | | | | 100 | % |
| Invesco S&P SmallCap 600 Revenue ETF | | | | 100 | % | | | | 97 | % |
| Invesco S&P Financials Revenue ETF | | | | 100 | % | | | | 100 | % |
| Invesco S&P Ultra Dividend Revenue ETF | | | | 100 | % | | | | 94 | % |
| Invesco Emerging Markets Ultra Dividend Revenue ETF | | | | 55 | % | | | | 0 | % |
| Invesco International Ultra Dividend Revenue ETF | | | | 85 | % | | | | 0 | % |
| Invesco Emerging Markets Revenue ETF | | | | 63 | % | | | | 0 | % |
| Invesco International Revenue ETF | | | | 94 | % | | | | 0 | % |
| Invesco Global Revenue ETF | | | | 94 | % | | | | 25 | % |
| Invesco Global ESG Revenue ETF | | | | 100 | % | | | | 22 | % |
| * | The above percentages are based on ordinary income dividends paid to shareholders during the Fund’s fiscal year. |
The Funds intend to elect to pass through to shareholders the credit for taxes paid to foreign countries. The gross foreign source income and foreign taxes paid are as follows:
| | | | | | | | | | |
Fund | | Gross Foreign
Income | | Foreign Taxes
Paid |
Invesco S&P 500 Revenue ETF | | | $ | — | | | | $ | — | |
Invesco S&P MidCap 400 Revenue ETF | | | | — | | | | | — | |
Invesco S&P SmallCap 600 Revenue ETF | | | | — | | | | | — | |
Invesco S&P Financials Revenue ETF | | | | — | | | | | — | |
Invesco S&P Ultra Dividend Revenue ETF | | | | — | | | | | — | |
| Invesco Emerging Markets Ultra Dividend Revenue ETF | | | | 151,973 | | | | | 12,007 | |
Invesco International Ultra Dividend Revenue ETF | | | | 115,208 | | | | | 11,385 | |
| Invesco Emerging Markets Revenue ETF | | | | 493,949 | | | | | 56,091 | |
| Invesco International Revenue ETF | | | | 496,037 | | | | | 36,670 | |
Invesco Global Revenue ETF | | | | 343,170 | | | | | 30,058 | |
| Invesco Global ESG Revenue ETF | | | | 645,379 | | | | | 54,112 | |
Proxy Results
A Special Meeting (“Meeting”) of Shareholders of Invesco S&P 500 Revenue ETF was held on May 9, 2019. The Meeting was held for the following purpose:
| (1) | Approval of an Agreement and Plan of Reorganization that provides for the reorganization of Oppenheimer S&P 500 Revenue ETF into Invesco S&P 500 Revenue ETF. |
The results of the voting on the above matter was as follows:
| | | | | | | | | | | | | | |
Matter | | Votes For | | | Votes
Against | | | Votes
Abstain | | | Broker
Non-Votes |
(1) Approval of an Agreement and Plan of Reorganization. | | | 9,469,721 | | | | 126,412 | | | | 832,996 | | | 0 |
A Special Meeting (“Meeting”) of Shareholders of Invesco S&P MidCap 400 Revenue ETF was held on May 9, 2019. The Meeting was held for the following purpose:
| (1) | Approval of an Agreement and Plan of Reorganization that provides for the reorganization of Oppenheimer S&P MidCap 400 Revenue ETF into Invesco S&P MidCap 400 Revenue ETF. |
The results of the voting on the above matter was as follows:
| | | | | | | | | | | | | | |
Matter | | Votes For | | | Votes
Against | | | Votes
Abstain | | | Broker
Non-Votes |
(1) Approval of an Agreement and Plan of Reorganization. | | | 2,833,860 | | | | 42,920 | | | | 254,684 | | | 0 |
A Special Meeting (“Meeting”) of Shareholders of Invesco S&P SmallCap 600 Revenue ETF was held on May 9, 2019. The Meeting was held for the following purpose:
| (1) | Approval of an Agreement and Plan of Reorganization that provides for the reorganization of Oppenheimer S&P SmallCap 600 Revenue ETF into Invesco S&P SmallCap 600 Revenue ETF. |
The results of the voting on the above matter was as follows:
| | | | | | | | | | | | | | |
Matter | | Votes For | | | Votes
Against | | | Votes
Abstain | | | Broker
Non-Votes |
(1) Approval of an Agreement and Plan of Reorganization. | | | 2,860,180 | | | | 36,370 | | | | 581,143 | | | 0 |
A Special Meeting (“Meeting”) of Shareholders of Invesco S&P Financials Revenue ETF was held on May 9, 2019. The Meeting was held for the following purpose:
| (1) | Approval of an Agreement and Plan of Reorganization that provides for the reorganization of Oppenheimer S&P Financials Revenue ETF into Invesco S&P Financials Revenue ETF. |
The results of the voting on the above matter was as follows:
| | | | | | | | | | | | | | |
Matter | | Votes For | | | Votes
Against | | | Votes
Abstain | | | Broker
Non-Votes |
(1) Approval of an Agreement and Plan of Reorganization. | | | 257,002 | | | | 4,901 | | | | 69,259 | | | 0 |
Proxy Results(continued)
A Special Meeting (“Meeting”) of Shareholders of Invesco S&P Ultra Dividend Revenue ETF was held on May 9, 2019. The Meeting was held for the following purpose:
| (1) | Approval of an Agreement and Plan of Reorganization that provides for the reorganization of Oppenheimer S&P Ultra Dividend Revenue ETF into Invesco S&P Ultra Dividend Revenue ETF. |
The results of the voting on the above matter was as follows:
| | | | | | | | | | | | | | |
Matter | | Votes For | | | Votes
Against | | | Votes
Abstain | | | Broker
Non-Votes |
(1) Approval of an Agreement and Plan of Reorganization. | | | 17,688,995 | | | | 273,867 | | | | 2,106,982 | | | 0 |
A Special Meeting (“Meeting”) of Shareholders of Invesco Emerging Markets Ultra Dividend Revenue ETF was held on April 12, 2019. The Meeting was held for the following purpose:
| (1) | Approval of an Agreement and Plan of Reorganization that provides for the reorganization of Oppenheimer Emerging Markets Ultra Dividend Revenue ETF into Invesco Emerging Markets Ultra Dividend Revenue ETF. |
The results of the voting on the above matter was as follows:
| | | | | | | | | | | | | | |
Matter | | Votes For | | | Votes
Against | | | Votes
Abstain | | | Broker
Non-Votes |
(1) Approval of an Agreement and Plan of Reorganization. | | | 74,620 | | | | 0 | | | | 418 | | | 0 |
A Special Meeting (“Meeting”) of Shareholders of Invesco International Ultra Dividend Revenue ETF was held on April 12, 2019. The Meeting was held for the following purpose:
| (1) | Approval of an Agreement and Plan of Reorganization that provides for the reorganization of Oppenheimer International Ultra Dividend Revenue ETF into Invesco International Ultra Dividend Revenue ETF. |
The results of the voting on the above matter was as follows:
| | | | | | | | | | | | | | |
Matter | | Votes For | | | Votes
Against | | | Votes
Abstain | | | Broker
Non-Votes |
(1) Approval of an Agreement and Plan of Reorganization. | | | 59,737 | | | | 0 | | | | 1,221 | | | 0 |
A Special Meeting (“Meeting”) of Shareholders of Invesco Emerging Markets Revenue ETF was held on April 12, 2019. The Meeting was held for the following purpose:
| (1) | Approval of an Agreement and Plan of Reorganization that provides for the reorganization of Oppenheimer Emerging Markets Revenue ETF into Invesco Emerging Markets Revenue ETF. |
The results of the voting on the above matter was as follows:
| | | | | | | | | | | | | | |
Matter | | Votes For | | | Votes
Against | | | Votes
Abstain | | | Broker
Non-Votes |
(1) Approval of an Agreement and Plan of Reorganization. | | | 427,458 | | | | 0 | | | | 76 | | | 0 |
Proxy Results(continued)
A Special Meeting (“Meeting”) of Shareholders of Invesco International Revenue ETF was held on April 12, 2019. The Meeting was held for the following purpose:
| (1) | Approval of an Agreement and Plan of Reorganization that provides for the reorganization of Oppenheimer International Revenue ETF into Invesco International Revenue ETF. |
The results of the voting on the above matter was as follows:
| | | | | | | | | | | | | | |
Matter | | Votes For | | | Votes
Against | | | Votes
Abstain | | | Broker
Non-Votes |
(1) Approval of an Agreement and Plan of Reorganization. | | | 349,800 | | | | 0 | | | | 266 | | | 0 |
A Special Meeting (“Meeting”) of Shareholders of Invesco Global Revenue ETF was held on April 12, 2019. The Meeting was held for the following purpose:
| (1) | Approval of an Agreement and Plan of Reorganization that provides for the reorganization of Oppenheimer Global Revenue ETF into Invesco Global Revenue ETF. |
The results of the voting on the above matter was as follows:
| | | | | | | | | | | | | | |
Matter | | Votes For | | | Votes
Against | | | Votes
Abstain | | | Broker
Non-Votes |
(1) Approval of an Agreement and Plan of Reorganization. | | | 447,535 | | | | 0 | | | | 0 | | | 0 |
A Special Meeting (“Meeting”) of Shareholders of Invesco Global ESG Revenue ETF was held on April 12, 2019. The Meeting was held for the following purpose:
| (1) | Approval of an Agreement and Plan of Reorganization that provides for the reorganization of Oppenheimer Global ESG Revenue ETF into Invesco Global ESG Revenue ETF. |
The results of the voting on the above matter was as follows:
| | | | | | | | | | | | | | |
Matter | | Votes For | | | Votes
Against | | | Votes
Abstain | | | Broker
Non-Votes |
(1) Approval of an Agreement and Plan of Reorganization. | | | 655,943 | | | | 208 | | | | 441 | | | 0 |
Trustees and Officers
The Independent Trustees of the Trust, their term of office and length of time served, their principal business occupations during at least the past five years, the number of portfolios in the Fund Complex (as defined below) overseen by each Independent Trustee and the other directorships, if any, held by each Independent Trustee are shown below.
As of June 30, 2019
| | | | | | | | | | |
Name, Address and Year of
Birth of Independent Trustees | | Position(s)
Held
with Trust | | Term of
Office
and
Length of
Time
Served* | | Principal
Occupation(s) During
Past 5 Years | | Number of
Portfolios
in Fund
Complex**
Overseen by
Independent
Trustees | | Other
Directorships
Held by
Independent
Trustees During
the Past 5 Years |
Ronn R. Bagge—1958
c/o Invesco Capital Management LLC
3500 Lacey Road, Suite 700
Downers Grove, IL 60515 | | Chairman of the Nominating and Governance Committee and Trustee | | Chairman of the Nominating and Governance Committee and Trustee since 2007 | | Founder and Principal, YQA Capital Management LLC (1998-Present); formerly, Owner/CEO of Electronic Dynamic Balancing Co., Inc. (high-speed rotating equipment service provider). | | 246 | | Trustee and Investment Oversight Committee member, Mission Aviation Fellowship (2017–Present) |
| | | | | |
Todd J. Barre—1957
c/o Invesco Capital Management LLC
3500 Lacey Road, Suite 700
Downers Grove, IL 60515 | | Trustee | | Since 2010 | | Assistant Professor of Business, Trinity Christian College (2010-2016); formerly, Vice President and Senior Investment Strategist (2001-2008), Director of Open Architecture and Trading (2007-2008), Head of Fundamental Research (2004-2007) and Vice President and Senior Fixed Income Strategist (1994-2001), BMO Financial Group/Harris Private Bank. | | 246 | | None |
| | | | | |
Edmund P. Giambastiani, Jr.—1948 c/o Invesco Capital Management LLC 3500 Lacey Road, Suite 700, Downers Grove, IL 60515 | | Trustee | | Since 2019 | | President of Giambastiani Group LLC (national security and energy consulting) (2007-Present); Director of The Boeing Company (2009-Present); Trustee of MITRE Corporation (federally-funded research development) (2008-Present); Director of THL Credit, Inc. (2016-Present) (alternative credit investment manager); Trustee of the U.S. Naval Academy Foundation Athletic & Scholarship Program (2010-Present); Advisory Board Member of the Massachusetts Institute of Technology Lincoln Laboratory (federally-funded research development) (2010-Present); Defense Advisory Board Member Lawrence Livermore National Laboratory (2013-present); formerly, Chairman of Monster Worldwide, Inc. (career services) (2015-2016), Director of Monster Worldwide, Inc. (2008-2011); Lead Director (2011-2015); Advisory Board Member of the Maxwell School of | | 153 | | Trustee, certain funds in the Oppenheimer Funds complex (2013-2019); Director of Mercury Defense Systems Inc. (information technology) (2011-2013); Independent Director of QinetiQ Group Plc (defense technology and security) (2008-2011); Chairman of Alenia North America, Inc. (military and |
| * | This is the date the Independent Trustee began serving the Trust. Each Independent Trustee serves an indefinite term, until his successor is elected. |
| ** | Fund Complex includes all open-andclosed-end funds (including all of their portfolios) advised by the Adviser and any affiliated person of the Adviser. |
Trustees and Officers(continued)
| | | | | | | | | | |
Name, Address and Year of
Birth of Independent Trustees | | Position(s)
Held
with Trust | | Term of
Office
and
Length of
Time
Served* | | Principal
Occupation(s) During
Past 5 Years | | Number of
Portfolios
in Fund
Complex**
Overseen by
Independent
Trustees | | Other
Directorships
Held by
Independent
Trustees During
the Past 5 Years |
| | | | | | Citizenship and Public Affairs of Syracuse University (2012-2016); United States Navy, career nuclear submarine officer (1970-2007); Seventh Vice Chairman of the Joint Chiefs of Staff (2005-2007); first NATO Supreme Allied Commander Transformation (2003-2005) and Commander, U.S. Joint Forces Command (2002-2005). | | | | defense products) (2008-2009); Director of SRA International, Inc. (information technology and services) (2008- 2011). |
| | | | | |
Victoria J. Herget—1951 c/o Invesco Capital Management LLC 3500 Lacey Road, Suite 700, Downers Grove, IL 60515 | | Trustee | | Since 2019 | | Formerly, Managing Director (1993-2001), Principal (1985-1993), Vice President (1978-1985) and Assistant Vice President (1973-1978) of Zurich Scudder Investments (investment adviser) (and its predecessor firms). | | 153 | | Trustee (2000-Present) and Chair (2010-2017) of Newberry Library; Trustee, Mather LifeWays (2001-Present); formerly, Board Chair (2008-2015) and Director (2004-2018) of United Educators; Trustee, certain funds in the Oppenheimer Funds complex (2012-2019); Independent Director of the First American Funds (2003-2011); Trustee, Chikaming Open Lands (2014-present); Trustee (1992-2007), Chair of the Board of Trustees (1999-2007), Investment Committee Chair (1994-1999) and Investment Committee |
| * | This is the date the Independent Trustee began serving the Trust. Each Independent Trustee serves an indefinite term, until his successor is elected. |
| ** | Fund Complex includes all open-andclosed-end funds (including all of their portfolios) advised by the Adviser and any affiliated person of the Adviser. |
Trustees and Officers(continued)
| | | | | | | | | | |
Name, Address and Year of
Birth of Independent Trustees | | Position(s)
Held
with Trust | | Term of
Office
and
Length of
Time
Served* | | Principal
Occupation(s) During
Past 5 Years | | Number of
Portfolios
in Fund
Complex**
Overseen by
Independent
Trustees | | Other
Directorships
Held by
Independent
Trustees During
the Past 5 Years |
| | | | | | | | | | member(2007-2010) of Wellesley College; Trustee, BoardSource (2006-2009) and Chicago City Day School (1994-2005). |
| | | | | |
Marc M. Kole—1960
c/o Invesco Capital Management LLC
3500 Lacey Road, Suite 700
Downers Grove, IL 60515 | | Chairman of the Audit Committee and Trustee | | Chairman of the Audit Committee since 2008; Trustee since 2007 | | Senior Director of Finance, By The Hand Club for Kids(not-for-profit) (2015-Present); formerly, Chief Financial Officer, Hope Network (social services) (2008-2012); Assistant Vice President and Controller, Priority Health (health insurance) (2005-2008); Regional Chief Financial Officer, United Healthcare (2005); Chief Accounting Officer, Senior Vice President of Finance, Oxford Health Plans (2000-2004); Audit Partner, Arthur Andersen LLP (1996-2000). | | 246 | | Treasurer (2018-Present), Finance Committee Member (2015-Present) and Audit Committee Member (2015), Thornapple Evangelical Covenant Church; formerly, Board and Finance Committee Member (2009-2017) and Treasurer (2010-2015, 2017), NorthPointe Christian Schools. |
| | | | | |
Yung Bong Lim—1964
c/o Invesco Capital Management LLC
3500 Lacey Road, Suite 700
Downers Grove, IL 60515 | | Chairman of the Investment Oversight Committee and Trustee | | Chairman of the Investment Oversight Committee since 2014; Trustee since 2013 | | Managing Partner, RDG Funds LLC (real estate) (2008-Present); formerly, Managing Director, Citadel LLC (1999-2007). | | 246 | | Advisory Board Member of Performance Trust Capital Partners (2008-Present); Board Director of Beacon Power Services (2019-Present). |
| * | This is the date the Independent Trustee began serving the Trust. Each Independent Trustee serves an indefinite term, until his successor is elected. |
| ** | Fund Complex includes all open-andclosed-end funds (including all of their portfolios) advised by the Adviser and any affiliated person of the Adviser. |
Trustees and Officers(continued)
| | | | | | | | | | |
Name, Address and Year of
Birth of Independent Trustees | | Position(s)
Held
with Trust | | Term of
Office
and
Length of
Time
Served* | | Principal
Occupation(s) During
Past 5 Years | | Number of
Portfolios
in Fund
Complex**
Overseen by
Independent
Trustees | | Other
Directorships
Held by
Independent
Trustees During
the Past 5 Years |
Joanne Pace—1958 c/o Invesco Capital Management LLC 3500 Lacey Road, Suite 700, Downers Grove, IL 60515 | | Trustee | | Since 2019 | | Senior Advisor of SECOR Asset Management, LP (2010-2011); Managing Director and Chief Operating Officer of Morgan Stanley Investment Management (2006-2010); Partner and Chief Operating Officer of FrontPoint Partners, LLC (alternative investments) (2005-2006); Credit Suisse (investment banking), Managing Director (2003-2005), Global Head of Human Resources and member of Executive Board and Operating Committee (2004-2005), Global Head of Operations and Product Control (2003-2004); Morgan Stanley, Managing Director (1997-2003), Controller and Principal Accounting Officer (1999-2003); Chief Financial Officer (temporary assignment) for the Oversight Committee, Long Term Capital Management (1998-1999). | | 153 | | Board Director of Horizon Blue Cross Blue Shield of New Jersey (2012-Present); Advisory Board Director of The Alberleen Group LLC (2012-Present); Governing Council Member (2016-Present) and Chair of Education Committee (2017-Present) of Independent Directors Council (IDC); Board Member of 100 Women in Finance (2015-Present); Advisory Council Member of Morgan Stanley Children’s Hospital (2012-Present); formerly, Trustee, certain funds in the Oppenheimer Funds complex (2012-2019); Lead Independent Director and Chair of the Audit and Nominating Committee of The Global Chartist Fund, LLC of Oppenheimer Asset Management (2011-2012); |
| * | This is the date the Independent Trustee began serving the Trust. Each Independent Trustee serves an indefinite term, until his successor is elected. |
| ** | Fund Complex includes all open-andclosed-end funds (including all of their portfolios) advised by the Adviser and any affiliated person of the Adviser. |
Trustees and Officers(continued)
| | | | | | | | | | |
Name, Address and Year of
Birth of Independent Trustees | | Position(s)
Held
with Trust | | Term of
Office
and
Length of
Time
Served* | | Principal
Occupation(s) During
Past 5 Years | | Number of
Portfolios
in Fund
Complex**
Overseen by
Independent
Trustees | | Other
Directorships
Held by
Independent
Trustees During
the Past 5 Years |
| | | | | | | | | | Board Director of Managed Funds Association (2008-2010); Board Director of Morgan Stanley Foundation (2007-2010) and Investment Committee Chair (2008-2010). |
| | | | | |
Gary R. Wicker—1961
c/o Invesco Capital Management LLC
3500 Lacey Road, Suite 700
Downers Grove, IL 60515 | | Trustee | | Since 2013 | | Senior Vice President of Global Finance and Chief Financial Officer at RBC Ministries (publishing company) (2013-Present); formerly, Executive Vice President and Chief Financial Officer, Zondervan Publishing (a division of Harper Collins/NewsCorp) (2007-2012); Senior Vice President and Group Controller (2005-2006), Senior Vice President and Chief Financial Officer (2003-2004), Chief Financial Officer (2001-2003), Vice President, Finance and Controller (1999-2001) and Assistant Controller (1997-1999), divisions of The Thomson Corporation (information services provider); Senior Audit Manager (1994-1997), PricewaterhouseCoopers LLP. | | 246 | | Board Member and Treasurer, Our Daily Bread Ministries Canada (2015-Present); Board and Finance Committee Member, West Michigan Youth For Christ (2010-Present). |
| | | | | |
Donald H. Wilson—1959
c/o Invesco Capital Management LLC
3500 Lacey Road, Suite 700
Downers Grove, IL 60515 | | Chairman of the Board and Trustee | | Chairman since 2012; Trustee since 2007 | | Chairman, President and Chief Executive Officer, McHenry Bancorp Inc. and McHenry Savings Bank (subsidiary) (2018-Present); Chairman and Chief Executive Officer, Stone Pillar Advisors, Ltd. (advisory services to the financial sector) (2010-Present); formerly, President and Chief Executive Officer, Stone Pillar Investments, Ltd. (2016- 2018); Chairman, President and Chief Executive Officer, Community Financial Shares, Inc. and Community Bank—Wheaton/Glen Ellyn (subsidiary) (2013-2015); Chief Operating Officer, AMCORE Financial, Inc. (bank holding company) (2007-2009); Executive Vice President and Chief Financial Officer, AMCORE Financial, Inc. (2006-2007); Senior Vice President and Treasurer, Marshall & Ilsley Corp. (bank holding company) (1995-2006). | | 246 | | Director, Penfield Children’s Center (2004-present); Board Chairman, Gracebridge Alliance, Inc. (2015-present). |
| * | This is the date the Independent Trustee began serving the Trust. Each Independent Trustee serves an indefinite term, until his successor is elected. |
| ** | Fund Complex includes all open-andclosed-end funds (including all of their portfolios) advised by the Adviser and any affiliated person of the Adviser. |
Trustees and Officers(continued)
The Interested Trustee and the executive officers of the Trust, their term of office and length of time served, their principal business occupations during at least the past five years, the number of portfolios in the Fund Complex (as defined below) overseen by the Interested Trustee and the other directorships, if any, held by the Interested Trustee are shown below.
| | | | | | | | | | |
Name, Address and Year of
Birth of Interested Trustee | | Position(s)
Held
with Trust | | Term of
Office
and
Length of
Time
Served* | | Principal
Occupation(s) During
Past 5 Years | | Number of
Portfolios
in Fund
Complex**
Overseen by
Interested
Trustee | | Other
Directorships
Held by
Interested
Trustee During
the Past 5 Years |
Kevin M. Carome—1956
Invesco Ltd.
Two Peachtree Pointe,
1555 Peachtree St., N.E.,
Suite 1800
Atlanta, GA 30309 | | Trustee | | Since 2010 | | Senior Managing Director, Secretary and General Counsel, Invesco Ltd. (2007-Present); Director, Invesco Advisers, Inc. (2009-Present); Director (2006-Present) and Executive Vice President (2008-Present), Invesco North American Holdings, Inc.; Executive Vice President (2008-Present), Invesco Investments (Bermuda) Ltd.; Manager, Horizon Flight Works LLC; Director, Invesco Finance PLC (2011-Present); Director and Secretary (2012-Present), Invesco Services (Bahamas) Private Limited; and Executive Vice President (2014-Present), INVESCO Asset Management (Bermuda) Ltd.; formerly, Director, INVESCO Asset Management (Bermuda) Ltd. (2014-2019); Director and Executive Vice President, Invesco Finance, Inc. (2011-2018); Director (2006-2018) and Executive Vice President (2008-2018), Invesco Group Services, Inc., Invesco Holding Company (US), Inc.; Director, Invesco Holding Company Limited (2007-2019); Director and Chairman, INVESCO Funds Group, Inc., Senior Vice President, Secretary and General Counsel, Invesco Advisers, Inc. (2003-2006); Director, Invesco Investments (Bermuda) Ltd. (2008-2016); Senior Vice President and General Counsel, Liberty Financial Companies, Inc. (2000-2001); General Counsel of certain investment management subsidiaries of Liberty Financial Companies, Inc. (1998-2000); Associate General Counsel, Liberty Financial Companies, Inc. (1993-1998); Associate, Ropes & Gray LLP. | | 246 | | None |
| * | This is the date the Interested Trustee began serving the Trust. The Interested Trustee serves an indefinite term, until his successor is elected. |
| ** | Fund Complex includes all open-andclosed-end funds (including all of their portfolios) advised by the Adviser and any affiliated person of the Adviser. |
Trustees and Officers(continued)
| | | | | | |
Name, Address and Year of
Birth of Executive Officers | | Position(s)
Held
with Trust | | Length of
Time
Served* | | Principal
Occupation(s)
During
Past 5 Years |
Daniel E. Draper—1968 Invesco Capital Management LLC 3500 Lacey Road, Suite 700 Downers Grove, IL 60515 | | President and Principal Executive Officer | | Since 2015 | | Chief Executive Officer, Manager and Principal Executive Officer, Invesco Specialized Products, LLC (2018-Present); President and Principal Executive Officer, Invesco Exchange-Traded Fund Trust, Invesco Exchange-Traded Fund Trust II, Invesco India Exchange-Traded Fund Trust, Invesco Actively Managed Exchange-Traded Fund Trust and Invesco Actively Managed Exchange-Traded Commodity Fund Trust (2015-Present) and Invesco Exchange-Traded Self-Indexed Fund Trust (2016-Present); Chief Executive Officer and Principal Executive Officer (2016-Present) and Managing Director (2013-Present), Invesco Capital Management LLC; Senior Vice President, Invesco Distributors, Inc. (2014-Present); formerly, Vice President, Invesco Exchange-Traded Fund Trust, Invesco Exchange-Traded Fund Trust II, Invesco India Exchange-Traded Fund Trust, Invesco Actively Managed Exchange-Traded Fund Trust (2013-2015) and Invesco Actively Managed Exchange-Traded Commodity Fund Trust (2014-2015); Managing Director, Credit Suisse Asset Management (2010-2013) and Lyxor Asset Management/Societe Generale (2007-2010). |
| | | |
Kelli Gallegos—1970 Invesco Capital Management LLC 3500 Lacey Road, Suite 700 Downers Grove, IL 60515 | | Vice President
and Treasurer | | Since 2018 | | Assistant Treasurer, Invesco Specialized Products, LLC (2018-Present); Vice President and Treasurer, Invesco Exchange-Traded Fund Trust, Invesco Exchange-Traded Fund Trust II, Invesco India Exchange-Traded Fund Trust, Invesco Actively Managed Exchange-Traded Fund Trust, Invesco Actively Managed Exchange-Traded Commodity Fund Trust and Invesco Exchange-Traded Self-Indexed Fund Trust (2018-Present); Principal Financial and Accounting Officer-Pooled Investments, Invesco Capital Management LLC (2018-Present); Vice President, Principal Financial Officer (2016-Present) and Assistant Treasurer (2008-Present), The Invesco Funds; formerly, Assistant Treasurer, Invesco Exchange-Traded Fund Trust, Invesco Exchange-Traded Fund Trust II, Invesco India Exchange-Traded Fund Trust and Invesco Actively Managed Exchange-Traded Fund Trust (2012-2018), Invesco Actively Managed Exchange-Traded Commodity Fund Trust (2014-2018) and Invesco Exchange-Traded Self-Indexed Fund Trust (2016-2018); Assistant Treasurer, Invesco Capital Management LLC (2013-2018); and Assistant Vice President, The Invesco Funds (2008-2016). |
| | | |
Peter Hubbard—1981 Invesco Capital Management LLC 3500 Lacey Road, Suite 700 Downers Grove, IL 60515 | | Vice President | | Since 2009 | | Vice President, Invesco Specialized Products, LLC (2018-Present); Vice President, Invesco Exchange-Traded Fund Trust, Invesco Exchange-Traded Fund Trust II, Invesco India Exchange-Traded Fund Trust, Invesco Actively Managed Exchange-Traded Fund Trust (2009-Present), Invesco Actively Managed Exchange-Traded Commodity Fund Trust (2014-Present) and Invesco Exchange-Traded Self-Indexed Fund Trust (2016-Present); Vice President and Director of Portfolio Management, Invesco Capital Management LLC (2010-Present); formerly, Vice President of Portfolio Management, Invesco Capital Management LLC (2008-2010); Portfolio Manager, Invesco Capital Management LLC (2007-2008); Research Analyst, Invesco Capital Management LLC (2005-2007); Research Analyst and Trader, Ritchie Capital, a hedge fund operator (2003-2005). |
| | | |
Sheri Morris—1964 Invesco Capital Management LLC 3500 Lacey Road, Suite 700 Downers Grove, IL 60515 | | Vice President | | Since 2012 | | President and Principal Executive Officer, The Invesco Funds (2016-Present); Treasurer, The Invesco Funds (2008-Present); Vice President, Invesco Advisers, Inc. (formerly known as Invesco Institutional (N.A.), Inc.) (registered investment adviser) (2009-Present) and Vice President, Invesco Exchange-Traded Fund Trust, Invesco Exchange-Traded Fund Trust II, Invesco India Exchange-Traded Fund Trust, Invesco Actively Managed Exchange-Traded Fund Trust (2012-Present), Invesco Actively Managed Exchange-Traded Commodity Fund Trust (2014-Present) and Invesco Exchange-Traded Self-Indexed Fund Trust (2016-Present); formerly, Vice President and Principal Financial Officer, The Invesco Funds (2008-2016); Treasurer, Invesco Exchange-Traded Fund Trust, Invesco Exchange-Traded Fund Trust II, Invesco India Exchange-Traded Fund Trust and Invesco Actively Managed Exchange-Traded Fund Trust (2011-2013); Vice President, Invesco Aim Advisers, Inc., Invesco Aim Capital Management, Inc. and Invesco Aim Private Asset Management, Inc.; Assistant Vice |
| * | This is the date each Officer began serving the Trust. Each Officer serves an indefinite term, until his or her successor is elected. |
Trustees and Officers(continued)
| | | | | | |
Name, Address and Year of
Birth of Executive Officers | | Position(s)
Held
with Trust | | Length of
Time
Served* | | Principal
Occupation(s)
During
Past 5 Years |
| | | | | | President and Assistant Treasurer, The Invesco Funds and Assistant Vice President, Invesco Advisers, Inc., Invesco Aim Capital Management, Inc. and Invesco Aim Private Asset Management, Inc. |
| | | |
Anna Paglia—1974 Invesco Capital Management LLC 3500 Lacey Road, Suite 700 Downers Grove, IL 60515 | | Secretary | | Since 2011 | | Secretary, Invesco Specialized Products, LLC (2018-Present); Secretary, Invesco Exchange-Traded Fund Trust, Invesco Exchange-Traded Fund Trust II, Invesco India Exchange-Traded Fund Trust, Invesco Actively Managed Exchange-Traded Fund Trust (2011-Present), Invesco Actively Managed Exchange-Traded Commodity Fund Trust (2014-Present) and Invesco Exchange-Traded Self-Indexed Fund Trust (2015-Present); Head of Legal (2010-Present) and Secretary (2015-Present), Invesco Capital Management LLC; Manager and Assistant Secretary, Invesco Indexing LLC (2017-Present); formerly, Partner, K&L Gates LLP (formerly, Bell Boyd & Lloyd LLP) (2007-2010); Associate Counsel at Barclays Global Investors Ltd. (2004-2006). |
| | | |
Rudolf E. Reitmann—1971 Invesco Capital Management LLC 3500 Lacey Road, Suite 700 Downers Grove, IL 60515 | | Vice President | | Since 2013 | | Head of Global Exchange Traded Funds Services, Invesco Specialized Products, LLC (2018-Present); Vice President, Invesco Exchange-Traded Fund Trust, Invesco Exchange-Traded Fund Trust II, Invesco India Exchange-Traded Fund Trust, Invesco Actively Managed Exchange-Traded Fund Trust (2013-Present), Invesco Actively Managed Exchange-Traded Commodity Fund Trust (2014-Present) and Invesco Exchange-Traded Self-Indexed Fund Trust (2016-Present); Head of Global Exchange Traded Funds Services, Invesco Capital Management LLC (2013-Present); Vice President, Invesco Capital Markets, Inc. (2018-Present). |
| | | |
David Warren—1957 Invesco Canada Ltd. 5140 Yonge Street, Suite 800 Toronto, Ontario M2N 6X7 | | Vice President | | Since 2009 | | Manager, Invesco Specialized Products, LLC (2018-Present); Vice President, Invesco Exchange-Traded Fund Trust, Invesco Exchange-Traded Fund Trust II, Invesco India Exchange-Traded Fund Trust, and Invesco Actively Managed Exchange-Traded Fund Trust (2009-Present), Invesco Actively Managed Exchange-Traded Commodity Fund Trust (2014-Present) and Invesco Exchange-Traded Self-Indexed Fund Trust (2016-Present); Senior Vice President, Invesco Advisers, Inc. (2009-Present); Director, Invesco Inc. (2009-Present); Director, Executive Vice President and Chief Financial Officer, Invesco Canada Ltd. (formerly, Invesco Trimark Ltd.) (2011-Present); Chief Administrative Officer, North American Retail, Invesco Ltd. (2007-Present); Director, Invesco Corporate Class Inc. (2014-Present); Director, Invesco Global Direct Real Estate Feeder GP Ltd. (2015-Present); Director, Invesco Canada Holdings Inc. (2002-Present); Director, Invesco Financial Services Ltd. / Services Financiers Invesco Ltée and Trimark Investments Ltd./Placements Trimark Ltée (2014-Present); Director, Invesco IP Holdings (Canada) Ltd. (2016-Present); Director, Invesco Global Direct Real Estate GP Ltd. (2015-Present); formerly, Managing Director—Chief Administrative Officer, Americas, Invesco Capital Management LLC (2013-2019); Senior Vice President, Invesco Management Group, Inc. (2007-2018); Executive Vice President and Chief Financial Officer, Invesco Inc. (2009-2015); Director, Executive Vice President and Chief Financial Officer, Invesco Canada Ltd. (formerly, Invesco Trimark Ltd.) (2000-2011). |
| | | |
Melanie Zimdars—1976 Invesco Capital Management LLC 3500 Lacey Road, Suite 700 Downers Grove, IL 60515 | | Chief Compliance Officer | | Since 2017 | | Chief Compliance Officer, Invesco Specialized Products, LLC (2018-Present); Chief Compliance Officer, Invesco Capital Management LLC (2017-Present); Chief Compliance Officer, Invesco Exchange-Traded Fund Trust, Invesco Exchange-Traded Fund Trust II, Invesco India Exchange-Traded Fund Trust, Invesco Actively Managed Exchange-Traded Fund Trust, Invesco Actively Managed Exchange-Traded Commodity Fund Trust and Invesco Exchange-Traded Self-Indexed Fund Trust (2017-Present); formerly, Vice President and Deputy Chief Compliance Officer at ALPS Holding, Inc. (2009-2017); Mutual Fund Treasurer/Chief Financial Officer at Wasatch Advisors, Inc. (2005-2008); Compliance Officer, U.S. Bancorp Fund Services, LLC (2001-2005). |
Availability of Additional Information About the Trustees
The Statement of Additional Information includes additional information about the Trustees and is available, without charge, upon request at (800)983-0903.
| * | This is the date each Officer began serving the Trust. Each Officer serves an indefinite term, until his or her successor is elected. |
Board Considerations Regarding Approval of Investment Advisory Agreement
Board Considerations Regarding Approval of Investment Advisory Agreement for
Invesco Emerging Markets Revenue ETF
Invesco Emerging Markets Ultra Dividend Revenue ETF
Invesco Global ESG Revenue ETF
Invesco Global Revenue ETF
Invesco International Revenue ETF
Invesco International Ultra Dividend Revenue ETF
Invesco Russell 1000® Low Volatility Factor ETF
Invesco Russell 1000® Momentum Factor ETF
Invesco Russell 1000® Quality Factor ETF
Invesco Russell 1000® Size Factor ETF
Invesco Russell 1000® Value Factor ETF
Invesco Russell 1000® Yield Factor ETF
Invesco S&P 500 Revenue ETF
Invesco S&P Financials Revenue ETF
Invesco S&P MidCap 400 Revenue ETF
Invesco S&P SmallCap 600 Revenue ETF
Invesco S&P Ultra Dividend Revenue ETF
At a meeting held on December 12, 2018, the Board of Trustees of the Invesco Exchange-Traded Fund Trust II (the “Trust”), including the Independent Trustees, approved the Investment Advisory Agreement (the “Agreement”) between Invesco Capital Management LLC (the “Adviser”) and the Trust for the funds listed above (each, a “Fund” and collectively, the “Funds”).
The Trustees reviewed information provided by the Adviser describing: (i) the nature, extent and quality of services to be provided, (ii) the proposed unitary advisory fee for each Fund and comparisons to amounts paid by other comparable registered investment companies, (iii) the extent to which economies of scale may be realized as each Fund grows, (iv) whether the fee levels reflect any possible economies of scale for the benefit of Fund shareholders, and (v) any benefits to be realized by the Adviser from its relationship with each Fund.
The Trustees noted that each Fund was created in connection with the purchase by Invesco Ltd. of OppenheimerFunds, Inc. and its subsidiaries, from Massachusetts Mutual Life Insurance Company (the “Transaction”) and that each Fund was structured substantially similar to a corresponding Oppenheimer ETF, including the unitary advisory fee, that would be reorganized into the Fund in connection with the Transaction.
Nature, Extent and Quality of Services. In evaluating the nature, extent and quality of the Adviser’s services, the Trustees reviewed information concerning the functions to be performed by the Adviser for each Fund, information describing the Adviser’s current organization and staffing, including operational support that would be provided by the Adviser’s parent organization, Invesco Ltd., and the background and experience of the persons who will be responsible for theday-to-day management of the Funds, and they considered the quality of services provided by the Adviser to other exchange-traded funds (“ETFs”). The Trustees also reviewed information related to the Adviser’s portfolio transaction policies and procedures, as well as reports on the correlation and tracking error between the underlying indexes and the performance of other ETFs for which the Adviser serves as investment adviser.
The Trustees also considered the services to be provided by the Adviser in its oversight of the Funds’ administrator, custodian and transfer agent. They noted the significant amount of time, effort and resources that had been devoted to this oversight function for the other ETFs and that was expected to be provided for each Fund.
The Trustees also considered information provided by the Adviser regarding the resources added in recent years to maintain and enhance the services provided to the Funds and all other Invesco ETFs.
Based on their review, the Trustees concluded that the nature, extent and quality of the services to be provided by the Adviser to each Fund under the Agreement were expected to be appropriate and reasonable.
Fees, Expenses and Profitability. The Trustees reviewed and discussed the information provided by the Adviser on each Fund’s proposed unitary advisory fee, as compared to information compiled by the Adviser from Lipper Inc. (“Lipper”) databases on the median net expense ratios of comparable passive ETFs,open-end(non-ETF) index funds andopen-end(non-ETF) actively managed funds. The Trustees noted that the fee data provided by the Adviser included only oneopen-end index fund peer for Invesco S&P Financials Revenue ETF. The Trustees also considered fee and expense data on Adviser-identified selected peers for each Fund other than Invesco Russell 1000® Momentum Factor ETF. The Trustees noted that the fee data provided by the Adviser included one Adviser-identified selected peer for Invesco Russell 1000® Low Volatility Factor ETF, Invesco Russell 1000® Quality Factor ETF, Invesco Russell 1000® Size Factor ETF and Invesco Russell 1000® Value Factor ETF and two Adviser-identified selected peers for Invesco S&P 500 Revenue ETF and Invesco S&P SmallCap 600 Revenue ETF.
Board Considerations Regarding Approval of Investment Advisory Agreement(continued)
The Trustees noted that the proposed annual advisory fee to be charged to each Fund was a unitary fee, and that the Adviser has agreed to pay all other expenses of each Fund except for the fee payment under the Agreement, payments under the Fund’s12b-1 plan, if any, brokerage expenses, taxes, interest, acquired fund fees and expenses, if any, litigation expenses and other extraordinary expenses. The Trustees noted each Fund’s proposed unitary advisory fee as compared to the median net expense ratio of its peer groups and select peer group, as applicable, as shown below:
| | | | | | | | |
Fund | | ETF Peer Group
(Number of Peers)1 | | Open-End
Index Fund
Peer Group
(Number of Peers)2 | | Open-End Active
Fund Peer Group
(Number of Peers) | | Select Peer Group
(Number of Peers)3 |
| Invesco Emerging Markets Revenue ETF | | Lower than
median (57) | | Higher than
median (10) | | Lower than
median (209) | | Lower than
median (3) |
| Invesco Emerging Markets Ultra Dividend Revenue ETF | | Lower than
median (44) | | Higher than
median (3) | | Lower than
median (20) | | Lower than
median (4) |
| Invesco Global ESG Revenue ETF | | N/A | | N/A | | Lower than
median (38) | | Lower than
median (3) |
| Invesco Global Revenue ETF | | N/A | | N/A | | Lower than
median (38) | | Lower than
median (3) |
| Invesco International Revenue ETF | | Lower than
median (8) | | Lower than
median (5) | | Lower than
median (41) | | Lower than
median (3) |
| Invesco International Ultra Dividend Revenue ETF | | Lower than
median (44) | | Higher than
median (3) | | Lower than
median (20) | | Lower than
median (4) |
| Invesco Russell 1000® Low Volatility Factor ETF | | Lower than
median (36) | | Lower than
median (24) | | Lower than
median (182) | | Lower than
median (1) |
| Invesco Russell 1000® Momentum Factor ETF | | Lower than
median (36) | | Lower than
median (24) | | Lower than
median (182) | | N/A |
| Invesco Russell 1000® Quality Factor ETF | | Higher than
median (14) | | Lower than
median (15) | | Lower than
median (155) | | Lower than
median (1) |
| Invesco Russell 1000® Size Factor ETF | | Lower than
median (36) | | Lower than
median (24) | | Lower than
median (182) | | Lower than
median (1) |
| Invesco Russell 1000® Value Factor ETF | | Higher than
median (12) | | Lower than
median (10) | | Lower than
median (105) | | Lower than
median (1) |
| Invesco Russell 1000® Yield Factor ETF | | Lower than
median (36) | | Lower than
median (24) | | Lower than
median (182) | | Lower than
median (3) |
| Invesco S&P 500 Revenue ETF | | Higher than
median (12) | | Lower than
median (10) | | Lower than
median (105) | | Higher than
median (2) |
| Invesco S&P Financials Revenue ETF | �� | Higher than
median (19) | | Higher than
median (1) | | Lower than
median (22) | | Lower than
median (3) |
| Invesco S&P MidCap 400 Revenue ETF | | Higher than
median (32) | | Higher than
median (31) | | Lower than
median (257) | | Higher than
median (4) |
| Invesco S&P SmallCap 600 Revenue ETF | | Higher than
median (14) | | Lower than
median (10) | | Lower than
median (81) | | Lower than
median (2) |
| Invesco S&P Ultra Dividend Revenue ETF | | Higher than
median (29) | | Lower than
median (4) | | Lower than
median (131) | | Lower than
median (4) |
| 1 | The information provided by the Adviser indicated that certain Funds did not have any comparable ETF peers. Those Funds have been designated with an “N/A” for not available. |
| 2 | The information provided by the Adviser indicated that certain Funds did not have any comparableopen-end index fund peers. Those Funds have been designated with an “N/A” for not available. |
| 3 | The information provided by the Adviser did not include a select peer group for Invesco Russell 1000® Momentum Factor ETF. The Fund has been designated with an “N/A” for not available. |
The Trustees considered each Fund’s proposed unitary advisory fee in light of the administrative, operational and management oversight services to be provided by the Adviser. The Board concluded that the unitary advisory fee to be charged to each Fund is reasonable and appropriate in light of the services expected to be provided by the Adviser.
Board Considerations Regarding Approval of Investment Advisory Agreement(continued)
In conjunction with their review of the unitary advisory fee, the Trustees considered that the Adviser did not provide a profitability analysis for the Adviser in managing the Funds because the Funds had not yet commenced operations. However, the Trustees noted other information the Board received at its April 2018 meeting on the Adviser’s overall profitability from its relationship with other ETFs for which it serves as investment adviser.
Economies of Scale and Whether Fee Levels Reflect These Economies of Scale. The Trustees reviewed the information provided by the Adviser as to the extent to which economies of scale may be realized as each Fund grows and whether fee levels reflect economies of scale for the benefit of shareholders. The Trustees noted that any reduction in fixed costs associated with the management of each Fund would be enjoyed by the Adviser, but that a unitary advisory fee provides a level of certainty in expenses for each Fund. The Trustees considered whether the proposed unitary advisory fee rate for each Fund is reasonable in relation to the proposed services and product strategy of each Fund, and they concluded that the unitary advisory fee was reasonable and appropriate.
Fall-Out Benefits. The Trustees noted that the Adviser had not identified any further benefits that it would derive from its relationships with each Fund, and had noted that it does not have any soft-dollar arrangements.
Based on all of the information considered and the conclusions reached, the Board, including the Independent Trustees, determined to approve the Agreement for each Fund. No single factor was determinative in the Board’s analysis.
Proxy Voting Policies and Procedures
A description of the Trust’s proxy voting policies and procedures that the Funds use to determine how to vote proxies relating to portfolio securities is available, without charge and upon request, by calling (800)983-0903. This information is also available on the Securities and Exchange Commission’s (the “Commission”) website atwww.sec.gov.
Information regarding how each Fund voted proxies for portfolio securities, if applicable, during the most recent12-month period ended June 30, is available, without charge and upon request, by (i) calling (800)983-0903; or (ii) accessing the Trust’s FormN-PX on the Commission’s website atwww.sec.gov.
Quarterly Portfolios
The Trust files its complete schedule of portfolio holdings for the Funds with the Commission for the first and third quarters of each fiscal year on FormN-Q (or any successor Form). The Trust’s FormsN-Q (or any successor Form) are available on the Commission’s website atwww.sec.gov.
Frequency Distribution of Discounts and Premiums
A table showing the number of days the market price of each Fund’s shares was greater than the Fund’s net asset value, and the number of days it was less than the Fund’s net asset value (i.e., premium or discount) for the most recently completed calendar year, and the calendar quarters since that year end (or the life of the Fund, if shorter) may be found at the Fund’s website atwww.invesco.com/ETFs.
| | | | |
©2019 Invesco Capital Management LLC 3500 Lacey Road, Suite 700 Downers Grove, IL 60515 | | O-REV-AR-1 | | invesco.com/ETFs |
Item 2. Code of Ethics.
The Registrant has adopted a Code of Ethics that applies to the Registrant’s principal executive officer and principal financial officer. This Code is filed as an exhibit to this report on FormN-CSR under Item 12(a)(1). No substantive amendments to this Code were made during the reporting period. There were no waivers for the fiscal year ended June 30, 2019.
Item 3. Audit Committee Financial Expert.
The Registrant’s Board of Trustees (the “Board”) has determined that the Registrant has four “audit committee financial experts” serving on its audit committee (the “Audit Committee”): Mr. Marc M. Kole, Ms. Joanne Pace, Mr. Gary R. Wicker and Mr. Donald H. Wilson. Each of these Audit Committee members is “independent,” meaning that he is not an “interested person” of the Registrant (as that term is defined in Section 2(a)(19) of the Investment Company Act of 1940, as amended) and he or she does not accept any consulting, advisory, or other compensatory fee from the Registrant (except in his or her capacity as a Board or committee member).
An “audit committee financial expert” is not an “expert” for any purpose, including for purposes of Section 11 of the Securities Act of 1933, as a result of being designated as an “audit committee financial expert.” Further, the designation of a person as an “audit committee financial expert” does not mean that person has any greater duties, obligations, or liability than those imposed on a person without the “audit committee financial expert” designation. Similarly, the designation of a person as an “audit committee financial expert” does not affect the duties, obligations, or liability of any other member of the Audit Committee or the Board.
Item 4. Principal Accountant Fees and Services.
(a) to (d)
Fees Billed by PwC to the Registrant
PricewaterhouseCoopers LLP (“PwC”), the Registrant’s independent registered public accounting firm, billed the series of the Registrant with a fiscalyear-end of June 30, 2019 (each a “Fund”) aggregate fees for services rendered to these Funds as shown in the following table. Each Fund is newly organized and was created, respectively, for the purpose of acquiring the assets and liabilities of a corresponding predecessor fund (each, a “Reorganization”). Each Reorganization was consummated after the close of business on May 24, 2019, prior to which each Fund had not yet commenced operations. Accordingly, the information shown in the following table has been provided for the period since each Fund’s commencement of operations. The Audit Committeepre-approved all audit andnon-audit services provided to the Funds.
| | | | |
| | | Fees Billed by PwC for
Services Rendered to
the Funds for fiscal
year-end of 2019 | |
Audit Fees | | $ | 227,340 | |
Audit-Related Fees | | $ | 0 | |
Tax Fees(1) | | $ | 119,000 | |
All Other Fees | | $ | 0 | |
| | | | |
Total Fees | | $ | 346,340 | |
| (1) | Tax Fees for the fiscal year ended June 30, 2019 include fees billed for reviewing tax returns, 2018 excise tax returns and excise tax distributions calculations. |
Fees Billed by PwC Related to Invesco and Invesco Affiliates
PwC billed Invesco Capital Management LLC (“Invesco” or “Adviser”), each Fund’s investment adviser, and any entity controlling, controlled by or under common control with Invesco that provides ongoing services to each Fund (“Affiliates”), aggregate fees forpre-approvednon-audit services rendered to Invesco and Affiliates for the period since each Fund’s commencement of operations as shown in the following table. The Audit Committeepre-approved allnon-audit services provided to Invesco and Affiliates that were required to bepre-approved.
| | | | |
| | | Fees Billed for Non-
Audit Services
Rendered to
Invesco and
Affiliates for fiscal
year end 2019 That
Were Required
to bePre-Approved
by the Registrant’s
Audit Committee | |
Audit-Related Fees(1) | | $ | 690,000 | |
Tax Fees | | $ | 0 | |
All Other Fees | | $ | 0 | |
| | | | |
Total Fees | | $ | 690,000 | |
| (1) | Audit-Related Fees for the year end 2019 include fees billed related to reviewing controls at a service organization. |
(e)(1)Audit Committee Pre Approval Policies and Procedures
Pre-Approval of Audit andNon-Audit Services Policies and Procedures
As Adopted by the Audit Committee of the Invesco ETFs
| | |
| Applicable to | | Invesco Exchange-Traded Fund Trust, Invesco Exchange-Traded Fund Trust II, Invesco India Exchange-Traded Fund Trust, Invesco Actively Managed Exchange-Traded Fund Trust, Invesco Actively Managed Exchange-Traded Commodity Fund Trust and Invesco Exchange-Traded Self-Indexed Fund Trust (collectively the “Funds”) |
| |
| Risk Addressed by Policy | | Approval of Audit andNon-Audit Services |
| |
| Relevant Law and Other Sources | | Sarbanes-Oxley Act of 2002; RegulationS-X. |
| |
| Last Reviewed by Compliance for Accuracy | | June 15, 2018 |
| |
| Approved/Adopted Date | | June 2009 |
Statement of Principles
Under the Sarbanes-Oxley Act of 2002 and rules adopted by the Securities and Exchange Commission (“SEC”) (“Rules”), the Audit Committee of the Funds’ (the “Audit Committee”) Board of Trustees (the “Board”) is responsible for the appointment, compensation and oversight of the work of independent accountants (an “Auditor”). As part of this responsibility and to assure that the Auditor’s independence is not impaired, the Audit Committeepre-approves the audit andnon-audit services provided to the Funds by each Auditor, as well as allnon-audit services provided by the Auditor to the Funds’ investment adviser and to affiliates of the adviser that provide ongoing services to the Funds (“Service Affiliates”) if the services directly impact the Funds’ operations or financial reporting. The SEC Rules also specify the types of services that an Auditor may not provide to its audit client. The following policies and procedures comply with the requirements forpre-approval and provide a mechanism by which management of the Funds may request and securepre-approval of audit andnon-audit services in an orderly manner with minimal disruption to normal business operations.
Proposed services either may bepre-approved without consideration of specificcase-by-case services by the Audit Committee (“generalpre-approval”) or require the specificpre-approval of the Audit Committee (“specificpre-approval”). As set forth in these policies and procedures, unless a type of service has received generalpre-approval, it will require specificpre-approval by the Audit Committee. Additionally, any fees exceeding 110% of estimatedpre-approved fee levels provided at the time the service waspre-approved will also require specific approval by the Audit Committee before payment is made. The Audit Committee will also consider the impact of additional fees on the Auditor’s independence when determining whether to approve any additional fees for previouslypre-approved services.
The Audit Committee will annually review and generallypre-approve the services that may be provided by each Auditor without obtaining specificpre-approval from the Audit Committee. The term of any generalpre-approval runs from the date of suchpre-approval through June 30th of the following year, unless the Audit Committee considers a different period and states otherwise. The Audit Committee will add to or subtract from the list of generalpre-approved services from time to time, based on subsequent determinations.
The purpose of these policies and procedures is to set forth the guidelines to assist the Audit Committee in fulfilling its responsibilities.
Delegation
The Chairman of the Audit Committee (or, in his or her absence, any member of the Audit Committee) may grant specificpre-approval fornon-prohibited services. All such delegatedpre-approvals shall be presented to the Audit Committee no later than the next Audit Committee meeting.
Audit Services
The annual Audit services engagement terms will be subject to specificpre-approval of the Audit Committee. Audit services include the annual financial statement audit and other procedures such as tax provision work that is required to be performed by the independent auditor to be able to form an opinion on the Funds’ financial statements. The Audit Committee will obtain, review and consider sufficient information concerning the proposed Auditor to make a reasonable evaluation of the Auditor’s qualifications and independence.
In addition to the annual Audit services engagement, the Audit Committee may grant either general or specificpre-approval of other Audit services, which are those services that only the independent auditor reasonably can provide. Other Audit services may include services such as issuing consents for the inclusion of audited financial statements with SEC registration statements, periodic reports and other documents filed with the SEC or other documents issued in connection with securities offerings.
Non-Audit Services
The Audit Committee may provide either general or specificpre-approval of anynon-audit services to the Funds and its Service Affiliates if the Audit Committee believes that the provision of the service will not impair the independence of the Auditor, is consistent with the SEC’s Rules on auditor independence, and otherwise conforms to the Audit Committee’s general principles and policies as set forth herein.
Audit-Related Services
“Audit-related services” are assurance and related services that are reasonably related to the performance of the audit or review of the Funds’ financial statements or that are traditionally performed by the independent auditor. Audit-related services include, among others, accounting consultations related to accounting, financial reporting or disclosure matters not classified as “Audit services”; and assistance with understanding and implementing new accounting and financial reporting guidance from rulemaking authorities.
Tax Services
“Tax services” include, but are not limited to, the review and signing of the Funds’ federal tax returns, the review of required distributions by the Funds and consultations regarding tax matters such as the tax treatment of new investments or the impact of new regulations. The Audit Committee will scrutinize carefully the retention of the Auditor in connection with a transaction initially recommended by the Auditor, the major business purpose of which may be tax avoidance or the tax treatment of which may not be supported in the Internal Revenue Code and related regulations. The Audit Committee will consult with the Funds’ Treasurer (or his or her designee) and may consult with outside counsel or advisors as necessary to ensure the consistency of Tax services rendered by the Auditor with the foregoing policy.
No Auditor shall represent any Fund or any Service Affiliate before a tax court, district court or federal court of claims.
Under rules adopted by the Public Company Accounting Oversight Board and approved by the SEC, in connection with seeking Audit Committeepre-approval of permissible Tax services, the Auditor shall:
1. Describe in writing to the Audit Committee, which writing may be in the form of the proposed engagement letter:
| | a. | The scope of the service, the fee structure for the engagement, and any side letter or amendment to the engagement letter, or any other agreement between the Auditor and the Fund, relating to the service; and |
| | b. | Any compensation arrangement or other agreement, such as a referral agreement, a referral fee orfee-sharing arrangement, between the Auditor and any person (other than the Fund) with respect to the promoting, marketing, or recommending of a transaction covered by the service; |
2. Discuss with the Audit Committee the potential effects of the services on the independence of the Auditor; and
3. Document the substance of its discussion with the Audit Committee.
All Other Auditor Services
The Audit Committee maypre-approvenon-audit services classified as “All other services” that are not categorically prohibited by the SEC, as listed in Exhibit 1 to this policy.
Pre-Approval Fee Levels or Established Amounts
Pre-approval of estimated fees or established amounts for services to be provided by the Auditor under general or specificpre-approval policies will be set periodically by the Audit Committee. Any proposed fees exceeding 110% of the maximum estimatedpre-approved fees or established amounts forpre-approved audit andnon-audit services will be reported to the Audit Committee at the quarterly Audit Committee meeting and will require specific approval by the Audit Committee before payment is made. The Audit Committee will always factor in the overall relationship of fees for audit andnon-audit services in determining whether topre-approve any such services and in determining whether to approve any additional fees exceeding 110% of the maximumpre-approved fees or established amounts for previouslypre-approved services.
Procedures
On an annual basis, the Auditor will submit to the Audit Committee for generalpre-approval, a list ofnon-audit services that the Funds or Service Affiliates of the Funds may request from the Auditor. The list will describe thenon-audit services in reasonable detail and will include an estimated range of fees and such other information as the Audit Committee may request.
Each request for services to be provided by the Auditor under the generalpre-approval of the Audit Committee will be submitted to the Funds’ Treasurer (or his or her designee) and must include a detailed description of the services to be rendered. The Treasurer or his or her designee will ensure that such services are included within the list of services that have received the generalpre-approval of the Audit Committee.
Each request to provide services that require specific approval by the Audit Committee shall be submitted to the Audit Committee jointly by the Funds’ Treasurer or his or her designee and the Auditor, and must include a joint statement that, in their view, such request is consistent with thepre-approval policies and procedures and the SEC Rules.
Each request to provide Tax services under either the general or specificpre-approval of the Audit Committee will describe in writing: (i) the scope of the service, the fee structure for the engagement, and any side letter or amendment to the engagement letter, or any other agreement between the Auditor and the audit client, relating to the service; and (ii) any compensation arrangement or other agreement between the Auditor and any person (other than the audit client) with respect to the promoting, marketing, or recommending of a transaction covered by the service. The Auditor will discuss with the Audit Committee the potential effects of the services on the Auditor’s independence and will document the substance of the discussion.
Non-audit services pursuant to the de minimis exception provided by the SEC Rules will be promptly brought to the attention of the Audit Committee for approval, including documentation that each of the conditions for this exception, as set forth in the SEC Rules, has been satisfied.
On at least an annual basis, the Auditor will prepare a summary of all the services provided to any entity in the investment company complex as defined in section2-01(f)(14) of RegulationS-X in sufficient detail as to the nature of the engagement and the fees associated with those services.
The Audit Committee has designated the Funds’ Treasurer to monitor the performance of all services provided by the Auditor and to ensure such services are in compliance with these policies and procedures. The Funds’ Treasurer will report to the Audit Committee on a periodic basis as to the results of such monitoring. Both the Funds’ Treasurer and management will immediately report to the Chairman of the Audit Committee any breach of these policies and procedures that comes to the attention of the Funds’ Treasurer or senior management.
Adopted: June 26, 2009
Amended: June 15, 2018
Exhibit 1 toPre-Approval of Audit andNon-Audit Services Policies and Procedures
Conditionally ProhibitedNon-Audit Services (not prohibited if the Fund can reasonably conclude that the results of the service would not be subject to audit procedures in connection with the audit of the Fund’s financial statements)
| | • | | Bookkeeping or other services related to the accounting records or financial statements of the audit client |
| | • | | Financial information systems design and implementation |
| | • | | Appraisal or valuation services, fairness opinions, orcontribution-in-kind reports |
| | • | | Internal audit outsourcing services |
Categorically ProhibitedNon-Audit Services
| | • | | Broker-dealer, investment adviser, or investment banking services |
| | • | | Expert services unrelated to the audit |
| | • | | Any service or product provided for a contingent fee or a commission |
| | • | | Services related to marketing, planning, or opining in favor of the tax treatment of confidential transactions or aggressive tax position transactions, a significant purpose of which is tax avoidance |
| | • | | Tax services for persons in financial reporting oversight roles at the Fund |
| | • | | Any other service that the Public Company Oversight Board determines by regulation is impermissible. |
| (e)(2) | There were no amounts that werepre-approved by the Audit Committee pursuant to the de minimus exception underRule 2-01 of RegulationS-X. | |
| | (g) | In addition to the amounts shown in the tables above, PwC billed Invesco and Affiliates aggregate fees of $3,213,000 for the fiscal year ended June 30, 2019 fornon-audit services not required to bepre-approved by the Registrant’s Audit Committee. In total, PwC billed the Registrant, Invesco and Affiliates aggregatenon-audit fees of $4,022,000 for the fiscal year ended 2019. |
| | (h) | With respect to thenon-audit services above billed to Invesco and Affiliates that were not required to bepre-approved by the Registrant’s Audit Committee, the Audit Committee received information from PwC about such services, including by way of comparison, that PwC provided audit services to entities within the Investment Company Complex, as defined by Rule2-01(f)(14) of RegulationS-X, of approximately $34 million andnon-audit services of approximately $19 million for the fiscal year ended 2019. The Audit Committee considered this information in evaluating PwC’s independence. |
PwC informed the Audit Committee that it has identified an issue related to its independence under Rule2-01(c)(1)(ii)(A) of RegulationS-X (referred to as the “Loan Rule”). The Loan Rule prohibits accounting firms, such as PwC, from being deemed independent if they have certain financial relationships with their audit clients or certain affiliates of those clients. The Registrant is required under various securities laws to have its financial statements audited by an independent accounting firm.
The Loan Rule specifically provides that an accounting firm would not be independent if it receives a loan from a lender that is a record or beneficial owner of more than ten percent of an audit client’s equity securities. For purposes of the Loan Rule, audit clients include the Registrant as well as all registered investment companies advised by the Adviser and its affiliates, including other subsidiaries of the Adviser’s parent company, Invesco Ltd. (collectively, the “Invesco Fund Complex”). PwC informed the Audit Committee it has relationships with lenders who hold, as record owner, more than ten percent of the shares of certain funds within the Invesco Fund Complex. These relationships call into question PwC’s independence under the Loan Rule with respect to those funds, as well as all other funds in the Invesco Fund Complex.
On June 20, 2016, the SEC Staff issued a“no-action” letter to another mutual fund complex (see Fidelity Management & Research Company et al.,No-Action Letter) related to the audit independence issue described above. In that letter, the SEC confirmed that it would not recommend enforcement action against a fund that relied on audit services performed by an audit firm that was not in compliance with the Loan Rule in certain specified circumstances. On June 18, 2019, the SEC adopted amendments to the Loan Rule (the “Amendments”) addressing many of the issues that led to the issuance of theno-action letter. The Amendments become effective and supersede theno-action letter on October 3, 2019, 90 days after publication in the Federal Register.
In an August 18, 2016 letter, and in subsequent communications, PwC affirmed to the Audit Committee that, as of the date of the letter and the subsequent communications, respectively, PwC is an independent accountant with respect to the Registrant within the meaning of PCAOB Rule 3520. In its letter and in its subsequent communications, PwC also informed the Audit Committee that, after evaluating the facts and circumstances and the applicable independence rules, PwC has concluded that with regard to its compliance with the independence criteria set forth in the rules and regulations of the SEC related to the Loan Rule, it believes that it remains objective and impartial despite matters that may ultimately be determined to be inconsistent with these criteria and therefore it can continue to serve as the Registrant’s registered public accounting firm. PwC has advised the Audit Committee that this conclusion is based in part on the following considerations: (1) the lenders to PwC have no influence over any fund, or other entity within the Invesco Fund Complex, or its Adviser; (2) none of the officers or trustees of the Invesco Fund Complex whose shares are owned by PwC lenders are associated with those lenders; (3) PwC understands that the shares held by PwC lenders are held for the benefit of and on behalf of its policy owners/end investors; (4) investments in funds such as the Invesco Fund Complex funds are passive; (5) the PwC lenders are part of various syndicates of unrelated lenders; (6) there have been no changes to the loans in question since the origination of each respective note; (7) the debts are in good standing and no lender has the right to take action against PwC, as borrower, in connection with the financings; (8) the debt balances with each lender are immaterial to PwC and to each lender; and (9) the PwC audit engagement team has no involvement in PwC’s treasury function and PwC’s treasury function has no oversight of or ability to influence the PwC audit engagement team. In addition, PwC has communicated that the lending relationships appear to be consistent with the lending relationships described in theno-action letter and that they are not aware of other relationships that would be implicated by the Loan Rule. In addition to relying on PwC’s August 18, 2016 letter and subsequent communications regarding its independence, the Registrant intends to rely upon theno-action letter.
If in the future the independence of PwC is called into question under the Loan Rule by circumstances that are not addressed in the SEC’sno-action letter or the Amendments, the Registrant may need to take other action in order for the Registrant’s filings with the SEC containing financial statements to be deemed compliant with applicable securities laws. Such additional actions could result in additional costs, impair the ability of the Registrant to issue new shares or have other material adverse effects on the Registrant. The SECno-action relief was initially set to expire 18 months from issuance, but has been extended by the SEC without an expiration date, except that theno-action letter will be withdrawn upon the effectiveness of the Amendments.
During the reporting period, PwC advised the Registrant’s Audit Committee of the following matter for consideration under the SEC auditor independence rules. PwC advised the Audit Committee that two PwC Managers, a PwC Senior Manager and a PwC Partner each held financial interests either directly or, in the case of the PwC Partner, indirectly through her spouse’s equivalent brokerage account, in investment companies within the Invesco Fund Complex that were inconsistent with the requirements of Rule 2-01(c)(1) of Regulation S-X. PwC noted, among other things, that during the time of its audit, the engagement team was not aware of the investments, the individuals were not in the chain of command of the audit or the audit partners of Invesco or the affiliates of the Registrant, the services each individual provided were not relied upon by the audit engagement team with respect to the audit of the Registrant or its affiliates, or in the case of the PwC Partner, the individual did not provide any audit services to the Registrant or its affiliates and the investments were not material to the net worth of each individual or their respective immediate family members which they considered in reaching their conclusion. PwC advised the Audit Committee that it believes its objectivity and impartiality has not been adversely affected by these matters as they relate to the audit of the Registrant.
On May 24, 2019, certain investment advisor subsidiaries of Invesco Ltd. assumed management responsibility from Oppenheimer Funds, Inc. (“OFI”) for 83open-end mutual funds and 20 exchange-traded funds (collectively, the “Oppenheimer Funds”). Assumption of management responsibility for the Oppenheimer Funds was accomplished through the reorganization of each Oppenheimer Fund into a new Invesco shell fund (collectively, the “New Invesco Funds”) that did not havepre-existing assets (together, the “Reorganizations”). The Reorganizations were part of the acquisition by Invesco Ltd. (together with its subsidiaries, “Invesco”) of the asset management business of OFI (including the Oppenheimer Funds) from Massachusetts Mutual Life Insurance Company (“MassMutual”), which was also consummated on May 24, 2019 (the “Acquisition”). Subsequent to the Acquisition, MassMutual became a significant shareholder of Invesco, and the Invesco Ltd. board of directors expanded by one director with the addition of a director selected by MassMutual.
Prior to the consummation of the Acquisition and the Reorganizations on May 24, 2019, PwC completed an independence assessment to evaluate the services and relationships with OFI and its affiliates, which became affiliates of Invesco upon the closing of the Acquisition. The assessment identified the following relationship and services that are inconsistent with the auditor independence rules under Rule2-01 of RegulationS-X (“Rule2-01”) if provided to an affiliate of an audit client. A retired PwC partner who receives a benefit from PwC that is not fully funded served as a member of Audit Committee of the Boards of Trustees of certain Oppenheimer Funds prior to the Acquisition (the“Pre-Reorganization Relationship”). Additionally, PwC provided certainnon-audit services, including expert legal services to one Oppenheimer Fund, custody of client assets in connection with payroll services, anon-audit service performed pursuant to a success-based fee,non-audit services in which PwC acted as an advocate on behalf of a MassMutual foreign affiliate and certain employee activities undertaken in connection with the provision ofnon-audit services for MassMutual and certain MassMutual foreign affiliates (collectively, the“Pre-Reorganization Services”).
PwC and the Audit Committees of the New Invesco Funds each considered the impact that thePre-Reorganization Relationship and Services have on PwC’s independence with respect to the New Invesco Funds. On the basis of the nature of the relationship and services performed, and in particular the mitigating factors described below, PwC concluded that a reasonable investor, possessing knowledge of all the relevant facts and circumstances regarding thePre-Reorganization Relationship and Services, would conclude that thePre-Reorganization Relationship and Services do not impair PwC’s ability to exhibit the requisite objectivity and impartiality to report on the financial statements of the New Invesco Funds for the years ending May 31, 2019 – April 30, 2020 (“PwC’s Conclusion”).
The Audit Committees of the Boards of Trustees of the New Invesco Funds, based upon PwC’s Conclusion and the concurrence of Invesco, considered the relevant facts and circumstances, including the mitigating factors described below, and after careful consideration, concluded that PwC is capable of exercising objective and impartial judgment in connection with its audits of the financial statements of the New Invesco Funds that the respective Boards of Trustees oversee.
Mitigating factors that PwC and the Audit Committees considered in reaching their respective conclusions included, among others, the following factors:
| • | | none of thePre-Reorganization Relationship or Services created a mutuality of interest between PwC and the New Invesco Funds; |
| • | | PwC will not act in a management or employee capacity for the New Invesco Funds or their affiliates during any portion of PwC’s professional engagement period; |
| • | | other than the expert legal services,Pre-Reorganization Services that have been provided to OFI, MassMutual and their affiliates do not have any impact on the financial statements of the New Invesco Funds; |
| • | | as it relates to the expert legal services, while the service provided by PwC related to litigation involving one Oppenheimer Fund, the impact of the litigation on the Oppenheimer Fund’s financial statements was based upon OFI’s decision, and OFI management represented that the PwC service was not considered a significant component of its decision; |
| • | | while certain employees of OFI who were involved in the financial reporting process of the Oppenheimer Funds will be employed by Invesco subsequent to the Reorganizations, existing officers of other Invesco Funds will serve as Principal Executive Officer and Principal Financial Officer or equivalent roles for the New Invesco Funds, and are ultimately responsible for the accuracy of all financial statement assertions for the entirety of the financial reporting periods for the New Invesco Funds; |
| • | | thePre-Reorganization Services giving rise to the lack of independence were provided to, or entered into with, OFI, MassMutual and their affiliates at a time when PwC had no independence restriction with respect to these entities; |
| • | | with the exception of the expert legal service provided to one Oppenheimer Fund, none of thePre-Reorganization Services affected the operations or financial reporting of the New Invesco Funds; |
| • | | thePre-Reorganization Services provided by PwC to OFI, MassMutual and their affiliates were performed by persons who were not, and will not be, part of the audit engagement team for the New Invesco Funds; and |
| • | | the fees associated with thePre-Reorganization Services were not material to MassMutual, Invesco or PwC. |
Item 5. Audit Committee of Listed Registrants.
| | (a) | The Registrant has a separately designated Audit Committee established in accordance with Section 3(a)(58)(A) of the Securities Exchange Act of 1934, as amended, which consists solely of independent trustees. The Audit Committee members are: Marc M. Kole, Joanne Pace, Gary R. Wicker, and Donald H. Wilson. |
Item 6. Schedule of Investments.
| (a) | The Schedules of Investments are included as a part of the report to shareholders filed under Item 1 of this FormN-CSR. |
Item 7. Disclosure of Proxy Voting Policies and Procedures forClosed-End Management Investment Companies.
Not applicable.
Item 8. Portfolio Managers ofClosed-End Management Investment Companies.
Not applicable.
Item 9. Purchases of Equity Securities byClosed-End Management Investment Company and Affiliated Purchasers.
Not applicable.
Item 10. Submission of Matters to a Vote of Security Holders.
There have been no material changes to the procedures by which shareholders may recommend nominees to the Board that would require disclosure herein.
Item 11. Controls and Procedures.
| | (a) | Based on their evaluation of the Registrant’s disclosure controls and procedures (as defined in Rule30a-3(c) under the Investment Company Act of 1940) as of a date within 90 days of the filing date of this report, the Registrant’s President (principal executive officer) and Treasurer (principal financial officer) have concluded that such disclosure controls and procedures are effective. |
| | (b) | There were no changes in the registrant’s internal control over financial reporting (as defined in Rule30a-3(d) under the Investment Company Act of 1940) that occurred during the period covered by this report that has materially affected, or is reasonably likely to materially affect, the registrant’s internal control over financial reporting. |
Item 12. Disclosure of Securities Lending Activities forClosed-End Management Investment Companies.
Not applicable.
Item 13. Exhibits.
| | (a)(1) | Code of Ethics is attached as Exhibit 99.CODEETH. |
| | (a)(2) | Certifications of the Registrant’s President and Treasurer pursuant to Rule30a-2(a) under the Investment Company Act of 1940 and Section 302 of the Sarbanes-Oxley Act of 2002 are attached as Exhibit 99.CERT. |
| | (a)(4) | Registrant’s Independent Public Accountant |
| | (b) | Certifications of the Registrant’s President and Treasurer pursuant to Rule30a-2(b) under the Investment Company Act of 1940 and Section 906 of the Sarbanes-Oxley Act of 2002 are attached as Exhibit 99.906CERT. |
SIGNATURES
Pursuant to the requirements of the Securities Exchange Act of 1934 and the Investment Company Act of 1940, the Registrant has duly caused this report to be signed on its behalf by the undersigned, thereunto duly authorized.
(Registrant) Invesco Exchange-Traded Fund Trust II
| | |
| By: | | /s/ Daniel E. Draper |
| Name: | | Daniel E. Draper |
| Title: | | President |
| |
| Date: | | September 6, 2019 |
Pursuant to the requirements of the Securities Exchange Act of 1934 and the Investment Company Act of 1940, this report has been signed below by the following persons on behalf of the Registrant and in the capacities and on the dates indicated.
| | |
| By: | | /s/ Daniel E. Draper |
| Name: | | Daniel E. Draper |
| Title: | | President |
| |
| Date: | | September 6, 2019 |
| |
| By: | | /s/ Kelli Gallegos |
| Name: | | Kelli Gallegos |
| Title: | | Treasurer |
| |
| Date: | | September 6, 2019 |