Filed by Targa Resources Partners LP.
Pursuant to Rule 425 of the Securities Act of 1933
and deemed filed pursuant to Rule 14a-12
of the Securities Exchange Act of 1934
Subject Company: Atlas Pipeline Partners, L.P.
Commission File No.: 001-14998
This filing relates to a proposed business combination involving Targa Resources Partners LP and Atlas Pipeline Partners, L.P.
 Targa Resources Acquisition of Atlas Pipeline Partners, L.P. and Atlas Energy, L.P. October 2014 |
 2 Forward Looking Statements Certain statements in this presentation are "forward-looking statements" within the meaning of Section 27A of the Securities Act of 1933, as amended, and Section 21E of the Securities Exchange Act of 1934, as amended. All statements, other than statements of historical facts, included in this presentation that address activities, events or developments that Targa Resources Partners LP (NYSE: NGLS; “TRP” or the “Partnership”) or Targa Resources Corp. (NYSE: TRGP; “TRC” or the “Company”) (together “Targa”) expect, believe or anticipate will or may occur in the future are forward-looking statements. These forward-looking statements rely on a number of assumptions concerning future events and are subject to a number of uncertainties, factors and risks, many of which are outside the Partnership’s and the Company’s control, which could cause results to differ materially from those expected by management of Targa Resources Partners LP and Targa Resources Corp. Such risks and uncertainties include, but are not limited to, weather, political, economic and market conditions, including declines in the production of natural gas or in the price and market demand for natural gas and natural gas liquids, the timing and success of business development efforts, the credit risk of customers and other uncertainties. These and other applicable uncertainties, factors and risks are described more fully in the Partnership's and the Company’s Annual Reports on Form 10-K for the year ended December 31, 2013 and other reports filed with the Securities and Exchange Commission. The Partnership and the Company undertake no obligation to update or revise any forward-looking statement, whether as a result of new information, future events or otherwise. |
 3 Additional Information Additional Information and Where to Find It In connection with the proposed transaction, Targa Resources Corp. (“TRGP”) will file with the U.S. Securities and Exchange Commission (the “SEC”) a registration statement on Form S-4 that will include a joint proxy statement of Atlas Energy, L.P. (“ATLS”) and TRGP and a prospectus of TRGP (the “TRGP joint proxy statement/prospectus”). In connection with the proposed transaction, TRGP plans to mail the definitive TRGP joint proxy statement/prospectus to its shareholders, and ATLS plans to mail the definitive TRGP joint proxy statement/prospectus to its unitholders. Also in connection with the proposed transaction, Targa Resources Partners LP (“NGLS”) will file with the SEC a registration statement on Form S-4 that will include a proxy statement of Atlas Pipeline Partners, L.P. (“APL”) and a prospectus of NGLS (the “NGLS proxy statement/prospectus”). In connection with the proposed transaction, APL plans to mail the definitive NGLS proxy statement/prospectus to its unitholders. INVESTORS, SHAREHOLDERS AND UNITHOLDERS ARE URGED TO READ THE TRGP JOINT PROXY STATEMENT/PROSPECTUS, THE NGLS PROXY STATEMENT/PROSPECTUS AND OTHER RELEVANT DOCUMENTS FILED OR TO BE FILED WITH THE SEC CAREFULLY AND IN THEIR ENTIRETY WHEN THEY BECOME AVAILABLE BECAUSE THEY WILL CONTAIN IMPORTANT INFORMATION ABOUT TRGP, NGLS, ATLS AND APL, AS WELL AS THE PROPOSED TRANSACTION AND RELATED MATTERS. This communication does not constitute an offer to sell or the solicitation of an offer to buy any securities or a solicitation of any vote or approval. A free copy of the TRGP Joint Proxy Statement/Prospectus, the NGLS Proxy Statement/Prospectus and other filings containing information about TRGP, NGLS, ATLS and APL may be obtained at the SEC’s Internet site at www.sec.gov. In addition, the documents filed with the SEC by TRGP and NGLS may be obtained free of charge by directing such request to: Targa Resources, Attention: Investor Relations, 1000 Louisiana, Suite 4300, Houston, Texas 77002 or emailing jkneale@targaresources.com or calling (713) 584-1133. These documents may also be obtained for free from TRGP’s and NGLS’s investor relations website at www.targaresources.com. The documents filed with the SEC by ATLS may be obtained free of charge by directing such request to: Atlas Energy, L.P., Attn: Investor Relations, 1845 Walnut Street, Philadelphia, Pennsylvania 19103 or emailing InvestorRelations@atlasenergy.com. These documents may also be obtained for free from ATLS’s investor relations website at www.atlasenergy.com. The documents filed with the SEC by APL may be obtained free of charge by directing such request to: Atlas Pipeline Partners, L.P., Attn: Investor Relations, 1845 Walnut Street, Philadelphia, Pennsylvania 19103 or emailing IR@atlaspipeline.com. These documents may also be obtained for free from APL’s investor relations website at www.atlaspipeline.com. Participants in Solicitation Relating to the Merger TRGP, NGLS, ATLS and APL and their respective directors, executive officers and other persons may be deemed to be participants in the solicitation of proxies from TRGP, ATLS or APL shareholders or unitholders, as applicable, in respect of the proposed transaction that will be described in the TRGP joint proxy statement/prospectus and NGLS proxy statement/prospectus. Information regarding TRGP’s directors and executive officers is contained in TRGP’s definitive proxy statement dated April 7, 2014, which has been filed with the SEC. Information regarding directors and executive officers of NGLS’s general partner is contained in NGLS’s Annual Report on Form 10-K for the year ended December 31, 2013, which has been filed with the SEC. Information regarding directors and executive officers of ATLS’s general partner is contained in ATLS’s definitive proxy statement dated March 21, 2014, which has been filed with the SEC. Information regarding directors and executive officers of APL’s general partner is contained in APL’s Annual Report on Form 10-K for the year ended December 31, 2013, which has been filed with the SEC. A more complete description will be available in the registration statement and the joint proxy statement/prospectus. |
 4 Targa + Atlas: Transaction Overview Targa Resources Partners LP (NYSE: NGLS; “TRP” or the “Partnership”) has executed a definitive agreement to acquire Atlas Pipeline Partners, L.P. (NYSE: APL) for $5.8 billion (1) 0.5846 NGLS common units plus a one-time cash payment of $1.26 for each APL LP unit (implied premium (1) of 15%) $1.8 billion of debt at September 30, 2014 Targa Resources Corp. (NYSE: TRGP; “TRC” or the “Company”) has executed a definitive agreement to acquire Atlas Energy, L.P. (NYSE: ATLS), after its spin-off of non APL-related assets, for $1.9 billion (1) Prior to TRGP’s acquisition, all assets held by ATLS not associated with APL will be spun out to existing ATLS unitholders 10.35 million TRGP shares issued to ATLS unitholders $610 million of cash to ATLS Each existing ATLS (after giving effect to ATLS’ spin out) unit will receive 0.1809 TRGP shares and $9.12 in cash Accretive to NGLS and TRGP cash flow per unit and share, respectively, immediately and over the longer-term, while providing APL and ATLS unitholders increased value now and into the future Post closing (2) , NGLS plans to increase its quarterly distribution by $0.04 per LP unit ($0.16 per LP unit annualized rate) NGLS expects 11-13% distribution growth in 2015 compared to 7-9% in 2014 Post closing (2) , TRGP plans to increase its quarterly dividend by $0.10 per share ($0.40 per share annualized rate) TRGP expects approximately 35% dividend growth (3) in 2015 compared to 25%+ in 2014 Transactions are cross-conditional and expected to close Q1 2015, subject to shareholder and regulatory approvals (1) Based on market data as of October 10, 2014, excluding transaction fees and expenses (2) Management intends to recommend this increase at the first regularly scheduled quarterly distribution declaration Board meeting after transaction closes (3) Assumes NGLS distribution growth of 11-13% |
 Targa + Atlas: Benefits All Shareholders NGLS Benefits from larger asset base to support additional long term growth Higher dividend growth outlook Lowers effective cash tax rate Long term dividend accretion of $1.00-$2.00 per share 5 TRGP APL NGLS + Cash ATLS TRGP + Cash $1.9 billion total consideration drives immediate value uplift Higher distribution/dividend growth outlook Benefits from transaction accrue to ATLS as new TRGP shareholders Direct leverage to pure-play high-growth midstream GP Complementary assets in attractive basins Higher distribution growth outlook Scale and diversity support enhanced credit profile Adds to already strong backlog of projects under development Immediate value uplift of 15% premium Higher distribution growth outlook Improved balance sheet and capital access to fund growth More diverse business mix and higher percentage of fee based margin to support distributions |
 6 Targa + Atlas: Strategic Highlights Attractive Positions in Active Basins Creates World- Class Permian Footprint Complementary Assets with Significant Growth Opportunities Enhances Credit Profile Significant Long- Term Value Creation Already strong positions in Permian and Bakken enhanced with entry into Mississippi Lime and Eagle Ford 4 of the top 5 basins by active rig count and unconventional well spuds (1) Top 3 basins by oil production (1) Also exposed to emerging SCOOP play and continued development of NGL-rich Barnett Shale Adds diversity and leadership position in all basins/plays Combines strong Permian Basin positions to create a premier franchise Provides new customer relationships with the most active operators in each basin Current combined processing capacity of 1,439 MMcf/d plus 500 MMcf/d of announced expansions Significant organic growth project opportunities 2014 growth capex of ~$1.2 billion 2015 growth capex expected to exceed $1.2 billion Additional projects under development of over $3 billion NGL production to support Targa’s leading NGL position in Mont Belvieu and Galena Park Estimated pro forma leverage ratio of 3.3x Total Debt / 2014E EBITDA (4) at NGLS Increased size and scale move NGLS credit metrics closer to investment grade over time Immediately accretive to distributable cash flow at both NGLS and TRGP Increases FY 2015 vs FY 2014 distribution growth at NGLS to 11-13% and at TRGP to approximately 35% Provides larger asset base with additional long-term growth opportunities Higher long-term distribution/dividend growth profile than Targa standalone (1) Source: Oil & Gas Investor (2) Based on market data as of October 10, 2014, less the value of 16.3 MM PF NGLS units owned by TRGP (3) Based on NGLS and APL guidance ranges (4) Based on estimated compliance ratio Increased Size and Scale Combined partnership will be one of the largest diversified MLPs Pro forma enterprise value (2) of $23 billion Pro forma 2014E EBITDA of approximately $1.3-$1.4 billion (3) |
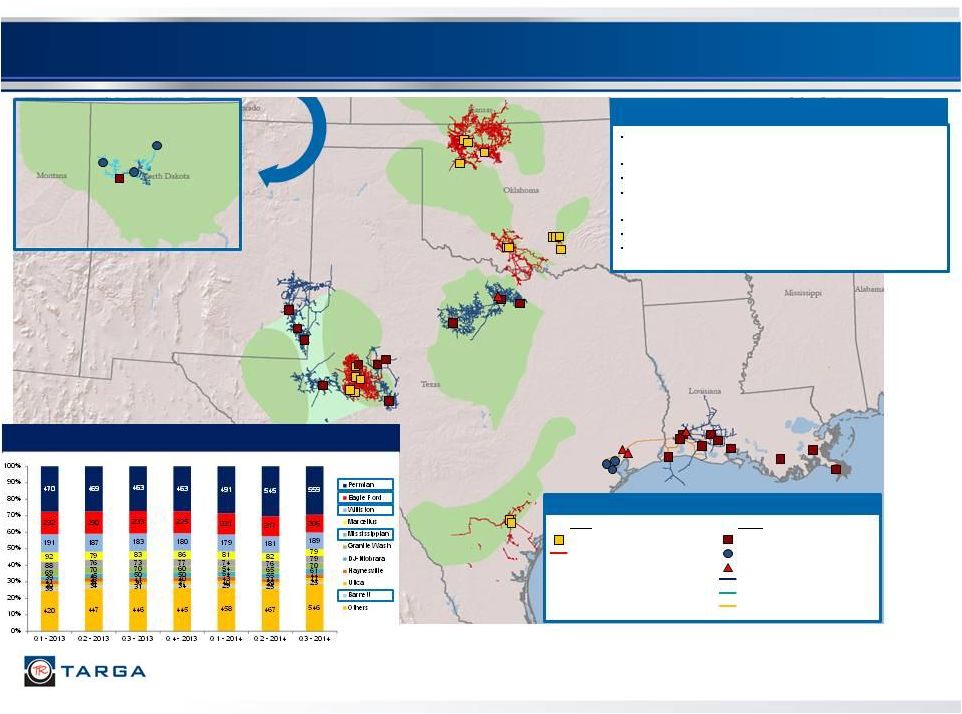 7 Attractive Positions in Active Basins Barnett Eagle Ford Delaware Bakken Mississippi Lime Woodford Pro Forma Asset Highlights Atlas Natural Gas Processing Plant Natural Gas Pipeline Targa Natural Gas Processing Plant Terminal Fractionator Natural Gas Pipeline Crude Oil Pipeline NGL Pipeline U.S. Land Rig Count by Basin (1) (1) Source: Baker Hughes Incorporated, as of September 26, 2014 SCOOP Midland Legend 39 natural gas processing plants (~6.9 Bcf/d gross processing capacity) Over 22,500 miles of natural gas and crude oil gathering pipeline Gross NGL production of 278.9 MBbls/d in 2Q 2014 3 crude oil and refined products terminals with 2.5 MMBbls of storage 17 gas treating facilities 573 MBbl/d gross fractionation capacity ~6.5 MMBbl/month capacity LPG export terminal |
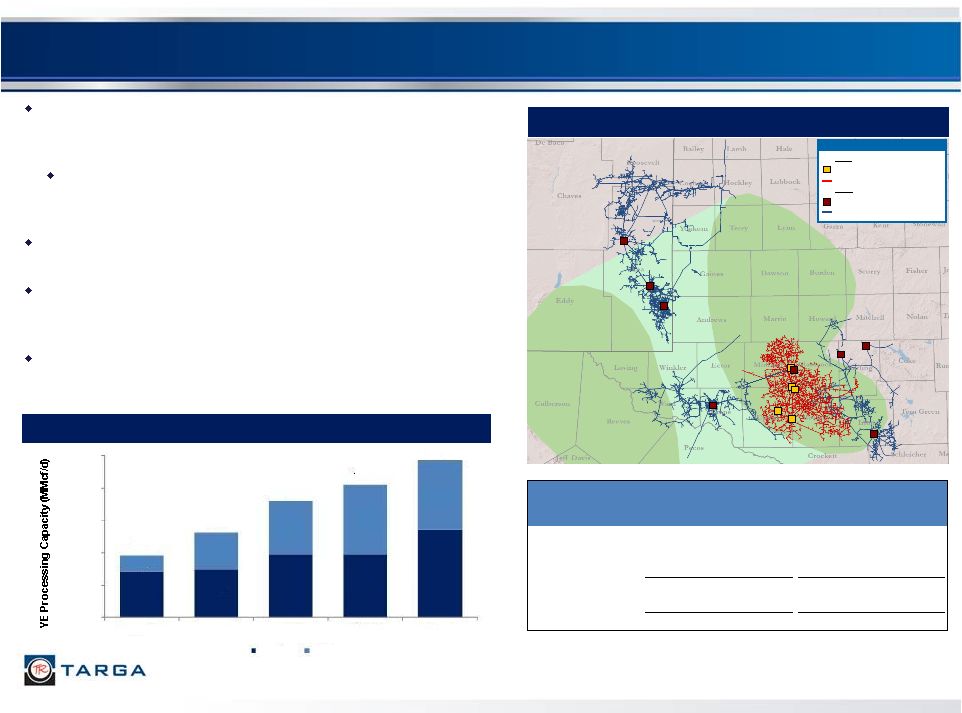 8 World Class Permian Footprint Atlas’ WestTX system sits in the core of the Midland Basin between Targa’s existing SAOU and Sand Hills systems More than 75% of the rigs currently running in the Midland Basin are in counties served by the combined systems Pro forma, NGLS will be the 2 nd largest Permian processor with 1.4 Bcf/d in gross processing capacity Recent activity includes Targa’s 200 MMcf/d High Plains plant placed in service June 2014 and Atlas’ 200 MMcf/d Driver plant placed in service September 2014 Announced expansions include Atlas’ 200 MMcf/d Buffalo plant (in service mid-2015) and Targa’s 300 MMcf/d Delaware Basin plant (in service 1Q 2016) Combined Permian Footprint Year-End Permian Gross Processing Capacity Legend Atlas Natural Gas Processing Plant Natural Gas Pipeline Targa Natural Gas Processing Plant Natural Gas Pipeline Current Permian Gross Processing Capacity (MMcf/d) Miles of Pipeline SAOU 369 1,800 Sand Hills 175 1,500 Versado 240 3,350 Total: Targa 784 6,650 Atlas WestTX 655 3,600 Total: PF Targa 1,439 10,250 Delaware Midland 575 600 784 784 1,084 195 455 655 855 855 770 1,055 1,439 1,639 1,939 0 400 800 1,200 1,600 2,000 2012 2013 2014E 2015E 2016E Targa Atlas |
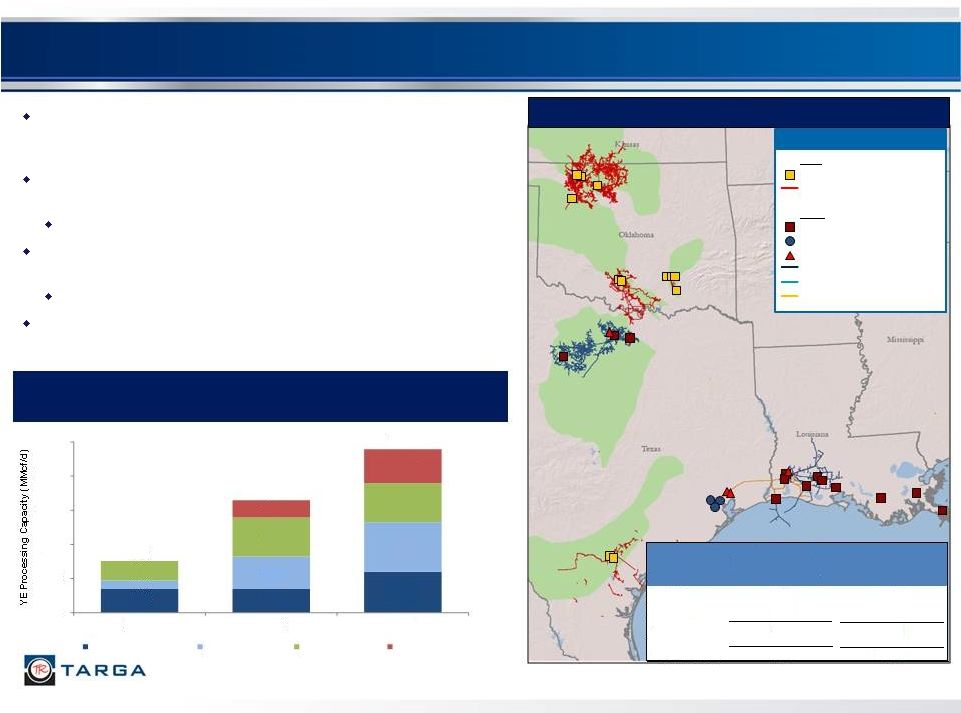 9 Leading Positions in Active Basins Combined Footprint Year-End NorthTX/SouthTX/OK Gross Processing Capacity Atlas Natural Gas Processing Plant Natural Gas Pipeline Targa Natural Gas Processing Plant Terminal Fractionator Natural Gas Pipeline Crude Oil Pipeline NGL Pipeline Legend Barnett Eagle Ford Woodford Mississippi Lime Atlas’ assets also provide exposure to significant drilling activity in the Mississippi Lime, SCOOP, Arkoma Woodford and Eagle Ford plays Largest gathering and processing footprint in the Mississippi Lime with 458 MMcf/d of nameplate capacity System remains full with volumes offloaded to third parties Current project underway to connect Velma & Arkoma systems to create a gathering and processing super-system Further potential to connect to Targa’s North Texas assets Long-term contracts with active producers in the Eagle Ford SCOOP Current North Texas/SouthTX/OK Gross Processing Capacity (MMcf/d) Miles of Pipeline SouthOK 500 1,300 WestOK 458 5,700 SouthTX 400 500 Total: Atlas 1,358 7,500 Targa North Texas 478 4,500 Total: PF Targa 1,836 12,000 606 1,316 1,916 278 278 478 100 380 580 458 458 200 400 – 400 800 1,200 1,600 2,000 2012 2013 2014E Targa - North Texas Atlas - SouthOK Atlas - WestOK Atlas - SouthTX 228 |
 10 10 Producer Activity Drives NGL Flows to Mont Belvieu Growing field NGL production increases NGL flows to Mont Belvieu Increased NGL production could support Targa’s existing and expanding Mont Belvieu and Galena Park presence Petrochemical investments, fractionation and export services will continue to clear additional supply Targa’s Mont Belvieu and Galena Park businesses very well positioned Barnett Eagle Ford Midland Mississippi Lime Woodford Delaware Marcellus & Others Rockies Galena Park Marine Import / Export Terminal Atlas Natural Gas Processing Plant Natural Gas Pipeline Targa Natural Gas Processing Plant Terminal Fractionator Natural Gas Pipeline Crude Oil Pipeline NGL Pipeline Third Party Ethylene Cracker Illustrative Y-Grade Flows Import / Export 121 124 129 137 149 48 54 77 115 118 169 178 206 251 268 0 50 100 150 200 250 300 2010 2011 2012 2013 YTD 2014 Targa Atlas Combined NGL Production (MBbl/d) Mont Belvieu Terminal SCOOP |
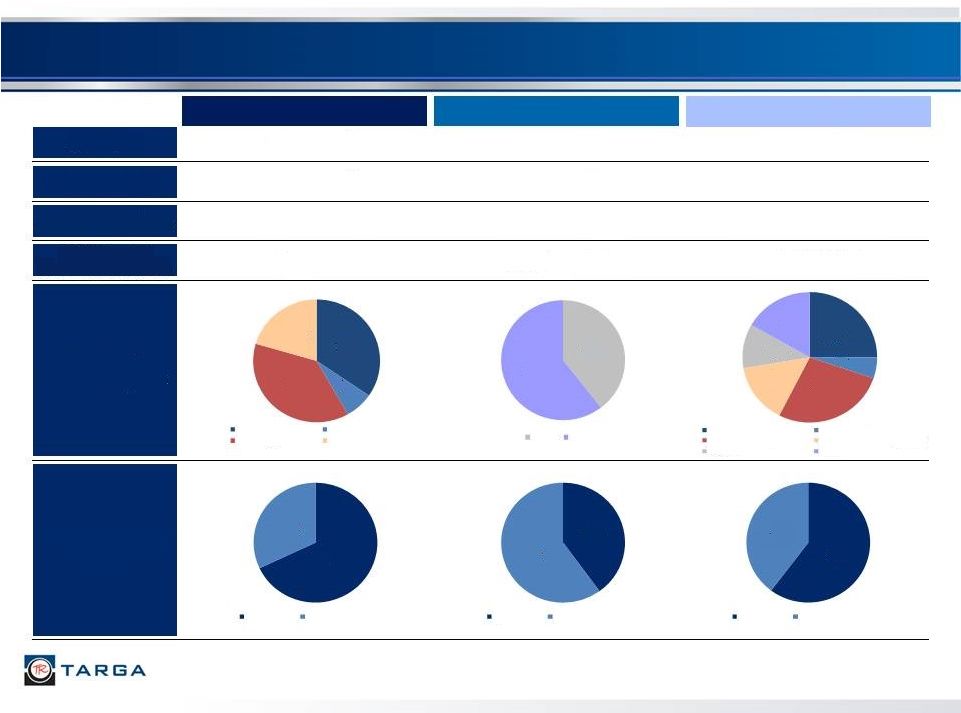 11 Increased Size and Scale Enhance Credit Profile Targa Atlas Pro Forma Targa (1) Represents combined market cap and enterprise value for NGLS and TRGP as of October 10, 2014, less the value of NGLS units or PF NGLS units owned by TRGP (2) Represents combined market cap and enterprise value for APL and ATLS as of October 10, 2014 based on transaction consideration (3) Includes keep-whole at 1% of total margin (3) Market Cap ~ $12 Billion (1) ~ $5 Billion (2) ~ $17 Billion (1) Enterprise Value ~ $15 Billion (1) ~ $8 Billion (2) ~ $23 Billion (1) 2014E EBITDA ($MM) $925 - $975 Million $400 - $425 Million $1,325 - $1,400 Million 2014E Capital Expenditures ($MM) $780 Million $400 - $450 Million $1,180 - $1,230 Million 2014E Operating Margin by Segment YE 2014E % Fee- Based 68% 32% Fixed Fee Percent of Proceeds 35% 7% 38% 20% Field G&P Coastal G&P Logistics Marketing and Dist. 40% 60% Texas Oklahoma 25% 5% 27% 15% 11% 17% Field G&P - Targa Coastal G&P - Targa Logistics - Targa Marketing and Dist. - Targa Texas - Atlas Oklahoma - Atlas 40% 60% Fixed Fee Percent of Proceeds 60% 40% Fixed Fee Percent of Proceeds |
 12 Targa’s Track Record of Value Creation (1) 2010 covers time period from IPO (December 6, 2010) through December 31, 2010 (2) 2014 YTD as October 10, 2014 Source: Bloomberg TRP – Total Return Since 2010 (1) TRC – Total Return Since IPO TRC – Dividends TRP – Distributions (1) NGLS Out/(Under) Performance vs. AMZ 16% 3% 2% 21% 18% TRGP Out/(Under) Performance vs. AMZ 20% 42% 30% 44% 31% (2) (2) Pro Forma Pro Forma -10% 0% 10% 20% 30% 40% 50% 60% 2010 2011 2012 2013 2014 YTD NGLS AMZ S&P 500 UTY Index -10% 0% 10% 20% 30% 40% 50% 60% 70% 80% 2010 2011 2012 2013 2014 YTD TRGP AMZ S&P 500 UTY Index 2.49 2.57 2.65 2.72 2.79 2.86 2.93 2.99 3.05 3.12 $1.00 $1.25 $1.50 $1.75 $2.00 $2.25 $2.50 $2.75 $3.00 $3.25 $3.50 $3.75 $4.00 Q1 Q2 Q3 Q4 Q1 Q2 Q3 Q4 Q1 Q2 Q3 Q4 Q1 Q2 Q3 Q4 2012 2013 2014 2015 1.46 1.58 1.69 1.83 1.98 2.13 2.28 2.43 2.59 2.76 $1.00 $1.25 $1.50 $1.75 $2.00 $2.25 $2.50 $2.75 $3.00 $3.25 $3.50 $3.75 $4.00 $4.25 $4.50 Q1 Q2 Q3 Q4 Q1 Q2 Q3 Q4 Q1 Q2 Q3 Q4 Q1 Q2 Q3 Q4 2012 2013 2014 2015 |
 Overview of Transaction Terms |
 14 NGLS Transaction Terms and Conditions Transaction Structure Consideration & Payments Pro Forma Ownership Pro Forma Leverage Closing Conditions NGLS acquires APL for total consideration of $5.8 billion (1) Includes $1.8 billion of APL debt at September 30, 2014 ($1.55 billion senior notes in place; revolver repaid) APL’s Class D convertible preferred units are converted to common units APL’s Class E perpetual preferred units are redeemed for an aggregate cash payment of $126.5 million 0.5846 NGLS units exchanged for each APL LP unit outstanding (implied consideration of $37.40 per APL LP unit (1) ) $1.26 per LP unit (~$127 million total) one-time cash payment to APL unitholders Total consideration of $38.66 per APL LP unit (1) (15% premium) $65 million for transaction fees and expenses and change of control payments Current NGLS unitholders will own approximately 66% of the combined partnership Current APL unitholders will own approximately 34% of the combined partnership 3.3x Total Debt / 2014E EBITDA (3) at NGLS APL unitholder vote Regulatory and other customary conditions GP/IDR Giveback from TRC GP/IDR giveback (2) of $37.5 million, $25.0 million, $10.0 million and $5.0 million for the four years following closing (1) Based on market data as of October 10, 2014, excluding fees and expenses (2) These amounts will be applied in equal quarterly installments for each successive four quarter period following closing (3) Based on total PF Debt / 2014E PF Compliance EBITDA |
 15 TRGP Transaction Terms and Conditions Transaction Structure ATLS Asset Spin-Off Consideration & Payments Financing Pro Forma Leverage / Taxes GP/IDR Giveback TRGP acquires ATLS for total consideration of $1.9 billion (1) (post spin-off) Includes acquisition of 5.8 million APL units held by ATLS that will be exchanged for NGLS units ATLS spins off all assets unrelated to APL prior to transaction 10.35 million TRGP shares issued to ATLS $610 million of cash $190 million for change of control payments and transaction fees and expenses $1.1 billion committed financing in place for cash components of acquisitions, no financing contingencies 3.8x Standalone Debt / 2014E EBITDA (2) at TRGP 3.9x Consolidated Debt / 2014E EBITDA (3) Additional depreciation and amortization reduces taxable income 10-15% pro forma effective cash tax rate (4) for 2015 compared to 2014 guidance of 33% GP/IDR giveback (5) of $37.5 million, $25.0 million, $10.0 million and $5.0 million for the four years following closing Closing Conditions TRGP shareholder and ATLS unitholder votes Contingent on closing of NGLS’ acquisition of APL Regulatory and other customary conditions (1) Based on market data as of October 10, 2014, excluding fees and expenses (2) Based on PF TRGP Debt / 2014E EBITDA. TRGP EBITDA based on cash distributions received from LP units, GP units and IDRs less TRGP G&A (3) Based on PF total NGLS and TRGP debt divided by PF NGLS Compliance EBITDA (4) Effective cash tax rate calculated as cash taxes divided by pre-tax cash available for dividends (5) These amounts will be applied in equal quarterly installments for each successive four quarter period following closing |
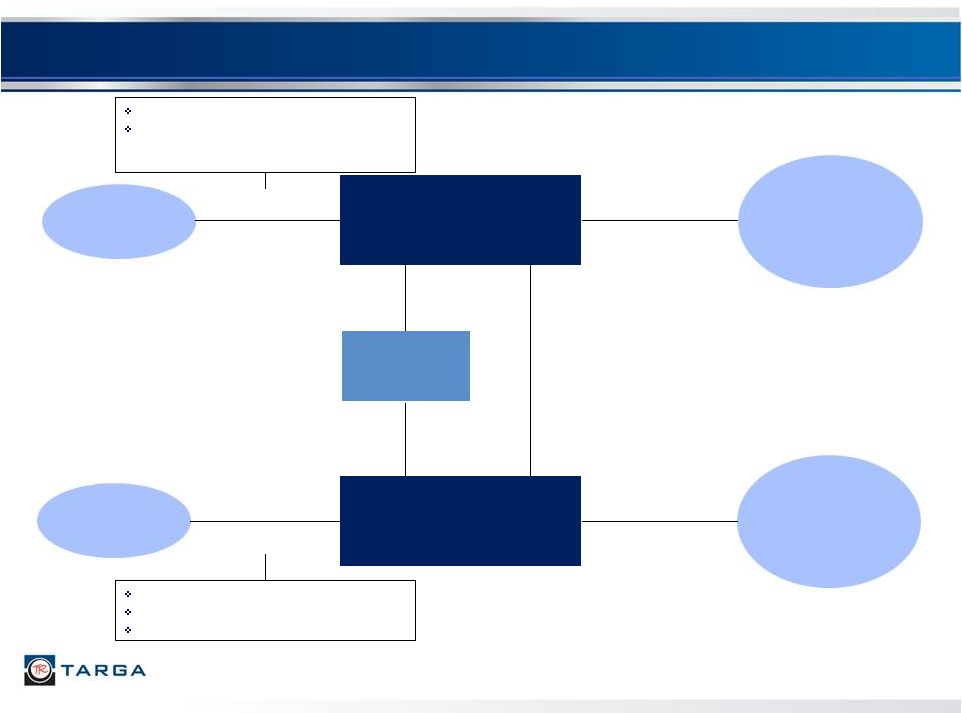 16 Pro Forma Organizational and Capital Structure Targa Resources Corp. (NYSE: TRGP) (“TRC” or the “Company”) PF Standalone Leverage (1) : 3.8x PF Consolidated Leverage (2) : 3.9x Targa Resources GP LLC Targa Resources Partners LP (NYSE: NGLS) (“TRP” or the “Partnership”) PF Leverage (3) : 3.3x Lenders Lenders Public Shareholders Legacy TRGP: 80% Legacy ATLS: 20% Public Unitholders Legacy NGLS: 59% Legacy APL: 32% $750 million of new Term Loan B borrowings $92 million of existing revolver borrowings plus $115 million of new revolver borrowings under new $350 million revolver $3.0 billion of existing debt at NGLS $1.8 billion of debt from APL $0.2 billion of new revolver borrowings 100% Interest (52.5 million shares) 100% Indirect Ownership 9% LP Interest (16.3 million LP Units) 2% General Partner Interest & IDRs $5.0 billion of debt 91% LP Interest (158.5 million LP units) $957 million of debt Note: Debt balances as of September 30, 2014. Transaction adjustments include estimated fees and expenses (1) Based on PF TRGP Debt / 2014E EBITDA. TRGP EBITDA based on cash distributions received from LP units, GP units and IDRs less TRGP G&A (2) Based on PF total NGLS and TRGP debt divided by 2014E PF NGLS Compliance EBITDA (3) Based on PF total NGLS Debt / 2014E PF NGLS Compliance EBITDA |
 Q&A |
 Atlas Asset Overview |
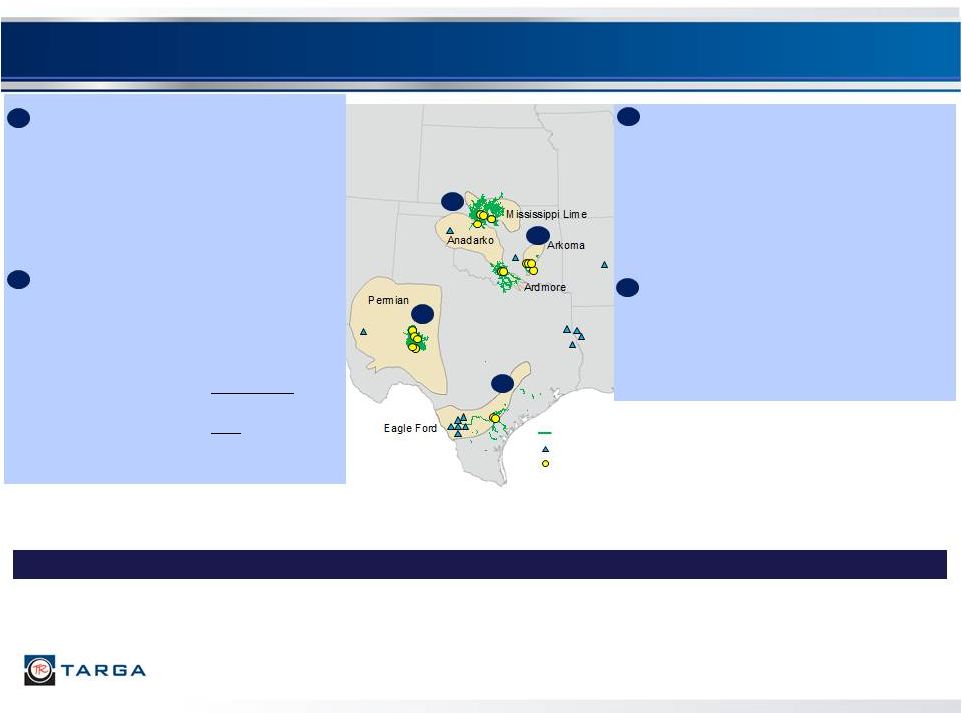 APL Asset Overview 19 (1) Indicates gross capacity, where APL owns 412 MMcf/d net processing capacity currently and will own 460 MMcf/d in net capacity by YE 2014 (2) Centrahoma JV ownership applies to Atoka, Coalgate and Stonewall plants. Velma and Tupelo plants are 100%-owned by APL Diversified Asset Base Oil / NGL-Rich Areas Provides Significant Exposure to Increased Drilling Activity Geographic Area: Eagle Ford Shale Gross Processing Capacity: 400 MMcf/d Processing Plants: 2 Miles of Pipeline: ~500 YE 2014 Capacity: 400 MMcf/d (as of 2Q 2014) JV Partners: Southcross/TexStar JV Ownership: High Pressure Pipe: APL – 75.0% Southcross/TexStar – 25.0% Cogen: APL – 50.0% Southcross/TexStar – 50.0% 1 2 3 4 Processing Plant Treating Facility Natural Gas Gathering Pipeline 1 2 4 3 West TX System Geographic Area: Permian Basin Gross Processing Capacity: 655 MMcf/d Processing Plants: 5 Miles of Pipeline: ~3,600 YE 2014 Capacity: 655 MMcf/d (as of 3Q 2014) JV Partner: Pioneer Natural Resources JV Ownership: APL – 72.8% Pioneer – 27.2% SouthTX System Geographic Area: Woodford Shale / Ardmore / Arkoma / SCOOP Gross Processing Capacity: 500 MMcf/d (1) Processing Plants: 6 Miles of Pipeline: ~1,300 YE 2014 Capacity: 580 MMcf/d (1) (as of 4Q 2014) JV Partner (2) : MarkWest JV Ownership (2) : APL – 60.0% MarkWest – 40.0% SouthOK System Geographic Area: Anadarko Basin / Mississippi Lime Gross Processing Capacity: 458 MMcf/d Processing Plants: 4 Miles of Pipeline: ~5,700 YE 2014 Capacity: 458 MMcf/d WestOK System |
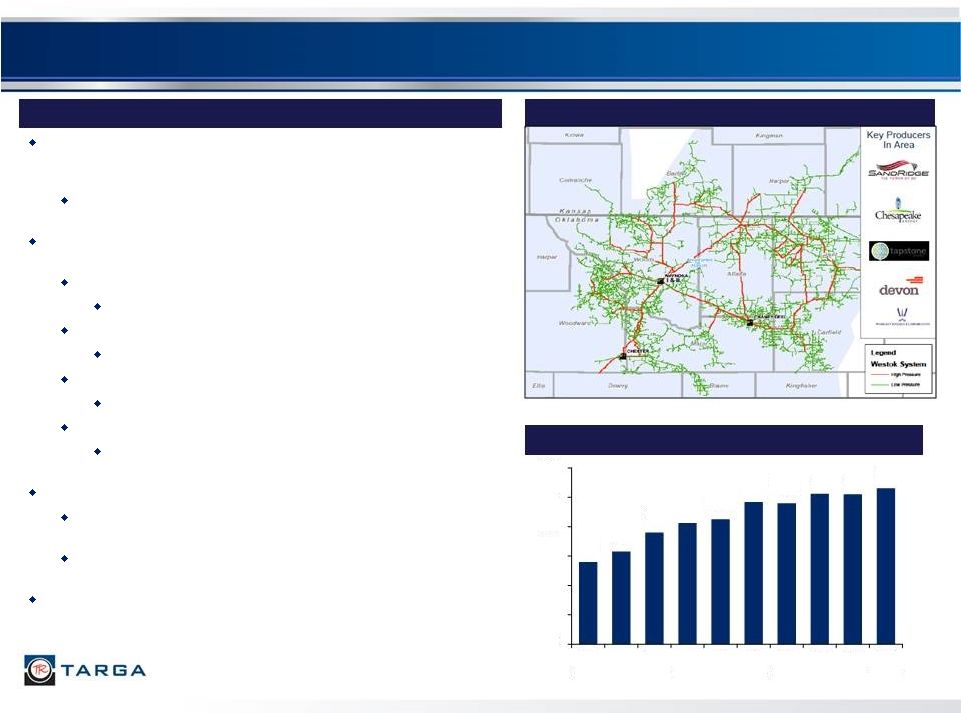 Summary WestOK Asset Map Owner and operator of 5,700 miles of natural gas gathering pipelines located in the Anadarko Basin / Mississippi Lime (“WestOK”) APL connecting approximately a well a day behind system and is the largest gatherer and processor in the Mississippi Lime Additionally owns and operates four processing plants (458 MMcf/d gross): Waynoka I Plant 200 MMcf/d (gross) cryogenic plant in Woods County Waynoka II Plant 200 MMcf/d (gross) cryogenic plant in Woods County Chester processing facility 28 MMcf/d (gross) in Woodward County Chaney Dell Plant 30 MMcf/d (gross) refrigeration plant located in Woods County 458 MMcf/d of nameplate capacity Recently completed enhancements to increase capacity to 110% of nameplate System remains full and some volumes continue to be bypassed and/or offloaded to third parties The primary producers on the WestOK system include SandRidge Exploration and Production, LLC and Chesapeake Energy Corporation Average Processed Volume (MMcf/d) APL – WestOK System 20 279 316 380 413 425 484 479 513 510 530 0 100 200 300 400 500 600 Q1 2012 Q2 2012 Q3 2012 Q4 2012 Q1 2013 Q2 2013 Q3 2013 Q4 2013 Q1 2014 Q2 2014 |
 Summary SouthOK Asset Map Owner and operator of 1,300 miles of natural gas gathering pipelines located in the Woodford Shale / SCOOP play consisting of the Velma and Arkoma Systems (1,200 miles and 100 miles, respectively) (“SouthOK”) Additionally owns and operates five processing plants (500 MMcf/d gross): Velma Plant 1 and 2 100 MMcf/d (gross) and 60 MMcf/d (gross) cryogenic plants in Stephens County Atoka Plant (60% owner/operator) 20 MMcf/d (gross) cryogenic plant in Atoka County Colgate plant (60% owner/operator) 80 MMcf/d (gross) cryogenic plant in Coal County Tupelo Plant 120 MMcf/d (gross) cryogenic plant in Coal County Stonewall Plant (60% owner/operator) 120 MMcf/d (gross) cryogenic plant in Coal County which is being expanded to 200 MMcf/d (gross) in 4Q 2014 Currently completing connection of the Velma and Arkoma Systems to create a gathering and processing super-system $80.0 million project to construct 55 miles of pipeline to connect the systems The primary producers on the SouthOK system include XTO Energy, Inc., Marathon Oil Company and Vanguard Natural Resources, LLC Average Processed Volume (MMcf/d) APL – SouthOK System (Velma and Arkoma) 21 123 129 133 107 327 335 397 376 373 409 0 100 200 300 400 500 Q1 2012 Q2 2012 Q3 2012 Q4 2012 Q1 2013 Q2 2013 Q3 2013 Q4 2013 Q1 2014 Q2 2014 Includes Velma Volumes Only |
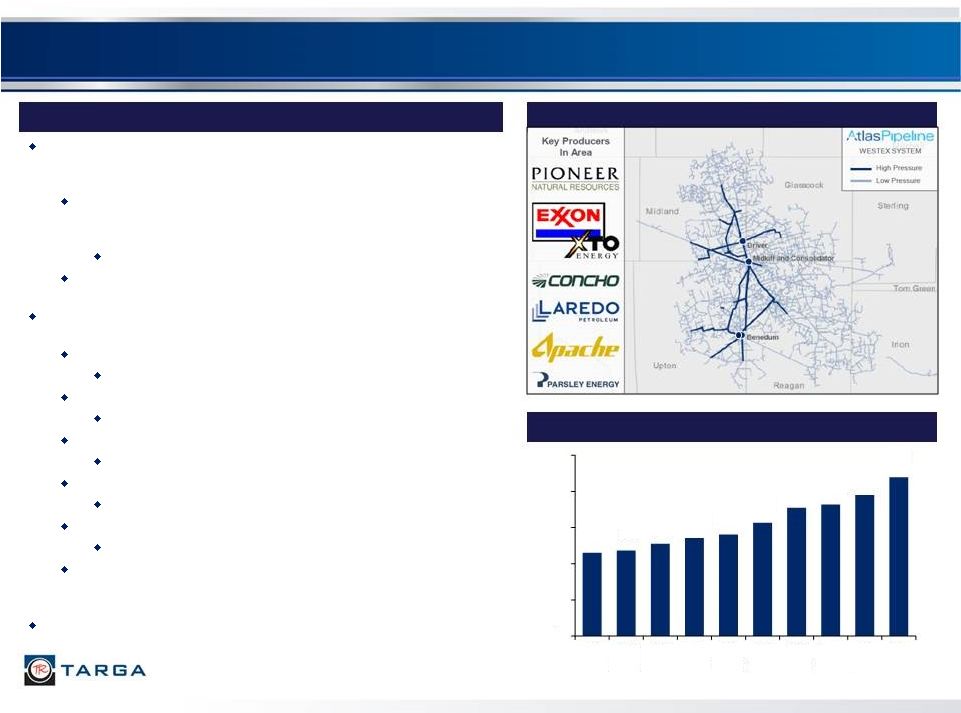 72.8% owner and operator of 3,600 miles of natural gas gathering pipelines located across seven counties in the Permian Basin in West Texas (“WestTX”) Minority interest owned by Pioneer Natural Resources Company (“Pioneer”), one of the largest active drillers in the Spraberry Trend Pioneer has over 900,000 acres in the Permian Gathering system being extended north into Martin County to serve further growth from production in Northern Permian Additionally owns and operates five processing plants (655 MMcf/d gross): Consolidator Plant 150 MMcf/d (gross) cryogenic plant in Reagan County Driver Plant 200 MMcf/d (gross) cryogenic plant in Midland County Benedum Plant 45 MMcf/d (gross) cryogenic plant in Upton County Midkiff Plant 60 MMcf/d (gross) cryogenic plant in Reagan County Edward Plant 200 MMcf/d (gross) cryogenic plant in Upton County Currently constructing one additional 200 MMcf/d (gross) processing plant to bring nameplate capacity to 855 MMcf/d (gross) by the second half of 2015 The primary producers include Pioneer, COG Operating, LLC and Laredo Petroleum, Inc. Summary WestTX Asset Map Average Processed Volume (MMcf/d) APL – WestTX System 22 Edward 231 236 256 272 281 314 355 364 390 439 0 100 200 300 400 500 Q1 2012 Q2 2012 Q3 2012 Q4 2012 Q1 2013 Q2 2013 Q3 2013 Q4 2013 Q1 2014 Q2 2014 |
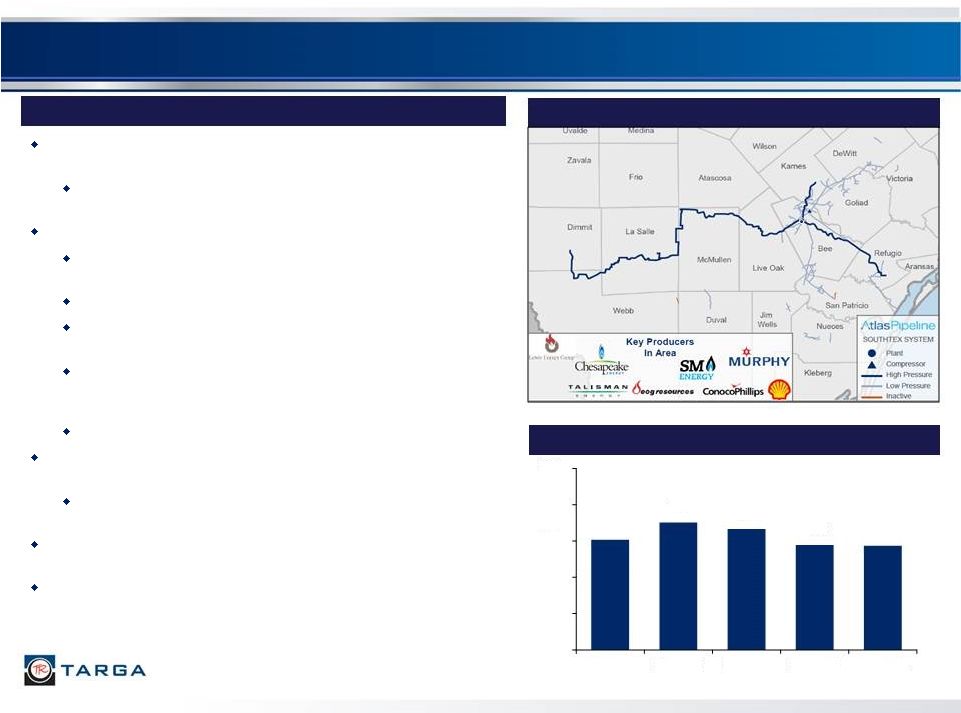 Summary South Texas gathering and processing assets (“SouthTX”) were acquired through the purchase of TEAK Midstream, L.L.C. Located in the wet gas / condensate window of the Eagle Ford Shale Gathering assets consist of: 265 miles of primarily 20-24 inch gathering and residue pipelines 275 miles of low pressure gathering lines 75% interest in a joint venture that owns a 62 mile, 24-inch gathering pipeline 75% interest in a joint venture that owns a 45 mile, 16-inch gathering pipeline, a 71 mile, 24-inch gathering pipeline and a 50 mile residue pipeline 50% interest in a cogeneration facility Additionally owns and operates two 200 MMcf/d (gross) cyrogenic natural gas processing plants Silver Oak II plant was placed in-service during the second quarter of 2014 The primary producers on SouthTX include Talisman Energy USA Inc. and Statoil Natural Gas LLC Added numerous producers to the system in 2014 and well positioned to capture processing volumes as current agreements with third party plants expire in 2015 and 2016 Average Processed Volume (MMcf/d) APL – SouthTX System SouthTX Asset Map 23 Silver Oak I Silver Oak II 121 141 133 116 115 0 40 80 120 160 200 Q2 2013 Q3 2013 Q4 2013 Q1 2014 Q2 2014 |
 24 1000 Louisiana Suite 4300 Houston, TX 77002 Phone: (713) 584-1000 Email: InvestorRelations@targaresources.com Website: www.targaresources.com |