Filed by Targa Resources Partners LP
Pursuant to Rule 425 of the Securities Act of 1933
and deemed filed pursuant to Rule 14a-12
of the Securities Exchange Act of 1934
Subject Company: Atlas Pipeline Partners, L.P.
Commission File No.: 001-14998
This filing relates to a proposed business combination involving Targa Resources Partners LP and Atlas Pipeline Partners, L.P.
 Targa Resources Investor Presentation Third Quarter 2014 November 4, 2014 |
 2 Forward Looking Statements Certain statements in this presentation are "forward-looking statements" within the meaning of Section 27A of the Securities Act of 1933, as amended, and Section 21E of the Securities Exchange Act of 1934, as amended. All statements, other than statements of historical facts, included in this presentation that address activities, events or developments that Targa Resources Partners LP (“TRP” or the “Partnership”) or Targa Resources Corp. (“TRC” or the “Company”) expect, believe or anticipate will or may occur in the future are forward-looking statements. These forward-looking statements rely on a number of assumptions concerning future events and are subject to a number of uncertainties, factors and risks, many of which are outside the Partnership’s and the Company’s control, which could cause results to differ materially from those expected by management of Targa Resources Partners LP and Targa Resources Corp. Such risks and uncertainties include, but are not limited to, weather, political, economic and market conditions, including declines in the production of natural gas or in the price and market demand for natural gas and natural gas liquids, the timing and success of business development efforts, the credit risk of customers and other uncertainties. These and other applicable uncertainties, factors and risks are described more fully in the Partnership's and the Company’s Annual Reports on Form 10-K for the year ended December 31, 2013 and other reports filed with the Securities and Exchange Commission. The Partnership and the Company undertake no obligation to update or revise any forward-looking statement, whether as a result of new information, future events or otherwise. |
 3 Additional Information Additional Information and Where to Find It In connection with the proposed transaction, Targa Resources Corp. (“TRGP”) will file with the U.S. Securities and Exchange Commission (the “SEC”) a registration statement on Form S-4 that will include a joint proxy statement of Atlas Energy, L.P. (“ATLS”) and TRGP and a prospectus of TRGP (the “TRGP joint proxy statement/prospectus”). In connection with the proposed transaction, TRGP plans to mail the definitive TRGP joint proxy statement/prospectus to its shareholders, and ATLS plans to mail the definitive TRGP joint proxy statement/prospectus to its unitholders. Also in connection with the proposed transaction, Targa Resources Partners LP (“NGLS”) will file with the SEC a registration statement on Form S-4 that will include a proxy statement of Atlas Pipeline Partners, L.P. (“APL”) and a prospectus of NGLS (the “NGLS proxy statement/prospectus”). In connection with the proposed transaction, APL plans to mail the definitive NGLS proxy statement/prospectus to its unitholders. INVESTORS, SHAREHOLDERS AND UNITHOLDERS ARE URGED TO READ THE TRGP JOINT PROXY STATEMENT/PROSPECTUS, THE NGLS PROXY STATEMENT/PROSPECTUS AND OTHER RELEVANT DOCUMENTS FILED OR TO BE FILED WITH THE SEC CAREFULLY AND IN THEIR ENTIRETY WHEN THEY BECOME AVAILABLE BECAUSE THEY WILL CONTAIN IMPORTANT INFORMATION ABOUT TRGP, NGLS, ATLS AND APL, AS WELL AS THE PROPOSED TRANSACTION AND RELATED MATTERS. This communication does not constitute an offer to sell or the solicitation of an offer to buy any securities or a solicitation of any vote or approval. A free copy of the TRGP Joint Proxy Statement/Prospectus, the NGLS Proxy Statement/Prospectus and other filings containing information about TRGP, NGLS, ATLS and APL may be obtained at the SEC’s Internet site at www.sec.gov. In addition, the documents filed with the SEC by TRGP and NGLS may be obtained free of charge by directing such request to: Targa Resources, Attention: Investor Relations, 1000 Louisiana, Suite 4300, Houston, Texas 77002 or emailing InvestorRelations@targaresources.com or calling (713) 584-1133. These documents may also be obtained for free from TRGP’s and NGLS’s investor relations website at www.targaresources.com. The documents filed with the SEC by ATLS may be obtained free of charge by directing such request to: Atlas Energy, L.P., Attn: Investor Relations, 1845 Walnut Street, Philadelphia, Pennsylvania 19103 or emailing InvestorRelations@atlasenergy.com. These documents may also be obtained for free from ATLS’s investor relations website at www.atlasenergy.com. The documents filed with the SEC by APL may be obtained free of charge by directing such request to: Atlas Pipeline Partners, L.P., Attn: Investor Relations, 1845 Walnut Street, Philadelphia, Pennsylvania 19103 or emailing IR@atlaspipeline.com. These documents may also be obtained for free from APL’s investor relations website at www.atlaspipeline.com. Participants in Solicitation Relating to the Merger TRGP, NGLS, ATLS and APL and their respective directors, executive officers and other persons may be deemed to be participants in the solicitation of proxies from TRGP, ATLS or APL shareholders or unitholders, as applicable, in respect of the proposed transaction that will be described in the TRGP joint proxy statement/prospectus and NGLS proxy statement/prospectus. Information regarding TRGP’s directors and executive officers is contained in TRGP’s definitive proxy statement dated April 7, 2014, which has been filed with the SEC. Information regarding directors and executive officers of NGLS’s general partner is contained in NGLS’s Annual Report on Form 10-K for the year ended December 31, 2013, which has been filed with the SEC. Information regarding directors and executive officers of ATLS’s general partner is contained in ATLS’s definitive proxy statement dated March 21, 2014, which has been filed with the SEC. Information regarding directors and executive officers of APL’s general partner is contained in APL’s Annual Report on Form 10-K for the year ended December 31, 2013, which has been filed with the SEC. A more complete description will be available in the registration statement and the joint proxy statement/prospectus. |
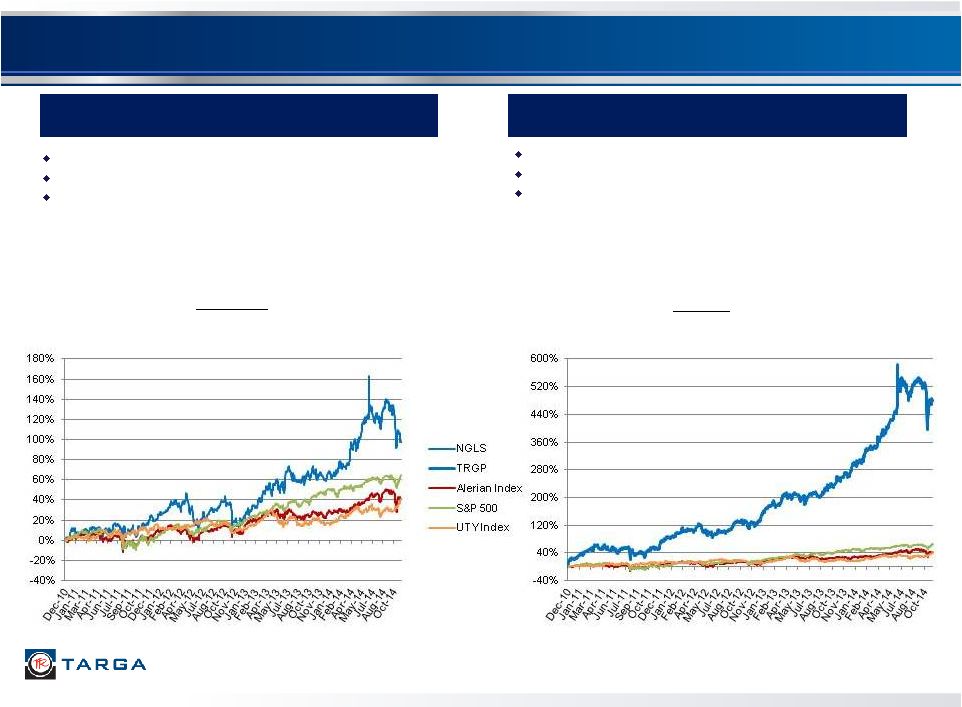 4 Targa Resources’ Two Public Companies IPO February 2007 MLP Owner/Operator of all assets IPO December 2010 C-Corp General Partner of NGLS Targa Resources Partners LP (NYSE: NGLS; “TRP” or the “Partnership”) Targa Resources Corp. (NYSE: TRGP; “TRC” or the “Company”) Market Cap: $7.1 billion Enterprise Value: $10.2 billion Unit Price: $61.41 Yield: 5.2% Current Annualized Distribution: $3.19 Sequential / YoY Growth: 2% / 9% Market Cap: $5.4 billion Enterprise Value: $5.5 billion Share Price: $127.89 Yield: 2.3% Current Annualized Dividend: $2.93 Sequential / YoY Growth: 6% / 29% Note: Market Cap, Unit/Share Price and Yield as of November 3, 2014. Enterprise Value calculated using current Market Cap as of November 3, 2014 and balance sheet data as of September 30, 2014. Unit and Stock Price Performance graphs through November 3, 2014 |
 5 TRP and TRC Performance (1) 2010 covers time period from IPO (December 6, 2010) through December 31, 2010 (2) 2014 YTD as November 3, 2014 Source: Bloomberg TRP – Total Return Since 2010 (1) TRC – Total Return Since IPO TRC – Dividends TRP – Distributions |
 6 Targa Current Corporate Structure (1) TRC had 42,143,463 common shares outstanding as of October 24, 2014 (2) TRP ownership as of October 24, 2014; TRP operating margin percentages based on LTM as of September 30, 2014. Field segment includes “Other” Operating Margin 100% Indirect Ownership Targa Resources Corp. (NYSE: TRGP) (“TRC” or the “Company”) (1) 11.2% LP Interest (12,945,659 LP Units) Public Unitholders Field Segment SAOU Sand Hills Versado North Texas System Badlands Coastal Segment Coastal Straddles VESCO LOU Gathering and Processing Division Logistics and Marketing Division Logistics Segment Fractionation Storage & Terminaling Transportation & Dist. Petroleum Logistics Mkt. and Dist. Segment NGL Marketing Gas Marketing Wholesale Propane Refinery Services Commercial Transportation Targa Resources GP LLC Targa Resources Partners LP (NYSE: NGLS) (“TRP” or the “Partnership”) (2) (S&P: BB+/BB+; Positive Moody’s: Ba1/Ba2; Positive) 88.8% LP Interest (102,828,437 LP Units) 2.0% General Partner Interest & IDRs 33% of Operating Margin 8% of Operating Margin 39% of Operating Margin 21% of Operating Margin |
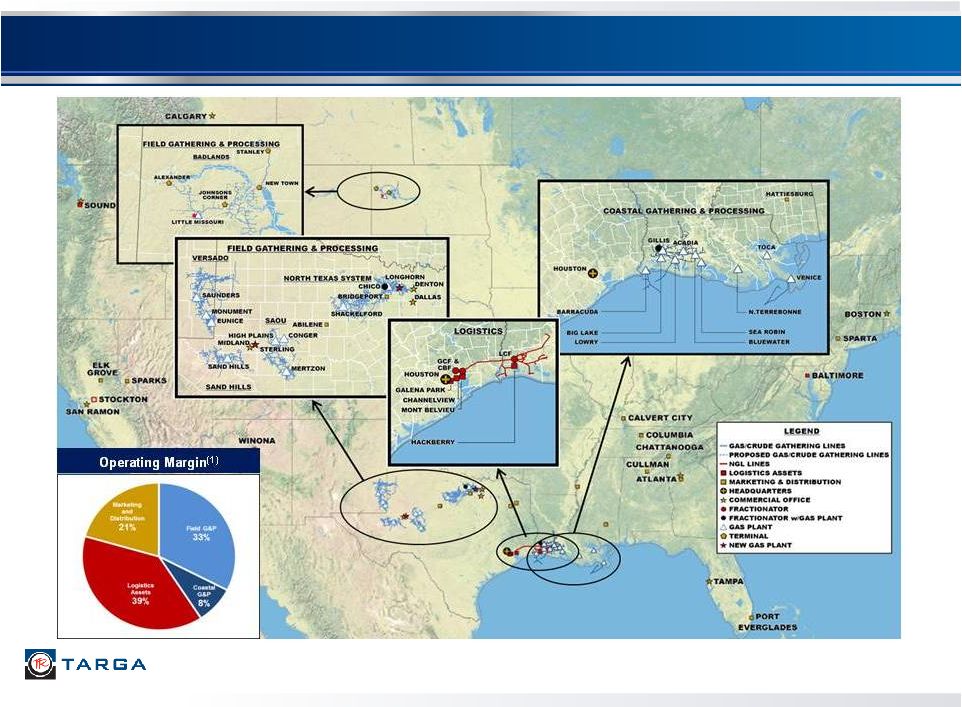 Targa’s Diversified Midstream Platform 7 (1) Operating margin percentages based on LTM as of September 30, 2014 |
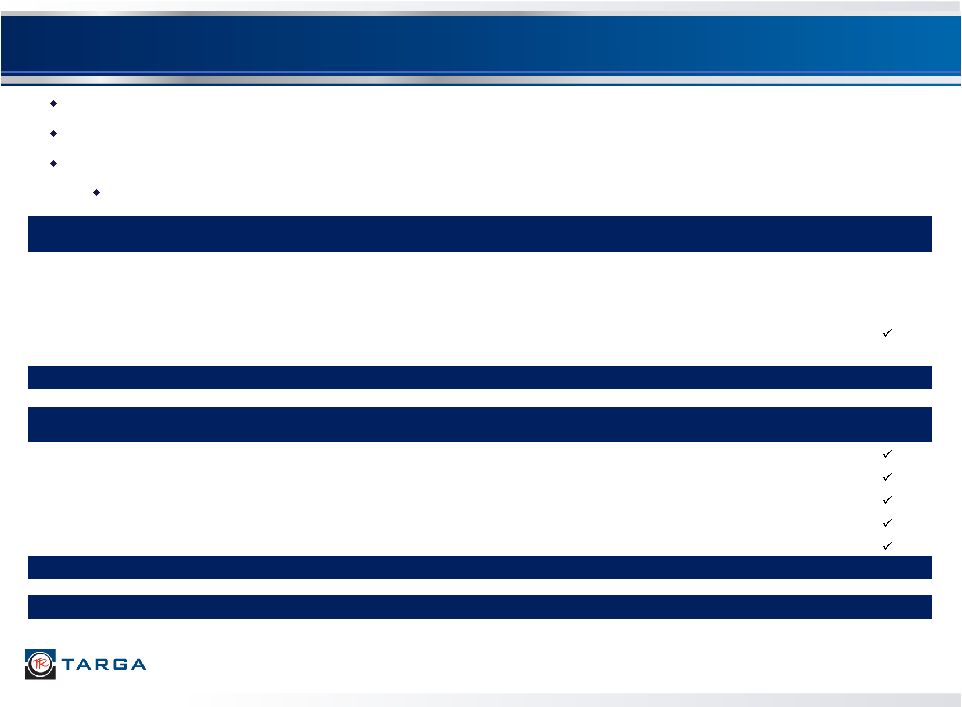
 8 A Strong Footprint in Active Basins And a Leading Position at Mont Belvieu Drive Targa’s Long-Term Growth Leadership position in oil and liquids rich Permian Basin Bakken position capitalizes on strong crude oil fundamentals and active drilling activity Leadership position in the active portion of Barnett Shale “combo” play GOM and onshore Louisiana provide longer term upside potential for well positioned assets Mont Belvieu is the NGL hub of North America Increased domestic NGL production is driving capacity expansions into and at Mont Belvieu Second largest fractionation ownership position at Mont Belvieu One of only two operating commercial NGL export facilities on the Gulf Coast linked to Mont Belvieu Position not easily replicated Approximately $2.6 billion in announced organic capex projects completed or underway Increased capacity to support multiple U.S. shale / resource plays Additional fractionation expansion to support increased NGL supply Increased connectivity to U.S. end users of NGLs Expansion of export services capacity for global LPG markets at Galena Park marine terminal Investment Highlights Increasing scale and diversity Increasing fee-based margin Expected 7 - 9% NGLS distribution growth in 2014, on track for the high end of the range Expected TRGP dividend growth in excess of 25% in 2014 2014 adjusted EBITDA guidance of $925 to $975 million Well Positioned for 2014 and Beyond |
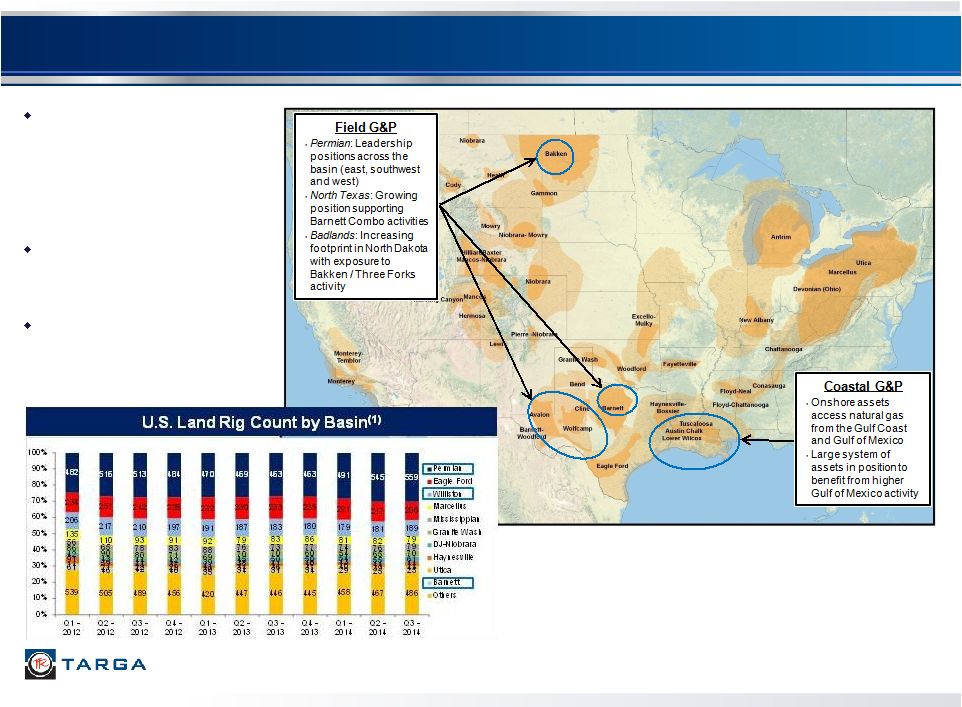 Targa’s G&P Assets are Well Positioned 9 (1) Source: Baker Hughes Incorporated, as of October 20, 2014 Targa’s G&P assets are located in and around some of the most active shale / resource plays, which is driving continued growth and expansion Field G&P assets are located in crude oil and liquids rich plays Field G&P gross processing capacity will expand from ~900 MMcf/d at YE 2013 to ~1,340 MMcf/d by YE 2014 |
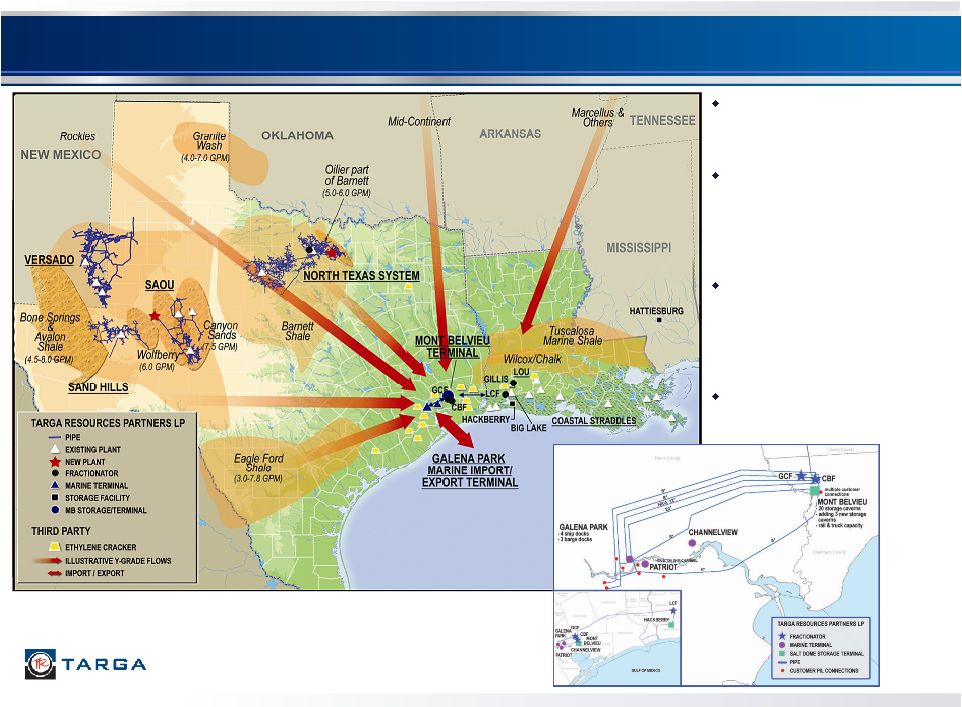 10 10 Producer Activity Drives NGL Flows to Mont Belvieu NGL flows to Mont Belvieu expected to increase Pipeline conversions may bring additional NGL volumes from the Utica/ Marcellus to the Gulf Coast Petrochemical investments, fractionation and export services will continue to clear additional supply Targa’s Mont Belvieu and Galena Park businesses very well positioned |
 Major Announced Capital Projects 11 Approximately $2.6 billion of announced projects completed or ongoing Over $1 billion of projects completed in 2013 and approximately $1 billion to be completed in 2014 Additional high quality growth projects under development for 2014 and beyond Commenced construction of CBF Train 5 Expansion (100 MBbl/d) (1) Includes additional spending in both North Texas and Permian Basin (2) Additional gas processing plant estimated completion YE 2014 and in-service early 2015 (3) 35 Mbbl/d condensate splitter located at the Channelview Terminal expected to be in-service end of 2016 or early 2017, depending on permit timing (4) ~$2.0 billion of fee-based capital, 77% of listed projects (4) G&P Growth Projects Actual / Expected Completion Primarily Fee-Based Gathering & Processing Expansion Program - 2013 / 2014 (1) 2013 / 2014 North Texas Longhorn Project (200 MMcf/d) May 2014 SAOU High Plains Plant (200 MMcf/d) June 2014 Badlands Expansion Program - 2013 / 2014 2013 / 2014 (2) Other Total G&P Projects $465 Downstream Growth Projects Actual / Expected Completion Primarily Fee-Based Petroleum Logistics Projects - 2013 / 2014 (3) 2013 / 2014+ CBF Train 4 Expansion (100 MBbl/d) Mid 2013 CBF Train 5 Expansion (100 MBbl/d) Mid 2016 International Export Project Q3 2013 / Q3 2014 Other Total Downstream Projects $1,520 Total Projects $1,985 50 385 0 Total CAP EX ($ millions) 2013 CAP EX ($ millions) 2014 CAP EX ($ millions) $185 $75 $110 150 40 20 225 125 85 465 250 215 40 25 15 $1,065 $515 $445 Total CAP EX ($ millions) 2013 CAP EX ($ millions) 2014 CAP EX ($ millions) $190 $40 $50 385 120 20 480 250 165 80 30 50 $1,520 $440 $335 $2,585 $955 $780 |
 Additional Growth Opportunities CAP EX ($ millions) Estimated Timing Primarily Fee-Based Badlands Expansion Program Permian Expansion Program Train 6 Expansion Train 7 Expansion Additional Condensate Splitter Ethane Export Project Other Projects primarily Total $2,000+ 2015 and beyond Major Capital Projects Under Development 12 Over $2.0 billion of additional opportunities are in various stages of development Opportunities include additional infrastructure in both G&P and Downstream Increasing NGL supplies across the country will continue to drive the need for more processing, fractionation and connectivity (1) Recently approved new 200 MMcf/d plant in the Williston Basin (2) Recently approved new 300 MMcf/d plant in the Delaware Basin (1) (2) |
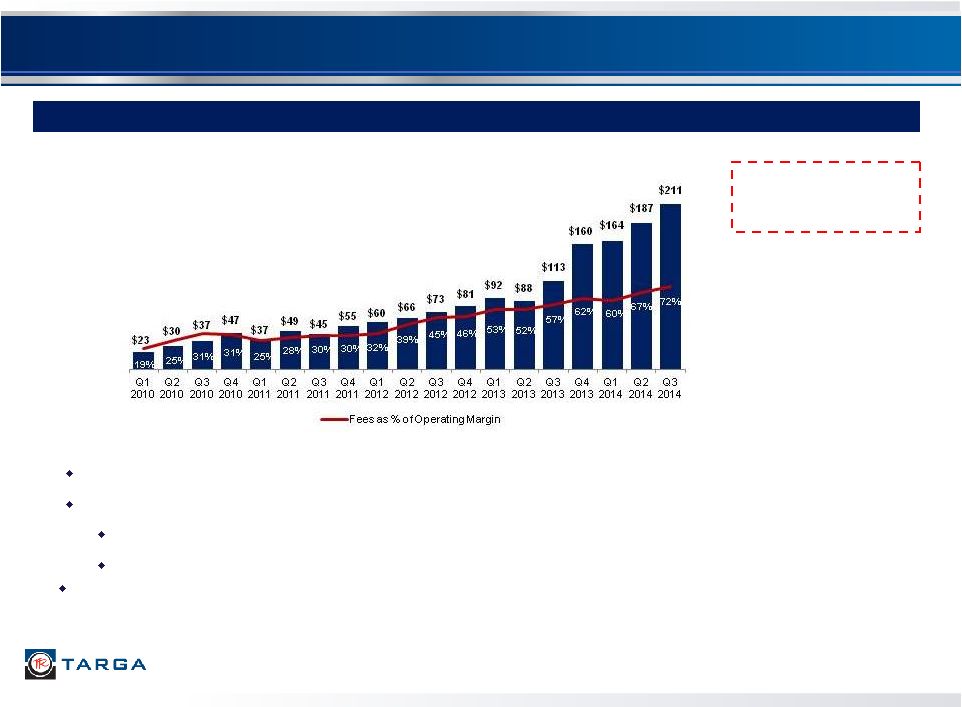 Strong Growth in Fee-Based Margin Continues 13 Capex projects with firm contracts provide clear visibility on increasing fee operating margin Announced fee-based projects coming online in 2014 International Export Expansion Phase II Additional Badlands Expansions ($ in millions) Fee-based operating margin expected to continue to increase to 65%+ for 2014 Increasing Fee-Based Margin Provides Additional Stability to Our Business Fee-based margin increases driven primarily through increased margin in the Logistics Assets segment including contributions from CBF Train 4 and International Export projects, and through contribution from Badlands |
 Diversity and Scale Mitigate Commodity Price Changes 14 Adjusted EBITDA vs. Commodity Prices (1) Will be towards bottom-end of range if there is significant ethane rejection in these years |
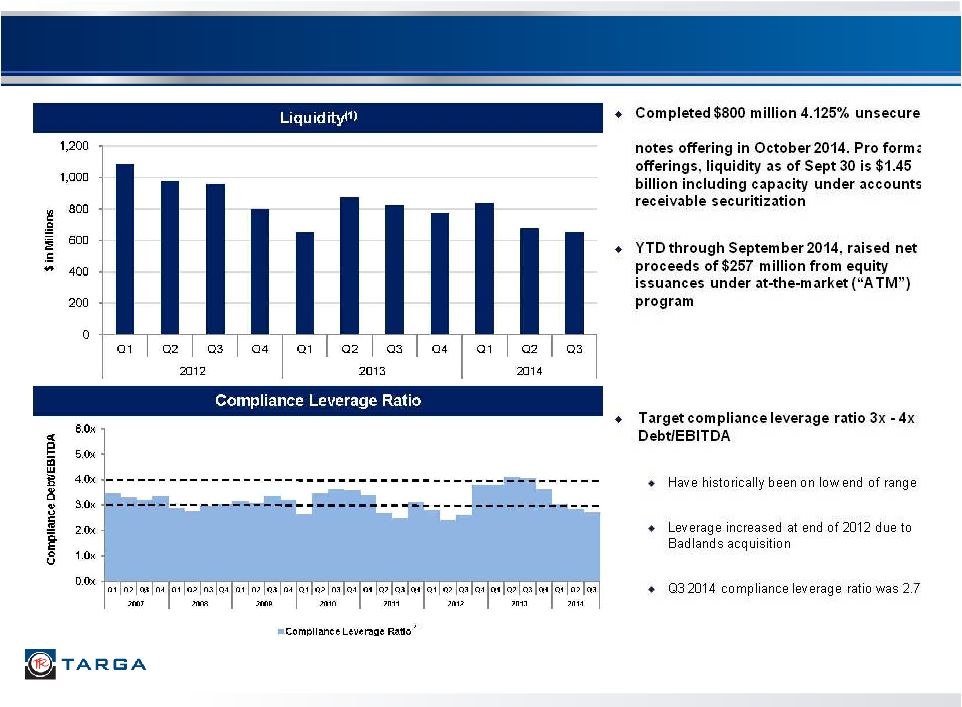 15 Targa Leverage and Liquidity (1) Includes TRP’s total availability under the revolver plus cash, less outstanding borrowings and letters of credit under the TRP revolver (2) Adjusts EBITDA to provide credit for material capital projects that are in process, but have not started commercial operation, and other items |
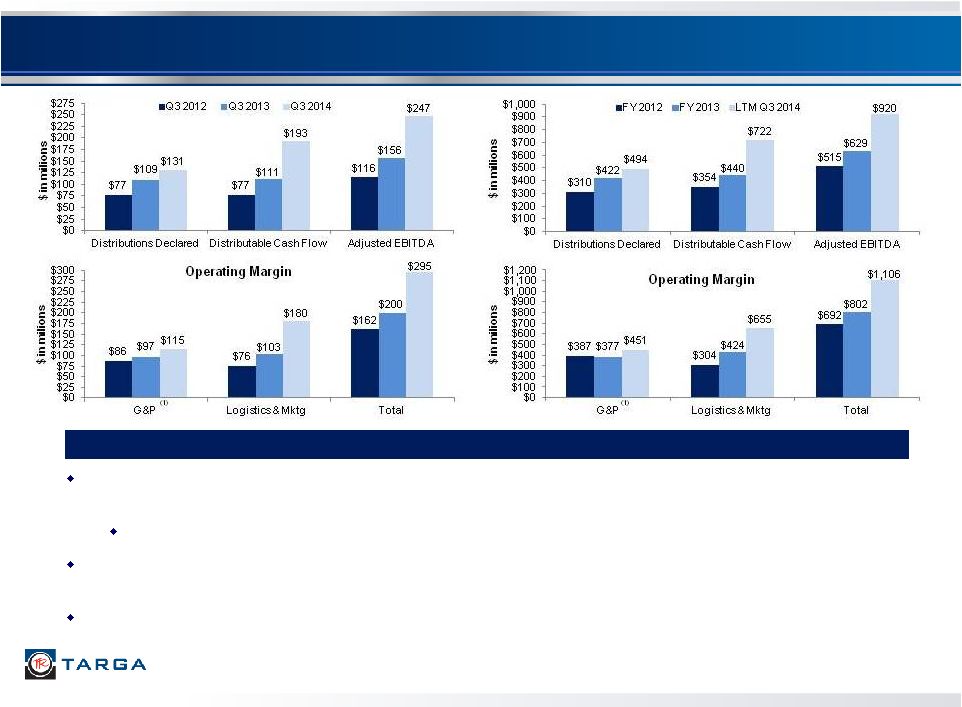 16 TRP Update Adjusted EBITDA increased compared to Q3 2013, primarily due to higher operating margin in the Field Gathering and Processing segment and in the Logistics and Marketing division $247 million of Adjusted EBITDA in Q3 2014 was 58% higher than Q3 2013 Logistics & Marketing operating margin increased by 75% in Q3 2014 versus Q3 2013 due to increased fractionation activities and increased LPG export activity Field Gathering & Processing operating margin increased in Q3 2014 compared to Q3 2013 due to increased throughput volumes and higher contributions from Badlands (1) Includes impact of commodity hedge settlements Highlights |
 17 TRP Capitalization and Liquidity (1) Adjusts EBITDA to provide credit for material capital projects that are in process, but have not started commercial operation, and other items Actual Actual Cash and Debt Maturity Coupon 6/30/2014 Adjustments 9/30/2014 Cash and Cash Equivalents $67.3 $5.1 $72.4 Accounts Receivable Securitization Dec-14 234.3 $3.3 237.6 Revolving Credit Facility Oct-17 495.0 80.0 575.0 Total Senior Secured Debt 729.3 812.6 Senior Notes Oct-18 7.875% 250.0 250.0 Senior Notes Feb-21 6.875% 483.6 483.6 Senior Notes Aug-22 6.375% 300.0 300.0 Senior Notes May-23 5.250% 600.0 600.0 Senior Notes Nov-23 4.250% 625.0 625.0 Unamortized Discounts (26.7) 0.7 (26.0) Total Consolidated Debt $2,961.2 $3,045.2 Compliance Leverage Ratio (1) 2.8x 2.7x Liquidity: Credit Facility Commitment 1,200.0 1,200.0 Funded Borrowings (495.0) (80.0) (575.0) Letters of Credit (94.6) $52.6 (42.0) Total Revolver Availability $610.4 $583.0 Cash 67.3 72.4 Total Liquidity $677.7 $655.4 |
 18 Targa 2014 Annual Guidance Summary (1) Based on an illustrative Targa NGL barrel that contains 44% ethane, 30% propane, 11% natural gasoline, 5% isobutane and 10% normal butane Financial FY 2014 Comments 2014 EBITDA ($ in millions) $925 - $975 Fee-Based Margin % 65%+ Growth Cap Ex - Announced Projects Only $780 Maintenance Cap Ex ($ in millions) $80 TRP Distribution Growth (FY 2014 vs FY 2013) 7% - 9% Expected to be on high side of range TRC Dividend Growth (FY 2014 vs FY 2013) 25%+ Operating Statistics FY 2014 Comments Field Gas Inlet Volumes Growth across all systems Badlands Crude Gathered Volumes (FY 2014 vs FY 2013) Approximately double Coastal NGL Production Higher than 2013 Commodity Price Assumptions FY 2014 Comments Weighted Average NGL ($/gallon) $0.90 Henry Hub Natural Gas ($/MMBtu) $3.75 Crude Oil ($/barrel) $95.00 (1) |
 19 Targa Investment Highlights Well positioned in U.S. shale / resource plays Leadership position at Mont Belvieu Increasing scale, diversity and fee-based margin Approximately $2.6 billion in announced organic cap ex projects completed or underway Additional projects under development of similar scale and mix Strong financial profile Strong track record of distribution and dividend growth Experienced management team Diversified Midstream Platform |
 20 Proposed Acquisition of Atlas |
 21 Targa + Atlas: Transaction Overview Targa Resources Partners LP (NYSE: NGLS; “TRP” or the “Partnership”) has executed a definitive agreement to acquire Atlas Pipeline Partners, L.P. (NYSE: APL) for $5.8 billion (1) 0.5846 NGLS common units plus a one-time cash payment of $1.26 for each APL LP unit (implied premium (1) of 15%) $1.8 billion of debt at September 30, 2014 Targa Resources Corp. (NYSE: TRGP; “TRC” or the “Company”) has executed a definitive agreement to acquire Atlas Energy, L.P. (NYSE: ATLS), after its spin-off of non APL-related assets, for $1.9 billion (1) Prior to TRGP’s acquisition, all assets held by ATLS not associated with APL will be spun out to existing ATLS unitholders 10.35 million TRGP shares issued to ATLS unitholders $610 million of cash to ATLS Each existing ATLS (after giving effect to ATLS’ spin out) unit will receive 0.1809 TRGP shares and $9.12 in cash Accretive to NGLS and TRGP cash flow per unit and share, respectively, immediately and over the longer-term, while providing APL and ATLS unitholders increased value now and into the future Post closing (2) , NGLS plans to increase its quarterly distribution by $0.04 per LP unit ($0.16 per LP unit annualized rate) NGLS expects 11-13% distribution growth in 2015 compared to 7-9% in 2014 Post closing (2) , TRGP plans to increase its quarterly dividend by $0.10 per share ($0.40 per share annualized rate) TRGP expects approximately 35% dividend growth (3) in 2015 compared to 25%+ in 2014 Transactions are cross-conditional and expected to close Q1 2015, subject to shareholder and regulatory approvals (1) Based on market data as of October 10, 2014, excluding transaction fees and expenses (2) Management intends to recommend this increase at the first regularly scheduled quarterly distribution declaration Board meeting after transaction closes (3) Assumes NGLS distribution growth of 11-13% |
 22 Targa + Atlas: Strategic Highlights Attractive Positions in Active Basins Creates World- Class Permian Footprint Complementary Assets with Significant Growth Opportunities Enhances Credit Profile Significant Long- Term Value Creation Already strong positions in Permian and Bakken enhanced with entry into Mississippi Lime and Eagle Ford 4 of the top 5 basins by active rig count and unconventional well spuds (1) Top 3 basins by oil production (1) Also exposed to emerging SCOOP play and continued development of NGL-rich Barnett Shale Adds diversity and leadership position in all basins/plays Combines strong Permian Basin positions to create a premier franchise Provides new customer relationships with the most active operators in each basin Current combined processing capacity of 1,439 MMcf/d plus 500 MMcf/d of announced expansions Significant organic growth project opportunities 2014 growth capex of ~$1.2 billion 2015 growth capex expected to exceed $1.2 billion Additional projects under development of over $3 billion NGL production to support Targa’s leading NGL position in Mont Belvieu and Galena Park Estimated pro forma leverage ratio of 3.3x Total Debt / 2014E EBITDA (4) at NGLS Increased size and scale move NGLS credit metrics closer to investment grade over time Immediately accretive to distributable cash flow at both NGLS and TRGP Increases FY 2015 vs FY 2014 distribution growth at NGLS to 11-13% and at TRGP to approximately 35% Provides larger asset base with additional long-term growth opportunities Higher long-term distribution/dividend growth profile than Targa standalone (1) Source: Oil & Gas Investor (2) Based on market data as of October 10, 2014, less the value of 16.3 MM PF NGLS units owned by TRGP (3) Based on NGLS and APL guidance ranges (4) Based on estimated compliance ratio Increased Size and Scale Combined partnership will be one of the largest diversified MLPs Pro forma enterprise value (2) of $23 billion Pro forma 2014E EBITDA of approximately $1.3-$1.4 billion (3) |
 23 Attractive Positions in Active Basins Barnett Eagle Ford Delaware Bakken Mississippi Lime Woodford Pro Forma Asset Highlights 39 natural gas processing plants (~6.9 Bcf/d gross processing capacity) Over 22,500 miles of natural gas and crude oil gathering pipeline Gross NGL production of 278.9 MBbls/d in 2Q 2014 3 crude oil and refined products terminals with 2.5 MMBbls of storage 17 gas treating facilities 573 MBbl/d gross fractionation capacity ~6.5 MMBbl/month capacity LPG export terminal Atlas Natural Gas Processing Plant Natural Gas Pipeline Targa Natural Gas Processing Plant Terminal Fractionator Natural Gas Pipeline Crude Oil Pipeline NGL Pipeline Legend U.S. Land Rig Count by Basin (1) (1) Source: Baker Hughes Incorporated, as of October 20, 2014 SCOOP Midland |
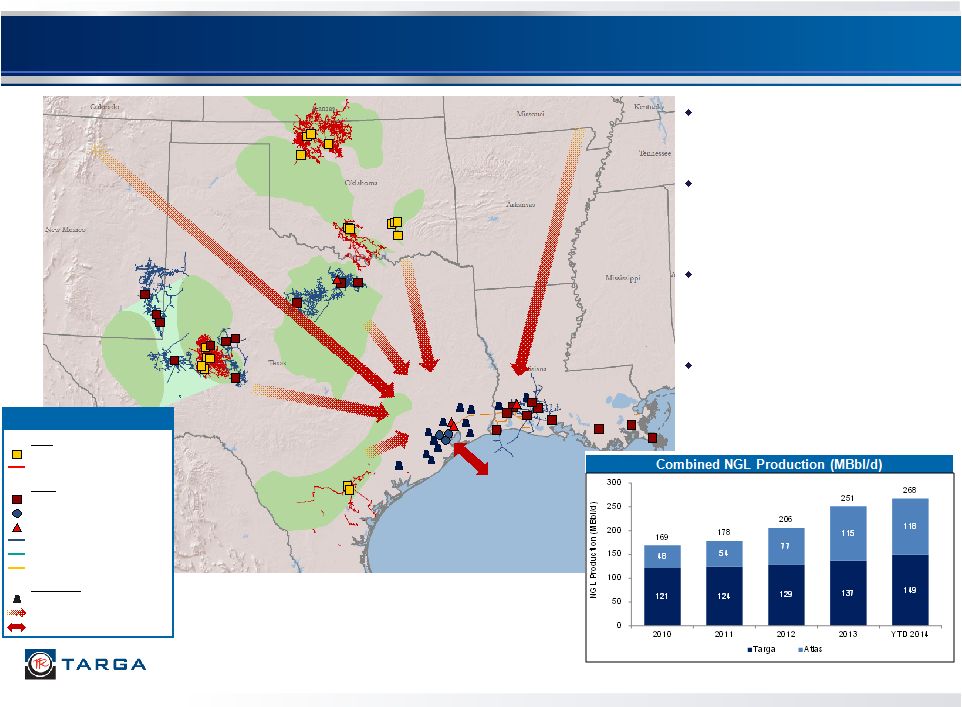 24 24 Producer Activity Drives NGL Flows to Mont Belvieu Growing field NGL production increases NGL flows to Mont Belvieu Increased NGL production could support Targa’s existing and expanding Mont Belvieu and Galena Park presence Petrochemical investments, fractionation and export services will continue to clear additional supply Targa’s Mont Belvieu and Galena Park businesses very well positioned Barnett Eagle Ford Midland Mississippi Lime Woodford Delaware Marcellus & Others Rockies Galena Park Marine Import / Export Terminal Atlas Natural Gas Processing Plant Natural Gas Pipeline Targa Natural Gas Processing Plant Terminal Fractionator Natural Gas Pipeline Crude Oil Pipeline NGL Pipeline Third Party Ethylene Cracker Illustrative Y-Grade Flows Import / Export Legend Mont Belvieu Terminal SCOOP |
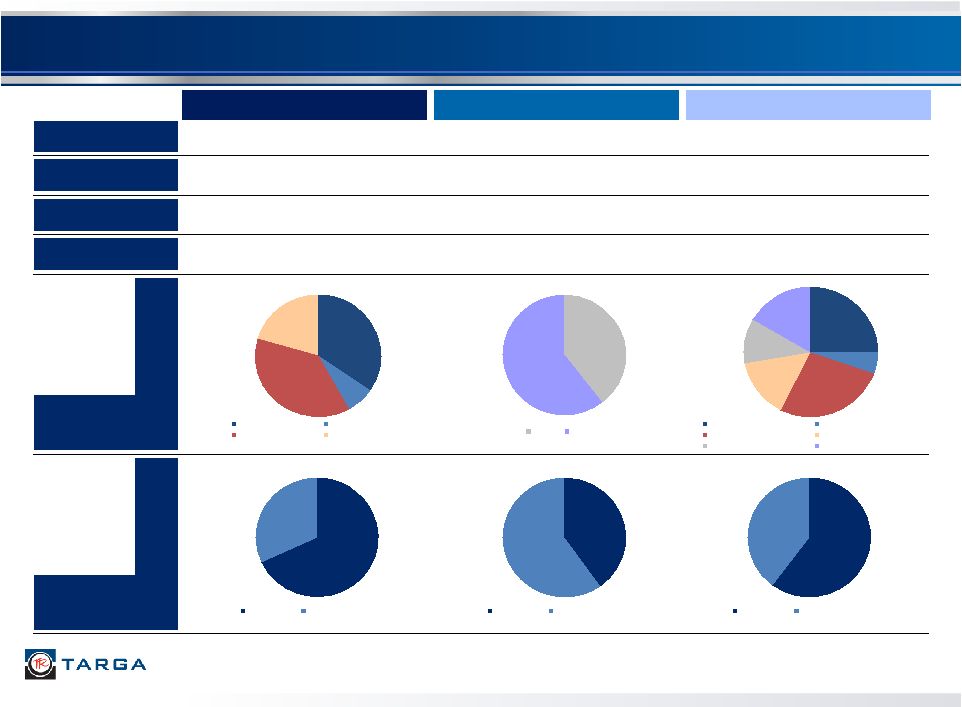   Market Cap ~ $12 Billion (1) ~ $5 Billion (2) ~ $17 Billion (1) Enterprise Value ~ $15 Billion (1) ~ $8 Billion (2) ~ $23 Billion (1) 2014E EBITDA ($MM) $925 - $975 Million $400 - $425 Million $1,325 - $1,400 Million 2014E Capital Expenditures ($MM) $780 Million $400 - $450 Million $1,180 - $1,230 Million 2014E Operating Margin by Segment YE 2014E % Fee- Based 68% 32% Fixed Fee Percent of Proceeds 35% 7% 38% 20% Field G&P Coastal G&P Logistics Marketing and Dist. 40% 60% Texas Oklahoma 25% 5% 27% 15% 11% 17% Field G&P - Targa Coastal G&P - Targa Logistics - Targa Marketing and Dist. - Targa Texas - Atlas Oklahoma - Atlas 40% 60% Fixed Fee Percent of Proceeds 60% 40% Fixed Fee Percent of Proceeds 25 Increased Size and Scale Enhance Credit Profile Targa Atlas Pro Forma Targa (1) Represents combined market cap and enterprise value for NGLS and TRGP as of October 10, 2014, less the value of NGLS units or PF NGLS units owned by TRGP (2) Represents combined market cap and enterprise value for APL and ATLS as of October 10, 2014 based on transaction consideration (3) Includes keep-whole at 1% of total margin (3) |
 26 Pro Forma Organizational and Capital Structure Targa Resources Corp. (NYSE: TRGP) (“TRC” or the “Company”) PF Standalone Leverage (1) : 3.8x PF Consolidated Leverage (2) : 3.9x Targa Resources GP LLC Targa Resources Partners LP (NYSE: NGLS) (“TRP” or the “Partnership”) PF Leverage (3) : 3.3x Lenders Lenders Public Shareholders Legacy TRGP: 80% Legacy ATLS: 20% Public Unitholders Legacy NGLS: 59% Legacy APL: 32% $750 million of new Term Loan B borrowings $92 million of existing revolver borrowings plus $115 million of new revolver borrowings under new $350 million revolver $3.0 billion of existing debt at NGLS $1.8 billion of debt from APL $0.2 billion of new revolver borrowings 100% Interest (52.5 million shares) 100% Indirect Ownership 9% LP Interest (16.3 million LP Units) 2% General Partner Interest & IDRs $5.0 billion of debt 91% LP Interest (158.5 million LP units) $957 million of debt Note: Debt balances as of September 30, 2014. Transaction adjustments include estimated fees and expenses (1) Based on PF TRGP Debt / 2014E EBITDA. TRGP EBITDA based on cash distributions received from LP units, GP units and IDRs less TRGP G&A (2) Based on PF total NGLS and TRGP debt divided by 2014E PF NGLS Compliance EBITDA (3) Based on PF total NGLS Debt / 2014E PF NGLS Compliance EBITDA |
 Targa Business Division and Segment Review |
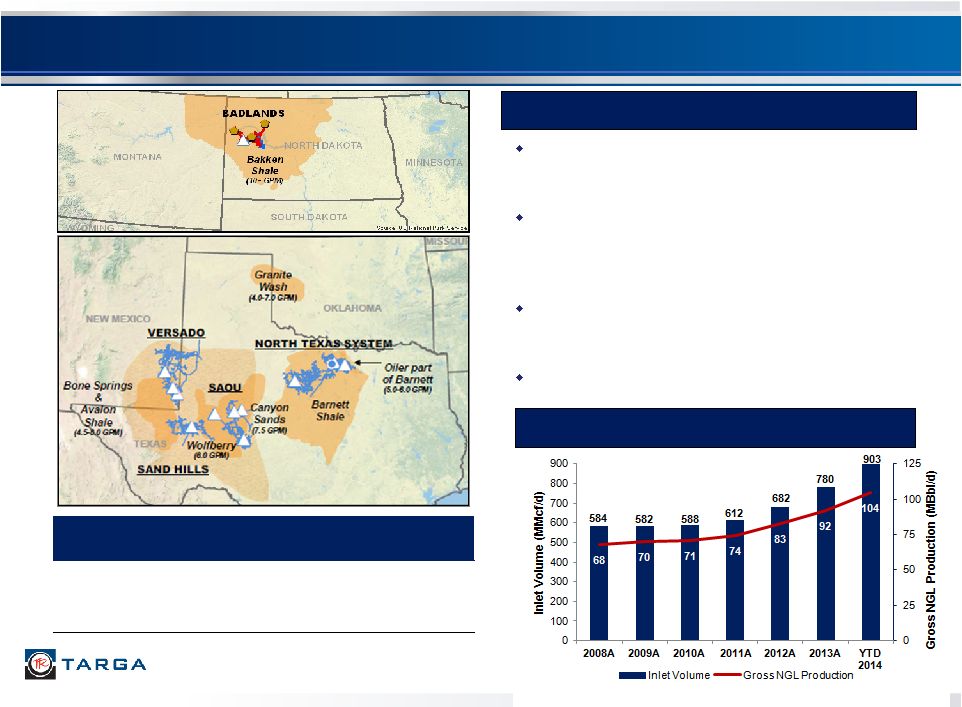  Field Gathering and Processing Segment 28 Approximately 900 MMcf/d of gross processing capacity at the end of 2013, expanding to approximately 1,340 MMcf/d in 2014 (2) Permian Basin activity dominated by oil shale / resource plays; SAOU, Sand Hills and Versado are gathering from oil wells with associated gas and NGLs North Texas assets are located in oiler portion of Barnett Shale where drilling activity remains active Bakken activity also dominated by oil shale / resource plays Field G&P Highlights Meaningful Increase in Plant Inlet Volumes North Texas 278 200 478 SAOU 169 200 369 Sand Hills 175 0 175 Versado 240 0 240 Badlands 38 40 78 Total 900 1,340 Gross Processing Capacity (MMcf/d) Expansions 2014 (MMcf/d) Capacity Post-Expansions (MMcf/d) (1) (1) As of YE 2013 (2) Additional Badlands plant estimated completion YE 2014 and in-service early 2015 (2) |
 Note: Gross processing capacity varies as GPM increases and decreases (1) As of Q3 2014 Targa’s Permian Basin Systems Across Broad Active Plays 29 2014 inlet volumes are expected to be meaningfully higher than 2013 in each of SAOU, Sand Hills and Versado More horizontal wells are accelerating production growth 200 MMcf/d High Plains Plant placed in service in June 2014 35 mile Midland County Pipeline placed in service in June 2014 Recently approved construction of new 300 MMcf/d gas processing plant in Delaware Basin expected to be in-service at the end of Q1 2016 Permian Growth Continues Addition of 200 MMcf/d High Plains Plant in June 2014 Targa’s Permian Basin Throughput and Capacity Gross Processing Capacity (MMcf/d) Q3 2014 Inlet Volume (MMcf/d) Pipeline Miles Q3 2014 Recovered GPM SAOU 369 207 1,800 5.3 Sand Hills 175 167 1,500 4.4 Versado 240 172 3,350 5.4 Total 784 546 6,650 (1) |
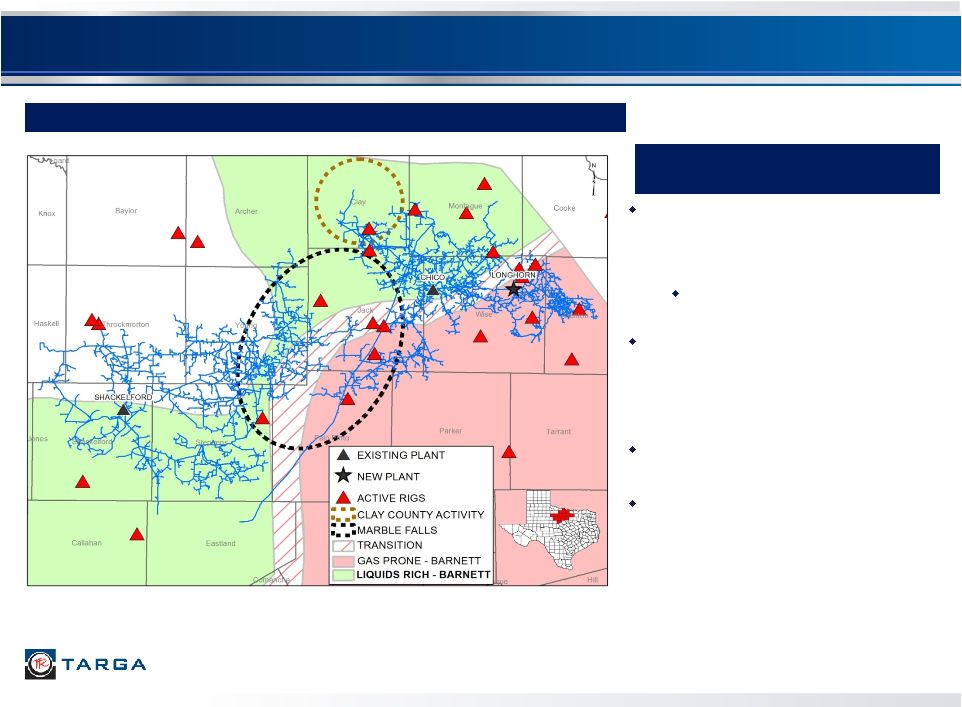 North Texas – Well Positioned for Growth 30 Liquids-Rich Barnett Shale and Marble Falls Driving Growth Targa’s assets are well positioned to access the active liquids-rich portion of the Barnett Shale and the Marble Falls play 200 MMcf/d Longhorn Plant placed in service in May 2014 Barnett volumes continue to trend higher as improvements in horizontal drilling and multi-staged frac completions result in higher initial production rates Producers starting to show increased activity in Clay County Marble Falls play in Jack and Palo Pinto counties leverages existing system, while providing expansion opportunities Rig Activity in North Texas (1) (1) Source: Drillinginfo; includes Archer, Clay, Cooke, Denton, Eastland, Haskell, Jack, Jones, Montague, Palo Pinto, Parker, Shackelford, Stephens, Throckmorton, Wise & Young Counties, TX |
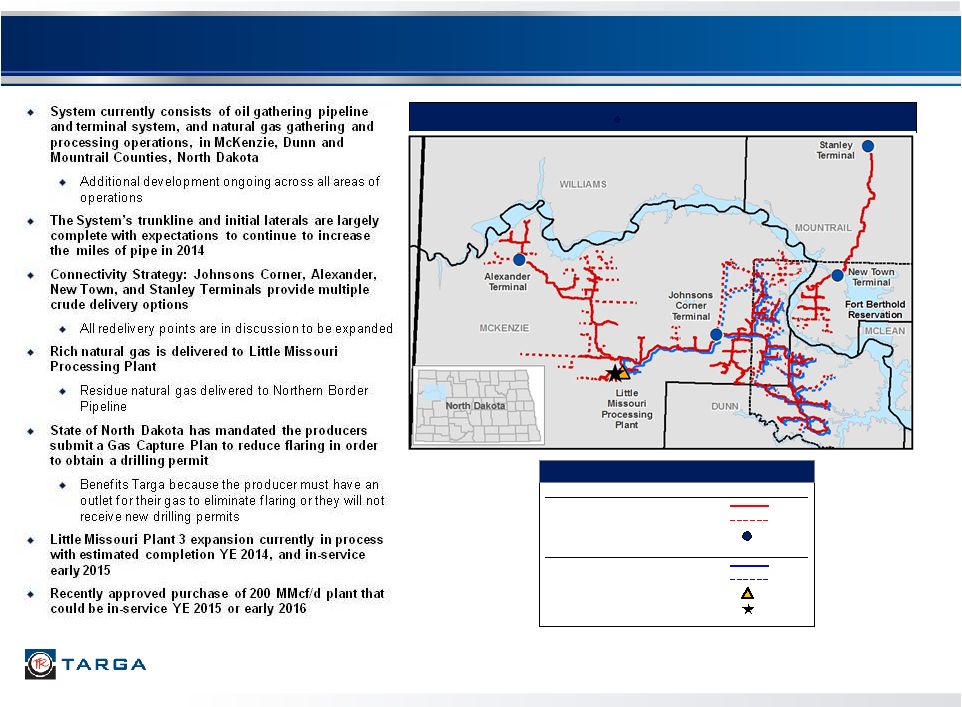 Badlands – High-Quality, Fee-Based Assets 31 System Map Crude Oil Assets Completed pipelines Proposed Pipelines Terminals Natural Gas Assets Completed Pipelines Processing Plant Proposed Pipelines Little Missouri Phase 3 Legend |
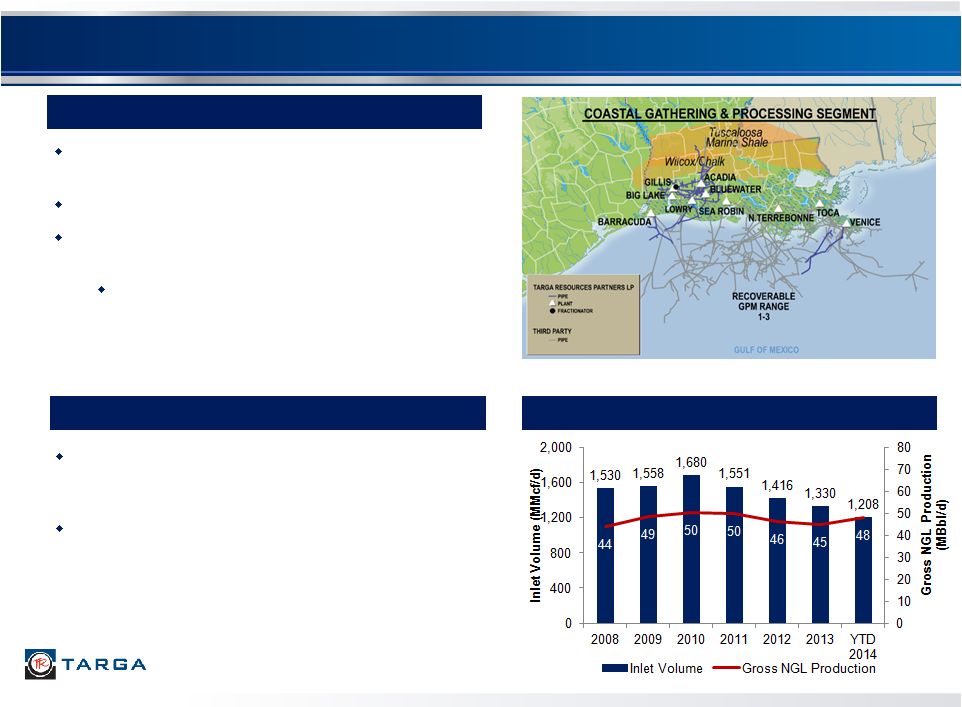 Coastal Gathering and Processing Segment Overview Positioned on mainline gas pipelines processing volumes of gas collected from multiple offshore producing areas VESCO is now processing rich gas from Shell’s Mars B / Olympus development Coastal Straddles (including VESCO) Processing Plants: Gillis (180 MMcf/d), Acadia (80 MMcf/d) and Big Lake (180 MMcf/d) Fractionation interconnected to LCF Traditional wellhead volumes have been declining but inlet volumes have longer term upside potential Other interconnected “straddle” volumes 32 LOU (Louisiana Operating Unit) Coastal G&P Segment Volumes |
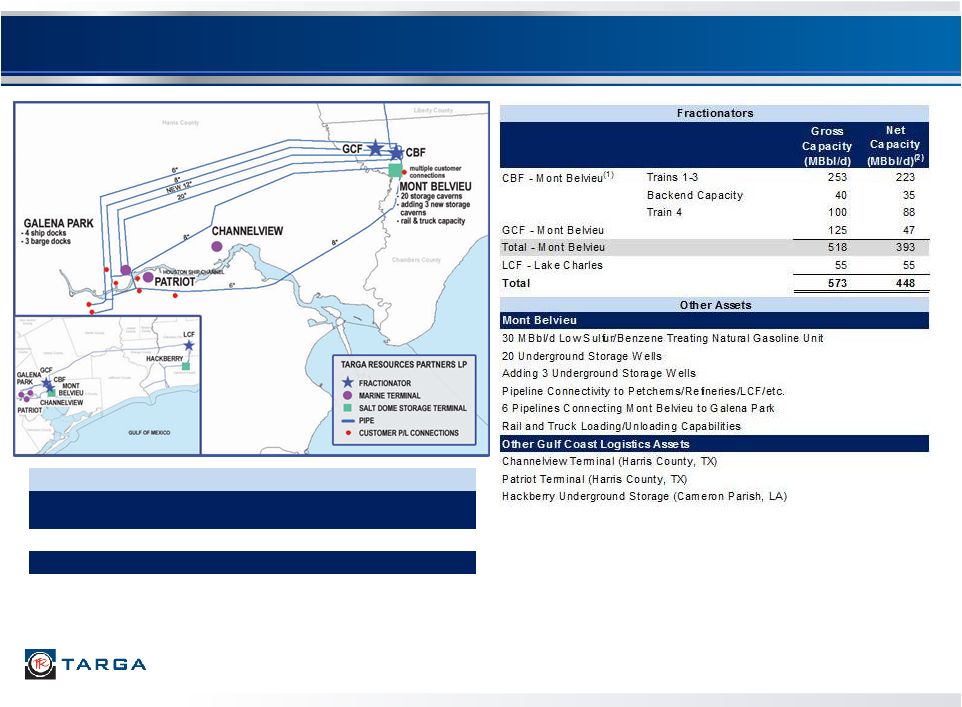 Logistics Assets – Extensive Gulf Coast Footprint 33 (1) Recently commenced construction on Train 5, a 100 MBbl/d expansion (2) Net capacity is calculated based on TRP’s 88% ownership of CBF and 39% ownership of GCF (3) Phase II expansion now fully complete Galena Park Marine Terminal Products MMBbl/ Month Export Capacity (3) LEP / HD5 / NC4 ~6.5 Other Assets 700 MBbls in Above Ground Storage Tanks 4 Ship Docks |
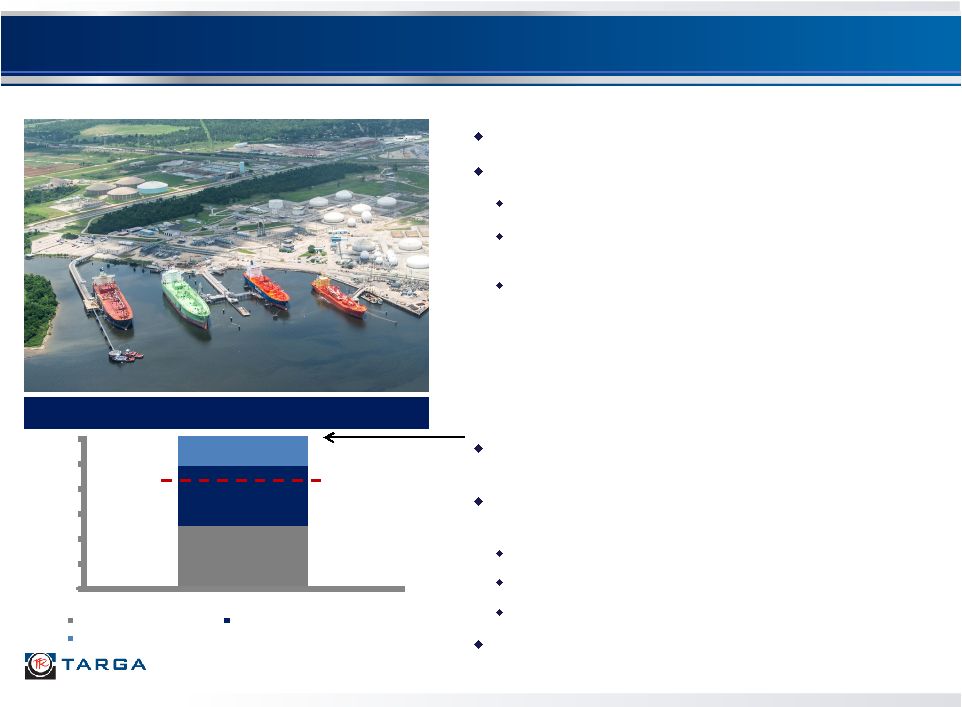 0 50 100 150 200 250 300 Loading Rates MBbl/d 5000 BPH Fully-Ref #1 Chiller 5000 BPH Fully-Ref #2 Chiller 2500 BPH Semi-Ref Chiller Effective Capacity 70% Galena Park Loading Rates Targa’s Galena Park Marine Terminal Effective Export Capacity 34 Phase I expansion completed in September 2013 Phase II was fully completed in September 2014 Phase II expansion was completed in stages Additional 12” pipeline, refrigeration, and new VLGC- capable dock were placed in-service in Q1 and Q2 2014 Additional de-ethanizer at Mont Belvieu was placed in- service in Q3 2014 Targa’s nameplate refrigeration capacity is ~12,500 Bbl/h or ~300 MBbl/d or ~9 MMBbl/month Effective capacity for Targa and others is primarily a function of: Equipment run-time and efficiencies Dock space and ship staging Storage and product availability Targa’s effective capacity of 6.5 MMBbl/month is ~70% of the nameplate |
 Demand for Exports Continues to Increase Long term incentive to export continues as expected supply growth exceeds domestic demand U.S. Propane (1) U.S. Butane (1) (2) Historically, U.S. Gulf Coast propane and butane have been favorably priced compared to world markets Year to date 2014, the spread between the Saudi Contract propane price and Mont Belvieu propane price narrowed versus the levels experienced in 2012 and 2013, but demand for long-term and short-term cargoes remains strong Targa owns one of only two operating commercial LPG export facilities on the Gulf Coast Currently exporting low ethane propane, HD5 and butane Targa can service small, mid-sized and VLGC vessels Targa’s Phase II expansion is now complete and has increased effective capacity to export to approximately 6.5 MMBbl/month (1) Source: IHS (2) CP = Saudi Contract Price 35 (2) |
 36 Petroleum Logistics – Highlights Expanding TRP’s Channelview Terminal In March 2014, announced the approval to construct a 35 MBbl/d condensate splitter at TRP’s Channelview Terminal (Houston) TRP has filed the permit, and expects the splitter to be in-service late 2016 or early 2017, depending on permit timing Supported by a long-term fee-based arrangement with Noble Americas Corp., a subsidiary of Noble Group Ltd. Continuing to expand TRP’s Sound Terminal Expanded in Q1 2013 with connection to a local products pipeline Added storage capacity in Q2 2014, and added ethanol, biodiesel and gasoline blending to the truck loading rack The acquisition announced in January 2013 of Patriot on the Houston Ship Channel provides additional growth opportunities Potential location for an additional condensate splitter Clean product storage and terminaling Expansion potential for LPG exports Connectivity to local pipelines and Targa Galena Park Growing backlog of additional organic growth projects Terminal Current Storage Products Capabilities Targa Channelview Houston, TX 556 MBbl Crude oil, blend stock, asphalt, marine diesel oil, used motor oil, vacuum gas oil, residual fuel oil Truck and barge transport; Blending and heating; Vapor controls Targa Sound Tacoma, WA 1,457 MBbl Crude oil, gasoline, distillates, asphalt, residual truck transport; fuel oils, LPGs, ethanol, biodiesel Ship, barge, pipe, rail, and Blending and heating; Vapor controls Targa Baltimore Baltimore, MD 505 MBbl Asphalt, fuel oil; ability to expand product handling Truck and barge transport; Blending and heating; Can add rail, pipe, and ship Total 2,518MBbl |
 Marketing and Distribution Segment 37 NGL and Natural Gas Marketing Manage physical distribution of mixed NGLs and specification products using owned and third party facilities Manage inventories for Targa downstream business Sell propane and butane for international export Buy and sell natural gas to optimize Targa assets Wholesale Propane Sell propane to multi-state, independent retailers and industrial accounts on a fixed or posted price at delivery Tightly managed inventory sold at an index plus Refinery Services Balance refinery NGL supply and demand requirements Propane, normal butane, isobutane, butylenes Contractual agreements with major refiners to market NGLs by barge, rail and truck Margin-based fees with a fixed minimum per gallon Commercial Transportation All fee-based 686 railcars leased and managed 75 owned and leased transport tractors 22 pressurized NGL barges This segment incorporates the skills and capabilities that enable other Targa businesses Operating Margin vs. NGL Price Marketing and Distribution Highlights |
 Appendix |
 39 This presentation includes the non-GAAP financial measure of Adjusted EBITDA. The presentation provides a reconciliation of this non-GAAP financial measures to its most directly comparable financial measure calculated and presented in accordance with generally accepted accounting principles in the United States of America ("GAAP"). Our non-GAAP financial measures should not be considered as alternatives to GAAP measures such as net income, operating income, net cash flows provided by operating activities or any other GAAP measure of liquidity or financial performance. Non-GAAP Measures Reconciliation |
 40 Adjusted EBITDA – The Partnership and Targa define Adjusted EBITDA as net income attributable to Targa Resources Partners LP before: interest; income taxes; depreciation and amortization; gains or losses on debt repurchases and redemptions; early debt extinguishment and asset disposals; non-cash risk management activities related to derivative instruments; changes in the fair value of the Badlands acquisition contingent consideration and the non-controlling interest portion of depreciation and amortization expenses. Adjusted EBITDA is used as a supplemental financial measure by our management and by external users of our financial statements such as investors, commercial banks and others. The economic substance behind management’s use of Adjusted EBITDA is to measure the ability of our assets to generate cash sufficient to pay interest costs, support our indebtedness and make distributions to our investors. Adjusted EBITDA is a non-GAAP financial measure. The GAAP measures most directly comparable to Adjusted EBITDA are net cash provided by operating activities and net income (loss) attributable to Targa Resources Partners LP. Adjusted EBITDA should not be considered as an alternative to GAAP net cash provided by operating activities or GAAP net income. Adjusted EBITDA has important limitations as an analytical tool. Investors should not consider Adjusted EBITDA in isolation or as a substitute for analysis of our results as reported under GAAP. Because Adjusted EBITDA excludes some, but not all, items that affect net income and net cash provided by operating activities and is defined differently by different companies in our industry, our definition of Adjusted EBITDA may not be comparable to similarly titled measures of other companies. Management compensates for the limitations of Adjusted EBITDA as an analytical tool by reviewing the comparable GAAP measures, understanding the differences between the measures and incorporating these insights into management’s decision-making processes. Non-GAAP Measures Reconciliation |
 41 Non-GAAP Reconciliation – 2014 EBITDA and Gross Margin The following table presents a reconciliation of Adjusted EBITDA and operating margin to net income (loss) for the periods shown for TRP: 2014 2013 Reconciliation of net income (loss) attributable to Targa Resources Partners LP to Adjusted EBITDA: Net income to Targa Resources Partners LP 128.3 $ 59.7 $ Add: Interest expense, net 36.0 32.6 Income tax expense 1.3 0.7 Depreciation and amortization expense 87.5 68.9 (Gain) Loss on sale or disposal of assets (4.4) (0.7) Loss on debt redemption and early debt extinguishments - 7.4 Change in contingent consideration - (9.1) Risk management activities 1.5 (0.3) Noncontrolling interest adjustment (3.5) (3.3) Adjusted EBITDA 246.7 $ 155.9 $ 2014 2013 Reconciliation of gross margin and operating margin to net income (loss): Gross margin 407.9 $ 297.1 $ Operating expenses (112.8) (97.6) Operating margin 295.1 199.5 Depreciation and amortization expenses (87.5) (68.9) General and administrative expenses (40.5) (35.4) Interest expense, net (36.0) (32.6) Income tax expense (1.3) (0.7) (Gain) Loss on sale or disposal of assets 4.4 0.7 Loss on debt redemption and early debt extinguishments - (7.4) Change in contingent consideration - 9.1 Other, net 4.0 0.7 Net income 138.2 $ 65.0 $ ($ in millions) ($ in millions) Three Months Ended Three Months Ended September 30, September 30, |
 42 Non-GAAP Reconciliation – 2014 EBITDA The following table presents a reconciliation of 2014 projected Adjusted EBITDA to net income for NGLS: Low Range High Range ($ in millions) Reconciliation of net income attributable to Targa Resources Partners LP to Adjusted EBITDA: Net income attributable to Targa Resources Partners LP 444.5 $ 494.5 $ Add: Interest expense, net 150.0 150.0 Income tax expense 4.0 4.0 Depreciation and amortization expenses 340.0 340.0 Noncontrolling interests adjustment (13.5) (13.5) Adjusted EBITDA 925.0 $ 975.0 $ Twelve Months Ended 12/31/2014 |
 43 Non-GAAP Reconciliation – DCF The following table presents a reconciliation of reported distributable cash flow to net income (loss) for the periods shown for TRP: ($ in millions) 31-Mar 30-Jun 30-Sep 31-Dec 31-Mar 30-Jun 30-Sep 2013 2013 2013 2013 2014 2014 2014 Reconciliation of net income (loss) attributable to Targa Resources Partners LP to distributable cash flow: Net income (loss) attributable to Targa Resources Partners LP 38.9 $ 26.3 $ 59.7 $ 108.6 $ 122.4 $ 108.8 $ 128.3 Add: Depreciation and amortization expense 63.9 65.7 68.9 73.1 79.5 85.8 87.5 Deferred income tax (expense) benefit 0.4 0.4 - 0.1 0.4 0.3 0.4 Amortization in interest expense 4.0 4.0 3.8 3.7 3.4 3.3 2.2 Loss (gain) on debt redemption and early debt extinguishments - 7.4 7.4 - - - - Change in contingent consideration 0.3 (6.5) (9.1) - - - - Loss (gain) on disposal of assets (0.1) 3.9 (0.7) 0.8 (0.8) (0.5) (4.4) Risk management activities (0.2) 0.2 (0.3) (0.3) (0.2) (0.4) 1.5 Maintenance capital expenditures (21.7) (21.8) (17.0) (19.5) (13.7) (20.0) (21.9) Other - (0.6) (1.9) (1.6) (2.0) (2.0) (1.1) Distributable cash flow $ 85.5 $ 79.0 $ 110.8 $ 164.9 $ 189.0 $ 175.3 $ 192.5 Distributions Declared 95.7 102.4 108.5 115.8 121.3 125.7 130.9 Distribution Coverage 0.9x 0.8x 1.0x 1.4x 1.6x 1.4x 1.5x Three Months Ended |
 44 Non-GAAP Reconciliation – 2010-2011 Fee-Based Margin The following table presents a reconciliation of operating margin to net income (loss) for the periods shown for TRP: 3/31/2010 6/30/2010 9/30/2010 12/31/2010 3/31/2011 6/30/2011 9/30/2011 12/31/2011 Reconciliation of gross margin and operating margin to net income (loss): Gross margin 185.9 $ 179.8 $ 184.7 $ 221.7 $ 213.9 $ 248.2 $ 227.2 $ 258.8 $ Operating expenses (62.2) (62.0) (66.0) (69.4) (65.9) (71.6) (76.5) (72.9) Operating margin 123.7 117.9 118.8 152.4 148.0 176.6 150.7 185.9 Depreciation and amortization expenses (42.0) (43.0) (43.3) (47.8) (42.7) (44.5) (45.0) (46.0) General and administrative expenses (25.0) (28.4) (26.7) (42.5) (31.8) (33.2) (33.7) (29.2) Interest expense, net (31.1) (27.5) (27.2) (25.1) (27.5) (27.2) (25.7) (27.3) Income tax expense (1.4) (0.9) (1.6) (0.1) (1.8) (1.9) (1.5) 0.9 Loss (gain) on sale or disposal of assets - - - - - - 0.3 (0.6) (Loss) gain on debt redemption and early debt extinguishments - - (0.8) 0.8 - - - - Change in contingent consideration - - - - - - - - Risk management activities 25.4 2.5 (1.9) - - (3.2) (1.8) - Equity in earnings of unconsolidated investments 0.3 2.4 1.1 1.7 1.7 1.3 2.2 - Other Operating income (loss) - - - 3.3 - - - - Other, net - 0.1 - 0.1 (0.2) 0.1 (0.6) 3.2 Net income 49.9 $ 22.9 $ 18.4 $ 42.8 $ 45.7 $ 68.0 $ 44.9 $ 86.9 $ Fee Based operating margin percentage 19% 25% 31% 31% 25% 28% 30% 30% Fee Based operating margin $ 23.0 $ 30.0 $ 36.9 $ 47.1 $ 37.3 $ 48.8 $ 44.8 $ 55.3 Three Months Ended ($ in millions) |
 45 Non-GAAP Reconciliation – 2012-2014 Fee-Based Margin The following table presents a reconciliation of operating margin to net income (loss) for the periods shown for TRP: |
 46 1000 Louisiana Suite 4300 Houston, TX 77002 Phone: (713) 584-1000 Email: InvestorRelations@targaresources.com Website: www.targaresources.com |