UNITED STATES
SECURITIES AND EXCHANGE COMMISSION
Washington, D.C. 20549
FORM N-CSR
CERTIFIED SHAREHOLDER REPORT OF REGISTERED MANAGEMENT INVESTMENT COMPANIES
Investment Company Act file number 811-21982
Claymore/Guggenheim Strategic Opportunities Fund
(Exact name of registrant as specified in charter)
2455 Corporate West Drive, Lisle, IL 60532
(Address of principal executive offices) (Zip code)
(Address of principal executive offices) (Zip code)
J. Thomas Futrell
2455 Corporate West Drive, Lisle, IL 60532
(Name and address of agent for service)
Registrant's telephone number, including area code: (630) 505-3700
Date of fiscal year end: May 31
Date of reporting period: May 31, 2010
Form N-CSR is to be used by management investment companies to file reports with the Commission not later than 10 days after the transmission to stockholders of any report that is required to be transmitted to stockholders under Rule 30e-1 under the Investment Company Act of 1940 (17 CFR 270.30e-1). The Commission may use the information provided on Form N-CSR in its regulatory, disclosure review, inspection, and policymaking roles.
A registrant is required to disclose the information specified by Form N-CSR, and the Commission will make this information public. A registrant is not required to respond to the collection of information contained in Form N-CSR unless the Form displays a currently valid Office of Management and Budget ("OMB") control number. Please direct comments concerning the accuracy of the information collection burden estimate and any suggestions for reducing the burden to Secretary, Securities and Exchange Commission, 450 Fifth Street, NW, Washington, DC 20549-0609. The OMB has reviewed this collection of information under the clearance requirements of 44 U.S.C. Section 3507.
Item 1. Reports to Stockholders.
The registrant's annual report transmitted to shareholders pursuant to Rule 30e-1 under the Investment Company Act of 1940, as amended (the “Investment Company Act”), is as follows:
Annual Report May 31, 2010 | Claymore/Guggenheim Strategic Opportunities Fund | GOF | |
 | |||
 |  | ||
| www.claymore.com/gof | |
| ... your window to the LATEST, | |
| most up-to-date information about the | |
| Claymore/Guggenheim Strategic Opportunities Fund |
The shareholder report you are reading right now is just the beginning of the story. Online at www.claymore.com/gof, you will find:
| • | Daily, weekly and monthly data on share prices, net asset values, distributions and more |
| • | Portfolio overviews and performance analyses |
| • | Announcements, press releases and special notices |
| • | Fund and adviser contact information |
Guggenheim Partners Asset Management, LLC and Claymore are continually updating and expanding shareholder information services on the Fund’s website, in an ongoing effort to provide you with the most current information about how your Fund’s assets are managed, and the results of our efforts. It is just one more small way we are working to keep you better informed about your investment in the Fund.
2 | Annual Report | May 31, 2010
GOF | Claymore/Guggenheim Strategic Opportunities Fund
Dear Shareholder |
We thank you for your investment in the Claymore/Guggenheim Strategic Opportunities Fund (the “Fund”). This report covers the Fund’s performance for the fiscal year ended May 31, 2010.
The Fund’s investment objective is to maximize total return through a combination of current income and capital appreciation. The Fund’s sub-adviser is Guggenheim Partners Asset Management, LLC (“GPAM” or “the Sub-Adviser”), a wholly-owned subsidiary of Guggenheim Partners, LLC (“Guggenheim” or “Guggenheim Partners”). GPAM seeks to achieve that objective by combining a credit-managed fixed-income portfolio with access to a diversified pool of alternative investments and equity strategies. The Fund pursues a relative value-based investment philosophy, which utilizes quantitative and qualitative analysis to seek to identify securities or spreads between securities that deviate from their perceived fair value and/or historical norms.
All Fund returns cited—whether based on net asset value (“NAV”) or market price—assume the reinvestment of all distributions. For the fiscal year ended May 31, 2010, the Fund generated a total return based on market price of 70.37% and a return of 59.06% based on NAV. As of May 31, 2010, the Fund’s last closing market price of $17.46 represented a discount of 0.57% to the Fund’s NAV of $17.56. Past performance is not a guarantee of future results. The market value of the Fund’s shares fluctuates from time to time, and it may be higher or lower than the Fund’s NAV. Investors should also be aware that these returns were primarily achieved during favorable market conditions and may not be sustainable.
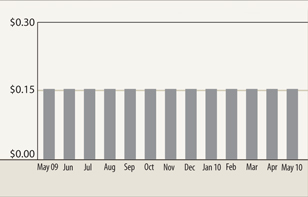
During the 2010 fiscal year the Fund paid monthly distributions of $0.154 per share. The most recent dividend represents an annualized distribution rate of 10.58% based on the Fund’s last closing market price of $17.46 as of May 31, 2010.
Claymore Advisors, LLC (“Claymore”) serves as the Investment Adviser to the Fund. Claymore Securities, Inc. is an affiliate of Claymore Advisors, LLC. Claymore Securities, Inc. offers strategic investment solutions for financial advisors and their clients. In total, Claymore entities provide supervision, management, or servicing on approximately $15.2 billion in assets as of May 31, 2010. Claymore and its associated entities are wholly-owned subsidiaries of Guggenheim Partners, a global, diversified financial services firm with more than $100 billion in assets under supervision.
As a result of the previously-announced Claymore/Guggenheim transaction, upon receiving the necessary shareholder approval on February 3, 2010, the Fund entered into a new investment advisory agreement with Claymore and a new investment sub-advisory agreement with Claymore and GPAM. These new agreements were necessary because the former agreements were automatically terminated upon the merger of Claymore Group Inc. (Claymore’s parent company) with Guggenheim Partners, which took place on October 14, 2009.
We encourage shareholders to consider the opportunity to reinvest their distributions from the Fund through the Dividend Reinvestment Plan (“DRIP”), which is described in detail on page 32 of the Fund’s annual report. When shares trade at a discount to NAV, the DRIP takes advantage of the discount by reinvesting the monthly dividend distribution in common shares of the Fund purchased in the market at a price less than NAV. Conversely, when the market price of the Fund’s common shares is at a premium above NAV, the DRIP reinvests participants’ dividends in newly-issued common shares at NAV, subject to an IRS limitation that the purchase price cannot be more than 5% below the market price per share. The DRIP provides a cost-effective means to accumulate additional shares and enjoy the benefits of compounding returns over time. Since the Fund endeavors to maintain a stable monthly distribution, the DRIP plan effectively provides an income averaging technique, which causes shareholders to accumulate a larger number of Fund shares when the market price is depressed than when the price is higher.
Annual Report | May 31, 2010 | 3
GOF | Claymore/Guggenheim Strategic Opportunities Fund | Dear Shareholder continued
To learn more about the Fund’s performance and investment strategy, we encourage you to read the Questions & Answers section of the report, which begins on page 5. You’ll find information on GPAM’s investment philosophy, its views on the economy and market environment, and detailed information about the factors that impacted the Fund’s performance.
We appreciate your investment and look forward to serving your investment needs in the future. For the most up-to-date information on your investment, please visit the Fund’s website at www. claymore.com/gof.
Sincerely,

J. Thomas Futrell
Chief Executive Officer
Claymore/Guggenheim Strategic Opportunities Fund
Update on Portfolio Management Team
Subsequent to the end of the reporting period, a member of the portfolio management team, Robert Daviduk, submitted his resignation from Guggenheim Partners Asset Management, LLC (“GPAM”). The Fund will continue to be managed by a team of professionals at GPAM, with the day to day responsibilities led by Anne Walsh.
4 | Annual Report | May 31, 2010
GOF | Claymore/Guggenheim Strategic Opportunities Fund
Questions & Answers |
Claymore/Guggenheim Strategic Opportunities Fund (the “Fund”) is managed by a team of seasoned professionals at Guggenheim Partners Asset Management, LLC. This team includes B. Scott Minerd, Chief Executive Officer and Chief Investment Officer; Anne Bookwalter Walsh, CFA, JD, Senior Managing Director; Michael Curcio, Managing Director; Robert N. Daviduk, CFA, Managing Director; Kerim Engin, Ph. D., Managing Director & Director of Risk Management; and Eric Silvergold, Managing Director. In the following interview, the investment team discusses the market environment and the Fund’s performance for the Fund’s fiscal year ended May 31, 2010.
Please remind us of this Fund’s objective and the way it is managed.
The Fund’s investment objective is to seek to maximize total return through a combination of current income and capital appreciation. The Fund pursues a relative value-based investment philosophy, which utilizes quantitative and qualitative analysis to seek to identify securities or spreads between securities that deviate from their perceived fair value and/or historical norms. GPAM seeks to combine a credit-managed fixed-income portfolio with access to a diversified pool of alternative investments and equity strategies. There is no guarantee that the perceived fair value will be achieved.
The Fund seeks to achieve its investment objective by investing in a wide range of fixed income and other debt and senior equity securities (“income securities”) selected from a variety of sectors and credit qualities, including, but not limited to, corporate bonds, loans and loan participations, structured finance investments, U.S. government and agency securities, mezzanine and preferred securities and convertible securities, and in common stocks, limited liability company interests, trust certificates and other equity investments (“common equity securities”) that GPAM believes offer attractive yield and/or capital appreciation potential, including employing a strategy of writing (selling) covered call and put options on such equities. GPAM believes the volatility (risk) of the Fund can be reduced by diversifying the portfolio across a large number of sectors and securities, many of which historically have not been highly correlated to one another.
| • | The Fund may invest, under normal market conditions, up to 60% of its total assets in income securities rated below investment grade (commonly referred to as “junk bonds”). |
| • | The Fund may invest up to 20% of its total assets in non-U.S. dollar-denominated fixed-income securities of corporate and governmental issuers located outside the U.S., including up to 10% of total assets in income securities of issuers located in emerging markets. |
| • | The Fund may invest up to 50% of its total assets in common equity securities consisting of common stock; and |
| • | The Fund may invest up to 30% of its total assets in investment funds that primarily hold (directly or indirectly) investments in which the Fund may invest directly and may invest up to 20% of the Fund’s total assets in investment funds that are registered as investment companies under the Investment Company Act of 1940, as amended (the “1940 Act”) to the extent permitted by applicable law and related interpretations of the staff of the U.S. Securities and Exchange Commission. |
GPAM’s investment process is a collaborative effort between its Portfolio Construction Group, which utilizes tools such as GPAM’s Dynamic Financial Analysis Model to determine allocation of assets among a variety of sectors, and its Sector Specialists, who are responsible for security selection within these sectors and for implementing securities transactions.
The Fund seeks to enhance the level of distributions by utilizing financial leverage through borrowings, reverse repurchase agreements or other forms of debt. As of May 31, 2010, the amount of leverage was approximately 30% of the Fund’s total assets.
Although the use of financial leverage by the Fund may create an opportunity for increased return for the common shares, it also results in additional risks and can magnify the effect of any losses. If the income and gains earned on securities purchased with the financial leverage proceeds are greater than the cost of the financial leverage, then the common shares’ return will be greater than if financial leverage had not been used. Conversely, if the income and gains from the securities purchased with the financial leverage is less than the cost of the financial leverage then the return on the common shares will be less than if financial leverage had not been used. There can be no assurance that a leveraging strategy will be implemented or that it will be successful during any period during which it is employed.
Please tell us about the market environment over the last 12 months.
Markets for both equity and fixed income securities have improved significantly over the last 12 months. This improvement followed an extremely volatile period for financial markets that began in the summer of 2007 and lasted until the early months of 2009. This difficult period was characterized by sharp declines in the market prices of most non-government securities. During that time, investors seemed to be pricing assets at levels that anticipated a very severe economic environment for an extended period—essentially another Great Depression. In the opinion of
Annual Report | May 31, 2010 | 5
GOF | Claymore/Guggenheim Strategic Opportunities Fund | Questions & Answers continued
GPAM, many securities were priced for a worst case economic outcome that did not come to pass. The U.S. economy did, in fact, experience the longest recession since the Great Depression, but it was far milder than the economic maelstrom that engulfed the world in the 1930s. In an effort to stem the very negative cycle that had begun, the federal government instituted several programs of fiscal stimulus financed by running budget deficits of about $1.5 trillion per year. In addition, the Federal Reserve (“Fed”) launched aggressive programs to improve liquidity and grow the money supply.
Beginning in March 2009, the outlook for the global economy began to improve, sparking a rally in virtually all asset classes that involved risk—including equities, corporate bonds, bank loans, asset-backed securities, non-Agency residential mortgage-backed securities, and commercial mortgage-backed securities among others. Market trends were generally positive during the Fund’s May 31, 2010, fiscal year. The Standard & Poor’s 500 (“S&P 500”) Index, which is generally regarded as an indicator of the broad U.S. stock market, returned 20.99% for the 12 months ended May 31, 2010. Most world equity markets were also strong: the Morgan Stanley Capital International (“MSCI”) World Index, which measures performance of world equity markets, returned 13.60%. Bonds also provided solid returns over this 12-month period: the Barclays Aggregate Bond Index, which is a proxy for the investment grade bond market, returned 8.4%. Reflecting investors’ increased appetite for risk, the return of the Barclays U.S. Corporate High Yield Index was 28.8% and the Barclays Commercial Backed Mortgage Securities Index also returned 28.8% over the 12-month period. Other non-government securities, such as investment grade corporate bonds, bank loans and asset backed securities have also performed very well. The return of the Barclays Capital 1-3 Month U.S. Treasury Bill Index was just 0.12%, a reflection of the record low Fed Funds target rate set between zero and 0.25%. Indices are unmanaged, reflect no expenses and it is not possible to invest directly in an index.
How did the Fund perform during this period?
The Fund performed very well over the last 12 months. All Fund returns cited—whether based on net asset value (“NAV”) or market price—assume the reinvestment of all distributions. For the 12-month period ended May 31, 2010, the Fund returned 59.06% on an NAV basis and 70.37% on a market price basis. The closing price of the Fund’s shares as of May 31, 2010, was $17.46, which represented a discount of 0.57% to the NAV of $17.56. The market value of the Fund’s shares fluctuates from time to time and it may be higher or lower than the Fund’s NAV.
An important goal of the Fund is to provide long-term returns in line with equity returns but with volatility that is closer to that of bonds. For the period from the Fund’s inception date of July 27, 2007, through May 31, 2010, the Fund’s NAV return on an annualized basis was 9.05%, compared with the annualized return of - -7.7% for the S&P 500. Over this same period, the Fund’s annualized volatility has been approximately 10.1%. This compares with annualized volatility of the Barclays Aggregate Bond Index (a proxy for bonds) of approximately 4.8% and volatility of the S&P 500 Index of approximately 31.0% over the same period. Since inception, on an annualized basis, the Fund has outperformed equities (as measured by the S&P 500 Index) by 16.8 percentage points with slightly higher volatility than fixed income and less than one-third the volatility of equities. The volatility is measured by calculating the standard deviation of the percentage changes in the Fund’s daily NAV and then annualizing these percentage changes. The relatively low volatility of the Fund’s NAV is attributable to its high level of diversification across many different asset classes. Investors should also be aware that these returns were primarily achieved during favorable market conditions and may not be sustainable.
During the 12-month period ended May 31, 2010, the Fund paid monthly dividends of $0.154 per share. The most recent dividend represents an annualized distribution rate of 10.58% based on the Fund’s last closing market price of $17.46 as of May 31, 2010.
How was the Fund allocated among asset classes during this period and how did these decisions affect performance?
This Fund was created to provide investors the potential to realize a level of return similar to that achieved by equities, but with volatility more typical of fixed income securities. GPAM tracks a large number of equity and fixed income asset classes and, in constructing this portfolio, it seeks to use investments that historically have had low correlations to one another. GPAM has attempted to optimize the portfolio by analyzing the historical returns generated by GPAM’s management team in each sector, the volatility of each sector and the correlations among the sectors. GPAM does this in an effort to reduce the risk of the portfolio while providing the potential for an attractive long-term return to their investors. Throughout the period, the Fund has been highly diversified, generally with exposure to over a dozen broad sector classifications and dozens of subsectors within the major sectors.
Since the final months of 2008, GPAM recognized some unusual opportunities in the market, especially for structured securities, which were selling at extremely depressed prices because hedge funds and other levered investors were forced to sell securities at a
6 | Annual Report | May 31, 2010
GOF | Claymore/Guggenheim Strategic Opportunities Fund | Questions & Answers continued
time of very poor market liquidity. This forced selling created attractive opportunities for opportunistic investors such as GPAM.
In order to take advantage of these opportunities, the Fund’s position in U.S. government and U.S. government agency securities, which performed well during the financial crisis, was reduced substantially and was kept quite low throughout the fiscal year; these securities represented less than 1% of the Fund’s total investments as of May 31, 2010. This proved to be a good decision, as returns of government securities were just marginally positive during the recent strong market recovery, while most equity-related, corporate and structured finance securities held by the Fund have posted double digit returns; although there is no guarantee these securities will continue such performance, GPAM believes continued positive performance is possible.
In late 2009 and into 2010, GPAM sold some securities that had appreciated in value which in turn caused their market yields to decline to yields of 5% or less. GPAM reinvested the proceeds in securities that have the potential to provide much higher returns over the coming years. Examples of the types of securities sold include investment-grade corporate bonds, bank loans, various types of asset-backed securities (“ABS”) and non-traditional commercial mortgage-backed securities (“CMBS”), such as those backed by cell towers and timber. These securities were replaced with securities that GPAM believes are undervalued, such as conduit CMBS, non-agency residential mortgages, numerous types of ABS, select high yield bonds and preferred securities. These trades proved to be advantageous for the Fund. The securities purchased have appreciated and have outperformed the securities that were sold.
The Fund’s positioning proved to be a strong contributor to its performance over the 12-month period ended May 31, 2010. The Fund generated double digit total returns as well as attractive levels of income from nearly all asset classes. The best performing securities were equities, preferred securities, high yield corporate debt, and securitized assets including ABS, CMBS and non-Agency RMBS. One example of how the Fund capitalized on the financial crisis and some of the unprecedented programs that policymakers have put in place is an investment in a commercial mortgage backed security that utilized financing offered by the Federal Reserve (the “Fed”) via the term asset-backed lending facility (“TALF”). The TALF program was put in place by the Fed in an effort to restart the securitized asset market, which had virtually ceased to function during the financial market crisis and the accompanying deep recession. The securitized markets have become a critical component of capital formation and a cost effective source of credit for consumers and businesses alike. GPAM took advantage of very attractive terms being offered by the Fed that included lending to investors on a non-recourse basis. In a non-recourse loan the only source of repayment for the loan is the collateral, in this case the CMBS bond that the Fund has pledged to the Fed. Since the Fed provided a loan against the security, the Fund is at risk only for the difference between the security’s purchase price and the amount of the loan that was provided by the Fed (this amount is known as the haircut). Since making the investment in September 2009, this position has provided a return of approximately 49% after factoring in the cost of leverage.
The lowest returns came from the Fund’s very small position in U.S. government and U.S. government agency securities.
How did the Fund’s leverage affect performance during this period?
For the past year the Fund’s leverage has enhanced the return of the Fund. The purpose of leverage (borrowing) is to fund the purchase of additional securities that provide increased income and potentially greater appreciation to common shareholders than could be achieved from an unleveraged portfolio. Of course, leverage results in greater NAV volatility and entails more downside risk than an unleveraged portfolio. Since leverage adds to performance when the cost of leverage is less than the total return generated by investments, the use of leverage contributed to the Fund’s total return during this period.
As of May 31, 2010, the Fund’s leverage was approximately 30% of total assets. Leverage was increased from less than 20% during the recent financial crisis to its current level in an effort to take advantage of attractive investment opportunities.
From the Fund’s inception through late 2008, GPAM employed leverage through reverse repurchase agreements, under which they lend securities and receive cash in return which can be used for additional investments. In November 2008, the Fund entered into a committed financing facility through BNP Paribas, a leading European bank. GPAM currently employs leverage via both reverse repurchase agreements and the BNP Paribas facility, in addition to the TALF program discussed earlier.
What is the current outlook for the markets and the Fund, and how is the Fund positioned for this outlook?
GPAM’s expectations for the economy are somewhat stronger than the consensus, which is calling for real growth (real growth is measurement of GDP expectations less inflation) of about 2.0% to 3.0% for the full year 2010. Recent reports indicate that consumer confidence and business confidence are improving, and some surveys indicate businesses plan to increase hiring, which over time should help to reduce the unacceptably high level of
Annual Report | May 31, 2010 | 7
GOF | Claymore/Guggenheim Strategic Opportunities Fund | Questions & Answers continued
domestic unemployment. It is likely that there will be continued turbulence in the market, with bouts of selling pressure such as that experienced during the month of May 2010, but GPAM views these periods of weakness as opportunities to purchase select investments that have good long term potential at discounted prices.
Some of the securitized sectors continue to trade very cheap relative to historical experience, creating continued opportunities. As a bottom-up investor, GPAM evaluates each potential investment on its own merit, carefully analyzing the creditworthiness of the issuer and the security’s level of seniority in its issuer’s capital structure. GPAM intends to take advantage of market volatility and to purchase securities when there are periods of time when, in its opinion, securities can be purchased at prices that are below their true intrinsic values. When bonds or other investments are under unwarranted selling pressure, GPAM plans to take positions that have the potential for attractive returns.
Given the Fund’s mandate and its ability to invest across many asset classes, it has been very well suited to take advantage of the opportunities that have prevailed since the summer of 2007 when the Fund was launched. In the name of this Fund—Claymore/Guggenheim Strategic Opportunities Fund—the key term is “opportunities.” The Fund was designed to invest across a broad array of sectors and securities, and to take advantage of the imbalances and dislocations that often exist in the financial markets. GPAM continues to believe that a portfolio that is highly diversified across many asset classes, such as those represented by the Fund, can be of great value to investors in a wide variety of market conditions.
Index Definitions
Indices are unmanaged, reflect no expenses and it is not possible to invest directly in an index.
The Standard & Poor’s 500 Index is a capitalization-weighted index of 500 stocks. The index is designed to measure performance of the broad domestic economy through changes in the aggregate market value of 500 stocks representing all major industries.
The Morgan Stanley Capital International World Index is a float-adjusted capitalization-weighted index created by Morgan Stanley Capital International to measure equity market performance throughout the world.
The Barclays U.S. Aggregate Bond Index represents securities that are U.S. domestic, taxable, and dollar denominated. The index covers the U.S. investment grade fixed rate bond market, with index components for government and corporate securities, mortgage pass-through securities, and asset-backed securities.
The Barclays U.S. Corporate High Yield Index is an unmanaged index of below investment grade bonds issued by U.S. corporations.
The Barclays Commercial Mortgage Backed Securities Index is an unmanaged index of securities secured by mortgages on commercial real estate.
The Barclays Capital 1-3 Month U.S. Treasury Bill Index tracks the performance of U.S. Treasury bills with a remaining maturity of one to three months. U.S. Treasury bills, which are short-term loans to the U.S. government, are full-faith-and-credit obligations of the U.S. Treasury and are generally regarded as being free of any risk of default.
Risks and Other Considerations
The views expressed in this report reflect those of the portfolio manager and Claymore only through the report period as stated on the cover. These views are subject to change at any time, based on market and other conditions and should not be construed as a recommendation of any kind. The material may also include forward looking statements that involve risk and uncertainty, and there is no guarantee that any predictions will come to pass. There can be no assurance that the Fund will achieve its investment objectives. The value of the Fund will fluctuate with the value of the underlying securities. Historically, closed-end funds often trade at a discount to their net asset value.
Below Investment-Grade Securities Risk: The Fund may invest in income securities rated below investment grade or, if unrated, determined by the Sub-Adviser to be of comparable credit quality, which are commonly referred to as “high-yield” or “junk” bonds. Investment in securities of below investment-grade quality involves substantial risk of loss. Income securities of below investment-grade quality are predominantly speculative with respect to the issuer’s capacity to pay interest and repay principal when due and therefore involve a greater risk of default or decline in market value due to adverse economic and issuer-specific developments.
Senior and Second Lien Secured Loans Risk: The Fund’s investments in senior loans and second lien secured floating-rate loans are typically below investment grade and are considered speculative because of the credit risk of their issuers. The risks associated with senior loans of below investment-grade quality are similar to the risks of other lower-grade income securities. Second lien loans are second in right of payment to senior loans and therefore are subject to the additional risk that the cash flow of the borrower and any property securing the loan may be insufficient to meet scheduled payments after giving effect to the senior-secured obligations of the borrower. Second lien loans are expected to have greater price volatility and exposure to losses upon default than senior loans and may be less liquid.
Structured Finance Investments Risk: The Fund’s structured finance investments may include residential and commercial mortgage-related and asset-backed securities issued by governmental entities and private issuers, collateralized debt obligations and risk-linked securities. These securities entail considerable risk, including many of the risks described above (e.g., market risk, credit risk, interest rate risk and prepayment risk). The value of collateralized debt obligations also may change because of changes in the market’s perception of the underlying collateral of the pool, the creditworthiness of the servicing agent for or the originator of the pool, or the financial institution or entity providing credit support for the pool. Returns on risk-linked securities are dependent upon such events as property or casualty damages which may be caused by such catastrophic events as hurricanes or earthquakes or other unpredictable events.
Mezzanine Investments Risk: Mezzanine investments are subject to the same risks associated with investment in senior loans, second lien loans and other lower-grade income securities. Mezzanine investments are expected to have greater price volatility than senior loans and second lien loans and may be less liquid.
8 | Annual Report | May 31, 2010
GOF | Claymore/Guggenheim Strategic Opportunities Fund | Questions & Answers continued
Preferred Stock Risk: Preferred stock is inherently more risky than the bonds and other debt instruments of the issuer, but typically less risky than its common stock. Preferred stocks may be significantly less liquid than many other securities, such as U.S. Government securities, corporate debt and common stock.
Convertible Securities Risk: As with all income securities, the market values of convertible securities tend to decline as interest rates increase and, conversely, to increase as interest rates decline. Convertible securities also tend to reflect the market price of the underlying stock in varying degrees, depending on the relationship of such market price to the conversion price in the terms of the convertible security.
Equity Risk: Common equity securities’ prices fluctuate for a number of reasons, including changes in investors’ perceptions of the financial condition of an issuer, the general condition of the relevant stock market, and broader domestic and international political and economic events.
Real Estate Securities Risk: Because of the Fund’s ability to invest in securities of companies in the real estate industry and to make indirect investments in real estate, it is subject to risks associated with the direct ownership of real estate, including declines in the value of real estate; general and local economic conditions; increased competition; and changes in interest rates. Because of the Fund’s ability to make indirect investments in natural resources and physical commodities, and in real property asset companies, the Fund is subject to risks associated with such real property assets, including supply and demand risk, depletion risk, regulatory risk and commodity pricing risk.
Personal Property Asset Company Risk: The Fund may invest in personal property asset companies such as special situation transportation assets. The risks of special situation transportation assets include cyclicality of supply and demand for transportation assets and risk of decline in the value of transportation assets and rental values. Private Securities Risk Private securities have additional risk considerations than with investments in comparable public investments.
Inflation/Deflation Risk: There is a risk that the value of assets or income from investments will be worth less in the future as inflation decreases the value of money.
Dividend Risk: Dividends on common stock and other common equity securities which the Fund may hold are not fixed but are declared at the discretion of an issuer’s board of directors. There is no guarantee that the issuers of the common equity securities in which the Fund invests will declare dividends in the future or that, if declared, they will remain at current levels or increase over time.
Portfolio Turnover Risk:The Fund’s annual portfolio turnover rate may vary greatly from year to year. A higher portfolio turnover rate results in correspondingly greater brokerage commissions and other transactional expenses that are borne by the Fund. High portfolio turnover may result in an increased realization of net short-term capital gains by the Fund which, when distributed to common shareholders, will be taxable as ordinary income. Additionally, in a declining market, portfolio turnover may create realized capital losses.
Derivatives Risk: The Fund may be exposed to certain additional risks should the Sub-Adviser use derivatives as a means to synthetically implement the Fund’s investment strategies. If the Fund enters into a derivative instrument whereby it agrees to receive the return of a security or financial instrument or a basket of securities or financial instruments, it will typically contract to receive such returns for a predetermined period of time. During such period, the Fund may not have the ability to increase or decrease its exposure. In addition, such customized derivative instruments will likely be highly illiquid, and it is possible that the Fund will not be able to terminate such derivative instruments prior to their expiration date or that the penalties associated with such a termination might impact the Fund’s performance in a material adverse manner. Furthermore, derivative instruments typically contain provisions giving the counterparty the right to terminate the contract upon the occurrence of certain events. If a termination were to occur, the Fund’s return could be adversely affected as it would lose the benefit of the indirect exposure to the reference securities and it may incur significant termination expenses.
Foreign Securities and Emerging Markets Risk: Investing in foreign issuers may involve certain risks not typically associated with investing in securities of U.S. issuers due to increased exposure to foreign economic, political and legal developments, including favorable or unfavorable changes in currency exchange rates, exchange control regulations, expropriation or nationalization of assets, imposition of withholding taxes on payments and possible difficulty in obtaining and enforcing judgments against foreign entities. Furthermore, issuers of foreign securities and obligations are subject to different, often less comprehensive, accounting, reporting and disclosure requirements than domestic issuers. The securities and obligations of some foreign companies and foreign markets are less liquid and at times more volatile than comparable U.S. securities, obligations and markets. These risks may be more pronounced to the extent that the Fund invests a significant amount of its assets in companies located in one region and to the extent that the Fund invests in securities of issuers in emerging markets. Heightened risks of investing in emerging markets include: smaller market capitalization of securities markets, which may suffer periods of relative illiquidity; significant price volatility; restrictions on foreign investment; and possible repatriation of investment income and capital.
Financial Leverage Risk: Although the use of Financial Leverage by the Fund may create an opportunity for increased after-tax total return for the Common Shares, it also results in additional risks and can magnify the effect of any losses. If the income and gains earned on securities purchased with Financial Leverage proceeds are greater than the cost of Financial Leverage, the Fund’s return will be greater than if Financial Leverage had not been used. Conversely, if the income or gains from the securities purchased with such proceeds does not cover the cost of Financial Leverage, the return to the Fund will be less than if Financial Leverage had not been used. Financial Leverage involves risks and special considerations for shareholders, including the likelihood of greater volatility of net asset value and market price of and dividends on the Common Shares than a comparable portfolio without leverage; the risk that fluctuations in interest rates on borrowings that the Fund must pay will reduce the return to the Common Shareholders; and the effect of Financial Leverage in a declining market, which is likely to cause a greater decline in the net asset value of the Common Shares than if the Fund were not leveraged, which may result in a greater decline in the market price of the Common Shares. There can be no assurance that a leveraging strategy will be implemented or that it will be successful during any period during which it is employed.
In addition to the risks described above, the Fund is also subject to: Income Securities Risk, Foreign Currency Risk, Risks Associated with the Fund’s Covered Call Option Strategy, Risks of Real Property Asset Companies, Risks of Personal Property Asset Companies, Private Securities Risk, Derivative Transactions Risks, Investment Funds Risk, Private Investment Funds Risk, Affiliated Investment Funds Risk, Synthetic Investments Risk, Inflation/Deflation Risk, Anti-Takeover Provisions, Market Discount Risk, and Current Developments Risks. Please see www.claymore.com/gof for a more detailed discussion about Fund risks and considerations.
Annual Report | May 31, 2010 | 9
GOF | Claymore/Guggenheim Strategic Opportunities Fund
Fund Summary |As of May 31, 2010 (unaudited)
| Fund Statistics | ||||
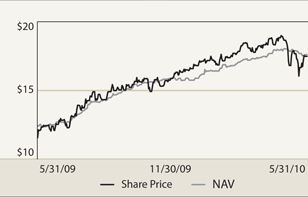
| Share Price | $ | 17.46 | ||
| Common Share Net Asset Value | $ | 17.56 | ||
| Premium/Discount to NAV | -0.57 | % | ||
| Net Assets Applicable to Common Shares ($000) | $ | 161,783 | ||
| Total Returns | ||||||||
| (Inception 7/27/07) | Market | NAV | ||||||
| One Year | 70.37 | % | 59.06 | % | ||||
| Since Inception - average annual | 7.91 | % | 9.05 | % | ||||
Performance data quoted represents past performance, which is no guarantee of future results and current performance may be lower or higher than the figures shown. For the most recent month-end performance figures, please visit www.claymore.com/gof. The investment return and principal value of an investment will fluctuate with changes in the market conditions and other factors so that an investor’s shares, when sold, may be worth more or less than their original cost. Investors should also be aware that these returns were primarily achieved during favorable market conditions and may not be sustainable.
| % of Long-Term | ||||
| Top Ten Holdings | Investments | |||
| Commercial Mortgage Pass Through Certificates, Ser. 2006-C7, | ||||
| Class A4, AAA, NR, | ||||
| 5.767%, 6/10/46 | 6.5 | % | ||
| Airplanes Pass Through Trust, Ser. 2001-1A, Class A9, CCC, B1, | ||||
| 0.887%, 3/15/19 | 3.7 | % | ||
| SPDR S&P 500 ETF Trust | 2.8 | % | ||
| Applebee’s Enterprises LLC, Ser. 2007-1A, Class A22A, AAA, Aa3, | ||||
| 6.427%, 12/20/37 | 2.8 | % | ||
| ProShares Ultra S&P500 | 1.7 | % | ||
| Telos CLO Ltd., Ser. 2006-1A, Class A2, AA+, Aa2, | ||||
| 0.694%, 10/11/21 (Cayman Islands) | 1.6 | % | ||
| Dominos Pizza Master Issuer LLC, Ser. 2007-1, Class A2, BBB-, Baa3, | ||||
| 5.261%, 4/25/37 | 1.6 | % | ||
| Aviation Capital Group Trust, Ser. 2003-2A, Class B1, BBB, A3, | ||||
| 3.340%, 9/20/33 | 1.6 | % | ||
| SPDR Dow Jones Industrial Average ETF Trust | 1.4 | % | ||
| Babcock & Brown Air Funding Ltd., Ser. 2007-1A, Class G1, | ||||
| BBB+, Baa2, | ||||
| 0.638%, 10/14/33 (Bermuda) | 1.4 | % | ||
Portfolio composition and holdings are subject to change daily. For more information, please visit www.claymore.com/gof. The above summaries are provided for informational purposes only and should not be viewed as recommendations. Past performance does not guarantee future results.
Share Price & NAV History
Monthly Dividends Per Share
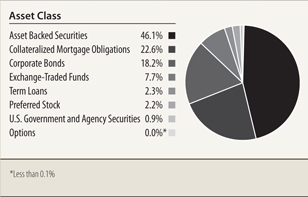
Portfolio Composition (% of Total Investments)
Credit Quality*
10 | Annual Report | May 31, 2010
GOF | Claymore/Guggenheim Strategic Opportunities Fund
Portfolio of Investments | May 31, 2010
| Principal | Optional Call | ||||||||||
| Amount | Description | Provision | Value | ||||||||
| Long-Term Investments – 131.7% | |||||||||||
| Corporate Bonds – 23.9% | |||||||||||
| Advertising – 0.3% | |||||||||||
| $ | 400,000 | MDC Partners, Inc., B+, B2 | |||||||||
| 11.000%, 11/1/16 (Canada) (a) (b) | 11/1/13 @ 105.50 | $ | 428,000 | ||||||||
| Aerospace/Defense – 0.8% | |||||||||||
| 785,000 | Global Aviation Holdings Ltd., BB-, Ba3, | ||||||||||
| 14.000%, 8/15/13 (United Kingdom) (a) (b) | 8/15/12 @ 110.50 | 792,850 | |||||||||
| 500,000 | Wyle Services Corp., B+, B3, | ||||||||||
| 10.500%, 4/1/18 (a) (b) | 4/1/14 @ 105.25 | 490,000 | |||||||||
| 1,282,850 | |||||||||||
| Airlines – 2.1% | |||||||||||
| 1,302,433 | America West Airlines 2001-1 Pass Through Trust, | ||||||||||
| Ser. 011G, BB+, B1, | |||||||||||
| 7.100%, 4/2/21 | N/A | 1,279,641 | |||||||||
| 2,000,000 | United Air Lines 2009-2A Pass Through Trust., BBB, Ba1, | ||||||||||
| 9.750%, 1/15/17 (a) | N/A | 2,150,000 | |||||||||
| 3,429,641 | |||||||||||
| Banks – 8.5% | |||||||||||
| 1,000,000 | Agfirst Farm Credit Bank, A, NR, | ||||||||||
| 7.300%, 10/31/49 (a) (b) | 7/2/10 @ 100.00 | 818,600 | |||||||||
| 1,250,000 | Barclays Bank PLC, A-, Baa3, | ||||||||||
| 6.278%, 12/29/49 (United Kingdom) (a) (c) | 12/15/34 @ 100.00 | 1,042,787 | |||||||||
| 1,200,000 | BNP Paribas, A, Baa1, | ||||||||||
| 7.195%, 6/29/49 (France) (a) (b) (c) | 6/25/37 @ 100.00 | 1,020,000 | |||||||||
| 1,000,000 | Credit Agricole SA, A-, A3, | ||||||||||
| 6.637%, 5/29/49 (France) (a) (b) (c) | 5/31/17 @ 100.00 | 710,000 | |||||||||
| 1,500,000 | Farm Credit Bank, Ser. 1, NR, A2, | ||||||||||
| 7.561%, 11/29/49 (a) (c) | 12/15/13 @100.00 | 1,233,180 | |||||||||
| 1,000,000 | Fifth Third Bancorp, BBB-, Baa2, | ||||||||||
| 8.250%, 3/1/38 (a) | N/A | 1,067,260 | |||||||||
| 1,000,000 | KeyCorp Capital III, BB, Baa3, | ||||||||||
| 7.750%, 7/15/29 (a) | N/A | 960,321 | |||||||||
| 1,250,000 | Mellon Capital IV, Ser. 1, A-, A3, | ||||||||||
| 6.244%, 6/29/49 (a) (c) | 6/20/12 @ 100.00 | 1,100,000 | |||||||||
| 1,250,000 | Northgroup Preferred Capital Corp., A, A2, | ||||||||||
| 6.378%, 1/29/49 (a) (b) (c) | 10/15/17 @ 100.00 | 1,152,288 | |||||||||
| 700,000 | PNC Preferred Funding Trust III, BBB, Baa3, | ||||||||||
| 8.700%, 3/29/49 (a) (b) (c) | 3/15/13 @ 100.00 | 711,186 | |||||||||
| 500,000 | Rabobank Nederland NV, AA-, A2, | ||||||||||
| 11.000%, 12/29/49 (Netherlands) (a) (b) (c) | 6/30/19 @ 100.00 | 606,549 | |||||||||
| 1,400,000 | Royal Bank of Scotland Group PLC, Ser. U, C, B3, | ||||||||||
| 7.640%, 3/31/49 (United Kingdom) (a) (c) | 9/29/17 @ 100.00 | 791,000 | |||||||||
| 650,000 | Susquehanna Capital II, BB-, Ba2, | ||||||||||
| 11.000%, 3/23/40 (a) | 3/23/15 @ 100.00 | 680,875 | |||||||||
| 1,250,000 | US AgBank FCB, A, A2, | ||||||||||
| 6.110%, 4/29/49 (a) (b) (c) | 7/10/12 @ 100.00 | 891,113 | |||||||||
| 1,000,000 | Wells Fargo Capital XIII, Ser. GMTN, A-, Ba1, | ||||||||||
| 7.700%, 12/29/49 (a) (c) | 3/26/13 @ 100.00 | 985,000 | |||||||||
| 13,770,159 | |||||||||||
| Commercial Services – 0.4% | |||||||||||
| 280,000 | PharmaNet Development Group, Inc., B+, B3, | ||||||||||
| 10.875%, 4/15/17 (b) | 4/15/14 @ 105.44 | 274,400 | |||||||||
| 250,000 | R.R. Donnelley & Sons Co., BBB, Baa3, | ||||||||||
| 11.250%, 2/1/19 (a) | N/A | 316,219 | |||||||||
| 590,619 | |||||||||||
| Computers – 0.1% | |||||||||||
| 250,000 | Stratus Technologies, Inc., B-, B2, | ||||||||||
| 12.000%, 3/29/15 (b) | 4/15/13 @ 112.00 | 230,312 | |||||||||
| Distribution/Wholesale – 0.4% | |||||||||||
| 700,000 | Intcomex, Inc., B-, B3, | ||||||||||
| 13.250%, 12/15/14 (b) | 12/15/12 @ 106.63 | 717,500 | |||||||||
| Diversified Financial Services – 2.1% | |||||||||||
| Hampton Roads PPV LLC, NR, Baa2, (a) (b) | |||||||||||
| 1,000,000 | 6.071%, 12/15/41 | N/A | 829,220 | ||||||||
| 1,000,000 | 6.171%, 6/15/53 | N/A | 834,370 | ||||||||
| 2,000,000 | Svensk Exportkredit AB, A, NR, | ||||||||||
| 6.375%, 10/29/49 (Sweden) (a) (b) | 9/27/10 @ 100.00 | 1,716,676 | |||||||||
| 3,380,266 | |||||||||||
| Electric – 0.8% | |||||||||||
| 400,000 | United Maritime Group LLC/United Maritime Group | ||||||||||
| Finance Corp., B, B3, | |||||||||||
| 11.750%, 6/15/15 (a) (b) | 12/15/12 @ 105.88 | 392,000 | |||||||||
| 1,000,000 | Wisconsin Energy Corp., BBB-, Baa1, | ||||||||||
| 6.250%, 5/15/67 (a) (c) | 5/15/17 @ 100.00 | 910,000 | |||||||||
| 1,302,000 | |||||||||||
| Entertainment and Gaming – 1.9% | |||||||||||
| 1,000,000 | Agua Caliente Band of Cahuilla Indians, NR, NR, | ||||||||||
| 6.350%, 10/1/15 (b) | N/A | 953,400 | |||||||||
| 500,000 | Downstream Development Authority of the Quapaw | ||||||||||
| Tribe of Oklahoma, B-, Caa1, | |||||||||||
| 12.000%, 10/15/15 (b) | 10/15/11 @ 109.00 | 445,000 | |||||||||
| 500,000 | Indianapolis Downs LLC/Indiana Downs Capital Corp., | ||||||||||
| CCC, Caa3, | |||||||||||
| 11.000%, 11/1/12 (b) | 11/1/10 @ 105.50 | 357,500 | |||||||||
| 700,000 | Lions Gate Entertainment, Inc., B, B1, | ||||||||||
| 10.250%, 11/1/16 (b) | 11/1/13 @ 105.13 | 705,250 | |||||||||
| 700,000 | River Rock Entertainment Authority (The), B+, B2, | ||||||||||
| 9.750%, 11/1/11 (a) | 7/2/10 @ 100.00 | 652,750 | |||||||||
| 3,113,900 | |||||||||||
| Health Care – 0.2% | |||||||||||
| 250,000 | Apria Healthcare Group, Inc., BB+, Ba2, | ||||||||||
| 11.250%, 11/1/14 (a) (b) | 11/1/11 @ 105.63 | 263,125 | |||||||||
| Insurance – 4.7% | |||||||||||
| 1,000,000 | Allstate Corp. (The), BBB, Baa1, | ||||||||||
| 6.500%, 5/15/57 (a) (c) | 5/15/37 @ 100.00 | 875,000 | |||||||||
| 1,000,000 | American Financial Group, Inc., BBB, Baa2, | ||||||||||
| 9.875%, 6/15/19 (a) | N/A | 1,187,693 | |||||||||
See notes to financial statements.
Annual Report | May 31, 2010 | 11
GOF | Claymore/Guggenheim Strategic Opportunities Fund | Portfolio of Investments continued
| Principal | Optional Call | ||||||||||
| Amount | Description | Provision | Value | ||||||||
| Insurance (continued) | |||||||||||
| $ | 1,000,000 | AXA SA, BBB, Baa1, | |||||||||
| 6.463%, 12/14/49 (France) (a) (b) (c) | 12/14/18 @ 100.00 | $ | 780,000 | ||||||||
| 400,000 | Blue Coast Ltd., Ser. A, B+, NR, | ||||||||||
| 9.777%, 12/8/10 (Cayman Islands) (b) (d) (e) | N/A | 395,368 | |||||||||
| 700,000 | Blue Fin Ltd., BB+, NR, | ||||||||||
| 4.695%, 4/10/12 (Cayman Islands) (a) (b) (d) (e) | 7/8/10 @ 101.00 | 654,640 | |||||||||
| 800,000 | Ironshore Holdings US, Inc., BBB-, Baa3, | ||||||||||
| 8.500%, 5/15/20 (b) | N/A | 810,384 | |||||||||
| 1,000,000 | Metlife Capital Trust IV, BBB, Baa2, | ||||||||||
| 7.875%, 12/15/37 (a) (b) | 12/15/32 @ 100.00 | 980,000 | |||||||||
| 700,000 | National Life Insurance Co., BBB+, Baa1, | ||||||||||
| 10.500%, 9/15/39 (a) (b) | N/A | 788,318 | |||||||||
| 1,250,000 | Progressive Corp. (The), A-, A2, | ||||||||||
| 6.700%, 6/15/37 (a) (c) | 6/15/17 @ 100.00 | 1,140,462 | |||||||||
| 7,611,865 | |||||||||||
| Investment Companies – 0.6% | |||||||||||
| Allied Capital Corp., BBB, Ba1, (a) | |||||||||||
| 695,000 | 6.625%, 7/15/11 | N/A | 697,076 | ||||||||
| 290,000 | 6.000%, 4/1/12 | N/A | 290,401 | ||||||||
| 987,477 | |||||||||||
| Iron/Steel – 0.1% | |||||||||||
| 240,000 | Standard Steel LLC/Standard Steel Finance Corp., | ||||||||||
| B, Caa1, | |||||||||||
| 12.000, 5/1/15 (b) | 5/1/13 @ 106.00 | 241,469 | |||||||||
| Software – 0.2% | |||||||||||
| 400,000 | Open Solutions, Inc., CCC+, Caa2, | ||||||||||
| 9.750%, 2/1/15 (b) | 2/1/11 @ 104.88 | 312,000 | |||||||||
| Telecommunications – 0.7% | |||||||||||
| 1,086,000 | Clearwire Communications LLC/Clearwire Finance, | ||||||||||
| Inc., B-, Caa1, | |||||||||||
| 12.000%, 12/1/15 (b) | 12/1/12 @ 106.00 | 1,053,420 | |||||||||
| Total Corporate Bonds – 23.9% | |||||||||||
| (Cost $40,798,461) | 38,714,603 | ||||||||||
| Asset Backed Securities – 60.8% | |||||||||||
| Collateralized Debt Obligations – 4.0% | |||||||||||
| 1,897,459 | Aspen Funding I Ltd., Ser. 2002-1A, Class A1L, A, Ba1, | ||||||||||
| 0.894%, 7/10/37 (Cayman Islands) (b) (d) | 1,239,743 | ||||||||||
| 1,024,426 | Coronado CDO Ltd., Ser. 1A, Class A1, BB+, B3, | ||||||||||
| 0.772%, 9/4/38 (Cayman Islands) (b) (d) | 679,942 | ||||||||||
| 2,145,722 | Diversified Asset Securitization Holdings III, Ser. 1A, Class A2, BB+, Ba1, | ||||||||||
| 7.420%, 7/5/36 (Cayman Islands) (b) | 1,802,407 | ||||||||||
| 4,347,270 | Duke Funding Ltd., Ser. 2003-5A, Class 1W, CCC, Caa2, | ||||||||||
| 0.910%, 8/7/33 (Cayman Islands) (b) (d) | 1,549,765 | ||||||||||
| 608,584 | MWAM CBO Ltd., Ser. 2001-1A, Class A, AA, A3, | ||||||||||
| 0.936%, 1/30/31 (Cayman Islands) (b) (d) | 495,661 | ||||||||||
| 878,851 | Saybrook Point CBO Ltd., Ser. 2001-1A, Class A, BBB-, B3, | ||||||||||
| 0.977%, 2/25/31 (Cayman Islands) (b) (d) | 688,167 | ||||||||||
| 6,455,685 | |||||||||||
| Principal | |||||||
| Amount | Description | Value | |||||
| Collateralized Loan Obligations – 16.0% | |||||||
| $ | 635,902 | Armstrong Loan Funding Ltd., Ser. 2008-1A, Class B, AA+, Aa3, | |||||
| 1.344%, 8/1/16 (Cayman Islands) (b) (d) | $ | 580,483 | |||||
| 2,000,000 | Black Diamond CLO Ltd., Ser. 2006-1A, Class B, A+, Baa2, | ||||||
| 0.718%, 4/29/19 (Cayman Islands) (a) (b) (d) | 1,551,460 | ||||||
| 2,000,000 | Black Diamond CLO Ltd., Ser. 2006-1A, Class C, BBB+, Ba2, | ||||||
| 1.018%, 4/29/19 (Cayman Islands) (a) (b) (d) | 1,392,180 | ||||||
| 1,854,059 | Business Loan Express, Ser. 2006-AA, Class A, BBB-, Aa3, | ||||||
| 0.580%, 10/20/38 (b) (d) | 1,268,308 | ||||||
| 1,259,374 | Business Loan Express, Ser. 2007-AA, Class A, BBB-, A2, | ||||||
| 0.740%, 10/20/40 (b) (d) | 850,077 | ||||||
| 750,000 | CapitalSource Commercial Loan Trust, Ser. 2006-2A, Class A1B, AA+, Aaa, | ||||||
| 0.670%, 9/20/22 (b) (d) | 659,415 | ||||||
| 1,181,541 | Coast Investment Grade, Ser. 2002-1X, Class A, BBB-, Caa3, | ||||||
| 0.933% 7/30/17 (Cayman Islands) (d) | 590,770 | ||||||
| 500,000 | Emporia Preferred Funding, Ser. 2005-1A, Class B1, AA-, Aa3, | ||||||
| 0.844%, 10/12/2018 (Cayman Islands) (b) (d) | 341,275 | ||||||
| 1,000,000 | Friedbergmilstein Private Capital Fund, Ser. 2004-1A, Class B2, AA, A3, | ||||||
| 5.409%, 1/15/19 (Cayman Islands) (b) | 869,680 | ||||||
| 800,000 | Mountain View Funding CLO, Ser. 2007-3A, Class A2, AA, A1, | ||||||
| 0.644%, 4/16/21 (Cayman Islands) (b) (d) | 682,992 | ||||||
| 1,000,000 | Nantucket CLO Ltd., Ser. 2006-1A, Class B, AA, A3, | ||||||
| 0.904%, 11/24/20 (Cayman Islands) (b) (d) | 827,540 | ||||||
| 1,500,000 | Rosedale CLO Ltd., Ser. I-A, Class A1J, A+, Baa1, | ||||||
| 0.726%, 7/24/21 (Cayman Islands) (b) (d) | 1,351,755 | ||||||
| 2,000,000 | Stanfield Modena CLO Ltd., Ser. 2004-1A, Class C, BBB-, Ba2, | ||||||
| 1.521%, 9/22/16 (Cayman Islands) (a) (b) (d) | 1,484,040 | ||||||
| 600,000 | Start CLO Ltd., Ser 2006-2, Class C, A+, Baa1, | ||||||
| 1.038%, 6/29/12 (Cayman Islands) (d) | 559,602 | ||||||
| 1,000,000 | Start CLO Ltd., Ser 2006-2, Class D, BBB+, Baa3, | ||||||
| 2.138%, 6/29/12 (Cayman Islands) (d) | 932,890 | ||||||
| 400,000 | Start CLO Ltd., Ser. 2006-3A, Class C, A-, A1, | ||||||
| 0.952%, 6/7/11 (Cayman Islands) (b) (d) | 399,524 | ||||||
| 550,000 | Start CLO Ltd., Ser. 2006-3A, Class D, BBB, Baa1, | ||||||
| 2.002%, 6/7/11 (Cayman Islands) (b) (d) | 543,758 | ||||||
| 100,000 | Start CLO Ltd., Ser 2006-3X, Class F, NR, NR, | ||||||
| 17.252%, 6/7/11 (Cayman Islands) (d) | 99,817 | ||||||
| 500,000 | Start CLO Ltd., Ser. 2007-4A, Class D, BBB+, Baa1, | ||||||
| 1.835%, 12/26/11 (Cayman Islands) (a) (b) (d) | 483,445 | ||||||
| 1,000,000 | Start CLO Ltd., Ser. 2007-4A, Class E, BB+, Ba1, | ||||||
| 3.885%, 12/26/11 (Cayman Islands) (a) (b) (d) | 966,060 | ||||||
| 100,000 | Start CLO Ltd., Ser 2007-4X, Class E, BB+, Ba1, | ||||||
| 3.885%, 12/26/11 (Cayman Islands) (d) | 96,606 | ||||||
| 2,000,000 | TCW Global Project Fund, Ser. 2004-1A, Class A1, NR, NR, | ||||||
| 1.203%, 6/15/16 (Cayman Islands) (b) (d) (f) | 1,704,200 | ||||||
| 2,000,000 | TCW Global Project Fund, Ser. 2004-1A, Class B1, NR, NR, | ||||||
| 2.253%, 6/15/16 (Cayman Islands) (a) (b) (d) (f) | 1,420,320 | ||||||
| 1,000,000 | TCW Global Project Fund, Ser. 2005-1A, Class B2, A, NR, | ||||||
| 5.793%, 9/1/17 (Cayman Islands) (b) | 771,230 | ||||||
See notes to financial statements.
12 | Annual Report | May 31, 2010
GOF | Claymore/Guggenheim Strategic Opportunities Fund | Portfolio of Investments continued
| Principal | |||||||
| Amount | Description | Value | |||||
| Collateralized Loan Obligations (continued) | |||||||
| $ | 4,000,000 | Telos CLO Ltd., Ser. 2006-1A, Class A2, AA+, Aa2, | |||||
| 0.694%, 10/11/21 (Cayman Islands) (b) (d) | $ | 3,513,280 | |||||
| 2,500,000 | Telos CLO Ltd., Ser. 2006-1A, Class B, A+, A2, | ||||||
| 0.784%, 10/11/21 (Cayman Islands) (b) (d) | 1,975,425 | ||||||
| 25,916,132 | |||||||
| Commercial Real Estate – 1.0% | |||||||
| 2,000,000 | Wrightwood Capital Real Estate CDO Ltd., Ser. 2005-1A, Class A1, BB, Aa3, | ||||||
| 0.798%, 11/21/40 (Cayman Islands) (b) (d) (f) | 1,507,380 | ||||||
| Commercial Receivables – 2.6% | |||||||
| 500,000 | FCC Financing Subsidiary LLC, Ser. 2010-1A, Class B, NR, NR, | ||||||
| 15.68%, 3/31/17 (d) | 502,500 | ||||||
| 2,000,000 | HFG Healthco-4 LLC, Ser. 2006-1A, Class A, NR, Aa2, | ||||||
| 0.680%, 6/5/12 (b) (d) | 1,849,460 | ||||||
| 2,000,000 | Sealane Trade Finance, Ser. 2007-1A, Class E, NR, NR, | ||||||
| 15.497%, 11/25/12 (Cayman Islands) (a) (b) (d) | 1,889,860 | ||||||
| 4,241,820 | |||||||
| Corporate Debt Obligations – 0.4% | |||||||
| 575,866 | Muzinich CBO II Ltd., Ser. A2-A, AA+, B1, | ||||||
| 7.150%, 10/15/13 (Bermuda) (b) | 546,900 | ||||||
| 112,680 | Phoenix Funding Ltd., Ser. 2001-1, AA, Aa2, | ||||||
| 0.753%, 4/15/13 (d) | 99,458 | ||||||
| 646,358 | |||||||
| Credit Cards – 2.8% | |||||||
| 500,000 | 1st Financial Bank USA, Ser. 2009-B, Class D, BBB-, NR, | ||||||
| 11.000%, 4/15/15 (b) | 500,153 | ||||||
| 1,000,000 | LCP Rights Trust, Ser. 2010-1, Class A, NR, NR, | ||||||
| 14.550%, 7/17/17 | 999,960 | ||||||
| 500,000 | LCP Rights Trust, Ser. 2010-1, Class C, NR, NR, | ||||||
| 19.210%, 7/17/17 | 499,955 | ||||||
| 1,000,000 | LCP Rights Trust, Ser. 2010-1, Class D, NR, NR, | ||||||
| 14.550%, 1/15/16 | 999,970 | ||||||
| 1,500,000 | LCP Rights Trust, Ser. 2010-1, Class F, NR, NR, | ||||||
| 19.210%, 1/15/16 | 1,499,895 | ||||||
| 4,499,933 | |||||||
| Financials – 0.0%* | |||||||
| 42,012 | Blue Falcon, Ser. A-2, NR, NR, | ||||||
| 5.460%, 12/25/16 (b) | 41,595 | ||||||
| Insurance – 2.3% | |||||||
| 1,758,677 | 321 Henderson Receivables I LLC, Ser. 2007-3A, Class A, BBB, Baa1, | ||||||
| 6.150%, 10/15/48 (a) (b) | 1,724,559 | ||||||
| 443,118 | 321 Henderson Receivables I LLC, Ser. 2008-1A, Class A, AA+, Aaa, | ||||||
| 6.190%, 1/15/44 (a) (b) | 446,073 | ||||||
| 500,000 | 321 Henderson Receivables I LLC, Ser. 2008-1A, Class B, AA, NR, | ||||||
| 8.370%, 1/15/46 (a) (b) | 518,215 | ||||||
| 500,000 | 321 Henderson Receivables I LLC, Ser. 2008-1A, Class C, A, NR, | ||||||
| 9.360%, 1/15/48 (b) | 505,820 | ||||||
| 500,000 | 321 Henderson Receivables I LLC, Ser. 2008-1A, Class D, BBB, NR, | ||||||
| 10.810%, 1/15/50 (b) | 535,420 | ||||||
| 3,730,087 | |||||||
| Residential Loans – 0.2% | |||||||
| 500,000 | GSAA Trust, Ser. 2007-5, Class 1F2A, CCC, Caa1, | ||||||
| 5.788%, 3/25/47 (a) (d) | 305,439 | ||||||
| Student Loans – 0.2% | |||||||
| 391,570 | MRU Student Loan Trust, Ser. 2008-A, Class A1A, AAA, NR, | ||||||
| 7.400%, 1/25/41 (b) | 197,391 | ||||||
| 202,567 | MRU Student Loan Trust, Ser. 2008-A, Class B, AA, NR, | ||||||
| 5.816%, 1/25/41 (b) (d) | 49,748 | ||||||
| 202,567 | MRU Student Loan Trust, Ser. 2008-A, Class C, A, NR, | ||||||
| 7.816%, 1/25/41 (b) (d) | 43,724 | ||||||
| 290,863 | |||||||
| Timeshares – 2.5% | |||||||
| 2,593,604 | Diamonds Resort Owner Trust, Ser. 2009-1, Class A, A, NR, | ||||||
| 9.310%, 3/20/26 (a) (b) | 2,595,760 | ||||||
| 1,369,941 | Sierra Receivables Funding Co., Ser. 2006-1A, Class A1, BBB-, Baa3, | ||||||
| 5.840%, 5/20/18 (a) (b) | 1,393,113 | ||||||
| 3,988,873 | |||||||
| Transportation – 18.0% | |||||||
| 1,907,592 | Aircraft Certificate Owner Trust, Ser. 2003-1A, Class D, BB+, Ba3, | ||||||
| 6.455%, 9/20/22 (b) | 1,735,909 | ||||||
| 2,000,000 | Aircraft Certificate Owner Trust, Ser. 2003-1A, Class E, BB+, Ba3, | ||||||
| 7.001%, 9/20/22 (b) | 1,645,020 | ||||||
| 2,311,685 | Aircraft Lease Securitisation Ltd., Ser. 2007-1A, Class G3, A-, Baa1, | ||||||
| 0.540%, 5/10/32 (Jersey) (b) (d) | 2,039,461 | ||||||
| 766,783 | Airplanes Pass Through Trust, Ser. 1R, Class A8, BB-, Baa3, | ||||||
| 0.712%, 3/15/19 (d) | 751,448 | ||||||
| 15,000,000 | Airplanes Pass Through Trust, Ser. 2001-1A, Class A9, CCC, B1, | ||||||
| 0.887%, 3/15/19 (d) | 7,837,500 | ||||||
| 1,087,247 | Aviation Capital Group Trust, Ser. 2000-1A, Class A1, BB, Ba3, | ||||||
| 0.817%, 11/15/25 (b) (d) | 595,964 | ||||||
| 5,813,296 | Aviation Capital Group Trust, Ser. 2003-2A, Class B1, BBB, A3, | ||||||
| 3.340%, 9/20/33 (b) (d) | 3,494,140 | ||||||
| 3,883,199 | Babcock & Brown Air Funding Ltd., Ser. 2007-1A, Class G1, BBB+, Baa2, | ||||||
| 0.638%, 10/14/33 (Bermuda) (a) (b) (d) | 2,912,400 | ||||||
| 894,145 | Blade Engine Securitization Ltd., Ser. 2006-1A, Class B, BBB+, Baa2, | ||||||
| 3.337%, 9/15/2041 (Cayman Islands) (b) (d) | 585,527 | ||||||
| 567,248 | CLI Funding LLC, Ser. 2006-1A, Class A, BBB, Baa3, | ||||||
| 0.518%, 8/18/21 (b) (d) | 461,308 | ||||||
| 267,307 | Helios Finance LP, Ser. 2007-S1, Class B1, BBB, Baa3, | ||||||
| 1.040%, 10/20/14 (Cayman Islands) (b) (d) | 260,670 | ||||||
| 3,221,236 | Lease Investment Flight Trust, Ser. 1, Class A3, B+, Baa3, | ||||||
| 0.767%, 7/15/16 (a) (d) | 2,844,319 | ||||||
| 5,200,000 | Pegasus Aviation Lease Securitization, Ser. 2001-1A, Class A1, NR, B2, | ||||||
| 0.777%, 5/10/31 (b) (d) | 1,924,000 | ||||||
| 500,000 | Pegasus Aviation Lease Securitization, Ser. 2001-1A, Class A2, NR, B2, | ||||||
| 0.877%, 5/10/31 (b) (d) | 185,000 | ||||||
See notes to financial statements.
Annual Report | May 31, 2010 | 13
GOF | Claymore/Guggenheim Strategic Opportunities Fund | Portfolio of Investments continued
| Principal | |||||||
| Amount | Description | Value | |||||
| Transportation (continued) | |||||||
| $ | 2,106,000 | Triton Container Finance LLC, Ser. 2006-1A, BBB, Baa2, | |||||
| 0.515%, 11/26/21 (b) (d) | $ | 1,884,013 | |||||
| 29,156,679 | |||||||
| Trust Preferred Stocks – 3.5% | |||||||
| 6,000,000 | Attentus CDO Ltd., Ser. 2007-3A, Class A1B, AAA, Aa3, | ||||||
| 0.554%, 10/11/42 (Cayman Islands) (b) (d) | 2,785,080 | ||||||
| 4,772,600 | Preferred Term Securities XXIII Ltd., BBB-, B1, | ||||||
| 0.567%, 12/22/36 (Cayman Islands) (b) (d) | 2,911,286 | ||||||
| 5,696,366 | |||||||
| Whole Business – 7.3% | |||||||
| 6,424,030 | Applebee’s Enterprises LLC, Ser. 2007-1A, Class A22A, AAA, Aa3, | ||||||
| 6.427%, 12/20/37 (a) (b) | 5,979,679 | ||||||
| 3,760,000 | Dominos Pizza Master Issuer LLC, Ser. 2007-1, Class A2, BBB-, Baa3, | ||||||
| 5.261%, 4/25/37 (a) (b) | 3,506,096 | ||||||
| 2,000,000 | IHOP Franchising LLC, Ser. 2007-1A, Class A1, BBB-, Baa2, | ||||||
| 5.144%, 3/20/37 (a) (b) | 1,822,720 | ||||||
| 600,000 | NuCO2 Funding LLC, Ser. 2008-1A, Class A1, NR, Baa2, | ||||||
| 7.250%, 6/25/38 (b) | 545,826 | ||||||
| 11,854,321 | |||||||
| Total Asset Backed Securities – 60.8% | |||||||
| (Cost $91,838,654) | 98,331,531 | ||||||
| Collateralized Mortgage Obligations – 29.8% | |||||||
| 500,000 | Banc of America Commercial Mortgage, Inc., Ser. 2003-2, Class G, A-, NR, | ||||||
| 5.333%, 3/11/41 (b) (d) | 422,554 | ||||||
| 1,000,000 | Banc of America Commercial Mortgage, Inc., Ser. 2004-5, Class B, AA+, Aa2, | ||||||
| 5.058%, 11/10/41 (a) (d) | 720,686 | ||||||
| 600,000 | Banc of America Commercial Mortgage, Inc., Ser. 2005-5, Class AJ, BBB+, Aaa, | ||||||
| 5.154%, 10/10/45 (a) (d) | 507,830 | ||||||
| 1,500,000 | Bear Stearns Commercial Mortgage Securities, Ser. 2005-PW10, Class AJ, BB+, NR, | ||||||
| 5.463%, 12/11/40 (a) (d) | 1,156,325 | ||||||
| 500,000 | Citigroup Commercial Mortgage Trust, Ser. 2004-C2, Class E, A-, A3, | ||||||
| 5.023%, 10/15/41 (b) (d) | 388,684 | ||||||
| 1,200,000 | Citigroup Commercial Mortgage Trust, Ser. 2007-C6, Class AM, A, NR, | ||||||
| 5.700%, 12/10/49 (d) | 1,021,904 | ||||||
| 2,000,000 | Citigroup/Deutsche Bank Commercial Mortgage Trust, Ser. 2005-CD1, Class AJ, | ||||||
| A-, Aa1, | |||||||
| 5.223%, 7/15/44 (a) (d) | 1,683,356 | ||||||
| 13,500,000 | Commercial Mortgage Pass Through Certificates, Ser. 2006-C7, Class A4, AAA, NR, | ||||||
| 5.767%, 6/10/46 (d) (g) | 13,928,007 | ||||||
| 1,000,000 | Commercial Mortgage Pass Through Certificates, Ser. 2006-C7, Class AM, A, NR, | ||||||
| 5.792%, 6/10/46 (a) (d) | 900,141 | ||||||
| 1,000,000 | Commercial Mortgage Pass Through Certificates, Ser. 2006-CN2A, Class F, CCC+, NR, | ||||||
| 5.570%, 2/5/19 (a) (b) (d) | 884,671 | ||||||
| 4,144,928 | Countrywide Alternative Loan Trust, Ser. 2006-OA19, Class A1, CCC, Ba2, | ||||||
| 0.520%, 2/20/47 (a) (d) | 2,078,101 | ||||||
| 3,001,260 | Countrywide Home Equity Loan Trust, Ser. 2004-S, Class 1A, CCC, B3, | ||||||
| 0.577%, 2/15/30 (d) | 1,586,703 | ||||||
| 1,599,910 | Countrywide Home Loan Mortgage Pass Through Trust, Ser. 2005-HYB8, | ||||||
| Class 4A1, B-, Caa3, | |||||||
| 5.383%, 12/20/35 (d) | 1,201,463 | ||||||
| 1,187,500 | Credit Suisse First Boston Mortgage Securities Corp., Ser. 2005-TFLA, | ||||||
| Class K, AA+, Aaa, | |||||||
| 1.637%, 2/15/20 (a) (b) (d) | 1,123,473 | ||||||
| 1,500,000 | Credit Suisse Mortgage Capital Certificates, Ser. 2006-C3, Class AM, BBB-, Aaa, | ||||||
| 5.825%, 6/15/38 (a) (d) | 1,331,004 | ||||||
| 121,885 | Deutsche ALT-A Securities, Inc., Alternate Loan Trust, Ser. 2006-AB4, | ||||||
| Class A1A, D, Caa1, | |||||||
| 6.005%, 10/25/36 (d) | 76,221 | ||||||
| 2,000,000 | Greenwich Capital Commercial Funding Corp., Ser. 2005-GG3, | ||||||
| Class AJ, AAA, Aa2, | |||||||
| 4.859%, 8/10/42 (a) (d) | 1,694,853 | ||||||
| 1,000,000 | Greenwich Capital Commercial Funding Corp., Ser. 2005-GG5, | ||||||
| Class AJ, BBB, Aaa, | |||||||
| 5.301%, 4/10/37 (a) (d) | 822,963 | ||||||
| 600,000 | GS Mortgage Securities Corp. II, Ser. 2001-GL3A, Class E, NR, A3, | ||||||
| 6.852%, 8/5/18 (b) (d) | 578,637 | ||||||
| 1,039,312 | Indymac Index Mortgage Loan Trust, Ser. 2006-AR9, Class 3A1, AAA, B3, | ||||||
| 5.640%, 6/25/36 (d) | 827,340 | ||||||
| 700,000 | JP Morgan Chase Commercial Mortgage Securities Corp., Ser. 2002-C1, | ||||||
| Class E, A-, A2, | |||||||
| 6.135%, 7/12/37 (b) | 649,147 | ||||||
| 1,000,000 | JP Morgan Chase Commercial Mortgage Securities Corp., Ser. 2005-LDP3, | ||||||
| Class AJ, BBB, A2, | |||||||
| 4.965%, 8/15/42 (a) (d) | 816,448 | ||||||
| 2,600,000 | JP Morgan Chase Commercial Mortgage Securities Corp., Ser. 2007-LD11, | ||||||
| Class AM, BB+, A3, | |||||||
| 5.818%, 6/15/49 (a) (d) | 1,937,098 | ||||||
| 2,000,000 | Morgan Stanley Capital I, Ser. 2005-HQ6, Class AJ, A-, NR, | ||||||
| 5.073%, 8/13/42 (a) (d) | 1,756,896 | ||||||
| 1,000,000 | Morgan Stanley Capital I, Ser. 2006-HQ10, Class AM, NR, Aaa, | ||||||
| 5.360%, 11/12/41 (a) | 922,407 | ||||||
| 1,250,000 | Morgan Stanley Capital I, Ser. 2006-IQ12, Class AM, A, NR, | ||||||
| 5.370%, 12/15/43 (a) | 1,064,239 | ||||||
| 1,000,000 | Morgan Stanley Capital I, Ser. 2006-T23, Class AM, A+, NR, | ||||||
| 5.810%, 8/12/41 (a) (d) | 912,135 | ||||||
| 436,711 | New Century Home Equity Loan Trust, Ser. 2004-A, Class AII9, B, A2, | ||||||
| 5.364%, 8/25/34 (d) | 353,970 | ||||||
| 1,088,000 | TBW Mortgage Backed Pass Through Certificates, Ser. 2006-6, | ||||||
| Class A3, D, Caa2, | |||||||
| 5.750%, 1/25/37 (h) | 629,458 | ||||||
| 2,500,000 | TBW Mortgage Backed Pass Through Certificates, Ser. 2006-6, | ||||||
| Class A5B, D, Caa3, | |||||||
| 6.040%, 1/25/37 (h) | 1,169,860 | ||||||
See notes to financial statements.
14 | Annual Report | May 31, 2010
GOF | Claymore/Guggenheim Strategic Opportunities Fund | Portfolio of Investments continued
| Principal | |||||||
| Amount | Description | Value | |||||
| Collateralized Mortgage Obligations (continued) | |||||||
| $ | 2,000,000 | TIAA Seasoned Commercial Mortgage Trust, Ser. 2007-C4, Class AJ, A+, NR, | |||||
| 6.072%, 8/15/39 (d) | $ | 1,818,309 | |||||
| 750,000 | Timberstar Trust, Ser. 2006-1A, Class C, A, A3, | ||||||
| 5.884%, 10/15/36 (a) (b) | 764,954 | ||||||
| 2,000,000 | Wachovia Bank Commercial Mortgage Trust, Ser. 2005-C20, Class AJ, BBB-, Aaa, | ||||||
| 5.139%, 7/15/42 (a) (d) | 1,667,477 | ||||||
| 1,000,000 | Wachovia Bank Commercial Mortgage Trust, Ser. 2005-C21, Class AJ, A-, Aa2, | ||||||
| 5.208%, 10/15/44 (a) (d) | 873,269 | ||||||
| Total Collateralized Mortgage Obligations – 29.8% | |||||||
| (Cost $50,030,593) | 48,270,583 | ||||||
| Number | |||||||
| of Shares | Value | ||||||
| Preferred Stock – 2.8% | |||||||
| Banks – 1.3% | |||||||
| 40,000 | BB&T Capital Trust VI, 9.600% (a) | 1,111,200 | |||||
| 50,000 | Santander Finance Preferred SA Unipersonal, 6.500% (Spain) (a) | 990,500 | |||||
| 2,101,700 | |||||||
| Diversified Financial Services – 0.6% | |||||||
| 50,000 | Deutsche Bank Contingent Capital Trust II, 6.550% (a) | 1,009,500 | |||||
| 37,600 | Lehman Brothers Holdings, Inc., Ser. J, 7.950% (i) | 827 | |||||
| 1,010,327 | |||||||
| Insurance – 0.2% | |||||||
| 20,000 | Aegon NV, 6.375% (Netherlands) (a) | 341,400 | |||||
| 3,800 | ING Groep NV, 7.050% (Netherlands) (a) | 68,134 | |||||
| 409,534 | |||||||
| Telecommunication – 0.7% | |||||||
| 1,000 | Centaur Funding Corp., 9.080% (Cayman Islands) (b) | 1,058,437 | |||||
| Total Preferred Stock – 2.8% | |||||||
| (Cost $5,817,313) | 4,579,998 | ||||||
| Exchange-Traded Funds – 10.1% | |||||||
| 55,000 | Powershares QQQ (a) (j) | 2,509,100 | |||||
| 27,500 | ProShares Ultra Dow30 (a) (j) | 1,144,825 | |||||
| 100,000 | ProShares Ultra S&P500 (a) (j) | 3,624,000 | |||||
| 30,000 | SPDR Dow Jones Industrial Average ETF Trust (a) (j) | 3,044,100 | |||||
| 55,000 | SPDR S&P 500 ETF Trust (a) (j) | 6,019,200 | |||||
| Total Exchange-Traded Funds – 10.1% | |||||||
| (Cost $16,018,936) | 16,341,225 | ||||||
| Principal | |||||||
| Amount | Description | Value | |||||
| U.S. Government and Agency Securities – 1.2% | |||||||
| $ | 2,000,000 | Freddie Mac, Ser. 1, AAA, Aaa, | |||||
| 6.500%, 6/3/24 (a) (d) | |||||||
| (Cost $2,000,000) | $ | 1,960,000 | |||||
| Term Loans (k) – 3.1% | |||||||
| Consumer Products – 0.3% | |||||||
| 447,659 | Navisite, Inc., B-, B3, | ||||||
| 9.150%, 9/19/14 (d) | 425,276 | ||||||
| Electronics – 0.2% | |||||||
| 283,064 | Clientlogic Corp., B+, B3, | ||||||
| 5.795%, 1/30/14 (d) | 277,403 | ||||||
| Healthcare, Education & Childcare – 0.4% | |||||||
| 843,384 | Embanet, B, B2, | ||||||
| 3.310%, 6/28/12 (d) | 691,574 | ||||||
| Home & Office Furnishings – 0.4% | |||||||
| 692,502 | Centaur LLC, CCC+, B2, | ||||||
| 11.250%, 11/9/14 (d) | 626,715 | ||||||
| Leisure – 0.8% | |||||||
| 1,448,876 | Bushnell Performance Optics, BB-, Ba3, | ||||||
| 4.540%, 8/24/13 (d) | 1,372,810 | ||||||
| Retail Stores – 1.0% | |||||||
| 1,078,241 | Deb Shops, Inc., B-, B3, | ||||||
| 7.000%, 4/23/14 (d) | 733,204 | ||||||
| 972,500 | Mattress Firm, B, Ba3, | ||||||
| 2.690%, 10/23/14 (d) | 802,313 | ||||||
| 1,535,517 | |||||||
| Total Term Loans – 3.1% | |||||||
| (Cost $5,609,694) | 4,929,295 | ||||||
| Total Long-Term Investments – 131.7% | |||||||
| (Cost $212,113,651) | 213,127,235 | ||||||
See notes to financial statements.
Annual Report | May 31, 2010 | 15
GOF | Claymore/Guggenheim Strategic Opportunities Fund | Portfolio of Investments continued
| Expiration | Exercise | ||||||||||||||
| Contracts | Options Purchased | Date | Price | Value | |||||||||||
| Call Options Purchased – 0.0%* | |||||||||||||||
| 32 | CBOE S&P 500 Volatility Index (j) (l) (m) | ||||||||||||||
| (Cost $38,080) | June 2010 | $ | 20.00 | $ | 32,000 | ||||||||||
| Total Investments – 131.7% | |||||||||||||||
| (Cost $212,151,731) | 213,159,235 | ||||||||||||||
| Other Assets in excess of Liabilities - 11.3% | 18,332,722 | ||||||||||||||
| Total Options Written - (0.3%) | (591,684 | ) | |||||||||||||
| Borrowings - (16.6%) | (26,865,369 | ) | |||||||||||||
| Reverse Repurchase Agreements - (19.5%) | (31,621,245 | ) | |||||||||||||
| TALF Loan – (6.6%) | (10,630,271 | ) | |||||||||||||
| Net Assets Applicable to Common Shareholders - 100.0% | $ | 161,783,388 | |||||||||||||
* Less than 0.1%
AB - Stock Company
CBO - Collateralized Bond Obligation
CDO - Collateralized Debt Obligation
CLO - Collateralized Loan Obligation
FCB - Farmers Credit Bureau
LLC - Limited Liability Company
LP - Limited Partnership
N/A - Not Available
NV - Publicly Traded Company
PLC - Public Limited Company
SA - Corporation
| (a) | All or a portion of this security has been physically segregated in connection with swap agreements, line of credit, options and reverse repurchase agreements. As of May 31, 2010, the total amount segregated was $109,614,982. |
| (b) | Securities are exempt from registration under Rule 144A of the Securities Act of 1933. These securities may be resold in transactions exempt from registration, normally to qualified institutional buyers. At May 31, 2010, these securities amounted to $106,936,897 which represents 66.1% of net assets applicable to common shares. |
| (c) | Security has a fixed rate coupon which will convert to a floating or variable rate coupon on a future date. |
| (d) | Floating or Variable Rate Coupon. Rate shown is in effect at May 31, 2010. |
| (e) | Risk-Linked Security – A risk-linked security is a form of derivative issued by insurance companies and insurance related special purpose vehicles that apply securitization techniques to catastrophic property and casualty damages. The security is typically a debt obligation for which the return of principal and the payment of interest are contingent on the non-occurrence of a pre-defined “trigger event.” Depending on the specific terms and structure of the security, this trigger could be the result of a hurricane, earthquake or some other catastrophic event. |
| (f) | Security is valued in accordance with Fair Valuation procedures established in good faith by the Board of Trustees and is based, in part on significant unobservable inputs. The total market value of such securities is $4,631,900 which represents 2.9% of net assets applicable to common shares. |
| (g) | All or a portion of this security was acquired, and has been physically segregated in connection with the Fund’s participation in the Term Asset-Backed Securities Loan Facility program(the “TALF program”) operated by the Federal Reserve Bank of New York. As of May 31, 2010, the total amount physically segregated was $13,928,007. See notes to financial statements. |
| (h) | Security is a “step-up” bond where the coupon increases or steps up at a predetermined date. |
| (i) | Non-income producing as security is in default. |
| (j) | All or a portion of this security position represents cover for outstanding options written. |
| (k) | Term loans held by the Fund have a variable interest rate feature which is periodically adjusted based on an underlying interest rate benchmark. In addition, term loans may include mandatory and/or optional prepayment terms. As a result, the actual maturity dates of the loans may be different than the amounts disclosed in the portfolio of investments. Term loans may be considered restricted in that the Fund may be contractually obligated to receive approval from the Agent Bank and/or Borrower prior to the sale or disposition of loan. |
| (l) | Non-income producing security. |
| (m) | Represents 100 shares per contract. |
Ratings (unaudited) shown are per Standard & Poor’s and Moody’s. Securities classified as NR are not rated.
| Expiration | Exercise | ||||||||||||||
| Contracts | Options Written (l) | Date | Price | Value | |||||||||||
| Call Options Written – (0.3%) | |||||||||||||||
| 32 | CBOE S&P 500 Volatility Index (m) | June 2010 | $ | 30.00 | $ | 11,200 | |||||||||
| 550 | Powershares QQQ (m) | June 2010 | 46.00 | 52,525 | |||||||||||
| 275 | ProShares Ultra Dow30 (m) | June 2010 | 42.00 | 50,187 | |||||||||||
| 1,000 | ProShares Ultra S&P500 (m) | June 2010 | 37.00 | 151,500 | |||||||||||
| 900 | S&P 500 Index | June 2010 | 1,120.00 | 11,430 | |||||||||||
| 6,900 | S&P 500 Index | June 2010 | 1,100.00 | 151,800 | |||||||||||
| 300 | SPDR Dow Jones Industrial Average | ||||||||||||||
| ETF Trust (m) | June 2010 | 102.00 | 61,650 | ||||||||||||
| 550 | SPDR S&P 500 ETF Trust (m) | June 2010 | 111.00 | 101,200 | |||||||||||
| Total Value of Call Options Written | |||||||||||||||
| (Premiums received $817,828) | 591,492 | ||||||||||||||
| Put Options Written - (0.0%*) | |||||||||||||||
| 32 | CBOE S&P 500 Volatility Index (m) | June 2010 | 20.00 | 192 | |||||||||||
| (Premiums received $320) | |||||||||||||||
| Total Value of Options Written - (0.3%) | |||||||||||||||
| (Premiums received $818,148) | $ | 591,684 | |||||||||||||
*Less than 0.1%
See notes to financial statements.
16 | Annual Report | May 31, 2010
GOF | Claymore/Guggenheim Strategic Opportunities Fund
Statement of Assets and Liabilities | May 31, 2010
| Assets | ||||
| Investments in securities, at value (cost $212,151,731) | $ | 213,159,235 | ||
| Cash | 13,393,104 | |||
| Restricted Cash | 2,930,000 | |||
| Unrealized appreciation on swaps | 1,252,075 | |||
| Interest receivable | 1,729,518 | |||
| Dividends receivable | 42,333 | |||
| Other assets | 97,927 | |||
| Total assets | 232,604,192 | |||
| Liabilities | ||||
| Reverse repurchase agreements | 31,621,245 | |||
| Borrowings | 26,865,369 | |||
| Payable on TALF Loan | 10,630,271 | |||
| Options written, at value (premiums received of $818,148) | 591,684 | |||
| Interest due on borrowings | 356,099 | |||
| Payable for securities purchased | 341,250 | |||
| Advisory fee payable | 197,472 | |||
| Administration fee payable | 5,223 | |||
| Accrued expenses and other liabilities | 212,191 | |||
| Total liabilities | 70,820,804 | |||
| Net Assets | $ | 161,783,388 | ||
| Composition of Net Assets | ||||
| Common stock, $.01 par value per share; unlimited number of shares authorized, 9,215,636 shares issued and outstanding | $ | 92,156 | ||
| Additional paid-in capital | 167,407,951 | |||
| Accumulated net realized loss on investments, options, futures and swaps | (9,063,320 | ) | ||
| Accumulated net unrealized appreciation on investments, options and swaps | 2,486,043 | |||
| Accumulated undistributed net investment income | 860,558 | |||
| Net Assets | $ | 161,783,388 | ||
Net Asset Value (based on 9,215,636 common shares outstanding) | $ | 17.56 | ||
See notes to financial statements.
Annual Report | May 31, 2010 | 17
GOF | Claymore/Guggenheim Strategic Opportunities Fund
Statement of Operations | For the Year Ended May 31, 2010
| Investment Income | ||||||||
| Dividends | $ | 450,557 | ||||||
| Interest | 19,885,476 | |||||||
| Total income | $ | 20,336,033 | ||||||
| Expenses | ||||||||
| Investment advisory fee | 1,965,337 | |||||||
| Professional fees | 272,834 | |||||||
| Fund accounting fee | 166,455 | |||||||
| Custodian fee | 106,966 | |||||||
| Trustees’ fees and expenses | 75,973 | |||||||
| Printing expense | 57,483 | |||||||
| Administration fee | 53,300 | |||||||
| Line of credit fee | 38,749 | |||||||
| Transfer agent fee | 21,733 | |||||||
| NYSE listing fee | 21,500 | |||||||
| TALF loan fees | 21,261 | |||||||
| Insurance | 17,509 | |||||||
| Miscellaneous | 7,831 | |||||||
| Interest expense | 1,409,486 | |||||||
| Total expenses | 4,236,417 | |||||||
| Net investment income | 16,099,616 | |||||||
| Realized and Unrealized Gain (Loss) on Investments, Options and Swap Transactions | ||||||||
| Net realized gain (loss) on: | ||||||||
| Investments | 4,065,356 | |||||||
| Options | (2,239,956 | ) | ||||||
| Swaps | 2,930,090 | |||||||
| Net change in unrealized appreciation on: | ||||||||
| Investments | 41,376,168 | |||||||
| Options | 551,885 | |||||||
| Swaps | 1,149,211 | |||||||
| Net realized and unrealized gain on investments, options, and swap transactions | 47,832,754 | |||||||
| Net Increase in Net Assets Resulting from Operations | $ | 63,932,370 | ||||||
See notes to financial statements.
18 | Annual Report | May 31, 2010
GOF | Claymore/Guggenheim Strategic Opportunities Fund
Statement of Changes in Net Assets |
| For the | For the | |||||||
| Year Ended | Year Ended | |||||||
| May 31, 2010 | May 31, 2009 | |||||||
| Increase (Decrease) in Net Assets from Operations | ||||||||
| Net investment income | $ | 16,099,616 | $ | 9,668,019 | ||||
| Net realized gain (loss) on investments, options, foreign currency transaction, futures and swaps | 4,755,490 | (9,642,859 | ) | |||||
| Net change in unrealized appreciation (depreciation) on investments, options, unfunded commitments and swaps | 43,077,264 | (29,632,229 | ) | |||||
| Net increase (decrease) in net assets resulting from operations | 63,932,370 | (29,607,069 | ) | |||||
| Distributions to Common Shareholders | ||||||||
| From and in excess of net investment income | (16,931,384 | ) | (12,332,718 | ) | ||||
| Return of capital | – | (4,493,766 | ) | |||||
| (16,931,384 | ) | (16,826,484 | ) | |||||
| Capital Share Transactions | ||||||||
| Reinvestment of dividends | 1,706,887 | – | ||||||
| Net increase from capital share transactions | 1,706,887 | – | ||||||
| Total increase (decrease) in net assets | 48,707,873 | (46,433,553 | ) | |||||
| Net Assets | ||||||||
| Beginning of period | 113,075,515 | 159,509,068 | ||||||
| End of period (including accumulated undistributed net investment income of $860,558 and $967,896, respectively) | $ | 161,783,388 | $ | 113,075,515 | ||||
See notes to financial statements.
Annual Report | May 31, 2010 | 19
GOF | Claymore/Guggenheim Strategic Opportunities Fund
Statement of Cash Flows | For the Year Ended May 31, 2010
| Cash Flows from Operating Activities: | ||||
| Net increase in net assets resulting from operations | $ | 63,932,370 | ||
| Adjustments to Reconcile Net Increase in Net Assets Resulting from Operations to | ||||
| Net Cash Used in Operating and Investing Activities: | ||||
| Net unrealized appreciation on investments | (41,376,168 | ) | ||
| Net unrealized appreciation on options | (551,885 | ) | ||
| Net unrealized appreciation on swaps | (1,149,211 | ) | ||
| Net accretion of bond discount and amortization of bond premium | (8,117,299 | ) | ||
| Net realized gain on investments | (4,065,356 | ) | ||
| Paydowns received | (2,205,103 | ) | ||
| Net realized loss on options | 2,239,956 | |||
| Net realized gain on swaps | (2,930,090 | ) | ||
| Purchase of long-term investments | (142,666,875 | ) | ||
| Cost of written options closed | (6,039,076 | ) | ||
| Proceeds from sale of long-term investments | 125,107,445 | |||
| Increase in dividends receivable | (29,905 | ) | ||
| Increase in interest receivable | (498,759 | ) | ||
| Decrease in receivable for investments sold | 4,249,691 | |||
| Increase in other assets | (82,023 | ) | ||
| Decrease in payable for investments purchased | (2,544,374 | ) | ||
| Increase in interest due on borrowings | 343,699 | |||
| Premiums received on call options written | 7,814,989 | |||
| Increase in advisory fee payable | 78,234 | |||
| Increase in administration fee payable | 1,944 | |||
| Increase in accrued expenses and other liabilities | 92,402 | |||
| Net Cash Used in Operating and Investing Activities | (8,395,394 | ) | ||
| Cash Flows From Financing Activities: | ||||
| Dividends paid to common shareholders | (15,224,497 | ) | ||
| Increase in reverse repurchase agreements | 22,663,995 | |||
| Proceeds from TALF loans | 10,630,271 | |||
| Proceeds from borrowings | 14,737,818 | |||
| Payments made on borrowings | (10,000,000 | ) | ||
| Net Cash Provided by Financing Activities | 22,807,587 | |||
| Net increase in cash | 14,412,193 | |||
| Cash at Beginning of Period | 1,910,911 | |||
| Cash at End of Period (including restricted cash) | $ | 16,323,104 | ||
| Supplemental Disclosure of Cash Flow Information: Cash paid during the period for interest | $ | 1,065,787 | ||
See notes to financial statements.
20 | Annual Report | May 31, 2010
GOF | Claymore/Guggenheim Strategic Opportunities Fund
Financial Highlights |
| For the period | ||||||||||||
| For the | For the | July 27, 2007* | ||||||||||
| Per share operating performance | Year Ended | Year Ended | through | |||||||||
| for a common share outstanding throughout the period | May 31, 2010 | May 31, 2009 | May 31, 2008 | |||||||||
| Net asset value, beginning of period | $ | 12.42 | $ | 17.52 | $ | 19.10 | (b) | |||||
| Income from investment operations | ||||||||||||
Net investment income (a) | 1.76 | 1.06 | 0.79 | |||||||||
| Net realized and unrealized gain (loss) on investments, options, futures, swaps and unfunded commitments | 5.23 | (4.31 | ) | (0.99 | ) | |||||||
| Total from investment operations | 6.99 | (3.25 | ) | (0.20 | ) | |||||||
| Common share offering expenses charged to paid-in-capital | – | – | (0.04 | ) | ||||||||
| Distributions to Common Shareholders | ||||||||||||
| From and in excess of net investment income | (1.85 | ) | (1.36 | ) | (0.98 | ) | ||||||
| Return of capital | – | (0.49 | ) | (0.36 | ) | |||||||
| Total distributions | (1.85 | ) | (1.85 | ) | (1.34 | ) | ||||||
| Net asset value, end of period | $ | 17.56 | $ | 12.42 | $ | 17.52 | ||||||
| Market value, end of period | $ | 17.46 | $ | 11.53 | $ | 16.78 | ||||||
Total investment return (c) | ||||||||||||
| Net asset value | 59.06 | % | -18.37 | % | -1.40 | % | ||||||
| Market value | 70.37 | % | -19.51 | % | -9.41 | % | ||||||
| Ratios and supplemental data | ||||||||||||
| Net assets, applicable to common shareholders, end of period (thousands) | $ | 161,783 | $ | 113,076 | $ | 159,509 | ||||||
| Ratios to Average Net Assets applicable to Common Shares: | ||||||||||||
| Total expenses, excluding interest expense | 1.98 | %(d) | 2.06 | %(d) | 1.72 | %(d)(e) | ||||||
| Total expenses, including interest expense | 2.97 | %(d) | 3.25 | %(d) | 3.36 | %(d)(e) | ||||||
| Net investment income, including interest expense | 11.30 | % | 7.84 | % | 5.08 | %(e) | ||||||
Portfolio turnover (f) | 67 | % | 58 | % | 210 | % | ||||||
| Senior Indebtedness | ||||||||||||
| Total Borrowings outstanding (in thousands) | $ | 69,117 | $ | 31,085 | $ | 76,016 | ||||||
Asset coverage per $1,000 of indebtedness (g) | $ | 3,341 | $ | 4,638 | $ | 3,098 | ||||||
| * | Commencement of operations. |
| (a) | Based on average shares outstanding during the period. |
| (b) | Before deduction of offering expenses charged to capital. |
| (c) | Total investment return is calculated assuming a purchase of a common share at the beginning of the period and a sale on the last day of the period reported either at net asset value (“NAV”) or market price per share. Dividends and distributions are assumed to be reinvested at NAV for NAV returns or the prices obtained under the Fund’s Dividend Reinvestment Plan for market value returns. Total investment return does not reflect brokerage commissions. A return calculated for a period of less than one year is not annualized. |
| (d) | The ratios of total expenses to average net assets applicable to common shares and to average managed assets do not reflect fees and expenses incurred indirectly by the Fund as a result of its investment in shares of other investment companies. If these fees were included in the expense ratios, expense ratios would increase by 0.05% for the year ended May 31, 2010, 0.08% for the year ended May 31, 2009, and 0.04% for the period ended May 31, 2008. |
| (e) | Annualized. |
| (f) | Portfolio turnover is not annualized for periods less than one year. |
| (g) | Calculated by subtracting the Fund’s total liabilities (not including the borrowings) from the Fund’s total assets and dividing by the total borrowings. |
See notes to financial statements.
Annual Report | May 31, 2010 | 21
GOF | Claymore/Guggenheim Strategic Opportunities Fund
Notes to Financial Statements | May 31, 2010
Note 1 – Organization:
Claymore/Guggenheim Strategic Opportunities Fund (the “Fund”) was organized as a Delaware statutory trust on November 13, 2006. The Fund is registered as a diversified, closed-end management investment company under the Investment Company Act of 1940, as amended (“1940 Act”).
The Fund’s primary investment objective is to maximize total return through a combination of current income and capital appreciation.
Note 2 – Accounting Policies:
The preparation of the financial statements in accordance with U.S. generally accepted accounting principles (“GAAP”) requires management to make estimates and assumptions that affect the reported amounts and disclosures in the financial statements. Actual results could differ from these estimates.
In June 2009, the Financial Accounting Standards Board (“FASB”) established the FASB Accounting Standards CodificationTM (“ASC”) as the single source of authoritative accounting principles reorganized by the FASB in preparation of financial statements in conformity with GAAP. The ASC superseded existing non-grandfathered, non-U.S. Securities and Exchange Commission (“SEC”) accounting and reporting standards. The ASC did not change GAAP but rather organized it into a hierarchy where all guidance with the ASC carried an equal level of authority. The ASC became effective for financial statements issued for interim and annual periods ending after September 15, 2009. The ASC did not have a material effect of the Fund’s financial statements.
The following is a summary of significant accounting policies followed by the Fund.
(a) Valuation of Investments
The Fund values equity securities at the last reported sale price on the principal exchange or in the principal Over-the-Counter (“OTC”) market in which such securities are traded, as of the close of regular trading on the New York Stock Exchange (“NYSE”) on the day the securities are being valued or, if there are no sales, at the mean between the last available bid and asked prices on that day. Securities traded on the NASDAQ are valued at the NASDAQ Official Closing Price. Preferred stocks are valued at their sales price as of the close of the exchange on which they are traded. Preferred stocks for which the last sales price is not available are valued at the last available bid price. Debt securities (including asset-backed securities, collateralized mortgage obligations, and term loans) are valued at the last available bid price. If bids are not available, debt securities are estimated using valuation models that incorporate market data that may include assumptions relating to current yields, timing of cash flows, dealer quotes, prepayment risk, value of underlying collateral, general market conditions, liquidity and prices of other debt securities with comparable coupon rates, maturities/duration, and credit quality. Foreign securities are translated from the local currency into U.S. dollars using the current exchange rate. The Fund’s securities that are primarily traded in foreign markets may be traded in such markets on days that the NYSE is closed. As a result, the net asset value of the Fund may be significantly affected on days when holders of common shares have no ability to trade common shares on the NYSE. Investment companies are valued at the last available closing price. The Fund values exchange-traded options and other derivative contracts at the mean of the best bid and asked prices at the close on those exchanges on which they are traded. Short-term securities with remaining maturities of 60 days or less are valued at amortized cost, which approximates market value.
When market price quotes are not readily available, the independent pricing service or in the absence of a pricing service for a particular investment or derivative instrument, the Board of Trustees of the Fund, or its designee, which may include Guggenheim Partners Asset Managers, LLC (“GPAM”), may establish fair value using a wide variety of market data including yields or prices of investments of comparable quality, type of issue, coupon, maturity, rating, indications of value from security dealers, evaluations of anticipated cash flows or collateral, spread over treasuries, and other information and analysis. GPAM also uses third party service providers to model certain securities using cash flow models to represent a fair market value.
For those securities where quotations or prices are not available, the valuations are determined in accordance with procedures established in good faith by the Board of Trustees. Valuations in accordance with these procedures are intended to reflect each security’s (or asset’s) “fair value”. Such “fair value” is the amount that the Fund might reasonably expect to receive for the security (or asset) upon its current sale. Each such determination should be based on a consideration of all relevant factors, which are likely to vary from one pricing context to another. Examples of such factors may include, but are not limited to: (i) the type of security, (ii) the initial cost of the security, (iii) the existence of any contractual restrictions on the security’s disposition, (iv) the price and extent of public trading in similar securities of the issuer or of comparable companies, (v) quotations or evaluated prices from broker-dealers and/or pricing services, (vi) information obtained from the issuer, analysts, and/or the appropriate stock exchange (for exchange traded securities), (vii) an analysis of the company’s financial statements, and (viii) an evaluation of the forces that influence the issuer and the market(s) in which the security is purchased and sold (e.g. the existence of pending merger activity, public offerings or tender offers that might affect the value of the security).
The Fund has elected to recognize the TALF loan at fair value, as permitted by GAAP, to mitigate the volatility in net assets caused by measuring related assets and liabilities differently. Consequently the Fund recorded the loan liability on the Statement of Assets and Liabilities, at fair value. The fair value option requires that the TALF loan be marked-to-market giving consideration to changes in the market value of the pledged collateral.
In accordance with ASC 820, Fair Value Measurements and Disclosures (formerly known as the Statement of Financial Accounting Standard No. 157), fair value is defined as the price that the Fund would receive to sell an investment or pay to transfer a liability in an orderly transaction with an independent buyer in the principal market, or in the absence of a principal market, the most advantageous market for the investment or liability. ASC 820 establishes three different categories for valuations. Level 1 valuations are those based upon quoted prices in active markets. Level 2 valuations are those based upon quoted prices in inactive markets or based upon significant observable inputs (e.g. yield curves; benchmark interest rates; indices). Level 3 valuations are those based upon unobservable inputs (e.g. discounted cash flow analysis; non-market based methods used to determine fair valuation). The following table represents the Fund’s investments carried on the Statement of Assets and Liabilities by caption and by level within the fair value hierarchy as of May 31, 2010:
| Description | ||||||||||||||||
| (value in $000s) | Level 1 | Level 2 | Level 3 | Total | ||||||||||||
| Assets: | ||||||||||||||||
| Corporate Bonds | $ | – | $ | 38,715 | $ | – | $ | 38,715 | ||||||||
| Asset Backed Securities | ||||||||||||||||
| Collateralized Debt Obligations | – | 6,456 | – | 6,456 | ||||||||||||
| Collateralized Loan Obligations | – | 22,791 | 3,125 | 25,916 | ||||||||||||
| Commercial Real Estate | – | – | 1,507 | 1,507 | ||||||||||||
| Commercial Receivables | – | 4,242 | – | 4,242 | ||||||||||||
| Corporate Debt Obligations | – | 646 | – | 646 | ||||||||||||
| Credit Cards | – | 4,500 | – | 4,500 | ||||||||||||
| Financials | – | 42 | – | 42 | ||||||||||||
| Insurance | – | 3,730 | – | 3,730 | ||||||||||||
| Residential Loans | – | 305 | – | 305 | ||||||||||||
| Student Loans | – | 291 | – | 291 | ||||||||||||
| Timeshares | – | 3,989 | – | 3,989 | ||||||||||||
| Transportation | – | 29,157 | – | 29,157 | ||||||||||||
| Trust Preferred Stocks | – | 5,696 | – | 5,696 | ||||||||||||
| Whole Business | – | 11,854 | – | 11,854 | ||||||||||||
| Collateralized Mortgage Obligations | – | 48,271 | – | 48,271 | ||||||||||||
| Preferred Stock | 4,580 | – | – | 4,580 | ||||||||||||
| Exchange-Traded Funds | 16,341 | – | – | 16,341 | ||||||||||||
22 | Annual Report | May 31, 2010
GOF | Claymore/Guggenheim Strategic Opportunities Fund | Notes to Financial Statements continued
| Description | ||||||||||||||||
| (value in $000s) | Level 1 | Level 2 | Level 3 | Total | ||||||||||||
| U.S. Government and Agency Securities | $ | – | $ | 1,960 | $ | – | $ | 1,960 | ||||||||
| Term Loans | – | 4,929 | – | 4,929 | ||||||||||||
| Interest Rate Swaps | – | 2,394 | – | 2,394 | ||||||||||||
| Total Return Swaps | – | 110 | – | 110 | ||||||||||||
| Call Options Purchased | – | 32 | – | 32 | ||||||||||||
| Total | $ | 20,921 | $ | 190,110 | $ | 4,632 | $ | 215,663 | ||||||||
| Liabilities: | ||||||||||||||||
| Credit Default Swaps | $ | – | $ | 1,237 | $ | – | $ | 1,237 | ||||||||
| Total Return Swaps | – | 22 | – | 22 | ||||||||||||
| Options Written | 417 | 175 | – | 592 | ||||||||||||
| TALF Loan | – | 10,630 | – | 10,630 | ||||||||||||
| Total | $ | 417 | $ | 12,064 | $ | – | $ | 12,481 | ||||||||
The following table presents the activity of the Fund’s investments measured at fair value using significant unobservable inputs (Level 3 valuations) for the period ended May 31, 2010.
| Level 3 Holdings | Securities | Derivatives | Total | |||||||||
| (value in $000s) | ||||||||||||
| Beginning Balance at 5/31/09 | $ | 33,038 | $ | – | $ | 33,038 | ||||||
| Total Realized Gain/Loss | 113 | – | 113 | |||||||||
| Change in Unrealized Gain/Loss | (2,792 | ) | – | (2,792 | ) | |||||||
| Net Purchases and Sales | (470 | ) | – | (470 | ) | |||||||
| Net Transfers In/Out | (25,257 | ) | – | (25,257 | ) | |||||||
| Ending Balance at 5/31/10 | $ | 4,632 | $ | – | $ | 4,632 | ||||||
(b) Investment Transactions and Investment Income
Investment transactions are accounted for on the trade date. Realized gains and losses on investments are determined on the identified cost basis. Paydown gains and losses on mortgage and asset-backed securities are treated as an adjustment to interest income. For the year ended May 31, 2010, the Fund recognized an increase of interest income and a decrease of net realized gain of $2,205,103. This reclassification is reflected on the Statement of Operations and had no effect on the net asset value of the Fund. Dividend income is recorded net of applicable withholding taxes on the ex-dividend date and interest income is recorded on an accrual basis. Discounts or premiums on debt securities purchased are accreted or amortized to interest income over the lives of the respective securities using the effective interest method.
(c) Swaps
A swap is an agreement to exchange the return generated by one instrument for the return generated by another instrument. The Fund may enter into swap agreements to manage its exposure to interest rates and/or credit risk or to generate income. The swaps are valued daily at current market value and any unrealized gain or loss is included in the Statement of Assets and Liabilities. Gain or loss is realized on the termination date of the swap and is equal to the difference between the Fund’s basis in the swap and the proceeds of the closing transaction, including any fees. During the period that the swap agreement is open, the Fund may be subject to risk from the potential inability of the counterparty to meet the terms of the agreement. The swaps involve elements of both market and credit risk in excess of the amounts reflected on the Statement of Assets and Liabilities. Upon termination of a swap agreement, a payable to or receivable from swap counterparty is established on the Statement of Assets and Liabilities to reflect the net gain/loss, including interest income/expense, on terminated swap positions. The line item is removed upon settlement according to the terms of the swap agreement.
Realized gain (loss) upon termination of swap contracts is recorded on the Statement of Operations. Fluctuations in the value of swap contracts are recorded as a component of net change in unrealized appreciation (depreciation) of swap contracts. Net periodic payments received by the Fund are included as part of realized gain (loss) and, in the case of accruals for periodic payments, are included as part of unrealized appreciation (depreciation) on the Statement of Operations.
(d) Covered Call Options
The Fund will pursue its primary objective by employing an option strategy of writing (selling) covered call options on equity securities and indices. The Fund seeks to generate current gains from option premiums as a means to enhance distributions payable to the Fund’s common shareholders.
When an option is written, the premium received is recorded as an asset with an equal liability and is subsequently marked to market to reflect the current market value of the option written. These liabilities are reflected as options written in the Statement of Assets and Liabilities. Premiums received from writing options which expire unexercised are recorded on the expiration date as a realized gain. The difference between the premium received and the amount paid on effecting a closing purchase transaction, including brokerage commissions, is also treated as a realized gain, or if the premium is less than the amount paid for the closing purchase transactions, as a realized loss. If an option is exercised, the premium is added to the proceeds from the sale of the underlying security in determining whether there has been a realized gain or loss.
(e) Currency Translation
Assets and liabilities denominated in foreign currencies are translated into U.S. dollars at the mean of the bid and asked price of respective exchange rates on the last day of the period. Purchases and sales of investments denominated in foreign currencies are translated at the exchange rate on the date of the transaction.
The Fund does not isolate that portion of the results of operations resulting from changes in foreign exchange rates on investments from the fluctuations arising from changes in market prices of securities held. Such fluctuations are included with the net realized and unrealized gain or loss from investments.
Foreign exchange realized gain or loss resulting from holding of a foreign currency, expiration of a currency exchange contract, difference in exchange rates between the trade date and settlement date of an investment purchased or sold, and the difference between dividends or interest actually received compared to the amount shown in a Fund’s accounting records on the date of receipt is shown as net realized gains or losses on foreign currency transactions on the Fund’s Statement of Operations.
Foreign exchange unrealized gain or loss on assets and liabilities, other than investments, is shown as unrealized appreciation (depreciation) on foreign currency translation in the Fund’s Statement of Operations.
(f) Distributions to Shareholders
The Fund declares and pays monthly dividends to common shareholders. These dividends consist of investment company taxable income, which generally includes qualified dividend income, ordinary income and short-term capital gains. To the extent distributions exceed net investment income, the excess will be deemed a return of capital. Any net realized long-term capital gains are distributed annually to common shareholders.
Distributions to shareholders are recorded on the ex-dividend date. The amount and timing of distributions are determined in accordance with federal income tax regulations, which may differ from U.S. generally accepted accounting principles.
Note 3 – Investment Advisory Agreement, Sub-Advisory Agreement and Other Agreements:
Pursuant to an Investment Advisory Agreement (the “Agreement”) among the Fund and Claymore Advisors, LLC (“the Adviser”), the Adviser furnished offices, necessary facilities and
Annual Report | May 31, 2010 | 23
GOF | Claymore/Guggenheim Strategic Opportunities Fund | Notes to Financial Statements continued
equipment, provides administrative services, oversees the activities of GPAM, provides personnel including certain officers required for the Fund’s administrative management and compensates all officers and trustees of the Fund who are its affiliates. As compensation for these services, the Fund pays the Adviser a fee, payable monthly, in an amount equal to 1.00% of the Fund’s average daily managed assets (net assets applicable to common shareholders plus any assets attributable to financial leverage).
Pursuant to a Sub-Advisory Agreement (the “Sub-Advisory Agreement”) among the Fund, the Adviser and GPAM, GPAM under the supervision of the Fund’s Board of Trustees and the Adviser, provides a continuous investment program for the Fund’s portfolio; provides investment research, makes and executes recommendations for the purchase and sale of securities; and provides certain facilities and personnel, including certain officers required for its administrative management and pays the compensation of all officers and trustees of the Fund who are its affiliates. As compensation for its services, the Adviser pays GPAM a fee, payable monthly, in an annual amount equal to 0.50% of the Fund’s average daily managed assets.
On October 15, 2009, Guggenheim Partners LLC, (“Guggenheim”), a global, diversified financial services firm, and Claymore Group Inc., parent of the Adviser, announced the completion of a previously announced merger. The closing of this transaction took place on October 14, 2009 (“The Effective Date”). This transaction resulted in a change-of-control whereby Claymore Group Inc. and its subsidiaries, including the Adviser, became indirect, wholly-owned subsidiaries of Guggenheim. The transaction has not affected the daily operations of the Fund or the investment activities or the investment management activities of the Adviser.
Under the 1940 Act, the consummation of the transaction resulted in the automatic termination of the Fund’s Advisory & Sub-Advisory Agreement. On September 29, 2009, the Board of Trustees approved a new investment advisory agreement between the Fund and the Adviser (the “New Advisory Agreement”) and a new investment sub-advisory agreement among the Fund, the Adviser and GPAM (the “New Sub-Advisory Agreement” and together with the New Advisory Agreement, the “New Agreements”) and recommended that the New Agreements be submitted to the shareholders of the Fund for their approval. On February 3, 2010, the shareholders approved the New Agreements on behalf of the Fund.
Under a separate Fund Administration agreement, the Adviser provides fund administration services to the Fund. As compensation for services performed under the Administration Agreement, the Advisor receives a fund administration fee payable monthly at the annual rate set forth below as a percentage of the average daily managed assets of the Fund.
| Managed Assets | Rate | |||
| First $200,000,000 | 0.0275 | % | ||
| Next $300,000,000 | 0.0200 | % | ||
| Next $500,000,000 | 0.0150 | % | ||
| Over $1,000,000,000 | 0.0100 | % | ||
For the year ended May 31, 2010, the Fund recognized expenses of $53,300 for these services.
The Bank of New York Mellon (“BNY”) acts as the Fund’s custodian, accounting agent, and transfer agent. As custodian, BNY is responsible for the custody of the Fund’s assets. As accounting agent, BNY is responsible for maintaining the books and records of the Fund’s securities and cash. As transfer agent, BNY is responsible for performing transfer agency services for the Fund.
Certain officers and trustees of the Fund are also officers and directors of the Adviser or GPAM. The Fund does not compensate its officers or trustees who are officers of the aforementioned firms.
Note 4 – Federal Income Taxes:
The Fund intends to comply with the requirements of Subchapter M of the Internal Revenue Code of 1986, as amended, applicable to regulated investment companies. Accordingly, no provision for U.S. federal income taxes is required. In addition, by distributing substantially all of its ordinary income and long-term capital gains, if any, during each calendar year, the Fund intends not to be subject to U.S. federal excise tax.
At May 31, 2010, the following reclassifications were made to the capital accounts of the Fund to reflect permanent book/tax differences and income and gains available for distributions under income tax regulations, which are primarily due to the differences between book and tax treatment of investments in real estate trusts and swaps. Net investment income, net realized gains and net assets were not affected by these changes.
| Undistributed | Accumulated | |||||||
| Net Investment | Net Realized | |||||||
| Income/(Loss) | Gain/(Loss) | Paid in Capital | ||||||
| $724,430 | $(724,430 | ) | $ – |
Information on the components of investments, excluding purchased and written options, and net assets as of May 31, 2010, is as follows:
| Net Tax | Net Tax | ||||||||||||
| Cost of | Gross Tax | Gross Tax | Unrealized | Unrealized | |||||||||
| Investments for | Unrealized | Unrealized | Depreciation | Appreciation on | |||||||||
| Tax Purposes | Appreciation | Depreciation | on Investments | Derivatives | |||||||||
| $216,503,947 | $13,660,339 | $(17,005,051 | ) | $(3,344,712 | ) | $2,620,593 |
| Undistributed | Undistributed | |||||
| Ordinary | Long-Term | |||||
| Income/ | Gains/ | |||||
| (Accumulated | (Accumulated | |||||
| Ordinary Loss) | Capital Loss) | |||||
| $(281,496 | ) | $(4,711,104 | ) |
The differences between book basis and tax basis unrealized appreciation (depreciation) is attributable to the tax deferral of losses on wash sales.
For federal income tax purposes, as of May 31, 2010, the Fund had a capital loss carryforward of $4,711,104 available to offset possible future capital gains. The capital loss carryforward is set to expire on May 31, 2018.
For the years ended May 31, 2010, and 2009, the tax character of distributions paid to common shareholders as reflected in the Statement of Changes in Net Assets was as follows:
| Distributions paid from | 2010 | 2009 | ||||||
| Ordinary Income | $ | 16,931,384 | $ | 12,332,718 | ||||
| Return of Capital | $ | – | $ | 4,493,766 | ||||
| $ | 16,931,384 | $ | 16,826,484 | |||||
For all open tax years and all major jurisdictions, management of the Fund has concluded that there are no significant uncertain tax positions that would require recognition in the financial statements. Open tax years are those that are open for examination by taxing authorities (i.e. generally the last four tax year ends and the interim tax period since then). Furthermore, management of the Fund is also not aware of any tax positions for which it is reasonably possible that the total amounts of unrecognized tax benefits will significantly change in the next twelve months.
Note 5 – Investments in Securities:
During the year ended May 31, 2010, the cost of purchases and proceeds from sales of investments, excluding written options and short-term investments were $142,666,875 and $125,107,445, respectively.
24 | Annual Report | May 31, 2010
GOF | Claymore/Guggenheim Strategic Opportunities Fund | Notes to Financial Statements continued
Note 6 – Derivatives:
(a) Covered Call Option
An option on a security is a contract that gives the holder of the option, in return for a premium, the right to buy from (in the case of a call) or sell to (in the case of a put) the writer of the option the security underlying the option at a specified exercise or “strike” price. The writer of an option on a security has the obligation upon exercise of the option to deliver the underlying security upon payment of the exercise price (in the case of a call) or to pay the exercise price upon delivery of the underlying security (in the case of a put).
There are several risks associated with transactions in options on securities. As the writer of a covered call option, the Fund forgoes, during the option’s life, the opportunity to profit from increases in the market value of the security covering the call option above the sum of the premium and the strike price of the call, but has retained the risk of loss should the price of the underlying security decline. The writer of an option has no control over the time when it may be required to fulfill its obligation as writer of the option. Once an option writer has received an exercise notice, it cannot effect a closing purchase transaction in order to terminate its obligation under the option and must deliver the underlying security at the exercise price.
The Fund entered into written option contracts during the year ended May 31, 2010.
Details of the transactions were as follows:
| Number of Contracts | Premiums Received | |||||||
| Options outstanding, beginning of year | 8,677 | $ | 779,378 | |||||
| Options written during the period | 123,298 | 7,814,989 | ||||||
| Options expired during the period | (20,779 | ) | (1,096,737 | ) | ||||
| Options closed during the period | (94,124 | ) | (5,613,432 | ) | ||||
| Options assigned during the period | (6,533 | ) | (1,066,050 | ) | ||||
| Options outstanding, end of period | 10,539 | $ | 818,148 | |||||
(b) Swaps
Swap agreements are contracts between parties in which one party agrees to make periodic payments to the other party (the “Counterparty”) based on the change in market value or level of a specified rate, index or asset. In return, the Counterparty agrees to make periodic payments to the first party based on the return of a different specified rate, index or asset. Swap agreements will usually be done on a net basis, the Fund receiving or paying only the net amount of the two payments. The net amount of the excess, if any, of the Fund’s obligations over its entitlements with respect to each swap is accrued on a daily basis and an amount of cash or highly liquid securities having an aggregate value at least equal to the accrued excess is maintained in an account at the Fund’s custodian bank. The Fund has entered into master netting arrangements, established within the Fund’s International Swap and Derivatives Association, Inc. master agreements, which allow the Fund to net unrealized appreciation and depreciation for positions in swaps for each individual counterparty.
Total return swap agreements are contracts in which one party agrees to make payments of the total return from the underlying asset during a specified period in return for receiving payments equal to a fixed or floating rate of interest or the total return from another designated underlying asset.
Interest rate swap agreements involve the Fund’s agreement to exchange a stream of interest payments for another party’s stream of cash flows.
Credit default swap transactions involve the Fund’s agreement to exchange the credit risk of an issuer. A buyer of a credit default swap is said to buy protection by paying periodic fees in return for a contingent payment from the seller if the issuer has a credit event such as bankruptcy, a failure to pay outstanding obligations or deteriorating credit while the swap is outstanding. A seller of a credit default swap is said to sell protection and thus collects the periodic fees and profits if the credit of the issuer remains stable or improves while the swap is outstanding but the seller in a credit default swap contract would be required to pay an agreed-upon amount, which approximates the notional amount of the swap, to the buyer in the event of an adverse credit event of the issuer.
The Fund entered into swap agreements during the year ended May 31, 2010, to potentially enhance return. Details of the swap agreements outstanding as of May 31, 2010, are as follows:
Credit Default Swap Agreements
| Counterparty | Reference Entity | Buy/Sell Protection | Termination Date | Implied Credit Spread at May 31, 2010 (2) | Notional Amount (000) | Receive Fixed Rate | Unrealized Appreciation (Depreciation) | ||||||||||||
Goldman Sachs(1) | Basket of distinct corporate entities | Sell | 09/20/14 | 14.23 | % | $3,000 | 1.180 | % | $(1,229,642 | ) | |||||||||
Interest Rate Swap Agreements
| Unrealized Appreciation | ||||||||||||||||
Counterparty | Floating Rate | Termination Date | Notional Amount (000) | Receive Fixed Rate | (Depreciation) | |||||||||||
Goldman Sachs (3) | 3 Month LIBOR | 01/04/38 | $ | 10,000 | 5.675 | % | $ | 775,751 | ||||||||
Goldman Sachs (3) | 3 Month LIBOR | 01/04/38 | 10,000 | 5.860 | 425,325 | |||||||||||
Goldman Sachs (3) | 3 Month LIBOR | 01/12/15 | 10,000 | 3.155 | 246,383 | |||||||||||
Goldman Sachs (3) | 3 Month LIBOR | 07/07/38 | 5,000 | 5.753 | 331,150 | |||||||||||
Goldman Sachs (3) | 3 Month LIBOR | 07/07/38 | 5,000 | 5.940 | 203,050 | |||||||||||
Goldman Sachs (3) | 3 Month LIBOR | 01/12/15 | 5,000 | 3.225 | 102,866 | |||||||||||
Goldman Sachs (3) | 3 Month LIBOR | 01/12/15 | 5,000 | 3.095 | 137,946 | |||||||||||
HSBC (3) | 3 Month LIBOR | 01/09/23 | 5,000 | 7.700 | (a) | 171,658 | ||||||||||
| $ | 2,394,129 | |||||||||||||||
Annual Report | May 31, 2010 | 25
GOF | Claymore/Guggenheim Strategic Opportunities Fund | Notes to Financial Statements continued
Total Return Swap Agreements
| Unrealized Appreciation | ||||||||||||||
Counterparty | Reference Entity | Floating Rate | Termination Date | Notional Amount (000) | (Depreciation) | |||||||||
Barclays Capital (4) | S&P 500 | 1 Month LIBOR + 0.15% | 12/27/10 | $1,000 | $ (22,414 | ) | ||||||||
Barclays Capital (4) | S&P 500 | 1 Month LIBOR + 0.15% | 12/22/10 | 7,401 | 110,002 | |||||||||
| $87,588 | ||||||||||||||
Total Unrealized Appreciation for Swap Agreements | $ 1,252,075 | |||||||||||||
(1) The Fund receives a fixed rate based upon the notional amount of $3 million and if a defined credit event occurs, pays cumulative losses in excess of a stated percentage on an underlying basket of distinct corporate entities with an aggregate notional value of $3 billion. The maximum loss exposure is $3 million.
(2) The implied credit spreads, represented in absolute terms, utilized in determining the market value of credit default swap agreements on corporate issues or sovereign issues of an emerging country as of period end serve as an indicator of the current status of the payment/performance risk and represent the likelihood or risk of default for the credit derivative. The implied credit spread of a particular referenced entity reflects the cost of buying/selling protection and may include upfront payments required to be made to enter into the agreement. Wider credit spreads represent a deterioration of the referenced entity’s credit soundness and a greater likelihood or risk of default or other credit event occurring as defined under the terms of the agreement. A credit spread identified as ‘Defaulted’ indicates a credit event has occurred for the reference entity or obligation.
(3) The Fund pays the floating rate and receives the fixed rate.
(a) For any day that the spread between the 30-year fixed for floating swap rate versus the 2-year fixed for floating swap rate is less than -0-, the fixed rate is - -0-.
(4) The Fund pays a floating rate and receives the total return of the Standard & Poor’s 500 Index.
The Fund adopted ASC 815, Derivatives and Hedging (“ASC 815”) (formerly known as SFAS No. 161). ASC 815 is intended to improve financial reporting about derivative instruments by requiring enhanced disclosures to enable investors to better understand: a) how and why a fund uses derivative instruments, b) how derivatives instruments and related hedge fund items are accounted for, and c) how derivative instruments and related hedge items affect a fund’s financial position, results of operations and cash flows.
The following table presents the types of derivatives in the Fund by location as presented on the Statement of Assets Liabilities as of May 31, 2010.
Statement of Asset and Liability Presentation of Fair Values of Derivative Instruments:
| (value in $000s) | ||||||||||
| Asset Derivatives | Liability Derivatives | |||||||||
| Derivatives not accounted for as hedging instruments | Statement of Assets and Liabilities Location | Fair Value | Statement of Assets and Liabilities Location | Fair Value | ||||||
| Equity risk | Investments in securities (Options Purchased), | $ | 142 | Options Written, Unrealized depreciation on swaps | $ | 614 | ||||
| Unrealized appreciation on swaps | ||||||||||
| Interest rate risk | Unrealized appreciation on swaps | 2,394 | Unrealized depreciation on interest rate swaps | – | ||||||
| Credit risk | Unrealized appreciation on swaps | – | Unrealized depreciation on credit default swaps | 1,230 | ||||||
| Total | $ | 2,536 | $ | 1,844 | ||||||
The following table presents the effect of Derivatives Instruments on the Statement of Operations for the year ended May 31, 2010.
Effect of Derivative Instruments on the Statement of Operations:
| (value in $000s) | ||||||||||||
| Amount of Realized Gain (Loss) on Derivatives | ||||||||||||
| Derivatives not accounted for as hedging instruments | Options | Swaps | Total | |||||||||
| Equity risk | $ | (2,240 | ) | $ | 987 | $ | (1,253 | ) | ||||
| Interest rate risk | – | 1,907 | 1,907 | |||||||||
| Credit risk | – | 36 | 36 | |||||||||
| Total | $ | (2,240 | ) | $ | 2,930 | $ | 690 | |||||
Change in Unrealized Appreciation (Depreciation) on Derivatives
| Derivatives not accounted for as hedging instruments | Options | Swaps | Total | |||||||||
| Equity risk | $ | 552 | $ | (82 | ) | $ | 470 | |||||
| Interest rate risk | – | 681 | 681 | |||||||||
| Credit risk | – | 550 | 550 | |||||||||
| Total | $ | 552 | $ | 1,149 | $ | 1,701 | ||||||
Derivative notional amounts and values as of May 31, 2010, are indicative of the volume of the Fund’s derivatives over the reporting period, except for swaps.
The Fund increased the volume of activity in swaps during the year ended May 31, 2010, with an average notional balance of approximately $52,535,811 during the year ended May 31, 2010, and an ending balance of $66,400,764.
26 | Annual Report | May 31, 2010
GOF | Claymore/Guggenheim Strategic Opportunities Fund | Notes to Financial Statements continued
Note 7 – Leverage:
Reverse Repurchase Agreements
The Fund may enter into reverse repurchase agreements as part of its financial leverage strategy. Under a reverse repurchase agreement, the Fund temporarily transfers possession of a portfolio instrument to another party, such as a bank or broker-dealer, in return for cash. At the same time, the Fund agrees to repurchase the instrument at an agreed upon time (normally within seven days) and price, which reflects an interest payment. Such agreements are considered to be borrowings under the 1940 Act. The Fund may enter into such agreements when it is able to invest the cash acquired at a rate higher than the cost of the agreement, which would increase earned income. When the Fund enters into a reverse repurchase agreement, any fluctuations in the market value of either the instruments transferred to another party or the instruments in which the proceeds may be invested would affect the market value of the Fund’s assets. As a result, such transactions may increase fluctuations in the market value of the Fund’s assets. For the year ended May 31, 2010, the average daily balance for which reverse repurchase agreements were outstanding amounted to $21,873,972. The weighted average interest rate was 2.47%. As of May 31, 2010, the total amount segregated in connection with reverse repurchase agreements was $54,860,611. At the period end, there was $31,621,245 in reverse repurchase agreements outstanding. As of May 31, 2010, the range of maturity dates on the outstanding reverse repurchase agreements were from June 1, 2010, to August 18, 2010.
Borrowings
On November 18, 2008, the Fund entered into a $30,000,000 credit facility agreement with BNP Paribas. Interest on the amount borrowed is based on the 3-month LIBOR plus 0.85%. An unused commitment fee of 0.75% is charged on the difference between the $30,000,000 credit facility and the amount borrowed. At May 31, 2010, there was $26,865,369 outstanding in connection with the Fund’s credit facility. The average daily amount of borrowings on the credit facility during the year ended May 31, 2010, was $24,904,263 with a related average interest rate of 1.20%. The maximum amount outstanding during the year ended May 31, 2010, was $29,227,551.
TALF Program
The Fund may invest a portion of its total assets through participation in the Term Asset-Backed Securities Loan Facility program (the “TALF program”), a program developed by the Board of Governors of the Federal Reserve System and the U.S. Department of the Treasury and operated by the Federal Reserve Bank of New York (“FRBNY”). Under the TALF program, the FRBNY may provide loans to the Fund to purchase certain investment-grade, asset-backed securities which must be backed by auto loans, student loans, credit card loans, small business loans or certain commercial mortgage-backed securities (“Eligible Securities”).
Per the terms of the TALF Program, the FRBNY lends to each borrower an amount equal to the lesser of par or market value of the Eligible Securities pledged as collateral minus a percentage of the par or market value of the Eligible Securities. The Fund pledges Eligible Securities as collateral for a TALF Program loan, which consist of securities that the Fund currently owns or securities that the Fund purchases with the loan proceeds. Loans acquired through the TALF Program may be prepaid at the option of the Fund without any prepayment penalty, and the Fund may satisfy its loan obligation in full at any time by surrendering the Eligible Securities pledged by the Fund to the FRBNY. The TALF program loans are non-recourse. If the Fund does not repay the loan, or if the Eligible Securities pledged by the Fund loses some or all of its value, under the terms of the TALF Program the FRBNY may enforce its rights only against the Eligible Securities pledged as collateral by the Fund and not against any other assets of the Fund.
The Fund is charged interest based on the terms of each loan and the type of Eligible Securities pledged as collateral by the Fund. During the fiscal year ended May 31, 2010, the Fund paid $523,407 of interest expense, which is included in Interest expense on the Statement of Operations. The Fund paid a one-time administration fee of 0.20% of the amount borrowed, which was expensed as incurred during the fiscal year and is included in TALF loan fees on the Statement of Operations.
As of May 31, 2010, borrowings under the TALF Program represent 4.5% of the Fund’s total assets.
Details of the loan outstanding as of May 31, 2010, are as follows:
| Loan | Loan | Loan | ||||||||||||||||
| Principal | Loan | Collateral | Interest | Maturity | Loan | Collateral | ||||||||||||
Amount | Type | Description | Rate | Date | Value | Value | ||||||||||||
| $ | 10,630,271 | Commercial Mortgage Obligation | Commercial Mortgage Pass Through Certificates | 3.796 | % | 9/25/14 | $ | 10,630,271 | $ | 13,928,007 | ||||||||
Note 8 – Capital:
Common Shares
The Fund has an unlimited amount of common shares, $0.01 par value, authorized and 9,215,636 issued and outstanding.
Transactions in common shares were as follows:
| Year Ended May 31, 2010 | Year Ended May 31, 2009 | |||||||
| Beginning Shares | 9,105,240 | 9,105,240 | ||||||
| Shares issued through dividend reinvestment | 110,396 | – | ||||||
| Ending Shares | 9,215,636 | 9,105,240 | ||||||
Note 9 – Indemnifications:
In the normal course of business, the Fund enters into contracts that contain a variety of representations, which provide general indemnifications. The Fund’s maximum exposure under these arrangements is unknown, as this would require future claims that may be made against the Fund that have not yet occurred. However, the Fund expects the risk of loss to be remote.
Annual Report | May 31, 2010 | 27
GOF | Claymore/Guggenheim Strategic Opportunities Fund | Notes to Financial Statements continued
Note 10 – Recent Accounting Pronouncements:
On January 21, 2010, the FASB issued an ASU, Fair Value Measurements and Disclosures (Topic 820): Improving Disclosures about Fair Value Measurements which provides guidance on how investment assets and liabilities are to be valued and disclosed. Specifically, the amendment requires reporting entities to disclose i) the input and valuation techniques used to measure fair value for both recurring and nonrecurring fair value measurements, for Level 2 or Level 3 positions ii) transfers between all levels (including Level 1 and Level 2) on a gross basis (i.e. transfers out must be disclosed separately from transfers in) as well as the reason(s) for the transfer, and iii) purchases, sales, issuances, and settlements on a gross basis in the Level 3 rollforward rather than as one net number. The effective date of the amendment is for interim and annual periods beginning after December 15, 2009, however, the requirement to provide the Level 3 activity for purchases, sales, issuances and settlements on a gross basis will be effective for interim and annual periods beginning after December 15, 2010. At this time the Fund is evaluating the implications of the amendment to ASC 820 and the impact to the financial statements.
Note 11 – Subsequent Event:
Subsequent to May 31, 2010, the Fund declared on June 1, 2010, a monthly dividend to common shareholders of $0.154 per common share. The dividend was payable on June 30, 2010, to shareholders of record on June 15, 2010.
On July 1, 2010, the Fund declared a monthly dividend to common shareholders of $0.154 per common share. The dividend was payable on July 30, 2010, to shareholders of record on July 15, 2010.
Subsequent to the end of the reporting period, a member of the portfolio management team, Robert Daviduk, submitted his resignation from Guggenheim Partners Asset Management, LLC (“GPAM”). The Fund will continue to be managed by a team of professionals at GPAM, with the day to day responsibilities led by Anne Walsh.
28 | Annual Report | May 31, 2010
GOF | Claymore/Guggenheim Strategic Opportunities Fund
Report of Independent Registered Public Accounting Firm |
The Board of Trustees and Shareholders of
Claymore/Guggenheim Strategic Opportunities Fund
We have audited the accompanying statement of assets and liabilities of Claymore/Guggenheim Strategic Opportunities Fund (the “Fund”), including the portfolio of investments, as of May 31, 2010, and the related statements of operations and cash flows for the year then ended, the statements of changes in net assets for each of the two years in the period then ended, and the financial highlights for each of the two years in the period then ended and for the period from July 27, 2007 (commencement of investment operations) through May 31, 2008. These financial statements and financial highlights are the responsibility of the Fund’s management. Our responsibility is to express an opinion on these financial statements and financial highlights based on our audits.
We conducted our audits in accordance with the standards of the Public Company Accounting Oversight Board (United States). Those standards require that we plan and perform the audit to obtain reasonable assurance about whether the financial statements and financial highlights are free of material misstatement. We were not engaged to perform an audit of the Fund’s internal control over financial reporting. Our audits included consideration of internal control over financial reporting as a basis for designing audit procedures that are appropriate in the circumstances, but not for the purpose of expressing an opinion on the effectiveness of the Fund’s internal control over financial reporting. Accordingly, we express no such opinion. An audit also includes examining, on a test basis, evidence supporting the amounts and disclosures in the financial statements and financial highlights, assessing the accounting principles used and significant estimates made by management, and evaluating the overall financial statement presentation. Our procedures included confirmation of securities owned as of May 31, 2010, by correspondence with the custodian and brokers or by other appropriate auditing procedures where replies from brokers were not received. We believe that our audits provide a reasonable basis for our opinion.
In our opinion, the financial statements and financial highlights referred to above present fairly, in all material respects, financial position of Claymore/Guggenheim Strategic Opportunities Fund at May 31, 2010, the results of its operations and its cash flows for the year then ended, the changes in its net assets for each of the two years in the period then ended, and the financial highlights for each of the two years in the period then ended and for the period from July 27, 2007 (commencement of investment operations) through May 31, 2008, in conformity with U.S. generally accepted accounting principles.

Chicago, Illinois
July 29, 2010
Annual Report | May 31, 2010 | 29
GOF | Claymore/Guggenheim Strategic Opportunities Fund
Supplemental Information | (unaudited)
Federal Income Tax Information
Qualified dividend income of as much as $349,310 was received by the Fund through May 31, 2010. The Fund intends to designate the maximum amount of dividends that qualify for the reduced tax rate pursuance to the Jobs and Growth Relief Reconciliation Act of 2003.
For corporate shareholders, $84,300 of investment income qualifies for the dividends-received deduction.
In January 2011, you will be advised on IRS Form 1099 DIV or substitute 1099 DIV as to the federal tax status of the distributions received by you in the calendar year 2010.
Result of Shareholder Votes
The Annual Meeting of Shareholders of the Fund was held on January 12, 2010, and adjourned until February 3, 2010. At the February 3, 2010, meeting, common shareholders voted on the election of Trustees and the proposal for a new Investment Advisory Agreement and Investment Sub-Advisory Agreement.
With regard to the election of the following Trustees by common shareholders of the Fund and the proposal for the new Investment Advisory Agreement and Investment Sub-Advisory Agreement:
| # of Shares | # of Shares | # of Shares | ||||||||||
| In Favor | Against | Withheld | ||||||||||
| Randall C. Barnes | 4,729,184 | – | 221,862 | |||||||||
| Kevin M. Robinson | 4,742,250 | – | 205,257 | |||||||||
| New Investment Advisory Agreement | 3,450,444 | 114,094 | 143,701 | |||||||||
| New Investment Sub-Advisory Agreement | 3,439,828 | 120,731 | 147,679 | |||||||||
The other Trustees of the Fund whose terms did not expire during the fiscal year ended May 31, 2010, are Ronald A. Nyberg and Ronald E. Toupin, Jr.
Trustees
The Trustees of the Claymore/Guggenheim Strategic Opportunities Fund and their principal occupations during the past five years:
| Name, Address*, Year | Term of Office** | Principal Occupations during | Number of Portfolios | |||||
| of Birth and Position(s) | and Length of | the Past Five Years and | in the Fund Complex*** | Other Directorships | ||||
| Held with Registrant | Time Served | Other Affiliations | Overseen by Trustee | Held by Trustee | ||||
| Independent Trustees: | ||||||||
Randall C. Barnes Year of Birth: 1951 Trustee | Since 2007 | Investor (2001-present). Formerly, Senior Vice President & Treasurer, PepsiCo., Inc. (1993-1997), President, Pizza Hut International (1991-1993) and Senior Vice President, Strategic Planning and New Business Development (1987-1990) of PepsiCo, Inc. (1987-1997). | 43 | None. | ||||
Roman Friedrich III Year of birth: 1946 Trustee | Since 2010 | Founder of Roman Friedrich & Company, which specializes in the provision of financial advisory services to corporations in the resource sector. Previously, Managing Director at TD Securities. Managing Director Lancaster Financial Ltd.; Wood Gundy; Burns Fry Ltd.; President, Chase Manhattan Bank (Canada) Ltd. | 2 | Director, Zincore Metals, Inc. and GFM Resources Ltd. | ||||
Robert B. Karn III Year of birth: 1942 Trustee | Since 2010 | Consultant (1998-present). Previously, Managing Partner, Financial and Economic Consulting, St. Louis office of Arthur Andersen, LLP. | 2 | Director of Peabody Energy Company, GP Natural Resource Partners LLC and Kennedy Capital Management, Inc. | ||||
Ronald A. Nyberg Year of birth: 1953 Trustee | Since 2007 | Partner of Nyberg & Cassioppi, LLC, a law firm specializing in corporate law, estate planning and business transactions (2000-present). Formerly, Executive Vice President, General Counsel and Corporate Secretary of Van Kampen Investments (1982-1999). | 46 | None. | ||||
Ronald E. Toupin, Jr. Year of birth: 1958 Trustee | Since 2007 | Retired. Formerly, Vice President, Manager and Portfolio Manager of Nuveen Asset Management (1998-1999), Vice President of Nuveen Investment Advisory Corp. (1992-1999), Vice President and Manager of Nuveen Unit Investment Trusts (1991-1999), and Assistant Vice President and Portfolio Manager of Nuveen Unit Investment Trusts (1988-1999), each of John Nuveen & Co., Inc. (1982-1999). | 43 | None. |
30 | Annual Report | May 31, 2010
GOF | Claymore/Guggenheim Strategic Opportunities Fund | Supplemental Information (unaudited) continued
| Name, Address*, Year | Term of Office** | Principal Occupations during | Number of Portfolios | |||||
| of Birth and Position(s) | and Length of | the Past Five Years and | in the Fund Complex*** | Other Directorships | ||||
| Held with Registrant | Time Served | Other Affiliations | Overseen by Trustee | Held by Trustee | ||||
| Interested Trustees: | ||||||||
Kevin M. Robinson† Year of Birth: 1959 Trustee and Chief Legal Officer | Since 2009 | Senior Managing Director and General Counsel of Claymore Advisors, LLC and Claymore Group, Inc. (2007-present). Formerly, Associate General Counsel and Assistant Corporate Secretary of NYSE Euronext, Inc. (2000-2007). | 2 | None. |
| * | Address for all Trustees unless otherwise noted: 2455 Corporate West Drive, Lisle, IL 60532 |
| ** | After a Trustee’s initial term, each Trustee is expected to serve a two-year term concurrent with the class of Trustees for which he serves: |
| —Messrs. Nyberg and Toupin, as Class II Trustees, are expected to stand for re-election at the Fund’s annual meeting of shareholders for the fiscal year ended May 31, 2011. | |
| —Mr. Friedrich, as newly appointed Class I Trustee, is expected to stand for election at the Fund’s annual meeting of shareholders for the fiscal year ended May 31, 2011. | |
| —Mr. Karn, as newly appointed Class II Trustee, is expected to stand for election at the Fund’s annual meeting of shareholders for the fiscal year ended May 31, 2011. | |
| —Messrs. Barnes and Robinson, as Class I Trustees, are expected to stand for re-election at the Fund’s annual meeting of shareholders for the fiscal year ended May 31, 2012. | |
| *** | The Claymore Fund Complex consists of U.S. registered investment companies advised or serviced by Claymore Advisors, LLC or Claymore Securities, Inc. The Claymore Fund Complex is overseen by multiple Boards of Trustees. |
| † | Mr. Robinson is an “interested person” (as defined in section 2(a)(19) of the 1940 Act) of the Fund because of his position as an officer of Claymore Advisors, LLC, the Fund’s Adviser. |
| As of October 14, 2009, Nicholas Dalmaso resigned his position as Trustee for the Fund. |
Officers
The officers of the Claymore/Guggenheim Strategic Opportunities Fund and their principal occupations during the past five years:
| Name, Address*, Year | Term of Office** | |||
| of Birth and Position(s) | and Length of | Principal Occupations During the Past Five Years | ||
| Held with Registrant | Time Served | and Other Affiliations | ||
J. Thomas Futrell Year of birth: 1955 Chief Executive Officer | Since 2008 | Senior Managing Director and Chief Investment Officer of Claymore Advisors, LLC and Claymore Securities, Inc. (2008-Present). Formerly, Managing Director of Research, Nuveen Asset Management (2000-2007). | ||
Steven M. Hill Year of birth: 1964 Chief Financial Officer Chief Accounting Officer and Treasurer | Since 2007 | Senior Managing Director of Claymore Advisors, LLC and Claymore Securities, Inc. (2005-present). Formerly, Chief Financial Officer of Claymore Group Inc. (2005-2006), Managing Director of Claymore Advisors, LLC and Claymore Securities, Inc. (2003-2005). Formerly, Treasurer of Henderson Global Funds and Operations Manager of Henderson Global Investors, (NA) Inc. (2002-2003); Managing Director, FrontPoint Partners LLC (2001-2002); Vice President, Nuveen Investments (1999-2001). | ||
Mark E. Mathiasen Year of birth: 1978 Secretary | Since 2008 | Vice President; Assistant General Counsel of Claymore Securities, Inc. (2007-present). Secretary of certain funds in the Fund Complex. Previously, Law Clerk, Idaho State Courts (2003-2006). | ||
Bruce Saxon Year of birth: 1957 Chief Compliance Officer | Since 2007 | Vice President, Fund Compliance Officer of Claymore Group, Inc. (2006-present). Formerly, Chief Compliance Officer/Assistant Secretary of Harris Investment Management, Inc. (2003-2006). Director-Compliance of Harrisdirect LLC (1999-2003). |
* Address for all Officers: 2455 Corporate West Drive, Lisle, IL 60532
** Officers serve at the pleasure of the Board of Trustees and until his or her successor is appointed and qualified or until his or her earlier resignation or removal.
Annual Report | May 31, 2010 | 31
GOF | Claymore/Guggenheim Strategic Opportunities Fund
Dividend Reinvestment Plan |
Unless the registered owner of common shares elects to receive cash by contacting the Plan Administrator, all dividends declared on common shares of the Fund will be automatically reinvested by The Bank of New York Mellon (the “Plan Administrator”), Administrator for shareholders in the Fund’s Dividend Reinvestment Plan (the “Plan”), in additional common shares of the Fund. Participation in the Plan is completely voluntary and may be terminated or resumed at any time without penalty by notice if received and processed by the Plan Administrator prior to the dividend record date; otherwise such termination or resumption will be effective with respect to any subsequently declared dividend or other distribution. Some brokers may automatically elect to receive cash on your behalf and may re-invest that cash in additional common shares of the Fund for you. If you wish for all dividends declared on your common shares of the Fund to be automatically reinvested pursuant to the Plan, please contact your broker.
The Plan Administrator will open an account for each common shareholder under the Plan in the same name in which such common shareholder’s common shares are registered. Whenever the Fund declares a dividend or other distribution (together, a “Dividend”) payable in cash, non-participants in the Plan will receive cash and participants in the Plan will receive the equivalent in common shares. The common shares will be acquired by the Plan Administrator for the participants’ accounts, depending upon the circumstances described below, either (i) through receipt of additional unissued but authorized common shares from the Fund (“Newly Issued Common Shares”) or (ii) by purchase of outstanding common shares on the open market (“Open-Market Purchases”) on the New York Stock Exchange or elsewhere. If, on the payment date for any Dividend, the closing market price plus estimated brokerage commission per common share is equal to or greater than the net asset value per common share, the Plan Administrator will invest the Dividend amount in Newly Issued Common Shares on behalf of the participants. The number of Newly Issued Common Shares to be credited to each participant’s account will be determined by dividing the dollar amount of the Dividend by the net asset value per common share on the payment date; provided that, if the net asset value is less than or equal to 95% of the closing market value on the payment date, the dollar amount of the Dividend will be divided by 95% of the closing market price per common share on the payment date. If, on the payment date for any Dividend, the net asset value per common share is greater than the closing market value plus estimated brokerage commission, the Plan Administrator will invest the Dividend amount in common shares acquired on behalf of the participants in Open-Market Purchases.
If, before the Plan Administrator has completed its Open-Market Purchases, the market price per common share exceeds the net asset value per common share, the average per common share purchase price paid by the Plan Administrator may exceed the net asset value of the common shares, resulting in the acquisition of fewer common shares than if the Dividend had been paid in Newly Issued Common Shares on the Dividend payment date. Because of the foregoing difficulty with respect to Open-Market Purchases, the Plan provides that if the Plan Administrator is unable to invest the full Dividend amount in Open-Market Purchases during the purchase period or if the market discount shifts to a market premium during the purchase period, the Plan Administrator may cease making Open-Market Purchases and may invest the uninvested portion of the Dividend amount in Newly Issued Common Shares at net asset value per common share at the close of business on the Last Purchase Date provided that, if the net asset value is less than or equal to 95% of the then current market price per common share; the dollar amount of the Dividend will be divided by 95% of the market price on the payment date.
The Plan Administrator maintains all shareholders’ accounts in the Plan and furnishes written confirmation of all transactions in the accounts, including information needed by shareholders for tax records. Common shares in the account of each Plan participant will be held by the Plan Administrator on behalf of the Plan participant, and each shareholder proxy will include those shares purchased or received pursuant to the Plan. The Plan Administrator will forward all proxy solicitation materials to participants and vote proxies for shares held under the Plan in accordance with the instruction of the participants.
There will be no brokerage charges with respect to common shares issued directly by the Fund. However, each participant will pay a pro rata share of brokerage commission incurred in connection with Open-Market Purchases. The automatic reinvestment of Dividends will not relieve participants of any Federal, state or local income tax that may be payable (or required to be withheld) on such Dividends.
The Fund reserves the right to amend or terminate the Plan. There is no direct service charge to participants with regard to purchases in the Plan; however, the Fund reserves the right to amend the Plan to include a service charge payable by the participants.
All correspondence or questions concerning the Plan should be directed to the Plan Administrator, BNY Mellon Shareowner Services, P.O. Box 358015, Pittsburgh, PA 15252-8015, Phone Number: (866) 488-3559.
32 | Annual Report | May 31, 2010
GOF | Claymore/Guggenheim Strategic Opportunities Fund
Board Considerations Regarding Investment Advisory Agreement and Investment
Subadvisory Agreement Contract Re-Approval
On May 10, 2010, the Board of Trustees (the “Board”) of Claymore/Guggenheim Strategic Opportunities Fund (the “Fund”), including those trustees who are not “interested persons” as defined by the Investment Company Act of 1940, as amended (the “Independent Trustees”), on the recommendation of the Nominating & Governance Committee (referred to as the “Committee” and consisting solely of the Independent Trustees) of the Board of the Fund, renewed: (1) the investment advisory agreement (“Investment Advisory Agreement”) between the Fund and Claymore Advisors, LLC (“Adviser”) and (2) the investment subadvisory agreement (“Investment Subadvisory Agreement”) among the Adviser, the Fund and Guggenheim Partners Asset Management, LLC (“Subadviser”). The Investment Advisory Agreement and the Investment Subadvisory Agreement are together referred to as the “Advisory Agreements.” As part of its review process, the Committee was represented by independent legal counsel. The Board and Committee reviewed materials received from the Adviser, the Subadviser and independent legal counsel. The Board and Committee had previously received, throughout the year, Board meeting information regarding performance and operating results of the Fund.
In preparation for its review, the Committee communicated with independent legal counsel regarding the nature of information to be requested, and independent legal counsel, on behalf of the Committee, sent a formal request for information to the Adviser and Subadviser. The Adviser and the Subadviser provided extensive information in response to that request and to a follow-up request for information. Among other information, the Adviser and Subadviser provided general information to assist the Committee in assessing the nature and quality of services provided by the Adviser and Subadviser, information comparing the investment performance, advisory fees and total expenses of the Fund to other funds, information about the profitability from the Advisory Agreements to each of the Adviser and the Subadviser and the compliance program of the Adviser and of the Subadviser.
Based upon its review, the Board and the Committee concluded that it was in the best interests of the Fund to renew each of the Advisory Agreements. In reaching this conclusion for the Fund, no single factor was determinative in the Board’s analysis, but rather the Board considered a variety of factors.
Investment Advisory Agreement
With respect to the nature, extent and quality of services currently provided by the Adviser, the Board noted that the Adviser had delegated responsibility for the investment and reinvestment of the Fund’s assets to the Subadviser. The Board considered the Adviser’s responsibility to oversee the Subadviser and that the Adviser has similar oversight responsibilities for other registered funds for which it serves as investment adviser. The Board reviewed financial information regarding the Adviser and its parent company and considered the parent company’s guaranty of the Adviser’s obligations under the Investment Advisory Agreement. The Board also considered the secondary market support provided by the Adviser to the Fund. The Board considered the experience and qualifications of the Adviser’s personnel, including those personnel providing compliance oversight and oversight of the Subadviser’s investment activities. Specifically, the Board noted the ongoing oversight activities performed by the Adviser, including on-site compliance reviews and monitoring of compliance with policies and procedures and with the Fund’s investment policies and restrictions. After considering these factors, the Board concluded that the Adviser and its personnel were qualified to serve the Fund in such capacity.
The Board considered the Fund’s investment performance by reviewing the Fund’s total return on a net asset value and market price basis for the three month, six month, one year and since inception periods ended March 31, 2010. The Board compared the Fund’s performance to the performance of a peer group of closed-end funds provided by the Adviser (“peer group of funds”) for the same time periods. The peer group of funds included other leveraged closed-end funds that generally invest a majority of their assets in investment-grade fixed income securities but excluded funds with a majority of their assets in one asset class, sector or country. The Board noted that the Fund’s investment results were consistent with the Subadviser’s goal of providing equity-like returns with a level of volatility that is closer to fixed income assets. The Board also considered that the Adviser does not directly manage the investment portfolio but had delegated such duties to the Subadviser. The Board also considered the Fund’s use of leverage and the positive impact of the leverage on the Fund’s performance. The Board concluded that the Adviser had reviewed and monitored the Subadviser’s investment performance.
The Board compared the Fund’s advisory fee (which includes the subadvisory fee paid to the Subadviser) and expense ratio to the peer group of funds, to a group of covered call closed-end funds provided by the Adviser and to the advisory fees that the Adviser charges to other closed-end funds for which it serves as adviser. The Board also reviewed the mean advisory fees and expense ratios of the peer group of funds. The Board noted that the Fund’s advisory fee was above the mean but within the range of the peer group of funds and considered the Adviser’s view that the Fund implements a variety of strategies, including a covered call equities strategy and swap transactions, which are typically not employed by the peer group of funds. The Board also noted that the Fund’s advisory fee was within the range of advisory fees charged to the covered call closed-end fund group provided by the Adviser.
With respect to the costs of services to be provided and profits realized by the Adviser from its relationship to the Fund, the Board reviewed information regarding the revenues the Adviser received under the Investment Advisory Agreement as well as the estimated allocated direct and indirect costs the Adviser incurred in providing the services to the Fund, including paying the subadvisory fee to the Subadviser.
The Board considered the extent to which economies of scale could be realized with respect to the management of the Fund as the Fund grows and whether fee levels reflected a reasonable sharing of such economies of scale for the benefit of Fund investors. Given the size of the Fund and the relatively fixed nature of closed-end fund assets, the Board does not anticipate significant economies of scale.
The Board considered other benefits available to the Adviser because of its relationship with the Fund and noted that the administrative services fees received by the Adviser from serving as administrator provides it with additional revenue. The Board also noted the Adviser’s statement that it benefits from its association with the Subadviser, which may lead to future business opportunities.
Investment Subadvisory Agreement
With respect to the nature, extent and quality of services provided by the Subadviser, the Board considered the qualifications, experience and skills of the Subadviser’s portfolio management and other key personnel. The Board considered the Subadviser’s efforts in pursuing the Fund’s investment objective of maximizing total return through a combination of current income and capital appreciation. The Board concluded that the Subadviser was qualified to provide the services under the Investment Subadvisory Agreement.
Annual Report | May 31, 2010 | 33
GOF | Claymore/Guggenheim Strategic Opportunities Fund | Board Considerations Regarding Investment Advisory Agreement and Investment Subadvisory Agreement Contract Re-Approval continued
The Board reviewed the performance of the Fund and the peer group of funds over various periods of time. The Board considered that, during the periods reviewed, the Fund, on a market and net asset value basis, outperformed the peer group of funds except for one fund in the peer group. The Board also compared the Fund’s investment performance on a net asset value basis to the S&P 500 Index and the Barclays Capital U.S. Aggregate Bond Index over relevant time periods. The Board noted that the Fund had outperformed the S&P 500 Index on a net asset value basis over all of the periods reviewed and the Barclays Capital U.S. Aggregate Bond Index over the three month, six month and one year periods.
The Board reviewed the subadvisory fee paid by the Adviser to the Subadviser and compared it to the fees charged by the Subadviser to clients for both fixed income and equity mandates. The Board noted that the Fund’s subadvisory fee was representative of the Subadviser’s standard client pricing, given the Fund’s exposure to both fixed income and equity securities.
With respect to the costs of services to be provided and profits realized by the Subadviser from its relationship to the Fund, the Board reviewed information regarding the revenues the Subadviser received under the Investment Subadvisory Agreement and estimated allocated expenses of the Subadviser in providing services under the Investment Subadvisory Agreement.
The Board reviewed the extent to which economies of scale with respect to the subadvisory services provided to the Fund would be realized as the Fund grows and whether fee levels reflect a reasonable sharing of such economies of scale for the benefit of Fund investors. Given the size of the Fund and the relatively fixed nature of closed-end fund assets, the Board does not anticipate significant economies of scale.
The Board considered other benefits derived by the Subadviser from its relationship to the Fund and noted the Subadviser’s statement that the Subadviser’s relationship with the Fund has provided new product development opportunities.
Overall Conclusions
Based upon all of the information considered and the conclusions reached, the Board determined that the terms of each Advisory Agreement continue to be fair and reasonable and that the continuation of each Advisory Agreement is in the best interests of the Fund, taking into consideration the costs of services to be provided and profit realized, economies of scale and other benefits to the Adviser and the Subadviser.
34 | Annual Report | May 31, 2010
GOF | Claymore/Guggenheim Strategic Opportunities Fund
Fund Information |
Board of Trustees Randall C. Barnes Roman Friedrich III Robert B. Karn III Ronald A. Nyberg Kevin M. Robinson* Ronald E. Toupin, Jr. * Trustee is an ‘interested person” of the Fund as defined in the Investment Company Act of 1940, as amended. | Officers J. Thomas Futrell Chief Executive Officer Kevin M. Robinson Chief Legal Officer Steven M. Hill Chief Financial Officer, Chief Accounting Officer and Treasurer Mark E. Mathiasen Secretary Bruce Saxon Chief Compliance Officer | Investment Adviser and Administrator Claymore Advisors, LLC Lisle, Illinois Investment Sub-Adviser Guggenheim Partners Asset Management, LLC Santa Monica, California Accounting Agent, Custodian and Transfer Agent The Bank of New York Mellon New York, New York Legal Counsel Skadden, Arps, Slate, Meagher & Flom LLP Chicago, Illinois Independent Registered Public Accounting Firm Ernst & Young LLP Chicago, Illinois |
Privacy Principles of the Fund
The Fund is committed to maintaining the privacy of its shareholders and to safeguarding their non-public personal information. The following information is provided to help you understand what personal information the Fund collects, how the Fund protects that information and why, in certain cases, the Fund may share information with select other parties.
Generally, the Fund does not receive any non-public personal information relating to its shareholders, although certain non-public personal information of its shareholders may become available to the Fund. The Fund does not disclose any non-public personal information about its shareholders or former shareholders to anyone, except as permitted by law or as is necessary in order to service shareholder accounts (for example, to a transfer agent or third party administrator).
The Fund restricts access to non-public personal information about its shareholders to employees of the Fund’s investment advisor and its affiliates with a legitimate business need for the information. The Fund maintains physical, electronic and procedural safeguards designed to protect the non-public personal information of its shareholders.
Questions concerning your shares of Claymore/Guggenheim Strategic Opportunities Fund?
•If your shares are held in a Brokerage Account, contact your Broker.
•If you have physical possession of your shares in certificate form, contact the Fund’s Administrator, Custodian and Transfer Agent:
The Bank of New York Mellon, 101 Barclay 11E, New York, NY 10286; (866) 488-3559.
This report is sent to shareholders of Claymore/Guggenheim Strategic Opportunities Fund for their information. It is not a Prospectus, circular or representation intended for use in the purchase or sale of shares of the Fund or of any securities mentioned in this report.
The Fund has delegated the voting of proxies relating to its voting securities to the Fund’s Sub-Adviser. A description of the Fund’s proxy voting policies and procedures related to portfolio securities is available without charge, upon request, by calling the Fund at (800) 345-7999 or on the U.S. Securities and Exchange Commission’s (“SEC”) website www.sec.gov.
The Fund files its complete schedule of portfolio holdings with the SEC for the first and third quarters of each fiscal year on Form N-Q. The Fund’s Form N-Q is available on the SEC website at www.sec.gov. The Fund’s Form N-Q may also be viewed and copied at the SEC’s Public Reference Room in Washington, DC; information on the operation of the Public Reference Room may be obtained by calling (800) SEC-0330 or at www.sec.gov.
Notice to Shareholders
Notice is hereby give in accordance with Section 23(c) of the Investment Company Act of 1940, as amended, that the Fund from time to time may purchase shares of its common stock in the open market.
Annual Report | May 31, 2010 | 35
GOF | Claymore/Guggenheim Strategic Opportunities Fund
About the Fund Manager |
Guggenheim Partners Asset Management, LLC
Guggenheim Partners Asset Management, LLC (“GPAM”) is a wholly owned subsidiary of Guggenheim Partners, LLC, a diversified financial services firm with more than 525 dedicated professionals. The firm provides capital markets services, portfolio and risk management expertise, wealth management, investment advisory and family office services. Clients are an elite mix of individuals, family offices, endowments, foundations, insurance companies and other institutions that have entrusted GPAM with the supervision of more than $100 billion of assets. The firm provides clients service from a global network of offices throughout the Americas, Europe, and Asia.
Investment Philosophy
GPAM’s investment philosophy is predicated upon the belief that thorough research and independent thought are rewarded with performance that has the potential to outperform benchmark indexes with both lower volatility and lower correlation of returns over time as compared to such benchmark indexes.
Investment Process
GPAM’s investment process is a collaborative effort between its Portfolio Construction Group, which utilizes tools such as GPAM’s Dynamic Financial Analysis Model to determine allocation of assets among a variety of sectors, and its Sector Specialists, who are responsible for security selection within these sectors and for implementing securities transactions, including the structuring of certain securities directly with the issuer or with investment banks and dealers involved in the origination of such securities.
Claymore Securities, Inc. 2455 Corporate West Drive Lisle, IL 60532 MemberFINRA/SIPC (07/10) |  |
Item 2. Code of Ethics.
(a) The registrant has adopted a code of ethics (the "Code of Ethics") that applies to its principal executive officer, principal financial officer, principal accounting officer or controller, or persons performing similar functions.
(b) No information need be disclosed pursuant to this paragraph.
(c) The registrant has not amended its Code of Ethics during the period covered by the report presented in Item 1 hereto.
(d) The registrant has not granted a waiver or an implicit waiver to its principal executive officer, principal financial officer, principal accounting officer or controller, or persons performing similar functions from a provision of its Code of Ethics during the period covered by this report.
(e) Not applicable.
(f) (1) The registrant's Code of Ethics is attached hereto as an exhibit.
(2) Not applicable.
(3) Not applicable.
Item 3. Audit Committee Financial Expert.
The registrant's Board of Trustees has determined that it has at least one audit committee financial expert serving on its audit committee, Ronald E. Toupin, Jr. Mr. Toupin is an “independent” Trustee as defined in this Item 3 of Form N-CSR. Mr. Toupin qualifies as an audit committee financial expert by virtue of his experience obtained as a portfolio manager and research analyst, which included review and analysis of offering documents and audited and unaudited financial statements using generally accepted accounting principles (“GAAP”) to show accounting estimates, accruals and reserves.
(Under applicable securities laws, a person who is determined to be an audit committee financial expert will not be deemed an "expert" for any purpose, including without limitation for the purposes of Section 11 of the Securities Act of 1933, as amended, as a result of being designated or identified as an audit committee financial expert. The designation or identification of a person as an audit committee financial expert does not impose on such person any duties, obligations, or liabilities that are greater than the duties, obligations, and liabilities imposed on such person as a member of the audit committee and Board of Trustees in the absence of such designation or identification. The designation or identification of a person as an audit committee financial
expert does not affect the duties, obligations or liability of any other member of the audit committee or Board of Trustees.)
Item 4. Principal Accountant Fees and Services.
(a) Audit Fees: the aggregate fees billed for professional services rendered by the principal accountant for the audit of the registrant's annual financial statements or services that are normally provided by the accountant in connection with statutory and regulatory filings or engagements were $55,000 and $55,000 for the fiscal year ending May 31, 2010, and May 31, 2009, respectively.
(b) Audit-Related Fees: the aggregate fees billed for assurance and related services by the principal accountant that are reasonably related to the performance of the audit of the registrant’s financial statements and are not reported under paragraph 4(a), were $0 and $0 for the fiscal year ending May 31, 2010, and May 31, 2009, respectively.
The registrant’s principal accountant did not bill for non-audit services that required approval by the audit committee pursuant to paragraph (c)(7)(ii) of Rule 2-01 of Regulation S-X during the registrant’s last two fiscal years.
(c) Tax Fees: the aggregate fees billed for professional services rendered by the principal accountant for tax compliance, tax advice and tax planning, including federal, state and local income tax return preparation and related advice and determination of taxable income and miscellaneous tax advice were $6,900 and $6,900 for the fiscal year ending May 31, 2010, and May 31, 2009, respectively.
The registrant’s principal accountant did not bill for non-audit services that required approval by the audit committee pursuant to paragraph (c)(7)(ii) of Rule 2-01 of Regulation S-X during the registrant’s last two fiscal years.
(d) All Other Fees: the aggregate fees billed for products and services provided by the principal accountant, other than the services reported in paragraphs (a) through (c) of this Item were $0 and $0 for the fiscal year ending May 31, 2010, and May 31, 2009, respectively.
The registrant’s principal accountant did not bill for non-audit services that required approval by the audit committee pursuant to paragraph (c)(7)(ii) of Rule 2-01 of Regulation S-X during the registrant’s last two fiscal years.
(e) Audit Committee Pre-Approval Policies and Procedures.
(1) The registrant’s audit committee reviews, and in its sole discretion, pre-approves, pursuant to written pre-approval procedures (A) all engagements for audit and non-audit services to be provided by the principal accountant to the registrant and (B) all engagements for non-audit services to be provided by the principal accountant (1) to the registrant’s investment adviser (not including a sub-adviser whose role is primarily portfolio management and is sub-contracted or overseen by another investment adviser) and (2) to any entity controlling, controlled by or under common control with the registrant’s investment adviser that provides ongoing services to the
| IV.C.2 | Pre-approve any engagement of the independent auditors to provide any non-prohibited services to the Trust, including the fees and other compensation to be paid to the independent auditors (unless an exception is available under Rule 2-01 of Regulation S-X). |
| (a) | The Chairman or any member of the Audit Committee may grant the pre-approval of services to the Fund for non-prohibited services up to $10,000. All such delegated pre-approvals shall be presented to the Audit Committee no later than the next Audit Committee meeting. |
| IV.C.3 | Pre-approve any engagement of the independent auditors, including the fees and other compensation to be paid to the independent auditors, to provide any non-audit services to the Adviser (or any “control affiliate” of the Adviser providing ongoing services to the Trust), if the engagement relates directly to the operations and financial reporting of the Trust (unless an exception is available under Rule 2-01 of Regulation S-X). |
| (a) | The Chairman or any member of the Audit Committee may grant the pre-approval for non-audit services to the Adviser up to $10,000. All such delegated pre-approvals shall be presented to the Audit Committee no later than the next Audit Committee meeting. |
(2) None of the services described in each of Items 4(b) through (d) were approved by the Audit Committee pursuant to paragraph (c)(7)(i)(C) of Rule 2-01 of Regulation S-X.
(f) Not applicable.
(g) The aggregate non-audit fees billed by the registrant's accountant for services rendered to the registrant, the registrant’s investment adviser (not including a sub-adviser whose role is primarily portfolio management and is sub-contracted with or overseen by another investment adviser) and/or any entity controlling, controlled by, or under common control with the adviser that provides ongoing services to the registrant that directly related to the operations and financial reporting of the registrant were $6,900 and $6,900 for the fiscal year ending May 31, 2010, and May 31, 2009, respectively.
(h) Not applicable.
Item 5. Audit Committee of Listed Registrants.
| (a) The registrant has a separately designated standing audit committee established in accordance with Section 3(a)(58)(A) of the Securities Exchange Act of 1934, as amended. The audit committee of the registrant is composed of: Randall C. Barnes, Ronald A. Nyberg, Ronald E. Toupin, Jr, Robert B. Karn III and Roman Friedrich III. |
(b) Not applicable.
Item 6. Schedule of Investments.
The Schedule of Investments is included as part of Item 1.
Item 7. Disclosure of Proxy Voting Policies and Procedures for Closed-End Management Investment Companies.
The registrant has delegated the voting of proxies relating to its voting securities to the registrant’s investment sub-adviser, Guggenheim Partners Asset Management, LLC (“Guggenheim”). Guggenheim’s proxy voting policies and procedures are included as an exhibit hereto.
Item 8. Portfolio Managers of Closed-End Management Investment Companies.
(a)(1) Guggenheim serves as sub-adviser for the registrant and is responsible for the day-to-day management of the registrant’s portfolio. Guggenheim uses a team approach to manage client portfolios. Day to day management of a client portfolio is conducted under the auspices of Guggenheim’s Portfolio Construction Group (“PCG”). PCG’s members include the Chief Investment Officer (“CIO”) and other key investment personnel. The PCG, in consultation with the CIO, provides direction for overall investment strategy. The PCG performs several duties as it relates to client portfolios including: determining both tactical and strategic asset allocations; and monitoring portfolio adherence to asset allocation targets; providing sector specialists with direction for overall investment strategy, which may include portfolio design and the rebalancing of portfolios; performing risk management oversight; assisting sector managers and research staff in determining the relative valuation of market sectors; and providing a forum for the regular discussion of the economy and the financial markets to enhance the robustness of Guggenheim’s strategic and tactical policy directives.
The following individuals at Guggenheim share primary responsibility for the management of the registrant’s portfolio and is provided as of May 31, 2010:
Name | Since | Professional Experience During the Last Five Years |
| Scott Minerd - CEO and CIO | 2007 | Guggenheim Partners Asset Management, LLC.: CEO and CIO – 12/05–Present; Guggenheim Partners, LLC: Managing Partner – Insurance Advisory – 5/98–Present. |
| Anne Walsh, CFA, FLMI – Senior Managing Director | 2007 | Guggenheim Partners Asset Management, LLC.: Senior Managing Director – 4/07–Present. Former, Reinsurance Group of America, Inc.: Senior Vice President and Chief Investment Officer – 5/00–3/07. |
(a)(2)(i-iii) Other Accounts Managed by the Portfolio Managers
The following tables summarize information regarding each of the other accounts managed by the Guggenheim portfolio managers as of May 31, 2010:
Scott Minerd:
| Type of Account | Number of Accounts | Total Assets in the Accounts | Number of Accounts In Which the Advisory Fee is Based on Performance | Total Assets in the Accounts In Which the Advisory Fee is Based on Performance | ||||||
Registered investment companies | 0 | 0 | 0 | 0 | ||||||
Other pooled investment vehicles | 2 | $1,621,000,000 | 2 | $1,621,000,000 | ||||||
Other accounts | 5 | $31,569,000,000 | 5 | $31,569,000,000 | ||||||
Anne Walsh:
| Type of Account | Number of Accounts | Total Assets in the Accounts | Number of Accounts In Which the Advisory Fee is Based on Performance | Total Assets in the Accounts In Which the Advisory Fee is Based on Performance | ||||
Registered investment companies | 1 | $161,000,000 | 1 | $161,000,000 | ||||
Other pooled investment vehicles | 2 | $1,621,000,000 | 2 | $1,621,000,000 | ||||
Other accounts | 17 | $8,230,000,000 | 17 | $8,230,000,000 |
(a)(2)(iv) Potential Conflicts of Interest
Actual or apparent conflicts of interest may arise when a portfolio manager has day-to-day management responsibilities with respect to more than one fund or other account. More specifically, portfolio managers who manage multiple funds and/or other accounts may be presented with one or more of the following potential conflicts.
The management of multiple funds and/or other accounts may result in a portfolio manager devoting unequal time and attention to the management of each fund and/or other account. Guggenheim seeks to manage such competing interests for the time and attention of a portfolio manager by having the portfolio manager focus on a particular investment discipline. Specifically, the ultimate decision maker for security selection for each client portfolio is the Sector Specialist Portfolio Manager. They are responsible for analyzing and selecting specific securities that they believe best reflect the risk and return level as provided in each client’s investment guidelines.
Guggenheim may have clients with similar investment strategies. As a result, if an investment opportunity would be appropriate for more than one client, Guggenheim may be required to choose among those clients in allocating such opportunity, or to allocate less of such opportunity to a client than it would ideally allocate if it did not have to allocate to multiple clients. In addition, Guggenheim may determine that an investment opportunity is appropriate for a particular account, but not for another.
Allocation decisions are made in accordance with the investment objectives, guidelines, and restrictions governing the respective clients and in a manner that will not unfairly favor one client over another. Guggenheim’s allocation policy provides that investment decisions must never be based upon account performance or fee structure. Accordingly, Guggenheim’s allocation procedures are designed to ensure that investment opportunities are allocated equitably among different client accounts over time. The procedures also seek to ensure reasonable efficiency in client transactions and to provide portfolio managers with flexibility to use allocation methodologies appropriate to Guggenheim’s investment disciplines and the specific goals and objectives of each client account.
In order to minimize execution costs and obtain best execution for clients, trades in the same security transacted on behalf of more than one client may be aggregated. In the event trades are aggregated, Guggenheim’s policy and procedures provide as follows: (i) treat all participating client accounts fairly; (ii) continue to seek best execution; (iii) ensure that clients who participate in an aggregated order will participate at the average share price with all transaction costs shared on a pro-rata basis based on each client’s participation in the transaction; (iv) disclose its aggregation policy to clients.
Guggenheim, as a fiduciary to its clients, considers numerous factors in arranging for the purchase and sale of clients’ portfolio securities in order to achieve best execution for its clients.
When selecting a broker, individuals making trades on behalf of Guggenheim clients consider the full range and quality of a broker’s services, including execution capability, commission rate, price, financial stability and reliability. Guggenheim is not obliged to merely get the lowest price or commission but also must determine whether the transaction represents the best qualitative execution for the account.
In the event that multiple broker/dealers make a market in a particular security, Guggenheim’s Portfolio Managers are responsible for selecting the broker-dealer to use with respect to executing the transaction. The broker-dealer will be selected on the basis of how the transaction can be executed to achieve the most favorable execution for the client under the circumstances. In many instances, there may only be one counter-party active in a particular security at a given time. In such situations the Employee executing the trade will use his/her best effort to obtain the best execution from the counter-party.
Guggenheim and the registrant have adopted certain compliance procedures which are designed to address these types of conflicts. However, there is no guarantee that such procedures will detect each and every situation in which a conflict arises.
(a)(3) Portfolio Manager Compensation
Guggenheim compensates Mr. Minerd and Ms. Walsh for their management of the registrant’s portfolio. Compensation is evaluated based on their contribution to investment performance relative to pertinent benchmarks and qualitatively based on factors such as teamwork and client service efforts. Guggenheim’s staff incentives may include: a competitive base salary, bonus determined by individual and firm wide performance, equity participation, and participation opportunities in various Guggenheim investments. All Guggenheim employees are also eligible to participate in a 401(k) plan to which Guggenheim may make a discretionary match after the completion of each plan year.
(a)(4) Portfolio Manager Securities Ownership
The following table discloses the dollar range of equity securities of the registrant beneficially owned by each Guggenheim portfolio manager as of May 31, 2010:
| Name of Portfolio Manager | Dollar Amount of Equity Securities in Fund | |
Scott Minerd Anne Walsh | $500,001-$1,000,000 $10,001-$50,000 |
Item 9. Purchases of Equity Securities by Closed-End Management Investment Company and Affiliated Purchasers.
None.
Item 10. Submission of Matters to a Vote of Security Holders.
The registrant has not made any material changes to the procedures by which shareholders may recommend nominees to the registrant’s Board of Trustees.
Item 11. Controls and Procedures.
(a) The registrant's principal executive officer and principal financial officer have evaluated the registrant's disclosure controls and procedures (as defined in Rule 30a-3(c) under the Investment Company Act) as of a date within 90 days of this filing and have concluded based on such evaluation, as required by Rule 30a-3(b) under the Investment Company Act, that the registrant's disclosure controls and procedures were effective, as of that date, in ensuring that information required to be disclosed by the registrant in this Form N-CSR was recorded, processed, summarized, and reported within the time periods specified in the Securities and Exchange Commission’s rules and forms.
(b) There were no changes in the registrant’s internal control over financial reporting (as defined in Rule 30a-3(d) under the Investment Company Act) that occurred during the registrant’s second fiscal quarter of the period covered by this report that have materially affected, or are reasonably likely to materially affect, the registrant’s internal control over financial reporting.
Item 12. Exhibits.
(a)(1) Claymore Funds’ Code of Ethics for Chief Executive and Senior Financial Officers.
(a)(2) Certifications of principal executive officer and principal financial officer pursuant to Rule 30a-2(a) of the Investment Company Act.
(a)(3) Not applicable.
(b) Certifications of principal executive officer and principal financial officer pursuant to Rule 30a-2(b) of the Investment Company Act and Section 906 of the Sarbanes-Oxley Act of 2002.
(c) Proxy Voting Policies and Procedures.
SIGNATURES
Pursuant to the requirements of the Securities Exchange Act of 1934 and the Investment Company Act of 1940, the registrant has duly caused this report to be signed on its behalf by the undersigned, thereunto duly authorized.
(Registrant) Claymore/Guggenheim Strategic Opportunities Fund
By: /s/ J. Thomas Futrell
_____________________________________________________________________
Name: J. Thomas Futrell
Title: Chief Executive Officer
Date: August 9, 2010
Pursuant to the requirements of the Securities Exchange Act of 1934 and the Investment Company Act of 1940, this report has been signed by the following persons on behalf of the registrant and in the capacities and on the dates indicated.
By: /s/ J. Thomas Futrell
_____________________________________________________________________
Name: J. Thomas Futrell
Title: Chief Executive Officer
Date: August 9, 2010
By: /s/ Steven M. Hill
_____________________________________________________________________
Name: Steven M. Hill
Title: Treasurer and Chief Financial Officer
Date: August 9, 2010