 August 11, 2009 Earnings Webcast & Conference Call Fourth Quarter and Fiscal Year 2009 Broadridge Financial Solutions, Inc. Exhibit 99.2 |
 1 Forward-Looking Statements This presentation and other written or oral statements made from time to time by representatives of Broadridge may contain “forward-looking statements” within the meaning of the Private Securities Litigation Reform Act of 1995. Statements that are not historical in nature, such as our fiscal year 2009 financial guidance, and which may be identified by the use of words like “expects,” “assumes,” “projects,” “anticipates,” “estimates,” “we believe,” “could be” and other words of similar meaning, are forward-looking statements. These statements are based on management’s expectations and assumptions and are subject to risks and uncertainties that may cause actual results to differ materially from those expressed. These risks and uncertainties include those risk factors discussed in Part I, “Item 1A. Risk Factors” of our Annual Report on Form 10-K for the fiscal year ended June 30, 2009 (the “2009 Annual Report”), as they may be updated in any future reports filed with the Securities and Exchange Commission. Any forward-looking statements are qualified in their entirety by reference to the factors discussed in the 2009 Annual Report. These risks include: the success of Broadridge in retaining and selling additional services to its existing clients and in obtaining new clients; the pricing of Broadridge’s products and services; changes in laws affecting the investor communication services provided by Broadridge; changes in laws regulating registered securities clearing firms and broker-dealers; declines in trading volume, market prices, or the liquidity of the securities markets; any material breach of Broadridge security affecting its clients’ customer information; Broadridge’s ability to continue to obtain data center services from its former parent company, Automatic Data Processing, Inc. (“ADP”); any significant slowdown or failure of Broadridge’s systems; Broadridge’s failure to keep pace with changes in technology and demands of its clients; availability of skilled technical employees; the impact of new acquisitions and divestitures; competitive conditions; overall market and economic conditions; and any adverse consequences from Broadridge’s spin-off from ADP. Broadridge disclaims any obligation to update any forward-looking statements, whether as a result of new information, future events or otherwise. This presentation may include certain Non-GAAP (generally accepted accounting principles) financial measures in describing Broadridge’s performance. Management believes that such Non-GAAP measures, when presented in conjunction with comparable GAAP measures provide investors a more complete understanding of Broadridge’s underlying operational results. These Non-GAAP measures are indicators that management uses to provide additional meaningful comparisons between current results and prior reported results, and as a basis for planning and forecasting for future periods. These measures should be considered in addition to and not a substitute for the measures of financial performance prepared in accordance with GAAP. The reconciliations of such measures to the comparable GAAP figures are included in this presentation. |
 2 Today’s Agenda Opening Remarks and Key Topics Rich Daly, CEO Fourth Quarter & Fiscal Year 2009 Dan Sheldon, CFO Results and Cash Flow Fiscal Year 2010 Guidance Summary Dan Sheldon, CFO Summary and Closing Comments Rich Daly, CEO Q&A Rich Daly, CEO Dan Sheldon, CFO Marvin Sims, VP Investor Relations Closing Remarks Rich Daly, CEO |
 3 Opening Remarks Key Topics: • Financial results for the fourth quarter and fiscal year 2009 • A review of closed sales performance and sales pipeline • Overview of fiscal year 2010 financial guidance • An update on our capital allocation policy and use of free cash flow |
 4 Opening Remarks – Key Topics Fourth Quarter and Fiscal Year 2009 Financial Results: • Financial performance for the quarter is in-line with expectations and concludes an acceptable fiscal year • Full year Non-GAAP Diluted Earnings Per Share (EPS) of $1.51 per share is slightly over the mid-point of our guidance range and revenue growth of -3% is at the low-end of guidance range GAAP Diluted EPS of $1.58 was just above the mid-point of our guidance range • Full year Non-GAAP Diluted EPS increased by 6% as a result of lower interest expense and lower effective tax rate GAAP Diluted EPS increased by 16% related to one-time gain on the purchase and retirement of Senior Notes and the retroactive benefit of a state tax credit • Recurring revenues continue to drive the business and have been the foundation for growth during this challenging market Growth in recurring fee revenues in Investor Communications business helped offset significant decline in Mutual Fund Event-Driven revenues • Generated annual free cash flow of $252M which enabled us to pay down debt, complete two acquisitions, repurchase 2 million shares and pay dividends • Resiliency of our recurring revenue model was proven by our fiscal year 2009 performance in a challenging market |
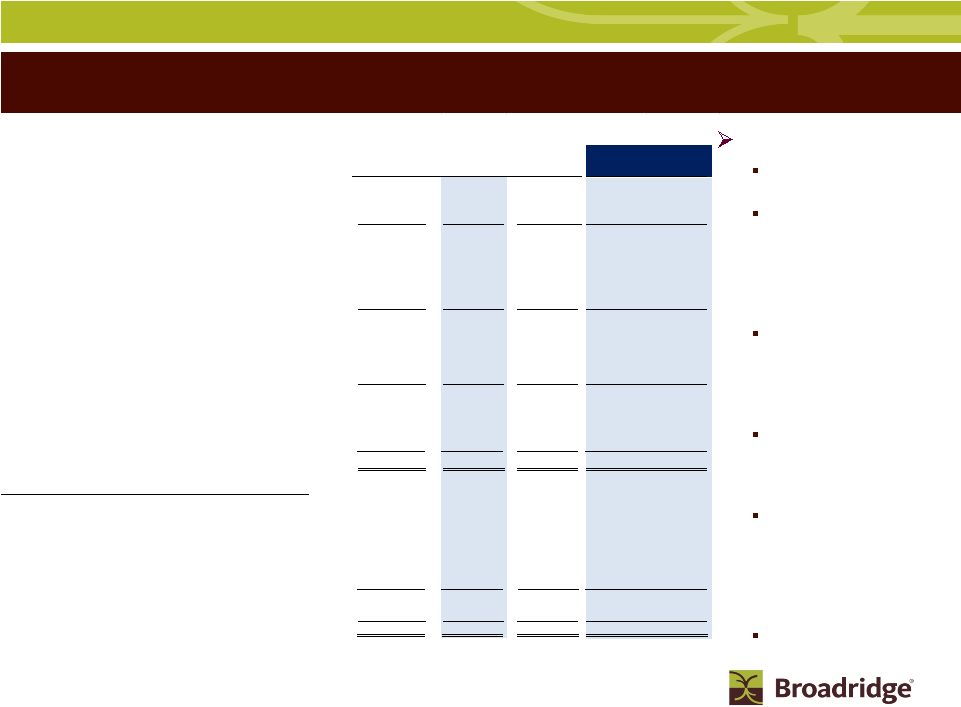
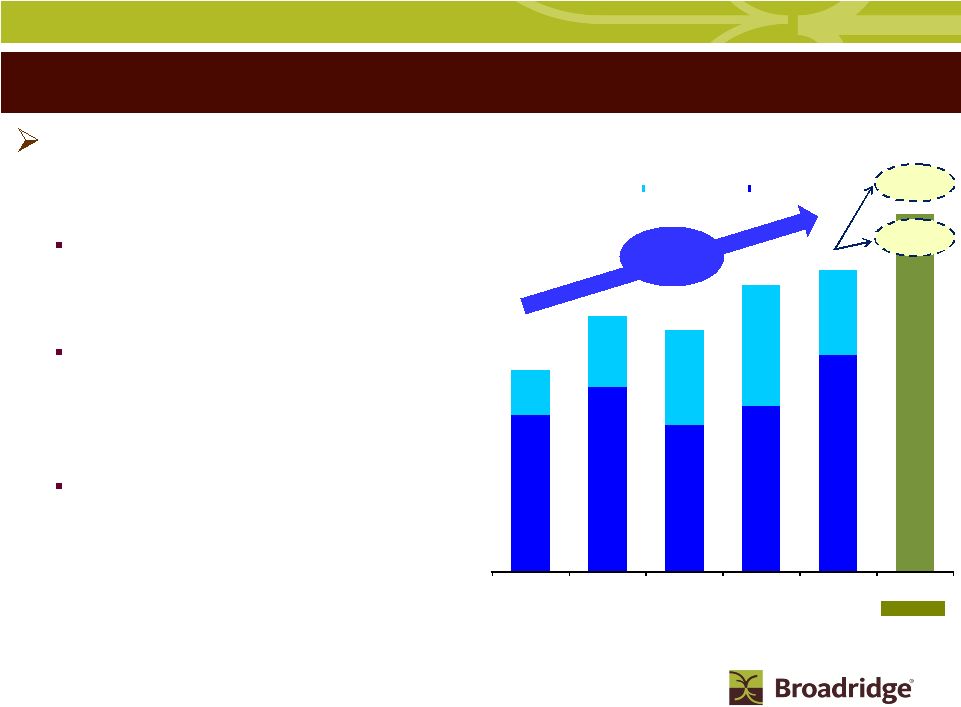 5 Opening Remarks – Key Topics Sales Performance Overview: • Closed sales of $156M grew 5% for the year with over 30% growth in recurring fee sales offsetting the significant shortfall in event-driven activity Closed sales in Investor Communication Solutions declined 10% to $98M due to lower event-driven activity. Recurring fee sales grew 18% to $55M, as we gained more market share in the registered corporate issuer market Recurring fee sales in the two securities processing businesses grew 47% to $58M, with closed sales for Securities Processing Solutions growing 66% and Clearing and Outsourcing Solutions growing 20% • Sales pipeline remains strong and has large promising opportunities The sales process for the large deals will be slow and the sales will be lumpy • Fiscal Year 2010 sales plan of $165M to $185M represents growth in the range of 6% to 19%, with greater than 10% growth in recurring fee sales • Again rated #1 in Brown & Wilson’s Black Book of Outsourcing® $104 $148 $133 $125 CAGR = 11% ED = 17% RC = 9% High: $185 $156 Forecast $81 $96 $76 $85 $113 $23 $37 $49 $63 $43 FY05 FY06 FY07 FY08 FY09 FY10 Closed Sales (Fee Only $ in millions) Event-Driven (ED) Recurring (RC) Low: $165 |
 6 Opening Remarks – Key Topics Fiscal Year 2010 Guidance Overview: • Expecting fiscal year 2010 to be another acceptable year with revenue growth in the range of 4% to 8%; modest growth in 1 st half of fiscal year and stronger growth in 2 nd half • Revenue growth in the business expected to be led by the Investor Communications business, as growth in recurring revenues and the anticipated return of higher Event- Driven revenues will offset the revenue grow-over challenges in the Securities Processing business • Diluted EPS (Non-GAAP and GAAP) in the range of $1.50 to $1.60 Non-GAAP Diluted EPS growth in the range of flat to 6%, as we overcome grow-overs related to the loss of the Bank of America equity business, higher than normal price concessions, and the impact of lower interest rates and margin balances on net interest income GAAP Diluted EPS growth in the range of -5% to 1%, as FY09 benefited by $0.07 per share from the gain on the purchase of our Senior Notes and the retroactive benefit of the state tax credit • Anticipating free cash flow in a range of $235M to $270M • Low and high-end of our guidance range will be driven by more event-driven activity, and to a lesser degree trades per day (TPD) growth and margin debit balances • Expecting to exit fiscal year 2010 with positive momentum as the strong performance of our operating segments is not expected to be weighed down by grow-overs |
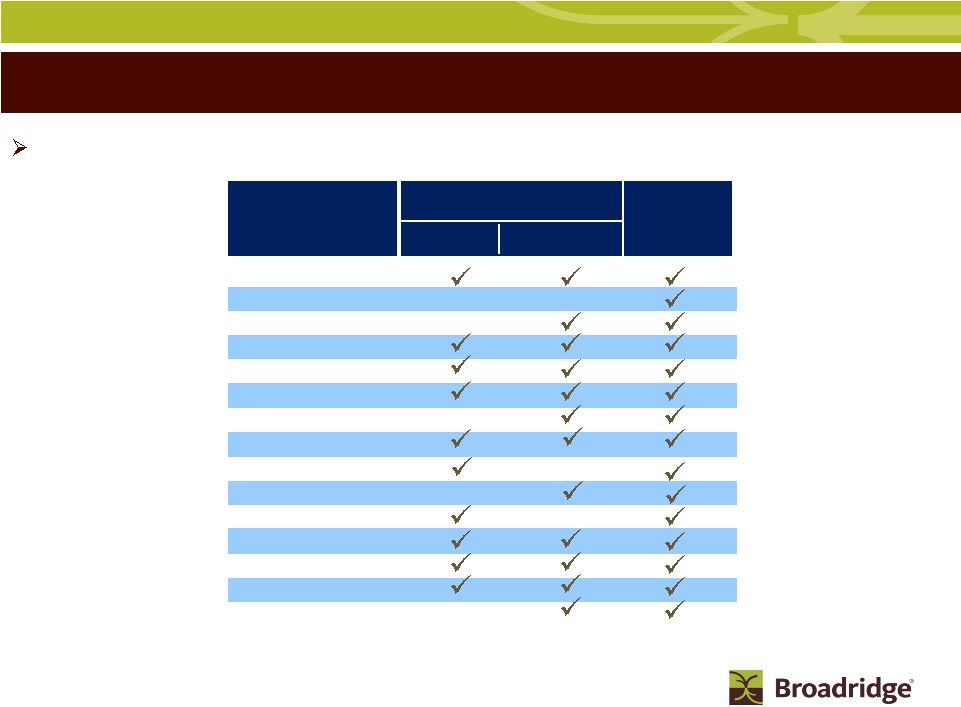
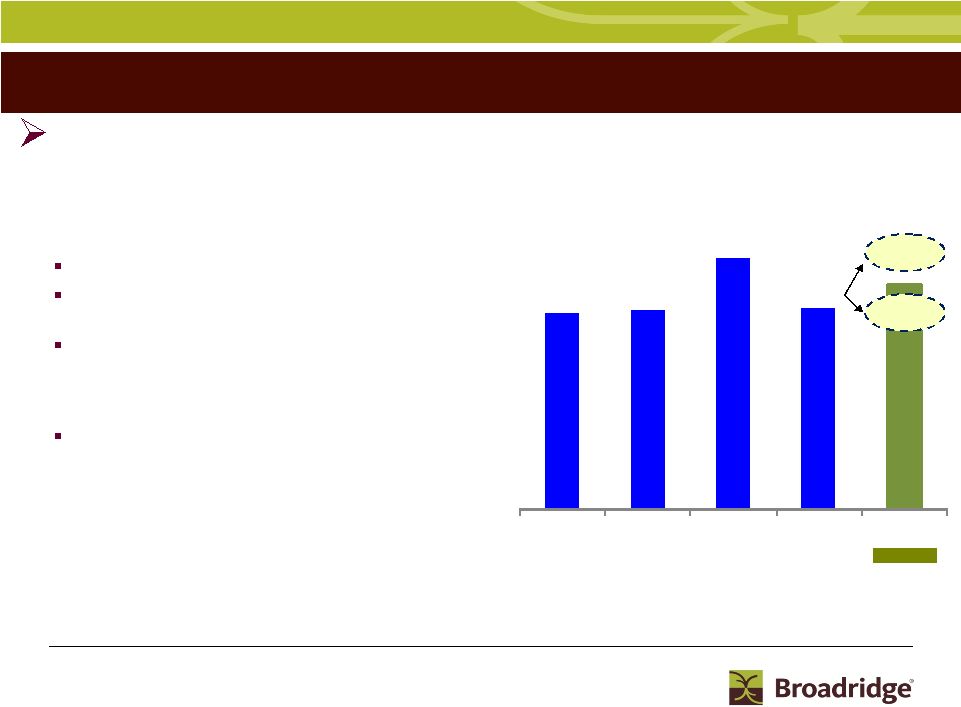 7 $248 $251 $290 FY06 FY07 FY08 FY09 FY10 Free Cash Flow ($ in millions) Opening Remarks – Key Topics Note: Free Cash Flow excludes financing activities in the Clearing and Outsourcing Solutions segment Free Cash Flow & Capital Allocation: • Free cash flow generation and strength of recurring revenues positions us to refine our capital structure •Capital allocation framework will consist of: Maintaining existing debt level Double annual dividend from $0.28 to $0.56 per share, or approximately 35% payout of GAAP net earnings A repurchase plan authorizing repurchase of up to 10 million shares, or approximately 7% of the shares outstanding, to offset dilution from equity compensation plans and to opportunistically repurchase shares Strategic acquisitions to leverage the Broadridge brand and distribution channels • Expect new products to generate an additional 1% in fee revenue growth and account for approximately 15% of closed sales in fiscal year 2010 High: $270 Low: $235 $252 Forecast |
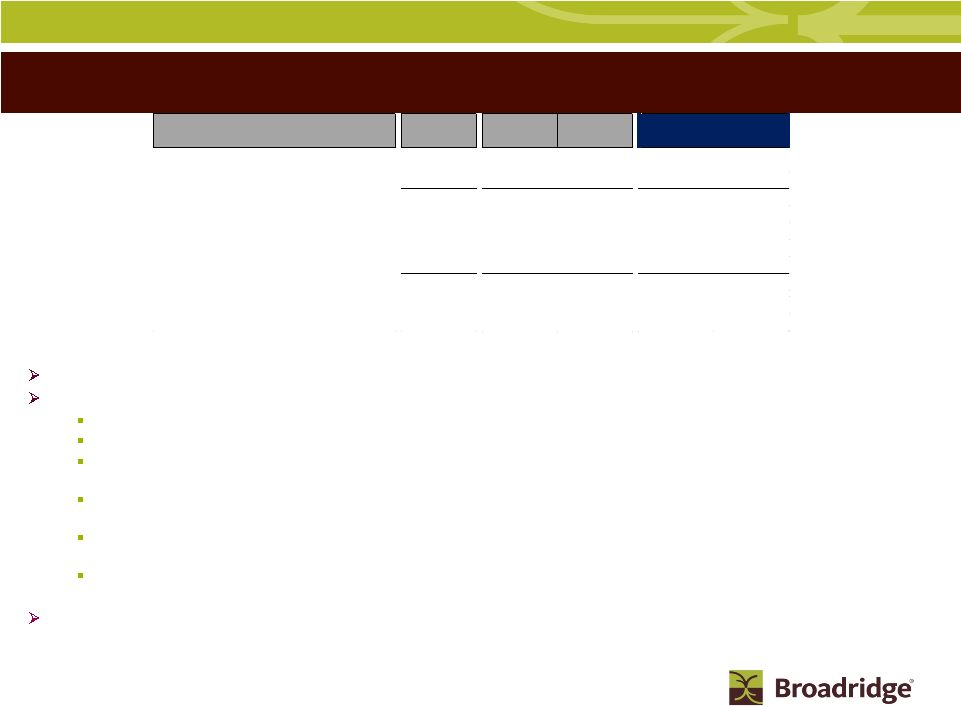 8 FY09 revenues are down 3% related to FX, Distribution revenues and Mutual Fund Proxy Event-Driven activity Historical revenue trends and context for FY10 Sales (recurring) – Growing percentage contribution to revenue from new products and market share gains Losses (recurring) – Retention rates average 98%; in FY10 Bank of America accounts for 1% in losses Internal Growth – 4% historical average prior to market crisis; FY09 flat and FY10 -2% to flat given carryover of price concessions, with growth in the 2 half of year Event-Driven - Flat to down since market downturn, expecting growth in FY10 due to return of mutual fund proxy activity. Historically, Event-Driven worst year down (35%) and best year up 34% Distribution Revenues - Down last two years due to Notice and Access, but expecting growth in FY10 due to higher anticipated event-driven activity and U.S. postal rate increase FX - Benefit in FY08 as U.S. dollar declined; drag in FY09 as U.S. dollar strengthened, and expecting continued strengthening in U.S. dollar in FY10 Net Income Margins – FY09 GAAP and Non-GAAP margins are up for the quarter and full year. FY10 slightly down due to Bank of America loss, impact of lower interest rates on net interest, and revenue mix Broadridge FY09 Results and FY10 Guidance FY08 4Q09 FY09 DRIVERS Actual Actual Actual Sales 2% 3% 3% 4% 4% Losses -3% -2% -1% -2% -2% Net New Business -1% 1% 2% 2% 2% Internal Growth 3% 0% 0% -2% 0% Event-Driven 0% -1% -1% 2% 3% Distribution -1% -5% -2% 2% 3% Other/FX 2% -2% -2% 0% 0% Total Revenues 3% -7% -3% 4% 8% Net Income Margins (Non-GAAP) 9.1% 15.9% 10.0% 9.6% 9.9% Net Income Margins (GAAP) 8.7% 15.9% 10.4% 9.6% 9.9% nd Low High FY10 Range |
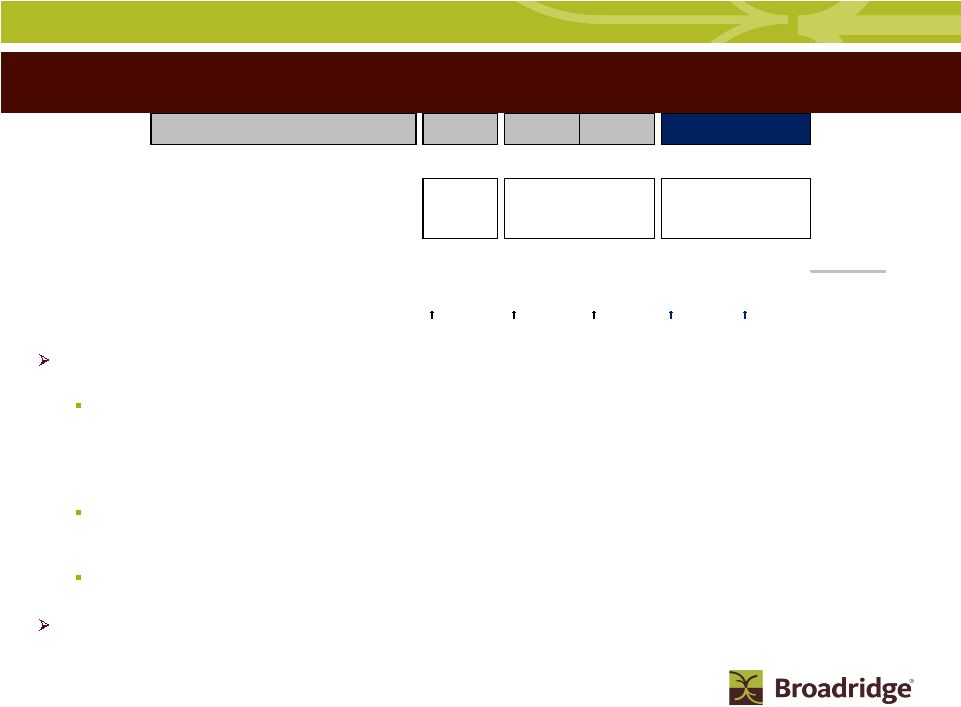 9 Segment Results – Investor Communication Solutions Strong fee growth in FY10 as solid recurring fee growth trend from FY09 continues into FY10, coupled with higher event- driven activity and the impact from the Access Data acquisition Recurring fee growth at 5% for FY09 and exiting Q4 at 3% growth. Expecting new business contribution from Access Data acquisition, transaction reporting, registered equity and global proxy, as well as internal growth contribution in- line with historical averages • Internal growth coming from slight increase in both equity proxy & mutual fund interim stock record growth, as well as an increase of Notice and Access adoption rates to 60% Event-Driven down 8% for FY09, but better than expected performance in Q4. Expect higher mutual funds proxy activity given Q4 trend, discussions with major fund companies and pent-up demand due to lack of activity over last 12 months Distribution revenues down 6% in FY09 due to lower event-driven activity and higher Notice and Access adoption rates. FY10 growth related to higher volumes and impact from postage rate increase Margin expansion lower than expected in Q4 due to lower fee revenue and product mix. FY10 revenue growth and mix along with operating leverage in the business expected to generate significant margin expansion FY08 4Q09 FY09 FY10 Range ($ in millions) Actual Actual Actual Low High Revenues $1,575 $587 $1,531 $1,655 $1,727 Growth Rate 1% -7% -3% 8% 13% Fee Revenues $767 $321 $774 $851 $891 Growth Rate 5% 0% 1% 10% 15% Recurring (RC) 8% 3% 5% 7% 10% Event-Driven (ED) -1% -12% -8% 18% 28% Distribution Revenues $808 $266 $757 $804 $836 Growth Rate -2% -14% -6% 6% 10% Margin $ $255 $173 $249 $292 $316 Margin % 16.2% 29.4% 16.3% 17.6% 18.3% Margin Basis Points (bps) Change 160 bps 10 bps 130 bps 200 bps 310 bps |
 10 10 Segment Results – Securities Processing Solutions Revenues: FY09 revenues exceeded the high-end of guidance due to increased internal trade volumes, and FY09 Q4 revenues down as strong sales contributions were more than offset by the impact of Bank of America loss and higher price concessions Closed Sales for the year finished at just under $40M representing 66% growth, and creating revenue carryover of approximately $25M into FY10; Q4 signed $10M deal FY10 revenues down due to carryover of lost business and price concessions, impacting the 1 three quarters • Sales will again be a strong contributor adding 6% to 7% to revenues, primarily from carryover sales from FY09; large deal signed in Q4 FY09 does not hit revenues until FY11 due to implementation timing • Internal growth from trade volume is expected in the range of 4-8% for equities and 9-13% for fixed income. Much of the trade volume growth is expected as we move into 2 half of FY10 Margins FY09 flat to FY08, but Q4 significantly higher due to one-time items in prior year FY10 1 half will be in high-teens given carryover impact of client losses and price concessions and then 2 half expected to be in the mid 20’s Revenue from new sales have 50% to 60% margin contribution due to conversion cost amortization and new products have lower margins than just strictly trade volume business. Losses and concessions tend to fall to bottom line FY08 4Q09 FY09 Actual Actual Actual Low High Revenues $514 $131 $534 $509 $520 Growth Rate 2% -2% 4% -5% -3% Margin $ $138 $31 $143 $112 $119 Margin % 26.7% 23.7% 26.7% 22.0% 22.9% Margin (bps) Changes 190bps 290 bps Flat 470bps 380bps FY10 Range ($ in millions) st st nd nd |
 11 Segment Results – Clearing and Outsourcing Solutions Revenues: FY09 revenues exceeded the high-end of guidance due to increased trading and clearing activity FY09 and Q4 revenues up due to contributions from net new business offset by lower internal growth from net interest income due to lower Federal Funds rate and lower margin balances • Contributions from new sales have been strong each quarter, primarily carryover sales from FY08 and Neuberger sale, and for the year added 26% to revenues on expectations of high teens to low 20’s • Outsourcing closed sales in FY09 of approximately $2M • From Q3, Federal Funds rate has not changed and margin balances improved slightly (-$8M Federal Funds rate impact in FY09) • Client revenue retention rate continues at > 95% FY10 revenues virtually flat to slight growth given that net interest revenue is down and has biggest impact to 1 half • Sales continue to drive >10% contribution to revenues and client revenue retention remains >95% • Net Interest income down $5M 1 half • Outsourcing revenues impacted by low sales in FY09; and FY10 sales will have little impact in FY10 given conversion times Operating losses are greater in FY10 due to net interest revenue decreases all fall to bottom line and new business has 20% or 50% contribution margins depending on whether it’s Outsourcing or Clearing, respectively FY08 4Q09 FY09 FY10 Range ($ in millions) Actual Actuals Actuals Low High Revenues $96 $26 $101 $100 $105 Growth Rate 2% 10% 6% -1% 4% Net Interest Income $27 $2 $13 $9 $10 Other Clearing Revenue $50 $18 $63 $68 $70 Outsourcing Revenue $19 $6 $25 $23 $25 Pre-tax Loss -$5 -$2 -$9 -$13 -$11 st st |
 12 Segment Results – Other & Foreign Exchange (FX) Other Fees: virtually flat FY09 and not planning any for FY10 FX: Large negative impact to revenues in FY09 and using forward rates for FY10 guidance range. International operations, primarily Canada, account for approximately 11% of total revenues Other: Interest – Q4 @ $3M and high end of FY10 guidance range assumes about the same each quarter and low end of FY10 guidance range assumes interest rates rise in line with LIBOR forward rates Corporate Expenses/Investments – Q4 @ $7M and high/low of FY10 guidance range impacted by variable investment spend depending on how year plays out FX Transaction Activity – Q4 impacted by U.S. cash in Canada and change in rates, while full year fairly “hedged” and not planning on any +/- in FY10 FY08 4Q09 FY09 FY10 Range ($ in millions) Actual Actual Actual Low High Other Fees Revenues $9 $0 $2 $0 $0 Other Fees Margin $9 $0 $2 $0 $0 FX Revenues $14 -$8 -$18 -$30 -$30 FX P&L Margin $6 -$2 -$4 -$10 -$10 Other Interest Expense -$30 -$3 -$14 -$13 -$12 Purchase of Senior Notes (1-time gain) $0 $8 Corporate Expenses & Investments -$32 -$7 -$30 -$24 -$35 Transition Expense -$14 FX Transaction Activity -$1 -$5 $2 $0 $0 $0 $0 $0 $0 $0 $0 $0 |
 13 Cash Flow (Non-GAAP) – FY09 and FY10 Forecast Calculation of Free Cash Flow (Non-GAAP) : Earnings Depreciation and amortization Stock-based compensation expense Gain from purchase of senior notes Other Subtotal Working capital changes Securities Clearing Activities Long-term assets & liabilities changes Net cash flow provided by operating activities Cash Flows From Investing Activities Capital expenditures & Intangibles Free cash flow Cash Flows From Other Investing and Financing Activities Acquisitions Long-term debt repayment Dividends Other Repurchases of Common Stock & Proceeds from exercise of Stock Options Short-term (bank overdrafts) Net change in cash and cash equivalents Cash and cash equivalents, at the beginning of year Cash and cash equivalents, at the end of year (a) Excluded from Earnings and Free Cash Flow (b) Guidance does not include effect of any future acquisitions, additional debt or share repurchases Unaudited (In millions) Low High Ridge Clearing All Other Financing Processing Broadridge Activities Activities Total - $ 223 $ 223 $ 215 $ 230 $ - 56 56 60 62 - 30 30 31 33 - (8) (8) a - 6 6 1 2 - 307 307 307 327 - (20) (20) (16) (12) 77 - 77 - - - (5) (5) (2) - 77 283 359 289 315 - (30) (30) (54) (45) 77 $ 252 $ 329 235 $ 270 $ - (61) (61) - - b - (114) (114) - - b - (38) (38) (67) (67) - 5 5 - - - (29) (29) - - b (9) - (9) - - 68 15 83 168 203 41 157 198 172 172 109 $ 172 $ 281 $ 340 $ 375 $ Twelve Months Ended FY10 Range June 2009 All Other Processing Activities $ Free Cash Flow: $252M is within the mid- range of our guidance Biggest swings are related to changes in working capital due to timing differences in receivables and payables Timing differences also in capital expenditures which are approximately 50% of spend related to new business Debt paid down to $324M and expect to hold at this level during FY10 Increased liquidity by $75M and now have committed lines of $575M and all credit rating agencies at investment grade FY09 stock repurchase of 2M shares |
 14 Broadridge - FY 2010 Financial Guidance Summary Revenue growth in a range of 4% to 8% Sales Plan for the year of $165M to $185M Earnings before interest and taxes margin of 16.0% to 16.3% GAAP Diluted EPS in the range of $1.50 to $1.60 Interest expense of approximately $13M Effective Tax Rate of approximately 37.5% Free cash flow in the range of $235M to $270M Diluted weighted-average shares of approximately 144M, which does not include the impact of any share repurchases |
 15 Summary Solid fiscal year 2009 where we maintained and achieved original annual EPS guidance despite unprecedented market conditions Good growth in closed sales with strong growth in recurring fee sales, as pipeline remains robust with promising large opportunities in all segments Exiting fiscal year 2009 with positive momentum driven by the Investor Communications business and strong sales contributions in our Securities Processing and Clearing businesses Anticipate revenue and EPS growth in fiscal year 2010 with revenue growth led by our Investor Communications business First half of fiscal year 2010 will have a tough compare as a result of client loss, price concessions and one-time events in fiscal year 2009 Capital allocation policy will allow us to double annual dividend payout and opportunistically repurchase shares as part of our authorization to repurchase up to 10 million shares Broadridge is well positioned as a result of our recurring revenue base, great value propositions, new initiatives, strong free cash flows, solid balance sheet and appropriate liquidity |
 16 Q&A There are no slides during this portion of the presentation |
 17 Closing Comments There are no slides during this portion of the presentation |
 18 Appendix Appendix |
 19 Segments – FY10 Financial Guidance Summary Investor Communication: Revenues 8% to 13% Margins 17.6% to 18.3% Sales $95M to $105M Securities Processing: Revenues -5% to -3% Margins 22.0% to 22.9% Clearing and Outsourcing: Revenues -1% to 4% Operating losses at $13M to $11M Sales Plan $70M to $80M for the combined Securities Processing and Clearing and Outsourcing business segments |
 20 Alliance Bernstein Bank of America/Merrill Lynch* Barclays Capital Services BMO Nesbitt Burns BNP Paribas CIBC World Markets Deutsche Bank E*Trade Group Edward Jones HSBC Securities J.P. Morgan Chase Jefferies & Company Royal Bank of Canada Scotia Capital UBS Securities The top 15 SPS clients generate approximately 70% of the SPS segment’s revenues Securities Processing Solutions Top 15 Clients Note: The above schedule is an alphabetical listing of the top 15 SPS clients based on fiscal year 2009 revenues * Bank of America/Merrill Lynch includes loss of equity processing business as previously disclosed Equity Processing Fixed Income Processing Retail Institutional Top Clients |