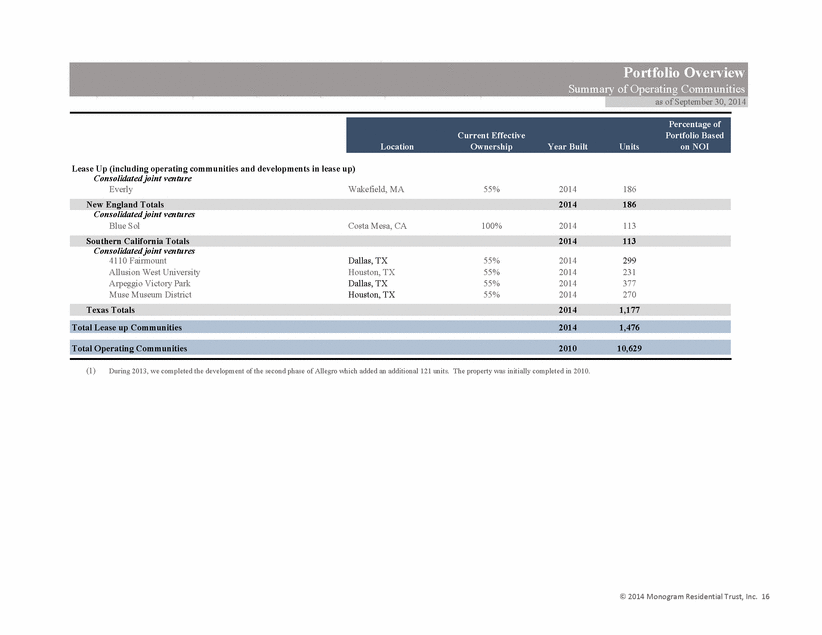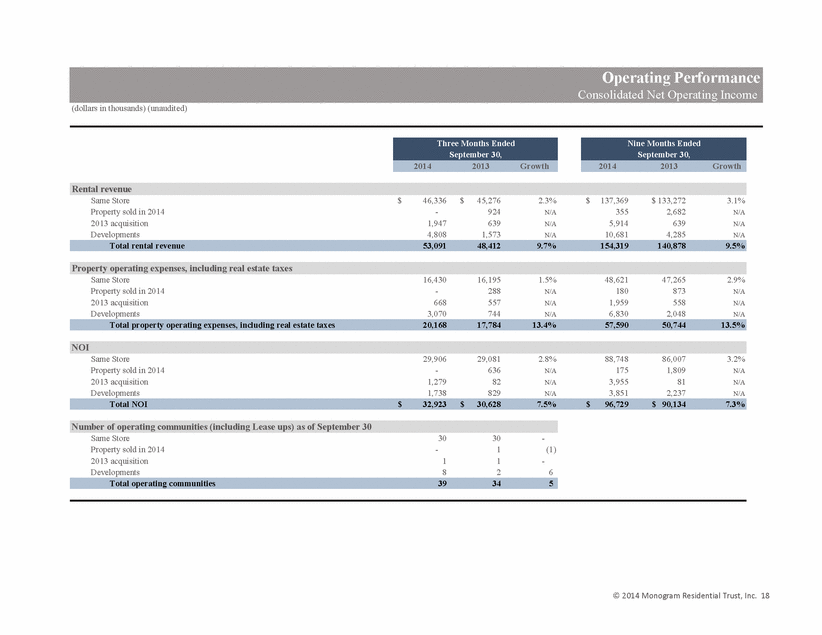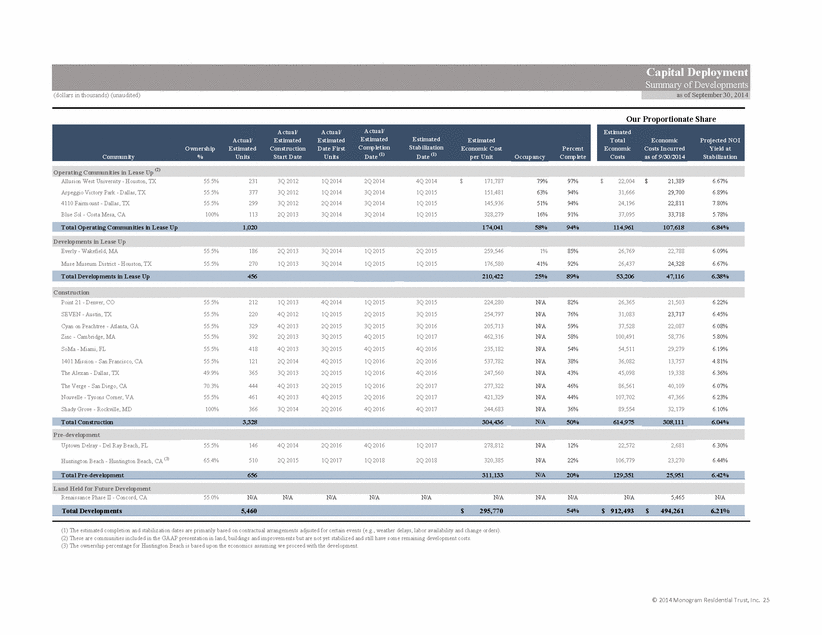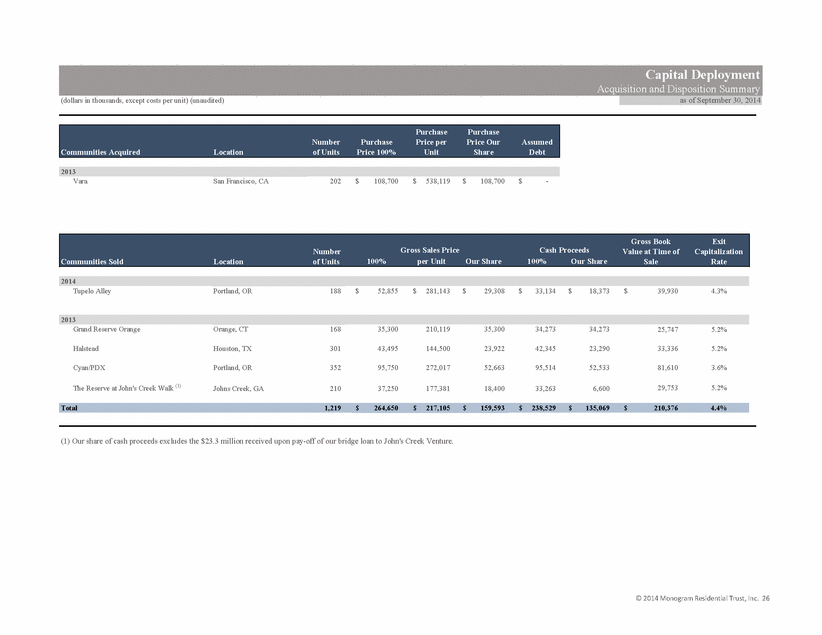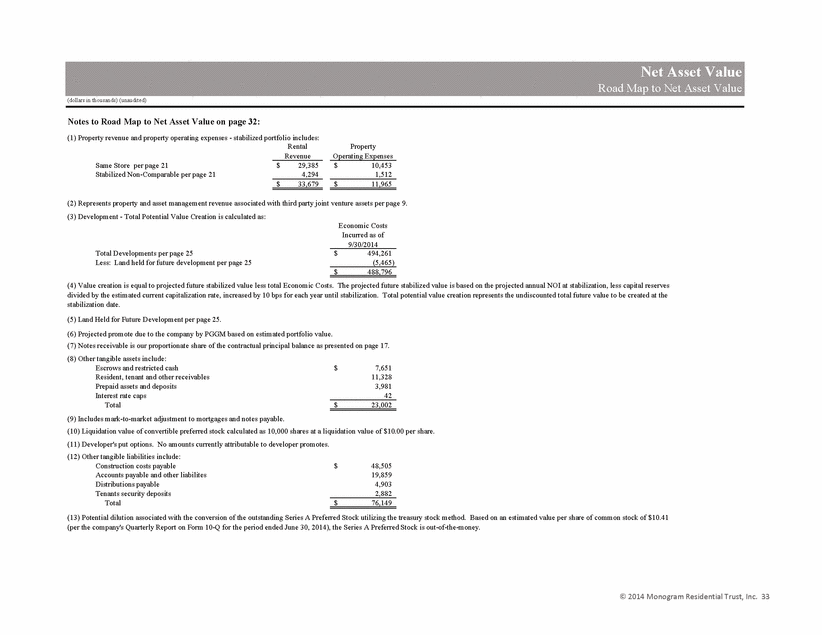
| (dollars in thousands) (unaudited) Operating Performance Proportionate Share YTD Net Operating Income and Other Operating Metrics (dollars in thousands) (unaudited) Operating Performance Proportionate Share YTD Net Operating Income and Other Operating Metrics (dollars in thousands) (unaudited) Operating Performance Proportionate Share YTD Net Operating Income and Other Operating Metrics (dollars in thousands) (unaudited) Operating Performance Proportionate Share YTD Net Operating Income and Other Operating Metrics (dollars in thousands) (unaudited) Operating Performance Proportionate Share YTD Net Operating Income and Other Operating Metrics (dollars in thousands) (unaudited) Operating Performance Proportionate Share YTD Net Operating Income and Other Operating Metrics (dollars in thousands) (unaudited) Operating Performance Proportionate Share YTD Net Operating Income and Other Operating Metrics (dollars in thousands) (unaudited) Operating Performance Proportionate Share YTD Net Operating Income and Other Operating Metrics (dollars in thousands) (unaudited) Operating Performance Proportionate Share YTD Net Operating Income and Other Operating Metrics (dollars in thousands) (unaudited) Operating Performance Proportionate Share YTD Net Operating Income and Other Operating Metrics (dollars in thousands) (unaudited) Operating Performance Proportionate Share YTD Net Operating Income and Other Operating Metrics (dollars in thousands) (unaudited) Operating Performance Proportionate Share YTD Net Operating Income and Other Operating Metrics (dollars in thousands) (unaudited) Operating Performance Proportionate Share YTD Net Operating Income and Other Operating Metrics (dollars in thousands) (unaudited) Operating Performance Proportionate Share YTD Net Operating Income and Other Operating Metrics (dollars in thousands) (unaudited) Operating Performance Proportionate Share YTD Net Operating Income and Other Operating Metrics © 2014 Monogram Residential Trust, Inc. 23 Rental Revenue Property Operating Expenses Net Operating Income Operating Margin Occupancy Monthly Rental Rate Per Unit © 2014 Monogram Residential Trust, Inc. 23 YTD YTD % YTD YTD % YTD YTD % YTD YTD YTD YTD YTD YTD 3Q 2014 3Q 2013 Change 3Q 2014 3Q 2013 Change 3Q 2014 3Q 2013 Change 3Q 2014 3Q 2013 3Q 2014 3Q 2013 3Q 2014 3Q 2013 © 2014 Monogram Residential Trust, Inc. 23 Proportionate Share Same Store Florida $ 5,639 $ 5,536 1.9% $ 2,071 $ 2,025 2.3% $ 3,568 $ 3,511 1.6% 63.3% 63.4% 92.8% 92.2% $ 1,549 $ 1,523 © 2014 Monogram Residential Trust, Inc. 23 Georgia 3,837 3,632 5.6% 1,502 1,453 3.4% 2,335 2,179 7.2% 60.9% 60.0% 94.7% 96.5% 1,391 1,329 Mid-Atlantic 14,855 14,852 0.0% 5,419 5,065 7.0% 9,436 9,787 -3.6% 63.5% 65.9% 93.6% 94.2% 1,947 1,989 Mid-West 6,945 6,741 3.0% 2,395 2,445 -2.0% 4,550 4,296 5.9% 65.5% 63.7% 94.3% 93.0% 2,274 2,262 Mountain 11,514 11,124 3.5% 3,585 3,547 1.1% 7,929 7,577 4.6% 68.9% 68.1% 95.9% 93.2% 1,400 1,361 New England 7,564 7,229 4.6% 2,719 2,825 -3.8% 4,845 4,404 10.0% 64.1% 60.9% 93.9% 96.1% 1,571 1,519 Northern California 11,147 10,415 7.0% 3,540 3,386 4.5% 7,607 7,029 8.2% 68.2% 67.5% 95.5% 95.1% 2,455 2,326 Southern California 9,672 9,297 4.0% 3,154 3,038 3.8% 6,518 6,259 4.1% 67.4% 67.3% 95.7% 96.5% 2,099 2,015 Texas 15,842 15,503 2.2% 6,586 6,439 2.3% 9,256 9,064 2.1% 58.4% 58.5% 93.0% 95.3% 1,499 1,455 © 2014 Monogram Residential Trust, Inc. 23 Total Same Store 87,015 84,329 3.2% 30,971 30,223 2.5% 56,044 54,106 3.6% 64.4% 64.2% 94.3% 94.6% $ 1,740 $ 1,701 © 2014 Monogram Residential Trust, Inc. 23 © 2014 Monogram Residential Trust, Inc. 23 Stabilized Non-Comparable Florida 1,498 24 N/A 584 93 N/A 914 (69) N/A 61.0% N/A 98.3% N/A $ 1,683 N/A © 2014 Monogram Residential Trust, Inc. 23 Northern California 5,714 639 N/A 1,959 558 N/A 3,755 81 N/A 65.7% N/A 96.0% N/A 3,156 N/A Texas 5,442 4,226 N/A 2,153 1,809 N/A 3,289 2,417 N/A 60.4% N/A 92.6% N/A 1,590 N/A © 2014 Monogram Residential Trust, Inc. 23 Total Stabilized Non-Comparable 12,654 4,889 N/A 4,696 2,460 N/A 7,958 2,429 N/A 62.9% N/A 94.8% N/A $ 2,020 N/A © 2014 Monogram Residential Trust, Inc. 23 Lease up (includes operating and development communities) New England - - N/A 58 - N/A (58) - N/A N/A N/A 1.1% N/A N/A N/A Southern California 4 - N/A 94 - N/A (90) - N/A N/A N/A 16.0% N/A N/A N/A Texas 1,516 - N/A 1,817 5 N/A (301) (5) N/A N/A N/A 58.0% N/A N/A N/A Total Lease up 1,520 - N/A 1,969 5 N/A (449) (5) N/A N/A N/A 50.2% N/A N/A N/A © 2014 Monogram Residential Trust, Inc. 23 Acquisitions, Dispositions and Developments 370 1,658 N/A 250 575 N/A 120 1,083 N/A © 2014 Monogram Residential Trust, Inc. 23 © 2014 Monogram Residential Trust, Inc. 23 Total Portfolio $ 101,559 $ 90,876 11.8% $ 37,886 $ 33,263 13.9% $ 63,673 $ 57,613 10.5% © 2014 Monogram Residential Trust, Inc. 23 Note: Certain amounts from the Proportionate Operating Information and FFO differ from the amounts above due to adjustments for non-FFO items (e.g., straight-line rents and start up expenses). © 2014 Monogram Residential Trust, Inc. 23 |


