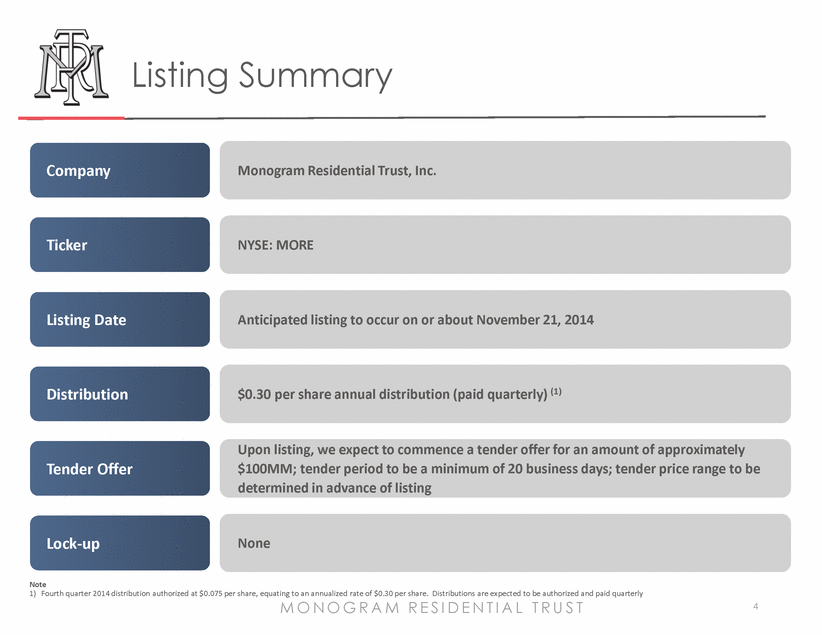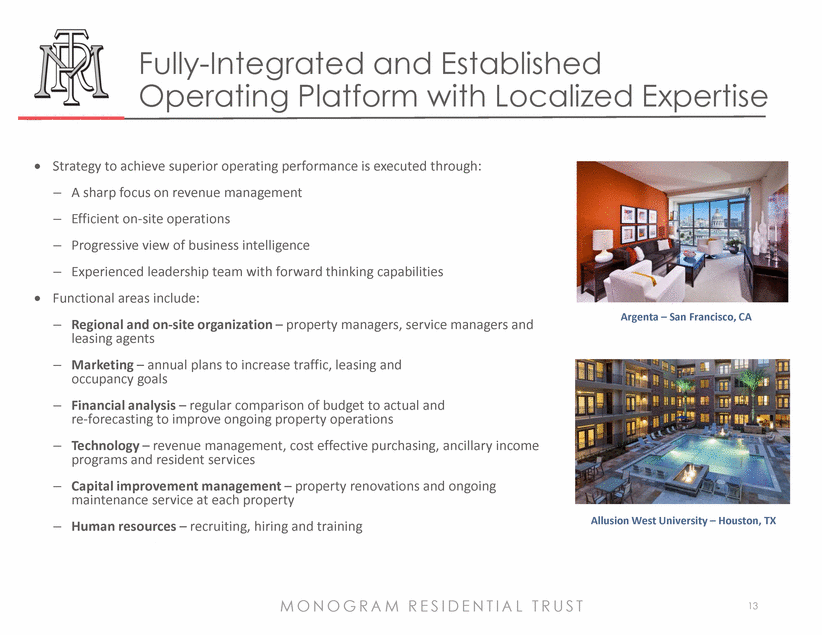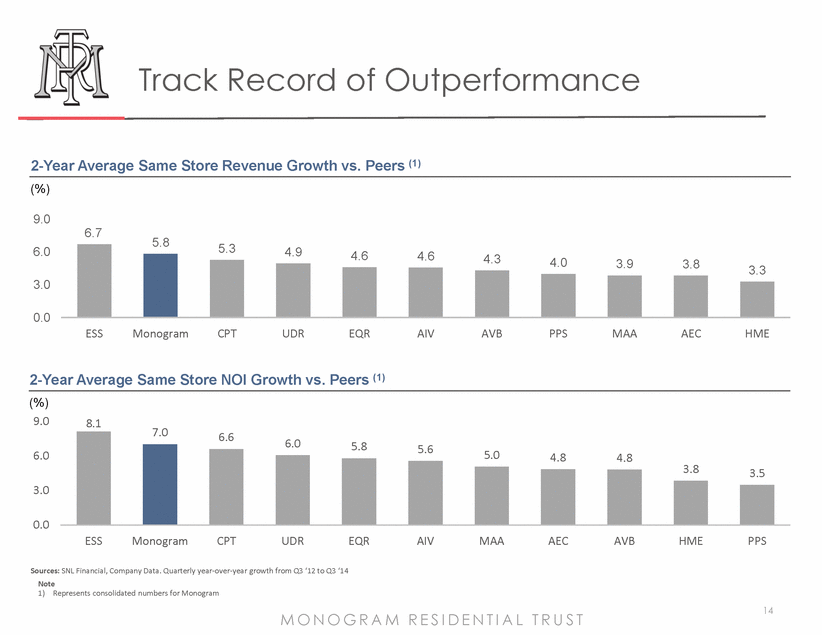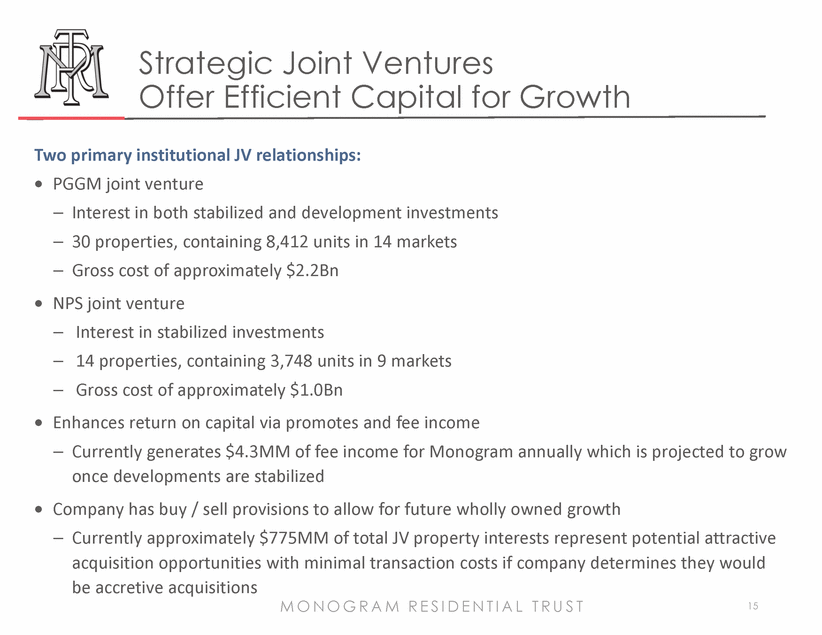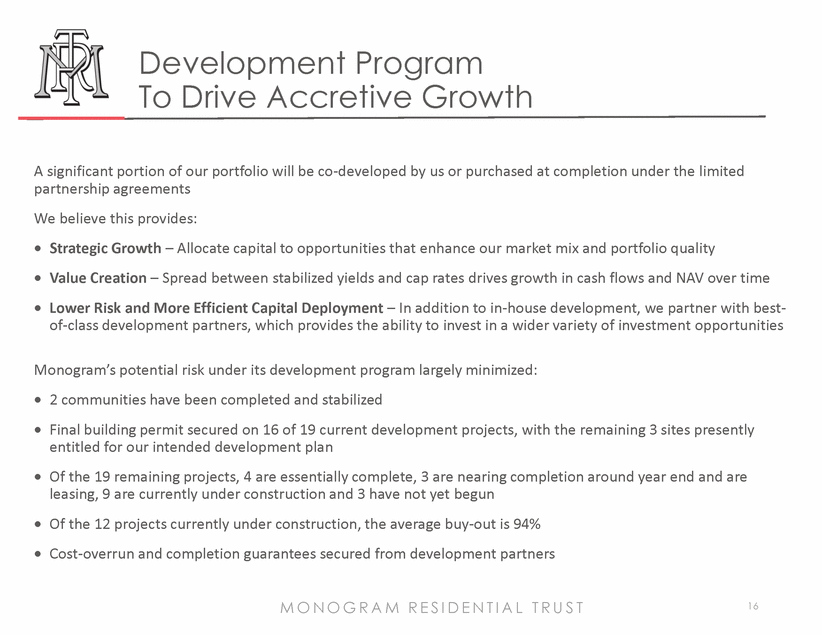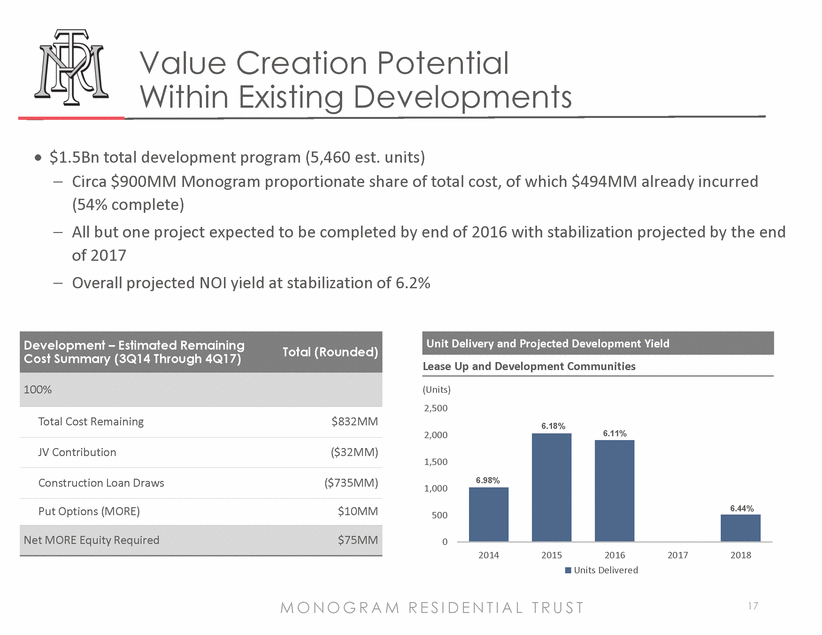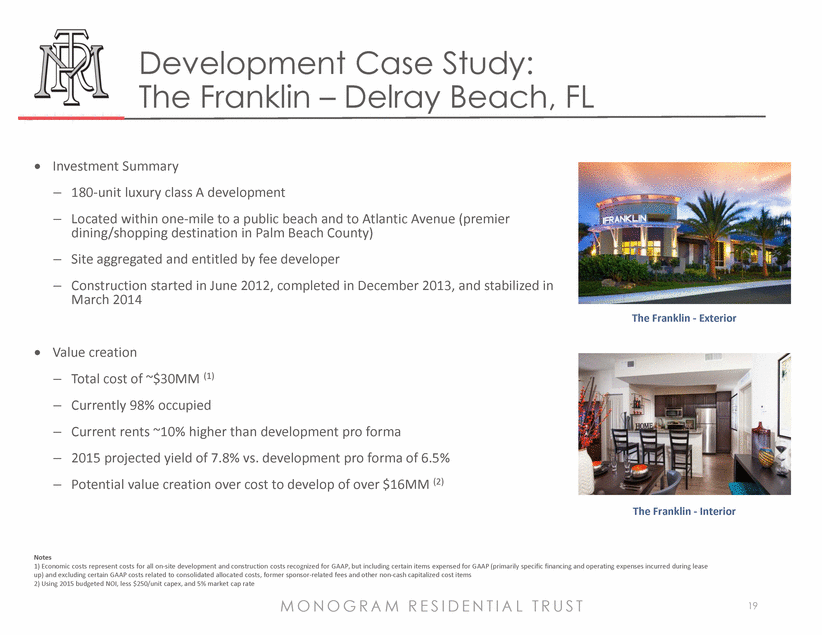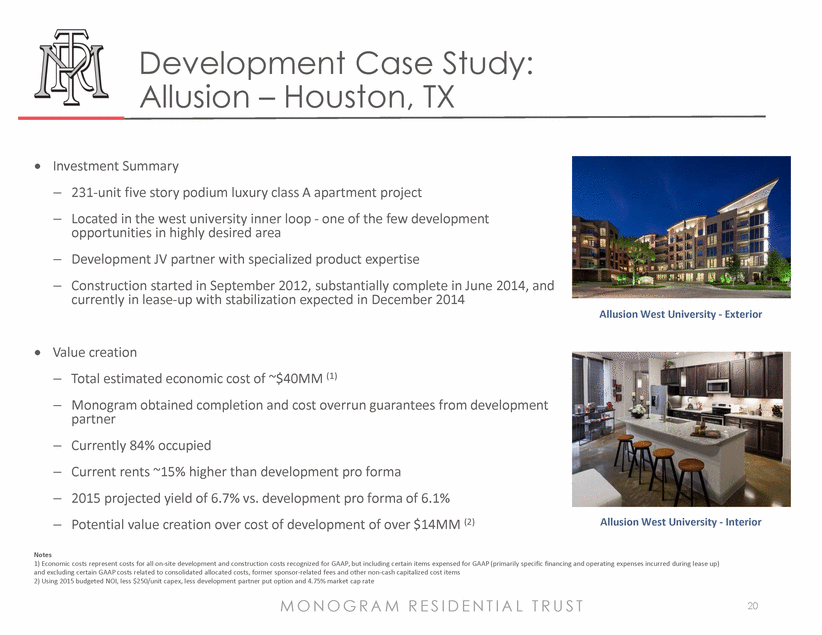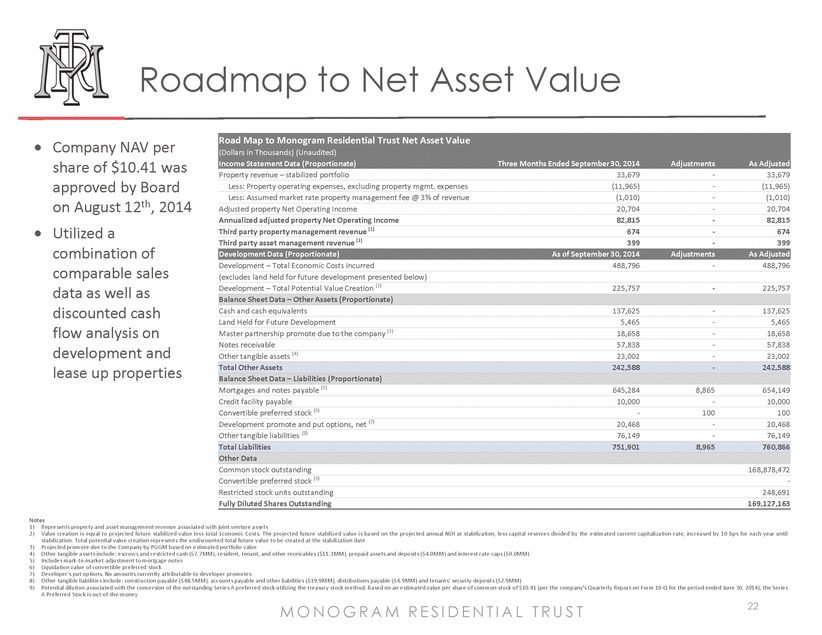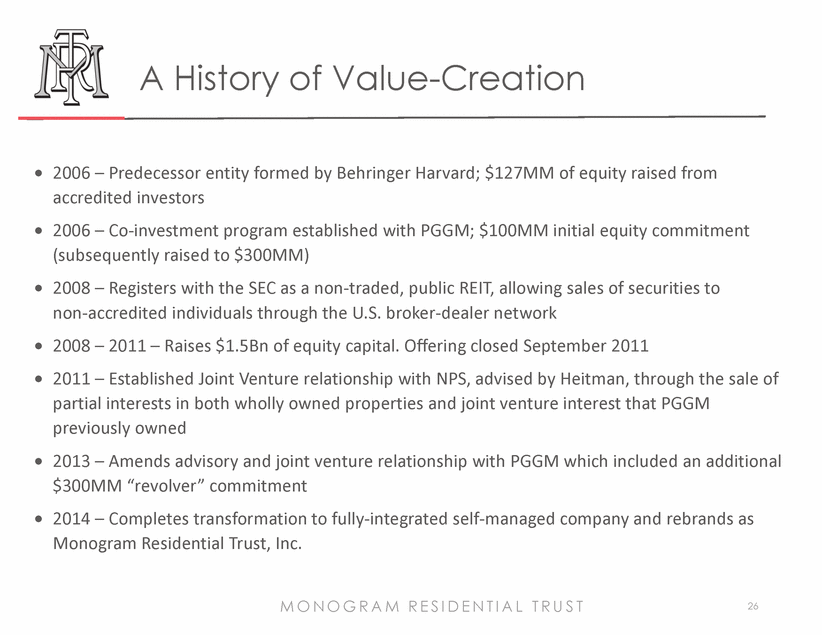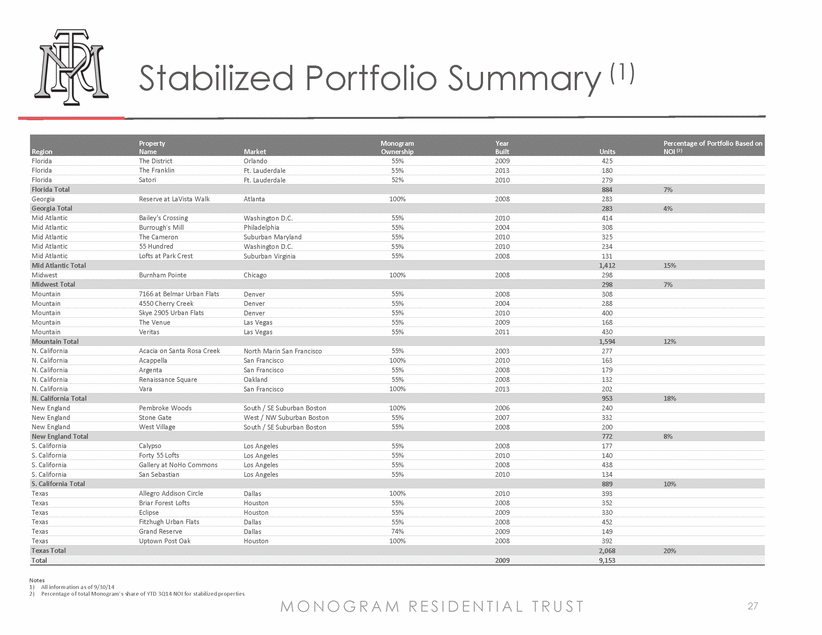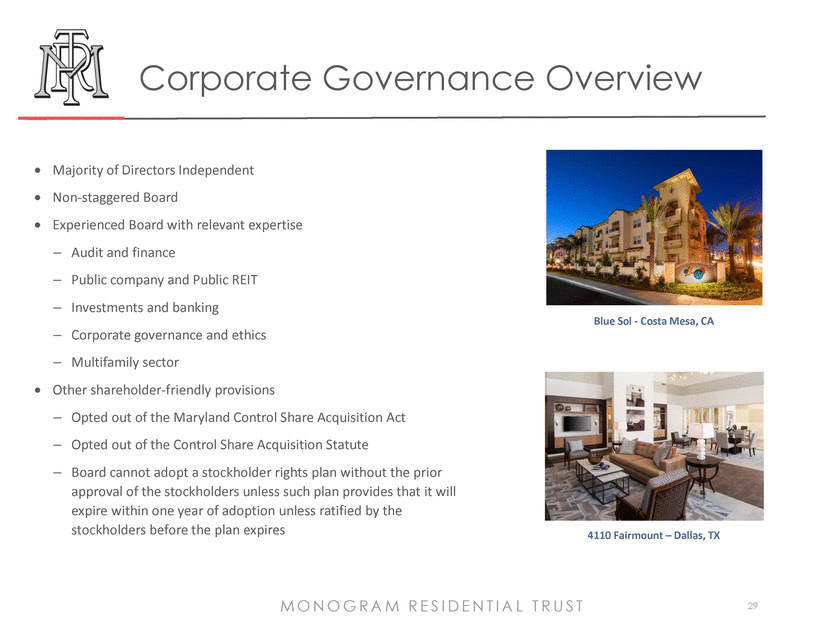
| 28 Development Pipeline Summary (1) 28 Community Ownership % Actual/ Estimated Units Actual/ Estimated Construction Start Date Actual/ Estimated Completion Date (2) Estimated Stabilization Date (2) Estimated Economic Cost per Unit Percent Complete Proportionate Estimated Total Economic Costs Proportionate Economic Costs Incurred as of 9/30/2014 Projected NOI Yield at Stabilization Operating Properties in Lease Up (3) Allusion West University - Houston, TX 55.5% 231 3Q 2012 2Q 2014 4Q 2014 $171,787 97% $22,004 $21,389 6.67% Arpeggio Victory Park - Dallas, TX 55.5% 377 3Q 2012 3Q 2014 1Q 2015 151,481 94% 31,666 29,700 6.89% 4110 Fairmount - Dallas, TX 55.5% 299 3Q 2012 3Q 2014 1Q 2015 145,936 94% 24,196 22,811 7.80% Blue Sol - Costa Mesa, CA 100.0% 113 2Q 2013 3Q 2014 1Q 2015 328,279 91% 37,095 33,718 5.78% Total Operating Properties in Lease Up 1,020 174,041 94% 114,961 107,618 6.84% Developments in Lease Up Everly - Wakefield, MA 55.5% 186 2Q 2013 1Q 2015 2Q 2015 259,546 85% 26,769 22,788 6.09% Muse Museum District - Houston, TX 55.5% 270 1Q 2013 1Q 2015 1Q 2015 176,580 92% 26,437 24,328 6.67% Total Developments in Lease Up 456 210,422 89% 53,206 47,116 6.38% Construction Point21 - Denver, CO 55.5% 212 1Q 2013 1Q 2015 3Q 2015 224,280 82% 26,365 21,503 6.22% SEVEN - Austin, TX 55.5% 220 4Q 2012 2Q 2015 3Q 2015 254,797 76% 31,083 23,717 6.45% Cyan on Peachtree - Atlanta, GA 55.5% 329 4Q 2013 3Q 2015 3Q 2016 205,713 59% 37,528 22,087 6.08% Zinc - Cambridge, MA 55.5% 392 2Q 2013 4Q 2015 1Q 2017 462,316 58% 100,491 58,776 5.80% SoMa - Miami, FL 55.5% 418 4Q 2013 4Q 2015 4Q 2016 235,182 54% 54,511 29,279 6.19% 1401 Mission - San Francisco, CA 55.5% 121 2Q 2014 1Q 2016 2Q 2016 537,782 38% 36,082 13,757 4.81% The Alexan - Dallas, TX 49.9% 365 3Q 2013 1Q 2016 4Q 2016 247,560 43% 45,098 19,338 6.36% The Verge - San Diego, CA 70.3% 444 4Q 2013 1Q 2016 2Q 2017 277,322 46% 86,561 40,109 6.07% Nouvelle - Tysons Corner, VA 55.5% 461 4Q 2013 2Q 2016 2Q 2017 421,329 44% 107,702 47,366 6.23% Shady Grove - Rockville, MD 100.0% 366 3Q 2014 4Q 2016 4Q 2017 244,683 36% 89,554 32,179 6.10% Total Construction 3,328 304,436 50% 614,975 308,111 6.04% Pre-Development Uptown Delray- Del Ray Beach, FL 55.5% 146 4Q 2014 4Q 2016 1Q 2017 278,812 12% 22,572 2,681 6.30% Huntington Beach - Huntington Beach, CA (4) 65.4% 510 2Q 2015 1Q 2018 2Q 2018 320,385 22% 106,779 23,270 6.44% Total Pre-Development 656 311,133 20% 129,351 25,951 6.42% Land Held for Future Development Renaissance Phase II - Concord, CA 55.0% N/A N/A N/A N/A N/A N/A N/A 5,465 N/A Total Developments 5,460 $295,770 54% $912,493 $494,261 6.21% Notes 1) All information as of 9/30/14 2) The estimated completion and stabilization dates are primarily based on contractual arrangements adjusted for certain events (e.g., weather delays, labor availability and change orders) 3) These are communities included in the GAAP presentation in land, buildings and improvements but are not yet stabilized and still have some remaining development costs 4) The ownership percentage for Huntington Beach is based upon the economics assuming we proceed with the development MONOGRAM R E S IDENT IAL T R U S T |
