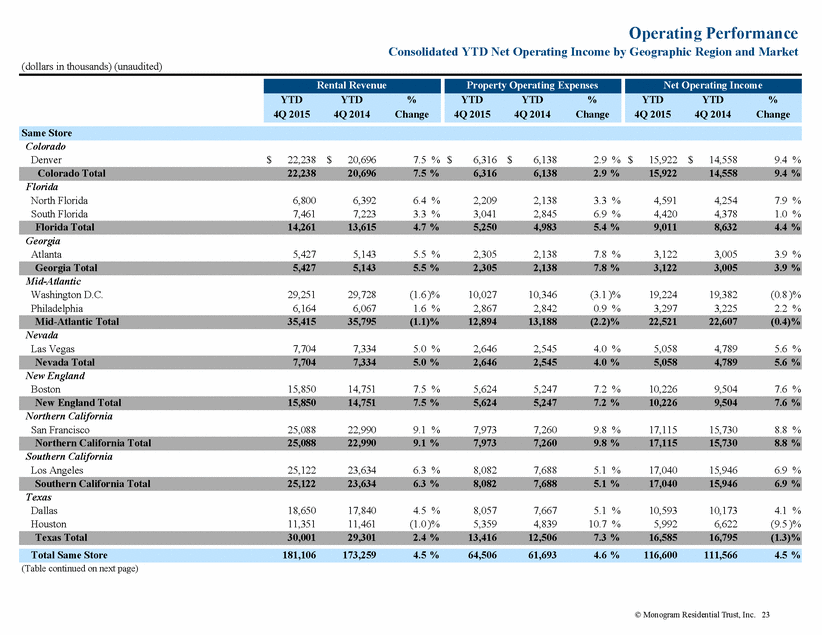
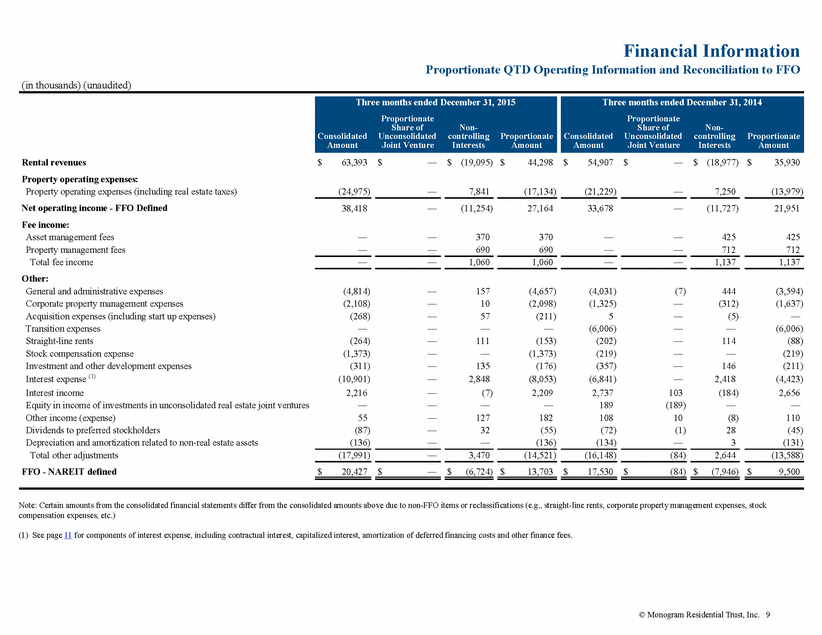
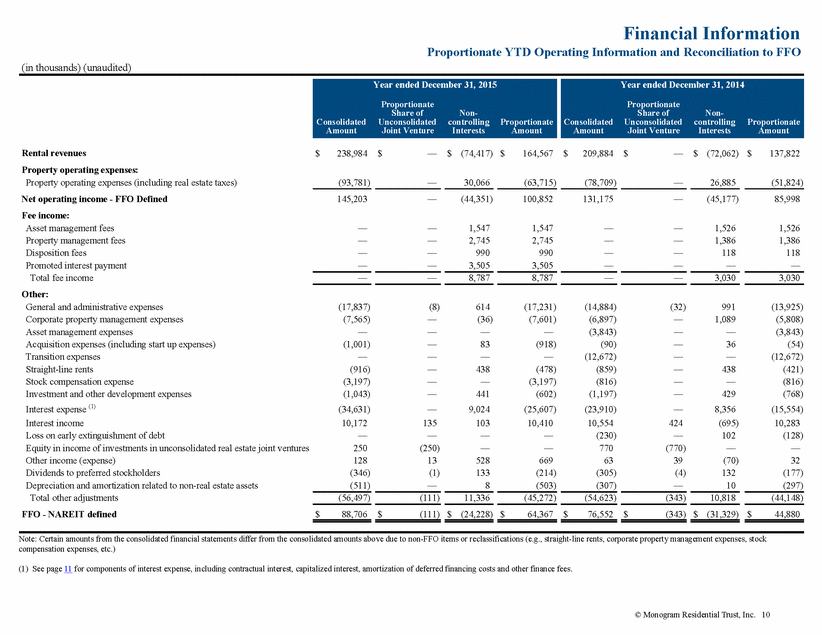
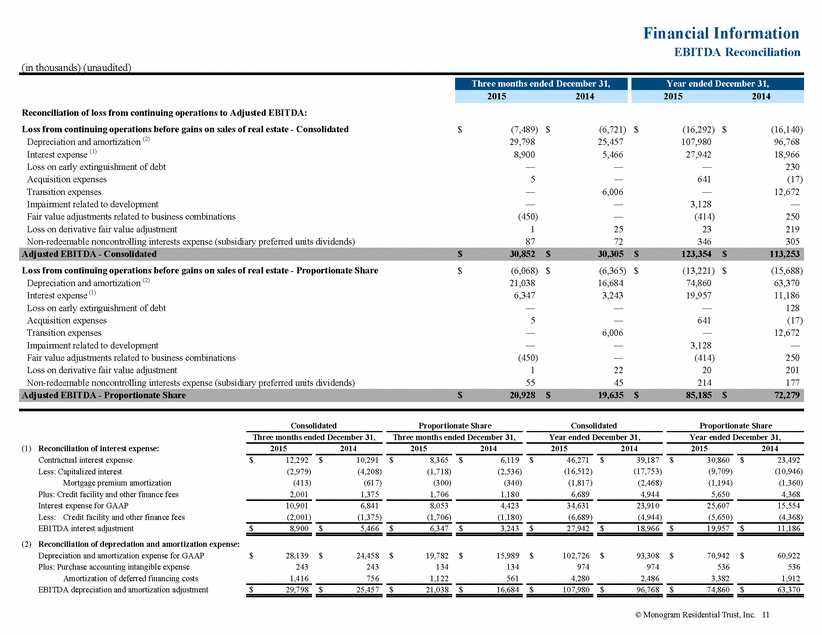
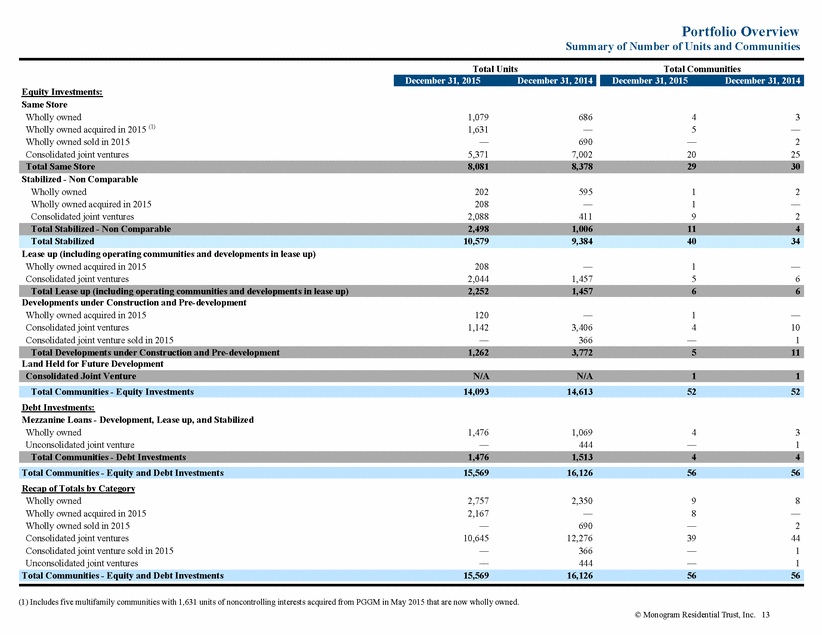
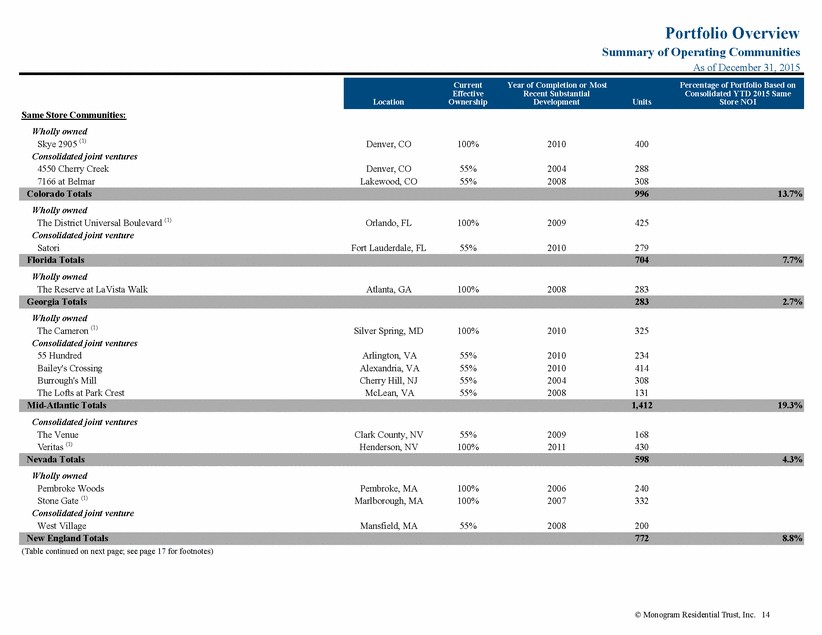
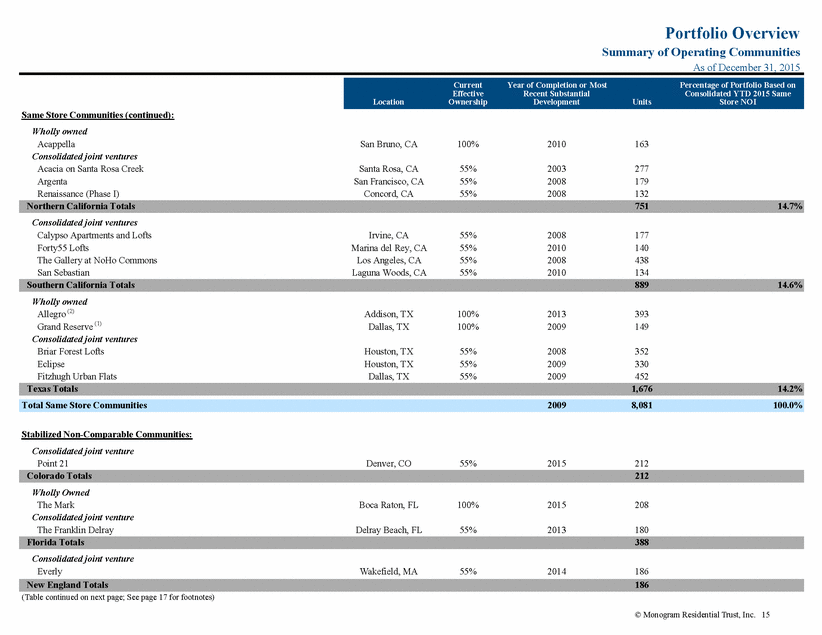
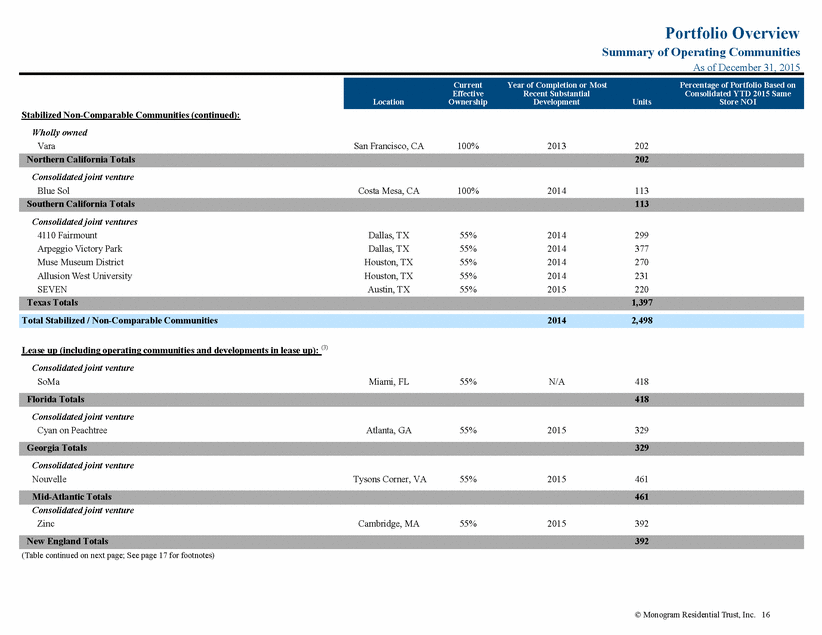
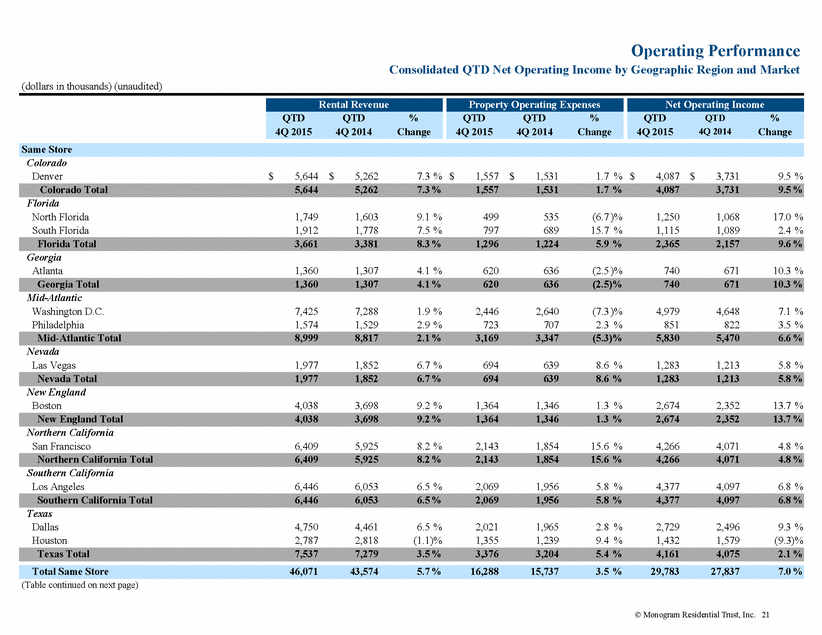
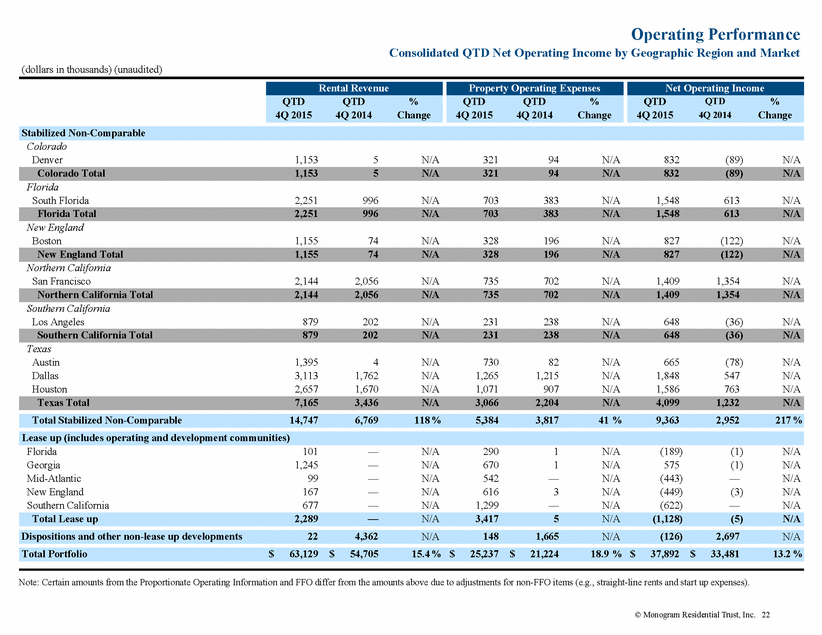
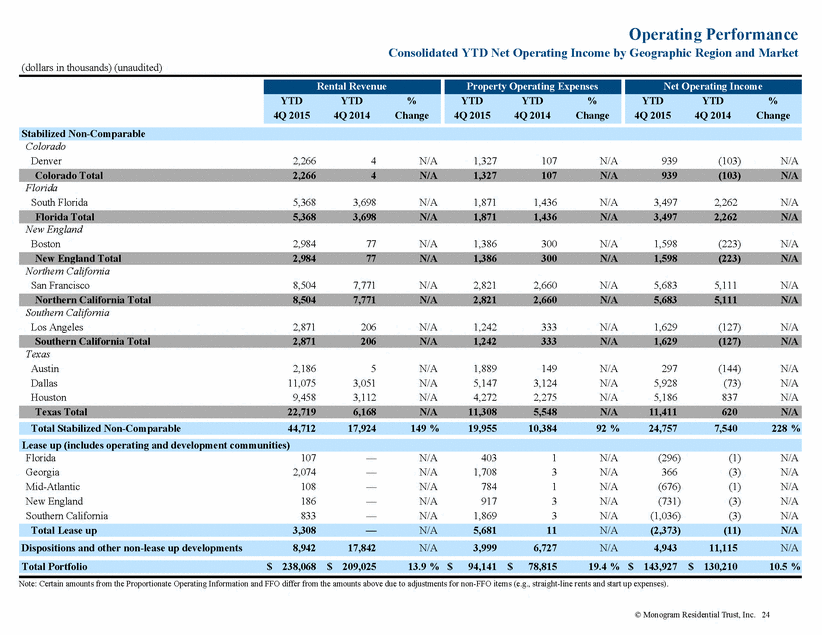
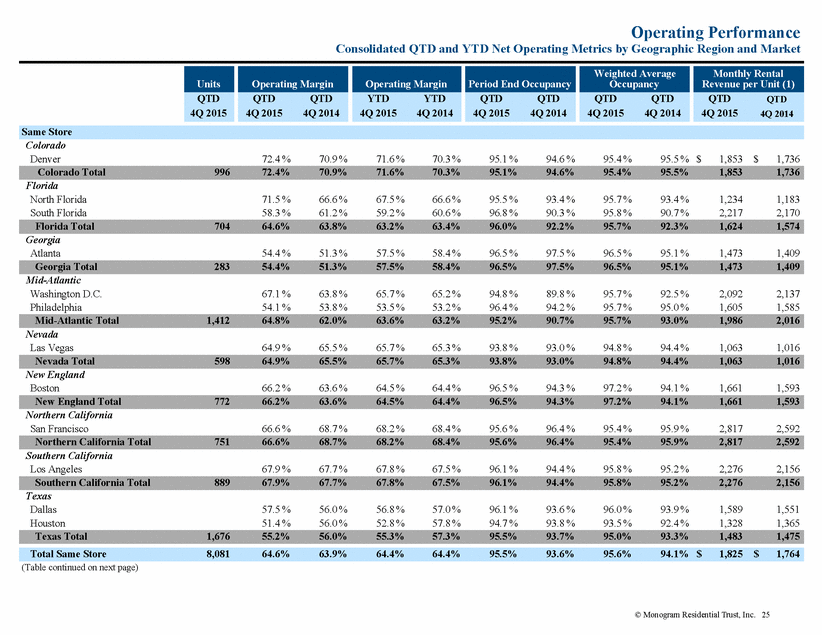
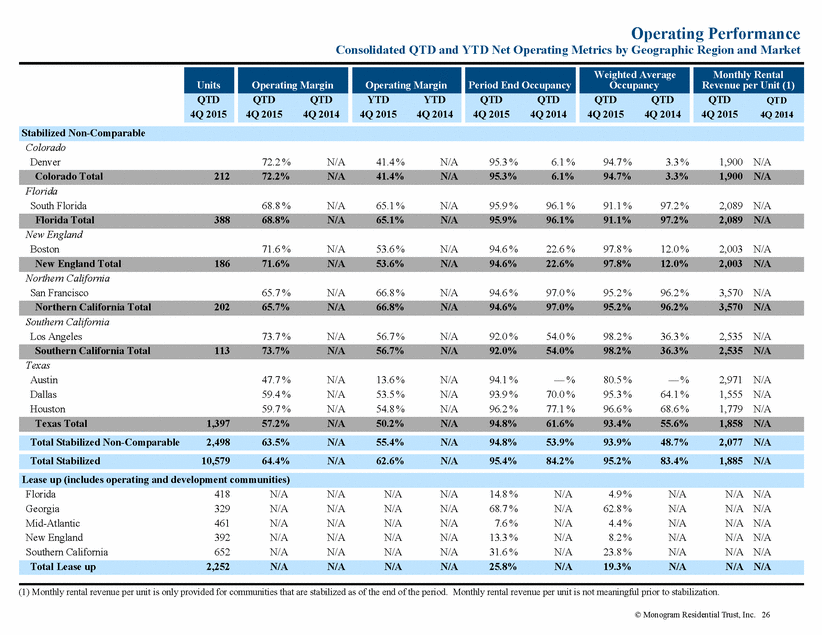
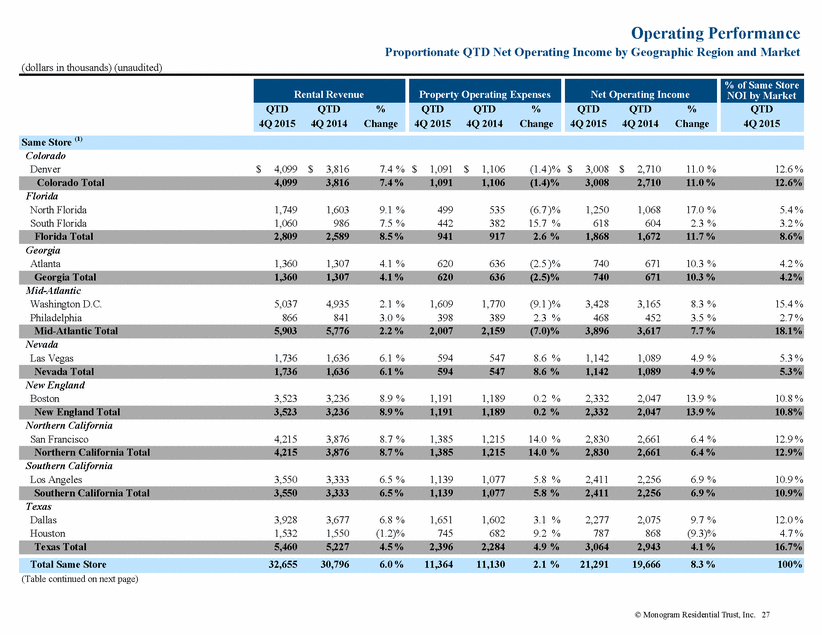
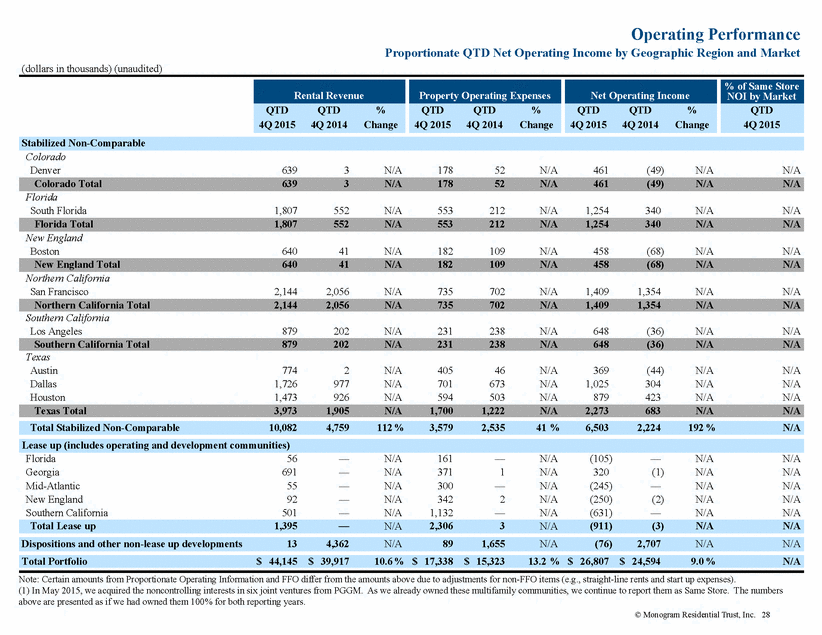
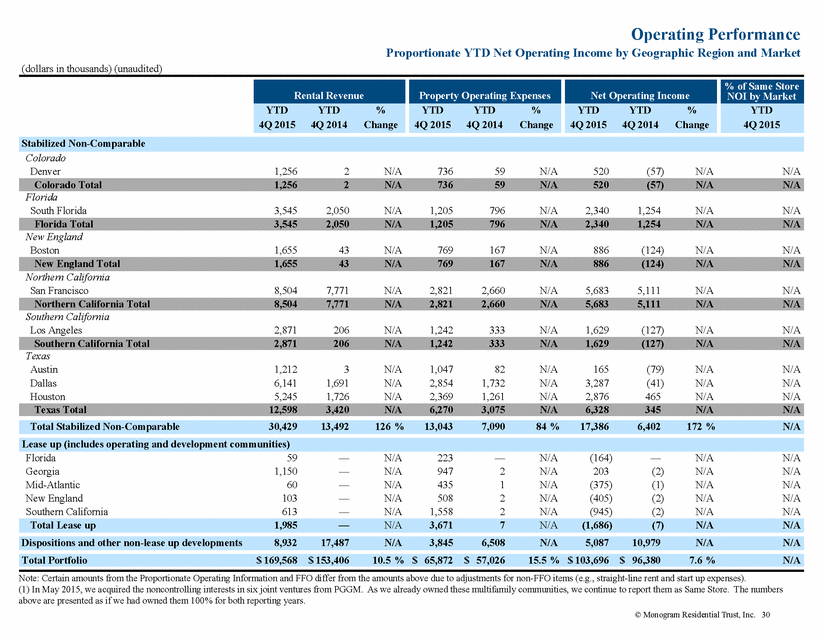
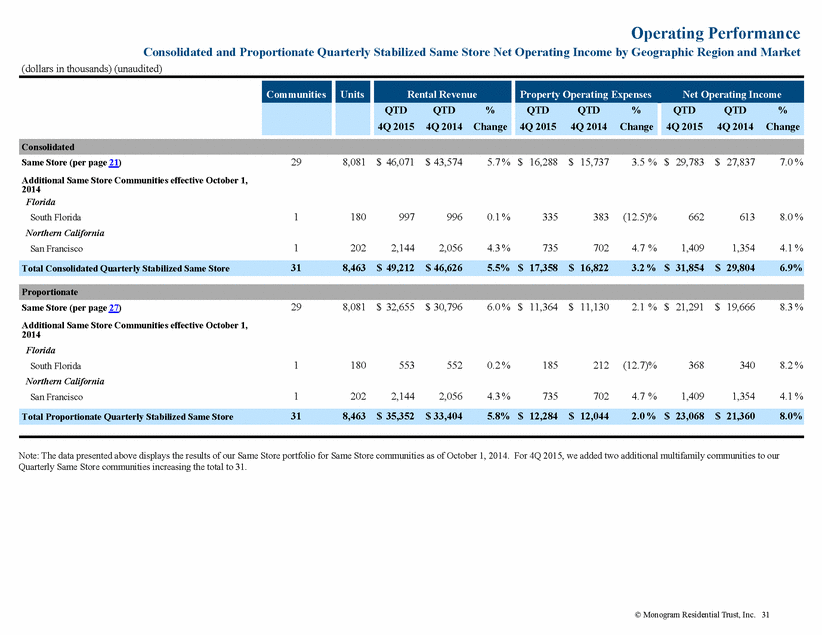
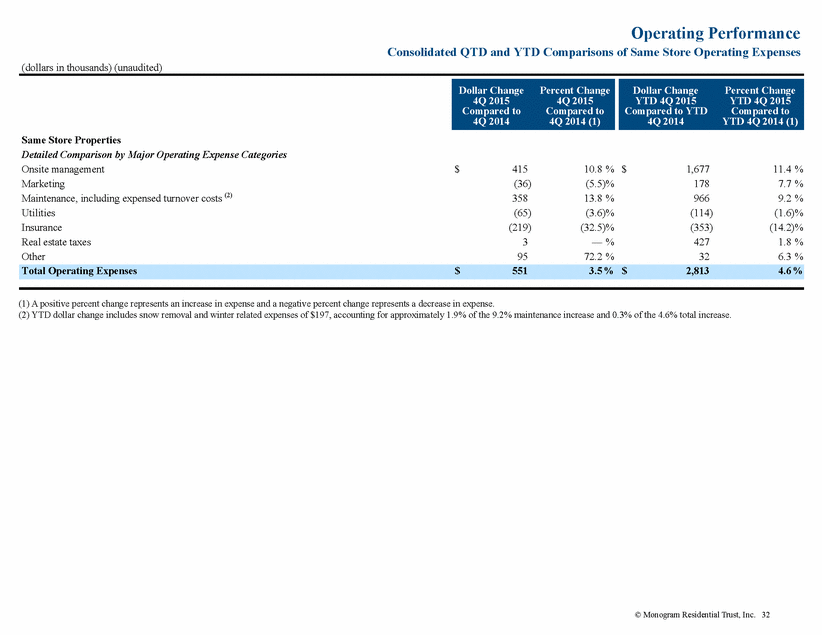
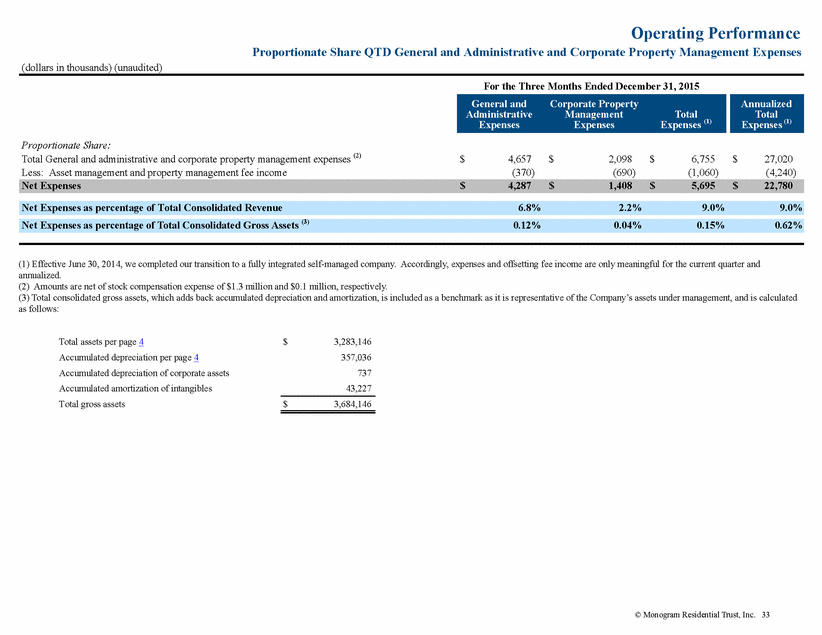
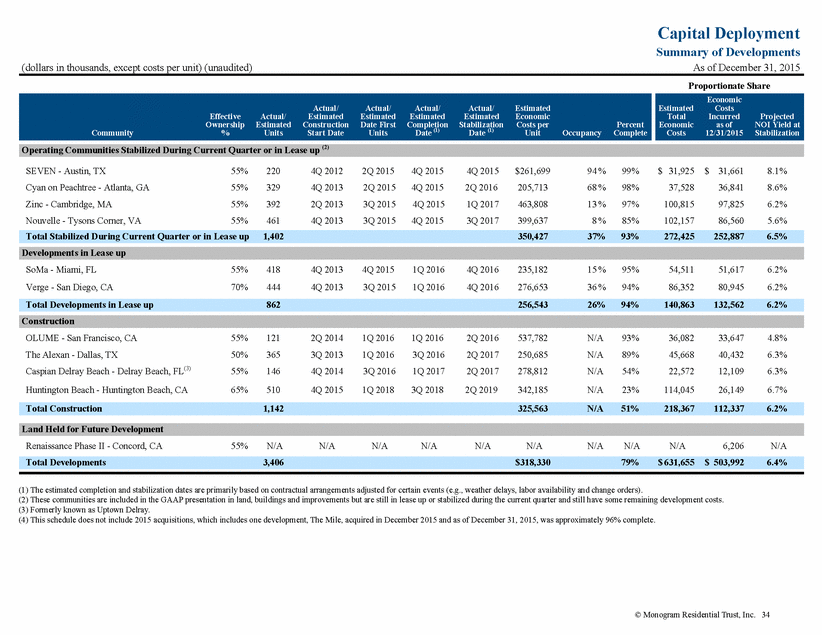
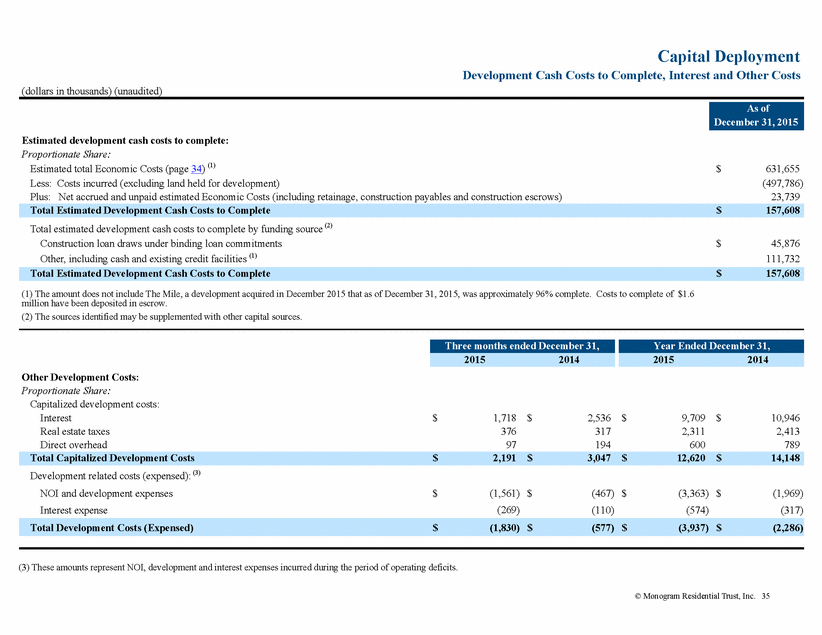
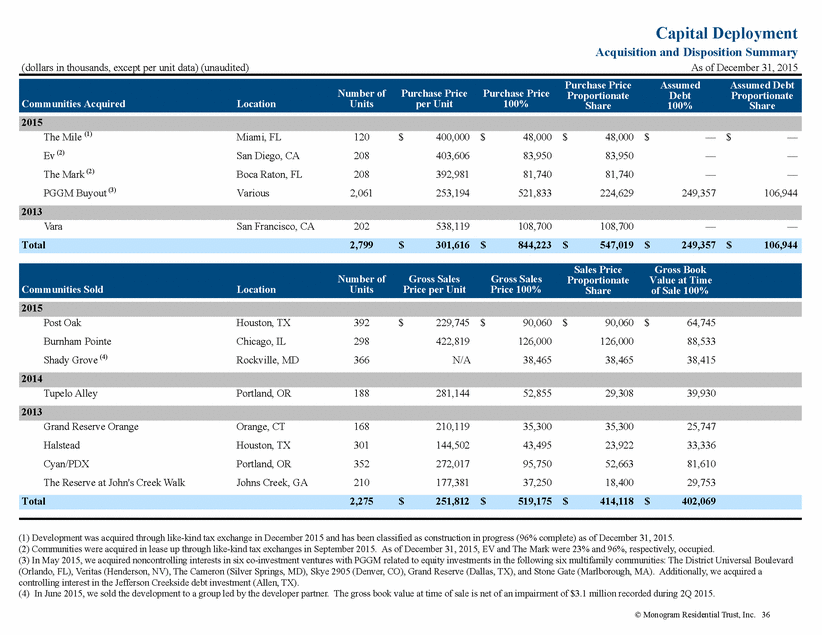
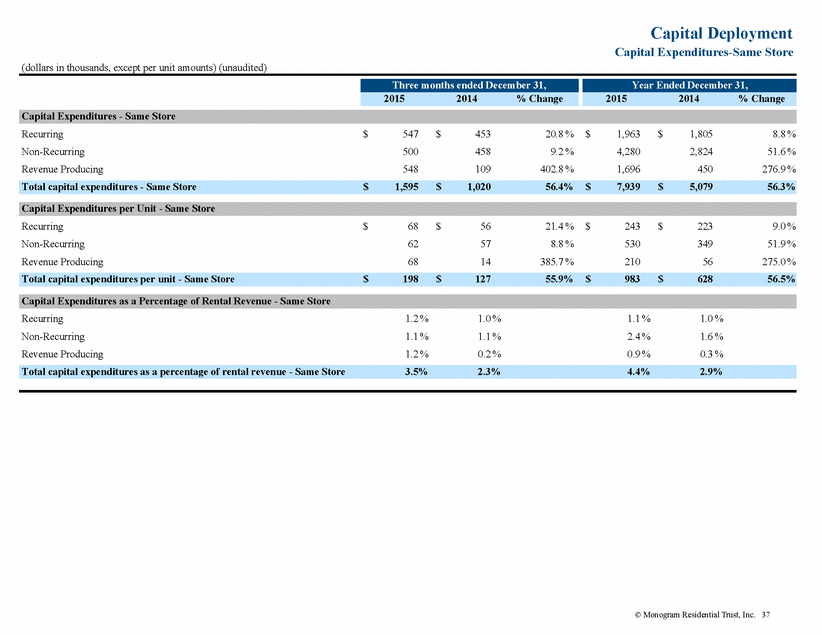
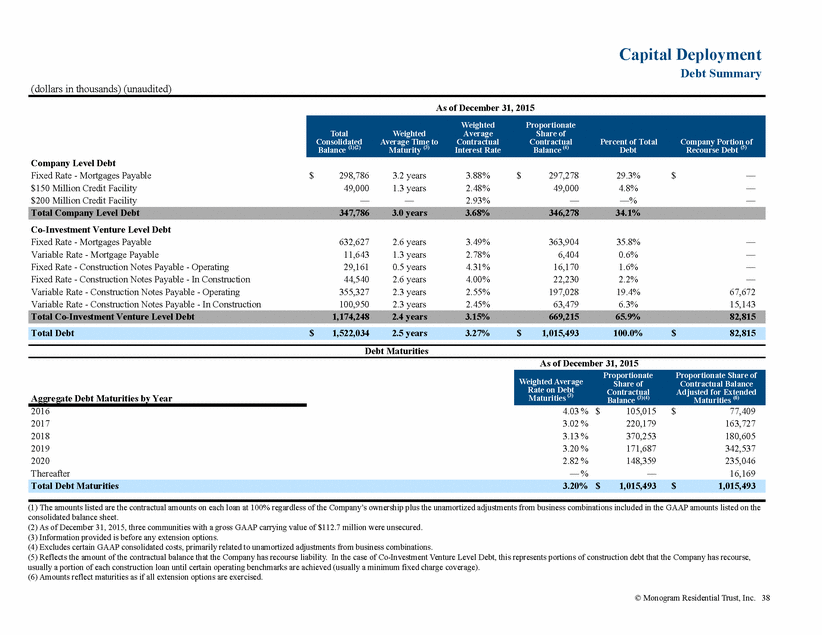
Operating Performance Consolidated YTD Net Operating Income by Geographic Region and Market (dollars in thousands) (unaudited) Colorado Denver $ 22,238 $ 20,696 7.5 % $ 6,316 $ 6,138 2.9 % $ 15,922 $ 14,558 9.4 % Florida North Florida South Florida 6,800 7,461 6,392 7,223 6.4 % 3.3 % 2,209 3,041 2,138 2,845 3.3 % 6.9 % 4,591 4,420 4,254 4,378 7.9 % 1.0 % Georgia Atlanta 5,427 5,143 5.5 % 2,305 2,138 7.8 % 3,122 3,005 3.9 % Mid-Atlantic Washington D.C. Philadelphia 29,251 6,164 29,728 6,067 (1.6 )% 1.6 % 10,027 2,867 10,346 2,842 (3.1 )% 0.9 % 19,224 3,297 19,382 3,225 (0.8 )% 2.2 % Nevada Las Vegas 7,704 7,334 5.0 % 2,646 2,545 4.0 % 5,058 4,789 5.6 % New England Boston 15,850 14,751 7.5 % 5,624 5,247 7.2 % 10,226 9,504 7.6 % Northern California San Francisco 25,088 22,990 9.1 % 7,973 7,260 9.8 % 17,115 15,730 8.8 % Southern California Los Angeles 25,122 23,634 6.3 % 8,082 7,688 5.1 % 17,040 15,946 6.9 % Texas Dallas Houston 18,650 11,351 17,840 11,461 4.5 % (1.0 )% 8,057 5,359 7,667 4,839 5.1 % 10.7 % 10,593 5,992 10,173 6,622 4.1 % (9.5 )% (Table continued on next page) © Monogram Residential Trust, Inc. 23 Total Same Store181,106173,2594.5 %64,50661,6934.6 %116,600111,5664.5 % Texas Total30,00129,3012.4 %13,41612,5067.3 %16,58516,795(1.3)% Southern California Total25,12223,6346.3 %8,0827,6885.1 %17,04015,9466.9 % Northern California Total25,08822,9909.1 %7,9737,2609.8 %17,11515,7308.8 % New England Total15,85014,7517.5 %5,6245,2477.2 %10,2269,5047.6 % Nevada Total7,7047,3345.0 %2,6462,5454.0 %5,0584,7895.6 % Mid-Atlantic Total35,41535,795(1.1)%12,89413,188(2.2)%22,52122,607(0.4)% Georgia Total5,4275,1435.5 %2,3052,1387.8 %3,1223,0053.9 % Florida Total14,26113,6154.7 %5,2504,9835.4 %9,0118,6324.4 % Colorado Total22,23820,6967.5 %6,3166,1382.9 %15,92214,5589.4 % Same Store Net Operating Income YTDYTD% 4Q 20154Q 2014Change Property Operating Expenses YTDYTD% 4Q 20154Q 2014Change Rental Revenue YTDYTD% 4Q 20154Q 2014Change
