UNITED STATES
SECURITIES AND EXCHANGE COMMISSION
Washington, D.C. 20549
FORM N-CSR
CERTIFIED SHAREHOLDER REPORT OF REGISTERED
MANAGEMENT INVESTMENT COMPANIES
Investment Company Act file number 811-22001
db-X Exchange-Traded Funds Inc.
(Exact name of registrant as specified in charter)
60 Wall Street
New York, New York 10005
(Address of principal executive offices) (Zip code)
Alex Depetris
db-X Exchange-Traded Funds Inc.
60 Wall Street
New York, New York 10005
(Name and address of agent for service)
Registrant’s telephone number, including area code: (212) 250-4352
Date of fiscal year end: May 31
Date of reporting period: November 30, 2014
Form N-CSR is to be used by management investment companies to file reports with the Commission not later than 10 days after the transmission to stockholders of any report that is required to be transmitted to stockholders under Rule 30e-1 under the Investment Company Act of 1940 (17 CFR 270.30e-1). The Commission may use the information provided on Form N-CSR in its regulatory, disclosure review, inspection, and policymaking roles.
A registrant is required to disclose the information specified by Form N-CSR, and the Commission will make this information public. A registrant is not required to respond to the collection of information contained in Form N-CSR unless the Form displays a currently valid Office of Management and Budget (“OMB”) control number. Please direct comments concerning the accuracy of the information collection burden estimate and any suggestions for reducing the burden to Secretary, Securities and Exchange Commission, 100 F Street, NE, Washington, DC 20549. The OMB has reviewed this collection of information under the clearance requirements of 44 U.S.C. § 3507.
| Item 1. | Reports to Stockholders. |
The Report to Shareholders is attached herewith.

November 30, 2014
Semi-Annual Report
db-X Exchange-Traded Funds Inc.
Deutsche X-trackers 2010 Target Date ETF (TDD)
Deutsche X-trackers 2020 Target Date ETF (TDH)
Deutsche X-trackers 2030 Target Date ETF (TDN)
Deutsche X-trackers 2040 Target Date ETF (TDV)
Deutsche X-trackers In-Target Date ETF (TDX)

db-X Exchange-Traded Funds Inc.
Table of contents
To our shareholders:
Dear Shareholder:
I am very pleased to tell you that the db X-trackers exchange-traded funds were renamed Deutsche X-trackers exchange-traded funds effective August 11, 2014, aligning more closely with the Deutsche Asset & Wealth Management brand. We are proud to adopt the Deutsche name – a brand that fully represents the global access, discipline and intelligence that support all of our products and services.
Deutsche Asset & Wealth Management combines the asset management and wealth management divisions of Deutsche Bank to deliver a comprehensive suite of investment capabilities. Your investment in the Deutsche X-trackers exchange-traded funds means you have access to the thought leadership and resources of one of the world’s largest and most influential financial institutions.
In conjunction with your fund’s name change, please note the new Web address for the Deutsche X-trackers exchange-traded funds. The former dbxus.com is now deutsche-etfs.com.
These changes have no effect on the day-to-day management of your investment, and there is no action required on your part. You will continue to experience the benefits that come from our decades of experience, in-depth research and worldwide network of investment professionals.
Thanks for your continued support. We appreciate your trust and the opportunity to put our capabilities to work for you.
Best regards,
s/ Alex Depetris
Alex Depetris
Chairman, President and Chief Executive Officer
1
db-X Exchange-Traded Funds Inc.
Performance summary (Unaudited)
Deutsche X-trackers 2010 Target Date ETF (TDD)
The Deutsche X-trackers 2010 Target Date ETF (the “Fund”) commenced investment operations and its shares began trading on NYSE Arca, Inc. (“NYSE Arca”) on October 1, 2007. The Fund seeks to track the performance, before fees and expenses, of the Zacks 2010 Lifecycle Index. Both the Fund’s equity and bond portfolios held fewer securities than the Zacks 2010 Lifecycle Index, a constraint imposed by the relatively small size of the Fund.
For the six-month period ended November 30, 2014, the Fund’s net asset value increased 0.87%, compared to an increase of 1.10% for the Zacks 2010 Lifecycle Index and an increase of 0.43% for the Dow Jones Target 2010 Index.
Performance as of 11/30/14
| | | | | | | | |
| Average Annual Total Returns |
| | | Net Asset Value | | Market Price | | Zacks 2010 Lifecycle Index | | Dow Jones Target 2010 Index |
One Year | | 2.04% | | 2.37% | | 2.43% | | 4.28% |
Five Year | | 2.86% | | 2.11% | | 3.35% | | 5.42% |
Since Inception1 | | 1.70% | | 1.27% | | 2.06% | | 4.29% |
|
| Cumulative Total Returns |
| | | Net Asset Value | | Market Price | | Zacks 2010 Lifecycle Index | | Dow Jones Target 2010 Index |
Six Months | | 0.87% | | 0.52% | | 1.10% | | 0.43% |
One Year | | 2.04% | | 2.37% | | 2.43% | | 4.28% |
Five Year | | 15.14% | | 11.01% | | 17.93% | | 30.19% |
Since Inception | | 12.88% | | 9.48% | | 15.77% | | 35.10% |
1 Total returns are calculated based on the commencement of operations, 10/1/07 (“Inception”).
Performance quoted represents past performance, assumes reinvestment of all dividends and capital gain distributions, and does not guarantee future results. Current performance may be higher or lower than the performance quoted. Performance data current to the most recent month end may be obtained by visiting www.deutsche-etfs.com. Investment in the fund poses investment risk including possible loss of principal. The investment return and principal value of an investment will fluctuate, so that shares, when sold or redeemed, may be worth more or less than their original cost. The gross expense ratio, as disclosed in the most recent prospectus dated October 1, 2014, was 1.48%. DBX Strategic Advisors LLC, the advisor to the Fund, has agreed to cap its fees and/or pay certain Fund operating expenses in order to limit Fund net annual operating expenses for shares of the Fund to 0.65% of the Fund’s average net assets until 9/30/15.
The preceding performance chart is provided for comparative purposes and represents the period(s) noted. The net asset value return is based on the changes in the Fund’s net asset value per share (“NAV”). The Fund’s NAV is calculated by dividing the value of the Fund’s total assets less total liabilities by the number of shares outstanding. The market price return is based on the change in the market price on the NYSE Arca of a share of the Fund for the period(s) indicated. The price used to calculate market price returns is the midpoint of the bid/ask spread for Fund shares at 4 p.m. Eastern Time on the NYSE Arca. NAV and market returns assume that dividends and capital gain distributions have been reinvested in the Fund at NAV and market price, respectively. The Dow Jones Target Date Indexes are indexes whose allocations are automatically adjusted to reduce potential risk over time. The Dow Jones Target Date Indexes are designed to measure the performance of multi-asset class portfolios that allocate among U.S. and global stock, bond and cash sub indexes on a monthly basis. The indexes automatically adjust their asset allocation over time to reflect reductions in potential risk as the investor’s target date approaches.
An index is a statistical measure of a specified financial market or sector. An index does not actually hold a portfolio of securities, incur expenses or pay any transaction costs. Therefore index returns do not reflect deductions for fees or expenses and are not available for direct investment. In comparison, the Fund’s performance is negatively impacted by these deductions. Fund returns do not reflect brokerage commissions or taxes that a shareholder would pay on Fund distributions or on transactions in Fund shares.
“Target Date” refers to a time in the future, generally a specified year, in which the investor expects to retire or otherwise require the use of the invested funds. Target date funds are generally more aggressive the further the target date is from the present, with an objective of capital appreciation. As the target date approaches, the fund’s objective will generally become more conservative, aiming to achieve a higher level of capital preservation. Upon reaching the target date, the index whose performance the Fund seeks to track will have approximately a 10% allocation to equity securities. Over the next five years, allocations shift from conservative to more moderately-conservative allocations, allowing for a larger exposure to equities than at the target date (“Moderately-Conservative Allocation”).
Investors should note that although target date funds aim to preserve capital as the target date approaches, there is no guarantee that the Fund will achieve this objective.
2
db-X Exchange-Traded Funds Inc.
Performance summary (Unaudited)
Deutsche X-trackers 2010 Target Date ETF (TDD) (Continued)
Growth of a $10,000 Investment in TDD2 as of 11/30/14
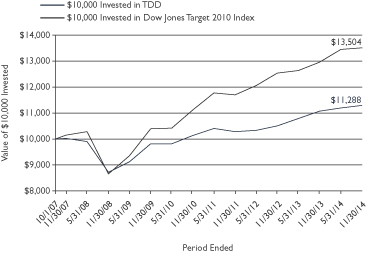
2 Based on Net Asset Value from commencement of operations 10/1/07.
Asset Class Breakdown* as of 11/30/14
| | | | |
Domestic Equities | | | 20.1% | |
International Equities | | | 6.3% | |
Fixed Income | | | 73.6% | |
| | | | |
Total | | | 100% | |
* Weightings are expressed as a percentage of total investments and may change over time.
Top Ten Holdings3 as of 11/30/14
| | | | |
| Top Ten Equity Holdings | |
| |
| Description | | % of Net Assets | |
Apple, Inc. | | | 0.8% | |
Exxon Mobil Corp. | | | 0.5% | |
Microsoft Corp. | | | 0.5% | |
Berkshire Hathaway, Inc., Class B | | | 0.5% | |
Johnson & Johnson | | | 0.4% | |
Wal-Mart Stores, Inc. | | | 0.4% | |
General Electric Co. | | | 0.4% | |
Wells Fargo & Co. | | | 0.3% | |
Procter & Gamble (The) Co. | | | 0.3% | |
Coca-Cola (The) Co. | | | 0.3% | |
| | | | |
| Top Ten Fixed Income Holdings | |
| |
| Description | | % of Net Assets | |
U.S. Treasury Bond/Note 4.125%, 5/15/15 | | | 10.1% | |
U.S. Treasury Bond/Note 2.50%, 3/31/15 | | | 7.6% | |
U.S. Treasury Bond/Note 4.00%, 2/15/15 | | | 6.0% | |
U.S. Treasury Bond/Note 1.25%, 9/30/15 | | | 4.4% | |
U.S. Treasury Bond/Note 1.75%, 7/31/15 | | | 4.1% | |
General Electric Capital Corp. 2.25%, 11/09/15 | | | 2.6% | |
U.S. Treasury Bond/Note 4.25%, 8/15/15 | | | 2.4% | |
Goldman Sachs Group (The), Inc. 3.625%, 2/07/16 | | | 2.3% | |
Westpac Banking Corp. (Australia) 3.00%, 12/09/15 | | | 1.5% | |
Dominion Resources, Inc., Series C 5.15%, 7/15/15 | | | 1.5% | |
3 Holdings are subject to change without notice and there is no guarantee that the Fund will remain invested in any particular security. For a complete list of holdings go to page 13.
Sector Breakdown* as of 11/30/14
| | | | |
Government | | | 43.0% | |
Financial | | | 24.4% | |
Consumer, Non-cyclical | | | 7.9% | |
Technology | | | 4.6% | |
Communications | | | 4.2% | |
Industrial | | | 4.2% | |
Utilities | | | 3.5% | |
Energy | | | 3.2% | |
Consumer, Cyclical | | | 3.1% | |
Basic Materials | | | 1.9% | |
Diversified | | | 0.0% | |
| | | | |
Total | | | 100% | |
* Weightings are expressed as a percentage of total investments and may change over time. The sector classifications used above are based on company classifications under Bloomberg industry name.
3
db-X Exchange-Traded Funds Inc.
Performance summary (Unaudited)
Deutsche X-trackers 2020 Target Date ETF (TDH)
The Deutsche X-trackers 2020 Target Date ETF (the “Fund”) commenced investment operations and its shares began trading on NYSE Arca, Inc. (“NYSE Arca”) on October 1, 2007. The Fund seeks to track the performance, before fees and expenses, of the Zacks 2020 Lifecycle Index. Both the Fund’s equity and bond portfolios held fewer securities than the Zacks 2020 Lifecycle Index, a constraint imposed by the relatively small size of the Fund.
For the six-month period ended November 30, 2014, the Fund’s net asset value increased 1.85%, compared to an increase of 2.20% for the Zacks 2020 Lifecycle Index and 1.24% for the Dow Jones Target 2020 Index.
Performance as of 11/30/14
| | | | | | | | |
| Average Annual Total Returns |
| | | Net Asset Value | | Market Price | | Zacks 2020 Lifecycle
Index | | Dow Jones Target 2020
Index |
One Year | | 4.55% | | 10.95% | | 5.17% | | 5.61% |
Five Year | | 7.79% | | 7.93% | | 8.18% | | 7.65% |
Since Inception1 | | 3.36% | | 3.12% | | 3.63% | | 4.14% |
|
| Cumulative Total Returns |
| | | Net Asset Value | | Market Price | | Zacks 2020 Lifecycle
Index | | Dow Jones Target 2020
Index |
Six Months | | 1.85% | | 2.60% | | 2.20% | | 1.24% |
One Year | | 4.55% | | 10.95% | | 5.17% | | 5.61% |
Five Year | | 45.50% | | 46.46% | | 48.15% | | 44.60% |
Since Inception1 | | 26.71% | | 24.63% | | 29.12% | | 33.78% |
1 Total returns are calculated based on the commencement of operations, 10/1/07 (“Inception”).
Performance quoted represents past performance, assumes reinvestment of all dividends and capital gain distributions, and does not guarantee future results. Current performance may be higher or lower than the performance quoted. Performance data current to the most recent month end may be obtained by visiting www.deutsche-etfs.com. Investment in the fund poses investment risk including possible loss of principal. The investment return and principal value of an investment will fluctuate, so that shares, when sold or redeemed, may be worth more or less than their original cost. The gross expense ratio, as disclosed in the most recent prospectus dated October 1, 2014, was 1.15%. DBX Strategic Advisors LLC, the advisor to the Fund, has agreed to cap its fees and/or pay certain Fund operating expenses in order to limit Fund net annual operating expenses for shares of the Fund to 0.65% of the Fund’s average net assets until 9/30/15.
The preceding performance chart is provided for comparative purposes and represents the period(s) noted. The net asset value return is based on the changes in the Fund’s net asset value per share (“NAV”). The Fund’s NAV is calculated by dividing the value of the Fund’s total assets less total liabilities by the number of shares outstanding. The market price return is based on the change in the market price on the NYSE Arca of a share of the Fund for the period(s) indicated. The price used to calculate market price returns is the midpoint of the bid/ask spread for Fund shares at 4 p.m. Eastern Time on the NYSE Arca. NAV and market returns assume that dividends and capital gain distributions have been reinvested in the Fund at NAV and market price, respectively. The Dow Jones Target Date Indexes are indexes whose allocations are automatically adjusted to reduce potential risk over time. The Dow Jones Target Date Indexes are designed to measure the performance of multi-asset class portfolios that allocate among U.S. and global stock, bond and cash subindexes on a monthly basis. The indexes automatically adjust their asset allocation over time to reflect reductions in potential risk as the investor’s target date approaches.
An index is a statistical measure of a specified financial market or sector. An index does not actually hold a portfolio of securities, incur expenses or pay any transaction costs. Therefore index returns do not reflect deductions for fees or expenses and are not available for direct investment. In comparison, the Fund’s performance is negatively impacted by these deductions. Fund returns do not reflect brokerage commissions or taxes that a shareholder would pay on Fund distributions or on transactions in Fund shares.
“Target Date” refers to a time in the future, generally a specified year, in which the investor expects to retire or otherwise require the use of the invested funds. Target date funds are generally more aggressive the further the target date is from the present, with an objective of capital appreciation. As the target date approaches, the fund’s objective will generally become more conservative, aiming to achieve a higher level of capital preservation. Upon reaching the target date, the index whose performance the Fund seeks to track will have approximately a 10% allocation to equity securities. Over the next five years, allocations shift from conservative to more moderately-conservative allocations, allowing for a larger exposure to equities than at the target date (“Moderately-Conservative Allocation”).
Investors should note that although target date funds aim to preserve capital as the target date approaches, there is no guarantee that the Fund will achieve this objective.
4
db-X Exchange-Traded Funds Inc.
Performance summary (Unaudited)
Deutsche X-trackers 2020 Target Date ETF (TDH) (Continued)
Growth of a $10,000 Investment in TDH2 as of 11/30/14
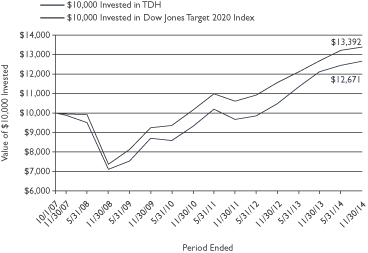
2 Based on Net Asset Value from commencement of operations 10/1/07.
Asset Class Breakdown* as of 11/30/14
| | | | |
Domestic Equities | | | 36.5% | |
International Equities | | | 12.1% | |
Fixed Income | | | 51.4% | |
| | | | |
Total | | | 100% | |
* Weightings are expressed as a percentage of total investments and may change over time.
Top Ten Holdings3 as of 11/30/14
| | | | |
| Top Ten Equity Holdings | |
| |
| Description | | % of Net Assets | |
Apple, Inc. | | | 1.6% | |
Exxon Mobil Corp. | | | 0.9% | |
Microsoft Corp. | | | 0.9% | |
Berkshire Hathaway, Inc., Class B | | | 0.8% | |
Wal-Mart Stores, Inc. | | | 0.7% | |
Johnson & Johnson | | | 0.7% | |
General Electric Co. | | | 0.6% | |
Wells Fargo & Co. | | | 0.6% | |
Procter & Gamble (The) Co. | | | 0.6% | |
JPMorgan Chase & Co. | | | 0.5% | |
| | | | |
| Top Ten Fixed Income Holdings | |
| |
| Description | | % of Net Assets | |
U.S. Treasury Bond/Note 4.25%, 8/15/15 | | | 6.4% | |
U.S. Treasury Bond/Note 0.375%, 4/30/16 | | | 5.2% | |
U.S. Treasury Bond/Note 0.25%, 7/31/15 | | | 5.2% | |
U.S. Treasury Bond/Note 1.25%, 9/30/15 | | | 4.4% | |
U.S. Treasury Bond/Note 1.875%, 6/30/15 | | | 4.2% | |
U.S. Treasury Bond/Note 0.25%, 11/30/15 | | | 2.4% | |
U.S. Treasury Bond/Note 2.00%, 1/31/16 | | | 2.3% | |
PNC Funding Corp. 5.25%, 11/15/15 | | | 1.3% | |
Goldman Sachs Group (The), Inc. 3.63%, 2/07/16 | | | 1.2% | |
General Electric Capital Corp. MTN 1.00%, 1/08/16 | | | 1.0% | |
3 Holdings are subject to change without notice and there is no guarantee that the Fund will remain invested in any particular security. For a complete list of holdings go to page 18.
Sector Breakdown* as of 11/30/14
| | | | |
Government | | | 31.7% | |
Financial | | | 21.8% | |
Consumer, Non-cyclical | | | 12.3% | |
Technology | | | 6.7% | |
Consumer, Cyclical | | | 5.8% | |
Energy | | | 5.7% | |
Industrial | | | 5.6% | |
Communications | | | 4.9% | |
Basic Materials | | | 3.2% | |
Utilities | | | 2.2% | |
Diversified | | | 0.1% | |
| | | | |
Total | | | 100% | |
* Weightings are expressed as a percentage of total investments and may change over time. The sector classifications used above are based on company classifications under Bloomberg industry name.
5
db-X Exchange-Traded Funds Inc.
Performance summary (Unaudited)
Deutsche X-trackers 2030 Target Date ETF (TDN)
The Deutsche X-trackers 2030 Target Date ETF (the “Fund”) commenced investment operations and its shares began trading on NYSE Arca, Inc. (“NYSE Arca”) on October 1, 2007. The Fund seeks to track the performance, before fees and expenses, of the Zacks 2030 Lifecycle Index. Both the Fund’s equity and bond portfolios held fewer securities than the Zacks 2030 Lifecycle Index, a constraint imposed by the relatively small size of the Fund.
For the six-month period ended November 30, 2014, the Fund’s net asset value increased 3.93%, compared to an increase of 4.38% for the Zacks 2030 Lifecycle Index and 2.28% for the Dow Jones Target 2030 Index.
Performance as of 11/30/14
| | | | | | | | |
| Average Annual Total Returns |
| | | Net Asset Value | | Market Price | | Zacks 2030 Lifecycle
Index | | Dow Jones Target 2030
Index |
One Year | | 10.70% | | 17.59% | | 11.31% | | 7.24% |
Five Year | | 11.80% | | 12.65% | | 12.56% | | 10.24% |
Since Inception1 | | 4.04% | | 4.53% | | 4.54% | | 4.44% |
|
| Cumulative Total Returns |
| | | Net Asset Value | | Market Price | | Zacks 2030 Lifecycle
Index | | Dow Jones Target 2030 Index |
Six Months | | 3.93% | | 8.80% | | 4.38% | | 2.28% |
One Year | | 10.70% | | 17.59% | | 11.31% | | 7.24% |
Five Year | | 74.67% | | 81.38% | | 80.71% | | 62.81% |
Since Inception1 | | 32.81 | | 37.38% | | 37.48% | | 36.55% |
1 Total returns are calculated based on the commencement of operations, 10/1/07 (“Inception”).
Performance quoted represents past performance, assumes reinvestment of all dividends and capital gain distributions, and does not guarantee future results. Current performance may be higher or lower than the performance quoted. Performance data current to the most recent month end may be obtained by visiting www.deutsche-etfs.com. Investment in the fund poses investment risk including possible loss of principal. The investment return and principal value of an investment will fluctuate, so that shares, when sold or redeemed, may be worth more or less than their original cost. The gross expense ratio, as disclosed in the most recent prospectus dated October 1, 2014, was 1.11%. DBX Strategic Advisors LLC, the advisor to the Fund, has agreed to cap its fees and/or pay certain Fund operating expenses in order to limit Fund net annual operating expenses for shares of the Fund to 0.65% of the Fund’s average net assets until 9/30/15.
The preceding performance chart is provided for comparative purposes and represents the period(s) noted. The net asset value return is based on the changes in the Fund’s net asset value per share (“NAV”). The Fund’s NAV is calculated by dividing the value of the Fund’s total assets less total liabilities by the number of shares outstanding. The market price return is based on the change in the market price on the NYSE Arca of a share of the Fund for the period(s) indicated. The price used to calculate market price returns is the midpoint of the bid/ask spread for Fund shares at 4 p.m. Eastern Time on the NYSE Arca. NAV and market returns assume that dividends and capital gain distributions have been reinvested in the Fund at NAV and market price, respectively. The Dow Jones Target Date Indexes are indexes whose allocations are automatically adjusted to reduce potential risk over time. The Dow Jones Target Date Indexes are designed to measure the performance of multi-asset class portfolios that allocate among U.S. and global stock, bond and cash subindexes on a monthly basis. The indexes automatically adjust their asset allocation over time to reflect reductions in potential risk as the investor’s target date approaches.
An index is a statistical measure of a specified financial market or sector. An index does not actually hold a portfolio of securities, incur expenses or pay any transaction costs. Therefore index returns do not reflect deductions for fees or expenses and are not available for direct investment. In comparison, the Fund’s performance is negatively impacted by these deductions. Fund returns do not reflect brokerage commissions or taxes that a shareholder would pay on Fund distributions or on transactions in Fund shares.
“Target Date” refers to a time in the future, generally a specified year, in which the investor expects to retire or otherwise require the use of the invested funds. Target date funds are generally more aggressive the further the target date is from the present, with an objective of capital appreciation. As the target date approaches, the fund’s objective will generally become more conservative, aiming to achieve a higher level of capital preservation. Upon reaching the target date, the index whose performance the Fund seeks to track will have approximately a 10% allocation to equity securities. Over the next five years, allocations shift from conservative to more moderately-conservative allocations, allowing for a larger exposure to equities than at the target date (“Moderately-Conservative Allocation”).
Investors should note that although target date funds aim to preserve capital as the target date approaches, there is no guarantee that the Fund will achieve this objective.
6
db-X Exchange-Traded Funds Inc.
Performance summary (Unaudited)
Deutsche X-trackers 2030 Target Date ETF (TDN) (Continued)
Growth of a $10,000 Investment in TDN2 as of 11/30/14
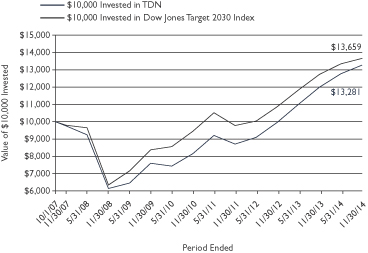
2 Based on Net Asset Value from commencement of operations 10/01/07.
Asset Class Breakdown* as of 11/30/14
| | | | |
Domestic Equities | | | 55.2% | |
International Equities | | | 18.0% | |
Fixed Income | | | 26.8% | |
| | | | |
Total | | | 100% | |
* Weightings are expressed as a percentage of total investments and may change over time.
Top Ten Holdings3 as of 11/30/14
| | | | |
| Top Ten Equity Holdings | |
| |
| Description | | % of Net Assets | |
Apple, Inc. | | | 2.3% | |
Exxon Mobil Corp. | | | 1.4% | |
Microsoft Corp. | | | 1.3% | |
Berkshire Hathaway, Inc., Class B | | | 1.3% | |
Johnson & Johnson | | | 1.1% | |
Wal-Mart Stores, Inc. | | | 1.0% | |
Wells Fargo & Co. | | | 1.0% | |
General Electric Co. | | | 1.0% | |
Procter & Gamble (The) Co. | | | 0.9% | |
JPMorgan Chase & Co. | | | 0.7% | |
| | | | |
| Top Ten Fixed Income Holdings | |
| |
| Description | | % of Net Assets | |
United Mexican States, 4.75%, 3/08/44 | | | 1.2% | |
Wal-Mart Stores, Inc., 4.00%, 4/11/43 | | | 1.1% | |
Tennessee Valley Authority, 4.88%, 1/15/48 | | | 1.1% | |
Virginia Electric and Power Co., 4.65%, 8/15/43 | | | 0.8% | |
Consolidated Edison Co. of New York, Inc., 3.95%, 3/01/43 | | | 0.8% | |
Southern California Edison Co., 6.05%, 3/15/39 | | | 0.8% | |
U.S. Treasury Bond, 4.38%, 5/15/41 | | | 0.8% | |
Shell International Finance BV, 6.38%, 12/15/38 | | | 0.7% | |
AT&T, Inc., 5.55%, 8/15/41 | | | 0.6% | |
Deere & Co., 3.90%, 6/09/42 | | | 0.6% | |
3 Holdings are subject to change without notice and there is no guarantee that the Fund will remain invested in any particular security. For a complete list of holdings go to page 24.
Sector Breakdown* as of 11/30/14
| | | | |
Consumer, Non-cyclical | | | 20.6% | |
Financial | | | 18.7% | |
Industrial | | | 10.5% | |
Technology | | | 10.2% | |
Communications | | | 8.9% | |
Consumer, Cyclical | | | 8.7% | |
Energy | | | 7.1% | |
Utilities | | | 6.8% | |
Government | | | 4.4% | |
Basic Materials | | | 4.0% | |
Diversified | | | 0.1% | |
| | | | |
Total | | | 100% | |
* Weightings are expressed as a percentage of total investments and may change over time. The sector classifications used above are based on company classifications under Bloomberg industry name.
7
db-X Exchange-Traded Funds Inc.
Performance summary (Unaudited)
Deutsche X-trackers 2040 Target Date ETF (TDV)
The Deutsche X-trackers 2040 Target Date ETF (the “Fund”) commenced investment operations and its shares began trading on NYSE Arca, Inc. (“NYSE Arca”) on October 1, 2007. The Fund seeks to track the performance, before fees and expenses, of the Zacks 2040 Lifecycle Index. Both the Fund’s equity and bond portfolios held fewer securities than the Zacks 2040 Lifecycle Index, a constraint imposed by the relatively small size of the Fund.
For the six-month period ended November 30, 2014, the Fund’s net asset value increased 4.15%, compared to an increase of 4.44% for the Zacks 2040 Lifecycle Index and 3.10% for the Dow Jones Target 2040 Index.
Performance as of 11/30/14
| | | | | | | | |
| Average Annual Total Returns |
| | | Net Asset Value | | Market Price | | Zacks 2040 Lifecycle
Index | | Dow Jones Target 2040
Index |
One Year | | 9.84% | | 8.66% | | 10.24% | | 8.51% |
Five Year | | 12.69% | | 12.29% | | 12.80% | | 11.98% |
Since Inception1 | | 4.04% | | 3.80% | | 4.12% | | 4.83% |
|
| Cumulative Total Returns |
| | | Net Asset Value | | Market Price | | Zacks 2040 Lifecycle
Index | | Dow Jones Target 2040
Index |
Six Months | | 4.15% | | 2.05% | | 4.44% | | 3.10% |
One Year | | 9.84% | | 8.66% | | 10.24% | | 8.51% |
Five Year | | 81.76% | | 78.55% | | 82.63% | | 76.06% |
Since Inception1 | | 32.87% | | 30.66% | | 33.57% | | 40.21% |
1 Total returns are calculated based on the commencement of operations, 10/1/07 (“Inception”).
Performance quoted represents past performance, assumes reinvestment of all dividends and capital gain distributions, and does not guarantee future results. Current performance may be higher or lower than the performance quoted. Performance data current to the most recent month end may be obtained by visiting www.deutsche-etfs.com. Investment in the fund poses investment risk including possible loss of principal. The investment return and principal value of an investment will fluctuate, so that shares, when sold or redeemed, may be worth more or less than their original cost. The gross expense ratio, as disclosed in the most recent prospectus dated October 1, 2014, was 1.12%. DBX Strategic Advisors LLC, the advisor to the Fund, has agreed to cap its fees and/or pay certain Fund operating expenses in order to limit Fund net annual operating expenses for shares of the Fund to 0.65% of the Fund’s average net assets until 9/30/15.
The preceding performance chart is provided for comparative purposes and represents the period(s) noted. The net asset value return is based on the changes in the Fund’s net asset value per share (“NAV”). The Fund’s NAV is calculated by dividing the value of the Fund’s total assets less total liabilities by the number of shares outstanding. The market price return is based on the change in the market price on the NYSE Arca of a share of the Fund for the period(s) indicated. The price used to calculate market price returns is the midpoint of the bid/ask spread for Fund shares at 4 p.m. Eastern Time on the NYSE Arca. NAV and market returns assume that dividends and capital gain distributions have been reinvested in the Fund at NAV and market price, respectively. The Dow Jones Target Date Indexes are indexes whose allocations are automatically adjusted to reduce potential risk over time. The Dow Jones Target Date Indexes are designed to measure the performance of multi-asset class portfolios that allocate among U.S. and global stock, bond and cash subindexes on a monthly basis. The indexes automatically adjust their asset allocation over time to reflect reductions in potential risk as the investor’s target date approaches.
An index is a statistical measure of a specified financial market or sector. An index does not actually hold a portfolio of securities, incur expenses or pay any transaction costs. Therefore index returns do not reflect deductions for fees or expenses and are not available for direct investment. In comparison, the Fund’s performance is negatively impacted by these deductions. Fund returns do not reflect brokerage commissions or taxes that a shareholder would pay on Fund distributions or on transactions in Fund shares.
“Target Date” refers to a time in the future, generally a specified year, in which the investor expects to retire or otherwise require the use of the invested funds. Target date funds are generally more aggressive the further the target date is from the present, with an objective of capital appreciation. As the target date approaches, the fund’s objective will generally become more conservative, aiming to achieve a higher level of capital preservation. Upon reaching the target date, the index whose performance the Fund seeks to track will have approximately a 10% allocation to equity securities. Over the next five years, allocations shift from conservative to more moderately-conservative allocations, allowing for a larger exposure to equities than at the target date (“Moderately-Conservative Allocation”).
Investors should note that although target date funds aim to preserve capital as the target date approaches, there is no guarantee that the Fund will achieve this objective.
8
db-X Exchange-Traded Funds Inc.
Performance summary (Unaudited)
Deutsche X-trackers 2040 Target Date ETF (TDV) (Continued)
Growth of a $10,000 Investment in TDV2 as of 11/30/14
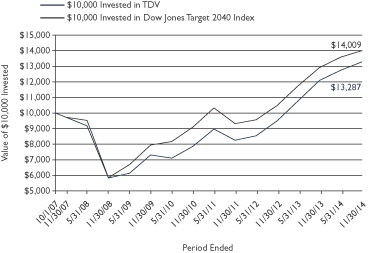
2 Based on Net Asset Value from commencement of operations 10/1/07.
Asset Class Breakdown* as of 11/30/14
| | | | |
Domestic Equities | | | 69.3% | |
International Equities | | | 22.3% | |
Fixed Income | | | 8.4% | |
| | | | |
Total | | | 100% | |
* Weightings are expressed as a percentage of total investments and may change over time.
Top Ten Holdings3 as of 11/30/14
| | | | |
| Top Ten Equity Holdings | |
| |
| Description | | % of Net Assets | |
Apple, Inc. | | | 2.9% | |
Exxon Mobil Corp. | | | 1.7% | |
Microsoft Corp. | | | 1.6% | |
Berkshire Hathaway, Inc., Class B | | | 1.6% | |
Johnson & Johnson | | | 1.4% | |
Wal-Mart Stores, Inc. | | | 1.3% | |
Wells Fargo & Co. | | | 1.2% | |
General Electric Co. | | | 1.2% | |
Procter & Gamble (The) Co. | | | 1.1% | |
JPMorgan Chase & Co. | | | 1.0% | |
| | | | |
| Top Ten Fixed Income Holdings | |
| |
| Description | | % of Net Assets | |
U.S. Treasury Bond/Note 3.75%, 11/15/43 | | | 1.4% | |
U.S. Treasury Bond/Note 4.375%, 11/15/39 | | | 0.7% | |
U.S. Treasury Bond/Note 3.125%, 2/15/42 | | | 0.7% | |
U.S. Treasury Bond/Note 4.375%, 5/15/41 | | | 0.6% | |
U.S. Treasury Bond/Note 4.625%, 2/15/40 | | | 0.4% | |
U.S. Treasury Bond/Note 4.75%, 2/15/41 | | | 0.3% | |
U.S. Treasury Bond/Note 4.375%, 5/15/40 | | | 0.3% | |
AT&T, Inc. 4.35%, 6/15/45 | | | 0.2% | |
Tennessee Valley Authority 4.875%, 1/15/48 | | | 0.2% | |
Wal-Mart Stores, Inc. 4.00%, 4/11/43 | | | 0.2% | |
3 Holdings are subject to change without notice and there is no guarantee that the Fund will remain invested in any particular security. For a complete list of holdings go to page 30.
Sector Breakdown* as of 11/30/14
| | | | |
Financial | | | 21.3% | |
Consumer, Non-cyclical | | | 20.5% | |
Technology | | | 11.5% | |
Industrial | | | 9.9% | |
Consumer, Cyclical | | | 9.2% | |
Communications | | | 9.0% | |
Energy | | | 7.1% | |
Government | | | 4.9% | |
Basic Materials | | | 3.8% | |
Utilities | | | 2.7% | |
Diversified | | | 0.1% | |
| | | | |
Total | | | 100% | |
* Weightings are expressed as a percentage of total investments and may change over time. The sector classifications used above are based on company classifications under Bloomberg industry name.
9
db-X Exchange-Traded Funds Inc.
Performance summary (Unaudited)
Deutsche X-trackers In-Target Date ETF (TDX)
The Deutsche X-trackers In-Target Date ETF (the “Fund”) commenced investment operations and its shares began trading on NYSE Arca, Inc. (“NYSE Arca”) on October 1, 2007. The Fund seeks to track the performance, before fees and expenses, of the Zacks In-Target Lifecycle Index. Both the Fund’s equity and bond portfolios held fewer securities than the Zacks In-Target Lifecycle Index, a constraint imposed by the relatively small size of the Fund.
For the six-month period ended November 30, 2014, the Fund’s net asset value increased 1.16%, compared to an increase of 1.43% for the Zacks In-Target Lifecycle Index and an increase of 0.34% for the Dow Jones Target Today Index.
Performance as of 11/30/14
| | | | | | | | |
| Average Annual Total Returns |
| | | Net Asset Value | | Market Price | | Zacks In-Target Lifecycle
Index | | Dow Jones Target Today
Index |
One Year | | 2.88% | | 5.10% | | 3.32% | | 3.85% |
Five Year | | 4.09% | | 3.97% | | 4.53% | | 4.62% |
Since Inception1 | | 3.53% | | 3.10% | | 3.83% | | 4.62% |
|
| Cumulative Total Returns |
| | | Net Asset Value | | Market Price | | Zacks In-Target Lifecycle
Index | | Dow Jones Target Today
Index |
Six Months | | 1.16% | | (1.55)% | | 1.43% | | 0.34% |
One Year | | 2.88% | | 5.10% | | 3.32% | | 3.85% |
Five Year | | 22.22% | | 21.46% | | 24.78% | | 25.36% |
Since Inception1 | | 28.22% | | 24.44% | | 30.91% | | 38.25% |
1 Total returns are calculated based on the commencement of operations, 10/1/07 (“Inception”).
Performance quoted represents past performance, assumes reinvestment of all dividends and capital gain distributions, and does not guarantee future results. Current performance may be higher or lower than the performance quoted. Performance data current to the most recent month end may be obtained by visiting www.deutsche-etfs.com. Investment in the fund poses investment risk including possible loss of principal. The investment return and principal value of an investment will fluctuate, so that shares, when sold or redeemed, may be worth more or less than their original cost. The gross expense ratio, as disclosed in the most recent prospectus dated October 1, 2014, was 1.41%. DBX Strategic Advisors LLC, the advisor to the Fund, has agreed to cap its fees and/or pay certain Fund operating expenses in order to limit Fund net annual operating expenses for shares of the Fund to 0.65% of the Fund’s average net assets until 9/30/15.
The preceding performance chart is provided for comparative purposes and represents the period(s) noted. The net asset value return is based on the changes in the Fund’s net asset value per share (“NAV”). The Fund’s NAV is calculated by dividing the value of the Fund’s total assets less total liabilities by the number of shares outstanding. The market price return is based on the change in the market price on the NYSE Arca of a share of the Fund for the period(s) indicated. The price used to calculate market price returns is the midpoint of the bid/ask spread for Fund shares at 4 p.m. Eastern Time on the NYSE Arca. NAV and market returns assume that dividends and capital gain distributions have been reinvested in the Fund at NAV and market price, respectively. The Dow Jones Target Date Indexes are indexes whose allocations are automatically adjusted to reduce potential risk over time. The Dow Jones Target Date Indexes are designed to measure the performance of multi-asset class portfolios that allocate among U.S. and global stock, bond and cash subindexes on a monthly basis. The indexes automatically adjust their asset allocation over time to reflect reductions in potential risk as the investor’s target date approaches.
An index is a statistical measure of a specified financial market or sector. An index does not actually hold a portfolio of securities, incur expenses or pay any transaction costs. Therefore index returns do not reflect deductions for fees or expenses and are not available for direct investment. In comparison, the Fund’s performance is negatively impacted by these deductions. Fund returns do not reflect brokerage commissions or taxes that a shareholder would pay on Fund distributions or on transactions in Fund shares.
“Target Date” refers to a time in the future, generally a specified year, in which the investor expects to retire or otherwise require the use of the invested funds. Target date funds are generally more aggressive the further the target date is from the present, with an objective of capital appreciation. As the target date approaches, the fund’s objective will generally become more conservative, aiming to achieve a higher level of capital preservation. Upon reaching the target date, the index whose performance the Fund seeks to track will have approximately a 10% allocation to equity securities. Over the next five years, allocations shift from conservative to more moderately-conservative allocations, allowing for a larger exposure to equities than at the target date (“Moderately-Conservative Allocation”).
Investors should note that although target date funds aim to preserve capital as the target date approaches, there is no guarantee that the Fund will achieve this objective.
10
db-X Exchange-Traded Funds Inc.
Performance summary (Unaudited)
Deutsche X-trackers In-Target Date ETF (TDX) (Continued)
Growth of a $10,000 Investment in TDX2 as of 11/30/14
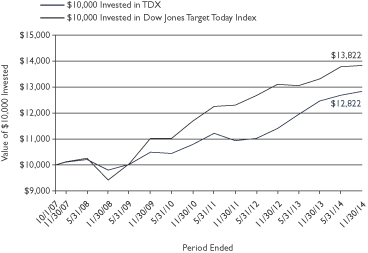
2 Based on Net Asset Value from commencement of operations 10/1/07.
Asset Class Breakdown* as of 11/30/14
| | | | |
Domestic Equities | | | 24.8% | |
International Equities | | | 7.7% | |
Fixed Income | | | 67.5% | |
| | | | |
Total | | | 100% | |
* Weightings are expressed as a percentage of total investments and may change over time.
Top Ten Holdings3 as of 11/30/14
| | | | |
| Top Ten Equity Holdings | |
| |
| Description | | % of Net Assets | |
Apple, Inc. | | | 1.0% | |
Exxon Mobil Corp. | | | 0.6% | |
Microsoft Corp. | | | 0.6% | |
Berkshire Hathaway, Inc., Class B | | | 0.6% | |
Wal-Mart Stores, Inc. | | | 0.5% | |
Johnson & Johnson | | | 0.5% | |
Wells Fargo & Co. | | | 0.4% | |
General Electric Co. | | | 0.4% | |
Procter & Gamble (The) Co. | | | 0.4% | |
JPMorgan Chase & Co. | | | 0.3% | |
| | | | |
| Top Ten Fixed Income Holdings | |
| |
| Description | | % of Net Assets | |
U.S. Treasury Bond/Note 4.125%, 5/15/15 | | | 9.3% | |
U.S. Treasury Bond/Note 2.50%, 3/31/15 | | | 6.7% | |
U.S. Treasury Bond/Note 4.00%, 2/15/15 | | | 5.1% | |
U.S. Treasury Bond/Note 1.25%, 9/30/15 | | | 3.4% | |
U.S. Treasury Bond/Note 1.75%, 7/31/15 | | | 3.2% | |
U.S. Treasury Bond/Note 2.50%, 4/30/15 | | | 3.2% | |
General Electric Capital Corp. 2.25%, 11/09/15 | | | 2.4% | |
Goldman Sachs Group (The), Inc. 3.625%, 2/07/16 | | | 2.1% | |
U.S. Treasury Bond/Note 2.125%, 5/31/15 | | | 1.7% | |
Westpac Banking Corp. (Australia) 3.00%, 12/09/15 | | | 1.4% | |
3 Holdings are subject to change without notice and there is no guarantee that the Fund will remain invested in any particular security. For a complete list of holdings go to page 36.
Sector Breakdown* as of 11/30/14
| | | | |
Government | | | 39.4% | |
Financial | | | 24.5% | |
Consumer, Non-cyclical | | | 9.1% | |
Technology | | | 5.1% | |
Communications | | | 4.7% | |
Industrial | | | 4.7% | |
Energy | | | 3.5% | |
Consumer, Cyclical | | | 3.5% | |
Utilities | | | 3.4% | |
Basic Materials | | | 2.1% | |
Diversified | | | 0.0% | |
| | | | |
Total | | | 100% | |
* Weightings are expressed as a percentage of total investments and may change over time. The sector classifications used above are based on company classifications under Bloomberg industry name.
11
db-X Exchange-Traded Funds Inc.
Fees and expenses (Unaudited)
As a shareholder of one or more of the funds, you incur two types of costs: (1) transaction costs, including brokerage commissions paid on purchases and sales of fund shares, and (2) ongoing costs, including management fees and other Fund expenses. The expense examples below are intended to help you understand your ongoing costs (in dollars) of investing in the Funds and to compare these costs with the ongoing costs of investing in other funds. In the most recent six month period each Fund limited these expenses; had they not done so, expenses would have been higher.
The examples are based on an investment of $1,000 made at the beginning of the period and held through the six-month period ended November 30, 2014 (June 1, 2014 to November 30, 2014).
Actual expenses
The first line in the following tables provides information about actual account values and actual expenses. You may use the information in this line, together with the amount you invested, to estimate the expenses that you paid over the period. Simply divide your account value by $1,000 (for example, an $8,600 account value divided by $1,000 = 8.6), then multiply the result by the number in the first line under the heading “Expenses Paid During the Period” to estimate the expenses you paid on your account during this period.
Hypothetical example for comparison purposes
The second line in the following tables provides information about hypothetical account values and hypothetical expenses based on the Funds’ actual expense ratios and an assumed rate of return of 5% per year before expenses (which is not the Funds’ actual return). The hypothetical account values and expenses may not be used to estimate the actual ending account balance or expenses you paid for the period. You may use this information to compare the ongoing costs of investing in the Fund and other funds. To do so, compare this 5% hypothetical example with the 5% hypothetical examples that appear in the shareholder reports of the other funds.
Please note that the expenses shown in the tables are meant to highlight your ongoing costs only, and do not reflect any transactional costs. Therefore the second line in the table is useful in comparing ongoing costs only, and will not help you determine the relative total costs of owning different funds. In addition, if these transactional costs were included, your costs would have been higher.
| | | | | | | | | | | | | | | | |
| | | Beginning Account Value June 1, 2014 | | | Ending Account Value November 30, 2014 | | | Annualized Expense Ratio | | | Expenses paid During the Period
Per $1,000(1) | |
| Deutsche X-trackers 2010 Target Date ETF | | | | | | | | | | | | | | | | |
Actual | | $ | 1,000.00 | | | $ | 1,008.66 | | | | 0.65 | % | | $ | 3.27 | |
Hypothetical (5% return before expenses) | | $ | 1,000.00 | | | $ | 1,021.81 | | | | 0.65 | % | | $ | 3.29 | |
| Deutsche X-trackers 2020 Target Date ETF | | | | | | | | | | | | | | | | |
Actual | | $ | 1,000.00 | | | $ | 1,018.45 | | | | 0.65 | % | | $ | 3.29 | |
Hypothetical (5% return before expenses) | | $ | 1,000.00 | | | $ | 1,021.81 | | | | 0.65 | % | | $ | 3.29 | |
| Deutsche X-trackers 2030 Target Date ETF | | | | | | | | | | | | | | | | |
Actual | | $ | 1,000.00 | | | $ | 1,039.35 | | | | 0.65 | % | | $ | 3.32 | |
Hypothetical (5% return before expenses) | | $ | 1,000.00 | | | $ | 1,021.81 | | | | 0.65 | % | | $ | 3.29 | |
| Deutsche X-trackers 2040 Target Date ETF | | | | | | | | | | | | | | | | |
Actual | | $ | 1,000.00 | | | $ | 1,041.51 | | | | 0.65 | % | | $ | 3.33 | |
Hypothetical (5% return before expenses) | | $ | 1,000.00 | | | $ | 1,021.81 | | | | 0.65 | % | | $ | 3.29 | |
| Deutsche X-trackers In-Target Date ETF | | | | | | | | | | | | | | | | |
Actual | | $ | 1,000.00 | | | $ | 1,011.58 | | | | 0.65 | % | | $ | 3.28 | |
Hypothetical (5% return before expenses) | | $ | 1,000.00 | | | $ | 1,021.81 | | | | 0.65 | % | | $ | 3.29 | |
(1) Expenses are calculated using the annualized expense ratio, which represents the ongoing expenses as a percentage of net assets for the period June 01, 2014 to November 30, 2014. Expenses are calculated by multiplying the Fund’s annualized expense ratio by the average account value for the period; then multiplying the result by 183 days and then dividing the result by 365.
12
db-X Exchange-Traded Funds Inc.
Schedule of investments
Deutsche X-trackers 2010 Target Date ETF
November 30, 2014 (Unaudited)
| | | | | | | | |
| | | Number
of Shares | | | Value | |
| | | | | | | | |
| COMMON STOCKS — 26.3% | | | | | | | | |
| Basic Materials — 1.0% | | | | | | | | |
Air Liquide SA (France) | | | 31 | | | $ | 3,901 | |
Anglo American PLC (United Kingdom) | | | 125 | | | | 2,580 | |
Axiall Corp. | | | 100 | | | | 4,328 | |
BASF SE (Germany) | | | 91 | | | | 8,261 | |
BHP Billiton Ltd. (Australia) | | | 308 | | | | 8,104 | |
BHP Billiton PLC (United Kingdom) | | | 204 | | | | 4,834 | |
Chemtura Corp.* | | | 100 | | | | 2,330 | |
Dow Chemical (The) Co. | | | 136 | | | | 6,619 | |
E.I. du Pont de Nemours & Co. | | | 106 | | | | 7,568 | |
Freeport-McMoRan, Inc. | | | 100 | | | | 2,685 | |
Glencore PLC (Switzerland)* | | | 1,270 | | | | 6,356 | |
KapStone Paper and Packaging Corp.* | | | 100 | | | | 2,987 | |
Linde AG (Germany) | | | 18 | | | | 3,397 | |
Monsanto Co. | | | 61 | | | | 7,315 | |
PolyOne Corp. | | | 100 | | | | 3,730 | |
Rio Tinto PLC (United Kingdom) | | | 113 | | | | 5,282 | |
Schnitzer Steel Industries, Inc., Class A | | | 100 | | | | 2,280 | |
Sherwin-Williams (The) Co. | | | 76 | | | | 18,608 | |
Syngenta AG (Switzerland) | | | 11 | | | | 3,624 | |
| | | | | | | | |
| | | | | | | 104,789 | |
| | | | | | | | |
| Communications — 2.5% | | | | | | | | |
8x8, Inc.* | | | 300 | | | | 2,334 | |
Amazon.com, Inc.* | | | 51 | | | | 17,271 | |
Angie’s List, Inc.* | | | 200 | | | | 1,188 | |
ARRIS Group, Inc.* | | | 100 | | | | 2,977 | |
AT&T, Inc. | | | 637 | | | | 22,537 | |
Bankrate, Inc.* | | | 100 | | | | 1,169 | |
BT Group PLC (United Kingdom) | | | 709 | | | | 4,543 | |
Cisco Systems, Inc. | | | 600 | | | | 16,584 | |
Comcast Corp., Class A | | | 297 | | | | 16,941 | |
Consolidated Communications Holdings, Inc. | | | 100 | | | | 2,741 | |
Deutsche Telekom AG (Germany) | | | 290 | | | | 4,940 | |
DigitalGlobe, Inc.* | | | 200 | | | | 5,402 | |
Finisar Corp.* | | | 100 | | | | 1,705 | |
Google, Inc., Class A* | | | 40 | | | | 21,963 | |
Google, Inc., Class C* | | | 40 | | | | 21,673 | |
Harmonic, Inc.* | | | 400 | | | | 2,800 | |
HealthStream, Inc.* | | | 100 | | | | 2,865 | |
Houghton Mifflin Harcourt Co.* | | | 100 | | | | 1,922 | |
Perficient, Inc.* | | | 100 | | | | 1,731 | |
Sinclair Broadcast Group, Inc., Class A | | | 100 | | | | 2,916 | |
SoftBank Corp. (Japan) | | | 100 | | | | 6,708 | |
Telefonaktiebolaget LM Ericsson, Class B (Sweden) | | | 268 | | | | 3,375 | |
Thomson Reuters Corp. (Canada) | | | 96 | | | | 3,828 | |
Time Warner, Inc. | | | 100 | | | | 8,512 | |
Twenty-First Century Fox, Inc., Class A | | | 300 | | | | 11,040 | |
Ubiquiti Networks, Inc. | | | 100 | | | | 2,890 | |
Verizon Communications, Inc. | | | 464 | | | | 23,474 | |
Vodafone Group PLC (United Kingdom) | | | 2,389 | | | | 8,730 | |
Walt Disney (The) Co. | | | 205 | | | | 18,965 | |
WPP PLC (United Kingdom) | | | 128 | | | | 2,679 | |
Yelp, Inc.* | | | 100 | | | | 5,709 | |
| | | | | | | | |
| | | Number
of Shares | | | Value | |
| | | | | | | | |
| Communications (Continued) | | | | | | | | |
Zillow, Inc., Class A* | | | 9 | | | $ | 1,065 | |
| | | | | | | | |
| | | | | | | 253,177 | |
| | | | | | | | |
| Consumer, Cyclical — 2.6% | | | | | | | | |
AMC Entertainment Holdings, Inc., Class A | | | 100 | | | | 2,622 | |
American Airlines Group, Inc. | | | 100 | | | | 4,853 | |
Bayerische Motoren Werke AG (Germany) | | | 35 | | | | 4,002 | |
Beacon Roofing Supply, Inc.* | | | 100 | | | | 2,708 | |
Brunswick Corp. | | | 100 | | | | 4,968 | |
Carnival Corp. | | | 100 | | | | 4,416 | |
Cie Financiere Richemont SA (Switzerland) | | | 50 | | | | 4,701 | |
Compass Group PLC (United Kingdom) | | | 168 | | | | 2,860 | |
CVS Health Corp. | | | 138 | | | | 12,608 | |
Daimler AG (Germany) | | | 84 | | | | 7,082 | |
Federal-Mogul Holdings Corp.* | | | 100 | | | | 1,552 | |
Ford Motor Co. | | | 430 | | | | 6,764 | |
Group 1 Automotive, Inc. | | | 100 | | | | 8,951 | |
Hennes & Mauritz AB, Class B (Sweden) | | | 126 | | | | 5,397 | |
Hilton Worldwide Holdings, Inc.* | | | 100 | | | | 2,622 | |
Home Depot (The), Inc. | | | 172 | | | | 17,097 | |
Honda Motor Co. Ltd. (Japan) | | | 131 | | | | 3,941 | |
Inditex SA (Spain) | | | 130 | | | | 3,785 | |
JetBlue Airways Corp.* | | | 200 | | | | 2,926 | |
Kate Spade & Co.* | | | 100 | | | | 3,203 | |
Kohl’s Corp. | | | 100 | | | | 5,962 | |
Las Vegas Sands Corp. | | | 100 | | | | 6,369 | |
Lennar Corp., Class A | | | 200 | | | | 9,448 | |
LVMH Moet Hennessy Louis Vuitton SA (France) | | | 35 | | | | 6,289 | |
McDonald’s Corp. | | | 100 | | | | 9,681 | |
Mitsubishi Corp. (Japan) | | | 100 | | | | 1,891 | |
Mitsui & Co. Ltd. (Japan) | | | 200 | | | | 2,759 | |
Mobile Mini, Inc. | | | 100 | | | | 4,149 | |
NIKE, Inc., Class B | | | 107 | | | | 10,624 | |
Office Depot, Inc.* | | | 400 | | | | 2,652 | |
Panasonic Corp. (Japan) | | | 200 | | | | 2,582 | |
Penske Automotive Group, Inc. | | | 100 | | | | 4,735 | |
Rite Aid Corp.* | | | 700 | | | | 3,836 | |
Skechers U.S.A., Inc., Class A* | | | 100 | | | | 6,141 | |
Spirit Airlines, Inc.* | | | 100 | | | | 8,269 | |
Standard Pacific Corp.* | | | 200 | | | | 1,510 | |
Toyota Motor Corp. (Japan) | | | 333 | | | | 20,516 | |
UniFirst Corp. | | | 44 | | | | 4,910 | |
Walgreen Co. | | | 103 | | | | 7,067 | |
Wal-Mart Stores, Inc. | | | 439 | | | | 38,430 | |
| | | | | | | | |
| | | | | | | 264,878 | |
| | | | | | | | |
| Consumer, Non-cyclical — 5.6% | | | | | | | | |
Accuray, Inc.* | | | 300 | | | | 2,067 | |
Affymetrix, Inc.* | | | 300 | | | | 2,739 | |
Align Technology, Inc.* | | | 100 | | | | 5,690 | |
Alnylam Pharmaceuticals, Inc.* | | | 100 | | | | 10,055 | |
Amgen, Inc. | | | 86 | | | | 14,217 | |
Anheuser-Busch InBev NV (Belgium) | | | 79 | | | | 9,279 | |
Anika Therapeutics, Inc.* | | | 100 | | | | 4,089 | |
AstraZeneca PLC (United Kingdom) | | | 112 | | | | 8,362 | |
| | | | |
| See Notes to Financial Statements. | | 13 | | |
db-X Exchange-Traded Funds Inc.
Schedule of investments
Deutsche X-trackers 2010 Target Date ETF (Continued)
November 30, 2014 (Unaudited)
| | | | | | | | |
| | | Number
of Shares | | | Value | |
| | | | | | | | |
| Consumer, Non-cyclical (Continued) | | | | | | | | |
Bayer AG (Germany) | | | 74 | | | $ | 11,129 | |
British American Tobacco PLC (United Kingdom) | | | 179 | | | | 10,609 | |
Cardinal Health, Inc. | | | 271 | | | | 22,274 | |
Centene Corp.* | | | 50 | | | | 4,939 | |
Coca-Cola (The) Co. | | | 622 | | | | 27,884 | |
CoStar Group, Inc.* | | | 30 | | | | 5,108 | |
CSL Ltd. (Australia) | | | 45 | | | | 3,162 | |
Darling Ingredients, Inc.* | | | 200 | | | | 3,720 | |
Diageo PLC (United Kingdom) | | | 238 | | | | 7,365 | |
Ensign Group (The), Inc. | | | 100 | | | | 3,942 | |
Foundation Medicine, Inc.* | | | 100 | | | | 2,362 | |
FTI Consulting, Inc.* | | | 100 | | | | 3,877 | |
Gilead Sciences, Inc.* | | | 168 | | | | 16,853 | |
GlaxoSmithKline PLC (United Kingdom) | | | 453 | | | | 10,508 | |
Haemonetics Corp.* | | | 100 | | | | 3,693 | |
Humana, Inc. | | | 121 | | | | 16,694 | |
Impax Laboratories, Inc.* | | | 100 | | | | 3,195 | |
Imperial Tobacco Group PLC (United Kingdom) | | | 90 | | | | 4,161 | |
Isis Pharmaceuticals, Inc.* | | | 100 | | | | 5,179 | |
Johnson & Johnson | | | 369 | | | | 39,945 | |
Kindred Healthcare, Inc. | | | 100 | | | | 1,989 | |
LDR Holding Corp.* | | | 100 | | | | 3,263 | |
Live Nation Entertainment, Inc.* | | | 183 | | | | 4,904 | |
Magellan Health, Inc.* | | | 107 | | | | 6,547 | |
MannKind Corp.* | | | 300 | | | | 1,845 | |
McGraw Hill Financial, Inc. | | | 200 | | | | 18,692 | |
Medicines (The) Co.* | | | 100 | | | | 2,681 | |
Merck & Co., Inc. | | | 348 | | | | 21,019 | |
Molina Healthcare, Inc.* | | | 67 | | | | 3,425 | |
Mondelez International, Inc., Class A | | | 303 | | | | 11,878 | |
Nestle SA (Switzerland) | | | 309 | | | | 23,200 | |
Novartis AG (Switzerland) | | | 232 | | | | 22,450 | |
Novo Nordisk A/S, Class B (Denmark) | | | 180 | | | | 8,209 | |
OncoMed Pharmaceuticals, Inc.* | | | 100 | | | | 2,203 | |
OPKO Health, Inc.* | | | 300 | | | | 2,514 | |
Orexigen Therapeutics, Inc.* | | | 400 | | | | 2,316 | |
Owens & Minor, Inc. | | | 100 | | | | 3,421 | |
Pfizer, Inc. | | | 828 | | | | 25,792 | |
Philip Morris International, Inc. | | | 200 | | | | 17,387 | |
Pilgrim’s Pride Corp.* | | | 200 | | | | 6,460 | |
Procter & Gamble (The) Co. | | | 313 | | | | 28,304 | |
Raptor Pharmaceutical Corp.* | | | 300 | | | | 2,886 | |
Reckitt Benckiser Group PLC (United Kingdom) | | | 66 | | | | 5,418 | |
Roche Holding AG (Switzerland) | | | 63 | | | | 18,869 | |
SABMiller PLC (United Kingdom) | | | 87 | | | | 4,843 | |
Sanofi (France) | | | 109 | | | | 10,553 | |
Seaboard Corp.* | | | 1 | | | | 3,450 | |
Shire PLC (Ireland) | | | 50 | | | | 3,559 | |
Takeda Pharmaceutical Co. Ltd. (Japan) | | | 100 | | | | 4,188 | |
Teva Pharmaceutical Industries Ltd. (Israel) | | | 76 | | | | 4,325 | |
Tyson Foods, Inc., Class A | | | 100 | | | | 4,234 | |
Unilever NV (Netherlands) | | | 159 | | | | 6,476 | |
Unilever PLC (United Kingdom) | | | 125 | | | | 5,284 | |
| | | | | | | | |
| | | Number
of Shares | | | Value | |
| | | | | | | | |
| Consumer, Non-cyclical (Continued) | | | | | | | | |
UnitedHealth Group, Inc. | | | 130 | | | $ | 12,822 | |
Wesfarmers Ltd. (Australia) | | | 101 | | | | 3,567 | |
Woolworths Ltd. (Australia) | | | 117 | | | | 3,098 | |
| | | | | | | | |
| | | | | | | 575,168 | |
| | | | | | | | |
| Diversified — 0.0% | | | | | | | | |
Hutchison Whampoa Ltd. (Hong Kong) | | | 198 | | | | 2,482 | |
| | | | | | | | |
| Energy — 2.0% | | | | | | | | |
Antero Resources Corp.* | | | 200 | | | | 9,384 | |
BG Group PLC (United Kingdom) | | | 336 | | | | 4,725 | |
BP PLC (United Kingdom) | | | 2,034 | | | | 13,350 | |
Chesapeake Energy Corp. | | | 600 | | | | 12,156 | |
Chevron Corp. | | | 222 | | | | 24,169 | |
Eni S.p.A. (Italy) | | | 231 | | | | 4,616 | |
EOG Resources, Inc. | | | 100 | | | | 8,672 | |
Exxon Mobil Corp. | | | 557 | | | | 50,432 | |
Forum Energy Technologies, Inc.* | | | 100 | | | | 2,401 | |
Geospace Technologies Corp.* | | | 100 | | | | 2,636 | |
ION Geophysical Corp.* | | | 600 | | | | 1,482 | |
Kodiak Oil & Gas Corp.* | | | 200 | | | | 1,466 | |
ONEOK, Inc. | | | 200 | | | | 10,832 | |
Royal Dutch Shell PLC, Class A (United Kingdom) | | | 368 | | | | 12,258 | |
Royal Dutch Shell PLC, Class B (United Kingdom) | | | 230 | | | | 7,986 | |
Schlumberger Ltd. (Netherland Antilles) | | | 149 | | | | 12,807 | |
Statoil ASA (Norway) | | | 111 | | | | 2,096 | |
Targa Resources Corp. | | | 31 | | | | 3,538 | |
Total SA (France) | | | 220 | | | | 12,307 | |
Western Refining, Inc. | | | 100 | | | | 4,111 | |
| | | | | | | | |
| | | | | | | 201,424 | |
| | | | | | | | |
| Financial — 6.1% | | | | | | | | |
AIA Group Ltd. (Hong Kong) | | | 1,032 | | | | 5,962 | |
Allianz SE (Germany) | | | 40 | | | | 6,886 | |
American Express Co. | | | 128 | | | | 11,830 | |
American International Group, Inc. | | | 272 | | | | 14,906 | |
American Realty Capital Properties, Inc. REIT | | | 600 | | | | 5,640 | |
American Tower Corp. REIT | | | 45 | | | | 4,725 | |
AmTrust Financial Services, Inc. | | | 100 | | | | 5,132 | |
Anworth Mortgage Asset Corp. REIT | | | 500 | | | | 2,700 | |
Australia & New Zealand Banking Group Ltd. (Australia) | | | 249 | | | | 6,763 | |
AXA SA (France) | | | 152 | | | | 3,670 | |
Banco Bilbao Vizcaya Argentaria SA (Spain) | | | 514 | | | | 5,521 | |
Banco Santander SA (Spain) | | | 1,200 | | | | 10,817 | |
Bank of America Corp. | | | 1,331 | | | | 22,680 | |
Bank of the Ozarks, Inc. | | | 100 | | | | 3,620 | |
Barclays PLC (United Kingdom) | | | 1,684 | | | | 6,449 | |
Berkshire Hathaway, Inc., Class B* | | | 313 | | | | 46,539 | |
BNP Paribas SA (France) | | | 88 | | | | 5,642 | |
Capital Senior Living Corp.* | | | 100 | | | | 2,545 | |
Charles Schwab (The) Corp. | | | 152 | | | | 4,305 | |
Chubb (The) Corp. | | | 200 | | | | 20,609 | |
Citigroup, Inc. | | | 350 | | | | 18,890 | |
| | | | |
| See Notes to Financial Statements. | | 14 | | |
db-X Exchange-Traded Funds Inc.
Schedule of investments
Deutsche X-trackers 2010 Target Date ETF (Continued)
November 30, 2014 (Unaudited)
| | | | | | | | |
| | | Number
of Shares | | | Value | |
| | | | | | | | |
| Financial (Continued) | | | | | | | | |
CNO Financial Group, Inc. | | | 200 | | | $ | 3,468 | |
Commonwealth Bank of Australia (Australia) | | | 145 | | | | 9,959 | |
Credit Suisse Group AG (Switzerland)* | | | 128 | | | | 3,420 | |
Deutsche Bank AG (Germany) (a) | | | 132 | | | | 4,314 | |
EastGroup Properties, Inc. REIT | | | 100 | | | | 6,722 | |
Employers Holdings, Inc. | | | 100 | | | | 2,028 | |
Equity One, Inc. REIT | | | 73 | | | | 1,769 | |
Equity Residential REIT | | | 300 | | | | 21,252 | |
First American Financial Corp. | | | 100 | | | | 3,201 | |
First Financial Bankshares, Inc. | | | 100 | | | | 3,017 | |
FirstMerit Corp. | | | 100 | | | | 1,789 | |
FXCM, Inc., Class A | | | 200 | | | | 3,220 | |
GAMCO Investors, Inc., Class A | | | 100 | | | | 8,616 | |
Hancock Holding Co. | | | 100 | | | | 3,271 | |
Hanmi Financial Corp. | | | 100 | | | | 2,010 | |
Highwoods Properties, Inc. REIT | | | 54 | | | | 2,331 | |
HSBC Holdings PLC (United Kingdom) | | | 1,776 | | | | 17,671 | |
ING Groep NV (Netherlands)* | | | 381 | | | | 5,581 | |
Investors Bancorp, Inc. | | | 274 | | | | 2,962 | |
JPMorgan Chase & Co. | | | 434 | | | | 26,109 | |
LaSalle Hotel Properties REIT | | | 50 | | | | 2,019 | |
Lloyds Banking Group PLC (United Kingdom)* | | | 5,454 | | | | 6,845 | |
Marsh & McLennan Cos., Inc. | | | 100 | | | | 5,659 | |
MGIC Investment Corp.* | | | 300 | | | | 2,793 | |
Mitsubishi UFJ Financial Group, Inc. (Japan) | | | 1,200 | | | | 6,938 | |
Mizuho Financial Group, Inc. (Japan) | | | 1,913 | | | | 3,295 | |
Muenchener Rueckversicherungs-Gesellschaft AG (Germany) | | | 18 | | | | 3,708 | |
National Australia Bank Ltd. (Australia) | | | 214 | | | | 5,936 | |
National Health Investors, Inc. REIT | | | 100 | | | | 6,628 | |
NewStar Financial, Inc.* | | | 200 | | | | 2,248 | |
Nordea Bank AB (Sweden) | | | 297 | | | | 3,710 | |
Northfield Bancorp, Inc. | | | 200 | | | | 2,818 | |
NorthStar Realty Finance Corp. REIT | | | 300 | | | | 5,481 | |
PacWest Bancorp | | | 100 | | | | 4,650 | |
Prospect Capital Corp. | | | 200 | | | | 1,886 | |
Prosperity Bancshares, Inc. | | | 100 | | | | 5,618 | |
Prudential PLC (United Kingdom) | | | 232 | | | | 5,610 | |
Public Storage REIT | | | 20 | | | | 3,753 | |
Radian Group, Inc. | | | 200 | | | | 3,410 | |
RAIT Financial Trust REIT | | | 300 | | | | 2,217 | |
RLJ Lodging Trust REIT | | | 100 | | | | 3,293 | |
Ryman Hospitality Properties, Inc. REIT | | | 63 | | | | 3,281 | |
Simon Property Group, Inc. REIT | | | 49 | | | | 8,859 | |
Springleaf Holdings, Inc.* | | | 100 | | | | 3,965 | |
Standard Chartered PLC (United Kingdom) | | | 210 | | | | 3,074 | |
Stifel Financial Corp.* | | | 100 | | | | 4,853 | |
Strategic Hotels & Resorts, Inc. REIT* | | | 200 | | | | 2,656 | |
Sumitomo Mitsui Financial Group, Inc. (Japan) | | | 181 | | | | 6,823 | |
Sun Communities, Inc. REIT | | | 100 | | | | 5,889 | |
Sunstone Hotel Investors, Inc. REIT | | | 100 | | | | 1,601 | |
T. Rowe Price Group, Inc. | | | 229 | | | | 19,115 | |
U.S. Bancorp | | | 216 | | | | 9,547 | |
| | | | | | | | |
| | | Number
of Shares | | | Value | |
| | | | | | | | |
| Financial (Continued) | | | | | | | | |
UBS AG (Switzerland)* | | | 337 | | | $ | 6,069 | |
Umpqua Holdings Corp. | | | 200 | | | | 3,398 | |
Urstadt Biddle Properties, Inc., Class A REIT | | | 100 | | | | 2,218 | |
Visa, Inc., Class A | | | 99 | | | | 25,561 | |
Vornado Realty Trust REIT | | | 140 | | | | 15,618 | |
Webster Financial Corp. | | | 100 | | | | 3,147 | |
Wells Fargo & Co. | | | 626 | | | | 34,104 | |
Western Alliance Bancorp* | | | 100 | | | | 2,643 | |
Westpac Banking Corp. (Australia) | | | 300 | | | | 8,309 | |
Weyerhaeuser Co. REIT | | | 400 | | | | 14,124 | |
Zurich Insurance Group AG (Switzerland)* | | | 13 | | | | 4,074 | |
| | | | | | | | |
| | | | | | | 625,984 | |
| | | | | | | | |
| Industrial — 2.7% | | | | | | | | |
3M Co. | | | 100 | | | | 16,009 | |
ABB Ltd. (Switzerland)* | | | 219 | | | | 4,916 | |
Actuant Corp., Class A | | | 100 | | | | 2,936 | |
Acuity Brands, Inc. | | | 109 | | | | 15,063 | |
Airbus Group NV (France) | | | 52 | | | | 3,168 | |
Berry Plastics Group, Inc.* | | | 100 | | | | 2,894 | |
Boeing (The) Co. | | | 87 | | | | 11,690 | |
Caterpillar, Inc. | | | 75 | | | | 7,545 | |
Cognex Corp.* | | | 100 | | | | 4,071 | |
Deutsche Post AG (Germany) | | | 78 | | | | 2,591 | |
Eaton Corp. PLC (Ireland) | | | 55 | | | | 3,731 | |
EMCOR Group, Inc. | | | 100 | | | | 4,335 | |
Emerson Electric Co. | | | 105 | | | | 6,694 | |
FedEx Corp. | | | 35 | | | | 6,236 | |
Fluor Corp. | | | 100 | | | | 6,199 | |
Generac Holdings, Inc.* | | | 100 | | | | 4,338 | |
General Dynamics Corp. | | | 40 | | | | 5,814 | |
General Electric Co. | | | 1,365 | | | | 36,158 | |
Graphic Packaging Holding Co.* | | | 200 | | | | 2,490 | |
Griffon Corp. | | | 200 | | | | 2,490 | |
HEICO Corp. | | | 100 | | | | 5,301 | |
Hitachi Ltd. (Japan) | | | 400 | | | | 3,088 | |
Ingersoll-Rand PLC (Ireland) | | | 248 | | | | 15,639 | |
Koninklijke Philips NV (Netherlands) | | | 90 | | | | 2,714 | |
LSB Industries, Inc.* | | | 100 | | | | 3,307 | |
Middleby (The) Corp.* | | | 50 | | | | 4,782 | |
Mistras Group, Inc.* | | | 100 | | | | 1,709 | |
Parker-Hannifin Corp. | | | 100 | | | | 12,903 | |
Ply Gem Holdings, Inc.* | | | 200 | | | | 2,504 | |
Precision Castparts Corp. | | | 19 | | | | 4,520 | |
Quanex Building Products Corp. | | | 100 | | | | 1,978 | |
Rofin-Sinar Technologies, Inc.* | | | 100 | | | | 2,692 | |
Rolls-Royce Holdings PLC (United Kingdom)* | | | 186 | | | | 2,448 | |
Sanmina Corp.* | | | 100 | | | | 2,460 | |
Schneider Electric SE (France) | | | 58 | | | | 4,731 | |
Siemens AG (Germany) | | | 77 | | | | 9,111 | |
SunPower Corp.* | | | 100 | | | | 2,816 | |
Swift Transportation Co.* | | | 100 | | | | 2,907 | |
TTM Technologies, Inc.* | | | 300 | | | | 2,028 | |
Union Pacific Corp. | | | 108 | | | | 12,611 | |
United Parcel Service, Inc., Class B | | | 107 | | | | 11,762 | |
| | | | |
| See Notes to Financial Statements. | | 15 | | |
db-X Exchange-Traded Funds Inc.
Schedule of investments
Deutsche X-trackers 2010 Target Date ETF (Continued)
November 30, 2014 (Unaudited)
| | | | | | | | |
| | | Number
of Shares | | | Value | |
| | | | | | | | |
| Industrial (Continued) | | | | | | | | |
USG Corp.* | | | 100 | | | $ | 2,881 | |
Vinci SA (France) | | | 48 | | | | 2,595 | |
Watts Water Technologies, Inc., Class A | | | 100 | | | | 6,046 | |
Woodward, Inc. | | | 100 | | | | 5,168 | |
| | | | | | | | |
| | | | | | | 278,069 | |
| | | | | | | | |
| Technology — 3.3% | | | | | | | | |
Acxiom Corp.* | | | 100 | | | | 1,903 | |
Amkor Technology, Inc.* | | | 200 | | | | 1,338 | |
Apple, Inc. | | | 723 | | | | 85,986 | |
Applied Materials, Inc. | | | 800 | | | | 19,240 | |
Aspen Technology, Inc.* | | | 200 | | | | 7,548 | |
Broadcom Corp., Class A | | | 400 | | | | 17,252 | |
Brooks Automation, Inc. | | | 200 | | | | 2,342 | |
Canon, Inc. (Japan) | | | 100 | | | | 3,202 | |
Convergys Corp. | | | 100 | | | | 2,085 | |
Dealertrack Technologies, Inc.* | | | 100 | | | | 4,716 | |
EMC Corp. | | | 242 | | | | 7,345 | |
Engility Holdings, Inc.* | | | 100 | | | | 4,205 | |
Fidelity National Information Services, Inc. | | | 245 | | | | 14,992 | |
Hewlett-Packard Co. | | | 200 | | | | 7,812 | |
Infoblox, Inc.* | | | 200 | | | | 3,600 | |
Intel Corp. | | | 603 | | | | 22,462 | |
International Business Machines Corp. | | | 132 | | | | 21,406 | |
International Rectifier Corp.* | | | 100 | | | | 3,988 | |
Intersil Corp., Class A | | | 100 | | | | 1,311 | |
MAXIMUS, Inc. | | | 100 | | | | 5,239 | |
Mentor Graphics Corp. | | | 100 | | | | 2,221 | |
Microsemi Corp.* | | | 67 | | | | 1,822 | |
Microsoft Corp. | | | 1,020 | | | | 48,767 | |
Oracle Corp. | | | 644 | | | | 27,312 | |
PTC, Inc.* | | | 73 | | | | 2,852 | |
SAP SE (Germany) | | | 110 | | | | 7,753 | |
SS&C Technologies Holdings, Inc. | | | 100 | | | | 5,055 | |
SunEdison, Inc.* | | | 200 | | | | 4,330 | |
| | | | | | | | |
| | | | | | | 338,084 | |
| | | | | | | | |
| Utilities — 0.5% | | | | | | | | |
Dominion Resources, Inc. | | | 167 | | | | 12,116 | |
Duke Energy Corp. | | | 100 | | | | 8,090 | |
Dynegy, Inc.* | | | 100 | | | | 3,315 | |
E.ON SE (Germany) | | | 169 | | | | 2,996 | |
Enel S.p.A. (Italy) | | | 654 | | | | 3,155 | |
GDF Suez (France) | | | 143 | | | | 3,523 | |
National Grid PLC (United Kingdom) | | | 327 | | | | 4,750 | |
PG&E Corp. | | | 300 | | | | 15,150 | |
| | | | | | | | |
| | | | | | | 53,095 | |
| | | | | | | | |
TOTAL COMMON STOCKS
(Cost $2,211,609) | | | | | | | 2,697,150 | |
| | | | | | | | |
| PREFERRED STOCKS — 0.0% | | | | | | | | |
| Consumer, Cyclical — 0.0% | | | | | | | | |
Volkswagen AG (Germany) | | | 15 | | | | 3,454 | |
| | | | | | | | |
| Industrial — 0.0% | | | | | | | | |
Rolls-Royce Holdings PLC, Class C
(United Kingdom)* | | | 16,740 | | | | 26 | |
| | | | | | | | |
TOTAL PREFERRED STOCKS
(Cost $2,540) | | | | | | | 3,480 | |
| | | | | | | | |
| | | | | | | | |
| | | Number
of Shares | | | Value | |
| | | | | | | | |
| RIGHTS — 0.0% | | | | | | | | |
| Communications — 0.0% | | | | | | | | |
Leap Wireless International, Inc. CVR*
(Cost $732) | | | 300 | | | $ | 732 | |
| | | | | | | | |
| | |
| | | Principal
Amount | | | Value | |
| | | | | | | | |
| CORPORATE BONDS — 31.6% | | | | | | | | |
| Basic Materials — 0.9% | | | | | | | | |
Eastman Chemical Co.
3.00%, 12/15/15 | | $ | 35,000 | | | | 35,813 | |
PPG Industries, Inc.
1.90%, 1/15/16 | | | 51,000 | | | | 51,630 | |
| | | | | | | | |
| | | | | | | 87,443 | |
| | | | | | | | |
| Communications — 1.7% | | | | | | | | |
AT&T, Inc.
0.90%, 2/12/16 | | | 23,000 | | | | 22,987 | |
Cisco Systems, Inc.
5.50%, 2/22/16 | | | 70,000 | | | | 74,247 | |
DIRECTV Holdings LLC/DIRECTV Financing Co., Inc.
3.50%, 3/01/16 | | | 49,000 | | | | 50,564 | |
Telefonica Emisiones S.A.U. (Spain)
3.992%, 2/16/16 | | | 24,000 | | | | 24,863 | |
| | | | | | | | |
| | | | | | | 172,661 | |
| | | | | | | | |
| Consumer, Cyclical — 0.5% | | | | | | | | |
Home Depot (The), Inc.
5.40%, 3/01/16 | | | 47,000 | | | | 49,821 | |
| | | | | | | | |
| Consumer, Non-cyclical — 2.2% | | | | | | | | |
Anheuser-Busch InBev Finance, Inc. (Belgium)
0.80%, 1/15/16 | | | 51,000 | | | | 51,171 | |
Bunge Ltd. Finance Corp.
4.10%, 3/15/16 | | | 49,000 | | | | 50,811 | |
Coca-Cola (The) Co.
1.50%, 11/15/15 | | | 51,000 | | | | 51,586 | |
Diageo Finance BV (Netherlands)
5.30%, 10/28/15 | | | 72,000 | | | | 75,043 | |
| | | | | | | | |
| | | | | | | 228,611 | |
| | | | | | | | |
| Energy — 1.2% | | | | | | | | |
BP Capital Markets PLC (United Kingdom)
3.20%, 3/11/16 | | | 49,000 | | | | 50,493 | |
Occidental Petroleum Corp.
2.50%, 2/01/16 | | | 74,000 | | | | 75,509 | |
| | | | | | | | |
| | | | | | | 126,002 | |
| | | | | | | | |
| Financial — 18.2% | | | | | | | | |
American Express Credit Corp., MTN
1.75%, 6/12/15 | | | 51,000 | | | | 51,359 | |
BB&T Corp.
5.20%, 12/23/15 | | | 73,000 | | | | 76,339 | |
BNP Paribas SA, MTN (France)
3.60%, 2/23/16 | | | 73,000 | | | | 75,459 | |
Canadian Imperial Bank of Commerce (Canada)
2.35%, 12/11/15 | | | 75,000 | | | | 76,418 | |
| | | | |
| See Notes to Financial Statements. | | 16 | | |
db-X Exchange-Traded Funds Inc.
Schedule of investments
Deutsche X-trackers 2010 Target Date ETF (Continued)
November 30, 2014 (Unaudited)
| | | | | | | | |
| | | Principal
Amount | | | Value | |
| | | | | | | | |
| Financial (Continued) | | | | | | | | |
Citigroup, Inc.
4.75%, 5/19/15 | | $ | 95,000 | | | $ | 96,831 | |
4.587%, 12/15/15 | | | 59,000 | | | | 61,212 | |
Deutsche Bank AG (Germany)
3.25%, 1/11/16 (a) | | | 50,000 | | | | 51,369 | |
Fifth Third Bancorp
3.625%, 1/25/16 | | | 49,000 | | | | 50,540 | |
General Electric Capital Corp.
2.25%, 11/09/15 | | | 266,000 | | | | 270,622 | |
Goldman Sachs Group (The), Inc.
3.625%, 2/07/16 | | | 232,000 | | | | 239,309 | |
JPMorgan Chase & Co.
2.60%, 1/15/16 | | | 100,000 | | | | 102,166 | |
KFW (Germany)
2.625%, 2/16/16 | | | 12,000 | | | | 12,343 | |
MetLife, Inc.
5.00%, 6/15/15 | | | 144,000 | | | | 147,382 | |
Morgan Stanley
1.75%, 2/25/16 | | | 25,000 | | | | 25,266 | |
National Australia Bank Ltd. (Australia)
1.60%, 8/07/15 | | | 51,000 | | | | 51,432 | |
PNC Funding Corp.
5.25%, 11/15/15 | | | 120,000 | | | | 124,893 | |
Royal Bank of Scotland (The) PLC (United Kingdom)
4.375%, 3/16/16 | | | 48,000 | | | | 50,062 | |
Simon Property Group LP
5.10%, 6/15/15 | | | 99,000 | | | | 101,446 | |
State Street Corp.
2.875%, 3/07/16 | | | 49,000 | | | | 50,418 | |
Westpac Banking Corp. (Australia)
3.00%, 12/09/15 | | | 149,000 | | | | 152,863 | |
| | | | | | | | |
| | | | | | | 1,867,729 | |
| | | | | | | | |
| Government — 1.2% | | | | | | | | |
Corp. Andina de Fomento (Supranational)
3.75%, 1/15/16 | | | 24,000 | | | | 24,862 | |
Inter-American Development Bank (Supranational)
2.25%, 7/15/15 | | | 101,000 | | | | 102,256 | |
| | | | | | | | |
| | | | | | | 127,118 | |
| | | | | | | | |
| Industrial — 1.5% | | | | | | | | |
Ryder System, Inc., MTN
3.60%, 3/01/16 | | | 24,000 | | | | 24,791 | |
Thermo Fisher Scientific, Inc.
3.20%, 3/01/16 | | | 98,000 | | | | 100,809 | |
United Technologies Corp.
4.875%, 5/01/15 | | | 28,000 | | | | 28,528 | |
| | | | | | | | |
| | | | | | | 154,128 | |
| | | | | | | | |
| Technology — 1.2% | | | | | | | | |
Oracle Corp.
5.25%, 1/15/16 | | | 96,000 | | | | 101,151 | |
Texas Instruments, Inc.
0.45%, 8/03/15 | | | 26,000 | | | | 26,028 | |
| | | | | | | | |
| | | | | | | 127,179 | |
| | | | | | | | |
| | | | | | | | |
| | | Principal
Amount | | | Value | |
| | | | | | | | |
| Utilities — 3.0% | | | | | | | | |
Alabama Power Co.
0.55%, 10/15/15 | | $ | 52,000 | | | $ | 52,064 | |
Constellation Energy Group, Inc.
4.55%, 6/15/15 | | | 51,000 | | | | 52,035 | |
Dominion Resources, Inc., Series C
5.15%, 7/15/15 | | | 147,000 | | | | 151,237 | |
LG&E and KU Energy LLC
2.125%, 11/15/15 | | | 25,000 | | | | 25,247 | |
NextEra Energy Capital Holdings, Inc.
2.60%, 9/01/15 | | | 25,000 | | | | 25,371 | |
| | | | | | | | |
| | | | | | | 305,954 | |
| | | | | | | | |
TOTAL CORPORATE BONDS
(Cost $3,247,647) | | | | | | | 3,246,646 | |
| | | | | | | | |
| UNITED STATES GOVERNMENT & AGENCY OBLIGATIONS — 40.6% | | | | | | | | |
| Federal National Mortgage Association — 0.7% | | | | | |
5.00%, 4/15/15 | | | 71,000 | | | | 72,285 | |
| | | | | | | | |
| United States Treasury Bonds/Notes — 39.9% | | | | | |
4.00%, 2/15/15 | | | 610,000 | | | | 614,992 | |
2.50%, 3/31/15 | | | 771,000 | | | | 777,189 | |
4.125%, 5/15/15 | | | 1,022,000 | | | | 1,041,162 | |
0.25%, 5/31/15 | | | 87,000 | | | | 87,102 | |
2.125%, 5/31/15 | | | 136,000 | | | | 137,413 | |
1.75%, 7/31/15 | | | 421,000 | | | | 425,638 | |
4.25%, 8/15/15 | | | 242,000 | | | | 249,109 | |
1.25%, 9/30/15 | | | 443,000 | | | | 447,188 | |
4.50%, 11/15/15 | | | 36,000 | | | | 37,491 | |
0.375%, 1/15/16 | | | 61,000 | | | | 61,138 | |
1.00%, 8/31/16 | | | 37,000 | | | | 37,399 | |
0.625%, 12/15/16 | | | 107,000 | | | | 107,259 | |
3.00%, 2/28/17 | | | 67,000 | | | | 70,596 | |
| | | | | | | | |
| | | | | | | 4,093,676 | |
| | | | | | | | |
TOTAL UNITED STATES GOVERNMENT & AGENCY OBLIGATIONS
(Cost $4,163,362) | | | | | | | 4,165,961 | |
| | | | | | | | |
| SOVEREIGN BOND — 1.0% | | | | | | | | |
Poland Government International Bond (Poland)
3.875%, 7/16/15
(Cost $101,234) | | | 99,000 | | | | 101,327 | |
| | | | | | | | |
| | |
TOTAL INVESTMENTS — 99.5% (Cost $9,727,124) | | | | | | $ | 10,215,296 | |
Other assets less liabilities — 0.5% | | | | | | | 53,761 | |
| | | | | | | | |
NET ASSETS — 100.0% | | | | | | $ | 10,269,057 | |
| | | | | | | | |
CVR – Contingent Value Rights.
MTN – Medium Term Note.
REIT – Real Estate Investment Trust.
* Non-income producing security.
(a) Affiliated issuer. This security is owned in proportion with its representation in the index.
| | | | |
| See Notes to Financial Statements. | | 17 | | |
db-X Exchange-Traded Funds Inc.
Schedule of investments
Deutsche X-trackers 2020 Target Date ETF
November 30, 2014 (Unaudited)
| | | | | | | | |
| | | Number
of Shares | | | Value | |
| | | | | | | | |
| COMMON STOCKS — 48.2% | | | | | | | | |
| Basic Materials — 2.0% | | | | | | | | |
Air Liquide SA (France) | | | 192 | | | $ | 24,161 | |
Anglo American PLC (United Kingdom) | | | 649 | | | | 13,397 | |
Axiall Corp. | | | 400 | | | | 17,312 | |
BASF SE (Germany) | | | 464 | | | | 42,124 | |
BHP Billiton Ltd. (Australia) | | | 1,505 | | | | 39,597 | |
BHP Billiton PLC (United Kingdom) | | | 1,106 | | | | 26,207 | |
Chemtura Corp* | | | 300 | | | | 6,990 | |
Dow Chemical (The) Co. | | | 849 | | | | 41,321 | |
E.I. du Pont de Nemours & Co. | | | 639 | | | | 45,625 | |
Freeport-McMoRan, Inc. | | | 712 | | | | 19,117 | |
Glencore PLC (Switzerland)* | | | 4,866 | | | | 24,353 | |
KapStone Paper and Packaging Corp.* | | | 400 | | | | 11,948 | |
Linde AG (Germany) | | | 106 | | | | 20,002 | |
Monsanto Co. | | | 389 | | | | 46,644 | |
PolyOne Corp. | | | 500 | | | | 18,650 | |
Rio Tinto PLC (United Kingdom) | | | 587 | | | | 27,438 | |
Schnitzer Steel Industries, Inc., Class A | | | 400 | | | | 9,120 | |
Sensient Technologies Corp. | | | 186 | | | | 10,965 | |
Sherwin-Williams (The) Co. | | | 410 | | | | 100,392 | |
Syngenta AG (Switzerland) | | | 51 | | | | 16,800 | |
U.S. Silica Holdings, Inc. | | | 200 | | | | 6,284 | |
| | | | | | | | |
| | | | | | | 568,447 | |
| | | | | | | | |
| Communications — 4.5% | | | | | | | | |
8x8, Inc.* | | | 1,700 | | | | 13,226 | |
Amazon.com, Inc.* | | | 260 | | | | 88,046 | |
Angie’s List, Inc.* | | | 1,200 | | | | 7,128 | |
ARRIS Group, Inc.* | | | 542 | | | | 16,135 | |
AT&T, Inc. | | | 3,423 | | | | 121,106 | |
Bankrate, Inc.* | | | 414 | | | | 4,840 | |
BT Group PLC (United Kingdom) | | | 4,212 | | | | 26,988 | |
Cisco Systems, Inc. | | | 3,032 | | | | 83,805 | |
Comcast Corp., Class A | | | 1,504 | | | | 85,788 | |
Consolidated Communications Holdings, Inc. | | | 114 | | | | 3,125 | |
Deutsche Telekom AG (Germany) | | | 1,631 | | | | 27,785 | |
DigitalGlobe, Inc.* | | | 400 | | | | 10,804 | |
Finisar Corp.* | | | 383 | | | | 6,530 | |
Google, Inc., Class A* | | | 200 | | | | 109,816 | |
Google, Inc., Class C* | | | 210 | | | | 113,784 | |
Harmonic, Inc.* | | | 2,100 | | | | 14,700 | |
HealthStream, Inc.* | | | 500 | | | | 14,325 | |
Houghton Mifflin Harcourt Co.* | | | 500 | | | | 9,610 | |
Perficient, Inc.* | | | 600 | | | | 10,386 | |
Sinclair Broadcast Group, Inc., Class A | | | 300 | | | | 8,748 | |
SoftBank Corp. (Japan) | | | 537 | | | | 36,020 | |
Telefonaktiebolaget LM Ericsson, Class B (Sweden) | | | 1,678 | | | | 21,131 | |
Thomson Reuters Corp. (Canada) | | | 599 | | | | 23,887 | |
Time Warner, Inc. | | | 600 | | | | 51,072 | |
Twenty-First Century Fox, Inc., Class A | | | 1,500 | | | | 55,200 | |
Ubiquiti Networks, Inc. | | | 300 | | | | 8,670 | |
Verizon Communications, Inc. | | | 2,577 | | | | 130,370 | |
Vodafone Group PLC (United Kingdom) | | | 12,526 | | | | 45,774 | |
Walt Disney (The) Co. | | | 1,122 | | | | 103,797 | |
WPP PLC (United Kingdom) | | | 663 | | | | 13,877 | |
| | | | | | | | |
| | | Number
of Shares | | | Value | |
| | | | | | | | |
| Communications (Continued) | | | | | | | | |
Yelp, Inc.* | | | 300 | | | $ | 17,127 | |
Zillow, Inc., Class A* | | | 176 | | | | 20,831 | |
| | | | | | | | |
| | | | | | | 1,304,431 | |
| | | | | | | | |
| Consumer, Cyclical — 4.7% | | | | | | | | |
AMC Entertainment Holdings, Inc., Class A | | | 400 | | | | 10,488 | |
American Airlines Group, Inc. | | | 400 | | | | 19,412 | |
Bayerische Motoren Werke AG (Germany) | | | 183 | | | | 20,923 | |
Beacon Roofing Supply, Inc.* | | | 200 | | | | 5,416 | |
Brunswick Corp. | | | 500 | | | | 24,840 | |
Carnival Corp. | | | 400 | | | | 17,664 | |
Cie Financiere Richemont SA (Switzerland) | | | 285 | | | | 26,797 | |
Columbia Sportswear Co. | | | 206 | | | | 9,280 | |
Compass Group PLC (United Kingdom) | | | 979 | | | | 16,668 | |
CVS Health Corp. | | | 873 | | | | 79,757 | |
Daimler AG (Germany) | | | 487 | | | | 41,057 | |
Federal-Mogul Holdings Corp.* | | | 500 | | | | 7,760 | |
Ford Motor Co. | | | 2,348 | | | | 36,934 | |
Genesco, Inc.* | | | 100 | | | | 8,137 | |
Group 1 Automotive, Inc. | | | 100 | | | | 8,951 | |
Hennes & Mauritz AB, Class B (Sweden) | | | 506 | | | | 21,674 | |
Hilton Worldwide Holdings, Inc.* | | | 600 | | | | 15,732 | |
Home Depot (The), Inc. | | | 885 | | | | 87,969 | |
Honda Motor Co. Ltd. (Japan) | | | 796 | | | | 23,947 | |
HSN, Inc. | | | 300 | | | | 21,879 | |
Inditex SA (Spain) | | | 615 | | | | 17,906 | |
JetBlue Airways Corp.* | | | 1,100 | | | | 16,093 | |
Kate Spade & Co.* | | | 600 | | | | 19,218 | |
Kohl’s Corp. | | | 100 | | | | 5,962 | |
Las Vegas Sands Corp. | | | 500 | | | | 31,845 | |
Lennar Corp., Class A | | | 800 | | | | 37,792 | |
LVMH Moet Hennessy Louis Vuitton SA (France) | | | 139 | | | | 24,975 | |
Macy’s, Inc. | | | 200 | | | | 12,982 | |
Marriott Vacations Worldwide Corp. | | | 200 | | | | 14,702 | |
McDonald’s Corp. | | | 700 | | | | 67,767 | |
Men’s Wearhouse (The), Inc. | | | 161 | | | | 7,522 | |
Mitsubishi Corp. (Japan) | | | 631 | | | | 11,933 | |
Mitsui & Co. Ltd. (Japan) | | | 800 | | | | 11,035 | |
Mobile Mini, Inc. | | | 300 | | | | 12,447 | |
NIKE, Inc., Class B | | | 582 | | | | 57,787 | |
Office Depot, Inc.* | | | 2,200 | | | | 14,586 | |
Panasonic Corp. (Japan) | | | 1,000 | | | | 12,909 | |
Penske Automotive Group, Inc. | | | 300 | | | | 14,205 | |
Restoration Hardware Holdings, Inc.* | | | 200 | | | | 16,894 | |
Rite Aid Corp.* | | | 3,800 | | | | 20,824 | |
Skechers U.S.A., Inc., Class A* | | | 100 | | | | 6,141 | |
Spirit Airlines, Inc.* | | | 200 | | | | 16,538 | |
Standard Pacific Corp.* | | | 1,100 | | | | 8,305 | |
Tenneco, Inc.* | | | 200 | | | | 10,870 | |
Tesla Motors, Inc.* | | | 100 | | | | 24,452 | |
Toyota Motor Corp. (Japan) | | | 1,425 | | | | 87,795 | |
UniFirst Corp. | | | 100 | | | | 11,159 | |
Walgreen Co. | | | 642 | | | | 44,048 | |
Wal-Mart Stores, Inc. | | | 2,310 | | | | 202,217 | |
| | | | | | | | |
| | | | | | | 1,346,194 | |
| | | | | | | | |
| | | | |
| See Notes to Financial Statements. | | 18 | | |
db-X Exchange-Traded Funds Inc.
Schedule of investments
Deutsche X-trackers 2020 Target Date ETF (Continued)
November 30, 2014 (Unaudited)
| | | | | | | | |
| | | Number
of Shares | | | Value | |
| | | | | | | | |
| Consumer, Non-cyclical — 10.4% | | | | | | | | |
Accuray, Inc.* | | | 1,500 | | | $ | 10,335 | |
Affymetrix, Inc.* | | | 1,400 | | | | 12,782 | |
Align Technology, Inc.* | | | 328 | | | | 18,663 | |
Alnylam Pharmaceuticals, Inc.* | | | 300 | | | | 30,165 | |
Amgen, Inc. | | | 539 | | | | 89,102 | |
AmSurg Corp.* | | | 87 | | | | 4,487 | |
Anheuser-Busch InBev NV (Belgium) | | | 400 | | | | 46,983 | |
Anika Therapeutics, Inc.* | | | 200 | | | | 8,178 | |
AstraZeneca PLC (United Kingdom) | | | 603 | | | | 45,022 | |
Bayer AG (Germany) | | | 418 | | | | 62,866 | |
British American Tobacco PLC (United Kingdom) | | | 916 | | | | 54,292 | |
Capella Education Co. | | | 200 | | | | 13,636 | |
Cardinal Health, Inc. | | | 1,280 | | | | 105,203 | |
Centene Corp.* | | | 312 | | | | 30,816 | |
Coca-Cola Bottling Co. Consolidated | | | 200 | | | | 18,912 | |
Coca-Cola (The) Co. | | | 2,823 | | | | 126,555 | |
CONMED Corp. | | | 100 | | | | 4,243 | |
CoStar Group, Inc.* | | | 142 | | | | 24,177 | |
CSL Ltd. (Australia) | | | 277 | | | | 19,462 | |
Darling Ingredients, Inc.* | | | 471 | | | | 8,761 | |
Deluxe Corp. | | | 100 | | | | 5,845 | |
Diageo PLC (United Kingdom) | | | 1,208 | | | | 37,380 | |
Ensign Group (The), Inc. | | | 400 | | | | 15,768 | |
Euronet Worldwide, Inc.* | | | 300 | | | | 17,421 | |
Foundation Medicine, Inc.* | | | 400 | | | | 9,448 | |
FTI Consulting, Inc.* | | | 86 | | | | 3,334 | |
Gilead Sciences, Inc.* | | | 960 | | | | 96,307 | |
GlaxoSmithKline PLC (United Kingdom) | | | 2,391 | | | | 55,461 | |
Haemonetics Corp.* | | | 100 | | | | 3,693 | |
Hain Celestial Group (The), Inc.* | | | 214 | | | | 24,229 | |
Humana, Inc. | | | 609 | | | | 84,024 | |
Impax Laboratories, Inc.* | | | 400 | | | | 12,780 | |
Imperial Tobacco Group PLC (United Kingdom) | | | 466 | | | | 21,546 | |
Integra LifeSciences Holdings Corp.* | | | 100 | | | | 4,924 | |
Intercept Pharmaceuticals, Inc.* | | | 100 | | | | 14,373 | |
Isis Pharmaceuticals, Inc.* | | | 500 | | | | 25,895 | |
Johnson & Johnson | | | 1,832 | | | | 198,315 | |
Kellogg Co. | | | 200 | | | | 13,250 | |
Kindred Healthcare, Inc. | | | 200 | | | | 3,978 | |
LDR Holding Corp.* | | | 500 | | | | 16,315 | |
Live Nation Entertainment, Inc.* | | | 836 | | | | 22,405 | |
Magellan Health, Inc.* | | | 92 | | | | 5,629 | |
MannKind Corp.* | | | 1,600 | | | | 9,840 | |
McGraw Hill Financial, Inc. | | | 1,100 | | | | 102,806 | |
Medicines (The) Co.* | | | 200 | | | | 5,362 | |
Merck & Co., Inc. | | | 1,812 | | | | 109,445 | |
Molina Healthcare, Inc.* | | | 150 | | | | 7,668 | |
Mondelez International, Inc., Class A | | | 1,270 | | | | 49,783 | |
Nestle SA (Switzerland) | | | 1,601 | | | | 120,209 | |
Novartis AG (Switzerland) | | | 1,126 | | | | 108,958 | |
Novo Nordisk A/S, Class B (Denmark) | | | 972 | | | | 44,330 | |
OncoMed Pharmaceuticals, Inc.* | | | 600 | | | | 13,218 | |
OPKO Health, Inc.* | | | 1,600 | | | | 13,408 | |
Orexigen Therapeutics, Inc.* | | | 2,100 | | | | 12,159 | |
Owens & Minor, Inc. | | | 300 | | | | 10,263 | |
| | | | | | | | |
| | | Number
of Shares | | | Value | |
| | | | | | | | |
| Consumer, Non-cyclical (Continued) | | | | | | | | |
Pfizer, Inc. | | | 4,056 | | | $ | 126,344 | |
Philip Morris International, Inc. | | | 1,100 | | | | 95,623 | |
Pilgrim’s Pride Corp.* | | | 784 | | | | 25,323 | |
Procter & Gamble (The) Co. | | | 1,800 | | | | 162,775 | |
Raptor Pharmaceutical Corp.* | | | 1,200 | | | | 11,544 | |
Reckitt Benckiser Group PLC (United Kingdom) | | | 325 | | | | 26,677 | |
Roche Holding AG (Switzerland) | | | 338 | | | | 101,234 | |
SABMiller PLC (United Kingdom) | | | 476 | | | | 26,499 | |
Sanofi (France) | | | 612 | | | | 59,251 | |
Seaboard Corp.* | | | 7 | | | | 24,150 | |
Shire PLC (Ireland) | | | 257 | | | | 18,293 | |
Spectrum Brands Holdings, Inc. | | | 186 | | | | 17,106 | |
Takeda Pharmaceutical Co. Ltd. (Japan) | | | 485 | | | | 20,313 | |
Teva Pharmaceutical Industries Ltd. (Israel) | | | 395 | | | | 22,477 | |
Tyson Foods, Inc., Class A | | | 200 | | | | 8,468 | |
Unilever NV (Netherlands) | | | 907 | | | | 36,942 | |
Unilever PLC (United Kingdom) | | | 712 | | | | 30,095 | |
UnitedHealth Group, Inc. | | | 563 | | | | 55,529 | |
WellCare Health Plans, Inc.* | | | 200 | | | | 14,748 | |
Wesfarmers Ltd. (Australia) | | | 526 | | | | 18,529 | |
WEX, Inc.* | | | 200 | | | | 22,616 | |
Woolworths Ltd. (Australia) | | | 604 | | | | 15,994 | |
| | | | | | | | |
| | | | | | | 2,974,939 | |
| | | | | | | | |
| Diversified — 0.0% | | | | | | | | |
Hutchison Whampoa Ltd. (Hong Kong) | | | 1,264 | | | | 15,842 | |
| | | | | | | | |
| Energy — 3.6% | | | | | | | | |
Antero Resources Corp.* | | | 1,200 | | | | 56,304 | |
BG Group PLC (United Kingdom) | | | 1,882 | | | | 26,463 | |
BP PLC (United Kingdom) | | | 9,318 | | | | 61,159 | |
Bristow Group, Inc. | | | 150 | | | | 9,615 | |
Chesapeake Energy Corp. | | | 3,100 | | | | 62,806 | |
Chevron Corp. | | | 1,200 | | | | 130,644 | |
Diamondback Energy, Inc.* | | | 200 | | | | 11,280 | |
Eni S.p.A (Italy) | | | 1,409 | | | | 28,155 | |
EOG Resources, Inc. | | | 300 | | | | 26,016 | |
Exxon Mobil Corp. | | | 2,852 | | | | 258,220 | |
Forum Energy Technologies, Inc.* | | | 300 | | | | 7,203 | |
Geospace Technologies Corp.* | | | 200 | | | | 5,272 | |
ION Geophysical Corp.* | | | 3,000 | | | | 7,410 | |
Kodiak Oil & Gas Corp.* | | | 900 | | | | 6,597 | |
ONEOK, Inc. | | | 800 | | | | 43,328 | |
Rosetta Resources, Inc.* | | | 200 | | | | 5,884 | |
Royal Dutch Shell PLC, Class A (United Kingdom) | | | 1,907 | | | | 63,522 | |
Royal Dutch Shell PLC, Class B (United Kingdom) | | | 1,192 | | | | 41,390 | |
Schlumberger Ltd. (Netherland Antilles) | | | 730 | | | | 62,744 | |
Statoil ASA (Norway) | | | 605 | | | | 11,427 | |
Targa Resources Corp. | | | 214 | | | | 24,426 | |
Total SA (France) | | | 1,165 | | | | 65,174 | |
Western Refining, Inc. | | | 300 | | | | 12,333 | |
| | | | | | | | |
| | | | | | | 1,027,372 | |
| | | | | | | | |
| | | | |
| See Notes to Financial Statements. | | 19 | | |
db-X Exchange-Traded Funds Inc.
Schedule of investments
Deutsche X-trackers 2020 Target Date ETF (Continued)
November 30, 2014 (Unaudited)
| | | | | | | | |
| | | Number
of Shares | | | Value | |
| | | | | | | | |
| Financial — 11.2% | | | | | | | | |
AIA Group Ltd. (Hong Kong) | | | 6,657 | | | $ | 38,456 | |
Allianz SE (Germany) | | | 209 | | | | 35,981 | |
American Express Co. | | | 613 | | | | 56,653 | |
American International Group, Inc. | | | 1,069 | | | | 58,581 | |
American Realty Capital Properties, Inc. REIT | | | 3,300 | | | | 31,020 | |
American Tower Corp. REIT | | | 296 | | | | 31,083 | |
AmTrust Financial Services, Inc. | | | 330 | | | | 16,936 | |
Anworth Mortgage Asset Corp. REIT | | | 2,400 | | | | 12,960 | |
Aon PLC (United Kingdom) | | | 200 | | | | 18,498 | |
Australia & New Zealand Banking Group Ltd. (Australia) | | | 1,355 | | | | 36,803 | |
AXA SA (France) | | | 947 | | | | 22,862 | |
Banco Bilbao Vizcaya Argentaria SA (Spain) | | | 3,075 | | | | 33,029 | |
Banco Santander SA (Spain) | | | 6,153 | | | | 55,461 | |
Bank of America Corp. | | | 6,648 | | | | 113,282 | |
Bank of the Ozarks, Inc. | | | 300 | | | | 10,860 | |
Barclays PLC (United Kingdom) | | | 7,878 | | | | 30,167 | |
Berkshire Hathaway, Inc., Class B* | | | 1,621 | | | | 241,026 | |
BNP Paribas SA (France) | | | 556 | | | | 35,647 | |
Capital Senior Living Corp.* | | | 500 | | | | 12,725 | |
Charles Schwab (The) Corp. | | | 982 | | | | 27,810 | |
Chubb (The) Corp. | | | 1,000 | | | | 103,050 | |
Citigroup, Inc. | | | 1,837 | | | | 99,143 | |
CNO Financial Group, Inc. | | | 1,100 | | | | 19,074 | |
Cohen & Steers, Inc. | | | 100 | | | | 4,327 | |
Commonwealth Bank of Australia (Australia) | | | 787 | | | | 54,055 | |
Credit Acceptance Corp.* | | | 125 | | | | 18,719 | |
Credit Suisse Group AG (Switzerland)* | | | 796 | | | | 21,271 | |
Deutsche Bank AG (Germany) (a) | | | 580 | | | | 18,957 | |
EastGroup Properties, Inc. REIT | | | 200 | | | | 13,444 | |
Employers Holdings, Inc. | | | 500 | | | | 10,140 | |
EPR Properties REIT | | | 300 | | | | 16,797 | |
Equity One, Inc. REIT | | | 517 | | | | 12,527 | |
Equity Residential REIT | | | 1,500 | | | | 106,261 | |
Evercore Partners, Inc., Class A | | | 100 | | | | 5,050 | |
Financial Engines, Inc. | | | 200 | | | | 6,536 | |
First American Financial Corp. | | | 600 | | | | 19,206 | |
First Financial Bankshares, Inc. | | | 400 | | | | 12,068 | |
FirstMerit Corp. | | | 800 | | | | 14,312 | |
FXCM, Inc., Class A | | | 900 | | | | 14,490 | |
GAMCO Investors, Inc., Class A | | | 100 | | | | 8,616 | |
Hancock Holding Co. | | | 328 | | | | 10,729 | |
Hanmi Financial Corp. | | | 800 | | | | 16,080 | |
Highwoods Properties, Inc. REIT | | | 301 | | | | 12,991 | |
HSBC Holdings PLC (United Kingdom) | | | 9,203 | | | | 91,569 | |
ING Groep NV (Netherlands)* | | | 2,133 | | | | 31,244 | |
Investors Bancorp, Inc. | | | 1,372 | | | | 14,831 | |
JPMorgan Chase & Co. | | | 2,341 | | | | 140,834 | |
LaSalle Hotel Properties REIT | | | 400 | | | | 16,148 | |
Lloyds Banking Group PLC (United Kingdom)* | | | 23,572 | | | | 29,585 | |
MarketAxess Holdings, Inc. | | | 200 | | | | 13,114 | |
Marsh & McLennan Cos., Inc. | | | 300 | | | | 16,977 | |
MGIC Investment Corp.* | | | 1,400 | | | | 13,034 | |
| | | | | | | | |
| | | Number
of Shares | | | Value | |
| | | | | | | | |
| Financial (Continued) | | | | | | | | |
Mitsubishi UFJ Financial Group, Inc. (Japan) | | | 6,453 | | | $ | 37,311 | |
Mizuho Financial Group, Inc. (Japan) | | | 11,650 | | | | 20,068 | |
Muenchener Rueckversicherungs-Gesellschaft AG (Germany) | | | 101 | | | | 20,804 | |
National Australia Bank Ltd. (Australia) | | | 1,116 | | | | 30,957 | |
National Health Investors, Inc. REIT | | | 200 | | | | 13,256 | |
NewStar Financial, Inc.* | | | 900 | | | | 10,116 | |
Nordea Bank AB (Sweden) | | | 1,537 | | | | 19,201 | |
Northfield Bancorp, Inc. | | | 1,000 | | | | 14,090 | |
NorthStar Realty Finance Corp. REIT | | | 1,400 | | | | 25,578 | |
PacWest Bancorp | | | 300 | | | | 13,950 | |
PRA Group, Inc.* | | | 300 | | | | 17,556 | |
Prospect Capital Corp. | | | 1,200 | | | | 11,316 | |
Prosperity Bancshares, Inc. | | | 300 | | | | 16,854 | |
Prudential PLC (United Kingdom) | | | 1,203 | | | | 29,088 | |
Public Storage REIT | | | 100 | | | | 18,763 | |
Radian Group, Inc. | | | 800 | | | | 13,640 | |
RAIT Financial Trust REIT | | | 1,500 | | | | 11,085 | |
RLJ Lodging Trust REIT | | | 600 | | | | 19,758 | |
Ryman Hospitality Properties, Inc. REIT | | | 182 | | | | 9,479 | |
Simon Property Group, Inc. REIT | | | 228 | | | | 41,222 | |
Sovran Self Storage, Inc. REIT | | | 167 | | | | 14,198 | |
Springleaf Holdings, Inc.* | | | 400 | | | | 15,860 | |
Standard Chartered PLC (United Kingdom) | | | 1,336 | | | | 19,556 | |
Stifel Financial Corp.* | | | 300 | | | | 14,559 | |
Strategic Hotels & Resorts, Inc. REIT* | | | 1,100 | | | | 14,608 | |
Sumitomo Mitsui Financial Group, Inc. (Japan) | | | 605 | | | | 22,806 | |
Sun Communities, Inc. REIT | | | 200 | | | | 11,778 | |
Sunstone Hotel Investors, Inc. REIT | | | 700 | | | | 11,207 | |
T. Rowe Price Group, Inc. | | | 1,205 | | | | 100,581 | |
U.S. Bancorp | | | 1,084 | | | | 47,913 | |
UBS AG (Switzerland)* | | | 2,002 | | | | 36,052 | |
UMB Financial Corp. | | | 100 | | | | 5,549 | |
Umpqua Holdings Corp. | | | 800 | | | | 13,592 | |
Urstadt Biddle Properties, Inc., Class A REIT | | | 600 | | | | 13,308 | |
Visa, Inc., Class A | | | 479 | | | | 123,673 | |
Vornado Realty Trust REIT | | | 780 | | | | 87,017 | |
Webster Financial Corp. | | | 500 | | | | 15,735 | |
Wells Fargo & Co. | | | 3,315 | | | | 180,600 | |
Western Alliance Bancorp* | | | 300 | | | | 7,929 | |
Westpac Banking Corp. (Australia) | | | 1,521 | | | | 42,127 | |
Weyerhaeuser Co. REIT | | | 2,300 | | | | 81,213 | |
Zurich Insurance Group AG (Switzerland)* | | | 82 | | | | 25,697 | |
| | | | | | | | |
| | | | | | | 3,204,669 | |
| | | | | | | | |
| Industrial — 5.0% | | | | | | | | |
3M Co. | | | 400 | | | | 64,036 | |
ABB Ltd. (Switzerland)* | | | 1,209 | | | | 27,139 | |
Actuant Corp., Class A | | | 200 | | | | 5,872 | |
Acuity Brands, Inc. | | | 217 | | | | 29,989 | |
Airbus Group NV (France) | | | 324 | | | | 19,739 | |
Belden, Inc. | | | 100 | | | | 7,303 | |
Berry Plastics Group, Inc.* | | | 400 | | | | 11,576 | |
Boeing (The) Co. | | | 563 | | | | 75,646 | |
| | | | |
| See Notes to Financial Statements. | | 20 | | |
db-X Exchange-Traded Funds Inc.
Schedule of investments
Deutsche X-trackers 2020 Target Date ETF (Continued)
November 30, 2014 (Unaudited)
| | | | | | | | |
| | | Number
of Shares | | | Value | |
| | | | | | | | |
| Industrial (Continued) | | | | | | | | |
Caterpillar, Inc. | | | 474 | | | $ | 47,684 | |
CLARCOR, Inc. | | | 100 | | | | 6,589 | |
Cognex Corp.* | | | 300 | | | | 12,213 | |
Deutsche Post AG (Germany) | | | 482 | | | | 16,012 | |
East Japan Railway Co. (Japan) | | | 114 | | | | 8,544 | |
Eaton Corp. PLC (Ireland) | | | 354 | | | | 24,012 | |
EMCOR Group, Inc. | | | 256 | | | | 11,098 | |
Emerson Electric Co. | | | 519 | | | | 33,086 | |
EnerSys | | | 205 | | | | 12,450 | |
Esterline Technologies Corp.* | | | 100 | | | | 11,883 | |
FANUC Corp. (Japan) | | | 154 | | | | 25,970 | |
FedEx Corp. | | | 181 | | | | 32,251 | |
FEI Co. | | | 187 | | | | 16,015 | |
Fluor Corp. | | | 700 | | | | 43,393 | |
Generac Holdings, Inc.* | | | 300 | | | | 13,014 | |
General Dynamics Corp. | | | 254 | | | | 36,921 | |
General Electric Co. | | | 6,835 | | | | 181,060 | |
Graphic Packaging Holding Co.* | | | 1,470 | | | | 18,302 | |
Griffon Corp. | | | 1,100 | | | | 13,695 | |
Haynes International, Inc. | | | 200 | | | | 8,978 | |
HEICO Corp. | | | 200 | | | | 10,602 | |
Hitachi Ltd. (Japan) | | | 2,498 | | | | 19,285 | |
Ingersoll-Rand PLC (Ireland) | | | 1,080 | | | | 68,105 | |
Koninklijke Philips NV (Netherlands) | | | 508 | | | | 15,321 | |
LSB Industries, Inc.* | | | 100 | | | | 3,307 | |
Middleby (The) Corp.* | | | 216 | | | | 20,658 | |
Mistras Group, Inc.* | | | 500 | | | | 8,545 | |
Parker-Hannifin Corp. | | | 700 | | | | 90,322 | |
Ply Gem Holdings, Inc.* | | | 1,200 | | | | 15,024 | |
Precision Castparts Corp. | | | 100 | | | | 23,790 | |
Quanex Building Products Corp. | | | 700 | | | | 13,846 | |
Rofin-Sinar Technologies, Inc.* | | | 500 | | | | 13,460 | |
Rolls-Royce Holdings PLC (United Kingdom)* | | | 1,028 | | | | 13,528 | |
Sanmina Corp.* | | | 300 | | | | 7,380 | |
Schneider Electric SE (France) | | | 303 | | | | 24,716 | |
Siemens AG (Germany) | | | 437 | | | | 51,709 | |
SunPower Corp.* | | | 500 | | | | 14,080 | |
Swift Transportation Co.* | | | 500 | | | | 14,535 | |
TTM Technologies, Inc.* | | | 1,600 | | | | 10,816 | |
Union Pacific Corp. | | | 577 | | | | 67,376 | |
United Parcel Service, Inc., Class B | | | 609 | | | | 66,940 | |
USG Corp.* | | | 500 | | | | 14,405 | |
Vinci SA (France) | | | 259 | | | | 14,001 | |
Watts Water Technologies, Inc., Class A | | | 200 | | | | 12,092 | |
Woodward, Inc. | | | 228 | | | | 11,783 | |
| | | | | | | | |
| | | | | | | 1,440,096 | |
| | | | | | | | |
| Technology — 5.9% | | | | | | | | |
Acxiom Corp.* | | | 300 | | | | 5,709 | |
Amkor Technology, Inc.* | | | 900 | | | | 6,021 | |
Apple, Inc. | | | 3,772 | | | | 448,604 | |
Applied Materials, Inc. | | | 4,200 | | | | 101,010 | |
Aspen Technology, Inc.* | | | 400 | | | | 15,096 | |
athenahealth, Inc.* | | | 114 | | | | 13,372 | |
Broadcom Corp., Class A | | | 1,900 | | | | 81,947 | |
Brooks Automation, Inc. | | | 1,200 | | | | 14,052 | |
| | | | | | | | |
| | | Number
of Shares | | | Value | |
| | | | | | | | |
| Technology (Continued) | | | | | | | | |
Canon, Inc. (Japan) | | | 567 | | | $ | 18,157 | |
Computer Programs & Systems, Inc. | | | 300 | | | | 17,622 | |
Convergys Corp. | | | 442 | | | | 9,216 | |
Dealertrack Technologies, Inc.* | | | 200 | | | | 9,432 | |
EMC Corp. | | | 1,483 | | | | 45,009 | |
Engility Holdings, Inc.* | | | 300 | | | | 12,615 | |
Entegris, Inc.* | | | 500 | | | | 6,735 | |
Fidelity National Information Services, Inc. | | | 1,130 | | | | 69,145 | |
Hewlett-Packard Co. | | | 1,200 | | | | 46,872 | |
Infoblox, Inc.* | | | 1,000 | | | | 18,000 | |
Intel Corp. | | | 2,684 | | | | 99,979 | |
International Business Machines Corp. | | | 696 | | | | 112,870 | |
International Rectifier Corp.* | | | 300 | | | | 11,964 | |
Intersil Corp., Class A | | | 500 | | | | 6,555 | |
MAXIMUS, Inc. | | | 200 | | | | 10,478 | |
Mentor Graphics Corp. | | | 477 | | | | 10,594 | |
Microsemi Corp.* | | | 400 | | | | 10,880 | |
Microsoft Corp. | | | 5,177 | | | | 247,512 | |
Oracle Corp. | | | 3,018 | | | | 127,993 | |
PTC, Inc.* | | | 512 | | | | 20,004 | |
SAP SE (Germany) | | | 448 | | | | 31,575 | |
SS&C Technologies Holdings, Inc. | | | 400 | | | | 20,220 | |
SunEdison, Inc.* | | | 900 | | | | 19,485 | |
SYNNEX Corp. | | | 114 | | | | 8,144 | |
Syntel, Inc.* | | | 228 | | | | 10,146 | |
Ultimate Software Group (The), Inc.* | | | 142 | | | | 20,908 | |
| | | | | | | | |
| | | | | | | 1,707,921 | |
| | | | | | | | |
| Utilities — 0.9% | | | | | | | | |
Chesapeake Utilities Corp. | | | 150 | | | | 6,740 | |
Cleco Corp. | | | 186 | | | | 9,994 | |
Dominion Resources, Inc. | | | 420 | | | | 30,471 | |
Duke Energy Corp. | | | 400 | | | | 32,359 | |
Dynegy, Inc.* | | | 400 | | | | 13,260 | |
E.ON SE (Germany) | | | 1,076 | | | | 19,073 | |
Enel S.p.A. (Italy) | | | 3,388 | | | | 16,346 | |
GDF Suez (France) | | | 742 | | | | 18,282 | |
National Grid PLC (United Kingdom) | | | 1,785 | | | | 25,930 | |
NRG Yield, Inc., Class A | | | 200 | | | | 9,478 | |
PG&E Corp. | | | 1,800 | | | | 90,900 | |
| | | | | | | | |
| | | | | | | 272,833 | |
| | | | | | | | |
TOTAL COMMON STOCKS
(Cost $11,027,291) | | | | | | | 13,862,744 | |
| | | | | | | | |
| PREFERRED STOCKS — 0.1% | | | | | | | | |
| Consumer, Cyclical — 0.1% | | | | | | | | |
Volkswagen AG (Germany) | | | 77 | | | | 17,732 | |
| | | | | | | | |
| Industrial — 0.0% | | | | | | | | |
Rolls-Royce Holdings PLC, Class C (United Kingdom)* | | | 92,520 | | | | 145 | |
| | | | | | | | |
TOTAL PREFERRED STOCKS
(Cost $16,616) | | | | | | | 17,877 | |
| | | | | | | | |
| RIGHTS — 0.0% | | | | | | | | |
| Communications — 0.0% | | | | | | | | |
Leap Wireless International, Inc. CVR*
(Cost $1,532) | | | 628 | | | | 1,532 | |
| | | | | | | | |
| | | | |
| See Notes to Financial Statements. | | 21 | | |
db-X Exchange-Traded Funds Inc.
Schedule of investments
Deutsche X-trackers 2020 Target Date ETF (Continued)
November 30, 2014 (Unaudited)
| | | | | | | | |
| | | Principal
Amount | | | Value | |
| | | | | | | | |
| CORPORATE BONDS — 20.6% | | | | | | | | |
| Basic Materials — 1.2% | |
Eastman Chemical Co.
3.00%, 12/15/15 | | $ | 137,000 | | | $ | 140,184 | |
PPG Industries, Inc.
1.90%, 1/15/16 | | | 209,000 | | | | 211,579 | |
| | | | | | | | |
| | | | | | | 351,763 | |
| | | | | | | | |
| Communications — 0.4% | | | | | | | | |
Cisco Systems, Inc.
5.50%, 2/22/16 | | | 94,000 | | | | 99,703 | |
| | | | | | | | |
| Consumer, Cyclical — 1.0% | | | | | | | | |
Home Depot (The), Inc.
5.40%, 3/01/16 | | | 62,000 | | | | 65,721 | |
PACCAR Financial Corp., MTN
0.70%, 11/16/15 | | | 78,000 | | | | 78,261 | |
Wal-Mart Stores, Inc.
2.80%, 4/15/16 | | | 141,000 | | | | 145,396 | |
| | | | | | | | |
| | | | | | | 289,378 | |
| | | | | | | | |
| Consumer, Non-cyclical — 1.9% | | | | | | | | |
Anheuser-Busch InBev Finance, Inc. (Belgium)
0.80%, 1/15/16 | | | 65,000 | | | | 65,218 | |
Bunge Ltd. Finance Corp.
4.10%, 3/15/16 | | | 64,000 | | | | 66,366 | |
Coca-Cola (The) Co.
1.50%, 11/15/15 | | | 141,000 | | | | 142,620 | |
Diageo Finance BV (Netherlands)
5.30%, 10/28/15 | | | 64,000 | | | | 66,705 | |
Dr Pepper Snapple Group, Inc.
2.90%, 1/15/16 | | | 63,000 | | | | 64,526 | |
GlaxoSmithKline Capital, Inc.
0.70%, 3/18/16 | | | 74,000 | | | | 74,163 | |
St Jude Medical, Inc.
2.50%, 1/15/16 | | | 64,000 | | | | 65,205 | |
| | | | | | | | |
| | | | | | | 544,803 | |
| | | | | | | | |
| Energy — 2.1% | | | | | | | | |
BP Capital Markets PLC (United Kingdom)
3.20%, 3/11/16 | | | 85,000 | | | | 87,590 | |
Occidental Petroleum Corp.
2.50%, 2/01/16 | | | 98,000 | | | | 99,998 | |
Petrobras International Finance Co. (Brazil)
3.875%, 1/27/16 | | | 200,000 | | | | 201,310 | |
Total Capital International SA (France)
0.75%, 1/25/16 | | | 65,000 | | | | 65,172 | |
TransCanada Pipelines Ltd. (Canada)
0.75%, 1/15/16 | | | 144,000 | | | | 144,035 | |
| | | | | | | | |
| | | | | | | 598,105 | |
| | | | | | | | |
| Financial — 10.5% | | | | | | | | |
Bank of America Corp., MTN
1.25%, 1/11/16 | | | 79,000 | | | | 79,336 | |
Bank of Nova Scotia (Canada)
2.90%, 3/29/16 | | | 98,000 | | | | 100,940 | |
BB&T Corp.
5.20%, 12/23/15 | | | 119,000 | | | | 124,443 | |
BNP Paribas SA, MTN (France)
3.60%, 2/23/16 | | | 97,000 | | | | 100,267 | |
| | | | | | | | |
| | | Principal
Amount | | | Value | |
| | | | | | | | |
| Financial (Continued) | | | | | | | | |
Canadian Imperial Bank of Commerce (Canada)
2.35%, 12/11/15 | | $ | 202,000 | | | $ | 205,819 | |
Charles Schwab (The) Corp.
0.85%, 12/04/15 | | | 131,000 | | | | 131,684 | |
Citigroup, Inc.
4.587%, 12/15/15 | | | 268,000 | | | | 278,047 | |
Deutsche Bank AG (Germany)
3.25%, 1/11/16 (a) | | | 66,000 | | | | 67,807 | |
Fifth Third Bancorp
3.625%, 1/25/16 | | | 122,000 | | | | 125,835 | |
General Electric Capital Corp.
2.25%, 11/09/15 | | | 217,000 | | | | 220,771 | |
General Electric Capital Corp., MTN
1.00%, 1/08/16 | | | 288,000 | | | | 289,738 | |
Goldman Sachs Group (The), Inc.
3.625%, 2/07/16 | | | 333,000 | | | | 343,492 | |
JPMorgan Chase & Co.
2.60%, 1/15/16 | | �� | 33,000 | | | | 33,715 | |
KFW (Germany)
2.625%, 2/16/16 | | | 142,000 | | | | 146,058 | |
Morgan Stanley
1.75%, 2/25/16 | | | 131,000 | | | | 132,391 | |
ORIX Corp. (Japan)
5.00%, 1/12/16 | | | 61,000 | | | | 63,483 | |
PNC Funding Corp.
5.25%, 11/15/15 | | | 357,000 | | | | 371,557 | |
Westpac Banking Corp. (Australia)
3.00%, 12/09/15 | | | 205,000 | | | | 210,315 | |
| | | | | | | | |
| | | | | | | 3,025,698 | |
| | | | | | | | |
| Government — 1.0% | | | | | | | | |
Corp. Andina de Fomento (Supranational)
3.75%, 1/15/16 | | | 125,000 | | | | 129,488 | |
Inter-American Development Bank (Supranational)
2.25%, 7/15/15 | | | 144,000 | | | | 145,791 | |
| | | | | | | | |
| | | | | | | 275,279 | |
| | | | | | | | |
| Industrial — 0.6% | | | | | | | | |
Thermo Fisher Scientific, Inc.
3.20%, 3/01/16 | | | 169,000 | | | | 173,845 | |
| | | | | | | | |
| Technology — 0.7% | | | | | | | | |
Oracle Corp.
5.25%, 1/15/16 | | | 119,000 | | | | 125,385 | |
Texas Instruments, Inc.
0.45%, 8/03/15 | | | 89,000 | | | | 89,096 | |
| | | | | | | | |
| | | | | | | 214,481 | |
| | | | | | | | |
| Utilities — 1.2% | | | | | | | | |
Dominion Resources, Inc., Series C
5.15%, 7/15/15 | | | 195,000 | | | | 200,620 | |
LG&E and KU Energy LLC
2.125%, 11/15/15 | | | 140,000 | | | | 141,381 | |
| | | | | | | | |
| | | | | | | 342,001 | |
| | | | | | | | |
TOTAL CORPORATE BONDS
(Cost $5,906,904) | | | | | | | 5,915,056 | |
| | | | | | | | |
| | | | |
| See Notes to Financial Statements. | | 22 | | |
db-X Exchange-Traded Funds Inc.
Schedule of investments
Deutsche X-trackers 2020 Target Date ETF (Continued)
November 30, 2014 (Unaudited)
| | | | | | | | |
| | | Principal
Amount | | | Value | |
| | | | | | | | |
| UNITED STATES GOVERNMENT & AGENCY OBLIGATIONS — 30.3% | | | | | | | | |
| Federal Home Loan Mortgage Corporation — 0.1% | | | | | | | | |
1.75%, 9/10/15 | | $ | 33,000 | | | $ | 33,407 | |
| | | | | | | | |
| Federal National Mortgage Association — 0.1% | | | | | |
2.375%, 4/11/16 | | | 33,000 | | | | 33,943 | |
| | | | | | | | |
| United States Treasury Bonds/Notes — 30.1% | | | | | |
1.875%, 6/30/15 | | | 1,190,000 | | | | 1,202,458 | |
0.25%, 7/31/15 | | | 1,478,000 | | | | 1,479,502 | |
4.25%, 8/15/15 | | | 1,782,700 | | | | 1,835,066 | |
1.25%, 9/30/15 | | | 1,261,700 | | | | 1,273,626 | |
0.25%, 11/30/15 | | | 686,000 | | | | 686,750 | |
2.00%, 1/31/16 | | | 652,000 | | | | 665,652 | |
0.375%, 4/30/16 | | | 1,481,000 | | | | 1,484,124 | |
| | | | | | | | |
| | | | | | | 8,627,178 | |
| | | | | | | | |
TOTAL UNITED STATES GOVERNMENT & AGENCY OBLIGATIONS
(Cost $8,680,360) | | | | | | | 8,694,528 | |
| | | | | | | | |
| SOVEREIGN BOND — 0.3% | | | | | | | | |
Poland Government International Bond (Poland)
3.875%, 7/16/2015
(Cost $85,895) | | | 84,000 | | | | 85,974 | |
| | | | | | | | |
| | |
TOTAL INVESTMENTS — 99.5% (Cost $25,718,598) | | | | | | $ | 28,577,711 | |
Other assets less liabilities — 0.5% | | | | | | | 149,857 | |
| | | | | | | | |
NET ASSETS — 100.0% | | | | | | $ | 28,727,568 | |
| | | | | | | | |
CVR – Contingent Value Rights.
MTN – Medium Term Note.
REIT – Real Estate Investment Trust.
* Non-income producing security.
(a) Affiliated issuer. This security is owned in proportion with its representation in the index.
| | | | |
| See Notes to Financial Statements. | | 23 | | |
db-X Exchange-Traded Funds Inc.
Schedule of investments
Deutsche X-trackers 2030 Target Date ETF
November 30, 2014 (Unaudited)
| | | | | | | | |
| | | Number
of Shares | | | Value | |
| | | | | | | | |
| COMMON STOCKS — 72.7% | | | | | | | | |
| Basic Materials — 2.9% | | | | | | | | |
Air Liquide SA (France) | | | 397 | | | $ | 49,958 | |
Anglo American PLC (United Kingdom) | | | 1,426 | | | | 29,435 | |
Axiall Corp. | | | 600 | | | | 25,968 | |
BASF SE (Germany) | | | 1,041 | | | | 94,507 | |
BHP Billiton Ltd. (Australia) | | | 3,551 | | | | 93,426 | |
BHP Billiton PLC (United Kingdom) | | | 2,275 | | | | 53,908 | |
Chemtura Corp.* | | | 817 | | | | 19,036 | |
Dow Chemical (The) Co. | | | 1,756 | | | | 85,465 | |
E.I. du Pont de Nemours & Co. | | | 1,336 | | | | 95,390 | |
Freeport-McMoRan, Inc. | | | 1,431 | | | | 38,422 | |
Glencore PLC (Switzerland)* | | | 10,679 | | | | 53,445 | |
KapStone Paper and Packaging Corp.* | | | 800 | | | | 23,896 | |
Linde AG (Germany) | | | 211 | | | | 39,815 | |
Monsanto Co. | | | 788 | | | | 94,489 | |
PolyOne Corp. | | | 798 | | | | 29,765 | |
Rio Tinto PLC (United Kingdom) | | | 1,430 | | | | 66,843 | |
Schnitzer Steel Industries, Inc., Class A | | | 1,050 | | | | 23,940 | |
Sensient Technologies Corp. | | | 396 | | | | 23,344 | |
Sherwin-Williams (The) Co. | | | 900 | | | | 220,374 | |
Syngenta AG (Switzerland) | | | 105 | | | | 34,589 | |
U.S. Silica Holdings, Inc. | | | 350 | | | | 10,997 | |
| | | | | | | | |
| | | | | | | 1,207,012 | |
| | | | | | | | |
| Communications — 6.9% | | | | | | | | |
8x8, Inc.* | | | 3,735 | | | | 29,058 | |
Amazon.com, Inc.* | | | 570 | | | | 193,025 | |
Angie’s List, Inc.* | | | 2,684 | | | | 15,943 | |
ARRIS Group, Inc.* | | | 1,292 | | | | 38,463 | |
AT&T, Inc. | | | 7,517 | | | | 265,951 | |
Bankrate, Inc.* | | | 889 | | | | 10,392 | |
BT Group PLC (United Kingdom) | | | 8,647 | | | | 55,404 | |
Cisco Systems, Inc. | | | 6,555 | | | | 181,180 | |
Comcast Corp., Class A | | | 3,432 | | | | 195,761 | |
Consolidated Communications Holdings, Inc. | | | 490 | | | | 13,431 | |
Deutsche Telekom AG (Germany) | | | 3,276 | | | | 55,808 | |
DigitalGlobe, Inc.* | | | 699 | | | | 18,880 | |
Finisar Corp.* | | | 791 | | | | 13,487 | |
Google, Inc., Class A* | | | 460 | | | | 252,577 | |
Google, Inc., Class C* | | | 455 | | | | 246,533 | |
Harmonic, Inc.* | | | 4,668 | | | | 32,676 | |
HealthStream, Inc.* | | | 1,284 | | | | 36,787 | |
Houghton Mifflin Harcourt Co.* | | | 1,167 | | | | 22,430 | |
Perficient, Inc.* | | | 1,401 | | | | 24,251 | |
Sinclair Broadcast Group, Inc., Class A | | | 817 | | | | 23,824 | |
SoftBank Corp. (Japan) | | | 1,067 | | | | 71,571 | |
Telefonaktiebolaget LM Ericsson, Class B (Sweden) | | | 3,460 | | | | 43,572 | |
Thomson Reuters Corp. (Canada) | | | 1,239 | | | | 49,408 | |
Time Warner, Inc. | | | 1,284 | | | | 109,294 | |
Twenty-First Century Fox, Inc., Class A | | | 3,568 | | | | 131,302 | |
Ubiquiti Networks, Inc. | | | 817 | | | | 23,611 | |
Verizon Communications, Inc. | | | 5,612 | | | | 283,911 | |
Vodafone Group PLC (United Kingdom) | | | 27,487 | | | | 100,446 | |
Walt Disney (The) Co. | | | 2,570 | | | | 237,751 | |
WPP PLC (United Kingdom) | | | 1,455 | | | | 30,455 | |
| | | | | | | | |
| | | Number
of Shares | | | Value | |
| | | | | | | | |
| Communications (Continued) | | | | | | | | |
Yelp, Inc.* | | | 700 | | | $ | 39,963 | |
Zillow, Inc., Class A* | | | 350 | | | | 41,426 | |
| | | | | | | | |
| | | | | | | 2,888,571 | |
| | | | | | | | |
| Consumer, Cyclical — 6.9% | | | | | | | | |
AMC Entertainment Holdings, Inc., Class A | | | 817 | | | | 21,422 | |
American Airlines Group, Inc. | | | 934 | | | | 45,327 | |
Bayerische Motoren Werke AG (Germany) | | | 379 | | | | 43,333 | |
Beacon Roofing Supply, Inc.* | | | 467 | | | | 12,646 | |
Brunswick Corp. | | | 900 | | | | 44,712 | |
Carnival Corp. | | | 934 | | | | 41,245 | |
Cie Financiere Richemont SA (Switzerland) | | | 586 | | | | 55,098 | |
Columbia Sportswear Co. | | | 684 | | | | 30,814 | |
Compass Group PLC (United Kingdom) | | | 2,019 | | | | 34,375 | |
CVS Health Corp. | | | 1,818 | | | | 166,093 | |
Daimler AG (Germany) | | | 1,003 | | | | 84,559 | |
Federal-Mogul Holdings Corp.* | | | 1,284 | | | | 19,928 | |
Ford Motor Co. | | | 5,076 | | | | 79,846 | |
Genesco, Inc.* | | | 200 | | | | 16,274 | |
Group 1 Automotive, Inc. | | | 200 | | | | 17,902 | |
Hennes & Mauritz AB, Class B (Sweden) | | | 1,026 | | | | 43,949 | |
Hilton Worldwide Holdings, Inc.* | | | 1,284 | | | | 33,666 | |
Home Depot (The), Inc. | | | 1,885 | | | | 187,369 | |
Honda Motor Co. Ltd. (Japan) | | | 1,822 | | | | 54,814 | |
HSN, Inc. | | | 498 | | | | 36,319 | |
Inditex SA (Spain) | | | 1,249 | | | | 36,365 | |
JetBlue Airways Corp.* | | | 2,451 | | | | 35,858 | |
Kate Spade & Co.* | | | 1,144 | | | | 36,642 | |
Kohl’s Corp. | | | 234 | | | | 13,951 | |
Las Vegas Sands Corp. | | | 1,284 | | | | 81,778 | |
Lennar Corp., Class A | | | 1,867 | | | | 88,197 | |
LVMH Moet Hennessy Louis Vuitton SA (France) | | | 286 | | | | 51,388 | |
Macy’s, Inc. | | | 467 | | | | 30,313 | |
Marriott Vacations Worldwide Corp. | | | 300 | | | | 22,053 | |
McDonald’s Corp. | | | 1,517 | | | | 146,861 | |
Men’s Wearhouse (The), Inc. | | | 495 | | | | 23,126 | |
Mitsubishi Corp. (Japan) | | | 1,361 | | | | 25,738 | |
Mitsui & Co. Ltd. (Japan) | | | 1,800 | | | | 24,828 | |
Mobile Mini, Inc. | | | 399 | | | | 16,555 | |
NIKE, Inc., Class B | | | 1,169 | | | | 116,070 | |
Office Depot, Inc.* | | | 4,901 | | | | 32,494 | |
Panasonic Corp. (Japan) | | | 2,300 | | | | 29,691 | |
Penske Automotive Group, Inc. | | | 700 | | | | 33,145 | |
Restoration Hardware Holdings, Inc.* | | | 399 | | | | 33,704 | |
Rite Aid Corp.* | | | 8,519 | | | | 46,684 | |
Skechers U.S.A., Inc., Class A* | | | 350 | | | | 21,494 | |
Spirit Airlines, Inc.* | | | 584 | | | | 48,291 | |
Standard Pacific Corp.* | | | 2,451 | | | | 18,505 | |
Tenneco, Inc.* | | | 467 | | | | 25,381 | |
Tesla Motors, Inc.* | | | 234 | | | | 57,218 | |
Toyota Motor Corp. (Japan) | | | 2,894 | | | | 178,299 | |
UniFirst Corp. | | | 200 | | | | 22,318 | |
Walgreen Co. | | | 1,315 | | | | 90,222 | |
Wal-Mart Stores, Inc. | | | 4,954 | | | | 433,673 | |
| | | | | | | | |
| | | | | | | 2,890,533 | |
| | | | | | | | |
| | | | |
| See Notes to Financial Statements. | | 24 | | |
db-X Exchange-Traded Funds Inc.
Schedule of investments
Deutsche X-trackers 2030 Target Date ETF (Continued)
November 30, 2014 (Unaudited)
| | | | | | | | |
| | | Number
of Shares | | | Value | |
| | | | | | | | |
| Consumer, Non-cyclical — 15.8% | | | | | | | | |
Accuray, Inc.* | | | 3,384 | | | $ | 23,316 | |
Affymetrix, Inc.* | | | 3,151 | | | | 28,769 | |
Align Technology, Inc.* | | | 692 | | | | 39,375 | |
Alnylam Pharmaceuticals, Inc.* | | | 817 | | | | 82,149 | |
Amgen, Inc. | | | 1,040 | | | | 171,922 | |
AmSurg Corp.* | | | 295 | | | | 15,213 | |
Anheuser-Busch InBev NV (Belgium) | | | 931 | | | | 109,352 | |
Anika Therapeutics, Inc.* | | | 467 | | | | 19,096 | |
AstraZeneca PLC (United Kingdom) | | | 1,410 | | | | 105,276 | |
Bayer AG (Germany) | | | 935 | | | | 140,620 | |
British American Tobacco PLC (United Kingdom) | | | 2,011 | | | | 119,193 | |
Capella Education Co. | | | 467 | | | | 31,840 | |
Cardinal Health, Inc. | | | 2,891 | | | | 237,611 | |
Centene Corp.* | | | 557 | | | | 55,015 | |
Coca-Cola Bottling Co. Consolidated | | | 399 | | | | 37,729 | |
Coca-Cola (The) Co. | | | 6,227 | | | | 279,156 | |
CONMED Corp. | | | 234 | | | | 9,929 | |
CoStar Group, Inc.* | | | 298 | | | | 50,737 | |
CSL Ltd. (Australia) | | | 566 | | | | 39,766 | |
Darling Ingredients, Inc.* | | | 1,576 | | | | 29,314 | |
Deluxe Corp. | | | 350 | | | | 20,458 | |
Diageo PLC (United Kingdom) | | | 2,776 | | | | 85,899 | |
Ensign Group (The), Inc. | | | 817 | | | | 32,206 | |
Euronet Worldwide, Inc.* | | | 399 | | | | 23,170 | |
Foundation Medicine, Inc.* | | | 934 | | | | 22,061 | |
FTI Consulting, Inc.* | | | 295 | | | | 11,437 | |
Gilead Sciences, Inc. * | | | 2,116 | | | | 212,277 | |
GlaxoSmithKline PLC (United Kingdom) | | | 5,247 | | | | 121,709 | |
Haemonetics Corp.* | | | 350 | | | | 12,926 | |
Hain Celestial Group (The), Inc.* | | | 397 | | | | 44,948 | |
Humana, Inc. | | | 1,347 | | | | 185,846 | |
Impax Laboratories, Inc.* | | | 600 | | | | 19,170 | |
Imperial Tobacco Group PLC (United Kingdom) | | | 1,024 | | | | 47,345 | |
Integra LifeSciences Holdings Corp.* | | | 234 | | | | 11,522 | |
Intercept Pharmaceuticals, Inc.* | | | 234 | | | | 33,633 | |
Isis Pharmaceuticals, Inc.* | | | 1,367 | | | | 70,797 | |
Johnson & Johnson | | | 4,150 | | | | 449,238 | |
Kellogg Co. | | | 467 | | | | 30,939 | |
Kindred Healthcare, Inc. | | | 467 | | | | 9,289 | |
LDR Holding Corp.* | | | 1,167 | | | | 38,079 | |
Live Nation Entertainment, Inc.* | | | 1,755 | | | | 47,034 | |
Magellan Health, Inc.* | | | 223 | | | | 13,645 | |
MannKind Corp.* | | | 3,501 | | | | 21,531 | |
McGraw Hill Financial, Inc. | | | 2,451 | | | | 229,070 | |
Medicines (The) Co.* | | | 584 | | | | 15,657 | |
Merck & Co., Inc. | | | 4,075 | | | | 246,130 | |
Molina Healthcare, Inc.* | | | 396 | | | | 20,244 | |
Mondelez International, Inc., Class A | | | 2,579 | | | | 101,097 | |
Nestle SA (Switzerland) | | | 3,515 | | | | 263,921 | |
Novartis AG (Switzerland) | | | 2,473 | | | | 239,302 | |
Novo Nordisk A/S, Class B (Denmark) | | | 2,310 | | | | 105,353 | |
OncoMed Pharmaceuticals, Inc.* | | | 1,284 | | | | 28,287 | |
OPKO Health, Inc.* | | | 3,501 | | | | 29,338 | |
Orexigen Therapeutics, Inc.* | | | 5,582 | | | | 32,320 | |
Owens & Minor, Inc. | | | 600 | | | | 20,526 | |
| | | | | | | | |
| | | Number
of Shares | | | Value | |
| | | | | | | | |
| Consumer, Non-cyclical (Continued) | | | | | | | | |
Pfizer, Inc. | | | 8,814 | | | $ | 274,556 | |
Philip Morris International, Inc. | | | 2,334 | | | | 202,895 | |
Pilgrim’s Pride Corp.* | | | 1,735 | | | | 56,041 | |
Procter & Gamble (The) Co. | | | 4,032 | | | | 364,614 | |
Raptor Pharmaceutical Corp.* | | | 3,516 | | | | 33,824 | |
Reckitt Benckiser Group PLC (United Kingdom) | | | 770 | | | | 63,204 | |
Roche Holding AG (Switzerland) | | | 741 | | | | 221,936 | |
SABMiller PLC (United Kingdom) | | | 1,112 | | | | 61,905 | |
Sanofi (France) | | | 1,343 | | | | 130,023 | |
Seaboard Corp.* | | | 15 | | | | 51,750 | |
Shire PLC (Ireland) | | | 564 | | | | 40,146 | |
Spectrum Brands Holdings, Inc. | | | 495 | | | | 45,525 | |
Takeda Pharmaceutical Co. Ltd. (Japan) | | | 937 | | | | 39,243 | |
Teva Pharmaceutical Industries Ltd. (Israel) | | | 994 | | | | 56,562 | |
Tyson Foods, Inc., Class A | | | 467 | | | | 19,773 | |
Unilever NV (Netherlands) | | | 1,851 | | | | 75,390 | |
Unilever PLC (United Kingdom) | | | 1,459 | | | | 61,669 | |
UnitedHealth Group, Inc. | | | 1,467 | | | | 144,690 | |
WellCare Health Plans, Inc.* | | | 399 | | | | 29,422 | |
Wesfarmers Ltd. (Australia)* | | | 1,155 | | | | 40,695 | |
WEX, Inc.* | | | 399 | | | | 45,119 | |
Woolworths Ltd. (Australia) | | | 1,327 | | | | 35,139 | |
| | | | | | | | |
| | | | | | | 6,615,903 | |
| | | | | | | | |
| Diversified — 0.0% | | | | | | | | |
Hutchison Whampoa Ltd. (Hong Kong) | | | 2,174 | | | | 27,248 | |
| | | | | | | | |
| Energy — 5.4% | | | | | | | | |
Antero Resources Corp.* | | | 2,567 | | | | 120,444 | |
BG Group PLC (United Kingdom) | | | 3,848 | | | | 54,108 | |
BP PLC (United Kingdom) | | | 20,447 | | | | 134,205 | |
Bristow Group, Inc. | | | 295 | | | | 18,910 | |
Chesapeake Energy Corp. | | | 6,652 | | | | 134,770 | |
Chevron Corp. | | | 2,647 | | | | 288,179 | |
Diamondback Energy, Inc.* | | | 467 | | | | 26,339 | |
Eni S.p.A (Italy) | | | 2,862 | | | | 57,189 | |
EOG Resources, Inc. | | | 817 | | | | 70,850 | |
Exxon Mobil Corp. | | | 6,271 | | | | 567,776 | |
Forum Energy Technologies, Inc.* | | | 817 | | | | 19,616 | |
Geospace Technologies Corp.* | | | 584 | | | | 15,394 | |
ION Geophysical Corp.* | | | 6,769 | | | | 16,719 | |
Kodiak Oil & Gas Corp.* | | | 2,101 | | | | 15,400 | |
ONEOK, Inc. | | | 1,751 | | | | 94,834 | |
Rosetta Resources, Inc.* | | | 467 | | | | 13,739 | |
Royal Dutch Shell PLC, Class A (United Kingdom) | | | 4,171 | | | | 138,936 | |
Royal Dutch Shell PLC, Class B (United Kingdom) | | | 2,617 | | | | 90,871 | |
Schlumberger Ltd. (Netherland Antilles) | | | 1,587 | | | | 136,403 | |
Statoil ASA (Norway) | | | 1,237 | | | | 23,363 | |
Targa Resources Corp. | | | 397 | | | | 45,314 | |
Total SA (France) | | | 2,389 | | | | 133,648 | |
Western Refining, Inc. | | | 817 | | | | 33,587 | |
| | | | | | | | |
| | | | | | | 2,250,594 | |
| | | | | | | | |
| | | | |
| See Notes to Financial Statements. | | 25 | | |
db-X Exchange-Traded Funds Inc.
Schedule of investments
Deutsche X-trackers 2030 Target Date ETF (Continued)
November 30, 2014 (Unaudited)
| | | | | | | | |
| | | Number
of Shares | | | Value | |
| | | | | | | | |
| Financial — 16.7% | | | | | | | | |
AIA Group Ltd. (Hong Kong) | | | 11,257 | | | $ | 65,029 | |
Allianz SE (Germany) | | | 508 | | | | 87,456 | |
American Express Co. | | | 1,574 | | | | 145,469 | |
American International Group, Inc. | | | 2,265 | | | | 124,122 | |
American Realty Capital Properties, Inc. REIT | | | 7,352 | | | | 69,109 | |
American Tower Corp. REIT | | | 602 | | | | 63,216 | |
AmTrust Financial Services, Inc. | | | 659 | | | | 33,820 | |
Anworth Mortgage Asset Corp. REIT | | | 5,252 | | | | 28,361 | |
Aon PLC (United Kingdom) | | | 350 | | | | 32,371 | |
Australia & New Zealand Banking Group Ltd. (Australia) | | | 3,154 | | | | 85,665 | |
AXA SA (France) | | | 1,960 | | | | 47,318 | |
Banco Bilbao Vizcaya Argentaria SA (Spain) | | | 6,753 | | | | 72,534 | |
Banco Santander SA (Spain) | | | 13,626 | | | | 122,822 | |
Bank of America Corp. | | | 15,303 | | | | 260,763 | |
Bank of the Ozarks, Inc. | | | 584 | | | | 21,141 | |
Barclays PLC (United Kingdom) | | | 19,177 | | | | 73,434 | |
Berkshire Hathaway, Inc., Class B* | | | 3,593 | | | | 534,243 | |
BNP Paribas SA (France) | | | 1,138 | | | | 72,960 | |
Capital Senior Living Corp.* | | | 1,050 | | | | 26,722 | |
Charles Schwab (The) Corp. | | | 2,021 | | | | 57,235 | |
Chubb (The) Corp. | | | 2,334 | | | | 240,519 | |
Citigroup, Inc. | | | 4,317 | | | | 232,988 | |
CNO Financial Group, Inc. | | | 2,049 | | | | 35,530 | |
Cohen & Steers, Inc. | | | 350 | | | | 15,144 | |
Commonwealth Bank of Australia (Australia) | | | 1,825 | | | | 125,349 | |
Credit Acceptance Corp.* | | | 211 | | | | 31,597 | |
Credit Suisse Group AG (Switzerland)* | | | 1,584 | | | | 42,327 | |
Deutsche Bank AG (Germany) (a) | | | 1,450 | | | | 47,392 | |
EastGroup Properties, Inc. REIT | | | 300 | | | | 20,166 | |
Employers Holdings, Inc. | | | 1,284 | | | | 26,039 | |
EPR Properties REIT | | | 399 | | | | 22,340 | |
Equity One, Inc. REIT | | | 1,081 | | | | 26,193 | |
Equity Residential REIT | | | 3,151 | | | | 223,217 | |
Evercore Partners, Inc., Class A | | | 234 | | | | 11,817 | |
Financial Engines, Inc. | | | 399 | | | | 13,039 | |
First American Financial Corp. | | | 1,059 | | | | 33,899 | |
First Financial Bankshares, Inc. | | | 600 | | | | 18,102 | |
FirstMerit Corp. | | | 1,399 | | | | 25,028 | |
FXCM, Inc., Class A | | | 1,984 | | | | 31,942 | |
GAMCO Investors, Inc., Class A | | | 317 | | | | 27,313 | |
Hancock Holding Co. | | | 693 | | | | 22,668 | |
Hanmi Financial Corp. | | | 1,299 | | | | 26,110 | |
Highwoods Properties, Inc. REIT | | | 746 | | | | 32,197 | |
HSBC Holdings PLC (United Kingdom) | | | 19,908 | | | | 198,085 | |
ING Groep NV (Netherlands)* | | | 4,346 | | | | 63,660 | |
Investors Bancorp, Inc. | | | 3,044 | | | | 32,906 | |
JPMorgan Chase & Co. | | | 5,149 | | | | 309,764 | |
LaSalle Hotel Properties REIT | | | 950 | | | | 38,351 | |
Lloyds Banking Group PLC (United Kingdom)* | | | 62,016 | | | | 77,835 | |
MarketAxess Holdings, Inc. | | | 335 | | | | 21,966 | |
Marsh & McLennan Cos., Inc. | | | 700 | | | | 39,613 | |
MGIC Investment Corp.* | | | 3,151 | | | | 29,336 | |
| | | | | | | | |
| | | Number
of Shares | | | Value | |
| | | | | | | | |
| Financial (Continued) | | | | | | | | |
Mitsubishi UFJ Financial Group, Inc. (Japan) | | | 13,270 | | | $ | 76,726 | |
Mizuho Financial Group, Inc. (Japan) | | | 24,168 | | | | 41,632 | |
Muenchener Rueckversicherungs-Gesellschaft AG (Germany) | | | 204 | | | | 42,020 | |
National Australia Bank Ltd. (Australia) | | | 2,702 | | | | 74,951 | |
National Health Investors, Inc. REIT | | | 300 | | | | 19,884 | |
NewStar Financial, Inc.* | | | 2,101 | | | | 23,615 | |
Nordea Bank AB (Sweden) | | | 3,373 | | | | 42,137 | |
Northfield Bancorp, Inc. | | | 2,217 | | | | 31,238 | |
NorthStar Realty Finance Corp. REIT | | | 3,151 | | | | 57,569 | |
PacWest Bancorp | | | 817 | | | | 37,990 | |
PRA Group, Inc.* | | | 600 | | | | 35,112 | |
Prospect Capital Corp. | | | 2,098 | | | | 19,784 | |
Prosperity Bancshares, Inc. | | | 498 | | | | 27,978 | |
Prudential PLC (United Kingdom) | | | 2,872 | | | | 69,445 | |
Public Storage REIT | | | 257 | | | | 48,221 | |
Radian Group, Inc. | | | 1,751 | | | | 29,855 | |
RAIT Financial Trust REIT | | | 3,384 | | | | 25,008 | |
RLJ Lodging Trust REIT | | | 1,116 | | | | 36,750 | |
Ryman Hospitality Properties, Inc. REIT | | | 460 | | | | 23,957 | |
Simon Property Group, Inc. REIT | | | 460 | | | | 83,168 | |
Sovran Self Storage, Inc. REIT | | | 298 | | | | 25,336 | |
Springleaf Holdings, Inc.* | | | 934 | | | | 37,033 | |
Standard Chartered PLC (United Kingdom) | | | 2,725 | | | | 39,887 | |
Stifel Financial Corp.* | | | 600 | | | | 29,118 | |
Strategic Hotels & Resorts, Inc. REIT* | | | 1,798 | | | | 23,877 | |
Sumitomo Mitsui Financial Group, Inc. (Japan) | | | 1,428 | | | | 53,829 | |
Sun Communities, Inc. REIT | | | 300 | | | | 17,667 | |
Sunstone Hotel Investors, Inc. REIT | | | 1,517 | | | | 24,287 | |
T. Rowe Price Group, Inc. | | | 2,376 | | | | 198,325 | |
U.S. Bancorp | | | 2,473 | | | | 109,307 | |
UBS AG (Switzerland)* | | | 4,171 | | | | 75,110 | |
UMB Financial Corp. | | | 350 | | | | 19,421 | |
Umpqua Holdings Corp. | | | 1,867 | | | | 31,720 | |
Urstadt Biddle Properties, Inc., Class A REIT | | | 1,284 | | | | 28,479 | |
Visa, Inc., Class A | | | 1,069 | | | | 276,005 | |
Vornado Realty Trust REIT | | | 1,704 | | | | 190,098 | |
Webster Financial Corp. | | | 798 | | | | 25,113 | |
Wells Fargo & Co. | | | 7,549 | | | | 411,270 | |
Western Alliance Bancorp* | | | 700 | | | | 18,501 | |
Westpac Banking Corp. (Australia) | | | 3,531 | | | | 97,797 | |
Weyerhaeuser Co. REIT | | | 5,018 | | | | 177,186 | |
Zurich Insurance Group AG (Switzerland)* | | | 154 | | | | 48,260 | |
| | | | | | | | |
| | | | | | | 6,970,888 | |
| | | | | | | | |
| Industrial — 7.6% | | | | | | | | |
3M Co. | | | 934 | | | | 149,524 | |
ABB Ltd. (Switzerland)* | | | 2,461 | | | | 55,243 | |
Actuant Corp., Class A | | | 584 | | | | 17,146 | |
Acuity Brands, Inc. | | | 459 | | | | 63,434 | |
Airbus Group NV (France) | | | 663 | | | | 40,392 | |
Belden, Inc. | | | 350 | | | | 25,560 | |
Berry Plastics Group, Inc.* | | | 934 | | | | 27,030 | |
| | | | |
| See Notes to Financial Statements. | | 26 | | |
db-X Exchange-Traded Funds Inc.
Schedule of investments
Deutsche X-trackers 2030 Target Date ETF (Continued)
November 30, 2014 (Unaudited)
| | | | | | | | |
| | | Number
of Shares | | | Value | |
| | | | | | | | |
| Industrial (Continued) | | | | | | | | |
Boeing (The) Co. | | | 1,144 | | | $ | 153,708 | |
Caterpillar, Inc. | | | 980 | | | | 98,588 | |
CLARCOR, Inc. | | | 350 | | | | 23,061 | |
Cognex Corp.* | | | 700 | | | | 28,497 | |
Deutsche Post AG (Germany) | | | 964 | | | | 32,023 | |
East Japan Railway Co. (Japan) | | | 396 | | | | 29,678 | |
Eaton Corp. PLC (Ireland) | | | 683 | | | | 46,328 | |
EMCOR Group, Inc. | | | 594 | | | | 25,750 | |
Emerson Electric Co. | | | 1,076 | | | | 68,595 | |
EnerSys | | | 518 | | | | 31,458 | |
Esterline Technologies Corp.* | | | 234 | | | | 27,806 | |
FANUC Corp. (Japan) | | | 343 | | | | 57,843 | |
FedEx Corp. | | | 350 | | | | 62,363 | |
FEI Co. | | | 397 | | | | 33,999 | |
Fluor Corp. | | | 1,517 | | | | 94,039 | |
Generac Holdings, Inc.* | | | 699 | | | | 30,323 | |
General Dynamics Corp. | | | 526 | | | | 76,459 | |
General Electric Co. | | | 15,082 | | | | 399,522 | |
Graphic Packaging Holding Co.* | | | 3,171 | | | | 39,479 | |
Griffon Corp. | | | 2,451 | | | | 30,515 | |
Haynes International, Inc. | | | 467 | | | | 20,964 | |
HEICO Corp. | | | 584 | | | | 30,958 | |
Hitachi Ltd. (Japan) | | | 5,685 | | | | 43,889 | |
Ingersoll-Rand PLC (Ireland) | | | 2,341 | | | | 147,623 | |
Koninklijke Philips NV (Netherlands) | | | 1,041 | | | | 31,397 | |
LSB Industries, Inc.* | | | 117 | | | | 3,869 | |
Middleby (The) Corp.* | | | 504 | | | | 48,202 | |
Mistras Group, Inc.* | | | 1,167 | | | | 19,944 | |
Parker-Hannifin Corp. | | | 1,401 | | | | 180,771 | |
Ply Gem Holdings, Inc.* | | | 2,801 | | | | 35,068 | |
Precision Castparts Corp. | | | 234 | | | | 55,669 | |
Quanex Building Products Corp. | | | 1,517 | | | | 30,006 | |
Rofin-Sinar Technologies, Inc.* | | | 1,167 | | | | 31,416 | |
Rolls-Royce Holdings PLC (United Kingdom)* | | | 2,122 | | | | 27,925 | |
Sanmina Corp.* | | | 700 | | | | 17,220 | |
Schneider Electric SE (France) | | | 616 | | | | 50,248 | |
Siemens AG (Germany) | | | 900 | | | | 106,495 | |
SunPower Corp.* | | | 1,167 | | | | 32,863 | |
Swift Transportation Co.* | | | 1,167 | | | | 33,925 | |
TTM Technologies, Inc.* | | | 3,501 | | | | 23,667 | |
Union Pacific Corp. | | | 1,297 | | | | 151,451 | |
United Parcel Service, Inc., Class B | | | 1,453 | | | | 159,714 | |
USG Corp.* | | | 1,284 | | | | 36,992 | |
Vinci SA (France) | | | 516 | | | | 27,895 | |
Watts Water Technologies, Inc., Class A | | | 300 | | | | 18,138 | |
Woodward, Inc. | | | 594 | | | | 30,698 | |
| | | | | | | | |
| | | | | | | 3,165,370 | |
| | | | | | | | |
| Technology — 9.0% | | | | | | | | |
Acxiom Corp.* | | | 700 | | | | 13,321 | |
Amkor Technology, Inc.* | | | 1,984 | | | | 13,273 | |
Apple, Inc. | | | 8,236 | | | | 979,507 | |
Applied Materials, Inc. | | | 9,336 | | | | 224,531 | |
Aspen Technology, Inc.* | | | 791 | | | | 29,852 | |
athenahealth, Inc.* | | | 295 | | | | 34,603 | |
Broadcom Corp., Class A | | | 4,201 | | | | 181,189 | |
| | | | | | | | |
| | | Number
of Shares | | | Value | |
| | | | | | | | |
| Technology (Continued) | | | | | | | | |
Brooks Automation, Inc. | | | 2,567 | | | $ | 30,060 | |
Canon, Inc. (Japan) | | | 1,225 | | | | 39,227 | |
Computer Programs & Systems, Inc. | | | 481 | | | | 28,254 | |
Convergys Corp. | | | 991 | | | | 20,662 | |
Dealertrack Technologies, Inc.* | | | 467 | | | | 22,024 | |
EMC Corp. | | | 3,033 | | | | 92,052 | |
Engility Holdings, Inc.* | | | 700 | | | | 29,435 | |
Entegris, Inc.* | | | 1,167 | | | | 15,719 | |
Fidelity National Information Services, Inc. | | | 2,521 | | | | 154,260 | |
Hewlett-Packard Co. | | | 2,684 | | | | 104,837 | |
Infoblox, Inc.* | | | 2,334 | | | | 42,012 | |
Intel Corp. | | | 5,986 | | | | 222,979 | |
International Business Machines Corp. | | | 1,534 | | | | 248,769 | |
International Rectifier Corp.* | | | 498 | | | | 19,860 | |
Intersil Corp., Class A | | | 1,050 | | | | 13,766 | |
MAXIMUS, Inc. | | | 584 | | | | 30,596 | |
Mentor Graphics Corp. | | | 1,090 | | | | 24,209 | |
Microsemi Corp.* | | | 768 | | | | 20,890 | |
Microsoft Corp. | | | 11,449 | | | | 547,377 | |
Oracle Corp. | | | 6,693 | | | | 283,850 | |
PTC, Inc.* | | | 1,043 | | | | 40,750 | |
SAP SE (Germany) | | | 984 | | | | 69,351 | |
SS&C Technologies Holdings, Inc. | | | 699 | | | | 35,334 | |
SunEdison, Inc.* | | | 2,217 | | | | 47,998 | |
SYNNEX Corp. | | | 295 | | | | 21,075 | |
Syntel, Inc.* | | | 794 | | | | 35,333 | |
Ultimate Software Group (The), Inc.* | | | 249 | | | | 36,663 | |
| | | | | | | | |
| | | | | | | 3,753,618 | |
| | | | | | | | |
| Utilities — 1.5% | | | | | | | | |
Chesapeake Utilities Corp. | | | 525 | | | | 23,588 | |
Cleco Corp. | | | 577 | | | | 31,002 | |
Dominion Resources, Inc. | | | 851 | | | | 61,740 | |
Duke Energy Corp. | | | 1,050 | | | | 84,945 | |
Dynegy, Inc.* | | | 934 | | | | 30,962 | |
E.ON SE (Germany) | | | 2,104 | | | | 37,294 | |
Enel S.p.A. (Italy) | | | 7,436 | | | | 35,876 | |
GDF Suez (France) | | | 1,516 | | | | 37,353 | |
National Grid PLC (United Kingdom) | | | 4,218 | | | | 61,274 | |
NRG Yield, Inc., Class A | | | 467 | | | | 22,131 | |
PG&E Corp. | | | 3,851 | | | | 194,476 | |
| | | | | | | | |
| | | | | | | 620,641 | |
| | | | | | | | |
TOTAL COMMON STOCKS
(Cost $25,225,811) | | | | | | | 30,390,378 | |
| | | | | | | | |
| PREFERRED STOCKS — 0.1% | | | | | | | | |
| Consumer, Cyclical — 0.1% | | | | | | | | |
Volkswagen AG (Germany) | | | 154 | | | | 35,464 | |
| | | | | | | | |
| Industrial — 0.0% | | | | | | | | |
Rolls-Royce Holdings PLC, Class C (United Kingdom)* | | | 163,620 | | | | 256 | |
| | | | | | | | |
TOTAL PREFERRED STOCKS
(Cost $33,421) | | | | | | | 35,720 | |
| | | | | | | | |
| RIGHTS — 0.0% | | | | | | | | |
| Communications — 0.0% | | | | | | | | |
Leap Wireless International, Inc. CVR*
(Cost $3,501) | | | 1,435 | | | | 3,501 | |
| | | | | | | | |
| | | | |
| See Notes to Financial Statements. | | 27 | | |
db-X Exchange-Traded Funds Inc.
Schedule of investments
Deutsche X-trackers 2030 Target Date ETF (Continued)
November 30, 2014 (Unaudited)
| | | | | | | | |
| | | Principal
Amount | | | Value | |
| | | | | | | | |
| CORPORATE BONDS — 22.6% | | | | | | | | |
| Basic Materials — 1.1% | |
BHP Billiton Finance USA Ltd. (Australia)
4.125%, 2/24/42 | | $ | 184,000 | | | $ | 183,732 | |
Dow Chemical (The) Co.
4.375%, 11/15/42 | | | 175,000 | | | | 170,351 | |
Rio Tinto Finance USA PLC (United Kingdom)
4.125%, 8/21/42 | | | 93,000 | | | | 86,202 | |
| | | | | | | | |
| | | | | | | 440,285 | |
| | | | | | | | |
| Communications — 1.9% | | | | | | | | |
AT&T, Inc. | | | | | | | | |
5.55%, 8/15/41 | | | 231,000 | | | | 259,019 | |
4.35%, 6/15/45 | | | 198,000 | | | | 188,249 | |
Comcast Corp.
4.75%, 3/01/44 | | | 81,000 | | | | 89,423 | |
Time Warner, Inc.
4.65%, 6/01/44 | | | 93,000 | | | | 94,598 | |
Walt Disney (The) Co., Series E
4.125%, 12/01/41 | | | 166,000 | | | | 175,242 | |
| | | | | | | | |
| | | | | | | 806,531 | |
| | | | | | | | |
| Consumer, Cyclical — 1.6% | | | | | | | | |
Home Depot (The), Inc.
5.95%, 4/01/41 | | | 99,000 | | | | 128,155 | |
McDonald’s Corp., MTN
3.70%, 2/15/42 | | | 121,000 | | | | 112,472 | |
Wal-Mart Stores, Inc.
4.00%, 4/11/43 | | | 438,000 | | | | 445,861 | |
| | | | | | | | |
| | | | | | | 686,488 | |
| | | | | | | | |
| Consumer, Non-cyclical — 4.7% | | | | | | | | |
AbbVie, Inc.
4.40%, 11/06/42 | | | 163,000 | | | | 162,640 | |
Altria Group, Inc.
4.50%, 5/02/43 | | | 163,000 | | | | 160,586 | |
Anheuser-Busch InBev Worldwide, Inc.
3.75%, 7/15/42 | | | 234,000 | | | | 217,106 | |
Baxter International, Inc.
3.65%, 8/15/42 | | | 93,000 | | | | 86,519 | |
Celgene Corp.
4.625%, 5/15/44 | | | 163,000 | | | | 167,247 | |
Diageo Investment Corp.
4.25%, 5/11/42 | | | 166,000 | | | | 166,166 | |
Medtronic, Inc.
4.50%, 3/15/42 | | | 120,000 | | | | 125,717 | |
Merck & Co., Inc.
4.15%, 5/18/43 | | | 163,000 | | | | 170,724 | |
Novartis Capital Corp.
4.40%, 5/06/44 | | | 76,000 | | | | 82,985 | |
PepsiCo, Inc.
4.00%, 3/05/42 | | | 78,000 | | | | 76,426 | |
Pfizer, Inc.
4.30%, 6/15/43 | | | 239,000 | | | | 247,254 | |
Philip Morris International, Inc.
4.50%, 3/20/42 | | | 121,000 | | | | 124,689 | |
Stryker Corp.
4.375%, 5/15/44 | | | 93,000 | | | | 96,639 | |
| | | | | | | | |
| | | Principal
Amount | | | Value | |
| | | | | | | | |
| Consumer, Non-cyclical (Continued) | | | | | | | | |
UnitedHealth Group, Inc.
4.625%, 11/15/41 | | $ | 57,000 | | | $ | 60,906 | |
| | | | | | | | |
| | | | | | | 1,945,604 | |
| | | | | | | | |
| Energy — 1.7% | | | | | | | | |
Apache Corp.
4.75%, 4/15/43 | | | 151,000 | | | | 145,887 | |
Halliburton Co.
4.50%, 11/15/41 | | | 38,000 | | | | 37,830 | |
National Oilwell Varco, Inc.
3.95%, 12/01/42 | | | 93,000 | | | | 88,113 | |
Shell International Finance BV (Netherlands)
6.375%, 12/15/38 | | | 210,000 | | | | 283,821 | |
Statoil ASA (Norway)
5.10%, 8/17/40 | | | 142,000 | | | | 162,854 | |
| | | | | | | | |
| | | | | | | 718,505 | |
| | | | | | | | |
| Financial — 1.9% | | | | | | | | |
American Express Co.
4.05%, 12/03/42 | | | 140,000 | | | | 137,498 | |
Berkshire Hathaway Finance Corp.
4.40%, 5/15/42 | | | 169,000 | | | | 175,778 | |
Citigroup, Inc.
4.95%, 11/07/43 | | | 193,000 | | | | 216,278 | |
KFW (Germany)
zero coupon, 4/18/36 | | | 175,000 | | | | 91,310 | |
Loews Corp.
4.125%, 5/15/43 | | | 175,000 | | | | 164,695 | |
| | | | | | | | |
| | | | | | | 785,559 | |
| | | | | | | | |
| Government — 0.3% | | | | | | | | |
Inter-American Development Bank, Series G, MTN (Supranational)
3.875%, 10/28/41 | | | 118,000 | | | | 126,969 | |
| | | | | | | | |
| Industrial — 2.9% | | | | | | | | |
Burlington Northern Santa Fe LLC
4.90%, 4/01/44 | | | 146,000 | | | | 160,574 | |
Deere & Co.
3.90%, 6/09/42 | | | 256,000 | | | | 254,133 | |
General Electric Co.
4.50%, 3/11/44 | | | 151,000 | | | | 164,396 | |
Lockheed Martin Corp.
4.07%, 12/15/42 | | | 222,000 | | | | 221,495 | |
Precision Castparts Corp.
3.90%, 1/15/43 | | | 93,000 | | | | 94,553 | |
Union Pacific Corp.
4.75%, 9/15/41 | | | 58,000 | | | | 64,440 | |
United Technologies Corp.
4.50%, 6/01/42 | | | 224,000 | | | | 243,022 | |
| | | | | | | | |
| | | | | | | 1,202,613 | |
| | | | | | | | |
| Technology — 1.2% | | | | | | | | |
Apple, Inc.
3.85%, 5/04/43 | | | 257,000 | | | | 250,541 | |
International Business Machines Corp.
4.00%, 6/20/42 | | | 222,000 | | | | 215,366 | |
Microsoft Corp.
4.50%, 10/01/40 | | | 40,000 | | | | 43,379 | |
| | | | | | | | |
| | | | | | | 509,286 | |
| | | | | | | | |
| | | | |
| See Notes to Financial Statements. | | 28 | | |
db-X Exchange-Traded Funds Inc.
Schedule of investments
Deutsche X-trackers 2030 Target Date ETF (Continued)
November 30, 2014 (Unaudited)
| | | | | | | | |
| | | Principal
Amount | | | Value | |
| | | | | | | | |
| Utilities — 5.3% | | | | | | | | |
Atmos Energy Corp.
5.50%, 6/15/41 | | $ | 79,000 | | | $ | 97,320 | |
CenterPoint Energy Houston Electric LLC
4.50%, 4/01/44 | | | 152,000 | | | | 165,777 | |
Consolidated Edison Co. of New York, Inc.
3.95%, 3/01/43 | | | 339,000 | | | | 330,906 | |
Dominion Gas Holdings LLC
4.80%, 11/01/43 | | | 81,000 | | | | 87,050 | |
Florida Power & Light Co.
4.125%, 2/01/42 | | | 165,000 | | | | 170,233 | |
Georgia Power Co.
4.30%, 3/15/42 | | | 195,000 | | | | 202,383 | |
Pacific Gas & Electric Co.
4.60%, 6/15/43 | | | 210,000 | | | | 223,393 | |
Puget Sound Energy, Inc.
4.434%, 11/15/41 | | | 96,000 | | | | 103,268 | |
San Diego Gas & Electric Co.
3.95%, 11/15/41 | | | 75,000 | | | | 75,952 | |
Southern California Edison Co.
6.05%, 3/15/39 | | | 253,000 | | | | 328,695 | |
Southern California Gas Co.
5.125%, 11/15/40 | | | 78,000 | | | | 94,494 | |
Virginia Electric and Power Co., Series D
4.65%, 8/15/43 | | | 304,000 | | | | 336,776 | |
| | | | | | | | |
| | | | | | | 2,216,247 | |
| | | | | | | | |
TOTAL CORPORATE BONDS
(Cost $9,323,925) | | | | | | | 9,438,087 | |
| | | | | | | | |
| UNITED STATES GOVERNMENT & AGENCY OBLIGATIONS — 1.6% | | | | | | | | |
| United States Treasury Bonds/Notes — 1.6% | | | | | |
4.50%, 8/15/39 | | | 73,300 | | | | 95,376 | |
4.625%, 2/15/40 | | | 109,000 | | | | 144,612 | |
4.375%, 5/15/41 | | | 252,400 | | | | 326,050 | |
3.625%, 2/15/44 | | | 107,700 | | | | 122,896 | |
| | | | | | | | |
| | | | | | | 688,934 | |
| | | | | | | | |
TOTAL UNITED STATES GOVERNMENT & AGENCY OBLIGATIONS
(Cost $644,954) | | | | | | | 688,934 | |
| | | | | | | | |
| SOVEREIGN BONDS — 2.5% | |
Israel Government International Bond (Israel)
4.50%, 1/30/2043 | | | 80,000 | | | | 82,500 | |
Tennessee Valley Authority
4.875%, 1/15/2048 | | | 373,000 | | | | 443,510 | |
United Mexican States, MTN (Mexico)
4.75%, 3/8/2044 | | | 490,000 | | | | 508,008 | |
| | | | | | | | |
TOTAL SOVEREIGN BONDS
(Cost $999,984) | | | | | | | 1,034,018 | |
| | | | | | | | |
| | |
TOTAL INVESTMENTS — 99.5% (Cost $36,231,596) | | | | | | $ | 41,590,638 | |
Other assets less liabilities — 0.5% | | | | | | | 219,517 | |
| | | | | | | | |
NET ASSETS — 100.0% | | | | | | $ | 41,810,155 | |
| | | | | | | | |
CVR – Contingent Value Rights.
MTN – Medium Term Note.
REIT – Real Estate Investment Trust.
* Non-income producing security.
(a) Affiliated issuer. This security is owned in proportion with its representation in the index.
| | | | |
| See Notes to Financial Statements. | | 29 | | |
db-X Exchange-Traded Funds Inc.
Schedule of investments
Deutsche X-trackers 2040 Target Date ETF
November 30, 2014 (Unaudited)
| | | | | | | | |
| | | Number
of Shares | | | Value | |
| | | | | | | | |
| COMMON STOCKS — 91.3% | | | | | | | | |
| Basic Materials — 3.6% | | | | | | | | |
Air Liquide SA (France) | | | 451 | | | $ | 56,753 | |
Anglo American PLC (United Kingdom) | | | 1,560 | | | | 32,202 | |
Axiall Corp. | | | 700 | | | | 30,296 | |
BASF SE (Germany) | | | 1,095 | | | | 99,409 | |
BHP Billiton Ltd. (Australia) | | | 3,694 | | | | 97,187 | |
BHP Billiton PLC (United Kingdom) | | | 2,375 | | | | 56,277 | |
Chemtura Corp.* | | | 900 | | | | 20,970 | |
Dow Chemical (The) Co. | | | 1,822 | | | | 88,677 | |
E.I. du Pont de Nemours & Co. | | | 1,575 | | | | 112,455 | |
Freeport-McMoRan, Inc. | | | 1,516 | | | | 40,705 | |
Glencore PLC (Switzerland)* | | | 12,724 | | | | 63,680 | |
KapStone Paper and Packaging Corp.* | | | 1,000 | | | | 29,870 | |
Linde AG (Germany) | | | 227 | | | | 42,834 | |
Monsanto Co. | | | 834 | | | | 100,005 | |
PolyOne Corp. | | | 1,000 | | | | 37,300 | |
Rio Tinto PLC (United Kingdom) | | | 1,473 | | | | 68,853 | |
Schnitzer Steel Industries, Inc., Class A | | | 1,100 | | | | 25,080 | |
Sensient Technologies Corp. | | | 496 | | | | 29,239 | |
Sherwin-Williams (The) Co. | | | 989 | | | | 242,167 | |
Syngenta AG (Switzerland) | | | 111 | | | | 36,565 | |
U.S. Silica Holdings, Inc. | | | 500 | | | | 15,710 | |
| | | | | | | | |
| | | | | | | 1,326,234 | |
| | | | | | | | |
| Communications — 8.6% | | | | | | | | |
8x8, Inc.* | | | 4,200 | | | | 32,676 | |
Amazon.com, Inc.* | | | 620 | | | | 209,957 | |
Angie’s List, Inc.* | | | 2,900 | | | | 17,226 | |
ARRIS Group, Inc.* | | | 1,314 | | | | 39,118 | |
AT&T, Inc. | | | 8,182 | | | | 289,479 | |
Bankrate, Inc.* | | | 900 | | | | 10,521 | |
BT Group PLC (United Kingdom) | | | 9,079 | | | | 58,173 | |
Cisco Systems, Inc. | | | 7,225 | | | | 199,699 | |
Comcast Corp., Class A | | | 3,682 | | | | 210,021 | |
Consolidated Communications Holdings, Inc. | | | 357 | | | | 9,785 | |
Deutsche Telekom AG (Germany) | | | 3,506 | | | | 59,726 | |
DigitalGlobe, Inc.* | | | 800 | | | | 21,608 | |
Finisar Corp.* | | | 814 | | | | 13,879 | |
Google, Inc., Class A * | | | 501 | | | | 275,088 | |
Google, Inc., Class C * | | | 490 | | | | 265,497 | |
Harmonic, Inc.* | | | 5,200 | | | | 36,400 | |
HealthStream, Inc.* | | | 1,400 | | | | 40,110 | |
Houghton Mifflin Harcourt Co.* | | | 1,400 | | | | 26,908 | |
Perficient, Inc.* | | | 1,500 | | | | 25,965 | |
Sinclair Broadcast Group, Inc., Class A | | | 900 | | | | 26,244 | |
SoftBank Corp. (Japan) | | | 1,014 | | | | 68,016 | |
Telefonaktiebolaget LM Ericsson, Class B (Sweden) | | | 3,576 | | | | 45,032 | |
Thomson Reuters Corp. (Canada) | | | 1,285 | | | | 51,243 | |
Time Warner, Inc. | | | 1,400 | | | | 119,168 | |
Twenty-First Century Fox, Inc., Class A | | | 3,900 | | | | 143,520 | |
Ubiquiti Networks, Inc. | | | 900 | | | | 26,010 | |
Verizon Communications, Inc. | | | 6,275 | | | | 317,452 | |
Vodafone Group PLC (United Kingdom) | | | 32,157 | | | | 117,512 | |
Walt Disney (The) Co. | | | 2,635 | | | | 243,764 | |
WPP PLC (United Kingdom) | | | 1,592 | | | | 33,322 | |
| | | | | | | | |
| | | Number
of Shares | | | Value | |
| | | | | | | | |
| Communications (Continued) | | | | | | | | |
Yelp, Inc.* | | | 800 | | | $ | 45,672 | |
Zillow, Inc., Class A* | | | 400 | | | | 47,344 | |
| | | | | | | | |
| | | | | | | 3,126,135 | |
| | | | | | | | |
| Consumer, Cyclical — 8.8% | | | | | | | | |
AMC Entertainment Holdings, Inc., Class A | | | 1,000 | | | | 26,220 | |
American Airlines Group, Inc. | | | 1,000 | | | | 48,530 | |
Bayerische Motoren Werke AG (Germany) | | | 393 | | | | 44,934 | |
Beacon Roofing Supply, Inc.* | | | 500 | | | | 13,540 | |
Brunswick Corp. | | | 900 | | | | 44,712 | |
Carnival Corp. | | | 1,000 | | | | 44,160 | |
Cie Financiere Richemont SA (Switzerland) | | | 610 | | | | 57,354 | |
Columbia Sportswear Co. | | | 668 | | | | 30,093 | |
Compass Group PLC (United Kingdom) | | | 2,123 | | | | 36,146 | |
CVS Health Corp. | | | 1,874 | | | | 171,208 | |
Daimler AG (Germany) | | | 1,146 | | | | 96,615 | |
Federal-Mogul Holdings Corp.* | | | 1,400 | | | | 21,728 | |
Ford Motor Co. | | | 5,907 | | | | 92,917 | |
Genesco, Inc.* | | | 300 | | | | 24,411 | |
Group 1 Automotive, Inc. | | | 300 | | | | 26,853 | |
Hennes & Mauritz AB, Class B (Sweden) | | | 1,092 | | | | 46,776 | |
Hilton Worldwide Holdings, Inc.* | | | 1,500 | | | | 39,330 | |
Home Depot (The), Inc. | | | 2,084 | | | | 207,149 | |
Honda Motor Co. Ltd. (Japan) | | | 1,898 | | | | 57,101 | |
HSN, Inc. | | | 500 | | | | 36,465 | |
Inditex SA (Spain) | | | 1,320 | | | | 38,433 | |
JetBlue Airways Corp.* | | | 2,700 | | | | 39,501 | |
Kate Spade & Co.* | | | 1,200 | | | | 38,436 | |
Kohl’s Corp. | | | 300 | | | | 17,886 | |
Las Vegas Sands Corp. | | | 1,300 | | | | 82,797 | |
Lennar Corp., Class A | | | 2,100 | | | | 99,204 | |
LVMH Moet Hennessy Louis Vuitton SA (France) | | | 346 | | | | 62,169 | |
Macy’s, Inc. | | | 600 | | | | 38,946 | |
Marriott Vacations Worldwide Corp. | | | 400 | | | | 29,404 | |
McDonald’s Corp. | | | 1,700 | | | | 164,577 | |
Men’s Wearhouse (The), Inc. | | | 527 | | | | 24,621 | |
Mitsubishi Corp. (Japan) | | | 1,493 | | | | 28,234 | |
Mitsui & Co. Ltd. (Japan) | | | 2,000 | | | | 27,587 | |
Mobile Mini, Inc. | | | 500 | | | | 20,745 | |
NIKE, Inc., Class B | | | 1,462 | | | | 145,163 | |
Office Depot, Inc.* | | | 5,400 | | | | 35,802 | |
Panasonic Corp. (Japan) | | | 2,600 | | | | 33,564 | |
Penske Automotive Group, Inc. | | | 800 | | | | 37,880 | |
Restoration Hardware Holdings, Inc.* | | | 500 | | | | 42,235 | |
Rite Aid Corp.* | | | 9,300 | | | | 50,964 | |
Skechers U.S.A., Inc., Class A* | | | 400 | | | | 24,564 | |
Spirit Airlines, Inc.* | | | 700 | | | | 57,883 | |
Standard Pacific Corp.* | | | 2,700 | | | | 20,385 | |
Tenneco, Inc.* | | | 600 | | | | 32,610 | |
Tesla Motors, Inc.* | | | 200 | | | | 48,904 | |
Toyota Motor Corp. (Japan) | | | 3,230 | | | | 198,999 | |
UniFirst Corp. | | | 200 | | | | 22,318 | |
Walgreen Co. | | | 1,573 | | | | 107,924 | |
Wal-Mart Stores, Inc. | | | 5,376 | | | | 470,614 | |
| | | | | | | | |
| | | | | | | 3,208,591 | |
| | | | | | | | |
| | | | |
| See Notes to Financial Statements. | | 30 | | |
db-X Exchange-Traded Funds Inc.
Schedule of investments
Deutsche X-trackers 2040 Target Date ETF (Continued)
November 30, 2014 (Unaudited)
| | | | | | | | |
| | | Number
of Shares | | | Value | |
| | | | | | | | |
| Consumer, Non-cyclical — 19.8% | | | | | | | | |
Accuray, Inc.* | | | 3,700 | | | $ | 25,493 | |
Affymetrix, Inc.* | | | 3,500 | | | | 31,955 | |
Align Technology, Inc.* | | | 743 | | | | 42,277 | |
Alnylam Pharmaceuticals, Inc.* | | | 900 | | | | 90,495 | |
Amgen, Inc. | | | 1,197 | | | | 197,876 | |
AmSurg Corp.* | | | 243 | | | | 12,532 | |
Anheuser-Busch InBev NV (Belgium) | | | 996 | | | | 116,987 | |
Anika Therapeutics, Inc.* | | | 600 | | | | 24,534 | |
AstraZeneca PLC (United Kingdom) | | | 1,492 | | | | 111,399 | |
Bayer AG (Germany) | | | 998 | | | | 150,095 | |
British American Tobacco PLC (United Kingdom) | | | 2,350 | | | | 139,286 | |
Capella Education Co. | | | 500 | | | | 34,090 | |
Cardinal Health, Inc. | | | 3,225 | | | | 265,063 | |
Centene Corp.* | | | 512 | | | | 50,570 | |
Coca-Cola Bottling Co. Consolidated | | | 407 | | | | 38,486 | |
Coca-Cola (The) Co. | | | 6,802 | | | | 304,934 | |
CONMED Corp. | | | 200 | | | | 8,486 | |
CoStar Group, Inc.* | | | 364 | | | | 61,975 | |
CSL Ltd. (Australia) | | | 598 | | | | 42,015 | |
Darling Ingredients, Inc.* | | | 1,714 | | | | 31,880 | |
Deluxe Corp. | | | 400 | | | | 23,380 | |
Diageo PLC (United Kingdom) | | | 2,956 | | | | 91,469 | |
Ensign Group (The), Inc. | | | 1,000 | | | | 39,420 | |
Euronet Worldwide, Inc.* | | | 500 | | | | 29,035 | |
Foundation Medicine, Inc.* | | | 1,100 | | | | 25,982 | |
FTI Consulting, Inc.* | | | 314 | | | | 12,174 | |
Gilead Sciences, Inc.* | | | 2,309 | | | | 231,639 | |
GlaxoSmithKline PLC (United Kingdom) | | | 5,856 | | | | 135,835 | |
Haemonetics Corp.* | | | 400 | | | | 14,772 | |
Hain Celestial Group (The), Inc.* | | | 428 | | | | 48,458 | |
Humana, Inc. | | | 1,470 | | | | 202,816 | |
Impax Laboratories, Inc.* | | | 800 | | | | 25,560 | |
Imperial Tobacco Group PLC (United Kingdom) | | | 1,120 | | | | 51,784 | |
Integra LifeSciences Holdings Corp.* | | | 300 | | | | 14,772 | |
Intercept Pharmaceuticals, Inc.* | | | 200 | | | | 28,746 | |
Isis Pharmaceuticals, Inc.* | | | 1,500 | | | | 77,685 | |
Johnson & Johnson | | | 4,583 | | | | 496,110 | |
Kellogg Co. | | | 600 | | | | 39,750 | |
Kindred Healthcare, Inc. | | | 500 | | | | 9,945 | |
LDR Holding Corp.* | | | 1,300 | | | | 42,419 | |
Live Nation Entertainment, Inc.* | | | 1,865 | | | | 49,982 | |
Magellan Health, Inc.* | | | 239 | | | | 14,624 | |
MannKind Corp.* | | | 3,900 | | | | 23,985 | |
McGraw Hill Financial, Inc. | | | 2,600 | | | | 242,996 | |
Medicines (The) Co.* | | | 600 | | | | 16,086 | |
Merck & Co., Inc. | | | 4,488 | | | | 271,075 | |
Molina Healthcare, Inc.* | | | 400 | | | | 20,448 | |
Mondelez International, Inc., Class A | | | 2,723 | | | | 106,742 | |
Nestle SA (Switzerland) | | | 3,920 | | | | 294,329 | |
Novartis AG (Switzerland) | | | 2,805 | | | | 271,428 | |
Novo Nordisk A/S, Class B (Denmark) | | | 2,450 | | | | 111,738 | |
OncoMed Pharmaceuticals, Inc.* | | | 1,500 | | | | 33,045 | |
OPKO Health, Inc.* | | | 3,800 | | | | 31,844 | |
Orexigen Therapeutics, Inc.* | | | 6,100 | | | | 35,319 | |
Owens & Minor, Inc. | | | 700 | | | | 23,947 | |
| | | | | | | | |
| | | Number
of Shares | | | Value | |
| | | | | | | | |
| Consumer, Non-cyclical (Continued) | | | | | | | | |
Pfizer, Inc. | | | 9,662 | | | $ | 300,971 | |
Philip Morris International, Inc. | | | 2,600 | | | | 226,018 | |
Pilgrim’s Pride Corp.* | | | 1,955 | | | | 63,147 | |
Procter & Gamble (The) Co. | | | 4,308 | | | | 389,572 | |
Raptor Pharmaceutical Corp.* | | | 3,800 | | | | 36,556 | |
Reckitt Benckiser Group PLC (United Kingdom) | | | 813 | | | | 66,734 | |
Roche Holding AG (Switzerland) | | | 811 | | | | 242,901 | |
SABMiller PLC (United Kingdom) | | | 1,182 | | | | 65,802 | |
Sanofi (France) | | | 1,488 | | | | 144,061 | |
Seaboard Corp.* | | | 11 | | | | 37,950 | |
Shire PLC (Ireland) | | | 617 | | | | 43,919 | |
Spectrum Brands Holdings, Inc. | | | 514 | | | | 47,273 | |
Takeda Pharmaceutical Co. Ltd. (Japan) | | | 941 | | | | 39,411 | |
Teva Pharmaceutical Industries Ltd. (Israel) | | | 1,039 | | | | 59,123 | |
Tyson Foods, Inc., Class A | | | 500 | | | | 21,170 | |
Unilever NV (Netherlands) | | | 1,945 | | | | 79,219 | |
Unilever PLC (United Kingdom) | | | 1,536 | | | | 64,924 | |
UnitedHealth Group, Inc. | | | 1,546 | | | | 152,482 | |
WellCare Health Plans, Inc.* | | | 400 | | | | 29,496 | |
Wesfarmers Ltd. (Australia) | | | 1,264 | | | | 44,540 | |
WEX, Inc.* | | | 400 | | | | 45,232 | |
Woolworths Ltd. (Australia) | | | 1,452 | | | | 38,449 | |
| | | | | | | | |
| | | | | | | 7,208,717 | |
| | | | | | | | |
| Diversified — 0.1% | | | | | | | | |
Hutchison Whampoa Ltd. (Hong Kong) | | | 2,706 | | | | 33,916 | |
| | | | | | | | |
| Energy — 6.9% | | | | | | | | |
Antero Resources Corp.* | | | 2,800 | | | | 131,376 | |
BG Group PLC (United Kingdom) | | | 4,050 | | | | 56,948 | |
BP PLC (United Kingdom) | | | 23,256 | | | | 152,642 | |
Bristow Group, Inc. | | | 343 | | | | 21,986 | |
Chesapeake Energy Corp. | | | 7,300 | | | | 147,898 | |
Chevron Corp. | | | 3,007 | | | | 327,372 | |
Diamondback Energy, Inc.* | | | 500 | | | | 28,200 | |
Eni S.p.A (Italy) | | | 3,030 | | | | 60,547 | |
EOG Resources, Inc. | | | 800 | | | | 69,376 | |
Exxon Mobil Corp. | | | 6,963 | | | | 630,431 | |
Forum Energy Technologies, Inc.* | | | 900 | | | | 21,609 | |
Geospace Technologies Corp.* | | | 700 | | | | 18,452 | |
ION Geophysical Corp.* | | | 7,400 | | | | 18,278 | |
Kodiak Oil & Gas Corp.* | | | 2,400 | | | | 17,592 | |
ONEOK, Inc. | | | 2,000 | | | | 108,320 | |
Rosetta Resources, Inc.* | | | 600 | | | | 17,652 | |
Royal Dutch Shell PLC, Class A (United Kingdom) | | | 4,404 | | | | 146,697 | |
Royal Dutch Shell PLC, Class B (United Kingdom) | | | 2,863 | | | | 99,413 | |
Schlumberger Ltd. (Netherland Antilles) | | | 1,901 | | | | 163,391 | |
Statoil ASA (Norway) | | | 1,307 | | | | 24,685 | |
Targa Resources Corp. | | | 428 | | | | 48,852 | |
Total SA (France) | | | 2,754 | | | | 154,067 | |
Western Refining, Inc. | | | 900 | | | | 36,999 | |
| | | | | | | | |
| | | | | | | 2,502,783 | |
| | | | | | | | |
| | | | |
| See Notes to Financial Statements. | | 31 | | |
db-X Exchange-Traded Funds Inc.
Schedule of investments
Deutsche X-trackers 2040 Target Date ETF (Continued)
November 30, 2014 (Unaudited)
| | | | | | | | |
| | | Number
of Shares | | | Value | |
| | | | | | | | |
| Financial — 20.9% | | | | | | | | |
AIA Group Ltd. (Hong Kong) | | | 14,278 | | | $ | 82,480 | |
Allianz SE (Germany) | | | 540 | | | | 92,965 | |
American Express Co. | | | 1,545 | | | | 142,789 | |
American International Group, Inc. | | | 2,294 | | | | 125,711 | |
American Realty Capital Properties, Inc. REIT | | | 8,000 | | | | 75,200 | |
American Tower Corp. REIT | | | 639 | | | | 67,101 | |
AmTrust Financial Services, Inc. | | | 770 | | | | 39,516 | |
Anworth Mortgage Asset Corp. REIT | | | 5,800 | | | | 31,320 | |
Aon PLC (United Kingdom) | | | 500 | | | | 46,245 | |
Australia & New Zealand Banking Group Ltd. (Australia) | | | 3,374 | | | | 91,640 | |
AXA SA (France) | | | 2,044 | | | | 49,346 | |
Banco Bilbao Vizcaya Argentaria SA (Spain) | | | 6,967 | | | | 74,832 | |
Banco Santander SA (Spain) | | | 14,929 | | | | 134,567 | |
Bank of America Corp. | | | 16,597 | | | | 282,813 | |
Bank of the Ozarks, Inc. | | | 700 | | | | 25,340 | |
Barclays PLC (United Kingdom) | | | 21,066 | | | | 80,667 | |
Berkshire Hathaway, Inc., Class B* | | | 4,025 | | | | 598,477 | |
BNP Paribas SA (France) | | | 1,197 | | | | 76,743 | |
Capital Senior Living Corp.* | | | 1,200 | | | | 30,540 | |
Charles Schwab (The) Corp. | | | 2,108 | | | | 59,699 | |
Chubb (The) Corp. | | | 2,500 | | | | 257,625 | |
Citigroup, Inc. | | | 4,597 | | | | 248,100 | |
CNO Financial Group, Inc. | | | 2,200 | | | | 38,148 | |
Cohen & Steers, Inc. | | | 400 | | | | 17,308 | |
Commonwealth Bank of Australia (Australia) | | | 1,958 | | | | 134,484 | |
Credit Acceptance Corp.* | | | 228 | | | | 34,143 | |
Credit Suisse Group AG (Switzerland)* | | | 1,713 | | | | 45,775 | |
Deutsche Bank AG (Germany) (a) | | | 1,537 | | | | 50,236 | |
EastGroup Properties, Inc. REIT | | | 300 | | | | 20,166 | |
Employers Holdings, Inc. | | | 1,400 | | | | 28,392 | |
EPR Properties REIT | | | 500 | | | | 27,995 | |
Equity One, Inc. REIT | | | 1,200 | | | | 29,076 | |
Equity Residential REIT | | | 3,500 | | | | 247,940 | |
Evercore Partners, Inc., Class A | | | 300 | | | | 15,150 | |
Financial Engines, Inc. | | | 500 | | | | 16,340 | |
First American Financial Corp. | | | 1,100 | | | | 35,211 | |
First Financial Bankshares, Inc. | | | 600 | | | | 18,102 | |
FirstMerit Corp. | | | 1,700 | | | | 30,413 | |
FXCM, Inc., Class A | | | 2,200 | | | | 35,420 | |
GAMCO Investors, Inc., Class A | | | 200 | | | | 17,232 | |
Hancock Holding Co. | | | 757 | | | | 24,761 | |
Hanmi Financial Corp. | | | 1,600 | | | | 32,160 | |
Highwoods Properties, Inc. REIT | | | 799 | | | | 34,485 | |
HSBC Holdings PLC (United Kingdom) | | | 21,405 | | | | 212,981 | |
ING Groep NV (Netherlands)* | | | 4,545 | | | | 66,575 | |
Investors Bancorp, Inc. | | | 3,348 | | | | 36,192 | |
JPMorgan Chase & Co. | | | 5,860 | | | | 352,537 | |
LaSalle Hotel Properties REIT | | | 1,000 | | | | 40,370 | |
Lloyds Banking Group PLC (United Kingdom)* | | | 67,839 | | | | 85,143 | |
MarketAxess Holdings, Inc. | | | 356 | | | | 23,343 | |
Marsh & McLennan Cos., Inc. | | | 800 | | | | 45,272 | |
MGIC Investment Corp.* | | | 3,500 | | | | 32,585 | |
| | | | | | | | |
| | | Number
of Shares | | | Value | |
| | | | | | | | |
| Financial (Continued) | | | | | | | | |
Mitsubishi UFJ Financial Group, Inc. (Japan) | | | 14,063 | | | $ | 81,311 | |
Mizuho Financial Group, Inc. (Japan) | | | 25,171 | | | | 43,360 | |
Muenchener Rueckversicherungs-Gesellschaft AG (Germany) | | | 218 | | | | 44,903 | |
National Australia Bank Ltd. (Australia) | | | 2,879 | | | | 79,861 | |
National Health Investors, Inc. REIT | | | 300 | | | | 19,884 | |
NewStar Financial, Inc.* | | | 2,400 | | | | 26,976 | |
Nordea Bank AB (Sweden) | | | 3,690 | | | | 46,097 | |
Northfield Bancorp, Inc. | | | 2,400 | | | | 33,816 | |
NorthStar Realty Finance Corp. REIT | | | 3,400 | | | | 62,118 | |
PacWest Bancorp | | | 900 | | | | 41,850 | |
PRA Group, Inc.* | | | 600 | | | | 35,112 | |
Prospect Capital Corp. | | | 2,600 | | | | 24,518 | |
Prosperity Bancshares, Inc. | | | 600 | | | | 33,708 | |
Prudential PLC (United Kingdom) | | | 3,051 | | | | 73,773 | |
Public Storage REIT | | | 280 | | | | 52,536 | |
Radian Group, Inc. | | | 1,900 | | | | 32,395 | |
RAIT Financial Trust REIT | | | 3,700 | | | | 27,343 | |
RLJ Lodging Trust REIT | | | 1,300 | | | | 42,809 | |
Ryman Hospitality Properties, Inc. REIT | | | 576 | | | | 29,998 | |
Simon Property Group, Inc. REIT | | | 491 | | | | 88,773 | |
Sovran Self Storage, Inc. REIT | | | 357 | | | | 30,352 | |
Springleaf Holdings, Inc.* | | | 1,100 | | | | 43,615 | |
Standard Chartered PLC (United Kingdom) | | | 2,863 | | | | 41,907 | |
Stifel Financial Corp.* | | | 700 | | | | 33,971 | |
Strategic Hotels & Resorts, Inc. REIT * | | | 2,200 | | | | 29,216 | |
Sumitomo Mitsui Financial Group, Inc. (Japan) | | | 1,501 | | | | 56,581 | |
Sun Communities, Inc. REIT | | | 400 | | | | 23,556 | |
Sunstone Hotel Investors, Inc. REIT | | | 1,700 | | | | 27,217 | |
T. Rowe Price Group, Inc. | | | 2,634 | | | | 219,859 | |
U.S. Bancorp | | | 2,967 | | | | 131,141 | |
UBS AG (Switzerland)* | | | 4,281 | | | | 77,091 | |
UMB Financial Corp. | | | 400 | | | | 22,196 | |
Umpqua Holdings Corp. | | | 2,000 | | | | 33,980 | |
Urstadt Biddle Properties, Inc., Class A REIT | | | 1,400 | | | | 31,052 | |
Visa, Inc., Class A | | | 1,244 | | | | 321,188 | |
Vornado Realty Trust REIT | | | 1,860 | | | | 207,502 | |
Webster Financial Corp. | | | 900 | | | | 28,323 | |
Wells Fargo & Co. | | | 8,190 | | | | 446,192 | |
Western Alliance Bancorp * | | | 800 | | | | 21,144 | |
Westpac Banking Corp. (Australia) | | | 3,784 | | | | 104,804 | |
Weyerhaeuser Co. REIT | | | 5,500 | | | | 194,205 | |
Zurich Insurance Group AG (Switzerland)* | | | 177 | | | | 55,468 | |
| | | | | | | | |
| | | | | | | 7,643,352 | |
| | | | | | | | |
| Industrial — 9.4% | | | | | | | | |
3M Co. | | | 1,100 | | | | 176,099 | |
ABB Ltd. (Switzerland)* | | | 2,616 | | | | 58,723 | |
Actuant Corp., Class A | | | 600 | | | | 17,616 | |
Acuity Brands, Inc. | | | 466 | | | | 64,401 | |
Airbus Group NV (France) | | | 702 | | | | 42,768 | |
Belden, Inc. | | | 400 | | | | 29,212 | |
Berry Plastics Group, Inc.* | | | 1,100 | | | | 31,834 | |
Boeing (The) Co. | | | 1,208 | | | | 162,308 | |
| | | | |
| See Notes to Financial Statements. | | 32 | | |
db-X Exchange-Traded Funds Inc.
Schedule of investments
Deutsche X-trackers 2040 Target Date ETF (Continued)
November 30, 2014 (Unaudited)
| | | | | | | | |
| | | Number
of Shares | | | Value | |
| | | | | | | | |
| Industrial (Continued) | | | | | | | | |
Caterpillar, Inc. | | | 1,019 | | | $ | 102,511 | |
CLARCOR, Inc. | | | 400 | | | | 26,356 | |
Cognex Corp.* | | | 800 | | | | 32,568 | |
Deutsche Post AG (Germany) | | | 1,036 | | | | 34,415 | |
East Japan Railway Co. (Japan) | | | 428 | | | | 32,076 | |
Eaton Corp. PLC (Ireland) | | | 756 | | | | 51,279 | |
EMCOR Group, Inc. | | | 585 | | | | 25,360 | |
Emerson Electric Co. | | | 1,115 | | | | 71,081 | |
EnerSys | | | 533 | | | | 32,369 | |
Esterline Technologies Corp.* | | | 300 | | | | 35,649 | |
FANUC Corp. (Japan) | | | 241 | | | | 40,642 | |
FedEx Corp. | | | 500 | | | | 89,090 | |
FEI Co. | | | 367 | | | | 31,430 | |
Fluor Corp. | | | 1,600 | | | | 99,184 | |
Generac Holdings, Inc.* | | | 700 | | | | 30,366 | |
General Dynamics Corp. | | | 543 | | | | 78,930 | |
General Electric Co. | | | 16,700 | | | | 442,382 | |
Graphic Packaging Holding Co.* | | | 3,298 | | | | 41,060 | |
Griffon Corp. | | | 2,600 | | | | 32,370 | |
Haynes International, Inc. | | | 600 | | | | 26,934 | |
HEICO Corp. | | | 600 | | | | 31,806 | |
Hitachi Ltd. (Japan) | | | 5,997 | | | | 46,298 | |
Ingersoll-Rand PLC (Ireland) | | | 2,603 | | | | 164,145 | |
Koninklijke Philips NV (Netherlands) | | | 1,088 | | | | 32,814 | |
LSB Industries, Inc.* | | | 200 | | | | 6,614 | |
Middleby (The) Corp.* | | | 513 | | | | 49,063 | |
Mistras Group, Inc.* | | | 1,300 | | | | 22,217 | |
Parker-Hannifin Corp. | | | 1,600 | | | | 206,449 | |
Ply Gem Holdings, Inc.* | | | 3,100 | | | | 38,812 | |
Precision Castparts Corp. | | | 200 | | | | 47,580 | |
Quanex Building Products Corp. | | | 1,700 | | | | 33,626 | |
Rofin-Sinar Technologies, Inc.* | | | 1,300 | | | | 34,996 | |
Rolls-Royce Holdings PLC (United Kingdom)* | | | 2,215 | | | | 29,149 | |
Sanmina Corp.* | | | 700 | | | | 17,220 | |
Schneider Electric SE (France) | | | 651 | | | | 53,103 | |
Siemens AG (Germany) | | | 940 | | | | 111,228 | |
SunPower Corp.* | | | 1,300 | | | | 36,608 | |
Swift Transportation Co.* | | | 1,300 | | | | 37,791 | |
TTM Technologies, Inc.* | | | 3,900 | | | | 26,364 | |
Union Pacific Corp. | | | 1,468 | | | | 171,418 | |
United Parcel Service, Inc., Class B | | | 1,536 | | | | 168,837 | |
USG Corp.* | | | 1,400 | | | | 40,334 | |
Vinci SA (France) | | | 555 | | | | 30,003 | |
Watts Water Technologies, Inc., Class A | | | 300 | | | | 18,138 | |
Woodward, Inc. | | | 657 | | | | 33,954 | |
| | | | | | | | |
| | | | | | | 3,427,580 | |
| | | | | | | | |
| Technology — 11.3% | | | | | | | | |
Acxiom Corp.* | | | 700 | | | | 13,321 | |
Amkor Technology, Inc.* | | | 2,200 | | | | 14,718 | |
Apple, Inc. | | | 9,036 | | | | 1,074,650 | |
Applied Materials, Inc. | | | 10,200 | | | | 245,310 | |
Aspen Technology, Inc.* | | | 857 | | | | 32,343 | |
athenahealth, Inc.* | | | 328 | | | | 38,474 | |
Broadcom Corp., Class A | | | 4,600 | | | | 198,398 | |
Brooks Automation, Inc. | | | 2,900 | | | | 33,959 | |
| | | | | | | | |
| | | Number
of Shares | | | Value | |
| | | | | | | | |
| Technology (Continued) | | | | | | | | |
Canon, Inc. (Japan) | | | 1,342 | | | $ | 42,974 | |
Computer Programs & Systems, Inc. | | | 500 | | | | 29,370 | |
Convergys Corp. | | | 1,000 | | | | 20,850 | |
Dealertrack Technologies, Inc.* | | | 500 | | | | 23,580 | |
EMC Corp. | | | 3,185 | | | | 96,665 | |
Engility Holdings, Inc.* | | | 800 | | | | 33,640 | |
Entegris, Inc.* | | | 1,200 | | | | 16,164 | |
Fidelity National Information Services, Inc. | | | 2,802 | | | | 171,454 | |
Hewlett-Packard Co. | | | 3,000 | | | | 117,180 | |
Infoblox, Inc.* | | | 2,600 | | | | 46,800 | |
Intel Corp. | | | 6,527 | | | | 243,131 | |
International Business Machines Corp. | | | 1,686 | | | | 273,419 | |
International Rectifier Corp.* | | | 700 | | | | 27,916 | |
Intersil Corp., Class A | | | 1,200 | | | | 15,732 | |
MAXIMUS, Inc. | | | 600 | | | | 31,434 | |
Mentor Graphics Corp. | | | 1,085 | | | | 24,098 | |
Microsemi Corp.* | | | 857 | | | | 23,310 | |
Microsoft Corp. | | | 12,560 | | | | 600,494 | |
Oracle Corp. | | | 7,437 | | | | 315,403 | |
PTC, Inc.* | | | 1,105 | | | | 43,172 | |
SAP SE (Germany) | | | 1,200 | | | | 84,575 | |
SS&C Technologies Holdings, Inc. | | | 800 | | | | 40,440 | |
SunEdison, Inc.* | | | 2,400 | | | | 51,960 | |
SYNNEX Corp. | | | 343 | | | | 24,504 | |
Syntel, Inc.* | | | 788 | | | | 35,066 | |
Ultimate Software Group (The), Inc.* | | | 257 | | | | 37,841 | |
| | | | | | | | |
| | | | | | | 4,122,345 | |
| | | | | | | | |
| Utilities — 1.9% | | | | | | | | |
Chesapeake Utilities Corp. | | | 600 | | | | 26,958 | |
Cleco Corp. | | | 600 | | | | 32,238 | |
Dominion Resources, Inc. | | | 970 | | | | 70,374 | |
Duke Energy Corp. | | | 1,100 | | | | 88,990 | |
Dynegy, Inc.* | | | 1,100 | | | | 36,465 | |
E.ON SE (Germany) | | | 2,289 | | | | 40,574 | |
Enel S.p.A. (Italy) | | | 8,135 | | | | 39,248 | |
GDF Suez (France) | | | 1,602 | | | | 39,472 | |
National Grid PLC (United Kingdom) | | | 4,448 | | | | 64,615 | |
NRG Yield, Inc., Class A | | | 600 | | | | 28,434 | |
PG&E Corp. | | | 4,200 | | | | 212,099 | |
| | | | | | | | |
| | | | | | | 679,467 | |
| | | | | | | | |
TOTAL COMMON STOCKS
(Cost $26,590,516) | | | | | | | 33,279,120 | |
| | | | | | | | |
| PREFERRED STOCKS — 0.1% | | | | | | | | |
| Consumer, Cyclical — 0.1% | | | | | | | | |
Volkswagen AG (Germany) | | | 165 | | | | 37,998 | |
| | | | | | | | |
| Industrial — 0.0% | | | | | | | | |
Rolls-Royce Holdings PLC, Class C (United Kingdom)* | | | 199,350 | | | | 311 | |
| | | | | | | | |
TOTAL PREFERRED STOCKS
(Cost $35,792) | | | | | | | 38,309 | |
| | | | | | | | |
| RIGHTS — 0.0% | | | | | | | | |
| Communications — 0.0% | | | | | | | | |
Leap Wireless International, Inc. CVR*
(Cost $3,587) | | | 1,470 | | | | 3,587 | |
| | | | | | | | |
| | | | |
| See Notes to Financial Statements. | | 33 | | |
db-X Exchange-Traded Funds Inc.
Schedule of investments
Deutsche X-trackers 2040 Target Date ETF (Continued)
November 30, 2014 (Unaudited)
| | | | | | | | |
| | | Principal
Amount | | | Value | |
| | | | | | | | |
| CORPORATE BONDS — 3.5% | | | | | | | | |
| Basic Materials — 0.1% | | | | | | | | |
BHP Billiton Finance USA Ltd. (Australia)
4.125%, 2/24/42 | | $ | 5,000 | | | $ | 4,993 | |
Dow Chemical (The) Co.
4.375%, 11/15/42 | | | 20,000 | | | | 19,469 | |
Rio Tinto Finance USA PLC (United Kingdom)
4.125%, 8/21/42 | | | 18,000 | | | | 16,684 | |
| | | | | | | | |
| | | | | | | 41,146 | |
| | | | | | | | |
| Communications — 0.4% | | | | | | | | |
AT&T, Inc.
4.35%, 6/15/45 | | | 95,000 | | | | 90,321 | |
Comcast Corp.
4.75%, 3/01/44 | | | 10,000 | | | | 11,040 | |
Time Warner, Inc.
4.65%, 6/01/44 | | | 10,000 | | | | 10,172 | |
Vodafone Group PLC (United Kingdom)
4.375%, 2/19/43 | | | 19,000 | | | | 18,287 | |
Walt Disney (The) Co., Series E
4.125%, 12/01/41 | | | 20,000 | | | | 21,113 | |
| | | | | | | | |
| | | | | | | 150,933 | |
| | | | | | | | |
| Consumer, Cyclical — 0.3% | | | | | | | | |
Home Depot (The), Inc.
4.20%, 4/01/43 | | | 23,000 | | | | 23,792 | |
McDonald’s Corp., MTN
3.70%, 2/15/42 | | | 17,000 | | | | 15,802 | |
Wal-Mart Stores, Inc.
4.00%, 4/11/43 | | | 60,000 | | | | 61,077 | |
| | | | | | | | |
| | | | | | | 100,671 | |
| | | | | | | | |
| Consumer, Non-cyclical — 0.7% | | | | | | | | |
AbbVie, Inc.
4.40%, 11/06/42 | | | 21,000 | | | | 20,954 | |
Altria Group, Inc.
4.50%, 5/02/43 | | | 20,000 | | | | 19,704 | |
Anheuser-Busch InBev Worldwide, Inc.
3.75%, 7/15/42 | | | 15,000 | | | | 13,917 | |
Baxter International, Inc.
3.65%, 8/15/42 | | | 10,000 | | | | 9,303 | |
Celgene Corp.
4.625%, 5/15/44 | | | 20,000 | | | | 20,521 | |
Diageo Investment Corp.
4.25%, 5/11/42 | | | 18,000 | | | | 18,018 | |
Medtronic, Inc.
4.50%, 3/15/42 | | | 20,000 | | | | 20,953 | |
Merck & Co., Inc.
4.15%, 5/18/43 | | | 10,000 | | | | 10,474 | |
Novartis Capital Corp.
4.40%, 5/06/44 | | | 10,000 | | | | 10,919 | |
PepsiCo, Inc.
4.00%, 3/05/42 | | | 5,000 | | | | 4,899 | |
Pfizer, Inc.
4.30%, 6/15/43 | | | 57,000 | | | | 58,969 | |
Philip Morris International, Inc.
4.50%, 3/20/42 | | | 18,000 | | | | 18,549 | |
Stryker Corp.
4.375%, 5/15/44 | | | 10,000 | | | | 10,391 | |
| | | | | | | | |
| | | Principal
Amount | | | Value | |
| | | | | | | | |
| Consumer, Non-cyclical (Continued) | | | | | | | | |
UnitedHealth Group, Inc.
4.625%, 11/15/41 | | $ | 8,000 | | | $ | 8,548 | |
| | | | | | | | |
| | | | | | | 246,119 | |
| | | | | | | | |
| Energy — 0.2% | | | | | | | | |
Apache Corp.
4.75%, 4/15/43 | | | 20,000 | | | | 19,322 | |
Halliburton Co.
4.50%, 11/15/41 | | | 5,000 | | | | 4,978 | |
National Oilwell Varco, Inc.
3.95%, 12/01/42 | | | 15,000 | | | | 14,212 | |
Shell International Finance BV (Netherlands)
4.55%, 8/12/43 | | | 15,000 | | | | 16,417 | |
Statoil ASA (Norway)
5.10%, 8/17/40 | | | 23,000 | | | | 26,378 | |
| | | | | | | | |
| | | | | | | 81,307 | |
| | | | | | | | |
| Financial — 0.3% | | | | | | | | |
American Express Co.
4.05%, 12/03/42 | | | 15,000 | | | | 14,732 | |
Berkshire Hathaway Finance Corp.
4.40%, 5/15/42 | | | 33,000 | | | | 34,323 | |
Citigroup, Inc.
4.95%, 11/07/43 | | | 20,000 | | | | 22,412 | |
KFW (Germany)zero coupon,
4/18/36 | | | 30,000 | | | | 15,653 | |
Loews Corp.
4.125%, 5/15/43 | | | 20,000 | | | | 18,822 | |
| | | | | | | | |
| | | | | | | 105,942 | |
| | | | | | | | |
| Government — 0.1% | | | | | | | | |
Inter-American Development Bank, Series G, MTN (Supranational)
3.875%, 10/28/41 | | | 19,000 | | | | 20,444 | |
| | | | | | | | |
| Industrial — 0.4% | | | | | | | | |
Burlington Northern Santa Fe LLC
4.90%, 4/01/44 | | | 20,000 | | | | 21,996 | |
Deere & Co.
3.90%, 6/09/42 | | | 20,000 | | | | 19,854 | |
General Electric Co.
4.50%, 3/11/44 | | | 25,000 | | | | 27,218 | |
Lockheed Martin Corp.
4.07%, 12/15/42 | | | 30,000 | | | | 29,932 | |
Precision Castparts Corp.
3.90%, 1/15/43 | | | 10,000 | | | | 10,167 | |
Union Pacific Corp.
4.75%, 9/15/41 | | | 26,000 | | | | 28,887 | |
United Technologies Corp.
4.50%, 6/01/42 | | | 18,000 | | | | 19,529 | |
| | | | | | | | |
| | | | | | | 157,583 | |
| | | | | | | | |
| Technology — 0.2% | | | | | | | | |
Apple, Inc.
3.85%, 5/04/43 | | | 37,000 | | | | 36,070 | |
International Business Machines Corp.
4.00%, 6/20/42 | | | 30,000 | | | | 29,104 | |
Microsoft Corp.
4.50%, 10/01/40 | | | 11,000 | | | | 11,929 | |
| | | | | | | | |
| | | | | | | 77,103 | |
| | | | | | | | |
| | | | |
| See Notes to Financial Statements. | | 34 | | |
db-X Exchange-Traded Funds Inc.
Schedule of investments
Deutsche X-trackers 2040 Target Date ETF (Continued)
November 30, 2014 (Unaudited)
| | | | | | | | |
| | | Principal
Amount | | | Value | |
| | | | | | | | |
| Utilities — 0.8% | | | | | | | | |
Atmos Energy Corp.
5.50%, 6/15/41 | | $ | 20,000 | | | $ | 24,638 | |
CenterPoint Energy Houston Electric LLC
4.50%, 4/01/44 | | | 20,000 | | | | 21,813 | |
Consolidated Edison Co. of New York, Inc.
3.95%, 3/01/43 | | | 24,000 | | | | 23,427 | |
Dominion Gas Holdings LLC
4.80%, 11/01/43 | | | 10,000 | | | | 10,747 | |
Florida Power & Light Co.
5.25%, 2/01/41 | | | 12,000 | | | | 14,633 | |
Georgia Power Co.
4.30%, 3/15/42 | | | 12,000 | | | | 12,454 | |
Pacific Gas & Electric Co.
4.60%, 6/15/43 | | | 30,000 | | | | 31,914 | |
Public Service Electric & Gas Co., MTN
3.65%, 9/01/42 | | | 23,000 | | | | 21,829 | |
Puget Sound Energy, Inc.
4.434%, 11/15/41 | | | 17,000 | | | | 18,287 | |
San Diego Gas & Electric Co.
3.95%, 11/15/41 | | | 12,000 | | | | 12,152 | |
Southern California Edison Co.
4.65%, 10/01/43 | | | 20,000 | | | | 22,419 | |
Southern California Gas Co.
5.125%, 11/15/40 | | | 12,000 | | | | 14,538 | |
Southern Power Co.
5.15%, 9/15/41 | | | 13,000 | | | | 14,761 | |
Virginia Electric and Power Co., Series D
4.65%, 8/15/43 | | | 45,000 | | | | 49,852 | |
| | | | | | | | |
| | | | | | | 293,464 | |
| | | | | | | | |
TOTAL CORPORATE BONDS
(Cost $1,238,518) | | | | | | | 1,274,712 | |
| | | | | | | | |
| UNITED STATES GOVERNMENT & AGENCY OBLIGATIONSS — 4.5% | | | | | | | | |
| United States Treasury Bonds/Notes — 4.5% | | | | | | | | |
4.375%, 11/15/39 | | | 205,200 | | | | 262,447 | |
4.625%, 2/15/40 | | | 98,700 | | | | 130,947 | |
4.375%, 5/15/40 | | | 84,800 | | | | 108,935 | |
4.75%, 2/15/41 | | | 84,500 | | | | 115,125 | |
4.375%, 5/15/41 | | | 183,400 | | | | 236,916 | |
3.125%, 2/15/42 | | | 245,100 | | | | 256,225 | |
3.75%, 11/15/43 | | | 450,000 | | | | 524,602 | |
| | | | | | | | |
| | | | | | | 1,635,197 | |
| | | | | | | | |
TOTAL UNITED STATES GOVERNMENT & AGENCY OBLIGATIONSS
(Cost $1,479,424) | | | | | | | 1,635,197 | |
| | | | | | | | |
| | | | | | | | |
| | | Principal
Amount | | | Value | |
| | | | | | | | |
| SOVEREIGN BONDS — 0.3% | | | | | | | | |
Israel Government International Bond (Israel)
4.50% 1/30/2043 | | $ | 10,000 | | | $ | 10,313 | |
Tennessee Valley Authority
4.875% 1/15/2048 | | | 54,000 | | | | 64,207 | |
United Mexican States, MTN (Mexico)
4.75% 3/8/2044 | | | 47,000 | | | | 48,727 | |
| | | | | | | | |
TOTAL SOVEREIGN BONDS
(Cost $111,945) | | | | | | | 123,247 | |
| | | | | | | | |
| | |
TOTAL INVESTMENTS — 99.7% (Cost $29,459,782) | | | | | | $ | 36,354,172 | |
Other assets less liabilities — 0.3% | | | | | | | 106,833 | |
| | | | | | | | |
NET ASSETS — 100.0% | | | | | | $ | 36,461,005 | |
| | | | | | | | |
CVR – Contingent Value Rights.
MTN – Medium Term Note.
REIT – Real Estate Investment Trust.
* Non-income producing security.
(a) Affiliated issuer. This security is owned in proportion with its representation in the index.
| | | | |
| See Notes to Financial Statements. | | 35 | | |
db-X Exchange-Traded Funds Inc.
Schedule of investments
Deutsche X-trackers In-Target Date ETF
November 30, 2014 (Unaudited)
| | | | | | | | |
| | | Number
of Shares | | | Value | |
| | | | | | | | |
| COMMON STOCKS — 32.3% | | | | | | | | |
| Basic Materials — 1.3% | | | | | | | | |
Air Liquide SA (France) | | | 47 | | | $ | 5,914 | |
Anglo American PLC (United Kingdom) | | | 180 | | | | 3,716 | |
BASF SE (Germany) | | | 129 | | | | 11,711 | |
BHP Billiton Ltd. (Australia) | | | 418 | | | | 10,997 | |
BHP Billiton PLC (United Kingdom) | | | 274 | | | | 6,493 | |
Chemtura Corp.* | | | 100 | | | | 2,330 | |
Dow Chemical (The) Co. | | | 233 | | | | 11,340 | |
E.I. du Pont de Nemours & Co. | | | 181 | | | | 12,923 | |
Freeport-McMoRan, Inc. | | | 134 | | | | 3,598 | |
Glencore PLC (Switzerland)* | | | 1,351 | | | | 6,761 | |
KapStone Paper and Packaging Corp.* | | | 100 | | | | 2,987 | |
Linde AG (Germany) | | | 29 | | | | 5,472 | |
Monsanto Co. | | | 100 | | | | 11,991 | |
PolyOne Corp. | | | 100 | | | | 3,730 | |
Rio Tinto PLC (United Kingdom) | | | 163 | | | | 7,619 | |
Schnitzer Steel Industries, Inc., Class A | | | 100 | | | | 2,280 | |
Sensient Technologies Corp. | | | 100 | | | | 5,895 | |
Sherwin-Williams (The) Co. | | | 117 | | | | 28,650 | |
Syngenta AG (Switzerland) | | | 13 | | | | 4,282 | |
U.S. Silica Holdings, Inc. | | | 100 | | | | 3,142 | |
| | | | | | | | |
| | | | | | | 151,831 | |
| | | | | | | | |
| Communications — 3.1% | | | | | | | | |
8x8, Inc.* | | | 500 | | | | 3,890 | |
Amazon.com, Inc.* | | | 76 | | | | 25,737 | |
Angie’s List, Inc.* | | | 400 | | | | 2,376 | |
ARRIS Group, Inc.* | | | 200 | | | | 5,954 | |
AT&T, Inc. | | | 993 | | | | 35,133 | |
Bankrate, Inc.* | | | 100 | | | | 1,169 | |
BT Group PLC (United Kingdom) | | | 1,213 | | | | 7,772 | |
Cisco Systems, Inc. | | | 828 | | | | 22,886 | |
Comcast Corp., Class A | | | 407 | | | | 23,215 | |
Deutsche Telekom AG (Germany) | | | 442 | | | | 7,530 | |
Finisar Corp.* | | | 100 | | | | 1,705 | |
Google, Inc., Class A * | | | 56 | | | | 30,748 | |
Google, Inc., Class C * | | | 60 | | | | 32,510 | |
Harmonic, Inc.* | | | 800 | | | | 5,600 | |
HealthStream, Inc.* | | | 200 | | | | 5,730 | |
Houghton Mifflin Harcourt Co.* | | | 200 | | | | 3,844 | |
Perficient, Inc.* | | | 200 | | | | 3,462 | |
Sinclair Broadcast Group, Inc., Class A | | | 100 | | | | 2,916 | |
SoftBank Corp. (Japan) | | | 100 | | | | 6,708 | |
Telefonaktiebolaget LM Ericsson, Class B (Sweden) | | | 456 | | | | 5,742 | |
Thomson Reuters Corp. (Canada) | | | 64 | | | | 2,552 | |
Time Warner, Inc. | | | 200 | | | | 17,024 | |
Twenty-First Century Fox, Inc., Class A | | | 500 | | | | 18,400 | |
Ubiquiti Networks, Inc. | | | 100 | | | | 2,890 | |
Verizon Communications, Inc. | | | 670 | | | | 33,895 | |
Vodafone Group PLC (United Kingdom) | | | 3,478 | | | | 12,709 | |
Walt Disney (The) Co. | | | 350 | | | | 32,379 | |
WPP PLC (United Kingdom) | | | 184 | | | | 3,851 | |
Yelp, Inc.* | | | 100 | | | | 5,709 | |
Zillow, Inc., Class A * | | | 50 | | | | 5,918 | |
| | | | | | | | |
| | | | | | | 369,954 | |
| | | | | | | | |
| | | | | | | | |
| | | Number
of Shares | | | Value | |
| | | | | | | | |
| Consumer, Cyclical — 3.0% | | | | | | | | |
AMC Entertainment Holdings, Inc., Class A | | | 100 | | | $ | 2,622 | |
American Airlines Group, Inc. | | | 100 | | | | 4,853 | |
Bayerische Motoren Werke AG (Germany) | | | 46 | | | | 5,259 | |
Beacon Roofing Supply, Inc.* | | | 100 | | | | 2,708 | |
Brunswick Corp. | | | 100 | | | | 4,968 | |
Carnival Corp. | | | 100 | | | | 4,416 | |
Cie Financiere Richemont SA (Switzerland) | | | 66 | | | | 6,206 | |
Columbia Sportswear Co. | | | 46 | | | | 2,072 | |
Compass Group PLC (United Kingdom) | | | 221 | | | | 3,763 | |
CVS Health Corp. | | | 235 | | | | 21,469 | |
Daimler AG (Germany) | | | 137 | | | | 11,550 | |
Federal-Mogul Holdings Corp.* | | | 200 | | | | 3,104 | |
Ford Motor Co. | | | 634 | | | | 9,973 | |
Hennes & Mauritz AB, Class B (Sweden) | | | 103 | | | | 4,412 | |
Hilton Worldwide Holdings, Inc.* | | | 200 | | | | 5,244 | |
Home Depot (The), Inc. | | | 195 | | | | 19,383 | |
Honda Motor Co. Ltd. (Japan) | | | 172 | | | | 5,175 | |
HSN, Inc. | | | 100 | | | | 7,293 | |
Inditex SA (Spain) | | | 150 | | | | 4,367 | |
JetBlue Airways Corp.* | | | 300 | | | | 4,389 | |
Kate Spade & Co.* | | | 100 | | | | 3,203 | |
Las Vegas Sands Corp. | | | 200 | | | | 12,738 | |
Lennar Corp., Class A | | | 200 | | | | 9,448 | |
LVMH Moet Hennessy Louis Vuitton SA (France) | | | 37 | | | | 6,648 | |
Macy’s, Inc. | | | 100 | | | | 6,491 | |
McDonald’s Corp. | | | 200 | | | | 19,362 | |
Men’s Wearhouse (The), Inc. | | | 75 | | | | 3,504 | |
Mitsubishi Corp. (Japan) | | | 166 | | | | 3,139 | |
Mitsui & Co. Ltd. (Japan) | | | 200 | | | | 2,759 | |
Mobile Mini, Inc. | | | 100 | | | | 4,149 | |
NIKE, Inc., Class B | | | 200 | | | | 19,858 | |
Office Depot, Inc.* | | | 700 | | | | 4,641 | |
Panasonic Corp. (Japan) | | | 300 | | | | 3,873 | |
Penske Automotive Group, Inc. | | | 100 | | | | 4,735 | |
Rite Aid Corp.* | | | 1,100 | | | | 6,028 | |
Skechers U.S.A., Inc., Class A * | | | 100 | | | | 6,141 | |
Spirit Airlines, Inc.* | | | 100 | | | | 8,269 | |
Standard Pacific Corp.* | | | 300 | | | | 2,265 | |
Tenneco, Inc.* | | | 100 | | | | 5,435 | |
Toyota Motor Corp. (Japan) | | | 320 | | | | 19,715 | |
Walgreen Co. | | | 176 | | | | 12,075 | |
Wal-Mart Stores, Inc. | | | 652 | | | | 57,075 | |
| | | | | | | | |
| | | | | | | 354,777 | |
| | | | | | | | |
| Consumer, Non-cyclical — 7.0% | | | | | | | | |
Accuray, Inc.* | | | 400 | | | | 2,756 | |
Affymetrix, Inc.* | | | 400 | | | | 3,652 | |
Align Technology, Inc.* | | | 80 | | | | 4,552 | |
Alnylam Pharmaceuticals, Inc.* | | | 100 | | | | 10,055 | |
Amgen, Inc. | | | 147 | | | | 24,301 | |
Anheuser-Busch InBev NV (Belgium) | | | 111 | | | | 13,038 | |
Anika Therapeutics, Inc.* | | | 100 | | | | 4,089 | |
AstraZeneca PLC (United Kingdom) | | | 168 | | | | 12,544 | |
Bayer AG (Germany) | | | 116 | | | | 17,446 | |
British American Tobacco PLC (United Kingdom) | | | 255 | | | | 15,114 | |
| | | | |
| See Notes to Financial Statements. | | 36 | | |
db-X Exchange-Traded Funds Inc.
Schedule of investments
Deutsche X-trackers In-Target Date ETF (Continued)
November 30, 2014 (Unaudited)
| | | | | | | | |
| | | Number
of Shares | | | Value | |
| | | | | | | | |
| Consumer, Non-cyclical (Continued) | | | | | | | | |
Capella Education Co. | | | 100 | | | $ | 6,818 | |
Cardinal Health, Inc. | | | 392 | | | | 32,219 | |
Centene Corp.* | | | 100 | | | | 9,877 | |
Coca-Cola (The) Co. | | | 792 | | | | 35,505 | |
CoStar Group, Inc.* | | | 37 | | | | 6,300 | |
CSL Ltd. (Australia) | | | 59 | | | | 4,145 | |
Darling Ingredients, Inc.* | | | 200 | | | | 3,720 | |
Deluxe Corp. | | | 100 | | | | 5,845 | |
Diageo PLC (United Kingdom) | | | 301 | | | | 9,314 | |
Ensign Group (The), Inc. | | | 100 | | | | 3,942 | |
Euronet Worldwide, Inc.* | | | 100 | | | | 5,807 | |
Foundation Medicine, Inc.* | | | 100 | | | | 2,362 | |
Gilead Sciences, Inc.* | | | 287 | | | | 28,792 | |
GlaxoSmithKline PLC (United Kingdom) | | | 664 | | | | 15,402 | |
Haemonetics Corp.* | | | 100 | | | | 3,693 | |
Hain Celestial Group (The), Inc.* | | | 100 | | | | 11,322 | |
Humana, Inc. | | | 168 | | | | 23,179 | |
Impax Laboratories, Inc.* | | | 100 | | | | 3,195 | |
Imperial Tobacco Group PLC (United Kingdom) | | | 130 | | | | 6,011 | |
Intercept Pharmaceuticals, Inc.* | | | 30 | | | | 4,312 | |
Isis Pharmaceuticals, Inc.* | | | 200 | | | | 10,358 | |
Johnson & Johnson | | | 506 | | | | 54,774 | |
Kellogg Co. | | | 100 | | | | 6,625 | |
Kindred Healthcare, Inc. | | | 100 | | | | 1,989 | |
LDR Holding Corp.* | | | 200 | | | | 6,526 | |
Live Nation Entertainment, Inc.* | | | 200 | | | | 5,360 | |
MannKind Corp.* | | | 500 | | | | 3,075 | |
McGraw Hill Financial, Inc. | | | 300 | | | | 28,038 | |
Medicines (The) Co.* | | | 100 | | | | 2,681 | |
Merck & Co., Inc. | | | 495 | | | | 29,898 | |
Mondelez International, Inc., Class A | | | 346 | | | | 13,563 | |
Nestle SA (Switzerland) | | | 445 | | | | 33,413 | |
Novartis AG (Switzerland) | | | 313 | | | | 30,288 | |
Novo Nordisk A/S, Class B (Denmark) | | | 270 | | | | 12,314 | |
OncoMed Pharmaceuticals, Inc.* | | | 200 | | | | 4,406 | |
OPKO Health, Inc.* | | | 400 | | | | 3,352 | |
Orexigen Therapeutics, Inc.* | | | 700 | | | | 4,053 | |
Pfizer, Inc. | | | 1,125 | | | | 35,043 | |
Philip Morris International, Inc. | | | 300 | | | | 26,079 | |
Pilgrim’s Pride Corp.* | | | 200 | | | | 6,460 | |
Procter & Gamble (The) Co. | | | 540 | | | | 48,833 | |
Raptor Pharmaceutical Corp.* | | | 400 | | | | 3,848 | |
Reckitt Benckiser Group PLC (United Kingdom) | | | 88 | | | | 7,223 | |
Roche Holding AG (Switzerland) | | | 94 | | | | 28,154 | |
SABMiller PLC (United Kingdom) | | | 131 | | | | 7,293 | |
Sanofi (France) | | | 170 | | | | 16,459 | |
Seaboard Corp.* | | | 1 | | | | 3,450 | |
Shire PLC (Ireland) | | | 71 | | | | 5,054 | |
Spectrum Brands Holdings, Inc. | | | 100 | | | | 9,197 | |
Takeda Pharmaceutical Co. Ltd. (Japan) | | | 7 | | | | 293 | |
Teva Pharmaceutical Industries Ltd. (Israel) | | | 104 | | | | 5,918 | |
Tyson Foods, Inc., Class A | | | 100 | | | | 4,234 | |
Unilever NV (Netherlands) | | | 217 | | | | 8,838 | |
Unilever PLC (United Kingdom) | | | 150 | | | | 6,340 | |
| | | | | | | | |
| | | Number
of Shares | | | Value | |
| | | | | | | | |
| Consumer, Non-cyclical (Continued) | |
UnitedHealth Group, Inc. | | | 199 | | | $ | 19,627 | |
Wesfarmers Ltd. (Australia) | | | 146 | | | | 5,161 | |
Woolworths Ltd. (Australia) | | | 168 | | | | 4,449 | |
| | | | | | | | |
| | | | | | | 831,973 | |
| | | | | | | | |
| Diversified — 0.0% | | | | | | | | |
Hutchison Whampoa Ltd. (Hong Kong) | | | 338 | | | | 4,236 | |
| | | | | | | | |
| Energy — 2.4% | | | | | | | | |
Antero Resources Corp.* | | | 300 | | | | 14,076 | |
BG Group PLC (United Kingdom) | | | 490 | | | | 6,890 | |
BP PLC (United Kingdom) | | | 2,587 | | | | 16,980 | |
Chesapeake Energy Corp. | | | 800 | | | | 16,208 | |
Chevron Corp. | | | 345 | | | | 37,560 | |
Diamondback Energy, Inc.* | | | 100 | | | | 5,640 | |
Eni S.p.A. (Italy) | | | 357 | | | | 7,134 | |
EOG Resources, Inc. | | | 100 | | | | 8,672 | |
Exxon Mobil Corp. | | | 797 | | | | 72,160 | |
Forum Energy Technologies, Inc.* | | | 100 | | | | 2,401 | |
Geospace Technologies Corp.* | | | 100 | | | | 2,636 | |
ION Geophysical Corp.* | | | 900 | | | | 2,223 | |
Kodiak Oil & Gas Corp.* | | | 300 | | | | 2,199 | |
ONEOK, Inc. | | | 200 | | | | 10,832 | |
Rosetta Resources, Inc.* | | | 100 | | | | 2,942 | |
Royal Dutch Shell PLC, Class A (United Kingdom) | | | 526 | | | | 17,521 | |
Royal Dutch Shell PLC, Class B (United Kingdom) | | | 331 | | | | 11,493 | |
Schlumberger Ltd. (Netherland Antilles) | | | 215 | | | | 18,479 | |
Statoil ASA (Norway) | | | 142 | | | | 2,682 | |
Targa Resources Corp. | | | 40 | | | | 4,566 | |
Total SA (France) | | | 303 | | | | 16,951 | |
Western Refining, Inc. | | | 100 | | | | 4,111 | |
| | | | | | | | |
| | | | | | | 284,356 | |
| | | | | | | | |
| Financial — 7.4% | | | | | | | | |
AIA Group Ltd. (Hong Kong) | | | 1,760 | | | | 10,167 | |
Allianz SE (Germany) | | | 57 | | | | 9,813 | |
American Express Co. | | | 219 | | | | 20,239 | |
American International Group, Inc. | | | 294 | | | | 16,111 | |
American Realty Capital Properties, Inc. REIT | | | 1,000 | | | | 9,400 | |
American Tower Corp. REIT | | | 76 | | | | 7,981 | |
AmTrust Financial Services, Inc. | | | 10 | | | | 513 | |
Anworth Mortgage Asset Corp. REIT | | | 700 | | | | 3,780 | |
Aon PLC (United Kingdom) | | | 100 | | | | 9,249 | |
Australia & New Zealand Banking Group Ltd. (Australia) | | | 376 | | | | 10,212 | |
AXA SA (France) | | | 210 | | | | 5,070 | |
Banco Bilbao Vizcaya Argentaria SA (Spain) | | | 875 | | | | 9,398 | |
Banco Santander SA (Spain) | | | 1,727 | | | | 15,567 | |
Bank of America Corp. | | | 1,902 | | | | 32,410 | |
Bank of the Ozarks, Inc. | | | 100 | | | | 3,620 | |
Barclays PLC (United Kingdom) | | | 2,422 | | | | 9,274 | |
Berkshire Hathaway, Inc., Class B * | | | 448 | | | | 66,614 | |
BNP Paribas SA (France) | | | 151 | | | | 9,681 | |
Capital Senior Living Corp.* | | | 100 | | | | 2,545 | |
| | | | |
| See Notes to Financial Statements. | | 37 | | |
db-X Exchange-Traded Funds Inc.
Schedule of investments
Deutsche X-trackers In-Target Date ETF (Continued)
November 30, 2014 (Unaudited)
| | | | | | | | |
| | | Number
of Shares | | | Value | |
| | | | | | | | |
| Financial (Continued) | | | | | | | | |
Charles Schwab (The) Corp. | | | 259 | | | $ | 7,335 | |
Chubb (The) Corp. | | | 300 | | | | 30,915 | |
Citigroup, Inc. | | | 597 | | | | 32,220 | |
CNO Financial Group, Inc. | | | 200 | | | | 3,468 | |
Commonwealth Bank of Australia (Australia) | | | 219 | | | | 15,042 | |
Credit Acceptance Corp.* | | | 50 | | | | 7,488 | |
Credit Suisse Group AG (Switzerland)* | | | 218 | | | | 5,825 | |
Deutsche Bank AG (Germany) (a) | | | 189 | | | | 6,177 | |
Employers Holdings, Inc. | | | 200 | | | | 4,056 | |
EPR Properties REIT | | | 100 | | | | 5,599 | |
Equity One, Inc. REIT | | | 154 | | | | 3,731 | |
Equity Residential REIT | | | 400 | | | | 28,336 | |
Financial Engines, Inc. | | | 100 | | | | 3,268 | |
First American Financial Corp. | | | 100 | | | | 3,201 | |
First Financial Bankshares, Inc. | | | 100 | | | | 3,017 | |
FirstMerit Corp. | | | 200 | | | | 3,578 | |
FXCM, Inc., Class A | | | 300 | | | | 4,830 | |
Hanmi Financial Corp. | | | 200 | | | | 4,020 | |
Highwoods Properties, Inc. REIT | | | 97 | | | | 4,187 | |
HSBC Holdings PLC (United Kingdom) | | | 2,555 | | | | 25,423 | |
ING Groep NV (Netherlands)* | | | 484 | | | | 7,090 | |
Investors Bancorp, Inc. | | | 396 | | | | 4,281 | |
JPMorgan Chase & Co. | | | 646 | | | | 38,863 | |
LaSalle Hotel Properties REIT | | | 100 | | | | 4,037 | |
Lloyds Banking Group PLC (United Kingdom)* | | | 7,847 | | | | 9,849 | |
MarketAxess Holdings, Inc. | | | 45 | | | | 2,951 | |
Marsh & McLennan Cos., Inc. | | | 100 | | | | 5,659 | |
MGIC Investment Corp.* | | | 400 | | | | 3,724 | |
Mitsubishi UFJ Financial Group, Inc. (Japan) | | | 1,692 | | | | 9,783 | |
Mizuho Financial Group, Inc. (Japan) | | | 3,027 | | | | 5,214 | |
Muenchener Rueckversicherungs-Gesellschaft AG (Germany) | | | 24 | | | | 4,943 | |
National Australia Bank Ltd. (Australia) | | | 310 | | | | 8,599 | |
NewStar Financial, Inc.* | | | 300 | | | | 3,372 | |
Nordea Bank AB (Sweden) | | | 427 | | | | 5,334 | |
Northfield Bancorp, Inc. | | | 300 | | | | 4,227 | |
NorthStar Realty Finance Corp. REIT | | | 400 | | | | 7,308 | |
PacWest Bancorp | | | 100 | | | | 4,650 | |
PRA Group, Inc.* | | | 100 | | | | 5,852 | |
Prospect Capital Corp. | | | 400 | | | | 3,772 | |
Prosperity Bancshares, Inc. | | | 100 | | | | 5,618 | |
Prudential PLC (United Kingdom) | | | 334 | | | | 8,076 | |
Public Storage REIT | | | 40 | | | | 7,505 | |
Radian Group, Inc. | | | 200 | | | | 3,410 | |
RAIT Financial Trust REIT | | | 500 | | | | 3,695 | |
RLJ Lodging Trust REIT | | | 100 | | | | 3,293 | |
Ryman Hospitality Properties, Inc. REIT | | | 13 | | | | 677 | |
Simon Property Group, Inc. REIT | | | 61 | | | | 11,029 | |
Springleaf Holdings, Inc.* | | | 100 | | | | 3,965 | |
Standard Chartered PLC (United Kingdom) | | | 342 | | | | 5,006 | |
Stifel Financial Corp.* | | | 100 | | | | 4,853 | |
Strategic Hotels & Resorts, Inc. REIT * | | | 300 | | | | 3,984 | |
Sumitomo Mitsui Financial Group, Inc. (Japan) | | | 222 | | | | 8,368 | |
| | | | | | | | |
| | | Number
of Shares | | | Value | |
| | | | | | | | |
| Financial (Continued) | | | | | | | | |
Sunstone Hotel Investors, Inc. REIT | | | 200 | | | $ | 3,202 | |
T. Rowe Price Group, Inc. | | | 334 | | | | 27,880 | |
U.S. Bancorp | | | 300 | | | | 13,260 | |
UBS AG (Switzerland)* | | | 553 | | | | 9,958 | |
UMB Financial Corp. | | | 100 | | | | 5,549 | |
Umpqua Holdings Corp. | | | 200 | | | | 3,398 | |
Urstadt Biddle Properties, Inc., Class A REIT | | | 200 | | | | 4,436 | |
Visa, Inc., Class A | | | 136 | | | | 35,114 | |
Vornado Realty Trust REIT | | | 220 | | | | 24,543 | |
Webster Financial Corp. | | | 100 | | | | 3,147 | |
Wells Fargo & Co. | | | 974 | | | | 53,065 | |
Western Alliance Bancorp * | | | 100 | | | | 2,643 | |
Westpac Banking Corp. (Australia) | | | 422 | | | | 11,688 | |
Weyerhaeuser Co. REIT | | | 600 | | | | 21,186 | |
Zurich Insurance Group AG (Switzerland)* | | | 16 | | | | 5,014 | |
| | | | | | | | |
| | | | | | | 886,430 | |
| | | | | | | | |
| Industrial — 3.4% | | | | | | | | |
3M Co. | | | 100 | | | | 16,009 | |
ABB Ltd. (Switzerland)* | | | 315 | | | | 7,072 | |
Actuant Corp., Class A | | | 100 | | | | 2,936 | |
Acuity Brands, Inc. | | | 50 | | | | 6,910 | |
Airbus Group NV (France) | | | 89 | | | | 5,422 | |
Berry Plastics Group, Inc.* | | | 100 | | | | 2,894 | |
Boeing (The) Co. | | | 149 | | | | 20,020 | |
Caterpillar, Inc. | | | 128 | | | | 12,877 | |
CLARCOR, Inc. | | | 100 | | | | 6,589 | |
Cognex Corp.* | | | 100 | | | | 4,071 | |
Deutsche Post AG (Germany) | | | 132 | | | | 4,385 | |
Eaton Corp. PLC (Ireland) | | | 94 | | | | 6,376 | |
EMCOR Group, Inc. | | | 100 | | | | 4,335 | |
Emerson Electric Co. | | | 39 | | | | 2,486 | |
EnerSys | | | 67 | | | | 4,069 | |
FedEx Corp. | | | 50 | | | | 8,909 | |
Fluor Corp. | | | 200 | | | | 12,398 | |
Generac Holdings, Inc.* | | | 100 | | | | 4,338 | |
General Dynamics Corp. | | | 83 | | | | 12,065 | |
General Electric Co. | | | 1,962 | | | | 51,972 | |
Graphic Packaging Holding Co.* | | | 400 | | | | 4,980 | |
Griffon Corp. | | | 300 | | | | 3,735 | |
Haynes International, Inc. | | | 100 | | | | 4,489 | |
HEICO Corp. | | | 100 | | | | 5,301 | |
Hitachi Ltd. (Japan) | | | 1,000 | | | | 7,720 | |
Ingersoll-Rand PLC (Ireland) | | | 252 | | | | 15,891 | |
Koninklijke Philips NV (Netherlands) | | | 106 | | | | 3,197 | |
Middleby (The) Corp.* | | | 90 | | | | 8,608 | |
Mistras Group, Inc.* | | | 200 | | | | 3,418 | |
Parker-Hannifin Corp. | | | 200 | | | | 25,806 | |
Ply Gem Holdings, Inc.* | | | 400 | | | | 5,008 | |
Precision Castparts Corp. | | | 30 | | | | 7,137 | |
Quanex Building Products Corp. | | | 200 | | | | 3,956 | |
Rofin-Sinar Technologies, Inc.* | | | 200 | | | | 5,384 | |
Rolls-Royce Holdings PLC (United Kingdom)* | | | 250 | | | | 3,290 | |
Sanmina Corp.* | | | 100 | | | | 2,460 | |
Schneider Electric SE (France) | | | 76 | | | | 6,199 | |
| | | | |
| See Notes to Financial Statements. | | 38 | | |
db-X Exchange-Traded Funds Inc.
Schedule of investments
Deutsche X-trackers In-Target Date ETF (Continued)
November 30, 2014 (Unaudited)
| | | | | | | | |
| | | Number
of Shares | | | Value | |
| | | | | | | | |
| Industrial (Continued) | | | | | | | | |
Siemens AG (Germany) | | | 121 | | | $ | 14,318 | |
SunPower Corp.* | | | 200 | | | | 5,632 | |
Swift Transportation Co.* | | | 200 | | | | 5,814 | |
TTM Technologies, Inc.* | | | 700 | | | | 4,732 | |
Union Pacific Corp. | | | 200 | | | | 23,354 | |
United Parcel Service, Inc., Class B | | | 183 | | | | 20,115 | |
USG Corp.* | | | 200 | | | | 5,762 | |
Vinci SA (France) | | | 54 | | | | 2,919 | |
Woodward, Inc. | | | 100 | | | | 5,168 | |
| | | | | | | | |
| | | | | | | 400,526 | |
| | | | | | | | |
| Technology — 4.0% | | | | | | | | |
Acxiom Corp.* | | | 100 | | | | 1,903 | |
Amkor Technology, Inc.* | | | 300 | | | | 2,007 | |
Apple, Inc. | | | 1,031 | | | | 122,617 | |
Applied Materials, Inc. | | | 1,200 | | | | 28,860 | |
Aspen Technology, Inc.* | | | 100 | | | | 3,774 | |
athenahealth, Inc.* | | | 28 | | | | 3,284 | |
Broadcom Corp., Class A | | | 500 | | | | 21,565 | |
Brooks Automation, Inc. | | | 400 | | | | 4,684 | |
Canon, Inc. (Japan) | | | 200 | | | | 6,404 | |
Computer Programs & Systems, Inc. | | | 100 | | | | 5,874 | |
Convergys Corp. | | | 100 | | | | 2,085 | |
Dealertrack Technologies, Inc.* | | | 100 | | | | 4,716 | |
EMC Corp. | | | 314 | | | | 9,530 | |
Engility Holdings, Inc.* | | | 100 | | | | 4,205 | |
Entegris, Inc.* | | | 100 | | | | 1,347 | |
Fidelity National Information Services, Inc. | | | 348 | | | | 21,294 | |
Hewlett-Packard Co. | | | 300 | | | | 11,718 | |
Infoblox, Inc.* | | | 300 | | | | 5,400 | |
Intel Corp. | | | 729 | | | | 27,155 | |
International Business Machines Corp. | | | 200 | | | | 32,434 | |
International Rectifier Corp.* | | | 100 | | | | 3,988 | |
Intersil Corp., Class A | | | 100 | | | | 1,311 | |
MAXIMUS, Inc. | | | 100 | | | | 5,239 | |
Mentor Graphics Corp. | | | 100 | | | | 2,221 | |
Microsemi Corp.* | | | 134 | | | | 3,645 | |
Microsoft Corp. | | | 1,466 | | | | 70,090 | |
Oracle Corp. | | | 835 | | | | 35,412 | |
PTC, Inc.* | | | 130 | | | | 5,079 | |
SAP SE (Germany) | | | 125 | | | | 8,810 | |
SS&C Technologies Holdings, Inc. | | | 100 | | | | 5,055 | |
SunEdison, Inc.* | | | 300 | | | | 6,495 | |
Ultimate Software Group (The), Inc.* | | | 29 | | | | 4,270 | |
| | | | | | | | |
| | | | | | | 472,471 | |
| | | | | | | | |
| Utilities — 0.7% | | | | | | | | |
Chesapeake Utilities Corp. | | | 150 | | | | 6,740 | |
Cleco Corp. | | | 100 | | | | 5,373 | |
Dominion Resources, Inc. | | | 100 | | | | 7,255 | |
Duke Energy Corp. | | | 100 | | | | 8,090 | |
Dynegy, Inc.* | | | 100 | | | | 3,315 | |
E.ON SE (Germany) | | | 263 | | | | 4,662 | |
Enel S.p.A. (Italy) | | | 941 | | | | 4,540 | |
GDF Suez (France) | | | 196 | | | | 4,829 | |
National Grid PLC (United Kingdom) | | | 479 | | | | 6,958 | |
NRG Yield, Inc., Class A | | | 100 | | | | 4,739 | |
| | | | | | | | |
| | | Number
of Shares | | | Value | |
| | | | | | | | |
| Utilities (Continued) | | | | | | | | |
PG&E Corp. | | | 500 | | | $ | 25,250 | |
| | | | | | | | |
| | | | | | | 81,751 | |
| | | | | | | | |
TOTAL COMMON STOCKS
(Cost $2,943,507) | | | | | | | 3,838,305 | |
| | | | | | | | |
| PREFERRED STOCKS — 0.0% | | | | | | | | |
| Consumer, Cyclical — 0.0% | | | | | | | | |
Volkswagen AG (Germany) | | | 21 | | | | 4,836 | |
| | | | | | | | |
| Industrial — 0.0% | | | | | | | | |
Rolls-Royce Holdings PLC, Class C (United Kingdom)* | | | 22,500 | | | | 35 | |
| | | | | | | | |
TOTAL PREFERRED STOCKS
(Cost $4,527) | | | | | | | 4,871 | |
| | | | | | | | |
| RIGHTS — 0.0% | | | | | | | | |
| Communications — 0.0% | | | | | | | | |
Leap Wireless International, Inc. CVR *
(Cost $244) | | | 100 | | | | 244 | |
| | | | | | | | |
| | |
| | | Principal
Amount | | | Value | |
| | | | | | | | |
| CORPORATE BONDS — 29.1% | | | | | | | | |
| Basic Materials — 0.8% | |
Eastman Chemical Co.
3.00%, 12/15/15 | | $ | 35,000 | | | $ | 35,813 | |
PPG Industries, Inc.
1.90%, 1/15/16 | | | 54,000 | | | | 54,667 | |
| | | | | | | | |
| | | | | | | 90,480 | |
| | | | | | | | |
| Communications — 1.5% | | | | | | | | |
AT&T, Inc.
0.90%, 2/12/16 | | | 21,000 | | | | 20,988 | |
Cisco Systems, Inc.
5.50%, 2/22/16 | | | 75,000 | | | | 79,550 | |
DIRECTV Holdings LLC/DIRECTV Financing Co., Inc.
3.50%, 3/01/16 | | | 52,000 | | | | 53,661 | |
Telefonica Emisiones S.A.U. (Spain)
3.992%, 2/16/16 | | | 26,000 | | | | 26,934 | |
| | | | | | | | |
| | | | | | | 181,133 | |
| | | | | | | | |
| Consumer, Cyclical — 0.5% | | | | | | | | |
Home Depot (The), Inc.
5.40%, 3/01/16 | | | 50,000 | | | | 53,001 | |
| | | | | | | | |
| Consumer, Non-cyclical — 2.0% | | | | | | | | |
Anheuser-Busch InBev Finance, Inc. (Belgium)
0.80%, 1/15/16 | | | 54,000 | | | | 54,181 | |
Bunge Ltd. Finance Corp.
4.10%, 3/15/16 | | | 52,000 | | | | 53,922 | |
Coca-Cola (The) Co.
1.50%, 11/15/15 | | | 54,000 | | | | 54,620 | |
Diageo Finance BV (Netherlands)
5.30%, 10/28/15 | | | 77,000 | | | | 80,254 | |
| | | | | | | | |
| | | | | | | 242,977 | |
| | | | | | | | |
| | | | |
| See Notes to Financial Statements. | | 39 | | |
db-X Exchange-Traded Funds Inc.
Schedule of investments
Deutsche X-trackers In-Target Date ETF (Continued)
November 30, 2014 (Unaudited)
| | | | | | | | |
| | | Principal
Amount | | | Value | |
| | | | | | | | |
| Energy — 1.1% | | | | | | | | |
BP Capital Markets PLC (United Kingdom)
3.20%, 3/11/16 | | $ | 52,000 | | | $ | 53,584 | |
Occidental Petroleum Corp.
2.50%, 2/01/16 | | | 79,000 | | | | 80,611 | |
| | | | | | | | |
| | | | | | | 134,195 | |
| | | | | | | | |
| Financial — 17.0% | | | | | | | | |
American Express Credit Corp., MTN
1.75%, 6/12/15 | | | 54,000 | | | | 54,380 | |
Bank of America Corp., MTN
1.25%, 1/11/16 | | | 54,000 | | | | 54,229 | |
BB&T Corp.
5.20%, 12/23/15 | | | 77,000 | | | | 80,522 | |
BNP Paribas SA, MTN (France)
3.60%, 2/23/16 | | | 78,000 | | | | 80,627 | |
Canadian Imperial Bank of Commerce (Canada)
2.35%, 12/11/15 | | | 80,000 | | | | 81,513 | |
Citigroup, Inc.
4.75%, 5/19/15 | | | 94,000 | | | | 95,812 | |
4.587%, 12/15/15 | | | 62,000 | | | | 64,324 | |
Deutsche Bank AG (Germany)
3.25%, 1/11/16 (a) | | | 53,000 | | | | 54,451 | |
Fifth Third Bancorp
3.625%, 1/25/16 | | | 52,000 | | | | 53,635 | |
General Electric Capital Corp.
2.25%, 11/09/15 | | | 283,000 | | | | 287,918 | |
Goldman Sachs Group (The), Inc.
3.625%, 2/07/16 | | | 245,000 | | | | 252,720 | |
JPMorgan Chase & Co.
2.60%, 1/15/16 | | | 106,000 | | | | 108,296 | |
KFW (Germany)
2.625%, 2/16/16 | | | 13,000 | | | | 13,372 | |
MetLife, Inc.
5.00%, 6/15/15 | | | 142,000 | | | | 145,335 | |
Morgan Stanley
1.75%, 2/25/16 | | | 27,000 | | | | 27,287 | |
National Australia Bank Ltd. (Australia)
1.60%, 8/07/15 | | | 54,000 | | | | 54,458 | |
PNC Funding Corp.
5.25%, 11/15/15 | | | 127,000 | | | | 132,179 | |
Royal Bank of Scotland PLC (The) (United Kingdom)
4.375%, 3/16/16 | | | 51,000 | | | | 53,190 | |
Simon Property Group LP
5.10%, 6/15/15 | | | 105,000 | | | | 107,594 | |
State Street Corp.
2.875%, 3/07/16 | | | 52,000 | | | | 53,505 | |
Westpac Banking Corp. (Australia)
3.00%, 12/09/15 | | | 158,000 | | | | 162,097 | |
| | | | | | | | |
| | | | | | | 2,017,444 | |
| | | | | | | | |
| Government — 1.1% | | | | | | | | |
Corp. Andina de Fomento (Supranational)
3.75%, 1/15/16 | | | 26,000 | | | | 26,933 | |
| | | | | | | | |
| | | Principal
Amount | | | Value | |
| | | | | | | | |
| Government (Continued) | | | | | | | | |
Inter-American Development Bank (Supranational)
2.25%, 7/15/15 | | $ | 107,000 | | | $ | 108,331 | |
| | | | | | | | |
| | | | | | | 135,264 | |
| | | | | | | | |
| Industrial — 1.3% | | | | | | | | |
Ryder System, Inc., MTN
3.60%, 3/01/16 | | | 26,000 | | | | 26,857 | |
Thermo Fisher Scientific, Inc.
3.20%, 3/01/16 | | | 104,000 | | | | 106,981 | |
United Technologies Corp.
4.875%, 5/01/15 | | | 18,000 | | | | 18,340 | |
| | | | | | | | |
| | | | | | | 152,178 | |
| | | | | | | | |
| Technology — 1.1% | | | | | | | | |
Oracle Corp.
5.25%, 1/15/16 | | | 102,000 | | | | 107,473 | |
Texas Instruments, Inc.
0.45%, 8/03/15 | | | 27,000 | | | | 27,029 | |
| | | | | | | | |
| | | | | | | 134,502 | |
| | | | | | | | |
| Utilities — 2.7% | |
Alabama Power Co.
0.55%, 10/15/15 | | | 55,000 | | | | 55,067 | |
Constellation Energy Group, Inc.
4.55%, 6/15/15 | | | 50,000 | | | | 51,015 | |
Dominion Resources, Inc., Series C
5.15%, 7/15/15 | | | 156,000 | | | | 160,496 | |
LG&E and KU Energy LLC
2.125%, 11/15/15 | | | 27,000 | | | | 27,266 | |
NextEra Energy Capital Holdings, Inc.
2.60%, 9/01/15 | | | 27,000 | | | | 27,401 | |
| | | | | | | | |
| | | | | | | 321,245 | |
| | | | | | | | |
TOTAL CORPORATE BONDS
(Cost $3,463,573) | | | | | | | 3,462,419 | |
| | | | | | | | |
| UNITED STATES GOVERNMENT & AGENCY OBLIGATIONS — 37.1% | | | | | | | | |
| Federal National Mortgage Association — 0.6% | | | | | | | | |
5.00%, 4/15/15 | | | 70,000 | | | | 71,267 | |
| | | | | | | | |
| United States Treasury Bonds/Notes — 36.5% | | | | | | | | |
4.00%, 2/15/15 | | | 603,000 | | | | 607,935 | |
2.50%, 3/31/15 | | | 786,000 | | | | 792,309 | |
2.50%, 4/30/15 | | | 377,000 | | | | 380,888 | |
4.125%, 5/15/15 | | | 1,084,000 | | | | 1,104,324 | |
0.25%, 5/31/15 | | | 88,000 | | | | 88,103 | |
2.125%, 5/31/15 | | | 198,000 | | | | 200,057 | |
1.75%, 7/31/15 | | | 379,000 | | | | 383,175 | |
4.25%, 8/15/15 | | | 98,000 | | | | 100,879 | |
1.25%, 9/30/15 | | | 397,000 | | | | 400,753 | |
4.50%, 11/15/15 | | | 35,000 | | | | 36,449 | |
0.375%, 1/15/16 | | | 64,000 | | | | 64,145 | |
1.00%, 8/31/16 | | | 80,000 | | | | 80,862 | |
| | | | |
| See Notes to Financial Statements. | | 40 | | |
db-X Exchange-Traded Funds Inc.
Schedule of investments
Deutsche X-trackers In-Target Date ETF (Continued)
November 30, 2014 (Unaudited)
| | | | | | | | |
| | | Principal
Amount | | | Value | |
| | | | | | | | |
| United States Treasury Bonds/Notes (Continued) | | | | | | | | |
0.625%, 12/15/16 | | $ | 106,000 | | | $ | 106,257 | |
| | | | | | | | |
| | | | | | | 4,346,136 | |
| | | | | | | | |
TOTAL UNITED STATES GOVERNMENT & AGENCY OBLIGATIONS
(Cost $4,414,977) | | | | | | | 4,417,403 | |
| | | | | | | | |
| SOVEREIGN BOND — 0.9% | | | | | | | | |
Poland Government International Bond (Poland)
3.875%, 7/16/15
(Cost $107,369) | | | 105,000 | | | | 107,468 | |
| | | | | | | | |
| | |
TOTAL INVESTMENTS — 99.4% (Cost $10,934,197) | | | | | | $ | 11,830,710 | |
Other assets less liabilities — 0.6% | | | | | | | 67,667 | |
| | | | | | | | |
NET ASSETS — 100.0% | | | | | | $ | 11,898,377 | |
| | | | | | | | |
CVR – Contingent Value Rights.
MTN – Medium Term Note.
REIT – Real Estate Investment Trust.
* Non-income producing security.
(a) Affiliated issuer. This security is owned in proportion with its representation in the index.
| | | | |
| See Notes to Financial Statements. | | 41 | | |
db-X Exchange-Traded Funds Inc.
Statements of assets and liabilities
November 30, 2014 (Unaudited)
| | | | | | | | | | | | |
| | | Deutsche X-trackers
2010 Target
Date ETF | | | Deutsche X-trackers
2020 Target
Date ETF | | | Deutsche X-trackers
2030 Target
Date ETF | |
Assets | | | | | | | | | | | | |
Investments in non-affiliated securities at fair value | | $ | 10,159,613 | | | $ | 28,490,947 | | | $ | 41,543,246 | |
Investments in affiliated securities at fair value (See Note 5) | | | 55,683 | | | | 86,764 | | | | 47,392 | |
Cash | | | 14,926 | | | | 72,929 | | | | 78,171 | |
Foreign currency at value | | | 4,013 | | | | 23,654 | | | | 37,582 | |
Due from investment advisor | | | 7,050 | | | | 11,522 | | | | 13,932 | |
Receivables: | | | | | | | | | | | | |
Interest and dividends | | | 61,730 | | | | 125,051 | | | | 179,202 | |
Foreign tax reclaim | | | 830 | | | | 22,205 | | | | 33,387 | |
Capital shares | | | — | | | | — | | | | 17,797 | |
Prepaid expenses | | | 2,390 | | | | 2,802 | | | | 2,671 | |
| | | | | | | | | | | | |
Total Assets | | $ | 10,306,235 | | | $ | 28,835,874 | | | $ | 41,953,380 | |
| | | | | | | | | | | | |
| | | |
Liabilities | | | | | | | | | | | | |
Payables: | | | | | | | | | | | | |
Investment securities purchased | | $ | — | | | $ | 30,029 | | | $ | 47,487 | |
Investment advisory fees | | | 5,468 | | | | 15,263 | | | | 20,378 | |
Accrued expenses and other liabilities | | | 31,710 | | | | 63,014 | | | | 75,360 | |
| | | | | | | | | | | | |
Total Liabilities | | | 37,178 | | | | 108,306 | | | | 143,225 | |
| | | | | | | | | | | | |
| | | |
Net Assets | | $ | 10,269,057 | | | $ | 28,727,568 | | | $ | 41,810,155 | |
| | | | | | | | | | | | |
| | | |
Net Assets Consist of | | | | | | | | | | | | |
Paid-in capital | | $ | 11,140,420 | | | $ | 27,668,641 | | | $ | 37,781,034 | |
Undistributed net investment income | | | 28,319 | | | | 231,955 | | | | 759,471 | |
Accumulated net realized gain (loss) | | | (1,387,611 | ) | | | (2,029,217 | ) | | | (2,085,150 | ) |
Net unrealized appreciation (depreciation) | | | 487,929 | | | | 2,856,189 | | | | 5,354,800 | |
| | | | | | | | | | | | |
| | | |
Net Assets | | $ | 10,269,057 | | | $ | 28,727,568 | | | $ | 41,810,155 | |
| | | | | | | | | | | | |
| | | |
Number of Common Shares outstanding | | | 400,800 | | | | 1,000,800 | | | | 1,400,800 | |
| | | | | | | | | | | | |
Net Assets Value | | $ | 25.62 | | | $ | 28.70 | | | $ | 29.85 | |
| | | | | | | | | | | | |
| | | |
Investments in non-affiliated securities at cost | | $ | 9,669,412 | | | $ | 25,601,246 | | | $ | 36,147,932 | |
| | | | | | | | | | | | |
| | | |
Investments in affiliated securities at cost | | $ | 57,712 | | | $ | 117,352 | | | $ | 83,664 | |
| | | | | | | | | | | | |
Foreign currency at cost | | $ | 4,143 | | | $ | 24,687 | | | $ | 38,791 | |
| | | | | | | | | | | | |
| | | | |
| See Notes to Financial Statements. | | 42 | | |
db-X Exchange-Traded Funds Inc.
Statements of assets and liabilities (Continued)
November 30, 2014 (Unaudited)
| | | | | | | | |
| | | Deutsche X-trackers
2040 Target
Date ETF | | | Deutsche X-trackers
In-Target
Date ETF | |
Assets | | | | | | | | |
Investments in non-affiliated securities at fair value | | $ | 36,303,936 | | | $ | 11,770,082 | |
Investments in affiliated securities at fair value (See Note 5) | | | 50,236 | | | | 60,628 | |
Cash | | | 59,113 | | | | 19,827 | |
Foreign currency at value | | | 35,658 | | | | 9,593 | |
Due from investment advisor | | | 13,224 | | | | 7,442 | |
Receivables: | | | | | | | | |
Interest and dividends | | | 96,396 | | | | 65,934 | |
Foreign tax reclaim | | | 38,716 | | | | 2,689 | |
Capital shares | | | — | | | | — | |
Prepaid expenses | | | 3,025 | | | | 2,416 | |
| | | | | | | | |
Total Assets | | $ | 36,600,304 | | | $ | 11,938,611 | |
| | | | | | | | |
| | |
Liabilities | | | | | | | | |
Payables: | | | | | | | | |
Investment securities purchased | | $ | 50,582 | | | $ | — | |
Investment advisory fees | | | 19,245 | | | | 6,334 | |
Accrued expenses and other liabilities | | | 69,472 | | | | 33,900 | |
| | | | | | | | |
Total Liabilities | | | 139,299 | | | | 40,234 | |
| | | | | | | | |
| | |
Net Assets | | $ | 36,461,005 | | | $ | 11,898,377 | |
| | | | | | | | |
| | |
Net Assets Consist of | | | | | | | | |
Paid-in capital | | $ | 32,518,756 | | | $ | 10,623,093 | |
Undistributed net investment income | | | 643,150 | | | | 50,899 | |
Accumulated net realized gain (loss) | | | (3,590,414 | ) | | | 328,531 | |
Net unrealized appreciation (depreciation) | | | 6,889,513 | | | | 895,854 | |
| | | | | | | | |
| | |
Net Assets | | $ | 36,461,005 | | | $ | 11,898,377 | |
| | | | | | | | |
| | |
Number of Common Shares outstanding | | | 1,200,800 | | | | 400,800 | |
| | | | | | | | |
Net Assets Value | | $ | 30.36 | | | $ | 29.69 | |
| | | | | | | | |
| | |
Investments in non-affiliated securities at cost | | $ | 29,359,154 | | | $ | 10,871,000 | |
| | | | | | | | |
| | |
Investments in affiliated securities at cost | | $ | 100,628 | | | $ | 63,197 | |
| | | | | | | | |
Foreign currency at cost | | $ | 36,992 | | | $ | 10,018 | |
| | | | | | | | |
| | | | |
| See Notes to Financial Statements. | | 43 | | |
db-X Exchange-Traded Funds Inc.
Statements of operations
For the Six Months Ended November 30, 2014 (Unaudited)
| | | | | | | | | | | | |
| | | Deutsche X-trackers
2010 Target
Date ETF | | | Deutsche X-trackers
2020 Target
Date ETF | | | Deutsche X-trackers
2030 Target
Date ETF | |
Investment Income | | | | | | | | | | | | |
Unaffiliated interest income | | $ | 15,034 | | | $ | 37,922 | | | $ | 194,758 | |
Unaffiliated dividend income* | | | 25,608 | | | | 136,921 | | | | 265,598 | |
Affiliated interest income | | | 582 | | | | 769 | | | | — | |
| | | | | | | | | | | | |
Total Investment Income | | | 41,224 | | | | 175,612 | | | | 460,356 | |
| | | | | | | | | | | | |
| | | |
Expenses | | | | | | | | | | | | |
Advisory fees | | | 33,223 | | | | 92,397 | | | | 117,978 | |
Audit and tax fees | | | 11,652 | | | | 11,652 | | | | 11,652 | |
Insurance | | | 9,124 | | | | 9,124 | | | | 9,124 | |
Directors | | | 6,991 | | | | 19,253 | | | | 27,245 | |
Listing fees | | | 6,689 | | | | 6,689 | | | | 6,689 | |
Printing | | | 5,202 | | | | 14,429 | | | | 19,455 | |
Legal fees | | | 3,104 | | | | 8,610 | | | | 11,602 | |
Other | | | 172 | | | | 172 | | | | 172 | |
| | | | | | | | | | | | |
Total Expenses | | | 76,157 | | | | 162,326 | | | | 203,917 | |
Less fees waived and expenses reimbursed: (See Note 3) | | | (42,762 | ) | | | (69,756 | ) | | | (85,767 | ) |
| | | | | | | | | | | | |
Net Expenses | | | 33,395 | | | | 92,570 | | | | 118,150 | |
| | | | | | | | | | | | |
Net Investment Income | | | 7,829 | | | | 83,042 | | | | 342,206 | |
| | | | | | | | | | | | |
| | | |
Net Realized and Unrealized Gain (Loss) | | | | | | | | | | | | |
Net realized gain (loss) on: | | | | | | | | | | | | |
Investments | | | 106,241 | | | | 1,014,756 | | | | 1,137,073 | |
Foreign currency related transactions | | | (232 | ) | | | (1,129 | ) | | | (1,730 | ) |
| | | | | | | | | | | | |
Net realized gain | | | 106,009 | | | | 1,013,627 | | | | 1,135,343 | |
Net change in unrealized appreciation (depreciation) on: | | | | | | | | | | | | |
Investments | | | (24,930 | ) | | | (570,454 | ) | | | 21,600 | |
Foreign currency translations | | | (339 | ) | | | (4,001 | ) | | | (5,582 | ) |
| | | | | | | | | | | | |
Net change in unrealized appreciation (depreciation) | | | (25,269 | ) | | | (574,455 | ) | | | 16,018 | |
| | | | | | | | | | | | |
Net realized and unrealized gain on investments and foreign currency transactions | | | 80,740 | | | | 439,172 | | | | 1,151,361 | |
| | | | | | | | | | | | |
| | | |
Net Increase in Net Assets from Operations | | $ | 88,569 | | | $ | 522,214 | | | $ | 1,493,567 | |
| | | | | | | | | | | | |
* Unaffiliated foreign tax withheld | | $ | 980 | | | $ | 6,929 | | | $ | 8,913 | |
| | | | |
| See Notes to Financial Statements. | | 44 | | |
db-X Exchange-Traded Funds Inc.
Statements of operations (Continued)
For the Six Months Ended November 30, 2014 (Unaudited)
| | | | | | | | |
| | | Deutsche X-trackers
2040 Target
Date ETF | | | Deutsche X-trackers
In-Target
Date ETF | |
Investment Income | | | | | | | | |
Unaffiliated interest income | | $ | 51,324 | | | $ | 15,242 | |
Unaffiliated dividend income* | | | 327,155 | | | | 37,992 | |
Affiliated interest income | | | — | | | | 617 | |
| | | | | | | | |
Total Investment Income | | | 378,479 | | | | 53,851 | |
| | | | | | | | |
| | |
Expenses | | | | | | | | |
Advisory fees | | | 115,357 | | | | 38,448 | |
Audit and tax fees | | | 11,652 | | | | 11,652 | |
Insurance | | | 9,124 | | | | 9,124 | |
Directors | | | 23,683 | | | | 8,059 | |
Listing fees | | | 6,689 | | | | 6,689 | |
Printing | | | 17,930 | | | | 6,012 | |
Legal fees | | | 10,700 | | | | 3,588 | |
Other | | | 172 | | | | 172 | |
| | | | | | | | |
Total Expenses | | | 195,307 | | | | 83,744 | |
Less fees waived and expenses reimbursed: (See Note 3) | | | (79,778 | ) | | | (45,124 | ) |
| | | | | | | | |
Net Expenses | | | 115,529 | | | | 38,620 | |
| | | | | | | | |
Net Investment Income | | | 262,950 | | | | 15,231 | |
| | | | | | | | |
| | |
Net Realized and Unrealized Gain (Loss) | | | | | | | | |
Net realized gain (loss) on: | | | | | | | | |
Investments | | | 1,663,423 | | | | 288,284 | |
Foreign currency related transactions | | | (2,154 | ) | | | (353 | ) |
| | | | | | | | |
Net realized gain | | | 1,661,269 | | | | 287,931 | |
Net change in unrealized appreciation (depreciation) on: | | | | | | | | |
Investments | | | (462,486 | ) | | | (166,017 | ) |
Foreign currency translations | | | (6,337 | ) | | | (775 | ) |
| | | | | | | | |
Net change in unrealized appreciation (depreciation) | | | (468,823 | ) | | | (166,792 | ) |
| | | | | | | | |
Net realized and unrealized gain on investments and foreign currency transactions | | | 1,192,446 | | | | 121,139 | |
| | | | | | | | |
| | |
Net Increase in Net Assets from Operations | | $ | 1,455,396 | | | $ | 136,370 | |
| | | | | | | | |
* Unaffiliated foreign tax withheld | | $ | 9,655 | | | $ | 1,132 | |
| | | | |
| See Notes to Financial Statements. | | 45 | | |
db-X Exchange-Traded Funds Inc.
Statements of changes in net assets
| | | | | | | | | | | | | | | | |
| | | Deutsche X-trackers
2010 Target
Date ETF | | | Deutsche X-trackers
2020 Target
Date ETF | |
| | | For the
Six Months Ended
November 30, 2014
(Unaudited) | | | Year Ended
May 31, 2014 | | | For the
Six Months Ended
November 30, 2014
(Unaudited) | | | Year Ended
May 31, 2014 | |
Increase (Decrease) in Net Assets from Operations | | | | | | | | | | | | | | | | |
Net investment income | | $ | 7,829 | | | $ | 40,831 | | | $ | 83,042 | | | $ | 275,112 | |
Net realized gain | | | 106,009 | | | | 159,716 | | | | 1,013,627 | | | | 1,899,246 | |
Net change in unrealized appreciation (depreciation) | | | (25,269 | ) | | | 176,423 | | | | (574,455 | ) | | | 371,167 | |
| | | | | | | | | | | | | | | | |
Net increase resulting from operations | | | 88,569 | | | | 376,970 | | | | 522,214 | | | | 2,545,525 | |
| | | | | | | | | | | | | | | | |
| | | | |
Distributions to Shareholders from | | | | | | | | | | | | | | | | |
Net investment income | | | — | | | | (28,553 | ) | | | — | | | | (248,749 | ) |
Net realized gain | | | — | | | | — | | | | — | | | | — | |
| | | | | | | | | | | | | | | | |
Total distributions | | | — | | | | (28,553 | ) | | | — | | | | (248,749 | ) |
| | | | | | | | | | | | | | | | |
| | | | |
Fund Shares Transactions | | | | | | | | | | | | | | | | |
Proceeds from shares sold | | | — | | | | — | | | | — | | | | — | |
Value of shares redeemed | | | — | | | | — | | | | — | | | | (5,188,581 | ) |
| | | | | | | | | | | | | | | | |
Net increase (decrease) in net assets resulting from fund share transactions | | | — | | | | — | | | | — | | | | (5,188,581 | ) |
| | | | | | | | | | | | | | | | |
Total increase (decrease) in Net Assets | | | 88,569 | | | | 348,417 | | | | 522,214 | | | | (2,891,805 | ) |
| | | | |
Net Assets | | | | | | | | | | | | | | | | |
Beginning of period | | | 10,180,488 | | | | 9,832,071 | | | | 28,205,354 | | | | 31,097,159 | |
| | | | | | | | | | | | | | | | |
End of period | | $ | 10,269,057 | | | $ | 10,180,488 | | | $ | 28,727,568 | | | $ | 28,205,354 | |
| | | | | | | | | | | | | | | | |
Undistributed net investment income | | $ | 28,319 | | | $ | 20,490 | | | $ | 231,955 | | | $ | 148,913 | |
| | | | | | | | | | | | | | | | |
| | | | |
Changes in Shares Outstanding | | | | | | | | | | | | | | | | |
Shares outstanding, beginning of period | | | 400,800 | | | | 400,800 | | | | 1,000,800 | | | | 1,200,800 | |
Shares sold | | | — | | | | — | | | | — | | | | — | |
Shares redeemed | | | — | | | | — | | | | — | | | | (200,000 | ) |
| | | | | | | | | | | | | | | | |
Shares outstanding, end of period | | | 400,800 | | | | 400,800 | | | | 1,000,800 | | | | 1,000,800 | |
| | | | | | | | | | | | | | | | |
| | | | |
| See Notes to Financial Statements. | | 46 | | |
db-X Exchange-Traded Funds Inc.
Statements of changes in net assets (Continued)
| | | | | | | | | | | | | | | | |
| | | Deutsche X-trackers
2030 Target
Date ETF | | | Deutsche X-trackers
2040 Target
Date ETF | |
| | | For the
Six Months Ended
November 30, 2014
(Unaudited) | | | Year Ended
May 31, 2014 | | | For the
Six Months Ended
November 30, 2014
(Unaudited) | | | Year Ended
May 31, 2014 | |
Increase (Decrease) in Net Assets from Operations | | | | | | | | | | | | | | | | |
Net investment income | | $ | 342,206 | | | $ | 796,728 | | | $ | 262,950 | | | $ | 661,564 | |
Net realized gain | | | 1,135,343 | | | | 2,305,317 | | | | 1,661,269 | | | | 1,876,800 | |
Net change in unrealized appreciation (depreciation) | | | 16,018 | | | | 1,974,031 | | | | (468,823 | ) | | | 2,887,667 | |
| | | | | | | | | | | | | | | | |
Net increase resulting from operations | | | 1,493,567 | | | | 5,076,076 | | | | 1,455,396 | | | | 5,426,031 | |
| | | | | | | | | | | | | | | | |
| | | | |
Distributions to Shareholders from | | | | | | | | | | | | | | | | |
Net investment income | | | — | | | | (620,525 | ) | | | — | | | | (482,157 | ) |
Net realized gain | | | — | | | | — | | | | — | | | | — | |
| | | | | | | | | | | | | | | | |
Total distributions | | | — | | | | (620,525 | ) | | | — | | | | (482,157 | ) |
| | | | | | | | | | | | | | | | |
| | | | |
Fund Shares Transactions | | | | | | | | | | | | | | | | |
Proceeds from shares sold | | | 5,896,973 | | | | 10,760,274 | | | | — | | | | — | |
Value of shares redeemed | | | (5,813,743 | ) | | | (5,246,577 | ) | | | — | | | | — | |
| | | | | | | | | | | | | | | | |
Net increase (decrease) in net assets resulting from fund share transactions | | | 83,230 | | | | 5,513,697 | | | | — | | | | — | |
| | | | | | | | | | | | | | | | |
Total increase (decrease) in Net Assets | | | 1,576,797 | | | | 9,969,248 | | | | 1,455,396 | | | | 4,943,874 | |
| | | | |
Net Assets | | | | | | | | | | | | | | | | |
Beginning of period | | | 40,233,358 | | | | 30,264,110 | | | | 35,005,609 | | | | 30,061,735 | |
| | | | | | | | | | | | | | | | |
End of period | | $ | 41,810,155 | | | $ | 40,233,358 | | | $ | 36,461,005 | | | $ | 35,005,609 | |
| | | | | | | | | | | | | | | | |
Undistributed net investment income | | $ | 759,471 | | | $ | 417,265 | | | $ | 643,150 | | | $ | 380,200 | |
| | | | | | | | | | | | | | | | |
| | | | |
Changes in Shares Outstanding | | | | | | | | | | | | | | | | |
Shares outstanding, beginning of period | | | 1,400,800 | | | | 1,200,800 | | | | 1,200,800 | | | | 1,200,800 | |
Shares sold | | | 200,000 | | | | 400,000 | | | | — | | | | — | |
Shares redeemed | | | (200,000 | ) | | | (200,000 | ) | | | — | | | | — | |
| | | | | | | | | | | | | | | | |
Shares outstanding, end of period | | | 1,400,800 | | | | 1,400,800 | | | | 1,200,800 | | | | 1,200,800 | |
| | | | | | | | | | | | | | | | |
| | | | |
| See Notes to Financial Statements. | | 47 | | |
db-X Exchange-Traded Funds Inc.
Statements of changes in net assets (Continued)
| | | | | | | | |
| | | Deutsche X-trackers
In-Target
Date ETF | |
| | | For the
Six Months Ended
November 30, 2014
(Unaudited) | | | Year Ended
May 31, 2014 | |
Increase (Decrease) in Net Assets from Operations | | | | | | | | |
Net investment income | | $ | 15,231 | | | $ | 65,058 | |
Net realized gain | | | 287,931 | | | | 310,289 | |
Net change in unrealized appreciation (depreciation) | | | (166,792 | ) | | | 304,919 | |
| | | | | | | | |
Net increase resulting from operations | | | 136,370 | | | | 680,266 | |
| | | | | | | | |
| | |
Distributions to Shareholders from | | | | | | | | |
Net investment income | | | — | | | | (51,246 | ) |
Net realized gain | | | — | | | | (53,935 | ) |
| | | | | | | | |
Total distributions | | | — | | | | (105,181 | ) |
| | | | | | | | |
| | |
Fund Shares Transactions | | | | | | | | |
Proceeds from shares sold | | | — | | | | — | |
Value of shares redeemed | | | — | | | | — | |
| | | | | | | | |
Net increase (decrease) in net assets resulting from fund share transactions | | | — | | | | — | |
| | | | | | | | |
Total increase (decrease) in Net Assets | | | 136,370 | | | | 575,085 | |
| | |
Net Assets | | | | | | | | |
Beginning of period | | | 11,762,007 | | | | 11,186,922 | |
| | | | | | | | |
End of period | | $ | 11,898,377 | | | $ | 11,762,007 | |
| | | | | | | | |
Undistributed net investment income | | $ | 50,899 | | | $ | 35,668 | |
| | | | | | | | |
| | |
Changes in Shares Outstanding | | | | | | | | |
Shares outstanding, beginning of period | | | 400,800 | | | | 400,800 | |
Shares sold | | | — | | | | — | |
Shares redeemed | | | — | | | | — | |
| | | | | | | | |
Shares outstanding, end of period | | | 400,800 | | | | 400,800 | |
| | | | | | | | |
| | | | |
| See Notes to Financial Statements. | | 48 | | |
db-X Exchange-Traded Funds Inc.
Financial highlights
For a Share outstanding throughout each period
| | | | | | | | | | | | | | | | | | | | | | | | |
| | | For the
Six Months Ended
November 30, 2014
(Unaudited) | | | | | | | | | | | | | | | | |
| Deutsche X-trackers 2010 Target Date ETF | | | Year Ended May 31, | |
| | | 2014 | | | 2013 | | | 2012 | | | 2011 | | | 2010 | |
Net Asset Value, beginning of period | | $ | 25.40 | | | $ | 24.53 | | | $ | 23.59 | | | $ | 23.98 | | | $ | 23.24 | | | $ | 22.09 | |
| | | | | | | | | | | | | | | | | | | | | | | | |
Income from Investment Operations: | | | | | | | | | | | | | | | | | | | | | | | | |
Net investment income* | | | 0.02 | | | | 0.10 | | | | 0.06 | | | | 0.16 | | | | 0.37 | | | | 0.55 | |
Net realized and unrealized gain (loss) | | | 0.20 | | | | 0.84 | | | | 0.98 | | | | (0.35 | ) | | | 0.99 | | | | 1.11 | |
Contributions from advisor | | | — | | | | — | | | | — | | | | — | | | | 0.04 | | | | — | |
| | | | | | | | | | | | | | | | | | | | | | | | |
Net increase (decrease) in net asset value from operations | | | 0.22 | | | | 0.94 | | | | 1.04 | | | | (0.19 | ) | | | 1.40 | | | | 1.66 | |
| | | | | | | | | | | | | | | | | | | | | | | | |
Distributions paid to shareholders from: | | | | | | | | | | | | | | | | | | | | | | | | |
Net investment income | | | — | | | | (0.07 | ) | | | (0.10 | ) | | | (0.20 | ) | | | (0.66 | ) | | | (0.51 | ) |
Net realized capital gains | | | — | | | | — | | | | — | | | | — | | | | — | | | | — | |
| | | | | | | | | | | | | | | | | | | | | | | | |
Total distributions | | | — | | | | (0.07 | ) | | | (0.10 | ) | | | (0.20 | ) | | | (0.66 | ) | | | (0.51 | ) |
| | | | | | | | | | | | | | | | | | | | | | | | |
Net Asset Value, end of period | | $ | 25.62 | | | $ | 25.40 | | | $ | 24.53 | | | $ | 23.59 | | | $ | 23.98 | | | $ | 23.24 | |
| | | | | | | | | | | | | | | | | | | | | | | | |
Total Return** | | | 0.87 | % | | | 3.84 | % | | | 4.41 | % | | | (0.79 | )% | | | 6.09 | % | | | 7.51 | % |
| | | | | | |
Ratios/Supplemental Data: | | | | | | | | | | | | | | | | | | | | | | | | |
Net assets, end of period (000’s omitted) | | $ | 10,269 | | | $ | 10,180 | | | $ | 9,832 | | | $ | 9,454 | | | $ | 14,408 | | | $ | 18,610 | |
Ratios to average net assets: | | | | | | | | | | | | | | | | | | | | | | | | |
Expenses, net of fee waiver and expense reimbursements | | | 0.65 | %† | | | 0.65 | % | | | 0.65 | % | | | 0.65 | % | | | 0.65 | % | | | 0.65 | % |
Expenses, prior to fee waiver and expense reimbursements | | | 1.49 | %† | | | 1.48 | % | | | 1.53 | % | | | 1.39 | % | | | 1.70 | % | | | 2.10 | % |
Net investment income | | | 0.15 | %† | | | 0.41 | % | | | 0.27 | % | | | 0.67 | % | | | 1.56 | % | | | 2.32 | % |
Portfolio turnover rate†† | | | 45 | % | | | 85 | % | | | 86 | % | | | 65 | % | | | 58 | % | | | 51 | % |
| | | | | | |
| | | For the
Six Months Ended
November 30, 2014
(Unaudited) | | | | | | | | | | | | | | | | |
| Deutsche X-trackers 2020 Target Date ETF | | | Year Ended May 31, | |
| | | 2014 | | | 2013 | | | 2012 | | | 2011 | | | 2010 | |
Net Asset Value, beginning of period | | $ | 28.18 | | | $ | 25.90 | | | $ | 22.79 | | | $ | 24.00 | | | $ | 20.69 | | | $ | 18.56 | |
| | | | | | | | | | | | | | | | | | | | | | | | |
Income from Investment Operations: | | | | | | | | | | | | | | | | | | | | | | | | |
Net investment income* | | | 0.08 | | | | 0.27 | | | | 0.26 | | | | 0.28 | | | | 0.44 | | | | 0.51 | |
Net realized and unrealized gain (loss) | | | 0.44 | | | | 2.26 | | | | 3.15 | | | | (1.12 | ) | | | 3.39 | | | | 2.10 | |
Contributions from advisor | | | — | | | | — | | | | — | | | | — | | | | 0.01 | | | | — | |
| | | | | | | | | | | | | | | | | | | | | | | | |
Net increase (decrease) in net asset value from operations | | | 0.52 | | | | 2.53 | | | | 3.41 | | | | (0.84 | ) | | | 3.84 | | | | 2.61 | |
| | | | | | | | | | | | | | | | | | | | | | | | |
Distributions paid to shareholders from: | | | | | | | | | | | | | | | | | | | | | | | | |
Net investment income | | | — | | | | (0.25 | ) | | | (0.30 | ) | | | (0.37 | ) | | | (0.53 | ) | | | (0.48 | ) |
Net realized capital gains | | | — | | | | — | | | | — | | | | — | | | | — | | | | — | |
| | | | | | | | | | | | | | | | | | | | | | | | |
Total distributions | | | — | | | | (0.25 | ) | | | (0.30 | ) | | | (0.37 | ) | | | (0.53 | ) | | | (0.48 | ) |
| | | | | | | | | | | | | | | | | | | | | | | | |
Net Asset Value, end of period | | $ | 28.70 | | | $ | 28.18 | | | $ | 25.90 | | | $ | 22.79 | | | $ | 24.00 | | | $ | 20.69 | |
| | | | | | | | | | | | | | | | | | | | | | | | |
Total Return** | | | 1.85 | % | | | 9.79 | % | | | 15.04 | % | | | (3.49 | )% | | | 18.71 | % | | | 13.99 | % |
| | | | | | |
Ratios/Supplemental Data: | | | | | | | | | | | | | | | | | | | | | | | | |
Net assets, end of period (000’s omitted) | | $ | 28,728 | | | $ | 28,205 | | | $ | 31,097 | | | $ | 31,918 | | | $ | 38,412 | | | $ | 41,405 | |
Ratios to average net assets: | | | | | | | | | | | | | | | | | | | | | | | | |
Expenses, net of fee waiver and expense reimbursements | | | 0.65 | %† | | | 0.65 | % | | | 0.65 | % | | | 0.65 | % | | | 0.65 | % | | | 0.65 | % |
Expenses, prior to fee waiver and expense reimbursements | | | 1.14 | %† | | | 1.15 | % | | | 1.15 | % | | | 1.16 | % | | | 1.42 | % | | | 1.90 | % |
Net investment income | | | 0.58 | %† | | | 0.99 | % | | | 1.08 | % | | | 1.20 | % | | | 1.97 | % | | | 2.43 | % |
Portfolio turnover rate†† | | | 35 | % | | | 49 | % | | | 52 | % | | | 55 | % | | | 49 | % | | | 37 | % |
| * | Based on average shares outstanding. |
| ** | Total Return is calculated assuming an initial investment made at the Net Asset Value at the beginning of the period, reinvestment of all dividends and capital gain distributions at Net Asset Value during the period, and redemption at Net Asset Value on the last day of the period. Total Return calculated for a period of less than one year is not annualized. The Total Return would have been lower if certain fees had not been reimbursed by the investment sub-advisor, Amerivest Investment Management LLC (from October 1, 2007 through October 20, 2010) and the Advisor, DBX Strategic Advisors LLC. |
| †† | Portfolio turnover rate is not annualized and does not include securities received or delivered from processing creations or redemptions. |
| | | | |
| See Notes to Financial Statements. | | 49 | | |
db-X Exchange-Traded Funds Inc.
Financial highlights (Continued)
For a Share outstanding throughout each period
| | | | | | | | | | | | | | | | | | | | | | | | |
| | | For the
Six Months Ended
November 30, 2014
(Unaudited) | | | | | | | | | | | | | | | | |
Deutsche X-trackers 2030 Target Date ETF | | | Year Ended May 31, | |
| | | 2014 | | | 2013 | | | 2012 | | | 2011 | | | 2010 | |
Net Asset Value, beginning of period | | $ | 28.72 | | | $ | 25.20 | | | $ | 21.30 | | | $ | 22.06 | | | $ | 18.18 | | | $ | 16.07 | |
| | | | | | | | | | | | | | | | | | | | | | | | |
Income from Investment Operations: | | | | | | | | | | | | | | | | | | | | | | | | |
Net investment income* | | | 0.27 | | | | 0.63 | | | | 0.49 | | | | 0.46 | | | | 0.39 | | | | 0.37 | |
Net realized and unrealized gain (loss) | | | 0.86 | | | | 3.41 | | | | 3.93 | | | | (0.74 | ) | | | 3.90 | | | | 2.07 | |
Contributions from advisor | | | — | | | | — | | | | — | | | | — | | | | 0.00 | (a) | | | — | |
| | | | | | | | | | | | | | | | | | | | | | | | |
Net increase (decrease) in net asset value from operations | | | 1.13 | | | | 4.04 | | | | 4.42 | | | | (0.28 | ) | | | 4.29 | | | | 2.44 | |
| | | | | | | | | | | | | | | | | | | | | | | | |
| | | | | | | | | | | | | | | | | | | | | | | | |
Net investment income | | | — | | | | (0.52 | ) | | | (0.52 | ) | | | (0.48 | ) | | | (0.41 | ) | | | (0.33 | ) |
Net realized capital gains | | | — | | | | — | | | | — | | | | — | | | | — | | | | — | |
| | | | | | | | | | | | | | | | | | | | | | | | |
Total distributions | | | — | | | | (0.52 | ) | | | (0.52 | ) | | | (0.48 | ) | | | (0.41 | ) | | | (0.33 | ) |
| | | | | | | | | | | | | | | | | | | | | | | | |
Net Asset Value, end of period | | $ | 29.85 | | | $ | 28.72 | | | $ | 25.20 | | | $ | 21.30 | | | $ | 22.06 | | | $ | 18.18 | |
| | | | | | | | | | | | | | | | | | | | | | | | |
Total Return** | | | 3.93 | % | | | 16.14 | % | | | 20.94 | % | | | (1.17 | )% | | | 23.74 | % | | | 15.13 | % |
| | | | | | |
Ratios/Supplemental Data: | | | | | | | | | | | | | | | | | | | | | | | | |
Net assets, end of period (000’s omitted) | | $ | 41,810 | | | $ | 40,233 | | | $ | 30,264 | | | $ | 29,834 | | | $ | 35,307 | | | $ | 32,740 | |
Ratios to average net assets: | | | | | | | | | | | | | | | | | | | | | | | | |
Expenses, net of fee waiver and expense reimbursements | | | 0.65 | %† | | | 0.65 | % | | | 0.65 | % | | | 0.65 | % | | | 0.65 | % | | | 0.65 | % |
Expenses, prior to fee waiver and expense reimbursements | | | 1.12 | %† | | | 1.10 | % | | | 1.16 | % | | | 1.18 | % | | | 1.43 | % | | | 1.95 | % |
Net investment income | | | 1.89 | %† | | | 2.34 | % | | | 2.11 | % | | | 2.17 | % | | | 1.93 | % | | | 2.01 | % |
Portfolio turnover rate†† | | | 37 | % | | | 36 | % | | | 46 | % | | | 40 | % | | | 39 | % | | | 42 | % |
| | | | | | |
| | | For the
Six Months Ended
November 30, 2014
(Unaudited) | | | | | | | | | | | | | | | | |
Deutsche X-trackers 2040 Target Date ETF | | | Year Ended May 31, | |
| | | 2014 | | | 2013 | | | 2012 | | | 2011 | | | 2010 | |
Net Asset Value, beginning of period | | $ | 29.15 | | | $ | 25.03 | | | $ | 20.24 | | | $ | 21.69 | | | $ | 17.48 | | | $ | 15.35 | |
| | | | | | | | | | | | | | | | | | | | | | | | |
Income from Investment Operations: | | | | | | | | | | | | | | | | | | | | | | | | |
Net investment income* | | | 0.22 | | | | 0.55 | | | | 0.43 | | | | 0.37 | | | | 0.32 | | | | 0.32 | |
Net realized and unrealized gain (loss) | | | 0.99 | | | | 3.97 | | | | 4.85 | | | | (1.44 | ) | | | 4.25 | | | | 2.08 | |
| | | | | | | | | | | | | | | | | | | | | | | | |
Net increase (decrease) in net asset value from operations | | | 1.21 | | | | 4.52 | | | | 5.28 | | | | (1.07 | ) | | | 4.57 | | | | 2.40 | |
| | | | | | | | | | | | | | | | | | | | | | | | |
Distributions paid to shareholders from: | | | | | | | | | | | | | | | | | | | | | | | | |
Net investment income | | | — | | | | (0.40 | ) | | | (0.49 | ) | | | (0.38 | ) | | | (0.36 | ) | | | (0.27 | ) |
Net realized capital gains | | | — | | | | — | | | | — | | | | — | | | | — | | | | — | |
| | | | | | | | | | | | | | | | | | | | | | | | |
Total distributions | | | — | | | | (0.40 | ) | | | (0.49 | ) | | | (0.38 | ) | | | (0.36 | ) | | | (0.27 | ) |
| | | | | | | | | | | | | | | | | | | | | | | | |
Net Asset Value, end of period | | $ | 30.36 | | | $ | 29.15 | | | $ | 25.03 | | | $ | 20.24 | | | $ | 21.69 | | | $ | 17.48 | |
| | | | | | | | | | | | | | | | | | | | | | | | |
Total Return** | | | 4.15 | % | | | 18.15 | % | | | 26.35 | % | | | (4.86 | )% | | | 26.32 | % | | | 15.59 | % |
| | | | | | |
Ratios/Supplemental Data: | | | | | | | | | | | | | | | | | | | | | | | | |
Net assets, end of period (000’s omitted) | | $ | 36,461 | | | $ | 35,006 | | | $ | 30,062 | | | $ | 28,358 | | | $ | 34,723 | | | $ | 31,477 | |
Ratios to average net assets: | | | | | | | | | | | | | | | | | | | | | | | | |
Expenses, net of fee waiver and expense reimbursements | | | 0.65 | %† | | | 0.65 | % | | | 0.65 | % | | | 0.65 | % | | | 0.65 | % | | | 0.65 | % |
Expenses, prior to fee waiver and expense reimbursements | | | 1.10 | %† | | | 1.11 | % | | | 1.17 | % | | | 1.20 | % | | | 1.43 | % | | | 1.97 | % |
Net investment income | | | 1.48 | %† | | | 2.03 | % | | | 1.88 | % | | | 1.84 | % | | | 1.64 | % | | | 1.79 | % |
Portfolio turnover rate†† | | | 28 | % | | | 31 | % | | | 34 | % | | | 34 | % | | | 35 | % | | | 38 | % |
| * | Based on average shares outstanding. |
| ** | Total Return is calculated assuming an initial investment made at the Net Asset Value at the beginning of the period, reinvestment of all dividends and capital gain distributions at Net Asset Value during the period, and redemption at Net Asset Value on the last day of the period. Total Return calculated for a period of less than one year is not annualized. The Total Return would have been lower if certain fees had not been reimbursed by the investment sub-advisor, Amerivest Investment Management LLC (from October 1, 2007 through October 20, 2010) and the Advisor, DBX Strategic Advisors LLC. |
| †† | Portfolio turnover rate is not annualized and does not include securities received or delivered from processing creations or redemptions. |
| (a) | Amount represents less than $0.01. |
| | | | |
| See Notes to Financial Statements. | | 50 | | |
db-X Exchange-Traded Funds Inc.
Financial highlights (Continued)
For a Share outstanding throughout each period
| | | | | | | | | | | | | | | | | | | | | | | | |
| | | For the
Six Months Ended
November 30, 2014
(Unaudited) | | | | | | | | | | | | | | | | |
Deutsche X-trackers In-Target Date ETF | | | Year Ended May 31, | |
| | | 2014 | | | 2013 | | | 2012 | | | 2011 | | | 2010 | |
Net Asset Value, beginning of period | | $ | 29.35 | | | $ | 27.91 | | | $ | 25.89 | | | $ | 26.54 | | | $ | 25.07 | | | $ | 24.38 | |
| | | | | | | | | | | | | | | | | | | | | | | | |
Income from Investment Operations: | | | | | | | | | | | | | | | | | | | | | | | | |
Net investment income* | | | 0.04 | | | | 0.16 | | | | 0.14 | | | | 0.16 | | | | 0.25 | | | | 0.33 | |
Net realized and unrealized gain (loss) | | | 0.30 | | | | 1.54 | | | | 2.02 | | | | (0.63 | ) | | | 1.61 | | | | 0.70 | |
Contributions from advisor | | | — | | | | — | | | | — | | | | — | | | | 0.00 | (a) | | | — | |
| | | | | | | | | | | | | | | | | | | | | | | | |
Net increase (decrease) in net asset value from operations | | | 0.34 | | | | 1.70 | | | | 2.16 | | | | (0.47 | ) | | | 1.86 | | | | 1.03 | |
| | | | | | | | | | | | | | | | | | | | | | | | |
Distributions paid to shareholders from: | | | | | | | | | | | | | | | | | | | | | | | | |
Net investment income | | | — | | | | (0.13 | ) | | | (0.14 | ) | | | (0.18 | ) | | | (0.39 | ) | | | (0.34 | ) |
Net realized capital gains | | | — | | | | (0.13 | ) | | | — | | | | — | | | | — | | | | — | |
| | | | | | | | | | | | | | | | | | | | | | | | |
Total distributions | | | — | | | | (0.26 | ) | | | (0.14 | ) | | | (0.18 | ) | | | (0.39 | ) | | | (0.34 | ) |
| | | | | | | | | | | | | | | | | | | | | | | | |
Net Asset Value, end of period | | $ | 29.69 | | | $ | 29.35 | | | $ | 27.91 | | | $ | 25.89 | | | $ | 26.54 | | | $ | 25.07 | |
| | | | | | | | | | | | | | | | | | | | | | | | |
Total Return** | | | 1.16 | % | | | 6.12 | % | | | 8.37 | % | | | (1.77 | )% | | | 7.44 | % | | | 4.23 | % |
| | | | | | |
Ratios/Supplemental Data: | | | | | | | | | | | | | | | | | | | | | | | | |
Net assets, end of period (000’s omitted) | | $ | 11,898 | | | $ | 11,762 | | | $ | 11,187 | | | $ | 10,376 | | | $ | 15,948 | | | $ | 20,074 | |
Ratios to average net assets: | | | | | | | | | | | | | | | | | | | | | | | | |
Expenses, net of fee waiver and expense reimbursements | | | 0.65 | %† | | | 0.65 | % | | | 0.65 | % | | | 0.65 | % | | | 0.65 | % | | | 0.65 | % |
Expenses, prior to fee waiver and expense reimbursements | | | 1.42 | %† | | | 1.41 | % | | | 1.47 | % | | | 1.36 | % | | | 1.66 | % | | | 2.06 | % |
Net investment income | | | 0.26 | %† | | | 0.57 | % | | | 0.51 | % | | | 0.59 | % | | | 0.96 | % | | | 1.30 | % |
Portfolio turnover rate†† | | | 44 | % | | | 79 | % | | | 62 | % | | | 59 | % | | | 60 | % | | | 42 | % |
| * | Based on average shares outstanding. |
| ** | Total Return is calculated assuming an initial investment made at the Net Asset Value at the beginning of the period, reinvestment of all dividends and capital gain distributions at Net Asset Value during the period, and redemption at Net Asset Value on the last day of the period. Total Return calculated for a period of less than one year is not annualized. The Total Return would have been lower if certain fees had not been reimbursed by the investment sub-advisor, Amerivest Investment Management LLC (from October 1, 2007 through October 20, 2010) and the Advisor, DBX Strategic Advisors LLC. |
| †† | Portfolio turnover rate is not annualized and does not include securities received or delivered from processing creations or redemptions. |
| (a) | Amount represents less than $0.01. |
| | | | |
| See Notes to Financial Statements. | | 51 | | |
db-X Exchange-Traded Funds Inc.
Notes to financial statements
1. Organization
db-X Exchange-Traded Funds Inc. (the “Company”) was organized as a Maryland corporation on December 22, 2006 and is registered under the Investment Company Act of 1940, as amended (the “Act”).
As of November 30, 2014, there were five diversified series of exchange-traded funds (“ETF”) (each, a “Fund,” and collectively, the “Funds”) in operation and trading:
| | |
New Fund Name | | Former Fund Name |
| Deutsche X-trackers 2010 Target Date ETF | | db X-trackers 2010 Target Date Fund |
| Deutsche X-trackers 2020 Target Date ETF | | db X-trackers 2020 Target Date Fund |
| Deutsche X-trackers 2030 Target Date ETF | | db X-trackers 2030 Target Date Fund |
| Deutsche X-trackers 2040 Target Date ETF | | db X-trackers 2040 Target Date Fund |
| Deutsche X-trackers In-Target Date ETF | | db X-trackers In-Target Date Fund |
DBX Strategic Advisors LLC (“DBX” or the “Advisor”), an indirect wholly owned subsidiary of Deutsche Bank AG, serves as investment advisor to the Funds and has overall responsibility for the general management and administration of the Funds, subject to the supervision of the Funds’ Board of Directors.
Each Fund offers shares that are listed and traded on the NYSE Arca, Inc. (“NYSE Arca”). Unlike conventional mutual funds, each Fund issues and redeems shares on a continuous basis, at net asset value, only in large specified lots consisting of 200,000 shares each called a “Creation Unit”, to authorized participants who have entered into agreements with the Funds’ distributor. Except when aggregated in Creation Units, shares are not individually redeemable securities of the Funds.
The investment objective of each Fund is to track the performance, before fees and expenses, of a particular index (the “Underlying Index”). Zacks Investment Research (“Zacks”) is the creator of each Underlying Index. Each Underlying Index is comprised of a mix of securities from three broad asset classes: international equities, domestic equities, and fixed income, which includes cash, cash equivalents or short-term money market instruments. Short-term instruments include obligations of the U.S. government and its agencies or instrumentalities; commercial paper, variable amount master demand notes and other debt securities, including high quality U.S. dollar-denominated short-term bonds and notes issued by domestic and foreign corporations; variable and floating rate securities; bank obligations; repurchase agreements collateralized by these securities; and shares of other investment companies that primarily invest in any of the above-referenced securities. These Underlying Indexes are designed to reflect a portfolio of investments that can be used for lifecycle investing. Lifecycle investing is an investment technique that starts by targeting a particular investment horizon. That investment horizon corresponds to the date the investor expects to need his or her invested assets.
The underlying indexes for the Funds are:
| | |
Fund | | Underlying Index |
| Deutsche X-trackers 2010 Target Date ETF | | Zacks 2010 Lifecycle Index |
| Deutsche X-trackers 2020 Target Date ETF | | Zacks 2020 Lifecycle Index |
| Deutsche X-trackers 2030 Target Date ETF | | Zacks 2030 Lifecycle Index |
| Deutsche X-trackers 2040 Target Date ETF | | Zacks 2040 Lifecycle Index |
| Deutsche X-trackers In-Target Date ETF | | Zacks In-Target Lifecycle Index |
Each Fund is entitled to use its respective Underlying Index pursuant to a licensing agreement between Zacks and DBX. There is no charge to the Funds in connection with these licensing agreements.
Each Fund may invest in securities of non-U.S. issuers that may trade in non-U.S. Markets. This may involve certain considerations and risks not typically associated with securities of U.S. issuers. Such risks include, but are not limited to: generally less liquid and less efficient securities markets; generally greater price volatility; exchange rate fluctuations and exchange controls; imposition of restrictions on the expatriation of funds or other assets of the Fund; less publicly available information about issuers; the imposition of withholding or other taxes; higher transaction and custody costs; settlement delays and risk of loss attendant in settlement procedures; difficulties in enforcing contractual obligations; less regulation of securities markets; different accounting, disclosure and reporting requirements; more substantial governmental involvement in the economy; higher inflation rates; greater social, economic and political uncertainties; the risk of nationalization or expropriation of assets and the risk of war.
52
db-X Exchange-Traded Funds Inc.
Notes to financial statements (Continued)
Pursuant to the Company’s organizational documents, the Company’s officers and directors are indemnified against certain liabilities that may arise out of the performance of their duties to the Funds. Additionally, in the normal course of business the Company enters into contracts that contain a variety of representations that provide indemnification for certain liabilities. The director’s maximum exposure under these arrangements is unknown, as this would involve future claims that may be made against the Funds that have not yet occurred. However, the Company expects the risk of loss to be remote.
2. Significant Accounting Policies
The financial statements have been prepared in conformity with U.S. generally accepted accounting principles (“U.S. GAAP”), which require management to make certain estimates and assumptions that affect the reported amounts and disclosures in the financial statements. Actual results could differ from those estimates. The following is a summary of significant accounting policies followed by the Funds.
Cash Cash consists of cash held at banks and are on deposit with major financial institutions.
Security Valuation The Net Asset Value (“NAV”), of each Fund’s shares is calculated each business day as of the close of regular trading on the New York Stock Exchange, generally 4:00 p.m. Eastern Time. NAV per share is calculated by dividing a Fund’s net assets by the number of Fund shares outstanding.
Various inputs are used in determining the value of the Funds’ investments. These inputs are summarized in three broad levels. Level 1 includes quoted prices in active markets for identical securities. Level 2 includes other significant observable inputs (including quoted prices for similar securities, interest rates, prepayment speeds, and credit risk). Level 3 includes significant unobservable inputs (including the Fund’s own assumptions in determining the fair value of investments). The level assigned to the securities valuations may not be an indication of the risk or liquidity associated with investing in those securities.
Equity securities are valued at the most recent sale price or official closing price reported on the exchange (U.S. or foreign) or over-the-counter market on which they trade. Securities for which no sales are reported are valued at the calculated mean between the most recent bid and asked quotations on the relevant market or, if a mean cannot be determined, at the most recent bid quotation. Equity securities are generally categorized as Level 1.
Debt securities are valued at prices supplied by independent pricing services approved by the Fund’s Board. Such services may use various pricing techniques which take into account appropriate factors such as yield, quality, coupon rate, maturity, type of issue, trading characteristics, prepayment speeds and other data, as well as broker quotes. If the pricing services are unable to provide valuations, debt securities are valued at the average of the most recent reliable bid quotations or evaluated prices, as applicable, obtained from broker-dealers. These securities are generally categorized as Level 2.
Securities and other assets for which market quotations are not readily available or for which the above valuation procedures are deemed not to reflect fair value are valued in a manner that is intended to reflect their fair value as determined in accordance with procedures approved by the Board and are generally categorized as Level 3. In accordance with the Fund’s valuation procedures, factors considered in determining value may include, but are not limited to, the type of the security; the size of the holding; the initial cost of the security; the existence of any contractual restrictions on the security’s disposition; the price and extent of public trading in similar securities of the issuer or of comparable companies; quotations or evaluated prices from broker-dealers and/or pricing services; information obtained from the issuer, analysts, and/or the appropriate stock exchange (for exchange-traded securities); an analysis of the company’s or issuer’s financial statements; an evaluation of the forces that influence the issuer and the market(s) in which the security is purchased and sold; and with respect to debt securities, the maturity, coupon, creditworthiness, currency denomination and the movement of the market in which the security is normally traded. The value determined under these procedures may differ from published values for the same securities.
Fair value pricing could result in a difference between the prices used to calculate a Fund’s net asset value and the prices used by the Fund’s underlying index, which in turn could result in a difference between the Fund’s performance and the performance of the Fund’s underlying index.
53
db-X Exchange-Traded Funds Inc.
Notes to financial statements (Continued)
The following table summarizes the valuation of each Fund’s investments by the above fair value hierarchy levels as of November 30, 2014 (see the Schedule of Investments for security categories). For the six months ended November 30, 2014, there were no transfers between investment levels.
| | | | | | | | | | | | | | | | |
| | | Level 1 | | | Level 2 | | | Level 3 | | | Fair Value at
11/30/2014 | |
| Deutsche X-trackers 2010 Target Date ETF | | | | | | | | | | | | | | | | |
Investment in Securities | | | | | | | | | | | | | | | | |
Common Stocks | | $ | 2,697,150 | | | $ | — | | | $ | — | | | $ | 2,697,150 | |
Preferred Stocks | | | 3,480 | | | | — | | | | — | | | | 3,480 | |
Rights | | | — | | | | — | | | | 732 | | | | 732 | |
Corporate Bonds | | | — | | | | 3,246,646 | | | | — | | | | 3,246,646 | |
United States Government & Agency Obligations | | | — | | | | 4,165,961 | | | | — | | | | 4,165,961 | |
Sovereign Bonds | | | — | | | | 101,327 | | | | — | | | | 101,327 | |
| | | | | | | | | | | | | | | | |
Total Investments | | $ | 2,700,630 | | | $ | 7,513,934 | | | $ | 732 | | | $ | 10,215,296 | |
| | | | | | | | | | | | | | | | |
| Deutsche X-trackers 2020 Target Date ETF | | | | | | | | | | | | | | | | |
Investment in Securities | | | | | | | | | | | | | | | | |
Common Stocks | | $ | 13,862,744 | | | $ | — | | | $ | — | | | $ | 13,862,744 | |
Preferred Stocks | | | 17,877 | | | | — | | | | — | | | | 17,877 | |
Rights | | | — | | | | — | | | | 1,532 | | | | 1,532 | |
Corporate Bonds | | | — | | | | 5,915,056 | | | | — | | | | 5,915,056 | |
United States Government & Agency Obligations | | | — | | | | 8,694,528 | | | | — | | | | 8,694,528 | |
Sovereign Bonds | | | — | | | | 85,974 | | | | — | | | | 85,974 | |
| | | | | | | | | | | | | | | | |
Total Investments | | $ | 13,880,621 | | | $ | 14,695,558 | | | $ | 1,532 | | | $ | 28,577,711 | |
| | | | | | | | | | | | | | | | |
| Deutsche X-trackers 2030 Target Date ETF | | | | | | | | | | | | | | | | |
Investment in Securities | | | | | | | | | | | | | | | | |
Common Stocks | | $ | 30,390,378 | | | $ | — | | | $ | — | | | $ | 30,390,378 | |
Preferred Stocks | | | 35,720 | | | | — | | | | — | | | | 35,720 | |
Rights | | | — | | | | — | | | | 3,501 | | | | 3,501 | |
Corporate Bonds | | | — | | | | 9,438,087 | | | | — | | | | 9,438,087 | |
United States Government & Agency Obligations | | | — | | | | 688,934 | | | | — | | | | 688,934 | |
Sovereign Bonds | | | — | | | | 1,034,018 | | | | — | | | | 1,034,018 | |
| | | | | | | | | | | | | | | | |
Total Investments | | $ | 30,426,098 | | | $ | 11,161,039 | | | $ | 3,501 | | | $ | 41,590,638 | |
| | | | | | | | | | | | | | | | |
| Deutsche X-trackers 2040 Target Date ETF | | | | | | | | | | | | | | | | |
Investment in Securities | | | | | | | | | | | | | | | | |
Common Stocks | | $ | 33,279,120 | | | $ | — | | | $ | — | | | $ | 33,279,120 | |
Preferred Stocks | | | 38,309 | | | | — | | | | — | | | | 38,309 | |
Rights | | | — | | | | — | | | | 3,587 | | | | 3,587 | |
Corporate Bonds | | | — | | | | 1,274,712 | | | | — | | | | 1,274,712 | |
United States Government & Agency Obligations | | | — | | | | 1,635,197 | | | | — | | | | 1,635,197 | |
Sovereign Bonds | | | — | | | | 123,247 | | | | — | | | | 123,247 | |
| | | | | | | | | | | | | | | | |
Total Investments | | $ | 33,317,429 | | | $ | 3,033,156 | | | $ | 3,587 | | | $ | 36,354,172 | |
| | | | | | | | | | | | | | | | |
| Deutsche X-trackers In-Target Date ETF | | | | | | | | | | | | | | | | |
Investment in Securities | | | | | | | | | | | | | | | | |
Common Stocks | | $ | 3,838,305 | | | $ | — | | | $ | — | | | $ | 3,838,305 | |
Preferred Stocks | | | 4,871 | | | | — | | | | — | | | | 4,871 | |
Rights | | | — | | | | — | | | | 244 | | | | 244 | |
Corporate Bonds | | | — | | | | 3,462,419 | | | | — | | | | 3,462,419 | |
United States Government & Agency Obligations | | | — | | | | 4,417,403 | | | | — | | | | 4,417,403 | |
Sovereign Bonds | | | — | | | | 107,468 | | | | — | | | | 107,468 | |
| | | | | | | | | | | | | | | | |
Total Investments | | $ | 3,843,176 | | | $ | 7,987,290 | | | $ | 244 | | | $ | 11,830,710 | |
| | | | | | | | | | | | | | | | |
54
db-X Exchange-Traded Funds Inc.
Notes to financial statements (Continued)
Investment Transactions and Investment Income Investment transactions are recorded as of the date that the securities are purchased or sold (trade date). Realized gains and losses from the sale or disposition of securities are calculated on the identified cost-method. Proceeds from litigation payments, if any, are included in net realized gain (loss) from investments. Dividend income is net of any foreign taxes withheld at source. Interest income is recorded on the accrual basis. Discounts and premiums on securities purchased are accreted/amortized over the lives of the respective securities.
Tax Information and Dividends and Distributions to Shareholders It is each Fund’s policy to comply with all requirements of the Internal Revenue Code of 1986, as amended (“the Code”). Each fund intends to qualify for and to elect treatment as a separate Regulated Investment Company (“RIC”) under Subchapter M of the Code. It is the policy of each Fund to pay out dividends, if any, to investors at least annually sufficient to relieve it from all, or substantially all, Federal income and excise taxes. Taxable net realized gains from investment transactions, reduced by capital loss carryforwards, if any, are declared and distributed to shareholders at least annually. The capital loss carryforward amount, if any, is available to offset future net capital gains. The Funds may occasionally be required to make supplemental distributions at some other time during the year. The Funds reserve the right to declare special distributions if, in their reasonable discretion, such action is necessary or advisable to preserve the status of each Fund as a RIC or to avoid imposition of income or excise taxes on undistributed income. Dividends and distributions to shareholders, if any, are recorded on the ex-dividend date. The amount of dividends and distributions from net investment income and net realized capital gains are determined in accordance with Federal income tax regulations which may differ from U.S. GAAP. These “book/tax” differences are either considered temporary or permanent in nature. To the extent these differences are permanent in nature, such amounts are reclassified at the end of the year within the components of net assets based on their federal tax treatment; temporary differences do not require reclassification. Dividends and distributions, which exceed earnings and profits for the full year for tax purposes, are reported as a tax return of capital. Each Fund pays out dividends from its net investment income to investors annually. Each Fund distributes any net capital gains annually.
In accordance with U.S. GAAP requirements regarding accounting for uncertainties in income taxes, management has analyzed the Funds’ tax positions taken or expected to be taken on foreign, federal and state income tax returns for all open tax years and has concluded that no provision for income tax is required in the Funds’ financial statements. The Advisor does not believe that the unrecognized tax benefits will change significantly in the next 12 months.
The Funds recognize interest and penalties, if any, related to uncertain tax positions as income tax expense on the Statements of Operations. For the six months ended November 30, 2014, the Funds did not incur any interest or penalties.
Foreign Taxes The Funds may be subject to foreign taxes (a portion of which may be reclaimable) on income, capital gains on investments, certain foreign currency transactions or other corporate events. All foreign taxes are recorded in accordance with the applicable foreign tax regulations and rates that exist in the foreign jurisdictions in which the Funds invest. These foreign taxes, if any, are paid by the Funds and are reflected in their Statements of Operations as follows: foreign taxes withheld at source are presented as a reduction of income, and foreign taxes on capital gains from sales of investments and foreign currency transactions are included in their respective net realized gain (loss) categories. Foreign taxes payable as of November 30, 2014, if any, are disclosed in the Funds’ Statements of Assets and Liabilities.
Expenses Expenses that are directly related to a specific Fund are charged to that respective Fund. Expenses which are not readily identifiable to a specific Fund are allocated in such a manner as deemed equitable, taking into consideration the nature and type of expense and the relative net assets of each Fund.
Foreign Currency Translations The books and records of the Funds are maintained in U.S. dollars. Investment securities and other assets and liabilities denominated in a foreign currency are translated into U.S. dollars at the prevailing exchange rates at period end. Purchases and sales of investment securities, income and expenses are translated into U.S. dollars at the prevailing exchange rates on the respective dates of the transactions.
Net realized and unrealized gains and losses on foreign currency transactions represent net gains and losses between trade and settlement dates on securities transactions, the acquisition and disposition of foreign currencies, and the difference between the amount of net investment income accrued and the U.S. dollar amount
55
db-X Exchange-Traded Funds Inc.
Notes to financial statements (Continued)
actually received. That portion of both realized and unrealized gains and losses on investments that results from fluctuations in foreign currency exchange rates is not separately disclosed, but is included with net realized and unrealized gain/appreciation and loss/depreciation on investments.
Real Estate Investment Trusts Each Fund periodically recharacterizes distributions received from a Real Estate Investment Trust (“REIT”) investment based on information provided by the REIT into the following categories: ordinary income, long-term and short-term capital gains, and return of capital. If information is not available timely from a REIT, the recharacterization will be estimated and a recharacterization will be made in the following year when such information becomes available. Distributions received from REITs in excess of income are recorded as either a reduction of cost of investments or realized gains. Each Fund distinguishes between dividends received on a tax basis and a financial reporting basis and only distributions in excess of tax basis earnings and profits are reported in the financial statements as a tax return of capital.
3. Investment Advisory and Other Agreements
The Advisor has overall responsibility for the general management and administration of the Funds, subject to the supervision of the Funds’ Board of Directors. Under an investment advisory agreement between the Company, on behalf of the Funds, and the Advisor (the “Investment Advisory Agreement”), the Advisor is responsible for arranging sub-advisory, transfer agency, custody, fund administration, and all other non-distribution related services for the Funds to operate. The Advisor is also responsible for employing any sampling strategy for the Funds.
TDAM USA Inc. (“TDAM”) acts as investment sub-advisor to the Funds (“Sub-Advisor”). TDAM is a direct, wholly-owned subsidiary of The Toronto-Dominion Bank. The Sub-Advisor is responsible for the day-to-day management of the Funds, subject to the supervision of the Advisor and the Funds’ Board of Directors. In this regard, the Sub-Advisor is responsible for implementing the replication strategy for each Fund with regard to its underlying index and for general administration, compliance and management services as may be agreed between the Advisor and Sub Advisor from time to time.
For the services it provides to the Funds, the Advisor receives an advisory fee computed daily and payable monthly in an amount equal to 0.65% on an annualized basis of each Fund’s average daily net assets. Out of the advisory fee, the Advisor pays, or arranges for the payment of, all fees and expenses of the Sub-Advisor, the Transfer Agent, the Administrator and Accounting Agent and the Custodian. Each Fund is responsible for the payment of all other expenses associated with its operations, including but not limited to, brokerage expenses, taxes, interest, fees and expenses of counsel to the Funds, fees and expenses of the Disinterested Directors (including legal counsel fees), certain out-of-pocket expenses of the Advisor or Sub-Advisor, including, but not limited to, cost of obtaining prices for security valuations (including manual broker quotes), Federal Reserve charges related to securities transactions, postage and insurance on physical transfer items, telecommunication charges, and proxy voting execution, advice and reporting etc., fees and expenses of the Chief Compliance Officer and expenses associated with the Funds’ compliance program, litigation expenses, fees and expenses of the Funds’ independent auditors, registration fees, expenses associated with compliance by the Funds with regulatory requirements, including those relating to the development and distribution of its prospectus and shareholder reports, and extraordinary expenses. Pursuant to the Investment Advisory Agreement, the Advisor is authorized to engage one or more sub-advisors to perform any of the services contemplated to be performed by the Advisor under the Investment Advisory Agreement.
The Advisor pays TDAM a fee based on a percentage of the average daily net assets of each Fund as set forth below:
| | — | | 10 basis points (0.10%) of the first $100 million in combined average daily net assets of all Funds; and |
| | — | | 5 basis points (0.05%) of the combined average daily net assets of all Funds in excess of $100 million. |
The Advisor pays TDAM a minimum annual fee of $35,000 per Fund.
The Advisor has contractually agreed to reduce its fees and/or pay Fund operating expenses (excluding, among other things, acquired fund fees and expenses, interest, taxes and extraordinary expenses) in order to limit each Fund’s net annual operating expenses to 0.65% of the Fund’s average daily net assets (the “Expense Cap”). The Expense Cap will remain in effect until September 30, 2015. The Advisor is permitted to be reimbursed for fee
56
db-X Exchange-Traded Funds Inc.
Notes to financial statements (Continued)
reductions and/or expense payments made in the prior three fiscal years. This reimbursement may be paid to the Advisor if the aggregate amount actually paid by a Fund toward operating expenses for such fiscal year (taking into account the reimbursement) does not exceed the Expense Cap. No amounts were reimbursed to the Advisor by the funds under this contractual arrangement during the six months ended November 30, 2014.
The amounts subject to potential reimbursement to the Advisor as of November 30, 2014 were as follows:
| | | | | | | | | | | | |
| | | Reimbursements available through: | |
| | | 5/31/2015 | | | 5/31/2016 | | | 5/31/2017 | |
Deutsche X-trackers 2010 Target Date ETF | | $ | 187,622 | | | $ | 84,788 | | | $ | 83,224 | |
Deutsche X-trackers 2020 Target Date ETF | | | 333,966 | | | | 155,260 | | | | 139,432 | |
Deutsche X-trackers 2030 Target Date ETF | | | 329,744 | | | | 161,871 | | | | 152,758 | |
Deutsche X-trackers 2040 Target Date ETF | | | 308,119 | | | | 150,327 | | | | 150,231 | |
Deutsche X-trackers In-Target Date ETF | | | 194,674 | | | | 88,106 | | | | 87,287 | |
For the six months ended November 30, 2014, the advisory fee waivers and expenses assumed by the Advisor were as follows:
| | | | | | | | |
| | | Advisory
Fees Waived
by DBX | | | Fees & Expenses
Assumed
by DBX | |
Deutsche X-trackers 2010 Target Date ETF | | $ | 33,223 | | | $ | 9,539 | |
Deutsche X-trackers 2020 Target Date ETF | | | 69,756 | | | | — | |
Deutsche X-trackers 2030 Target Date ETF | | | 85,767 | | | | — | |
Deutsche X-trackers 2040 Target Date ETF | | | 79,778 | | | | — | |
Deutsche X-trackers In-Target Date ETF | | | 38,448 | | | | 6,676 | |
The Bank of New York Mellon, a wholly-owned subsidiary of The Bank of New York Mellon Corporation, serves as Administrator, Custodian, Accounting Agent and Transfer Agent for each Fund.
ALPS Distributors, Inc. (the “Distributor”) serves as the distributor of Creation Units for each Fund on an agency basis. The Distributor does not maintain a secondary market in shares of the Funds.
The Board of Directors is currently comprised of four Directors, of whom three are Independent Directors. The Company pays each Independent Director an annual fee, plus a fee per meeting attended in-person or telephonically. Each Independent Director also receives a fee per Audit Committee meeting attended in- person or telephonically, although the Audit Committee Chairman receives a fee per Audit Committee meeting attended in-person. The Company reimburses each Director for their costs and expenses associated with the performance of their duties hereunder, including the cost and expenses associated with attendance at meetings of the Board. Directors’ fees and expenses are allocated among the Funds based on each Fund’s relative average daily net assets.
4. Federal Income Taxes
Under the Regulated Investment Company Modernization Act of 2010, net capital losses incurred post-enactment may be carried forward indefinitely, and their character is retained as short-term and/or long term. Previously, net capital losses were carried forward for eight years and treated as short-term losses. As a transition rule, the Act requires that post-enactment net capital losses be used before pre-enactment net capital losses.
As of November 30, 2014, the cost of investments for Federal income tax purposes and the aggregated gross unrealized appreciation/depreciation on investments were as follows:
| | | | | | | | | | | | | | | | |
| | | Cost | | | Net Unrealized
Appreciation
(Depreciation) | | | Gross
Unrealized
Appreciation | | | Gross
Unrealized
(Depreciation) | |
Deutsche X-trackers 2010 Target Date ETF | | $ | 9,732,878 | | | $ | 482,418 | | | $ | 599,653 | | | $ | (117,235 | ) |
Deutsche X-trackers 2020 Target Date ETF | | | 25,731,408 | | | | 2,846,303 | | | | 3,580,446 | | | | (734,143 | ) |
Deutsche X-trackers 2030 Target Date ETF | | | 36,470,115 | | | | 5,120,523 | | | | 6,562,250 | | | | (1,441,727 | ) |
Deutsche X-trackers 2040 Target Date ETF | | | 29,471,991 | | | | 6,882,181 | | | | 8,539,354 | | | | (1,657,173 | ) |
Deutsche X-trackers In-Target Date ETF | | | 10,936,736 | | | | 893,974 | | | | 1,036,020 | | | | (142,046 | ) |
57
db-X Exchange-Traded Funds Inc.
Notes to financial statements (Continued)
At May 31, 2014, for Federal income tax purposes, the Funds have capital loss carryforwards available as shown in the table below, to the extent provided by regulations, to offset future capital gains through the years indicated. To the extent that these loss carryforwards are used to offset future capital gains, it is probable that the capital gains so offset will not be distributed to shareholders.
| | | | | | | | | | | | | | | | |
| | | Year of Expiration | | | Total
Amount | |
| | | 2017 | | | 2018 | | | 2019 | | |
Deutsche X-trackers 2010 Target Date ETF | | $ | 467,239 | | | $ | 1,020,627 | | | $ | — | | | $ | 1,487,866 | |
Deutsche X-trackers 2020 Target Date ETF | | | — | | | | 3,030,034 | | | | — | | | | 3,030,034 | |
Deutsche X-trackers 2030 Target Date ETF | | | — | | | | 2,910,271 | | | | 71,703 | | | | 2,981,974 | |
Deutsche X-trackers 2040 Target Date ETF | | | — | | | | 4,886,949 | | | | 352,525 | | | | 5,239,474 | |
Deutsche X-trackers In-Target Date ETF | | | — | | | | — | | | | — | | | | — | |
The tax character of current year distributions will be determined at the end of the current fiscal year.
5. Investments in Affiliates
The Advisor is a wholly-owned subsidiary of Deutsche Bank AG. Therefore, Deutsche Bank AG is considered to be affiliated with the Funds. The table below shows the transactions in and earnings from investments in Deutsche Bank AG Securities for the six months ended November 30, 2014.
| | | | | | | | | | | | | | | | | | | | | | | | | | | | |
| | | Fair Value
05/31/14 | | | Purchases
at Cost | | | Proceeds
from
Sales | | | Change in
Unrealized
Appreciation/
(Depreciation) | | | Realized
Gain (Loss) | | | Fair Value
11/30/14 | | | Interest
Income | |
Deutsche X-trackers 2010 Target Date ETF | | | | | | | | | | | | | | | | | | | | | | | | | | | | |
Deutsche Bank AG (Common Stock) | | $ | 3,767 | | | $ | 1,406 | | | $ | — | | | $ | (859 | ) | | $ | — | | | $ | 4,314 | | | $ | — | |
Deutsche Bank AG (Corporate Bond) | | | — | | | | 51,891 | | | | — | | | | (522 | ) | | | — | | | | 51,369 | | | | 582 | |
Deutsche X-trackers 2020 Target Date ETF | | | | | | | | | | | | | | | | | | | | | | | | | | | | |
Deutsche Bank AG (Common Stock) | | | 23,494 | | | | — | | | | — | | | | (4,537 | ) | | | — | | | | 18,957 | | | | — | |
Deutsche Bank AG (Corporate Bond) | | | — | | | | 68,495 | | | | — | | | | (688 | ) | | | — | | | | 67,807 | | | | 769 | |
Deutsche X-trackers 2030 Target Date ETF | | | | | | | | | | | | | | | | | | | | | | | | | | | | |
Deutsche Bank AG (Common Stock) | | | 48,405 | | | | 13,928 | | | | (6,083 | ) | | | 540 | | | | (9,398 | ) | | | 47,392 | | | | — | |
Deutsche X-trackers 2040 Target Date ETF | | | | | | | | | | | | | | | | | | | | | | | | | | | | |
Deutsche Bank AG (Common Stock) | | | 50,028 | | | | 11,026 | | | | — | | | | (11,018 | ) | | | — | | | | 50,236 | | | | — | |
Deutsche X-trackers In-Target Date ETF | | | | | | | | | | | | | | | | | | | | | | | | | | | | |
Deutsche Bank AG (Common Stock) | | | 6,116 | | | | 1,370 | | | | — | | | | (1,309 | ) | | | — | | | | 6,177 | | | | — | |
Deutsche Bank AG (Corporate Bond) | | | — | | | | 55,004 | | | | — | | | | (553 | ) | | | — | | | | 54,451 | | | | 617 | |
6. Investment Portfolio Transactions
For the six months ended November 30, 2014, the cost of investments purchased and proceeds from sale of investments (excluding in-kind transactions and short-term investments) were as follows:
| | | | | | | | | | | | | | | | |
| | | Purchases | | | Sales | |
| | | Other | | | U.S. Government | | | Other | | | U.S. Government | |
Deutsche X-trackers 2010 Target Date ETF | | $ | 3,515,489 | | | $ | 123,805 | | | $ | 3,285,131 | | | $ | 1,969,946 | |
Deutsche X-trackers 2020 Target Date ETF | | | 5,955,360 | | | | 3,755,613 | | | | 5,925,427 | | | | 3,974,843 | |
Deutsche X-trackers 2030 Target Date ETF | | | 13,187,622 | | | | 199,243 | | | | 18,415,358 | | | | 394,074 | |
Deutsche X-trackers 2040 Target Date ETF | | | 9,764,245 | | | | 603,327 | | | | 9,776,114 | | | | 309,684 | |
Deutsche X-trackers In-Target Date ETF | | | 3,902,377 | | | | 163,135 | | | | 4,016,037 | | | | 2,209,279 | |
For the six months ended November 30, 2014 the cost of in-kind purchases and the proceeds from in-kind sales were as follows:
| | | | | | | | |
| | | Purchases | | | Sales | |
Deutsche X-trackers 2030 Target Date ETF | | $ | 5,845,836 | | | $ | — | |
58
db-X Exchange-Traded Funds Inc.
Notes to financial statements (Continued)
7. Fund Share Transactions
As of November 30, 2014, there were 12.5 billion Fund shares of $0.0001 par value authorized by the Company. Fund shares are issued and redeemed by each Fund only in Creation Units or multiples thereof. Except when aggregated in Creation Units, shares of each Fund are not redeemable. Transactions in capital shares for each Fund are disclosed in detail in the Statements of Changes in Net Assets. The consideration for the purchase of Creation Units of a Fund generally consists of the in-kind contribution of a designated portfolio of securities constituting a portfolio sampling representation of the securities included in the respective Fund’s Underlying Index and an amount of cash, which under certain circumstances may include cash in lieu of portfolio securities. Investors purchasing and redeeming Creation Units pay a purchase transaction fee and a redemption transaction fee to offset transfer and other transaction costs associated with the issuance and redemption of Creation Units.
59
db-X Exchange-Traded Funds Inc.
Additional information (Unaudited)
Proxy Voting
The Funds’ policies and procedures for voting proxies for portfolio securities and information about how each Fund voted proxies related to its portfolio securities during the 12-month period ended June 30 are available on our website — www.deutsche-etfs.com (click on “proxy voting” at the bottom of the page) — or on the SEC’s website — www.sec.gov. To obtain a written copy of the Funds’ policies and procedures without charge, upon request, call us toll free at (855) 329-3837.
Quarterly Portfolio Disclosure
The Funds are required to file their complete schedule of portfolio holdings with the SEC for their first and third fiscal quarters on Form N-Q. Copies of the filings are available without charge, upon request on the SEC’s website at www.sec.gov and are available by calling the Company at 855-369-4617. You can also obtain copies of Form N-Q by (i) visiting the SEC’s Public Reference Room in Washington, DC (information on the operation of the Public Reference Room may be obtained by calling 800-SEC-0330); (ii) sending your request and a duplicating fee to the SEC’s Public Reference Room, Washington, DC 20549-0102; or (iii) sending your request electronically to publicinfo@sec.gov.
Information about each Fund’s portfolio holdings is available daily at www.deutsche-etfs.com.
60
db-X Exchange-Traded Funds Inc.
Privacy policy notice (Unaudited)
DBX Strategic Advisors, LLC (“Advisors”) collects non-public information about you from the following sources: (i) information received from you on applications or other forms; and (ii) information about your transactions with the Advisors, Advisors’ affiliates and third-party service providers and vendors. Advisors does not disclose any non-public personal information about you to anyone, other than as set forth below, as permitted by applicable law and regulation. Advisors may disclose non-public personal information about you to the funds in which you invest, to Advisors’ affiliates, and to non-affiliated companies that work with Advisors to service your account(s), or to provide services or process transactions that you have requested. Advisors may disclose non-public personal information in situations that may include, but are not limited to, in response to legal and/or regulatory inquiries and the proposed or actual sale, assignment merger or other transfer of all or a portion of Advisors’ business to another business entity. Advisors may also disclose non-public personal information about you to parties representing you, such as your investment representative, your accountant, your tax adviser, or to other third parties at your direction/consent. Advisors will not sell, rent, license or trade your personal and financial information to or with third parties for their own direct marketing use unless you give us general or specific consent to do so. If you decide to close your account(s) or become an inactive customer, Advisors will adhere to the privacy policies and practices as described in this notice. Advisors restricts access to your personal and account information to those employees who need to know that information to provide products and services to you. Advisors maintains reasonable and customary physical, electronic and procedural safeguards to guard your non-public personal information.
Advisors reserves the right, at their discretion, to change, modify, add, or remove portions of this Privacy Policy Notice, and any of the policies described herein, at any time. Advisors will indicate any such changes to the Privacy Policy Notice at the privacy link which can be found at www.deutsche-etfs.com. At all times, you are bound by the then-current version of the Privacy Policy and all applicable laws. Advisors highly recommends that you review this Privacy Policy Notice from time to time to ensure that you are familiar with the most recent version. The examples contained in this Privacy Policy Notice are illustrations; they are not intended to be exclusive.
61
db-X Exchange-Traded Funds Inc.
This report is intended for the shareholders of the db-X Exchange-Traded Funds.
An Investor should consider the fund’s investment objective, risks, charges and expenses carefully before investing. For this and more complete information about the fund call 877-369-4617 or visit the website www.deutsche-etfs.com. Please read the prospectus carefully before investing.
Investing involves risk, including the possible loss of principal. Stocks may decline in value. Bond investments are subject to interest-rate, credit, liquidity and market risks to varying degrees. When interest rates rise, bond prices generally fall. Credit risk refers to the ability of an issuer to make timely payments of principal and interest. The allocation model used to calculate the Underlying Index may not maximize returns and/or minimize risks in accordance with the targeted time horizon for the Underlying Index. Performance of the Fund may diverge from that of the Underlying Index due to operating expenses, transaction costs, cash flows, use of sampling strategies or operational inefficiencies. An investment in this fund should be considered only as a supplement to a complete investment program for those investors willing to accept the risks associated with the fund. See the prospectus for details.
Shares of the Funds are bought and sold at market price (not NAV) throughout the day on the New York Stock Exchange. Transactions in Fund shares may result in brokerage commissions and may generate tax consequences. There can be no assurance that an active trading market for shares of a fund will develop or be maintained.
db-X Exchange-Traded Funds are distributed by ALPS Distributors, Inc., member of FINRA, which is neither affiliated with db-X Exchange-Traded Funds Inc. or any other affiliate, nor is it affiliated with The Bank of New York Mellon, Amerivest Investment Management, LLC, or TDAM USA Inc.
“Target Date” refers to a time in the future, generally a specified year, in which the investor expects to retire or otherwise require the use of the invested funds. Target date funds are generally more aggressive the further the target date is from the present, with an objective of capital appreciation. As the target date approaches, the fund’s objective will generally become more conservative, aiming to achieve a higher level of capital preservation.
Zacks and Zacks Lifecycle index are servicemarks of Zacks Investment Research, Inc. (“Zacks”) and have been licensed for use by Deutsche Bank AG. The Fund is not sponsored, endorsed, issued, sold or promoted by Zacks. Zacks does not make any representation regarding the advisability of investing in the Funds.
Investors should note that although target date funds aim to preserve capital as the target date approaches, there is no guarantee that the fund will achieve this objective.
Copyright © 2014 Deutsche Bank AG. All rights reserved. db-X® and Deutsche X-trackers® are registered trademarks of Deutsche Bank AG. All other trademarks, servicemarks or registered trademarks are the property of their respective owners.
Not FDIC Insured | No Bank Guarantee | May Lose Value
db-X Exchange-Traded Funds Inc.
| | | | |
Investment advisor DBX Strategic Advisors LLC 60 Wall Street New York, NY 10005 | | Investment sub-advisor TDAM USA Inc. 161 Bay Street, 35th Floor TD Canada Trust Tower Toronto, Ontario Canada M5J 2T2 | | Administrator, custodian,
fund accountant & transfer agent The Bank of New York Mellon 101 Barclay Street New York, NY 10286 |
| | |
Distributor ALPS Distributors, Inc. 1290 Broadway Suite 1100 Denver, CO 80203 | | Independent registered public accounting firm Ernst & Young LLP 5 Times Square New York, NY 10036 | | Legal counsel Dechert LLP 1095 Avenue of the Americas New York, NY 10036 |
R-36925-1 (1/15) TDX 863 (1/16)
Not applicable.
| Item 3. | Audit Committee Financial Expert. |
Not applicable.
| Item 4. | Principal Accountant Fees and Services. |
Not applicable.
| Item 5. | Audit Committee of Listed Registrants. |
Not applicable.
| (a) | Schedule of Investments in securities of unaffiliated issuers as of the close of the reporting period is included as part of the report to shareholders filed under Item 1 of this form. |
| Item 7. | Disclosure of Proxy Voting Policies and Procedures for Closed-End Management Investment Companies. |
Not applicable.
| Item 8. | Portfolio Managers of Closed-End Management Investment Companies. |
Not applicable.
| Item 9. | Purchases of Equity Securities by Closed-End Management Investment Company and Affiliated Purchasers. |
Not applicable.
| Item 10. | Submission of Matters to a Vote of Security Holders. |
There were no material changes to the procedures by which shareholders may recommend nominees to the Registrant’s Board of Trustees.
| Item 11. | Controls and Procedures. |
| (a) | The Chief Executive and Financial Officers concluded that the Registrant’s Disclosure Controls and Procedures are effective based on the evaluation of the Disclosure Controls and Procedures as of a date within 90 days of the filing date of this report. |
| (b) | There have been no changes in the registrant’s internal control over financial reporting that occurred during the second fiscal quarter of the period covered by this report that has materially affected, or is reasonably likely to materially affect, the registrant’s internal controls over financial reporting. |
| | |
| (a)(1) | | Not applicable. |
| |
| (a)(2) | | Certifications pursuant to Rule 30a-2(a) under the 1940 Act and Section 302 of the Sarbanes-Oxley Act of 2002 are attached hereto. |
| |
| (a)(3) | | Not applicable. |
| |
| (b) | | Certifications pursuant to Rule 30a-2(b) under the 1940 Act and Section 906 of the Sarbanes Oxley Act of 2002 are attached hereto. |
SIGNATURES
Pursuant to the requirements of the Securities Exchange Act of 1934 and the Investment Company Act of 1940, the registrant has duly caused this report to be signed on its behalf by the undersigned, thereunto duly authorized.
| | |
(Registrant) db-X Exchange-Traded Funds Inc. |
| |
| By (Signature and Title)* | | /s/ Alex Depetris |
| | Alex Depetris |
| | President and Chief Executive Officer |
| |
| Date February 4, 2015 | | |
Pursuant to the requirements of the Securities Exchange Act of 1934 and the Investment Company Act of 1940, this report has been signed below by the following persons on behalf of the registrant and in the capacities and on the dates indicated.
| | |
| |
| By (Signature and Title)* | | /s/ Alex Depetris |
| | Alex Depetris |
| | President and Chief Executive Officer |
| |
| Date February 4, 2015 | | |
| |
| By (Signature and Title)* | | /s/ Michael Gilligan |
| | Michael Gilligan Treasurer, Chief Financial Officer and Controller |
| |
| Date February 4, 2015 | | |
| * | Print the name and title of each signing officer under his or her signature. |