UNITED STATES
SECURITIES AND EXCHANGE COMMISSION
Washington, D.C. 20549
FORM N-CSR
CERTIFIED SHAREHOLDER REPORT OF REGISTERED MANAGEMENT INVESTMENT COMPANIES
Investment Company Act file number 811-22003
Nuveen Core Equity Alpha Fund
(Exact name of registrant as specified in charter)
Nuveen Investments
333 West Wacker Drive
Chicago, IL 60606
(Address of principal executive offices) (Zip code)
Kevin J. McCarthy
Nuveen Investments
333 West Wacker Drive
Chicago, IL 60606
(Name and address of agent for service)
Registrant’s telephone number, including area code: (312) 917-7700
Date of fiscal year end: December 31
Date of reporting period: December 31, 2010
Form N-CSR is to be used by management investment companies to file reports with the Commission not later than 10 days after the transmission to stockholders of any report that is required to be transmitted to stockholders under Rule 30e-1 under the Investment Company Act of 1940 (17 CFR 270.30e-1). The Commission may use the information provided on Form N-CSR in its regulatory, disclosure review, inspection, and policymaking roles.
A registrant is required to disclose the information specified by Form N-CSR, and the Commission will make this information public. A registrant is not required to respond to the collection of information contained in Form N-CSR unless the Form displays a currently valid Office of Management and Budget (“OMB”) control number. Please direct comments concerning the accuracy of the information collection burden estimate and any suggestions for reducing the burden to Secretary, Securities and Exchange Commission, 450 Fifth Street, NW, Washington, DC 20549-0609. The OMB has reviewed this collection of information under the clearance requirements of 44 U.S.C. ss. 3507.
ITEM 1. REPORTS TO SHAREHOLDERS
Closed-End Funds
| | | |
| |
Nuveen Investments
Closed-End Funds
Mathematically-driven investment strategy that seeks to
generate excess risk-adjusted returns | | |
| | | |
Annual Report
December 31, 2010 | | |
| |
| | | | | | | |
| | | | | | |
Nuveen Core Equity
Alpha Fund
JCE | | | | | | |
INVESTMENT ADVISER NAME CHANGE
Effective January 1, 2011, Nuveen Asset Management, the Fund’s investment adviser, changed its name to Nuveen Fund Advisors, Inc. (“Nuveen Fund Advisors”). Concurrently, Nuveen Fund Advisors formed a wholly-owned subsidiary, Nuveen Asset Management, LLC, to house its portfolio management capabilities.
NUVEEN INVESTMENTS COMPLETES STRATEGIC COMBINATION WITH FAF ADVISORS
On December 31, 2010, Nuveen Investments completed the strategic combination between Nuveen Asset Management, LLC, the largest investment affiliate of Nuveen Investments, and FAF Advisors. As part of this transaction, U.S. Bancorp—the parent of FAF Advisors—received cash consideration and a 9.5% stake in Nuveen Investments in exchange for the long term investment business of FAF Advisors, including investment-management responsibilities for the non-money market mutual funds of the First American Funds family.
The approximately $27 billion of mutual fund and institutional assets managed by FAF Advisors, along with the investment professionals managing these assets and other key personnel, have become part of Nuveen Asset Management, LLC. With these additions to Nuveen Asset Management, LLC, this affiliate now manages more than $100 billion of assets across a broad range of strategies from municipal and taxable fixed income to traditional and specialized equity investments.
This combination does not affect the investment objectives or strategies of this Fund. Over time, Nuveen Investments expects that the combination will provide even more ways to meet the needs of investors who work with financial advisors and consultants by enhancing the multi-boutique model of Nuveen Investments, which also includes highly respected investment teams at HydePark, NWQ Investment Management, Santa Barbara Asset Management, Symphony Asset Management, Tradewinds Global Investors and Winslow Capital. Nuveen Investments managed approximately $195 billion of assets as of December 31, 2010.
| | | |
| | | |
| Chairman’s Letter to Shareholders | | 4 |
| | | |
| Portfolio Managers’ Comments | | 5 |
| | | |
| Distribution and Share Price Information | | 8 |
| | | |
| Performance Overview | | 10 |
| | | |
| Report of Independent Registered Public Accounting Firm | | 11 |
| | | |
| Portfolio of Investments | | 12 |
| | | |
| Statement of Assets & Liabilities | | 20 |
| | | |
| Statement of Operations | | 21 |
| | | |
| Statement of Changes in Net Assets | | 22 |
| | | |
| Financial Highlights | | 23 |
| | | |
| Notes to Financial Statements | | 26 |
| | | |
| Board Members & Officers | | 33 |
| | | |
| Annual Investment Management Agreement Approval Process | | 39 |
| | | |
| Board Approval of Sub-Advisory Arrangement with Nuveen Asset Management, LLC | | 44 |
| | | |
| Reinvest Automatically Easily and Conveniently | | 45 |
| | | |
| Glossary of Terms Used in this Report | | 47 |
| | | |
| Other Useful Information | | 51 |
Chairman’s
Letter to Shareholders
Dear Shareholders,
The global economy recorded another year of recovery from the financial and economic crises of 2008, but many of the factors that caused the crises still weigh on the prospects for continued recovery. In the U.S., ongoing weakness in housing values is putting pressure on homeowners and mortgage lenders. Similarly, the strong earnings recovery for corporations and banks has not been translated into increased hiring or more active lending. In addition, media and analyst reports on the fiscal conditions of various state and local entities have raised concerns with some investors. Globally, deleveraging by private and public borrowers is inhibiting economic growth and this process is far from complete.
Encouragingly, a variety of constructive actions are being taken by governments around the world to stimulate further recovery. In the U.S., the recent passage of a stimulatory tax bill relieves some of the pressure on the Federal Reserve System to promote economic expansion through quantitative easing and offers the promise of faster economic growth. A number of European governments are undertaking programs that could significantly reduce their budget deficits. Governments across the emerging markets are implementing various steps to deal with global capital flows without undermining international trade and investment.
The success of these government actions could have an important impact on whether 2011 brings further economic recovery and financial market progress. One risk associated with the extraordinary efforts to strengthen U.S. economic growth is that the debt of the U.S. government will continue to grow to unprecedented levels. Another risk is that over time there could be upward pressures on asset values in the U.S. and abroad, because what happens in the U.S. impacts the rest of the world economy. We must hope that the progress made on the fiscal front in 2010 will continue into 2011. In this environment, your Nuveen investment team continues to seek sustainable investment opportunities and to remain alert to potential risks in a recovery still facing many headwinds. On your behalf, we monitor their activities to assure they maintain their investment disciplines.
As you will note elsewhere in this report, on January 1, 2011, Nuveen Investments completed the acquisition of FAF Advisors, Inc., the manager of the First American Funds. The acquisition adds highly respected and distinct investment teams to meet the needs of investors and their advisors and is designed to benefit all fund shareholders by creating a fund organization with the potential for further economies of scale and the ability to draw from even greater talent and expertise to meet these investor needs.
As always, I encourage you to contact your financial consultant if you have any questions about your investment in a Nuveen fund. On behalf of the other members of your Fund Board, we look forward to continuing to earn your trust in the months and years ahead.
Sincerely,
Robert P. Bremner
Chairman of the Board and Lead Independent Director
February 22, 2011
Portfolio Managers’ Comments
Nuveen Core Equity Alpha Fund (JCE)
The equity portion of the Nuveen Core Equity Alpha Fund (JCE) is managed by INTECH Investment Management LLC (INTECH), an independently managed indirect subsidiary of Janus Capital Group Inc. INTECH’s Chief Investment Officer Dr. E. Robert Fernholz, PhD, leads the portfolio management team that also includes Dr. Adrian Banner and Joseph Runnels, CFA.
The Fund also employs a call option strategy managed by Nuveen Asset Management, LLC. Keith Hembre, CFA, David Friar and James Colon, CFA, now oversee this program.
Here Dr. Fernholz and other team members talk about general economic and market conditions, their management strategies and the performance of the Fund for the twelve-month period ended December 31, 2010.
What were the general market conditions during the reporting period?
Certain statements in this report are forward-looking statements. Discussions of specific investments are for illustration only and are not intended as recommendations of individual investments. The forward-looking statements and other views expressed herein are those of the portfolio managers as of the date of this report. Actual future results or occurrences may differ significantly from those anticipated in any forward-looking statements and the views expressed herein are subject to change at any time, due to numerous market and other factors. The Fund disclaims any obligation to update publicly or revise any forward-looking statements or views expressed herein.
During this reporting period, the U.S. economy remained under considerable stress, and both the Federal Reserve and the federal government continued their efforts to improve the overall economic environment. For its part, the Fed held the benchmark fed funds rate in a target range of zero to 0.25% after cutting it to this record low level in December 2008. At its September 2010 meeting, the central bank renewed its commitment to keep the fed funds rate at “exceptionally low levels” for an “extended period.” The Fed also stated that it was “prepared to take further policy actions as needed” to support economic recovery. The federal government continued to focus on implementing the economic stimulus package passed early in 2009 that was intended to provide job creation, tax relief, fiscal assistance to state and local governments, and expand unemployment benefits and other federal social welfare programs. Cognizant of the fragility of the financial system, in the fall of 2010 the Federal Reserve announced a second round of quantitative easing designed to help stimulate increased economic growth.
Recently, nearly all U.S. indicators of production, spending, and labor market activity have pointed toward an acceleration in economic growth. At the same time, inflation has remained relatively tame, as the Consumer Price Index rose just 1.5% year-over-year as of December 31, 2010. However, unemployment remained at historically high levels. As of December 2010, the national unemployment rate was 9.4%. In addition, the housing market continued to show signs of weakness with the average home price in the Standard & Poor’s/Case-Shiller Index of 20 large metro areas falling 1.6% over the twelve months ended November 2010 (the latest available figures at the time this report was prepared).
Overall, the U.S. stock market performed well during the twelve-month period, with the Dow Jones Industrial Average climbing 14%, the S&P 500 Index advancing 15% and the NASDAQ-100 Index gaining more than 19%.
Over this period, what key strategies were used to manage the Fund?
The investment objective of the Fund is to provide an attractive level of total return, primarily through long-term capital appreciation and secondarily through income and gains. The Fund invests in a portfolio of common stocks selected from among the stocks comprising the S&P 500 Index, using a proprietary mathematical process designed by INTECH, and also employs innovative risk reduction techniques. Typically, the Fund’s equity portfolio will hold 150–450 stocks included in the S&P 500 Index.
The Fund also employs an option strategy that seeks to enhance the Fund’s risk-adjusted performance over time through a meaningful reduction in the volatility of the Fund’s returns relative to the returns of the S&P 500 Index. The Fund expects to write call options on a custom basket of equities with a notional value of up to 50% of the value of the equity portfolio.
The goal of the Fund’s equity portfolio is to produce long-term returns in excess of the S&P 500 Index with an equal or lesser amount of risk. The continued market uncertainty during this period reconfirmed the importance of disciplined risk management, which is at the heart of INTECH’s investment process. The firm’s core risk controls are focused on minimizing the volatility of excess returns relative to the S&P 500 Index, so that any excess return is as consistent as possible and any relative underperformance is limited in magnitude and duration. We believe this helps minimize tracking error vis a vis the S&P 500 Index during periods of short-term market instability.
INTECH seeks to generate excess returns by harnessing the natural volatility of stock prices to build a potentially more efficient portfolio than the S&P 500 Index. INTECH’s investment process focuses solely on relative volatility and correlation. Specifically, the process searches for stocks with high relative volatility and low correlation, attempting to combine stocks in a manner that outperforms the benchmark. The actual positioning of the portfolio–from a sector and stock specific standpoint–is a residual of the process and the rationale for over and underweighted positions is a function of stocks’ relative volatility and correlation characteristics in aggregate.
Because INTECH’s process does not forecast the direction of stock prices, equity holdings that are overweighted or underweighted relative to the index are expected to beat the benchmark in approximately equal proportions over time.
While INTECH does not employ fundamental analysis in the management of the equity portfolio, fundamentals can have a significant impact on the general direction of the market. As stock prices moved naturally throughout the period, we continued to implement our mathematical process in a disciplined and precise manner in an effort to maintain a more efficient portfolio than the S&P 500 Index, without increasing relative risk. While other factors may influence performance over the short term, we believe that the consistent application of our process will help long-term performance.
During this reporting period, the Fund’s Board of Trustees approved minor changes to the investment policies of the equity portfolio strategy of the Fund. Specifically, the Board
approved a change to the Fund’s non-fundamental investment policy to provide that, under normal market circumstances, the equity portfolio will consist of a diversified portfolio of 150 to 450 common stocks included in the S&P 500 Index. The changes are a result of enhancements to INTECH’s mathematical portfolio construction process. The turnover in the portfolio (measured in terms of total dollar volume of stock trading) is estimated to range between 70% and 100% (versus the previous 80% and 120%) per year. The expected investment outcomes including excess return and tracking error targets have not changed as a result of this portfolio engineering enhancement but the portfolio is expected to have a lower weighted average market capitalization.
Past performance is not predictive of future results. Current performance may be higher or lower than the data shown. Returns do not reflect the deduction of taxes that shareholders may have to pay on Fund distributions or upon the sale of Fund shares.
For additional information, see the Performance Overview for the Fund in this report.
| |
| * | Since Inception returns are from 3/27/07. |
| |
| 1 | The S&P 500 Index is an unmanaged index generally considered representative of the U.S. stock market. Index returns do not include the effects of sales charges or management fees. It is not possible to invest directly in an index. |
| |
| 2 | JCE’s Comparative Benchmark is a blend of returns consisting of 1) 50% of the S&P 500 Index and 2) 50% of the CBOE S&P 500 BuyWrite Index (BXM) which is a passive total return index based on selling the near-term, at-the-money S&P 500 Index (SPX) call option against the S&P 500 Index portfolio each month, on the day the current contract expires. Index returns do not include the effects of sales charges or management fees. It is not possible to invest directly in an index. |
The Fund also employs an option strategy that seeks to enhance its risk-adjusted returns over time through a meaningful reduction in the volatility of the Fund’s returns relative to the returns of the S&P 500 Index. Under normal market circumstances, the Fund expects to write (sell) call options on a custom basket of equities with a notional value of up to 50% of the value of the equity portfolio. During this period, the Fund wrote call options on a basket of stocks, while investing in a portfolio of equities, to enhance returns while foregoing some upside potential.
The Fund also entered into futures contracts, buying equity index futures to gain equity market exposure where the portfolio holds cash.
How did the Fund perform over this twelve-month period?
The performance of JCE, as well as a widely followed equity index and a customized benchmark, is presented in the accompanying table.
Average Annual Total Returns on Net Asset Value
For periods ended 12/31/10
| | | | | | | | | |
| | | | | Since
|
| | | 1-Year | | Inception* |
| JCE | | | 15.82 | % | | | 0.90 | % |
S&P 500 Index1 | | | 15.06 | % | | | -1.06 | % |
Comparative Benchmark2 | | | 10.49 | % | | | -0.36 | % |
| | | | | | | | | |
For the twelve-month period ended December 31, 2010, the Fund outperformed both the S&P 500 Stock Index and its Comparative Benchmark.
INTECH’s relative performance is typically impacted by the market’s relative volatility structure and size (market diversity). In 2010, the U.S. stock market continued to exhibit more normal stability in terms of relative volatility, which was beneficial to INTECH’s investment process.
Size (market diversity) is a measure of how capital is distributed among stocks in a market or an index. The relationship between the market-cap size of stocks (small vs. large) affects the relative performance of all managers. Rising market diversity, which the U.S. equity market experienced over the period had the potential to benefit INTECH’s relative performance.
During the year, INTECH’s analysis indicated that the relative volatility environment was remaining stable. Size (market diversity) remained below its long-term average. This produced an investment environment conducive to INTECH’s investment strategy.
As noted, the Fund also employed an option strategy designed to generate incremental cash flow and reduce the Fund’s overall risk profile. During the period, these activities contributed modestly to performance while reducing volatility within the portfolio.
Distribution and
Share Price Information
The following information regarding your Fund’s distributions is current as of December 31, 2010, and likely will vary over time based on the Fund’s investment activities and portfolio investment value changes.
Over the course of 2010, the Fund reduced its quarterly distribution to shareholders during September. Some of the factors affecting the amount and composition of these distributions are summarized below.
The Fund has a managed distribution program. The goal of this program is to provide shareholders with relatively consistent and predictable cash flow by systematically converting the Fund’s expected long-term return potential into regular distributions. As a result, regular distributions throughout the year are likely to include a portion of expected long-term gains (both realized and unrealized), along with net investment income.
Important points to understand about a managed distribution program are:
| |
| • | The Fund seeks to establish a relatively stable distribution rate that roughly corresponds to the projected total return from its investment strategy over an extended period of time. However, you should not draw any conclusions about the Fund’s past or future investment performance from its current distribution rate. |
| |
| • | Actual returns will differ from projected long-term returns (and therefore the Fund’s distribution rate), at least over shorter time periods. Over a specific timeframe, the difference between actual returns and total distributions will be reflected in an increasing (returns exceed distributions) or a decreasing (distributions exceed returns) Fund net asset value. |
| |
| • | Each distribution is expected to be paid from some or all of the following sources: |
| | |
| | • | net investment income (regular interest and dividends), |
| |
| | • | realized capital gains, and |
| |
| | • | unrealized gains, or, in certain cases, a return of principal (non-taxable distributions). |
| |
| • | A non-taxable distribution is a payment of a portion of the Fund’s capital. When the Fund’s returns exceed distributions, it may represent portfolio gains generated, but not realized as a taxable capital gain. In periods when the Fund’s returns fall short of distributions, the shortfall will represent a portion of your original principal, unless the shortfall is offset during other time periods over the life of your investment (previous or subsequent) when the Fund’s total return exceeds distributions. |
| |
| • | Because distribution source estimates are updated during the year based on the Fund’s performance and forecast for its current fiscal year (which is the calendar year for the Fund), estimates on the nature of your distributions provided at the time the distributions are paid may differ from both the tax information reported to you in your Fund’s |
| |
| IRS Form 1099 statement provided at year end, as well as the ultimate economic sources of distributions over the life of your investment. |
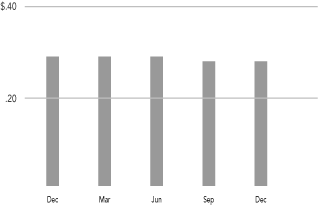
The following table provides information regarding the Fund’s distributions and total return performance for the fiscal year ended December 31, 2010. This information is intended to help you better understand whether the Fund’s returns for the specified time period were sufficient to meet the Fund’s distributions.
| | | | | |
| As of 12/31/10 | | JCE | |
| Inception date | | | 3/27/07 | |
| Calendar year ended December 31, 2010: | | | | |
| Per share distribution: | | | | |
| From net investment income | | | $0.92 | |
| From short-term capital gains | | | 0.00 | |
| From long-term capital gains | | | 0.00 | |
| Return of capital | | | 0.18 | |
| | | | | |
| Total per share distribution | | | $1.10 | |
| | | | | |
| | | | | |
| Distribution rate on NAV | | | 7.83% | |
| | | | | |
| Average annual total returns: | | | | |
| 1-Year on NAV | | | 15.82% | |
| Since inception on NAV | | | 0.90% | |
| | | | | |
Share Repurchases and Share Price Information
As of December 31, 2010, and since the inception of the Fund’s repurchase program, the Fund has cumulatively repurchased and retired shares as shown in the accompanying table.
| | | | | |
| | | Shares
| | % of Outstanding
|
| | | Repurchased and Retired | | Shares |
| | | 444,800 | | 2.8% |
| | | | | |
During the twelve-month reporting period, the Fund repurchased and retired its shares at a weighted average price and a weighted average discount per share as shown in the accompanying table.
| | | | | | | |
| | | | | Weighted Average Price
| | Weighted Average Discount
|
| | | Shares
| | Per Share
| | Per Share
|
| | | Repurchased and Retired | | Repurchased and Retired | | Repurchased and Retired |
| | | 7,100 | | $10.36 | | 23.38% |
| | | | | | | |
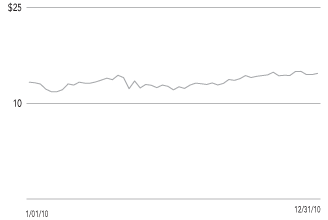
At December 31, 2010, the Fund was trading at a -6.62% discount to its net asset value, compared with an average discount of -6.98% for the twelve-month period.
| | | | |
| | | | |
JCE
Performance
OVERVIEW | | | Nuveen Core Equity Alpha Fund |
| | | | December 31, 2010 |
| | | |
| Fund Snapshot |
| Share Price | | $13.12 |
| | | |
| Net Asset Value (NAV) | | $14.05 |
| | | |
| Premium/(Discount) to NAV | | -6.62% |
| | | |
| Current Distribution Rate1 | | 8.23% |
| | | |
| Net Assets ($000) | | $225,187 |
| | | |
| | | | | |
Average Annual Total Return
|
| (Inception 3/27/07) |
| | | On Share Price | | On NAV |
| 1-Year | | 17.25% | | 15.82% |
| | | | | |
| Since Inception | | -1.09% | | 0.90% |
| | | | | |
| | | |
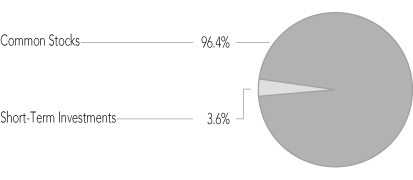
Portfolio Composition
|
(as a % of total investments)2
|
| Food Products | | 6.4% |
| | | |
| Computers & Peripherals | | 6.4% |
| | | |
| Health Care Providers & Services | | 5.9% |
| | | |
| Health Care Equipment & Supplies | | 4.8% |
| | | |
| Specialty Retail | | 4.0% |
| | | |
| Hotels, Restaurants & Leisure | | 3.7% |
| | | |
| IT Services | | 3.7% |
| | | |
| Internet Software & Services | | 3.6% |
| | | |
| Multi-Utilities | | 3.5% |
| | | |
| Aerospace & Defense | | 3.3% |
| | | |
| Pharmaceuticals | | 3.2% |
| | | |
| Internet & Catalog Retail | | 3.1% |
| | | |
| Media | | 3.0% |
| | | |
| Machinery | | 2.5% |
| | | |
| Software | | 2.4% |
| | | |
| Chemicals | | 2.3% |
| | | |
| Commercial Banks | | 2.1% |
| | | |
| Electrical Equipment | | 1.9% |
| | | |
| Household Durables | | 1.9% |
| | | |
| Personal Products | | 1.8% |
| | | |
| Insurance | | 1.8% |
| | | |
| Wireless Telecommunication Services | | 1.7% |
| | | |
| Oil, Gas & Consumable Fuels | | 1.7% |
| | | |
| Tobacco | | 1.6% |
| | | |
| Communications Equipment | | 1.6% |
| | | |
| Short-Term Investments | | 3.6% |
| | | |
| Other | | 18.5% |
| | | |
Portfolio Allocation (as a % of total investments)2
2009-2010 Distributions Per Share
Share Price Performance—Weekly Closing Price
| |
| 1 | Current Distribution Rate is based on the Fund’s current annualized quarterly distribution divided by the Fund’s current market price. The Fund’s quarterly distributions to its shareholders may be comprised of ordinary income, net realized capital gains and, if at the end of the calendar year the Fund’s cumulative net ordinary income and net realized gains are less than the amount of the Fund’s distributions, a return of capital for tax purposes. |
| 2 | Excluding investments in derivatives. |
Report of Independent Registered
Public Accounting Firm
To the Board of Trustees and Shareholders of
Nuveen Core Equity Alpha Fund:
In our opinion, the accompanying statement of assets and liabilities, including the portfolio of investments, and the related statements of operations and of changes in net assets and the financial highlights present fairly, in all material respects, the financial position of Nuveen Core Equity Alpha Fund (the “Fund”) at December 31, 2010, and the results of its operations for the year then ended, the changes in its net assets for each of the two years in the period then ended and the financial highlights for each of the periods indicated in conformity with accounting principles generally accepted in the United States of America. These financial statements and financial highlights (hereafter referred to as “financial statements”) are the responsibility of the Fund’s management; our responsibility is to express an opinion on these financial statements based on our audits. We conducted our audits of these financial statements in accordance with the standards of the Public Company Accounting Oversight Board (United States). Those standards require that we plan and perform the audit to obtain reasonable assurance about whether the financial statements are free of material misstatement. An audit includes examining, on a test basis, evidence supporting the amounts and disclosures in the financial statements, assessing the accounting principles used and significant estimates made by management, and evaluating the overall financial statement presentation. We believe that our audits, which included confirmation of securities at December 31, 2010 by correspondence with the custodian and brokers, provide a reasonable basis for our opinion.
PricewaterhouseCoopers LLP
Chicago, IL
February 25, 2011
| | | | | | |
| | | | | | |
JCE | | | Nuveen Core Equity Alpha Fund
Portfolio of Investments |
| | | | | | December 31, 2010 |
| | | | | | | | | | | | | | | | | | | | | |
| | | | | | | | | | | | | | | |
| | | | | | | | | | | | | | | |
| Shares | | | Description (1) | | | | | | | | | | | Value | |
| | | | | Common Stocks – 98.0% |
| | | | | |
| | | | | Aerospace & Defense – 3.4% |
| | | | | | | | | | | | | | | | | | | | | |
| | 36,400 | | | Boeing Company | | | | | | | | | | | | | | $ | 2,375,464 | |
| | 600 | | | Goodrich Corporation | | | | | | | | | | | | | | | 52,842 | |
| | 27,100 | | | Northrop Grumman Corporation | | | | | | | | | | | | | | | 1,755,538 | |
| | 12,900 | | | Precision Castparts Corporation | | | | | | | | | | | | | | | 1,795,809 | |
| | 16,100 | | | Rockwell Collins, Inc. | | | | | | | | | | | | | | | 937,986 | |
| | 8,200 | | | United Technologies Corporation | | | | | | | | | | | | | | | 645,504 | |
| | | | | | | | | | | | | | | | | | | | | |
| | | | | Total Aerospace & Defense | | | | | | | | | | | | | | | 7,563,143 | |
| | | | | | | | | | | | | | | | | | | | | |
| | | | | Air Freight & Logistics – 1.1% |
| | | | | | | | | | | | | | | | | | | | | |
| | 7,000 | | | C.H. Robinson Worldwide, Inc. | | | | | | | | | | | | | | | 561,330 | |
| | 7,300 | | | Expeditors International of Washington, Inc. | | | | | | | | | | | | | | | 398,580 | |
| | 15,300 | | | FedEx Corporation | | | | | | | | | | | | | | | 1,423,053 | |
| | 1,000 | | | United Parcel Service, Inc., Class B | | | | | | | | | | | | | | | 72,580 | |
| | | | | | | | | | | | | | | | | | | | | |
| | | | | Total Air Freight & Logistics | | | | | | | | | | | | | | | 2,455,543 | |
| | | | | | | | | | | | | | | | | | | | | |
| | | | | Airlines – 0.9% |
| | | | | | | | | | | | | | | | | | | | | |
| | 147,900 | | | Southwest Airlines Co | | | | | | | | | | | | | | | 1,919,742 | |
| | | | | | | | | | | | | | | | | | | | | |
| | | | | Automobiles – 0.3% |
| | | | | | | | | | | | | | | | | | | | | |
| | 39,400 | | | Ford Motor Company, (2) | | | | | | | | | | | | | | | 661,526 | |
| | 700 | | | Harley-Davidson, Inc. | | | | | | | | | | | | | | | 24,269 | |
| | | | | | | | | | | | | | | | | | | | | |
| | | | | Total Automobiles | | | | | | | | | | | | | | | 685,795 | |
| | | | | | | | | | | | | | | | | | | | | |
| | | | | Beverages – 1.3% |
| | | | | | | | | | | | | | | | | | | | | |
| | 4,700 | | | Brown-Forman Corporation | | | | | | | | | | | | | | | 327,214 | |
| | 1,700 | | | Coca-Cola Company | | | | | | | | | | | | | | | 111,809 | |
| | 21,300 | | | Coca Cola Enterprises Inc. | | | | | | | | | | | | | | | 533,139 | |
| | 51,000 | | | Dr. Pepper Snapple Group, (2) | | | | | | | | | | | | | | | 1,793,160 | |
| | 1,300 | | | Molson Coors Brewing Company, Class B | | | | | | | | | | | | | | | 65,247 | |
| | | | | | | | | | | | | | | | | | | | | |
| | | | | Total Beverages | | | | | | | | | | | | | | | 2,830,569 | |
| | | | | | | | | | | | | | | | | | | | | |
| | | | | Biotechnology – 0.4% |
| | | | | | | | | | | | | | | | | | | | | |
| | 2,000 | | | Amgen Inc., (2) | | | | | | | | | | | | | | | 109,800 | |
| | 1,500 | | | Biogen Idec Inc., (2) | | | | | | | | | | | | | | | 100,575 | |
| | 1,200 | | | Celgene Corporation, (2) | | | | | | | | | | | | | | | 70,968 | |
| | 8,200 | | | Genzyme Corporation, (2) | | | | | | | | | | | | | | | 583,840 | |
| | | | | | | | | | | | | | | | | | | | | |
| | | | | Total Biotechnology | | | | | | | | | | | | | | | 865,183 | |
| | | | | | | | | | | | | | | | | | | | | |
| | | | | Capital Markets – 1.6% |
| | | | | | | | | | | | | | | | | | | | | |
| | 14,100 | | | Ameriprise Financial, Inc. | | | | | | | | | | | | | | | 811,455 | |
| | 1,500 | | | E*Trade Group Inc., (2) | | | | | | | | | | | | | | | 24,000 | |
| | 21,700 | | | Franklin Resources, Inc. | | | | | | | | | | | | | | | 2,413,257 | |
| | 400 | | | Goldman Sachs Group, Inc. | | | | | | | | | | | | | | | 67,264 | |
| | 700 | | | Invesco LTD | | | | | | | | | | | | | | | 16,842 | |
| | 600 | | | Legg Mason, Inc. | | | | | | | | | | | | | | | 21,762 | |
| | 5,500 | | | Morgan Stanley | | | | | | | | | | | | | | | 149,655 | |
| | 1,500 | | | State Street Corporation | | | | | | | | | | | | | | | 69,510 | |
| | 500 | | | T. Rowe Price Group Inc. | | | | | | | | | | | | | | | 32,270 | |
| | | | | | | | | | | | | | | | | | | | | |
| | | | | Total Capital Markets | | | | | | | | | | | | | | | 3,606,015 | |
| | | | | | | | | | | | | | | | | | | | | |
| | | | | Chemicals – 2.3% |
| | | | | | | | | | | | | | | | | | | | | |
| | 1,500 | | | Air Products & Chemicals Inc. | | | | | | | | | | | | | | | 136,425 | |
| | 8,000 | | | Airgas, Inc. | | | | | | | | | | | | | | | 499,680 | |
| | 700 | | | CF Industries Holdings, Inc. | | | | | | | | | | | | | | | 94,605 | |
| | 19,400 | | | E.I. Du Pont de Nemours and Company | | | | | | | | | | | | | | | 967,672 | |
| | 3,900 | | | Eastman Chemical Company | | | | | | | | | | | | | | | 327,912 | |
| | 4,300 | | | Ecolab Inc. | | | | | | | | | | | | | | | 216,806 | |
| | 21,100 | | | International Flavors & Fragrances Inc. | | | | | | | | | | | | | | | 1,172,949 | |
| | 1,400 | | | Monsanto Company | | | | | | | | | | | | | | | 97,496 | |
| | 3,500 | | | PPG Industries, Inc. | | | | | | | | | | | | | | | 294,245 | |
| | 3,400 | | | Praxair, Inc. | | | | | | | | | | | | | | | 324,598 | |
| | | | | | | | | | | | | | | | | | | | | |
| | | | | | | | | | | | | | | |
| | | | | | | | | | | | | | | |
| Shares | | | Description (1) | | | | | | | | | | | Value | |
| | | | | Chemicals (continued) |
| | | | | | | | | | | | | | | | | | | | | |
| | 10,700 | | | Sherwin-Williams Company | | | | | | | | | | | | | | $ | 896,125 | |
| | 1,900 | | | Sigma-Aldrich Corporation | | | | | | | | | | | | | | | 126,464 | |
| | | | | | | | | | | | | | | | | | | | | |
| | | | | Total Chemicals | | | | | | | | | | | | | | | 5,154,977 | |
| | | | | | | | | | | | | | | | | | | | | |
| | | | | Commercial Banks – 2.2% |
| | | | | | | | | | | | | | | | | | | | | |
| | 1,700 | | | BB&T Corporation | | | | | | | | | | | | | | | 44,693 | |
| | 21,400 | | | Comerica Incorporated | | | | | | | | | | | | | | | 903,936 | |
| | 15,700 | | | Fifth Third Bancorp. | | | | | | | | | | | | | | | 230,476 | |
| | 38 | | | First Horizon National Corporation, (2) | | | | | | | | | | | | | | | 448 | |
| | 33,100 | | | Huntington BancShares Inc. | | | | | | | | | | | | | | | 227,397 | |
| | 10,000 | | | KeyCorp. | | | | | | | | | | | | | | | 88,500 | |
| | 13,000 | | | M&T Bank Corporation | | | | | | | | | | | | | | | 1,131,650 | |
| | 14,600 | | | Marshall and Ilsley Corporation | | | | | | | | | | | | | | | 101,032 | |
| | 4,700 | | | PNC Financial Services Group, Inc. | | | | | | | | | | | | | | | 285,384 | |
| | 61,100 | | | Regions Financial Corporation | | | | | | | | | | | | | | | 427,700 | |
| | 4,600 | | | SunTrust Banks, Inc. | | | | | | | | | | | | | | | 135,746 | |
| | 11,500 | | | U.S. Bancorp | | | | | | | | | | | | | | | 310,155 | |
| | 8,950 | | | Wells Fargo & Company | | | | | | | | | | | | | | | 277,361 | |
| | 28,700 | | | Zions Bancorporation | | | | | | | | | | | | | | | 695,401 | |
| | | | | | | | | | | | | | | | | | | | | |
| | | | | Total Commercial Banks | | | | | | | | | | | | | | | 4,859,879 | |
| | | | | | | | | | | | | | | | | | | | | |
| | | | | Commercial Services & Supplies – 0.5% |
| | | | | | | | | | | | | | | | | | | | | |
| | 11,300 | | | Republic Services, Inc. | | | | | | | | | | | | | | | 337,418 | |
| | 9,500 | | | Stericycle Inc., (2) | | | | | | | | | | | | | | | 768,740 | |
| | | | | | | | | | | | | | | | | | | | | |
| | | | | Total Commercial Services & Supplies | | | | | | | | | | | | | | | 1,106,158 | |
| | | | | | | | | | | | | | | | | | | | | |
| | | | | Communications Equipment – 1.6% |
| | | | | | | | | | | | | | | | | | | | | |
| | 800 | | | F5 Networks, Inc., (2) | | | | | | | | | | | | | | | 104,128 | |
| | 38,300 | | | Harris Corporation | | | | | | | | | | | | | | | 1,734,990 | |
| | 2,100 | | | Juniper Networks Inc., (2) | | | | | | | | | | | | | | | 77,532 | |
| | 123,400 | | | Motorola, Inc., (2) | | | | | | | | | | | | | | | 1,119,238 | |
| | 900 | | | QUALCOMM, Inc. | | | | | | | | | | | | | | | 44,541 | |
| | 88,100 | | | Tellabs Inc. | | | | | | | | | | | | | | | 597,318 | |
| | | | | | | | | | | | | | | | | | | | | |
| | | | | Total Communications Equipment | | | | | | | | | | | | | | | 3,677,747 | |
| | | | | | | | | | | | | | | | | | | | | |
| | | | | Computers & Peripherals – 6.5% |
| | | | | | | | | | | | | | | | | | | | | |
| | 34,200 | | | Apple, Inc., (2) | | | | | | | | | | | | | | | 11,031,553 | |
| | 1,800 | | | EMC Corporation, (2) | | | | | | | | | | | | | | | 41,220 | |
| | 9,100 | | | Lexmark International, Inc., Class A, (2) | | | | | | | | | | | | | | | 316,862 | |
| | 59,400 | | | Network Appliance Inc., (2) | | | | | | | | | | | | | | | 3,264,624 | |
| | | | | | | | | | | | | | | | | | | | | |
| | | | | Total Computers & Peripherals | | | | | | | | | | | | | | | 14,654,259 | |
| | | | | | | | | | | | | | | | | | | | | |
| | | | | Construction & Engineering – 0.0% |
| | | | | | | | | | | | | | | | | | | | | |
| | 1,300 | | | Fluor Corporation | | | | | | | | | | | | | | | 86,138 | |
| | | | | | | | | | | | | | | | | | | | | |
| | | | | Consumer Finance – 0.1% |
| | | | | | | | | | | | | | | | | | | | | |
| | 600 | | | American Express Company | | | | | | | | | | | | | | | 25,752 | |
| | 2,500 | | | Capital One Financial Corporation | | | | | | | | | | | | | | | 106,400 | |
| | 3,100 | | | Discover Financial Services | | | | | | | | | | | | | | | 57,443 | |
| | 2,000 | | | SLM Corporation, (2) | | | | | | | | | | | | | | | 25,180 | |
| | | | | | | | | | | | | | | | | | | | | |
| | | | | Total Consumer Finance | | | | | | | | | | | | | | | 214,775 | |
| | | | | | | | | | | | | | | | | | | | | |
| | | | | Containers & Packaging – 0.1% |
| | | | | | | | | | | | | | | | | | | | | |
| | 4,800 | | | Ball Corporation | | | | | | | | | | | | | | | 326,640 | |
| | | | | | | | | | | | | | | | | | | | | |
| | | | | Distributors – 0.0% |
| | | | | | | | | | | | | | | | | | | | | |
| | 900 | | | Genuine Parts Company | | | | | | | | | | | | | | | 46,206 | |
| | | | | | | | | | | | | | | | | | | | | |
| | | | | Diversified Consumer Services – 0.5% |
| | | | | | | | | | | | | | | | | | | | | |
| | 900 | | | Apollo Group, Inc., (2) | | | | | | | | | | | | | | | 35,541 | |
| | 20,800 | | | Devry, Inc. | | | | | | | | | | | | | | | 997,984 | |
| | 8,900 | | | H & R Block Inc. | | | | | | | | | | | | | | | 105,999 | |
| | | | | | | | | | | | | | | | | | | | | |
| | | | | Total Diversified Consumer Services | | | | | | | | | | | | | | | 1,139,524 | |
| | | | | | | | | | | | | | | | | | | | | |
| | | | | Diversified Financial Services – 0.4% |
| | | | | | | | | | | | | | | | | | | | | |
| | 6,900 | | | Bank of America Corporation | | | | | | | | | | | | | | | 92,046 | |
| | 50,500 | | | Citigroup Inc., (2) | | | | | | | | | | | | | | | 238,865 | |
| | 8,105 | | | JPMorgan Chase & Co | | | | | | | | | | | | | | | 343,814 | |
| | | | |
| | | | |
JCE | | | Nuveen Core Equity Alpha Fund (continued)
Portfolio of Investments December 31, 2010 |
| | | | | | | | | | | | | | | | | | | | | |
| | | | | | | | | | | | | | | |
| | | | | | | | | | | | | | | |
| Shares | | | Description (1) | | | | | | | | | | | Value | |
| | | | | Diversified Financial Services (continued) |
| | | | | | | | | | | | | | | | | | | | | |
| | 2,300 | | | Leucadia National Corporation, (2) | | | | | | | | | | | | | | $ | 67,114 | |
| | 7,200 | | | Moody’s Corporation | | | | | | | | | | | | | | | 191,088 | |
| | | | | | | | | | | | | | | | | | | | | |
| | | | | Total Diversified Financial Services | | | | | | | | | | | | | | | 932,927 | |
| | | | | | | | | | | | | | | | | | | | | |
| | | | | Diversified Telecommunication Services – 1.0% |
| | | | | | | | | | | | | | | | | | | | | |
| | 6,600 | | | AT&T Inc. | | | | | | | | | | | | | | | 193,908 | |
| | 4,000 | | | CenturyLink Inc. | | | | | | | | | | | | | | | 184,680 | |
| | 174,200 | | | Qwest Communications International Inc. | | | | | | | | | | | | | | | 1,325,662 | |
| | 1,000 | | | Verizon Communications Inc. | | | | | | | | | | | | | | | 35,780 | |
| | 42,300 | | | Windstream Corporation | | | | | | | | | | | | | | | 589,662 | |
| | | | | | | | | | | | | | | | | | | | | |
| | | | | Total Diversified Telecommunication Services | | | | | | | | | | | | | | | 2,329,692 | |
| | | | | | | | | | | | | | | | | | | | | |
| | | | | Electric Utilities – 1.2% |
| | | | | | | | | | | | | | | | | | | | | |
| | 5,400 | | | American Electric Power Company, Inc. | | | | | | | | | | | | | | | 194,292 | |
| | 6,100 | | | Duke Energy Corporation | | | | | | | | | | | | | | | 108,641 | |
| | 4,000 | | | NextEra Energy Inc. | | | | | | | | | | | | | | | 207,960 | |
| | 9,300 | | | Northeast Utilities | | | | | | | | | | | | | | | 296,484 | |
| | 41,600 | | | Pepco Holdings, Inc. | | | | | | | | | | | | | | | 759,200 | |
| | 7,400 | | | Pinnacle West Capital Corporation | | | | | | | | | | | | | | | 306,730 | |
| | 11,500 | | | Progress Energy, Inc. | | | | | | | | | | | | | | | 500,020 | |
| | 10,300 | | | Southern Company | | | | | | | | | | | | | | | 393,769 | |
| | | | | | | | | | | | | | | | | | | | | |
| | | | | Total Electric Utilities | | | | | | | | | | | | | | | 2,767,096 | |
| | | | | | | | | | | | | | | | | | | | | |
| | | | | Electrical Equipment – 2.0% |
| | | | | | | | | | | | | | | | | | | | | |
| | 31,900 | | | Emerson Electric Company | | | | | | | | | | | | | | | 1,823,723 | |
| | 34,500 | | | Rockwell Automation, Inc. | | | | | | | | | | | | | | | 2,473,995 | |
| | 1,100 | | | Roper Industries Inc. | | | | | | | | | | | | | | | 84,073 | |
| | | | | | | | | | | | | | | | | | | | | |
| | | | | Total Electrical Equipment | | | | | | | | | | | | | | | 4,381,791 | |
| | | | | | | | | | | | | | | | | | | | | |
| | | | | Electronic Equipment & Instruments – 0.1% |
| | | | | | | | | | | | | | | | | | | | | |
| | 2,800 | | | Corning Incorporated | | | | | | | | | | | | | | | 54,096 | |
| | 4,600 | | | FLIR Systems Inc., (2) | | | | | | | | | | | | | | | 136,850 | |
| | | | | | | | | | | | | | | | | | | | | |
| | | | | Total Electronic Equipment & Instruments | | | | | | | | | | | | | | | 190,946 | |
| | | | | | | | | | | | | | | | | | | | | |
| | | | | Energy Equipment & Services – 1.4% |
| | | | | | | | | | | | | | | | | | | | | |
| | 1,127 | | | Baker Hughes Incorporated | | | | | | | | | | | | | | | 64,431 | |
| | 700 | | | FMC Technologies Inc., (2) | | | | | | | | | | | | | | | 62,237 | |
| | 22,000 | | | Halliburton Company | | | | | | | | | | | | | | | 898,260 | |
| | 600 | | | Helmerich & Payne Inc. | | | | | | | | | | | | | | | 29,088 | |
| | 700 | | | National-Oilwell Varco Inc. | | | | | | | | | | | | | | | 47,075 | |
| | 2,700 | | | Rowan Companies Inc., (2) | | | | | | | | | | | | | | | 94,257 | |
| | 22,642 | | | Schlumberger Limited | | | | | | | | | | | | | | | 1,890,607 | |
| | | | | | | | | | | | | | | | | | | | | |
| | | | | Total Energy Equipment & Services | | | | | | | | | | | | | | | 3,085,955 | |
| | | | | | | | | | | | | | | | | | | | | |
| | | | | Food & Staples Retailing – 0.1% |
| | | | | | | | | | | | | | | | | | | | | |
| | 2,200 | | | Kroger Co | | | | | | | | | | | | | | | 49,192 | |
| | 2,500 | | | Sysco Corporation | | | | | | | | | | | | | | | 73,500 | |
| | 700 | | | Wal-Mart Stores, Inc. | | | | | | | | | | | | | | | 37,751 | |
| | | | | | | | | | | | | | | | | | | | | |
| | | | | Total Food & Staples Retailing | | | | | | | | | | | | | | | 160,443 | |
| | | | | | | | | | | | | | | | | | | | | |
| | | | | Food Products – 6.5% |
| | | | | | | | | | | | | | | | | | | | | |
| | 5,100 | | | Archer-Daniels-Midland Company | | | | | | | | | | | | | | | 153,408 | |
| | 95,800 | | | General Mills, Inc. | | | | | | | | | | | | | | | 3,409,522 | |
| | 19,100 | | | Hershey Foods Corporation | | | | | | | | | | | | | | | 900,565 | |
| | 2,000 | | | Hormel Foods Corporation | | | | | | | | | | | | | | | 102,520 | |
| | 31,200 | | | JM Smucker Company | | | | | | | | | | | | | | | 2,048,280 | |
| | 30,300 | | | Kellogg Company | | | | | | | | | | | | | | | 1,547,724 | |
| | 3,100 | | | Kraft Foods Inc. | | | | | | | | | | | | | | | 97,681 | |
| | 4,300 | | | McCormick & Company, Incorporated | | | | | | | | | | | | | | | 200,079 | |
| | 24,500 | | | Mead Johnson Nutrition Company, Class A Shares | | | | | | | | | | | | | | | 1,525,125 | |
| | 168,900 | | | Sara Lee Corporation | | | | | | | | | | | | | | | 2,957,439 | |
| | 100,200 | | | Tyson Foods, Inc., Class A | | | | | | | | | | | | | | | 1,725,444 | |
| | | | | | | | | | | | | | | | | | | | | |
| | | | | Total Food Products | | | | | | | | | | | | | | | 14,667,787 | |
| | | | | | | | | | | | | | | | | | | | | |
| | | | | Gas Utilities – 0.4% |
| | | | | | | | | | | | | | | | | | | | | |
| | 17,800 | | | ONEOK, Inc. | | | | | | | | | | | | | | | 987,366 | |
| | | | | | | | | | | | | | | | | | | | | |
| | | | | | | | | | | | | | | | | | | | | |
| | | | | | | | | | | | | | | |
| | | | | | | | | | | | | | | |
| Shares | | | Description (1) | | | | | | | | | | | Value | |
| | | | | Health Care Equipment & Supplies – 4.9% |
| | | | | | | | | | | | | | | | | | | | | |
| | 39,500 | | | CareFusion Corporation, (2) | | | | | | | | | | | | | | $ | 1,015,150 | |
| | 14,600 | | | Intuitive Surgical, Inc., (2) | | | | | | | | | | | | | | | 3,763,150 | |
| | 60,500 | | | Stryker Corporation | | | | | | | | | | | | | | | 3,248,850 | |
| | 21,900 | | | Varian Medical Systems, Inc., (2) | | | | | | | | | | | | | | | 1,517,232 | |
| | 26,400 | | | Zimmer Holdings, Inc., (2) | | | | | | | | | | | | | | | 1,417,152 | |
| | | | | | | | | | | | | | | | | �� | | | | |
| | | | | Total Health Care Equipment & Supplies | | | | | | | | | | | | | | | 10,961,534 | |
| | | | | | | | | | | | | | | | | | | | | |
| | | | | Health Care Providers & Services – 6.0% |
| | | | | | | | | | | | | | | | | | | | | |
| | 116,900 | | | AmerisourceBergen Corporation | | | | | | | | | | | | | | | 3,988,628 | |
| | 125,900 | | | Cardinal Health, Inc. | | | | | | | | | | | | | | | 4,823,229 | |
| | 1,700 | | | Express Scripts, Inc., (2) | | | | | | | | | | | | | | | 91,885 | |
| | 23,200 | | | Humana Inc., (2) | | | | | | | | | | | | | | | 1,269,968 | |
| | 46,600 | | | McKesson HBOC Inc. | | | | | | | | | | | | | | | 3,279,708 | |
| | 400 | | | Wellpoint Inc., (2) | | | | | | | | | | | | | | | 22,744 | |
| | | | | | | | | | | | | | | | | | | | | |
| | | | | Total Health Care Providers & Services | | | | | | | | | | | | | | | 13,476,162 | |
| | | | | | | | | | | | | | | | | | | | | |
| | | | | Hotels, Restaurants & Leisure – 3.8% |
| | | | | | | | | | | | | | | | | | | | | |
| | 35,300 | | | Darden Restaurants, Inc. | | | | | | | | | | | | | | | 1,639,332 | |
| | 9,300 | | | Marriott International, Inc., Class A | | | | | | | | | | | | | | | 386,322 | |
| | 5,600 | | | McDonald’s Corporation | | | | | | | | | | | | | | | 429,856 | |
| | 135,400 | | | Starbucks Corporation, (2) | | | | | | | | | | | | | | | 4,350,402 | |
| | 4,700 | | | Starwood Hotels & Resorts Worldwide, Inc. | | | | | | | | | | | | | | | 285,666 | |
| | 6,500 | | | Wyndham Worldwide Corporation | | | | | | | | | | | | | | | 194,740 | |
| | 600 | | | Wynn Resorts Ltd | | | | | | | | | | | | | | | 62,304 | |
| | 24,200 | | | YUM! Brands, Inc. | | | | | | | | | | | | | | | 1,187,010 | |
| | | | | | | | | | | | | | | | | | | | | |
| | | | | Total Hotels, Restaurants & Leisure | | | | | | | | | | | | | | | 8,535,632 | |
| | | | | | | | | | | | | | | | | | | | | |
| | | | | Household Durables – 1.9% |
| | | | | | | | | | | | | | | | | | | | | |
| | 1,700 | | | Fortune Brands Inc. | | | | | | | | | | | | | | | 102,425 | |
| | 600 | | | Harman International Industries Inc., (2) | | | | | | | | | | | | | | | 27,780 | |
| | 3,500 | | | Lennar Corporation, Class A | | | | | | | | | | | | | | | 65,625 | |
| | 53,987 | | | Stanley Black & Decker Inc. | | | | | | | | | | | | | | | 3,610,111 | |
| | 4,900 | | | Whirlpool Corporation | | | | | | | | | | | | | | | 435,267 | |
| | | | | | | | | | | | | | | | | | | | | |
| | | | | Total Household Durables | | | | | | | | | | | | | | | 4,241,208 | |
| | | | | | | | | | | | | | | | | | | | | |
| �� | | | | Household Products – 0.3% |
| | | | | | | | | | | | | | | | | | | | | |
| | 5,300 | | | Clorox Company | | | | | | | | | | | | | | | 335,384 | |
| | 2,300 | | | Colgate-Palmolive Company | | | | | | | | | | | | | | | 184,851 | |
| | 3,700 | | | Kimberly-Clark Corporation | | | | | | | | | | | | | | | 233,248 | |
| | | | | | | | | | | | | | | | | | | | | |
| | | | | Total Household Products | | | | | | | | | | | | | | | 753,483 | |
| | | | | | | | | | | | | | | | | | | | | |
| | | | | Independent Power Producers & Energy Traders – 0.0% |
| | | | | | | | | | | | | | | | | | | | | |
| | 1,600 | | | NRG Energy Inc., (2) | | | | | | | | | | | | | | | 31,264 | |
| | | | | | | | | | | | | | | | | | | | | |
| | | | | Industrial Conglomerates – 0.4% |
| | | | | | | | | | | | | | | | | | | | | |
| | 200 | | | 3M Co. | | | | | | | | | | | | | | | 17,260 | |
| | 22,400 | | | General Electric Company | | | | | | | | | | | | | | | 409,696 | |
| | 2,200 | | | Textron Inc. | | | | | | | | | | | | | | | 52,008 | |
| | 10,400 | | | Tyco International Ltd | | | | | | | | | | | | | | | 430,976 | |
| | | | | | | | | | | | | | | | | | | | | |
| | | | | Total Industrial Conglomerates | | | | | | | | | | | | | | | 909,940 | |
| | | | | | | | | | | | | | | | | | | | | |
| | | | | Insurance – 1.8% |
| | | | | | | | | | | | | | | | | | | | | |
| | 3,700 | | | Ace Limited | | | | | | | | | | | | | | | 230,325 | |
| | 2,600 | | | AFLAC Incorporated | | | | | | | | | | | | | | | 146,718 | |
| | 4,800 | | | American International Group, (2) | | | | | | | | | | | | | | | 276,576 | |
| | 16,600 | | | Assurant Inc. | | | | | | | | | | | | | | | 639,432 | |
| | 3,331 | | | Berkshire Hathaway Inc., Class B, (2) | | | | | | | | | | | | | | | 266,846 | |
| | 2,500 | | | Chubb Corporation | | | | | | | | | | | | | | | 149,100 | |
| | 2,200 | | | Lincoln National Corporation | | | | | | | | | | | | | | | 61,182 | |
| | 1,800 | | | Marsh & McLennan Companies, Inc. | | | | | | | | | | | | | | | 49,212 | |
| | 2,000 | | | MetLife, Inc. | | | | | | | | | | | | | | | 88,880 | |
| | 2,000 | | | Principal Financial Group, Inc. | | | | | | | | | | | | | | | 65,120 | |
| | 35,800 | | | Progressive Corporation | | | | | | | | | | | | | | | 711,346 | |
| | 7,800 | | | Torchmark Corporation | | | | | | | | | | | | | | | 465,972 | |
| | 15,000 | | | Travelers Companies, Inc. | | | | | | | | | | | | | | | 835,650 | |
| | 4,200 | | | XL Capital Ltd, Class A | | | | | | | | | | | | | | | 91,644 | |
| | | | | | | | | | | | | | | | | | | | | |
| | | | | Total Insurance | | | | | | | | | | | | | | | 4,078,003 | |
| | | | | | | | | | | | | | | | | | | | | |
| | | | |
| | | | |
JCE | | | Nuveen Core Equity Alpha Fund (continued)
Portfolio of Investments December 31, 2010 |
| | | | | | | | | | | | | | | | | | | | | |
| | | | | | | | | | | | | | | |
| | | | | | | | | | | | | | | |
| Shares | | | Description (1) | | | | | | | | | | | Value | |
| | | | | Internet & Catalog Retail – 3.2% |
| | | | | | | | | | | | | | | | | | | | | |
| | 23,100 | | | Amazon.com, Inc., (2) | | | | | | | | | | | | | | $ | 4,158,000 | |
| | 400 | | | NetFlix.com Inc., (2) | | | | | | | | | | | | | | | 70,280 | |
| | 7,400 | | | Priceline.com Incorporated, (2) | | | | | | | | | | | | | | | 2,956,670 | |
| | | | | | | | | | | | | | | | | | | | | |
| | | | | Total Internet & Catalog Retail | | | | | | | | | | | | | | | 7,184,950 | |
| | | | | | | | | | | | | | | | | | | | | |
| | | | | Internet Software & Services – 3.6% |
| | | | | | | | | | | | | | | | | | | | | |
| | 23,200 | | | Akamai Technologies, Inc., (2) | | | | | | | | | | | | | | | 1,091,560 | |
| | 56,000 | | | eBay Inc., (2) | | | | | | | | | | | | | | | 1,558,480 | |
| | 9,100 | | | Google Inc., Class A, (2) | | | | | | | | | | | | | | | 5,405,127 | |
| | 3,400 | | | VeriSign, Inc., (2) | | | | | | | | | | | | | | | 111,078 | |
| | | | | | | | | | | | | | | | | | | | | |
| | | | | Total Internet Software & Services | | | | | | | | | | | | | | | 8,166,245 | |
| | | | | | | | | | | | | | | | | | | | | |
| | | | | IT Services – 3.7% |
| | | | | | | | | | | | | | | | | | | | | |
| | 84,700 | | | Cognizant Technology Solutions Corporation, Class A, (2) | | | | | | | | | | | | | | | 6,207,663 | |
| | 9,600 | | | Fidelity National Information Services | | | | | | | | | | | | | | | 262,944 | |
| | 12,100 | | | International Business Machines Corporation (IBM) | | | | | | | | | | | | | | | 1,775,796 | |
| | 400 | | | MasterCard, Inc. | | | | | | | | | | | | | | | 89,644 | |
| | 400 | | | Visa Inc. | | | | | | | | | | | | | | | 28,152 | |
| | | | | | | | | | | | | | | | | | | | | |
| | | | | Total IT Services | | | | | | | | | | | | | | | 8,364,199 | |
| | | | | | | | | | | | | | | | | | | | | |
| | | | | Leisure Equipment & Products – 1.1% |
| | | | | | | | | | | | | | | | | | | | | |
| | 50,300 | | | Hasbro, Inc. | | | | | | | | | | | | | | | 2,373,154 | |
| | | | | | | | | | | | | | | | | | | | | |
| | | | | Life Sciences Tools & Services – 0.8% |
| | | | | | | | | | | | | | | | | | | | | |
| | 41,400 | | | Agilent Technologies, Inc., (2) | | | | | | | | | | | | | | | 1,715,202 | |
| | | | | | | | | | | | | | | | | | | | | |
| | | | | Machinery – 2.5% |
| | | | | | | | | | | | | | | | | | | | | |
| | 13,200 | | | Caterpillar Inc. | | | | | | | | | | | | | | | 1,236,312 | |
| | 5,100 | | | Cummins Inc. | | | | | | | | | | | | | | | 561,051 | |
| | 5,500 | | | Deere & Company | | | | | | | | | | | | | | | 456,775 | |
| | 25,300 | | | Eaton Corporation | | | | | | | | | | | | | | | 2,568,203 | |
| | 300 | | | Flowserve Corporation | | | | | | | | | | | | | | | 35,766 | |
| | 4,600 | | | Ingersoll Rand Company Limited, Class A | | | | | | | | | | | | | | | 216,614 | |
| | 2,700 | | | PACCAR Inc. | | | | | | | | | | | | | | | 155,034 | |
| | 4,800 | | | Parker Hannifin Corporation | | | | | | | | | | | | | | | 414,240 | |
| | | | | | | | | | | | | | | | | | | | | |
| | | | | Total Machinery | | | | | | | | | | | | | | | 5,643,995 | |
| | | | | | | | | | | | | | | | | | | | | |
| | | | | Media – 3.1% |
| | | | | | | | | | | | | | | | | | | | | |
| | 2,300 | | | Cablevision Systems Corporation | | | | | | | | | | | | | | | 77,832 | |
| | 4,700 | | | Comcast Corporation, Class A | | | | | | | | | | | | | | | 103,259 | |
| | 120,900 | | | DIRECTV Group, Inc., (2) | | | | | | | | | | | | | | | 4,827,537 | |
| | 8,300 | | | Discovery Communications Inc., Class A Shares, (2) | | | | | | | | | | | | | | | 346,110 | |
| | 12,800 | | | Interpublic Group Companies, Inc., (2) | | | | | | | | | | | | | | | 135,936 | |
| | 4,400 | | | McGraw-Hill Companies, Inc. | | | | | | | | | | | | | | | 160,204 | |
| | 4,000 | | | News Corporation, Class A | | | | | | | | | | | | | | | 58,240 | |
| | 7,300 | | | Scripps Networks Interactive, Class A Shares | | | | | | | | | | | | | | | 377,775 | |
| | 4,900 | | | Time Warner Cable, Class A | | | | | | | | | | | | | | | 323,547 | |
| | 7,400 | | | Viacom Inc., Class B | | | | | | | | | | | | | | | 293,114 | |
| | 6,800 | | | Walt Disney Company | | | | | | | | | | | | | | | 255,068 | |
| | | | | | | | | | | | | | | | | | | | | |
| | | | | Total Media | | | | | | | | | | | | | | | 6,958,622 | |
| | | | | | | | | | | | | | | | | | | | | |
| | | | | Metals & Mining – 0.2% |
| | | | | | | | | | | | | | | | | | | | | |
| | 1,500 | | | Alcoa Inc. | | | | | | | | | | | | | | | 23,085 | |
| | 900 | | | Cliffs Natural Resources Inc. | | | | | | | | | | | | | | | 70,209 | |
| | 800 | | | Freeport-McMoRan Copper & Gold, Inc. | | | | | | | | | | | | | | | 96,072 | |
| | 2,000 | | | Nucor Corporation | | | | | | | | | | | | | | | 87,640 | |
| | 7,300 | | | Titanium Metals Corporation, (2) | | | | | | | | | | | | | | | 125,414 | |
| | | | | | | | | | | | | | | | | | | | | |
| | | | | Total Metals & Mining | | | | | | | | | | | | | | | 402,420 | |
| | | | | | | | | | | | | | | | | | | | | |
| | | | | Multiline Retail – 0.6% |
| | | | | | | | | | | | | | | | | | | | | |
| | 3,100 | | | Big Lots, Inc., (2) | | | | | | | | | | | | | | | 94,426 | |
| | 19,400 | | | Family Dollar Stores, Inc. | | | | | | | | | | | | | | | 964,374 | |
| | 4,300 | | | Sears Holding Corporation, (2) | | | | | | | | | | | | | | | 317,125 | |
| | | | | | | | | | | | | | | | | | | | | |
| | | | | Total Multiline Retail | | | | | | | | | | | | | | | 1,375,925 | |
| | | | | | | | | | | | | | | | | | | | | |
| | | | | | | | | | | | | | | | | | | | | |
| | | | | | | | | | | | | | | |
| | | | | | | | | | | | | | | |
| Shares | | | Description (1) | | | | | | | | | | | Value | |
| | | | | Multi-Utilities – 3.5% |
| | | | | | | | | | | | | | | | | | | | | |
| | 5,200 | | | Ameren Corporation | | | | | | | | | | | | | | $ | 146,588 | |
| | 41,600 | | | CenterPoint Energy, Inc. | | | | | | | | | | | | | | | 653,952 | |
| | 28,000 | | | CMS Energy Corporation | | | | | | | | | | | | | | | 520,800 | |
| | 4,000 | | | Consolidated Edison, Inc. | | | | | | | | | | | | | | | 198,280 | |
| | 12,200 | | | Dominion Resources, Inc. | | | | | | | | | | | | | | | 521,184 | |
| | 54,300 | | | DTE Energy Company | | | | | | | | | | | | | | | 2,460,876 | |
| | 28,800 | | | Integrys Energy Group, Inc. | | | | | | | | | | | | | | | 1,397,088 | |
| | 33,500 | | | NiSource Inc. | | | | | | | | | | | | | | | 590,270 | |
| | 5,000 | | | Public Service Enterprise Group Incorporated | | | | | | | | | | | | | | | 159,050 | |
| | 3,900 | | | Scana Corporation | | | | | | | | | | | | | | | 158,340 | |
| | 900 | | | Sempra Energy | | | | | | | | | | | | | | | 47,232 | |
| | 18,700 | | | TECO Energy, Inc. | | | | | | | | | | | | | | | 332,860 | |
| | 11,400 | | | Wisconsin Energy Corporation | | | | | | | | | | | | | | | 671,004 | |
| | 4,300 | | | Xcel Energy, Inc. | | | | | | | | | | | | | | | 101,265 | |
| | | | | | | | | | | | | | | | | | | | | |
| | | | | Total Multi-Utilities | | | | | | | | | | | | | | | 7,958,789 | |
| | | | | | | | | | | | | | | | | | | | | |
| | | | | Oil, Gas & Consumable Fuels – 1.7% |
| | | | | | | | | | | | | | | | | | | | | |
| | 1,400 | | | Anadarko Petroleum Corporation | | | | | | | | | | | | | | | 106,624 | |
| | 600 | | | Chevron Corporation | | | | | | | | | | | | | | | 54,750 | |
| | 2,400 | | | ConocoPhillips | | | | | | | | | | | | | | | 163,440 | |
| | 8,000 | | | Denbury Resources Inc., (2) | | | | | | | | | | | | | | | 152,720 | |
| | 6,000 | | | El Paso Corporation | | | | | | | | | | | | | | | 82,560 | |
| | 700 | | | Exxon Mobil Corporation | | | | | | | | | | | | | | | 51,184 | |
| | 1,100 | | | Hess Corporation | | | | | | | | | | | | | | | 84,194 | |
| | 1,900 | | | Marathon Oil Corporation | | | | | | | | | | | | | | | 70,357 | |
| | 1,700 | | | Murphy Oil Corporation | | | | | | | | | | | | | | | 126,735 | |
| | 1,200 | | | Newfield Exploration Company, (2) | | | | | | | | | | | | | | | 86,532 | |
| | 800 | | | Noble Energy, Inc. | | | | | | | | | | | | | | | 68,864 | |
| | 400 | | | Peabody Energy Corporation | | | | | | | | | | | | | | | 25,592 | |
| | 28,700 | | | Pioneer Natural Resources Company | | | | | | | | | | | | | | | 2,491,734 | |
| | 2,000 | | | QEP Resources Inc., (2) | | | | | | | | | | | | | | | 72,620 | |
| | 4,900 | | | Sunoco, Inc. | | | | | | | | | | | | | | | 197,519 | |
| | | | | | | | | | | | | | | | | | | | | |
| | | | | Total Oil, Gas & Consumable Fuels | | | | | | | | | | | | | | | 3,835,425 | |
| | | | | | | | | | | | | | | | | | | | | |
| | | | | Personal Products – 1.8% |
| | | | | | | | | | | | | | | | | | | | | |
| | 6,300 | | | Avon Products, Inc. | | | | | | | | | | | | | | | 183,078 | |
| | 48,400 | | | Estee Lauder Companies Inc., Class A | | | | | | | | | | | | | | | 3,905,880 | |
| | | | | | | | | | | | | | | | | | | | | |
| | | | | Total Personal Products | | | | | | | | | | | | | | | 4,088,958 | |
| | | | | | | | | | | | | | | | | | | | | |
| | | | | Pharmaceuticals – 3.2% |
| | | | | | | | | | | | | | | | | | | | | |
| | 30,800 | | | Abbott Laboratories | | | | | | | | | | | | | | | 1,475,628 | |
| | 4,700 | | | Bristol-Myers Squibb Company | | | | | | | | | | | | | | | 124,456 | |
| | 2,400 | | | Eli Lilly and Company | | | | | | | | | | | | | | | 84,096 | |
| | 33,700 | | | Hospira Inc., (2) | | | | | | | | | | | | | | | 1,876,753 | |
| | 1,300 | | | Johnson & Johnson | | | | | | | | | | | | | | | 80,405 | |
| | 94,232 | | | Merck & Company Inc. | | | | | | | | | | | | | | | 3,396,121 | |
| | 12,100 | | | Mylan Laboratories Inc., (2) | | | | | | | | | | | | | | | 255,673 | |
| | | | | | | | | | | | | | | | | | | | | |
| | | | | Total Pharmaceuticals | | | | | | | | | | | | | | | 7,293,132 | |
| | | | | | | | | | | | | | | | | | | | | |
| | | | | Professional Services – 0.3% |
| | | | | | | | | | | | | | | | | | | | | |
| | 16,600 | | | Equifax Inc. | | | | | | | | | | | | | | | 590,960 | |
| | | | | | | | | | | | | | | | | | | | | |
| | | | | Real Estate – 1.3% |
| | | | | | | | | | | | | | | | | | | | | |
| | 6,600 | | | Apartment Investment & Management Company, Class A | | | | | | | | | | | | | | | 170,544 | |
| | 4,400 | | | AvalonBay Communities, Inc. | | | | | | | | | | | | | | | 495,220 | |
| | 2,200 | | | Boston Properties, Inc. | | | | | | | | | | | | | | | 189,420 | |
| | 13,300 | | | Equity Residential | | | | | | | | | | | | | | | 690,935 | |
| | 3,900 | | | Health Care Property Investors Inc. | | | | | | | | | | | | | | | 143,481 | |
| | 1,900 | | | Health Care REIT, Inc. | | | | | | | | | | | | | | | 90,516 | |
| | 3,600 | | | Host Hotels & Resorts Inc. | | | | | | | | | | | | | | | 64,332 | |
| | 6,800 | | | Public Storage, Inc. | | | | | | | | | | | | | | | 689,656 | |
| | 300 | | | Simon Property Group, Inc. | | | | | | | | | | | | | | | 29,847 | |
| | 3,400 | | | Ventas Inc. | | | | | | | | | | | | | | | 178,432 | |
| | 2,300 | | | Vornado Realty Trust | | | | | | | | | | | | | | | 191,659 | |
| | 2,000 | | | Weyerhaeuser Company | | | | | | | | | | | | | | | 37,860 | |
| | | | | | | | | | | | | | | | | | | | | |
| | | | | Total Real Estate | | | | | | | | | | | | | | | 2,971,902 | |
| | | | | | | | | | | | | | | | | | | | | |
| | | | |
| | | | |
JCE | | | Nuveen Core Equity Alpha Fund (continued)
Portfolio of Investments December 31, 2010 |
| | | | | | | | | | | | | | | | | | | | | |
| | | | | | | | | | | | | | | |
| | | | | | | | | | | | | | | |
| Shares | | | Description (1) | | | | | | | | | | | Value | |
| | | | | Real Estate Management & Development – 0.0% |
| | | | | | | | | | | | | | | | | | | | | |
| | 1,900 | | | CB Richard Ellis Group, Inc., Class A, (2) | | | | | | | | | | | | | | $ | 38,912 | |
| | | | | | | | | | | | | | | | | | | | | |
| | | | | Road & Rail – 0.0% |
| | | | | | | | | | | | | | | | | | | | | |
| | 1,100 | | | Union Pacific Corporation | | | | | | | | | | | | | | | 101,926 | |
| | | | | | | | | | | | | | | | | | | | | |
| | | | | Semiconductors & Equipment – 1.2% |
| | | | | | | | | | | | | | | | | | | | | |
| | 1,600 | | | Advanced Micro Devices, Inc., (2) | | | | | | | | | | | | | | | 13,088 | |
| | 2,500 | | | Altera Corporation | | | | | | | | | | | | | | | 88,950 | |
| | 3,500 | | | Linear Technology Corporation | | | | | | | | | | | | | | | 121,065 | |
| | 4,400 | | | Microchip Technology Incorporated | | | | | | | | | | | | | | | 150,524 | |
| | 69,800 | | | Texas Instruments Incorporated | | | | | | | | | | | | | | | 2,268,500 | |
| | | | | | | | | | | | | | | | | | | | | |
| | | | | Total Semiconductors & Equipment | | | | | | | | | | | | | | | 2,642,127 | |
| | | | | | | | | | | | | | | | | | | | | |
| | | | | Software – 2.4% |
| | | | | | | | | | | | | | | | | | | | | |
| | 1,400 | | | Autodesk, Inc., (2) | | | | | | | | | | | | | | | 53,480 | |
| | 400 | | | Citrix Systems, (2) | | | | | | | | | | | | | | | 27,364 | |
| | 4,000 | | | Electronic Arts Inc. (EA), (2) | | | | | | | | | | | | | | | 65,520 | |
| | 19,100 | | | Intuit, Inc., (2) | | | | | | | | | | | | | | | 941,630 | |
| | 1,500 | | | McAfee Inc., (2) | | | | | | | | | | | | | | | 69,465 | |
| | 60,200 | | | Microsoft Corporation | | | | | | | | | | | | | | | 1,680,784 | |
| | 105,700 | | | Novell Inc., (2) | | | | | | | | | | | | | | | 625,744 | |
| | 1,500 | | | Red Hat, Inc., (2) | | | | | | | | | | | | | | | 68,475 | |
| | 14,300 | | | Salesforce.com, Inc., (2) | | | | | | | | | | | | | | | 1,887,600 | |
| | | | | | | | | | | | | | | | | | | | | |
| | | | | Total Software | | | | | | | | | | | | | | | 5,420,062 | |
| | | | | | | | | | | | | | | | | | | | | |
| | | | | Specialty Retail – 4.1% |
| | | | | | | | | | | | | | | | | | | | | |
| | 2,000 | | | Abercrombie & Fitch Co., Class A | | | | | | | | | | | | | | | 115,260 | |
| | 5,300 | | | AutoNation Inc., (2) | | | | | | | | | | | | | | | 149,460 | |
| | 3,900 | | | AutoZone, Inc., (2) | | | | | | | | | | | | | | | 1,063,101 | |
| | 1,000 | | | GameStop Corporation, (2) | | | | | | | | | | | | | | | 22,880 | |
| | 8,000 | | | Home Depot, Inc. | | | | | | | | | | | | | | | 280,480 | |
| | 87,300 | | | Limited Brands, Inc. | | | | | | | | | | | | | | | 2,682,729 | |
| | 9,200 | | | O’Reilly Automotive Inc. | | | | | | | | | | | | | | | 555,864 | |
| | 900 | | | Ross Stores, Inc. | | | | | | | | | | | | | | | 56,925 | |
| | 6,300 | | | Tiffany & Co | | | | | | | | | | | | | | | 392,301 | |
| | 87,900 | | | TJX Companies, Inc. | | | | | | | | | | | | | | | 3,901,881 | |
| | | | | | | | | | | | | | | | | | | | | |
| | | | | Total Specialty Retail | | | | | | | | | | | | | | | 9,220,881 | |
| | | | | | | | | | | | | | | | | | | | | |
| | | | | Textiles, Apparel & Luxury Goods – 0.0% |
| | | | | | | | | | | | | | | | | | | | | |
| | 800 | | | Nike, Inc., Class B | | | | | | | | | | | | | | | 68,336 | |
| | | | | | | | | | | | | | | | | | | | | |
| | | | | Thrifts & Mortgage Finance – 0.1% |
| | | | | | | | | | | | | | | | | | | | | |
| | 10,700 | | | Hudson City Bancorp, Inc. | | | | | | | | | | | | | | | 136,318 | |
| | | | | | | | | | | | | | | | | | | | | |
| | | | | Tobacco – 1.6% |
| | | | | | | | | | | | | | | | | | | | | |
| | 34,000 | | | Altria Group, Inc. | | | | | | | | | | | | | | | 837,080 | |
| | 8,500 | | | Philip Morris International | | | | | | | | | | | | | | | 497,505 | |
| | 72,000 | | | Reynolds American Inc. | | | | | | | | | | | | | | | 2,348,640 | |
| | | | | | | | | | | | | | | | | | | | | |
| | | | | Total Tobacco | | | | | | | | | | | | | | | 3,683,225 | |
| | | | | | | | | | | | | | | | | | | | | |
| | | | | Trading Companies & Distributors – 1.3% |
| | | | | | | | | | | | | | | | | | | | | |
| | 46,300 | | | Fastenal Company | | | | | | | | | | | | | | | 2,773,833 | |
| | 1,200 | | | W.W. Grainger, Inc. | | | | | | | | | | | | | | | 165,732 | |
| | | | | | | | | | | | | | | | | | | | | |
| | | | | Total Trading Companies & Distributors | | | | | | | | | | | | | | | 2,939,565 | |
| | | | | | | | | | | | | | | | | | | | | |
| | | | | Wireless Telecommunication Services – 1.7% |
| | | | | | | | | | | | | | | | | | | | | |
| | 74,300 | | | American Tower Corporation, (2) | | | | | | | | | | | | | | | 3,836,851 | |
| | | | | | | | | | | | | | | | | | | | | |
| | | | | Total Common Stocks (cost $181,165,127) | | | 220,695,603 | |
| | | | | | | | | | | | | | | | | | | | | |
| | | | | | | | | | | | | | | | | | | | | |
| | | | | | | | | | | | | | | |
Principal
| | | | | | | | | | | | | | | |
| Amount (000) | | | Description (1) | | Coupon | | | Maturity | | | Ratings (3) | | | Value | |
| | | | | Short-Term Investments – 3.7% |
| | | | | |
| | | | | U.S. Government and Agency Obligations – 3.1% |
| $ | 2,000 | | | U.S. Treasury Bills, (4) | | | 0.000% | | | | 1/27/11 | | | | AAA | | | $ | 1,999,718 | |
| | 5,000 | | | U.S. Treasury Bills, (4) | | | 0.000% | | | | 2/03/11 | | | | AAA | | | | 4,999,423 | |
| | | | | | | | | | | | | | | | | | | | | |
| | 7,000 | | | Total U.S. Government and Agency Obligations | | | | | | | | | | | | | | | 6,999,141 | |
| | | | | | | | | | | | | | | | | | | | | |
| | | | | |
| | | | | Repurchase Agreements – 0.6% |
| | | | | | | | | | | | | | | | | | | | | |
| | 1,284 | | | Repurchase Agreement with State Street Bank, dated 12/31/10, repurchase price $1,284,452, collateralized by $1,300,000 U.S. Treasury Notes, 1.000%, 4/30/12 value $1,311,960 | | | 0.040% | | | | 1/03/11 | | | | N/A | | | | 1,284,448 | |
| | | | | | | | | | | | | | | | | | | | | |
| $ | 8,284 | | | Total Short-Term Investments (cost $8,283,589) | | | | | | | | | | | | | | | 8,283,589 | |
| | | | | | | | | | | | | | | | | | | | | |
| | | | | Total Investments (cost $189,448,716) – 101.7% | | | 228,979,192 | |
| | | | | | | | | | | | | | | | | | | | | |
| | | | | Other Assets Less Liabilities – (1.7)% (5) | | | (3,792,541 | ) |
| | | | | | | | | | | | | | | | | | | | | |
| | | | | Net Assets – 100% | | $ | 225,186,651 | |
| | | | | | | | | | | | | | | | | | | | | |
Investment in Derivatives
Call Options Written outstanding at December 31, 2010:
| | | | | | | | | | | | | | | | | | | | | |
| | | | | | | | | | | | | | | |
| | | | | | | | | | | | | | | |
Number of
| | | | | Notional
| | | Expiration
| | | Strike
| | | | |
| Contracts | | | Type | | Amount (6) | | | Date | | | Price | | | Value | |
| | | | | Call Options Written | | | | | | | | | | | | | | | | |
| | | | | | | | | | | | | | | | | | | | | |
| | (507,335 | ) | | Custom Basket 3 NASDAQ | | $ | (50,733,551 | ) | | | 1/27/11 | | | $ | 103.0 | | | $ | (408,913 | ) |
| | (497,404 | ) | | Custom Basket 4 NASDAQ | | | (49,740,394 | ) | | | 1/13/11 | | | | 103.0 | | | | (571,716 | ) |
| | | | | | | | | | | | | | | | | | | | | |
| | (1,004,739 | ) | | Total Call Options Written (premiums received $788,274) | | $ | (100,473,945 | ) | | | | | | | | | | $ | (980,629 | ) |
| | | | | | | | | | | | | | | | | | | | | |
Futures Contracts outstanding at December 31, 2010:
| | | | | | | | | | | | | | | | | | | |
| | | | | | | | | | | | | Unrealized
| |
| | | | Number of
| | | Contract
| | | Value at
| | | Appreciation
| |
| Type | | Contract Position | | Contracts | | | Expiration | | | December 31, 2010 | | | (Depreciation) | |
| | | | | | | | | | | | | | | | | | | |
| S&P 500 Index | | Long | | | 125 | | | | 3/11 | | | $ | 7,831,250 | | | $ | 106,188 | |
| | | | | | | | | | | | | | | | | | | |
| | | | | | | |
| | | | | | | For Fund portfolio compliance purposes, the Fund’s industry classifications refer to any one or more of the industry sub-classifications used by one or more widely recognized market indexes or ratings group indexes, as/or as defined by Fund management. This definition may not apply for purposes of this report, which may combine industry sub-classifications into sectors for reporting ease. |
| | | | | (1) | | All percentages shown in the Portfolio of Investments are based on net assets. |
| | | | | (2) | | Non-income producing; issuer has not declared a dividend within the past twelve months. |
| | | | | (3) | | Ratings (not covered by the report of independent registered public accounting firm): Using the highest of Standard and Poor’s Group (“Standard & Poor’s”), Moody’s Investor Service, Inc. (“Moody’s”) or Fitch, Inc. (“Fitch”) rating. Rating below BBB by Standard & Poor’s, Baa by Moody’s or BBB by Fitch are considered to below investment grade. Holdings designated N/R are not rated by any of these national rating agencies. |
| | | | | (4) | | Investment, or portion of investment, has been pledged to collateralize the net payment obligations for investments in derivatives. |
| | | | | (5) | | Other Assets Less Liabilities includes Value and/or Unrealized Appreciation (Depreciation) of derivative instruments as noted in Investments in Derivatives. |
| | | | | (6) | | For disclosure purposes, Notional Amount is calculated by multiplying the Number of Contracts by $100. |
| | | | | N/A | | Not Applicable. |
See accompanying notes to financial statements.
| | | | | | |
| | | | | | |
| | | Statement of
Assets & Liabilities |
| | | | | | December 31, 2010 |
| | | | | |
Assets | | | | |
| Investments, at value (cost $189,448,716) | | $ | 228,979,192 | |
| Receivables: | | | | |
| Dividends | | | 259,653 | |
| Investments sold | | | 492,525 | |
| Other assets | | | 11,383 | |
| | | | | |
| Total assets | | | 229,742,753 | |
| | | | | |
Liabilities | | | | |
| Call options written, at value (premiums received $788,274) | | | 980,629 | |
| Cash overdraft | | | 3,072,709 | |
| Payables: | | | | |
| Investments purchased | | | 180,204 | |
| Variation margin on futures contracts | | | 9,375 | |
| Accrued expenses: | | | | |
| Management fees | | | 178,422 | |
| Other | | | 134,763 | |
| | | | | |
| Total liabilities | | | 4,556,102 | |
| | | | | |
| Net assets | | $ | 225,186,651 | |
| | | | | |
| Shares outstanding | | | 16,026,686 | |
| | | | | |
| Net asset value per share outstanding | | $ | 14.05 | |
| | | | | |
| | | | | |
Net assets consist of: | | | | |
| | | | | |
| Shares, $.01 par value per share | | $ | 160,267 | |
| Paid-in surplus | | | 237,006,823 | |
| Undistributed (Over-distribution of) net investment income | | | (10,659 | ) |
| Accumulated net realized gain (loss) | | | (51,414,089 | ) |
| Net unrealized appreciation (depreciation) | | | 39,444,309 | |
| | | | | |
| Net assets | | $ | 225,186,651 | |
| | | | | |
| Authorized shares | | | Unlimited | |
| | | | | |
See accompanying notes to financial statements.
| | | | | | |
| | | | | | |
| | | Statement of
Operations |
| | | | | | Year Ended December 31, 2010 |
| | | | | |
Investment Income | | | | |
| Dividends | | $ | 3,877,046 | |
| Interest | | | 7,656 | |
| | | | | |
| Total investment income | | | 3,884,702 | |
| | | | | |
Expenses | | | | |
| Management fees | | | 1,975,791 | |
| Shareholders’ servicing agent fees and expenses | | | 381 | |
| Custodian’s fees and expenses | | | 166,320 | |
| Trustees’ fees and expenses | | | 4,669 | |
| Professional fees | | | 34,972 | |
| Shareholders’ reports – printing and mailing expenses | | | 59,895 | |
| Stock exchange listing fees | | | 9,089 | |
| Investor relations expense | | | 46,791 | |
| Other expenses | | | 41,609 | |
| | | | | |
| Total expenses before custodian fee credit | | | 2,339,517 | |
| Custodian fee credit | | | (43 | ) |
| | | | | |
| Net expenses | | | 2,339,474 | |
| | | | | |
| Net investment income | | | 1,545,228 | |
| | | | | |
Realized and Unrealized Gain (Loss) | | | | |
| Net realized gain (loss) from: | | | | |
| Investments and foreign currency | | | 13,727,824 | |
| Call options written | | | (455,413 | ) |
| Futures contracts | | | 1,056,375 | |
| Change in net unrealized appreciation (depreciation) of: | | | | |
| Investments and foreign currency | | | 16,130,477 | |
| Call options written | | | (427,493 | ) |
| Futures contracts | | | (52,187 | ) |
| | | | | |
| Net realized and unrealized gain (loss) | | | 29,979,583 | |
| | | | | |
| Net increase (decrease) in net assets from operations | | $ | 31,524,811 | |
| | | | | |
See accompanying notes to financial statements.
| | | | | | |
| | | | | | |
| | | Statement of
Changes in Net Assets |
| | | | | | |
| | | | | | | | | |
| | | Year Ended
| | | Year Ended
| |
| | | 12/31/10 | | | 12/31/09 | |
Operations | | | | | | | | |
| Net investment income | | $ | 1,545,228 | | | $ | 2,278,503 | |
| Net realized gain (loss) from: | | | | | | | | |
| Investments and foreign currency | | | 13,727,824 | | | | (30,916,731 | ) |
| Call options written | | | (455,413 | ) | | | (479,434 | ) |
| Futures contracts | | | 1,056,375 | | | | 1,591,913 | |
| Change in net unrealized appreciation (depreciation) of: | | | | | | | | |
| Investments and foreign currency | | | 16,130,477 | | | | 68,063,304 | |
| Call options written | | | (427,493 | ) | | | 24,246 | |
| Futures contracts | | | (52,187 | ) | | | 47,450 | |
| | | | | | | | | |
| Net increase (decrease) in net assets from operations | | | 31,524,811 | | | | 40,609,251 | |
| | | | | | | | | |
Distributions to Shareholders | | | | | | | | |
| From net investment income | | | (14,715,856 | ) | | | (2,458,704 | ) |
| Return of capital | | | (2,915,487 | ) | | | (15,338,552 | ) |
| | | | | | | | | |
| Decrease in net assets from distributions to shareholders | | | (17,631,343 | ) | | | (17,797,256 | ) |
| | | | | | | | | |
Capital Share Transactions | | | | | | | | |
| Offering costs adjustments | | | – | | | | 4,600 | |
| Cost of shares repurchased and retired | | | (73,692 | ) | | | (2,629,545 | ) |
| | | | | | | | | |
| Net increase (decrease) in net assets from capital share transactions | | | (73,692 | ) | | | (2,624,945 | ) |
| | | | | | | | | |
| Net increase (decrease) in net assets | | | 13,819,776 | | | | 20,187,050 | |
| Net assets at the beginning of year | | | 211,366,875 | | | | 191,179,825 | |
| | | | | | | | | |
| Net assets at the end of year | | $ | 225,186,651 | | | $ | 211,366,875 | |
| | | | | | | | | |
| Undistributed (Over-distribution of) net investment income at the end of year | | $ | (10,659 | ) | | $ | (7,141 | ) |
| | | | | | | | | |
See accompanying notes to financial statements.
| | | | | | |
| | | | | | |
| | | | Financial
Highlights |
| | | | Selected data for a share outstanding throughout each period: |
| | | | | | | | | | | | | | | | | | | | | | | | | | | | | | | | | | | | | | | | | | | | | | | | | |
| | | | | | | | | | | | | | | | | | | | | | | | | | | Discount
| | | | | | | | | | |
| | | Investment Operations | | | | | | | | | | | | | | | from
| | | | | | | | | | |
| | | | | | | | | Net
| | | | | | Less Distributions | | | Shares
| | | | | | | | | | |
| | | Beginning
| | | Net
| | | Realized/
| | | | | | Net
| | | | | | | | | | | | Repurchased
| | | | | | Ending
| | | Ending
| |
| | | Net Asset
| | | Investment
| | | Unrealized
| | | | | | Investment
| | | Capital
| | | Return of
| | | | | | and
| | | Offering
| | | Net Asset
| | | Market
| |
| | | Value | | | Income(a) | | | Gain (Loss) | | | Total | | | Income | | | Gains | | | Capital | | | Total | | | Retired | | | Costs | | | Value | | | Value | |
| Year Ended 12/31: |
| 2010 | | $ | 13.18 | | | $ | .10 | | | $ | 1.87 | | | | 1.97 | | | $ | (.92 | ) | | $ | – | | | $ | (.18 | ) | | $ | (1.10 | ) | | $ | – | * | | $ | – | | | $ | 14.05 | | | $ | 13.12 | |
| 2009 | | | 11.74 | | | | .14 | | | | 2.40 | | | | 2.54 | | | | (.15 | ) | | | – | | | | (.95 | ) | | | (1.10 | ) | | | .02 | | | | – | * | | | 13.18 | | | | 12.21 | |
| 2008 | | | 18.72 | | | | .16 | | | | (5.64 | ) | | | (5.48 | ) | | | (.16 | ) | | | – | | | | (1.34 | ) | | | (1.50 | ) | | | .01 | | | | – | * | | | 11.74 | | | | 9.61 | |
| 2007(d) | | | 19.10 | | | | .15 | | | | .81 | | | | 0.96 | | | | (.14 | ) | | | – | | | | (1.16 | ) | | | (1.30 | ) | | | – | * | | | (0.04 | ) | | | 18.72 | | | | 16.35 | |
| | | | | | | | | | | | | | | | | | | | | | | | | | | | | | | | | | | | | | | | | | | | | | | | | |
| | | | | | | | | | | | | | | | | | | | | | | | | |
| | | | | | | | | Ratios/Supplemental Data | |
| | | Total Returns | | | | | | Ratios to Average Net Assets(c) | | | | |
| | | Based on
| | | Based on
| | | | | | | | | Net
| | | Portfolio
| |
| | | Market
| | | Net Asset
| | | Ending Net
| | | | | | Investment
| | | Turnover
| |
| | | Value(b) | | | Value(b) | | | Assets (000) | | | Expenses | | | Income | | | Rate | |
| | | | | | | | | | | | | | | | | | | | | | | | | |
| | | | 17.25 | % | | | 15.82 | % | | $ | 225,187 | | | | 1.11 | % | | | .73 | % | | | 131 | % |
| | | | 41.27 | | | | 23.16 | | | | 211,367 | | | | 1.15 | | | | 1.20 | | | | 112 | |
| | | | (34.06 | ) | | | (30.84 | ) | | | 191,180 | | | | 1.11 | | | | 1.04 | | | | 51 | |
| | | | (12.08 | ) | | | 4.84 | | | | 307,877 | | | | 1.07 | ** | | | 1.03 | ** | | | 73 | |
| | | | | | | | | | | | | | | | | | | | | | | | | |
| | |
| (a) | | Per share Net Investment Income is calculated using the average daily shares method. |
| (b) | | Total Return Based on Market Value is the combination of changes in the market price per share and the effect of reinvested dividend income and reinvested capital gains distributions, if any, at the average price paid per share at the time of reinvestment. The last dividend declared in the period, which is typically paid on the first business day of the following month, is assumed to be reinvested at the ending market price. The actual reinvestment for the last dividend declared in the period may take place over several days, and in some instances may not be based on the market price, so the actual reinvestment price may be different from the price used in the calculation. Total returns are not annualized. |
| |
| | Total Return Based on Net Asset Value is the combination of changes in net asset value, reinvested dividend income at net asset value and reinvested capital gains distributions at net asset value, if any. The last dividend declared in the period, which is typically paid on the first business day of the following month, is assumed to be reinvested at the ending net asset value. The actual reinvest price for the last dividend declared in the period may often be based on the Fund’s market price (and not its net asset value), and therefore may be different from the price used in the calculation. Total returns are not annualized. |
| (c) | | Ratios do not reflect the effect of custodian fee credits earned on the Fund’s net cash on deposit with the custodian bank, where applicable. |
| (d) | | For the period March 27, 2007 (commencement of operations) through December 31, 2007. |
| * | | Rounds to less than $.01 per share. |
| ** | | Annualized. |
See accompanying notes to financial statements.
| | | | | | |
| | | | | | |
| | | | Notes to
Financial Statements |
| | | | | | |
| |
| 1. | General Information and Significant Accounting Policies |
General Information
Nuveen Core Equity Alpha Fund (the “Fund”) is a closed-end registered investment company registered under the Investment Company Act of 1940, as amended. The Fund’s shares are listed on the New York Stock Exchange (“NYSE”) and trade under the ticker symbol “JCE.” The Fund was organized as a Massachusetts business trust on January 9, 2007.
The Fund’s investment objective is to provide an attractive level of total return, primarily through long-term capital appreciation and secondarily through income and gains. The Fund will invest in a portfolio of common stocks selected from among the 500 stocks comprising the S&P 500 Index, using a proprietary mathematical process designed by the Fund’s sub-adviser INTECH Investment Management, LLC (“INTECH”) to select large cap, core equity securities and will also employ innovative risk reduction techniques. Typically, the Fund’s equity portfolio will hold 250-450 stocks included in the S&P 500 Index. The Fund will also employ an option strategy that seeks to enhance the Fund’s risk-adjusted performance over time through a meaningful reduction in the volatility of the Fund’s returns relative to the returns of the S&P 500 Index. The Fund expects to write custom basket call options with a notional value of up to 50% of the value of the equity portfolio. Nuveen Asset Management (the “Adviser”), a wholly-owned subsidiary of Nuveen Investments, Inc. (“Nuveen”), is responsible for Fund’s option strategy.
During this reporting period, the Fund’s Board of Trustees approved minor changes to the investment policies of the equity portfolio strategy of the Fund. Specifically, the Board of Trustees approved a change to the Fund’s non-fundamental investment policy to provide that, under normal market circumstances, the equity portfolio will consist of a diversified portfolio of 150 to 450 common stocks included in the S&P 500 Index. The changes are a result of enhancements to INTECH’s mathematical portfolio construction process. The turnover in the portfolio (measured in terms of total dollar volume of stock trading) is estimated to range between 70% and 100% (versus the previous 80% and 120%) per year.
Effective January 1, 2011, Nuveen Asset Management, the Fund’s Adviser, has changed its name to Nuveen Fund Advisors, Inc. (“Nuveen Fund Advisors”). Concurrently, Nuveen Fund Advisors has formed a wholly-owned subsidiary, Nuveen Asset Management, LLC, to house its portfolio management capabilities. Nuveen Asset Management, LLC now serves as the sub-adviser for the Fund’s call option strategy. Nuveen Fund Advisors will compensate Nuveen Asset Management, LLC for the portfolio management services it provides to the Fund from the Fund’s management fee, which will not change as a result of this restructuring. Nuveen Fund Advisors and Nuveen Asset Management, LLC retain the right to reallocate investment management and advisory responsibilities and fees between themselves in the future. This restructuring did not result in any change to INTECH’s Sub-Advisory Agreement.
The following is a summary of significant accounting policies followed by the Fund in the preparation of its financial statements in accordance with accounting principles generally accepted in the United States (“U.S. GAAP”).
Significant Accounting Policies
Investment Valuation
Common stocks and other equity-type securities are valued at the last sales price on the securities exchange on which such securities are primarily traded and are generally classified as Level 1. Securities primarily traded on the NASDAQ National Market (“NASDAQ”) are valued, except as indicated below, at the NASDAQ Official Closing Price and are generally classified as Level 1. However, securities traded on a securities exchange or NASDAQ for which there were no transactions on a given day or securities not listed on a securities exchange or NASDAQ are valued at the mean between the quoted bid and ask prices and are generally classified as Level 1.
Prices of fixed-income securities are provided by a pricing service approved by the Fund’s Board of Trustees. These securities are generally classified as Level 2. Prices of fixed-income securities are based on the mean between the bid and asked price. When price quotes are not readily available, the pricing service establishes a security’s fair value using methods that may include consideration of the following: yields or prices of investments of comparable quality, type of issue, coupon, maturity and rating, market quotes or indications of value from security dealers, evaluations of anticipated cash flows or collateral, general market conditions and other information and analysis, including the obligor’s credit characteristics considered relevant. In pricing certain securities, particularly less liquid and lower quality securities, the pricing service may consider information about a security, its issuer, or market activity provided by the Adviser. These securities are generally classified as Level 2 or Level 3, depending on the priority of the significant
inputs. Highly rated zero coupon fixed-income securities, like U.S. Treasury Bills, issued with maturities of one year or less, are valued using the amortized cost method when 60 days or less remain until maturity. With amortized cost, any discount or premium is amortized each day, regardless of the impact of fluctuating rates on the market value of the security. These securities are generally classified as Level 1.
The value of exchange-traded options are based on the mean of the bid and ask prices. Futures contracts are valued using the closing settlement price. Exchange-traded options and futures contracts are generally classified as Level 1. Options traded in the over-the-counter market are valued using market implied volatilities and are generally classified as Level 2.
Repurchase agreements are valued at contract amount plus interest, which approximates market value. These securities are generally classified as Level 2.
Certain securities may not be able to be priced by the pre-established pricing methods as described above. Such securities may be valued by the Fund’s Board of Trustees or its designee at fair value. These securities generally include, but are not limited to, restricted securities (securities which may not be publicly sold without registration under the Securities Act of 1933, as amended) for which a pricing service is unable to provide a market price; securities whose trading has been formally suspended; debt securities that have gone into default and for which there is no current market quotation; a security whose market price is not available from a pre-established pricing source; a security with respect to which an event has occurred that is likely to materially affect the value of the security after the market has closed but before the calculation of the Fund’s net asset value (as may be the case in non-U.S. markets on which the security is primarily traded) or make it difficult or impossible to obtain a reliable market quotation; and a security whose price, as provided by the pricing service, is not deemed to reflect the security’s fair value. As a general principle, the fair value of a security would appear to be the amount that the owner might reasonably expect to receive for it in a current sale. A variety of factors may be considered in determining the fair value of such securities, which may include consideration of the following: yields or prices of investments of comparable quality, type of issue, coupon, maturity and rating, market quotes or indications of value from security dealers, evaluations of anticipated cash flows or collateral, general market conditions and other information and analysis, including the obligor’s credit characteristics considered relevant. These securities are classified as Level 2 or Level 3 depending on the priority of the significant inputs. Regardless of the method employed to value a particular security, all valuations are subject to review by the Fund’s Board of Trustees, or its designee.
Refer to Footnote 2 – Fair Value Measurements for further details on the leveling of securities held by the Fund as of the end of the reporting period.
Investment Transactions
Investment transactions are recorded on a trade date basis. Realized gains and losses from investment transactions are determined on the specific identification method, which is the same basis used for federal income tax purposes.
Investment Income
Dividend income is recorded on the ex-dividend date or, for foreign securities, when information is available. Interest income is recorded on an accrual basis.
Income Taxes
The Fund intends to distribute substantially all of its investment company taxable income to shareholders and to otherwise comply with the requirements of Subchapter M of the Internal Revenue Code applicable to regulated investment companies. In any year when the Fund realizes net capital gains, the Fund may choose to distribute all or a portion of its net capital gains to shareholders, or alternatively, to retain all or a portion of its net capital gains and pay federal corporate income taxes on such retained gains.
For all open tax years and all major taxing jurisdictions, management of the Fund has concluded that there are no significant uncertain tax positions that would require recognition in the financial statements. Open tax years are those that are open for examination by taxing authorities (i.e., generally the last four tax year ends and the interim tax period since then). Furthermore, management of the Fund is also not aware of any tax positions for which it is reasonably possible that the total amounts of unrecognized tax benefits will significantly change in the next twelve months.
Dividends and Distributions to Shareholders
Distributions to shareholders are recorded on the ex-dividend date. The amount and timing of distributions are determined in accordance with federal income tax regulations, which may differ from U.S. GAAP.
The Fund makes quarterly cash distributions to shareholders of a stated dollar amount per share. Subject to approval and oversight by the Fund’s Board of Trustees, the Fund seeks to maintain a stable distribution level designed to deliver the long-term return potential of the Fund’s investment strategy through regular quarterly distributions (a “Managed Distribution Program”). Total distributions during a calendar year generally will be made from the Fund’s net investment income, net realized capital gains and net unrealized capital gains in the Fund’s portfolio, if any. The portion of distributions paid attributed to net unrealized gains, if any, is distributed from the Fund’s assets and is treated by shareholders as a non-taxable distribution (“Return of Capital”) for tax purposes. In the event that total distributions during a calendar year exceed the Fund’s total return on net asset value, the difference will reduce net asset value per share. If the Fund’s total return on net asset value exceeds total distributions during a calendar year, the excess will be reflected
| | | | |
| | | | |
| | | | Notes to
Financial Statements (continued) |
as an increase in net asset value per share. The final determination of the source and character of all distributions for the fiscal year are made after the end of the fiscal year and are reflected in the financial statements contained in the annual report as of December 31 each year.
Foreign Currency Transactions
The Fund is authorized to engage in foreign currency exchange transactions, including foreign currency forward, futures, options and swap contracts. To the extent that the Fund invests in securities and/or contracts that are denominated in a currency other than U.S. dollars, the Fund will be subject to currency risk, which is the risk that an increase in the U.S. dollar relative to the foreign currency will reduce returns or portfolio value. Generally, when the U.S. dollar rises in value against a foreign currency, the Fund’s investments denominated in that currency will lose value because its currency is worth fewer U.S. dollars; the opposite effect occurs if the U.S. dollar falls in relative value. Investments and other assets and liabilities denominated in foreign currencies are converted into U.S. dollars on a spot (i.e. cash) basis at the spot rate prevailing in the foreign currency exchange market at the time of valuation. Purchases and sales of investments and income denominated in foreign currencies are translated into U.S. dollars on the respective dates of such transactions.
The books and records of the Fund are maintained in U.S. dollars. Foreign currencies, investments and other assets and liabilities are translated into U.S. dollars at 4:00 p.m. Eastern time. Investments, income and expenses are translated on the respective dates of such transactions. Net realized foreign currency gains and losses resulting from changes in exchange rates include foreign currency gains and losses between trade date and settlement date of the transactions, foreign currency transactions, and the difference between the amounts of interest and dividends recorded on the books of the Fund and the amounts actually received.
The realized and unrealized gains or losses resulting from changes in foreign exchange rates are recognized as a component of “Net realized gain (loss) from investments and foreign currency” and “Change in net unrealized appreciation (depreciation) of investments and foreign currency” on the Statement of Operations, when applicable.
Futures Contracts
The Fund is subject to equity price risk in the normal course of pursuing its investment objectives and is authorized to invest in futures. Upon entering into a futures contract, the Fund is required to deposit with the broker an amount of cash or liquid securities equal to a specified percentage of the contract amount. This is known as the “initial margin.” Cash held by the broker to cover initial margin requirements on open futures contracts, if any, is recognized as “Deposits with brokers for open futures contracts” on the Statement of Assets and Liabilities. Subsequent payments (“variation margin”) are made or received by a Fund each day, depending on the daily fluctuation of the value of the contract. Variation margin is recognized as a receivable or payable for “Variation margin on futures contracts” on the Statement of Assets and Liabilities, when applicable.
During the period the futures contract is open, changes in the value of the contract are recorded as an unrealized gain or loss by “marking-to-market” on a daily basis to reflect the changes in market value of the contract and is recognized as “Change in net unrealized appreciation (depreciation) of futures contracts” on the Statement of Operations. When the contract is closed or expired, a Fund records a realized gain or loss equal to the difference between the value of the contract on the closing date and value of the contract when originally entered into and is recognized as “Net realized gain (loss) from futures contracts” on the Statement of Operations.
Risks of investments in futures contracts include the possible adverse movement of the securities or indices underlying the contracts, the possibility that there may not be a liquid secondary market for the contracts and/or that a change in the value of the contract may not correlate with a change in the value of the underlying securities or indices.
During the fiscal year ended December 31, 2010, the Fund entered into futures contracts, buying equity index futures to gain equity market exposure where the portfolio holds cash.
The average number of futures contracts outstanding during the fiscal year ended December 31, 2010, was 125. Refer to Footnote 3 – Derivative Instruments and Hedging Activities for further details on futures contract activity.
Options Transactions
The Fund is subject to equity price risk in the normal course of pursuing its investment objectives and is authorized to write (sell) call options, primarily on custom baskets of securities, in an attempt to manage such risk. When the Fund writes a call option, an amount equal to the net premium received (the premium less commission) is recognized as a component of “Call options written, at value” on the Statement of Asset and Liabilities and is subsequently adjusted to reflect the current value of the written option until the option expires or the Fund enters into a closing purchase transaction. The changes in value of the options during the reporting period are recognized as a component of “Change in net unrealized appreciation (depreciation) of call options written” on the Statement of Operations. When a call option expires or the Fund enters into a closing purchase transaction, the difference between the net premium received and any amount paid at expiration or upon executing a closing purchase transaction, including commission, is recognized as a component of “Net realized gain (loss) from call options written” on the Statements of Operations. The Fund, as writer of a call option, has no control over whether the underlying instrument may be sold (called) and as a result bears the risk of an unfavorable change in the market value of the instrument or index underlying the written option. There is also the risk the Fund may not be able to enter into a closing transaction because of an illiquid market.
During fiscal year ended December 31, 2010, the Fund wrote call options on a basket of stocks, while investing in a portfolio of equities, to enhance returns while foregoing some upside potential.
The average notional amount of call options written during the fiscal year ended December 31, 2010, was $(92,849,491). The average notional amount is calculated based on the outstanding amount at the beginning of the fiscal year and at the end of each fiscal quarter within the current fiscal year. Refer to Footnote 3 – Derivative Instruments and Hedging Activities for further details on call options written.
Market and Counterparty Credit Risk
In the normal course of business the Fund may invest in financial instruments and enter into financial transactions where risk of potential loss exists due to changes in the market (market risk) or failure of the other party to the transaction to perform (counterparty credit risk). The potential loss could exceed the value of the financial assets recorded on the financial statements. Financial assets, which potentially expose the Fund to counterparty credit risk, consist principally of cash due from counterparties on forward, option and swap transactions, when applicable. The extent of the Fund’s exposure to counterparty credit risk in respect to these financial assets approximates their carrying value as recorded on the Statement of Assets and Liabilities. Futures contracts, when applicable, expose the Fund to minimal counterparty credit risk as they are exchange traded and the exchange’s clearing house, which is counterparty to all exchange traded futures, guarantees the futures contracts against default.
The Fund helps manage counterparty credit risk by entering into agreements only with counterparties the Adviser believes have the financial resources to honor their obligations and by having the Adviser monitor the financial stability of the counterparties. Additionally, counterparties may be required to pledge collateral daily (based on the daily valuation of the financial asset) on behalf of the Fund with a value approximately equal to the amount of any unrealized gain above a pre-determined threshold. Reciprocally, when the Fund has an unrealized loss, the Fund has instructed the custodian to pledge assets of the Fund as collateral with a value approximately equal to the amount of the unrealized loss above a pre-determined threshold. Collateral pledges are monitored and subsequently adjusted if and when the valuations fluctuate, either up or down, by at least the predetermined threshold amount.
Repurchase Agreements
In connection with transactions in repurchase agreements, it is the Fund’s policy that its custodian take possession of the underlying collateral securities, the fair value of which exceeds the principal amount of the repurchase transaction, including accrued interest, at all times. If the counterparty defaults, and the fair value of the collateral declines, realization of the collateral may be delayed or limited.
Zero Coupon Securities
The Fund is authorized to invest in zero coupon securities. A zero coupon security does not pay a regular interest coupon to its holders during the life of the security. Tax-exempt income to the holder of the security comes from accretion of the difference between the original purchase price of the security at issuance and the par value of the security at maturity and is effectively paid at maturity. The market prices of zero coupon securities generally are more volatile than the market prices of securities that pay interest periodically.
Custodian Fee Credit
The Fund has an arrangement with the custodian bank whereby certain custodian fees and expenses are reduced by net credits earned on the Fund’s cash on deposit with the bank. Such deposit arrangements are an alternative to overnight investments. Credits for cash balances may be offset by charges for any days on which the Fund overdraws its account at the custodian bank.
Indemnifications
Under the Fund’s organizational documents, its officers and trustees are indemnified against certain liabilities arising out of the performance of their duties to the Fund. In addition, in the normal course of business, the Fund enters into contracts that provide general indemnifications to other parties. The Fund’s maximum exposure under these arrangements is unknown as this would involve future claims that may be made against the Fund that have not yet occurred. However, the Fund has not had prior claims or losses pursuant to these contracts and expects the risk of loss to be remote.
Use of Estimates
The preparation of financial statements in conformity with U.S. GAAP requires management to make estimates and assumptions that affect the reported amounts of assets and liabilities at the date of the financial statements and the reported amounts of increases and decreases in net assets from operations during the reporting period. Actual results may differ from those estimates.
| |
| 2. | Fair Value Measurements |
In determining the fair value of the Fund’s investments, various inputs are used. These inputs are summarized in the three broad levels listed below:
| | | | | |
| Level 1 | | – | | Quoted prices in active markets for identical securities. |
| Level 2 | | – | | Other significant observable inputs (including quoted prices for similar securities, interest rates, prepayment speeds, credit risk, etc.). |
| Level 3 | | – | | Significant unobservable inputs (including management’s assumptions in determining the fair value of investments). |
| | | | |
| | | | |
| | | | Notes to
Financial Statements (continued) |
The inputs or methodologies used for valuing securities are not an indication of the risk associated with investing in those securities. The following is a summary of the Fund’s fair value measurements as of December 31, 2010:
| | | | | | | | | | | | | | | | | |
| | | Level 1 | | | Level 2 | | | Level 3 | | | Total | |
| Investments: | | | | | | | | | | | | | | | | |
| Common Stocks | | $ | 220,695,603 | | | $ | – | | | $ | – | | | $ | 220,695,603 | |
| Short-Term Investments | | | – | | | | 8,283,589 | | | | – | | | | 8,283,589 | |
| Derivatives: | | | | | | | | | | | | | | | | |
| Call Options Written | | | – | | | | (980,629 | ) | | | – | | | | (980,629 | ) |
| Futures Contracts * | | | 106,188 | | | | – | | | | – | | | | 106,188 | |
| | | | | | | | | | | | | | | | | |
| Total | | $ | 220,801,791 | | | $ | 7,302,960 | | | $ | – | | | $ | 228,104,751 | |
| | | | | | | | | | | | | | | | | |
| |
| * | Represents net unrealized appreciation (depreciation). |
During the fiscal year ended December 31, 2010, the Fund recognized no significant transfers to/from Level 1, Level 2 or Level 3.
| |
| 3. | Derivative Instruments and Hedging Activities |
The Fund records derivative instruments at fair value, with changes in fair value recognized on the Statement of Operations, when applicable. Even though the Fund’s investments in derivatives may represent economic hedges, they are not considered to be hedge transactions for financial reporting purposes. For additional information on the derivative instruments in which the Fund was invested during and at the end of the reporting period, refer to the Portfolio of Investments, Financial Statements and Footnote 1 – General Information and Significant Accounting Policies.
The following table presents the fair value of all derivative instruments held by the Fund as of December 31, 2010, the location of these instruments on the Statement of Assets and Liabilities, and the primary underlying risk exposure.
| | | | | | | | | | | | | | | |
| | | | | Location on the Statement of Assets and Liabilities |
| | | Derivative
| | Asset Derivatives | | Liability Derivatives |
| Underlying Risk Exposure | | Instrument | | Location | | Value | | Location | | Value |
| Equity Price | | Futures contracts | | Payable for variation margin on futures contracts* | | $ | 106,188 | | | – | | $ | – | |
| | | | | | | | | | | | | | | |
| | | | | | | | | | | | | | | |
| Equity Price | | Options | | – | | | – | | | Call options written, at value | | | 980,629 | |
| | | | | | | | | | | | | | | |
| Total | | | | | | $ | 106,188 | | | | | $ | 980,629 | |
| | | | | | | | | | | | | | | |
| |
| * | Value represents cumulative unrealized appreciation (depreciation) of futures contracts as reported in the Portfolio of Investments and not the deposits with brokers, if any, or the receivable or payable for variation margin presented on the Statement of Assets and Liabilities. |
The following tables present the amount of net realized gain (loss) and change in net unrealized appreciation (depreciation) recognized for the fiscal year ended December 31, 2010, on derivative instruments, as well as the primary risk exposure associated with each.
| | | | | |
| Net Realized Gain (Loss) from Call Options Written | | | |
Risk Exposure | | | | |
| Equity Price | | $ | (455,413 | ) |
| | | | | |
| | | | | |
| Net Realized Gain (Loss) from Futures Contracts | | |
Risk Exposure | | | | |
| Equity Price | | $ | 1,056,375 | |
| | | | | |
| | | | | |
| Change in Net Unrealized Appreciation (Depreciation) of Call Options Written | | |
Risk Exposure | | | | |
| Equity Price | | $ | (427,493) | |
| | | | | |
| | | | | |
| Change in Net Unrealized Appreciation (Depreciation) of Futures Contracts | | |
Risk Exposure | | | | |
| Equity Price | | $ | (52,187) | |
| | | | | |
Transactions in shares were as follows:
| | | | | | | | | |
| | | Year
| | | Year
| |
| | | Ended
| | | Ended
| |
| | | 12/31/10 | | | 12/31/09 | |
| Shares repurchased and retired | | | (7,100 | ) | | | (255,100 | ) |
| | | | | | | | | |
| Weighted average: | | | | | | | | |
| Price per share repurchased and retired | | $ | 10.36 | | | $ | 10.29 | |
| Discount per share repurchased and retired | | | 23.38 | % | | | 15.00 | % |
| | | | | | | | | |
| |
| 5. | Investment Transactions |
Purchases and sales (excluding short-term investments and derivative transactions) during the fiscal year ended December 31, 2010, aggregated $267,949,920 and $279,151,572, respectively.
Transactions in call options written during the fiscal year ended December 31, 2010, were as follows:
| | | | | | | | | |
| | | Number of
| | | Premiums
| |
| | | Contracts | | | Received | |
| Outstanding, beginning of year | | | 899,509 | | | $ | 998,023 | |
| Call options written | | | 8,502,891 | | | | 9,422,874 | |
| Call options terminated in closing purchase transactions | | | (3,620,326 | ) | | | (3,938,530 | ) |
| Call options expired | | | (4,777,335 | ) | | | (5,694,093 | ) |
| | | | | | | | | |
| Outstanding, end of year | | | 1,004,739 | | | $ | 788,274 | |
| | | | | | | | | |
| |
| 6. | Income Tax Information |
The following information is presented on an income tax basis. Differences between amounts for financial statement and federal income tax purposes are primarily due to timing differences in recognizing certain gains and losses on investment transactions and the recognition of unrealized gain or loss for tax (mark-to-market) on futures contracts. To the extent that differences arise that are permanent in nature, such amounts are reclassified within the capital accounts as detailed below. Temporary differences do not require reclassification. Temporary and permanent differences do not impact the net asset value of the Fund.
At December 31, 2010, the cost and unrealized appreciation (depreciation) of investments (excluding investments in derivatives), as determined on a federal income tax basis, were as follows:
| | | | | |
| Cost of investments | | $ | 189,904,337 | |
| | | | | |
| Gross unrealized: | | | | |
| Appreciation | | $ | 40,884,837 | |
| Depreciation | | | (1,809,982 | ) |
| | | | | |
| Net unrealized appreciation (depreciation) of investments | | $ | 39,074,855 | |
| | | | | |
Permanent differences, primarily due to REIT adjustments, return of capital distributions and tax basis earnings and profit adjustments, resulted in reclassifications among the Fund’s components of net assets at December 31, 2010, the Fund’s tax year-end, as follows:
| | | | | |
| Paid-in surplus | | $ | (16,074,468 | ) |
| Undistributed (Over-distribution) of net investment income | | | 16,082,597 | |
| Accumulated net realized gain (loss) | | | (8,129 | ) |
| | | | | |
The tax components of undistributed net ordinary income and net long-term capital gains at December 31, 2010, the Fund’s tax year end, were as follows:
| | | | | |
| Undistributed net ordinary income | | $ | – | |
| Undistributed net long-term capital gains | | | – | |
| | | | | |
The tax character of distributions paid during the Fund’s tax years ended December 31, 2010 and December 31, 2009, was designated for purposes of the dividends paid deduction as follows:
| | | | | |
| 2010 | | | |
| Distributions from net ordinary income * | | $ | 14,715,856 | |
| Distributions from net long-term capital gains | | | – | |
| Return of capital | | | 2,915,487 | |
| | | | | |
| | | | | |
| 2009 | | | |
| Distributions from net ordinary income * | | $ | 2,458,704 | |
| Distributions from net long-term capital gains | | | – | |
| Return of capital | | | 15,338,552 | |
| | | | | |
| |
| * | Net ordinary income consists of net taxable income derived from dividends and interest, and current year earnings and profits attributable to realized gains. |
| | | | |
| | | | |
| | | | Notes to
Financial Statements (continued) |
At December 31, 2010, the Fund’s tax year end, the Fund had an unused capital loss carryforwards available for federal income tax purposes to be applied against future capital gains, if any. If not applied, the carryforward will expire as follows:
| | | | | |
| Expiration: | | | | |
| December 31, 2016 | | $ | 254,115 | |
| December 31, 2017 | | | 50,597,748 | |
| | | | | |
| Total | | $ | 50,851,863 | |
| | | | | |
During the tax year ended December 31, 2010, the Fund utilized $13,159,398 of its capital loss carryforwards.
| |
| 7. | Management Fees and Other Transactions with Affiliates |
The Fund’s management fee consists of two components – a fund-level fee, based only on the amount of assets within the Fund, and a complex-level fee, based on the aggregate amount of all eligible fund assets managed by the Adviser. This pricing structure enables Fund shareholders to benefit from growth in the assets within the Fund as well as from growth in the amount of complex-wide assets managed by the Adviser.
The annual fund-level fee, payable monthly, is calculated according to the following schedule:
| | | | | |
| Average Daily Managed Assets* | | Fund-Level Fee Rate |
| For the first $500 million | | | .7500 | % |
| For the next $500 million | | | .7250 | |
| For the next $500 million | | | .7000 | |
| For the next $500 million | | | .6750 | |
| For managed assets over $2 billion | | | .6500 | |
| | | | | |
The annual complex-level fee, payable monthly, is calculated according to the following schedule:
| | | | | |
| Complex-Level Managed Asset Breakpoint Level* | | Effective Rate at Breakpoint Level |
| $55 billion | | | .2000 | % |
| $56 billion | | | .1996 | |
| $57 billion | | | .1989 | |
| $60 billion | | | .1961 | |
| $63 billion | | | .1931 | |
| $66 billion | | | .1900 | |
| $71 billion | | | .1851 | |
| $76 billion | | | .1806 | |
| $80 billion | | | .1773 | |
| $91 billion | | | .1691 | |
| $125 billion | | | .1599 | |
| $200 billion | | | .1505 | |
| $250 billion | | | .1469 | |
| $300 billion | | | .1445 | |
| | | | | |
| |
| * | For the fund-level and complex-level fees, managed assets include closed-end fund assets managed by the Adviser that are attributable to financial leverage. For these purposes, financial leverage includes the funds’ use of preferred stock and borrowings and certain investments in the residual interest certificates (also called inverse floating rate securities) in tender option bond (TOB) trusts, including the portion of assets held by a TOB trust that has been effectively financed by the trust’s issuance of floating rate securities, subject to an agreement by the Adviser as to certain funds to limit the amount of such assets for determining managed assets in certain circumstances. The complex-level fee is calculated based upon the aggregate daily managed assets of all Nuveen funds that constitute “eligible assets.” Eligible assets do not include assets attributable to investments in other Nuveen funds and assets in excess of $2 billion added to the Nuveen Fund complex in connection with the Adviser’s assumption of the management of the former First American Funds effective January 1, 2011. As of December 31, 2010, the complex-level fee rate was .1831%. |
The management fee compensates the Adviser for overall investment advisory and administrative services and general office facilities. The Adviser is responsible for the overall investment strategy and asset allocation decisions. The Adviser has entered into Sub-Advisory Agreements with INTECH and Nuveen Asset Management, LLC. INTECH and Nuveen Asset Management, LLC are compensated for their services to the Fund from the management fee paid to the Adviser.
The Fund pays no compensation directly to those of its trustees who are affiliated with the Adviser or to its officers, all of whom receive remuneration for their services to the Fund from the Adviser or its affiliates. The Board of Trustees has adopted a deferred compensation plan for independent trustees that enables trustees to elect to defer receipt of all or a portion of the annual compensation they are entitled to receive from certain Nuveen advised funds. Under the plan, deferred amounts are treated as though equal dollar amounts had been invested in shares of select Nuveen advised funds.
Board Members & Officers (Unaudited)
The management of the Fund, including general supervision of the duties performed for the Fund by the Adviser, is the responsibility of the Board Members of the Fund. The number of board members of the Fund is currently set at ten. None of the board members who are not “interested” persons of the Fund (referred to herein as “independent board members”) has ever been a director or employee of, or consultant to, Nuveen or its affiliates. The names and business addresses of the board members and officers of the Fund, their principal occupations and other affiliations during the past five years, the number of portfolios each oversees and other directorships they hold are set forth below.
| | | | | | | | | | |
| |
Name, Birthdate
| | | Position(s) Held with
| | Year First
| | Principal Occupation(s)
| | Number of Portfolios
|
and Address
| | | the Fund
| | Elected or
| | Including other Directorships
| | in Fund Complex
|
| | |
| | Appointed
| | During Past 5 Years
| | Overseen by
|
| | | | | | and Term(1) | | | | Board Member |
| |
| |
| INDEPENDENT BOARD MEMBERS: |
| |
| n ROBERT P. BREMNER(2) |
8/22/40
333 W. Wacker Drive
Chicago, IL 60606 | | | Chairman of
the Board
and Board Member | | 1996
Class III | | Private Investor and Management Consultant; Treasurer and Director, Humanities Council of Washington, D.C.; Board Member, Independent Directors Council affiliated with the Investment Company Institute. | | 244 |
| |
| n JACK B. EVANS |
10/22/48
333 W. Wacker Drive
Chicago, IL 60606 | | | Board Member | | 1999
Class III | | President, The Hall-Perrine Foundation, a private philanthropic corporation (since 1996); Director and Chairman, United Fire Group, a publicly held company; President Pro Tem of the Board of Regents for the State of Iowa University System; Director, Gazette Companies; Life Trustee of Coe College and the Iowa College Foundation; formerly, Director, Alliant Energy; formerly, Director, Federal Reserve Bank of Chicago; formerly, President and Chief Operating Officer, SCI Financial Group, Inc., a regional financial services firm. | | 244 |
| |
| n WILLIAM C. HUNTER |
3/6/48
333 W. Wacker Drive
Chicago, IL 60606 | | | Board Member | | 2004
Class I | | Dean, Tippie College of Business, University of Iowa (since 2006); Director (since 2004) of Xerox Corporation; Director (since 2005), Beta Gamma Sigma International Honor Society; formerly, Dean and Distinguished Professor of Finance, School of Business at the University of Connecticut (2003-2006); previously, Senior Vice President and Director of Research at the Federal Reserve Bank of Chicago (1995-2003); formerly, Director (1997-2007), Credit Research Center at Georgetown University. | | 244 |
Board Members & Officers (Unaudited) (continued)
| | | | | | | | | | |
| |
Name, Birthdate
| | | Position(s) Held with
| | Year First
| | Principal Occupation(s)
| | Number of Portfolios
|
and Address
| | | the Fund
| | Elected or
| | Including other Directorships
| | in Fund Complex
|
| | |
| | Appointed
| | During Past 5 Years
| | Overseen by
|
| | | | | | and Term(1) | | | | Board Member |
| |
| INDEPENDENT BOARD MEMBERS (continued): |
| | | | | | | | | | |
| |
| n DAVID J. KUNDERT(2) |
10/28/42
333 W. Wacker Drive
Chicago, IL 60606 | | | Board Member | | 2005
Class II | | Director, Northwestern Mutual Wealth Management Company; retired (since 2004) as Chairman, JPMorgan Fleming Asset Management, President and CEO, Banc One Investment Advisors Corporation, and President, One Group Mutual Funds; prior thereto, Executive Vice President, Banc One Corporation and Chairman and CEO, Banc One Investment Management Group; Member, Board of Regents, Luther College; member of the Wisconsin Bar Association; member of Board of Directors, Friends of Boerner Botanical Gardens; member of Board of Directors and chair of Investment Committee, Greater Milwaukee Foundation. | | 244 |
| |
| n WILLIAM J. SCHNEIDER(2) |
9/24/44
333 W. Wacker Drive
Chicago, IL 60606 | | | Board Member | | 1997
Class III | | Chairman of Miller-Valentine Partners Ltd., a real estate investment company; formerly, Senior Partner and Chief Operating Officer (retired 2004) of Miller-Valentine Group; member, University of Dayton Business School Advisory Council; member, Mid-America Health System board; formerly member and Chair, Dayton Philharmonic Orchestra Association; formerly, member, Business Advisory Council, Cleveland Federal Reserve Bank. | | 244 |
| |
| n JUDITH M. STOCKDALE |
12/29/47
333 W. Wacker Drive
Chicago, IL 60606 | | | Board Member | | 1997
Class I | | Executive Director, Gaylord and Dorothy Donnelley Foundation (since 1994); prior thereto, Executive Director, Great Lakes Protection Fund (1990-1994). | | 244 |
| |
| n CAROLE E. STONE(2) |
6/28/47
333 W. Wacker Drive
Chicago, IL 60606 | | | Board Member | | 2007
Class I | | Director, Chicago Board Options Exchange (since 2006); Director, C2 Options Exchange, Incorporated (since 2009) formerly, Commissioner, New York State Commission on Public Authority Reform (2005-2010); formerly, Chair, New York Racing Association Oversight Board (2005-2007). | | 244 |
| |
| n VIRGINIA L. STRINGER |
8/16/44
333 West Wacker Drive
Chicago, IL 60606 | | | Board Member | | 2011 | | Board Member, Mutual Fund Directors Forum; Member, Governing Board, Investment Company Institute’s Independent Directors Council; governance consultant and non-profit board member; former Owner and President, Strategic Management Resources, Inc. a management consulting firm; previously, held several executive positions in general management, marketing and human resources at IBM and The Pillsbury Company; Independent Director, First American Fund Complex (1987-2010) and Chair (1997-2010). | | 244 |
| | | | | | | | | | |
| |
Name, Birthdate
| | | Position(s) Held with
| | Year First
| | Principal Occupation(s)
| | Number of Portfolios
|
and Address
| | | the Fund
| | Elected or
| | Including other Directorships
| | in Fund Complex
|
| | |
| | Appointed
| | During Past 5 Years
| | Overseen by
|
| | | | | | and Term(1) | | | | Board Member |
| |
| INDEPENDENT BOARD MEMBERS (continued): |
| | | | | | | | | | |
| |
| n TERENCE J. TOTH(2) |
9/29/59
333 W. Wacker Drive
Chicago, IL 60606 | | | Board Member | | 2008
Class II | | Director, Legal & General Investment Management America, Inc. (since 2008); Managing Partner, Promus Capital (since 2008); formerly CEO and President, Northern Trust Global Investments (2004-2007); Executive Vice President, Quantitative Management & Securities Lending (2000-2004); prior thereto, various positions with Northern Trust Company (since 1994); member: Goodman Theatre Board (since 2004); Chicago Fellowship Boards (since 2005), University of Illinois Leadership Council Board (since 2007) and Catalyst Schools of Chicago Board (since 2008); formerly, member: Northern Trust Mutual Funds Board (2005-2007), Northern Trust Global Investments Board (2004-2007), Northern Trust Japan Board (2004-2007), Northern Trust Securities Inc. Board (2003-2007) and Northern Trust Hong Kong Board (1997-2004). | | 244 |
| |
| INTERESTED BOARD MEMBER: |
| |
| n JOHN P. AMBOIAN(3) |
6/14/61
333 W. Wacker Drive
Chicago, IL 60606 | | | Board Member | | 2008
Class II | | Chief Executive Officer and Chairman (since 2007) and Director (since 1999) of Nuveen Investments, Inc.; Chief Executive Officer (since 2007) of Nuveen Investments Advisors, Inc.; Director (since 1998) formerly, Chief Executive Officer (2007-2010) of Nuveen Fund Advisors, Inc. | | 244 |
| |
Name, Birthdate
| | | Position(s) Held with
| | Year First
| | Principal Occupation(s)
| | Number of Portfolios
|
and Address
| | | the Fund
| | Elected or
| | During Past 5 Years
| | in Fund Complex
|
| | |
| | Appointed(4)
| |
| | Overseen by
|
| | | | | | | | | | Officer |
| |
| |
| OFFICERS of the FUND: |
| |
| n GIFFORD R. ZIMMERMAN |
9/9/56
333 W. Wacker Drive
Chicago, IL 60606 | | | Chief
Administrative
Officer | | 1988 | | Managing Director (since 2002), Assistant Secretary and Associate General Counsel of Nuveen Investments LLC; Managing Director (since 2004) and Assistant Secretary (since 1994) of Nuveen Investments, Inc.; Managing Director (since 2002), Assistant Secretary (since 1997) and Co-General Counsel (since 2011) of Nuveen Fund Advisors, Inc.; Managing Director, Assistant Secretary and Associate General Counsel of Nuveen Asset Management, LLC (since 2011); Managing Director, Associate General Counsel and Assistant Secretary, of Symphony Asset Management LLC, (since 2003); Vice President and Assistant Secretary of NWQ Investment Management Company, LLC (since 2002), Nuveen Investments Advisers Inc. (since 2002), Tradewinds Global Investors LLC, and Santa Barbara Asset Management, LLC (since 2006), Nuveen HydePark Group LLC and Nuveen Investment Solutions, Inc. (since 2007) and of Winslow Capital Management Inc. (since 2010); Chief Administrative Officer and Chief Compliance Officer (since 2010) of Nuveen Commodities Asset Management, LLC; Chartered Financial Analyst. | | 244 |
Board Members & Officers (Unaudited) (continued)
| | | | | | | | | | |
| |
Name, Birthdate
| | | Position(s) Held with
| | Year First
| | Principal Occupation(s)
| | Number of Portfolios
|
and Address
| | | the Fund
| | Elected or
| | During Past 5 Years
| | in Fund Complex
|
| | |
| | Appointed(4)
| |
| | Overseen by
|
| | | | | | | | | | Officer |
| |
| OFFICERS of the FUND (continued): |
| | | | | | | | | | |
| |
| n WILLIAM ADAMS IV |
6/9/55
333 W. Wacker Drive
Chicago, IL 60606 | | | Vice President | | 2007 | | Senior Executive Vice President, Global Structured Products (since 2010), formerly, Executive Vice President (1999-2010) of Nuveen Investments, LLC; Co-President of Nuveen Fund Advisors, Inc. (since 2011); Managing Director (since 2010) of Nuveen Commodities Asset Management, LLC. | | 131 |
| |
| n MARGO L. COOK |
4/11/64
333 W. Wacker Drive
Chicago, IL 60606 | | | Vice President | | 2009 | | Executive Vice President (since 2008) of Nuveen Investments, Inc. and of Nuveen Fund Advisors, Inc. (Since-2011); previously, Head of Institutional Asset Management (2007-2008) of Bear Stearns Asset Management; Head of Institutional Asset Mgt (1986-2007) of Bank of NY Mellon; Chartered Financial Analyst. | | 244 |
| |
| n LORNA C. FERGUSON |
10/24/45
333 W. Wacker Drive
Chicago, IL 60606 | | | Vice President | | 1998 | | Managing Director (since 2004) of Nuveen Investments, LLC and Managing Director (since 2005) of Nuveen Fund Advisors, Inc. | | 244 |
| |
| n STEPHEN D. FOY |
5/31/54
333 W. Wacker Drive
Chicago, IL 60606 | | | Vice President
and Controller | | 1998 | | Senior Vice President (since 2010), formerly, Vice President (1993-2010) and Funds Controller (since 1998) of Nuveen Investments, LLC; Senior Vice President (since 2010), formerly, Vice President (2005-2010) of Nuveen Fund Advisors, Inc.; Certified Public Accountant. | | 244 |
| |
| n SCOTT S. GRACE |
8/20/70
333 W. Wacker Drive
Chicago, IL 60606 | | | Vice President
and Treasurer | | 2009 | | Managing Director, Corporate Finance & Development, Treasurer (since 2009) of Nuveen Investments, LLC; Managing Director and Treasurer (since 2009) of Nuveen Fund Advisors, Inc., Nuveen Investment Solutions, Inc., Nuveen Investments Advisers, Inc., Nuveen Investments Holdings Inc. and (since (2011) Nuveen Asset Management, LLC; Vice President and Treasurer of NWQ Investment Management Company, LLC, Tradewinds Global Investors, LLC, Symphony Asset Management LLC and Winslow Capital Management, Inc.; Vice President of Santa Barbara Asset Management, LLC; formerly, Treasurer (2006-2009), Senior Vice President (2008-2009), previously, Vice President (2006-2008) of Janus Capital Group, Inc.; formerly, Senior Associate in Morgan Stanley’s Global Financial Services Group (2000-2003); Chartered Accountant Designation. | | 244 |
| | | | | | | | | | |
| |
Name, Birthdate
| | | Position(s) Held with
| | Year First
| | Principal Occupation(s)
| | Number of Portfolios
|
and Address
| | | the Fund
| | Elected or
| | During Past 5 Years
| | in Fund Complex
|
| | |
| | Appointed(4)
| |
| | Overseen by
|
| | | | | | | | | | Officer |
| |
| OFFICERS of the FUND (continued): |
| | | | | | | | | | |
| |
| n WALTER M. KELLY |
2/24/70
333 W. Wacker Drive
Chicago, IL 60606 | | | Chief Compliance
Officer and
Vice President | | 2003 | | Senior Vice President (since 2008), Vice President (2006-2008) of Nuveen Investments, LLC; Senior Vice President (since 2008) and Assistant Secretary (since 2008) of Nuveen Fund Advisors, Inc. | | 244 |
| |
| n TINA M. LAZAR |
8/27/61
333 W. Wacker Drive
Chicago, IL 60606 | | | Vice President | | 2002 | | Senior Vice President (since 2009), formerly, Vice President of Nuveen Investments, LLC (1999-2009); Senior Vice President (since 2010), formerly, Vice President (2005-2010) of Nuveen Fund Advisors, Inc. | | 244 |
| |
| n LARRY W. MARTIN |
7/27/51
333 West Wacker Drive
Chicago, IL 60606 | | | Vice President and
Assistant Secretary | | 1997 | | Senior Vice President (since 2010), formerly, Vice President (1993-2010), Assistant Secretary and Assistant General Counsel of Nuveen Investments, LLC; Senior Vice President (since 2011) of Nuveen Asset Management, LLC: Senior Vice President (since 2010), formerly, Vice President (2005-2010), and Assistant Secretary of Nuveen Investments, Inc.; Senior Vice President (since 2010), formerly Vice President (2005-2010), and Assistant Secretary (since 1997) of Nuveen Fund Advisors, Inc., Vice President and Assistant Secretary of Nuveen Investments Advisers Inc. (since 2002), NWQ Investment Management Company, LLC, Symphony Asset Management, LLC (since 2003), Tradewinds Global Investors, LLC, Santa Barbara Asset Management LLC (since 2006), Nuveen HydePark Group, LLC and Nuveen Investment Solutions, Inc. (since 2007); Vice President and Assistant Secretary of Nuveen Commodities Asset Management, LLC (since 2010). | | 244 |
| |
| n KEVIN J. MCCARTHY |
3/26/66
333 W. Wacker Drive
Chicago, IL 60606 | | | Vice President
and Secretary | | 2007 | | Managing Director (since 2008), formerly, Vice President (2007-2008), Nuveen Investments, LLC; Managing Director (since 2008), Assistant Secretary (since 2007) and Co-General Counsel (since 2011) of Nuveen Fund Advisors, Inc.; Managing Director, Assistant Secretary and Associate General Counsel (since 2011) of Nuveen Asset Management, LLC; Managing Director (since 2008), and Assistant Secretary, Nuveen Investment Holdings, Inc.; Vice President (since 2007) and Assistant Secretary, Nuveen Investment Advisers Inc., NWQ Investment Management Company, LLC, Tradewinds Global Investors LLC, NWQ Holdings, LLC, Symphony Asset Management LLC, Santa Barbara Asset Management LLC, Nuveen HydePark Group, LLC and Nuveen Investment Solutions, Inc. (since 2007) and of Winslow Capital Management, Inc. (since 2010); Vice President and Secretary (since 2010) of Nuveen Commodities Asset Management, LLC; prior thereto, Partner, Bell, Boyd & Lloyd LLP (1997-2007). | | 244 |
Board Members & Officers (Unaudited) (continued)
| | | | | | | | | | |
| |
Name, Birthdate
| | | Position(s) Held with
| | Year First
| | Principal Occupation(s)
| | Number of Portfolios
|
and Address
| | | the Fund
| | Elected or
| | During Past 5 Years
| | in Fund Complex
|
| | |
| | Appointed(4)
| |
| | Overseen by
|
| | | | | | | | | | Officer |
| |
| OFFICERS of the FUND (continued): |
| | | | | | | | | | |
| |
n KATHLEEN L. PRUDHOMME |
3/30/53
800 Nicollet Mall
Minneapolis, MN 55402 | | | Vice President and
Assistant Secretary | | 2011 | | Managing Director, Assistant Secretary and Co-General Counsel (since 2011) of Nuveen Fund Advisors, Inc.; Managing Director, Assistant Secretary and Associate General Counsel (since 2011) of Nuveen Asset Management, LLC; formerly, Secretary of FASF (2004-2010); prior thereto, Assistant Secretary of FASF (1998-2004); Deputy General Counsel, FAF Advisors, Inc. (1998-2010). | | 244 |
| |
| (1) | Board Members serve three year terms. The Board of Trustees is divided into three classes. Class I, Class II, and Class III, with each being elected to serve until the third succeeding annual shareholders’ meeting subsequent to its election or thereafter in each case when its respective successors are duly elected or appointed. The first year elected or appointed represents the year in which the board member was first elected or appointed to any fund in the Nuveen Complex. |
| |
| (2) | Also serves as a trustee of the Nuveen Diversified Commodity Fund, an exchange-traded commodity pool managed by Nuveen Commodities Asset Management, LLC, an affiliate of the Adviser. |
| |
| (3) | Mr. Amboian is an interested trustee because of his position with Nuveen Investments, Inc. and certain of its subsidiaries, which are affiliates of the Nuveen Funds. |
| |
| (4) | Officers serve one year terms through August of each year. The year first elected or appointed represents the year in which the Officer was first elected or appointed to any fund in the Nuveen Complex. |
Annual Investment Management
Agreement Approval Process (Unaudited)
The Investment Company Act of 1940, as amended (the “1940 Act”), provides, in substance, that each investment advisory agreement between a fund and its investment adviser (including sub-advisers) will continue in effect from year to year only if its continuance is approved at least annually by the fund’s board members, including by a vote of a majority of the board members who are not parties to the advisory agreement or “interested persons” of any parties (the “Independent Board Members”), cast in person at a meeting called for the purpose of considering such approval. In connection with such approvals, the fund’s board members must request and evaluate, and the investment adviser is required to furnish, such information as may be reasonably necessary to evaluate the terms of the advisory agreement. Accordingly, at a meeting held on May 25-26, 2010 (the “May Meeting”), the Board of Trustees (the “Board,” and each Trustee, a “Board Member”) of the Fund, including a majority of the Independent Board Members, considered and approved the continuation of the advisory and sub-advisory agreements for the Fund for an additional one-year period. These agreements include the investment advisory agreement between Nuveen Asset Management (“NAM”) and the Fund and the sub-advisory agreement between NAM and INTECH Investment Management LLC (the “Sub-Adviser”). In preparation for their considerations at the May Meeting, the Board also held a separate meeting on April 21-22, 2010 (the “April Meeting”). Accordingly, the factors considered and determinations made regarding the renewals by the Independent Board Members include those made at the April Meeting.
In addition, in evaluating the advisory agreement (the “Investment Management Agreement”) and the sub-advisory agreement (the “Sub-advisory Agreement,” and the Investment Management Agreement and Sub-advisory Agreement are each an “Advisory Agreement”), the Independent Board Members reviewed a broad range of information relating to the Fund, NAM and the Sub-Adviser (NAM and the Sub-Adviser are each a “Fund Adviser”), including absolute and comparative performance, fee and expense information for the Fund (as described in more detail below), the profitability of Nuveen for its advisory activities (which includes its wholly owned subsidiaries), and other information regarding the organization, personnel, and services provided by the respective Fund Adviser. The Independent Board Members also met quarterly as well as at other times as the need arose during the year and took into account the information provided at such meetings and the knowledge gained therefrom. Prior to approving the renewal of the Advisory Agreements, the Independent Board Members reviewed the foregoing information with their independent legal counsel and with management, reviewed materials from independent legal counsel describing applicable law and their duties in reviewing advisory contracts, and met with independent legal counsel in private sessions without management present. The Independent Board Members considered the legal advice provided by independent legal counsel and relied upon their knowledge of the Fund Adviser, its services and the Fund resulting from their meetings and other interactions throughout the year and their own business judgment in determining the factors to be considered in evaluating the Advisory Agreements. Each Board Member may have accorded different weight to the various factors in reaching his or her conclusions with respect to the Fund’s Advisory Agreements. The Independent Board Members did not identify any single factor as all-important or controlling. The Independent Board Members’ considerations were instead based on a comprehensive consideration of all the information presented. The principal factors considered by the Board and its conclusions are described below.
| |
| A. | Nature, Extent and Quality of Services |
In considering renewal of the Advisory Agreements, the Independent Board Members considered the nature, extent and quality of the Fund Adviser’s services, including advisory services and administrative services. The Independent Board Members reviewed materials outlining, among other things, the Fund Adviser’s organization and business; the types of services that the Fund Adviser or its affiliates provide and are expected to provide to the Fund; the performance record of the Fund (as described in further detail below); and any initiatives Nuveen had taken for the applicable fund product line, including continued activities to refinance auction rate preferred
Annual Investment Management
Agreement Approval Process (Unaudited) (continued)
securities, manage leverage during periods of market turbulence and implement an enhanced leverage management process, modify investment mandates in light of market conditions and seek shareholder approval as necessary, maintain the fund share repurchase program and maintain shareholder communications to keep shareholders apprised of Nuveen’s efforts in refinancing preferred shares. In addition to the foregoing, the Independent Board Members also noted the additional services that NAM or its affiliates provide to closed-end funds, including, in particular, Nuveen’s continued commitment to supporting the secondary market for the common shares of its closed-end funds through a variety of programs designed to raise investor and analyst awareness and understanding of closed-end funds. These efforts include maintaining an investor relations program to provide timely information and education to financial advisers and investors; providing marketing for the closed-end funds; maintaining and enhancing a closed-end fund website; participating in conferences and having direct communications with analysts and financial advisors.
As part of their review, the Independent Board Members also evaluated the background, experience and track record of the Fund Adviser’s investment personnel. In this regard, the Independent Board Members considered any changes in the personnel, and the impact on the level of services provided to the Fund, if any. The Independent Board Members also reviewed information regarding portfolio manager compensation arrangements to evaluate the Fund Adviser’s ability to attract and retain high quality investment personnel, preserve stability, and reward performance but not provide an incentive for taking undue risks.
In addition to advisory services, the Independent Board Members considered the quality of administrative services provided by NAM and its affiliates including product management, fund administration, oversight of service providers, shareholder services, administration of Board relations, regulatory and portfolio compliance and legal support. Given the importance of compliance, the Independent Board Members also considered NAM’s compliance program, including the report of the chief compliance officer regarding the Fund’s compliance policies and procedures.
The Independent Board Members also considered NAM’s oversight of the performance, business activities and compliance of the Sub-Adviser. In that regard, the Independent Board Members reviewed an evaluation of the Sub-Adviser from NAM. The evaluation also included information relating to the Sub-Adviser’s organization, operations, personnel, assets under management, investment philosophy, strategies and techniques in managing the Fund, developments affecting the Sub-Adviser, and an analysis of the Sub-Adviser. As described in further detail below, the Board also considered the performance of the Fund. In addition, the Board recognized that the Sub-advisory Agreement was essentially an agreement for portfolio management services only and the Sub-Adviser was not expected to supply other significant administrative services to the Fund. As part of their oversight, the Independent Board Members also continued their program of seeking to visit each sub-adviser to the Nuveen funds at least once over a multiple year rotation, meeting with key investment and business personnel. The Independent Board Members noted that NAM recommended the renewal of the Sub-advisory Agreement and considered the basis for such recommendations.
Based on their review, the Independent Board Members found that, overall, the nature, extent and quality of services provided (and expected to be provided) to the Fund under the Investment Management Agreement or Sub-advisory Agreement, as applicable, were satisfactory.
| |
| B. | The Investment Performance of the Fund and Fund Advisers |
The Board considered the performance results of the Fund over various time periods. The Board reviewed, among other things, the Fund’s historic investment performance as well as information comparing the Fund’s performance information with that of other funds (the “Performance Peer Group”) based on data provided by an independent provider of mutual fund data and with recognized and/or customized benchmarks. In this regard, the performance information the Board reviewed included the Fund’s total return information compared to the returns of its Performance Peer Group and recognized and/or customized benchmarks for the quarter and one-year periods ending December 31, 2009 and for the quarter, one-year and three-year periods ending March 31, 2010. The Independent Board Members also reviewed historic premium and discount levels, including a summary of actions taken to date for the Fund. This information supplemented the Fund performance information provided to the Board at each of its quarterly meetings.
In reviewing peer comparison information, the Independent Board Members recognized that he Performance Peer Group of certain funds may not adequately represent the objectives and strategies of the funds, thereby limiting the usefulness of comparing a fund’s performance with that of its Performance Peer Group. Based on
their review, the Independent Board Members determined that the Fund’s investment performance over time had been satisfactory. More specifically, the Board noted that the performance of the Fund over time was satisfactory compared to peers, falling within the second or third quartile over various periods.
| |
| C. | Fees, Expenses and Profitability |
1. Fees and Expenses
The Board evaluated the management fees and expenses of the Fund reviewing, among other things, the Fund’s gross management fees, net management fees and net expense ratios in absolute terms as well as compared to the fee and expenses of a comparable universe of funds based on data provided by an independent fund data provider (the “Peer Universe”) and in certain cases, to a more focused subset of funds in the Peer Universe (the “Peer Group”) and any expense limitations.
The Independent Board Members further reviewed the methodology regarding the construction of the applicable Peer Universe and/or Peer Group. In reviewing the comparisons of fee and expense information, the Independent Board Members took into account that in certain instances various factors such as: the asset level of a fund relative to peers; the limited size and particular composition of the Peer Universe or Peer Group; the investment objectives of the peers; expense anomalies; changes in the funds comprising the Peer Universe or Peer Group from year to year; levels of reimbursement; the timing of information used; and the differences in the type and use of leverage may impact the comparative data, thereby limiting the ability to make a meaningful comparison with peers.
In reviewing the fee schedule for the Fund, the Independent Board Members also considered the fund-level and complex-wide breakpoint schedules (described in further detail below) and any fee waivers and reimbursements provided by Nuveen (applicable, in particular, for certain closed-end funds launched since 1999). The Independent Board Members noted that the Fund had net management fees and/or a net expense ratio below the peer average of its Peer Group or Peer Universe.
Based on their review of the fee and expense information provided, the Independent Board Members determined that the Fund’s management fees were reasonable in light of the nature, extent and quality of services provided to the Fund.
2. Comparisons with the Fees of Other Clients
The Independent Board Members further reviewed information regarding the nature of services and fee rates offered by NAM to other clients. Such clients include separately managed accounts (both retail and institutional accounts), foreign investment funds offered by Nuveen and funds that are not offered by Nuveen but are sub-advised by one of Nuveen’s investment management teams. In evaluating the comparisons of fees, the Independent Board Members noted that the fee rates charged to the Fund and other clients vary, among other things, because of the different services involved and the additional regulatory and compliance requirements associated with registered investment companies, such as the Fund. Accordingly, the Independent Board Members considered the differences in the product types, including, but not limited to, the services provided, the structure and operations, product distribution and costs thereof, portfolio investment policies, investor profiles, account sizes and regulatory requirements. The Independent Board Members noted, in particular, that the range of services provided to the Fund (as discussed above) is much more extensive than that provided to separately managed accounts. Given the inherent differences in the products, particularly the extensive services provided to the Fund, the Independent Board Members believe such facts justify the different levels of fees.
In considering the fees of the Sub-Adviser, the Independent Board Members also considered the pricing schedule or fees that the Sub-Adviser charges for similar investment management services for other fund sponsors or clients (such as retail and/or institutional managed accounts) as applicable. The Independent Board Members noted that such fees were the result of arm’s-length negotiations.
3. Profitability of Fund Advisers
In conjunction with its review of fees, the Independent Board Members also considered the profitability of Nuveen for its advisory activities (which incorporated Nuveen’s wholly-owned affiliated sub-advisers) and its financial condition. The Independent Board Members reviewed the revenues and expenses of Nuveen’s advisory activities for the last two years, the allocation methodology used in preparing the profitability data
Annual Investment Management
Agreement Approval Process (Unaudited) (continued)
and an analysis of the key drivers behind the changes in revenues and expenses that impacted profitability in 2009. The Independent Board Members noted this information supplemented the profitability information requested and received during the year to help keep them apprised of developments affecting profitability (such as changes in fee waivers and expense reimbursement commitments). In this regard, the Independent Board Members noted that they had also appointed an Independent Board Member as a point person to review and keep them apprised of changes to the profitability analysis and/or methodologies during the year. The Independent Board Members also considered Nuveen’s revenues for advisory activities, expenses, and profit margin compared to that of various unaffiliated management firms with similar amounts of assets under management and relatively comparable asset composition prepared by Nuveen.
In reviewing profitability, the Independent Board Members recognized the subjective nature of determining profitability which may be affected by numerous factors including the allocation of expenses. Further, the Independent Board Members recognized the difficulties in making comparisons as the profitability of other advisers generally is not publicly available and the profitability information that is available for certain advisers or management firms may not be representative of the industry and may be affected by, among other things, the adviser’s particular business mix, capital costs, types of funds managed and expense allocations. Notwithstanding the foregoing, the Independent Board Members reviewed Nuveen’s methodology and assumptions for allocating expenses across product lines to determine profitability. In reviewing profitability, the Independent Board Members recognized Nuveen’s investment in its fund business.
Based on their review, the Independent Board Members concluded that Nuveen’s level of profitability for its advisory activities was reasonable in light of the services provided. The Independent Board Members also considered the Sub-Adviser’s revenues, expenses and profitability margins (pre- and post-tax). Based on their review, the Independent Board Members were satisfied that the Sub-Adviser’s level of profitability was reasonable in light of the services provided.
In evaluating the reasonableness of the compensation, the Independent Board Members also considered other amounts paid to a Fund Adviser by the Fund as well as any indirect benefits (such as soft dollar arrangements, if any) the Fund Adviser and its affiliates receive, or are expected to receive, that are directly attributable to the management of the Fund, if any. See Section E below for additional information on indirect benefits a Fund Adviser may receive as a result of its relationship with the Fund. Based on their review of the overall fee arrangements of the Fund, the Independent Board Members determined that the advisory fees and expenses of the Fund were reasonable.
| |
| D. | Economies of Scale and Whether Fee Levels Reflect These Economies of Scale |
With respect to economies of scale, the Independent Board Members have recognized the potential benefits resulting from the costs of a fund being spread over a larger asset base, although economies of scale are difficult to measure and predict with precision, particularly on a fund-by-fund basis. One method to help ensure the shareholders share in these benefits is to include breakpoints in the advisory fee schedule. Generally, management fees for funds in the Nuveen complex are comprised of a fund-level component and a complex-level component, subject to certain exceptions. Accordingly, the Independent Board Members reviewed and considered the applicable fund-level breakpoints in the advisory fee schedules that reduce advisory fees as asset levels increase. Further, the Independent Board Members noted that although closed-end funds may from time to time make additional share offerings, the growth of their assets will occur primarily through the appreciation of such funds’ investment portfolio.
In addition to fund-level advisory fee breakpoints, the Board also considered the Fund’s complex-wide fee arrangement. Pursuant to the complex-wide fee arrangement, the fees of the funds in the Nuveen complex are generally reduced as the assets in the fund complex reach certain levels. The complex-wide fee arrangement seeks to provide the benefits of economies of scale to fund shareholders when total fund complex assets increase, even if assets of a particular fund are unchanged or have decreased. The approach reflects the notion that some of Nuveen’s costs are attributable to services provided to all its funds in the complex and therefore all funds benefit if these costs are spread over a larger asset base.
Based on their review, the Independent Board Members concluded that the breakpoint schedules and complex-wide fee arrangement were acceptable and reflect economies of scale to be shared with shareholders when assets under management increase.
In evaluating fees, the Independent Board Members received and considered information regarding potential “fall out” or ancillary benefits the respective Fund Adviser or its affiliates may receive as a result of its relationship with the Fund. In this regard, the Independent Board Members considered any revenues received by affiliates of NAM for serving as agent at Nuveen’s trading desk and as co-manager in initial public offerings of new closed-end funds.
In addition to the above, the Independent Board Members considered whether each Fund Adviser received any benefits from soft dollar arrangements whereby a portion of the commissions paid by the Fund for brokerage may be used to acquire research that may be useful to the Fund Adviser in managing the assets of the Fund and other clients. With respect to NAM, the Independent Board Members noted that NAM does not currently have any soft dollar arrangements; however, to the extent certain bona fide agency transactions that occur on markets that traditionally trade on a principal basis and riskless principal transactions are considered as generating “commissions,” NAM intends to comply with the applicable safe harbor provisions. With respect to the Sub-Adviser, the Independent Board Members considered that the Sub-Adviser does not participate in soft dollar arrangements. It may, however, pay higher commissions for execution services as permitted under applicable law.
Based on their review, the Independent Board Members concluded that any indirect benefits received by a Fund Adviser as a result of its relationship with the Fund were reasonable and within acceptable parameters.
The Independent Board Members did not identify any single factor discussed previously as all-important or controlling. The Board Members, including the Independent Board Members, unanimously concluded that the terms of the Investment Management Agreement and Sub-advisory Agreement are fair and reasonable, that the respective Fund Adviser’s fees are reasonable in light of the services provided to the Fund and that the Investment Management Agreement and the Sub-advisory Agreement be renewed.
Board Approval of Sub-Advisory Arrangement
with Nuveen Asset Management, LLC (Unaudited)
Since the May Meeting, Nuveen has engaged in an internal restructuring (the “Restructuring”) pursuant to which the portfolio management services provided by NAM to the Fund would be transferred to Nuveen Asset Management, LLC (“NAM LLC”), a newly-organized wholly-owned subsidiary of NAM and NAM would change its name to Nuveen Fund Advisors, Inc. (“NFA”). NAM, under its new name NFA, will continue to serve as investment adviser to the Fund and, in that capacity, will continue to provide various oversight, administrative, compliance and other services. To effectuate the foregoing, NFA will enter into a sub-advisory agreement with NAM LLC on behalf of the Fund (the “NAM LLC Sub-Advisory Agreement”). Under the NAM LLC Sub-Advisory Agreement, NAM LLC, subject to the oversight of NFA and the Board, will furnish an investment program, make investment decisions for, and place all orders for the purchase and sale of securities for the portion of the Fund’s investment portfolio allocated to it by NFA. The Restructuring will not result in any change to the INTECH Sub-Advisory Agreement. In addition, there will be no change in the advisory fees paid by the Fund. Rather, NFA will pay a portion of the investment advisory fee it receives to NAM LLC for its sub-advisory services. The Independent Board Members reviewed the allocation of fees between NFA and NAM LLC. NFA and NAM LLC do not anticipate any reduction in the nature or level of services provided to the Fund following the Restructuring. The personnel of NFA who engaged in portfolio management activities prior to the spinoff of NAM LLC are not expected to materially change as a result of the spinoff. In light of the foregoing, at a meeting held on November 16-18, 2010, the Board Members, including a majority of the Independent Board Members, approved the NAM LLC Sub-Advisory Agreement on behalf of the Fund. Given that the Restructuring was not expected to reduce the level or nature of services provided and the advisory fees paid by the Fund were the same, the factors considered and determinations made at the May Meeting in approving the Advisory Agreement were equally applicable to the approval of the NAM LLC Sub-Advisory Agreement. For a discussion of these considerations, please see the shareholder report of the Fund that was first issued after the May Meeting for the period including May 2010.
Reinvest Automatically
Easily and Conveniently
Nuveen makes reinvesting easy. A phone call is all it takes to set up your reinvestment account.
Nuveen Closed-End Funds Automatic Reinvestment Plan
Your Nuveen Closed-End Fund allows you to conveniently reinvest distributions in additional Fund shares.
By choosing to reinvest, you’ll be able to invest money regularly and automatically, and watch your investment grow through the power of compounding. Just like distributions in cash, there may be times when income or capital gains taxes may be payable on distributions that are reinvested.
It is important to note that an automatic reinvestment plan does not ensure a profit, nor does it protect you against loss in a declining market.
Easy and convenient
To make recordkeeping easy and convenient, each quarter you’ll receive a statement showing your total distributions, the date of investment, the shares acquired and the price per share, and the total number of shares you own.
How shares are purchased
The shares you acquire by reinvesting will either be purchased on the open market or newly issued by the Fund. If the shares are trading at or above net asset value at the time of valuation, the Fund will issue new shares at the greater of the net asset value or 95% of the then-current market price. If the shares are trading at less than net asset value, shares for your account will be purchased on the open market. If the Plan Agent begins purchasing Fund shares on the open market while shares are trading below net asset value, but the Fund’s shares subsequently trade at or above their net asset value before the Plan Agent is able to complete its purchases, the Plan Agent may cease open-market purchases and may invest the uninvested portion of the distribution in newly-issued Fund shares at a price equal to the greater of the shares’ net asset value or 95% of the shares’ market value on the last business day immediately prior to the purchase date. Distributions received to purchase shares in the open market will normally be invested shortly after the distribution payment date. No interest will be paid on distributions awaiting reinvestment. Because the market price of the shares may increase before purchases are completed, the average purchase price per share may exceed the market price at the time of valuation, resulting in the acquisition of fewer shares than if the distribution had been paid in shares issued by the Fund. A pro rata portion of any applicable brokerage commissions on open market purchases will be paid by Plan participants. These commissions usually will be lower than those charged on individual transactions.
Flexible
You may change your distribution option or withdraw from the Plan at any time, should your needs or situation change.
You can reinvest whether your shares are registered in your name, or in the name of a brokerage firm, bank, or other nominee. Ask your financial advisor if his or her firm will participate on your behalf. Participants whose shares are registered in the name of one firm may not be able to transfer the shares to another firm and continue to participate in the Plan.
The Fund reserves the right to amend or terminate the Plan at any time. Although the Fund reserves the right to amend the Plan to include a service charge payable by the participants, there is no direct service charge to participants in the Plan at this time.
Call today to start reinvesting distributions
For more information on the Nuveen Automatic Reinvestment Plan or to enroll in or withdraw from the Plan, speak with your financial advisor or call us at (800) 257-8787.
Glossary of Terms
Used in this Report
| |
| n | Average Annual Total Return: This is a commonly used method to express an investment’s performance over a particular, usually multi-year time period. It expresses the return that would have been necessary each year to equal the investment’s actual cumulative performance (including change in NAV or market price and reinvested dividends and capital gains distributions, if any) over the time period being considered. |
| |
| n | Current Distribution Rate: Market yield is based on the Fund’s current annualized quarterly distribution divided by the Fund’s current market price. The Fund’s quarterly distributions to its shareholders may be comprised of ordinary income, net realized capital gains and, if at the end of the calendar year the Fund’s cumulative net ordinary income and net realized gains are less than the amount of the Fund’s distributions, a tax return of capital. |
| |
| n | Net Asset Value (NAV): A Fund’s NAV per share is calculated by subtracting the liabilities of the Fund from its total assets and then dividing the remainder by the number of shares outstanding. Fund NAVs are calculated at the end of each business day. |
Board of Trustees
John P. Amboian
Robert P. Bremner
Jack B. Evans
William C. Hunter
David J. Kundert
William J. Schneider
Judith M. Stockdale
Carole E. Stone
Virginia L. Stringer
Terence J. Toth
Fund Manager
Nuveen Fund Advisors, Inc.
333 West Wacker Drive
Chicago, IL 60606
Custodian
State Street Bank & Trust Company
Boston, MA
Transfer Agent and
Shareholder Services
State Street Bank & Trust Company
Nuveen Funds
P.O. Box 43071
Providence, RI 02940-3071
(800) 257-8787
Legal Counsel
Chapman and Cutler LLP
Chicago, IL
Independent Registered
Public Accounting Firm
PricewaterhouseCoopers LLP
Chicago, IL
Quarterly Portfolio of Investments and Proxy Voting Information
You may obtain (i) the Fund’s quarterly portfolio of investments, (ii) information regarding how the Fund voted proxies relating to portfolio securities held during the most recent twelve-month period ended June 30, and (iii) a description of the policies and procedures that the Fund used to determine how to vote proxies relating to portfolio securities without charge, upon request, by calling Nuveen Investments toll-free at (800) 257-8787 or on Nuveen’s website at www.nuveen.com.
You may also obtain this and other Fund information directly from the Securities and Exchange Commission (SEC). The SEC may charge a copying fee for this information. Visit the SEC on-line at http://www.sec.gov or in person at the SEC’s Public Reference Room in Washington, D.C. Call the SEC at (202) 942-8090 for room hours and operation. You may also request Fund information by sending an e-mail request to publicinfo@sec.gov or by writing to the SEC’s Public Reference Section at 100 F Street NE, Washington, D.C. 20549.
CEO Certification Disclosure
The Fund’s Chief Executive Officer has submitted to the New York Stock Exchange (NYSE) the annual CEO certification as required by Section 303A.12(a) of the NYSE Listed Company Manual.
The Fund has filed with the SEC the certification of its Chief Executive Officer and Chief Financial Officer required by Section 302 of the Sarbanes-Oxley Act.
Distribution Information
The Fund hereby designates its percentages of dividends paid from net ordinary income as dividends qualifying for the 70% dividends received deduction (DRD) for corporations and their percentages as qualified dividend income (QDI) for individuals under Section 1 (h)(11) of the Internal Revenue Code as shown in the accompanying table. The actual qualified dividend income distributions will be reported to shareholders on Form 1099-DIV which will be sent to shareholders shortly after calendar year end.
| | | | | | | | | |
| | | % of DRD | | % of QDI |
| JCE | | | 25.84 | % | | | 25.76 | % |
| | | | | | | | | |
Common Share Information
The Fund intends to repurchase shares of its own common stock in the future at such times and in such amounts as is deemed advisable. During the period covered by this report, the Fund repurchased shares of its common stock as shown in the accompanying table.
| | | | | | | | | |
| | | | | Common Shares
|
| | | | | Repurchased |
| JCE | | | | | | | 7,100 | |
| | | | | | | | | |
Any future repurchases will be reported to shareholders in the next annual or semi-annual report.
Nuveen Investments:
Serving Investors for Generations
Since 1898, financial advisors and their clients have relied on Nuveen Investments to provide dependable investment solutions through continued adherence to proven, longterm investing principles. Today, we offer a range of high quality equity and fixed-income solutions designed to be integral components of a well-diversified core portfolio.
Focused on meeting investor needs.
Nuveen Investments is a global investment management firm that seeks to help secure the long-term goals of institutions and high net worth investors as well as the consultants and financial advisors who serve them. We market our growing range of specialized investment solutions under the high-quality brands of HydePark, NWQ, Nuveen Asset Management, Santa Barbara, Symphony, Tradewinds and Winslow Capital. In total, Nuveen Investments managed approximately $195 billion of assets as of December 31, 2010.
Find out how we can help you.
To learn more about how the products and services of Nuveen Investments may be able to help you meet your financial goals, talk to your financial advisor, or call us at (800) 257-8787. Please read the information provided carefully before you invest. Investors should consider the investment objective and policies, risk considerations, charges and expenses of any investment carefully. Where applicable, be sure to obtain a prospectus, which contains this and other relevant information. To obtain a prospectus, please contact your securities representative or Nuveen Investments, 333 W. Wacker Dr., Chicago, IL 60606. Please read the prospectus carefully before you invest or send money.
Learn more about Nuveen Funds at: www.nuveen.com/cef
Nuveen makes things e-simple.
It only takes a minute to sign up for e-Reports. Once enrolled, you’ll receive an e-mail as soon as your Nuveen Fund information is ready—no more waiting for delivery by regular mail. Just click on the link within the e-mail to see the report and save it on your computer if you wish.
Free e-Reports right to your e-mail!
www.investordelivery.com
If you receive your Nuveen Fund distributions and statements from your financial advisor or brokerage account.
OR
www.nuveen.com/accountaccess
If you receive your Nuveen Fund distributions and statements directly from Nuveen.
| | | | | |
Distributed by
Nuveen Investments, LLC
333 West Wacker Drive
Chicago, IL 60606
www.nuveen.com | | | | |
EAN-I-1210D
ITEM 2. CODE OF ETHICS.
As of the end of the period covered by this report, the registrant has adopted a code of ethics that applies to the registrant’s principal executive officer, principal financial officer, principal accounting officer or controller, or persons performing similar functions. There were no amendments to or waivers from the Code during the period covered by this report. The registrant has posted the code of ethics on its website at www.nuveen.com/CEF/Info/Shareholder/. (To view the code, click on Fund Governance and then click on Code of Conduct.)
ITEM 3. AUDIT COMMITTEE FINANCIAL EXPERT.
The registrant’s Board of Directors or Trustees (“Board”) determined that the registrant has at least one “audit committee financial expert” (as defined in Item 3 of Form N-CSR) serving on its Audit Committee. As of January 1, 2011, registrant’s audit committee financial expert is Carole E. Stone, who is “independent” for purposes of Item 3 of Form N-CSR.
Ms. Stone served for five years as Director of the New York State Division of the Budget. As part of her role as Director, Ms. Stone was actively involved in overseeing the development of the State’s operating, local assistance and capital budgets, its financial plan and related documents; overseeing the development of the State’s bond-related disclosure documents and certifying that they fairly presented the State’s financial position; reviewing audits of various State and local agencies and programs; and coordinating the State’s system of internal audit and control. Prior to serving as Director, Ms Stone worked as a budget analyst/examiner with increasing levels of responsibility over a 30 year period, including approximately five years as Deputy Budget Director. Ms. Stone has also served as Chair of the New York State Racing Association Oversight Board, as Chair of the Public Authorities Control Board, as a Commissioner on the New York State Commission on Public Authority Reform and as a member of the Boards of Directors of several New York State public authorities. These positions have involved overseeing operations and finances of certain entities and assessing the adequacy of project/entity financing and financial reporting. Currently, Ms. Stone is on the Board of Directors of CBOE Holdings, Inc., of the Chicago Board Options Exchange, and of C2 Options Exchange. Ms. Stone’s position on the boards of these entities and as a member of both CBOE Holdings’ Audit Committee and its Finance Committee has involved, among other things, the oversight of audits, audit plans and preparation of financial statements.
ITEM 4. PRINCIPAL ACCOUNTANT FEES AND SERVICES.
NUVEEN CORE EQUITY ALPHA FUND
The following tables show the amount of fees that PricewaterhouseCoopers LLP, the Fund’s auditor, billed to the Fund during the Fund’s last two full fiscal years. For engagements with PricewaterhouseCoopers LLP the Audit Committee approved in advance all audit services and non-audit services that PricewaterhouseCoopers LLP provided to the Fund, except for those non-audit services that were subject to the pre-approval exception under Rule 2-01 of Regulation S-X (the “pre-approval exception”). The pre-approval exception for services provided directly to the Fund waives the pre-approval requirement for services other than audit, review or attest services if: (A) the aggregate amount of all such services provided constitutes no more than 5% of the total amount of revenues paid by the Fund to its accountant during the fiscal year in which the services are provided; (B) the Fund did not recognize the services as non-audit services at the time of the engagement; and (C) the services are promptly brought to the Audit Committee’s attention, and the Committee (or its delegate) approves the services before the audit is completed.
The Audit Committee has delegated certain pre-approval responsibilities to its Chairman (or, in his absence, any other member of the Audit Committee).
SERVICES THAT THE FUND’S AUDITOR BILLED TO THE FUND
| | | | | | | | | | | | | | | | | |
| | | Audit Fees Billed | | | Audit-Related Fees | | | Tax Fees | | | All Other Fees | |
| Fiscal Year Ended | | to Fund 1 | | | Billed to Fund 2 | | | Billed to Fund 3 | | | Billed to Fund 4 | |
| |
| December 31, 2010 | | $ | 25,273 | | | $ | 0 | | | $ | 2,840 | | | $ | 0 | |
| |
| | | | | | | | | | | | | | | | | |
| Percentage approved pursuant to pre-approval exception | | | 0 | % | | | 0 | % | | | 0 | % | | | 0 | % |
| |
| | | | | | | | | | | | | | | | | |
| |
| December 31, 2009 | | $ | 17,227 | | | $ | 0 | | | $ | 2,750 | | | $ | 0 | |
| |
| | | | | | | | | | | | | | | | | |
| Percentage approved pursuant to pre-approval exception | | | 0 | % | | | 0 | % | | | 0 | % | | | 0 | % |
| |
| | |
| 1 | | “Audit Fees” are the aggregate fees billed for professional services for the audit of the Fund’s annual financial statements and services provided in connection with statutory and regulatory filings or engagements. |
| |
| 2 | | “Audit Related Fees” are the aggregate fees billed for assurance and related services reasonably related to the performance of the audit or review of financial statements and are not reported under “Audit Fees”. |
| |
| 3 | | “Tax Fees” are the aggregate fees billed for professional services for tax advice, tax compliance, and tax planning. |
| |
| 4 | | “All Other Fees” are the aggregate fees billed for products and services for agreed upon procedures engagements performed for leveraged funds. |
SERVICES THAT THE FUND’S AUDITOR BILLED TO THE
ADVISER AND AFFILIATED FUND SERVICE PROVIDERS
The following tables show the amount of fees billed by PricewaterhouseCoopers LLP to Nuveen Fund Advisors, Inc. (formerly Nuveen Asset Management) (the “Adviser”), and any entity controlling, controlled by or under common control with the Adviser that provides ongoing services to the Fund (“Affiliated Fund Service Provider”), for engagements directly related to the Fund’s operations and financial reporting, during the Fund’s last two full fiscal years.
The tables also show the percentage of fees subject to the pre-approval exception. The pre-approval exception for services provided to the Adviser and any Affiliated Fund Service Provider (other than audit, review or attest services) waives the pre-approval requirement if: (A) the aggregate amount of all such services provided constitutes no more than 5% of the total amount of revenues paid to PricewaterhouseCoopers LLP by the Fund, the Adviser and Affiliated Fund Service Providers during the fiscal year in which the services are provided that would have to be pre-approved by the Audit Committee; (B) the Fund did not recognize the services as non-audit services at the time of the engagement; and (C) the services are promptly brought to the Audit Committee’s attention, and the Committee (or its delegate) approves the services before the Fund’s audit is completed.
| | | | | | | | | | | | | |
| | | Audit-Related Fees | | | Tax Fees Billed to | | | All Other Fees | |
| | | Billed to Adviser and | | | Adviser and | | | Billed to Adviser | |
| | | Affiliated Fund | | | Affiliated Fund | | | and Affiliated Fund | |
| Fiscal Year Ended | | Service Providers | | | Service Providers | | | Service Providers | |
| |
| December 31, 2010 | | $ | 0 | | | $ | 0 | | | $ | 0 | |
| |
| | | | | | | | | | | | | |
| Percentage approved pursuant to pre-approval exception | | | 0 | % | | | 0 | % | | | 0 | % |
| |
| | | | | | | | | | | | | |
| December 31, 2009 | | $ | 0 | | | $ | 0 | | | $ | 0 | |
| |
| | | | | | | | | | | | | |
| Percentage approved pursuant to pre-approval exception | | | 0 | % | | | 0 | % | | | 0 | % |
| |
NON-AUDIT SERVICES
The following table shows the amount of fees that PricewaterhouseCoopers LLP billed during the Fund’s last two full fiscal years for non-audit services. The Audit Committee is required to pre-approve non-audit services that PricewaterhouseCoopers LLP provides to the Adviser and any Affiliated Fund Services Provider, if the engagement related directly to the Fund’s operations and financial reporting (except for those subject to the pre-approval exception described above). The Audit Committee requested and received information from PricewaterhouseCoopers LLP about any non-audit services that PricewaterhouseCoopers LLP rendered during the Fund’s last fiscal year to the Adviser and any Affiliated Fund Service Provider. The Committee considered this information in evaluating PricewaterhouseCoopers LLP’s independence.
| | | | | | | | | | | | | | | | | |
| | | | | | | Total Non-Audit Fees | | | | | | | |
| | | | | | | billed to Adviser and | | | | | | | |
| | | | | | | Affiliated Fund Service | | | Total Non-Audit Fees | | | | |
| | | | | | | Providers (engagements | | | billed to Adviser and | | | | |
| | | | | | | related directly to the | | | Affiliated Fund Service | | | | |
| | | Total Non-Audit Fees | | | operations and financial | | | Providers (all other | | | | |
| Fiscal Year Ended | | Billed to Fund | | | reporting of the Fund) | | | engagements) | | | Total | |
| |
| December 31, 2010 | | $ | 2,840 | | | $ | 0 | | | $ | 0 | | | $ | 2,840 | |
| December 31, 2009 | | $ | 2,750 | | | $ | 0 | | | $ | 0 | | | $ | 2,750 | |
“Non-Audit Fees billed to Fund” for both fiscal year ends represent “Tax Fees” and “All Other Fees” billed to Fund in their respective amounts from the previous table.
Audit Committee Pre-Approval Policies and Procedures. Generally, the Audit Committee must approve (i) all non-audit services to be performed for the Fund by the Fund’s independent accountants and (ii) all audit and non-audit services to be performed by the Fund’s independent accountants for the Affiliated Fund Service Providers with respect to operations and financial reporting of the Fund. Regarding tax and research projects conducted by the independent accountants for the Fund and Affiliated Fund Service Providers (with respect to operations and financial reports of the Fund) such engagements will be (i) pre-approved by the Audit Committee if they are expected to be for amounts greater than $10,000; (ii) reported to the Audit Committee chairman for his verbal approval prior to engagement if they are expected to be for amounts under $10,000 but greater than $5,000; and (iii) reported to the Audit Committee at the next Audit Committee meeting if they are expected to be for an amount under $5,000.
ITEM 5. AUDIT COMMITTEE OF LISTED REGISTRANTS.
The registrant’s Board has a separately designated Audit Committee established in accordance with Section 3(a)(58)(A) of the Securities Exchange Act of 1934, as amended (15 U.S.C. 78c(a)(58)(A)). As of January 1, 2011, members of the audit committee are Robert P. Bremner, David J. Kundert, William J. Schneider, Carole E. Stone and Terence J. Toth.
ITEM 6. SCHEDULE OF INVESTMENTS.
| | (a) | | See Portfolio of Investments in Item 1. |
| |
| | (b) | | Not applicable. |
ITEM 7. DISCLOSURE OF PROXY VOTING POLICIES AND PROCEDURES FOR CLOSED-END MANAGEMENT INVESTMENT COMPANIES.
The Adviser, Nuveen Fund Advisors, Inc., has engaged Nuveen Asset Management, LLC (“NAM”) and INTECH Investment Management LLC (“INTECH”, and collectively with NAM, the “Sub-Advisers”) to provide discretionary investment advisory services to the Fund. As part of these services, the Adviser has also delegated to INTECH the full responsibility for proxy voting and related duties in accordance with INTECH’s policy and procedures. The Adviser periodically will monitor INTECH’s voting to ensure that they are carrying out their duties.
INTECH has engaged Institutional Shareholder Services Inc. (“ISS”) to vote all Fund proxies in accordance with the ISS’s Benchmark Proxy Voting Guidelines (“ISS Recommendations”). Concurrent with the adoption of these procedures, INTECH will not accept direction in the voting of proxies for which it has voting responsibility from any person or organization other than the ISS Recommendations. INTECH has engaged the services of the Janus Investment Accounting Operations Group to provide the administration for its proxy voting. INTECH has adopted procedures and controls to avoid conflicts of interest that may arise in connection with proxy voting.
In light of INTECH’s policies, it is not expected that any conflicts will arise in the proxy voting process. In the unusual circumstance that ISS seeks direction on any matter or INTECH is otherwise in a position of evaluating a proposal on a case-by-case basis, the matter shall be referred to the INTECH Chief Compliance Officer to determine whether a material conflict exists. The matter will be reviewed by INTECH’s General Counsel, Chief Financial Officer and Chief Compliance Officer (“Proxy Review Group”). To the extent that a conflict of interest is identified, INTECH will vote the proxy according to the ISS recommendation unless otherwise determined by the Proxy Review Group and INTECH will report the resolution of the vote to the Fund’s Proxy Voting Committee.
ITEM 8. PORTFOLIO MANAGERS OF CLOSED-END MANAGEMENT INVESTMENT COMPANIES.
ITEM 8.
Nuveen Fund Advisors, Inc. (“NFA”) is the registrant’s investment adviser (NFA is also referred to as the “Adviser”.) NFA is responsible for the selection and on-going monitoring of the Fund’s investment portfolio, managing the Fund’s business affairs and providing certain clerical, bookkeeping and administrative services. The Adviser has engaged INTECH Investment Management LLC (“INTECH”) and Nuveen Asset Management, LLC (“NAM, LLC”) (INTECH and NAM, LLC are also collectively referred to as “Sub-Advisers”), as Sub-Advisers to provide discretionary investment advisory services. The following section provides information on the portfolio managers at each Sub-Adviser:
NAM, LLC
Item 8(a)(1). PORTFOLIO MANAGER BIOGRAPHIES
Messrs. Keith B. Hembre, CFA, David A. Friar and James Colon, CFA are primarily responsible for the day-to-day management of the portion of the registrant’s portfolio managed by NAM, LLC.
Mr. Hembre, Managing Director of Nuveen HydePark Group, LLC (HydePark) and Nuveen Asset Management, LLC, entered the financial services industry in 1992. He joined Nuveen Asset Management, LLC in January 2011 following the firm’s acquisition of a portion of the asset management business of FAF Advisors, Inc. (“FAF Advisors”) and currently serves as Nuveen Asset Management’s Chief Economist & Chief Investment Strategist. Mr. Hembre previously served in various positions with FAF Advisors since 1997 where he headed the team that managed the firm’s asset allocation, international equity, quantitative equity, and index products and most recently also served as Chief Economist and Chief Investment Strategist.
Mr. Friar, a Portfolio Manager of HydePark and Nuveen Asset Management, LLC since January 2011, entered the financial services industry in 1998. He joined Nuveen Asset Management, LLC in January 2011 following the firm’s acquisition of a portion of the asset management business of FAF Advisors. Mr. Friar previously served in various positions with FAF Advisors since 1999 where he served as a member of FAF’s Performance Measurement group.
Mr. Colon is a portfolio manager and senior quantitative analyst for HydePark and Nuveen Asset Management, LLC. His responsibilities include portfolio management, risk management and research, with a specific focus on asset allocation strategies. Prior to HydePark, he was a Vice President and Portfolio Manager at HydePark affiliate Nuveen Investment Solutions (“NIS”), where he managed the quantitative analysis underlying NIS’s asset allocation, alternative investment research, and risk management methods. He is a member of the CFA Institute, the CFA Society of Chicago, and the International Association of Financial Engineers.
Item 8(a)(2). OTHER ACCOUNTS MANAGED BY PORTFOLIO MANAGERS
| | | | | | | | | | | | | | | | | | | | | | | | | | | | | | | | | | | | | |
| | | | | | | | | | | | | | | | | | | | | | | | | | | (iii) Number of Other Accounts and | |
| | | | | | | (ii) Number of Other Accounts Managed | | | Assets for Which Advisory Fee is | |
| | | | | | | and Assets by Account Type | | | Performance-Based | |
| | | | | | | Other | | | | | | | | | | | | | | | | | | | | | | | | | |
| | | | | | | Registered | | | | | | | Other Pooled | | | | | | | | | | | Other | | | Other Pooled | | | | |
| (i) Name of | | | | | | Investment | | | | | | | Investment | | | | | | | Other | | | Registered Investment | | | Investment | | | Other | |
| Portfolio Manager | | | | | | Companies | | | | | | | Vehicles | | | | | | | Accounts | | | Companies | | | Vehicles | | | Accounts | |
| Keith Hembre | | | 8 | | | | 2,786,297,788 | | | | 1 | | | | 1,801,530 | | | | 16 | | | | 504,392,704 | | | NA | | NA | | NA |
| David Friar | | | 13 | | | | 994,397,788 | | | | 34 | | | $ | 1,166,912,000 | | | | 2 | | | $ | 150,000 | | | NA | | NA | | NA |
| James Colon | | | 8 | | | | 872,150,027 | | | | 1 | | | | 1,801,530 | | | | 16 | | | | 504,392,704 | | | NA | | NA | | NA |
POTENTIAL MATERIAL CONFLICTS OF INTEREST
The simultaneous management of the Fund and the other registered investment companies noted above by the Portfolio Managers may present actual or apparent conflicts of interest with respect to the allocation and aggregation of securities orders placed on behalf of the Fund and the other accounts.
NAM, LLC has adopted several policies that address potential conflicts of interest, including best execution and trade allocation policies that are designed to ensure (1) that portfolio management is seeking the best price for portfolio securities under the circumstances, (2) fair and equitable allocation of investment opportunities among accounts over time and (3) compliance with applicable regulatory requirements. All accounts are to be treated in a non-preferential manner, such that allocations are not based upon account performance, fee structure or preference of the portfolio manager. In addition, the NAM, LLC has adopted a Code of Conduct that sets forth policies regarding conflicts of interest.
Item 8(a)(3). FUND MANAGER COMPENSATION
Portfolio manager compensation consists primarily of base pay, an annual cash incentive and long term incentive payments.
Base pay is determined based upon an analysis of the portfolio manager’s general performance, experience, and market levels of base pay for such position. Portfolio managers are paid an annual cash incentive based upon investment performance, generally over the past one- and three-year periods unless the portfolio manager’s tenure is shorter. The maximum potential annual cash incentive is equal to a multiple of base pay, determined based upon the particular portfolio manager’s performance and experience, and market levels of base pay for such position.
The portion of the maximum potential annual cash incentive that is paid out is based upon performance relative to the portfolio’s benchmark and performance relative to an appropriate Lipper industry peer group. Generally, the threshold for payment of an annual cash incentive is (i) benchmark performance and (ii) median performance versus the peer group, and the maximum annual cash incentive is attained at (i) a spread over the benchmark which the Adviser believes will, over time, deliver top quartile performance and (ii) top quartile performance versus the Lipper industry peer group. Investment performance is measured on a pre-tax basis, gross of fees for a Fund’s results and for its Lipper industry peer group.
Payments pursuant to a long term incentive plan are paid to portfolio managers on an annual basis based upon general performance and expected contributions to the success of the Adviser.
Item 8(a)(4). OWNERSHIP OF JCE SECURITIES AS OF FEBRUARY 28, 2011
| | | | | | | | | | | | | | | |
| Name of | | | | | | | | | | | | | | |
| Portfolio Manager | | None | | $1 - $10,000 | | $10,001-$50,000 | | $50,001-$100,000 | | $100,001-$500,000 | | $500,001-$1,000,000 | | Over $1,000,000 |
| Keith Hembre | | X | | | | | | | | | | | | |
| David Friar | | X | | | | | | | | | | | | |
| James Colon | | X | | | | | | | | | | | | |
INTECH
Item 8(a)(1). PORTFOLIO MANAGER BIOGRAPHIES
No one person of the investment team is primarily responsible for implementing the investment strategies of the Fund. A team of investment professionals consisting of Dr. Robert Fernholz, Dr. Adrian Banner, and Joseph Runnels works together to implement the mathematical portfolio management process.
E. Robert Fernholz has been Chief Investment Officer (“CIO”) of INTECH since January 1991. Dr. Fernholz joined INTECH in June 1987. He received his A.B. in Mathematics from Princeton University and his Ph.D. in Mathematics from Columbia University. As CIO, Dr. Fernholz sets policy for the investment strategy, reviews proposed changes, and assures adherence to policy. Dr. Fernholz implements and supervises the optimization process.
Adrian Banner has been Co-Chief Investment Officer (“Co-CIO”) of INTECH since January 2009. Dr. Banner, previously Senior Investment Officer since September 2007 and Director of Research from August 2002 to August 2007, joined INTECH in 2002. He received his Ph.D. in Mathematics from Princeton University and holds a M.Sc. and B.Sc. in Mathematics from the University of New South Wales, Australia. Dr. Banner has delivered lectures on the stability of market capitalization at a number of academic and professional conferences. Dr. Banner continues to teach at Princeton University, where he is also a part-time Lecturer in the Department of Mathematics. Dr. Banner implements the optimization process and supervises implementation of the portfolio management and trading process. He conducts mathematical research on the investment process and reviews and recommends improvements.
Joseph W. Runnels, CFA, has been Vice President of Portfolio Management at INTECH since March 2003. Mr. Runnels, previously Director of Trading and Operations from January 1999 to March 2003, joined INTECH in June 1998. Mr. Runnels holds a B.S. in Business Administration from Murray State University. Mr. Runnels implements the day-to-day portfolio management and trading process for client portfolios. He also handles brokerage relationships and supervises the daily execution of trading for client accounts. Mr. Runnels holds the Chartered Financial Analyst designation.
| | | Item 8(a)(2). OTHER ACCOUNTS MANAGED BY PORTFOLIO MANAGERS |
In addition to managing the Equity Portfolio, Dr. Fernholz is also primarily responsible for the day-to-day portfolio management of the following accounts. Information is provided as of December 31, 2010 unless otherwise indicated:
| | | | | | | | | |
| Type of Account Managed | | Number of Accounts | | Assets |
| Registered Investment Company* | | | 14 | | | $ | 5,173,805,347 | |
| Other Pooled Investment | | | 34 | | | $ | 7,190,396,643 | |
| Other Accounts** | | | 231 | | | $ | 31,382,516,735 | |
In addition to managing the Equity Portfolio, Dr. Banner is also primarily responsible for the day-to-day portfolio management of the following accounts. Information is provided as of December 31, 2010 unless otherwise indicated:
| | | | | | | | | |
| Type of Account Managed | | Number of Accounts | | | Assets | |
| Registered Investment Company* | | | 14 | | | $ | 5,173,805,347 | |
| Other Pooled Investment | | | 34 | | | $ | 7,190,396,643 | |
| Other Accounts** | | | 231 | | | $ | 31,382,516,735 | |
In addition to managing the Equity Portfolio, Mr. Runnels is also primarily responsible for the day-to-day portfolio management of the following accounts. Information is provided as of December 31, 2010 unless otherwise indicated:
| | | | | | | | | |
| Type of Account Managed | | Number of Accounts | | | Assets | |
| Registered Investment Company* | | | 14 | | | $ | 5,173,805,347 | |
| Other Pooled Investment | | | 34 | | | $ | 7,190,396,643 | |
| Other Accounts** | | | 231 | | | $ | 31,382,516,735 | |
| | |
| * | | 1 of the accounts included in the totals, consisting of $300,555,248 of the total assets in the category, has performance-based advisory fees. |
| |
| ** | | 36 of the accounts included in the totals, consisting of $6,990,877,789 of the total assets in the category, have performance-based advisory fees. |
Material Conflicts of Interest. Actual or apparent conflicts of interest may arise when a portfolio manager has day-to-day management responsibilities with respect to more than one account. More specifically, a portfolio manager who manages multiple accounts is presented with the following potential conflicts:
| | • | | The management of multiple accounts may result in a portfolio manager devoting unequal time and attention to the management of each account. INTECH believes its mathematical investment process and the procedures it has in place are reasonably designed to mitigate these potential conflicts and risks. Specifically, INTECH’s mathematical investment process significantly removes investment discretion. |
| |
| | • | | If a portfolio manager identifies a limited investment opportunity that may be suitable for more than one account, an account may not be able to take full advantage of that opportunity due to an allocation of filled purchase or sale orders across all eligible accounts. For INTECH, all allocations are based on computer-generated target weightings and trades occur simultaneously for all accounts on a rotating basis. Before submission for execution, trades are reviewed by the trader for errors or discrepancies. Trades are submitted to designated brokers in a single electronic file at one time during the day, pre-allocated to individual clients. In the event that an aggregated order is not completely filled, executed shares are allocated to participating client accounts in proportion to the order. |
| | • | | INTECH has an established procedure for the selection, approval, management and annual review of broker relationships. INTECH gives primary consideration to obtaining the most favorable price and efficient execution. INTECH may, however, pay a higher commission than would otherwise be necessary for a particular transaction when, in INTECH’s opinion, to do so would further the goal of obtaining the best available execution. INTECH does not participate in soft dollar or directed brokerage commission arrangements and will not accept directed brokerage instructions. INTECH has a policy of paying commissions for execution services only and does not purchase research or other services from or through brokers using commissions. |
| |
| | • | | The Fund is subject to different regulation than the other pooled investment vehicles and other accounts managed by the portfolio manager. As a consequence of this difference in regulatory requirements, the Fund may not be permitted to engage in all the investment techniques or transactions or to engage in these transactions to the same extent as the other accounts managed by the portfolio manager. INTECH’s mathematical investment process may result in situations in which some of its clients may sell or sell short securities when other clients purchase the same securities at or about the same time. In an attempt to reduce the likelihood of the orders matching up in the market and in an effort to maintain the confidentiality of INTECH’s trading activities for purposes of improved execution, INTECH will direct purchase orders to different brokers than sell and/or sell short orders. |
INTECH has adopted certain compliance procedures that are designed to address these types of conflicts common among investment managers. However, there is no guarantee that such procedures will detect each and every situation in which a conflict arises.
Item 8(a)(3). FUND MANAGER COMPENSATION
Salary and Cash Bonus. With respect to INTECH, the compensation structure of the investment personnel is determined by INTECH and is summarized by INTECH below. The following describes the structure and method of calculating INTECH’s investment personnel’s compensation as of December 31, 2010.
For managing the Fund and all other accounts, the investment personnel receive base pay in the form of a fixed annual salary paid by INTECH, and which is not based on performance or assets of the Fund or other accounts. The investment personnel are also eligible for a cash bonus as determined by INTECH, and which is not based on performance or assets of the Fund or other accounts.
Long-Term Incentive Compensation. The investment personnel, as part owners of INTECH, also receive compensation by virtue of their ownership interest in INTECH. The investment personnel may elect to defer payment of a designated percentage of their fixed compensation and/or up to all of their variable compensation in accordance with Janus Capital Group Inc.’s Executive Income Deferral Program.
Item 8(a)(4). OWNERSHIP OF JCE SECURITIES AS OF DECEMBER 31, 2010
| | | | | | | | | | | | | | | |
| Name of | | | | | | | | | | | | | | |
| Portfolio Manager | | None | | $1 - $10,000 | | $10,001-$50,000 | | $50,001-$100,000 | | $100,001-$500,000 | | $500,001-$1,000,000 | | Over $1,000,000 |
| Fernholz | | X | | | | | | | | | | | | |
| Banner | | X | | | | | | | | | | | | |
| Runnels | | X | | | | | | | | | | | | |
ITEM 9. PURCHASES OF EQUITY SECURITIES BY CLOSED-END MANAGEMENT INVESTMENT COMPANY AND AFFILIATED PURCHASERS.
| | | | | | | | | | | | | | | | | |
| | | | | | | (b) | | (c) | | (d)* |
| | | (a) | | Average | | Total Number of Shares | | Maximum Number (or |
| | | Total Number of | | Price | | (or Units) Purchased as | | Approximate Dollar Value) of |
| | | Shares (or | | Paid Per | | Part of Publicly | | Shares (or Units) that may yet |
| | | Units) | | Share (or | | Announced Plans or | | be Purchased Under the Plans or |
| Period* | | Purchased | | Unit) | | Programs | | Programs |
| |
| January 1-31, 2010 | | | 0 | | | | | | | | 0 | | | | 1,462,500 | |
| February 1-28, 2010 | | | 0 | | | | | | | | 0 | | | | 1,462,500 | |
| March 1-31, 2010 | | | 0 | | | | | | | | 0 | | | | 1,462,500 | |
| April 1-30, 2010 | | | 0 | | | | | | | | 0 | | | | 1,462,500 | |
| May 1-31, 2009 | | | 7,100 | | | | 10.36 | | | | 7,100 | | | | 1,455,400 | |
| June 1-30, 2009 | | | 0 | | | | | | | | 0 | | | | 1,455,400 | |
| July 1-31, 2010 | | | 0 | | | | | | | | 0 | | | | 1,455,400 | |
| August 1-31, 2010 | | | 0 | | | | | | | | 0 | | | | 1,455,400 | |
| September 1-30, 2010 | | | 0 | | | | | | | | 0 | | | | 1,455,400 | |
| October 1-31, 2010 | | | 0 | | | | | | | | 0 | | | | 1,455,400 | |
| November 1-30, 2010 | | | 0 | | | | | | | | 0 | | | | 1,605,000 | |
| December 1-31, 2010 | | | 0 | | | | | | | | 0 | | | | 1,605,000 | |
| Total | | | 7,100 | | | | | | | | | | | | | |
| | |
| * | | The registrant’s repurchase program, which authorized the repurchase of 1,620,000 shares, was announced October 3, 2009. The program was reauthorized for a maximum repurchase amount of 1,605,000 shares on November 16, 2010. Any repurchases made by the registrant pursuant to the program were made through open-market transactions. |
ITEM 10. SUBMISSION OF MATTERS TO A VOTE OF SECURITY HOLDERS.
There have been no material changes to the procedures by which shareholders may recommend nominees to the registrant’s Board implemented after the registrant last provided disclosure in response to this Item.
ITEM 11. CONTROLS AND PROCEDURES.
| | (a) | | The registrant’s principal executive and principal financial officers, or persons performing similar functions, have concluded that the registrant’s disclosure controls and procedures (as defined in Rule 30a-3(c) under the Investment Company Act of 1940, as amended (the “1940 Act”) (17 CFR 270.30a-3(c))) are effective, as of a date within 90 days of the filing date of this report that includes the disclosure required by this paragraph, based on their evaluation of the controls and procedures required by Rule 30a-3(b) under the 1940 Act (17 CFR 270.30a-3(b)) and Rules 13a-15(b) or 15d-15(b) under the Securities Exchange Act of 1934, as amended (the “Exchange Act”) (17 CFR 240.13a-15(b) or 240.15d-15(b)). |
| |
| | (b) | | There were no changes in the registrant’s internal control over financial reporting (as defined in Rule 30a-3(d) under the 1940 Act (17 CFR 270.30a-3(d)) that occurred during the second fiscal quarter of the period covered by this report that has materially affected, or is reasonably likely to materially affect, the registrant’s internal control over financial reporting. |
ITEM 12. EXHIBITS.
File the exhibits listed below as part of this Form. Letter or number the
exhibits in the sequence indicated.
(a)(1) Any code of ethics, or amendment thereto, that is the subject of the disclosure required by Item 2, to the extent that the registrant intends to satisfy the Item 2 requirements through filing of an exhibit: Not applicable because the code is posted on registrant’s website at www.nuveen.com/CEF/Info/Shareholder/ and there were no amendments during the period covered by this report. (To view the code, click on Fund Governance and then Code of Conduct.)
(a)(2) A separate certification for each principal executive officer and principal financial officer of the registrant as required by Rule 30a-2(a) under the 1940 Act (17 CFR 270.30a-2(a)) in the exact form set forth below: Ex-99.CERT Attached hereto.
(a)(3) Any written solicitation to purchase securities under Rule 23c-1 under the 1940 Act (17 CFR 270.23c-1) sent or given during the period covered by the report by or on behalf of the registrant to 10 or more persons. Not applicable.
(b) If the report is filed under Section 13(a) or 15(d) of the Exchange Act, provide the certifications required by Rule 30a-2(b) under the 1940 Act (17 CFR 270.30a-2(b)); Rule 13a-14(b) or Rule 15d-14(b) under the Exchange Act (17 CFR 240.13a-14(b) or 240.15d-14(b)), and Section 1350 of Chapter 63 of Title 18 of the United States Code (18 U.S.C. 1350) as an exhibit. A certification furnished pursuant to this paragraph will not be deemed “filed” for purposes of Section 18 of the Exchange Act (15 U.S.C. 78r), or otherwise subject to the liability of that section. Such certification will not be deemed to be incorporated by reference into any filing under the Securities Act of 1933 or the Exchange Act, except to the extent that the registrant specifically incorporates it by reference. Ex-99.906 CERT attached hereto.
SIGNATURES
Pursuant to the requirements of the Securities Exchange Act of 1934 and the Investment Company Act of 1940, the registrant has duly caused this report to be signed on its behalf by the undersigned, thereunto duly authorized.
(Registrant) Nuveen Core Equity Alpha Fund
| | | | | |
| | | |
| By (Signature and Title) | /s/ Kevin J. McCarthy | | |
| | Kevin J. McCarthy | | |
| | Vice President and Secretary | | |
Date: March 11, 2011
Pursuant to the requirements of the Securities Exchange Act of 1934 and the Investment Company Act of 1940, this report has been signed below by the following persons on behalf of the registrant and in the capacities and on the dates indicated.
| | | | | |
| | | |
| By (Signature and Title) | /s/ Gifford R. Zimmerman | | |
| | Gifford R. Zimmerman | | |
| | Chief Administrative Officer
(principal executive officer) | | |
Date: March 11, 2011
| | | | | |
| | | |
| By (Signature and Title) | /s/ Stephen D. Foy | | |
| | Stephen D. Foy | | |
| | Vice President and Controller
(principal financial officer) | | |
Date: March 11, 2011