| | | | |
| | SKADDEN, ARPS, SLATE, MEAGHER & FLOM | | |
PARTNERS EDWARD H.P. LAM ¨* NICHOLAS A. NORRIS¨ JONATHAN B. STONE * ALEC P. TRACY * DOMINIC W.L. TSUN¨* ¨ (ALSO ADMITTEDIN ENGLAND & WALES) * (ALSO ADMITTEDIN NEW YORK) REGISTERED FOREIGN LAWYERS GREGORY G.H. MIAO (NEW YORK) ALAN G. SCHIFFMAN (NEW YORK) | | 
42/F, EDINBURGH TOWER, THE LANDMARK 15 QUEEN’S ROAD CENTRAL, HONG KONG ____________ TEL: (852) 3740-4700 FAX: (852) 3740-4727 www.skadden.com | | AFFILIATE OFFICES ____ BOSTON CHICAGO HOUSTON LOS ANGELES NEW YORK PALO ALTO SAN FRANCISCO WASHINGTON, D.C. ____ BEIJING BRUSSELS FRANKFURT LONDON MOSCOW MUNICH PARIS SINGAPORE SYDNEY TOKYO TORONTO VIENNA |
November 5, 2007
Mr. Tom Jones
Division of Corporation Finance
Securities and Exchange Commission
100 F Street, N.E., Mail Stop 6010
Washington D.C. 20549
U.S.A.
Registration Statement on Form S-1
Filed on September 28, 2007
File No. 333-146377
Dear Mr. Jones:
On behalf of our client, MEMSIC, Inc. (“Memsic” or “the Company”), set forth below are the Company’s responses to your comment letter dated October 25, 2007 (the “Comment Letter”) with respect to the above-referenced Registration Statement on Form S-1 (the “Registration Statement”) filed with the Securities and Exchange Commission (the “Commission”) on September 28, 2007. We are also providing you in hard copy form a copy of Amendment No. 1 to the Registration Statement (“Amendment No. 1”), with exhibits to show changes made to the Registration Statement filed on September 28, 2007.
We would like to bring to your attention that in addition to the revisions made in response to the Staff’s comments, Amendment No.1 includes the Company’s September 30, 2007 interim financial statements and updated quarterly financial information.
For your convenience, we have reproduced the comments from the Commission’s staff (the “Staff”) in the order provided followed by Memsic’s
Mr. Tom Jones
Securities and Exchange Commission
November 5, 2007
RE: MEMSIC, Inc. S-1 Registration Statement (File No. 333-146377)
Page 2
corresponding response. All references in Memsic’s responses to pages and captioned sections are to Amendment No.1 to the Registration Statement as filed today. Capitalized terms used in this letter and not otherwise defined herein have the meaning ascribed to them in the prospectus included in Amendment No. 1.
Prospectus Cover Page
| 1. | Please confirm that any preliminary prospectus you circulate will include all non-Rule 430A information. This includes the price range and related information based on a bona fide estimate of the public offering price within that range. Also note that we may have additional comments after you include this information. |
The Company will provide all non-Rule 430A information in a subsequent amendment to the Registration Statement prior to the circulation of any preliminary prospectus and acknowledges that the Staff may have additional comments thereafter.
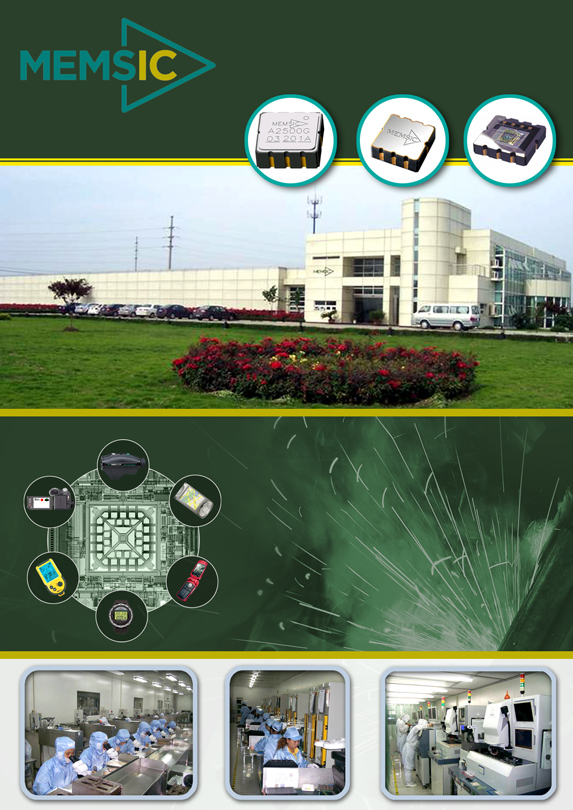
| 2. | Please furnish copies of any graphics you intend to use in your prospectus. |
The Company has provided the artwork it intends to use asExhibit A hereto. The Company intends to use the artwork in the inside front cover of the prospectus.
| 3. | Please remove the reference to “Sole Book-Runner.” |
The Company has deleted the reference to “Sole Book-Runner” on the cover page of the prospectus.
Overview, page 1
| 4. | Please provide us independent, objective support for the statements regarding your leadership and market standing. For example, you state on page 1 of your prospectus that you “are a pioneer in providing accelerometers to China’s fast growing mobile phone market and are among the leading providers of accelerometers for image projector supplying to several Japanese OEMs,” that your products “have been used by leading international and China-based manufacturers” and that one of your customers includes “a leading European automotive safety systems supplier”. Please also provide us with independent support for your statement that the thermal technology you are using to produce MEMS accelerometers has a “higher shock tolerance, lower failure rate and lower cost relative to alternative mechanical solutions”. |
Mr. Tom Jones
Securities and Exchange Commission
November 5, 2007
RE: MEMSIC, Inc. S-1 Registration Statement (File No. 333-146377)
Page 3
In response to the Staff’s comment, the Company sets forth below independent sources of information to support each of the statements relating to the Company’s leadership and market standing. None of the cited reports or data was commissioned by the Company.
| | Specifically | with respect to the claim that: |
| | (i) | the Company is “a pioneer in providing accelerometers to China’s fast growing mobile phone market,” |
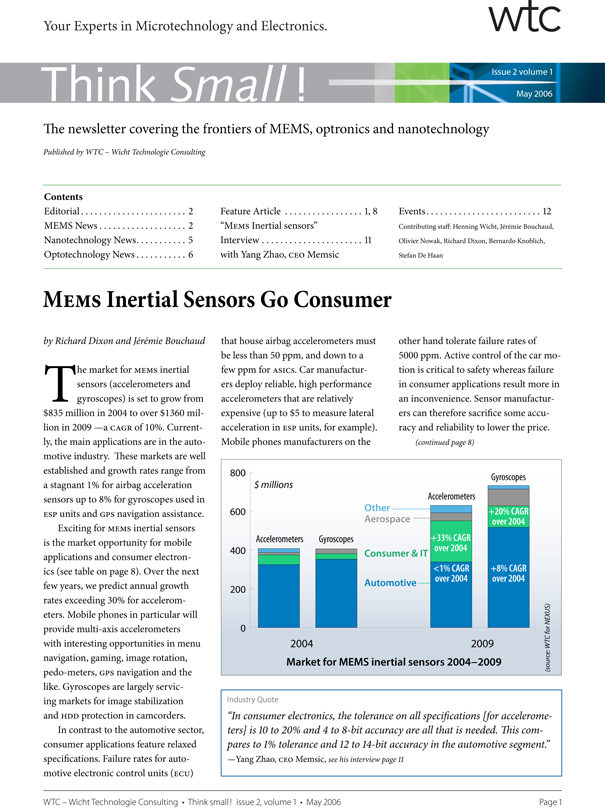
According to page 8 of Wicht Technologie Consulting feature article of May 2006 (Issue 2, Volume 1), commercialization of accelerometers in mobile phones began in 2003. SeeExhibit B. The Company commenced sales of accelerometers in 2003 and sold 543,000 units of accelerometers to mobile phone manufacturers in 2004. Since 2005, the Company’s revenue from mobile phone applications has grown primarily in the China market. Sales to China mobile phone manufacturers through distributors increased from $0.3 million in 2005, to $6.2 million in 2006, and to $9.3 million in the first nine months of 2007.
In addition, the Company’s current largest end-customer is Tianyu, who according to iSuppli, is the third largest China based handset OEM. SeeExhibit C. Tianyu has been a customer of the Company since 2006 and the Company believes Tianyu was one of the pioneers in the China market to introduce accelerometer-based features such as motion games and pedometers.
According to a report from Bear Stearns published in December 2006, shipments of mobile handsets in China increased from 36.4 million units in 2000 to an estimated 143.8 million units in 2006, representing a compound annual growth rate of 31.6%. See page 34 ofExhibit D.
| | (ii) | the Company is “among the leading providers of accelerometers for image projector supplying to several Japanese OEMs,” |
According to page 12 of IDC report titled Worldwide Projector 2007-2010 Forecast and Analysis, total worldwide projector shipments were 4.79 million units in 2006. In the same year, the Company shipped approximately 1.24 million accelerometers (or approximately 26% of worldwide total) for projector usage. SeeExhibit E. Most of the Company’s products were provided to prominent Japanese OEMs such as Epson, Sony, NEC, Panasonic and Toshiba. The function for projectors that require accelerometers are only incorporated in some higher end projectors, which consequently means that the Company’s market
Mr. Tom Jones
Securities and Exchange Commission
November 5, 2007
RE: MEMSIC, Inc. S-1 Registration Statement (File No. 333-146377)
Page 4
share in this smaller sub-segment is higher than the 26% of the worldwide total for all projectors noted above. Based on this information, the Company supplementally advises the Staff that the Company believes it is the single largest accelerometer provider for the projector market. However, the claims in the prospectus to be merely “among the leading providers” are due to a lack of independent tracking of this sub-segment of the projector market.
| | (iii) | the Company’s products “have been used by leading international and China-based manufacturers,” |
The Company supplementally advises the Staff that its customers include IBM, Sony, Mitsubishi and Autoliv Inc., each of which the Company respectfully submits is recognized as a leading international manufacturer.
The Company further supplementally advises the Staff that its China-based customers include Tianyu and Bird. According to a news article published in the Shanghai Daily on October 26, 2007 quoting a recent iSuppli report, Tianyu and Bird are expected to be the third and fourth, respectively, largest OEM handset makers in China in 2007 based on units sold. SeeExhibit C.
| | (iv) | one of the Company’s customers is “a leading European automotive safety systems supplier,” |
The Company supplementally advises the Staff that the customer being referred to is Autoliv Inc., which the Company respectfully submits is recognized as a leading European automotive safety systems supplier.
Moreover, Datamonitor, an independent provider of online database and analysis services for key industry sectors, also states that Autoliv Inc. is a leading supplier of safety systems to the global automotive industry – page 5 of Autoliv Inc. Company Profile (publication date: January 2007, reference code: 4268). SeeExhibit F.
| | (v) | Please provide with independent support for the Company’s statement that the thermal technology it is using to produce MEMS accelerometers has a “higher shock tolerance, lower failure rate and lower cost relative to alternative mechanical solutions”. |
According to a press release dated October 16, 2007 from Frost & Sullivan, an independent market research firm, the Company’s accelerometers (a) can withstand a theoretical shock limit of over
Mr. Tom Jones
Securities and Exchange Commission
November 5, 2007
RE: MEMSIC, Inc. S-1 Registration Statement (File No. 333-146377)
Page 5
50,000 g which is over five times that of traditional accelerometers; and (b) have the lowest failure rate for any device in its class.
The same press release also notes that the Company has a competitive edge over other MEMS inertial sensor manufacturers in terms of performance versus price. SeeExhibit G.
On page 8 of the Wicht Technologie Consulting feature article, it is stated that the Company provides the lowest cost solution for 2-axis sensors. SeeExhibit B.
| 5. | You state on page 1 that you have shipped more than 20 million units since 2004, yet you state on page 38 that you have shipped more than 19 million units since that time. Please reconcile these two statements. |
The Company has updated and amended the disclosure on pages 1 and 38.
| 6. | Please tell us the criteria used to identify Autoliv Electronics. Also, tell us whether there are any other customers that satisfy those criteria. |
The Company supplementally advises the Staff that the Company has amended references to Autoliv Electronics in the disclosure to Autoliv Inc., parent company of Autoliv Electronics.
The Company also supplementally advises the Staff that Autoliv Inc. has historically been, and continues to be, the Company’s largest customer for automotive applications, and has accounted for a significant majority of the Company’s revenue for automotive application products during the periods presented in the financial statements. The Company has revised the disclosure to clarify the relevant statements on pages 1 and 62.
Industry Overview, page 2
| | 7. | Please provide us with copies of the sources of all third-party data included in the prospectus. Please mark the relevant sections of those reports and key them to the disclosure. Please tell us whether: |
| | (i) | the data is publicly available, |
| | (ii) | the sources of the cited data have consented to your use of their names and data, |
| | (iii) | you commissioned any of the data, or |
| | (iv) | it was prepared for use in this registration statement. |
Mr. Tom Jones
Securities and Exchange Commission
November 5, 2007
RE: MEMSIC, Inc. S-1 Registration Statement (File No. 333-146377)
Page 6
Also, tell us about any other relationship between you and the authors of the data.
The sources of the third-party data included in the prospectus are from: (1) the Frost & Sullivan Report on World MEMS Sensors Markets (the “Frost Report”), attached hereto asExhibit H; and (2) the Quote Indemnification Agreement with Gartner, Inc. (the “Gartner Agreement”), attached hereto asExhibit I. The relevant sections of the reports have been marked and keyed to the disclosure. The data in these two sources are publicly available, were not commissioned by the Company and were not prepared for use in the Registration Statement. Frost & Sullivan and Gartner, Inc. have consented to the Company’s use of their names and data. There are no relationships between the Company and the authors of these two reports.
Risk Factors, page 10
| 8. | Please note that your risk factors must immediately follow a one-page prospectus cover or your prospectus summary. Although we do not object to the placement of your table of contents, please relocate the disclosure on page ii to a more appropriate section of your document. |
In response to the Staff’s comment, this information has been moved from page ii to page 5.
We depend and expect to continue to depend on a limited number, page 12
| 9. | Please expand this section and page 70 to identify the customers that represent over 10% of your revenues. |
The Company respectfully submits that both the Company and its customers consider the identities of such customers to be highly confidential and commercially sensitive. In addition, the Company believes that, to prospective investors, the identities of its customers are of significantly less importance than a qualitative and quantitative description of the profiles of the Company’s largest customers and the extent to which revenue from such customers are relied upon. The Company believes that the current disclosure on pages 12, 40 and 72 is sufficient. Accordingly, the Company proposes not to specifically identify its largest customers in the prospectus.
Failure of suppliers to deliver on a timely basis, page 14
| 10. | Please clarify whether you have written agreements with your two suppliers of ceramic packaging materials and your third party packaging service provider disclosed on page 17. In addition, expand the |
Mr. Tom Jones
Securities and Exchange Commission
November 5, 2007
RE: MEMSIC, Inc. S-1 Registration Statement (File No. 333-146377)
Page 7
| | appropriate section to discuss the material terms of such agreements, such as the duration and cancellation provisions of the agreements. Also, tell us why you have not filed the agreements as exhibits. |
| | (i) | Suppliers of ceramic packaging materials. Purchases from these suppliers are documented with purchase orders and quotations. The Company enters into these purchase orders and quotations in the ordinary course of its business. The Company has revised the prospectus to disclose that it has not entered into any long-term agreements with its suppliers of ceramic packaging materials. See page 74. The Company’s purchase orders and quotations contain basic terms and conditions, including method of payment, payment terms and terms of shipment, which the Company believes to be standard within the industry in which it operates. The Company further supplementally advises the Staff that ceramic packaging materials that it uses for its products are readily available in the market, and that it believes that it would be able to replace its current suppliers without significantly disrupting its business operations. Accordingly, the Company believes that it is not “substantially dependent” on its relationship with its ceramic packaging material suppliers. |
| | (ii) | Third party packaging service provider. The Company supplementally advises the Staff that although it has entered into an agreement with its third party packaging service provider and has historically outsourced some of its packaging services to such provider, since the second half of 2005, the Company has increasingly met its packaging requirements in-house. As a result, cost of third party packaging services as a percentage of the Company’s total cost of goods sold declined from 2004 to 2005 and has since remained relatively stable. In 2004, 2005, 2006 and for the nine months ended September 30, 2007, the Company’s cost of third party packaging services totaled approximately $350,000, $110,000, $330,000 and $335,000, respectively, or approximately 11%, 6%, 6.5% and 5.6%, respectively, of the Company’s cost of goods sold during the corresponding period. For the nine months ended September 30, 2007, a majority of the Company’s products were packaged in-house. The Company further supplementally advises the Staff that the packaging services provided by such provider are readily available in the market, and that it believes that it would be able to obtain such services from alternative service providers without significantly disrupting its business operations. Accordingly, the Company believes that it is not “substantially dependent” on its relationship with its third party packaging service provider. |
Mr. Tom Jones
Securities and Exchange Commission
November 5, 2007
RE: MEMSIC, Inc. S-1 Registration Statement (File No. 333-146377)
Page 8
For the foregoing reasons, the Company respectfully submits that its purchase orders and quotations with its ceramic packaging materials suppliers and written agreement with its third party packaging service provider are not “material contracts” within the definition of Item 601(b)(10) of Regulation S-K, and as a result, are not required to be filed as exhibits.
Use of Proceeds, page 32
| 11. | Please revise to state the approximate amount intended to be used for each purpose for which the net proceeds from the securities to be offered are intended to be used. Refer to Item 504 of Regulation S-K. |
In response to the Staff’s comment, the Company has revised the disclosure on page 32 to state the approximate amount intended to be used for each purpose.
Capitalization, page 34
| 12. | Please revise to remove the caption “cash and cash equivalents” from the capitalization table. |
In response to the Staff’s comment, the Company has revised the disclosure on page 34.
| 13. | Please revise the table to separately show a column for the pro forma effect of the conversion of the preferred shares. |
In response to the Staff’s comment, the Company has revised the disclosure on page 34 to separately show a column for the pro forma effect of the conversion of the preferred shares.
Critical Accounting Policies, page 45
| 14. | We note that on pages 48, 89 and F-23 you refer to using the valuation of an independent third party when determining fair value of your common stock and valuing assets acquired in the business combination. While management may elect to take full responsibility for valuing the equity instruments and assets, if you choose to continue to refer to the expert in any capacity, please revise the filing to name the independent valuation expert and include its consent as an exhibit. Refer to Rule 436 and Item 601(b)(23) of Regulation S-K. |
In response to the Staff’s comment, the Company has revised the disclosure on page 123 to identify Orchard Partners, Inc. as an expert and has filed its consent as an exhibit to Amendment No. 1.
Mr. Tom Jones
Securities and Exchange Commission
November 5, 2007
RE: MEMSIC, Inc. S-1 Registration Statement (File No. 333-146377)
Page 9
Stock-Based Compensation, page 47
| 15. | Since the valuation of your common stock as of December 31,2006 was retrospective, we believe the following disclosures would be helpful to an investor since changes in methodologies and assumptions could have a material impact upon your financial statements. Please revise to provide the following disclosures in MD&A: |
| | (i) | The aggregate intrinsic value of all outstanding options based on the midpoint of the estimated IPO price range. |
| | (ii) | A discussion of each significant factor contributing to the difference between the estimated fair value as of the date of grant and the estimated IPO price (or pricing range) for options granted during the twelve months prior to the date of the most recent balance sheet. |
The Company respectfully submits to the Staff that the Company and its underwriters do not presently have such information which would enable them to derive a sufficiently accurate estimated IPO price or price range for disclosure in the prospectus. However, as soon as an estimated IPO price or price range is determined, the Company will submit to the Staff its response to this question as well as the corresponding revision in the prospectus. The Company recognizes that the Staff will require a reasonable amount of time to review such amendments prior to considering any request for effectiveness.
Results of Operations, page 52
Six months ended June 30, 2007 compared to the six months ended June 30, 2006
Net Sales, page 52
| 16. | Please revise to quantify the impact of increases in number of units sold and the decline in average selling prices of your products on net sales. Your discussion should also address whether you expect the trend of the declining gross margins to continue. Please also apply to your discussion for the year ended December 31, 2006. |
In response to the Staff’s comment, the Company has added disclosure to quantify the impact of the increase in quantity sold and the decline in average selling prices of its products on net sales on pages 52 and 54.
| 17. | Please disclose the reasons for the change in revenues from material customers. Provide similar disclosure in your discussion for the year ended December 31, 2006. |
Mr. Tom Jones
Securities and Exchange Commission
November 5, 2007
RE: MEMSIC, Inc. S-1 Registration Statement (File No. 333-146377)
Page 10
In response to the Staff’s comment, the Company has added disclosure to provide reasons for the change in revenues from material customers on pages 52 and 54.
Research and Development, page 53
| 18. | Please revise to quantify the items listed as responsible for the increase in research and development expense and to identify the number of new employees added during the period, Please also apply to your discussion of the increases in sales and marketing and general and administrative expenses. In addition, please apply this comment to your discussion of research and development, sales and marketing and general and administrative expenses for the year ended December 31, 2006. |
In response to the Staff’s comment, the Company has revised the disclosure on pages 53 and 54.
Sales and Customers, page 70
| 19. | Please expand to discuss the material terms of the agreements with your major customers. Also, file the agreements as exhibits. |
The Company supplementally advises the Staff that the distribution agreements entered into by the Company and its distributors have been generally based on the Company’s form, and consequently contain substantially similar terms and conditions. The Company has filed as exhibits its distribution agreements with its largest distributor customer, World Peace Industrial Co., Ltd, or WPI. Please see Exhibits 10.3A and 10.3B as previously filed. In 2006 and for the nine months ended September 30, 2007, WPI accounted for 34.6% and 45.7%, respectively, of the Company’s total net sales. The Company has amended the disclosure to clarify that the description on pages 71 and 72 summarizes the material terms of the Company’s distribution agreements.
The Company supplementally advises the Staff that it generally does not enter into long-term agreements with its OEM and ODM customers. Sales to these customers are solely documented in quotations. The Company enters into these quotations in the ordinary course of its business. The Company has amended the disclosure to summarize the material terms of the quotations on page 72. Because these quotations are made in the ordinary course of the Company’s business, and the terms and conditions contained in each quotation apply only to a single transaction, the Company respectfully submits that its quotations with its OEM and ODM customers are not “material contracts” within the definition of Item 601(b)(10), and as a result, are not required to be filed as exhibits.
Mr. Tom Jones
Securities and Exchange Commission
November 5, 2007
RE: MEMSIC, Inc. S-1 Registration Statement (File No. 333-146377)
Page 11
Wafer Production, page 72
| 20. | Please expand to discuss the material terms of your agreements with TSMC and your two additional foundry service providers, such as the duration and cancellation provisions of the agreements. |
In response to the Staff’s comment, the Company has revised its disclosure to expand the discussion of the material terms of its agreements with TSMC and its two other foundry service providers on page 73.
| 21. | Please file the agreement with TSMC as an exhibit. Also, tell us why you have not filed the agreements as exhibits with your two foundry service providers. |
The Company supplementally advises the Staff that with respect to the Company’s agreement with TSMC, the Company does not enter into long-term agreements with TSMC and places orders solely on a purchase order basis. Such information has been disclosed on pages 13 and 73. The Company enters into these purchase orders in the ordinary course of its business. The Company further supplementally advises the Staff that, although TSMC has to date produced substantially all of the wafers used by the Company in its products, the Company’s wafers use a standard CMOS process. See pages 1 and 62 for further discussion of the standard CMOS process. Accordingly, the Company believes that it is not “substantially dependent” on its relationship with TSMC.
With respect to the Company’s agreements with its two other foundry service providers, the Company supplementally advises the Staff that, orders placed under these agreements totaled $16,041 in 2006 and $88,562 for the nine months ended September 30, 2007, and are therefore insignificant compared to orders placed with TSMC. The Company supplementally advises the Staff that it does not believe purchases under these contracts will become a major part of its wafer requirements for the foreseeable future. Accordingly, the Company believes that it is not “substantially dependent” on its relationship with these foundry service providers.
For the foregoing reasons, the Company respectfully submits that its purchase orders with TSMC and agreements with the two other foundry service providers are not “material contracts” within the definition of Item 601(b)(10) of Regulation S-K, and as a result, are not required to be filed as exhibits.
Compensation Discussion and Analysis, page 88
| 22. | We direct your attention to theStaff Observations in the Review of Executive Compensation Disclosure, dated October 9, 2007, and |
Mr. Tom Jones
Securities and Exchange Commission
November 5, 2007
RE: MEMSIC, Inc. S-1 Registration Statement (File No. 333-146377)
Page 12
available on our website, for specific guidance in the preparation of this discussion. In addition to the specific comments that follow, please consider this report in providing a more fulsome compensation discussion and analysis in your amended filing. We may have further comment.
The Company has considered the guidance in Staff Observations in the Review of Executive Compensation Disclosure dated October 9, 2007 with respect to its responses herein and the Company has revised the “Compensation and Discussion and Analysis” in accordance therewith.
Elements of Compensation, page 89
| 23. | It appears from your disclosure on pages 88 through 90 that you benchmark compensation of your named executive officers against peer companies in the semiconductor and other advanced technology and information technology related industries. Please identify these peer companies. We note your statement in the second whole paragraph on page 89 that the annual Compensation & Entrepreneurship Report in Information Technology does not identify the companies sampled, however, your disclosure in this paragraph suggests that this is not the only report from which you derive information relating to compensation levels. If this is the only report you considered, it is unclear how you were able to determine that the data in the report related to companies you deemed your peers. |
In response to the Staff’s comment, the Company has provided additional disclosure on page 90. In addition, the Company has included a copy the 2006 Compensation & Entrepreneurship Report in Information Technology asExhibit J hereto for the Staff’s reference.
| 24. | Please clarify the meaning of the phrase “comparable with executive officers in other companies.” Are you targeting total compensation or specific elements of compensation at a specific percentile? For example, is the target level of each element of compensation as well as overall target compensation at the 50th, 60th or 75th percentile of your peer companies? |
In response to the Staff’s comment, the Company has provided additional disclosure on page 90.
Discretionary annual bonus, page 89
| 25. | You indicate that bonus levels depend on each executive officer’s performance measured against their specific performance objectives, but you have not provided a quantitative discussion of the objectives to be achieved in order for your executive officers to earn their annual bonuses. Please disclose the specific financial and operational targets and |
Mr. Tom Jones
Securities and Exchange Commission
November 5, 2007
RE: MEMSIC, Inc. S-1 Registration Statement (File No. 333-146377)
Page 13
| | individual annual performance objectives used to determine incentive amounts. To the extent you believe disclosure of these targets is not required because it would result in competitive harm such that you may omit this information under Instruction 4 to Item 402(b) of Regulation S-K, please provide on a supplemental basis a detailed explanation for such conclusion. Disclose how difficult it would be for the named executive officers or how likely it will be for you to achieve the undisclosed target levels or other factors. General statements regarding the level of difficulty or ease associated with achieving performance goals are not sufficient. In discussing how difficult it will be for an executive or how likely it will be for you to achieve the target levels or other factors, provide as much detail as necessary without providing information that would result in competitive harm. Please provide insight into the factors considered by the compensation committee prior to the awarding of performance-based compensation such as historical analyses prior to the granting of these awards or correlations between historical bonus practice and the incentive parameters set for the relevant fiscal period. |
In response to the Staff’s comment, the Company has provided additional disclosure on pages 91 and 92.
| 26. | You also indicate that in 2006, the compensation committee established a bonus plan focused on revenue, major account wins and introduction of new products to market with the weight of each element varying depending on the executive officer’s responsibilities. Please identify the objectives for each named executive officer and how they were weighted. |
In response to the Staff’s comment, the Company has revised disclosure on pages 91 and 92.
Long term incentives, page 90
| 27. | Please describe with specificity how the compensation committee determined the grants in 2006 and 2007. Include a discussion of how the factors led to decisions about the size of the option grants for the different executive officers. |
In response to the Staff’s comment, the Company has revised the disclosure to include the requested discussion on pages 92 and 93.
Grants of plan-based awards in 2006, page 91
| 28. | Your table in this section indicates that the exercise price of the options granted to Ms. Niu was $0.77. Please reconcile this with footnote (1) to the table on page 92 indicating that the exercise price was $0.15 per share. |
Mr. Tom Jones
Securities and Exchange Commission
November 5, 2007
RE: MEMSIC, Inc. S-1 Registration Statement (File No. 333-146377)
Page 14
In response to the Staff’s comment, the Company has clarified its disclosure on page 94. The Company notes that none of the options in respect of 50,000 shares granted to Ms. Niu on November 9, 2006 at an exercise price of $0.77 shown in the table titled “Grants of plan-based awards in 2006” on page 94 had vested as of December 31, 2006. The shares referenced by footnote (1) on page 95 relates to the option granted on September 25, 2003 with an exercise price of $0.15, which had vested as of December 31, 2006. Such options were exercised by Ms. Niu in 2006.
2000 Omnibus Stock Plan, page 92
| 29. | You indicate that as of June 30, 2007, 2,443,750 shares of stock options were outstanding and were available for future grant under the 2000 Stock Plan. Please clarify. Are you saying that options exerciseable into 2,443,750 shares of common stock have been issued or that such options are available for future issuance? |
In response to the Staff’s comment, the Company has revised the disclosure on page 96.
2006 Director compensation, page 98
| 30. | Please confirm in your response letter whether the options issued to Messrs. Blethen and Zavracky had fully vested in 2005. |
The options issued to Messrs. Blethen and Zavracky did not fully vest in 2005 and the Company has revised the disclosure on page 101 to provide greater clarity.
Certain Relationships and Related Party Transactions, page 99
| 31. | Please revise the first paragraph to comply with the definition of “related person” as set forth in Item 404 of Regulation S-K. |
In response to the Staff’s comment, the Company has revised the disclosure on page 102.
Relationship with InveStar and TSMC, page 101
| 32. | Please disclose the amount of wafers purchased from TSMC since January 1, 2004. |
In response to the Staff’s comment, the Company has revised the disclosure to provide such information on page 104.
Mr. Tom Jones
Securities and Exchange Commission
November 5, 2007
RE: MEMSIC, Inc. S-1 Registration Statement (File No. 333-146377)
Page 15
Policies and Procedures for Related Party Transactions, page 101
| 33. | Please provide the disclosure required by Regulation S-K Item 404(b) regarding the standards to be applied to your policies and procedures. |
In response to the Staff’s comment, the Company has revised the disclosure on page 104.
Principal and Selling Shareholders, page 102
| 34. | Please tell us whether the selling shareholders are broker-dealers or affiliates of broker-dealers. A selling shareholder who is a broker-dealer must be identified in the prospectus as an underwriter. In addition, a selling shareholder who is an affiliate of a broker-dealer must be identified in the prospectus as an underwriter unless that selling shareholder is able to make the following representations in the prospectus: |
| | (i) | The selling shareholder purchased the shares being registered for resale in the ordinary course of business, and |
| | (ii) | At the time of the purchase, the selling shareholder had no agreements or understandings, directly or indirectly, with any person to distribute the securities. |
Please revise as appropriate.
The Company supplementally advises the Staff that currently no selling shareholders have been identified. The Staff’s comment is noted and the Company will provide this information in a subsequent amendment to the Registration Statement if selling shareholders are identified. The Company recognizes that the Staff will require a reasonable amount of time to review such amendments prior to considering any request for effectiveness.
| 35. | With respect to the shares to be offered for resale by each selling shareholder that is a legal entity, please disclose the natural person or persons who exercise the sole or shared voting and/or dispositive powers with respect to the shares to be offered by that selling shareholder. |
Please refer to our response to comment 34.
Common Stock, page 106
| 36. | Please disclose the number of holders of your common equity. |
In response to the Staff’s comment, the Company has provided disclosure on the number of holders of its common equity on page 109.
Mr. Tom Jones
Securities and Exchange Commission
November 5, 2007
RE: MEMSIC, Inc. S-1 Registration Statement (File No. 333-146377)
Page 16
Consolidated Financial Statements
| 37. | Please update the financial statements as required by Rule 3-12 of Regulation S-X. |
In response to the Staff’s comment, the Company has updated the financial statements and related disclosure throughout the prospectus.
Note 3. Summary of Significant Accounting Policies, page F-I0
Note 10. Stock Incentive Plan, page F-22
Determination of Fair Value of Common Stock, page F-22
| 38. | Please provide us with a schedule showing in chronological order, the date of grant, optionee, number of options granted, exercise price and the fair value of the underlying shares of common stock for options issued within the year preceding the contemplated offering. Also include common shares issued during the period. |
| | (i) | Please indicate the compensation recorded for each of these issuances and reconcile to the amounts recorded in the financial statements. |
In response to the Staff’s comment, the Company has supplementally provided the requested schedule asExhibit K which includes the compensation recorded for each of these issuances reconciled to the amounts recorded in the financial statements and the common shares issued during those periods.
| | (ii) | Clarify how you considered the issuances of Series D preferred stock at $2.20 per share in December 2006 and April 2007. We see that the preferred shares are convertible into common stock on a one-for-one basis. |
The Company supplementally advises the Staff that the Series D financing was completed in December 2006. However, the Series D preferred shares were issued on December 2006 and April 2007 because closing of the transaction and subsequent payment and transfer of the shares with one investor was delayed until April 2007.
The Company further supplementally advises the Staff that, under the probability weighted expected returns method, or PWERM, the Company considered the value of the Series D preferred shares as well as the value of common shares in each scenario of (i) an initial public offering, or IPO; (ii) sale above the liquidation
Mr. Tom Jones
Securities and Exchange Commission
November 5, 2007
RE: MEMSIC, Inc. S-1 Registration Statement (File No. 333-146377)
Page 17
preference; (iii) sale at or below the liquidation preference; and (iv) remaining private. For the IPO and sale above liquidation preference scenarios, the Company discounted the future values indicated for Series D preferred shares and common shares to present value. In three of the four scenarios, the Company assumed conversion of the Series D preferred shares to common stock. The Company weighted each scenario according to an assessment of its probability and took into account that the probability weighting should approximate a price for the Series D preferred shares to the price paid for such shares in a market transaction. In aggregate, the three scenarios which indicated conversion to common were assigned a probability weighting of 70%. The value derived from such calculation for the Series D preferred shares as of December 31, 2006 was close to the price paid for those shares on December 22, 2006. The same scenarios and probability weightings provided a basis for valuing the common stock.
The Series D preferred shares are convertible into common stock, initially on a one-for-one basis. However, the Series D preferred shares are valued at a premium over the common shares because holders of the Series D shares are entitled to the following preferential terms:
| | • | | cumulative dividends at an annual rate of $0.066 per share; |
| | • | | in a liquidation event, each Series D share is entitled to receive an amount equal to the greater of (A) $0.55 (appropriately adjusted for any Series D recapitalization event), or (B) the amount per share which would be payable to the holders of Series D shares if all of such shares had been converted into common stock immediately prior to such liquidation event. If the proceeds in liquidation are insufficient to pay out all classes of preferred in full, Series D participates in the distributions on a pari passu basis with the other outstanding classes of preferred shares; and |
| | • | | rights including voting, protective provisions, representation on the board of directors (one member), and anti-dilution provisions. |
| | (iii) | Discuss the nature of any significant business events which occurred between the dates the options were granted and the date the registration statement was filed that would contribute to fluctuations in fair value. |
The Company supplementally advises the Staff that the business events it considered in determining the fair value of its common
Mr. Tom Jones
Securities and Exchange Commission
November 5, 2007
RE: MEMSIC, Inc. S-1 Registration Statement (File No. 333-146377)
Page 18
stock include the Company’s historical financial performance, changes in our estimates of future performance, the risks associated with achieving these results, the trading prices of public companies that are, in material respects, comparable to the Company, the prices paid to acquire companies that are, in material respects, comparable to the Company, and the expected timing of a future liquidity event, such as an IPO or sale. The Company has increased its estimates of the fair value of its common stock as its financial performance has improved and as it has progressed toward a successful liquidity event.
For the period from November 1, 2006 to March 1, 2007, the estimated fair value of the Company’s ordinary shares increased from $1.47 per share to $1.61 per share due to the following factors:
| | • | | The Company closed its Series D financing in December 2006; |
| | • | | Its sales to mobile phone applications increased by 78% from 2005 to 2006; |
| | • | | The Company’s strong 2006 result prompted the preparation of an improved 2007 budget; and |
| | • | | It opened Shanghai and Shenzhen sales offices in China. |
For the period from March 1, 2007 to April 26, 2007, the estimated fair value of the Company’s ordinary shares increased from $1.61 per share to $1.85 per share due to the following factors:
| | • | | The Company’s overall revenue continued to increase with first quarter results exceeding management expectations; and |
| | • | | It hired the Vice President of Marketing and Business Development. |
For the period from April 26, 2007 to July 26, 2007, the estimated fair value of the Company’s ordinary shares increased from $1.85 per share to $3.42 per share due to the following factors:
| | • | | The Company’s overall revenue and net income continued to increase. Its revenue increased by 67% from $3.1 million in the second quarter of 2006 to $5.1 million in the second quarter of 2007. Net income increased by 89% from $0.6 million in the second quarter of 2006 to $1.2 million in the second quarter of 2007; |
| | • | | It hired the Chief Financial Officer and Vice President of Engineering; |
Mr. Tom Jones
Securities and Exchange Commission
November 5, 2007
RE: MEMSIC, Inc. S-1 Registration Statement (File No. 333-146377)
Page 19
| | • | | Its largest mobile phone customer listed the Company’s accelerometers as a standard component in their mid to low-end product lines; |
| | • | | The Company added approximately 15 new design-wins primarily with major mobile phone manufacturers in China; |
| | • | | It held discussions with several investment banks about a potential initial public offering; |
| | • | | It engaged Citigroup as its underwriter for its potential initial public offering; and |
| | • | | It launched the initial public offering process. |
For the period from July 26, 2007 to August 22, 2007, the estimated fair value of the Company’s ordinary shares increased from $3.42 per share to $3.82 per share due to the following factors:
| | • | | As the probability of the Company’s initial public offering increased, the discount for lack of marketability decreased; and |
| | • | | It continued to execute its business plan. |
For the period from August 22, 2007 to September 30, 2007, the estimated fair value of the Company’s ordinary shares increased from $3.82 per share to $4.97 per share due to the following factors:
| | • | | The Company filed its initial S-1 registration statement with SEC; |
| | • | | Its third quarter financial results were very strong. Total revenue increased by 64% from the same period of last year and exceeded budget by 62%; |
| | • | | It successfully won two new design-wins for digital camera applications with two new digital camera manufacturers; and |
| | • | | The management was more confident about a near term initial public offering. |
The Company has re-calibrated its estimates as necessary based on business events which provide independent indicators of the value of its shares. On December 22, 2006, it completed a Series D preferred stock financing priced at $2.20 per Series D share. The issuance of Series D preferred shares provided an opportunity for the Company to evaluate its estimated probabilities for future liquidity events. For its December 31, 2006 retrospective determination of fair value, the Company selected probabilities which generated a value for the Series D preferred shares which was consistent with the Series D price of $2.20 per share.
Mr. Tom Jones
Securities and Exchange Commission
November 5, 2007
RE: MEMSIC, Inc. S-1 Registration Statement (File No. 333-146377)
Page 20
| | (iv) | Provide us with a chronological bridge of management’s fair value per share determinations to the current estimated per share offering price. Indicate when discussions were initiated with your underwriter(s) about possible offering price ranges and provide us a history of pricing discussions. |
The Company supplementally advises the Staff that in the first week of June 2007, prospective bookrunning underwriters provided it with their preliminary assessments of the value of the Company in an IPO. The range of values was very wide because of differences in assumptions regarding the timing of an IPO, the Company’s future performance and the selection of comparable companies. Based on these assessments, the Company assumed a higher probability of achieving an IPO by March 2008.
The Company has engaged Orchard Partners, Inc., an independent third party, to prepare retrospective and contemporaneous valuation since February 2006 to support management estimates of the fair value of the options granted. The fair market value of the Company’s common stock was estimated using a probability-weighted analysis of the present value of the returns afforded to its shareholders under each of four possible future scenarios: (i) an initial public offering, or IPO; (ii) sale above the liquidation preference; (iii) sale at or below the liquidation preference; and (iv) remaining private.
As of November 9, 2006, the Company estimated the fair value of its common stock at $1.47 per share which was supported by a retrospective appraisal performed by Orchard Partners, Inc. The Company maintained the probability of an IPO in March 2008 at 23% and the discount rate at 25%. Factors which contributed to an increase in the estimate of fair value were (a) continued revenue growth of more than 40% from the previous year and (b) shorter discount timeframe for a successful liquidity event.
As of December 31, 2006, the Company estimated the fair value of its common stock at $1.61 per share which was supported by a retrospective appraisal performed by Orchard Partners, Inc. The Company maintained the probability of an IPO in March 2008 at 23% and the discount rate at 25%. Using the same probabilities to value the Series D shares, the Company reached the same price of $2.20 per share as paid by the Series D investors on December 22, 2007. The key factor which contributed to an increase in the estimate of fair value of the common stock was the closing of the Series D financing round.
Mr. Tom Jones
Securities and Exchange Commission
November 5, 2007
RE: MEMSIC, Inc. S-1 Registration Statement (File No. 333-146377)
Page 21
As of March 31, 2007, the Company estimated the fair value of its common stock at $1.85 per share which was supported by a contemporaneous appraisal performed by Orchard Partners, Inc. The Company increased the probability of an IPO in March 2008 to 25% and maintained the discount rate at 25%. Factors which contributed to an increase in the estimate of fair value include: (a) over a 100% growth in revenue in the first quarter of 2007 as compared with the same period in 2006; and (b) the hiring of the Vice President of Marketing and Business Development.
As of June 30, 2007, the Company estimated the fair value of its common stock at $3.42 per share which was supported by a retrospective appraisal performed by Orchard Partners, Inc. The Company raised the probability of an IPO in March 2008 to 60% and decreased the discount rate to 20%. This probability reflected favorable meetings with underwriters in the first week of June 2007. Additional factors which contributed to an increase in the estimate of fair value include: (a) initial discussions with prospective underwriters about a potential IPO; (b) revenue growth of 67% and net income growth of 89% in the second quarter of 2007 as compared with the same period in 2006; and (c) the hiring of the Chief Financial Officer and Vice President of Engineering.
As of August 22, 2007, the Company estimated the fair value of its common stock at $3.82 per share which was supported by a contemporaneous appraisal performed by Orchard Partners, Inc. The Company increased the probability of an IPO in March 2008 to 70% and decreased the discount rate to 18%. Factors which contributed to an increase in the estimate of fair value include the Company’s financial performance and progress toward a successful liquidity event.
| 39. | Please note that we are deferring any final evaluation of stock compensation until the estimated offering price is specified, and we may have further comments in that regard when you file the amendment containing that information. |
The Staff’s comment is acknowledged.
Mr. Tom Jones
Securities and Exchange Commission
November 5, 2007
RE: MEMSIC, Inc. S-1 Registration Statement (File No. 333-146377)
Page 22
Valuation of Stock Options, page F-24
| 40. | Please provide the SFAS 123 pro forma disclosures about stock based compensation for 2005 and 2004 or tell us why those disclosures are not required. Refer to paragraphs 84 and 85 to SFAS 123(R). If you previously used the minimum value method and relied on the paragraph 85 exception, please disclose so. |
In response to the Staff’s comment, the Company has revised the disclosure to provide such information on page F-25.
Note 14. Commitments and Contingencies, page F-31
Licensing Agreement and Marketing Agreements, page F-31
| 41. | We see that you record amounts paid as royalty fees under the license agreement as general and administrative expenses. Please tell us why this amount should not be recorded as cost of sales in the period the underlying products are sold. |
The Company respectfully advises the Staff that the technology which the Company obtained in 1999 was neither mature nor complete at that time. The technology had to be significantly developed or enhanced before the Company was able to use it in its production. Therefore, the Company historically classified the royalty expense related to this technology as general and administrative expenses rather than cost of sales. The Company believes the royalty expenses are immaterial to gross margin and to general and administrative expenses. Please see the table below. Since the royalty expenses are capped at $100,000, such amounts will diminish as a percentage of revenue and general and administrative expenses as our business continues to grow. The Company does not expect to enter into any significant licensing arrangements in the future.
| | | | | | | | | | | | | | | | | | | | |
| | | For the year ended December 31, | | | For the nine
months ended
September 30, | |
| | | 2003 | | | 2004 | | | 2005 | | | 2006 | | | 2007 | |
Gross profit | | $ | 1,140,928 | | | $ | 4,897,587 | | | $ | 6,162,502 | | | $ | 8,786,404 | | | $ | 12,319,981 | |
Royalty | | $ | 10,000 | | | $ | 55,842 | | | $ | 91,419 | | | $ | 100,000 | | | $ | 100,000 | |
Impact on gross margin (%) | | | 0.5 | % | | | 0.8 | % | | | 1.0 | % | | | 0.8 | % | | | 0.5 | % |
General and administrative expenses | | $ | 1,391,847 | | | $ | 1,685,790 | | | $ | 2,003,624 | | | $ | 2,544,747 | | | $ | 2,640,794 | |
Royalty as a percentage of general and administrative expenses (%) | | | 0.7 | % | | | 3.3 | % | | | 4.6 | % | | | 3.9 | % | | | 0.8 | % |
Mr. Tom Jones
Securities and Exchange Commission
November 5, 2007
RE: MEMSIC, Inc. S-1 Registration Statement (File No. 333-146377)
Page 23
Recent Sales of Unregistered Securities, page II-2
| 42. | Please provide the information required by Item 701(d) of Regulation S-K. Also, pursuant to Item 701(b), please also name the purchasers or identify the class of persons to whom the securities were sold. |
In response to the Staff’s comment, the Company has provided additional disclosure on page II-2.
Undertakings, page II-3
| 43. | Please provide the undertakings required by Item 512(a)(5)(ii) and Item 512(a)(6) of Regulation S-K. |
In response to the Staff’s comment, the Company has amended the disclosure to provide such undertakings on page II-3.
Exhibit 23.1
| 44. | Please include a currently dated and signed consent from your independent auditors prior to requesting effectiveness. |
The Staff’s comment is acknowledged and the Company will provide this in a subsequent amendment to the Registration Statement prior to requesting effectiveness. The Company has included a currently dated and signed consent from its independent auditors for purposes of this filing.
*********
Mr. Tom Jones
Securities and Exchange Commission
November 5, 2007
RE: MEMSIC, Inc. S-1 Registration Statement (File No. 333-146377)
Page 24
We appreciate the Staff’s agreement to review this letter and the Company’s Registration Statement. Please feel free to contact the undersigned in Hong Kong at the office: (852) 3740-4780, at home: (852) 2803-1823, or mobile phone: (852) 9460-8675 if you wish to discuss the Company’s revised submission.
|
| Very truly yours, |
|
| /s/ Gregory G.H. Miao |
Gregory G.H. Miao |
| cc: | Dr. Yang Zhao, MEMSIC, Inc. |
David Lau, Citigroup Global Markets
John D. Young, Jr., Sullivan & Cromwell LLP
Edward Nelson, Ernst & Young
Exhibit A
MEMSIC
Exhibit B
Your Experts in Microtechnology and Electronics.
Think Small wtc Issue 2 volume 1 May 2006
The newsletter covering the frontiers of MEMS, optronics and nanotechnology
Published by WTC — Wicht Technologie Consulting
Contents
Editorial 2 MEMS News 2 Nanotechnology News 5 Optotechnology News 6 Feature Article 1, 8 “MEMS Inertial sensors” Interview 11 with Yang Zhao, CEO Memsic Events 12
Contributing staff: Henning Wicht. Jéremie Bouchaud, Olivier Nowak Richard Dixon, Bernardo Knoblich, Stefan De Haan
MEMS Inertial Sensors Go Consumer
by Richard Dixon and Jérémie Bouchaud
The market for MEMS inertial sensors (accelerometers and gyroscopes) is set to grow from $835 million in 2004 to over $1360 million in 2009 —a CAGR of 10%. Currently, the main applications are in the automotive industry. These markets are well established and growth rates range from a stagnant 1% for airbag acceleration sensors up to 8% for gyroscopes used in ESP units and GPS navigation assistance. Exciting for MEMS inertial sensors is the market opportunity for mobile applications and consumer electronics (see table on page 8). Over the next few years, we predict annual growth rates exceeding 30% for accelerometers. Mobile phones in particular will provide multi-axis accelerometers with interesting opportunities in menu navigation, gaming, image rotation, pedo-meters, GPS navigation and the like. Gyroscopes are largely servicing markets for image stabilization and HDD protection in camcorders. In contrast to the automotive sector, consumer applications feature relaxed specifications. Failure rates for automotive electronic control units (Ecu) that house airbag accelerometers must be less than 50 ppm, and down to a few ppm for ASIC5. Car manufacturers deploy reliable, high performance accelerometers that are relatively expensive (up to $5 to measure lateral acceleration in ESP units, for example). Mobile phones manufacturers on the other hand tolerate failure rates of 5000 ppm. Active control of the car motion is critical to safety whereas failure in consumer applications result more in an inconvenience. Sensor manufacturers can therefore sacrifice some accuracy and reliability to lower the price. (continued page 8) 800 $ millions 600 Gyroscopes Other Aerospace Accelerometers Accelerometers 400 Gyroscopes over 2004 200 Consumer & IT ;•33% CAGR over 2004 ra <1% CAGR over 2004 Automotive — 0 +8% CAGR over 2004 2004 Market for MEMS inertial sensors 2004—2009 2009 Li
Industry Quote
“In consumer electronics, the tolerance on all specifications [for accelerometers] is 10 to 20% and 4 to 8-bit accuracy are all that is needed. This compares to 1% tolerance and 12 to 14-bit accuracy in the automotive segment.” —Yang Zhao, CEO Memsic, see his interview page 11
WTC Wichtlechnologie Consulting Think small! issue 2, volume 1 May 2006 Page 1
Your Experts in Microtechnology and Electronics. wtc
Editorial
Dr. Henning Wicht, CEO
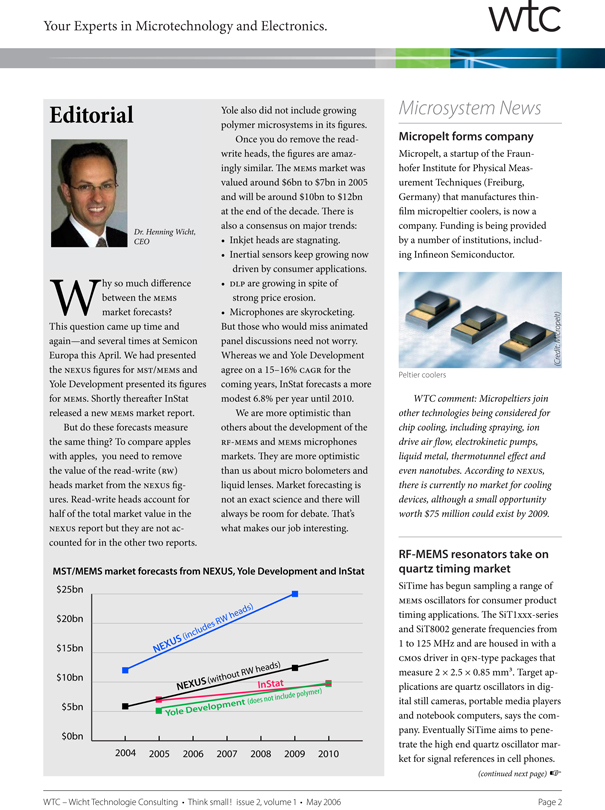
Why so much difference between the MEMS market forecasts? This question came up time and again—and several times at Semicon Europa this April. We had presented the NEXUS figures for MST!MEMS and Yole Development presented its figures for MEMS. Shortly thereafter InStat released a new MEMS market report. But do these forecasts measure the same thing? To compare apples with apples, you need to remove the value of the read-write (Rw) heads market from the NEXUS figures. Read-write heads account for half of the total market value in the NEXUS report but they are not accounted for in the other two reports. Yole also did not include growing polymer microsystems in its figures. Once you do remove the read- write heads, the figures are amazingly similar. The MEMS market was valued around $6bn to $7bn in 2005 and will be around $lObn to $l2bn at the end of the decade. There is also a consensus on major trends:
• Inkjet heads are stagnating.
• Inertial sensors keep growing now driven by consumer applications.
• DLP are growing in spite of strong price erosion.
• Microphones are skyrocketing. But those who would miss animated panel discussions need not worry. Whereas we and Yole Development agree on a 15–16% CAGR for the coming years, InStat forecasts a more modest 6.8% per year until 2010. We are more optimistic than others about the development of the RF-MEMS and MEMS microphones markets. They are more optimistic than us about micro bolometers and liquid lenses. Market forecasting is not an exact science and there will always be room for debate. That’s what makes our job interesting.
MST/MEMS market forecasts from NEXIS, Yole Development and InStat
Microsystem News
Micropelt forms company
Micropelt, a startup of the Fraunhofer Institute for Physical Measurement Techniques (Freiburg, Germany) that manufactures thin- film micropeltier coolers, is now a company. Funding is being provided by a number of institutions, including Infineon Semiconductor.
WTC comment: Micropeltiers join other technologies being considered for chip cooling, including spraying, ion drive airflow, electrokinetic pumps, liquid metal, thermotunnel effect and even nanotubes. According to NEXUS, there is currently no market for cooling devices, although a small opportunity worth $75 million could exist by 2009.
RF-MEMS resonators take on quartz timing market
SiTime has begun sampling a range of MEMS oscillators for consumer product timing applications. The SiT ixxx-series and SiT8002 generate frequencies from ito 125 MHz and are housed in with a CMOS driver in QFN-type packages that measure 2 x 2.5 x 0.85 mm3. Target applications are quartz oscillators in digital still cameras, portable media players and notebook computers, says the company. Eventually SiTime aims to penetrate the high end quartz oscillator market for signal references in cell phones. (continued next page) if Editorial Dr. Henning Wicht, CEO d Peltier coolers MST/MEMS market forecasts from N EXUS, Yole Development and I nStat $25bn NEXUS (includes RW heads) NEXUS (without RW heads) InStat Yole Development (does not include polymer)
$2Obn $l5bn $1 Obn $5bn $Obn 2004 2005 2006 2007 2008 2009 2010 WTC WichtlechnologieConsulting . ThinksmalH issue2,volumel . May2006 Page 2
Your Experts in Microtechnology and Electronics.
Microsystern News wtc
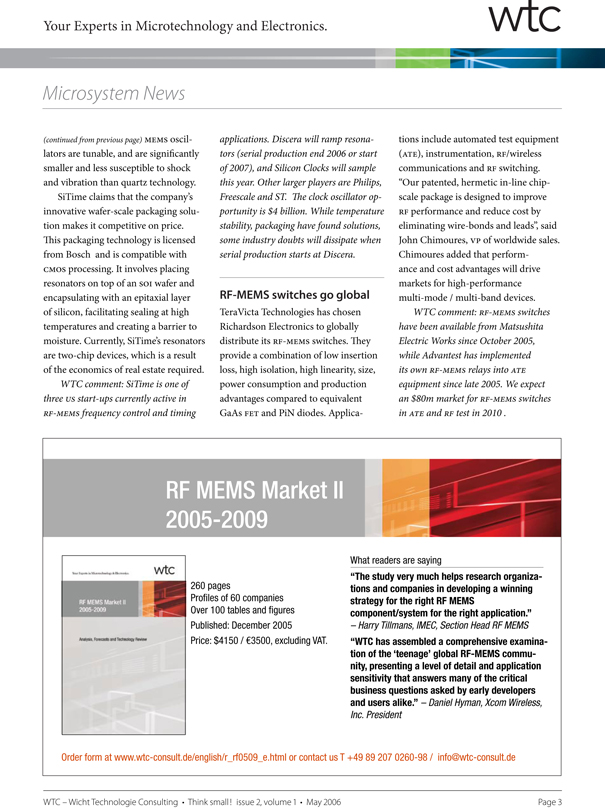
(continued from previous page) MEMS oscillators are tunable, and are significantly smaller and less susceptible to shock and vibration than quartz technology. SiTime claims that the company’s innovative wafer-scale packaging solution makes it competitive on price. This packaging technology is licensed from Bosch and is compatible with CMOS processing. It involves placing resonators on top of an SOT wafer and encapsulating with an epitaxial layer of silicon, facilitating sealing at high temperatures and creating a barrier to moisture. Currently, SiTime’s resonators are two-chip devices, which is a result of the economics of real estate required.
WTC comment: SiTime is one of three us start-ups currently active in RF-MEMS frequency control and timing applications. Discera will ramp resonators (serial production end 2006 or start of 2007), and Silicon Clocks will sample this year. Other larger players are Philips, Freescale and ST. The clock oscillator opportunity is $4 billion. While temperature stability, packaging have found solutions, some industry doubts will dissipate when serial production starts at Discera.
RF-MEMS switches go global
TeraVicta Technologies has chosen Richardson Electronics to globally distribute its RF-MEMS switches. They provide a combination of low insertion loss, high isolation, high linearity, size, power consumption and production advantages compared to equivalent GaAs FET and PiN diodes. Applica tions include automated test equipment (ATE), instrumentation, RF!wireless communications and RF switching. “Our patented, hermetic in-line chip- scale package is designed to improve RF performance and reduce cost by eliminating wire-bonds and leads”, said John Chimoures, vp of worldwide sales. Chimoures added that performance and cost advantages will drive markets for high-performance multi-mode / multi-band devices.
WTC comment: RF-MEM5 switches have been available from Matsushita Electric Works since October 2005, while Advantest has implemented its own RF-MEM5 relays into ATE equipment since late 2005. We expect an $80m market for RF-MEM5 switches in ATE andRF test in 2010.
RF MEMS Market II 2005-2009
260 pages Profiles of 60 companies Over 100 tables and figures Published: December 2005
Price: $4150! €3500, excluding VAT.
What readers are saying
“The study very much helps research organizations and companies in developing a winning strategy for the right RF MEMS component/system for the right application.”
— Harry Tilimans, IMEC, Section Head RF MEMS
“WTC has assembled a comprehensive examination of the ‘teenage’ global RF-MEMS community, presenting a level of detail and application sensitivity that answers many of the critical business questions asked by early developers and users alike.” – Daniel Hyman, Xcom Wireless, Inc. President
Order form at www.wtc-consult.de!english!r_rf0509_e.html or contact us T +49 89 207 0260-98! info©wtc-consult.de
WTC WichtlechnologieConsulting . ThinksmalH issue2,volumel . May2006 Page 3
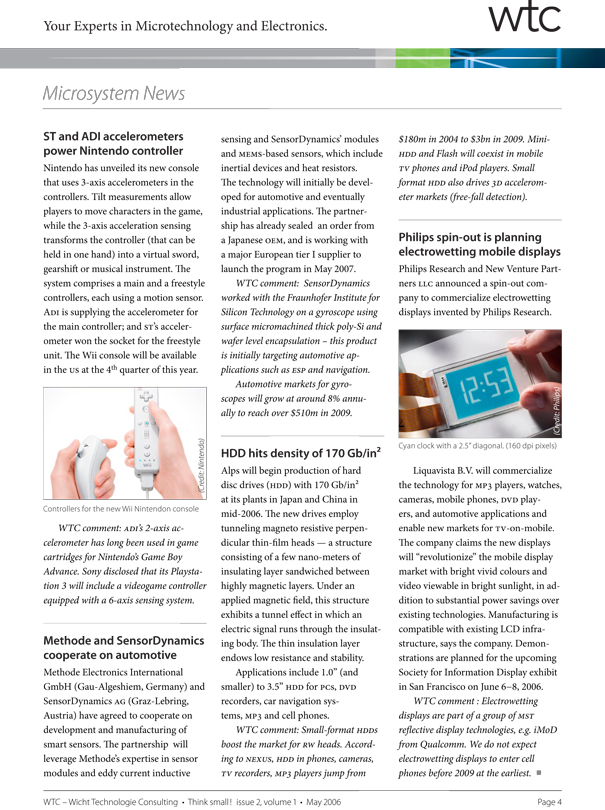
Your Experts in Microtechnology and Electronics.
Microsystern News wtc
ST and ADI accelerometers power Nintendo controller
Nintendo has unveiled its new console that uses 3-axis accelerometers in the controllers. Tilt measurements allow players to move characters in the game, while the 3-axis acceleration sensing transforms the controller (that can be held in one hand) into a virtual sword, gearshift or musical instrument. The system comprises a main and a freestyle controllers, each using a motion sensor. Am is supplying the accelerometer for the main controller; and ST’S accelerometer won the socket for the freestyle unit. The Wii console will be available in the us at the 4th quarter of this year.
(Credit: Nintendo)
Controllers for the newWn Nintendon console
WTC comment: ADI’s 2-axis accelerometer has long been used in game cartridges for Nintendo’s Game Boy Advance. Sony disclosed that its Playstation 3 will include a videogame controller equipped with a 6-axis sensing system.
Methode and SensorDynamics cooperate on automotive
Methode Electronics International GmbH (Gau-Algeshiem, Germany) and SensorDynamics AG (Graz-Lebring, Austria) have agreed to cooperate on development and manufacturing of smart sensors. The partnership will leverage Methode’s expertise in sensor modules and eddy current inductive sensing and SensorDynamics’ modules and MEMS-based sensors, which include inertial devices and heat resistors. The technology will initially be developed for automotive and eventually industrial applications. The partnership has already sealed an order from a Japanese OEM, and is working with a major European tier I supplier to launch the program in May 2007.
WTC comment: SensorDynamics worked with the Fraunhofer Institute for Silicon Technology on a gyroscope using surface micromachined thick poly-Si and wafer level encapsulation — this product is initially targeting automotive applications such as ESP and navigation.
Automotive markets for gyroscopes will grow at around 8% annually to reach over $510m in 2009.
HDD hits density of 170 Gb/in2
Alps will begin production of hard disc drives (Hun) with 170 Gb/in2 at its plants in Japan and China in mid-2006. The new drives employ tunneling magneto resistive perpendicular thin-film heads — a structure consisting of a few nano-meters of insulating layer sandwiched between highly magnetic layers. Under an applied magnetic field, this structure exhibits a tunnel effect in which an electric signal runs through the insulating body. The thin insulation layer endows low resistance and stability.
Applications include 1.0” (and smaller) to 3.5” HDD for Pcs, DVD recorders, car navigation systems, MP3 and cell phones.
WTC comment: Small-format HDD5 boost the market for RW heads. According to NExus, HDD in phones, cameras, TV recorders, MP3 players jump from $180m in 2004 to $3bn in 2009. MiniHDD and Flash will coexist in mobile TV phones and iPod players. Small format HDD also drives 3D accelerometer markets (free-fall detection).
Philips spin-out is planning electrowetting mobile displays
Philips Research and New Venture Partners LLC announced a spin-out company to commercialize electrowetting displays invented by Philips Research.
Cyan clock with a 2.5” diagonal. (160 dpi pixels)
Liquavista B.V. will commercialize the technology for MP3 players, watches, cameras, mobile phones, DVD players, and automotive applications and enable new markets for Tv-on-mobile. The company claims the new displays will “revolutionize” the mobile display market with bright vivid colours and video viewable in bright sunlight, in addition to substantial power savings over existing technologies. Manufacturing is compatible with existing LCD infrastructure, says the company. Demonstrations are planned for the upcoming Society for Information Display exhibit in San Francisco on June 6—8, 2006.
WTC comment: Electrowetting displays are part of a group ofMsT reflective display technologies, e.g. iMoD from Qualcomm. We do not expect electrowetting displays to enter cell phones before 2009 at the earliest.
WTC WichtlechnologieConsulting . ThinksmalH issue2,volumel . May2006 Page 4
Your Experts in Microtechnology and Electronics.
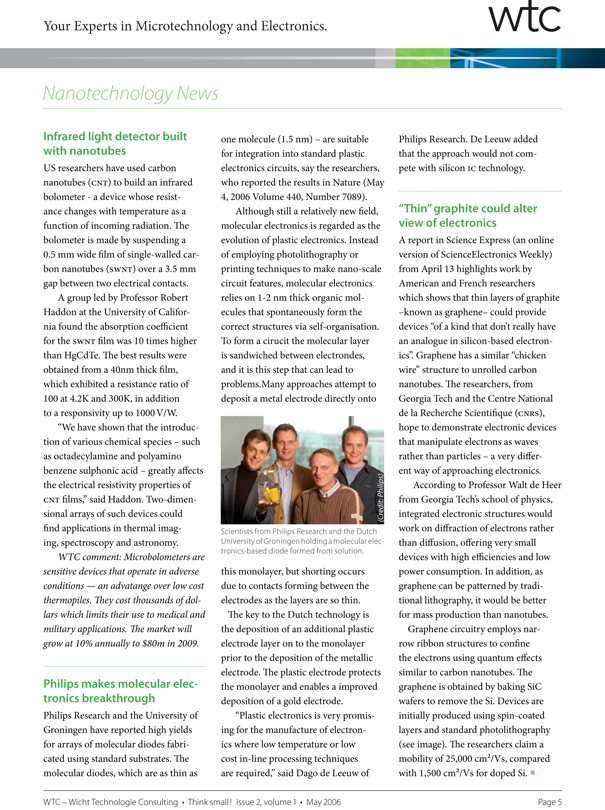
Nanotechnology News wtc
Infrared light detector built with nanotubes
US researchers have used carbon nanotubes (CNT) to build an infrared bolometer—a device whose resistance changes with temperature as a function of incoming radiation. The bolometer is made by suspending a 0.5 mm wide film of single-walled carbon nanotubes (swNT) over a 3.5 mm gap between two electrical contacts.
A group led by Professor Robert Haddon at the University of California found the absorption coefficient for the SWNT film was 10 times higher than HgCdTe. The best results were obtained from a 40nm thick film, which exhibited a resistance ratio of 100 at 4.2K and 300K, in addition to a responsivity up to 1000V!W
“We have shown that the introduction of various chemical species — such as octadecylamine and polyamino benzene sulphonic acid — greatly affects the electrical resistivity properties of CNT films:’ said Haddon. Two-dimensional arrays of such devices could find applications in thermal imaging, spectroscopy and astronomy.
WTC comment: Microbolometers are sensitive devices that operate in adverse conditions — an advatange over low cost thermopiles. They cost thousands of dollars which limits their use to medical and military applications. The market will grow at 10% annually to $80m in 2009.
Philips makes molecular electronics breakthrough
Philips Research and the University of Groningen have reported high yields for arrays of molecular diodes fabricated using standard substrates. The molecular diodes, which are as thin as one molecule (1.5 nm) — are suitable for integration into standard plastic electronics circuits, say the researchers, who reported the results in Nature (May 4, 2006 Volume 440, Number 7089).
Although still a relatively new field, molecular electronics is regarded as the evolution of plastic electronics. Instead of employing photolithography or printing techniques to make nano-scale circuit features, molecular electronics relies on 1-2 nm thick organic molecules that spontaneously form the correct structures via self-organisation. To form a cirucit the molecular layer is sandwiched between electrondes, and it is this step that can lead to problems.Many approaches attempt to deposit a metal electrode directly onto LI Scientists from Philips Research and the Dutch University of Groningen holding a molecular dec tronics based diode formed from solution. this monolayer, but shorting occurs due to contacts forming between the electrodes as the layers are so thin. The key to the Dutch technology is the deposition of an additional plastic electrode layer on to the monolayer prior to the deposition of the metallic electrode. The plastic electrode protects the monolayer and enables a improved deposition of a gold electrode.
“Plastic electronics is very promising for the manufacture of electronics where low temperature or low cost in-line processing techniques are required:’ said Dago de Leeuw of Philips Research. Dc Leeuw added that the approach would not compete with siliconic technology.
Scientists from Philips Research and the Dutch University of Groningen holding a molecular electronics-based diode formed from solution.
(Credit Philips)
“Thin” graphite could alter view of electronics
A report in Science Express (an online version of ScienceElectronics Weekly) from April 13 highlights work by American and French researchers which shows that thin layers of graphite-known as graphene- could provide devices “of a kind that don’t really have an analogue in silicon-based electronics”. Graphene has a similar “chicken wire” structure to unrolled carbon nanotubes. The researchers, from Georgia Tech and the Centre National de la Recherche Scientifique (CNRS), hope to demonstrate electronic devices that manipulate electrons as waves rather than particles — a very different way of approaching electronics.
According to Professor Walt de Heer from Georgia Tech’s school of physics, integrated electronic structures would work on diffraction of electrons rather than diffusion, offering very small devices with high efficiencies and low power consumption. In addition, as graphene can be patterned by traditional lithography, it would be better for mass production than nanotubes.
Graphene circuitry employs narrow ribbon structures to confine the electrons using quantum effects similar to carbon nanotubes. The graphene is obtained by baking SiC wafers to remove the Si. Devices are initially produced using spin-coated layers and standard photolithography (see image). The researchers claim a mobility of 25,000 cm2! Vs, compared with 1,500 cm2!Vs for doped Si. r’I
WTC WichtlechnologieConsulung . ThinksmalH issue2volumel .. May2006 Page 5
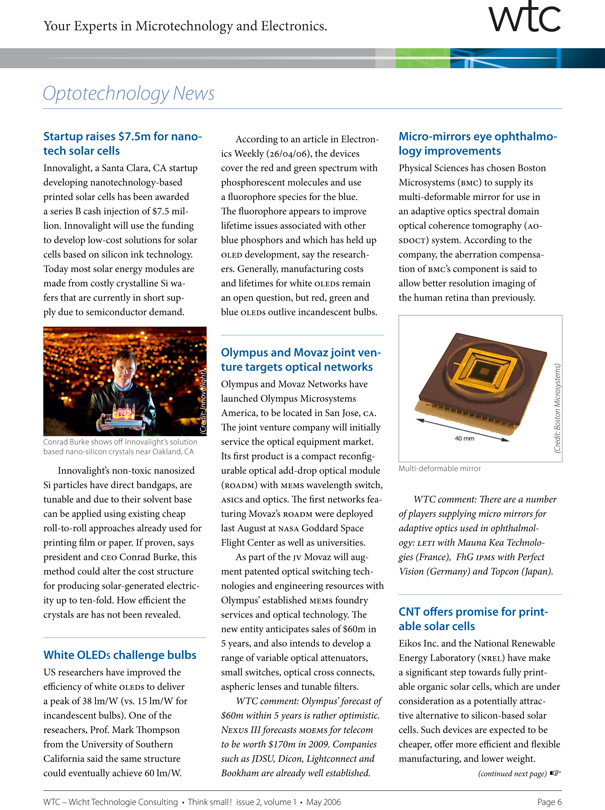
Your Experts in Microtechnology and Electronics. wtc
Optotechnology News.
Startup raises $7.5m for nanotech solar cells
Innovalight, a Santa Clara, CA startup developing nanotechnology-based printed solar cells has been awarded a series B cash injection of $7.5 million. Innovalight will use the funding to develop low-cost solutions for solar cells based on silicon ink technology. Today most solar energy modules are made from costly crystalline Si wafers that are currently in short supply due to semiconductor demand.
Conrad Burke shows off Innovalights solution based nano silicon crystals near Oakland, CA Si particles have direct bandgaps, are tunable and due to their solvent base can be applied using existing cheap roll-to-roll approaches already used for printing film or paper. If proven, says president and CEO Conrad Burke, this method could alter the cost structure for producing solar-generated electricity up to ten-fold. How efficient the crystals are has not been revealed. White OLEDs challenge bulbs US researchers have improved the efficiency of white OLED5 to deliver a peak of 38 lm/W (vs. 15 lm/W for incandescent bulbs). One of the reseachers, Prof. Mark Thompson from the University of Southern California said the same structure could eventually achieve 60 lm/W According to an article in Electronics Weekly (26/04/06), the devices cover the red and green spectrum with phosphorescent molecules and use a fluorophore species for the blue. The fluorophore appears to improve lifetime issues associated with other blue phosphors and which has held up OLED development, say the researchers. Generally, manufacturing costs and lifetimes for white OLED5 remain an open question, but red, green and blue OLED5 outlive incandescent bulbs. Olympus and Movaz joint venture targets optical networks Olympus and Movaz Networks have launched Olympus Microsystems America, to be located in San Jose, CA. The joint venture company will initially service the optical equipment market. Its first product is a compact reconfigurable optical add-drop optical module (bAUM) with MEMS wavelength switch, ASIC5 and optics. The first networks featuring Movaz’s ROADM were deployed last August at NASA Goddard Space Flight Center as well as universities. As part of the jv Movaz will augment patented optical switching technologies and engineering resources with Olympus’ established MEMS foundry services and optical technology. The new entity anticipates sales of $60m in 5 years, and also intends to develop a range of variable optical attenuators, small switches, optical cross connects, aspheric lenses and tunable filters. WTC comment: Olympus’forecast of $60m within 5 years is rather optimistic. NEXUS Iliforecasts MOEMS for telecom to be worth $170m in 2009. Companies such as JDSU, Dicon, Lightconnect and Bookham are already well established. Micro-mirrors eye ophthalmology improvements Physical Sciences has chosen Boston Microsystems (BMC) to supply its multi-deformable mirror for use in an adaptive optics spectral domain optical coherence tomography (AoSDOCT) system. According to the company, the aberration compensation of BMC’s component is said to allow better resolution imaging of the human retina than previously. Multi deformable mirror 0 0 0 WTC comment: There are a number of players supplying micro mirrors for adaptive optics used in ophthalmology: LETI with Mauna Kea Technologies (France), FhG IPMS with Perfect Vision (Germany) and Topcon (Japan). CNT offers promise for printable solar cells Eikos Inc. and the National Renewable Energy Laboratory (NREL) have make a significant step towards fully printable organic solar cells, which are under consideration as a potentially attractive alternative to silicon-based solar cells. Such devices are expected to be cheaper, offer more efficient and flexible manufacturing, and lower
weight. (continued next page) if -. I l-’o_ 0”o • Innovalight’s non-toxic nanosized WTC WichtlechnologieConsulting . ThinksmalH issue2,volumel . May2006 Page 6
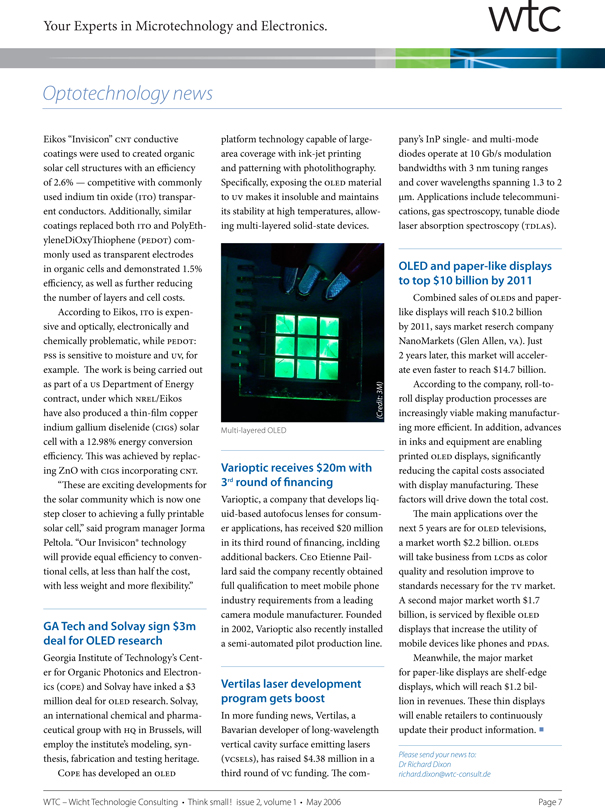
Your Experts in Microtechnology and Electronics. Optotechnology news wit Eikos “Invisicon” CNT conductive coatings were used to created organic solar cell structures with an efficiency of 2.6% — competitive with commonly used indium tin oxide (ITo) transparent conductors. Additionally, similar coatings replaced both ITO and PolyEthyleneDiOxyThiophene (PEDOT) commonly used as transparent electrodes in organic cells and demonstrated 1.5% efficiency, as well as further reducing the number of layers and cell costs. According to Eikos, ITO is expensive and optically, electronically and chemically problematic, while PEDOT: PSS is sensitive to moisture and uv, for example. The work is being carried out as part of a us Department of Energy contract, under which NREL!Eikos have also produced a thin-film copper indium gallium diselenide (GIGs) solar cell with a 12.98% energy conversion efficiency. This was achieved by replacing ZnO with GIGS incorporating GNT. “These are exciting developments for the solar community which is now one step closer to achieving a fully printable solar cell:’ said program manager Jorma Peltola. “Our Invisicon technology will provide equal efficiency to conventional cells, at less than half the cost, with less weight and more flexibility:’ GA Tech and Solvay sign $3m deal for OLED research Georgia Institute of Technology’s Center for Organic Photonics and Electronics (GOPE) and Solvay have inked a $3 million deal for OLED research. Solvay, an international chemical and pharmaceutical group with HQ in Brussels, will employ the institute’s modeling, synthesis, fabrication and testing heritage. COPE has developed an OLED platform technology capable of large- area coverage with ink-jet printing and patterning with photolithography. Specifically, exposing the OLED material to uv makes it insoluble and maintains its stability at high temperatures, allowing multi-layered solid-state devices. Multi layered OLED Varioptic receives $20m with 3rd round of financing Varioptic, a company that develops liquid-based autofocus lenses for consumer applications, has received $20 million in its third round of financing, inclding additional backers. CEO Etienne Pail- lard said the company recently obtained full qualification to meet mobile phone industry requirements from a leading camera module manufacturer. Founded in 2002, Varioptic also recently installed a semi-automated pilot production line. Vertilas laser development program gets boost In more funding news, Vertilas, a Bavarian developer of long-wavelength vertical cavity surface emitting lasers (vGsELs), has raised $4.38 million in a third round of VG funding. The com pany’s InP single- and multi-mode diodes operate at 10 Gb/s modulation bandwidths with 3 nm tuning ranges and cover wavelengths spanning 1.3 to 2 im. Applications include telecommunications, gas spectroscopy, tunable diode laser absorption spectroscopy (TDLAS). OLED and paper-like displays to top $10 billion by 2011 Combined sales of OLED5 and paper- like displays will reach $10.2 billion by 2011, says market reserch company NanoMarkets (Glen Allen, VA). Just 2 years later, this market will accelerate even faster to reach $14.7 billion. According to the company, roll-to- roll display production processes are increasingly viable making manufacturing more efficient. In addition, advances in inks and equipment are enabling printed OLED displays, significantly reducing the capital costs associated with display manufacturing. These factors will drive down the total cost. The main applications over the next 5 years are for OLED televisions, a market worth $2.2 billion. OLED5 will take business from LGD5 as color quality and resolution improve to standards necessary for the TV market. A second major market worth $1.7 billion, is serviced by flexible OLED displays that increase the utility of mobile devices like phones and PDA5. Meanwhile, the major market for paper-like displays are shelf-edge displays, which will reach $1.2 billion in revenues. These thin displays will enable retailers to continuously update their product information. Please send your news to: Dr Richard Dixon richarddixon@wtc consulLde an In In WTC WichtlechnologieConsulung . ThinksmalH issue2volumel . May2006 Page 7

Your Experts in Microtechnology and Electronics. Feature Article wtc MEMS Inertial Sensors Go Consumer Continued from page 1 Tn-axis accelerometers for mobile applications At least 10 companies are working on tn-axis MEMS accelerometers, some of which were initially developed for the automotive industry. Three axes sensing is needed to fully describe three-dimensional motion, although certain applications benefit from 2-axis devices if one axis (like the horizon) is assumed fixed or for a simple 2D (tilt) game in a cell phone. With few exceptions accelerometers work by measuring the motion of a proof mass versus a fixed frame or reference. The main sensing approaches are capacitive (e.g. Bosch, Freescale, Kionix, OKI Electric, STMicroelectronics and Analog Devices), piezoresistive (e.g. Hitachi Metals, Matsushita, Fujitsu, and Hokuriku) or less common thermal accelerometers from sole proponent MEMSIC (with 2-axis and 3-axis in development). Each has its advantages but price is the bottom line. Requirements for cell phones Mobile phone integrators want the following attributes from accelerometers: • Small packages, e.g. 3.5 x 3.5 mm2 and 1 mm thick or less • Sensor and signal conditioning ASIC in the same package • Digital output • Power consumption < 3 mW (1 mA @ 3V). Many devices feature a microwatt-level sleep mode to reduce power consumption further • Compatibility with lead- free soldering processes • Availability in volume for $1.35 or less in next 2—3 years. These conditions have already been met. The smallest acceler ometer to date is made by Hitachi Metals, a 3-axis device in a 12 mm3 (3.4 x 3.7 x 0.92) package at least 50% smaller than its nearest competitor. The lowest cost 3-axis sensors come from Analog Devices or Freescale ($2 in volume). MEMSIC provides the lowest cost solution for 2-axis sensors (now under $1 and $0.50 expected in 2007). Meanwhile, the power consumption prize goes to Analog Devices’ ADXL33O with power consumption well under 1 mW Gyroscopes improve picture quality Today, gyroscopes are used in image stabilization, where two axes of motion sensing are needed to remove vibration and shake. While other approaches are also used to damp vibration, gyros are a superior solution. (continued next page) r- PDA Digital still cameras (D SC) Camcorders Function Pedometer, image rotation, menu scroll, gaming, free-fall detection (HDD protection), navigation Navigation IMU, Web content navigation — Image stabilisation Examples of products NTT DoCoMo pedometer (2003) Vodafone image rotation (2004) Samsung SGH E760, Nokia 3230 (navigation and gaming) Toshiba PocketPC e740 All Panasonic DSCs, e.g. Lumix ($200), PentaxOptio AlO ($350) Canon, Sony DSC5 Upper end: Panasonic (over $1500) High end: JVC3OGb,Toshiba 60Gb IBM, Toshiba, Apple laptops Status of commercialisation Accelerometer in cell phone since 2003 Gyroscope expected in 2007—2008 2-or 3-axis accelerometer 2-axis gyroscope Two 1-axis gyroscopes or one 2-axis gyroscope Two 2-axis accelerometers Two 1-axis gyroscopes or one 2-axis gyroscope 2-or 3-axis accelerometer Demonstrator in 2002 at Paris PDA show Gyroscope established since late 1990s Accelerometer emerging Gyroscope established since late 1990s Free-fall detection established Other applications emerging Established Established Applications of MEMS accelerometers and gyroscopes in consumer products Consumer product Cell phones MEMS inertial device(s) 2-or 3-axis accelerometer, 1-or 2-axis gyroscope Image stabilisation, free-fall detection (HDD protection) Laptops — MP3 players Others: toys, games, personal transporter, robots Free fall detection (HDD protection), GPS dead-reckoning assist (anti-theft) Free fall (HDD protection) Realistic motion iPod with hard disc drive Nintendo’s Kirby “Tilt-n-Tumble”GameBoy Microsoft gamepad “Sidewinder Freestyle Pro Segway, Sony Aibo robot, Sony PS3 3-axis accelerometer 2-or 3-axis accelerometers, 1-or 2-axis gyroscopes WTC WichtlechnologieConsulting . ThinksmalH issue2,volumel . May2006 Page 8
Your Experts in Microtechnology and Electronics. Feature Article wtc Gyroscopes have been a feature of the top range of Panasonic camcorders for some years. They are now also employed in some Pentax and Panasonic digital still cameras costing as little as $250. Interestingly, MEMS gyroscopes are also used for HDD free-fall protection in recent camcorders from jvc and Toshiba (these camcorders retail for over $1,000). Most commercial gyros are vibratory and use the transfer of energy between two vibration modes caused by Coriolis force. They are challenging to manufacture (hence their higher cost compared to accelerometers), being essentially two very high performing MEM5 devices in single device, usually a self tuned resonator for drive and micro-g for the sensing. Compared to automotive applications, packages in consumer electronics are about 1110th the size (targeting 25 mm3). The resolution requirements are lower, i.e. 5—10 O/ compared to 0.1—1 O/ in cars. A gyro is a larger device than an accelerometer, and can require as much as 10 times more power due to the higher drive requirements (5 V). There are many different sensing approaches and materials employed to make MEM5 gyroscopess. Silicon micromachined capacitive gyros are produced by Analog Devices and Kionix. Piezo-ceramic devices are available from NEC Tokin and Murata, thin-film resonators deposited with PZT from Matsushita, quartz from Seiko Epson and Microcomponents (part of Swatch). These are all single axis solutions. Currently, Murata manufactures a piezoceramic single-axis solution that costs $7—8. Sony and Invensense are examples of companies with two-axis solutions estimated to cost under $10. Today, the smallest packaged device is 21 mm3 — a single axis quartz piezoelectric gyroscope from Seiko Epson. At 6 mW, it is also the lowest power solution, in part due to a lower drive voltage compared to 5V drive capacitive gyroscopes. The cell phone remains the dangling carrot for gyroscopes, but they are still too expensive for this application. Cell phone companies tell us the acceptable price is somewhere around $3—S for 2-axis sensing for an application like GP5 navigation. (continued next poge) ‘te NEXUS Market Analysis for MEMS and Microsystems III, 2005-2009 Coordinated byWTC in collaboration with NEXUS 26 MEMS I MST products 8 application fields 240 pages 55 tables and graphs Published: December 2005 Price: $1300 I €1100, excluding VAT What readers are saying “This provides a good perspective on mst gyros and their applications. The reporting at the component level is a timely and helpful description of this growing and important market.” — Bob Sulouff, Director Business Development Analog Devices, Micromachined Products Division “The report combines a very good survey of the entire field of products that are available in MEMS technology with detailed and precise information on important parameters such as market size, sales price, important vendors, etc. I appreciate both aspects of the study very much.” — Dr Peter Ernst BOSGH, Product Planning and Marketing Sensors WTC — Wicht Technologie Consu ting . Think sma II issue 2, volume] . May 2006 Page 9
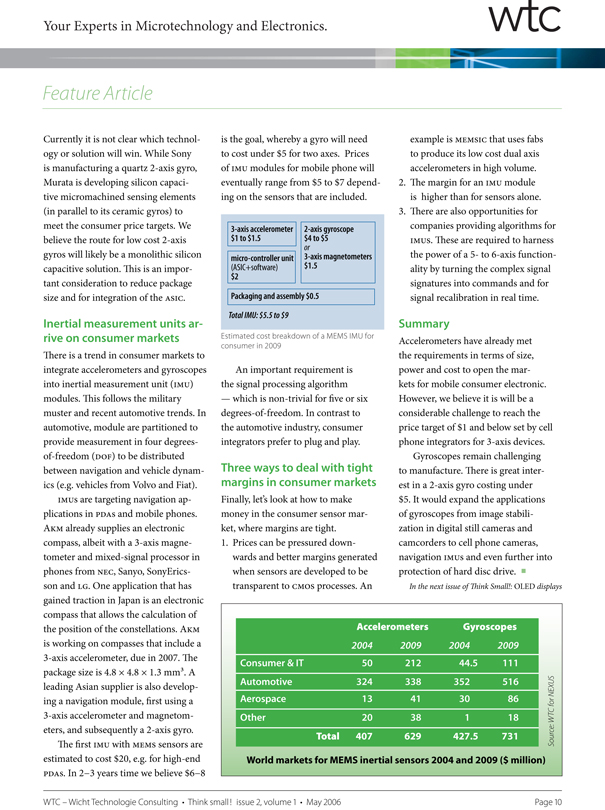
Your Experts in Microtechnology and Electronics. Feature Article wtc Currently it is not clear which technology or solution will win. While Sony is manufacturing a quartz 2-axis gyro, Murata is developing silicon capacitive micromachined sensing elements (in parallel to its ceramic gyros) to meet the consumer price targets. We believe the route for low cost 2-axis gyros will likely be a monolithic silicon capacitive solution. This is an important consideration to reduce package size and for integration of the ASIC. Inertia I measurement units arrive on consumer markets There is a trend in consumer markets to integrate accelerometers and gyroscopes into inertial measurement unit (IMu) modules. This follows the military muster and recent automotive trends. In automotive, module are partitioned to provide measurement in four degrees- of-freedom (D0F) to be distributed between navigation and vehicle dynamics (e.g. vehicles from Volvo and Fiat). IMU5 are targeting navigation applications in PDA5 and mobile phones. AKM already supplies an electronic compass, albeit with a 3-axis magnetometer and mixed-signal processor in phones from NEC, Sanyo, SonyEricsson and LG. One application that has gained traction in Japan is an electronic compass that allows the calculation of the position of the constellations. AKM is working on compasses that include a 3-axis accelerometer, due in 2007. The package size is 4.8 x 4.8 x 1.3 mm3. A leading Asian supplier is also developing a navigation module, first using a 3-axis accelerometer and magnetometers, and subsequently a 2-axis gyro. The first IMU with MEMS sensors are estimated to cost $20, e.g. for high-end PDA5. In 2—3 years time we believe $6—8 is the goal, whereby a gyro will need to cost under $5 for two axes. Prices of IMU modules for mobile phone will eventually range from $5 to $7 depending on the sensors that are included. 3-axis accelerometer $lto$1,5 2-axis gyroscope $4to$5 or micro-controller unit (ASIC+software) $2 3-axis magnetometers $1.5 Packaging and assembly $0.5 ThtoIIMU:$5.5 to$9 Estimated cost breakdown ofa MEMS IMU for consumer in 2009 An important requirement is the signal processing algorithm — which is non-trivial for five or six degrees-of-freedom. In contrast to the automotive industry, consumer integrators prefer to plug and play. Three ways to deal with tight margins in consumer markets Finally, let’s look at how to make money in the consumer sensor market, where margins are tight. 1. Prices can be pressured downwards and better margins generated when sensors are developed to be transparent to CMOS processes. An example is MEMSIC that uses fabs to produce its low cost dual axis accelerometers in high volume. 2. The margin for an IMU module is higher than for sensors alone. 3. There are also opportunities for companies providing algorithms for IMUS. These are required to harness the power of a 5- to 6-axis functionality by turning the complex signal signatures into commands and for signal recalibration in real time. Summary Accelerometers have already met the requirements in terms of size, power and cost to open the markets for mobile consumer electronic. However, we believe it is will be a considerable challenge to reach the price target of $1 and below set by cell phone integrators for 3-axis devices. Gyroscopes remain challenging to manufacture. There is great interest in a 2-axis gyro costing under $5. It would expand the applications of gyroscopes from image stabilization in digital still cameras and camcorders to cell phone cameras, navigation IMU5 and even further into protection of hard disc drive. In the next issue of Think Small!: OLED displays 44 Accelerometers Gyroscopes 2004 2009 2004 2009 Consumer&IT 50 212 44.5 111 Automotive 324 338 352 516 13 41 30 86 Other 20 38 1 18 ‘ Total 407 629 427.5 731_—: World markets for MEMS inertial sensors 2004 and 2009 ($ million) WTC WichtlechnologieConsulting . ThinksmalH issue2,volumel . May2006 Page 10
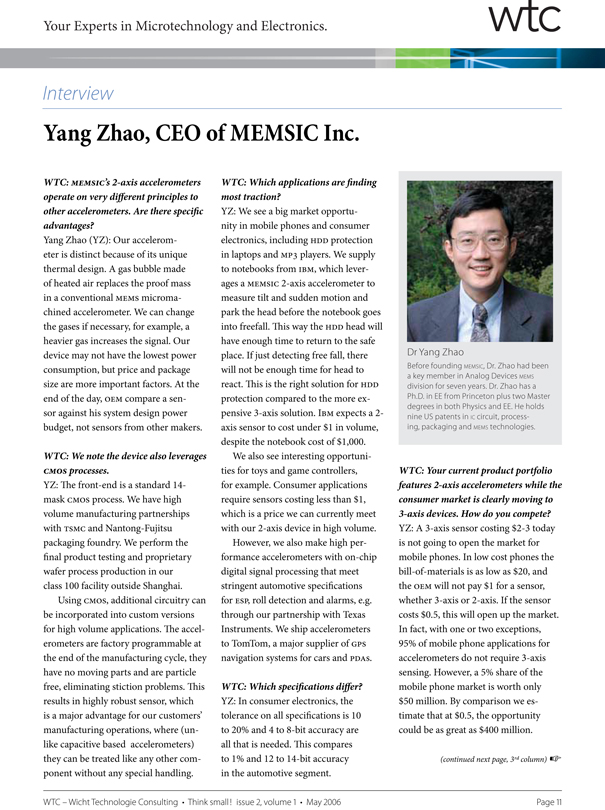
Your Experts in Microtechnology and Electronics. p Interview wit Yang Zhao, CEO of MEMSIC Inc. WTC: MEMSIC’s 2-axis accelerometers operate on very different principles to other accelerometers. Are there specific advantages? Yang Zhao (YZ): Our accelerometer is distinct because of its unique thermal design. A gas bubble made of heated air replaces the proof mass in a conventional MEMS micromachined accelerometer. We can change the gases if necessary, for example, a heavier gas increases the signal. Our device may not have the lowest power consumption, but price and package size are more important factors. At the end of the day, OEM compare a sensor against his system design power budget, not sensors from other makers. WTC: We note the device also leverages CMOS processes. YZ: The front-end is a standard 14- mask CMOS process. We have high volume manufacturing partnerships with TSMC and Nantong-Fujitsu packaging foundry. We perform the final product testing and proprietary wafer process production in our class 100 facility outside Shanghai. Using CMOS, additional circuitry can be incorporated into custom versions for high volume applications. The accelerometers are factory programmable at the end of the manufacturing cycle, they have no moving parts and are particle free, eliminating stiction problems. This results in highly robust sensor, which is a major advantage for our customers’ manufacturing operations, where (unlike capacitive based accelerometers) they can be treated like any other component without any special handling. WTC: Which applications are finding most traction? YZ: We see a big market opportunity in mobile phones and consumer electronics, including HDD protection in laptops and MP3 players. We supply to notebooks from IBM, which leverages a MEMSIC 2-axis accelerometer to measure tilt and sudden motion and park the head before the notebook goes into freefall. This way the HDD head will have enough time to return to the safe place. If just detecting free fall, there will not be enough time for head to react. This is the right solution for HDD protection compared to the more expensive 3-axis solution. IBM expects a 2- axis sensor to cost under $1 in volume, despite the notebook cost of $1,000. We also see interesting opportunities for toys and game controllers, for example. Consumer applications require sensors costing less than $1, which is a price we can currently meet with our 2-axis device in high volume. However, we also make high performance accelerometers with on-chip digital signal processing that meet stringent automotive specifications for ESP, roll detection and alarms, e.g. through our partnership with Texas Instruments. We ship accelerometers to TomTom, a major supplier of GPS navigation systems for cars and PDA5. WTC: Which specifications differ? YZ: In consumer electronics, the tolerance on all specifications is 10 to 20% and 4 to 8-bit accuracy are all that is needed. This compares to 1% and 12 to 14-bit accuracy in the automotive segment. Dr Yang Zhao Before founding NA M , Dr. hao had been a key member in Analog Devices M M division for seven years. Dr. hao has a Ph.D. in FE from Princeton plus two Master degrees in both Physics and FE. He holds nine US patents in circuit, process ing, packaging and NA M technologies. WTC: Your current product portfolio features 2-axis accelerometers while the consumer market is clearly moving to 3-axis devices. How do you compete? YZ: A 3-axis sensor costing $2-3 today is not going to open the market for mobile phones. In low cost phones the bill-of-materials is as low as $20, and the OEM will not pay $1 for a sensor, whether 3-axis or 2-axis. If the sensor costs $0.5, this will open up the market. In fact, with one or two exceptions, 95% of mobile phone applications for accelerometers do not require 3-axis sensing. However,
a 5% share of the mobile phone market is worth only $50 million. By comparison we estimate that at $0.5, the opportunity could be as great as $400 million. (continued next page, 3rd column) Ef WTC WichtlechnologieConsulung . ThinksmalH issue2volumel . May2006 Page 11
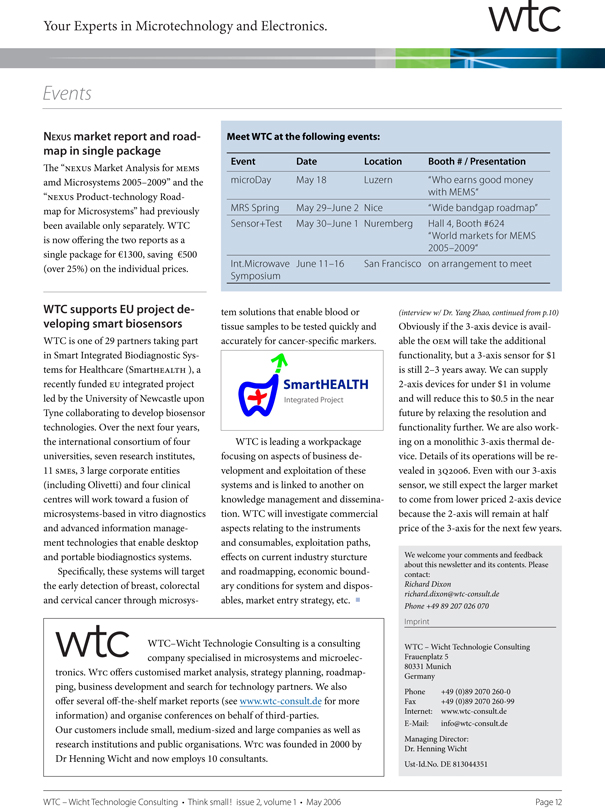
Your Experts in Microtechnology and Electronics. Events wtc —I- NEXUS market report and road- map in single package The “NEXUS Market Analysis for MEMS amd Microsystems 2005—2009” and the “NExus Product-technology Road- map for Microsystems” had previously been available only separately. WTC is now offering the two reports as a single package for €1300, saving €500 (over 25%) on the individual prices. Meet WTC at the following events: Event Date Location Booth # / Presentation microDay May 18 Luzern “Who earns good money with MEMS” MRS Spring May29 June 2 Nice “Wide bandgap roadmap” Sensor+Test May30 June 1 Nuremberg Hall 4, Booth #624 “World markets for MEMS 2005 2009” lnt.Microwave Symposium June 11—16 San Francisco on arrangement to meet WTC supports EU project developing smart biosensors WTC is one of 29 partners taking part in Smart Integrated Biodiagnostic Systems for Healthcare (SmartHEALTH ), a recently funded EU integrated project led by the University of Newcastle upon Tyne collaborating to develop biosensor technologies. Over the next four years, the international consortium of four universities, seven research institutes, 11 SME5, 3 large corporate entities (including Olivetti) and four clinical centres will work toward a fusion of microsystems-based in vitro diagnostics and advanced information management technologies that enable desktop and portable biodiagnostics systems. Specifically, these systems will target the early detection of breast, colorectal and cervical cancer through microsys tem solutions that enable blood or tissue samples to be tested quickly and accurately for cancer-specific markers. WTC is leading a workpackage focusing on aspects of business development and exploitation of these systems and is linked to another on knowledge management and dissemination. WTC will investigate commercial aspects relating to the instruments and consumables, exploitation paths, effects on current industry sturcture and roadmapping, economic boundary conditions for system and disposables, market entry strategy, etc. (interview w/ Dr. Yang Zhao, continued from p.10) Obviously if the 3-axis device is available the OEM will take the additional functionality, but a 3-axis sensor for $1 is still 2—3 years away. We can supply 2-axis devices for under $1 in volume and will reduce this to $0.5 in the near future by relaxing the resolution and functionality further. We are also working on a monolithic 3-axis thermal device. Details of its operations will be revealed in 3Q2006. Even with our 3-axis sensor, we still expect the larger market to come from lower priced 2-axis device because the 2-axis will remain at half price of the 3-axis for the next few years. We welcome your comments and feedback about this newsletter and its contents. Please contact: Richard Dixon richard.dixon@wtc-consult.de Phone +4989207 026 070 SmartHEALTH Integrated Project wtc WTC—Wicht Technologie Consulting is a consulting company specialised in microsystems and microelec m pr nt tronics. WTC offers customised market analysis, strategy planning, roadmapping, business development and search for technology partners. We also offer several off-the-shelf market reports (see www.wtc-consult.de for more information) and organise conferences on behalf of third-parties. Our customers include small, medium-sized and large companies as well as research institutions and public organisations. WTC was founded in 2000 by Dr Henning Wicht and now employs 10 consultants. WTC — Wicht Technologie Consulting Frauenplatz 5 80331 Mimich Germany Phone Fax Internet: E-Mail: +49 (0)89 2070 260-0 +49 (0)89 2070 260-99 www.wtc-consult.de info@wtc-consult.de Managing Director: Dr. Henning Wicht Ust-Id.No. DE 813044351 WTC—WichtlechnoloqieConsulting . Thinksmall! issue2,volumel . May2006 Page 12
Exhibit C
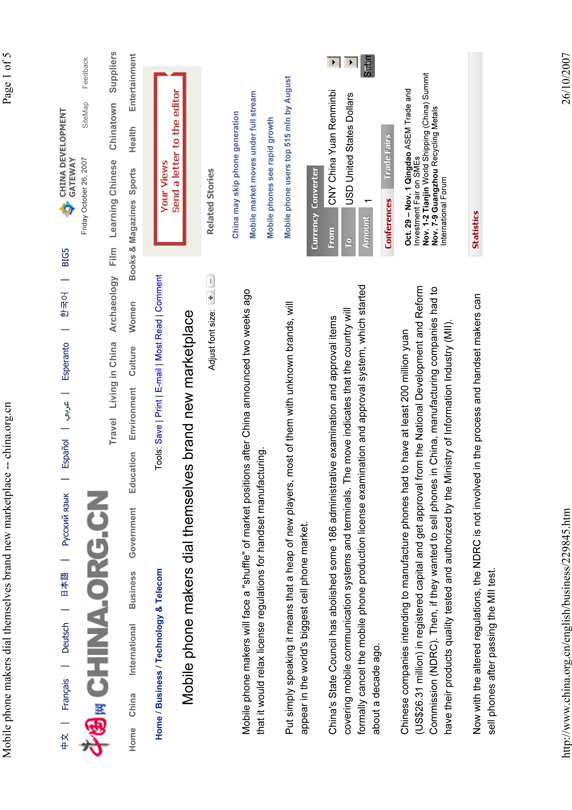
Mobile phone makers dial themselves brand new marketplace — china.org.cn
Page 1 of 5
Français Deutsch Español Esperanto BIG5
CHINA DEVELOPMENT GATEWAY
Friday October 26, 2007 SiteMap Feedback
CHINA.ORG.CN
Travel Living in China Archaeology Film Learning Chinese Chinatown Suppliers
Home China International Business Government Education Environment Culture Women Books & Magazines Sports Health Entertainment
Home / Business / Technology & Telecom Tools: Save | Print | E-mail | Most Read | Comment
Your Views Send a letter to the editor
Mobile phone makers dial themselves brand new marketplace
Adjust font size: + -
Related Stories
Mobile phone makers will face a “shuffle” of market positions after China announced two weeks ago that it would relax license regulations for handset manufacturing.
Put simply speaking it means that a heap of new players, most of them with unknown brands, will appear in the world’s biggest cell phone market.
China’s State Council has abolished some 186 administrative examination and approval items covering mobile communication systems and terminals. The move indicates that the country will formally cancel the mobile phone production license examination and approval system, which started about a decade ago.
Chinese companies intending to manufacture phones had to have at least 200 million yuan
(US$26.31 million) in registered capital and get approval from the National Development and Reform Commission (NDRC). Then, if they wanted to sell phones in China, manufacturing companies had to have their products quality tested and authorized by the Ministry of Information Industry (MII).
Now with the altered regulations, the NDRC is not involved in the process and handset makers can sell phones after passing the MII test.
China may skip phone generation Mobile market moves under full stream Mobile phones see rapid growth Mobile phone users top 515 min by August
Currency Converter
From CNY China Yuan Renminbi To USD United States Dollars Amount
Conferences Trade Fairs
Oct. 29 – Nov. 1 Qingdao ASEM Trade and Investment Fair on SMEs Nov. 1-2 Tianjin World Shipping (China) Summit
Nov. 7-9 Guangzhou Recycling Metals International Forum Statistics
http://www.china.org.cn/english/business/229845.htm 26/10/2007

Mobile phone makers dial themselves brand new marketplace – china.org.cn Page 2 of 5
“The omission of the NDRC shows the government is willing to establish a market-oriented industry environment,” said Kevin Wang, an analyst for the US-based research firm iSuppli.
China has licensed 90 firms to produce mobile phones with an annual production capacity of 600 million units, 50 percent over the combined domestic demand of 100 million units and export demand of 300 million units, according to MII.
Long period
“The oversupply has existed for a long period and it’s not necessary for a government regulation,” said United Securities Co in a recent note.
Now is the time to let the market rule and see qualified new players replace the market positions held by established companies which depended heavily on the income from renting licenses to other companies, according to United Securities.
The new players, largely unknown by established industry players, have challenged and even surpassed leading domestic firms like Ningbo Bird and TCL Communications.
“Tianyu is new star in the industry with its strong experience in electronics retail industry,” said Wang.
Tianyu, the Beijing-based handset vendor, is expected to sell 13 million mobile phone units in 2007, a 113.1-percent growth year-on-year to become China’s No. 3 OEM (original equipment manufacturer) maker. Bird, which led the OEM market in 2006, is expected to sell 12.5 million units this year and will come in at No. 4 position behind Tianyu, according to iSuppli.
“Tianyu uses heavy promotional methods in smaller cities such as offering high under-table commissions to traders. It is not the traditional way to compete,” said a Nokia China official.
The Nokia official admitted that Nokia’s sales had been affected by new brands like Tianyu in the
FDI in China Year-on-year growth 9.3% 5.5% 8.7% 21.9% Mar Apr May Jun
Source: Ministry of Commerce
- Output of Major Industrial Products
- Investment by Various Sectors
- Foreign Direct Investment by Country or Region
- National Price Index
- Value of Major Commodity Import
- Money Supply
- Exchange Rate and Foreign Exchange Reserve
FAQs
- What does the China-Pakistan Free Trade Agreement cover?
- How to Set up a Foreign Capital Enterprise in China?
- How Does the VAT Works in China?
- How Much RMB or Foreign Currency Can Be Physically Carried Out of or Into China?
- What Is the Electrical Fitting in China?
! Click here to see more Questions Write to us
http://www.china.org.cn/english/business/229845.htm 26/10/2007

Mobile phone makers dial themselves brand new marketplace — china.org.cn Page 3 of 5 second or third-tier markets.
ZTE and Huawei, which focused on telecom equipment market during the handset license period, are expected to become the top two OEM handset makers in China. ZTE is expected to sell 23 million phones in 2007, a 215.1-percent growth year-on-year, according to iSuppli.
Foreign-brands, which haven’t established a foothold in China, are also eager to penetrate the domestic market after the loosening of the regulations.
Research In Motion (RIM), the developer of BlackBerry, will sell its popular Email phones in China by the end of this year through the distribution partner Alcatel Lucent, the companies announced this week.
“BlackBerry will grab market share in the high-end market and influence brands like Dopod, Nokia and Motorola,” said Sandy Shen, an analyst at US-based Gartner Inc.
Other foreign giants like Hewlett-Packard and Palm, also intend to sell phones directly in China in future.
Fierce competition
Traditional market leaders, like Bird, TCL and Amoi, have suffered from the fierce competition.
Bird posted a loss of 237.2 million yuan (US$31.18 million) in the first half and Amoi reported a loss of 350 million yuan in the first six months.
The “black phones”—handsets sold in the market without government approval—are also expected to become legal under the new regulations.
From January to June, 23.43 million “black phones” were sold in China, compared with 71.47 million
http://www.china.org.cn/english/business/229845.htm 26/10/2007
Mobile phone makers dial themselves brand new marketplace — china.org.cn Page 4 of 5
licensed handsets, according to CCID Consulting, a research firm under MII.
Some of these phones will become legal but others, including copies of famous brands and low quality models, will not as they not want to take the MII quality test, according to Jiang Lifeng, a CCID analyst.
The new policy will attract more players and boost related phone design sectors and this trend will accelerate China’s transition from a manufacture base to a design center, according to Wang.
(Shanghai Daily October 26, 2007)
Tools: Save | Print | E-mail | Most Read
Comment
Username Password Anonymous
Submit Query View All Comments
http://www.china.org.cn/english/business/229845.htm 26/10/2007

Mobile phone makers dial themselves brand new marketplace — china.org.cn Page 5 of 5
Photo News
Gold and silver ‘Bird’s Nest’ unveiled Sichuan Highway Closed by Heavy Fog US imposes new sanctions against Iran A master comes to town Pollution challenge for Olympics: UN Sixth Chinese City Games open in Wuhan
It’s time for ‘China Now’ in UK Tibetan singer promote debut album in Beijing
SERVICES SiteMap | About Us | RSS | Newsletter | Feedback CHINA.ORG.CN SEARCH (THIS SITE) Submit Q
Copyright © China.org.cn. All Rights Reserved E-mail: webmaster@china.org.cn Tel: 86-10-88828000 ICP 040089
http://www.china.org.cn/english/business/229845.htm 26/10/2007
SEARCH THIS SITE Submit Q
Exhibit D
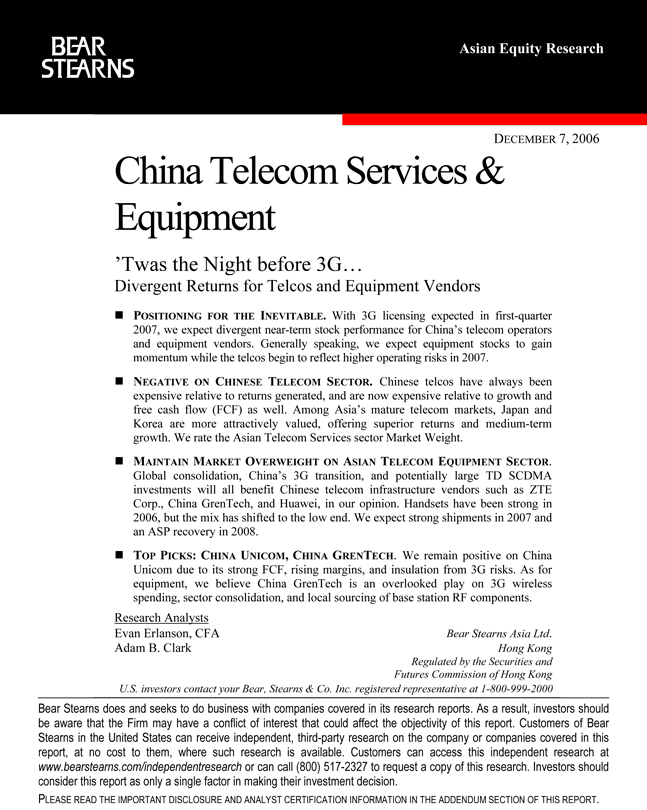
BEAR STEARNS
Asian Equity Research
DECEMBER 7, 2006
China Telecom Services & Equipment
‘Twas the Night before 3G…
Divergent Returns for Telcos and Equipment Vendors
POSITIONING FOR THE INEVITABLE. With 3G licensing expected in first-quarter 2007, we expect divergent near-term stock performance for China’s telecom operators and equipment vendors. Generally speaking, we expect equipment stocks to gain momentum while the telcos begin to reflect higher operating risks in 2007.
NEGATIVE ON CHINESE TELECOM SECTOR. Chinese telcos have always been expensive relative to returns generated, and are now expensive relative to growth and free cash flow (FCF) as well. Among Asia’s mature telecom markets, Japan and Korea are more attractively valued, offering superior returns and medium-term growth. We rate the Asian Telecom Services sector Market Weight.
MAINTAIN MARKET OVERWEIGHT ON ASIAN TELECOM EQUIPMENT SECTOR. Global consolidation, China’s 3G transition, and potentially large TD SCDMA investments will all benefit Chinese telecom infrastructure vendors such as ZTE Corp., China GrenTech, and Huawei, in our opinion. Handsets have been strong in 2006, but the mix has shifted to the low end. We expect strong shipments in 2007 and an ASP recovery in 2008.
TOP PICKS: CHINA UNICOM, CHINA GRENTECH. We remain positive on China Unicom due to its strong FCF, rising margins, and insulation from 3G risks. As for equipment, we believe China GrenTech is an overlooked play on 3G wireless spending, sector consolidation, and local sourcing of base station RF components.
Research Analysts
Evan Erlanson, CFA
Adam B. Clark
Bear Stearns Asia Ltd. Hong Kong
Regulated by the Securities and
Futures Commission of Hong Kong
U.S. investors contact your Bear, Stearns & Co. Inc. registered representative at 1-800-999-2000
Bear Stearns does and seeks to do business with companies covered in its research reports. As a result, investors should be aware that the Firm may have a conflict of interest that could affect the objectivity of this report. Customers of Bear Stearns in the United States can receive independent, third-party research on the company or companies covered in this report, at no cost to them, where such research is available. Customers can access this independent research at www.bearstearns.com/independentresearch or can call (800) 517-2327 to request a copy of this research. Investors should consider this report as only a single factor in making their investment decision.
PLEASE READ THE IMPORTANT DISCLOSURE AND ANALYST CERTIFICATION INFORMATION IN THE ADDENDUM SECTION OF THIS REPORT.

BEAR STEARNS
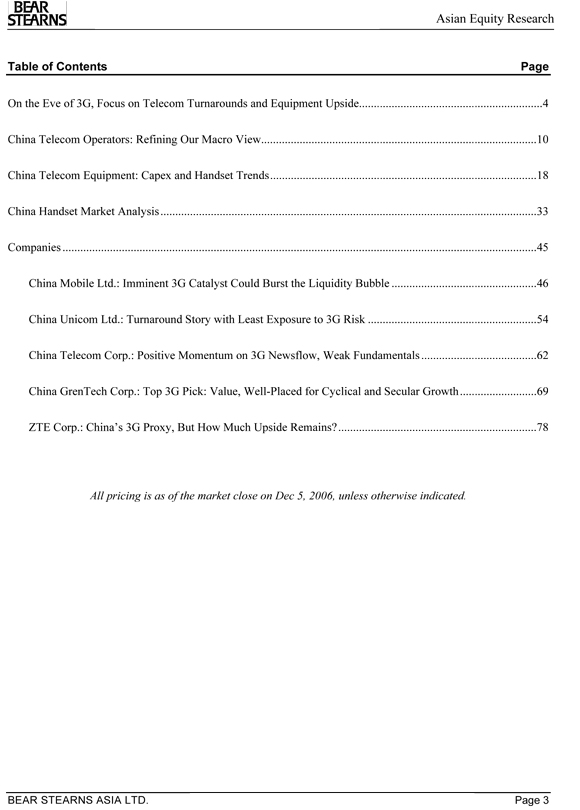
BEAR STEARNS
Asian Equity Research
Table of Contents Page
On the Eve of 3G, Focus on Telecom Turnarounds and Equipment Upside 4
China Telecom Operators: Refining Our Macro View 10
China Telecom Equipment: Capex and Handset Trends 18
China Handset Market Analysis 33
Companies 45
China Mobile Ltd.: Imminent 3G Catalyst Could Burst the Liquidity Bubble 46 China Unicom Ltd.: Turnaround Story with Least Exposure to 3G Risk 54
China Telecom Corp.: Positive Momentum on 3G Newsflow, Weak Fundamentals62 China GrenTech Corp.: Top 3G Pick: Value, Well-Placed for Cyclical and Secular Growth 69
ZTE Corp.: China’s 3G Proxy, But How Much Upside Remains? 78
All pricing is as of the market close on Dec 5, 2006, unless otherwise indicated.
BEAR STEARNS ASIA LTD. Page 3
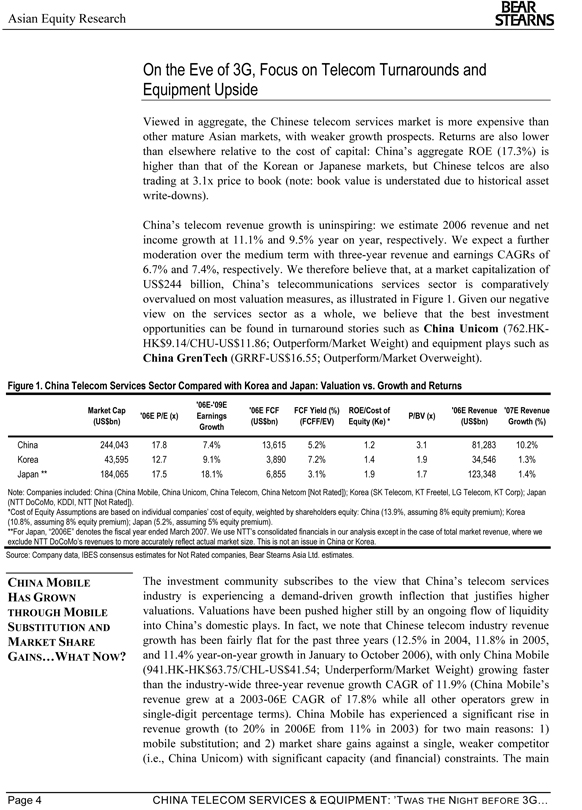
Asian Equity Research
BEAR STEARNS
On the Eve of 3G, Focus on Telecom Turnarounds and Equipment Upside
Viewed in aggregate, the Chinese telecom services market is more expensive than other mature Asian markets, with weaker growth prospects. Returns are also lower than elsewhere relative to the cost of capital: China’s aggregate ROE (17.3%) is higher than that of the Korean or Japanese markets, but Chinese telcos are also trading at 3.1x price to book (note: book value is understated due to historical asset write-downs).
China’s telecom revenue growth is uninspiring: we estimate 2006 revenue and net income growth at 11.1% and 9.5% year on year, respectively. We expect a further moderation over the medium term with three-year revenue and earnings CAGRs of 6.7% and 7.4%, respectively. We therefore believe that, at a market capitalization of US$244 billion, China’s telecommunications services sector is comparatively overvalued on most valuation measures, as illustrated in Figure 1. Given our negative view on the services sector as a whole, we believe that the best investment opportunities can be found in turnaround stories such as China Unicom (762.HK-HK$9.14/CHU-US$11.86; Outperform/Market Weight) and equipment plays such as China GrenTech (GRRF-US$16.55; Outperform/Market Overweight).
Figure 1. China Telecom Services Sector Compared with Korea and Japan: Valuation vs. Growth and Returns
'06E-'09E
Market Cap '06E FCF FCF Yield (%) ROE/Cost of '06E Revenue '07E Revenue
Earnings '06E P/E (x) P/BV (x)
(US$bn)(US$bn)(FCFF/EV) Equity (Ke) *(US$bn) Growth (%)
Growth
China 244,043 17.8 7.4% 13,615 5.2% 1.2 3.1 81,283 10.2%
Korea 43,595 12.7 9.1% 3,890 7.2% 1.4 1.9 34,546 1.3%
Japan ** 184,065 17.5 18.1% 6,855 3.1% 1.9 1.7 123,348 1.4%
Note: Companies included: China (China Mobile, China Unicom, China Telecom, China Netcom [Not Rated]); Korea (SK Telecom, KT Freetel, LG Telecom, KT Corp); Japan (NTT DoCoMo, KDDI, NTT [Not Rated]).
*Cost of Equity Assumptions are based on individual companies’ cost of equity, weighted by shareholders equity: China (13.9%, assuming 8% equity premium); Korea (10.8%, assuming 8% equity premium); Japan (5.2%, assuming 5% equity premium).
**For Japan, “2006E” denotes the fiscal year ended March 2007. We use NTT’s consolidated financials in our analysis except in the case of total market revenue, where we exclude NTT DoCoMo’s revenues to more accurately reflect actual market size. This is not an issue in China or Korea.
Source: Company data, IBES consensus estimates for Not Rated companies, Bear Stearns Asia Ltd. estimates.
CHINA MOBILE HAS GROWN THROUGH MOBILE SUBSTITUTION AND MARKET SHARE GAINS…WHAT NOW?
The investment community subscribes to the view that China’s telecom services industry is experiencing a demand-driven growth inflection that justifies higher valuations. Valuations have been pushed higher still by an ongoing flow of liquidity into China’s domestic plays. In fact, we note that Chinese telecom industry revenue growth has been fairly flat for the past three years (12.5% in 2004, 11.8% in 2005, and 11.4% year-on-year growth in January to October 2006), with only China Mobile (941.HK-HK$63.75/CHL-US$41.54; Underperform/Market Weight) growing faster than the industry-wide three-year revenue growth CAGR of 11.9% (China Mobile’s revenue grew at a 2003-06E CAGR of 17.8% while all other operators grew in single-digit percentage terms). China Mobile has experienced a significant rise in revenue growth (to 20% in 2006E from 11% in 2003) for two main reasons: 1) mobile substitution; and 2) market share gains against a single, weaker competitor (i.e., China Unicom) with significant capacity (and financial) constraints. The main
Page 4 CHINA TELECOM SERVICES & EQUIPMENT: ’TWAS THE NIGHT BEFORE 3G…
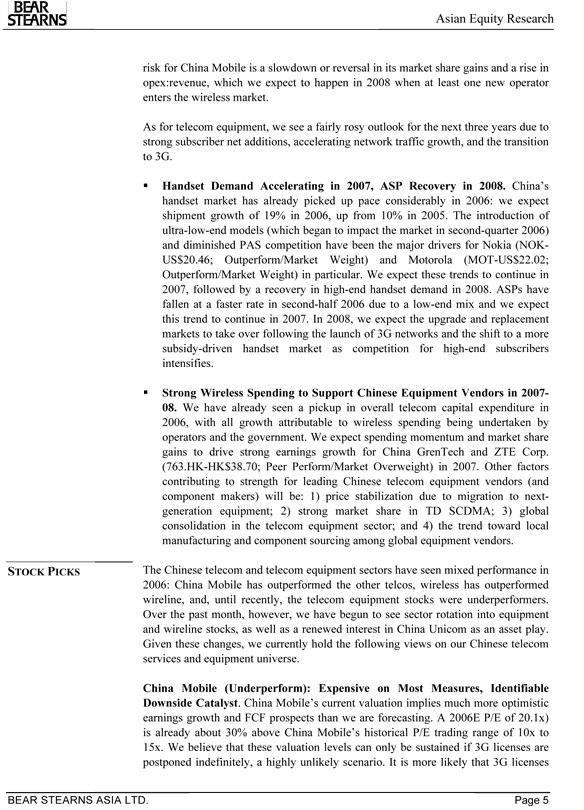
BEAR STEARNS
Asian Equity Research
risk for China Mobile is a slowdown or reversal in its market share gains and a rise in opex:revenue, which we expect to happen in 2008 when at least one new operator enters the wireless market.
As for telecom equipment, we see a fairly rosy outlook for the next three years due to strong subscriber net additions, accelerating network traffic growth, and the transition to 3G.
Handset Demand Accelerating in 2007, ASP Recovery in 2008. China’s handset market has already picked up pace considerably in 2006: we expect shipment growth of 19% in 2006, up from 10% in 2005. The introduction of ultra-low-end models (which began to impact the market in second-quarter 2006) and diminished PAS competition have been the major drivers for Nokia (NOK-US$20.46; Outperform/Market Weight) and Motorola (MOT-US$22.02; Outperform/Market Weight) in particular. We expect these trends to continue in 2007, followed by a recovery in high-end handset demand in 2008. ASPs have fallen at a faster rate in second-half 2006 due to a low-end mix and we expect this trend to continue in 2007. In 2008, we expect the upgrade and replacement markets to take over following the launch of 3G networks and the shift to a more subsidy-driven handset market as competition for high-end subscribers intensifies.
Strong Wireless Spending to Support Chinese Equipment Vendors in 2007-08. We have already seen a pickup in overall telecom capital expenditure in
2006, with all growth attributable to wireless spending being undertaken by operators and the government. We expect spending momentum and market share gains to drive strong earnings growth for China GrenTech and ZTE Corp. (763.HK-HK$38.70; Peer Perform/Market Overweight) in 2007. Other factors contributing to strength for leading Chinese telecom equipment vendors (and component makers) will be: 1) price stabilization due to migration to next-generation equipment; 2) strong market share in TD SCDMA; 3) global consolidation in the telecom equipment sector; and 4) the trend toward local manufacturing and component sourcing among global equipment vendors.
STOCK PICKS
The Chinese telecom and telecom equipment sectors have seen mixed performance in 2006: China Mobile has outperformed the other telcos, wireless has outperformed wireline, and, until recently, the telecom equipment stocks were underperformers. Over the past month, however, we have begun to see sector rotation into equipment and wireline stocks, as well as a renewed interest in China Unicom as an asset play. Given these changes, we currently hold the following views on our Chinese telecom services and equipment universe.
China Mobile (Underperform): Expensive on Most Measures, Identifiable Downside Catalyst. China Mobile’s current valuation implies much more optimistic earnings growth and FCF prospects than we are forecasting. A 2006E P/E of 20.1x) is already about 30% above China Mobile’s historical P/E trading range of 10x to 15x. We believe that these valuation levels can only be sustained if 3G licenses are postponed indefinitely, a highly unlikely scenario. It is more likely that 3G licenses
BEAR STEARNS ASIA LTD. Page 5
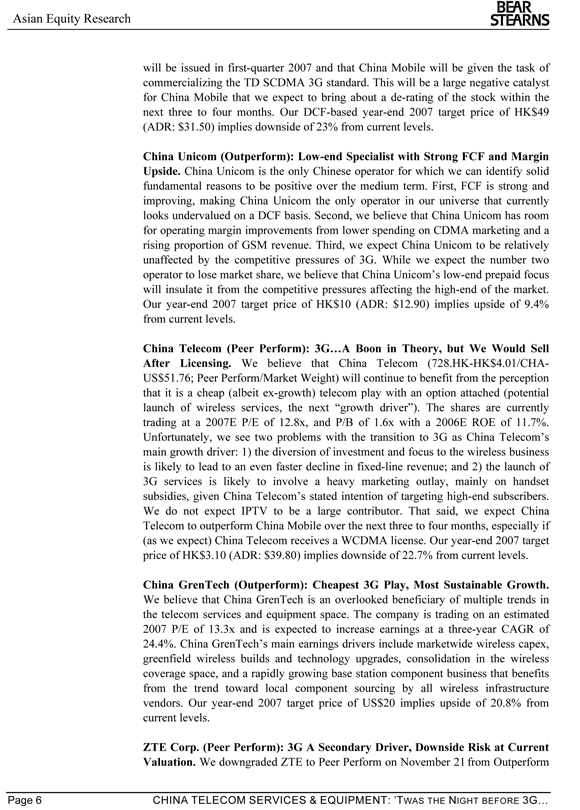
BEAR STEARNS
Asian Equity Research
will be issued in first-quarter 2007 and that China Mobile will be given the task of commercializing the TD SCDMA 3G standard. This will be a large negative catalyst for China Mobile that we expect to bring about a de-rating of the stock within the next three to four months. Our DCF-based year-end 2007 target price of HK$49 (ADR: $31.50) implies downside of 23% from current levels.
China Unicom (Outperform): Low-end Specialist with Strong FCF and Margin Upside. China Unicom is the only Chinese operator for which we can identify solid fundamental reasons to be positive over the medium term. First, FCF is strong and improving, making China Unicom the only operator in our universe that currently looks undervalued on a DCF basis. Second, we believe that China Unicom has room for operating margin improvements from lower spending on CDMA marketing and a rising proportion of GSM revenue. Third, we expect China Unicom to be relatively unaffected by the competitive pressures of 3G. While we expect the number two operator to lose market share, we believe that China Unicom’s low-end prepaid focus will insulate it from the competitive pressures affecting the high-end of the market. Our year-end 2007 target price of HK$10 (ADR: $12.90) implies upside of 9.4% from current levels.
China Telecom (Peer Perform): 3G…A Boon in Theory, but We Would Sell After Licensing. We believe that China Telecom (728.HK-HK$4.01/CHA-US$51.76; Peer Perform/Market Weight) will continue to benefit from the perception that it is a cheap (albeit ex-growth) telecom play with an option attached (potential launch of wireless services, the next “growth driver”). The shares are currently trading at a 2007E P/E of 12.8x, and P/B of 1.6x with a 2006E ROE of 11.7%. Unfortunately, we see two problems with the transition to 3G as China Telecom’s main growth driver: 1) the diversion of investment and focus to the wireless business is likely to lead to an even faster decline in fixed-line revenue; and 2) the launch of 3G services is likely to involve a heavy marketing outlay, mainly on handset subsidies, given China Telecom’s stated intention of targeting high-end subscribers. We do not expect IPTV to be a large contributor. That said, we expect China Telecom to outperform China Mobile over the next three to four months, especially if (as we expect) China Telecom receives a WCDMA license. Our year-end 2007 target price of HK$3.10 (ADR: $39.80) implies downside of 22.7% from current levels.
China GrenTech (Outperform): Cheapest 3G Play, Most Sustainable Growth. We believe that China GrenTech is an overlooked beneficiary of multiple trends in the telecom services and equipment space. The company is trading on an estimated 2007 P/E of 13.3x and is expected to increase earnings at a three-year CAGR of 24.4%. China GrenTech’s main earnings drivers include marketwide wireless capex, greenfield wireless builds and technology upgrades, consolidation in the wireless coverage space, and a rapidly growing base station component business that benefits from the trend toward local component sourcing by all wireless infrastructure vendors. Our year-end 2007 target price of US$20 implies upside of 20.8% from current levels.
ZTE Corp. (Peer Perform): 3G A Secondary Driver, Downside Risk at Current Valuation. We downgraded ZTE to Peer Perform on November 21 from Outperform
Page 6 CHINA TELECOM SERVICES & EQUIPMENT: ’TWAS THE NIGHT BEFORE 3G…
BEAR STEARNS
Asian Equity Research
because we believe that, at current valuations, downside risk is beginning to outweigh upside risks for China’s second-largest telecom equipment vendor. Apart from valuation, we believe that ZTE’s strong recent performance owes much to its proxy status as a China 3G/TD SCDMA play, which could lead to future disappointments, in our view. First, ZTE does not derive a large proportion of its revenue from domestic sales of non-PAS wireless infrastructure: we estimate that domestic wireless infrastructure will constitute just 11% of 2006 revenue and 19% of 2007 revenue, even with fairly optimistic domestic 3G spending and market share assumptions. Second, ZTE’s main source of earnings growth over the past three years – international equipment sales – may slow down over the next three years due to a high base effect, slow capex growth in emerging markets, and the fact that low-margin products (e.g., broadband access equipment and handsets) constitute an increasing proportion of marginal growth. Finally, we are concerned that ZTE may lose its proxy status as the largest listed Chinese equipment vendor if its local competitors choose to tap the equity markets to take advantage of the massive public exposure that is likely to surround the final issuance of 3G licenses in China. Our year-end 2007 target price of HK$31.00 implies downside of 19.9% from current levels.
BEAR STEARNS ASIA LTD. Page 7
BEAR STEARNS
Asian Equity Research
Figure 2. Global Wireless Operator Comparables
Price Mkt Cap Ent Val EV/EBITDA EBITDA CAGR P/E EV/Revenue Rev CAGR Capex/ Rev YTD
Ticker Rating
(local $)(US$ mn)(US$ mn) 06E 07E 06E—09E 06E 07E 06E 07E 06E—09E 05A Share Price
Asia Wireless Services (Market Weight)
China Mobile 941 HK U 63.75 172,816 161,596 7.6x 6.3x 10.4% 20.0x 15.4x 4.3x 3.6x 12.0% 27.2% 74%
China Unicom 762 HK O 9.14 15,664 18,544 4.6x 4.3x 9.2% 21.6x 17.2x 1.5x 1.4x 6.6% 19.1% 45%
SK Telecom 017670 KS O 216,000 19,029 22,104 4.7x 4.6x 3.6% 11.3x 9.3x 1.9x 1.9x 2.6% 14.4% 19%
KTF 032390 KS P 30,450 6,648 8,215 4.4x 4.2x 2.0% 15.4x 14.3x 1.2x 1.2x 2.1% 11.8% 24%
LG Telecom 032640 KS P 10,900 3,279 4,065 5.3x 4.8x 5.0% 15.1x 8.9x 1.0x 0.9x 2.1% 9.5% 64%
NTT DoCoMo 9437 JP O 180,000 73,322 73,929 5.3x 5.3x 2.7% 16.3x 15.9x 1.8x 1.8x 2.1% 18.6% 0%
KDDI 9433 JP O 791,000 30,473 35,970 5.8x 5.4x 6.4% 16.4x 15.5x 1.2x 1.2x 4.9% 13.5% 16%
Taiwan Mobile 3045 TT NR 31.85 4,894 4,585 5.6x 5.6x 1.0% 9.7x 11.5x 2.5x 2.5x 0.9% 5.4% -16%
Far EasTone 4904 TT NR 36.80 4,413 4,332 4.7x 4.7x 0.9% 10.4x 10.5x 2.0x 2.0x 1.2% 8.6% -1%
Advanced Info Services ADVANC TB NR 82.00 6,796 6,754 5.2x 4.8x 2.0% 13.3x 12.1x 2.6x 2.4x 3.0% 17.5% -24%
Total Access Comm. TAC SP NR 4.44 2,106 3,220 6.5x 5.6x 10.6% 15.0x 11.0x 2.3x 2.1x 7.2% 1.2% 6%
Globe Telecom Inc GLO PM NR 1,235.0 3,289 3,922 5.2x 4.8x 1.2% 13.7x 12.1x 3.1x 2.9x 1.5% 27.1% 68%
MobileOne M1 SP NR 2.11 1,357 1,438 6.7x 6.6x -0.8% 12.6x 12.3x 2.8x 2.8x -0.4% 8.0% 0%
Maxis MAXIS MK NR 10.00 7,075 7,237 6.9x 6.5x 0.9% 14.2x 14.3x 3.5x 3.1x 8.8% 18.0% 19%
Bharti Airtel BHARTI IN NR 638.80 27,197 28,349 18.1x 12.9x 27.1% 32.4x 23.1x 7.0x 5.1x 24.6% 47.4% 85%
Hutchison Telecom 2332 HK P 17.18 10,512 14,768 10.4x 7.7x 27.3% 235.5x 64.2x 3.4x 2.6x 21.8% 19.4% 59%
Average 6.7x 5.9x 29.6x 16.7x 2.6x 2.3x
Latin America Wireless Services (Market Overweight (Mexico); Market Overweight (Brazil)), Covered by Rizwan Ali
Telemig Celular TMB O 36.77 301 318 4.3x 3.9x 8.2% 10.0x 7.8x 1.1x 1.0x 7.5% 19.0% -7%
Tele Celular Sul TSU O 33.93 2,862 2,769 7.7x 6.2x 15.8% 17.4x 11.9x 2.1x 1.9x 8.6% 23.4% 34%
Tele Norte Celular TCN P 8.95 28 107 6.0x 5.3x 12.2% NM 24.3x 0.8x 0.8x 6.6% 10.0% 20%
America Movil AMX O 45.67 7,554 7,861 11.4x 9.8x 13.1% 20.2x 17.2x 4.1x 3.7x 8.7% 21.3% 56%
Vivo VIV O 8.10 3,413 2,490 4.3x 3.8x 6.0% 7.9x 5.7x 1.7x 1.6x 4.0% 15.7% - -8%
Average 6.7x 5.8x 18.7x 15.0x 2.0x 1.8x
EMEA Wireless Services (Market Weight), Covered by Rizwan Ali
Orascom Telecom OTLD.LI P 331.40 12,693 3,192 9.3x 7.7x 11.4% 16.7x 13.4x 4.1x 3.5x 9.6% 51.7% 11%
Turkcell TKC O 12.70 11,176 11,554 8.9x 7.9x 9.4% 14.7x 12.8x 3.5x 3.3x 6.7% 19.2% -7%
Partner Communications PTNR US NR 11.71 1,802 4,182 10.5x 10.4x NA 11.6x 10.4x 3.6x 0.9x NA 9.7% 30%
Average 9.6x 8.7x 14.3x 12.2x 3.8x 2.5x
European Wireless Services (Market Underweight), Covered by Fanos Hira
Vodafone VOD L U 1.38 143,910 161,280 7.6x 7.7x 1.1% 13.0x 13.8x 5.1x 5.1x 1.3% 17.5% 10%
Mobistar MSTAR.BR P 63.95 5,390 7,301 7.0x 7.0x 1.6% 14.4x 14.6x 3.6x 3.6x 1.5% 13.4% -5%
Cosmote COSr.AT P 21.20 9,421 12,727 8.4x 7.3x 11.6% 21.8x 18.1x 4.2x 3.6x 10.4% 14.6% 13%
Average 7.3x 7.3x 13.7x 14.2x 4.3x 4.1x
North American Wireless Operators (Market Weight), Covered by Phil Cusick
Sprint Nextel Corp S P 19.50 54,161 71,000 5.6x 5.4x 8.0% 15.8x 14.6x 1.7x 1.7x 1.9% 14.2% -8%
Dobson Communications DCEL O 8.70 1,485 4,009 9.2x 7.9x 8.0% NM 22.2x 3.2x 2.9x 4.4% 12.4% 16%
Alltel AT P 58.25 21,764 24,477 9.4x 8.4x 8.0% 20.6x 19.9x 3.1x 2.9x 4.7% 15.1% 13%
U.S. Cellular USM P 67.36 3,651 6,087 7.2x 6.3x 8.0% 35.8x 29.3x 1.9x 1.8x 5.4% 19.6% 36%
Leap Wireless LEAP P 57.09 3,869 4,873 18.5x 12.1x 8.0% NM NM 4.2x 3.3x 17.9% 22.1% 51%
Rogers Communications RG O 74.34 4,180 11,084 4.0x 3.4x 8.0% 45.6x 33.9x 1.2x 1.1x 7.3% 17.7% 39%
Average 9.0x 7.2x 29.5x 24.0x 2.6x 2.3x
Bear Stearns Rating System: Sector Ratings—Market Overweight (MO), Market Weight (MW), Market Underweight (MU) / Stock Ratings—Outperform (O), Peer Perform (P), Underperform (U) 1.) SmarTone has a June YE.
2.) NTT DoCoMo, Vodafone KK and KDDI have March year ends, hence FY2005 relates to the year ending March 2006, FY2006 relates to the year ending March 2007 etc. 3.) Vodafone and Panafon have March year ends hence 2005 relates to the year ending March 2006, 2006 relates to the year ending March 2007 etc.
4.) Vodafone net income estimates have excluded goodwill amortisation 5.) TIM and TEM net income estimates have excluded exceptional items 6.) Operating Free Cash Flow is defined as EBITDA—Capex
Source: Bear Stearns & Co., Bear Stearns International Ltd, Bear Stearns Asia Ltd., IBES consensus estimates for Not Rated companies
Page 8 CHINA TELECOM SERVICES & EQUIPMENT: ’TWAS THE NIGHT BEFORE 3G…
BEAR STEARNS
Asian Equity Research
Figure 3. Global Fixed Line and Integrated Operator Comparables
Ticker Rating Price Mkt Cap Ent Val Div Yield P/E EV/EBITDA EV/Revenue Capex/ Rev YTD
(local $)(US$ mn)(US$ mn) 05A 06E 07E 06E 07E 06E 07E 05A Share Price
Asia Wireline Services (Market Weight)
China Netcom 906 HK NR 16.16 13,795 23,439 0.2% 9.2 x 9.1 x 4.1x 4.0x 2.1x 2.1x 31.3% 28.8%
China Telecom 728 HK P 4.01 41,767 58,512 1.9% 12.1 x 12.8 x 5.0x 5.1x 2.6x 2.6x 31.8% 40.7%
Hanaro 033630 KS NR 7,910 1,993 2,935 0.0% NM 21.7 x 7.0x 5.1x 1.6x 1.6x 19.6% 54.8%
KT Corp. 030200 KS P 48,250 14,639 19,926 6.2% 9.3 x 9.7 x 4.8x 4.8x 1.6x 1.6x 18.8% 18.1%
PCCW 8 HK P 4.81 4,173 6,230 3.8% 13.4 x 11.8 x 6.8x NA 1.9x NA 6.3% 0.7%
Singtel ST SP NR 2.97 30,650 34,283 3.5% 14.1 x 13.4 x 10.9x 10.9x 4.0x 4.0x 13.0% 14.3%
Chunghwa Telecom 2412 TT NR 59.80 17,903 15,901 7.8% 13.1 x 12.5 x 5.3x 5.2x 2.8x 2.8x 12.5% 7.4%
Indosat ISAT IJ NR 5,900.00 3,519 4,607 2.6% 19.3 x 16.9 x 5.9x 5.2x 3.4x 3.0x 58.4% 6.3%
NTT 9432 JP NR 586,000 80,270 109,676 1.0% 16.1 x 15.5 x 3.8x 3.8x 1.2x 1.2x 15.8% 9.3%
PT Telekomunikasi TLKM IJ NR 10,500 23,236 24,061 1.4% 18.1 x 15.9 x 6.8x 5.9x 4.3x 3.7x 29.0% 78.0%
Telstra TLS AU NR 3.79 49,817 61,780 8.7% 14.1 x 13.4 x 8.0x 7.7x 3.4x 3.3x 16.0% -3.6%
Telecom Corp. NZ TEL NZ NR 4.49 6,126 8,649 8.5% 10.8 x 11.3 x 5.9x 6.0x 2.1x 2.1x 14.9% -25.3%
Average 4.1% 14.1 x 14.1 x 6.2 x 5.8 x 2.6 x 2.6 x 21.5%
Latin America Telecommunications Services (Market Overweight (Brazil, Chile, Mexico). Market Underweight (Argentina, Venezuela)), Covered by Rizwan Ali
Telecom Argentina—ADR TEO P 17.88 3,520 4,686 0.0% 32.0 x 30.0 x 6.0x 5.1x 2.0x 1.9x 9.6% 38.7%
Brazil Telecom—ADR BRP O 38.93 2,834 4,683 0.0% 14.0 x 11.3 x 2.9x 3.0x 2.0x 2.2x 39.3% 4.2%
Telmex—ADR TMX O 27.21 26,929 39,245 0.0% 9.5 x 10.2 x 5.7x 6.1x 2.5x 2.7x 13.6% 10.3%
CANTV—ADR VNT P 19.55 2,223 3,410 8.8% 6.2 x 4.8 x 4.3x 3.4x 1.3x 1.1x 18.1% 36.7%
CTC—ADR CTC O 8.08 1,765 2,943 2.7% 49.6 x 32.3 x 5.8x 5.7x 2.8x 2.7x 13.2% -8.2%
Average 2.3% 22.3 x 17.7 x 4.9 x 4.7 x 2.1 x 2.1 x 18.8%
European PTOs(Market Underweight), Covered by Johnathan Dann
BT Group BT.L O 2.91 47,623 88,527 4.1% 13.2 x 12.9 x 8.0x 7.9x 2.2x 2.2x 16.1% 30.5%
Deutsche Telekom DTEGn.DE U 13.31 77,975 129,326 5.4% 15.5 x 21.6 x 5.1x 5.2x 1.6x 1.6x 15.6% -5.5%
France Telecom FTE.PA P 19.59 67,911 126,969 6.1% 11.6 x 12.4 x 5.0x 5.2x 1.8x 1.9x 12.3% -6.7%
KPN NV KPN.AS P 10.47 28,391 40,108 4.3% 13.9 x 14.4 x 6.2x 6.3x 2.5x 2.5x 11.8% 23.6%
Swisscom AG SCMN VX P 442.25 29,900 31,327 3.6% 14.7 x 13.3 x 6.8x 6.6x 2.8x 2.8x 11.2% 7.3%
Telecom Italia TLIT.MI O 2.27 56,584 106,422 6.2% 15.2 x 15.2 x 6.1x 6.1x 2.5x 2.5x 16.9% -7.8%
Telefonica TEF.MC O 15.53 101,779 172,273 3.2% 15.7 x 13.6 x 6.6x 6.3x 2.5x 2.4x 14.3% 22.2%
Telenor TEL.OL O 114.00 30,738 38,579 1.8% 13.6 x 15.7 x 7.5x 6.5x 2.7x 2.4x 23.8% 72.1%
Average 4.3% 14.2 x 14.9 x 6.4 x 6.3 x 2.3 x 2.3 x 15.2%
Bear Stearns Rating System: Sector Ratings—Market Overweight (MO), Market Weight (MW), Market Underweight (MU) / Stock Ratings—Outperform (O), Peer Perform (P), Underperform (U) 0.) KT Corp. valuations are based on "normalized net income", excluding gains from sale of SK Telecom holdings 1.) China Telecom Valuations are based on "adjusted financials", excluding upfront connection fees 2.) Singtel has a March YE.
3.) NTT has a March YE
4.) Telecom Corp and Telstra has a June YE 5.) AT&T exclude Broadband from 2003 and beyond 6.) Operating Free Cash Flow is defined as EBITDA—Capex
7.) CE defined as Cash Earnings = Net Income + Depreciation
Source: Bear Stearns & Co., Bear Stearns International Ltd, Bear Stearns Asia Ltd., IBES consensus estimates for Not Rated companies
BEAR STEARNS ASIA LTD.
Page 9
BEAR STEARNS
Asian Equity Research
China Telecom Operators: Refining Our Macro View
Wireless Subscriber Trends: China Mobile’s Dominance to Continue?
We have recently revised our high-level subscriber assumptions for China. We have raised our 2006 wireless (ex-PAS) subscriber growth estimate slightly due to observed monthly net addition trends during the first ten months of 2006. We expect annual net additions of 67.6 million subscribers in 2006, representing a 15.4% increase from the 58.6 million subscribers reported in 2005. However, including PAS net additions, we expect total wireless net additions to be relatively flat at 78.6 million subscribers in 2006, compared with 79.8 million subscribers in 2005. Therefore, we believe that declining PAS net additions and GSM-PAS substitution have been the key factors driving subscriber net addition and market share trends for the wireless operators in 2006.
GSM Strength Expected to Continue. We expect GSM to remain the dominant technology in terms of total subscribers and net additions, and forecast GSM net additions of 66.0 million subscribers in 2006, up 23% from 53.7 million subscribers in 2005, comprising 84.1% of total market net additions. We view competitive pricing (particularly versus PAS) and increased availability of ultra-low-end GSM handsets to be the main drivers of the stronger GSM net addition trend, particularly in rural areas. China Mobile has been particularly aggressive in opening this new market segment. We also believe that China Unicom’s GSM network is well positioned to benefit from strength in the low-end market.
PAS Decline is Accelerating. Monthly PAS net additions have slowed considerably over the past year, dropping to 81,000 in October 2006 from 1.4 million in October 2005. We currently forecast full-year net additions of 8.8 million in 2006, compared with 21.0 million subscribers last year. GSM voice pricing (on a per-minute basis) has been falling more rapidly than comparable pricing on China’s PAS networks. Fixed-line operators have in many cases effectively raised PAS pricing by giving away fewer free minutes to new PAS subscribers. PAS handset subsidies have also disappeared in most cities recently surveyed, and are now used mainly as a tool to retain existing fixed-line subscribers. At the same time, pricing on newly introduced (i.e., not end-of-life products) entry-level GSM handsets has fallen by about 30% year on year, while PAS handset pricing has been stable. Therefore, we believe that there has been increasing substitution between PAS and GSM in the China market, contributing to stronger GSM subscriber growth.
CDMA Net Additions Stabilizing at a Low Level. Due to China Unicom’s shift to a more GSM-focused strategy, CDMA net additions remain weak, but have been fairly stable over the past 12 months. We expect full-year CDMA additions of about 3.7 million in 2006, equal to less than one month of net additions for China’s GSM networks. CDMA continues to suffer from a range of issues, including weak branding, expensive handsets, and poor handset selection.
Page 10 CHINA TELECOM SERVICES & EQUIPMENT: ’TWAS THE NIGHT BEFORE 3G…
BEAR STEARNS
Asian Equity Research
FIXED-LINE OPERATORS MAY ONCE AGAIN ROCK THE BOAT
CHINA UNICOM THE BEST 3G PLAY BY VIRTUE OF AVOIDANCE
Based on current subscriber trends, we believe that China Mobile and China Unicom’s GSM networks will continue to attract most of China’s net subscriber additions over the next 24 months. Over the longer term, following the entry of one or both fixed-line operators into the mobile market (after 3G license issuance), we expect China Mobile’s dominance to be threatened, particularly in the high-end segment.
While China Unicom’s experience with CDMA demonstrates the difficulty of introducing a new wireless technology to China’s mass market, it is also important to keep in mind that the fixed-line operators have, in the past, demonstrated an ability to rock the boat, having developed a 93 million PAS subscriber base, most of this between 2003 and 2005. This is an even more considerable accomplishment after taking into account the regulatory and technical limitations involved with PAS technology. As a consequence, we believe that China’s fixed-line operators could create significant headaches for China Mobile. At a minimum, the new entrants will likely introduce pricing pressure and additional operating costs to the incumbent’s lucrative postpaid segment, even assuming that the fixed-line operators capture a relatively small share of overall net additions.
We remain convinced that China Unicom, with its predominantly low-end subscriber base, is the best-positioned operator going into 3G, as it will be able to maintain relatively low levels of capex and could be relatively unaffected by aggressive high-end competition from new 3G license holders. While China Unicom classifies about 62% of its total subscriber base (and 51% of its GSM subscribers) as postpaid, we note that China Unicom’s postpaid subscribers have ARPU that is about the same as that of China Mobile’s prepaid subscribers, and that China Unicom’s postpaid GSM ARPM (as measured by our bottom-up market pricing surveys) is already at a large discount not only to China Mobile’s postpaid pricing but also to China Unicom’s own prepaid GSM pricing.
BEAR STEARNS ASIA LTD. Page 11
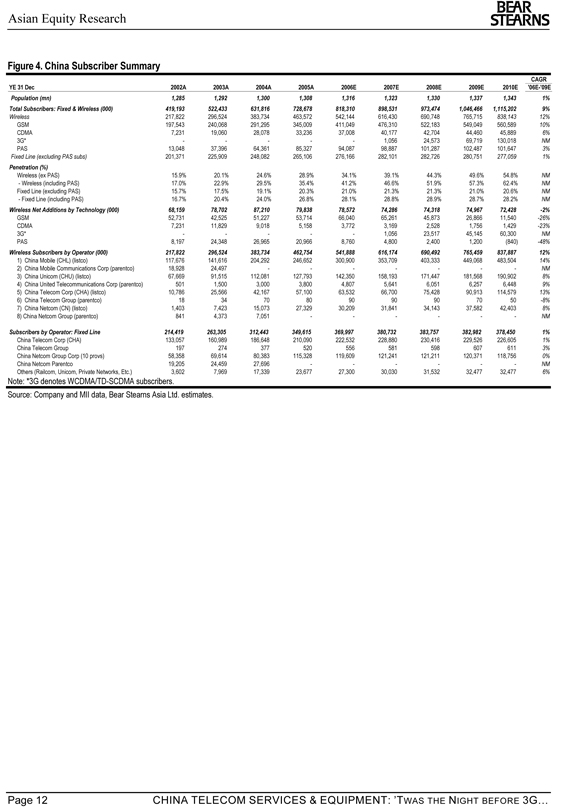
BEAR STEARNS
Asian Equity Research
Figure 4. China Subscriber Summary
CAGR
YE 31 Dec 2002A 2003A 2004A 2005A 2006E 2007E 2008E 2009E 2010E '06E-'09E
Population (mn) 1,285 1,292 1,300 1,308 1,316 1,323 1,330 1,337 1,343 1%
Total Subscribers: Fixed & Wireless (000) 419,193 522,433 631,816 728,678 818,310 898,531 973,474 1,046,466 1,115,202 9%
Wireless 217,822 296,524 383,734 463,572 542,144 616,430 690,748 765,715 838,143 12%
GSM 197,543 240,068 291,295 345,009 411,049 476,310 522,183 549,049 560,589 10%
CDMA 7,231 19,060 28,078 33,236 37,008 40,177 42,704 44,460 45,889 6%
3G----- 1,056 24,573 69,719 130,018 NM
PAS 13,048 37,396 64,361 85,327 94,087 98,887 101,287 102,487 101,647 3%
Fixed Line (excluding PAS subs) 201,371 225,909 248,082 265,106 276,166 282,101 282,726 280,751 277,059 1%
Penetration (%)
Wireless (ex PAS) 15.9% 20.1% 24.6% 28.9% 34.1% 39.1% 44.3% 49.6% 54.8% NM
- Wireless (including PAS) 17.0% 22.9% 29.5% 35.4% 41.2% 46.6% 51.9% 57.3% 62.4% NM
Fixed Line (excluding PAS) 15.7% 17.5% 19.1% 20.3% 21.0% 21.3% 21.3% 21.0% 20.6% NM
- Fixed Line (including PAS) 16.7% 20.4% 24.0% 26.8% 28.1% 28.8% 28.9% 28.7% 28.2% NM
Wireless Net Additions by Technology (000) 68,159 78,702 87,210 79,838 78,572 74,286 74,318 74,967 72,428 -2%
GSM 52,731 42,525 51,227 53,714 66,040 65,261 45,873 26,866 11,540 -26%
CDMA 7,231 11,829 9,018 5,158 3,772 3,169 2,528 1,756 1,429 -23%
3G*----- 1,056 23,517 45,145 60,300 NM
PAS 8,197 24,348 26,965 20,966 8,760 4,800 2,400 1,200(840) -48%
Wireless Subscribers by Operator (000) 217,822 296,524 383,734 462,754 541,888 616,174 690,492 765,459 837,887 12%
1) China Mobile (CHL) (listco) 117,676 141,616 204,292 246,652 300,900 353,709 403,333 449,068 483,504 14%
2) China Mobile Communications Corp (parentco) 18,928 24,497—————NM
3) China Unicom (CHU) (listco) 67,669 91,515 112,081 127,793 142,350 158,193 171,447 181,568 190,902 8%
4) China United Telecommunications Corp (parentco) 501 1,500 3,000 3,800 4,807 5,641 6,051 6,257 6,448 9%
5) China Telecom Corp (CHA) (listco) 10,786 25,566 42,167 57,100 63,532 66,700 75,428 90,913 114,579 13%
6) China Telecom Group (parentco) 18 34 70 80 90 90 90 70 50 -8%
7) China Netcom (CN) (listco) 1,403 7,423 15,073 27,329 30,209 31,841 34,143 37,582 42,403 8%
8) China Netcom Group (parentco) 841 4,373 7,051———— NM
Subscribers by Operator: Fixed Line 214,419 263,305 312,443 349,615 369,997 380,732 383,757 382,982 378,450 1%
China Telecom Corp (CHA) 133,057 160,989 186,648 210,090 222,532 228,880 230,416 229,526 226,605 1%
China Telecom Group 197 274 377 520 556 581 598 607 611 3%
China Netcom Group Corp (10 provs) 58,358 69,614 80,383 115,328 119,609 121,241 121,211 120,371 118,756 0%
China Netcom Parentco 19,205 24,459 27,696———— NM
Others (Railcom, Unicom, Private Networks, Etc.) 3,602 7,969 17,339 23,677 27,300 30,030 31,532 32,477 32,477 6%
Note: *3G denotes WCDMA/TD-SCDMA subscribers.
Source: Company and MII data, Bear Stearns Asia Ltd. estimates.
Page 12 CHINA TELECOM SERVICES & EQUIPMENT: ’TWAS THE NIGHT BEFORE 3G…
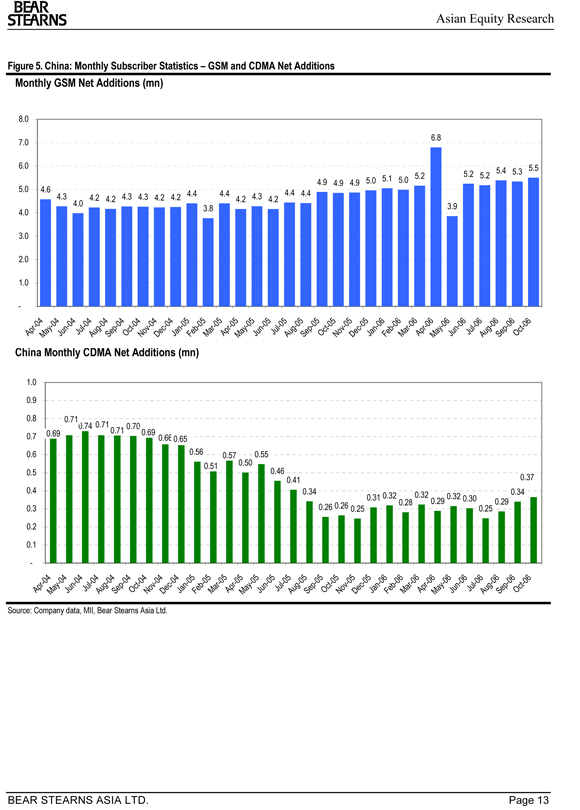
BEAR STEARNS
Asian Equity Research
Figure 5. China: Monthly Subscriber Statistics – GSM and CDMA Net Additions
Monthly GSM Net Additions (mn)
8.0
6.8 7.0
6.0
5.2 5.2 5.4 5.3 5.5 4.9 4.9 4.9 5.0 5.1 5.0 5.2 5.0 4.6 4.4 4.4 4.2 4.3 4.2 4.4 4.4 4.3 4.0 4.2 4.2 4.3 4.3 4.2 4.2 3.9 4.0 3.8
3.0 2.0 1.0 -
06 06 6—04—04—04—04—04—04 t—04—04—04—05—0 5—05—0 5y—05—0 5—05—05—05—05v—05c—05—06 r—06—06—06—06—06—06 t—0 AprMay J un J ul Aug Sep Oc Nov Dec J an Fe b Mar Apr Ju n Ju l A ug Se p Oct No De Jan -Feb M a Apr Jun Jul Aug -Sep Oc
M a May
China Monthly CDMA Net Additions (mn)
1.0 0.9
0.6 | | 0.56 0.57 0.55 0.51 0.50 0.5 0.46 |
0.41 | | 0.37 0.4 0.34 0.34 0.31 0.32 0.29 0.32 0.30 0.28 0.32 0.3 0.26 0.26 0.25 0.25 0.29 0.2 0.1 - |
- 0 4—04—0 4—04 0 4—0 4—04—05—05—05—0 5—05—05—0 5—05—05—0 5—05—06—0 6—06—0 6—06—0 6—06 0 6—0 6 y—04 c—04 c—05 y—06
Apr Jun JulAug Sep -Oc tNov De Jan F eb Mar Apr Jun JulAug Sep Oct NovDe Jan F eb Mar Apr Jun Ju l A ugSep -O ct M a M ay M a
Source: Company data, MII, Bear Stearns Asia Ltd.
BEAR STEARNS ASIA LTD. Page 13
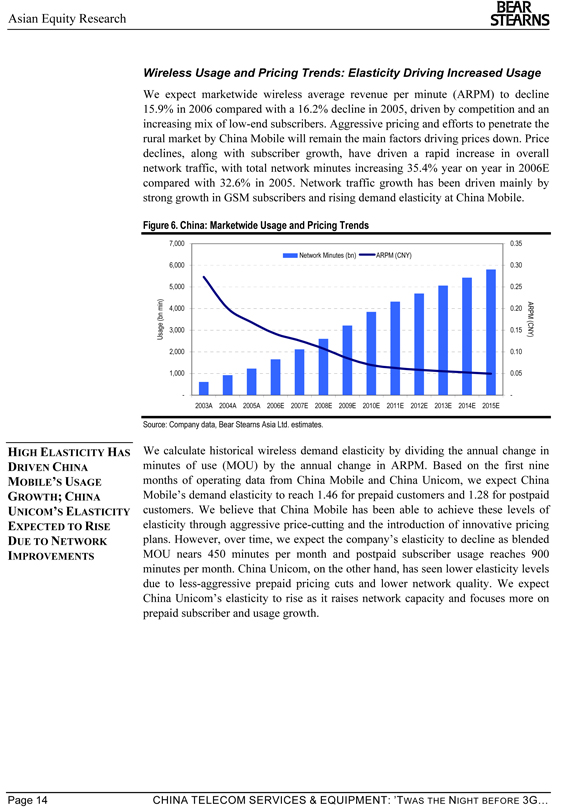
BEAR STEARNS
Asian Equity Research
Wireless Usage and Pricing Trends: Elasticity Driving Increased Usage
We expect marketwide wireless average revenue per minute (ARPM) to decline 15.9% in 2006 compared with a 16.2% decline in 2005, driven by competition and an increasing mix of low-end subscribers. Aggressive pricing and efforts to penetrate the rural market by China Mobile will remain the main factors driving prices down. Price declines, along with subscriber growth, have driven a rapid increase in overall network traffic, with total network minutes increasing 35.4% year on year in 2006E compared with 32.6% in 2005. Network traffic growth has been driven mainly by strong growth in GSM subscribers and rising demand elasticity at China Mobile.
Figure 6. China: Marketwide Usage and Pricing Trends
7,000 0.35 Network Minutes (bn) ARPM (CNY) 6,000 0.30
5,000 0.25
4,000 0.20 Usage (bn min) 3,000 0.15 ARPM (CNY) 2,000 0.10
1,000 0.05
—2003A 2004A 2005A 2006E 2007E 2008E 2009E 2010E 2011E 2012E 2013E 2014E 2015E
Source: Company data, Bear Stearns Asia Ltd. estimates.
HIGH ELASTICITY HAS DRIVEN CHINA
MOBILE’S USAGE GROWTH; CHINA UNICOM’S ELASTICITY EXPECTED TO RISE DUE TO NETWORK IMPROVEMENTS
We calculate historical wireless demand elasticity by dividing the annual change in minutes of use (MOU) by the annual change in ARPM. Based on the first nine months of operating data from China Mobile and China Unicom, we expect China Mobile’s demand elasticity to reach 1.46 for prepaid customers and 1.28 for postpaid customers. We believe that China Mobile has been able to achieve these levels of elasticity through aggressive price-cutting and the introduction of innovative pricing plans. However, over time, we expect the company’s elasticity to decline as blended MOU nears 450 minutes per month and postpaid subscriber usage reaches 900 minutes per month. China Unicom, on the other hand, has seen lower elasticity levels due to less-aggressive prepaid pricing cuts and lower network quality. We expect China Unicom’s elasticity to rise as it raises network capacity and focuses more on prepaid subscriber and usage growth.
Page 14 CHINA TELECOM SERVICES & EQUIPMENT: ’TWAS THE NIGHT BEFORE 3G…
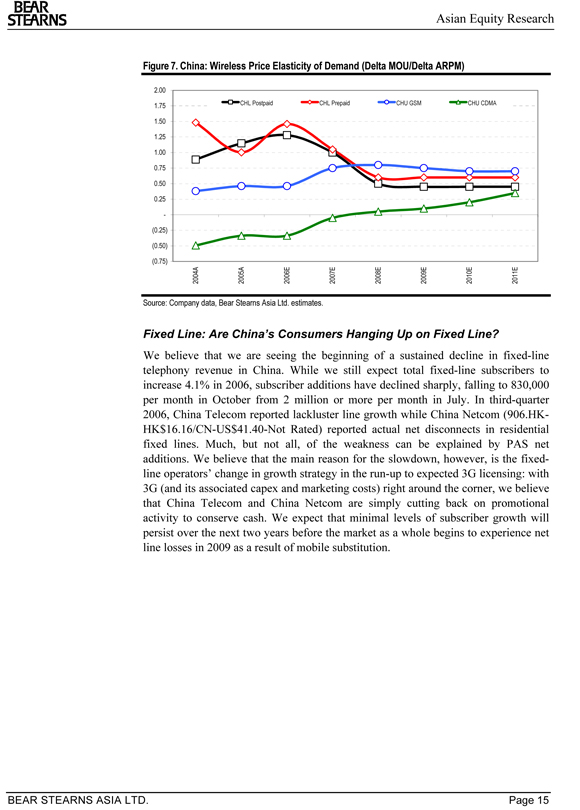
BEAR STEARNS
Asian Equity Research
Figure 7. China: Wireless Price Elasticity of Demand (Delta MOU/Delta ARPM)
2.00
1.75 | | CHL Postpaid CHL Prepaid CHU GSM CHU CDMA |
1.50 1.25 1.00 0.75 0.50 0.25 -(0.25) (0.50)
(0.75)
2004A 2005A 2006E 2007E 2008E 2009E 2010E 2011E
Source: Company data, Bear Stearns Asia Ltd. estimates.
Fixed Line: Are China’s Consumers Hanging Up on Fixed Line?
We believe that we are seeing the beginning of a sustained decline in fixed-line telephony revenue in China. While we still expect total fixed-line subscribers to increase 4.1% in 2006, subscriber additions have declined sharply, falling to 830,000 per month in October from 2 million or more per month in July. In third-quarter 2006, China Telecom reported lackluster line growth while China Netcom (906.HK-HK$16.16/CN-US$41.40-Not Rated) reported actual net disconnects in residential fixed lines. Much, but not all, of the weakness can be explained by PAS net additions. We believe that the main reason for the slowdown, however, is the fixed-line operators’ change in growth strategy in the run-up to expected 3G licensing: with 3G (and its associated capex and marketing costs) right around the corner, we believe that China Telecom and China Netcom are simply cutting back on promotional activity to conserve cash. We expect that minimal levels of subscriber growth will persist over the next two years before the market as a whole begins to experience net line losses in 2009 as a result of mobile substitution.
BEAR STEARNS ASIA LTD. Page 15
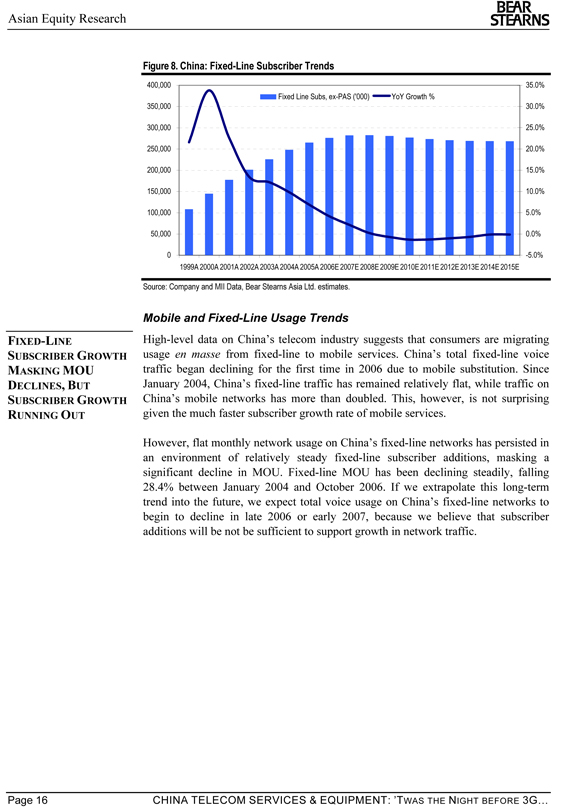
BEAR STEARNS
Asian Equity Research
Figure 8. China: Fixed-Line Subscriber Trends
400,000 35.0% Fixed Line Subs, ex-PAS ('000) YoY Growth % 350,000 30.0%
300,000 25.0% 250,000 20.0% 200,000 15.0% 150,000 10.0% 100,000 5.0% 50,000 0.0%
0 -5.0% 1999A 2000A 2001A 2002A 2003A 2004A 2005A 2006E 2007E 2008E 2009E 2010E 2011E 2012E 2013E 2014E 2015E
Source: Company and MII Data, Bear Stearns Asia Ltd. estimates.
FIXED-LINE
SUBSCRIBER GROWTH MASKING MOU DECLINES, BUT SUBSCRIBER GROWTH RUNNING OUT
Mobile and Fixed-Line Usage Trends
High-level data on China’s telecom industry suggests that consumers are migrating usage en masse from fixed-line to mobile services. China’s total fixed-line voice traffic began declining for the first time in 2006 due to mobile substitution. Since January 2004, China’s fixed-line traffic has remained relatively flat, while traffic on China’s mobile networks has more than doubled. This, however, is not surprising given the much faster subscriber growth rate of mobile services.
However, flat monthly network usage on China’s fixed-line networks has persisted in an environment of relatively steady fixed-line subscriber additions, masking a significant decline in MOU. Fixed-line MOU has been declining steadily, falling 28.4% between January 2004 and October 2006. If we extrapolate this long-term trend into the future, we expect total voice usage on China’s fixed-line networks to begin to decline in late 2006 or early 2007, because we believe that subscriber additions will be not be sufficient to support growth in network traffic.
Page 16 CHINA TELECOM SERVICES & EQUIPMENT: ’TWAS THE NIGHT BEFORE 3G…
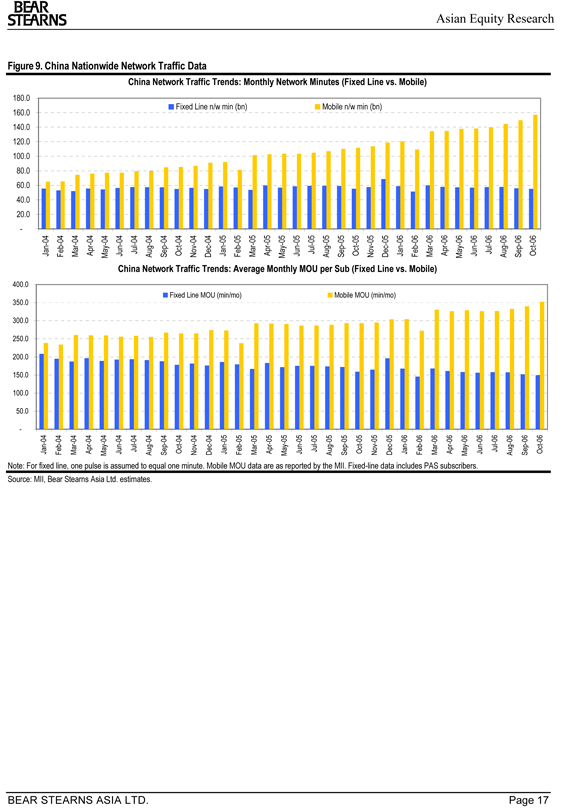
BEAR STEARNS
Asian Equity Research
Figure 9. China Nationwide Network Traffic Data
China Network Traffic Trends: Monthly Network Minutes (Fixed Line vs. Mobile)
- 20.0 40.0 60.0 80.0 100.0 120.0 140.0 160.0 180.0 Jan-04 Feb-04 Mar-04 Apr-04 May-04 Jun-04 Jul-04 Aug-04 Sep-04 Oct-04 Nov-04 Dec-04 Jan-05 Feb-05 Fixed Line n/w min (bn) Mar-05 Apr-05 May-05 Jun-05 Jul-05 Aug-05 Sep-05 Oct-05 Nov-05 Mobile n/w min (bn) Dec-05 Jan-06 Feb-06 Mar-06 Apr-06 May-06 Jun-06 Jul-06 Aug-06 Sep-06 Oct-06
China Network Traffic Trends: Average Monthly MOU per Sub (Fixed Line vs. Mobile)
- 50.0 100.0 150.0 200.0 250.0 300.0 350.0 400.0 Jan-04 Feb-04 Mar-04 Apr-04 May-04 Jun-04 Jul-04 Aug-04 Sep-04 Oct-04 Nov-04 Dec-04 Jan-05 Feb-05 Fixed Line MOU (min/mo) Mar-05 Apr-05 May-05 Jun-05 Jul-05 Aug-05 Sep-05 Oct-05 Nov-05 Dec-05 Mobile MOU (min/mo) Jan-06 Feb-06 Mar-06 Apr-06 May-06 Jun-06 Jul-06 Aug-06 Sep-06 Oct-06
Note: For fixed line, one pulse is assumed to equal one minute. Mobile MOU data are as reported by the MII. Fixed-line data includes PAS subscribers. Source: MII, Bear Stearns Asia Ltd. estimates.
BEAR STEARNS ASIA LTD. Page 17
BEAR STEARNS
Asian Equity Research
China Telecom Equipment: Capex and Handset Trends
From a vendor standpoint, 2006 has turned out much better than expected in terms of both telecom capex and handset shipments. This has reinforced our positive stance on the Chinese telecom equipment sector and wireless equipment vendor China GrenTech in particular. We downgraded ZTE Corp. to Peer Perform from Outperform on November 21, 2006, because we believe the stock is trading slightly above fair value and could be vulnerable to uncertainty over 3G license timing after recent strong performance. As for handsets, we believe that the leading global handset vendors will continue to benefit from the continued growth (in both volume and value terms) of the Chinese handset market. In this section, we will address the following:
Telecom infrastructure discussion points include: 2006 capex seasonality; 3G equipment market (TD SCDMA and WCDMA); the recent uptick in “residual capex” attributable to spending outside of China’s listed operators; IPTV developments (regulatory and commercial) and the equipment market opportunity for IPTV; wireless coverage market; and the PAS infrastructure market outlook.
Handsets: We have recently updated our China handset supply and demand macro to reflect higher estimated subscriber growth in 2006 and 2007. We have also updated our macro to reflect reported third-quarter shipments on a vendor-by-vendor basis; ASP trends for new handset introductions; and individual vendors’ own reported handset shipment data.
Analysis of Telecom Infrastructure Spending
Chinese telecom capex has surprised on the upside year to date due to a combination of factors, including: accelerating network traffic growth; faster-than-expected subscriber growth; and, we hypothesize, wireless spending by unlisted operators (and possibly the Chinese government). We believe that we are witnessing the beginning of a three-year wireless capex boom that will culminate in 2008 with the fixed-line operators’ wireless market debut.
2006 Year-to-Date Statistics Point to 16.6% Capex Growth; 31.5% Wireless Capex Growth. We recently raised our estimate of 2006 capex by 5.5% to CNY237 billion (US$29.7 billion). The revision was due almost entirely to our belief that wireless capex will rise by 31.5% year on year in 2006. We believe that GSM and 3G capex are contributing all of the growth in 2006 wireless capex, while CDMA is declining by an estimated 77.7% year on year. We expect wireline capex (including PAS) to experience a single-digit percentage decline in 2006.
Monthly and Quarterly Telco Capex. As seen in Figure 10 below, capex began to spike upward in June 2006 and has yet to show signs of slowing. Third-quarter seasonality was stronger than usual, rising 5.7% quarter on quarter – over the past three years, third-quarter capex has declined by 20%, 18%, and 13% quarter on quarter, respectively.
Page 18 CHINA TELECOM SERVICES & EQUIPMENT: ’TWAS THE NIGHT BEFORE 3G…
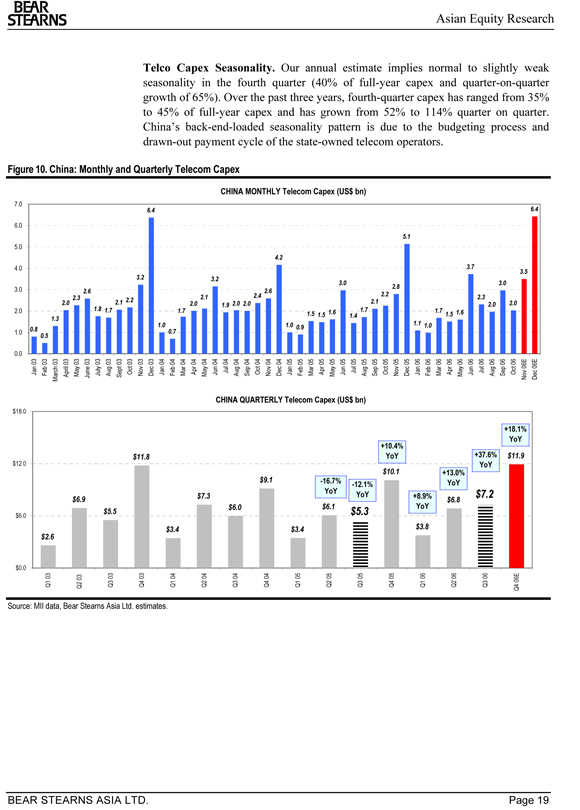
BEAR STEARNS
Asian Equity Research
Telco Capex Seasonality. Our annual estimate implies normal to slightly weak seasonality in the fourth quarter (40% of full-year capex and quarter-on-quarter growth of 65%). Over the past three years, fourth-quarter capex has ranged from 35% to 45% of full-year capex and has grown from 52% to 114% quarter on quarter. China’s back-end-loaded seasonality pattern is due to the budgeting process and drawn-out payment cycle of the state-owned telecom operators.
Figure 10. China: Monthly and Quarterly Telecom Capex
CHINA MONTHLY Telecom Capex (US$ bn)
7.0
6.0
5.1
5.0
4.2
2.0 2.3 2.1 2.2 2.0 2.0 2.0 2.1 2.0 2.0 1.9 2.0 1.8 1.7 1.7 1.7 1.5 1.5 1.6 1.4 1.7 1.5 1.6 1.3 1.0 1.0 0.9 1.1 1.0 1.0 0.8 0.7 0.5
0.0
Jan 03 Feb 03 March 03 April 03 May 03 June 03 July 03 Aug 03 Sept 03 Oct 03 Nov 03 Dec 03 Jan 04 Feb 04 Mar 04 Apr 04 May 04 Jun 04 Jul 04 Aug 04 Sep 04 Oct 04 Nov 04 Dec 04 Jan 05 Feb 05 Mar 05 Apr 05 May 05 Jun 05 Jul 05 Aug 05 Sep 05 Oct 05 Nov 05 Dec 05 Jan 06 Feb 06 Mar 06 Apr 06 May 06 Jun 06 Jul 06 Aug 06 Sep 06 Oct 06 Nov 06E Dec 06E
CHINA QUARTERLY Telecom Capex (US$ bn)
bn) $18.0
+18.1% YoY
+10.4% | | $11.8 YoY +37.6% $11.9 $12.0 YoY $10.1 +13.0% $9.1 -16.7% YoY |
-12.1%
YoY YoY $7.2 $6.9 $7.3 +8.9% $6.8 $6.0 $6.1 YoY $5.5 $5.3 $6.0 $3.4 $3.4 $3.8 $2.6
$0.0
Q1 03 Q2 03 Q3 03 Q4 03 Q1 04 Q2 04 Q3 04 Q4 04 Q1 05 Q2 05 Q3 05 Q4 05 Q1 06 Q2 06 Q3 06 Q4 06E
Source: MII data, Bear Stearns Asia Ltd. estimates.
BEAR STEARNS ASIA LTD. Page 19
BEAR STEARNS
Asian Equity Research
Wireless Capex: “Residual” Spending of US$6.4 billion in 2006, Up 60% Year on Year
Subtracting estimated listed operator capex (for China Mobile, China Unicom, China Telecom, and China Netcom) from our total capex estimate yields a “residual capex” figure of CNY50.7 billion (US$6.4 billion), versus CNY33.0 billion (US$4.0 billion) in 2005. Other operators: Apart from the listed companies, the only discrete operators in China are ChinaSat, China Railcom, Guizhou Unicom, and Tibet Telecom. Parent company capex: (China Mobile Communications Corp., China United Telecommunications Corp. [CMCC], China Telecom Corp. [CTC], and China Network Communications Group Corp. [CNCG]): For the past two years, due to the fact that most provincial telecom subsidiaries of the big four telco groups had been acquired by the listed companies, the main components of parent company spending were the Unicom CDMA network and the nationwide interprovincial backbones of CMCC and CTC.
CDMA Less of a Factor in 2006: From 43% to 6% of Residual Capex. What makes the jump in residual capex even more surprising is the fact that CDMA capex, once the largest component of the residual figure, is declining by nearly 80% in 2006, comprising just 6% of residual capex versus 43% in 2005.
Other Residual Capex. Based on the trends taking shape in the first three quarters of 2006, we estimate that the non-CDMA portion of residual capex will rise 154% year on year in 2006 to CNY47.5 billion. We assume that Guizhou Unicom, Tibet Telecom, China Sat, Railcom, and interprovincial backbone spending rises to CNY22.5 billion in 2006 from CNY18.7 billion in 2005.
A New Category in 2006 – Parent Company 3G Spending. We believe that most of the 2006 increase in residual spending is coming from 3G spending at the parent company level. We believe this spending has been taking place in preparation for more extensive TD SCDMA commercial trials conducted by China Telecom, China Mobile and China Netcom, beginning with Beijing on November 5 and Shanghai on November 15. This is consistent with the timing of the ramp in overall telco capex, which began in June (+21% year on year) and continued into September (+41% year on year).
Page 20 CHINA TELECOM SERVICES & EQUIPMENT: ’TWAS THE NIGHT BEFORE 3G…
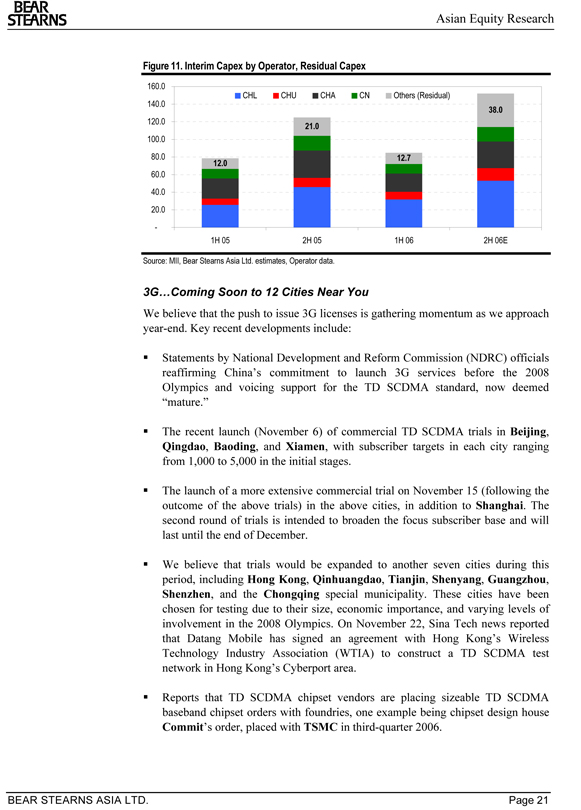
BEAR STEARNS
Asian Equity Research
Figure 11. Interim Capex by Operator, Residual Capex
160.0
CHL CHU CHA CN Others (Residual) 140.0
38.0
120.0
21.0
100.0
60.0 40.0 20.0 -
1H 05 2H 05 1H 06 2H 06E
Source: MII, Bear Stearns Asia Ltd. estimates, Operator data.
3G…Coming Soon to 12 Cities Near You
We believe that the push to issue 3G licenses is gathering momentum as we approach year-end. Key recent developments include:
Statements by National Development and Reform Commission (NDRC) officials reaffirming China’s commitment to launch 3G services before the 2008 Olympics and voicing support for the TD SCDMA standard, now deemed “mature.”
The recent launch (November 6) of commercial TD SCDMA trials in Beijing, Qingdao, Baoding, and Xiamen, with subscriber targets in each city ranging from 1,000 to 5,000 in the initial stages.
The launch of a more extensive commercial trial on November 15 (following the outcome of the above trials) in the above cities, in addition to Shanghai. The second round of trials is intended to broaden the focus subscriber base and will last until the end of December.
We believe that trials would be expanded to another seven cities during this period, including Hong Kong, Qinhuangdao, Tianjin, Shenyang, Guangzhou,
Shenzhen, and the Chongqing special municipality. These cities have been chosen for testing due to their size, economic importance, and varying levels of involvement in the 2008 Olympics. On November 22, Sina Tech news reported that Datang Mobile has signed an agreement with Hong Kong’s Wireless Technology Industry Association (WTIA) to construct a TD SCDMA test network in Hong Kong’s Cyberport area.
Reports that TD SCDMA chipset vendors are placing sizeable TD SCDMA baseband chipset orders with foundries, one example being chipset design house Commit’s order, placed with TSMC in third-quarter 2006.
BEAR STEARNS ASIA LTD. Page 21
BEAR STEARNS
Asian Equity Research
TD SCDMA handsets gaining regulatory approval: handsets from vendors including ZTE, LG Electronics (066570.KS-KRW53,900-Peer Perform/Market Overweight), Holley, Inventec Appliances, Haier, Simtech (Sim Technology), Bird, Hisense, Lenovo (992.HK-HK$3.17-Peer Perform/Market Weight), Longcheer, Amoi, and Xinyoutong (a local vendor) all underwent testing and gained approval for use in commercial TD SCDMA trials in late October. We expect the range of vendors and handsets to increase as trials take place.
Our 3G Base Case Scenario. We still expect China’s 3G licenses to be issued in two stages: TD SCDMA in first-quarter 2007 and WCDMA/CDMA2000 in second-quarter 2007. However, based on recent capex trends and discussions with vendors, we believe that 3G network builds (TD SCDMA, WCDMA, and EV DO) are already underway, potentially shortening the time lag between 3G license issuance and actual commercialization. We are interested in the implications of the large residual capex number noted above and are now taking the view that the official 3G licenses will be less of a catalyst for network rollout than a “rubber stamp” on the rollouts currently in progress.
Which 3G Standard? Our base case assumes the following technology split between operators: China Mobile (TD SCDMA); China Telecom (WCDMA); China Netcom (WCDMA); and China Unicom (CDMA2000, specifically EV DO Rev. A). Our reasoning is as follows:
China Mobile ? TD SCDMA: China Mobile is the only operator that can make
TD SCDMA a success, in our view. Reasons include the company’s huge scale, leverage and existing purchasing relationships with handset suppliers (key to ensuring adequate supply of handsets), and its extensive retail network. Regulatory perspective: China Mobile is also increasingly dominant in the wireless business, so designating it as the TD SCDMA operator might give China’s other 3G operators more of a fighting chance.
China Telecom ? WCDMA: Realistically, China Telecom can only be competitive if it is able to compete using a mature 3G standard with a well-developed handset supply chain. Given China Telecom’s stated strategy of targeting high-end subscribers in urban areas (initially, at least), we believe that pursuing a subsidy-driven strategy accompanied by fixed-mobile bundling discounts is likely the only way that China Telecom will be able to wrest enough subscribers from the incumbents to establish a critical mass of wireless subscribers.
China Netcom ? WCDMA: Same argument as in the case of China Telecom, only more so, due to the relative weakness of China Netcom’s brand and balance sheet.
China Unicom ? EV DO, Pursues Incremental GSM Upgrades: We assume that China Unicom remains intact (i.e., no breakup) and that CUTC undertakes a gradual upgrade to EV DO Rev A to accommodate its heavy data users.
Page 22 CHINA TELECOM SERVICES & EQUIPMENT: ’TWAS THE NIGHT BEFORE 3G…
BEAR STEARNS
Asian Equity Research
Based on this expected 3G scenario, we expect continuous wireless capex expansion in 2007 and 2008, followed by a slight downtick in 2009 on completion of large initial network rollouts/upgrades. We expect 2G spending to go into a sustained decline, as illustrated in Figure 12. While it is difficult to estimate how much spending will be apportioned to TD SCDMA versus WCDMA infrastructure within the 3G category, we believe that the spending ratio will be roughly 50:50 in our base case scenario.
We note, however, that estimates vary: CCID Consulting, the quasi-official research consultancy affiliated with the Ministry of Information Industry (MII), estimated in its February 2006 report “China 3G Market and Telecom Equipment Development and Research in 2005-2006” that TD SCDMA spending would amount to CNY109 billion in the first five years of network rollout, compared with WCDMA investment of CNY86 billion and CDMA2000 investment of CNY55 billion. We discuss 3G network rollout assumptions on an individual operator basis in the section below.
BEAR STEARNS ASIA LTD. Page 23
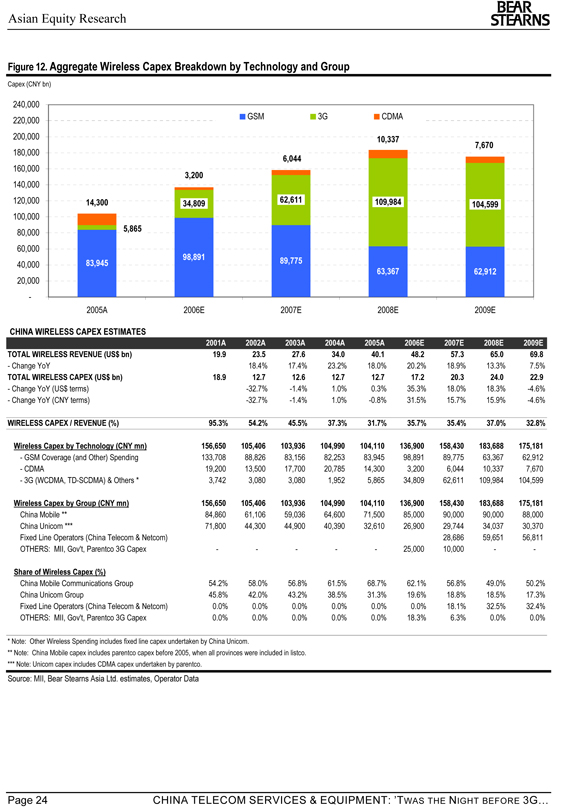
Asian Equity Research
BEAR STEARNS
Figure 12. Aggregate Wireless Capex Breakdown by Technology and Group
Capex (CNY bn)
240,000
220,000 GSM 3G CDMA 200,000 10,337
7,670
180,000
6,044
160,000
3,200
140,000
120,000 14,300 34,809 62,611 109,984
104,599
100,000
80,000 5,865 60,000
98,891 89,775
40,000 83,945
63,367 62,912
20,000 -
2005A 2006E 2007E 2008E 2009E
CHINA WIRELESS CAPEX ESTIMATES
2001A 2002A 2003A 2004A 2005A 2006E 2007E 2008E 2009E TOTAL WIRELESS REVENUE (US$ bn) 19.9 23.5 27.6 34.0 40.1 48.2 57.3 65.0 69.8
- Change YoY 18.4% 17.4% 23.2% 18.0% 20.2% 18.9% 13.3% 7.5%
TOTAL WIRELESS CAPEX (US$ bn) 18.9 12.7 12.6 12.7 12.7 17.2 20.3 24.0 22.9
- Change YoY (US$ terms) -32.7% -1.4% 1.0% 0.3% 35.3% 18.0% 18.3% -4.6%—Change YoY (CNY terms) -32.7% -1.4% 1.0% -0.8% 31.5% 15.7% 15.9% -4.6%
WIRELESS CAPEX / REVENUE (%) 95.3% 54.2% 45.5% 37.3% 31.7% 35.7% 35.4% 37.0% 32.8%
Wireless Capex by Technology (CNY mn) 156,650 105,406 103,936 104,990 104,110 136,900 158,430 183,688 175,181
- GSM Coverage (and Other) Spending 133,708 88,826 83,156 82,253 83,945 98,891 89,775 63,367 62,912—CDMA 19,200 13,500 17,700 20,785 14,300 3,200 6,044 10,337 7,670—3G (WCDMA, TD-SCDMA) & Others * 3,742 3,080 3,080 1,952 5,865 34,809 62,611 109,984 104,599
Wireless Capex by Group (CNY mn) 156,650 105,406 103,936 104,990 104,110 136,900 158,430 183,688 175,181
China Mobile ** 84,860 61,106 59,036 64,600 71,500 85,000 90,000 90,000 88,000 China Unicom *** 71,800 44,300 44,900 40,390 32,610 26,900 29,744 34,037 30,370 Fixed Line Operators (China Telecom & Netcom) 28,686 59,651 56,811 OTHERS: MII, Gov't, Parentco 3G Capex———- 25,000 10,000—-
Share of Wireless Capex (%)
China Mobile Communications Group 54.2% 58.0% 56.8% 61.5% 68.7% 62.1% 56.8% 49.0% 50.2% China Unicom Group 45.8% 42.0% 43.2% 38.5% 31.3% 19.6% 18.8% 18.5% 17.3% Fixed Line Operators (China Telecom & Netcom) 0.0% 0.0% 0.0% 0.0% 0.0% 0.0% 18.1% 32.5% 32.4% OTHERS: MII, Gov't, Parentco 3G Capex 0.0% 0.0% 0.0% 0.0% 0.0% 18.3% 6.3% 0.0% 0.0%
* | | Note: Other Wireless Spending includes fixed line capex undertaken by China Unicom. |
** Note: China Mobile capex includes parentco capex before 2005, when all provinces were included in listco. *** Note: Unicom capex includes CDMA capex undertaken by parentco.
Source: MII, Bear Stearns Asia Ltd. estimates, Operator Data
Page 24 CHINA TELECOM SERVICES & EQUIPMENT: ’TWAS THE NIGHT BEFORE 3G…
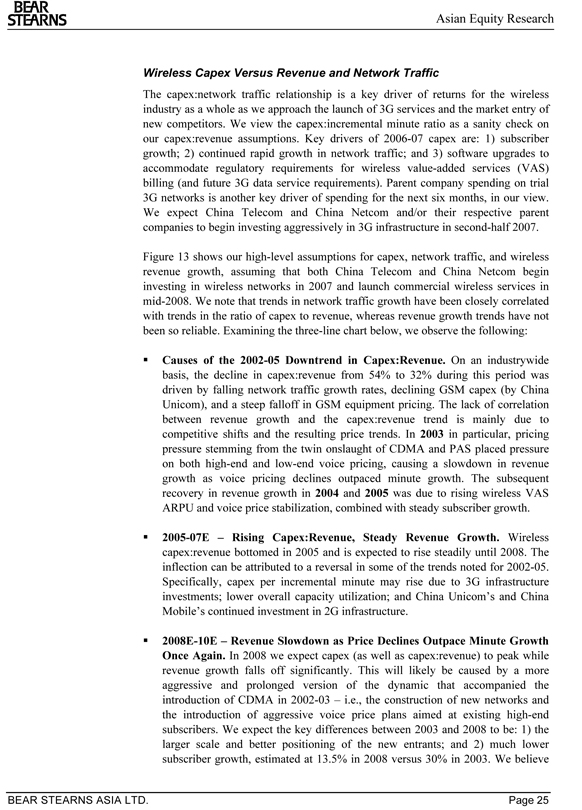
Asian Equity Research
BEAR STEARNS
Wireless Capex Versus Revenue and Network Traffic
The capex:network traffic relationship is a key driver of returns for the wireless industry as a whole as we approach the launch of 3G services and the market entry of new competitors. We view the capex:incremental minute ratio as a sanity check on our capex:revenue assumptions. Key drivers of 2006-07 capex are: 1) subscriber growth; 2) continued rapid growth in network traffic; and 3) software upgrades to accommodate regulatory requirements for wireless value-added services (VAS) billing (and future 3G data service requirements). Parent company spending on trial 3G networks is another key driver of spending for the next six months, in our view. We expect China Telecom and China Netcom and/or their respective parent companies to begin investing aggressively in 3G infrastructure in second-half 2007.
Figure 13 shows our high-level assumptions for capex, network traffic, and wireless revenue growth, assuming that both China Telecom and China Netcom begin investing in wireless networks in 2007 and launch commercial wireless services in mid-2008. We note that trends in network traffic growth have been closely correlated with trends in the ratio of capex to revenue, whereas revenue growth trends have not been so reliable. Examining the three-line chart below, we observe the following:
Causes of the 2002-05 Downtrend in Capex:Revenue. On an industrywide basis, the decline in capex:revenue from 54% to 32% during this period was driven by falling network traffic growth rates, declining GSM capex (by China Unicom), and a steep falloff in GSM equipment pricing. The lack of correlation between revenue growth and the capex:revenue trend is mainly due to competitive shifts and the resulting price trends. In 2003 in particular, pricing pressure stemming from the twin onslaught of CDMA and PAS placed pressure on both high-end and low-end voice pricing, causing a slowdown in revenue growth as voice pricing declines outpaced minute growth. The subsequent recovery in revenue growth in 2004 and 2005 was due to rising wireless VAS ARPU and voice price stabilization, combined with steady subscriber growth.
2005-07E – Rising Capex:Revenue, Steady Revenue Growth. Wireless capex:revenue bottomed in 2005 and is expected to rise steadily until 2008. The inflection can be attributed to a reversal in some of the trends noted for 2002-05.
Specifically, capex per incremental minute may rise due to 3G infrastructure investments; lower overall capacity utilization; and China Unicom’s and China Mobile’s continued investment in 2G infrastructure.
2008E-10E – Revenue Slowdown as Price Declines Outpace Minute Growth Once Again. In 2008 we expect capex (as well as capex:revenue) to peak while revenue growth falls off significantly. This will likely be caused by a more aggressive and prolonged version of the dynamic that accompanied the introduction of CDMA in 2002-03 – i.e., the construction of new networks and the introduction of aggressive voice price plans aimed at existing high-end subscribers. We expect the key differences between 2003 and 2008 to be: 1) the larger scale and better positioning of the new entrants; and 2) much lower subscriber growth, estimated at 13.5% in 2008 versus 30% in 2003. We believe
BEAR STEARNS ASIA LTD. Page 25
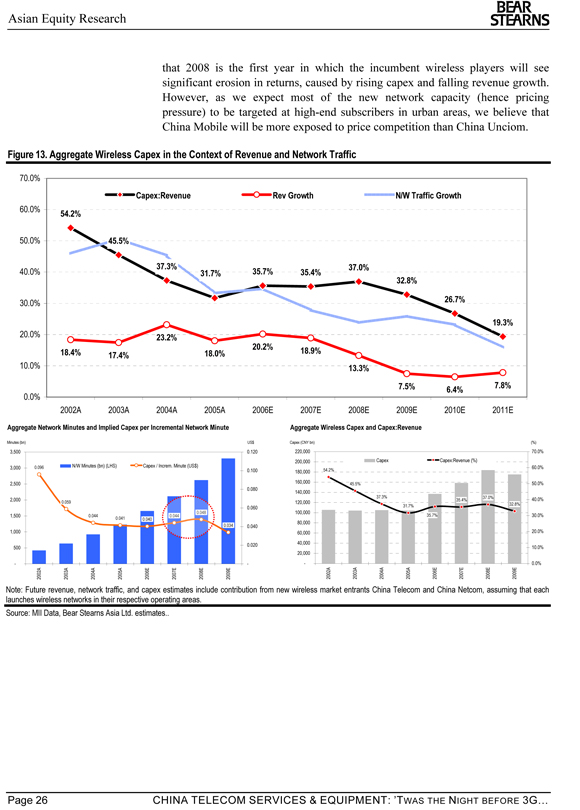
Asian Equity Research
BEAR STEARNS
that 2008 is the first year in which the incumbent wireless players will see significant erosion in returns, caused by rising capex and falling revenue growth. However, as we expect most of the new network capacity (hence pricing pressure) to be targeted at high-end subscribers in urban areas, we believe that China Mobile will be more exposed to price competition than China Unciom.
Figure 13. Aggregate Wireless Capex in the Context of Revenue and Network Traffic
70.0%
Capex:Revenue Rev Growth N/W Traffic Growth
60.0%
54.2%
37.3% | | 37.0% 40.0% 31.7% 35.7% 35.4% |
32.8%
19.3%
20.2% | | 18.9% 18.4% 17.4% 18.0% |
0.0%
2002A 2003A 2004A 2005A 2006E 2007E 2008E 2009E 2010E 2011E
Aggregate Network Minutes and Implied Capex per Incremental Network Minute
Minutes (bn) US$
3,500 0.120
3,000 0.096 N/W Minutes (bn) (LHS) Capex / Increm. Minute (US$)
0.100
2,500
0.048 | | 1,500 0.044 0.044 0.041 0.040 |
0.034 0.040 1,000
0.020 500
—2002A 2003A 2004A 2005A 2006E 2007E 2008E 2009E
Aggregate Wireless Capex and Capex:Revenue
Capex (CNY bn)(%)
220,000 70.0% 200,000 Capex Capex:Revenue (%) 60.0% 180,000 54.2% 160,000 45.5% 50.0% 140,000
35.4% | | 40.0% 120,000 32.8% 31.7% |
100,000
35.7% | | 30.0% 80,000 60,000 20.0% 40,000 10.0% 20,000 |
- 0.0% 2002A 2003A 2004A 2005A 2006E 2007E 2008E 2009E
Note: Future revenue, network traffic, and capex estimates include contribution from new wireless market entrants China Telecom and China Netcom, assuming that each launches wireless networks in their respective operating areas.
Source: MII Data, Bear Stearns Asia Ltd. estimates.
Page 26 CHINA TELECOM SERVICES & EQUIPMENT: ’TWAS THE NIGHT BEFORE 3G…
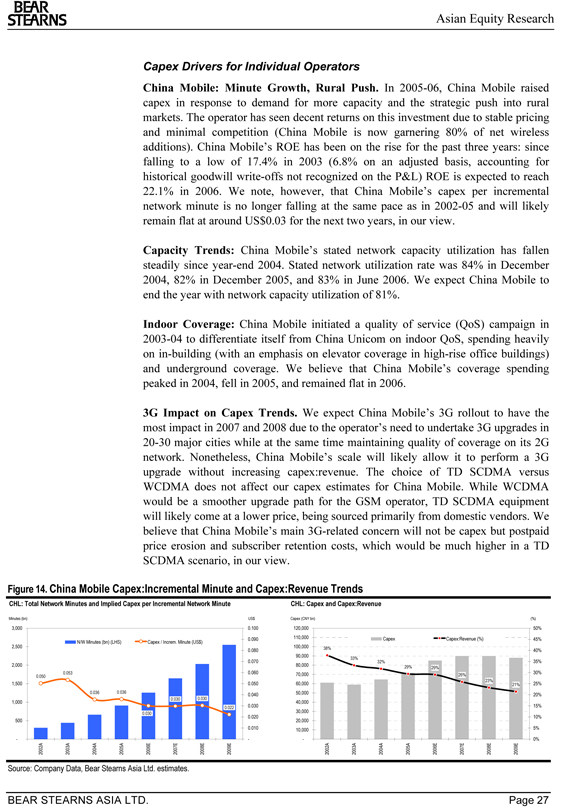
Asian Equity Research
BEAR STEARNS
Capex Drivers for Individual Operators
China Mobile: Minute Growth, Rural Push. In 2005-06, China Mobile raised capex in response to demand for more capacity and the strategic push into rural markets. The operator has seen decent returns on this investment due to stable pricing and minimal competition (China Mobile is now garnering 80% of net wireless additions). China Mobile’s ROE has been on the rise for the past three years: since falling to a low of 17.4% in 2003 (6.8% on an adjusted basis, accounting for historical goodwill write-offs not recognized on the P&L) ROE is expected to reach 22.1% in 2006. We note, however, that China Mobile’s capex per incremental network minute is no longer falling at the same pace as in 2002-05 and will likely remain flat at around US$0.03 for the next two years, in our view.
Capacity Trends: China Mobile’s stated network capacity utilization has fallen steadily since year-end 2004. Stated network utilization rate was 84% in December 2004, 82% in December 2005, and 83% in June 2006. We expect China Mobile to end the year with network capacity utilization of 81%.
Indoor Coverage: China Mobile initiated a quality of service (QoS) campaign in 2003-04 to differentiate itself from China Unicom on indoor QoS, spending heavily on in-building (with an emphasis on elevator coverage in high-rise office buildings) and underground coverage. We believe that China Mobile’s coverage spending peaked in 2004, fell in 2005, and remained flat in 2006.
3G Impact on Capex Trends. We expect China Mobile’s 3G rollout to have the most impact in 2007 and 2008 due to the operator’s need to undertake 3G upgrades in 20-30 major cities while at the same time maintaining quality of coverage on its 2G network. Nonetheless, China Mobile’s scale will likely allow it to perform a 3G upgrade without increasing capex:revenue. The choice of TD SCDMA versus WCDMA does not affect our capex estimates for China Mobile. While WCDMA would be a smoother upgrade path for the GSM operator, TD SCDMA equipment will likely come at a lower price, being sourced primarily from domestic vendors. We believe that China Mobile’s main 3G-related concern will not be capex but postpaid price erosion and subscriber retention costs, which would be much higher in a TD SCDMA scenario, in our view.
Figure 14. China Mobile Capex:Incremental Minute and Capex:Revenue Trends
CHL: Total Network Minutes and Implied Capex per Incremental Network Minute CHL: Capex and Capex:Revenue
Minutes (bn) US$
3,000 0.100
0.090 | | N/W Minutes (bn) (LHS) Capex / Increm. Minute (US$) 2,500 0.080 |
0.070 2,000
1,500 0.050
0.036 0.036
0.040
0.030 0.030
1,000
0.022 0.030 0.030
0.020 500 0.010
—2002A 2003A 2004A 2005A 2006E 2007E 2008E 2009E
CHL: Capex and Capex:Revenue
Capex (CNY bn)(%)
120,000 50% 110,000 Capex Capex:Revenue (%) 45% 100,000 38% 40% 90,000
33%
32% 35% 80,000 29% 29%
70,000 26% 30%
23%
60,000 21% 25% 50,000 20% 40,000 15% 30,000 10% 20,000 10,000 5%
- 0% 2002A 2003A 2004A 2005A 2006E 2007E 2008E 2009E
Source: Company Data, Bear Stearns Asia Ltd. estimates.
BEAR STEARNS ASIA LTD. Page 27
Asian Equity Research
BEAR STEARNS
China Unicom: GSM Capacity; GPRS Upgrades. China Unicom’s capex trajectory looks slightly different than China Mobile’s. Historically, China Unicom has had slightly higher capex per network minute than China Mobile for a few reasons. (Note that for China Unicom we compare listco capex excluding fixed-line spending to GSM network minutes, as the Unicom CDMA network is owned by CUTC). The biggest reasons for China Unicom’s higher cost per minute are scale and spectrum: China Unicom has just 6x2 Mhz of spectrum in the 900Mhz range, with 10x2Mhz in the 1800Mhz range, giving it a higher cost of network buildout compared with China Mobile, which has more than twice China Unicom’s overall spectrum, most of it in the 900Mhz range. China Mobile also has much larger purchasing scale than China Unicom and has sought to leverage this scale by centralizing equipment procurement, allowing it to negotiate more aggressively on equipment pricing. Nonetheless, China Unicom’s capex per minute is declining to levels that rival China Mobile’s, particularly given China Mobile’s added burden of upgrading to 3G beginning in 2007.
Capacity Trends: China Unicom has operated above its stated GSM network capacity for the past two years and has only recently clawed its way back to full network utilization. The utilization rate was 100% in December 2004, 106% in December 2005, and 100% in June 2006. We expect China Unicom to end the year at 97% of stated GSM network capacity.
Indoor Coverage: China Unicom began installing indoor coverage systems later than China Mobile and when it did begin, it was for the CDMA network, then thought to be the company’s future growth driver and high-end offering. Now China Unicom has cut back on CDMA coverage and is attempting to be more competitive on GSM indoor coverage. This is particularly important in the larger cities, where China Unicom is upgrading to GPRS.
3G to Have Minimal Effect on China Unicom’s Capex Plans. We expect China Unicom to maintain flat wireless network capex in 2007-08 after an estimated 32% increase (taking into account capex related to GSM, transmission, and other shared facilities) in 2006. We believe that China Unicom will apply most of its network spending to GPRS upgrades, capacity expansion, and indoor coverage (also a type of capacity expansion). It is also likely to expand its coverage in smaller cities and towns where the company does not face the same spectrum shortages currently being encountered in some of the highly penetrated coastal cities. In general, we expect China Unicom to benefit from its continued focus on GSM/GPRS. Given China Unicom’s mass-market strategy, network capacity and QoS are the main constraints to network traffic growth (China Unicom’s main revenue driver). Fortunately for China Unicom, capacity and QoS are also some of the easiest issues to address, due to continued declines in legacy 2G equipment.
Page 28 CHINA TELECOM SERVICES & EQUIPMENT: ’TWAS THE NIGHT BEFORE 3G…
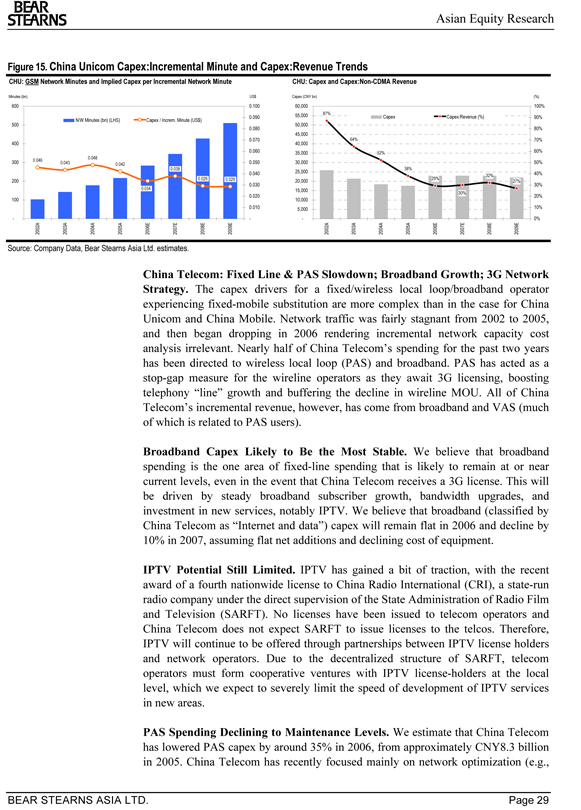
BEAR STEARNS
Asian Equity Research
Figure 15. China Unicom Capex:Incremental Minute and Capex:Revenue Trends
CHU: GSM Network Minutes and Implied Capex per Incremental Network Minute CHU: Capex and Capex:Non-CDMA Revenue
Minutes (bn) US$
600 0.100
0.090 | | N/W Minutes (bn) (LHS) Capex / Increm. Minute (US$) 500 0.080 |
0.070 400 0.060
0.048
300 0.046 0.050
0.038
0.030
0.034
0.020 100 0.010
—2002A 2003A 2004A 2005A 2006E 2007E 2008E 2009E
Capex (CNY bn)(%)
60,000 100% 55,000 87% Capex Capex:Revenue (%) 90% 50,000 80% 45,000
64% 70% 40,000 35,000 52% 60% 30,000 50%
38%
25,000 40%
32% 29%
20,000 27%
30% 15,000
30%
20% 10,000 5,000 10%
- 0% 2002A 2003A 2004A 2005A 2006E 2007E 2008E 2009E
Source: Company Data, Bear Stearns Asia Ltd. estimates.
China Telecom: Fixed Line & PAS Slowdown; Broadband Growth; 3G Network Strategy. The capex drivers for a fixed/wireless local loop/broadband operator experiencing fixed-mobile substitution are more complex than in the case for China Unicom and China Mobile. Network traffic was fairly stagnant from 2002 to 2005, and then began dropping in 2006 rendering incremental network capacity cost analysis irrelevant. Nearly half of China Telecom’s spending for the past two years has been directed to wireless local loop (PAS) and broadband. PAS has acted as a stop-gap measure for the wireline operators as they await 3G licensing, boosting telephony “line” growth and buffering the decline in wireline MOU. All of China Telecom’s incremental revenue, however, has come from broadband and VAS (much of which is related to PAS users).
Broadband Capex Likely to Be the Most Stable. We believe that broadband spending is the one area of fixed-line spending that is likely to remain at or near current levels, even in the event that China Telecom receives a 3G license. This will be driven by steady broadband subscriber growth, bandwidth upgrades, and investment in new services, notably IPTV. We believe that broadband (classified by China Telecom as “Internet and data”) capex will remain flat in 2006 and decline by 10% in 2007, assuming flat net additions and declining cost of equipment.
IPTV Potential Still Limited. IPTV has gained a bit of traction, with the recent award of a fourth nationwide license to China Radio International (CRI), a state-run radio company under the direct supervision of the State Administration of Radio Film and Television (SARFT). No licenses have been issued to telecom operators and China Telecom does not expect SARFT to issue licenses to the telcos. Therefore, IPTV will continue to be offered through partnerships between IPTV license holders and network operators. Due to the decentralized structure of SARFT, telecom operators must form cooperative ventures with IPTV license-holders at the local level, which we expect to severely limit the speed of development of IPTV services in new areas.
PAS Spending Declining to Maintenance Levels. We estimate that China Telecom has lowered PAS capex by around 35% in 2006, from approximately CNY8.3 billion in 2005. China Telecom has recently focused mainly on network optimization (e.g.,
BEAR STEARNS ASIA LTD. Page 29
Asian Equity Research
BEAR STEARNS
services, BTS relocation, and indoor coverage), however, which means that the traditional PAS equipment vendors likely saw equipment orders drop by more than 35% during the year. We estimate that China Telecom will invest approximately CNY 1,000 million (about 18.5% of its total PAS capex) on indoor coverage in 2006, up 40-45% year on year. The indoor push has two motivations: 1) to improve the notoriously bad quality of PAS indoor reception (due to the low-power design of the network), hence boosting at-home usage and MOU; and 2) 3G preparation: having a PAS coverage system already in place would allow the operator to quickly upgrade to 3G simply by adding a 3G repeater (as well as compatible trunk amplifiers).
3G Network Buildout Strategy: Going Toe-to-Toe with China Mobile. China Telecom has stated that its 3G strategy will be based around comprehensive network builds in major cities, but this does not tell the whole story. We believe that China Telecom’s strategy is to take a large share of China Mobile’s existing postpaid subscriber base, as well as a large proportion of marketwide net additions in the first two years following network launch. China Telecom (and probably China Netcom as well) have learned a lesson from China Unicom’s experience with CDMA and will seek to front-end-load network spending and marketing expenditure in order to establish critical mass and a positive brand image from the outset. Based on our conversations with regional China Telecom subsidiaries and equipment vendors, we believe that from China Telecom’s perspective, “comprehensive” implies the following prioritization of network coverage:
1) Matching China Mobile in First-Tier Markets. China Telecom will attempt to match China Mobile’s network coverage and quality of service (QoS) in the wealthier first-tier “megacities” such as Shenzhen, Shanghai, and Tianjin. We believe that there are about 20 such cities in China.
2) Focused Coverage in Secondary Cities. In large urban markets with economic significance but lower affordability and smaller populations than the megacities, China Telecom will focus on broad outdoor coverage with indoor coverage being focused on major office complexes, five-star hotels, and well-trafficked shopping areas.
3) “Presence” in Third-Tier Cities. In cities with large populations but lower affordability, China Telecom will likely seek to establish an initial presence with thin network coverage and minimal indoor coverage.
Page 30 CHINA TELECOM SERVICES & EQUIPMENT: ’TWAS THE NIGHT BEFORE 3G…
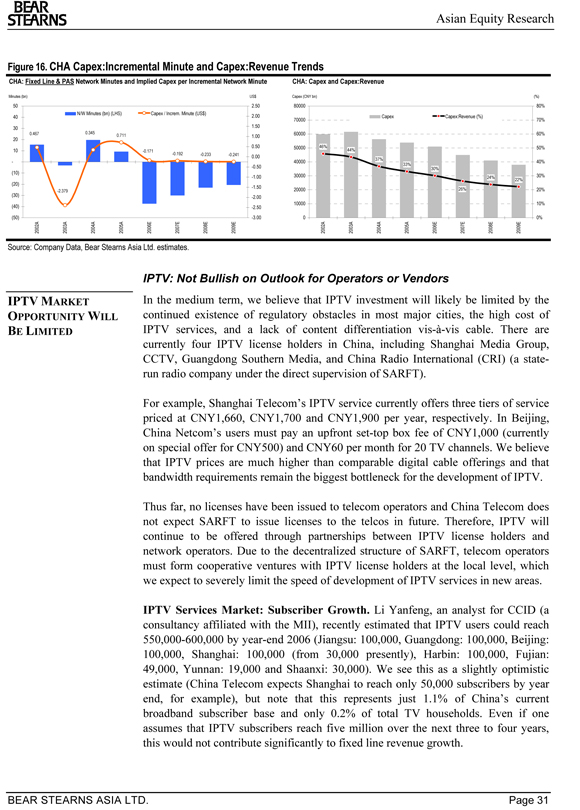
Asian Equity Research
BEAR STEARNS
Figure 16. CHA Capex:Incremental Minute and Capex:Revenue Trends
CHA: Fixed Line & PAS Network Minutes and Implied Capex per Incremental Network Minute CHA: Capex and Capex:Revenue
Minutes (bn) US$
50 | | 2.50 N/W Minutes (bn) (LHS) Capex / Increm. Minute (US$) |
-0.192 -0.233 -0.241
0.00 —0.50 (10) -1.00 (20) -1.50
-2.379
(30) | | -2.00 (40) -2.50 (50) -3.00 2002A 2003A 2004A 2005A 2006E 2007E 2008E 2009E |
Capex (CNY bn)(%)
80000 80% Capex Capex:Revenue (%) 70000 70%
60000 60%
50000 46% 50%
44%
40000 37% 40%
33%
30%
30000 24% 30%
22%
20000 26% 20%
10000 10%
0 0% 2002A 2003A 2004A 2005A 2006E 2007E 2008E 2009E
Source: Company Data, Bear Stearns Asia Ltd. estimates.
IPTV MARKET OPPORTUNITY WILL BE LIMITED
IPTV: Not Bullish on Outlook for Operators or Vendors
In the medium term, we believe that IPTV investment will likely be limited by the continued existence of regulatory obstacles in most major cities, the high cost of IPTV services, and a lack of content differentiation vis-à-vis cable. There are currently four IPTV license holders in China, including Shanghai Media Group, CCTV, Guangdong Southern Media, and China Radio International (CRI) (a state-run radio company under the direct supervision of SARFT).
For example, Shanghai Telecom’s IPTV service currently offers three tiers of service priced at CNY1,660, CNY1,700 and CNY1,900 per year, respectively. In Beijing, China Netcom’s users must pay an upfront set-top box fee of CNY1,000 (currently on special offer for CNY500) and CNY60 per month for 20 TV channels. We believe that IPTV prices are much higher than comparable digital cable offerings and that bandwidth requirements remain the biggest bottleneck for the development of IPTV.
Thus far, no licenses have been issued to telecom operators and China Telecom does not expect SARFT to issue licenses to the telcos in future. Therefore, IPTV will continue to be offered through partnerships between IPTV license holders and network operators. Due to the decentralized structure of SARFT, telecom operators must form cooperative ventures with IPTV license holders at the local level, which we expect to severely limit the speed of development of IPTV services in new areas.
IPTV Services Market: Subscriber Growth. Li Yanfeng, an analyst for CCID (a consultancy affiliated with the MII), recently estimated that IPTV users could reach 550,000-600,000 by year-end 2006 (Jiangsu: 100,000, Guangdong: 100,000, Beijing: 100,000, Shanghai: 100,000 (from 30,000 presently), Harbin: 100,000, Fujian: 49,000, Yunnan: 19,000 and Shaanxi: 30,000). We see this as a slightly optimistic estimate (China Telecom expects Shanghai to reach only 50,000 subscribers by year end, for example), but note that this represents just 1.1% of China’s current broadband subscriber base and only 0.2% of total TV households. Even if one assumes that IPTV subscribers reach five million over the next three to four years, this would not contribute significantly to fixed line revenue growth.
BEAR STEARNS ASIA LTD. Page 31
Asian Equity Research
BEAR STEARNS
IPTV Equipment Opportunity. We expect the IPTV equipment market (platforms and set-top boxes) will be modest in size, failing a major regulatory breakthrough, and we expect most of the benefits of IPTV spending to accrue to chipset manufacturers and broadband equipment vendors, who will likely have to upgrade operators’ existing systems to enable more interactive forms of IPTV. We recently learned from China Telecom that its total capex on IPTV systems in Shanghai (with subscriber capacity of 100,000) amounted to CNY50 million (US$6 million) and that set-top boxes were averaging CNY800 currently, with an expected annual price decline of 20%. We estimate the size of China’s total IPTV equipment market optimistically at US$80 million in 2006, rising to US$200 million in 2007, assuming that subscriber net additions triple year on year, and that equipment pricing falls by 20%. IPTV equipment appears to be a crowded market, however, with multiple vendors competing for business, hence margins are likely to be lower than average.
Page 32 CHINA TELECOM SERVICES & EQUIPMENT: ’TWAS THE NIGHT BEFORE 3G…
Asian Equity Research
BEAR STEARNS
China Handset Market Analysis
Estimating the size of China’s handset market is more of an art than a science, due to the many factors complicating data collection and reconciliation. We expect 2006 handset shipments to grow by 19% year on year, with the top-four players in the market growing shipments by an estimated 57%. As shown in Figure 17, we estimate 2006 handset shipments and sell-through at 143.8 million and 137.0 million units, respectively.
Fourth-quarter 2006 Outlook. While we do not currently see signs of abnormal inventory buildup in the market, we expect fourth-quarter shipments to rise by just 3% quarter on quarter following 12% quarter-on-quarter growth in third-quarter 2006. While this is slower than growth recorded in fourth-quarter 2005, we note that China’s fourth- and first-quarter seasonality tends to vary according to the timing of Chinese New Year (CNY). As handset production stops during the two weeks surrounding CNY, most vendors tend to stock the retail channels in the three to four weeks preceding CNY. The lunar holiday has fallen on the following dates in 2005, 2006, and 2007:
2005: February 9-11 2006: January 28-31 2007: February 17-20
Later Chinese New Year Points to Weaker Fourth Quarter, Stronger First-Quarter Seasonality. For example, fourth-quarter 2005 handset shipment seasonality was strong, rising 15.5% quarter on quarter, while first-quarter 2006 was weak, down 7.1% sequentially, reflecting inventory builds at year-end 2005. With Chinese New Year coming 20 days later (starting on February 17) than in 2006 (January 28), we believe that a slow fourth-quarter 2006 will be followed by a strong first-quarter 2007, with sequential shipment growth estimated at 5%-10%.
BEAR STEARNS ASIA LTD. Page 33
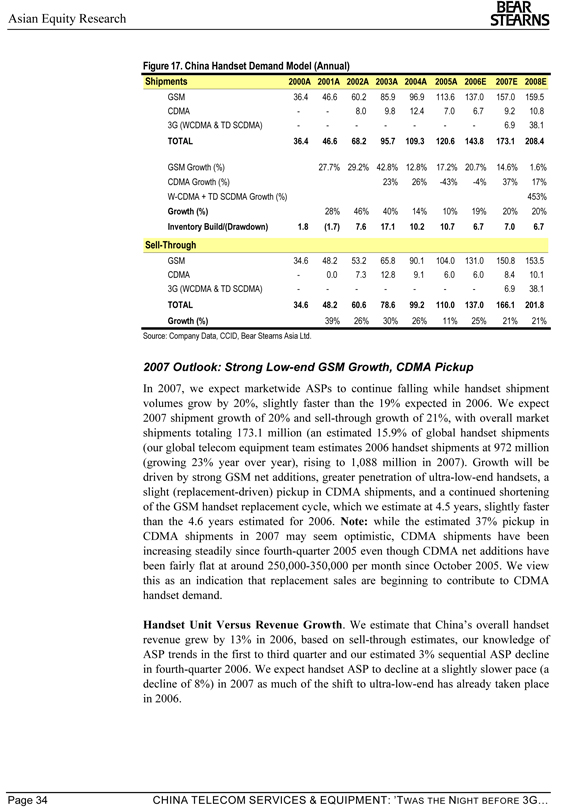
Asian Equity Research
BEAR STEARNS
Figure 17. China Handset Demand Model (Annual)
Shipments 2000A 2001A 2002A 2003A 2004A 2005A 2006E 2007E 2008E
GSM 36.4 46.6 60.2 85.9 96.9 113.6 137.0 157.0 159.5 CDMA—- 8.0 9.8 12.4 7.0 6.7 9.2 10.8 3G (WCDMA & TD SCDMA)—————6.9 38.1
TOTAL 36.4 46.6 68.2 95.7 109.3 120.6 143.8 173.1 208.4
GSM Growth (%) 27.7% 29.2% 42.8% 12.8% 17.2% 20.7% 14.6% 1.6% CDMA Growth (%) 23% 26% -43% -4% 37% 17% W-CDMA + TD SCDMA Growth (%) 453% Growth (%) 28% 46% 40% 14% 10% 19% 20% 20%
Inventory Build/(Drawdown) 1.8 (1.7) 7.6 17.1 10.2 10.7 6.7 7.0 6.7
Sell-Through
GSM 34.6 48.2 53.2 65.8 90.1 104.0 131.0 150.8 153.5 CDMA—0.0 7.3 12.8 9.1 6.0 6.0 8.4 10.1 3G (WCDMA & TD SCDMA)—————6.9 38.1
TOTAL 34.6 48.2 60.6 78.6 99.2 110.0 137.0 166.1 201.8 Growth (%) 39% 26% 30% 26% 11% 25% 21% 21%
Source: Company Data, CCID, Bear Stearns Asia Ltd.
2007 Outlook: Strong Low-end GSM Growth, CDMA Pickup
In 2007, we expect marketwide ASPs to continue falling while handset shipment volumes grow by 20%, slightly faster than the 19% expected in 2006. We expect 2007 shipment growth of 20% and sell-through growth of 21%, with overall market shipments totaling 173.1 million (an estimated 15.9% of global handset shipments (our global telecom equipment team estimates 2006 handset shipments at 972 million (growing 23% year over year), rising to 1,088 million in 2007). Growth will be driven by strong GSM net additions, greater penetration of ultra-low-end handsets, a slight (replacement-driven) pickup in CDMA shipments, and a continued shortening of the GSM handset replacement cycle, which we estimate at 4.5 years, slightly faster than the 4.6 years estimated for 2006. Note: while the estimated 37% pickup in CDMA shipments in 2007 may seem optimistic, CDMA shipments have been increasing steadily since fourth-quarter 2005 even though CDMA net additions have been fairly flat at around 250,000-350,000 per month since October 2005. We view this as an indication that replacement sales are beginning to contribute to CDMA handset demand.
Handset Unit Versus Revenue Growth. We estimate that China’s overall handset revenue grew by 13% in 2006, based on sell-through estimates, our knowledge of ASP trends in the first to third quarter and our estimated 3% sequential ASP decline in fourth-quarter 2006. We expect handset ASP to decline at a slightly slower pace (a decline of 8%) in 2007 as much of the shift to ultra-low-end has already taken place in 2006.
Page 34 CHINA TELECOM SERVICES & EQUIPMENT: ’TWAS THE NIGHT BEFORE 3G…
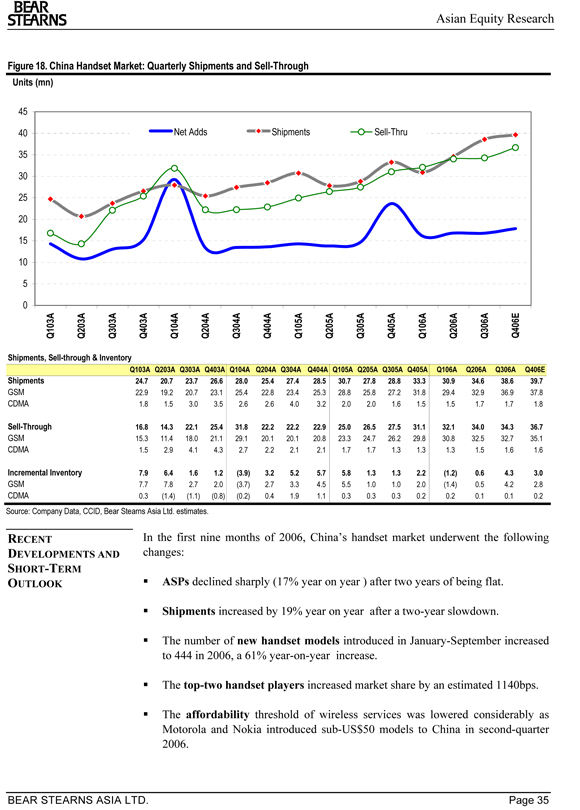
Asian Equity Research
BEAR STEARNS
Figure 18. China Handset Market: Quarterly Shipments and Sell-Through
Units (mn)
45
40 | | Net Adds Shipments Sell-Thru 35 |
30 25 20 15 10 5
0
Q103A Q203A Q303A Q403A Q104A Q204A Q304A Q404A Q105A Q205A Q305A Q405A Q106A Q206A Q306A Q406E
Shipments, Sell-through & Inventory
Q103A Q203A Q303A Q403A Q104A Q204A Q304A Q404A Q105A Q205A Q305A Q405A Q106A Q206A Q306A Q406E Shipments 24.7 20.7 23.7 26.6 28.0 25.4 27.4 28.5 30.7 27.8 28.8 33.3 30.9 34.6 38.6 39.7
GSM 22.9 19.2 20.7 23.1 25.4 22.8 23.4 25.3 28.8 25.8 27.2 31.8 29.4 32.9 36.9 37.8 CDMA 1.8 1.5 3.0 3.5 2.6 2.6 4.0 3.2 2.0 2.0 1.6 1.5 1.5 1.7 1.7 1.8
Sell-Through 16.8 14.3 22.1 25.4 31.8 22.2 22.2 22.9 25.0 26.5 27.5 31.1 32.1 34.0 34.3 36.7
GSM 15.3 11.4 18.0 21.1 29.1 20.1 20.1 20.8 23.3 24.7 26.2 29.8 30.8 32.5 32.7 35.1 CDMA 1.5 2.9 4.1 4.3 2.7 2.2 2.1 2.1 1.7 1.7 1.3 1.3 1.3 1.5 1.6 1.6
Incremental Inventory 7.9 6.4 1.6 1.2 (3.9) 3.2 5.2 5.7 5.8 1.3 1.3 2.2 (1.2) 0.6 4.3 3.0
GSM 7.7 7.8 2.7 2.0 (3.7) 2.7 3.3 4.5 5.5 1.0 1.0 2.0 (1.4) 0.5 4.2 2.8 CDMA 0.3 (1.4) (1.1) (0.8) (0.2) 0.4 1.9 1.1 0.3 0.3 0.3 0.2 0.2 0.1 0.1 0.2
Source: Company Data, CCID, Bear Stearns Asia Ltd. estimates.
RECENT
DEVELOPMENTS AND SHORT-TERM OUTLOOK
In the first nine months of 2006, China’s handset market underwent the following changes:
ASPs declined sharply (17% year on year ) after two years of being flat.
Shipments increased by 19% year on year after a two-year slowdown.
The number of new handset models introduced in January-September increased to 444 in 2006, a 61% year-on-year increase.
The top-two handset players increased market share by an estimated 1140bps.
The affordability threshold of wireless services was lowered considerably as Motorola and Nokia introduced sub-US$50 models to China in second-quarter 2006.
BEAR STEARNS ASIA LTD. Page 35
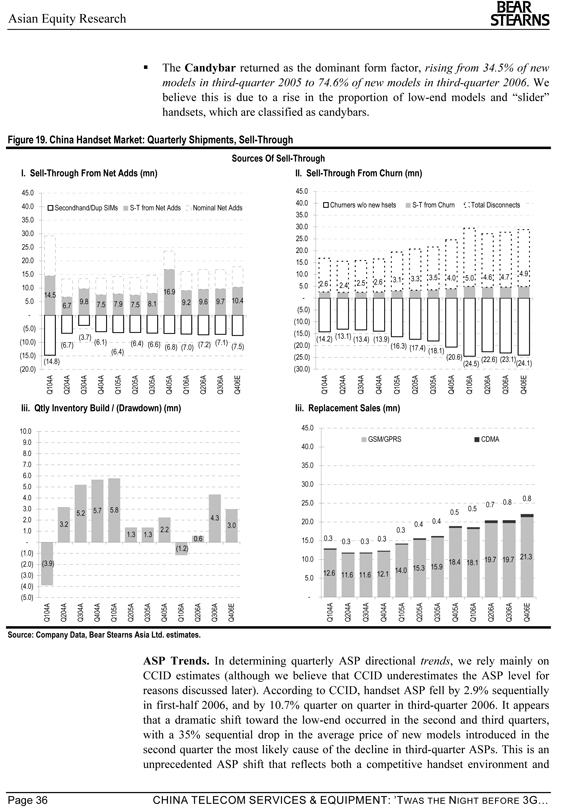
Asian Equity Research
BEAR STEARNS
The Candybar returned as the dominant form factor, rising from 34.5% of new models in third-quarter 2005 to 74.6% of new models in third-quarter 2006. We believe this is due to a rise in the proportion of low-end models and “slider” handsets, which are classified as candybars.
Figure 19. China Handset Market: Quarterly Shipments, Sell-Through
Sources Of Sell-Through
I. Sell-Through From Net Adds (mn)
45.0
40.0 Secondhand/Dup SIMs S-T from Net Adds Nominal Net Adds 35.0 30.0 25.0 20.0 15.0 10.0 14.5 16.9 5.0 9.8 7.9 8.1 9.2 9.6 9.7 10.4 6.7 7.5 7.5 -(5.0) (3.7) (10.0)(6.7)(6.1)(6.4) (6.6) (6.8) (7.0) (7.2) (7.1) (7.5) (6.4) (15.0) (14.8) (20.0) Q104A Q204A Q304A Q404A Q105A Q205A Q305A Q405A Q106A Q206A Q306A Q406E
II. Sell-Through From Churn (mn)
45.0
40.0 Churners w/o new hsets S-T from Churn Total Disconnects 35.0 30.0 25.0 20.0 15.0 10.0 4.6 4.7 4.9 3.1 3.3 3.5 4.0 5.0 2.6 2.4 2.5 2.6 5.0 - -(5.0) (10.0) (15.0)(13.1) (14.2)(13.4) (13.9) (20.0)(16.3) (17.4) (18.1) (25.0)(20.6) (24.5) (22.6) (23.1)(24.1) (30.0) Q104A Q204A Q304A Q404A Q105A Q205A Q305A Q405A Q106A Q206A Q306A Q406E
Iii. Qtly Inventory Build / (Drawdown) (mn)
10.0 9.0 8.0 7.0 6.0 5.0 4.0
2.0 | | 4.3 3.2 3.0 1.0 2.2 1.3 1.3 |
- 0.6 (1.2) (1.0) (2.0) (3.9) (3.0) (4.0) (5.0)
Q104A Q204A Q304A Q404A Q105A Q205A Q305A Q405A Q106A Q206A Q306A Q406E
Iii. Replacement Sales (mn)
45.0
GSM/GPRS CDMA 40.0
35.0
30.0
0.8 25.0 0.7 0.8 0.5 0.5 20.0 0.4 0.4 0.3 15.0 0.3 0.3 0.3 0.3 10.0 19.7 19.7 21.3 15.9 18.4 18.1 12.6 11.6 11.6 12.1 14.0 15.3 5.0 -
Q104A Q204A Q304A Q404A Q105A Q205A Q305A Q405A Q106A Q206A Q306A Q406E
Source: Company Data, Bear Stearns Asia Ltd. estimates.
ASP Trends. In determining quarterly ASP directional trends, we rely mainly on CCID estimates (although we believe that CCID underestimates the ASP level for reasons discussed later). According to CCID, handset ASP fell by 2.9% sequentially in first-half 2006, and by 10.7% quarter on quarter in third-quarter 2006. It appears that a dramatic shift toward the low-end occurred in the second and third quarters, with a 35% sequential drop in the average price of new models introduced in the second quarter the most likely cause of the decline in third-quarter ASPs. This is an unprecedented ASP shift that reflects both a competitive handset environment and
Page 36 CHINA TELECOM SERVICES & EQUIPMENT: ’TWAS THE NIGHT BEFORE 3G…
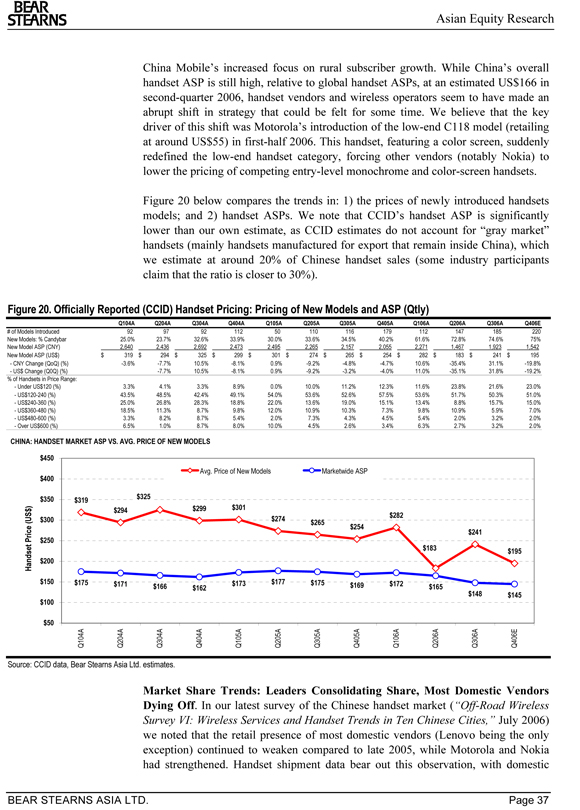
Asian Equity Research
BEAR STEARNS
China Mobile’s increased focus on rural subscriber growth. While China’s overall handset ASP is still high, relative to global handset ASPs, at an estimated US$166 in second-quarter 2006, handset vendors and wireless operators seem to have made an abrupt shift in strategy that could be felt for some time. We believe that the key driver of this shift was Motorola’s introduction of the low-end C118 model (retailing at around US$55) in first-half 2006. This handset, featuring a color screen, suddenly redefined the low-end handset category, forcing other vendors (notably Nokia) to lower the pricing of competing entry-level monochrome and color-screen handsets.
Figure 20 below compares the trends in: 1) the prices of newly introduced handsets models; and 2) handset ASPs. We note that CCID’s handset ASP is significantly lower than our own estimate, as CCID estimates do not account for “gray market” handsets (mainly handsets manufactured for export that remain inside China), which we estimate at around 20% of Chinese handset sales (some industry participants claim that the ratio is closer to 30%).
Figure 20. Officially Reported (CCID) Handset Pricing: Pricing of New Models and ASP (Qtly)
Q104A Q204A Q304A Q404A Q105A Q205A Q305A Q405A Q106A Q206A Q306A Q406E
# of Models Introduced 92 97 92 112 50 110 116 179 112 147 185 220 New Models: % Candybar 25.0% 23.7% 32.6% 33.9% 30.0% 33.6% 34.5% 40.2% 61.6% 72.8% 74.6% 75% New Model ASP (CNY) 2,640 2,436 2,692 2,473 2,495 2,265 2,157 2,055 2,271 1,467 1,923 1,542 New Model ASP (US$) $ 319 $ 294 $ 325 $ 299 $ 301 $ 274 $ 265 $ 254 $ 282 $ 183 $ 241 $ 195—CNY Change (QoQ) (%) -3.6% -7.7% 10.5% -8.1% 0.9% -9.2% -4.8% -4.7% 10.6% -35.4% 31.1% -19.8%—US$ Change (Q0Q) (%) -7.7% 10.5% -8.1% 0.9% -9.2% -3.2% -4.0% 11.0% -35.1% 31.8% -19.2% % of Handsets in Price Range:—Under US$120 (%) 3.3% 4.1% 3.3% 8.9% 0.0% 10.0% 11.2% 12.3% 11.6% 23.8% 21.6% 23.0%—US$120-240 (%) 43.5% 48.5% 42.4% 49.1% 54.0% 53.6% 52.6% 57.5% 53.6% 51.7% 50.3% 51.0%—US$240-360 (%) 25.0% 26.8% 28.3% 18.8% 22.0% 13.6% 19.0% 15.1% 13.4% 8.8% 15.7% 15.0%—US$360-480 (%) 18.5% 11.3% 8.7% 9.8% 12.0% 10.9% 10.3% 7.3% 9.8% 10.9% 5.9% 7.0%—US$480-600 (%) 3.3% 8.2% 8.7% 5.4% 2.0% 7.3% 4.3% 4.5% 5.4% 2.0% 3.2% 2.0%—Over US$600 (%) 6.5% 1.0% 8.7% 8.0% 10.0% 4.5% 2.6% 3.4% 6.3% 2.7% 3.2% 2.0%
CHINA: HANDSET MARKET ASP VS. AVG. PRICE OF NEW MODELS
$450
Avg. Price of New Models Marketwide ASP $400
$350 $325 $319
) $299 $301 $ $294 $282 $300 $274 $265 $254
Price (US $241 $250
Handset $183 $195 $200
$150 $175 $171 $173 $177 $175 $172 $166 $162 $169 $165 $148 $145 $100
$50
Q104A Q204A Q304A Q404A Q105A Q205A Q305A Q405A Q106A Q206A Q306A Q406E
Source: CCID data, Bear Stearns Asia Ltd. estimates.
Market Share Trends: Leaders Consolidating Share, Most Domestic Vendors Dying Off. In our latest survey of the Chinese handset market (“Off-Road Wireless Survey VI: Wireless Services and Handset Trends in Ten Chinese Cities,” July 2006) we noted that the retail presence of most domestic vendors (Lenovo being the only exception) continued to weaken compared to late 2005, while Motorola and Nokia had strengthened. Handset shipment data bear out this observation, with domestic
BEAR STEARNS ASIA LTD. Page 37
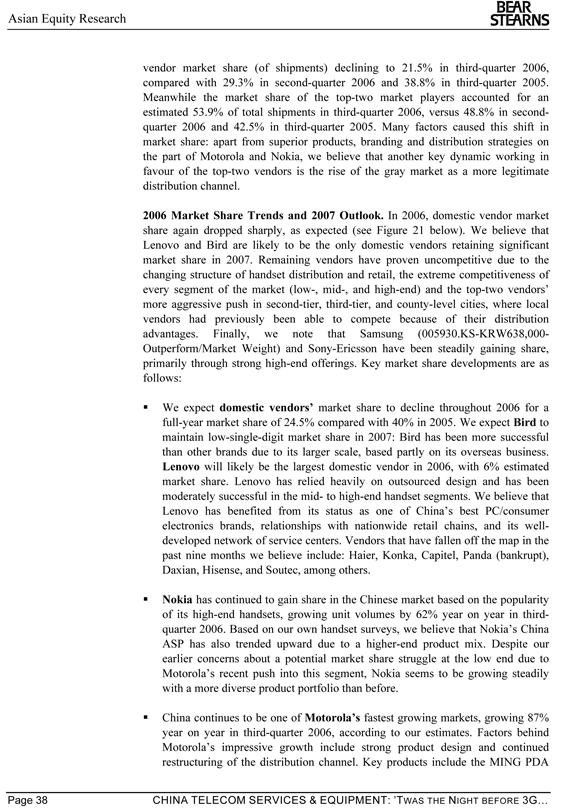
Asian Equity Research
BEAR STEARNS
vendor market share (of shipments) declining to 21.5% in third-quarter 2006, compared with 29.3% in second-quarter 2006 and 38.8% in third-quarter 2005. Meanwhile the market share of the top-two market players accounted for an estimated 53.9% of total shipments in third-quarter 2006, versus 48.8% in second-quarter 2006 and 42.5% in third-quarter 2005. Many factors caused this shift in market share: apart from superior products, branding and distribution strategies on the part of Motorola and Nokia, we believe that another key dynamic working in favour of the top-two vendors is the rise of the gray market as a more legitimate distribution channel.
2006 Market Share Trends and 2007 Outlook. In 2006, domestic vendor market share again dropped sharply, as expected (see Figure 21 below). We believe that Lenovo and Bird are likely to be the only domestic vendors retaining significant market share in 2007. Remaining vendors have proven uncompetitive due to the changing structure of handset distribution and retail, the extreme competitiveness of every segment of the market (low-, mid-, and high-end) and the top-two vendors’ more aggressive push in second-tier, third-tier, and county-level cities, where local vendors had previously been able to compete because of their distribution advantages. Finally, we note that Samsung (005930.KS-KRW638,000-Outperform/Market Weight) and Sony-Ericsson have been steadily gaining share, primarily through strong high-end offerings. Key market share developments are as follows:
?? We expect domestic vendors’ market share to decline throughout 2006 for a full-year market share of 24.5% compared with 40% in 2005. We expect Bird to maintain low-single-digit market share in 2007: Bird has been more successful than other brands due to its larger scale, based partly on its overseas business. Lenovo will likely be the largest domestic vendor in 2006, with 6% estimated market share. Lenovo has relied heavily on outsourced design and has been moderately successful in the mid- to high-end handset segments. We believe that Lenovo has benefited from its status as one of China’s best PC/consumer electronics brands, relationships with nationwide retail chains, and its well-developed network of service centers. Vendors that have fallen off the map in the past nine months we believe include: Haier, Konka, Capitel, Panda (bankrupt), Daxian, Hisense, and Soutec, among others.
?? Nokia has continued to gain share in the Chinese market based on the popularity of its high-end handsets, growing unit volumes by 62% year on year in third-quarter 2006. Based on our own handset surveys, we believe that Nokia’s China ASP has also trended upward due to a higher-end product mix. Despite our earlier concerns about a potential market share struggle at the low end due to Motorola’s recent push into this segment, Nokia seems to be growing steadily with a more diverse product portfolio than before.
China continues to be one of Motorola’s fastest growing markets, growing 87% year on year in third-quarter 2006, according to our estimates. Factors behind Motorola’s impressive growth include strong product design and continued restructuring of the distribution channel. Key products include the MING PDA
Page 38 CHINA TELECOM SERVICES & EQUIPMENT: ’TWAS THE NIGHT BEFORE 3G…
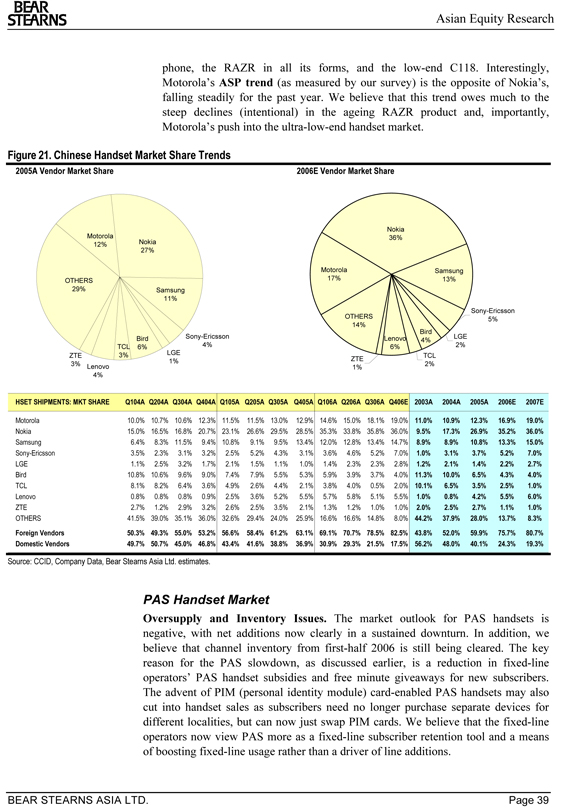
Asian Equity Research
BEAR STEARNS
phone, the RAZR in all its forms, and the low-end C118. Interestingly, Motorola’s ASP trend (as measured by our survey) is the opposite of Nokia’s, falling steadily for the past year. We believe that this trend owes much to the steep declines (intentional) in the ageing RAZR product and, importantly, Motorola’s push into the ultra-low-end handset market.
Figure 21. Chinese Handset Market Share Trends
2005A Vendor Market Share
2006E Vendor Market Share
Motorola
12% Nokia 27%
OTHERS
29% Samsung 11%
Bird Sony-Ericsson TCL 6% 4% ZTE 3% LGE
3% 1% Lenovo 4%
Nokia 36%
Motorola Samsung 17% 13%
Sony-Ericsson OTHERS 5% 14% Bird Lenovo LGE
4%
6% 2% TCL
ZTE
2% 1%
HSET SHIPMENTS: MKT SHARE Q104A Q204A Q304A Q404A Q105A Q205A Q305A Q405A Q106A Q206A Q306A Q406E 2003A 2004A 2005A 2006E 2007E
Motorola 10.0% 10.7% 10.6% 12.3% 11.5% 11.5% 13.0% 12.9% 14.6% 15.0% 18.1% 19.0% 11.0% 10.9% 12.3% 16.9% 19.0% Nokia 15.0% 16.5% 16.8% 20.7% 23.1% 26.6% 29.5% 28.5% 35.3% 33.8% 35.8% 36.0% 9.5% 17.3% 26.9% 35.2% 36.0% Samsung 6.4% 8.3% 11.5% 9.4% 10.8% 9.1% 9.5% 13.4% 12.0% 12.8% 13.4% 14.7% 8.9% 8.9% 10.8% 13.3% 15.0% Sony-Ericsson 3.5% 2.3% 3.1% 3.2% 2.5% 5.2% 4.3% 3.1% 3.6% 4.6% 5.2% 7.0% 1.0% 3.1% 3.7% 5.2% 7.0% LGE 1.1% 2.5% 3.2% 1.7% 2.1% 1.5% 1.1% 1.0% 1.4% 2.3% 2.3% 2.8% 1.2% 2.1% 1.4% 2.2% 2.7% Bird 10.8% 10.6% 9.6% 9.0% 7.4% 7.9% 5.5% 5.3% 5.9% 3.9% 3.7% 4.0% 11.3% 10.0% 6.5% 4.3% 4.0% TCL 8.1% 8.2% 6.4% 3.6% 4.9% 2.6% 4.4% 2.1% 3.8% 4.0% 0.5% 2.0% 10.1% 6.5% 3.5% 2.5% 1.0% Lenovo 0.8% 0.8% 0.8% 0.9% 2.5% 3.6% 5.2% 5.5% 5.7% 5.8% 5.1% 5.5% 1.0% 0.8% 4.2% 5.5% 6.0% ZTE 2.7% 1.2% 2.9% 3.2% 2.6% 2.5% 3.5% 2.1% 1.3% 1.2% 1.0% 1.0% 2.0% 2.5% 2.7% 1.1% 1.0% OTHERS 41.5% 39.0% 35.1% 36.0% 32.6% 29.4% 24.0% 25.9% 16.6% 16.6% 14.8% 8.0% 44.2% 37.9% 28.0% 13.7% 8.3% Foreign Vendors 50.3% 49.3% 55.0% 53.2% 56.6% 58.4% 61.2% 63.1% 69.1% 70.7% 78.5% 82.5% 43.8% 52.0% 59.9% 75.7% 80.7% Domestic Vendors 49.7% 50.7% 45.0% 46.8% 43.4% 41.6% 38.8% 36.9% 30.9% 29.3% 21.5% 17.5% 56.2% 48.0% 40.1% 24.3% 19.3%
Source: CCID, Company Data, Bear Stearns Asia Ltd. estimates.
PAS Handset Market
Oversupply and Inventory Issues. The market outlook for PAS handsets is negative, with net additions now clearly in a sustained downturn. In addition, we believe that channel inventory from first-half 2006 is still being cleared. The key reason for the PAS slowdown, as discussed earlier, is a reduction in fixed-line operators’ PAS handset subsidies and free minute giveaways for new subscribers. The advent of PIM (personal identity module) card-enabled PAS handsets may also cut into handset sales as subscribers need no longer purchase separate devices for different localities, but can now just swap PIM cards. We believe that the fixed-line operators now view PAS more as a fixed-line subscriber retention tool and a means of boosting fixed-line usage rather than a driver of line additions.
BEAR STEARNS ASIA LTD. Page 39
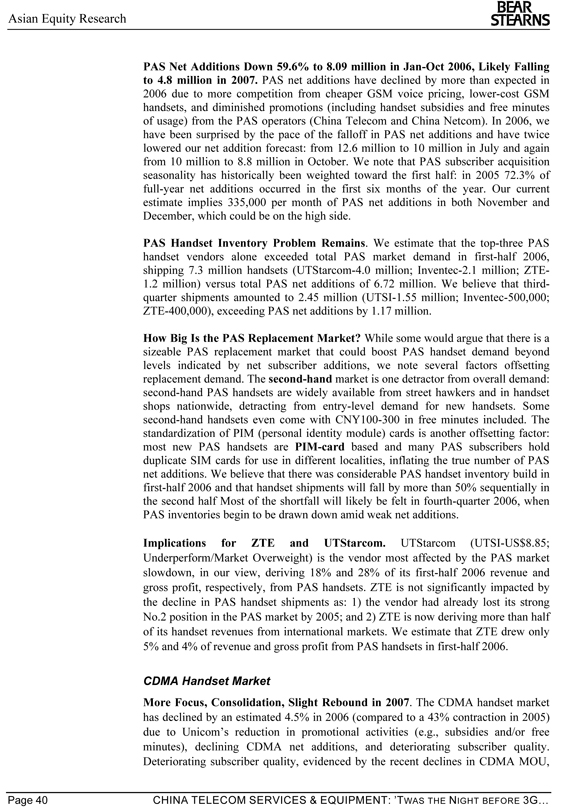
Asian Equity Research
BEAR STEARNS
PAS Net Additions Down 59.6% to 8.09 million in Jan-Oct 2006, Likely Falling to 4.8 million in 2007. PAS net additions have declined by more than expected in 2006 due to more competition from cheaper GSM voice pricing, lower-cost GSM handsets, and diminished promotions (including handset subsidies and free minutes of usage) from the PAS operators (China Telecom and China Netcom). In 2006, we have been surprised by the pace of the falloff in PAS net additions and have twice lowered our net addition forecast: from 12.6 million to 10 million in July and again from 10 million to 8.8 million in October. We note that PAS subscriber acquisition seasonality has historically been weighted toward the first half: in 2005 72.3% of full-year net additions occurred in the first six months of the year. Our current estimate implies 335,000 per month of PAS net additions in both November and December, which could be on the high side.
PAS Handset Inventory Problem Remains. We estimate that the top-three PAS handset vendors alone exceeded total PAS market demand in first-half 2006, shipping 7.3 million handsets (UTStarcom-4.0 million; Inventec-2.1 million; ZTE-1.2 million) versus total PAS net additions of 6.72 million. We believe that third-quarter shipments amounted to 2.45 million (UTSI-1.55 million; Inventec-500,000; ZTE-400,000), exceeding PAS net additions by 1.17 million.
How Big Is the PAS Replacement Market? While some would argue that there is a sizeable PAS replacement market that could boost PAS handset demand beyond levels indicated by net subscriber additions, we note several factors offsetting replacement demand. The second-hand market is one detractor from overall demand: second-hand PAS handsets are widely available from street hawkers and in handset shops nationwide, detracting from entry-level demand for new handsets. Some second-hand handsets even come with CNY100-300 in free minutes included. The standardization of PIM (personal identity module) cards is another offsetting factor: most new PAS handsets are PIM-card based and many PAS subscribers hold duplicate SIM cards for use in different localities, inflating the true number of PAS net additions. We believe that there was considerable PAS handset inventory build in first-half 2006 and that handset shipments will fall by more than 50% sequentially in the second half Most of the shortfall will likely be felt in fourth-quarter 2006, when PAS inventories begin to be drawn down amid weak net additions.
Implications for ZTE and UTStarcom. UTStarcom (UTSI-US$8.85; Underperform/Market Overweight) is the vendor most affected by the PAS market slowdown, in our view, deriving 18% and 28% of its first-half 2006 revenue and gross profit, respectively, from PAS handsets. ZTE is not significantly impacted by the decline in PAS handset shipments as: 1) the vendor had already lost its strong No.2 position in the PAS market by 2005; and 2) ZTE is now deriving more than half of its handset revenues from international markets. We estimate that ZTE drew only 5% and 4% of revenue and gross profit from PAS handsets in first-half 2006.
CDMA Handset Market
More Focus, Consolidation, Slight Rebound in 2007. The CDMA handset market has declined by an estimated 4.5% in 2006 (compared to a 43% contraction in 2005) due to Unicom’s reduction in promotional activities (e.g., subsidies and/or free minutes), declining CDMA net additions, and deteriorating subscriber quality. Deteriorating subscriber quality, evidenced by the recent declines in CDMA MOU,
Page 40 CHINA TELECOM SERVICES & EQUIPMENT: ’TWAS THE NIGHT BEFORE 3G…
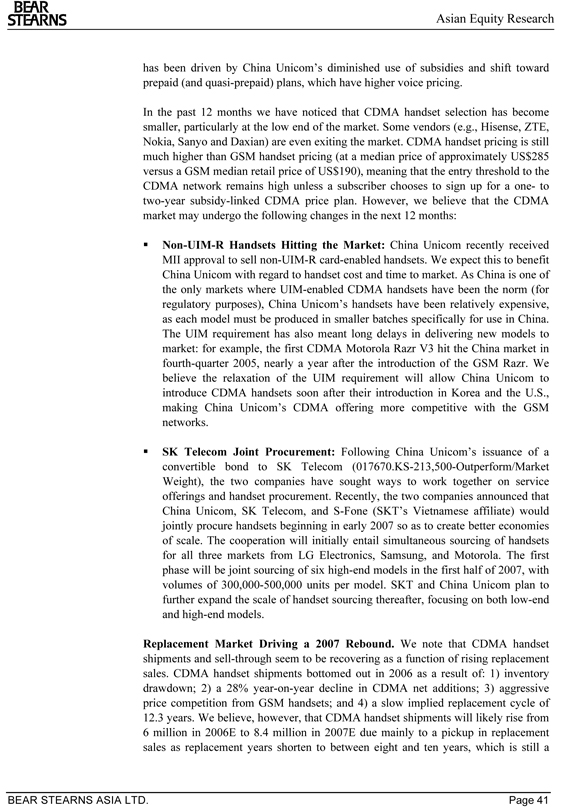
Asian Equity Research
BEAR STEARNS
has been driven by China Unicom’s diminished use of subsidies and shift toward prepaid (and quasi-prepaid) plans, which have higher voice pricing.
In the past 12 months we have noticed that CDMA handset selection has become smaller, particularly at the low end of the market. Some vendors (e.g., Hisense, ZTE, Nokia, Sanyo and Daxian) are even exiting the market. CDMA handset pricing is still much higher than GSM handset pricing (at a median price of approximately US$285 versus a GSM median retail price of US$190), meaning that the entry threshold to the CDMA network remains high unless a subscriber chooses to sign up for a one- to two-year subsidy-linked CDMA price plan. However, we believe that the CDMA market may undergo the following changes in the next 12 months:
Non-UIM-R Handsets Hitting the Market: China Unicom recently received MII approval to sell non-UIM-R card-enabled handsets. We expect this to benefit China Unicom with regard to handset cost and time to market. As China is one of the only markets where UIM-enabled CDMA handsets have been the norm (for regulatory purposes), China Unicom’s handsets have been relatively expensive, as each model must be produced in smaller batches specifically for use in China.
The UIM requirement has also meant long delays in delivering new models to market: for example, the first CDMA Motorola Razr V3 hit the China market in fourth-quarter 2005, nearly a year after the introduction of the GSM Razr. We believe the relaxation of the UIM requirement will allow China Unicom to introduce CDMA handsets soon after their introduction in Korea and the U.S., making China Unicom’s CDMA offering more competitive with the GSM networks.
SK Telecom Joint Procurement: Following China Unicom’s issuance of a convertible bond to SK Telecom (017670.KS-213,500-Outperform/Market Weight), the two companies have sought ways to work together on service offerings and handset procurement. Recently, the two companies announced that China Unicom, SK Telecom, and S-Fone (SKT’s Vietnamese affiliate) would jointly procure handsets beginning in early 2007 so as to create better economies of scale. The cooperation will initially entail simultaneous sourcing of handsets for all three markets from LG Electronics, Samsung, and Motorola. The first phase will be joint sourcing of six high-end models in the first half of 2007, with volumes of 300,000-500,000 units per model. SKT and China Unicom plan to further expand the scale of handset sourcing thereafter, focusing on both low-end and high-end models.
Replacement Market Driving a 2007 Rebound. We note that CDMA handset shipments and sell-through seem to be recovering as a function of rising replacement sales. CDMA handset shipments bottomed out in 2006 as a result of: 1) inventory drawdown; 2) a 28% year-on-year decline in CDMA net additions; 3) aggressive price competition from GSM handsets; and 4) a slow implied replacement cycle of 12.3 years. We believe, however, that CDMA handset shipments will likely rise from 6 million in 2006E to 8.4 million in 2007E due mainly to a pickup in replacement sales as replacement years shorten to between eight and ten years, which is still a
BEAR STEARNS ASIA LTD. Page 41
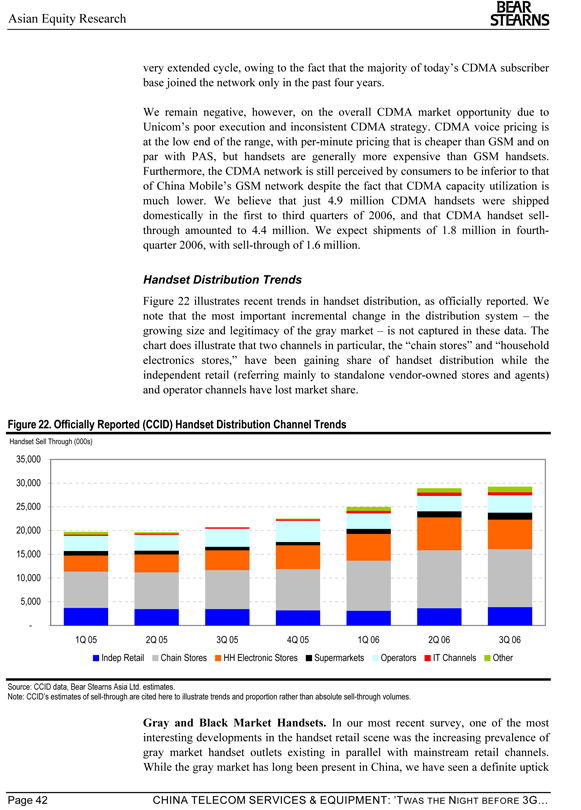
Asian Equity Research
BEAR STEARNS
very extended cycle, owing to the fact that the majority of today’s CDMA subscriber base joined the network only in the past four years.
We remain negative, however, on the overall CDMA market opportunity due to Unicom’s poor execution and inconsistent CDMA strategy. CDMA voice pricing is at the low end of the range, with per-minute pricing that is cheaper than GSM and on par with PAS, but handsets are generally more expensive than GSM handsets. Furthermore, the CDMA network is still perceived by consumers to be inferior to that of China Mobile’s GSM network despite the fact that CDMA capacity utilization is much lower. We believe that just 4.9 million CDMA handsets were shipped domestically in the first to third quarters of 2006, and that CDMA handset sell-through amounted to 4.4 million. We expect shipments of 1.8 million in fourth-quarter 2006, with sell-through of 1.6 million.
Handset Distribution Trends
Figure 22 illustrates recent trends in handset distribution, as officially reported. We note that the most important incremental change in the distribution system – the growing size and legitimacy of the gray market – is not captured in these data. The chart does illustrate that two channels in particular, the “chain stores” and “household electronics stores,” have been gaining share of handset distribution while the independent retail (referring mainly to standalone vendor-owned stores and agents) and operator channels have lost market share.
Figure 22. Officially Reported (CCID) Handset Distribution Channel Trends
Handset Sell Through (000s)
35,000 30,000 25,000 20,000 15,000 10,000 5,000 -
1Q 05 2Q 05 3Q 05 4Q 05 1Q 06 2Q 06 3Q 06 Indep Retail Chain Stores HH Electronic Stores Supermarkets Operators IT Channels Other
Source: CCID data, Bear Stearns Asia Ltd. estimates.
Note: CCID’s estimates of sell-through are cited here to illustrate trends and proportion rather than absolute sell-through volumes.
Gray and Black Market Handsets. In our most recent survey, one of the most interesting developments in the handset retail scene was the increasing prevalence of gray market handset outlets existing in parallel with mainstream retail channels. While the gray market has long been present in China, we have seen a definite uptick
Page 42 CHINA TELECOM SERVICES & EQUIPMENT: ’TWAS THE NIGHT BEFORE 3G…

Asian Equity Research
BEAR STEARNS
in the presence of gray market handsets on the market over the past six months. We now believe that gray market sales make up about 20% of total sell-through in the China market.
Gray market handset vendors sell illegally imported handsets, thereby avoiding China’s import and VAT taxes, and are priced at anywhere from 15% to 50% below the normal retail price for the same handset, with more expensive handsets generally enjoying greater discounts. Occasionally the gray market also offers handsets not yet introduced in the China market or that will never be introduced in China, such as Sharp handsets originally intended for distribution to SmarTone customers in Hong Kong or LG’s “3” brand 3G handsets. Since nearly all gray market handsets lack warranty coverage inside China, gray market vendors have begun to provide their own service guarantees and have also increased their visibility, even going so far as to set up boutique-like retail shops intended to give customers greater confidence in the products.
BEAR STEARNS ASIA LTD. Page 43

Asian Equity Research
BEAR STEARNS
BEAR STEARNS
Page 44 CHINA TELECOM SERVICES & EQUIPMENT: ’TWAS THE NIGHT BEFORE 3G…

Asian Equity Research
BEAR STEARNS
Companies
BEAR STEARNS ASIA LTD. Page 45
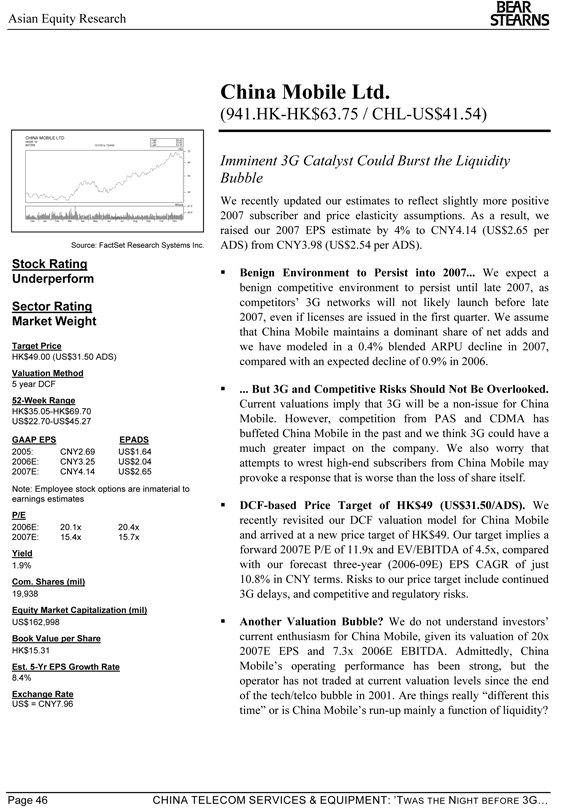
Asian Equity Research
BEAR STEARNS
China Mobile Ltd.
(941.HK-HK$63.75 / CHL-US$41.54)
CHINA MOBILE LTD
High: 69.40 HKD0.10 Low: 35.60 607355 12/1/05 to 12/4/06 Last: 63.30 HKD
70 60 50 40
Millions 81.6
40.8
Dec Jan Feb Mar Apr May Jun Jul Aug Sep Oct Nov
Source: FactSet Research Systems Inc.
Stock Rating Underperform
Sector Rating Market Weight
Target Price
HK$49.00 (US$31.50 ADS)
Valuation Method
52-Week Range
HK$35.05-HK$69.70 US$22.70-US$45.27
GAAP EPS EPADS 2005: CNY2.69 US$1.64 2006E: CNY3.25 US$2.04 2007E: CNY4.14 US$2.65
Note: Employee stock options are inmaterial to earnings estimates
P/E
2006E: 20.1x 20.4x 2007E: 15.4x 15.7x
Yield
1.9%
Com. Shares (mil)
19,938
Equity Market Capitalization (mil)
US$162,998
Book Value per Share
HK$15.31
Est. 5-Yr EPS Growth Rate
8.4%
Exchange Rate
US$ = CNY7.96
Imminent 3G Catalyst Could Burst the Liquidity Bubble
We recently updated our estimates to reflect slightly more positive 2007 subscriber and price elasticity assumptions. As a result, we raised our 2007 EPS estimate by 4% to CNY4.14 (US$2.65 per ADS) from CNY3.98 (US$2.54 per ADS).
Benign Environment to Persist into 2007. We expect a benign competitive environment to persist until late 2007, as competitors’ 3G networks will not likely launch before late 2007, even if licenses are issued in the first quarter. We assume that China Mobile maintains a dominant share of net adds and we have modeled in a 0.4% blended ARPU decline in 2007, compared with an expected decline of 0.9% in 2006.
... But 3G and Competitive Risks Should Not Be Overlooked.
Current valuations imply that 3G will be a non-issue for China Mobile. However, competition from PAS and CDMA has buffeted China Mobile in the past and we think 3G could have a much greater impact on the company. We also worry that attempts to wrest high-end subscribers from China Mobile may provoke a response that is worse than the loss of share itself.
DCF-based Price Target of HK$49 (US$31.50/ADS). We recently revisited our DCF valuation model for China Mobile and arrived at a new price target of HK$49. Our target implies a forward 2007E P/E of 11.9x and EV/EBITDA of 4.5x, compared with our forecast three-year (2006-09E) EPS CAGR of just 10.8% in CNY terms. Risks to our price target include continued 3G delays, and competitive and regulatory risks.
Another Valuation Bubble? We do not understand investors’ current enthusiasm for China Mobile, given its valuation of 20x 2007E EPS and 7.3x 2006E EBITDA. Admittedly, China
Mobile’s operating performance has been strong, but the operator has not traded at current valuation levels since the end of the tech/telco bubble in 2001. Are things really “different this time” or is China Mobile’s run-up mainly a function of liquidity?
Page 46 CHINA TELECOM SERVICES & EQUIPMENT: ’TWAS THE NIGHT BEFORE 3G…
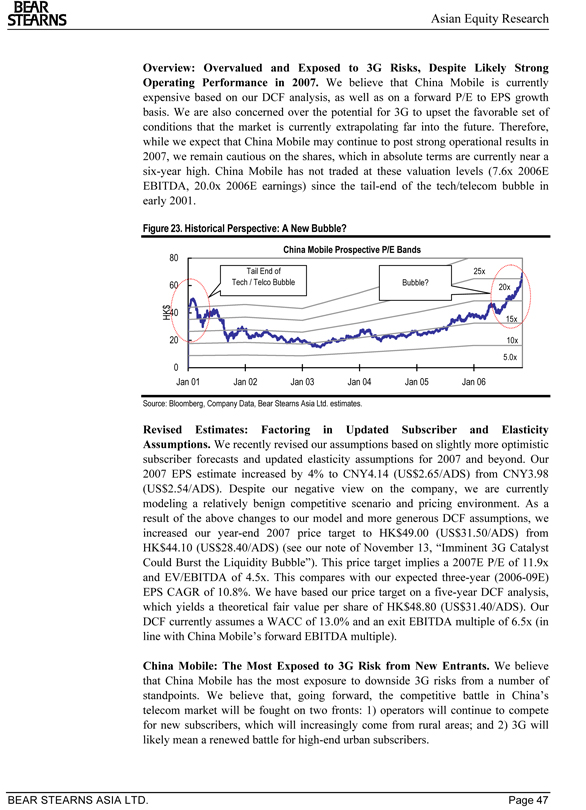
Asian Equity Research
BEAR STEARNS
Overview: Overvalued and Exposed to 3G Risks, Despite Likely Strong Operating Performance in 2007. We believe that China Mobile is currently expensive based on our DCF analysis, as well as on a forward P/E to EPS growth basis. We are also concerned over the potential for 3G to upset the favorable set of conditions that the market is currently extrapolating far into the future. Therefore, while we expect that China Mobile may continue to post strong operational results in 2007, we remain cautious on the shares, which in absolute terms are currently near a six-year high. China Mobile has not traded at these valuation levels (7.6x 2006E EBITDA, 20.0x 2006E earnings) since the tail-end of the tech/telecom bubble in early 2001.
Figure 23. Historical Perspective: A New Bubble?
China Mobile Prospective P/E Bands
80
Tail End of 25x
60 Tech / Telco Bubble Bubble?
20x
$40
HK 15x
20 10x 5.0x
0
Jan 01 Jan 02 Jan 03 Jan 04 Jan 05 Jan 06
Source: Bloomberg, Company Data, Bear Stearns Asia Ltd. estimates.
Revised Estimates: Factoring in Updated Subscriber and Elasticity Assumptions. We recently revised our assumptions based on slightly more optimistic subscriber forecasts and updated elasticity assumptions for 2007 and beyond. Our 2007 EPS estimate increased by 4% to CNY4.14 (US$2.65/ADS) from CNY3.98 (US$2.54/ADS). Despite our negative view on the company, we are currently modeling a relatively benign competitive scenario and pricing environment. As a result of the above changes to our model and more generous DCF assumptions, we increased our year-end 2007 price target to HK$49.00 (US$31.50/ADS) from HK$44.10 (US$28.40/ADS) (see our note of November 13, “Imminent 3G Catalyst Could Burst the Liquidity Bubble”). This price target implies a 2007E P/E of 11.9x and EV/EBITDA of 4.5x. This compares with our expected three-year (2006-09E) EPS CAGR of 10.8%. We have based our price target on a five-year DCF analysis, which yields a theoretical fair value per share of HK$48.80 (US$31.40/ADS). Our DCF currently assumes a WACC of 13.0% and an exit EBITDA multiple of 6.5x (in line with China Mobile’s forward EBITDA multiple).
China Mobile: The Most Exposed to 3G Risk from New Entrants. We believe that China Mobile has the most exposure to downside 3G risks from a number of standpoints. We believe that, going forward, the competitive battle in China’s telecom market will be fought on two fronts: 1) operators will continue to compete for new subscribers, which will increasingly come from rural areas; and 2) 3G will likely mean a renewed battle for high-end urban subscribers.
BEAR STEARNS ASIA LTD. Page 47
Asian Equity Research
BEAR STEARNS
Rural Market: The Advantage Remains with China Mobile (for Now). In the rural market, we expect China Mobile will continue to pursue its low-cost strategy of cost-efficient investment (including using low-cost domestic equipment and low-cost technologies, such as half-rate), low subscriber acquisition costs (no subsidies, using cheap advertising media such as wall ads, etc.) and low-cost distribution (using local “agents” rather than investing in expensive distribution channels). We believe that this strategy will continue to serve China Mobile well in the near term. However, we believe that China Unicom could also replicate this strategy, implying slightly more rural competition in the future. If China Telecom were to acquire a 2G mobile network from China Unicom (not currently our base case scenario for telecom restructuring), we believe it would be an even more formidable competitor, owing to brand name and China Telecom’s greater physical presence in the rural market. In the near term, we expect that China Mobile’s push into rural areas, combined with a relatively benign pre-3G competitive environment in higher penetration areas will allow it to maintain its dominant share of market net additions. We currently assume that China Mobile’s total subscriber base grows by 17.6% in 2007, implying a 76% market share of net additions, slightly lower than the 77.7% achieved in 2006E.
Urban Warfare: 3G Entrants Likely to Pay Up for High-End Subs. Longer-term, we expect to see a more competitive environment in urban areas, prompted by the entry of new competitors beginning in late 2007 following the issuance of 3G licenses. In our current base case scenario, China Mobile will be awarded a nationwide TD SCDMA license and China Telecom will be awarded a WCDMA license, putting China Mobile at a long-term disadvantage in the 3G market (which we assume will initially be a high-end market segment). If the reverse were true (TD SCDMA were taken up by China Telecom), we believe this would be good long-term news for China Mobile. Nonetheless, were China Telecom to adopt the TD SCDMA standard, we believe it could still make a deep competitive impact on the market. Just three years ago China Telecom made a serious impact on wireless pricing using an obsolete Japanese wireless technology (PAS/PHS) with limited mobility and virtually non-existent indoor coverage.
As China Telecom already has a wireless service (PAS) that addresses the low-end segment, we expect that in our 3G scenario it would use its technology advantages –better handset selection and more stable infrastructure – to compete for subscribers in China’s high-end urban markets. We expect that China Telecom would likely offer heavily subsidized WCDMA handsets to its fixed-line subscriber base in affluent areas, a demographic that overlaps with China Mobile’s high-end postpaid subscriber base. China Telecom has proven to be a credible competitor at the low end in the past, with the introduction of PAS in major cities in 2003-04. The recent PAS slowdown has stemmed less from China Telecom’s inability to compete than from uncertainty over 3G licensing. This uncertainty, combined with the need to conserve cash, has constrained China Telecom’s PAS ambitions during the past two years, we believe, allowing China Mobile to regain lost market share.
In our 3G scenario, we expect that China Mobile would respond to China Telecom’s aggression with competitive postpaid pricing and subsidies, driving up subscriber retention costs and pushing down postpaid voice ARPU. Despite the fact that more
Page 48 CHINA TELECOM SERVICES & EQUIPMENT: ’TWAS THE NIGHT BEFORE 3G…
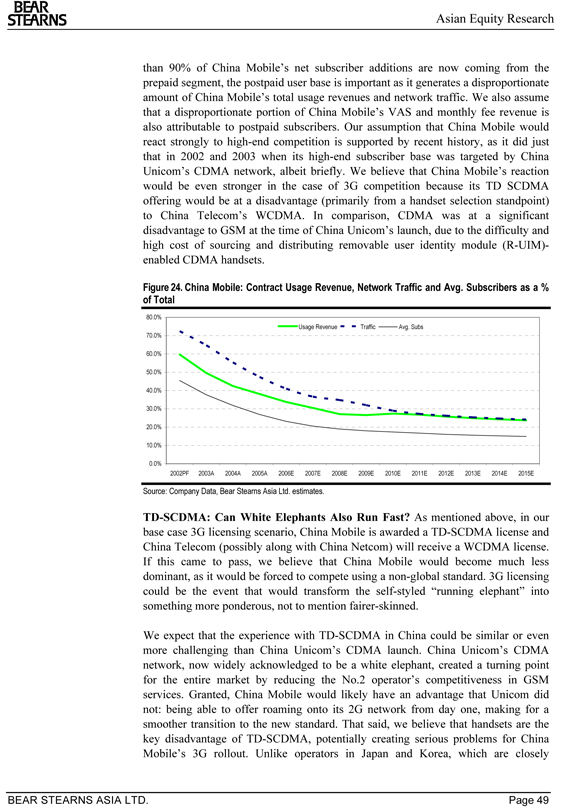
Asian Equity Research
BEAR STEARNS
than 90% of China Mobile’s net subscriber additions are now coming from the prepaid segment, the postpaid user base is important as it generates a disproportionate amount of China Mobile’s total usage revenues and network traffic. We also assume that a disproportionate portion of China Mobile’s VAS and monthly fee revenue is also attributable to postpaid subscribers. Our assumption that China Mobile would react strongly to high-end competition is supported by recent history, as it did just that in 2002 and 2003 when its high-end subscriber base was targeted by China Unicom’s CDMA network, albeit briefly. We believe that China Mobile’s reaction would be even stronger in the case of 3G competition because its TD SCDMA offering would be at a disadvantage (primarily from a handset selection standpoint) to China Telecom’s WCDMA. In comparison, CDMA was at a significant disadvantage to GSM at the time of China Unicom’s launch, due to the difficulty and high cost of sourcing and distributing removable user identity module (R-UIM)-enabled CDMA handsets.
Figure 24. China Mobile: Contract Usage Revenue, Network Traffic and Avg. Subscribers as a % of Total
80.0%
Usage Revenue Traffic Avg. Subs 70.0%
60.0% 50.0% 40.0% 30.0% 20.0% 10.0%
0.0%
2002PF 2003A 2004A 2005A 2006E 2007E 2008E 2009E 2010E 2011E 2012E 2013E 2014E 2015E
Source: Company Data, Bear Stearns Asia Ltd. estimates.
TD-SCDMA: Can White Elephants Also Run Fast? As mentioned above, in our base case 3G licensing scenario, China Mobile is awarded a TD-SCDMA license and China Telecom (possibly along with China Netcom) will receive a WCDMA license. If this came to pass, we believe that China Mobile would become much less dominant, as it would be forced to compete using a non-global standard. 3G licensing could be the event that would transform the self-styled “running elephant” into something more ponderous, not to mention fairer-skinned.
We expect that the experience with TD-SCDMA in China could be similar or even more challenging than China Unicom’s CDMA launch. China Unicom’s CDMA network, now widely acknowledged to be a white elephant, created a turning point for the entire market by reducing the No.2 operator’s competitiveness in GSM services. Granted, China Mobile would likely have an advantage that Unicom did not: being able to offer roaming onto its 2G network from day one, making for a smoother transition to the new standard. That said, we believe that handsets are the key disadvantage of TD-SCDMA, potentially creating serious problems for China Mobile’s 3G rollout. Unlike operators in Japan and Korea, which are closely
BEAR STEARNS ASIA LTD. Page 49
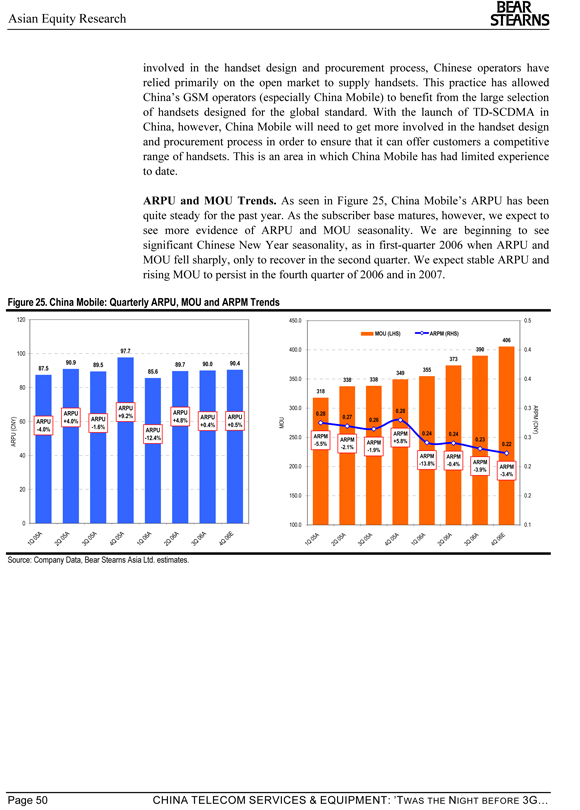
Asian Equity Research
BEAR STEARNS
involved in the handset design and procurement process, Chinese operators have relied primarily on the open market to supply handsets. This practice has allowed China’s GSM operators (especially China Mobile) to benefit from the large selection of handsets designed for the global standard. With the launch of TD-SCDMA in China, however, China Mobile will need to get more involved in the handset design and procurement process in order to ensure that it can offer customers a competitive range of handsets. This is an area in which China Mobile has had limited experience to date.
ARPU and MOU Trends. As seen in Figure 25, China Mobile’s ARPU has been quite steady for the past year. As the subscriber base matures, however, we expect to see more evidence of ARPU and MOU seasonality. We are beginning to see significant Chinese New Year seasonality, as in first-quarter 2006 when ARPU and MOU fell sharply, only to recover in the second quarter. We expect stable ARPU and rising MOU to persist in the fourth quarter of 2006 and in 2007.
Figure 25. China Mobile: Quarterly ARPU, MOU and ARPM Trends
120
100 97.7
90.9 89.5 89.7 90.0 90.4 87.5 85.6
80
ARPU
ARPU ARPU
+9.2% ARPU ARPU
60 ARPU +4.0% ARPU +4.8%
-1.6% +0.4% +0.5% -4.0% ARPU
ARPU (CNY) -12.4% 40
20
0
A A
05A0 505A05A06A06A0 606E
1Q 2Q 3Q 4Q 1Q 2Q 3Q 4Q
450.0 0.5
MOU (LHS) ARPM (RHS)
406
400.0 390 0.4
373 355 349
350.0 338 338 0.4
318
300.0 0.3
0.28 0.28 0.27
MOU 0.26 ARPM (CNY)
ARPM 0.24 0.24
250.0 ARPM 0.3
ARPM +5.8% 0.23
-5.5% ARPM 0.22 -2.1% -1.9% ARPM ARPM
-13.8% -0.4% ARPM
200.0 ARPM 0.2
-3.9%
-3.4%
150.0 0.2
100.0 0.1
A A A A A A A E 0 50 50 50 50 60 60 60 6 1 Q 2 Q 3 Q 4 Q 1 Q 2 Q 3 Q 4 Q
Source: Company Data, Bear Stearns Asia Ltd. estimates.
Page 50 CHINA TELECOM SERVICES & EQUIPMENT: ’TWAS THE NIGHT BEFORE 3G…
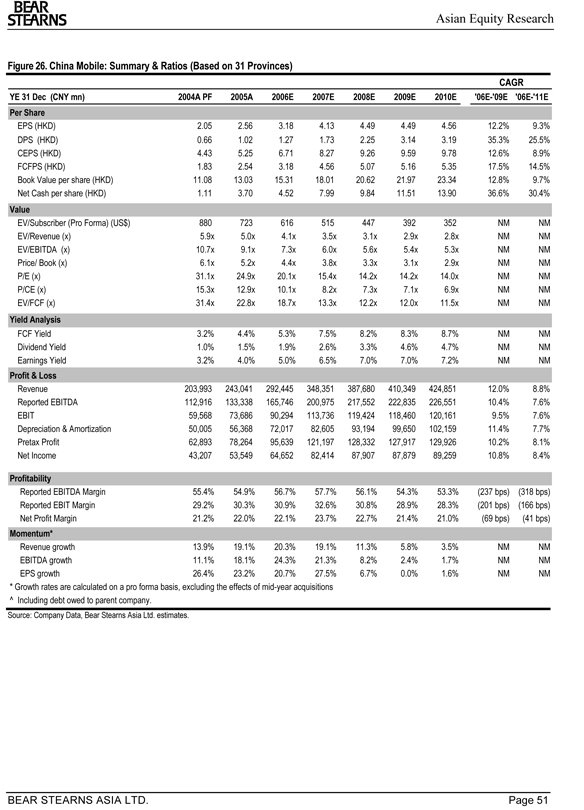
Asian Equity Research
BEAR STEARNS
Figure 26. China Mobile: Summary & Ratios (Based on 31 Provinces)
CAGR
YE 31 Dec (CNY mn) 2004A PF 2005A 2006E 2007E 2008E 2009E 2010E '06E-'09E '06E-'11E Per Share
EPS (HKD) 2.05 2.56 3.18 4.13 4.49 4.49 4.56 12.2% 9.3% DPS (HKD) 0.66 1.02 1.27 1.73 2.25 3.14 3.19 35.3% 25.5% CEPS (HKD) 4.43 5.25 6.71 8.27 9.26 9.59 9.78 12.6% 8.9% FCFPS (HKD) 1.83 2.54 3.18 4.56 5.07 5.16 5.35 17.5% 14.5% Book Value per share (HKD) 11.08 13.03 15.31 18.01 20.62 21.97 23.34 12.8% 9.7% Net Cash per share (HKD) 1.11 3.70 4.52 7.99 9.84 11.51 13.90 36.6% 30.4%
Value
EV/Subscriber (Pro Forma) (US$) 880 723 616 515 447 392 352 NM NM EV/Revenue (x) 5.9x 5.0x 4.1x 3.5x 3.1x 2.9x 2.8x NM NM EV/EBITDA (x) 10.7x 9.1x 7.3x 6.0x 5.6x 5.4x 5.3x NM NM Price/ Book (x) 6.1x 5.2x 4.4x 3.8x 3.3x 3.1x 2.9x NM NM P/E (x) 31.1x 24.9x 20.1x 15.4x 14.2x 14.2x 14.0x NM NM P/CE (x) 15.3x 12.9x 10.1x 8.2x 7.3x 7.1x 6.9x NM NM EV/FCF (x) 31.4x 22.8x 18.7x 13.3x 12.2x 12.0x 11.5x NM NM
Yield Analysis
FCF Yield 3.2% 4.4% 5.3% 7.5% 8.2% 8.3% 8.7% NM NM Dividend Yield 1.0% 1.5% 1.9% 2.6% 3.3% 4.6% 4.7% NM NM Earnings Yield 3.2% 4.0% 5.0% 6.5% 7.0% 7.0% 7.2% NM NM
Profit & Loss
Revenue 203,993 243,041 292,445 348,351 387,680 410,349 424,851 12.0% 8.8% Reported EBITDA 112,916 133,338 165,746 200,975 217,552 222,835 226,551 10.4% 7.6% EBIT 59,568 73,686 90,294 113,736 119,424 118,460 120,161 9.5% 7.6% Depreciation & Amortization 50,005 56,368 72,017 82,605 93,194 99,650 102,159 11.4% 7.7% Pretax Profit 62,893 78,264 95,639 121,197 128,332 127,917 129,926 10.2% 8.1% Net Income 43,207 53,549 64,652 82,414 87,907 87,879 89,259 10.8% 8.4%
Profitability
Reported EBITDA Margin 55.4% 54.9% 56.7% 57.7% 56.1% 54.3% 53.3% (237 bps) (318 bps) Reported EBIT Margin 29.2% 30.3% 30.9% 32.6% 30.8% 28.9% 28.3% (201 bps) (166 bps) Net Profit Margin 21.2% 22.0% 22.1% 23.7% 22.7% 21.4% 21.0%(69 bps) (41 bps)
Momentum*
Revenue growth 13.9% 19.1% 20.3% 19.1% 11.3% 5.8% 3.5% NM NM EBITDA growth 11.1% 18.1% 24.3% 21.3% 8.2% 2.4% 1.7% NM NM EPS growth 26.4% 23.2% 20.7% 27.5% 6.7% 0.0% 1.6% NM NM
* Growth rates are calculated on a pro forma basis, excluding the effects of mid-year acquisitions
^ Including debt owed to parent company.
Source: Company Data, Bear Stearns Asia Ltd. estimates.
BEAR STEARNS ASIA LTD. Page 51
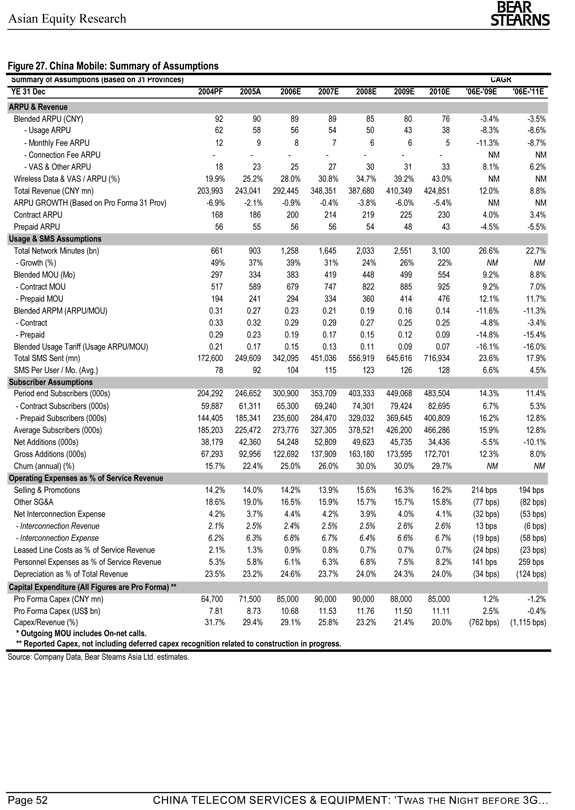
Asian Equity Research
BEAR STEARNS
Summary of Assumptions (Based on 31 Provinces)
YE 31 Dec 2004PF 2005A 2006E 2007E 2008E 2009E 2010E '06E-'09E '06E-'11E ARPU & Revenue
Blended ARPU (CNY) 92 90 89 89 85 80 76 -3.4% -3.5%—Usage ARPU 62 58 56 54 50 43 38 -8.3% -8.6%—Monthly Fee ARPU 12 9 8 7 6 6 5 -11.3% -8.7%—Connection Fee ARPU —————NM NM
- VAS & Other ARPU 18 23 25 27 30 31 33 8.1% 6.2% Wireless Data & VAS / ARPU (%) 19.9% 25.2% 28.0% 30.8% 34.7% 39.2% 43.0% NM NM Total Revenue (CNY mn) 203,993 243,041 292,445 348,351 387,680 410,349 424,851 12.0% 8.8% ARPU GROWTH (Based on Pro Forma 31 Prov) -6.9% -2.1% -0.9% -0.4% -3.8% -6.0% -5.4% NM NM Contract ARPU 168 186 200 214 219 225 230 4.0% 3.4% Prepaid ARPU 56 55 56 56 54 48 43 -4.5% -5.5%
Usage & SMS Assumptions
Total Network Minutes (bn) 661 903 1,258 1,645 2,033 2,551 3,100 26.6% 22.7% —Growth (%) 49% 37% 39% 31% 24% 26% 22% NM NM Blended MOU (Mo) 297 334 383 419 448 499 554 9.2% 8.8% —Contract MOU 517 589 679 747 822 885 925 9.2% 7.0% —Prepaid MOU 194 241 294 334 360 414 476 12.1% 11.7% Blended ARPM (ARPU/MOU) 0.31 0.27 0.23 0.21 0.19 0.16 0.14 -11.6% -11.3% —Contract 0.33 0.32 0.29 0.29 0.27 0.25 0.25 -4.8% -3.4% —Prepaid 0.29 0.23 0.19 0.17 0.15 0.12 0.09 -14.8% -15.4% Blended Usage Tariff (Usage ARPU/MOU) 0.21 0.17 0.15 0.13 0.11 0.09 0.07 -16.1% -16.0% Total SMS Sent (mn) 172,600 249,609 342,095 451,036 556,919 645,616 716,934 23.6% 17.9% SMS Per User / Mo. (Avg.) 78 92 104 115 123 126 128 6.6% 4.5%
Subscriber Assumptions
Period end Subscribers (000s) 204,292 246,652 300,900 353,709 403,333 449,068 483,504 14.3% 11.4% —Contract Subscribers (000s) 59,887 61,311 65,300 69,240 74,301 79,424 82,695 6.7% 5.3% —Prepaid Subscribers (000s) 144,405 185,341 235,600 284,470 329,032 369,645 400,809 16.2% 12.8% Average Subscribers (000s) 185,203 225,472 273,776 327,305 378,521 426,200 466,286 15.9% 12.8% Net Additions (000s) 38,179 42,360 54,248 52,809 49,623 45,735 34,436 -5.5% -10.1% Gross Additions (000s) 67,293 92,956 122,692 137,909 163,180 173,595 172,701 12.3% 8.0% Churn (annual) (%) 15.7% 22.4% 25.0% 26.0% 30.0% 30.0% 29.7% NM NM
Operating Expenses as % of Service Revenue
Selling & Promotions 14.2% 14.0% 14.2% 13.9% 15.6% 16.3% 16.2% 214 bps 194 bps Other SG&A 18.6% 19.0% 16.5% 15.9% 15.7% 15.7% 15.8%(77 bps)(82 bps) Net Interconnection Expense 4.2% 3.7% 4.4% 4.2% 3.9% 4.0% 4.1%(32 bps)(53 bps)
—Interconnection Revenue 2.1% 2.5% 2.4% 2.5% 2.5% 2.6% 2.6% 13 bps(6 bps) —Interconnection Expense 6.2% 6.3% 6.8% 6.7% 6.4% 6.6% 6.7%(19 bps)(58 bps) Leased Line Costs as % of Service Revenue 2.1% 1.3% 0.9% 0.8% 0.7% 0.7% 0.7%(24 bps)(23 bps) Personnel Expenses as % of Service Revenue 5.3% 5.8% 6.1% 6.3% 6.8% 7.5% 8.2% 141 bps 259 bps Depreciation as % of Total Revenue 23.5% 23.2% 24.6% 23.7% 24.0% 24.3% 24.0%(34 bps) (124 bps)
Capital Expenditure (All Figures are Pro Forma) **
Pro Forma Capex (CNY mn) 64,700 71,500 85,000 90,000 90,000 88,000 85,000 1.2% - -1.2% Pro Forma Capex (US$ bn) 7.81 8.73 10.68 11.53 11.76 11.50 11.11 2.5% -0.4% Capex/Revenue (%) 31.7% 29.4% 29.1% 25.8% 23.2% 21.4% 20.0% (762 bps) (1,115 bps)
* Outgoing MOU includes On-net calls.
** Reported Capex, not including deferred capex recognition related to construction in progress.
Source: Company Data, Bear Stearns Asia Ltd. estimates.
Page 52 CHINA TELECOM SERVICES & EQUIPMENT: ’TWAS THE NIGHT BEFORE 3G…
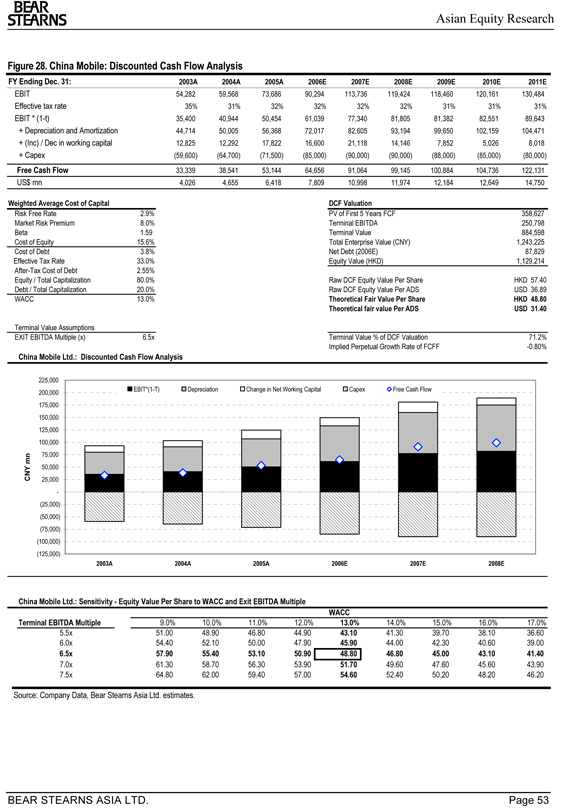
Asian Equity Research
BEAR STEARNS
Figure 28. China Mobile: Discounted Cash Flow Analysis
FY Ending Dec. 31: 2003A 2004A 2005A 2006E 2007E 2008E 2009E 2010E 2011E
EBIT 54,282 59,568 73,686 90,294 113,736 119,424 118,460 120,161 130,484 Effective tax rate 35% 31% 32% 32% 32% 32% 31% 31% 31% EBIT * (1-t) 35,400 40,944 50,454 61,039 77,340 81,805 81,382 82,551 89,643 + Depreciation and Amortization 44,714 50,005 56,368 72,017 82,605 93,194 99,650 102,159 104,471 + (Inc) / Dec in working capital 12,825 12,292 17,822 16,600 21,118 14,146 7,852 5,026 8,018 + Capex(59,600)(64,700)(71,500)(85,000)(90,000)(90,000)(88,000)(85,000)(80,000) Free Cash Flow 33,339 38,541 53,144 64,656 91,064 99,145 100,884 104,736 122,131 US$ mn 4,026 4,655 6,418 7,809 10,998 11,974 12,184 12,649 14,750
Weighted Average Cost of Capital
Risk Free Rate 2.9% Market Risk Premium 8.0% Beta 1.59 Cost of Equity 15.6% Cost of Debt 3.8% Effective Tax Rate 33.0% After-Tax Cost of Debt 2.55% Equity / Total Capitalization 80.0% Debt / Total Capitalization 20.0% WACC 13.0%
Terminal Value Assumptions
EXIT EBITDA Multiple (x) 6.5x
DCF Valuation
PV of First 5 Years FCF 358,627 Terminal EBITDA 250,798 Terminal Value 884,598 Total Enterprise Value (CNY) 1,243,225 Net Debt (2006E) 87,829 Equity Value (HKD) 1,129,214
Raw DCF Equity Value Per Share HKD 57.40 Raw DCF Equity Value Per ADS USD 36.89
Theoretical Fair Value Per Share HKD 48.80 Theoretical fair value Per ADS USD 31.40
Terminal Value % of DCF Valuation 71.2% Implied Perpetual Growth Rate of FCFF - -0.80%
China Mobile Ltd.: Discounted Cash Flow Analysis
225,000
EBIT*(1-T) Depreciation Change in Net Working Capital Capex Free Cash Flow 200,000 175,000 150,000 125,000 100,000 75,000
CNY mn 50,000 25,000 -(25,000) (50,000) (75,000) (100,000) (125,000)
2003A 2004A 2005A 2006E 2007E 2008E
China Mobile Ltd.: Sensitivity—Equity Value Per Share to WACC and Exit EBITDA Multiple
WACC
Terminal EBITDA Multiple ### 9.0% 10.0% 11.0% 12.0% 13.0% 14.0% 15.0% 16.0% 17.0% 5.5x ### 51.00 48.90 46.80 44.90 43.10 41.30 39.70 38.10 36.60 6.0x ### 54.40 52.10 50.00 47.90 45.90 44.00 42.30 40.60 39.00
6.5x | | ### 57.90 55.40 53.10 50.90 48.80 46.80 45.00 43.10 41.40 |
7.0x | | ### 61.30 58.70 56.30 53.90 51.70 49.60 47.60 45.60 43.90 7.5x ### 64.80 62.00 59.40 57.00 54.60 52.40 50.20 48.20 |
46.20
Source: Company Data, Bear Stearns Asia Ltd. estimates.
BEAR STEARNS ASIA LTD. Page 53
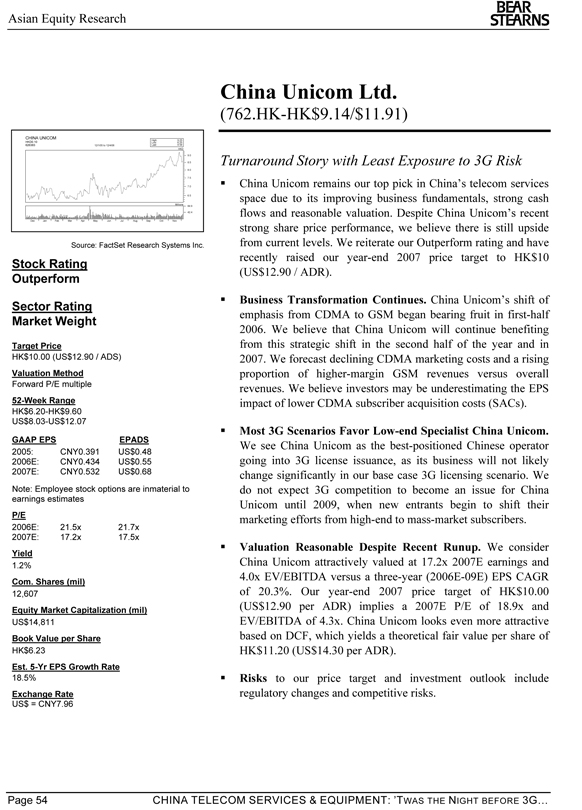
Asian Equity Research
BEAR STEARNS
China Unicom Ltd.
(762.HK-HK$9.14/$11.91)
CHINA UNICOM
High: 9.25 HKD0.10 Low: 6.25 626383 12/1/05 to 12/4/06 Last: 8.58 HKD
9.0 8.5 8.0 7.5 7.0 6.5
Millions 84.9
42.4
Dec Jan Feb Mar Apr May Jun Jul Aug Sep Oct Nov
Source: FactSet Research Systems Inc.
Stock Rating Outperform
Sector Rating Market Weight
Target Price
HK$10.00 (US$12.90 / ADS)
Valuation Method
Forward P/E multiple
52-Week Range
HK$6.20-HK$9.60 US$8.03-US$12.07
GAAP EPS EPADS 2005: CNY0.391 US$0.48 2006E: CNY0.434 US$0.55 2007E: CNY0.532 US$0.68
Note: Employee stock options are inmaterial to earnings estimates
P/E
2006E: 21.5x 21.7x 2007E: 17.2x 17.5x
Yield
1.2%
Com. Shares (mil)
12,607
Equity Market Capitalization (mil)
US$14,811
Book Value per Share
HK$6.23
Est. 5-Yr EPS Growth Rate
18.5%
Exchange Rate
US$ = CNY7.96
Turnaround Story with Least Exposure to 3G Risk
China Unicom remains our top pick in China’s telecom services space due to its improving business fundamentals, strong cash flows and reasonable valuation. Despite China Unicom’s recent strong share price performance, we believe there is still upside from current levels. We reiterate our Outperform rating and have recently raised our year-end 2007 price target to HK$10 (US$12.90 / ADR).
Business Transformation Continues. China Unicom’s shift of emphasis from CDMA to GSM began bearing fruit in first-half 2006. We believe that China Unicom will continue benefiting from this strategic shift in the second half of the year and in 2007. We forecast declining CDMA marketing costs and a rising proportion of higher-margin GSM revenues versus overall revenues. We believe investors may be underestimating the EPS impact of lower CDMA subscriber acquisition costs (SACs).
Most 3G Scenarios Favor Low-end Specialist China Unicom.
We see China Unicom as the best-positioned Chinese operator going into 3G license issuance, as its business will not likely change significantly in our base case 3G licensing scenario. We do not expect 3G competition to become an issue for China Unicom until 2009, when new entrants begin to shift their marketing efforts from high-end to mass-market subscribers.
Valuation Reasonable Despite Recent Runup. We consider
China Unicom attractively valued at 17.2x 2007E earnings and 4.0x EV/EBITDA versus a three-year (2006E-09E) EPS CAGR of 20.3%. Our year-end 2007 price target of HK$10.00 (US$12.90 per ADR) implies a 2007E P/E of 18.9x and EV/EBITDA of 4.3x. China Unicom looks even more attractive based on DCF, which yields a theoretical fair value per share of HK$11.20 (US$14.30 per ADR).
Risks to our price target and investment outlook include regulatory changes and competitive risks.
Page 54 CHINA TELECOM SERVICES & EQUIPMENT: ’TWAS THE NIGHT BEFORE 3G…
Asian Equity Research
BEAR STEARNS
Overview: Our Favorite Chinese Telco. We like China Unicom for its improving business fundamentals, strong cash flows and limited downside from 3G license issuance. Despite the company’s recent strong share price performance, we believe there is still upside from current levels. We maintain our Outperform rating and year-end 2007 price target of HK$10.00 (US$12.90 per ADR). Our DCF analysis yields a hypothetical fair value per share of HK$11.20 (US$14.30 per ADR).
Business Transformation Likely to Continue. We expect China Unicom to continue to benefit from improved fundamental operating trends set in motion by management’s decision to deemphasize the company’s beleaguered CDMA segment. We have long believed that China Unicom would be better off reducing its exposure to CDMA, rather than swimming against the tide and attempting to grow the CDMA business. We believe that China Unicom’s management is currently on the right track in attempting to keep CDMA marketing costs down. China Unicom’s rebranding initiative has also taken hold, allowing the operator to create well-defined product segments spanning both the CDMA and GSM networks. The results of this strategic shift are apparent in the company’s results for the first nine months of 2006, which show year-on-year EBITDA margin improvements in each quarter. We estimate that China Unicom’s full-year 2006 EBITDA margin will rise by 99bps year on year. Our 2007 estimates assume a modest EBITDA margin improvement of 16bps.
CDMA Marketing Expense Declining Relative to CDMA Service Revenue.
We attribute China Unicom’s recent margin improvement mainly to the downtrend in the ratio of CDMA marketing expenses:CDMA service revenue, as well as the downtrend in CDMA/total service revenue. We estimate that CDMA marketing costs fell to 35.6% of CDMA service revenue in 2006 from 41% in 2005. We also believe we are being quite conservative in our assumption that CDMA marketing expense remains at 34%-36% of CDMA service revenue in 2007-08E (versus a 16.2% marketing cost:revenue ratio for China Unicom’s GSM business and an estimated 14.2% for China Mobile). Our marketing cost assumption actually implies a rise in the average subsidy cost per CDMA handset sold.
CDMA Cash Cost Analysis. By the end of 2006, we expect that China Unicom will have only CNY1.2 billion in unamortized customer acquisition costs remaining on its balance sheet. As a result, we expect CDMA marketing costs to become increasingly aligned with current marketing and promotional activity being undertaken by China Unicom. We estimate that China Unicom will amortize CNY4.1 billion in marketing costs incurred in prior periods during 2006, down from CNY5.9 billion in 2005. We also estimate that the effective cash marketing expense per gross addition will fall to around US$100 at the end of 2006. While we assume that the effective cash CDMA SAC stays at around the US$100 level in the future, we also note that China Unicom earnings are very sensitive to CDMA SAC trends and would react very positively to any cost savings on the handset side. We also believe that joint procurement efforts with SK Telecom could potentially enable China Unicom to procure a more attractive and competitive selection of CDMA handsets, maybe even at lower price points, although we do not currently assume this.
BEAR STEARNS ASIA LTD. Page 55

Asian Equity Research
BEAR STEARNS
Figure 29. China Unicom: Analysis of CDMA Marketing Costs, Expensed and Capitalized
CDMA Selling & Marketing Costs EXPENSED on P&L 1H 04A 2H 04A 1H 05A 2H 05A 1H 06A 2H 06E
Amortization of Capitalized Marketing Cost 3,051 3,069 3,124 2,824 2,391 1,734 Expenses Recognized Upfront 2,348 2,869 2,789 2,572 2,835 2,694 Gross Additions (Pro Forma) 6,257 6,797 5,372 4,954 5,079 4,614
Reported CDMA Marketing Expenses 5,399 5,938 5,913 5,396 5,226 4,428
Reported CDMA Marketing Cost / Gross Add (CNY) 863 874 1,101 1,089 1,029 960 Reported CDMA Marketing Cost / Gross Add (US$) 104 106 133 134 128 121
CASH CDMA Selling & Marketing Cost 1H 04A 2H 04A 1H 05A 2H 05A 1H 06A 2H 06E
BOP Deferred Cust. Acquis. Costs 4,892 3,247 4,745 4,171 2,944 1,904 EOP Deferred Cust. Acquis. Costs 3,247 4,745 4,171 2,944 1,904 1,181
Net Incremental Capitalized Acquisition Cost 1,406 4,567 2,550 1,597 1,351 1,012
CDMA: Cash Marketing Cost / Gross Add (CNY) 600 1,094 994 841 824 803 CDMA: Cash Marketing Cost / Gross Add (US$) 72 132 120 104 103 101
CNY/US$ assumption 8.28 8.28 8.28 8.10 8.03 7.95
Source: Company Data, Bear Stearns Asia Ltd. estimates.
GSM Transformation to Drive Revenue, EPS Growth. We expect the revitalization of China Unicom’s profitable GSM business to be the key driver of future revenue and EPS growth. We expect China Unicom’s GSM service revenue will grow at a three-year (2006-09E) CAGR of 10.1% based on improvements in branding, marketing, network quality (including technology upgrades), and capacity improvements. China Unicom’s GSM network has been operating well in excess of stated capacity for the past two years. Capacity utilization reached 100% by the end of 2004, and rose to 106% by year-end 2005 before falling to 100% by the end of first-half 2006. High utilization is clearly one of the biggest limitations for China Unicom: without excess capacity, it is difficult to lower prices, attract new subscribers, and remain competitive. Due to continued network optimization and capacity improvements, we expect utilization on China Unicom’s network to fall to 98% by year-end 2006 and 92% by year-end 2007, giving China Unicom more headroom to compete. As China Unicom grows its GSM service revenues, we expect the proportion of higher-margin GSM revenues to increase to 66.4% of total service revenues in 2006 from 61.9% in 2005, and 68.5% in 2007E. We believe that this favorable revenue mix shift, combined with lower CDMA SAC will drive EPS growth at a three-year (2006-09E) CAGR of 20.3% in CNY terms.
Improving Cash Flows. We expect China Unicom’s improving business fundamentals to drive steady free cash flow growth. Based on our current assumptions, we expect China Unicom’s free cash flow to be CNY11.4 billion in 2006, growing at a three-year (2006-09E) CAGR of 13% and a five year (2006-11E) CAGR of 16%. China Unicom is likely to have the healthiest FCF yields in its peer group for the next three years, in our view, given the relative stability of its business and falling capex:revenue.
Page 56 CHINA TELECOM SERVICES & EQUIPMENT: ’TWAS THE NIGHT BEFORE 3G…

Asian Equity Research
BEAR STEARNS
Figure 30. China Unicom: Free Cash Flow Composition
50,000
45,000 EBIT*(1-T) Depreciation Change in NWC Capex FCF
40,000 35,000 30,000 25,000 20,000 15,000 CNY mn 10,000 5,000 -
(5,000) 2003A 2004A 2005A 2006E 2007E 2008E 2009E 2010E (10,000) (15,000) (20,000) (25,000) (30,000)
Source: Company Data, Bear Stearns Asia Ltd. estimates.
Limited Downside from 3G. We believe that China Unicom has limited exposure to downside risks from the issuance of 3G licenses under most scenarios.
Base Case Scenario. In our base case scenario, China Unicom receives a license to upgrade its existing CDMA 1x network to EV-DO, which would involve a relatively small amount of capex that would, in any case, be undertaken by China Unicom’s parent company. In this scenario, we assume that not much would change for China Unicom. EV-DO would likely be rolled out relatively quickly and China Unicom would likely market the service as a niche wireless broadband product for business travelers that wish to use EV-DO as a remote broadband solution. We expect that there would be relatively little competitive pressure on China Unicom’s core GSM business, as we expect that most of the new competition would be at the high end, not a focus area for China Unicom. Although China Unicom classifies 51% of its subscribers as “postpaid,” we believe that most of these subscribers would be classified as prepaid by China Mobile.
WCDMA License Scenario. In the low-probability event that China Unicom receives a WCDMA license, it would gain a 3G upgrade path for its existing GSM subscriber base. We think that this would also likely provide China
Unicom with an entrée into the high-end market by giving it a technological advantage from which to attack China Mobile’s high-end subscriber base. However, we believe that China Unicom would take a cautious approach to its initial rollout of WCDMA (as has been the case with China Unicom’s GPRS upgrades, which began in earnest only in 2006). We think that a WCDMA scenario would weaken earnings in the short term, but would be positive in the long term as China Unicom would benefit from adopting a mainstream 3G technology. We believe that this scenario would also be taken very positively by the market.
Breakup Scenarios. For the past two years, the market has been rife with speculation that China Unicom would be split up and merged with China’s fixed-
BEAR STEARNS ASIA LTD. Page 57

Asian Equity Research
BEAR STEARNS
line operators or somehow induced to sell one of its networks to China Telecom. While we do not currently believe that these scenarios are likely, we think that most such scenarios would be positive for China Unicom shareholders. A breakup of China Unicom or a sale of GSM assets would require the purchaser(s) to pay a premium to China Unicom’s current market value. We believe that, from China Unicom’s perspective, a parent company disposal of the CDMA network would be positive even if the listed company were not compensated for the disposal of CDMA subscribers.
?? TD-SCDMA License Scenario. We believe that the only negative 3G scenario would be if China Unicom were required to roll out TD-SCDMA alongside its two existing 2G networks. However, we currently believe that the likelihood of this outcome is extremely small. First, a TD-SCDMA license would mean that China Unicom would become a three-network operator. Second, we believe that China Unicom would be less well-positioned than either China Mobile or China Telecom to make TD-SCDMA a success: China Unicom is smaller than both China Mobile and China Telecom in terms of subscribers and capex budget; China Unicom would not be as focused (either in terms of network spending or marketing activity) as either China Telecom or China Mobile in its deployment of TD-SCDMA technology; and China Unicom’s franchise and distribution network is weaker than either China Mobile or China Telecom’s in the first-tier cities that will be the focal points of 3G investment and competition.
Given the above scenarios, we believe that China Unicom will have the most limited downside from 3G of any of China’s operators. We expect that China Mobile will suffer a competitive onslaught from new 3G competitors attacking its valuable high-end segment, while fixed-line operators will likely be forced to offer gigantic subsidies to attract high-end subscribers as they build greenfield 3G networks.
Valuation Still Reasonable, Especially on DCF. We believe that China Unicom is valued attractively at 17.2x 2007E earnings compared with our expected three-year (2006-09E) EPS CAGR of 20.3%. Our year-end 2007 price target of HK$10.00 (US$12.90 per ADR) implies a 2007E P/E of 18.9x. Our DCF valuation yields a theoretical fair value per share of HK$11.20 (US$14.30 per ADS), assuming a WACC of 10%, an exit EBITDA multiple of 4.0x, and a 10% public market discount. We note that China Unicom is the only Chinese operator in our universe currently trading at a discount to its DCF-derived fair value.
Page 58 CHINA TELECOM SERVICES & EQUIPMENT: ’TWAS THE NIGHT BEFORE 3G…
Asian Equity Research
BEAR STEARNS
Figure 31. China Unicom: Discounted Cash Flow Analysis
FY Ending Dec. 31: 2003A 2004A 2005A 2006E 2007E 2008E 2009E 2010E 2011E
EBIT 8,514 7,956 8,072 9,101 9,546 11,095 13,317 15,516 16,940 Effective tax rate 31% 32% 31% 30% 30% 30% 30% 30% 30% EBIT * (1-t) 5,877 5,397 5,605 6,330 6,639 7,716 9,262 10,791 11,782 + Depreciation and Amortization 16,385 19,063 20,368 22,622 24,788 26,956 28,026 29,102 30,354 + (Inc) / Dec in working capital 2,258(524) 3,831 5,487 2,001 1,650 1,254 1,309 1,080 + Capex(21,089)(19,107)(16,643)(23,000)(23,000)(23,000)(22,000)(20,000)(19,000) Unlevered Free Cash Flow 3,430 4,829 13,190 11,439 10,427 13,322 16,543 21,202 24,216 US$ mn 414 583 1,611 1,437 1,336 1,741 2,162 2,771 3,165
Weighted Average Cost of Capital
Risk Free Rate 2.90% Market Risk Premium 8.00% Beta 1.28 Cost of Equity 13.1% Cost of Debt 3.9% Tax Rate 33.0% After-Tax Cost of Debt 2.61% Equity / Total Capitalization (Steady State 70.0% Debt / Total Capitalization 30.0%
WACC 10.0%
Terminal Value Assumptions
EXIT EBITDA Multiple 4.0x
DCF Valuation
PV of First 5 Years FCF 62,468 Terminal EBITDA 46,863 Terminal Value 116,490 Total Enterprise Value (CNY) 178,958 Net Debt (2006E) 19,105 Equity Value (HKD mn) 156,230
Raw DCF Equity Value Per Share HKD 12.40 Raw DCF Equity Value Per ADS USD 15.90
Theoretical Fair Value Per Share HKD 11.20 Theoretical Fair Value Per ADS USD 14.30
Terminal Value % of DCF Valuation 65.1% Implied Perpetual Growth Rate of FCFF -1.5%
Source: Company Data, Bear Stearns Asia Ltd. estimates,
Figure 32. China Unicom: Discounted Cash Flow – Sensitivity of Equity Value per Share to WACC and Exit EBITDA Multiple
WACC
Exit EBITDA Multiple # 8.0% 8.5% 9.0% 9.5% 10.0% 10.5% 11.0% 11.5% 12.0% 3.0 x # 10.00 9.80 9.50 9.40 9.20 8.90 8.70 8.60 8.40 3.5 x # 11.20 10.90 10.60 10.40 10.20 10.00 9.70 9.50 9.30
4.0 x # 12.20 12.00 11.70 11.40 11.20 11.00 10.70 10.40 10.30 4.5 x # 13.30 13.10 12.80 12.50 12.20 12.00 11.70 11.40 11.20 5.0 x # 14.50 14.10 13.90 13.50 13.20 13.00 12.70 12.40
12.20
Source: Company Data, Bear Stearns Asia Ltd. estimates.
BEAR STEARNS ASIA LTD. Page 59
Asian Equity Research
BEAR STEARNS
Figure 33. China Unicom: Financial Summary (based on Reported Financials)
CAGR
2003A 2004A 2005A 2006E 2007E 2008E 2009E '06E-'09E '06E-'11E Per Share
Diluted EPS (CNY) 0.336 0.348 0.391 0.434 0.532 0.614 0.756 20.3% 18.5% EPS (HKD) 0.32 0.33 0.37 0.42 0.53 0.62 0.77 21.9% 19.4%—EPADS (USD) 0.41 0.42 0.48 0.55 0.68 0.80 0.99 21.9% 19.0% DPS (HKD) 0.09 0.09 0.10 0.11 0.16 0.22 0.27 34.6% 30.2%—DPADS (USD) 0.12 0.12 0.13 0.14 0.20 0.28 0.35 34.6% 30.2% CEPS (HKD) 1.54 1.75 1.91 2.18 2.49 2.80 3.03 11.6% 9.8%—CEPADS (USD) 1.98 2.25 2.45 2.80 3.20 3.60 3.89 11.6% 9.8% Book Value per Share (HKD) 5.21 5.43 5.75 6.23 6.72 7.26 7.76 7.6% NM
Value
EV/Sub YE (US$) 205 148 131 121 111 104 99 NM NM EV/Revenue 2.0 1.7 1.6 1.5 1.3 1.3 1.2 NM NM EV/EBITDA 5.5 5.1 4.8 4.3 4.0 3.6 3.3 NM NM Price/ Book 1.8 1.7 1.6 1.5 1.4 1.3 1.2 NM NM P/E 29.0 28.0 24.6 21.5 17.2 14.6 11.9 NM NM P/CE 5.9 5.2 4.8 4.2 3.7 3.3 3.0 NM NM EV/FCF 39.9 28.4 10.4 12.0 13.1 10.3 8.3 NM NM
Yield Analysis
FCF Yield ** 2.4% 3.3% 9.1% 8.2% 7.6% 9.9% 12.3% NM NM Dividend Yield 1.0% 1.0% 1.1% 1.2% 1.7% 2.4% 2.9% NM NM Earnings Yield 3.4% 3.6% 4.1% 4.6% 5.8% 6.8% 8.4% NM NM
Balance Sheet
Shareholders Equity 69,615 72,810 76,284 80,336 85,029 90,059 96,258 6.2% 6.6% Adjusted Shareholders Equity 81,177 84,372 87,846 91,898 96,591 101,621 107,820 5.5% 3.8% Net Debt/ Equity 63.6% 56.1% 37.0% 23.8% 12.5% cash cash NM NM
Efficiency
ROE (Average) 6.2% 6.2% 6.6% 7.0% 8.1% 8.8% 10.2% NM NM ROA (Average) 2.8% 3.0% 3.4% 3.9% 4.7% 5.4% 6.5% NM NM ROIC (Average) 3.7% 4.5% 5.3% 6.6% 8.7% 10.8% 15.0% NM NM
Profitability
Reported EBITDA Margin 36.8% 34.1% 32.7% 33.7% 33.8% 35.2% 36.2% NM NM Reported EBIT Margin 12.6% 10.0% 9.3% 9.7% 9.4% 10.2% 11.7% NM NM Net Profit Margin 6.2% 5.5% 5.7% 5.8% 6.6% 7.1% 8.4% NM NM
Momentum *
Services Revenue Growth 38.3% 10.7% 10.5% 6.9% 8.4% 7.3% 5.8% NM NM EBITDA Growth 13.5% -0.7% 5.3% 11.5% 8.2% 10.8% 8.7% NM NM Net Income Growth 5.9% -24.0% 12.4% 11.0% 22.4% 15.4% 23.2% NM NM EPS Growth 5.8% -24.2% 12.4% 11.0% 22.4% 15.4% 23.2% NM NM
* 2003 & 2004 growth rates calculated on the basis of pro forma results for 30 provinces.
** FCF Yield calculated as Unlevered FCF/Enterprise Value
Source: Company Data, Bear Stearns Asia Ltd. estimates.
Page 60 CHINA TELECOM SERVICES & EQUIPMENT: ’TWAS THE NIGHT BEFORE 3G…
Asian Equity Research
BEAR STEARNS
Figure 34. China Unicom: Summary of Assumptions
Based on Reported Historical Results CAGR YE 31 Dec 2003A 2004A 2005A 2006E 2007E 2008E 2009E 2010E '06E-'09E ARPU / Revenue Blended ARPU (GSM & CDMA) (CNY) 67.5 58.0 55.4 53.6 52.6 51.7 51.2 51.3 -1.5% Total Revenue (CNY mn) 67,636 79,332 87,050 94,254 101,536 108,240 114,137 120,167 6.6% GSM ARPU (CNY) 56.9 49.5 48.5 49.5 49.5 49.7 49.6 49.8 0.0%
- Usage ARPU 41 34 30 30 28 27 26 25 -4.7%—Monthly Fee ARPU 10 7 6 6 5 5 5 4 -6.6%—Data ARPU 2 2 4 4 4 5 5 5 4.0%—VAS & Other ARPU 1 3 5 6 8 9 10 11 15.6%—Interconnection & Other ARPU 3 3 3 4 4 4 5 5 9.1%
CDMA ARPU 128.4 86.3 75.9 65.5 61.5 57.8 56.1 56.1 -5.0%
- Usage ARPU * 90 58 46 36 32 28 26 26 -10.0%—Monthly Fee ARPU 27 17 14 13 11 11 10 10 -6.5%—VAS & Other ARPU 7 9 13 13 14 15 16 16 5.2%—Interconnection & Other ARPU 5 3 4 4 4 4 4 4 3.1% ARPU GROWTH (2003 and 2004 are Pro Forma) -4.9% -13.2% -4.4% -3.2% -2.0% -1.7% -0.9% 0.2% NM
- GSM ARPU Growth (%) -16% -13% -2% 2% 0% 0% 0% 0% NM —CDMA ARPU Growth (%) -26% -32% -12% -14% -6% -6% -3% 0% NM
Revenue Growth 34.6% 9.7% 9.7% 8.3% 7.7% 6.6% 5.4% 5.3% NM
Usage Assumptions
Total Network Minutes (bn) 167 261 319 397 471 569 664 745 18.7% —Growth (%) 70% 36% 22% 24% 19% 21% 17% 12% NM Blended MOU (Mo) 198 214 222 245 261 288 313 333 8.6% GSM 175 190 202 235 256 287 318 341 10.6% CDMA 338 292 277 274 276 290 300 310 3.1% Blended ARPM (ARPU/MOU) (CNY/min.) 0.34 0.27 0.250 0.22 0.20 0.18 0.16 0.15 -9.3% GSM 0.32 0.26 0.240 0.21 0.19 0.17 0.16 0.15 - -9.5% CDMA 0.38 0.30 0.274 0.24 0.22 0.20 0.19 0.18 -7.9% Blended Usage Tariff (Usage ARPU/MOU) 0.24 0.18 0.15 0.13 0.11 0.09 0.08 0.07 -13.6% GSM 0.24 0.18 0.15 0.13 0.11 0.09 0.08 0.07 -13.8% CDMA 0.27 0.20 0.17 0.13 0.12 0.10 0.09 0.08 -12.7%
Subscriber Assumptions
Period end Subscribers (000s) 80,833 112,082 127,794 142,350 158,193 171,447 181,568 190,902 8.4% Pro Forma Subscriber Growth (%) 35.4% 22.5% 14.0% 11.4% 11.1% 8.4% 5.9% 5.1% —Contract GSM Subscribers (000s) 32,458 42,844 48,166 54,300 61,615 67,556 72,008 75,975 9.9% —Prepaid GSM Subscribers (000s) 31,465 41,423 46,905 51,800 57,318 62,179 66,127 70,094 8.5% —CDMA Contract Subscribers (000s) 16,046 25,824 30,010 33,300 36,160 38,489 40,124 41,454 6.4% —CDMA Prepaid Subscribers (000s) 864 1,991 2,713 2,950 3,101 3,223 3,309 3,379 3.9%
Operating Expenses / Service Revene (%)
Leased lines 1.3% 1.0% 0.9% 0.7% 0.6% 0.6% 0.6% 0.5% NM Leased CDMA Capacity 5.7% 9.0% 9.9% 9.5% 9.2% 8.6% 8.3% 8.1% NM Net Interconnection Expense (GSM, CDMA & Fixed Line 4.5% 4.6% 3.5% 2.8% 2.9% 2.8% 2.8% 2.9% NM
—Interconnection charges 9.6% 9.9% 9.9% 9.9% 10.3% 11.0% 11.7% 12.3% NM —Interconnection revenue 5.1% 5.3% 6.4% 7.1% 7.4% 8.2% 9.0% 9.4% NM
Personnel 7.4% 6.1% 6.9% 8.0% 8.7% 8.9% 9.3% 9.4% NM Sales and Marketing 24.4% 25.5% 25.2% 23.5% 23.1% 21.6% 20.3% 19.5% NM General Admin and Other 14.7% 14.1% 14.4% 14.7% 14.0% 13.8% 13.1% 12.5% NM Opex (ex Dep.): Service Revenue (%) 63.0% 65.5% 67.2% 66.3% 66.0% 64.5% 63.3% 62.3% NM
Capital Expenditure
Capex (Reported) 19,755 18,164 17,613 23,000 23,000 23,000 22,000 20,000 -1.5% Capex / Service Revenue (%) 30.8% 23.8% 20.9% 25.5% 23.5% 21.9% 19.9% 17.1% NM
—Capex / Service Revenue (ex CDMA) (%) 41.7% 34.9% 31.1% 36.5% 33.0% 30.0% 26.8% 22.9% NM Subscriber Capacity (GSM) (000 subs) 68,050 84,552 89,461 107,172 122,611 136,563 145,406 153,757 10.7% Capex / Avg. Subscriber $ 34 $ 22 $ 18 $ 21 $ 20 $ 18 $ 16 $ 14 -8.7% Capex per Net Addition $ 113 $ 107 $ 137 $ 198 $ 186 $ 227 $ 284 $ 280 12.7% Capex / Incremental Minute (US$) 0.061 0.063 0.055 0.044 0.047 0.037 0.035 0.037 -7.2% * Outgoing MOU includes On-net calls.
** Segmental EBITDA margin excludes equipment sales and cost.
Source: Company Data, Bear Stearns Asia Ltd. estimates.
BEAR STEARNS ASIA LTD. Page 61
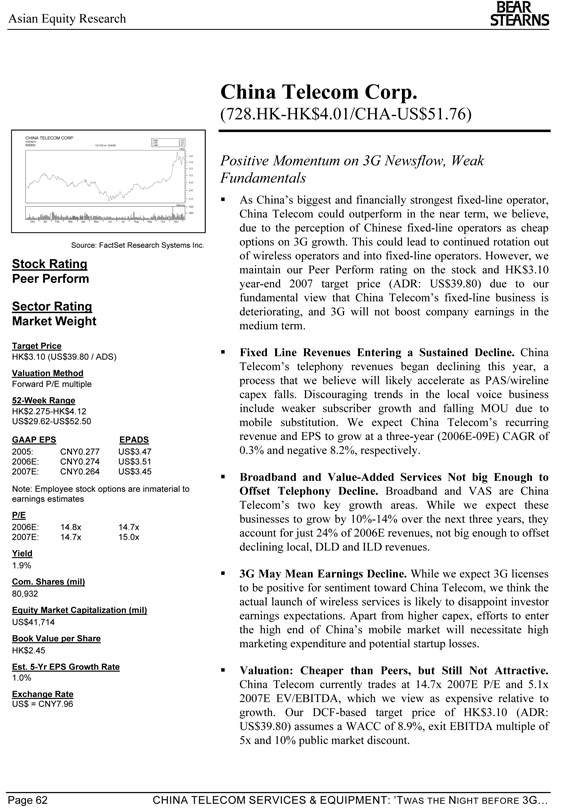
Asian Equity Research
BEAR STEARNS
China Telecom Corp.
(728.HK-HK$4.01/CHA-US$51.76)
CHINA TELECOM CORP
High: 3.74 'H'CNY1 Low: 2.35 655933 12/1/05 to 12/4/06 Last: 3.47 HKD
3.6
3.4 | | Positive Momentum on 3G Newsflow, Weak |
3.2
2.8
2.6
2.4 | | As China’s biggest and financially strongest fixed-line operator, |
Millions 520
260 China Telecom could outperform in the near term, we believe, Dec Jan Feb Mar Apr May Jun Jul Aug Sep Oct Nov due to the perception of Chinese fixed-line operators as cheap Source: FactSet Research Systems Inc. options on 3G growth. This could lead to continued rotation out of wireless operators and into fixed-line operators. However, we
Stock Rating maintain our Peer Perform rating on the stock and HK$3.10 Peer Perform year-end 2007 target price (ADR: US$39.80) due to our fundamental view that China Telecom’s fixed-line business is Sector Rating deteriorating, and 3G will not boost company earnings in the
Market Weight medium term.
Target Price
HK$3.10 | | (US$39.80 / ADS) ?? Fixed Line Revenues Entering a Sustained Decline. China |
Telecom’s telephony revenues began declining this year, a
Valuation Method
Forward P/E multiple process that we believe will likely accelerate as PAS/wireline capex falls. Discouraging trends in the local voice business
52-Week Range
HK$2.275-HK$4.12 include weaker subscriber growth and falling MOU due to US$29.62-US$52.50 mobile substitution. We expect China Telecom’s recurring GAAP EPS EPADS revenue and EPS to grow at a three-year (2006E-09E) CAGR of 2005: CNY0.277 US$3.47 0.3% and negative 8.2%, respectively.
2006E: CNY0.274 US$3.51
2007E: CNY0.264 US$3.45 ?? Broadband and Value-Added Services Not big Enough to
Note: Employee stock options are inmaterial to Offset Telephony Decline. Broadband and VAS are China earnings estimates
Telecom’s two key growth areas. While we expect these P/E businesses to grow by 10%-14% over the next three years, they 2006E: 14.8x 14.7x account for just 24% of 2006E revenues, not big enough to offset
2007E: 14.7x 15.0x
declining local, DLD and ILD revenues.
Yield
1.9%
3G May Mean Earnings Decline. While we expect 3G licenses
Com. Shares (mil)
to be positive for sentiment toward China Telecom, we think the
80,932
actual launch of wireless services is likely to disappoint investor Equity Market Capitalization (mil) earnings expectations. Apart from higher capex, efforts to enter
US$41,714
the high end of China’s mobile market will necessitate high Book Value per Share marketing expenditure and potential startup losses.
HK$2.45
Est. 5-Yr EPS Growth Rate ?? Valuation: Cheaper than Peers, but Still Not Attractive.
1.0%
China Telecom currently trades at 14.7x 2007E P/E and 5.1x Exchange Rate 2007E EV/EBITDA, which we view as expensive relative to
US$ = CNY7.96
growth. Our DCF-based target price of HK$3.10 (ADR: US$39.80) assumes a WACC of 8.9%, exit EBITDA multiple of 5x and 10% public market discount.
Page 62 CHINA TELECOM SERVICES & EQUIPMENT: ’TWAS THE NIGHT BEFORE 3G…
Asian Equity Research
BEAR STEARNS
Overview: Mobile Ambitions Overshadowed by Declining Core Business and Uncertain 3G Economics. We are optimistic on the outlook for China Telecom’s near-term stock performance, which is being driven by strong performance of the Chinese wireless operators and positive sentiment on hopes that imminent 3G licensing will improve the company’s long-term outlook. Longer term, however, we remain concerned about China Telecom’s declining core fixed-line business. Given our base case assumption of a greenfield 3G build, we also expect the reality of building a 3G network (heavy capex and marketing expenditures and a deteriorating competitive environment) to disappoint the market’s current expectations regarding China Telecom’s potential foray into mobile (renewed top- and bottom-line growth and competitive leverage from China Telecom’s existing fixed-line subscriber base). Weighing the short-term positives against the long-term concerns, we maintain our Peer Perform rating. We recently raised our year-end 2007 price target to HK$3.10 (US$39.80 per ADR) from HK$2.80, which implies 9% downside from current levels (please refer to our note “Positive Momentum on 3G News flow, but Weak Fundamental Outlook”, November 13th).
3G Licensing Fuelling Positive Near-Term Sentiment. We believe that the market’s expectation of imminent 3G licensing in China will continue to fuel positive sentiment toward China’s fixed-line operators – particularly China Telecom – that that are expected to receive licenses. We believe that our base case 3G scenario, with China Telecom receiving a WCDMA license and mobile incumbent China Mobile receiving a TD-SCDMA license, would likely be positive for China Telecom shares in the near term. If China Telecom were to receive an existing 2G network (likely from China Unicom) in an industry restructuring, we believe that this would also be viewed positively by investors. In fact, even if China Telecom were saddled with TD-SCDMA responsibility, by far the “worst case” 3G scenario for China Telecom, in our view, the news could be viewed positively by investors due to the expectation that the MII would compensate for the technological disadvantage via subsidies and potential asymmetric regulation. In addition, we think that China Telecom could also benefit from a near-term rotation out of the mobile operators and into the fixed-line carriers, as China Telecom has underperformed year to date (up 41%) versus China Mobile (+74%) and China Unicom (+45%).
Fixed-Line Business in Sustained Decline. We expect China Telecom’s fixed-line business to enter prolonged decline in 2006, driven by mobile substitution and continued intense competition in DLD and ILD (also caused by mobile operators) in China. We expect to see continued strong performance from the company’s growth segments, Internet and VAS, but this growth is simply insufficient to offset declines in China Telecom’s core business, we feel.
?? Local Voice: Mobile Operators Eating China Telecom’s Lunch. We believe that 2006 will be the first year that China Telecom experiences an absolute revenue decline in its local telephony business, with revenue expected to decline by 4.2% year on year to CNY77.6 billion. We expect total fixed-lines in service (including PAS) to grow by a tepid 5.9% to 222.5 million. We expect 51.7% of China Telecom’s 12.4 million 2006 net additions will come from PAS subscribers. However, PAS is now being primarily marketed to existing fixed-
BEAR STEARNS ASIA LTD. Page 63
Asian Equity Research
BEAR STEARNS
line subscribers as a subscriber retention tool, and we believe that existing fixed line subscribers now comprise more than 50% of PAS net adds in some areas. Therefore, we expect to see a 14.3% decline in MOU in 2006 (compared with an 8.3% decline in 2005) as many of these “new” PAS additions will actually cannibalize existing fixed-line MOU. We expect that residential lines, the largest single pool of subscribers, will grow by just 2.8% in 2006 to 121.3 million. We also assume that China Telecom will begin to see residential line loss beginning in 2008, which could prove generous given that China Telecom’s northern neighbor China Netcom experienced sequential net residential line losses in third-quarter 2006.
?? 3G Licensing Could Exacerbate Existing Trends. Our current model assumes a continuation of existing trends, with total subscribers growing at a snail-like three-year (2006-09E) CAGR of 1.0% and MOU declining at a three-year CAGR of 7.4%, resulting in a three-year local voice revenue CAGR of -6.3% over the period. We believe these assumptions are reasonable in a status quo scenario (i.e., not factoring in 3G). However, these trends could potentially become more pronounced as China Telecom begins to roll out 3G, as we expect that the company would reallocate significant amounts of capex, marketing expenditure and labor away from fixed line and toward 3G.
?? DLD and ILD Declines to Persist. China Telecom saw declining DLD and ILD revenues in 2005 due to market share shifts and VOIP tariff competition among China’s fixed-line and mobile operators. We expect these trends to continue in 2006 and future years. We have forecast growth in ILD traffic in 2008 due to the Beijing Olympics, along with pre- and post-Olympic activities. However, we expect DLD revenues to decline at a three-year (2006-09E) CAGR of 5.3% and ILD revenues to decline at a CAGR of 3.0% over the period.
?? Interconnection Revenues: Compensatory Morsels from the Mobile Dining Table. Due to the China’s current one-way interconnection regime, with fixed-line operators receiving interconnection revenues from mobile operators (but not vice versa), we expect to see continued growth in China Telecom’s interconnection revenues – increasing at a three-year CAGR (2006-09E) of 7.4%.
However, we do not expect these table scraps from China’s burgeoning mobile industry (accounting for only 7.3% of total forecast recurring revenue in 2006) to improve China Telecom’s overall growth prospects. In addition, as mobile-to-mobile calls continue to make up a greater portion of total traffic over China’s mobile networks, we expect China Telecom to benefit less and less from rising mobile traffic.
?? Broadband Trends Positive, but Not Positive Enough. Broadband adoption has been a major growth area for China Telecom over the past few years. We expect total broadband subscribers to increase by 39.7% in 2006 and to continue to grow at a three-year CAGR (2006-09E) of 20.6%. Due to falling broadband ARPU and declining dial-up Internet revenues, we expect that total Internet revenues will grow by only 32.4% in 2006, at a 2006-09E CAGR of 13.7%.
Page 64 CHINA TELECOM SERVICES & EQUIPMENT: ’TWAS THE NIGHT BEFORE 3G…
Asian Equity Research
BEAR STEARNS
Forecast 2006 Internet revenues of CNY23.6 billion represent 14.0% of China Telecom’s total 2006E recurring revenue, rising to 20.4% by 2009E.
IPTV Probably Not a Significant Revenue Contributor for the Next Three Years. China Telecom has been experimenting with IPTV as a way to increase broadband uptake and bolster broadband ARPU. However, we remain cautious over the prospects for IPTV in the near term due to regulatory uncertainties. SARFT, China’s broadcasting regulator, has recently become more willing to allow IPTV to grow alongside the digital cable standard that it has been championing. However, SARFT is unlikely to loosen its grasp on content and programming, particularly at the local level. As it stands, China Telecom currently has a handful of IPTV trial networks up and running, the largest of which is in Shanghai. China Telecom operates this network in cooperation with Shanghai Media Group (SMG), a media conglomerate under direct supervision of the Shanghai branch of SARFT.
Extrapolating from the Shanghai Experience. China Telecom’s Shanghai
IPTV trial network currently provides TV applications, including broadcast TV programming, time shifting functionality, and video on demand (VOD) content. China Telecom hopes to provide various value-added services via the IPTV platform in the future, which would not fall under the regulatory control of SARFT. The company expects that its Shanghai trial network will have 50,000 subscribers by the end of 2006. IPTV services are currently provided at CNY60 per month (during the trial period) on top of the average Shanghai broadband ARPU of CNY110 per month (versus the nationwide average of CNY77 per month). The revenue share arrangement with SMG is 60/40, with the larger portion going to the party that acquires the subscriber (in practice, China Telecom acquires most IPTV subscribers). Given these economics (and assuming that 50% of IPTV subscribers are new broadband subscribers), our back-of-the-envelope estimate shows that China Telecom would need to scale its IPTV subscriber base to at least 9.5 million before seeing meaningful (~5%) revenue impact from IPTV. This number is close to one-third of our estimated 2006 year-end broadband subscriber base for China Telecom and would likely be more difficult to achieve than it sounds. A major constraint on ITPV subscriber growth is that China Telecom will need to make separate deals with local media groups across China. There are now only four nationwide IPTV broadcast license holders.
Strong VAS Growth Likely to Slow. China Telecom has recently focused its efforts on expanding its VAS revenues, consisting of traditional VAS such as caller-ID and SMS, on its PAS network, as well as on ICT services provided to SMEs in China. We expect that these revenues will grow 26.6% year on year in 2006. However, with China Telecom’s overall fixed-line subscriber base remaining stagnant, we believe that ICT services will remain a niche business for China Telecom and thus growth will likely slow in subsequent years. We currently assume that China Telecom’s total “Other” revenues (including traditional VAS and ICT revenues) will grow at a three-year 2006-09E CAGR of 10.3%.
BEAR STEARNS ASIA LTD. Page 65
Asian Equity Research
BEAR STEARNS
3G Likely to Be Dilutive. While we believe that 3G licensing will likely be a source of near-term upside for China Telecom shares, we expect the implementation of 3G to be a greater challenge than the market is currently anticipating.
Capex Likely to Exceed Expectations. While China Telecom’s stated strategy with respect to 3G is to build primarily in large cities in China’s wealthy coastal regions, we believe that for 3G to succeed as a high-end product, nationwide coverage will be imperative. While there has been some speculation in the market (including public statements by China Mobile CEO Wang Jianzhou) that the MII will require existing mobile operators to share network resources and offer roaming services to subscribers of the new 3G entrants, China Telecom would likely have to pay for these benefits, making this more of a short-term solution. We believe that China Telecom will eventually need to build a nationwide 3G network comparable to China Mobile’s current network in order to remain a viable choice for high-end subscribers. The capex requirement for a nationwide 3G network would likely be many times the amount required for more selective coverage in first-tier cities. The resulting depreciation charges would likely be a drag on China Telecom’s earnings for several years as network utilization rises from low levels.
High-End Competition Challenging. As we noted above, we believe that China Telecom will likely first enter the high end of the mobile market. This would entail taking subscribers from China Mobile (currently the high-end operator of choice), which would require significant handset subsidies as well as attractive tariff plans. China Mobile would likely react aggressively to attempts to poach its most valuable subscribers, as it has in the past when China Unicom introduced CDMA as a high-end product in 2002-03. In fact, we believe that China Mobile has been busy offering handset subsidies to its best subscribers already, as we have observed in our past Off-Road Wireless Surveys. Therefore, we expect that China Telecom may face an even greater challenge than China Unicom encountered with CDMA.
Acquisition of a 2G Network Helpful, but Most Likely Dilutive. If China
Telecom acquired one of China Unicom’s existing 2G networks (not our base case 3G/restructuring scenario), it would definitely help the fixed-line operator establish nationwide coverage more rapidly, but such a transaction would also be dilutive from an EPS standpoint, according to our estimates. If China Telecom were to acquire the CDMA network, it would have to face the same set of problems that have plagued China Unicom since the launch of the network in 2002. China Telecom would still need to rely on handset subsidies for subscriber acquisition/retention while at the same time stepping up marketing efforts to revive the CDMA network’s tarnished brand image. If, on the other hand, China Telecom acquired China Unicom’s GSM network (less likely, in our view), the company would be better positioned, with a sizeable subscriber base, and a mainstream network technology. Even so, we believe that the transaction would be dilutive, as the GSM network would command a higher valuation than China Telecom’s own current trading valuation.
Page 66 CHINA TELECOM SERVICES & EQUIPMENT: ’TWAS THE NIGHT BEFORE 3G…
Asian Equity Research
BEAR STEARNS
Figure 35. China Telecom: Financial Summary & Ratios
CHINA TELECOM: Financial Summary & Ratios CAGR YE 31 Dec (CNY mn) 2003A 2004A 2005A 2006E 2007E 2008E 2009E 2010E '06E-'09E Per Share
Reported EPS (CNY) 0.326 0.346 0.345 0.338 0.314 0.289 0.261 0.243 -8.2%—Reported EPS (HKD) 0.307 0.325 0.328 0.330 0.313 0.294 0.266 0.247 -7.0%—Reported EPS (USD) 3.94 4.18 4.21 4.24 4.03 3.77 3.41 3.17 -7.0% Recurring EPS (CNY) 0.222 0.242 0.261 0.277 0.274 0.264 0.247 0.237 -3.7% Recurring EPS (HKD) 0.209 0.227 0.248 0.270 0.273 0.268 0.251 0.241 -2.4% Recurring EPADR (USD) 2.68 2.92 3.19 3.47 3.51 3.45 3.23 3.09 -2.4% DPS (HKD) 0.065 0.065 0.075 0.075 0.077 0.078 0.078 0.078 1.3%
Value (Based on Recurring Items)
EV/Revenue (x) 4.0x 2.9x 2.7x 2.6x 2.6x 2.6x 2.6x 2.6x NM EV/EBITDA (x) 7.7x 5.6x 5.4x 5.1x 5.1x 5.2x 5.3x 5.4x NM EV/EBIT (x) 18.0x 14.1x 13.7x 12.7x 12.8x 13.3x 14.2x 14.8x NM EV/FCF (x) 94.7x 28.3x 24.2x 16.4x 14.2x 13.4x 12.9x 12.2x NM EV/Op FCF (x) 4.4x 3.3x 3.3x 3.2x 3.4x 3.5x 3.7x 3.8x NM P/FCF (x) 74.1x 22.1x 19.0x 12.8x 11.1x 10.5x 10.1x 9.6x NM P/E (x) 19.2x 17.7x 16.2x 14.8x 14.7x 15.0x 16.0x 16.7x NM P/CE (x) 5.6x 4.3x 4.2x 4.1x 4.2x 4.3x 4.5x 4.5x NM Price/ Book 2.5x 2.0x 1.8x 1.6x 1.5x 1.4x 1.3x 1.2x NM
Yield Analysis
FCF Yield (FCFF/EV) 1.1% 3.5% 4.1% 6.1% 7.0% 7.5% 7.7% 8.2% NM Dividend Yield 1.6% 1.6% 1.9% 1.9% 1.9% 1.9% 1.9% 1.9% NM Earnings Yield 5.2% 5.7% 6.2% 6.7% 6.8% 6.7% 6.3% 6.0% NM
Recurring Profit & Loss (Excluding Upfront Connection Fee)
Revenue 110,566 152,754 162,529 169,378 171,332 171,958 170,898 168,852 0.3% EBITDA 57,484 78,542 81,825 86,005 85,803 84,673 82,801 81,599 -1.3% EBIT 24,563 31,372 32,173 34,816 34,434 33,140 31,116 29,774 -3.7% CE 49,722 66,735 70,783 73,567 73,525 72,881 71,672 70,986 -0.9% Pretax Profit 22,790 24,805 27,333 29,314 29,502 28,732 27,092 26,162 -2.6% Net Income 16,801 19,565 21,131 22,378 22,156 21,348 19,988 19,161 -3.7%
Cash Flow
Operating Cash Flow 47,774 60,942 74,888 78,933 77,075 75,007 73,147 72,019 -2.5% Change in Net Working Capital(11,613) (8,886) (9,508) (5,049) (4,677) (4,304) (3,700) (3,077) -9.8% Capex 42,819 56,307 53,864 51,000 45,000 41,000 38,000 35,000 -9.3% Adjusted OpFCF 100,303 134,849 135,689 137,005 130,803 125,673 120,801 116,599 -4.1% Unlevered Free Cash Flow 4,661 15,596 18,200 26,956 31,045 33,015 34,195 36,124 8.3%
Balance Sheet
S/T Debt 46,531 77,818 84,968 60,750 56,250 56,250 56,250 56,250 -2.5% L/T Debt 49,665 72,366 55,777 74,250 68,750 68,750 68,750 68,750 - -2.5% Net Debt (Cash) 85,649 136,404 125,332 109,255 88,030 64,059 38,346 10,134 NM Net Debt/ Equity 65.2% 85.7% 69.0% 53.9% 39.7% 26.8% 15.1% 3.8% NM Shareholders Equity 131,272 159,206 181,517 202,650 221,890 239,049 253,977 267,425 7.8% Net Debt / EBITDA 1.5 1.7 1.5 1.3 1.0 0.8 0.5 0.1 NM
Efficiency (Based on Recurring Earnings)
Adjusted ROE (Average) 11.8% 12.6% 12.4% 11.7% 10.4% 9.3% 8.1% 7.3% NM Adjusted ROA (Average) 5.5% 4.8% 5.1% 5.3% 5.2% 4.9% 4.4% 4.1% NM Adjusted ROIC (Average) 6.6% 5.9% 6.2% 6.4% 6.2% 5.8% 5.2% 4.9% NM
Recurring Profitability
EBITDA Margin 52.0% 51.4% 50.3% 50.8% 50.1% 49.2% 48.5% 48.3% NM EBIT Margin 22.2% 20.5% 19.8% 20.6% 20.1% 19.3% 18.2% 17.6% NM Net Profit Margin 15.2% 12.8% 13.0% 13.2% 12.9% 12.4% 11.7% 11.3% NM
Momentum (Apples to Apples) 10 vs. 10 20 vs. 20
Rec. Revenue Growth 9.5% 7.9% 6.4% 4.2% 1.2% 0.4% -0.6% -1.2% NM Rec. EBITDA Growth 13.9% 12.4% 4.2% 5.1% -0.2% -1.3% -2.2% -1.5% NM Rec. Net Income Growth 5.6% -4.8% 8.0% 5.9% -1.0% -3.6% -6.4% -4.1% NM
Momentum (20 provinces)
Rec. Revenue Growth 8.6% 7.9% 6.4% 4.2% 1.2% 0.4% -0.6% -1.2% NM Rec. EBITDA Growth 15.8% 12.4% 4.2% 5.1% -0.2% -1.3% -2.2% -1.5% NM Rec. Net Income Growth 245.3% -4.8% 8.0% 5.9% -1.0% -3.6% -6.4% -4.1% NM
Source: Company Data, Bear Stearns Asia Ltd. estimates.
BEAR STEARNS ASIA LTD. Page 67
Asian Equity Research
BEAR STEARNS
Figure 36. China Telecom: Summary of Assumptions
** '99—'02 represents 4 provinces, '03 represents 10 provinces and '04E-'09E represents 20 provinces CAGR (%)
YE 31 Dec 2003A 2004A 2005A 2006E 2007E 2008E '06E-'09E '06E-'11E Subscriber Assumptions
Lines in Service (mn) 118.1 186.7 210.1 222.5 228.9 230.4 1.0% -0.2% Avg. LIS (mn) 107.4 173.8 198.4 216.3 225.7 229.6 2.1% 0.7% Residential Lines 79,415 113,100 118,000 121,273 123,120 122,582 -0.2% -1.1% —Growth (%)* 9.9% 4.6% 4.3% 2.8% 1.5% -0.4% NM NM Corporate Lines 13,615 19,000 20,900 22,144 22,842 23,073 1.7% 1.4% —Growth (%)* 9.3% 7.4% 10.0% 6.0% 3.2% 1.0% NM NM Public Telephones 6,715 12,400 14,100 15,583 16,218 16,525 2.5% 2.0% —Growth (%)* 39.9% 28.9% 13.7% 10.5% 4.1% 1.9% NM NM PAS Subscribers 18,346 42,200 57,100 63,532 66,700 68,236 2.8% 0.4% —Growth (%)* 153.4% 65.1% 35.3% 11.3% 5.0% 2.3% NM NM Broadband Subscribers (DSL / FTTH) 5,630 13,840 21,020 29,375 37,534 44,765 20.6% 17.4% —Growth (%) 200.4% 90.7% 51.9% 39.7% 27.8% 19.3% NM NM
Traffic
Local MOU / User / month (ex Dial-up) 228 206 189 162 146 136 -7.4% -5.9% Total Market Traffic: Local Minutes (bn) (ex Dial Up) 294.2 429.2 449.4 420.0 395.0 375.0 -5.5% -5.3% DLD Minutes (Outgoing) (bn) 53.8 82.0 93.8 94.7 95.5 96.0 0.2% -0.6% ILD Minutes (Outgoing) (mn) 1.6 1.7 1.7 1.7 1.6 1.8 3.9% 2.9%
China Telecom Minutes / Nationwide Minutes (%)
DLD Minutes* 38.8% 44.0% 42.4% 37.7% 34.1% 31.3% NM NM ILD Minutes * 50.2% 51.9% 46.0% 42.0% 40.0% 36.0% NM NM
Tariffs
Local (ex Dial-up Usage) 0.12 0.12 0.11 0.11 0.10 0.10 -2.0% -2.0% DLD (Blended) 0.37 0.32 0.28 0.27 0.26 0.25 -5.4% -5.3% ILD (Blended) 2.33 2.29 1.99 1.79 1.65 1.53 -6.7% -6.0% Leased Line: Tariffs (E1 / Mo) 30,443 24,515 22,612 20,351 18,315 16,484 -10.0% -10.0% Managed Data: 64Kb (CNY / Mo) 2,424 1,946 1,739 1,555 1,390 1,242 -10.6% -10.6%
Operating Costs (%) of Recurring Revenue
Network Operations and Support 20.6% 18.1% 18.7% 17.3% 17.3% 17.3% NM NM SG&A 11.0% 12.6% 12.2% 12.3% 12.3% 12.2% NM NM Personnel 13.8% 15.2% 15.4% 15.8% 16.2% 16.8% NM NM Net Interconnection Expense -3.2% -4.3% -4.5% -4.7% -5.0% -5.4% NM NM
—Interconnection Revenue 5.8% 7.0% 7.9% 8.5% 9.1% 9.8% NM NM —Interconnection Expense 2.6% 2.7% 3.4% 3.8% 4.1% 4.4% NM NM Depreciation 29.8% 30.9% 30.5% 30.2% 30.0% 30.0% NM NM
Capex
Capex (CNY mn) 42,819 56,307 53,864 51,000 45,000 41,000 -9.3% -8.9% Capex as % of Recurring Revenue 38.7% 36.9% 33.1% 30.1% 26.3% 23.8% NM NM
Source: Company Data, Bear Stearns Asia Ltd. estimates.
Page 68 CHINA TELECOM SERVICES & EQUIPMENT: ’TWAS THE NIGHT BEFORE 3G…

Asian Equity Research
BEAR STEARNS
China GrenTech Corp.
(GRRF-$16.55)
CHINA GRENTECH CRP -ADR-REDH
High: 19.00 ADR Low: 8.55 GRRF 3/30/06 to 12/4/06 Last: 15.65 USD
18
16 | | Top 3G Pick: Value, Well-Placed for Cyclical and |
14
10
Value Play on China 3G Theme. We believe China GrenTech
Millions 6.77
3.39(GRRF) is the most undervalued and fastest-growing company in
Dec Jan Feb Mar Apr May Jun Jul Aug Sep Oct Nov
our telco equipment universe. We estimate US$ revenue growth Source: FactSet Research Systems Inc. at 21% in 2006, vs. 9.9% growth for ZTE and consensus
Stock Rating estimates of 20% growth for Comba. In 2007, we expect GRRF Outperform to grow revenues by 58%, driven by 3G spending, base station RF modules, and market consolidation.
Sector Rating
Market Overweight ?? Expecting Wireless Coverage Capex to Rise 16% in 2007 Following a Lackluster 2006. In 2006, we believe that China's Target Price wireless coverage equipment industry revenue was relatively flat US$20 at CNY7.62 billion (US$957 million) due to pricing pressure on Valuation Method GSM equipment and weak China Unicom CDMA spending. In
Forward P/E multiple
2007 we expect coverage equipment revenue to reach CNY8.66 52-Week Range billion (US$1,110 million).
US$8.21-US$22.50
GAAP EPS EPADS ?? Margin Stabilization: Copper, Sales Mix. Gross margin fell
2005: US$1.09
2006E: US$0.84 by 640 bps (to 48%) in 2006E due to high cable prices, but 2007E: US$1.24 declining copper prices in June-December 2006 are allowing for Note: Employee stock options are inmaterial to margin stabilization. Margins for GRRF's other products earnings estimates declined gradually in 2006 due to pricing pressure but we expect P/E 3G equipment sales to slow GRRF's rate of margin erosion in
2006E: 19.6x 2007-08. 2007E: 13.3x
Dividend
2007E P/E OF 13.3x, US$2.31 IN NET CASH/SHARE. While
$0.0
we have reduced 2007 estimates on lower margin assumptions,
Yield
0.0% we maintain our year-end 2007 target price of US$20, which implies an 2007E P/E of 16.1x. We view GRRF as the most
Com. Shares (mil)
625 (ADS: 25mn) direct play on China's 3G network spending. GRRF is also attractive relative to its peers, ZTE (28.0x 2007E P/E) and
Equity Market Capitalization (mil)
US$414 Comba (15.7x 2007E P/E, based on consensus).
Book Value per Share
US$7.52
Risks to our price target and investment outlook include weaker-Est. 3-Yr EPS Growth Rate than-expected telecom capex in China and competitive risks.
24.4%
Exchange Rate
US$ = CNY7.96
BEAR STEARNS ASIA LTD. Page 69
Asian Equity Research
BEAR STEARNS
We consider China GrenTech to be the most attractively valued Asian telecom equipment stock in our coverage universe. It also offers pure-play exposure to the key theme that we expect to drive the sector over the next 12 months: China 3G licensing and network buildout. The company’s other growth driver, wireless base transceiver station (BTS) RF modules, will also become a significant revenue contributor in 2007 and should allow GrenTech to sustain a healthy growth rate even after 3G-related wireless coverage spending slows down (expected in 2009).
Figure 37. GrenTech—Quarterly Results Summary (CNY mn unless otherwise stated)
Reported Results Full-Year Ests. Q3 05A Q4 05A Q1 06A Q2 06A Q3 06A Q4 06E 2006E 2007E
Revenue 156.0 378.1 14.8 180.0 187.7 460.3 842.8 1,329.3 Gross Profit 80.1 203.6 8.0 89.5 89.1 216.3 402.8 582.5
Gross Margin (%) 51.3% 53.9% 54.1% 49.7% 47.4% 47.0% 47.8% 43.8%
Research & Development(7.5)(10.4)(8.4)(8.3)(13.9)(20.0)(50.6)(77.1) Sales & Distribution(26.0)(22.9)(24.1)(26.6)(25.9)(32.9)(109.6)(152.9) General & Administrative(10.4)(11.8)(11.1)(11.0)(11.4)(17.1)(50.6)(66.5) Operating Income /(loss) 36.3 158.5(35.6) 43.6 37.9 146.2 192.1 286.1
Operating Margin (%) 23.3% 41.9% -240.8% 24.2% 20.2% 31.8% 22.8% 21.5%
Net Income / (loss) 17.4 155.3(35.7) 39.4 30.7 125.3 159.8 241.9
Net Margin (%) 11.1% 41.1% -241.5% 21.9% 16.4% 27.2% 19.0% 18.2%
Dil. EPS (ord. sh., CNY) 0.03 0.31(0.07) 0.06 0.05 0.20 0.27 0.39 Dil. EPADS (US$) $0.11 $0.96($0.22) $0.20 $0.16 $0.64 $0.84 $1.24
Source: Company data, Bear Stearns Asia Ltd. estimates.
From a growth and profitability standpoint, 2006 was a tough year for all listed Chinese telecom equipment companies due to a slowdown in domestic CDMA and PAS spending (although PAS indoor coverage spending was strong), continued pricing pressure on legacy GSM equipment, rising commodity prices, and a working capital crunch at China Unicom. Although overall wireless capex was strong in 2006, we believe that a slowdown at China Unicom and pricing pressure at China Mobile caused a decline in wireless coverage revenues in 2006, meaning that vendors were forced to compete for market share in order to grow. From GrenTech’s perspective, we expect an improvement in most of these dynamics in 2007 for the following reasons:
Strong wireless capex: We expect overall wireless capex growth of 16% in 2007.
New technologies, less price pressure: We expect WCDMA, TD SCDMA, and CDMA 2000 EV DO products to alleviate the pricing pressure that has weighed down sales and margins for GSM, PAS, and CDMA2000 1xRTT products for the past three years.
China Mobile centralized procurement a mixed positive: China Mobile will apply its centralized procurement policy to wireless coverage equipment for the first time in 2007. While centralized procurement entails competitive bidding and pricing pressure, it will also give GrenTech an opportunity to gain market share at the No.1 operator. Furthermore, centralized procurement will eliminate the most price competitive vendors in the market – the small, regionally specific
Page 70 CHINA TELECOM SERVICES & EQUIPMENT: ’TWAS THE NIGHT BEFORE 3G…
Asian Equity Research
BEAR STEARNS
vendors. It is also worthy of note that GrenTech’s working capital burden will likely decline if China Mobile rises as a proportion of overall revenue, as China Mobile’s payments terms are much more vendor-friendly than China Unicom’s. GrenTech estimates that more than 50% of its receivables, for example, are related to China Unicom, even though it makes up only around 40%-45% of sales in a given quarter.
Copper prices less of a factor in 2007: Due to copper’s rise from US$2.20/pound in late December 2005 to a high of US$3.99/pound in mid-May 2006, GrenTech experienced rising coaxial cable costs, one of the main reasons for an estimated 640bps decline in gross margins in 2006. Copper has since stabilized at around US$3.20, leading to a decline in coaxial cable prices.
R&D investment paying off as RF Modules and 3G products begin to ship in 2007: We expect 3G products to make up 50% or more of GrenTech’s 2007E wireless coverage revenues and for BTS RF modules to rise from less than 2% of 2006 sales to an estimated 13% in 2007E. We believe that GrenTech may begin to see some operating leverage due to the fact that much of the company’s 2005 and 2006 R&D expenditures were related to products that were not yet commercial, leading to a rise in R&D costs, relative to revenue. R&D could potentially fall in relation to revenue as GrenTech realizes the benefits of its historical spending.
Wireless Coverage Segment (94.8% of 2006E Revenue): Revenue Assumptions and Market Environment. We believe that wireless coverage capex rose only marginally in CNY terms (rising by 3% in US$ terms) in 2006, totaling CNY7.62 billion versus CNY7.60 billion in 2005. While China Mobile and the fixed-line operators increased their spending by more than this amount (we estimate an 8% rise at China Mobile and a 45% rise at the fixed-line operators), the decline in China Unicom’s CDMA capex more than offset a rise in its GSM coverage spending. GrenTech was more affected by the China Unicom shortfall than Comba Telecom Systems (2342.HK-HIK$3.60; Not Rated) due to the fact that 42% of GrenTech’s 2006E revenue will be attributable to China Unicom, while Comba will only source an estimated 22% of 2006E revenue from China Unicom (based on consensus revenue estimates from Thomson). Still, GrenTech was able to increase its market share in a flat market, growing 2006E revenue by 17.7% in CNY terms (21% in U.S. dollar terms) due to rising PAS coverage spending by the wireline operators and market share gains at China Mobile. By comparison, consensus expectations imply 2006E revenue growth of 20.5% for Comba (in US dollar terms).
In 2007, we expect China’s wireless coverage capex to rise by 13.7% in CNY terms (16% in US dollar terms), tracking the expected rise in wireless capex. This large jump in coverage capex will be driven by 3G network buildouts, expected to begin in second-quarter 2007. We believe that operators have been delaying some of their indoor coverage spending due to uncertainty over which technologies would be adopted. When 3G licenses are issued (expected in first quarter 2007), the technology decision will be clear and a great deal of pent-up demand will be released. Key sources of spending will be: 1) upgrades of existing indoor coverage to be 3G-compliant; 2) greenfield builds by new market entrants; and 3) resumed spending by China Unicom’s parentco, which will begin upgrading its CDMA 1xRTT indoor
BEAR STEARNS ASIA LTD. Page 71
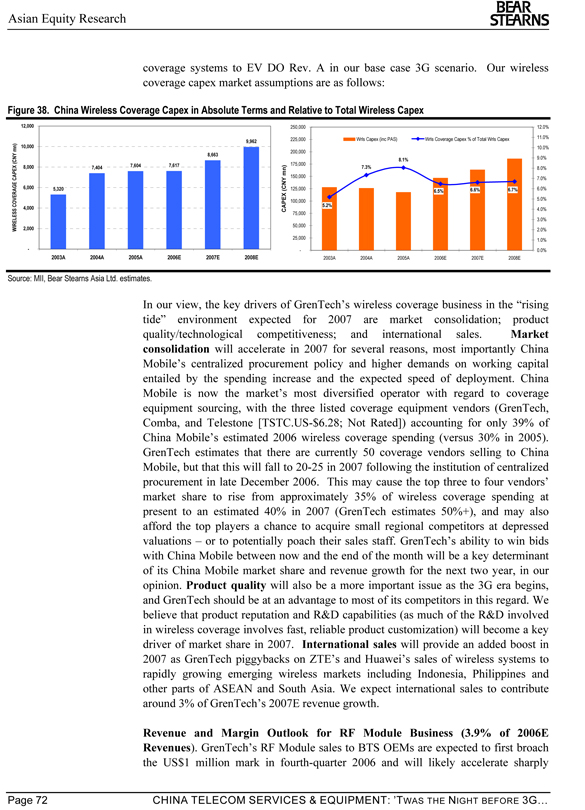
Asian Equity Research
BEAR STEARNS
coverage systems to EV DO Rev. A in our base case 3G scenario. Our wireless coverage capex market assumptions are as follows:
Figure 38. China Wireless Coverage Capex in Absolute Terms and Relative to Total Wireless Capex
12,000 250,000 12.0% 225,000 Wrls Capex (inc PAS) Wrls Coverage Capex % of Total Wrls Capex 11.0%
9,962
10,000 10.0% 200,000
8,663
8.1% | | 9.0% 7,604 7,617 175,000 8,000 7,404 7.3% 8.0% 150,000 7.0% |
6,000 5,320 125,000 6.6% 6.7% 6.0% 6.5%
100,000 5.0%
5.2%
4,000 CAPEX (CNY mn) 4.0% 75,000 3.0% 50,000
WIRELESS COVERAGE CAPEX (CNY mn) 2,000 2.0% 25,000 1.0%
— 0.0%
2003A 2004A 2005A 2006E 2007E 2008E 2003A 2004A 2005A 2006E 2007E 2008E
Source: MII, Bear Stearns Asia Ltd. estimates.
In our view, the key drivers of GrenTech’s wireless coverage business in the “rising tide” environment expected for 2007 are market consolidation; product quality/technological competitiveness; and international sales. Market consolidation will accelerate in 2007 for several reasons, most importantly China Mobile’s centralized procurement policy and higher demands on working capital entailed by the spending increase and the expected speed of deployment. China Mobile is now the market’s most diversified operator with regard to coverage equipment sourcing, with the three listed coverage equipment vendors (GrenTech, Comba, and Telestone [TSTC.US-$6.28; Not Rated]) accounting for only 39% of China Mobile’s estimated 2006 wireless coverage spending (versus 30% in 2005). GrenTech estimates that there are currently 50 coverage vendors selling to China Mobile, but that this will fall to 20-25 in 2007 following the institution of centralized procurement in late December 2006. This may cause the top three to four vendors’ market share to rise from approximately 35% of wireless coverage spending at present to an estimated 40% in 2007 (GrenTech estimates 50%+), and may also afford the top players a chance to acquire small regional competitors at depressed valuations – or to potentially poach their sales staff. GrenTech’s ability to win bids with China Mobile between now and the end of the month will be a key determinant of its China Mobile market share and revenue growth for the next two year, in our opinion. Product quality will also be a more important issue as the 3G era begins, and GrenTech should be at an advantage to most of its competitors in this regard. We believe that product reputation and R&D capabilities (as much of the R&D involved in wireless coverage involves fast, reliable product customization) will become a key driver of market share in 2007. International sales will provide an added boost in 2007 as GrenTech piggybacks on ZTE’s and Huawei’s sales of wireless systems to rapidly growing emerging wireless markets including Indonesia, Philippines and other parts of ASEAN and South Asia. We expect international sales to contribute around 3% of GrenTech’s 2007E revenue growth.
Revenue and Margin Outlook for RF Module Business (3.9% of 2006E Revenues). GrenTech’s RF Module sales to BTS OEMs are expected to first broach the US$1 million mark in fourth-quarter 2006 and will likely accelerate sharply
Page 72 CHINA TELECOM SERVICES & EQUIPMENT: ’TWAS THE NIGHT BEFORE 3G…
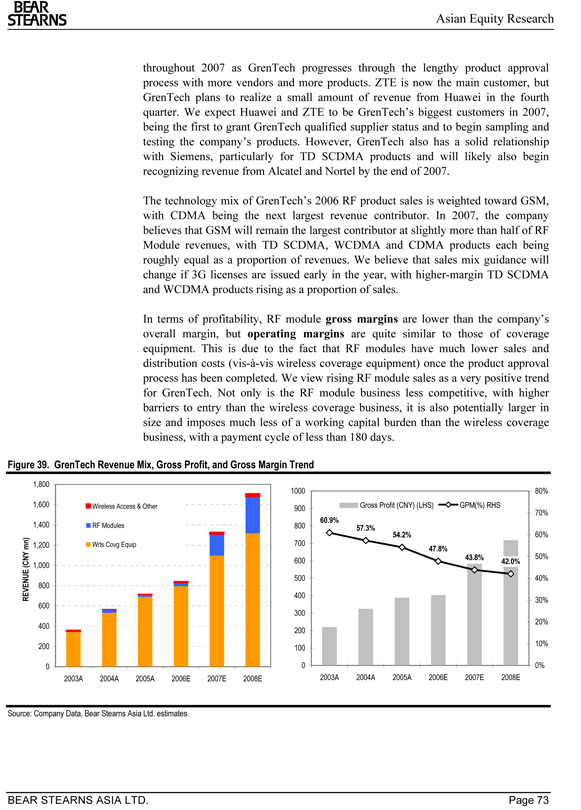
Asian Equity Research
BEAR STEARNS
throughout 2007 as GrenTech progresses through the lengthy product approval process with more vendors and more products. ZTE is now the main customer, but GrenTech plans to realize a small amount of revenue from Huawei in the fourth quarter. We expect Huawei and ZTE to be GrenTech’s biggest customers in 2007, being the first to grant GrenTech qualified supplier status and to begin sampling and testing the company’s products. However, GrenTech also has a solid relationship with Siemens, particularly for TD SCDMA products and will likely also begin recognizing revenue from Alcatel and Nortel by the end of 2007.
The technology mix of GrenTech’s 2006 RF product sales is weighted toward GSM, with CDMA being the next largest revenue contributor. In 2007, the company believes that GSM will remain the largest contributor at slightly more than half of RF Module revenues, with TD SCDMA, WCDMA and CDMA products each being roughly equal as a proportion of revenues. We believe that sales mix guidance will change if 3G licenses are issued early in the year, with higher-margin TD SCDMA and WCDMA products rising as a proportion of sales.
In terms of profitability, RF module gross margins are lower than the company’s overall margin, but operating margins are quite similar to those of coverage equipment. This is due to the fact that RF modules have much lower sales and distribution costs (vis-à-vis wireless coverage equipment) once the product approval process has been completed. We view rising RF module sales as a very positive trend for GrenTech. Not only is the RF module business less competitive, with higher barriers to entry than the wireless coverage business, it is also potentially larger in size and imposes much less of a working capital burden than the wireless coverage business, with a payment cycle of less than 180 days.
Figure 39. GrenTech Revenue Mix, Gross Profit, and Gross Margin Trend
1,800
1000 80% 1,600 Wireless Access & Other Gross Profit (CNY) (LHS) GPM(%) RHS
900
70%
60.9%
1,400 RF Modules 800 57.3%
54.2% | | 60% 1,200 Wrls Covg Equip 700 |
47.8%
1,000
500 40% 800
REVENUE (CNY mn) 400
30% 600 300 20% 400 200 200 10% 100
0 0 0% 2003A 2004A 2005A 2006E 2007E 2008E 2003A 2004A 2005A 2006E 2007E 2008E
Source: Company Data, Bear Stearns Asia Ltd. estimates.
BEAR STEARNS ASIA LTD. Page 73
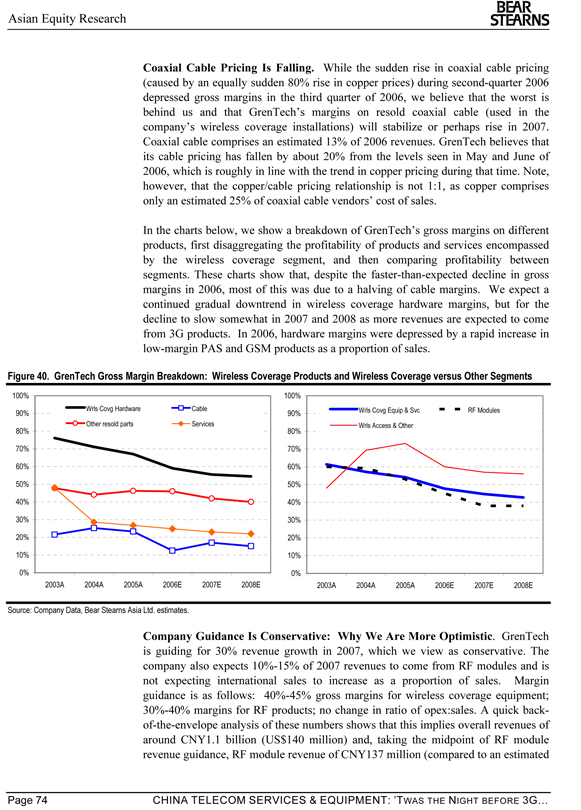
Asian Equity Research
BEAR STEARNS
Coaxial Cable Pricing Is Falling. While the sudden rise in coaxial cable pricing (caused by an equally sudden 80% rise in copper prices) during second-quarter 2006 depressed gross margins in the third quarter of 2006, we believe that the worst is behind us and that GrenTech’s margins on resold coaxial cable (used in the company’s wireless coverage installations) will stabilize or perhaps rise in 2007. Coaxial cable comprises an estimated 13% of 2006 revenues. GrenTech believes that its cable pricing has fallen by about 20% from the levels seen in May and June of 2006, which is roughly in line with the trend in copper pricing during that time. Note, however, that the copper/cable pricing relationship is not 1:1, as copper comprises only an estimated 25% of coaxial cable vendors’ cost of sales.
In the charts below, we show a breakdown of GrenTech’s gross margins on different products, first disaggregating the profitability of products and services encompassed by the wireless coverage segment, and then comparing profitability between segments. These charts show that, despite the faster-than-expected decline in gross margins in 2006, most of this was due to a halving of cable margins. We expect a continued gradual downtrend in wireless coverage hardware margins, but for the decline to slow somewhat in 2007 and 2008 as more revenues are expected to come from 3G products. In 2006, hardware margins were depressed by a rapid increase in low-margin PAS and GSM products as a proportion of sales.
Figure 40. GrenTech Gross Margin Breakdown: Wireless Coverage Products and Wireless Coverage versus Other Segments
100% 100%
Wrls Covg Hardware Cable Wrls Covg Equip & Svc RF Modules
90% 90%
Other resold parts Services Wrls Access & Other
80% 80% 70% 70% 60% 60%
50% 50% 40% 40% 30% 30% 20% 20% 10% 10%
0% 0%
2003A 2004A 2005A 2006E 2007E 2008E 2003A 2004A 2005A 2006E 2007E 2008E
Source: Company Data, Bear Stearns Asia Ltd. estimates.
Company Guidance Is Conservative: Why We Are More Optimistic. GrenTech is guiding for 30% revenue growth in 2007, which we view as conservative. The company also expects 10%-15% of 2007 revenues to come from RF modules and is not expecting international sales to increase as a proportion of sales. Margin guidance is as follows: 40%-45% gross margins for wireless coverage equipment; 30%-40% margins for RF products; no change in ratio of opex:sales. A quick back-of-the-envelope analysis of these numbers shows that this implies overall revenues of around CNY1.1 billion (US$140 million) and, taking the midpoint of RF module revenue guidance, RF module revenue of CNY137 million (compared to an estimated
Page 74 CHINA TELECOM SERVICES & EQUIPMENT: ’TWAS THE NIGHT BEFORE 3G…

Asian Equity Research
BEAR STEARNS
33 million in 2006). In other words, GrenTech expects about 12%-13% of its revenue growth to come from RF modules and only 17%-18% to come from wireless coverage, in line with its 2006 performance. We are significantly above guidance on the point of revenue growth, mainly because we expect faster growth from the wireless coverage business due to the twin positives of higher wireless spending and continued market share gains, especially at China Mobile. We also expect RF modules to grow more rapidly than guidance, which is also partly due to our more optimistic outlook on 3G timing and related demand for TD SCDMA and WCDMA BTS components.
BEAR STEARNS ASIA LTD. Page 75
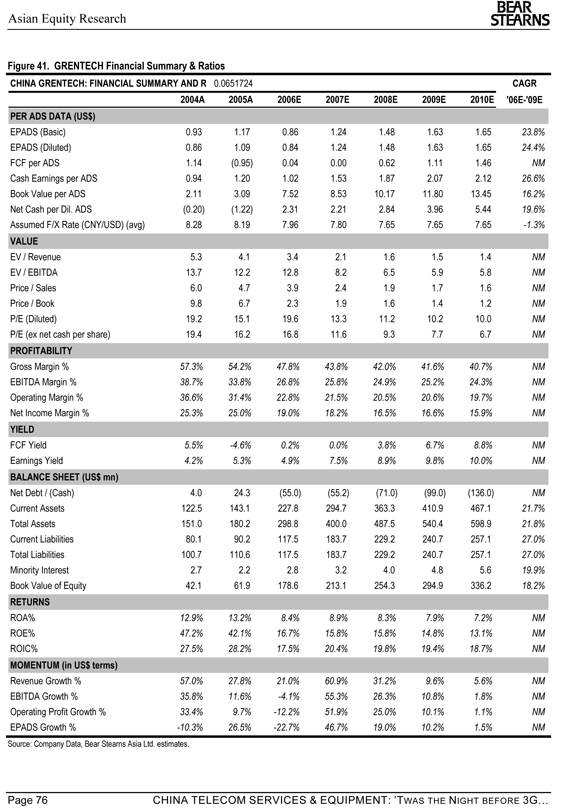
Asian Equity Research
BEAR STEARNS
Figure 41. GRENTECH Financial Summary & Ratios
CHINA GRENTECH: FINANCIAL SUMMARY AND R 0.0651724 CAGR
2004A 2005A 2006E 2007E 2008E 2009E 2010E '06E-'09E PER ADS DATA (US$)
EPADS (Basic) 0.93 1.17 0.86 1.24 1.48 1.63 1.65 23.8% EPADS (Diluted) 0.86 1.09 0.84 1.24 1.48 1.63 1.65 24.4% FCF per ADS 1.14(0.95) 0.04 0.00 0.62 1.11 1.46 NM Cash Earnings per ADS 0.94 1.20 1.02 1.53 1.87 2.07 2.12 26.6% Book Value per ADS 2.11 3.09 7.52 8.53 10.17 11.80 13.45 16.2% Net Cash per Dil. ADS(0.20)(1.22) 2.31 2.21 2.84 3.96 5.44 19.6% Assumed F/X Rate (CNY/USD) (avg) 8.28 8.19 7.96 7.80 7.65 7.65 7.65 -1.3%
VALUE
EV / Revenue 5.3 4.1 3.4 2.1 1.6 1.5 1.4 NM EV / EBITDA 13.7 12.2 12.8 8.2 6.5 5.9 5.8 NM Price / Sales 6.0 4.7 3.9 2.4 1.9 1.7 1.6 NM Price / Book 9.8 6.7 2.3 1.9 1.6 1.4 1.2 NM P/E (Diluted) 19.2 15.1 19.6 13.3 11.2 10.2 10.0 NM P/E (ex net cash per share) 19.4 16.2 16.8 11.6 9.3 7.7 6.7 NM
PROFITABILITY
Gross Margin % 57.3% 54.2% 47.8% 43.8% 42.0% 41.6% 40.7% NM EBITDA Margin % 38.7% 33.8% 26.8% 25.8% 24.9% 25.2% 24.3% NM Operating Margin % 36.6% 31.4% 22.8% 21.5% 20.5% 20.6% 19.7% NM Net Income Margin % 25.3% 25.0% 19.0% 18.2% 16.5% 16.6% 15.9% NM
YIELD
FCF Yield 5.5% -4.6% 0.2% 0.0% 3.8% 6.7% 8.8% NM Earnings Yield 4.2% 5.3% 4.9% 7.5% 8.9% 9.8% 10.0% NM
BALANCE SHEET (US$ mn)
Net Debt / (Cash) 4.0 24.3(55.0)(55.2)(71.0)(99.0)(136.0) NM Current Assets 122.5 143.1 227.8 294.7 363.3 410.9 467.1 21.7% Total Assets 151.0 180.2 298.8 400.0 487.5 540.4 598.9 21.8% Current Liabilities 80.1 90.2 117.5 183.7 229.2 240.7 257.1 27.0% Total Liabilities 100.7 110.6 117.5 183.7 229.2 240.7 257.1 27.0% Minority Interest 2.7 2.2 2.8 3.2 4.0 4.8 5.6 19.9% Book Value of Equity 42.1 61.9 178.6 213.1 254.3 294.9 336.2 18.2%
RETURNS
ROA% 12.9% 13.2% 8.4% 8.9% 8.3% 7.9% 7.2% NM ROE% 47.2% 42.1% 16.7% 15.8% 15.8% 14.8% 13.1% NM ROIC% 27.5% 28.2% 17.5% 20.4% 19.8% 19.4% 18.7% NM
MOMENTUM (in US$ terms)
Revenue Growth % 57.0% 27.8% 21.0% 60.9% 31.2% 9.6% 5.6% NM EBITDA Growth % 35.8% 11.6% -4.1% 55.3% 26.3% 10.8% 1.8% NM Operating Profit Growth % 33.4% 9.7% -12.2% 51.9% 25.0% 10.1% 1.1% NM EPADS Growth % -10.3% 26.5% -22.7% 46.7% 19.0% 10.2% 1.5% NM
Source: Company Data, Bear Stearns Asia Ltd. estimates.
Page 76 CHINA TELECOM SERVICES & EQUIPMENT: ’TWAS THE NIGHT BEFORE 3G…
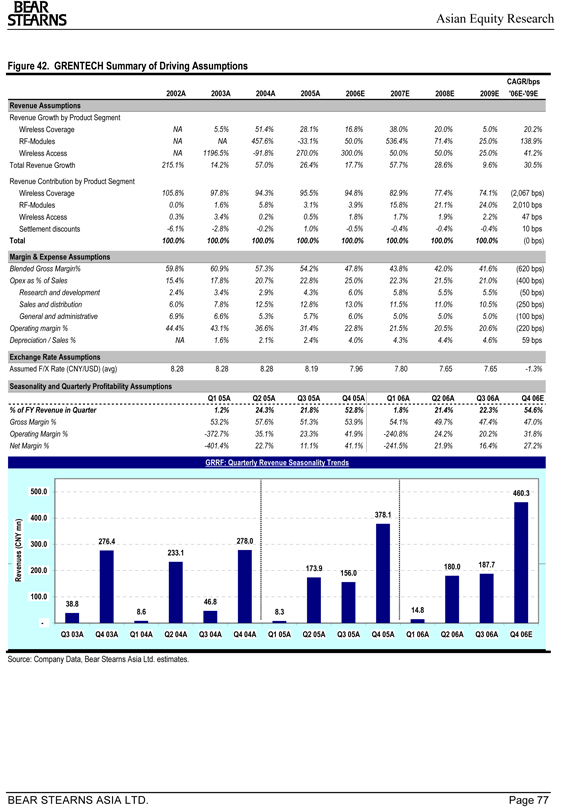
Asian Equity Research
BEAR STEARNS
Figure 42. GRENTECH Summary of Driving Assumptions
CAGR/bps 2002A 2003A 2004A 2005A 2006E 2007E 2008E 2009E '06E-'09E
Revenue Assumptions
Revenue Growth by Product Segment
Wireless Coverage NA 5.5% 51.4% 28.1% 16.8% 38.0% 20.0% 5.0% 20.2% RF-Modules NA NA 457.6% -33.1% 50.0% 536.4% 71.4% 25.0% 138.9% Wireless Access NA 1196.5% -91.8% 270.0% 300.0% 50.0% 50.0% 25.0% 41.2% Total Revenue Growth 215.1% 14.2% 57.0% 26.4% 17.7% 57.7% 28.6% 9.6% 30.5%
Revenue Contribution by Product Segment
Wireless Coverage 105.8% 97.8% 94.3% 95.5% 94.8% 82.9% 77.4% 74.1% (2,067 bps) RF-Modules 0.0% 1.6% 5.8% 3.1% 3.9% 15.8% 21.1% 24.0% 2,010 bps Wireless Access 0.3% 3.4% 0.2% 0.5% 1.8% 1.7% 1.9% 2.2% 47 bps Settlement discounts -6.1% -2.8% -0.2% 1.0% -0.5% -0.4% -0.4% -0.4% 10 bps
Total 100.0% 100.0% 100.0% 100.0% 100.0% 100.0% 100.0% 100.0%(0 bps)
Margin & Expense Assumptions
Blended Gross Margin% 59.8% 60.9% 57.3% 54.2% 47.8% 43.8% 42.0% 41.6% (620 bps) Opex as % of Sales 15.4% 17.8% 20.7% 22.8% 25.0% 22.3% 21.5% 21.0% (400 bps) Research and development 2.4% 3.4% 2.9% 4.3% 6.0% 5.8% 5.5% 5.5%(50 bps) Sales and distribution 6.0% 7.8% 12.5% 12.8% 13.0% 11.5% 11.0% 10.5% (250 bps) General and administrative 6.9% 6.6% 5.3% 5.7% 6.0% 5.0% 5.0% 5.0% (100 bps) Operating margin % 44.4% 43.1% 36.6% 31.4% 22.8% 21.5% 20.5% 20.6% (220 bps) Depreciation / Sales % NA 1.6% 2.1% 2.4% 4.0% 4.3% 4.4% 4.6% 59 bps
Exchange Rate Assumptions
Assumed F/X Rate (CNY/USD) (avg) 8.28 8.28 8.28 8.19 7.96 7.80 7.65 7.65 -1.3%
Seasonality and Quarterly Profitability Assumptions
Q1 05A Q2 05A Q3 05A Q4 05A Q1 06A Q2 06A Q3 06A Q4 06E
% of FY Revenue in Quarter 1.2% 24.3% 21.8% 52.8% 1.8% 21.4% 22.3% 54.6%
Gross Margin % 53.2% 57.6% 51.3% 53.9% 54.1% 49.7% 47.4% 47.0% Operating Margin % -372.7% 35.1% 23.3% 41.9% -240.8% 24.2% 20.2% 31.8% Net Margin % -401.4% 22.7% 11.1% 41.1% -241.5% 21.9% 16.4% 27.2%
GRRF: Quarterly Revenue Seasonality Trends
400.0 | | 378.1 (CNY mn) 300.0 276.4 278.0 233.1 Revenues |
173.9 | | 180.0 187.7 200.0 156.0 |
100.0
Q3 03A Q4 03A Q1 04A Q2 04A Q3 04A Q4 04A Q1 05A Q2 05A Q3 05A Q4 05A Q1 06A Q2 06A Q3 06A Q4 06E
Source: Company Data, Bear Stearns Asia Ltd. estimates.
BEAR STEARNS ASIA LTD. Page 77
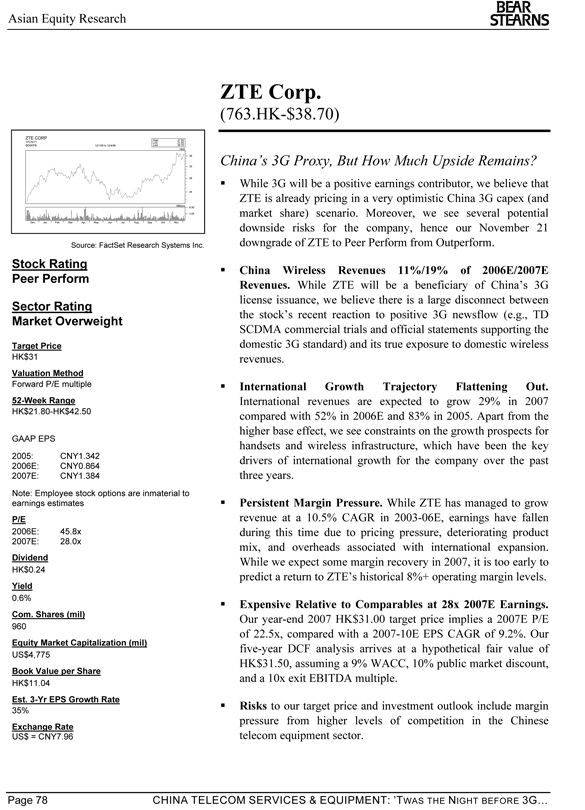
Asian Equity Research
BEAR STEARNS
ZTE Corp.
(763.HK-$38.70)
ZTE CORP
High: 37.50 'H'CNY1 Low: 21.50 B04KP8 12/1/05 to 12/4/06 Last: 36.35 HKD
36 China’s 3G Proxy, But How Much Upside Remains?
32
28 While 3G will be a positive earnings contributor, we believe that
24 ZTE is already pricing in a very optimistic China 3G capex (and
Millions 6.50
3.25 market share) scenario. Moreover, we see several potential Dec Jan Feb Mar Apr May Jun Jul Aug Sep Oct Nov downside risks for the company, hence our November 21 Source: FactSet Research Systems Inc. downgrade of ZTE to Peer Perform from Outperform.
Stock Rating
China Wireless Revenues 11%/19% of 2006E/2007E
Peer Perform
Revenues. While ZTE will be a beneficiary of China’s 3G license issuance, we believe there is a large disconnect between
Sector Rating the stock’s recent reaction to positive 3G newsflow (e.g., TD
Market Overweight
SCDMA commercial trials and official statements supporting the Target Price domestic 3G standard) and its true exposure to domestic wireless HK$31 revenues.
Valuation Method
Forward P/E multiple ?? International Growth Trajectory Flattening Out.
52-Week Range International revenues are expected to grow 29% in 2007 HK$21.80-HK$42.50 compared with 52% in 2006E and 83% in 2005. Apart from the higher base effect, we see constraints on the growth prospects for
GAAP EPS
handsets and wireless infrastructure, which have been the key 2005: CNY1.342 drivers of international growth for the company over the past
2006E: CNY0.864
2007E: CNY1.384 three years. Note: Employee stock options are inmaterial to
earnings estimates ?? Persistent Margin Pressure. While ZTE has managed to grow P/E revenue at a 10.5% CAGR in 2003-06E, earnings have fallen 2006E: 45.8x during this time due to pricing pressure, deteriorating product 2007E: 28.0x mix, and overheads associated with international expansion. Dividend While we expect some margin recovery in 2007, it is too early to
HK$0.24
predict a return to ZTE’s historical 8%+ operating margin levels.
Yield
0.6%
Expensive Relative to Comparables at 28x 2007E Earnings.
Com. Shares (mil) Our year-end 2007 HK$31.00 target price implies a 2007E P/E
960
of 22.5x, compared with a 2007-10E EPS CAGR of 9.2%. Our
Equity Market Capitalization (mil)
five-year DCF analysis arrives at a hypothetical fair value of
US$4,775
HK$31.50, assuming a 9% WACC, 10% public market discount,
Book Value per Share
and a 10x exit EBITDA multiple.
HK$11.04
Est. 3-Yr EPS Growth Rate
35% Risks to our target price and investment outlook include margin pressure from higher levels of competition in the Chinese
Exchange Rate
US$ = CNY7.96 telecom equipment sector.
Page 78 CHINA TELECOM SERVICES & EQUIPMENT: ’TWAS THE NIGHT BEFORE 3G…
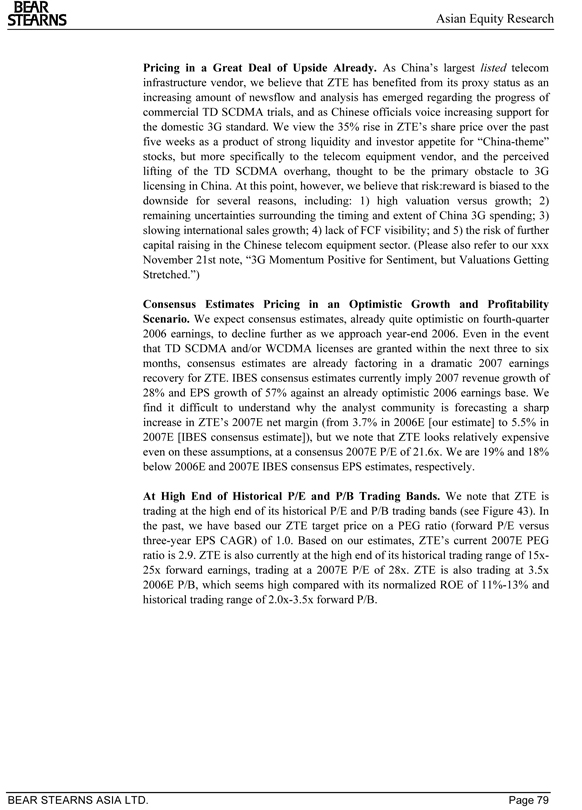
Asian Equity Research
BEAR STEARNS
Pricing in a Great Deal of Upside Already. As China’s largest listed telecom infrastructure vendor, we believe that ZTE has benefited from its proxy status as an increasing amount of newsflow and analysis has emerged regarding the progress of commercial TD SCDMA trials, and as Chinese officials voice increasing support for the domestic 3G standard. We view the 35% rise in ZTE’s share price over the past five weeks as a product of strong liquidity and investor appetite for “China-theme” stocks, but more specifically to the telecom equipment vendor, and the perceived lifting of the TD SCDMA overhang, thought to be the primary obstacle to 3G licensing in China. At this point, however, we believe that risk:reward is biased to the downside for several reasons, including: 1) high valuation versus growth; 2) remaining uncertainties surrounding the timing and extent of China 3G spending; 3) slowing international sales growth; 4) lack of FCF visibility; and 5) the risk of further capital raising in the Chinese telecom equipment sector. (Please also refer to our xxx November 21st note, “3G Momentum Positive for Sentiment, but Valuations Getting Stretched.”)
Consensus Estimates Pricing in an Optimistic Growth and Profitability Scenario. We expect consensus estimates, already quite optimistic on fourth-quarter 2006 earnings, to decline further as we approach year-end 2006. Even in the event that TD SCDMA and/or WCDMA licenses are granted within the next three to six months, consensus estimates are already factoring in a dramatic 2007 earnings recovery for ZTE. IBES consensus estimates currently imply 2007 revenue growth of 28% and EPS growth of 57% against an already optimistic 2006 earnings base. We find it difficult to understand why the analyst community is forecasting a sharp increase in ZTE’s 2007E net margin (from 3.7% in 2006E [our estimate] to 5.5% in 2007E [IBES consensus estimate]), but we note that ZTE looks relatively expensive even on these assumptions, at a consensus 2007E P/E of 21.6x. We are 19% and 18% below 2006E and 2007E IBES consensus EPS estimates, respectively.
At High End of Historical P/E and P/B Trading Bands. We note that ZTE is trading at the high end of its historical P/E and P/B trading bands (see Figure 43). In the past, we have based our ZTE target price on a PEG ratio (forward P/E versus three-year EPS CAGR) of 1.0. Based on our estimates, ZTE’s current 2007E PEG ratio is 2.9. ZTE is also currently at the high end of its historical trading range of 15x-25x forward earnings, trading at a 2007E P/E of 28x. ZTE is also trading at 3.5x 2006E P/B, which seems high compared with its normalized ROE of 11%-13% and historical trading range of 2.0x-3.5x forward P/B.
BEAR STEARNS ASIA LTD. Page 79
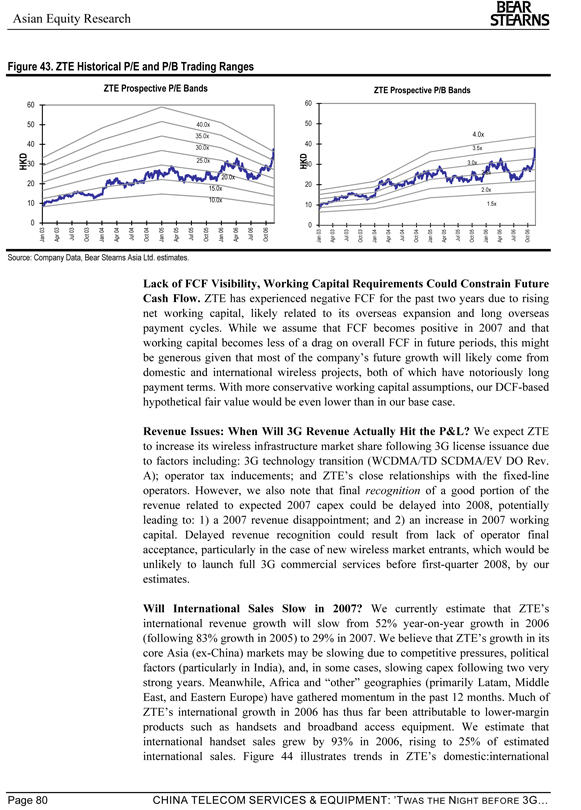
Asian Equity Research
BEAR STEARNS
Figure 43. ZTE Historical P/E and P/B Trading Ranges
ZTE Prospective P/E Bands ZTE Prospective P/B Bands
HKD HKD30
2.5x
20.0x
0 0
Jan 03 Apr 03 Jul 03 Oct 03 Jan 04 Apr 04 Jul 04 Oct 04 Jan 05 Apr 05 Jul 05 Oct 05 Jan 06 Apr 06 Jul 06 Oct 06 Jan 03 Apr 03 Jul 03 Oct 03 Jan 04 Apr 04 Jul 04 Oct 04 Jan 05 Apr 05 Jul 05 Oct 05 Jan 06 Apr 06 Jul 06 Oct 06
Source: Company Data, Bear Stearns Asia Ltd. estimates.
Lack of FCF Visibility, Working Capital Requirements Could Constrain Future Cash Flow. ZTE has experienced negative FCF for the past two years due to rising net working capital, likely related to its overseas expansion and long overseas payment cycles. While we assume that FCF becomes positive in 2007 and that working capital becomes less of a drag on overall FCF in future periods, this might be generous given that most of the company’s future growth will likely come from domestic and international wireless projects, both of which have notoriously long payment terms. With more conservative working capital assumptions, our DCF-based hypothetical fair value would be even lower than in our base case.
Revenue Issues: When Will 3G Revenue Actually Hit the P&L? We expect ZTE to increase its wireless infrastructure market share following 3G license issuance due to factors including: 3G technology transition (WCDMA/TD SCDMA/EV DO Rev. A); operator tax inducements; and ZTE’s close relationships with the fixed-line operators. However, we also note that final recognition of a good portion of the revenue related to expected 2007 capex could be delayed into 2008, potentially leading to: 1) a 2007 revenue disappointment; and 2) an increase in 2007 working capital. Delayed revenue recognition could result from lack of operator final acceptance, particularly in the case of new wireless market entrants, which would be unlikely to launch full 3G commercial services before first-quarter 2008, by our estimates.
Will International Sales Slow in 2007? We currently estimate that ZTE’s international revenue growth will slow from 52% year-on-year growth in 2006 (following 83% growth in 2005) to 29% in 2007. We believe that ZTE’s growth in its core Asia (ex-China) markets may be slowing due to competitive pressures, political factors (particularly in India), and, in some cases, slowing capex following two very strong years. Meanwhile, Africa and “other” geographies (primarily Latam, Middle East, and Eastern Europe) have gathered momentum in the past 12 months. Much of ZTE’s international growth in 2006 has thus far been attributable to lower-margin products such as handsets and broadband access equipment. We estimate that international handset sales grew by 93% in 2006, rising to 25% of estimated international sales. Figure 44 illustrates trends in ZTE’s domestic:international
Page 80 CHINA TELECOM SERVICES & EQUIPMENT: ’TWAS THE NIGHT BEFORE 3G…
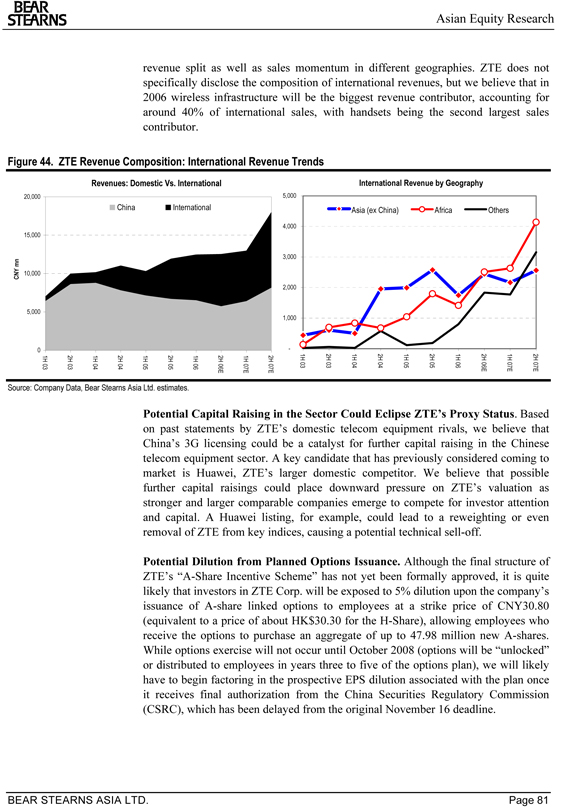
Asian Equity Research
BEAR STEARNS
revenue split as well as sales momentum in different geographies. ZTE does not specifically disclose the composition of international revenues, but we believe that in 2006 wireless infrastructure will be the biggest revenue contributor, accounting for around 40% of international sales, with handsets being the second largest sales contributor.
Figure 44. ZTE Revenue Composition: International Revenue Trends
Revenues: Domestic Vs. International International Revenue by Geography
20,000 5,000
China International Asia (ex China) Africa Others
4,000 15,000
3,000
CNY mn 10,000
2,000
5,000
1,000 0 -
1H 03 2H 03 1H 04 2H 04 1H 05 2H 05 1H 06 2H 06E 1H 07E 2H 07E 1H 03 2H 03 1H 04 2H 04 1H 05 2H 05 1H 06 2H 06E 1H 07E 2H 07E
Source: Company Data, Bear Stearns Asia Ltd. estimates.
Potential Capital Raising in the Sector Could Eclipse ZTE’s Proxy Status. Based on past statements by ZTE’s domestic telecom equipment rivals, we believe that China’s 3G licensing could be a catalyst for further capital raising in the Chinese telecom equipment sector. A key candidate that has previously considered coming to market is Huawei, ZTE’s larger domestic competitor. We believe that possible further capital raisings could place downward pressure on ZTE’s valuation as stronger and larger comparable companies emerge to compete for investor attention and capital. A Huawei listing, for example, could lead to a reweighting or even removal of ZTE from key indices, causing a potential technical sell-off.
Potential Dilution from Planned Options Issuance. Although the final structure of ZTE’s “A-Share Incentive Scheme” has not yet been formally approved, it is quite likely that investors in ZTE Corp. will be exposed to 5% dilution upon the company’s issuance of A-share linked options to employees at a strike price of CNY30.80 (equivalent to a price of about HK$30.30 for the H-Share), allowing employees who receive the options to purchase an aggregate of up to 47.98 million new A-shares. While options exercise will not occur until October 2008 (options will be “unlocked” or distributed to employees in years three to five of the options plan), we will likely have to begin factoring in the prospective EPS dilution associated with the plan once it receives final authorization from the China Securities Regulatory Commission (CSRC), which has been delayed from the original November 16 deadline.
BEAR STEARNS ASIA LTD. Page 81
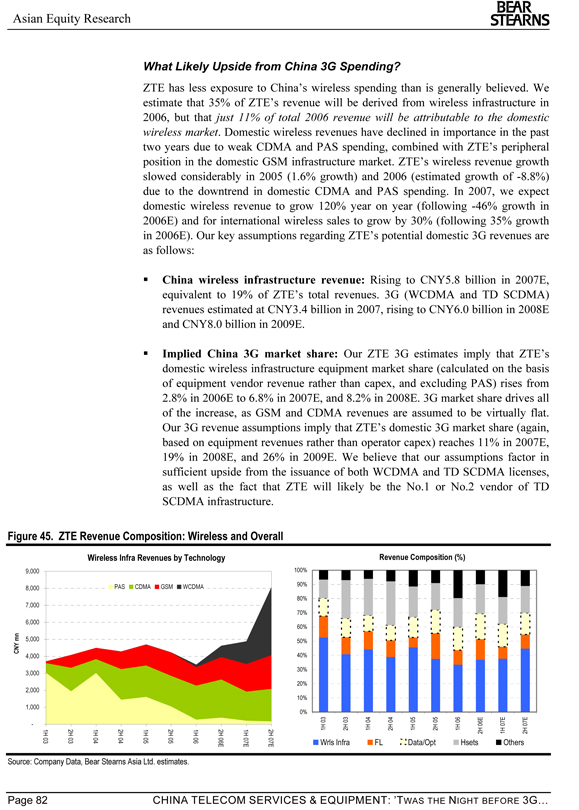
Asian Equity Research
BEAR STEARNS
What Likely Upside from China 3G Spending?
ZTE has less exposure to China’s wireless spending than is generally believed. We estimate that 35% of ZTE’s revenue will be derived from wireless infrastructure in 2006, but that just 11% of total 2006 revenue will be attributable to the domestic wireless market. Domestic wireless revenues have declined in importance in the past two years due to weak CDMA and PAS spending, combined with ZTE’s peripheral position in the domestic GSM infrastructure market. ZTE’s wireless revenue growth slowed considerably in 2005 (1.6% growth) and 2006 (estimated growth of -8.8%) due to the downtrend in domestic CDMA and PAS spending. In 2007, we expect domestic wireless revenue to grow 120% year on year (following -46% growth in 2006E) and for international wireless sales to grow by 30% (following 35% growth in 2006E). Our key assumptions regarding ZTE’s potential domestic 3G revenues are as follows:
China wireless infrastructure revenue: Rising to CNY5.8 billion in 2007E, equivalent to 19% of ZTE’s total revenues. 3G (WCDMA and TD SCDMA) revenues estimated at CNY3.4 billion in 2007, rising to CNY6.0 billion in 2008E and CNY8.0 billion in 2009E.
Implied China 3G market share: Our ZTE 3G estimates imply that ZTE’s domestic wireless infrastructure equipment market share (calculated on the basis of equipment vendor revenue rather than capex, and excluding PAS) rises from 2.8% in 2006E to 6.8% in 2007E, and 8.2% in 2008E. 3G market share drives all of the increase, as GSM and CDMA revenues are assumed to be virtually flat.
Our 3G revenue assumptions imply that ZTE’s domestic 3G market share (again, based on equipment revenues rather than operator capex) reaches 11% in 2007E, 19% in 2008E, and 26% in 2009E. We believe that our assumptions factor in sufficient upside from the issuance of both WCDMA and TD SCDMA licenses, as well as the fact that ZTE will likely be the No.1 or No.2 vendor of TD SCDMA infrastructure.
Figure 45. ZTE Revenue Composition: Wireless and Overall
Wireless Infra Revenues by Technology Revenue Composition (%)
9,000 100% PAS CDMA GSM WCDMA 90% 8,000
80%
7,000
70%
6,000
60%
CNY mn 5,000 50%
4,000 40% 30%
3,000
20%
2,000
10%
1,000
0%
- 1H 03 2H 03 1H 04 2H 04 1H 05 2H 05 1H 06 2H 06E 1H 07E 2H 07E
1H 03 2H 03 1H 04 2H 04 1H 05 2H 05 1H 06 2H 06E 1H 07E 2H 07E Wrls Infra FL Data/Opt Hsets Others
Source: Company Data, Bear Stearns Asia Ltd. estimates.
Page 82 CHINA TELECOM SERVICES & EQUIPMENT: ’TWAS THE NIGHT BEFORE 3G…
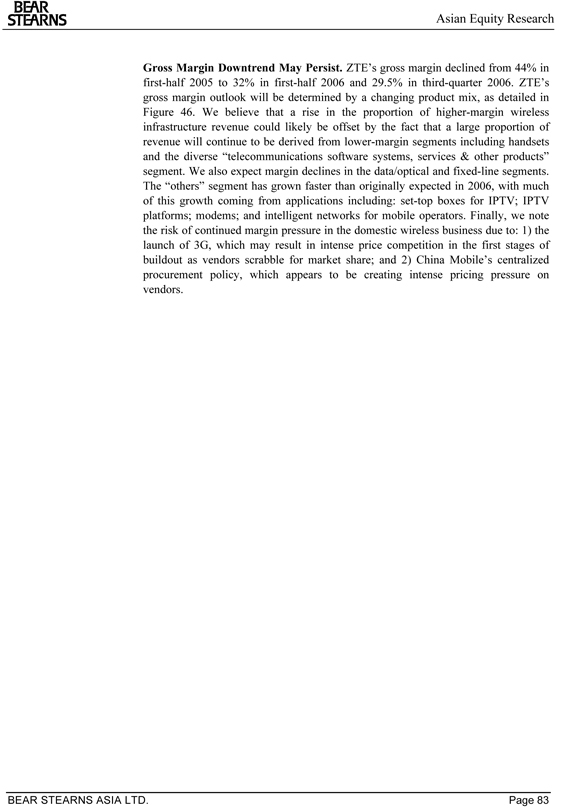
Asian Equity Research
BEAR STEARNS
Gross Margin Downtrend May Persist. ZTE’s gross margin declined from 44% in first-half 2005 to 32% in first-half 2006 and 29.5% in third-quarter 2006. ZTE’s gross margin outlook will be determined by a changing product mix, as detailed in Figure 46. We believe that a rise in the proportion of higher-margin wireless infrastructure revenue could likely be offset by the fact that a large proportion of revenue will continue to be derived from lower-margin segments including handsets and the diverse “telecommunications software systems, services & other products” segment. We also expect margin declines in the data/optical and fixed-line segments. The “others” segment has grown faster than originally expected in 2006, with much of this growth coming from applications including: set-top boxes for IPTV; IPTV platforms; modems; and intelligent networks for mobile operators. Finally, we note the risk of continued margin pressure in the domestic wireless business due to: 1) the launch of 3G, which may result in intense price competition in the first stages of buildout as vendors scrabble for market share; and 2) China Mobile’s centralized procurement policy, which appears to be creating intense pricing pressure on vendors.
BEAR STEARNS ASIA LTD. Page 83
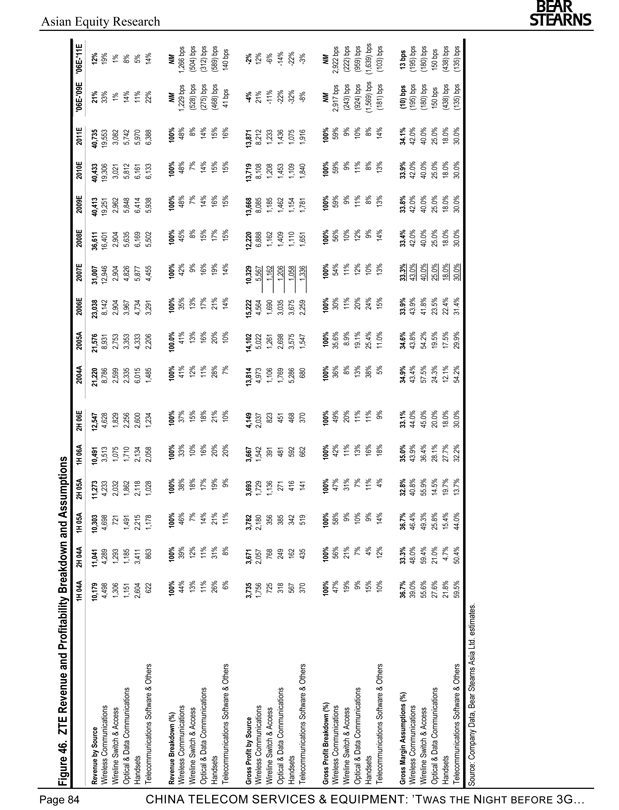
Asian Equity Research
BEAR STEARNS
Page
Figure 46. ZTE Revenue and Profitability Breakdown and Assumptions
84 | | 1H 04A 2H 04A 1H 05A 2H 05A 1H 06A 2H 06E 2004A 2005A 2006E 2007E 2008E 2009E 2010E 2011E '06E-'09E '06E-'11E |
Revenue by Source 10,179 11,041 10,303 11,273 10,491 12,547 21,220 21,576 23,038 31,007 36,611 40,413 40,433 40,735 21% 12%
Wireless Communications 4,498 4,289 4,698 4,233 3,513 4,628 8,786 8,931 8,142 12,946 16,401 19,251 19,306 19,553 33% 19% Wireline Switch & Access 1,306 1,293 721 2,032 1,075 1,829 2,599 2,753 2,904 2,904 2,904 2,962 3,021 3,082 1% 1% Optical & Data Communications 1,151 1,185 1,491 1,862 1,710 2,256 2,335 3,353 3,967 4,826 5,635 5,848 5,812 5,742 14% 8% Handsets 2,604 3,411 2,215 2,118 2,134 2,600 6,015 4,333 4,734 5,877 6,169 6,414 6,161 5,970 11% 5% CHINA Telecommunications Software & Others 622 863 1,178 1,028 2,058 1,234 1,485 2,206 3,291 4,455 5,502 5,938 6,133 6,388 22% 14%
Revenue Breakdown (%) 100% 100% 100% 100% 100% 100% 100% 100.0% 100% 100% 100% 100% 100% 100% NM NM
Wireless Communications 44% 39% 46% 38% 33% 37% 41% 41% 35% 42% 45% 48% 48% 48% 1,229 bps 1,266 bps TELECOM Wireline Switch & Access 13% 12% 7% 18% 10% 15% 12% 13% 13% 9% 8% 7% 7% 8% (528) bps (504) bps Optical & Data Communications 11% 11% 14% 17% 16% 18% 11% 16% 17% 16% 15% 14% 14% 14% (275) bps (312) bps Handsets 26% 31% 21% 19% 20% 21% 28% 20% 21% 19% 17% 16% 15% 15% (468) bps (589) bps Telecommunications Software & Others 6% 8% 11% 9% 20% 10% 7% 10% 14% 14% 15% 15% 15% 16% 41 bps 140 bps
Gross Profit by Source 3,735 3,671 3,782 3,693 3,667 4,149 13,814 14,102 15,222 10,329 12,220 13,668 13,719 13,871 -4% -2%
SERVICES Wireless Communications 1,756 2,057 2,180 1,729 1,542 2,037 4,973 5,022 4,564 5,567 6,888 8,085 8,108 8,212 21% 12% Wireline Switch & Access 725 768 356 1,136 391 823 1,106 1,261 1,690 1,162 1,162 1,185 1,208 1,233 -11% -6% Optical & Data Communications 318 249 385 271 481 451 1,769 2,698 3,035 1,206 1,409 1,462 1,453 1,436 -22% -14% Handsets 567 162 342 416 592 468 5,286 3,575 3,675 1,058 1,110 1,154 1,109 1,075 -32% -22% Telecommunications Software & Others 370 435 519 141 662 370 680 1,547 2,259 1,336 1,651 1,781 1,840 1,916 -8% -3%
& Gross Profit Breakdown (%) 100% 100% 100% 100% 100% 100% 100% 100% 100% 100% 100% 100% 100% 100% NM NM
EQUIPMENT: Wireless Communications 47% 56% 58% 47% 42% 49% 36% 35.6% 30% 54% 56% 59% 59% 59% 2,917 bps 2,922 bps Wireline Switch & Access 19% 21% 9% 31% 11% 20% 8% 8.9% 11% 11% 10% 9% 9% 9% (243) bps (222) bps Optical & Data Communications 9% 7% 10% 7% 13% 11% 13% 19.1% 20% 12% 12% 11% 11% 10% (924) bps (959) bps Handsets 15% 4% 9% 11% 16% 11% 38% 25.4% 24% 10% 9% 8% 8% 8% (1,569) bps (1,639) bps Telecommunications Software & Others 10% 12% 14% 4% 18% 9% 5% 11.0% 15% 13% 14% 13% 13% 14% (181) bps (103) bps
Gross Margin Assumptions (%) 36.7% 33.3% 36.7% 32.8% 35.0% 33.1% 34.9% 34.6% 33.9% 33.3% 33.4% 33.8% 33.9% 34.1% (10) bps 13 bps
Wireless Communications 39.0% 48.0% 46.4% 40.8% 43.9% 44.0% 43.4% 43.8% 43.9% 43.0% 42.0% 42.0% 42.0% 42.0% (195) bps (195) bps ’T
Wireline Switch & Access 55.6% 59.4% 49.3% 55.9% 36.4% 45.0% 57.5% 54.2% 41.8% 40.0% 40.0% 40.0% 40.0% 40.0% (180) bps (180) bps
WAS
Optical & Data Communications 27.6% 21.0% 25.8% 14.5% 28.1% 20.0% 24.3% 19.5% 23.5% 25.0% 25.0% 25.0% 25.0% 25.0% 150 bps 150 bps Handsets 21.8% 4.7% 15.4% 19.7% 27.7% 18.0% 12.1% 17.5% 22.4% 18.0% 18.0% 18.0% 18.0% 18.0% (438) bps (438) bps THE Telecommunications Software & Others 59.5% 50.4% 44.0% 13.7% 32.2% 30.0% 54.2% 29.9% 31.4% 30.0% 30.0% 30.0% 30.0% 30.0% (135) bps (135) bps
Source: Company Data, Bear Stearns Asia Ltd. estimates.
Page 84 CHINA TELECOM SERVICES & EQUIPMENT: ’TWAS THE NIGHT BEFORE 3G…
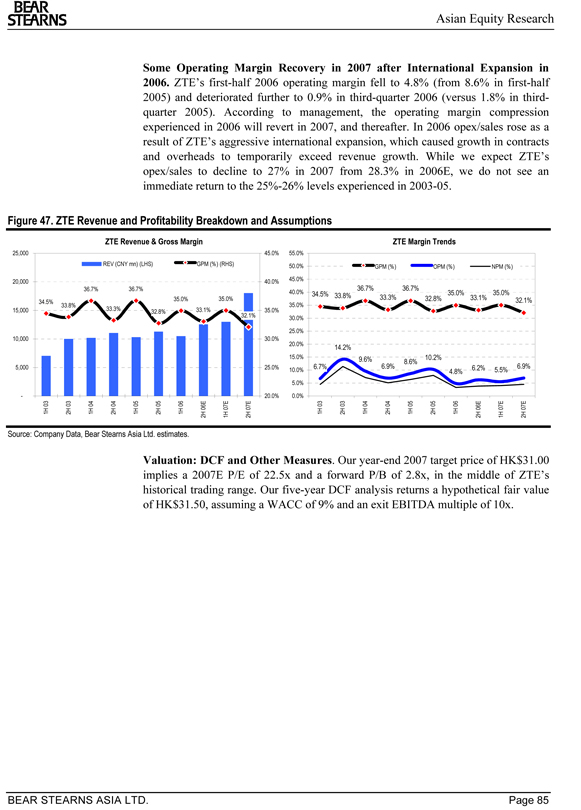
Asian Equity Research
BEAR STEARNS
Some Operating Margin Recovery in 2007 after International Expansion in 2006. ZTE’s first-half 2006 operating margin fell to 4.8% (from 8.6% in first-half 2005) and deteriorated further to 0.9% in third-quarter 2006 (versus 1.8% in third-quarter 2005). According to management, the operating margin compression experienced in 2006 will revert in 2007, and thereafter. In 2006 opex/sales rose as a result of ZTE’s aggressive international expansion, which caused growth in contracts and overheads to temporarily exceed revenue growth. While we expect ZTE’s opex/sales to decline to 27% in 2007 from 28.3% in 2006E, we do not see an immediate return to the 25%-26% levels experienced in 2003-05.
Figure 47. ZTE Revenue and Profitability Breakdown and Assumptions
ZTE Revenue & Gross Margin ZTE Margin Trends
25,000 45.0% 55.0%
REV (CNY mn) (LHS) GPM (%) (RHS) 50.0% GPM (%) OPM (%) NPM (%) 20,000 40.0% 45.0% 36.7% 36.7% 36.7% 36.7%
40.0% 34.5% 35.0% 35.0% 33.8% 33.3% 32.8% 35.0% 33.1%
34.5% 35.0% 32.1% 33.8% 35.0% 15,000 33.3% 32.8% 33.1% 35.0% 32.1% 30.0% 25.0% 10,000 30.0% 20.0% 14.2%
15.0% 9.6% 10.2% 8.6%
5,000 25.0% 6.7% 6.9% 6.2% 6.9% 10.0% 4.8% 5.5%
5.0%
- 20.0% 0.0%
1H 03 2H 03 1H 04 2H 04 1H 05 2H 05 1H 06 2H 06E 1H 07E 2H 07E 1H 03 2H 03 1H 04 2H 04 1H 05 2H 05 1H 06 2H 06E 1H 07E 2H 07E
Source: Company Data, Bear Stearns Asia Ltd. estimates.
Valuation: DCF and Other Measures. Our year-end 2007 target price of HK$31.00 implies a 2007E P/E of 22.5x and a forward P/B of 2.8x, in the middle of ZTE’s historical trading range. Our five-year DCF analysis returns a hypothetical fair value of HK$31.50, assuming a WACC of 9% and an exit EBITDA multiple of 10x.
BEAR STEARNS ASIA LTD. Page 85
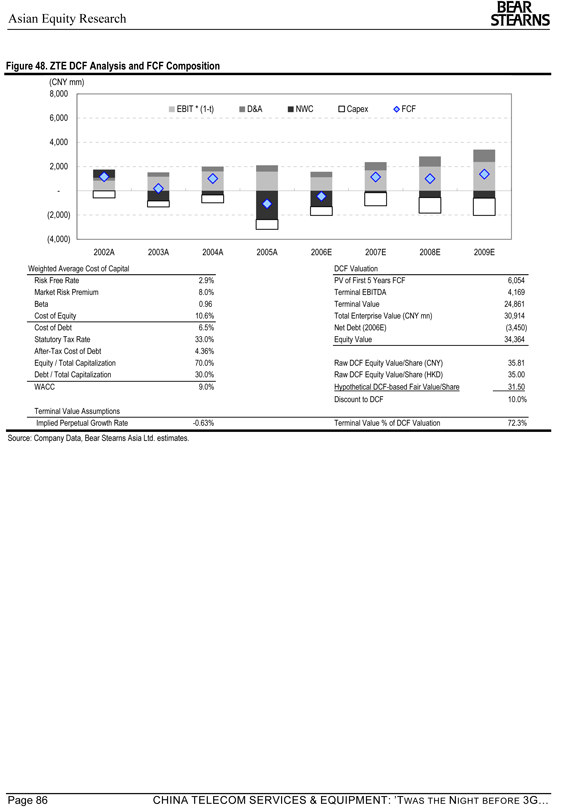
Asian Equity Research
BEAR STEARNS
Figure 48. ZTE DCF Analysis and FCF Composition
(CNY mm) 8,000
EBIT * (1-t) D&A NWC Capex FCF 6,000
4,000 2,000 -(2,000)
(4,000)
2002A 2003A 2004A 2005A 2006E 2007E 2008E 2009E
Weighted Average Cost of Capital DCF Valuation
Risk Free Rate 2.9% PV of First 5 Years FCF 6,054 Market Risk Premium 8.0% Terminal EBITDA 4,169 Beta 0.96 Terminal Value 24,861 Cost of Equity 10.6% Total Enterprise Value (CNY mn) 30,914 Cost of Debt 6.5% Net Debt (2006E)(3,450) Statutory Tax Rate 33.0% Equity Value 34,364 After-Tax Cost of Debt 4.36% Equity / Total Capitalization 70.0% Raw DCF Equity Value/Share (CNY) 35.81 Debt / Total Capitalization 30.0% Raw DCF Equity Value/Share (HKD) 35.00 WACC 9.0% Hypothetical DCF-based Fair Value/Share 31.50 Discount to DCF 10.0% Terminal Value Assumptions Implied Perpetual Growth Rate -0.63% Terminal Value % of DCF Valuation 72.3%
Source: Company Data, Bear Stearns Asia Ltd. estimates.
Page 86 CHINA TELECOM SERVICES & EQUIPMENT: ’TWAS THE NIGHT BEFORE 3G…
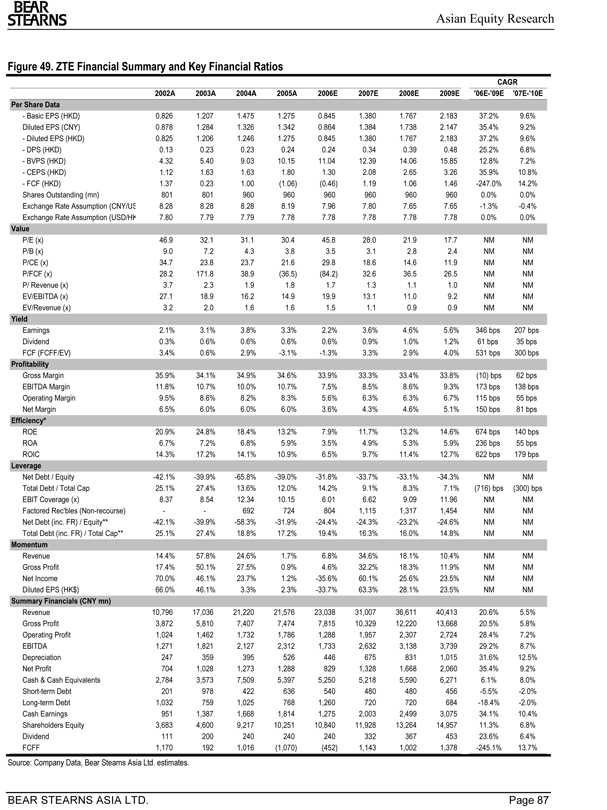
Asian Equity Research
BEAR STEARNS
Figure 49. ZTE Financial Summary and Key Financial Ratios
CAGR 2002A 2003A 2004A 2005A 2006E 2007E 2008E 2009E '06E-'09E '07E-'10E
Per Share Data
- Basic EPS (HKD) 0.826 1.207 1.475 1.275 0.845 1.380 1.767 2.183 37.2% 9.6% Diluted EPS (CNY) 0.878 1.284 1.326 1.342 0.864 1.384 1.738 2.147 35.4% 9.2%—Diluted EPS (HKD) 0.825 1.206 1.246 1.275 0.845 1.380 1.767 2.183 37.2% 9.6%—DPS (HKD) 0.13 0.23 0.23 0.24 0.24 0.34 0.39 0.48 25.2% 6.8%—BVPS (HKD) 4.32 5.40 9.03 10.15 11.04 12.39 14.06 15.85 12.8% 7.2%—CEPS (HKD) 1.12 1.63 1.63 1.80 1.30 2.08 2.65 3.26 35.9% 10.8%—FCF (HKD) 1.37 0.23 1.00(1.06)(0.46) 1.19 1.06 1.46 -247.0% 14.2% Shares Outstanding (mn) 801 801 960 960 960 960 960 960 0.0% 0.0% Exchange Rate Assumption (CNY/US 8.28 8.28 8.28 8.19 7.96 7.80 7.65 7.65 -1.3% -0.4% Exchange Rate Assumption (USD/HK 7.80 7.79 7.79 7.78 7.78 7.78 7.78 7.78 0.0% 0.0%
Value
P/E (x) 46.9 32.1 31.1 30.4 45.8 28.0 21.9 17.7 NM NM P/B (x) 9.0 7.2 4.3 3.8 3.5 3.1 2.8 2.4 NM NM P/CE (x) 34.7 23.8 23.7 21.6 29.8 18.6 14.6 11.9 NM NM P/FCF (x) 28.2 171.8 38.9(36.5)(84.2) 32.6 36.5 26.5 NM NM P/ Revenue (x) 3.7 2.3 1.9 1.8 1.7 1.3 1.1 1.0 NM NM EV/EBITDA (x) 27.1 18.9 16.2 14.9 19.9 13.1 11.0 9.2 NM NM EV/Revenue (x) 3.2 2.0 1.6 1.6 1.5 1.1 0.9 0.9 NM NM
Yield
Earnings 2.1% 3.1% 3.8% 3.3% 2.2% 3.6% 4.6% 5.6% 346 bps 207 bps Dividend 0.3% 0.6% 0.6% 0.6% 0.6% 0.9% 1.0% 1.2% 61 bps 35 bps FCF (FCFF/EV) 3.4% 0.6% 2.9% -3.1% -1.3% 3.3% 2.9% 4.0% 531 bps 300 bps
Profitability
Gross Margin 35.9% 34.1% 34.9% 34.6% 33.9% 33.3% 33.4% 33.8% (10) bps 62 bps EBITDA Margin 11.8% 10.7% 10.0% 10.7% 7.5% 8.5% 8.6% 9.3% 173 bps 138 bps Operating Margin 9.5% 8.6% 8.2% 8.3% 5.6% 6.3% 6.3% 6.7% 115 bps 55 bps Net Margin 6.5% 6.0% 6.0% 6.0% 3.6% 4.3% 4.6% 5.1% 150 bps 81 bps
Efficiency*
ROE 20.9% 24.8% 18.4% 13.2% 7.9% 11.7% 13.2% 14.6% 674 bps 140 bps ROA 6.7% 7.2% 6.8% 5.9% 3.5% 4.9% 5.3% 5.9% 236 bps 55 bps ROIC 14.3% 17.2% 14.1% 10.9% 6.5% 9.7% 11.4% 12.7% 622 bps 179 bps
Leverage
Net Debt / Equity -42.1% -39.9% -65.8% -39.0% -31.8% -33.7% -33.1% -34.3% NM NM Total Debt / Total Cap 25.1% 27.4% 13.6% 12.0% 14.2% 9.1% 8.3% 7.1% (716) bps (300) bps EBIT Coverage (x) 8.37 8.54 12.34 10.15 6.01 6.62 9.09 11.96 NM NM Factored Rec'bles (Non-recourse) —- 692 724 804 1,115 1,317 1,454 NM NM Net Debt (inc. FR) / Equity** -42.1% -39.9% -58.3% -31.9% - -24.4% -24.3% -23.2% -24.6% NM NM Total Debt (inc. FR) / Total Cap** 25.1% 27.4% 18.8% 17.2% 19.4% 16.3% 16.0% 14.8% NM NM
Momentum
Revenue 14.4% 57.8% 24.6% 1.7% 6.8% 34.6% 18.1% 10.4% NM NM Gross Profit 17.4% 50.1% 27.5% 0.9% 4.6% 32.2% 18.3% 11.9% NM NM Net Income 70.0% 46.1% 23.7% 1.2% -35.6% 60.1% 25.6% 23.5% NM NM Diluted EPS (HK$) 66.0% 46.1% 3.3% 2.3% -33.7% 63.3% 28.1% 23.5% NM NM
Summary Financials (CNY mn)
Revenue 10,796 17,036 21,220 21,576 23,038 31,007 36,611 40,413 20.6% 5.5% Gross Profit 3,872 5,810 7,407 7,474 7,815 10,329 12,220 13,668 20.5% 5.8% Operating Profit 1,024 1,462 1,732 1,786 1,288 1,957 2,307 2,724 28.4% 7.2% EBITDA 1,271 1,821 2,127 2,312 1,733 2,632 3,138 3,739 29.2% 8.7% Depreciation 247 359 395 526 446 675 831 1,015 31.6% 12.5% Net Profit 704 1,028 1,273 1,288 829 1,328 1,668 2,060 35.4% 9.2% Cash & Cash Equivalents 2,784 3,573 7,509 5,397 5,250 5,218 5,590 6,271 6.1% 8.0% Short-term Debt 201 978 422 636 540 480 480 456 -5.5% -2.0% Long-term Debt 1,032 759 1,025 768 1,260 720 720 684 -18.4% -2.0% Cash Earnings 951 1,387 1,668 1,814 1,275 2,003 2,499 3,075 34.1% 10.4% Shareholders Equity 3,683 4,600 9,217 10,251 10,840 11,928 13,264 14,957 11.3% 6.8% Dividend 111 200 240 240 240 332 367 453 23.6% 6.4% FCFF 1,170 192 1,016(1,070)(452) 1,143 1,002 1,378 -245.1% 13.7%
Source: Company Data, Bear Stearns Asia Ltd. estimates.
BEAR STEARNS ASIA LTD. Page 87
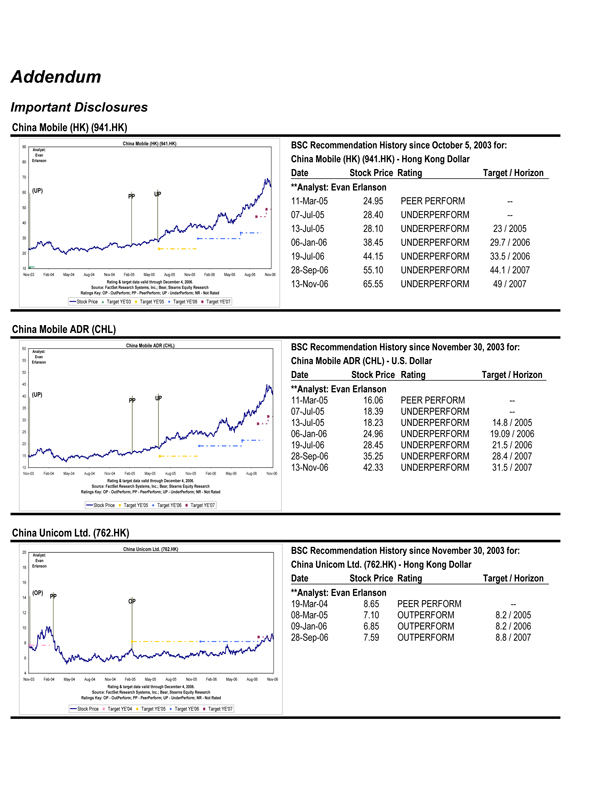
Asian Equity Research
BEAR STEARNS
Addendum
Important Disclosures
China Mobile (HK) (941.HK)
China Mobile (HK) (941.HK)
90 BSC Recommendation History since October 5, 2003 for:
Analyst: Evan
80 Erlanson China Mobile (HK) (941.HK)—Hong Kong Dollar
Date Stock Price Rating Target / Horizon
70
(UP)**Analyst: Evan Erlanson
60 UP
PP 11-Mar-05 24.95 PEER PERFORM —
50
07-Jul-05 28.40 UNDERPERFORM —
40
13-Jul-05 28.10 UNDERPERFORM 23 / 2005
30 06-Jan-06 38.45 UNDERPERFORM 29.7 / 2006
20 19-Jul-06 44.15 UNDERPERFORM 33.5 / 2006
10 28-Sep-06 55.10 UNDERPERFORM 44.1 / 2007
Nov-03 Feb-04 May-04 Aug-04 Nov-04 Feb-05 May-05 Aug-05 Nov-05 Feb-06 May-06 Aug-06 Nov-06
Rating & target data valid through December 4, 2006. 13-Nov-06 65.55 UNDERPERFORM 49 / 2007 Source: FactSet Research Systems, Inc.; Bear, Stearns Equity Research Ratings Key: OP—OutPerform; PP—PeerPerform; UP—UnderPerform; NR—Not Rated
Stock Price Target YE'03 Target YE'05 Target YE'06 Target YE'07
China Mobile ADR (CHL)
China Mobile ADR (CHL)
60 BSC Recommendation History since November 30, 2003 for:
Analyst: Evan
55 Erlanson China Mobile ADR (CHL)—U.S. Dollar
50 Date Stock Price Rating Target / Horizon
45**Analyst: Evan Erlanson
40(UP)
PP UP 11-Mar-05 16.06 PEER PERFORM —
35 07-Jul-05 18.39 UNDERPERFORM —
30 13-Jul-05 18.23 UNDERPERFORM 14.8 / 2005
25 06-Jan-06 24.96 UNDERPERFORM 19.09 / 2006
20 19-Jul-06 28.45 UNDERPERFORM 21.5 / 2006
15 28-Sep-06 35.25 UNDERPERFORM 28.4 / 2007
10 13-Nov-06 42.33 UNDERPERFORM 31.5 / 2007
Nov-03 Feb-04 May-04 Aug-04 Nov-04 Feb-05 May-05 Aug-05 Nov-05 Feb-06 May-06 Aug-06 Nov-06
Rating & target data valid through December 4, 2006. Source: FactSet Research Systems, Inc.; Bear, Stearns Equity Research Ratings Key: OP—OutPerform; PP—PeerPerform; UP—UnderPerform; NR—Not Rated
Stock Price Target YE'05 Target YE'06 Target YE'07
China Unicom Ltd. (762.HK)
China Unicom Ltd. (762.HK)
20 BSC Recommendation History since November 30, 2003 for:
Analyst: Evan
18 Erlanson China Unicom Ltd. (762.HK)—Hong Kong Dollar
Date Stock Price Rating Target / Horizon
16
(OP)**Analyst: Evan Erlanson
14 PP
OP 19-Mar-04 8.65 PEER PERFORM —
12 08-Mar-05 7.10 OUTPERFORM 8.2 / 2005
10 09-Jan-06 6.85 OUTPERFORM 8.2 / 2006 28-Sep-06 7.59 OUTPERFORM 8.8 / 2007
8
6
4
Nov-03 Feb-04 May-04 Aug-04 Nov-04 Feb-05 May-05 Aug-05 Nov-05 Feb-06 May-06 Aug-06 Nov-06
Rating & target data valid through December 4, 2006. Source: FactSet Research Systems, Inc.; Bear, Stearns Equity Research Ratings Key: OP—OutPerform; PP—PeerPerform; UP—UnderPerform; NR—Not Rated
Stock Price Target YE'04 Target YE'05 Target YE'06 Target YE'07
‘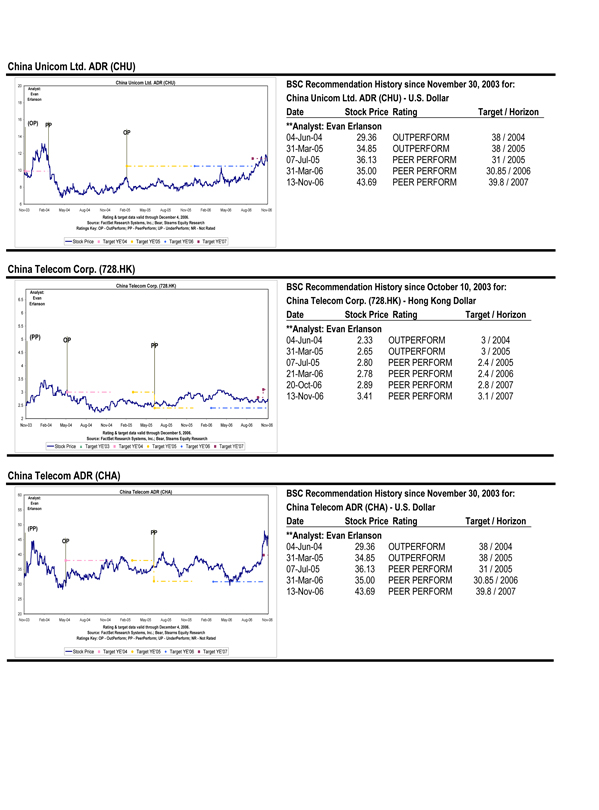
Asian Equity Research
BEAR STEARNS
China Unicom Ltd. ADR (CHU)
China Unicom Ltd. ADR (CHU)
20 BSC Recommendation History since November 30, 2003 for:
Analyst: Evan
Erlanson China Unicom Ltd. ADR (CHU)—U.S. Dollar
18
Date Stock Price Rating Target / Horizon
16
(OP) PP**Analyst: Evan Erlanson
OP
14 04-Jun-04 29.36 OUTPERFORM 38 / 2004 31-Mar-05 34.85 OUTPERFORM 38 / 2005
12
07-Jul-05 36.13 PEER PERFORM 31 / 2005
10 31-Mar-06 35.00 PEER PERFORM 30.85 / 2006 13-Nov-06 43.69 PEER PERFORM 39.8 / 2007
8
6
Nov-03 Feb-04 May-04 Aug-04 Nov-04 Feb-05 May-05 Aug-05 Nov-05 Feb-06 May-06 Aug-06 Nov-06
Rating & target data valid through December 4, 2006. Source: FactSet Research Systems, Inc.; Bear, Stearns Equity Research Ratings Key: OP—OutPerform; PP—PeerPerform; UP—UnderPerform; NR—Not Rated
Stock Price Target YE'04 Target YE'05 Target YE'06 Target YE'07
China Telecom Corp. (728.HK)
China Telecom Corp. (728.HK) BSC Recommendation History since October 10, 2003 for:
Analyst:
6.5 Evan China Telecom Corp. (728.HK)—Hong Kong Dollar
Erlanson
6 Date Stock Price Rating Target / Horizon 5.5**Analyst: Evan Erlanson
5(PP) OP 04-Jun-04 2.33 OUTPERFORM 3 / 2004
PP
4.5 31-Mar-05 2.65 OUTPERFORM 3 / 2005
4 07-Jul-05 2.80 PEER PERFORM 2.4 / 2005 21-Mar-06 2.78 PEER PERFORM 2.4 / 2006
3.5
20-Oct-06 2.89 PEER PERFORM 2.8 / 2007
3 13-Nov-06 3.41 PEER PERFORM 3.1 / 2007
2.5
2
Nov-03 Feb-04 May-04 Aug-04 Nov-04 Feb-05 May-05 Aug-05 Nov-05 Feb-06 May-06 Aug-06 Nov-06
Rating & target data valid through December 5, 2006. Source: FactSet Research Systems, Inc.; Bear, Stearns Equity Research
Stock PriceRatings Key: OP—OutPerform; PP—PeerPerform; UP—UnderPerform; NR—Not Rated Target YE'03 Target YE'04 Target YE'05 Target YE'06 Target YE'07
China Telecom ADR (CHA)
China Telecom ADR (CHA)
60 BSC Recommendation History since November 30, 2003 for:
Analyst: Evan
55 Erlanson China Telecom ADR (CHA)—U.S. Dollar
50 Date Stock Price Rating Target / Horizon
(PP)
PP**Analyst: Evan Erlanson
45 OP
04-Jun-04 29.36 OUTPERFORM 38 / 2004
40 31-Mar-05 34.85 OUTPERFORM 38 / 2005
35 07-Jul-05 36.13 PEER PERFORM 31 / 2005 31-Mar-06 35.00 PEER PERFORM 30.85 / 2006
30
13-Nov-06 43.69 PEER PERFORM 39.8 / 2007 25
20
Nov-03 Feb-04 May-04 Aug-04 Nov-04 Feb-05 May-05 Aug-05 Nov-05 Feb-06 May-06 Aug-06 Nov-06
Rating & target data valid through December 4, 2006. Source: FactSet Research Systems, Inc.; Bear, Stearns Equity Research Ratings Key: OP—OutPerform; PP—PeerPerform; UP—UnderPerform; NR—Not Rated
Stock Price Target YE'04 Target YE'05 Target YE'06 Target YE'07
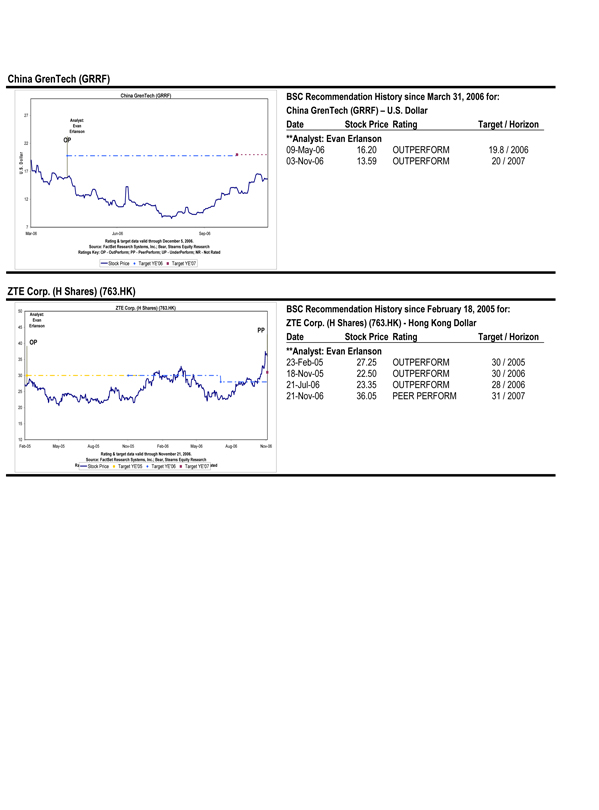
Asian Equity Research
BEAR STEARNS
China GrenTech (GRRF)
China GrenTech (GRRF) BSC Recommendation History since March 31, 2006 for: China GrenTech (GRRF) – U.S. Dollar
27
Analyst:
Evan Date Stock Price Rating Target / Horizon
Erlanson
OP**Analyst: Evan Erlanson
22
r 09-May-06 16.20 OUTPERFORM 19.8 / 2006
lla
o 03-Nov-06 13.59 OUTPERFORM 20 / 2007
. D
.S 17
U
12
7
Mar-06 Jun-06 Sep-06
Rating & target data valid through December 5, 2006. Source: FactSet Research Systems, Inc.; Bear, Stearns Equity Research Ratings Key: OP—OutPerform; PP—PeerPerform; UP—UnderPerform; NR—Not Rated
Stock Price Target YE'06 Target YE'07
ZTE Corp. (H Shares) (763.HK)
ZTE Corp. (H Shares) (763.HK) BSC Recommendation History since February 18, 2005 for:
50
Analyst:
Evan ZTE Corp. (H Shares) (763.HK)—Hong Kong Dollar
45 Erlanson
PP
Date Stock Price Rating Target / Horizon
40 OP
**Analyst: Evan Erlanson
35 23-Feb-05 27.25 OUTPERFORM 30 / 2005
30 18-Nov-05 22.50 OUTPERFORM 30 / 2006 21-Jul-06 23.35 OUTPERFORM 28 / 2006
25 21-Nov-06 36.05 PEER PERFORM 31 / 2007 20 15
10
Feb-05 May-05 Aug-05 Nov-05 Feb-06 May-06 Aug-06 Nov-06
Rating & target data valid through November 21, 2006. Source: FactSet Research Systems, Inc.; Bear, Stearns Equity Research RatingsStock Price Key: OP—OutPerform; Target YE'05 PP—PeerPerform; Target UP -YE'06 UnderPerform; Target YE'07 NR—Not Rated
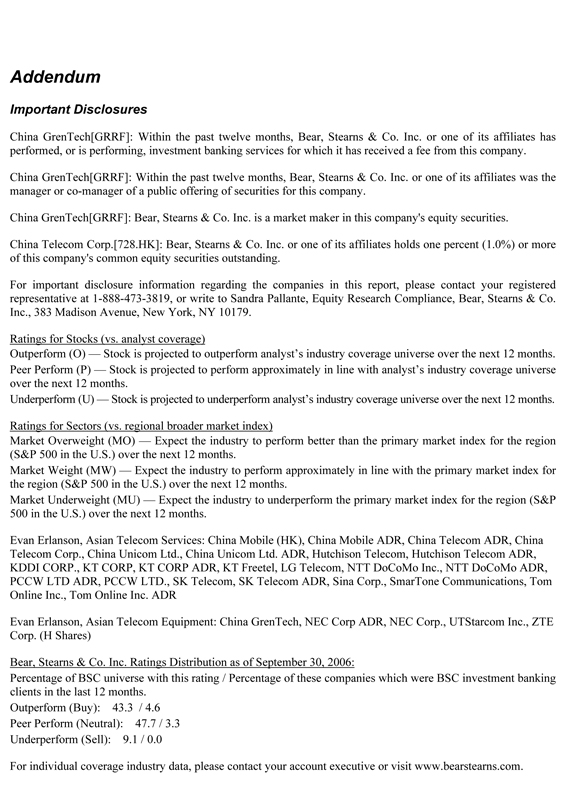
Addendum
Important Disclosures
China GrenTech[GRRF]: Within the past twelve months, Bear, Stearns & Co. Inc. or one of its affiliates has performed, or is performing, investment banking services for which it has received a fee from this company.
China GrenTech[GRRF]: Within the past twelve months, Bear, Stearns & Co. Inc. or one of its affiliates was the manager or co-manager of a public offering of securities for this company.
China GrenTech[GRRF]: Bear, Stearns & Co. Inc. is a market maker in this company's equity securities.
China Telecom Corp.[728.HK]: Bear, Stearns & Co. Inc. or one of its affiliates holds one percent (1.0%) or more of this company's common equity securities outstanding.
For important disclosure information regarding the companies in this report, please contact your registered representative at 1-888-473-3819, or write to Sandra Pallante, Equity Research Compliance, Bear, Stearns & Co. Inc., 383 Madison Avenue, New York, NY 10179.
Ratings for Stocks (vs. analyst coverage)
Outperform (O) — Stock is projected to outperform analyst’s industry coverage universe over the next 12 months. Peer Perform (P) — Stock is projected to perform approximately in line with analyst’s industry coverage universe over the next 12 months.
Underperform (U) — Stock is projected to underperform analyst’s industry coverage universe over the next 12 months.
Ratings for Sectors (vs. regional broader market index)
Market Overweight (MO) — Expect the industry to perform better than the primary market index for the region (S&P 500 in the U.S.) over the next 12 months.
Market Weight (MW) — Expect the industry to perform approximately in line with the primary market index for the region (S&P 500 in the U.S.) over the next 12 months.
Market Underweight (MU) — Expect the industry to underperform the primary market index for the region (S&P 500 in the U.S.) over the next 12 months.
Evan Erlanson, Asian Telecom Services: China Mobile (HK), China Mobile ADR, China Telecom ADR, China Telecom Corp., China Unicom Ltd., China Unicom Ltd. ADR, Hutchison Telecom, Hutchison Telecom ADR, KDDI CORP., KT CORP, KT CORP ADR, KT Freetel, LG Telecom, NTT DoCoMo Inc., NTT DoCoMo ADR, PCCW LTD ADR, PCCW LTD., SK Telecom, SK Telecom ADR, Sina Corp., SmarTone Communications, Tom Online Inc., Tom Online Inc. ADR
Evan Erlanson, Asian Telecom Equipment: China GrenTech, NEC Corp ADR, NEC Corp., UTStarcom Inc., ZTE Corp. (H Shares)
Bear, Stearns & Co. Inc. Ratings Distribution as of September 30, 2006:
Percentage of BSC universe with this rating / Percentage of these companies which were BSC investment banking clients in the last 12 months.
Outperform (Buy): 43.3 / 4.6 Peer Perform (Neutral): 47.7 / 3.3 Underperform (Sell): 9.1 / 0.0
For individual coverage industry data, please contact your account executive or visit www.bearstearns.com.

Addendum
Important Disclosures
Analyst Certification
The Research Analyst(s) who prepared the research report hereby certify that the views expressed in this research report accurately reflect the analyst(s) personal views about the subject companies and their securities. The Research Analyst(s) also certify that the Analyst(s) have not been, are not, and will not be receiving direct or indirect compensation for expressing the specific recommendation(s) or view(s) in this report.
Evan Erlanson
The costs and expenses of Equity Research, including the compensation of the analyst(s) that prepared this report, are paid out of the Firm’s total revenues, a portion of which is generated through investment banking activities.
This report has been prepared in accordance with the Firm's conflict management policies. Bear Stearns is unconditionally committed to the integrity, objectivity, and independence of its research. Bear Stearns research analysts and personnel report to the Director of Research and are not subject to the direct or indirect supervision or control of any other Firm department (or members of such department).
This publication and any recommendation contained herein speak only as of the date hereof and are subject to change without notice. Bear Stearns and its affiliated companies and employees shall have no obligation to update or amend any information or opinion contained herein, and the frequency of subsequent publications, if any, remain in the discretion of the author and the Firm.
Price targets, risks, and valuation methods, where appropriate, may be found on the first page of each company profile.

Other Disclaimers
This report has been prepared by Bear, Stearns & Co. Inc., Bear, Stearns International Limited or Bear Stearns Asia Limited (together with their affiliates, “Bear Stearns”), as indicated on the cover page hereof. This report has been adopted and approved for distribution in the United States by Bear, Stearns & Co. Inc. for its and its affiliates’ customers. If you are a recipient of this publication in the United States, orders in any securities referred to herein should be placed with Bear, Stearns & Co. Inc. This report has been approved for publication in the United Kingdom by Bear, Stearns International Limited, which is authorized and regulated by the United Kingdom Financial Services Authority. Private Customers in the U.K. should contact their Bear, Stearns International Limited representatives about the investments concerned. This report is distributed in Hong Kong by Bear Stearns Asia Limited, which is regulated by the Securities and Futures Commission of Hong Kong. Additional information is available upon request.
Bear Stearns and its employees, officers, and directors deal as principal in transactions involving the securities referred to herein (or options or other instruments related thereto), including in transactions which may be contrary to any recommendations contained herein. Bear Stearns and its employees may also have engaged in transactions with issuers identified herein. Bear Stearns is affiliated with a specialist that may make a market in the securities of the issuers referred to in this document, and such specialist may have a position (long or short) and may be on the opposite side of public orders in such securities.
This publication does not constitute an offer or solicitation of any transaction in any securities referred to herein. Any recommendation contained herein may not be suitable for all investors. Although the information contained in the subject report (not including disclosures contained herein) has been obtained from sources we believe to be reliable, the accuracy and completeness of such information and the opinions expressed herein cannot be guaranteed. This publication and any recommendation contained herein speak only as of the date hereof and are subject to change without notice. Bear Stearns and its affiliated companies and employees shall have no obligation to update or amend any information or opinion contained herein.
This publication is being furnished to you for informational purposes only and on the condition that it will not form the sole basis for any investment decision. Each investor must make their own determination of the appropriateness of an investment in any securities referred to herein based on the tax, or other considerations applicable to such investor and its own investment strategy. By virtue of this publication, neither Bear Stearns nor any of its employees nor any data provider or any of its employees shall be responsible for any investment decision. This report may not be reproduced, distributed, or published without the prior consent of Bear Stearns. ©2006. All rights reserved by Bear Stearns. Bear Stearns and its logo are registered trademarks of The Bear Stearns Companies Inc.
This report may discuss numerous securities, some of which may not be qualified for sale in certain states and may therefore not be offered to investors in such states. This document should not be construed as providing investment services. Investing in non-U.S. securities including ADRs involves significant risks such as fluctuation of exchange rates that may have adverse effects on the value or price of income derived from the security. Securities of some foreign companies may be less liquid and prices more volatile than securities of U.S. companies. Securities of non-U.S. issuers may not be registered with or subject to Securities and Exchange Commission reporting requirements; therefore, information regarding such issuers may be limited.
NOTE TO ACCOUNT EXECUTIVES: For securities that are not listed on the NYSE, AMEX, or Nasdaq National Market System, check the Compliance page of the Bear Stearns Intranet site for State Blue Sky data prior to soliciting or accepting orders from clients.
CIR 230 Disclaimer
Bear Stearns does not provide tax, legal or accounting advice. You should consult your own tax, legal and accounting advisors before engaging in any transaction.
In order for Bear Stearns to comply with Internal Revenue Service Circular 230 (if applicable), you are notified that any discussion of U.S. federal tax issues contained or referred to herein is not intended or written to be used, and cannot be used, for the purpose of: (A) avoiding penalties that may be imposed under the Internal Revenue Code; nor (B) promoting, marketing or recommending to another party any transaction or matter discussed herein.
Exhibit E
IDC
Analyze the Future
M A R K E T AN A L Y S I S
W o r l d w i d e P r o j e c t o r 2 0 0 7 – 2 0 1 0 F o r e c a s t a n d A n a l ys i s
Tom Mainelli
I D C O P I N I O N
The projector market experienced slowing growth in 2005 as the year-over-year growth rate dropped from more than 54% in 2004 to 7.5%. The market appears to be rebounding quite well and was on track to resume double-digit growth rates by the end of 2006. As technology continues to improve and prices continue to drop, IDC predicts continued solid growth in 2007 and into the later years of the forecast. We expect the home theater (HT) segment of the market to drive a portion of this growth in the coming years. While the segment has taken off somewhat more slowly than originally expected, the continued rollout of more affordable 720p projectors and — over time — well-priced 1080p units should spur interest in this exciting part of the market. Specific market developments we expect during the forecast period include:
Total worldwide projector unit shipments will reach 9.6 million units by 2010, representing a 19.5% compound annual growth rate (CAGR) from 2005 to 2010.
Despite healthy growth in shipments, declining average selling prices (ASPs) will result in a revenue CAGR of only 0.9% during that same time period.
The sub-3.0lb category will grow from 4.9% of the market in 2005 to 9.3% in 2010, while the 5.0–9.9lb market will decline from 54.8% to 36.9% during that same time. Meanwhile the 3.0–4.9lb segment will grow to dominate the market, moving from 31.4% in 2005 to 50.5% in 2010.
The United States and Western Europe owned the lion's share of the market in 2005, holding 37.8% and 26.8%, respectively. IDC predicts that by 2010, the United States will cede share to both Western Europe and a hard-charging Asia/Pacific market (led by China), dropping to 30.2%, while Western Europe grows to 28.2% and Asia/Pacific reaches 29.2%.
Home theater projectors will grow from about 8.5% of the market in 2005 to more than 21% by 2010.
Projector vendors face a potentially harmful standards battle in the near term as HDMI and DisplayPort technologies seek to become the dominant digital interface.
Filing Information: January 2007, IDC #205028, Volume: 1, Tab: Markets Displays and Projectors: Market Analysis
Global Headquarters: 5 Speen Street Framingham, MA 01701 USA P.508.872.8200 F.508.935.4015 www.idc.com

T A B L E O F C O N T E N T S
P
In This Study 1
Methodology 1 Executive Summary 2
Situation Overview 2
Vendor Market Shares 3
Future Outlook 6
Forecast and Assumptions 6
Market Context 44
Essential Guidance 45 Learn More 45
Related Research 45 Definitions 45
#205028 ©2007 IDC

L I S T O F T A B L E S
P
1 Key Forecast Assumptions for the Worldwide Projector Market, 2007–2010 7
2 Worldwide Projector Shipments, ASP, and Revenue by Region, 2005–2010 11
3 Worldwide Projector Shipments, ASP, and Revenue by Form Factor, 2005–2010 15
4 U.S. Projector Shipments, ASP, and Revenue by Form Factor, 2005–2010 19
5 Western Europe Projector Shipments, ASP, and Revenue by Form Factor, 2005–2010 21
6 Japan Projector Shipments, ASP, and Revenue by Form Factor, 2005–2010 23
7 Asia/Pacific Projector Shipments, ASP, and Revenue by Form Factor, 2005–2010 25
8 Rest of World Projector Shipments, ASP, and Revenue by Form Factor, 2005–2010 27
9 Worldwide and U.S. Projector Shipments by Channel, 2005–2010 29
10 Worldwide and U.S. Projector Shipments by Type, 2005–2010 32
11 Worldwide and U.S. Projector Shipments by Technology Type, 2005–2010 34
12 Worldwide Projector Shipments by Resolution, 2005–2010 36
13 Worldwide Projector Shipments by Aspect Ratio, 2005–2010 38
14 Worldwide Projector Shipments by Lumen Count, 2005–2010 39
15 Worldwide Projector Shipments by Interface, 2005–2010 41
16 Worldwide Notebook and Projector Shipments and Projector-to–Notebook PC Attach Ratio by Region, 2005–2010 43
17 Worldwide Projector Shipments, 2005–2010: Comparison of 2005 and 2006 Forecasts 44
©2007 IDC #205028

L I S T O F F I G U R E S
P
1 Worldwide Projector Shipment Share by Vendor, 2005 3
2 Worldwide Projector Shipment Share by Vendor, 1H06 4
3 U.S. Projector Shipment Share by Vendor, 2005 5
4 U.S. Projector Shipment Share by Vendor, 1H06 6
5 Worldwide Projector Shipments by Region, 2005–2010 14
6 Worldwide Projector Revenue by Region, 2005–2010 14
7 Worldwide Projector Shipments by Form Factor, 2005–2010 17
8 Worldwide Projector Revenue by Form Factor, 2005–2010 18
9 Worldwide Projector Shipment Share by Channel, 2005–2010 31
10 Worldwide Projector Shipment Share by Type, 2005–2010 33
11 Worldwide Projector Shipment Share by Technology Type, 2005–2010 35
12 Worldwide Projector Shipment Share by Resolution, 2005–2010 37
13 Worldwide Projector Shipment Share by Lumen Count, 2005–2010 40
14 Worldwide Projector Shipment Share by Interface, 2005–2010 42
15 Worldwide Projector Shipments, 2005–2010: Comparison of 2005 and 2006 Forecasts 44
#205028 ©2007 IDC
I N T H I S S T U D Y
This study reviews the worldwide landscape of front digital projectors, providing current and forecast market sizing on a worldwide and regional scale. We examine specific areas such as technology, form factor, purchase channel, resolution, brightness, and consumer/enterprise outlook in order to better demonstrate where this growing market is headed. We also provide vendor share findings on the worldwide and U.S. levels.
M e t h o d o l o g y
This document is the result of IDC's ongoing research on digital front projectors. We used both primary and secondary sources in its development. Primary sources included surveys of vendors and component suppliers, and secondary sources consisted of publicly accessible financial information (for example, the 10K and annual reports of projector vendors, as well as in-depth meetings and discussions with these vendors). In addition, IDC reviewed our internal forecasts that size IT spending, gross domestic product (GDP) growth, and the growth of notebooks, all of which have dotted-line relationships to the growth of the projector market.
Note: All numbers in this document may not be exact due to rounding.
Scope
This document reviews the digital projector market in the United States, Western Europe, Japan, Asia/Pacific, and the rest of the world (ROW). We provide worldwide projector unit shipment and value forecasts. The document includes 2005 and 1H06 estimates of actual shipment figures for the U.S. and worldwide markets. We generated forecasts for 2007–2010 and calculated compound annual growth rates for 2005–2010. IDC reserves the right to adjust historical data if better and more granular information is later supplied by vendors.
Weight Classes
We classify the worldwide projector market into five primary weight classes: Sub-3.0lb 3.0–4.9lb 5.0–9.9lb 10.0–39.9lb 40.0lb+
©2007 IDC #205028 1
E x e c u t i v e S u m m a r y
The worldwide projector market experienced a dramatic slowdown in growth last year, dropping from a phenomenal 54% year-over-year rate in 2004 to a tame 7.5% by the end of 2005. The industry has rebounded quite nicely in 2006 and is on track to experience a growth rate of 21.1% for the full year. We predict solid growth continuing throughout our forecast period, with worldwide shipments reaching 9.6 million units by 2010, generating a CAGR of 19.5%. A majority of these units will continue to be multimedia projectors that appear largely in business and educational settings. However, home theater–specific projectors will make up a larger portion of the market over time, growing from about 9% in 2005 to 21% in 2010.
XGA has overtaken SVGA as the market-leading resolution, and we expect it to grow from 46.8% in 2005 to 68.4% in 2007, after which it will begin to decline as adoption of WXGA, SXGA, and HDTV (1080p) resolutions grows. However, we expect XGA to remain the dominant resolution throughout our forecast period.
The most dominant projector size will also shift during the forecast period. In 2005, 5.0–9.9lb projectors owned 54.8% of the market, but by the end of 2010, that number will drop to 36.9%. Rising to dominance will be the 3.0–4.9lb category, which will grow from 31.4% in 2005 to 50.5% in 2010.
As projectors become smaller, a growing percentage of them will also get brighter. In 2005, the most popular brightness level was 1,501–2,000 lumens, with 29.8% of the market. By the end of 2006, projectors offering brightness levels of 2,001–2,500 lumens will move to the front, grabbing about 31.4% of the market. That number will grow to about 40.1% of the market by 2010.
In 2005, DLP technology continued its attack on the market-leading share of LCD technology. In 2005, DLP claimed about 45.9%, while LCD dropped to about 54%. IDC expects DLP to continue to make inroads, particularly as home theater projectors gain more traction. By 2008, DLP will overtake LCD in terms of market share leadership, and by 2010, it will hold a comfortable leadership position of 53.8% to LCD's 45.9%. Despite Sony's success with its SXRD line, LCoS technology will continue to be a sub-1% player in the market.
Finally, in 2005, the United States continued to maintain its leadership role in terms of shipments. However, both Western Europe and Asia/Pacific will chip away at the U.S. market share over the next few years. By 2010, the regions will reach near parity, with the United States maintaining a slight lead with 30.2% of units shipped, Western Europe with 28.2%, and Asia/Pacific at 29.2%.
S I T U AT I O N O V E R V I E W
The once phenomenal growth rate of the worldwide projector market slowed dramatically in 2005 but picked up steam again this year. IDC expects worldwide shipments to reach 4.79 million units by the end of 2006, for a year-over-year growth rate of 21.1%.
2 #205028 ©2007 IDC
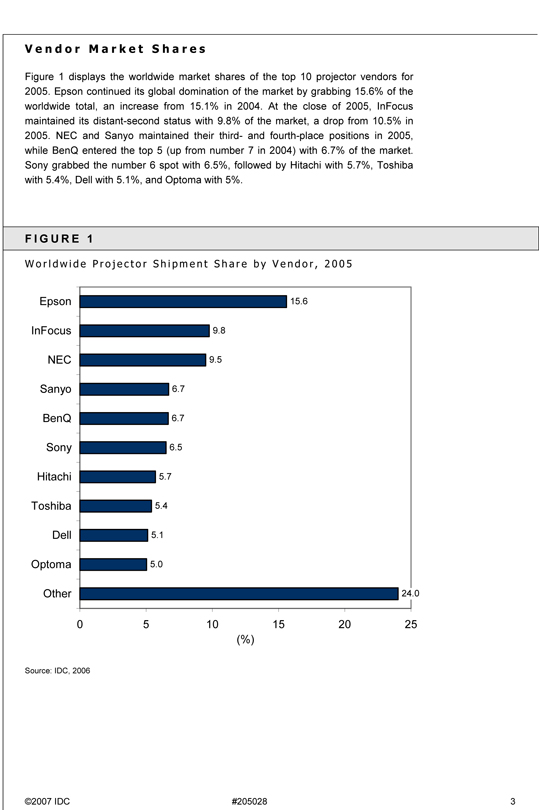
V e n d o r M a r k e t S h a r e s
Figure 1 displays the worldwide market shares of the top 10 projector vendors for 2005. Epson continued its global domination of the market by grabbing 15.6% of the worldwide total, an increase from 15.1% in 2004. At the close of 2005, InFocus maintained its distant-second status with 9.8% of the market, a drop from 10.5% in 2005. NEC and Sanyo maintained their third- and fourth-place positions in 2005, while BenQ entered the top 5 (up from number 7 in 2004) with 6.7% of the market. Sony grabbed the number 6 spot with 6.5%, followed by Hitachi with 5.7%, Toshiba with 5.4%, Dell with 5.1%, and Optoma with 5%.
F I G U R E 1
W o r l d w i d e P r o j e c t o r S h i p m e n t S h a r e b y V e n d o r , 2 0 0 5
Epson 15.6 InFocus 9.8 NEC 9.5 Sanyo 6.7 BenQ 6.7 Sony 6.5 Hitachi 5.7 Toshiba 5.4 Dell 5.1 Optoma 5.0
Other 24.0
0 5 10 15 20 25 (%)
Source: IDC, 2006
©2007 IDC #205028 3
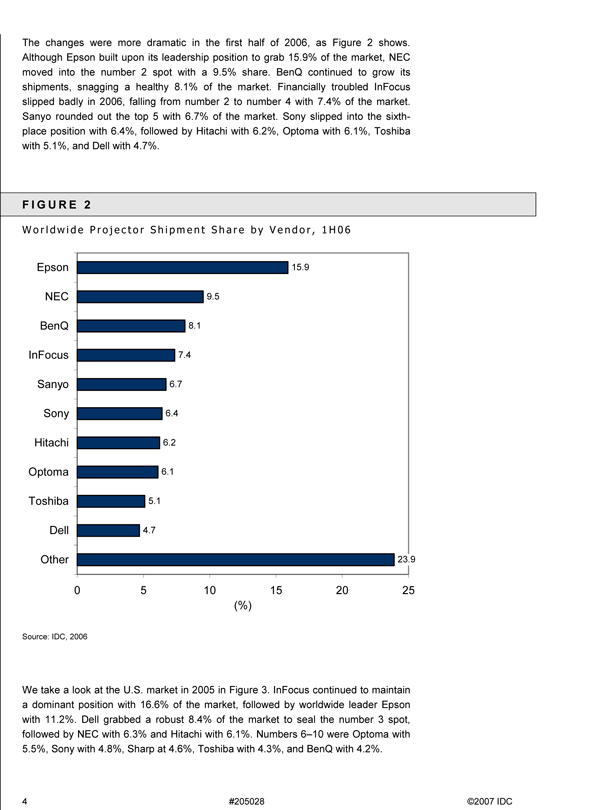
The changes were more dramatic in the first half of 2006, as Figure 2 shows. Although Epson built upon its leadership position to grab 15.9% of the market, NEC moved into the number 2 spot with a 9.5% share. BenQ continued to grow its shipments, snagging a healthy 8.1% of the market. Financially troubled InFocus slipped badly in 2006, falling from number 2 to number 4 with 7.4% of the market. Sanyo rounded out the top 5 with 6.7% of the market. Sony slipped into the sixth-place position with 6.4%, followed by Hitachi with 6.2%, Optoma with 6.1%, Toshiba with 5.1%, and Dell with 4.7%.
F I G U R E 2
W o r l d w i d e P r o j e c t o r S h i p m e n t S h a r e b y V e n d o r , 1 H 0 6
Epson 15.9 NEC 9.5 BenQ 8.1 InFocus 7.4 Sanyo 6.7 Sony 6.4 Hitachi 6.2 Optoma 6.1 Toshiba 5.1 Dell 4.7
Other 23.9
0 5 10 15 20 25 (%)
Source: IDC, 2006
We take a look at the U.S. market in 2005 in Figure 3. InFocus continued to maintain a dominant position with 16.6% of the market, followed by worldwide leader Epson with 11.2%. Dell grabbed a robust 8.4% of the market to seal the number 3 spot, followed by NEC with 6.3% and Hitachi with 6.1%. Numbers 6–10 were Optoma with 5.5%, Sony with 4.8%, Sharp at 4.6%, Toshiba with 4.3%, and BenQ with 4.2%.
4 #205028 ©2007 IDC
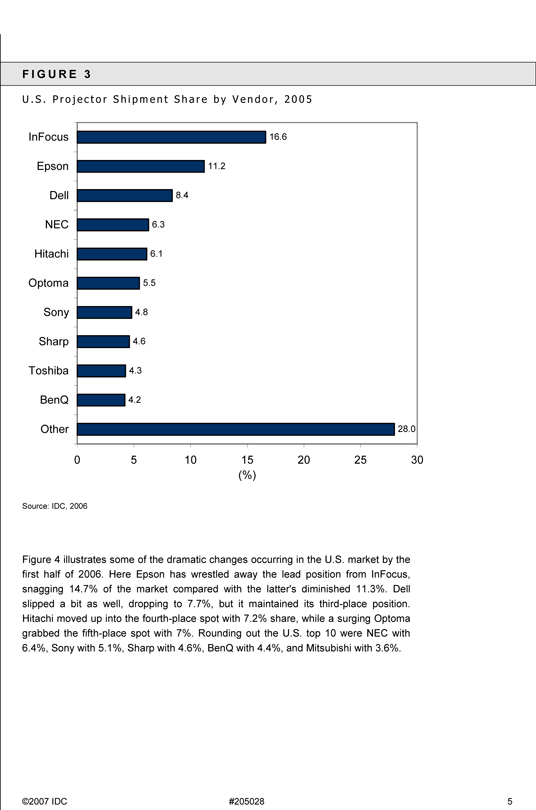
F I G U R E 3
U . S . P r o j e c t o r S h i p m e n t S h a r e b y V e n d o r , 2 0 0 5
InFocus 16.6 Epson 11.2 Dell 8.4 NEC 6.3 Hitachi 6.1 Optoma 5.5 Sony 4.8 Sharp 4.6 Toshiba 4.3 BenQ 4.2
Other 28.0
0 5 10 15 20 25 30 (%)
Source: IDC, 2006
Figure 4 illustrates some of the dramatic changes occurring in the U.S. market by the first half of 2006. Here Epson has wrestled away the lead position from InFocus, snagging 14.7% of the market compared with the latter's diminished 11.3%. Dell slipped a bit as well, dropping to 7.7%, but it maintained its third-place position. Hitachi moved up into the fourth-place spot with 7.2% share, while a surging Optoma grabbed the fifth-place spot with 7%. Rounding out the U.S. top 10 were NEC with 6.4%, Sony with 5.1%, Sharp with 4.6%, BenQ with 4.4%, and Mitsubishi with 3.6%.
©2007 IDC #205028 5
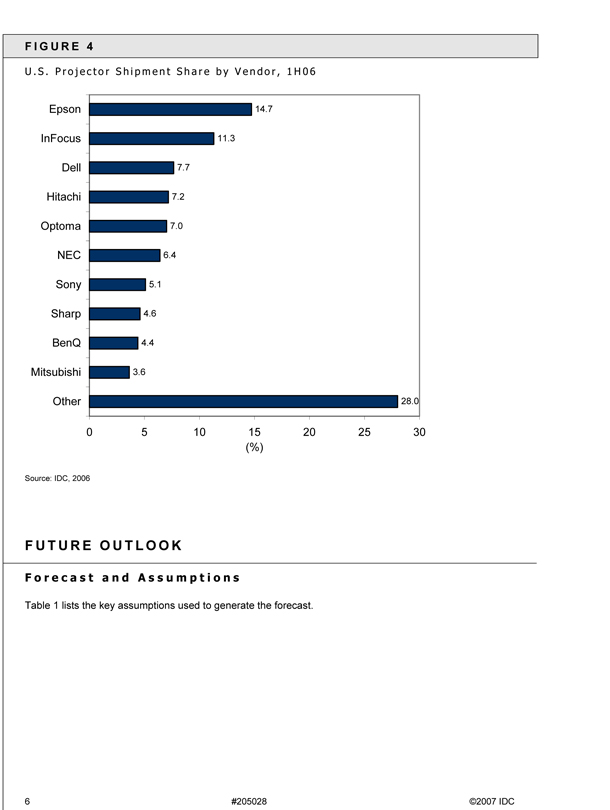
F I G U R E 4
U . S . P r o j e c t o r S h i p m e n t S h a r e b y V e n d o r , 1 H 0 6
Epson 14.7 InFocus 11.3 Dell 7.7 Hitachi 7.2 Optoma 7.0 NEC 6.4 Sony 5.1 Sharp 4.6 BenQ 4.4 Mitsubishi 3.6
Other 28.0
0 5 10 15 20 25 30 (%)
Source: IDC, 2006
F U T U R E O U T L O O K
F o r e c a s t a n d A s s u m p t i o n s
Table 1 lists the key assumptions used to generate the forecast.
6 #205028 ©2007 IDC
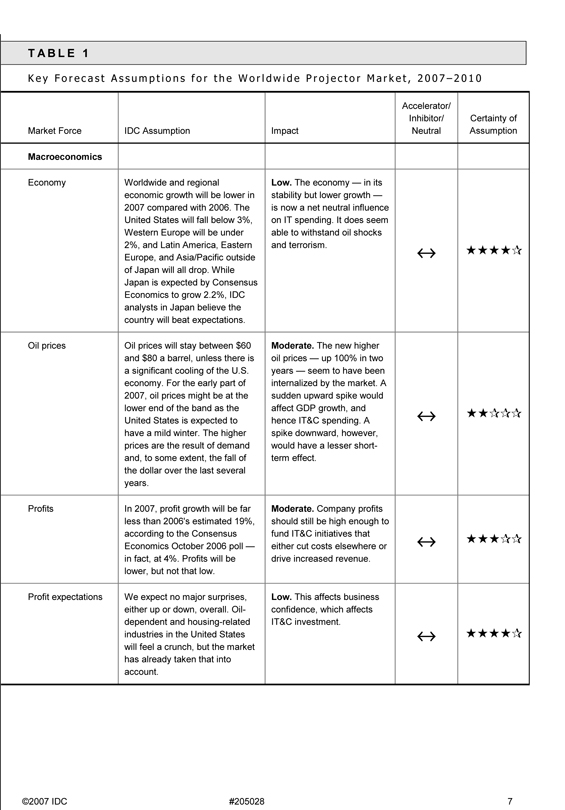
T A B L E 1
K e y F o r e c a s t A s s u m p t i o n s f o r t h e W o r l d w i d e P r o j e c t o r M a r k e t , 2 0 0 7 – 2 0 1 0
Accelerator/
Inhibitor/ Certainty of Market Force IDC Assumption Impact Neutral Assumption
Macroeconomics
Economy Worldwide and regional Low. The economy — in its economic growth will be lower in stability but lower growth — 2007 compared with 2006. The is now a net neutral influence United States will fall below 3%, on IT spending. It does seem Western Europe will be under able to withstand oil shocks
2%, and Latin America, Eastern and terrorism. ?Europe, and Asia/Pacific outside ??of Japan will all drop. While Japan is expected by Consensus Economics to grow 2.2%, IDC analysts in Japan believe the country will beat expectations.
Oil prices Oil prices will stay between $60 Moderate. The new higher and $80 a barrel, unless there is oil prices — up 100% in two a significant cooling of the U.S. years — seem to have been economy. For the early part of internalized by the market. A 2007, oil prices might be at the sudden upward spike would lower end of the band as the affect GDP growth, and ?United States is expected to hence IT&C spending. A ??have a mild winter. The higher spike downward, however, prices are the result of demand would have a lesser short-and, to some extent, the fall of term effect. the dollar over the last several years.
Profits In 2007, profit growth will be far Moderate. Company profits less than 2006's estimated 19%, should still be high enough to according to the Consensus fund IT&C initiatives that ?Economics October 2006 poll — either cut costs elsewhere or ??in fact, at 4%. Profits will be drive increased revenue. lower, but not that low.
Profit expectations We expect no major surprises, Low. This affects business either up or down, overall. Oil- confidence, which affects dependent and housing-related IT&C investment. industries in the United States ?? ?will feel a crunch, but the market has already taken that into account.
©2007 IDC #205028 7
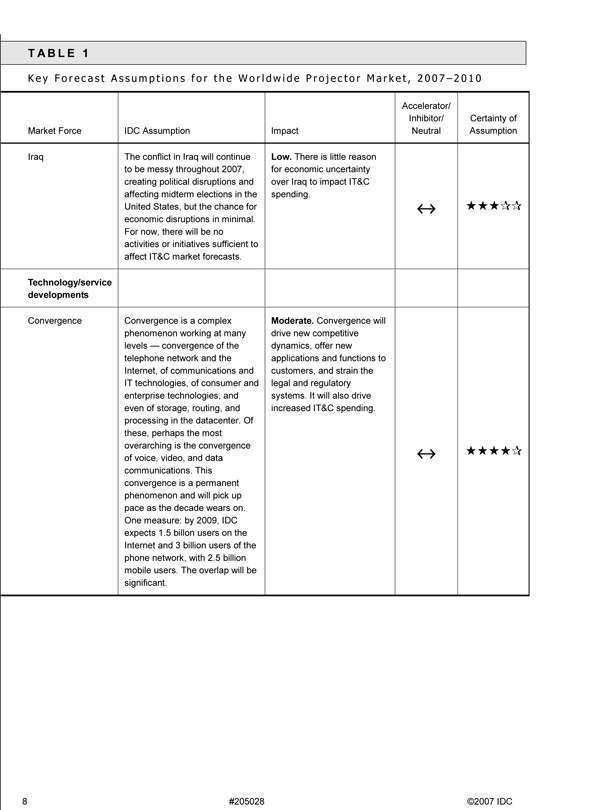
T A B L E 1
K e y F o r e c a s t A s s u m p t i o n s f o r t h e W o r l d w i d e P r o j e c t o r M a r k e t , 2 0 0 7 – 2 0 1 0
Accelerator/
Inhibitor/ Certainty of Market Force IDC Assumption Impact Neutral Assumption
Iraq The conflict in Iraq will continue Low. There is little reason to be messy throughout 2007, for economic uncertainty creating political disruptions and over Iraq to impact IT&C affecting midterm elections in the spending.
United States, but the chance for economic disruptions in minimal.
For now, there will be no activities or initiatives sufficient to affect IT&C market forecasts.
Technology/service developments
Convergence Convergence is a complex Moderate. Convergence will phenomenon working at many drive new competitive levels — convergence of the dynamics, offer new telephone network and the applications and functions to Internet, of communications and customers, and strain the IT technologies, of consumer and legal and regulatory enterprise technologies, and systems. It will also drive even of storage, routing, and increased IT&C spending. processing in the datacenter. Of these, perhaps the most overarching is the convergence ?of voice, video, and data ??communications. This convergence is a permanent phenomenon and will pick up pace as the decade wears on.
One measure: by 2009, IDC expects 1.5 billon users on the Internet and 3 billion users of the phone network, with 2.5 billion mobile users. The overlap will be significant.
8 #205028 ©2007 IDC
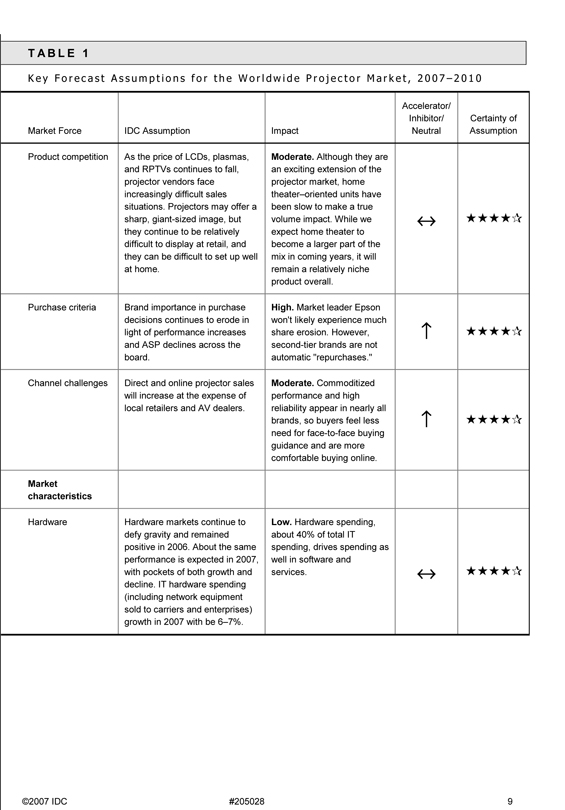
T A B L E 1
K e y F o r e c a s t A s s u m p t i o n s f o r t h e W o r l d w i d e P r o j e c t o r M a r k e t , 2 0 0 7 – 2 0 1 0
Accelerator/
Inhibitor/ Certainty of Market Force IDC Assumption Impact Neutral Assumption
Product competition As the price of LCDs, plasmas, Moderate. Although they are and RPTVs continues to fall, an exciting extension of the projector vendors face projector market, home increasingly difficult sales theater–oriented units have situations. Projectors may offer a been slow to make a true sharp, giant-sized image, but volume impact. While we ?? ?they continue to be relatively expect home theater to difficult to display at retail, and become a larger part of the they can be difficult to set up well mix in coming years, it will at home. remain a relatively niche product overall.
Purchase criteria Brand importance in purchase High. Market leader Epson decisions continues to erode in won't likely experience much light of performance increases share erosion. However, ?? ?and ASP declines across the second-tier brands are not board. automatic "repurchases."
Channel challenges Direct and online projector sales Moderate. Commoditized will increase at the expense of performance and high local retailers and AV dealers. reliability appear in nearly all brands, so buyers feel less ?? ?need for face-to-face buying guidance and are more comfortable buying online.
Market characteristics
Hardware Hardware markets continue to Low. Hardware spending, defy gravity and remained about 40% of total IT positive in 2006. About the same spending, drives spending as performance is expected in 2007, well in software and with pockets of both growth and services. decline. IT hardware spending (including network equipment sold to carriers and enterprises) growth in 2007 with be 6–7%.
©2007 IDC #205028 9
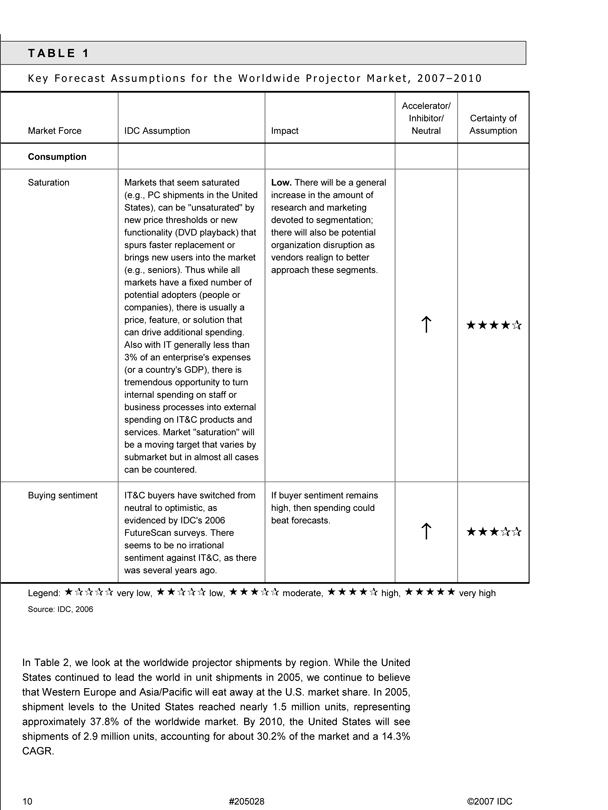
T A B L E 1
K e y F o r e c a s t A s s u m p t i o n s f o r t h e W o r l d w i d e P r o j e c t o r M a r k e t , 2 0 0 7 – 2 0 1 0
Accelerator/
Inhibitor/ Certainty of Market Force IDC Assumption Impact Neutral Assumption
Consumption
Saturation Markets that seem saturated Low. There will be a general
(e.g., PC shipments in the United increase in the amount of States), can be "unsaturated" by research and marketing new price thresholds or new devoted to segmentation; functionality (DVD playback) that there will also be potential spurs faster replacement or organization disruption as brings new users into the market vendors realign to better (e.g., seniors). Thus while all approach these segments. markets have a fixed number of potential adopters (people or companies), there is usually a price, feature, or solution that can drive additional spending.
Also with IT generally less than 3% of an enterprise's expenses (or a country's GDP), there is tremendous opportunity to turn internal spending on staff or business processes into external spending on IT&C products and services. Market "saturation" will be a moving target that varies by submarket but in almost all cases can be countered.
Buying sentiment IT&C buyers have switched from If buyer sentiment remains neutral to optimistic, as high, then spending could evidenced by IDC's 2006 beat forecasts.
FutureScan surveys. There seems to be no irrational sentiment against IT&C, as there was several years ago.
Legend: very low, low, moderate, high, very high
Source: IDC, 2006
In Table 2, we look at the worldwide projector shipments by region. While the United States continued to lead the world in unit shipments in 2005, we continue to believe that Western Europe and Asia/Pacific will eat away at the U.S. market share. In 2005, shipment levels to the United States reached nearly 1.5 million units, representing approximately 37.8% of the worldwide market. By 2010, the United States will see shipments of 2.9 million units, accounting for about 30.2% of the market and a 14.3% CAGR.
10 #205028 ©2007 IDC
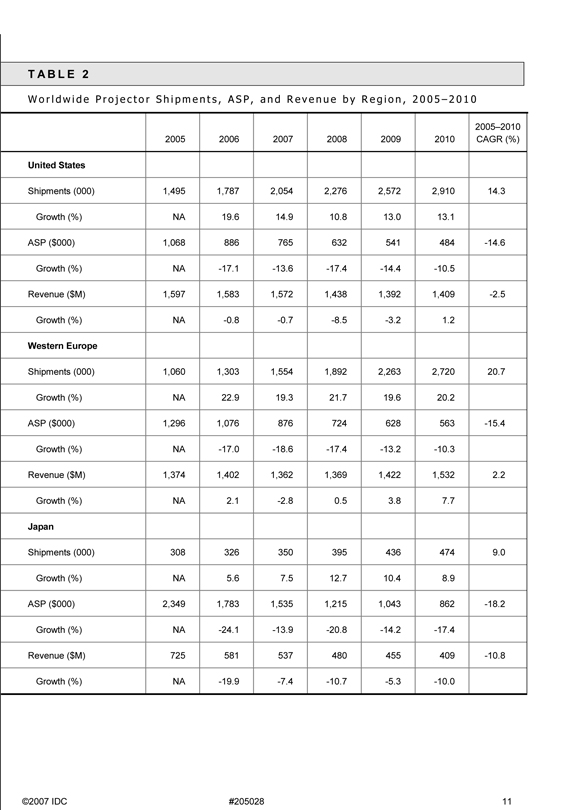
T A B L E 2
W o r l d w i d e P r o j e c t o r S h i p m e n t s , A S P , a n d R e v e n u e b y R e g i o n , 2 0 0 5 – 2 0 1 0
2005–2010 2005 2006 2007 2008 2009 2010 CAGR (%)
United States Shipments (000) 1,495 1,787 2,054 2,276 2,572 2,910 14.3 Growth (%) NA 19.6 14.9 10.8 13.0 13.1 ASP ($000) 1,068 886 765 632 541 484 -14.6 Growth (%) NA -17.1 -13.6 -17.4 -14.4 -10.5 Revenue ($M) 1,597 1,583 1,572 1,438 1,392 1,409 -2.5 Growth (%) NA -0.8 -0.7 -8.5 -3.2 1.2
Western Europe Shipments (000) 1,060 1,303 1,554 1,892 2,263 2,720 20.7 Growth (%) NA 22.9 19.3 21.7 19.6 20.2 ASP ($000) 1,296 1,076 876 724 628 563 -15.4 Growth (%) NA -17.0 -18.6 -17.4 - -13.2 -10.3 Revenue ($M) 1,374 1,402 1,362 1,369 1,422 1,532 2.2 Growth (%) NA 2.1 -2.8 0.5 3.8 7.7 Japan Shipments (000) 308 326 350 395 436 474 9.0 Growth (%) NA 5.6 7.5 12.7 10.4 8.9 ASP ($000) 2,349 1,783 1,535 1,215 1,043 862 -18.2 Growth (%) NA -24.1 -13.9 -20.8 -14.2 -17.4 Revenue ($M) 725 581 537 480 455 409 -10.8 Growth (%) NA -19.9 -7.4 -10.7 -5.3 -10.0
©2007 IDC #205028 11
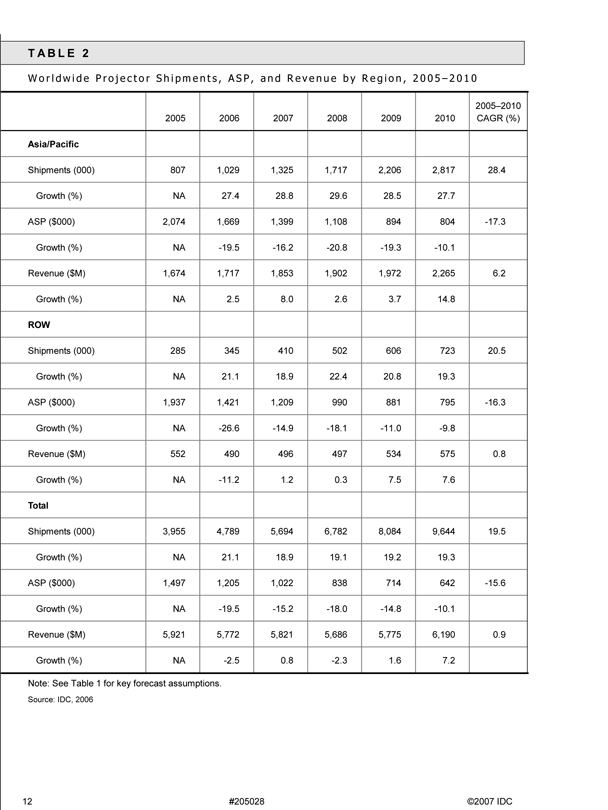
T A B L E 2
W o r l d w i d e P r o j e c t o r S h i p m e n t s , A S P , a n d R e v e n u e b y R e g i o n , 2 0 0 5 – 2 0 1 0
2005–2010 2005 2006 2007 2008 2009 2010 CAGR (%)
Asia/Pacific Shipments (000) 807 1,029 1,325 1,717 2,206 2,817 28.4 Growth (%) NA 27.4 28.8 29.6 28.5 27.7 ASP ($000) 2,074 1,669 1,399 1,108 894 804 -17.3 Growth (%) NA -19.5 -16.2 -20.8 -19.3 -10.1 Revenue ($M) 1,674 1,717 1,853 1,902 1,972 2,265 6.2 Growth (%) NA 2.5 8.0 2.6 3.7 14.8 ROW Shipments (000) 285 345 410 502 606 723 20.5 Growth (%) NA 21.1 18.9 22.4 20.8 19.3 ASP ($000) 1,937 1,421 1,209 990 881 795 -16.3 Growth (%) NA -26.6 -14.9 -18.1 -11.0 -9.8 Revenue ($M) 552 490 496 497 534 575 0.8 Growth (%) NA -11.2 1.2 0.3 7.5 7.6 Total Shipments (000) 3,955 4,789 5,694 6,782 8,084 9,644 19.5 Growth (%) NA 21.1 18.9 19.1 19.2 19.3 ASP ($000) 1,497 1,205 1,022 838 714 642 -15.6 Growth (%) NA -19.5 -15.2 -18.0 -14.8 -10.1 Revenue ($M) 5,921 5,772 5,821 5,686 5,775 6,190 0.9 Growth (%) NA -2.5 0.8 -2.3 1.6 7.2
Note: See Table 1 for key forecast assumptions.
Source: IDC, 2006
12 #205028 ©2007 IDC
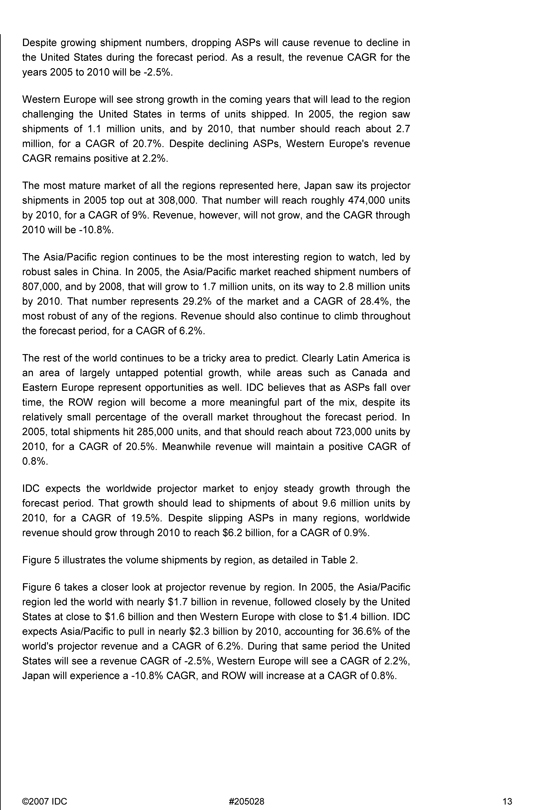
Despite growing shipment numbers, dropping ASPs will cause revenue to decline in the United States during the forecast period. As a result, the revenue CAGR for the years 2005 to 2010 will be -2.5%.
Western Europe will see strong growth in the coming years that will lead to the region challenging the United States in terms of units shipped. In 2005, the region saw shipments of 1.1 million units, and by 2010, that number should reach about 2.7 million, for a CAGR of 20.7%. Despite declining ASPs, Western Europe's revenue CAGR remains positive at 2.2%.
The most mature market of all the regions represented here, Japan saw its projector shipments in 2005 top out at 308,000. That number will reach roughly 474,000 units by 2010, for a CAGR of 9%. Revenue, however, will not grow, and the CAGR through 2010 will be -10.8%.
The Asia/Pacific region continues to be the most interesting region to watch, led by robust sales in China. In 2005, the Asia/Pacific market reached shipment numbers of 807,000, and by 2008, that will grow to 1.7 million units, on its way to 2.8 million units by 2010. That number represents 29.2% of the market and a CAGR of 28.4%, the most robust of any of the regions. Revenue should also continue to climb throughout the forecast period, for a CAGR of 6.2%.
The rest of the world continues to be a tricky area to predict. Clearly Latin America is an area of largely untapped potential growth, while areas such as Canada and Eastern Europe represent opportunities as well. IDC believes that as ASPs fall over time, the ROW region will become a more meaningful part of the mix, despite its relatively small percentage of the overall market throughout the forecast period. In 2005, total shipments hit 285,000 units, and that should reach about 723,000 units by 2010, for a CAGR of 20.5%. Meanwhile revenue will maintain a positive CAGR of 0.8%.
IDC expects the worldwide projector market to enjoy steady growth through the forecast period. That growth should lead to shipments of about 9.6 million units by 2010, for a CAGR of 19.5%. Despite slipping ASPs in many regions, worldwide revenue should grow through 2010 to reach $6.2 billion, for a CAGR of 0.9%.
Figure 5 illustrates the volume shipments by region, as detailed in Table 2.
Figure 6 takes a closer look at projector revenue by region. In 2005, the Asia/Pacific region led the world with nearly $1.7 billion in revenue, followed closely by the United States at close to $1.6 billion and then Western Europe with close to $1.4 billion. IDC expects Asia/Pacific to pull in nearly $2.3 billion by 2010, accounting for 36.6% of the world's projector revenue and a CAGR of 6.2%. During that same period the United States will see a revenue CAGR of -2.5%, Western Europe will see a CAGR of 2.2%, Japan will experience a -10.8% CAGR, and ROW will increase at a CAGR of 0.8%.
©2007 IDC #205028 13
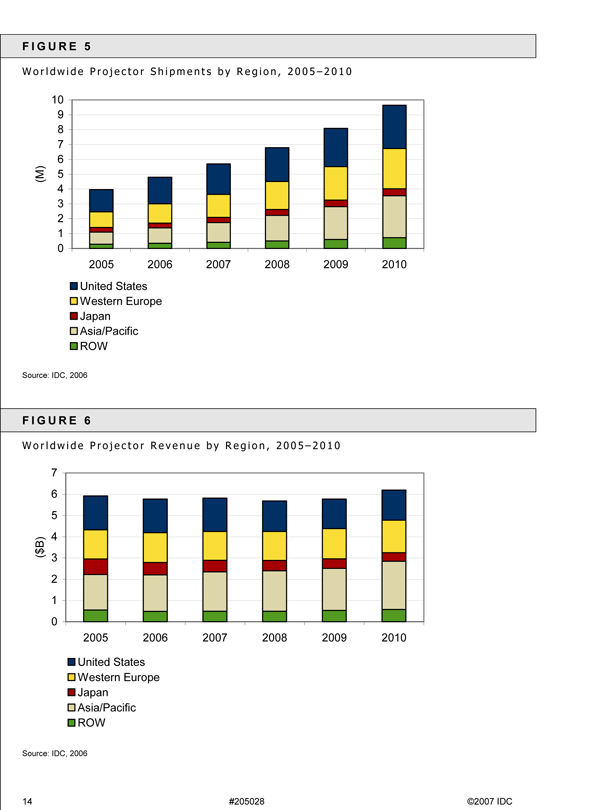
F I G U R E 5
W o r l d w i d e P r o j e c t o r S h i p m e n t s b y R e g i o n , 2 0 0 5 – 2 0 1 0
10 9 8 7 6 (M) 5 4 3 2 1 0
2005 2006 2007 2008 2009 2010
United States Western Europe Japan Asia/Pacific ROW
Source: IDC, 2006
F I G U R E 6
W o r l d w i d e P r o j e c t o r R e v e n u e b y R e g i o n , 2 0 0 5 – 2 0 1 0
7 6 5 4 B) $
( 3 2 1 0
2005 2006 2007 2008 2009 2010
United States Western Europe Japan Asia/Pacific ROW
Source: IDC, 2006
14 #205028 ©2007 IDC
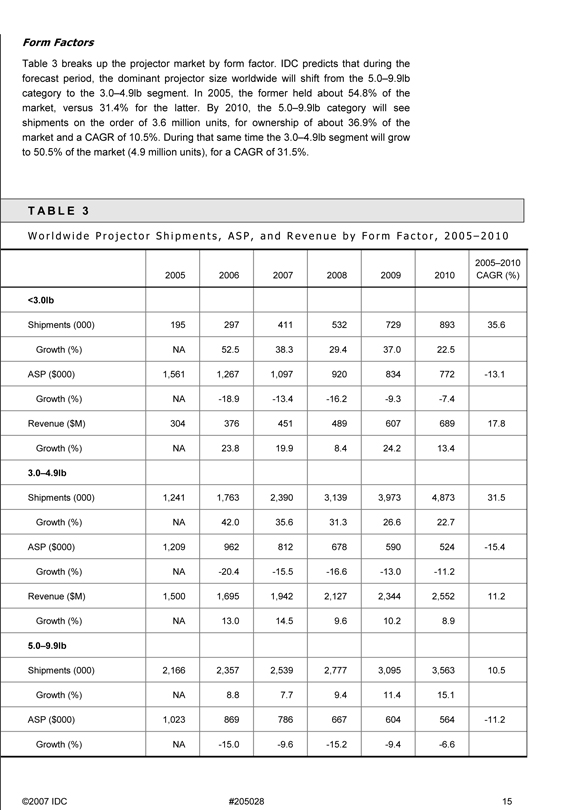
Form Factors
Table 3 breaks up the projector market by form factor. IDC predicts that during the forecast period, the dominant projector size worldwide will shift from the 5.0–9.9lb category to the 3.0–4.9lb segment. In 2005, the former held about 54.8% of the market, versus 31.4% for the latter. By 2010, the 5.0–9.9lb category will see shipments on the order of 3.6 million units, for ownership of about 36.9% of the market and a CAGR of 10.5%. During that same time the 3.0–4.9lb segment will grow to 50.5% of the market (4.9 million units), for a CAGR of 31.5%.
T A B L E 3
W o r l d w i d e P r o j e c t o r S h i p m e n t s , A S P , a n d R e v e n u e b y F o r m F a c t o r , 2 0 0 5 – 2 0 1 0
2005–2010 2005 2006 2007 2008 2009 2010 CAGR (%)
<3.0lb Shipments (000) 195 297 411 532 729 893 35.6 Growth (%) NA 52.5 38.3 29.4 37.0 22.5 ASP ($000) 1,561 1,267 1,097 920 834 772 -13.1 Growth (%) NA -18.9 -13.4 -16.2 -9.3 -7.4 Revenue ($M) 304 376 451 489 607 689 17.8 Growth (%) NA 23.8 19.9 8.4 24.2 13.4
3.0–4.9lb Shipments (000) 1,241 1,763 2,390 3,139 3,973 4,873 31.5 Growth (%) NA 42.0 35.6 31.3 26.6 22.7 ASP ($000) 1,209 962 812 678 590 524 -15.4 Growth (%) NA -20.4 -15.5 -16.6 -13.0 -11.2 Revenue ($M) 1,500 1,695 1,942 2,127 2,344 2,552 11.2 Growth (%) NA 13.0 14.5 9.6 10.2 8.9
5.0–9.9lb Shipments (000) 2,166 2,357 2,539 2,777 3,095 3,563 10.5 Growth (%) NA 8.8 7.7 9.4 11.4 15.1 ASP ($000) 1,023 869 786 667 604 564 -11.2 Growth (%) NA -15.0 -9.6 -15.2 -9.4 -6.6
©2007 IDC #205028 15
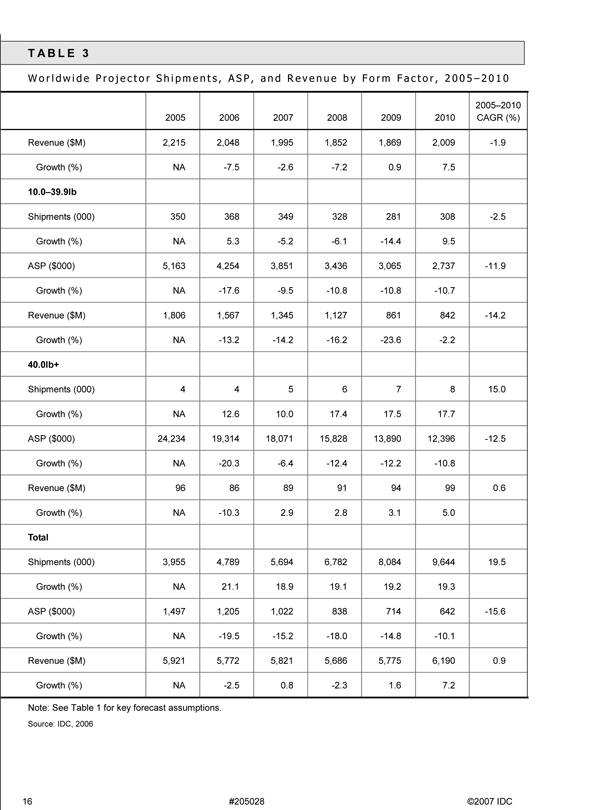
T A B L E 3
W o r l d w i d e P r o j e c t o r S h i p m e n t s , A S P , a n d R e v e n u e b y F o r m F a c t o r , 2 0 0 5 – 2 0 1 0
2005–2010 2005 2006 2007 2008 2009 2010 CAGR (%)
Revenue ($M) 2,215 2,048 1,995 1,852 1,869 2,009 -1.9
Growth (%) NA -7.5 -2.6 -7.2 0.9 7.5
10.0–39.9lb Shipments (000) 350 368 349 328 281 308 -2.5 Growth (%) NA 5.3 -5.2 -6.1 -14.4 9.5 ASP ($000) 5,163 4,254 3,851 3,436 3,065 2,737 -11.9 Growth (%) NA -17.6 -9.5 -10.8 -10.8 -10.7 Revenue ($M) 1,806 1,567 1,345 1,127 861 842 -14.2 Growth (%) NA -13.2 - -14.2 -16.2 -23.6 -2.2
40.0lb+ Shipments (000) 4 4 5 6 7 8 15.0 Growth (%) NA 12.6 10.0 17.4 17.5 17.7 ASP ($000) 24,234 19,314 18,071 15,828 13,890 12,396 -12.5 Growth (%) NA -20.3 -6.4 -12.4 -12.2 -10.8 Revenue ($M) 96 86 89 91 94 99 0.6 Growth (%) NA -10.3 2.9 2.8 3.1 5.0 Total Shipments (000) 3,955 4,789 5,694 6,782 8,084 9,644 19.5 Growth (%) NA 21.1 18.9 19.1 19.2 19.3 ASP ($000) 1,497 1,205 1,022 838 714 642 -15.6 Growth (%) NA -19.5 -15.2 -18.0 -14.8 -10.1 Revenue ($M) 5,921 5,772 5,821 5,686 5,775 6,190 0.9 Growth (%) NA -2.5 0.8 -2.3 1.6 7.2
Note: See Table 1 for key forecast assumptions.
Source: IDC, 2006
16 #205028 ©2007 IDC
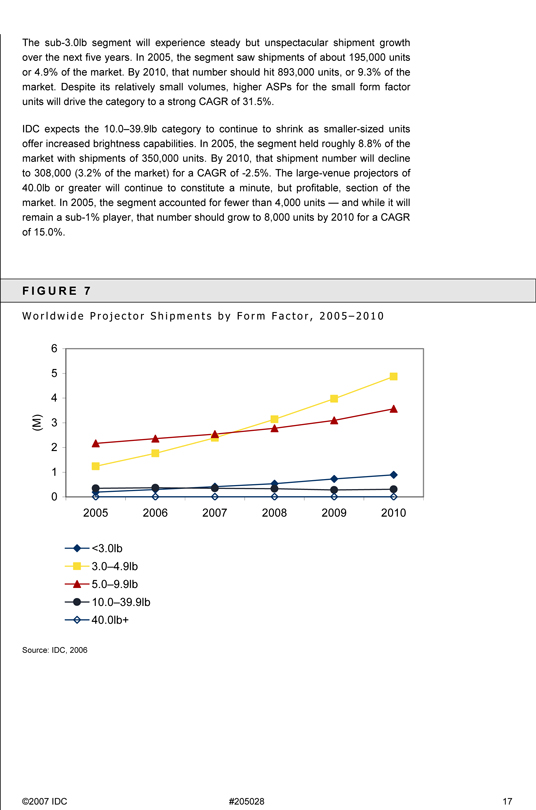
The sub-3.0lb segment will experience steady but unspectacular shipment growth over the next five years. In 2005, the segment saw shipments of about 195,000 units or 4.9% of the market. By 2010, that number should hit 893,000 units, or 9.3% of the market. Despite its relatively small volumes, higher ASPs for the small form factor units will drive the category to a strong CAGR of 31.5%.
IDC expects the 10.0–39.9lb category to continue to shrink as smaller-sized units offer increased brightness capabilities. In 2005, the segment held roughly 8.8% of the market with shipments of 350,000 units. By 2010, that shipment number will decline to 308,000 (3.2% of the market) for a CAGR of -2.5%. The large-venue projectors of 40.0lb or greater will continue to constitute a minute, but profitable, section of the market. In 2005, the segment accounted for fewer than 4,000 units — and while it will remain a sub-1% player, that number should grow to 8,000 units by 2010 for a CAGR of 15.0%.
F I G U R E 7
W o r l d w i d e P r o j e c t o r S h i p m e n t s b y F o r m F a c t o r , 2 0 0 5 – 2 0 1 0
6 5 4 (M) 3 2 1 0
2005 2006 2007 2008 2009 2010
<3.0lb 3.0–4.9lb 5.0–9.9lb 10.0–39.9lb 40.0lb+
Source: IDC, 2006
©2007 IDC #205028 17
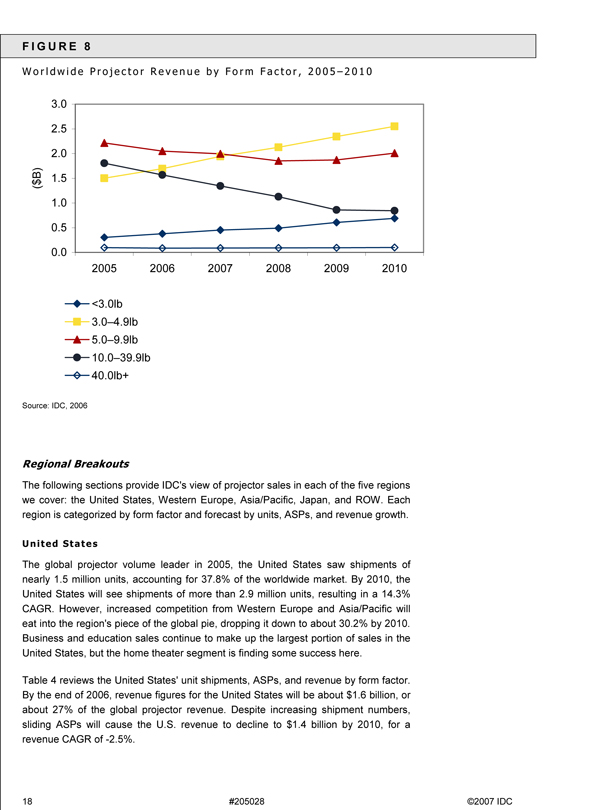
F I G U R E 8
W o r l d w i d e P r o j e c t o r R e v e n u e b y F o r m F a c t o r , 2 0 0 5 – 2 0 1 0
3.0 2.5 2.0 B) 1.5
$ ( 1.0 0.5 0.0 2005 2006 2007 2008 2009 2010
<3.0lb 3.0–4.9lb 5.0–9.9lb 10.0–39.9lb 40.0lb+
Source: IDC, 2006
Regional Breakouts
The following sections provide IDC's view of projector sales in each of the five regions we cover: the United States, Western Europe, Asia/Pacific, Japan, and ROW. Each region is categorized by form factor and forecast by units, ASPs, and revenue growth.
United States
The global projector volume leader in 2005, the United States saw shipments of nearly 1.5 million units, accounting for 37.8% of the worldwide market. By 2010, the United States will see shipments of more than 2.9 million units, resulting in a 14.3% CAGR. However, increased competition from Western Europe and Asia/Pacific will eat into the region's piece of the global pie, dropping it down to about 30.2% by 2010. Business and education sales continue to make up the largest portion of sales in the United States, but the home theater segment is finding some success here.
Table 4 reviews the United States' unit shipments, ASPs, and revenue by form factor. By the end of 2006, revenue figures for the United States will be about $1.6 billion, or about 27% of the global projector revenue. Despite increasing shipment numbers, sliding ASPs will cause the U.S. revenue to decline to $1.4 billion by 2010, for a revenue CAGR of -2.5%.
18 #205028 ©2007 IDC
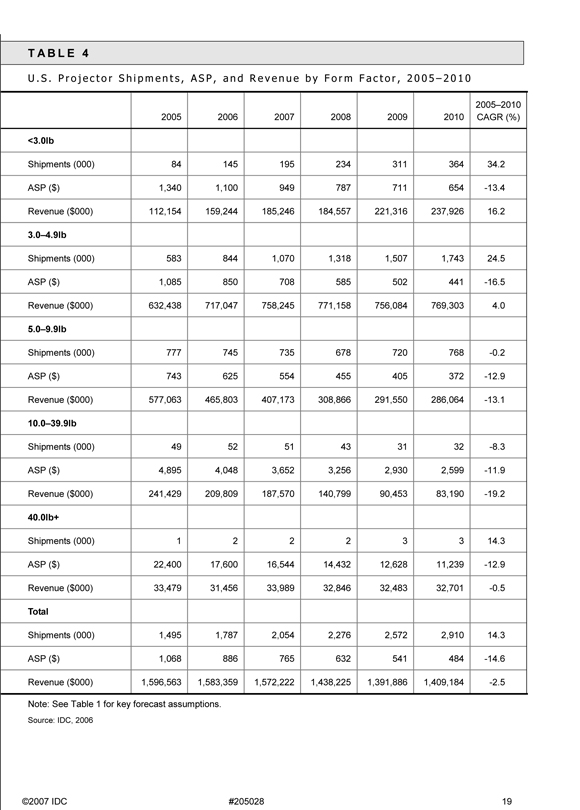
T A B L E 4
U . S . P r o j e c t o r S h i p m e n t s , A S P , a n d R e v e n u e b y F o r m F a c t o r , 2 0 0 5 – 2 0 1 0
2005–2010 2005 2006 2007 2008 2009 2010 CAGR (%)
<3.0lb Shipments (000) 84 145 195 234 311 364 34.2 ASP ($) 1,340 1,100 949 787 711 654 -13.4 Revenue ($000) 112,154 159,244 185,246 184,557 221,316 237,926 16.2
3.0–4.9lb Shipments (000) 583 844 1,070 1,318 1,507 1,743 24.5 ASP ($) 1,085 850 708 585 502 441 -16.5 Revenue ($000) 632,438 717,047 758,245 771,158 756,084 769,303 4.0
5.0–9.9lb Shipments (000) 777 745 735 678 720 768 -0.2 ASP ($) 743 625 554 455 405 372 -12.9 Revenue ($000) 577,063 465,803 407,173 308,866 291,550 286,064 -13.1
10.0–39.9lb Shipments (000) 49 52 51 43 31 32 -8.3 ASP ($) 4,895 4,048 3,652 3,256 2,930 2,599 -11.9 Revenue ($000) 241,429 209,809 187,570 140,799 90,453 83,190 -19.2
40.0lb+ Shipments (000) 1 2 2 2 3 3 14.3 ASP ($) 22,400 17,600 16,544 14,432 12,628 11,239 -12.9 Revenue ($000) 33,479 31,456 33,989 32,846 32,483 32,701 -0.5 Total Shipments (000) 1,495 1,787 2,054 2,276 2,572 2,910 14.3 ASP ($) 1,068 886 765 632 541 484 -14.6 Revenue ($000) 1,596,563 1,583,359 1,572,222 1,438,225 1,391,886 1,409,184 -2.5
Note: See Table 1 for key forecast assumptions.
Source: IDC, 2006
©2007 IDC #205028 19
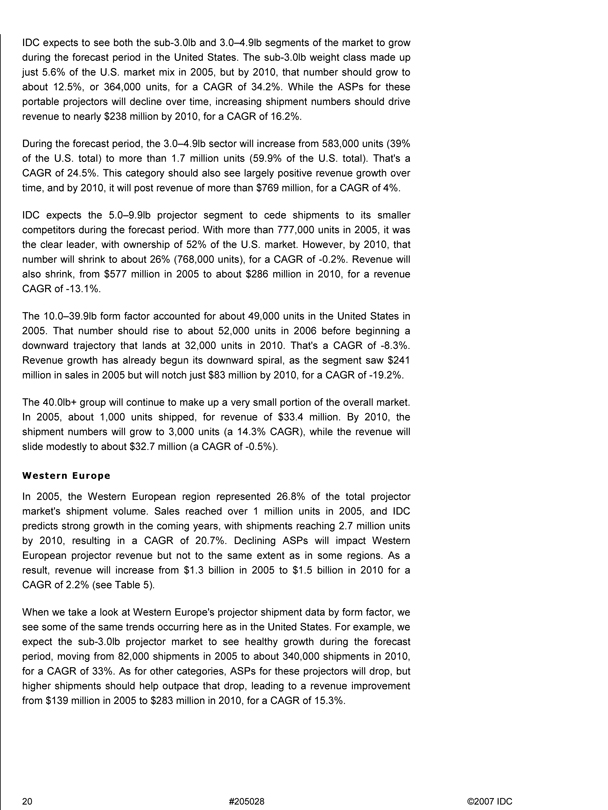
IDC expects to see both the sub-3.0lb and 3.0–4.9lb segments of the market to grow during the forecast period in the United States. The sub-3.0lb weight class made up just 5.6% of the U.S. market mix in 2005, but by 2010, that number should grow to about 12.5%, or 364,000 units, for a CAGR of 34.2%. While the ASPs for these portable projectors will decline over time, increasing shipment numbers should drive revenue to nearly $238 million by 2010, for a CAGR of 16.2%.
During the forecast period, the 3.0–4.9lb sector will increase from 583,000 units (39% of the U.S. total) to more than 1.7 million units (59.9% of the U.S. total). That's a CAGR of 24.5%. This category should also see largely positive revenue growth over time, and by 2010, it will post revenue of more than $769 million, for a CAGR of 4%.
IDC expects the 5.0–9.9lb projector segment to cede shipments to its smaller competitors during the forecast period. With more than 777,000 units in 2005, it was the clear leader, with ownership of 52% of the U.S. market. However, by 2010, that number will shrink to about 26% (768,000 units), for a CAGR of -0.2%. Revenue will also shrink, from $577 million in 2005 to about $286 million in 2010, for a revenue CAGR of -13.1%.
The 10.0–39.9lb form factor accounted for about 49,000 units in the United States in 2005. That number should rise to about 52,000 units in 2006 before beginning a downward trajectory that lands at 32,000 units in 2010. That's a CAGR of -8.3%. Revenue growth has already begun its downward spiral, as the segment saw $241 million in sales in 2005 but will notch just $83 million by 2010, for a CAGR of -19.2%.
The 40.0lb+ group will continue to make up a very small portion of the overall market. In 2005, about 1,000 units shipped, for revenue of $33.4 million. By 2010, the shipment numbers will grow to 3,000 units (a 14.3% CAGR), while the revenue will slide modestly to about $32.7 million (a CAGR of -0.5%).
Western Europe
In 2005, the Western European region represented 26.8% of the total projector market's shipment volume. Sales reached over 1 million units in 2005, and IDC predicts strong growth in the coming years, with shipments reaching 2.7 million units by 2010, resulting in a CAGR of 20.7%. Declining ASPs will impact Western European projector revenue but not to the same extent as in some regions. As a result, revenue will increase from $1.3 billion in 2005 to $1.5 billion in 2010 for a CAGR of 2.2% (see Table 5).
When we take a look at Western Europe's projector shipment data by form factor, we see some of the same trends occurring here as in the United States. For example, we expect the sub-3.0lb projector market to see healthy growth during the forecast period, moving from 82,000 shipments in 2005 to about 340,000 shipments in 2010, for a CAGR of 33%. As for other categories, ASPs for these projectors will drop, but higher shipments should help outpace that drop, leading to a revenue improvement from $139 million in 2005 to $283 million in 2010, for a CAGR of 15.3%.
20 #205028 ©2007 IDC
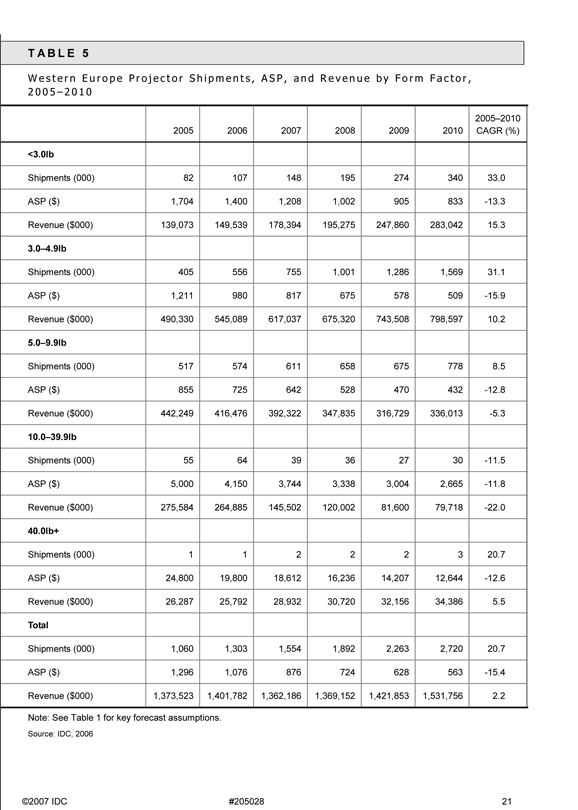
T A B L E 5
W e s t e r n E u r o p e P r o j e c t o r S h i p m e n t s , A S P , a n d R e v e n u e b y F o r m F a c t o r ,
2 0 0 5 – 2 0 1 0
2005–2010 2005 2006 2007 2008 2009 2010 CAGR (%)
<3.0lb Shipments (000) 82 107 148 195 274 340 33.0 ASP ($) 1,704 1,400 1,208 1,002 905 833 -13.3 Revenue ($000) 139,073 149,539 178,394 195,275 247,860 283,042 15.3
3.0–4.9lb Shipments (000) 405 556 755 1,001 1,286 1,569 31.1 ASP ($) 1,211 980 817 675 578 509 -15.9 Revenue ($000) 490,330 545,089 617,037 675,320 743,508 798,597 10.2
5.0–9.9lb Shipments (000) 517 574 611 658 675 778 8.5 ASP ($) 855 725 642 528 470 432 -12.8 Revenue ($000) 442,249 416,476 392,322 347,835 316,729 336,013 -5.3
10.0–39.9lb Shipments (000) 55 64 39 36 27 30 -11.5 ASP ($) 5,000 4,150 3,744 3,338 3,004 2,665 -11.8 Revenue ($000) 275,584 264,885 145,502 120,002 81,600 79,718 -22.0
40.0lb+ Shipments (000) 1 1 2 2 2 3 20.7 ASP ($) 24,800 19,800 18,612 16,236 14,207 12,644 -12.6 Revenue ($000) 26,287 25,792 28,932 30,720 32,156 34,386 5.5 Total Shipments (000) 1,060 1,303 1,554 1,892 2,263 2,720 20.7 ASP ($) 1,296 1,076 876 724 628 563 -15.4 Revenue ($000) 1,373,523 1,401,782 1,362,186 1,369,152 1,421,853 1,531,756 2.2
Note: See Table 1 for key forecast assumptions.
Source: IDC, 2006
©2007 IDC #205028 21
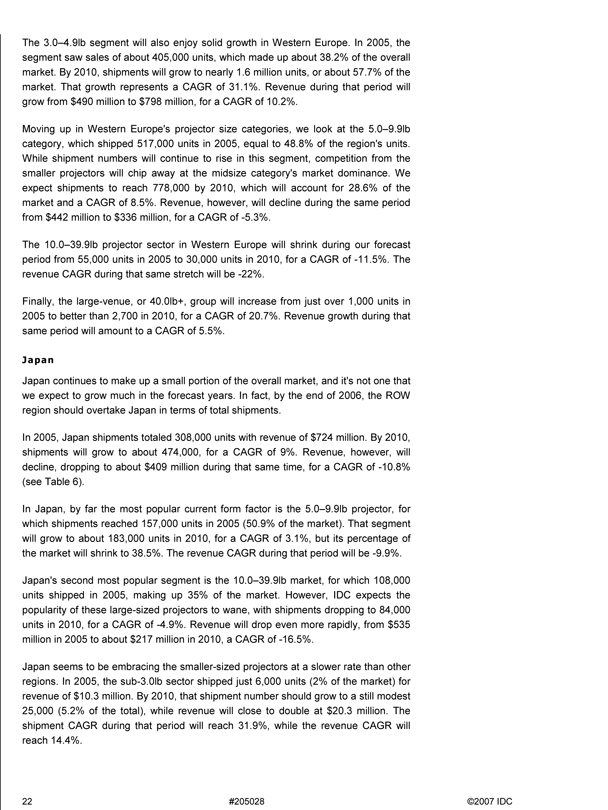
The 3.0–4.9lb segment will also enjoy solid growth in Western Europe. In 2005, the segment saw sales of about 405,000 units, which made up about 38.2% of the overall market. By 2010, shipments will grow to nearly 1.6 million units, or about 57.7% of the market. That growth represents a CAGR of 31.1%. Revenue during that period will grow from $490 million to $798 million, for a CAGR of 10.2%.
Moving up in Western Europe's projector size categories, we look at the 5.0–9.9lb category, which shipped 517,000 units in 2005, equal to 48.8% of the region's units. While shipment numbers will continue to rise in this segment, competition from the smaller projectors will chip away at the midsize category's market dominance. We expect shipments to reach 778,000 by 2010, which will account for 28.6% of the market and a CAGR of 8.5%. Revenue, however, will decline during the same period from $442 million to $336 million, for a CAGR of -5.3%.
The 10.0–39.9lb projector sector in Western Europe will shrink during our forecast period from 55,000 units in 2005 to 30,000 units in 2010, for a CAGR of -11.5%. The revenue CAGR during that same stretch will be -22%.
Finally, the large-venue, or 40.0lb+, group will increase from just over 1,000 units in 2005 to better than 2,700 in 2010, for a CAGR of 20.7%. Revenue growth during that same period will amount to a CAGR of 5.5%.
Japan
Japan continues to make up a small portion of the overall market, and it's not one that we expect to grow much in the forecast years. In fact, by the end of 2006, the ROW region should overtake Japan in terms of total shipments.
In 2005, Japan shipments totaled 308,000 units with revenue of $724 million. By 2010, shipments will grow to about 474,000, for a CAGR of 9%. Revenue, however, will decline, dropping to about $409 million during that same time, for a CAGR of -10.8% (see Table 6).
In Japan, by far the most popular current form factor is the 5.0–9.9lb projector, for which shipments reached 157,000 units in 2005 (50.9% of the market). That segment will grow to about 183,000 units in 2010, for a CAGR of 3.1%, but its percentage of the market will shrink to 38.5%. The revenue CAGR during that period will be -9.9%.
Japan's second most popular segment is the 10.0–39.9lb market, for which 108,000 units shipped in 2005, making up 35% of the market. However, IDC expects the popularity of these large-sized projectors to wane, with shipments dropping to 84,000 units in 2010, for a CAGR of -4.9%. Revenue will drop even more rapidly, from $535 million in 2005 to about $217 million in 2010, a CAGR of -16.5%.
Japan seems to be embracing the smaller-sized projectors at a slower rate than other regions. In 2005, the sub-3.0lb sector shipped just 6,000 units (2% of the market) for revenue of $10.3 million. By 2010, that shipment number should grow to a still modest 25,000 (5.2% of the total), while revenue will close to double at $20.3 million. The shipment CAGR during that period will reach 31.9%, while the revenue CAGR will reach 14.4%.
22 #205028 ©2007 IDC
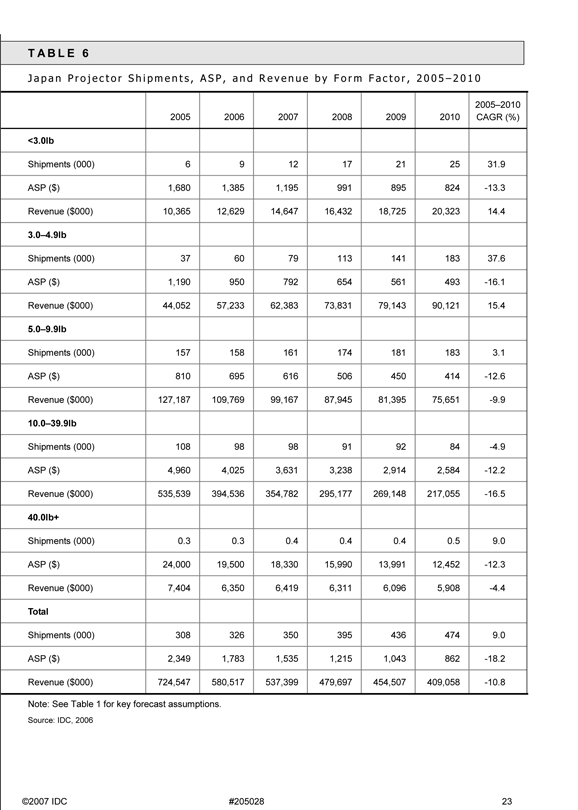
T A B L E 6
J a p a n P r o j e c t o r S h i p m e n t s , A S P , a n d R e v e n u e b y F o r m F a c t o r , 2 0 0 5 – 2 0 1 0
2005–2010 2005 2006 2007 2008 2009 2010 CAGR (%)
<3.0lb Shipments (000) 6 9 12 17 21 25 31.9 ASP ($) 1,680 1,385 1,195 991 895 824 -13.3 Revenue ($000) 10,365 12,629 14,647 16,432 18,725 20,323 14.4
3.0–4.9lb Shipments (000) 37 60 79 113 141 183 37.6 ASP ($) 1,190 950 792 654 561 493 -16.1 Revenue ($000) 44,052 57,233 62,383 73,831 79,143 90,121 15.4
5.0–9.9lb Shipments (000) 157 158 161 174 181 183 3.1 ASP ($) 810 695 616 506 450 414 -12.6 Revenue ($000) 127,187 109,769 99,167 87,945 81,395 75,651 -9.9
10.0–39.9lb Shipments (000) 108 98 98 91 92 84 -4.9 ASP ($) 4,960 4,025 3,631 3,238 2,914 2,584 -12.2 Revenue ($000) 535,539 394,536 354,782 295,177 269,148 217,055 -16.5
40.0lb+ Shipments (000) 0.3 0.3 0.4 0.4 0.4 0.5 9.0 ASP ($) 24,000 19,500 18,330 15,990 13,991 12,452 -12.3 Revenue ($000) 7,404 6,350 6,419 6,311 6,096 5,908 -4.4 Total Shipments (000) 308 326 350 395 436 474 9.0 ASP ($) 2,349 1,783 1,535 1,215 1,043 862 -18.2 Revenue ($000) 724,547 580,517 537,399 479,697 454,507 409,058 -10.8
Note: See Table 1 for key forecast assumptions.
Source: IDC, 2006
©2007 IDC #205028 23
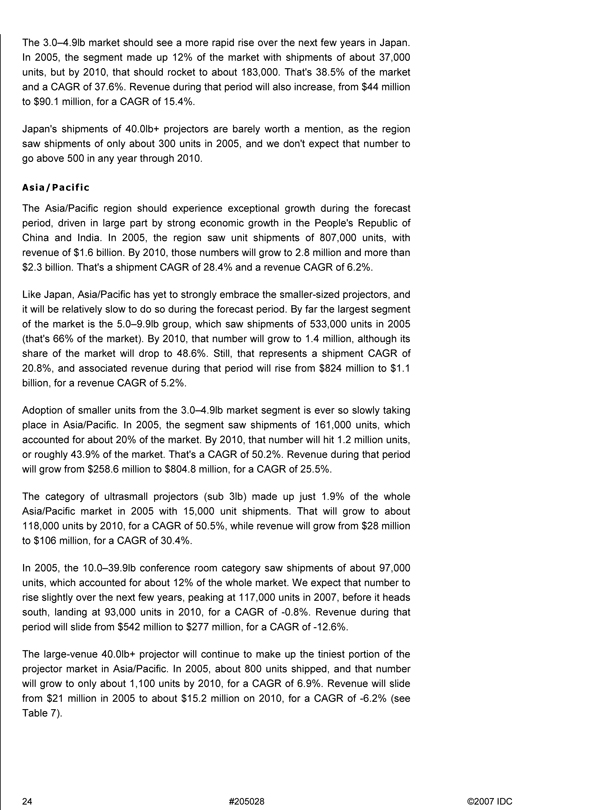
The 3.0–4.9lb market should see a more rapid rise over the next few years in Japan. In 2005, the segment made up 12% of the market with shipments of about 37,000 units, but by 2010, that should rocket to about 183,000. That's 38.5% of the market and a CAGR of 37.6%. Revenue during that period will also increase, from $44 million to $90.1 million, for a CAGR of 15.4%.
Japan's shipments of 40.0lb+ projectors are barely worth a mention, as the region saw shipments of only about 300 units in 2005, and we don't expect that number to go above 500 in any year through 2010.
Asia/Pacific
The Asia/Pacific region should experience exceptional growth during the forecast period, driven in large part by strong economic growth in the People's Republic of China and India. In 2005, the region saw unit shipments of 807,000 units, with revenue of $1.6 billion. By 2010, those numbers will grow to 2.8 million and more than $2.3 billion. That's a shipment CAGR of 28.4% and a revenue CAGR of 6.2%.
Like Japan, Asia/Pacific has yet to strongly embrace the smaller-sized projectors, and it will be relatively slow to do so during the forecast period. By far the largest segment of the market is the 5.0–9.9lb group, which saw shipments of 533,000 units in 2005 (that's 66% of the market). By 2010, that number will grow to 1.4 million, although its share of the market will drop to 48.6%. Still, that represents a shipment CAGR of 20.8%, and associated revenue during that period will rise from $824 million to $1.1 billion, for a revenue CAGR of 5.2%.
Adoption of smaller units from the 3.0–4.9lb market segment is ever so slowly taking place in Asia/Pacific. In 2005, the segment saw shipments of 161,000 units, which accounted for about 20% of the market. By 2010, that number will hit 1.2 million units, or roughly 43.9% of the market. That's a CAGR of 50.2%. Revenue during that period will grow from $258.6 million to $804.8 million, for a CAGR of 25.5%.
The category of ultrasmall projectors (sub 3lb) made up just 1.9% of the whole Asia/Pacific market in 2005 with 15,000 unit shipments. That will grow to about 118,000 units by 2010, for a CAGR of 50.5%, while revenue will grow from $28 million to $106 million, for a CAGR of 30.4%.
In 2005, the 10.0–39.9lb conference room category saw shipments of about 97,000 units, which accounted for about 12% of the whole market. We expect that number to rise slightly over the next few years, peaking at 117,000 units in 2007, before it heads south, landing at 93,000 units in 2010, for a CAGR of -0.8%. Revenue during that period will slide from $542 million to $277 million, for a CAGR of -12.6%.
The large-venue 40.0lb+ projector will continue to make up the tiniest portion of the projector market in Asia/Pacific. In 2005, about 800 units shipped, and that number will grow to only about 1,100 units by 2010, for a CAGR of 6.9%. Revenue will slide from $21 million in 2005 to about $15.2 million on 2010, for a CAGR of -6.2% (see Table 7).
24 #205028 ©2007 IDC
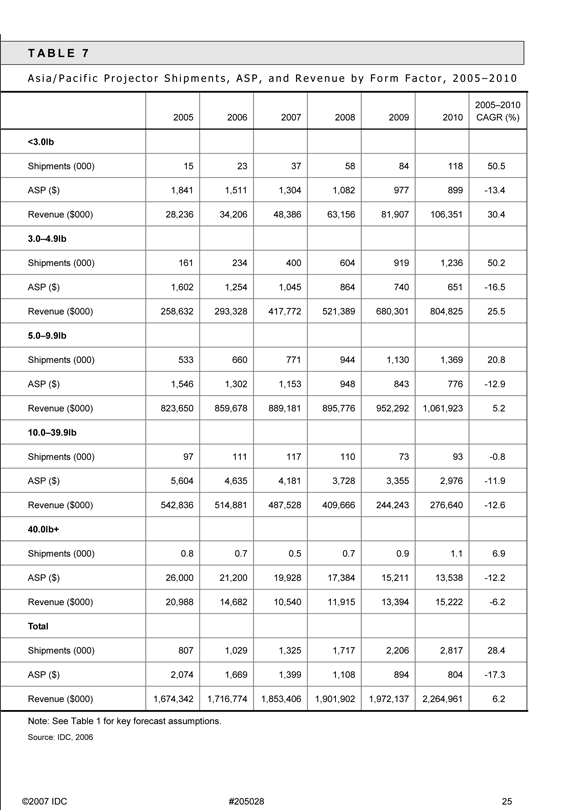
T A B L E 7
A s i a / P a c i f i c P r o j e c t o r S h i p m e n t s , A S P , a n d R e v e n u e b y F o r m F a c t o r , 2 0 0 5 – 2 0 1 0
2005–2010 2005 2006 2007 2008 2009 2010 CAGR (%)
<3.0lb Shipments (000) 15 23 37 58 84 118 50.5 ASP ($) 1,841 1,511 1,304 1,082 977 899 -13.4 Revenue ($000) 28,236 34,206 48,386 63,156 81,907 106,351 30.4
3.0–4.9lb Shipments (000) 161 234 400 604 919 1,236 50.2 ASP ($) 1,602 1,254 1,045 864 740 651 -16.5 Revenue ($000) 258,632 293,328 417,772 521,389 680,301 804,825 25.5
5.0–9.9lb Shipments (000) 533 660 771 944 1,130 1,369 20.8 ASP ($) 1,546 1,302 1,153 948 843 776 -12.9 Revenue ($000) 823,650 859,678 889,181 895,776 952,292 1,061,923 5.2
10.0–39.9lb Shipments (000) 97 111 117 110 73 93 -0.8 ASP ($) 5,604 4,635 4,181 3,728 3,355 2,976 -11.9 Revenue ($000) 542,836 514,881 487,528 409,666 244,243 276,640 -12.6
40.0lb+ Shipments (000) 0.8 0.7 0.5 0.7 0.9 1.1 6.9 ASP ($) 26,000 21,200 19,928 17,384 15,211 13,538 -12.2 Revenue ($000) 20,988 14,682 10,540 11,915 13,394 15,222 -6.2 Total Shipments (000) 807 1,029 1,325 1,717 2,206 2,817 28.4 ASP ($) 2,074 1,669 1,399 1,108 894 804 -17.3 Revenue ($000) 1,674,342 1,716,774 1,853,406 1,901,902 1,972,137 2,264,961 6.2
Note: See Table 1 for key forecast assumptions.
Source: IDC, 2006
©2007 IDC #205028 25
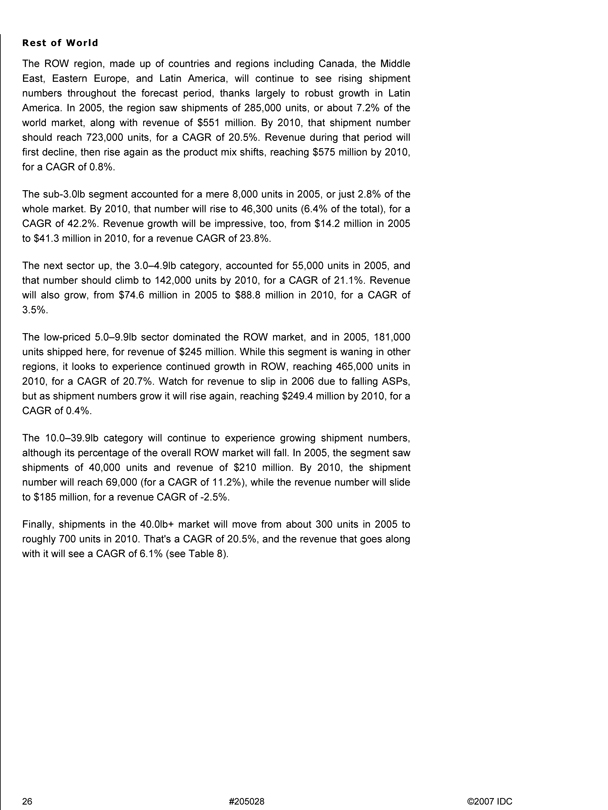
Rest of World
The ROW region, made up of countries and regions including Canada, the Middle East, Eastern Europe, and Latin America, will continue to see rising shipment numbers throughout the forecast period, thanks largely to robust growth in Latin America. In 2005, the region saw shipments of 285,000 units, or about 7.2% of the world market, along with revenue of $551 million. By 2010, that shipment number should reach 723,000 units, for a CAGR of 20.5%. Revenue during that period will first decline, then rise again as the product mix shifts, reaching $575 million by 2010, for a CAGR of 0.8%.
The sub-3.0lb segment accounted for a mere 8,000 units in 2005, or just 2.8% of the whole market. By 2010, that number will rise to 46,300 units (6.4% of the total), for a CAGR of 42.2%. Revenue growth will be impressive, too, from $14.2 million in 2005 to $41.3 million in 2010, for a revenue CAGR of 23.8%.
The next sector up, the 3.0–4.9lb category, accounted for 55,000 units in 2005, and that number should climb to 142,000 units by 2010, for a CAGR of 21.1%. Revenue will also grow, from $74.6 million in 2005 to $88.8 million in 2010, for a CAGR of 3.5%.
The low-priced 5.0–9.9lb sector dominated the ROW market, and in 2005, 181,000 units shipped here, for revenue of $245 million. While this segment is waning in other regions, it looks to experience continued growth in ROW, reaching 465,000 units in 2010, for a CAGR of 20.7%. Watch for revenue to slip in 2006 due to falling ASPs, but as shipment numbers grow it will rise again, reaching $249.4 million by 2010, for a CAGR of 0.4%.
The 10.0–39.9lb category will continue to experience growing shipment numbers, although its percentage of the overall ROW market will fall. In 2005, the segment saw shipments of 40,000 units and revenue of $210 million. By 2010, the shipment number will reach 69,000 (for a CAGR of 11.2%), while the revenue number will slide to $185 million, for a revenue CAGR of -2.5%.
Finally, shipments in the 40.0lb+ market will move from about 300 units in 2005 to roughly 700 units in 2010. That's a CAGR of 20.5%, and the revenue that goes along with it will see a CAGR of 6.1% (see Table 8).
26 #205028 ©2007 IDC
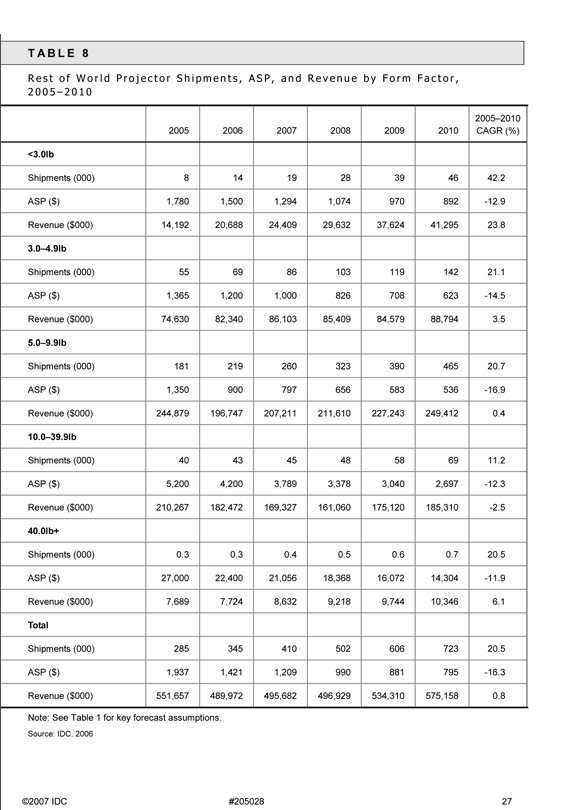
T A B L E 8
R e s t o f W o r l d P r o j e c t o r S h i p m e n t s , A S P , a n d R e v e n u e b y F o r m F a c t o r ,
2 0 0 5 – 2 0 1 0
2005–2010 2005 2006 2007 2008 2009 2010 CAGR (%)
<3.0lb Shipments (000) 8 14 19 28 39 46 42.2 ASP ($) 1,780 1,500 1,294 1,074 970 892 -12.9 Revenue ($000) 14,192 20,688 24,409 29,632 37,624 41,295 23.8
3.0–4.9lb Shipments (000) 55 69 86 103 119 142 21.1 ASP ($) 1,365 1,200 1,000 826 708 623 -14.5 Revenue ($000) 74,630 82,340 86,103 85,409 84,579 88,794 3.5
5.0–9.9lb Shipments (000) 181 219 260 323 390 465 20.7 ASP ($) 1,350 900 797 656 583 536 -16.9 Revenue ($000) 244,879 196,747 207,211 211,610 227,243 249,412 0.4
10.0–39.9lb Shipments (000) 40 43 45 48 58 69 11.2 ASP ($) 5,200 4,200 3,789 3,378 3,040 2,697 -12.3 Revenue ($000) 210,267 182,472 169,327 161,060 175,120 185,310 -2.5
40.0lb+ Shipments (000) 0.3 0.3 0.4 0.5 0.6 0.7 20.5 ASP ($) 27,000 22,400 21,056 18,368 16,072 14,304 -11.9 Revenue ($000) 7,689 7,724 8,632 9,218 9,744 10,346 6.1 Total Shipments (000) 285 345 410 502 606 723 20.5 ASP ($) 1,937 1,421 1,209 990 881 795 -16.3 Revenue ($000) 551,657 489,972 495,682 496,929 534,310 575,158 0.8
Note: See Table 1 for key forecast assumptions.
Source: IDC, 2006
©2007 IDC #205028 27
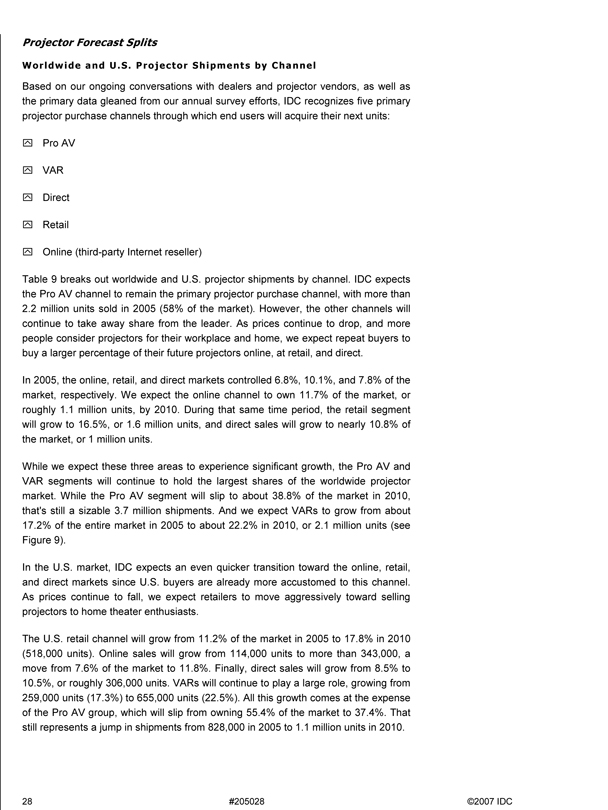
Projector Forecast Splits
Worldwide and U.S. Projector Shipments by Channel
Based on our ongoing conversations with dealers and projector vendors, as well as the primary data gleaned from our annual survey efforts, IDC recognizes five primary projector purchase channels through which end users will acquire their next units:
Pro AV VAR Direct Retail
Online (third-party Internet reseller)
Table 9 breaks out worldwide and U.S. projector shipments by channel. IDC expects the Pro AV channel to remain the primary projector purchase channel, with more than 2.2 million units sold in 2005 (58% of the market). However, the other channels will continue to take away share from the leader. As prices continue to drop, and more people consider projectors for their workplace and home, we expect repeat buyers to buy a larger percentage of their future projectors online, at retail, and direct.
In 2005, the online, retail, and direct markets controlled 6.8%, 10.1%, and 7.8% of the market, respectively. We expect the online channel to own 11.7% of the market, or roughly 1.1 million units, by 2010. During that same time period, the retail segment will grow to 16.5%, or 1.6 million units, and direct sales will grow to nearly 10.8% of the market, or 1 million units.
While we expect these three areas to experience significant growth, the Pro AV and VAR segments will continue to hold the largest shares of the worldwide projector market. While the Pro AV segment will slip to about 38.8% of the market in 2010, that's still a sizable 3.7 million shipments. And we expect VARs to grow from about 17.2% of the entire market in 2005 to about 22.2% in 2010, or 2.1 million units (see Figure 9).
In the U.S. market, IDC expects an even quicker transition toward the online, retail, and direct markets since U.S. buyers are already more accustomed to this channel. As prices continue to fall, we expect retailers to move aggressively toward selling projectors to home theater enthusiasts.
The U.S. retail channel will grow from 11.2% of the market in 2005 to 17.8% in 2010 (518,000 units). Online sales will grow from 114,000 units to more than 343,000, a move from 7.6% of the market to 11.8%. Finally, direct sales will grow from 8.5% to 10.5%, or roughly 306,000 units. VARs will continue to play a large role, growing from 259,000 units (17.3%) to 655,000 units (22.5%). All this growth comes at the expense of the Pro AV group, which will slip from owning 55.4% of the market to 37.4%. That still represents a jump in shipments from 828,000 in 2005 to 1.1 million units in 2010.
28 #205028 ©2007 IDC
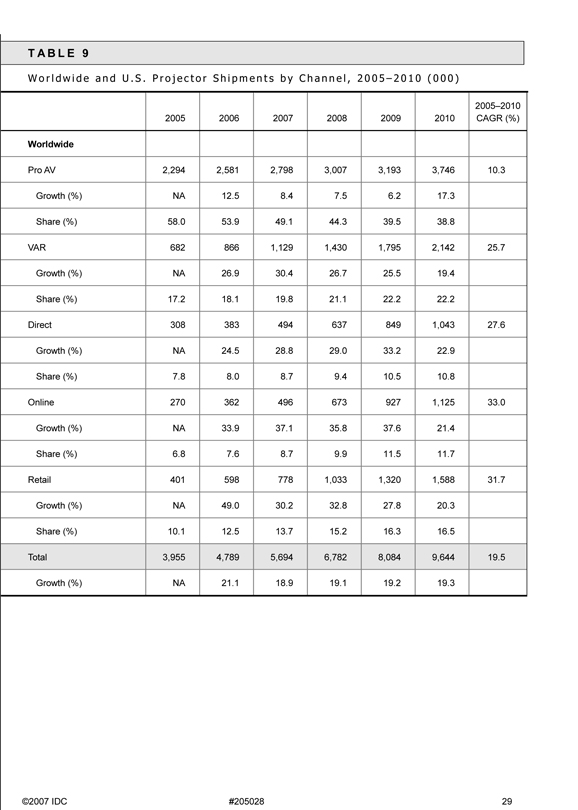
T A B L E 9
W o r l d w i d e a n d U . S . P r o j e c t o r S h i p m e n t s b y C h a n n e l , 2 0 0 5 – 2 0 1 0 ( 0 0 0 )
2005–2010 2005 2006 2007 2008 2009 2010 CAGR (%)
Worldwide
Pro AV 2,294 2,581 2,798 3,007 3,193 3,746 10.3
Growth (%) NA 12.5 8.4 7.5 6.2 17.3 Share (%) 58.0 53.9 49.1 44.3 39.5 38.8 VAR 682 866 1,129 1,430 1,795 2,142 25.7
Growth (%) NA 26.9 30.4 26.7 25.5 19.4 Share (%) 17.2 18.1 19.8 21.1 22.2 22.2 Direct 308 383 494 637 849 1,043 27.6 Growth (%) NA 24.5 28.8 29.0 33.2 22.9 Share (%) 7.8 8.0 8.7 9.4 10.5 10.8 Online 270 362 496 673 927 1,125 33.0 Growth (%) NA 33.9 37.1 35.8 37.6 21.4 Share (%) 6.8 7.6 8.7 9.9 11.5 11.7 Retail 401 598 778 1,033 1,320 1,588 31.7 Growth (%) NA 49.0 30.2 32.8 27.8 20.3 Share (%) 10.1 12.5 13.7 15.2 16.3 16.5 Total 3,955 4,789 5,694 6,782 8,084 9,644 19.5 Growth (%) NA 21.1 18.9 19.1 19.2 19.3
©2007 IDC #205028 29
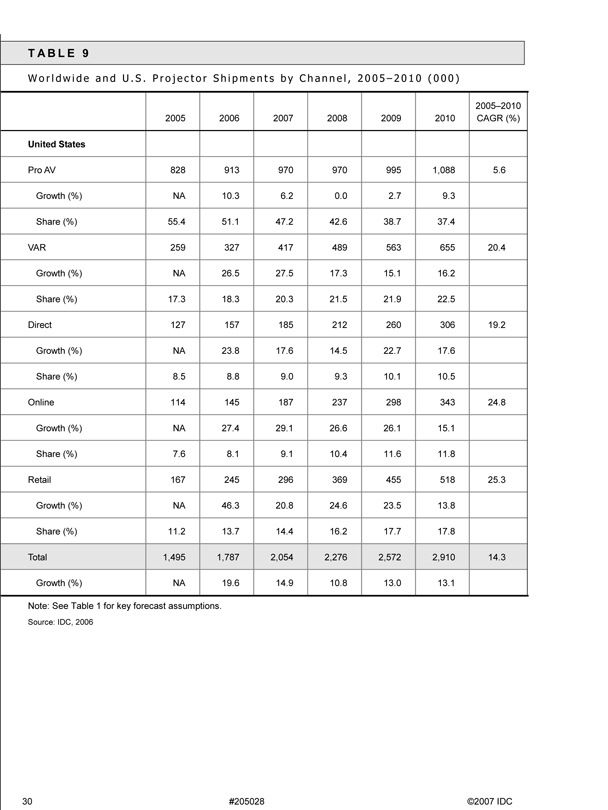
T A B L E 9
W o r l d w i d e a n d U . S . P r o j e c t o r S h i p m e n t s b y C h a n n e l , 2 0 0 5 – 2 0 1 0 ( 0 0 0 )
2005–2010 2005 2006 2007 2008 2009 2010 CAGR (%)
United States
Pro AV 828 913 970 970 995 1,088 5.6
Growth (%) NA 10.3 6.2 0.0 2.7 9.3 Share (%) 55.4 51.1 47.2 42.6 38.7 37.4 VAR 259 327 417 489 563 655 20.4
Growth (%) NA 26.5 27.5 17.3 15.1 16.2 Share (%) 17.3 18.3 20.3 21.5 21.9 22.5 Direct 127 157 185 212 260 306 19.2 Growth (%) NA 23.8 17.6 14.5 22.7 17.6 Share (%) 8.5 8.8 9.0 9.3 10.1 10.5 Online 114 145 187 237 298 343 24.8 Growth (%) NA 27.4 29.1 26.6 26.1 15.1 Share (%) 7.6 8.1 9.1 10.4 11.6 11.8 Retail 167 245 296 369 455 518 25.3 Growth (%) NA 46.3 20.8 24.6 23.5 13.8 Share (%) 11.2 13.7 14.4 16.2 17.7 17.8 Total 1,495 1,787 2,054 2,276 2,572 2,910 14.3 Growth (%) NA 19.6 14.9 10.8 13.0 13.1
Note: See Table 1 for key forecast assumptions.
Source: IDC, 2006
30 #205028 ©2007 IDC

F I G U R E 9
W o r l d w i d e P r o j e c t o r S h i p m e n t S h a r e b y C h a n n e l , 2 0 0 5 – 2 0 1 0
100 90 80 70 60 (%) 50 40 30 20 10 0
2005 2006 2007 2008 2009 2010
Pro AV VAR Direct Online Retail
Source: IDC, 2006
Home Theater Versus Enterprise
There's no denying that a high-quality projector, when used in an adequately configured room, offers one of the best home theater experiences around. Still, arranging the average living room to accommodate a projector can be difficult. Finding the space for a screen, setting up the projector, running cables, and dealing with ambient light are no small tasks. And that is probably why the home theater segment has been slower to take off than we'd originally predicted. However, we're still bullish on the idea that a segment of the population will go through these hassles to get the best possible big-screen image.
In 2005, roughly 8.5% of the worldwide projector market was made up of home theater projectors. We expect that number to rise to more than 21%, or more than 2 million units, by 2010. That's a CAGR of 43.5%.
We still believe the adoption of home theater projectors in the United States will be slightly more aggressive than the worldwide totals. In 2005, about 149,000 HT units shipped in the United States, or about 10% of the market. By 2010, that number will rise to 756,000, or about 26% of the market, for a CAGR of 38.3%.
Table 10 details the global and U.S. splits for enterprise/home theater projectors, while Figure 10 illustrates worldwide percentages on a graphical scale.
©2007 IDC #205028 31
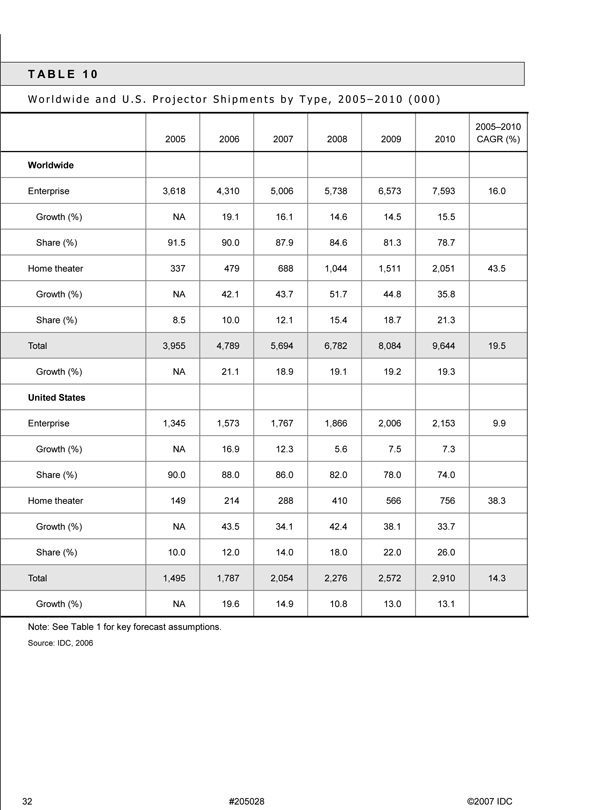
T A B L E 1 0
W o r l d w i d e a n d U . S . P r o j e c t o r S h i p m e n t s b y T y p e , 2 0 0 5 – 2 0 1 0 ( 0 0 0 )
2005–2010 2005 2006 2007 2008 2009 2010 CAGR (%)
Worldwide Enterprise 3,618 4,310 5,006 5,738 6,573 7,593 16.0 Growth (%) NA 19.1 16.1 14.6 14.5 15.5 Share (%) 91.5 90.0 87.9 84.6 81.3 78.7 Home theater 337 479 688 1,044 1,511 2,051 43.5 Growth (%) NA 42.1 43.7 51.7 44.8 35.8 Share (%) 8.5 10.0 12.1 15.4 18.7 21.3 Total 3,955 4,789 5,694 6,782 8,084 9,644 19.5 Growth (%) NA 21.1 18.9 19.1 19.2 19.3
United States Enterprise 1,345 1,573 1,767 1,866 2,006 2,153 9.9 Growth (%) NA 16.9 12.3 5.6 7.5 7.3 Share (%) 90.0 88.0 86.0 82.0 78.0 74.0 Home theater 149 214 288 410 566 756 38.3 Growth (%) NA 43.5 34.1 42.4 38.1 33.7 Share (%) 10.0 12.0 14.0 18.0 22.0 26.0 Total 1,495 1,787 2,054 2,276 2,572 2,910 14.3 Growth (%) NA 19.6 14.9 10.8 13.0 13.1
Note: See Table 1 for key forecast assumptions.
Source: IDC, 2006
32 #205028 ©2007 IDC
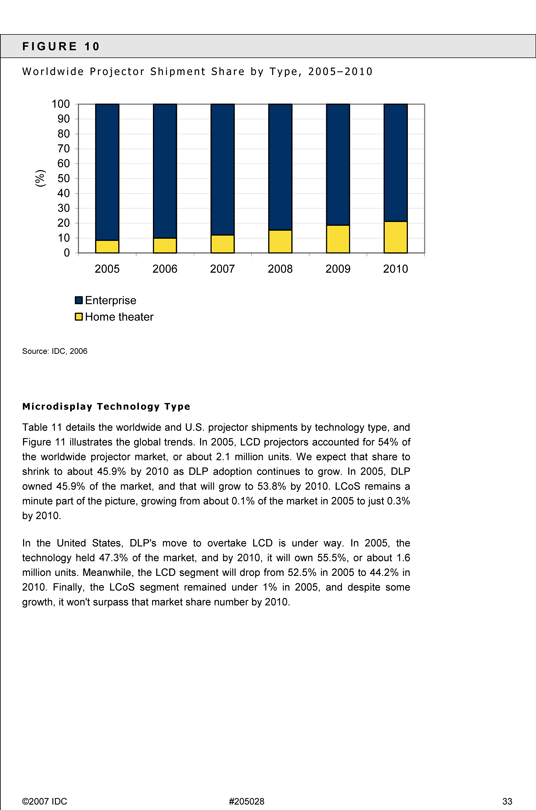
F I G U R E 1 0
W o r l d w i d e P r o j e c t o r S h i p m e n t S h a r e b y T y p e , 2 0 0 5 – 2 0 1 0
100 90 80 70 60 (%) 50 40 30 20 10 0
2005 2006 2007 2008 2009 2010
Enterprise Home theater
Source: IDC, 2006
Microdisplay Technology Type
Table 11 details the worldwide and U.S. projector shipments by technology type, and Figure 11 illustrates the global trends. In 2005, LCD projectors accounted for 54% of the worldwide projector market, or about 2.1 million units. We expect that share to shrink to about 45.9% by 2010 as DLP adoption continues to grow. In 2005, DLP owned 45.9% of the market, and that will grow to 53.8% by 2010. LCoS remains a minute part of the picture, growing from about 0.1% of the market in 2005 to just 0.3% by 2010.
In the United States, DLP's move to overtake LCD is under way. In 2005, the technology held 47.3% of the market, and by 2010, it will own 55.5%, or about 1.6 million units. Meanwhile, the LCD segment will drop from 52.5% in 2005 to 44.2% in 2010. Finally, the LCoS segment remained under 1% in 2005, and despite some growth, it won't surpass that market share number by 2010.
©2007 IDC #205028 33
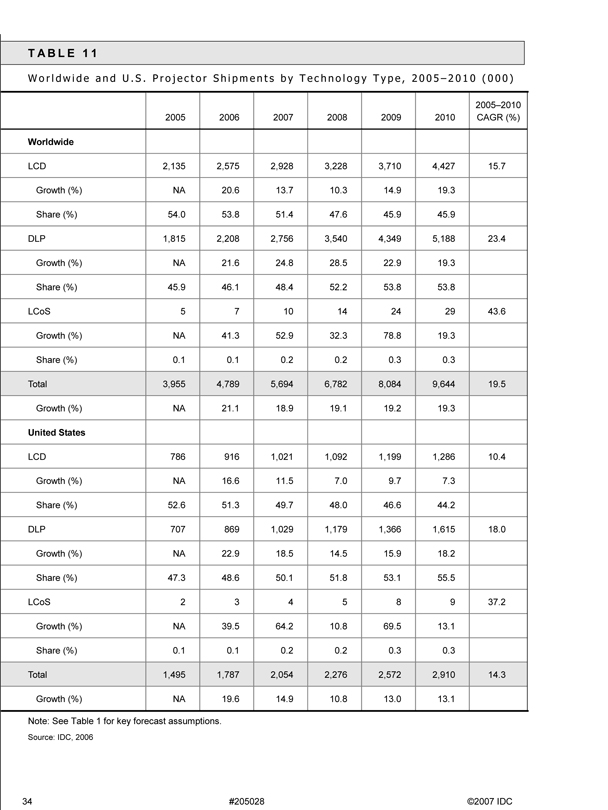
T A B L E 1 1
W o r l d w i d e a n d U . S . P r o j e c t o r S h i p m e n t s b y T e c h n o l o g y T y p e , 2 0 0 5 – 2 0 1 0 ( 0 0 0 )
2005–2010 2005 2006 2007 2008 2009 2010 CAGR (%)
Worldwide
LCD 2,135 2,575 2,928 3,228 3,710 4,427 15.7
Growth (%) NA 20.6 13.7 10.3 14.9 19.3 Share (%) 54.0 53.8 51.4 47.6 45.9 45.9 DLP 1,815 2,208 2,756 3,540 4,349 5,188 23.4
Growth (%) NA 21.6 24.8 28.5 22.9 19.3 Share (%) 45.9 46.1 48.4 52.2 53.8 53.8 LCoS 5 7 10 14 24 29 43.6
Growth (%) NA 41.3 52.9 32.3 78.8 19.3 Share (%) 0.1 0.1 0.2 0.2 0.3 0.3 Total 3,955 4,789 5,694 6,782 8,084 9,644 19.5 Growth (%) NA 21.1 18.9 19.1 19.2 19.3
United States
LCD 786 916 1,021 1,092 1,199 1,286 10.4
Growth (%) NA 16.6 11.5 7.0 9.7 7.3 Share (%) 52.6 51.3 49.7 48.0 46.6 44.2 DLP 707 869 1,029 1,179 1,366 1,615 18.0
Growth (%) NA 22.9 18.5 14.5 15.9 18.2 Share (%) 47.3 48.6 50.1 51.8 53.1 55.5 LCoS 2 3 4 5 8 9 37.2
Growth (%) NA 39.5 64.2 10.8 69.5 13.1 Share (%) 0.1 0.1 0.2 0.2 0.3 0.3 Total 1,495 1,787 2,054 2,276 2,572 2,910 14.3 Growth (%) NA 19.6 14.9 10.8 13.0 13.1
Note: See Table 1 for key forecast assumptions.
Source: IDC, 2006
34 #205028 ©2007 IDC
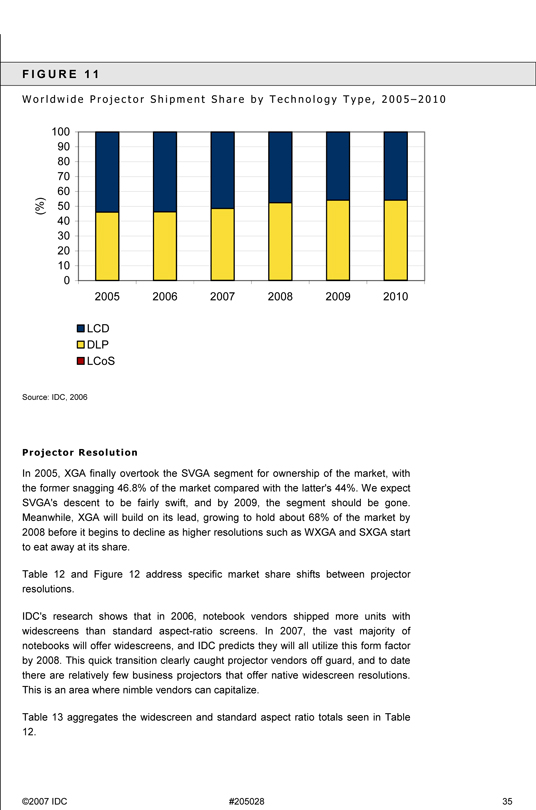
F I G U R E 1 1
W o r l d w i d e P r o j e c t o r S h i p m e n t S h a r e b y T e c h n o l o g y T y p e , 2 0 0 5 – 2 0 1 0
100 90 80 70 60 (%) 50 40 30 20 10 0
2005 2006 2007 2008 2009 2010
LCD DLP LCoS
Source: IDC, 2006
Projector Resolution
In 2005, XGA finally overtook the SVGA segment for ownership of the market, with the former snagging 46.8% of the market compared with the latter's 44%. We expect SVGA's descent to be fairly swift, and by 2009, the segment should be gone. Meanwhile, XGA will build on its lead, growing to hold about 68% of the market by 2008 before it begins to decline as higher resolutions such as WXGA and SXGA start to eat away at its share.
Table 12 and Figure 12 address specific market share shifts between projector resolutions.
IDC's research shows that in 2006, notebook vendors shipped more units with widescreens than standard aspect-ratio screens. In 2007, the vast majority of notebooks will offer widescreens, and IDC predicts they will all utilize this form factor by 2008. This quick transition clearly caught projector vendors off guard, and to date there are relatively few business projectors that offer native widescreen resolutions. This is an area where nimble vendors can capitalize.
Table 13 aggregates the widescreen and standard aspect ratio totals seen in Table 12.
©2007 IDC #205028 35
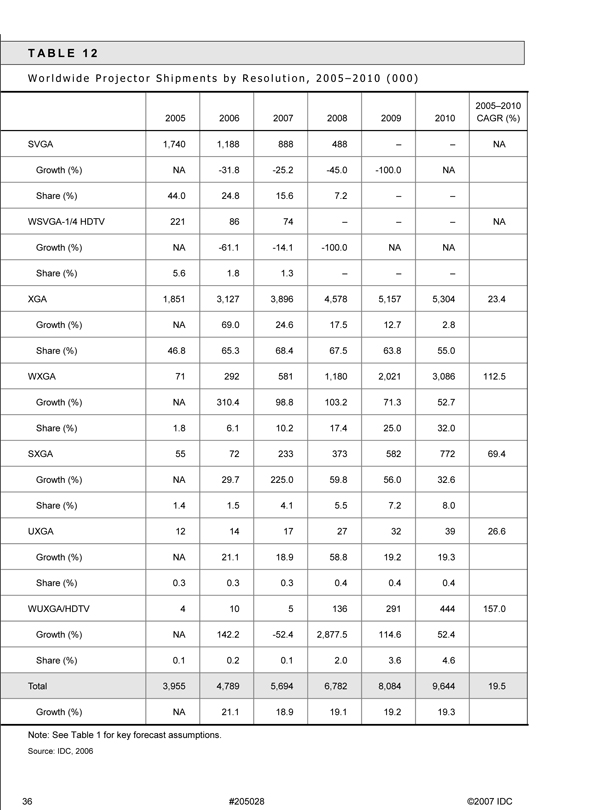
T A B L E 1 2
W o r l d w i d e P r o j e c t o r S h i p m e n t s b y R e s o l u t i o n , 2 0 0 5 – 2 0 1 0 ( 0 0 0 )
2005–2010 2005 2006 2007 2008 2009 2010 CAGR (%)
SVGA 1,740 1,188 888 488 – NA
Growth (%) NA -31.8 -25.2 -45.0 -100.0 NA Share (%) 44.0 24.8 15.6 7.2 WSVGA-1/4 HDTV 221 86 74 NA
Growth (%) NA -61.1 -14.1 -100.0 NA NA Share (%) 5.6 1.8 1.3 XGA 1,851 3,127 3,896 4,578 5,157 5,304 23.4
Growth (%) NA 69.0 24.6 17.5 12.7 2.8 Share (%) 46.8 65.3 68.4 67.5 63.8 55.0 WXGA 71 292 581 1,180 2,021 3,086 112.5
Growth (%) NA 310.4 98.8 103.2 71.3 52.7 Share (%) 1.8 6.1 10.2 17.4 25.0 32.0 SXGA 55 72 233 373 582 772 69.4
Growth (%) NA 29.7 225.0 59.8 56.0 32.6 Share (%) 1.4 1.5 4.1 5.5 7.2 8.0 UXGA 12 14 17 27 32 39 26.6
Growth (%) NA 21.1 18.9 58.8 19.2 19.3 Share (%) 0.3 0.3 0.3 0.4 0.4 0.4 WUXGA/HDTV 4 10 5 136 291 444 157.0
Growth (%) NA 142.2 -52.4 2,877.5 114.6 52.4 Share (%) 0.1 0.2 0.1 2.0 3.6 4.6 Total 3,955 4,789 5,694 6,782 8,084 9,644 19.5 Growth (%) NA 21.1 18.9 19.1 19.2 19.3
Note: See Table 1 for key forecast assumptions.
Source: IDC, 2006
36 #205028 ©2007 IDC
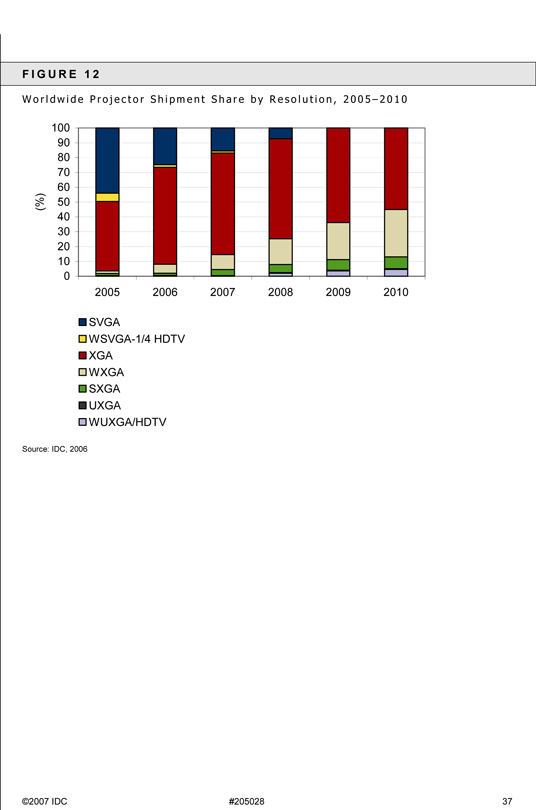
F I G U R E 1 2
W o r l d w i d e P r o j e c t o r S h i p m e n t S h a r e b y R e s o l u t i o n , 2 0 0 5 – 2 0 1 0
100 90 80 70 60 (%) 50 40 30 20 10 0
2005 2006 2007 2008 2009 2010
SVGA
WSVGA-1/4 HDTV XGA
WXGA SXGA UXGA WUXGA/HDTV
Source: IDC, 2006
©2007 IDC #205028 37
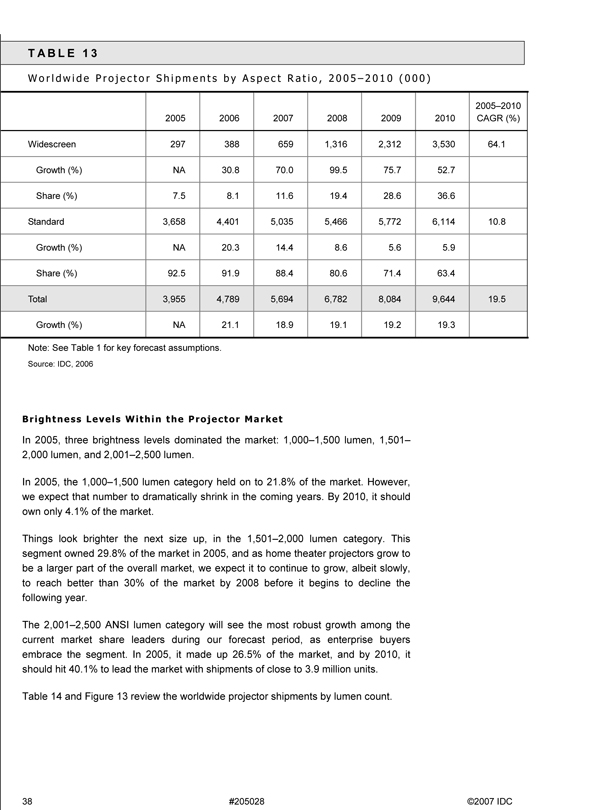
T A B L E 1 3
W o r l d w i d e P r o j e c t o r S h i p m e n t s b y A s p e c t R a t i o , 2 0 0 5 – 2 0 1 0 ( 0 0 0 )
2005–2010 2005 2006 2007 2008 2009 2010 CAGR (%)
Widescreen 297 388 659 1,316 2,312 3,530 64.1 Growth (%) NA 30.8 70.0 99.5 75.7 52.7 Share (%) 7.5 8.1 11.6 19.4 28.6 36.6 Standard 3,658 4,401 5,035 5,466 5,772 6,114 10.8 Growth (%) NA 20.3 14.4 8.6 5.6 5.9 Share (%) 92.5 91.9 88.4 80.6 71.4 63.4 Total 3,955 4,789 5,694 6,782 8,084 9,644 19.5 Growth (%) NA 21.1 18.9 19.1 19.2 19.3
Note: See Table 1 for key forecast assumptions.
Source: IDC, 2006
Brightness Levels Within the Projector Market
In 2005, three brightness levels dominated the market: 1,000–1,500 lumen, 1,501–2,000 lumen, and 2,001–2,500 lumen.
In 2005, the 1,000–1,500 lumen category held on to 21.8% of the market. However, we expect that number to dramatically shrink in the coming years. By 2010, it should own only 4.1% of the market.
Things look brighter the next size up, in the 1,501–2,000 lumen category. This segment owned 29.8% of the market in 2005, and as home theater projectors grow to be a larger part of the overall market, we expect it to continue to grow, albeit slowly, to reach better than 30% of the market by 2008 before it begins to decline the following year.
The 2,001–2,500 ANSI lumen category will see the most robust growth among the current market share leaders during our forecast period, as enterprise buyers embrace the segment. In 2005, it made up 26.5% of the market, and by 2010, it should hit 40.1% to lead the market with shipments of close to 3.9 million units.
Table 14 and Figure 13 review the worldwide projector shipments by lumen count.
38 #205028 ©2007 IDC
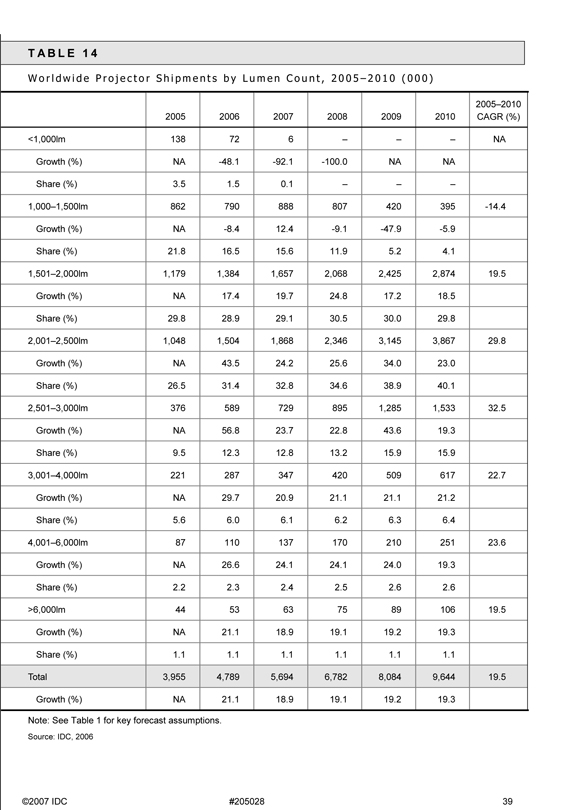
T A B L E 1 4
W o r l d w i d e P r o j e c t o r S h i p m e n t s b y L u m e n C o u n t , 2 0 0 5 – 2 0 1 0 ( 0 0 0 )
2005–2010 2005 2006 2007 2008 2009 2010 CAGR (%)
<1,000lm 138 72 6 NA Growth (%) NA -48.1 -92.1 -100.0 NA NA Share (%) 3.5 1.5 0.1 1,000–1,500lm 862 790 888 807 420 395 - -14.4 Growth (%) NA -8.4 12.4 -9.1 -47.9 -5.9 Share (%) 21.8 16.5 15.6 11.9 5.2 4.1 1,501–2,000lm 1,179 1,384 1,657 2,068 2,425 2,874 19.5 Growth (%) NA 17.4 19.7 24.8 17.2 18.5 Share (%) 29.8 28.9 29.1 30.5 30.0 29.8 2,001–2,500lm 1,048 1,504 1,868 2,346 3,145 3,867 29.8 Growth (%) NA 43.5 24.2 25.6 34.0 23.0 Share (%) 26.5 31.4 32.8 34.6 38.9 40.1 2,501–3,000lm 376 589 729 895 1,285 1,533 32.5 Growth (%) NA 56.8 23.7 22.8 43.6 19.3 Share (%) 9.5 12.3 12.8 13.2 15.9 15.9 3,001–4,000lm 221 287 347 420 509 617 22.7 Growth (%) NA 29.7 20.9 21.1 21.1 21.2 Share (%) 5.6 6.0 6.1 6.2 6.3 6.4 4,001–6,000lm 87 110 137 170 210 251 23.6 Growth (%) NA 26.6 24.1 24.1 24.0 19.3 Share (%) 2.2 2.3 2.4 2.5 2.6 2.6 >6,000lm 44 53 63 75 89 106 19.5 Growth (%) NA 21.1 18.9 19.1 19.2 19.3 Share (%) 1.1 1.1 1.1 1.1 1.1 1.1 Total 3,955 4,789 5,694 6,782 8,084 9,644 19.5 Growth (%) NA 21.1 18.9 19.1 19.2 19.3
Note: See Table 1 for key forecast assumptions.
Source: IDC, 2006
©2007 IDC #205028 39
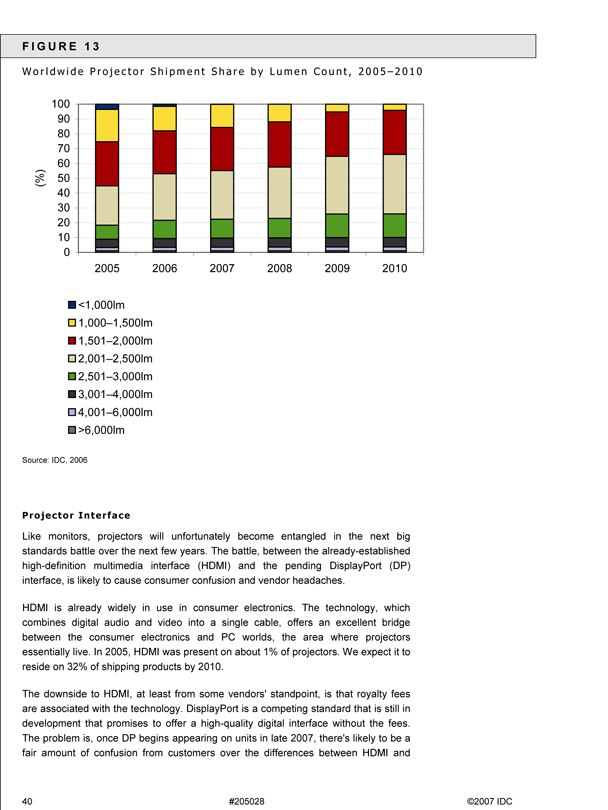
F I G U R E 1 3
W o r l d w i d e P r o j e c t o r S h i p m e n t S h a r e b y L u m e n C o u n t , 2 0 0 5 – 2 0 1 0
100 90 80 70 60 (%) 50 40 30 20 10 0
2005 2006 2007 2008 2009 2010
<1,000lm 1,000–1,500lm 1,501–2,000lm 2,001–2,500lm 2,501–3,000lm 3,001–4,000lm 4,001–6,000lm >6,000lm
Source: IDC, 2006
Projector Interface
Like monitors, projectors will unfortunately become entangled in the next big standards battle over the next few years. The battle, between the already-established high-definition multimedia interface (HDMI) and the pending DisplayPort (DP) interface, is likely to cause consumer confusion and vendor headaches.
HDMI is already widely in use in consumer electronics. The technology, which combines digital audio and video into a single cable, offers an excellent bridge between the consumer electronics and PC worlds, the area where projectors essentially live. In 2005, HDMI was present on about 1% of projectors. We expect it to reside on 32% of shipping products by 2010.
The downside to HDMI, at least from some vendors' standpoint, is that royalty fees are associated with the technology. DisplayPort is a competing standard that is still in development that promises to offer a high-quality digital interface without the fees. The problem is, once DP begins appearing on units in late 2007, there's likely to be a fair amount of confusion from customers over the differences between HDMI and
40 #205028 ©2007 IDC
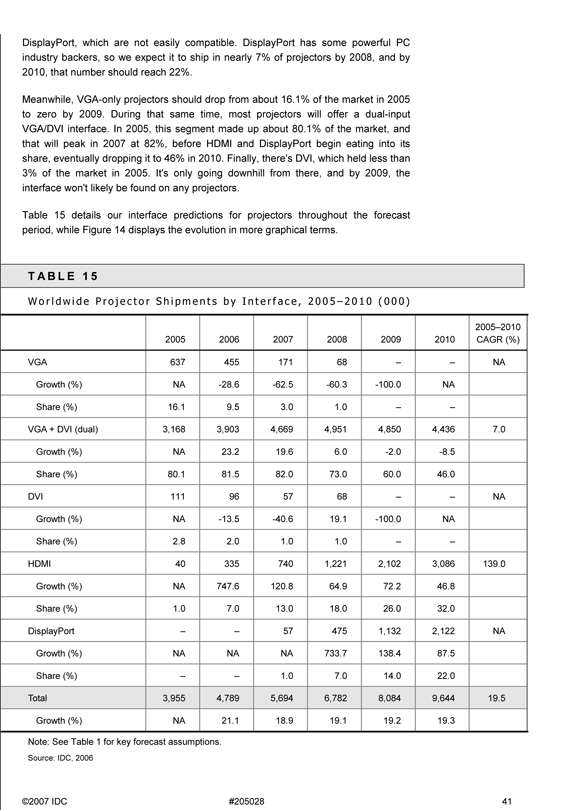
DisplayPort, which are not easily compatible. DisplayPort has some powerful PC industry backers, so we expect it to ship in nearly 7% of projectors by 2008, and by 2010, that number should reach 22%.
Meanwhile, VGA-only projectors should drop from about 16.1% of the market in 2005 to zero by 2009. During that same time, most projectors will offer a dual-input VGA/DVI interface. In 2005, this segment made up about 80.1% of the market, and that will peak in 2007 at 82%, before HDMI and DisplayPort begin eating into its share, eventually dropping it to 46% in 2010. Finally, there's DVI, which held less than 3% of the market in 2005. It's only going downhill from there, and by 2009, the interface won't likely be found on any projectors.
Table 15 details our interface predictions for projectors throughout the forecast period, while Figure 14 displays the evolution in more graphical terms.
T A B L E 1 5
W o r l d w i d e P r o j e c t o r S h i p m e n t s b y I n t e r f a c e , 2 0 0 5 – 2 0 1 0 ( 0 0 0 )
2005–2010 2005 2006 2007 2008 2009 2010 CAGR (%)
VGA 637 455 171 68 – – NA
Growth (%) NA -28.6 -62.5 -60.3 -100.0 NA Share (%) 16.1 9.5 3.0 1.0 – – VGA + DVI (dual) 3,168 3,903 4,669 4,951 4,850 4,436 7.0 Growth (%) NA 23.2 19.6 6.0 -2.0 -8.5 Share (%) 80.1 81.5 82.0 73.0 60.0 46.0 DVI 111 96 57 68 – – NA
Growth (%) NA -13.5 -40.6 19.1 -100.0 NA Share (%) 2.8 2.0 1.0 1.0 – – HDMI 40 335 740 1,221 2,102 3,086 139.0
Growth (%) NA 747.6 120.8 64.9 72.2 46.8 Share (%) 1.0 7.0 13.0 18.0 26.0 32.0 DisplayPort – – 57 475 1,132 2,122 NA Growth (%) NA NA NA 733.7 138.4 87.5 Share (%) – – 1.0 7.0 14.0 22.0 Total 3,955 4,789 5,694 6,782 8,084 9,644 19.5 Growth (%) NA 21.1 18.9 19.1 19.2 19.3
Note: See Table 1 for key forecast assumptions.
Source: IDC, 2006
©2007 IDC #205028 41
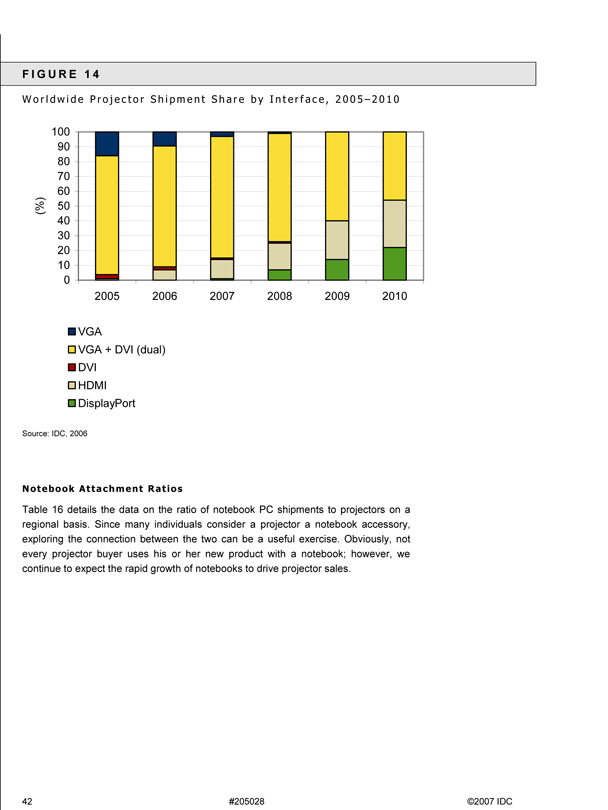
F I G U R E 1 4
W o r l d w i d e P r o j e c t o r S h i p m e n t S h a r e b y I n t e r f a c e , 2 0 0 5 – 2 0 1 0
100 90 80 70 60 (%) 50 40 30 20 10 0
2005 2006 2007 2008 2009 2010
VGA
VGA + DVI (dual) DVI
HDMI DisplayPort
Source: IDC, 2006
Notebook Attachment Ratios
Table 16 details the data on the ratio of notebook PC shipments to projectors on a regional basis. Since many individuals consider a projector a notebook accessory, exploring the connection between the two can be a useful exercise. Obviously, not every projector buyer uses his or her new product with a notebook; however, we continue to expect the rapid growth of notebooks to drive projector sales.
42 #205028 ©2007 IDC
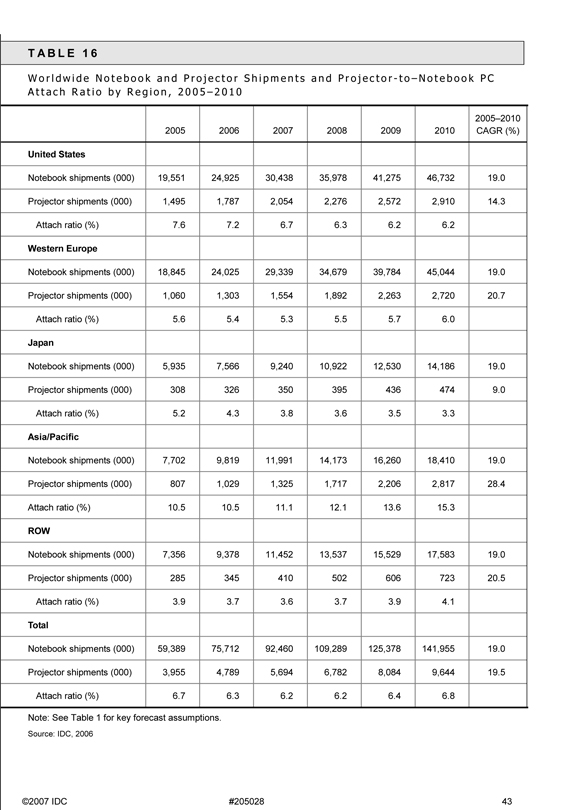
T A B L E 1 6
W o r l d w i d e N o t e b o o k a n d P r o j e c t o r S h i p m e n t s a n d P r o j e c t o r—t o – N o t e b o o k P C A t t a c h R a t i o b y R e g i o n , 2 0 0 5 – 2 0 1 0
2005–2010 2005 2006 2007 2008 2009 2010 CAGR (%)
United States Notebook shipments (000) 19,551 24,925 30,438 35,978 41,275 46,732 19.0 Projector shipments (000) 1,495 1,787 2,054 2,276 2,572 2,910 14.3 Attach ratio (%) 7.6 7.2 6.7 6.3 6.2 6.2
Western Europe Notebook shipments (000) 18,845 24,025 29,339 34,679 39,784 45,044 19.0 Projector shipments (000) 1,060 1,303 1,554 1,892 2,263 2,720 20.7 Attach ratio (%) 5.6 5.4 5.3 5.5 5.7 6.0 Japan Notebook shipments (000) 5,935 7,566 9,240 10,922 12,530 14,186 19.0 Projector shipments (000) 308 326 350 395 436 474 9.0 Attach ratio (%) 5.2 4.3 3.8 3.6 3.5 3.3
Asia/Pacific Notebook shipments (000) 7,702 9,819 11,991 14,173 16,260 18,410 19.0 Projector shipments (000) 807 1,029 1,325 1,717 2,206 2,817 28.4 Attach ratio (%) 10.5 10.5 11.1 12.1 13.6 15.3 ROW Notebook shipments (000) 7,356 9,378 11,452 13,537 15,529 17,583 19.0 Projector shipments (000) 285 345 410 502 606 723 20.5 Attach ratio (%) 3.9 3.7 3.6 3.7 3.9 4.1 Total Notebook shipments (000) 59,389 75,712 92,460 109,289 125,378 141,955 19.0 Projector shipments (000) 3,955 4,789 5,694 6,782 8,084 9,644 19.5 Attach ratio (%) 6.7 6.3 6.2 6.2 6.4 6.8
Note: See Table 1 for key forecast assumptions.
Source: IDC, 2006
©2007 IDC #205028 43
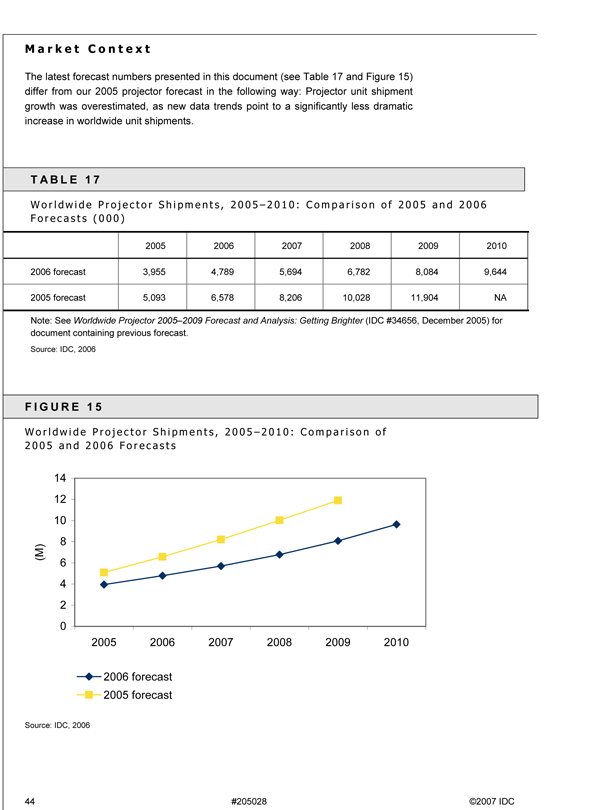
M a r k e t C o n t e x t
The latest forecast numbers presented in this document (see Table 17 and Figure 15) differ from our 2005 projector forecast in the following way: Projector unit shipment growth was overestimated, as new data trends point to a significantly less dramatic increase in worldwide unit shipments.
T A B L E 1 7
W o r l d w i d e P r o j e c t o r S h i p m e n t s , 2 0 0 5 – 2 0 1 0 : C o m p a r i s o n o f 2 0 0 5 a n d 2 0 0 6 F o r e c a s t s ( 0 0 0 )
2005 2006 2007 2008 2009 2010 2006 forecast 3,955 4,789 5,694 6,782 8,084 9,644 2005 forecast 5,093 6,578 8,206 10,028 11,904 NA
Note: See Worldwide Projector 2005–2009 Forecast and Analysis: Getting Brighter (IDC #34656, December 2005) for document containing previous forecast.
Source: IDC, 2006
F I G U R E 1 5
W o r l d w i d e P r o j e c t o r S h i p m e n t s , 2 0 0 5 – 2 0 1 0 : C o m p a r i s o n o f
2 0 0 5 a n d 2 0 0 6 F o r e c a s t s
14 12 10 8 (M) 6 4 2 0
2005 2006 2007 2008 2009 2010
2006 forecast 2005 forecast
Source: IDC, 2006
44 #205028 ©2007 IDC
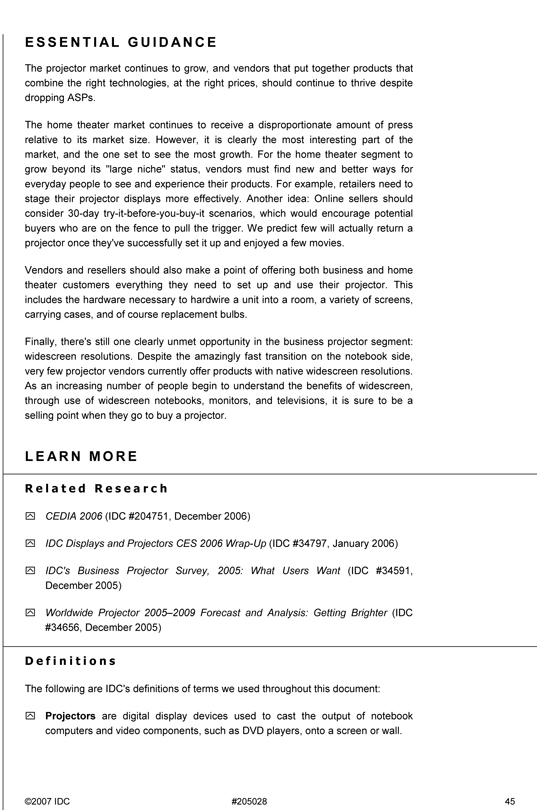
E S S E N T I AL G U I D A N C E
The projector market continues to grow, and vendors that put together products that combine the right technologies, at the right prices, should continue to thrive despite dropping ASPs.
The home theater market continues to receive a disproportionate amount of press relative to its market size. However, it is clearly the most interesting part of the market, and the one set to see the most growth. For the home theater segment to grow beyond its "large niche" status, vendors must find new and better ways for everyday people to see and experience their products. For example, retailers need to stage their projector displays more effectively. Another idea: Online sellers should consider 30-day try-it-before-you-buy-it scenarios, which would encourage potential buyers who are on the fence to pull the trigger. We predict few will actually return a projector once they've successfully set it up and enjoyed a few movies.
Vendors and resellers should also make a point of offering both business and home theater customers everything they need to set up and use their projector. This includes the hardware necessary to hardwire a unit into a room, a variety of screens, carrying cases, and of course replacement bulbs.
Finally, there's still one clearly unmet opportunity in the business projector segment: widescreen resolutions. Despite the amazingly fast transition on the notebook side, very few projector vendors currently offer products with native widescreen resolutions. As an increasing number of people begin to understand the benefits of widescreen, through use of widescreen notebooks, monitors, and televisions, it is sure to be a selling point when they go to buy a projector.
L E AR N M O R E
R e l a t e d R e s e a r c h
CEDIA 2006 (IDC #204751, December 2006)
IDC Displays and Projectors CES 2006 Wrap-Up (IDC #34797, January 2006)
IDC's Business Projector Survey, 2005: What Users Want (IDC #34591, December 2005)
Worldwide Projector 2005–2009 Forecast and Analysis: Getting Brighter (IDC #34656, December 2005)
D e f i n i t i o n s
The following are IDC's definitions of terms we used throughout this document:
Projectors are digital display devices used to cast the output of notebook computers and video components, such as DVD players, onto a screen or wall.
©2007 IDC #205028 45
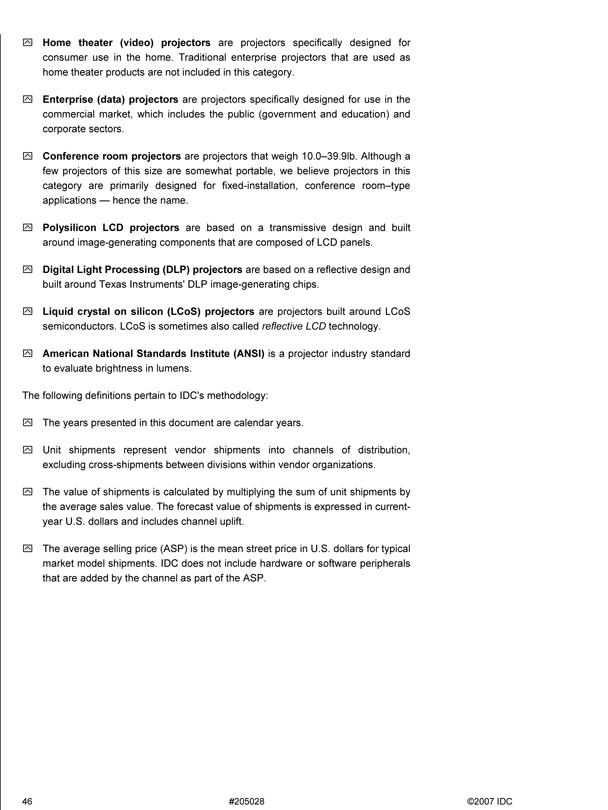
Home theater (video) projectors are projectors specifically designed for consumer use in the home. Traditional enterprise projectors that are used as home theater products are not included in this category.
Enterprise (data) projectors are projectors specifically designed for use in the commercial market, which includes the public (government and education) and corporate sectors.
Conference room projectors are projectors that weigh 10.0–39.9lb. Although a few projectors of this size are somewhat portable, we believe projectors in this category are primarily designed for fixed-installation, conference room–type applications — hence the name.
Polysilicon LCD projectors are based on a transmissive design and built around image-generating components that are composed of LCD panels.
Digital Light Processing (DLP) projectors are based on a reflective design and built around Texas Instruments' DLP image-generating chips.
Liquid crystal on silicon (LCoS) projectors are projectors built around LCoS semiconductors. LCoS is sometimes also called reflective LCD technology.
American National Standards Institute (ANSI) is a projector industry standard to evaluate brightness in lumens.
The following definitions pertain to IDC's methodology:
The years presented in this document are calendar years.
Unit shipments represent vendor shipments into channels of distribution, excluding cross-shipments between divisions within vendor organizations.
The value of shipments is calculated by multiplying the sum of unit shipments by the average sales value. The forecast value of shipments is expressed in current-year U.S. dollars and includes channel uplift.
The average selling price (ASP) is the mean street price in U.S. dollars for typical market model shipments. IDC does not include hardware or software peripherals that are added by the channel as part of the ASP.
46 #205028 ©2007 IDC
C o p y r i g h t N o t i c e
This IDC research document was published as part of an IDC continuous intelligence service, providing written research, analyst interactions, telebriefings, and conferences. Visit www.idc.com to learn more about IDC subscription and consulting services. To view a list of IDC offices worldwide, visit www.idc.com/offices. Please contact the IDC Hotline at 800.343.4952, ext. 7988 (or +1.508.988.7988) or sales@idc.com for information on applying the price of this document toward the purchase of an IDC service or for information on additional copies or Web rights.
Copyright 2007 IDC. Reproduction is forbidden unless authorized. All rights reserved.
Published Under Services: Displays and Projectors
©2007 IDC #205028 47
Exhibit F

DATAMONITOR
Autoliv Inc.
Company Profile
Reference Code: 4268
Publication Date: Jan 2007
www.datamonitor.com
Datamonitor USA Datamonitor Europe Datamonitor Germany Datamonitor Hong Kong
245 5th Avenue Charles House Kastor & Pollux 2802-2803 Admiralty Centre
4th Floor 108-110 Finchley Road Platz der Einheit 1 Tower 1
New York, NY 10016 London NW3 5JJ 60327 Frankfurt 18 Harcourt Road
USA United Kingdom Deutschland Hong Kong
t: +1 212 686 7400 t: +44 20 7675 7000 t: +49 69 9754 4517 t: +852 2520 1177
f: +1 212 686 2626 f: +44 20 7675 7500 f: +49 69 9754 4900 f: +852 2520 1165
e: usinfo@datamonitor.com e: eurinfo@datamonitor.com e: deinfo@datamonitor.com e: hkinfo@datamonitor.com

DATAMONITOR
ABOUT DATAMONITOR
Datamonitor is a leading business information company specializing in industry analysis.
Through its proprietary databases and wealth of expertise, Datamonitor provides clients with unbiased expert analysis and in depth forecasts for six industry sectors: Healthcare, Technology, Automotive, Energy, Consumer Markets, and Financial Services.
The company also advises clients on the impact that new technology and eCommerce will have on their businesses. Datamonitor maintains its headquarters in London, and regional offices in New York, Frankfurt, and Hong Kong. The company serves the world's largest 5000 companies.
Datamonitor's premium reports are based on primary research with industry panels and consumers. We gather information on market segmentation, market growth and pricing, competitors and products. Our experts then interpret this data to produce detailed forecasts and actionable recommendations, helping you create new business opportunities and ideas.
Our series of company, industry and country profiles complements our premium products, providing top-level information on 10,000 companies, 2,500 industries and 50 countries. While they do not contain the highly detailed breakdowns found in premium reports, profiles give you the most important qualitative and quantitative summary information you need - including predictions and forecasts.
All Rights Reserved.
No part of this publication may be reproduced, stored in a retrieval system or transmitted in any form by any means, electronic, mechanical, photocopying, recording or otherwise, without the prior permission of the publisher, Datamonitor plc.
The facts of this profile are believed to be correct at the time of publication but cannot be guaranteed. Please note that the findings, conclusions and recommendations that Datamonitor delivers will be based on information gathered in good faith from both primary and secondary sources, whose accuracy we are not always in a position to guarantee. As such Datamonitor can accept no liability whatever for actions taken based on any information that may subsequently prove to be incorrect.
Autoliv Inc.
© Datamonitor Page 2
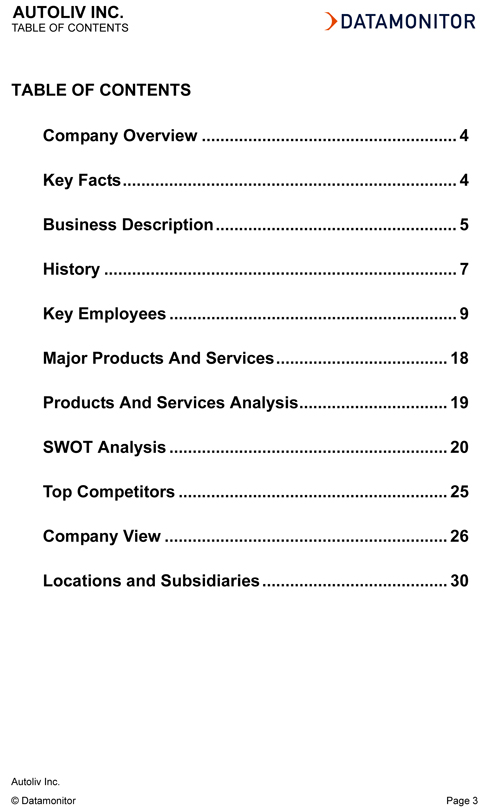
AUTOLIV INC.
TABLE OF CONTENTS
DATAMONITOR
TABLE OF CONTENTS
Company Overview 4
Key Facts 4
Business Description 5
History 7
Key Employees 9
Major Products And Services 18
Products And Services Analysis 19
SWOT Analysis 20
Top Competitors 25
Company View 26
Locations and Subsidiaries 30
Autoliv Inc.
© Datamonitor Page 3
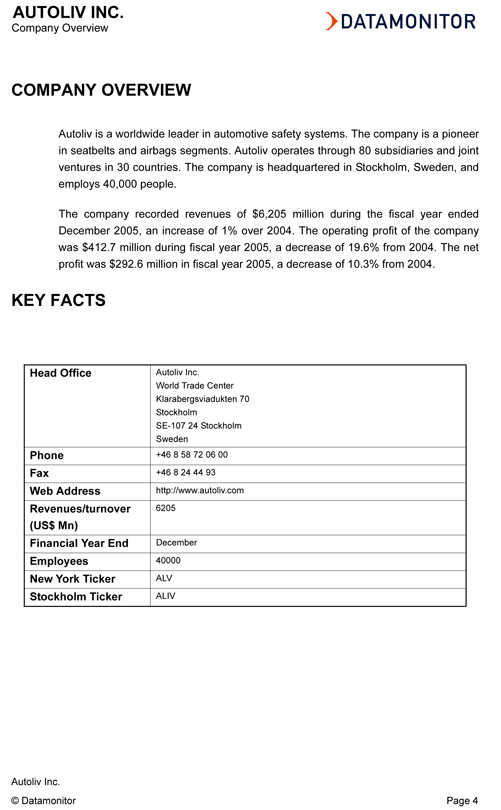
AUTOLIV INC.
Company Overview
DATAMONITOR
COMPANY OVERVIEW
Autoliv is a worldwide leader in automotive safety systems. The company is a pioneer in seatbelts and airbags segments. Autoliv operates through 80 subsidiaries and joint ventures in 30 countries. The company is headquartered in Stockholm, Sweden, and employs 40,000 people.
The company recorded revenues of $6,205 million during the fiscal year ended December 2005, an increase of 1% over 2004. The operating profit of the company was $412.7 million during fiscal year 2005, a decrease of 19.6% from 2004. The net profit was $292.6 million in fiscal year 2005, a decrease of 10.3% from 2004.
KEY FACTS
Head Office Autoliv Inc.
World Trade Center
Klarabergsviadukten 70
Stockholm
SE-107 24 Stockholm
Sweden
Phone +46 8 58 72 06 00
Fax +46 8 24 44 93
Web Address http://www.autoliv.com
Revenues/turnover 6205
(US$ Mn)
Financial Year End December
Employees 40000
New York Ticker ALV
Stockholm Ticker ALIV
Autoliv Inc.
© Datamonitor Page 4

AUTOLIV INC.
Business Description
DATAMONITOR
BUSINESS DESCRIPTION
Autoliv is a leading supplier of safety systems to the global automotive industry. The company offers a range of products, including seat belts, airbags, anti-whiplash seat, and child restraints. The company operates through 80 subsidiaries and joint ventures in 30 countries around the world. Autoliv has 20 crash test tracks in nine countries.
The company generates revenues through two business segments: ’airbags and associated products’ and ’seat belts and associated products’.
In the airbags and associated products segment, the company’s products include driver airbags, e-call, thorax side airbags, passenger airbags and new airbags. Driver airbag is estimated to reduce driver fatalities in frontal crashes by approximately 25% (for belted drivers) and serious head injuries by over 60%. The power of the airbag can be tuned to the severity of the crash, using a dual-stage airbag inflator that is an airbag inflator with two separate charges.
E-Call is a post crash system, wherein the airbag control unit (ACU) automatically calls a vehicle manufacturer’s On-Call Emergency Center after a severe crash and provides the rescue team with the location of the accident. This post-crash system can also be used to trace a stolen vehicle. Thorax or chest airbags are estimated to reduce the risk of serious chest injuries in side impact crashes by approximately 25%. Thorax side airbags deploy eight times faster than the blink of an eye.
Passenger Airbag is estimated to reduce fatalities in frontal crashes by approximately 20% (for belted occupants). It deploys in 50 milliseconds, half the time of the blink of an eye. The power of the airbag can be tuned to the severity of the crash, using a dual-stage inflator that is an airbag inflator with two separate charges. Autoliv has also launched the world’s first door-mounted curtain airbag. In side-impact collisions, standard curtain airbags are estimated to reduce the risk of fatalities by 50% by protecting the head. However, curtain airbags have so far only been installed in vehicles that have roofs from which the curtains can be deployed.
The company also manufactures combo bags for convertible vehicles to provide side-impact protection. These bags combine chest side airbags with an extension that inflates upwards to protect the head. The head extension does not cover as large of an area as a curtain airbag. In T-bone side impacts, this difference is less important. However, in oblique side-impact crashes when the occupant is hurled towards the windshield pillar, a larger bag may provide better protection. Whiplash protection is estimated to reduce the risk for neck injuries in rear-end collisions by over 50%.
Autoliv Inc.
© Datamonitor Page 5

AUTOLIV INC.
Business Description
DATAMONITOR
Autoliv is a leading manufacturer of seatbelt systems. The company’s product range includes belt grabber, belt-in-seat, buckle, height adjuster, load limiter, pretensioners, retractor, smart belt, trunk belt and webbing.
Seatbelts are estimated to reduce the overall risk for serious injuries in frontal crashes by 60-70%. The company manufactures front and rear seat belts with advanced seatbelt technologies. The company also makes pretensioners, which tighten the belt up to 15 cm (6 inches) at the onset of a crash, using a small pyrotechnic charge. Slack is eliminated and the occupant is restrained as early as possible. Therefore, the occupant is not caught by a sudden jerk and the risk of rib fractures is reduced. Load limiters pay out some webbing before the load on the occupant’s chest becomes too high. The excessive energy is instead absorbed more uniformly by the frontal airbag. In combination with pretensioners, load limiters and frontal airbags reduce the risk for life-threatening chest injuries by 75% in frontal crashes.
Other important products of Autoliv include electronic airbag control units (ACUs), knee airbags, anti-sliding bags, steering wheels (typically integrated with the driver airbag), and child seats, as well as integrated booster cushions for children, night vision systems, satellite sensor and other active safety systems.
Autoliv’s manufacturing operations are vertically integrated, with in-house divisions for all key components. The company’s component production is concentrated in a relatively few locations, while its assembly plants are located close to its customers. The company’s final products are typically delivered "just-in-time" to its customer’s vehicle manufacturing plant. Autoliv also operates sequence centers (which undertake the final assembly and feed Autoliv’s products into the car assembly line in the right order) inside or in direct vicinity to the customer’s car factory. In order to assure standardization and maintain high-quality, the company develops and manufactures its own production lines and equipment.
Autoliv supplies its products to all major vehicle manufacturers in the world including Audi, BMW, Ford, Honda, Toyota, Renault, Hyundai, MAN, and Daimler-Chrysler.
Autoliv Inc.
© Datamonitor Page 6

AUTOLIV INC.
History
DATAMONITOR
HISTORY
Autoliv was formed in 1997 through a merger of Europe’s leading automotive safety company, Autoliv AB of Sweden and Morton ASP, a leading airbag manufacturer in North America and Asia.
Prior to the merger, Autoliv’s parent company Autoliv AB, pioneered seat belt technology in 1956. Autoliv AB was acquired in 1974 by Granges Weda, and in 1980, the Granges Group was acquired by Electrolux. The company’s other parent company, Morton, had been a leader in airbag development and was involved in the launch of the first airbag system in 1980. In 1984, Granges Weda changed its name to Electrolux Autoliv.
During 1997, Autoliv acquired one of its main suppliers, Marling Industries including its subsidiary Van Oerle Alberton, the world leading producer of seatbelt webbing.
Autoliv acquired Nokia’s stake in Autoliv-Nokia and Nokia’s automotive related business in 1998. The company also acquired Sagem’s stake in Sagem-Autoliv, Autoliv’s electronics joint venture. In addition, Autoliv acquired most of the assets of Sensor Technologies, a Japanese airbag and airbag sensor manufacturer. The company also began producing steering wheels in the US, during the same year.
In the following year, Autoliv increased its stake in Livbag and received an option to acquire the remaining shares in phases in 2001 and 2003.
The company acquired a stake in the Estonian company, Norma, and further increased its stake in Norma in 2000. The company acquired Izumi (the second largest Japanese steering wheel company) and the North American seat belt operations of the Japanese company, NSK, in 2000. Autoliv also acquired a stake in NSK’s Asian seat belt business and began producing inflators at its new Japanese plant. In the same year, the company acquired OEA, a leading supplier of initiators for airbag inflators.
During 2001, the company formed a joint venture, Autoliv Mando Corporation, in the Korean market. Autoliv also increased its stake in Livbag, during the same year.
Autoliv acquired Visteon Restraint Electronics in 2002, and established its first airbag plant in China. In the following year, Autoliv acquired the steering wheel assets of the Japanese Nippon Steering Industries. The company also fully acquired Livbag.
Autoliv Inc.
© Datamonitor Page 7
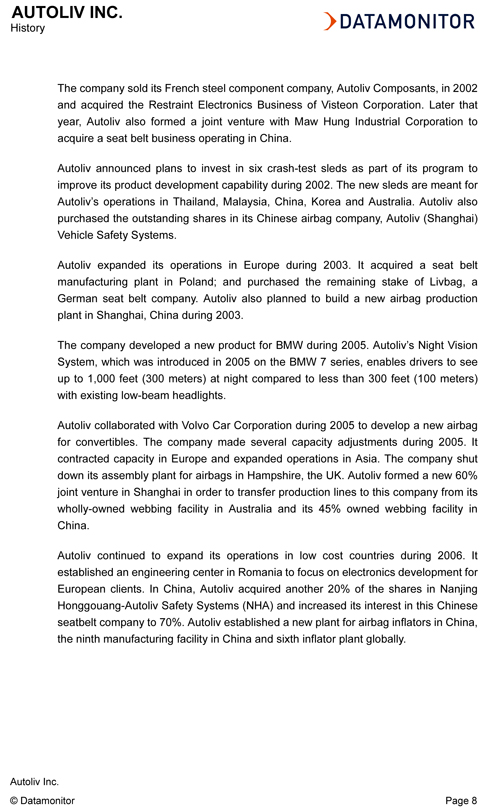
AUTOLIV INC.
History
DATAMONITOR
The company sold its French steel component company, Autoliv Composants, in 2002 and acquired the Restraint Electronics Business of Visteon Corporation. Later that year, Autoliv also formed a joint venture with Maw Hung Industrial Corporation to acquire a seat belt business operating in China.
Autoliv announced plans to invest in six crash-test sleds as part of its program to improve its product development capability during 2002. The new sleds are meant for Autoliv’s operations in Thailand, Malaysia, China, Korea and Australia. Autoliv also purchased the outstanding shares in its Chinese airbag company, Autoliv (Shanghai) Vehicle Safety Systems.
Autoliv expanded its operations in Europe during 2003. It acquired a seat belt manufacturing plant in Poland; and purchased the remaining stake of Livbag, a German seat belt company. Autoliv also planned to build a new airbag production plant in Shanghai, China during 2003.
The company developed a new product for BMW during 2005. Autoliv’s Night Vision System, which was introduced in 2005 on the BMW 7 series, enables drivers to see up to 1,000 feet (300 meters) at night compared to less than 300 feet (100 meters) with existing low-beam headlights.
Autoliv collaborated with Volvo Car Corporation during 2005 to develop a new airbag for convertibles. The company made several capacity adjustments during 2005. It contracted capacity in Europe and expanded operations in Asia. The company shut down its assembly plant for airbags in Hampshire, the UK. Autoliv formed a new 60% joint venture in Shanghai in order to transfer production lines to this company from its wholly-owned webbing facility in Australia and its 45% owned webbing facility in China.
Autoliv continued to expand its operations in low cost countries during 2006. It established an engineering center in Romania to focus on electronics development for European clients. In China, Autoliv acquired another 20% of the shares in Nanjing Honggouang-Autoliv Safety Systems (NHA) and increased its interest in this Chinese seatbelt company to 70%. Autoliv established a new plant for airbag inflators in China, the ninth manufacturing facility in China and sixth inflator plant globally.
Autoliv Inc.
© Datamonitor Page 8

AUTOLIV INC.
Key Employees
DATAMONITOR
KEY EMPLOYEES
Name Job Title Board Compensation
Lars Westerberg President and Chief Execu-tive Officer Executive Board $ 1,794,945
S Jay Stewart Chairman Non Executive Board
Sune Carlsson Director Non Executive Board
George Lorch Director Non Executive Board
Tetsuo Sekiya Director Non Executive Board
William E. Johnston Director Non Executive Board
Robert W. Alspaugh Director Non Executive Board
Per Welin Director Non Executive Board
Per Olof Aronson Director Non Executive Board
Walter Kunerth Director Non Executive Board
James Ringler Director Non Executive Board
Lars Nyberg Director Non Executive Board
Magnus Lindquist Vice President and Chief Financial Officer Senior Management $ 493,600
Leif Berntsson Vice President, Quality Senior Management
Yngve Haland Vice President, Research Senior Management
Halvar Jonzon Vice President, Purchasing Senior Management $ 684,627
Benoit Marsaud Vice President, Manufacturing Senior Management $ 659,841
Mats Odman Director, Corporate Communications Senior Management
Jan Olsson Vice President, Engineering Senior Management
Hans Goran Patring Vice President, Human Resources Senior Management
Jorgen Svensson Vice President Legal Affairs, General Counsel and Secretary Senior Management $ 396,120
Autoliv Inc.
© Datamonitor Page 9

AUTOLIV INC.
Key Employee Biographies
DATAMONITOR
KEY EMPLOYEE BIOGRAPHIES
Lars Westerberg
Board: Executive Board
Job Title: President and Chief Executive Officer
Since: 1999
Age: 56
Salary: $ 924,529
Bonus: $ 870,416
Total Annual Compensation: $ 1,794,945
Mr Westerberg has been a director, president and chief executive officer of Autoliv since 1999. From 1994 until his current appointment, he served as president and chief executive officer of Granges, a Swedish-based aluminum and plastics company. From 1991 to 1994, he was president and chief executive officer of Esab. He started his career at Esab in 1984 and held several executive positions, including president of Esab´s North American subsidiary. He is the chairman of Ahlsell, a Swedish heating, water and sanitation company. He also serves as a director of Plastal, a Swedish supplier of automotive plastic components and Haldex, a Swedish automatic braking and transmission supplier.
S Jay Stewart
Board: Non Executive Board
Job Title: Chairman
Since: 2001
Age: 67
Mr Stewart has been a director of Autoliv since 1997 and has served as the chairman of the board since 2001. He was chairman and chief executive officer of Morton International from 1994 through 1999 and was a director of Morton between 1989 and 1999. Mr Stewart was president and chief operating officer of Morton International from 1989 through 1994. He is a director of Household International and of Box USA Corporation.
Sune Carlsson
Autoliv Inc.
© Datamonitor Page 10

AUTOLIV INC.
Key Employee Biographies
DATAMONITOR
Board: Non Executive Board
Job Title: Director
Since: 2003
Age: 63
Mr Carlsson has been the president, chief executive officer and director of AB SKF, a Swedish- based leading global supplier of products, customer solutions and services in the rolling bearing, seals and related businesses. He is chairman of the board of Atlas Copco, a Swedish-based industrial group. He also serves on the boards of Investor - Sweden’s largest industrial holding company and Picanol, a Belgium-based weaving systems company.
George Lorch
Board: Non Executive Board
Job Title: Director
Since: 2003
Age: 63
Mr Lorch is chairman emeritus of Armstrong Holdings, a global company that manufactures flooring and ceiling materials, since 2000. He has been chairman and chief executive officer of Armstrong Holdings since 2002 and served as its president and chief executive officer from 1993 to 1994. He was chairman of Armstrong World Industries from 1994 to 2000, its president and chief executive from 1993 to 2000 and a director from 1988 to 2000. He serves on the board of Pfizer, Williams Companies and Household International.
Tetsuo Sekiya
Board: Non Executive Board
Job Title: Director
Since: 2001
Age: 70
Mr Sekiya presently serves as advisor to the board of NSK, a leading global manufacturer of bearings and automotive parts. He was chairman of NSK between 2002 and 2004 and president and chief executive officer between 1994 and 2002. Mr Sekiya also serves as advisor to the Japan Bearing Industrial Association; an
Autoliv Inc.
© Datamonitor Page 11

AUTOLIV INC.
Key Employee Biographies
DATAMONITOR
executive member of the board of directors of Nippon Keidanren, the Japan Federation of Economic Organizations; director of Taisei Corporation, one of Japan’s major construction firms and president of the Japan-Poland Economic Committee.
William E. Johnston
Board: Non Executive Board
Job Title: Director
Mr. Johnston has been a Non Executive Director of Autoliv since 2005. He is former President, Chief Operating Officer and Director of Morton International. He has also been a former Director and Chairman of the Supervisory Board of Salins Europe. He has been a Senior Vice President of Rohm & Haas Co, and a former Director of Unitrin.
Robert W. Alspaugh
Board: Non Executive Board
Job Title: Director
Mr. Alspaugh has been a Non Executive Director of Autoliv since 2006. He has been the Chief Executive Officer of KPMG International.
Per Welin
Board: Non Executive Board
Job Title: Director
Since: 1997
Age: 68
Mr Welin has been a director of Autoliv since 1995. He served as executive vice president and director of the investment company L-E Lundberg-foretagen from 1991 to 1998 and has been chairman of the board of L-E Lundberg-foretagen since 1998.
Per Olof Aronson
Board: Non Executive Board
Job Title: Director
Autoliv Inc.
© Datamonitor Page 12
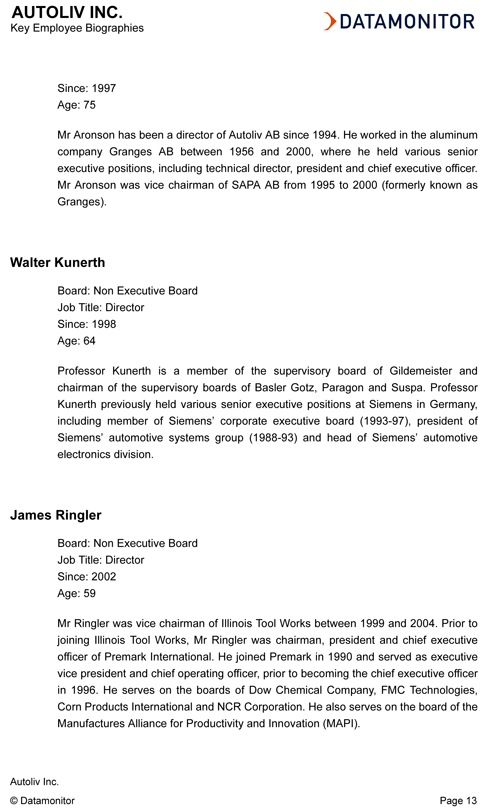
AUTOLIV INC.
Key Employee Biographies
DATAMONITOR
Since: 1997
Age: 75
Mr Aronson has been a director of Autoliv AB since 1994. He worked in the aluminum company Granges AB between 1956 and 2000, where he held various senior executive positions, including technical director, president and chief executive officer. Mr Aronson was vice chairman of SAPA AB from 1995 to 2000 (formerly known as Granges).
Walter Kunerth
Board: Non Executive Board
Job Title: Director
Since: 1998
Age: 64
Professor Kunerth is a member of the supervisory board of Gildemeister and chairman of the supervisory boards of Basler Gotz, Paragon and Suspa. Professor Kunerth previously held various senior executive positions at Siemens in Germany, including member of Siemens’ corporate executive board (1993-97), president of Siemens’ automotive systems group (1988-93) and head of Siemens’ automotive electronics division.
James Ringler
Board: Non Executive Board
Job Title: Director
Since: 2002
Age: 59
Mr Ringler was vice chairman of Illinois Tool Works between 1999 and 2004. Prior to joining Illinois Tool Works, Mr Ringler was chairman, president and chief executive officer of Premark International. He joined Premark in 1990 and served as executive vice president and chief operating officer, prior to becoming the chief executive officer in 1996. He serves on the boards of Dow Chemical Company, FMC Technologies, Corn Products International and NCR Corporation. He also serves on the board of the Manufactures Alliance for Productivity and Innovation (MAPI).
Autoliv Inc.
© Datamonitor Page 13
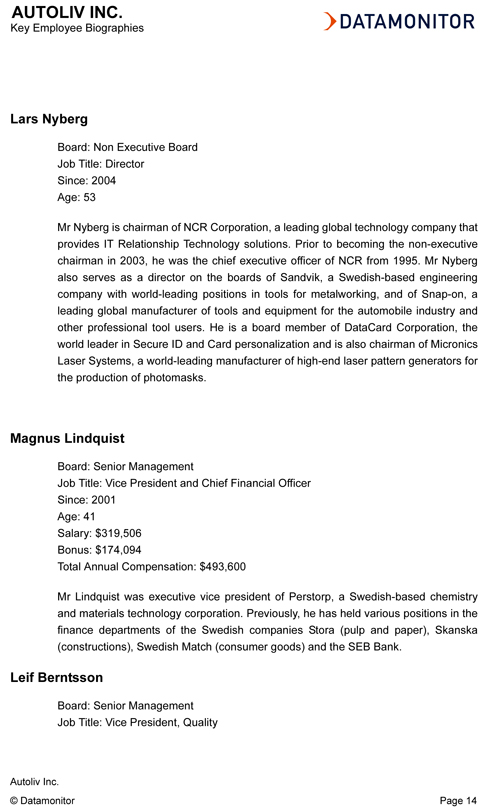
AUTOLIV INC.
Key Employee Biographies
DATAMONITOR
Lars Nyberg
Board: Non Executive Board
Job Title: Director
Since: 2004
Age: 53
Mr Nyberg is chairman of NCR Corporation, a leading global technology company that provides IT Relationship Technology solutions. Prior to becoming the non-executive chairman in 2003, he was the chief executive officer of NCR from 1995. Mr Nyberg also serves as a director on the boards of Sandvik, a Swedish-based engineering company with world-leading positions in tools for metalworking, and of Snap-on, a leading global manufacturer of tools and equipment for the automobile industry and other professional tool users. He is a board member of DataCard Corporation, the world leader in Secure ID and Card personalization and is also chairman of Micronics Laser Systems, a world-leading manufacturer of high-end laser pattern generators for the production of photomasks.
Magnus Lindquist
Board: Senior Management
Job Title: Vice President and Chief Financial Officer
Since: 2001
Age: 41
Salary: $319,506
Bonus: $174,094
Total Annual Compensation: $493,600
Mr Lindquist was executive vice president of Perstorp, a Swedish-based chemistry and materials technology corporation. Previously, he has held various positions in the finance departments of the Swedish companies Stora (pulp and paper), Skanska (constructions), Swedish Match (consumer goods) and the SEB Bank.
Leif Berntsson
Board: Senior Management
Job Title: Vice President, Quality
Autoliv Inc.
© Datamonitor Page 14
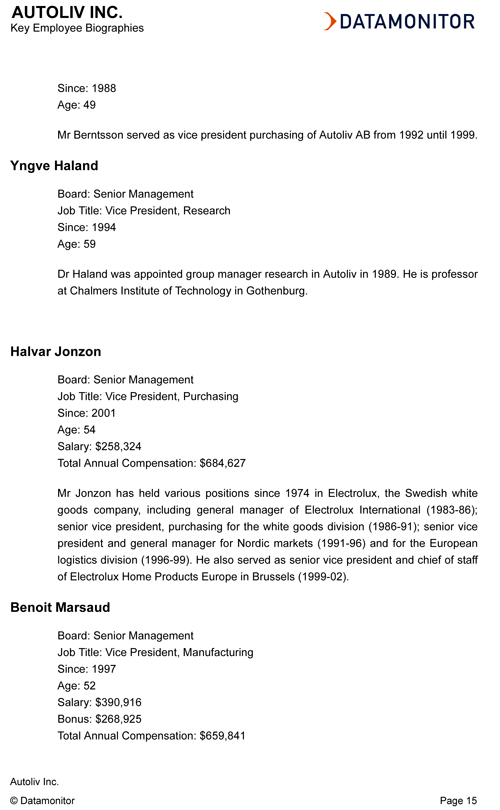
AUTOLIV INC.
Key Employee Biographies
DATAMONITOR
Since: 1988
Age: 49
Mr Berntsson served as vice president purchasing of Autoliv AB from 1992 until 1999.
Yngve Haland
Board: Senior Management Job
Title: Vice President, Research
Since: 1994
Age: 59
Dr Haland was appointed group manager research in Autoliv in 1989. He is professor at Chalmers Institute of Technology in Gothenburg.
Halvar Jonzon
Board: Senior Management
Job Title: Vice President, Purchasing
Since: 2001
Age: 54
Salary: $258,324
Total Annual Compensation: $684,627
Mr Jonzon has held various positions since 1974 in Electrolux, the Swedish white goods company, including general manager of Electrolux International (1983-86); senior vice president, purchasing for the white goods division (1986-91); senior vice president and general manager for Nordic markets (1991-96) and for the European logistics division (1996-99). He also served as senior vice president and chief of staff of Electrolux Home Products Europe in Brussels (1999-02).
Benoit Marsaud
Board: Senior Management
Job Title: Vice President, Manufacturing
Since: 1997
Age: 52
Salary: $390,916
Bonus: $268,925 T otal Annual Compensation: $659,841
Autoliv Inc.
© Datamonitor Page 15

AUTOLIV INC.
Key Employee Biographies
DATAMONITOR
Mr Marsaud has been vice president manufacturing of Autoliv AB since 1992 and was appointed president of Autoliv France in 1997.
Mats Odman
Board: Senior Management
Job Title: Director, Corporate Communications
Since: 1987
Age: 50
Mr Odman has been director of investor relations of Autoliv AB since 1994. Before that he held the same position in Fermenta and Gambro. He also served as the investor relations manager of Pharmacia.
Jan Olsson
Board: Senior Management
Job Title: Vice President, Engineering
Since: 1987
Age: 50
Mr Olsson was manager of engineering for Autoliv Sverige from 1989 until 1994. He was appointed president in 1994.
Hans Goran Patring
Board: Senior Management
Job Title: Vice President, Human Resources
Since: 2001
Age: 55
Prior to assuming his current position, Mr Patring was deputy vice president, human resources. He was appointed group vice president of human resources of the global automation division at ABB in Zurich, Switzerland in 1999. Previously, he was vice president of human resources for ABB’s global robotics business based in the UK for three years.
Autoliv Inc.
© Datamonitor Page 16

AUTOLIV INC.
Key Employee Biographies
DATAMONITOR
Jorgen Svensson
Board: Senior Management
Job Title: Vice President Legal Affairs, General Counsel and Secretary
Since: 1989
Age: 42
Salary: $248,807
Bonus: $147,313
Total Annual Compensation: $396,120
Mr Svensson has been legal counsel of Autoliv AB since 1989, general counsel since 1991, and vice president legal affairs and general counsel since 1994.
Autoliv Inc.
© Datamonitor Page 17

AUTOLIV INC.
Major Products And Services
DATAMONITOR
MAJOR PRODUCTS AND SERVICES
Autoliv is a leading supplier of safety systems such as seat belts and airbags to the global automotive industry. The company’s products and services include:
Airbags:
Frontal airbags
Side-impact airbags
Seatbelts:
Belt grabber
Belt-in-seat
Buckle Height adjuster
Load limiter
Pretensioners
Retractor
Smart belt
Trunk belt
Webbing
Electronics:
Night vision systems
Electronic control unit
Satellite sensor
Automatic SOS system
Others:
Child restraints
Inflators
Anti-whiplash seat
Steering wheels
Fixed hub steering wheel
Night vision system
Pedestrian protection
Autoliv Inc.
© Datamonitor Page 18
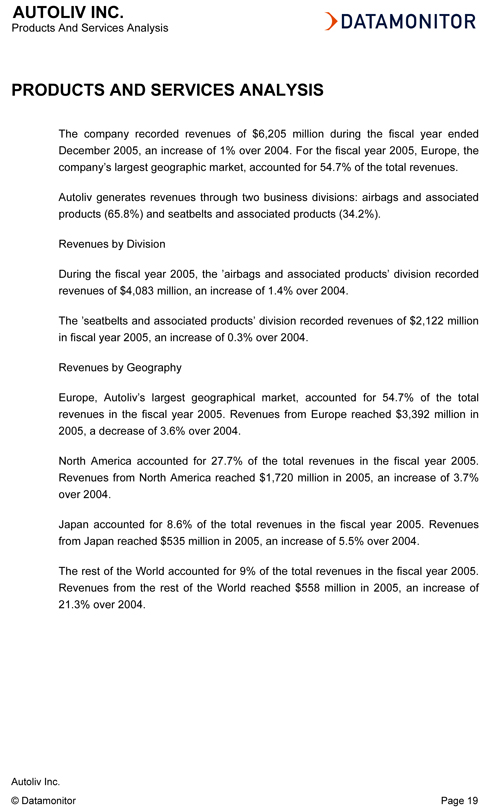
AUTOLIV INC.
Products And Services Analysis
DATAMONITOR
PRODUCTS AND SERVICES ANALYSIS
The company recorded revenues of $6,205 million during the fiscal year ended December 2005, an increase of 1% over 2004. For the fiscal year 2005, Europe, the company’s largest geographic market, accounted for 54.7% of the total revenues.
Autoliv generates revenues through two business divisions: airbags and associated products (65.8%) and seatbelts and associated products (34.2%).
Revenues by Division
During the fiscal year 2005, the ’airbags and associated products’ division recorded revenues of $4,083 million, an increase of 1.4% over 2004.
The ’seatbelts and associated products’ division recorded revenues of $2,122 million in fiscal year 2005, an increase of 0.3% over 2004.
Revenues by Geography
Europe, Autoliv’s largest geographical market, accounted for 54.7% of the total revenues in the fiscal year 2005. Revenues from Europe reached $3,392 million in 2005, a decrease of 3.6% over 2004.
North America accounted for 27.7% of the total revenues in the fiscal year 2005. Revenues from North America reached $1,720 million in 2005, an increase of 3.7% over 2004.
Japan accounted for 8.6% of the total revenues in the fiscal year 2005. Revenues from Japan reached $535 million in 2005, an increase of 5.5% over 2004.
The rest of the World accounted for 9% of the total revenues in the fiscal year 2005. Revenues from the rest of the World reached $558 million in 2005, an increase of 21.3% over 2004.
Autoliv Inc.
© Datamonitor Page 19
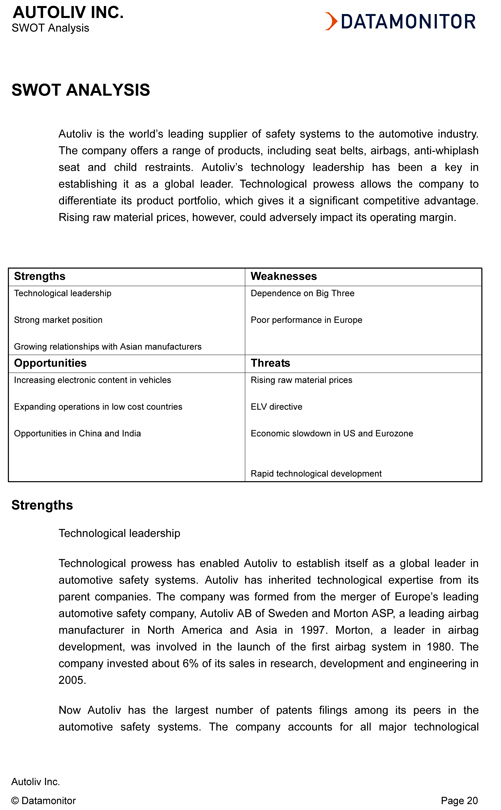
AUTOLIV INC.
SWOT Analysis
DATAMONITOR
SWOT ANALYSIS
Autoliv is the world’s leading supplier of safety systems to the automotive industry. The company offers a range of products, including seat belts, airbags, anti-whiplash seat and child restraints. Autoliv’s technology leadership has been a key in establishing it as a global leader. Technological prowess allows the company to differentiate its product portfolio, which gives it a significant competitive advantage. Rising raw material prices, however, could adversely impact its operating margin.
Strengths Weaknesses
Technological leadership Dependence on Big Three
Strong market position Poor performance in Europe
Growing relationships with Asian manufacturers
Opportunities Threats
Increasing electronic content in vehicles Rising raw material prices
Expanding operations in low cost countries ELV directive
Opportunities in China and India Economic slowdown in US and Eurozone
Rapid technological development
Strengths
Technological leadership
Technological prowess has enabled Autoliv to establish itself as a global leader in automotive safety systems. Autoliv has inherited technological expertise from its parent companies. The company was formed from the merger of Europe’s leading automotive safety company, Autoliv AB of Sweden and Morton ASP, a leading airbag manufacturer in North America and Asia in 1997. Morton, a leader in airbag development, was involved in the launch of the first airbag system in 1980. The company invested about 6% of its sales in research, development and engineering in 2005.
Now Autoliv has the largest number of patents filings among its peers in the automotive safety systems. The company accounts for all major technological
Autoliv Inc.
© Datamonitor Page 20

AUTOLIV INC.
SWOT Analysis
DATAMONITOR
breakthroughs in the occupant restraint industry over the last two decades. Some of the products introduced by the company include thorax or chest airbags, whiplash protection, post-crash system, load limiters and pretensioners. The company’s technological competency allows it to differentiate its product portfolio. The company’s technology prowess gives it a significant competitive advantage.
Strong market position
Autoliv has a strong market position in the global automotive safety systems market. Autoliv accounts for over one-third of the global automotive safety systems market. Its closest competitor, TRW Automotive, accounts for about a fifth of the automotive safety systems market. Takata, a Japanese company, also accounts for a fifth of the global automotive safety systems market. All other competitors (including Toyoda Gosei and Key Safety Systems) together account for approximately a fourth of the market. The company’s strong market position gives it significant bargaining power.
Growing relationships with Asian manufacturers
Autoliv has made a conscious attempt to strengthen presence in Asia even while building relationships with Asian manufacturers such as Toyota and Honda over the last five years. The company has invested aggressively in Asia, as a result of which its market share of the Japanese market crossed 20%. The company has also captured strong market share in Korea and China.
Toyota now accounts for about 7% of the company’s sales, while Honda accounts for about 6% of sales. Strong presence in Asia and improving relationships with Asian manufacturers would help the company partially offset weakness in other regions and reduce dependence upon the Big Three.
Weaknesses
Dependence on Big Three
Autoliv is dependent on the Big Three (GM, Ford and DaimlerChrysler) for a substantial portion of its revenues. In 2005, Ford accounted for 21% of Autoliv’s revenues, GM 13% and DaimlerChrysler 7%. The Big Three are facing stiff competition from Asian vehicle manufacturers in their key markets and as a result, have been losing market share. The Big Three are also grappling with pension and healthcare obligations. High dependence on a few customers reduce the bargaining power of the company.
Poor performance in Europe
Autoliv Inc.
© Datamonitor Page 21
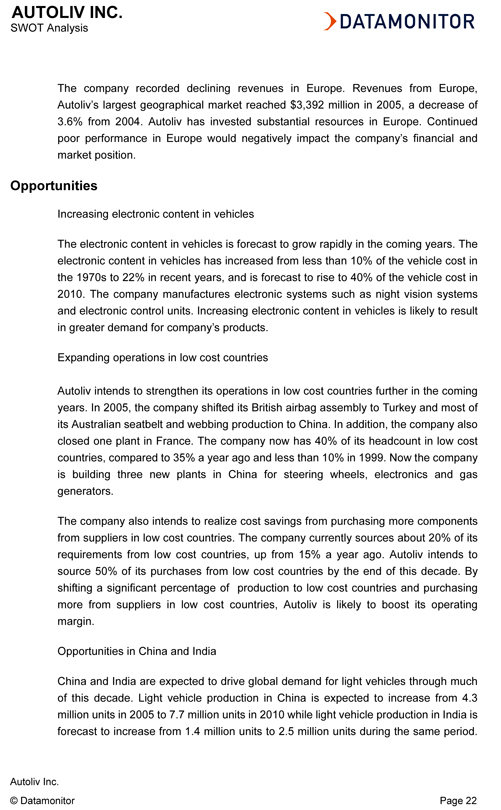
AUTOLIV INC.
SWOT Analysis
DATAMONITOR
The company recorded declining revenues in Europe. Revenues from Europe, Autoliv’s largest geographical market reached $3,392 million in 2005, a decrease of 3.6% from 2004. Autoliv has invested substantial resources in Europe. Continued poor performance in Europe would negatively impact the company’s financial and market position.
Opportunities
Increasing electronic content in vehicles
The electronic content in vehicles is forecast to grow rapidly in the coming years. The electronic content in vehicles has increased from less than 10% of the vehicle cost in the 1970s to 22% in recent years, and is forecast to rise to 40% of the vehicle cost in 2010. The company manufactures electronic systems such as night vision systems and electronic control units. Increasing electronic content in vehicles is likely to result in greater demand for company’s products.
Expanding operations in low cost countries
Autoliv intends to strengthen its operations in low cost countries further in the coming years. In 2005, the company shifted its British airbag assembly to Turkey and most of its Australian seatbelt and webbing production to China. In addition, the company also closed one plant in France. The company now has 40% of its headcount in low cost countries, compared to 35% a year ago and less than 10% in 1999. Now the company is building three new plants in China for steering wheels, electronics and gas generators.
The company also intends to realize cost savings from purchasing more components from suppliers in low cost countries. The company currently sources about 20% of its requirements from low cost countries, up from 15% a year ago. Autoliv intends to source 50% of its purchases from low cost countries by the end of this decade. By shifting a significant percentage of production to low cost countries and purchasing more from suppliers in low cost countries, Autoliv is likely to boost its operating margin.
Opportunities in China and India
China and India are expected to drive global demand for light vehicles through much of this decade. Light vehicle production in China is expected to increase from 4.3 million units in 2005 to 7.7 million units in 2010 while light vehicle production in India is forecast to increase from 1.4 million units to 2.5 million units during the same period.
Autoliv Inc.
© Datamonitor Page 22
AUTOLIV INC.
SWOT Analysis
DATAMONITOR
The company has operations in both China and India, but scope exists to ramp up operations. Growing automotive markets in China and India would provide an opportunity for the company to increase revenues and reduce dependence upon mature markets in Europe and North America.
Threats
Rising raw material prices
Steel prices, after declining by about 30% in 2005, have stabilized, but could rise to higher levels if industry consolidation continues. The price of hot rolled steel coil rose from $386 per ton in January 2004 to a high of $653 per ton in November 2004 and thereafter fell to a low of $493 per ton in July 2005 owing to de-stocking in inventories and changeover of China from a net importer to a net exporter. Since then steel prices have stabilized and recovered some of the lost ground. Hot rolled coil prices averaged $579 a ton during the first four months of 2006.
Demand outlook for steel has strengthened in recent months owing to pick up in global industrial production and restocking due to low inventory levels. Hot rolled coil prices are expected to average $572 a ton in 2006. Ongoing consolidation in the steel industry, however, could push prices to higher levels. In June 2006, for instance, Arcelor merged with Mittal Steel to form the largest steel company in the world.
High crude oil prices have also led to an increase in polymer prices. Plastic materials are used extensively in the automotive industry. London Brent Crude rose to a record $78.7 per barrel in August 2006 after BP announced the closure of about 400 thousand bbl/d of crude oil production from the Alaskan Prudhoe Bay field owing to corrosion in the pipelines which gather crude oil from the producing wells for delivery to the Trans-Alaskan pipeline.
Currently, approximately 39% of the company’s raw material costs are based on steel prices, 33% on oil prices (nylon, polyester and engineering plastics) and 14% on circuit boards and other electronic components. Recovering steel prices and increasing polymer prices would adversely affect the company’s cost structure.
ELV directive
The European Union’s End of Life of Vehicle (ELV) directive requires that 85% of the material in all new vehicle models should be recoverable by 2006 and 95% should be recoverable by 2015. Although the ELV does not specify recovering levels for individual car components (such as airbags), it only states the recovery levels for the
Autoliv Inc.
© Datamonitor Page 23
AUTOLIV INC.
SWOT Analysis
DATAMONITOR
whole vehicle. The EU-directive also bans the use of hazardous substances such as lead. Currently, some of the company’s igniters for airbags contain lead (less than one-hundredth of a gram). The company would have to phase out these igniters within the required time limit. The company may have to make substantial changes to its products to comply with ELV directive, which could result in additional costs.
Economic slowdown in US and Eurozone
According to the Organization for Economic Cooperation and Development (OECD), GDP growth in the US and Eurozone is expected to slowdown in 2007. While the GDP growth of the US economy is forecast to slow down from an estimated 3.6% in 2006 to 3.1% in 2007, the GDP growth in the Eurozone is forecast to decline from an estimated 2.2% in 2006 to 2.1% in 2007.
More importantly, the US has seen 17 successive interest rate hikes over the past few years leading to the current high of 5.25%. In August 2006, the European Central Bank (ECB) raised interest rates by a quarter of a percentage point to 3% to deal with inflationary pressures. With inflation in the Eurozone remaining at 2.5% for the last three months, above the bank’s 2% target, interest rates in the Eurozone are forecast to reach 3.25% to 3.5% by the end of 2006. A weak economic outlook for Eurozone and the US, two key markets, would put pressure on the revenues of Autoliv.
Autoliv Inc.
© Datamonitor Page 24

AUTOLIV INC.
Top Competitors
DATAMONITOR
TOP COMPETITORS
The following companies are the major competitors of Autoliv Inc.:
Delphi Corporation Takara Holdings Inc. Honeywell International Inc. First Technology PLC Key Safety Systems Inc.
TRW Automotive Holdings Corporation
Autoliv Inc.
© Datamonitor Page 25

AUTOLIV INC.
Company View
DATAMONITOR
COMPANY VIEW
A statement by Lars Westerberg, President and Chief Executive Officer of Autoliv is given below. The statement has been taken from the company’s 2005 Annual Report.
2005 was a challenging year for the automotive industry. Steel prices skyrocketed and vehicle production declined in Western Europe, our most important market. Several vehicle manufacturers were faced with heavy losses, and some suppliers (as well as Rover) even had to file for bankruptcy.
In this environment Autoliv fared comparably well because our consolidated sales rose by 1% and operating income was maintained despite an increase of about $90 million in raw material prices.
To cope with this tough environment, we continued to restructure our operations and "invested" $16 million more in 2005 than in 2004 in plant consolidations and other restructuring activities. Excluding this additional cost, operating margin improved to 8.5%. Thus continuing the underlying trends from prior years.
Since 2001, sales have jumped by 55% and organic sales (i.e. sales excluding currency effects and acquisitions/divestitures) have increased by 23%. During the same period, net income and earnings per share have tripled, even after adjusting for negative one-time items in 2001.
As in prior years strong cash generation also continued and hit $176 million before financing activities (but after voluntary pension plan contributions of $30 million). This means a free cash flow yield of more than 4% (cash flow relative to Autoliv’s average market capitalization during 2005 of $4.1 billion).
All of this cash has been returned to shareholders. In addition, to create value for you and the other Autoliv shareholders, we have taken advantage of Autoliv’s strong balance sheet and low borrowing cost to raise dividend payments and increase the level of share repurchases. As a result, we have returned a total of $483 million, which is 65% more than our 2005 net income.
Strategies for the future
Customer Mix
Over the past five years we have invested aggressively in Asia. With these investments, our market share in Japan has grown to nearly 20% and to even higher
Autoliv Inc.
© Datamonitor Page 26

AUTOLIV INC.
Company View
DATAMONITOR
market shares in Korea and China. Equally important is the superior global customer mix that we have attained through this expansion. Many Asian vehicle manufacturers have set up production in North America and Europe and now take market share from our traditional customers. For continued success, it is therefore crucial that we have strengthened our presence in Asia and among the Asian vehicle manufacturers.
Market Mix
Our investments in Asia and Eastern Europe are also important because the Rest of the World region already produces more vehicles than any other region. In addition, the RoW vehicle production is expected to grow by 8-10% per year.
The average safety content in these vehicles is still much lower than in vehicles in our traditional markets. But increasingly these vehicles will be equipped with improved seatbelts, frontal airbags and even side airbags. As a consequence, the automotive safety market is expanding faster in these markets than in our traditional markets. Thanks to Autoliv’s strong position in these regions, we will benefit from this trend.
However, this shift in mix will also slow down the growth in the average safety content per vehicle as more low-end cars will be produced globally for the emerging markets and relatively fewer premium vehicles for the established markets in Western Europe and the U.S. In parallel, we expect prices for safety products to continue to decline, partially as a result of the scramble for production capability in low-cost countries, which reflects the current trend in our industry as well as many others.
Cost Reductions
Our strategy to move production to low-cost countries has been pivotal in offsetting the pricing pressure from customers. In 2005, we decided to move our British airbag assembly primarily to Turkey and most of our Australian seatbelt and webbing production to China. In addition, we closed one plant in France.
We now have 40% of headcount in low-cost countries, compared to 35% a year ago and less than 10% in 1999 when the focus on production reallocation was initiated.
R,D&E Investments
In line with our strategy, we continued to invest in R,D&E. In 2005, these expenditures, net, rose by 5% and amounted to 6.2% of sales.
We launched the world’s first curtain airbag for convertible vehicles and Autoliv’s night vision system. We also introduced an "active hood" that protects pedestrians.
Autoliv Inc.
© Datamonitor Page 27
AUTOLIV INC.
Company View
DATAMONITOR
In addition, we entered into a cooperation agreement with Magneti Marelli for emergency call systems and other telematics systems.
Market Growth
Last year, we continued to expand our manufacturing capacity, mainly for side airbags. We expect a particularly strong demand for the Inflatable Curtain.
In 2004, the U.S. government proposed new regulations that could, in effect, mandate such curtain airbags on all new vehicles by 2011. As a result, we expect sales for this product to continue to grow during the rest of this decade.
Plans for 2006
In 2006, we expect to strengthen our superior presence in the Asian markets. We are currently building three new plants in China for steering wheels, electronics and gas generators.
We are committed to continuing consolidating our supplier base. As existing long-term contracts expire, we will gradually reduce the number of suppliers from over 2,000 to around 500. The move of our production to low-cost countries will continue, but the greatest cost savings potential could be realized by purchasing more of the components we need in low-cost countries. Before the end of this decade, we intend to source 50% of our purchase cost in these countries compared to our current level of "only" 20% and less than 15% a year ago.
Outlook
During the first quarter, light vehicle production in the Triad is expected to increase by 2%. However, light vehicle production in Western Europe is expected to decline by 1% with a significant negative model mix effect for us. Currency effects are expected to reduce our sales by 5%. Consequently, sales are expected to decline by 8%. Despite this decline, operating margin is expected to improve from the 7.6% level recorded in the first quarter 2005, and operating income is expected to exceed the $129 million recorded in the same quarter 2005.
During the full year 2006, light vehicle production in the Triad is expected to increase by 1% despite a 2% decline in Western Europe with a negative vehicle model mix. The decline in our sales in the first quarter is expected to diminish already in the second quarter, and during the fall sales are expected to start to pick up gradually with
Autoliv Inc.
© Datamonitor Page 28

AUTOLIV INC.
Company View
DATAMONITOR
a positive momentum into 2007. As a result, we expect organic sales for 2006 to be relatively flat.
Interest expense, net should be favorably impacted by the Jobs Act transaction in 2005 and by Autoliv’s Eurobond coming to maturity in May 2006. These transactions could potentially reduce interest expense in 2006 by approximately $15 million, given current exchange rate and interest rate differences in Sweden and the U.S. However, this favorable effect may be offset by higher market interest rates and a higher average net debt due to the share repurchases. Consequently, we expect a healthy growth in earnings per share despite a challenging vehicle production.
Autoliv Inc.
© Datamonitor Page 29

AUTOLIV INC.
Locations and Subsidiaries
DATAMONITOR
LOCATIONS AND SUBSIDIARIES
Head Office
Autoliv Inc.
World Trade Center
Klarabergsviadukten 70
Stockholm
SE-107 24
Stockholm
Sweden
P: 46 8 58 72 06 00
F: 46 8 24 44 93
www.autoliv.com
Other Locations and Subsidiaries
Autoliv—Czech Republic Autoliv Argentina
Konevova 313 Ruta 8 Km 60
CZ-293 01 Mlada Boleslav Calle 7 y del Canal
Czech Republic Parque Industrial Pilar
P: 420 3 2673 6526(1629) Pilar—Bs As
F: 420 32 673 6647 Argentina
P: 54 2322 537 400
F: 54 2322 537 401
Autoliv Hirotako SRS Autoliv BV & Co
Lot 1989 Lebuh Tanming Werk Nord
Taman Tanming Off Jalan Balakong D-25333 Elmshorn
Selangor Darul Ehsan Germany
43300 Balakong P: 49 4121 797 0
Malaysia F: 49 4121 757 76
P: 60 3 8961 2020
F: 60 3 8961 3030
Autoliv Canada Autoliv Belgium
Tilbury Mai Zetterlingstraat 70/Magazijn 28B
Ontario B-9042 Gent
NOP 2LO Belgium
Canada P: 32 9 255 8381
P: 1 519 682 1083 F: 32 9 255 8380
F: 1 519 682 3767
Autoliv Inc.
© Datamonitor Page 30
AUTOLIV INC.
Locations and Subsidiaries
DATAMONITOR
Autoliv Shanghai Representative Office Autoliv Sicherheitstechnik
Bridge No 5, Shengxin Road Werk Ost
Jiading Industrial Zone Eichbergstrasse 10-13
Shanghai 201821 D-04720 Dobeln
China Germany
P: 86 21 691 696 99 P: 49 3431 6601 0
F: 86 21 691 696 98 F: 49 3431 6601 14
Autoliv Headquarter & Yokohama Regionals Sales Office Autoliv Electronics
9F Nisso 13 Building F-76807 St Etienne du Rouvray
2-5-1 Shinyokohama France
Kohoku-ku P: 33 2 32 91 43 43
Yokohama 222 0033 F: 33 2 32 91 43 44
Japan
P: 81 45 475 3501
F: 81 45 475 3502
Autoliv Shanghai Safety Belt Webbing Autoliv IFB India
No 635 Yaohua Road 16 Visveswaraiah Industrial Estate
Pudong New Area 1st Main Road off Whitefield Road
Shanghai 200126 Mahadevapura Post
China Bangalore 560 048
P: 86 21 5845 5999 India
F: 86 21 5845 5365 P: 91 80 852 4017
F: 91 80 852 4185
P T Autoliv Indonesia Autoliv North America
BPSP Building 2nd Floor Ogden Technical Center
No Pulo Buaran V Blok JJ4 3350 Airport Road
Jakarta Industrial Estate Pulogadung Ogden
Jakarta 13920 Utah 84405
Indonesia United States
P: 62 21 460 4245 P: 1 801 625 4800
F: 62 21 460 4246 F: 1 801 625 4964
Autoliv Shanghai Vehicle Safety Systems Autoliv Shanghai Representative Office
No 820 Bridge No 5
Gaotai Road Shengxin Road
Jiading Industrial Zone Jiading Industrial Zone
Shanghai 201821 Shanghai
China China
P: 86 21 691 696 99 P: 86 21 691 696 99
F: 86 21 691 696 98 F: 86 21 691 696 98
Autoliv Inc.
© Datamonitor Page 31

AUTOLIV INC.
Locations and Subsidiaries
DATAMONITOR
Autoliv IFB India Gebze Organize Sanayi Bolgesi
16 Visveswaraiah Industrial Estate Ihsan Dede Cad 800 Sok
1st Main Road off Whitefield Road No 801
Mahadevapura Post 41480 Gebze Kocaeli
Bangalore 560 048 Turkey
India P: 90 262 648 4600
P: 91 80 852 4017 F: 90 262 648 4601
F: 91 80 852 4185
Autoliv do Brasil Autoliv Australia
Av Marginal a Rodovia Floriano 1521 Hume Highway
Rodrigues Pinheiro 551 Campbellfield
Area Industrial do Piracangaguá VIC 3061
CEP 12043-000 TAUBATE-SP Australia
Brazil P: 61 3 9355 5500
P: 55 12 3627 1077 F: 61 3 9355 5511
F: 55 12 3627 1069
Autoliv France
2 rue Villaret-de-Joyeuse
F-75017 Paris
France
P: 33 1 53 81 21 00
F: 33 1 53 81 21 19
Autoliv Inc.
© Datamonitor Page 32
Exhibit G
Frost & Sullivan Recognizes MEMSIC for its Technological Edge in the MEMS-based Accelerometers Market Page 1 of 3
Frost & Sullivan Press Release Published: 16 Oct 2007
Frost & Sullivan Recognizes MEMSIC for its Technological Edge in the MEMS-based Accelerometers Market
Date Published: 16 Oct 2007
Palo Alto, Calif. — October 16, 2007 — Based on its recent analysis of the micro-electromechanical system (MEMS) based accelerometers market, Frost & Sullivan recognizes MEMSIC, Inc. with the 2007 North American Frost & Sullivan Award for Excellence in Technology.
This Award is in recognition of the company’s innovative thermally based accelerometer design that has done away with a number of drawbacks associated with capacitive- or piezoresistive-based MEMS accelerometers.
Capacitive or piezoresistive MEMS inertial sensors suffer from hysteresis, mechanical ringing, and surface adhesion. They are also susceptible to electromagnetic interference (EMI). Another significant obstacle for these inertial sensors is the complexity and cost involved in their design and fabrication since they are typically application-specific.
"MEMSIC takes a considerably different approach," notes Frost & Sullivan Research Analyst Prithvi Raj. "It has pioneered unique thermal-based MEMS motion sensors that boast of high reliability and low cost, thus making them ideal for high-volume applications typically found in the automotive and consumer electronic industries."
The company’s accelerometer product family is based on a patented unique thermal technology with mixed signal processing circuitry on a single chip using standard complementary metal oxide semiconductor (CMOS) process. The principle of operation of the sensor is heat transfer by natural convection.
"MEMSIC's sensors measure internal changes in heat transfer caused by acceleration and this is what makes it fundamentally different from all competing technologies available today," says Raj. "By eliminating the need for a solid proof-mass structure MEMSIC accelerometers sidestep conventional issues present in other MEMS inertial sensors."
When encountering an acceleration incident, the gas molecules within the sensor act as a proof mass and induce a change in temperature across temperature sensors embedded within the device. As there are no moving parts, MEMSIC accelerometers can withstand a theoretical shock limit of over 50,000 g, which is over five times that of traditional accelerometers. Surface adhesion or static friction is also, thus, eliminated.
MEMSIC’s technology also allows for perfect integration into standard CMOS integrated circuit (IC) fabrication. This helps to keep costs down and scale up production to meet rising demand. As a result, MEMSIC has a competitive edge over other MEMS inertial sensor manufacturers in terms of performance vs. price.
MEMSIC has a proven track record and provides some of the most reliable accelerometers aimed primarily at automotive and consumer sectors. Its accelerometers have the lowest failure rate
http://www.frost.com/prod/servlet/press-release-print.pag?docid=109450716 26/10/2007
Frost & Sullivan Recognizes MEMSIC for its Technological Edge in the MEMS-based Accelerometers Market Page 2 of 3
for any device in its class. Their reliability coupled with low cost open up new applications especially in the coveted consumer electronic sector.
The company is also the largest supplier of accelerometers and tilt sensors in Asia and is the first MEMS manufacturer to provide hard disk drive (HDD) protection in laptops.
MEMSIC has been issued two patents and has another five pending. These patents relate to ‘Method and Circuitry for Thermal Accelerometer Signal Conditioning’, ‘Wafer-Level Package for Integrated Circuits’, ‘Single Chip Tri-Axis Accelerometer’, and so on. With these and other patents, MEMSIC has and continues to pioneer the development of thermal accelerometers.
"Patents such as the Single Chip Tri-Axis Accelerometer indicate the direction of MEMSIC’s R&D and its drive to develop designs that improve on conventional technology," notes Raj. "Current three-axis sensors employ two accelerometers, while MEMSIC is investigating ways of using a single accelerometer to sense three degrees of freedom, adding new levels of capability and reliability to these systems."
For developing an innovative motion sensing technology as well as successfully commercializing its technology, MEMSIC is a worthy recipient for the Frost & Sullivan Award for Excellence in Technology.
Each year Frost & Sullivan presents this Award to the company that has pioneered the development and introduction of an innovative technology into the market; a technology that has either impacted or has the potential to impact several market sectors. The Award recognizes a company’s successful technology development that is expected to bring significant contributions to the industry in terms of adoption, change, and competitive posture.
Frost & Sullivan Best Practices Awards recognize companies in a variety of regional and global markets for demonstrating outstanding achievement and superior performance in areas such as leadership, technological innovation, customer service, and strategic product development. Industry analysts compare market participants and measure performance through in-depth interviews, analysis, and extensive secondary research in order to identify best practices in the industry.
About MEMSIC
Headquartered in Andover, Massachusetts, MEMSIC, Inc. designs, manufactures and markets CMOS Micro-Electro-Mechanical Systems (MEMS) IC products that have on-chip mixed signal processing. MEMSIC is the first and the only company that integrates a MEMS inertial sensor with mixed signal processing circuitry onto a single chip using a standard CMOS IC process. This combination of technology has successfully yielded highly affordable standard IC products with the highest long-term reliability and performance available today in the MEMS IC industry. This technological advantage forms the basis of Memsic's approach towards more sophisticated integrated sensor solutions used in many consumer and automotive applications. For further information, please visit www.memsic.com
About Frost & Sullivan
Frost & Sullivan, the Growth Consulting Company, partners with clients to accelerate their growth. The company's Growth Partnership Services, Growth Consulting and Career Best
http://www.frost.com/prod/servlet/press-release-print.pag?docid=109450716 26/10/2007
Frost & Sullivan Recognizes MEMSIC for its Technological Edge in the MEMS-based Accelerometers Market Page 3 of 3
Practices empower clients to create a growth focused culture that generates, evaluates and implements effective growth strategies. Frost & Sullivan employs over 45 years of experience in partnering with Global 1000 companies, emerging businesses and the investment community from more than 30 offices on six continents. For more information, visit http://www.awards.frost.com.
Contact:
Stacie Jones
210.247.2450
Stacie.jones@frost.com
BACK TO TOP RETURN
Exhibit H

World MEMS Sensors Markets
FA0A-32
www.frost.com

Frost & Sullivan takes no responsibility for any incorrect information supplied to us by manufacturers or users. Quantitative market information is based primarily on interviews and therefore is subject to fluctuation.
Frost & Sullivan reports are limited publications containing valuable market information provided to a select group of customers in response to orders. Our customers acknowledge when ordering that Frost & Sullivan reports are for our customers’ internal use and not for general publication or disclosure to third parties.
No part of this report may be given, lent, resold, or disclosed to non-customers without written permission. Furthermore, no part may be reproduced, stored in a retrieval system, or transmitted in any form or by any means, electronic, mechanical, photocopying, recording, or otherwise, without the permission of the publisher.
For information regarding permission, write:
Frost & Sullivan
2400 Geng Road, Suite 201 Palo Alto, CA 94303-3331 United States
#FA0A-32 © 2006 Frost & Sullivan www.frost.com

Table of Contents
C H A P T E R 1
Executive Summary
Executive Summary 1-1
Introduction and Summary of Findings 1-1
C H A P T E R 2
Total World MEMS Sensors Market
Introduction 2-1
Technology Overview 2-1 MEMS Accelerometers 2-1 MEMS Gyroscopes 2-2 MEMS Pressure Sensors 2-2
Market Overview 2-3
Market Engineering Measurement Analysis 2-3
Industry Challenges and Market Dynamics 2-4
Industry Challenges 2-4 Facing the Pricing Pressure 2-5 Packaging of MEMS Sensors 2-5 Product Differentiation 2-6 Meeting the Customer Requirements 2-6 Understanding End-user Dynamics 2-6 Bridging the gap between the Lab and Business 2-7
#FA0A-32 © 2006 Frost & Sullivan www.frost.com iii

Market Drivers 2-7 Automotive and Consumer Segments 2-7 Miniaturization 2-8 High Performance of Inertial Sensors 2-8 Reduced Price of MEMS Sensors 2-8 Investments in MEMS Technologies 2-9 Strong Global Economy 2-9
Market Restraints 2-10 Competition Leading to Pricing Pressures 2-10 Slow Penetration into Emerging Economies 2-10
Revenue Forecasts 2-11
Revenue Forecasts 2-11 Revenue Forecasts by End User 2-12 Forecasts by MEMS Sensor 2-14
Market and Competitive Analysis 2-17
Competitive Factors 2-17
Distribution Analysis 2-18 Automotive Segment 2-19 Medical Segment 2-19 Aerospace and Defense Segment 2-19 Consumer Segment 2-19
Mergers and Acquisitions 2-20 Texas Instruments sells Sensors & Controls Business to Bain Capital, LLC. 2-20 Measurement Specialties acquires HL Planartechnik GmbH 2-20 Dover Electronics acquires Knowles Electronics 2-20 Schneider Electric SA acquires BEI Technologies, Inc. 2-21
#FA0A-32 © 2006 Frost & Sullivan www.frost.com iv
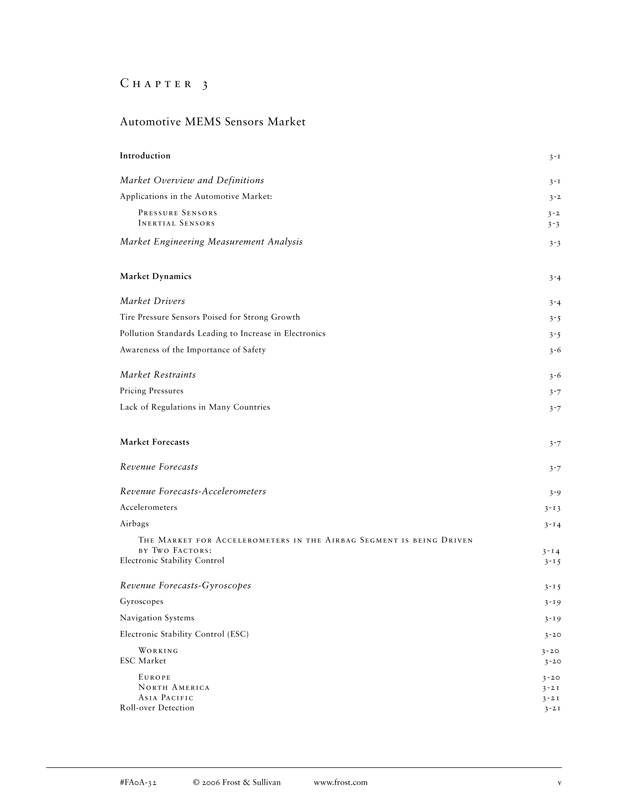
C H A P T E R 3
Automotive MEMS Sensors Market
Introduction 3-1
Market Overview and Definitions 3-1
Applications in the Automotive Market: 3-2
PRESS URE SENSO RS 3-2 IN ERTIAL SEN SORS 3-3
Market Engineering Measurement Analysis 3-3
Market Dynamics 3-4
Market Drivers 3-4 Tire Pressure Sensors Poised for Strong Growth 3-5 Pollution Standards Leading to Increase in Electronics 3-5 Awareness of the Importance of Safety 3-6
Market Restraints 3-6 Pricing Pressures 3-7 Lack of Regulations in Many Countries 3-7
Market Forecasts 3-7
Revenue Forecasts 3-7
Revenue Forecasts-Accelerometers 3-9 Accelerometers 3-13 Airbags 3-14
THE M ARKET FOR ACCELEROM ETERS IN THE AIRBAG SEGMEN T IS BEING DRIVEN
BY TWO FACTO RS: 3-14
Electronic Stability Control 3-15
Revenue Forecasts-Gyroscopes 3-15 Gyroscopes 3-19 Navigation Systems 3-19 Electronic Stability Control (ESC) 3-20
WORKING 3-20
ESC Market 3-20
EUROPE 3-20 NORTH AMERICA 3-21 AS IA PACIFIC 3-21
Roll-over Detection 3-21
#FA0A-32 © 2006 Frost & Sullivan www.frost.com v
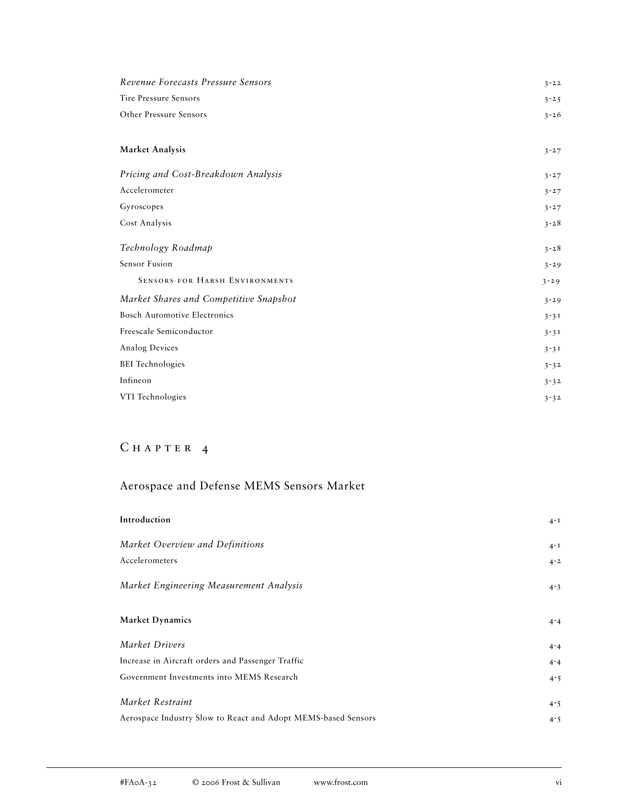
Revenue Forecasts Pressure Sensors 3-22 Tire Pressure Sensors 3-25 Other Pressure Sensors 3-26
Market Analysis 3-27
Pricing and Cost-Breakdown Analysis 3-27 Accelerometer 3-27 Gyroscopes 3-27 Cost Analysis 3-28
Technology Roadmap 3-28
Sensor Fusion 3-29
SENSORS FOR HARSH ENVIRONM ENTS 3-29
Market Shares and Competitive Snapshot 3-29 Bosch Automotive Electronics 3-31 Freescale Semiconductor 3-31 Analog Devices 3-31 BEI Technologies 3-32 Infineon 3-32 VTI Technologies 3-32
C H A P T E R 4
Aerospace and Defense MEMS Sensors Market
Introduction 4-1
Market Overview and Definitions 4-1
Accelerometers 4-2
Market Engineering Measurement Analysis 4-3
Market Dynamics 4-4
Market Drivers 4-4 Increase in Aircraft orders and Passenger Traffic 4-4 Government Investments into MEMS Research 4-5
Market Restraint 4-5
Aerospace Industry Slow to React and Adopt MEMS-based Sensors 4-5
#FA0A-32 © 2006 Frost & Sullivan www.frost.com vi
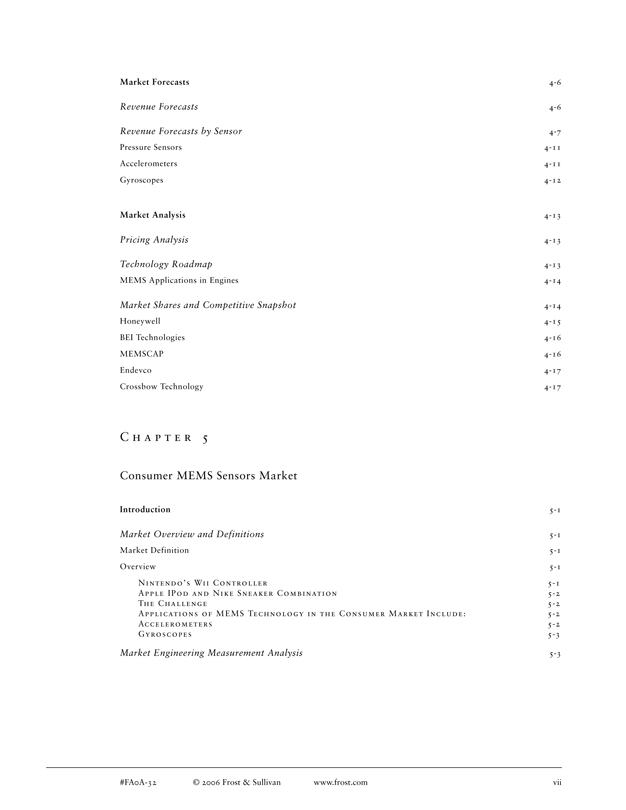
Market Forecasts 4-6
Revenue Forecasts 4-6
Revenue Forecasts by Sensor 4-7 Pressure Sensors 4-11 Accelerometers 4-11 Gyroscopes 4-12
Market Analysis 4-13
Pricing Analysis 4-13
Technology Roadmap 4-13
MEMS Applications in Engines 4-14
Market Shares and Competitive Snapshot 4-14 Honeywell 4-15 BEI Technologies 4-16 MEMSCAP 4-16 Endevco 4-17 Crossbow Technology 4-17
C H A P T E R 5
Consumer MEMS Sensors Market
Introduction 5-1
Market Overview and Definitions 5-1 Market Definition 5-1 Overview 5-1
NINTENDO ’S WII CONTROLLER 5-1 APPLE IPOD AN D NIKE SNEAKER COM BIN ATION 5-2 THE CHALLENG E 5-2 APPLICATION S OF M EMS TECHNOLOG Y IN THE CONS UM ER M ARKET INCLUDE: 5-2 ACCELEROM ETERS 5-2 GYROSCOPES 5-3
Market Engineering Measurement Analysis 5-3
#FA0A-32 © 2006 Frost & Sullivan www.frost.com vii

Market Dynamics 5-4
Market Drivers 5-4 Convergence in the Mobile Phones Industry 5-5 Inertial Sensors Enabling Functionality 5-5
Market Restraint 5-6
High Price Restrains Growth 5-6
Market Forecasts 5-6
Revenue Forecasts 5-6
MEMS Accelerometers 5-8 Computer Notebooks 5-11 Audio Players and Gaming Devices 5-12 Mobile Phones 5-12
MEMS Gyroscopes 5-13
Mobile Phones 5-15
Market Analysis 5-16
Pricing Analysis 5-16 Accelerometers 5-17 Gyroscopes 5-17
Technology Roadmap 5-17 Accelerometers 5-17 Development of a new Motion Control Sensor 5-18
Market Rankings and Competitive Snapshot 5-18 Analog Devices 5-19 Bosch Sensortec 5-19 Kionix 5-19 MEMSIC 5-20 InvenSense 5-20
#FA0A-32 © 2006 Frost & Sullivan www.frost.com viii

C H A P T E R 6
Medical MEMS Sensors Market
Introduction 6-1
Market Overview 6-1 Pressure Sensors 6-2 Accelerometers 6-3
Market Engineering Measurement Analysis 6-3
Market Dynamics 6-4
Market Drivers 6-4 MEMS Technology Improving Performance 6-5 Demographic Factors Driving the Healthcare Market 6-5 Medical Markets in the Developing Economies 6-6
Market Restraints 6-6 Pricing Pressures in the Medical Industry 6-6 Regulatory Hurdles to Restrain Growth of Sensors 6-6
Market Forecasts 6-7
Revenue Forecasts 6-7
Revenue Forecasts by Sensor 6-8 Pressure Sensors 6-11 Accelerometers 6-11
Market Analysis 6-12
Pricing Analysis 6-12
Technology Roadmap 6-12 EndSure Sensor by CardioMEMS 6-13 Wireless MEMS Capacitance Sensor by Integrated Sensing Systems, Inc. 6-13 Biochip 6-14
Market Shares and Competitive Snapshot 6-14 GE Sensing (NovaSensor) 6-15 Honeywell 6-15 Measurement Specialties 6-16
#FA0A-32 © 2006 Frost & Sullivan www.frost.com ix

C H A P T E R 7
Emerging Market Participants
Overview 7-1
Introduction 7-1
Research Methodology 7-1
Emerging Market Participants 7-2
InvenSense 7-2 CardioMEMS 7-3 MEMSIC 7-4 Akustica 7-5 ISSYS Sensing Systems 7-6 Colibrys 7-7 Kionix 7-8
C H A P T E R 8
Appendix
Decision Support Database Tables 8-1
Car Production 8-1 Total Healthcare Expenditure 8-4 Labtop Installed Base 8-6 Mobile Subscriber Base 8-9 Mobile Penetration 8-11
#FA0A-32 © 2006 Frost & Sullivan www.frost.com x

List of Figures
C H A P T E R 2
Total World MEMS Sensors Market
2-1 Total MEMS Sensors Market:
Impact of Top Industry Challenges (World), 2006-2012 2-5
2-2 Total MEMS Sensors Market:
Market Drivers Ranked in Order of Impact (World), 2006-2012 2-7
2-3 Total MEMS Sensors Market:
Market Restraints Ranked in Order of Impact (World), 2006-2012 2-10
2-4 Total MEMS Sensors Market:
Revenue Forecasts (World), 2002-2012 2-11
2-5 Total MEMS Sensors Market:
Revenue Forecasts by End-user Type (World), 2002-2012 2-13
2-6 Total MEMS Sensors Market:
Revenue Forecasts by Product Type (World), 2002-2012 2-15
2-7 Total MEMS Sensors Market:
Competitive Structure (World), 2005 2-17
C H A P T E R 3
Automotive MEMS Sensors Market
3-1 Automotive MEMS Sensors Market:
Market Drivers Ranked in Order of Impact (World), 2006-2012 3-5
#FA0A-32 © 2006 Frost & Sullivan www.frost.com xi
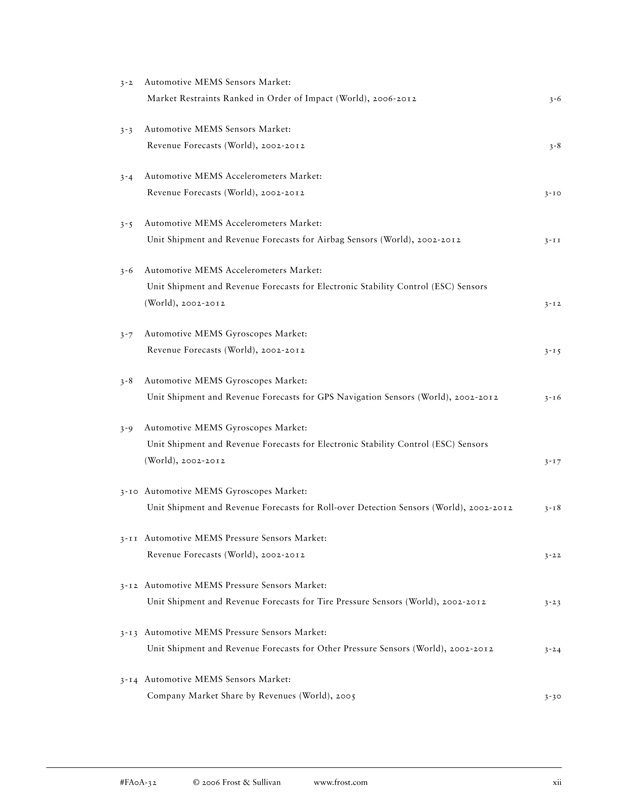
3-2 Automotive MEMS Sensors Market:
Market Restraints Ranked in Order of Impact (World), 2006-2012 3-6
3-3 Automotive MEMS Sensors Market:
Revenue Forecasts (World), 2002-2012 3-8
3-4 Automotive MEMS Accelerometers Market:
Revenue Forecasts (World), 2002-2012 3-10
3-5 Automotive MEMS Accelerometers Market:
Unit Shipment and Revenue Forecasts for Airbag Sensors (World), 2002-2012 3-11
3-6 Automotive MEMS Accelerometers Market:
Unit Shipment and Revenue Forecasts for Electronic Stability Control (ESC) Sensors
(World), 2002-2012 3-12
3-7 Automotive MEMS Gyroscopes Market:
Revenue Forecasts (World), 2002-2012 3-15
3-8 Automotive MEMS Gyroscopes Market:
Unit Shipment and Revenue Forecasts for GPS Navigation Sensors (World), 2002-2012 3-16
3-9 Automotive MEMS Gyroscopes Market:
Unit Shipment and Revenue Forecasts for Electronic Stability Control (ESC) Sensors
(World), 2002-2012 3-17
3-10 Automotive MEMS Gyroscopes Market:
Unit Shipment and Revenue Forecasts for Roll-over Detection Sensors (World), 2002-2012 3-18
3-11 Automotive MEMS Pressure Sensors Market:
Revenue Forecasts (World), 2002-2012 3-22
3-12 Automotive MEMS Pressure Sensors Market:
Unit Shipment and Revenue Forecasts for Tire Pressure Sensors (World), 2002-2012 3-23
3-13 Automotive MEMS Pressure Sensors Market:
Unit Shipment and Revenue Forecasts for Other Pressure Sensors (World), 2002-2012 3-24
3-14 Automotive MEMS Sensors Market:
Company Market Share by Revenues (World), 2005 3-30
#FA0A-32 © 2006 Frost & Sullivan www.frost.com xii
C H A P T E R 4
Aerospace and Defense MEMS Sensors Market
4-1 Aerospace and Defense MEMS Sensors Market:
Market Drivers Ranked in Order of Impact (World), 2006-2012 4-4
4-2 Aerospace and Defense MEMS Sensors Market:
Market Restraint (World), 2006-2012 4-5
4-3 Aerospace and Defense MEMS Sensors Market:
Revenue Forecasts (World), 2002-2012 4-6
4-4 Aerospace and Defense MEMS Pressure Sensors Market:
Unit Shipment and Revenue Forecasts (World), 2002-2012 4-8
4-5 Aerospace and Defense MEMS Accelerometers Market:
Unit Shipment and Revenue Forecasts (World), 2002-2012 4-9
4-6 Aerospace and Defense MEMS Gyroscopes Market:
Unit Shipment and Revenue Forecasts (World), 2002-2012 4-10
4-7 Aerospace and Defense MEMS Sensors Market:
Company Market Share by Revenues (World), 2005 4-14
C H A P T E R 5
Consumer MEMS Sensors Market
5-1 Consumer Electronics MEMS Sensors Market:
Market Drivers Ranked in Order of Impact (World), 2006-2012 5-5
5-2 Consumer Electronics MEMS Sensors Market:
Market Restraint (World), 2006-2012 5-6
5-3 Consumer Electronics MEMS Sensors Market:
Revenue Forecasts (World), 2002-2012 5-7
5-4 Consumer Electronics MEMS Accelerometers Market:
Revenue Forecasts (World), 2002-2012 5-8
#FA0A-32 © 2006 Frost & Sullivan www.frost.com xiii
5-5 Consumer Electronics MEMS Accelerometers Market:
Unit Shipment and Revenue Forecasts for Computer Notebooks (World), 2002-2012 5-9
5-6 Consumer Electronics MEMS Accelerometers Market:
Unit Shipment and Revenue Forecasts for Mobile Phones (World), 2002-2012 5-10
5-7 Consumer Electronicss MEMS Gyroscopes Market:
Revenue Forecasts (World), 2002-2012 5-13
5-8 Consumer Electronicss MEMS Gyroscopes Market:
Unit Shipment and Revenue Forecasts for Mobile Phones (World), 2002-2012 5-14
5-9 Consumer Electronics MEMS Sensors Market:
Company Market Ranking by Revenues (World), 2005 5-18
C H A P T E R 6
Medical MEMS Sensors Market
6-1 Medical MEMS Sensors Market:
Market Drivers Ranked in Order of Impact (World), 2006-2012 6-5
6-2 Medical MEMS Sensors Market:
Market Restraints Ranked in Order of Impact (World), 2006-2012 6-6
6-3 Medical MEMS Sensors Market:
Revenue Forecasts (World), 2002-2012 6-7
6-4 Medical MEMS Pressure Sensors Market:
Unit Shipment and Revenue Forecasts (World), 2002-2012 6-9
6-5 Medical MEMS Accelerometers Market:
Revenue Forecasts (World), 2002-2012 6-10
6-6 Medical MEMS Sensors Market:
Company Market Share by Revenues (World), 2005 6-14
#FA0A-32 © 2006 Frost & Sullivan www.frost.com xiv
C H A P T E R 7
Emerging Market Participants
7-1 MEMS Sensors Market:
Emerging Participant—InvenSense, Inc. (World), 2005 7-2
7-2 MEMS Sensors Market:
Emerging Participant—CardioMEMS, Inc. (World), 2005 7-3
7-3 MEMS Sensors Market:
Emerging Participant—MEMSIC, Inc. (World), 2005 7-4
7-4 MEMS Sensors Market:
Emerging Participant—Akustica, Inc. (World), 2005 7-5
7-5 MEMS Sensors Market:
Emerging Participant—ISSYS Sensing Systems, Inc. (World), 2005 7-6
7-6 MEMS Sensors Market:
Emerging Participant—Colibrys, Inc. (World), 2005 7-7
7-7 MEMS Sensors Market:
Emerging Participant—Kionix, Inc. (World), 2005 7-8
C H A P T E R 8
Appendix
8-1 Decision Support Database:
Car Production in ’000 Units (World), 1999-2006 8-1
8-2 Decision Support Database:
Total Healthcare Expenditure in Billion USD (World), 1999-2006 8-4
8-3 Decision Support Database:
Laptop Install Base in Million (World), 1999-2006 8-6
8-4 Decision Support Database:
Mobile Subscribers in Million (World), 1999-2006 8-9
8-5 Decision Support Database:
Mobile Penetration (World), 1999-2006 8-11
#FA0A-32 © 2006 Frost & Sullivan www.frost.com xv
List of Charts
C H A P T E R 2
Total World MEMS Sensors Market
2.1 Total MEMS Sens ors Market:
Market Engineering Measurements (World), 2005 2-4
2.2 Total MEMS Sensors Market:
Revenue Forecasts (World), 2002-2012 2-11
2.3 Total MEMS Sensors Market:
Revenue Forecasts by End-user Type (World), 2002-2012 2-13
2.4 Total MEMS Sensors Market:
Revenue Forecasts by Product Type (World), 2002-2012 2-15
C H A P T E R 3
Automotive MEMS Sensors Market
3.1 Automotive MEMS Sensors Market:
Market Engineering Measurements (World), 2005 3-4
3.2 Automotive MEMS Sensors Market:
Revenue Forecasts (World), 2002-2012 3-8
3.3 Automotive MEMS Accelerometers Market:
Revenue Forecasts (World), 2002-2012 3-10
3.4 Automotive MEMS Accelerometers Market:
Unit Shipment and Revenue Forecasts for Airbag Sensors (World), 2002-2012 3-11
#FA0A-32 © 2006 Frost & Sullivan www.frost.com xvi
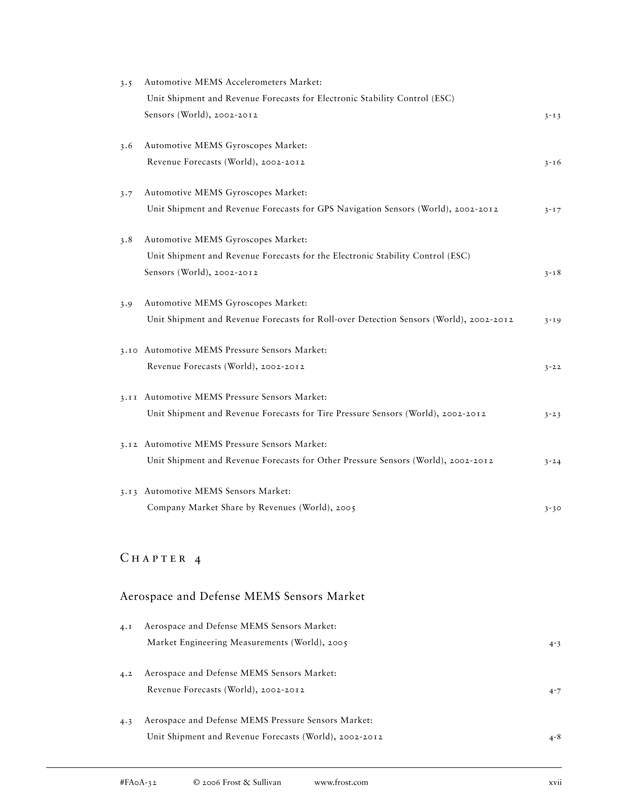
3.5 Automotive MEMS Accelerometers Market:
Unit Shipment and Revenue Forecasts for Electronic Stability Control (ESC)
Sensors (World), 2002-2012 3-13
3.6 Automotive MEMS Gyroscopes Market:
Revenue Forecasts (World), 2002-2012 3-16
3.7 Automotive MEMS Gyroscopes Market:
Unit Shipment and Revenue Forecasts for GPS Navigation Sensors (World), 2002-2012 3-17
3.8 Automotive MEMS Gyroscopes Market:
Unit Shipment and Revenue Forecasts for the Electronic Stability Control (ESC)
Sensors (World), 2002-2012 3-18
3.9 Automotive MEMS Gyroscopes Market:
Unit Shipment and Revenue Forecasts for Roll-over Detection Sensors (World), 2002-2012 3-19
3.10 Automotive MEMS Pressure Sensors Market:
Revenue Forecasts (World), 2002-2012 3-22
3.11 Automotive MEMS Pressure Sensors Market:
Unit Shipment and Revenue Forecasts for Tire Pressure Sensors (World), 2002-2012 3-23
3.12 Automotive MEMS Pressure Sensors Market:
Unit Shipment and Revenue Forecasts for Other Pressure Sensors (World), 2002-2012 3-24
3.13 Automotive MEMS Sensors Market:
Company Market Share by Revenues (World), 2005 3-30
C H A P T E R 4
Aerospace and Defense MEMS Sensors Market
4.1 Aerospace and Defense MEMS Sensors Market:
Market Engineering Measurements (World), 2005 4-3
4.2 Aerospace and Defense MEMS Sensors Market:
Revenue Forecasts (World), 2002-2012 4-7
4.3 Aerospace and Defense MEMS Pressure Sensors Market:
Unit Shipment and Revenue Forecasts (World), 2002-2012 4-8
#FA0A-32 © 2006 Frost & Sullivan www.frost.com xvii
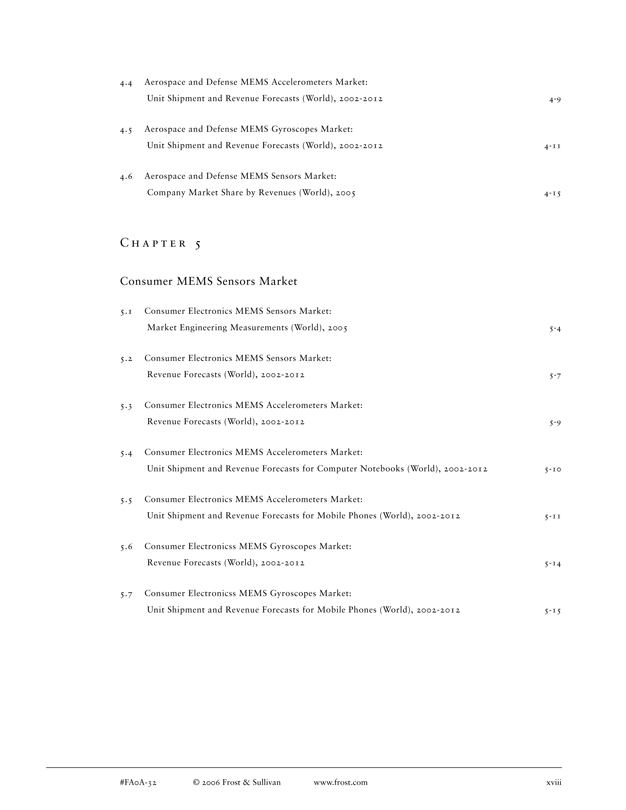
4.4 Aerospace and Defense MEMS Accelerometers Market:
Unit Shipment and Revenue Forecasts (World), 2002-2012 4-9
4.5 Aerospace and Defense MEMS Gyroscopes Market:
Unit Shipment and Revenue Forecasts (World), 2002-2012 4-11
4.6 Aerospace and Defense MEMS Sensors Market:
Company Market Share by Revenues (World), 2005 4-15
C H A P T E R 5
Consumer MEMS Sensors Market
5.1 Consumer Electronics MEMS Sensors Market:
Market Engineering Measurements (World), 2005 5-4
5.2 Consumer Electronics MEMS Sensors Market:
Revenue Forecasts (World), 2002-2012 5-7
5.3 Consumer Electronics MEMS Accelerometers Market:
Revenue Forecasts (World), 2002-2012 5-9
5.4 Consumer Electronics MEMS Accelerometers Market:
Unit Shipment and Revenue Forecasts for Computer Notebooks (World), 2002-2012 5-10
5.5 Consumer Electronics MEMS Accelerometers Market:
Unit Shipment and Revenue Forecasts for Mobile Phones (World), 2002-2012 5-11
5.6 Consumer Electronicss MEMS Gyroscopes Market:
Revenue Forecasts (World), 2002-2012 5-14
5.7 Consumer Electronicss MEMS Gyroscopes Market:
Unit Shipment and Revenue Forecasts for Mobile Phones (World), 2002-2012 5-15
#FA0A-32 © 2006 Frost & Sullivan www.frost.com xviii
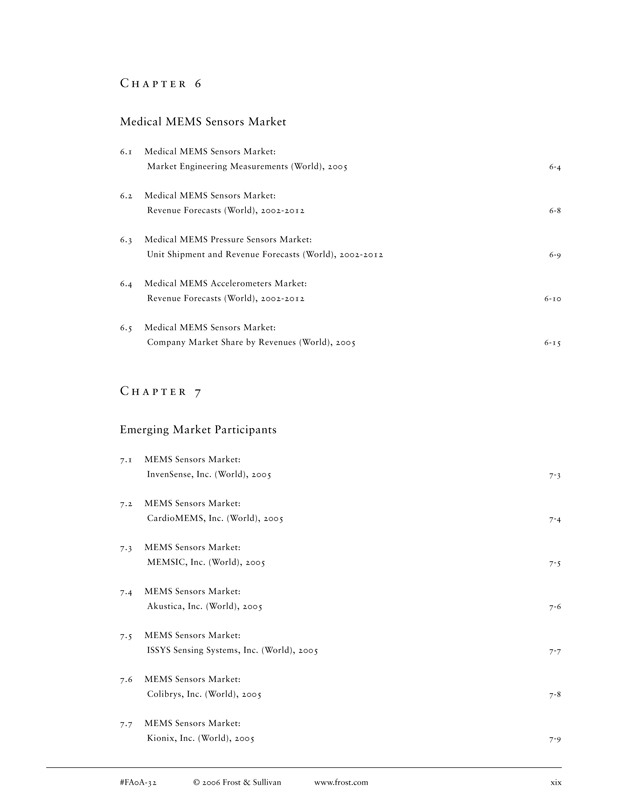
C H A P T E R 6
Medical MEMS Sensors Market
6.1 Medical MEMS Sensors Market:
Market Engineering Measurements (World), 2005 6-4
6.2 Medical MEMS Sensors Market:
Revenue Forecasts (World), 2002-2012 6-8
6.3 Medical MEMS Pressure Sensors Market:
Unit Shipment and Revenue Forecasts (World), 2002-2012 6-9
6.4 Medical MEMS Accelerometers Market:
Revenue Forecasts (World), 2002-2012 6-10
6.5 Medical MEMS Sensors Market:
Company Market Share by Revenues (World), 2005 6-15
C H A P T E R 7
Emerging Market Participants
7.1 MEMS Sensors Market:
InvenSense, Inc. (World), 2005 7-3
7.2 MEMS Sensors Market:
CardioMEMS, Inc. (World), 2005 7-4
7.3 MEMS Sensors Market:
MEMSIC, Inc. (World), 2005 7-5
7.4 MEMS Sensors Market:
Akustica, Inc. (World), 2005 7-6
7.5 MEMS Sensors Market:
ISSYS Sensing Systems, Inc. (World), 2005 7-7
7.6 MEMS Sensors Market:
Colibrys, Inc. (World), 2005 7-8
7.7 MEMS Sensors Market:
Kionix, Inc. (World), 2005 7-9
#FA0A-32 © 2006 Frost & Sullivan www.frost.com xix

Executive Summary
E X E C U T I V E S U M M A R Y
Introduction and Summary of Findings
The attached power point shows the summary of findings in detail.
WORLD MEMS SENSORS MARKET
FA0A-32 November, 2006 C Frost & Sullivan
#FA0A-32 © 2006 Frost & Sullivan www.frost.com 1-1
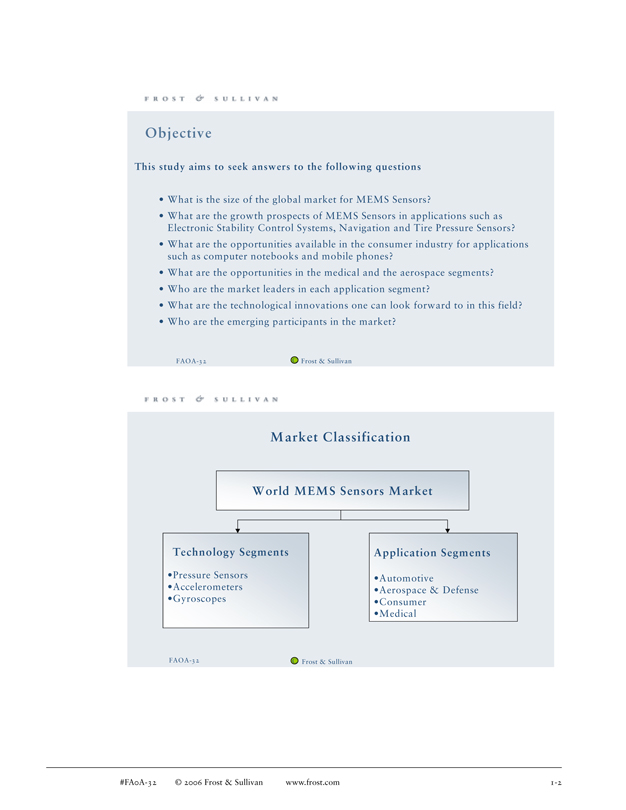
FORST & SULLIVAN
Objective
This study aims to seek answers to the following questions
• What is the size of the global market for MEMS Sensors?
• What are the growth prospects of MEMS Sensors in applications such as Electronic Stability Control Systems, Navigation and Tire Pressure Sensors?
• What are the opportunities available in the consumer industry for applications such as computer notebooks and mobile phones?
• What are the opportunities in the medical and the aerospace segments?
• Who are the market leaders in each application segment?
• What are the technological innovations one can look forward to in this field?
• Who are the emerging participants in the market?
FAOA-32 C Frost & Sullivan
FORST & SULLIVAN
Market Classification
W orld M EM S Sensors M arket
Technology Segments Application Segments
•Pressure Sensors •Automotive
•Accelerometers •Aerospace & Defense •Gyroscopes •Consumer •Medical
FAOA-32 C Frost & Sullivan
#FA0A-32 © 2006 Frost & Sullivan www.frost.com 1-2
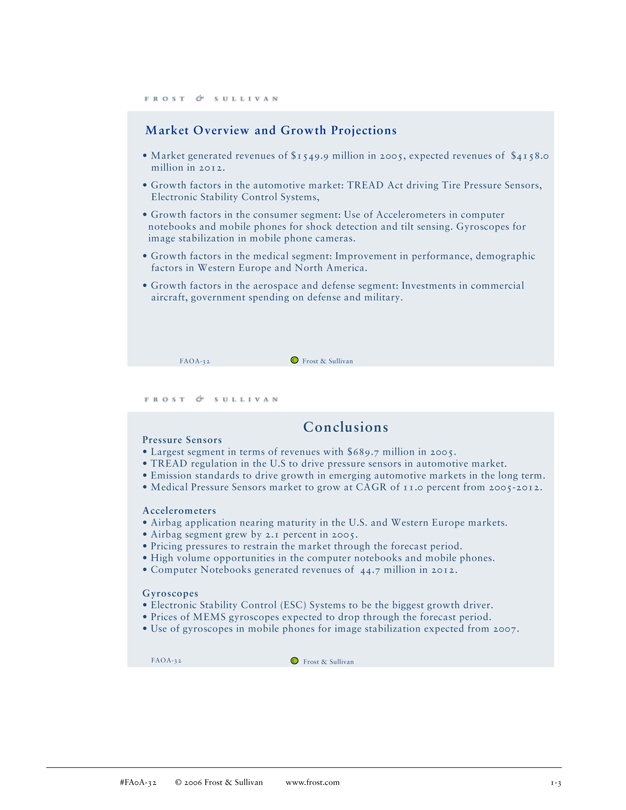
FORST & SULLIVAN
Market Overview and Growth Projections
• Market generated revenues of $1549.9 million in 2005, expected revenues of $4158.0 million in 2012.
• Growth factors in the automotive market: TREAD Act driving Tire Pressure Sensors, Electronic Stability Control Systems,
• Growth factors in the consumer segment: Use of Accelerometers in computer notebooks and mobile phones for shock detection and tilt sensing. Gyroscopes for image stabilization in mobile phone cameras.
• Growth factors in the medical segment: Improvement in performance, demographic factors in Western Europe and North America.
• Growth factors in the aerospace and defense segment: Investments in commercial aircraft, government spending on defense and military.
FAOA-32 C Frost & Sullivan
Conclusions
Pressure Sensors
• Largest segment in terms of revenues with $689.7 million in 2005.
• TREAD regulation in the U.S to drive pressure sensors in automotive market.
• Emission standards to drive growth in emerging automotive markets in the long term.
• Medical Pressure Sensors market to grow at CAGR of 11.0 percent from 2005-2012.
Accelerometers
• Airbag application nearing maturity in the U.S. and Western Europe markets.
• Airbag segment grew by 2.1 percent in 2005.
• Pricing pressures to restrain the market through the forecast period.
• High volume opportunities in the computer notebooks and mobile phones.
• Computer Notebooks generated revenues of 44.7 million in 2012.
Gyroscopes
• Electronic Stability Control (ESC) Systems to be the biggest growth driver.
• Prices of MEMS gyroscopes expected to drop through the forecast period.
• Use of gyroscopes in mobile phones for image stabilization expected from 2007.
FAOA-32 C Frost & Sullivan
#FA0A-32 © 2006 Frost & Sullivan www.frost.com 1-3
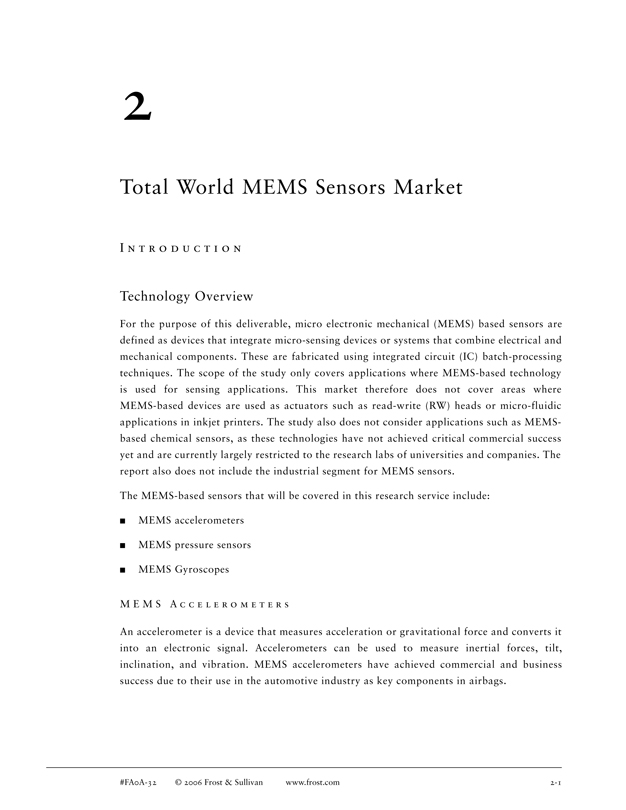
Total World MEMS Sensors Market
I N T R O D U C T I O N
Technology Overview
For the purpose of this deliverable, micro electronic mechanical (MEMS) based sensors are defined as devices that integrate micro-sensing devices or systems that combine electrical and mechanical components. These are fabricated using integrated circuit (IC) batch-processing techniques. The scope of the study only covers applications where MEMS-based technology is used for sensing applications. This market therefore does not cover areas where MEMS-based devices are used as actuators such as read-write (RW) heads or micro-fluidic applications in inkjet printers. The study also does not consider applications such as MEMS-based chemical sensors, as these technologies have not achieved critical commercial success yet and are currently largely restricted to the research labs of universities and companies. The report also does not include the industrial segment for MEMS sensors.
The MEMS-based sensors that will be covered in this research service include:
MEMS accelerometers
MEMS pressure sensors
MEMS Gyroscopes
M E M S A C C E L E R O M E T E R S
An accelerometer is a device that measures acceleration or gravitational force and converts it into an electronic signal. Accelerometers can be used to measure inertial forces, tilt, inclination, and vibration. MEMS accelerometers have achieved commercial and business success due to their use in the automotive industry as key components in airbags.
#FA0A-32 © 2006 Frost & Sullivan www.frost.com 2-1
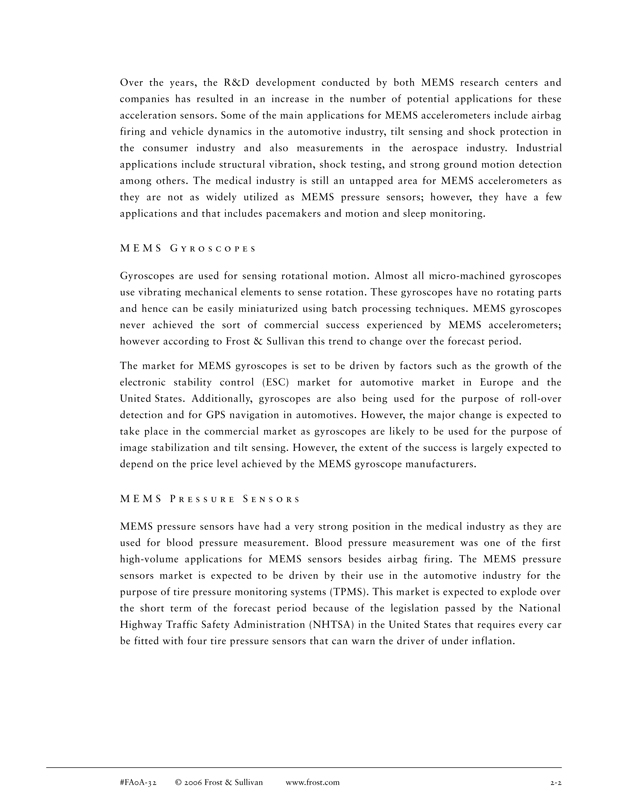
Over the years, the R&D development conducted by both MEMS research centers and companies has resulted in an increase in the number of potential applications for these acceleration sensors. Some of the main applications for MEMS accelerometers include airbag firing and vehicle dynamics in the automotive industry, tilt sensing and shock protection in the consumer industry and also measurements in the aerospace industry. Industrial applications include structural vibration, shock testing, and strong ground motion detection among others. The medical industry is still an untapped area for MEMS accelerometers as they are not as widely utilized as MEMS pressure sensors; however, they have a few applications and that includes pacemakers and motion and sleep monitoring.
M E M S G Y R O S C O P E S
Gyroscopes are used for sensing rotational motion. Almost all micro-machined gyroscopes use vibrating mechanical elements to sense rotation. These gyroscopes have no rotating parts and hence can be easily miniaturized using batch processing techniques. MEMS gyroscopes never achieved the sort of commercial success experienced by MEMS accelerometers; however according to Frost & Sullivan this trend to change over the forecast period.
The market for MEMS gyroscopes is set to be driven by factors such as the growth of the electronic stability control (ESC) market for automotive market in Europe and the United States. Additionally, gyroscopes are also being used for the purpose of roll-over detection and for GPS navigation in automotives. However, the major change is expected to take place in the commercial market as gyroscopes are likely to be used for the purpose of image stabilization and tilt sensing. However, the extent of the success is largely expected to depend on the price level achieved by the MEMS gyroscope manufacturers.
M E M S P R E S S U R E S E N S O R S
MEMS pressure sensors have had a very strong position in the medical industry as they are used for blood pressure measurement. Blood pressure measurement was one of the first high-volume applications for MEMS sensors besides airbag firing. The MEMS pressure sensors market is expected to be driven by their use in the automotive industry for the purpose of tire pressure monitoring systems (TPMS). This market is expected to explode over the short term of the forecast period because of the legislation passed by the National Highway Traffic Safety Administration (NHTSA) in the United States that requires every car be fitted with four tire pressure sensors that can warn the driver of under inflation.
#FA0A-32 © 2006 Frost & Sullivan www.frost.com 2-2
Market Overview
MEMS based sensors have been in existence for a number of decades, achieving mass-market penetration in several applications such as medical pressure sensors and also accelerometers for airbag applications. Despite, these successful applications in the market, MEMS sensors have been largely restricted to a few industries such as automotive and the medical segments. Even within these segments, the applications were restricted to one or two such as airbags in automotive and blood pressure sensors in the medical industry.
The adoption of this technology for the purpose of sensing has been slowed due to many reasons including a economic slump, and also due to the lack of willingness on the part of customers to invest and adopt new technologies. This is expected to change over the next decade as MEMS sensors enter new markets such as consumer electronics and achieve broader penetration into other segments such as industrial applications and automotive. The MEMS sensors are expected to gain public acceptance in some global consumer lifestyle products such as mobile phones, music players, and computer notebooks.
The market is also expected to witness the entry of several new manufacturers in various segments. These companies have largely been founded by MEMS industry veterans and the launch of products is expected to open new segments for MEMS sensors besides sustaining the investments in the technology.
Market Engineering Measurement Analysis
Chart 2.1 shows the Market Engineering measurements for the world MEMS Sensors market for 2005.
#FA0A-32 © 2006 Frost & Sullivan www.frost.com 2-3
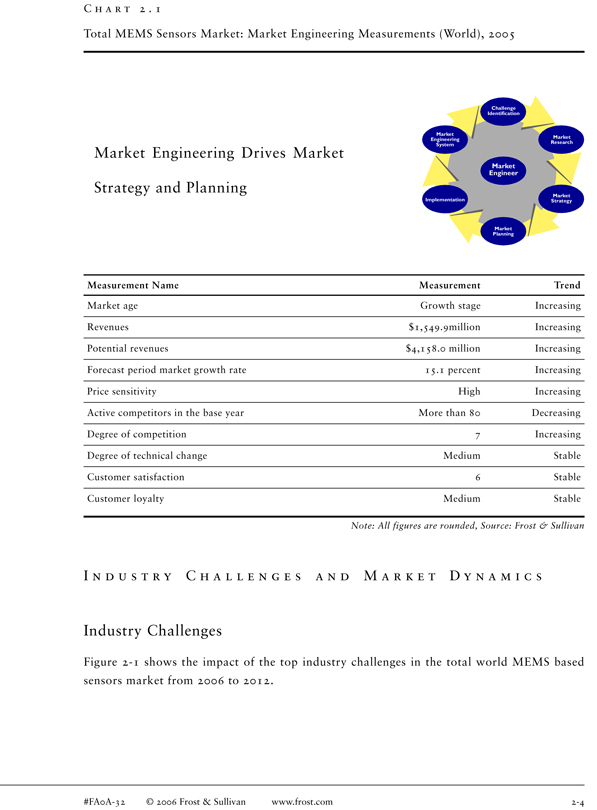
C H A R T 2 . 1
Total MEMS Sensors Market: Market Engineering Measurements (World), 2005
Challenge Identification
Market
Market Engineering Research System
Market Engineering Drives Market
Market Engineer
Strategy and Planning
Market Implementation Strategy
Market Planning
Measurement Name Measurement Trend
Market age Growth stage Increasing Revenues $1,549.9million Increasing Potential revenues $4,158.0 million Increasing Forecast period market growth rate 15.1 percent Increasing Price sensitivity High Increasing Active competitors in the base year More than 80 Decreasing Degree of competition 7 Increasing Degree of technical change Medium Stable Customer satisfaction 6 Stable Customer loyalty Medium Stable
Note: All figures are rounded, Source: Frost & Sullivan
I N D U S T R Y C H A L L E N G E S A N D M A R K E T D Y N A M I C S
Industry Challenges
Figure 2-1 shows the impact of the top industry challenges in the total world MEMS based sensors market from 2006 to 2012.
#FA0A-32 © 2006 Frost & Sullivan www.frost.com 2-4

F I G U R E 2—1
Total MEMS Sensors Market: Impact of Top Industry Challenges (World), 2006-2012
Challenge 1-2 Years 3-4 Years 5-7 Years
Facing the pricing pressure High High High Packaging of MEMS sensors High High High Product differentiation High High Medium Meeting the customer requirements Medium Medium Medium Understanding end-user dynamics Medium Medium High Bridging the gap between labs and business Medium Medium Medium
Source: Frost & Sullivan
F A C I N G T H E P R I C I N G P R E S S U R E
Manufacturers are making immense efforts to penetrate new markets such as cellular phone applications in consumer electronics. MEMS-based sensors will need an extremely compelling price point balanced with the right features for the electronics manufacturers to incorporate these sensors into their products. Unfortunately, the prices can only be brought down at higher volumes, which in turn cannot be generated without reaching the required price. There is significant evidence in the market that manufacturers are working toward products that can penetrate these high-volume applications; however this still remains as a challenge for a large number of manufacturers. Sensor manufacturers should aim at increasing volumes first for applications at the higher end and then work toward targeting the lower-end segments as well.
This challenge is expected to have a high impact throughout the forecast period from 2006 to 2012.
P A C K A G I N G O F M E M S S E N S O R S
One of the most important challenges that the MEMS industry is facing is that of packaging. The relationship between the sensor component and the packaging is more important in the MEMS industry when compared to the semiconductor industry. This is because of the moving parts within the MEMS-based sensors and also because of the environments they function in. The packaging challenges become more crucial when one considers the hostile environments such as those in automotive and the industrial applications in which these sensors have to function.Companies have consistently become better at packaging through the years. However, the challenge of reducing costs and at the same time not compromising on performance still remains.
This challenge is expected to have a high impact throughout the forecast period.
#FA0A-32 © 2006 Frost & Sullivan www.frost.com 2-5
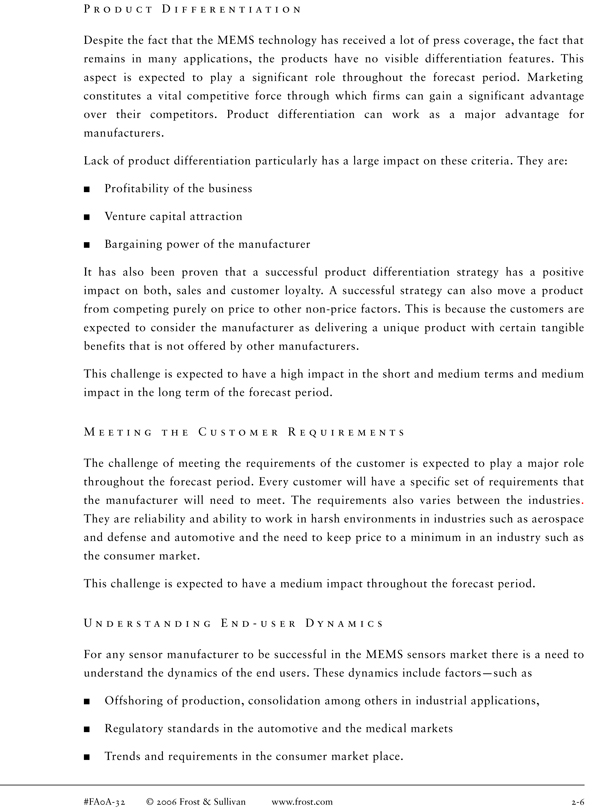
P R O D U C T D I F F E R E N T I A T I O N
Despite the fact that the MEMS technology has received a lot of press coverage, the fact that remains in many applications, the products have no visible differentiation features. This aspect is expected to play a significant role throughout the forecast period. Marketing constitutes a vital competitive force through which firms can gain a significant advantage over their competitors. Product differentiation can work as a major advantage for manufacturers.
Lack of product differentiation particularly has a large impact on these criteria. They are:
Profitability of the business
Venture capital attraction
Bargaining power of the manufacturer
It has also been proven that a successful product differentiation strategy has a positive impact on both, sales and customer loyalty. A successful strategy can also move a product from competing purely on price to other non-price factors. This is because the customers are expected to consider the manufacturer as delivering a unique product with certain tangible benefits that is not offered by other manufacturers.
This challenge is expected to have a high impact in the short and medium terms and medium impact in the long term of the forecast period.
M E E T I N G T H E C U S T O M E R R E Q U I R E M E N T S
The challenge of meeting the requirements of the customer is expected to play a major role throughout the forecast period. Every customer will have a specific set of requirements that the manufacturer will need to meet. The requirements also varies between the industries. They are reliability and ability to work in harsh environments in industries such as aerospace and defense and automotive and the need to keep price to a minimum in an industry such as the consumer market.
This challenge is expected to have a medium impact throughout the forecast period.
U N D E R S T A N D I N G E N D—U S E R D Y N A M I C S
For any sensor manufacturer to be successful in the MEMS sensors market there is a need to understand the dynamics of the end users. These dynamics include factors—such as
Offshoring of production, consolidation among others in industrial applications,
Regulatory standards in the automotive and the medical markets
Trends and requirements in the consumer market place.
#FA0A-32 © 2006 Frost & Sullivan www.frost.com 2-6
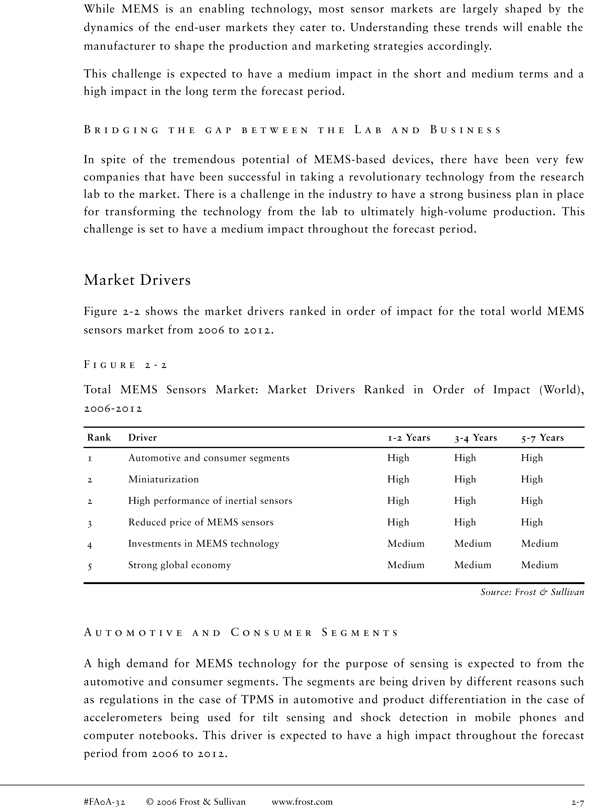
While MEMS is an enabling technology, most sensor markets are largely shaped by the dynamics of the end-user markets they cater to. Understanding these trends will enable the manufacturer to shape the production and marketing strategies accordingly.
This challenge is expected to have a medium impact in the short and medium terms and a high impact in the long term the forecast period.
B R I D G I N G T H E G A P B E T W E E N T H E L A B A N D B U S I N E S S
In spite of the tremendous potential of MEMS-based devices, there have been very few companies that have been successful in taking a revolutionary technology from the research lab to the market. There is a challenge in the industry to have a strong business plan in place for transforming the technology from the lab to ultimately high-volume production. This challenge is set to have a medium impact throughout the forecast period.
Market Drivers
Figure 2-2 shows the market drivers ranked in order of impact for the total world MEMS sensors market from 2006 to 2012.
F I G U R E 2—2
Total MEMS Sensors Market: Market Drivers Ranked in Order of Impact (World), 2006-2012
Rank Driver 1-2 Years 3-4 Years 5-7 Years
1 Automotive and consumer segments High High High
2 Miniaturization High High High
2 High performance of inertial sensors High High High
3 Reduced price of MEMS sensors High High High
4 Investments in MEMS technology Medium Medium Medium
5 Strong global economy Medium Medium Medium
Source: Frost & Sullivan
A U T O M O T I V E A N D C O N S U M E R S E G M E N T S
A high demand for MEMS technology for the purpose of sensing is expected to from the automotive and consumer segments. The segments are being driven by different reasons such as regulations in the case of TPMS in automotive and product differentiation in the case of accelerometers being used for tilt sensing and shock detection in mobile phones and computer notebooks. This driver is expected to have a high impact throughout the forecast period from 2006 to 2012.
#FA0A-32 © 2006 Frost & Sullivan www.frost.com 2-7
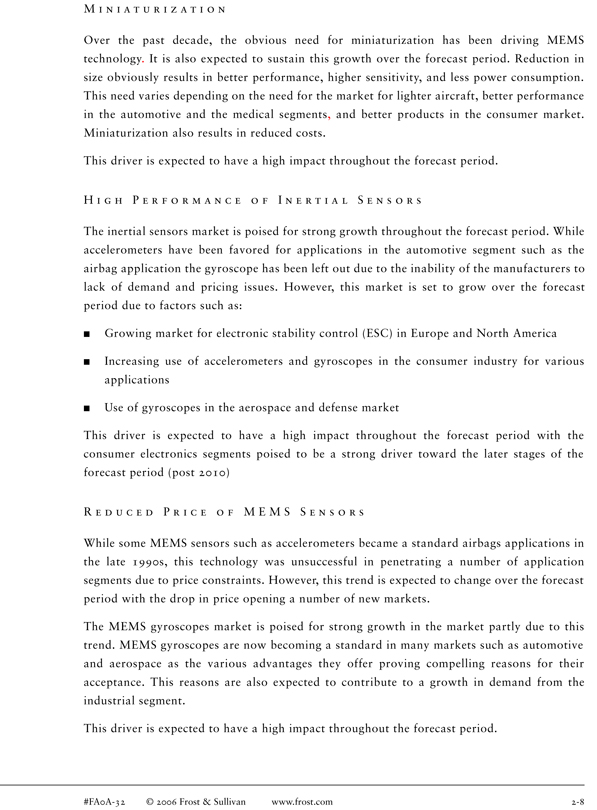
M I N I A T U R I Z A T I O N
Over the past decade, the obvious need for miniaturization has been driving MEMS technology. It is also expected to sustain this growth over the forecast period. Reduction in size obviously results in better performance, higher sensitivity, and less power consumption. This need varies depending on the need for the market for lighter aircraft, better performance in the automotive and the medical segments, and better products in the consumer market. Miniaturization also results in reduced costs.
This driver is expected to have a high impact throughout the forecast period.
H I G H P E R F O R M A N C E O F I N E R T I A L S E N S O R S
The inertial sensors market is poised for strong growth throughout the forecast period. While accelerometers have been favored for applications in the automotive segment such as the airbag application the gyroscope has been left out due to the inability of the manufacturers to lack of demand and pricing issues. However, this market is set to grow over the forecast period due to factors such as:
Growing market for electronic stability control (ESC) in Europe and North America
Increasing use of accelerometers and gyroscopes in the consumer industry for various applications
Use of gyroscopes in the aerospace and defense market
This driver is expected to have a high impact throughout the forecast period with the consumer electronics segments poised to be a strong driver toward the later stages of the forecast period (post 2010)
R E D U C E D P R I C E O F M E M S S E N S O R S
While some MEMS sensors such as accelerometers became a standard airbags applications in the late 1990s, this technology was unsuccessful in penetrating a number of application segments due to price constraints. However, this trend is expected to change over the forecast period with the drop in price opening a number of new markets.
The MEMS gyroscopes market is poised for strong growth in the market partly due to this trend. MEMS gyroscopes are now becoming a standard in many markets such as automotive and aerospace as the various advantages they offer proving compelling reasons for their acceptance. This reasons are also expected to contribute to a growth in demand from the industrial segment.
This driver is expected to have a high impact throughout the forecast period.
#FA0A-32 © 2006 Frost & Sullivan www.frost.com 2-8
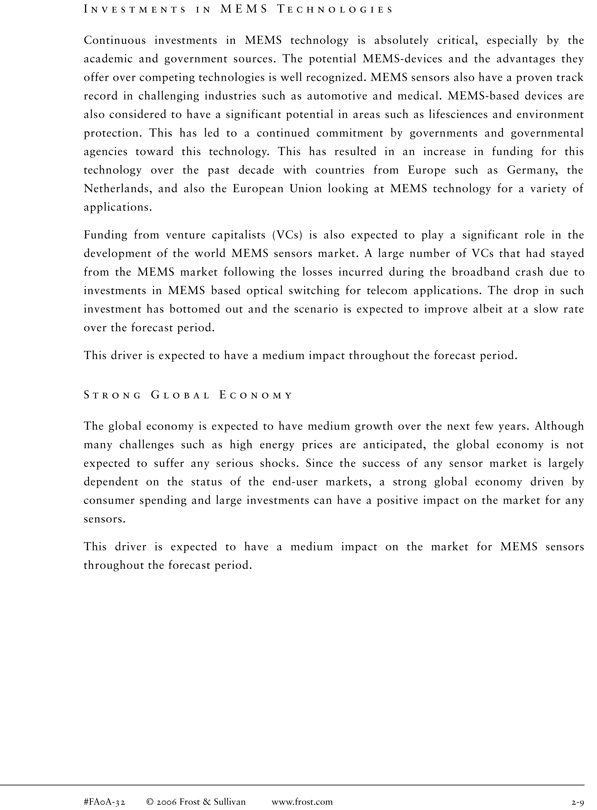
I N V E S T M E N T S I N M E M S T E C H N O L O G I E S
Continuous investments in MEMS technology is absolutely critical, especially by the academic and government sources. The potential MEMS-devices and the advantages they offer over competing technologies is well recognized. MEMS sensors also have a proven track record in challenging industries such as automotive and medical. MEMS-based devices are also considered to have a significant potential in areas such as lifesciences and environment protection. This has led to a continued commitment by governments and governmental agencies toward this technology. This has resulted in an increase in funding for this technology over the past decade with countries from Europe such as Germany, the Netherlands, and also the European Union looking at MEMS technology for a variety of applications.
Funding from venture capitalists (VCs) is also expected to play a significant role in the development of the world MEMS sensors market. A large number of VCs that had stayed from the MEMS market following the losses incurred during the broadband crash due to investments in MEMS based optical switching for telecom applications. The drop in such investment has bottomed out and the scenario is expected to improve albeit at a slow rate over the forecast period.
This driver is expected to have a medium impact throughout the forecast period.
S T R O N G G L O B A L E C O N O M Y
The global economy is expected to have medium growth over the next few years. Although many challenges such as high energy prices are anticipated, the global economy is not expected to suffer any serious shocks. Since the success of any sensor market is largely dependent on the status of the end-user markets, a strong global economy driven by consumer spending and large investments can have a positive impact on the market for any sensors.
This driver is expected to have a medium impact on the market for MEMS sensors throughout the forecast period.
#FA0A-32 © 2006 Frost & Sullivan www.frost.com 2-9
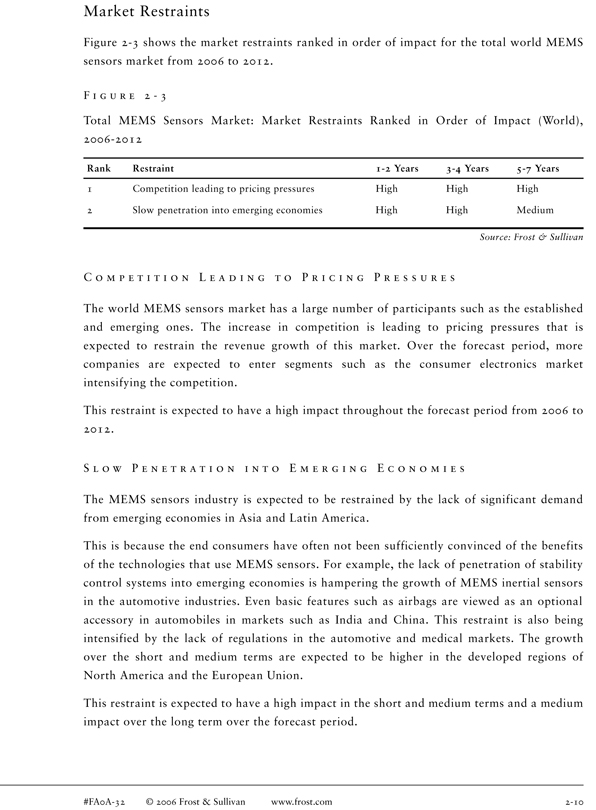
Market Restraints
Figure 2-3 shows the market restraints ranked in order of impact for the total world MEMS sensors market from 2006 to 2012.
F I G U R E 2—3
Total MEMS Sensors Market: Market Restraints Ranked in Order of Impact (World), 2006-2012
Rank Restraint 1-2 Years 3-4 Years 5-7 Years
1 Competition leading to pricing pressures High High High
2 Slow penetration into emerging economies High High Medium
Source: Frost & Sullivan
C O M P E T I T I O N L E A D I N G T O P R I C I N G P R E S S U R E S
The world MEMS sensors market has a large number of participants such as the established and emerging ones. The increase in competition is leading to pricing pressures that is expected to restrain the revenue growth of this market. Over the forecast period, more companies are expected to enter segments such as the consumer electronics market intensifying the competition.
This restraint is expected to have a high impact throughout the forecast period from 2006 to 2012.
S L O W P E N E T R A T I O N I N T O E M E R G I N G E C O N O M I E S
The MEMS sensors industry is expected to be restrained by the lack of significant demand from emerging economies in Asia and Latin America.
This is because the end consumers have often not been sufficiently convinced of the benefits of the technologies that use MEMS sensors. For example, the lack of penetration of stability control systems into emerging economies is hampering the growth of MEMS inertial sensors in the automotive industries. Even basic features such as airbags are viewed as an optional accessory in automobiles in markets such as India and China. This restraint is also being intensified by the lack of regulations in the automotive and medical markets. The growth over the short and medium terms are expected to be higher in the developed regions of North America and the European Union.
This restraint is expected to have a high impact in the short and medium terms and a medium impact over the long term over the forecast period.
#FA0A-32 © 2006 Frost & Sullivan www.frost.com 2-10
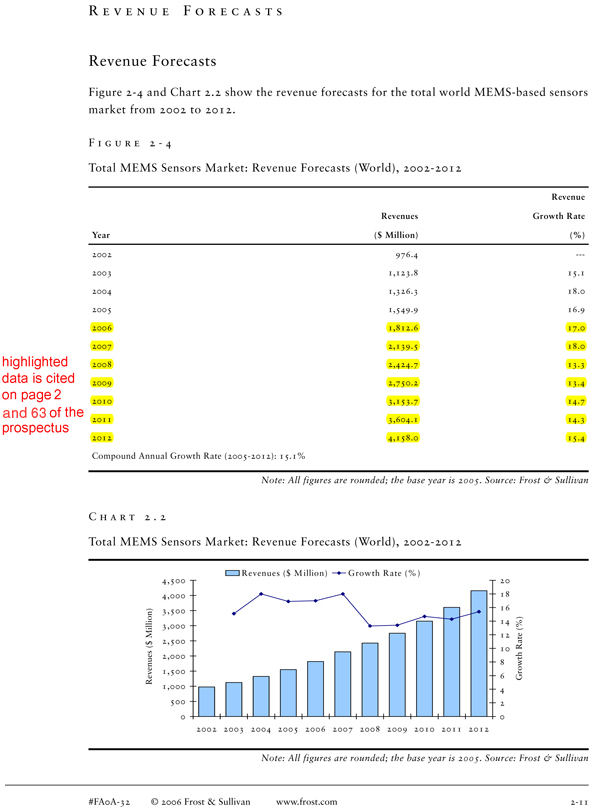
R E V E N U E F O R E C A S T S
Revenue Forecasts
Figure 2-4 and Chart 2.2 show the revenue forecasts for the total world MEMS-based sensors market from 2002 to 2012.
F I G U R E 2—4
Total MEMS Sensors Market: Revenue Forecasts (World), 2002-2012
Revenue Revenues Growth Rate Year($ Million)(%)
2002 976.4 -2003 1,123.8 15.1 2004 1,326.3 18.0 2005 1,549.9 16.9 2006 1,812.6 17.0 2007 2,139.5 18.0 2008 2,424.7 13.3 2009 2,750.2 13.4 2010 3,153.7 14.7 2011 3,604.1 14.3 2012 4,158.0 15.4 Compound Annual Growth Rate (2005-2012): 15.1%
Note: All figures are rounded; the base year is 2005. Source: Frost & Sullivan
C H A R T 2 . 2
Total MEMS Sensors Market: Revenue Forecasts (World), 2002-2012
Revenues ($ M illion) Growth Rate (% )
4,500 20 4,000 18 3,500 16 Million) 14 3,000 12 2,500 $
( Rate (%) 10 Revenues 2,000 Growth 8 1,500 6 1,000 4 500 2
0 0 2002 2003 2004 2005 2006 2007 2008 2009 2010 2011 2012
Note: All figures are rounded; the base year is 2005. Source: Frost & Sullivan
#FA0A-32 © 2006 Frost & Sullivan www.frost.com 2-11
highlighted data is cited on page 2 and 63 of the prospectus.

The total world MEMS sensors market generated revenues of $1,549.9 million in 2005 with a base year growth rate of 16.9 percent. In the short term the growth is expected to come from the success of ESC systems in the automotive market and also from tire pressure sensors in the United States. Automotive manufacturers are expected to fit tire pressure systems on all their automobiles by September 2007 as required by the regulation passed by the safety authority in the country.
In the long term, it is expected that, the success of MEMS sensors in the consumer segment especially in mobile phone application will drive the market. The market can be restrained if manufacturers fail to meet the stringent price requirements of the mobile phone manufacturers. However, manufacturers are expected to meet those requirements. Accelerometers are being fitted into mobile phones of manufacturers such as Nokia. The launch of the low-priced gyroscope by InvenSense is expected to open the market for gyroscopes in mobile phones in the near future.
Long term growth is also expected to be driven by the penetration of technologies that use MEMS sensors into emerging economies such as India and China. This is especially the case for market segments such as the automotive and medical markets. The total world MEMS sensors market is expected to generate revenues of $4,158.0 million in 2012.
Revenue Forecasts by End User
Figure 2-5 and Chart 2.3 show the revenue forecasts by end user for the total world MEMS-based sensors market from 2002 to 2012.
#FA0A-32 © 2006 Frost & Sullivan www.frost.com 2-12
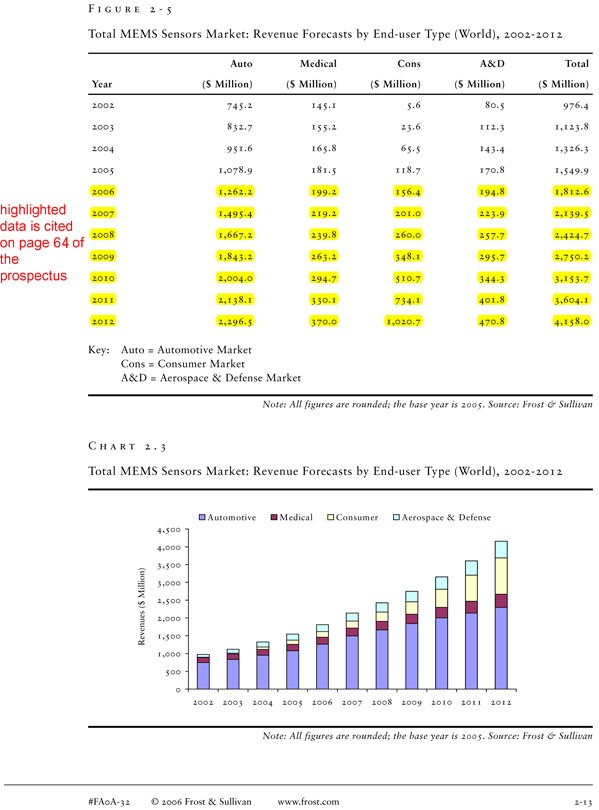
F I G U R E 2—5
Total MEMS Sensors Market: Revenue Forecasts by End-user Type (World), 2002-2012
Auto Medical Cons A&D Total
Year($ Million)($ Million)($ Million)($ Million)($ Million)
2002 745.2 145.1 5.6 80.5 976.4 2003 832.7 155.2 23.6 112.3 1,123.8 2004 951.6 165.8 65.5 143.4 1,326.3 2005 1,078.9 181.5 118.7 170.8 1,549.9 2006 1,262.2 199.2 156.4 194.8 1,812.6 2007 1,495.4 219.2 201.0 223.9 2,139.5 2008 1,667.2 239.8 260.0 257.7 2,424.7 2009 1,843.2 263.2 348.1 295.7 2,750.2 2010 2,004.0 294.7 510.7 344.3 3,153.7 2011 2,138.1 330.1 734.1 401.8 3,604.1 2012 2,296.5 370.0 1,020.7 470.8 4,158.0
Key: Auto = Automotive Market Cons = Consumer Market
A&D = Aerospace & Defense Market
Note: All figures are rounded; the base year is 2005. Source: Frost & Sullivan
C H A R T 2 . 3
Total MEMS Sensors Market: Revenue Forecasts by End-user Type (World), 2002-2012
Automotive M edical Consumer Aerospace & Defense 4,500
4,000
3,500 Million) 3,000
2,500 $ ( Revenues 2,000 1,500
1,000
500
0
2002 2003 2004 2005 2006 2007 2008 2009 2010 2011 2012
Note: All figures are rounded; the base year is 2005. Source: Frost & Sullivan
#FA0A-32 © 2006 Frost & Sullivan www.frost.com 2-13
highlighted data is cited on page 64 of the prospectus.
The automotive segment was the largest one terms of revenues. It had revenues of $1,078.9 million in 2005. The automotive segment provided the first real high-volume application for MEMS-based devices in the form of the airbag applications. The demand for sensors in the automotive market is expected to be strong along with the increased demand for fuel efficient cars by environmental and legislative mandates. The segment is expected to generate revenues of $2,296.5 million in 2012 with the growth being driven by the TPMS and the ESC applications.
The medical segment generated revenues of $181.5 million in 2005. The primary use of MEMS sensors in the medical industry is for the purpose of blood pressure sensing. MEMS technology with the accurate sensing and the small size provides the perfect fit within the medical industry. The use of accelerometers has been growing in the medical industry as well for patient monitoring and in pacemakers. The segment is expected to generate revenues of $370.0 million in 2012 with the growth largely driven by the pressure sensors segment.
The consumer segment is expected to be the next big growth driver for MEMS technology with the use of inertial sensors in applications such as shock detection, tilt sensing, navigation, and image stabilization. The market, which is in the nascent stage generated revenues of $118.7 million in 2005, and is expected to reach $1,020.7 million in 2012. This growth is due to the use of accelerometers and gyroscopes in various electronics. The market is expected to witness strong growth post 2012.
The aerospace and defense segment is important in terms of technology investments especially by the government and also by labs. The segment generated revenues of $170.8 million in 2005 and is expected to grow to $470.9 million in 2012. The revenue growth in this segment is from all three sensors. MEMS technology has been slowly replacing entrenched sensors and this along with the boom in commercial aircraft is poised to drive growth in the market.
Forecasts by MEMS Sensor
Figure 2-6 and Chart 2.4 show the revenue forecasts by type for the total world MEMS sensors market from 2002 to 2012.
#FA0A-32 © 2006 Frost & Sullivan www.frost.com 2-14

F I G U R E 2—6
Total MEMS Sensors Market: Revenue Forecasts by Product Type (World), 2002-2012
Pressure Accel Gyro Total
Year($ Million)($ Million)($ Million)($ Million)
2002 476.7 278.4 221.3 976.4 2003 533.9 318.8 271.1 1,123.8 2004 601.4 385.3 339.6 1,326.3 2005 689.7 456.7 403.5 1,549.9 2006 835.9 508.0 468.7 1,812.6 2007 1,033.9 564.1 541.5 2,139.5 2008 1,171.7 631.9 621.0 2,424.7 2009 1,325.4 703.0 721.9 2,750.2 2010 1,470.2 797.0 885.8 3,152.9 2011 1,609.5 930.9 1,063.7 3,604.1 2012 1,772.9 1,110.0 1,275.1 4,158.0
Key: Pressure = MEMS Pressure Sensor Accel = MEMS Accelerometer Gyro = MEMS Gyroscope
Note: All figures are rounded; the base year is 2005. Source: Frost & Sullivan
C H A R T 2 . 4
Total MEMS Sensors Market: Revenue Forecasts by Product Type (World), 2002-2012
4,500 Pressure Accelerometer Gyroscope 4,000
3,500 Million) 3,000
2,500 $ ( Revenues 2,000 1,500
1,000
500
0
2002 2003 2004 2005 2006 2007 2008 2009 2010 2011 2012
Note: All figures are rounded; the base year is 2005. Source: Frost & Sullivan
#FA0A-32 © 2006 Frost & Sullivan www.frost.com 2-15
highlighted data is cited on page 64 of the prospectus.
The MEMS pressure sensors is the largest segment in terms of revenue in 2005. It had revenues $689.7 million in that year. The majority of the revenues come from the automotive segment as the pressure sensors also find wide use in the medical industry and the aerospace and defense market. This market is expected to have a high growth in the short term with automotive manufacturers in the United States working toward meeting the deadline set by the NHTSA to fit tire pressure sensors in every automobile. Growth in the long term is expected to be driven by the demand for pressure sensors from emerging economies and large automotive markets such as India and China. The growth will be more strong if the European Union or other countries pass legislations similar to that of the NHTSA. Growth is also expected to be driven by the aerospace and defense segment where MEMS pressure sensors are finding use because of the numerous advantages they offer. The pressure sensors segment is expected to generate revenues of $1,772.9 million in 2012.
MEMS accelerometers generated revenues of $456.7 million in 2005. MEMS accelerometers have been traditionally associated with the automotive market in terms of impact sensing for the airbag application. This application provided one of the first major high-volume opportunities for MEMS sensors. The market is expected to be driven in the short and the long terms by the success of ESC systems and also by the use of these sensors in the consumer market for applications such as shock detection in computer notebooks and in mobile phones. The market is expected to severely restrained by the pricing pressures that manufacturers are facing. Additionally, the entry of new competitors into the market is further expected to intensify this pressure. This market segment is expected to generate revenues of $1,110.0 million in 2012.
MEMS gyroscopes generated revenues of $403.5 million in 2005, with a significant portion of the revenues coming from the automotive segment. The sensor is poised for strong growth over the forecast period. The main driver in the short term is expected to be the automotive market, with significant gains coming from the ESC segment. These systems are fast becoming a standard in countries in western Europe. Additionally, car manufacturers have been introducing them in the U.S. market as well. There is expected to be immense growth if transport authorities pass regulations that call for compulsory installation of these systems in every vehicle. The automotive navigation and roll-over detection segments are expected to contribute to this market as well; however, to a lesser extent.
Long-term growth for MEMS gyroscopes is expected to come from the consumer segment, especially if sensor manufacturers succeed in achieving the right price point for mobile phones. Gyroscopes are used for the purpose of image stabilization and have achieved moderate penetration rates in the digital still cameras and the camcorders segment. However, the real volume opportunity remains the mobile phones segment. According to Frost & Sullivan, the market is anticipated to have immense growth in the long term (post 2010).
#FA0A-32 © 2006 Frost & Sullivan www.frost.com 2-16
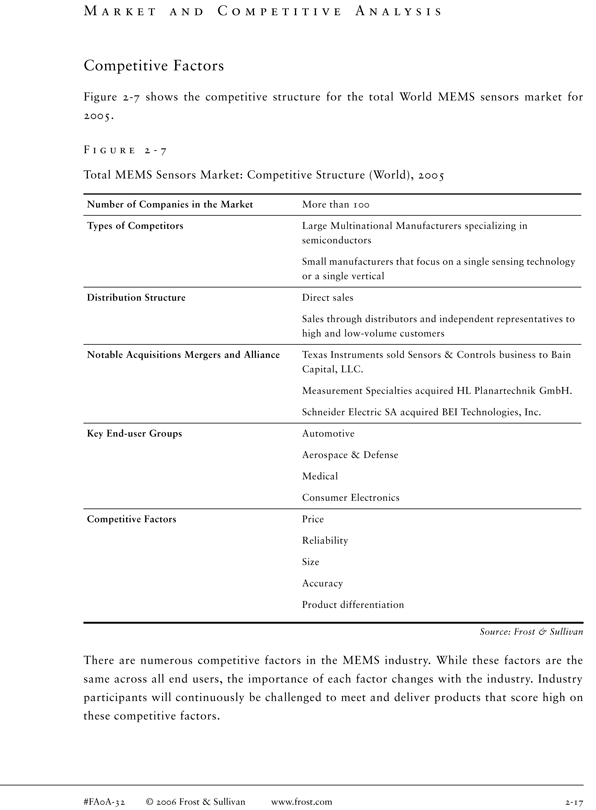
M A R K E T A N D C O M P E T I T I V E A N A L Y S I S
Competitive Factors
Figure 2-7 shows the competitive structure for the total World MEMS sensors market for 2005.
F I G U R E 2—7
Total MEMS Sensors Market: Competitive Structure (World), 2005
Number of Companies in the Market More than 100
Types of Competitors Large Multinational Manufacturers specializing in semiconductors
Small manufacturers that focus on a single sensing technology or a single vertical
Distribution Structure Direct sales
Sales through distributors and independent representatives to high and low-volume customers
Notable Acquisitions Mergers and Alliance Texas Instruments sold Sensors & Controls business to Bain Capital, LLC.
Measurement Specialties acquired HL Planartechnik GmbH.
Schneider Electric SA acquired BEI Technologies, Inc.
Key End-user Groups Automotive
Aerospace & Defense Medical Consumer Electronics
Competitive Factors Price Reliability Size Accuracy
Product differentiation
Source: Frost & Sullivan
There are numerous competitive factors in the MEMS industry. While these factors are the same across all end users, the importance of each factor changes with the industry. Industry participants will continuously be challenged to meet and deliver products that score high on these competitive factors.
#FA0A-32 © 2006 Frost & Sullivan www.frost.com 2-17
Automotive Industry: In the automotive industry, the most important competitive factor has been that of price. With sensor manufacturers having successfully delivered highly reliable products to the automotive industry for decades, the biggest challenge for sensor manufacturers has become that of delivering highly reliable products while meeting the pricing pressures put by the customer. Sensor manufacturers are trying to continuously refine production methods to meet this challenge.
Aerospace and Defense: Performance and reliability are the main competitive factors in the aerospace and defense market. Due to the existence of highly specialized military applications, MEMS-based sensor manufacturers must offer more reliable and accurate sensors that can function in harsh environments.
Medical Industry: The main competitive factors in the medical industry are that of reliability, small size, and price. Reliability remains one of the key issues in this market due to the healthcare concerns. Recently, medical research has focused more on finding ways to design smaller devices. Medical researchers and device manufacturers want to be able have a closer look into the arteries and organs, to understand and control them. Devices also are getting minimally invasive in order to reduce the harm to the patient. MEMS-based sensor manufacturers are already working toward the same, simultaneously reducing power consumption.
Consumer Industry: The biggest competitive factor in the consumer industry is that of price. The MEMS-based sensor manufacturers need to reduce the price in order to meet the OEM requirements. This is especially proving to be the case in the mobile phones segment. Other competitive factors in this segment are size and power consumption with OEMs setting some very tough targets for both these competitive factors.
Distribution Analysis
In a competitive market, a great deal of importance needs to be given to developing a successful distribution strategy. A sales approach can be leveraged as a competitive advantage depending upon the cost and its fit within the overall company business model. In the MEMS-based sensors industry, the distribution channel varies with the end user.
#FA0A-32 © 2006 Frost & Sullivan www.frost.com 2-18
A U T O M O T I V E S E G M E N T
In the automotive industry, the largest segment in terms of revenues was system suppliers. The trend in the automotive industry is for automobile manufacturers to seek full-service suppliers that are capable of providing complete systems or subsystems rather than those that produce only an individual component such as an MEMS sensor. By outsourcing complete the production of entire systems or subsystems, OEMs are able to reduce the overall production costs by minimizing the cost of design and integration. This also results in improved quality as suppliers assemble and test major portions of the vehicle prior to the automotive production. This segment has a 65 percent share of the total market revenues. The share of this distribution channel is expected to increase over the forecast period. A significant portion of the sales is now taking place through distributors especially in emerging sections of automotive production.
M E D I C A L S E G M E N T
The revenues in the medical industry are split between distributors and OEMs. In most cases distributors sell the blood pressure sensors directly to the customer. This segment has a 65 percent share of the total market revenues. In other cases manufacturers sell the sensors such as accelerometers to the medical device manufacturers that incorporate these sensors into their patient monitoring systems.
A E R O S P A C E A N D D E F E N S E S E G M E N T
In the aerospace and defense industry majority of the sales takes place directly to the customer. This constitutes around 80 to 90 percent of overall sales. The industry is closed in terms of buyers and suppliers and relationships are well established. In this case most sales takes place directly to the customer. Only a small portion of the sales takes place through distributors or through system integrators.
C O N S U M E R S E G M E N T
The channel of distribution in the consumer segment is primarily sales to the OEMs. However, a lot of manufacturers have been establishing business deals with distributors in Asia Pacific region in order to cater to consumer OEMs. This segment is expected to increase its market share throughout the forecast period.
#FA0A-32 © 2006 Frost & Sullivan www.frost.com 2-19
Mergers and Acquisitions
Market participants have adopted a variety of strategies as a part of their expansion, and to support progression in the total world MEMS sensors market. The growth of competing technologies has also forced a number of technological developments. Companies have adopted a variety of strategies as a part of their expansion and growth. To achieve market dominance and cover weaknesses in product offerings, a number of strategic partnerships and acquisitions have taken place, although since 2003 there has not been any major change in the company acquisitions.
T E X A S I N S T R U M E N T S S E L L S S E N S O R S & C O N T R O L S B U S I N E S S T O B A I N C A P I T A L , L L C
In January 2006, Texas Instruments sold the Sensors & Controls business to affiliates of Bain Capital, LLC, a leading global private equity investment firm, for $3 billion in cash. The agreement is about unlocking value and will enable Texas Instruments to intensify its focus on its strengths including digital signal processing and analog semiconductors. This will enable the Sensors & Controls business to have greater access to the investment and strategic resources that it requires to grow in such a challenging environment.
M E A S U R E M E N T S P E C I A L T I E S A C Q U I R E S H L P L A N A R T E C H N I K G M B H
In November 2005, Measurement Specialties Inc, a designer and manufacturer of sensors and sensor-based commercial products, acquired HL Planartechnik GmbH, a sensor company from Dortmund, Germany for $7.1 million. HL Planartechnik GmbH specializes in infrared thermopiles, magneto-resistive sensors, mass air flow (MAF), and MEMS-based inclination sensors.
D O V E R E L E C T R O N I C S A C Q U I R E S K N O W L E S E L E C T R O N I C S
In August 2005, Dover Electronics signed a definitive agreement to acquire Knowles Electronics for $750 million. Knowles Electronics, headquartered in Itasca, Illinois, is the leading manufacturer of MEMS microphones, which provide significant advantages over existing technologies. MEMS microphones are currently being used in high-end mobile phones. However, various advantages are expected to aid its penetration into the entire mobile phone market besides the other markets such as medical and automotive.
#FA0A-32 © 2006 Frost & Sullivan www.frost.com 2-20
S C H N E I D E R E L E C T R I C S A A C Q U I R E S B E I T E C H N O L O G I E S , I N C .
In July 2005, Schneider Electric acquired BEI Technologies, Inc. This acquisition, which valued BEI Technology at around $562 million fits Schneider Electric’s strategy of acquisitions in industries that are adjacent to its core competencies. This acquisition strategy witnessed Schneider Electric acquire Kavlico Corporation in 2004.
BEI Technologies is a leading specialist in customized sensors with a very strong presence in quartz sensing technologies. BEI Technologies also has a very strong presence in key vertical markets including transportation, aerospace and defense and has had a very strong growth record since 1997. BEI Technologies is a key participant in the inertial sensors market. The company has significant potential in areas such as transportation and aerospace and defense.
#FA0A-32 © 2006 Frost & Sullivan www.frost.com 2-21
Automotive MEMS Sensors Market
I N T R O D U C T I O N
Market Overview and Definitions
The automotive market is one of the most important application segments of Micro Electronic Mechanical Systems (MEMS) sensors. MEMS-based devices are used in a variety of applications in automotive for improving the safety and comfort levels of the automobile. This segment has the distinction of being the first high-volume application for MEMS-based devices. There has been a marked change in the position of sensors in an automobile from ancillary to essential units. The demand for sensors in the automotive market is expected to be strong along with the increased need for fuel-efficient cars made by environmental and legislative mandates.
MEMS applications in the automotive market began with the use of the technology for manifold absolute pressure (MAP) sensors in the mid 1980s. The major large-volume application in automotive market came in the form of inertial sensors for airbag firing in the 1990s. The success of MEMS-based devices in the harsh environments of a vehicle has been important in convincing the industry about the advantage of this technology and aided the subsequent increase in investments in other markets. The success of this technology in the automotive industry is simple to comprehend, there was a demand in the market for a product that could improve passenger safety. This product was required at high volumes and a low cost and this facilitated the use of MEMS technology.
#FA0A-32 © 2006 Frost & Sullivan www.frost.com 3-1
MEMS sensor manufacturers will have to meet some unique challenges in catering to this industry over the forecast period.They are:
Meeting a number of stringent criteria including performing in conditions of high-vibration environments
Consistent price reduction in the automotive industry due to reasons such as competition
Reliability and robustness criteria are expected to get tougher over the forecast period. This is because all companies along the automotive supply chain are aiming to achieve zero-defects in their products and this puts the pressure on the sensor manufacturers.
A P P L I C A T I O N S I N T H E A U T O M O T I V E M A R K E T :
This study aims to cover the applications for the following types of sensors in the automotive market.
Pressure Sensors
Inertial Sensors
Flow Sensors
Pressure Sensors
MEMS-based pressure sensors are currently used for measuring MAP and also for measuring pressure for applications such as the fuel rail, fuel tank, engine oil among others. Further, pressure sensors are also used for taking measurement in the side doors and for passenger detection. The pressure sensor segment in the automotive market is set for explosive growth, driven by the application of tire pressure monitoring systems (TPMS) driven by regulation in the United States. Tire pressure sensors are also expected to gain acceptance in Europe and Japan and also in luxury vehicles in the emerging economies.
Pressure sensors were developed for the purpose of MAP sensing in the mid 1980s. Pressure sensors have progressed from uncompensated bulk micromachined piezoresistive pressure sensors to a Complementary Metal Oxide Semiconductor (CMOS)��integrated bulk micromachined pressure sensor with non volatile memory that enabled the addition of features such as three-wire interface and changeable rail voltages besides helping in the improvement of accuracy.
#FA0A-32 © 2006 Frost & Sullivan www.frost.com 3-2

Inertial Sensors
This segment consists of accelerometers and Gyroscopes that constitute another high-volume application in the automotive industry for MEMS technology.
Accelerometers are used in automotive applications for the following purposes:
Airbag firing
Roll-over detection
Electronic stability control
Vehicle navigation systems
Vehicle security
Active Suspension
Airbags are one of the key safety devices in any vehicles. All the airbag systems use accelerometers, that are placed across various points in the automotive to sense the impact of the crash. Accelerometers calculate the rate of deceleration that occurs in the event of a collision and help in converting this information into an electric signal that triggers the airbag. Accelerometers also find use in electronic stability control systems.
Gyroscopes are used in automotive applications for the following purposes:
Electronic stability control
Anti-rollover systems
Global Positioning Systems (GPS) navigation
Market Engineering Measurement Analysis
Chart 3.1 shows the Market Engineering measurements for the world automotive MEMS sensors market for 2005.
#FA0A-32 © 2006 Frost & Sullivan www.frost.com 3-3
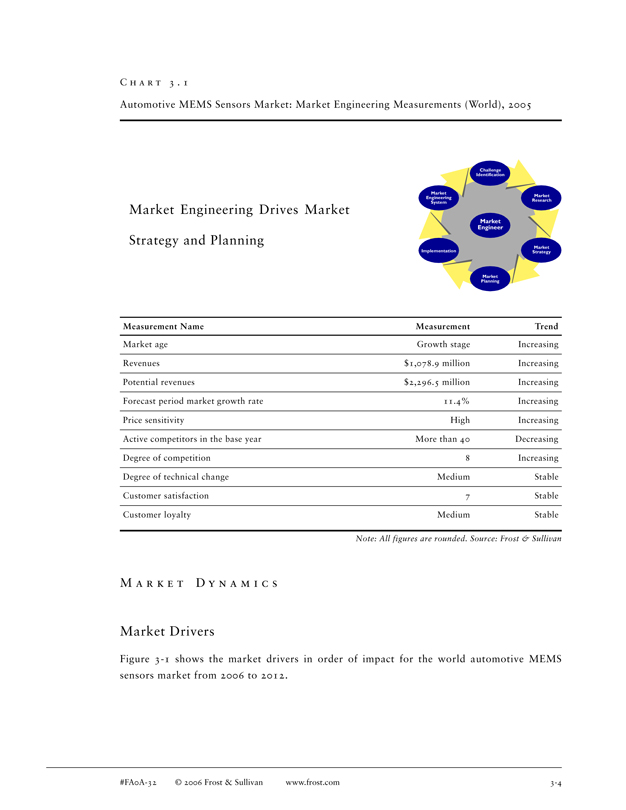
C H A R T 3 . 1
Automotive MEMS Sensors Market: Market Engineering Measurements (World), 2005
Challenge Identification
Market
Market Engineering Research System
Market Engineering Drives Market
Market Engineer
Strategy and Planning
Market Implementation Strategy
Market Planning
Measurement Name Measurement Trend
Market age Growth stage Increasing Revenues $1,078.9 million Increasing Potential revenues $2,296.5 million Increasing Forecast period market growth rate 11.4% Increasing Price sensitivity High Increasing Active competitors in the base year More than 40 Decreasing Degree of competition 8 Increasing Degree of technical change Medium Stable Customer satisfaction 7 Stable Customer loyalty Medium Stable
Note: All figures are rounded. Source: Frost & Sullivan
M A R K E T D Y N A M I C S
Market Drivers
Figure 3-1 shows the market drivers in order of impact for the world automotive MEMS sensors market from 2006 to 2012.
#FA0A-32 © 2006 Frost & Sullivan www.frost.com 3-4

F I G U R E 3—1
Automotive MEMS Sensors Market: Market Drivers Ranked in Order of Impact (World), 2006-2012
Rank Driver 1-2 Years 3-4 Years 5-7 Years
1 Tire pressure sensors poised for strong growth Very High Very High High
2 Pollution standards leading to increase in electronics High High High
3 Awareness of the importance of safety High High High
Source: Frost & Sullivan
T I R E P R E S S U R E S E N S O R S P O I S E D F O R S T R O N G G R O W T H
Tire pressure sensors have been available in the market for quite sometime;however, their presence has been largely limited to the high-end vehicle segments. These sensors are expected to have immense growth over the forecast period due to the passing of the Transportation Recall Enhancement, Accountability and Documentation (TREAD) act. The law mandated by U.S. Government’s National Highway Transportation and Safety Administration came about as a result of a controversy surrounding the high incidence of tire failure and roll-over accidents on Ford Explorer vehicles fitted with Firestone tires.
The TREAD mandate requires pressure sensors to be fitted on all the wheels as part of the TPMS, which will intimate the driver of under inflation in his tires. The threshold limit has been set at 25 percent under-inflation and the dashboard indicator has to illuminate within 20 minutes of detection. The phase in the period after a number of alterations has been set that 20 percent of all the cars must comply by September 1, 2005, 70 percent by September 1, 2006, and 100 percent by September 1, 2007.
This driver is expected to have a very high impact in the short and medium terms and high impact in the long term of the forecast period from 2006 to 2012.
P O L L U T I O N S T A N D A R D S L E A D I N G T O I N C R E A S E I N E L E C T R O N I C S
The automotive market is expected to be driven by factors such as favorable trends in consumer expenditure, improved affordability, and increasing income levels in emerging economies. The automotive market for MEMS sensors is growing by around 20 to 25 percent in many such emerging economies because of the environmental norms and consumer demand for better vehicles.
#FA0A-32 © 2006 Frost & Sullivan www.frost.com 3-5
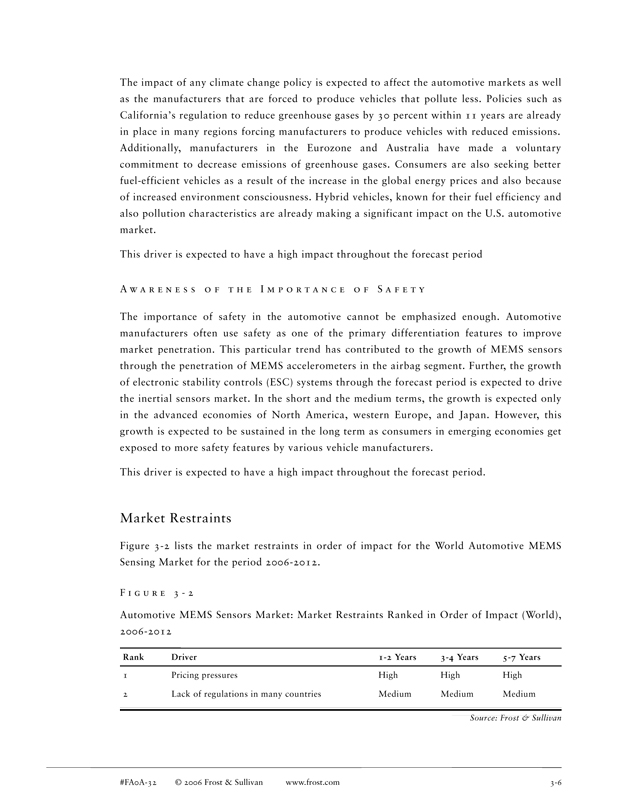
The impact of any climate change policy is expected to affect the automotive markets as well as the manufacturers that are forced to produce vehicles that pollute less. Policies such as California’s regulation to reduce greenhouse gases by 30 percent within 11 years are already in place in many regions forcing manufacturers to produce vehicles with reduced emissions. Additionally, manufacturers in the Eurozone and Australia have made a voluntary commitment to decrease emissions of greenhouse gases. Consumers are also seeking better fuel-efficient vehicles as a result of the increase in the global energy prices and also because of increased environment consciousness. Hybrid vehicles, known for their fuel efficiency and also pollution characteristics are already making a significant impact on the U.S. automotive market.
This driver is expected to have a high impact throughout the forecast period
A W A R E N E S S O F T H E I M P O R T A N C E O F S A F E T Y
The importance of safety in the automotive cannot be emphasized enough. Automotive manufacturers often use safety as one of the primary differentiation features to improve market penetration. This particular trend has contributed to the growth of MEMS sensors through the penetration of MEMS accelerometers in the airbag segment. Further, the growth of electronic stability controls (ESC) systems through the forecast period is expected to drive the inertial sensors market. In the short and the medium terms, the growth is expected only in the advanced economies of North America, western Europe, and Japan. However, this growth is expected to be sustained in the long term as consumers in emerging economies get exposed to more safety features by various vehicle manufacturers.
This driver is expected to have a high impact throughout the forecast period.
Market Restraints
Figure 3-2 lists the market restraints in order of impact for the World Automotive MEMS Sensing Market for the period 2006-2012.
F I G U R E 3—2
Automotive MEMS Sensors Market: Market Restraints Ranked in Order of Impact (World), 2006-2012
Rank Driver 1-2 Years 3-4 Years 5-7 Years
1 Pricing pressures High High High
2 Lack of regulations in many countries Medium Medium Medium
Source: Frost & Sullivan
#FA0A-32 © 2006 Frost & Sullivan www.frost.com 3-6
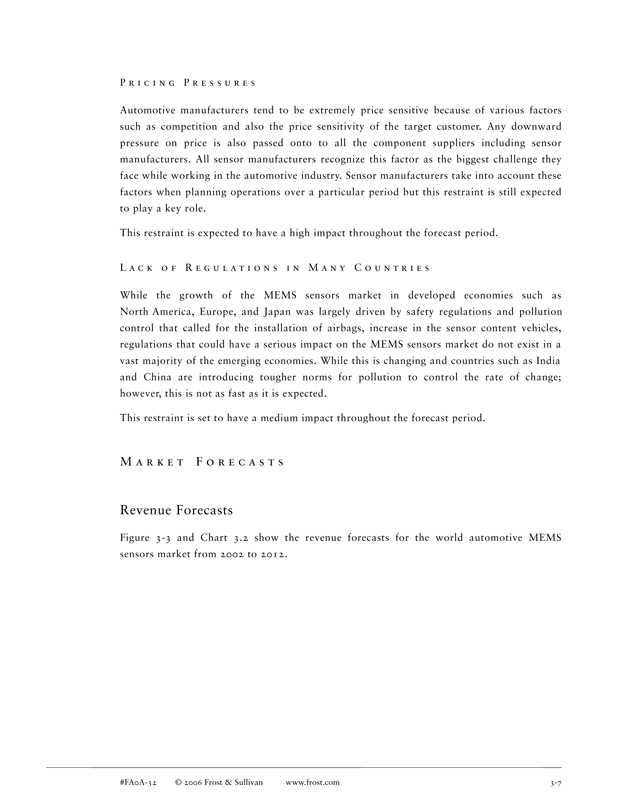
P R I C I N G P R E S S U R E S
Automotive manufacturers tend to be extremely price sensitive because of various factors such as competition and also the price sensitivity of the target customer. Any downward pressure on price is also passed onto to all the component suppliers including sensor manufacturers. All sensor manufacturers recognize this factor as the biggest challenge they face while working in the automotive industry. Sensor manufacturers take into account these factors when planning operations over a particular period but this restraint is still expected to play a key role.
This restraint is expected to have a high impact throughout the forecast period.
L A C K O F R E G U L A T I O N S I N M A N Y C O U N T R I E S
While the growth of the MEMS sensors market in developed economies such as North America, Europe, and Japan was largely driven by safety regulations and pollution control that called for the installation of airbags, increase in the sensor content vehicles, regulations that could have a serious impact on the MEMS sensors market do not exist in a vast majority of the emerging economies. While this is changing and countries such as India and China are introducing tougher norms for pollution to control the rate of change; however, this is not as fast as it is expected.
This restraint is set to have a medium impact throughout the forecast period.
M A R K E T F O R E C A S T S
Revenue Forecasts
Figure 3-3 and Chart 3.2 show the revenue forecasts for the world automotive MEMS sensors market from 2002 to 2012.
#FA0A-32 © 2006 Frost & Sullivan www.frost.com 3-7
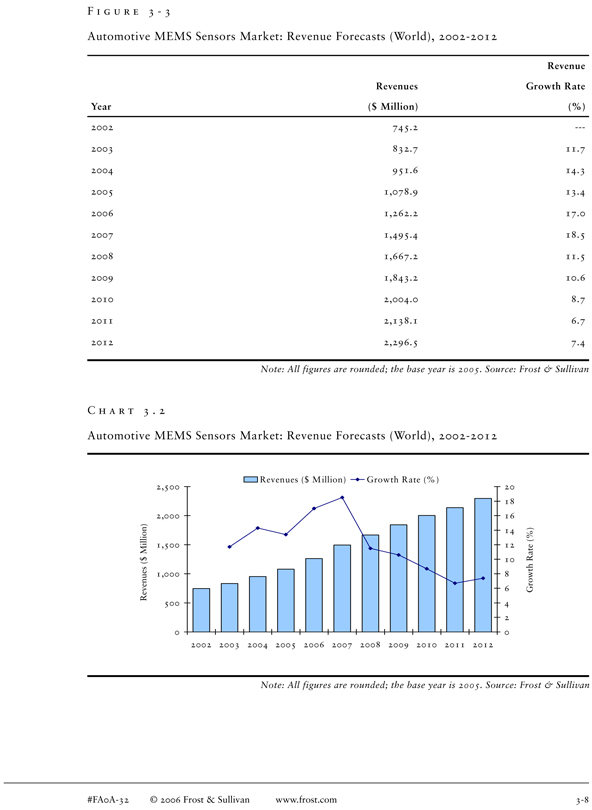
F I G U R E 3—3
Automotive MEMS Sensors Market: Revenue Forecasts (World), 2002-2012
Revenue Revenues Growth Rate Year($ Million)(%)
2002 745.2 -2003 832.7 11.7 2004 951.6 14.3 2005 1,078.9 13.4 2006 1,262.2 17.0 2007 1,495.4 18.5 2008 1,667.2 11.5 2009 1,843.2 10.6 2010 2,004.0 8.7 2011 2,138.1 6.7 2012 2,296.5 7.4
Note: All figures are rounded; the base year is 2005. Source: Frost & Sullivan
C H A R T 3 . 2
Automotive MEMS Sensors Market: Revenue Forecasts (World), 2002-2012
Revenues ($ M illion) Growth Rate (% )
2,500 20 18 2,000 16 Million) 14 1,500 12 $ 10 ( Revenues 1,000 8
6 Growth Rate (%) 500 4 2
0 0 2002 2003 2004 2005 2006 2007 2008 2009 2010 2011 2012
Note: All figures are rounded; the base year is 2005. Source: Frost & Sullivan
#FA0A-32 © 2006 Frost & Sullivan www.frost.com 3-8
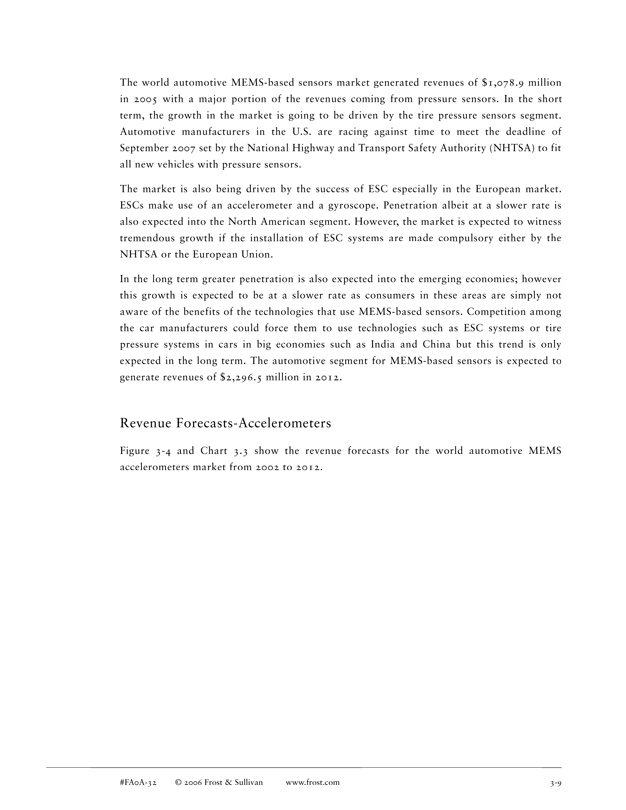
The world automotive MEMS-based sensors market generated revenues of $1,078.9 million in 2005 with a major portion of the revenues coming from pressure sensors. In the short term, the growth in the market is going to be driven by the tire pressure sensors segment. Automotive manufacturers in the U.S. are racing against time to meet the deadline of September 2007 set by the National Highway and Transport Safety Authority (NHTSA) to fit all new vehicles with pressure sensors.
The market is also being driven by the success of ESC especially in the European market. ESCs make use of an accelerometer and a gyroscope. Penetration albeit at a slower rate is also expected into the North American segment. However, the market is expected to witness tremendous growth if the installation of ESC systems are made compulsory either by the NHTSA or the European Union.
In the long term greater penetration is also expected into the emerging economies; however this growth is expected to be at a slower rate as consumers in these areas are simply not aware of the benefits of the technologies that use MEMS-based sensors. Competition among the car manufacturers could force them to use technologies such as ESC systems or tire pressure systems in cars in big economies such as India and China but this trend is only expected in the long term. The automotive segment for MEMS-based sensors is expected to generate revenues of $2,296.5 million in 2012.
Revenue Forecasts-Accelerometers
Figure 3-4 and Chart 3.3 show the revenue forecasts for the world automotive MEMS accelerometers market from 2002 to 2012.
#FA0A-32 © 2006 Frost & Sullivan www.frost.com 3-9
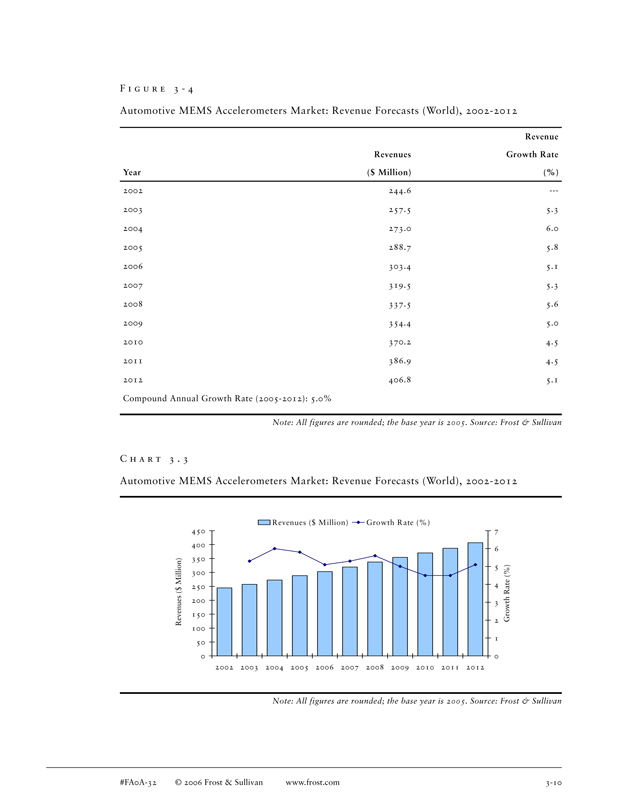
F I G U R E 3—4
Automotive MEMS Accelerometers Market: Revenue Forecasts (World), 2002-2012
Revenue Revenues Growth Rate Year($ Million)(%)
2002 244.6 -—2003 257.5 5.3 2004 273.0 6.0 2005 288.7 5.8 2006 303.4 5.1 2007 319.5 5.3 2008 337.5 5.6 2009 354.4 5.0 2010 370.2 4.5 2011 386.9 4.5 2012 406.8 5.1 Compound Annual Growth Rate (2005-2012): 5.0%
Note: All figures are rounded; the base year is 2005. Source: Frost & Sullivan
C H A R T 3 . 3
Automotive MEMS Accelerometers Market: Revenue Forecasts (World), 2002-2012
Revenues ($ Million) Growth Rate (%)
450 7
400
6 Million) 350 5 300 250 4 $ ( Revenues 200 3 150 Growth Rate (%) 2 100 1 50
0 0 2002 2003 2004 2005 2006 2007 2008 2009 2010 2011 2012
Note: All figures are rounded; the base year is 2005. Source: Frost & Sullivan
#FA0A-32 © 2006 Frost & Sullivan www.frost.com 3-10
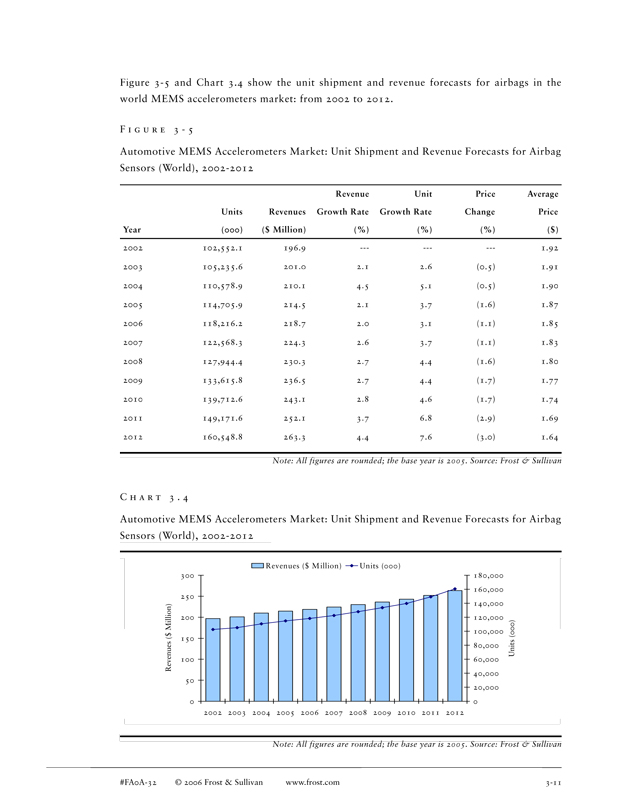
Figure 3-5 and Chart 3.4 show the unit shipment and revenue forecasts for airbags in the world MEMS accelerometers market: from 2002 to 2012.
F I G U R E 3—5
Automotive MEMS Accelerometers Market: Unit Shipment and Revenue Forecasts for Airbag Sensors (World), 2002-2012
Revenue Unit Price Average Units Revenues Growth Rate Growth Rate Change Price Year(000)($ Million)(%)(%)(%)($)
2002 102,552.1 196.9 1.92 2003 105,235.6 201.0 2.1 2.6 (0.5) 1.91 2004 110,578.9 210.1 4.5 5.1 (0.5) 1.90 2005 114,705.9 214.5 2.1 3.7 (1.6) 1.87 2006 118,216.2 218.7 2.0 3.1 (1.1) 1.85 2007 122,568.3 224.3 2.6 3.7 (1.1) 1.83 2008 127,944.4 230.3 2.7 4.4 (1.6) 1.80 2009 133,615.8 236.5 2.7 4.4 (1.7) 1.77 2010 139,712.6 243.1 2.8 4.6 (1.7) 1.74 2011 149,171.6 252.1 3.7 6.8 (2.9) 1.69 2012 160,548.8 263.3 4.4 7.6 (3.0) 1.64
Note: All figures are rounded; the base year is 2005. Source: Frost & Sullivan
C H A R T 3 . 4
Automotive MEMS Accelerometers Market: Unit Shipment and Revenue Forecasts for Airbag Sensors (World), 2002-2012
Revenues ($ M illion) Units (000)
300 180,000
160,000 250 140,000 Million) 200 120,000
100,000 $
150
Revenues 80,000 Units (000) 100 60,000
40,000 50 20,000
0 0 2002 2003 2004 2005 2006 2007 2008 2009 2010 2011 2012
Note: All figures are rounded; the base year is 2005. Source: Frost & Sullivan
#FA0A-32 © 2006 Frost & Sullivan www.frost.com 3-11
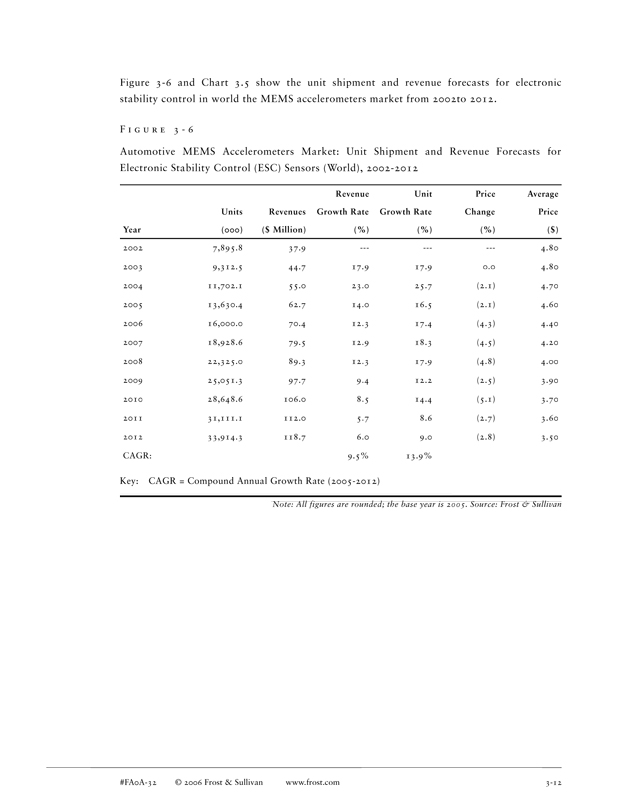
Figure 3-6 and Chart 3.5 show the unit shipment and revenue forecasts for electronic stability control in world the MEMS accelerometers market from 2002to 2012.
F I G U R E 3—6
Automotive MEMS Accelerometers Market: Unit Shipment and Revenue Forecasts for Electronic Stability Control (ESC) Sensors (World), 2002-2012
Revenue Unit Price Average Units Revenues Growth Rate Growth Rate Change Price Year(000)($ Million)(%)(%)(%)($)
2002 7,895.8 37.9 4.80 2003 9,312.5 44.7 17.9 17.9 0.0 4.80 2004 11,702.1 55.0 23.0 25.7 (2.1) 4.70 2005 13,630.4 62.7 14.0 16.5 (2.1) 4.60 2006 16,000.0 70.4 12.3 17.4 (4.3) 4.40 2007 18,928.6 79.5 12.9 18.3 (4.5) 4.20 2008 22,325.0 89.3 12.3 17.9 (4.8) 4.00 2009 25,051.3 97.7 9.4 12.2 (2.5) 3.90 2010 28,648.6 106.0 8.5 14.4 (5.1) 3.70 2011 31,111.1 112.0 5.7 8.6 (2.7) 3.60 2012 33,914.3 118.7 6.0 9.0 (2.8) 3.50 CAGR: 9.5% 13.9%
Key: CAGR = Compound Annual Growth Rate (2005-2012)
Note: All figures are rounded; the base year is 2005. Source: Frost & Sullivan
#FA0A-32 © 2006 Frost & Sullivan www.frost.com 3-12
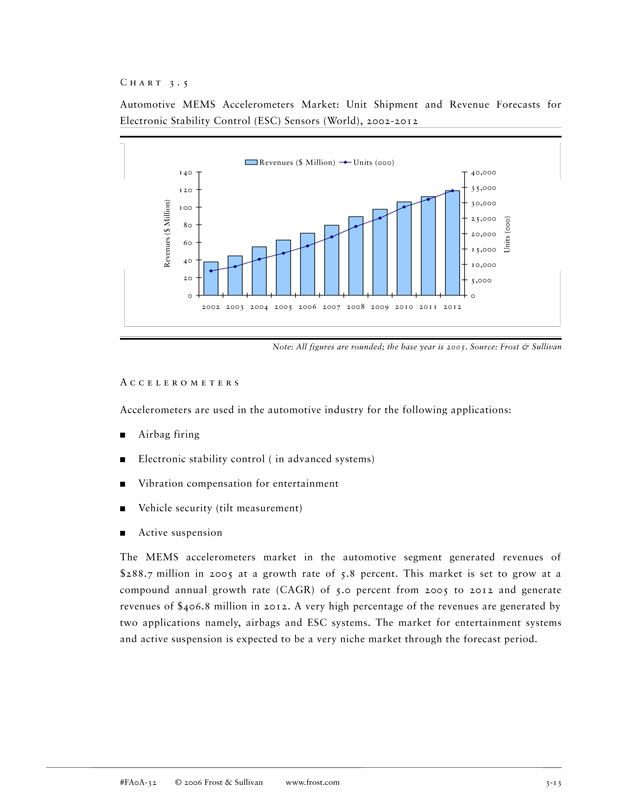
C H A R T 3 . 5
Automotive MEMS Accelerometers Market: Unit Shipment and Revenue Forecasts for Electronic Stability Control (ESC) Sensors (World), 2002-2012
Revenues ($ Million) Units (000)
140 40,000
120 35,000 30,000 100 Million) 25,000 80 $ 20,000 60 15,000 Units (000) 40 Revenues ( 10,000
20 5,000
0 0 2002 2003 2004 2005 2006 2007 2008 2009 2010 2011 2012
Note: All figures are rounded; the base year is 2005. Source: Frost & Sullivan
A C C E L E R O M E T E R S
Accelerometers are used in the automotive industry for the following applications:
Airbag firing
Electronic stability control ( in advanced systems)
Vibration compensation for entertainment
Vehicle security (tilt measurement)
Active suspension
The MEMS accelerometers market in the automotive segment generated revenues of $288.7 million in 2005 at a growth rate of 5.8 percent. This market is set to grow at a compound annual growth rate (CAGR) of 5.0 percent from 2005 to 2012 and generate revenues of $406.8 million in 2012. A very high percentage of the revenues are generated by two applications namely, airbags and ESC systems. The market for entertainment systems and active suspension is expected to be a very niche market through the forecast period.
#FA0A-32 © 2006 Frost & Sullivan www.frost.com 3-13
A I R B A G S
Airbags have become ubiquitous in almost all cars in the United States, western Europe, and Japan because of legislation and the importance of safety. Airbags have reached high penetration rates in these regions especially the ones used for the purposes of driver and passenger safety. The trend is toward increasing the airbags on the doors as well in case of a roll-over or a side crash.
This segment is expected to grow at a very flat rate throughout the forecast period. Growth in the North American, western Europe, and Japanese segments is expected to mirror growth in the automotive segment. Further, growth in the European region will be driven as more countries adopt the European Union safety policies. The challenge for MEMS sensor manufacturers would be to keep their customers and profit margins in light of the commoditization status that accelerometers have reached for the purpose of airbag firing.
The Market for Accelerometers in the Airbag Segment is being Driven by Two Factors:
Need for better information and the drive toward creating sensor networks that enable the use of multistage airbags. The airbags are coupled with occupation detection systems and are not only deployed on the basis of crash severity but also on the size of the occupant. These are expected to be launched in the medium to the long term. The latest Hyundai Tucson SUV has as many as six airbags besides an ESC system attached to it.
In the long term that is 2010 and beyond, there is expected to be increasing levels of adoption in countries such as India and China. These markets are not expected to grow at very high rates over the short term due to the absence of safety standards that make the installation of airbags mandatory. However, it is expected to grow in the long term due to competition between vehicle manufacturers leading to safety being one of the main product differentiators. Moreover, customer preferences are expected to change and safety is expected to become a more crucial aspect.
This market generated revenues of $214.5 million in 2005 and the unit shipments for the year were 114,705 thousand (114.7 million). At the end of the forecast period the units shipped is expected to rise to 160,548 thousand (160.5 million) and the market is expected to generate revenues of $263.3 million. The growth of the market is expected to be restrained by the pricing pressures that is dominating the automotive segment. In the later stages of the forecast period, growth in the emerging economies is expected to put further pressures on price.
#FA0A-32 © 2006 Frost & Sullivan www.frost.com 3-14
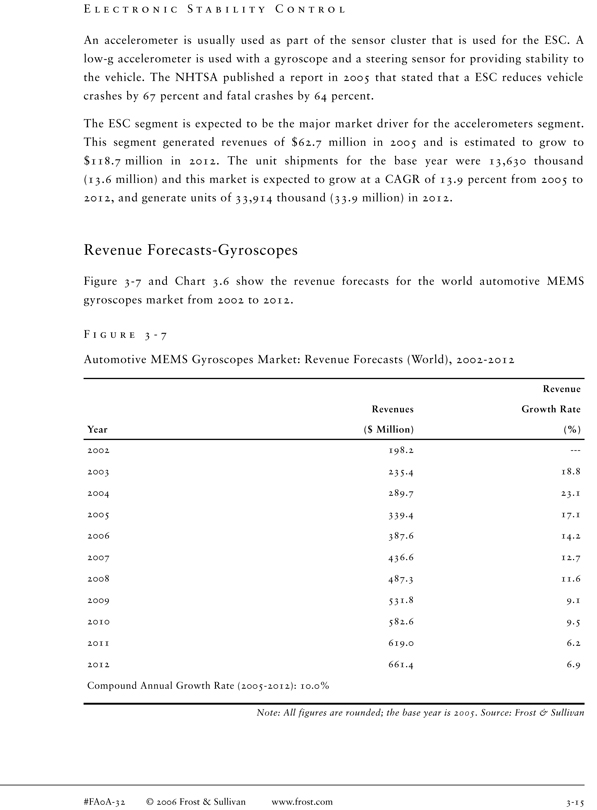
E L E C T R O N I C S T A B I L I T Y C O N T R O L
An accelerometer is usually used as part of the sensor cluster that is used for the ESC. A low-g accelerometer is used with a gyroscope and a steering sensor for providing stability to the vehicle. The NHTSA published a report in 2005 that stated that a ESC reduces vehicle crashes by 67 percent and fatal crashes by 64 percent.
The ESC segment is expected to be the major market driver for the accelerometers segment. This segment generated revenues of $62.7 million in 2005 and is estimated to grow to $118.7 million in 2012. The unit shipments for the base year were 13,630 thousand (13.6 million) and this market is expected to grow at a CAGR of 13.9 percent from 2005 to 2012, and generate units of 33,914 thousand (33.9 million) in 2012.
Revenue Forecasts-Gyroscopes
Figure 3-7 and Chart 3.6 show the revenue forecasts for the world automotive MEMS gyroscopes market from 2002 to 2012.
F I G U R E 3—7
Automotive MEMS Gyroscopes Market: Revenue Forecasts (World), 2002-2012
Revenue Revenues Growth Rate Year($ Million)(%)
2002 198.2 —2003 235.4 18.8 2004 289.7 23.1 2005 339.4 17.1 2006 387.6 14.2 2007 436.6 12.7 2008 487.3 11.6 2009 531.8 9.1 2010 582.6 9.5 2011 619.0 6.2 2012 661.4 6.9 Compound Annual Growth Rate (2005-2012): 10.0%
Note: All figures are rounded; the base year is 2005. Source: Frost & Sullivan
#FA0A-32 © 2006 Frost & Sullivan www.frost.com 3-15
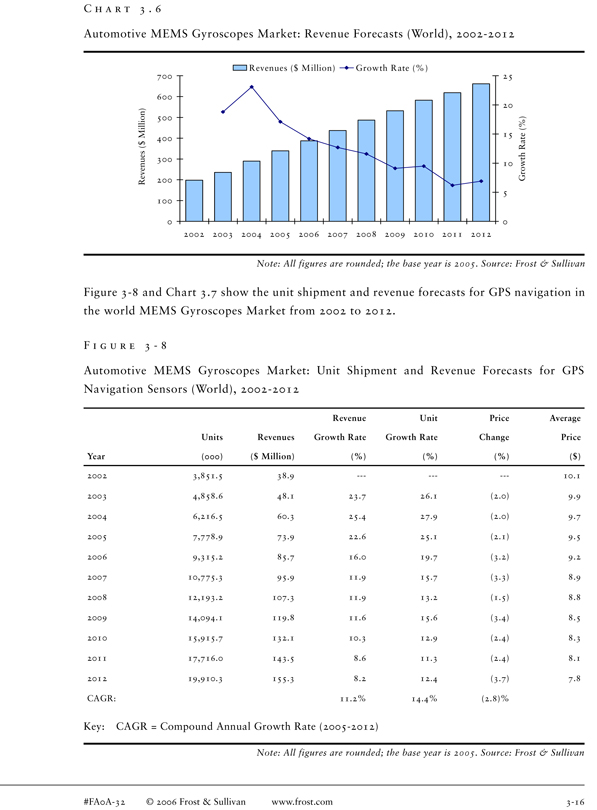
C H A R T 3 . 6
Automotive MEMS Gyroscopes Market: Revenue Forecasts (World), 2002-2012
Revenues ($ Million) Growth Rate (%)
700 25
600
20 Million) 500
15 400 $
( Rate (%) Revenues 300 Growth 10
200
5 100
0 0 2002 2003 2004 2005 2006 2007 2008 2009 2010 2011 2012
Note: All figures are rounded; the base year is 2005. Source: Frost & Sullivan
Figure 3-8 and Chart 3.7 show the unit shipment and revenue forecasts for GPS navigation in the world MEMS Gyroscopes Market from 2002 to 2012.
F I G U R E 3—8
Automotive MEMS Gyroscopes Market: Unit Shipment and Revenue Forecasts for GPS Navigation Sensors (World), 2002-2012
Revenue Unit Price Average Units Revenues Growth Rate Growth Rate Change Price Year(000)($ Million)(%)(%)(%)($)
2002 3,851.5 38.9 10.1 2003 4,858.6 48.1 23.7 26.1(2.0) 9.9 2004 6,216.5 60.3 25.4 27.9(2.0) 9.7 2005 7,778.9 73.9 22.6 25.1(2.1) 9.5 2006 9,315.2 85.7 16.0 19.7(3.2) 9.2 2007 10,775.3 95.9 11.9 15.7(3.3) 8.9 2008 12,193.2 107.3 11.9 13.2(1.5) 8.8 2009 14,094.1 119.8 11.6 15.6(3.4) 8.5 2010 15,915.7 132.1 10.3 12.9(2.4) 8.3 2011 17,716.0 143.5 8.6 11.3(2.4) 8.1 2012 19,910.3 155.3 8.2 12.4(3.7) 7.8 CAGR: 11.2% 14.4%(2.8)%
Key: CAGR = Compound Annual Growth Rate (2005-2012)
Note: All figures are rounded; the base year is 2005. Source: Frost & Sullivan
#FA0A-32 © 2006 Frost & Sullivan www.frost.com 3-16
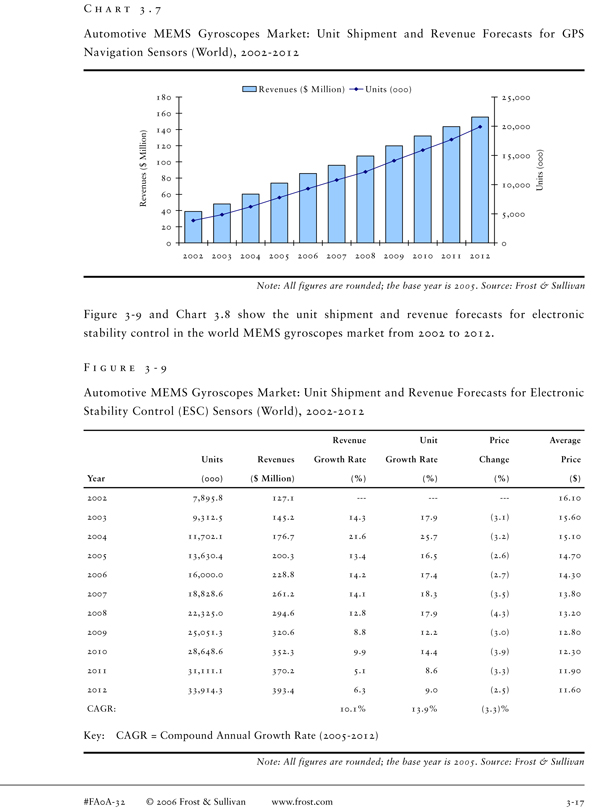
C H A R T 3 . 7
Automotive MEMS Gyroscopes Market: Unit Shipment and Revenue Forecasts for GPS Navigation Sensors (World), 2002-2012
Revenues ($ Million) Units (000)
180 25,000
160
20,000 140 Million) 120 15,000 100 $ ( Revenues 80 10,000 Units (000) 60
40
5,000 20
0 0 2002 2003 2004 2005 2006 2007 2008 2009 2010 2011 2012
Note: All figures are rounded; the base year is 2005. Source: Frost & Sullivan
Figure 3-9 and Chart 3.8 show the unit shipment and revenue forecasts for electronic stability control in the world MEMS gyroscopes market from 2002 to 2012.
F I G U R E 3—9
Automotive MEMS Gyroscopes Market: Unit Shipment and Revenue Forecasts for Electronic Stability Control (ESC) Sensors (World), 2002-2012
Revenue Unit Price Average Units Revenues Growth Rate Growth Rate Change Price Year(000)($ Million)(%)(%)(%)($)
2002 7,895.8 127.1 16.10 2003 9,312.5 145.2 14.3 17.9 (3.1) 15.60 2004 11,702.1 176.7 21.6 25.7 (3.2) 15.10 2005 13,630.4 200.3 13.4 16.5 (2.6) 14.70 2006 16,000.0 228.8 14.2 17.4 (2.7) 14.30 2007 18,828.6 261.2 14.1 18.3 (3.5) 13.80 2008 22,325.0 294.6 12.8 17.9 (4.3) 13.20 2009 25,051.3 320.6 8.8 12.2 (3.0) 12.80 2010 28,648.6 352.3 9.9 14.4 (3.9) 12.30 2011 31,111.1 370.2 5.1 8.6 (3.3) 11.90 2012 33,914.3 393.4 6.3 9.0 (2.5) 11.60 CAGR: 10.1% 13.9%(3.3)%
Key: CAGR = Compound Annual Growth Rate (2005-2012)
Note: All figures are rounded; the base year is 2005. Source: Frost & Sullivan
#FA0A-32 © 2006 Frost & Sullivan www.frost.com 3-17
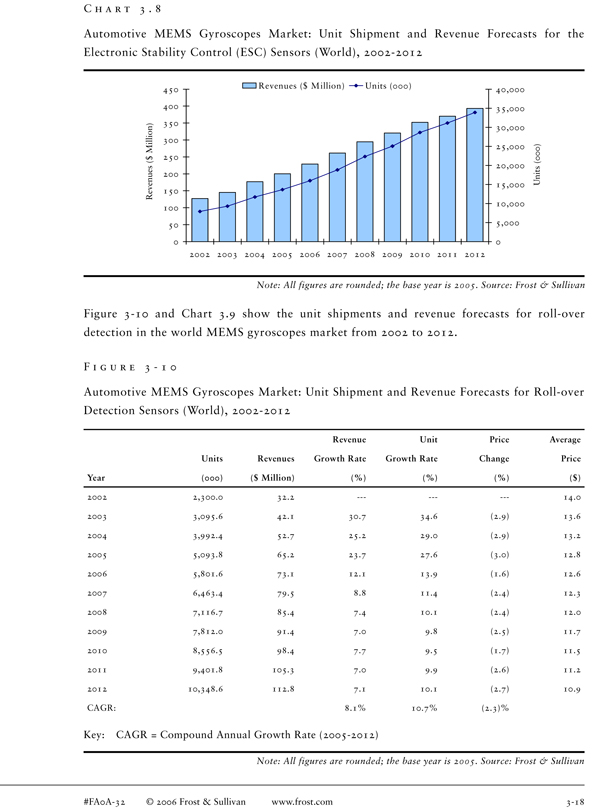
C H A R T 3 . 8
Automotive MEMS Gyroscopes Market: Unit Shipment and Revenue Forecasts for the Electronic Stability Control (ESC) Sensors (World), 2002-2012
Revenues ($ Million) Units (000)
450 40,000
400 35,000 350 Million) 30,000 300 25,000 250 $ ( 20,000 Revenues 200 Units (000) 15,000 150 10,000 100
50 5,000
0 0 2002 2003 2004 2005 2006 2007 2008 2009 2010 2011 2012
Note: All figures are rounded; the base year is 2005. Source: Frost & Sullivan
Figure 3-10 and Chart 3.9 show the unit shipments and revenue forecasts for roll-over detection in the world MEMS gyroscopes market from 2002 to 2012.
F I G U R E 3—1 0
Automotive MEMS Gyroscopes Market: Unit Shipment and Revenue Forecasts for Roll-over Detection Sensors (World), 2002-2012
Revenue Unit Price Average Units Revenues Growth Rate Growth Rate Change Price Year(000)($ Million)(%)(%)(%)($)
2002 2,300.0 32.2 - 14.0 2003 3,095.6 42.1 30.7 34.6 (2.9) 13.6 2004 3,992.4 52.7 25.2 29.0 (2.9) 13.2 2005 5,093.8 65.2 23.7 27.6 (3.0) 12.8 2006 5,801.6 73.1 12.1 13.9 (1.6) 12.6 2007 6,463.4 79.5 8.8 11.4 (2.4) 12.3 2008 7,116.7 85.4 7.4 10.1 (2.4) 12.0 2009 7,812.0 91.4 7.0 9.8 (2.5) 11.7 2010 8,556.5 98.4 7.7 9.5 (1.7) 11.5 2011 9,401.8 105.3 7.0 9.9 (2.6) 11.2 2012 10,348.6 112.8 7.1 10.1 (2.7) 10.9 CAGR: 8.1% 10.7%(2.3)%
Key: CAGR = Compound Annual Growth Rate (2005-2012)
Note: All figures are rounded; the base year is 2005. Source: Frost & Sullivan
#FA0A-32 © 2006 Frost & Sullivan www.frost.com 3-18
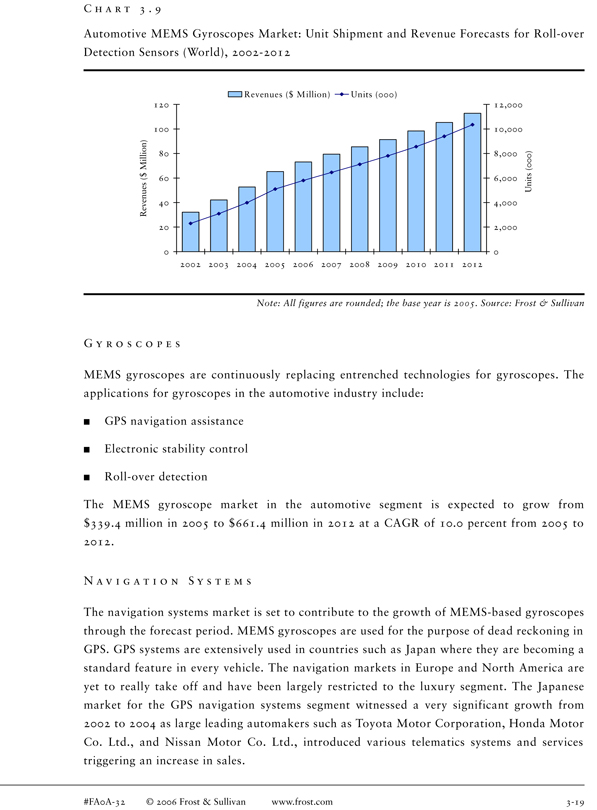
C H A R T 3 . 9
Automotive MEMS Gyroscopes Market: Unit Shipment and Revenue Forecasts for Roll-over Detection Sensors (World), 2002-2012
Revenues ($ Million) Units (000)
120 12,000
100 10,000 Million) 80 8,000
$ 60 6,000 Units (000) Revenues ( 40 4,000
20 2,000
0 0 2002 2003 2004 2005 2006 2007 2008 2009 2010 2011 2012
Note: All figures are rounded; the base year is 2005. Source: Frost & Sullivan
G Y R O S C O P E S
MEMS gyroscopes are continuously replacing entrenched technologies for gyroscopes. The applications for gyroscopes in the automotive industry include:
GPS navigation assistance
Electronic stability control
Roll-over detection
The MEMS gyroscope market in the automotive segment is expected to grow from $339.4 million in 2005 to $661.4 million in 2012 at a CAGR of 10.0 percent from 2005 to 2012.
N A V I G A T I O N S Y S T E M S
The navigation systems market is set to contribute to the growth of MEMS-based gyroscopes through the forecast period. MEMS gyroscopes are used for the purpose of dead reckoning in GPS. GPS systems are extensively used in countries such as Japan where they are becoming a standard feature in every vehicle. The navigation markets in Europe and North America are yet to really take off and have been largely restricted to the luxury segment. The Japanese market for the GPS navigation systems segment witnessed a very significant growth from 2002 to 2004 as large leading automakers such as Toyota Motor Corporation, Honda Motor Co. Ltd., and Nissan Motor Co. Ltd., introduced various telematics systems and services triggering an increase in sales.
#FA0A-32 © 2006 Frost & Sullivan www.frost.com 3-19
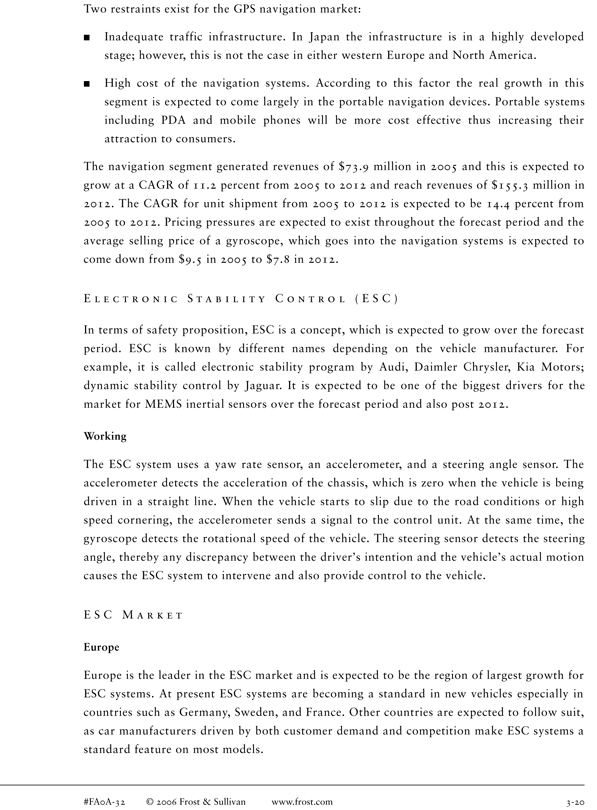
Two restraints exist for the GPS navigation market:
Inadequate traffic infrastructure. In Japan the infrastructure is in a highly developed stage; however, this is not the case in either western Europe and North America.
High cost of the navigation systems. According to this factor the real growth in this segment is expected to come largely in the portable navigation devices. Portable systems including PDA and mobile phones will be more cost effective thus increasing their attraction to consumers.
The navigation segment generated revenues of $73.9 million in 2005 and this is expected to grow at a CAGR of 11.2 percent from 2005 to 2012 and reach revenues of $155.3 million in 2012. The CAGR for unit shipment from 2005 to 2012 is expected to be 14.4 percent from 2005 to 2012. Pricing pressures are expected to exist throughout the forecast period and the average selling price of a gyroscope, which goes into the navigation systems is expected to come down from $9.5 in 2005 to $7.8 in 2012.
E L E C T R O N I C S T A B I L I T Y C O N T R O L ( E S C )
In terms of safety proposition, ESC is a concept, which is expected to grow over the forecast period. ESC is known by different names depending on the vehicle manufacturer. For example, it is called electronic stability program by Audi, Daimler Chrysler, Kia Motors; dynamic stability control by Jaguar. It is expected to be one of the biggest drivers for the market for MEMS inertial sensors over the forecast period and also post 2012.
Working
The ESC system uses a yaw rate sensor, an accelerometer, and a steering angle sensor. The accelerometer detects the acceleration of the chassis, which is zero when the vehicle is being driven in a straight line. When the vehicle starts to slip due to the road conditions or high speed cornering, the accelerometer sends a signal to the control unit. At the same time, the gyroscope detects the rotational speed of the vehicle. The steering sensor detects the steering angle, thereby any discrepancy between the driver’s intention and the vehicle’s actual motion causes the ESC system to intervene and also provide control to the vehicle.
E S C M A R K E T
Europe
Europe is the leader in the ESC market and is expected to be the region of largest growth for ESC systems. At present ESC systems are becoming a standard in new vehicles especially in countries such as Germany, Sweden, and France. Other countries are expected to follow suit, as car manufacturers driven by both customer demand and competition make ESC systems a standard feature on most models.
#FA0A-32 © 2006 Frost & Sullivan www.frost.com 3-20
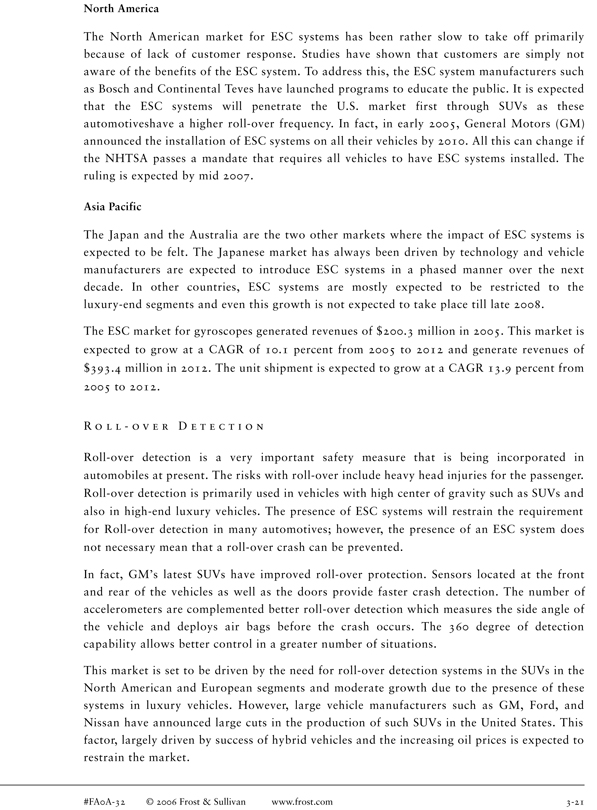
North America
The North American market for ESC systems has been rather slow to take off primarily because of lack of customer response. Studies have shown that customers are simply not aware of the benefits of the ESC system. To address this, the ESC system manufacturers such as Bosch and Continental Teves have launched programs to educate the public. It is expected that the ESC systems will penetrate the U.S. market first through SUVs as these automotiveshave a higher roll-over frequency. In fact, in early 2005, General Motors (GM) announced the installation of ESC systems on all their vehicles by 2010. All this can change if the NHTSA passes a mandate that requires all vehicles to have ESC systems installed. The ruling is expected by mid 2007.
Asia Pacific
The Japan and the Australia are the two other markets where the impact of ESC systems is expected to be felt. The Japanese market has always been driven by technology and vehicle manufacturers are expected to introduce ESC systems in a phased manner over the next decade. In other countries, ESC systems are mostly expected to be restricted to the luxury-end segments and even this growth is not expected to take place till late 2008.
The ESC market for gyroscopes generated revenues of $200.3 million in 2005. This market is expected to grow at a CAGR of 10.1 percent from 2005 to 2012 and generate revenues of $393.4 million in 2012. The unit shipment is expected to grow at a CAGR 13.9 percent from 2005 to 2012.
R O L L—O V E R D E T E C T I O N
Roll-over detection is a very important safety measure that is being incorporated in automobiles at present. The risks with roll-over include heavy head injuries for the passenger. Roll-over detection is primarily used in vehicles with high center of gravity such as SUVs and also in high-end luxury vehicles. The presence of ESC systems will restrain the requirement for Roll-over detection in many automotives; however, the presence of an ESC system does not necessary mean that a roll-over crash can be prevented.
In fact, GM’s latest SUVs have improved roll-over protection. Sensors located at the front and rear of the vehicles as well as the doors provide faster crash detection. The number of accelerometers are complemented better roll-over detection which measures the side angle of the vehicle and deploys air bags before the crash occurs. The 360 degree of detection capability allows better control in a greater number of situations.
This market is set to be driven by the need for roll-over detection systems in the SUVs in the North American and European segments and moderate growth due to the presence of these systems in luxury vehicles. However, large vehicle manufacturers such as GM, Ford, and Nissan have announced large cuts in the production of such SUVs in the United States. This factor, largely driven by success of hybrid vehicles and the increasing oil prices is expected to restrain the market.
#FA0A-32 © 2006 Frost & Sullivan www.frost.com 3-21
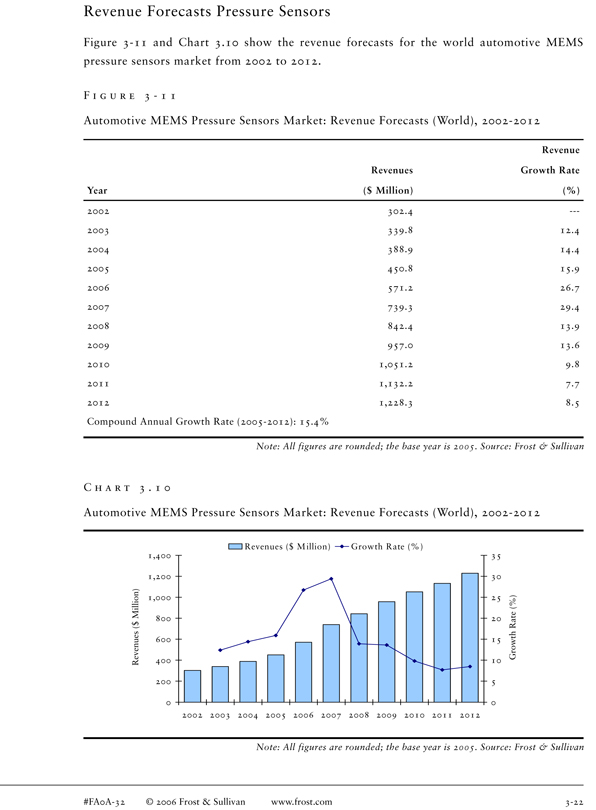
Revenue Forecasts Pressure Sensors
Figure 3-11 and Chart 3.10 show the revenue forecasts for the world automotive MEMS pressure sensors market from 2002 to 2012.
F I G U R E 3—1 1
Automotive MEMS Pressure Sensors Market: Revenue Forecasts (World), 2002-2012
Revenue Revenues Growth Rate Year($ Million)(%)
2002 302.4 -—2003 339.8 12.4 2004 388.9 14.4 2005 450.8 15.9 2006 571.2 26.7 2007 739.3 29.4 2008 842.4 13.9 2009 957.0 13.6 2010 1,051.2 9.8 2011 1,132.2 7.7 2012 1,228.3 8.5 Compound Annual Growth Rate (2005-2012): 15.4%
Note: All figures are rounded; the base year is 2005. Source: Frost & Sullivan
C H A R T 3 . 1 0
Automotive MEMS Pressure Sensors Market: Revenue Forecasts (World), 2002-2012
Revenues ($ M illion) Growth Rate (%)
1,400 35
1,200 30
Million) 1,000 25 800 20 $ ( Revenues 600 15 Growth Rate (%) 400 10
2005
0 0 2002 2003 2004 2005 2006 2007 2008 2009 2010 2011 2012
Note: All figures are rounded; the base year is 2005. Source: Frost & Sullivan
#FA0A-32 © 2006 Frost & Sullivan www.frost.com 3-22
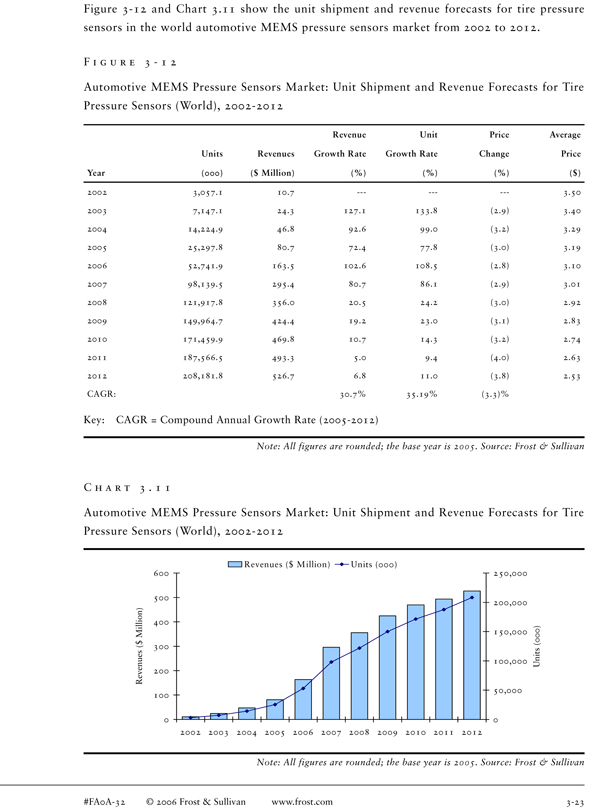
Figure 3-12 and Chart 3.11 show the unit shipment and revenue forecasts for tire pressure sensors in the world automotive MEMS pressure sensors market from 2002 to 2012.
F I G U R E 3—1 2
Automotive MEMS Pressure Sensors Market: Unit Shipment and Revenue Forecasts for Tire Pressure Sensors (World), 2002-2012
Revenue Unit Price Average Units Revenues Growth Rate Growth Rate Change Price Year(000)($ Million)(%)(%)(%)($)
2002 3,057.1 10.7 3.50 2003 7,147.1 24.3 127.1 133.8 (2.9) 3.40 2004 14,224.9 46.8 92.6 99.0 (3.2) 3.29 2005 25,297.8 80.7 72.4 77.8 (3.0) 3.19 2006 52,741.9 163.5 102.6 108.5 (2.8) 3.10 2007 98,139.5 295.4 80.7 86.1 (2.9) 3.01 2008 121,917.8 356.0 20.5 24.2 (3.0) 2.92 2009 149,964.7 424.4 19.2 23.0 (3.1) 2.83 2010 171,459.9 469.8 10.7 14.3 (3.2) 2.74 2011 187,566.5 493.3 5.0 9.4 (4.0) 2.63 2012 208,181.8 526.7 6.8 11.0 (3.8) 2.53 CAGR: 30.7% 35.19% (3.3)%
Key: CAGR = Compound Annual Growth Rate (2005-2012)
Note: All figures are rounded; the base year is 2005. Source: Frost & Sullivan
C H A R T 3 . 1 1
Automotive MEMS Pressure Sensors Market: Unit Shipment and Revenue Forecasts for Tire Pressure Sensors (World), 2002-2012
Revenues ($ Million) Units (000)
600 250,000
500
200,000 Million) 400 150,000 $
( 300 Revenues
100,000 Units (000) 200
50,000 100
0 0 2002 2003 2004 2005 2006 2007 2008 2009 2010 2011 2012
Note: All figures are rounded; the base year is 2005. Source: Frost & Sullivan
#FA0A-32 © 2006 Frost & Sullivan www.frost.com 3-23
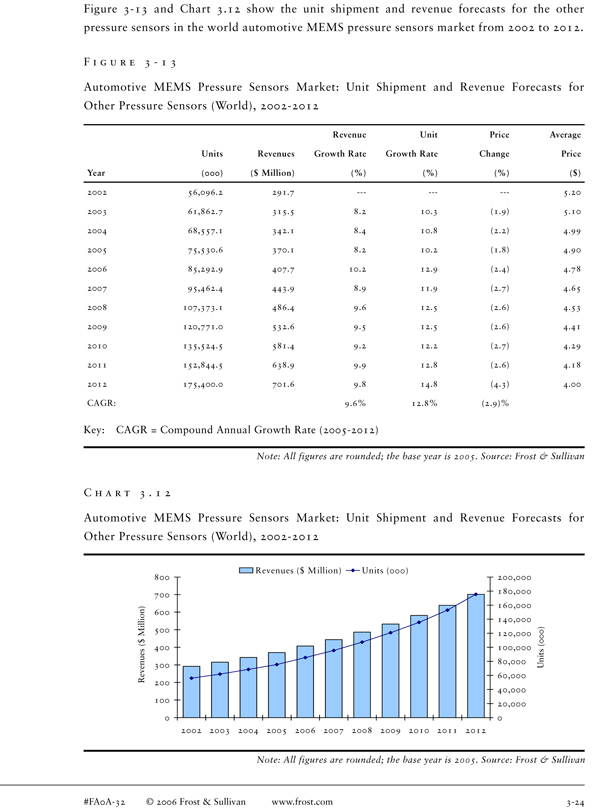
Figure 3-13 and Chart 3.12 show the unit shipment and revenue forecasts for the other pressure sensors in the world automotive MEMS pressure sensors market from 2002 to 2012.
F I G U R E 3—1 3
Automotive MEMS Pressure Sensors Market: Unit Shipment and Revenue Forecasts for Other Pressure Sensors (World), 2002-2012
Revenue Unit Price Average Units Revenues Growth Rate Growth Rate Change Price Year(000)($ Million)(%)(%)(%)($)
2002 56,096.2 291.7 - 5.20 2003 61,862.7 315.5 8.2 10.3 (1.9) 5.10 2004 68,557.1 342.1 8.4 10.8 (2.2) 4.99 2005 75,530.6 370.1 8.2 10.2 (1.8) 4.90 2006 85,292.9 407.7 10.2 12.9 (2.4) 4.78 2007 95,462.4 443.9 8.9 11.9 (2.7) 4.65 2008 107,373.1 486.4 9.6 12.5 (2.6) 4.53 2009 120,771.0 532.6 9.5 12.5 (2.6) 4.41 2010 135,524.5 581.4 9.2 12.2 (2.7) 4.29 2011 152,844.5 638.9 9.9 12.8 (2.6) 4.18 2012 175,400.0 701.6 9.8 14.8 (4.3) 4.00 CAGR: 9.6% 12.8% (2.9)%
Key: CAGR = Compound Annual Growth Rate (2005-2012)
Note: All figures are rounded; the base year is 2005. Source: Frost & Sullivan
C H A R T 3 . 1 2
Automotive MEMS Pressure Sensors Market: Unit Shipment and Revenue Forecasts for Other Pressure Sensors (World), 2002-2012
Revenues ($ M illion) Units (000)
800 200,000 180,000 700 160,000 Million) 600 140,000 500 120,000 $ ( 400 100,000 Revenues 80,000 300 Units (000) 60,000 200 40,000 100 20,000
0 0 2002 2003 2004 2005 2006 2007 2008 2009 2010 2011 2012
Note: All figures are rounded; the base year is 2005. Source: Frost & Sullivan
#FA0A-32 © 2006 Frost & Sullivan www.frost.com 3-24

T I R E P R E S S U R E S E N S O R S
Around 40 percent of all vehicle owners do not check the tire pressure in their vehicles and this led to a need for a stable tire pressure monitoring system that would warn the driver of low tire pressure. Major accidents caused by improperly inflated tires and the resulting recall of a large number of Firestone tires resulted in the U.S. Congress being pressurized into taking legislative action to protect motorists. The legislation called TREAD Act requires the mandatory installation of TPMS in all vehicles that will warn the driver within 20 minutes of detection of under inflation of the vehicle.
The unit shipment for 2005 was 25, 297 thousand (25.3 million) units with most of the shipments entering the U.S. market. The revenues generated for the base year were $80.7 million. Market revenues are expected to grow at a CAGR of 30. 7 percent from 2005 to 2012 and generate revenues of $526.7 million in 2012. The average price of a tire pressure sensor is expected to come down from $3.19 in 2005 to $2.53 in 2012
The phase in period after a number of alterations has been that 20 percent of all the cars must comply by September 1, 2005, 70 percent by September 1, 2006, and 100 percent by September, 1 2007. Lead by the TREAD mandate the U.S. market is expected to be the leader in the in the world tire pressure Sensors segment and offer tremendous opportunities to the MEMS pressure sensors manufacturers over the next 5-7 years. The growth rate is expected to be the maximum in the short term as manufacturers meet the deadline. The unit shipments is set to grow by 108.5 and 86.1 percent in 2005 and 2006, respectively.
In Europe a decline in price is expected from the TPMS systems that will contribute to the growth of this segment. This market is not expected to grow at the same pace as the United States; however, a significant growth is anticipated. This is because competition between various automotive manufacturers and the priority of safety will lead to many these manufacturers fitting TPMS systems on their European models as well. The migration of the installation of TPMS systems from high-end vehicles to the lower-end vehicles is expected to take place very rapidly. Additionally, consumer activist groups have been pressurizing the European Union to pass a law that mandates the compulsory fitment of pressure sensors onto the vehicles.
Growth in the Asia Pacific market is expected to be driven by the Japanese, South Korean, and Australian markets. The Japanese market has been always been quick to adopt any new technologies dealing with automotive safety and its expected to be the same with the tire pressure sensors segment. The Chinese and Indian markets require regulations to be mandated for the markets to take off but such regulations are not expected before 2010. However, companies such as Infineon and Freescale Semiconductor are already gearing up for sudden changes in demand from these countries especially China.
#FA0A-32 © 2006 Frost & Sullivan www.frost.com 3-25
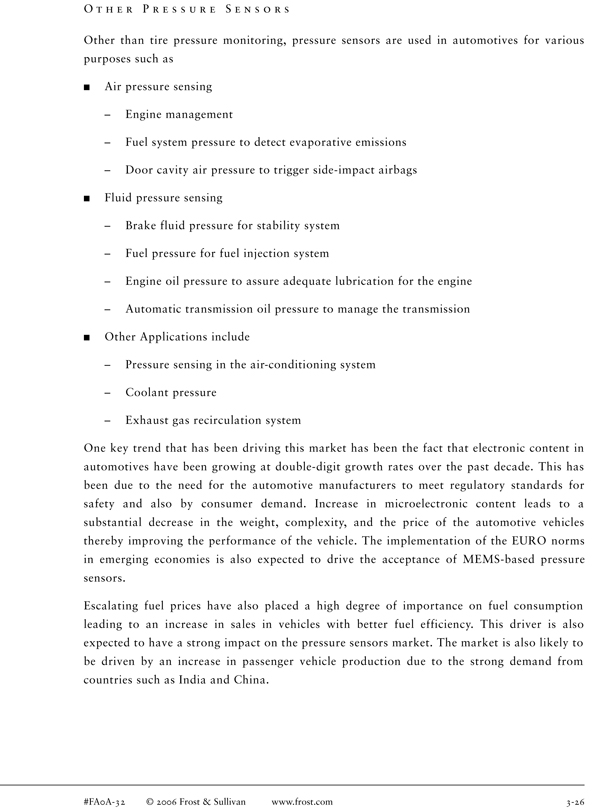
O T H E R P R E S S U R E S E N S O R S
Other than tire pressure monitoring, pressure sensors are used in automotives for various purposes such as
Air pressure sensing
– Engine management
– Fuel system pressure to detect evaporative emissions
– Door cavity air pressure to trigger side-impact airbags
Fluid pressure sensing
– Brake fluid pressure for stability system
– Fuel pressure for fuel injection system
– Engine oil pressure to assure adequate lubrication for the engine
– Automatic transmission oil pressure to manage the transmission
Other Applications include
– Pressure sensing in the air-conditioning system
– Coolant pressure
– Exhaust gas recirculation system
One key trend that has been driving this market has been the fact that electronic content in automotives have been growing at double-digit growth rates over the past decade. This has been due to the need for the automotive manufacturers to meet regulatory standards for safety and also by consumer demand. Increase in microelectronic content leads to a substantial decrease in the weight, complexity, and the price of the automotive vehicles thereby improving the performance of the vehicle. The implementation of the EURO norms in emerging economies is also expected to drive the acceptance of MEMS-based pressure sensors.
Escalating fuel prices have also placed a high degree of importance on fuel consumption leading to an increase in sales in vehicles with better fuel efficiency. This driver is also expected to have a strong impact on the pressure sensors market. The market is also likely to be driven by an increase in passenger vehicle production due to the strong demand from countries such as India and China.
#FA0A-32 © 2006 Frost & Sullivan www.frost.com 3-26
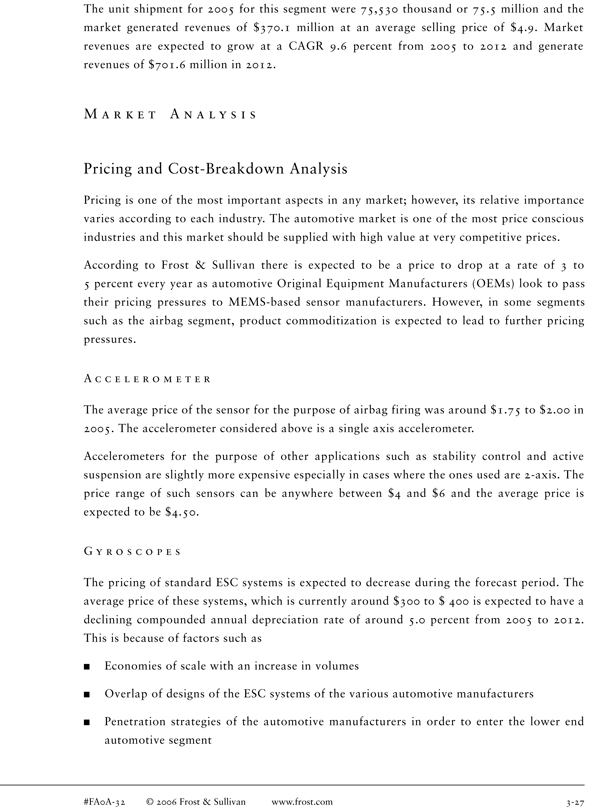
The unit shipment for 2005 for this segment were 75,530 thousand or 75.5 million and the market generated revenues of $370.1 million at an average selling price of $4.9. Market revenues are expected to grow at a CAGR 9.6 percent from 2005 to 2012 and generate revenues of $701.6 million in 2012.
M A R K E T A N A L Y S I S
Pricing and Cost-Breakdown Analysis
Pricing is one of the most important aspects in any market; however, its relative importance varies according to each industry. The automotive market is one of the most price conscious industries and this market should be supplied with high value at very competitive prices.
According to Frost & Sullivan there is expected to be a price to drop at a rate of 3 to 5 percent every year as automotive Original Equipment Manufacturers (OEMs) look to pass their pricing pressures to MEMS-based sensor manufacturers. However, in some segments such as the airbag segment, product commoditization is expected to lead to further pricing pressures.
A C C E L E R O M E T E R
The average price of the sensor for the purpose of airbag firing was around $1.75 to $2.00 in 2005. The accelerometer considered above is a single axis accelerometer.
Accelerometers for the purpose of other applications such as stability control and active suspension are slightly more expensive especially in cases where the ones used are 2-axis. The price range of such sensors can be anywhere between $4 and $6 and the average price is expected to be $4.50.
G Y R O S C O P E S
The pricing of standard ESC systems is expected to decrease during the forecast period. The average price of these systems, which is currently around $300 to $ 400 is expected to have a declining compounded annual depreciation rate of around 5.0 percent from 2005 to 2012. This is because of factors such as
Economies of scale with an increase in volumes
Overlap of designs of the ESC systems of the various automotive manufacturers
Penetration strategies of the automotive manufacturers in order to enter the lower end automotive segment
#FA0A-32 © 2006 Frost & Sullivan www.frost.com 3-27
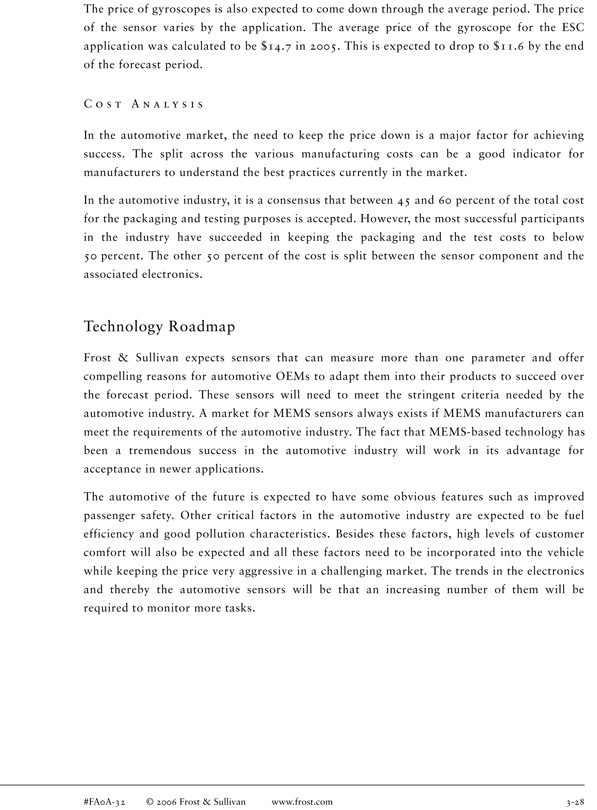
The price of gyroscopes is also expected to come down through the average period. The price of the sensor varies by the application. The average price of the gyroscope for the ESC application was calculated to be $14.7 in 2005. This is expected to drop to $11.6 by the end of the forecast period.
C O S T A N A L Y S I S
In the automotive market, the need to keep the price down is a major factor for achieving success. The split across the various manufacturing costs can be a good indicator for manufacturers to understand the best practices currently in the market.
In the automotive industry, it is a consensus that between 45 and 60 percent of the total cost for the packaging and testing purposes is accepted. However, the most successful participants in the industry have succeeded in keeping the packaging and the test costs to below 50 percent. The other 50 percent of the cost is split between the sensor component and the associated electronics.
Technology Roadmap
Frost & Sullivan expects sensors that can measure more than one parameter and offer compelling reasons for automotive OEMs to adapt them into their products to succeed over the forecast period. These sensors will need to meet the stringent criteria needed by the automotive industry. A market for MEMS sensors always exists if MEMS manufacturers can meet the requirements of the automotive industry. The fact that MEMS-based technology has been a tremendous success in the automotive industry will work in its advantage for acceptance in newer applications.
The automotive of the future is expected to have some obvious features such as improved passenger safety. Other critical factors in the automotive industry are expected to be fuel efficiency and good pollution characteristics. Besides these factors, high levels of customer comfort will also be expected and all these factors need to be incorporated into the vehicle while keeping the price very aggressive in a challenging market. The trends in the electronics and thereby the automotive sensors will be that an increasing number of them will be required to monitor more tasks.
#FA0A-32 © 2006 Frost & Sullivan www.frost.com 3-28

S E N S O R F U S I O N
The trend toward using clusters of sensors has been increasing in the automotive industry. According to Frost & Sullivan, this trend is expected to really takeoff in the long term (post 2010). The advantage of using different sensors as a combination usually results in better information and performance than just one. Sensor fusion also results in the costs of packaging /decreasing. However, there are a lot of issues regarding packaging and also in the retrieval of data for the various applications.
Sensors for Harsh Environments
Sensor manufacturers and research labs have been on the look out to develop better packaging for MEMS sensors in the automotive industry in order to reduce packaging costs and also provide more reliable sensors.
One of the major areas of focus has been the development of better pressure sensors for measurement in the engine cylinder. The Cleveland based FLX Micro Inc. has recently partnered with ZIN technologies to develop harsh environment sensors. The sensors are fabricated from polycrystalline silicon carbide (poly-SIC), a cost effective high-performance material. MEMS-based sensors built on silicon carbide can operate at higher temperatures, are cost effective, and are inert to all kinds of corrosion. These sensors are expected to be beneficial for a number of applications including diesel homogenous charge compression ignition (HCCI) and for exhaust gas pressure measurement.
Market Shares and Competitive Snapshot
Figure 3-14 and Chart 3.13 show the company market share by revenue for the world automotive MEMS-based sensors market for 2005.
#FA0A-32 © 2006 Frost & Sullivan www.frost.com 3-29
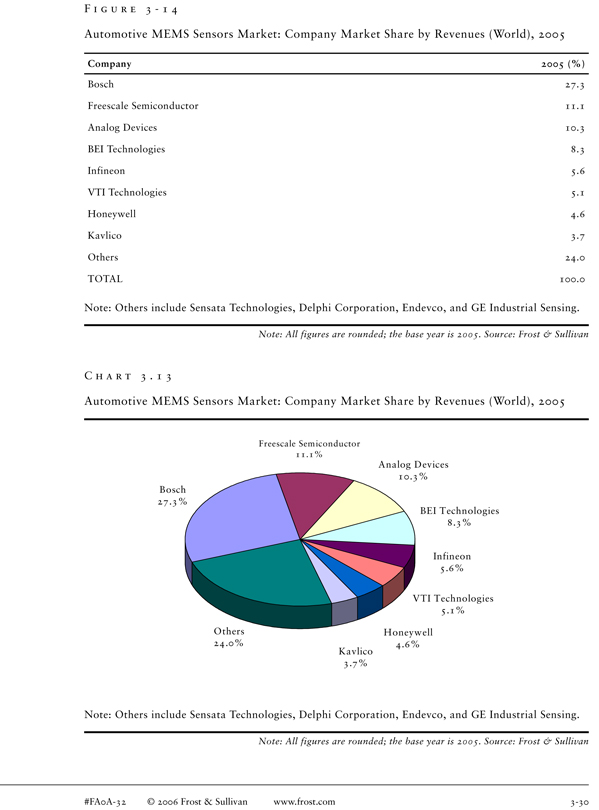
F I G U R E 3—1 4
Automotive MEMS Sensors Market: Company Market Share by Revenues (World), 2005
Company 2005 (%)
Bosch 27.3 Freescale Semiconductor 11.1 Analog Devices 10.3 BEI Technologies 8.3 Infineon 5.6 VTI Technologies 5.1 Honeywell 4.6 Kavlico 3.7 Others 24.0 TOTAL 100.0
Note: Others include Sensata Technologies, Delphi Corporation, Endevco, and GE Industrial Sensing.
Note: All figures are rounded; the base year is 2005. Source: Frost & Sullivan
C H A R T 3 . 1 3
Automotive MEMS Sensors Market: Company Market Share by Revenues (World), 2005
Freescale Semiconductor 11.1%
Analog Devices 10.3% Bosch 27.3%
BEI Technologies 8.3%
Infineon 5.6%
VTI Technologies 5.1%
Others Honeywell 24.0% 4.6% Kavlico 3.7%
Note: Others include Sensata Technologies, Delphi Corporation, Endevco, and GE Industrial Sensing.
Note: All figures are rounded; the base year is 2005. Source: Frost & Sullivan
#FA0A-32 © 2006 Frost & Sullivan www.frost.com 3-30
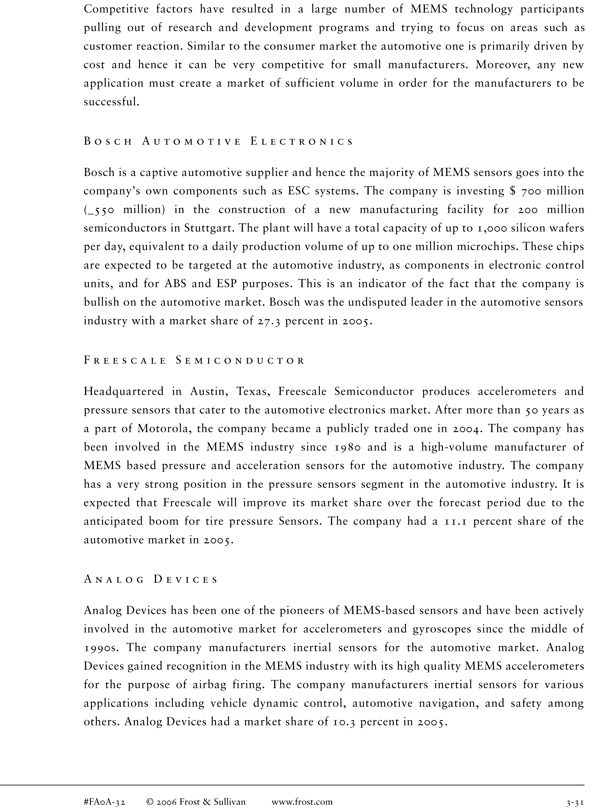
Competitive factors have resulted in a large number of MEMS technology participants pulling out of research and development programs and trying to focus on areas such as customer reaction. Similar to the consumer market the automotive one is primarily driven by cost and hence it can be very competitive for small manufacturers. Moreover, any new application must create a market of sufficient volume in order for the manufacturers to be successful.
B O S C H A U T O M O T I V E E L E C T R O N I C S
Bosch is a captive automotive supplier and hence the majority of MEMS sensors goes into the company’s own components such as ESC systems. The company is investing $ 700 million (_550 million) in the construction of a new manufacturing facility for 200 million semiconductors in Stuttgart. The plant will have a total capacity of up to 1,000 silicon wafers per day, equivalent to a daily production volume of up to one million microchips. These chips are expected to be targeted at the automotive industry, as components in electronic control units, and for ABS and ESP purposes. This is an indicator of the fact that the company is bullish on the automotive market. Bosch was the undisputed leader in the automotive sensors industry with a market share of 27.3 percent in 2005.
F R E E S C A L E S E M I C O N D U C T O R
Headquartered in Austin, Texas, Freescale Semiconductor produces accelerometers and pressure sensors that cater to the automotive electronics market. After more than 50 years as a part of Motorola, the company became a publicly traded one in 2004. The company has been involved in the MEMS industry since 1980 and is a high-volume manufacturer of MEMS based pressure and acceleration sensors for the automotive industry. The company has a very strong position in the pressure sensors segment in the automotive industry. It is expected that Freescale will improve its market share over the forecast period due to the anticipated boom for tire pressure Sensors. The company had a 11.1 percent share of the automotive market in 2005.
A N A L O G D E V I C E S
Analog Devices has been one of the pioneers of MEMS-based sensors and have been actively involved in the automotive market for accelerometers and gyroscopes since the middle of 1990s. The company manufacturers inertial sensors for the automotive market. Analog Devices gained recognition in the MEMS industry with its high quality MEMS accelerometers for the purpose of airbag firing. The company manufacturers inertial sensors for various applications including vehicle dynamic control, automotive navigation, and safety among others. Analog Devices had a market share of 10.3 percent in 2005.
#FA0A-32 © 2006 Frost & Sullivan www.frost.com 3-31
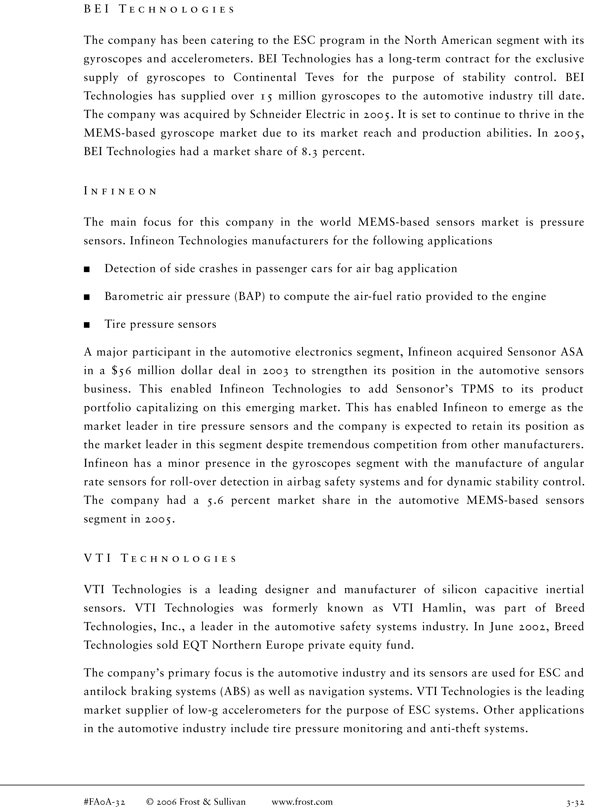
B E I T E C H N O L O G I E S
The company has been catering to the ESC program in the North American segment with its gyroscopes and accelerometers. BEI Technologies has a long-term contract for the exclusive supply of gyroscopes to Continental Teves for the purpose of stability control. BEI Technologies has supplied over 15 million gyroscopes to the automotive industry till date. The company was acquired by Schneider Electric in 2005. It is set to continue to thrive in the MEMS-based gyroscope market due to its market reach and production abilities. In 2005, BEI Technologies had a market share of 8.3 percent.
I N F I N E O N
The main focus for this company in the world MEMS-based sensors market is pressure sensors. Infineon Technologies manufacturers for the following applications
Detection of side crashes in passenger cars for air bag application
Barometric air pressure (BAP) to compute the air-fuel ratio provided to the engine
Tire pressure sensors
A major participant in the automotive electronics segment, Infineon acquired Sensonor ASA in a $56 million dollar deal in 2003 to strengthen its position in the automotive sensors business. This enabled Infineon Technologies to add Sensonor’s TPMS to its product portfolio capitalizing on this emerging market. This has enabled Infineon to emerge as the market leader in tire pressure sensors and the company is expected to retain its position as the market leader in this segment despite tremendous competition from other manufacturers. Infineon has a minor presence in the gyroscopes segment with the manufacture of angular rate sensors for roll-over detection in airbag safety systems and for dynamic stability control. The company had a 5.6 percent market share in the automotive MEMS-based sensors segment in 2005.
V T I T E C H N O L O G I E S
VTI Technologies is a leading designer and manufacturer of silicon capacitive inertial sensors. VTI Technologies was formerly known as VTI Hamlin, was part of Breed Technologies, Inc., a leader in the automotive safety systems industry. In June 2002, Breed Technologies sold EQT Northern Europe private equity fund.
The company’s primary focus is the automotive industry and its sensors are used for ESC and antilock braking systems (ABS) as well as navigation systems. VTI Technologies is the leading market supplier of low-g accelerometers for the purpose of ESC systems. Other applications in the automotive industry include tire pressure monitoring and anti-theft systems.
#FA0A-32 © 2006 Frost & Sullivan www.frost.com 3-32
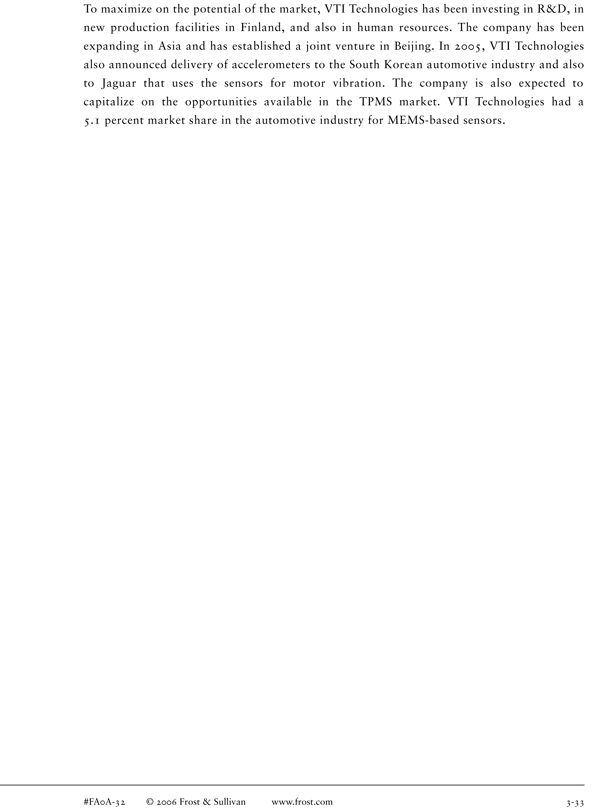
To maximize on the potential of the market, VTI Technologies has been investing in R&D, in new production facilities in Finland, and also in human resources. The company has been expanding in Asia and has established a joint venture in Beijing. In 2005, VTI Technologies also announced delivery of accelerometers to the South Korean automotive industry and also to Jaguar that uses the sensors for motor vibration. The company is also expected to capitalize on the opportunities available in the TPMS market. VTI Technologies had a 5.1 percent market share in the automotive industry for MEMS-based sensors.
#FA0A-32 © 2006 Frost & Sullivan www.frost.com 3-33
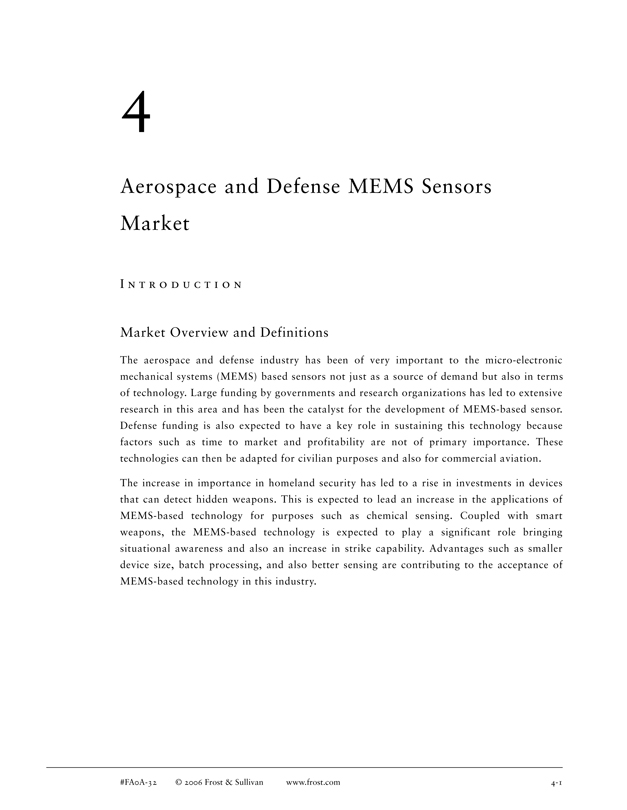
Aerospace and Defense MEMS Sensors
Market
I N T R O D U C T I O N
Market Overview and Definitions
The aerospace and defense industry has been of very important to the micro-electronic mechanical systems (MEMS) based sensors not just as a source of demand but also in terms of technology. Large funding by governments and research organizations has led to extensive research in this area and has been the catalyst for the development of MEMS-based sensor. Defense funding is also expected to have a key role in sustaining this technology because factors such as time to market and profitability are not of primary importance. These technologies can then be adapted for civilian purposes and also for commercial aviation.
The increase in importance in homeland security has led to a rise in investments in devices that can detect hidden weapons. This is expected to lead an increase in the applications of MEMS-based technology for purposes such as chemical sensing. Coupled with smart weapons, the MEMS-based technology is expected to play a significant role bringing situational awareness and also an increase in strike capability. Advantages such as smaller device size, batch processing, and also better sensing are contributing to the acceptance of MEMS-based technology in this industry.
#FA0A-32 © 2006 Frost & Sullivan www.frost.com 4-1
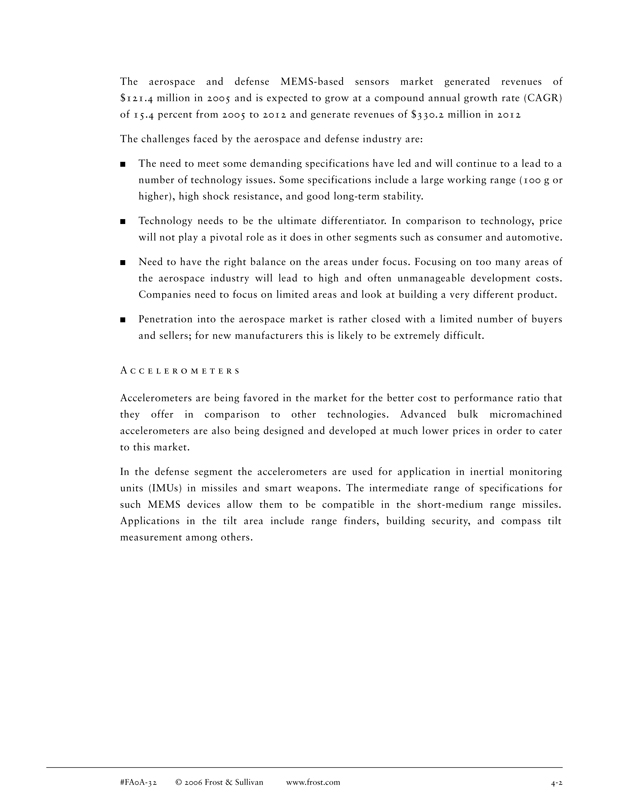
The aerospace and defense MEMS-based sensors market generated revenues of $121.4 million in 2005 and is expected to grow at a compound annual growth rate (CAGR) of 15.4 percent from 2005 to 2012 and generate revenues of $330.2 million in 2012
The challenges faced by the aerospace and defense industry are:
The need to meet some demanding specifications have led and will continue to a lead to a number of technology issues. Some specifications include a large working range (100 g or higher), high shock resistance, and good long-term stability.
Technology needs to be the ultimate differentiator. In comparison to technology, price will not play a pivotal role as it does in other segments such as consumer and automotive.
Need to have the right balance on the areas under focus. Focusing on too many areas of the aerospace industry will lead to high and often unmanageable development costs. Companies need to focus on limited areas and look at building a very different product.
Penetration into the aerospace market is rather closed with a limited number of buyers and sellers; for new manufacturers this is likely to be extremely difficult.
A C C E L E R O M E T E R S
Accelerometers are being favored in the market for the better cost to performance ratio that they offer in comparison to other technologies. Advanced bulk micromachined accelerometers are also being designed and developed at much lower prices in order to cater to this market.
In the defense segment the accelerometers are used for application in inertial monitoring units (IMUs) in missiles and smart weapons. The intermediate range of specifications for such MEMS devices allow them to be compatible in the short-medium range missiles. Applications in the tilt area include range finders, building security, and compass tilt measurement among others.
#FA0A-32 © 2006 Frost & Sullivan www.frost.com 4-2
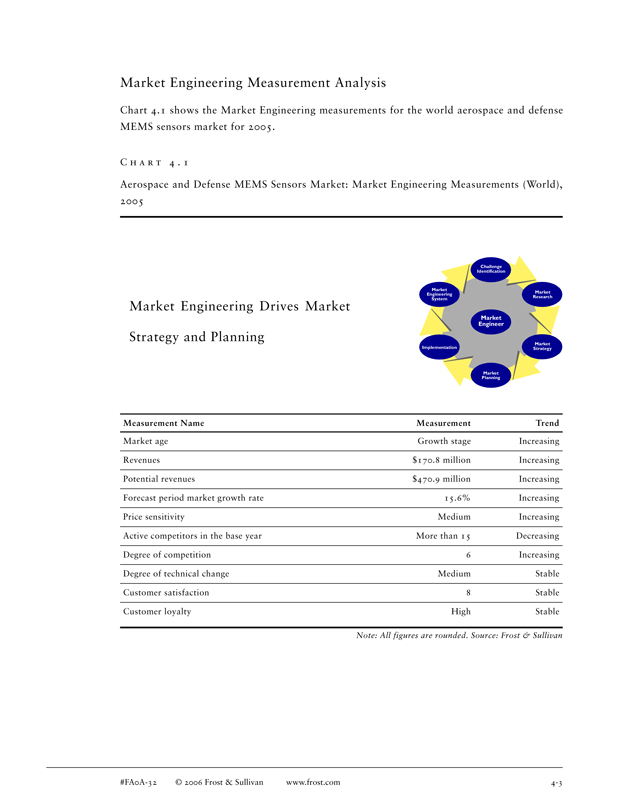
Market Engineering Measurement Analysis
Chart 4.1 shows the Market Engineering measurements for the world aerospace and defense MEMS sensors market for 2005.
C H A R T 4 . 1
Aerospace and Defense MEMS Sensors Market: Market Engineering Measurements (World), 2005
Challenge Identification
Market
Market Engineering Research System
Market Engineering Drives Market
Market Engineer
Strategy and Planning
Market Implementation Strategy
Market Planning
Measurement Name Measurement Trend
Market age Growth stage Increasing Revenues $170.8 million Increasing Potential revenues $470.9 million Increasing Forecast period market growth rate 15.6% Increasing Price sensitivity Medium Increasing Active competitors in the base year More than 15 Decreasing Degree of competition 6 Increasing Degree of technical change Medium Stable Customer satisfaction 8 Stable Customer loyalty High Stable
Note: All figures are rounded. Source: Frost & Sullivan
#FA0A-32 © 2006 Frost & Sullivan www.frost.com 4-3
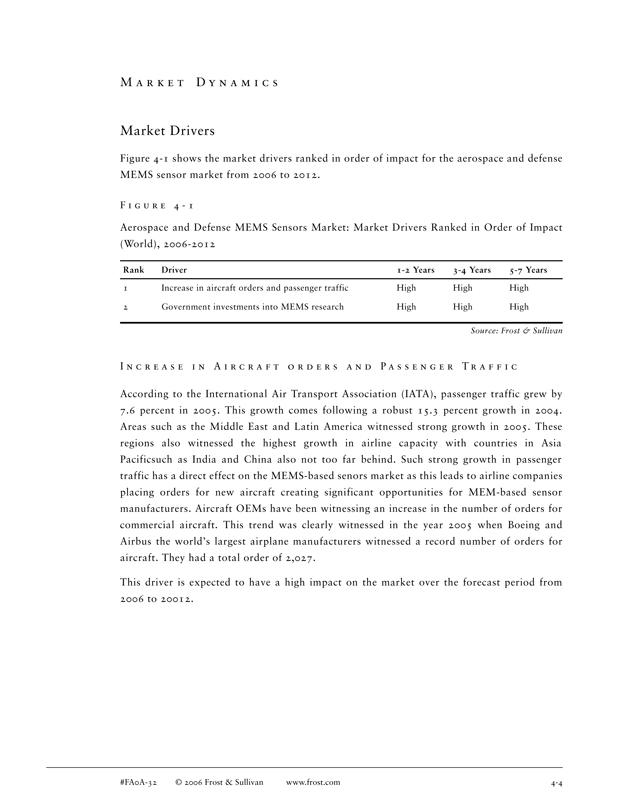
M A R K E T D Y N A M I C S
Market Drivers
Figure 4-1 shows the market drivers ranked in order of impact for the aerospace and defense MEMS sensor market from 2006 to 2012.
F I G U R E 4—1
Aerospace and Defense MEMS Sensors Market: Market Drivers Ranked in Order of Impact (World), 2006-2012
Rank Driver 1-2 Years 3-4 Years 5-7 Years
1 Increase in aircraft orders and passenger traffic High High High
2 Government investments into MEMS research High High High
Source: Frost & Sullivan
I N C R E A S E I N A I R C R A F T O R D E R S A N D P A S S E N G E R T R A F F I C
According to the International Air Transport Association (IATA), passenger traffic grew by 7.6 percent in 2005. This growth comes following a robust 15.3 percent growth in 2004. Areas such as the Middle East and Latin America witnessed strong growth in 2005. These regions also witnessed the highest growth in airline capacity with countries in Asia Pacificsuch as India and China also not too far behind. Such strong growth in passenger traffic has a direct effect on the MEMS-based senors market as this leads to airline companies placing orders for new aircraft creating significant opportunities for MEM-based sensor manufacturers. Aircraft OEMs have been witnessing an increase in the number of orders for commercial aircraft. This trend was clearly witnessed in the year 2005 when Boeing and Airbus the world’s largest airplane manufacturers witnessed a record number of orders for aircraft. They had a total order of 2,027.
This driver is expected to have a high impact on the market over the forecast period from 2006 to 20012.
#FA0A-32 © 2006 Frost & Sullivan www.frost.com 4-4
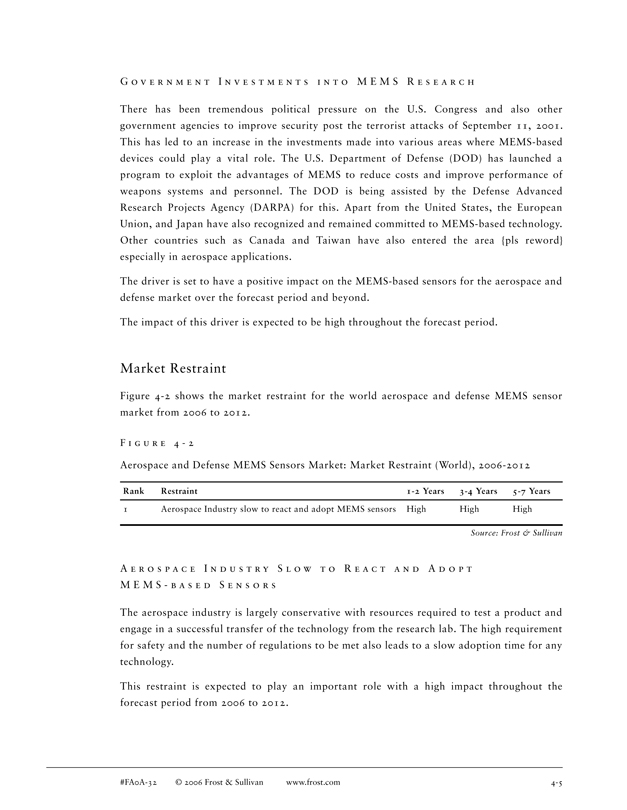
G O V E R N M E N T I N V E S T M E N T S I N T O M E M S R E S E A R C H
There has been tremendous political pressure on the U.S. Congress and also other government agencies to improve security post the terrorist attacks of September 11, 2001. This has led to an increase in the investments made into various areas where MEMS-based devices could play a vital role. The U.S. Department of Defense (DOD) has launched a program to exploit the advantages of MEMS to reduce costs and improve performance of weapons systems and personnel. The DOD is being assisted by the Defense Advanced Research Projects Agency (DARPA) for this. Apart from the United States, the European Union, and Japan have also recognized and remained committed to MEMS-based technology. Other countries such as Canada and Taiwan have also entered the area {pls reword} especially in aerospace applications.
The driver is set to have a positive impact on the MEMS-based sensors for the aerospace and defense market over the forecast period and beyond.
The impact of this driver is expected to be high throughout the forecast period.
Market Restraint
Figure 4-2 shows the market restraint for the world aerospace and defense MEMS sensor market from 2006 to 2012.
F I G U R E 4—2
Aerospace and Defense MEMS Sensors Market: Market Restraint (World), 2006-2012
Rank Restraint 1-2 Years 3-4 Years 5-7 Years
1 Aerospace Industry slow to react and adopt MEMS sensors High High High
Source: Frost & Sullivan
A E R O S P A C E I N D U S T R Y S L O W T O R E A C T A N D A D O P T M E M S—B A S E D S E N S O R S
The aerospace industry is largely conservative with resources required to test a product and engage in a successful transfer of the technology from the research lab. The high requirement for safety and the number of regulations to be met also leads to a slow adoption time for any technology.
This restraint is expected to play an important role with a high impact throughout the forecast period from 2006 to 2012.
#FA0A-32 © 2006 Frost & Sullivan www.frost.com 4-5
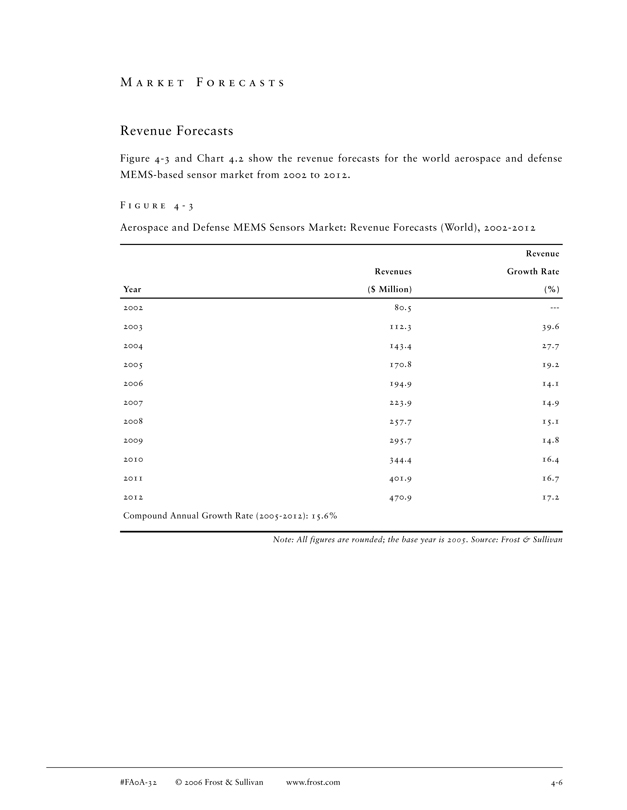
M A R K E T F O R E C A S T S
Revenue Forecasts
Figure 4-3 and Chart 4.2 show the revenue forecasts for the world aerospace and defense MEMS-based sensor market from 2002 to 2012.
F I G U R E 4—3
Aerospace and Defense MEMS Sensors Market: Revenue Forecasts (World), 2002-2012
Revenue Revenues Growth Rate Year($ Million)(%)
2002 80.5 -—2003 112.3 39.6 2004 143.4 27.7 2005 170.8 19.2 2006 194.9 14.1 2007 223.9 14.9 2008 257.7 15.1 2009 295.7 14.8 2010 344.4 16.4 2011 401.9 16.7 2012 470.9 17.2 Compound Annual Growth Rate (2005-2012): 15.6%
Note: All figures are rounded; the base year is 2005. Source: Frost & Sullivan
#FA0A-32 © 2006 Frost & Sullivan www.frost.com 4-6
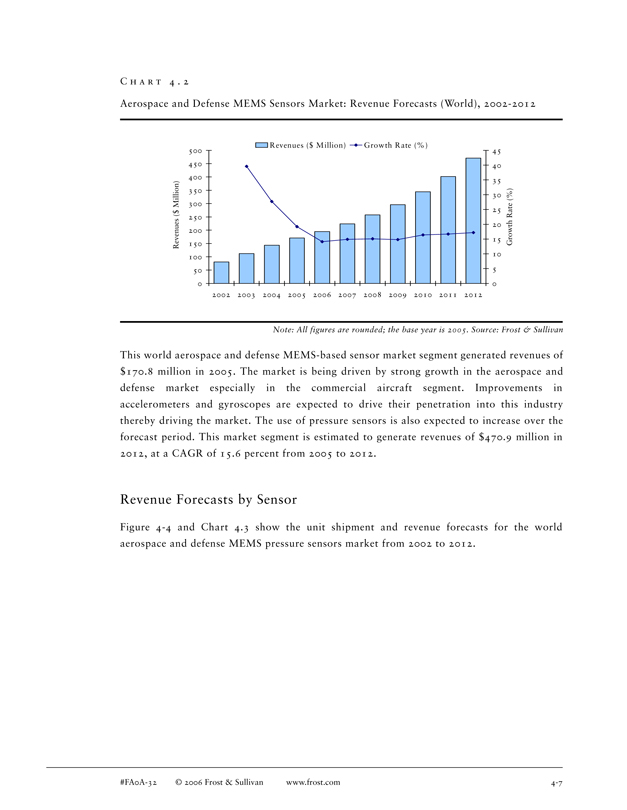
C H A R T 4 . 2
Aerospace and Defense MEMS Sensors Market: Revenue Forecasts (World), 2002-2012
Revenues ($ Million) Growth Rate (%)
500 45
450 40 400 35 350 30 Million) 300 25 $ 250 20 200
15 Growth Rate (%) Revenues ( 150 10 100
50 5
0 0 2002 2003 2004 2005 2006 2007 2008 2009 2010 2011 2012
Note: All figures are rounded; the base year is 2005. Source: Frost & Sullivan
This world aerospace and defense MEMS-based sensor market segment generated revenues of $170.8 million in 2005. The market is being driven by strong growth in the aerospace and defense market especially in the commercial aircraft segment. Improvements in accelerometers and gyroscopes are expected to drive their penetration into this industry thereby driving the market. The use of pressure sensors is also expected to increase over the forecast period. This market segment is estimated to generate revenues of $470.9 million in 2012, at a CAGR of 15.6 percent from 2005 to 2012.
Revenue Forecasts by Sensor
Figure 4-4 and Chart 4.3 show the unit shipment and revenue forecasts for the world aerospace and defense MEMS pressure sensors market from 2002 to 2012.
#FA0A-32 © 2006 Frost & Sullivan www.frost.com 4-7
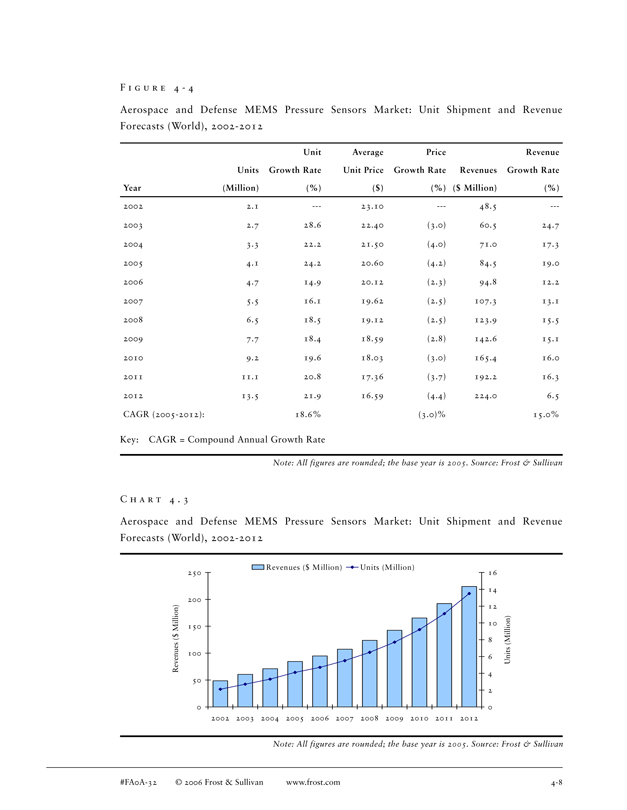
F I G U R E 4 - 4
Aerospace and Defense MEMS Pressure Sensors Market: Unit Shipment and Revenue Forecasts (World), 2002-2012
Unit Average Price Revenue Units Growth Rate Unit Price Growth Rate Revenues Growth Rate Year(Million)(%)($)(%) ($ Million)(%)
2002 2.1 - 23.10 - 48.5 -2003 2.7 28.6 22.40(3.0) 60.5 24.7 2004 3.3 22.2 21.50(4.0) 71.0 17.3 2005 4.1 24.2 20.60(4.2) 84.5 19.0 2006 4.7 14.9 20.12(2.3) 94.8 12.2 2007 5.5 16.1 19.62(2.5) 107.3 13.1 2008 6.5 18.5 19.12(2.5) 123.9 15.5 2009 7.7 18.4 18.59(2.8) 142.6 15.1 2010 9.2 19.6 18.03(3.0) 165.4 16.0 2011 11.1 20.8 17.36(3.7) 192.2 16.3 2012 13.5 21.9 16.59(4.4) 224.0 6.5 CAGR (2005-2012): 18.6%(3.0)% 15.0%
Key: CAGR = Compound Annual Growth Rate
Note: All figures are rounded; the base year is 2005. Source: Frost & Sullivan
C H A R T 4 . 3
Aerospace and Defense MEMS Pressure Sensors Market: Unit Shipment and Revenue Forecasts (World), 2002-2012
Revenues ($ M illion) Units (M illion)
250 16
14 200 Million) 12
10 (Million) 150 $
( 8 Revenues 100
6 Units 4 50 2
0 0 2002 2003 2004 2005 2006 2007 2008 2009 2010 2011 2012
Note: All figures are rounded; the base year is 2005. Source: Frost & Sullivan
#FA0A-32 © 2006 Frost & Sullivan www.frost.com 4-8
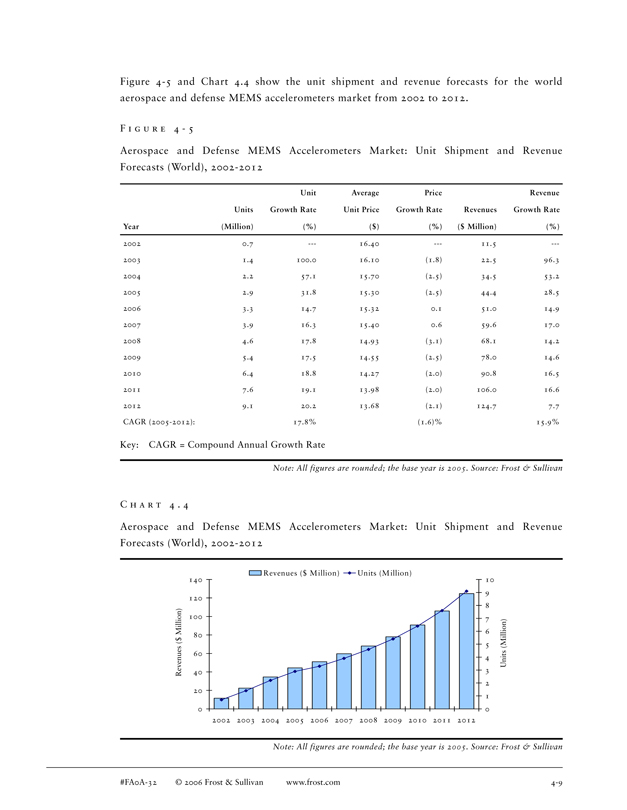
Figure 4-5 and Chart 4.4 show the unit shipment and revenue forecasts for the world aerospace and defense MEMS accelerometers market from 2002 to 2012.
F I G U R E 4 - 5
Aerospace and Defense MEMS Accelerometers Market: Unit Shipment and Revenue Forecasts (World), 2002-2012
Unit Average Price Revenue Units Growth Rate Unit Price Growth Rate Revenues Growth Rate Year(Million)(%)($)(%) ($ Million)(%)
2002 0.7 - 16.40 - 11.5 -2003 1.4 100.0 16.10(1.8) 22.5 96.3 2004 2.2 57.1 15.70(2.5) 34.5 53.2 2005 2.9 31.8 15.30(2.5) 44.4 28.5 2006 3.3 14.7 15.32 0.1 51.0 14.9 2007 3.9 16.3 15.40 0.6 59.6 17.0 2008 4.6 17.8 14.93(3.1) 68.1 14.2 2009 5.4 17.5 14.55(2.5) 78.0 14.6 2010 6.4 18.8 14.27(2.0) 90.8 16.5 2011 7.6 19.1 13.98(2.0) 106.0 16.6 2012 9.1 20.2 13.68(2.1) 124.7 7.7 CAGR (2005-2012): 17.8%(1.6)% 15.9%
Key: CAGR = Compound Annual Growth Rate
Note: All figures are rounded; the base year is 2005. Source: Frost & Sullivan
C H A R T 4 . 4
Aerospace and Defense MEMS Accelerometers Market: Unit Shipment and Revenue Forecasts (World), 2002-2012
Revenues ($ Million) Units (M illion)
140 10 9 120 8 Million) 100 7 (Million) 6 80 $ ( 5 Revenues 60
4 Units
40 3 2 20 1
0 0 2002 2003 2004 2005 2006 2007 2008 2009 2010 2011 2012
Note: All figures are rounded; the base year is 2005. Source: Frost & Sullivan
#FA0A-32 © 2006 Frost & Sullivan www.frost.com 4-9
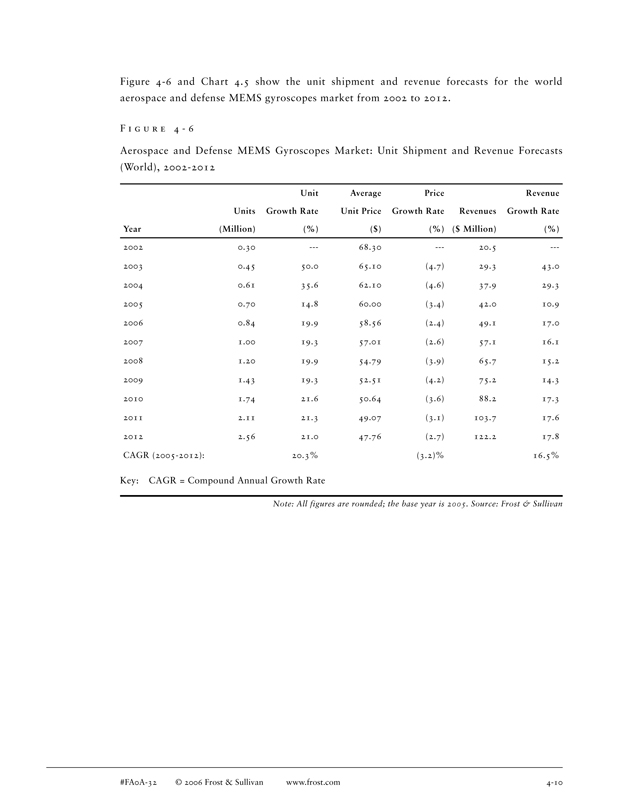
Figure 4-6 and Chart 4.5 show the unit shipment and revenue forecasts for the world aerospace and defense MEMS gyroscopes market from 2002 to 2012.
F I G U R E 4 - 6
Aerospace and Defense MEMS Gyroscopes Market: Unit Shipment and Revenue Forecasts (World), 2002-2012
Unit Average Price Revenue Units Growth Rate Unit Price Growth Rate Revenues Growth Rate Year(Million)(%)($)(%) ($ Million)(%)
2002 0.30 - 68.30 - 20.5 -2003 0.45 50.0 65.10 (4.7) 29.3 43.0 2004 0.61 35.6 62.10 (4.6) 37.9 29.3 2005 0.70 14.8 60.00 (3.4) 42.0 10.9 2006 0.84 19.9 58.56 (2.4) 49.1 17.0 2007 1.00 19.3 57.01 (2.6) 57.1 16.1 2008 1.20 19.9 54.79 (3.9) 65.7 15.2 2009 1.43 19.3 52.51 (4.2) 75.2 14.3 2010 1.74 21.6 50.64 (3.6) 88.2 17.3 2011 2.11 21.3 49.07 (3.1) 103.7 17.6 2012 2.56 21.0 47.76 (2.7) 122.2 17.8 CAGR (2005-2012): 20.3%(3.2)% 16.5%
Key: CAGR = Compound Annual Growth Rate
Note: All figures are rounded; the base year is 2005. Source: Frost & Sullivan
#FA0A-32 © 2006 Frost & Sullivan www.frost.com 4-10
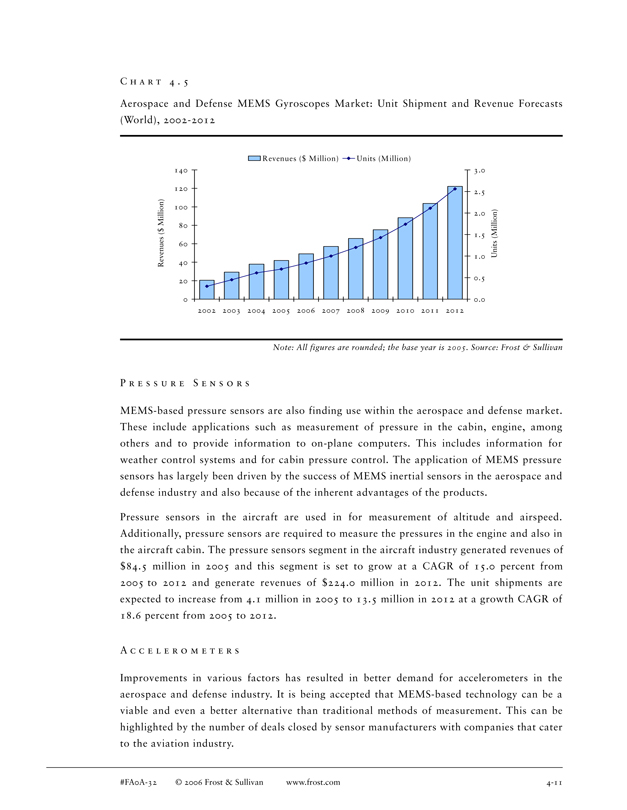
C H A R T 4 . 5
Aerospace and Defense MEMS Gyroscopes Market: Unit Shipment and Revenue Forecasts (World), 2002-2012
Revenues ($ Million) Units (M illion)
140 3.0
120
2.5
100
Million) 2.0 80 $ 1.5
60 | | Units (Million) 1.0 Revenues ( 40 0.5 20 |
0 0.0 2002 2003 2004 2005 2006 2007 2008 2009 2010 2011 2012
Note: All figures are rounded; the base year is 2005. Source: Frost & Sullivan
P R E S S U R E S E N S O R S
MEMS-based pressure sensors are also finding use within the aerospace and defense market. These include applications such as measurement of pressure in the cabin, engine, among others and to provide information to on-plane computers. This includes information for weather control systems and for cabin pressure control. The application of MEMS pressure sensors has largely been driven by the success of MEMS inertial sensors in the aerospace and defense industry and also because of the inherent advantages of the products.
Pressure sensors in the aircraft are used in for measurement of altitude and airspeed. Additionally, pressure sensors are required to measure the pressures in the engine and also in the aircraft cabin. The pressure sensors segment in the aircraft industry generated revenues of $84.5 million in 2005 and this segment is set to grow at a CAGR of 15.0 percent from 2005 to 2012 and generate revenues of $224.0 million in 2012. The unit shipments are expected to increase from 4.1 million in 2005 to 13.5 million in 2012 at a growth CAGR of 18.6 percent from 2005 to 2012.
A C C E L E R O M E T E R S
Improvements in various factors has resulted in better demand for accelerometers in the aerospace and defense industry. It is being accepted that MEMS-based technology can be a viable and even a better alternative than traditional methods of measurement. This can be highlighted by the number of deals closed by sensor manufacturers with companies that cater to the aviation industry.
#FA0A-32 © 2006 Frost & Sullivan www.frost.com 4-11

In May 2005, Colibrys Switzerland Ltd. signed an agreement with BAE Systems of Plymouth, UK. for the supply of high performance MEMS-based accelerometers to be incorporated within IMUs. MEMS-based accelerometers may not have the necessary specifications to compete directly with traditional technologies but they have been gaining acceptance on the basis of the advantages they offer. These advantages include ability to work in harsh environments and inherent ones such as size, weight, and cost. Accelerometers are being used in IMUs that provide six degree of freedom motion sensing for the purpose of navigation and control. The market for accelerometers in the aerospace industry generated revenues of $44.4 million in 2005 and this is expected to grow at a CAGR 15.9 percent from 2005 to 2012. The market is estimated to generate revenues of $124.7 million in 2012.
G Y R O S C O P E S
MEMS-based gyroscopes have a number of advantages in comparison to the competing technologies such as fiber optic gyroscopes (FOG) and ring laser gyroscopes (RLG).
These include
Low power consumption
Less degree of complexity
Less expensive
Mass production
Good reliability
Applications in future navigation and missile systems.
Gyroscopes are used for both aviation and defense purposes for applications such as missile guidance, general navigation, and platform stabilization with the potential application of smart munitions in the future. This market has a limited number of participants due to the nature of the technology, the fact that large capital is required for R&D, and the nature of the aerospace industry. This segment generated revenues of $42.0 million in 2005 and the units shipped were 0.7 million. The CAGR for units from is expected to be 20.3 percent from 2005 to 2012 as MEMS-based gyroscopes replace entrenched technologies and gain significant market share. The revenue growth rates for the period is likely to be restrained by the significant drop in price that is anticipated. The market is expected to grow at a CAGR of 16.5 percent from 2005 to 2012 and generate revenues of $122.2 million in 2012.
#FA0A-32 © 2006 Frost & Sullivan www.frost.com 4-12
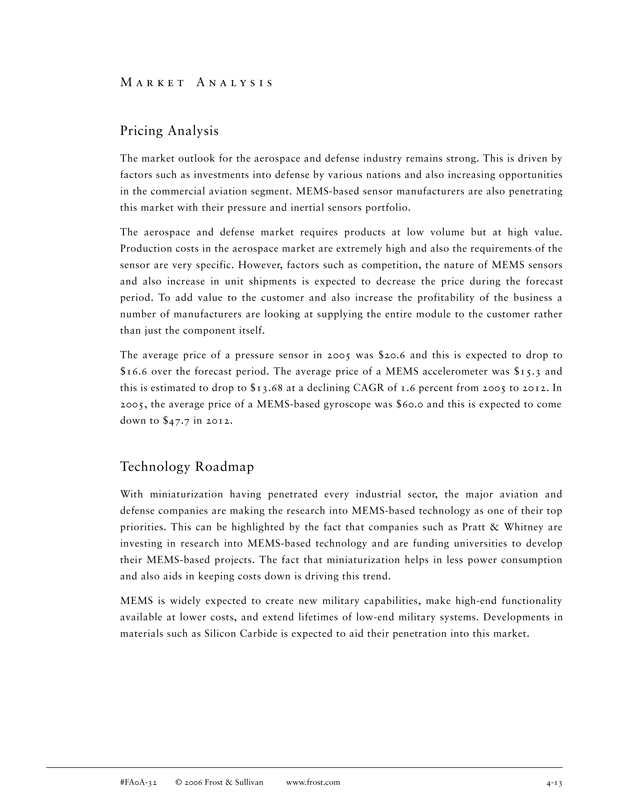
M A R K E T A N A L Y S I S
Pricing Analysis
The market outlook for the aerospace and defense industry remains strong. This is driven by factors such as investments into defense by various nations and also increasing opportunities in the commercial aviation segment. MEMS-based sensor manufacturers are also penetrating this market with their pressure and inertial sensors portfolio.
The aerospace and defense market requires products at low volume but at high value. Production costs in the aerospace market are extremely high and also the requirements of the sensor are very specific. However, factors such as competition, the nature of MEMS sensors and also increase in unit shipments is expected to decrease the price during the forecast period. To add value to the customer and also increase the profitability of the business a number of manufacturers are looking at supplying the entire module to the customer rather than just the component itself.
The average price of a pressure sensor in 2005 was $20.6 and this is expected to drop to $16.6 over the forecast period. The average price of a MEMS accelerometer was $15.3 and this is estimated to drop to $13.68 at a declining CAGR of 1.6 percent from 2005 to 2012. In 2005, the average price of a MEMS-based gyroscope was $60.0 and this is expected to come down to $47.7 in 2012.
Technology Roadmap
With miniaturization having penetrated every industrial sector, the major aviation and defense companies are making the research into MEMS-based technology as one of their top priorities. This can be highlighted by the fact that companies such as Pratt & Whitney are investing in research into MEMS-based technology and are funding universities to develop their MEMS-based projects. The fact that miniaturization helps in less power consumption and also aids in keeping costs down is driving this trend.
MEMS is widely expected to create new military capabilities, make high-end functionality available at lower costs, and extend lifetimes of low-end military systems. Developments in materials such as Silicon Carbide is expected to aid their penetration into this market.
#FA0A-32 © 2006 Frost & Sullivan www.frost.com 4-13
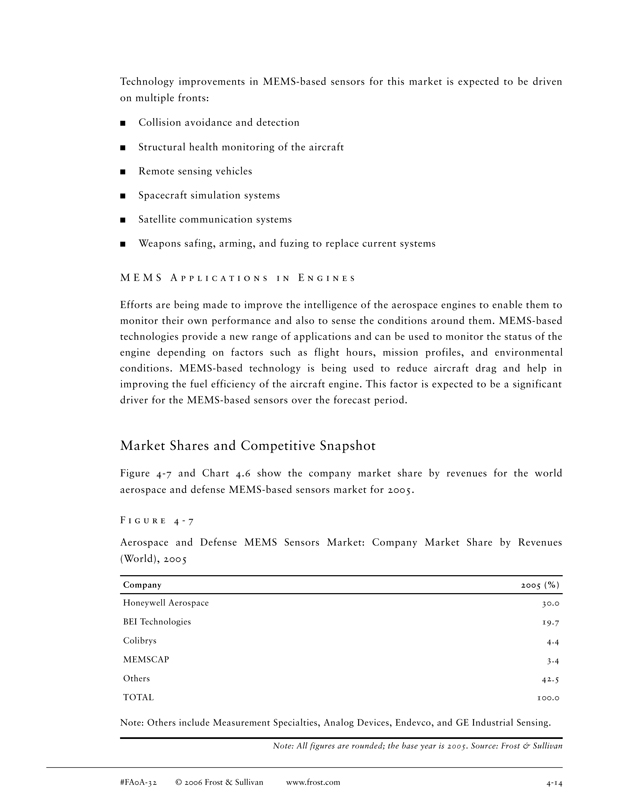
Technology improvements in MEMS-based sensors for this market is expected to be driven on multiple fronts:
Collision avoidance and detection
Structural health monitoring of the aircraft
Remote sensing vehicles
Spacecraft simulation systems
Satellite communication systems
Weapons safing, arming, and fuzing to replace current systems
M E M S A P P L I C A T I O N S I N E N G I N E S
Efforts are being made to improve the intelligence of the aerospace engines to enable them to monitor their own performance and also to sense the conditions around them. MEMS-based technologies provide a new range of applications and can be used to monitor the status of the engine depending on factors such as flight hours, mission profiles, and environmental conditions. MEMS-based technology is being used to reduce aircraft drag and help in improving the fuel efficiency of the aircraft engine. This factor is expected to be a significant driver for the MEMS-based sensors over the forecast period.
Market Shares and Competitive Snapshot
Figure 4-7 and Chart 4.6 show the company market share by revenues for the world aerospace and defense MEMS-based sensors market for 2005.
F I G U R E 4 - 7
Aerospace and Defense MEMS Sensors Market: Company Market Share by Revenues (World), 2005
Company 2005 (%)
Honeywell Aerospace 30.0 BEI Technologies 19.7 Colibrys 4.4 MEMSCAP 3.4 Others 42.5 TOTAL 100.0
Note: Others include Measurement Specialties, Analog Devices, Endevco, and GE Industrial Sensing.
Note: All figures are rounded; the base year is 2005. Source: Frost & Sullivan
#FA0A-32 © 2006 Frost & Sullivan www.frost.com 4-14

C H A R T 4 . 6
Aerospace and Defense MEMS Sensors Market: Company Market Share by Revenues (World), 2005
Honeywell Aerospace 30.0%
BEI Technologies 19.7%
Colibrys 4.4% Others 42.5% MEMSCAP
3.4%
Note: Others include Measurement Specialties, Analog Devices, Endevco, and GE Industrial Sensing.
Note: All figures are rounded; the base year is 2005. Source: Frost & Sullivan
The aerospace and defense industry has its own set of trends when compared to other industries that MEMS sensors find applications in. The industry is largely conservative when it comes to new technology, characterized by very limited number of buyers and sellers.
Competitive factors in this industry include:
Performance and reliability
Technology differentiation
Ability to invest in research and development
H O N E Y W E L L
Honeywell is a major company in the aerospace and defense industry with sales of $10.5 billion in 2005 and expected sales of $11.1 billion in 2006. Honeywell has multiple products targeted at various applications within the aerospace and defense market. The company’s broad product line includes propulsion systems, engine systems and accessories, avionics, and electronics among others. Honeywell has a very strong position in the market for integrated GPS-inertial navigation systems for aircraft and military applications. The company manufacturers both ring-laser gyroscopes and MEMS-based gyroscopes.
#FA0A-32 © 2006 Frost & Sullivan www.frost.com 4-15
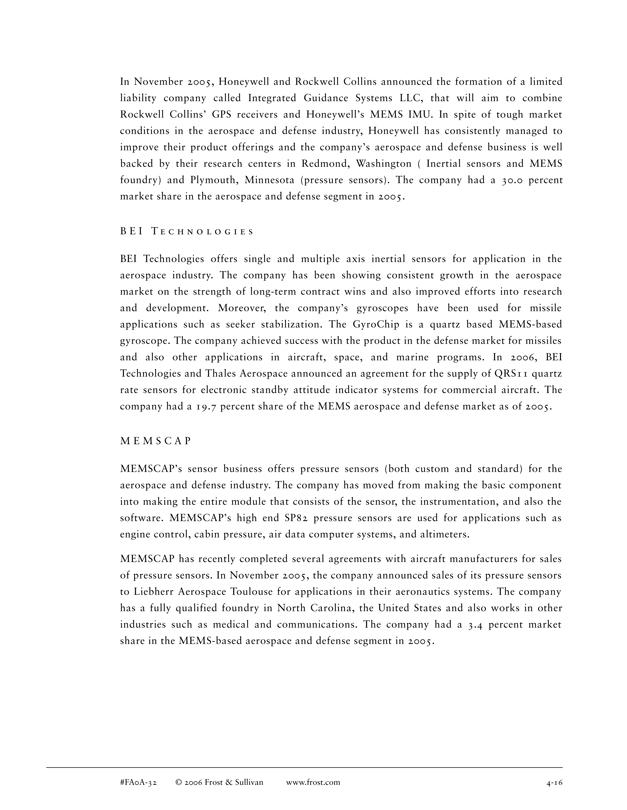
In November 2005, Honeywell and Rockwell Collins announced the formation of a limited liability company called Integrated Guidance Systems LLC, that will aim to combine Rockwell Collins’ GPS receivers and Honeywell’s MEMS IMU. In spite of tough market conditions in the aerospace and defense industry, Honeywell has consistently managed to improve their product offerings and the company’s aerospace and defense business is well backed by their research centers in Redmond, Washington ( Inertial sensors and MEMS foundry) and Plymouth, Minnesota (pressure sensors). The company had a 30.0 percent market share in the aerospace and defense segment in 2005.
B E I T E C H N O L O G I E S
BEI Technologies offers single and multiple axis inertial sensors for application in the aerospace industry. The company has been showing consistent growth in the aerospace market on the strength of long-term contract wins and also improved efforts into research and development. Moreover, the company’s gyroscopes have been used for missile applications such as seeker stabilization. The GyroChip is a quartz based MEMS-based gyroscope. The company achieved success with the product in the defense market for missiles and also other applications in aircraft, space, and marine programs. In 2006, BEI Technologies and Thales Aerospace announced an agreement for the supply of QRS11 quartz rate sensors for electronic standby attitude indicator systems for commercial aircraft. The company had a 19.7 percent share of the MEMS aerospace and defense market as of 2005.
M E M S C A P
MEMSCAP’s sensor business offers pressure sensors (both custom and standard) for the aerospace and defense industry. The company has moved from making the basic component into making the entire module that consists of the sensor, the instrumentation, and also the software. MEMSCAP’s high end SP82 pressure sensors are used for applications such as engine control, cabin pressure, air data computer systems, and altimeters.
MEMSCAP has recently completed several agreements with aircraft manufacturers for sales of pressure sensors. In November 2005, the company announced sales of its pressure sensors to Liebherr Aerospace Toulouse for applications in their aeronautics systems. The company has a fully qualified foundry in North Carolina, the United States and also works in other industries such as medical and communications. The company had a 3.4 percent market share in the MEMS-based aerospace and defense segment in 2005.
#FA0A-32 © 2006 Frost & Sullivan www.frost.com 4-16
E N D E V C O
Endevco ( a part of Meggitt PLC) is a leading supplier of sensors to the aerospace industry. The company has been in the sensors industry for over three decades and its expertise and capabilities in the aerospace market have helped it retain its market share position. Endevco also supplies pressure transducers and microphones for vehicle dynamics studies.
C R O S S B O W T E C H N O L O G Y
Crossbow Technology is a leading supplier of inertial sensors to the aerospace and defense industry and is the leading end-to-end solutions suppliers in wireless sensor networks and the largest manufacturer of smart dust wireless sensors. Existing investors in the company include the Paladin Capital Group. The company has also developed the world’s first attitude and heading reference system (AHRS) based on MEMS technology.
#FA0A-32 © 2006 Frost & Sullivan www.frost.com 4-17
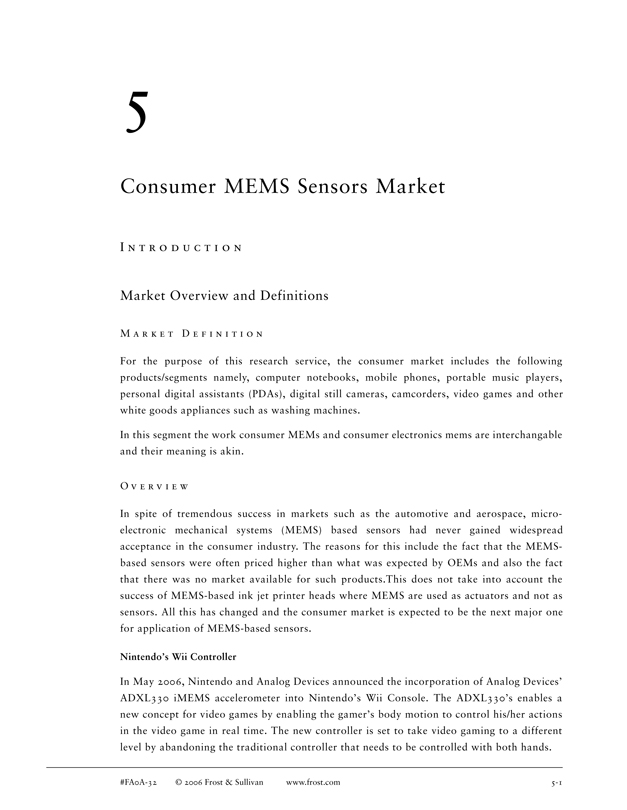
Consumer MEMS Sensors Market
I N T R O D U C T I O N
Market Overview and Definitions
M A R K E T D E F I N I T I O N
For the purpose of this research service, the consumer market includes the following products/segments namely, computer notebooks, mobile phones, portable music players, personal digital assistants (PDAs), digital still cameras, camcorders, video games and other white goods appliances such as washing machines.
In this segment the work consumer MEMs and consumer electronics mems are interchangable and their meaning is akin.
O V E R V I E W
In spite of tremendous success in markets such as the automotive and aerospace, microelectronic mechanical systems (MEMS) based sensors had never gained widespread acceptance in the consumer industry. The reasons for this include the fact that the MEMS-based sensors were often priced higher than what was expected by OEMs and also the fact that there was no market available for such products.This does not take into account the success of MEMS-based ink jet printer heads where MEMS are used as actuators and not as sensors. All this has changed and the consumer market is expected to be the next major one for application of MEMS-based sensors.
Nintendo’s Wii Controller
In May 2006, Nintendo and Analog Devices announced the incorporation of Analog Devices’ ADXL330 iMEMS accelerometer into Nintendo’s Wii Console. The ADXL330’s enables a new concept for video games by enabling the gamer’s body motion to control his/her actions in the video game in real time. The new controller is set to take video gaming to a different level by abandoning the traditional controller that needs to be controlled with both hands.
#FA0A-32 © 2006 Frost & Sullivan www.frost.com 5-1

Apple IPod and Nike Sneaker Combination
In 2006, Apple and Nike teamed up to develop a sports kit that uses the runner’s movement to adjust the volume or even to select the songs. The kit uses an accelerometer that is tucked into the shoe to detect and measure the motion of the runner. This is believed to be the first of a number of products that can change the tempo of the music based on the pace of the listener’s activity.
The Challenge
The biggest challenge facing MEMS manufacturers is not having enough demand to scale up production to bring the prices down in order to meet the requirements of the consumer electronic manufacturers. While, sensor manufacturers are expected to meet the price requirements for applications such as camcorders and PDAs the major market is the mobile phones segment. Achieving the price point for this market will remain a major challenge for products such as inertial measurement unit (IMU)
The importance of the consumer market can be underlined by the fact that traditional automotive sensor manufacturers such as Bosch and VTI Technologies are now working on products that can cater to the consumer market. These companies have been working on a product line that includes three axis accelerometers that can be used to measure acceleration, detect motion, and inclination. These are expected to find applications in areas such as sports equipment, PDAs, and mobile phones among others.
Applications of MEMS Technology in the Consumer Market Include:
Accelerometers and Gyroscopes
Motion sensing by means of inertial sensors such as accelerometers and gyroscopes are becoming very common in the consumer electronics and the IT industry.
Image and video stabilization in mobile phones and digital cameras
Drop protection in laptops, MP3 players, camcorders, and mobile phones
Motion control
Pedometer
Theft detection
Accelerometers
Accelerometers have become very common in the consumer electronics industry. These are used to detect small changes in the g-force when any device is tilted. This tilt can be detected and be used as a command thus improving the interface between the user and the device.
#FA0A-32 © 2006 Frost & Sullivan www.frost.com 5-2
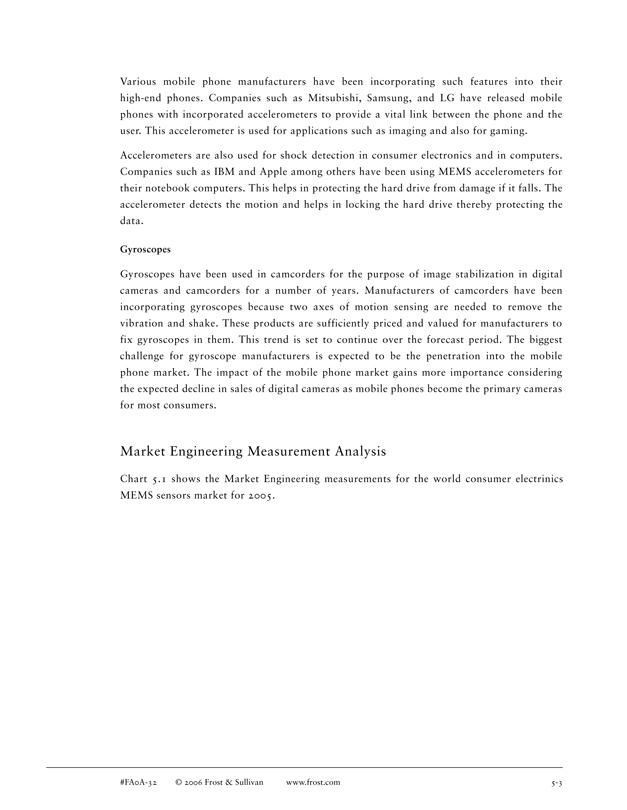
Various mobile phone manufacturers have been incorporating such features into their high-end phones. Companies such as Mitsubishi, Samsung, and LG have released mobile phones with incorporated accelerometers to provide a vital link between the phone and the user. This accelerometer is used for applications such as imaging and also for gaming.
Accelerometers are also used for shock detection in consumer electronics and in computers. Companies such as IBM and Apple among others have been using MEMS accelerometers for their notebook computers. This helps in protecting the hard drive from damage if it falls. The accelerometer detects the motion and helps in locking the hard drive thereby protecting the data.
Gyroscopes
Gyroscopes have been used in camcorders for the purpose of image stabilization in digital cameras and camcorders for a number of years. Manufacturers of camcorders have been incorporating gyroscopes because two axes of motion sensing are needed to remove the vibration and shake. These products are sufficiently priced and valued for manufacturers to fix gyroscopes in them. This trend is set to continue over the forecast period. The biggest challenge for gyroscope manufacturers is expected to be the penetration into the mobile phone market. The impact of the mobile phone market gains more importance considering the expected decline in sales of digital cameras as mobile phones become the primary cameras for most consumers.
Market Engineering Measurement Analysis
Chart 5.1 shows the Market Engineering measurements for the world consumer electrinics MEMS sensors market for 2005.
#FA0A-32 © 2006 Frost & Sullivan www.frost.com 5-3
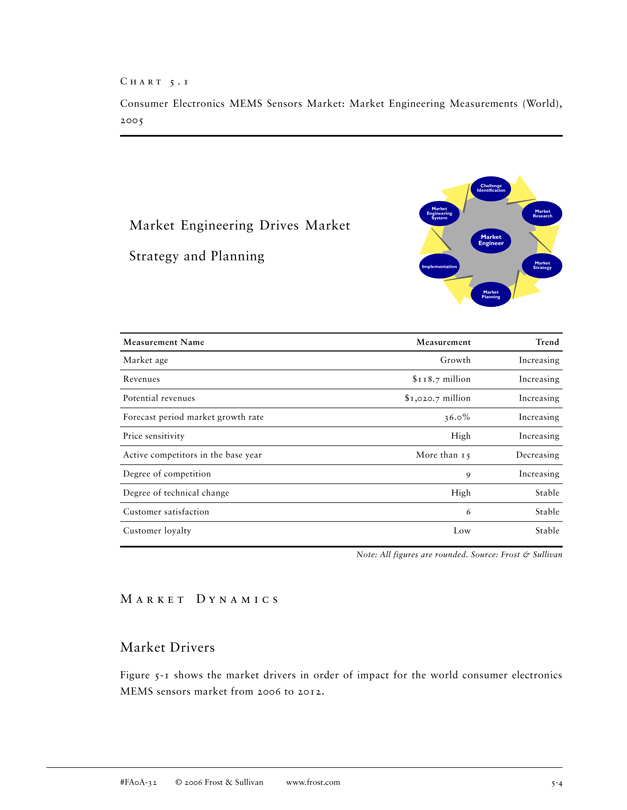
C H A R T 5 . 1
Consumer Electronics MEMS Sensors Market: Market Engineering Measurements (World), 2005
Challenge Identification
Market
Market Engineering Research System
Market Engineering Drives Market
Market Engineer
Strategy and Planning
Market Implementation Strategy
Market Planning
Measurement Name Measurement Trend
Market age Growth Increasing Revenues $118.7 million Increasing Potential revenues $1,020.7 million Increasing Forecast period market growth rate 36.0% Increasing Price sensitivity High Increasing Active competitors in the base year More than 15 Decreasing Degree of competition 9 Increasing Degree of technical change High Stable Customer satisfaction 6 Stable Customer loyalty Low Stable
Note: All figures are rounded. Source: Frost & Sullivan
M A R K E T D Y N A M I C S
Market Drivers
Figure 5-1 shows the market drivers in order of impact for the world consumer electronics MEMS sensors market from 2006 to 2012.
#FA0A-32 © 2006 Frost & Sullivan www.frost.com 5-4
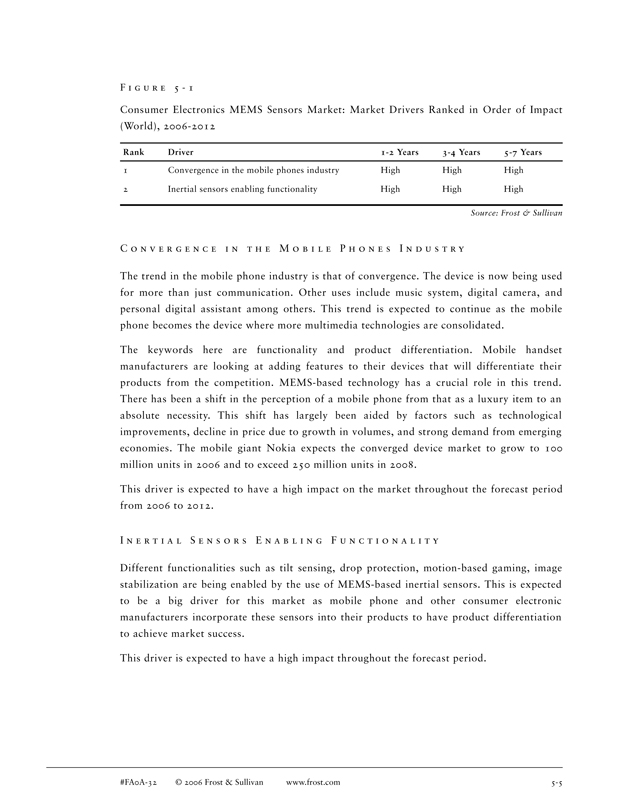
F I G U R E 5—1
Consumer Electronics MEMS Sensors Market: Market Drivers Ranked in Order of Impact (World), 2006-2012
Rank Driver 1-2 Years 3-4 Years 5-7 Years
1 Convergence in the mobile phones industry High High High
2 Inertial sensors enabling functionality High High High
Source: Frost & Sullivan
C O N V E R G E N C E I N T H E M O B I L E P H O N E S I N D U S T R Y
The trend in the mobile phone industry is that of convergence. The device is now being used for more than just communication. Other uses include music system, digital camera, and personal digital assistant among others. This trend is expected to continue as the mobile phone becomes the device where more multimedia technologies are consolidated.
The keywords here are functionality and product differentiation. Mobile handset manufacturers are looking at adding features to their devices that will differentiate their products from the competition. MEMS-based technology has a crucial role in this trend. There has been a shift in the perception of a mobile phone from that as a luxury item to an absolute necessity. This shift has largely been aided by factors such as technological improvements, decline in price due to growth in volumes, and strong demand from emerging economies. The mobile giant Nokia expects the converged device market to grow to 100 million units in 2006 and to exceed 250 million units in 2008.
This driver is expected to have a high impact on the market throughout the forecast period from 2006 to 2012.
I N E R T I A L S E N S O R S E N A B L I N G F U N C T I O N A L I T Y
Different functionalities such as tilt sensing, drop protection, motion-based gaming, image stabilization are being enabled by the use of MEMS-based inertial sensors. This is expected to be a big driver for this market as mobile phone and other consumer electronic manufacturers incorporate these sensors into their products to have product differentiation to achieve market success.
This driver is expected to have a high impact throughout the forecast period.
#FA0A-32 © 2006 Frost & Sullivan www.frost.com 5-5
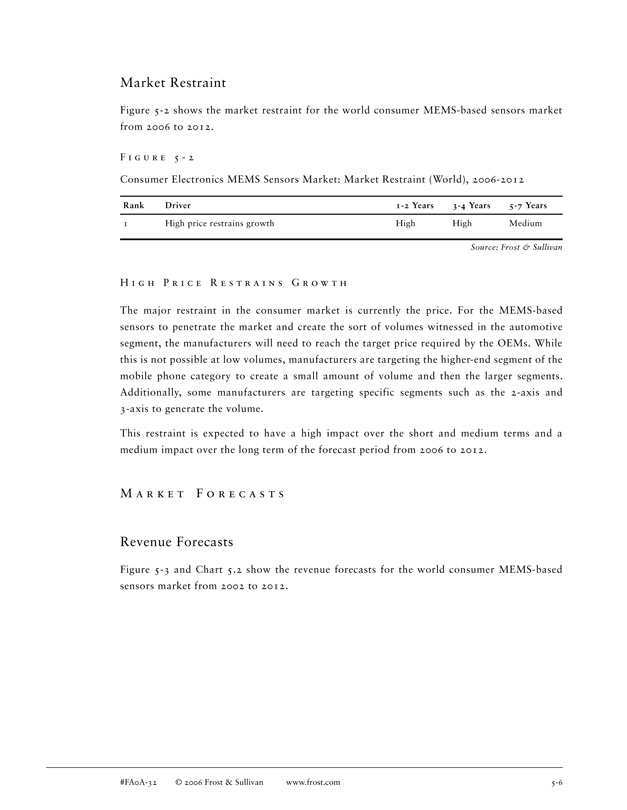
Market Restraint
Figure 5-2 shows the market restraint for the world consumer MEMS-based sensors market from 2006 to 2012.
F I G U R E 5 - 2
Consumer Electronics MEMS Sensors Market: Market Restraint (World), 2006-2012
Rank Driver 1-2 Years 3-4 Years 5-7 Years
1 High price restrains growth High High Medium
Source: Frost & Sullivan
H I G H P R I C E R E S T R A I N S G R O W T H
The major restraint in the consumer market is currently the price. For the MEMS-based sensors to penetrate the market and create the sort of volumes witnessed in the automotive segment, the manufacturers will need to reach the target price required by the OEMs. While this is not possible at low volumes, manufacturers are targeting the higher-end segment of the mobile phone category to create a small amount of volume and then the larger segments. Additionally, some manufacturers are targeting specific segments such as the 2-axis and 3-axis to generate the volume.
This restraint is expected to have a high impact over the short and medium terms and a medium impact over the long term of the forecast period from 2006 to 2012.
M A R K E T F O R E C A S T S
Revenue Forecasts
Figure 5-3 and Chart 5.2 show the revenue forecasts for the world consumer MEMS-based sensors market from 2002 to 2012.
#FA0A-32 © 2006 Frost & Sullivan www.frost.com 5-6
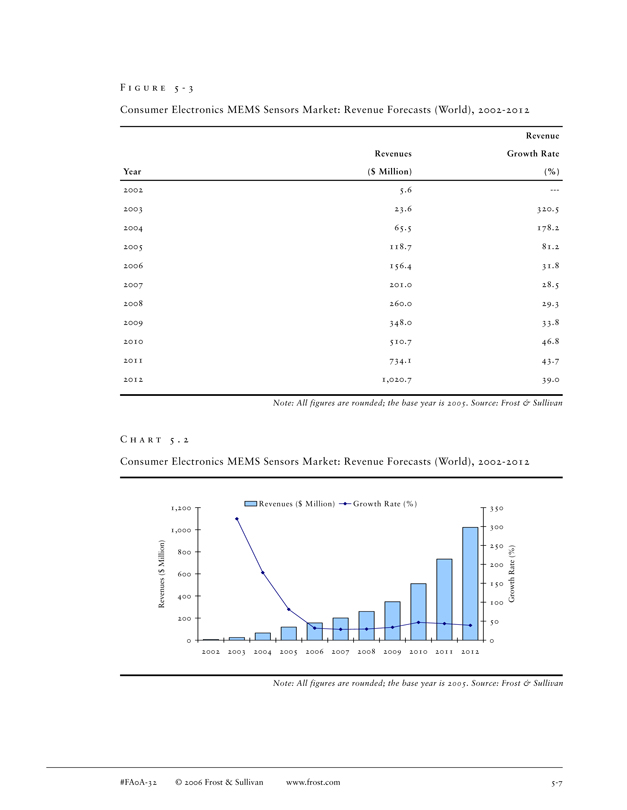
F I G U R E 5 - 3
Consumer Electronics MEMS Sensors Market: Revenue Forecasts (World), 2002-2012
Revenue Revenues Growth Rate Year($ Million)(%)
2002 5.6 -2003 23.6 320.5 2004 65.5 178.2 2005 118.7 81.2 2006 156.4 31.8 2007 201.0 28.5 2008 260.0 29.3 2009 348.0 33.8 2010 510.7 46.8 2011 734.1 43.7 2012 1,020.7 39.0
Note: All figures are rounded; the base year is 2005. Source: Frost & Sullivan
C H A R T 5 . 2
Consumer Electronics MEMS Sensors Market: Revenue Forecasts (World), 2002-2012
Revenues ($ Million) Growth Rate (%)
1,200 350
300 1,000
($ Million) 250 800 200
600
Revenues 150 400 Growth Rate (%) 100
200
50
0 0 2002 2003 2004 2005 2006 2007 2008 2009 2010 2011 2012
Note: All figures are rounded; the base year is 2005. Source: Frost & Sullivan
#FA0A-32 © 2006 Frost & Sullivan www.frost.com 5-7
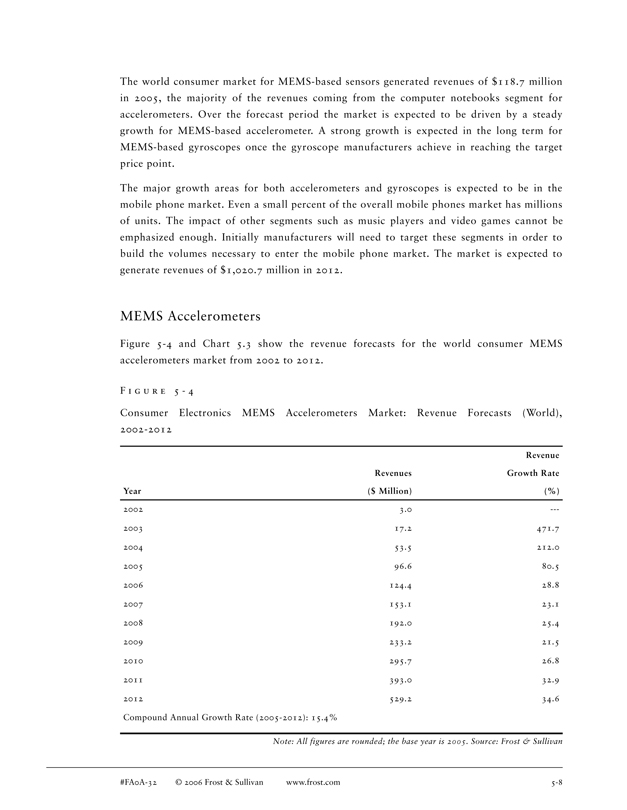
The world consumer market for MEMS-based sensors generated revenues of $118.7 million in 2005, the majority of the revenues coming from the computer notebooks segment for accelerometers. Over the forecast period the market is expected to be driven by a steady growth for MEMS-based accelerometer. A strong growth is expected in the long term for MEMS-based gyroscopes once the gyroscope manufacturers achieve in reaching the target price point.
The major growth areas for both accelerometers and gyroscopes is expected to be in the mobile phone market. Even a small percent of the overall mobile phones market has millions of units. The impact of other segments such as music players and video games cannot be emphasized enough. Initially manufacturers will need to target these segments in order to build the volumes necessary to enter the mobile phone market. The market is expected to generate revenues of $1,020.7 million in 2012.
MEMS Accelerometers
Figure 5-4 and Chart 5.3 show the revenue forecasts for the world consumer MEMS accelerometers market from 2002 to 2012.
F I G U R E 5 - 4
Consumer Electronics MEMS Accelerometers Market: Revenue Forecasts (World), 2002-2012
Revenue Revenues Growth Rate Year($ Million)(%)
2002 3.0 -2003 17.2 471.7 2004 53.5 212.0 2005 96.6 80.5 2006 124.4 28.8 2007 153.1 23.1 2008 192.0 25.4 2009 233.2 21.5 2010 295.7 26.8 2011 393.0 32.9 2012 529.2 34.6 Compound Annual Growth Rate (2005-2012): 15.4%
Note: All figures are rounded; the base year is 2005. Source: Frost & Sullivan
#FA0A-32 © 2006 Frost & Sullivan www.frost.com 5-8
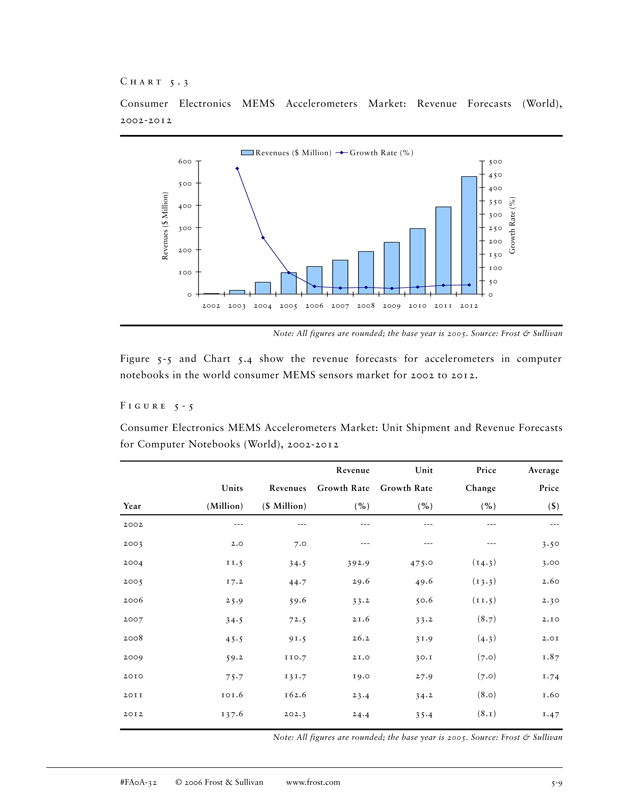
C H A R T 5 . 3
Consumer Electronics MEMS Accelerometers Market: Revenue Forecasts (World), 2002-2012
Revenues ($ Million) Growth Rate (% )
600 500
450 500 400 Million) 350 400 300 $ ( 300 250 Revenues 200 200 Growth Rate (%) 150
100 100 50
0 0 2002 2003 2004 2005 2006 2007 2008 2009 2010 2011 2012
Note: All figures are rounded; the base year is 2005. Source: Frost & Sullivan
Figure 5-5 and Chart 5.4 show the revenue forecasts for accelerometers in computer notebooks in the world consumer MEMS sensors market for 2002 to 2012.
F I G U R E 5 - 5
Consumer Electronics MEMS Accelerometers Market: Unit Shipment and Revenue Forecasts for Computer Notebooks (World), 2002-2012
Revenue Unit Price Average Units Revenues Growth Rate Growth Rate Change Price Year(Million)($ Million)(%)(%)(%)($)
2002 2003 2.0 7.0 3.50 2004 11.5 34.5 392.9 475.0 (14.3) 3.00 2005 17.2 44.7 29.6 49.6 (13.3) 2.60 2006 25.9 59.6 33.2 50.6 (11.5) 2.30 2007 34.5 72.5 21.6 33.2 (8.7) 2.10 2008 45.5 91.5 26.2 31.9 (4.3) 2.01 2009 59.2 110.7 21.0 30.1 (7.0) 1.87 2010 75.7 131.7 19.0 27.9 (7.0) 1.74 2011 101.6 162.6 23.4 34.2 (8.0) 1.60 2012 137.6 202.3 24.4 35.4 (8.1) 1.47
Note: All figures are rounded; the base year is 2005. Source: Frost & Sullivan
#FA0A-32 © 2006 Frost & Sullivan www.frost.com 5-9
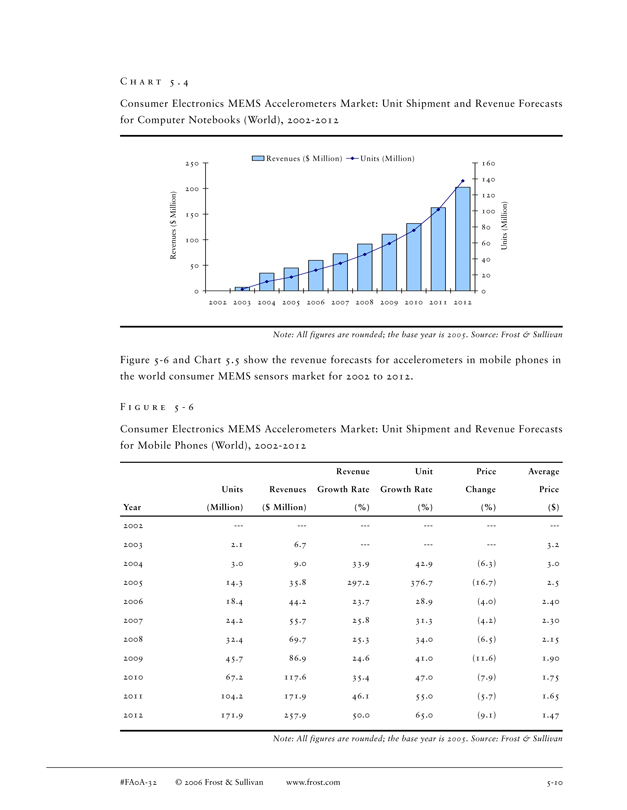
C H A R T 5 . 4
Consumer Electronics MEMS Accelerometers Market: Unit Shipment and Revenue Forecasts for Computer Notebooks (World), 2002-2012
Revenues ($ M illion) Units (Million)
250 160
140 200 Million) 120 (Million) 100 150 $ ( 80 Revenues 100
60 Units 40 50 20
0 0 2002 2003 2004 2005 2006 2007 2008 2009 2010 2011 2012
Note: All figures are rounded; the base year is 2005. Source: Frost & Sullivan
Figure 5-6 and Chart 5.5 show the revenue forecasts for accelerometers in mobile phones in the world consumer MEMS sensors market for 2002 to 2012.
F I G U R E 5 - 6
Consumer Electronics MEMS Accelerometers Market: Unit Shipment and Revenue Forecasts for Mobile Phones (World), 2002-2012
Revenue Unit Price Average Units Revenues Growth Rate Growth Rate Change Price Year(Million)($ Million)(%)(%)(%)($)
2002 -2003 2.1 6.7 3.2 2004 3.0 9.0 33.9 42.9 (6.3) 3.0 2005 14.3 35.8 297.2 376.7 (16.7) 2.5 2006 18.4 44.2 23.7 28.9 (4.0) 2.40 2007 24.2 55.7 25.8 31.3 (4.2) 2.30 2008 32.4 69.7 25.3 34.0 (6.5) 2.15 2009 45.7 86.9 24.6 41.0 (11.6) 1.90 2010 67.2 117.6 35.4 47.0 (7.9) 1.75 2011 104.2 171.9 46.1 55.0 (5.7) 1.65 2012 171.9 257.9 50.0 65.0 (9.1) 1.47
Note: All figures are rounded; the base year is 2005. Source: Frost & Sullivan
#FA0A-32 © 2006 Frost & Sullivan www.frost.com 5-10
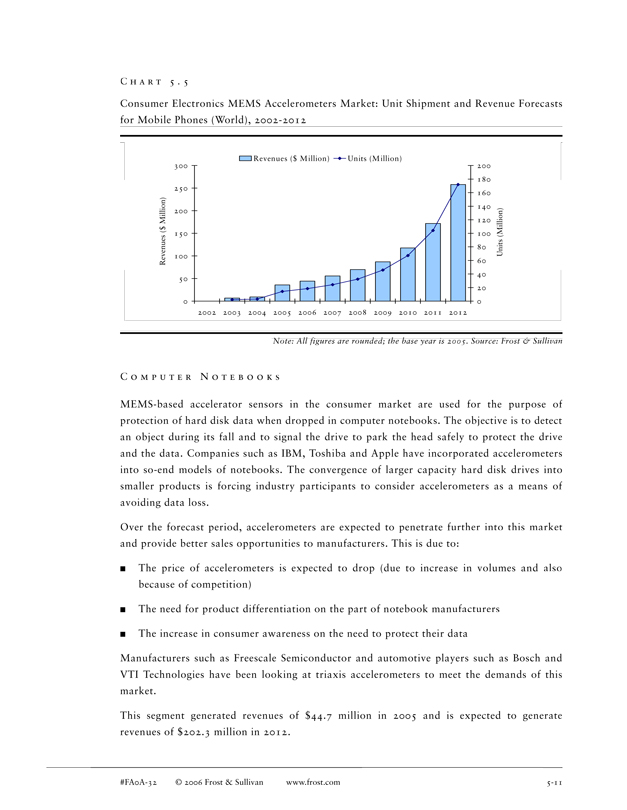
C H A R T 5 . 5
Consumer Electronics MEMS Accelerometers Market: Unit Shipment and Revenue Forecasts for Mobile Phones (World), 2002-2012
Revenues ($ Million) Units (M illion)
300 200
180 250 160
140 200 Million) 120 $ 150 100
80 Units (Million) 100 Revenues ( 60 40 50 20
0 0 2002 2003 2004 2005 2006 2007 2008 2009 2010 2011 2012
Note: All figures are rounded; the base year is 2005. Source: Frost & Sullivan
C O M P U T E R N O T E B O O K S
MEMS-based accelerator sensors in the consumer market are used for the purpose of protection of hard disk data when dropped in computer notebooks. The objective is to detect an object during its fall and to signal the drive to park the head safely to protect the drive and the data. Companies such as IBM, Toshiba and Apple have incorporated accelerometers into so-end models of notebooks. The convergence of larger capacity hard disk drives into smaller products is forcing industry participants to consider accelerometers as a means of avoiding data loss.
Over the forecast period, accelerometers are expected to penetrate further into this market and provide better sales opportunities to manufacturers. This is due to:
The price of accelerometers is expected to drop (due to increase in volumes and also because of competition)
The need for product differentiation on the part of notebook manufacturers
The increase in consumer awareness on the need to protect their data
Manufacturers such as Freescale Semiconductor and automotive players such as Bosch and VTI Technologies have been looking at triaxis accelerometers to meet the demands of this market.
This segment generated revenues of $44.7 million in 2005 and is expected to generate revenues of $202.3 million in 2012.
#FA0A-32 © 2006 Frost & Sullivan www.frost.com 5-11
A U D I O P L A Y E R S A N D G A M I N G D E V I C E S
Accelerometers are also finding use in portable MP3 and audio players. In 2005, Samsung Electronics incorporated the MMA7260Q into digital audio players enabling the devices to intelligently respond to changes in position, orientation, and movement. Accelerometer can also provide data protection in the same way as in computer notebooks.
Accelerometers are also finding use in gaming devices taking the interaction between the game and the gamer to a new level. Gaming devices can respond to the movements of the gamer in real-time thereby enabling an improved gaming experience. Both the audio players and the gaming devices markets are poised for strong growth over the forecast period.
Frost & Sullivan expects these markets to be key to the aspirations of MEMS-based sensor manufacturers to penetrate the consumer segment. These markets will help the MEMs manufacturers to build up a certain degree of volume for their sensors enabling them to target the larger and more lucrative mobile phone segment.
M O B I L E P H O N E S
For MEMS manufacturers, mobile phones provide a major market and opportunity. Only this industry can generate and sustain the volumes required for the sensor manufacturers to achieve their price targets and also maximize revenue. The mobile market is largely expected to be aided by the tremendous trend of convergence currently witnessed in the industry. Mobile phone manufacturers such as Nokia, Motorola, Samsung, and Sony Ericsson have been introducing various products that integrate a number of features onto one phone.
Accelerometers can be used to add the following functionalities to the mobile phone . They are:
Image stability
Shock detection
Text scroll
Motion dialling
Compass
Silent mode activation
Gaming controller
One potential driver for the market has been the growth in use of hard disk drives in mobile phones, this has enabled the use of accelerometers to protect the data content in these drives in the similar manner as in the notebooks industry.
#FA0A-32 © 2006 Frost & Sullivan www.frost.com 5-12
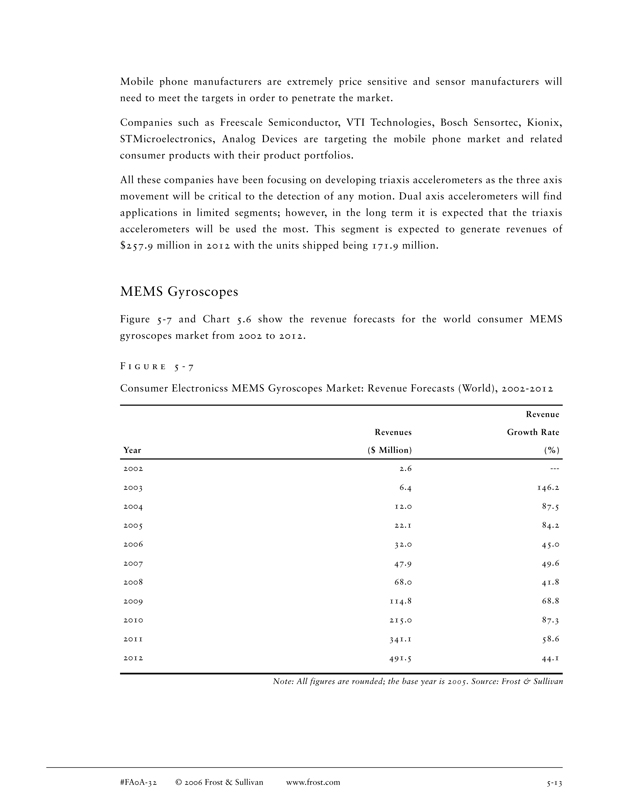
Mobile phone manufacturers are extremely price sensitive and sensor manufacturers will need to meet the targets in order to penetrate the market.
Companies such as Freescale Semiconductor, VTI Technologies, Bosch Sensortec, Kionix, STMicroelectronics, Analog Devices are targeting the mobile phone market and related consumer products with their product portfolios.
All these companies have been focusing on developing triaxis accelerometers as the three axis movement will be critical to the detection of any motion. Dual axis accelerometers will find applications in limited segments; however, in the long term it is expected that the triaxis accelerometers will be used the most. This segment is expected to generate revenues of $257.9 million in 2012 with the units shipped being 171.9 million.
MEMS Gyroscopes
Figure 5-7 and Chart 5.6 show the revenue forecasts for the world consumer MEMS gyroscopes market from 2002 to 2012.
F I G U R E 5 - 7
Consumer Electronicss MEMS Gyroscopes Market: Revenue Forecasts (World), 2002-2012
Revenue Revenues Growth Rate Year($ Million)(%)
2002 2.6 -2003 6.4 146.2 2004 12.0 87.5 2005 22.1 84.2 2006 32.0 45.0 2007 47.9 49.6 2008 68.0 41.8 2009 114.8 68.8 2010 215.0 87.3 2011 341.1 58.6 2012 491.5 44.1
Note: All figures are rounded; the base year is 2005. Source: Frost & Sullivan
#FA0A-32 © 2006 Frost & Sullivan www.frost.com 5-13
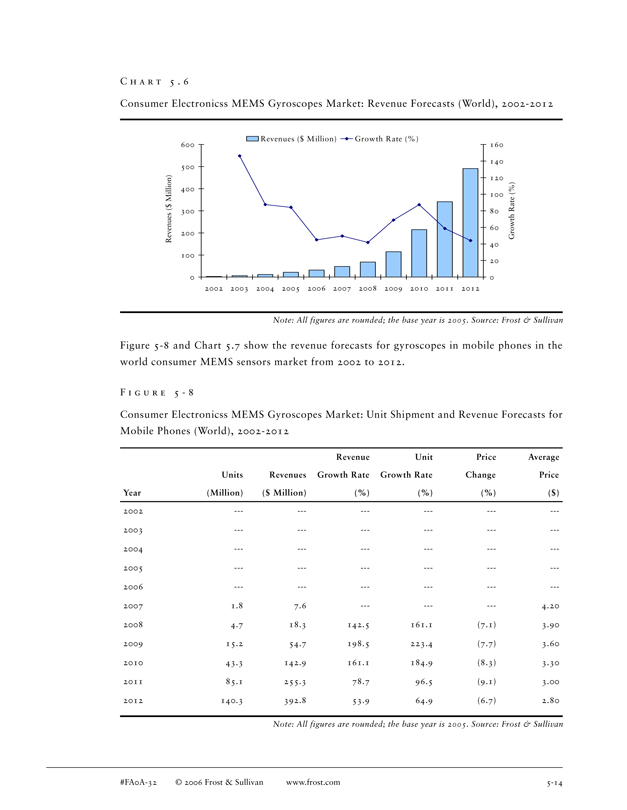
C H A R T 5 . 6
Consumer Electronicss MEMS Gyroscopes Market: Revenue Forecasts (World), 2002-2012
Revenues ($ M illion) Growth Rate (%)
600 160
140 500 Million) 120 400 100 $ ( 300 80 Revenues 60 200 Growth Rate (%) 40 100 20
0 0 2002 2003 2004 2005 2006 2007 2008 2009 2010 2011 2012
Note: All figures are rounded; the base year is 2005. Source: Frost & Sullivan
Figure 5-8 and Chart 5.7 show the revenue forecasts for gyroscopes in mobile phones in the world consumer MEMS sensors market from 2002 to 2012.
F I G U R E 5 - 8
Consumer Electronicss MEMS Gyroscopes Market: Unit Shipment and Revenue Forecasts for Mobile Phones (World), 2002-2012
Revenue Unit Price Average Units Revenues Growth Rate Growth Rate Change Price Year(Million)($ Million)(%)(%)(%)($)
2002 2003 2004 2005 2006 2007 1.8 7.6 4.20 2008 4.7 18.3 142.5 161.1 (7.1) 3.90 2009 15.2 54.7 198.5 223.4 (7.7) 3.60 2010 43.3 142.9 161.1 184.9 (8.3) 3.30 2011 85.1 255.3 78.7 96.5 (9.1) 3.00 2012 140.3 392.8 53.9 64.9 (6.7) 2.80
Note: All figures are rounded; the base year is 2005. Source: Frost & Sullivan
#FA0A-32 © 2006 Frost & Sullivan www.frost.com 5-14
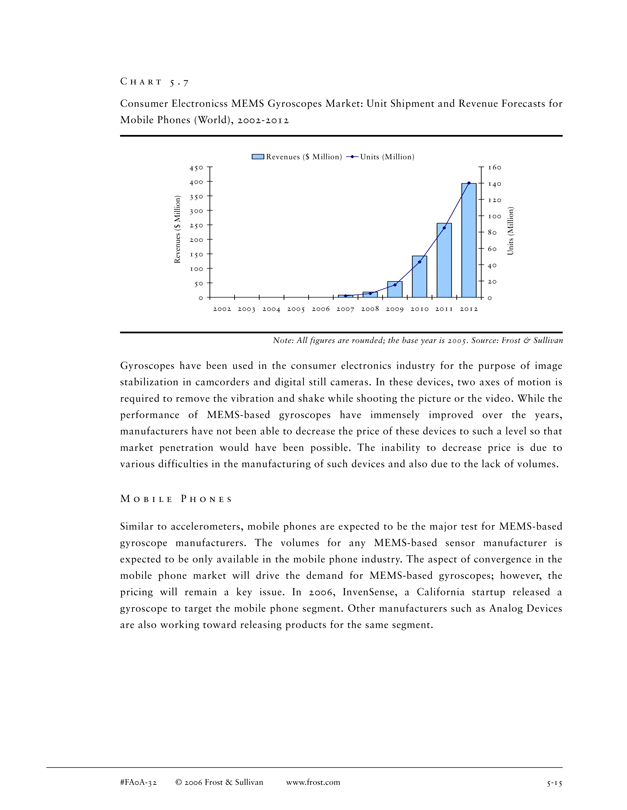
C H A R T 5 . 7
Consumer Electronicss MEMS Gyroscopes Market: Unit Shipment and Revenue Forecasts for Mobile Phones (World), 2002-2012
Revenues ($ M illion) Units (M illion)
450 160
400 140 350 120 300 Million) 100 250 $ 80 200
60 Units (Million) Revenues ( 150 40 100
50 20
0 0 2002 2003 2004 2005 2006 2007 2008 2009 2010 2011 2012
Note: All figures are rounded; the base year is 2005. Source: Frost & Sullivan
Gyroscopes have been used in the consumer electronics industry for the purpose of image stabilization in camcorders and digital still cameras. In these devices, two axes of motion is required to remove the vibration and shake while shooting the picture or the video. While the performance of MEMS-based gyroscopes have immensely improved over the years, manufacturers have not been able to decrease the price of these devices to such a level so that market penetration would have been possible. The inability to decrease price is due to various difficulties in the manufacturing of such devices and also due to the lack of volumes.
M O B I L E P H O N E S
Similar to accelerometers, mobile phones are expected to be the major test for MEMS-based gyroscope manufacturers. The volumes for any MEMS-based sensor manufacturer is expected to be only available in the mobile phone industry. The aspect of convergence in the mobile phone market will drive the demand for MEMS-based gyroscopes; however, the pricing will remain a key issue. In 2006, InvenSense, a California startup released a gyroscope to target the mobile phone segment. Other manufacturers such as Analog Devices are also working toward releasing products for the same segment.
#FA0A-32 © 2006 Frost & Sullivan www.frost.com 5-15
The trends in the industry include:
By the long term (2010 and beyond) the camera in the mobile phone is expected to be the only one for most people, and this factor is expected to spur mobile phone manufacturers to improve its quality and the flexibility, thereby driving the market for MEMS-based gyroscopes. Additionally, it is expected that navigation segment to drive the gyroscopes market
The average consumer is a late adopter of new technology and it is expected that mobile phones with better image resolutions and picture clarity incorporating these gyroscopes will take off slower than expected.
There is a trend of enhancing the functionality of the mobile phone to enhance user interaction. This could prove to be a very important driver in the long run once customers in areas such as Europe and North America start adopting these technologies. The initial growth is only expected in a few countries such as Japan and South Korea.
Although, the market growth rates in this segment are expected to be very high, gyroscopes are expected to capture only a limited share of the phone market by 2012. Further growth will be expected post 2012 as gyroscopes achieve much higher penetration into the market. Despite the impressive volumes the market is expected to generate in 2012, it should be noted that this is only a minor fraction of the overall mobile phone market. This segment is expected to grow from $7.6 million in 2007 to $392.8 million in 2012. Unit shipments for the same are expected to increase from 1.8 million in 2007 to 140.3 million in 2012.
M A R K E T A N A L Y S I S
Pricing Analysis
There is a demand in the market for sensors that can be incorporated into high-volume electronics by enabling the addition of features that can allow electronic manufacturers to differentiate their products from their competitors. There is demand in the consumer industry is for products that are low cost, small size, and have very low power consumption. Manufacturers will need to meet all these requirements to have any chance of succeeding in this competitive and dynamic market.
#FA0A-32 © 2006 Frost & Sullivan www.frost.com 5-16
A C C E L E R O M E T E R S
Several manufacturers are working on accelerometers for the consumer industry with a number of these products being initially developed for the automotive industry. The automotive and consumer industry have different requirements; however, the consumer market is expected to be a much easier one to cater to because of the relaxed specifications. Accelerometers pricing depends on the nature of the accelerometer and also the number of axes. Analog Devices’ latest 3 axis accelerometer ADXL330 is priced at less than $2 at high volumes.
G Y R O S C O P E S
Gyroscopes are much more challenging products to manufacture when compared to either accelerometers and pressure sensors. Manufacturing gyroscopes is a tough process with a number of factors to be taken into account. Packaging is also a serious issue when it comes to gyroscopes due to the high sensitivity of these sensors.
Gyroscopes have generally been used only in the high-value products such as camcorders and digital cameras; however, the dropping prices and the efforts of a few manufacturers have helped this sensor to penetrate some newer products as well. Market penetration of mobile phones is expected to take place over the forecast period. Companies such as InvenSense have introduced products that possess great features at low prices to convince mobile phone manufacturers to consider incorporating them into their products.
Technology Roadmap
The year 2005, was a good one for MEMS sensor manufacturers, with several companies announcing the closure of deals with participants in the consumer electronics industry. Recent events have also witnessed the introduction of MEMS-based inertial sensors in the products of some global lifestyle companies such as Apple, Nintendo, and Samsung. This is expected to have a ripple effect as other electronics participants are also expected to focus on inertial sensors to provide a degree of differentiation in their products.
A C C E L E R O M E T E R S
Accelerometers have been in use in consumer electronics for around four years with the introduction of MEMS-based accelerometers in the notebooks by manufacturers such as IBM. Accelerometers are used for the purpose of protecting the contents of the hard drive from damage due to impact after a fall. This feature is now being implemented in certain high-end mobile phones and PDAs.
#FA0A-32 © 2006 Frost & Sullivan www.frost.com 5-17
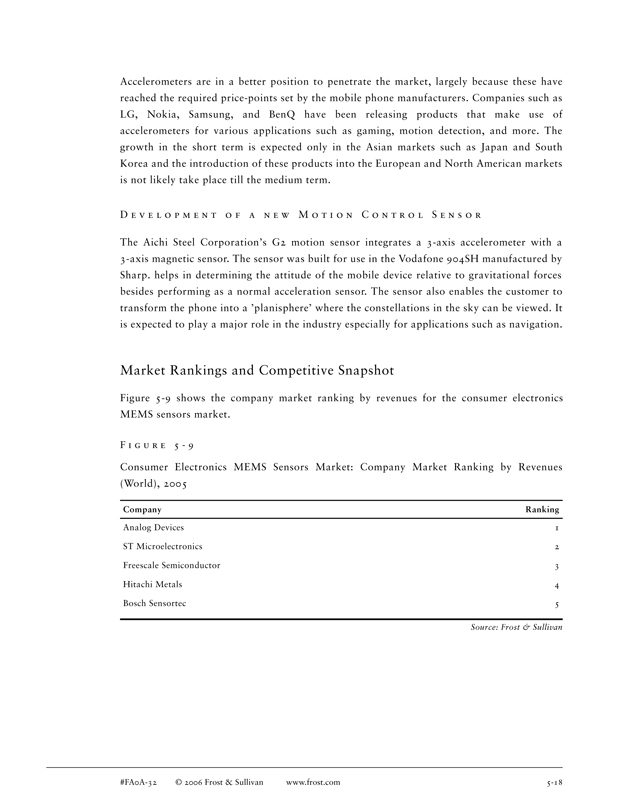
Accelerometers are in a better position to penetrate the market, largely because these have reached the required price-points set by the mobile phone manufacturers. Companies such as LG, Nokia, Samsung, and BenQ have been releasing products that make use of accelerometers for various applications such as gaming, motion detection, and more. The growth in the short term is expected only in the Asian markets such as Japan and South Korea and the introduction of these products into the European and North American markets is not likely take place till the medium term.
D E V E L O P M E N T O F A N E W M O T I O N C O N T R O L S E N S O R
The Aichi Steel Corporation’s G2 motion sensor integrates a 3-axis accelerometer with a 3-axis magnetic sensor. The sensor was built for use in the Vodafone 904SH manufactured by Sharp. helps in determining the attitude of the mobile device relative to gravitational forces besides performing as a normal acceleration sensor. The sensor also enables the customer to transform the phone into a ’planisphere’ where the constellations in the sky can be viewed. It is expected to play a major role in the industry especially for applications such as navigation.
Market Rankings and Competitive Snapshot
Figure 5-9 shows the company market ranking by revenues for the consumer electronics MEMS sensors market.
F I G U R E 5 - 9
Consumer Electronics MEMS Sensors Market: Company Market Ranking by Revenues (World), 2005
Company Ranking
Analog Devices 1 ST Microelectronics 2 Freescale Semiconductor 3 Hitachi Metals 4 Bosch Sensortec 5
Source: Frost & Sullivan
#FA0A-32 © 2006 Frost & Sullivan www.frost.com 5-18
A N A L O G D E V I C E S
Analog Devices has been one of the industry pioneers for over a decade and the company has been recognized for its manufacturing and design capabilities in the accelerometers and gyroscopes marketplace. In May 2006, the company announced the incorporation of the company’s triaxis ADXL330 iMEMS accelerometer into Nintendo’s Wii controller. Analog Devices was at the forefront of the application of accelerometers in the laptops with the usage of the device in IBM’s ThinkPad (IBM has since then sold its PC business to Lenovo Group) the first application of its kind in 2003. The company is expected to be at the forefront of any developments in the consumer market for inertial sensors and is one of the few companies that has had success in both the automotive and the consumer market.
B O S C H S E N S O R T E C
In early 2005, the Bosch group, in an effort to increase the focus on the opportunities in the MEMS industry and solidify its position in the marketplace founded Bosch Sensortec GmbH. The company has a strong background in the technology and this helps in the adaptation of existing technology to newer applications such as those in the consumer industry. The company has been aligning its products to exploit the opportunities available in the consumer market. In 2005, Bosch Sensortec GmbH released the SMB360, a triaxial low-g acceleration sensor for this market. The company is introducing new marketing channels to capitalize on the opportunities available in the consumer electronics industry for MEMS-based devices.
K I O N I X
Kionix is a perfect example of a success story of technology transfer from the university to the industry. Based in Ithaca, New York, Kionix was founded by Cornell University graduates Greg Galvin and Tim Davis in 1993. Since then, Kionix has emerged as one of the most important participants in the accelerometers market for consumer applications. The company also manufacturers gyroscopes and some combination sensors. The company is targeting the consumer market with its triaxis accelerometer product line.
#FA0A-32 © 2006 Frost & Sullivan www.frost.com 5-19
M E M S I C
MEMSIC Inc., North Andover, Massachusetts has made some significant contributions to the MEMS-based accelerometers segment. The company is funded by venture capitalists such as Investar, Celtic House International, and Panjit International. MEMSIC Inc. has made tremendous progress in creating a name in the consumer electronic markets aided by strong technological and marketing efforts. The company’s accelerometers have already made an impact in the Japanese video projector market with several large participants such as Panasonic, Fujitsu, and SONY using the accelerometers for their projectors. The accelerometers have also entered the mobile phones of both Mitsubishi and LG for gaming and camera purposes. The company is focusing on 2-axis accelerometers to cater to the mobile phone market and expects to decrease the price to a level where the mobile phone manufacturers will use it for multiple models.
I N V E N S E N S E
InvenSense, founded by MEMS industry pioneer Steve Nasiri in 2003, is a California-based venture capitalist backed company that is targeting at developing products to meet the requirements of the consumer electronics industry especially the mobile phones segment. The company is at the forefront of the trend toward the usage of MEMSgyroscopes being accepted in the mobile phones industry. The company released a dual axis gyroscope in early 2006 that was priced at $3 at extremely high volumes. The company is also working toward developing an inertial monitoring unit for use in the consumer electronics industry.
#FA0A-32 © 2006 Frost & Sullivan www.frost.com 5-20
Medical MEMS Sensors Market
I N T R O D U C T I O N
Market Overview
Facing demand for better equipment and also improved performance, medical devices designers and manufacturers are looking at different methods of improving the capabilities of their offerings. This has and will continue to help the acceptance of MEMS devices in the medical market. The inherent advantages offered by MEMS technology including good performance at low price will continue to support this market.
Manufacturers usually face a number of unique challenges in the medical industry. These include:
Demanding component manufacturers that expect certain unique features in the product at very low prices. Infact this industry largely mirrors the automotive one in terms of the pressures put by the customers on the MEMS sensor manufacturers in terms of obtaining high quality at low prices.
Regulatory challenges in terms of approval from the government organizations such as the Food and Drug Association (FDA) and the Advancement of Medical Instrumentation (AAMI) in the United States, which usually results in a lengthy development period.
Product needs to have a lengthy life cycle with an operating life of millions of life cycles and also good temperature compensation characteristics.
Reliability constraints are extremely high and this is as a result of complying with both the customer and regulatory authority’s requirements.
Development costs also tend to be high.
Complex industry with different sub-segments each with specific R&D segments, value chains, and much more.
#FA0A-32 © 2006 Frost & Sullivan www.frost.com 6-1
In addition to these challenges, other general industry challenges such as packaging issues, accuracy, and cost remain. Despite these challenges, MEMS technology is expected to penetrate into the medical industry because of both developments in medical electronics and advantages offered by the MEMS-based devices.
The following sensor types will be considered for the purpose of this study.
Pressure sensor
Accelerometers
R E S S U R E S E N S O R S
The primary use of MEMS sensors in the medical industry is to measure pressure. Disposable MEMS pressure sensors in the medical industry have been existing for a number of years and this remains one of the largest applications by volume for MEMS sensors. Introduced in 1982, disposable pressure sensors are used in applications such as infusion pumps, sphygmomanometers, respirators, and dialysis equipment among others.
Most pressure sensors are created using a micro-machined Wheatstone bridge piezoresistive technology. The piezo resistors change value as they are stretched or compressed during measurements. This change in resistive value can then be used to measure the pressure that is causing the change in size of the diaphragm.
Some of the applications of MEMS pressure sensors in the industry are:
Disposable and non-disposable blood pressure monitors
Angioplasty
Dialysis machines
Infusion pumps
Inhalers/respirators
Vital signs monitors
Muscle stimulators and drug delivery systems
Implanted pressure sensors
Prosthetics
Ocular surgery
#FA0A-32 © 2006 Frost & Sullivan www.frost.com 6-2
A C C E L E R O M E T E R S
Accelerometers are used in medical devices in applications such as patient monitoring and for pacemakers for cardiac applications. Though the spectrum of applications that use accelerometers in the medical industry is quite low, it is widely accepted that accelerometers will find increased use in the medical industry over the coming years as sensor manufacturer’s products are used in other segments for the medical industry. Accelerometers are being utilized to measure the frequency and amplitude of vibrations, or under steady-state conditions, to determine tilt angle or the amplitude of a single shock or pulse. Recent designs of implantable pacemakers also use MEMS-based accelerometers to monitor the activity level of the patient. Moreover, pacemaker systems use accelerometers in conjunction with microprocessors to determine the exertion level of the patient and suitably adjust the output signal rate.
Market Engineering Measurement Analysis
Chart 6.1 shows the Market Engineering measurements for the world medical MEMS sensors market for 2005.
#FA0A-32 © 2006 Frost & Sullivan www.frost.com 6-3
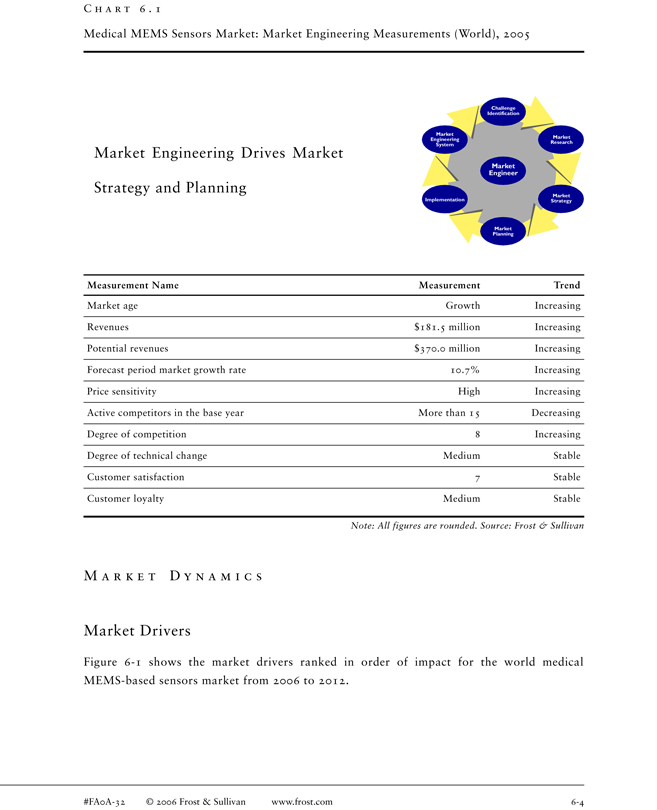
C H A R T 6 . 1
Medical MEMS Sensors Market: Market Engineering Measurements (World), 2005
Challenge Identification
Market
Market Engineering System
Market Engineering Research System
Market Engineering Drives Market
Market Engineer
Strategy and Planning
Market Implementation Strategy
Market Planning
Measurement Name Measurement Trend
Market age Growth Increasing Revenues $181.5 million Increasing Potential revenues $370.0 million Increasing Forecast period market growth rate 10.7% Increasing Price sensitivity High Increasing Active competitors in the base year More than 15 Decreasing Degree of competition 8 Increasing Degree of technical change Medium Stable Customer satisfaction 7 Stable Customer loyalty Medium Stable
Note: All figures are rounded. Source: Frost & Sullivan
M A R K E T D Y N A M I C S
Market Drivers
Figure 6-1 shows the market drivers ranked in order of impact for the world medical MEMS-based sensors market from 2006 to 2012.
#FA0A-32 © 2006 Frost & Sullivan www.frost.com 6-4
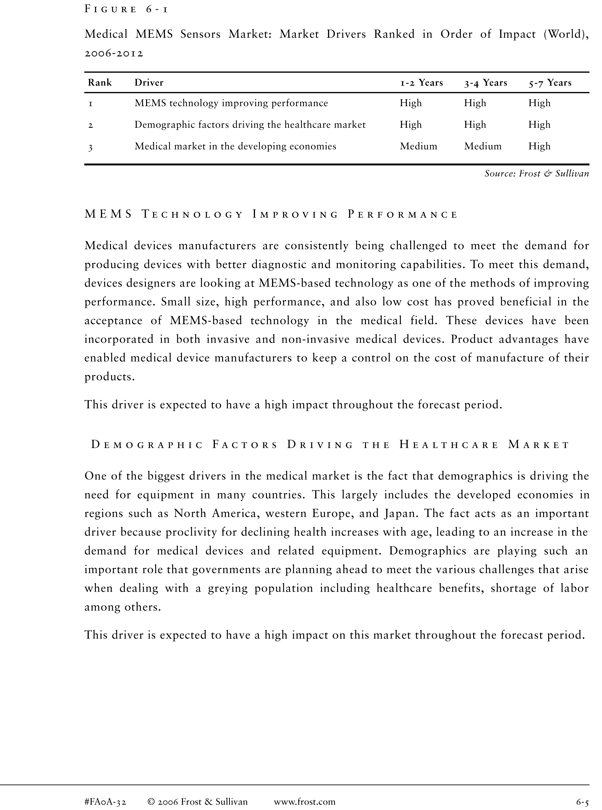
F I G U R E 6 - 1
Medical MEMS Sensors Market: Market Drivers Ranked in Order of Impact (World), 2006-2012
Rank Driver 1-2 Years 3-4 Years 5-7 Years
1 MEMS technology improving performance High High High
2 Demographic factors driving the healthcare market High High High
3 Medical market in the developing economies Medium Medium High
Source: Frost & Sullivan
M E M S T E C H N O L O G Y I M P R O V I N G P E R F O R M A N C E
Medical devices manufacturers are consistently being challenged to meet the demand for producing devices with better diagnostic and monitoring capabilities. To meet this demand, devices designers are looking at MEMS-based technology as one of the methods of improving performance. Small size, high performance, and also low cost has proved beneficial in the acceptance of MEMS-based technology in the medical field. These devices have been incorporated in both invasive and non-invasive medical devices. Product advantages have enabled medical device manufacturers to keep a control on the cost of manufacture of their products.
This driver is expected to have a high impact throughout the forecast period.
D E M O G R A P H I C F A C T O R S D R I V I N G T H E H E A L T H C A R E M A R K E T
One of the biggest drivers in the medical market is the fact that demographics is driving the need for equipment in many countries. This largely includes the developed economies in regions such as North America, western Europe, and Japan. The fact acts as an important driver because proclivity for declining health increases with age, leading to an increase in the demand for medical devices and related equipment. Demographics are playing such an important role that governments are planning ahead to meet the various challenges that arise when dealing with a greying population including healthcare benefits, shortage of labor among others.
This driver is expected to have a high impact on this market throughout the forecast period.
#FA0A-32 © 2006 Frost & Sullivan www.frost.com 6-5
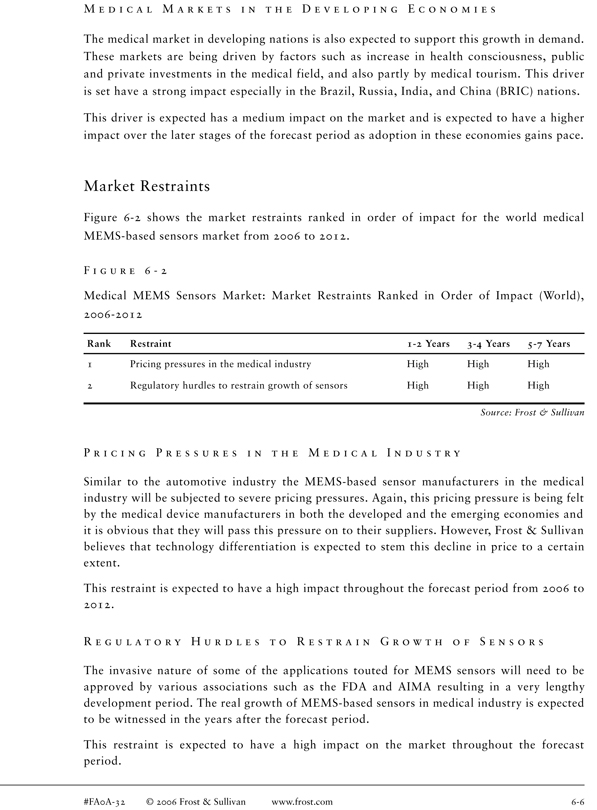
M E D I C A L M A R K E T S I N T H E D E V E L O P I N G E C O N O M I E S
The medical market in developing nations is also expected to support this growth in demand. These markets are being driven by factors such as increase in health consciousness, public and private investments in the medical field, and also partly by medical tourism. This driver is set have a strong impact especially in the Brazil, Russia, India, and China (BRIC) nations.
This driver is expected has a medium impact on the market and is expected to have a higher impact over the later stages of the forecast period as adoption in these economies gains pace.
Market Restraints
Figure 6-2 shows the market restraints ranked in order of impact for the world medical MEMS-based sensors market from 2006 to 2012.
F I G U R E 6 - 2
Medical MEMS Sensors Market: Market Restraints Ranked in Order of Impact (World), 2006-2012
Rank Restraint 1-2 Years 3-4 Years 5-7 Years
1 Pricing pressures in the medical industry High High High
2 Regulatory hurdles to restrain growth of sensors High High High
Source: Frost & Sullivan
P R I C I N G P R E S S U R E S I N T H E M E D I C A L I N D U S T R Y
Similar to the automotive industry the MEMS-based sensor manufacturers in the medical industry will be subjected to severe pricing pressures. Again, this pricing pressure is being felt by the medical device manufacturers in both the developed and the emerging economies and it is obvious that they will pass this pressure on to their suppliers. However, Frost & Sullivan believes that technology differentiation is expected to stem this decline in price to a certain extent.
This restraint is expected to have a high impact throughout the forecast period from 2006 to 2012.
R E G U L A T O R Y H U R D L E S T O R E S T R A I N G R O W T H O F S E N S O R S
The invasive nature of some of the applications touted for MEMS sensors will need to be approved by various associations such as the FDA and AIMA resulting in a very lengthy development period. The real growth of MEMS-based sensors in medical industry is expected to be witnessed in the years after the forecast period.
This restraint is expected to have a high impact on the market throughout the forecast period.
#FA0A-32 © 2006 Frost & Sullivan www.frost.com 6-6
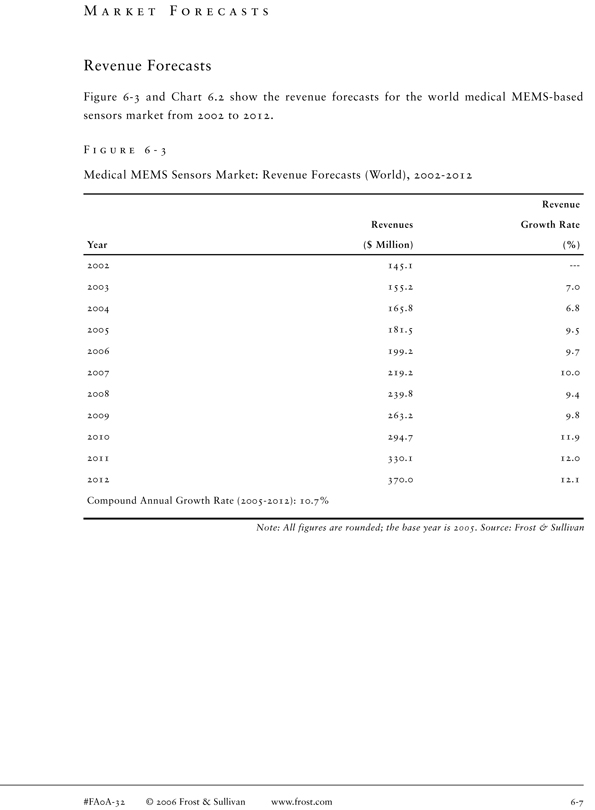
M A R K E T F O R E C A S T S
Revenue Forecasts
Figure 6-3 and Chart 6.2 show the revenue forecasts for the world medical MEMS-based sensors market from 2002 to 2012.
F I G U R E 6 - 3
Medical MEMS Sensors Market: Revenue Forecasts (World), 2002-2012
Revenue Revenues Growth Rate Year($ Million)(%)
2002 145.1 2003 155.2 7.0 2004 165.8 6.8 2005 181.5 9.5 2006 199.2 9.7 2007 219.2 10.0 2008 239.8 9.4 2009 263.2 9.8 2010 294.7 11.9 2011 330.1 12.0 2012 370.0 12.1 Compound Annual Growth Rate (2005-2012): 10.7%
Note: All figures are rounded; the base year is 2005. Source: Frost & Sullivan
#FA0A-32 © 2006 Frost & Sullivan www.frost.com 6-7
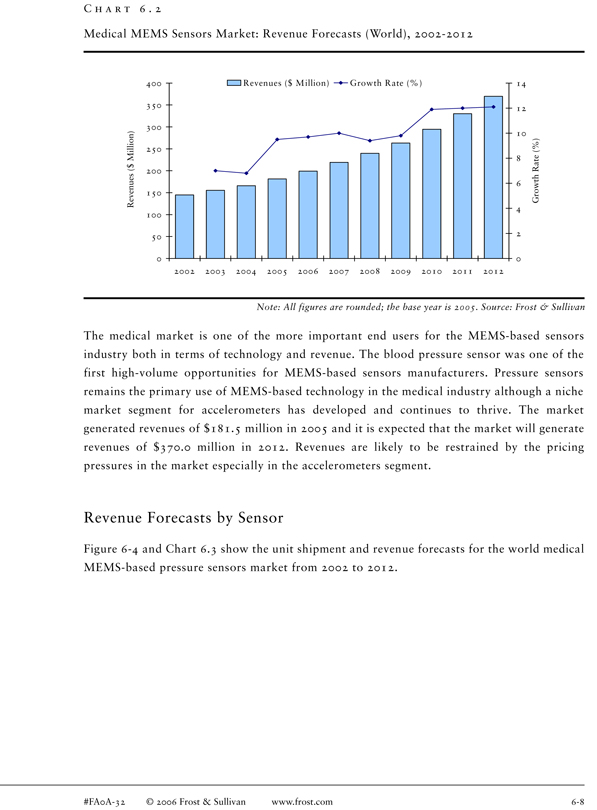
C H A R T 6 . 2
Medical MEMS Sensors Market: Revenue Forecasts (World), 2002-2012
400 Revenues ($ Million) Growth Rate (%) 14
350 12 300 10
250
Million) 8 $ 200 6 Revenues ( 150 Growth Rate (%) 4 100
50 2
0 0 2002 2003 2004 2005 2006 2007 2008 2009 2010 2011 2012
Note: All figures are rounded; the base year is 2005. Source: Frost & Sullivan
The medical market is one of the more important end users for the MEMS-based sensors industry both in terms of technology and revenue. The blood pressure sensor was one of the first high-volume opportunities for MEMS-based sensors manufacturers. Pressure sensors remains the primary use of MEMS-based technology in the medical industry although a niche market segment for accelerometers has developed and continues to thrive. The market generated revenues of $181.5 million in 2005 and it is expected that the market will generate revenues of $370.0 million in 2012. Revenues are likely to be restrained by the pricing pressures in the market especially in the accelerometers segment.
Revenue Forecasts by Sensor
Figure 6-4 and Chart 6.3 show the unit shipment and revenue forecasts for the world medical MEMS-based pressure sensors market from 2002 to 2012.
#FA0A-32 © 2006 Frost & Sullivan www.frost.com 6-8
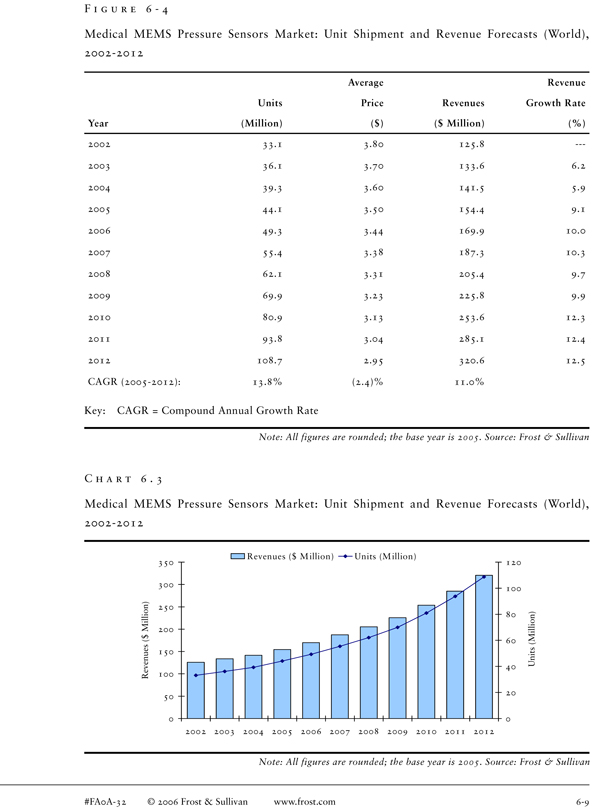
F I G U R E 6 - 4
Medical MEMS Pressure Sensors Market: Unit Shipment and Revenue Forecasts (World), 2002-2012
Average Revenue Units Price Revenues Growth Rate Year(Million)($)($ Million)(%)
2002 33.1 3.80 125.8 2003 36.1 3.70 133.6 6.2 2004 39.3 3.60 141.5 5.9 2005 44.1 3.50 154.4 9.1 2006 49.3 3.44 169.9 10.0 2007 55.4 3.38 187.3 10.3 2008 62.1 3.31 205.4 9.7 2009 69.9 3.23 225.8 9.9 2010 80.9 3.13 253.6 12.3 2011 93.8 3.04 285.1 12.4 2012 108.7 2.95 320.6 12.5 CAGR (2005-2012): 13.8%(2.4)% 11.0%
Key: CAGR = Compound Annual Growth Rate
Note: All figures are rounded; the base year is 2005. Source: Frost & Sullivan
C H A R T 6 . 3
Medical MEMS Pressure Sensors Market: Unit Shipment and Revenue Forecasts (World), 2002-2012
Revenues ($ M illion) Units (M illion)
350 120
300
100
($ Million) 250
80 (Million) 200
60 Revenues 150 Units 40 100
20 50
0 0 2002 2003 2004 2005 2006 2007 2008 2009 2010 2011 2012
Note: All figures are rounded; the base year is 2005. Source: Frost & Sullivan
#FA0A-32 © 2006 Frost & Sullivan www.frost.com 6-9
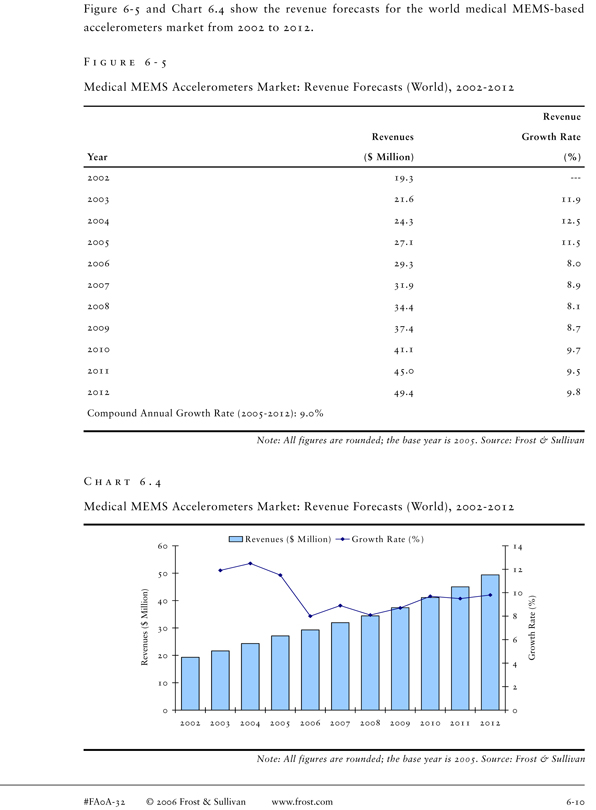
Figure 6-5 and Chart 6.4 show the revenue forecasts for the world medical MEMS-based accelerometers market from 2002 to 2012.
F I G U R E 6 - 5
Medical MEMS Accelerometers Market: Revenue Forecasts (World), 2002-2012
Revenue Revenues Growth Rate Year($ Million)(%)
2002 19.3 2003 21.6 11.9 2004 24.3 12.5 2005 27.1 11.5 2006 29.3 8.0 2007 31.9 8.9 2008 34.4 8.1 2009 37.4 8.7 2010 41.1 9.7 2011 45.0 9.5 2012 49.4 9.8 Compound Annual Growth Rate (2005-2012): 9.0%
Note: All figures are rounded; the base year is 2005. Source: Frost & Sullivan
C H A R T 6 . 4
Medical MEMS Accelerometers Market: Revenue Forecasts (World), 2002-2012
Revenues ($ M illion) Growth Rate (%)
60 14
12 50
($ Million) 10 40
30
Revenues 6
20 Growth Rate (%) 4
10
0 0 2002 2003 2004 2005 2006 2007 2008 2009 2010 2011 2012
Note: All figures are rounded; the base year is 2005. Source: Frost & Sullivan
#FA0A-32 © 2006 Frost & Sullivan www.frost.com 6-10
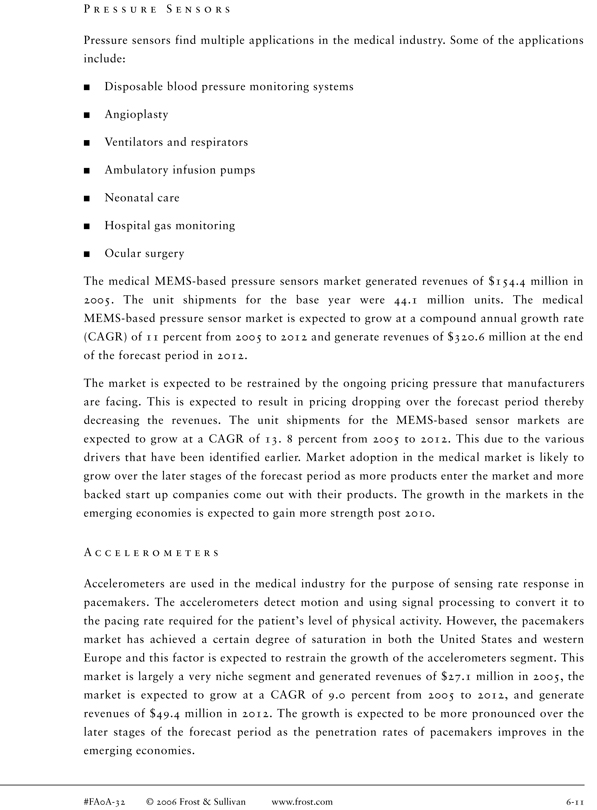
P R E S S U R E S E N S O R S
Pressure sensors find multiple applications in the medical industry. Some of the applications include:
Disposable blood pressure monitoring systems
Angioplasty
Ventilators and respirators
Ambulatory infusion pumps
Neonatal care
Hospital gas monitoring
Ocular surgery
The medical MEMS-based pressure sensors market generated revenues of $154.4 million in 2005. The unit shipments for the base year were 44.1 million units. The medical MEMS-based pressure sensor market is expected to grow at a compound annual growth rate (CAGR) of 11 percent from 2005 to 2012 and generate revenues of $320.6 million at the end of the forecast period in 2012.
The market is expected to be restrained by the ongoing pricing pressure that manufacturers are facing. This is expected to result in pricing dropping over the forecast period thereby decreasing the revenues. The unit shipments for the MEMS-based sensor markets are expected to grow at a CAGR of 13. 8 percent from 2005 to 2012. This due to the various drivers that have been identified earlier. Market adoption in the medical market is likely to grow over the later stages of the forecast period as more products enter the market and more backed start up companies come out with their products. The growth in the markets in the emerging economies is expected to gain more strength post 2010.
A C C E L E R O M E T E R S
Accelerometers are used in the medical industry for the purpose of sensing rate response in pacemakers. The accelerometers detect motion and using signal processing to convert it to the pacing rate required for the patient’s level of physical activity. However, the pacemakers market has achieved a certain degree of saturation in both the United States and western Europe and this factor is expected to restrain the growth of the accelerometers segment. This market is largely a very niche segment and generated revenues of $27.1 million in 2005, the market is expected to grow at a CAGR of 9.0 percent from 2005 to 2012, and generate revenues of $49.4 million in 2012. The growth is expected to be more pronounced over the later stages of the forecast period as the penetration rates of pacemakers improves in the emerging economies.
#FA0A-32 © 2006 Frost & Sullivan www.frost.com 6-11
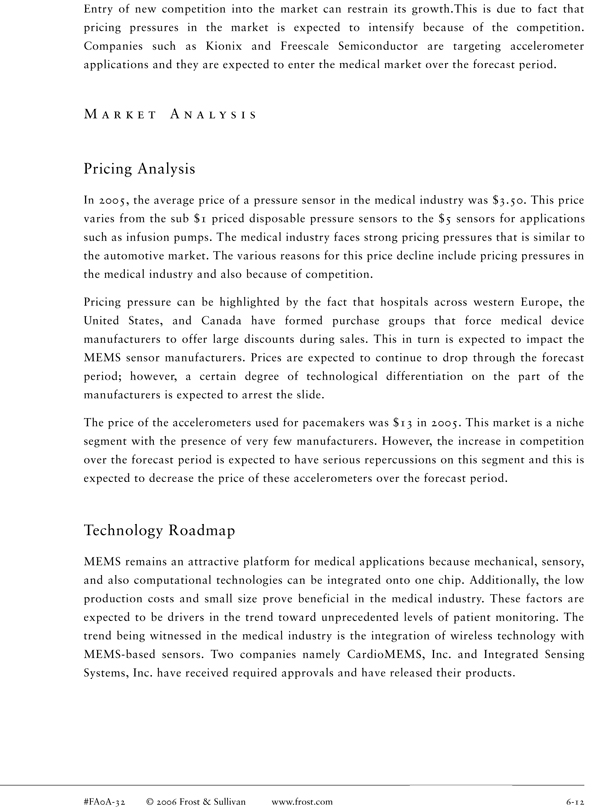
Entry of new competition into the market can restrain its growth.This is due to fact that pricing pressures in the market is expected to intensify because of the competition. Companies such as Kionix and Freescale Semiconductor are targeting accelerometer applications and they are expected to enter the medical market over the forecast period.
M A R K E T A N A L Y S I S
Pricing Analysis
In 2005, the average price of a pressure sensor in the medical industry was $3.50. This price varies from the sub $1 priced disposable pressure sensors to the $5 sensors for applications such as infusion pumps. The medical industry faces strong pricing pressures that is similar to the automotive market. The various reasons for this price decline include pricing pressures in the medical industry and also because of competition.
Pricing pressure can be highlighted by the fact that hospitals across western Europe, the United States, and Canada have formed purchase groups that force medical device manufacturers to offer large discounts during sales. This in turn is expected to impact the MEMS sensor manufacturers. Prices are expected to continue to drop through the forecast period; however, a certain degree of technological differentiation on the part of the manufacturers is expected to arrest the slide.
The price of the accelerometers used for pacemakers was $13 in 2005. This market is a niche segment with the presence of very few manufacturers. However, the increase in competition over the forecast period is expected to have serious repercussions on this segment and this is expected to decrease the price of these accelerometers over the forecast period.
Technology Roadmap
MEMS remains an attractive platform for medical applications because mechanical, sensory, and also computational technologies can be integrated onto one chip. Additionally, the low production costs and small size prove beneficial in the medical industry. These factors are expected to be drivers in the trend toward unprecedented levels of patient monitoring. The trend being witnessed in the medical industry is the integration of wireless technology with MEMS-based sensors. Two companies namely CardioMEMS, Inc. and Integrated Sensing Systems, Inc. have received required approvals and have released their products.
#FA0A-32 © 2006 Frost & Sullivan www.frost.com 6-12
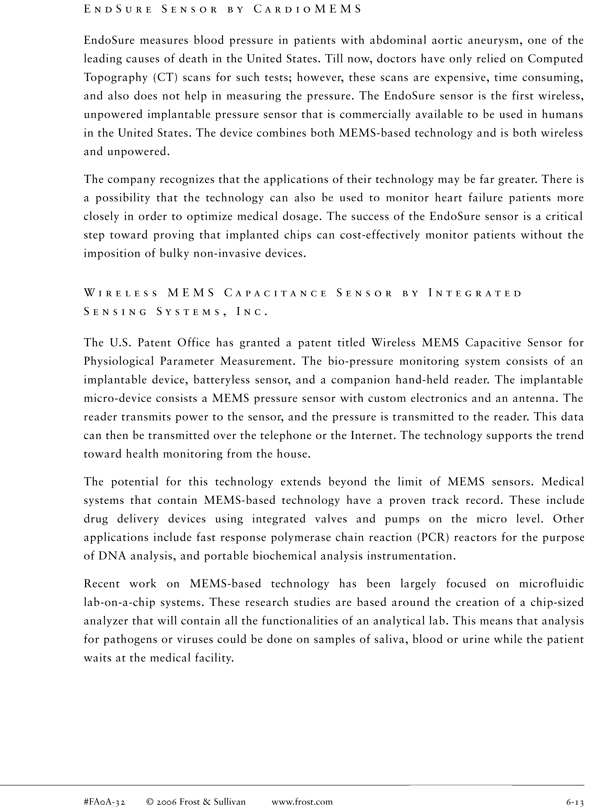
E N D S U R E S E N S O R B Y C A R D I O M E M S
EndoSure measures blood pressure in patients with abdominal aortic aneurysm, one of the leading causes of death in the United States. Till now, doctors have only relied on Computed Topography (CT) scans for such tests; however, these scans are expensive, time consuming, and also does not help in measuring the pressure. The EndoSure sensor is the first wireless, unpowered implantable pressure sensor that is commercially available to be used in humans in the United States. The device combines both MEMS-based technology and is both wireless and unpowered.
The company recognizes that the applications of their technology may be far greater. There is a possibility that the technology can also be used to monitor heart failure patients more closely in order to optimize medical dosage. The success of the EndoSure sensor is a critical step toward proving that implanted chips can cost-effectively monitor patients without the imposition of bulky non-invasive devices.
W I R E L E S S M E M S C A P A C I T A N C E S E N S O R B Y I N T E G R A T E D S E N S I N G S Y S T E M S , I N C .
The U.S. Patent Office has granted a patent titled Wireless MEMS Capacitive Sensor for Physiological Parameter Measurement. The bio-pressure monitoring system consists of an implantable device, batteryless sensor, and a companion hand-held reader. The implantable micro-device consists a MEMS pressure sensor with custom electronics and an antenna. The reader transmits power to the sensor, and the pressure is transmitted to the reader. This data can then be transmitted over the telephone or the Internet. The technology supports the trend toward health monitoring from the house.
The potential for this technology extends beyond the limit of MEMS sensors. Medical systems that contain MEMS-based technology have a proven track record. These include drug delivery devices using integrated valves and pumps on the micro level. Other applications include fast response polymerase chain reaction (PCR) reactors for the purpose of DNA analysis, and portable biochemical analysis instrumentation.
Recent work on MEMS-based technology has been largely focused on microfluidic lab-on-a-chip systems. These research studies are based around the creation of a chip-sized analyzer that will contain all the functionalities of an analytical lab. This means that analysis for pathogens or viruses could be done on samples of saliva, blood or urine while the patient waits at the medical facility.
#FA0A-32 © 2006 Frost & Sullivan www.frost.com 6-13
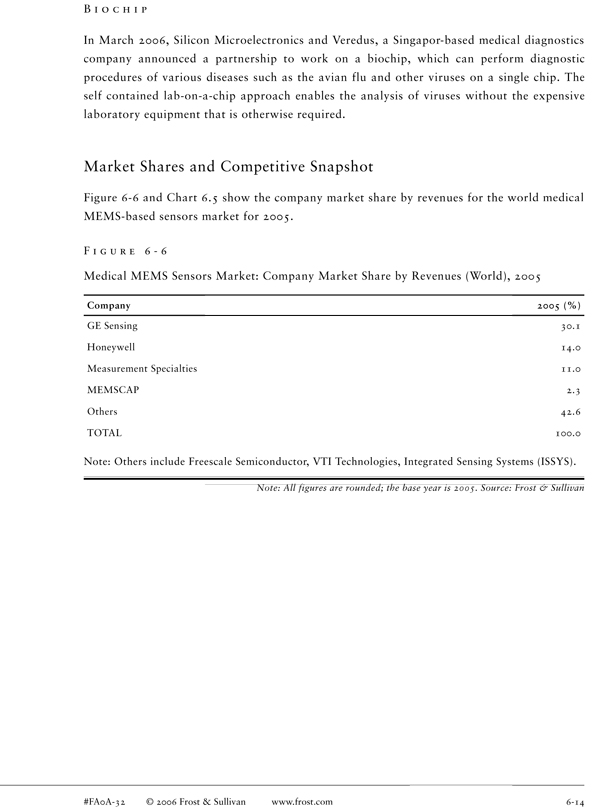
B I O C H I P
In March 2006, Silicon Microelectronics and Veredus, a Singapor-based medical diagnostics company announced a partnership to work on a biochip, which can perform diagnostic procedures of various diseases such as the avian flu and other viruses on a single chip. The self contained lab-on-a-chip approach enables the analysis of viruses without the expensive laboratory equipment that is otherwise required.
Market Shares and Competitive Snapshot
Figure 6-6 and Chart 6.5 show the company market share by revenues for the world medical MEMS-based sensors market for 2005.
F I G U R E 6 - 6
Medical MEMS Sensors Market: Company Market Share by Revenues (World), 2005
Company 2005 (%)
GE Sensing 30.1 Honeywell 14.0 Measurement Specialties 11.0 MEMSCAP 2.3 Others 42.6 TOTAL 100.0
Note: Others include Freescale Semiconductor, VTI Technologies, Integrated Sensing Systems (ISSYS).
Note: All figures are rounded; the base year is 2005. Source: Frost & Sullivan
#FA0A-32 © 2006 Frost & Sullivan www.frost.com 6-14
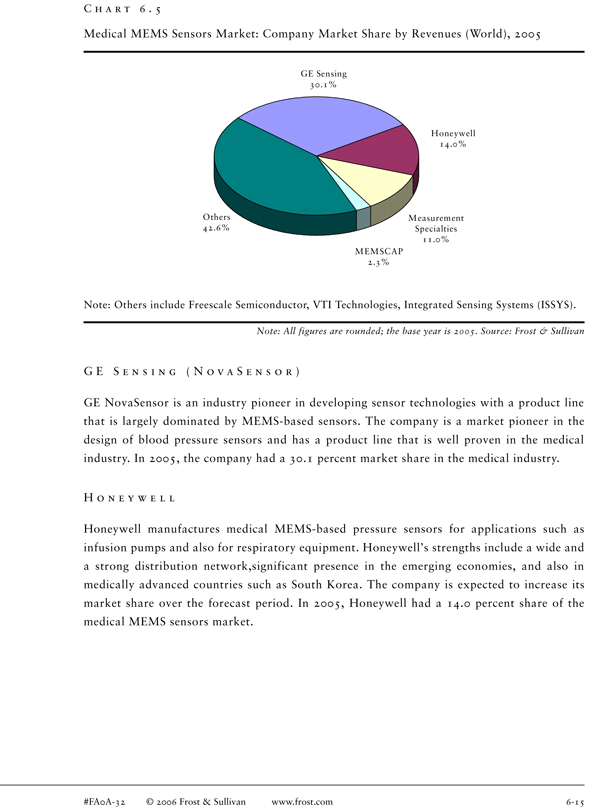
C H A R T 6 . 5
Medical MEMS Sensors Market: Company Market Share by Revenues (World), 2005
GE Sensing 30.1%
Honeywell 14.0%
Others M easurement 42.6% Specialties 11.0% MEM SCAP
2.3%
Note: Others include Freescale Semiconductor, VTI Technologies, Integrated Sensing Systems (ISSYS).
Note: All figures are rounded; the base year is 2005. Source: Frost & Sullivan
G E S E N S I N G ( N O V A S E N S O R )
GE NovaSensor is an industry pioneer in developing sensor technologies with a product line that is largely dominated by MEMS-based sensors. The company is a market pioneer in the design of blood pressure sensors and has a product line that is well proven in the medical industry. In 2005, the company had a 30.1 percent market share in the medical industry.
H O N E Y W E L L
Honeywell manufactures medical MEMS-based pressure sensors for applications such as infusion pumps and also for respiratory equipment. Honeywell’s strengths include a wide and a strong distribution network,significant presence in the emerging economies, and also in medically advanced countries such as South Korea. The company is expected to increase its market share over the forecast period. In 2005, Honeywell had a 14.0 percent share of the medical MEMS sensors market.
#FA0A-32 © 2006 Frost & Sullivan www.frost.com 6-15
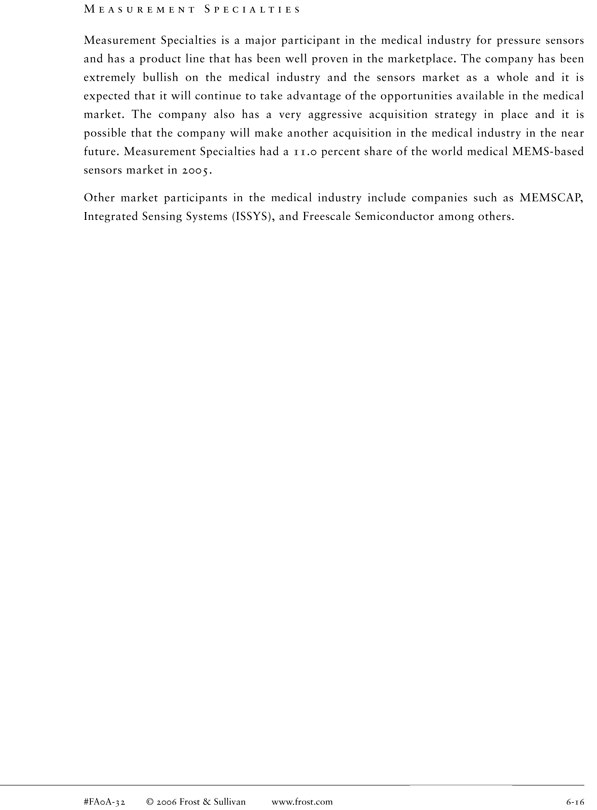
M E A S U R E M E N T S P E C I A L T I E S
Measurement Specialties is a major participant in the medical industry for pressure sensors and has a product line that has been well proven in the marketplace. The company has been extremely bullish on the medical industry and the sensors market as a whole and it is expected that it will continue to take advantage of the opportunities available in the medical market. The company also has a very aggressive acquisition strategy in place and it is possible that the company will make another acquisition in the medical industry in the near future. Measurement Specialties had a 11.0 percent share of the world medical MEMS-based sensors market in 2005.
Other market participants in the medical industry include companies such as MEMSCAP, Integrated Sensing Systems (ISSYS), and Freescale Semiconductor among others.
#FA0A-32 © 2006 Frost & Sullivan www.frost.com 6-16
Emerging Market Participants
O V E R V I E W
Introduction
The world Microelectronic Mechanical Systems (MEMS) sensors market is witnessing the emergence of a number of companies that are expected to play a significant role in affecting market dynamics in the future. MEMS has evolved into an irreplaceable part of many applications especially in the case of sensing applications. The technology also has a proven track record in diverse industries such as automotive and medical ensuring that investments into the technology have declined despite many issues.
The potential for innovation in the MEMS-based sensors industry is vast and over the forecast period more companies are expected to enter the market. The rise of the fabless model of manufacturing has also enabled small companies with unique product solutions to manufacture their products. Additionally, advances in software has helped in improvements in the design stage of MEMS sensors. In this section some of the emerging participants in the world MEMS-based sensors market have been identified. These companies have unique product solutions and are active in a variety of markets. It is expected that these companies will have a significant impact on the world MEMS-based sensors market over the next decade.
Research Methodology
Research into emerging participants was carried out during the course of the research on the world MEMS sensors market. Emerging participants were identified based on interactions with industry participants and also using Frost & Sullivan’s extensive knowledge on the MEMS industry. These companies are profiled in this section.
#FA0A-32 © 2006 Frost & Sullivan www.frost.com 7-1
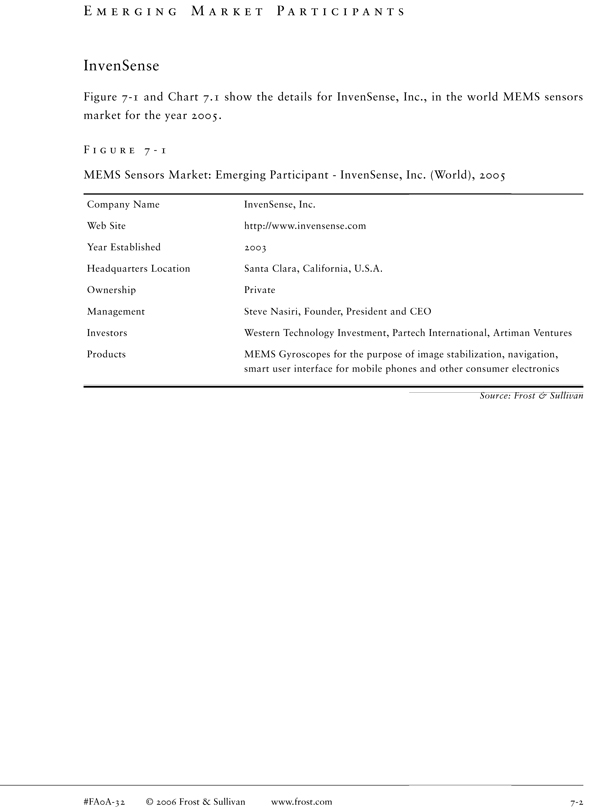
E M E R G I N G M A R K E T P A R T I C I P A N T S
InvenSense
Figure 7-1 and Chart 7.1 show the details for InvenSense, Inc., in the world MEMS sensors market for the year 2005.
F I G U R E 7 - 1
MEMS Sensors Market: Emerging Participant - InvenSense, Inc. (World), 2005
Company Name InvenSense, Inc.
Web Site http://www.invensense.com Year Established 2003 Headquarters Location Santa Clara, California, U.S.A. Ownership Private
Management Steve Nasiri, Founder, President and CEO
Investors Western Technology Investment, Partech International, Artiman Ventures
Products MEMS Gyroscopes for the purpose of image stabilization, navigation, smart user interface for mobile phones and other consumer electronics
Source: Frost & Sullivan
#FA0A-32 © 2006 Frost & Sullivan www.frost.com 7-2
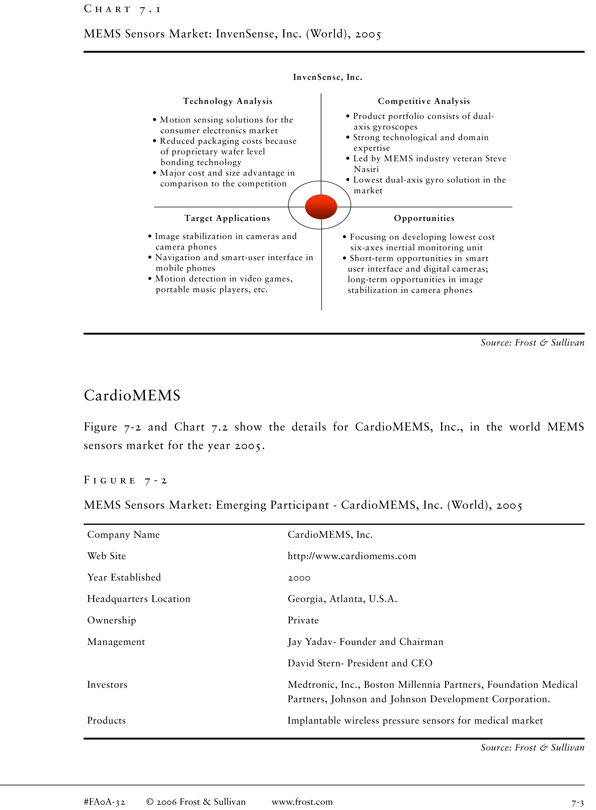
C H A R T 7 . 1
MEMS Sensors Market: InvenSense, Inc. (World), 2005
InvenSense, Inc.
Technology Analysis Com petitive Analysis
• Product portfolio consists of dual
• Motion sensing solutions for the axis gyroscopes consumer electronics market
• Strong technological and domain
• Reduced packaging costs because expertise of proprietary wafer level
• Led by MEMS industry veteran Steve bonding technology Nasiri
• Major cost and size advantage in
• Lowest dual-axis gyro solution in the comparison to the competition market
Target Applications O pportunities
• Image stabilization in cameras and
• Focusing on developing lowest cost camera phones six-axes inertial monitoring unit
• Navigation and smart-user interface in
• Short-term opportunities in smart mobile phones user interface and digital cameras;
• Motion detection in video games, long-term opportunities in image portable music players, etc. stabilization in camera phones
Source: Frost & Sullivan
CardioMEMS
Figure 7-2 and Chart 7.2 show the details for CardioMEMS, Inc., in the world MEMS sensors market for the year 2005.
F I G U R E 7 - 2
MEMS Sensors Market: Emerging Participant - CardioMEMS, Inc. (World), 2005
Company Name CardioMEMS, Inc.
Web Site http://www.cardiomems.com Year Established 2000 Headquarters Location Georgia, Atlanta, U.S.A. Ownership Private Management Jay Yadav- Founder and Chairman David Stern- President and CEO
Investors Medtronic, Inc., Boston Millennia Partners, Foundation Medical Partners, Johnson and Johnson Development Corporation.
Products Implantable wireless pressure sensors for medical market
Source: Frost & Sullivan
#FA0A-32 © 2006 Frost & Sullivan www.frost.com 7-3
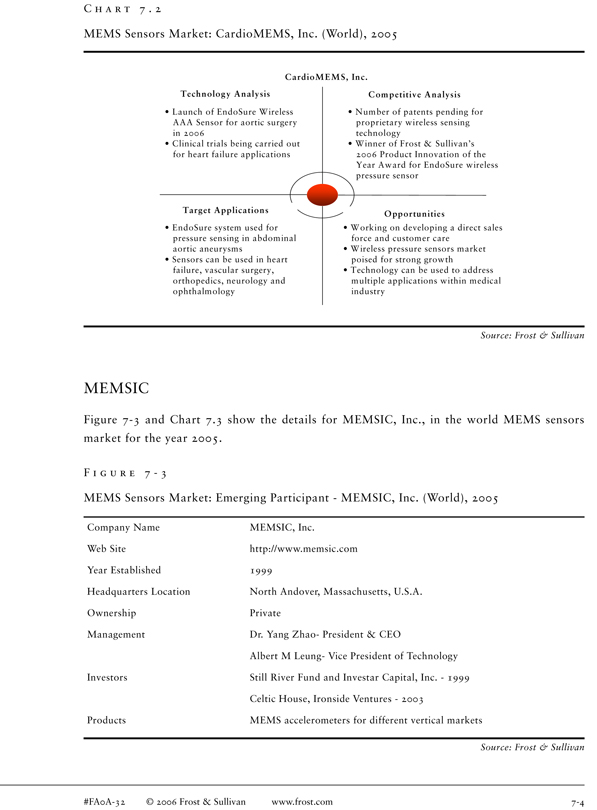
C H A R T 7 . 2
MEMS Sensors Market: CardioMEMS, Inc. (World), 2005
CardioM EM S, Inc.
Technology Analysis C om petitive A nalysis
• Launch of EndoSure Wireless
• Number of patents pending for AAA Sensor for aortic surgery proprietary wireless sensing in 2006 technology
• Clinical trials being carried out
• Winner of Frost & Sullivan’s for heart failure applications 2006 Product Innovation of the Year Award for EndoSure wireless pressure sensor
Target Applications
Opportunities
• EndoSure system used for
• Working on developing a direct sales pressure sensing in abdominal force and customer care aortic aneurysms
• Wireless pressure sensors market
• Sensors can be used in heart poised for strong growth failure, vascular surgery,
• Technology can be used to address orthopedics, neurology and multiple applications within medical ophthalmology industry
Source: Frost & Sullivan
MEMSIC
Figure 7-3 and Chart 7.3 show the details for MEMSIC, Inc., in the world MEMS sensors market for the year 2005.
F I G U R E 7—3
MEMS Sensors Market: Emerging Participant—MEMSIC, Inc. (World), 2005
Company Name MEMSIC, Inc.
Web Site http://www.memsic.com
Year Established 1999
Headquarters Location North Andover, Massachusetts, U.S.A. Ownership Private Management Dr. Yang Zhao- President & CEO
Albert M Leung- Vice President of Technology Investors Still River Fund and Investar Capital, Inc.—1999 Celtic House, Ironside Ventures—2003 Products MEMS accelerometers for different vertical markets
Source: Frost & Sullivan
#FA0A-32 © 2006 Frost & Sullivan www.frost.com 7-4
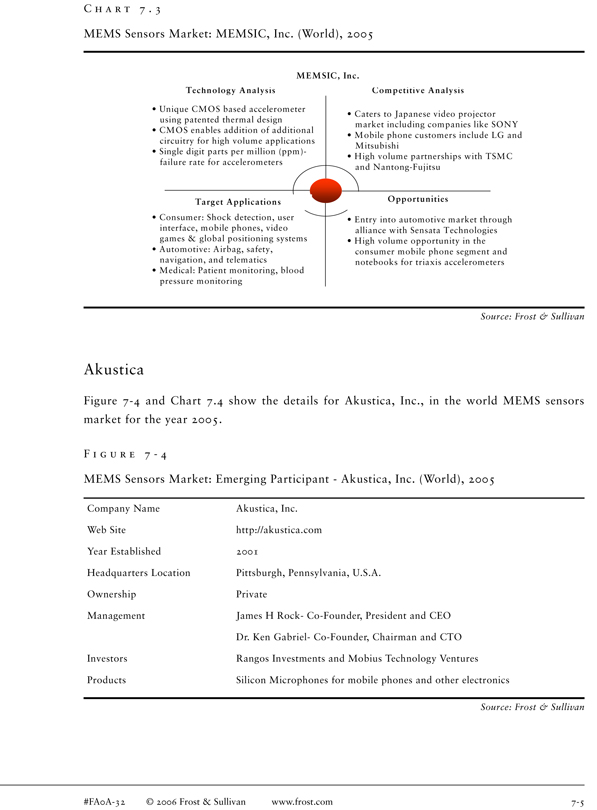
C H A R T 7 . 3
MEMS Sensors Market: MEMSIC, Inc. (World), 2005
M EM SIC, Inc.
Technology A nalysis Com petitive Analysis
• Unique CMOS based accelerometer
• Caters to Japanese video projector using patented thermal design market including companies like SONY
• CMOS enables addition of additional
• Mobile phone customers include LG and circuitry for high volume applications Mitsubishi • Single digit parts per million (ppm)-• High volume partnerships with TSMC failure rate for accelerometers and Nantong-Fujitsu
Target A pplications O pportunities
• Consumer: Shock detection, user • Entry into automotive market through interface, mobile phones, video alliance with Sensata Technologies games & global positioning systems • High volume opportunity in the • Automotive: Airbag, safety, consumer mobile phone segment and navigation, and telematics notebooks for triaxis accelerometers • Medical: Patient monitoring, blood pressure monitoring
Source: Frost & Sullivan
Akustica
Figure 7-4 and Chart 7.4 show the details for Akustica, Inc., in the world MEMS sensors market for the year 2005.
F I G U R E 7 - 4
MEMS Sensors Market: Emerging Participant - Akustica, Inc. (World), 2005
Company Name Akustica, Inc. Web Site http://akustica.com Year Established 2001
Headquarters Location Pittsburgh, Pennsylvania, U.S.A.
Ownership Private
Management James H Rock- Co-Founder, President and CEO
Dr. Ken Gabriel- Co-Founder, Chairman and CTO Investors Rangos Investments and Mobius Technology Ventures Products Silicon Microphones for mobile phones and other electronics
Source: Frost & Sullivan
#FA0A-32 © 2006 Frost & Sullivan www.frost.com 7-5
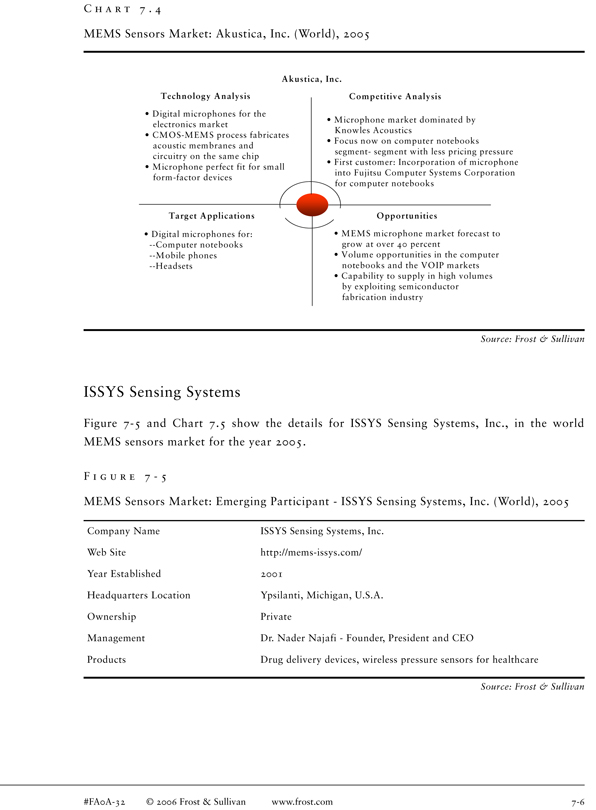
C H A R T 7 . 4
MEMS Sensors Market: Akustica, Inc. (World), 2005
A kustica, Inc.
Technology A nalysis Com petitive Analysis
• Digital microphones for the
• Microphone market dominated by electronics market Knowles Acoustics
• CMOS-MEMS process fabricates
• Focus now on computer notebooks acoustic membranes and segment- segment with less pricing pressure circuitry on the same chip
• First customer: Incorporation of microphone
• Microphone perfect fit for small into Fujitsu Computer Systems Corporation form-factor devices for computer notebooks
Target A pplications O pportunities
• Digital microphones for:
• MEMS microphone market forecast to - Computer notebooks grow at over 40 percent - Mobile phones
• Volume opportunities in the computer - Headsets notebooks and the VOIP markets
• Capability to supply in high volumes by exploiting semiconductor fabrication industry
Source: Frost & Sullivan
ISSYS Sensing Systems
Figure 7-5 and Chart 7.5 show the details for ISSYS Sensing Systems, Inc., in the world MEMS sensors market for the year 2005.
F I G U R E 7 - 5
MEMS Sensors Market: Emerging Participant - ISSYS Sensing Systems, Inc. (World), 2005
Company Name ISSYS Sensing Systems, Inc. Web Site http://mems-issys.com/ Year Established 2001 Headquarters Location Ypsilanti, Michigan, U.S.A. Ownership Private
Management Dr. Nader Najafi - Founder, President and CEO
Products Drug delivery devices, wireless pressure sensors for healthcare
Source: Frost & Sullivan
#FA0A-32 © 2006 Frost & Sullivan www.frost.com 7-6
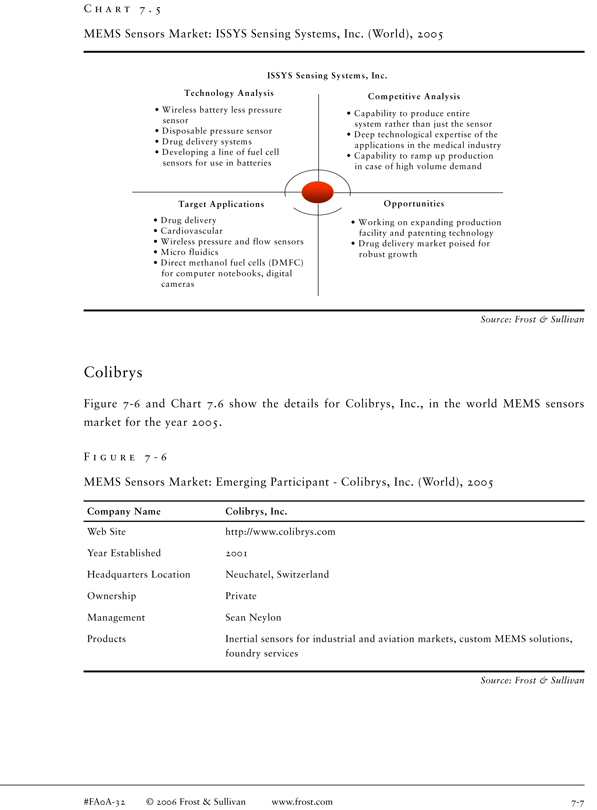
C H A R T 7 . 5
MEMS Sensors Market: ISSYS Sensing Systems, Inc. (World), 2005
ISSY S Sensing System s, Inc.
Technology A nalysis
Com petitive Analysis
• Wireless battery less pressure
• Capability to produce entire sensor system rather than just the sensor
• Disposable pressure sensor
• Deep technological expertise of the
• Drug delivery systems applications in the medical industry
• Developing a line of fuel cell
• Capability to ramp up production sensors for use in batteries in case of high volume demand
Target A pplications O pportunities
• Drug delivery
• Working on expanding production
• Cardiovascular facility and patenting technology
• Wireless pressure and flow sensors
• Drug delivery market poised for
• Micro fluidics robust growth
• Direct methanol fuel cells (DMFC) for computer notebooks, digital cameras
Source: Frost & Sullivan
Colibrys
Figure 7-6 and Chart 7.6 show the details for Colibrys, Inc., in the world MEMS sensors market for the year 2005.
F I G U R E 7 - 6
MEMS Sensors Market: Emerging Participant - Colibrys, Inc. (World), 2005
Company Name Colibrys, Inc.
Web Site http://www.colibrys.com Year Established 2001 Headquarters Location Neuchatel, Switzerland Ownership Private Management Sean Neylon
Products Inertial sensors for industrial and aviation markets, custom MEMS solutions, foundry services
Source: Frost & Sullivan
#FA0A-32 © 2006 Frost & Sullivan www.frost.com 7-7
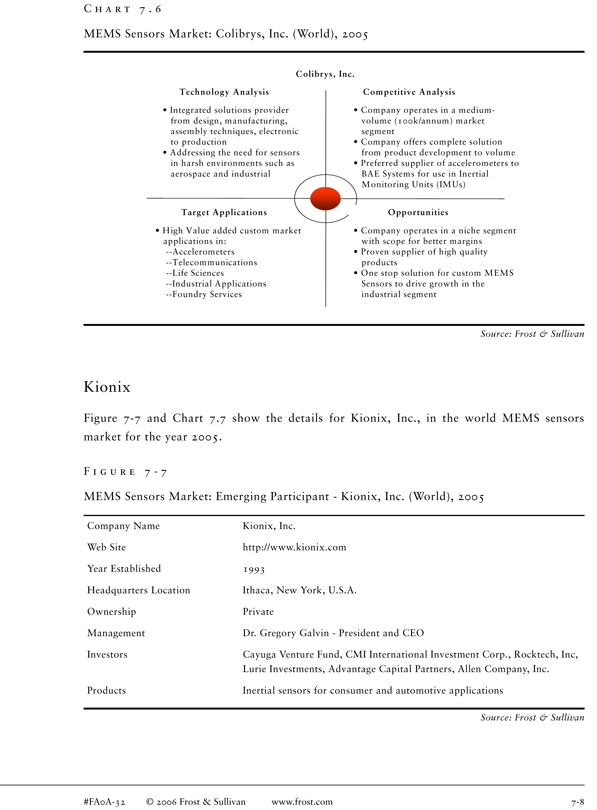
C H A R T 7 . 6
MEMS Sensors Market: Colibrys, Inc. (World), 2005
C olibrys, Inc.
Technology Analysis Com petitive A nalysis
• Integrated solutions provider
• Company operates in a medium-from design, manufacturing, volume (100k/annum) market assembly techniques, electronic segment to production
• Company offers complete solution
• Addressing the need for sensors from product development to volume in harsh environments such as
• Preferred supplier of accelerometers to aerospace and industrial BAE Systems for use in Inertial Monitoring Units (IMUs)
Target Applications O pportunities
• High Value added custom market
• Company operates in a niche segment applications in: with scope for better margins - Accelerometers
• Proven supplier of high quality - Telecommunications products - Life Sciences
• One stop solution for custom MEMS - Industrial Applications Sensors to drive growth in the - Foundry Services industrial segment
Source: Frost & Sullivan
Kionix
Figure 7-7 and Chart 7.7 show the details for Kionix, Inc., in the world MEMS sensors market for the year 2005.
F I G U R E 7 - 7
MEMS Sensors Market: Emerging Participant - Kionix, Inc. (World), 2005
Company Name Kionix, Inc.
Web Site http://www.kionix.com Year Established 1993 Headquarters Location Ithaca, New York, U.S.A. Ownership Private
Management Dr. Gregory Galvin - President and CEO
Investors Cayuga Venture Fund, CMI International Investment Corp., Rocktech, Inc, Lurie Investments, Advantage Capital Partners, Allen Company, Inc.
Products Inertial sensors for consumer and automotive applications
Source: Frost & Sullivan
#FA0A-32 © 2006 Frost & Sullivan www.frost.com 7-8
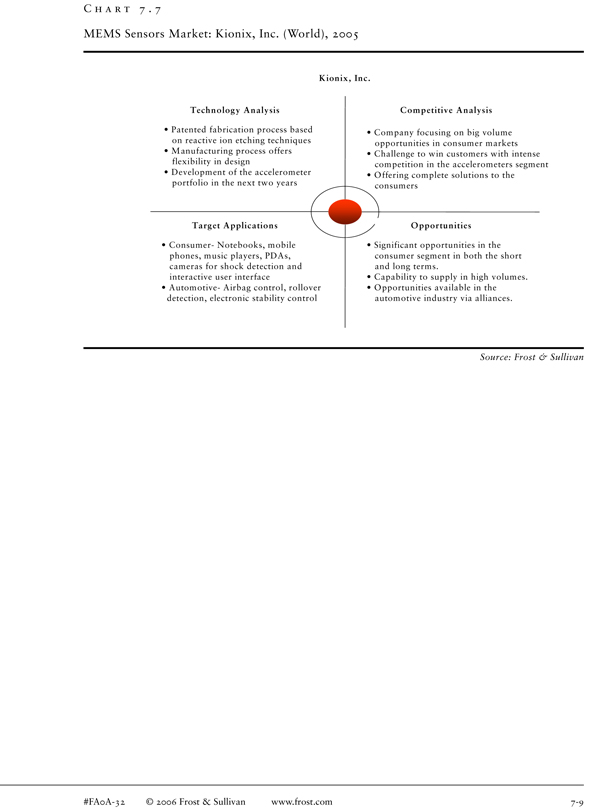
C H A R T 7 . 7
MEMS Sensors Market: Kionix, Inc. (World), 2005
K ionix, Inc.
Technology Analysis Com petitive Analysis
• Patented fabrication process based
• Company focusing on big volume on reactive ion etching techniques opportunities in consumer markets
• Manufacturing process offers
• Challenge to win customers with intense flexibility in design competition in the accelerometers segment
• Development of the accelerometer • Offering complete solutions to the portfolio in the next two years consumers
Target A pplications O pportunities
• Consumer- Notebooks, mobile
• Significant opportunities in the phones, music players, PDAs, consumer segment in both the short cameras for shock detection and and long terms. interactive user interface
• Capability to supply in high volumes.
• Automotive- Airbag control, rollover
• Opportunities available in the detection, electronic stability control automotive industry via alliances.
Source: Frost & Sullivan
#FA0A-32 © 2006 Frost & Sullivan www.frost.com 7-9
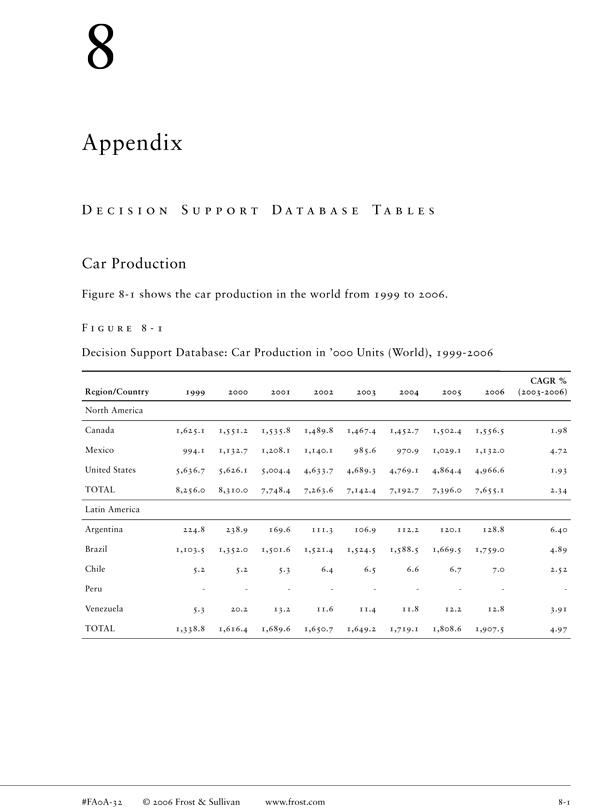
Appendix
D E C I S I O N S U P P O R T D A T A B A S E T A B L E S
Car Production
Figure 8-1 shows the car production in the world from 1999 to 2006.
F I G U R E 8 - 1
Decision Support Database: Car Production in ’000 Units (World), 1999-2006
CAGR % Region/Country 1999 2000 2001 2002 2003 2004 2005 2006 (2003-2006)
North America
Canada 1,625.1 1,551.2 1,535.8 1,489.8 1,467.4 1,452.7 1,502.4 1,556.5 1.98 Mexico 994.1 1,132.7 1,208.1 1,140.1 985.6 970.9 1,029.1 1,132.0 4.72 United States 5,636.7 5,626.1 5,004.4 4,633.7 4,689.3 4,769.1 4,864.4 4,966.6 1.93 TOTAL 8,256.0 8,310.0 7,748.4 7,263.6 7,142.4 7,192.7 7,396.0 7,655.1 2.34 Latin America Argentina 224.8 238.9 169.6 111.3 106.9 112.2 120.1 128.8 6.40 Brazil 1,103.5 1,352.0 1,501.6 1,521.4 1,524.5 1,588.5 1,669.5 1,759.0 4.89 Chile 5.2 5.2 5.3 6.4 6.5 6.6 6.7 7.0 2.52 Peru Venezuela 5.3 20.2 13.2 11.6 11.4 11.8 12.2 12.8 3.91 TOTAL 1,338.8 1,616.4 1,689.6 1,650.7 1,649.2 1,719.1 1,808.6 1,907.5 4.97
#FA0A-32 © 2006 Frost & Sullivan www.frost.com 8-1
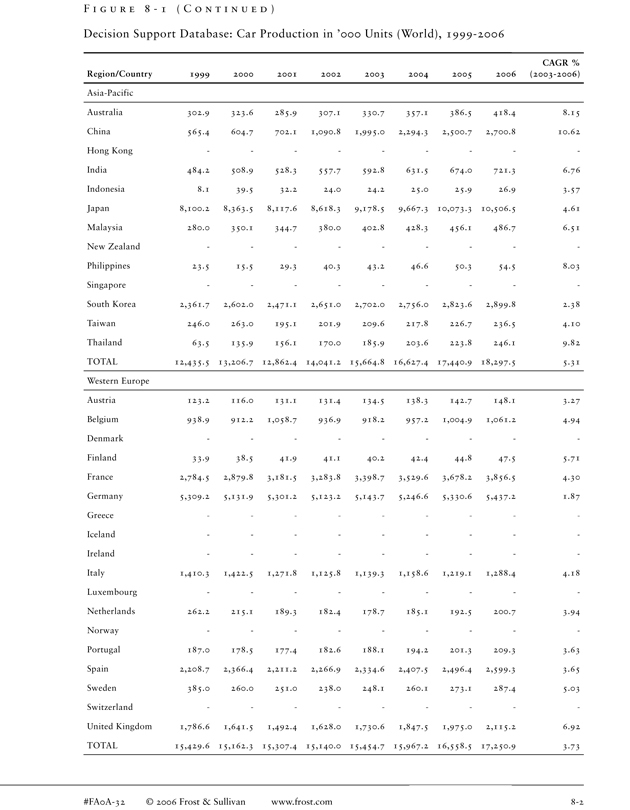
F I G U R E 8 - 1 ( C O N T I N U E D )
Decision Support Database: Car Production in ’000 Units (World), 1999-2006
CAGR % Region/Country 1999 2000 2001 2002 2003 2004 2005 2006 (2003-2006)
Asia-Pacific
Australia 302.9 323.6 285.9 307.1 330.7 357.1 386.5 418.4 8.15 China 565.4 604.7 702.1 1,090.8 1,995.0 2,294.3 2,500.7 2,700.8 10.62 Hong Kong India 484.2 508.9 528.3 557.7 592.8 631.5 674.0 721.3 6.76 Indonesia 8.1 39.5 32.2 24.0 24.2 25.0 25.9 26.9 3.57 Japan 8,100.2 8,363.5 8,117.6 8,618.3 9,178.5 9,667.3 10,073.3 10,506.5 4.61 Malaysia 280.0 350.1 344.7 380.0 402.8 428.3 456.1 486.7 6.51 New Zealand Philippines 23.5 15.5 29.3 40.3 43.2 46.6 50.3 54.5 8.03 Singapore South Korea 2,361.7 2,602.0 2,471.1 2,651.0 2,702.0 2,756.0 2,823.6 2,899.8 2.38 Taiwan 246.0 263.0 195.1 201.9 209.6 217.8 226.7 236.5 4.10 Thailand 63.5 135.9 156.1 170.0 185.9 203.6 223.8 246.1 9.82 TOTAL 12,435.5 13,206.7 12,862.4 14,041.2 15,664.8 16,627.4 17,440.9 18,297.5 5.31 Western Europe Austria 123.2 116.0 131.1 131.4 134.5 138.3 142.7 148.1 3.27 Belgium 938.9 912.2 1,058.7 936.9 918.2 957.2 1,004.9 1,061.2 4.94 Denmark Finland 33.9 38.5 41.9 41.1 40.2 42.4 44.8 47.5 5.71 France 2,784.5 2,879.8 3,181.5 3,283.8 3,398.7 3,529.6 3,678.2 3,856.5 4.30 Germany 5,309.2 5,131.9 5,301.2 5,123.2 5,143.7 5,246.6 5,330.6 5,437.2 1.87 Greece Iceland Ireland Italy 1,410.3 1,422.5 1,271.8 1,125.8 1,139.3 1,158.6 1,219.1 1,288.4 4.18 Luxembourg Netherlands 262.2 215.1 189.3 182.4 178.7 185.1 192.5 200.7 3.94 Norway Portugal 187.0 178.5 177.4 182.6 188.1 194.2 201.3 209.3 3.63 Spain 2,208.7 2,366.4 2,211.2 2,266.9 2,334.6 2,407.5 2,496.4 2,599.3 3.65 Sweden 385.0 260.0 251.0 238.0 248.1 260.1 273.1 287.4 5.03 Switzerland United Kingdom 1,786.6 1,641.5 1,492.4 1,628.0 1,730.6 1,847.5 1,975.0 2,115.2 6.92 TOTAL 15,429.6 15,162.3 15,307.4 15,140.0 15,454.7 15,967.2 16,558.5 17,250.9 3.73
#FA0A-32 © 2006 Frost & Sullivan www.frost.com 8-2
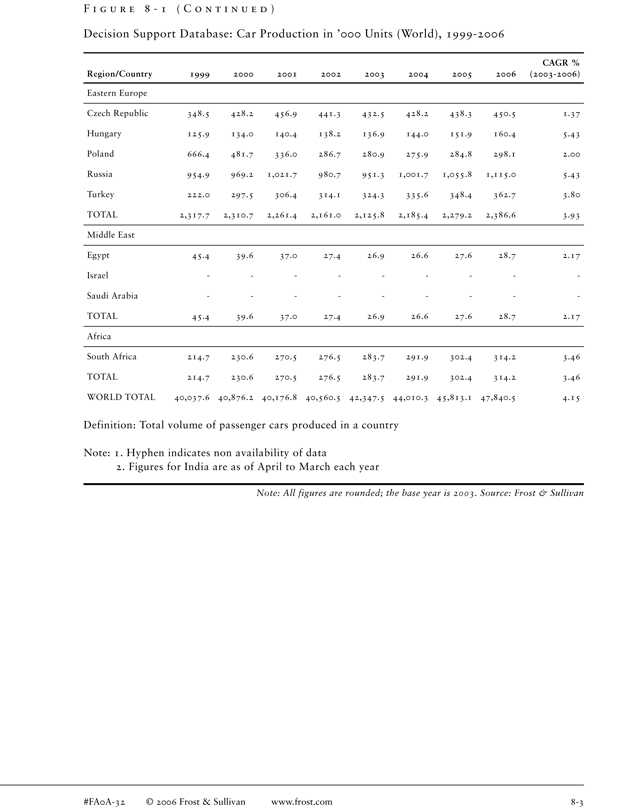
F I G U R E 8 - 1 ( C O N T I N U E D )
Decision Support Database: Car Production in ’000 Units (World), 1999-2006
CAGR % Region/Country 1999 2000 2001 2002 2003 2004 2005 2006 (2003-2006)
Eastern Europe
Czech Republic 348.5 428.2 456.9 441.3 432.5 428.2 438.3 450.5 1.37 Hungary 125.9 134.0 140.4 138.2 136.9 144.0 151.9 160.4 5.43 Poland 666.4 481.7 336.0 286.7 280.9 275.9 284.8 298.1 2.00 Russia 954.9 969.2 1,021.7 980.7 951.3 1,001.7 1,055.8 1,115.0 5.43 Turkey 222.0 297.5 306.4 314.1 324.3 335.6 348.4 362.7 3.80 TOTAL 2,317.7 2,310.7 2,261.4 2,161.0 2,125.8 2,185.4 2,279.2 2,386.6 3.93 Middle East Egypt 45.4 39.6 37.0 27.4 26.9 26.6 27.6 28.7 2.17 Israel Saudi Arabia TOTAL 45.4 39.6 37.0 27.4 26.9 26.6 27.6 28.7 2.17 Africa South Africa 214.7 230.6 270.5 276.5 283.7 291.9 302.4 314.2 3.46 TOTAL 214.7 230.6 270.5 276.5 283.7 291.9 302.4 314.2 3.46 WORLD TOTAL 40,037.6 40,876.2 40,176.8 40,560.5 42,347.5 44,010.3 45,813.1 47,840.5 4.15
Definition: Total volume of passenger cars produced in a country
Note: 1. Hyphen indicates non availability of data
2. Figures for India are as of April to March each year
Note: All figures are rounded; the base year is 2003. Source: Frost & Sullivan
#FA0A-32 © 2006 Frost & Sullivan www.frost.com 8-3
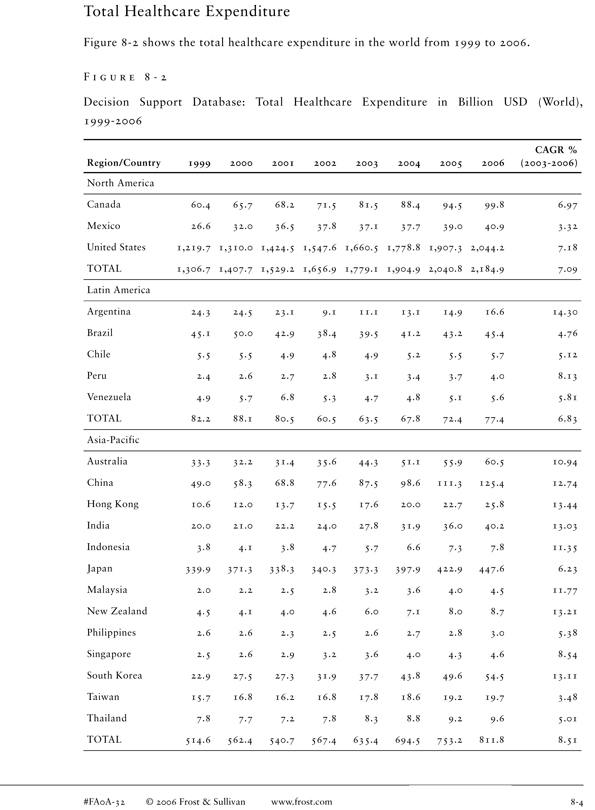
Total Healthcare Expenditure
Figure 8-2 shows the total healthcare expenditure in the world from 1999 to 2006.
F I G U R E 8 - 2
Decision Support Database: Total Healthcare Expenditure in Billion USD (World), 1999-2006
CAGR % Region/Country 1999 2000 2001 2002 2003 2004 2005 2006 (2003-2006)
North America
Canada 60.4 65.7 68.2 71.5 81.5 88.4 94.5 99.8 6.97 Mexico 26.6 32.0 36.5 37.8 37.1 37.7 39.0 40.9 3.32 United States 1,219.7 1,310.0 1,424.5 1,547.6 1,660.5 1,778.8 1,907.3 2,044.2 7.18 TOTAL 1,306.7 1,407.7 1,529.2 1,656.9 1,779.1 1,904.9 2,040.8 2,184.9 7.09 Latin America Argentina 24.3 24.5 23.1 9.1 11.1 13.1 14.9 16.6 14.30 Brazil 45.1 50.0 42.9 38.4 39.5 41.2 43.2 45.4 4.76 Chile 5.5 5.5 4.9 4.8 4.9 5.2 5.5 5.7 5.12 Peru 2.4 2.6 2.7 2.8 3.1 3.4 3.7 4.0 8.13 Venezuela 4.9 5.7 6.8 5.3 4.7 4.8 5.1 5.6 5.81 TOTAL 82.2 88.1 80.5 60.5 63.5 67.8 72.4 77.4 6.83 Asia-Pacific Australia 33.3 32.2 31.4 35.6 44.3 51.1 55.9 60.5 10.94 China 49.0 58.3 68.8 77.6 87.5 98.6 111.3 125.4 12.74 Hong Kong 10.6 12.0 13.7 15.5 17.6 20.0 22.7 25.8 13.44 India 20.0 21.0 22.2 24.0 27.8 31.9 36.0 40.2 13.03 Indonesia 3.8 4.1 3.8 4.7 5.7 6.6 7.3 7.8 11.35 Japan 339.9 371.3 338.3 340.3 373.3 397.9 422.9 447.6 6.23 Malaysia 2.0 2.2 2.5 2.8 3.2 3.6 4.0 4.5 11.77 New Zealand 4.5 4.1 4.0 4.6 6.0 7.1 8.0 8.7 13.21 Philippines 2.6 2.6 2.3 2.5 2.6 2.7 2.8 3.0 5.38 Singapore 2.5 2.6 2.9 3.2 3.6 4.0 4.3 4.6 8.54 South Korea 22.9 27.5 27.3 31.9 37.7 43.8 49.6 54.5 13.11 Taiwan 15.7 16.8 16.2 16.8 17.8 18.6 19.2 19.7 3.48 Thailand 7.8 7.7 7.2 7.8 8.3 8.8 9.2 9.6 5.01 TOTAL 514.6 562.4 540.7 567.4 635.4 694.5 753.2 811.8 8.51
#FA0A-32 © 2006 Frost & Sullivan www.frost.com 8-4
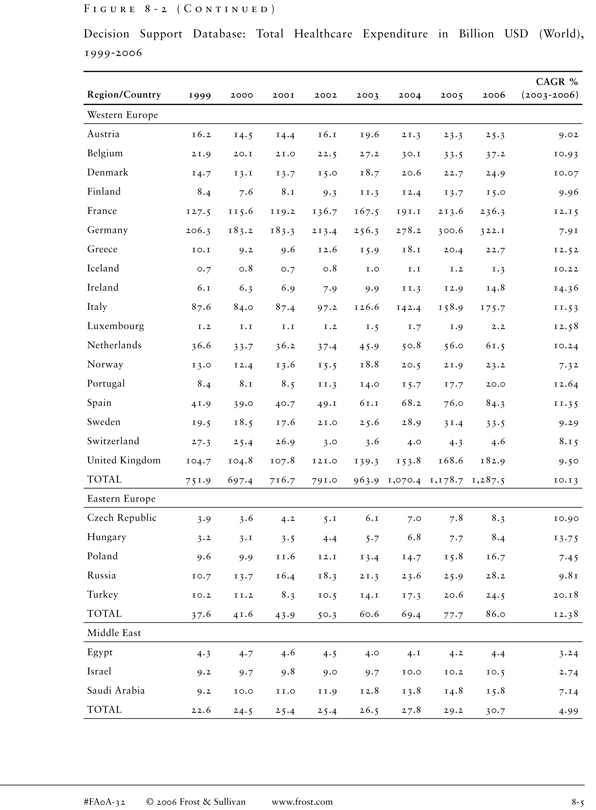
F I G U R E 8 - 2 ( C O N T I N U E D )
Decision Support Database: Total Healthcare Expenditure in Billion USD (World), 1999-2006
CAGR % Region/Country 1999 2000 2001 2002 2003 2004 2005 2006 (2003-2006)
Western Europe
Austria 16.2 14.5 14.4 16.1 19.6 21.3 23.3 25.3 9.02 Belgium 21.9 20.1 21.0 22.5 27.2 30.1 33.5 37.2 10.93 Denmark 14.7 13.1 13.7 15.0 18.7 20.6 22.7 24.9 10.07 Finland 8.4 7.6 8.1 9.3 11.3 12.4 13.7 15.0 9.96 France 127.5 115.6 119.2 136.7 167.5 191.1 213.6 236.3 12.15 Germany 206.3 183.2 183.3 213.4 256.3 278.2 300.6 322.1 7.91 Greece 10.1 9.2 9.6 12.6 15.9 18.1 20.4 22.7 12.52 Iceland 0.7 0.8 0.7 0.8 1.0 1.1 1.2 1.3 10.22 Ireland 6.1 6.3 6.9 7.9 9.9 11.3 12.9 14.8 14.36 Italy 87.6 84.0 87.4 97.2 126.6 142.4 158.9 175.7 11.53 Luxembourg 1.2 1.1 1.1 1.2 1.5 1.7 1.9 2.2 12.58 Netherlands 36.6 33.7 36.2 37.4 45.9 50.8 56.0 61.5 10.24 Norway 13.0 12.4 13.6 15.5 18.8 20.5 21.9 23.2 7.32 Portugal 8.4 8.1 8.5 11.3 14.0 15.7 17.7 20.0 12.64 Spain 41.9 39.0 40.7 49.1 61.1 68.2 76.0 84.3 11.35 Sweden 19.5 18.5 17.6 21.0 25.6 28.9 31.4 33.5 9.29 Switzerland 27.3 25.4 26.9 3.0 3.6 4.0 4.3 4.6 8.15 United Kingdom 104.7 104.8 107.8 121.0 139.3 153.8 168.6 182.9 9.50 TOTAL 751.9 697.4 716.7 791.0 963.9 1,070.4 1,178.7 1,287.5 10.13 Eastern Europe Czech Republic 3.9 3.6 4.2 5.1 6.1 7.0 7.8 8.3 10.90 Hungary 3.2 3.1 3.5 4.4 5.7 6.8 7.7 8.4 13.75 Poland 9.6 9.9 11.6 12.1 13.4 14.7 15.8 16.7 7.45 Russia 10.7 13.7 16.4 18.3 21.3 23.6 25.9 28.2 9.81 Turkey 10.2 11.2 8.3 10.5 14.1 17.3 20.6 24.5 20.18 TOTAL 37.6 41.6 43.9 50.3 60.6 69.4 77.7 86.0 12.38 Middle East Egypt 4.3 4.7 4.6 4.5 4.0 4.1 4.2 4.4 3.24 Israel 9.2 9.7 9.8 9.0 9.7 10.0 10.2 10.5 2.74 Saudi Arabia 9.2 10.0 11.0 11.9 12.8 13.8 14.8 15.8 7.14 TOTAL 22.6 24.5 25.4 25.4 26.5 27.8 29.2 30.7 4.99
#FA0A-32 © 2006 Frost & Sullivan www.frost.com 8-5
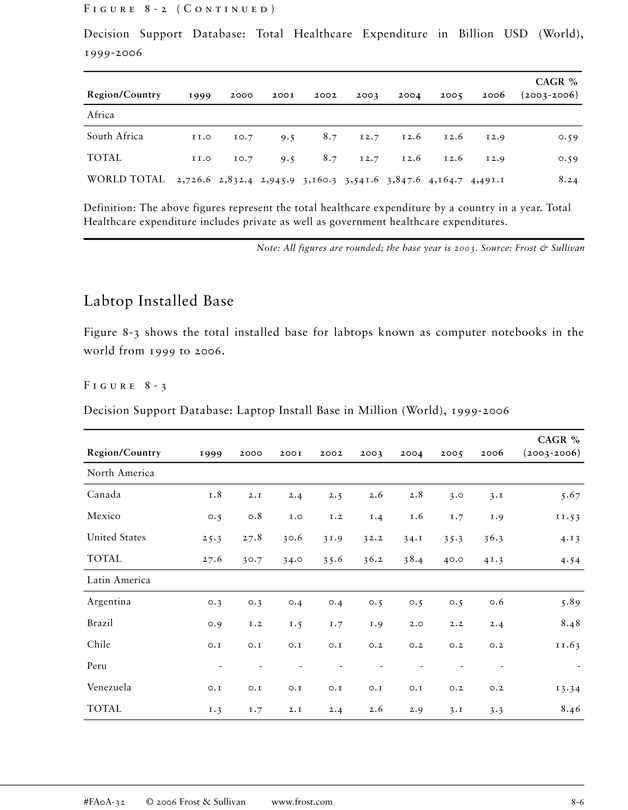
F I G U R E 8 - 2 ( C O N T I N U E D )
Decision Support Database: Total Healthcare Expenditure in Billion USD (World), 1999-2006
CAGR % Region/Country 1999 2000 2001 2002 2003 2004 2005 2006 (2003-2006)
Africa
South Africa 11.0 10.7 9.5 8.7 12.7 12.6 12.6 12.9 0.59 TOTAL 11.0 10.7 9.5 8.7 12.7 12.6 12.6 12.9 0.59 WORLD TOTAL 2,726.6 2,832.4 2,945.9 3,160.3 3,541.6 3,847.6 4,164.7 4,491.1 8.24
Definition: The above figures represent the total healthcare expenditure by a country in a year. Total Healthcare expenditure includes private as well as government healthcare expenditures.
Note: All figures are rounded; the base year is 2003. Source: Frost & Sullivan
Labtop Installed Base
Figure 8-3 shows the total installed base for labtops known as computer notebooks in the world from 1999 to 2006.
F I G U R E 8 - 3
Decision Support Database: Laptop Install Base in Million (World), 1999-2006
CAGR % Region/Country 1999 2000 2001 2002 2003 2004 2005 2006 (2003-2006)
North America
Canada 1.8 2.1 2.4 2.5 2.6 2.8 3.0 3.1 5.67 Mexico 0.5 0.8 1.0 1.2 1.4 1.6 1.7 1.9 11.53 United States 25.3 27.8 30.6 31.9 32.2 34.1 35.3 36.3 4.13 TOTAL 27.6 30.7 34.0 35.6 36.2 38.4 40.0 41.3 4.54 Latin America Argentina 0.3 0.3 0.4 0.4 0.5 0.5 0.5 0.6 5.89 Brazil 0.9 1.2 1.5 1.7 1.9 2.0 2.2 2.4 8.48 Chile 0.1 0.1 0.1 0.1 0.2 0.2 0.2 0.2 11.63 Peru Venezuela 0.1 0.1 0.1 0.1 0.1 0.1 0.2 0.2 13.34 TOTAL 1.3 1.7 2.1 2.4 2.6 2.9 3.1 3.3 8.46
#FA0A-32 © 2006 Frost & Sullivan www.frost.com 8-6
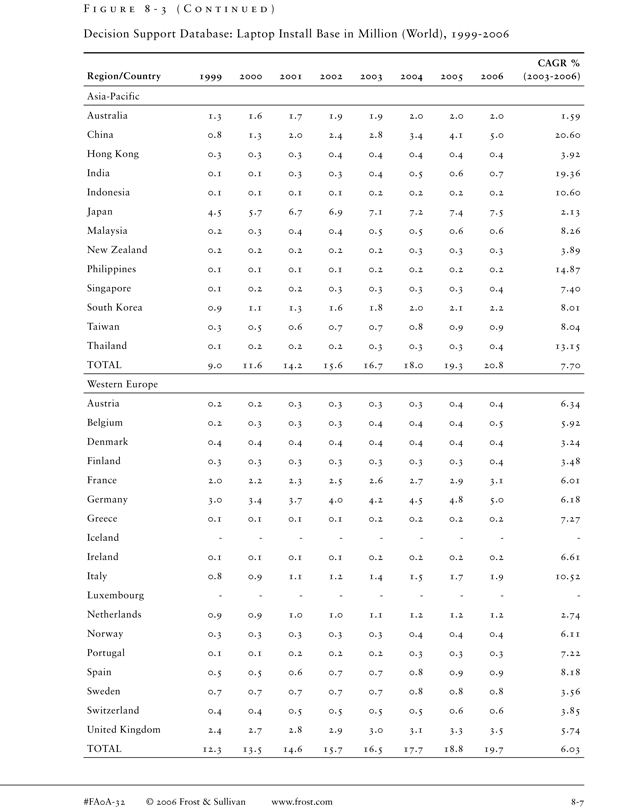
F I G U R E 8 - 3 ( C O N T I N U E D )
Decision Support Database: Laptop Install Base in Million (World), 1999-2006
CAGR % Region/Country 1999 2000 2001 2002 2003 2004 2005 2006 (2003-2006)
Asia-Pacific
Australia 1.3 1.6 1.7 1.9 1.9 2.0 2.0 2.0 1.59 China 0.8 1.3 2.0 2.4 2.8 3.4 4.1 5.0 20.60 Hong Kong 0.3 0.3 0.3 0.4 0.4 0.4 0.4 0.4 3.92 India 0.1 0.1 0.3 0.3 0.4 0.5 0.6 0.7 19.36 Indonesia 0.1 0.1 0.1 0.1 0.2 0.2 0.2 0.2 10.60 Japan 4.5 5.7 6.7 6.9 7.1 7.2 7.4 7.5 2.13 Malaysia 0.2 0.3 0.4 0.4 0.5 0.5 0.6 0.6 8.26 New Zealand 0.2 0.2 0.2 0.2 0.2 0.3 0.3 0.3 3.89 Philippines 0.1 0.1 0.1 0.1 0.2 0.2 0.2 0.2 14.87 Singapore 0.1 0.2 0.2 0.3 0.3 0.3 0.3 0.4 7.40 South Korea 0.9 1.1 1.3 1.6 1.8 2.0 2.1 2.2 8.01 Taiwan 0.3 0.5 0.6 0.7 0.7 0.8 0.9 0.9 8.04 Thailand 0.1 0.2 0.2 0.2 0.3 0.3 0.3 0.4 13.15 TOTAL 9.0 11.6 14.2 15.6 16.7 18.0 19.3 20.8 7.70 Western Europe Austria 0.2 0.2 0.3 0.3 0.3 0.3 0.4 0.4 6.34 Belgium 0.2 0.3 0.3 0.3 0.4 0.4 0.4 0.5 5.92 Denmark 0.4 0.4 0.4 0.4 0.4 0.4 0.4 0.4 3.24 Finland 0.3 0.3 0.3 0.3 0.3 0.3 0.3 0.4 3.48 France 2.0 2.2 2.3 2.5 2.6 2.7 2.9 3.1 6.01 Germany 3.0 3.4 3.7 4.0 4.2 4.5 4.8 5.0 6.18 Greece 0.1 0.1 0.1 0.1 0.2 0.2 0.2 0.2 7.27 Iceland Ireland 0.1 0.1 0.1 0.1 0.2 0.2 0.2 0.2 6.61 Italy 0.8 0.9 1.1 1.2 1.4 1.5 1.7 1.9 10.52 Luxembourg Netherlands 0.9 0.9 1.0 1.0 1.1 1.2 1.2 1.2 2.74 Norway 0.3 0.3 0.3 0.3 0.3 0.4 0.4 0.4 6.11 Portugal 0.1 0.1 0.2 0.2 0.2 0.3 0.3 0.3 7.22 Spain 0.5 0.5 0.6 0.7 0.7 0.8 0.9 0.9 8.18 Sweden 0.7 0.7 0.7 0.7 0.7 0.8 0.8 0.8 3.56 Switzerland 0.4 0.4 0.5 0.5 0.5 0.5 0.6 0.6 3.85 United Kingdom 2.4 2.7 2.8 2.9 3.0 3.1 3.3 3.5 5.74 TOTAL 12.3 13.5 14.6 15.7 16.5 17.7 18.8 19.7 6.03
#FA0A-32 © 2006 Frost & Sullivan www.frost.com 8-7
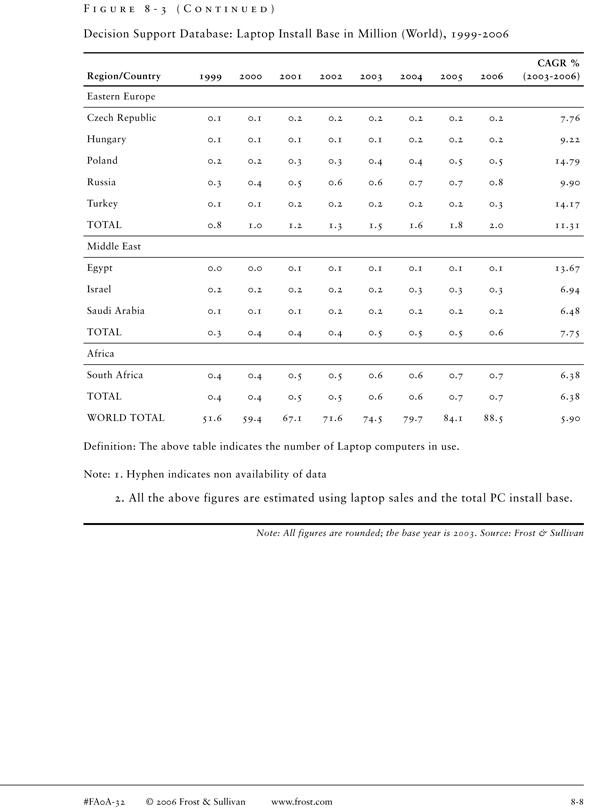
F I G U R E 8 - 3 ( C O N T I N U E D )
Decision Support Database: Laptop Install Base in Million (World), 1999-2006
CAGR % Region/Country 1999 2000 2001 2002 2003 2004 2005 2006 (2003-2006)
Eastern Europe
Czech Republic 0.1 0.1 0.2 0.2 0.2 0.2 0.2 0.2 7.76 Hungary 0.1 0.1 0.1 0.1 0.1 0.2 0.2 0.2 9.22 Poland 0.2 0.2 0.3 0.3 0.4 0.4 0.5 0.5 14.79 Russia 0.3 0.4 0.5 0.6 0.6 0.7 0.7 0.8 9.90 Turkey 0.1 0.1 0.2 0.2 0.2 0.2 0.2 0.3 14.17 TOTAL 0.8 1.0 1.2 1.3 1.5 1.6 1.8 2.0 11.31 Middle East Egypt 0.0 0.0 0.1 0.1 0.1 0.1 0.1 0.1 13.67 Israel 0.2 0.2 0.2 0.2 0.2 0.3 0.3 0.3 6.94 Saudi Arabia 0.1 0.1 0.1 0.2 0.2 0.2 0.2 0.2 6.48 TOTAL 0.3 0.4 0.4 0.4 0.5 0.5 0.5 0.6 7.75 Africa South Africa 0.4 0.4 0.5 0.5 0.6 0.6 0.7 0.7 6.38 TOTAL 0.4 0.4 0.5 0.5 0.6 0.6 0.7 0.7 6.38 WORLD TOTAL 51.6 59.4 67.1 71.6 74.5 79.7 84.1 88.5 5.90
Definition: The above table indicates the number of Laptop computers in use.
Note: 1. Hyphen indicates non availability of data
2. All the above figures are estimated using laptop sales and the total PC install base.
Note: All figures are rounded; the base year is 2003. Source: Frost & Sullivan
#FA0A-32 © 2006 Frost & Sullivan www.frost.com 8-8
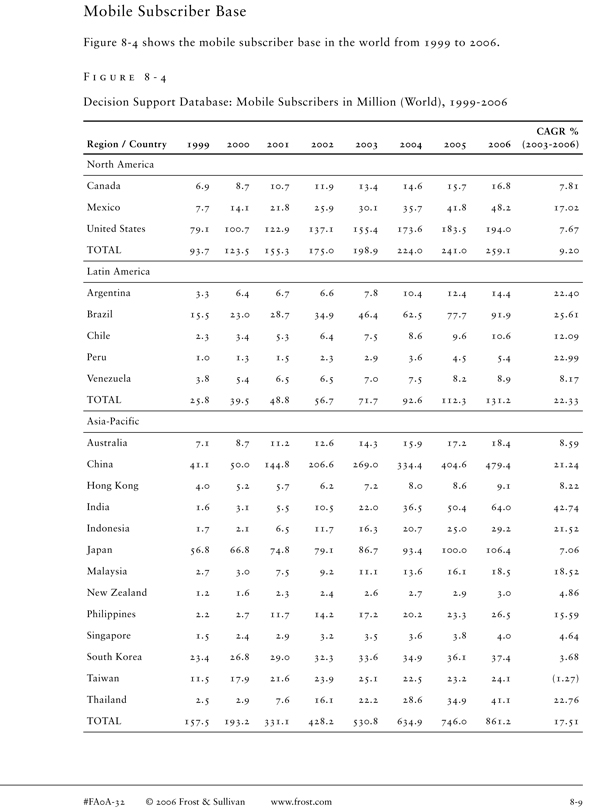
Mobile Subscriber Base
Figure 8-4 shows the mobile subscriber base in the world from 1999 to 2006.
F I G U R E 8 - 4
Decision Support Database: Mobile Subscribers in Million (World), 1999-2006
CAGR % Region / Country 1999 2000 2001 2002 2003 2004 2005 2006 (2003-2006)
North America
Canada 6.9 8.7 10.7 11.9 13.4 14.6 15.7 16.8 7.81 Mexico 7.7 14.1 21.8 25.9 30.1 35.7 41.8 48.2 17.02 United States 79.1 100.7 122.9 137.1 155.4 173.6 183.5 194.0 7.67 TOTAL 93.7 123.5 155.3 175.0 198.9 224.0 241.0 259.1 9.20 Latin America Argentina 3.3 6.4 6.7 6.6 7.8 10.4 12.4 14.4 22.40 Brazil 15.5 23.0 28.7 34.9 46.4 62.5 77.7 91.9 25.61 Chile 2.3 3.4 5.3 6.4 7.5 8.6 9.6 10.6 12.09 Peru 1.0 1.3 1.5 2.3 2.9 3.6 4.5 5.4 22.99 Venezuela 3.8 5.4 6.5 6.5 7.0 7.5 8.2 8.9 8.17 TOTAL 25.8 39.5 48.8 56.7 71.7 92.6 112.3 131.2 22.33 Asia-Pacific Australia 7.1 8.7 11.2 12.6 14.3 15.9 17.2 18.4 8.59 China 41.1 50.0 144.8 206.6 269.0 334.4 404.6 479.4 21.24 Hong Kong 4.0 5.2 5.7 6.2 7.2 8.0 8.6 9.1 8.22 India 1.6 3.1 5.5 10.5 22.0 36.5 50.4 64.0 42.74 Indonesia 1.7 2.1 6.5 11.7 16.3 20.7 25.0 29.2 21.52 Japan 56.8 66.8 74.8 79.1 86.7 93.4 100.0 106.4 7.06 Malaysia 2.7 3.0 7.5 9.2 11.1 13.6 16.1 18.5 18.52 New Zealand 1.2 1.6 2.3 2.4 2.6 2.7 2.9 3.0 4.86 Philippines 2.2 2.7 11.7 14.2 17.2 20.2 23.3 26.5 15.59 Singapore 1.5 2.4 2.9 3.2 3.5 3.6 3.8 4.0 4.64 South Korea 23.4 26.8 29.0 32.3 33.6 34.9 36.1 37.4 3.68 Taiwan 11.5 17.9 21.6 23.9 25.1 22.5 23.2 24.1(1.27) Thailand 2.5 2.9 7.6 16.1 22.2 28.6 34.9 41.1 22.76 TOTAL 157.5 193.2 331.1 428.2 530.8 634.9 746.0 861.2 17.51
#FA0A-32 © 2006 Frost & Sullivan www.frost.com 8-9
F I G U R E 8 - 4 ( C O N T I N U E D )
Decision Support Database: Mobile Subscribers in Million (World), 1999-2006
CAGR % Region / Country 1999 2000 2001 2002 2003 2004 2005 2006 (2003-2006)
Western Europe
Austria 4.3 6.3 6.7 6.8 7.1 7.8 8.2 8.5 6.15 Belgium 3.2 5.3 7.7 8.1 8.5 8.9 9.3 9.7 4.23 Denmark 2.6 3.4 4.0 4.5 4.8 5.1 5.4 5.7 6.04 Finland 3.3 3.7 4.2 4.4 4.7 5.0 5.3 5.6 5.73 France 21.4 29.1 35.9 38.6 41.7 44.4 47.2 50.0 6.27 Germany 23.4 48.2 56.2 59.2 64.8 69.6 74.3 78.6 6.66 Greece 3.9 5.9 8.0 9.2 8.9 9.4 9.9 10.3 4.77 Iceland 0.2 0.2 0.2 0.3 0.3 0.3 0.3 0.3 6.39 Ireland 1.7 2.5 2.8 3.0 3.4 3.7 4.0 4.2 7.36 Italy 30.3 42.2 51.2 52.3 55.9 59.7 63.5 67.5 6.49 Luxembourg 0.2 0.3 0.4 0.5 0.5 0.5 0.6 0.6 5.28 Netherlands 6.7 10.8 12.4 11.7 12.5 13.3 14.1 14.9 6.07 Norway 2.7 3.4 3.6 3.8 4.2 4.5 4.8 5.1 6.85 Portugal 4.7 6.7 8.0 8.5 9.4 10.1 10.9 11.6 7.33 Spain 15.0 24.3 29.7 33.5 37.5 40.7 43.9 47.1 7.90 Sweden 5.2 6.4 7.0 7.9 8.5 9.2 9.8 10.4 6.90 Switzerland 3.1 4.6 5.3 5.7 6.2 6.6 7.0 7.5 6.56 United Kingdom 27.2 43.5 46.3 49.9 53.0 55.5 57.1 58.9 3.60 TOTAL 159.1 246.6 289.5 307.9 331.9 354.3 375.5 396.5 6.11 Eastern Europe Czech Republic 1.9 4.3 6.9 8.6 9.7 10.5 11.4 12.2 7.91 Hungary 1.6 3.1 5.0 6.6 7.4 7.9 8.5 9.0 6.73 Poland 4.0 6.7 10.1 14.0 17.4 20.5 23.3 25.5 13.52 Russia 1.4 3.3 5.6 17.7 24.9 32.9 42.1 51.8 27.61 Turkey 8.1 16.1 19.6 23.4 27.9 32.5 37.0 41.3 13.98 TOTAL 17.0 33.6 47.1 70.2 87.3 104.4 122.2 139.7 16.97
#FA0A-32 © 2006 Frost & Sullivan www.frost.com 8-10
F I G U R E 8 - 4 ( C O N T I N U E D )
Decision Support Database: Mobile Subscribers in Million (World), 1999-2006
CAGR % Region / Country 1999 2000 2001 2002 2003 2004 2005 2006 (2003-2006)
Middle East
Egypt 0.5 1.4 2.8 4.4 5.8 7.4 9.1 10.8 22.95 Israel 2.9 4.4 4.8 5.2 5.5 5.9 6.2 6.6 6.01 Saudi Arabia 0.8 1.4 2.5 3.4 7.2 10.7 13.8 16.3 30.97 TOTAL 4.2 7.1 10.2 13.0 18.6 24.0 29.1 33.6 21.89 Africa South Africa 5.2 8.3 10.8 12.1 16.9 20.4 23.8 27.0 17.06 TOTAL 5.2 8.3 10.8 12.1 16.9 20.4 23.8 27.0 17.06 WORLD TOTAL 462.5 651.9 892.7 1,063.2 1,255.9 1,454.6 1,649.9 1,848.3 13.75
Definition: The above figures represent total number of person subscribing to cellular mobile telephony services each year.
Note: All figures are rounded; the base year is 2003. Source: Frost & Sullivan
Mobile Penetration
Figure 8-5 shows the mobile penetration in the world from 1999 to 2006.
F I G U R E 8 - 5
Decision Support Database: Mobile Penetration (World), 1999-2006
Region/Country 1999 2000 2001 2002 2003 2004 2005 2006
North America
Canada 22.2 27.9 33.8 37.4 41.7 45.0 48.0 50.8 Mexico 7.8 14.1 21.4 25.1 28.7 33.6 38.8 44.2 United States 28.3 35.7 43.1 47.7 53.5 59.3 62.0 65.0 TOTAL 22.9 29.9 37.1 41.4 46.6 51.9 55.2 58.8
#FA0A-32 © 2006 Frost & Sullivan www.frost.com 8-11
F I G U R E 8 - 5 ( C O N T I N U E D )
Decision Support Database: Mobile Penetration (World), 1999-2006
Region/Country 1999 2000 2001 2002 2003 2004 2005 2006
Latin America
Argentina 8.8 17.0 17.8 17.1 20.2 26.5 31.3 36.0 Brazil 8.9 13.1 16.2 19.4 25.5 34.0 41.7 48.9 Chile 15.1 22.6 34.4 41.6 48.0 54.2 60.1 65.6 Peru 3.8 4.7 5.6 8.2 10.2 12.6 15.3 18.2 Venezuela 16.3 23.1 27.1 26.9 28.5 30.2 32.2 34.5 TOTAL 9.4 14.2 17.3 19.8 24.8 31.6 37.9 43.8 Asia-Pacific Australia 37.6 45.1 57.7 64.4 72.7 79.6 85.5 90.7 China 3.3 4.0 11.4 16.2 20.9 25.8 31.1 36.6 Hong Kong 57.1 73.6 79.1 85.2 97.3 106.5 113.3 119.1 India 0.2 0.3 0.5 1.0 2.1 3.4 4.7 5.8 Indonesia 0.8 0.9 2.9 5.1 6.9 8.7 10.3 11.9 Japan 44.9 52.7 59.0 62.2 68.1 73.4 78.5 83.4 Malaysia 12.7 13.8 33.6 40.8 48.2 58.0 67.2 76.0 New Zealand 31.5 42.3 59.2 62.3 65.8 68.5 71.2 73.5 Philippines 2.8 3.4 14.4 17.1 20.3 23.4 26.5 29.7 Singapore 36.7 58.8 66.5 72.9 75.5 76.0 77.0 78.2 South Korea 50.0 56.7 61.0 67.4 69.6 71.7 73.9 76.1 Taiwan 52.5 80.7 97.0 106.5 111.0 98.9 101.4 104.8 Thailand 4.1 4.7 12.0 25.3 34.6 44.1 53.3 62.3 TOTAL 5.5 6.7 11.4 14.5 17.8 21.1 24.6 28.1 Western Europe Austria 52.4 76.9 81.6 82.7 86.6 95.6 99.7 103.1 Belgium 31.2 52.1 75.0 79.2 82.9 86.5 90.0 93.5 Denmark 49.4 63.0 74.0 83.4 88.9 94.4 99.8 105.1 Finland 63.5 72.2 80.7 84.9 90.5 96.1 101.6 106.6 France 36.3 48.9 60.2 64.4 69.3 73.5 77.8 82.2 Germany 28.6 58.7 68.4 71.9 78.6 84.4 90.1 95.4 Greece 36.9 56.0 74.9 86.8 83.8 88.1 92.3 95.9 Iceland 62.9 77.9 89.2 92.9 99.6 105.7 111.6 118.3 Ireland 44.7 64.8 72.9 76.5 86.7 93.2 99.1 104.2
#FA0A-32 © 2006 Frost & Sullivan www.frost.com 8-12
F I G U R E 8 - 5 ( C O N T I N U E D )
Decision Support Database: Mobile Penetration (World), 1999-2006
Region/Country 1999 2000 2001 2002 2003 2004 2005 2006
Italy 52.6 73.2 88.6 90.3 96.4 102.8 109.3 116.2 Luxembourg 48.4 69.3 92.3 105.6 110.8 115.9 120.2 124.9 Netherlands 42.7 67.7 77.3 72.8 77.4 81.9 86.4 91.1 Norway 61.6 75.2 80.4 84.9 91.6 97.7 104.0 110.3 Portugal 46.6 66.3 79.3 84.6 92.6 100.0 107.1 113.9 Spain 37.6 60.6 74.0 83.4 93.3 101.0 108.9 116.6 Sweden 58.2 71.8 79.3 89.2 96.3 103.4 110.5 117.6 Switzerland 42.2 63.9 72.4 78.5 84.3 90.1 95.8 101.5 United Kingdom 45.8 72.9 77.5 83.3 88.2 92.1 94.6 97.2 TOTAL 41.0 63.3 74.2 78.7 84.6 90.1 95.4 100.5 Eastern Europe Czech Republic 18.9 42.3 67.7 83.9 94.7 102.6 110.9 119.4 Hungary 16.0 30.3 49.2 65.1 73.6 79.3 85.0 90.3 Poland 10.2 17.5 26.0 36.3 45.1 53.0 60.3 65.9 Russia 0.9 2.2 3.8 12.2 17.2 22.8 29.3 36.1 Turkey 12.5 24.6 29.4 34.7 41.0 47.2 53.2 58.7 TOTAL 6.3 12.4 17.4 25.9 32.2 38.4 44.9 51.3 Middle East Egypt 0.7 1.9 3.9 6.0 7.8 9.7 11.7 13.7 Israel 50.2 75.3 81.7 86.1 90.5 95.0 99.4 103.8 Saudi Arabia 3.9 6.3 11.1 14.6 29.8 42.8 53.1 60.7 TOTAL 4.4 7.3 10.1 12.7 17.7 22.3 26.5 30.0 Africa South Africa 12.3 19.7 25.3 28.3 39.4 47.8 56.0 64.0 TOTAL 12.3 19.7 25.3 28.3 39.4 47.8 56.0 64.0 WORLD TOTAL 10.7 14.9 20.2 23.8 27.9 32.0 36.0 39.9
Definition: The above figures represent mobile penetration per 100 population
Note: 1. The above table is calculated using mobile subscribers and total population
2. Regional and World total are calculated using weighted average of countries in the region and are not the simple average
Note: All figures are rounded; the base year is 2003. Source: Frost & Sullivan
#FA0A-32 © 2006 Frost & Sullivan www.frost.com 8-13
Exhibit I
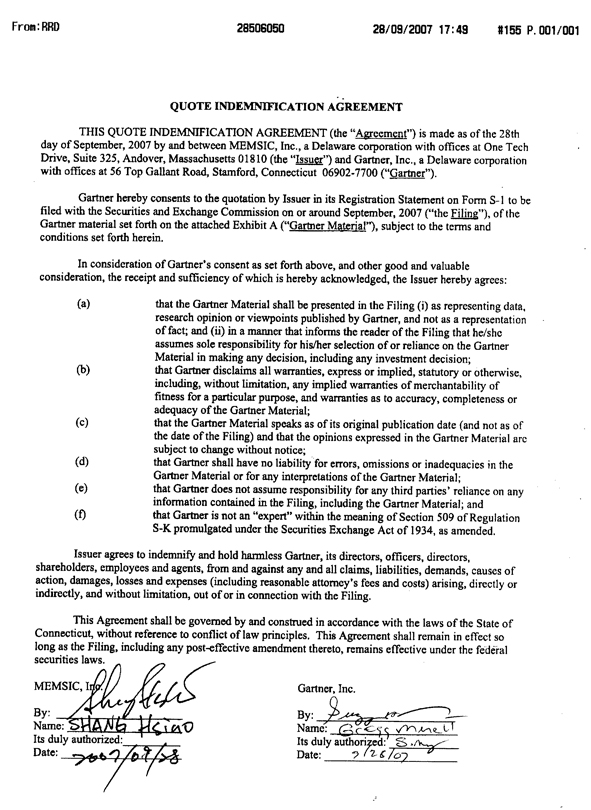
QUOTE INDEMNIFICATION AGREEMENT
THIS QUOTE INDEMNIFICATION AGREEMENT (The “Agreement”) is made as of the 28th day of September, 2007 by and between MEMSIC, Inc., a Delaware corporation with offices at one Tech Drive, Suite 325, Andover, Massachusetts 01810 (the “Issuer”) and Gartner, Inc., a Delaware corporation with offices at 56 Top Gallant Road, Stamford, Connecticut 06902-7700 (“Gartner”).
Gartner hereby consents to the quotation by Issuer in its Registration Statement on Form S-1 to be filed with the Securities and Exchange Commission on or around September, 2007 (“the Filing”) of the Gartner material set forth on the attached Exhibit A (“Gartner Material”), subject to the terms and conditions set forth herein.
In consideration of Gartner’s consent as set forth above, and other good and valuable consideration, the receipt and sufficiency of which is hereby acknowledge, the Issuer hereby agrees.
(a) that the Gartner Material shall be presented in the Filling (i) as representing data, research opinion or viewpoints published by Gartner, and not as a representation of fact; and (ii) in a manner that informs the reader of the Filing that he/she assumes sole responsibility for his/her selection of or reliance on the Gartner. Material in making any decision, including any investment decision;
(b) that Gartner disclaims all warranties, express or implied, statutory or otherwise, including, without limitations, any implied warranties of merchantability of fitness for a particular purpose, and warranties as to accuracy, completeness or adequacy of the Gartner Material;
(c) that the Gartner Material speaks as of its original publication date (and not as of the date of the Filing) and that the opinions expressed in the Gartner Material are subject to change without notice;
(d) that Gartner shall have no liability for errors, omissions or inadequacies in the Gartner Material or for any interpretations of the Gartner Material;
(e) that Gartner does not assume responsibility for any third parties’ reliance on any information contained in the Filing, including the Gartner Material; and
(f) that Gartner is not an “expert” within the meaning of Section 509 of Regulation S-K promulgated under the Securities Exchange Act of 1934, as amended.
Issuer agrees to indemnify and hold harmless Gartner, its directors, officers, directors, shareholders, employees and agents, from and against any and all claims, liabilities, demands, causes of action, damages, losses and expenses (including reasonable attorney’s fees and costs) arising, directly or indirectly, and without limitation, out of or in connection with the Filing.
This Agreement shall be governed by and construed in accordance with the laws of the State of Connecticut, without reference to conflict of law principles. This Agreement shall remain in effect so long as the Filing, including any post-effective amendment thereto, remains effective under the federal securities laws.
MEMSIC, Inc. Gartner, Inc.
By: By:
Name: Name:
Its duly authorized: Its Duly authorized:
Date: Date:

Exhibit A
Industry Background
Analog and Mixed-signal Semiconductor Market
Semiconductor components are the building blocks of electronic systems. Analog semiconductors monitor, regulate or transform physical properties, including voltage, current, temperature, pressure, weight, light, sound or speed into electrical signals that have a continuous range of values. Electronic systems rely on analog semiconductors to provide the interface between digital semiconductors and the physical world. Mixed-signal semiconductors combine elements of both analog and digital semiconductors, but are generally classified as analog semiconductors because of their analog content. Analog and mixed-signal semiconductors are often used in applications and markets where users have unique requirements regarding performance specifications such as size, speed, accuracy and efficiency. As a result, the analog and mixed-signal semiconductor market is highly fragmented, providing smaller companies an opportunity to compete successfully against larger companies in certain market segments.
According to “Semiconductor Forecast Worldwide: Forecast Database” published by Gartner Inc. an information technology research and advisory firm, on August 29, 2007, the market for analog semiconductors will grow from $16.4 billion in 2006 to $22.3 billion in 2011.
highlighted data is cited on page 62 of the prospectus
As digital semiconductors, such as microprocessors, graphics processors, digital signal processors and memory chips become more technologically advanced, the analog arid mixed-signal semiconductors that interface with them must also operate with greater speed, accuracy and efficiency. These factors, coupled with growth in the consumer electronic market, are fostering growth in the analog and mixed-signal semiconductor market.
highlighted data is cited on page 63 of the prospectus
Exhibit J

2006 Compensation & Entrepreneurship Report in Information Technology
2006
www.compstudy.com
A
WILMERHALE ERNST & YOUNG J.ROBERT SCOTT
Quality In Everything We Do


A
TABLE
OF
CONTENTS
Letter to the Industry . . . . . . . . . . . . . . . . . . . . . .3
Summary of Results . . . . . . .. . . . . . . . . . . . . . . . .4
Founders . . . . . . . . . . . . . . . . . . . . . . . . . . . . . . . .10
Interview
Frank Moss – MIT Media Lab . . . . . . . . . . . . . . . . . . . . . . . . . . . .12
2006 Compensation and Entrepreneurship
Report in Information Technology
Chief Executive Officer . . . . . . . . . . . . . . . . . . . . . . . . . . . . . . . . . .18
President/Chief Operating Officer . . . . . . . . . . . . . . . . . . . . . . . .22
Chief Financial Officer . . . . . . . . . . . . . . . . . . . . . . . . . . . . . . . . . .36
Chief Technology Officer . . . . . . . . . . . . . . . . . . . . . . . . . . . . . . . .30
Head of Engineering . . . . . . . . . . . . . . . . . . . . . . . . . . . . . . . . . . . .34
Head of Sales . . . . . . . . . . . . . . . . . . . . . . . . . . . . . . . . . . . . . . . . . .38
Head of Marketing . . . . . . . . . . . . . . . . . . . . . . . . . . . . . . . . . . . . . .40
Head of Business Development . . . . . . . . . . . . . . . . . . . . . . . . . .46
Head of Human Resources . . . . . . . . . . . . . . . . . . . . . . . . . . . . . .50
Head of Professional Services . . . . . . . . . . . . . . . . . . . . . . . . . . .54
Board of Directors . . . . . . . . . . . . . . . . . . . . . . . . . . . . . . . . . . . . . .58
About the Sponsors . . . . . . . . . . . . . . . . . . . . . . .60


A
LETTER
TO THE
INDUSTRY
We are pleased to present the 2006 edition of our Compensation and Entrepreneurship Report in Information Technology. This Report – our seventh annual and largest to date – includes summaries and analysis of compensation data collected from more than 300 private companies located throughout the country in the following five industry segments: Software; Communications; Hardware, Semiconductors and Electronics; Services, Consulting and Integration; and Community, Content and Information Providers. The Report also includes an interview with Frank Moss, the Director of the MIT Media Lab, who describes his experience as the new leader of this highly innovative academic research organization that has contributed greatly to the broader world, as well as specifically to entrepreneurial endeavors in the high tech arena.
Our inspiration for creating this survey was a direct response to our clients’ requests for better access to reliable, comparable compensation data to assist them in the critical decisions involved in attracting, motivating and retaining key executives at private companies. With the significant increase in our sample size, we have been able to present the correlation between executive compensation and a number of variables, including financing stage, company size both in terms of revenue and headcount, founder/non-founder status, industry segment, and geography. We have also been able to provide a number of new analytics, including how an organization evolves with additional financing, Boards of Directors compensation and make-up, and a more granular look at company equity plans.
The survey data was collected between April and June of 2006, during a period that has seen venture capital investment in the sector steadily increase and many new companies formed. As a result, our expectation is to continue to see upward pressure on competition for executive talent, along with an increase in compensation packages.
Our survey has evolved over the years based on input received directly from the industry, and our hope is to continuously improve our data so that we can best serve the needs of our clients in the Information Technology industry. In that regard, we encourage readers of this publication to submit comments and suggestions to help us most efficiently and accurately present the compensation dynamics of the market. Suggestions and comments should be directed to Mike DiPierro of J. Robert Scott (mike.dipierro@fmr.com).
Lastly, we would like to express our gratitude to two individuals who continue to contribute greatly to our publication: Professor Brian Hall and Associate Professor
Noam Wasserman of the Harvard Business School.
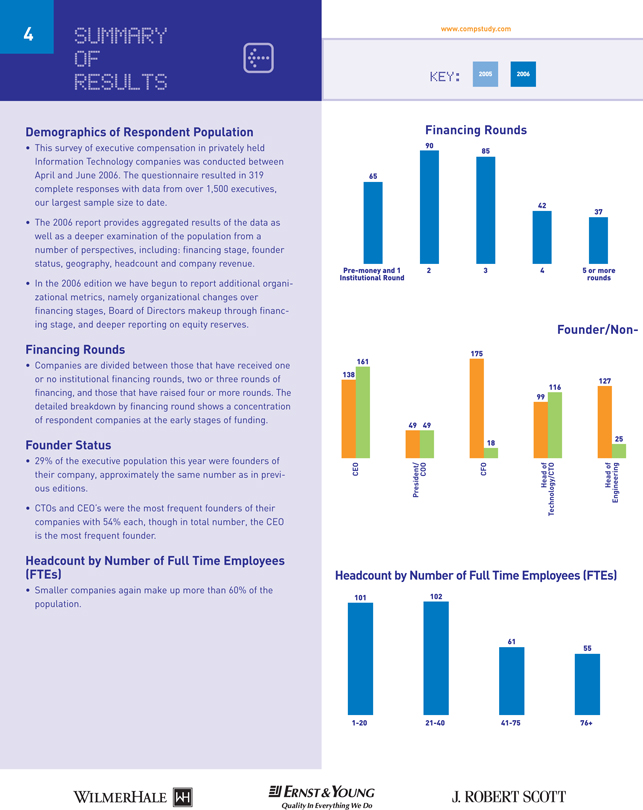
B
SUMMARY
OF
RESULTS
Financing Rounds
Pre-money and 1 2 3 4 5 or more
Institutional Round rounds
65 90 85 37 42
Demographics of Respondent Population
• This survey of executive compensation in privately held Information Technology companies was conducted between April and June 2006. The questionnaire resulted in 319 complete responses with data from over 1,500 executives, our largest sample size to date.
• The 2006 report provides aggregated results of the data as well as a deeper examination of the population from a number of perspectives, including: financing stage, founder status, geography, headcount and company revenue.
• In the 2006 edition we have begun to report additional organizational metrics, namely organizational changes over financing stages, Board of Directors makeup through financing stage, and deeper reporting on equity reserves.
Financing Rounds
• Companies are divided between those that have received one or no institutional financing rounds, two or three rounds of financing, and those that have raised four or more rounds. The detailed breakdown by financing round shows a concentration of respondent companies at the early stages of funding.
Founder Status
• 29% of the executive population this year were founders of their company, approximately the same number as in previous editions.
• CTOs and CEO’s were the most frequent founders of their companies with 54% each, though in total number, the CEO is the most frequent founder.
Headcount by Number of Full Time Employees
(FTEs)
• Smaller companies again make up more than 60% of the population.
Founder/Non-
CEO
President/
COO
CFO
Head of
Engineering
Head of
Technology/CTO
138 161 49 49 175 18 99 116 127 25
1-20 21-40 41-75 76+
Headcount by Number of Full Time Employees (FTEs)
101 102 61 55
KEY: 2006 2005
WILMERHALE ERNST & YOUNG J. ROBERT SCOTT
Quality In Everything We Do
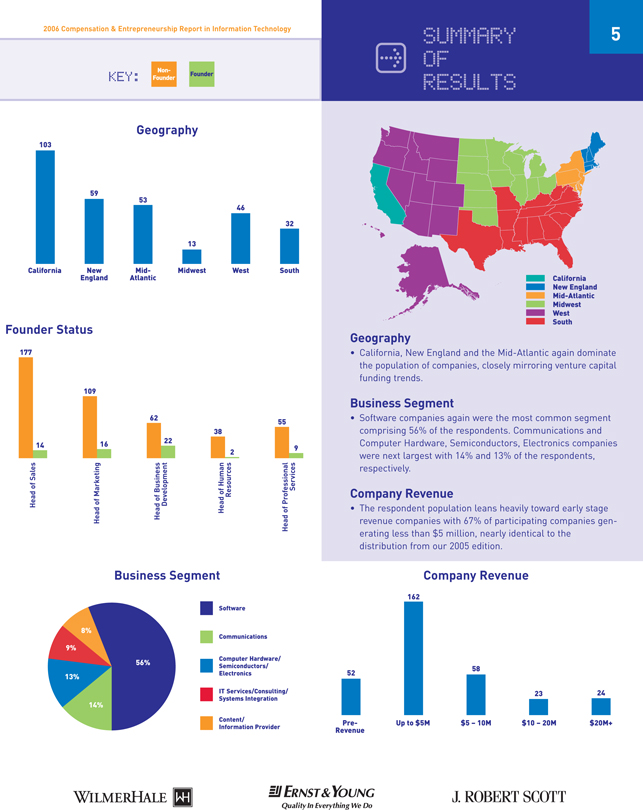
A
SUMMARY
OF
RESULTS
2006 Compensation & Entrepreneurship Report in Information Technology
California New England Mid-Atlantic Midwest West South
California
Geography
New England Mid-Atlantic Midwest West South
59 103 53 13 46
Founder Status
Business Segment
• California, New England and the Mid-Atlantic again dominate the population of companies, closely mirroring venture capital funding trends.
Business Segment
• Software companies again were the most common segment comprising 56% of the respondents. Communications and Computer Hardware, Semiconductors, Electronics companies were next largest with 14% and 13% of the respondents, respectively.
Company Revenue
• The respondent population leans heavily toward early stage revenue companies with 67% of participating companies generating less than $5 million, nearly identical to the distribution from our 2005 edition.
Head of Human
Resources
Head of Marketing
Head of Business
Development
Head of Sales
Head of Professional
Services
177 14
109 16
62 22
38 2
55 9
Software
Communications
Computer Hardware/
Semiconductors/
Electronics
IT Services/Consulting/
Systems Integration
Content/
Information Provider
Geography
KEY: Non- Founder Founder
56% 13%
8% 9%
14% 32
Company Revenue
Pre- Up to $5M $5 – 10M $10 – 20M $20M+
Revenue
52
162
58
24 23
WILMERHALE ERNST & YOUNG J. ROBERT SCOTT
Quality In Everything We Do
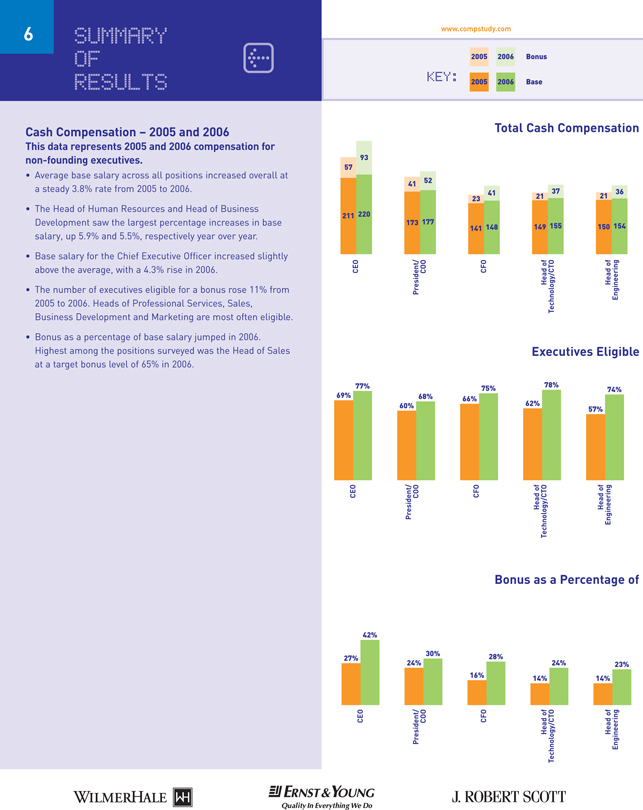
Cash Compensation – 2005 and 2006
This data represents 2005 and 2006 compensation for non-founding executives.
• Average base salary across all positions increased overall at a steady 3.8% rate from 2005 to 2006.
• The Head of Human Resources and Head of Business Development saw the largest percentage increases in base salary, up 5.9% and 5.5%, respectively year over year.
• Base salary for the Chief Executive Officer increased slightly above the average, with a 4.3% rise in 2006.
• The number of executives eligible for a bonus rose 11% from 2005 to 2006. Heads of Professional Services, Sales, Business Development and Marketing are most often eligible.
• Bonus as a percentage of base salary jumped in 2006. Highest among the positions surveyed was the Head of Sales at a target bonus level of 65% in 2006.
6 www.compstudy.com
B
SUMMARY
OF
RESULTS
Executives Eligible Bonus as a Percentage of CEO
President/ COO
CFO
Head of Engineering
Head of Technology/CTO
27% 42% 30% 14% 23% 14% 24% 16% 28% 24%
CEO
President/ COO
CFO
Head of Engineering
Head of Technology/CTO
69% 77% 68% 57% 74% 62% 78% 66% 75% 60%
KEY:
2005 2006 Bonus
Base 2005 2006
Total Cash Compensation 211 220
57 93 173 177 41 52 141 148 23 41 149 155 37 150 154 21 21 36
CEO
President/ COO
CFO
Head of Engineering
Head of Technology/CTO
WILMERHALE ERNST & YOUNG J. ROBERT SCOTT
Quality In Everything We Do
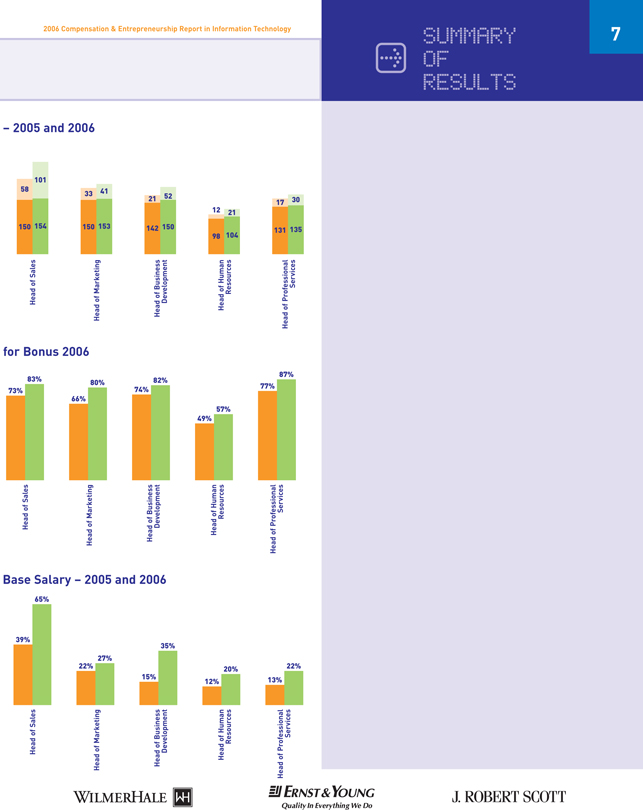
2006 Compensation & Entrepreneurship Report in Information Technology
A
SUMMARY
OF
RESULTS
for Bonus 2006
Base Salary – 2005 and 2006
Head of Human Resources
Head of Marketing
Head of Business Development
Head of Sales
Head of Professional Services
13% 22% 12% 20% 15% 35% 22% 27% 39% 65%
Head of Human Resources
Head of Marketing
Head of Business Development
Head of Sales
Head of Professional Services
77% 87% 49% 57% 74% 82% 66% 80% 73% 83%
Head of Sales
– 2005 and 2006
58 21 17 52 21 41 150 154 101 150 153 142 150 98 104 12 131 135 30
Head of Human Resources
Head of Marketing
Head of Business Development
Head of Professional Services
33
WILMERHALE ERNST & YOUNG J. ROBERT SCOTT
Quality In Everything We Do
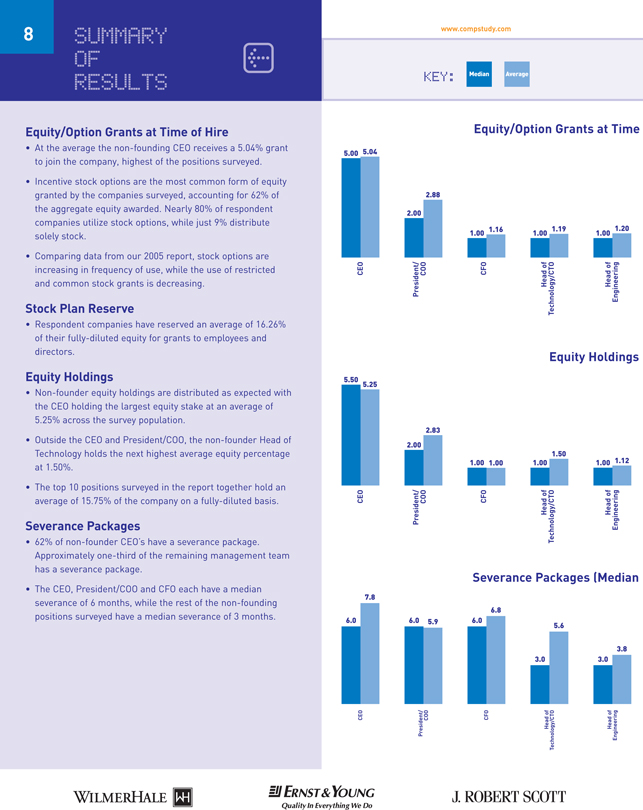
EQUITY/OPTION GRANTSAT TIMEOF HIRE
• At the average the non-founding CEO receives a 5.04% grant to join the company, highest of the positions surveyed.
• Incentive stock options are the most common form of equity granted by the companies surveyed, accounting for 62% of the aggregate equity awarded. Nearly 80% of respondent companies utilize stock options, while just 9% distribute solely stock.
• Comparing data from our 2005 report, stock options are increasing in frequency of use, while the use of restricted and common stock grants is decreasing.
Stock Plan Reserve
• Respondent companies have reserved an average of 16.26% of their fully-diluted equity for grants to employees and directors.
Equity Holdings
• Non-founder equity holdings are distributed as expected with the CEO holding the largest equity stake at an average of 5.25% across the survey population.
• Outside the CEO and President/COO, the non-founder Head of Technology holds the next highest average equity percentage at 1.50%.
• The top 10 positions surveyed in the report together hold an average of 15.75% of the company on a fully-diluted basis.
Severance Packages
• 62% of non-founder CEO’s have a severance package. Approximately one-third of the remaining management team has a severance package.
• The CEO, President/COO and CFO each have a median severance of 6 months, while the rest of the non-founding positions surveyed have a median severance of 3 months.
8 www.compstudy.com
B
SUMMARY
OF
RESULTS
6.0 7.8 6.0 5.9 6.0 6.8 3.0 5.6 3.0 3.8
Severance Packages (Median CEO
President/ COO
CFO
Head of Technology/CTO
Head of Engineering
KEY: Average Median
Equity/Option Grants at Time CEO
President/ COO
CFO
Head of Engineering
Head of Technology/CTO
5.00 5.04 1.00 1.20 1.00 1.19 1.00 1.16 2.00 2.88
Equity Holdings CEO
President/ COO
CFO
Head of Engineering
Head of Technology/CTO
5.50 5.25 1.00 1.12 1.00 1.50 1.00 1.00 2.00 2.83
WILMERHALE ERNST & YOUNG J. ROBERT SCOTT
Quality In Everything We Do
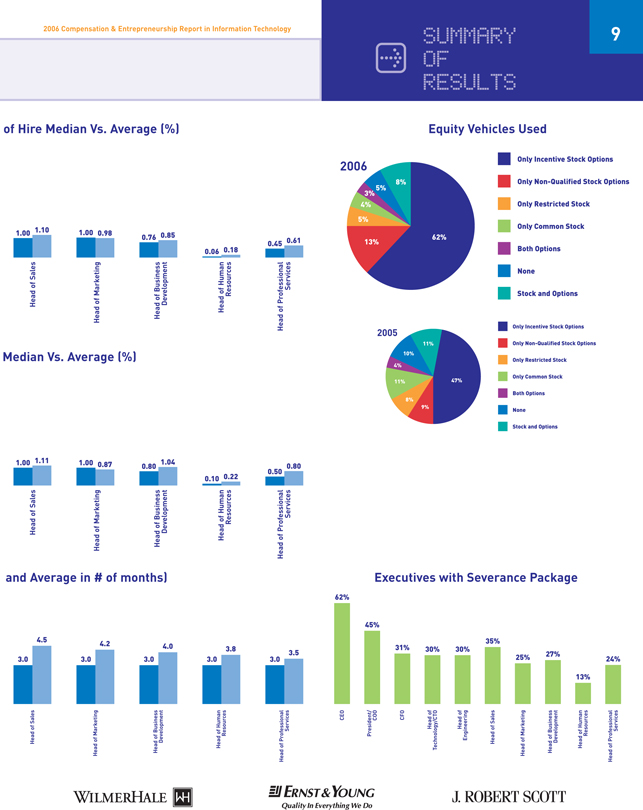
2006 Compensation & Entrepreneurship Report in Information Technology
A
SUMMARY
OF
RESULTS
9
Executives with Severance Package
62% 45% 31% 30% 30% 35% 25% 27% 13% 24%
3.0 4.5 3.0 4.2 3.0 4.0 3.0 3.8 3.0 3.5
and Average in # of months)
CEO
President/ COO
CFO
Head of Technology/CTO
Head of Sales
Head of Human Resources
Head of Engineering
Head of Marketing
Head of Business Development
Head of Professional Services
Head of Sales
Head of Human Resources
Head of Marketing
Head of Business Development
Head of Professional Services
of Hire Median Vs. Average (%)
Head of Human Resources
Head of Marketing
Head of Business Development
Head of Sales
Head of Professional Services
0.45 0.61 0.06 0.18 0.76 0.85 1.00 0.98 1.00 1.10
Median Vs. Average (%)
Head of Human Resources
Head of Marketing
Head of Business Development
Head of Sales
Head of Professional Services
0.50 0.80 0.10 0.22 0.80 1.04 1.00 0.87 1.00 1.11
Equity Vehicles Used
Only Incentive Stock Options
Only Non-Qualified Stock Options
Only Restricted Stock
Only Common Stock
Both Options
None
Stock and Options
62% 13% 5% 4% 3% 8% 5%
Only Incentive Stock Options
Only Non-Qualified Stock Options
Only Restricted Stock
Only Common Stock
Both Options
None
Stock and Options
47%
9% 8% 11% 4% 11% 10%
2006 2005
WILMERHALE ERNST & YOUNG J. ROBERT SCOTT
Quality In Everything We Do
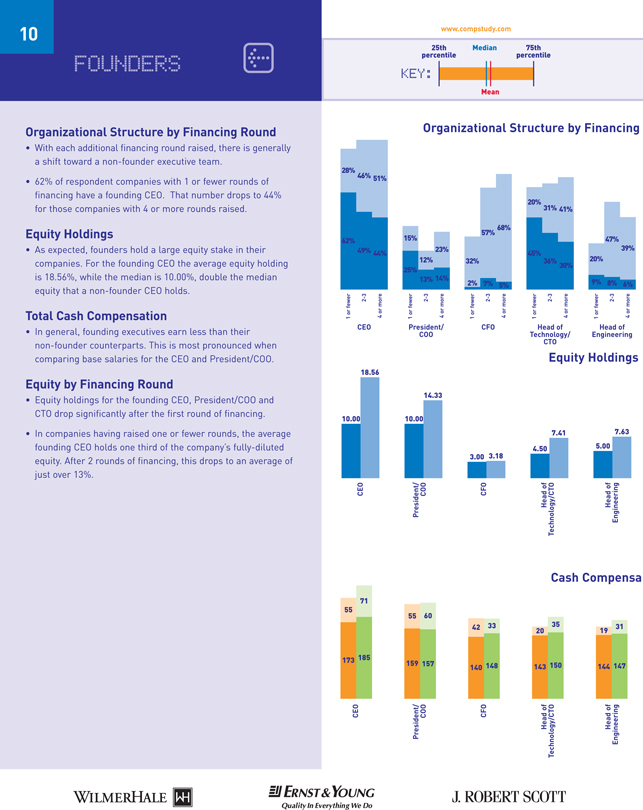
Organizational Structure by Financing Round
• With each additional financing round raised, there is generally a shift toward a non-founder executive team.
• 62% of respondent companies with 1 or fewer rounds of financing have a founding CEO. That number drops to 44% for those companies with 4 or more rounds raised.
Equity Holdings
• As expected, founders hold a large equity stake in their companies. For the founding CEO the average equity holding is 18.56%, while the median is 10.00%, double the median equity that a non-founder CEO holds.
Total Cash Compensation
• In general, founding executives earn less than their non-founder counterparts. This is most pronounced when comparing base salaries for the CEO and President/COO.
Equity by Financing Round
• Equity holdings for the founding CEO, President/COO and CTO drop significantly after the first round of financing.
• In companies having raised one or fewer rounds, the average founding CEO holds one third of the company’s fully-diluted equity. After 2 rounds of financing, this drops to an average of just over 13%.
10 www.compstudy.com
B FOUNDERS
Equity Holdings Organizational Structure by Financing CEO
President/ COO
CFO
Head of Engineering
Head of Technology/CTO
10.00 18.56 5.00 7.63 4.50 7.41 3.00 3.18 10.00 14.33
Cash Compensa
173 185 55 71 159 157 55 60 140 148 42 20 19 33 143 150 35 31 144 147 CEO
President/ COO
CFO
Head of Engineering
Head of Technology/CTO
25th Median 75th
percentile percentile
Mean
KEY:
62% 28% 49% 46% 44% 51% 25% 15% 13% 12% 14% 23% 32% 2% 7% 57% 5% 68% 45% 20% 36% 31% 30% 41% 9% 20% 8%
47% 6% 39%
1 or fewer
2-3 4 or more 1 or fewer
2-3 4 or more 1 or fewer
2-3 4 or more 1 or fewer
2-3 4 or more 1 or fewer
2-3 4 or more
CEO
President/ COO
CFO
Head of Technology/ CTO
Head of Engineering
WILMERHALE ERNST & YOUNG J. ROBERT SCOTT
Quality In Everything We Do
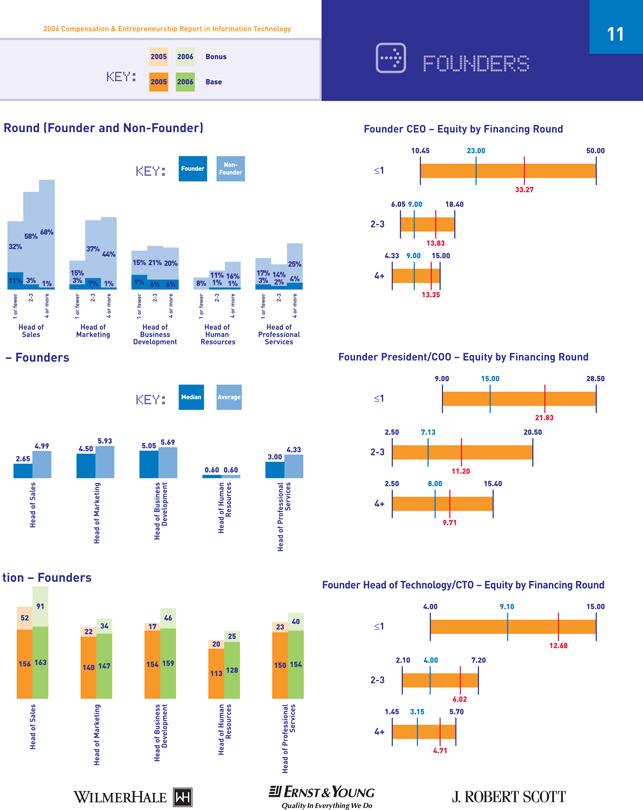
2006 Compensation & Entrepreneurship Report in Information Technology
A FOUNDERS
11
KEY: Average Median
KEY: Non- Founder Founder
– Founders
Round (Founder and Non-Founder)
Head of Human Resources
Head of Marketing
Head of Business Development
Head of Sales
Head of Professional Services
3.00 4.33 0.60 0.60 5.05 5.69 4.50 5.93 2.65 4.99
KEY:
2005 2006 Bonus
Base 2005 2006
tion – Founders
22 52 17 20 23 25 34 46 156 163 91 140 147 154 159 113 128 150 154 40
Head of Human Resources
Head of Marketing
Head of Business Development
Head of Sales
Head of Professional Services
Founder CEO – Equity by Financing Round
?1 4+ 2-3 10.45 23.00 50.00 33.27 6.05 9.00 18.40 13.83 4.33 9.00 15.00 13.35
Founder President/COO – Equity by Financing Round
?1 4+ 2-3 9.00 15.00 28.50 21.83 2.50 7.13 20.50 11.20 2.50 8.00 15.40 9.71
Founder Head of Technology/CTO – Equity by Financing Round
?1 4+ 2-3 4.00 9.10 15.00 12.68 2.10 4.00 7.20 6.02 1.45 3.15 5.70 4.71
11% 32% 58% 3% 68% 1% 15% 3% 7% 37% 44% 1% 9% 15% 6% 21% 6% 20% 8% 11% 1% 16% 1% 17% 3% 14% 2% 25% 4%
1 or fewer 2-3 4 or more
1 or fewer 2-3 4 or more
1 or fewer 2-3 4 or more
1 or fewer 2-3 4 or more
1 or fewer 2-3 4 or more
Head of Sales
Head of Marketing
Head of Business Development
Head of Human Resources
Head of Professional Services
WILMERHALE ERNST & YOUNG J. ROBERT SCOTT
Quality In Everything We Do
FRANK MOSS
Director
Professor of the Practice of Media Arts and Sciences
Jerome B. Wiesner Professorship of Media Technology
An entrepreneur and 25-year veteran of the software and computer industries, Frank Moss has spent his career bringing innovative business technologies to market.
In the last five years, however, he’s been seeking something different: how to make a broader contribution to the world by using technology to address pressing social issues—such as health care—and to improve quality of life for people worldwide.
Most recently, he co-founded and is on the board of Infinity Pharmaceuticals, Inc., a cancer-drug discovery company doing innovative work at the intersection of technology and the life sciences. In addition, he chaired the advisory council for the creation of the Systems Biology Department at Harvard Medical School, where he remains an advisor.
During his career in the computer and software industries, Moss served as CEO and chairman of Tivoli Systems Inc., a pioneer in the distributed systems management field, which he took public in 1995 and subsequently merged with IBM in 1996. He co-founded several other companies, including Stellar Computer, Inc., a developer of graphic supercomputers; and Bowstreet, Inc., a pioneer in the emerging field of Web services.
He began his career at IBM’s scientific center in Haifa, Israel, where he also taught at the Technion, Israel Institute of Technology. He later held various research and management positions at IBM’s Yorktown Heights (NY) Research Center, working on advanced development projects in the areas of networking and distributed computing; and executive management positions at Apollo Computer, Inc., and Lotus Development Corporation.
Moss is a member of the Advisory Council for the School of Engineering and Applied Sciences at Princeton University.
continued on page 14
Aaron: Perhaps we can begin by having you provide a synopsis of your career before the Media Lab?
Frank: I grew up in the sixties with an interest in the space program.
This directed my studies as an undergraduate at Princeton toward aerospace engineering. I thought I would go into that field. I carried that idea to MIT for a Master’s and Ph.D. in the aeronautical engineering department. During that time, the popularity and funding for the space program waned. They had landed on the moon, and after that, opportunities plummeted as investment from the government dissipated. While my degree was in aeronautical engineering, as a graduate student, I became increasingly involved with and interested in computers.
After finishing at MIT, I joined IBM, and spent the first six or seven years of my professional life in Research and Development there, before leaving to pursue an entrepreneurial career. I was part of a number of different start-up companies, some of which were successful, others of which were failures, or somewhere in between. Perhaps the best known company was Tivoli Systems, which I joined in 1991 as CEO. I led that company to a public offering, merged it with IBM in 1996, and stayed on after the merger for a couple of years. After that, I came back to Boston and participated in the computer industry, not as an operational person but as an investor, consultant, advisor, and founder of companies. I co-founded Bow Street, which was eventually sold to IBM, and a number of other interesting companies in software, the Internet, and related areas.
I turned 50 in 2000, and decided it was time to do something different with my life, and became interested in biology and the coming wave of genomics.
Aaron: Was that from some earlier exposure or just general intellectual curiosity?
Frank: General intellectual curiosity. I began reading, as many people did, about how tremendous advances were being made in biomedicine and biology, particularly with the help of com-
12 www.compstudy.com
B INTERVIEWS

a way that nobody else really was doing. So, I would say that the most profound contribution of the Media Lab has been to establish the framework for a new kind of research in the academic world, and its connection with industry.
Aaron: What are the closest analogues to the Media Lab?
Frank: In the past, the closest analogues to the Media Lab have been the advanced research organizations of corporations, which mainly no longer exist, such as IBM Research Labs, AT&T/Bell Labs, and Xerox PARC. By their very nature, these organizations were tightly connected to industry. They employed the best and the brightest, usually young people out of the best graduate schools in the country, who were given the charter to think out of the box and invent. I think the “unconstrained,” nonlinear nature of these organizations is their most important feature. Out of them came advances in transistors, software, silicon technology, and much more that likely wouldn’t have been possible in a constrained environment. These organizations are fundamentally gone now; they have been gradually disappearing over the past 20-25 years. I started my career in such an organization.
Aaron: What is your vision for the growth and evolution of the Media Lab?
Frank: My vision for the Lab involves embracing and maintaining those things about it that are good and right and important: such as the nonlinear, unconstrained approach to thinking and research. I have not yet mentioned it, but the interdisciplinary nature of it as well, which is very much in tune with the digital revolution and the way it integrates people. Artists, engineers, scientists, designers, all working together in an interdisciplinary and collaborative environment. What needs to evolve here at the Media Lab is the process by which we interact with industry.
Aaron: What do you mean by this?
Frank: The Media Lab has excelled at introducing our industry sponsors to possibilities of the future, and immersing them in a
13
puters, which attracted my interest. It led me to think that this would be an area where I could bring something different to the table. I began working with the Harvard Medical School and MIT on a non-formal basis as an advisor to various committees and groups, and ended up co-founding a drug discovery company called Infinity Pharmaceuticals.
Several years later, I was contacted to be Director of the MIT Media Lab. I concluded that the Media Lab represented a tremendous venue for achieving some of the goals that I’ve wanted to achieve at this stage of my life, which involve leveraging what I have learned about business and technology to improve people’s lives.
Aaron: What do you reflect on as being some of the Media Lab’s greatest accomplishments over its 20-year history?
Frank: I think its greatest accomplishment has been establishing a unique environment for doing research that’s very tuned in to where the world is and where it’s going. Classical research has been mostly of a reductionist approach, where individual faculty members tackle a specific problem, write papers on it, and have students that are pursuing Ph.D.s work with them. In terms of funding, over the last thirty or forty years these problems were generally supported by various government agencies. The MIT Media Lab created an entirely different environment. The idea was to put twenty or thirty of some of the finest minds in the world, many from different disciplines, and fund that group’s effort in an undirected way. The money comes from industry, and goes into a single pot that funds the collaboration of these great minds, and gives them the freedom and flexibility to do what they think is most interesting. They were able to envision and visualize the digital revolution in a way that nobody else was. They had the charismatic leadership of Nicholas Negroponte, who was able to articulate that vision extremely well, through his book and through speeches, and just through his general presence. Behind that vision, the Lab was exploring new ideas in a highly unconstrained fashion, which ended up pointing to the future in
INTERVIEW WITH FRANK MOSS, PROFESSOR OF THE PRACTICE OF MEDIA ARTS AND SCIENCES
2006 Compensation & Entrepreneurship Report in Information Technology
WILMERHALE ERNST & YOUNG J. ROBERT SCOTT
Quality In Everything We Do

continued from page 12
He received a BS in aerospace and mechanical sciences from Princeton University, and both his MS and PhD in aeronautics and astronautics from MIT. His citations include Ernst & Young’s Entrepreneur of the Year award and Forbes Magazine’s “Leaders
for Tomorrow.”
The Media Lab has played a pioneering role over the last 20 years in creating the digital lifestyle we enjoy today. But Moss believes the best is yet to come: a globally connected digital society that makes people smarter, healthier, and more creative. The Lab is conducting research on computers that extend and enhance people’s physical, cognitive, and social capabilities; computers that can relate to people in more human terms; and organically decentralized networks that unlock the creative, innovative, and problem-solving powers of people—particularly young people who have grown up “being digital”—in ways not before possible.
kind of digital ether. They’d come here, see what other sponsors were doing, and what advanced thinkers were doing, particularly the students, who are the real asset of the Media Lab. If you think back ten years ago, before Google and wireless technology became a reality, executives and even technical people within large corporations were really at the very fringes of what was going on from an innovation perspective, if not outside of it. The Media Lab has served them by bringing them into the fold, and educating them.
The world is different now. When companies pay $200,000 to $500,000 a year for sponsorship, they need to understand that the research that goes on here is going to eventually connect with their business. That’s our challenge. If we were to become a directed research operation, where we dealt with a particular problem from a particular company, and we set researchers to solve that problem, the Media Lab would lose its true value.
Aaron: You would ostensibly become an outsourced, linearoriented directed research organization?
Frank: Exactly right – but probably with a bit more of an imaginative approach. Our niche would be the high creative end of the directed research world. But that wouldn’t distinguish us very much from what 90% of the other academic departments are. They’re essentially doing that kind of directed research for corporations or the government. On the other hand, I have to enable companies to connect with the research here, and I need to put in place processes by which our faculty and our students interact with sponsors that enable them to listen to what sponsors need. That’s a new thing. When I go out and talk to sponsors, particularly ones who have been here at the Media Lab for a long time, I tell them my job is to reach a balance between this nonlinear, unconstrained thinking and make connections between the work that’s going on here with what is going on in their business. I tell them I’ll do that first by listening to what their business is and what their problems are.
14 www.compstudy.com
B BIOGRAPHICAL
INFORMATION
WILMERHALE ERNST & YOUNG J. ROBERT SCOTT
Quality In Everything We Do

Aaron: How do you imagine the relationship between the Media Lab and the world of commercial entrepreneurship?
Frank: Great question. Many Media Lab graduates go on to found companies, here in the Boston area and elsewhere, but
there hasn’t been a clear mechanism for including venture capitalists and other investors into the flow of ideas here at the Media Lab.
Aaron: It could, however, be fertile soil for venture capitalists, if you can figure out the model.
Frank: I agree. I have been brainstorming with several VCs I know from my past life to determine if there’s a way they can interact more intimately with the Media Lab. The VCs would love to hang out here, and they have. The Media Lab is richly connected to the web of venture capitalists through graduates and so forth.
Aaron: What’s the relationship been between the Media Lab and Lita Nelsen’s Office of Technology Licensing?
Frank: Lita’s office plays a very important role. All the intellectual property that’s developed here becomes available to our sponsors royalty-free, but it’s also available to anyone else for a royalty, under the right conditions. So, Lita Nelsen’s office represents us to the world in terms of technology licensing in the same way she would represent any other lab or academic department here at MIT.
Aaron: Are there particular disciplines or fields of study that the Media Lab has not embraced that you would like to pursue, or interdisciplinary connections that you’d like to see emphasized that haven’t been?
Frank: Absolutely. For instance, what was unique ten years ago in interactive digital media is no longer unique today, such as virtual reality or human/computer interfaces. You can go to a hundred different academic institutions or research labs today
15
Aaron: How will you measure the success of sponsor relationships and then more broadly, the success of the Lab in general?
Frank: That’s a good question. Measuring the success of these relationships is important to both sides of the equation. Let’s look at MIT as an example. MIT has, in the past, been funded by about $500 million a year, mostly in government funds, basically from DARPA, NSF, and NIH. This kind of funding has historically made the research here at MIT go. I think that’s true of most universities throughout the country, and maybe throughout the world. Government-funded research, however, has been decreasing for some time, and will continue to do so. I’m not saying it will go away altogether, but it will become a less significant factor. Industry will increasingly be looked upon to fund research in universities. Today, the system that matches unconstrained thinking in universities with constrained thinking and the needs of industry is not in existence. The Media Lab might be closer to that by virtue of its history than anybody else. So basically a lot of work needs to be done to match these two things.
Aaron: The Media Lab appears to be in an interesting leadership position, in terms of being able to establish the framework for how the rest of the academic world will seek to cultivate relationships with industry.
Frank: Yes, exactly right. The Media Lab needs to go through a period of evolution, which we already are beginning. We are probably closer to something that works than anybody else on the face of the planet. In the process, the Media Lab will also be reaching out to the rest of MIT. I hope that when we get this right, we can influence the rest of MIT to both help us and us help them as well. I believe that finding a solution to this issue is perhaps one of the biggest contributions I can make here over the next few years.
INTERVIEW WITH FRANK MOSS, PROFESSOR OF THE PRACTICE OF MEDIA ARTS AND SCIENCES
2006 Compensation & Entrepreneurship Report in Information Technology
WILMERHALE ERNST & YOUNG J. ROBERT SCOTT
Quality In Everything We Do

AARON D. LAPAT
Managing Director
J. ROBERT SCOTT
Aaron has been with J. Robert Scott since 1993 and built the firm’s practice in Information Technology. He has successfully completed over 200 searches across a range of industry segments, including software, communications, semiconductors/microelectronics, specialty materials and services. His practice emphasizes recruiting CEOs and functional leaders for growth-oriented and venturebacked companies.
Additionally, Aaron oversees the creation of the annual Compensation and Entrepreneurship Report in Information Technology at www.compstudy.com.
Prior to joining J. Robert Scott, Aaron spent four years with a retainer-based executive search firm that serviced the high technology industry.
Aaron holds a B.A. in Anthropology as well as an M.B.A. from Boston University. He serves on the Board of Advisors of Stax, Inc., a privately-held consulting and market research firm. Aaron and his wife Lauren have two children, Sophie and Sammy. In his spare time, Aaron plays tennis and is a runner. He has competed in numerous triathlons, and ran the Boston Marathon. On the off days, he can be found stoking the embers of his VW-sized Texas BBQ, mixing up a homemade hot sauce, or trying to create the perfect playlist from his ever-expanding record (mp3) collection.
that are doing research in interactive digital media, which the Media Lab was doing ten years ago. The real challenge here is to find what will be relevant five to ten years from today. That’s a significant challenge, because a lot of real innovation today is not taking place in corporations or academic research labs, but rather it’s taking place out in the world, with individuals. Ordinary people are creating new services and capabilities, so centralized research has to focus on deeper, more profound problems.
To answer your question more pointedly, there is a tremendous amount of interest in the intersection of Brain and Cognitive sciences and how they relate to the digital world and the work here at the Media Lab. We’re beginning to understand how the brain operates and functions in a way that we never have in the past. How that now gets tied into technology is a fascinating subject. Simple things, like how a computer can have a greater sensitivity and sensibility toward what we’re thinking and feeling than it does today. If machines can learn from humans, particularly about how humans think, that would go a long way toward making computers easier to use, friendlier, and more approachable, which is a huge problem today. I would say the generic area of simplicity—making technology easier and approachable by using new advances in Brain and Cognitive sciences will be a big deal.
Aaron: Could you talk a little bit about particularly extraordinary faculty members or research going on at the Lab?
Frank: One of the most extraordinary things that I realized that much of the work at the Media Lab is focused on the disabled, whether physically or developmentally disabled people, as well as the disadvantaged – economically disadvantaged and culturally disadvantaged. This is one of the reasons I came to the Media Lab. The work here is not just about building the next great gadget that’s going to help people access pop culture, or
16 www.compstudy.com
B BIOGRAPHICAL
INFORMATION
WILMERHALE ERNST & YOUNG J. ROBERT SCOTT
Quality In Everything We Do

here in the developed world in how we approach education. I think everybody knows that we will need to undergo a revolution in how we teach children. That could actually come from the Third World, which in some sense, is a green field for these ideas. So, I see that as an interesting counter-intuitive kind of development in technology over the next ten years. It’s not all about giving kids the next i-Pod.
Aaron: How do you cultivate and develop the team here at the Media Lab?
Frank: The talent has been developed mostly from the inside. I will have to go outside some to create a broader mix. That’s one observation. But the real benefits to sponsors here are the students. A lot of the work that gets done here, the new ideas that are created, the insights, the nonlinear thinking, comes from students. My real focus has been not so much on how I make faculty more productive, but how I get students more involved with the sponsors and the work that goes on here. Because they really are the juice that fuels the Media Lab. Integrating students more into the sponsor interaction process is one of my important challenges. The students like it because they get to work with industry, because they know ultimately they’ll go out and do a start-up, or join a big company, or go into academia, and be faced with the issue of needing to interact with industry. So there’s a significant untapped opportunity here to further connect the students more intimately with sponsors.
automate some particular business process. Rather, finding ways in which we can profoundly affect the quality of people’s lives is very important. I think that we’re going to see over the next five or ten years a lot of advances come into the mainstream that were originally developed for the disabled or disadvantaged. A great example is the work of Media Lab faculty member Hugh Herr.
Hugh is a double amputee whose goal in life has been to embrace technologies that could enable himself and others with his disability to walk normally. He has created robotic prosthetics. Typically, prosthetics have been inert, dumb appendages to your body. His have motors that react and feel and integrate with your peripheral nervous system and your central nervous system to enable a double amputee to walk normally and even to run and climb – he’s an ice climber. We’re looking at how those ideas and technologies can apply to nondisabled people, such as the elderly. For instance, what if elderly people could pull on a pair of tights that would restore much of the mobility that naturally degrades with age? We are doing work with autistic children to enable them to relate more naturally to emotions and interactions with other people. How could this eventually enter the mainstream and make all of us more aware and interact better?
Aaron: So part of your vision is to position the Media Lab to play some role in solving the world’s problems and helping those who need help the most.
Frank: Exactly. I think another good example is the work we do around the idea that you can learn outside of schools, without teachers, simply by being given the tools to create and invent. Lego Mindstorms came out of a project here at the Media Lab. The ability to actually build and create contributes to learning. That concept is now being applied in the $100 Laptop project, which enables kids in the Third World to actually invent and create and learn without teachers. We have a huge problem
INTERVIEW WITH FRANK MOSS, PROFESSOR OF THE PRACTICE OF MEDIA ARTS AND SCIENCES
2006 Compensation & Entrepreneurship Report in Information Technology 17
WILMERHALE ERNST & YOUNG J. ROBERT SCOTT
Quality In Everything We Do

$211 $220 $220 $185
25th percentile 75th percentile
Median Mean
KEY:
Base Salary – 2005 and 2006
• CEO base salary increased 4% at the average, from $211,000 to $220,000.
Bonus – 2005 and 2006
• CEOs are expected to receive an average bonus of $93,000 for 2006, which represents 42% of base salary. This compares to an average actual bonus in 2005 of $57,000.
Equity Holdings
• Current equity held by the CEO ranges from 4.00% at the 25th percentile to 7.00% at the 75th percentile. The average equity holding for the CEO is 5.25%.
• The average time of hire equity grant for the CEO is 5.04%, while the median time of hire grant is 5.00%.
Base, Bonus and Equity by Financing Rounds
• In 2006, those CEOs at companies that raised one or fewer rounds of financing are earning, at the average, 9% less base salary than their counterparts at companies with four or more rounds of financing.
• As expected, the average equity position held by the CEO drops significantly with an increase in financing rounds. For those companies with one or fewer rounds raised, the non-founder CEO holds an average of 7.25% of the company, compared to 5.32% in those companies with two or three rounds of financing raised, a decrease of 27%. Average equity decreases to 4.94% at companies having raised four or more rounds.
Base, Bonus and Equity by Founder Status
• Non-founder total cash compensation is considerably higher than that of the founding CEO, a difference of 22%, $313,000 for non-founders and $256,000 for founding CEO’s.
• Founding CEOs hold an average of 18.56% of their company, as expected a significantly higher amount than non-founders.
$180 $210 $250 $199 $225 $250
2005 2006
Base Salary – 2005 and 2006
Base Salary by Financing Rounds
$199 $225 $250 $150 $185 $214
Non-Founder
Founder
Base Salary by Founder Status
www.compstudy.com
B
CHIEF EXECUTIVE OFFICER
18 1 4+ 2-3
$150 $200 $225 $202 $194 $225 $250 $224 $200 $225 $250 $220
WILMERHALE ERNST & YOUNG J. ROBERT SCOTT
Quality In Everything We Do
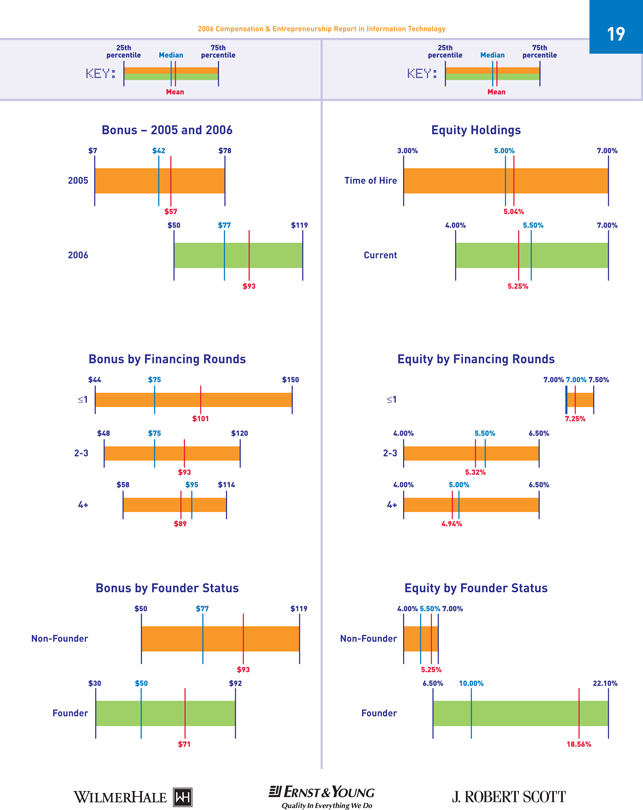
£1 4+ 2-3
$44 $75 $150 $101 $48 $75 $120 $93 $58 $95 $114 $89
£1 4+ 2-3
7.00% 7.00% 7.50% 7.25% 4.00% 5.50% 6.50% 5.32% 4.00% 5.00% 6.50% 4.94%
Current
4.00% 5.50% 7.00% 5.25%
$57 $93 $93 $71
25th 75th
percentile Median percentile
Mean
KEY:
25th 75th
percentile Median percentile
Mean
KEY:
$7 $42 $78
$50 $77 $119
2005
2006
Bonus – 2005 and 2006
Bonus by Financing Rounds
$50 $77 $119
Non-Founder
Bonus by Founder Status
2006 Compensation & Entrepreneurship Report in Information Technology
$30 $50 $92
Founder
19
4.00% 5.50% 7.00%
5.25%
Equity Holdings
Equity by Financing Rounds
Non-Founder
Founder
Equity by Founder Status
6.50% 10.00% 22.10%
18.56%
3.00% 5.00% 7.00%
5.04%
WILMERHALE ERNST & YOUNG J. ROBERT SCOTT
Quality In Everything We Do
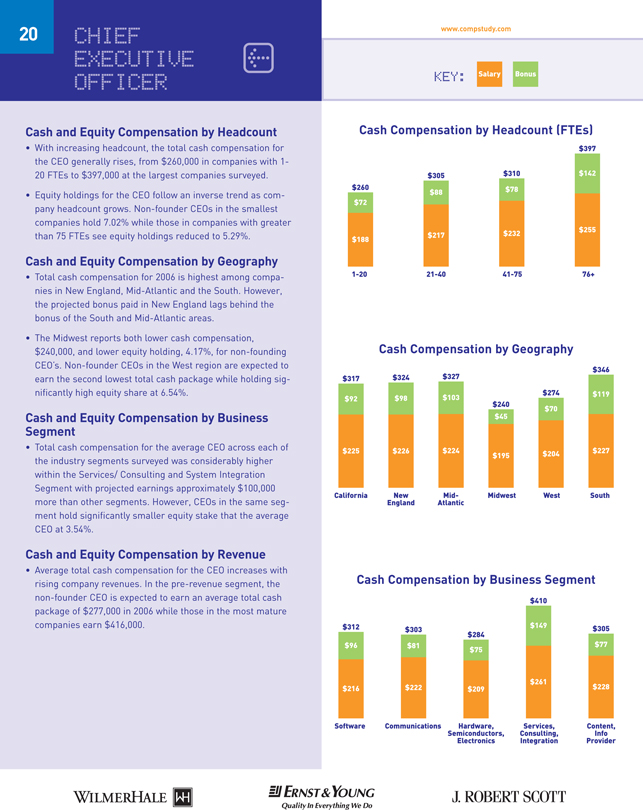
www.compstudy.com
KEY: Salary Bonus
Cash and Equity Compensation by Headcount
• With increasing headcount, the total cash compensation forthe CEO generally rises, from $260,000 in companies with 1- 20 FTEs to $397,000 at the largest companies surveyed.
• Equity holdings for the CEO follow an inverse trend as company headcount grows. Non-founder CEOs in the smallest companies hold 7.02% while those in companies with greater than 75 FTEs see equity holdings reduced to 5.29%.
Cash and Equity Compensation by Geography
• Total cash compensation for 2006 is highest among companies in New England, Mid-Atlantic and the South. However, the projected bonus paid in New England lags behind the bonus of the South and Mid-Atlantic areas.
• The Midwest reports both lower cash compensation, $240,000, and lower equity holding, 4.17%, for non-founding CEO’s. Non-founder CEOs in the West region are expected to earn the second lowest total cash package while holding significantly high equity share at 6.54%.
Cash and Equity Compensation by Business Segment
• Total cash compensation for the average CEO across each of the industry segments surveyed was considerably higher within the Services/ Consulting and System Integration Segment with projected earnings approximately $100,000 more than other segments. However, CEOs in the same segment hold significantly smaller equity stake that the average CEO at 3.54%.
Cash and Equity Compensation by Revenue
• Average total cash compensation for the CEO increases with rising company revenues. In the pre-revenue segment, the non-founder CEO is expected to earn an average total cash package of $277,000 in 2006 while those in the most mature companies earn $416,000.
20 CHIEF
EXECUTIVE
OFFICER
B
Cash Compensation by Headcount (FTEs)
Cash Compensation by Geography
$142 $255
1-20 21-40 41-75 76+
$397 $78 $232 $310 $88 $217 $305 $72 $188 $260 $92 $225 $317 $98 $226 $324 $103 $224 $327 $119 $227 $346 $45
$195 $240 $70 $204 $274
California New Mid- Midwest West South
England Atlantic
Cash Compensation by Business Segment
$96 $216 $312 $77 $228 $305 $81 $222 $303 $75 $209 $284 $149 $261 $410
Software Communications Hardware, Services, Content,
Semiconductors, Consulting, Info
Electronics Integration Provider
WILMERHALE ERNST & YOUNG J. ROBERT SCOTT
Quality In Everything We Do
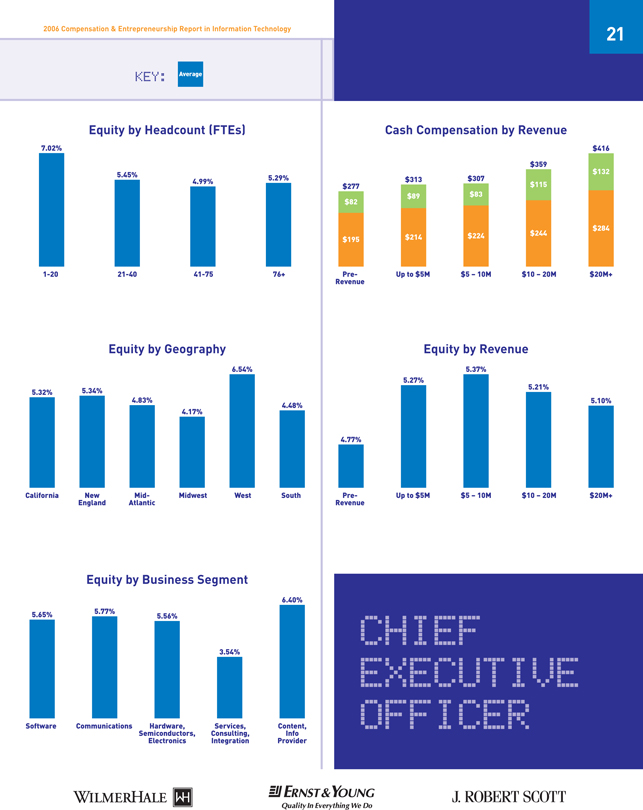
KEY: Average
Cash Compensation by Revenue
$82 $195 $277 $132 $284 $416 $89 $214 $313 $83 $224 $307 $115 $244 $359
Pre- Up to $5M $5 – 10M $10 – 20M $20M+
Revenue
Equity by Revenue
4.77% 5.37% 5.10% 5.27% 5.21%
Pre- Up to $5M $5 – 10M $10 – 20M $20M+
Revenue
2006 Compensation & Entrepreneurship Report in Information Technology
CHIEF
EXECUTIVE
OFFICER
21
Equity by Headcount (FTEs)
Equity by Geography
1-20 21-40 41-75 76+
5.29% 4.99%
5.45% 7.02% 5.32% 6.54% 4.48% 5.34% 4.83% 4.17%
California New Mid- Midwest West South
England Atlantic
Equity by Business Segment
5.65% 5.77%
5.56% 3.54%
6.40%
Software Communications Hardware, Services, Content,
Semiconductors, Consulting, Info
Electronics Integration Provider
WILMERHALE ERNST & YOUNG J. ROBERT SCOTT
Quality In Everything We Do
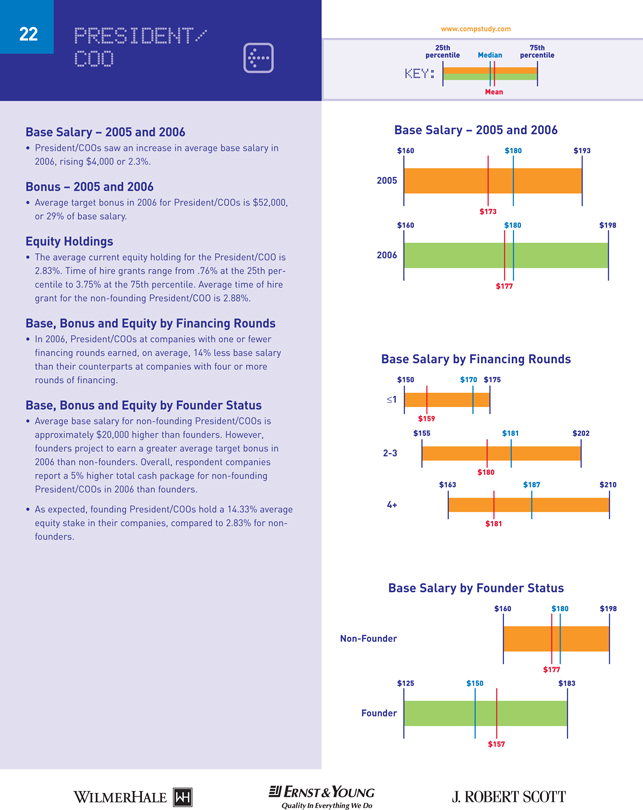
25th percentile 75th percentile
Median
Mean
KEY: B
Base Salary – 2005 and 2006
• President/COOs saw an increase in average base salary in 2006, rising $4,000 or 2.3%.
Bonus – 2005 and 2006
• Average target bonus in 2006 for President/COOs is $52,000, or 29% of base salary.
Equity Holdings
• The average current equity holding for the President/COO is 2.83%. Time of hire grants range from .76% at the 25th percentile to 3.75% at the 75th percentile. Average time of hire grant for the non-founding President/COO is 2.88%.
Base, Bonus and Equity by Financing Rounds
• In 2006, President/COOs at companies with one or fewer financing rounds earned, on average, 14% less base salary than their counterparts at companies with four or more rounds of financing.
Base, Bonus and Equity by Founder Status
• Average base salary for non-founding President/COOs is approximately $20,000 higher than founders. However, founders project to earn a greater average target bonus in 2006 than non-founders. Overall, respondent companies report a 5% higher total cash package for non-founding President/COOs in 2006 than founders.
• As expected, founding President/COOs hold a 14.33% average equity stake in their companies, compared to 2.83% for nonfounders.
PRESIDENT/
COO
www.compstudy.com 22
2005
2006
Base Salary – 2005 and 2006
Base Salary by Financing Rounds
£1 4+ 2-3
Non-Founder
Founder
Base Salary by Founder Status
$160 $180 $193
$173
$177
$160 $180 $198
$150 $170 $175
$159
$160 $180 $198
$177
$125 $150 $183
$157
$155 $181 $202
$180
$163 $187 $210
$181
WILMERHALE ERNST & YOUNG J. ROBERT SCOTT
Quality In Everything We Do
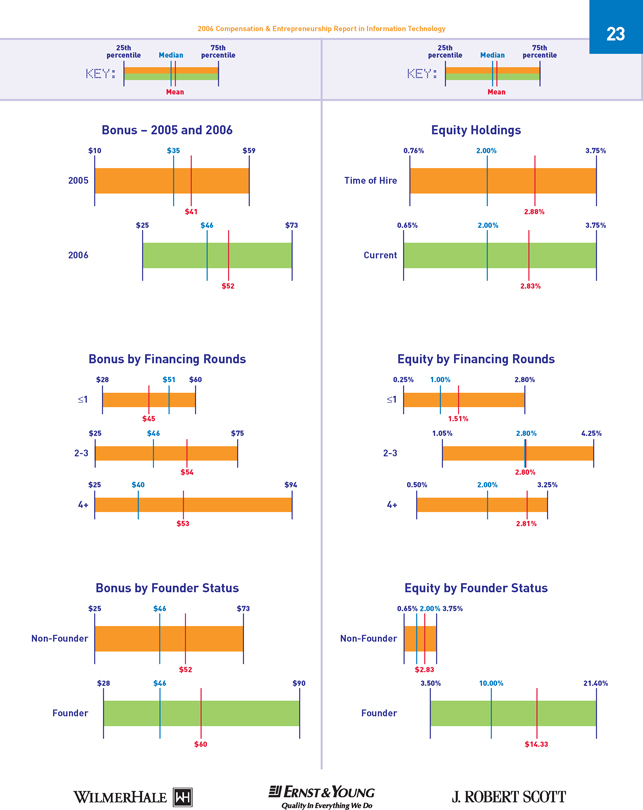
25th percentile 75th percentile
Median
Mean
KEY:
25th percentile 75th percentile
Median
Mean
KEY:
23 2006 Compensation & Entrepreneurship Report in Information Technology
Time of Hire
Equity Holdings
Equity by Financing Rounds
Non-Founder
Founder
Equity by Founder Status
2005
2006
Bonus – 2005 and 2006
Bonus by Financing Rounds
Non-Founder
Founder
Bonus by Founder Status
0.76% 2.00% 3.75% 2.88%
0.65% 2.00% 3.75%
$2.83
3.50% 10.00% 21.40%
$14.33 $10 $35 $59
$41 $25 $46 $73 $52 $25 $46 $73 $52 $28 $46 $90 $60
Current
0.65% 2.00% 3.75% 2.83%
£1 4+ 2-3
$28 $51 $60 $45 $25 $46 $75
$54
$25 $40 $94
$53
£1 4+ 2-3
0.25% 1.00% 2.80% 1.51%
1.05% 2.80% 4.25% 2.80%
0.50% 2.00% 3.25% 2.81%
WILMERHALE ERNST & YOUNG J. ROBERT SCOTT
Quality In Everything We Do
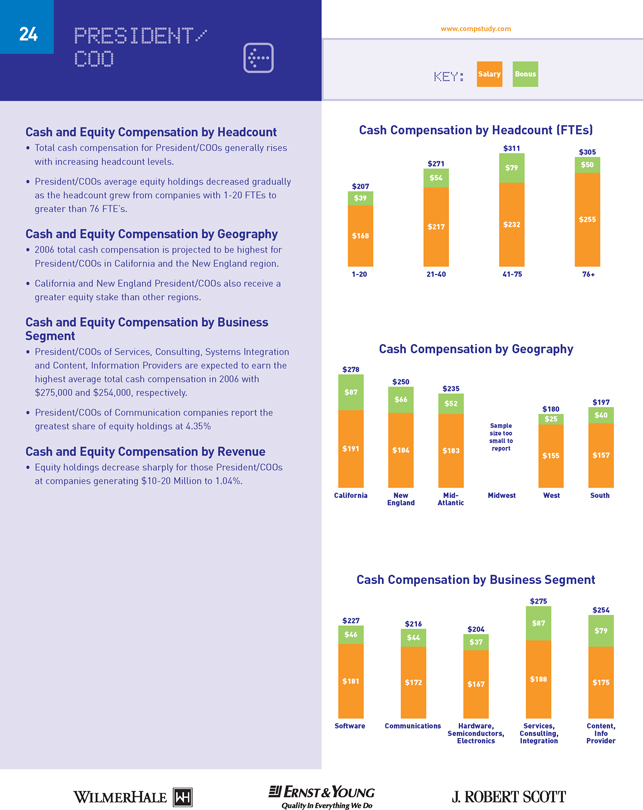
www.compstudy.com
KEY: Salary Bonus
Cash and Equity Compensation by Headcount
• Total cash compensation for President/COOs generally rises
with increasing headcount levels.
• President/COOs average equity holdings decreased gradually
as the headcount grew from companies with 1-20 FTEs to
greater than 76 FTE’s.
Cash and Equity Compensation by Geography
• 2006 total cash compensation is projected to be highest for
President/COOs in California and the New England region.
• California and New England President/COOs also receive a
greater equity stake than other regions.
Cash and Equity Compensation by Business
Segment
• President/COOs of Services, Consulting, Systems Integration
and Content, Information Providers are expected to earn the
highest average total cash compensation in 2006 with
$275,000 and $254,000, respectively.
• President/COOs of Communication companies report the
greatest share of equity holdings at 4.35%
Cash and Equity Compensation by Revenue
• Equity holdings decrease sharply for those President/COOs
at companies generating $10-20 Million to 1.04%.
24 PRESIDENT/
COO B
Cash Compensation by Headcount (FTEs)
Cash Compensation by Geography
$50
$255
1-20 21-40 41-75 76+
$305
$79 $232 $311
$54 $217 $271 $39
$168 $207
$66 $184
$250 $87 $191
$278
$40
$157
$197 $52
$183
$235 $25
$155 $180
California New Mid- Midwest West South
England Atlantic
Cash Compensation by Business Segment $46 $181
$227
$79 $175 $254 $44
$172
$216 $37 $167 $204
$87 $188 $275
Software Communications Hardware, Services, Content,
Semiconductors, Consulting, Info
Electronics Integration Provider
Sample
size too
small to
report
WILMERHALE ERNST&YOUNG J.ROBERT SCOTT Quality In Everything We Do
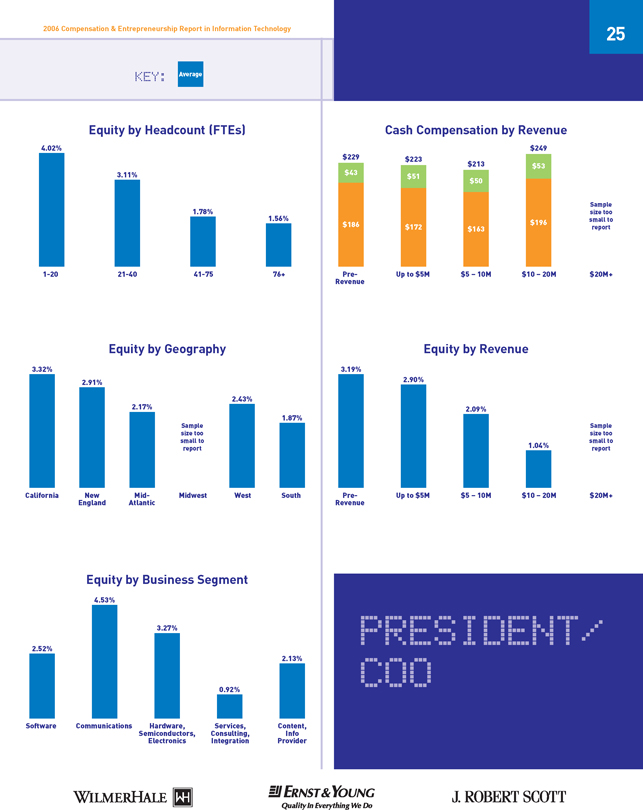
KEY: Average
Cash Compensation by Revenue
$51
$172
$223
$50
$163
$213
$43
$186
$229
$53
$196
$249
Pre- Up to $5M $5 – 10M $10 – 20M $20M+
Revenue
Equity by Revenue
2.90%
2.09%
1.04%
3.19%
Pre- Up to $5M $5 – 10M $10 – 20M $20M+
Revenue
2006 Compensation & Entrepreneurship Report in Information Technology
PRESIDENT/
COO
25
Equity by Headcount (FTEs)
Equity by Geography
1-20 21-40 41-75 76+
1.56%
1.78%
3.11%
4.02% 2.91%
3.32%
2.17% 2.43%
1.87%
California New Mid- Midwest West South
England Atlantic
Equity by Business Segment
2.52% 2.13%
4.53%
3.27%
0.92%
Software Communications Hardware, Services, Content,
Semiconductors, Consulting, Info
Electronics Integration Provider
Sample
size too
small to
report
Sample
size too
small to
report
Sample
size too
small to
report
WILMERHALE ERNST&YOUNG J.ROBERT SCOTT Quality In Everything We Do

25th 75th
percentile Median percentile
Mean
KEY: B
Base Salary – 2005 and 2006
• Average base salary for CFOs increased 5.0%, or $7,000,
from 2005 to 2006.
Bonus – 2005 and 2006
• Average bonus in 2006 for the CFO is targeted at $41,000, an
increase of $18,000 over 2005 actual bonus paid.
Equity Holdings
• Time of hire equity grants for non-founding CFOs average
1.16% and ranged from 0.20% at the 25th percentile to 1.23%
at the 75th percentile.
• Average current equity holdings ranged from 0.40% at the
25th percentile to 1.23% at the 75th percentile. The average
current equity stake for the CFO is 1.00%.
Base, Bonus and Equity by Financing Rounds
• The CFOs average base salary increases gradually with additional
rounds of financing raised, from $135,000, at
companies having raised 1 or fewer rounds, to $147,000 at
companies having raised four or more rounds.
• Consistent with dilution, equity holdings for CFOs decrease
gradually with additional financing rounds.
Base, Bonus and Equity by Founder Status
• Founding CFOs earned an equal base salary to that of their
non-founder counterparts.
• As expected, founding CFOs hold a significantly higher average
equity stake, 3.18%, compared to 1.00% for non-founders.
CHIEF
FINANCIAL
OFFICER
www.compstudy.com 26
2005
2006
Base Salary – 2005 and 2006
Base Salary by Financing Rounds
£1
4+
2-3
Non-Founder
Founder
Base Salary by Founder Status
$120 $144 $163
$141
$148
$125 $150 $170
$92 $148 $165
$135
$125 $150 $170
$148
$123 $145 $170
$148
$130 $150 $175
$150
$120 $150 $168
$147
WILMERHALE ERNST&YOUNG J.ROBERT SCOTT Quality In Everyting We Do
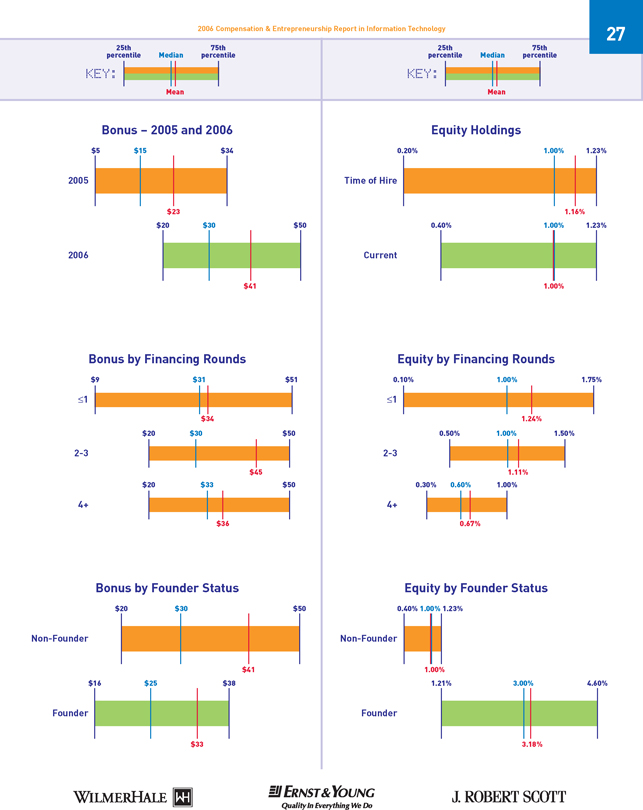
25th 75th
percentile Median percentile
Mean
KEY:
25th 75th
percentile Median percentile
Mean
KEY:
27 2006 Compensation & Entrepreneurship Report in Information Technology
Time of Hire
Equity Holdings
Equity by Financing Rounds
Non-Founder
Founder
Equity by Founder Status
2005
2006
Bonus – 2005 and 2006
Bonus by Financing Rounds
Non-Founder
Founder
Bonus by Founder Status
0.20% 1.00% 1.23%
1.16%
0.40% 1.00% 1.23%
1.00%
1.21% 3.00% 4.60%
3.18%
$5 $15 $34
$23
$20 $30 $50
$41
$20 $30 $50
$41
$16 $25 $38
$33
Current
0.40% 1.00% 1.23%
1.00%
£1
4+
2-3
$9 $31 $51
$34
$20 $30 $50
$45
$20 $33 $50
$36
£1
4+
2-3
0.10% 1.00% 1.75%
1.24%
0.50% 1.00% 1.50%
1.11%
0.30% 0.60% 1.00%
0.67%
WILMERHALE ERNST&YOUNG J.ROBERT SCOTT Quality In Everyting We Do
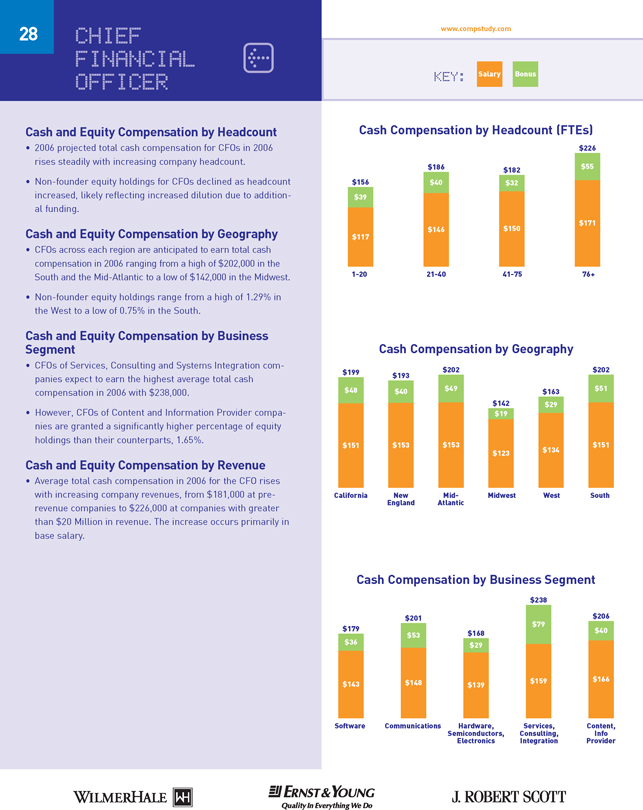
www.compstudy.com
KEY: Salary Bonus
Cash and Equity Compensation by Headcount
• 2006 projected total cash compensation for CFOs in 2006
rises steadily with increasing company headcount.
• Non-founder equity holdings for CFOs declined as headcount
increased, likely reflecting increased dilution due to additional
funding.
Cash and Equity Compensation by Geography
• CFOs across each region are anticipated to earn total cash
compensation in 2006 ranging from a high of $202,000 in the
South and the Mid-Atlantic to a low of $142,000 in the Midwest.
• Non-founder equity holdings range from a high of 1.29% in
the West to a low of 0.75% in the South.
Cash and Equity Compensation by Business
Segment
• CFOs of Services, Consulting and Systems Integration companies
expect to earn the highest average total cash
compensation in 2006 with $238,000.
• However, CFOs of Content and Information Provider companies
are granted a significantly higher percentage of equity
holdings than their counterparts, 1.65%.
Cash and Equity Compensation by Revenue
• Average total cash compensation in 2006 for the CFO rises
with increasing company revenues, from $181,000 at prerevenue
companies to $226,000 at companies with greater
than $20 Million in revenue. The increase occurs primarily in
base salary.
28 CHIEF
FINANCIAL
OFFICER
B
Cash Compensation by Headcount (FTEs)
Cash Compensation by Geography
$55
$171
1-20 21-40 41-75 76+
$226
$32
$150
$182
$40 $146 $186 $39 $117 $156 $48 $151 $199 $51 $151 $202 $49 $153 $202 $40 $153 $193 $19 $123 $142 $29 $134 $163
California New Mid- Midwest West South
England Atlantic
Cash Compensation by Business Segment
$36 $143 $179 $40 $166 $206 $79 $159 $238 $53 $148 $201 $29
$139
$168
Software Communications Hardware, Services, Content,
Semiconductors, Consulting, Info
Electronics Integration Provider
WILMERHALE ERNST&YOUNG J.ROBERT SCOTT Quality In Everyting We Do
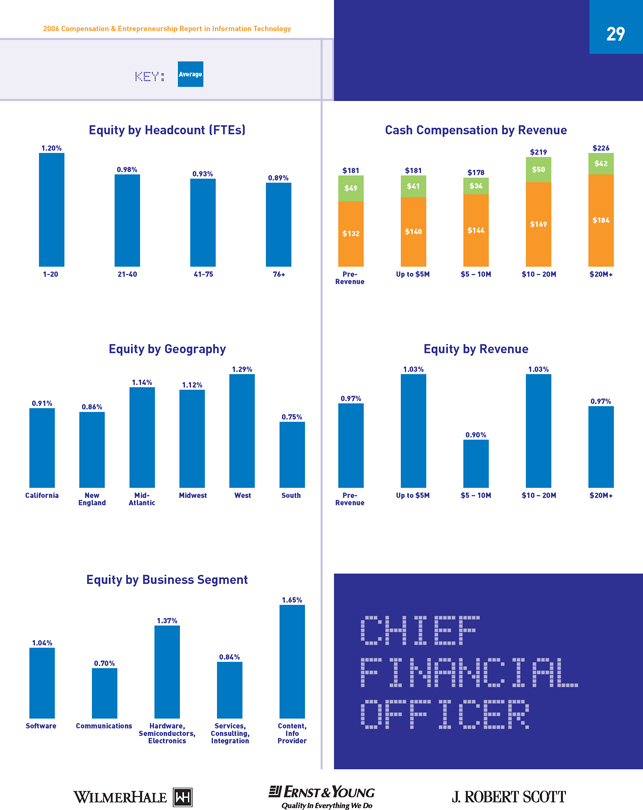
KEY: Average
Cash Compensation by Revenue
$49
$132
$181
$42
$184
$226
$41
$140
$181
$34
$144
$178 $50
$169
$219
Pre- Up to $5M $5 – 10M $10 – 20M $20M+
Revenue
Equity by Revenue
0.97% 0.97%
1.03% 1.03%
0.90%
Pre- Up to $5M $5 – 10M $10 – 20M $20M+
Revenue
2006 Compensation & Entrepreneurship Report in Information Technology
CHIEF
FINANCIAL
OFFICER
29
Equity by Headcount (FTEs)
Equity by Geography
1-20 21-40 41-75 76+
0.89% 0.93% 0.98%
1.20%
0.91%
0.75%
1.29%
0.86%
1.14% 1.12%
California New Mid- Midwest West South
England Atlantic
Equity by Business Segment
1.04%
0.70%
1.37%
0.84%
1.65%
Software Communications Hardware, Services, Content,
Semiconductors, Consulting, Info
Electronics Integration Provider
WILMERHALE ERNST&YOUNG J.ROBERT SCOTT Quality In Everyting We Do
25th 75th
percentile Median percentile
Mean
KEY: B
Base Salary – 2005 and 2006
• Average base salary for the CTO increased by $6,000, or
4.0%, between 2005 and 2006.
Bonus – 2005 and 2006
• 2006 target bonus for CTOs averages $37,000 in 2006.
Equity Holdings delete (Non-Founders)
• Time of hire grants for the CTO range from 0.10% at the 25th
percentile to 2.00% at the 75th percentile. The average time
of hire grant falls within this spectrum at 1.19%. Average
current equity for the CTO is 1.50%
Base, Bonus and Equity by Financing Rounds
• There is a 10% increase in base salary for the CTO in companies
with two to three rounds of financing raised when
compared to CTOs in companies with one or fewer rounds.
Additionally, a 7% decrease in base salary for CTOs was
noted at companies with four or more rounds of financing.
• Projected 2006 bonus for CTOs in companies with two to
three rounds of financing are lower as compared to CTOs in
companies with one or fewer rounds. Moreover, the downward
trend continues with a $1,000 decrease in bonuses in
companies with four or more rounds of financing.
• For companies with one or fewer rounds raised the average
equity stake is 2.43%, for companies with two to three rounds
of financing the average equity stake is 1.35%. At companies
with four or more rounds raised the average equity holding is
1.38%.
Base, Bonus and Equity by Founder Status
• Founding CTOs are projected to earn a 3% lower total cash
compensation package than their non-founding counterparts.
• As expected, founding CTOs hold considerably more equity in
their company than non-founders, with an average of 7.41%.
CHIEF
TECHNOLOGY
OFFICER
www.compstudy.com 30
2005
2006
Base Salary – 2005 and 2006
Base Salary by Financing Rounds
£1
4+
2-3
Non-Founder
Founder
Base Salary by Founder Status
$125 $150 $170
$149
$155
$128 $153 $175
$110 $150 $157
$145
$128 $153 $175
$155
$130 $150 $170
$150
$138 $160 $180
$161
$125 $150 $173
$151
WILMERHALE ERNST&YOUNG J.ROBERT SCOTT Quality In Everyting We Do
25th 75th
percentile Median percentile
Mean
KEY:
25th 75th
percentile Median percentile
Mean
KEY:
31 2006 Compensation & Entrepreneurship Report in Information Technology
Time of Hire
Equity Holdings
Equity by Financing Rounds
Non-Founder
Founder
Equity by Founder Status
2005
2006
Bonus – 2005 and 2006
Bonus by Financing Rounds
Non-Founder
Founder
Bonus by Founder Status
0.10% 1.00% 2.00%
1.19%
0.50% 1.00% 2.00%
$1.50
2.30% 4.50% 9.00%
$7.41
$0 $13 $30
$21
$20 $30 $50
$37
$20 $30 $50
$37
$20 $29 $46
$35
Current
0.50% 1.00% 2.00%
1.50%
£1
4+
2-3
$19 $30 $47
$38
$20 $30 $50
$37
$20 $30 $50
$36
£1
4+
2-3
0.63% 2.00% 4.00%
2.43%
0.55% 1.00% 2.00%
1.35%
0.50% 1.04% 1.95%
1.38%
WILMERHALE ERNST&YOUNG J.ROBERT SCOTT Quality In Everyting We Do
www.compstudy.com
KEY: Salary Bonus
Cash and Equity Compensation by Headcount
• Total cash compensation for CTOs varies across groupings.
The highest average compensation is found at 76 or more
FTE’s, $213,000. The lowest compensation is found at 1-20
FTE’s, $165,000.
• CTO equity holdings decrease gradually as the company
grows between the three smallest headcount categories
however slightly climbs again for companies with greater
than 76 FTEs.
Cash and Equity Compensation by Geography
• CTOs in New England are expected to earn the highest average
total cash compensation in 2006 at $209,000.
• Average projected total cash compensation for the CTO is relatively
consistent across the remaining regions surveyed,
from $157,000 in the lowest region, the Midwest, to $199,000
in the Mid-Atlantic.
Cash and Equity Compensation by Business
Segment
• Services, Consulting and Systems Integration CTOs hold the
largest amount of equity, at 2.06%.
Cash and Equity Compensation by Revenue
• 2006 total cash compensation generally trends upward with
increasing company revenues. At pre-revenue companies
the CTO is expected to earn $172,000, and at companies with
revenue above $20 Million total cash projects to $262,000.
• Equity holdings for the CTO generally follow the typical downward
trend with increasing company size. At companies
earning between $10 and $20 Million, equity jumps to 1.41%.
32
B
CHIEF
TECHNOLOGY
OFFICER
Cash Compensation by Headcount (FTEs)
Cash Compensation by Geography
1-20 21-40 41-75 76+
$29
$155
$184
$41
$160
$201
$27
$138
$165
$47
$166
$213
$32
$166
$198
$48
$161
$209
$32
$142
$174 $40
$159
$199
$26
$131
$157 $32
$148
$180
California New Mid- Midwest West South
England Atlantic
Cash Compensation by Business Segment
$38
$153
$191
$36
$167
$203
$32
$153
$185
$39 $47
$153
$192
$151
$198
Software Communications Hardware, Services, Content,
Semiconductors, Consulting, Info
Electronics Integration Provider
WILMERHALE ERNST&YOUNG J.ROBERT SCOTT Quality In Everyting We Do
KEY: Average
Cash Compensation by Revenue
$30
$142
$172
$61
$201
$262
$35
$155
$190
$32
$144
$176 $42
$163
$205
Pre- Up to $5M $5 – 10M $10 – 20M $20M+
Revenue
Equity by Revenue
0.62%
1.66%
1.11%
2.13%
1.41%
Pre- Up to $5M $5 – 10M $10 – 20M $20M+
Revenue
2006 Compensation & Entrepreneurship Report in Information Technology
CHIEF
TECHNOLOGY
OFFICER
33
Equity by Headcount (FTEs)
Equity by Geography
1-20 21-40 41-75 76+
1.19%
1.06%
1.65%
2.01%
1.43% 1.41%
1.97%
1.41%
0.73%
1.64%
California New Mid- Midwest West South
England Atlantic
Equity by Business Segment
1.49%
2.06%
1.20% 1.24%
1.48%
Software Communications Hardware, Services, Content,
Semiconductors, Consulting, Info
Electronics Integration Provider
WILMERHALE ERNST&YOUNG J.ROBERT SCOTT Quality In Everyting We Do
25th 75th
percentile Median percentile
Mean
KEY:
Base Salary – 2005 and 2006
• Base salaries for Heads of Engineering tend to be in a tight
band with both the average and the median at $150,000 in
2005, rising slightly in 2006 to an average of $154,000.
Bonus – 2005 and 2006
• The average bonus target for Heads of Engineering in 2006 is
significantly higher than actual bonuses paid in 2005, rising
from $21,000 to $36,000.
Equity Holdings (Non-Founders)
• The median equity grant is 1.00% at time of hire for the Head
of Engineering.
• Current equity for Heads of Engineering ranges from 0.40%
at the 25th percentile to 1.50% at the 75th percentile, with an
average of 1.12%.
Base, Bonus and Equity by Financing Rounds
• Average base salary for Heads of Engineering remains fairly
constant despite the number of rounds of financing, ranging
from $145,000 for companies with one or fewer rounds raised
to $155,000 for companies with four or more rounds raised.
• Consistent with the expected effects of dilution, average
current equity holdings for Heads of Engineering decrease
by approximately half when comparing companies with one
or fewer rounds of financing and companies with four or
more rounds.
Base, Bonus and Equity by Founder Status
• Non-founding Heads of Engineering receive an average base
salary that is 5% higher than their founder counterparts.
• This difference is largely derived from companies in the top
half of Heads of Engineering base salary compensation. At
the 25th percentile founding Heads of Engineering have a
base salary that is actually 2.3% higher than their non-founding
counterparts, and at the median the base salaries are
nearly identical.
• As expected, founding Heads of Engineering have a substantially
greater current equity stake in the company. The
average current equity for founders is 7.63% and for nonfounders
it is 1.12%.
www.compstudy.com
B
HEAD OF
ENGINEERING
34
2005
2006
Base Salary – 2005 and 2006
Base Salary by Financing Rounds
£1
4+
2-3
Non-Founder
Founder
Base Salary by Founder Status
$130 $150 $173
$150
$154
$130 $151 $175
$123 $140 $170
$145
$130 $151 $175
$154
$133 $150 $170
$147
$132 $152 $175
$155
$130 $153 $175
$155
WILMERHALE ERNST&YOUNG J.ROBERT SCOTT Quality In Everyting We Do

25th 75th
percentile Median percentile
Mean
KEY:
25th 75th
percentile Median percentile
Mean
KEY:
35 2006 Compensation & Entrepreneurship Report in Information Technology
Time of Hire
Equity Holdings
Equity by Financing Rounds
Non-Founder
Founder
Equity by Founder Status
2005
2006
Bonus – 2005 and 2006
Bonus by Financing Rounds
Non-Founder
Founder
Bonus by Founder Status
0.39% 1.00% 1.50%
1.20%
0.37% 1.00% 1.30%
1.12%
2.60% 4.50% 9.50%
7.63%
$3 $20 $35
$21
$20 $30 $40
$36
$20 $30 $40
$36
$19 $25 $40
$31
Current
0.37% 1.00% 1.30%
1.12%
£1
4+
2-3
$28 $30 $45
$48
$20 $25 $40
$34
$27 $36 $45
$37
£1
4+
2-3
0.30% 1.00% 2.15%
2.00%
0.30% 1.00% 1.50%
1.36%
0.41% 1.00% 1.20%
0.94%
WILMERHALE ERNST&YOUNG J.ROBERT SCOTT Quality In Everyting We Do
www.compstudy.com
KEY: Salary Bonus
Cash and Equity Compensation by Business
Segment
• Heads of Engineering in the Services/Consulting/Integration
segment are expected to earn the highest average base
salary, $184,000, and the highest average bonus, $100,000.
• The average current equity holdings for Heads of Engineering
vary substantially among business segments, with those in
the Software segment holding the largest share.
Cash and Equity Compensation by Revenue
• Heads of Engineering at pre-revenue companies are projected
to receive the highest average total cash compensation in
2006, largely due to a target bonus that is double that of later
stage revenue companies.
36
B
HEAD OF
ENGINEERING
Cash Compensation by Headcount (FTEs)
Cash Compensation by Geography
$47
$165
1-20 21-40 41-75 76+
$212
$32
$160
$192
$33
$157
$190
$35
$134
$169
$39
$173
$212
$36
$144
$180
$36
$150
$186
$42
$147
$189
$25
$136
$161
California New Mid- Midwest West South
England Atlantic
Cash Compensation by Business Segment
$35
$149
$184
$100
$184
$284
$19
$141
$160 $26
$159
$185
$39
$160
$199
Software Communications Hardware, Services, Content,
Semiconductors, Consulting, Info
Electronics Integration Provider
Sample
size too
small to
report
WILMERHALE ERNST&YOUNG J.ROBERT SCOTT Quality In Everyting We Do
KEY: Average
Cash Compensation by Revenue
$33
$166
$199
$66
$156
$222
$33
$150
$183
$35
$153
$188
$18
$162
$180
Pre- Up to $5M $5 – 10M $10 – 20M $20M+
Revenue
Equity by Revenue
1.46%
0.85%
1.58%
0.80%
0.75%
Pre- Up to $5M $5 – 10M $10 – 20M $20M+
Revenue
2006 Compensation & Entrepreneurship Report in Information Technology
HEAD OF
ENGINEERING
37
Equity by Headcount (FTEs)
Equity by Geography
1-20 21-40 41-75 76+
0.63%
0.82%
1.63%
1.82%
0.56%
1.12%
1.21%
1.04%
1.71%
California New Mid- Midwest West South
England Atlantic
Equity by Business Segment
1.49%
1.18%
0.97%
0.77%
1.36%
Software Communications Hardware, Services, Content,
Semiconductors, Consulting, Info
Electronics Integration Provider
Sample
size too
small to
report
WILMERHALE ERNST&YOUNG J.ROBERT SCOTT Quality In Everyting We Do
25th 75th
percentile Median percentile
Mean
KEY: B
Base Salary – 2005 and 2006
• Average base salary for Heads of Sales increased by 2.7%
from 2005 to 2006.
Bonus – 2005 and 2006
• Average 2006 bonus for Heads of Sales are targeted to be
substantially higher than actual bonuses paid in 2005. The
increase is projected to be robust across the range, including
increases of $39,000 at the 25th percentile, $60,000 at the
median, and $65,000 at the 75th percentile, as compared to
actual 2005 figures.
Base, Bonus and Equity by Financing Rounds
• Base salary for Heads of Sales tends to be higher at companies
that have had two to three rounds of financing while
average bonuses are projected to be highest at companies
with one or less rounds of financing.
• Both the average and the top quartile equity holdings for
Heads of Sales decrease as companies raise additional
rounds of financing. Heads of Sales at companies that have
raised four or more rounds of financing hold an average of
0.89% of their company, 23% less than the average held by
Heads of Sales at companies that have raised two or three
rounds of financing.
Base, Bonus and Equity by Founder Status
• The average base salary for founding Heads of Sales is
$9,000, or 5.8%, higher than the average base salary for nonfounders.
• However, the reverse is true for 2006 average target bonuses.
Non-founding Heads of Sales are anticipated to receive an
average bonus of $101,000 for 2006 versus $91,000 for
founders in the same year.
• As expected, non-founding Heads of Sales hold significantly
less equity than founders.
HEAD OF
SALES
www.compstudy.com 38
2005
2006
Base Salary – 2005 and 2006
Base Salary by Financing Rounds
£1
4+
2-3
Non-Founder
Founder
Base Salary by Founder Status
$125 $150 $175
$150
$154
$135 $152 $175
$120 $140 $158
$144
$135 $152 $175
$154
$140 $151 $178
$163
$145 $160 $180
$157
$123 $152 $178
$152
WILMERHALE ERNST&YOUNG J.ROBERT SCOTT Quality In Everyting We Do
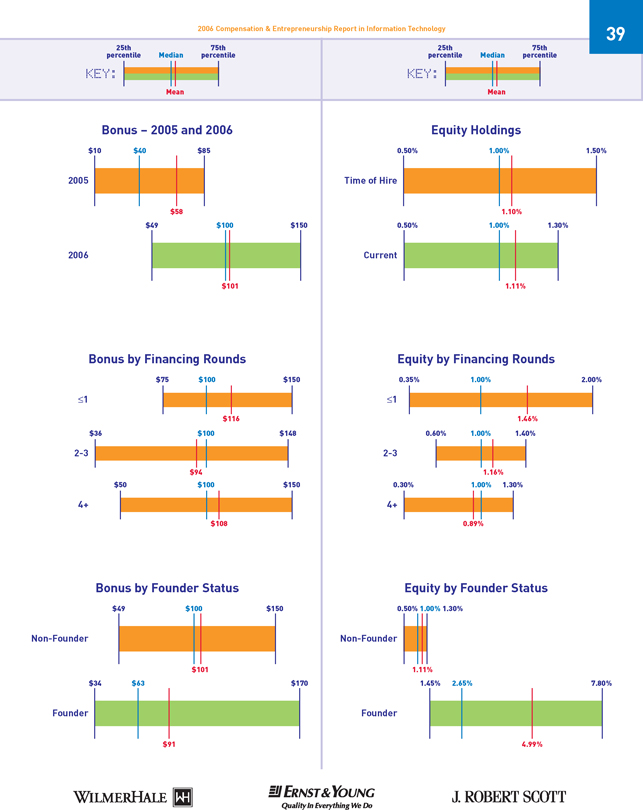
25th 75th
percentile Median percentile
Mean
KEY:
25th 75th
percentile Median percentile
Mean
KEY:
39 2006 Compensation & Entrepreneurship Report in Information Technology
Time of Hire
Equity Holdings
Equity by Financing Rounds
Non-Founder
Founder
Equity by Founder Status
2005
2006
Bonus – 2005 and 2006
Bonus by Financing Rounds
Non-Founder
Founder
Bonus by Founder Status
0.50% 1.00% 1.50%
1.10%
0.50% 1.00% 1.30%
1.11%
1.45% 2.65% 7.80%
4.99%
$10 $40 $85
$58
$49 $100 $150
$101
$49 $100 $150
$101
$34 $63 $170
$91
Current
0.50% 1.00% 1.30%
1.11%
£1
4+
2-3
$75 $100 $150
$116
$36 $100 $148
$94
$50 $100 $150
$108
£1
4+
2-3
0.35% 1.00% 2.00%
1.46%
0.60% 1.00% 1.40%
1.16%
0.30% 1.00% 1.30%
0.89%
WILMERHALE ERNST&YOUNG J.ROBERT SCOTT Quality In Everyting We Do
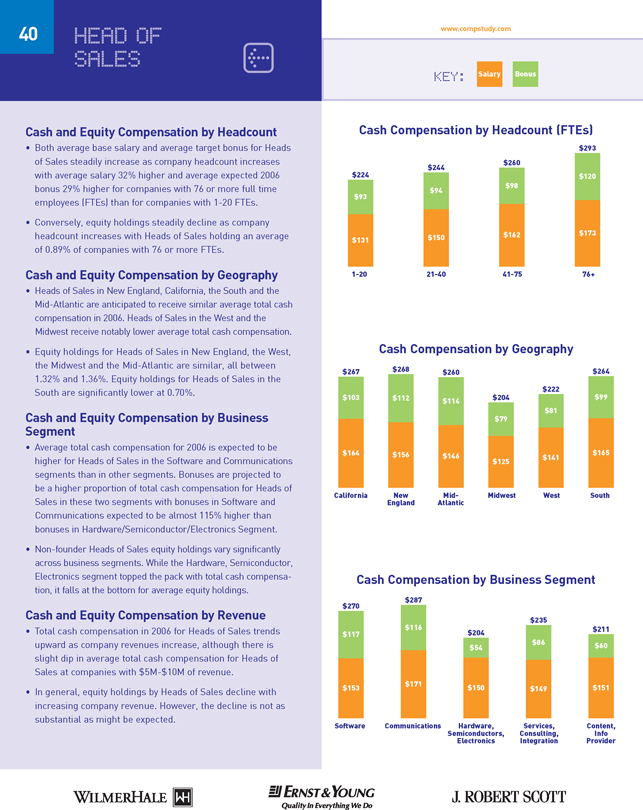
KEY: Salary Bonus Cash and Equity Compensation by Headcount • Both average base salary and average target bonus for Heads
of Sales steadily increase as company headcount increases with average salary 32% higher and average expected 2006
bonus 29% higher for companies with 76 or more full time
employees (FTEs) than for companies with 1-20 FTEs. • Conversely, equity holdings steadily decline as company
headcount increases with Heads of Sales holding an average of 0.89% of companies with 76 or more FTEs.
Cash and Equity Compensation by Geography
• Heads of Sales in New England, California, the South and the Mid-Atlantic are anticipated to receive similar average total cash
compensation in 2006. Heads of Sales in the West and the
Midwest receive notably lower average total cash compensation. • Equity holdings for Heads of Sales in New England, the West,
the Midwest and the Mid-Atlantic are similar, all between
1.32% and 1.36%. Equity holdings for Heads of Sales in the South are significantly lower at 0.70%.
Cash and Equity Compensation by Business
Segment • Average total cash compensation for 2006 is expected to be
higher for Heads of Sales in the Software and Communications
segments than in other segments. Bonuses are projected to
be a higher proportion of total cash compensation for Heads of Sales in these two segments with bonuses in Software and
Communications expected to be almost 115% higher than bonuses in Hardware/Semiconductor/Electronics Segment.
• Non-founder Heads of Sales equity holdings vary significantly across business segments. While the Hardware, Semiconductor,
Electronics segment topped the pack with total cash compensation, it falls at the bottom for average equity holdings.
Cash and Equity Compensation by Revenue • Total cash compensation in 2006 for Heads of Sales trends
upward as company revenues increase, although there is slight dip in average total cash compensation for Heads of
Sales at companies with $5M-$10M of revenue. • In general, equity holdings by Heads of Sales decline with
increasing company revenue. However, the decline is not as substantial as might be expected.
40 HEAD OF SALES B
Cash Compensation by Headcount (FTEs)
Cash Compensation by Geography
$120 $173 1-20 21-40 41-75 76+ $293
$98 $162 $260 $94 $150 $244 $93 $131 $224 $103
$164 $267 $112 $156 $268 $99 $165 $264 $114 $146 $260 $79 $125 $204 $81 $141 $222
California New Mid- Midwest West South
England Atlantic
Cash Compensation by Business Segment $117 $153 $270 $60 $151 $211 $116 $171 $287 $54 $150 $204 $86 $149 $235
Software Communications Hardware, Services, Content,
Semiconductors, Consulting, Info
Electronics Integration Provider
WILMERHALE ERNST&YOUNG J.ROBERT SCOTT Quality In Everyting We Do
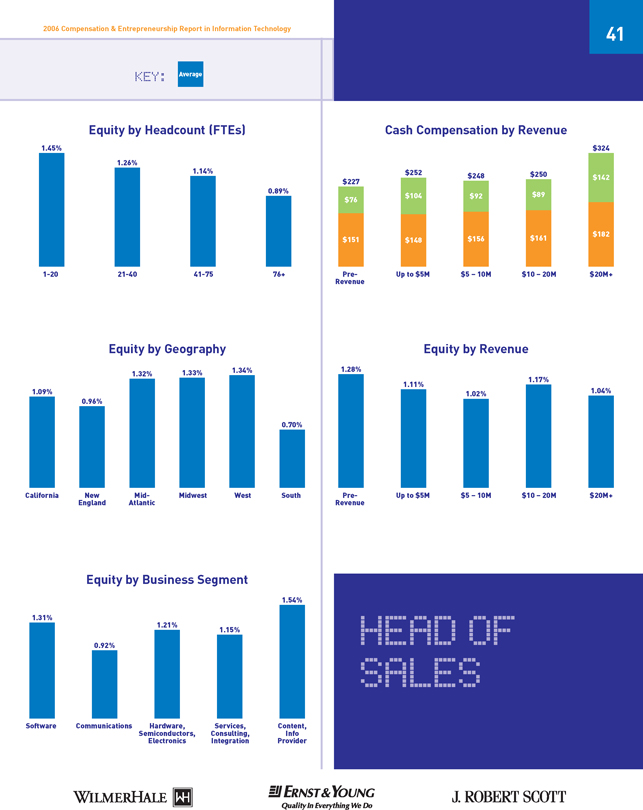
KEY: Average
Cash Compensation by Revenue
$76
$151
$227 $142
$182
$324
$104
$148
$252
$92
$156
$248
$89
$161
$250
Pre- Up to $5M $5 – 10M $10 – 20M $20M+
Revenue
Equity by Revenue
1.28%
1.04%
1.11%
1.02%
1.17%
Pre- Up to $5M $5 – 10M $10 – 20M $20M+
Revenue
2006 Compensation & Entrepreneurship Report in Information Technology
HEAD OF
SALES
41
Equity by Headcount (FTEs)
Equity by Geography
1-20 21-40 41-75 76+
0.89%
1.14%
1.26%
1.45%
1.09%
0.96%
0.70%
1.32% 1.33% 1.34%
California New Mid- Midwest West South
England Atlantic
Equity by Business Segment
1.31%
1.54%
0.92%
1.21%
1.15%
Software Communications Hardware, Services, Content,
Semiconductors, Consulting, Info
Electronics Integration Provider
WILMERHALE ERNST&YOUNG J.ROBERT SCOTT Quality In Everyting We Do
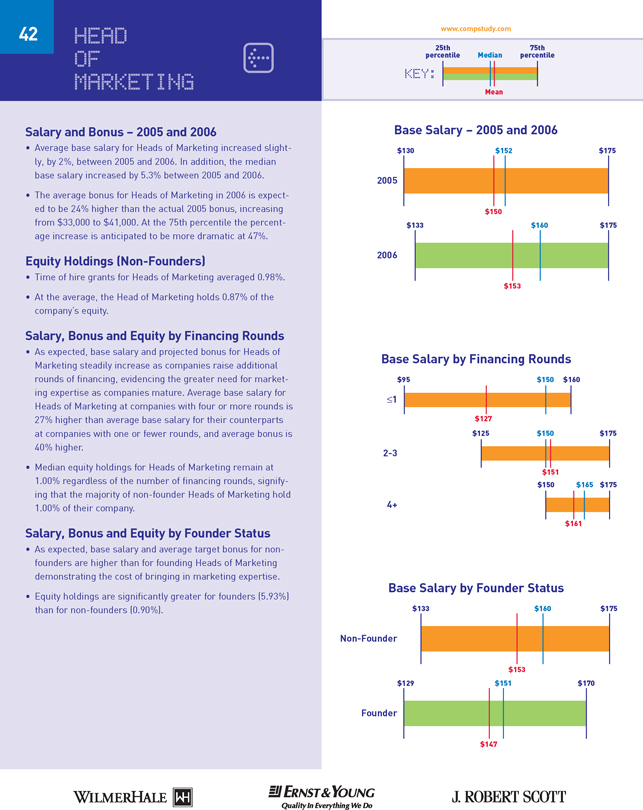
25th 75th
percentile Median percentile
Mean
KEY: B
Salary and Bonus – 2005 and 2006
• Average base salary for Heads of Marketing increased slightly,
by 2%, between 2005 and 2006. In addition, the median
base salary increased by 5.3% between 2005 and 2006.
• The average bonus for Heads of Marketing in 2006 is expected
to be 24% higher than the actual 2005 bonus, increasing
from $33,000 to $41,000. At the 75th percentile the percentage
increase is anticipated to be more dramatic at 47%.
Equity Holdings (Non-Founders)
• Time of hire grants for Heads of Marketing averaged 0.98%.
• At the average, the Head of Marketing holds 0.87% of the
company’s equity.
Salary, Bonus and Equity by Financing Rounds
• As expected, base salary and projected bonus for Heads of
Marketing steadily increase as companies raise additional
rounds of financing, evidencing the greater need for marketing
expertise as companies mature. Average base salary for
Heads of Marketing at companies with four or more rounds is
27% higher than average base salary for their counterparts
at companies with one or fewer rounds, and average bonus is
40% higher.
• Median equity holdings for Heads of Marketing remain at
1.00% regardless of the number of financing rounds, signifying
that the majority of non-founder Heads of Marketing hold
1.00% of their company.
Salary, Bonus and Equity by Founder Status
• As expected, base salary and average target bonus for nonfounders
are higher than for founding Heads of Marketing
demonstrating the cost of bringing in marketing expertise.
• Equity holdings are significantly greater for founders (5.93%)
than for non-founders (0.90%). HEAD OF MARKETING
www.compstudy.com 42 2005 2006 Base Salary – 2005 and 2006 Base Salary by Financing Rounds
£1 4+ 2-3 Non-Founder Founder Base Salary by Founder Status $130 $152 $175 $150 $153
$133 $160 $175 $95 $150 $160 $127 $133 $160 $175 $153 $129 $151 $170 $147 $125 $150 $175 $151 $150 $165 $175 $161
WILMERHALE ERNST&YOUNG J.ROBERT SCOTT Quality In Everyting We Do
25th 75th
percentile Median percentile Mean KEY: 25th 75th percentile Median percentile Mean
KEY: 43 2006 Compensation & Entrepreneurship Report in Information Technology
Time of Hire Equity Holdings Equity by Financing Rounds
Non-Founder Founder Equity by Founder Status 2005 2006
Bonus – 2005 and 2006
Bonus by Financing Rounds
Non-Founder
Founder
Bonus by Founder Status
0.20% 1.00% 1.30%
0.98%
0.40% 1.00% 1.20%
$0.87
2.45% 4.50% 9.00%
$5.93
$8 $20 $34
$33
$20 $33 $50
$41
$20 $33 $50
$41
$17 $27 $50
$34
Current
0.40% 1.00% 1.20% 0.87%
£1
4+ 2-3 $10 $30 $35
$32 $18 $30 $50
$40
$27 $35 $53
$45 £1
4+
2-3
0.00% 1.00% 1.00%
0.65%
0.50% 1.00% 1.20%
0.96%
0.30% 1.00% 1.20% 0.86%
WILMERHALE ERNST&YOUNG J.ROBERT SCOTT Quality In Everyting We Do
www.compstudy.com
KEY: Salary Bonus
Cash and Equity Compensation by Headcount
• Average total cash compensation for the Head of Marketing
tends to increase as the number of full-time employees (FTES) increases. However, Heads of Marketing at companies
with 21-40 FTEs receive average total compensation that is 6% higher than the average received by Heads of Marketing
at companies with 41-75 FTEs. • Average equity holdings for Heads of Marketing steadily
decline as headcount increases. Cash and Equity Compensation by Geography
• Total cash compensation for Heads of Marketing varies widely by region.
• Heads of Marketing in California received the highest average
base salary at $170,000, 10% higher than the next highest
region, however, Heads of Marketing in the Mid-Atlantic are
expected to receive the largest average bonus in 2006 at
$76,000, 95% higher than the next highest region pushing the
Mid-Atlantic to the top for average total compensation.
• Average current equity holdings for Heads of Marketing also
vary widely by region, from 0.54% in the South to 1.14% in
New England and 0.71% in the West.
Cash and Equity Compensation by Business
Segment
• Heads of Marketing in the Services, Consulting, Systems
Integration segment are expected to receive the highest average
total cash compensation in 2006, largely due to bonuses
that are 60% higher than those in any other segment. • Heads of Marketing in the Content, Information Provider segment hold the highest average equity share, while earning
the lowest average total cash compensation.
Cash and Equity Compensation by Revenue • Total cash compensation for Heads of Marketing tends to rise
as company revenues increase, although this pattern does not hold true for pre-revenue companies.
• In general, equity holdings for Heads of Marketing decline with increasing company revenue, from 1.17% for pre-revenue companies to 0.66% for companies with more than
$20M of revenue. 44 B HEAD OF MARKETING Cash Compensation by Headcount (FTEs) Cash Compensation by Geography $58 $158
1-20 21-40 41-75 76+
$216 $38 $149 $187 $34 $163 $197 $28 $132 $160 $37 $170 $207 $39 $155 $194 $76 $140 $216 $35 $145 $180 $30 $138 $168
California New Mid- Midwest West South
England Atlantic Cash Compensation by Business Segment
$45 $147 $192 $27 $143 $170 $32 $166 $198 $24 $166 $190 $72 $165 $237
Software Communications Hardware, Services, Content,
Semiconductors, Consulting, Info
Electronics Integration Provider
Sample
size too
small to
report
WILMERHALE ERNST&YOUNG J.ROBERT SCOTT Quality In Everyting We Do
KEY: Average
Cash Compensation by Revenue
$48
$160
$208
$70
$155
$225
$33
$153
$186
$42
$144
$186
$38
$161
$199
Pre- Up to $5M $5 – 10M $10 – 20M $20M+
Revenue
Equity by Revenue
1.17%
0.66%
0.90% 0.85%
0.76%
Pre- Up to $5M $5 – 10M $10 – 20M $20M+
Revenue
2006 Compensation & Entrepreneurship Report in Information Technology
HEAD OF
MARKETING
45
Equity by Headcount (FTEs)
Equity by Geography 1-20 21-40 41-75 76+ 0.85% 0.86% 0.90% 1.03% 0.97% 1.14% 0.67% 1.27% 0.71% 0.54%
California New Mid- Midwest West South
England Atlantic Equity by Business Segment 0.95% 0.74% 0.69%
1.17%
1.35%
Software Communications Hardware, Services, Content,
Semiconductors, Consulting, Info
Electronics Integration Provider
WILMERHALE ERNST&YOUNG J.ROBERT SCOTT Quality In Everyting We Do
25th 75th percentile Median percentile Mean KEY: Base Salary – 2005 and 2006
• The average base salary for Heads of Business Development rose $8,000 from 2005 to 2006.
Bonus 2005 and 2006 • At $52,000, bonus for the average Head of Business
Development in 2006 is targeted at just over 33% of base salary. Equity Holdings
• The Head of Business Development holds an average of 1.04% of the company.
Base, Bonus and Equity by Financing Rounds
• The average base salary for Heads of Business Development increases with additional financing rounds showing the
largest increase for companies with four or more rounds. • Heads of Business Development at companies with two or
three rounds of financing are expected to receive the highest
average bonus in 2006 at $62,000, almost 45% higher than the expected 2006 bonus at companies with four or more
rounds of financing. • Consistent with the effects of dilution, equity holdings for
non-founding Heads of Business Development are higher at companies with one or fewer rounds of financing (1.66%) than
at companies that have raised four or more rounds (0.93%).
Base, Bonus and Equity by Founder Status
• The average base salary for founding Heads of Business
Development was $9,000, or 6%, higher than the average
base salary for non-founders.
• In contrast, the average anticipated 2006 bonus to be
received by non-founding Heads of Business Development is
$6,000, or 13%, higher than the average bonus for founders.
• Founding Heads of Business Development hold a 5.69% equity
stake compared to 1.04% for non-founders.
www.compstudy.com B HEAD OF BUSINESS
DEVELOPMENT 46 2005 2006 Base Salary – 2005 and 2006
Base Salary by Financing Rounds £1 4+ 2-3 Non-Founder Founder Base Salary by Founder Status
$120 $150 $168 $142 $150 $130 $150 $173 $98 $150 $183
$145
$130 $150 $173
$150
$130 $154 $175
$159
$125 $150 $170
$147
$145 $165 $175
$159
WILMERHALE ERNST&YOUNG J.ROBERT SCOTT Quality In Everyting We Do
25th 75th
percentile Median percentile
Mean
KEY:
25th 75th
percentile Median percentile
Mean
KEY:
47 2006 Compensation & Entrepreneurship Report in Information Technology
Time of Hire
Equity Holdings
Equity by Financing Rounds
Non-Founder Founder
Equity by Founder Status 2005
2006 Bonus – 2005 and 2006 Bonus by Financing Rounds Non-Founder Founder Bonus by Founder Status
0.23% 0.76% 1.00% 0.85% 0.40% 0.80% 1.05% $1.04 1.65% 5.05% 10.00%
$5.69 $0 $15 $30 $21 $20 $40 $68 $52 $20 $40 $68 $52 $13 $33 $50 $46
Current
0.40% 0.80% 1.05% 1.04% £1 4+
2-3 $10 $22 $50
$26
$20 $50 $100
$62
$22 $38 $68
$43
?1
4+
2-3
0.00% 1.00% 3.50%
1.66%
0.50% 0.93% 1.00%
0.91%
0.40% 0.68% 1.10%
0.93%
WILMERHALE ERNST&YOUNG J.ROBERT SCOTT Quality In Everyting We Do
www.compstudy.com
KEY: Salary Bonus
Cash and Equity Compensation by Headcount
• Total cash compensation for Heads of Business Development
generally trends upward as companies hire more full-time
employees (FTEs), but the trend is uneven, with Heads of
Business Development at companies with 21-40 FTEs expected
to receive the highest average total compensation in 2006.
• In contrast, Heads of Business Development equity holdings
decrease steadily with increasing company headcount.
Cash and Equity Compensation by Geography
• Average total cash compensation for Heads of Business
Development is anticipated to be highest in California and the
Mid-Atlantic during 2006 at $229,000 and $225,000, respectively.
• Heads of Business Development in New England and in the
West hold the greatest equity stakes at 1.34% and 1.36%,
respectively.
Cash and Equity Compensation by Business
Segment
• Average base salary for Heads of Business Development is
relatively consistent across all business segments, with the
highest average base salary, $156,000, in the Hardware,
Semiconductors, and Electronics segment.
Cash and Equity Compensation by Revenue
• Total cash compensation generally rises for the Head of
Business Development as revenue increases, although companies
with revenue of $0-$5 Million provide the highest
bonus as a percentage of total cash compensation.
• Average equity holdings for Heads of Business Development
decline steadily as revenue increases.
48
B
HEAD OF
BUSINESS
DEVELOPMENT
Cash Compensation by Headcount (FTEs)
Cash Compensation by Geography
$50
$155
1-20 21-40 41-75 76+
$205
$38
$146
$184
$65
$149
$214
$34
$145
$178
$48
$143
$191 $64
$165
$229
$63
$162
$225
$55
$140
$195
$29
$136
$165
California New Mid- Midwest West South
England Atlantic
Cash Compensation by Business Segment
$42
$151
$193
$60
$147
$207
$48
$153
$201
$34
$156
$190
Software Communications Hardware, Services, Content,
Semiconductors, Consulting, Info
Electronics Integration Provider
Sample
size too
small to
report
Sample
size too
small to
report
WILMERHALE ERNST&YOUNG J.ROBERT SCOTT Quality In Everyting We Do
KEY: Average
Cash Compensation by Revenue
$24
$146
$170
$47
$176
$223
$66
$152
$218
$42
$134
$1776
$46
$147
$193
Pre- Up to $5M $5 – 10M $10 – 20M $20M+
Revenue
Equity by Revenue
0.48%
1.20%
2.08%
0.43%
0.71%
Pre- Up to $5M $5 – 10M $10 – 20M $20M+
Revenue
2006 Compensation & Entrepreneurship Report in Information Technology
HEAD OF
BUSINESS
DEVELOPMENT
49
Equity by Headcount (FTEs)
Equity by Geography
1-20 21-40 41-75 76+
0.53%
0.99%
1.09%
1.68%
0.95%
1.36% 1.34%
0.80%
0.27%
California New Mid- Midwest West South
England Atlantic
Equity by Business Segment
1.01%
1.21%
1.07%
Software Communications Hardware, Services, Content,
Semiconductors, Consulting, Info
Electronics Integration Provider
Sample
size too
small to
report
Sample
size too
small to
report
Sample
size too
small to
report
WILMERHALE ERNST&YOUNG J.ROBERT SCOTT Quality In Everyting We Do
25th 75th
percentile Median percentile
Mean
KEY:
Base Salary – 2005 and 2006
• Average base salary for the Head of Human Resources
increased slightly from 2005 to 2006 from $98,000 to $104,000.
Bonus – 2005 and 2006
• Target bonus for the Head of Human Resources in 2006 is
$21,000, or 20% of base salary.
Equity Holdings
• Current equity held by the non-founding Head of Human
Resources is the lowest among the executive positions surveyed
in this report and ranges from zero at the 25th
percentile to 0.25% at the 75th percentile.
Base, Bonus and Equity by Financing Rounds
• The range of average base salaries for the Head of Human
Resources widens in companies that have raised two to three
rounds, from $90,000 at the 25th percentile to $135,000 at
the 75th percentile.
• The average equity position held by the Head of Human
Resources drops significantly as the company moves from
one or fewer rounds raised to two and three rounds of
financing. For those companies with one or fewer rounds
raised, the non-founder Head of Human Resources holds an
average of 0.62% of the company, compared to 0.15% in
those companies with two or three rounds of financing
raised, a decrease of 76%.
www.compstudy.com
B
HEAD OF
HUMAN
RESOURCES
50
2005
2006
Base Salary – 2005 and 2006
Base Salary by Financing Rounds
?1
4+
2-3
Non-Founder
Founder
Base Salary by Founder Status
$83 $90 $120
$98
$104
$90 $95 $121
$72 $83 $100
$86
$90 $95 $121
$104
$90 $106 $135
$113
$74 $90 $120
$95
Sample size too small to report
WILMERHALE ERNST&YOUNG J.ROBERT SCOTT Quality In Everyting We Do
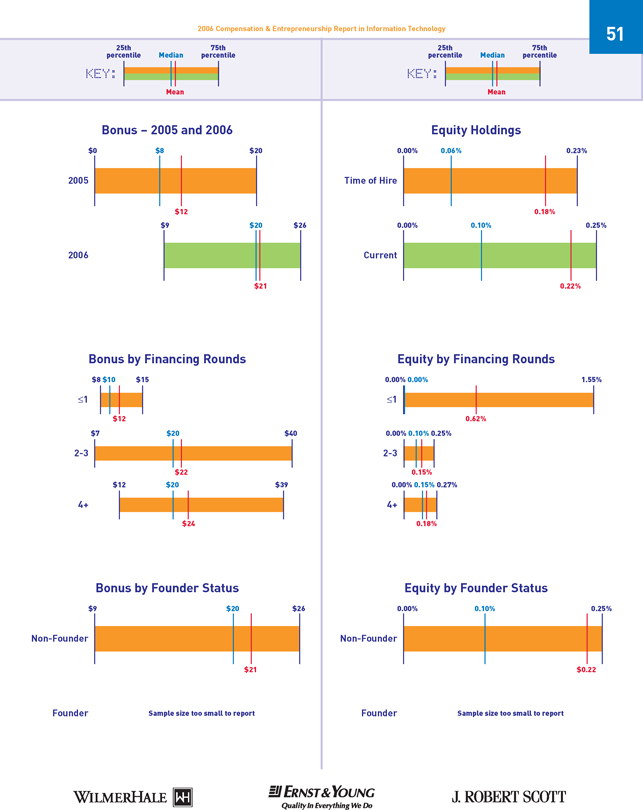
25th 75th
percentile Median percentile
Mean
KEY:
25th 75th
percentile Median percentile
Mean
KEY:
51 2006 Compensation & Entrepreneurship Report in Information Technology
Time of Hire
Equity Holdings
Equity by Financing Rounds
Non-Founder
Founder
Equity by Founder Status 2005
2006
Bonus – 2005 and 2006
Bonus by Financing Rounds
Non-Founder
Founder
Bonus by Founder Status
0.00% 0.06% 0.23%
0.18%
0.00% 0.10% 0.25%
$0.22
$0 $8 $20
$12
$9 $20 $26
$21
$9 $20 $26
$21
Current
0.00% 0.10% 0.25%
0.22%
?1
4+
2-3
$8 $10 $15
$12
$7 $20 $40
$22
$12 $20 $39
$24
?1
4+
2-3
0.00% 0.00% 1.55%
0.62%
0.00% 0.10% 0.25%
0.15%
0.00% 0.15% 0.27%
0.18%
Sample size too small to report Sample size too small to report
WILMERHALE ERNST&YOUNG J.ROBERT SCOTT Quality In Everyting We Do
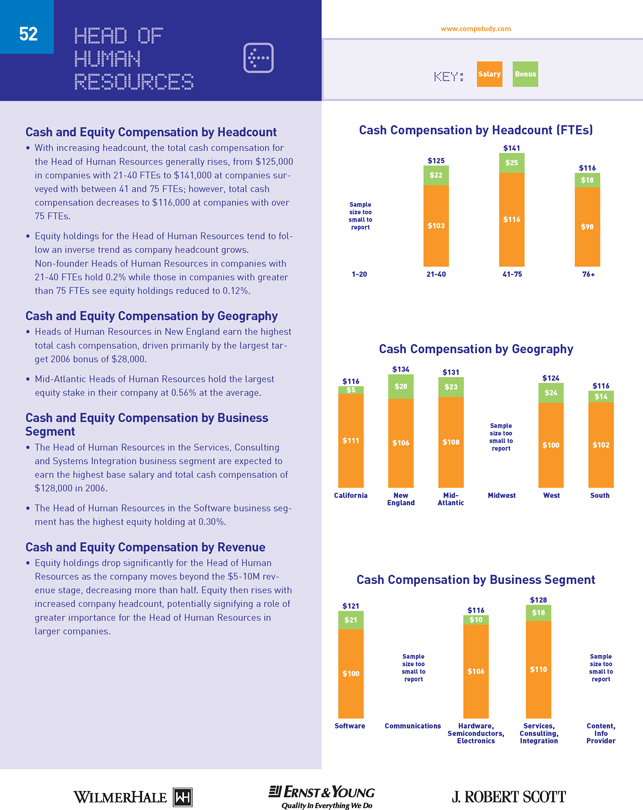
www.compstudy.com
KEY: Salary Bonus
Cash and Equity Compensation by Headcount
• With increasing headcount, the total cash compensation for
the Head of Human Resources generally rises, from $125,000
in companies with 21-40 FTEs to $141,000 at companies surveyed
with between 41 and 75 FTEs; however, total cash
compensation decreases to $116,000 at companies with over
75 FTEs.
• Equity holdings for the Head of Human Resources tend to follow
an inverse trend as company headcount grows.
Non-founder Heads of Human Resources in companies with
21-40 FTEs hold 0.2% while those in companies with greater
than 75 FTEs see equity holdings reduced to 0.12%.
Cash and Equity Compensation by Geography
• Heads of Human Resources in New England earn the highest
total cash compensation, driven primarily by the largest target
2006 bonus of $28,000.
• Mid-Atlantic Heads of Human Resources hold the largest
equity stake in their company at 0.56% at the average.
Cash and Equity Compensation by Business
Segment
• The Head of Human Resources in the Services, Consulting
and Systems Integration business segment are expected to
earn the highest base salary and total cash compensation of
$128,000 in 2006.
• The Head of Human Resources in the Software business segment
has the highest equity holding at 0.30%.
Cash and Equity Compensation by Revenue
• Equity holdings drop significantly for the Head of Human
Resources as the company moves beyond the $5-10M revenue
stage, decreasing more than half. Equity then rises with
increased company headcount, potentially signifying a role of
greater importance for the Head of Human Resources in
larger companies.
52
B
HEAD OF
HUMAN
RESOURCES
Cash Compensation by Headcount (FTEs)
Cash Compensation by Geography
$18
$98
1-20 21-40 41-75 76+
$116
$22
$103
$125 $25
$116
$141
$5
$111
$116
$28
$106
$134
$24
$100
$124
$14
$102
$116 $23
$108
$131
California New Mid- Midwest West South
England Atlantic
Cash Compensation by Business Segment
$21
$100
$121
$18
$110
$128
$10
$106
$116
Software Communications Hardware, Services, Content,
Semiconductors, Consulting, Info
Electronics Integration Provider
Sample
size too
small to
report
Sample
size too
small to
report
Sample
size too
small to
report
Sample
size too
small to
report
WILMERHALE ERNST&YOUNG J.ROBERT SCOTT Quality In Everyting We Do
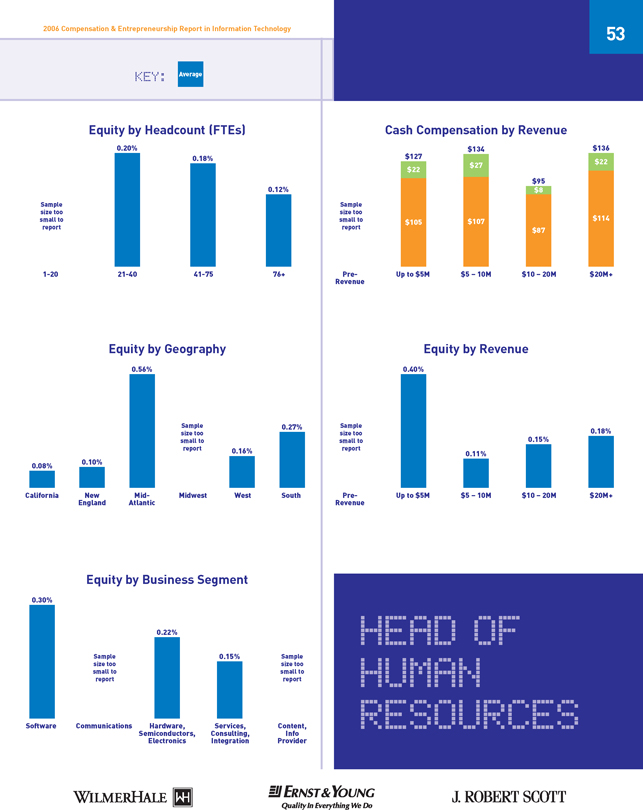
KEY: Average
Cash Compensation by Revenue
$22
$114 $136 $22 $105 $127 $27 $107 $134 $8 $87
$95
Pre- Up to $5M $5 – 10M $10 – 20M $20M+
Revenue
Equity by Revenue
0.18%
0.40%
0.11%
0.15%
Pre- Up to $5M $5 – 10M $10 – 20M $20M+
Revenue
2006 Compensation & Entrepreneurship Report in Information Technology
HEAD OF
HUMAN
RESOURCES
53
Equity by Headcount (FTEs)
Equity by Geography
1-20 21-40 41-75 76+
0.12% 0.18% 0.20% 0.08% 0.10% 0.16%
0.27%
0.56%
California New Mid- Midwest West South
England Atlantic
Equity by Business Segment
0.30%
0.22%
0.15%
Software Communications Hardware, Services, Content,
Semiconductors, Consulting, Info
Electronics Integration Provider Sample size too small to report Sample size too
small to report Sample size too small to report Sample size too small to report Sample
size too small to report Sample size too
small to
report
WILMERHALE ERNST&YOUNG J.ROBERT SCOTT Quality In Everyting We Do
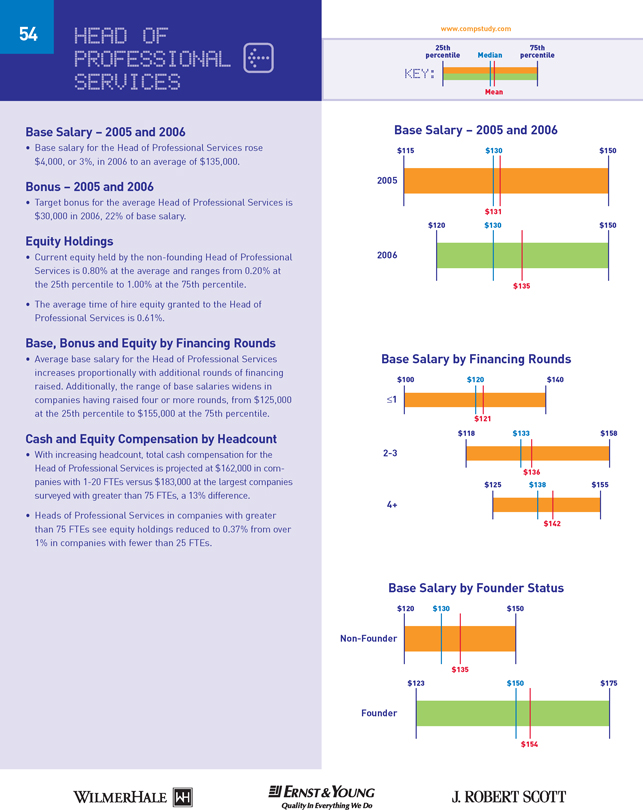
25th 75th
percentile Median percentile
Mean
KEY: B
Base Salary – 2005 and 2006
• Base salary for the Head of Professional Services rose $4,000, or 3%, in 2006 to an average of $135,000.
Bonus – 2005 and 2006
• Target bonus for the average Head of Professional Services is $30,000 in 2006, 22% of base salary.
Equity Holdings
• Current equity held by the non-founding Head of Professional Services is 0.80% at the average and ranges from 0.20% at the 25th percentile to 1.00% at the 75th percentile.
• The average time of hire equity granted to the Head of Professional Services is 0.61%.
Base, Bonus and Equity by Financing Rounds
• Average base salary for the Head of Professional Services increases proportionally with additional rounds of financing raised. Additionally, the range of base salaries widens in companies having raised four or more rounds, from $125,000 at the 25th percentile to $155,000 at the 75th percentile.
Cash and Equity Compensation by Headcount
• With increasing headcount, total cash compensation for the Head of Professional Services is projected at $162,000 in companies with 1-20 FTEs versus $183,000 at the largest companies surveyed with greater than 75 FTEs, a 13% difference.
• Heads of Professional Services in companies with greater than 75 FTEs see equity holdings reduced to 0.37% from over
1% in companies with fewer than 25 FTEs.
HEAD OF PROFESSIONAL SERVICES
www.compstudy.com 54
2005 2006
Base Salary – 2005 and 2006
Base Salary by Financing Rounds
£1 4+ 2-3 Non-Founder Founder Base Salary by Founder Status $115 $130 $150 $131 $135
$120 $130 $150
$100 $120 $140 $121 $120 $130 $150 $135
$123 $150 $175 $154
$118 $133 $158
$136
$125 $138 $155
$142
WILMERHALE ERNST&YOUNG J.ROBERT SCOTT
Quality In Everyting We Do
25th 75th
percentile Median percentile
Mean
KEY:
25th 75th
percentile Median percentile
Mean
KEY:
55 2006 Compensation & Entrepreneurship Report in Information Technology Time of Hire
Equity Holdings Equity by Financing Rounds Non-Founder Founder
Equity by Founder Status 2005 2006 Bonus – 2005 and 2006
Bonus by Financing Rounds Non-Founder Founder Bonus by Founder Status 0.00% 0.45% 1.00%
0.61% 0.20% 0.50% 1.00% 0.80%
1.65% 5.05% 10.00% 5.69% $3 $11 $25
$17 $20 $30 $40 $30
$20 $30 $40
$30
$20 $30 $60
$40
Current
0.20% 0.50% 1.00%
0.80%
£1
4+
2-3
$18 $25 $41
$28
$22 $29 $40
$31
$21 $32 $40
$30
£1
4+
2-3
0.00% 0.50% 1.00%
1.27%
0.25% 0.55% 0.90% 0.60%
0.35% 0.50% 1.30%
0.82%
WILMERHALE ERNST&YOUNG J.ROBERT SCOTT Quality In Everyting We Do
www.compstudy.com
KEY: Salary Bonus
Cash and Equity Compensation by Geography
• Heads of Professional Services in the New England and Mid-
Atlantic areas are expected earn the highest average total
cash compensation, $170,000.
• Mid-Atlantic Heads of Professional Services hold the largest
equity stake in their company at 1.21% at the average.
Cash and Equity Compensation by Business
Segment
• The Head of Professional Services in the Software business
segment earns the highest base salary and total cash compensation,
but generally total cash compensation varied little
across segments. Equity, however, contrasts from the low
variance in cash compensation. The Services, Consulting,
Systems Integration industry Head of Professional Services
gets at least 100% more than their counterparts in all other
segments.
Cash and Equity Compensation by Revenue
• Average total cash compensation is slated to rise in 2006
with increasing company revenues, from $165,000 for companies
earning less than $5M to $202,000 in the largest
revenue category of over $20M, an increase of 22%.
• Equity holdings drop consistently for the Head of Professional
Services as company revenue increases. Specifically, equity
decreases from 1.13% at companies with less than $5M in
revenue to 0.35% at the largest revenue companies surveyed.
56
B
HEAD OF
PROFESSIONAL
SERVICES
Cash Compensation by Headcount (FTEs)
Cash Compensation by Geography
$39
$144
1-20 21-40 41-75 76+
$183
$22
$130
$152 $34
$137
$171
$33
$129
$162
$29
$140
$169
$28
$139
$167
$22
$121
$143 $35
$135
$170
$34
$136
$170
California New Mid- Midwest West South
England Atlantic
Cash Compensation by Business Segment
$37
$124
$161
$30
$137
$167
Software Communications Hardware, Services, Content,
Semiconductors, Consulting, Info
Electronics Integration Provider
Sample
size too
small to
report
Sample
size too
small to
report
Sample
size too
small to
report
Sample
size too
small to
report
WILMERHALE ERNST&YOUNG J.ROBERT SCOTT Quality In Everyting We Do
KEY: Average
Cash Compensation by Revenue
Pre- Up to $5M $5 – 10M $10 – 20M $20M+
Revenue
Equity by Revenue
0.35%
1.13%
0.53%
0.18%
Pre- Up to $5M $5 – 10M $10 – 20M $20M+
Revenue
2006 Compensation & Entrepreneurship Report in Information Technology
HEAD OF
PROFESSIONAL
SERVICES
57
Equity by Headcount (FTEs)
Equity by Geography
1-20 21-40 41-75 76+
0.37%
0.64%
1.08% 1.06%
0.85%
0.60% 0.60%
0.24%
1.21%
California New Mid- Midwest West South
England Atlantic
Equity by Business Segment
0.73%
1.52%
Software Communications Hardware, Services, Content,
Semiconductors, Consulting, Info
Electronics Integration Provider
Sample
size too
small to
report
Sample
size too
small to
report
Sample
size too
small to
report
Sample
size too
small to
report
$51
$151
$202
$29
$135
$164
$26
$124
$150 $27
$148
$175
Sample
size too
small to
report
Sample
size too
small to
report
WILMERHALE ERNST&YOUNG J.ROBERT SCOTT Quality In Everyting We Do
Chairperson Demographics Chairperson
• There were 312 reported Chairpersons in this survey.
• The Chairperson is the CEO of the company 43% of the time.
An investor acts as Chairperson at 20% of the companies
surveyed.
Board Members
• Of the over 1,400 Board Members reported in this survey,
investors comprise 49% of the board seats while outside
members make up 24% of the Board.
Board Composition by Financing Round
• With increasing financing rounds, the makeup of the Board of
Directors shifts to include both a greater number of outside
members and, more so, a larger percentage of investors.
• Investors comprise 33% of the Board of Directors in the earliest
stage companies, shifting to nearly half the Board in those
companies having raised five or more rounds of financing.
• Current and former employees generally lose seats on the
Board with increasing financing rounds raised.
58 www.compstudy.com
B
BOARD OF
DIRECTORS
Board Member Demographics
CEO Current Former Investor Outside Academia/
Executive Executive Executive Other
(Non-CEO)
11%
9%
6%
20%
43%
10%
CEO Current Former Investor Outside Academia/
Executive Executive Executive Other
(Non-CEO)
10%
6%
3%
9%
49%
24%
Board Composition by Financing Round
1 2 3 4 5+
Outside Directors
Investors
Current/Former Employees
32%
42%
26%
28%
39%
32%
22%
47%
31%
27%
33%
40%
26%
46%
28%
WILMERHALE ERNST&YOUNG J.ROBERT SCOTT Quality In Everyting We Do
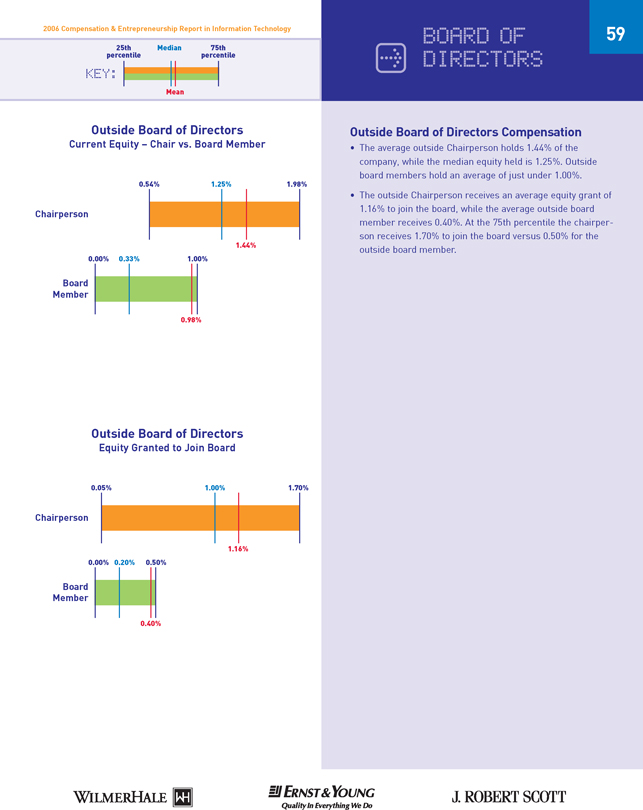
Outside Board of Directors
Current Equity – Chair vs. Board Member
2006 Compensation & Entrepreneurship Report in Information Technology
Outside Board of Directors Compensation
• The average outside Chairperson holds 1.44% of the
company, while the median equity held is 1.25%. Outside
board members hold an average of just under 1.00%.
• The outside Chairperson receives an average equity grant of
1.16% to join the board, while the average outside board
member receives 0.40%. At the 75th percentile the chairperson
receives 1.70% to join the board versus 0.50% for the
outside board member.
A
BOARD OF
DIRECTORS
59
Outside Board of Directors
Equity Granted to Join Board
1.44%
0.98%
0.54% 1.25% 1.98%
Chairperson
0.00% 0.33% 1.00%
Board
Member
1.16%
0.40%
0.05% 1.00% 1.70%
Chairperson
0.00% 0.20% 0.50%
Board
Member
25th Median 75th
percentile percentile
Mean
KEY:
WILMERHALE ERNST&YOUNG J.ROBERT SCOTT Quality In Everyting We Do

Wilmer Cutler Pickering
Hale and Dorr LLP
60 State Street
Boston, MA 02109
617.526.6000
1875 Pennsylvania Avenue, NW
Washington, DC 20006
202.663.6000
www.wilmerhale.com
WilmerHale is internationally recognized for its experience in representing both venturebacked companies and venture capital firms in their initial public offerings, mergers and acquisitions, intellectual property and intellectual property litigation. As a leader in
technology and life sciences, the firm represents clients in a wide variety of sectors including telecom and wireless, software, electronics, biotechnology and medical devices. The firm’s full service practice also includes antitrust and competition; aviation; bankruptcy; civil and criminal trial and appellate litigation (including white collar defense); communications; defense and
national security; financial institutions; international arbitration; securities regulation, enforcement and litigation; tax; and trade.
The firm is more than 1,100 lawyers strong and has offices in Baltimore, Beijing, Berlin, Boston, Brussels, London, Munich, New York, Northern Virginia, Oxford, Palo Alto, Waltham and Washington, DC. If you would like more information about WilmerHale’s compensation and benefits practice group, please call or email:
A. William Caporizzo
Co-Chair, Tax Department
617.526.6411
william.caporizzo@wilmerhale.com
Kimberly B. Wethly
Partner, Tax Department
617.526.6481
kimberly.wethly@wilmerhale.com
Ernst & Young LLP
200 Clarendon Street
Boston, MA 02116
617.266.2000
www.eyonline.ey.com/growth
Ernst & Young has more than 107,000 people in more than 140 countries around the world that are dedicated to delivering audit, tax and corporate financial services. We have created a culture that emphasizes great diversity of background, perspective and ideas. Ernst & Young has consistently been named one of the world’s top organizations in fostering opportunity, knowledge, technology,innovation, work-life balance, quality and leadership. We serve leaders in every industry and in every
location throughout the United States and the world. Our extensive experience around the world means that our clients will receive consistent and dependable services, no matter where they do business.
Ernst & Young’s Strategic Growth Markets (SGM) practice is committed to helping emerging and high-growth companies realize the promise of innovation and achieve success through a comprehensive array of services, deep experience, and sharp insights focused on every stage of growth—from start-up to rapid growth to market leader. With over 30 years of experience advising emerging and
new market leaders, the SGM practice has grown along side the hundreds of companies it has assisted, becoming the leading provider to growth companies. The SGM offering includes three foundation programs: the Venture Capital Advisory Group, the Entrepreneur of the Year® Award program, and the IPO Transformation~CEO Retreat. If you would like more information about Ernst &
Young’s services, please call or e-mail:
Bryan Pearce
Northeast SGM Leader,
Venture Capital Advisory Group
617.859.6199
bryan.pearce@ey.com
Joseph Muscat
National Venture Capital Advisory Group
Leader
650.496.4517
joseph.muscat@ey.com
J. Robert Scott
260 Franklin Street, Suite 620
Boston, MA 02110
617.563.2770
www.j-robert-scott.com
J. Robert Scott is a retainer-based executive
search firm specializing in the recruitment
and selection of senior managers across a
broad range of selected industries. Founded in
1986 as a wholly-owned subsidiary of Fidelity
Investments, the firm has developed a specialization
in entrepreneurial oriented technology
businesses. Specialty vertical practices
include: Information Technology, Life Sciences,
Financial Services, Higher Education and
Not-for-Profit.
J. Robert Scott provides a thorough, timely and
proven process for locating and attracting
highly qualified candidates to fill key positions.
Our approach is client-oriented and distinguished
by a commitment to service that is not
only promised, but guaranteed. If you would
like more information about J. Robert Scott’s
services, please call or e-mail:
Aaron Lapat
Managing Director
617.563.2770
aaronl@j-robert-scott.com
WILMERHALE ERNST&YOUNG J.ROBERT SCOTT Quality In Everyting We Do


Exhibit K
MEMSIC
| | | | | | | | | | | | | | | | | | | | | | | | | | | | | | |
Grant
Date | | Type | | Name | | Description | | Shares | | Exercise
Price | | Fair
value of
option | | Total Stock
compensation | | Recognition
period
(months) | | Stock
compensation
expensed for
year ended
2006 | | Stock
compensation
expense for
nine mths
ended 2007 | | Unrecognized
Compensation
as of 9/30/07 | | |
Options Issued | | | | | | | | | | | | | | | | | | | | | | | | | | |
| 11/09/06 | | NQL | | Changhao Shi | | Employee - new hire | | 2,000 | | $ | 0.77 | | $ | 1.19 | | | 1,736 | | 48 | | $ | 53 | | $ | 325 | | $ | 1,358 | | |
| 11/09/06 | | NQL | | Chen Xi | | Employee - new hire | | 1,000 | | $ | 0.77 | | $ | 1.19 | | | 868 | | 48 | | | 26 | | | 163 | | | 679 | | |
| 11/09/06 | | NQL | | Dianpu Hu | | Employee - new hire | | 1,000 | | $ | 0.77 | | $ | 1.19 | | | 868 | | 48 | | | 26 | | | 163 | | | - | | |
| 11/09/06 | | NQL | | Dongwei Li | | Employee - new hire | | 1,000 | | $ | 0.77 | | $ | 1.19 | | | 868 | | 48 | | | 26 | | | 163 | | | 679 | | |
| 11/09/06 | | NQL | | Feng Lu | | Employee - new hire | | 2,000 | | $ | 0.77 | | $ | 1.19 | | | 1,736 | | 48 | | | 53 | | | 325 | | | 1,358 | | |
| 11/09/06 | | NQL | | Grabowski, Stanley | | Employee - new hire | | 30,000 | | $ | 0.77 | | $ | 1.19 | | | 26,034 | | 48 | | | 789 | | | 4,881 | | | 20,364 | | |
| 11/09/06 | | NQL | | Juan Qian | | Employee - new hire | | 1,000 | | $ | 0.77 | | $ | 1.19 | | | 868 | | 48 | | | 26 | | | 163 | | | 679 | | |
| 11/09/06 | | NQL | | Kehui Zhang | | Employee - new hire | | 1,000 | | $ | 0.77 | | $ | 1.19 | | | 868 | | 48 | | | 26 | | | 163 | | | 679 | | |
| 11/09/06 | | NQL | | Kun Sui | | Employee - new hire | | 2,000 | | $ | 0.77 | | $ | 1.19 | | | 1,736 | | 48 | | | 53 | | | 325 | | | 1,358 | | |
| 11/09/06 | | NQL | | Leung, Albert | | Consultant services | | 10,400 | | $ | 0.15 | | $ | 3.30 | | | 33,871 | | 0 | | | 33,871 | | | - | | | - | | |
| 11/09/06 | | NQL | | Liang Chen | | Employee - new hire | | 1,000 | | $ | 0.77 | | $ | 1.19 | | | 868 | | 48 | | | 26 | | | 163 | | | 679 | | |
| 11/09/06 | | NQL | | Liang, Jin | | Employee - new hire | | 50,000 | | $ | 0.77 | | $ | 1.19 | | | 43,390 | | 48 | | | 1,315 | | | 8,136 | | | 33,939 | | |
| 11/09/06 | | NQL | | Ming Xie | | Employee - new hire | | 1,000 | | $ | 0.77 | | $ | 1.19 | | | 868 | | 48 | | | 26 | | | 163 | | | - | | |
| 11/09/06 | | ISO | | Niu, Patricia | | Employee - new hire | | 50,000 | | $ | 0.77 | | $ | 1.19 | | | 43,390 | | 48 | | | 1,315 | | | 8,136 | | | 33,939 | | |
| 11/09/06 | | NQL | | Qian, Dahong | | Consultant services | | 80,000 | | $ | 0.77 | | $ | 3.48 | | | 278,400 | | 48 | | | 3,866 | | | 52,307 | | | 222,228 | | |
| 11/09/06 | | NQL | | Shi Han | | Employee - new hire | | 2,000 | | $ | 0.77 | | $ | 1.19 | | | 1,736 | | 48 | | | 53 | | | 325 | | | 1,358 | | |
| 11/09/06 | | NQL | | Shouyuan Shen | | Employee - new hire | | 1,000 | | $ | 0.77 | | $ | 1.19 | | | 868 | | 48 | | | 26 | | | 163 | | | 679 | | |
| 11/09/06 | | NQL | | Songheng Liao | | Employee - new hire | | 2,000 | | $ | 0.77 | | $ | 1.19 | | | 1,736 | | 48 | | | 53 | | | 325 | | | - | | |
| 11/09/06 | | NQL | | Xianghua Yu | | Employee - new hire | | 2,000 | | $ | 0.77 | | $ | 1.19 | | | 1,736 | | 48 | | | 53 | | | 325 | | | 1,358 | | |
| 11/09/06 | | NQL | | Yanlong Chen | | Employee - new hire | | 1,000 | | $ | 0.77 | | $ | 1.19 | | | 868 | | 48 | | | 26 | | | 163 | | | 679 | | |
| 11/09/06 | | NQL | | Yanwei Chen | | Employee - new hire | | 2,000 | | $ | 0.77 | | $ | 1.19 | | | 1,736 | | 48 | | | 53 | | | 325 | | | 1,358 | | |
| 11/09/06 | | NQL | | Yonghui Yang | | Employee - new hire | | 2,000 | | $ | 0.77 | | $ | 1.19 | | | 1,736 | | 48 | | | 53 | | | 325 | | | 1,358 | | |
| 11/09/06 | | NQL | | Zhi Yang | | Employee - new hire | | 2,000 | | $ | 0.77 | | $ | 1.19 | | | 1,736 | | 48 | | | 53 | | | 325 | | | 1,358 | | |
| 01/18/07 | | NQL | | Steinbeiser, Christian | | Employee - new hire | | 10,000 | | $ | 0.77 | | $ | 1.19 | | | 8,682 | | 48 | | | | | | 1,628 | | | 7,054 | | |
| 02/05/07 | | ISO | | Chiumiento, Patrick | | Employee - new hire | | 220,000 | | $ | 0.77 | | $ | 1.19 | | | 190,886 | | 48 | | | | | | 31,814 | | | 159,072 | | |
| 03/12/07 | | NQL | | Yang, Hongyuan | | Employee - new hire | | 30,000 | | $ | 1.85 | | $ | 1.08 | | | 23,644 | | 48 | | | | | | 3,448 | | | 20,196 | | |
| 04/26/07 | | NQL | | Amy Yang | | Employee | | 10,000 | | $ | 1.85 | | $ | 1.08 | | | 7,894 | | 48 | | | | | | 987 | | | 6,908 | | |
| 04/26/07 | | NQL | | Haidong Liu | | Employee | | 5,000 | | $ | 1.85 | | $ | 1.08 | | | 3,947 | | 48 | | | | | | 493 | | | 3,454 | | |
| 04/26/07 | | NQL | | Jianping Yu | | Employee | | 5,000 | | $ | 1.85 | | $ | 1.08 | | | 3,947 | | 48 | | | | | | 493 | | | 3,454 | | |
| 04/26/07 | | NQL | | Jilie Wei | | Employee | | 10,000 | | $ | 1.85 | | $ | 1.08 | | | 7,894 | | 48 | | | | | | 987 | | | 6,908 | | |
| 04/26/07 | | NQL | | Junde Zhang | | Employee - new hire | | 1,000 | | $ | 1.85 | | $ | 1.08 | | | 789 | | 48 | | | | | | 99 | | | 691 | | |
| 04/26/07 | | NQL | | Kay Lin | | Employee - new hire | | 3,000 | | $ | 1.85 | | $ | 1.08 | | | 2,368 | | 48 | | | | | | 296 | | | 2,072 | | |
| 04/26/07 | | NQL | | Matthieu Lagogue | | Employee | | 5,000 | | $ | 1.85 | | $ | 1.08 | | | 3,947 | | 48 | | | | | | 493 | | | 3,454 | | |
| 04/26/07 | | NQL | | Mingyu Meng | | Employee | | 1,000 | | $ | 1.85 | | $ | 1.08 | | | 789 | | 48 | | | | | | 99 | | | 691 | | |
| 04/26/07 | | NQL | | Song Cao | | Employee | | 1,000 | | $ | 1.85 | | $ | 1.08 | | | 789 | | 48 | | | | | | 99 | | | 691 | | |
| 04/26/07 | | NQL | | Xianfeng Gan | | Employee - new hire | | 1,000 | | $ | 1.85 | | $ | 1.08 | | | 789 | | 48 | | | | | | 99 | | | 691 | | |
| 04/26/07 | | NQL | | Yang Huang | | Employee - new hire | | 1,000 | | $ | 1.85 | | $ | 1.08 | | | 789 | | 48 | | | | | | 99 | | | 691 | | |
| 04/26/07 | | NQL | | Zhiquan He | | Employee | | 1,000 | | $ | 1.85 | | $ | 1.08 | | | 789 | | 48 | | | | | | 99 | | | 691 | | |
| 04/26/07 | | NQL | | Zhongmin Shang | | Employee | | 1,000 | | $ | 1.85 | | $ | 1.08 | | | 789 | | 48 | | | | | | 99 | | | 691 | | |
| 07/01/07 | | NQL | | Katsumoto, Kenichi | | Modified - Consultant to Employee | | 5,000 | | $ | 0.15 | | $ | 3.31 | | | 12,093 | | 48 | | | 1,422 | | | 1,067 | | | 11,026 | | |
| 07/12/07 | | ISO | | Shang Hsiao | | Employee - new hire | | 116,959 | | $ | 3.42 | | $ | 2.09 | | | 179,079 | | 48 | | | | | | 11,192 | | | 167,887 | | a |
| 07/12/07 | | NQL | | Shang Hsiao | | Employee - new hire | | 433,041 | | $ | 3.42 | | $ | 2.09 | | | 663,041 | | 48 | | | | | | 41,440 | | | 621,601 | | a |
| 07/26/07 | | NQL | | Juanjuan Chen | | Employee - new hire | | 1,500 | | $ | 3.42 | | $ | 2.09 | | | 2,289 | | 48 | | | | | | 143 | | | 2,146 | | a |
| 07/26/07 | | NQL | | Liangliang Ge | | Employee - new hire | | 1,500 | | $ | 3.42 | | $ | 2.09 | | | 2,289 | | 48 | | | | | | 143 | | | 2,146 | | a |
| 07/26/07 | | NQL | | Ling Li | | Employee - new hire | | 1,500 | | $ | 3.42 | | $ | 2.09 | | | 2,289 | | 48 | | | | | | 143 | | | 2,146 | | a |
| 07/26/07 | | NQL | | Lubin Zhang | | Employee - new hire | | 1,000 | | $ | 3.42 | | $ | 2.09 | | | 1,526 | | 48 | | | | | | 95 | | | 1,430 | | a |
| 07/26/07 | | NQL | | O'Brien, Gary | | Employee - new hire | | 110,000 | | $ | 3.42 | | $ | 2.09 | | | 167,827 | | 48 | | | | | | 10,489 | | | 157,338 | | a |
| 07/26/07 | | NQL | | Peng Xiao | | Employee - new hire | | 6,000 | | $ | 3.42 | | $ | 2.09 | | | 9,154 | | 48 | | | | | | 572 | | | 8,582 | | a |
| 07/26/07 | | NQL | | Ping Zhao | | Employee - new hire | | 1,500 | | $ | 3.42 | | $ | 2.09 | | | 2,289 | | 48 | | | | | | 143 | | | 2,146 | | a |
| 07/26/07 | | NQL | | Profit, Stephen | | Employee - new hire | | 50,000 | | $ | 3.42 | | $ | 2.09 | | | 76,285 | | 48 | | | | | | 4,768 | | | 71,517 | | a |
| 07/26/07 | | NQL | | Sashuang Jia | | Employee - new hire | | 2,500 | | $ | 3.42 | | $ | 2.09 | | | 3,814 | | 48 | | | | | | 238 | | | 3,576 | | a |
| 07/26/07 | | NQL | | Valente, Lisa | | Employee - new hire | | 6,000 | | $ | 3.42 | | $ | 2.09 | | | 9,154 | | 48 | | | | | | 572 | | | 8,582 | | a |
| 07/26/07 | | NQL | | Varghese, Mathew | | Employee - new hire | | 40,000 | | $ | 3.42 | | $ | 2.09 | | | 61,028 | | 48 | | | | | | 3,814 | | | 57,214 | | a |
| 07/26/07 | | NQL | | Wei Dong | | Employee - new hire | | 2,000 | | $ | 3.42 | | $ | 2.09 | | | 3,051 | | 48 | | | | | | 191 | | | 2,861 | | a |
| 07/26/07 | | NQL | | Yurong Gao | | Employee - new hire | | 2,500 | | $ | 3.42 | | $ | 2.09 | | | 3,814 | | 48 | | | | | | 238 | | | 3,576 | | a |
| 07/26/07 | | NQL | | Ze Wang | | Employee - new hire | | 2,000 | | $ | 3.42 | | $ | 2.09 | | | 3,051 | | 48 | | | | | | 191 | | | 2,861 | | a |
| 08/22/07 | | NQL | | Alexander, Dribinsky | | Employee | | 10,000 | | $ | 3.82 | | $ | 2.32 | | | 16,964 | | 48 | | | | | | 707 | | | 16,257 | | a |
| 08/22/07 | | NQL | | Cai, Bochun | | Employee | | 1,500 | | $ | 3.82 | | $ | 2.32 | | | 2,545 | | 48 | | | | | | 106 | | | 2,439 | | a |
| 08/22/07 | | NQL | | Cai, Yanhui | | Employee | | 30,000 | | $ | 3.82 | | $ | 2.32 | | | 50,892 | | 48 | | | | | | 2,120 | | | 48,771 | | a |
| 08/22/07 | | NQL | | Cai, Yongyao | | Employee | | 40,000 | | $ | 3.82 | | $ | 2.32 | | | 67,856 | | 48 | | | | | | 2,827 | | | 65,028 | | a |
| 08/22/07 | | NQL | | Cao, Song | | Employee | | 1,000 | | $ | 3.82 | | $ | 2.32 | | | 1,696 | | 48 | | | | | | 71 | | | 1,626 | | a |
| 08/22/07 | | NQL | | Chen, Fei | | Employee | | 1,000 | | $ | 3.82 | | $ | 2.32 | | | 1,696 | | 48 | | | | | | 71 | | | 1,626 | | a |
| 08/22/07 | | NQL | | Chen, Xiaolei | | Employee | | 500 | | $ | 3.82 | | $ | 2.32 | | | 848 | | 48 | | | | | | 35 | | | 813 | | a |
| 08/22/07 | | NQL | | Chen, Yanlong | | Employee | | 1,000 | | $ | 3.82 | | $ | 2.32 | | | 1,696 | | 48 | | | | | | 71 | | | 1,626 | | a |
| 08/22/07 | | NQL | | Chu, Hushun | | Employee | | 10,000 | | $ | 3.82 | | $ | 2.32 | | | 16,964 | | 48 | | | | | | 707 | | | 16,257 | | a |
| 08/22/07 | | NQL | | Fang, Zhengbin | | Employee | | 400 | | $ | 3.82 | | $ | 2.32 | | | 679 | | 48 | | | | | | 28 | | | 650 | | a |
| 08/22/07 | | NQL | | Gregory, Pucci | | Employee | | 10,000 | | $ | 3.82 | | $ | 2.32 | | | 16,964 | | 48 | | | | | | 707 | | | 16,257 | | a |
| 08/22/07 | | NQL | | Gu, Haoqi | | Employee | | 2,000 | | $ | 3.82 | | $ | 2.32 | | | 3,393 | | 48 | | | | | | 141 | | | 3,251 | | a |
| 08/22/07 | | NQL | | He, Fengya | | Employee | | 500 | | $ | 3.82 | | $ | 2.32 | | | 848 | | 48 | | | | | | 35 | | | 813 | | a |
| 08/22/07 | | NQL | | Hua, Yaping | | Employee | | 30,000 | | $ | 3.82 | | $ | 2.32 | | | 50,892 | | 48 | | | | | | 2,120 | | | 48,771 | | a |
| 08/22/07 | | ISO | | Huang, Feiming | | Employee | | 116,959 | | $ | 3.82 | | $ | 2.32 | | | 198,408 | | 48 | | | | | | 8,267 | | | 190,141 | | a |
| 08/22/07 | | NQL | | Huang, Feiming | | Employee | | 83,041 | | $ | 3.82 | | $ | 2.32 | | | 140,870 | | 48 | | | | | | 5,870 | | | 135,000 | | a |
| 08/22/07 | | NQL | | Jiang, leyue | | Employee | | 1,500 | | $ | 3.82 | | $ | 2.32 | | | 2,545 | | 48 | | | | | | 106 | | | 2,439 | | a |
| 08/22/07 | | NQL | | Jiang, Peiyu | | Employee | | 2,000 | | $ | 3.82 | | $ | 2.32 | | | 3,393 | | 48 | | | | | | 141 | | | 3,251 | | a |
| 08/22/07 | | NQL | | Jin, Lingli | | Employee | | 500 | | $ | 3.82 | | $ | 2.32 | | | 848 | | 48 | | | | | | 35 | | | 813 | | a |
| 08/22/07 | | NQL | | Jin, Yanghua | | Employee | | 2,000 | | $ | 3.82 | | $ | 2.32 | | | 3,393 | | 48 | | | | | | 141 | | | 3,251 | | a |
| 08/22/07 | | NQL | | Jin, Zugiang | | Employee | | 5,000 | | $ | 3.82 | | $ | 2.32 | | | 8,482 | | 48 | | | | | | 353 | | | 8,129 | | a |
| 08/22/07 | | NQL | | Katsumoto, Kenichi | | Employee | | 45,000 | | $ | 3.82 | | $ | 2.32 | | | 76,338 | | 34 | | | | | | 3,181 | | | 73,157 | | a |
| 08/22/07 | | NQL | | Lagogue, Matthieu | | Employee | | 5,000 | | $ | 3.82 | | $ | 2.32 | | | 8,482 | | 48 | | | | | | 353 | | | 8,129 | | a |
| 08/22/07 | | NQL | | Lei, Xiaofeng | | Employee | | 40,000 | | $ | 3.82 | | $ | 2.32 | | | 67,856 | | 48 | | | | | | 2,827 | | | 65,028 | | a |
| 08/22/07 | | NQL | | Li, Jiaqing | | Employee | | 3,000 | | $ | 3.82 | | $ | 2.32 | | | 5,089 | | 48 | | | | | | 212 | | | 4,877 | | a |
| 08/22/07 | | NQL | | Li, Qin | | Employee | | 300 | | $ | 3.82 | | $ | 2.32 | | | 509 | | 48 | | | | | | 21 | | | 488 | | a |
| 08/22/07 | | NQL | | Li, Zhengfeng | | Employee | | 200 | | $ | 3.82 | | $ | 2.32 | | | 339 | | 48 | | | | | | 14 | | | 325 | | a |
| 08/22/07 | | NQL | | Li, Zongya | | Employee | | 30,000 | | $ | 3.82 | | $ | 2.32 | | | 50,892 | | 48 | | | | | | 2,120 | | | 48,771 | | a |
| 08/22/07 | | NQL | | Liu, Haidong | | Employee | | 60,000 | | $ | 3.82 | | $ | 2.32 | | | 101,783 | | 48 | | | | | | 4,241 | | | 97,542 | | a |
| 08/22/07 | | NQL | | Liu, Jian | | Employee | | 500 | | $ | 3.82 | | $ | 2.32 | | | 848 | | 48 | | | | | | 35 | | | 813 | | a |
| 08/22/07 | | NQL | | Liu, Xin | | Employee | | 60,000 | | $ | 3.82 | | $ | 2.32 | | | 101,783 | | 48 | | | | | | 4,241 | | | 97,542 | | a |
| 08/22/07 | | NQL | | Lu, Feng | | Employee | | 1,000 | | $ | 3.82 | | $ | 2.32 | | | 1,696 | | 48 | | | | | | 71 | | | 1,626 | | a |
| 08/22/07 | | NQL | | Lu, Guorong | | Employee | | 500 | | $ | 3.82 | | $ | 2.32 | | | 848 | | 48 | | | | | | 35 | | | 813 | | a |
| 08/22/07 | | NQL | | McQuilkin, Kerri | | Employee | | 5,000 | | $ | 3.82 | | $ | 2.32 | | | 8,482 | | 48 | | | | | | 353 | | | 8,129 | | a |
| 08/22/07 | | NQL | | Meng, Mingyu | | Employee | | 10,000 | | $ | 3.82 | | $ | 2.32 | | | 16,964 | | 48 | | | | | | 707 | | | 16,257 | | a |
| 08/22/07 | | NQL | | Ni, Qiuying | | Employee | | 400 | | $ | 3.82 | | $ | 2.32 | | | 679 | | 48 | | | | | | 28 | | | 650 | | a |
| 08/22/07 | | ISO | | Niu, Patricia | | Employee | | 100,000 | | $ | 3.82 | | $ | 2.32 | | | 169,639 | | 48 | | | | | | 7,068 | | | 162,571 | | a |
| 08/22/07 | | NQL | | Ren, Caifeng | | Employee | | 500 | | $ | 3.82 | | $ | 2.32 | | | 848 | | 48 | | | | | | 35 | | | 813 | | a |
| 08/22/07 | | NQL | | Shang, Zhongmin | | Employee | | 15,000 | | $ | 3.82 | | $ | 2.32 | | | 25,446 | | 48 | | | | | | 1,060 | | | 24,386 | | a |
| 08/22/07 | | NQL | | Shen, Shouyuan | | Employee | | 500 | | $ | 3.82 | | $ | 2.32 | | | 848 | | 48 | | | | | | 35 | | | 813 | | a |
| 08/22/07 | | NQL | | Sima, Huiquan | | Employee | | 4,000 | | $ | 3.82 | | $ | 2.32 | | | 6,786 | | 48 | | | | | | 283 | | | 6,503 | | a |
| 08/22/07 | | NQL | | Wang, Hongchen | | Employee - new hire | | 30,000 | | $ | 3.82 | | $ | 2.32 | | | 50,892 | | 48 | | | | | | 2,120 | | | 48,771 | | a |
| 08/22/07 | | NQL | | Wang, Jinhui | | Employee | | 400 | | $ | 3.82 | | $ | 2.32 | | | 679 | | 48 | | | | | | 28 | | | 650 | | a |
| 08/22/07 | | NQL | | Wang, Tong | | Employee | | 3,000 | | $ | 3.82 | | $ | 2.32 | | | 5,089 | | 48 | | | | | | 212 | | | 4,877 | | a |
| 08/22/07 | | NQL | | Wang, Xiaofeng | | Employee | | 2,000 | | $ | 3.82 | | $ | 2.32 | | | 3,393 | | 48 | | | | | | 141 | | | 3,251 | | a |
| 08/22/07 | | NQL | | Wei, Jilie | | Employee | | 25,000 | | $ | 3.82 | | $ | 2.32 | | | 42,410 | | 48 | | | | | | 1,767 | | | 40,643 | | a |
| 08/22/07 | | NQL | | Wu, Mingchang | | Employee | | 600 | | $ | 3.82 | | $ | 2.32 | | | 1,018 | | 48 | | | | | | 42 | | | 975 | | a |
| 08/22/07 | | NQL | | Wu, Zhufang | | Employee | | 300 | | $ | 3.82 | | $ | 2.32 | | | 509 | | 48 | | | | | | 21 | | | 488 | | a |
| 08/22/07 | | NQL | | Xia, Hongjun | | Employee | | 300 | | $ | 3.82 | | $ | 2.32 | | | 509 | | 48 | | | | | | 21 | | | 488 | | a |
| 08/22/07 | | NQL | | Xia, Xiaoqing | | Employee | | 3,000 | | $ | 3.82 | | $ | 2.32 | | | 5,089 | | 48 | | | | | | 212 | | | 4,877 | | a |
| 08/22/07 | | NQL | | Xiao, Hanwu | | Employee | | 4,000 | | $ | 3.82 | | $ | 2.32 | | | 6,786 | | 48 | | | | | | 283 | | | 6,503 | | a |
| 08/22/07 | | NQL | | Xiao, Peng | | Employee | | 10,000 | | $ | 3.82 | | $ | 2.32 | | | 16,964 | | 48 | | | | | | 707 | | | 16,257 | | a |
| 08/22/07 | | NQL | | Xing, Najie | | Employee | | 300 | | $ | 3.82 | | $ | 2.32 | | | 509 | | 48 | | | | | | 21 | | | 488 | | a |
| 08/22/07 | | NQL | | Xu, Guanfeng | | Employee | | 300 | | $ | 3.82 | | $ | 2.32 | | | 509 | | 48 | | | | | | 21 | | | 488 | | a |
| 08/22/07 | | NQL | | Yang, Fan | | Employee | | 300 | | $ | 3.82 | | $ | 2.32 | | | 509 | | 48 | | | | | | 21 | | | 488 | | a |
| 08/22/07 | | NQL | | Yang, Hongyuan | | Employee | | 5,000 | | $ | 3.82 | | $ | 2.32 | | | 8,482 | | 48 | | | | | | 353 | | | 8,129 | | a |
| 08/22/07 | | NQL | | Yu, Weijun | | Employee | | 1,000 | | $ | 3.82 | | $ | 2.32 | | | 1,696 | | 48 | | | | | | 71 | | | 1,626 | | a |
| 08/22/07 | | NQL | | Zai, Lei | | Employee | | 200 | | $ | 3.82 | | $ | 2.32 | | | 339 | | 48 | | | | | | 14 | | | 325 | | a |
| 08/22/07 | | NQL | | Zeng, Jin | | Employee | | 3,000 | | $ | 3.82 | | $ | 2.32 | | | 5,089 | | 48 | | | | | | 212 | | | 4,877 | | a |
| 08/22/07 | | NQL | | Zhang, Fengchao | | Employee | | 4,000 | | $ | 3.82 | | $ | 2.32 | | | 6,786 | | 48 | | | | | | 283 | | | 6,503 | | a |
| 08/22/07 | | NQL | | Zhang, Wei | | Employee | | 40,000 | | $ | 3.82 | | $ | 2.32 | | | 67,856 | | 48 | | | | | | 2,827 | | | 65,028 | | a |
| 08/22/07 | | NQL | | Zhang, Yunyun | | Employee | | 200 | | $ | 3.82 | | $ | 2.32 | | | 339 | | 48 | | | | | | 14 | | | 325 | | a |
| 08/22/07 | | NQL | | Zhao, Bin | | Employee | | 1,500 | | $ | 3.82 | | $ | 2.32 | | | 2,545 | | 48 | | | | | | 106 | | | 2,439 | | a |
| 08/22/07 | | NQL | | Zhou, Haiyan | | Employee | | 200 | | $ | 3.82 | | $ | 2.32 | | | 339 | | 48 | | | | | | 14 | | | 325 | | a |
| 08/22/07 | | NQL | | Zhu, Weiming | | Employee | | 1,000 | | $ | 3.82 | | $ | 2.32 | | | 1,696 | | 48 | | | | | | 71 | | | 1,626 | | a |
| 08/22/07 | | NQL | | Zhu, Xian | | Employee | | 500 | | $ | 3.82 | | $ | 2.32 | | | 848 | | 48 | | | | | | 35 | | | 813 | | a |
| 08/29/07 | | NQL | | Carlson, Albert | | Employee - new hire | | 50,000 | | $ | 3.82 | | $ | 2.32 | | | 84,666 | | 48 | | | | | | 3,528 | | | 81,139 | | a |
Common stock issued | | | | | | | | | | | | | | | | | | | | | | | | | | |
| 01/03/07 | | NQL | | Liu, Xin | | Options exercised | | 15,000 | | $ | 0.15 | | | | | | | | | | | | | | | | | | | |
| 01/17/07 | | NQL | | Huang, Feiming | | Options exercised | | 420,000 | | $ | 0.15 | | | | | | | | | | | | | | | | | | | |
| 03/02/07 | | ISO | | Niu, Patricia | | Options exercised | | 20,000 | | $ | 0.15 | | | | | | | | | | | | | | | | | | | |
| 03/15/07 | | NQL | | Huang, Feiming | | Options exercised | | 40,000 | | $ | 0.15 | | | | | | | | | | | | | | | | | | | |
| 03/27/07 | | NQL | | Cai, Yongyao | | Options exercised | | 25,000 | | $ | 0.15 | | | | | | | | | | | | | | | | | | | |
| 04/02/07 | | NQL | | Zhao, Yang | | Options exercised | | 92,500 | | $ | 0.15 | | | | | | | | | | | | | | | | | | | |
| 04/23/07 | | NQL | | Katsumoto, Kenichi | | Options exercised | | 1,250 | | $ | 0.15 | | | | | | | | | | | | | | | | | | | |
| 08/26/07 | | NQL | | Lee, Robert | | Options exercised | | 70,000 | | $ | 0.15 | | | | | | | | | | | | | | | | | | | |
| 09/10/07 | | NQL | | Huang, Feiming | | Options exercised | | 200,000 | | $ | 0.50 | | | | | | | | | | | | | | | | | | | |
| | | | | | | | | | | | | | | | | | | | | | | | | | | | | | |
| Total Activity 9/1/06 to 9/30/07 | | 3,135,050 | | | | | | | | $ | 3,462,895 | | | | $ | 43,288 | | $ | 259,356 | | $ | 3,158,958 | | |
| | | | | | | | | | | | | | | | | | | | | | | | | | | | | | |
| | | | | | | | |
| | | | | | | | Activity for options issued prior to September 2006 | | | 178,475 | | | 146,854 | | | 52,014 | | |
| | | | | | | | | | | | | | | | | | | | | | | | | | | | | | |
| | | | | | | | Total compensation recorded in financial statements | | $ | 221,762 | | $ | 406,209 | | $ | 3,210,972 | | |
| | | | | | | | | | | | | | | | | | | | | | | | | | | | | | |
NOTE:
| a. | The Company granted 778,000 common stock options with an exercise price of $2.44 per share in July 2007 and 915,900 common stock options with an exercise price of $3.25 per share in August 2007. At the time of the grants the exercise prices were determined by the Board with input from management based on the estimated fair value of its common stock. Subsequently, the Company prepared retrospective valuation reports to support the fair value of the options granted and determined the fair value to be $3.42 for the options granted in July and $3.82 for the options granted in August. As a result of the valuation reports, the grants were modified to increase their respective exercise prices to the reported fair values. |


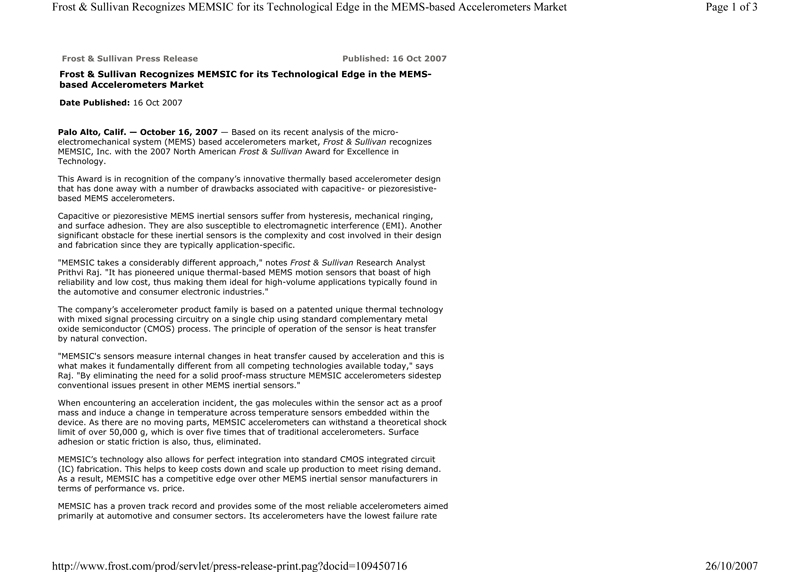




 ors Market:


