| SKADDEN, ARPS, SLATE, MEAGHER & FLOM | ||||
PARTNERS EDWARD H.P. LAM ¨* NICHOLAS A. NORRIS¨ JONATHAN B. STONE * ALEC P. TRACY * DOMINIC W.L. TSUN¨* ¨ (ALSO ADMITTEDIN ENGLAND & WALES) * (ALSO ADMITTEDIN NEW YORK)
REGISTERED FOREIGN LAWYERS GREGORY G.H. MIAO (NEW YORK) ALAN G. SCHIFFMAN (NEW YORK) |
42/F, EDINBURGH TOWER, THE LANDMARK 15 QUEEN’S ROAD CENTRAL, HONG KONG ____________
TEL: (852) 3740-4700 FAX: (852) 3740-4727 www.skadden.com | AFFILIATE OFFICES ____
BOSTON CHICAGO HOUSTON LOS ANGELES NEW YORK PALO ALTO SAN FRANCISCO WASHINGTON, D.C. ____
BEIJING BRUSSELS FRANKFURT LONDON MOSCOW MUNICH PARIS SINGAPORE SYDNEY TOKYO TORONTO VIENNA |

November 21, 2007
Mr. Tom Jones
Division of Corporation Finance
Securities and Exchange Commission
100 F Street, N.E., Mail Stop 6010
Washington D.C. 20549
U.S.A.
| RE: | MEMSIC, Inc. |
Amendment No. 2
to Registration Statement on Form S-1
Filed on November 5, 2007
File No. 333-146377
Dear Mr. Jones:
On behalf of our client, MEMSIC, Inc. (“Memsic” or “the Company”), set forth below are the Company’s responses to your comment letter dated November 19, 2007 (the “Comment Letter”) with respect to the above-referenced Amendment No. 1 to Registration Statement on Form S-1 ( “Amendment No. 1”) filed with the Securities and Exchange Commission (the “Commission”) on November 5, 2007. We have also arranged to have four courtesy copies of Amendment No. 2 to the Registration Statement (“Amendment No. 2”), without exhibits, marked to show changes made to Amendment No. 1 filed on November 5, 2007 to be hand delivered to your office at the above address.
We would like to bring to your attention that in addition to the revisions made in response to the Staff’s comments, Amendment No. 2 also reflects the Company’s one-to-two reverse stock split of the shares of its common stock effected on November 20, 2007.
Mr. Tom Jones
Securities and Exchange Commission
November 21, 2007
Page 2
For your convenience, we have reproduced the comments from the Commission’s staff (the “Staff”) in the order provided followed by Memsic’s corresponding response. All references in Memsic’s responses to pages and captioned sections are to Amendment No. 2 as filed today. Capitalized terms used in this letter and not otherwise defined herein have the meaning ascribed to them in the prospectus included in Amendment No. 2.
Graphics
| 1. | Please refer to prior comment 2. Please revise the graphics to clarify which products and services you sell. Also, please clarify whether any of your products and services depicted in the graphics has not generated substantial revenues. |
The Company has revised the graphics as Exhibit A to replace the previous pictures in the middle with narrative.
The narrative in the middle of the graphics is an extract from page 1 of the prospectus.
The two pictures on the top of the graphics are existing products of the Company, which are being used by its customers in a wide range of applications, for example, mobile phones, automotive safety systems and video projectors. The picture in the middle is the integrated circuit diagram of the Company’s product.
The Company supplementally advises the Staff that in terms of net sales by application, mobile phone accounted for 55.2% of the Company’s net sales for the nine months ended September 30, 2007. Automotive applications and consumer applications (including video projectors) accounted for 19.7% and 17.6% of the Company’s net sales, respectively, during the same period.
Industry Overview, page 2
| 2. | Please refer to the second sentence of prior comment 7. Please mark the materials in exhibit H so they are keyed to the disclosure. |
In response to the Staff’s comment, the Company has included as Exhibit B marked pages of the prospectus to which third-party data are referred. The Company also reattaches, as Exhibit C, the relevant pages of Exhibit H to Amendment No. 1 for the Staff’s convenience.
Mr. Tom Jones
Securities and Exchange Commission
November 21, 2007
Page 3
We depend and expect to continue to depend on a limited number, page 12
| 3. | Please refer to prior comment 9. Please identify the customers that represent over 10% of your revenues. See Item 101(c)(vii) of Regulation S-K. |
In response to the Staff’s comment, the Company has revised the disclosure on pages 40 and 74 to identify its customers that represent 10% or more of its revenues.
Stock Based Compensation, page 47
| 4. | We refer to your response to prior comments 15 and 38 to our letter dated October 25, 2007. Please note that our evaluation of stock-based compensation will not be complete until you provide an amendment with the pricing information. In your next amendment, please also include the requested disclosures from prior comment 15 in MD&A. Please also include a discussion of the factors occurring between the respective valuation dates that affected the assumptions used to determine the fair value of your common stock, similar to what you provided in the response. The next amendment should also disclose the timing of discussions with underwriters and how those discussions impacted your determination of fair value of your common stock. |
In response to the Staff’s comment, the Company has revised the disclosure on page 49 to include the requested information.
Nine Months Ended September 30, 2007 Compared to Nine Months Ended September 30, 2006, page 53
| 5. | Please expand the first paragraph of this section to quantify the portion of the increase related to the amendment. |
In response to the Staff’s comment, the Company has revised the disclosure on page 53.
| 6. | Please refer to prior comment 17. Please tell us how you determined the amount of revenues for the two customers disclosed in the second paragraph of this section and the fifth full paragraph on page 54 based on the first table on page F-12. |
The Company has included on pages 54 and 55 the disclosure of net sales to each significant customer as well as their percentages of net sales for the periods. Those percentages agree to percentage for those customers included in the significant customer revenue percentage table on page F-12. The Company further advises the Staff that the reason for the discrepancy in Amendment No. 1 is that the Company had only included certain product application revenues for those customers in the MD&A discussion and therefore, the amounts did not reconcile to the table on page F-12. The Company has also made clarifying changes in the disclosure and revised the relevant amounts on pages 54 and 55 of the disclosure.
Mr. Tom Jones
Securities and Exchange Commission
November 21, 2007
Page 4
Year Ended December 31 2006 Compared to Year Ended December 31 2005, page 54
| 7. | Please expand the last sentence of the second paragraph of this section to quantify the loss in revenues. |
In response to the Staff’s comment, the Company has revised the disclosure on page 55 to quantify the loss in revenues.
Sales and Customers, page 71
| 8. | Please refer to prior comment 19. Please tell us where you revised the disclosure to discuss the material terms of the agreements with major customers. |
With respect to agreements with the Company’s largest OEM and ODM customers, the disclosure appears on the second full paragraph on page 74 of the prospectus. For the Staff’s supplemental reference, a typical quotation to the Company’s major direct OEM customer, Autoliv Inc., is attached hereto as Exhibit D.
With respect to agreements with the Company’s major distributor customers, the material terms of such agreements are summarized on the bottom of page 73 and top of page 74.
Elements of Compensation, page 90
| 9. | We note your response to our prior comment 23. Please disclose the specific parameters within each classification used to benchmark compensation. For example, specify the size, region and business segments of the peer group companies. |
In response to the Staff’s comment, the Company has provided additional disclosure on page 92.
| 10. | We note your response to our prior comment 24. You indicate in the third paragraph of this section that the weight of each element of compensation may vary based on individual contribution to our overall performance. Discuss the factors considered in determining such individual contribution. |
Mr. Tom Jones
Securities and Exchange Commission
November 21, 2007
Page 5
In response to the Staff’s comment, the Company has revised the disclosure on page 92.
Discretionary Annual Bonus, page 91
| 11. | Please provide us with a table that reconciles the calculations of the bonuses in the third and fourth paragraphs of this section with the bonus in the table on page 94. |
In response to the Staff’s comment, the Company provides the table below to reconcile the amount of bonuses awarded in 2006 for our executive officers with their individual bonus targets that were achieved.
Name | 2006 Bonus Target | Bonus Amount ($) | ||
Yang Zhao | Net sales of $13,118,000 | 30,000 | ||
| Key account (5) | 50,000 | |||
| New product (3) | 60,000 | |||
| Management team | 25,000 | |||
Total | 165,000 | |||
Feiming Huang | Net sales of $13,118,000 | 5,479 | ||
| Net income of $3,187,000 | 5,479 | |||
| Customer return rate | 10,957 | |||
| Total | 27,393 | |||
Patricia Niu | Net income of $3,187,000 | 16,016 | ||
Total | 16,016 | |||
| 12. | Please revise the last sentence of the third paragraph of this section to clarify the meaning of the phrase “in consideration of his performance in 2005.” Also specify in this paragraph to what year the increase in revenue refers. For example, are the various increase in revenue targets described in this paragraph referring to an increase in fiscal year 2005 revenue? In addition, describe what a “key account” is. |
In response to the Staff’s comment, the Company has revised the disclosure on page 93. The Company advises the Staff that the phrase “in consideration of his performance in 2005” has been replaced with an explanation of the basis for determining Dr. Zhao’s level of performance.
Mr. Tom Jones
Securities and Exchange Commission
November 21, 2007
Page 6
| 13. | We reissue our prior comment 25. Please expand the fourth and sixth paragraphs of this section to quantify the net income targets. Also, expand the first full paragraph on page 93 to quantify the thresholds. |
In response to the Staff’s comment, the Company has provided additional disclosure on pages 93, 94 and 95.
| 14. | In the sixth paragraph of this section, indicate what factors the compensation committee will consider in awarding the chief financial officer the discretionary bonus and explain how a “key partnership development” is determined. |
In response to the Staff’s comment, the Company has revised the disclosure on page 94.
2006 Director Compensation page 101
| 15. | Please revise the table in this section to provide the information required by Item 402(k)(2)(iv) of Regulation S-K. Please also disclose by footnote the aggregate number of Mr. Zavracky’s option awards outstanding at fiscal year end. See the Instruction to Item 402(k)(2)(iii) and (iv). In addition, similar to the information you have provided in footnote 1 to your summary compensation table on page 94, please include a footnote describing all assumptions made in the valuation of the option awards granted to your directors by reference to a discussion of those assumptions in your financial statements, footnotes to the financial statements or discussion in the Management’s Discussion and Analysis. See the instruction to Item 402(k), indicating that the instruction to 402(c)(2)(v) and (vi) applies equally to Item 402(k). |
In response to the Staff’s comment, the Company has revised the disclosure on page 103.
Certain Relationships and Related Party Transactions, page 102
| 16. | We note your response to our prior comment 31. A reader should not have to refer to Regulation S-K in order to fully understand the definition of a related party. Please revise accordingly. |
In response to the Staff’s comment, the Company has revised the disclosure on page 104 to include the definition of “related persons” under Item 404(a) of Regulation S-K.
Mr. Tom Jones
Securities and Exchange Commission
November 21, 2007
Page 7
Exhibit 23.3
| 17. | We reference the consent of Orchard Partners, Inc. filed in response to prior comment 14 in our letter dated October 25, 2007. The valuation expert may not attempt to limit its liability under Section 7 and 11 of the Securities Act by stating that the ultimate responsibility for the valuation of the securities rests with the registrant. Please revise to remove the last sentence from the consent in the next amendment. |
In response to the Staff’s comment, Orchard Partners, Inc. has revised its consent as filed under Exhibit 23.3.
*********
We appreciate the Staff’s agreement to review this letter and the Company’s Registration Statement. Please feel free to contact the undersigned in Hong Kong at the office: (852) 3740-4780, at home: (852) 2803-1823, or mobile phone: (852) 9460-8675 if you wish to discuss the Company’s revised submission.
| Very truly yours, |
| /S/ GREGORY G.H. MIAO |
| Gregory G.H. Miao |
| cc: | Dr. Yang Zhao, MEMSIC, Inc. |
David Lau, Citigroup Global Markets
John D. Young, Jr., Sullivan & Cromwell LLP
Edward Nelson, Ernst & Young
Exhibit A

MEMSIC
Exhibit B
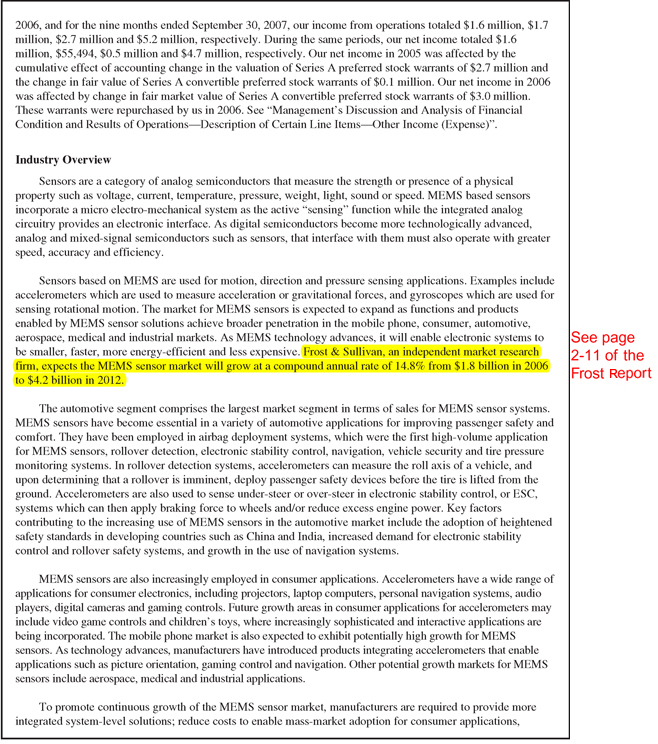
2006, and for the nine months ended September 30, 2007, our income from operations totaled $1.6 million, $1.7 million, $2.7 million and $5.2 million, respectively. During the same periods, our net income totaled $1.6 million, $55,494, $0.5 million and $4.7 million, respectively. Our net income in 2005 was affected by the cumulative effect of accounting change in the valuation of Series A preferred stock warrants of $2.7 million and the change in fair value of Series A convertible preferred stock warrants of $0.1 million. Our net income in 2006 was affected by change in fair market value of Series A convertible preferred stock warrants of $3.0 million. These warrants were repurchased by us in 2006. See “Management’s Discussion and Analysis of Financial Condition and Results of Operations—Description of Certain Line Items—Other Income (Expense)”.
Industry Overview
Sensors are a category of analog semiconductors that measure the strength or presence of a physical property such as voltage, current, temperature, pressure, weight, light, sound or speed. MEMS based sensors incorporate a micro electro-mechanical system as the active “sensing” function while the integrated analog circuitry provides an electronic interface. As digital semiconductors become more technologically advanced, analog and mixed-signal semiconductors such as sensors, that interface with them must also operate with greater speed, accuracy and efficiency.
Sensors based on MEMS are used for motion, direction and pressure sensing applications. Examples include accelerometers which are used to measure acceleration or gravitational forces, and gyroscopes which are used for sensing rotational motion. The market for MEMS sensors is expected to expand as functions and products enabled by MEMS sensor solutions achieve broader penetration in the mobile phone, consumer, automotive, aerospace, medical and industrial markets. As MEMS technology advances, it will enable electronic systems to be smaller, faster, more energy-efficient and less expensive. Frost & Sullivan, an independent market research firm, expects the MEMS sensor market will grow at a compound annual rate of 14.8% from $1.8 billion in 2006 to $4.2 billion in 2012.
The automotive segment comprises the largest market segment in terms of sales for MEMS sensor systems. MEMS sensors have become essential in a variety of automotive applications for improving passenger safety and comfort. They have been employed in airbag deployment systems, which were the first high-volume application for MEMS sensors, rollover detection, electronic stability control, navigation, vehicle security and tire pressure monitoring systems. In rollover detection systems, accelerometers can measure the roll axis of a vehicle, and upon determining that a rollover is imminent, deploy passenger safety devices before the tire is lifted from the ground. Accelerometers are also used to sense under-steer or over-steer in electronic stability control, or ESC, systems which can then apply braking force to wheels and/or reduce excess engine power. Key factors contributing to the increasing use of MEMS sensors in the automotive market include the adoption of heightened safety standards in developing countries such as China and India, increased demand for electronic stability control and rollover safety systems, and growth in the use of navigation systems.
MEMS sensors are also increasingly employed in consumer applications. Accelerometers have a wide range of applications for consumer electronics, including projectors, laptop computers, personal navigation systems, audio players, digital cameras and gaming controls. Future growth areas in consumer applications for accelerometers may include video game controls and children’s toys, where increasingly sophisticated and interactive applications are being incorporated. The mobile phone market is also expected to exhibit potentially high growth for MEMS sensors. As technology advances, manufacturers have introduced products integrating accelerometers that enable applications such as picture orientation, gaming control and navigation. Other potential growth markets for MEMS sensors include aerospace, medical and industrial applications.
To promote continuous growth of the MEMS sensor market, manufacturers are required to provide more integrated system-level solutions; reduce costs to enable mass-market adoption for consumer applications,

Industry Background
Analog and Mixed-signal Semiconductor Market
Semiconductor components are the building blocks of electronic systems. Analog semiconductors monitor, regulate or transform physical properties, including voltage, current, temperature, pressure, weight, light, sound or speed into electrical signals that have a continuous range of values. Electronic systems rely on analog semiconductors to provide the interface between digital semiconductors and the physical world. Mixed-signal semiconductors combine elements of both analog and digital semiconductors, but are generally classified as analog semiconductors because of their analog content. Analog and mixed-signal semiconductors are often used in applications and markets where users have unique requirements regarding performance specifications such as size, speed, accuracy and efficiency. As a result, the analog and mixed-signal semiconductor market is highly fragmented, providing smaller companies an opportunity to compete successfully against larger companies in certain market segments. According to “Semiconductor Forecast Worldwide: Forecast Database” published by Gartner Inc., an information technology research and advisory firm, on August 29, 2007, the market for analog semiconductors will grow from $16.4 billion in 2006 to $22.3 billion in 2011.
As digital semiconductors, such as microprocessors, graphics processors, digital signal processors and memory chips become more technologically advanced, the analog and mixed-signal semiconductors that interface with them must also operate with greater speed, accuracy and efficiency. These factors, coupled with growth in the consumer electronic market, are fostering growth in the analog and mixed-signal semiconductor market.
Worldwide MEMS Sensor Market
Sensors are a type of analog semiconductor that measures the strength or presence of a physical property such as voltage, current, temperature, pressure, weight, light, sound or speed. MEMS are microscopic structures integrated onto silicon that combine mechanical, optical or fluidic elements with electronics. These devices, when built into sensors, provide the direct measurement between the physical world variable and the electronic circuitry. In a typical sensor incorporating MEMS technology, the MEMS structure provides the active “sensing” function while the integrated analog circuitry provides the electrical interface. MEMS enable electronic systems of all kinds to be smaller, faster, more energy-efficient and less expensive.
MEMS sensors used for motion, direction and pressure sensing applications include accelerometers, which measure acceleration or gravitational forces, gyroscopes, used for sensing rotational motion, and pressure sensors, employed in pressure monitoring systems. MEMS sensors have been marketed for several decades, achieving high market penetration in the automotive market with use in airbag deployment systems. Through significant advances in MEMS design and manufacturing, MEMS sensors may increasingly be priced at an affordable price to enable mass-market adoption. Frost & Sullivan expects the MEMS sensor market will grow as functions and products enabled by MEMS sensor solutions achieve broader penetration in the mobile phone, consumer, automotive, aerospace, medical and industrial markets.
Frost & Sullivan, an independent market research firm, estimates that the MEMS sensor market will grow at a compound annual rate of 14.8% from $1.8 billion in 2006 to $4.2 billion in 2012. The following tables set forth the actual and estimated total MEMS sensor revenue by market segment and product type for the period indicated, according to Frost & Sullivan.
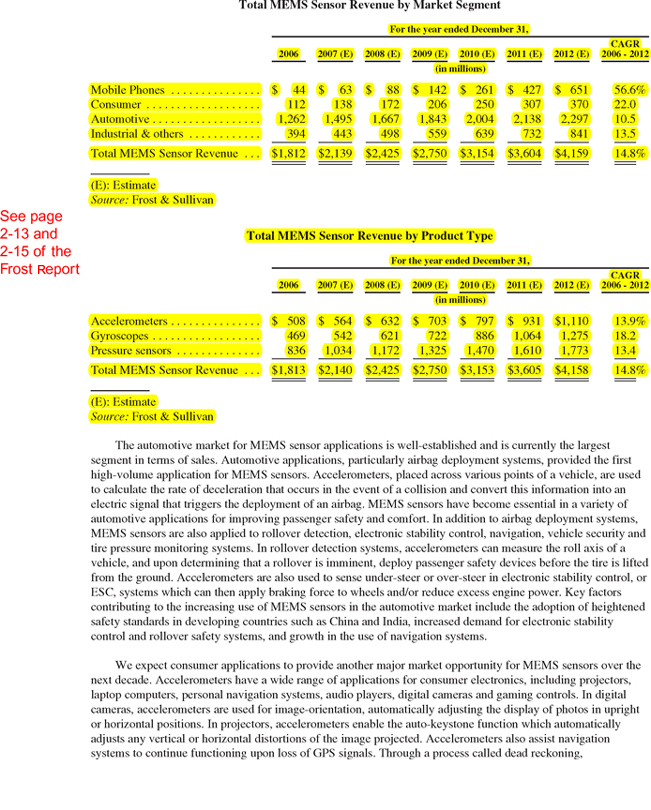
Total MEMS Sensor Revenue by Market Segment
For the year ended December 31,
2006 2007 (E) 2008 (E) 2009 (E) 2010 (E) 2011 (E) 2012 (E) CAGR 2006 - 2012
(in millions) Mobile Phones $44 $63 $88 $142 $261 $427 $651 56.6% Consumer 112 138 172 206 250 307 370 22.0 Automotive 1,262 1,495 1,667 1,843 2,004 2,138 2,297 10.5 Industrial & others 394 443 498 559 639 732 841 13.5 Total MEMS Sensor Revenue $1,812 $2,139 $2,425 $2,750 $3,154 $3,604 $4,159 14.8% (E): Estimate Source: Frost & Sullivan
Total MEMS Sensor Revenue by Product Type
For the year ended December 31, 2006 2007 (E) 2008 (E) 2009 (E) 2010 (E) 2011 (E) 2012 (E) CAGR 2006 - 2012
(in millions)
Accelerometers $508 $564 $632 $703 $797 $931 $1,110 13.9%
Gyroscopes 469 542 621 722 886 1,064 1,275 18.2
Pressure sensors 836 1,034 1,172 1,325 1,470 1,610 1,773 13.4
Total MEMS Sensor Revenue $1,813 $2,140 $2,425 $2,750 $3,153 $3,605 $4,158 14.8%
(E): Estimate
Source: Frost & Sullivan
The automotive market for MEMS sensor applications is well-established and is currently the largest segment in terms of sales. Automotive applications, particularly airbag deployment systems, provided the first high-volume application for MEMS sensors. Accelerometers, placed across various points of a vehicle, are used to calculate the rate of deceleration that occurs in the event of a collision and convert this information into an electric signal that triggers the deployment of an airbag. MEMS sensors have become essential in a variety of automotive applications for improving passenger safety and comfort. In addition to airbag deployment systems, MEMS sensors are also applied to rollover detection, electronic stability control, navigation, vehicle security and tire pressure monitoring systems. In rollover detection systems, accelerometers can measure the roll axis of a vehicle, and upon determining that a rollover is imminent, deploy passenger safety devices before the tire is lifted from the ground. Accelerometers are also used to sense under-steer or over-steer in electronic stability control, or ESC, systems which can then apply braking force to wheels and/or reduce excess engine power. Key factors contributing to the increasing use of MEMS sensors in the automotive market include the adoption of heightened safety standards in developing countries such as China and India, increased demand for electronic stability control and rollover safety systems, and growth in the use of navigation systems.
We expect consumer applications to provide another major market opportunity for MEMS sensors over the next decade. Accelerometers have a wide range of applications for consumer electronics, including projectors, laptop computers, personal navigation systems, audio players, digital cameras and gaming controls. In digital cameras, accelerometers are used for image-orientation, automatically adjusting the display of photos in upright or horizontal positions. In projectors, accelerometers enable the auto-keystone function which automatically adjusts any vertical or horizontal distortions of the image projected. Accelerometers also assist navigation systems to continue functioning upon loss of GPS signals. Through a process called dead reckoning,
Exhibit C
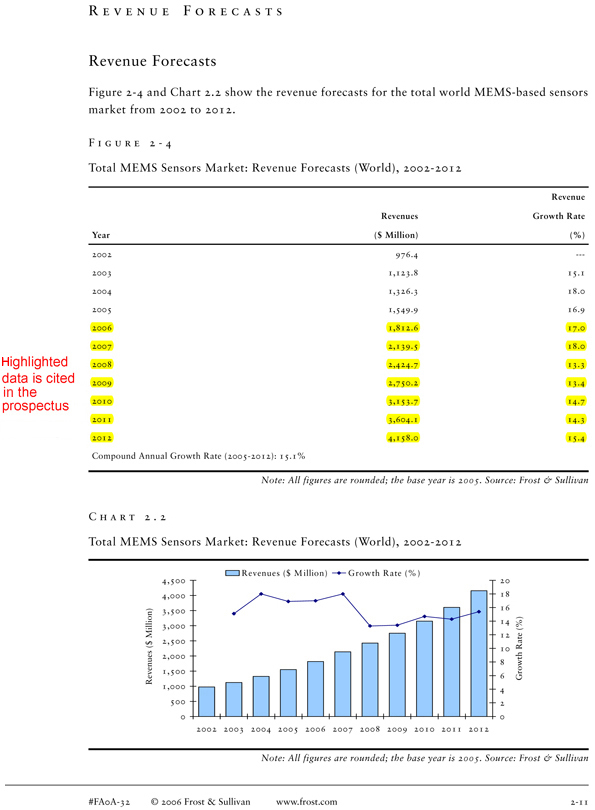
R E V E N U E F O R E C A S T S
Revenue Forecasts
Figure 2-4 and Chart 2.2 show the revenue forecasts for the total world MEMS-based sensors market from 2002 to 2012.
F I G U R E 2—4
Total MEMS Sensors Market: Revenue Forecasts (World), 2002-2012
Revenue Revenues Growth Rate Year($ Million)(%)
2002 976.4 -2003 1,123.8 15.1 2004 1,326.3 18.0 2005 1,549.9 16.9 2006 1,812.6 17.0 2007 2,139.5 18.0 2008 2,424.7 13.3 2009 2,750.2 13.4 2010 3,153.7 14.7 2011 3,604.1 14.3 2012 4,158.0 15.4 Compound Annual Growth Rate (2005-2012): 15.1%
Note: All figures are rounded; the base year is 2005. Source: Frost & Sullivan
C H A R T 2 . 2
Total MEMS Sensors Market: Revenue Forecasts (World), 2002-2012
Revenues ($ M illion) Growth Rate (% )
4,500 20 4,000 18 3,500 16 Million) 14 3,000 12 2,500 $
( Rate (%) 10 Revenues 2,000 Growth 8 1,500 6 1,000 4 500 2
0 0 2002 2003 2004 2005 2006 2007 2008 2009 2010 2011 2012
Note: All figures are rounded; the base year is 2005. Source: Frost & Sullivan
#FA0A-32 © 2006 Frost & Sullivan www.frost.com 2-11
highlighted data is cited on page 2 and 63 of the prospectus.
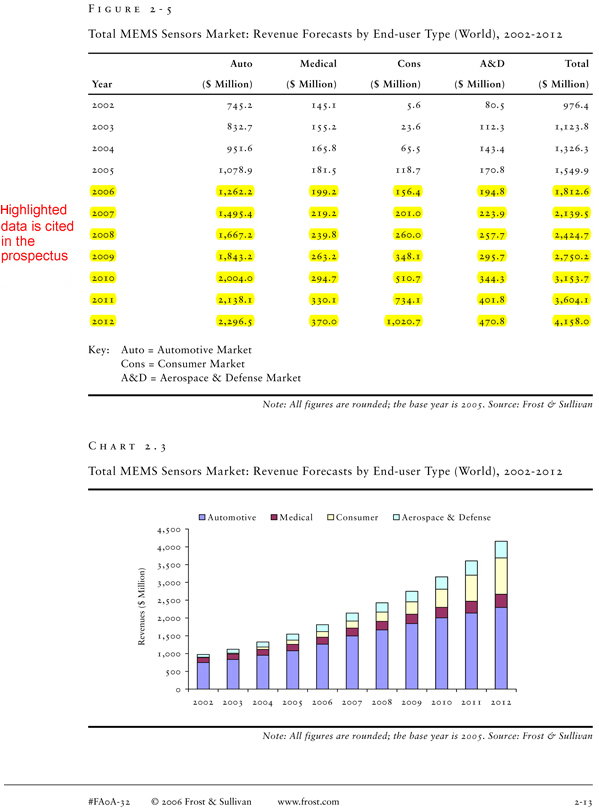
F I G U R E 2—5
Total MEMS Sensors Market: Revenue Forecasts by End-user Type (World), 2002-2012
Auto Medical Cons A&D Total
Year($ Million)($ Million)($ Million)($ Million)($ Million)
2002 745.2 145.1 5.6 80.5 976.4 2003 832.7 155.2 23.6 112.3 1,123.8 2004 951.6 165.8 65.5 143.4 1,326.3 2005 1,078.9 181.5 118.7 170.8 1,549.9 2006 1,262.2 199.2 156.4 194.8 1,812.6 2007 1,495.4 219.2 201.0 223.9 2,139.5 2008 1,667.2 239.8 260.0 257.7 2,424.7 2009 1,843.2 263.2 348.1 295.7 2,750.2 2010 2,004.0 294.7 510.7 344.3 3,153.7 2011 2,138.1 330.1 734.1 401.8 3,604.1 2012 2,296.5 370.0 1,020.7 470.8 4,158.0
Key: Auto = Automotive Market Cons = Consumer Market
A&D = Aerospace & Defense Market
Note: All figures are rounded; the base year is 2005. Source: Frost & Sullivan
C H A R T 2 . 3
Total MEMS Sensors Market: Revenue Forecasts by End-user Type (World), 2002-2012
Automotive M edical Consumer Aerospace & Defense 4,500
4,000
3,500 Million) 3,000
2,500 $ ( Revenues 2,000 1,500
1,000
500
0
2002 2003 2004 2005 2006 2007 2008 2009 2010 2011 2012
Note: All figures are rounded; the base year is 2005. Source: Frost & Sullivan
#FA0A-32 © 2006 Frost & Sullivan www.frost.com 2-13
highlighted data is cited on page 64 of the prospectus.
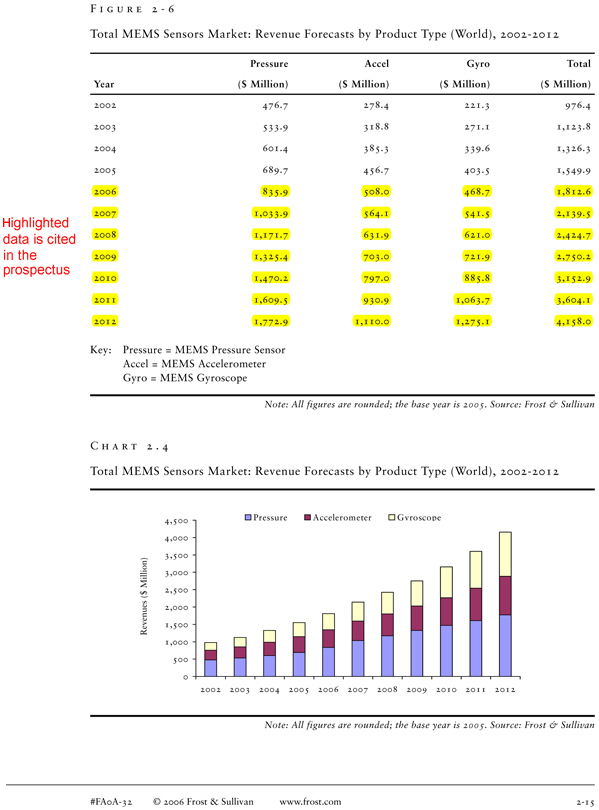
F I G U R E 2—6
Total MEMS Sensors Market: Revenue Forecasts by Product Type (World), 2002-2012
Pressure Accel Gyro Total
Year($ Million)($ Million)($ Million)($ Million)
2002 476.7 278.4 221.3 976.4 2003 533.9 318.8 271.1 1,123.8 2004 601.4 385.3 339.6 1,326.3 2005 689.7 456.7 403.5 1,549.9 2006 835.9 508.0 468.7 1,812.6 2007 1,033.9 564.1 541.5 2,139.5 2008 1,171.7 631.9 621.0 2,424.7 2009 1,325.4 703.0 721.9 2,750.2 2010 1,470.2 797.0 885.8 3,152.9 2011 1,609.5 930.9 1,063.7 3,604.1 2012 1,772.9 1,110.0 1,275.1 4,158.0
Key: Pressure = MEMS Pressure Sensor Accel = MEMS Accelerometer Gyro = MEMS Gyroscope
Note: All figures are rounded; the base year is 2005. Source: Frost & Sullivan
C H A R T 2 . 4
Total MEMS Sensors Market: Revenue Forecasts by Product Type (World), 2002-2012
4,500 Pressure Accelerometer Gyroscope 4,000
3,500 Million) 3,000
2,500 $ ( Revenues 2,000 1,500
1,000
500
0
2002 2003 2004 2005 2006 2007 2008 2009 2010 2011 2012
Note: All figures are rounded; the base year is 2005. Source: Frost & Sullivan
#FA0A-32 © 2006 Frost & Sullivan www.frost.com 2-15
highlighted data is cited on page 64 of the prospectus.
Exhibit D

Quotation #R013-111504-JW
| Company: | Autoliv attn Patrick Bernard | From: Kerri McQuilkin | ||||
| Address: | France | Date: August 15, 2007 | ||||
| Cc: | J. Wise@MEMSIC, J.L. Rivals @ Eurocomposant | |||||
On behalf of MEMSIC, Inc., I am pleased to quote you the following:
Qty | Part # | Description | Unit Price | Std. Lead Time | Notes | ||||||
| 55K | MXR2312VL | Dual axis, +/-2g, analog ratiometric, low cost accelerometer | $ | 2.85 | 6 weeks ARO | **Net 30; FOB Wuxi | |||||
Please reference quotation # on any purchase orders
Terms:
Accelerometers are NC/NR
All pricing quoted is in US dollars.
| ** | Shipping charges, duties and taxes are the responsibility of the customer on all shipments. |
Quote is valid for 30 days.
800 Turnpike Street, Suite 202 ¨ N. Andover, MA 01845 ¨ www.memsic.com
¨ Phone 978.738.0900 ¨ Fax 978.738.0196