Exhibit 99.2
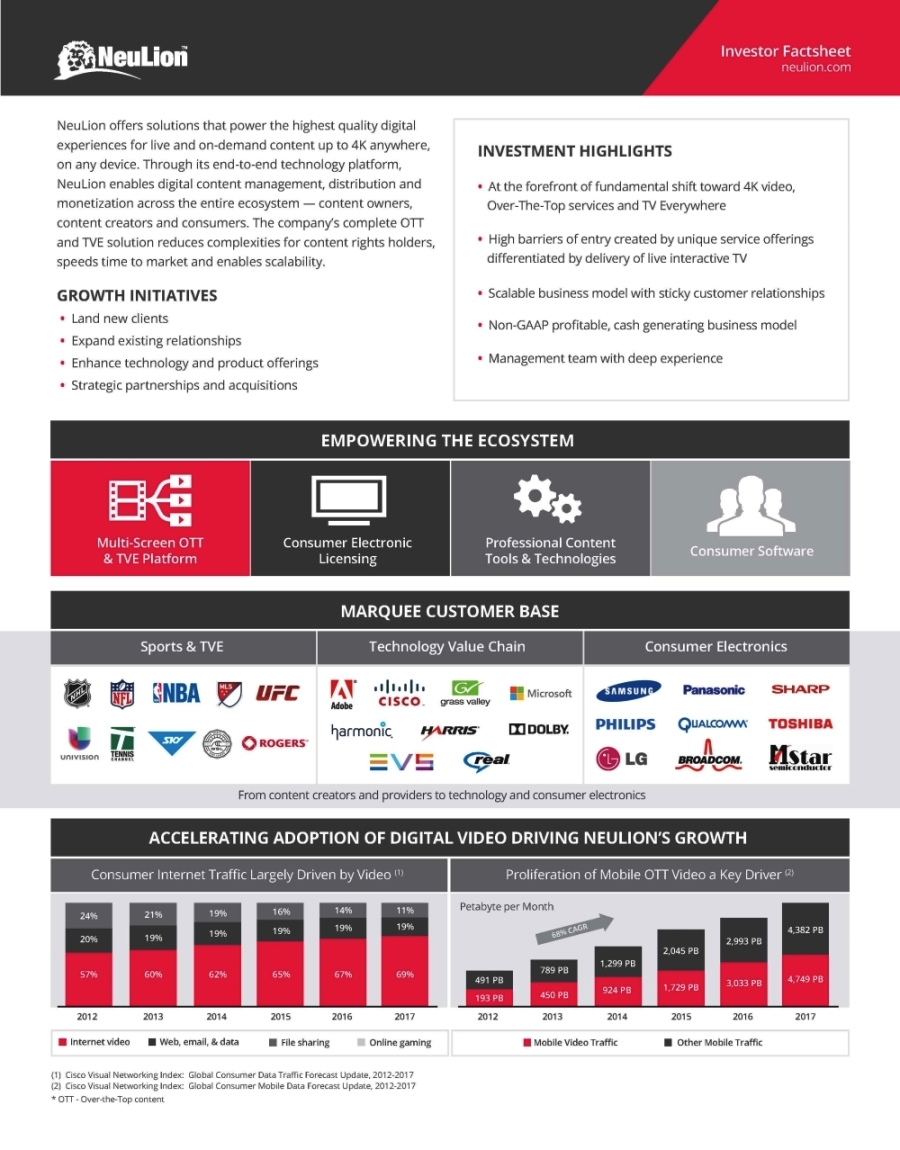
Investor Factsheetneulion.com NeuLion offers solutions that power the highest quality digital experiences for live and on-demand content up to 4K anywhere, on any device. Through its end-to-end technology platform, NeuLion enables digital content management, distribution and monetization across the entire ecosystem — content owners, content creators and consumers. The company’s complete OTT and TVE solution reduces complexities for content rights holders, speeds time to market and enables scalability. GROWTH INITIATIVES • Land new clients • Expand existing relationships • Enhance technology and product offerings • Strategic partnerships and acquisitions INVESTMENT HIGHLIGHTS• At the forefront of fundamental shift toward 4K video, Over-The-Top services and TV Everywhere• High barriers of entry created by unique service offerings differentiated by delivery of live interactive TV• Scalable business model with sticky customer relationships• Non-GAAP profitable, cash generating business model• Management team with deep experience EMPOWERING THE ECOSYSTEM Multi-Screen OTT & TVE Platform Consumer Electronic Licensing Professional Content Tools & Technologies Consumer Software MARQUEE CUSTOMER BASE Technology Value Chain Consumer Electronics Sports & TVE From content creators and providers to technology and consumer electronics ACCELERATING ADOPTION OF DIGITAL VIDEO DRIVING NEULION’S GROWTH Consumer Internet Traffic Largely Driven by Video (1) Proliferation of Mobile OTT Video a Key Driver (2) Petabyte per Month 14% 11% 16% 19% 21% 24% 68% CAGR 19% 19% 4,382 PB 19% 19% 19% 20% 2,993 PB 2,045 PB 1,299 PB 789 PB 67% 69% 65% 62% 60% 57% 4,749 PB 491 PB 3,033 PB 1,729 PB 924 PB 450 PB 193 PB 2017 2016 2015 2014 2013 2012 2012 2013 2017 2016 2015 2014 Internet video Web, email, & data Online gaming Mobile Video Traffic File sharing Other Mobile Traffic (1) Cisco Visual Networking Index: Global Consumer Data Traffic Forecast Update, 2012-2017 (2) Cisco Visual Networking Index: Global Consumer Mobile Data Forecast Update, 2012-2017 * OTT - Over-the-Top content
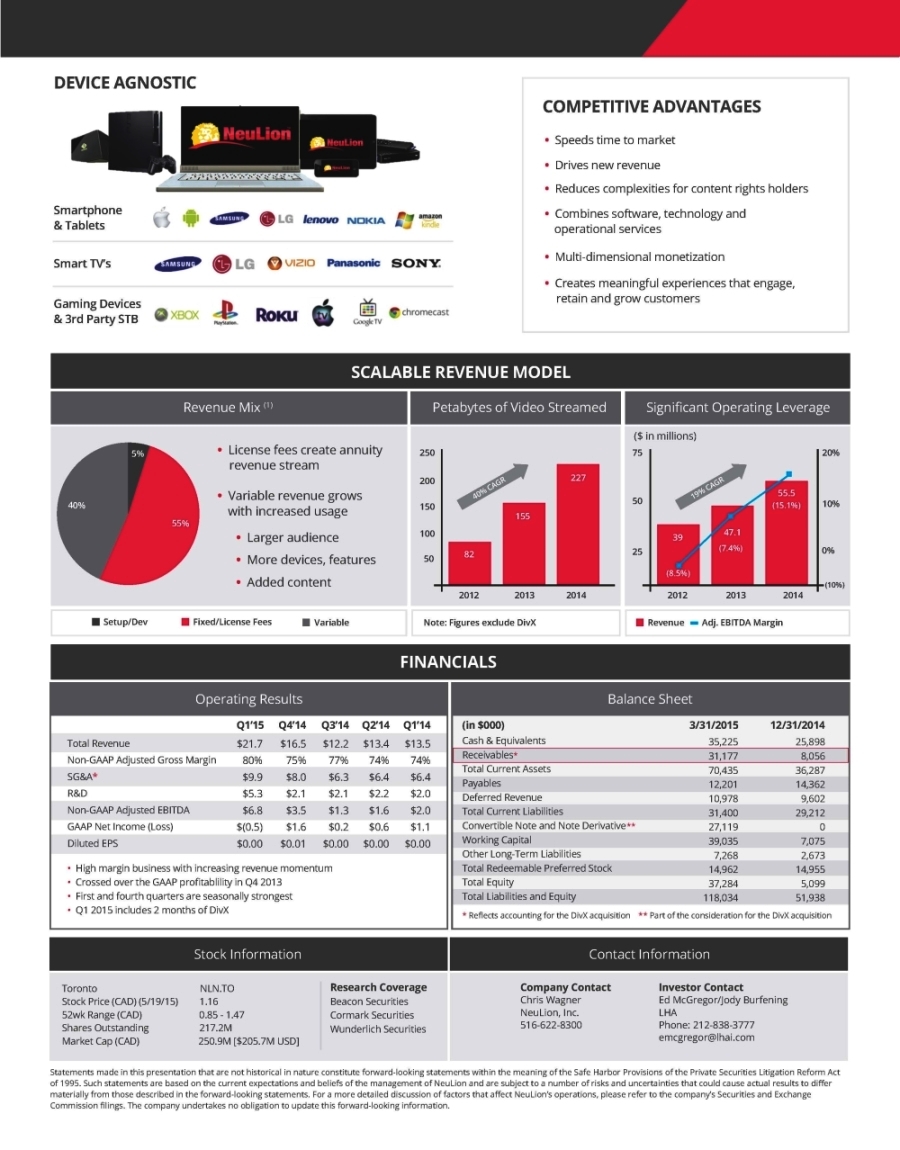
DEVICE AGNOSTIC • Speeds time to market • Drives new revenue • Reduces complexities for content rights holders • Combines software, technology and operational services • Multi-dimensional monetization • Creates meaningful experiences that engage, retain and grow customers Smartphone & Tablets Smart TV’s Gaming Devices & 3rd Party STB SCALABLE REVENUE MODEL Significant Operating Leverage Petabytes of Video Streamed Revenue Mix (1) ($ in millions) • License fees create annuity revenue stream • Variable revenue grows with increased usage • Larger audience • More devices, features • Added content 250 75 20% 5% 40% CAGR 19% CAGR 227 200 55.5 50 10% 40% (15.1%) 150 155 55% 47.1 100 39 (7.4%) 0% 25 82 50 (8.5%) (10%) 2013 2014 2013 2012 2012 2014 Setup/Dev Fixed/License Fees Variable Note: Figures exclude DivX Revenue Adj. EBITDA Margin FINANCIALS Balance Sheet Operating Results Q4’14 Q3’14 Q2’14 Q1’14 3/31/2015 (in $000) Q1’15 12/31/2014 Cash & Equivalents Receivables* Total Current Assets Payables Deferred Revenue Total Current Liabilities Convertible Note and Note Derivative** Working Capital Other Long-Term Liabilities Total Redeemable Preferred Stock Total Equity Total Liabilities and Equity 35,225 31,177 70,435 12,201 10,978 31,400 27,119 39,035 7,268 14,962 37,284 118,034 25,898 8,056 36,287 14,362 9,602 29,212 0 7,075 2,673 14,955 5,099 51,938 $13.5 74% $6.4 $2.0 $2.0 $1.1 $0.00 $13.4 74% $6.4 $2.2 $1.6 $0.6 $0.00 Total Revenue Non-GAAP Adjusted Gross Margin SG&A* R&D Non-GAAP Adjusted EBITDA GAAP Net Income (Loss) Diluted EPS $21.7 80% $9.9 $5.3 $6.8 $(0.5) $0.00 $12.2 77% $6.3 $2.1 $1.3 $0.2 $0.00 $16.5 75% $8.0 $2.1 $3.5 $1.6 $0.01 • High margin business with increasing revenue momentum • Crossed over the GAAP profitablility in Q4 2013 • First and fourth quarters are seasonally strongest • Q1 2015 includes 2 months of DivX * Reflects accounting for the DivX acquisition ** Part of the consideration for the DivX acquisition Stock Information Contact Information Research Coverage Beacon Securities Cormark Securities Wunderlich Securities Investor Contact Ed McGregor/Jody Burfening LHA Phone: 212-838-3777 emcgregor@lhai.com Company Contact Chris Wagner NeuLion, Inc. 516-622-8300 Toronto NLN.TO Stock Price (CAD) (5/19/15) 1.16 52wk Range (CAD) 0.85 - 1.47 Shares Outstanding 217.2M Market Cap (CAD) 250.9M [$205.7M USD] Statements made in this presentation that are not historical in nature constitute forward-looking statements within the meaning of the Safe Harbor Provisions of the Private Securities Litigation Reform Act of 1995. Such statements are based on the current expectations and beliefs of the management of NeuLion and are subject to a number of risks and uncertainties that could cause actual results to differ materially from those described in the forward-looking statements. For a more detailed discussion of factors that affect NeuLion’s operations, please refer to the company’s Securities and Exchange Commission filings. The company undertakes no obligation to update this forward-looking information.