Index to Financial Statements
UNITED STATES
SECURITIES AND EXCHANGE COMMISSION
Washington, D.C. 20549
FORM 10-Q
| x | QUARTERLY REPORT PURSUANT TO SECTION 13 OR 15(d) OF THE SECURITIES EXCHANGE ACT OF 1934 |
For the quarterly period ended June 30, 2012
or
| ¨ | TRANSITION REPORT PURSUANT TO SECTION 13 OR 15 (d) OF THE SECURITIES EXCHANGE ACT OF 1934 |
For the transition period from to
Commission file number: 001-33631
Crestwood Midstream Partners LP
(Exact name of registrant as specified in its charter)
| Delaware | 56-2639586 | |
(State or other jurisdiction of incorporation or organization) | (I.R.S. Employer Identification No.) |
| 700 Louisiana Street, Suite 2060 Houston, Texas | 77002 | |||||
| (Address of principal executive offices) | (Zip Code) | |||||
(832) 519-2200
(Registrant’s telephone number, including area code)
717 Texas Avenue, Suite 3150, Houston, Texas
(Former name, former address and former fiscal year, if changed since last report)
Indicate by check mark whether the registrant: (1) has filed all reports required to be filed by Section 13 or 15(d) of the Securities Exchange Act of 1934 during the preceding 12 months (or for such shorter period that the registrant was required to file such reports), and (2) has been subject to such filing requirements for the past 90 days. Yes x No ¨
Indicate by check mark whether the registrant has submitted electronically and posted on its corporate Web site, if any, every Interactive Data File required to be submitted and posted pursuant to Rule 405 of Regulation S-T (§232.405 of this chapter) during the preceding 12 months (or for such shorter period that the registrant was required to submit and post such files). Yes x No ¨
Indicate by check mark whether the registrant is a large accelerated filer, an accelerated filer, a non-accelerated filer, or a smaller reporting company. See the definitions of “large accelerated filer,” “accelerated filer” and “smaller reporting company” in Rule 12b-2 of the Exchange Act.
| Large accelerated filer | ¨ | Accelerated filer | x | |||
| Non-accelerated filer | ¨ (Do not check if a smaller reporting company) | Smaller Reporting company | ¨ | |||
Indicate by check mark whether the registrant is a shell company (as defined in Rule 12b-2 of the Exchange Act). Yes ¨ No x
Indicate the number of shares outstanding of the issuer’s common units and Class C units, as of the latest practicable date:
Title of Class | Outstanding as of August 2, 2012 | |
| Common Units | 41,148,228 | |
| Class C Units | 6,852,858 |
Index to Financial Statements
CRESTWOOD MIDSTREAM PARTNERS LP
For the Period Ended June 30, 2012
| 4 | ||||
| 4 | ||||
| 4 | ||||
Condensed Consolidated Balance Sheets as of June 30, 2012 and December 31, 2011 | 5 | |||
Condensed Consolidated Statements of Cash Flows for the six months ended June 30, 2012 and 2011 | 6 | |||
| 7 | ||||
| 8 | ||||
Item 2. Management’s Discussion and Analysis of Financial Condition and Results of Operations | 24 | |||
Item 3. Quantitative and Qualitative Disclosures About Market Risk | 34 | |||
| 34 | ||||
| 35 | ||||
| 35 | ||||
| 35 | ||||
Item 2. Unregistered Sales of Equity Securities and Use of Proceeds | 36 | |||
| 36 | ||||
| 36 | ||||
| 36 | ||||
| 37 | ||||
| 38 | ||||
Certification(s) Pursuant to Section 302 | ||||
Certification Pursuant to Section 906 | ||||
2
Index to Financial Statements
FORWARD-LOOKING INFORMATION
Certain statements contained in this report and other materials we file with the U.S. Securities and Exchange Commission (“SEC”), or in other written or oral statements made or to be made by us, other than statements of historical fact, are “forward-looking statements” as defined in the Private Securities Litigation Reform Act of 1995. Forward-looking statements reflect our current expectations or forecasts of future events. Words such as “may,” “assume,” “forecast,” “predict,” “strategy,” “expect,” “intend,” “plan,” “aim,” “estimate,” “anticipate,” “believe,” “project,” “budget,” “potential,” or “continue,” and similar expressions are used to identify forward-looking statements. Forward-looking statements can be affected by assumptions used or by known or unknown risks or uncertainties. Consequently, no forward-looking statements can be guaranteed.
Important factors that could cause our actual results to differ materially from the results contemplated by such forward-looking statements include, but are not limited to, the following risks and uncertainties:
| • | changes in general economic conditions; |
| • | fluctuations in oil, natural gas and natural gas liquids prices; |
| • | the extent and success of drilling efforts, as well as the extent and quality of natural gas volumes produced within proximity of our assets; |
| • | failure or delays by our customers in achieving expected production in their natural gas projects; |
| • | competitive conditions in our industry and their impact on our ability to connect natural gas supplies to our gathering and processing assets or systems; |
| • | actions or inactions taken or non-performance by third parties, including suppliers, contractors, operators, processors, transporters and customers; |
| • | our ability to consummate acquisitions, successfully integrate the acquired businesses, realize any cost savings and other synergies from any acquisition; |
| • | changes in the availability and cost of capital; |
| • | operating hazards, natural disasters, weather-related delays, casualty losses and other matters beyond our control; |
| • | timely receipt of necessary government approvals and permits, our ability to control the costs of construction, including costs of materials, labor and right-of-way and other factors that may impact our ability to complete projects within budget and on schedule; |
| • | the effects of existing and future laws and governmental regulations, including environmental and climate change requirements; |
| • | the effects of existing and future litigation; |
| • | risks related to our substantial indebtedness; and |
| • | certain factors discussed elsewhere in this report. |
These factors do not necessarily include all of the important factors that could cause actual results to differ materially from those expressed in any of our forward-looking statements. Other factors could also have material adverse effects on future results. Consequently, all of the forward-looking statements made in this document are qualified by these cautionary statements, and we cannot assure you that actual results or developments that we anticipate will be realized or, even if substantially realized, will have the expected consequences to, or effect on, us or our business or operations. Also note that we provided additional cautionary discussion of risks and uncertainties under “Risk Factors” in our Annual Report on Form 10-K for the year ended December 31, 2011, our quarterly reports on Form 10-Q and in our other public filings and press releases.
Although the expectations in the forward-looking statements are based on our current beliefs and expectations, caution should be taken not to place undue reliance on any such forward-looking statements because such statements speak only as of the date hereof. Except as required by federal and state securities laws, we undertake no obligation to publicly update or revise any forward-looking statements, whether as a result of new information, future events or otherwise. All forward-looking statements attributable to us or any person acting on our behalf are expressly qualified in their entirety by the cautionary statements contained or referred to in this report and in our future periodic reports filed with the SEC. In light of these risks, uncertainties and assumptions, the forward-looking events discussed in this report may not occur.
3
Index to Financial Statements
Item 1. Financial Statements (Unaudited)
CRESTWOOD MIDSTREAM PARTNERS LP
CONDENSED CONSOLIDATED STATEMENTS OF INCOME
(In thousands, except for per unit data - Unaudited)
| Three Months Ended June 30, | Six Months Ended June 30, | |||||||||||||||
| 2012 | 2011 | 2012 | 2011 | |||||||||||||
Revenue | ||||||||||||||||
Gathering revenue - related party | $ | 21,616 | $ | 24,515 | $ | 45,462 | $ | 47,866 | ||||||||
Gathering revenue | 10,734 | 8,425 | 22,571 | 9,901 | ||||||||||||
Processing revenue - related party | 6,550 | 7,903 | 13,321 | 14,540 | ||||||||||||
Processing revenue | 1,198 | 659 | 2,394 | 1,175 | ||||||||||||
Product sales | 8,104 | 14,033 | 18,187 | 14,433 | ||||||||||||
|
|
|
|
|
|
|
| |||||||||
Total revenue | 48,202 | 55,535 | 101,935 | 87,915 | ||||||||||||
|
|
|
|
|
|
|
| |||||||||
Expenses | ||||||||||||||||
Product purchases | 7,441 | 12,105 | 16,414 | 12,528 | ||||||||||||
Operations and maintenance | 8,887 | 8,634 | 18,598 | 15,592 | ||||||||||||
General and administrative | 6,936 | 6,060 | 13,674 | 12,430 | ||||||||||||
Depreciation, amortization and accretion | 10,838 | 8,361 | 21,484 | 14,386 | ||||||||||||
|
|
|
|
|
|
|
| |||||||||
Total expenses | 34,102 | 35,160 | 70,170 | 54,936 | ||||||||||||
|
|
|
|
|
|
|
| |||||||||
Operating income | 14,100 | 20,375 | 31,765 | 32,979 | ||||||||||||
Earnings from unconsolidated affiliate | 441 | — | 441 | — | ||||||||||||
Interest expense | 8,286 | 9,819 | 15,843 | 12,825 | ||||||||||||
|
|
|
|
|
|
|
| |||||||||
Income from operations before income taxes | 6,255 | 10,556 | 16,363 | 20,154 | ||||||||||||
Income tax provision | 275 | 329 | 578 | 551 | ||||||||||||
|
|
|
|
|
|
|
| |||||||||
Net income | $ | 5,980 | $ | 10,227 | $ | 15,785 | $ | 19,603 | ||||||||
|
|
|
|
|
|
|
| |||||||||
General partner’s interest in net income | $ | 3,336 | $ | 1,628 | $ | 6,704 | $ | 2,516 | ||||||||
Limited partners’ interest in net income | $ | 2,644 | $ | 8,599 | $ | 9,081 | $ | 17,087 | ||||||||
Basic income per unit: | ||||||||||||||||
Net income per limited partner unit | $ | 0.06 | $ | 0.22 | $ | 0.21 | $ | 0.49 | ||||||||
Diluted income per unit: | ||||||||||||||||
Net income per limited partner unit | $ | 0.06 | $ | 0.22 | $ | 0.21 | $ | 0.49 | ||||||||
Weighted-average number of limited partner units: | ||||||||||||||||
Basic | $ | 43,333 | 38,558 | $ | 43,014 | 34,893 | ||||||||||
Diluted | $ | 43,534 | 38,694 | $ | 43,204 | 35,029 | ||||||||||
Distributions declared per limited partner unit (attributable to the period ended) | $ | 0.50 | $ | 0.46 | $ | 1.00 | $ | 0.90 | ||||||||
The accompanying notes are an integral part of these condensed consolidated financial statements.
4
Index to Financial Statements
CRESTWOOD MIDSTREAM PARTNERS LP
CONDENSED CONSOLIDATED BALANCE SHEETS
(In thousands, except for unit data - Unaudited)
| June 30, | December 31, | |||||||
| 2012 | 2011 | |||||||
| ASSETS | ||||||||
Current assets | ||||||||
Cash and cash equivalents | $ | 21 | $ | 797 | ||||
Accounts receivable - related party | 23,369 | 27,312 | ||||||
Accounts receivable | 9,344 | 11,926 | ||||||
Prepaid expenses and other | 5,141 | 1,935 | ||||||
|
|
|
| |||||
Total current assets | 37,875 | 41,970 | ||||||
Investment in unconsolidated affiliate | 129,966 | — | ||||||
Property, plant and equipment, net | 751,656 | 746,045 | ||||||
Intangible assets, net | 124,434 | 127,760 | ||||||
Goodwill | 90,978 | 93,628 | ||||||
Deferred financing costs, net | 14,536 | 16,699 | ||||||
Other assets | 794 | 790 | ||||||
|
|
|
| |||||
Total assets | $ | 1,150,239 | $ | 1,026,892 | ||||
|
|
|
| |||||
| LIABILITIES AND PARTNERS’ CAPITAL | ||||||||
Current liabilities | ||||||||
Accrued additions to property, plant and equipment | $ | 6,266 | $ | 7,500 | ||||
Capital leases | 3,656 | 2,693 | ||||||
Accounts payable - related party | 262 | 1,308 | ||||||
Accounts payable, accrued expenses and other liabilities | 25,916 | 31,794 | ||||||
|
|
|
| |||||
Total current liabilities | 36,100 | 43,295 | ||||||
Long-term debt | 561,450 | 512,500 | ||||||
Long-term capital leases | 4,266 | 3,929 | ||||||
Asset retirement obligations | 12,244 | 11,545 | ||||||
Commitments and contingent liabilities (Note 12) | ||||||||
Partners’ capital | ||||||||
Common unitholders (36,548,228 and 32,997,696 units issued and outstanding at June 30, 2012 and December 31, 2011, respectively) | 362,063 | 286,945 | ||||||
Class C unitholders (6,852,858 and 6,596,635 units issued and outstanding at June 30, 2012 and December 31, 2011, respectively) | 158,803 | 157,386 | ||||||
General partner | 15,313 | 11,292 | ||||||
|
|
|
| |||||
Total partners’ capital | 536,179 | 455,623 | ||||||
|
|
|
| |||||
| $ | 1,150,239 | $ | 1,026,892 | |||||
|
|
|
| |||||
The accompanying notes are an integral part of these condensed consolidated financial statements.
5
Index to Financial Statements
CRESTWOOD MIDSTREAM PARTNERS LP
CONDENSED CONSOLIDATED STATEMENTS OF CASH FLOWS
(In thousands - Unaudited)
| Six Months Ended June 30, | ||||||||
| 2012 | 2011 | |||||||
Operating activities: | ||||||||
Net income | $ | 15,785 | $ | 19,603 | ||||
Adjustments to reconcile net income to net cash provided by operating activities: | ||||||||
Depreciation, amortization and accretion | 21,484 | 14,386 | ||||||
Equity-based compensation | 994 | 565 | ||||||
Amortization/accretion of deferred financing costs and capital lease obligations | 2,230 | 1,610 | ||||||
Changes in assets and liabilities: | ||||||||
Accounts receivable - related party | 3,943 | (2,999 | ) | |||||
Accounts receivable | 2,582 | (6,568 | ) | |||||
Prepaid expenses and other assets | (560 | ) | (1,612 | ) | ||||
Accounts payable - related party | (1,046 | ) | (219 | ) | ||||
Accounts payable, accrued expenses and other liabilities | (5,878 | ) | 13,791 | |||||
|
|
|
| |||||
Net cash provided by operating activities | 39,534 | 38,557 | ||||||
|
|
|
| |||||
Investing activities: | ||||||||
Capital expenditures | (21,535 | ) | (16,888 | ) | ||||
Acquisitions, net of cash acquired | — | (353,966 | ) | |||||
Investment in unconsolidated affiliate | (131,250 | ) | — | |||||
Capital distributions from unconsolidated affiliate | 1,284 | — | ||||||
|
|
|
| |||||
Net cash used in investing activities | (151,501 | ) | (370,854 | ) | ||||
|
|
|
| |||||
Financing activities: | ||||||||
Proceeds from issuance of senior notes | — | 200,000 | ||||||
Proceeds from credit facility | 223,700 | 64,200 | ||||||
Repayments of credit facility | (174,750 | ) | (110,204 | ) | ||||
Payments on capital leases | (1,375 | ) | — | |||||
Deferred financing costs paid | (161 | ) | (6,982 | ) | ||||
Proceeds from issuance of Class C units | — | 152,671 | ||||||
Proceeds from issuance of common units, net | 103,034 | 53,550 | ||||||
Contributions from partners | 3,413 | 8,741 | ||||||
Distributions to partners | (42,268 | ) | (29,130 | ) | ||||
Taxes paid for equity-based compensation vesting | (402 | ) | — | |||||
|
|
|
| |||||
Net cash provided by financing activities | 111,191 | 332,846 | ||||||
|
|
|
| |||||
Net increase (decrease) in cash and cash equivalents | (776 | ) | 549 | |||||
Cash and cash equivalents at beginning of period | 797 | 2 | ||||||
|
|
|
| |||||
Cash and cash equivalents at end of period | $ | 21 | $ | 551 | ||||
|
|
|
| |||||
Cash paid for interest | $ | 13,976 | $ | 7,357 | ||||
Cash paid for income taxes | $ | 1,259 | $ | 220 | ||||
Non-cash transactions: | ||||||||
Accrued capital expenditures | $ | 6,266 | $ | 10,331 | ||||
Increase in Class C unitholders equity paid in kind | $ | 7,532 | $ | 2,900 | ||||
Capital lease additions | $ | 2,769 | $ | — | ||||
The accompanying notes are an integral part of these condensed consolidated financial statements.
6
Index to Financial Statements
CRESTWOOD MIDSTREAM PARTNERS LP
CONDENSED CONSOLIDATED STATEMENTS OF CHANGES IN PARTNERS’ CAPITAL
(In thousands - Unaudited)
| Partners’ Capital | ||||||||||||||||
| Limited Partners | ||||||||||||||||
| Common | Class C Unitholders | General Partner | Total | |||||||||||||
Balance at December 31, 2011 | 286,945 | $ | 157,386 | $ | 11,292 | $ | 455,623 | |||||||||
Issuance of units, net of offering costs | 103,034 | — | — | 103,034 | ||||||||||||
Contributions from partners | — | — | 3,413 | 3,413 | ||||||||||||
Net income | 7,664 | 1,417 | 6,704 | 15,785 | ||||||||||||
Equity-based compensation | 994 | — | — | 994 | ||||||||||||
Taxes paid for equity-based compensation vesting | (402 | ) | — | — | (402 | ) | ||||||||||
Distributions paid | (36,172 | ) | — | (6,096 | ) | (42,268 | ) | |||||||||
|
|
|
|
|
|
|
| |||||||||
Balance at June 30, 2012 | $ | 362,063 | $ | 158,803 | $ | 15,313 | $ | 536,179 | ||||||||
|
|
|
|
|
|
|
| |||||||||
| Partners’ Capital | ||||||||||||||||
| Limited Partners | ||||||||||||||||
| Common | Class C Unitholders | General Partner | Total | |||||||||||||
Balance at December 31, 2010 | $ | 258,069 | $ | — | $ | 684 | $ | 258,753 | ||||||||
Issuance of units, net of offering costs | 53,550 | 152,671 | — | 206,221 | ||||||||||||
Contribution from partners | — | — | 8,741 | 8,741 | ||||||||||||
Net income | 15,702 | 1,385 | 2,516 | 19,603 | ||||||||||||
Equity-based compensation | 565 | — | — | 565 | ||||||||||||
Distributions paid | (27,134 | ) | — | (1,996 | ) | (29,130 | ) | |||||||||
|
|
|
|
|
|
|
| |||||||||
Balance at June 30, 2011 | $ | 300,752 | $ | 154,056 | $ | 9,945 | $ | 464,753 | ||||||||
|
|
|
|
|
|
|
| |||||||||
The accompanying notes are an integral part of these condensed consolidated financial statements.
7
Index to Financial Statements
CRESTWOOD MIDSTREAM PARTNERS LP
NOTES TO CONDENSED CONSOLIDATED INTERIM FINANCIAL STATEMENTS
UNAUDITED
1. ORGANIZATION AND DESCRIPTION OF BUSINESS
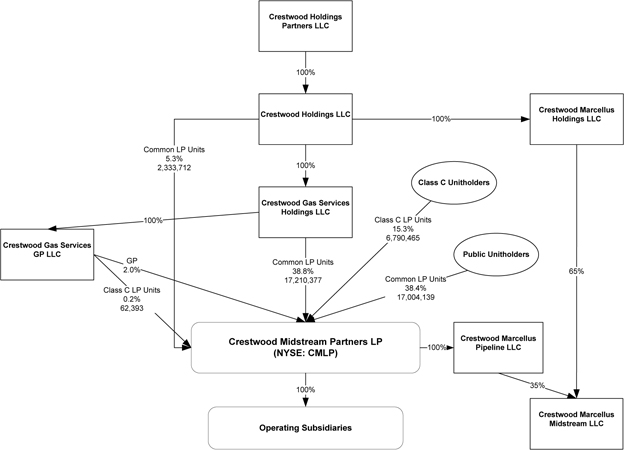
Organization— Crestwood Midstream Partners LP (“CMLP”) is a publicly traded Delaware limited partnership formed for the purpose of acquiring and operating midstream assets. Crestwood Gas Services GP LLC, our general partner (“General Partner”), is owned by Crestwood Holdings Partners LLC and its affiliates (“Crestwood Holdings”). Our common units are listed on the New York Stock Exchange (“NYSE”) under the symbol “CMLP.” In this report, unless the context requires otherwise, references to “we,” “us,” “our” or the “Partnership” are intended to mean the business and operations of CMLP and its subsidiaries.
Organizational Structure
The following chart depicts our ownership structure as of June 30, 2012:
8
Index to Financial Statements
Our ownership is as follows:
| June 30, 2012 | ||||||||||||
| Crestwood Holdings | Public | Total | ||||||||||
General partner interest | 2.0 | % | — | 2.0 | % | |||||||
Limited partner interest: | ||||||||||||
Common unitholders | 44.1 | % | 38.4 | % | 82.5 | % | ||||||
Class C unitholders | 0.2 | % | 15.3 | % | 15.5 | % | ||||||
|
|
|
|
|
| |||||||
Total | 46.3 | % | 53.7 | % | 100.0 | % | ||||||
|
|
|
|
|
| |||||||
See Note 16 – “Partners’ Capital and Distributions” for additional information concerning ownership interests.
Description of Business— We are primarily engaged in the gathering, processing, treating, compression, transportation and sales of natural gas and the delivery of natural gas liquids (“NGLs”) produced in the geological formations of the Barnett Shale in north Texas, the Fayetteville Shale in northwestern Arkansas, the Granite Wash in the Texas Panhandle, the Marcellus Shale in northern West Virginia, the emerging Avalon Shale trend in southeastern New Mexico, and the Haynesville/Bossier Shale in western Louisiana.
On March 26, 2012, we invested $131 million in cash in exchange for a 35% interest in Crestwood Marcellus Midstream LLC (“CMM”), which is held by our wholly-owned subsidiary. Crestwood Holdings LLC invested $244 million in cash for the remaining 65% interest, which is held by its wholly-owned subsidiary. CMM is a new joint venture formed for the purpose of acquiring certain of Antero Resources Appalachian Corporation’s (“Antero”) Marcellus Shale gathering system assets located in Harrison and Doddridge Counties, West Virginia.
The assets acquired by CMM at closing included approximately 33 miles of low pressure gathering pipelines gathering approximately 210 MMcfd from 59 existing horizontal Marcellus Shale wells. The gathering pipelines deliver Antero’s Marcellus Shale production to various regional pipeline systems including Columbia, Dominion and Equitrans.
See Note 4 – “Investment in Unconsolidated Affiliate” and Note 18— “Segment Information” for a further description of our investment in an unconsolidated affiliate and our segments. See Note 1 to the consolidated financial statements in our 2011 Annual Report on Form 10-K for additional information about our business.
2. SUMMARY OF SIGNIFICANT ACCOUNTING POLICIES
Basis of Presentation— We prepared this Quarterly Report on Form 10-Q under the rules and regulations of the SEC. As an interim period filing presented using a condensed format, it does not include all of the disclosures required by U.S. generally accepted accounting principles (“GAAP”) and should be read along with our 2011 Annual Report on Form 10-K. The financial statements as of June 30, 2012, and for the three and six months ended June 30, 2012 and 2011, are unaudited. In management’s opinion, all necessary adjustments to fairly present our results of operations, financial position and cash flows for the periods presented have been made and all such adjustments are of a normal and recurring nature. During the second quarter of 2012, we reclassified approximately $2.7 million from goodwill to other current assets to reflect the fair value of certain contracts acquired in the Frontier Gas Acquisition (as defined in Note 3—“Acquisitions” below) that were not recorded when the purchase price allocation was finalized for the acquired assets. This reclassification had no impact on previously reported net income, earnings per unit or partners’ capital. Our disclosures in this Form 10-Q are an update to those provided in our 2011 Annual Report on Form 10-K.
Significant Accounting Policies
There were no changes in the significant accounting policies described in our 2011 Annual Report on Form 10-K, except as noted below.
Principles of Consolidation— We consolidate entities when we have the ability to control or direct the operating and financial decisions of the entity or when we have a significant interest in the entity that gives us the ability to direct the activities that are significant to that entity. The determination of our ability to control, direct or exert significant influence over an entity involves the use of judgment. We currently do not have ownership in any variable interest entities. We apply the equity method of accounting where we can exert significant influence over, but do not control or direct the policies, decisions or activities of the entity. We use the cost method of accounting where we are unable to exert significant influence over the entity.
9
Index to Financial Statements
Segment Information— We conduct all of our operations within eight operating segments, four of which are reportable. Our operating segments reflect how we manage our operations and are generally reflective of the geographic areas in which we operate. Our reportable segments consist of Barnett, Fayetteville, Granite Wash and Marcellus. Our operating segments are engaged in gathering, processing, treating, compression, transportation and sales of natural gas and delivery of NGLs in the United States.
Equity Investment Impairment—Financial Accounting Standards Board, Accounting Standards Codification 323“Investments – Equity Method and Joint Ventures”(“ASC 323”) requires entities to periodically review their equity method investments to determine whether current events or circumstances justify an adjustment to the carrying value of the equity method investment. We evaluate our equity investment for impairment when there are indicators of impairment. If indicators suggest impairment we will perform an impairment test to assess whether an adjustment is necessary. The impairment test, as required by ASC 323, considers whether the fair value, as determined by us, of our equity method investment has declined, and if the decline is other than temporary. If the decline in fair value is determined to be other than temporary, the investment’s carrying value may be required to be written down to fair value.
New Accounting Pronouncements Issued But Not Yet Adopted
Accounting standard-setting organizations frequently issue new or revised accounting rules. We regularly review all new pronouncements to determine their impact, if any, on our financial statements. As of June 30, 2012, the following accounting standard had not yet been adopted by us.
In September 2011, the Financial Accounting Standards Board amended the accounting literature for goodwill impairment testing by issuing Accounting Standards Update 2011-08 (“ASU 2011-08”). ASU 2011-08 amended guidance to provide an entity with the option to first assess qualitative factors to evaluate whether it is more likely than not that the fair value of a reporting unit is less than the carry amount as the basis to determine if the two-step goodwill impairment is required. The effective date of ASU 2011-08 is for annual and interim goodwill tests for fiscal years beginning after December 15, 2011, and early adoption is permitted. We are evaluating the effect of adopting ASU 2011-08 for our annual goodwill impairment test, which we complete during December.
3. ACQUISITIONS
2011 Acquisitions
Las Animas Acquisition
On February 16, 2011, we completed the acquisition of certain midstream assets in the Avalon Shale play from a group of independent producers for $5.1 million (“Las Animas Acquisition”). The Las Animas Acquisition was recorded in property, plant and equipment at fair value of $5.1 million.
Frontier Gas Acquisition
On April 1, 2011, we completed the acquisition of certain midstream assets in the Fayetteville Shale and the Granite Wash from Frontier Gas Services, LLC for approximately $345 million (“Frontier Gas Acquisition”). In third quarter 2011, we finalized the Frontier Gas Acquisition purchase price, which resulted in the recognition of approximately $93.6 million in goodwill.
10
Index to Financial Statements
Tristate Acquisition
On November 1, 2011, we acquired Tristate Sabine, LLC (“Tristate”) from affiliates of Energy Spectrum Capital, Zwolle Pipeline, LLC, and Tristate’s management for approximately $73 million in cash consideration comprised of $65 million paid at closing plus a deferred payment of $8 million due on November 1, 2012, subject to customary post-closing adjustments (“Tristate Acquisition”). The final purchase price allocation is pending the completion of the valuation of the assets acquired, liabilities assumed and settlement of the deferred amounts due in the Tristate Acquisition. The preliminary purchase price allocation is as follows (In thousands):
Purchase price: | ||||
Cash | $ | 65,000 | ||
Deferred payment | 8,000 | |||
|
| |||
Total purchase price | $ | 73,000 | ||
|
| |||
Preliminary purchase price allocation: | ||||
Cash | $ | 589 | ||
Accounts receivable | 2,564 | |||
Prepaid expenses and other | 365 | |||
Property, plant and equipment | 56,261 | |||
Intangible assets | 16,000 | |||
|
| |||
Total assets | $ | 75,779 | ||
|
| |||
Accounts payable, accrued expenses and other | $ | 1,915 | ||
Asset retirement obligation | 864 | |||
|
| |||
Total liabilities | $ | 2,779 | ||
|
| |||
Total | $ | 73,000 | ||
|
| |||
11
Index to Financial Statements
The following table is the presentation of income for the three and six months ended June 30, 2011 as if we had completed the Frontier Gas, Tristate and Las Animas Acquisitions on January 1, 2011 (In thousands, except per unit data):
| Three Months Ended June 30, 2011 | ||||||||||||
| Crestwood Midstream Partners LP (1) | Proforma Adjustment(2) | Combined | ||||||||||
Revenue | $ | 55,535 | $ | 2,716 | $ | 58,251 | ||||||
Operating expenses | (35,160 | ) | (1,854 | ) | (37,014 | ) | ||||||
|
|
|
|
|
| |||||||
Operating income | $ | 20,375 | $ | 862 | $ | 21,237 | ||||||
|
|
|
|
|
| |||||||
Basic earnings per unit: | ||||||||||||
Net income per limited partner | $ | 0.22 | $ | 0.22 | ||||||||
Diluted earnings per unit: | ||||||||||||
Net income per limited partner | $ | 0.22 | $ | 0.22 | ||||||||
Weighted-average number of limited partner units: | ||||||||||||
Basic | 38,558 | 38,709 | ||||||||||
Diluted | 38,694 | 38,845 | ||||||||||
| Six Months Ended June 30, 2011 | ||||||||||||
| Crestwood Midstream Partners LP(3) | Proforma Adjustment (4) | Combined | ||||||||||
Revenue | $ | 87,915 | $ | 22,045 | $ | 109,960 | ||||||
Operating expenses | (54,936 | ) | (20,112 | ) | (75,048 | ) | ||||||
|
|
|
|
|
| |||||||
Operating income | $ | 32,979 | $ | 1,933 | $ | 34,912 | ||||||
|
|
|
|
|
| |||||||
Basic earnings per unit: | ||||||||||||
Net income per limited partner | $ | 0.49 | $ | 0.35 | ||||||||
Diluted earnings per unit: | ||||||||||||
Net income per limited partner | $ | 0.49 | $ | 0.35 | ||||||||
Weighted-average number of limited partner units: | ||||||||||||
Basic | 34,893 | 38,100 | ||||||||||
Diluted | 35,029 | 38,236 | ||||||||||
| (1) | Includes approximately three months of operating income for the Las Animas Acquisition, three months of operating income from the Frontier Gas Acquisition and no operating income for the Tristate Acquisition. |
| (2) | Represents the second quarter of 2011 of operating income for the Tristate Acquisition, prior to acquisition. |
| (3) | Includes approximately five months of operating income for the Las Animas Acquisition, three months of operating income from the Frontier Gas Acquisition and no operating income for the Tristate Acquisition. |
| (4) | Represents half of the first quarter 2011 operating income for the Las Animas Acquisition, first quarter 2011 operating income for the Frontier Gas Acquisition and first and second quarter 2011 operating income for the Tristate Acquisition. |
12
Index to Financial Statements
4. INVESTMENT IN UNCONSOLIDATED AFFILIATE
On March 26, 2012, we invested approximately $131 million in cash to CMM in exchange for a 35% interest in CMM, which is held by our wholly-owned subsidiary. We account for our investment in CMM under the equity method of accounting.
On March 26, 2012, CMM, indirectly owned 65% by Crestwood Holdings LLC and 35% by us, completed the acquisition of Antero’s gathering system assets located in Harrison and Doddridge Counties, West Virginia for $375 million in cash, subject to normal purchase price adjustments plus an earn-out which would allow Antero to earn additional payments of up to $40 million based upon average annual production levels achieved during 2012, 2013 and 2014 (“Antero Acquisition”).
Additionally, CMM entered into a 20-year, fixed fee, Gas Gathering and Compression Agreement (“GGA”) with Antero, which provides for an area of dedication of approximately 127,000 gross acres, or 104,000 net acres, largely located in the rich gas corridor of the southwestern core of the Marcellus Shale play. We have provided guarantees to Antero of future performance by CMM under the GGA. We expect that any impact from nonperformance by CMM under the GGA would be inconsequential to our consolidated financial statements. As part of the GGA, Antero committed to delivery of minimum annual throughput volumes to CMM for a seven year period from January 1, 2012 to January 1, 2019, resulting in total guaranteed throughput volume commitments over such period to CMM of approximately 300 million cubic feet per day (“MMcfd”) to 450 MMcfd.
Concurrent with the Antero Acquisition by CMM, we entered into an operating agreement with CMM to operate the acquired assets. The terms of the operating agreement provide for the reimbursement of costs incurred by us on behalf of CMM or in conjunction with operating CMM’s assets. For the three and six months ended June 30, 2012, CMM reimbursed us $1.3 million for costs under the operating agreement which is reflected as a reduction to operating expenses in our consolidated statement of income.
In June 2012, CMM finalized its final settlement statement with Antero based on performance and expenditures earned and incurred by Antero from January 1, 2012 to March 26, 2012. Based on this statement, CMM paid Antero an additional $4.9 million in July 2012 which will be included in CMM’s purchase price allocation.
Our investment in CMM totaled $130 million as of June 30, 2012, which equals our respective share in our equity investment. Our earnings from an unconsolidated affiliate was not material for the quarter ended March 31, 2012. The summarized financial information for our investment in CMM, which is accounted for under the equity method, is as follows (In thousands):
| For the Three and Six Months Ended June 30, 2012 | ||||
Revenue | $ | 7,027 | ||
Operations and maintenance expense | 513 | |||
General and administrative expense | 1,721 | |||
Depreciation and amortization expense | 2,857 | |||
Interest expense | 677 | |||
|
| |||
Net Income | $ | 1,259 | ||
Ownership % | 35% | |||
|
| |||
Equity in earnings from CMM | $ | 441 | ||
|
| |||
Distributions: | ||||
Earnings distributions received | $ | 441 | ||
Capital distributions received | 1,284 | |||
|
| |||
Total Distributions | $ | 1,725 | ||
|
| |||
13
Index to Financial Statements
5. NET INCOME PER LIMITED PARTNER UNIT
The following is a reconciliation of the limited partner units used in the basic and diluted earnings per unit calculations for the three and six months ended June 30, 2012 and 2011 (In thousands, except per unit data):
| Three Months Ended June 30, | Six Months Ended June 30, | |||||||||||||||
| 2012 | 2011 | 2012 | 2011 | |||||||||||||
Limited partners’ interest in net income | $ | 2,644 | $ | 8,599 | $ | 9,081 | $ | 17,087 | ||||||||
Weighted-average limited partner units - basic(1) | 43,333 | 38,558 | 43,014 | 34,893 | ||||||||||||
Effect of unvested phantom units | 201 | 136 | 190 | 136 | ||||||||||||
|
|
|
|
|
|
|
| |||||||||
Weighted-average limited partner units - diluted(1) | 43,534 | 38,694 | 43,204 | 35,029 | ||||||||||||
|
|
|
|
|
|
|
| |||||||||
Basic earnings per unit: | ||||||||||||||||
Net income per limited partner | $ | 0.06 | $ | 0.22 | $ | 0.21 | $ | 0.49 | ||||||||
Diluted earnings per unit: | ||||||||||||||||
Net income per limited partner | $ | 0.06 | $ | 0.22 | $ | 0.21 | $ | 0.49 | ||||||||
| (1) | Includes 6,791,526 and 6,727,074 Class C units for the three and six months ended June 30, 2012. |
There were no units excluded from our dilutive earnings per share as we do not have any anti-dilutive units for the three and six months ended June 30, 2012 and 2011.
6. PROPERTY, PLANT AND EQUIPMENT
Property, plant and equipment consists of the following (In thousands):
| Depreciable Life | June 30, 2012 | December 31, 2011 | ||||||||||
Gathering systems | 20 years | $ | 306,810 | $ | 298,207 | |||||||
Processing plants and compression facilities | 20-25 years | 423,572 | 429,908 | |||||||||
Rights-of-way and easements | 20 years | 52,880 | 50,085 | |||||||||
Buildings and other | 5-40 years | 6,393 | 5,958 | |||||||||
|
|
|
| |||||||||
Total | 789,655 | 784,158 | ||||||||||
Accumulated depreciation | (107,553 | ) | (89,860 | ) | ||||||||
|
|
|
| |||||||||
Total, net of accumulated depreciation | 682,102 | 694,298 | ||||||||||
Land | 4,674 | 4,674 | ||||||||||
Construction in progress | 64,880 | 47,073 | ||||||||||
|
|
|
| |||||||||
Property, plant and equipment, net | $ | 751,656 | $ | 746,045 | ||||||||
|
|
|
| |||||||||
We recognized $17.8 million and $13.4 million of depreciation expense on property, plant and equipment for the six months ended June 30, 2012 and 2011.
On June 21, 2012 we entered into an amendment to the Memorandum of Understanding (“MOU Amendment”) with Mountaineer Keystone LLC (“MK”), which extends the term of the original MOU, including its exclusivity provisions from January 31, 2013 to January 31, 2014 (“Extension Period”). In addition to the Extension Period, the MOU Amendment increased the reimbursable project costs of the Tygart Valley Pipeline incurred by us during the Extension Period from a cumulative total of $2.3 million to $2.9 million.
We have capitalized costs in construction in progress relating to the Tygart Valley Pipeline project under the MOU Amendment with MK for the six months ended June 30, 2012 of approximately $2.9 million. We incurred no costs under the MOU Amendment in the six month period ended June 30, 2011.
14
Index to Financial Statements
7. INTANGIBLE ASSETS
Intangible assets consist of the assigned fair value associated with acquired gas gathering and processing contracts. The following table summarizes our intangible assets (In thousands):
| June 30, 2012 | December 31, 2011 | |||||||
Intangible Assets, beginning of period | $ | 130,200 | $ | — | ||||
Additions | — | 130,200 | ||||||
|
|
|
| |||||
Total intangible assets, end of period | $ | 130,200 | $ | 130,200 | ||||
Accumulated amortization | (5,766 | ) | (2,440 | ) | ||||
|
|
|
| |||||
Intangible Assets, net | $ | 124,434 | $ | 127,760 | ||||
|
|
|
| |||||
The gas gathering and processing contracts have useful lives of 6 to 17 years, as determined based upon the anticipated life of the contracts with our customers. Amortization expense recorded was approximately $1.7 million and $3.3 million for the three and six months ended June 30, 2012 and $0.7 million for the three and six months ended June 30, 2011. The expected amortization of intangible assets is as follows (In thousands):
2012 (remaining) | $ | 3,326 | ||
2013 | 8,007 | |||
2014 | 9,176 | |||
2015 | 9,729 | |||
Thereafter | 94,196 | |||
|
| |||
Total | $ | 124,434 | ||
|
|
8. ACCOUNTS PAYABLE, ACCRUED EXPENSES AND OTHER LIABILITES
Accounts payable, accrued expenses and other liabilities consist of the following (In thousands):
| June 30, | December 31, | |||||||
| 2012 | 2011 | |||||||
Accrued expenses | $ | 5,361 | $ | 3,175 | ||||
Accrued property taxes | 2,618 | 5,204 | ||||||
Accrued product purchases payable | 2,550 | 3,594 | ||||||
Tax payable | 826 | 1,545 | ||||||
Interest payable | 4,527 | 4,788 | ||||||
Accounts payable | 1,684 | 5,128 | ||||||
Tristate Acquisition deferred payment (Note 3) | 8,000 | 8,000 | ||||||
Other | 350 | 360 | ||||||
|
|
|
| |||||
Total accounts payable, accrued expenses and other liabilities | $ | 25,916 | $ | 31,794 | ||||
|
|
|
| |||||
15
Index to Financial Statements
9. LONG-TERM DEBT
Debt consists of the following (In thousands):
| June 30, | December 31, | |||||||
| 2012 | 2011 | |||||||
Credit Facility | $ | 361,450 | $ | 312,500 | ||||
Senior Notes | 200,000 | 200,000 | ||||||
|
|
|
| |||||
| 561,450 | 512,500 | |||||||
Current maturities of debt | — | — | ||||||
|
|
|
| |||||
Long-term debt | $ | 561,450 | $ | 512,500 | ||||
|
|
|
| |||||
The following table summarizes our principal payments due by period (In thousands):
| Payments Due by Period | ||||||||||||||||||||||||||||
Long-Term Debt | Total | 2012 | 2013 | 2014 | 2015 | 2016 | Thereafter | |||||||||||||||||||||
Credit Facility, due October 2015 | $ | 361,450 | $ | — | $ | — | $ | — | $ | 361,450 | $ | — | $ | — | ||||||||||||||
Senior Notes, due April 2019 | 200,000 | — | — | — | — | — | 200,000 | |||||||||||||||||||||
|
|
|
|
|
|
|
|
|
|
|
|
|
| |||||||||||||||
Total long-term debt | $ | 561,450 | $ | — | $ | — | $ | — | $ | 361,450 | $ | — | $ | 200,000 | ||||||||||||||
|
|
|
|
|
|
|
|
|
|
|
|
|
| |||||||||||||||
Credit Facility— Our senior secured credit facility dated October 1, 2010 (“Credit Facility”) allows for revolving loans, letters of credit and swingline loans in an aggregate amount of up to $500 million. On April 1, 2011, we entered into an agreement with certain lenders of our Credit Facility, which expanded our borrowing capacity from $400 million to $500 million. The Credit Facility is secured by substantially all of our and our subsidiaries’ assets and is guaranteed by our wholly-owned subsidiaries. Borrowings under the Credit Facility bear interest at London Interbank Offered Rate (“LIBOR”) plus an applicable margin or a base rate as defined in the credit agreement. Under the terms of the Credit Facility, the applicable margin under LIBOR borrowings was 3.5% at June 30, 2012. Based on our results through June 30, 2012, our total availability under the Credit Facility was $454 million and our borrowings were $361.5 million. For the three and six months ended June 30, 2012, our average outstanding borrowings were $360.4 million and $306.3 million. For the three and six months ended June 30, 2012, our maximum outstanding borrowings were $375 million. The weighted-average interest rate as of June 30, 2012 was 3.78%. The Credit Facility’s carrying value at June 30, 2012 approximates its fair value.
On March 20, 2012, we further amended our Credit Facility to permit the acquisition of an equity interest in CMM and to allow for additional investments in CMM of up to $160 million. Our Credit Facility requires us to maintain:
| • | a ratio of our consolidated trailing 12-month EBITDA (as defined in the Credit Facility) to our net interest expense of not less than 2.5 to 1.0; and |
| • | a ratio of total indebtedness to consolidated trailing 12-month EBITDA (as defined in the Credit Facility) of not more than 5.0 to 1.0, or not more than 5.5 to 1.0 for up to nine months following certain acquisitions. |
As of June 30, 2012, we were in compliance with these financial covenants.
The Credit Facility contains restrictive covenants that prohibit the declaration or payment of distributions by us if a default then exists or would result therefrom, and otherwise limits the amount of distributions that we can make. An event of default may result in the acceleration of our repayment of outstanding borrowings under the Credit Facility, the termination of the Credit Facility and foreclosure on collateral.
Bridge Loans– In February 2011, in connection with the Frontier Gas Acquisition, we obtained commitments from multiple lenders for senior unsecured bridge loans in an aggregate amount up to $200 million. The commitment was terminated on April 1, 2011 in connection with the closing of the Senior Notes described below. We recognized $2.5 million of commitment fees in the second quarter of 2011, which is included in interest expense, related to the bridge loans.
16
Index to Financial Statements
Senior Notes – On April 1, 2011, we issued $200 million of senior notes, which accrue interest at the rate of 7.75% per annum and mature in April 2019 (“Senior Notes”). Our obligations under the Senior Notes are guaranteed on an unsecured basis by our current and future domestic subsidiaries. Interest is payable semi-annually in arrears on April 1 and October 1 of each year. Our Senior Notes require us to maintain a ratio of our consolidated trailing 12-month EBITDA (as defined in the indenture governing the Senior Notes) to fixed charges of at least 1.75 to 1.0. As of June 30, 2012, we were in compliance with this covenant.
The fair value of our Senior Notes was $200.1 million and $197 million as of June 30, 2012 and December 31, 2011. The fair value was determined using quoted market prices on the same or similar debt issuances, which are considered Level 2 inputs.
Guarantor Subsidiaries– Our consolidated subsidiaries are wholly-owned by CMLP and are full and unconditional, joint and several guarantors of our Credit Facility and Senior Notes. CMLP has no independent assets or operations.
10. ASSET RETIREMENT OBLIGATIONS
Activity for asset retirement obligations is as follows (In thousands):
| Six months | ||||
| ended June 30, 2012 | ||||
Liability at beginning of period | $ | 11,545 | ||
Liabilities incurred | 367 | |||
Accretion expense | 332 | |||
|
| |||
Liability at end of period | $ | 12,244 | ||
|
| |||
We did not have any material assets that were legally restricted for use in settling asset retirement obligations as of June 30, 2012 or December 31, 2011.
11. CAPITAL LEASES
We have compressor, treating facility and auto leases which are accounted for as capital leases.
The total liability outstanding at June 30, 2012 related to these leases is $7.9 million. Accretion related to this liability for the three and six months ended June 30, 2012 was immaterial. Future minimum lease payments related to capital leases are as follows (In thousands):
2012 (remaining) | $ | 2,084 | ||
2013 | 3,792 | |||
2014 | 2,042 | |||
2015 | 449 | |||
Thereafter | 40 | |||
|
| |||
Total payments | 8,407 | |||
Imputed interest | (485 | ) | ||
|
| |||
Present value of future payments | $ | 7,922 | ||
|
|
12. COMMITMENTS AND CONTINGENT LIABILITIES
In May 2011, a putative class action lawsuit, Ginardi v. Frontier Gas Services, LLC, et al No 4:11-cv-0420 BRW, was filed in the United States District Court of the Eastern District of Arkansas against Frontier Gas Services, LLC, Chesapeake Energy Corporation, BHP Billiton Petroleum (“BHP”), Kinder Morgan Treating, LP, and Crestwood Arkansas Pipeline LLC (which was served in August 2011). The lawsuit alleged that the defendants’ operations pollute the atmosphere, groundwater, and soil with allegedly harmful gases, chemicals, and compounds and the facilities create excessive noise levels constituting trespass, nuisance and annoyance (the “Ginardi case”).
On June 27, 2012, we settled the Ginardi case and the case was dismissed. The settlement did not have a material impact on our results of operations or financial condition.
17
Index to Financial Statements
In addition, in connection with the Ginardi settlement, the parties in the lawsuit styled George Bartlett, et al, v. Frontier Gas Services, LLC, et al including Crestwood Arkansas Pipeline, LLC, Chesapeake Energy Corporation, and Kinder Morgan Treating LP, which was filed in the United States District Court of the Eastern District of Arkansas (No 4 11-cv-0910 BSM) (the “Bartlett case”) agreed that the Bartlett case would not proceed as a class action. The Bartlett case is otherwise ongoing. While we cannot reasonably quantify our ultimate liability, if any, for the payment of any damages or other remedial actions, the Bartlett case has not had, nor is expected to have, a material impact on our results of operation or financial condition. We intend to vigorously defend against this lawsuit and to mitigate any claims by pursuing any and all indemnification obligations to which we may be entitled with respect to the properties as well as any coverage from our insurance.
From time to time, we are party to certain legal, regulatory or administrative proceedings that arise in the ordinary course and are incidental to our business. However, except as set forth above, there are currently no such pending proceedings to which we are a party that our management believes will have a material adverse effect on our results of operations, cash flows or financial condition. However, future events or circumstances, currently unknown to management, will determine whether the resolution of any litigation or claims will ultimately have a material effect on our results of operations, cash flows or financial condition in any future reporting periods.
Regulatory Compliance— In the ordinary course of our business, we are subject to various laws and regulations. In the opinion of our management, compliance with current laws and regulations will not have a material effect on our results of operations, cash flows or financial condition.
Environmental Compliance— Our operations are subject to stringent and complex laws and regulations pertaining to health, safety, and the environment. We are subject to laws and regulations at the federal, state and local levels that relate to air and water quality, hazardous and solid waste management and disposal and other environmental matters. The cost of planning, designing, constructing and operating our facilities must incorporate compliance with environmental laws and regulations and safety standards. Failure to comply with these laws and regulations may trigger a variety of administrative, civil and potentially criminal enforcement measures. At June 30, 2012, we had recorded no liabilities for environmental matters.
Commitments — Consolidated lease and rental expense was $1.8 million and $4 million for the three and six months ended June 30, 2012 and $1.7 million and $2.2 million for the three and six months ended June 30, 2011. There have been no material changes to our operating leases commitments since those reported in our Annual Report 2011 Form 10-K.
13. INCOME TAXES
No provision for federal or state income taxes is included in our results of operations as such income is taxable directly to the partners.
However, we are subject to Texas Margin tax and our current tax liability will be assessed based on 0.7% of the gross revenue apportioned to Texas. The margin tax qualifies as an income tax under GAAP, which requires us to recognize the impact of this tax on the temporary differences between the financial statement assets and liabilities and their tax basis attributable to such tax.
See Note 14 to the consolidated financial statements in our 2011 Annual Report on Form 10-K for more information about our income taxes.
14. EQUITY PLAN
Awards of phantom and restricted units have been granted under our Fourth Amended and Restated 2007 Equity Plan (“2007 Equity Plan”). The following table summarizes information regarding 2012 phantom unit activity:
| Payable In Cash | Payable In Units | |||||||||||||||
| Units | Weighted- Average Grant Date Fair Value | Units | Weighted- Average Grant Date Fair Value | |||||||||||||
Unvested - January 1, 2012 | 13,346 | $ | 26.40 | 128,795 | $ | 27.22 | ||||||||||
Vested - phantom units | (519 | ) | $ | 27.72 | (40,929 | ) | $ | 27.21 | ||||||||
Vested - restricted units | — | — | (1,348 | ) | $ | 27.11 | ||||||||||
Issued - phantom units | — | — | 124,868 | $ | 29.95 | |||||||||||
Issued - restricted units | — | — | 20,000 | $ | 27.54 | |||||||||||
Canceled - phantom units | (567 | ) | $ | 25.10 | (16,927 | ) | $ | 28.49 | ||||||||
|
|
|
| |||||||||||||
Unvested - June 30, 2012 | 12,260 | $ | 26.41 | 214,459 | $ | 28.73 | ||||||||||
|
|
|
| |||||||||||||
18
Index to Financial Statements
As of June 30, 2012 and December 31, 2011, we had total unamortized compensation expense of approximately $4.4 million and $2.2 million related to phantom and restricted units, which we expect will be amortized over the original vesting periods of these instruments of three years, except for grants to non-employee directors of our General Partner which vest over one year. We recognized compensation expense of approximately $1.0 million and $0.6 million during the six months ended June 30, 2012 and 2011. We granted phantom and restricted units with a grant date fair value of approximately $4.3 million during the six months ended June 30, 2012. As of June 30, 2012, we had 515,667 units available for issuance under the 2007 Equity Plan.
Under the 2007 Equity Plan, participants who have grants of issued restricted units may elect to have us withhold common units to satisfy minimum statutory tax withholding obligations arising in connection with the vesting of non-vested common units. Any such common units withheld are returned to the 2007 Equity Plan on the applicable vesting dates, which correspond to the times at which income is recognized by the employee. When we withhold these common units, we are required to remit to the appropriate taxing authorities the fair value of the units withheld as of the vesting date. The number of units withheld is determined based on the closing price per common unit as reported on the NYSE on such dates. During the quarter ended March 31, 2012, we withheld 414 common units to satisfy employee tax withholding obligations. The withholding of common units by us could be deemed a purchase of the common units. There were no common units withheld to satisfy employee tax withholding obligations for the quarter ended June 30, 2012.
See Note 15 to the consolidated financial statements in our 2011 Annual Report on Form 10-K, for a more complete description of our 2007 Equity Plan.
15. TRANSACTIONS WITH RELATED PARTIES
Omnibus Agreement— In October 2010, concurrent with Quicksilver Resources Inc.’s (“Quicksilver”) sale of all of its ownership interests in CMLP to Crestwood Holdings (“Crestwood Transaction”), we entered into an omnibus agreement with Crestwood Holdings and our General Partner (“Omnibus Agreement”) that addresses the following matters:
| • | restrictions on Crestwood Holdings’ ability to engage in certain midstream business activities or own certain related assets in the Hood, Somervell, Johnson, Tarrant, Hill, Parker, Bosque and Erath Counties in Texas; |
| • | Crestwood Holdings’ obligation to indemnify us for certain liabilities and our obligation to indemnify Crestwood Holdings for certain liabilities; |
| • | our obligation to reimburse Crestwood Holdings for all expenses incurred by Crestwood Holdings (or payments made on our behalf) in conjunction with Crestwood Holdings’ provision of general and administrative services to us, including salary and benefits of Crestwood Holdings personnel, our public company expenses, general and administrative expenses and salaries and benefits of our executive management who are Crestwood Holdings’ employees; |
| • | our obligation to reimburse Crestwood Holdings for all insurance coverage expenses it incurs or payments it makes with respect to our assets; and |
| • | our obligation to reimburse Crestwood Holdings for all expenses incurred by Crestwood Holdings (or payments made on our behalf) in conjunction with Crestwood Holdings’ provision of services necessary to operate, manage and maintain our assets. |
Any or all of the provisions of the Omnibus Agreement are terminable by Crestwood Holdings at its option if our General Partner is removed without cause and units held by our General Partner and its affiliates are not voted in favor of that removal. The Omnibus Agreement terminates on the earlier of August 10, 2017 or at such times as Crestwood Holdings ceases to own or control a majority of the issued and outstanding voting securities of our General Partner.
We paid Crestwood Holdings approximately $4.7 million and $9.4 million during the three and six months ended June 30, 2012 and $4.2 million and $8.1 million during the three and six months ended June 30, 2011 to reimburse Crestwood Holdings for expenses incurred on our behalf under the Omnibus Agreement. These amounts were reflected as operating expense in our income statement.
Pursuant to the terms of the purchase agreement entered into with Quicksilver in connection with the Crestwood Transaction, Quicksilver is entitled to appoint a director to our General Partner’s board of directors. To date, such appointee has been an executive officer of Quicksilver, and accordingly Quicksilver is considered a related party. We have several contracts with Quicksilver, which include the following:
Gas Gathering and Processing Agreements— Quicksilver has agreed to dedicate all of the natural gas produced on properties operated by Quicksilver within the areas served by our Alliance, Cowtown, and Lake Arlington Systems through 2020. We recognized $28.2 million and $58.8 million in Revenue — related party for the three and six months ended June 30, 2012 and $32.4 million and $62.4 million in Revenue — related party for the three and six months ended June 30, 2011.
19
Index to Financial Statements
Alliance Pipeline Lease— We also entered into an agreement with Quicksilver to lease pipeline assets attached to the Alliance System. We recognized $0.1 million for the three and six months ended June 30, 2012 and $0.1 million and $0.3 million for the three and six months ended June 30, 2011 of expense related to this agreement.
Hill County Dry System— We operated the Hill County Dry System pursuant to an operating agreement with Quicksilver effective as of the Crestwood Transaction to October 2011. There were no reimbursements by Quicksilver for the three and six months ended June 30, 2012 and $0.2 million and $0.3 million for the three and six months ended June 30, 2011 related to this agreement.
Joint Operating Agreement— We entered into an agreement with Quicksilver for the joint development of areas governed by certain of our existing commercial agreements. Quicksilver reimbursed us $0.2 million and $0.5 million for the three and six months ended June 30, 2012 and $0.3 million and $0.5 million for the three and six months ended June 30, 2011 for services rendered related to this agreement.
Other Agreements — During 2010 we entered in an agreement with Quicksilver to lease office space in Glen Rose, Texas. We recognized $22,000 and $44,000 for the three and six months ended June 30, 2012 and $22,000 and $44,000 for the three and six months ended June 30, 2011 in expense related to this agreement.
16. PARTNERS’ CAPITAL AND DISTRIBUTIONS
Partnership Agreement
Our Second Amended and Restated Agreement of Limited Partnership, dated February 19, 2008, as amended, requires that, within 45 days after the end of each quarter, we distribute all of our Available Cash (as defined therein) to unitholders of record on the applicable record date, as determined by our General Partner. See Note 17 to the consolidated financial statements in our 2011 Annual Report for a more complete description of our distribution policy.
On January 13, 2012, we completed a public offering of 3,500,000 common units, representing limited partner interests in us, at a price of $30.73 per common unit ($29.50 per common unit, net of underwriting discounts), providing net proceeds of approximately $103 million. The net proceeds from the offering were used to reduce indebtedness under our Credit Facility. Our General Partner did not make an additional capital contribution at the time of the offering, resulting in a reduction in our General Partner’s general partner interest in us to approximately 1.74%.
On April 12, 2012, our General Partner made an additional capital contribution of $3.4 million to us in exchange for the issuance of an additional 118,862 General Partner units, increasing the General Partner interest from 1.74% to 2%.
The following table presents distributions for 2012 and 2011 (In millions, except per unit data):
| Distribution Paid | ||||||||||||||||||||||||||||||
| Limited Partners | General Partner | |||||||||||||||||||||||||||||
Payment Date | Attributable to the Quarter Ended | Per Unit Distribution | Cash paid to common | Paid-In-Kind Value to Class C unitholders (1) | Cash paid to General Partner and IDR | Paid-In-Kind Value to Class C unitholders (1) | Total Cash | Total Distribution | ||||||||||||||||||||||
2012 | ||||||||||||||||||||||||||||||
August 10, 2012 | June 30, 2012(2) | $ | 0.50 | $ | 20.6 | $ | 3.4 | $ | 3.7 | $ | 0.5 | $ | 24.3 | $ | 28.2 | |||||||||||||||
May 11, 2012 | March 31, 2012 | $ | 0.50 | $ | 18.2 | $ | 3.4 | $ | 3.3 | $ | 0.5 | $ | 21.5 | $ | 25.4 | |||||||||||||||
February 10, 2012 | December 31, 2011 | $ | 0.49 | $ | 17.9 | $ | 3.2 | $ | 2.8 | $ | 0.5 | $ | 20.7 | $ | 24.4 | |||||||||||||||
2011 | ||||||||||||||||||||||||||||||
November 10, 2011 | September 30, 2011 | $ | 0.48 | $ | 15.8 | $ | 3.1 | $ | 2.3 | $ | 0.4 | $ | 18.1 | $ | 21.6 | |||||||||||||||
August 12, 2011 | June 30, 2011 | $ | 0.46 | $ | 15.2 | $ | 2.9 | $ | 1.6 | $ | 0.2 | $ | 16.8 | $ | 19.9 | |||||||||||||||
May 13, 2011 | March 31, 2011 | $ | 0.44 | $ | 13.7 | $ | 2.7 | $ | 1.1 | $ | 0.2 | $ | 14.8 | $ | 17.7 | |||||||||||||||
February 11, 2011 | December 31, 2010 | $ | 0.43 | $ | 13.4 | $ | — | $ | 0.9 | $ | — | $ | 14.3 | $ | 14.3 | |||||||||||||||
| (1) | We issued 94,093, 115,140, 144,402, 120,095 and 136,128 Class C units to Class C unitholders on May 13, 2011, August 12, 2011, November 10, 2011, February 10, 2012 and May 11, 2012. |
| (2) | Subsequent to June 30, 2012, we issued an additional 4,600,000 common units. In conjunction with this issuance, our General Partner made an additional capital contribution of $2.5 million to us in exchange for the issuance of an additional 96,860 General Partner units to maintain its 2% General Partner interest in us. The additional units will participate in the second quarter distributions which results in an additional cash distribution of $2.3 million to our limited partners and $0.4 million to our General Partner that is included in the table above in the August 10, 2012 distribution. |
We have the option to pay distributions to our Class C unitholders with cash or by issuing additional Paid-In-Kind Class C units based upon the volume weighted-average price of our common units for the 10 trading days immediately preceding the date the distribution is declared. We plan to issue an additional 138,731 Class C units to Class C unitholders on August 10, 2012.
20
Index to Financial Statements
17. SUBSEQUENT EVENTS
Subsequent Equity Offering
Subsequent to June 30, 2012, we completed a public offering of 4,600,000 common units, representing limited partner interests in us, at a price of $26.00 per common unit ($24.97 per common unit, net of underwriting discounts), providing net proceeds of approximately $114.9 million. We used the net proceeds from the offering to reduce indebtedness under our Credit Facility. In connection with the issuance of common units, our General Partner made an additional capital contribution of $2.5 million to maintain its 2% general partner interest in us.
Devon Acquisition
On July 21, 2012, we entered into a purchase and sale agreement (the “Purchase and Sale Agreement”) with Devon Gas Services, L.P. and Southwestern Gas Pipeline, Inc., both of which are subsidiaries of Devon Energy Corporation (“Devon”). Under the Purchase and Sale Agreement, we will acquire certain gathering and processing assets in the liquids-rich southwestern area of the Barnett Shale for $90 million (the “Devon Acquisition”), subject to normal closing adjustments. The assets to be acquired from Devon consist of a 74 mile low pressure natural gas gathering system, a 100 MMcfd cryogenic processing facility and 23,100 horsepower of compression equipment located in the western portion of Johnson County, Texas in close proximity to our Cowtown gathering system. Additionally, we will enter into a 20 year, fixed-fee gathering, processing and compression agreement with Devon Energy Production Company, L.P. under which we will gather and process Devon’s natural gas production from a 20,500 acre dedication. Current natural gas production under the agreement is approximately 95 MMcfd of natural gas. The transaction is expected to close in the third quarter 2012, subject to customary closing conditions. The Purchase and Sale Agreement contains representations and warranties, covenants and indemnification provisions that are typical for transactions of this nature. We can provide no assurance that we will complete the Devon Acquisition.
18. SEGMENT INFORMATION
Our operations include four reportable operating segments. These operating segments reflect the way we internally report the financial information used to make decisions and allocate resources in connection with our operations. We evaluate the performance of our operating segments based on EBITDA, which represents operating income plus, depreciation, amortization and accretion expense.
Our reportable segments reflect the primary geographic areas in which we operate and consist of Barnett, Fayetteville, Granite Wash and Marcellus, all of which are located within the United States. Our reportable segments are engaged in the gathering, processing, treating, compression, transportation and sales of natural gas and delivery of NGLs.
Other consists of those operating segments or reporting units that did not meet quantitative reporting thresholds. For the six months ended June 30, 2012, two customers accounted for 58% and 11% of total revenue in the Barnett and Fayetteville segments, respectively.
The following table is a reconciliation of Net Income to EBITDA (In thousands):
| Three Months Ended June 30, | Six Months Ended June 30, | |||||||||||||||
| 2012 | 2011 | 2012 | 2011 | |||||||||||||
Net Income | $ | 5,980 | $ | 10,227 | $ | 15,785 | $ | 19,603 | ||||||||
Add: | ||||||||||||||||
Interest expense | 8,286 | 9,819 | 15,843 | 12,825 | ||||||||||||
Income tax provision | 275 | 329 | 578 | 551 | ||||||||||||
Depreciation, amortization and accretion expense | 10,838 | 8,361 | 21,484 | 14,386 | ||||||||||||
|
|
|
|
|
|
|
| |||||||||
EBITDA | $ | 25,379 | $ | 28,736 | $ | 53,690 | $ | 47,365 | ||||||||
|
|
|
|
|
|
|
| |||||||||
21
Index to Financial Statements
The following tables summarize the reportable segment data for the three and six months ended June 30, 2012 and 2011 (In thousands):
| Three Months Ended June 30, 2012 | ||||||||||||||||||||||||||||
| Barnett | Fayetteville | Granite Wash | Marcellus | Other | Corporate | Total | ||||||||||||||||||||||
Revenue | $ | 3,337 | $ | 6,330 | $ | 7,722 | $ | — | $ | 2,647 | $ | — | $ | 20,036 | ||||||||||||||
Revenue - related party | 28,166 | — | — | — | — | — | 28,166 | |||||||||||||||||||||
Product purchases | — | 124 | 6,732 | — | 585 | — | 7,441 | |||||||||||||||||||||
Operations and maintenance expense | 5,345 | 2,231 | 541 | — | 770 | — | 8,887 | |||||||||||||||||||||
General and administrative expense | — | — | — | — | — | 6,936 | 6,936 | |||||||||||||||||||||
Earnings from unconsolidated affiliate | — | — | — | 441 | — | — | 441 | |||||||||||||||||||||
|
|
|
|
|
|
|
|
|
|
|
|
|
| |||||||||||||||
EBITDA | $ | 26,158 | $ | 3,975 | $ | 449 | $ | 441 | $ | 1,292 | $ | (6,936 | ) | $ | 25,379 | |||||||||||||
|
|
|
|
|
|
|
|
|
|
|
|
|
| |||||||||||||||
Goodwill | $ | — | $ | 76,767 | $ | 14,211 | $ | — | $ | — | $ | — | $ | 90,978 | ||||||||||||||
Total assets | $ | 537,333 | $ | 305,767 | $ | 77,031 | $ | 129,966 | $ | 82,774 | $ | 17,368 | $ | 1,150,239 | ||||||||||||||
Capital Expenditures | $ | 4,132 | $ | 886 | $ | 675 | $ | — | $ | 2,660 | $ | 293 | $ | 8,646 | ||||||||||||||
| Three Months Ended June 30, 2011 | ||||||||||||||||||||||||||||
| Barnett | Fayetteville | Granite Wash | Marcellus | Other | Corporate | Total | ||||||||||||||||||||||
Revenue | $ | 2,243 | $ | 7,083 | $ | 12,536 | $ | — | $ | 1,255 | $ | — | $ | 23,117 | ||||||||||||||
Revenue - related party | 32,418 | — | — | — | — | — | 32,418 | |||||||||||||||||||||
Product purchases | — | 559 | 10,474 | — | 1,072 | — | 12,105 | |||||||||||||||||||||
Operations and maintenance expense | 5,585 | 2,391 | 499 | — | 159 | — | 8,634 | |||||||||||||||||||||
General and administrative expense | — | — | — | — | — | 6,060 | 6,060 | |||||||||||||||||||||
Earnings from unconsolidated affiliate | — | — | — | — | — | — | — | |||||||||||||||||||||
|
|
|
|
|
|
|
|
|
|
|
|
|
| |||||||||||||||
EBITDA | $ | 29,076 | $ | 4,133 | $ | 1,563 | $ | — | $ | 24 | $ | (6,060 | ) | $ | 28,736 | |||||||||||||
|
|
|
|
|
|
|
|
|
|
|
|
|
| |||||||||||||||
Goodwill | $ | — | $ | 73,845 | $ | 17,323 | $ | — | $ | — | $ | — | $ | 91,168 | ||||||||||||||
Total assets | $ | 555,566 | $ | 291,306 | $ | 79,099 | $ | — | $ | 6,223 | $ | 20,461 | $ | 952,655 | ||||||||||||||
Capital Expenditures | $ | 3,805 | $ | 2,328 | $ | 2,741 | $ | — | $ | 38 | $ | — | $ | 8,912 | ||||||||||||||
22
Index to Financial Statements
| Six Months Ended June 30, 2012 | ||||||||||||||||||||||||||||
| Barnett | Fayetteville | Granite Wash | Marcellus (1) | Other | Corporate | Total | ||||||||||||||||||||||
Revenue | $ | 6,663 | $ | 13,194 | $ | 17,319 | $ | — | $ | 5,976 | $ | — | $ | 43,152 | ||||||||||||||
Revenue - related party | 58,783 | — | — | — | — | — | 58,783 | |||||||||||||||||||||
Product purchases | — | 206 | 15,033 | — | 1,175 | — | 16,414 | |||||||||||||||||||||
Operations and maintenance expense | 11,475 | 4,544 | 1,059 | — | 1,520 | — | 18,598 | |||||||||||||||||||||
General and administrative expense | — | — | — | — | — | 13,674 | 13,674 | |||||||||||||||||||||
Earnings from unconsolidated affiliate | — | — | — | 441 | — | — | 441 | |||||||||||||||||||||
|
|
|
|
|
|
|
|
|
|
|
|
|
| |||||||||||||||
EBITDA | $ | 53,971 | $ | 8,444 | $ | 1,227 | $ | 441 | $ | 3,281 | $ | (13,674 | ) | $ | 53,690 | |||||||||||||
|
|
|
|
|
|
|
|
|
|
|
|
|
| |||||||||||||||
Goodwill | $ | — | $ | 76,767 | $ | 14,211 | $ | — | $ | — | $ | — | $ | 90,978 | ||||||||||||||
Total assets | $ | 537,333 | $ | 305,767 | $ | 77,031 | $ | 129,966 | $ | 82,774 | $ | 17,368 | $ | 1,150,239 | ||||||||||||||
Capital Expenditures | $ | 5,999 | $ | 8,954 | $ | 1,963 | $ | — | $ | 4,185 | $ | 434 | $ | 21,535 | ||||||||||||||
| Six Months Ended June 30, 2011 | ||||||||||||||||||||||||||||
| Barnett | Fayetteville (2) | Granite Wash(2) | Marcellus | Other(3) | Corporate | Total | ||||||||||||||||||||||
Revenue | $ | 4,154 | $ | 7,083 | $ | 12,536 | $ | — | $ | 1,736 | $ | — | $ | 25,509 | ||||||||||||||
Revenue - related party | 62,406 | — | — | — | — | — | 62,406 | |||||||||||||||||||||
Product purchases | — | 559 | 10,474 | — | 1,495 | — | 12,528 | |||||||||||||||||||||
Operations and maintenance expense | 12,513 | 2,391 | 499 | — | 189 | — | 15,592 | |||||||||||||||||||||
General and administrative expense | — | — | — | — | — | 12,430 | 12,430 | |||||||||||||||||||||
Earnings from unconsolidated affiliate | — | — | — | — | — | — | — | |||||||||||||||||||||
|
|
|
|
|
|
|
|
|
|
|
|
|
| |||||||||||||||
EBITDA | $ | 54,047 | $ | 4,133 | $ | 1,563 | $ | — | $ | 52 | $ | (12,430 | ) | $ | 47,365 | |||||||||||||
|
|
|
|
|
|
|
|
|
|
|
|
|
| |||||||||||||||
Goodwill | $ | — | $ | 73,845 | $ | 17,323 | $ | — | $ | — | $ | — | $ | 91,168 | ||||||||||||||
Total assets | $ | 555,566 | $ | 291,306 | $ | 79,099 | $ | — | $ | 6,223 | $ | 20,461 | $ | 952,655 | ||||||||||||||
Capital Expenditures | $ | 11,781 | $ | 2,328 | $ | 2,741 | $ | — | $ | 38 | $ | — | $ | 16,888 | ||||||||||||||
| (1) | Includes approximately three months of income for Marcellus , from March 26, 2012 to June 30, 2012, subsequent to the acquisition. |
| (2) | Includes three months of income for Fayetteville and Granite Wash, from April 1, 2011 to June 30, 2011, subsequent to the acquisition. |
| (3) | Includes approximately five months of income for Las Animas Systems, from February 1, 2011 to June 30, 2011, subsequent to the acquisition. |
23
Index to Financial Statements
Item 2. Management’s Discussion and Analysis of Financial Condition and Results of Operations
Overview and Performance Metrics
We are a growth-oriented publicly traded Delaware master limited partnership engaged in the gathering, processing, treating, compression, transportation and sales of natural gas and the delivery of NGLs produced from the geological formations of the Barnett Shale in north Texas, the Fayetteville Shale in northwestern Arkansas, the Granite Wash in the Texas Panhandle, the Marcellus Shale in northern West Virginia, the emerging Avalon Shale in southeastern New Mexico, and the Haynesville/Bossier Shale in western Louisiana. We began operations in 2004 to provide midstream services primarily to Quicksilver Resources Inc. (“Quicksilver”) as well as to other natural gas producers in the Barnett Shale. For the six months ended June 30, 2012, Quicksilver accounted for 58% of our total consolidated revenue, including approximately 9% that is comprised of natural gas purchased by Quicksilver from Eni SpA and gathered under an agreement with Quicksilver.
We conduct all of our operations in the midstream sector with eight operating segments, four of which are reportable. Our operating segments reflect how we manage our operations and are generally reflective of the geographic areas in which we operate. Our reportable segments consist of Barnett, Fayetteville, Granite Wash and Marcellus. Our operating segments are engaged in gathering, processing, treating, compression, transportation and sales of natural gas and delivery of NGLs in the United States.
The results of our operations are significantly influenced by the volumes of natural gas gathered and processed through our systems. We gather, process, treat, compress, transport and sell natural gas pursuant to fee-based and percent-of-proceeds contracts. Under our fixed fee contracts, we do not take title to the natural gas or associated NGLs. For the six months ended June 30, 2012, approximately 98% of our gross margin, which we define as total revenue less product purchases, is derived from fee-based service contracts, which minimizes our commodity price exposure and provides us with less volatile operating performance and cash flows. Under our percent-of-proceeds contracts, we take title to the residue gas, NGLs and condensate and remit a portion of the sale proceeds to the producer based on prevailing commodity prices. For the six months ended June 30, 2012, the net revenues from percent-of-proceeds contracts accounted for approximately 2% of gross margin.
Although we do not have significant direct commodity price exposure, lower natural gas prices could have a potential negative impact on the pace of drilling in dry gas areas – such as areas in the Barnett Shale (gathered by the Alliance and Lake Arlington Systems), the Fayetteville Systems and the Sabine System (part of the Haynesville/Bossier Shale). We operate four systems located in basins that include NGL rich gas shale plays: (i) the Cowtown System, part of the Barnett segment; (ii) the Granite Wash System; and (iii) two systems acquired by CMM in the Marcellus segment. For the six months ended June 30, 2012, our systems located in NGL rich basins contributed approximately 52% of our total revenue. A prolonged decrease in the commodity price environment could result in our customers reducing their production volumes which would cause a resulting decrease in our revenue.
Our management uses a variety of financial and operational measures to analyze our performance. We view these measures as important factors affecting our profitability and unitholder value and therefore we review them monthly for consistency and to identify trends in our operations. These performance measures are outlined below.
Volume– We must continually obtain new supplies of natural gas to maintain or increase throughput volumes on our gathering and processing systems. We routinely monitor producer activity in the areas we serve to identify new supply opportunities. Our ability to achieve these objectives is impacted by:
| • | the level of successful drilling and production activity in areas where our systems are located; |
| • | our ability to compete with other midstream companies for production volumes; and |
| • | our pursuit of new acquisition opportunities. |
Operating and Maintenance Expenses– We consider operating and maintenance expenses in evaluating the performance of our operations. These expenses are comprised primarily of labor, parts and materials, insurance, taxes, repair and maintenance costs, utilities and contract services. Our ability to manage operating and maintenance expenses has a significant impact on our profitability and ability to pay distributions.
EBITDA and Adjusted EBITDA– We believe that EBITDA and Adjusted EBITDA are widely accepted financial indicators of a company’s operational performance and its ability to incur and service debt, fund capital expenditures and make distributions. EBITDA and Adjusted EBITDA are not measures calculated in accordance with GAAP, as they do not include deductions for items such as depreciation, amortization and accretion, interest and income taxes, which are necessary to maintain our business. In addition, Adjusted EBITDA considers certain expenses related to non-recurring matters identified in a specific reporting period. Additionally, Adjusted EBITDA considers the adjusted earnings impact of our unconsolidated affiliate by adjusting our equity earnings from our unconsolidated affiliate for our proportionate share of its depreciation, interest and other non-recurring charges for a specific reporting period. EBITDA and Adjusted EBITDA should not be considered an alternative to net income, operating cash flow or any other measure of financial performance presented in accordance with GAAP. EBITDA and Adjusted EBITDA calculations may vary among entities, so our computation may not be comparable to measures of other entities.
See our reconciliation of Net Income to EBITDA and Adjusted EBITDA in “Results of Operations”.
24
Index to Financial Statements
Current Year Highlights
The following events took place during the six months ended June 30, 2012 and the month of July 2012, and have impacted or are likely to impact our financial condition and results of operations.
Operational and Industry Highlights
Shale gas production in the United States has grown rapidly in recent years as the natural gas industry has improved drilling and extraction methods while increasing exploration efforts. The United States has a wide distribution of shale formations containing vast resources of natural gas, NGLs and oil. Led by the rapid development of the Barnett Shale in Texas, shale gas activity has expanded into other areas such as the Marcellus, Fayetteville and Haynesville/Bossier shale plays.
Growth through Diversification –Our operating results reflect our ability to diversify our shale play portfolio and increase volumes not only through our base business located in the Barnett Shale, but also through strategic acquisitions in a number of lucrative shale plays in the United States. We gathered 586 MMcfd during the six months ended June 30, 2012 which is an increase of 17% from 499 MMcfd during the same period 2011. Additionally, our processed volumes increased slightly from 141 MMcfd for the six months ended June 30, 2011 to 146 MMcfd for the same period in 2012. The increase in volumes equated to an increase in revenue of 16% period-over-period for the six months ended June 30, 2012.
Additionally, in March 2012, we made an equity investment in CMM, a joint venture, which purchased gathering assets in the Marcellus Shale. For the three months ended June 30, 2012, the gathering assets purchased by the joint venture gathered 257 MMcfd. This equated to $0.4 million in equity income to us for the three months ended June 30, 2012, which is included in our condensed consolidated statements of income. We believe that this investment will be an integral component of our growth-oriented business model.
Distribution Growth – For the three months ended June 30, 2012, we declared a distribution of $0.50 per limited partner unit compared to $0.46 per limited partner unit for the second quarter 2011. This represents a 9% increase period over period.
Devon Acquisition
On July 21, 2012, we entered into a purchase and sale agreement (the “Purchase and Sale Agreement”) with Devon Gas Services, L.P. and Southwestern Gas Pipeline, Inc., both of which are subsidiaries of Devon Energy Corporation (“Devon”). Under the Purchase and Sale Agreement, we will acquire certain gathering and processing assets in the liquids-rich southwestern area of the Barnett Shale for $90 million (the “Devon Acquisition”), subject to normal closing adjustments. The assets to be acquired from Devon consist of a 74 mile low pressure natural gas gathering system, a 100 MMcfd cryogenic processing facility and 23,100 horsepower of compression equipment located in the western portion of Johnson County, Texas in close proximity to our Cowtown gathering system. Additionally, we will enter into a 20 year, fixed-fee gathering, processing and compression agreement with Devon Energy Production Company, L.P. under which we will gather and process Devon’s natural gas production from a 20,500 acre dedication. Current natural gas production under the agreement is approximately 95 MMcfd of natural gas. The transaction is expected to close in the third quarter 2012, subject to customary closing conditions. The Purchase and Sale Agreement contains representations and warranties, covenants and indemnification provisions that are typical for transactions of this nature.
Devon’s West Johnson County system currently has approximately 230 producing wells. Additionally, due to the liquids-rich quality of the natural gas production in this portion of the Barnett Shale, Devon has maintained an active drilling and development plan for the West Johnson County area in 2012 and expects to continue to further develop the dedicated properties in 2013. This investment will be immediately accretive to us and we believe it will add to our volume growth during 2012.
Investment in an Unconsolidated Affiliate
On March 26, 2012, we invested $131 million in cash to CMM in exchange for a 35% interest in CMM which is held by our wholly-owned subsidiary. Crestwood Holdings LLC invested $244 million for the remaining 65% interest, which is held by its wholly-owned subsidiary. CMM is a new joint venture formed for the purpose of acquiring certain of Antero’s Marcellus Shale gathering system assets located in Harrison and Doddridge Counties, West Virginia. CMM’s purchase price to acquire the assets was $375 million, subject to normal purchase price adjustments, in cash, plus an earn-out which would allow Antero to earn additional purchase price payments of up to $40 million based upon average annual production levels achieved during 2012, 2013 and 2014.
Additionally, CMM entered into the 20-year, fixed-fee, GGA with Antero, which provides for an area of dedication of approximately 127,000 gross acres, largely located in the rich gas corridor of the southwestern core of the Marcellus Shale play. As part of the GGA, Antero committed to delivery of minimum annual volumes to CMM for a seven year period from January 1, 2012 to January 1, 2019, resulting in total guaranteed throughput volume commitments over such period to CMM of approximately 300 MMcfd to 450 MMcfd.
25
Index to Financial Statements
The assets acquired by CMM at closing include approximately 33 miles of low pressure gathering pipelines gathering approximately 210 MMcfd from 59 existing horizontal Marcellus Shale wells. The gathering pipelines deliver Antero’s Marcellus Shale production to various regional pipeline systems including Columbia, Dominion and Equitrans.
In June 2012, CMM finalized its final settlement statement with Antero based on performance and expenditures earned and incurred by Antero from January 1, 2012 to March 26, 2012. Based on this statement, CMM paid Antero an additional $4.9 million in July 2012 which will be included in their purchase price allocation.
On June 29, 2012, we received a $1.7 million cash distribution from CMM in accordance with the CMM Limited Liability Agreement. See Part I, Item 1, “Notes to Condensed Consolidated Financial Statements— Note 4— Investment in Unconsolidated Affiliate” to this report for further discussion of our investment in CMM.
Financing Activities
Equity Offerings
Subsequent to June 30, 2012, we completed a public offering of 4,600, 000 common units, representing limited partner interests in us, at a price of $26.00 per common unit ($24.97 per common unit, net of underwriting discounts), providing net proceeds of approximately $114.9 million. We used the net proceeds from the offering to reduce indebtedness under our Credit Facility. We anticipate that approximately $90 million of the amount repaid under our Credit Facility will be reborrowed and used to finance, in whole or in part, the Devon Acquisition. In connection with the issuance of common units, our General Partner made an additional capital contribution of $2.5 million to maintain its 2% general partner interest in us.
On January 13, 2012, we completed a public offering of 3,500,000 common units, representing limited partner interests in us, at a price of $30.73 per common unit ($29.50 per common unit, net of underwriting discounts), providing net proceeds of approximately $103 million. The net proceeds from the offering were used to reduce indebtedness under our Credit Facility. Our General Partner did not make an additional capital contribution at the time of the offering, resulting in a reduction in our General Partner’s general partner interest in us to approximately 1.74%.
On April 12, 2012, our General Partner made an additional capital contribution of $3.4 million to us in exchange for the issuance of an additional 118,862 General Partner units, increasing the General Partner interest from 1.74% to 2%.
26
Index to Financial Statements
Results of Operations
Three and Six Months Ended June 30, 2012 Compared with Three and Six Months Ended June 30, 2011
The following table summarizes our results of operations (In thousands):
| Three Months Ended June 30, | Six Months Ended June 30, | |||||||||||||||
| 2012 | 2011 | 2012 | 2011 | |||||||||||||
Total revenues | $ | 48,202 | $ | 55,535 | $ | 101,935 | $ | 87,915 | ||||||||
Product purchases | 7,441 | 12,105 | 16,414 | 12,528 | ||||||||||||
Operations and maintenance | 8,887 | 8,634 | 18,598 | 15,592 | ||||||||||||
General and administrative | 6,936 | 6,060 | 13,674 | 12,430 | ||||||||||||
Depreciation, amortization and accretion | 10,838 | 8,361 | 21,484 | 14,386 | ||||||||||||
|
|
|
|
|
|
|
| |||||||||
Operating income | 14,100 | 20,375 | 31,765 | 32,979 | ||||||||||||
Earnings from unconsolidated affiliate | 441 | — | 441 | — | ||||||||||||
Interest expense | 8,286 | 9,819 | 15,843 | 12,825 | ||||||||||||
Income tax provision | 275 | 329 | 578 | 551 | ||||||||||||
|
|
|
|
|
|
|
| |||||||||
Net income | $ | 5,980 | $ | 10,227 | $ | 15,785 | $ | 19,603 | ||||||||
Add: | ||||||||||||||||
Interest expense | 8,286 | 9,819 | 15,843 | 12,825 | ||||||||||||
Income tax provision | 275 | 329 | 578 | 551 | ||||||||||||
Depreciation, amortization and accretion expense | 10,838 | 8,361 | 21,484 | 14,386 | ||||||||||||
|
|
|
|
|
|
|
| |||||||||
EBITDA | $ | 25,379 | $ | 28,736 | $ | 53,690 | $ | 47,365 | ||||||||
Non-recurring expenses | 1,727 | 1,072 | 1,778 | 3,037 | ||||||||||||
Earnings from unconsolidated affiliate | (441 | ) | — | (441 | ) | — | ||||||||||
Adjusted earnings from unconsolidated affiliate | 1,876 | — | 1,876 | — | ||||||||||||
|
|
|
|
|
|
|
| |||||||||
Adjusted EBITDA | $ | 28,541 | $ | 29,808 | $ | 56,903 | $ | 50,402 | ||||||||
|
|
|
|
|
|
|
| |||||||||
The following table summarizes the results of our Barnett, Fayetteville and Granite Wash segments and other operations. Total EBITDA in the table above includes results from these segments and operations and also earnings from our unconsolidated affiliate (which comprises our Marcellus segment) and general and administrative expenses. (In thousands):
| Three Months Ended June 30, | ||||||||||||||||||||||||||||||||||||||||
| Barnett | Fayetteville | Granite Wash | Other | Total | ||||||||||||||||||||||||||||||||||||
| 2012 | 2011 | 2012 | 2011 | 2012 | 2011 | 2012 | 2011 | 2012 | 2011 | |||||||||||||||||||||||||||||||
Gathering Revenues | $ | 23,771 | $ | 26,104 | $ | 6,228 | $ | 6,561 | $ | 270 | $ | 95 | $ | 2,081 | $ | 180 | $ | 32,350 | $ | 32,940 | ||||||||||||||||||||
Processing Revenues | 7,732 | 8,557 | — | — | 16 | 5 | — | — | 7,748 | 8,562 | ||||||||||||||||||||||||||||||
Product Sales | — | — | 102 | 522 | 7,436 | 12,436 | 566 | 1,075 | 8,104 | 14,033 | ||||||||||||||||||||||||||||||
|
|
|
|
|
|
|
|
|
|
|
|
|
|
|
|
|
|
|
| |||||||||||||||||||||
Total Revenues | $ | 31,503 | $ | 34,661 | $ | 6,330 | $ | 7,083 | $ | 7,722 | $ | 12,536 | $ | 2,647 | $ | 1,255 | $ | 48,202 | $ | 55,535 | ||||||||||||||||||||
Product Purchases | — | — | 124 | 559 | 6,732 | 10,474 | 585 | 1,072 | 7,441 | 12,105 | ||||||||||||||||||||||||||||||
Operation and Maintenance Expense | 5,345 | 5,585 | 2,231 | 2,391 | 541 | 499 | 770 | 159 | 8,887 | 8,634 | ||||||||||||||||||||||||||||||
|
|
|
|
|
|
|
|
|
|
|
|
|
|
|
| |||||||||||||||||||||||||
EBITDA | $ | 26,158 | $ | 29,076 | $ | 3,975 | $ | 4,133 | $ | 449 | $ | 1,563 | $ | 1,292 | $ | 24 | ||||||||||||||||||||||||
|
|
|
|
|
|
|
|
|
|
|
|
|
|
|
| |||||||||||||||||||||||||
Gathering Volumes (in MMcf) | 36,529 | 40,946 | 7,112 | 7,334 | 1,367 | 1,538 | 6,044 | 1,100 | 51,052 | 50,918 | ||||||||||||||||||||||||||||||
Processing Volumes (in MMcf) | 11,765 | 13,093 | — | — | 1,362 | 1,466 | — | — | 13,127 | 14,559 | ||||||||||||||||||||||||||||||
27
Index to Financial Statements
| Six Months Ended June 30, | ||||||||||||||||||||||||||||||||||||||||
| Barnett | Fayetteville | Granite Wash | Other | Total | ||||||||||||||||||||||||||||||||||||
| 2012 | 2011 | 2012 | 2011 | 2012 | 2011 | 2012 | 2011 | 2012 | 2011 | |||||||||||||||||||||||||||||||
Gathering Revenues | $ | 49,830 | $ | 50,850 | $ | 12,994 | $ | 6,561 | $ | 409 | $ | 95 | $ | 4,800 | $ | 261 | $ | 68,033 | $ | 57,767 | ||||||||||||||||||||
Processing Revenues | 15,616 | 15,710 | — | — | 99 | 5 | — | — | 15,715 | 15,715 | ||||||||||||||||||||||||||||||
Product Sales | — | — | 200 | 522 | 16,811 | 12,436 | 1,176 | 1,475 | 18,187 | 14,433 | ||||||||||||||||||||||||||||||
|
|
|
|
|
|
|
|
|
|
|
|
|
|
|
|
|
|
|
| |||||||||||||||||||||
Total Revenues | $ | 65,446 | $ | 66,560 | $ | 13,194 | $ | 7,083 | $ | 17,319 | $ | 12,536 | $ | 5,976 | $ | 1,736 | $ | 101,935 | $ | 87,915 | ||||||||||||||||||||
Product Purchases | — | — | 206 | 559 | 15,033 | 10,474 | 1,175 | 1,495 | 16,414 | 12,528 | ||||||||||||||||||||||||||||||
Operation and Maintenance Expense | 11,475 | 12,513 | 4,544 | 2,391 | 1,059 | 499 | 1,520 | 189 | 18,598 | 15,592 | ||||||||||||||||||||||||||||||
|
|
|
|
|
|
|
|
|
|
|
|
|
|
|
| |||||||||||||||||||||||||
EBITDA | $ | 53,971 | $ | 54,047 | $ | 8,444 | $ | 4,133 | $ | 1,227 | $ | 1,563 | $ | 3,281 | $ | 52 | ||||||||||||||||||||||||
|
|
|
|
|
|
|
|
|
|
|
|
|
|
|
| |||||||||||||||||||||||||
Gathering Volumes (in MMcf) | 77,182 | 79,829 | 14,647 | 7,334 | 2,720 | 1,538 | 12,107 | 1,618 | 106,656 | 90,319 | ||||||||||||||||||||||||||||||
Processing Volumes (in MMcf) | 23,822 | 24,053 | — | — | 2,707 | 1,466 | — | — | 26,529 | 25,519 | ||||||||||||||||||||||||||||||
EBITDA and Adjusted EBITDA —EBITDA decreased $3.4 million for the three months ended June 30, 2012 compared to same period during 2011. However, EBITDA increased by $6.3 million for the six months ended June 30, 2012 compared to the respective period in 2011. In the same manner, Adjusted EBITDA decreased $1.3 million and increased by $6.5 million for the three and six months ended June 30, 2012 compared to the respective periods in 2011. Adjusted EBITDA considers expenses related to legal and other consulting services related to evaluating certain transaction opportunities and other non-recurring matters. For the three and six months ended June 30, 2012, $1.7 million and $1.8 million represented our adjustments to EBITDA for those items that met the criteria noted previously. Additionally, Adjusted EBITDA includes $1.4 million of the net earnings adjustments related to adding back our proportionate share of our unconsolidated affiliate’s depreciation, interest expense and non-recurring expenses for the three and six months ended June 30, 2012.
The following section discusses the factors that caused the fluctuations in EBITDA for the three and six months ended June 30, 2012 and 2011, by segment:
Barnett:
For the three months ended June 30, 2012, our Barnett segment’s EBITDA was approximately $3 million less than the same period in 2011, which was primarily due to lower gathering and processing revenues. For the six months ended June 30, 2012, our Barnett segment’s EBITDA was relatively flat as compared to the same period in 2011, which was primarily due to lower gathering revenues offset by lower operations and maintenance expense.
Revenue and Volumes —Revenues in our Barnett segment decreased by approximately $3.2 million quarter over quarter and by $1.1 million six months over six months. This decrease was primarily due to (i) gathered volumes decreasing by approximately 49 MMcfd and 17 MMcfd for the three and six months ended June 30, 2012 compared to the same periods in 2011 and (ii) processed volumes decreasing by 15 MMcfd for the three months ended June 30, 2012, while remaining relatively level for the six month period. The decrease in gathering volumes primarily related to reduced production from existing wells, well shut-ins and lower gas lift volumes at our Alliance and Lake Arlington gathering systems. Producers shut-in eighteen wells for operational reasons and an additional 15 wells were shut-in due to poor well economics experienced in the second quarter of 2012. These shut-in wells coupled with lower gas prices and producer efforts to reduce costs, reduced producer gas lift volumes by approximately 41% during the second quarter of 2012 when compared to the first quarter of 2012. These decreases in volumes were partially offset by producers connecting 24 and 32 new wells during the three and six months ended June 30, 2012. We anticipate that the number of new wells that may be connected to our systems may be impacted by moderated drilling activity in dry gas areas for the remainder of 2012.
Operations and Maintenance Expense — Operations and maintenance expense decreased by approximately $1.0 million for the six months ended June 30, 2012 when compared to the same period in 2011, while remaining relatively flat for the quarter. The decrease in expense relates to reduced labor and lower facility operating costs resulting from the decrease in volumes described above.
Fayetteville:
We acquired our operations in Fayetteville on April 1, 2011, which contributed to the $4.3 million increase in our Fayetteville segment’s EBITDA for the six months ended June 30, 2012 when compared to the same period in 2011. For the three months ended June 30, 2012, our Fayetteville segment’s EBITDA was relatively consistent with the same period in 2011 as a result of consistent volumes period over period.
28
Index to Financial Statements
Granite Wash:
Granite Wash’s operations were acquired on April 1, 2011 with the Fayetteville assets noted above. Although our Granite Wash segment had six months of operations in 2012 (as compared to three months of operations in 2011), EBITDA for the segment was relatively flat for the six months ended June 30, 2012 when compared to the same period in 2011. For the three months ended June 30, 2012, Granite Wash’s EBITDA decreased approximately $1.1 million from the same period in 2011. This decrease in quarter over quarter EBITDA was due to lower margin earned on our percent-of-proceeds contracts in Granite Wash, which primarily resulted from lower NGL and natural gas prices experienced in the second quarter of 2012 coupled with relatively consistent costs per volume.
For the three months ended June 30, 2012 compared to the same period in 2011, operation and maintenance expense remained relatively constant as our operations in Granite Wash remain relatively unchanged.
Other:
Our other operations include our assets in the Hayesville/Bossier Shale (“Sabine System”) and our assets in the Avalon Shale (“Las Animas Systems”).
For the three and six months ended June 30, 2012, our other operations’ EBITDA increased approximately $1.3 million and $3.2 million from the same period in 2011, which primarily relates to the operations of our Sabine System which was acquired in November 2011. The Sabine System had 57 MMcfd in gathered volumes for the three and six months ended June 30, 2012 which equated to $1.9 million and $4.5 million in revenue for the three and six months ended June 30, 2012. EBITDA related to our Las Animas Systems remained relatively unchanged for the three and six months ended June 30, 2012, compared to the same periods in 2011.
Marcellus:
In March 2012, we invested $131 million in cash into CMM in exchange for a 35% ownership interest, which is held by our wholly-owned subsidiary. At the same time, CMM purchased assets in the Marcellus Shale from Antero. This investment in CMM, which is an unconsolidated affiliate, represents our Marcellus segment. For the three months ended June 30, 2012, we had $0.4 million in equity earnings related to this investment. Our proportionate share of CMM’s depreciation expense, interest expense and non-recurring expenses was $1.0 million, $0.2 million and $0.2 million, respectively, during the three and six months ended June 30, 2012.
For the three months ended June 30, 2012, CMM gathered 257 MMcfd through its assets acquired from Antero. Antero connected 14 wells to CMM during the three months ended June 30, 2012, and is expected to add another 38 wells during the remainder of the year. The expected increase in volumes from the added wells are expected to add to our equity earnings from this investment.
The following expense relates to the fluctuation in EBITDA, but is not allocated to segments.
General and Administrative Expense — During the three and six months ended June 30, 2012, general and administrative expense increased by $0.9 million and $1.2 million when compared to the same periods in 2011. General and administrative expense includes costs related to legal and other consulting services to evaluate certain transaction opportunities and other non-recurring matters. We incurred approximately $1.7 million of these costs during the three months ended June 30, 2012, which was the primary driver for the increase in general and administrative expense quarter over quarter. During the six months ended June 30, 2011, we incurred approximately $3.0 million of these costs, as compared to $1.8 million during the six months ended June 30, 2012.
Also impacting our general and administrative expense for the six months ended June 30, 2012 were increases in payroll and related benefit costs, which reflects the increased scope of our business operations compared to the same period in 2011.
Items not affecting EBITDA include the following:
Depreciation, Amortization and Accretion Expense —Depreciation, amortization and accretion expense increased by $2.5 million for the three months ended June 30, 2012 compared to the same period in 2011, which primarily resulted from the assets acquired through our Tristate Acquisition during November 2011. For the six months ended June 30, 2012, depreciation, amortization and accretion expense was higher by $7.1 million, which again primarily related to the Tristate Acquisition and other assets acquired in 2011.
Interest Expense— Interest expense decreased for the three months ended June 30, 2012 compared to the same period in 2011 primarily due $2.5 million of one-time commitment fees incurred in 2011 related to a bridge loan. Additionally, interest expense increased for the six months ended June 30, 2012 compared the six months ended June 30, 2011 due to the increase in the outstanding balance on our Credit Facility and due to our Senior Notes being outstanding for the full six months during 2012 rather than three months for 2011 as we issued our Senior Notes in April 2011.
29
Index to Financial Statements
The following table provides a summary of interest expense (In thousands):
| Three Months Ended June 30, | Six Months Ended June 30, | |||||||||||||||
| 2012 | 2011 | 2012 | 2011 | |||||||||||||
Interest cost: | ||||||||||||||||
Credit Facility | $ | 4,226 | $ | 3,195 | $ | 7,429 | $ | 6,237 | ||||||||
Senior Notes | 4,027 | 4,091 | 8,054 | 4,091 | ||||||||||||
Bridge Loan | — | 2,500 | — | 2,500 | ||||||||||||
Capital lease interest | 45 | 65 | 94 | 65 | ||||||||||||
Other debt-related costs | 93 | — | 462 | — | ||||||||||||
|
|
|
|
|
|
|
| |||||||||
Total cost | 8,391 | 9,851 | 16,039 | 12,893 | ||||||||||||
Less capitalized interest | (105 | ) | (32 | ) | (196 | ) | (68 | ) | ||||||||
|
|
|
|
|
|
|
| |||||||||
Interest expense | $ | 8,286 | $ | 9,819 | $ | 15,843 | $ | 12,825 | ||||||||
|
|
|
|
|
|
|
| |||||||||
Liquidity and Capital Resources
Our sources of liquidity include cash flows generated from operations, available borrowing capacity under our Credit Facility, and issuances of additional debt and equity in the capital markets. We believe that our sources of liquidity will be sufficient to fund our short-term working capital requirements, capital expenditures and cash distributions during 2012. The amount of distributions to unitholders is determined by the board of directors of our General Partner on a quarterly basis.
We regularly review opportunities for both acquisitions and greenfield growth projects that will enhance our financial performance. Since we distribute most of our available cash to our unitholders, we depend on a combination of borrowings under our Credit Facility and debt or equity offerings to finance the majority of our long-term growth capital expenditures or acquisitions.
Management continuously monitors our leverage position and our anticipated capital expenditures relative to our expected cash flows. We continue to evaluate funding alternatives, including additional borrowings and the issuance of debt or equity securities, to secure funds as needed or refinance outstanding debt balances with longer-term notes.
Known Trends and Uncertainties Impacting Liquidity
Our financial condition and results of operations, including our liquidity and profitability, can be significantly affected by the following:
| • | Concentration of Gathering Revenues from Quicksilver:For the six months ended June 30, 2012, Quicksilver accounted for 58% of our total consolidated revenue, including approximately 9% that is comprised of natural gas purchased by Quicksilver from Eni SpA and gathered under Quicksilver’s Alliance System gathering agreement. While we have reduced our dependency upon Quicksilver through the acquisition of additional midstream assets including long term contracts with creditworthy producers such as BHP Billiton Petroleum (“BHP”), British Petroleum, Plc. (“BP”), XTO Energy, a subsidiary of Exxon Mobil Corporation (“XTO Energy”) and Chesapeake Energy Corporation, we remain dependent upon Quicksilver for a substantial percentage of our current business. The risk of revenue fluctuations in the near term is mitigated by the use of fixed-fee contracts for providing gathering, processing, treating and compression services; however, we are still susceptible to volume fluctuations. While our acquisitions reduce the concentration of risk associated with our dependency on one producer and one geographic area, we continue to regularly review opportunities for both acquisitions and greenfield growth projects in other producing basins and with other producers in the future. |
| • | Access to Capital Markets:During 2011, we raised approximately $500 million through debt and equity offerings and increases to our Credit Facility to fund acquisitions and growth capital projects. Additionally, during 2012 an aggregate of $217.9 million was raised through the public issuance of common units. While we anticipate that our currently available borrowing capacity under our Credit Facility is sufficient to fund our planned level of growth capital spending in 2012, additional debt and equity offerings would be necessary to fund additional acquisitions or other growth capital projects. |
30
Index to Financial Statements
| • | Natural Gas Prices: Adding new volumes through our gathering systems is dependent on the drilling and completion activities of natural gas producers in our area of operations. Although investment returns differ between natural gas basins, rich gas and dry gas reservoirs in certain natural gas basins and between various production companies, low natural gas prices may reduce the levels of drilling activity in areas around certain of our assets, particularly those that concentrate on gathering from dry gas reservoirs. We seek to mitigate this risk by diversifying into various geographical production basins with predominately rich gas natural gas reservoirs. We have observed that largely due to superior prices for crude oil and NGLs compared to natural gas, producers are shifting their drilling and development plans to focus on increasing production from rich gas basins or shale plays which offer better drilling economics as compared to production from dry gas basins. We have six systems located in basins that include NGL rich gas shale plays, (i) the Cowtown System, part of the Barnett segment, (ii) the Granite Wash System, (iii) and two systems acquired by CMM in the Marcellus segment. For the six months ended June 30, 2012, these rich gas systems accounted for approximately 52% of our total revenues. We will continue to focus on expanding our business activities and opportunities in rich gas basins or rich gas shale plays due to the current trend of increased drilling and producer activities in these areas. |
| • | Regulatory Requirements: Our operations and the operations of our customers are subject to complex and evolving federal, state, local and other laws and regulations. For example, on April 17, 2012, the Environmental Protection Agency (“EPA”) issued a final rule establishing new emission limitations for certain oil and gas facilities. These rules establish emission standards for gas wells that are hydraulically fractured (or re-fractured). These rules also establish emissions standards for natural gas processing equipment, including compressors, controllers, storage tanks, and gas processing plants. These or other federal or state initiatives relating to hydraulic fracturing or other environmental matters could impact the extent of our operations and/or give rise to or accelerate the need for additional capital projects. In addition, any further changes in laws or regulations, or delays in the issuance of required permits, may further impact the throughput on our systems. |
| • | Impact of Inflation and Interest Rates: Although inflation in the U.S. has been relatively low in recent years, the U.S. economy may experience a significant inflationary effect in the future. Although inflation would negatively impact the cost of our operations and cash flows through services provided to us, the majority of our gathering and processing agreements allow us to charge increased rates based on indices expected to track such inflationary trends. Interest rates have also stayed low in recent years, as compared with historical averages. Should interest rates rise, our financing costs would increase accordingly. In addition, as with other yield-oriented securities, our unit price would also be negatively impacted by higher interest rates. Higher interest rates would increase the costs of issuing debt or equity necessary to finance potential future acquisitions. However, our competitors would face similar circumstances and we expect our cost of capital to remain competitive. |
Cash Flows
The following table provides a summary of our cash flows by category (In thousands):
| Six Months Ended June 30, | ||||||||
| 2012 | 2011 | |||||||
Net cash provided by operating activities | $ | 39,534 | $ | 38,557 | ||||
Net cash used in investing activities | (151,501 | ) | (370,854 | ) | ||||
Net cash provided by financing activities | 111,191 | 332,846 | ||||||
Operating Activities
Six Months Ended June 30, 2012 Compared with Six Months Ended June 30, 2011 –The increase in cash flows from operating activities resulted from an increase of $4.3 million in net income after non-cash income adjustments offset by higher cash used in working capital changes of approximately $3.4 million primarily related to an decrease in accounts payable, accrued expenses and other liabilities.
Investing Activities
The midstream energy business is capital intensive, requiring significant investment for the acquisition or development of new facilities. We categorize our capital expenditures as either:
| • | expansion capital expenditures, which are made to construct additional assets, expand and upgrade existing systems, or acquire additional assets; or |
| • | maintenance capital expenditures, which are made to replace partially or fully depreciated assets, to maintain the existing operating capacity of our assets, and extend their useful lives or required for regulatory purposes. |
31
Index to Financial Statements
We anticipate that we will continue to make capital expenditures to develop our gathering and processing assets in the producing basins in which we operate as well as opportunities to expand into new geographical areas through acquisitions and greenfield growth opportunities.
Six Months Ended June 30, 2012 Compared with Six Months Ended June 30, 2011 – For the six months ended June 30, 2012, we spent $21.5 million on capital projects including $1.6 million related to maintenance capital expenditures. In addition, approximately $2.9 million of the $21.5 million spent on capital projects for the six months ended June 30, 2012 related to the Tygart Valley Pipeline project. Under the MOU Amendment, costs incurred for certain development costs for the Tygart Valley Pipeline project are reimbursable up to $2.9 million in the event of termination of the project. For the six months ended June 30, 2011, we increased gross property, plant and equipment by $170.4 million, including $149.3 million for the Frontier Gas Acquisition, expansion capital expenditures of approximately $15.2 million, $0.7 million in maintenance capital expenditures and $0.1 million in asset retirement costs.
The following table summarizes capital expenditures for the six months ended June 30, 2012 and our expected capital expenditures for the remainder of 2012 (In millions):
| Actual Spending Six Months Ended June 30, 2012 | Forecast Spending Six Months Ended December 31, 2012 | Total 2012 | ||||||||||
Expansion capital expenditures | $ | 19.9 | $ | 4.9 | $ | 24.8 | ||||||
Maintenance capital expenditures | 1.6 | 3.6 | 5.2 | |||||||||
|
|
|
|
|
| |||||||
Total | $ | 21.5 | $ | 8.5 | $ | 30.0 | ||||||
|
|
|
|
|
| |||||||
In addition to the expansion of our assets through capital projects, we invested $131 million in cash to CMM in exchange for an indirect 35% interest. We received capital distributions from CMM in the amount of $1.3 million for the three months ended June 30, 2012. Concurrent with the acquisition of the Antero gathering assets, CMM entered into a $200 million revolving credit facility to finance its future capital requirements and working capital needs of CMM.
Financing Activities
Six Months Ended June 30, 2012 Compared with Six Months Ended June 30, 2011 – The increase in cash flows provided by financing activities was due to:
| • | Net borrowings under our Credit Facility of $49 million; |
| • | $103 million in proceeds from the issuance of 3,500,000 common units in January 2012; and |
| • | General Partner’s additional capital contribution of $3.4 million to us in exchange for the issuance of an additional 118,862 General Partner units, increasing the General Partner interest from 1.74% to 2%. |
This increase was primarily offset by $42.3 million of distributions paid to unitholders during the six months ended June 30, 2012, which increased by $13.1 million when compared to the same period in 2011.
Amendment of Revolving Credit Facility– On March 20, 2012, we amended our Credit Agreement to permit the acquisition of an equity interest in CMM described above and to allow for additional investments in CMM of up to $160 million. Based on our results through June 30, 2012, our total availability under the Credit Facility was $454 million and our borrowings were $361.5 million.
32
Index to Financial Statements
Contractual Obligations
The following table summarizes our contractual obligations as of June 30, 2012 (In thousands):
| Payments Due by Period | ||||||||||||||||||||||||||||
Contractual Obligations | Total | 2012 (remaining) | 2013 | 2014 | 2015 | 2016 | Thereafter | |||||||||||||||||||||
Long-term debt(1) | 561,450 | — | — | — | 361,450 | — | 200,000 | |||||||||||||||||||||
Scheduled interest obligations(2) (3) | 149,029 | 14,581 | 29,163 | 29,163 | 25,747 | 15,500 | 34,875 | |||||||||||||||||||||
Operating lease obligations(4) | 3,412 | 552 | 975 | 832 | 607 | 193 | 253 | |||||||||||||||||||||
Capital lease obligations(5) | 8,407 | 2,084 | 3,792 | 2,042 | 449 | 40 | — | |||||||||||||||||||||
Asset retirement obligations(6) | 12,244 | — | — | — | — | — | 12,244 | |||||||||||||||||||||
Purchase obligations(7) | 1,485 | 1,485 | — | — | — | — | — | |||||||||||||||||||||
|
|
|
|
|
|
|
|
|
|
|
|
|
| |||||||||||||||
Contractual obligations | 736,027 | 18,702 | 33,930 | 32,037 | 388,253 | 15,733 | 247,372 | |||||||||||||||||||||
|
|
|
|
|
|
|
|
|
|
|
|
|
| |||||||||||||||
| (1) | For a complete description of Long-Term Debt, see Part I, Item 1, “Financial Statements (Unaudited)— Notes to the Condensed Consolidated Financial Statements— Note 9— Long-Term Debt”. |
| (2) | We estimate interest payments to be approximately $15.5 million annually on our Senior Notes. |
| (3) | Based on our debt outstanding and interest rates in effect at June 30, 2012, we estimate interest payments to be approximately $13.7 million annually on our Credit Facility. For each additional $10 million in borrowings, annual interest payments will increase by approximately $0.4 million. If the committed amount under our Credit Facility would have been fully utilized at year-end 2012 at interest rates in effect at June 30, 2012, annual interest expense would increase by approximately $5.2 million. If interest rates on our June 30, 2012 variable debt balance of $361.5 million increase or decrease by one percentage point, our annual income will decrease or increase by $3.6 million related to interest expense. |
| (4) | We lease compressors, office buildings and other property under operating leases. |
| (5) | We have compressor, treating facilities and auto leases which are accounted for as capital leases. Amounts reflect our obligations under those capital leases. |
| (6) | For more information regarding our asset retirement obligations, see Part I, Item 1, “Financial Statements (Unaudited)— Notes to the Condensed Consolidated Financial Statements— Note 10— Asset Retirement Obligations”, none of which is expected to be due before 2016. |
| (7) | Purchase obligations are defined as legally enforceable agreements to purchase goods or services that have fixed or minimum quantities and fixed or minimum variable price provisions, and that detail approximate timing of the underlying obligations. Included in this amount are commitments for purchasing pipeline and related assets in our pipeline operations and assets related to our treating operations. |
Off-Balance Sheet Arrangements
We have no off-balance sheet arrangements within the meaning of Item 303(a)(4) of Regulation S-K.
Recently Issued Accounting Pronouncements
The information regarding recent accounting pronouncements is included in Part I, Item 1, “Notes to Condensed Consolidated Financial Statements— Note 2— Summary of Significant Accounting Policies” to this report.
Critical Accounting Estimates
Management’s discussion and analysis of financial condition and results of operations are based on our condensed consolidated interim financial statements and related footnotes contained within Item 1 of Part I of this Quarterly Report. The process of preparing financial statements in conformity with GAAP requires the use of estimates and assumptions that affect the reported amounts of assets, liabilities, revenue and expenses. Our critical accounting estimates used in the preparation of the consolidated financial statements were discussed in Part II Item 7, “Management Discussion and Analysis of Financial Condition and Results of Operations” included in our 2011 Annual Report on Form 10-K. These critical estimates, for which no significant changes have occurred in the six months ended June 30, 2012, include estimates and assumptions pertaining to:
| • | depreciation expense and cost capitalization; |
| • | asset retirement obligations; |
| • | impairment of long-lived assets; and |
| • | goodwill impairment. |
33
Index to Financial Statements
These estimates and assumptions are based upon what we believe is the best information available at the time of the estimates or assumptions. The estimates and assumptions could change materially as conditions within and beyond our control change. Accordingly, actual results could differ materially from those estimates.
In addition to the critical estimates noted above, we have also adopted a new critical accounting policy related to our equity method investment in CMM. Financial Accounting Standards Board, Accounting Standards Codification 323“Investments – Equity Method and Joint Ventures” (“ASC 323”) requires entities to periodically review their equity method investments to determine whether current events or circumstances justify an adjustment to the carrying value of the equity method investment. We have determined that when there are indicators of impairment, we will perform an impairment test to assess whether an adjustment is necessary. The impairment test, as required by ASC 323, considers whether the fair value, as determined by us, of the equity method investment has declined, and if the decline is other than temporary. If the decline in fair value is determined to be other than temporary, the investment’s carrying value may be required to be written down. Inherent in the fair value calculation, management must apply judgment to the estimates and assumptions used.
As of June 30, 2012, we have considered the above policy and determined that there is no impairment to our equity method investment. We will continue to monitor the equity method investment for indicators that would require us to complete the aforementioned impairment test.
Item 3. Quantitative and Qualitative Disclosures About Market Risk
We have established policies and procedures for managing risk within our organization, including internal controls. The level of risk assumed by us is based on our objectives and capacity to manage risk.
Credit Risk
Our primary credit risk relates to our dependency on Quicksilver for a significant portion of our revenues, which causes us to be subject to the risk of nonpayment or late payment by Quicksilver. Quicksilver’s credit ratings are below investment grade, where they may remain for the foreseeable future. Accordingly, this risk could be higher than it might be with a more creditworthy customer or with a more diversified group of customers. As our largest customer, we remain dependent upon Quicksilver for a substantial percentage of our revenues and unless and until we further diversify our customer base, we expect to continue to be subject to non-diversified risk of nonpayment or late payment of our fees. However, our dependency on Quicksilver and the resulting credit risk has been reduced from prior periods through the acquisition of additional midstream assets, primarily through the Frontier Gas and Tristate Acquisitions, including long term contracts with investment grade customers such as BHP, XTO Energy, Devon Energy Corporation and Enterprise Products. Additionally, we perform credit analyses of our customers on a regular basis pursuant to our corporate credit policy. We have not had any significant losses due to counter-party failures to perform.
Interest Rate Risk
Although our base interest rates remain low, our leverage ratios directly influence the spreads charged by lenders. The credit markets could also drive the spreads charged by lenders upward. As base rates or spreads increase, our financing costs will increase accordingly. Although this could limit our ability to raise funds in the capital markets, we expect that our competitors would face similar challenges with respect to funding acquisitions and capital projects. We are exposed to variable interest rate risk as a result of borrowings under our Credit Facility. The table of contractual obligations contained in Part I, Item 2 of this Quarterly Report contains more information regarding interest rate sensitivity.
Item 4. Controls and Procedures
Disclosure Controls and Procedures
We carried out an evaluation, under the supervision and with the participation of management, including the Chief Executive Officer and Chief Financial Officer of our General Partner, of the effectiveness of the design and operation of our disclosure controls and procedures (as defined in Rules 13a-15(e) and 15(d)-15(e) under the Exchange Act) as of the end of the period covered by this report. Based upon that evaluation, the Chief Executive Officer and Chief Financial Officer of our General Partner concluded that, as of June 30, 2012, our disclosure controls and procedures were effective to provide reasonable assurance that information required to be disclosed by us in reports that we file or submit under the Exchange Act is recorded, processed, summarized and reported within the time periods specified in the SEC’s rules and forms and that information required to be disclosed by us in the reports we file or submit under the Exchange Act is accumulated and communicated to our management, including the Chief Executive Officer and Chief Financial Officer of our General Partner, as appropriate to allow timely decisions regarding required disclosure.
34
Index to Financial Statements
Changes in Internal Control Over Financial Reporting
There has not been any change in our internal control over financial reporting (as such term is defined in Rules 13a-15(f) and 15d-15(f) under the Exchange Act) during the fiscal quarter ended June 30, 2012 that have materially affected, or are reasonable likely to materially affect our internal control over financial reporting.
In May 2011, a putative class action lawsuit, Ginardi v. Frontier Gas Services, LLC, et al No 4:11-cv-0420 BRW, was filed in the United States District Court of the Eastern District of Arkansas against Frontier Gas Services, LLC, Chesapeake Energy Corporation, BHP Billiton Petroleum (“BHP”), Kinder Morgan Treating, LP, and Crestwood Arkansas Pipeline LLC (which was served in August 2011). The lawsuit alleged that the defendants’ operations pollute the atmosphere, groundwater, and soil with allegedly harmful gases, chemicals, and compounds and the facilities create excessive noise levels constituting trespass, nuisance and annoyance (the “Ginardi case”).
On June 27, 2012, we settled the Ginardi case and the case was dismissed. The settlement did not have a material impact on our results of operations or financial condition.
In addition, in connection with the Ginardi settlement, the parties in the lawsuit styled George Bartlett, et al, v. Frontier Gas Services, LLC, et al including Crestwood Arkansas Pipeline, LLC, Chesapeake Energy Corporation, and Kinder Morgan Treating LP, which was filed in the United States District Court of the Eastern District of Arkansas (No 4 11-cv-0910 BSM) (the “Bartlett case”) agreed that the Bartlett case would not proceed as a class action. The Bartlett case is otherwise ongoing. While we cannot reasonably quantify our ultimate liability, if any, for the payment of any damages or other remedial actions, the Bartlett case has not had, nor is expected to have, a material impact on our results of operation or financial condition. We intend to vigorously defend against this lawsuit and to mitigate any claims by pursuing any and all indemnification obligations to which we may be entitled with respect to the properties as well as any coverage from our insurance.
From time to time, we are party to certain legal, regulatory or administrative proceedings that arise in the ordinary course and are incidental to our business. However, except as set forth above, there are currently no such pending proceedings to which we are a party that our management believes will have a material adverse effect on our results of operations, cash flows or financial condition. However, future events or circumstances, currently unknown to management, will determine whether the resolution of any litigation or claims will ultimately have a material effect on our results of operations, cash flows or financial condition in any future reporting periods.
In addition to the other information set forth in this report, you should review our Annual Report on Form 10-K for the year ended December 31, 2011 which contains a detailed description of risk factors that may materially affect our business, financial condition, results of operations and cash flows. Aside from the additional risk factors set forth below, there were no material changes to the risk factors previously described in Part I, Item 1A. “Risk Factors” included in our Annual Report on our Form 10-K for the year ended December 31, 2011 and Part II, Item 1A, “Risk Factors” included in our Quarterly Report on Form 10-Q for the quarter ended March 31, 2012:
Our pending acquisition of Devon assets in the Barnett Shale
The Devon Acquisition is expected to close in the third quarter of 2012 and is subject to customary closing conditions and regulatory approvals. If these conditions and regulatory approvals are not satisfied or waived, the acquisition will not be consummated. If the closing of the acquisition is substantially delayed or does not occur at all, or if the terms of the acquisition are required to be modified substantially due to regulatory concerns, we may not realize the anticipated benefits of the acquisition fully or at all. Certain of the conditions remaining to be satisfied include:
| • | timely approval under the Hart-Scott-Rodino Antitrust Improvements Act of 1976 for the transaction contemplated by the Purchase and Sale Agreement; |
| • | the continued accuracy of the representations and warranties contained in the Purchase and Sale Agreement; |
| • | the performance by each party of its obligations under the Purchase and Sale Agreement; and |
| • | the absence of any injunction, decree or other order from any governmental authority enjoining or prohibiting, or of any law being enacted which would prohibit, the consummation of the transactions contemplated in the Purchase and Sale Agreement. |
35
Index to Financial Statements
In addition, the Purchase and Sale Agreement may be terminated by mutual agreement of the parties or by either Devon or us (i) if the acquisition has not closed on or before November 30, 2012 (the “Termination Date”), provided however, that if the Closing does not occur by the Termination Date solely for failure to obtain governmental approval of the transactions contemplated by the Purchase and Sale Agreement, such date will be extended to December 31, 2012, (ii) if any of the mutual conditions to Closing becomes permanently incapable of fulfillment, (iii) if the other party has breached its obligations under the Purchase and Sale Agreement, which breaches have not been cured in 30 days, (iv) if any order permanently prohibiting the consummation of the transactions contemplated thereby has become final and non-appealable, or (v) by mutual agreement of Devon and us in writing.
Item 2. Unregistered Sales of Equity Securities and Use of Proceeds
None.
Item 3. Defaults Upon Senior Securities
None.
Item 4. Mine and Safety Disclosures
Not Applicable.
None.
36
Index to Financial Statements
The exhibit index is incorporated herein by reference into this quarterly report on Form 10-Q.
37
Index to Financial Statements
Pursuant to the requirements of the Securities Exchange Act of 1934, the registrant has duly caused this report to be signed on its behalf by the undersigned thereunto duly authorized.
Dated: August 6, 2012
CRESTWOOD MIDSTREAM PARTNERS LP
By: CRESTWOOD GAS SERVICES GP LLC, its General Partner | ||||||
| By: | /s/ William G. Manias | |||||
| William G. Manias | ||||||
Senior Vice President – Chief Financial Officer (Principal Financial Officer) | ||||||
| August 6, 2012 | By: | /s/ Steven M. Dougherty | ||||
| Steven M. Dougherty | ||||||
Vice President – Chief Accounting Officer (Principal Accounting Officer) | ||||||
38
Index to Financial Statements
EXHIBIT INDEX
Exhibits designated by an asterisk (*) are filed herewith and those with (**) are furnished and not filed herewith, all exhibits not so designated are incorporated herein by reference to a prior filing as indicated.
| Exhibit No. | Description | |
| 10.1 | Fourth Amended and Restated Crestwood Midstream Partners LP 2007 Equity Plan date May 11, 2012 (incorporated by reference to Exhibit 10.1 to the Company’s Form 8-K filed May 15, 2012). | |
| *31.1 | Certification Pursuant to Section 302 of the Sarbanes-Oxley Act of 2002. | |
| *31.2 | Certification Pursuant to Section 302 of the Sarbanes-Oxley Act of 2002. | |
| *32.1 | Certification Pursuant to 18 U.S.C. Section 1350, as adopted pursuant to Section 906 of the Sarbanes-Oxley Act of 2002. | |
| **101.INS | XBRL Instance Document | |
| **101.SCH | XBRL Taxonomy Extension Schema Linkbase Document | |
| **101.CAL | XBRL Taxonomy Extension Calculation Linkbase Document | |
| **101.DEF | XBRL Taxonomy Extension Definition Linkbase Document | |
| **101.LAB | XBRL Taxonomy Extension Labels Linkbase Document | |
| **101.PRE | XBRL Taxonomy Extension Presentation Linkbase Document | |