 Crestwood Midstream Partners LP National Association of Publicly Traded Partnerships 2013 MLP Investor Conference May 22-23, 2013 Filed by Crestwood Midstream Partners LP pursuant to Rule 425 under the Securities Act of 1933 and deemed filed pursuant to Rule 14a-12 under the Securities Exchange Act of 1934 Subject Company: Crestwood Midstream Partners LP Commission File No.: 001-33631 |
 2 Additional Information and Where to Find it This communication contains information about the proposed merger transaction involving Crestwood Midstream Partners LP (“Crestwood”) and Inergy Midstream, L.P. (“Inergy”). In connection with the proposed merger transaction, Inergy will file with the SEC a registration statement on Form S-4 that will include a proxy statement/prospectus for the unitholders of Crestwood. Crestwood will mail the final proxy statement/prospectus to its unitholders. INVESTORS AND UNITHOLDERS ARE URGED TO READ THE PROXY STATEMENT/PROSPECTUS AND OTHER RELEVANT DOCUMENTS FILED OR TO BE FILED WITH THE SEC CAREFULLY WHEN THEY BECOME AVAILABLE BECAUSE THEY WILL CONTAIN IMPORTANT INFORMATION ABOUT CRESTWOOD, INERGY, THE PROPOSED MERGER TRANSACTION AND RELATED MATTERS. Investors and unitholders will be able to obtain free copies of the proxy statement/prospectus and other documents filed with the SEC by Inergy and Crestwood through the website maintained by the SEC at www.sec.gov. In addition, investors and unitholders will be able to obtain free copies of documents filed by Crestwood with the SEC from Crestwood’s website, www.crestwoodlp.com, under the heading “SEC Filings” in the “Investor Relations” tab and free copies of documents filed by Inergy with the SEC from Inergy’s website, www.inergylp.com/midstream, under the heading “SEC Filings” in the “Investor Relations” tab. PARTICIPANTS IN THE SOLICITATION Crestwood, Inergy and their respective general partner’s directors and executive officers may be deemed to be participants in the solicitation of proxies from the unitholders of Crestwood in respect of the proposed merger transaction. Information regarding the persons who may, under the rules of the SEC, be deemed participants in the solicitation of the unitholders of Crestwood in connection with the proposed transaction, including a description of their direct or indirect interests, by security holdings or otherwise, will be set forth in the proxy statement/prospectus when it is filed with the SEC. Information regarding Crestwood’s directors and executive officers is contained in Crestwood’s Annual Report on Form 10-K for the year ended December 31, 2012, which is filed with the SEC. Information regarding Inergy’s directors and executive officers is contained in Inergy’s Annual Report on Form 10-K for the year ended September 30, 2012, which is filed with the SEC. Free copies of these documents may be obtained from the sources described above. SAFE HARBOR FOR FORWARD-LOOKING STATEMENTS The statements in this communication regarding future events, occurrences, circumstances, activities, performance, outcomes and results are forward-looking statements. Although these statements reflect the current views, assumptions and expectations of Crestwood and Inergy management, the matters addressed herein are subject to numerous risks and uncertainties which could cause actual activities, performance, outcomes and results to differ materially from those indicated. Such forward-looking statements include, but are not limited to, statements about the future financial and operating results, objectives, expectations and intentions and other statements that are not historical facts. Factors that could result in such differences or otherwise materially affect Crestwood’s or Inergy’s financial condition, results of operations and cash flows include, without limitation, failure to satisfy closing conditions with respect to the merger; the risks that the Crestwood and Inergy businesses will not be integrated successfully or may take longer than anticipated; the possibility that expected synergies will not be realized, or will not be realized within the expected timeframe; fluctuations in oil, natural gas and NGL prices; the extent and success of drilling efforts, as well as the extent and quality of natural gas volumes produced within proximity of Crestwood or Inergy assets; failure or delays by customers in achieving expected production in their natural gas projects; competitive conditions in the industry and their impact on the ability of Crestwood or Inergy to connect natural gas supplies to Crestwood or Inergy gathering and processing assets or systems; actions or inactions taken or non-performance by third parties, including suppliers, contractors, operators, processors, transporters and customers; the ability of Crestwood or Inergy to consummate acquisitions, successfully integrate the acquired businesses, realize any cost savings and other synergies from any acquisition; changes in the availability and cost of capital; operating hazards, natural disasters, weather-related delays, casualty losses and other matters beyond Crestwood or Inergy’s control; timely receipt of necessary government approvals and permits, the ability of Crestwood or Inergy to control the costs of construction, including costs of materials, labor and right-of-way and other factors that may impact either company’s ability to complete projects within budget and on schedule; the effects of existing and future laws and governmental regulations, including environmental and climate change requirements; the effects of existing and future litigation; and risks related to the substantial indebtedness of either company, as well as other factors disclosed in Crestwood and Inergy’s filings with the U.S. Securities and Exchange Commission. You should read filings made by Crestwood and Inergy with the U.S. Securities and Exchange Commission, including Annual Reports on Form 10-K for the year ended December 31, 2012 and September 30, 2012, respectively, and the most recent Quarterly Reports and Current Reports, for a more extensive list of factors that could affect results. Crestwood and Inergy do not assume any obligation to update these forward- looking statements. |
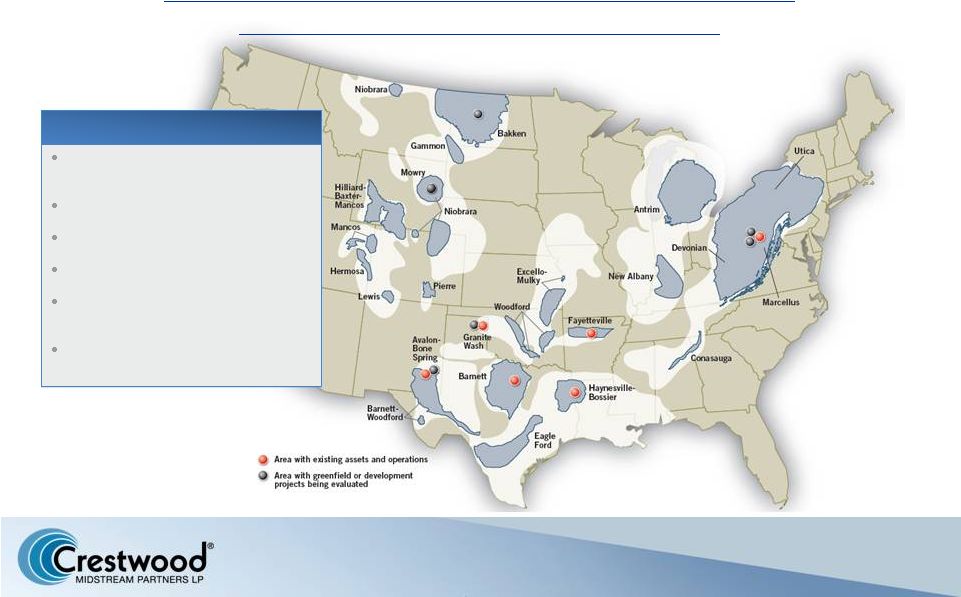 Crestwood Midstream Partners Crestwood Asset Summary 1.0 Bcf/d of gathering volumes across six resource plays 850 miles of gathering pipelines 6 processing plants 260,000 horsepower of compression > 450,000 acres of production dedicated under long term contracts 98% fee-based revenues Shale focused partnership well positioned to participate in the long-term build-out of midstream infrastructure 3 |
 Transformational Combination Crestwood and Inergy to merge forming a $7 billion midstream partnership Combined, Crestwood and Inergy provide an integrated midstream service offering that links fundamental energy supply with fundamental energy demand 4 Crestwood Midstream Partners (NYSE: CMLP), Crestwood Holdings LLC, Inergy, L.P. (NYSE:NRGY) and Inergy Midstream, L.P. (NYSE: NRGM) have executed definitive agreements to create a fully integrated midstream partnership with a total enterprise value of over $7 billion Deal announced May 6 th ; general partner close expected June 2013; MLP merger expected end of Q3 2013 Transaction approved by the Boards of Directors and committees of independent directors of NRGY, NRGM and CMLP; subject to CMLP unitholder vote; no financing contingencies Unified strategy focused on servicing the midstream infrastructure needs of the most prolific shale plays in North America Marcellus Shale, Bakken Shale, Eagle Ford Shale, Permian Basin, PRB Niobrara Shale, Utica Shale, Barnett Shale, Fayetteville Shale, Granite Wash, Haynesville Shale and Monterey Shale Diverse midstream assets and services along the midstream value chain with visible long-term growth potential Complementary blend of long-term fee-based contracted cash flows with high-growth shale assets and organic expansion opportunities |
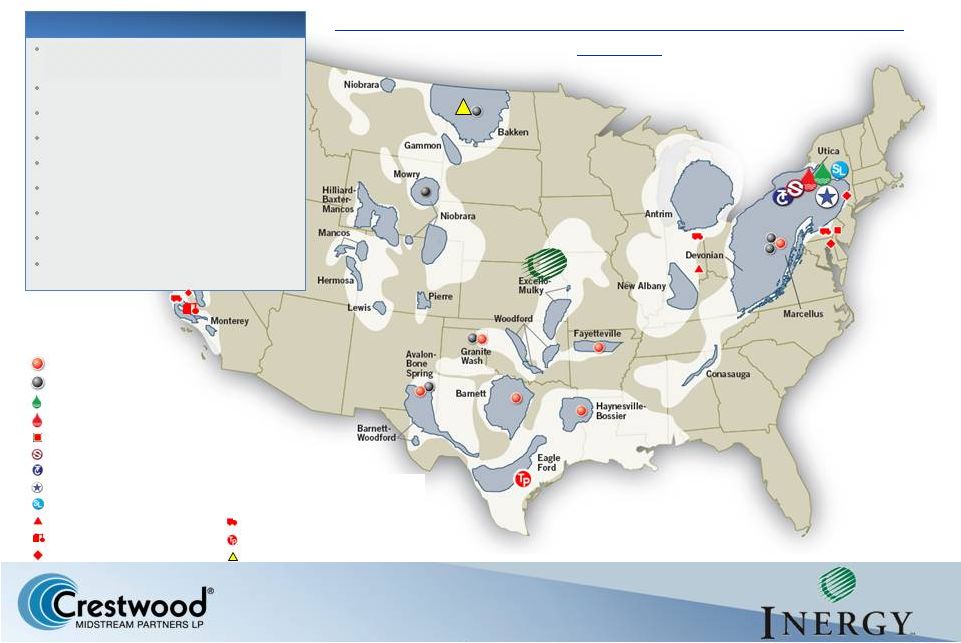 Crestwood + Inergy = Premier Shale Player Operations in virtually every premier shale play in North America Steuben Gas Storage Seymour LPG Facility West Coast Midstream NGL Transportation Offices Tres Palacios Thomas Corners Gas Storage Watkins Glen NGL Storage Facility Bath NGL Storage Facility South Jersey Terminal Gathering and Processing Assets Greenfield Development Targets Stagecoach Gas Storage Seneca Lake Gas Storage Rail Terminal 5 1,300+ mmcf/d natural gas transportation capacity 2,000+ mmcf/d gathering capacity 400+ mmcf/d processing capacity 1,000+ miles of pipeline 7 processing plants 80+ Bcf of current storage capacity 120,000 BPD crude oil rail loading capacity 275 tractors and 531 trailers Significant North American NGL Logistics business Pro Forma Asset Summary COLT Hub |
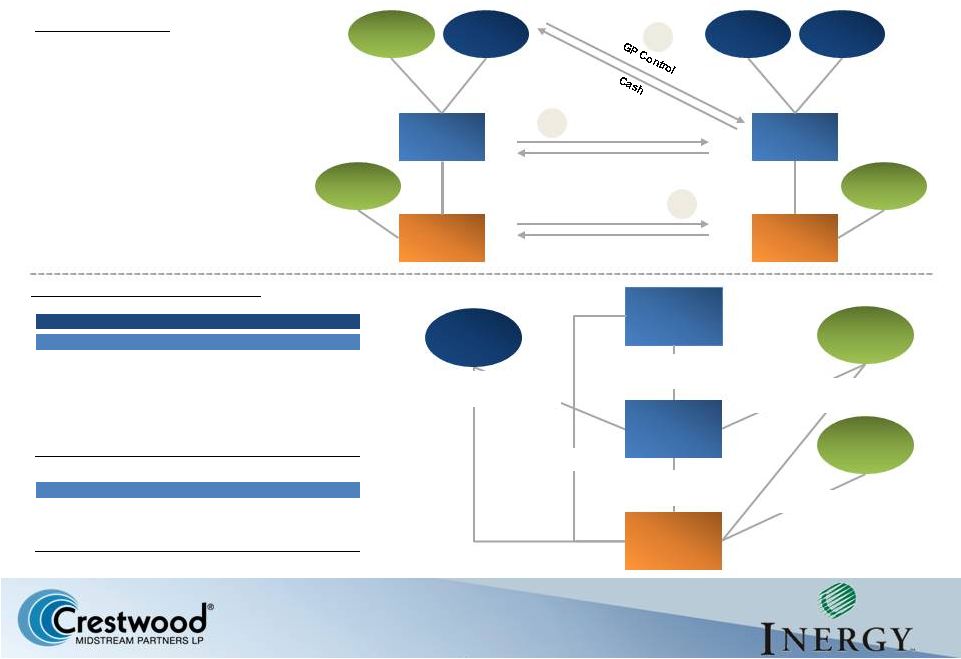 Transaction Structure Crestwood Holdings NRGY Public Current Inergy Mgmt. NRGY NRGM NRGM Public NRGY NRGM Public Public Management Crestwood Holdings CMLP Public Management First Reserve 1 2 NRGY LP units CMLP GP / IDR interest + NRGM units (post merger) 3 LP Units + Cash 100% equity ownership + assumption of CMLP debt 4 Transaction Steps: 1. NRGY distributes all NRGM units currently held to NRGY unitholders in a tax-free distribution 2. Crestwood Holdings acquires the GP control of NRGY 3. Crestwood Holdings contributes the GP/IDRs of CMLP plus CMLP NRGM units (post merger) in exchange for NRGY units 4. CMLP merged with wholly-owned subsidiary of NRGM Pro Forma Ownership Structure: 53.8 MM Units: 29% Non-economic GP 7.1 MM Units: 5% GP / IDR interest 27.1 MM NRGY Units: 15% 11.9 MM NRGM Units: 8% 65.9 MM Units: 44% 20.5 MM Units: 14% 104.6 MM NRGY Units: 56% 45.0 MM NRGM Units: 30% 6 ($ in MM except per unit data) Units (MM) Value % NRGM Public - NRGM 29.1 $699 19.4% Public - CMLP 36.8 882 24.4% Crestwood Holdings 20.5 493 13.7% NRGY Unitholders 45.0 1,079 29.9% NRGY 7.1 171 4.7% Inergy Management 11.9 285 7.9% Total Units 150.4 $3,609 100.0% NRGY Public - NRGY 104.6 $1,192 56.4% Crestwood Holdings 53.8 613 29.0% Inergy Management 27.1 309 14.6% Total Units 185.5 $2,114 100.0% |
 Strategic Highlights Materially Increased Size, Scale and Diversity Complementary Growth Strategies Low Cost Capital Drives Organic Growth Significant Management Experience & Track Record Cash Flow Stability and Visibility Enhanced Credit Profile Strong Sponsorship and Alignment of Interest with LPs Expanded Participation in Midstream Value Chain 7 |
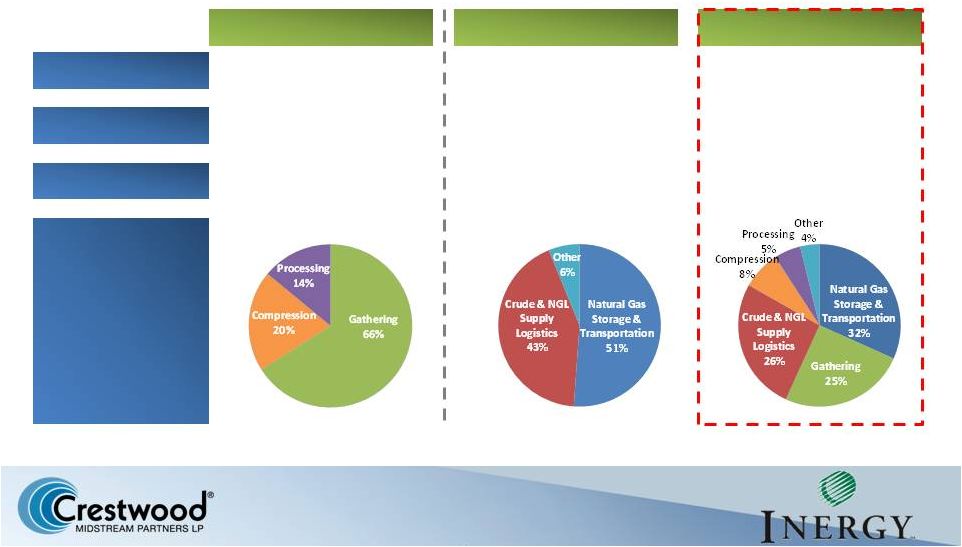 Increasing Scale & Diversification CMLP NRGM + NRGY Pro Forma Market Cap Enterprise Value (1) Approximate Segment EBITDA In a market where size matters, the pro forma enterprise possesses the critical scale and diversified platform to be a formidable competitor across the full midstream value chain $1.5 B $2.7 B $3.3 B $4.6 B $5.4 B $7.3 B 2013E EBITDA (2) ~$178 MM ~$270 MM ~$450 MM (1) Represents CMLP enterprise value (including private GP value) plus consolidated NRGY and NRGM enterprise value. (2) Represents midpoint of 2013E guidance for CMLP and estimated EBITDA for NRGY and NRGM for calendar year ended 12/31/2013. 8 |
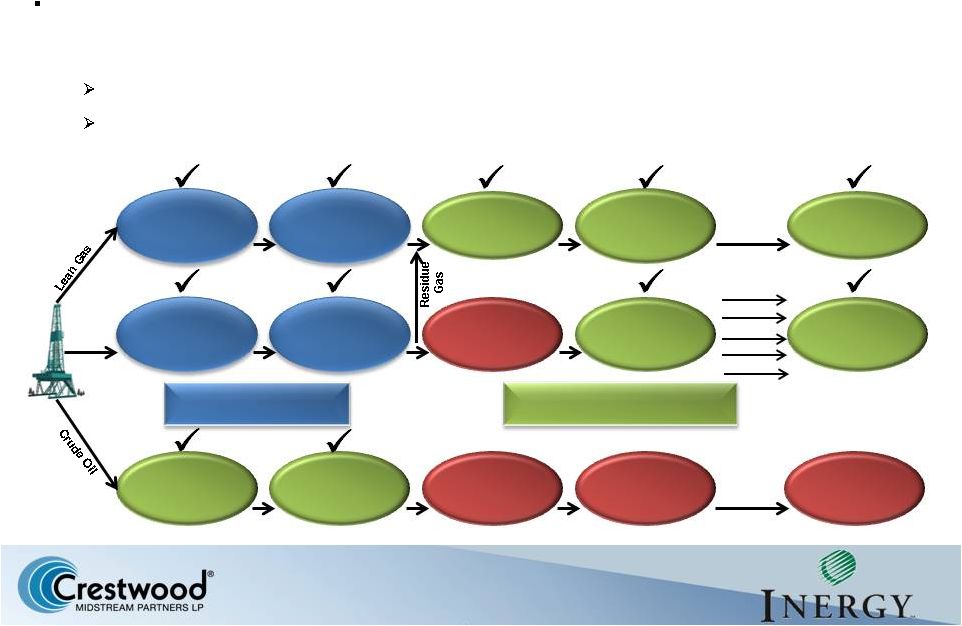 Expanding the Value Chain Inergy Crestwood Gas Gathering Pipelines CO2 Treating Intrastate & Interstate Pipelines Nat Gasoline Iso-Butane Butane Propane Ethane Gas Gathering Pipelines Gas Processing Intrastate & Interstate Pipelines Gas Storage NGL Fractionation Mixed NGL Pipelines NGL Storage & NGL Pipelines Trucks, Rail Barges & Crude Pipelines Crude Oil Storage & Terminals Crude Oil Refining Storage Barges & Refined Products Pipelines Rich Gas The combined partnership represents a fully integrated midstream service provider with complementary business platforms positioned to compete across the midstream value chain Offering customers a more comprehensive and competitive suite of services Capturing incremental fee opportunities that expand margins and maximize returns on investment 9 |
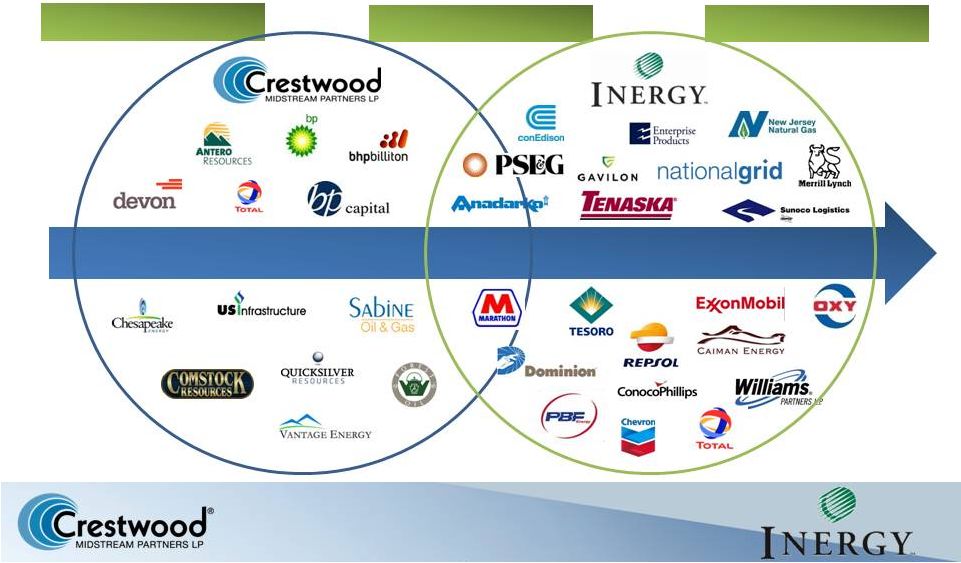 Linking Supply to Demand Expect significant commercial and operating synergy by linking Crestwood producer relationships and access to supply at the wellhead with Inergy demand-side services and relationships Natural Gas NGLs Crude Oil Supply Demand 10 |
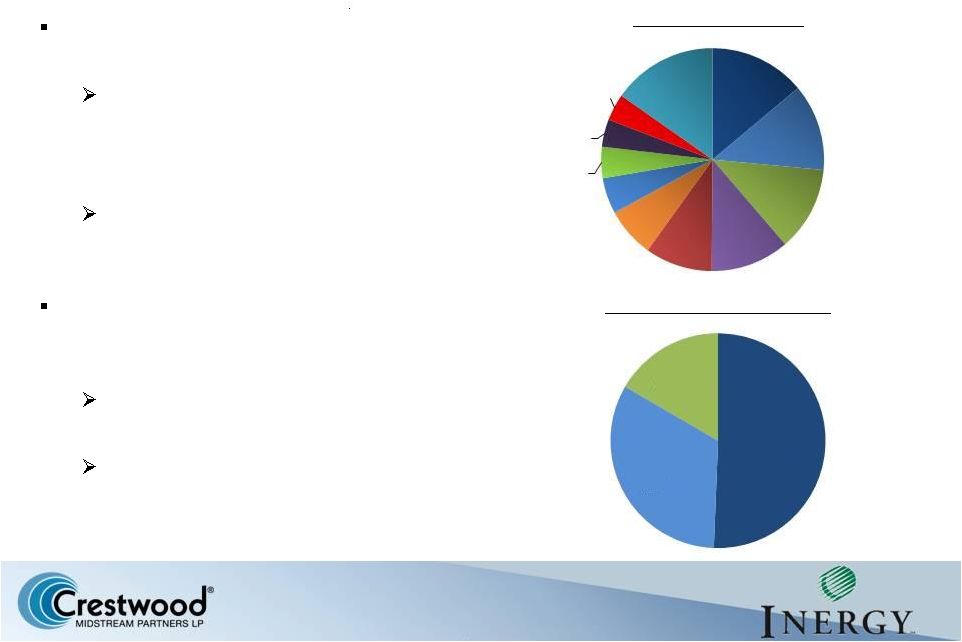 Cash Flow Stability and Visibility Significant diversification provides greater cash flow stability Within the core operating segments; 10+ different assets with diversified fundamental growth drivers generating ~$20MM of EBITDA No single customer, asset or business unit constituting more than ~15% of total cash flows Significant gross margin supported by long-term (take or pay and equivalent) contracts ~51% of pro forma consolidated 2013E gross margin under firm contract Minimal direct commodity exposure; no speculative commodity positions 2013E EBITDA Mix 11 Cowtown Inergy Services Marcellus Stagecoach COLT Hub Marc I Alliance Tres Palacios Fayetteville US Salt Other Firm Contracts 51% Fixed-Fee 33% Un- Contracted 16% 2013E Gross Margin Mix |
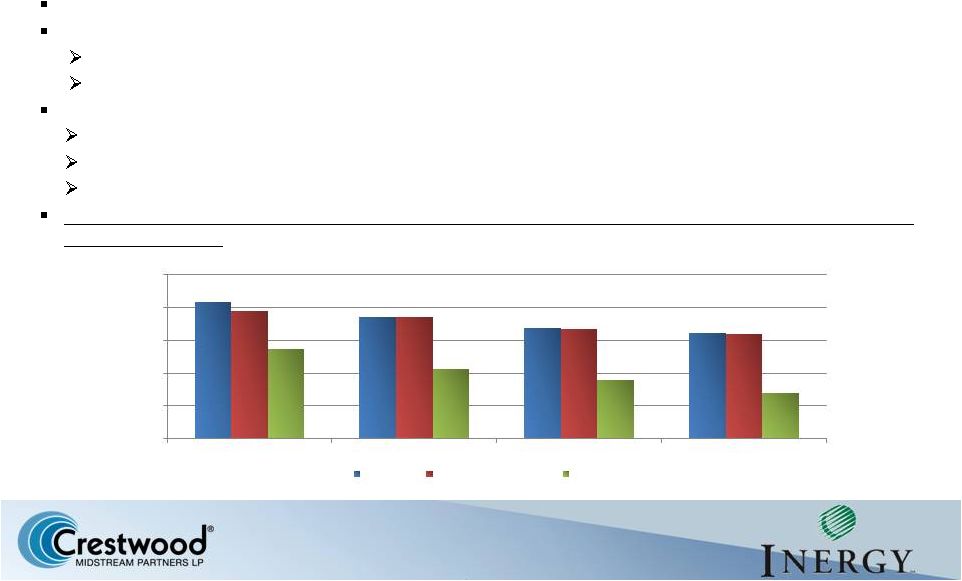 Enhanced Credit Profile Significantly increases size, scale and cash flow diversity Balance sheet friendly transaction >$2.0 billion of equity issued to facilitate transaction No new debt issuance Expected credit rating in-line with current Inergy corporate family rating Achieving investment grade status to further drive cost of capital synergies is a key objective of the partnership Strong Balance Sheet, enhanced credit profile and increasing float maximizes access to capital and minimizes cost of capital (1) Represents total consolidated pro forma Inergy debt divided by NRGM EBITDA plus NRGY EBITDA attributable to operating assets. (1) 12 4.2x 3.7x 3.4x 3.2x 3.9x 3.7x 3.4x 3.2x 2.7x 2.1x 1.8x 1.4x 0.0x 1.0x 2.0x 3.0x 4.0x 5.0x 2H 2013 2014E 2015E 2016E NRGM PF Consolidated NRGY PF NRGY PF Strong pro forma balance sheet Significant contracted cash flows and visible growth Strong ability to continue de-leveraging |
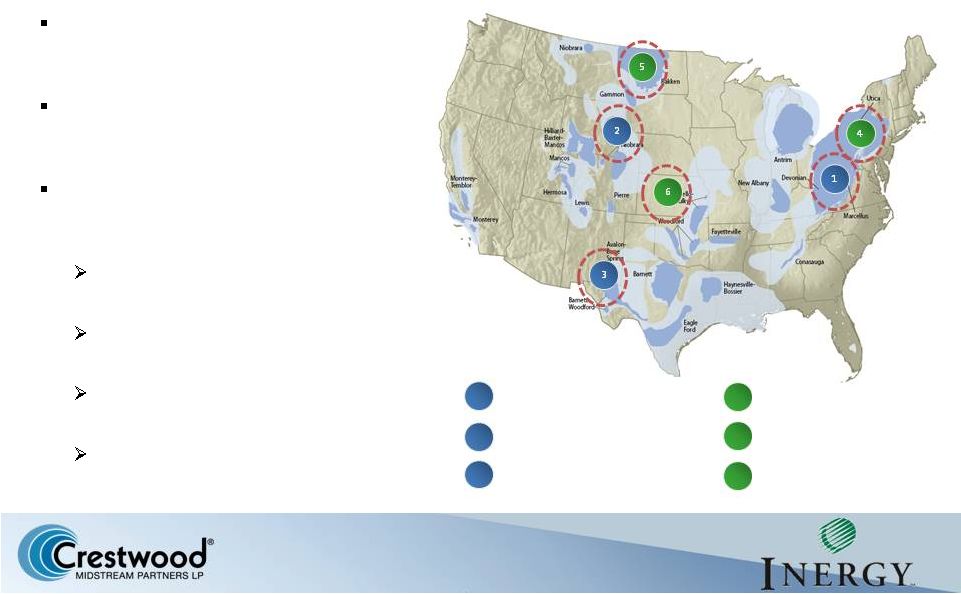 Low Cost Capital Drives Organic Growth Significant Backlog of Organic Growth Projects and the Currency to Execute Northeast Storage and Transportation 1 Marcellus / Utica Gathering and Processing Bakken Crude Oil Logistics 2 Niobrara Gathering and Processing 3 Permian Basin Gathering and Processing NGL Logistics >$2.0 Bn of identified potential greenfield development and bolt-on acquisition opportunities Both Crestwood and Inergy are opportunity rich; expanded value chain will drive additional opportunities The combined partnership has the scale and currency to execute large-scale greenfield development opportunities 4 5 6 13 Two low-cost public currencies to capitalize on growth opportunities $1.2 Bn of committed revolver capacity at NRGM and NRGY Current NRGM 6.0% 2020 senior notes YTW at ~4.6% Current equity yield: NRGM at ~6.4% and NRGY at ~5.2% yield |
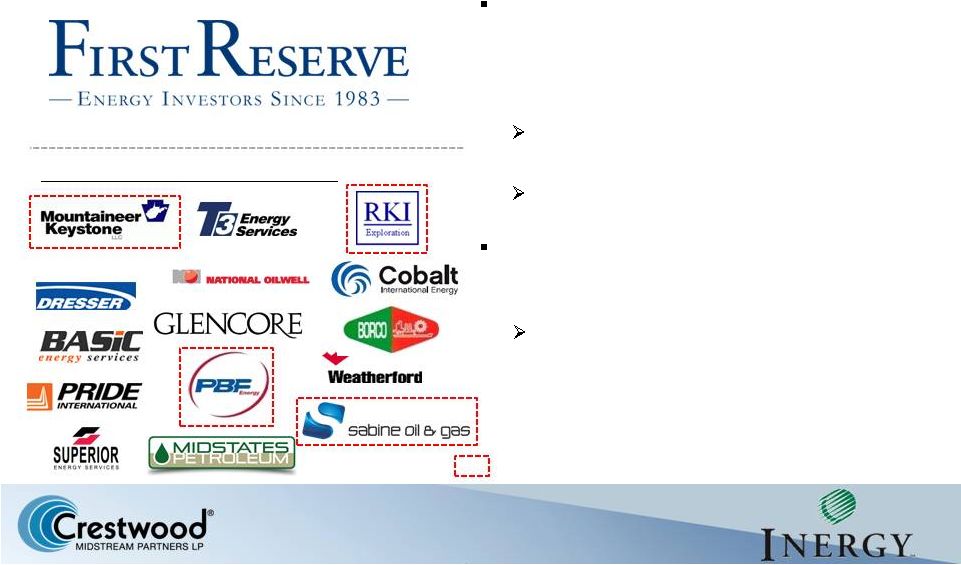 Strong Sponsorship After this transaction, First Reserve, Crestwood management and Inergy management will have in excess of $1.5 billion invested in the combined partnership First Reserve, the largest and most experienced private equity firm focused exclusively on energy, continues to demonstrate its commitment to the ongoing growth of the combined partnership Significant industry relationships and broad portfolio energy assets facilitate new business opportunities Selected Significant Investments: Denotes First Reserve portfolio companies currently under contract or engaged in business activities with Crestwood and/or Inergy. 14 Examples include Crestwood’s current contracts with Sabine Oil and Gas, Mountaineer Keystone and RKI Exploration and Inergy’s current contract with PBF Energy 30 year history of investing exclusively in energy Over $23 billion of capital raised since inception |
 Financial Principles Continue to grow utilizing a disciplined financial policy Grow pro forma business consistent with stable, fee-based MLP business model Maintain ample liquidity and preserve financial flexibility Fund organic growth and acquisitions with appropriate mix of debt and equity (~50/50) Target long-term leverage ratio of <4.0x Debt / EBITDA at the MLP level Expected NRGM corporate family credit ratings of BB (stable) / Ba3 (positive) Grow distributions while targeting appropriate coverage Target coverage of 1.1x and 6-10% Y-o-Y growth Use excess distributable cash flow to reduce leverage or invest in cash flow generating assets 15 |
 Crestwood is Building a Footprint in High-Growth Shale Plays 16 |
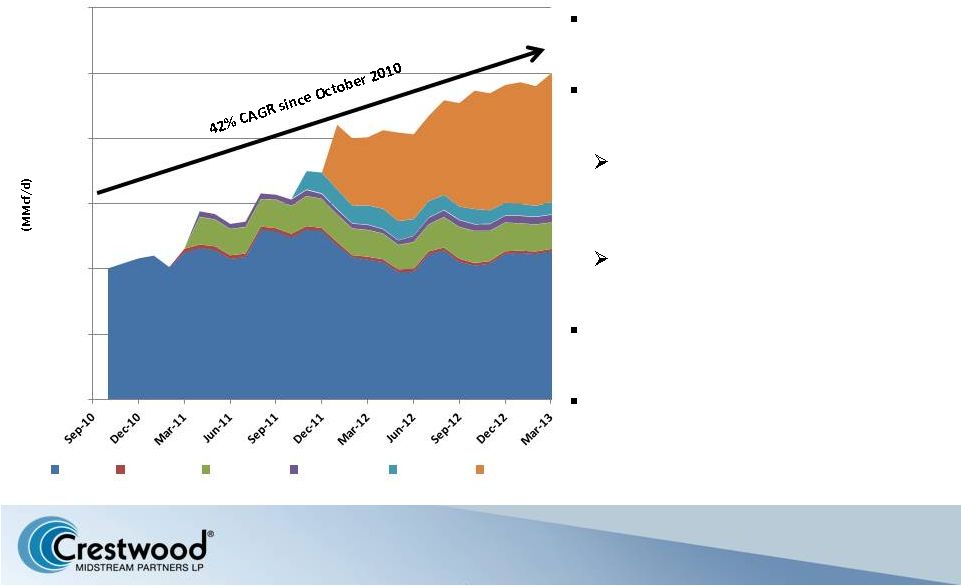 Building a Footprint in High Growth Shale Plays While Barnett provides the base, Marcellus will drive growth Marcellus the backbone of future growth Barnett volumes flattening as they mature on the decline curve KWK Closed sale of 25% of Barnett Reserves to Tokyo Gas for $485 million Drilling activity expected to pick up in 2014 BHP to add ~25 Fayetteville wells in mid 2013 Dry gas volumes expected to accelerate with improving natural gas prices 17 0 200 400 600 800 1,000 1,200 Barnett Las Animas Fayetteville Granite Wash Haynesville Marcellus |
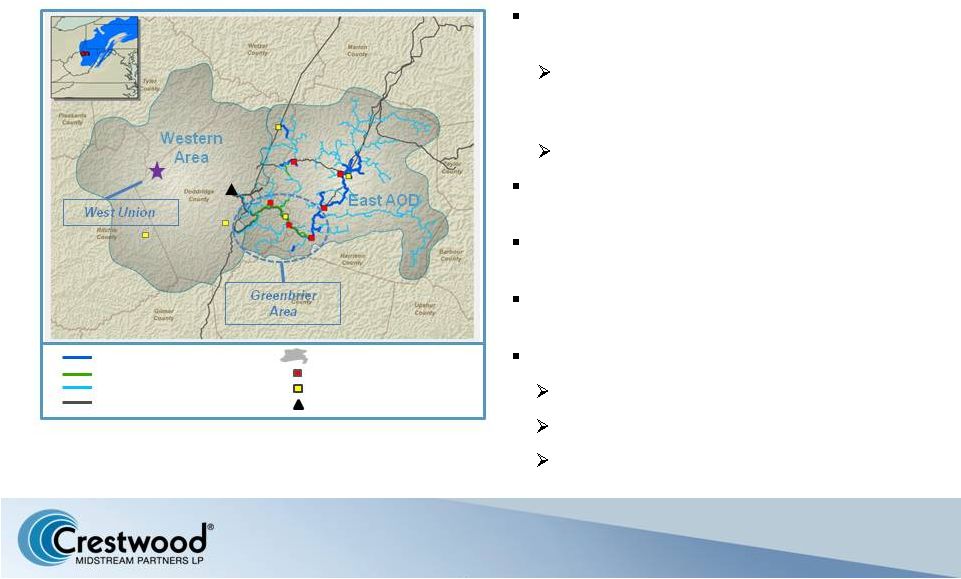 Acquired Marcellus Shale gathering assets in March 2012 Acquired compression assets from Enerven in December 2012 ~$500 million total capital investment through year-end 2012 $105–$115 million 2013 budgeted capital for Greenbrier area expansions Significant volume growth Building a Footprint in High Growth Shale Plays Marcellus Shale Rich Gas Development 18 Existing pipeline 2013 Pipelines Planned build out 2014-2016 3 Party take away Area of Dedication CMM compressor stations 3 Party comp stations MWE Sherwood Plant 20 year 100% fixed-fee contract for gathering and compression services for Antero Resources (“Antero”) ~136,000 net acres area of dedication Jan 1, 2012: ~200 MMcf/d Current: ~430 MMcf/d 2013 exit rate: ~500 MMcf/d rd rd |
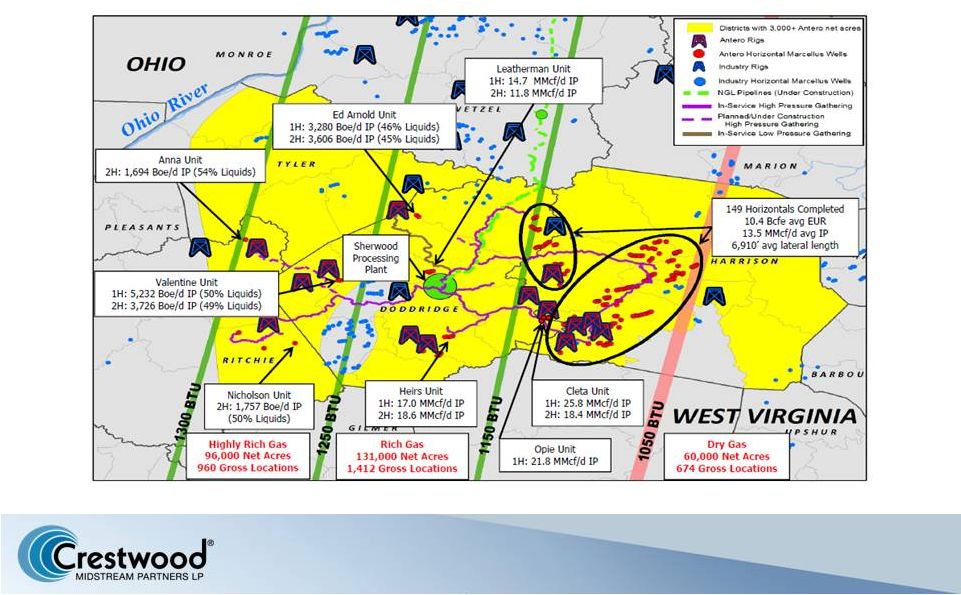 Building a Footprint in High Growth Shale Plays >3,000 well inventory of future Marcellus Shale drilling locations from Antero 19 Source: Antero Resources May 2013 Investor Presentation |
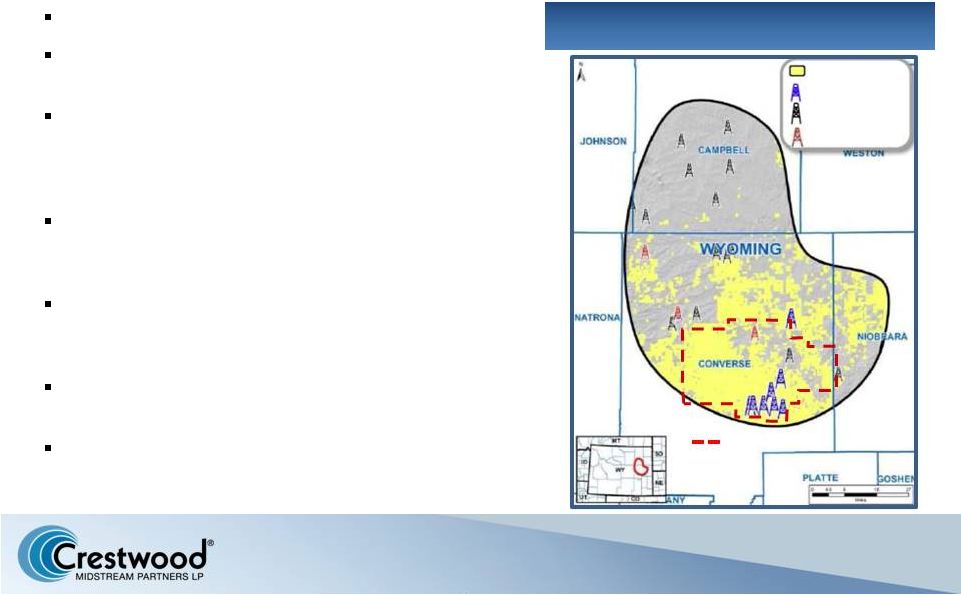 CHK/RKI Leasehold CHK Operated Rigs Industry Rigs Non-Operated Rigs Jackalope AMI (311,000 acres) Signed revised letter agreement on April 25, 2013 RKI Exploration is a First Reserve portfolio company Conducting final due diligence and negotiating definitive documentation to acquire RKI’s 50% interest in the Jackalope Gas Gathering System (“JGGS”) Participate in 50/50 JGGS JV with Access Midstream (operator) to provide gas gathering and processing for CHK, CNOOC and RKI Jackalope AMI (311K gross acres) gas gathering & processing dedication of Frontier & Niobrara formations 20-year cost of service fee-based gathering and processing agreement Significant gathering and processing infrastructure build-out through 2015 Building a Footprint in High Growth Shale Plays Chesapeake Energy and RKI Exploration Niobrara project development 20 Combined CHK/RKI Powder River Basin (PRB) footprint of ~750,000 acres |
 CHK currently operating 10 rigs within the Jackalope AMI ~$480 million drilling carry from CNOOC drives activity through 2014 Over ~1,000+ drilling locations (>10 yr drilling inventory) Current production limited due to infrastructure constraints Crude oil and rich-gas production creates significant potential opportunity for future infrastructure build-out Building a Footprint in High Growth Shale Plays CHK / RKI Jackalope drilling activity focused on crude oil and liquids-rich production 21 Natural gas gathering, compression and processing NGL storage, stabilization, blending, truck & rail terminalling, transportation and marketing Crude oil gathering, truck and rail terminalling and transportation |
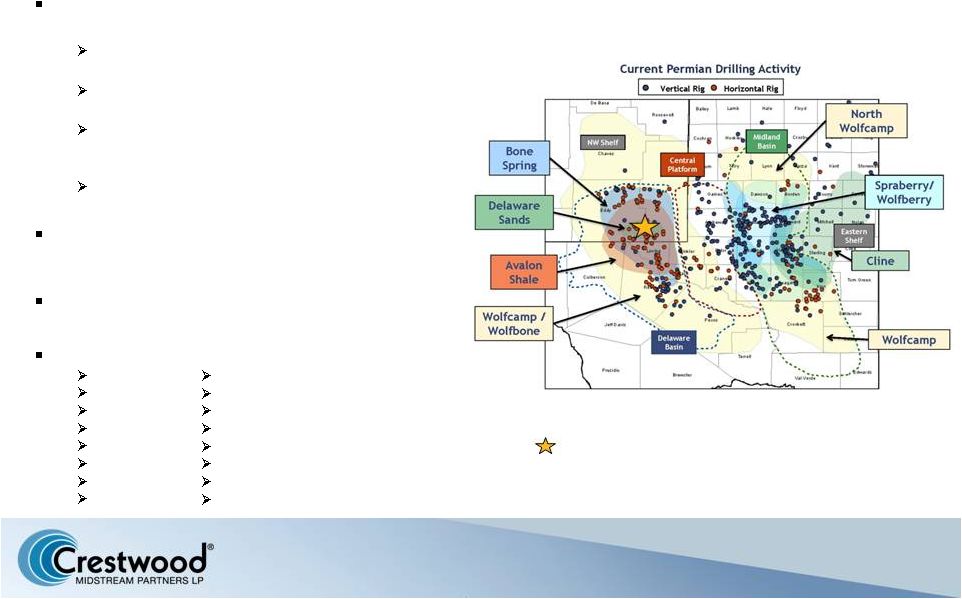 Source: TPH – Nov 2012 Upstream Team Report Focusing on 5 county area including Eddy & Lea NM and Culberson, Reeves & Loving TX Significant ramp up in producer activities across multiple stacked formations Delaware Basin lacks sufficient midstream infrastructure Higher GORs in area requires more gas gathering and processing than eastern Delaware & Midland Basins ~2,600 Wells permitted in focus area in last 18 months Leveraging conversion of Las Animas dry gas gathering assets to build early traction with producers in the area Leveraging previous Poker Lake gathering & processing development activities Key Producers Chevron Oxy Conoco Devon Shell EOG Anadarko Apache Cimarex Concho Bass Energen Nadle&Gussman Mack Mewborne RKI Crestwood’s Existing Las Animas System Building a Footprint in High Growth Shale Plays Permian and Delaware Basin Development Opportunities 22 |
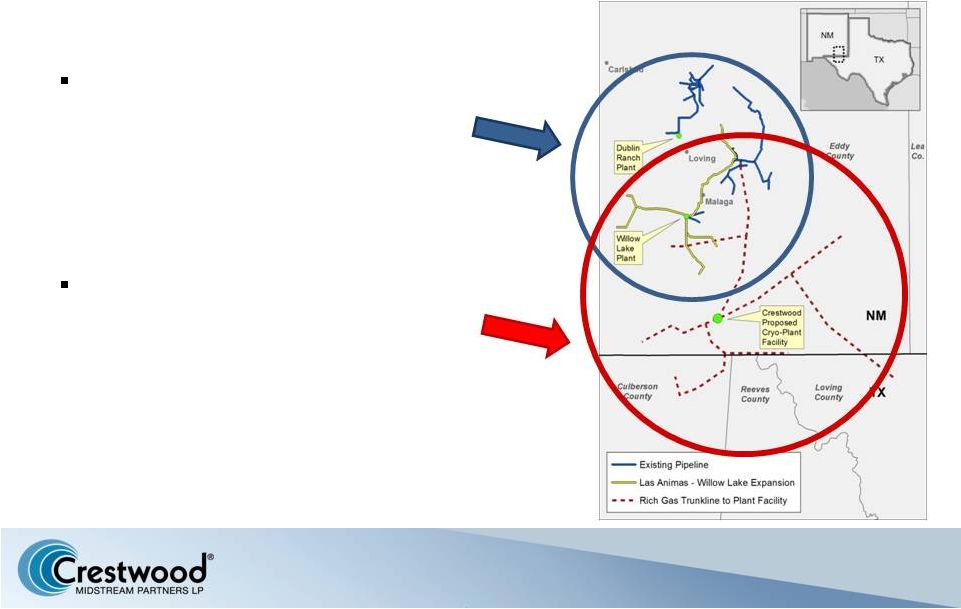 Part 1: Expanding the Las Animas footprint and adding near term processing capacity in Eddy County, NM Part 2: New central cryogenic processing plant facility and rich gas trunkline system targeting Eddy & Lea Counties, NM and Culberson, Reeves & Loving Counties in West TX Building a Footprint in High Growth Shale Plays Permian and Delaware Basin Project Overview 23 |
 Inergy / Crestwood merger is transformational for future growth objectives Operating and financial platform to compete for large scale infrastructure projects and acquisitions Merger integration to be completed in 4Q 2013 Combined assets and skill sets well-positioned to capture opportunities in new rich-gas, NGL and crude plays to provide full value chain services and enhance investment returns Key Investor Highlights 24 Combined platform positioned to deliver 6% – 10% long-term annual distribution growth |
 Appendix 25 |
 CMLP Capitalization 26 (in millions) 12/31/2012 3/31/2013 Capitalization Revolving credit facility - CMLP $206.7 $293.2 7.75% Senior Notes, due 2019 350.0 350.0 Capitalized leases 7.1 6.1 Total CMLP Debt $563.8 $649.3 Revolving credit facility - CMM 127.0 83.0 Consolidated debt $690.8 $732.3 Partners' capital 859.6 817.5 Total Crestwood capitalization $1,550.4 $1,549.8 Pro Forma LTM Adjusted EBITDA (1) $132.8 $150.7 Credit Statistics Consolidated debt / Total capitalization 45% 47% CMLP Debt / Pro Forma LTM Adjusted EBITDA 4.2x 4.3x Liquidity Revolving credit facility - CMLP (2) $166.6 $179.6 Revolving credit facility - CMM (2) 59.0 113.0 Total $225.6 $292.6 Units Outstanding Common Units (3) 41.2 45.7 Class C Units (4) 7.2 7.3 Class D Units (5) – 6.2 Total Limited Partner Interests 48.4 59.2 (1) Represents latest twelve months as defined in CMLP’s credit agreement. (2) Represents remaining borrowing capacity pursuant to maximum debt/ pro forma adjusted EBITDA ratios under respective credit agreements. (3) 4.5 million common units issued in March 2013. Excludes 575,000 units issued in April 2013 pursuant to overallotment exercise. (4) The Class C Units converted to common units on April 1, 2013. (5) Class D Units issued in January 2013 to Crestwood Holdings in the CMM drop-down transaction. |
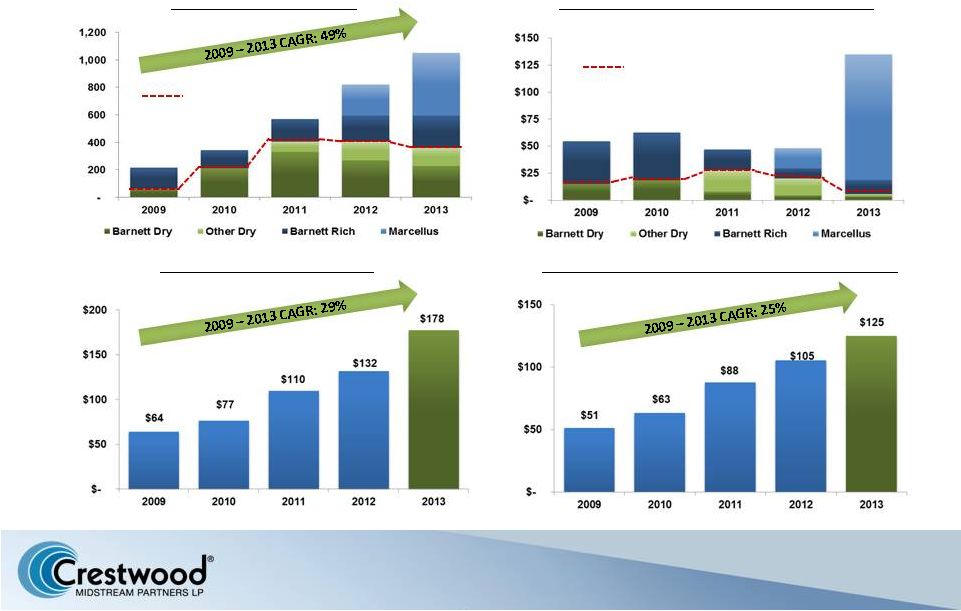 CMLP Financial Forecast Throughput (MMcf/d) Adjusted EBITDA ($MM) Growth Capital Expenditures ($MM) Adjusted Distributable Cash Flow ($MM) 343 570 823 1,050 $55 $63 $47 $48 $125 215 Rich Dry Rich Dry (1) Represents mid-point of 2013 guidance (1) (1) (1) (1) 27 |
 The following slides of this presentation provide reconciliations of the non-GAAP financial measures adjusted EBITDA and adjusted distributable cash flow to their most directly comparable financial measures calculated and presented in accordance with generally accepted accounting principles in the United States of America ("GAAP"). Our non-GAAP financial measures should not be considered as alternatives to GAAP measures such as net income or operating income or any other GAAP measure of liquidity or financial performance. We define adjusted EBITDA as net income from continuing operations adjusted for interest expense, income taxes, depreciation, amortization and accretion expense and certain non-recurring expenses, including but not limited to items such as transaction related expenses and gains/losses on the exchange of property, plant and equipment. Adjusted EBITDA is commonly used as a supplemental financial measure by senior management and by external users of our financial statements, such as investors, research analysts and rating agencies, to assess the financial performance of our assets without regard to financing methods, capital structures or historical cost basis. We define adjusted distributable cash flow as net income from continuing operations adjusted for: (i) the addition of depreciation, amortization and accretion expense; (ii) the addition of income taxes; (iii) the addition of non-cash interest expense; (iv) the subtraction of maintenance capital expenditures and (v) certain non-recurring expenses, including but not limited to items such as transaction related expenses and gains/losses on the exchange of property, plant and equipment. The GAAP measure most directly comparable to adjusted distributable cash flow is net income from continuing operations. Non-GAAP Financial Measures 28 |
 Non-GAAP Reconciliations 29 2009 2010 2011 2012 Total revenues 95,881 $ 113,590 $ 205,820 $ 239,463 $ Product purchases - - (38,787) (39,005) Operations and maintenance expense (21,968) (25,702) (36,303) (43,108) General and administrative expense (9,676) (17,657) (24,153) (29,582) Other income 1 - - - Gain from exchange of property, plant and equipment - - 1,106 - EBITDA 64,238 70,231 107,683 127,768 Gain from exchange of property, plant and equipment - - (1,106) - Non-cash compensation (accelerated vesting) - 3,581 - - Significant transaction related expenses - 2,737 3,385 4,697 Adjusted EBITDA 64,238 76,549 109,962 132,465 Less: Depreciation, amortization and accretion expense 20,829 22,359 33,812 51,908 Interest and debt expense 8,519 13,550 27,617 35,765 Income tax expense (benefit) 399 (550) 1,251 1,206 Gain from exchange of property, plant and equipment - - (1,106) - Non-cash compensation (accelerated vesting) - 3,581 - - Significant transaction related expenses - 2,737 3,385 4,697 Net income from continuing operations 34,491 $ 34,872 $ 45,003 $ 38,889 $ Net income from continuing operations 34,491 $ 34,872 $ 45,003 $ 38,889 $ Depreciation, amortization and accretion expense 20,829 22,359 33,812 51,908 Income tax expense (benefit) 399 (550) 1,251 1,206 Amortization of deferred financing fees 3,836 4,961 3,473 5,455 Non-cash equity compensation 1,705 5,522 916 1,877 Maintenance capital expenditures (10,000) (6,600) (1,409) (4,302) Distributable cash flow 51,260 60,564 83,046 95,033 Add: Gain from exchange of property, plant and equipment - - (1,106) - Add: Interest expense (bridge loan fees) - - 2,500 - Add: Significant transaction related expenses - 2,737 3,385 4,697 Add: Significant minimum volume deficiency payment - - - 5,352 Adjusted distributable cash flow 51,260 $ 63,301 $ 87,825 $ 105,082 $ Year Ended December 31, ($ in thousands) |
 Non-GAAP Reconciliations 2013 Guidance Net income: $38 million to $53 million Add/Deduct: Depreciation, amortization and accretion expense $80 million Interest expense, net $50 million Income tax provision $2 million Adjusted EBITDA $170 million to $185 million Note: Information as provided in Crestwood's February 26, 2013 news release. 30 |