 Preliminary Materials Prepared for the Conflicts Committee of the Board of Directors of Crestwood Gas Services GP LLC Project Intrepid April 26, 2013 |
These materials have been prepared by Evercore Group L.L.C. (“Evercore”) for the Conflicts Committee of the Board of Directors (the “Conflicts Committee”) of Crestwood Gas Services GP LLC (the “Company”), the general partner of Crestwood Midstream Partners LP (the “Partnership”), to whom such materials are directly addressed and delivered and may not be used or relied upon for any purpose other than as specifically contemplated by a written agreement with Evercore. These materials are based on information provided by or on behalf of the Partnership and/or other potential transaction participants, from public sources or otherwise reviewed by Evercore. Evercore assumes no responsibility for independent investigation or verification of such information and has relied on such information being complete and accurate in all material respects. To the extent such information includes estimates and forecasts of future financial performance prepared by or reviewed with the management of the Partnership and/or other potential transaction participants or obtained from public sources, Evercore has assumed that such estimates and forecasts have been reasonably prepared on bases reflecting the best currently available estimates and judgments of such management (or, with respect to estimates and forecasts obtained from public sources, represent reasonable estimates). No representation or warranty, express or implied, is made as to the accuracy or completeness of such information and nothing contained herein is, or shall be relied upon as, a representation, whether as to the past, the present or the future. These materials were designed for use by specific persons familiar with the business and affairs of the Partnership. These materials are not intended to provide the sole basis for evaluating, and should not be considered a recommendation with respect to, any transaction or other matter. These materials have been developed by and are proprietary to Evercore and were prepared for the benefit and internal use of the Conflicts Committee. These materials were compiled on a confidential basis for use by the Conflicts Committee in evaluating the potential transaction described herein and not with a view to public disclosure or filing thereof under state or federal securities laws, and may not be reproduced, disseminated, quoted or referred to, in whole or in part, without the prior written consent of Evercore. These materials do not constitute an offer or solicitation to sell or purchase any securities and are not a commitment by Evercore (or any affiliate) to provide or arrange any financing for any transaction or to purchase any security in connection therewith. Evercore assumes no obligation to update or otherwise revise these materials. These materials may not reflect information known to other professionals in other business areas of Evercore and its affiliates. Evercore and its affiliates do not provide legal, accounting or tax advice. Accordingly, any statements contained herein as to tax matters were neither written nor intended by Evercore or its affiliates to be used and cannot be used by any taxpayer for the purpose of avoiding tax penalties that may be imposed on such taxpayer. Each person should seek legal, accounting and tax advice based on his, her or its particular circumstances from independent advisors regarding the impact of the transactions or matters described herein. |
 Confidential Table of Contents Introduction Executive Summary Overview of CMLP Indicative Valuation of CMLP Overview of NRGM Indicative Valuation of NRGM Summary Analysis of the Proposed Consideration Summary Pro Forma Impact Certain Benefits and Issues for Consideration With Appendix A. Weighted Average Cost of Capital Section I II III IV V VI VII VIII IX DRAFT Respect to the Proposed Transaction |
 I. Introduction |
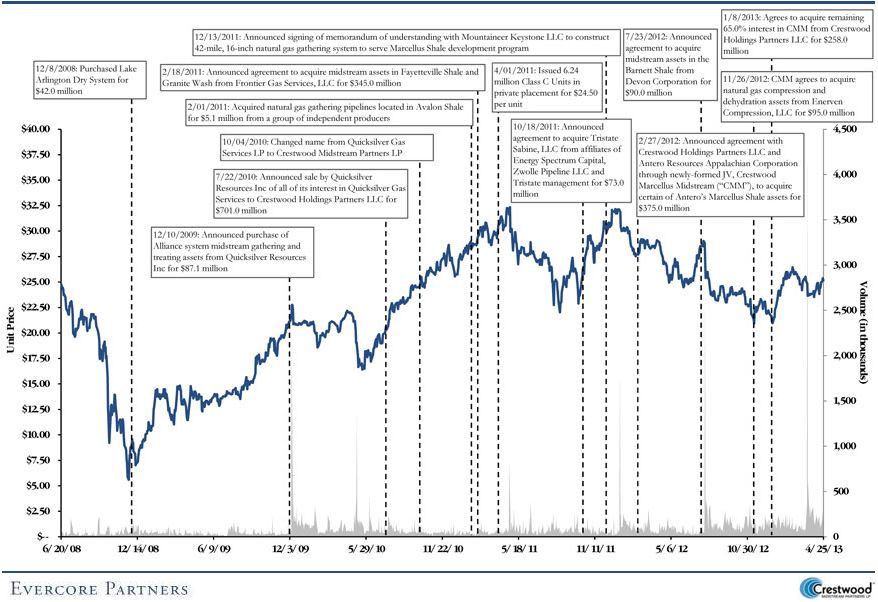
 Confidential Evercore Partners (“Evercore”) is pleased to provide the materials herein to the Conflicts Committee of the Board of Directors (the “Conflicts Committee”) of Crestwood Gas Services GP LLC, the general partner of Crestwood Midstream Partners LP (“Crestwood”, “CMLP” or the “Partnership”), regarding the proposed merger of CMLP with and into Inergy Midstream, L.P. (“NRGM”) (the “Proposed Transaction” or “Project Intrepid”) – As part of the Proposed Transaction, each common unit and Class D Unit (1) of CMLP is to be exchanged for 1.089x NRGM units and $0.41 in cash (the “Proposed Consideration”) based on a proposed 5.0% premium to CMLP’s volume-weighted average unit price over the previous 20 trading days ending April 25, 2013 and an aggregate $25.0 million dollar one-time cash payment to CMLP unitholders – Pro forma for Project Intrepid, CMLP will survive as a wholly-owned subsidiary of NRGM – As part of the Proposed Transaction, NRGM will assume CMLP’s current debt outstanding – As a condition to the Proposed Transaction, Inergy, L.P. (“NRGY”) and Crestwood Holdings, LLC (“Crestwood Holdings”) will enter into a series of transactions to consolidate the general partner of both entities including: (i) NRGY distributing all its existing NRGM units to existing NRGY unitholders; (ii) Crestwood Holdings acquiring Inergy Holdings GP, LLC (“IHGP”) from NRGY principals and (iii) NRGY acquiring CMLP’s general partner and IDR interest from Crestwood Holdings Overview of Materials Introduction 1 (1) Class D Units are similar in certain respects to existing common units, except that CMLP has the option to pay distributions on Class D Units for the period from March 2013 to March 2014 with cash or by issuing additional paid-in-kind Class D Units based upon the volume weighted-average price of CMLP common units for the ten trading days immediately preceding the date the distribution is declared |
 Confidential As such, the materials herein review the following: – An executive summary including: (i) an overview of the Proposed Transaction, including summary proposed terms; (ii) a review of Evercore’s evaluation process to-date; (iii) Evercore’s remaining outstanding due diligence and evaluation items and (iv) a summary preliminary analysis of the value of the Proposed Consideration relative to the preliminary value of a CMLP unit and an analysis of the proposed pro forma ownership relative to each of CMLP’s and NRGM’s contribution to the proposed MLP based on various financial metrics – An overview of CMLP, including an overview of CMLP’s assets and operations, a review of CMLP’s market and capitalization data and historical and projected operating and financial results as provided by CMLP management (the “CMLP Management Financial Projections”), a review of the assumptions utilized by CMLP management in deriving such financial projections, a review of a potential alternative set of projected operating and financial provided by CMLP management representing a downside scenario to the CMLP Management Financial Projections (the “CMLP Downside Financial Projections”), a review of the assumptions utilized by CMLP management in deriving such financial projections and a comparison of the two sets of financial projections provided by CMLP management to projected financial results per Wall Street Research analysts covering CMLP (the “CMLP Research Financial Projections”) – A preliminary valuation analysis of CMLP utilizing both the CMLP Management Financial Projections and the CMLP Downside Financial Projections – An overview of NRGM, including an overview of NRGM’s assets and operations, a review of NRGM’s market and capitalization data and historical and projected operating and financial results as provided by NRGM management (the “NRGM Management Financial Projections”), a review of the assumptions utilized by NRGM management in deriving such financial projections, a review of a potential alternative set of projected operating and financial provided by CMLP management representing a downside scenario to the NRGM Management Financial Projections (the “NRGM Downside Financial Projections”), a review of the assumptions utilized by NRGM management in deriving such financial projections and a comparison of the two sets of financial projections provided by NRGM management to projected financial results per Wall Street Research analysts covering NRGM (the “NRGM Research Financial Projections”) Overview of Materials (cont’d) Introduction 2 |
 Confidential – A preliminary analysis of the Proposed Consideration utilizing the NRGM Management Financial Projections and the NRGM Downside Financial Projections, including an analysis of the proposed pro forma ownership relative to each of CMLP’s and NRGM’s contribution to the pro forma entity based on various financial metrics – A review of the pro forma financial impact of the Proposed Transaction to CMLP unitholders, including sensitivities assuming various adjustments to the assumptions underlying the CMLP Management Financial Projections, the CMLP Downside Financial projections, the NRGM Management Financial Projections and the NRGM Downside Financial Projections – A review of certain benefits and issues for consideration with respect to the Proposed Transaction The materials herein are preliminary and are subject to potentially material changes Overview of Materials (cont’d) Introduction 3 |
 II. Executive Summary |
 Confidential Overview of Project Intrepid Opinion Requested: 4 Executive Summary As part of the Proposed Transaction, NRGM has proposed to acquire each CMLP common unit and Class D Unit outstanding in exchange for: (i) 1.089x NRGM common units and (ii) $0.41 cash assuming no more than a [5.0]% premium to CMLP’s volume- weighted average closing unit price over the 20 trading days prior to execution of a definitive agreement (“20-Day VWAP”) as described below and a one-time payment to CMLP unitholders not to exceed $[25.0] million in total – Represents an aggregate CMLP equity value of approximately $1.6 billion based on a 20-Day VWAP as of April 25, 2013 and, including NRGM’s assumption of CMLP’s approximately $787.4 million of net debt projected to be outstanding as of July 1, 2013, a CMLP enterprise value of approximately $2.4 billion – Pro forma for the Proposed Transaction, CMLP unitholders will own 43.3% of the pro forma entity – Expected announcement on May 6, 2013 Prior to the Proposed Transaction, it is anticipated that NRGY and Crestwood Holdings will enter into a series of transactions to consolidate the general partner of both entities (together the “GP Consolidation”), including: – Step 1: NRGY will distribute all of its 56.4 million NRGM units to NRGY unitholders – Step 2: Crestwood Holdings will acquire IHGP for a cash payment of [$70 million -$80 million], with the exact amount of such payment still to be determined based on certain tax and other considerations – Step 3: NRGY will acquire CMLP’s general partner and IDR interest on a debt-free basis from Crestwood Holdings in exchange for $450 million in NRGY units (40.2 million NRGY units based on the 20-Day VWAP as of April 25, 2013) – Step 4: Crestwood Holdings will contribute a portion of its CMLP units, currently proposed to be 6.3 million CMLP units, for an equivalent value of NRGY units such that Crestwood Holdings owns a 29.0% interest in NRGY on a pro forma basis While Steps 1 through 4 above are conditions precedent to closing of the Proposed Transaction, closing of the Proposed Transaction is not a condition precedent to the GP Consolidation Evercore has been asked by the Conflicts Committee, whether, in Evercore’s opinion, the Proposed Consideration to be received in the Proposed Transaction is fair, from a financial point of view, to the holders of the Partnership’s common units other than Crestwood Gas Services GP LLC, Crestwood Gas Services Holdings LLC and their respective affiliates |
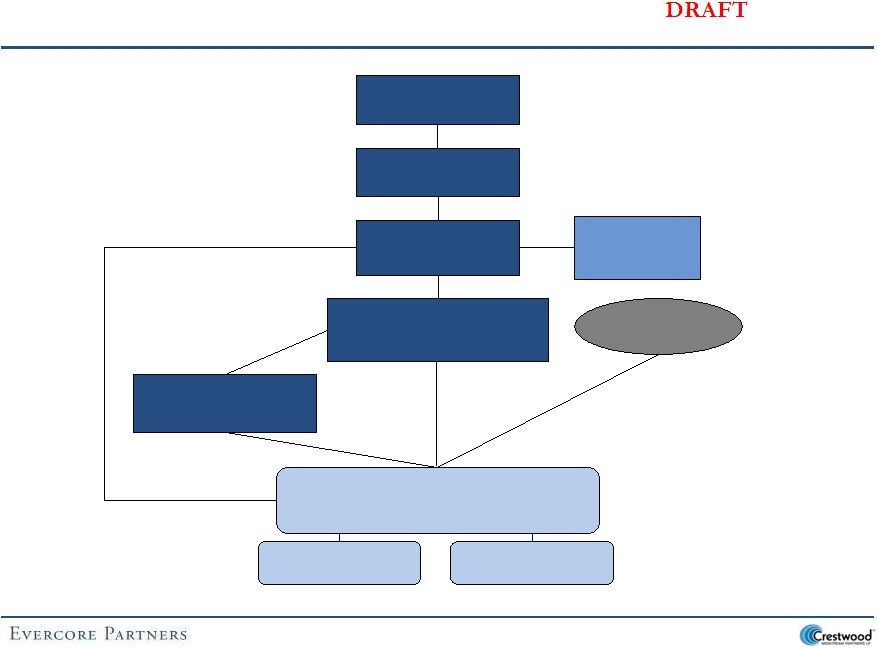
 Confidential Current NRGM Organizational Structure Note: Structure as of 4/1/13 5 Executive Summary |
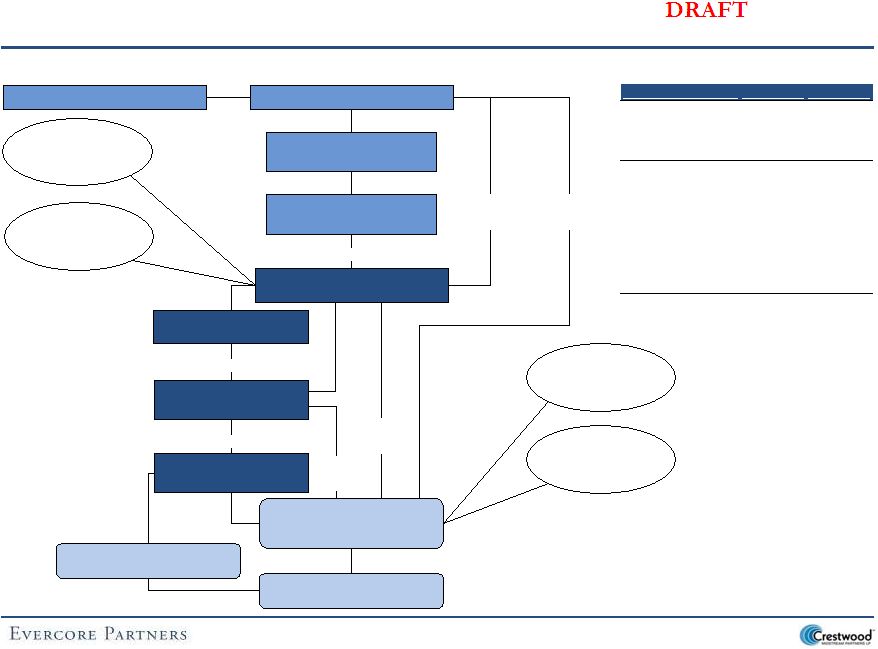
 Confidential 100% Current CMLP Organizational Structure 6 Executive Summary Source: Public partnership filings (1) Class D Units are similar in certain respects to existing common units, except that CMLP has the option to pay distributions to Class D unitholders for a period of one year with cash or by issuing additional paid-in-kind Class D units based upon the volume weighted-average price of CMLP common units for the ten trading days immediately preceding the date the distribution is declared 100% 100% Public Unitholders 34,083,730 Common LP Units Crestwood Holdings Partners LLC Crestwood Gas Services Holdings LLC 17,210,377 Common LP Units 6,190,469 Class D LP Units Crestwood Holdings LLC 2,333,712 Common LP Units 55.8% Operating Subsidiaries Class D LP Units (1) 10.1% 100% GP 1.8% GP LLC 137,105 Common LP Units 1,112,674 GP Units Common LP Units 28.2% Crestwood Marcellus Midstream LLC Crestwood Holdings II LLC Crestwood Marcellus Holdings LLC 3.8% LP 0.2% Crestwood Midstream Partners LP Market Capitalization: $1,535.9 million Net Debt: $702.5 million B3 / B Crestwood Gas Services |
 Confidential Summary Transaction Structure 7 Executive Summary Summary Structure |
 Confidential Common LP Units 12.0 million 7.9% Common LP Units 26.7 million 14.4% 100% 100% 100% Common LP Units 105.0 million 56.6% Pro Forma Ownership Structure 8 Executive Summary 100% Crestwood Holdings Partners LLC Inergy Holdings, L.P. Public Unitholders Crestwood Holdings LLC 100% 100% 100% 100% Common LP Units 111.0 million 73.3% Inergy GP, LLC Inergy, L.P. Public Unitholders MGP GP, LLC NRGM GP, LLC Common LP Units 6.8 million 4.5% Non-Economic General Partner Interest Non-Economic General Partner Interest Inergy Midstream Holdings, L.P. Non-Economic General Partner Interest 100% Incentive Distribution Rights Non-Economic General Partner Interest Common LP Units 53.8 million 29.0% Management Management Common LP Units 21.7 million 14.3% Inergy Midstream, L.P. Pro Forma Ownership Units (MM) % NRGY Public - NRGY 105.0 56.6% Crestwood Holdings 53.8 29.0% Management 26.7 14.4% Total NRGY Units 185.6 100.0% NRGM Public - NRGM 17.5 11.6% Public - CMLP 37.1 24.5% Crestwood Holdings 21.7 14.3% NRGY Unitholders 56.4 37.2% NRGY 6.8 4.5% Management 12.0 7.9% Total NRGM Units 151.5 100.0% Crestwood Midstream Partners, LP 100% Crestwood Gas Services, LLC 100% Non-Economic General Partner Interest 100% |
 Confidential Pro Forma Asset Map 9 Executive Summary Gathering Systems (CMLP) Compression and Treating Facility (CMLP) Processing Facility (CMLP) Legend Gas Storage (NRGM) NGL Storage (NRGM) COLT Hub (NRGM) |
 Confidential Summary Side by Side Comparison Executive Summary 10 Source: CMLP and NRGM management, respectively and CMLP and NRGM filings Note:: All entities listed on a fiscal year basis; NRGM fiscal year ends September 30 (1) Distribution per LP unit and Distributable Cash Flow per LP Unit for the three months ending September 30, 2013 NRGM CMLP NRGM Pro Forma Unit Price (as of 04/25/2013) $25.15 $24.40 $24.40 Total Equity Value $1,535.9 $2,096.0 $3,716.1 Plus: Net Debt $702.5 $679.8 $1,637.9 Plus: Minority Interest -- -- -- Enterprise Value $2,238.4 $2,775.8 $5,354.0 Adjusted EBITDA 2013E $173.3 $194.3 $377.5 2014E 214.8 228.6 458.4 Enterprise Value / Adjusted EBITDA 2013E 12.9x 14.3x 14.2x 2014E 10.4 12.1 11.7 Distributed Cash Flow Yield Current Annualized 8.1% 6.5% 6.9% 2013E 8.2% 6.5% 6.7% 2014E 8.6% 6.9% 7.5% Distributable Cash Flow Yield Current Annualized 7.8% 5.6% 7.1% 2013E 7.9% 6.2% 6.8% 2014E 8.5% 7.2% 7.8% Credit Rating B3 / B Ba3 / BB NA (1) (1) ($ in millions, except per unit amounts) |
 Confidential Summary of Merger Agreement 11 Executive Summary Source: Draft of the Agreement and Plan of Merger by and among Inergy Midstream, L.P., NRGM GP, LLC, Intrepid Merger Sub, LLC, Inergy, L.P., Crestwood Midstream Partners LP and Crestwood Gas Services GP LLC dated April 19, 2013 (1) Subject to NRGM’s further confirmation of impact of merger transaction on CMLP equity awards |
 Confidential Summary of Merger Agreement (cont’d) 12 Executive Summary Covenants: Conditions to Closing: Customary closing conditions (including absence of Material Adverse Effect); GP Consolidation has occurred; and Required Approvals obtained (see page 11) Termination: Termination (i) by mutual consent of the parties; (ii) by either CMLP or NRGM if merger is not consummated [within one year of Merger Agreement execution], CMLP unitholder or requisite governmental approval not obtained, or material breach and failure to cure by the other party or (iii) by NRGM if CMLP GP Board changes its recommendation or willfully breaches non-solicitation provision Termination Fee: CMLP must pay termination fee of $[ ] if CMLP willfully breaches non-solicitation provision, CMLP GP Board changes its recommendation or CMLP agrees to a superior proposal Expense Reimbursement: CMLP must pay NRGM $[ ] million as expense reimbursement if CMLP unitholder approval is not obtained Controlling Law: Delaware Source: Draft of the Agreement and Plan of Merger by and among Inergy Midstream, L.P., NRGM GP, LLC, Intrepid Merger Sub, LLC, Inergy, L.P., Crestwood Midstream Partners LP and Crestwood Gas Services GP LLC dated April 19, 2013 Parties agree to continue to conduct business in the ordinary course through Closing and abide by customary restrictions on issuance of equity, incurrence of debt, entry into material contracts, etc. No-Shop Clause: CMLP agrees not to solicit or otherwise agree to an alternative to the Proposed Transaction; includes fiduciary out allowing CMLP GP’s Board to agree to superior proposal Indemnification: NRGM must indemnify directors and officers of CMLP and related parties for 6 years after closing, including for claims relating to the Proposed Transaction Directors of CMLP Board (and related entities as NRGM may designate) must resign Securities Law Filings: Parties agree to cooperate in filing Joint Proxy Statement/Prospectus, Schedule 13E-3 (if needed), and other filings as required by the SEC |
 Confidential Evercore Evaluation Process To-Date 13 Executive Summary Reviewed certain publicly-available financial and operating data relating to CMLP and NRGM that we deemed to be relevant; Reviewed publicly-available research analyst estimates for CMLP’s and NRGM’s future financial performance on a standalone basis; Reviewed certain non-public projected financial and operating data relating to CMLP prepared and furnished to us by management of CMLP; Discussed the past and current operations, financial projections and current financial condition of CMLP with management of CMLP (including management’s views of the risks and uncertainties of achieving such projections); Reviewed certain non-public projected financial and operating data relating to NRGM prepared and furnished to us by management of NRGM; Reviewed the past and current operations, financial projections and current financial condition of NRGM with CMLP management; Reviewed the dynamics of each of the markets in which CMLP and NRGM participates with CMLP management; Reviewed the Crestwood Management Presentation dated April 11, 2013 prepared for NRGY and NRGM by CMLP management Reviewed the Inergy Management Presentation dated April 11, 2013 prepared for CMLP by NRGM management Reviewed the Project Intrepid Due Diligence Presentation dated April 19, 2013 prepared by CMLP management Reviewed a draft of the Agreement and Plan of Merger by and among Inergy Midstream, L.P., NRGM GP, LLC, Intrepid Merger Sub, LLC, Inergy, L.P., Crestwood Midstream Partners LP and Crestwood Gas Services GP LLC Reviewed a draft of the Purchase and Sale Agreement among Crestwood Holdings LLC, Intrepid Holdings GP, LLC and NRGP Limited Partner, LLC Reviewed a draft of the Contribution Agreement of Membership Interests of Crestwood Gas Services GP LLC among Crestwood Holdings LLC, Crestwood Gas Services Holdings LLC as Contributing Parties and Intrepid GP, LLC, Intrepid, L.P. as Recipient Parties April 24, 2013 In connection with its review of the Proposed Transaction as of April 24, 2013, Evercore has, among other things: dated April 24, 2013 dated dated April 19, 2013 |
 Confidential Evercore Remaining Due Diligence/Evaluation 14 Executive Summary In connection with its review of the Proposed Transaction, as of April 26, 2013 Evercore has the following remaining items to complete: – Reviewing additional information from ongoing diligence with respect to NRGM as such information continues to be provided to CMLP management and Evercore – Reviewing certain tax information requested on April 21, 2013 |
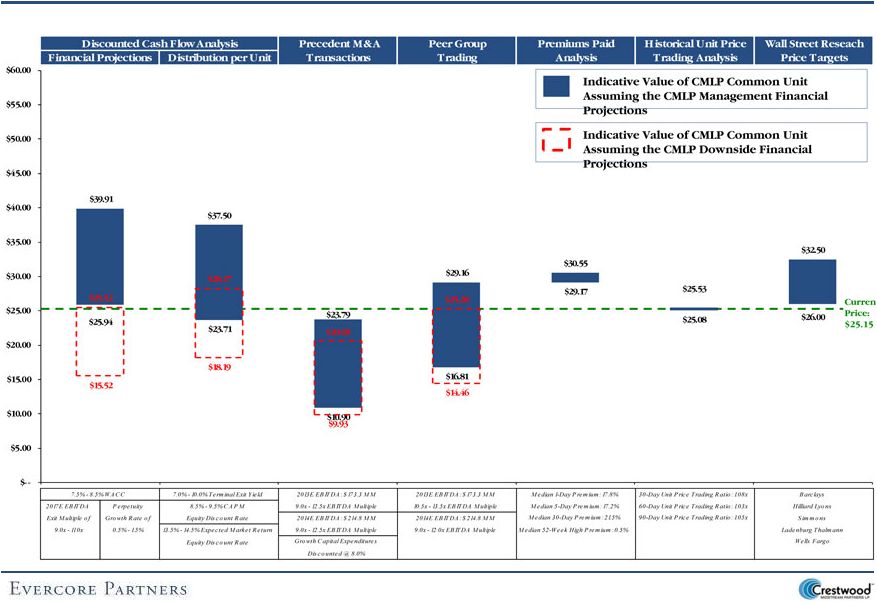
 Confidential Crestwood Midstream Partners LP Indicative Valuation per LP Unit Indicative Valuation of Proposed Consideration Discounted Cash Flow Analysis Precedent M&A Peer Group Wall Street Discounted Cash Flow Analysis Precedent M&A Peer Group Wall Street Financial Distirbution Transactions Trading Research Price Financial Distirbution Transactions Trading Research Price Projections Per LP Unit Analysis Analysis Targets Projections Per LP Unit Analysis Analysis Targets 7.5% - 8.5% WACC 7.0% - 10.0% 2013E EBITDA 2013E EBITDA: Barclays 6.5% - 7.5% WACC 6.0% - 8.0% 2013E EBITDA: 2013E EBITDA: Barclays 2017E EBITDA Terminal Exit Yield $173.3 MM $173.3 MM Hilliard Lyons 2017E EBITDA Terminal Exit Yield $171.6 MM $171.6 MM Credit Suisse Exit Multiple of 8.5% - 9.5% CAPM 9.0x - 12.5x 10.5x - 13.5x Simmons Exit Multiple of 7.5% - 9.5% CAPM 11.5x - 13.5x 14.0x - 17.0x JP Morgan 9.0x - 11.0x Equity Discount Rate EBITDA Multiple EBITDA Multiple Ladenburg Thalmann 11.5x - 13.5x Equity Discount Rate EBITDA Multiple EBITDA Multiple Morgan Stanley Perpetuity Growth 13.5% - 14.5% 2014E EBITDA: 2014E EBITDA: Wells Fargo Perpetuity Growth 9.0% - 11.0% 2014E EBITDA: 2014E EBITDA: Robert W. Baird & Co. Rate of Expected Market Return $214.8 MM $214.8 MM Rate of Expected Market Return $223.5 MM $223.5 MM Stifel Nicolaus 0.5% - 1.5% Equity Discount Rate 9.0x - 12.5x 9.0x - 12.0x 0.5% - 1.5% Equity Discount Rate 11.5x - 13.5x 10.0x - 13.0x EBITDA Multiple EBITDA Multiple EBITDA Multiple EBITDA Multiple Growth Capital Expenditures Growth Capital Expenditures Discounted @ 8.0% Discounted @ 7.0% $25.94 $23.71 $10.90 $16.81 $26.00 $20.05 $23.46 $15.15 $19.27 $26.55 $39.91 $37.50 $23.79 $29.16 $32.50 $33.54 $32.58 $24.91 $27.90 $30.91 $-- $10.00 $20.00 $30.00 $40.00 $50.00 $60.00 Summary Preliminary Valuation Analysis 15 Executive Summary Relevant Range of the Proposed Consideration $27.00 $22.00 Indicative Value per CMLP Common Unit Assuming the CMLP Management Financial Projections Indicative Value of the Proposed Consideration to be Paid per CMLP Common Unit Assuming the NRGM Management Financial Projections 1.089x NRGM Units + $0.41 per unit of cash Current CMLP Unit Price: $25.15 |
 DRAFT Confidential Summary Contribution Analysis 16 Executive Summary (1) Adjusted for CMLP and NRGM projected net debt outstanding as of July 1, 2013 (2) Proposed exchange ratio excludes cash consideration of $0.41 per unit |
 DRAFT Confidential Summary Pro Forma Accretion/Dilution Results 17 Executive Summary (1) Based on CMLP’s current 8.1% yield |
DRAFT III. Overview of CMLP |
 DRAFT Confidential CMLP Asset Map ($ in millions) 18 Overview of CMLP Source: Public partnership filings (1) Excludes corporate expenses |
 DRAFT Confidential Asset Overview 19 Overview of CMLP Source: Public partnership filings Pipeline Nominal Capacity (MMcfd) Installed Compression Asset Miles Gathering Processing Treating Dehydration Compression (HP) Units Barnett Shale Owned: Cowtown System 298 425 425 -- 425 103,590 33 Lake Arlington System 10 230 -- -- 235 30,480 7 Alliance System 42 300 -- 340 240 43,680 7 Owned 350 955 425 340 900 177,750 47 Operated Non-Owned: Cowtown System 104 -- -- -- -- -- -- Lake Arlington System 10 -- -- -- -- -- -- Alliance System 35 -- -- -- -- -- -- Operated Non-Owned 149 -- -- -- -- -- -- Total Barnett Shale Assets 499 955 425 340 900 177,750 47 Fayetteville Shale Twin Groves/Prairie Creek/Woolly Hollow System 129 350 -- 185 180 26,635 14 Wilson Creek System 24 100 -- -- 5 425 1 Rose Bud System 15 60 -- -- 5 630 1 Total Fayetteville Shale Assets 168 510 -- 185 190 27,690 16 Granite Wash Total Granite Wash Assets 36 36 36 -- -- 10,890 10 Marcellus Shale Total Marcellus Shale Assets 42 420 -- -- 300 43,100 31 Other Las Animas System 47 50 -- -- 34 -- 1 Sabine System 57 100 -- 74 72 -- -- Total Other Assets 104 150 -- 74 106 -- 1 Total CMLP 849 2,071 461 599 1,496 259,430 105 |
 DRAFT Confidential Asset Overview (cont’d) 20 Overview of CMLP Source: Public partnership filings (1) Excludes corporate expenses |
 DRAFT Confidential Asset Overview (cont’d) 21 Overview of CMLP Source: Public partnership filings (1) Excludes corporate expenses |
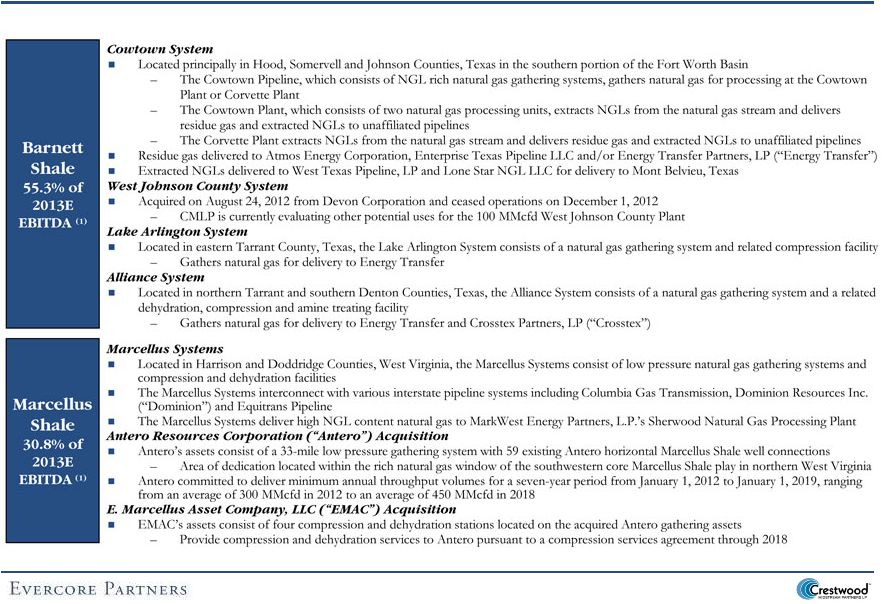
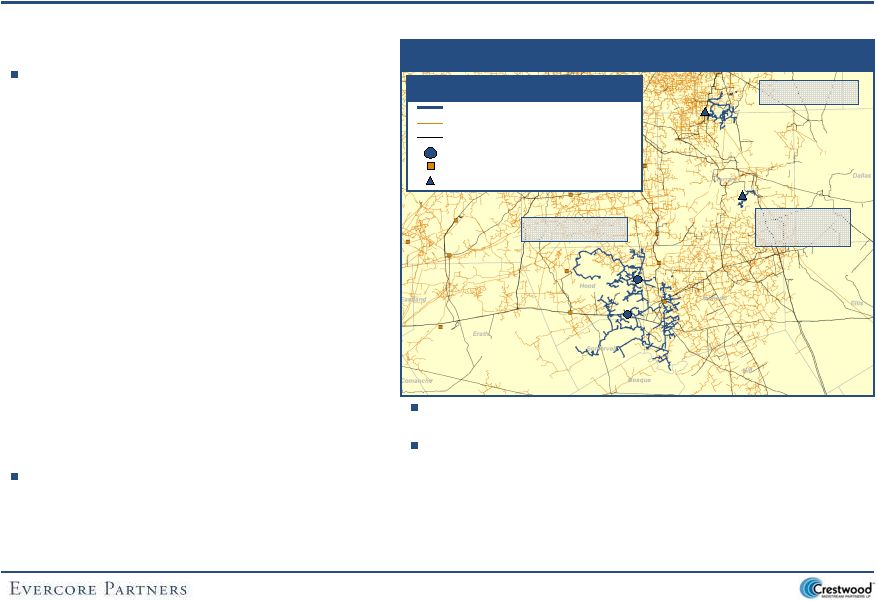 DRAFT Confidential Asset Overview – Barnett Shale (55.3% of 2013E EBITDA Excluding Corporate Expenses) 22 Overview of CMLP Source: Public partnership filings and CMLP management During the year ended December 31, 2012, CMLP’s Barnett Shale EBITDA declined $8.9 million from 2011 levels – Gathering volumes declined from 473.5 MMfcd in 2011 to 433.1 MMcfd in 2012 given reduced production from existing wells and well shut-ins on the Alliance System and Lake Arlington System – Such volume declines were partially offset by producers connecting 64 new wells during the year ended December 31, 2012 mostly on the Cowtown System – During the year ended December 31, 2011, Quicksilver Resources Inc.’s (“Quicksilver”) joint development agreement with Eni SpA resulted in an increase of approximately 75 MMcfd in gathered volumes and approximately $16.0 million in revenue Given the higher NGL content of the natural gas production in Johnson County, Texas, Devon Energy Corporation maintained an active drilling and development plan in 2012 Map – Barnett Shale Assets CMLP Natural Gas Gathering Pipeline Third-Party Natural Gas Gathering Pipeline Third-Party Natural Gas Takeaway Pipeline CMLP Natural Gas Processing Plants Third-Party Natural Gas Processing Plants CMLP Treating and Compression Facility Competitive Asset Legend Cowtown System Alliance System Lake Arlington System The primary producer on the system, Quicksilver, represented 71.6% of CMLP’s Barnett Shale gathering volumes On March 29, 2013, Quicksilver announced that it had executed an agreement to sell an undivided 25.0% interest in its Barnett Shale oil and gas assets for $485.0 million to TG Barnett Resources LP, a U.S. subsidiary of Tokyo Gas Co., Ltd. – Future development spending will be shared in proportion to each party’s working interest |
 DRAFT Confidential 23 Overview of CMLP Source: Public partnership filings and HPDI On August 24, 2012, CMLP acquired certain gathering and processing assets from Devon Corporation (“Devon”) in west Johnson County, Texas (the “West Johnson County System”) – The assets acquired consist of a 74-mile low pressure natural gas gathering system, a 100 MMcfd cryogenic processing facility and 23,100 horsepower of compression equipment – Additionally, CMLP entered into a 20-year, fixed-fee gathering, processing and compression agreement with Devon, pursuant to which CMLP will gather and process Devon’s natural gas production from a 20,500 acre dedication – The West Johnson County System was operational from August 24, 2012 to December 1, 2012 Natural gas production gathered and processed pursuant to the agreement was approximately 96 MMcfd as of December 31, 2012 On December 1, 2012, CMLP elected to cease operating the 100 MMcfd natural gas processing plant and consolidated natural gas volumes then on the West Johnson County System onto the Cowtown System CMLP is currently evaluating other potential uses for the 100 MMcfd natural gas processing plant Wells Spud and Permits by Quarter (Denton, Tarrant, Hood, Johnson, Somervell and Bosque Counties, Texas) Producing Wells and Production by Quarter (Denton, Tarrant, Hood, Johnson, Somervell and Bosque Counties, Texas) -- 150 300 450 Q1 2010 Q2 2010 Q3 2010 Q4 2010 Q1 2011 Q2 2011 Q3 2011 Q4 2011 Q1 2012 Q2 2012 Q3 2012 Q4 2012 Permits Spuds 7,500 8,500 9,500 10,500 3,750 4,000 4,250 4,500 Q1 2010 Q2 2010 Q3 2010 Q4 2010 Q1 2011 Q2 2011 Q3 2011 Q4 2011 Q1 2012 Q2 2012 Q3 2012 Q4 2012 Production (MMcfed) Average Producing Wells 4,750 Asset Overview – Barnett Shale (55.3% of 2013E EBITDA Excluding Corporate Expenses) (cont’d) |
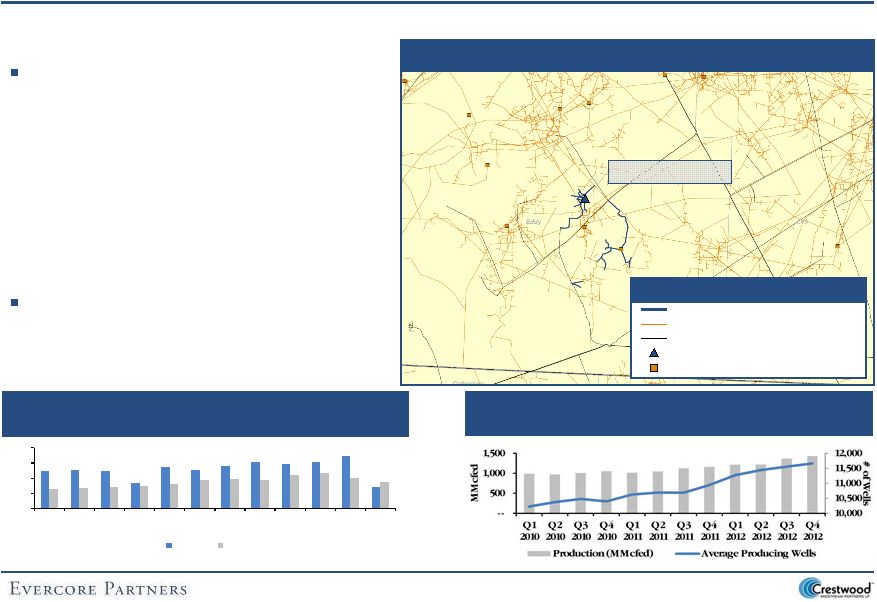
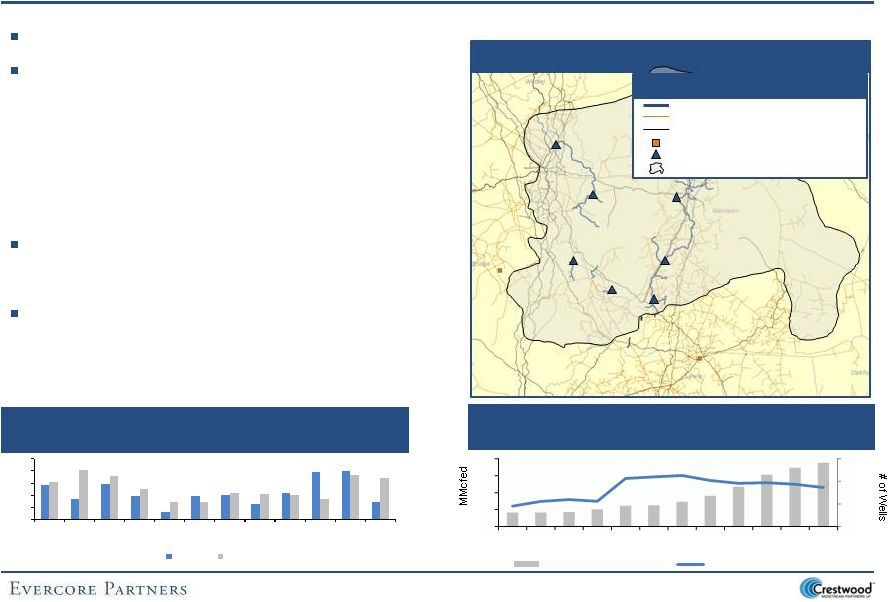 DRAFT Confidential 24 Overview of CMLP Antero Resources LLC (“Antero”) is the only producer on CMLP’s Marcellus Shale assets Based upon Antero’s current 2013 drilling plan in the eastern part of CMLP’s dedicated acreage: – CMLP management expects 60 to 70 new well connections in 2013 – CMLP management expects to expand its low pressure gathering systems with an additional 18 miles of pipeline – In addition to the four compressor stations acquired from Enerven in January 2013 for $95.0 million, CMLP also expects to add at least two new compressor stations during 2013 CMLP is in early discussions with Antero regarding the accelerated development of midstream infrastructure in the western part of CMLP’s dedicated acreage including the addition of incremental compressor stations to increase total gathering capacity CMLP’s Marcellus Shale assets gather natural gas production that Evercore believes, given well costs and production profile, generate 20.0% + IRRs for producers down to a $3.50 per MMBtu natural gas price Source: Public partnership filings and HPDI Wells Spud and Permits by Quarter (Harrison and Doddridge Counties, West Virginia) -- 10 20 30 40 50 Q1 2010 Q2 2010 Q3 2010 Q4 2010 Q1 2011 Q2 2011 Q3 2011 Q4 2011 Q1 2012 Q2 2012 Q3 2012 Q4 2012 Permits Spuds Producing Wells and Production by Quarter (Harrison and Doddridge Counties, West Virginia) 5,000 5,500 6,000 6,500 -- 100 200 300 400 Q1 2009 Q2 2009 Q3 2009 Q4 2009 Q1 2010 Q2 2010 Q3 2010 Q4 2010 Q1 2011 Q2 2011 Q3 2011 Q4 2011 Production (MMcfed) Average Producing Wells Competitive Asset Legend Map – Marcellus Shale Assets CMLP Natural Gas Gathering Pipeline Third-Party Natural Gas Gathering Pipeline Third-Party Natural Gas Takeaway Pipeline Third-Party Natural Gas Processing Plants CMLP Compression Station Antero Acreage Dedication Asset Overview – Marcellus Shale (30.8% of 2013E EBITDA Excluding Corporate Expenses) |
 Confidential DRAFT Asset Overview – Fayetteville Shale (10.5% of 2013E EBITDA Excluding Corporate Expenses) 25 Overview of CMLP Fayetteville segment EBITDA increased approximately $7.9 million during the year ended December 31, 2012 compared to 2011 and gathering volume increased by 22.5 MMcfd in 2012 compared to 2011 – During the year ended December 31, 2012, BHP connected six new wells on the Twin Groves System The Fayetteville System’s volumes are supported by long-term fixed- fee contracts with producers with approximately 100,000 acres dedicated to CMLP – These contracts have initial terms that extend through 2020 and include an option, by either party to the contract, to extend the contract through 2025 Primary producer, BHP, acquired CHK’s Fayetteville Shale upstream assets on February 22, 2011 for $4.25 billion On August 3, 2012, BHP took a $2.84 billion writedown on its Fayetteville assets, and BHP’s CEO Marius Kloppers stated, “The Fayetteville charge reflects the fall in United States domestic gas prices and the company’s decision to adjust its development plans by shifting drilling from dry gas to more liquids rich fields” Map – Fayetteville Shale Assets Source: Public partnership filings and HPDI Wells Spud and Permits by Quarter (Van Buren, Conway, Faulkner and White Counties, Arkansas) -- 75 150 225 Q1 2010 Q2 2010 Q3 2010 Q4 2010 Q1 2011 Q2 2011 Q3 2011 Q4 2011 Q1 2012 Q2 2012 Q3 2012 Q4 2012 Permits Spuds CMLP Natural Gas Gathering Pipeline Third-Party Natural Gas Gathering Pipeline Third-Party Natural Gas Takeaway Pipeline CMLP Treating and Compression Facility Third-Party Natural Gas Processing Plants Competitive Asset Legend Wilson Creek Prairie Creek Twin Groves Woolly Hollow Rose Bud Producing Wells and Production by Quarter (Van Buren, Conway, Faulkner and White Counties, Arkansas) |
 Confidential DRAFT Asset Overview – Granite Wash (1.8% of 2013E EBITDA Excluding Corporate Expenses) 26 Overview of CMLP For the year ended December 31, 2012, the Granite Wash segment’s EBITDA was approximately $0.8 million lower than in 2011, primarily due to lower product sales margin and higher operations and maintenance expenses while volumes on the system increased by 5.2 MMcfd, or 41.4%, versus 2011 – Lower margins earned on percent-of-proceeds contracts, which primarily resulted from lower NGL and natural gas prices coupled with relatively consistent costs per volume – Higher gathering revenues from new wells connected by Sabine Oil and Gas LLC (“Sabine”) partially offset the decline in product sales margin in 2012 Map – Granite Wash Assets Source: Public partnership filings and HPDI Wells Spud and Permits by Quarter (Roberts County, Texas) -- 10 20 30 Q1 2010 Q2 2010 Q3 2010 Q4 2010 Q1 2011 Q2 2011 Q3 2011 Q4 2011 Q1 2012 Q2 2012 Q3 2012 Q4 2012 Permits Spuds CMLP Natural Gas Gathering Pipeline Third-Party Natural Gas Gathering Pipeline Third-Party Natural Gas Takeaway Pipeline CMLP Natural Gas Processing Plants Third-Party Natural Gas Processing Plants Competitive Asset Legend Indian Creek System Producing Wells and Production by Quarter (Roberts County, Texas) |
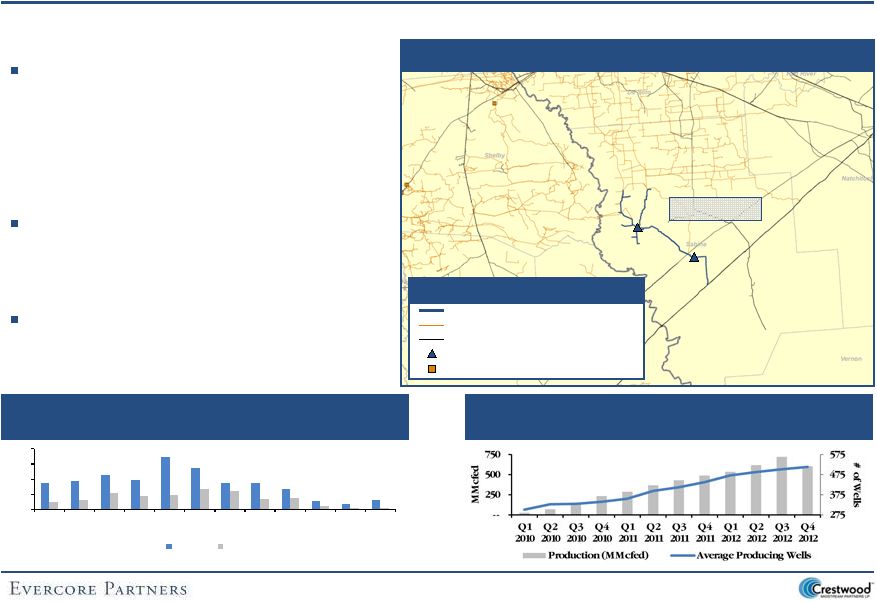 Confidential DRAFT Asset Overview – Haynesville Shale (1.5% of 2013E EBITDA Excluding Corporate Expenses) 27 Overview of CMLP Map – Haynesville Shale Assets Source: Public partnership filings and HPDI Wells Spud and Permits by Quarter (Sabine Parish, Louisiana) -- 25 50 75 100 Q1 2010 Q2 2010 Q3 2010 Q4 2010 Q1 2011 Q2 2011 Q3 2011 Q4 2011 Q1 2012 Q2 2012 Q3 2012 Q4 2012 Permits Spuds On November 1, 2011, CMLP acquired Tristate Sabine, LLC (“Tristate”) from affiliates of Energy Spectrum Capital, Zwolle Pipeline, LLC and Tristate’s management for approximately $72.0 million in cash consideration comprised of $64.0 million paid at closing plus a deferred payment of approximately $8.0 million, which was paid during the fourth quarter of 2012 The Sabine System is supported by long-term, fixed- fee contracts with approximately 20,000 acres dedicated to CMLP – These contracts have various initial terms that extend through 2019 and 2021 The Sabine System had 50 MMcfd in gathered volumes for the year ended December 31, 2012, which resulted in approximately $10.0 million in revenues for the year ended December 31, 2012 CMLP Natural Gas Gathering Pipeline Third-Party Natural Gas Gathering Pipeline Third-Party Natural Gas Takeaway Pipeline CMLP Treating and Compression Facility Third-Party Natural Gas Processing Plants Competitive Asset Legend Sabine System Producing Wells and Production by Quarter (Sabine Parish, Louisiana) |
 Confidential DRAFT Asset Overview – Avalon Shale (0.1% of 2013E EBITDA Excluding Corporate Expenses) 28 Overview of CMLP Effective February 1, 2011, CMLP acquired approximately 46 miles of natural gas gathering systems located in the Morrow/Atoka trend and the Avalon Shale for $5.1 million from a group of independent producers – Supported by long term, fixed-fee contracts which include existing Morrow/Atoka production and dedications of approximately 90,000 acres at the time of the acquisition – The Las Animas Systems currently has approximately 55,000 acres of dedication from Bass Oil Production Company through 2017 EBITDA related to the Las Animas System remained relatively unchanged for the year ended December 31, 2012 compared to 2011 as volumes decreased by 5.3% during the year Map – Avalon Shale Assets Source: Public partnership filings and HPDI -- 100 200 300 400 Q1 2010 Q2 2010 Q3 2010 Q4 2010 Q1 2011 Q2 2011 Q3 2011 Q4 2011 Q1 2012 Q2 2012 Q3 2012 Q4 2012 Permits Spuds CMLP Natural Gas Gathering Pipeline Third-Party Natural Gas Gathering Pipeline Third-Party Natural Gas Takeaway Pipeline CMLP Treating and Compression Facility Third-Party Natural Gas Processing Plants Competitive Asset Legend Las Animas Systems Wells Spud and Permits by Quarter (Eddy County, New Mexico) Producing Wells and Production by Quarter (Eddy County, New Mexico) |
 Confidential DRAFT CMLP – Summary Market Data ($ in millions, except per unit amounts) Market Capitalization Balance Sheet and Credit Data Unit Price and Distribution Information Overview of CMLP 29 Source: Public partnership filings and Factset (1) Includes 6,190,469 Class D Units (2) Excludes 6,190,469 Class D Units General Partner Incentive Distribution Rights Quarterly Distribution per LP Unit $0.5100 Quarterly Total Total Total Total LP Quarterly Quarterly Distribution Total Quarterly Quarterly Annual Annual Distribution Distribution to GP LP Units (2) Distribution Distribution Distribution Distribution % to LP % to GP Range Within Range per LP Unit Outstanding to LPs to GP to LPs to GP 98.2% 1.8% $0.0000 $0.3450 $0.3450 $0.0064 53.8 $18.5 $0.3 $74.2 $1.4 85.2% 14.8% 0.3450 0.3750 0.0300 0.0052 53.8 1.6 0.3 6.5 1.1 75.2% 24.8% 0.3750 0.4500 0.0750 0.0248 53.8 4.0 1.3 16.1 5.3 50.2% 49.8% 0.4500 0.4500 0.0600 0.0596 53.8 3.2 3.2 12.9 12.8 $27.4 $5.2 $109.7 $20.6 % of Total Distributions to the GP 15.8% % of Total Distributions to the IDRs 14.0% As of December 31, 2012 Cash and Marketable Securities $0.1 Short-term Debt 3.9 Long-term Debt 698.8 Total Debt $702.7 Net Debt 702.5 Plus: Partners' Capital 978.6 Net Book Capitalization $1,681.2 Revolver Availability / Revolver Capacity $406 / $750 Net Debt / Net Book Cap 41.8% Net Debt / 2013E EBITDA 3.9x Net Debt / 2014E EBITDA 3.1x Current Ratings: Moody's B3 S&P B As of April 25, 2013 Total Units Outstanding (1) 61.1 Common Unit Price $25.15 Total Equity Value $1,535.9 Plus: Total Debt 702.7 Less: Cash (0.1) Total Enterprise Value $2,238.4 IBES Yield/ Data Multiple Distribution Yield Current $2.04 8.1% 2013E 2.07 8.2% 2014E 2.15 8.5% 2015E 2.26 9.0% TEV / EBITDA 2013E $179.1 12.5x 2014E 229.5 9.8 2015E 296.3 7.6 |
 Confidential DRAFT Trading Performance 30 Overview of CMLP Source: Public partnership filings and Factset |
  Confidential DRAFT Overview of CMLP 31 Relevant Relative Trading Metrics Source: Partnership filings, FactSet, IBES Enterprise Value / Price Equity Enterprise EBITDA Distribution Yield Distribution Total Partnership (04/25/2013) Value Value 2013E 2014E Current 2013E 2014E Growth Return Natural Gas Gathering and Processing MLPs American Midstream Partners, LP $18.21 $170.4 $380.6 12.1x 11.0x 9.5% 9.5% 9.5% 2.4% 11.9% Atlas Pipeline Partners, L.P. 36.18 2,383.4 3,627.1 10.3 8.2 6.4% 7.0% 7.9% 9.9% 16.3% Access Midstream Partners, L.P. 41.07 7,941.9 10,488.6 12.9 10.1 4.4% 4.8% 5.5% 10.6% 14.9% Crosstex Energy, L.P. 18.85 1,802.2 2,838.3 12.1 9.2 7.0% 7.4% 8.1% 5.3% 12.3% DCP Midstream Partners, LP 47.47 2,936.8 4,591.2 12.5 9.2 5.8% 6.0% 6.5% 8.4% 14.2% MarkWest Energy Partners, L.P. 62.18 9,270.4 11,773.9 16.9 12.5 5.3% 5.5% 6.1% 9.2% 14.5% Regency Energy Partners LP 26.51 5,450.8 8,304.4 13.2 10.6 6.9% 7.1% 7.3% 4.3% 11.2% Southcross Energy Partners, L.P. 21.13 526.8 969.1 18.3 17.0 7.6% 7.6% 7.7% 6.3% 13.9% Summit Midstream Partners, LP 27.13 1,351.5 1,542.8 13.3 10.9 6.0% 6.4% 7.0% 8.0% 14.1% Targa Resources Partners LP 46.68 4,848.5 7,324.3 11.5 9.0 5.8% 6.1% 6.8% 8.5% 14.4% Western Gas Partners, LP 58.64 6,289.4 8,087.4 18.5 13.5 3.7% 3.9% 4.5% 11.6% 15.3% Mean 13.8x 11.0x 6.2% 6.5% 7.0% 7.7% 13.9% Median 12.9 10.6 6.0% 6.4% 7.0% 8.4% 14.2% Crestwood Midstream Partners LP $25.15 $1,535.9 $2,267.4 12.7x 9.9x 8.1% 8.2% 8.5% 4.1% 12.2% ($ in millions, except per unit amounts) |
 Confidential DRAFT Wall Street Research Price Targets ($ in millions, except per unit amounts) Summary Price Targets 32 Analyst Recommendations Source: Bloomberg, IBES Distribution Per Unit Estimates EBITDA Estimates Overview of CMLP Hold (2) 33.3% Buy (4) 66.7% Target Firm Analyst Date Recommendation Price Ladenburg Thalmann Eduardo Seda 02/27/13 Buy $32.50 Hilliard Lyons Joel K. Havard 02/27/13 Long-term Buy 32.00 Simmons Mark L. Reichman 03/21/13 Overweight 30.00 Barclays Richard Gross 02/28/13 Equalweight 27.00 RBC T.J. Schultz 02/27/13 Sector Perform 26.00 Wells Fargo Michael J. Blum 02/28/13 Outperform NA Median: $30.00 Mean: 29.50 Low: 26.00 High: 32.50 $2.09 $2.17 $2.26 $2.12 $2.24 $2.36 $2.04 $2.14 $2.07 $2.10 $2.20 $2.07 $2.15 $2.26 $1.80 $1.90 $2.00 $2.10 $2.20 $2.30 $2.40 2013E 2014E 2015E $178.0 $258.0 $307.0 $179.1 $209.0 $180.7 $229.0 $178.6 $248.8 $316.4 $179.1 $229.5 $296.3 $-- $50.0 $100.0 $150.0 $200.0 $250.0 $300.0 $350.0 2013E 2014E 2015E Barclays Ladenburg Thalmann RBC Wells Fargo IBES |
 Confidential DRAFT Research Analyst Commentary “In our opinion, given our assumption of an improving sector growth outlook, a weak natural gas but strong crude oil and NGL commodity price environment, additional organic growth projects coming on-line, as well as contributions from the recent acquisitions and CMLP’s increased growth capex budget, we believe CMLP is well positioned to achieve a distribution growth rate of 5.6% CAGR over the 2013-15 period, and thereafter at a higher rate.” – Ladenburg Thalmann, Eduardo Seda; February 27, 2013 Price Target: $32.50 “We expect CMLP's valuation to improve as investors better appreciate the partnership's growing geographic footprint, stable cash flow (98% fee-based), strong sponsor support, and potential upside tied to future acquisitions and organic investments. We forecast CMLP to grow distributions at a 5-year CAGR of approximately 4% supported by volume growth in liquids-rich areas.” – Wells Fargo Securities, Ronald F. Londe; February 28, 2013 Price Target: NA “We forecast 5-year distribution CAGR of 3.9%. We believe CMLP will be able to raise distribution at a moderate pace, but expect near-term coverage to be impacted (and light) from Class C and D unit conversions in 2Q13 and 1Q14, respectively. Risks to the upside include potential parent-led drop downs, a recovery in dry gas volumes or new oil / rich gas projects” – Barclays Capital, Richard Gross; February 28, 2013 Price Target: $27.00 Overview of CMLP 33 |
 Confidential DRAFT Ratings Agency Commentary 34 Overview of CMLP |
 Confidential DRAFT Equity Ownership Summary Overview of CMLP Source: FactSet (1) Includes 6,190,469 Class D Units and 1,112,674 GP units (2) Source: NASDAQ National Markets as of April 15, 2013 35 Current Unitholders Units % of Total Institutional Top 10: Kayne Anderson Capital Advisors LP 5,807,677 9.5% Tortoise Capital Advisors LLC 2,676,178 4.4% ClearBridge Investments LLC 2,481,349 4.1% Center Coast Capital Advisors LP 2,463,613 4.0% Tiverton Asset Management LLC 600,000 1.0% JPMorgan Securities LLC 512,084 0.8% UBS Global Asset Management 279,425 0.5% Advisors Asset Management, Inc. 159,065 0.3% Wells Fargo Advisors LLC 115,524 0.2% Fidelity Management & Research Co. 95,332 0.2% Other 888,299 1.5% Total Institutional Ownership 16,078,546 26.3% Insiders First Reserve Corp. (1) 27,135,412 44.4% Other 448,596 0.7% Total Insiders 27,584,008 45.2% Retail / Other 17,405,513 28.5% Total Units Outstanding (1) 61,068,067 100.0% Short Interest (2) 684,307 1.1% |
 Confidential DRAFT Overview of CMLP 36 The CMLP Management Financial Projections as provided by CMLP management and utilized herein by Evercore, incorporate the following assumptions: – Marcellus volumes are expected to increase 101.2% year-over-year from 227.2 MMcfd in 2012A to 457.1 MMcfd in 2013E based on Antero’s volume forecast provided to CMLP management – Barnett rich natural gas volumes are expected to increase 32.2% year-over-year from 163.5 MMcfd in 2012A to 216.1 MMcfd in 2013E based on a full year contribution from Devon and increasing offload point volumes from Empire Pipeline Corporation (“Empire”) Empire is as a natural gas utility serving Parker, western Tarrant, northern Hood and western Johnson Counties, Texas operating over 240 miles of low-pressure gathering and transmission pipeline – Barnett dry natural gas volumes are expected to decline by 12.5% year-over-year from 268.4 MMcfd in 2012A to 234.9 MMcfd in 2013E due to limited anticipated 2013E drilling activity and no well completions by Quicksilver – Fayetteville dry natural gas volumes are expected to increase by 12.9% year-over-year from 86.7 MMcfd in 2012A to 97.9 MMcfd in 2013E due to 23 new BHP wells expected to be connected to the CMLP gathering system – Rich natural gas volumes from the Marcellus, Barnett, Granite Wash and Avalon are expected to grow at a 5-year compound annual growth rate (“CAGR”) of 10.9% based on forecasts provided by producers and management’s estimates of drilling activity corresponding to current 5-year commodity strip pricing – Dry natural gas volumes are expected to grow at a 5-year CAGR of 11.6% based on management’s estimate of two to three rigs working in the Fayetteville Shale for BHP beginning in 2014E, one to two rigs working in the Barnett Shale beginning in 2014E and an average of one half of one rig per year working in the Haynesville beginning in 2014E – Operations and maintenance expenses were derived from a bottom-up forecast provided by CMLP operations managers 2013E includes full-year expenses for CMM, West Johnson County and Enerven assets and a partial year of expenses for new Marcellus compressor stations in addition to the incremental costs of 18 new full time employees Fixed costs assumed to increase at 3.0% per year after 2013E CMLP Management Financial Projections – Assumptions |
 Confidential DRAFT Overview of CMLP 37 – General and administrative expenses were also derived from a bottom-up forecast provided by CMLP operations managers 2013E includes incremental costs for 23 additional full-time employees and additional equity compensation and amortization expenses General and administrative expenses assumed to increase at 4.0% per annum after 2013E – Similarly, 2013E maintenance and growth capital expenditure estimates were also derived from a bottom-up forecast provided by CMLP operations managers and include: 2013E maintenance capital expenditures are projected to be $9.3 million including compressor overhauls and a new compressor warehouse – Five year maintenance capital expenditures based on 2013E budget and consist primarily of compressor overhauls 2013E growth capital expenditures are projected to be $126.8 million and include $77.1 million of new pipeline and compressor stations in the Marcellus, $22.0 million for the West Union Compressor Station in Doddridge County, West Virginia, $5.1 million for the upgrade of Enerven compressor stations with the remaining $22.7 million primarily related to new well connections – Five year growth capital expenditures based on forecasted well connections and associated pipeline capital projects, as well as additional Marcellus compressor stations and Fayetteville and Granite Wash facility expansions Excludes potential other growth capital expenditure opportunities, including: – The potential acquisition of RKI Exploration & Production, LLC’s (“RKI”) 50.0% non-operating interest in the Jackalope Gas Gathering System (“JGGS”) in the Niobrara Basin, and the further development of that system for $199.1 million in 2013E – The potential acquisition of 41 miles of high-pressure pipeline and two compressor stations in the Marcellus from MarkWest Energy Partners, L.P. (the “MarkWest Marcellus Bolt-On Acquisition”) for $125.0 million – The potential acquisition of certain pipeline assets pursuant to CMM’s seven-year right of first offer to acquire any midstream assets sold by Antero in an area of approximately 100,000 acres adjacent to Antero’s current area of dedication (“Antero Western AOD Acquisition”) for $250.0 million CMLP Management Financial Projections – Assumptions (cont’d) |
 Confidential DRAFT Overview of CMLP 38 – Growth capital expenditures to be financed with revolver borrowings at an interest rate of 3.60%, 3.75%, 4.50%, 5.00% and 5.50% in 2013E, 2014E, 2015E, 2016E and 2017E, respectively – Assumes CMLP’s Class D Units distributions are paid in-kind with additional Class D Units until conversion into 6.8 million CMLP common units in March 2014 on a one-for-one basis Assumes CMLP yield of 9.0%, 8.5%, 8.0% and 7.5% in the first, second, third and fourth quarter of 2013E, respectively – $200.0 million senior note offering on June 30, 2014 assumed to be issued at an 8.0% interest rate with proceeds utilized to reduce borrowings from CMLP’s revolving credit facility – Distribution per LP unit of $2.07 and $2.15 in 2013E and 2014E, respectively, and a target 10.0% distribution per LP unit growth rate in 2015E, 2016E and 2017E LP distribution coverage of 1.10x, 1.10x and 1.06x for 2015E, 2016E and 2017E, respectively – No interest income on cash balances CMLP Management Financial Projections – Assumptions (cont’d) |
 Confidential DRAFT 2013E Growth Capital Expenditures – Summary 39 Overview of CMLP Source: CMLP management For the Quarter Ending Fiscal Year Budgeted Growth Capital Expenditures 3/31/13E 6/30/13E 9/30/13E 12/31/13E 2013E Marcellus: Zinnia Mainlines $-- $30.1 $7.1 $-- $37.2 Perkins/Morgan Stations 5.0 12.7 6.4 4.9 29.0 Other Marcellus Laterals -- 3.5 6.7 0.7 10.9 Enerven Engine Upgrades 1.3 2.5 1.3 -- 5.1 Mackey Wolfe Lateral 1.8 1.8 -- -- 3.6 West Union Station 14.7 3.8 0.4 3.1 22.0 Total Marcellus $22.8 $54.4 $21.9 $8.7 $107.8 Barnett 1.8 2.4 3.7 2.5 10.4 Fayetteville 0.8 0.2 0.9 -- 1.9 Granite Wash 1.5 -- -- -- 1.5 Haynesville 0.1 0.3 -- -- 0.4 Avalon -- -- -- -- -- Corporate (Oracle/SAP) 0.2 2.2 1.2 1.2 4.8 Total Budgeted Growth Capital Expenditures $27.2 $59.5 $27.7 $12.4 $126.8 Upside Growth Capital Expenditures Q1 2013 Q2 2013 Q3 2013 Q4 2013 2013E RKI Niobrara Development $91.5 $12.0 $47.8 $47.8 $199.1 MarkWest Marcellus Bolt-On Acquisition -- 125.0 -- -- 125.0 Antero Western AOD Acquisition -- -- 250.0 -- 250.0 Identified Incremental Capital Expenditures $91.5 $137.0 $297.8 $47.8 $574.1 Total Potential Capital Expenditures (Budget + Potential) $118.7 $196.5 $325.5 $60.2 $700.9 ($ in millions) |
 Confidential DRAFT CMLP Management Financial Projections 40 Overview of CMLP The following sets forth selected operating projections provided by CMLP management utilized in deriving the CMLP Management Financial Projections herein: For the Year Ended December 31, For the Years Ending December 31, CAGR 2010A 2011A 2012A 2013E 2014E 2015E 2016E 2017E 2013E - 2017E Gathering Volumes (MMcfd) Barnett Rich 129.5 143.9 163.5 216.1 211.6 210.6 212.9 215.9 (0.0%) Granite Wash -- 16.6 17.6 29.7 46.1 58.4 66.4 72.1 24.8% Avalon -- 11.5 9.0 6.8 5.2 4.3 3.6 3.1 (17.4%) Marcellus -- -- 227.2 457.1 572.5 692.0 740.5 783.3 14.4% Total Rich Gathering Volumes 129.5 172.0 417.2 709.7 835.3 965.3 1,023.4 1,074.4 10.9% Barnett Dry 213.8 329.7 268.4 234.9 256.6 275.7 277.8 283.2 4.8% Fayetteville -- 85.2 86.7 97.9 117.1 160.6 205.7 235.7 24.6% Haynesville -- 60.1 50.5 33.6 32.4 42.4 46.0 48.9 9.8% Total Dry Gathering Volumes 213.8 475.0 405.6 366.4 406.1 478.8 529.5 567.8 11.6% Total Gathering 343.3 647.0 822.8 1,076.1 1,241.5 1,444.0 1,552.9 1,642.2 11.1% Processing Volumes (MMcfd) Barnett 127.8 131.8 155.7 207.0 202.6 201.6 203.8 206.8 (0.0%) Granite Wash -- 12.3 17.5 29.4 45.6 57.8 65.7 71.3 24.8% Total Processing Volumes 127.8 144.1 173.2 236.4 248.2 259.4 269.6 278.1 4.1% Compression Volumes (MMcfd) Marcellus -- -- 6.4 331.8 543.9 702.9 752.0 794.8 24.4% Well Connections Barnett Rich NA NA 43.0 60.0 68.0 68.0 68.0 68.0 Granite Wash NA NA 5.0 10.0 16.0 16.0 15.0 15.0 Avalon NA NA -- -- -- -- -- -- Marcellus NA NA 60.0 65.0 102.0 69.0 73.0 73.0 Total Rich Well Connections NA NA 108.0 135.0 186.0 153.0 156.0 156.0 Barnett Dry NA NA 23.0 8.0 41.0 35.0 32.0 32.0 Fayetteville NA NA 18.0 23.0 35.0 60.0 60.0 60.0 Haynesville NA NA 1.0 -- 5.0 5.0 5.0 5.0 Total Dry Well Connections NA NA 42.0 31.0 81.0 100.0 97.0 97.0 Total Well Connections NA NA 150.0 166.0 267.0 253.0 253.0 253.0 |
 Confidential DRAFT CMLP Management Financial Projections (cont’d) 41 Overview of CMLP The following sets forth the CMLP Management Financial Projections utilized by Evercore in its analysis herein: For the Years Ending December 31, CAGR 2013E 2014E 2015E 2016E 2017E 2013E - 2017E Revenue, Less Purchases: Barnett Rich $90.5 $93.7 $101.5 $108.4 $115.1 Granite Wash 5.9 10.2 14.0 16.5 18.4 Avalon 0.4 0.3 0.3 0.2 0.2 Marcellus 69.9 100.1 127.6 140.4 152.3 Total Rich Natural Gas Revenue $166.7 $204.3 $243.3 $265.6 $285.9 14.4% Barnett Dry 49.5 52.5 59.1 62.4 65.8 Fayetteville 30.6 36.5 49.7 66.1 78.2 Haynesville 5.3 5.6 7.9 8.2 9.0 Total Dry Natural Gas Revenue $85.4 $94.7 $116.7 $136.7 $153.0 15.7% Total Revenue, Less Purchases $252.1 $299.0 $360.0 $402.3 $439.0 14.9% Operating Expense: CMLP Operating Expense $42.9 $44.9 $48.6 $51.7 $54.1 CMM Operating Expense 7.9 9.8 10.6 10.9 11.2 Total Operating Expense $50.8 $54.7 $59.2 $62.6 $65.3 6.5% General and Administrative Expense: CMLP General and Administrative Expense $25.4 $26.4 $27.4 $28.5 $29.7 CMM General and Administrative Expense 2.9 3.0 3.2 3.3 3.4 Total General and Administrative Expense 28.3 29.4 30.6 31.8 33.1 4.0% Plus: Other Corporate Adjustments 0.3 -- -- -- -- Adjusted EBITDA $173.3 $214.8 $270.3 $307.9 $340.6 18.4% ($ in millions) |
 Confidential DRAFT CMLP Management Financial Projections (cont’d) ($ in millions, except per unit amounts) 42 Overview of CMLP The following sets forth the CMLP Management Financial Projections utilized by Evercore in its analysis herein: For the Years Ending December 31, CAGR 2013E 2014E 2015E 2016E 2017E 2013E - 2017E Distributable Cash Flow Adjusted EBITDA $173.3 $214.8 $270.3 $307.9 $340.6 18.4% Less: Cash Interest Expense, net (43.0) (52.5) (62.8) (67.6) (72.8) Less: Maintenance Capital Expenditures (9.3) (7.2) (7.7) (8.9) (11.8) Plus: Non-Cash Equity Compensation 3.8 4.5 4.7 4.9 5.2 Distributable Cash Flow $124.7 $159.6 $204.4 $236.3 $261.1 20.3% Distributed Cash Flow Common Units (Public) $70.6 $73.3 $80.7 $88.7 $97.6 Common Units (Crestwood Holdings) 40.7 57.0 62.7 69.0 75.9 GP 22.2 30.3 43.4 57.7 73.5 Total $133.5 $160.7 $186.7 $215.4 $247.0 16.6% % to GP 16.6% 18.9% 23.2% 26.8% 29.7% GP IDRs $20.1 $27.7 $40.4 $54.5 $69.9 Weighted Average LP Units Outstanding 60.2 60.6 60.6 60.6 60.6 DCF / LP Unit $1.99 $2.14 $2.51 $2.78 $2.98 10.6% Distribution / LP Unit $2.07 $2.15 $2.37 $2.60 $2.86 8.4% LP Coverage 0.96x 1.00x 1.06x 1.07x 1.04x Total Coverage 0.93x 0.99x 1.09x 1.10x 1.06x Distributable Cash Flow Surplus / (Shortfall) ($8.7) ($1.1) $17.7 $20.9 $14.2 |
 Confidential DRAFT CMLP Management Financial Projections (cont’d) 43 The following sets forth the funding assumptions utilized in the CMLP Management Financial Projections and CMLP’s resulting capital structure and credit statistics Overview of CMLP ($ in millions) |
 Confidential DRAFT Wall Street Research vs. CMLP Management Financial Projections ($ in millions, except per unit amounts) 44 Overview of CMLP Wall Street Research Analyst CMLP Management Financial Projections Comparison |
 Confidential DRAFT Overview of CMLP 45 CMLP management also provided Evercore with an alternative downside case to the CMLP Management Financial Projections, which incorporate the following assumptions: – Operating and financial projections for the year ending December 31, 2013 assumed to equal the operating and financial projections in the CMLP Management Financial Projections – Rich natural gas volumes from the Barnett, Granite Wash and Avalon are assumed to equal the projections in the CMLP Management Financial Projections Expected to grow at a 5-year CAGR of 10.9% Natural gas processing volumes from the Barnett and Granite Wash are assumed to equal the projections in the CMLP Management Financial Projections – Marcellus rich natural gas volume 5-year CAGR of 14.4% in the CMLP Management Financial Projections decreased to 3.6% in the CMLP Downside Financial Projections based on a CMLP management case of Antero’s drilling schedule deceleration Marcellus compression volume 5-year CAGR of 24.4% in the CMLP Management Financial Projections decreased to 12.8% in the CMLP Downside Financial Projections due to the lower gathering volumes assumed – Dry natural gas volumes 5-year CAGR of 11.6% in the CMLP Management Financial Projections decreased to (2.4%) in the CMLP Downside Financial Projections – Operations and maintenance expenses were derived from a bottom-up forecast provided by CMLP operations managers 2013E includes full-year expenses for CMM, West Johnson County and Enerven assets and a partial year of expenses for new Marcellus compressor stations in addition to the incremental costs of 18 new full time employees Fixed costs assumed to increase at 3.0% per year after 2013E – General and administrative expenses are assumed to equal the projections in the CMLP Management Financial Projections General and administrative expenses assumed to increase at 4.0% per annum after 2013E CMLP Downside Financial Projections – Assumptions |
 Confidential DRAFT Overview of CMLP 46 – Five year maintenance capital expenditures adjusted from the CMLP Management Financial Projections based on compressor overhauls necessary in the CMLP Downside Financial Projections given decreased Marcellus volumes – Five year growth capital expenditures based on forecasted well connections and associated pipeline capital projects, as well as additional Marcellus compressor stations and Fayetteville and Granite Wash facility expansions – Excludes potential other growth capital expenditure opportunities, including: The potential acquisition of RKI’s 50.0% non-operating interest in the JGGS in the Niobrara Basin, and the further development of that system for $199.1 million in 2013E The MarkWest Marcellus Bolt-On Acquisition for $125.0 million The Antero Western AOD Acquisition for $250.0 million – Growth capital expenditures to be financed with revolver borrowings at an interest rate of 3.60%, 3.75%, 4.50%, 5.00% and 5.50% in 2013E, 2014E, 2015E, 2016E and 2017E, respectively – Assumes CMLP’s Class D Units distributions are paid in-kind with additional Class D Units until conversion into 6.8 million CMLP common units in March 2014 on a one-for-one basis Distributions paid in-kind assume CMLP yield of 9.0%, 8.5%, 8.0% and 7.5% in the first, second, third and fourth quarter of 2013E, respectively – CMLP projected unit price assumes CMLP yield of 9.0% in the first quarter of 2013E and 8.5% in each quarter of the forecast period thereafter – $200.0 million senior note offering on June 30, 2015 assumed to be issued at an 8.0% interest rate with proceeds utilized to reduce borrowings from CMLP’s revolving credit facility – Distribution per LP unit remains constant until target coverage of 1.05x is reached Distribution per LP unit of $2.04 in each of 2013E, 2014E, 2015E and 2016E, respectively – No interest income on cash balances CMLP Downside Financial Projections – Assumptions (cont’d) |
 Confidential DRAFT CMLP Downside Financial Projections 47 Overview of CMLP The following sets forth selected operating projections provided by CMLP management utilized in deriving the CMLP Downside Financial Projections herein: For the Year Ended December 31, For the Years Ending December 31, CAGR 2010A 2011A 2012A 2013E 2014E 2015E 2016E 2017E 2013E - 2017E Gathering Volumes (MMcfd) Barnett Rich 129.5 143.9 163.5 216.1 211.6 210.6 212.9 215.9 (0.0%) Granite Wash -- 16.6 17.6 29.7 46.1 58.4 66.4 72.1 24.8% Avalon -- 11.5 9.0 6.8 5.2 4.3 3.6 3.1 (17.4%) Marcellus -- -- 227.2 457.1 468.7 486.6 513.3 526.0 3.6% Total Rich Gathering Volumes 129.5 172.0 417.2 709.7 731.5 759.9 796.2 817.1 3.6% Barnett Dry 213.8 329.7 268.4 234.9 225.2 212.8 205.4 200.3 (3.9%) Fayetteville -- 85.2 86.7 97.9 105.7 109.4 112.8 116.4 4.4% Haynesville -- 60.1 50.5 33.6 20.5 18.4 17.0 16.0 (17.0%) Total Dry Gathering Volumes 213.8 475.0 405.6 366.4 351.4 340.6 335.2 332.7 (2.4%) Total Gathering 343.3 647.0 822.8 1,076.1 1,082.9 1,100.5 1,131.4 1,149.8 1.7% Processing Volumes (MMcfd) Barnett 127.8 131.8 155.7 207.0 202.6 201.6 203.8 206.8 (0.0%) Granite Wash -- 12.3 17.5 29.4 45.6 57.8 65.7 71.3 24.8% Total Processing Volumes 127.8 144.1 173.2 236.4 248.2 259.4 269.6 278.1 4.1% Compression Volumes (MMcfd) Marcellus -- -- 6.4 331.8 448.4 497.5 524.8 537.5 12.8% Well Connections Barnett Rich NA NA 43.0 60.0 68.0 68.0 68.0 68.0 Granite Wash NA NA 5.0 10.0 16.0 16.0 15.0 15.0 Avalon NA NA -- -- -- -- -- -- Marcellus NA NA 60.0 65.0 43.0 43.0 42.0 41.0 Total Rich Well Connections NA NA 108.0 135.0 127.0 127.0 125.0 124.0 Barnett Dry NA NA 23.0 8.0 10.0 10.0 10.0 10.0 Fayetteville NA NA 18.0 23.0 24.0 21.0 21.0 21.0 Haynesville NA NA 1.0 -- -- -- -- -- Total Dry Well Connections NA NA 42.0 31.0 34.0 31.0 31.0 31.0 Total Well Connections NA NA 150.0 166.0 161.0 158.0 156.0 155.0 |
 Confidential DRAFT CMLP Downside Financial Projections (cont’d) ($ in millions) 48 Overview of CMLP The following sets forth the CMLP Downside Financial Projections utilized by Evercore in its analysis herein: For the Years Ending December 31, CAGR 2013E 2014E 2015E 2016E 2017E 2013E - 2017E Revenue, Less Purchases: Barnett Rich $90.5 $93.7 $101.5 $108.4 $115.1 Granite Wash 5.9 10.2 14.0 16.5 18.4 Avalon 0.4 0.3 0.3 0.2 0.2 Marcellus 69.9 81.7 89.2 96.8 101.6 Total Rich Natural Gas Revenue $166.7 $185.9 $204.9 $221.9 $235.3 9.0% Barnett Dry 49.5 46.7 46.8 46.6 46.7 Fayetteville 30.6 33.6 36.6 39.2 41.8 Haynesville 5.3 3.1 2.8 2.5 2.4 Total Dry Natural Gas Revenue $85.4 $83.4 $86.2 $88.4 $90.9 1.6% Total Revenue, Less Purchases $252.1 $269.3 $291.1 $310.3 $326.2 6.7% Operating Expense: CMLP Operating Expense $42.9 $43.9 $45.0 $46.2 $47.4 CMM Operating Expense 7.9 9.8 10.5 10.8 11.1 Total Operating Expense $50.8 $53.8 $55.5 $57.0 $58.5 3.6% General and Administrative Expense: CMLP General and Administrative Expense $25.4 $26.4 $27.4 $28.5 $29.7 CMM General and Administrative Expense 2.9 3.0 3.2 3.3 3.4 Total General and Administrative Expense 28.3 29.4 30.6 31.8 33.1 4.0% Plus: Other Corporate Adjustments 0.3 -- -- -- -- Adjusted EBITDA $173.3 $186.1 $205.0 $221.4 $234.6 7.9% |
 Confidential DRAFT CMLP Downside Financial Projections (cont’d) ($ in millions, except per unit amounts) 49 Overview of CMLP For the Years Ending December 31, CAGR 2013E 2014E 2015E 2016E 2017E 2013E - 2017E Distributable Cash Flow Adjusted EBITDA $173.3 $186.1 $205.0 $221.4 $234.6 7.9% Less: Cash Interest Expense, net (43.0) (47.9) (57.4) (64.8) (68.6) Less: Maintenance Capital Expenditures (9.3) (7.2) (7.7) (8.9) (11.8) Plus: Non-Cash Equity Compensation 3.8 4.5 4.7 4.9 5.2 Distributable Cash Flow $124.8 $135.6 $144.6 $152.7 $159.4 6.3% Distributed Cash Flow Common Units (Public) $69.5 $69.5 $69.5 $69.5 $70.8 Common Units (Crestwood Holdings) 40.1 54.1 54.1 54.1 55.1 GP 20.6 23.6 23.6 23.6 25.9 Total $130.3 $147.2 $147.2 $147.2 $151.8 3.9% % to GP 15.8% 16.0% 16.0% 16.0% 17.1% GP IDRs $18.6 $21.1 $21.1 $21.1 $23.3 Weighted Average LP Units Outstanding 60.2 60.6 60.6 60.6 60.6 DCF / LP Unit $1.99 $1.94 $2.02 $2.09 $2.14 1.9% Distribution / LP Unit $2.04 $2.04 $2.04 $2.04 $2.08 0.5% LP Coverage 0.97x 0.95x 0.99x 1.02x 1.03x Total Coverage 0.96x 0.92x 0.98x 1.04x 1.05x Distributable Cash Flow Surplus / (Shortfall) ($5.5) ($11.6) ($2.6) $5.5 $7.6 The following sets forth the CMLP Downside Financial Projections utilized by Evercore in its analysis herein: |
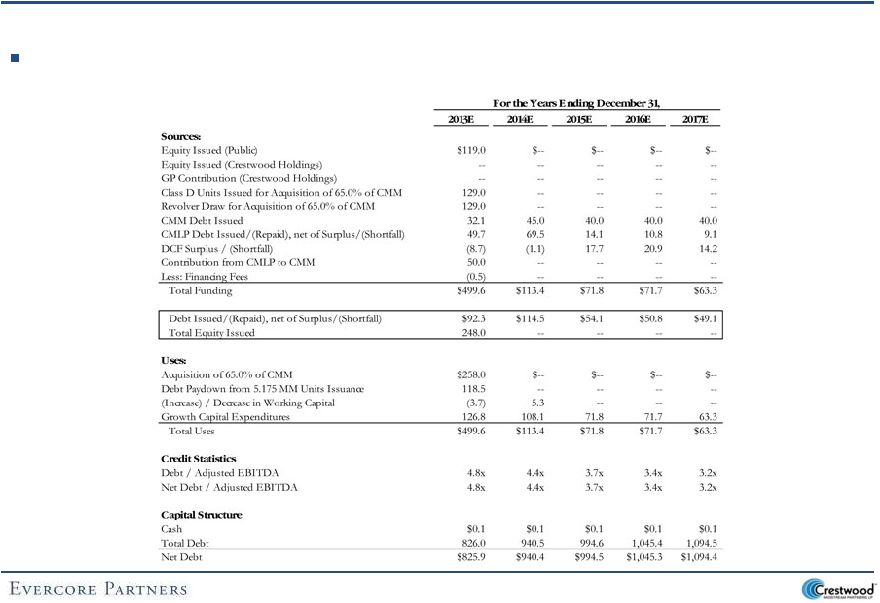
 Confidential DRAFT CMLP Downside Financial Projections (cont’d) 50 Overview of CMLP For the Years Ending December 31, 2013E 2014E 2015E 2016E 2017E Sources: Equity Issued (Public) $119.0 $-- $-- $-- $-- Equity Issued (Crestwood Holdings) -- -- -- -- -- GP Contribution (Crestwood Holdings) -- -- -- -- -- Class D Units Issued for Acquisition of 65.0% of CMM 129.0 -- -- -- -- Revolver Draw for Acquisition of 65.0% of CMM 129.0 -- -- -- -- CMM Debt Issued 32.1 19.0 24.9 23.0 22.5 CMLP Debt Issued/(Repaid), net of Surplus/(Shortfall) 46.5 68.3 19.4 11.3 4.1 DCF Surplus / (Shortfall) (5.5) (11.6) (2.6) 5.5 7.6 Contribution from CMLP to CMM 50.0 -- -- -- -- Less: Financing Fees (0.5) -- -- -- -- Total Funding $499.6 $75.7 $41.7 $39.8 $34.1 Debt Issued/(Repaid), net of Surplus/(Shortfall) $89.1 $87.3 $44.3 $34.3 $26.5 Total Equity Issued 248.0 -- -- -- -- Uses: Acquisition of 65.0% of CMM $258.0 $-- $-- $-- $-- Debt Paydown from 5.175 MM Units Issuance 118.5 -- -- -- -- (Increase) / Decrease in Working Capital (3.7) 2.2 -- -- -- Growth Capital Expenditures 126.8 73.5 41.7 39.8 34.1 Total Uses $499.6 $75.7 $41.7 $39.8 $34.1 Credit Statistics Debt / Adjusted EBITDA 4.7x 4.9x 4.7x 4.5x 4.3x Net Debt / Adjusted EBITDA 4.7x 4.9x 4.7x 4.5x 4.3x Capital Structure Cash $0.1 $0.1 $0.1 $0.1 $0.1 Total Debt 822.8 910.1 954.4 988.7 1,015.2 Net Debt $822.7 $910.0 $954.3 $988.6 $1,015.1 The following sets forth the funding assumptions utilized in the CMLP Management Financial Projections and CMLP’s resulting capital structure and credit statistics ($ in millions) |
 Confidential DRAFT CMLP Downside Financial Projections (cont’d) 51 Overview of CMLP CMLP Management Financial Projections CMLP Downside Financial Projections For the Years Ending December 31, CAGR 2013E 2014E 2015E 2016E 2017E 2013E - 2017E Distributable Cash Flow Adjusted EBITDA $173.3 $214.8 $270.3 $307.9 $340.6 18.4% Less: Cash Interest Expense, net (43.0) (52.5) (62.8) (67.6) (72.8) Less: Maintenance Capital Expenditures (9.3) (7.2) (7.7) (8.9) (11.8) Plus: Non-Cash Equity Compensation 3.8 4.5 4.7 4.9 5.2 Distributable Cash Flow $124.7 $159.6 $204.4 $236.3 $261.1 20.3% DCF / LP Unit $1.99 $2.14 $2.51 $2.78 $2.98 10.6% Distribution / LP Unit $2.07 $2.15 $2.37 $2.60 $2.86 8.4% LP Coverage 0.96x 1.00x 1.06x 1.07x 1.04x Total Coverage 0.93 0.99 1.09 1.10 1.06 Distributable Cash Flow Surplus / (Shortfall) ($8.7) ($1.1) $17.7 $20.9 $14.2 ($ in millions) For the Years Ending December 31, CAGR Difference versus CMLP Management Financial Projections 2013E 2014E 2015E 2016E 2017E 2013E - 2017E 2013E 2014E 2015E 2016E 2017E Distributable Cash Flow Adjusted EBITDA $173.3 $186.1 $205.0 $221.4 $234.6 7.9% $-- $28.7 $65.3 $86.4 $106.0 Less: Cash Interest Expense, net (43.0) (47.9) (57.4) (64.8) (68.6) (0.0) (4.6) (5.4) (2.8) (4.2) Less: Maintenance Capital Expenditures (9.3) (7.2) (7.7) (8.9) (11.8) -- -- -- -- -- Plus: Non-Cash Equity Compensation 3.8 4.5 4.7 4.9 5.2 -- -- -- -- -- Distributable Cash Flow $124.8 $135.6 $144.6 $152.7 $159.4 6.3% ($0.0) $24.0 $59.9 $83.6 $101.7 DCF / LP Unit $1.99 $1.94 $2.02 $2.09 $2.14 1.9% ($0.00) $0.20 $0.49 $0.69 $0.84 Distribution / LP Unit $2.04 $2.04 $2.04 $2.04 $2.08 0.5% $0.03 $0.11 $0.33 $0.56 $0.79 LP Coverage 0.97x 0.95x 0.99x 1.02x 1.03x Total Coverage 0.96 0.92 0.98 1.04 1.05 Distributable Cash Flow Surplus / (Shortfall) ($5.5) ($11.6) ($2.6) $5.5 $7.6 |
 Confidential DRAFT Overview of CMLP 52 Comparison of CMLP Management Provided Financial Projections to Wall Street Research Estimates ($ in millions, except per unit amounts) The following sets forth a comparison of the CMLP Management Financial Projections, the CMLP Downside Financial Projections and Wall Street Research consensus estimates EBITDA Distribution per LP Unit DCF per LP Unit $173.3 $214.8 $270.3 $307.9 $340.6 $173.3 $186.1 $205.0 $221.4 $234.6 $179.1 $229.5 $296.3 $370.1 $446.5 $-- $100.0 $200.0 $300.0 $400.0 $500.0 2013E 2014E 2015E 2016E 2017E CMLP Management Financial Projections CMLP Downside Financial Projections Wall Street Research $1.99 $2.14 $1.94 $2.51 $2.78 $2.98 $1.99 $2.02 $2.09 $2.14 $2.05 $2.25 $2.66 $2.95 $3.21 $-- $0.50 $1.00 $1.50 $2.00 $2.50 $3.00 $3.50 2013E 2014E 2015E 2016E 2017E CMLP Management Financial Projections CMLP Downside Financial Projections Wall Street Research $2.07 $2.15 $2.37 $2.60 $2.86 $2.04 $2.04 $2.04 $2.04 $2.08 $2.07 $2.15 $2.26 $2.35 $2.43 $-- $0.50 $1.00 $1.50 $2.00 $2.50 $3.00 $3.50 2013E 2014E 2015E 2016E 2017E CMLP Management Financial Projections CMLP Downside Financial Projections Wall Street Research Distribution Coverage 0.93x 0.99x 1.09x 1.10x 1.06x 0.96x 0.92x 0.98x 1.04x 1.05x 0.99x 1.07x 1.28x 1.39x 1.49x -- 0.20x 0.40x 0.60x 0.80x 1.00x 1.20x 1.40x 1.60x 2013E 2014E 2015E 2016E 2017E CMLP Management Financial Projections CMLP Downside Financial Projections Wall Street Research |
DRAFT IV. Indicative Valuation of CMLP |
 Confidential DRAFT Valuation Methodologies Utilizing the following methodologies, Evercore analyzed the value of CMLP common units 53 Indicative Valuation of CMLP Methodology Description Metrics/Assumptions Discounted Cash Flow Analysis: Financials Projections Values CMLP common units based on the concepts of the time value of money Utilizing the CMLP Management Financial Projections and the CMLP Downside Financial Projections as previously reviewed herein, Evercore: Tax depreciation based on schedule provided by CMLP management EBITDA exit multiple of 9.0x to 11.0x and a perpetuity growth rate of 0.5% to 1.5% For the terminal value, tax depreciation assumed to be equal to maintenance capital expenditures Weighted average cost of capital based on mid-point of the Capital Asset Pricing Model (“CAPM”) Tax rate of 35.0% based on unitholders’ tax rates Discounted the projected cash flows to the assumed July 1, 2013 effective date Discounted Cash Flow Analysis: Projected Distribution per Unit Values the CMLP common units based on the concepts of the time value of money Utilizing projected distributions per unit from the CMLP Management Financial Projections and the CMLP Downside Financial Projections as previously reviewed herein, Evercore: Terminal exit yield range of 7.0% to 10.0% Cost of equity of 8.5% to 9.5% based on the Capital Asset Pricing Model utilizing betas from selected publicly-traded peers Cost of equity of 13.5% to 14.5% based on the expected market total return of selected publicly- traded peers Precedent M&A Transaction Analysis Valuation for the CMLP common units based on multiples of transaction value to EBITDA in historical transactions involving other natural gas gathering and processing assets Based on transaction value / EBITDA Enterprise value / EBITDA multiples applied to 2013E and 2014E EBITDA with the resulting value discounted at an 8.0% discount rate, the midpoint of the weighted average cost of capital range based on the assumed July 1, 2013 effective date Growth capital expenditures discounted at an 8.0% discount rate Peer Group Trading Analysis Valuation for the CMLP common units based on current market enterprise value multiples of relevant EBITDA for selected comparable publicly- traded entities Enterprise value / EBITDA multiples applied to 2013E EBITDA and 2014E EBITDA Premiums Paid Analysis Valuation for the CMLP common units based historical premiums paid in MLP unit-for-unit transactions Median 1-Day, 5-Day, 30-Day and 52-Week high premiums paid applied to relevant CMLP unit prices Historical Unit Price Trading Ratio Valuation for the CMLP common units based on historical exchange ratio between CMLP unit prices and NRGM unit prices 30-Day, 60-Day and 90-Day High exchange ratio applied to NRGM current unit price Wall Street Research Price Targets Valuation for the CMLP common units based on the most recent research analyst price targets of firms covering CMLP Research price targets from: Barlcays, Hilliard Lyons, Ladenburg Thalmann, RBC, Simmons and Wells Fargo – Utilized varying weighted average cost of capital (“WACC”) discount rates and applied various perpetuity growth rates to derive after-tax valuation ranges for CMLP – Calculated terminal values based on a range of multiples of EBITDA derived from precedent transactions as well as assumed perpetuity growth rates – Utilized varying total expected market return discount rates and calculated a terminal value based on various terminal exit yields |
 Confidential DRAFT Summary Valuation – CMLP Common Unit 54 Indicative Valuation of CMLP |
 Confidential DRAFT Discounted Cash Flow Analysis – Assumptions 55 Indicative Valuation of CMLP Evercore utilized a DCF Analysis based on the following assumptions: – Effective date of July 1, 2013 – EBITDA and capital expenditures through December 31, 2017E per the CMLP Management Financial Projections and CMLP Downside Financial Projections as previously reviewed herein – A 35.0% tax rate – Tax depreciation based on schedule provided by CMLP management – Mid-point discount rate of 8.0% utilizing a weighted average cost of capital based on CAPM – Terminal value based on both: (i) a 9.0x to 11.0x EBITDA exit multiple and (ii) a 0.5% to 1.5% perpetuity growth rate Tax depreciation is set equal to maintenance capital expenditures in perpetuity |
 Confidential DRAFT DCF Analysis – CMLP Management Financial Projections ($ in millions, except per unit amounts) EBITDA Exit Multiple Sensitivities Perpetuity Growth Rate Sensitivities (1) Assumes tax depreciation equal to maintenance capital expenditures in perpetuity Summary Results 56 Indicative Valuation of CMLP WACC EBITDA Multiple $35.0 8.0x 9.0x 10.0x 11.0x 12.0x 7.0% $28.67 $32.76 $36.85 $40.94 $45.03 7.5% 27.89 31.90 35.90 39.91 43.92 8.0% 27.13 31.06 34.98 38.90 42.83 8.5% 26.39 30.23 34.08 37.92 41.76 9.0% 25.67 29.43 33.20 36.96 40.73 WACC Perpetuity Growth Rate $31.3 0.0% 0.5% 1.0% 1.5% 2.0% 7.0% $32.61 $35.63 $39.15 $43.31 $48.30 7.5% 29.35 31.93 34.90 38.36 42.46 8.0% 26.51 28.73 31.26 34.18 37.59 8.5% 24.01 25.94 28.12 30.61 33.48 9.0% 21.80 23.48 25.37 27.52 29.97 For the Six Months Ending Terminal Value December 31, For the Years Ending December 31, EBITDA Perpetuity 2013E 2014E 2015E 2016E 2017E Exit Multiple Growth Rate (1) EBITDA $116.4 $214.8 $270.3 $307.9 $340.6 $340.6 $340.6 Less: Tax DD&A (89.2) (164.8) (164.8) (114.3) (103.5) (11.8) EBIT $27.2 $50.0 $105.5 $193.5 $237.1 $328.7 Less: Taxes @ 35.0% (9.5) (17.5) (36.9) (67.7) (83.0) (115.1) EBIAT $17.7 $32.5 $68.6 $125.8 $154.1 $213.7 Plus: Tax DD&A 89.2 164.8 164.8 114.3 103.5 11.8 Less: Maintenance Capital Expenditures (3.6) (7.2) (7.7) (8.9) (11.8) (11.8) Less: Growth Capital Expenditures (44.9) (108.1) (71.8) (71.7) (63.3) -- Unlevered FCF $58.4 $82.0 $153.8 $159.6 $182.5 $213.7 Terminal Value Multiple/Growth Rate 10.0x 1.0% PV of Terminal Value @ 8.0% $2,408.9 $2,180.6 Plus: Present Value of Unlevered FCF Implied Enterprise Value $2,934.9 $2,706.6 Less: Debt as of July 1, 2013 Plus: Cash as of July 1, 2013 Implied Equity Value $2,147.5 $1,919.3 Total Units Outstanding as of July 1, 2013 Implied Unit Price $34.98 $31.26 526.0 (787.4) 0.0 61.4 |
 Confidential DRAFT DCF Analysis – CMLP Downside Financial Projections ($ in millions, except per unit amounts) EBITDA Exit Multiple Sensitivities Perpetuity Growth Rate Sensitivities (1) Assumes tax depreciation equal to maintenance capital expenditures in perpetuity Summary Results 57 Indicative Valuation of CMLP WACC EBITDA Multiple $22.1 8.0x 9.0x 10.0x 11.0x 12.0x 7.0% $17.79 $20.61 $23.43 $26.25 $29.07 7.5% 17.24 20.00 22.76 25.52 28.28 8.0% 16.70 19.40 22.11 24.81 27.51 8.5% 16.17 18.82 21.47 24.12 26.76 9.0% 15.66 18.25 20.85 23.44 26.03 WACC Perpetuity Growth Rate $19.1 0.0% 0.5% 1.0% 1.5% 2.0% 7.0% $20.10 $22.14 $24.53 $27.35 $30.73 7.5% 17.87 19.62 21.63 23.98 26.75 8.0% 15.93 17.43 19.15 21.13 23.44 8.5% 14.22 15.52 17.00 18.69 20.64 9.0% 12.70 13.84 15.12 16.58 18.24 For the Six Months Ending Terminal Value December 31, For the Years Ending December 31, EBITDA Perpetuity 2013E 2014E 2015E 2016E 2017E Exit Multiple Growth Rate (1) EBITDA $95.5 $186.1 $205.0 $221.4 $234.6 $234.6 $234.6 Less: Tax DD&A (89.2) (164.8) (164.8) (114.3) (103.5) (11.8) EBIT $6.4 $21.3 $40.2 $107.1 $131.1 $222.8 Less: Taxes @ 35.0% (2.2) (7.5) (14.1) (37.5) (45.9) (78.0) EBIAT $4.1 $13.9 $26.1 $69.6 $85.2 $144.8 Plus: Tax DD&A 89.2 164.8 164.8 114.3 103.5 11.8 Less: Maintenance Capital Expenditures (3.6) (7.2) (7.7) (8.9) (11.8) (11.8) Less: Growth Capital Expenditures (27.7) (73.5) (41.7) (39.8) (34.1) -- Unlevered FCF $62.0 $98.0 $141.5 $135.3 $142.8 $144.8 Terminal Value Multiple/Growth Rate 10.0x 1.0% PV of Terminal Value @ 8.0% $1,659.4 $1,477.7 Plus: Present Value of Unlevered FCF Implied Enterprise Value $2,144.6 $1,962.9 Less: Debt as of July 1, 2013 Plus: Cash as of July 1, 2013 Implied Equity Value $1,357.2 $1,175.6 Total Units Outstanding as of July 1, 2013 Implied Unit Price $22.11 $19.15 485.2 (787.4) 0.0 61.4 |
 Confidential DRAFT Indicative Valuation of CMLP 58 (1) CMLP 52-week yield range of 6.89% to 9.74%, with an average yield of 8.33% The analysis below sets forth CMLP’s projected annual distribution per unit based on the CMLP Management Financial Projections for the six months ending December 31, 2013E and for the years ending December 31, 2014E, 2015E, 2016E and 2017E and a terminal value based on an CMLP yield range of 7.0% to 10.0% discounted at a cost of equity for CMLP ranging between 8.5% and 9.5% based on CAPM and 13.5% to 14.5% based on the total expected market return (as detailed in the Appendix) Discounted Cash Flow Analysis – CMLP Common Units For the Six Months Ending December 31, For the Years Ending December 31, Terminal Value 2013E 2014E 2015E 2016E 2017E Low High CMLP Standalone Distribution per LP Unit $1.09 $2.15 $2.37 $2.60 $2.86 $2.86 Terminal Yield (1) 10.00% - 7.00% Terminal Value $28.63 - $40.90 Equity Cost of Capital Based on CAPM PV @ 8.0% of Value per CMLP Common Unit $29.51 - $38.19 PV @ 8.5% of Value per CMLP Common Unit 29.00 - 37.50 PV @ 9.0% of Value per CMLP Common Unit 28.50 - 36.83 PV @ 9.5% of Value per CMLP Common Unit 28.01 - 36.17 PV @ 10.0% of Value per CMLP Common Unit 27.53 - 35.53 Implied CMLP Common Unit Value Range $28.01 - $37.50 Equity Cost of Capital Based on Total Expected Market Return PV @ 13.0% of Value per CMLP Common Unit $24.90 - $31.98 PV @ 13.5% of Value per CMLP Common Unit 24.49 - 31.43 PV @ 14.0% of Value per CMLP Common Unit 24.09 - 30.90 PV @ 14.5% of Value per CMLP Common Unit 23.71 - 30.38 PV @ 15.0% of Value per CMLP Common Unit 23.33 - 29.87 Implied CMLP Common Unit Value Range $23.71 - $31.43 Implied Unit Price $23.71 - $37.50 |
 Confidential DRAFT Indicative Valuation of CMLP 59 (1) CMLP 52-week yield range of 6.89% to 9.74%, with an average yield of 8.33% The analysis below sets forth CMLP’s projected annual distribution per unit based on the CMLP Downside Financial Projections for the six months ending December 31, 2013E and for the years ending December 31, 2014E, 2015E, 2016E and 2017E and a terminal value based on an CMLP yield range of 7.0% to 10.0% discounted at a cost of equity for CMLP ranging between 8.5% and 9.5% based on CAPM and 13.5% to 14.5% based on the total expected market return (as detailed in the Appendix) Discounted Cash Flow Analysis – CMLP Common Units For the Six Months Ending December 31, For the Years Ending December 31, Terminal Value 2013E 2014E 2015E 2016E 2017E Low High CMLP Standalone Distribution per LP Unit $1.02 $2.04 $2.04 $2.04 $2.08 $2.08 Terminal Yield (1) 10.00% - 7.00% Terminal Value $20.78 - $29.68 Equity Cost of Capital Based on CAPM PV @ 8.0% of Value per CMLP Common Unit $22.48 - $28.78 PV @ 8.5% of Value per CMLP Common Unit 22.10 - 28.27 PV @ 9.0% of Value per CMLP Common Unit 21.73 - 27.78 PV @ 9.5% of Value per CMLP Common Unit 21.37 - 27.29 PV @ 10.0% of Value per CMLP Common Unit 21.02 - 26.82 Implied CMLP Common Unit Value Range $21.37 - $28.27 Equity Cost of Capital Based on Total Expected Market Return PV @ 13.0% of Value per CMLP Common Unit $19.07 - $24.21 PV @ 13.5% of Value per CMLP Common Unit 18.77 - 23.81 PV @ 14.0% of Value per CMLP Common Unit 18.48 - 23.42 PV @ 14.5% of Value per CMLP Common Unit 18.19 - 23.03 PV @ 15.0% of Value per CMLP Common Unit 17.91 - 22.66 Implied CMLP Common Unit Value Range $18.19 - $23.81 Implied Unit Price $18.19 - $28.27 |
 Confidential DRAFT 60 Source: Public filings and Wall Street research Indicative Valuation of CMLP Precedent M&A Transactions ($ in millions) 04/13 Atlas Pipeline Partners, L.P. / TEAK Midstream, L.L.C. $1,000.0 17.5x 02/13 Regency Energy Partners LP / Southern Union Gathering Company, LLC (Southern Union Company) 1,429.0 16.1 02/13 Western Gas Partners, LP / 33.75% Interest in Liberty and Rome Gas Gathering Systems (Anadarko Petroleum Corporation) 490.0 7.6 02/13 Western Gas Partners, LP / 33.75% Interest in Larry's Creek, Seely and Warrensville Gas Gathering Systems (Chesapeake Energy Corporation) 133.5 9.7 02/13 DCP Midstream Partners LP / Additional 47.0% Interest in Eagle Ford Joint Venture and Additional Interest in the Goliad Plant (DCP Midstream LLC) 856.0 NA 01/13 Summit Midstream Partners / Bear Tracker Energy, LLC 513.0 9.2 01/13 Crestwood Midstream Partners / 65.0% Interest in Crestwood Marcellus Midstream LLC (Crestwood Holdings Partners LLC) 258.0 8.9 11/12 Targa Resources Partners LP / Saddle Butte Pipeline, LLC 950.0 11.5 11/12 Atlas Pipeline Partners, L.P. / Cardinal Midstream L.L.C. 600.0 10.0 08/12 Eagle Rock Energy Partners/Sunray and Hemphill processing plants and associated 2,500 mile gathering system (BP America Production Co.) 227.5 9.5 07/12 Crestwood Midstream Partners LP / West Johnson County Gathering and Processing Assets in the Barnett Shale (Devon Energy Corporation) 90.0 NA 06/12 CenterPoint Energy, Inc. / 50% Interest in Waskom Gas Processing and Other Gathering and Processing Assets (Martin Midstream Partners L.P.) 275.0 10.9 05/12 MarkWest Energy Partners, L.P. / Keystone Midstream Services, LLC (Stonehenge Energy Resources, L.P., Rex Energy Corporation, Sumitomo Corporation) 512.0 28.4 04/12 PennVirginia Resource Partners, L.P. / Chief Gathering LLC 1,252.5 13.9 03/12 Williams Partners L.P. / Caiman Eastern Midstream LLC 2,500.0 12.5 01/12 Western Gas Partners L.P. / Red Desert Complex (Anadarko Petroleum Corporation) 483.0 7.0 12/11 Crestwood Midstream Partners LP / Antero Resources' Marcellus Shale Gathering Assets 375.0 11.5 12/11 Plains All American Pipelines, LP / Velocity South Texas Gathering LLC 352.0 43.3 10/11 Kinder Morgan Energy Partners, L.P./SouthTex Treaters 155.0 NA 10/11 Crestwood Midstream Partners LP/Tristate Sabine, LLC (Energy Spectrum Capital and Zwolle Pipeline, LLC) 73.0 9.4 07/11 Western Gas Partners, LP/Bison Gas Treating Facility (Anadarko Petroleum Corporation) 130.0 8.8 06/11 Sable NGL LLC / Stanley Condensate Recovery Plant and Prairie Rose Pipeline Inc. (EOG Resources, Inc.) 185.0 NA 05/11 Kinder Morgan Energy Partners, L.P. / 50% Interest in KinderHawk Field Services and 25% of Eagle Ford Midstream (Petrohawk Energy Corporation) 920.0 NA 03/11 Energy Transfer Partners, L.P. and Regency Energy Partners LP / Louis Dreyfus Highbridge Energy LLC 1,925.0 11.6 03/11 Anadarko Petroleum Corp / 93% Interest in Wattenburg Processing Plant (BP plc) 575.5 7.5 02/11 Crestwood Midstream Partners / Gathering and Processing assets in the Fayetteville Shale and Granite Wash (Frontier Gas Services, LLC) 338.0 12.5 01/11 MarkWest Energy Partners L.P. / Kentucky Hydro Natural Gas Processing Complex and NGL Pipeline (EQT Corporation) 230.0 12.7 01/11 Western Gas Partners, LP / Fort Lupton Processing Plant and Related Gathering Systems in the DJ Basin (Encana Oil & Gas (USA) Inc.) 303.3 9.3 12/10 Chesapeake Midstream Partners LP / Springridge Natural Gas Gathering System and Related Facilities in the Haynesville Shale 500.0 11.9 11/10 Williams Partners L.P. / Marcellus Midstream Assets in Susquehanna County, Pennslyvania (Cabot Oil & Gas Corporation) 150.0 NA 11/10 Chevron Corporation / 49% Interest in Laurel Mountain Midstream in Marcellus (Atlas Pipeline Partners, LP) 403.0 NA 11/10 ArcLight Capital Partners LLC / 9.9% Equity Interest in Enogex (OGE Energy) 183.0 9.5 10/10 Williams Partners L.P. / Gathering and Processing Assets in Colorado's Piceance Basin (Williams Companies, Inc.) 782.0 7.4 10/10 Cardinal Midstream, LLC / Gathering and Processing Assets in the Arkoma Woodford Shale in Eastern Oklahoma (Antero Resources, LLC) 268.0 9.8 09/10 Targa Resources Partners LP / Venice Energy Services Company (Targa Resources, Inc.) 167.5 7.2 08/10 Targa Resources Partners LP / Versado Gas Processors, L.L.C. (Targa Resources, Inc.) 230.0 5.7 08/10 Regency Energy Partners, L.P. / Zephyr Gas Services 185.0 9.5 08/10 Western Gas Partners, LP / Wattenberg Gathering System & Fort Lupton Processing Plant (Anadarko Petroleum Corporation) 498.0 8.2 07/10 Enbridge Energy Partners, L.P. / Elk City Gathering and Processing System (Atlas Pipeline Partners, LP) 686.1 16.5 06/10 DCP Midstream, LLC / Liberty Gathering System and South Raywood Processing Plant (Ceritas Energy) 79.0 NA 04/10 Regency Energy Partners LP / 7% Interest in Haynesville Joint Venture Increasing its Total Interest to 49.99% (GE Energy Financial Services) 92.1 NA 04/10 Kinder Morgan Energy Partners, L.P. / 50% interest in Haynesville Gathering & Treating Business (Petrohawk Energy) 875.0 20.5 04/10 Enterprise Products Partners, L.P. / M2 Midsteam LLC (Yorktown Partners) 1,200.0 15.2 03/10 Targa Resources Partners LP / Sand Hills, Coastal Straddles and Targa Gas Marketing (Targa Resources, Inc.) 420.0 6.0 02/10 Western Gas Partners, LP / Southwest Wyoming Gathering and Processing Assets (Anadarko Petroleum Corporation) 254.4 7.2 Mean 12.0x Median 9.8 |
 Confidential DRAFT 61 Source: Public filings and Wall Street research Indicative Valuation of CMLP Precedent M&A Transactions – CMLP Management Financial Projections ($ in millions, except per unit amounts) 2013E EBITDA $173.3 Relevant EBITDA Multiple 9.0x - 12.5x Implied Enterprise Value Range on December 31, 2013 $1,559.5 - $2,166.0 Implied Enterprise Value Range on July 1, 2013 @ 8.0% Discount Rate $1,500.5 - $2,084.0 Less: Present Value of Q3 2013E and Q4 2013E Growth Capital Expenditures @ 8.0% Discount Rate (44.0) Implied Enterprise Value $1,456.5 - $2,040.0 2014E EBITDA $214.8 Relevant EBITDA Multiple 9.0x - 12.5x Implied Enterprise Value Range on December 31, 2014 $1,933.3 - $2,685.1 Implied Enterprise Value Range on July 1, 2013 @ 8.0% Discount Rate $1,722.3 - $2,392.1 Less: Present Value of Q3 2013E, Q4 2013E and 2014E Growth Capital Expenditures @ 8.0% Discount Rate (144.1) Implied Enterprise Value $1,578.2 - $2,247.9 Relevant Range - Enterprise Value $1,456.5 - $2,247.9 Less: Debt as of July 1, 2013 (787.4) Plus: Cash as of July 1, 2013 0.0 Implied Equity Value $669.1 - $1,460.6 Total Units Outstanding as of July 1, 2013 61.4 Implied Unit Price $10.90 - $23.79 |
 Confidential DRAFT 62 Source: Public filings and Wall Street research Indicative Valuation of CMLP Precedent M&A Transactions – CMLP Downside Financial Projections ($ in millions, except per unit amounts) 2013E EBITDA $173.3 Relevant EBITDA Multiple 9.0x - 12.5x Implied Enterprise Value Range on December 31, 2013 $1,559.5 - $2,166.0 Implied Enterprise Value Range on July 1, 2013 @ 8.0% Discount Rate $1,500.5 - $2,084.0 Less: Present Value of Q3 2013E and Q4 2013E Growth Capital Expenditures @ 8.0% Discount Rate (27.2) Implied Enterprise Value $1,473.3 - $2,056.8 2014E EBITDA $186.1 Relevant EBITDA Multiple 9.0x - 12.5x Implied Enterprise Value Range on December 31, 2014 $1,675.1 - $2,326.6 Implied Enterprise Value Range on July 1, 2013 @ 8.0% Discount Rate $1,492.3 - $2,072.7 Less: Present Value of Q3 2013E, Q4 2013E and 2014E Growth Capital Expenditures @ 8.0% Discount Rate (95.2) Implied Enterprise Value $1,397.1 - $1,977.4 Relevant Range - Enterprise Value $1,397.1 - $2,056.8 Less: Debt as of July 1, 2013 (787.4) Plus: Cash as of July 1, 2013 0.0 Implied Equity Value $609.7 - $1,269.5 Total Units Outstanding as of July 1, 2013 61.4 Implied Unit Price $9.93 - $20.68 |
  Confidential DRAFT Peer Group Trading Analysis 63 Indicative Valuation of CMLP Source: Public filings Natural Gas Gathering and Processing Enterprise Value / Price Equity Enterprise EBITDA Distribution Yield Distribution Total Partnership (04/25/2013) Value Value 2013E 2014E Current 2013E 2014E Growth Return Natural Gas Gathering and Processing MLPs American Midstream Partners, LP $18.21 $170.4 $380.6 12.1x 11.0x 9.5% 9.5% 9.5% 2.4% 11.9% Atlas Pipeline Partners, L.P. 36.18 2,383.4 3,627.1 10.3 8.2 6.4% 7.0% 7.9% 9.9% 16.3% Access Midstream Partners, L.P. 41.07 7,941.9 10,488.6 12.9 10.1 4.4% 4.8% 5.5% 10.6% 14.9% Crosstex Energy, L.P. 18.85 1,802.2 2,838.3 12.1 9.2 7.0% 7.4% 8.1% 5.3% 12.3% DCP Midstream Partners, LP 47.47 2,936.8 4,591.2 12.5 9.2 5.8% 6.0% 6.5% 8.4% 14.2% MarkWest Energy Partners, L.P. 62.18 9,270.4 11,773.9 16.9 12.5 5.3% 5.5% 6.1% 9.2% 14.5% Regency Energy Partners LP 26.51 5,450.8 8,304.4 13.2 10.6 6.9% 7.1% 7.3% 4.3% 11.2% Southcross Energy Partners, L.P. 21.13 526.8 969.1 18.3 17.0 7.6% 7.6% 7.7% 6.3% 13.9% Summit Midstream Partners, LP 27.13 1,351.5 1,542.8 13.3 10.9 6.0% 6.4% 7.0% 8.0% 14.1% Targa Resources Partners LP 46.68 4,848.5 7,324.3 11.5 9.0 5.8% 6.1% 6.8% 8.5% 14.4% Western Gas Partners, LP 58.64 6,289.4 8,087.4 18.5 13.5 3.7% 3.9% 4.5% 11.6% 15.3% Mean 13.8x 11.0x 6.2% 6.5% 7.0% 7.7% 13.9% Median 12.9 10.6 6.0% 6.4% 7.0% 8.4% 14.2% Crestwood Midstream Partners LP $25.15 $1,535.9 $2,267.4 12.7x 9.9x 8.1% 8.2% 8.5% 4.1% 12.2% ($ in millions, except per unit amounts) |
 Confidential DRAFT Peer Group Trading Analysis (cont’d) 64 Indicative Valuation of CMLP Source: Public filings CMLP Management Financial Projections 2013E EBITDA $173.3 Relevant EBITDA Multiple 10.5x - 13.5x Implied Enterprise Value $1,819.4 - $2,339.3 2014E EBITDA $214.8 Relevant EBITDA Multiple 9.0x - 12.0x Implied Enterprise Value $1,933.3 - $2,577.7 Relevant Range - Enterprise Value $1,819.4 - $2,577.7 Less: Debt as of July 1, 2013 (787.4) Plus: Cash as of July 1, 2013 0.0 Implied Equity Value $1,032.1 - $1,790.3 Total Units Outstanding as of July 1, 2013 61.4 Implied Unit Price $16.81 - $29.16 CMLP Downside Financial Projections 2013E EBITDA $173.3 Relevant EBITDA Multiple 10.5x - 13.5x Implied Enterprise Value $1,819.4 - $2,339.3 2014E EBITDA $186.1 Relevant EBITDA Multiple 9.0x - 12.0x Implied Enterprise Value $1,675.1 - $2,233.5 Relevant Range - Enterprise Value $1,675.1 - $2,339.3 Less: Debt as of July 1, 2013 (787.4) Plus: Cash as of July 1, 2013 0.0 Implied Equity Value $887.8 - $1,551.9 Total Units Outstanding as of July 1, 2013 61.4 Implied Unit Price $14.46 - $25.28 ($ in millions, except per unit amounts) |
 Confidential DRAFT MLP Merger Premiums MLP Merger Premiums Paid Analysis 65 Historically, MLP merger premiums have varied widely based on specific considerations with respect to each transaction, with a range of 2.2% to 31.8% premium to one-day trailing trading price and a mean premium of 18.0% Transaction Premium Date Equity Enterprise 52-Week Announced Target Acquiror(s) Consideration Value Value 1-Day 5-Day 30-Day High 01/29/13 Copano Energy, L.L.C. Kinder Morgan Energy Partners, L.P. Unit-for-Unit $3,834.3 $4,781.1 23.7% 23.6% 38.7% 7.7% 02/23/11 Duncan Energy Partners L.P. Enterprise Products Partners L.P. Unit-for-Unit 2,405.0 3,302.8 27.9% 27.7% 27.4% 2.3% 06/09/09 TEPPCO Partners LP Enterprise Products Partners L.P. Unit-for-Unit 3,290.7 6,024.5 7.1% 4.3% 8.9% (13.5%) 06/12/06 Pacific Energy Partners, L.P. Plains All American Pipeline, L.P. Unit-for-Unit 1,395.4 2,007.9 10.6% 10.2% 14.4% (0.5%) 11/01/04 Kaneb Pipeline Partners, L.P. Valero L.P. Unit-for-Unit 1,741.5 2,371.4 21.2% 17.6% 18.6% 4.2% 12/15/03 GulfTerra Energy Partners, L.P. Enterprise Products Partners L.P. Unit-for-Unit 2,408.4 4,240.3 2.2% 3.7% 2.1% (2.0%) 10/18/97 Santa Fe Pacific Pipeline Partners LP Kinder Morgan Energy Partners, L.P. Unit-for-Unit 1,038.0 1,339.9 31.8% 33.2% 40.3% 5.3% Median 21.2% 17.6% 18.6% 2.3% Mean 17.8% 17.2% 21.5% 0.5% Max 31.8% 33.2% 40.3% 7.7% Min 2.2% 3.7% 2.1% (13.5%) 1-Day 5-Day 30-Day 52-Week High Current Trading Price $25.15 $24.97 $25.14 $29.03 Estimated Merger Premium 2.2% - 31.8% 3.7% - 33.2% 2.1% - 40.3% (13.5%) - 7.7% Implied Transaction Price Range $25.70 - $33.15 $25.88 - $33.27 $25.68 - $35.28 $25.12 - $31.27 Mean Merger Premium 17.8% 17.2% 21.5% 0.5% Mean Implied Transaction Price $29.62 $29.26 $30.55 $29.17 Indicative Valuation of CMLP ($ in millions, except per unit amounts) |
  Confidential DRAFT Historical Unit Price Trading Ratio 66 Indicative Valuation of CMLP 0.800x 0.900x 1.000x 1.100x 1.200x 1.300x 1.400x 1.500x 1.600x 1.700x 1.800x 12/16/2011 3/7/2012 5/29/2012 8/20/2012 11/10/2012 2/1/2013 4/25/2013 Implied Period NRGM CMLP Ratio Current as of 04/25/13 $24.40 $25.15 1.031x 30-Day Average 23.68 24.34 1.028x 60-Day Average 23.82 24.92 1.046x 90-Day Average 23.42 24.47 1.045x Over the twelve months ended December 31, 2012, CMLP’s unit price decreased by 32.2%, while NRGM’s unit price increased by 17.4%, resulting in a decrease in the NRGM/CMLP unit price trading ratio from 1.675x to 0.968x Since January 1, 2012, NRGM and CMLP unit prices have increased by 9.7% and 16.8%, respectively, as of April 25, 2013 Current Offer = 1.089x + $0.41 Cash per unit |
 Confidential DRAFT Wall Street Research Price Targets Summary Price Targets 67 Analyst Recommendations Source: Bloomberg, IBES Distribution Per Unit Estimates EBITDA Estimates Indicative Valuation of CMLP Hold (2) 33.3% Buy (4) 66.7% Target Firm Analyst Date Recommendation Price Ladenburg Thalmann Eduardo Seda 02/27/13 Buy $32.50 Hilliard Lyons Joel K. Havard 02/27/13 Long-term Buy 32.00 Simmons Mark L. Reichman 03/21/13 Overweight 30.00 Barclays Richard Gross 02/28/13 Equalweight 27.00 RBC T.J. Schultz 02/27/13 Sector Perform 26.00 Wells Fargo Michael J. Blum 02/28/13 Outperform NA Median: $30.00 Mean: 29.50 Low: 26.00 High: 32.50 $2.09 $2.17 $2.26 $2.12 $2.24 $2.36 $2.04 $2.14 $2.07 $2.10 $2.20 $2.07 $2.15 $2.26 $2.07 $2.15 $2.37 $1.80 $1.90 $2.00 $2.10 $2.20 $2.30 $2.40 2013E 2014E 2015E $178.0 $258.0 $307.0 $179.1 $209.0 $180.7 $229.0 $178.6 $248.8 $316.4 $179.1 $229.5 $296.3 $173.3 $214.8 $270.3 $-- $50.0 $100.0 $150.0 $200.0 $250.0 $300.0 $350.0 2013E 2014E 2015E Barclays Ladenburg Thalmann RBC Wells Fargo IBES CMLP Management Projections ($ in millions, except per unit amounts) |
DRAFT V. Overview of NRGM |
 Confidential DRAFT NRGM Map 68 Overview of NRGM Source: Public partnership filings NRGM Asset Map Gas Storage NGL Storage COLT Hub Legend COLT Hub: – Located in Epping, North Dakota – 120,000 barrels per day rail loading capacity – 720,000 barrel crude oil storage capacity Steuben (Adrian Field): – Located in Steuben County, New York – Working gas of 6.2 Bcf with 30/60 MMcfd injection/withdrawal capability – Owned by ASC, a subsidiary of NRGM U.S. Salt Gas Storage Development: – Located in Watkins Glen, New York – Potential development of up to approximately 10.0 Bcf of natural gas storage capacity – Development rights owned by NRGM Stagecoach: – Located 150 miles northwest of New York City – Working gas of 26.3 Bcf with 250/500 MMcfd injection/withdrawal capability Seneca Lake – Located in Schuyler County, New York – Working Gas of 1.5 Bcf with 72.5/145 MMcfd injection/withdrawal capability – Owned by ASC, a subsidiary of NRGM Thomas Corners: – Located in Steuben County, New York – Working gas of 7.0 Bcf with 70/140 MMcf per day (“MMcfd”) injection / withdrawal capability – Owned by Arlington Storage Company (“ASC”), a subsidiary of NRGM Finger Lakes NGL Storage – Two facilities: • Bath Facility: 1.5 million barrels of NGL storage • Watkins Glen Facility: 2.1 million barrels of NGL storage |
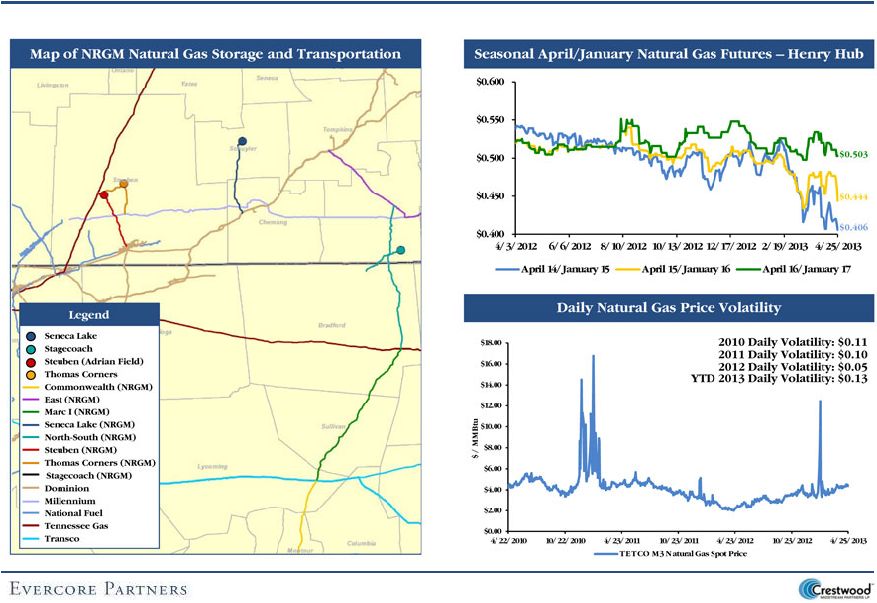 Confidential DRAFT NRGM Asset Overview – Natural Gas Storage and Transportation 69 Overview of NRGM Source: NRGM website and Bloomberg |
 Confidential DRAFT NRGM Asset Overview – Natural Gas Storage Facilities (cont’d) 70 Overview of NRGM Natural gas storage facility located 150 miles northwest of New York City Working gas capacity of 26.25 Bcf 18 horizontal storage wells with 250/500 MMcfd injection/withdrawal capability Connected to Tennessee Gas Pipeline Company, L.L.C’s (“TGP”) 300 Line and Millennium Pipeline Company, L.L.C. (“Millennium”) 24-mile South lateral pipeline connected to TGP's 300 Line and 10-mile North lateral pipeline connected to Millennium Stagecoach Natural gas storage facility located in Steuben County, New York Initial working gas capacity of 5.7 Bcf although certified to 7.0 Bcf 10 high angle vertical storage wells provide two-cycle non- seasonal service with 70/140 MMcfd injection/withdrawal capacity Connections to TGP and Millennium 8-mile lateral pipeline connected to TGP's 400 Line and 7.5-mile lateral pipeline connected to Millennium Thomas Corners Source: Management presentation and NRGM filings |
 Confidential DRAFT NRGM Asset Overview – Natural Gas Storage Facilities (cont’d) 71 Overview of NRGM Steuben (Adrian Field) Natural gas storage facility located in Steuben County, New York Working gas capacity of 6.2 Bcf 11 vertical wells with 30/60 MMcfd injection/withdrawal capability 12.5-mile lateral pipeline connected to Dominion’s Woodhull line Received FERC approval to charge market based rates under ASC’s tariff effective April 1, 2013 Natural gas storage facility located in Schuyler County, New York – Located on U.S. Salt property Working gas capacity of 1.5 Bcf with 72.5/145 MMcfd injection/withdrawal capability 20-mile, 16-inch lateral pipeline connected to Dominion and Millennium Seneca Lake Source: Management presentation and NRGM filings |
 Confidential DRAFT NRGM Asset Overview – Natural Gas Transportation 72 Overview of NRGM Provides approximately 325 MMcfd of interstate transportation service for shippers seeking to transport natural gas on a firm basis through NRGM’s existing North and/or South Laterals of Stagecoach Includes compression and associated facilities installed to expand transportation capacity on the Stagecoach north and south pipeline laterals Generates fee-based revenue pursuant to a negotiated rate structure authorized by the FERC Placed into service in December 2011 100% contracted with weighted average maturity through 2016 Future connection to Dominion would potentially allow access to Iroquois Pipeline Operating Company (“Iroquois”) via Dominion-Iroquois expansion North-South Pipeline Source: Management presentation and NRGM filings Marc I Pipeline 39-mile, 30-inch bi-directional natural gas pipeline connecting NRGM’s Stagecoach South Lateral pipeline interconnect at TGP’s 300 Line to Transco’s Leidy Line Provides 550 MMcfd of interstate transportation capacity Includes a 16,360 horsepower gas-fired compressor station in the vicinity of the Transco interconnection and a 15,000 horsepower electric-powered compressor station at the proposed interconnection between the Stagecoach south lateral and TGP's 300 Line Generates fee-based revenue pursuant to a negotiated rate structure authorized by the FERC Placed into service in December 2011 82% contracted with 10-year terms |
 Confidential East Pipeline NRGM Asset Overview – Natural Gas Transportation (cont’d) 73 Overview of NRGM Source: Management presentation and NRGM filings 37.5-mile, 12-inch diameter natural gas intrastate pipeline located in New York Transports 30 MMcfd of natural gas from Dominion to the Binghamton, New York city gate Runs within three miles of the Stagecoach north lateral's point of interconnection with Millennium Generates fee-based revenue pursuant to under a negotiated rate structure authorized by the New York State Public Service Commission NRGM acquired the East Pipeline (formerly known as the Seneca Lake east pipeline) from New York State Electric & Gas Corporation on July 13, 2011 as part of its acquisition of the Seneca Lake natural gas storage facility 100% contracted through 2021 Commonwealth Pipeline Approximately 120-mile, 30-inch natural gas pipeline extending from southern end of Marc I Pipeline to Chester County, Pennsylvania Approximately $750.0 million total capital investment of which NRGM is responsible for $250.0 million Expected to be in-service in the second half of 2016 or the first half of 2017 and to generate $32.5 million of EBITDA annually at full run-rate – 7.7x run-rate EBITDA DRAFT |
 Confidential NRGM Asset Overview – NGL Storage and Terminals 74 Overview of NRGM 1.5 million barrels of underground NGL storage in Steuben County, New York Rail and truck terminal facilities capable of loading and unloading 23 railcars per day and 17 truck transports per day Nine separate caverns allow for segregation of multiple streams 100% contracted with Inergy Services, LLC (1) , with maturity to 2016 Expansion potential with U.S. Salt as brine outlet Bath Facility Developing an initial 2.1 million barrels of NGL storage in Schuyler County, New York Connected to TE Products Pipeline ("TEPPCO") pipeline with rail and truck access capable of loading and unloading 32 railcars per day and 45 truck transports per day 95% contracted with BP plc with maturity to 2016 and option to take back capacity Expected in-service calendar 1H 2013, subject to regulatory approval Source: Management presentation and NRGM filings (1) Wholly-owned subsidiary of NRGY Watkins Glen Facility DRAFT |
 Confidential NRGM Asset Overview – U.S. Salt 75 Overview of NRGM U.S. Salt Operations Acquired from NRGY on May 14, 2012 for a total purchase price of $192.5 million, including $182.5 million in cash and 473,707 common units U.S. Salt Operations Solution mining and salt production company located outside of Watkins Glen, New York Produces and sells approximately 300,000 tons of food, pharmaceutical and chemical feedstock grade salt each year Over 40.0 million barrels of previously solution mined cavern capacity convertible to energy storage U.S. Salt Gas Storage Development NRGM’s Seneca Lake facility is located on U.S. Salt property Potential development of up to approximately 10.0 Bcf of natural gas storage capacity Additional storage capacity available via the solution-mining process at U.S. Salt Historical and Projected U.S. Salt Performance U.S. Salt Management Team Name Position Previous Position Mitchell Dascher President President of Southern Lime Barry Wall VP of Finance Midwest Controller at Compass Minerals Don Krider VP of Sales Eastern Regional sales manager at North American Salt Source: NRGM filings, NRGM website and projections provided by NRGM management DRAFT |
 Confidential NRGM Asset Overview – U.S. Salt – Market Dynamics 76 Overview of NRGM DRAFT |
 Confidential NRGM Asset Overview – COLT Hub 77 Overview of NRGM COLT Hub Overview On November 5, 2012, NRGM announced the acquisition of the COLT Hub for $425.0 million Crude oil rail terminal located in Epping, North Dakota – Commenced commercial operation in May 2012 120,000 Bpd rail loading capacity, 720,000 Bbl crude oil storage capacity Ability to handle up to 120-car unit trains Connected to Burlington Northern Santa Fe rail system 21-mile, 10" bi-directional pipeline (“COLT Connector”) connecting the COLT Terminal to the Dry Fork Terminal Dry Fork Terminal located at the Beaver Lodge/Ramberg pipeline hub providing crude oil pipeline access and interconnects – Crude oil metering and pipeline interconnection facilities allow transfer to Tesoro and Enbridge pipelines Product sourcing via truck unloading racks, pipelines and gathering system interconnects 98% of capacity is contracted or committed pursuant to “take-or-pay” contracts with weighted average maturity of 3.6 years Source: Management presentation and NRGM filings DRAFT |
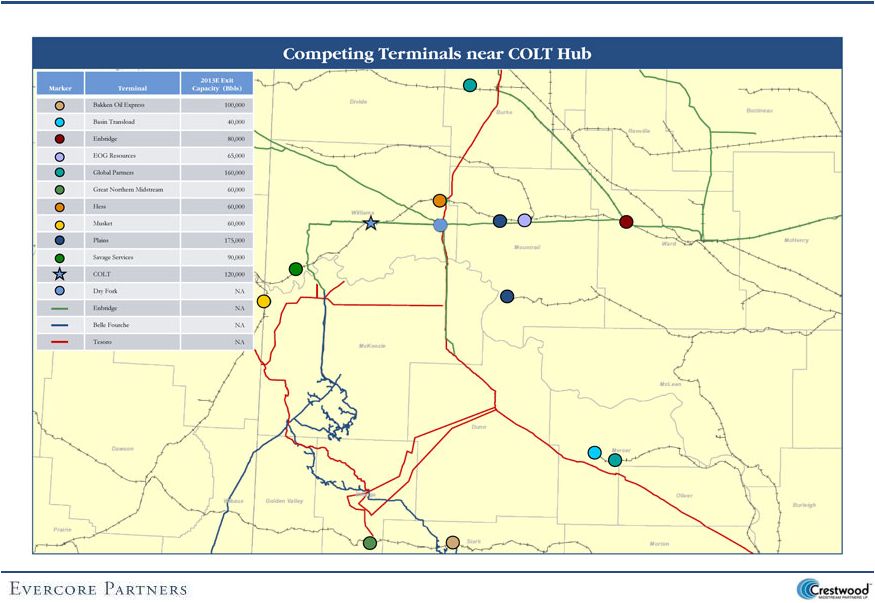 Confidential NRGM Asset Overview – COLT Hub (cont’d) 78 Overview of NRGM Source: Management presentation, NRGM filings and Platts DRAFT |
 Confidential Overview of NRGM NRGM – Summary Market Data ($ in millions, except per unit amounts) 79 Balance Sheet and Credit Data Unit Price and Distribution Information General Partner Incentive Distribution Rights Market Capitalization DRAFT |
 Confidential Price Performance 80 Overview of NRGM (1) IPO volume of 8,000,420 exceeds scale of the volume axis DRAFT |
   Confidential Relevant Relative Trading Metrics ($ in millions, except per unit amounts) 81 Publicly Traded Natural Gas Pipeline and Storage MLPs Overview of NRGM Publicly Traded Natural Gas Storage MLPs Enterprise Value / Price Equity Enterprise EBITDA Distribution Yield Distribution Total Partnership (04/25/2013) Value Value 2013E 2014E Current 2013E 2014E Growth Return Natural Gas Storage Niska Gas Storage Partners LLC $14.96 $526.4 $917.9 6.6x 6.5x 9.4% 9.4% 9.4% 2.9% 12.3% PAA Natural Gas Storage, L.P. 22.53 1,634.7 2,216.1 18.4 16.9 6.3% 6.4% 6.4% 1.7% 8.1% Mean 12.5x 11.7x 7.9% 7.9% 7.9% 2.3% 10.2% Inergy Midstream, L.P. (1) $24.40 $2,096.0 $2,775.8 13.5x 9.8x 6.5% 6.7% 7.3% 8.7% 15.2% (1) IBES estimates are on a calendar basis, fiscal year ends September 30 DRAFT Enterprise Value / Price Equity Enterprise EBITDA Distribution Yield Distribution Total Partnership (04/25/2013) Value Value 2013E 2014E Current 2013E 2014E Growth Return Natural Gas Pipelines/ Storage Boardwalk Pipeline Partners, LP $30.36 $7,143.1 $10,678.4 13.6x 12.8x 7.0% 7.0% 7.1% 2.4% 9.4% El Paso Pipeline Partners, L.P. 43.07 9,483.7 13,615.7 11.7 11.0 5.7% 5.9% 6.2% 6.1% 11.7% EQT Midstream Partners, LP 41.25 1,459.7 1,437.8 15.2 11.4 3.4% 3.7% 4.2% 37.2% 40.6% Niska Gas Storage Partners LLC 14.96 526.4 917.9 6.6 6.5 9.4% 9.4% 9.4% 2.9% 12.3% PAA Natural Gas Storage, L.P. 22.53 1,634.7 2,216.1 18.4 16.9 6.3% 6.4% 6.4% 1.7% 8.1% Spectra Energy Partners, LP 38.17 4,153.3 5,246.2 20.4 17.2 5.2% 5.3% 5.6% 5.1% 10.3% TC PipeLines, LP 48.22 2,631.1 3,319.1 17.5 16.6 6.5% 6.5% 6.7% 2.3% 8.8% Mean 14.8x 13.2x 6.2% 6.3% 6.5% 8.2% 14.5% Median 15.2 12.8 6.3% 6.4% 6.4% 2.9% 10.3% Inergy Midstream, L.P. (1) $24.40 $2,096.0 $2,775.8 13.5x 9.8x 6.5% 6.7% 7.3% 8.7% 15.2% |
 Confidential Wall Street Research Price Targets Summary Price Targets 82 Analyst Recommendations Source: Bloomberg, IBES (1) Distribution per unit and EBITDA estimates shown on a fiscal basis Distribution Per Unit Estimates (1) EBITDA Estimates (1) Overview of NRGM Hold (2) 33.3% Buy (4) 66.7% Target Firm Analyst Date Recommendation Price Credit Suisse Brett Reilly 01/09/13 Outperform $28.00 JPMorgan Jeremy Tonet 03/21/13 Overweight 26.00 Stifel Nicolaus Selman Akyol 02/06/13 Buy 26.00 Barclays Brian J. Zarahn 02/06/13 Overweight 26.00 Morgan Stanley Stephen J. Maresca 11/5/12 Equal-weight 25.00 Robert W. Baird & Co Ethan H. Bellamy 02/06/13 Neutral 24.00 Median: $26.00 Mean: 25.83 Low: 24.00 High: 28.00 $1.60 $1.73 $1.88 $1.66 $1.92 $2.14 $1.62 $1.73 $1.61 $1.76 $1.96 $-- $0.50 $1.00 $1.50 $2.00 $2.50 2013E 2014E 2015E $182.0 $245.0 $295.0 $250.1 $399.3 $361.3 $177.4 $224.0 $186.4 $263.6 $344.7 $-- $50.0 $100.0 $150.0 $200.0 $250.0 $300.0 $350.0 $400.0 $450.0 2013E 2014E 2015E Barclays Morgan Stanley Stifel Nicolaus IBES DRAFT ($ in millions, except per unit amounts) |
 Confidential Research Analyst Commentary Overview of NRGM 83 DRAFT |
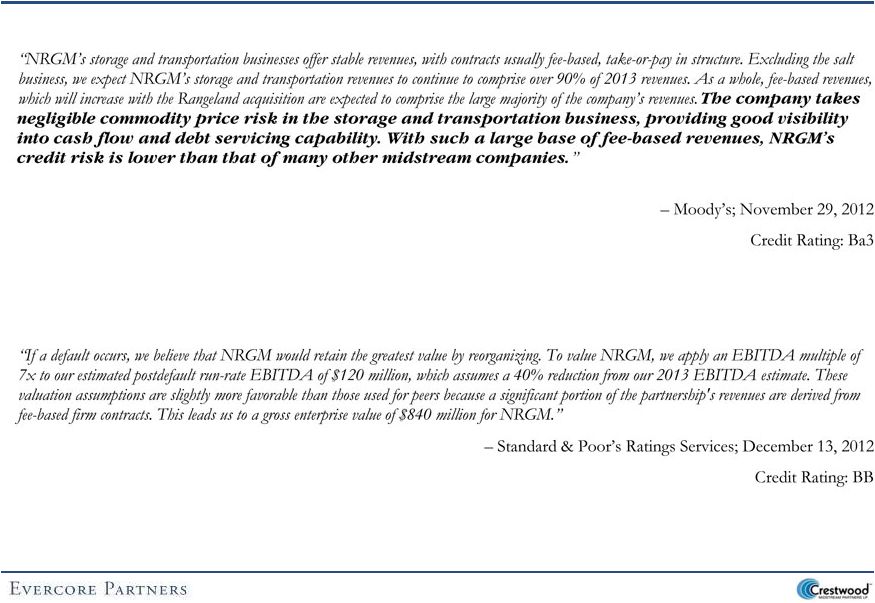 Confidential Ratings Agency Commentary Overview of NRGM 84 DRAFT |
  Confidential NRGM Equity Ownership Summary Overview of NRGM Note: Shading denotes overlapping ownership 85 NRGM CMLP Current Unitholders (Excluding Broker Holdings in Street Name) Shares Percentage Shares Percentage Kayne Anderson Capital Advisors LP 8,657,629 10.1% 5,807,677 9.5% Neuberger Berman LLC 3,720,166 4.3% -- 0.0% Tortoise Capital Advisors LLC 3,123,176 3.6% 2,676,178 4.4% Eagle Global Advisors LLC 1,894,945 2.2% 10,280 0.0% OppenheimerFunds, Inc. 1,617,827 1.9% -- 0.0% OFI Steelpath, Inc. 1,600,605 1.9% -- 0.0% Advisory Research, Inc. 929,260 1.1% -- 0.0% Magnetar Financial LLC 833,333 1.0% -- 0.0% Mason Street Advisors LLC 629,680 0.7% -- 0.0% Fidelity Management & Research Co. 603,900 0.7% 95,332 0.2% Salient Capital Advisors LLC 277,857 0.3% -- 0.0% Credit Suisse Securities (USA) LLC (Broker) 246,545 0.3% 87,772 0.1% JPMorgan Chase Bank NA 178,425 0.2% -- 0.0% Merrill Lynch, Pierce, Fenner & Smith, Inc. 148,233 0.2% 2,105 0.0% Glenmede Investment Management LP 53,150 0.1% -- 0.0% Oxford Asset Management LLP 46,718 0.1% -- 0.0% Stifel, Nicolaus & Co., Inc. 30,582 0.0% -- 0.0% Morgan Stanley Investment Management, Inc. 30,333 0.0% 20,236 0.0% Wells Fargo Advisors LLC 29,410 0.0% 115,524 0.2% Morgan Stanley Smith Barney LLC (Securities) 26,235 0.0% 60,203 0.1% JPMorgan Securities LLC 15,446 0.0% 512,084 0.8% Cadence Bank, NA (Investment Management) 13,853 0.0% -- 0.0% Salem Investment Counselors, Inc. 12,500 0.0% -- 0.0% UBS Global Asset Management 11,994 0.0% 279,425 0.5% Susquehanna Financial Group LLLP 11,726 0.0% -- 0.0% Bank of America NA (Private Banking) 4,884 0.0% 1,733 0.0% RBC Dominion Securities, Inc. 3,948 0.0% -- 0.0% Westport Resources Management, Inc. 3,847 0.0% 575 0.0% Royal Alliance Associates, Inc. 2,970 0.0% 200 0.0% Deutsche Bank Investment Management, Inc. 2,300 0.0% 23,309 0.0% Morgan Stanley & Co. LLC 2,078 0.0% 7,958 0.0% Group One Trading LP 2,012 0.0% 5,308 0.0% UBS Securities LLC 1,508 0.0% 21,634 0.0% Creative Planning, Inc. 1,450 0.0% -- 0.0% PNC Bank NA (Trust Department) 1,000 0.0% -- 0.0% Harbor Springs Financial Management LLC 1,000 0.0% -- 0.0% Retirement Planning Group, Inc. 605 0.0% -- 0.0% Union Bank, NA 600 0.0% -- 0.0% C. M. Bidwell & Associates Ltd. 600 0.0% -- 0.0% Central Trust & Investment Co. 300 0.0% -- 0.0% Tower Research Capital LLC 298 0.0% 1,293 0.0% Citigroup Global Markets Inc. (Broker) 200 0.0% 946 0.0% Baystate Wealth Management LLC 200 0.0% -- 0.0% Barclays Capital, Inc. 100 0.0% 1,587 0.0% Invesco Advisers, Inc. -- 0.0% -- 0.0% Delta Asset Management LLC (Tennessee) -- 0.0% -- 0.0% Atlantic Trust Private Wealth Management -- 0.0% -- 0.0% Susquehanna Investment Group LLC -- 0.0% -- 0.0% Goldman Sachs & Co. -- 0.0% 9,564 0.0% NRGM Institutional Owners Represent 16.0% Ownership in CMLP DRAFT Current Unitholders Units % of Total Institutional Top 10: Kayne Anderson Capital Advisors LP 8,657,629 10.1% Neuberger Berman LLC 3,720,166 4.3% Tortoise Capital Advisors LLC 3,123,176 3.6% Eagle Global Advisors LLC 1,894,945 2.2% OppenheimerFunds, Inc. 1,617,827 1.9% OFI Steelpath, Inc. 1,600,605 1.9% Advisory Research, Inc. 929,260 1.1% Magnetar Financial LLC 833,333 1.0% Mason Street Advisors LLC 629,680 0.7% Fidelity Management & Research Co. 603,900 0.7% Other 1,162,907 1.4% Total Institutional Ownership 24,773,428 28.8% Insiders Inergy LP 56,398,707 65.7% William C. Gautreaux 140,000 0.2% John J. Sherman 100,000 0.1% R. Brooks Sherman Jr. 55,000 0.1% Laura L. Ozenberger 45,000 0.1% Other 88,924 0.1% Total Insiders 56,827,631 66.2% Retail / Other 4,273,656 5.0% Total Common Units Outstanding 85,874,715 100.0% Short Interest (1) 232,938 0.3% (1) Source: NASDAQ National Markets as of April 15, 2013 |
 Confidential Overview of NRGM 86 The NRGM Management Financial Projections utilized herein by Evercore incorporate the following assumptions: – Growth in EBITDA from $171.6 million in 2013E to $223.5 million in 2014E primarily attributed to full-year COLT Hub performance and the Phase I expansion project providing an additional 20,000 Bpd of rail loading capacity (“COLT Hub Phase I”), additional Watkins Glen NGL storage of 2.1 million barrels on US Salt property and full year performance of the Marc I pipeline – Growth in EBITDA from $223.5 million in 2014E to $242.7 million in 2015E primarily attributed to full year COLT Hub Phase I performance, the COLT Hub Phase II expansion project providing an additional 20,000 Bpd of rail loading capacity (“COLT Hub Phase II”) and expansion of natural gas storage capacity at Seneca Lake (“Seneca Lake Gas Storage Expansion”) – Maintenance capital expenditures of $4.5 million to $8.6 million annually in 2013E through 2017E – Growth capital expenditures of $126.7 million in 2013E and $66.5 million in 2014E, primarily attributable to the Marc I pipeline that was placed into service on December 1, 2012, the Seneca Lake Gas Storage Expansion and COLT Hub Phase I – Growth capital expenditures in 2015E of $137.5 million are primarily attributable to the Commonwealth Pipeline, Seneca Lake Gas Storage Expansion and COLT Hub Phase II project Growth capital expenditures in 2016E of $189.5 million are primarily attributable to the Commonwealth Pipeline – Issuance of $200.0 million of 6.0% Senior Notes in fiscal 2015E – Issuance of $150.0 million of common equity in the fourth quarter of fiscal 2016E at an assumed net common unit price of $26.57 – No minimum cash balance NRGM Management Financial Projections – Assumptions DRAFT |
 Confidential 87 Overview of NRGM Source: Public partnership filings DRAFT ($ in millions) For the Fiscal Years Ending September 30, 2013E 2014E 2015E 2016E 2017E Growth Capital Expenditures Commonwealth Pipeline -- (62.5) (187.5) -- Seneca Lake Gas Storage Expansion (21.3) (28.8) -- -- COLT Hub Expansion I (28.5) -- -- -- COLT Hub Expansion II (14.8) (44.3) -- -- Other NRGM Growth (2.0) (2.0) (2.0) (2.0) Total ($126.7) ($66.5) ($137.5) ($189.5) ($2.0) Projected EBITDA Stagecoach $51.2 $55.6 $55.6 $55.6 $55.6 North-South 14.7 14.7 14.7 14.7 14.7 Marc I 27.7 33.5 33.5 33.5 33.5 Commonwealth Pipeline -- -- -- 8.1 32.5 Steuben Gas 4.8 4.7 4.7 4.7 4.7 Thomas Corners 11.5 12.5 11.9 11.9 11.9 Seneca Lake 6.9 7.6 7.6 8.1 8.1 Seneca Lake Gas Storage Expansion -- -- 3.8 7.5 7.5 FL NGL - Bath 11.5 11.7 11.7 11.7 11.7 FL NGL - Watkins Glen 1.8 7.4 9.2 9.2 9.2 US Salt 17.2 18.7 19.4 19.4 19.4 COLT Hub 33.3 57.6 58.3 59.6 61.7 COLT Expansion I -- 8.4 12.8 13.0 13.0 COLT Expansion II -- -- 8.5 13.0 13.0 NRGM Corporate (9.2) (9.1) (9.1) (9.1) (9.1) Total $171.6 $223.5 $242.7 $260.9 $287.5 Growth Capital Expenditures – NRGM Management Financial Projections |
 Confidential NRGM Management Financial Projections ($ in millions) 88 Overview of NRGM The following sets forth selected operating and financial projections utilized by NRGM management to derive the NRGM Management Financial Projections herein: DRAFT For the Fiscal Years Ending September 30, CAGR 2013E 2014E 2015E 2016E 2017E 2013E - 2017E Working Gas Capacity (Bcf) 41.2 41.4 43.9 46.4 46.4 Natural Gas Transportation (MMcfd) 813.3 905.0 905.0 1,105.0 1,705.0 20.3% NGL Storage Capacity (MMBbls) 2.0 3.6 3.6 3.6 3.6 Salt Tons Sold 362,423.3 378,013.8 388,013.8 388,013.8 388,013.8 1.7% Revenue Firm Storage $103.2 $106.8 $113.1 $117.6 $117.6 3.3% Transportation 48.5 60.2 60.2 69.8 98.6 19.4% Hub Services 11.0 14.3 13.9 15.1 16.2 10.0% Salt 48.1 50.3 51.4 51.4 51.4 1.7% Crude and Other 41.5 78.7 93.4 99.8 102.3 25.3% Total Revenue $252.3 $310.3 $332.0 $353.6 $386.1 11.2% Cost of Sales/Service Storage ($7.4) ($4.7) ($4.9) ($5.1) ($5.1) (9.0%) Transportation (7.7) (10.5) (10.5) (11.9) (16.1) 20.3% Salt (29.0) (29.5) (30.0) (30.0) (30.0) 0.8% Crude and Other (5.6) (8.4) (9.1) (9.4) (9.6) 14.4% Total Cost of Sales/Service ($49.7) ($53.0) ($54.5) ($56.4) ($60.7) 5.1% Gross Profit Storage & Transportation $147.6 $166.2 $171.8 $185.4 $211.2 9.4% Salt 19.1 20.8 21.5 21.5 21.5 2.9% Crude and Other 35.9 70.3 84.3 90.3 92.7 26.7% Total Gross Profit $202.6 $257.3 $277.6 $297.2 $325.3 12.6% Less: Total Operating Expenses (31.1) (33.8) (34.9) (36.3) (37.8) Plus: Minority Interest and Other Expense 0.0 -- -- -- -- Adjusted EBITDA $171.6 $223.5 $242.7 $260.9 $287.5 13.8% |
 Confidential NRGM Management Financial Projections (cont’d) 89 Overview of NRGM The following sets forth the NRGM Management Financial Projections utilized by Evercore in its analysis herein: For the Fiscal Years Ending September 30, CAGR 2013E 2014E 2015E 2016E 2017E 2014E - 2017E Adjusted EBITDA $171.6 $223.5 $242.7 $260.9 $287.5 8.8% Less: Maintenance Capital Expenditures (4.5) (7.0) (7.8) (8.2) (8.6) Less: Interest Expense (34.8) (42.7) (52.1) (56.5) (57.2) Other 4.6 (0.3) 2.7 1.3 (1.3) Distributable Cash Flow $136.9 $173.5 $185.4 $197.5 $220.4 8.3% Distributed Cash Flow Common Units - Public $46.9 $49.7 $52.2 $57.2 $66.1 Common Units - NRGY 89.7 94.9 99.8 104.3 106.0 General Partner 9.4 17.4 24.9 32.3 36.6 Distributed Cash Flow $146.0 $161.9 $177.0 $193.8 $208.7 8.8% % to GP 6.5% 10.7% 14.1% 16.7% 17.5% GP IDRs $9.4 $17.4 $24.9 $32.3 $36.6 28.2% Weighted Average LP Units Outstanding 85.9 85.9 85.9 87.3 91.5 DCF / LP Unit $1.52 $1.75 $1.82 $1.87 $1.94 3.6% Distribution / LP Unit 1.59 1.68 1.77 1.85 1.88 3.8% LP Coverage 0.96x 1.04x 1.03x 1.01x 1.03x Total Coverage 0.94 1.07 1.05 1.02 1.06 Distributable Cash Flow Surplus / (Shortfall) ($9.2) $11.6 $8.4 $3.6 $11.6 DRAFT ($ in millions, except per unit amounts) |
 Confidential NRGM Management Financial Projections (cont’d) ($ in millions) 90 The following sets forth the funding assumptions utilized in the NRGM Management Financial Projections and NRGM’s resulting capital structure and credit statistics Overview of NRGM For the Fiscal Years Ending September 30, 2013E 2014E 2015E 2016E 2017E Sources: Equity Issued for Growth Capital Expenditures $-- $-- $-- $-- $-- Equity Issued for Rangeland Acquisition 225.0 -- -- -- -- Equity Issuance in Q4 2016E -- -- -- 150.0 -- Debt Issued / (Repaid) 361.5 46.5 130.7 37.4 (9.2) DCF Surplus / (Shortfall) (9.2) 11.6 8.4 3.6 11.6 Total Sources $577.4 $58.0 $139.1 $191.0 $2.4 Debt Issued / (Repaid), net of Surplus / (Shortfall) $361.5 $46.5 $130.7 $37.4 ($9.2) Total Equity Issued 225.0 -- -- -- -- Uses: Growth Capital Expenditures $126.7 $66.5 $137.5 $189.5 $2.0 Rangeland Acquisition 425.0 -- -- -- -- Rangeland Transaction Fees and Expenses 6.0 -- -- -- -- Excess Cash -- -- -- -- -- Other 19.7 (8.5) 1.6 1.5 0.4 Total Uses $577.4 $58.0 $139.1 $191.0 $2.4 Credit Statistics Debt / Adjusted EBITDA 4.5x 3.7x 3.9x 3.8x 3.4x Net Debt / Adjusted EBITDA 4.5 3.7 3.9 3.8 3.4 Capital Structure Cash $-- $-- $-- $-- $-- Total Debt 778.0 824.5 955.2 992.5 983.3 Net Debt $778.0 $824.5 $955.2 $992.5 $983.3 DRAFT |
 Confidential NRGM Research Financial Projections 91 Overview of NRGM The following sets forth a comparison of the NRGM Management Financial Projections and the NRGM Research Financial Projections utilized by Evercore in its analysis herein Source: NRGM management; Wall Street Research NRGM Management Financial Projections NRGM Research Financial Projections Difference versus NRGM For the Fiscal Years Ending September 30, CAGR Management Financial Projections 2013E 2014E 2015E 2013E - 2015E 2013E 2014E 2015E Adjusted EBITDA $195.9 $299.6 $388.2 40.8% ($24.4) ($76.0) ($145.5) Less: Maintenance Capital Expenditures (10.0) (10.0) (20.2) 5.5 3.0 12.4 Less: Interest Expense (33.4) (40.6) (47.2) (1.3) (2.1) (4.9) Other 4.6 (0.3) 2.7 -- -- -- Distributable Cash Flow $157.1 $248.6 $323.5 43.5% ($20.2) ($75.1) ($138.1) DCF / LP Unit $1.63 $2.10 $2.45 22.5% ($0.11) ($0.35) ($0.63) Distribution / LP Unit 1.66 1.92 2.14 13.5% (0.07) (0.24) (0.37) LP Coverage 0.98x 1.09x 1.15x Total Coverage 0.97 1.15 1.22 Distributable Cash Flow Surplus / (Shortfall) ($4.6) $33.0 $59.2 DRAFT For the Fiscal Years Ending September 30, CAGR 2013E 2014E 2015E 2016E 2017E 2013E - 2015E Adjusted EBITDA $171.6 $223.5 $242.7 $260.9 $287.5 18.9% Less: Maintenance Capital Expenditures (4.5) (7.0) (7.8) (8.2) (8.6) Less: Interest Expense (34.8) (42.7) (52.1) (56.5) (57.2) Other 4.6 (0.3) 2.7 1.3 (1.3) Distributable Cash Flow $136.9 $173.5 $185.4 $197.5 $220.4 16.4% DCF / LP Unit $1.52 $1.75 $1.82 $1.87 $1.94 9.3% Distribution / LP Unit 1.59 1.68 1.77 1.85 1.88 5.5% LP Coverage 0.96x 1.04x 1.03x 1.01x 1.03x Total Coverage 0.94 1.07 1.05 1.02 1.06 Distributable Cash Flow Surplus / (Shortfall) ($9.2) $11.6 $8.4 $3.6 $11.6 ($ in millions, except per unit amounts) |
 Confidential Overview of NRGM 92 The NRGM Downside Financial Projections as provided by CMLP management and utilized herein by Evercore are based off the NRGM Management Financial Projections and adjusted by the following assumptions: – Firm storage is re-contracted at an average rate of $0.085 per [maximum storage quantity per month] with a $0.01 increase each year beginning in fiscal 2015E – Hub Services EBITDA remains flat at $11.0 million following 2013E – A reduction of 100 MMcfd of Marc I unsubscribed firm transportation volume at $0.192/Dekatherm beginning the third quarter of fiscal 2013E through the end of fiscal 2014E Assumes 50.0% of 100 Mcfd capacity is utilized beginning in 2015E and thereafter – All COLT contracts roll to mid-2016E at current take-or-pay rates COLT contracts roll to volumetric recovery upon expiration at 60.0% utilization thereafter – Elimination of the Seneca Lake Gas Storage Expansion project in 2015E and associated growth capital expenditures – Delay of Watkins-Glen NGL storage by one quarter from Q4 2013 to Q1 2014 – Elimination of COLT Hub Phase II project in 2015E and associated growth capital expenditures, while COLT Hub Phase I is assumed to secure long-term take-or-pay contracts at current projected rates – Elimination of the Commonwealth Pipeline expansion project in 2016E and associated growth capital expenditures – Assumes the same total distribution coverage that was assumed in the NRGM Management Financial Projections NRGM Downside Financial Projections – Assumptions DRAFT |
 Confidential NRGM Downside Financial Projections 93 Overview of NRGM The following sets forth selected operating and financial projections provided by CMLP management to derive the NRGM Downside Financial Projections utilized herein: Note: Bold text represents those line items that differ from the NRGM Management Financial Projections For the Fiscal Years Ending September 30, CAGR 2013E 2014E 2015E 2016E 2017E 2013E - 2017E Growth Capital Expenditures Commonwealth Pipeline -- -- -- -- Seneca Lake Gas Storage Expansion -- -- -- -- Watkins Glen NGL Expansion (10.7) -- -- -- COLT Hub -- -- -- -- COLT Hub Expansion I (28.5) -- -- -- COLT Hub Expansion II -- -- -- -- Other NRGM Growth (2.0) (2.0) (2.0) (2.0) Total ($116.0) ($41.2) ($2.0) ($2.0) ($2.0) Revenue Firm Storage $101.4 $104.7 $101.3 $99.4 $99.4 (0.5%) Transportation 44.9 53.2 56.7 58.2 62.6 8.6% Hub Services 11.0 11.0 11.0 11.0 11.0 0.0% Salt 48.1 50.3 51.4 51.4 51.4 1.7% Crude and Other 41.5 78.7 84.9 81.9 72.0 14.8% Total Revenue $247.0 $297.9 $305.4 $302.0 $296.5 4.7% Cost of Sales/Service Storage ($7.4) ($4.7) ($4.9) ($5.1) ($5.1) (9.0%) Transportation (7.7) (10.5) (10.5) (11.9) (16.1) 20.3% Salt (29.0) (29.5) (30.0) (30.0) (30.0) 0.8% Crude and Other (5.6) (8.4) (9.1) (9.4) (9.6) 14.4% Total Cost of Sales/Service ($49.7) ($53.0) ($54.5) ($56.4) ($60.7) 5.1% Gross Profit Storage & Transportation $142.3 $153.7 $153.6 $151.6 $151.8 1.6% Salt 19.1 20.8 21.5 21.5 21.5 2.9% Crude and Other 35.9 70.3 75.8 72.5 62.4 14.8% Total Gross Profit $197.3 $244.9 $250.9 $245.6 $235.8 4.5% Less: Total Operating Expenses (31.1) (33.8) (34.9) (36.3) (37.8) Plus: Minority Interest and Other Expense 0.0 -- -- -- -- Adjusted EBITDA $166.3 $211.1 $216.0 $209.3 $198.0 4.5% DRAFT ($ in millions) |
 Confidential NRGM Downside Financial Projections (cont’d) 94 Overview of NRGM The following sets forth the NRGM Downside Financial Projections utilized by Evercore in its analysis herein: For the Fiscal Years Ending September 30, CAGR 2013E 2014E 2015E 2016E 2017E 2014E - 2017E Adjusted EBITDA $166.3 $211.1 $216.0 $209.3 $198.0 (2.1%) Less: Maintenance Capital Expenditures (4.5) (7.0) (7.8) (8.2) (8.6) Less: Interest Expense (34.7) (42.3) (46.6) (44.4) (42.7) Other 4.6 (0.3) 2.7 1.3 (1.3) Distributable Cash Flow $131.7 $161.5 $164.2 $157.9 $145.3 (3.5%) Distributed Cash Flow Common Units - Public $46.5 $47.7 $48.8 $51.1 $58.1 Common Units - NRGY 88.8 91.2 93.2 93.2 93.2 General Partner 8.2 11.8 14.8 15.1 15.8 Distributed Cash Flow $143.5 $150.7 $156.8 $159.3 $167.1 3.5% % to GP 5.7% 7.8% 9.4% 9.4% 9.4% GP IDRs $8.2 $11.8 $14.8 $15.1 $15.8 10.3% Weighted Average LP Units Outstanding 85.9 85.9 85.9 87.3 91.5 DCF / LP Unit $1.49 $1.68 $1.70 $1.64 $1.53 (3.0%) Distribution / LP Unit 1.58 1.62 1.65 1.65 1.65 0.7% LP Coverage 0.95x 1.04x 1.03x 1.00x 0.93x Total Coverage 0.92 1.07 1.05 0.99 0.87 Distributable Cash Flow Surplus / (Shortfall) ($11.8) $10.8 $7.5 ($1.4) ($21.8) DRAFT ($ in millions, except per unit amounts) |
 Confidential NRGM Downside Financial Projections (cont’d) 95 The following sets forth the funding assumptions utilized in the NRGM Downside Financial Projections and NRGM’s resulting capital structure and credit statistics Overview of NRGM For the Fiscal Years Ending September 30, 2013E 2014E 2015E 2016E 2017E Sources: Equity Issued for Growth Capital Expenditures $-- $-- $-- $-- $-- Equity Issued for Rangeland Acquisition 225.0 -- -- -- -- Equity Issuance in Q4 2016E -- -- -- 150.0 -- Debt Issued / (Repaid) 353.5 21.9 (3.9) (88.0) 24.2 DCF Surplus / (Shortfall) (11.8) 10.8 7.5 (1.4) (21.8) Total Sources $566.7 $32.7 $3.6 $60.6 $2.4 Debt Issued / (Repaid), net of Surplus / (Shortfall) $353.5 $21.9 ($3.9) ($88.0) $24.2 Total Equity Issued 225.0 -- -- -- -- Uses: Growth Capital Expenditures $116.0 $41.2 $2.0 $2.0 $2.0 Rangeland Acquisition 425.0 -- -- -- -- Rangeland Transaction Fees and Expenses 6.0 -- -- -- -- Excess Cash -- -- -- 57.1 -- Other 19.7 (8.5) 1.6 1.5 0.4 Total Uses $566.7 $32.7 $3.6 $60.6 $2.4 Credit Statistics Debt / Adjusted EBITDA 4.6x 3.8x 3.6x 3.3x 3.7x Net Debt / Adjusted EBITDA 4.6 3.8 3.6 3.1 3.4 Capital Structure Cash $-- $-- $-- $57.1 $57.1 Total Debt 770.0 791.9 788.0 700.0 724.2 Net Debt $770.0 $791.9 $788.0 $642.9 $667.1 DRAFT ($ in millions) |
 Confidential Overview of NRGM 96 NRGM Management Financial Projections Comparison to Wall Street Research Estimates ($ in millions, except per unit amounts) The following sets forth a comparison of the NRGM Management Financial Projections and Wall Street Research consensus estimates EBITDA Distribution per LP Unit DCF per LP Unit Distribution Coverage DRAFT |
 Confidential NRGM Downside Financial Projections 97 Overview of NRGM The following sets forth a comparison of the NRGM Management Financial Projections and the NRGM Downside Financial Projections utilized by Evercore in its analysis herein Source: NRGM management; Wall Street Research NRGM Management Financial Projections NRGM Downside Financial Projections For the Fiscal Years Ending September 30, CAGR 2013E 2014E 2015E 2016E 2017E 2013E - 2015E Adjusted EBITDA $171.6 $223.5 $242.7 $260.9 $287.5 18.9% Less: Maintenance Capital Expenditures (4.5) (7.0) (7.8) (8.2) (8.6) Less: Interest Expense (34.8) (42.7) (52.1) (56.5) (57.2) Other 4.6 (0.3) 2.7 1.3 (1.3) Distributable Cash Flow $136.9 $173.5 $185.4 $197.5 $220.4 16.4% DCF / LP Unit $1.52 $1.75 $1.82 $1.87 $1.94 9.3% Distribution / LP Unit 1.59 1.68 1.77 1.85 1.88 5.5% LP Coverage 0.96x 1.04x 1.03x 1.01x 1.03x Total Coverage 0.94 1.07 1.05 1.02 1.06 Distributable Cash Flow Surplus / (Shortfall) ($9.2) $11.6 $8.4 $3.6 $11.6 For the Fiscal Years Ending September 30, CAGR Difference versus NRGM Management Financial Projections 2013E 2014E 2015E 2016E 2017E 2013E - 2015E 2013E 2014E 2015E 2016E 2017E Adjusted EBITDA $166.3 $211.1 $216.0 $209.3 $198.0 14.0% $5.3 $12.4 $26.7 $51.6 $89.6 Less: Maintenance Capital Expenditures (4.5) (7.0) (7.8) (8.2) (8.6) -- -- -- -- -- Less: Interest Expense (34.7) (42.3) (46.6) (44.4) (42.7) (0.1) (0.4) (5.5) (12.1) (14.5) Other 4.6 (0.3) 2.7 1.3 (1.3) -- -- -- -- -- Distributable Cash Flow $131.7 $161.5 $164.2 $157.9 $145.3 11.7% $5.2 $12.0 $21.2 $39.6 $75.1 DCF / LP Unit $1.49 $1.68 $1.70 $1.64 $1.53 6.6% $0.03 $0.07 $0.12 $0.23 $0.41 Distribution / LP Unit 1.58 1.62 1.65 1.65 1.65 2.4% 0.01 0.07 0.12 0.20 0.23 LP Coverage 0.95x 1.04x 1.03x 1.00x 0.93x Total Coverage 0.92 1.07 1.05 0.99 0.87 Distributable Cash Flow Surplus / (Shortfall) ($11.8) $10.8 $7.5 ($1.4) ($21.8) DRAFT ($ in millions, except per unit amounts) |
VI. Indicative Value of NRGM DRAFT |
 Confidential Valuation Methodologies Utilizing the following methodologies, Evercore analyzed the value of NRGM common units 98 Indicative Value of NRGM Methodology Description Metrics/Assumptions Discounted Cash Flow Analysis: Financials Projections Values NRGM based on the concepts of the time value of money Utilizing the NRGM Management Financial Projections and the NRGM Downside Financial Projections as previously reviewed herein, Evercore: – Utilized varying weighted average cost of capital (“WACC”) discount rates and applied various perpetuity growth rates to derive after-tax valuation ranges for NRGM – Calculated terminal values based on a range of multiples of EBITDA derived from precedent transactions as well as assumed perpetuity growth rates Tax depreciation based on a 15-year MACRS schedule and a full step-up in tax basis EBITDA exit multiple of 11.5x to 13.5x and a perpetuity growth rate of 0.5% to 1.5% For the terminal value, tax depreciation assumed to be equal to maintenance capital expenditures Weighted average cost of capital based on mid-point of the Capital Asset Pricing Model (“CAPM”) and distribution yields and expected growth in distributions for entities with comparable assets Tax rate of 35.0% based on unitholders’ tax rates Discounted the projected cash flows to the assumed July 1, 2013 effective date Discounted Cash Flow Analysis: Projected Distribution per Unit Values the NRGM common units based on the concepts of the time value of money Utilizing projected distributions per unit from the NRGM Management Financial Projections and the NRGM Downside Financial Projections as previously reviewed herein; Evercore: – Utilized varying total expected market return discount rates and calculated a terminal value based on a various terminal exit yields Terminal exit yield range of 6.0% to 8.0% Cost of equity of 7.5% to 9.5% based on the Capital Asset Pricing Model utilizing betas from selected publicly-traded peers Cost of equity of 9.0% to 11.0% based on the expected market total return of selected publicly-traded peers Precedent M&A Transaction Analysis Valuation for the NRGM common units based on multiples of transaction value to EBITDA in historical transactions involving other natural gas storage and pipeline assets Based on transaction value / EBITDA Enterprise value / EBITDA multiples applied to 2013E and 2014E EBITDA with the resulting value discounted at a 7.0% discount rate, the midpoint of the weighted average cost of capital range based on the assumed July 1, 2013 effective date Growth capital expenditures discounted at a 7.0% discount rate Peer Group Trading Analysis Valuation for the NRGM common units based on current market enterprise value multiples of relevant EBITDA for selected comparable publicly-traded entities Enterprise value / EBITDA multiples applied to 2013E EBITDA and 2014E EBITDA Wall Street Research Price Targets Valuation for the NRGM common units based on the most recent research analyst price targets of firms covering NRGM Research price targets from: Barclays, Credit Suisse, JP Morgan, Morgan Stanley, Robert W. Baird & Co. and Stifel Nicolaus DRAFT |
 Confidential Discounted Cash Flow Analysis Precedent M&A Transactions Peer Group Trading Wall Street Research Financial Projections Distribution per Unit Analysis Analysis Price Target 6.5% - 7.5% WACC 6.0% - 8.0% Terminal Exit Yield 2013E EBITDA: $171.6 MM 2013E EBITDA: $171.6 MM Barclays 2017E EBITDA Exit Multiple of 7.5% - 9.5% CAPM 11.5x - 13.5x EBITDA Multiple 14.0x - 17.0x EBITDA Multiple Credit Suisse 11.5x - 13.5x Equity Discount Rate 2014E EBITDA: $223.5 MM 2014E EBITDA: $223.5 MM JP Morgan Perpetuity Growth Rates of 9.0% - 11.0% Expected Market Return 11.5x - 13.5x EBITDA Multiple 10.0x - 13.0x EBITDA Multiple Morgan Stanley 0.50% - 1.50% Equity Discount Rate Growth Capital Expenditures Robert W. Baird & Co. Discounted @ 7.0% Stifel Nicolaus $18.03 $21.17 $13.53 $17.31 $24.00 $30.42 $29.54 $22.49 $25.24 $28.00 $5.00 $10.00 $15.00 $20.00 $25.00 $30.00 $35.00 $40.00 $13.00 $18.87 $12.89 $15.87 $21.81 $26.25 $21.03 $24.19 Current Price: $24.40 Summary*Preliminary*Valuation *–*NRGM*Common*Unit 99 Indicative Value of NRGM Preliminary Value of NRGM Common Unit Assuming the NRGM Do wnside Financial Projections Preliminary Value of NRGM Common Unit Assuming the NRGM Ma nagement Financial Projections DRAFT |
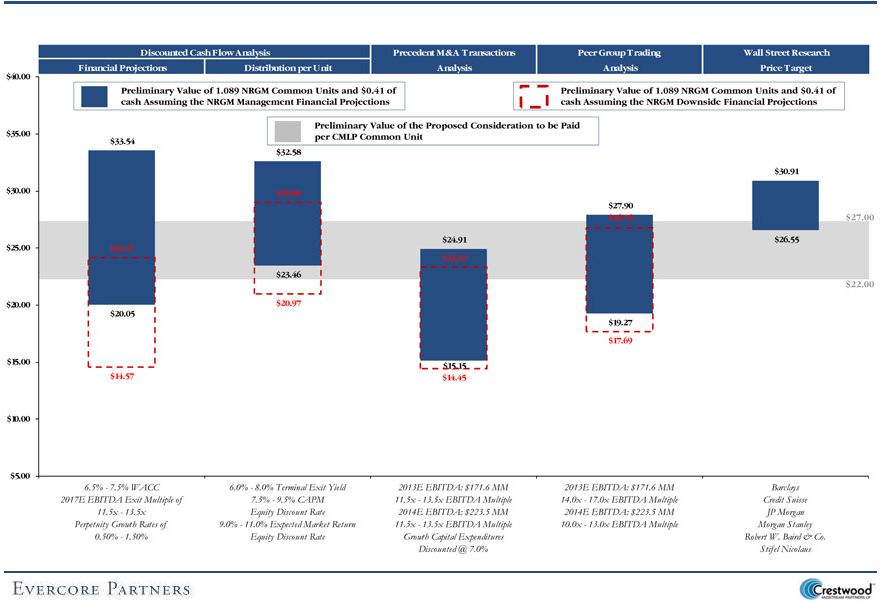 Confidential Summary*Preliminary*Valuation *–*Valuation*of*Proposed*Consideration 100 Indicative Value of NRGM DRAFT |
 Confidential Discounted*Cash*Flow*Analysis*–*Assumptions 101 Indicative Value of NRGM Evercore utilized a DCF Analysis based on the following assumptions: – Effective date on July 1, 2013 – EBITDA and capital expenditures through December 31, 2017E per the NRGM Management Financial Projections as previously review herein – A 35.0% tax rate – Tax depreciation forecast based on a full tax-basis step-up and a 15-year MACRS depreciation schedule – Mid-point discount rate of 7.0% utilizing a weighted average cost of capital based on CAPM – Terminal value based on both: (i) a 11.5x to 13.5x EBITDA exit multiple and (ii) a 0.50% to 1.50% perpetuity growth rate Tax depreciation is set equal to maintenance capital expenditures in perpetuity DRAFT |
 Confidential Discounted*Cash*Flow*Analysis*–*NRGM*Management*Financial*Projections ($ in millions, except per unit amounts) EBITDA Exit Multiple Sensitivities Perpetuity Growth Rate Sensitivities (1) Assumes tax depreciation equal to maintenance capital expenditures in perpetuity Summary Results 102 Indicative Value of NRGM WACC EBITDA Multiple $27.18 10.5x 11.5x 12.5x 13.5x 14.5x 6.0% $23.33 $25.94 $28.56 $31.17 $33.78 6.5% 22.74 25.30 27.86 30.42 32.98 7.0% 22.16 24.67 27.18 29.69 32.20 7.5% 21.59 24.05 26.51 28.98 31.44 8.0% 21.04 23.45 25.87 28.28 30.69 WACC Perpetuity Growth Rate $22.44 0.00% 0.50% 1.00% 1.50% 2.00% 6.0% $23.35 $26.00 $29.18 $33.06 $37.91 6.5% 20.69 22.89 25.50 28.63 32.45 7.0% 18.41 20.27 22.44 25.01 28.09 7.5% 16.44 18.03 19.86 22.00 24.53 8.0% 14.72 16.09 17.66 19.46 21.57 For the Three Months Ending Terminal Value September 30, For the Fiscal Years Ending September 30, EBITDA Perpetuity 2013E 2014E 2015E 2016E 2017E Exit Multiple / Growth Rate (1) EBITDA $50.6 $223.5 $242.7 $260.9 $287.5 $287.5 $287.5 Less: Depreciation and Amortization (39.0) (154.9) (151.9) (153.1) (130.0) (8.6) EBIT $11.6 $68.7 $90.8 $107.8 $157.5 $278.9 Less: Taxes (4.1) (24.0) (31.8) (37.7) (55.1) (97.6) Plus: NOL -- -- -- -- -- -- EBIAT $7.6 $44.6 $59.0 $70.1 $102.4 $181.3 Less: Maintenance Capital Expenditures (1.0) (7.0) (7.8) (8.2) (8.6) (8.6) Less: Growth Capital Expenditures (29.7) (66.5) (137.5) (189.5) (2.0) -- Plus: Depreciation and Amortization 39.0 154.9 151.9 153.1 130.0 8.6 Unlevered Free Cash Flow $15.9 $126.0 $65.5 $25.5 $221.8 $181.3 Exit multiple / Perpetuity Growth Rate 12.5x / 1.0% Terminal Value $3,593.9 / $3,051.8 PV of Unlevered Free Cash Flow @ 7.0% $387.0 Plus: PV of Terminal Value @ 7.0% $2,695.8 / $2,289.1 Plus: PV of 0.5x 2017E NOL $-- Implied Enterprise Value $3,082.8 / $2,676.1 Less: Net Debt ($748.1) ($748.1) Implied Equity Value $2,334.7 / $1,928.0 Total Units Outstanding 85.9 Implied Unit Price $27.18 / $22.44 DRAFT |
 Confidential Discounted*Cash*Flow*Analysis*–*NRGM*Downside*Financial*Projections ($ in millions, except per unit amounts) EBITDA Exit Multiple Sensitivities Perpetuity Growth Rate Sensitivities (1) Assumes tax depreciation equal to maintenance capital expenditures in perpetuity Summary Results 103 Indicative Value of NRGM WACC EBITDA Multiple $19.55 10.5x 11.5x 12.5x 13.5x 14.5x 6.0% $16.96 $18.76 $20.56 $22.36 $24.16 6.5% 16.52 18.28 20.05 21.81 23.57 7.0% 16.09 17.82 19.55 21.27 23.00 7.5% 15.67 17.36 19.06 20.75 22.45 8.0% 15.26 16.92 18.58 20.24 21.90 WACC Perpetuity Growth Rate $16.03 0.00% 0.50% 1.00% 1.50% 2.00% 6.0% $16.72 $18.51 $20.67 $23.30 $26.60 6.5% 14.87 16.37 18.14 20.26 22.86 7.0% 13.29 14.56 16.03 17.77 19.86 7.5% 11.92 13.00 14.25 15.70 17.41 8.0% 10.72 11.65 12.72 13.94 15.37 For the Three Months Ending Terminal Value September 30, For the Fiscal Years Ending September 30, EBITDA Perpetuity 2013E 2014E 2015E 2016E 2017E Exit Multiple / Growth Rate (1) EBITDA $47.1 $211.1 $216.0 $209.3 $198.0 $198.0 $198.0 Less: Depreciation and Amortization (38.4) (150.6) (138.0) (126.2) (98.8) (8.6) EBIT $8.6 $60.5 $78.0 $83.1 $99.2 $189.4 Less: Taxes (3.0) (21.2) (27.3) (29.1) (34.7) (66.3) Plus: NOL -- -- -- -- -- -- EBIAT $5.6 $39.3 $50.7 $54.0 $64.5 $123.1 Less: Maintenance Capital Expenditures (1.0) (7.0) (7.8) (8.2) (8.6) (8.6) Less: Growth Capital Expenditures (25.0) (41.2) (2.0) (2.0) (2.0) -- Plus: Depreciation and Amortization 38.4 150.6 138.0 126.2 98.8 8.6 Unlevered Free Cash Flow $18.1 $141.7 $178.9 $170.0 $152.6 $123.1 Exit multiple / Perpetuity Growth Rate 12.5x / 1.0% Terminal Value $2,474.4 / $2,071.8 PV of Unlevered Free Cash Flow @ 7.0% $571.1 Plus: PV of Terminal Value @ 7.0% $1,856.1 / $1,554.1 Plus: PV of 0.5x 2017E NOL $-- Implied Enterprise Value $2,427.2 / $2,125.2 Less: Net Debt ($748.1) ($748.1) Implied Equity Value $1,679.1 / $1,377.1 Total Units Outstanding 85.9 Implied Unit Price $19.55 / $16.03 DRAFT |
 Confidential Indicative Value of NRGM 104 (1) NRGM 52-week yield range of 6.16% to 7.76%, with an average yield of 6.73% The analysis below sets forth NRGM’s projected annual distribution per unit based on the NRGM Management Financial Projections for the three months ending September 30, 2013E and for the years ending September 30, 2014E, 2015E, 2016E and 2017E and a terminal value based on an NRGM yield range of 6.0% to 8.0% discounted at a cost of equity for NRGM ranging between 7.5% and 9.5% based on CAPM and 9.0% to 11.0% based on the total expected market return (as detailed in the Appendix) Discounted*Cash*Flow*Analysis*–*NRGM*Common*Units ($ in millions, except per unit amounts) DRAFT For the Three Months Ending September 30, For the Fiscal Years Ending September 30, Terminal Value 2013E 2014E 2015E 2016E 2017E Low - High NRGM Standalone Distribution per Unit $0.40 $1.68 $1.77 $1.85 $1.88 $1.88 Terminal Yield (1) 8.0% - 6.0% Terminal Value $23.50 - $31.33 Equity Cost of Capital Based on CAPM PV @ 6.5% of Value per NRGM Common Unit $24.61 - $30.60 PV @ 7.5% of Value per NRGM Common Unit 23.78 - 29.54 PV @ 8.5% of Value per NRGM Common Unit 22.99 - 28.53 PV @ 9.5% of Value per NRGM Common Unit 22.24 - 27.56 PV @ 10.5% of Value per NRGM Common Unit 21.51 - 26.64 Implied NRGM Common Unit Value Range Equity Cost of Capital Based on Total Expected Market Return PV @ 8.0% of Value per NRGM Common Unit $23.38 - $29.03 PV @ 9.0% of Value per NRGM Common Unit 22.61 - 28.04 PV @ 10.0% of Value per NRGM Common Unit 21.87 - 27.10 PV @ 11.0% of Value per NRGM Common Unit 21.17 - 26.19 PV @ 12.0% of Value per NRGM Common Unit 20.49 - 25.33 Implied NRGM Common Unit Value Range $21.17 - $29.54 |
 Confidential Indicative Value of NRGM 105 (1) NRGM 52-week yield range of 6.16% to 7.76%, with an average yield of 6.73% DRAFT Discounted Cash Flow Analysis – NRGM Common Units ($ in millions, except per unit amounts) The analysis below sets forth NRGM’s projected annual distribution per unit based on the NRGM Downside Financial Projections for the three months ending September 30, 2013E and for the years ending September 30, 2014E, 2015E, 2016E and 2017E and a terminal value based on an NRGM yield range of 6.0% to 8.0% discounted at a cost of equity for NRGM ranging between 7.5% and 9.5% based on CAPM and 9.0% to 11.0% based on the total expected market return (as detailed in the Appendix) For the Three Months Ending September 30, For the Fiscal Years Ending September 30, Terminal Value 2013E 2014E 2015E 2016E 2017E Low - High NRGM Standalone Distribution per Unit $0.40 $1.62 $1.65 $1.65 $1.65 $1.65 8.0% - 6.0% Terminal Value $20.65 - $27.54 Equity Cost of Capital Based on CAPM PV @ 6.5% of Value per NRGM Common Unit $21.91 - $27.18 PV @ 7.5% of Value per NRGM Common Unit 21.18 - 26.25 PV @ 8.5% of Value per NRGM Common Unit 20.48 - 25.35 PV @ 9.5% of Value per NRGM Common Unit 19.82 - 24.50 PV @ 10.5% of Value per NRGM Common Unit 19.18 - 23.69 Implied NRGM Common Unit Value Range Equity Cost of Capital Based on Total Expected Market Return PV @ 8.0% of Value per NRGM Common Unit $20.83 - $25.79 PV @ 9.0% of Value per NRGM Common Unit 20.15 - 24.92 PV @ 10.0% of Value per NRGM Common Unit 19.50 - 24.09 PV @ 11.0% of Value per NRGM Common Unit 18.87 - 23.29 PV @ 12.0% of Value per NRGM Common Unit 18.28 - 22.53 Implied NRGM Common Unit Value Range $18.87 - $26.25 Terminal Yield (1) |
 Confidential 106 Source: Public filings and Wall Street research Indicative Value of NRGM Precedent*M&A*Transactions ($ in millions) Facility Type Date Salt Depleted Transaction EBITDA Bcf of $MM/Bcf Announced Acquiror/Seller Cavern Reservior Value ($MM) Multiple Storage of Storage 08/12 Boardwalk Pipeline Partners, LP/PL Midstream LLC (PL Logistics LLC) $625.0 NA 11.2 $55.8 10/11 Boardwalk Pipeline Partners, LP/ Petal Gas Storage, L.L.C. and Hattiesburg Gas Storage Company (Enterprise Products Partners L.P.) 550.0 12.2x 29.0 $19.0 07/11 Inergy, L.P. / Seneca Lake storage facility (New York State Electric & Gas Corp.) 65.0 NA 2.0 32.5 06/11 Cardinal Gas Storage Partners LLC / 70% Interest in Monroe Gas Storage Co. LLC (High Sierra Energy LP) 148.0 NA 12.0 12.3 01/11 DCP Midstream Partners LP / Propane and Butane Storage Facility (Marysville Hydrocarbon Holdings LLC) 101.0 NA 6.8 14.9 12/10 PAA Natural Gas Storage, L.P. / Southern Pines Energy Center (SGR Holdings, L.L.C.) 750.0 17.0 40.0 18.8 09/10 Inergy, L.P. / Tres Palacios Gas Storage LLC (NGS Energy LP) 725.0 NA 38.4 18.9 07/10 Spectra Energy Corp. / Bobcat Gas Storage (Haddington Energy Partners, GE Energy Financial Services) 965.0 NA 46.0 21.0 07/10 Buckeye Partners / Lodi Gas Storage (ArcLight Capital Partners) 484.0 NA 34.0 14.2 08/09 Plains All American Pipeline, L.P./Remaining 50% Interest in PAA Natural Gas Storage, LLC (Vulcan Capital) 220.0 11.5 35.0 6.3 03/06 Riverstone (Niska) / Majority of Encana's Gas Storage assets (EnCana Corp.) 1,515.0 NA 191.0 7.9 08/05 Plains All American Pipeline, L.P. and Vulcan Capital / Energy Center Investments Corporation (Sempra Energy) 510.0 7.0 48.5 10.5 07/05 Inergy, L.P. / Stagecoach natural gas storage facility (eCORP, L.L.C.) 230.0 NA 13.6 16.9 08/04 AGL Resources / Jefferson Island Storage (AEP) 86.0 6.5 9.2 9.3 08/02 Scottish Power PLC (PacifiCorp Power Marketing) / Katy Storage Assets (Aquila, Inc.) 180.0 NA 32.0 5.6 08/00 Duke Energy Gas Transmission Corp. / Market Hub Partners (NiSource) 400.0 15.3 23.1 17.3 07/00 El Paso Energy Partners / Gas Crystal Storage (El Paso Corp.) 170.0 16.6 6.7 25.4 All Transactions Mean 12.3x 34.0 $18.0 Median 12.2 29.0 16.9 DRAFT |
 Confidential 107 Indicative Value of NRGM Precedent*M&A*Transactions *–*NRGM*Management*Financial*Projections ($ in millions, except per unit amounts) 2013E EBITDA $171.6 Relevant EBITDA Multiple 11.5x - 13.5x Implied Enterprise Value Range on September 30, 2013 $1,972.9 - $2,316.0 Implied Enterprise Value Range on July 1, 2013 @ 7.0% Discount Rate $1,939.8 - $2,277.2 Less: Present Value of FQ4 2013E Growth Capital Expenditures @ 7.0% Discount Rate (29.4) Implied Enterprise Value $1,910.4 - $2,247.8 2014E EBITDA $223.5 Relevant EBITDA Multiple 11.5x - 13.5x Implied Enterprise Value Range on September 30, 2014 $2,570.6 - $3,017.7 Implied Enterprise Value Range on July 1, 2013 @ 7.0% Discount Rate $2,362.2 - $2,773.0 Less: Present Value of FQ4 2013E and FY 2014E Growth Capital Expenditures @ 7.0% Discount Rate (92.7) Implied Enterprise Value $2,269.5 - $2,680.3 Relevant Range - Enterprise Value $1,910.4 - $2,680.3 Less: Net Debt (748.1) Implied Equity Value $1,162.3 - $1,932.2 Total Units Outstanding 85.9 Implied Unit Price $13.53 - $22.49 DRAFT |
 Confidential 108 Indicative Value of NRGM Precedent*M&A*Transactions *–*NRGM*Downside*Financial*Projections ($ in millions, except per unit amounts) 2013E EBITDA $166.3 Relevant EBITDA Multiple 11.5x - 13.5x Implied Enterprise Value Range on September 30, 2013 $1,911.9 - $2,244.4 Implied Enterprise Value Range on July 1, 2013 @ 7.0% Discount Rate $1,879.8 - $2,206.7 Less: Present Value of FQ4 2013E Growth Capital Expenditures @ 7.0% Discount Rate (24.7) Implied Enterprise Value $1,855.1 - $2,182.0 2014E EBITDA $211.1 Relevant EBITDA Multiple 11.5x - 13.5x Implied Enterprise Value Range on September 30, 2014 $2,427.7 - $2,849.9 Implied Enterprise Value Range on July 1, 2013 @ 7.0% Discount Rate $2,230.8 - $2,618.8 Less: Present Value of FQ4 2013E and FY 2014E Growth Capital Expenditures @ 7.0% Discount Rate (63.9) Implied Enterprise Value $2,166.9 - $2,554.9 Relevant Range - Enterprise Value $1,855.1 - $2,554.9 Less: Net Debt (748.1) Implied Equity Value $1,107.0 - $1,806.8 Total Units Outstanding 85.9 Implied Unit Price $12.89 - $21.03 DRAFT |
   Confidential Peer Group Trading Analysis ($ in millions, except per unit amounts) 109 Indicative Value of NRGM Source: Public filings (1) IBES estimates are on a calendar basis, fiscal year ends September 30 Publicly Traded Natural Gas Pipeline and Storage MLPs Publicly Traded Natural Gas Storage MLPs Enterprise Value / Price Equity Enterprise EBITDA Distribution Yield Distribution Total Partnership (04/25/2013) Value Value 2013E 2014E Current 2013E 2014E Growth Return Natural Gas Pipelines/Storage Boardwalk Pipeline Partners, LP $30.36 $7,143.1 $10,678.4 13.6x 12.8x 7.0% 7.0% 7.1% 2.4% 9.4% El Paso Pipeline Partners, L.P. 43.07 9,483.7 13,615.7 11.7 11.0 5.7% 5.9% 6.2% 6.1% 11.7% EQT Midstream Partners, LP 41.25 1,459.7 1,437.8 15.2 11.4 3.4% 3.7% 4.2% 37.2% 40.6% Niska Gas Storage Partners LLC 14.96 526.4 917.9 6.6 6.5 9.4% 9.4% 9.4% 2.9% 12.3% PAA Natural Gas Storage, L.P. 22.53 1,634.7 2,216.1 18.4 16.9 6.3% 6.4% 6.4% 1.7% 8.1% Spectra Energy Partners, LP 38.17 4,153.3 5,246.2 20.4 17.2 5.2% 5.3% 5.6% 5.1% 10.3% TC PipeLines, LP 48.22 2,631.1 3,319.1 17.5 16.6 6.5% 6.5% 6.7% 2.3% 8.8% Mean 14.8x 13.2x 6.2% 6.3% 6.5% 8.2% 14.5% Median 15.2 12.8 6.3% 6.4% 6.4% 2.9% 10.3% Inergy Midstream, L.P. (1) $24.40 $2,096.0 $2,775.8 13.5x 9.8x 6.5% 6.7% 7.3% 8.7% 15.2% Enterprise Value / Price Equity Enterprise EBITDA Distribution Yield Distribution Total Partnership (04/25/2013) Value Value 2013E 2014E Current 2013E 2014E Growth Return Natural Gas Storage Niska Gas Storage Partners LLC $14.96 $526.4 $917.9 6.6x 6.5x 9.4% 9.4% 9.4% 2.9% 12.3% PAA Natural Gas Storage, L.P. 22.53 1,634.7 2,216.1 18.4 16.9 6.3% 6.4% 6.4% 1.7% 8.1% Mean 12.5x 11.7x 7.9% 7.9% 7.9% 2.3% 10.2% Inergy Midstream, L.P. (1) $24.40 $2,096.0 $2,775.8 13.5x 9.8x 6.5% 6.7% 7.3% 8.7% 15.2% DRAFT |
 Confidential 110 Indicative Value of NRGM Source: Public filings Fiscal 2013E EBITDA $171.6 Relevant EBITDA Multiple 14.0x - 17.0x Implied Enterprise Value $2,401.8 - $2,916.5 Fiscal 2014E EBITDA $223.5 Relevant EBITDA Multiple 10.0x - 13.0x Implied Enterprise Value $2,235.3 - $2,905.9 Relevant Enterprise Value Range $2,235.3 - $2,916.5 Less: Net Debt (748.1) - (748.1) Implied Equity Value $1,487.2 - $2,168.4 Total Units Outstanding 85.9 Implied Unit Price $17.31 - $25.24 DRAFT |
 Confidential 111 Indicative Value of NRGM Source: Public filings Fiscal 2013E EBITDA $166.3 Relevant EBITDA Multiple 14.0x - 17.0x Implied Enterprise Value $2,327.5 - $2,826.3 Fiscal 2014E EBITDA $211.1 Relevant EBITDA Multiple 10.0x - 13.0x Implied Enterprise Value $2,111.1 - $2,744.4 Relevant Enterprise Value Range $2,111.1 - $2,826.3 Less: Net Debt (748.1) - (748.1) Implied Equity Value $1,363.0 - $2,078.2 Total Units Outstanding 85.9 Implied Unit Price $15.87 - $24.19 DRAFT |
 Confidential Wall Street Research Price Targets Summary Price Targets 112 Analyst Recommendations Source: Bloomberg, IBES (1) Distribution per unit and EBITDA estimates shown on a fiscal basis Distribution Per Unit Estimates (1) EBITDA Estimates (1) Indicative Value of NRGM Hold (2) 33.3% Buy (4) 66.7% Target Firm Analyst Date Recommendation Price Credit Suisse Brett Reilly 01/09/13 Outperform $28.00 JPMorgan Jeremy Tonet 03/21/13 Overweight 26.00 Stifel Nicolaus Selman Akyol 02/06/13 Buy 26.00 Barclays Brian J. Zarahn 02/06/13 Overweight 26.00 Morgan Stanley Stephen J. Maresca 11/5/12 Equal-weight 25.00 Robert W. Baird & Co Ethan H. Bellamy 02/06/13 Neutral 24.00 Median: $26.00 Mean: 25.83 Low: 24.00 High: 28.00 $1.60 $1.73 $1.88 $1.66 $1.92 $2.14 $1.62 $1.73 $1.61 $1.76 $1.96 $1.59 $1.68 $1.77 $-- $0.50 $1.00 $1.50 $2.00 $2.50 2013E 2014E 2015E $182.0 $245.0 $295.0 $250.1 $399.3 $361.3 $177.4 $224.0 $186.4 $263.6 $344.7 $171.6 $223.5 $242.7 $-- $50.0 $100.0 $150.0 $200.0 $250.0 $300.0 $350.0 $400.0 $450.0 2013E 2014E 2015E Barclays Morgan Stanley Stifel Nicolaus IBES NRGM Management Financial Projections DRAFT ($ in millions, except per unit amounts) |
VII. Summary Analysis of the Proposed Exchange Ratio DRAFT |
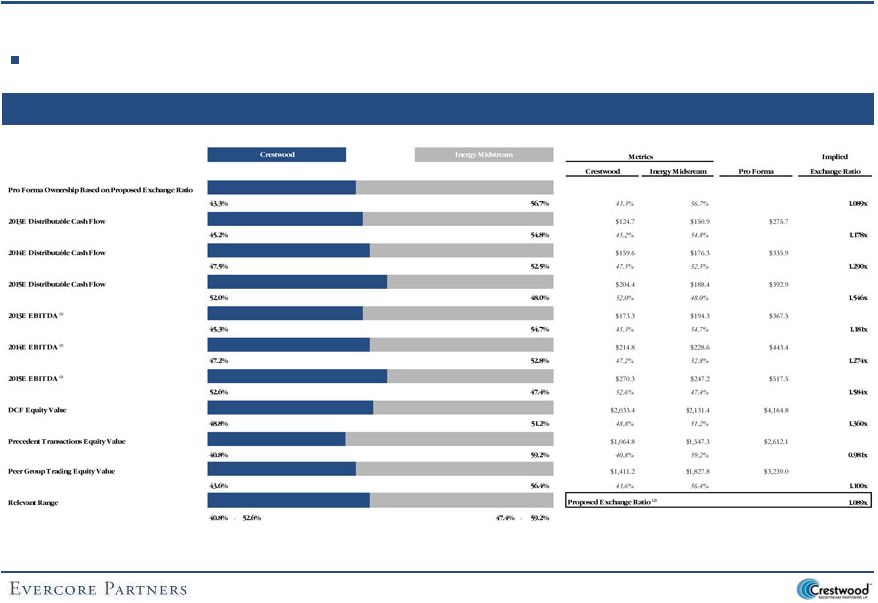 Confidential Summary Analysis of the Proposed Exchange Ratio 113 Set forth below is a summary of the relevant contribution percentages to the pro forma entity from CMLP and NRGM Contribution Summary Contribution*Analysis* –*Management *Projections ($ in millions) (1) Adjusted for CMLP and NRGM net debt outstanding as of the most recent public disclosure (2) Proposed exchange ratio excludes cash consideration of $0.41 per unit DRAFT |
 Confidential Summary Analysis of the Proposed Exchange Ratio 114 Set forth below is a summary of the relevant contribution percentages to the pro forma entity from CMLP and NRGM Contribution Summary Contribution*Analysis* –*Downside *Projections ($ in millions) (1) Adjusted for CMLP and NRGM net debt outstanding as of the most recent public disclosure (2) Proposed exchange ratio excludes cash consideration of $0.41 per unit DRAFT |
VIII. Summary Pro Forma Impact DRAFT |
 Confidential Assumptions*–*Management *Financial*Projections 115 Summary Pro Forma Impact Evercore analyzed the pro forma impact to NRGM unitholders and CMLP unitholders from the Proposed Transaction, utilizing the CMLP Management Financial Projections and the NRGM Management Financial Projections previously reviewed herein – NRGM acquires CMLP assuming a 5.0% premium to CMLP’s 20-Day VWAP of $24.42 as of April 25, 2013, or $25.64 per unit, plus $0.41 in cash for a total value of $26.06 per CMLP unit, representing a total enterprise value of $2.4 billion or 11.0x 2014E EBITDA Transaction assumed to be financed with NRGM common equity issued directly to CMLP common unitholders and the $25.0 million of cash consideration financed with borrowings from NRGM’s existing revolver Implies a 1.089x NRGM/CMLP exchange ratio, assuming NRGM’s 20-Day VWAP of $23.55 – CMLP’s projected total debt outstanding of $787.4 million as of July 1, 2013 assumed by NRGM, without triggering change of control provisions – Assumes one-time change of control payments to NRGM management of $10.0 million and one-time integration expenses of $15.0 million are funded with borrowings from NRGM’s existing revolver – Assumes a total distribution coverage equal to NRGM’s standalone distribution coverage pro forma for the Proposed Transaction – Assumes NRGM and CMLP (excluding CMM) growth capital expenditures are funded 50.0% with equity issued to the public at an all-in discount of 8.0% to the then-current projected unit price assuming NRGM’s current yield of 6.48% CMM growth capital expenditures are funded 100.0% with borrowings on CMM’s revolving credit facility – Transaction fees and expenses of $20.0 million are funded with borrowings on NRGM’s existing revolver – Assumes $10.0 million and $15.0 million of annual synergies in 2013E and 2014E, respectively, and $20.0 million of annual synergies in each of 2015E, 2016E and 2017E – Evercore analyzed the pro forma impact to distributable cash flow per current CMLP unit and distribution per current CMLP unit utilizing sensitivities related to: (i) incremental EBITDA at NRGM pro forma for the Proposed Transaction (in excess of the annual synergies previously reviewed herein) ranging from ($15.0) to $15.0 million and (ii) an offer price premium to CMLP’s 20-Day VWAP ranging between 0.0% and 25.0% – Evercore also analyzed the pro forma NRGM yield necessary for the CMLP implied pro forma projected price to equal the CMLP standalone projected price based on CMLP’s current yield utilizing sensitivities related to an offer price premium to CMLP’s 20-Day VWAP ranging between 0.0% and 25.0% per unit DRAFT |
 Confidential Transaction*Economics*– *Management*Financial*Projections ($ in millions, except per unit amounts) 116 Summary Pro Forma Impact Sources and Uses Transaction Economics Net NRGM Equity Issued $1,545.8 Cash Consideration 25.0 Equity Value $1,570.8 CMLP Net Debt Assumed as of July 1, 2013 787.4 Transaction Enterprise Value $2,358.2 Assumed Annual Synergies: 2013E Annual Synergies $10.0 2014E Annual Synergies 15.0 2015E Annual Synergies 20.0 CMLP Enterprise Value as a Multiple of: Data Multiple 2013E EBITDA $173.3 13.6x 2014E EBITDA 214.8 11.0 2015E EBITDA 270.3 8.7 2013E EBITDA + Synergies $183.3 12.9x 2014E EBITDA + Synergies 229.8 10.3 2015E EBITDA + Synergies 290.3 8.1 CMLP Equity Value as a Multiple of: Data Multiple 2013E DCF $124.7 12.6x 2014E DCF 159.6 9.8 2015E DCF 204.4 7.7 2013E DCF + Synergies $134.7 11.7x 2014E DCF + Synergies 174.6 9.0 2015E DCF + Synergies 224.4 7.0 CMLP 20-Day VWAP $24.42 Offer Premium to CMLP's 20-Day VWAP 5.0% Offer Price $25.64 NRGM 20-Day VWAP 23.55 CMLP / NRGM Exchange Ratio 1.09x Value of Equity Consideration $25.64 Value of Cash Consideration 0.41 Total Consideration per CMLP Unit $26.06 Consideration per CMLP Unit (1) Includes 6,516,776 common units from the conversion of the Class D Units outstanding as of July 1, 2013 DRAFT CMLP LP Units Outstanding (1) 60.3 Assumed LP Unit Price @ 5.0% Premium to $24.42 $25.64 Acquired LP Equity Value $1,545.8 Plus: Transaction Fees 20.0 Plus: One-Time Integration Expenses 15.0 Plus: Management Change of Control Payments 10.0 Plus: Cash Consideration 25.0 Less: Funding on NRGM Revolver (70.0) Net NRGM Equity Issued $1,545.8 Net NRGM LP Equity Issued $1,545.8 NRGM 20-Day VWAP $23.55 New NRGM LP Units Issued 65.6 CMLP Pro Forma Ownership of NRGM 43.3% |
 Confidential Proposed Transaction – Management Financial Projections 117 Summary Pro Forma Impact For the Quarter Ending For the Years Ending December 31, CAGR 3/31/13E 6/30/13E 9/30/13E 12/31/13E 2013E 2014E 2015E 2016E 2017E 2014E - 2017E NRGM Adjusted EBITDA $42.4 $45.6 $50.6 $55.6 $194.3 $228.6 $247.2 $267.6 $294.8 CMLP Adjusted EBITDA -- -- 45.2 45.9 91.1 214.8 270.3 307.9 340.6 Synergies -- -- 5.0 5.0 10.0 15.0 20.0 20.0 20.0 Adjusted EBITDA $42.4 $45.6 $100.8 $106.5 $295.4 $458.4 $537.5 $595.4 $655.4 12.7% Less: NRGM Maintenance Capital Expenditures (1.3) (1.6) (1.0) (1.6) (5.5) (7.3) (7.9) (8.3) (8.8) Less: CMLP Maintenance Capital Expenditures -- -- (3.6) (2.5) (6.1) (7.2) (7.7) (8.9) (11.8) Less: NRGM Interest Expense (9.0) (9.6) (9.8) (10.3) (38.7) (45.4) (53.2) (56.7) (57.2) Less: CMLP Interest Expense -- -- (11.0) (11.3) (22.3) (52.5) (62.8) (67.6) (72.8) Less: Incremental Interest (Expense) / Savings -- -- (0.5) (0.4) (0.9) 5.0 7.4 14.1 17.1 NRGM - Other Income 0.4 0.5 0.0 (0.1) 0.9 0.4 2.3 0.6 (1.3) CMLP - Other Income -- -- 0.9 1.0 1.9 4.5 4.7 4.9 5.2 Distributable Cash Flow $32.6 $35.0 $75.9 $81.3 $224.8 $355.9 $420.3 $473.6 $525.6 13.9% Distributable Cash Flow Common Units - Public $11.1 $11.5 $13.1 $13.9 $49.5 $61.6 $73.0 $89.9 $105.0 Common Units - NRGY 21.1 21.9 24.5 25.4 93.0 106.6 117.1 123.6 130.2 Common Units - CMLP -- -- 28.5 29.6 58.1 124.1 136.3 143.9 151.6 General Partner 0.4 1.6 9.8 12.4 24.2 63.6 93.8 116.1 138.9 Distributable Cash Flow $32.6 $35.0 $75.9 $81.3 $224.8 $355.9 $420.3 $473.6 $525.6 Distributed Cash Flow Common Units - Public $11.7 $11.8 $12.8 $13.0 $49.2 $59.7 $71.2 $88.3 $101.2 Common Units - NRGY 22.3 22.6 23.8 23.8 92.4 103.4 114.2 121.4 125.5 Common Units - CMLP -- -- 27.7 27.7 55.4 120.4 132.9 141.3 146.2 General Partner 2.1 2.6 7.9 7.9 20.5 54.8 85.7 109.7 125.0 Distributed Cash Flow $36.1 $36.9 $72.1 $72.3 $217.4 $338.3 $404.0 $460.7 $497.9 13.7% Pro Forma Impact DRAFT ($ in millions, except per unit amounts) |
 Confidential 118 Summary Pro Forma Impact Pro Forma Impact DRAFT For the Quarter Ending For the Years Ending December 31, CAGR 3/31/13E 6/30/13E 9/30/13E 12/31/13E 2013E 2014E 2015E 2016E 2017E 2014E - 2017E Distributed Cash Flow $36.1 $36.9 $72.1 $72.3 $217.4 $338.3 $404.0 $460.7 $497.9 % to GP 6.0% 7.0% 10.9% 10.9% 9.4% 16.2% 21.2% 23.8% 25.1% GP IDRs $2.1 $2.6 $7.9 $7.9 $20.5 $54.8 $85.7 $109.7 $125.0 31.6% Weighted Average LP Units Outstanding 85.9 85.9 152.3 152.8 119.2 154.6 157.2 163.0 167.5 NRGM Summary: DCF / LP Unit - Pro Forma $0.37 $0.39 $0.43 $0.45 $1.65 $1.89 $2.08 $2.19 $2.31 6.9% Distribution / LP Unit - Pro Forma 0.40 0.40 0.42 0.42 $1.64 $1.83 2.02 2.15 2.23 6.7% CMLP Summary: DCF / LP Unit - Pro Forma $0.48 $0.49 $0.47 $0.49 $1.94 $2.06 $2.26 $2.39 $2.51 6.9% Distribution / LP Unit - Pro Forma $0.51 $0.51 $0.46 $0.46 $1.94 $2.00 $2.21 $2.34 $2.42 6.7% LP Coverage 0.95x 0.97x 1.03x 1.07x 1.01x 1.03x 1.03x 1.02x 1.04x Total Coverage 0.90 0.95 1.05 1.12 1.03 1.05 1.04 1.03 1.06 Distributable Cash Flow Surplus / (Shortfall) ($3.5) ($1.9) $3.9 $9.0 $7.4 $17.6 $16.3 $12.9 $27.7 ($ in millions, except per unit amounts) Proposed Transaction – Management Financial Projections (cont’d) |
 ($ in millions) 119 Summary Pro Forma Impact DRAFT Confidential For the Quarter Ending For the Years Ending December 31, 3/31/13E 6/30/13E 9/30/13E 12/31/13E 2013E 2014E 2015E 2016E 2017E Sources: Equity Issued for CMLP Acquisition $-- $-- $1,545.8 $-- $1,545.8 $-- $-- $-- $-- Revolver Draw for Cash Consideration -- -- 25.0 -- 25.0 -- -- -- -- CMLP Net Debt Assumed -- -- 787.4 -- 787.4 -- -- -- -- Revolver Draw for Transaction Fees and Expenses -- -- 70.0 -- 70.0 -- -- -- -- Equity Issued for Growth Capital Expenditures -- -- 18.0 11.5 29.5 73.9 91.2 87.1 12.6 Equity Issuance in Q4 2016E -- -- -- -- -- -- -- 150.0 -- Debt Issued / (Repaid) 42.0 38.1 35.8 3.5 119.4 97.8 116.4 (34.5) 25.2 DCF Surplus / (Shortfall) (3.5) (1.9) 3.9 9.0 7.4 17.6 16.3 12.9 27.7 Total Sources $38.5 $36.2 $2,485.8 $24.0 $2,584.5 $189.2 $223.9 $215.5 $65.6 Debt Issued / (Repaid), net of Surplus / (Shortfall) $42.0 $38.1 $60.8 $3.5 $144.4 $97.8 $116.4 ($34.5) $25.2 Total Equity Issued -- -- 1,563.8 11.5 1,575.3 73.9 91.2 87.1 12.6 Uses: CMLP Merger $-- $-- $2,358.2 $-- $2,358.2 $-- $-- $-- $-- CMLP Transaction Fees and Expenses -- -- 70.0 -- 70.0 -- -- -- -- NRGM Growth Capital Expenditures 28.8 26.6 29.7 16.3 101.4 84.6 150.5 142.6 2.0 CMLP Growth Capital Expenditures -- -- 6.3 6.8 13.1 63.1 31.8 31.7 23.3 CMM Growth Capital Expenditures -- -- 21.5 5.5 27.0 45.0 40.0 40.0 40.0 Other 9.7 9.6 0.2 (4.6) 14.8 (3.5) 1.5 1.2 0.3 Total Uses $38.5 $36.2 $2,485.8 $24.0 $2,584.5 $189.2 $223.9 $215.5 $65.6 Pro Forma Credit Statistics Debt / Adjusted EBITDA 4.3x 3.8x 3.5x 3.1x 2.8x Net Debt / Adjusted EBITDA 4.3 3.8 3.5 3.1 2.8 Standalone NRGM Credit Statistics Debt / Adjusted EBITDA 4.0x 3.6x 3.9x 3.7x 3.3x Net Debt / Adjusted EBITDA 4.0 3.6 3.9 3.7 3.3 Standalone CMLP Credit Statistics Debt / Adjusted EBITDA 4.8x 4.4x 3.7x 3.4x 3.2x Net Debt / Adjusted EBITDA 4.8 4.4 3.7 3.4 3.2 Capital Structure Cash $-- $-- $-- $-- $-- ($0.0) $0.0 ($0.0) ($0.0) Total Debt 712.1 750.2 1,637.9 1,641.4 1,641.4 1,739.2 1,855.5 1,821.0 1,846.2 Net Debt $712.1 $750.2 $1,637.9 $1,641.4 $1,641.4 $1,739.2 $1,855.5 $1,821.0 $1,846.2 Proposed*Transaction*– *Management*Financial*Projections* (cont’d) |
 Confidential DRAFT 120 Summary Pro Forma Impact CMLP Accretion / (Dilution) For the Quarter Ending For the Years Ending December 31, CAGR 9/30/13E 12/31/13E 2013E 2014E 2015E 2016E 2017E 2014E - 2017E CMLP Accretion / (Dilution): DCF / LP Unit - Standalone $0.50 $0.52 $1.99 $2.14 $2.51 $2.78 $2.98 11.6% DCF / LP Unit - Pro Forma $0.47 $0.49 $1.94 $2.06 $2.26 $2.39 $2.51 6.9% Accretion / (Dilution) - $ ($0.03) ($0.02) ($0.05) ($0.08) ($0.25) ($0.39) ($0.47) Accretion / (Dilution) - % (5.6%) (4.6%) (2.6%) (3.9%) (10.0%) (14.0%) (15.6%) Distribution / LP Unit - Standalone $0.52 $0.53 $2.07 $2.15 $2.37 $2.60 $2.86 10.0% Distribution / LP Unit - Pro Forma $0.46 $0.46 $1.94 $2.00 $2.21 $2.34 $2.42 6.7% Accretion / (Dilution) - $ ($0.06) ($0.07) ($0.13) ($0.15) ($0.16) ($0.26) ($0.44) Accretion / (Dilution) - % (11.7%) (13.4%) (6.4%) (7.1%) (6.8%) (9.9%) (15.3%) Standalone Distribution Coverage 0.94x 0.95x 0.93x 0.99x 1.09x 1.10x 1.06x Pro Forma Distribution Coverage 1.05 1.12 1.03 1.05 1.04 1.03 1.06 Standalone Debt/EBITDA 4.8x 4.4x 3.7x 3.4x 3.2x Pro Forma Debt/EBITDA 4.3 3.8 3.5 3.1 2.8 |
 Confidential DRAFT 121 Summary Pro Forma Impact For the Quarter Ending For the Years Ending December 31, CAGR 9/30/13E 12/31/13E 2013E 2014E 2015E 2016E 2017E 2014E - 2017E NRGM Accretion / (Dilution): DCF / LP Unit - Standalone $0.42 $0.44 $1.62 $1.77 $1.83 $1.89 $1.96 3.6% DCF / LP Unit - Pro Forma $0.43 $0.45 $1.65 $1.89 $2.08 $2.19 $2.31 6.9% Accretion / (Dilution) - $ $0.02 $0.01 $0.03 $0.12 $0.24 $0.30 $0.35 Accretion / (Dilution) - % 4.2% 2.8% 1.8% 7.1% 13.4% 16.1% 17.7% Distribution / LP Unit - Standalone $0.41 $0.41 $1.61 $1.72 $1.79 $1.86 $1.89 3.2% Distribution / LP Unit - Pro Forma 0.42 0.42 1.64 1.83 2.02 2.15 2.23 6.7% Accretion / (Dilution) - $ $0.02 $0.01 $0.03 $0.12 $0.23 $0.30 $0.34 Accretion / (Dilution) - % 4.1% 2.8% 1.8% 6.9% 13.1% 15.9% 18.0% Standalone Distribution Coverage 1.05x 1.13x 1.01x 1.07x 1.04x 1.03x 1.06x Pro Forma Distribution Coverage 1.05 1.12 1.03 1.05 1.04 1.03 1.06 Standalone Debt/EBITDA 4.0x 3.6x 3.9x 3.7x 3.3x Pro Forma Debt/EBITDA 4.3 3.8 3.5 3.1 2.8 NRGM Accretion / (Dilution) |
 Confidential DRAFT CMLP*Sensitivity*Analysis*–*Management*Financial*Projections ($ in millions, except per unit amounts) 122 Summary Pro Forma Impact (1) Based on CMLP’s current yield of 8.1%. Assumes $0.0 million of incremental EBITDA CMLP 2013E Distribution/LP Unit Accretion/(Dilution) - $ Implied Exchange Ratio/ Offer Price per CMLP Unit/Premium to 20-Day VWAP/ 1.04x 1.09x 1.14x 1.19x 1.24x 1.30x $24.42 $25.64 $26.86 $28.09 $29.31 $30.53 ($0.13) -- 5.0% 10.0% 15.0% 20.0% 25.0% ($15.0) ($0.21) ($0.18) ($0.14) ($0.10) ($0.05) ($0.01) (10.0) (0.20) (0.17) (0.13) (0.10) (0.05) (0.01) (5.0) (0.18) (0.15) (0.12) (0.08) (0.05) (0.01) -- (0.17) (0.13) (0.10) (0.07) (0.03) (0.00) 5.0 (0.15) (0.11) (0.08) (0.05) (0.02) 0.02 10.0 (0.13) (0.10) (0.06) (0.03) 0.00 0.03 15.0 (0.12) (0.08) (0.05) (0.01) 0.02 0.05 Breakeven Yield (1) 7.5% 7.6% 7.7% 7.9% 8.0% 8.1% CMLP 2014E Distribution/LP Unit Accretion/(Dilution) - $ Implied Exchange Ratio/ Offer Price per CMLP Unit/Premium to 20-Day VWAP/ 1.04x 1.09x 1.14x 1.19x 1.24x 1.30x $24.42 $25.64 $26.86 $28.09 $29.31 $30.53 ($0.15) -- 5.0% 10.0% 15.0% 20.0% 25.0% ($15.0) ($0.27) ($0.20) ($0.13) ($0.07) $0.00 $0.07 (10.0) (0.26) (0.19) (0.12) (0.05) 0.02 0.08 (5.0) (0.24) (0.17) (0.10) (0.03) 0.03 0.10 -- (0.23) (0.15) (0.08) (0.01) 0.05 0.12 5.0 (0.21) (0.14) (0.07) 0.00 0.07 0.14 10.0 (0.19) (0.12) (0.05) 0.02 0.09 0.16 15.0 (0.18) (0.10) (0.03) 0.04 0.11 0.18 Breakeven Yield (1) 7.3% 7.5% 7.8% 8.1% 8.3% 8.6% CMLP 2015E Distribution/LP Unit Accretion/(Dilution) - $ Implied Exchange Ratio/ Offer Price per CMLP Unit/Premium to 20-Day VWAP/ 1.04x 1.09x 1.14x 1.19x 1.24x 1.30x $24.42 $25.64 $26.86 $28.09 $29.31 $30.53 ($0.16) -- 5.0% 10.0% 15.0% 20.0% 25.0% ($15.0) ($0.29) ($0.21) ($0.14) ($0.06) $0.01 $0.08 (10.0) (0.27) (0.19) (0.12) (0.05) 0.03 0.10 (5.0) (0.25) (0.18) (0.10) (0.03) 0.04 0.12 -- (0.24) (0.16) (0.09) (0.01) 0.06 0.13 5.0 (0.22) (0.14) (0.07) 0.01 0.08 0.15 10.0 (0.21) (0.13) (0.05) 0.02 0.10 0.17 15.0 (0.19) (0.11) (0.03) 0.04 0.12 0.19 Breakeven Yield (1) 7.3% 7.6% 7.8% 8.1% 8.3% 8.6% CMLP 2016E Distribution/LP Unit Accretion/(Dilution) - $ Implied Exchange Ratio/ Offer Price per CMLP Unit/Premium to 20-Day VWAP/ 1.04x 1.09x 1.14x 1.19x 1.24x 1.30x $24.42 $25.64 $26.86 $28.09 $29.31 $30.53 ($0.26) -- 5.0% 10.0% 15.0% 20.0% 25.0% ($15.0) ($0.39) ($0.31) ($0.23) ($0.15) ($0.08) ($0.00) (10.0) (0.37) (0.29) (0.21) (0.13) (0.06) 0.02 (5.0) (0.36) (0.27) (0.19) (0.12) (0.04) 0.04 -- (0.34) (0.18) (0.10) (0.02) 0.05 5.0 (0.32) (0.24) (0.16) (0.08) (0.00) 0.07 10.0 (0.31) (0.23) (0.14) (0.06) 0.01 0.09 15.0 (0.29) (0.21) (0.13) (0.05) 0.03 0.11 Breakeven Yield (1) 7.1% 7.3% 7.6% 7.8% 8.0% 8.3% CMLP 2017E Distribution/LP Unit Accretion/(Dilution) - $ Implied Exchange Ratio/ Offer Price per CMLP Unit/Premium to 20-Day VWAP/ 1.04x 1.09x 1.14x 1.19x 1.24x 1.30x $24.42 $25.64 $26.86 $28.09 $29.31 $30.53 ($0.44) -- 5.0% 10.0% 15.0% 20.0% 25.0% ($15.0) ($0.57) ($0.48) ($0.40) ($0.32) ($0.24) ($0.17) (10.0) (0.55) (0.47) (0.39) (0.31) (0.23) (0.15) (5.0) (0.54) (0.45) (0.37) (0.29) (0.21) (0.13) -- (0.52) (0.44) (0.36) (0.27) (0.19) (0.12) 5.0 (0.51) (0.42) (0.34) (0.26) (0.18) (0.10) 10.0 (0.49) (0.41) (0.32) (0.24) (0.16) (0.08) 15.0 (0.48) (0.39) (0.31) (0.23) (0.14) (0.06) Breakeven Yield (1) 6.6% 6.9% 7.1% 7.3% 7.6% 7.8% (0.26) |
 Confidential DRAFT 123 Summary Pro Forma Impact For the Quarter Ending For the Years Ending December 31, 9/30/13E 12/31/13E 2013E 2014E 2015E 2016E 2017E Potential CMLP Unit Price Impact: Distribution / LP Unit - Standalone $0.52 $0.53 $2.07 $2.15 $2.37 $2.60 $2.86 CMLP Current Yield 8.1% 8.1% 8.1% 8.1% 8.1% 8.1% 8.1% CMLP Standalone Projected Unit Price - Current Yield $25.64 $26.14 $25.52 $26.52 $29.17 $32.09 $35.30 Standalone Projected Yield - CMLP Management Financial Projections 8.0% 7.5% 7.5% 7.5% 7.5% 7.5% 7.5% CMLP Standalone Unit Price - CMLP Management Financial Projections $26.00 $28.27 $27.60 $28.68 $31.55 $34.70 $38.18 Distribution / LP Unit - Pro Forma $0.46 $0.46 $1.94 $2.00 $2.21 $2.34 $2.42 NRGM Current Yield 6.5% 6.5% 6.5% 6.5% 6.5% 6.5% 6.5% CMLP Implied Pro Forma Unit Price $28.36 $28.36 $29.93 $30.85 $34.05 $36.21 $37.44 CMLP Standalone Unit Price - Current Yield $25.64 $26.14 $25.52 $26.52 $29.17 $32.09 $35.30 CMLP Implied Pro Forma Unit Price $28.36 $28.36 $29.93 $30.85 $34.05 $36.21 $37.44 Per Unit Value Accretion / (Dilution) - $ $2.72 $2.22 $4.41 $4.33 $4.88 $4.12 $2.14 Per Unit Value Accretion / (Dilution) - % 10.6% 8.5% 17.3% 16.3% 16.7% 12.8% 6.1% NRGM Yield Necessary to Achieve CMLP Standalone Projected Unit Price (Breakeven Yield) 7.2% 7.0% 7.6% 7.5% 7.6% 7.3% 6.9% CMLP Standalone Unit Price - CMLP Management Financial Projections $26.00 $28.27 $27.60 $28.68 $31.55 $34.70 $38.18 CMLP Implied Pro Forma Unit Price $28.36 $28.36 $29.93 $30.85 $34.05 $36.21 $37.44 Per Unit Value Accretion / (Dilution) - $ $2.36 $0.09 $2.33 $2.16 $2.50 $1.50 ($0.73) Per Unit Value Accretion / (Dilution) - % 9.1% 0.3% 8.5% 7.5% 7.9% 4.3% (1.9%) NRGM Yield Necessary to Achieve CMLP Standalone Projected Unit Price (Breakeven Yield) 7.1% 6.5% 7.0% 7.0% 7.0% 6.8% 6.4% Potential CMLP Unit Price Impact |
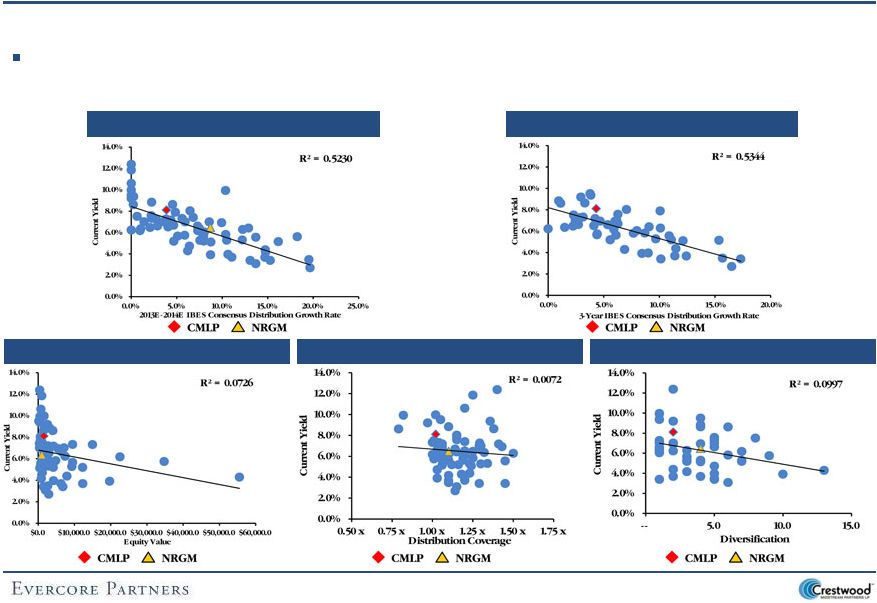 Confidential DRAFT Summary Pro Forma Impact 124 MLP Yield Determinants The following charts set forth the yield for all MLPs excluding variable rate and upstream MLPs relative to: (i) near-term distribution growth; (ii) long-term distribution growth; (iii) size, as reflected by equity market capitalization; (iv) distribution coverage and diversification as measured by the number of business lines in which each MLP participates Long-Term Distribution Growth Size Near-Term Distribution Growth Diversification Distribution Coverage |
 Confidential DRAFT Summary Pro Forma Impact 125 Current Near Term Long Term 2013E Equity Distribution Distribution Distribution Distribution Partnership Value Yield Growth Growth Coverage MPLX LP $2,932.0 2.7% 19.7% 16.5% 1.14x Tesoro Logistics LP 2,620.6 3.5% 19.5% 15.7% 1.10x Seadrill Partners LLC 1,269.4 5.6% 18.2% 0.0% 1.10x Blueknight Energy Partners, L.P. 481.9 5.1% 16.2% 15.4% 1.06x Sunoco Logistics Partners, L.P. 6,805.0 3.4% 15.3% 10.1% 1.45x Rose Rock Midstream, L.P. 849.5 4.2% 14.8% 0.0% 1.10x Access Midstream Partners, L.P. 7,941.9 4.4% 14.7% 11.5% 1.23x Western Gas Partners, LP 6,289.4 3.7% 14.7% 12.4% 1.10x Oiltanking Partners, L.P. 2,004.9 3.1% 13.7% 0.0% 1.15x Susser Petroleum Partners LP 689.0 5.6% 13.7% 10.9% 1.45x EQT Midstream Partners, LP 1,459.7 3.4% 13.1% 17.3% 1.29x Atlas Pipeline Partners, L.P. 2,383.4 6.4% 12.9% 9.1% 1.15x NGL Energy Partners LP 1,621.4 6.3% 12.3% 10.1% 1.50x Inergy, L.P. 2,878.5 5.3% 12.2% 0.0% 1.34x Pro Forma NRGM 3,716.1 TBD 12.0% 9.5% 1.03x Magellan Midstream Partners, L.P. 12,281.5 3.7% 11.1% 11.4% 1.20x Genesis Energy, L.P. 4,230.6 4.0% 10.6% 9.0% 1.20x MarkWest Energy Partners, L.P. 9,270.4 5.3% 10.5% 9.7% 1.23x Targa Resources Partners LP 4,848.5 5.8% 10.4% 8.7% 1.25x Hi-Crush Partners LP 522.2 9.9% 10.4% 0.0% 0.82x Calumet Specialty Products Partners, L.P. 2,628.6 6.9% 9.9% 6.0% 1.43x Delek Logistics Partners, LP 720.0 5.1% 8.7% 12.1% 1.24x Plains All American Pipeline, L.P. 19,723.2 3.9% 8.7% 8.4% 1.03x Inergy Midstream, L.P. 2,096.0 6.5% 8.7% 0.0% 1.10x Crosstex Energy, L.P. 1,802.2 7.0% 8.6% 6.2% 1.30x Summit Midstream Partners, LP 1,351.5 6.0% 8.0% 8.0% 1.20x ONEOK Partners, L.P. 12,267.1 5.2% 8.0% 11.1% 1.12x Copano Energy, L.L.C. 3,229.4 5.6% 7.9% 6.1% 1.19x DCP Midstream Partners, LP 2,936.8 5.8% 7.9% 7.7% 1.19x TransMontaigne Partners L.P. 716.6 5.3% 7.5% 0.0% 1.30x Global Partners LP 993.6 6.4% 7.5% 0.0% 1.32x Williams Partners L.P. 22,545.5 6.2% 7.3% 5.9% 1.00x Alliance Resource Partners, L.P. 2,523.3 6.6% 7.3% 5.4% 1.30x Lehigh Gas Partners LP 362.9 7.4% 6.8% 0.0% 1.20x USA Compression Partners, LP 628.9 8.0% 6.5% 7.0% 1.15x Current Near Term Long Term 2013E Equity Distribution Distribution Distribution Distribution Partnership Value Yield Growth Growth Coverage Holly Energy Partners, L.P. $1,154.5 4.7% 6.4% 0.0% 1.03x Enterprise Products Partners L.P. 55,545.6 4.3% 6.2% 6.9% 1.18x Compressco Partners LP 380.4 7.0% 5.9% 0.0% 1.29x Kinder Morgan Energy Partners, L.P. 34,775.3 5.7% 5.9% 4.4% 1.01x Energy Transfer Partners, L.P. 14,986.5 7.3% 5.6% 0.0% 1.04x El Paso Pipeline Partners, L.P. 9,483.7 5.7% 5.1% 4.4% 1.06x SunCoke Energy Partners, L.P. 670.4 7.9% 4.8% 10.1% 1.15x Spectra Energy Partners, LP 4,153.3 5.2% 4.7% 5.6% 1.16x Teekay Offshore Partners 2,302.7 6.7% 4.7% 6.3% 1.14x Eagle Rock Energy Partners, L.P. 1,503.8 8.6% 4.5% 3.3% 1.38x Amerigas Partners, L.P. 4,224.1 7.2% 4.4% 4.2% 1.41x Teekay LNG Partners L.P. 2,945.9 6.5% 4.0% 4.1% 1.20x Crestwood Midstream Partners LP 1,535.9 8.1% 3.9% 4.3% 1.02x Exterran Partners, L.P. 1,216.9 7.3% 3.8% 2.9% 1.29x Regency Energy Partners LP 5,450.8 6.9% 3.7% 4.7% 1.06x Buckeye Partners, L.P. 6,601.1 6.6% 2.9% 2.7% 1.03x Suburban Propane Partners, L.P. 2,779.8 7.2% 2.8% 2.8% 1.06x Enbridge Energy Partners, L.P. 9,500.3 7.3% 2.3% 3.1% 1.00x PVR Partners, L.P. 3,196.9 8.8% 2.2% 1.0% 1.10x Southcross Energy Partners, L.P. 526.8 7.6% 2.2% 6.3% 1.15x TC PipeLines, LP 2,631.1 6.5% 2.1% 2.2% 1.25x Boardwalk Pipeline Partners, LP 7,143.1 7.0% 1.4% 2.4% 1.04x PAA Natural Gas Storage, L.P. 1,634.7 6.3% 1.0% 1.5% 1.08x Golar LNG Partners LP 1,866.1 6.2% 1.0% 0.0% 1.10x Martin Midstream Partners L.P. 1,114.2 7.5% 0.6% 2.3% 1.01x Niska Gas Storage Partners LLC 526.4 9.4% 0.3% 3.8% 1.36x NuStar Energy LP 4,042.1 8.6% 0.2% 1.1% 0.79x Cheniere Energy Partners, L.P. 7,437.7 6.2% 0.0% 0.0% 1.04x Natural Resource Partners L.P. 2,538.3 9.2% 0.0% 2.9% 0.97x Rhino Resource Partners LP 407.3 12.4% 0.0% 0.0% 1.40x Ferrellgas Partners, L.P. 1,618.0 10.0% 0.0% 0.0% 1.02x Capital Products Partners L.P. 760.9 10.6% 0.0% 0.0% 1.20x Navios Maritime Partners 985.0 11.8% 0.0% 0.0% 1.25x American Midstream Partners, LP 170.4 9.5% 0.0% 3.8% 1.05x Stonemor Partners L.P. 577.9 8.8% 0.0% 0.0% 1.07x R**= 0.5230 2 |
 Confidential DRAFT Summary Pro Forma Impact 126 MLPs*by*Long-Term*Distribution*Growth*(3-Year*IBES*Consensus) Current Near Term Long Term 2013E Equity Distribution Distribution Distribution Distribution Partnership Value Yield Growth Growth Coverage EQT Midstream Partners, LP $1,459.7 3.4% 13.1% 17.3% 1.29x MPLX LP 2,932.0 2.7% 19.7% 16.5% 1.14x Tesoro Logistics LP 2,620.6 3.5% 19.5% 15.7% 1.10x Blueknight Energy Partners, L.P. 481.9 5.1% 16.2% 15.4% 1.06x Western Gas Partners, LP 6,289.4 3.7% 14.7% 12.4% 1.10x Delek Logistics Partners, LP 720.0 5.1% 8.7% 12.1% 1.24x Access Midstream Partners, L.P. 7,941.9 4.4% 14.7% 11.5% 1.23x Magellan Midstream Partners, L.P. 12,281.5 3.7% 11.1% 11.4% 1.20x ONEOK Partners, L.P. 12,267.1 5.2% 8.0% 11.1% 1.12x Susser Petroleum Partners LP 689.0 5.6% 13.7% 10.9% 1.45x Sunoco Logistics Partners, L.P. 6,805.0 3.4% 15.3% 10.1% 1.45x NGL Energy Partners LP 1,621.4 6.3% 12.3% 10.1% 1.50x SunCoke Energy Partners, L.P. 670.4 7.9% 4.8% 10.1% 1.15x MarkWest Energy Partners, L.P. 9,270.4 5.3% 10.5% 9.7% 1.23x Pro Forma NRGM 3,716.1 TBD 12.0% 9.5% 1.03x Atlas Pipeline Partners, L.P. 2,383.4 6.4% 12.9% 9.1% 1.15x Genesis Energy, L.P. 4,230.6 4.0% 10.6% 9.0% 1.20x Targa Resources Partners LP 4,848.5 5.8% 10.4% 8.7% 1.25x Plains All American Pipeline, L.P. 19,723.2 3.9% 8.7% 8.4% 1.03x Summit Midstream Partners, LP 1,351.5 6.0% 8.0% 8.0% 1.20x DCP Midstream Partners, LP 2,936.8 5.8% 7.9% 7.7% 1.19x USA Compression Partners, LP 628.9 8.0% 6.5% 7.0% 1.15x Enterprise Products Partners L.P. 55,545.6 4.3% 6.2% 6.9% 1.18x Southcross Energy Partners, L.P. 526.8 7.6% 2.2% 6.3% 1.15x Teekay Offshore Partners 2,302.7 6.7% 4.7% 6.3% 1.14x Crosstex Energy, L.P. 1,802.2 7.0% 8.6% 6.2% 1.30x Copano Energy, L.L.C. 3,229.4 5.6% 7.9% 6.1% 1.19x Calumet Specialty Products Partners, L.P. 2,628.6 6.9% 9.9% 6.0% 1.43x Williams Partners L.P. 22,545.5 6.2% 7.3% 5.9% 1.00x Spectra Energy Partners, LP 4,153.3 5.2% 4.7% 5.6% 1.16x Alliance Resource Partners, L.P. 2,523.3 6.6% 7.3% 5.4% 1.30x Regency Energy Partners LP 5,450.8 6.9% 3.7% 4.7% 1.06x Kinder Morgan Energy Partners, L.P. 34,775.3 5.7% 5.9% 4.4% 1.01x El Paso Pipeline Partners, L.P. 9,483.7 5.7% 5.1% 4.4% 1.06x Crestwood Midstream Partners LP 1,535.9 8.1% 3.9% 4.3% 1.02x Current Near Term Long Term 2013E Equity Distribution Distribution Distribution Distribution Partnership Value Yield Growth Growth Coverage Amerigas Partners, L.P. $4,224.1 7.2% 4.4% 4.2% 1.41x Teekay LNG Partners L.P. 2,945.9 6.5% 4.0% 4.1% 1.20x Niska Gas Storage Partners LLC 526.4 9.4% 0.3% 3.8% 1.36x American Midstream Partners, LP 170.4 9.5% 0.0% 3.8% 1.05x Eagle Rock Energy Partners, L.P. 1,503.8 8.6% 4.5% 3.3% 1.38x Enbridge Energy Partners, L.P. 9,500.3 7.3% 2.3% 3.1% 1.00x Natural Resource Partners L.P. 2,538.3 9.2% 0.0% 2.9% 0.97x Exterran Partners, L.P. 1,216.9 7.3% 3.8% 2.9% 1.29x Suburban Propane Partners, L.P. 2,779.8 7.2% 2.8% 2.8% 1.06x Buckeye Partners, L.P. 6,601.1 6.6% 2.9% 2.7% 1.03x Boardwalk Pipeline Partners, LP 7,143.1 7.0% 1.4% 2.4% 1.04x Martin Midstream Partners L.P. 1,114.2 7.5% 0.6% 2.3% 1.01x TC PipeLines, LP 2,631.1 6.5% 2.1% 2.2% 1.25x PAA Natural Gas Storage, L.P. 1,634.7 6.3% 1.0% 1.5% 1.08x NuStar Energy LP 4,042.1 8.6% 0.2% 1.1% 0.79x PVR Partners, L.P. 3,196.9 8.8% 2.2% 1.0% 1.10x Cheniere Energy Partners, L.P. 7,437.7 6.2% 0.0% 0.0% 1.04x Compressco Partners LP 380.4 7.0% 5.9% 0.0% 1.29x Energy Transfer Partners, L.P. 14,986.5 7.3% 5.6% 0.0% 1.04x Global Partners LP 993.6 6.4% 7.5% 0.0% 1.32x Holly Energy Partners, L.P. 1,154.5 4.7% 6.4% 0.0% 1.03x Inergy Midstream, L.P. 2,096.0 6.5% 8.7% 0.0% 1.10x Lehigh Gas Partners LP 362.9 7.4% 6.8% 0.0% 1.20x Rose Rock Midstream, L.P. 849.5 4.2% 14.8% 0.0% 1.10x TransMontaigne Partners L.P. 716.6 5.3% 7.5% 0.0% 1.30x Rhino Resource Partners LP 407.3 12.4% 0.0% 0.0% 1.40x Ferrellgas Partners, L.P. 1,618.0 10.0% 0.0% 0.0% 1.02x Hi-Crush Partners LP 522.2 9.9% 10.4% 0.0% 0.82x Inergy, L.P. 2,878.5 5.3% 12.2% 0.0% 1.34x Seadrill Partners LLC 1,269.4 5.6% 18.2% 0.0% 1.10x Capital Products Partners L.P. 760.9 10.6% 0.0% 0.0% 1.20x Golar LNG Partners LP 1,866.1 6.2% 1.0% 0.0% 1.10x Navios Maritime Partners 985.0 11.8% 0.0% 0.0% 1.25x Oiltanking Partners, L.P. 2,004.9 3.1% 13.7% 0.0% 1.15x Stonemor Partners L.P. 577.9 8.8% 0.0% 0.0% 1.07x R**= 0.5344 2 ($ in millions) |
 Confidential DRAFT Summary Pro Forma Impact 127 MLPs*by*Equity*Value*–*As*of*April*19,*2013 Current Near Term Long Term 2013E Equity Distribution Distribution Distribution Distribution Partnership Value Yield Growth Growth Coverage Enterprise Products Partners L.P. $55,545.6 4.3% 6.2% 6.9% 1.18x Kinder Morgan Energy Partners, L.P. 34,775.3 5.7% 5.9% 4.4% 1.01x Williams Partners L.P. 22,545.5 6.2% 7.3% 5.9% 1.00x Plains All American Pipeline, L.P. 19,723.2 3.9% 8.7% 8.4% 1.03x Energy Transfer Partners, L.P. 14,986.5 7.3% 5.6% 0.0% 1.04x Magellan Midstream Partners, L.P. 12,281.5 3.7% 11.1% 11.4% 1.20x ONEOK Partners, L.P. 12,267.1 5.2% 8.0% 11.1% 1.12x Enbridge Energy Partners, L.P. 9,500.3 7.3% 2.3% 3.1% 1.00x El Paso Pipeline Partners, L.P. 9,483.7 5.7% 5.1% 4.4% 1.06x MarkWest Energy Partners, L.P. 9,270.4 5.3% 10.5% 9.7% 1.23x Access Midstream Partners, L.P. 7,941.9 4.4% 14.7% 11.5% 1.23x Cheniere Energy Partners, L.P. 7,437.7 6.2% 0.0% 0.0% 1.04x Boardwalk Pipeline Partners, LP 7,143.1 7.0% 1.4% 2.4% 1.04x Sunoco Logistics Partners, L.P. 6,805.0 3.4% 15.3% 10.1% 1.45x Buckeye Partners, L.P. 6,601.1 6.6% 2.9% 2.7% 1.03x Western Gas Partners, LP 6,289.4 3.7% 14.7% 12.4% 1.10x Regency Energy Partners LP 5,450.8 6.9% 3.7% 4.7% 1.06x Targa Resources Partners LP 4,848.5 5.8% 10.4% 8.7% 1.25x Genesis Energy, L.P. 4,230.6 4.0% 10.6% 9.0% 1.20x Amerigas Partners, L.P. 4,224.1 7.2% 4.4% 4.2% 1.41x Spectra Energy Partners, LP 4,153.3 5.2% 4.7% 5.6% 1.16x NuStar Energy LP 4,042.1 8.6% 0.2% 1.1% 0.79x Pro Forma NRGM 3,716.1 TBD 12.0% 9.5% 1.03x Copano Energy, L.L.C. 3,229.4 5.6% 7.9% 6.1% 1.19x PVR Partners, L.P. 3,196.9 8.8% 2.2% 1.0% 1.10x Teekay LNG Partners L.P. 2,945.9 6.5% 4.0% 4.1% 1.20x DCP Midstream Partners, LP 2,936.8 5.8% 7.9% 7.7% 1.19x MPLX LP 2,932.0 2.7% 19.7% 16.5% 1.14x Inergy, L.P. 2,878.5 5.3% 12.2% 0.0% 1.34x Suburban Propane Partners, L.P. 2,779.8 7.2% 2.8% 2.8% 1.06x TC PipeLines, LP 2,631.1 6.5% 2.1% 2.2% 1.25x Calumet Specialty Products Partners, L.P. 2,628.6 6.9% 9.9% 6.0% 1.43x Tesoro Logistics LP 2,620.6 3.5% 19.5% 15.7% 1.10x Natural Resource Partners L.P. 2,538.3 9.2% 0.0% 2.9% 0.97x Alliance Resource Partners, L.P. 2,523.3 6.6% 7.3% 5.4% 1.30x Current Near Term Long Term 2013E Equity Distribution Distribution Distribution Distribution Partnership Value Yield Growth Growth Coverage Atlas Pipeline Partners, L.P. $2,383.4 6.4% 12.9% 9.1% 1.15x Teekay Offshore Partners 2,302.7 6.7% 4.7% 6.3% 1.14x Inergy Midstream, L.P. 2,096.0 6.5% 8.7% 0.0% 1.10x Oiltanking Partners, L.P. 2,004.9 3.1% 13.7% 0.0% 1.15x Golar LNG Partners LP 1,866.1 6.2% 1.0% 0.0% 1.10x Crosstex Energy, L.P. 1,802.2 7.0% 8.6% 6.2% 1.30x PAA Natural Gas Storage, L.P. 1,634.7 6.3% 1.0% 1.5% 1.08x NGL Energy Partners LP 1,621.4 6.3% 12.3% 10.1% 1.50x Ferrellgas Partners, L.P. 1,618.0 10.0% 0.0% 0.0% 1.02x Crestwood Midstream Partners LP 1,535.9 8.1% 3.9% 4.3% 1.02x Eagle Rock Energy Partners, L.P. 1,503.8 8.6% 4.5% 3.3% 1.38x EQT Midstream Partners, LP 1,459.7 3.4% 13.1% 17.3% 1.29x Summit Midstream Partners, LP 1,351.5 6.0% 8.0% 8.0% 1.20x Seadrill Partners LLC 1,269.4 5.6% 18.2% 0.0% 1.10x Exterran Partners, L.P. 1,216.9 7.3% 3.8% 2.9% 1.29x Holly Energy Partners, L.P. 1,154.5 4.7% 6.4% 0.0% 1.03x Martin Midstream Partners L.P. 1,114.2 7.5% 0.6% 2.3% 1.01x Global Partners LP 993.6 6.4% 7.5% 0.0% 1.32x Navios Maritime Partners 985.0 11.8% 0.0% 0.0% 1.25x Rose Rock Midstream, L.P. 849.5 4.2% 14.8% 0.0% 1.10x Capital Products Partners L.P. 760.9 10.6% 0.0% 0.0% 1.20x Delek Logistics Partners, LP 720.0 5.1% 8.7% 12.1% 1.24x TransMontaigne Partners L.P. 716.6 5.3% 7.5% 0.0% 1.30x Susser Petroleum Partners LP 689.0 5.6% 13.7% 10.9% 1.45x SunCoke Energy Partners, L.P. 670.4 7.9% 4.8% 10.1% 1.15x USA Compression Partners, LP 628.9 8.0% 6.5% 7.0% 1.15x Stonemor Partners L.P. 577.9 8.8% 0.0% 0.0% 1.07x Southcross Energy Partners, L.P. 526.8 7.6% 2.2% 6.3% 1.15x Niska Gas Storage Partners LLC 526.4 9.4% 0.3% 3.8% 1.36x Hi-Crush Partners LP 522.2 9.9% 10.4% 0.0% 0.82x Blueknight Energy Partners, L.P. 481.9 5.1% 16.2% 15.4% 1.06x Rhino Resource Partners LP 407.3 12.4% 0.0% 0.0% 1.40x Compressco Partners LP 380.4 7.0% 5.9% 0.0% 1.29x Lehigh Gas Partners LP 362.9 7.4% 6.8% 0.0% 1.20x American Midstream Partners, LP 170.4 9.5% 0.0% 3.8% 1.05x R**= 0.0726 2 ($ in millions) |
 Confidential DRAFT Summary Pro Forma Impact 128 MLPs*by*2013E *Distribution*Coverage Current Near Term Long Term 2013E Equity Distribution Distribution Distribution Distribution Partnership Value Yield Growth Growth Coverage NGL Energy Partners LP $1,621.4 6.3% 12.3% 10.1% 1.50x Sunoco Logistics Partners, L.P. 6,805.0 3.4% 15.3% 10.1% 1.45x Susser Petroleum Partners LP 689.0 5.6% 13.7% 10.9% 1.45x Calumet Specialty Products Partners, L.P. 2,628.6 6.9% 9.9% 6.0% 1.43x Amerigas Partners, L.P. 4,224.1 7.2% 4.4% 4.2% 1.41x Rhino Resource Partners LP 407.3 12.4% 0.0% 0.0% 1.40x Eagle Rock Energy Partners, L.P. 1,503.8 8.6% 4.5% 3.3% 1.38x Niska Gas Storage Partners LLC 526.4 9.4% 0.3% 3.8% 1.36x Inergy, L.P. 2,878.5 5.3% 12.2% 0.0% 1.34x Global Partners LP 993.6 6.4% 7.5% 0.0% 1.32x Crosstex Energy, L.P. 1,802.2 7.0% 8.6% 6.2% 1.30x TransMontaigne Partners L.P. 716.6 5.3% 7.5% 0.0% 1.30x Alliance Resource Partners, L.P. 2,523.3 6.6% 7.3% 5.4% 1.30x Exterran Partners, L.P. 1,216.9 7.3% 3.8% 2.9% 1.29x Compressco Partners LP 380.4 7.0% 5.9% 0.0% 1.29x EQT Midstream Partners, LP 1,459.7 3.4% 13.1% 17.3% 1.29x Targa Resources Partners LP 4,848.5 5.8% 10.4% 8.7% 1.25x TC PipeLines, LP 2,631.1 6.5% 2.1% 2.2% 1.25x Navios Maritime Partners 985.0 11.8% 0.0% 0.0% 1.25x Delek Logistics Partners, LP 720.0 5.1% 8.7% 12.1% 1.24x Access Midstream Partners, L.P. 7,941.9 4.4% 14.7% 11.5% 1.23x MarkWest Energy Partners, L.P. 9,270.4 5.3% 10.5% 9.7% 1.23x Genesis Energy, L.P. 4,230.6 4.0% 10.6% 9.0% 1.20x Lehigh Gas Partners LP 362.9 7.4% 6.8% 0.0% 1.20x Magellan Midstream Partners, L.P. 12,281.5 3.7% 11.1% 11.4% 1.20x Summit Midstream Partners, LP 1,351.5 6.0% 8.0% 8.0% 1.20x Capital Products Partners L.P. 760.9 10.6% 0.0% 0.0% 1.20x Teekay LNG Partners L.P. 2,945.9 6.5% 4.0% 4.1% 1.20x Copano Energy, L.L.C. 3,229.4 5.6% 7.9% 6.1% 1.19x DCP Midstream Partners, LP 2,936.8 5.8% 7.9% 7.7% 1.19x Enterprise Products Partners L.P. 55,545.6 4.3% 6.2% 6.9% 1.18x Spectra Energy Partners, LP 4,153.3 5.2% 4.7% 5.6% 1.16x Atlas Pipeline Partners, L.P. 2,383.4 6.4% 12.9% 9.1% 1.15x Southcross Energy Partners, L.P. 526.8 7.6% 2.2% 6.3% 1.15x SunCoke Energy Partners, L.P. 670.4 7.9% 4.8% 10.1% 1.15x Current Near Term Long Term 2013E Equity Distribution Distribution Distribution Distribution Partnership Value Yield Growth Growth Coverage Oiltanking Partners, L.P. $2,004.9 3.1% 13.7% 0.0% 1.15x USA Compression Partners, LP 628.9 8.0% 6.5% 7.0% 1.15x MPLX LP 2,932.0 2.7% 19.7% 16.5% 1.14x Teekay Offshore Partners 2,302.7 6.7% 4.7% 6.3% 1.14x ONEOK Partners, L.P. 12,267.1 5.2% 8.0% 11.1% 1.12x Inergy Midstream, L.P. 2,096.0 6.5% 8.7% 0.0% 1.10x Rose Rock Midstream, L.P. 849.5 4.2% 14.8% 0.0% 1.10x Tesoro Logistics LP 2,620.6 3.5% 19.5% 15.7% 1.10x Western Gas Partners, LP 6,289.4 3.7% 14.7% 12.4% 1.10x PVR Partners, L.P. 3,196.9 8.8% 2.2% 1.0% 1.10x Seadrill Partners LLC 1,269.4 5.6% 18.2% 0.0% 1.10x Golar LNG Partners LP 1,866.1 6.2% 1.0% 0.0% 1.10x PAA Natural Gas Storage, L.P. 1,634.7 6.3% 1.0% 1.5% 1.08x Stonemor Partners L.P. 577.9 8.8% 0.0% 0.0% 1.07x Blueknight Energy Partners, L.P. 481.9 5.1% 16.2% 15.4% 1.06x El Paso Pipeline Partners, L.P. 9,483.7 5.7% 5.1% 4.4% 1.06x Regency Energy Partners LP 5,450.8 6.9% 3.7% 4.7% 1.06x Suburban Propane Partners, L.P. 2,779.8 7.2% 2.8% 2.8% 1.06x American Midstream Partners, LP 170.4 9.5% 0.0% 3.8% 1.05x Energy Transfer Partners, L.P. 14,986.5 7.3% 5.6% 0.0% 1.04x Boardwalk Pipeline Partners, LP 7,143.1 7.0% 1.4% 2.4% 1.04x Cheniere Energy Partners, L.P. 7,437.7 6.2% 0.0% 0.0% 1.04x Pro Forma NRGM 3,716.1 TBD 12.0% 9.5% 1.03x Buckeye Partners, L.P. 6,601.1 6.6% 2.9% 2.7% 1.03x Holly Energy Partners, L.P. 1,154.5 4.7% 6.4% 0.0% 1.03x Plains All American Pipeline, L.P. 19,723.2 3.9% 8.7% 8.4% 1.03x Crestwood Midstream Partners LP 1,535.9 8.1% 3.9% 4.3% 1.02x Ferrellgas Partners, L.P. 1,618.0 10.0% 0.0% 0.0% 1.02x Kinder Morgan Energy Partners, L.P. 34,775.3 5.7% 5.9% 4.4% 1.01x Martin Midstream Partners L.P. 1,114.2 7.5% 0.6% 2.3% 1.01x Enbridge Energy Partners, L.P. 9,500.3 7.3% 2.3% 3.1% 1.00x Williams Partners L.P. 22,545.5 6.2% 7.3% 5.9% 1.00x Natural Resource Partners L.P. 2,538.3 9.2% 0.0% 2.9% 0.97x Hi-Crush Partners LP 522.2 9.9% 10.4% 0.0% 0.82x NuStar Energy LP 4,042.1 8.6% 0.2% 1.1% 0.79x R**= 0.0072 2 ($ in millions) |
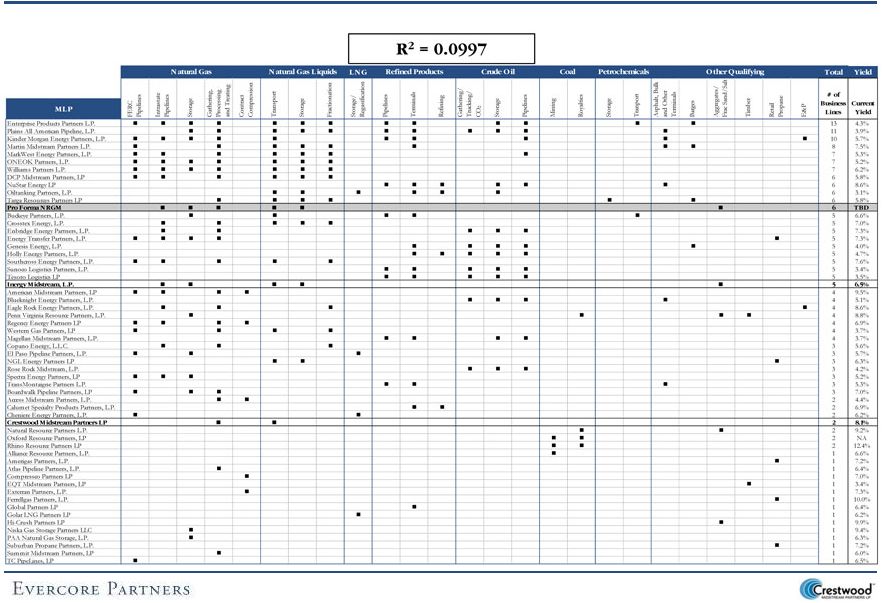 Confidential DRAFT Summary Pro Forma Impact 129 MLPs*by*Diversification*(Number*of*Business*Lines) |
 Confidential DRAFT Assumptions – Downside Financial Projections 130 Summary Pro Forma Impact Evercore analyzed the pro forma impact to NRGM unitholders and CMLP unitholders from the Proposed Transaction, utilizing the CMLP Downside Financial Projections and the NRGM Downside Financial Projections previously reviewed herein – NRGM acquires CMLP assuming a 5.0% premium to CMLP’s 20-Day VWAP of $24.42 as of April 25, 2013, or $25.64 per unit, plus $0.41 in cash for a total value of $26.06 per CMLP unit, representing a total enterprise value of $2.4 billion or 11.0x 2014E EBITDA – CMLP’s projected total debt outstanding of $787.4 million as of July 1, 2013 assumed by NRGM, without triggering change of control provisions – Assumes one-time change of control payments to NRGM management of $10.0 million and one-time integration expenses of $15.0 million are funded with borrowings from NRGM’s existing revolver – Assumes a total distribution coverage equal to NRGM’s standalone distribution coverage pro forma for the Proposed Transaction – Assumes NRGM and CMLP (excluding CMM) growth capital expenditures are funded 50.0% with equity issued to the public at an all-in discount of 8.0% to the then-current projected unit price assuming NRGM’s current yield of 6.48% – Transaction fees and expenses of $20.0 million are funded with borrowings on NRGM’s existing revolver – Assumes $10.0 million and $15.0 million of annual synergies in 2013E and 2014E, respectively, and $20.0 million of annual synergies in each of 2015E, 2016E and 2017E – Evercore analyzed the pro forma impact to distributable cash flow per current CMLP unit and distribution per current CMLP unit utilizing sensitivities related to: (i) incremental EBITDA at NRGM pro forma for the Proposed Transaction (in excess of the annual synergies previously reviewed herein) ranging from ($15.0) to $15.0 million and (ii) an offer price premium to CMLP’s 20-Day VWAP ranging between 0.0% and 25.0% – Evercore also analyzed the pro forma NRGM yield necessary for the CMLP implied pro forma projected price to equal the CMLP standalone projected price based on CMLP’s current yield utilizing sensitivities related to an offer price premium to CMLP’s 20-Day VWAP ranging between 0.0% and 25.0% per unit Transaction assumed to be financed with NRGM common equity issued directly to CMLP common unitholders and the $25.0 million of cash consideration financed with borrowings from NRGM’s existing revolver Implies a 1.089x NRGM/CMLP exchange ratio, assuming NRGM’s 20-Day VWAP of $23.55 CMM growth capital expenditures are funded 100.0% with borrowings on CMM’s revolving credit facility |
 Confidential DRAFT Transaction Economics – Downside Financial Projections 131 Summary Pro Forma Impact Sources and Uses Transaction Economics Net NRGM Equity Issued $1,545.8 Cash Consideration 25.0 Equity Value $1,570.8 CMLP Net Debt Assumed as of July 1, 2013 787.4 Transaction Enterprise Value $2,358.2 Assumed Annual Synergies: 2013E Annual Synergies $10.0 2014E Annual Synergies 15.0 2015E Annual Synergies 20.0 CMLP Enterprise Value as a Multiple of: Data Multiple 2013E EBITDA $173.3 13.6x 2014E EBITDA 186.1 12.7 2015E EBITDA 205.0 11.5 2013E EBITDA + Synergies $183.3 12.9x 2014E EBITDA + Synergies 201.1 11.7 2015E EBITDA + Synergies 225.0 10.5 CMLP Equity Value as a Multiple of: Data Multiple 2013E DCF $124.8 12.6x 2014E DCF 135.6 11.6 2015E DCF 144.6 10.9 2013E DCF + Synergies $134.8 11.7x 2014E DCF + Synergies 150.6 10.4 2015E DCF + Synergies 164.6 9.5 CMLP 20-Day VWAP $24.42 Offer Premium to CMLP's 20-Day VWAP 5.0% Offer Price $25.64 NRGM 20-Day VWAP 23.55 CMLP / NRGM Exchange Ratio 1.09x Value of Equity Consideration $25.64 Value of Cash Consideration 0.41 Total Consideration per CMLP Unit $26.06 Consideration per CMLP Unit (1) Includes 6,516,776 common units from the conversion of the Class D Units outstanding as of July 1, 2013 CMLP LP Units Outstanding (1) 60.3 Assumed LP Unit Price @ 5.0% Premium to $24.42 $25.64 Acquired LP Equity Value $1,545.8 Plus: Transaction Fees 20.0 Plus: One-Time Integration Expenses 15.0 Plus: Management Change of Control Payments 10.0 Plus: Cash Consideration 25.0 Less: Funding on NRGM Revolver (70.0) Net NRGM Equity Issued $1,545.8 Net NRGM LP Equity Issued $1,545.8 NRGM 20-Day VWAP $23.55 New NRGM LP Units Issued 65.6 CMLP Pro Forma Ownership of NRGM 43.3% ($ in millions, except per unit amounts) |
 Confidential DRAFT Proposed Transaction – Downside Financial Projections ($ in millions, except per unit amounts) 132 Summary Pro Forma Impact For the Quarter Ending For the Years Ending December 31, CAGR 3/31/13E 6/30/13E 9/30/13E 12/31/13E 2013E 2014E 2015E 2016E 2017E 2014E - 2017E NRGM Adjusted EBITDA $42.4 $43.9 $47.1 $53.3 $186.7 $211.8 $214.3 $206.4 $195.3 CMLP Adjusted EBITDA -- -- 45.2 45.9 91.1 186.1 205.0 221.4 234.6 Synergies -- -- 5.0 5.0 10.0 15.0 20.0 20.0 20.0 Adjusted EBITDA $42.4 $43.9 $97.3 $104.3 $287.8 $412.9 $439.3 $447.9 $449.9 2.9% Less: NRGM Maintenance Capital Expenditures (1.3) (1.6) (1.0) (1.6) (5.5) (7.3) (7.9) (8.3) (8.5) Less: CMLP Maintenance Capital Expenditures -- -- (3.6) (2.5) (6.1) (7.2) (7.7) (8.9) (11.8) Less: NRGM Interest Expense (9.0) (9.5) (9.8) (10.3) (38.6) (43.7) (46.1) (44.0) (42.7) Less: CMLP Interest Expense -- -- (11.0) (11.3) (22.2) (47.9) (57.4) (64.8) (68.6) Less: Incremental Interest (Expense) / Savings -- -- (0.5) (0.4) (1.0) (0.4) 0.6 8.5 9.0 NRGM - Other Income 0.4 0.5 0.0 (0.1) 0.9 0.4 2.3 0.6 (1.3) CMLP - Other Income -- -- 0.9 1.0 1.9 4.5 4.7 4.9 5.2 Distributable Cash Flow $32.6 $33.3 $72.4 $79.0 $217.3 $311.4 $327.8 $335.9 $331.1 2.1% Distributable Cash Flow Common Units - Public $11.1 $11.2 $12.8 $13.7 $48.7 $56.0 $58.5 $64.4 $68.7 Common Units - NRGY 21.1 21.4 23.8 25.0 91.3 98.7 101.5 101.8 99.8 Common Units - CMLP -- -- 27.8 29.1 56.9 114.9 118.2 118.5 116.1 General Partner 0.4 0.7 8.1 11.2 20.4 41.7 49.5 51.3 46.5 Distributable Cash Flow $32.6 $33.3 $72.4 $79.0 $217.3 $311.4 $327.8 $335.9 $331.1 Distributed Cash Flow Common Units - Public $11.7 $11.7 $12.7 $13.0 $49.0 $54.6 $57.4 $66.0 $74.7 Common Units - NRGY 22.3 22.3 23.8 23.8 92.1 96.2 99.6 104.2 108.5 Common Units - CMLP -- -- 27.7 27.7 55.3 112.1 115.9 121.4 126.3 General Partner 2.1 2.1 7.8 7.8 19.9 34.9 44.2 58.1 71.3 Distributed Cash Flow $36.1 $36.1 $71.9 $72.2 $216.3 $297.8 $317.2 $349.7 $380.7 8.5% Pro Forma Impact |
 Confidential DRAFT Proposed Transaction – Downside Financial Projections (cont’d) 133 Summary Pro Forma Impact For the Quarter Ending For the Years Ending December 31, CAGR 3/31/13E 6/30/13E 9/30/13E 12/31/13E 2013E 2014E 2015E 2016E 2017E 2014E - 2017E Distributed Cash Flow $36.1 $36.1 $71.9 $72.2 $216.3 $297.8 $317.2 $349.7 $380.7 % to GP 6.0% 6.0% 10.9% 10.9% 9.2% 11.7% 13.9% 16.6% 18.7% GP IDRs $2.1 $2.1 $7.8 $7.8 $19.9 $34.9 $44.2 $58.1 $71.3 26.8% Weighted Average LP Units Outstanding 85.9 85.9 152.2 152.9 119.2 154.0 154.5 157.7 160.8 NRGM Summary: DCF / LP Unit - Pro Forma $0.37 $0.38 $0.42 $0.44 $1.62 $1.75 $1.80 $1.81 $1.77 0.3% Distribution / LP Unit - Pro Forma 0.40 0.40 0.42 0.42 $1.63 $1.71 1.77 1.85 1.92 4.1% CMLP Summary: DCF / LP Unit - Pro Forma $0.48 $0.49 $0.46 $0.48 $1.92 $1.91 $1.96 $1.97 $1.93 0.3% Distribution / LP Unit - Pro Forma $0.51 $0.51 $0.46 $0.46 $1.94 $1.86 $1.92 $2.01 $2.09 4.1% LP Coverage 0.95x 0.96x 1.00x 1.05x 0.99x 1.03x 1.02x 0.98x 0.92x Total Coverage 0.90 0.92 1.01 1.09 1.00 1.05 1.03 0.96 0.87 Distributable Cash Flow Surplus / (Shortfall) ($3.5) ($2.8) $0.5 $6.8 $1.0 $13.6 $10.6 ($13.7) ($49.6) Pro Forma Impact ($ in millions, except per unit amounts) |
 Confidential DRAFT Proposed Transaction – Downside Financial Projections (cont’d) 134 Summary Pro Forma Impact For the Quarter Ending For the Years Ending December 31, 3/31/13E 6/30/13E 9/30/13E 12/31/13E 2013E 2014E 2015E 2016E 2017E Sources: Equity Issued for CMLP Acquisition $-- $-- $1,545.8 $-- $1,545.8 $-- $-- $-- $-- Revolver Draw for Cash Consideration -- -- 25.0 -- 25.0 -- -- -- -- CMLP Net Debt Assumed -- -- 787.4 -- 787.4 -- -- -- -- Revolver Draw for Transaction Fees and Expenses -- -- 70.0 -- 70.0 -- -- -- -- Equity Issued for Growth Capital Expenditures -- -- 15.6 15.6 31.3 35.9 9.4 9.4 6.8 Equity Issuance in Q4 2016E -- -- -- -- -- -- -- 150.0 -- Debt Issued / (Repaid) 42.0 33.0 36.8 9.8 121.6 37.7 25.2 (102.6) 79.2 DCF Surplus / (Shortfall) (3.5) (2.8) 0.5 6.8 1.0 13.6 10.6 (13.7) (49.6) Total Sources $38.5 $30.2 $2,481.1 $32.2 $2,582.0 $87.2 $45.3 $43.0 $36.4 Debt Issued / (Repaid), net of Surplus / (Shortfall) $42.0 $33.0 $61.8 $9.8 $146.6 $37.7 $25.2 ($102.6) $79.2 Total Equity Issued -- -- 1,561.4 15.6 1,577.1 35.9 9.4 9.4 6.8 Uses: CMLP Merger $-- $-- $2,358.2 $-- $2,358.2 $-- $-- $-- $-- CMLP Transaction Fees and Expenses -- -- 70.0 -- 70.0 -- -- -- -- NRGM Growth Capital Expenditures 28.8 20.6 25.0 24.5 98.9 17.2 2.0 2.0 2.0 CMLP Growth Capital Expenditures -- -- 6.3 6.8 13.1 54.5 16.8 16.8 11.7 CMM Growth Capital Expenditures -- -- 21.5 5.5 27.0 19.0 24.9 23.0 22.5 Other 9.7 9.6 0.2 (4.6) 14.8 (3.5) 1.5 1.2 0.3 Total Uses $38.5 $30.2 $2,481.1 $32.2 $2,582.0 $87.2 $45.3 $43.0 $36.4 Pro Forma Credit Statistics Debt / Adjusted EBITDA 4.4x 4.1x 3.9x 3.6x 3.7x Net Debt / Adjusted EBITDA 4.4 4.1 3.9 3.6 3.7 Standalone NRGM Credit Statistics Debt / Adjusted EBITDA 4.2x 3.7x 3.7x 3.4x 3.7x Net Debt / Adjusted EBITDA 4.2 3.7 3.7 3.1 3.4 Standalone CMLP Credit Statistics Debt / Adjusted EBITDA 4.7x 4.9x 4.7x 4.5x 4.3x Net Debt / Adjusted EBITDA 4.7 4.9 4.7 4.5 4.3 Capital Structure Cash $-- $-- $-- $-- $-- $0.0 ($0.0) $0.0 ($0.0) Total Debt 712.1 745.1 1,633.8 1,643.6 1,643.6 1,681.3 1,706.5 1,603.9 1,683.1 Net Debt $712.1 $745.1 $1,633.8 $1,643.6 $1,643.6 $1,681.3 $1,706.5 $1,603.9 $1,683.1 ($ in millions) |
 Confidential DRAFT Pro Forma Impact – CMLP Unitholder – Downside Financial Projections 135 Summary Pro Forma Impact CMLP Accretion / (Dilution) For the Quarter Ending For the Years Ending December 31, CAGR 9/30/13E 12/31/13E 2013E 2014E 2015E 2016E 2017E 2014E - 2017E CMLP Accretion / (Dilution): DCF / LP Unit - Standalone $0.50 $0.52 $1.99 $1.94 $2.02 $2.09 $2.14 3.3% DCF / LP Unit - Pro Forma $0.46 $0.48 $1.92 $1.91 $1.96 $1.97 $1.93 0.3% Accretion / (Dilution) - $ ($0.04) ($0.03) ($0.07) ($0.04) ($0.06) ($0.12) ($0.21) Accretion / (Dilution) - % (8.1%) (6.3%) (3.7%) (1.9%) (2.9%) (5.8%) (10.0%) Distribution / LP Unit - Standalone $0.51 $0.51 $2.04 $2.04 $2.04 $2.04 $2.08 0.6% Distribution / LP Unit - Pro Forma $0.46 $0.46 $1.94 $1.86 $1.92 $2.01 $2.09 4.1% Accretion / (Dilution) - $ ($0.05) ($0.05) ($0.10) ($0.18) ($0.12) ($0.03) $0.02 Accretion / (Dilution) - % (10.0%) (10.0%) (5.0%) (8.9%) (5.7%) (1.3%) 0.8% Standalone Distribution Coverage 0.97x 1.02x 0.96x 0.92x 0.98x 1.04x 1.05x Pro Forma Distribution Coverage 1.01 1.09 1.00 1.05 1.03 0.96 0.87 Standalone Debt/EBITDA 4.7x 4.9x 4.7x 4.5x 4.3x Pro Forma Debt/EBITDA 4.4 4.1 3.9 3.6 3.7 |
 Confidential DRAFT Pro Forma Impact – NRGM Unitholder – Downside Financial Projections 136 Summary Pro Forma Impact For the Quarter Ending For the Years Ending December 31, CAGR 9/30/13E 12/31/13E 2013E 2014E 2015E 2016E 2017E 2014E - 2017E NRGM Accretion / (Dilution): DCF / LP Unit - Standalone $0.40 $0.43 $1.58 $1.68 $1.68 $1.62 $1.51 (3.5%) DCF / LP Unit - Pro Forma $0.42 $0.44 $1.62 $1.75 $1.80 $1.81 $1.77 0.3% Accretion / (Dilution) - $ $0.03 $0.02 $0.04 $0.07 $0.12 $0.19 $0.26 Accretion / (Dilution) - % 6.7% 4.2% 2.8% 4.3% 7.0% 11.7% 17.3% Distribution / LP Unit - Standalone $0.40 $0.40 $1.58 $1.63 $1.65 $1.65 $1.65 0.4% Distribution / LP Unit - Pro Forma 0.42 0.42 1.63 1.71 1.77 1.85 1.92 4.1% Accretion / (Dilution) - $ $0.03 $0.02 $0.05 $0.08 $0.11 $0.20 $0.27 Accretion / (Dilution) - % 6.7% 5.7% 3.1% 4.6% 6.9% 11.9% 16.4% Standalone Distribution Coverage 1.01x 1.13x 0.99x 1.07x 1.03x 0.96x 0.87x Pro Forma Distribution Coverage 1.01 1.09 1.00 1.05 1.03 0.96 0.87 Standalone Debt/EBITDA 4.2x 3.7x 3.7x 3.4x 3.7x Pro Forma Debt/EBITDA 4.4 4.1 3.9 3.6 3.7 NRGM Accretion / (Dilution) |
 Confidential DRAFT 137 Summary Pro Forma Impact (1) Based on CMLP’s current yield of 8.1%. Assumes $0.0 million of incremental EBITDA Implied Exchange Ratio/ Offer Price per CMLP Unit/Premium to 20-Day VWAP/ 1.04x 1.09x 1.14x 1.19x 1.24x 1.30x $24.42 $25.64 $26.86 $28.09 $29.31 $30.53 ($0.10) -- 5.0% 10.0% 15.0% 20.0% 25.0% ($15.0) ($0.19) ($0.16) ($0.12) ($0.08) ($0.04) $0.00 (10.0) (0.17) (0.14) (0.11) (0.07) (0.04) 0.00 (5.0) (0.15) (0.12) (0.09) (0.06) (0.02) 0.01 -- (0.14) (0.10) (0.07) (0.04) (0.01) 0.03 5.0 (0.12) (0.08) (0.05) (0.02) 0.01 0.05 10.0 (0.10) (0.07) (0.03) 0.00 0.03 0.06 15.0 (0.08) (0.05) (0.01) 0.02 0.05 0.08 7.6% 7.7% 7.8% 8.0% 8.1% 8.2% Implied Exchange Ratio/ Offer Price per CMLP Unit/Premium to 20-Day VWAP/ 1.04x 1.09x 1.14x 1.19x 1.24x 1.30x $24.42 $25.64 $26.86 $28.09 $29.31 $30.53 ($0.18) -- 5.0% 10.0% 15.0% 20.0% 25.0% ($15.0) ($0.27) ($0.20) ($0.14) ($0.07) ($0.01) $0.05 (10.0) (0.27) (0.20) (0.13) (0.07) (0.00) 0.06 (5.0) (0.26) (0.19) (0.12) (0.06) 0.01 0.07 -- (0.25) (0.18) (0.11) (0.05) 0.01 0.08 5.0 (0.24) (0.17) (0.10) (0.04) 0.03 0.09 10.0 (0.22) (0.15) (0.09) (0.02) 0.05 0.11 15.0 (0.20) (0.14) (0.07) (0.00) 0.06 0.13 7.1% 7.4% 7.7% 7.9% 8.2% 8.4% Implied Exchange Ratio/ Offer Price per CMLP Unit/Premium to 20-Day VWAP/ 1.04x 1.09x 1.14x 1.19x 1.24x 1.30x $24.42 $25.64 $26.86 $28.09 $29.31 $30.53 ($0.12) -- 5.0% 10.0% 15.0% 20.0% 25.0% ($15.0) ($0.24) ($0.17) ($0.10) ($0.04) $0.03 $0.09 (10.0) (0.22) (0.15) (0.08) (0.02) 0.05 0.11 (5.0) (0.20) (0.13) (0.07) 0.00 0.07 0.13 -- (0.19) (0.12) (0.05) 0.02 0.08 0.15 5.0 (0.17) (0.10) (0.03) 0.04 0.10 0.17 10.0 (0.15) (0.08) (0.01) 0.05 0.12 0.19 15.0 (0.14) (0.07) 0.00 0.07 0.14 0.21 7.4% 7.6% 7.9% 8.2% 8.4% 8.7% Implied Exchange Ratio/ Offer Price per CMLP Unit/Premium to 20-Day VWAP/ 1.04x 1.09x 1.14x 1.19x 1.24x 1.30x $24.42 $25.64 $26.86 $28.09 $29.31 $30.53 ($0.03) -- 5.0% 10.0% 15.0% 20.0% 25.0% ($15.0) ($0.15) ($0.08) ($0.01) $0.06 $0.12 $0.19 (10.0) (0.13) (0.06) 0.01 0.08 0.14 0.21 (5.0) (0.12) (0.04) 0.03 0.09 0.16 0.23 -- (0.10) (0.03) 0.04 0.11 0.18 0.25 5.0 (0.08) (0.01) 0.06 0.13 0.20 0.27 10.0 (0.06) 0.01 0.08 0.15 0.22 0.29 15.0 (0.05) 0.03 0.10 0.17 0.24 0.31 7.7% 8.0% 8.3% 8.6% 8.8% 9.1% Implied Exchange Ratio/ Offer Price per CMLP Unit/Premium to 20-Day VWAP/ 1.04x 1.09x 1.14x 1.19x 1.24x 1.30x $24.42 $25.64 $26.86 $28.09 $29.31 $30.53 $0.02 -- 5.0% 10.0% 15.0% 20.0% 25.0% ($15.0) ($0.11) ($0.04) $0.03 $0.10 $0.17 $0.24 (10.0) (0.10) (0.02) 0.05 0.12 0.19 0.26 (5.0) (0.08) (0.00) 0.07 0.14 0.21 0.28 -- (0.06) 0.02 0.09 0.16 0.23 0.30 5.0 (0.04) 0.04 0.11 0.18 0.25 0.32 10.0 (0.02) 0.06 0.13 0.20 0.28 0.35 15.0 (0.00) 0.07 0.15 0.22 0.30 0.37 7.9% 8.2% 8.5% 8.7% 9.0% 9.3% CMLP 2013E Distribution/LP Unit Accretion/(Dilution) - $ CMLP 2014E Distribution/LP Unit Accretion/(Dilution) - $ CMLP 2015E Distribution/LP Unit Accretion/(Dilution) - $ CMLP 2016E Distribution/LP Unit Accretion/(Dilution) - $ CMLP 2016E Distribution/LP Unit Accretion/(Dilution) - $ Breakeven Yield Breakeven Yield Breakeven Yield Breakeven Yield Breakeven Yield (1) (1) (1) (1) (1) CMLP Sensitivity Analysis – Downside Financial Projections ($ in millions, except per unit amounts) |
 Confidential DRAFT Pro Forma Impact to CMLP Unitholder – Downside Financial Projections 138 Summary Pro Forma Impact For the Quarter Ending For the Years Ending December 31, 9/30/13E 12/31/13E 2013E 2014E 2015E 2016E 2017E Potential CMLP Unit Price Impact: Distribution / LP Unit - Standalone $0.51 $0.51 $2.04 $2.04 $2.04 $2.04 $2.08 CMLP Current Yield 8.1% 8.1% 8.1% 8.1% 8.1% 8.1% 8.1% CMLP Standalone Projected Unit Price - Current Yield $25.15 $25.15 $25.15 $25.15 $25.15 $25.15 $25.62 Standalone Projected Yield - CMLP Downside Financial Projections 8.5% 8.5% 8.5% 8.5% 8.5% 8.5% 8.5% Standalone Projected Yield - CMLP Downside Financial Projections $24.00 $24.00 $24.00 $24.00 $24.00 $24.00 $24.45 Distribution / LP Unit - Pro Forma $0.46 $0.46 $1.94 $1.86 $1.92 $2.01 $2.09 NRGM Current Yield 6.5% 6.5% 6.5% 6.5% 6.5% 6.5% 6.5% CMLP Implied Pro Forma Unit Price $28.34 $28.34 $29.92 $28.71 $29.70 $31.09 $32.35 CMLP Standalone Unit Price - Current Yield $25.15 $25.15 $25.15 $25.15 $25.15 $25.15 $25.62 CMLP Implied Pro Forma Unit Price $28.34 $28.34 $29.92 $28.71 $29.70 $31.09 $32.35 Per Unit Value Accretion / (Dilution) - $ $3.19 $3.19 $4.77 $3.56 $4.55 $5.94 $6.73 Per Unit Value Accretion / (Dilution) - % 12.7% 12.7% 19.0% 14.1% 18.1% 23.6% 26.3% NRGM Yield Necessary to Achieve CMLP Standalone Projected Unit Price (Breakeven Yield) 7.3% 7.3% 7.7% 7.4% 7.6% 8.0% 8.2% CMLP Standalone Unit Price - CMLP Downside Financial Projections $24.00 $24.00 $24.00 $24.00 $24.00 $24.00 $24.45 CMLP Implied Pro Forma Unit Price $28.34 $28.34 $29.92 $28.71 $29.70 $31.09 $32.35 Per Unit Value Accretion / (Dilution) - $ $4.34 $4.34 $5.92 $4.71 $5.70 $7.09 $7.90 Per Unit Value Accretion / (Dilution) - % 18.1% 18.1% 24.7% 19.6% 23.8% 29.5% 32.3% NRGM Yield Necessary to Achieve CMLP Standalone Projected Unit Price (Breakeven Yield) 7.6% 7.6% 8.1% 7.7% 8.0% 8.4% 8.6% Potential CMLP Unit Price Impact |
DRAFT IX. Certain Benefits and Issues for Consideration With Respect to the Proposed Transaction |
 Confidential DRAFT Benefits Certain Benefits and Issues for Consideration With Respect to the Proposed Transaction 139 Overview Proposed Transaction provides larger scale and more diversified business mix – Combined entity would be 48.4% gathering & processing, 28.4% storage and transportation, 19.1% NGL and crude supply logistics and 4.1% other – Expanded footprint to all the major U.S. shale plays, excluding the Eagle Ford Shale – Reduces Quicksilver and Antero to 28.1% and 29.1%, respectively, of pro forma 2013E EBITDA Potentially improved cost of capital – NRGM is currently rated ‘BB’ with a “fair” business risk profile and “significant” financial risk profile as compared to CMLP’s ‘B’ credit rating and “Weak/Aggressive” profiles – NRGM currently has a 6.5% common unit yield versus CMLP’s current 8.1% common unit yield Creates a platform that may be better positioned to compete for new projects – Vertically integrated across the natural gas and NGL value chain – Potentially improved cost of capital Considerations Ability of CMLP to execute on CMLP Management Financial Projections and risk of not executing on that set of projections Distribution of pro forma distributable cash flow per unit and distribution per unit for CMLP units Likely pro forma yield and ability to provide incremental value for CMLP unitholders despite dilution Benefits of potential asset transfers from NRGY Future accretion in distributable cash flow per unit Ability to support pro forma distribution and credit ratios |
DRAFT Appendix |
DRAFT A. Weighted Average Cost of Capital |
   Confidential DRAFT CAPM WACC Analysis – CMLP Weighted Average Cost of Capital (1) Source: Predicted raw betas from FactSet; Adjusted Equity Beta calculated as: (0.67) × Raw Beta +(0.33) × 1.0 (2) Unlevered Beta calculated as: Adjusted Equity Beta × (E/(E + D × (1-T)); Assumes corporate tax rate of 35.0% (3) Excludes American Midstream Partners, LP and Southcross Energy Partners, L.P. due to relatively new partnerships with a non-comparable size (4) 10-year Treasury as of April 25, 2013 (5) Source: Ibbotson Associates (6) Equity Cost of Capital calculated as: Risk-free rate + (Levered Equity Beta × Market Risk Premium) + Small Company Risk Premium 140 Unit Price Market Equity Total Debt and Total Debt / Adjusted Unlevered Partnership 4/25/2013 Value Preferred Stock Total Capitalization Beta (1) Beta (2) American Midstream Partners, LP $18.21 $170 $203 54.4% 0.57 0.32 Atlas Pipeline Partners, L.P. 36.18 2,383 1,180 33.1% 1.05 0.80 Access Midstream Partners, L.P. 41.07 7,942 2,500 23.9% 0.66 0.55 Crosstex Energy, L.P. 18.85 1,802 1,036 36.5% 0.91 0.66 DCP Midstream Partners, LP 47.47 2,937 1,620 35.6% 0.70 0.51 MarkWest Energy Partners, L.P. 62.18 9,270 2,523 21.4% 0.75 0.64 Regency Energy Partners LP 26.51 5,451 2,830 34.2% 0.71 0.53 Equity Cost Southcross Energy Partners, L.P. 21.13 527 450 46.1% 0.62 0.40 of Capital Summit Midstream Partners, LP 27.13 1,352 199 12.8% 1.08 0.98 Targa Resources Partners LP 46.68 4,848 2,393 33.0% 0.73 0.55 Western Gas Partners, LP 58.64 6,289 1,927 23.5% 0.73 0.61 Mean 28.2% 0.81 0.65 Median 33.0% 0.73 0.61 WACC Risk-free Rate (4) 1.7% Unlevered Beta 0.65 Debt and Preferred / Total Capitalization 28.2% Adjusted Levered Equity Beta 0.81 Market Risk Premium (5) 6.6% Small Company Risk Premium (5) 1.8% Equity Cost of Capital (6) 8.9% Pre-Tax Cost of Debt 8.0% After-Tax Cost of Debt 5.2% WACC 7.8% WACC (3) (3) ($ in millions, except per unit amounts) |
   Confidential DRAFT Total Expected Market Return WACC Analysis – CMLP Weighted Average Cost of Capital (1) Excludes American Midstream Partners, LP and Southcross Energy Partners, L.P. due to relatively new partnerships with a non-comparable size 141 Current Distribution Total Partnership Yield Growth Return American Midstream Partners, LP 9.5% 2.4% 11.9% Atlas Pipeline Partners, L.P. 6.4% 9.9% 16.3% Access Midstream Partners, L.P. 4.4% 10.6% 14.9% Crosstex Energy, L.P. 7.0% 5.3% 12.3% DCP Midstream Partners, LP 5.8% 8.4% 14.2% MarkWest Energy Partners, L.P. 5.3% 9.2% 14.5% Regency Energy Partners LP 6.9% 4.3% 11.2% Total Return Southcross Energy Partners, L.P. 7.6% 6.3% 13.9% Summit Midstream Partners, LP 6.0% 8.0% 14.1% Targa Resources Partners LP 5.8% 8.5% 14.4% Western Gas Partners, LP 3.7% 11.6% 15.3% Mean 14.1% Median 14.4% WACC Debt and Preferred / Total Capitalization 28.2% WACC Market Required Equity Return 14.4% Pre-Tax Cost of Debt 8.0% After-Tax Cost of Debt 5.2% WACC 11.8% (1) (1) |
 Confidential DRAFT ($ in millions, except per unit amounts) Weighted Average Cost of Capital (1) Source: Predicted raw betas from FactSet; Adjusted Equity Beta calculated as: (0.67) × Raw Beta +(0.33) × 1.0 (2) Unlevered Beta calculated as: Adjusted Equity Beta × (E/(E + D × (1-T)); Assumes corporate tax rate of 35.0% (3) Excludes EQT Midstream, LP due to non-comparable capitalization (4) 10-year Treasury as of April 25, 2013 (5) Source: Ibbotson Associates (6) Equity Cost of Capital calculated as: Risk-free rate + (Levered Equity Beta × Market Risk Premium) + Small Company Risk Premium 142 Unit Price Market Equity Total Debt and Total Debt / Adjusted Unlevered Partnership 4/25/2013 Value Preferred Stock Total Capitalization Beta (1) Beta (2) Boardwalk Pipeline Partners, LP $30.36 $7,143.1 $3,539.2 33.1% 0.73 0.55 El Paso Pipeline Partners, L.P. 43.07 9,483.7 4,246.0 30.9% 0.62 0.48 EQT Midstream Partners, LP 41.25 1,459.7 0.0 0.0% 1.02 1.02 Niska Gas Storage Partners LLC 14.96 526.4 400.0 43.2% 0.80 0.54 Equity Cost PAA Natural Gas Storage, L.P. 22.53 1,634.7 582.1 26.3% 0.79 0.64 of Capital Spectra Energy Partners, LP 38.17 4,153.3 1,149.3 21.7% 0.74 0.63 TC PipeLines, LP 48.22 2,631.1 691.0 20.8% 0.57 0.48 Mean 29.3% 0.71 0.55 Median 28.6% 0.73 0.54 WACC Risk-free Rate (4) 1.7% Unlevered Beta 0.55 Debt and Preferred / Total Capitalization 29.3% WACC Adjusted Levered Equity Beta 0.70 Market Risk Premium (5) 6.6% Small Company Risk Premium (5) 1.8% Equity Cost of Capital (6) 8.1% Pre-Tax Cost of Debt 6.0% After-Tax Cost of Debt 3.9% WACC 6.9% (3) (3) CAPM WACC Analysis – NRGM |
   Confidential DRAFT Total Expected Market Return WACC Analysis – NRGM Weighted Average Cost of Capital (1) Excludes EQT Midstream, LP due to non-comparable capitalization 143 Unit Price Market Equity Current Distribution Total Partnership 4/25/2013 Value Yield Growth Return Boardwalk Pipeline Partners, LP $30.36 $7,143.1 7.0% 2.4% 9.4% El Paso Pipeline Partners, L.P. 43.07 9,483.7 5.7% 6.1% 11.7% EQT Midstream Partners, LP 41.25 1,459.7 3.4% 37.2% 40.6% Niska Gas Storage Partners LLC 14.96 526.4 9.4% 2.9% 12.3% Total Return PAA Natural Gas Storage, L.P. 22.53 1,634.7 6.3% 1.7% 8.1% Spectra Energy Partners, LP 38.17 4,153.3 5.2% 5.1% 10.3% TC PipeLines, LP 48.22 2,631.1 6.5% 2.3% 8.8% Mean 10.1% Median 9.9% WACC Debt and Preferred / Total Capitalization 29.3% WACC Market Required Equity Return 10.1% Pre-Tax Cost of Debt 6.0% After-Tax Cost of Debt 3.9% WACC 8.3% (1) (1) |