Project Intrepid May 5, 2013 Presentation to the Special Committee & Conflicts Committee of the Board of Directors of Inergy GP, LLC EXHIBIT (C)(24) |
1 Disclaimer These materials are provided for the information of the Special Committee and Conflicts Committee of Inergy GP LLP (“Conflicts Committee”) by SunTrust Robinson Humphrey, Inc. ("STRH") in connection with the Board's consideration of a potential transaction involving Inergy, L.P. (“NRGY” or the “Company”) and Crestwood Holdings LLC and Crestwood Midstream Partners LP (“CMLP”) (the “Transaction”). These materials are for discussion purposes only and may not be relied upon by any security holder of the Company or any other third party for any purpose whatsoever. These materials were prepared for a specific use by specific persons and were not prepared with a view to public disclosure or to conform with any disclosure standards under securities laws or otherwise. These materials were not prepared for use by readers not as familiar with the business and affairs of the Company as the Board and, accordingly, neither the Board, the Company nor STRH or their respective advisors take any responsibility for these materials when used by persons other than the Board. These materials were provided on a confidential basis for the information of the Board and may not be disclosed to or shared with others (other than the Conflicts Committee’s advisors), in whole or in part, or summarized or otherwise referred to except as agreed to in writing by STRH. Notwithstanding the foregoing, STRH imposes no restrictions on the disclosure by the Conflicts Committee (including its representatives and agents) of the tax treatment or tax structure of any transaction, including those portions of any materials containing such information that are provided by STRH to the Conflicts Committee. Any tax statement contained in these materials regarding any U.S. federal tax is not intended or written to be used, and cannot be used, by any taxpayer for the purpose of avoiding any penalties. Each taxpayer should seek advice based on the taxpayer's particular circumstances from an independent tax advisor. STRH is not an expert on, and nothing contained herein should be construed as advice with regard to, legal, accounting, regulatory, insurance or tax matters. These materials necessarily are based on financial, economic, market and other conditions as in effect on, and the information made available to us as of, the date of these materials. STRH does not undertake any obligation to update, revise or reaffirm these materials. Any opinions expressed in these materials are subject to change without notice and may differ from or be contrary to other opinions expressed by STRH or its affiliates. These materials are not intended to provide the sole basis for evaluation of the Transaction, do not purport to contain all information that may be required and should not be considered a recommendation with respect to the Transaction. The analyses contained in these materials must be considered as a whole. Selecting portions of the analyses, without considering all analyses, would create an incomplete view. The implied reference range values indicated by STRH's analyses are illustrative and not necessarily indicative of actual values or predictive of future results or values, which may be significantly more or less favorable than those suggested by the analyses. In addition, any analyses relating to the value of assets, businesses or securities do not purport to be appraisals or to reflect the prices at which businesses or securities actually may be sold, which may depend on a variety of factors, many of which are beyond our control and the control of STRH. In preparing these materials, STRH has not conducted any physical inspection or independent appraisal or evaluation of any of the assets, properties or liabilities (contingent or otherwise) of the Company or any other participant in the Transaction, nor was STRH provided with any such appraisal or evaluation. STRH has assumed and relied upon the accuracy and completeness of the financial and other information obtained from management of the Company and other participants in the Transaction and public sources without assuming any responsibility for independent verification of such information, makes no representation or warranty (express or implied) in respect of the accuracy or completeness of such information and has further relied upon the assurances of the Company and other participants in the Transaction that they are not aware of any facts or circumstances that would make such information inaccurate or misleading. To the extent such information includes estimates and forecasts of future financial performance (including estimates of potential cost savings and synergies) prepared by or reviewed or discussed with managements of the Company and other participants in the Transaction or obtained from public sources, we have assumed that such estimates and forecasts have been reasonably prepared on bases reflecting the best currently available estimates and judgments of such managements (or, with respect to estimates and forecasts obtained from public sources, represent reasonable estimates). STRH takes no responsibility for such estimates or forecasts or the assumptions on which they are based. In addition, we have relied upon and assumed, without independent verification, that the final forms of the draft documents reviewed by us will not differ in any material respect from such draft documents. We and our affiliates have adopted policies and guidelines designed to preserve the independence of our and their research analysts. Our and their policies prohibit employees from directly or indirectly offering a favorable research rating or a specific price target, or offering to change a research rating or price target, as consideration for or an inducement to obtain business or other compensation. Our and their policies prohibit research analysts from being compensated for their involvement in investment banking transactions. This presentation is for informational purposes only and is being furnished on a confidential basis. By accepting this information, the recipient agrees that it will use the information only to evaluate the transaction referred to herein and for no other purpose and will not divulge any such information to any other party. This presentation does not constitute a commitment to lend money, underwrite any proposed transaction, purchase securities or other assets, provide financing, arrange financing, or provide any other services. SunTrust Robinson Humphrey, Inc. and its representatives and affiliates make no representation and have given you no advice concerning the appropriate regulatory treatment, accounting treatment, or possible tax consequences of the proposed transactions described herein. Prior to entering into any proposed transaction, you should determine, without reliance upon SunTrust Robinson Humphrey, Inc. or its representatives or affiliates, the economic risks and merits, as well as the legal, tax and accounting characteristics and consequences, of the transaction and that you are able to assume these risks. These materials should not be relied upon for the maintenance of your books and records or for any tax, accounting, legal or other purposes. Except as required by applicable law, we make no representation or warranty, express or implied, to you or to any person as to the content of the information contained herein. Opinions expressed herein are current opinions only as of the date indicated. Any historical price(s) or value(s) are also only as of the date indicated. We are under no obligation to update opinions or other information. |
2 Table of Contents Transaction Background [ 03 ] Financial Analyses – Acquisition of Crestwood’s GP & IDRs (Base Case) [ 15 ] Financial Analyses – Acquisition of Crestwood’s GP & IDRs (Challenge Case) [ 29 ] Summary Impact to NRGY and NRGY Unitholders [ 43 ] Appendix A: Pro Forma Financials [ 46 ] Appendix B: NRGY Distribution of NRGM Units [ 51 ] Appendix C: NRGM Merges with CMLP (Base Case) [ 65 ] Appendix D: NRGM Merges with CMLP (Challenge Case) [ 81 ] Financial Analyses – Acquisition of Crestwood’s GP & IDRs (Base Case) Financial Analyses – Acquisition of Crestwood’s GP & IDRs (Challenge Case) SECTION 1 SECTION 2 SECTION 3 SECTION 4 APPENDIX |
Transaction Background SECTION 1 |
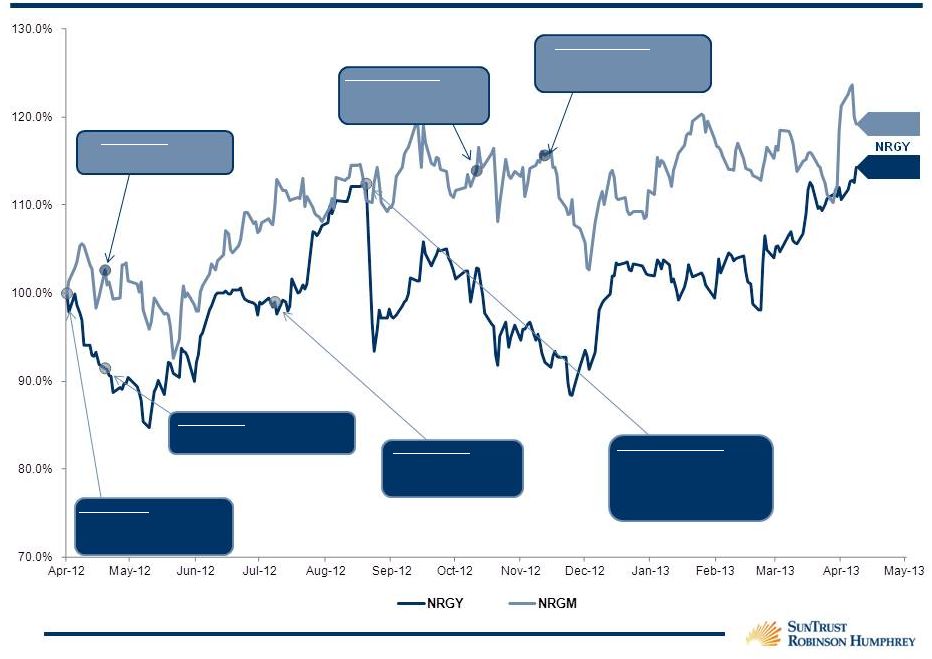
4 Inergy, L.P. (NYSE:NRGY) Company Overview (1) Based on fully diluted units outstanding as of 5/3/2013 per NRGY / NRGM management (2) Enterprise value = market capitalization + debt + minority interest + preferred – cash (3) 2014 and 2015 projections based on base case projections provided by NRGY / NRGM management Source: Capital IQ, Public Filings and NRGY Website Inergy, L.P. (“NRGY”), is a publicly traded master limited partnership whose operations include a natural gas storage business in Texas and an NGL supply logistics, transportation, and marketing business that serves customers in the United States and Canada. Through its general partner interest and majority equity ownership interest in Inergy Midstream, L.P., Inergy is also engaged in the development and operation of natural gas, NGL and crude oil storage, transportation, and logistics businesses in the Northeast region of the United States and in North Dakota. The company operates as the general partner of NRGM with incentive distribution rights and significant L.P. ownership. Headquarters: Kansas City, MO Ownership Profile: NYSE:NRGY Founded: 2001 CEO: John Sherman Areas of Operation Unit Price Chart Market Stats (3) Partnership Structure Price as of (5/03/13) $22.30 Market Capitalization (1) $2,937.8 52-Week High $22.45 Net Debt (Cash) 1,284.8 52-Week Low $16.40 Enterprise Value (2) $4,222.6 2014E P/CFPS 15.8x EV / 2014E EBITDA 20.8x 2015E P/CFPS 14.3x EV / 2015E EBITDA 18.7x Distribution Yield 5.2% Inergy, L.P. (NRGY) ~66% L.P. Interest (1) Inergy Midstream, L.P. (NRGM) Incentive Distribution Rights $550MM Senior Secured Bank Facility $600MM Senior Secured Bank Facility $500MM Senior Unsecured Notes 0 1,000 2,000 3,000 4,000 5,000 $10.00 $13.00 $16.00 $19.00 $22.00 $25.00 05/12 08/12 11/12 02/13 05/13 |
5 Inergy Midstream, L.P. (NYSE:NRGM) Company Overview (1) Based on fully diluted units outstanding as of 5/3/2013 per NRGY / NRGM management (2) Enterprise value = market capitalization + debt + minority interest + preferred – cash (3) 2014 and 2015 projections based on base case projections provided by NRGY / NRGM management Source: Capital IQ, Public Filings and NRGM Website Headquarters: Kansas City, MO Ownership Profile: NYSE:NRGM Founded: 2004 CEO: John Sherman Areas of Operation Unit Price Chart Operations Natural Gas Storage & Transportation: Stagecoach – Multi-cycle gas pipeline, 26.25 Bcf of working gas capacity Seneca Lake – 20 mile lateral pipeline, 1.5 Bcf of working gas capacity Steuben – 12.5 mile lateral pipeline, 6.2 Bcf of working gas capacity Thomas Corners – Eight mile lateral pipeline, 7.0 Bcf of working gas capacity Gas Storage Development – Project with potential of up to ~10 Bcf of capacity North/South Pipeline - ~325 MMcf/d of interstate transportation service Marc I Pipeline - 39 mile, 30 inch bi-directional gas pipeline NGL Storage: Bath - 1.5 MMbbls NGL storage facility 60 miles from Stagecoach Watkins Glen - Developing an initial 2.1 MMbbls of NGL storage at U.S. Salt Crude Terminalling: COLT Hub – Bakken Shale facility with 120,000 BPD rail loading capacity and 720,000 Bbl crude oil storage capacity U.S. Salt Operations: Industry-leading solution mining and salt production company Produces and sells over 300,000 tons of salt each year; >40 million barrels of previously solution mined cavern capacity convertible to energy storage Indicates assets owned by NRGM Market Stats (3) Price as of (5/03/13) $24.55 Market Capitalization (1) $2,109.9 52-Week High $26.01 Net Debt (Cash) 679.8 52-Week Low $18.31 Enterprise Value (2) $2,789.7 2014E P/CFPS 13.6x EV / 2014E EBITDA 12.5x 2015E P/CFPS 13.2x EV / 2015E EBITDA 11.5x Distribution Yield 6.4% 0 100 200 300 400 $10.00 $15.00 $20.00 $25.00 $30.00 05/12 08/12 11/12 02/13 05/13 Inergy Midstream, L.P . (“NRGM”) engages in acquiring, owning, developing, and operating midstream energy assets and is primarily involved in the storage and transportation of natural gas and natural gas liquids in northeast United States. Owns and operates four natural gas storage facilities located in NY and PA with an aggregate working gas storage capacity of 41.0 billion cubic feet (“Bcf”), natural gas pipelines located in NY and PA with 30 million cubic feet per day (MMcf/d) of intrastate transportation capacity; and 1.5 million barrel (MMbbls) natural gas liquids storage facility located near Bath, NY. NRGM was founded in 2005 and is based in Kansas City, MO. Inergy Midstream, L.P. is a subsidiary of Inergy, L.P. Inergy Midstream, L.P. |
6 Crestwood Overview Headquarters: Houston, TX Ticker: NYSE: CMLP Founded: 2010 CEO: Robert G. Phillips CMLP Market Statistics (3) Areas of Operation CMLP Historical Unit Performance Source: SNL Financial, company filings and company press releases *Denotes midpoint of management guidance (1) Based on fully diluted units outstanding as of 5/3/2013 per NRGY / NRGM management (2) Enterprise value = market capitalization + debt + minority interest + preferred – cash (3) 2014 and 2015 projections based on base case projections provided by NRGY / NRGM management CMLP Assets and Business Description Assets: ~850 miles of natural gas pipeline with ~1.6 Bcf/d of total capacity >200,000 horsepower of electric and gas-fired compression Three cryogenic processing units with total capacity of 360 MMcf/d ~575 MMcf/d of treating capacity across the Fayetteville, Haynesville and Barnett Shale Plays Business: More than 95% of Crestwood's revenue is fixed-fee under varying contract types Producers include: Antero Resources, Quicksilver Resources, BHP Billiton, BP, Chesapeake Energy, XTO, Devon, Comstock Resources, Forest Oil and Total CMLP’s GP and IDRs are owned by First Reserve Corporation, one of the largest energy-focused global private equity firms 0 1,000 2,000 3,000 4,000 5,000 $15.00 $18.00 $21.00 $24.00 $27.00 $30.00 05/12 08/12 11/12 02/13 05/13 Price as of (5/03/13) $23.85 Market Capitalization (1) $1,429.9 52-Week High $29.12 Net Debt (Cash) 598.5 52-Week Low $19.90 Enterprise Value (2) $2,028.5 2014E P/CFPS 9.7x EV / 2014E EBITDA 10.1x 2015E P/CFPS 7.3x EV / 2015E EBITDA 7.7x Distribution Yield 8.6% Crestwood Midstream Partners LP (“CMLP”) is a master limited partnership engaged in the gathering, processing, treating, compressing, transporting, and selling of natural gas in the U.S. Crestwood services more than 1,250 natural gas wells across the Barnett, Fayetteville, Granite Wash, Marcellus, Avalon Shale/Bone Spring and Haynesville/Bossier shales. |
7 First Reserve Overview Realized Investments / Illustrative Historical Returns Crestwood Investment & Growth Initial Investment October 1, 2010: CMLP and the Partnership’s GP was purchased from Quicksilver Resources Inc. by First Reserve for $701MM and additional earn out payments of up to $72MM CMLP’s EBITDA grew at a CAGR of 29.6% from 9/30/10 to 9/30/12 Continued Financial Support March 26, 2012: CMLP and Crestwood Holdings LLC acquired Antero Resources’ Marcellus Shale Gathering assets for $382MM CMLP and Crestwood Holdings formed a joint venture, Crestwood Marcellus Midstream LLC (“CMM”) to acquire the assets CMLP initially owned 35% of CMM and Crestwood Holdings owned the remaining 65% The formation of the joint venture allowed CMLP to purchase the Marcellus assets without overstress to CMLP’s balance sheet January 8, 2013: The remaining 65% of CMM was dropped down to CMLP The drop-down allowed First Reserve to reset Crestwood Holdings for future greenfield and M&A transactions First Reserve has significant experience in the midstream sector and maintains strong producer and service provider relationships First Reserve Corporation (“First Reserve”) is a global energy-focused private equity and infrastructure investment firm with $23.1BN of raised capital and $18BN in equity invested since the firm’s since inception Founded in 1983 and headquartered in Greenwich, CT with offices in Houston, London and Hong Kong Recent Midstream Investments Midstream and CMLP Producer Portfolio Companies RKI Exploration Source: SNL Financial, company filings and company press releases One of the largest energy-focused private equity firms globally with more than $20BN in assets under management Date Value ($MM) at Return Acquired Sold Investment Purchase Sale Sold To CoC CAGR Ownership Description Partners 4/29/08 1/18/11 Bahamas Oil Refining Company (BORCO) $440 $1,360 Buckeye Partners, L.P. 3.1x 51.3% 80% Independent storage terminal with a capacity of 20MMbbls located in Freeport, Bahamas Vopak Bahamas B.V. 3/1/08 Active Investment PBF Energy (1) $667 $837 Initial Public Offering (December 2012) 1.3x 4.8% 33% PPHN, BG and FR announced a partnership to pursue the acquisition of crude refineries in the United States. Each partner committed $667MM of equity capital to the partnership Petroplus Holdings AG (PPHN) The Blackstone Group (BG) 3/21/05 11/15/06 LB Pacific, LP NA $140 Plains All American Pipeline, L.P. NA NA 30% GP of Pacific Energy Partners, L.P., an MLP engaged in the business of gathering, transporting, storing and distributing crude oil and related products Lehman Brothers Merchant Banking Group (1) Value at Sale reflects market capitalization at completion of IPO illustrated based on a one-for-one exchange of PBF LLC Series A Units for new Class A common stock; CAGR as of 12/13/12 |
8 Proposed Transaction Overview & Rationale The proposed transaction involves Inergy partnering with First Reserve, one of the largest, energy focused private equity funds in the world and merging NRGM with one of First Reserve’s publicly held portfolio companies, CMLP CMLP is a midstream MLP with gathering and processing assets in several of the major U.S. Shale plays The company has a market cap of $1.4 billion and an enterprise value that exceeds $2.0 billion Crestwood has an experienced management team led by Robert Phillips, former president of El Paso Energy Services, Enterprise Products Partners L.P. (“EPD”), and GulfTerra Energy Partners, L.P. (“GulfTerra”) and an industry veteran with more than 30 years of experience. Robert has been involved in a large number of complex midstream energy transactions, including the merger of GulfTerra and EPD The proposed combination of Inergy and Crestwood would be a transformative transaction that would create a large-scale midstream partnership with access to future growth projects and a high-quality foundation of stable fee-based assets Source: NRGY management Inergy LP’s acquisition of Crestwood Holdings’ Interests in CMLP Increases scale and asset diversification with midstream assets in most U.S. shale plays Complementary union of gathering and processing assets with storage, pipeline, and NGL assets Improved access to capital and ability to participate in larger projects due to scale and scope Fee-based income and contracted cash flows help mitigate commodity price exposure Ongoing growth support from three active avenues, organic projects, acquisitions and drop-downs from GP Enhances depth of management Proposed Transaction Overview Merger of NRGM and CMLP Opportunity to become a pure-play GP with anticipated drop- down of remaining operating assets at NRGY to pro forma partnership Future potential to warehouse additional development assets before contributing to pro forma partnership Strong private equity partner in First Reserve that is capable of supporting the continued growth of the business Publicly-held units provide access to capital and currency for future acquisitions Enhanced, experienced management teams |
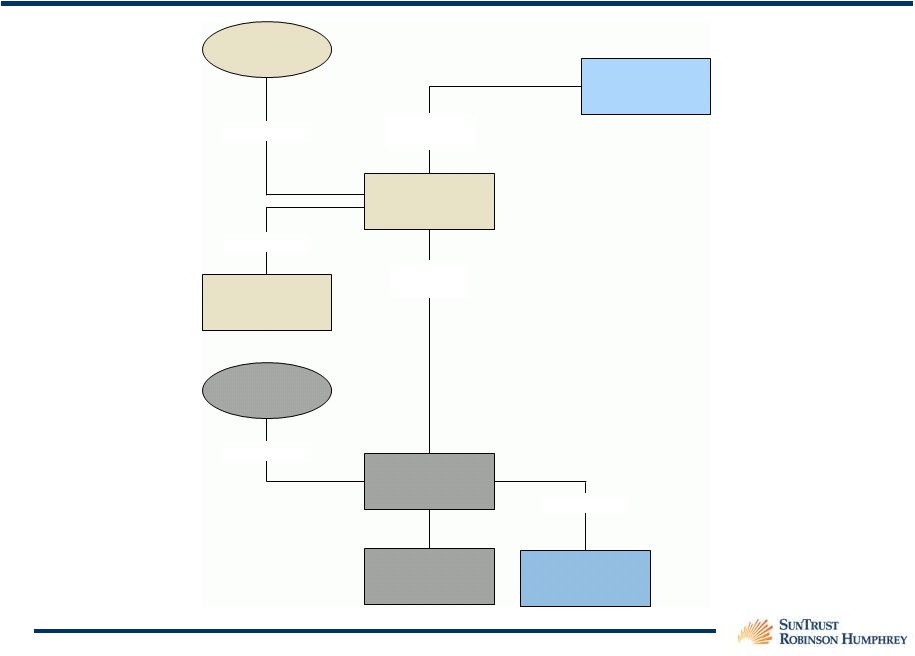
9 Summary Transaction Steps (1) Crestwood Holdings LLC (“CH”) acquires Inergy Holdings GP (“IHGP”) for cash payment of $80MM Step 1: Crestwood Acquires Inergy Holdings GP from Stakeholders Source: NRGY management (1) Summary of key transaction terms only. Please refer to each of the agreements for a complete description of each of the transactions NRGY distributes 100% of the units it holds in NRGM to existing NRGY unitholders before NRGY’s acquisition of Crestwood Holdings’ GP and IDR interest in CMLP Step 2: NRGY Distributes NRGM Units Step 3B: NRGY Acquires CMLP Units from CH CH is granted a one-time option to acquire up to a 29% interest in NRGY pro forma CH will have the option to contribute to NRGY either CMLP units or NRGM units in exchange for common units of NRGY NRGY acquires CMLP’s GP and IDR interest debt-free from CH for $450MM in the form of NRGY units (common and subordinated) The number of NRGY units shall be calculated by deducting the fair market value of the NRGM units distributed to the NRGY unitholders from the equity value of NRGY immediately prior to the distribution of the NRGM units The value of the NRGY and NRGM units are calculated based on the weighted average of the unit price at market closing for the 20 days prior to the execution of a definitive agreement Step 3A: NRGY Acquires Crestwood’s GP & IDRs Description of Transaction Steps Step 4: NRGM Merges with CMLP (“MLP Merger”) NRGM acquires CMLP in a 100% unit-for-unit exchange to be done at (i) an agreed upon premium not to exceed 5% for CMLP units and (ii) a one-time payment to CMLP unitholders not to exceed $25MM (an amount to prevent CMLP unitholders from incurring distribution dilution through calendar year 2015) NRGM and CMLP unit pricing and exchange ratio to be based on the weighted average of the unit price at market closing for the 20 days prior to the execution of a definitive agreement Definitive agreement for MLP Merger to be negotiated and executed simultaneously with GP transaction – closing of MLP Merger not to be a condition of GP transaction NRGY will transfer the Interests to NRGM GP, LLC, and the CMLP general partner units will be converted into a non-economic general partner interest and the CMLP incentive distribution rights will be cancelled, and NRGM GP, LLC will receive a right to any capital accounts in CMLP associated with the conversion of such CMLP general partner units and the cancellation of such CMLP incentive distribution rights and no additional consideration |
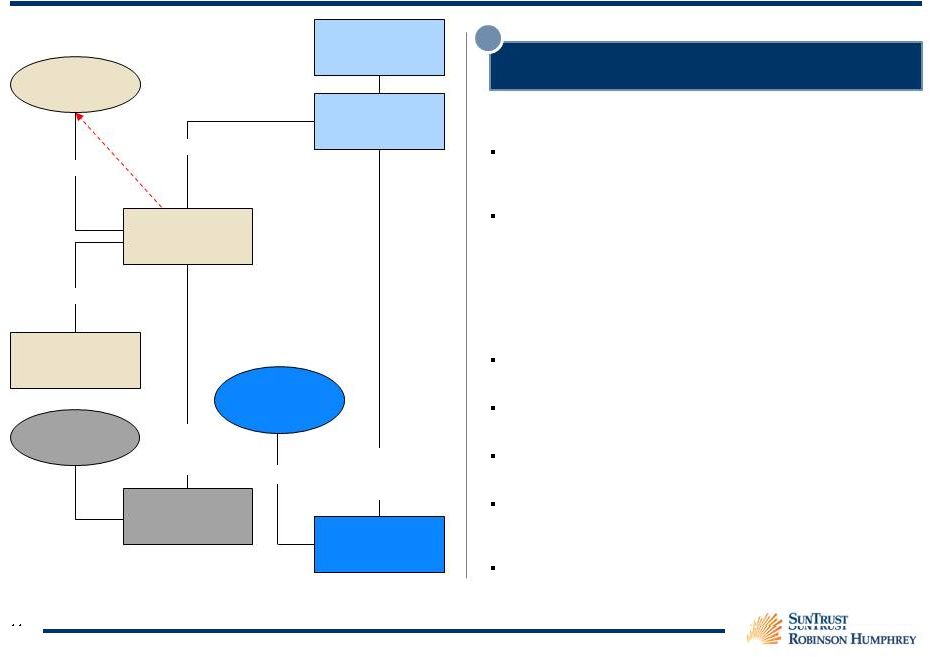
10 Step 1: Transaction Step Summary (1)(2)(3) Inergy Holdings GP Crestwood Holdings LLC CMLP NRGM CMLP Public Unitholders LP Interest, GP Control + IDRs GP Control NRGY NRGY Operating Assets 100% Interest LP Interest Crestwood Holdings Acquires Inergy Holdings GP from Inergy Holdings GP Stakeholders for Cash 1 Key Considerations Purchase price is $80 million dollars Represents 1.9% of NRGY’s current enterprise value of $4,223MM (4) Crestwood Holdings Partners will directly control Inergy, L.P. (NRGY) and Crestwood Holdings LLC (“Crestwood Holdings”) and will indirectly control Inergy Midstream, L.P. (“NRGM”) and Crestwood Midstream Partners LP (CMLP) Crestwood Holding Partners is controlled by First Reserve and senior management of Crestwood Holdings / CMLP Private-to-private transaction; no approvals required from NRGY or Crestwood Holdings First Reserve’s ability and desire to invest additional capital is a positive from NRGY’s point of view Timing to complete expected to be less than one month Source: Public Filings and company investor presentations (1) Summary of key transaction terms only. Please refer to each of the agreements for a complete description of each of the transactions (2) Steps 1-4 are assumed to occur simultaneously (3) Step 4 (Merger of NRGM and CMLP) not a condition for closing of Step 3 (NRGY acquisition of CMLP general partner IDRs and portion of CMLP LP interest from Crestwood Holdings) (4) Based on NRGY unit price of $22.30 as of 5/3/2013, fully diluted units outstanding as of 5/3/2013 per NRGY / NRGM management and net debt of $1,285 million as of 12/31/2012 Crestwood Holdings Partners NRGY Public Unitholders NRGM Public Unitholders LP Interest, GP Control + IDRs |
11 Step 2: Transaction Step Summary (1)(2)(3) NRGY Distributes 100% of its NRGM LP Ownership Interest Pro Rata to Existing NRGY Unitholders 2 Key Considerations Based on 131.740 (4) million units of NRGY currently outstanding and NRGY’s ownership of 56.399 (4) million units of NRGM; each holder of one unit of NRGY will receive 0.428 NRGM units NRGY’s unit price is expected to decline by the amount of value of NRGM units distributed to each NRGY unitholder – Currently $10.51 of value related to NRGM units will be distributed to each NRGY unit (5) – Pro Forma NRGY unit price is expected to be $11.79 ($22.30 less $10.51) (5) NRGY retains its legacy operating assets, GP control of NRGM and NRGM IDRs NRGY will need to reduce its quarterly distribution due to the loss of cash flow from its stake in NRGM The distribution of NRGM units to NRGY unit holders is expected to be a tax-free transaction Likely to need an underwritten amendment to the NRGY Credit Agreement to allow for the distribution of NRGM units to NRGY unit holders Timing to complete expected to be less than one month GP Control NRGY NRGY Operating Assets 100% Interest LP Interest, GP Control + IDRs NRGY Public Unitholders LP Interest NRGM Crestwood Holdings LLC CMLP CMLP Public Unitholders LP Interest, GP Control + IDRs LP Interest Crestwood Holdings Partners NRGM Public Unitholders Source: Public Filings and company investor presentations (1) Summary of key transaction terms only. Please refer to each of the agreements for a complete description of each of the transactions (2) Steps 1-4 are assumed to occur simultaneously (3) Step 4 (Merger of NRGM and CMLP) not a condition for closing of Step 3 (NRGY acquisition of CMLP general partner IDRs and portion of CMLP LP interest from Crestwood Holdings) (4) Assumes projected unit count as of 5/3/2013 per NRGY / NRGM management (5) Pricing as of 5/3/2013 close |
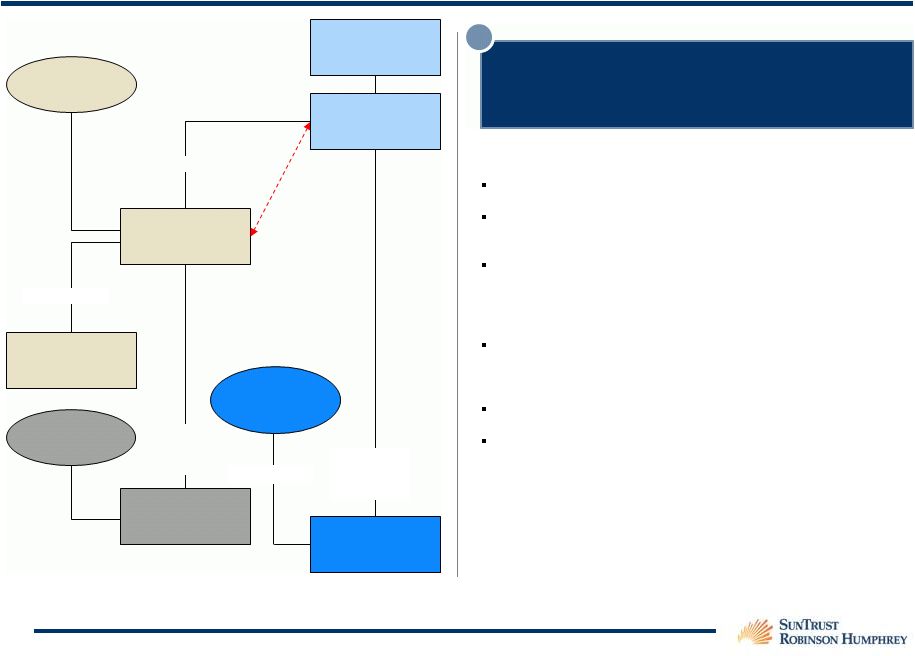
12 Step 3: Transaction Step Summary (1)(2)(3) NRGY Acquires CMLP General Partner, IDRs, and Some Portion of Crestwood Holdings’ Interest in CMLP (or Pro Forma NRGM Units) (4) in Exchange for NRGY Units (Debt Free) 3 Key Considerations Purchase price is $450 million and will be structured as an asset deal Pro forma NRGY will own its legacy operating assets, NRGM IDRs, CMLP IDRs and some CMLP units Pro forma NRGY unit price (post-distribution of NRGM stake) will be calculated based on the 20-day average of the NRGY and NRGM unit prices to determine the number of NRGY units (common and subordinated) to be issued to Crestwood Holdings CH is granted a one-time option to acquire up to a 29% interest in NRGY pro forma. CH will have the option to contribute to NRGY either CMLP units or NRGM units in exchange for common units of NRGY No unit holder vote required by either party to approve the transaction Timing to complete expected to be less than one month GP Control NRGY NRGY Operating Assets 100% Interest LP Interest, GP Control + IDRs NRGM Source: SEC Filings, company investor presentations and Capital IQ (1) Summary of key transaction terms only. Please refer to each of the agreements for a complete description of each of the transactions (2) Steps 1-4 are assumed to occur simultaneously (3) Step 4 (Merger of NRGM and CMLP) not a condition for closing of Step 3 (NRGY acquisition of CMLP general partner IDRs and portion of CMLP LP interest from Crestwood Holdings) (4) Determination of units to be made at Crestwood’s discretion; pricing to be determined at time of transaction NRGY Public Unitholders Crestwood Holdings LLC CMLP CMLP Public Unitholders LP Interest, GP Control + IDRs LP Interest Crestwood Holdings Partners NRGM Public Unitholders |
13 NRGM Public Unitholders Step 4: Transaction Step Summary (1)(2)(3) NRGY Public Unitholders NRGM Acquires CMLP from Crestwood Holdings and Public Unitholders in a Unit-for-Unit Exchange Plus a One-Time Cash Payment 4 Key Considerations Pro forma NRGM will own legacy operating assets of NRGM and CMLP NRGY will transfer the Interests to NRGM GP, LLC, and the CMLP general partner units will be converted into a non-economic general partner interest and the CMLP incentive distribution rights will be cancelled, and NRGM GP, LLC will receive a right to any capital accounts in CMLP associated with the conversion of such CMLP general partner units and the cancellation of such CMLP incentive distribution rights and no additional consideration Assuming a 5% premium to the 20-day VWAP average unit price of CMLP and the 20-day VWAP average unit price of NRGM, each unit of CMLP will receive 1.070x units of NRGM CMLP unitholders will own 13.7% of NRGM Exchange ratio determines relative ownership Pro forma capital structure at NRGM (impact on legacy debt at NRGM and CMLP) Unit holder vote required for CMLP (but not for NRGM) to approve the transaction Transaction #4 is not contingent upon the other transactions described in Steps 1 – 3 Timing to complete expected to be approximately 4 months CMLP Public Unitholders LP Interest + GP Control NRGY NRGY Operating Assets 100% Interest GP Control + IDRs LP Interest NRGM LP Interest LP Interest, GP Control + IDRs Source: SEC Filings, company investor presentations and Capital IQ (1) Summary of key transaction terms only. Please refer to each of the agreements for a complete description of each of the transactions (2) Steps 1-4 are assumed to occur simultaneously (3) Step 4 (Merger of NRGM and CMLP) not a condition for closing of Step 3 (NRGY acquisition of CMLP general partner IDRs and portion of CMLP LP interest from Crestwood Holdings) Crestwood Holdings LLC Crestwood Holdings Partners CMLP |
14 Pro Forma Transaction Structure (1) Source: NRGY / NRGM management (1) Summary of key transaction terms only. Please refer to each of the agreements for a complete description of each of the transactions LP Interest + GP Control 100% Interest GP Control + IDRs NRGM Crestwood Holdings LLC Former CMLP Operating Assets 100% Interest LP Interest NRGM Public Unitholders LP Interest NRGM Operating Assets NRGY Public Unitholders NRGY NRGY Operating Assets |
SECTION 2 Financial Analyses – Acquisition of Crestwood’s GP & IDRs (Base Case) |
16 Pro Forma NRGY Unit Price & Units Issued (1) Based on 20-day VWAP as of 5/3/2013 per Bloomberg ($ in millions, except per unit amounts) Step 2: NRGY Distributes NRGM Units Beginning NRGM Units Owned by NRGY 56.399 Less NRGM Units Retained by NRGY 0.000 NRGM Units Distributed to Unitholders 56.399 Current NRGM Unit Price (1) $24.00 Market Value of NRGM Units Distributed $1,353.6 NRGY Current Units Outstanding 131.740 NRGY Current Unit Price (1) $21.67 NRGY Current Market Capitalization $2,854.8 Less: Market Value of Units Distributed (1,353.6) Pro Forma NRGY Market Capitalization $1,501.2 Implied Pro Forma NRGY Unit Price $11.40 NRGM Units Distributed to Unitholders 56.399 NRGY Current Units Outstanding 131.740 NRGM Units Distributed per NRGY Unit 0.428x |
17 Step #3A: NRGY Acquires Crestwood's GP & IDRs CMLP GP Purchase Price $450.0 Implied Pro Forma NRGY Unit Price (Post-Spin) $11.40 NRGY Units Issued to Crestwood Holdings for GP & IDRs 39.491 Step #3B: NRGY Acquires CMLP Units from Crestwood Holdings Crestwood Holdings Target Interest in Pro Forma NRGY 29.0% NRGY Current Units Outstanding 131.740 Target NRGY Units Issued 53.809 Less: NRGY Units Issued for GP & IDRs 39.491 Additional NRGY Units Issued to Crestwood Holdings 14.318 Implied Pro Forma NRGY Unit Price (Post-Spin) $11.40 Value of Additional NRGY Units Issue to Crestwood Holdings $163.2 CMLP Current Unit Price $24.46 CMLP Units Acquired from Crestwood Holdings (at market) 6.671 Pro Forma NRGY Unit Price & Units Issued ($ in millions, except per unit amounts) = 53.8MM (29%) |
18 Status Quo Pro Forma (1) # Investor # Units Ownership (%) # Units Ownership (%) 1. Crestwood Holdings 0.0 0.0% 53.8 29.0% 2. John J. Sherman 19.1 14.5% 19.1 10.3% 3. Neuberger Berman LLC 12.9 9.8% 12.9 7.0% 4. Kayne Anderson Capital Advisors, L.P. 8.5 6.4% 8.5 4.6% 5. Advisory Research, Inc. 5.5 4.2% 5.5 3.0% 6. Cushing MLP Asset Management, LP 3.7 2.8% 3.7 2.0% 7. UBS Global Asset Management 2.6 2.0% 2.6 1.4% 8. William C. Gautreaux 2.5 1.9% 2.5 1.3% 9. Phillip L. Elbert 2.1 1.6% 2.1 1.1% 10. Merrill Lynch & Co. Inc., Asset Management 1.9 1.4% 1.9 1.0% 11. Invesco Ltd. 1.9 1.4% 1.9 1.0% 12. ClearBridge Investments, LLC 1.7 1.3% 1.7 0.9% 13. Morgan Stanley Investment Management Inc. 1.6 1.2% 1.6 0.9% 14. Commerce Investment Advisors, Inc. 1.1 0.8% 1.1 0.6% 15. Credit Suisse, Investment Banking and Securities Investments 1.0 0.8% 1.0 0.5% 16. All Others 65.8 49.9% 65.8 35.4% Total 131.7 100.0% 185.5 100.0% NRGY Unitholder Composition – Status Quo & Pro Forma for Step 3 Source: SEC Filings and Capital IQ (1) Pro forma for NRGY acquisition of Crestwood GP and NRGY acquiring CMLP units from Crestwood Holdings (2) 39.5 units received for the sale of CMLP GP & IDRs for $450 million of PF NRGY units and the exchange of 6.7 CMLP units for 14.3 PF NRGY units NRGY Unitholder Summary (2) |
19 Calculation of CMLP IDR Payment to NRGY (Base Case) Source: SEC Filings, company investor presentations and Capital IQ (1) Per CMLP splits and coverage ratio (2) Per NRGM splits and coverage ratio ($ in millions) 2014E 2015E 2016E 2017E Stand Alone CMLP Revenue $283.4 $351.1 $391.7 $429.8 EBITDA $201.1 $262.4 $298.5 $332.4 Less: Interest Expense (48.9) (62.2) (67.2) (72.7) Less: Maintenance Capex (7.9) (7.6) (8.6) (11.1) Plus: Non-cash Compensation 4.3 4.7 4.9 5.1 Distributable Cash Flow $148.5 $197.3 $227.6 $253.7 CMLP Coverage Ratio Assumptions 0.97x 1.05x 1.05x 1.05x To LP Unit Holders (1) 125.2 144.0 158.4 170.8 To GP for IDRs (1) 28.1 44.0 58.4 70.8 Total Cash Distributions Paid $153.3 $187.9 $216.7 $241.6 Merger Adjustments to Pro Forma CMLP Distributable Cash Flow Stand Alone Distributable Cash Flow $148.5 $197.3 $227.6 $253.7 Less: Non-cash Compensation (4.3) (4.7) (4.9) (5.1) Less Interest Expense 1.8 10.7 14.1 15.4 Synergies 5.0 10.0 15.0 15.0 Pro Forma Distributable Cash Flow $151.1 $213.3 $251.8 $279.0 Pro Forma NRGM Implied Coverage Ratio Assumptions 1.05x 1.05x 1.05x 1.05x To LP Unit Holders (2) 120.6 152.7 171.9 184.6 To GP for IDRs (2) 23.3 50.4 67.9 81.1 Pro Forma Total Cash Distributions Paid $144.0 $203.1 $239.8 $265.8 |
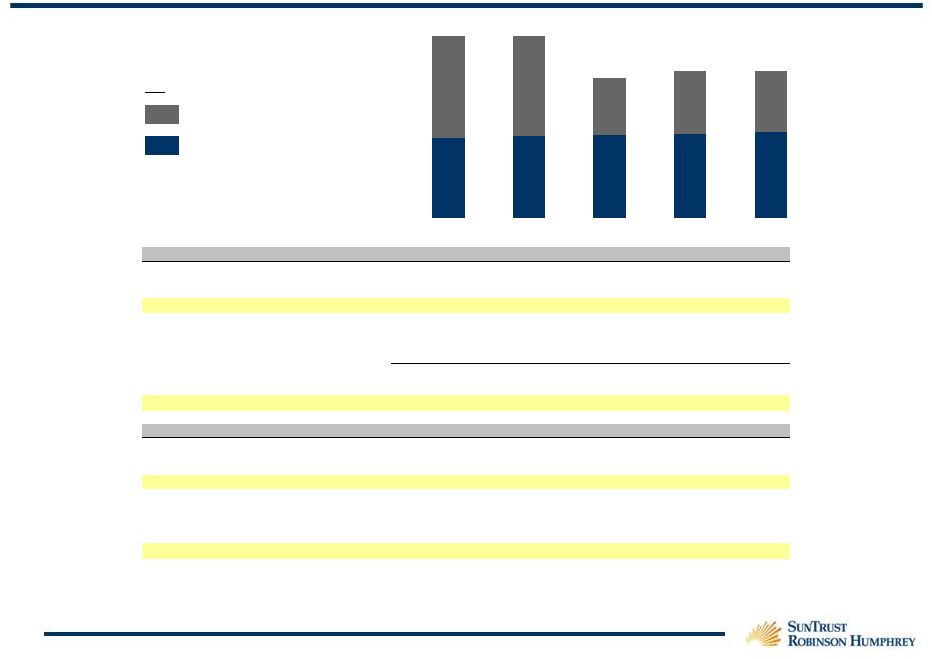
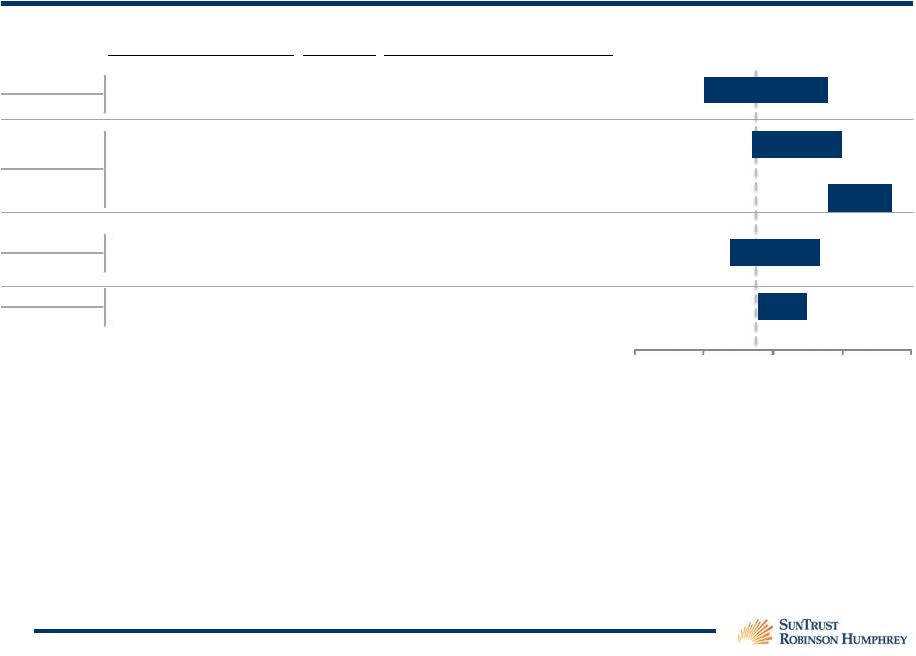
20 Financial Analyses Summary (Base Case) (1) Selected Transactions: Public Comparables: Selected Transactions: Public Comparables: ($ in millions) Source: Company management (1) No particular weight given to any analysis (2) Provided by NRGY management (3) The range of discount rates is based on the calculation of the sum of NRGY’s current yield (5.2%) and the current - 2017 LP distribution CAGR (8.9%) (2) (3) $450MM Consideration Financial Metric Statistic Implied Multiple Equity Value Reference Range 2014E Yield $23.3 Million 4.5% - 3.5% 2014E GP Distributions $23.3 Million 18.0x - 22.0x Discounted Cash Flow 2014E Yield $28.1 Million 4.5% - 3.5% 2014E GP Distributions $28.1 Million 18.0x - 22.0x Discounted Cash Flow $875 $506 $624 $995 $419 $518 $1,108 $618 $803 $1,261 $513 $666 $200 $500 $800 $1,100 $1,400 Discount Rate: 13.0% - 15.0% Terminal Multiple: 18.0x - 22.0x Discount Rate: 13.0% - 15.0% Terminal Multiple: 18.0x - 22.0x (3) |
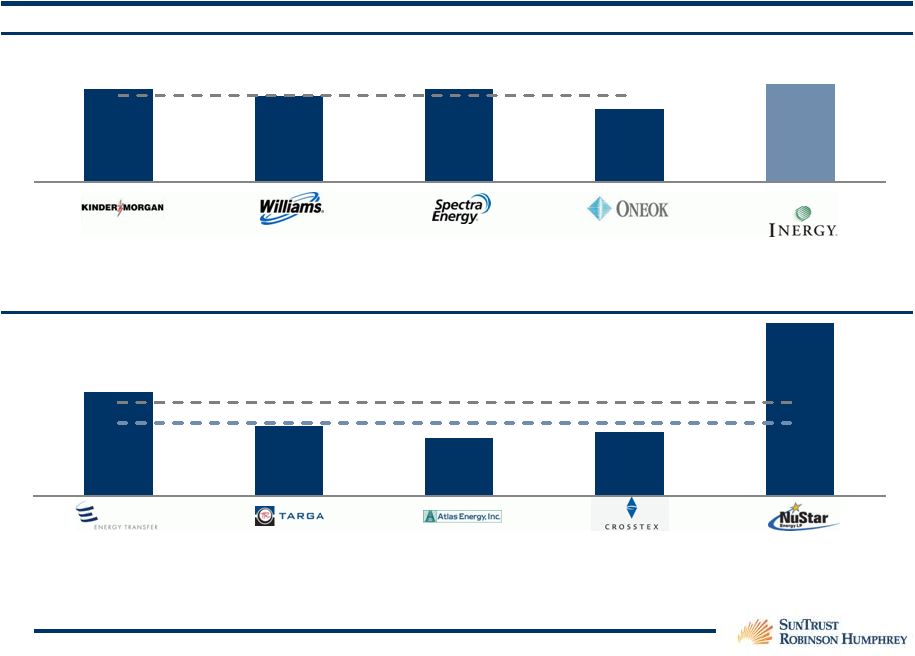
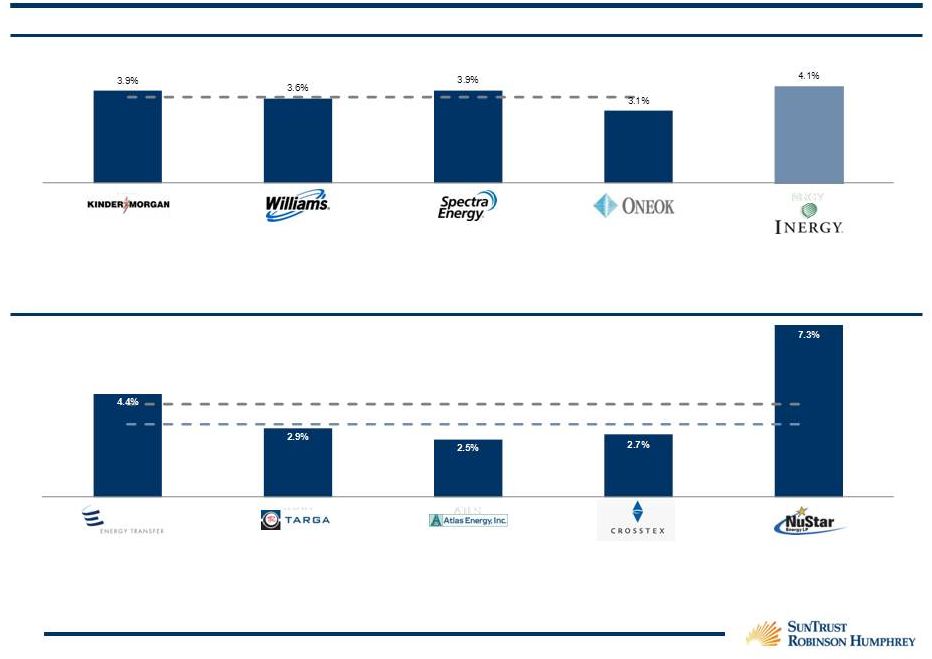
21 Selected GP Yield Analysis Pure Play GP Mean: 4.0% Pure Play GP Mean (Excluding NSH): 3.1% Pure Play GP: Yields EV: (1) Market Cap: $52.8BN $16.5BN $7.0BN $2.9BN $6.2BN $2.7BN $2.7BN $876MM $1.3BN $1.3BN Source: Capital IQ, SEC filings and company press releases Note: Market cap based on closing unit price as of 5/3/2013 (1) Enterprise value includes debt consolidated from respective underlying MLPs (2) Pro forma NRGY yield post-spin of NRGM units; Total units outstanding as of 5/3/2013 per NRGY / NRGM management and net debt of $1,285 million as of 12/31/2012 GPs with Assets: Yields EV: (1) Market Cap: $35.3BN $20.8BN $38.4BN $25.8BN $84.1BN $40.2BN $18.9BN $9.9BN Pro Forma GPs with Assets Mean: 3.6% (2) $2.8BN $1.6BN 4.4% 2.9% 2.5% 2.7% 7.3% 3.9% 3.6% 3.9% 3.1% 4.1% |
22 Implied G.P. Equity Value / Announce Stake GP Equity G.P. Distributions Date Acquiror Target MLP Acquired Value NTM N+2 12/11/12 Williams Companies, Inc. Access Midstream Ventures, LLC Access Midstream Partners, L.P. 50.0% $1,303 37.6x * 13.3x 06/06/12 Global Infrastructure Partners Access Midstream Ventures, LLC Access Midstream Partners, L.P. 50.0% 701 42.9x * 18.8x 03/13/11 Kirby Corporation K-Sea General Partner GP LLC K-Sea Transportation Partners, L.P. 100.0% 20 NM NM 12/28/10 Genesis Energy LP Genesis Energy LP IDRs and GP Interest Genesis Energy LP 100.0% 690 25.3x 19.5x 12/10/10 Occidental Petroleum, The Energy & Minerals Group, Kayne Anderson, First Reserve and other investors Plains All American Pipeline, L.P. GP Interests Plains All American Pipeline, L.P. 50.1% 3,308 15.7x 13.1x 09/21/10 Penn Virginia Resource Partners, L.P. Penn Virginia GP Holdings, L.P. Penn Virginia Resource Partners, L.P. 100.0% 466 14.5x 12.7x 09/07/10 Enterprise Products Partners L.P. Enterprise GP Holdings L.P. Enterprise Product Partners L.P. 100.0% 5,817 17.1x 15.4x 08/09/10 Inergy, L.P. Inergy Holdings, L.P. Inergy, L.P. 100.0% 2,022 21.6x 18.5x 06/11/10 Buckeye Partners, L.P. Buckeye GP Holdings L.P. Buckeye Partners, L.P. 100.0% 1,163 20.6x 18.8x 05/10/10 Energy Transfer Equity, L.P. Regency GU GP LLC Regency Energy Partners LP 100.0% 300 24.8x NA MEAN 85.0% $1,579 19.9x 16.3x MEDIAN 100.0% $932 20.6x 16.9x HIGH 100.0% $5,817 25.3x 19.5x LOW 50.0% $20 14.5x 12.7x Selected Transaction Analysis Source: Company filings, Capital IQ, SNL Financial and Wall Street equity research estimates Note: Projected G.P. distributions based on pre-announce Wall Street equity research estimates unless otherwise noted below\ * Denotes multiples excluded from mean and median calculations (1) NTM represents the next twelve months from the date of announcement (2) N+2 represents the subsequent twelve months or two years forward from the date of announcement (3) Assumes a transaction value of $1,823MM less the implied equity value of the 34.5MM sub-units of AMCP at ACMP’s 12/10/2012 closing unit price of $33.92; G.P. distributions based on post- announce consensus estimates, including the contemplated acquisition of assets from Chesapeake Energy (4) Assumes a total transaction value of $2,000MM less the implied equity value of 34.5MM sub-units and 33.7MM common units of ACMP at ACMP’s 6/5/2012 closing unit price of $24.17 (5) Based on 202,447 general partner units priced at $8.15 / unit and $18MM of cash consideration; According to Wall Street equity research, the G.P. was not expected to received any distributions throughout the projection period (6) Assumes a total transaction value of $690MM based on the implied value of 20.0MM GEL common units, 7.0MM GEL waiver units and a 12/27/2010 closing GEL unit price of $25.57 (7) G.P. equity value based on Occidental Petroleum’s 13% stake acquired for ~$430MM, per OXY’s 12/31/2010 10K filing (8) Assumes 38.3MM units of PVR were issued as consideration to the G.P. unit holders; Equity value and projected G.P. distributions excludes 19.6MM PVR units already owned by the G.P. (9) Assumes 208.8MM EPD units were issued as consideration to the G.P. unit holders and a EPD closing price of $38.45 as of 9/3/2010; Equity value and projected G.P. distributions excludes 21.6MM units of EPD already owned by the G.P., as well as 39.0MM ETE L.P. units (at a 9/3/2010 ETE closing price of $35.49 / unit) also owned by the G.P. (10) Assumes 47.7MM units of NRGY are issued to NRGP at a 8/6/2010 closing price of $43.37 / unit; Equity value and projected G.P. distributions excludes 1.1MM NRGY units already owned by NRGP (11) Assumes 20.0MM units of BPL are issued to the G.P. unit holders at a 6/10/2010 BPL closing price of $58.17 / unit (12) G.P. equity value represents preferred units in ETE with a stated value of ~$300MM per Regency Energy Partners LP’s SEC filing (13) Transactions multiples denoted with an asterisk (“*”) have been excluded from the mean, median, high and low statistics (1) (2) (3) (4) (5) (6) (7) (8) (9) (10) (11) (12) (13) (13) (13) (13) ($ in millions) |
23 Discounted Cash Flow Analysis Cash Flow Terminal Multiple 18.0x 20.0x 22.0x Discount Rate 13.0% 14.0% 15.0% 13.0% 14.0% 15.0% 13.0% 14.0% 15.0% Discounted GP Distributions ('14 - '17) $166.8 $163.4 $160.2 $166.8 $163.4 $160.2 $166.8 $163.4 $160.2 Present Value of Terminal Value ('17) $895.3 $864.3 $834.6 $994.8 $960.4 $927.4 $1,094.3 $1,056.4 $1,020.1 GP & IDR Implied Equity Value $1,062.1 $1,027.8 $994.8 $1,161.6 $1,123.8 $1,087.6 $1,261.1 $1,219.8 $1,180.3 Financial Projections Fiscal Year-Ending September 30, 2014E 2015E 2016E 2017E CMLP IDR & GP Interest Payment to NRGY $23.3 $50.4 $67.9 $81.1 Discounted Cash Flow Analysis of CMLP GP Interest and IDRs (Merger Completed / Base Case) ($ in millions) (1) Note: Assumes midpoint convention to discount projection period free cash flow (1) The range of discount rates is based on the calculation of the sum of NRGY’s current yield (5.2%) and the current - 2017 LP distribution CAGR (8.9%) |
24 Discounted Cash Flow Analysis Cash Flow Terminal Multiple 18.0x 20.0x 22.0x Discount Rate 13.0% 14.0% 15.0% 13.0% 14.0% 15.0% 13.0% 14.0% 15.0% Discounted GP Distributions ('14 - '17) $152.2 $149.3 $146.5 $152.2 $149.3 $146.5 $152.2 $149.3 $146.5 Present Value of Terminal Value ('17) $781.6 $754.5 $728.6 $868.5 $838.4 $809.6 $955.3 $922.2 $890.6 GP & IDR Implied Equity Value $933.9 $903.9 $875.1 $1,020.7 $987.7 $956.1 $1,107.6 $1,071.5 $1,037.0 Financial Projections Fiscal Year-Ending September 30, 2014E 2015E 2016E 2017E CMLP IDR & GP Interest Payment to NRGY $28.1 $44.0 $58.4 $70.8 Discounted Cash Flow Analysis CMLP GP Interest and IDRs (Merger Not Completed / Base Case) ($ in millions) (1) Note: Assumes midpoint convention to discount projection period free cash flow (1) The range of discount rates is based on the calculation of the sum of NRGY’s current yield (5.2%) and the current - 2017 LP distribution CAGR (8.9%) |
25 Overview of NRGM and CMLP Merger Source: Project Intrepid 5/5/2013 discussion materials Note: Market data as of 5/3/2013 (1) Based on 20-day VWAP as of 5/3/2013 per Bloomberg ($ in millions, except per unit amounts) Step 4: NRGM Merges with CMLP CMLP Current Unit Price (1) $24.46 Offer Premium 5.0% Offer Price Per CMLP Unit $25.68 CMLP Total Units Outstanding 59.955 Equity Offer Value for CMLP $1,539.8 NRGM Current Unit Price (1) $24.00 NRGM Units Issued 64.154 Implied Merger Exchange Ratio 1.070x Beginning CMLP Units Owned by Crestwood Holdings 25.872 Less: CMLP Units Acquired by NRGY (6.671) Pro Forma CMLP Units Owned by Crestwood Holdings 19.201 CMLP Units "Owned" by NRGY 6.671 Merger Exchange Ratio 1.070x NRGM Units Issued to NRGY for Merger 7.138 NRGM Special Cash Distribution to CMLP Cash Payment for Special Distribution $25.0 CMLP Units Outstanding 59.955 Special Distribution to CMLP Unitholder $0.42 Implied Premium to Current CMLP Unit Price 1.7% |
26 NRGM Pro Forma and Stand Alone Financial Projections (Base Case) Source: NRGY / NRGM management (1) CAGR represents annualized growth rate from 2014E through 2017E (2) Based on the financial terms of NRGM / CMLP merger ($ in millions, except per unit amounts) (2) Stand Alone NRGM Pro Forma NRGM 2014E 2015E 2016E 2017E CAGR (1) 2014E 2015E 2016E 2017E CAGR (1) Total Adjusted EBITDA (Mgmt) $223.5 $242.7 $260.9 $287.5 8.8% $429.6 $515.0 $574.4 $634.9 13.9% Interest Expense (Net) ($42.8) ($50.7) ($55.3) ($59.8) ($89.9) ($102.2) ($108.4) ($117.1) Maintenance Capex (7.0) (7.8) (8.2) (8.6) (14.9) (15.4) (16.8) (19.7) Non-Cash Compensation 0.0 0.0 0.0 0.0 0.0 0.0 0.0 0.0 Total Distributable Cash Flow (To All) $173.7 $184.1 $197.3 $219.1 8.0% $324.8 $397.4 $449.1 $498.1 15.3% Distribution Coverage Ratio 1.05x 1.05x 1.05x 1.05x 1.05x 1.05x 1.05x 1.05x Distributions Paid to LP $146.3 $151.3 $159.7 $172.2 5.6% $266.9 $304.0 $331.6 $356.8 10.2% Distributions Paid to GP 19.1 24.1 28.2 36.4 24.0% 42.4 74.5 96.1 117.6 40.5% Total Distributions Paid $165.4 $175.4 $187.9 $208.6 8.0% $309.4 $378.5 $427.7 $474.4 15.3% Beginning Common Units 85.943 85.943 85.943 91.724 150.098 153.240 156.958 161.283 New Units Issued 0.000 0.000 5.781 0.000 3.142 3.718 4.325 0.728 Ending Common Units 85.943 85.943 91.724 91.724 153.240 156.958 161.283 162.011 Average Common Units Outstanding 85.943 85.943 88.834 91.724 151.669 155.099 159.121 161.647 Distributions Paid Per NRGM LP Unit $1.70 $1.76 $1.80 $1.88 3.4% $1.76 $1.96 $2.08 $2.21 7.9% |
27 NRGM Standalone Adjustment for NRGY Adjustment for Merger Pro Forma NRGM # Investor Position (Units) Distribution of NRGM Stake with CMLP @ 1.070x Position (Units) Ownership (%) 1. Crestwood Holdings 0.0 0.0 20.5 20.5 13.7% 2. Kayne Anderson Capital Advisors, L.P. 8.7 3.6 7.5 19.8 13.2% 3. Neuberger Berman LLC 3.7 5.5 0.0 9.2 6.2% 4. Tortoise Capital Advisors L.L.C. 3.1 0.0 5.7 8.9 5.9% 5. John J. Sherman 0.0 8.2 0.0 8.2 5.4% 6. Inergy, L.P. (NYSE:NRGY) 56.4 (56.4) 7.1 7.1 4.8% 7. ClearBridge Investments, LLC 0.2 0.7 2.7 3.6 2.4% 8. Advisory Research, Inc. 1.0 2.4 0.0 3.3 2.2% 9. Center Coast Capital Advisors, LP 0.0 0.0 2.6 2.6 1.8% 10. Liberty Street Advisors, Inc. 0.0 0.0 2.2 2.2 1.5% 11. Eagle Global Advisors, LLC 1.9 0.0 0.0 1.9 1.3% 12. OppenheimerFunds, Inc. 1.6 0.0 0.0 1.6 1.1% 13. OFI SteelPath, Inc. 1.6 0.0 0.0 1.6 1.1% 14. Fiduciary Asset Management, LLC 1.4 0.0 0.2 1.6 1.0% 15. Nationwide Asset Management LLC. 1.0 0.0 0.0 1.0 0.7% 16. All Others 5.4 35.9 15.5 56.9 37.9% Total 85.9 150.1 100.0% Pro Forma NRGM Ownership Source: SEC Filings and Capital IQ (1) Unitholders of NRGY will be distributed a pro rata portion of 56.4 NRGM units based on their ownership of NRGY (2) Consists of units controlled by First Reserve and CMLP management (3) Units acquired by NRGY in connection with Step 3B (6.7MM units acquired from Crestwood Holdings at market value); converted to NRGM units @ 1.070x (1) (2) (3) Top 7: 51.5 % ownership |
28 Distribution Coverage Ratio 1.05x 1.05x 1.05x 1.05x 1.05x 1.05x 1.05x 1.05x Distributions Paid to NRGY LP Unit Holders $118.9 $161.4 $191.6 $216.5 $125.0 $157.1 $185.0 $209.5 NRGY Units Outstanding 185.550 185.550 185.550 185.550 185.550 185.550 185.550 185.550 Paid Distribution Per NRGY LP Unit $0.64 $0.87 $1.03 $1.17 $0.67 $0.85 $1.00 $1.13 Pro Forma NRGM Distributions Per LP Unit $1.76 $1.96 $2.08 $2.21 $1.70 $1.76 $1.80 $1.88 NRGM Units Distributed Per NRGY Unit 0.428x 0.428x 0.428x 0.428x 0.428x 0.428x 0.428x 0.428x NRGM Paid Distribution Per NRGY LP Unit $0.75 $0.84 $0.89 $0.95 $0.73 $0.75 $0.77 $0.80 Total Paid Distribution Per Original NRGY LP Unit $1.39 $1.71 $1.92 $2.12 $1.40 $1.60 $1.77 $1.93 NRGY Standalone Paid Distribution Per Unit $1.31 $1.45 $1.57 $1.69 $1.31 $1.45 $1.57 $1.69 Change - $ $0.08 $0.26 $0.35 $0.43 $0.09 $0.15 $0.20 $0.24 Change - % 6.4% 17.9% 22.3% 25.2% 6.7% 10.6% 12.8% 14.5% Consolidated “Has - Gets” Analysis for NRGY and NRGY Unitholders (Base Case) (1) Represents distributions from NRGM LP units (merger completed) or distributions from CMLP LP units (merger not completed); Includes minor adjustments to interest expense ($ in millions) NRGY (Merger Completed) NRGY (Merger Not Completed) 2014E 2015E 2016E 2017E 2014E 2015E 2016E 2017E NRGY Stand Alone Distributable Cash Flow $185.1 $204.9 $220.5 $237.2 $185.1 $204.9 $220.5 $237.2 Step 1: Inergy GP Acquired by Crestwood Holdings 0.0 0.0 0.0 0.0 0.0 0.0 0.0 0.0 Step 2: Distribution of NRGM Units by NRGY (1) (96.1) (99.9) (102.4) (107.3) (96.1) (99.9) (102.4) (107.3) Sub-Total $89.0 $105.0 $118.1 $129.9 $89.0 $105.0 $118.1 $129.9 Step 3: NRGY Acquires Crestwood GP and IDRs 23.3 50.4 67.9 81.1 28.1 44.0 58.4 70.8 LP Distributions from NRGM or CMLP units (1) 12.6 14.1 15.2 16.3 14.2 16.0 17.7 19.3 Sub-Total $124.9 $169.5 $201.2 $227.3 $131.3 $165.0 $194.2 $220.0 Step 4: NRGM Merges with CMLP 0.0 0.0 0.0 0.0 0.0 0.0 0.0 0.0 Total Distributable Cash Flow $124.9 $169.5 $201.2 $227.3 $131.3 $165.0 $194.2 $220.0 Change - $ ($60.2) ($35.4) ($19.3) ($9.9) ($53.8) ($39.9) ($26.3) ($17.2) Change - % (32.5%) (17.3%) (8.8%) (4.2%) (29.1%) (19.5%) (11.9%) (7.3%) |
SECTION 3 Financial Analyses – Acquisition of Crestwood’s GP & IDRs (Challenge Case) |
30 Pro Forma NRGY Unit Price & Units Issued (1) Based on 20-day VWAP as of 5/3/2013 per Bloomberg ($ in millions, except per unit amounts) Step 2: NRGY Distributes NRGM Units Beginning NRGM Units Owned by NRGY 56.399 Less NRGM Units Retained by NRGY 0.000 NRGM Units Distributed to Unitholders 56.399 Current NRGM Unit Price (1) $24.00 Market Value of NRGM Units Distributed $1,353.6 NRGY Current Units Outstanding 131.740 NRGY Current Unit Price (1) $21.67 NRGY Current Market Capitalization $2,854.8 Less: Market Value of Units Distributed (1,353.6) Pro Forma NRGY Market Capitalization $1,501.2 Implied Pro Forma NRGY Unit Price $11.40 NRGM Units Distributed to Unitholders 56.399 NRGY Current Units Outstanding 131.740 NRGM Units Distributed per NRGY Unit 0.428x |
31 Step #3A: NRGY Acquires Crestwood's GP & IDRs CMLP GP Purchase Price $450.0 Implied Pro Forma NRGY Unit Price (Post-Spin) $11.40 NRGY Units Issued to Crestwood Holdings for GP & IDRs 39.491 Step #3B: NRGY Acquires CMLP Units from Crestwood Holdings Crestwood Holdings Target Interest in Pro Forma NRGY 29.0% NRGY Current Units Outstanding 131.740 Target NRGY Units Issued 53.809 Less: NRGY Units Issued for GP & IDRs 39.491 Additional NRGY Units Issued to Crestwood Holdings 14.318 Implied Pro Forma NRGY Unit Price (Post-Spin) $11.40 Value of Additional NRGY Units Issue to Crestwood Holdings $163.2 CMLP Current Unit Price $24.46 CMLP Units Acquired from Crestwood Holdings (at market) 6.671 Pro Forma NRGY Unit Price & Units Issued ($ in millions, except per unit amounts) = 53.8MM (29%) |
32 Status Quo Pro Forma (1) # Investor # Units Ownership (%) # Units Ownership (%) 1. Crestwood Holdings 0.0 0.0% 53.8 29.0% 2. John J. Sherman 19.1 14.5% 19.1 10.3% 3. Neuberger Berman LLC 12.9 9.8% 12.9 7.0% 4. Kayne Anderson Capital Advisors, L.P. 8.5 6.4% 8.5 4.6% 5. Advisory Research, Inc. 5.5 4.2% 5.5 3.0% 6. Cushing MLP Asset Management, LP 3.7 2.8% 3.7 2.0% 7. UBS Global Asset Management 2.6 2.0% 2.6 1.4% 8. William C. Gautreaux 2.5 1.9% 2.5 1.3% 9. Phillip L. Elbert 2.1 1.6% 2.1 1.1% 10. Merrill Lynch & Co. Inc., Asset Management 1.9 1.4% 1.9 1.0% 11. Invesco Ltd. 1.9 1.4% 1.9 1.0% 12. ClearBridge Investments, LLC 1.7 1.3% 1.7 0.9% 13. Morgan Stanley Investment Management Inc. 1.6 1.2% 1.6 0.9% 14. Commerce Investment Advisors, Inc. 1.1 0.8% 1.1 0.6% 15. Credit Suisse, Investment Banking and Securities Investments 1.0 0.8% 1.0 0.5% 16. All Others 65.8 49.9% 65.8 35.4% Total 131.7 100.0% 185.5 100.0% NRGY Unitholder Composition – Status Quo & Pro Forma for Step 3 Source: SEC Filings and Capital IQ (1) Pro forma for NRGY acquisition of Crestwood GP and NRGY acquiring CMLP units from Crestwood Holdings (2) 39.5 units received for the sale of CMLP GP & IDRs for $450 million of PF NRGY units and the exchange of 6.7 CMLP units for 14.3 PF NRGY units NRGY Unitholder Summary (2) |
33 Calculation of CMLP IDR Payment to NRGY (Challenge Case) Source: SEC Filings, company investor presentations and Capital IQ (1) Per CMLP splits and coverage ratio (2) Per NRGM splits and coverage ratio ($ in millions) 2014E 2015E 2016E 2017E Stand Alone CMLP Revenue $281.7 $325.0 $355.4 $380.4 EBITDA $199.4 $239.1 $266.7 $288.8 Less: Interest Expense (52.7) (63.0) (67.7) (72.6) Less: Maintenance Capex (7.9) (7.6) (8.6) (11.1) Plus: Non-cash Compensation 4.3 4.7 4.9 5.1 Distributable Cash Flow $143.1 $173.3 $195.3 $210.3 CMLP Coverage Ratio Assumptions 0.97x 1.05x 1.05x 1.05x To LP Unit Holders (1) 123.8 132.5 143.0 150.1 To GP for IDRs (1) 23.9 32.5 43.0 50.1 Total Cash Distributions Paid $147.7 $165.1 $186.0 $200.3 Merger Adjustments to Pro Forma CMLP Distributable Cash Flow Stand Alone Distributable Cash Flow $143.1 $173.3 $195.3 $210.3 Less: Non-cash Compensation (4.3) (4.7) (4.9) (5.1) Less Interest Expense 4.0 8.3 13.1 16.5 Synergies 5.0 10.0 15.0 15.0 Pro Forma Distributable Cash Flow $147.8 $187.0 $218.5 $236.7 Pro Forma NRGM Implied Coverage Ratio Assumptions 1.05x 1.05x 1.05x 1.05x To LP Unit Holders (2) 118.9 139.2 155.2 164.4 To GP for IDRs (2) 21.9 38.7 52.9 61.0 Pro Forma Total Cash Distributions Paid $140.8 $177.9 $208.1 $225.4 |
34 Financial Analyses Summary (Challenge Case) (1) ($ in millions) (2) Selected Transactions: Public Comparables: Selected Transactions: Public Comparables: (3) Source: Company management (1) No particular weight given to any analysis (2) Provided by NRGY management (1) The range of discount rates is based on the calculation of the sum of NRGY’s current yield (5.2%) and the current - 2017 LP distribution CAGR (3.5%) $450MM Consideration Financial Metric Statistic Implied Multiple Equity Value Reference Range 2014E Yield $21.9 Million 4.5% - 3.5% 2014E GP Distributions $21.9 Million 18.0x - 22.0x Discounted Cash Flow 2014E Yield $23.9 Million 4.5% - 3.5% 2014E GP Distributions $23.9 Million 18.0x - 22.0x Discounted Cash Flow $737 $430 $531 $890 $394 $487 $936 $526 $683 $1,132 $482 $626 $200 $500 $800 $1,100 $1,400 Discount Rate: 8.0% - 10.0% Terminal Multiple: 18.0x - 22.0x Discount Rate: 8.0% - 10.0% Terminal Multiple: 18.0x - 22.0x (3) |
35 Selected GP Yield Analysis Pure Play GP Mean: 4.0% Pure Play GP Mean (Excluding NSH): 3.1% Pure Play GP: Yields EV: (1) Market Cap: $52.8BN $16.5BN $7.0BN $2.9BN $6.2BN $2.7BN $2.7BN $876MM $1.3BN $1.3BN Source: Capital IQ, SEC filings and company press releases Note: Market cap based on closing unit price as of 5/3/2013 (1) Enterprise value includes debt consolidated from respective underlying MLPs (2) Pro forma NRGY yield post-spin of NRGM units; Total units outstanding as of 5/3/2013 per NRGY / NRGM management and net debt of $1,285 million as of 12/31/2012 GPs with Assets: Yields EV: (1) Market Cap: $35.3BN $20.8BN $38.4BN $25.8BN $84.1BN $40.2BN $18.9BN $9.9BN Pro Forma GPs with Assets Mean: 3.6% (2) $2.8BN $1.6BN 3.9% 3.6% 3.9% 3.1% 4.1% 4.4% 2.9% 2.5% 2.7% 7.3% |
36 Implied G.P. Equity Value / Announce Stake GP Equity G.P. Distributions Date Acquiror Target MLP Acquired Value NTM N+2 12/11/12 Williams Companies, Inc. Access Midstream Ventures, LLC Access Midstream Partners, L.P. 50.0% $1,303 37.6x * 13.3x 06/06/12 Global Infrastructure Partners Access Midstream Ventures, LLC Access Midstream Partners, L.P. 50.0% 701 42.9x * 18.8x 03/13/11 Kirby Corporation K-Sea General Partner GP LLC K-Sea Transportation Partners, L.P. 100.0% 20 NM NM 12/28/10 Genesis Energy LP Genesis Energy LP IDRs and GP Interest Genesis Energy LP 100.0% 690 25.3x 19.5x 12/10/10 Occidental Petroleum, The Energy & Minerals Group, Kayne Anderson, First Reserve and other investors Plains All American Pipeline, L.P. GP Interests Plains All American Pipeline, L.P. 50.1% 3,308 15.7x 13.1x 09/21/10 Penn Virginia Resource Partners, L.P. Penn Virginia GP Holdings, L.P. Penn Virginia Resource Partners, L.P. 100.0% 466 14.5x 12.7x 09/07/10 Enterprise Products Partners L.P. Enterprise GP Holdings L.P. Enterprise Product Partners L.P. 100.0% 5,817 17.1x 15.4x 08/09/10 Inergy, L.P. Inergy Holdings, L.P. Inergy, L.P. 100.0% 2,022 21.6x 18.5x 06/11/10 Buckeye Partners, L.P. Buckeye GP Holdings L.P. Buckeye Partners, L.P. 100.0% 1,163 20.6x 18.8x 05/10/10 Energy Transfer Equity, L.P. Regency GU GP LLC Regency Energy Partners LP 100.0% 300 24.8x NA MEAN 85.0% $1,579 19.9x 16.3x MEDIAN 100.0% $932 20.6x 16.9x HIGH 100.0% $5,817 25.3x 19.5x LOW 50.0% $20 14.5x 12.7x Selected Transaction Analysis Source: Company filings, Capital IQ, SNL Financial and Wall Street equity research estimates Note: Projected G.P. distributions based on pre-announce Wall Street equity research estimates unless otherwise noted below (1) NTM represents the next twelve months from the date of announcement (2) N+2 represents the subsequent twelve months or two years forward from the date of announcement (3) Assumes a transaction value of $1,823MM less the implied equity value of the 34.5MM sub-units of AMCP at ACMP’s 12/10/2012 closing unit price of $33.92; G.P. distributions based on post-announce consensus estimates, including the contemplated acquisition of assets from Chesapeake Energy (4) Assumes a total transaction value of $2,000MM less the implied equity value of 34.5MM sub-units and 33.7MM common units of ACMP at ACMP’s 6/5/2012 closing unit price of $24.17 (5) Based on 202,447 general partner units priced at $8.15 / unit and $18MM of cash consideration; According to Wall Street equity research, the G.P. was not expected to received any distributions throughout the projection period (6) Assumes a total transaction value of $690MM based on the implied value of 20.0MM GEL common units, 7.0MM GEL waiver units and a 12/27/2010 closing GEL unit price of $25.57 (7) G.P. equity value based on Occidental Petroleum’s 13% stake acquired for ~$430MM, per OXY’s 12/31/2010 10K filing (8) Assumes 38.3MM units of PVR were issued as consideration to the G.P. unit holders; Equity value and projected G.P. distributions excludes 19.6MM PVR units already owned by the G.P. (9) Assumes 208.8MM EPD units were issued as consideration to the G.P. unit holders and a EPD closing price of $38.45 as of 9/3/2010; Equity value and projected G.P. distributions excludes 21.6MM units of EPD already owned by the G.P., as well as 39.0MM ETE L.P. units (at a 9/3/2010 ETE closing price of $35.49 / unit) also owned by the G.P. (10) Assumes 47.7MM units of NRGY are issued to NRGP at a 8/6/2010 closing price of $43.37 / unit; Equity value and projected G.P. distributions excludes 1.1MM NRGY units already owned by NRGP (11) Assumes 20.0MM units of BPL are issued to the G.P. unit holders at a 6/10/2010 BPL closing price of $58.17 / unit (12) G.P. equity value represents preferred units in ETE with a stated value of ~$300MM per Regency Energy Partners LP’s SEC filing (13) Transactions multiples denoted with an asterisk (“*”) have been excluded from the mean, median, high and low statistics (1) (2) (3) (4) (5) (6) (7) (8) (9) (10) (11) (12) (13) (13) (13) (13) |
37 Discounted Cash Flow Analysis Cash Flow Terminal Multiple 18.0x 20.0x 22.0x Discount Rate 8.0% 9.0% 10.0% 8.0% 9.0% 10.0% 8.0% 9.0% 10.0% Discounted GP Distributions ('14 - '17) $145.8 $142.7 $139.8 $145.8 $142.7 $139.8 $145.8 $142.7 $139.8 Present Value of Terminal Value ('17) $807.1 $777.9 $749.9 $896.7 $864.3 $833.3 $986.4 $950.7 $916.6 GP & IDR Implied Equity Value $952.9 $920.6 $889.8 $1,042.5 $1,007.0 $973.1 $1,132.2 $1,093.5 $1,056.4 Financial Projections Fiscal Year-Ending September 30, 2014E 2015E 2016E 2017E CMLP IDR & GP Interest Payment to NRGY $21.9 $38.7 $52.9 $61.0 Discounted Cash Flow Analysis of CMLP GP Interest and IDRs (Merger Completed / Challenge Case) (1) Note: Assumes midpoint convention to discount projection period free cash flow (1) The range of discount rates is based on the calculation of the sum of NRGY’s current yield (5.2%) and the current - 2017 LP distribution CAGR (3.5%) |
38 Discounted Cash Flow Analysis Cash Flow Terminal Multiple 18.0x 20.0x 22.0x Discount Rate 8.0% 9.0% 10.0% 8.0% 9.0% 10.0% 8.0% 9.0% 10.0% Discounted GP Distributions ('14 - '17) $125.7 $123.2 $120.7 $125.7 $123.2 $120.7 $125.7 $123.2 $120.7 Present Value of Terminal Value ('17) $662.8 $638.9 $615.9 $736.5 $709.8 $684.4 $810.1 $780.8 $752.8 GP & IDR Implied Equity Value $788.5 $762.0 $736.7 $862.2 $833.0 $805.1 $935.8 $904.0 $873.5 Financial Projections Fiscal Year-Ending September 30, 2014E 2015E 2016E 2017E CMLP IDR & GP Interest Payment to NRGY $23.9 $32.5 $43.0 $50.1 Discounted Cash Flow Analysis of CMLP GP Interest and IDRs (Merger Not Completed / Challenge Case) (1) Note: Assumes midpoint convention to discount projection period free cash flow (1) The range of discount rates is based on the calculation of the sum of NRGY’s current yield (5.2%) and the current - 2017 LP distribution CAGR (3.5%) |
39 Overview of NRGM and CMLP Merger Source: Project Intrepid 5/5/2013 discussion materials Note: Market data as of 5/3/2013 (1) Based on 20-day VWAP as of 5/3/2013 per Bloomberg ($ in millions, except per unit amounts) Step 4: NRGM Merges with CMLP CMLP Current Unit Price (1) $24.46 Offer Premium 5.0% Offer Price Per CMLP Unit $25.68 CMLP Total Units Outstanding 59.955 Equity Offer Value for CMLP $1,539.8 NRGM Current Unit Price (1) $24.00 NRGM Units Issued 64.154 Implied Merger Exchange Ratio 1.070x Beginning CMLP Units Owned by Crestwood Holdings 25.872 Less: CMLP Units Acquired by NRGY (6.671) Pro Forma CMLP Units Owned by Crestwood Holdings 19.201 CMLP Units "Owned" by NRGY 6.671 Merger Exchange Ratio 1.070x NRGM Units Issued to NRGY for Merger 7.138 NRGM Special Cash Distribution to CMLP Cash Payment for Special Distribution $25.0 CMLP Units Outstanding 59.955 Special Distribution to CMLP Unitholder $0.42 Implied Premium to Current CMLP Unit Price 1.7% |
40 Stand Alone NRGM Pro Forma NRGM 2014E 2015E 2016E 2017E CAGR (1) 2014E 2015E 2016E 2017E CAGR (1) Total Adjusted EBITDA (Mgmt) $216.5 $231.9 $238.3 $240.5 3.6% $420.9 $481.1 $519.9 $544.3 8.9% Interest Expense (Net) ($43.0) ($49.5) ($52.8) ($52.5) ($91.7) ($104.2) ($107.4) ($108.6) Maintenance Capex (7.0) (7.8) (8.0) (8.0) (14.9) (15.3) (16.6) (19.1) Non-Cash Compensation 0.0 0.0 0.0 0.0 0.0 0.0 0.0 0.0 Total Distributable Cash Flow (To All) $166.5 $174.7 $177.5 $180.0 2.6% $314.4 $361.5 $395.9 $416.6 9.8% Distribution Coverage Ratio 1.05x 1.05x 1.05x 1.05x 1.05x 1.05x 1.05x 1.05x Distributions Paid to LP $142.9 $146.8 $148.1 $149.3 1.5% $261.8 $286.0 $303.3 $313.7 6.2% Distributions Paid to GP 15.7 19.6 20.9 22.1 12.1% 37.6 58.3 73.8 83.1 30.3% Total Distributions Paid $158.6 $166.4 $169.0 $171.4 2.6% $299.4 $344.3 $377.1 $396.8 9.8% Beginning Common Units 85.943 85.943 85.943 85.943 150.098 152.913 154.745 155.454 New Units Issued 0.000 0.000 0.000 0.000 2.815 1.832 0.709 0.648 Ending Common Units 85.943 85.943 85.943 85.943 152.913 154.745 155.454 156.102 Average Common Units Outstanding 85.943 85.943 85.943 85.943 151.505 153.829 155.099 155.778 Distributions Paid Per NRGM LP Unit $1.66 $1.71 $1.72 $1.74 1.6% $1.73 $1.86 $1.96 $2.01 5.1% NRGM Pro Forma and Stand Alone Financial Projections (Challenge Case) ($ in millions, except per unit amounts) Source: NRGY / NRGM management (1) CAGR represents annualized growth rate from 2014E through 2017E (2) Based on the financial terms of NRGM / CMLP merger (2) |
41 NRGM Standalone Adjustment for NRGY Adjustment for Merger Pro Forma NRGM # Investor Position (Units) Distribution of NRGM Stake with CMLP @ 1.070x Position (Units) Ownership (%) 1. Crestwood Holdings 0.0 0.0 20.5 20.5 13.7% 2. Kayne Anderson Capital Advisors, L.P. 8.7 3.6 7.5 19.8 13.2% 3. Neuberger Berman LLC 3.7 5.5 0.0 9.2 6.2% 4. Tortoise Capital Advisors L.L.C. 3.1 0.0 5.7 8.9 5.9% 5. John J. Sherman 0.0 8.2 0.0 8.2 5.4% 6. Inergy, L.P. (NYSE:NRGY) 56.4 (56.4) 7.1 7.1 4.8% 7. ClearBridge Investments, LLC 0.2 0.7 2.7 3.6 2.4% 8. Advisory Research, Inc. 1.0 2.4 0.0 3.3 2.2% 9. Center Coast Capital Advisors, LP 0.0 0.0 2.6 2.6 1.8% 10. Liberty Street Advisors, Inc. 0.0 0.0 2.2 2.2 1.5% 11. Eagle Global Advisors, LLC 1.9 0.0 0.0 1.9 1.3% 12. OppenheimerFunds, Inc. 1.6 0.0 0.0 1.6 1.1% 13. OFI SteelPath, Inc. 1.6 0.0 0.0 1.6 1.1% 14. Fiduciary Asset Management, LLC 1.4 0.0 0.2 1.6 1.0% 15. Nationwide Asset Management LLC. 1.0 0.0 0.0 1.0 0.7% 16. All Others 5.4 35.9 15.5 56.9 37.9% Total 85.9 150.1 100.0% Pro Forma NRGM Ownership Source: SEC Filings and Capital IQ (1) Unitholders of NRGY will be distributed a pro rata portion of 56.4 NRGM units based on their ownership of NRGY (2) Consists of units controlled by First Reserve and CMLP management (3) Units acquired by NRGY in connection with Step 3B (6.7MM units acquired from Crestwood Holdings at market value); converted to NRGM units @ 1.070x (1) (2) (3) Top 7: 51.5 % ownership |
42 Distribution Coverage Ratio 1.05x 1.05x 1.05x 1.05x 1.05x 1.05x 1.05x 1.05x Distributions Paid to NRGY LP Unit Holders $106.1 $126.8 $145.3 $158.1 $109.2 $122.2 $137.6 $149.8 NRGY Units Outstanding 185.550 185.550 185.550 185.550 185.550 185.550 185.550 185.550 Paid Distribution Per NRGY LP Unit $0.57 $0.68 $0.78 $0.85 $0.59 $0.66 $0.74 $0.81 Pro Forma NRGM Distributions Per LP Unit $1.73 $1.86 $1.96 $2.01 $1.66 $1.71 $1.72 $1.74 NRGM Units Distributed Per NRGY Unit 0.428x 0.428x 0.428x 0.428x 0.428x 0.428x 0.428x 0.428x NRGM Paid Distribution Per NRGY LP Unit $0.74 $0.80 $0.84 $0.86 $0.71 $0.73 $0.74 $0.74 Total Paid Distribution Per Original NRGY LP Unit $1.31 $1.48 $1.62 $1.71 $1.30 $1.39 $1.48 $1.55 NRGY Standalone Paid Distribution Per Unit $1.20 $1.27 $1.32 $1.35 $1.20 $1.27 $1.32 $1.35 Change - $ $0.11 $0.21 $0.30 $0.36 $0.10 $0.12 $0.16 $0.20 Change - % 9.2% 16.2% 22.6% 26.7% 8.4% 9.6% 11.8% 15.2% Consolidated “Has - Gets” Analysis for NRGY and NRGY Unitholders (Challenge Case) (1) Represents distributions from NRGM LP units (merger completed) or distributions from CMLP LP units (merger not completed); Includes minor adjustments to interest expense ($ in millions, except per unit amounts) NRGY (Merger Completed) NRGY (Merger Not Completed) 2014E 2015E 2016E 2017E 2014E 2015E 2016E 2017E NRGY Stand Alone Distributable Cash Flow $171.1 $177.9 $183.6 $189.3 $171.1 $177.9 $183.6 $189.3 Step 1: Inergy GP Acquired by Crestwood Holdings 0.0 0.0 0.0 0.0 0.0 0.0 0.0 0.0 Step 2: Distribution of NRGM Units by NRGY (1) (94.0) (96.9) (98.1) (99.1) (94.0) (96.9) (98.1) (99.1) Sub-Total $77.1 $81.0 $85.5 $90.2 $77.1 $81.0 $85.5 $90.2 Step 3: NRGY Acquires Crestwood GP and IDRs 21.9 38.7 52.9 61.0 23.9 32.5 43.0 50.1 LP Distributions from NRGM or CMLP units (1) 12.4 13.5 14.2 14.8 13.7 14.8 16.0 17.0 Sub-Total $111.4 $133.2 $152.6 $166.0 $114.7 $128.3 $144.5 $157.3 Step 4: NRGM Merges with CMLP 0.0 0.0 0.0 0.0 0.0 0.0 0.0 0.0 Total Distributable Cash Flow $111.4 $133.2 $152.6 $166.0 $114.7 $128.3 $144.5 $157.3 Change - $ ($59.7) ($44.7) ($31.0) ($23.3) ($56.4) ($49.6) ($39.1) ($32.0) Change - % (34.9%) (25.1%) (16.9%) (12.3%) (33.0%) (27.9%) (21.3%) (16.9%) |
SECTION 4 Summary Impact to NRGY and NRGY Unitholders |
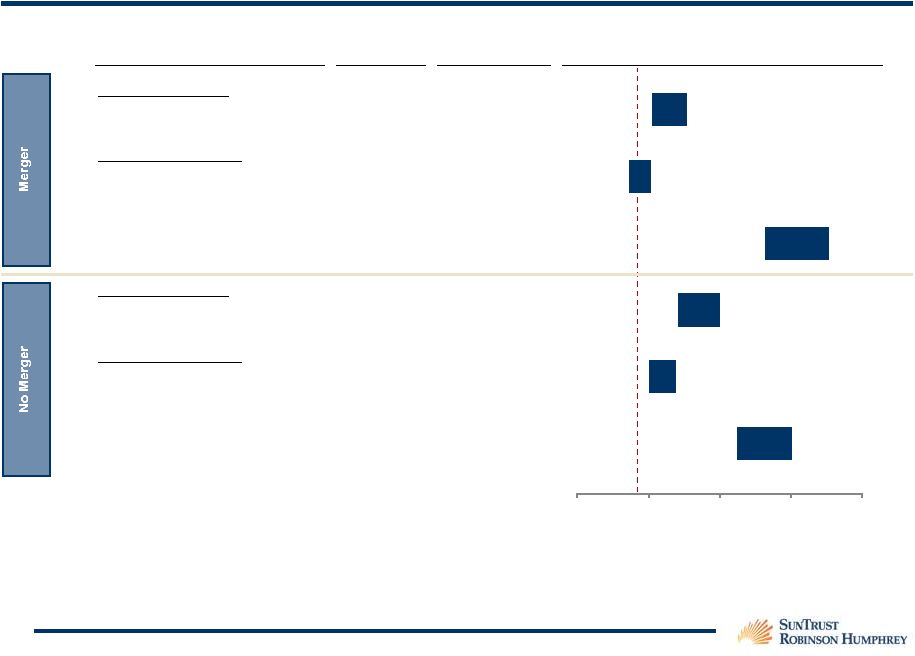
44 2014E 2015E 2016E 2017E Standalone NRGY $1.20 $1.27 $1.32 $1.35 Merger $1.31 $1.48 $1.62 $1.71 No Merger $1.30 $1.39 $1.48 $1.55 Change - $ $0.01 $0.08 $0.14 $0.16 Change - % 0.8% 6.0% 9.7% 10.0% 2014E 2015E 2016E 2017E Standalone NRGY $1.31 $1.45 $1.57 $1.69 Merger $1.39 $1.71 $1.92 $2.12 No Merger $1.40 $1.60 $1.77 $1.93 Change - $ ($0.00) $0.11 $0.15 $0.18 Change - % (0.3%) 6.6% 8.5% 9.4% Pro Forma NRGY Total Paid Distributions per Original NRGY LP Unit Source: NRGY / NRGM management ($ per unit amounts) |
Appendix |
APPENDIX A Pro Forma Financials |
47 NRGY Pro Forma Financials – Merger (Base Case) Unit Spin, NRGY Acquires CMLP’s GP & IDRs & NRGM Acquires CMLP at 5% Premium Source: NRGY / NRGM management ($ in millions, except per unit amounts) NRGY Status Quo (Post Spin) Adjustments NRGY Pro Forma FYE September 30, FYE September 30, FYE September 30, Adjusted EBITDA Break down: 2014E 2015E 2016E 2017E 2014E 2015E 2016E 2017E 2014E 2015E 2016E 2017E EBITDA from Existing Operations $87.9 $102.4 $113.2 $116.5 $87.9 $102.4 $113.2 $116.5 Distributions from NRGM LP Interest 0.0 0.0 0.0 0.0 12.6 14.0 14.9 15.8 12.6 14.0 14.9 15.8 Distributions from NRGM GP Interest 19.1 24.1 28.2 36.4 23.3 50.4 67.9 81.1 42.4 74.5 96.1 117.6 Other 0.2 0.2 0.2 0.2 0.0 0.0 0.0 0.0 0.2 0.2 0.2 0.2 Total Adjusted EBITDA $107.2 $126.8 $141.6 $153.2 $143.1 $191.1 $224.4 $250.1 Interest Expense (Net) ($14.3) ($17.9) ($19.6) ($19.4) ($14.3) ($17.7) ($19.3) ($18.9) Maintenance Capex (4.0) (4.0) (4.0) (4.0) 0.0 0.0 0.0 0.0 (4.0) (4.0) (4.0) (4.0) Total Distributable Cash Flow $89.0 $105.0 $118.1 $129.9 $124.9 $169.5 $201.2 $227.3 Distribution Coverage Ratio 1.05x 1.05x 1.05x 1.05x 1.05x 1.05x 1.05x 1.05x Distributions Paid to LPs $84.7 $100.0 $112.5 $123.7 $118.9 $161.4 $191.6 $216.5 Distributions Paid to GP 0.0 0.0 0.0 0.0 0.0 0.0 0.0 0.0 Total Distributions Paid $84.7 $100.0 $112.5 $123.7 $118.9 $161.4 $191.6 $216.5 Beginning Common Units 131.740 131.740 131.740 131.740 53.809 185.550 185.550 185.550 185.550 New Units Issued 0.000 0.000 0.000 0.000 0.000 0.000 0.000 0.000 Ending Common Units 131.740 131.740 131.740 131.740 185.550 185.550 185.550 185.550 Average Common Units Outstanding 131.740 131.740 131.740 131.740 185.550 185.550 185.550 185.550 Distributable Cash Flow Per LP Unit $0.68 $0.80 $0.90 $0.99 $0.67 $0.91 $1.08 $1.22 Accretion / (Dilution) (%) (0.3%) 14.7% 21.0% 24.3% Paid Distribution Per LP Unit $0.64 $0.76 $0.85 $0.94 $0.64 $0.87 $1.03 $1.17 Accretion / (Dilution) (%) (0.3%) 14.7% 21.0% 24.3% Coverage Cash $4.2 $5.0 $5.6 $6.2 $5.9 $8.1 $9.6 $10.8 Growth Capex (8.1) (44.6) (2.0) (2.0) 0.0 0.0 0.0 0.0 (8.1) (44.6) (2.0) (2.0) Subordinated Note Issuance 0.0 0.0 0.0 0.0 0.0 0.0 0.0 0.0 Free Cash Flow (Cash Shortfall) ($3.9) ($39.6) $3.6 $4.2 ($2.2) ($36.5) $7.6 $8.8 Cash (Shortfall) Coverage from Debt ($3.9) ($39.6) $0.0 $0.0 ($2.2) ($36.5) $0.0 $0.0 Cash (Shortfall) Coverage from Equity 0.0 0.0 0.0 0.0 0.0 0.0 0.0 0.0 New Equity Issue Price $11.42 $13.47 $15.15 $16.66 $11.38 $15.44 $18.32 $20.70 New NRGY Units Issued 0.000 0.000 0.000 0.000 0.000 0.000 0.000 0.000 Post-Capital Raise Free Cash Flow $0.0 $0.0 $3.6 $4.2 $0.0 $0.0 $7.6 $8.8 Beginning Total Debt $331.2 $335.0 $374.7 $371.0 $0.0 $331.2 $333.3 $369.9 $362.3 Debt Drawdown (Paydown) 3.9 39.6 (3.6) (4.2) 2.2 36.5 (7.6) (8.8) Ending Total Debt $335.0 $374.7 $371.0 $366.8 $333.3 $369.9 $362.3 $353.5 Total Debt / Adjusted EBITDA 3.1x 3.0x 2.6x 2.4x 2.3x 1.9x 1.6x 1.4x Total Net Debt / Adjusted EBITDA 3.1x 2.9x 2.6x 2.4x 2.3x 1.9x 1.6x 1.4x |
48 NRGY Pro Forma Financials – No Merger (Base Case) Unit Spin, NRGY Acquires CMLP’s GP & IDRs for $450 million Source: NRGY / NRGM management ($ in millions, except per unit amounts) NRGY Status Quo (Post Spin) Adjustments NRGY Pro Forma FYE September 30, FYE September 30, FYE September 30, 2014E 2015E 2016E 2017E 2014E 2015E 2016E 2017E 2014E 2015E 2016E 2017E EBITDA from Existing Operations $87.9 $102.4 $113.2 $116.5 $87.9 $102.4 $113.2 $116.5 Distributions from NRGM LP Interest 0.0 0.0 0.0 0.0 0.0 0.0 0.0 0.0 Distributions from NRGM GP Interest 19.1 24.1 28.2 36.4 19.1 24.1 28.2 36.4 Distributions from CMLP LP Interest 0.0 0.0 0.0 0.0 14.2 15.9 17.4 18.8 14.2 15.9 17.4 18.8 Distributions from CMLP GP Interest 0.0 0.0 0.0 0.0 28.1 44.0 58.4 70.8 28.1 44.0 58.4 70.8 Other 0.2 0.2 0.2 0.2 0.2 0.2 0.2 0.2 Total Adjusted EBITDA $107.2 $126.8 $141.6 $153.2 $149.5 $186.6 $217.4 $242.9 Interest Expense (Net) ($14.3) ($17.9) ($19.6) ($19.4) ($14.3) ($17.7) ($19.3) ($18.9) Maintenance Capex (4.0) (4.0) (4.0) (4.0) 0.0 0.0 0.0 0.0 (4.0) (4.0) (4.0) (4.0) Total Distributable Cash Flow $89.0 $105.0 $118.1 $129.9 $131.3 $165.0 $194.2 $220.0 Distribution Coverage Ratio 1.05x 1.05x 1.05x 1.05x 1.05x 1.05x 1.05x 1.05x Distributions Paid to LPs $84.7 $100.0 $112.5 $123.7 $125.0 $157.1 $185.0 $209.5 Distributions Paid to GP 0.0 0.0 0.0 0.0 0.0 0.0 0.0 0.0 Total Distributions Paid $84.7 $100.0 $112.5 $123.7 $125.0 $157.1 $185.0 $209.5 Beginning Common Units 131.740 131.740 131.740 131.740 53.809 185.550 185.550 185.550 185.550 New Units Issued 0.000 0.000 0.000 0.000 0.000 0.000 0.000 0.000 Ending Common Units 131.740 131.740 131.740 131.740 185.550 185.550 185.550 185.550 Average Common Units Outstanding 131.740 131.740 131.740 131.740 185.550 185.550 185.550 185.550 Distributable Cash Flow Per LP Unit $0.68 $0.80 $0.90 $0.99 $0.71 $0.89 $1.05 $1.19 Accretion / (Dilution) (%) 4.7% 11.6% 16.8% 20.3% Paid Distribution Per LP Unit $0.64 $0.76 $0.85 $0.94 $0.67 $0.85 $1.00 $1.13 Accretion / (Dilution) (%) 4.7% 11.6% 16.8% 20.3% Coverage Cash $4.2 $5.0 $5.6 $6.2 $6.3 $7.9 $9.2 $10.5 Growth Capex (8.1) (44.6) (2.0) (2.0) 0.0 0.0 0.0 0.0 (8.1) (44.6) (2.0) (2.0) Subordinated Note Issuance 0.0 0.0 0.0 0.0 0.0 0.0 0.0 0.0 Free Cash Flow (Cash Shortfall) ($3.9) ($39.6) $3.6 $4.2 ($1.9) ($36.8) $7.2 $8.5 Cash (Shortfall) Coverage from Debt ($3.9) ($39.6) $0.0 $0.0 ($1.9) ($36.8) $0.0 $0.0 Cash (Shortfall) Coverage from Equity 0.0 0.0 0.0 0.0 0.0 0.0 0.0 0.0 New Equity Issue Price $11.42 $13.47 $15.15 $16.66 $11.96 $15.03 $17.69 $20.04 New NRGY Units Issued 0.000 0.000 0.000 0.000 0.000 0.000 0.000 0.000 Post-Capital Raise Free Cash Flow $0.0 $0.0 $3.6 $4.2 $0.0 $0.0 $7.2 $8.5 Beginning Total Debt $331.2 $335.0 $374.7 $371.0 $0.0 $331.2 $333.0 $369.8 $362.5 Debt Drawdown (Paydown) 3.9 39.6 (3.6) (4.2) 1.9 36.8 (7.2) (8.5) Ending Total Debt $335.0 $374.7 $371.0 $366.8 $333.0 $369.8 $362.5 $354.1 Total Debt / Adjusted EBITDA 3.1x 3.0x 2.6x 2.4x 2.2x 2.0x 1.7x 1.5x Total Net Debt / Adjusted EBITDA 3.1x 2.9x 2.6x 2.4x 2.2x 2.0x 1.7x 1.5x Adjusted EBITDA Break down: |
49 NRGY Pro Forma Financials – Merger (Challenge Case) Unit Spin, NRGY Acquires CMLP’s GP & IDRs & NRGM Acquires CMLP at 5% Premium Source: NRGY / NRGM management ($ in millions, except per unit amounts) NRGY Status Quo (Post Spin) Adjustments NRGY Pro Forma FYE September 30, FYE September 30, FYE September 30, Adjusted EBITDA Break down: 2014E 2015E 2016E 2017E 2014E 2015E 2016E 2017E 2014E 2015E 2016E 2017E EBITDA from Existing Operations $79.5 $82.6 $85.7 $89.0 $79.5 $82.6 $85.7 $89.0 Distributions from NRGM LP Interest 0.0 0.0 0.0 0.0 12.3 13.3 14.0 14.4 12.3 13.3 14.0 14.4 Distributions from NRGM GP Interest 15.7 19.6 20.9 22.1 21.9 38.7 52.9 61.0 37.6 58.3 73.8 83.1 Other 0.2 0.2 0.2 0.2 0.0 0.0 0.0 0.0 0.2 0.2 0.2 0.2 Total Adjusted EBITDA $95.4 $102.4 $106.8 $111.4 $129.7 $154.4 $173.6 $186.8 Interest Expense (Net) ($14.4) ($17.5) ($17.4) ($17.3) ($14.3) ($17.3) ($17.1) ($16.8) Maintenance Capex (4.0) (4.0) (4.0) (4.0) 0.0 0.0 0.0 0.0 (4.0) (4.0) (4.0) (4.0) Total Distributable Cash Flow $77.1 $81.0 $85.5 $90.2 $111.4 $133.2 $152.6 $166.0 Distribution Coverage Ratio 1.05x 1.05x 1.05x 1.05x 1.05x 1.05x 1.05x 1.05x Distributions Paid to LPs $73.5 $77.2 $81.4 $85.9 $106.1 $126.8 $145.3 $158.1 Distributions Paid to GP 0.0 0.0 0.0 0.0 0.0 0.0 0.0 0.0 Total Distributions Paid $73.5 $77.2 $81.4 $85.9 $106.1 $126.8 $145.3 $158.1 Beginning Common Units 131.740 131.740 131.740 131.740 53.809 185.550 185.550 185.550 185.550 New Units Issued 0.000 0.000 0.000 0.000 0.000 0.000 0.000 0.000 Ending Common Units 131.740 131.740 131.740 131.740 185.550 185.550 185.550 185.550 Average Common Units Outstanding 131.740 131.740 131.740 131.740 185.550 185.550 185.550 185.550 Distributable Cash Flow Per LP Unit $0.59 $0.62 $0.65 $0.68 $0.60 $0.72 $0.82 $0.89 Accretion / (Dilution) (%) 2.5% 16.7% 26.7% 30.7% Paid Distribution Per LP Unit $0.56 $0.59 $0.62 $0.65 $0.57 $0.68 $0.78 $0.85 Accretion / (Dilution) (%) 2.5% 16.7% 26.7% 30.7% Coverage Cash $3.7 $3.9 $4.1 $4.3 $5.3 $6.3 $7.3 $7.9 Growth Capex (2.0) (2.0) (2.0) (2.0) 0.0 0.0 0.0 0.0 (2.0) (2.0) (2.0) (2.0) Subordinated Note Issuance 0.0 0.0 0.0 0.0 0.0 0.0 0.0 0.0 Free Cash Flow (Cash Shortfall) $1.7 $1.9 $2.1 $2.3 $3.3 $4.3 $5.3 $5.9 Cash (Shortfall) Coverage from Debt $0.0 $0.0 $0.0 $0.0 $0.0 $0.0 $0.0 $0.0 Cash (Shortfall) Coverage from Equity 0.0 0.0 0.0 0.0 0.0 0.0 0.0 0.0 New Equity Issue Price $9.90 $10.40 $10.97 $11.57 $10.14 $12.13 $13.90 $15.12 New NRGY Units Issued 0.000 0.000 0.000 0.000 0.000 0.000 0.000 0.000 Post-Capital Raise Free Cash Flow $1.7 $1.9 $2.1 $2.3 $3.3 $4.3 $5.3 $5.9 Beginning Total Debt $332.3 $330.6 $328.8 $326.7 $0.0 $332.3 $329.0 $324.7 $319.4 Debt Drawdown (Paydown) (1.7) (1.9) (2.1) (2.3) (3.3) (4.3) (5.3) (5.9) Ending Total Debt $330.6 $328.8 $326.7 $324.4 $329.0 $324.7 $319.4 $313.5 Total Debt / Adjusted EBITDA 3.5x 3.2x 3.1x 2.9x 2.5x 2.1x 1.8x 1.7x Total Net Debt / Adjusted EBITDA 3.4x 3.2x 3.0x 2.9x 2.5x 2.1x 1.8x 1.7x |
50 ($ in millions, except per unit amounts) NRGY Status Quo (Post Spin) Adjustments NRGY Pro Forma FYE September 30, FYE September 30, FYE September 30, Adjusted EBITDA Breakdown: 2014E 2015E 2016E 2017E 2014E 2015E 2016E 2017E 2014E 2015E 2016E 2017E EBITDA from Existing Operations $79.5 $82.6 $85.7 $89.0 $79.5 $82.6 $85.7 $89.0 Distributions from NRGM LP Interest 0.0 0.0 0.0 0.0 0.0 0.0 0.0 0.0 Distributions from NRGM GP Interest 15.7 19.6 20.9 22.1 15.7 19.6 20.9 22.1 Distributions from CMLP LP Interest 0.0 0.0 0.0 0.0 13.6 14.6 15.7 16.5 13.6 14.6 15.7 16.5 Distributions from CMLP GP Interest 0.0 0.0 0.0 0.0 23.9 32.5 43.0 50.1 23.9 32.5 43.0 50.1 Other 0.2 0.2 0.2 0.2 0.2 0.2 0.2 0.2 Total Adjusted EBITDA $95.4 $102.4 $106.8 $111.4 $132.9 $149.6 $165.6 $178.1 Interest Expense (Net) ($14.4) ($17.5) ($17.4) ($17.3) ($14.3) ($17.3) ($17.1) ($16.9) Maintenance Capex (4.0) (4.0) (4.0) (4.0) 0.0 0.0 0.0 0.0 (4.0) (4.0) (4.0) (4.0) Total Distributable Cash Flow $77.1 $81.0 $85.5 $90.2 $114.7 $128.3 $144.5 $157.3 Distribution Coverage Ratio 1.05x 1.05x 1.05x 1.05x 1.05x 1.05x 1.05x 1.05x Distributions Paid to LPs $73.5 $77.2 $81.4 $85.9 $109.2 $122.2 $137.6 $149.8 Distributions Paid to GP 0.0 0.0 0.0 0.0 0.0 0.0 0.0 0.0 Total Distributions Paid $73.5 $77.2 $81.4 $85.9 $109.2 $122.2 $137.6 $149.8 Beginning Common Units 131.740 131.740 131.740 131.740 53.809 185.550 185.550 185.550 185.550 New Units Issued 0.000 0.000 0.000 0.000 0.000 0.000 0.000 0.000 Ending Common Units 131.740 131.740 131.740 131.740 185.550 185.550 185.550 185.550 Average Common Units Outstanding 131.740 131.740 131.740 131.740 185.550 185.550 185.550 185.550 Distributable Cash Flow Per LP Unit $0.59 $0.62 $0.65 $0.68 $0.62 $0.69 $0.78 $0.85 Accretion / (Dilution) (%) 5.5% 12.4% 20.0% 23.8% Paid Distribution Per LP Unit $0.56 $0.59 $0.62 $0.65 $0.59 $0.66 $0.74 $0.81 Accretion / (Dilution) (%) 5.5% 12.4% 20.0% 23.8% Coverage Cash $3.7 $3.9 $4.1 $4.3 $5.5 $6.1 $6.9 $7.5 Growth Capex (2.0) (2.0) (2.0) (2.0) 0.0 0.0 0.0 0.0 (2.0) (2.0) (2.0) (2.0) Subordinated Note Issuance 0.0 0.0 0.0 0.0 0.0 0.0 0.0 0.0 Free Cash Flow (Cash Shortfall) $1.7 $1.9 $2.1 $2.3 $3.5 $4.1 $4.9 $5.5 Cash (Shortfall) Coverage from Debt $0.0 $0.0 $0.0 $0.0 $0.0 $0.0 $0.0 $0.0 Cash (Shortfall) Coverage from Equity 0.0 0.0 0.0 0.0 0.0 0.0 0.0 0.0 New Equity Issue Price $9.90 $10.40 $10.97 $11.57 $10.44 $11.69 $13.16 $14.33 New NRGY Units Issued 0.000 0.000 0.000 0.000 0.000 0.000 0.000 0.000 Post-Capital Raise Free Cash Flow $1.7 $1.9 $2.1 $2.3 $3.5 $4.1 $4.9 $5.5 Beginning Total Debt $332.3 $330.6 $328.8 $326.7 $0.0 $332.3 $328.8 $324.7 $319.9 Debt Drawdown (Paydown) (1.7) (1.9) (2.1) (2.3) (3.5) (4.1) (4.9) (5.5) Ending Total Debt $330.6 $328.8 $326.7 $324.4 $328.8 $324.7 $319.9 $314.4 Total Debt / Adjusted EBITDA 3.5x 3.2x 3.1x 2.9x 2.5x 2.2x 1.9x 1.8x Total Net Debt / Adjusted EBITDA 3.4x 3.2x 3.0x 2.9x 2.5x 2.2x 1.9x 1.8x NRGY Pro Forma Financials – No Merger (Challenge Case) Unit Spin, NRGY Acquires CMLP’s GP & IDRs for $450 million Source: NRGY / NRGM management |
APPENDIX B NRGY Distribution of NRGM Units |
52 Historical Relative Unit Price Performance (4/26/2012 – 5/3/2013) Source: Capital IQ and other public information Note: Market data as of 5/3/2013 + 19.2% + 14.3% NRGM August 2, 2012 – NRGY closes Contribution of Retail Propane Operations to Suburban Propane May 14, 2012 – NRGY Contributes US Salt, LLC to NRGM in Exchange for $192.5MM in Consideration April 26, 2012 – NRGY Agrees to Contribute Retail Propane Operations to Suburban Propane for $1.8 billion December 7, 2012 – NRGM Completes the Acquisition of the COLT Crude Oil Logistics Hub and Related Long-term Financing November 5, 2012 – NRGM announces acquisition of Rangeland Energy, LLC for $425 million May 14, 2012 – NRGM announces acquisition of US Salt, LLC for $192.5 million September 14, 2012 – NRGY Completes the Distribution of Approximately 14.1 million SPH Common Units in Connection with the Sale of its Retail Propane Operations |
53 Historical Market Capitalization: NRGY and NRGM (1) (1) Market capitalization based on total units outstanding, excluding outstanding un-vested restricted units (2) Pro forma for Inergy Midstream, L.P.’s acquisition of US Salt LLC on 5/14/2012; Issued 473,707 partnership common units to NRGY as part of the consideration (3) Represents NRGY's market capitalization minus the market capitalization of NRGY's stake in NRGM (4) Represents the implied NRGY market capitalization (ex. NRGM stake) divided by the total NRGY units outstanding (5) Units outstanding as of 5/3/2013 per NRGY / NRGM management; Current pricing as of 5/3/2013 ($ in millions, except per unit amounts) Key: Announce Date of NRGY Distribution 4/26/2012 7/26/2012 10/26/2012 1/25/2013 4/25/2013 (5) Current (5) Inergy, LP NRGY Closing Price / Unit $19.51 $19.31 $19.82 $19.92 $21.85 $22.30 Common Units 125.7 125.8 125.8 131.7 131.7 131.7 Class B Units 5.8 5.9 5.9 0.0 0.0 0.0 Total Units 131.5 131.6 131.7 131.7 131.7 131.7 Date of Available Share Count 2/1/2012 5/3/2012 8/3/2012 11/21/2012 5/3/2013 5/3/2013 Market Capitalization (1) $2,565.7 $2,541.9 $2,610.5 $2,623.0 $2,878.5 $2,937.8 Inergy Midstream, L.P. NRGM Closing Price / Unit $20.60 $22.05 $23.00 $23.00 $24.40 $24.55 Total Common Units owned by NRGY (2) 55.9 56.4 56.4 56.4 56.4 56.4 Date of Available Share Count 12/21/2011 5/14/2012 5/14/2012 1/9/2013 5/3/2013 5/3/2013 Market Capitalization of NRGY's Stake in NRGM $1,152.1 $1,243.6 $1,297.2 $1,297.2 $1,376.1 $1,384.6 % of NRGY Total Market Capitalization 44.9% 48.9% 49.7% 49.5% 47.8% 47.1% Implied NRGY Mkt Cap (Ex. NRGM Stake) (3) $1,413.7 $1,298.3 $1,313.3 $1,325.9 $1,502.4 $1,553.2 Implied NRGY Close Price / Unit (Ex. NRGM Stake) (4) $10.75 $9.86 $9.97 $10.07 $11.40 $11.79 $1,152 $1,244 $1,297 $1,297 $1,376 $1,385 $2,566 $2,542 $2,610 $2,623 $2,879 $2,938 45% 49% 50% 50% 48% 48% NRGY Total Market Capitalization NRGY's Stake in NRGM's Market Capitalization Percentages represent the market capitalization of NRGM's stake in NRGY divided by the total NRGY market capitalization |
54 Statistics NRGY PF NRGY % Change Current $22.30 $11.79 (47.1%) 20-Day $21.72 $11.44 (47.3%) 60-Day $20.89 $10.68 (48.9%) 90-Day $20.57 $10.33 (49.8%) 180-Day $19.78 $9.72 (50.9%) 365-Day $19.51 $9.75 (50.0%) Historical Closing Prices per Unit: NRGY and Implied NRGY (Excluding NRGM Stake) Note: Statistics represent an average of closing prices; Day count based on number of calendar days; Market data ranging from 4/26/2012 – 5/3/2013 $11.79 $22.30 NRGY NRGY (Excl. NRGM Stake) Implied Per-Unit Value of NRGY’s Stake in NRGM Implied Per-Unit Value of NRGY (Excluding Stake in NRGM) |
55 Historical Distribution Analysis: NRGY and NRGM (1) Note: Unit count excludes outstanding un-vested restricted units (1) Analysis excludes all IDR distributions (2) Quarterly distribution / unit multiplied by four (3) Class B units pay distributions in kind rather than cash; Class B units converted to common units during Q1 2013; The exact date of the conversion is not publically disclosed (4) Assumes class B units convert on 12/31/2012 and receive the distribution payment on 2/14/2013 (5) Pro forma for Inergy Midstream, L.P.’s acquisition of US Salt LLC on 5/14/2012; Issued 0.5 partnership common units to NRGY as part of the consideration ($ in millions, except per unit amounts) Key: Fiscal Quarter of Distribution Payment Q3 2012 Q4 2012 Q1 2013 Q2 2013 Q3 2013 Inergy, LP Distribution Announce Date 4/26/2012 7/26/2012 10/26/2012 1/25/2013 4/25/2013 Distribution Payment Date 5/15/2012 8/14/2012 11/14/2012 2/14/2013 5/15/2013 Quarterly Distribution / Unit $0.375 $0.375 $0.290 $0.290 $0.290 Annualized Distribution / Unit (2) $1.500 $1.500 $1.160 $1.160 $1.160 Common Units 125.7 125.8 125.8 131.7 131.7 Class B Units (3) 5.8 5.9 5.9 0.0 0.0 Total Units 131.5 131.6 131.7 131.7 131.7 Date of Available Share Count 2/1/2012 5/3/2012 8/3/2012 11/21/2012 5/3/2013 Total Cash Distribution ($MM) (4) $47.1 $47.2 $36.5 $38.2 $38.2 Inergy Midstream, L.P. Distribution Announce Date 4/25/2012 7/26/2012 10/26/2012 1/25/2013 4/26/2013 Distribution Payment Date 5/15/2012 8/14/2012 11/14/2012 2/14/2013 5/15/2013 Quarterly Distribution / Unit $0.370 $0.380 $0.385 $0.390 $0.395 Annualized Distribution / Unit (2) $1.480 $1.520 $1.540 $1.560 $1.580 Total Common Units owned by NRGY (5) 55.9 56.4 56.4 56.4 56.4 Date of Available Share Count 12/21/2011 5/14/2012 5/14/2012 1/9/2013 5/3/2013 Total Cash Distributions to NRGY ($MM) $20.7 $21.4 $21.7 $22.0 $22.3 % of NRGY Total Cash Distribution 43.9% 45.4% 59.5% 57.6% 58.3% $21 $21 $22 $22 $22 $47 $47 $36 $38 $38 44% 45% 60% 58% 59% NRGY Total Cash Distribution NRGM Total Cash Distribution to NRGY Percentages represent the total NRGM cash distribution divided by the total NRGY cash distribution |
56 Historical Yield Analysis: NRGY and NRGM (1) Quarterly distribution / unit multiplied by four (2) Class B units pay distributions in kind rather than cash; Class B units converted to common units during Q1 2013; The exact date of the conversion is not publically disclosed (3) Implied quarterly distribution / unit represents the implied pro forma NRGY cash distribution divided by the total cash pay NRGY units outstanding (4) Total units outstanding as of 5/3/2013 per NRGY / NRGM managements; Current unit price as of 5/3/2013 ($ in millions, except per unit amounts) Key: Announce Date of NRGY Distribution 4/26/2012 7/26/2012 10/26/2012 1/25/2013 4/25/2013 (4) Current (4) Inergy, LP NRGY Closing Price / Unit $19.51 $19.31 $19.82 $19.92 $21.85 $22.30 Annualized Distribution / Unit (1) $1.50 $1.50 $1.16 $1.16 $1.16 $1.16 Yield 7.7% 7.8% 5.9% 5.8% 5.3% 5.2% Inergy, L.P. (Excluding NRGM Stake) Implied NRGY Closing Price / Unit (Ex. NRGM Stake) $10.75 $9.86 $9.97 $10.07 $11.40 $11.79 NRGY Total Cash Distribution ($MM) $47.1 $47.2 $36.5 $38.2 $38.2 $38.2 (-) NRGY's Cash Distribution from NRGM ($MM) 20.7 21.4 21.7 22.0 22.3 22.3 Implied Pro forma NRGY Cash Distribution ($MM) $26.5 $25.7 $14.8 $16.2 $15.9 $15.9 Common Units 125.7 125.8 125.8 131.7 131.7 131.7 Class B Units (2) 5.8 5.9 5.9 0.0 0.0 0.0 Total Units 131.5 131.6 131.7 131.7 131.7 131.7 Implied Quarterly Distribution / Unit (3) $0.21 $0.20 $0.12 $0.12 $0.12 $0.12 Annualized Distribution / Unit (1) $0.84 $0.82 $0.47 $0.49 $0.48 $0.48 Implied Yield 7.8% 8.3% 4.7% 4.9% 4.2% 4.1% 7.7% 7.8% 5.9% 5.8% 5.3% 5.2% 7.8% 8.3% 4.7% 4.9% 4.2% 4.1% NRGY Yield Implied Pro Forma NRGY Yield |
57 Statistics NRGY PF NRGY Current 5.20% 4.10% 20-Day 5.34% 4.27% 60-Day 5.56% 4.62% 90-Day 5.65% 4.79% 180-Day 5.89% 5.01% 365-Day 6.84% 6.75% Historical Yields: NRGY and Implied NRGY (Excluding NRGM Stake) Note: Statistics represent an average of closing prices; Market data ranging from 4/26/2012 – 5/3/2013 4.1% 5.2% NRGY NRGY (Excl. NRGM Stake) August 2, 2012 – NRGY closes Contribution of Retail Propane Operations to Suburban Propane May 14, 2012 – NRGY Contributes US Salt, LLC to NRGM April 26, 2012 – NRGY Agrees to Contribute Retail Propane Operations to Suburban Propane for $1.8BN September 14, 2012 – NRGY Completes the Distribution of Approximately 14.1 million SPH Common Units in Connection with the Sale of its Retail Propane Operations |
Selected GP Yield Analysis Pure Play GP Mean: 4.0% Pure Play GP Mean (Excluding NSH): 3.1% Pure Play GP: Yields EV: Market Cap: $52.8BN $16.5BN $7.0BN $2.9BN $6.2BN $2.7BN $2.7BN $876MM $1.3BN $1.3BN Source: Capital IQ, SEC filings and company press releases Note: Market cap based on closing unit price as of 5/3/2013 (1) Enterprise value includes debt consolidated from respective underlying MLPs (2) Pro forma NRGY yield post-spin of NRGM units; Total units outstanding as of 5/3/2013 per NRGY / NRGM management and net debt of $1,285 million as of 12/31/2012 GPs with Assets: Yields EV: Market Cap: $35.3BN $20.8BN $38.4BN $25.8BN $84.1BN $40.2BN $18.9BN $9.9BN Pro Forma GPs with Assets Mean: 3.6% (2) $2.8BN $1.6BN 58 (1) (1) |
59 NRGY Annual Distributions Per LP Unit – Historical and Expected (Base Case) (1) Source: Historical figures based on company press releases and SEC filings; Projections based on NRGY standalone (post-spin) projections provided by management Note: Historical unit count figures exclude outstanding un-vested restricted units (1) Assumes no drop down of NRGY’s operating assets to NRGM, acquisition of CMLP’s GP & IDRs or NRGM / CMLP merger (2) Represents the last quarterly distribution paid in each fiscal year annualized (3) Class B units pay distributions in kind rather than cash; Class B units converted to common units during Q1 2013; The exact date of the conversion is not publically disclosed (4) Represents total distributions paid to LPs multiplied by common units outstanding Impact of sale of propane assets Impact of distribution of stake in NRGM (22.7%) (44.8%) Assumes no drop down of NRGY’s operating assets to NRGM, acquisition of CMLP’s GP & IDRs or NRGM / CMLP merger ($ in millions, except per unit amounts) Key: Fiscal Year End FY 2012A Q2 Annualized FY 2014E FY 2015E FY 2016E FY 2017E Total Distributions Paid to LPs (2) $1.500 $1.160 $0.640 $0.760 $0.850 $0.940 Payment Date 8/14/2012 5/15/2013 NA NA NA NA Common Units 125.8 131.7 131.7 131.7 131.7 131.7 Class B Units (3) 5.9 0.0 0.0 0.0 0.0 0.0 Total Units 131.6 131.7 131.7 131.7 131.7 131.7 Date of Available Share Count 5/3/2012 5/3/2013 NA NA NA NA Implied Total Cash Distribution ($MM) (4) $188.6 $152.8 $84.3 $100.1 $112.0 $123.8 $1.50 $1.16 $0.64 $0.76 $0.85 $0.94 NRGY actual distributions / unit NRGY pro forma (post -spin)projected distributions / unit |
60 Current 2014E 2015E 2016E 2017E NRGM Distribution per LP Unit (No Merger) $1.58 $1.70 $1.76 $1.80 $1.88 NRGM Units Distributed per NRGY LP Unit 0.428x 0.428x 0.428x 0.428x 0.428x Pro Rata NRGM Distribution per NRGY LP Unit $0.68 $0.73 $0.75 $0.77 $0.80 Post-Spin NRGY Distribution per LP Unit $0.48 $0.64 $0.76 $0.85 $0.94 Combined Distributions per NRGY LP Unit $1.16 $1.37 $1.51 $1.62 $1.74 Standalone NRGY LP Unit Distribution $1.16 $1.31 $1.45 $1.57 $1.69 Accretion / (Dilution) $ $0.00 $0.06 $0.06 $0.05 $0.05 Accretion / (Dilution) % 0.0% 4.2% 4.2% 3.1% 3.1% $1.16 $0.48 $1.31 $0.64 $1.45 $0.76 $1.57 $0.85 $1.69 $0.94 $0.68 $0.73 $0.75 $0.77 $0.80 Pro Forma Impact to NRGY Unitholder (Base Case) Source: Historical figures based on company press releases and SEC filings; Projections based on NRGY standalone (post-spin) projections provided by management NRGY Standalone Pro Forma NRGY NRGM (Pro Rata Post-Distribution) |
61 Key: Fiscal Year End FY 2012A Q2 Annualized FY 2014E FY 2015E FY 2016E FY 2017E Total Distributions Paid to LPs (2) $1.500 $1.160 $0.560 $0.590 $0.620 $0.650 Payment Date 8/14/2012 5/15/2013 NA NA NA NA Common Units 125.8 131.7 131.7 131.7 131.7 131.7 Class B Units (3) 5.9 0.0 0.0 0.0 0.0 0.0 Total Units 131.6 131.7 131.7 131.7 131.7 131.7 Date of Available Share Count 5/3/2012 5/3/2013 NA NA NA NA Implied Total Cash Distribution ($MM) (4) $188.6 $152.8 $73.8 $77.7 $81.7 $85.6 $1.50 $1.16 $0.56 $0.59 $0.62 $0.65 NRGY actualdistributions / unit NRGY pro forma (post-spin) projected distributions / unit NRGY Annual Distributions Per LP Unit – Historical and Expected (Challenge Case) (1) Source: Historical figures based on company press releases and SEC filings; Projections based on NRGY standalone (post-spin) projections provided by management Note: Historical unit count figures exclude outstanding un-vested restricted units (1) Assumes no drop down of NRGY’s operating assets to NRGM, acquisition of CMLP’s GP & IDRs or NRGM / CMLP merger (2) Represents the last quarterly distribution paid in each fiscal year annualized (3) Class B units pay distributions in kind rather than cash; Class B units converted to common units during Q1 2013; The exact date of the conversion is not publically disclosed (4) Represents total distributions paid to LPs multiplied by common units outstanding Impact of sale of propane assets Impact of distribution of stake in NRGM (22.7%) (51.7%) Assumes no drop down of NRGY’s operating assets to NRGM, acquisition of CMLP’s GP & IDRs or NRGM / CMLP merger ($ in millions, except per unit amounts) |
62 Current 2014E 2015E 2016E 2017E NRGM Distribution per LP Unit (No Merger) $1.58 $1.66 $1.71 $1.72 $1.74 NRGM Units Distributed per NRGY LP Unit 0.428x 0.428x 0.428x 0.428x 0.428x Pro Rata NRGM Distribution per NRGY LP Unit $0.68 $0.71 $0.73 $0.74 $0.74 Post-Spin NRGY Distribution per LP Unit $0.48 $0.56 $0.59 $0.62 $0.65 Combined Distributions per NRGY LP Unit $1.16 $1.27 $1.32 $1.36 $1.39 Standalone NRGY LP Unit Distribution $1.16 $1.20 $1.27 $1.32 $1.35 Accretion / (Dilution) $ $0.00 $0.07 $0.05 $0.04 $0.04 Accretion / (Dilution) % 0.0% 5.5% 3.9% 2.7% 3.2% $1.16 $0.48 $1.20 $0.56 $1.27 $0.59 $1.32 $0.62 $1.35 $0.65 $0.68 $0.71 $0.73 $0.74 $0.74 Pro Forma Impact to NRGY Unitholder (Challenge Case) Source: Historical figures based on company press releases and SEC filings; Projections based on NRGY standalone (post-spin) projections provided by management NRGY Standalone Pro Forma NRGY NRGM (Pro Rata Post-Distribution) |
63 Financial Projections Fiscal Year-Ending September 30, 2014E 2015E 2016E 2017E EBITDA $107.2 $126.8 $141.6 $153.2 Less: Interest Expense (net) (14.3) (17.9) (19.6) (19.4) Less: Maintenance Capex (4.0) (4.0) (4.0) (4.0) Total Distributable Cash Flow $89.0 $105.0 $118.1 $129.9 Coverage Ratio 1.05x 1.05x 1.05x 1.05x Total Distributions paid to LPs $84.7 $100.0 $112.5 $123.7 Average Common Units Outstanding 131.740 131.740 131.740 131.740 Paid Distributions per LP Unit $0.64 $0.76 $0.85 $0.94 NRGY Discounted Cash Flow Analysis (Post-Spin / Base Case) EBITDA – Earnings Before Interest, Taxes, Depreciation and Amortization Note: Assumes midpoint convention to discount projection period free cash flow (1) The range of discount rates is based on the calculation of the sum of NRGY’s current yield (5.2%) and the current - 2017 LP distribution CAGR (8.9%) ($ in millions, except per unit amounts) (1) Discounted Cash Flow Analysis Terminal Value Capitilization Rate 4.5% 5.0% 5.5% Discount Rate 13.0% 14.0% 15.0% 13.0% 14.0% 15.0% 13.0% 14.0% 15.0% Discounted LP Distributions ('14 - '17) $2.47 $2.43 $2.39 $2.47 $2.43 $2.39 $2.47 $2.43 $2.39 Present Value of Terminal Value ('17) $12.81 $12.37 $11.94 $11.53 $11.13 $10.75 $10.48 $10.12 $9.77 NRGY per Unit Equity Value $15.29 $14.80 $14.33 $14.00 $13.56 $13.14 $12.96 $12.55 $12.16 29.6% 25.5% 21.6% 18.8% 15.0% 11.4% 9.9% 6.4% 3.1% Premium / (Discount) to Pro Forma NRGY unit price of $11.79 |
64 Discounted Cash Flow Analysis Terminal Value Capitilization Rate 4.5% 5.0% 5.5% Discount Rate 8.0% 9.0% 10.0% 8.0% 9.0% 10.0% 8.0% 9.0% 10.0% Discounted LP Distributions ('14 - '17) $2.07 $2.04 $2.00 $2.07 $2.04 $2.00 $2.07 $2.04 $2.00 Present Value of Terminal Value ('17) $10.62 $10.23 $9.87 $9.56 $9.21 $8.88 $8.69 $8.37 $8.07 NRGY per Unit Equity Value $12.69 $12.27 $11.87 $11.63 $11.24 $10.88 $10.76 $10.41 $10.07 7.6% 4.1% 0.6% (1.4%) (4.6%) (7.7%) (8.7%) (11.7%) (14.6%) Premium / (Discount) to Pro Forma NRGY unit price of $11.79 Financial Projections Fiscal Year-Ending September 30, 2014E 2015E 2016E 2017E EBITDA $95.4 $102.4 $106.8 $111.4 Less: Interest Expense (net) (14.4) (17.5) (17.4) (17.3) Less: Maintenance Capex (4.0) (4.0) (4.0) (4.0) Total Distributable Cash Flow $77.1 $81.0 $85.5 $90.2 Coverage Ratio 1.05x 1.05x 1.05x 1.05x Total Distributions paid to LPs $73.5 $77.2 $81.4 $85.9 Average Common Units Outstanding 131.740 131.740 131.740 131.740 Paid Distributions per LP Unit $0.56 $0.59 $0.62 $0.65 NRGY Discounted Cash Flow Analysis (Post-Spin / Challenge Case) EBITDA – Earnings Before Interest, Taxes, Depreciation and Amortization Note: Assumes midpoint convention to discount projection period free cash flow (1) The range of discount rates is based on the calculation of the sum of NRGY’s current yield (5.2%) and the current - 2017 LP distribution CAGR (3.5%) ($ in millions, except per unit amounts) (1) |
APPENDIX C NRGM Merges with CMLP (Base Case) |
Pro Forma Map of Operations CMLP Areas with Existing Assets and Operations CMLP Areas with Greenfield or Development Projects being Evaluated Inergy Assets Crestwood Assets Source: NRGY / NRGM investor presentations, CMLP investor presentations and other public information 66 Stagecoach: 26.3 Bcf working gas capacity Thomas Corners: 5.7 Bcf operational working gas capacity Steuben: 6.2 Bcf working gas capacity Seneca Lake: 1.5 Bcf working gas capacity COLT Hub: 120,000 BPD rail loading capacity, 720,000 Bbl crude oil storage capacity Tres Palacios: 38.4 Bcf working gas capacity Bath Facility: 1.5 MMBbl of NGL underground storage Watkins Glen Project: Developing 2.1 MMBbl of underground NGL storage West Coast Midstream: 25,000 mcfd natural gas processing |
67 NRGM and CMLP Unitholder Composition Source: SEC Filings and Capital IQ NRGM Stockholder Composition CMLP Stockholder Composition Shading Indicates Investors with holdings of both NRGM and CMLP Top 10: 80.0% ownership # Investor Ownership (%) Position (Units) 1. Inergy, L.P. (NYSE:NRGY) 65.6% 56.4 2. Kayne Anderson Capital Advisors, L.P. 10.1% 8.7 3. Neuberger Berman LLC 4.3% 3.7 4. Tortoise Capital Advisors L.L.C. 3.6% 3.1 5. Eagle Global Advisors, LLC 2.2% 1.9 6. OppenheimerFunds, Inc. 1.9% 1.6 7. OFI SteelPath, Inc. 1.9% 1.6 8. Fiduciary Asset Management, LLC 1.6% 1.4 9. Nationwide Asset Management LLC. 1.2% 1.0 10. Advisory Research, Inc. 1.1% 1.0 11. Magnetar Capital, LLC 1.1% 0.9 12. Guggenheim Partners, LLC 1.0% 0.8 13. Fidelity Investments 0.8% 0.7 14. Mason Street Advisors, LLC 0.7% 0.6 15. Credit Suisse, Investment Banking and Securities Investments 0.6% 0.5 16. All Others 2.3% 2.0 100.0% 85.9 # Investor Ownership (%) Position (Units) 1. Crestwood Holdings 43.2% 25.9 2. Kayne Anderson Capital Advisors, L.P. 11.7% 7.0 3. Tortoise Capital Advisors L.L.C. 8.9% 5.3 4. ClearBridge Investments, LLC 4.1% 2.5 5. Center Coast Capital Advisors, LP 4.1% 2.5 6. Liberty Street Advisors, Inc. 3.5% 2.1 7. Guggenheim Partners, LLC 1.4% 0.8 8. The Northwestern Mutual Life Insurance Company, Asset Management Arm 1.2% 0.7 9. Tiverton Asset Management Llc 1.0% 0.6 10. Invesco Ltd. (NYSE:IVZ) 1.0% 0.6 11. JPMorgan Chase & Co, Private Banking and Investment Banking Investments 0.8% 0.5 12. UBS Global Asset Management 0.5% 0.3 13. KA First Reserve, LLC 0.5% 0.3 14. Third Security, LLC 0.4% 0.3 15. Citigroup Inc., Asset Management Arm 0.3% 0.2 16. All Others 17.4% 10.4 100.0% 60.0 Top 3: 80.0% ownership Top 10: 93.5% ownership Top 3: 63.8% ownership |
68 NRGM CMLP FYE September 30, Calendarized to FYE September 30, 2014E 2015E 2016E 2017E CAGR (1) 2014E 2015E 2016E 2017E CAGR (1) Total Adjusted EBITDA (Mgmt) $223.5 $242.7 $260.9 $287.5 8.8% $201.1 $262.4 $298.5 $332.4 18.2% Interest Expense (Net) ($42.8) ($50.7) ($55.3) ($59.8) ($48.9) ($62.2) ($67.2) ($72.7) Maintenance Capex (7.0) (7.8) (8.2) (8.6) (7.9) (7.6) (8.6) (11.1) Non-Cash Compensation 0.0 0.0 0.0 0.0 4.3 4.7 4.9 5.1 Total Distributable Cash Flow (To All) $173.7 $184.1 $197.3 $219.1 8.0% $148.5 $197.3 $227.6 $253.7 19.5% Distribution Coverage Ratio 1.05x 1.05x 1.05x 1.05x 0.97x 1.05x 1.05x 1.05x Distributions Paid to LP $146.3 $151.3 $159.7 $172.2 5.6% $125.2 $144.0 $158.4 $170.8 10.9% Distributions Paid to GP 19.1 24.1 28.2 36.4 24.0% 28.1 44.0 58.4 70.8 36.1% Total Distributions Paid $165.4 $175.4 $187.9 $208.6 8.0% $153.3 $187.9 $216.7 $241.6 16.4% Beginning Common Units 85.943 85.943 85.943 91.724 N/A N/A N/A N/A New Units Issued 0.000 0.000 5.781 0.000 N/A N/A N/A N/A Ending Common Units 85.943 85.943 91.724 91.724 N/A N/A N/A N/A Average Common Units Outstanding 85.943 85.943 88.834 91.724 60.540 60.578 60.578 60.578 Distributions Paid Per LP Unit $1.70 $1.76 $1.80 $1.88 3.4% $2.13 $2.38 $2.61 $2.82 9.8% Comparison of Standalone Financial Projections Summary (Base Case) ($ in millions, except per unit amounts) Source: Company management (1) CAGR represents annualized growth rate from 2014E through 2017E |
69 DCF – Discounted cash flow EBITDA – Earnings Before Interest, Taxes, Depreciation and Amortization EV – Enterprise value Source: Capital IQ, Thomson ONE, NRGY / NRGM management (1) No particular weight given to any analysis Exchange Ratio Summary (Base Case) (1) Public Comparables DCF Analysis Selected Transactions Transaction Exchange Ratio: 1.070x 52-Wk Range Average Metric Exchange Financial Metric NRGM CMLP Ratio 52-Week High/Low (Closing) $18.31 - $26.01 $19.90 - $29.12 1.178x EV / FY2014E EBITDA $23.30 - $28.50 $23.53 - $30.24 1.062x Current Yield $24.31 - $28.73 $29.14 - $34.00 1.207x EV / FY2014E EBITDA $19.40 - $24.60 $21.86 - $28.57 1.181x DCF Analysis $23.14 - $27.76 $23.96 - $27.64 1.029x 0.863x 0.889x 1.014x 0.826x 0.765x 1.195x 1.473x 1.399x 1.298x 1.590x 0.500x 0.750x 1.000x 1.250x 1.500x 1.750x 2.000x 2.250x |
52-week Range NRGM CMLP High $26.01 $29.12 Low $18.31 $19.90 Historical Exchange Ratio (Number of NRGM Units Per CMLP Unit) Source: Capital IQ, Bloomberg and other public information (1) 1.070x represents a 5% premium to CMLP based on the 20-day average unit prices for NRGM and CMLP Trading Averages CMLP / NRGM Premium (Discount) to Offer (1) Current 0.97x (9.2%) 30-Day Average: 1.02x (4.6%) 60-Day Average: 1.03x (4.2%) 90-Day Average: 1.04x (3.0%) 1-Year Average: 1.08x 0.7% Since IPO: 1.17x 9.6% 0.80x 1.05x 1.30x 1.55x 1.80x Dec-11 Feb-12 Apr-12 Jun-12 Aug -12 Oct-12 Dec-12 Feb-13 Apr-13 70 |
71 Current Price (5/3) = $24.55/ unit Selected Company Analysis 52-Wk Range DCF Analysis DCF – Discounted cash flow EBITDA – Earnings Before Interest, Taxes, Depreciation and Amortization EV – Enterprise value Source: Capital IQ, Thomson ONE, NRGY / NRGM management Note: Enterprise value assumes $680MM in net debt outstanding and 85.9 million fully diluted units outstanding as of 5/3/2013 per NRGY / NRGM management (1) No particular weight given to any analysis (2) The range of discount rates is based on the calculation of the sum of NRGM’s current yield (6.4%) and the current - 2017 LP distribution CAGR (4.0%) Summary Financial Analyses – NRGM Implied Per Unit Value (Base Case) (1) Selected Transaction Analysis ($ in millions, except per unit amounts) (2) Financial Metric Statistic Selected Multiple Reference Range 52-Week High/Low (Closing) $18.31 / unit - $26.01 / unit EV / FY2014E EBITDA $223.5 Million 12.0x - 14.0x Current Yield $1.58 per unit 6.5% - 5.5% EV / FY2014E EBITDA $223.5 Million 10.5x - 12.5x DCF Analysis Discount Rate: 9.5% -11.5% Terminal Value Capitalization Rate: 7.0% - 6.0% $23.14 $19.40 $24.31 $23.30 $18.31 $27.76 $24.60 $28.73 $28.50 $26.01 $15 $20 $25 $30 $35 |
72 Market % of Distribution Market Enterprise Price 52-week Distribution Growth Cap Value EV / EBITDA Company Name 5/3/2013 High Yield Rate ($MMs) ($MMs) 2014E 2015E El Paso Pipeline Partners, L.P. $42.50 95% 5.8% 21.6% $9,193 $13,323 10.8x 10.6x Boardwalk Pipeline Partners, LP 30.27 97% 7.0% 0.5% 6,986 10,664 12.7x 11.8x Spectra Energy Partners, LP 37.35 93% 5.4% 4.4% 4,064 4,820 23.8x 27.4x TC PipeLines, LP 43.06 86% 7.2% 1.3% 2,303 3,013 15.5x 14.8x PAA Natural Gas Storage, L.P. 21.90 95% 6.5% 0.0% 1,857 2,468 18.8x 16.9x EQT Midstream Partners, LP 46.38 98% 3.2% NA 1,615 1,815 13.3x 9.1x Niska Gas Storage Partners LLC 15.11 95% 9.3% 0.0% 535 1,291 9.1x 9.0x MEAN 94% 6.4% 4.6% $3,793 $5,342 14.9x 14.2x MEDIAN 95% 6.5% 0.9% $2,303 $3,013 13.3x 11.8x HIGH 98% 9.3% 21.6% $9,193 $13,323 23.8x 27.4x LOW 86% 3.2% 0.0% $535 $1,291 9.1x 9.0x Inergy Midstream, L.P. $24.55 94% 6.4% 6.8% $2,110 $2,790 12.5x 11.5x (3) NRGM – Selected Companies Analysis Source: SEC filings, company investor presentations and company press releases (1) Calculated based on annualized run rate of the most recent quarter’s dividend. Special dividends are not calculated on a run rate basis (2) Based on fully diluted units outstanding, including in-the-money unit options, unvested restricted units and other dilutive securities; unit count includes subordinated units and excludes GP units (3) Company has filed a press release or 3/31/2013 financials (4) Pro forma for subsequent equity offering of 4.5MM units and 0.7MM over-allotment (5) Pro forma for equity restructuring of 33.8MM subordinated units and prior inventive distribution rights; 33.8MM subordinated units were eliminated from outstanding unit count (6) 2014 and 2015 projections based on base case estimates per NRGY / NRGM management (1) (2) (3) (3) (3) (3) (4) (5) ($ in millions, except per unit amounts) (6) |
73 Announced Date Buyer Seller Transaction Value TV / EBITDA Assets Acquired 3/21/2013 Energy Transfer Partners, L.P. Energy Transfer Equity, L.P. $6,224.4 (1) 12.9x ETP acquired the remaining 60% interest in ETP HoldCo from ETE. ETP HoldCo includes Panhandle Eastern Pipeline Company, Sea Robin Pipeline Company, Southwest Gas Storage Company, Trunkline Gas Company, Trunkline LNG Company and the retail and marketing operations of Sunoco, Inc. 10/23/2012 Spectra Energy Partners, L.P. Spectra Energy Corp. 545.0 10.9x SEP acquired a 38.76% interest in Maritimes & Northeast Pipeline, LLC which owns a 338-mile FERC-regulated interstate natural gas transportation system which extends from the border of Canada near Baileyville, Maine to northeastern Massachusetts. M&N has deilivery capability of 0.8 Bcf/d. 8/20/2012 Tallgrass Energy Partners, LP Kinder Morgan Energy Partners, LP 3,300.0 8.4x Tallgrass acquired a 50% interest in Rockies Express Pipeline, Kinder Morgan Interstate Gas Transmission, Trailblazer Pipeline Company, the Casper-Douglas natural gas processing plant and West Frenchie Draw treating facilities in Wyoming from Kinder Morgan Energy Partners 8/6/2012 Kinder Morgan Energy Partners, LP Kinder Morgan, Inc. 6,220.0 8.0x KMP acquired 100% of Tennessee Gas Pipeline and a 50% interest in El Paso Natural Gas Pipeline. TGP is a 13,900 mile pipeline system with capacity of 7.5 Bcf/d transporting gas from the Gulf Coast to the northeastern United States; EPNG is a 10,200 mile pipeline system with capacity of 5.6 Bcf/d transporting gas from Californian basins to other western states 5/18/2012 El Paso Pipeline Partners, L.P. El Paso Corporation 877.0 8.5x EPB agreed to acquire the remaining 14% interest in Colorado Interstate Gas Company and all of Cheyenne Plains Investment Company which owns Cheyenne Plains Gas Pipeline Company. 10/16/2011 Kinder Morgan, Inc. El Paso Corporation 37,467.8 11.0x Kinder Morgan signed a definitive agreement to acquire El Paso Corp., which owns interests in 43,100 miles of natural gas pipelines as well as General Partner and Limited Partner interest in El Paso Pipeline Partners, LP. 7/5/2011 Energy Transfer Partners, L.P. Energy Transfer Equity, L.P. 1,900.0 6.3x Energy Transfer Equity LP signed a definitive agreement to contribute to ETP by merger an indirect 50% interest in Citrus Corp., which owns 100% of Florida Gas Transmission pipeline system - a 5,500 mile interstate pipeline 5/11/2011 Spectra Energy Partners, L.P. EQT Corp. 390.0 NA SEP acquired Big Sandy pipeline from EQT Corp. Big Sandy pipeline is a Federal Energy Regulatory Commission (FERC) regulated natural gas pipeline system located in eastern KY. The Pipeline has 171 mmcfe/d of capacity and is approximately 70 miles in length 4/26/2011 Atlas Pipeline Partners L.P. Buckeye Partners, L.P. 85.0 NA Acquired 20% interest in West Texas LPG Pipeline Limited Partnership, which owns a 2,295-mile common- carrier pipeline system that transports NGLs from New Mexico and Texas to Mont Belvieu for fractionation 4/26/2011 TC PipeLines, LP TransCanada Corporation 605.0 10.1x Acquired a 25% interest in both Gas Transmission Northwest LLC, a 1,353 mile natural gas transmission system that transports natural gas to third party pipelines in Washington, Oregon, and California and Bison Pipeline LLC, a new 303-mile natural gas pipeline connecting Rocky Mountain gas supply to downstream markets via the Northern Border pipeline system 4/21/2011 Williams Partners, L.P. Williams Companies, Inc. 330.0 NA Additional 24.5% interest in the Gulfstream interstate gas pipeline system, a 745-mile interstate gas pipeline system that extends from the Mobile Bay area to markets in Florida 3/22/2011 Energy Transfer Partners (70%); Regency Energy Partners (30%) Louis Dreyfus Highbridge Energy LLC 1,925.0 12.3x Acquired LDH Energy Asset Holdings LLC, which owns and operates a NGL, storage, fractionation and transportation business 3/7/2011 El Paso Pipeline Partners, L.P. El Paso Corporation 787.4 9.2x Additional 22% interest in 7,600 miles of pipeline, 3,700 MMcf/d capacity and 60 Bcf of storage capacity 1/10/2011 Western Gas Partners, L.P. EnCana Corp.; EnCana Oil & Gas (USA) Inc. 303.0 9.3x Fort Lupton natural gas processing plant in CO; plant processes ~84 Mmcfe/d and includes five natural gas gathering pipeline systems and associated compression facilities; contract includes 3,500 b/d of NGLs extraction from plant until close 1/4/2011 MarkWest Energy Partners, L.P. EQT Corp. 230.0 NA Langley, KY natural gas processing complex and associated NGL pipeline; assets include 100 Mmcfe/d cryogenic processing plant, 75 Mmcfe/d refrigeration processing plant and ~28,000 horsepower of compression 12/17/2010 Chesapeake Midstream Partners, L.P. Chesapeake Energy Corp. 500.0 11.9x Springridge system, which consists of 220 miles of gathering pipeline in Caddo and De Soto Parishes, Louisiana 11/30/2010 Spectra Energy Partners, L.P. Spectra Energy Corp. 330.0 5.6x Acquired a 24.5% interest in Gulfstream Natural Gas System, a 745-mile natural gas transportation system extending from Pascagoula, MS and Mobile, AL across the Gulf of Mexico into FL with a market delivery capability of 1.26 Bcf/d Mean $3,648.2 9.6x Median $605.0 9.3x NRGM – Selected Transactions Analysis Source: Capital IQ, Thomson One, Public Filings and other public information (1) Includes proportional ETP HoldCo debt ($ in millions) |
74 Discounted Cash Flow Analysis Terminal Value Capitalization Rate 7.0% 6.5% 6.0% Discount Rate 9.5% 10.5% 11.5% 9.5% 10.5% 11.5% 9.5% 10.5% 11.5% Discounted LP Distributions ('14 - '17) $5.96 $5.86 $5.76 $5.96 $5.86 $5.76 $5.96 $5.86 $5.76 Present Value of Terminal Value ('17) $18.68 $18.01 $17.38 $20.12 $19.40 $18.71 $21.79 $21.02 $20.27 Implied Price / Unit $24.64 $23.87 $23.14 $26.08 $25.26 $24.47 $27.76 $26.88 $26.03 Financial Projections Fiscal Year-Ending September 30, 2014E 2015E 2016E 2017E EBITDA $223.5 $242.7 $260.9 $287.5 Less: Interest Expense (net) (42.8) (50.7) (55.3) (59.8) Less: Maintenance Capex (7.0) (7.8) (8.2) (8.6) Total Distributable Cash Flow $173.7 $184.1 $197.3 $219.1 Coverage Ratio 1.05x 1.05x 1.05x 1.05x Total Distributions paid to LPs $146.3 $151.3 $159.7 $172.2 Average Common Units Outstanding 85.943 85.943 88.834 91.724 Paid Distributions per LP Unit $1.70 $1.76 $1.80 $1.88 NRGM – Discounted Cash Flow Analysis (Base Case) ($ in millions, except per unit amounts) (1) EBITDA – Earnings Before Interest, Taxes, Depreciation and Amortization Note: Assumes midpoint convention to discount projection period free cash flow (1) The range of discount rates is based on the calculation of the sum of NRGM’s current yield (6.4%) and the current - 2017 LP distribution CAGR (4.0%) |
75 Current Price (5/3) = $23.85/ unit Selected Company Analysis DCF Analysis DCF – Discounted cash flow EBITDA – Earnings Before Interest, Taxes, Depreciation and Amortization EV – Enterprise value Source: Capital IQ, Thomson ONE, NRGY / NRGM management Note: Enterprise value assumes $600MM in net debt outstanding and 60.0 million fully diluted units outstanding as of 5/3/2013 per NRGY / NRGM management (1) No particular weight given to any analysis (2) The range of discount rates is based on the calculation of the sum of CMLP’s current yield (8.6%) and the current - 2017 LP distribution CAGR (7.6%) Summary Financial Analyses – CMLP Implied Per Unit Value (Base Case) (1) Selected Transaction Analysis 52-Wk Range ($ in millions, except per unit amounts) Financial Metric Statistic Selected Multiple Reference Range 52-Week High/Low (Closing) $19.90 / unit - $29.12 / unit EV / FY2014E EBITDA $201.1 Million 10.0x - 12.0x Current Yield $2.04 per unit 7.0% - 6.0% EV / FY2014E EBITDA $201.1 Million 9.5x - 11.5x DCF Analysis $23.96 $21.86 $29.14 $23.53 $19.90 $27.64 $28.57 $34.00 $30.24 $29.12 $15 $20 $25 $30 $35 Terminal Value Capitalization Rate: 8.0% - 9.0% (2) Discount Rate: 15.0% - 17.0% |
76 Market % of Distribution Market Enterprise Price 52-week Distribution Growth Cap Value EV / EBITDA Company Name 5/3/2013 High Yield Rate ($MMs) ($MMs) 2014E 2015E MarkWest Energy Partners, L.P. $60.70 95% 5.4% 7.9% $9,091 $11,639 12.3x 10.5x Access Midstream Partners, L.P. 42.48 98% 4.4% 15.4% 8,542 11,137 10.9x 9.4x Western Gas Partners LP 59.73 98% 3.6% 17.4% 6,288 7,904 13.3x 10.5x Targa Resources Partners LP 46.63 95% 6.0% 12.0% 4,846 7,398 9.1x 7.9x DCP Midstream Partners LP 48.06 97% 5.7% 6.3% 3,557 5,209 10.5x 8.0x Atlas Pipeline Partners, L.P. 36.48 97% 6.5% 5.4% 3,305 4,888 10.9x 9.6x PVR Partners, L.P. 25.25 92% 8.7% 5.8% 3,259 4,846 11.4x 9.8x Crosstex Energy LP 18.78 95% 7.0% 0.0% 1,768 2,831 9.2x 7.3x Summit Midstream Partners, LP 27.46 96% 6.1% NA 1,344 1,556 11.0x 8.8x Southcross Energy Partners, L.P. 21.61 82% 7.4% NA 531 721 11.4x 8.9x MEAN 94% 6.1% 8.8% $4,253 $5,813 11.0x 9.1x MEDIAN 96% 6.1% 7.1% $3,431 $5,049 11.0x 9.2x HIGH 98% 8.7% 17.4% $9,091 $11,639 13.3x 10.5x LOW 82% 3.6% 0.0% $531 $721 9.1x 7.3x Crestwood Midstream Partners LP $23.85 82% 8.6% 2.0% $1,430 $2,028 10.1x 7.7x CMLP – Selected Companies Analysis Source: SEC filings, company investor presentations and company press releases (1) Calculated based on annualized run rate of the most recent quarter’s dividend. Special dividends are not calculated on a run rate basis (2) Based on fully diluted units outstanding, including in-the-money unit options, unvested restricted units and other dilutive securities; unit count includes subordinated units and excludes GP units (3) Adjusted to reflect pro forma impact of $1BN public notes offering and subsequent debt repurchase (4) Company has filed a press release or 3/31/2013 financials (5) Pro forma for equity issuance of 10.35MM units and subsequent debt repayment (6) Pro form $500MM notes issuance used to fund the recent acquisition of DCP SC Texas GP for $626MM, equity offering of 12.65MM units and subsequent revolver paydown (7) Pro forma for pending TEAK Midstream, L.L.C. acquisition; includes issuance of 11.845MM common LP units, $400MM in Series D Convertible Preferred units and $203.4MM in bank financing (8) Pro forma for Series A convertible preferred issuance and subsequent revolver paydown (9) Pro forma for equity issuance of 5.175MM units and subsequent debt repayment; 2014 and 2015 projections based on base case estimates per NRGY / NRGM management (1) (2) (4) (3) (4) (5) (4) (4) (6) (6) (8) (9) (4) (7) ($ in millions, except per unit amounts) |
77 Announced Date Buyer Seller Enterprise Value TV / EBITDA TV / Developed EBITDA Assets Acquired 4/16/2013 Atlas Pipeline Partners, L.P. TEAK Midstream, L.L.C. $1,000.0 NA 6.9x (1) APL announced a definitive agreement to acquire TEAK Midstream, which owns a 200 MMcf/d cryogenic processing plant and 265 miles of rich gas gathering lines with 750 MMcf/d of capacity. TEAK is in the process of installing a second 200 MMcf/d processing plant which is expected to be in service during 2014. 2/27/2013 Regency Energy Partners LP Energy Transfer Equity, L.P. Energy Transfer Partners, L.P. 1,500.0 NA 13.0x RGP announced it would acquire Southern Union Gathering Company, LLC, the owner of Southern Union Gas Services, Ltd. (SUGS). SUGS' assets include a 5,600-mile gathering system and ~500 MMcf/d of processing and treating facilities in West TX and NM. 2/27/2013 Western Gas Partners, LP Chesapeake Energy Corporation 395.6 (2) 9.7x NA WES agreed to acquire a 33.75% interest in the Larry's Creek, Seely and Warrensville gas gathering systems from an affiliate of Chesapeake Energy Corporation. The assets are located in north-central Pennsylvania in the Marcellus Shale. 2/27/2013 Western Gas Partners, LP Anadarko Petroleum Corporation 1,451.9 (2) 7.6x NA WES acquired a 33.75% in the Liberty and Rome gas gathering systems in north-central Pennsylvania. 1/29/2013 Kinder Morgan Energy Partners, L.P. Copano Energy, LLC 4,746.6 (3) 15.8x NA Copano owns and operates assets primarily in Texas, Oklahoma and Wyoming, and is engaged in natural gas gathering, processing, treating and natural gas liquids fractionation. Copano owns an interest in or operates about 6,900 miles of pipelines with 2.7 Bcf/d of natural gas throughput capacity and 9 processing plants with more than 1 Bcf/d of processing capacity and 315 MMcf/d of treating capacity. 1/9/2013 Summit Midstream Partners, LLC GSO Capital Partners LP 513.0 NA NA Summit Investments executed a definitive agreement to acquire 100% of the equity interests of Bear Tracker Energy, LLC. Bear Tracker owns, operates and is developing various natural gas gathering and processing assets along with crude oil and water gathering assets to serve its exploration and production customers in Mountrail, Burke, Williams and Divide counties in North Dakota and in Weld County, Colorado. 12/11/2012 Access Midstream Partners, L.P. Chesapeake Energy Corporation 2,160.0 12.3x 7.7x ACMP agreed to acquire Chesapeake Midstream Operating, L.L.C., which owns natural gas gathering and processing assets in the Eagle Ford, Utica and Niobrara liquids-rich plays as well as in the Haynesville and Marcellus dry gas plays. 12/3/2012 Atlas Pipeline Partners, L.P. Cardinal Midstream, LLC 600.0 10.0x NA Atlas Pipeline agreed to acquire Cardinal Midstream, which owns 3 cryogenic processing plants totaling 220 MMcf/d in processing capacity, 66 miles of associated gathering pipelines, and a gas treating business that includes 17 treating facilities located in numerous hydrocarbon basins. 11/26/2012 Crestwood Marcellus Midstream LLC Enerven Compression, LLC 95.0 NA 8.3x (3) Crestwood Marcellus Midstream LLC acquired natural gas compression and dehydration assets from Enerven Compression, LLC for $95 million.The assets are connected to CMM's gathering systems in Harrison and Doddridge Counties, West Virginia. The assets are currently operating under a five-year compression services agreement with Antero and provide aggregate capacity of 295 MMcf/d. 11/15/2012 Targa Resources Partners LP Saddle Butte Pipeline, LLC 1,000.0 (4) 14.4x NA Targa agreed to acquire 100% of Saddle Butte Pipeline's Williston Basin crude oil pipeline and terminal system and natural gas gathering and processing operations in the Bakken Shale Play in North Dakota, including 155 miles of crude oil pipelines, crude oil storage capacity of 70,000 barrels, 95 miles of natural gas gathering pipelines and a 20 MMcf/d natural gas processing plant. 10/1/2012 Honeywell International Thomas Russell Co. 593.0 NA NA Honeywell (HON) announced its UOP business has signed a definitive agreement to purchase a 70% stake in Thomas Russell Co., a privately-held provider of technology and equipment for natural gas processing and treating. Thomas Russell specializes in the design, engineering, fabrication and start-up of skid-mounted modular packaged plants systems for the recovery and upgrading of natural gas liquids (NGLs). 9/14/2012 Summit Midstream Partners, LLC Energy Transfer Partners, L.P. 207.0 NA NA Summit acquired the ETC Canyon Pipeline, which gathers and processes natural gas in the Piceance and Uinta Basins in Colorado and Utah. ETC Canyon consists of more than 1,600 miles of pipelines, 44,000 hp of compression, processing assets with capacity of 97 MMcf/d and 2 NGL injection stations. 9/12/2012 Undisclosed company(ies) Chesapeake Energy Corporation 300.0 NA NA Chesapeake Energy Corp has sold or entered into purchase and sale agreements with two undisclosed companies to sell certain US Mid- Continent midstream assets and also expects to enter into a third agreement with an undisclosed buyer to sell certain oil gathering assets in the Eagle Ford Shale for combined proceeds of approximately $300 million 8/10/2012 Eagle Rock Energy Partners, LP BP America Production Company 227.5 NA 6.0x (5) EROC agreed to acquire BP's Sunray and Hemphill processing plants and associated 2,500 mile gathering system serving the Texas Panhandle (aggregate capacity of 220 MMcf/d). In connection with the acquisition EROC and BP entered into a 20 yr. fixed fee G&P agreement. 8/1/2012 Western Gas Partners LP Anadarko Petroleum Corp. 562.5 (6) 7.9x NA WES agreed to acquire an additional 24% interest in Chipeta Processing LLC from Anadarko Petroleum Corp. The Chipeta natural gas processing plant complex includes three processing trains: a 240 MMcf/d capacity refrigeration unit, a 250 MMcf/d capacity cryogenic unit, and a 300 MMcf/d capacity cryogenic unit which is scheduled to come on line in the third quarter of 2012. 7/23/2012 Crestwood Midstream Partners LP Devon Energy Corporation 90.0 NA NA CMLP agreed to acquire a 74 mile low pressure natural gas gathering system, a 100 MMcf/d cryogenic processing facility and 23,100 horsepower of compression equipment located in the western portion of Johnson County, Texas. 6/25/2012 DCP Midstream Partners, LP DCP Midstream, LLC 200.0 NA NA DPM acquired a 12.5% interest in the Enterprise fractionator (operated by Enterprise Products Partners) and a 20% interest in the Mont Belvieu 1 fractionator (operated by ONEOK Partners) 6/19/2012 Centerpoint Energy Resources Corp. Martin Midstream Partners, LP 275.0 12.0x NA Centerpoint agreed to acquire a 50% interest in Waskom Gas Processing Co. (320 MMcf/d processing facility, 14,500 bpd fractionation facility and 75 MMcf/d gathering system), the Woodlawn plant and gathering system (30 MMcf/d), and the McLeod, Hallsville and Darco gathering systems (40 MMcf/d) 6/18/2012 DCP Midstream Partners, LP Penn Virginia Resource Partners, L.P. 63.0 14.0x NA DCP agreed to acquire the Crossroads processing plant and associated gathering system in East Texas. The Crossroads plant has 80 MMc/d of capacity. 6/8/2012 Global Infrastructure Partners, LP Chesapeake Energy Corporation 2,000.0 9.1x NA GIP agreed to acquire CHK's LP and GP interests in Chesapeake Midstream Partners, LP 6/1/2012 American Midstream Partners LP Quantum Resources Management, LLC 62.9 7.9x NA AMID agreed to acquire an 87.4% interest in the Chatom Processing and Fractionation Plant which consists of a 25 MMcf/d refrigeration processing plant, 1,900 bpd fractionation unit, a 160 LT/d sulfur recovery unit and 29-mile gas gathering system. Chatom is located in Washington County, Alabama. 5/7/2012 MarkWest Energy Partners, L.P. Stonehenge Energy Resources LP Rex Energy Corporation Sumitomo Corporation 512.0 NA 7.8x (7) MarkWest announced the acquisition of Keystone Midstream Services, LLC. Keystone's assets are located in Butler County, PA and include 2 cryogenic gas processing plants totaling 90 MMcf/d of capacity, a gas gathering system and associated field compression. Mean $843.4 11.0x 8.3x Median $512.5 10.0x 7.7x CMLP – Selected Transactions Analysis Source: Capital IQ, Thomson One, Public Filings and other public information (1) Based on 2014E EBITDA; Includes $100MM of future capital expenditures (2) Implied based on 33.75% stake acquired (3) Transaction value as of announcement date (4) Includes $50MM in contingent earnout (5) Based on 2013E EBITDA (6) Implied based on 24% stake acquired (7) Based on 2014E EBITDA per management guidance provided in acquisition announcement |
78 Discounted Cash Flow Analysis Terminal Value Capitalization Rate 9.0% 8.5% 8.0% Discount Rate 15.0% 16.0% 17.0% 15.0% 16.0% 17.0% 15.0% 16.0% 17.0% Discounted GP Distributions ('14 - '17) $7.49 $7.36 $7.24 $7.49 $7.36 $7.24 $7.49 $7.36 $7.24 Present Value of Terminal Value ('17) $17.91 $17.31 $16.72 $18.97 $18.32 $17.70 $20.15 $19.47 $18.81 Implied Price / Unit $25.40 $24.67 $23.96 $26.45 $25.68 $24.94 $27.64 $26.83 $26.05 Financial Projections Fiscal Year-Ending September 30, 2014E 2015E 2016E 2017E EBITDA $201.1 $262.4 $298.5 $332.4 Less: Interest Expense (net) (48.9) (62.2) (67.2) (72.7) Less: Maintenance Capex (7.9) (7.6) (8.6) (11.1) Plus: Non-Cash Compensation 4.3 4.7 4.9 5.1 Total Distributable Cash Flow $148.5 $197.3 $227.6 $253.7 Coverage Ratio 0.97x 1.05x 1.05x 1.05x Total Distributions paid to LPs $125.2 $144.0 $158.4 $170.8 Average Common Units Outstanding 60.540 60.578 60.578 60.578 Paid Distributions per LP Unit $2.13 $2.38 $2.61 $2.82 CMLP – Discounted Cash Flow Analysis (Base Case) ($ in millions, except per share amounts) (1) EBITDA – Earnings Before Interest, Taxes, Depreciation and Amortization Note: Assumes midpoint convention to discount projection period free cash flow (1) The range of discount rates is based on the calculation of the sum of CMLP’s current yield (8.6%) and the current - 2017 LP distribution CAGR (7.6%) |
79 Pro Forma Impact to NRGM Distributable Cash Flow (Base Case) Source: NRGY / NRGM management ($ in millions, except per unit amounts) Pro Forma NRGM FYE September 30, 2014E 2015E 2016E 2017E CAGR (1) Adjusted EBITDA Breakdown: EBITDA from Existing Operations $223.5 $242.7 $260.9 $287.5 8.8% (+) CMLP Adjusted EBITDA 201.1 262.4 298.5 332.4 18.2% (+) Synergies 5.0 10.0 15.0 15.0 Total NRGM Adjusted EBITDA $429.6 $515.0 $574.4 $634.9 13.9% Interest Expense (Net) (89.9) (102.2) (108.4) (117.1) Maintenance Capex (14.9) (15.4) (16.8) (19.7) Total Distributable Cash Flow (To All) $324.8 $397.4 $449.1 $498.1 15.3% Distribution Coverage Ratio 1.05x 1.05x 1.05x 1.05x Distributions Paid to LPs 266.9 304.0 331.6 356.8 10.2% Distributions Paid to GP 42.4 74.5 96.1 117.6 40.5% Total Distributions Paid $309.4 $378.5 $427.7 $474.4 15.3% Beginning Common Units 150.1 153.2 157.0 161.3 New Units Issued 3.1 3.7 4.3 0.7 Ending Common Units 153.2 157.0 161.3 162.0 Average Common Units Outstanding 151.7 155.1 159.1 161.6 Distributable Cash Flow Per LP Unit $1.86 $2.08 $2.22 $2.35 8.1% Accretion / (Dilution) (%) 3.5% 11.8% 16.5% 18.2% Paid Distribution Per LP Unit $1.76 $1.96 $2.08 $2.21 7.9% Accretion / (Dilution) (%) 3.4% 11.4% 15.9% 17.6% |
80 Pro Forma NRGM FYE September 30, 2014E 2015E 2016E 2017E Coverage Cash $15.5 $18.9 $21.4 $23.7 Growth Capex (165.6) (216.8) (266.0) (67.4) Free Cash Flow (Cash Shortfall) ($150.1) ($197.8) ($244.6) ($43.6) Cash (Shortfall) Coverage from Debt ($75.1) ($98.9) ($122.3) ($21.8) Cash (Shortfall) Coverage from Equity (75.1) (98.9) (122.3) (21.8) New Equity Issue Price (5.0% Discount) $23.88 $26.60 $28.28 $29.96 New Midway Units Issued 3.1 3.7 4.3 0.7 Post-Capital Raise Free Cash Flow $0.0 $0.0 $0.0 $0.0 Beginning Total Debt $1,621.1 $1,696.1 $1,795.0 $1,917.4 Debt Drawdown (Paydown) 75.1 98.9 122.3 21.8 Ending Total Debt $1,696.1 $1,795.0 $1,917.4 $1,939.2 Total Debt / Adjusted EBITDA 3.9x 3.5x 3.3x 3.1x Total Net Debt / Adjusted EBITDA 3.9x 3.5x 3.3x 3.1x Pro Forma NRGM Balance Sheet (Base Case) ($ in millions) Source: NRGY / NRGM management |
APPENDIX D NRGM Merges with CMLP (Challenge Case) |
82 Comparison of Standalone Financial Projections Summary (Challenge Case) ($ in millions, except per unit amounts) Source: Company management (1) CAGR represents annualized growth rate from 2014E through 2017E NRGM CMLP FYE September 30, Calendarized to FYE September 30, 2014E 2015E 2016E 2017E CAGR (1) 2014E 2015E 2016E 2017E CAGR (1) Total Adjusted EBITDA (Mgmt) $216.5 $231.9 $238.3 $240.5 3.6% $199.4 $239.1 $266.7 $288.8 13.1% Interest Expense (Net) ($43.0) ($49.5) ($52.8) ($52.5) ($52.7) ($63.0) ($67.7) ($72.6) Maintenance Capex (7.0) (7.8) (8.0) (8.0) (7.9) (7.6) (8.6) (11.1) Non-Cash Compensation 0.0 0.0 0.0 0.0 4.3 4.7 4.9 5.1 Total Distributable Cash Flow (To All) $166.5 $174.7 $177.5 $180.0 2.6% $143.1 $173.3 $195.3 $210.3 13.7% Distribution Coverage Ratio 1.05x 1.05x 1.05x 1.05x 0.97x 1.05x 1.05x 1.05x Distributions Paid to LP $142.9 $146.8 $148.1 $149.3 1.5% $123.8 $132.5 $143.0 $150.1 6.6% Distributions Paid to GP 15.7 19.6 20.9 22.1 12.1% 23.9 32.5 43.0 50.1 28.0% Total Distributions Paid $158.6 $166.4 $169.0 $171.4 2.6% $147.7 $165.1 $186.0 $200.3 10.7% Beginning Common Units 85.943 85.943 85.943 85.943 N/A N/A N/A N/A New Units Issued 0.000 0.000 0.000 0.000 N/A N/A N/A N/A Ending Common Units 85.943 85.943 85.943 85.943 N/A N/A N/A N/A Average Common Units Outstanding 85.943 85.943 85.943 85.943 60.578 60.578 60.578 60.578 Distributions Paid Per LP Unit $1.66 $1.71 $1.72 $1.74 1.6% $2.04 $2.19 $2.36 $2.48 6.7% |
83 DCF – Discounted cash flow EBITDA – Earnings Before Interest, Taxes, Depreciation and Amortization EV – Enterprise value Source: Capital IQ, Thomson ONE, NRGY / NRGM management (1) No particular weight given to any analysis Exchange Ratio Summary (Challenge Case) (1) Public Comparables DCF Analysis Selected Transactions Transaction Exchange Ratio: 1.070x 52-Wk Range Average Metric Exchange Financial Metric NRGM CMLP Ratio 52-Week High/Low (Closing) $18.31 - $26.01 $19.90 - $29.12 1.178x EV / FY2014E EBITDA $22.32 - $27.36 $23.25 - $29.90 1.095x Current Yield $24.31 - $28.73 $29.14 - $34.00 1.207x EV / FY2014E EBITDA $18.54 - $23.58 $21.59 - $28.24 1.219x DCF Analysis $23.01 - $27.64 $23.29 - $26.92 1.007x 0.843x 0.916x 1.014x 0.850x 0.765x 1.170x 1.523x 1.399x 1.340x 1.590x 0.500x 0.750x 1.000x 1.250x 1.500x 1.750x 2.000x 2.250x |
84 Current Price (5/3) = $24.55/ unit Selected Company Analysis 52-Wk Range DCF Analysis DCF – Discounted cash flow EBITDA – Earnings Before Interest, Taxes, Depreciation and Amortization EV – Enterprise value Source: Capital IQ, Thomson ONE, NRGY / NRGM management Note: Enterprise value assumes $680MM in net debt outstanding and 85.9 million fully diluted units outstanding as of 5/3/2013 per NRGY / NRGM management (1) No particular weight given to any analysis (2) The range of discount rates is based on the calculation of the sum of NRGM’s current yield (6.4%) and the current - 2017 LP distribution CAGR (2.2%) Summary Financial Analyses – NRGM Implied Per Unit Value (Challenge Case) (1) Selected Transaction Analysis ($ in millions, except per unit amounts) (2) Financial Metric Statistic Selected Multiple Reference Range 52-Week High/Low (Closing) $18.31 / unit - $26.01 / unit EV / FY2014E EBITDA $216.5 Million 12.0x - 14.0x Current Yield $1.58 per unit 6.5% - 5.5% EV / FY2014E EBITDA $216.5 Million 10.5x - 12.5x DCF Analysis Discount Rate: 7.5% -9.5% Terminal Value Capitalization Rate: 7.0% - 6.0% $23.01 $18.54 $24.31 $22.32 $18.31 $27.64 $23.58 $28.73 $27.36 $26.01 $15 $20 $25 $30 $35 |
85 Discounted Cash Flow Analysis Terminal Value Capitalization Rate 7.0% 6.5% 6.0% Discount Rate 7.5% 8.5% 9.5% 7.5% 8.5% 9.5% 7.5% 8.5% 9.5% Discounted LP Distributions ('14 - '17) $5.92 $5.82 $5.72 $5.92 $5.82 $5.72 $5.92 $5.82 $5.72 Present Value of Terminal Value ('17) $18.61 $17.94 $17.29 $20.04 $19.32 $18.62 $21.72 $20.93 $20.17 Implied Price / Unit $24.53 $23.75 $23.01 $25.97 $25.13 $24.34 $27.64 $26.74 $25.89 Financial Projections Fiscal Year-Ending September 30, 2014E 2015E 2016E 2017E EBITDA $216.5 $231.9 $238.3 $240.5 Less: Interest Expense (net) (43.0) (49.5) (52.8) (52.5) Less: Maintenance Capex (7.0) (7.8) (8.0) (8.0) Total Distributable Cash Flow $166.5 $174.7 $177.5 $180.0 Coverage Ratio 1.05x 1.05x 1.05x 1.05x Total Distributions paid to LPs $142.9 $146.8 $148.1 $149.3 Average Common Units Outstanding 85.943 85.943 85.943 85.943 Paid Distributions per LP Unit $1.66 $1.71 $1.72 $1.74 NRGM – Discounted Cash Flow Analysis (Challenge Case) ($ in millions, except per unit amounts) (1) EBITDA – Earnings Before Interest, Taxes, Depreciation and Amortization Note: Assumes midpoint convention to discount projection period free cash flow (1) The range of discount rates is based on the calculation of the sum of NRGM’s current yield (6.4%) and the current - 2017 LP distribution CAGR (2.2%) |
86 Current Price (5/3) = $23.85/ unit Selected Company Analysis DCF Analysis DCF – Discounted cash flow EBITDA – Earnings Before Interest, Taxes, Depreciation and Amortization EV – Enterprise value Source: Capital IQ, Thomson ONE, NRGY / NRGM management Note: Enterprise value assumes $600MM in net debt outstanding and 60.0 million fully diluted units outstanding as of 5/3/2013 per NRGY / NRGM management (1) No particular weight given to any analysis (2) The range of discount rates is based on the calculation of the sum of CMLP’s current yield (8.6%) and the current - 2017 LP distribution CAGR (4.5%) Summary Financial Analyses – CMLP Implied Per Unit Value (Challenge Case) (1) Selected Transaction Analysis 52-Wk Range ($ in millions, except per unit amounts) (2) Financial Metric Statistic Selected Multiple Reference Range 52-Week High/Low (Closing) $19.90 / unit - $29.12 / unit EV / FY2014E EBITDA $199.4 Million 10.0x - 12.0x Current Yield $2.04 per unit 7.0% - 6.0% EV / FY2014E EBITDA $199.4 Million 9.5x - 11.5x DCF Analysis $23.29 $21.59 $29.14 $23.25 $19.90 $26.92 $28.24 $34.00 $29.90 $29.12 $15 $20 $25 $30 $35 Discount Rate: 12.0% -14.0% Terminal Value Capitalization Rate: 8.0% - 9.0% |
87 Discounted Cash Flow Analysis Terminal Value Capitalization Rate 9.0% 8.5% 8.0% Discount Rate 12.0% 13.0% 14.0% 12.0% 13.0% 14.0% 12.0% 13.0% 14.0% Discounted GP Distributions ('14 - '17) $7.22 $7.10 $6.98 $7.22 $7.10 $6.98 $7.22 $7.10 $6.98 Present Value of Terminal Value ('17) $17.51 $16.90 $16.32 $18.54 $17.89 $17.27 $19.70 $19.01 $18.35 Implied Price / Unit $24.73 $24.00 $23.29 $25.76 $24.99 $24.25 $26.92 $26.11 $25.33 Financial Projections Fiscal Year-Ending September 30, 2014E 2015E 2016E 2017E EBITDA $199.4 $239.1 $266.7 $288.8 Less: Interest Expense (net) (52.7) (63.0) (67.7) (72.6) Less: Maintenance Capex (7.9) (7.6) (8.6) (11.1) Plus: Non-Cash Compensation 4.3 4.7 4.9 5.1 Total Distributable Cash Flow $143.1 $173.3 $195.3 $210.3 Coverage Ratio 0.97x 1.05x 1.05x 1.05x Total Distributions paid to LPs $123.8 $132.5 $143.0 $150.1 Average Common Units Outstanding 60.578 60.578 60.578 60.578 Paid Distributions per LP Unit $2.04 $2.19 $2.36 $2.48 CMLP – Discounted Cash Flow Analysis (Challenge Case) ($ in millions, except per share amounts) (1) EBITDA – Earnings Before Interest, Taxes, Depreciation and Amortization Note: Assumes midpoint convention to discount projection period free cash flow (1) The range of discount rates is based on the calculation of the sum of CMLP’s current yield (8.6%) and the current - 2017 LP distribution CAGR (4.5%) |
88 Pro Forma Impact to NRGM Distributable Cash Flow (Challenge Case) Source: NRGY / NRGM management ($ in millions, except per unit amounts) Pro Forma NRGM FYE September 30, 2014E 2015E 2016E 2017E CAGR (1) Adjusted EBITDA Break down: EBITDA from Existing Operations $216.5 $231.9 $238.3 $240.5 3.6% (+) CMLP Adjusted EBITDA 199.4 239.1 266.7 288.8 13.1% (+) Synergies 5.0 10.0 15.0 15.0 Total NRGM Adjusted EBITDA $420.9 $481.1 $519.9 $544.3 8.9% Interest Expense (Net) (91.7) (104.2) (107.4) (108.6) Maintenance Capex (14.9) (15.3) (16.6) (19.1) Total Distributable Cash Flow (To All) $314.4 $361.5 $395.9 $416.6 9.8% Distribution Coverage Ratio 1.05x 1.05x 1.05x 1.05x Distributions Paid to LPs 261.8 286.0 303.3 313.7 6.2% Distributions Paid to GP 37.6 58.3 73.8 83.1 30.3% Total Distributions Paid $299.4 $344.3 $377.1 $396.8 9.8% Beginning Common Units 150.1 152.9 154.7 155.5 New Units Issued 2.8 1.8 0.7 0.6 Ending Common Units 152.9 154.7 155.5 156.1 Average Common Units Outstanding 151.5 153.8 155.1 155.8 Distributable Cash Flow Per LP Unit $1.83 $1.97 $2.08 $2.14 5.4% Accretion / (Dilution) (%) 4.1% 9.2% 14.0% 16.5% Paid Distribution Per LP Unit $1.73 $1.86 $1.96 $2.01 5.1% Accretion / (Dilution) (%) 3.9% 8.9% 13.5% 15.9% |
89 Pro Forma NRGM FYE September 30, 2014E 2015E 2016E 2017E Coverage Cash $15.0 $17.2 $18.9 $19.8 Growth Capex (147.0) (109.7) (56.5) (55.3) Free Cash Flow (Cash Shortfall) ($132.1) ($92.4) ($37.6) ($35.4) Cash (Shortfall) Coverage from Debt ($66.0) ($46.2) ($18.8) ($17.7) Cash (Shortfall) Coverage from Equity (66.0) (46.2) (18.8) (17.7) New Equity Issue Price (5.0% Discount) $23.45 $25.23 $26.54 $27.33 New Midway Units Issued 2.8 1.8 0.7 0.6 Post-Capital Raise Free Cash Flow $0.0 $0.0 $0.0 $0.0 Beginning Total Debt $1,664.6 $1,730.6 $1,776.9 $1,795.7 Debt Drawdown (Paydown) 66.0 46.2 18.8 17.7 Ending Total Debt $1,730.6 $1,776.9 $1,795.7 $1,813.4 Total Debt / Adjusted EBITDA 4.1x 3.7x 3.5x 3.3x Total Net Debt / Adjusted EBITDA 4.1x 3.7x 3.5x 3.3x Pro Forma NRGM Balance Sheet (Challenge Case) ($ in millions) Source: NRGY / NRGM management |