EXHIBIT (C)(25)
Project Intrepid
Discussion Materials
January 2013
Greenhill
HIGHLY CONFIDENTIAL
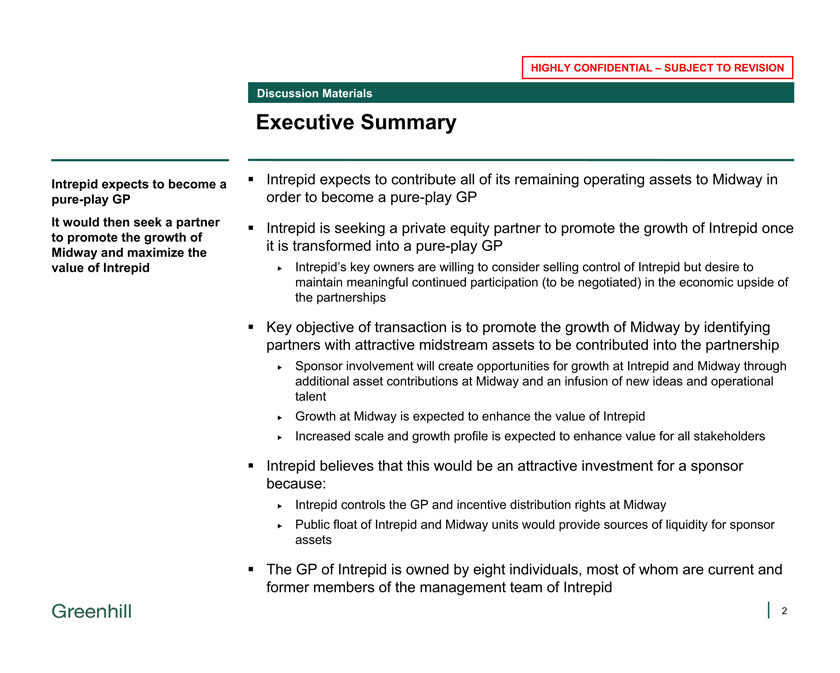
Intrepid expects to become a pure-play GP
It would then seek a partner to promote the growth of Midway and maximize the value of Intrepid
Discussion Materials
Executive Summary
Intrepid expects to contribute all of its remaining operating assets to Midway in order to become a pure-play GP
Intrepid is seeking a private equity partner to promote the growth of Intrepid once it is transformed into a pure-play GP
Intrepid’s key owners are willing to consider selling control of Intrepid but desire to maintain meaningful continued participation (to be negotiated) in the economic upside of the partnerships
Key objective of transaction is to promote the growth of Midway by identifying partners with attractive midstream assets to be contributed into the partnership
Sponsor involvement will create opportunities for growth at Intrepid and Midway through additional asset contributions at Midway and an infusion of new ideas and operational talent Growth at Midway is expected to enhance the value of Intrepid Increased scale and growth profile is expected to enhance value for all stakeholders
Intrepid believes that this would be an attractive investment for a sponsor because:
Intrepid controls the GP and incentive distribution rights at Midway
Public float of Intrepid and Midway units would provide sources of liquidity for sponsor assets
The GP of Intrepid is owned by eight individuals, most of whom are current and former members of the management team of Intrepid
2
Greenhill
HIGHLY CONFIDENTIAL – SUBJECT TO REVISION
Discussion Materials
Standalone Strategic Plan
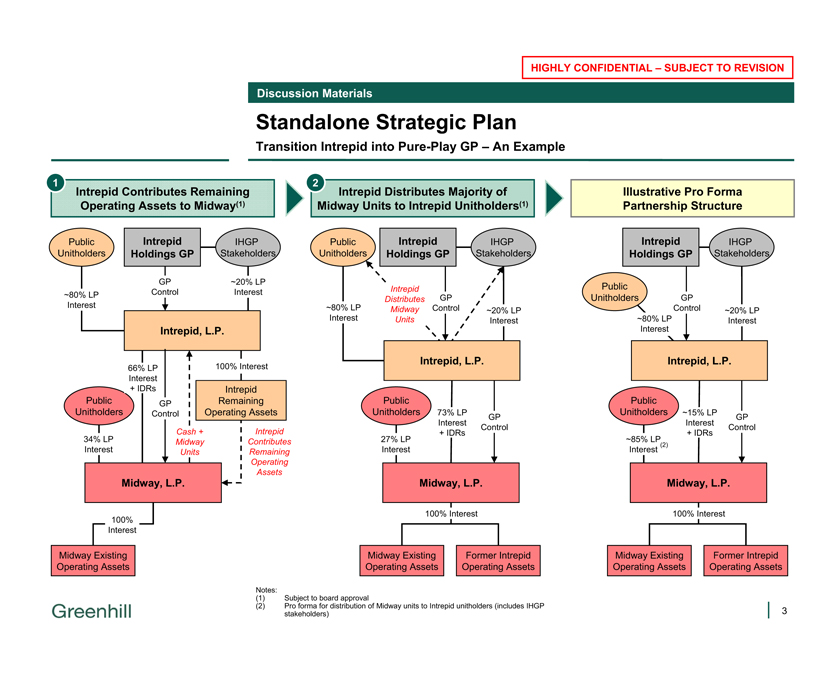
Transition Intrepid into Pure-Play GP – An Example
1 Intrepid Contributes Remaining Operating Assets to Midway(1)
2 Intrepid Distributes Majority of Midway Units to Intrepid Unitholders(1)
Illustrative Pro Forma Partnership Structure
Public Unitholders Intrepid Holdings GP IHGP Stakeholders Public Unitholders Intrepid Holdings GP IHGP Stakeholders Intrepid Holdings GP IHGP Stakeholders ~80% LP Interest GP Control ~20% LP Interest ~80% LP Interest Intrepid Distributes Midway Units GP Control ~20% LP Interest Public Unitholders GP Control ~20% LP Interest ~80% LP Interest Intrepid, L.P. Intrepid, L.P. Intrepid, L.P. 66% LP Interest + IDRs 100% Interest Intrepid Remaining Operating Assets GP Control Public Unitholders 34% LP Interest Cash + Midway Units Intrepid Contributes Remaining Operating Assets Public Unitholders 73% LP GP Interest Control + IDRs 27% LP Interest Public Unitholders ~15% LP
GP Interest Control + IDRs ~85% LP (2) Interest Midway, L.P. 100% Interest Midway Existing Operating Assets Midway, L.P. 100% Interest Midway Existing Former Intrepid Operating Assets Operating Assets Midway, L.P. 100% Interest Midway Existing Former Intrepid Operating Assets Operating Assets Notes:
(1) Subject to board approval (2) Pro forma for distribution of Midway units to Intrepid unitholders (includes IHGP stakeholders) Greenhill 3
HIGHLY CONFIDENTIAL – SUBJECT TO REVISION
Discussion Materials
Standalone Strategic Plan
Transition Intrepid into Pure-Play GP – An Example
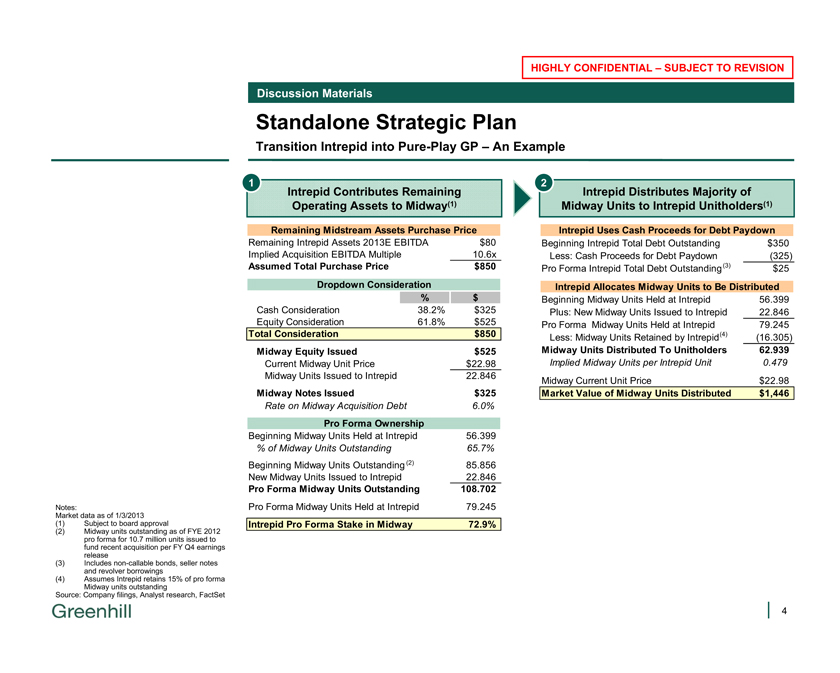
1 Intrepid Contributes Remaining Operating Assets to Midway(1)
2 Intrepid Distributes Majority of Midway Units to Intrepid Unitholders(1)
Remaining Midstream Assets Purchase Price
Remaining Intrepid Assets 2013E EBITDA
Implied Acquisition EBITDA Multiple
Assumed Total Purchase Price
$80
10.6x
$850
Dropdown Consideration
% $
Cash Consideration 38.2% $325
Equity Consideration 61.8% $525
Total Consideration $850
Midway Equity Issued $525
Current Midway Unit Price $22.98
Midway Units Issued to Intrepid 22.846
Midway Notes Issued $325
Rate on Midway Acquisition Debt 6.0%
Pro Forma Ownership
Beginning Midway Units Held at Intrepid 56.399
% of Midway Units Outstanding 65.7%
Beginning Midway Units Outstanding (2) 85.856
New Midway Units Issued to Intrepid 22.846
Pro Forma Midway Units Outstanding 108.702
Pro Forma Midway Units Held at Intrepid 79.245
Intrepid Pro Forma Stake in Midway 72.9%
Intrepid Uses Cash Proceeds for Debt Paydown
Beginning Intrepid Total Debt Outstanding $350 Less: Cash Proceeds for Debt Paydown (325) Pro Forma Intrepid Total Debt Outstanding(3) $25
Intrepid Allocates Midway Units to Be Distributed
Beginning Midway Units Held at Intrepid 56.399 Plus: New Midway Units Issued to Intrepid 22.846 Pro Forma Midway Units Held at Intrepid 79.245 Less: Midway Units Retained by Intrepid(4) (16.305)
Midway Units Distributed To Unitholders 62.939
Implied Midway Units per Intrepid Unit 0.479
Midway Current Unit Price $22.98
Market Value of Midway Units Distributed $1,446
Notes:
Market data as of 1/3/2013 (1) Subject to board approval
(2) Midway units outstanding as of FYE 2012 pro forma for 10.7 million units issued to fund recent acquisition per FY Q4 earnings release (3) Includes non-callable bonds, seller notes and revolver borrowings (4) Assumes Intrepid retains 15% of pro forma Midway units outstanding Source: Company filings, Analyst research, FactSet
Greenhill 4HIGHLY CONFIDENTIAL – SUBJECT TO REVISION
Discussion Materials
Intrepid Holdings GP, LLC (“IHGP”)
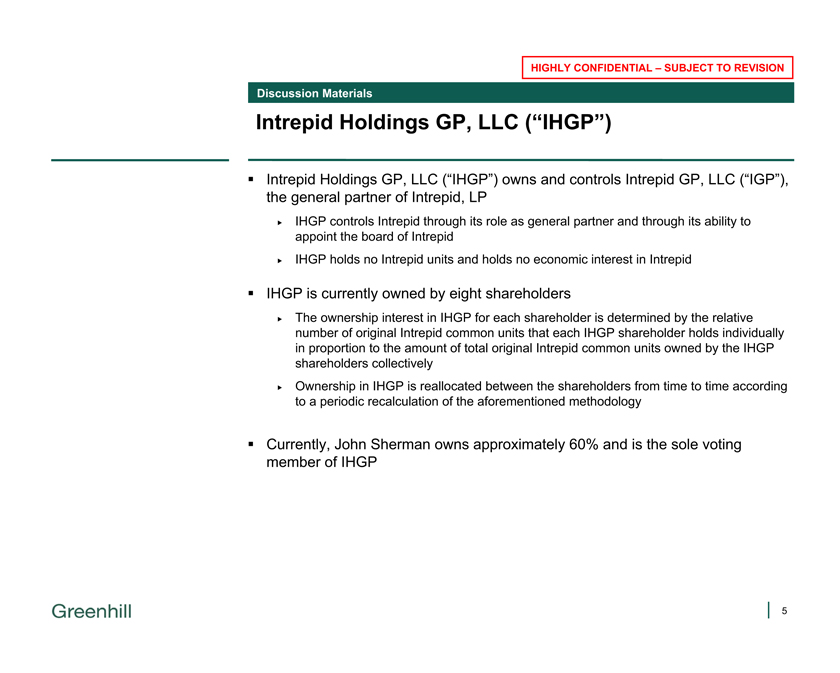
Intrepid Holdings GP, LLC (“IHGP”) owns and controls Intrepid GP, LLC (“IGP”), the general partner of Intrepid, LP
IHGP controls Intrepid through its role as general partner and through its ability to appoint the board of Intrepid ? IHGP holds no Intrepid units and holds no economic interest in Intrepid
IHGP is currently owned by eight shareholders
The ownership interest in IHGP for each shareholder is determined by the relative number of original Intrepid common units that each IHGP shareholder holds individually in proportion to the amount of total original Intrepid common units owned by the IHGP shareholders collectively Ownership in IHGP is reallocated between the shareholders from time to time according to a periodic recalculation of the aforementioned methodology
Currently, John Sherman owns approximately 60% and is the sole voting member of IHGP
5
Greenhill HIGHLY CONFIDENTIAL – SUBJECT TO REVISION
Discussion Materials
Process Next Steps
Key Items to Include In Initial Proposal & Preliminary Process Timeline
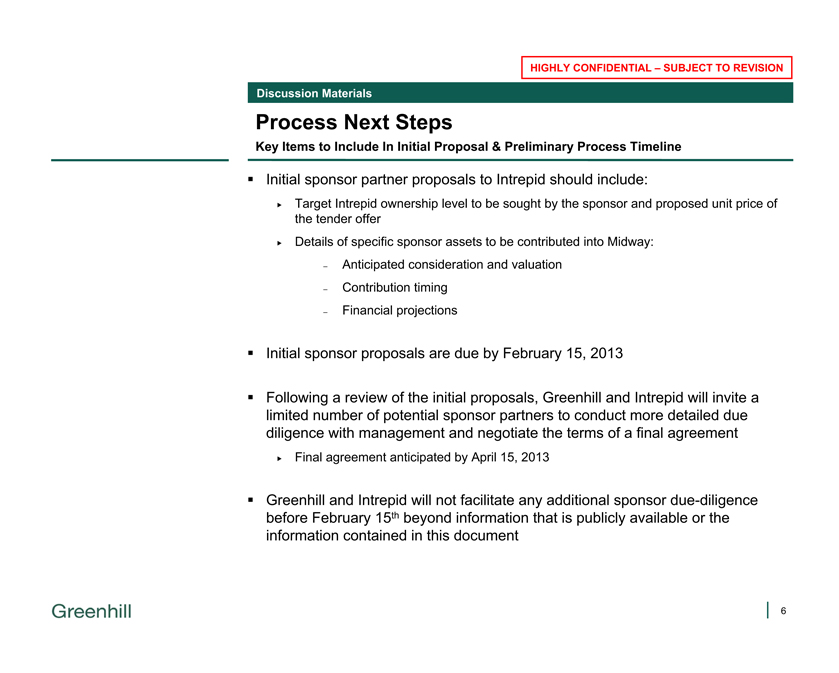
Initial sponsor partner proposals to Intrepid should include:
Target Intrepid ownership level to be sought by the sponsor and proposed unit price of the tender offer ? Details of specific sponsor assets to be contributed into Midway:
Anticipated consideration and valuation
Contribution timing
Financial projections
Initial sponsor proposals are due by February 15, 2013
Following a review of the initial proposals, Greenhill and Intrepid will invite a limited number of potential sponsor partners to conduct more detailed due diligence with management and negotiate the terms of a final agreement
Final agreement anticipated by April 15, 2013
Greenhill and Intrepid will not facilitate any additional sponsor due-diligence before February 15th beyond information that is publicly available or the information contained in this document
Greenhill HIGHLY CONFIDENTAL – SUBJECT TO REVISION
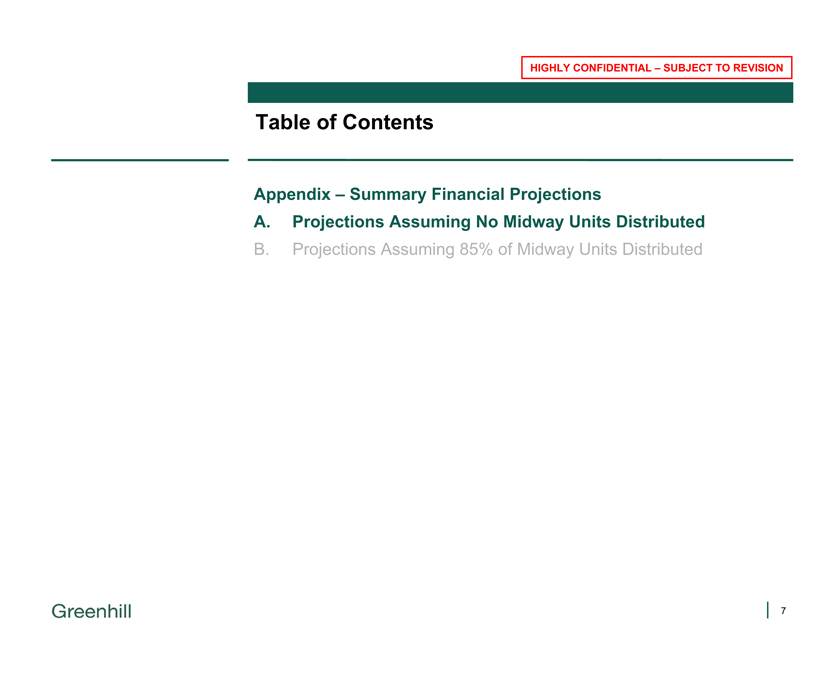
Table of Contents
Appendix – Summary Financial Projections
A. Projections Assuming No Midway Units Distributed
B. Projections Assuming 85% of Midway Units Distributed
Greenhill HIGHLY CONFIDENTIAL – SUBJECT TO REVISION

Discussion Materials
Summary Financial Projections
Intrepid & Midway (No Wedge Capital)
($ in millions except per unit amounts) Fiscal Year Ended September 30,
2013E 2014E 2015E 2016E 2017E
Intrepid Total Adjusted EBITDA $146 $170 $183 $204 $206
EBITDA from LP Interest in Midway 129 139 144 153 153
EBITDA from GP Interest in Midway 17 30 38 51 52
Interest Expense (Net)($2)($2)($2)($2)($2)
Intrepid Total Distributable Cash Flow $144 $168 $181 $202 $204
Intrepid Total Units Outstanding 131.5 131.5 131.5 131.5 131.5
Distribution Coverage Ratio 0.95x 1.00x 1.00x 1.00x 1.00x
Declared Distribution Per LP Unit $1.16 $1.28 $1.37 $1.54 $1.55
Midway Total Adjusted EBITDA $260 $299 $329 $370 $372
EBITDA from Existing Operations 180 215 233 267 269
EBITDA from Dropdowns 80 84 96 103 103
Interest Expense (Net)(46)(56)(65)(74)(74)
Maintenance Capital Expenditures(10)(10)(11)(11)(11)
Total Distributable Cash Flow $204 $233 $253 $285 $287
Midway Total Distributions to GP & LPs $194 $222 $241 $272 $274
Less: DCF to GP IDRs(17)(30)(38)(51)(52)
Total Distributions to LPs $177 $191 $203 $220 $221
Midway Total Units Outstanding 108.7 108.7 111.5 114.4 114.4
Distribution Coverage Ratio 1.05x 1.05x 1.05x 1.05x 1.05x
Declared Distribution Per LP Unit $1.63 $1.76 $1.82 $1.93 $1.94
Growth Capital Expenditures $95 $106 $287 $0 $0
Projections assume no distribution of Midway units to Intrepid unitholders
Note:
Projected financials presented pro forma for assumed dropdown of remaining Intrepid operating assets to Midway
Greenhill HIGHLY CONFIDENTIAL – SUBJECT TO REVISION
Discussion Materials
Summary Financial Projections
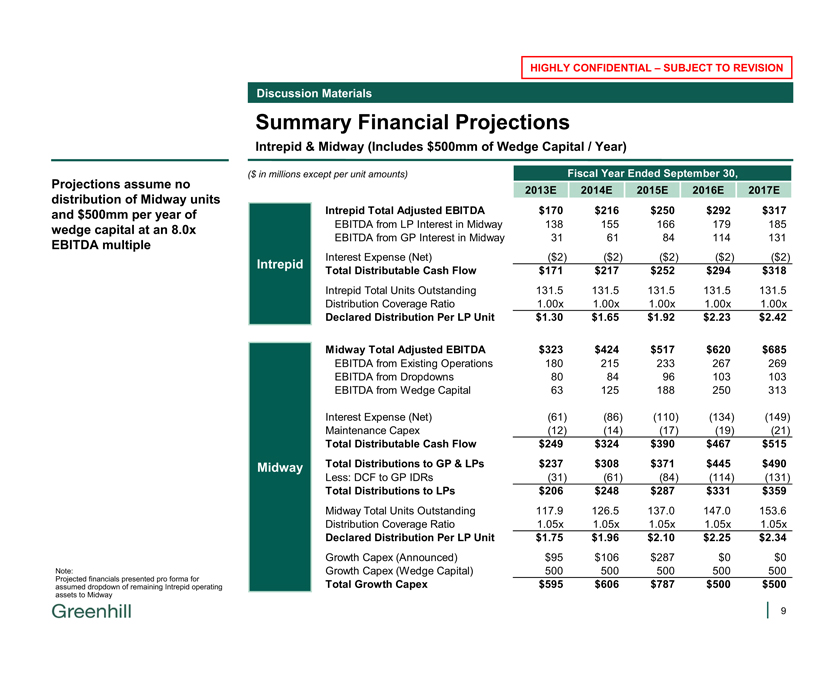
Intrepid & Midway (Includes $500mm of Wedge Capital / Year)
($ in millions except per unit amounts) Fiscal Year Ended September 30,
2013E 2014E 2015E 2016E 2017E
Intrepid Total Adjusted EBITDA $170 $216 $250 $292 $317
EBITDA from LP Interest in Midway 138 155 166 179 185
EBITDA from GP Interest in Midway 31 61 84 114 131
Interest Expense (Net)($2)($2)($2)($2)($2)
Intrepid Total Distributable Cash Flow $171 $217 $252 $294 $318
Intrepid Total Units Outstanding 131.5 131.5 131.5 131.5 131.5
Distribution Coverage Ratio 1.00x 1.00x 1.00x 1.00x 1.00x
Declared Distribution Per LP Unit $1.30 $1.65 $1.92 $2.23 $2.42
Midway Total Adjusted EBITDA $323 $424 $517 $620 $685
EBITDA from Existing Operations 180 215 233 267 269
EBITDA from Dropdowns 80 84 96 103 103
EBITDA from Wedge Capital 63 125 188 250 313
Interest Expense (Net)(61)(86)(110)(134)(149)
Maintenance Capex(12)(14)(17)(19)(21)
Total Distributable Cash Flow $249 $324 $390 $467 $515
Midway Total Distributions to GP & LPs $237 $308 $371 $445 $490
Less: DCF to GP IDRs(31)(61)(84)(114)(131)
Total Distributions to LPs $206 $248 $287 $331 $359
Midway Total Units Outstanding 117.9 126.5 137.0 147.0 153.6
Distribution Coverage Ratio 1.05x 1.05x 1.05x 1.05x 1.05x
Declared Distribution Per LP Unit $1.75 $1.96 $2.10 $2.25 $2.34
Growth Capex (Announced) $95 $106 $287 $0 $0
Growth Capex (Wedge Capital) 500 500 500 500 500
Total Growth Capex $595 $606 $787 $500 $500
Projections assume no distribution of Midway units and $500mm per year of wedge capital at an 8.0x EBITDA multiple
Note:
Projected financials presented pro forma for assumed dropdown of remaining Intrepid operating assets to Midway
Greenhill HIGHLY CONFIDENTIAL – SUBJECT TO REVISION
Table of Contents
Appendix – Summary Financial Projections
A. Projections Assuming No Midway Units Distributed
B. Projections Assuming 85% of Midway Units Distributed
Greenhill HIGHLY CONFIDENTIAL – SUBJECT TO REVISION
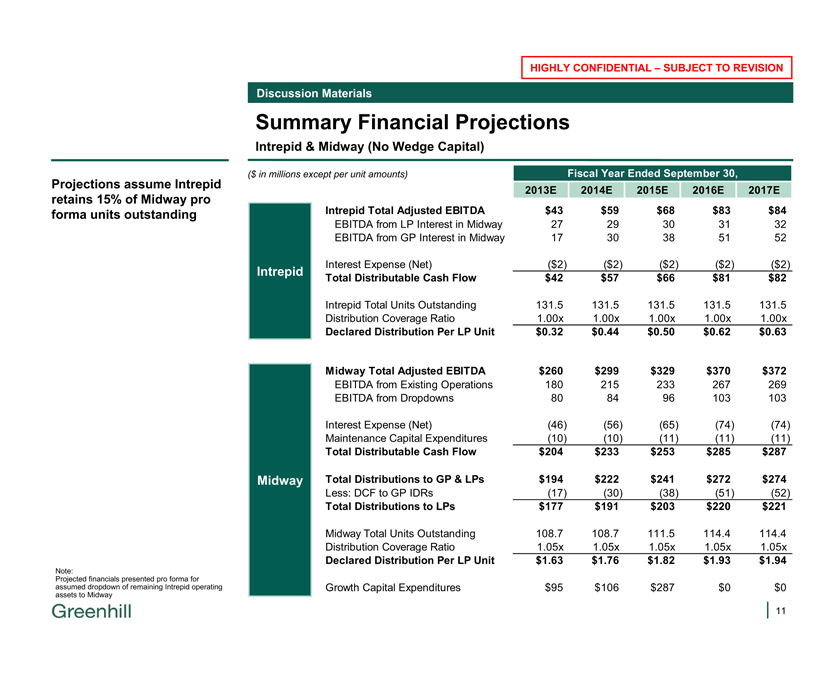
Discussion Materials
Summary Financial Projections
Intrepid & Midway (No Wedge Capital)
($ in millions except per unit amounts) Fiscal Year Ended September 30,
2013E 2014E 2015E 2016E 2017E
Intrepid Total Adjusted EBITDA $43 $59 $68 $83 $84
EBITDA from LP Interest in Midway 27 29 30 31 32
EBITDA from GP Interest in Midway 17 30 38 51 52
Interest Expense (Net)($2)($2)($2)($2)($2)
Intrepid Total Distributable Cash Flow $42 $57 $66 $81 $82
Intrepid Total Units Outstanding 131.5 131.5 131.5 131.5 131.5
Distribution Coverage Ratio 1.00x 1.00x 1.00x 1.00x 1.00x
Declared Distribution Per LP Unit $0.32 $0.44 $0.50 $0.62 $0.63
Midway Total Adjusted EBITDA $260 $299 $329 $370 $372
EBITDA from Existing Operations 180 215 233 267 269
EBITDA from Dropdowns 80 84 96 103 103
Interest Expense (Net)(46)(56)(65)(74)(74)
Maintenance Capital Expenditures(10)(10)(11)(11)(11)
Total Distributable Cash Flow $204 $233 $253 $285 $287
Midway Total Distributions to GP & LPs $194 $222 $241 $272 $274
Less: DCF to GP IDRs(17)(30)(38)(51)(52)
Total Distributions to LPs $177 $191 $203 $220 $221
Midway Total Units Outstanding 108.7 108.7 111.5 114.4 114.4
Distribution Coverage Ratio 1.05x 1.05x 1.05x 1.05x 1.05x
Declared Distribution Per LP Unit $1.63 $1.76 $1.82 $1.93 $1.94
Growth Capital Expenditures $95 $106 $287 $0 $0
Projections assume Intrepid retains 15% of Midway pro forma units outstanding
Note:
Projected financials presented pro forma for assumed dropdown of remaining Intrepid operating assets to Midway
Greenhill HIGHLY CONFIDENTIAL – SUBJECT TO REVISION
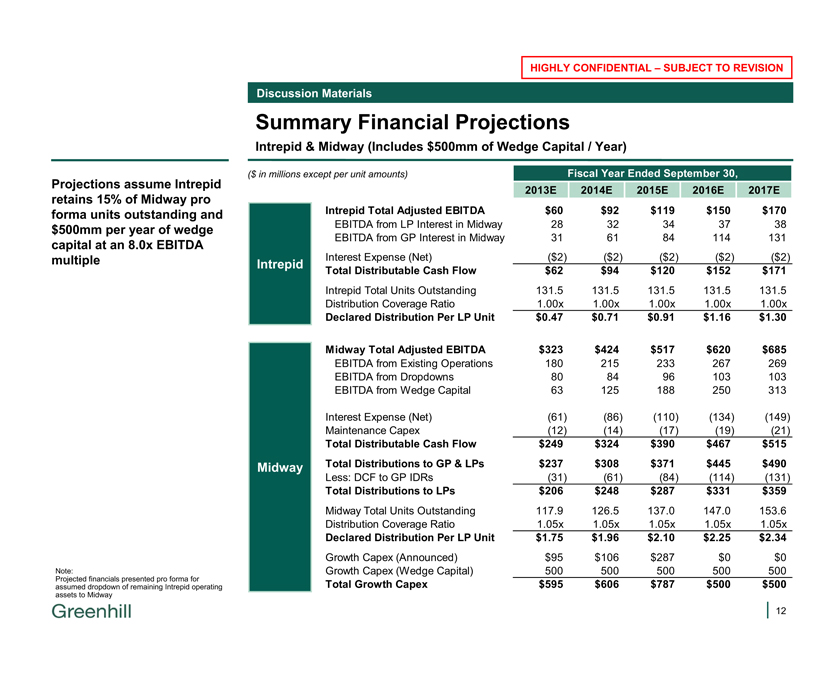
Discussion Materials
Summary Financial Projections
Intrepid & Midway (Includes $500mm of Wedge Capital / Year)
($ in millions except per unit amounts) Fiscal Year Ended September 30,
2013E 2014E 2015E 2016E 2017E
Intrepid Total Adjusted EBITDA $60 $92 $119 $150 $170
EBITDA from LP Interest in Midway 28 32 34 37 38
EBITDA from GP Interest in Midway 31 61 84 114 131
Interest Expense (Net)($2)($2)($2)($2)($2)
Intrepid Total Distributable Cash Flow $62 $94 $120 $152 $171
Intrepid Total Units Outstanding 131.5 131.5 131.5 131.5 131.5
Distribution Coverage Ratio 1.00x 1.00x 1.00x 1.00x 1.00x
Declared Distribution Per LP Unit $0.47 $0.71 $0.91 $1.16 $1.30
Midway Total Adjusted EBITDA $323 $424 $517 $620 $685
EBITDA from Existing Operations 180 215 233 267 269
EBITDA from Dropdowns 80 84 96 103 103
EBITDA from Wedge Capital 63 125 188 250 313
Interest Expense (Net)(61)(86)(110)(134)(149)
Maintenance Capex(12)(14)(17)(19)(21)
Total Distributable Cash Flow $249 $324 $390 $467 $515
Midway Total Distributions to GP & LPs $237 $308 $371 $445 $490
Less: DCF to GP IDRs(31)(61)(84)(114)(131)
Total Distributions to LPs $206 $248 $287 $331 $359
Midway Total Units Outstanding 117.9 126.5 137.0 147.0 153.6
Distribution Coverage Ratio 1.05x 1.05x 1.05x 1.05x 1.05x
Declared Distribution Per LP Unit $1.75 $1.96 $2.10 $2.25 $2.34
Growth Capex (Announced) $95 $106 $287 $0 $0
Growth Capex (Wedge Capital) 500 500 500 500 500
Total Growth Capex $595 $606 $787 $500 $500
Projections assume Intrepid retains 15% of Midway pro forma units outstanding and $500mm per year of wedge capital at an 8.0x EBITDA multiple
Note:
Projected financials presented pro forma for assumed dropdown of remaining Intrepid operating assets to Midway
Greenhill HIGHLY CONFIDENTIAL – SUBJECT TO REVISION