UNITED STATES
SECURITIES AND EXCHANGE COMMISSION
Washington, D.C. 20549
FORM N-CSR
CERTIFIED SHAREHOLDER REPORT OF REGISTERED
MANAGEMENT INVESTMENT COMPANIES
Investment Company Act file number | 811-22018 | |||||
| ||||||
Nuveen Diversified Currency Opportunities Fund | ||||||
(Exact name of registrant as specified in charter) | ||||||
| ||||||
Nuveen Investments | ||||||
(Address of principal executive offices) (Zip code) | ||||||
| ||||||
Kevin J. McCarthy Nuveen Investments 333 West Wacker Drive Chicago, IL 60606 | ||||||
(Name and address of agent for service) | ||||||
| ||||||
Registrant’s telephone number, including area code: | (312) 917-7700 |
| ||||
| ||||||
Date of fiscal year end: | December 31 |
| ||||
| ||||||
Date of reporting period: | June 30, 2013 |
| ||||
Form N-CSR is to be used by management investment companies to file reports with the Commission not later than 10 days after the transmission to stockholders of any report that is required to be transmitted to stockholders under Rule 30e-1 under the Investment Company Act of 1940 (17 CFR 270.30e-1). The Commission may use the information provided on Form N-CSR in its regulatory, disclosure review, inspection, and policymaking roles.
A registrant is required to disclose the information specified by Form N-CSR, and the Commission will make this information public. A registrant is not required to respond to the collection of information contained in Form N-CSR unless the Form displays a currently valid Office of Management and Budget ("OMB") control number. Please direct comments concerning the accuracy of the information collection burden estimate and any suggestions for reducing the burden to Secretary, Securities and Exchange Commission, 450 Fifth Street, NW, Washington, DC 20549-0609. The OMB has reviewed this collection of information under the clearance requirements of 44 U.S.C. ss. 3507.
ITEM 1. REPORTS TO STOCKHOLDERS.

Closed-End Funds
Nuveen Investments
Closed-End Funds
Seeks High Current Income and Gains from an Enhanced Global Debt Strategy
Semi-Annual Report
June 30, 2013

Nuveen Global
Income Opportunities
Fund
JGG
Nuveen Diversified
Currency Opportunities
Fund
JGT

LIFE IS COMPLEX.
Nuveen makes things e-simple.
It only takes a minute to sign up for e-Reports. Once enrolled, you'll receive an e-mail as soon as your Nuveen Fund information is ready. No more waiting for delivery by regular mail. Just click on the link within the e-mail to see the report and save it on your computer if you wish.
Free e-Reports right to your e-mail!
www.investordelivery.com
If you receive your Nuveen Fund distributions and statements from your financial advisor or brokerage account.
OR
www.nuveen.com/accountaccess
If you receive your Nuveen Fund distributions and statements directly from Nuveen.

Table of Contents
Letter to Shareholders | 4 | ||||||
Portfolio Managers' Comments | 5 | ||||||
Fund Leverage and Currency Investment Exposure | 8 | ||||||
Share Information | 9 | ||||||
Risk Considerations | 12 | ||||||
Performance Overview and Holding Summaries | 14 | ||||||
Shareholder Meeting Report | 16 | ||||||
Portfolios of Investments | 17 | ||||||
Statement of Assets & Liabilities | 34 | ||||||
Statement of Operations | 35 | ||||||
Statement of Changes in Net Assets | 36 | ||||||
Statement of Cash Flows | 37 | ||||||
Financial Highlights | 38 | ||||||
Notes to Financial Statements | 40 | ||||||
Annual Investment Management Agreement Approval Process | 55 | ||||||
Reinvest Automatically, Easily and Conveniently | 63 | ||||||
Glossary of Terms Used in this Report | 64 | ||||||
Additional Fund Information | 67 | ||||||
Letter to Shareholders

Dear Shareholders,
After nine years of serving as lead director and independent chairman of the Nuveen Fund Board, my term of office has come to an end as of June 30, 2013. It has been a privilege to use this space to communicate with you on some of the broad economic trends in the U.S. and abroad and how they are impacting the investment environment in which your funds operate. In addition, I have enjoyed offering some perspective on how your Board views the various Nuveen investment teams as they apply their investment disciplines in that investment environment.
My term has coincided with a particularly challenging period for both mutual fund sponsors and investors. Since 2000 there have been three periods of unusually strong stock market growth and two major market declines. Recent years have been characterized by a search for yield in fixed income securities to compensate for an extended period of very low interest rates. Funds are investing more in foreign and emerging markets that require extensive research capabilities to overcome the more limited transparency and higher volatility in those markets. New fund concepts often incorporate derivative financial instruments that offer efficient ways to hedge investment risk or gain exposure to selected markets. Fund trading teams operate in many new domestic and international venues with quite different characteristics. Electronic trading and global communication networks mean that fund managers must be able to thrive in financial markets that react instantaneously to newsworthy events and are more interconnected than ever.
Nuveen has committed additional resources to respond to these changes in the fund industry environment. It has added IT and research resources to assemble and evaluate the increased flow of detailed information on economies, markets and individual companies. Based on its experience during the financial crisis of 2008-09, Nuveen has expanded its resources dedicated to valuing and trading portfolio securities with a particular focus on stressed financial market conditions. It has added systems and experienced risk management professionals to work with investment teams to better help evaluate whether their funds' risk exposures are appropriate in view of the return targets. The investment teams have also reflected on recent experience to reaffirm or modify their investment disciplines. Finally, experienced professionals and IT resources have been added to address new regulatory requirements designed to better inform and protect investors. The Nuveen Fund Board has enthusiastically encouraged these initiatives.
The Board has always viewed itself as your representatives to assure that Nuveen brings together experienced people, proven technologies and effective processes designed to produce results that meet investor expectations. It is important to note that our activities are highlighted by the annual contract renewal process. Despite its somewhat formal language, I strongly encourage you to read the summary because it offers an insight into our oversight process. The report is included in the back of this shareholder report. The renewal process is very comprehensive and includes a number of evaluations and discussions between the Board and Nuveen during the year. The summary also describes what has been achieved across the Nuveen fund complex and at individual funds such as yours.
As I leave the chairmanship and resume my role as a member of the Board, please be assured that I and my fellow Board members will continue to hold your interests uppermost in our minds as we oversee the management of your funds and that we greatly appreciate your confidence in your Nuveen fund.
Very sincerely,

Robert P. Bremner
August 22, 2013
Nuveen Investments
4
Portfolio Managers' Comments
Nuveen Global Income Opportunities Fund (JGG)
Nuveen Diversified Currency Opportunities Fund (JGT)
These Funds feature portfolio management by Nuveen Asset Management (NAM), LLC, an affiliate of Nuveen Investments. Steve Lee, CFA and Timothy Palmer, CFA manage these Funds.
Here they discuss their investment strategies and the performance of the Funds during the six-month period ending June 30, 2013.
What key strategies were used to manage the Funds during this six-month reporting period ended June 30, 2013?
During this reporting period, JGG's investment objective of high current income and gains with a secondary objective of seeking capital preservation remained unchanged.
JGG features a more traditional, multi-sector global bond strategy that invests primarily in sovereign, corporate and other types of debt from developed and emerging markets around the world.
JGG intends to actively manage its country, currency, sector and interest rate exposures as market conditions change. JGG will invest at least 80% of its managed assets in global debt securities, including but not limited to global sovereign and government-related debt, domestic and foreign debt securities, U.S. government securities, residential and commercial mortgage-backed securities and asset backed securities. JGG will invest primarily in securities rated investment grade at the time of purchase, from issuers in both developed and emerging market countries.
Our primary strategic sector and duration themes remained in place during the reporting period, but we took advantage of market conditions to make adjustments to JGG to manage risk and position for intermediate term performance opportunities. We continued to emphasize corporates, with activity in the sector oriented toward repositioning based on relative value opportunities and research based ideas. We had reduced our high yield holdings early in the second quarter of 2013, which allowed us to take advantage of late quarter attractive valuations to add to credits with yield and return potential. In addition, we actively managed interest rate exposure, remaining defensive in our Fund's portfolio duration positioning to protect against higher rates.
The Fund's currency exposures were changed meaningfully during the reporting period, particularly during the second quarter in response to changes in valuations and fundamental economic developments. Early in the second quarter, we reduced positions in former overweights to Australia, South Korea and Canada in light of economic developments. Later in the quarter, we took advantage of a rally in the euro and other large developed currencies to sell positions, increasing the Fund's U.S. dollar overweight significantly in the segment. With relative economic and policy progress in
Certain statements in this report are forward-looking statements. Discussions of specific investments are for illustration only and are not intended as recommendations of individual investments. The forward-looking statements and other views expressed herein are those of the portfolio managers as of the date of this report. Actual future results or occurrences may differ significantly from those anticipated in any forward-looking statements and the views expressed herein are subject to change at any time, due to numerous market and other factors. The Funds disclaim any obligation to update publicly or revise any forward-looking statements or views expressed herein.
Ratings shown are the highest rating given by one of the following national rating agencies: Standard & Poor's, Moody's Investors Service, Inc. or Fitch, Inc. Credit ratings are subject to change. AAA, AA, A, and BBB are investment grade ratings; BB, B, CCC, CC, C and D are below investment grade ratings. Certain bonds backed by U.S. Government or agency securities are regarded as having an implied rating equal to the rating of such securities. Holdings designated N/R are not rated by these national rating agencies.
Nuveen Investments
5
the U.S., the valuation and direction of the dollar is increasingly situational: currency selection and relative performance based on unique factors are becoming major determinants as the global recovery matures. We favored currencies on weakness, including India and Turkey and reduced our peripheral European bond exposure, based on recovery in valuations and rising structural risk. We selectively added to several emerging market bond markets at higher yields following the Federal Reserve (Fed) induced sell-off, believing these had overshot fundamentals amid short-term investor liquidation.
JGT seeks to provide the potential for an attractive level of current income and total return. The Fund offers actively managed, diversified exposure to foreign currencies and short-term global yields by investing directly and indirectly in a portfolio of short-term international government securities denominated in unhedged, non-U.S. currencies. Indirect investments in international non-U.S. government securities are made by purchasing forward currency contracts and other derivative instruments that are collateralized by direct investments in U.S. cash equivalents, including U.S. government debt and agency paper. This strategy may create the economic effect of financial leverage. JGT also actively manages both long and short currency positions in multiple currencies.
By the end of the reporting period, we increased focus on market selection as the dollar is no longer in a broad based downtrend and global monetary policies increasingly respond at the margin to domestic priorities and developments. We remained underweight the Japanese yen, euro and the British pound. We continued to invest in select currencies that could benefit from structural reforms and long-term growth potentials. Despite dislocations driven by shifting U.S. policy and moderating growth in China, long-term secular progress in emerging markets continues to be an important positive fundamental factor supporting their asset markets. Against this backdrop, by the end of reporting period we remained overweight the Mexican peso, Indian rupee and Brazilian real.
In both Funds, although more so in JGG, our duration strategy has been tactical in nature, although biased to be short of the market benchmark, given the asymmetrical nature of interest rate risk and our expectations for ongoing improvement in the economy and reduction of systemic risk premiums.
How did the Funds perform during this six-month reporting period ended June 30, 2013?
The tables in the Performance Overview and Holding Summaries section of this report provide total return performance for the Funds for the six-month, one-year, five-year and since inception periods ended June 30, 2013. For the six-month reporting period, the Funds' total returns at net asset value (NAV) underperformed their respective index amid a sharp sell-off in global bond markets and a rally in the U.S. dollar.
During the reporting period, JGG underperformed the Barclays Global Aggregate Bond Index. The sharp liquidation and broad based decline in bond prices during the second quarter of 2013 not only drove rates higher, but sector spreads wider. Sharp investor flow reversals and the Fed shift drove the U.S. dollar higher, further pressuring international bonds and currencies. The strength of the U.S. dollar coupled with our underweight exposure to it detracted from performance. The Fund's underweight duration in Japan also detracted from performance, as did our overweight to bonds in emerging markets such as Mexico and Turkey, where interest rates rose more than other markets.
Meanwhile, our large underweight to the Japanese yen proved beneficial to performance. In addition, our overweight to the Mexican peso contributed to performance. Also, our overall global interest rate strategy was beneficial as the Fund's duration was significantly shorter than the benchmark.
From a sector perspective, although high-yield spreads widened, excess returns versus Treasuries were marginally positive, owing to the benefit of higher yields cushioning price declines from wider yield spreads. The Fund had a significant overweight to high yield, which produced a relative gain. Investment grade credit exposure detracted marginally from Fund performance, given the underperformance of credit generally.
Nuveen Investments
6
JGT also underperformed its Comparative Benchmark, which is a 50% blend of the Citigroup Non-U.S. World Government Bond 1-3 Year Index and JP Morgan Emerging Local Markets Index Plus. The negative performance was mainly due to the strength of the U.S. dollar. We were generally short U.S. dollar exposures during the reporting period. The sharp sell-off in growth sensitive currencies, particularly in emerging markets, detracted significantly in light of our overweight to these regions. The detractors to performance were our long positions in Australian dollar, Indian rupee, and South African rand, while JGT's underweight position in Japanese yen and long position in Mexican peso and Canadian dollar contributed to performance.
JGT's net foreign currency exposure was reduced during the reporting period in response to changes in valuations and fundamental economic developments. During the reporting period, we reduced currency exposures in Australia, Korea, Canada, Chile and Malaysia, while adding exposure to India, Brazil and Mexico.
In both JGG and JGT, forward foreign currency exchange contracts were used both to reduce risk and to take active currency exposures. Currency forward contracts were used to reduce risk by hedging the foreign currency risk associated with each Fund's foreign debt investments. The Funds also actively managed the currency exposures through currency forwards in an attempt to benefit from the potential appreciation.
Both JGG and JGT sold U.S. Treasury futures to hedge against potential increases in U.S. interest rates; purchased selected foreign bond futures to gain exposure to those markets. The effect of these activities in the period was a positive one. These derivative exposures are integrated with the overall portfolio construction and as such losses and gains may be naturally related to/may offset impacts elsewhere in the portfolio.
Both JGG and JGT wrote put options and purchased call options on select currencies during the period in an attempt to benefit from changes in the spot values of these currencies. The overall effect of these activities during the period was modestly negative.
JGG entered into credit default swaps as a way to take on credit risk and earn a commensurate credit spread. These derivative exposures are integrated with the overall portfolio construction and as such losses and gains may be naturally related to/may offset impacts elsewhere in the portfolio.
Nuveen Investments
7
Fund Leverage and
Currency Investment Exposure
IMPACT OF LEVERAGE STRATEGIES ON PERFORMANCE
One important factor impacting the return of JGG relative to its benchmarks was the Fund's use of leverage through the use of bank borrowings. The Fund uses leverage because its managers believe that, over time, leveraging provides opportunities for additional income and total return for shareholders. However, use of leverage also can expose shareholders to additional volatility. For example, as the prices of securities held by the Fund decline, the negative impact of these valuation changes on net asset value and total return is magnified by the use of leverage. Conversely, leverage may enhance returns during periods when the prices of securities held by the Fund generally are rising. Leverage had a negative impact on the performance of JGG during this reporting period. During the period, JGG held swap contracts in order to hedge leverage costs, which had a positive effect on performance.
JGT's investment strategies did not create the economic effects of leverage for the Fund during this reporting period.
JGG'S REGULATORY LEVERAGE
Bank Borrowings
As discussed previously, JGG employs regulatory leverage through the use of bank borrowings. As of June 30, 2013, the Fund has outstanding bank borrowings of $61,000,000.
Refer to Notes to Financial Statements, Footnote 8—Borrowing Arrangements for further details.
As of June 30, 2013, JGG's percentages of leverage are shown in the accompanying table.
| Effective Leverage* | Regulatory Leverage* | ||||||||||
JGG | 33.01 | % | 32.15 | % | |||||||
* Effective leverage is the Fund's effective economic leverage and includes regulatory leverage. Effective leverage attempts to measure the extent to which the return and risk of an investment in the Fund's shares are magnified through the use of certain forms of leverage. This Fund uses leverage in the form of borrowings from a credit facility, and may also use derivatives that increase or decrease investment risk compared to the exposure level of the securities in the portfolio. This measure includes the notional value of certain of these derivatives considered to increase investment risk. The Fund's borrowings are considered regulatory leverage as they are part of the Fund's capital structure. Regulatory leverage is sometimes referred to as "'40 Act Leverage" and is subject to asset coverage limits set forth in the Investment Company Act of 1940.
THE FUNDS' CURRENCY INVESTMENT EXPOSURE IN EXCESS OF MANAGED ASSETS
Currency Investment Exposure in Excess of Managed Assets is a Fund's net exposure to currencies other than the U.S. dollar greater than the amount of Managed Assets resulting from:
(i) the purchase of non-U.S. dollar denominated securities, and
(ii) the use of foreign exchange contracts such as forwards or options.
As of June 30, 2013, JGT's currency investment exposure in excess of the Fund's Managed Assets is as shown in the accompanying table.
| Currency Investment Exposure In Excess of Managed Assets | |||||||
JGT | 19.04 | % | |||||
JGG's investment strategies did not create currency investment exposure for the Fund that exceeded its Managed Assets during this reporting period.
Nuveen Investments
8
Share Information
Distribution Information
The following information regarding each Fund's distributions is current as of June 30, 2013, and likely will vary over time based on the Fund's investment activities and portfolio investment changes.
During the current reporting period, the Funds' quarterly distributions to shareholders were as shown in the accompanying table.
Per Share Amounts | |||||||||||
JGG | JGT | ||||||||||
March | $ | 0.2950 | $ | 0.2975 | |||||||
June | 0.2620 | 0.2645 | |||||||||
Current Distribution Rate* | 8.48 | % | 9.44 | % | |||||||
* Current Distribution Rate is based on the Fund's current annualized quarterly distribution divided by the Fund's current market price. The Fund's quarterly distributions to its shareholders may be comprised of ordinary income, net realized capital gains and, if at the end of the fiscal year the Fund's cumulative net ordinary income and net realized gains are less than the amount of the Fund's distributions, a return of capital for tax purposes.
JGG employs financial leverage through the use of bank borrowings. Financial leverage provides the potential for higher earnings (net investment income), total returns and distributions over time, but also increases the variability of shareholders' net asset value per share in response to changing market conditions.
Each Fund has a managed distribution program. The goal of this program is to provide shareholders with relatively consistent and predictable cash flow by systematically converting the Fund's expected long-term return potential into regular distributions. As a result, regular distributions throughout the year are likely to include a portion of expected long-term gains (both realized and unrealized), along with net investment income.
Important points to understand about a managed distribution program are:
• Each Fund seeks to establish a relatively stable distribution rate that roughly corresponds to the projected total return from its investment strategy over an extended period of time. However, you should not draw any conclusions about a Fund's past or future investment performance from its current distribution rate.
• Actual returns will differ from projected long-term returns (and therefore a Fund's distribution rate), at least over shorter time periods. Over a specific timeframe, the difference between actual returns and total distributions will be reflected in an increasing (returns exceed distributions) or a decreasing (distributions exceed returns) Fund net asset value.
• Each distribution is expected to be paid from some or all of the following sources:
• net investment income (regular interest and dividends),
• realized capital gains, and
• unrealized gains, or, in certain cases, a return of principal (non-taxable distributions).
• A non-taxable distribution is a payment of a portion of a Fund's capital. When a Fund's returns exceed distributions, it may represent portfolio gains generated, but not realized as a taxable capital gain. In periods when the Fund's returns fall short of distributions, the shortfall will represent a portion of your original principal, unless the shortfall is offset
Nuveen Investments
9
during other time periods over the life of your investment (previous or subsequent) when the Fund's total return exceeds distributions.
• Because distribution source estimates are updated during the year based on a Fund's performance and forecast for its current fiscal year (which is the calendar year for each Fund), estimates on the nature of your distributions provided at the time the distributions are paid may differ from both the tax information reported to you in your Fund's IRS Form 1099 statement provided at year end, as well as the ultimate economic sources of distributions over the life of your investment.
The following table provides estimated information regarding each Fund's distributions and total return performance for the six months ended June 30, 2013. This information is provided on a tax basis rather than a generally accepted accounting principles (GAAP) basis. This information is intended to help you better understand whether the Funds' returns for the specified time period were sufficient to meet each Fund's distributions.
As of June 30, 2013 | JGG | JGT | |||||||||
Inception date | 6/27/06 | 4/25/07 | |||||||||
Six months ended June 30, 2013: | |||||||||||
Per share distribution: | |||||||||||
From net investment income | $ | 0.35 | $ | 0.15 | |||||||
From realized capital gains | 0.00 | 0.00 | |||||||||
Return of capital | 0.21 | 0.41 | |||||||||
Total per share distribution | $ | 0.56 | $ | 0.56 | |||||||
Annualized distribution rate on NAV | 8.15 | % | 8.63 | % | |||||||
Average annual total returns: | |||||||||||
Excluding retained gain tax credit/refund**: | |||||||||||
6-Month (Cumulative) on NAV | -7.29 | % | -7.97 | % | |||||||
| 1-Year on NAV | -3.52 | % | -0.91 | % | |||||||
| 5-Year on NAV | 3.51 | % | 0.75 | % | |||||||
Since inception on NAV | 3.75 | % | 2.85 | % | |||||||
Including retained gain tax credit/refund**: | |||||||||||
6-Month (Cumulative) on NAV | N/A | -7.97 | % | ||||||||
| 1-Year on NAV | N/A | -0.91 | % | ||||||||
| 5-Year on NAV | N/A | 0.75 | % | ||||||||
Since inception on NAV | N/A | 2.96 | % | ||||||||
** JGT elected to retain a portion of its realized long-term capital gains for the tax year ended December 31, 2007, and pay required federal corporate income taxes on this amount. As reported on Form 2439, shareholders on record date must include their pro-rata share of these gains on their applicable federal tax returns, and are entitled to take offsetting tax credits, for their pro-rata share of the taxes paid by the Fund. The total returns "Including retained gain tax credit/refund" include the economic benefit to shareholders on record date of these tax credits/refunds. The Fund had no retained capital gains for the tax years ended December 31, 2012 through December 31, 2008.
Nuveen Investments
10
Share Repurchases and Price Information
As of June 30, 2013, and since the inception of the Funds' repurchase programs, the Funds have cumulatively repurchased and retired their outstanding shares as shown in the accompanying table.
Fund | Shares Repurchased and Retired | % of Authorized Shares | |||||||||
JGG | 25,900 | 2.8 | % | ||||||||
JGT | 1,784,193 | 41.5 | % | ||||||||
During the current reporting period, JGG did not repurchase any of its outstanding shares. JGT's shares were repurchased and retired at a weighted average price and a weighted average discount per share as shown in the accompanying table.
Fund | Shares Repurchased and Retired | Weighted Average Price Per Share Repurchased and Retired | Weighted Average Discount Per Share Repurchased and Retired | ||||||||||||
JGT | 225,124 | $ | 12.33 | 13.00 | % | ||||||||||
Other Share Information
As of June 30, 2013, and during the six-month reporting period, the Funds' share price was trading at a premium/(discount) to their NAVs as shown in the accompanying table.
JGG | JGT | ||||||||||
Share NAV | $ | 13.75 | $ | 12.98 | |||||||
Share Price | $ | 12.36 | $ | 11.21 | |||||||
Premium/(Discount) to NAV | (10.11 | )% | (13.64 | )% | |||||||
6-Month Average Premium/(Discount) to NAV | (6.81 | )% | (10.85 | )% | |||||||
Nuveen Investments
11
Risk Considerations
Fund shares are not guaranteed or endorsed by any bank or other insured depository institution, and are not federally insured by the Federal Deposit Insurance Corporation. Shares of closed-end funds are subject to investment risks, including the possible loss of principal invested. Past performance is no guarantee of future results. Fund common shares are subject to a variety of risks, including:
Investment, Market and Price Risk. An investment in common shares is subject to investment risk, including the possible loss of the entire principal amount that you invest. Your investment in common shares represents an indirect investment in the corporate securities owned by the Funds, which generally trade in the over-the-counter markets. Shares of closed-end investment companies like the Funds' frequently trade at a discount to their NAV. Your common shares at any point in time may be worth less than your original investment, even after taking into account the reinvestment of Fund dividends and distributions.
Leverage Risk. A Fund's use of leverage creates the possibility of higher volatility for the Fund's per share NAV, market price, and distributions. Leverage risk can be introduced through regulatory leverage (issuing preferred shares or debt borrowings at the Fund level) or through certain derivative investments held in a Fund's portfolio. Leverage typically magnifies the total return of a Fund's portfolio, whether that return is positive or negative. The use of leverage creates an opportunity for increased common share net income, but there is no assurance that a Fund's leveraging strategy will be successful.
Tax Risk. The tax treatment of Fund distributions may be affected by new IRS interpretations of the Internal Revenue Code and future changes in tax laws and regulations. This is particularly true for funds employing a managed distribution program.
Below-Investment Grade Risk. Investments in securities below-investment grade quality are predominantly speculative and subject to greater volatility and risk of default.
Non-U.S. Securities Risk. Investments in non-U.S securities involve special risks not typically associated with domestic investments including currency risk and adverse political, social and economic development. These risks often are magnified in emerging markets.
Call Risk or Prepayment Risk. Issuers may exercise their option to prepay principal earlier than scheduled, forcing the Funds to reinvest in lower-yielding securities.
Derivatives Strategy Risk. Derivative securities, such as calls, puts, warrants, swaps and forwards, carry risks different from, and possibly greater than, the risks associated with the underlying investments.
Issuer Credit Risk. This is the risk that a security in a Fund's portfolio will fail to make dividend or interest payments when due.
Interest Rate Risk. Fixed-income securities such as bonds, preferred, convertible and other debt securities will decline in value if market interest rates rise.
Currency Risk. Changes in exchange rates will affect the value of a Fund's investments.
Counterparty Risk. To the extent that a Fund's derivative investments are purchased or sold in over-the-counter transactions, the Fund will be exposed to the risk that counter- parties to these transactions will be unable to meet their obligations.
Nuveen Investments
12
Interest Rate Swaps Risk. The risk that yields will move in the direction opposite to the direction anticipated by a Fund, which would cause a Fund to make payments to its counterparty in the transaction that could adversely affect the Fund's performance.
Forward Currency Contracts Risk. Forward currency contracts are not standardized and are substantially unregulated. Principals are not required to continue to make markets in the securities or currencies they trade and these markets can experience periods of illiquidity, sometimes of significant duration. In addition, trading forward currency contracts can have the effect of financial leverage by creating additional investment exposure.
Reinvestment Risk. If market interest rates decline, income earned from a Fund's portfolio may be reinvested at rates below that of the original bond that generated the income.
Nuveen Investments
13
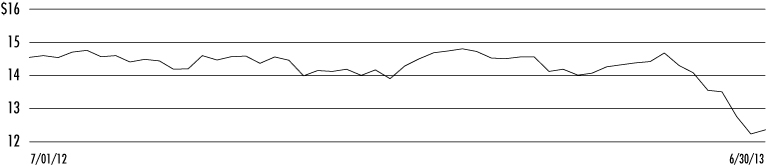
Nuveen Global Income Opportunities Fund (JGG)
Performance Overview and Holding Summaries as of June 30, 2013
Average Annual Total Returns as of June 30, 2013
Cumulative | Average Annual | ||||||||||||||||||
6-Month | 1-Year | 5-Year | Since Inception5 | ||||||||||||||||
JGG at NAV | -7.29 | % | -3.52 | % | 3.51 | % | 3.75 | % | |||||||||||
JGG at Share Price | -8.10 | % | -7.41 | % | 3.79 | % | 2.00 | % | |||||||||||
Barclays Global Aggregate Bond Index | -4.83 | % | -2.18 | % | 3.68 | % | 5.26 | % | |||||||||||
Past performance is not predictive of future results. Current performance may be higher or lower than the data shown. Returns do not reflect the deduction of taxes that shareholders may have to pay on Fund distributions or upon the sale of Fund shares. Comparative index return information is provided for the Fund's shares at NAV only. Indexes are not available for direct investment.
Share Price Performance — Weekly Closing Price
Portfolio Credit Quality1,2,3,4
(as a % of total investments)
AAA/U.S. Guaranteed | 3.4 | % | |||||
AA | 8.6 | % | |||||
A | 28.9 | % | |||||
BBB | 31.4 | % | |||||
BB or Lower | 23.7 | % | |||||
N/R | 4.0 | % | |||||
Country Allocation2,3,4
(as a % of total investments)
United States | 43.7 | % | |||||
Mexico | 11.4 | % | |||||
Turkey | 6.2 | % | |||||
United Kingdom | 4.5 | % | |||||
South Africa | 4.4 | % | |||||
South Korea | 3.0 | % | |||||
Canada | 3.0 | % | |||||
Malaysia | 2.8 | % | |||||
Italy | 2.4 | % | |||||
Other | 18.6 | % | |||||
Portfolio Allocation2,3
(as a % of total investments)
Corporate Bonds | 44.3 | % | |||||
Sovereign Debt | 41.7 | % | |||||
| Asset-Backed and Mortgage-Backed Securities | 5.2 | % | |||||
| $1,000 Par (or similar) Institutional Structures | 4.3 | % | |||||
Repurchase Agreements | 3.0 | % | |||||
$25 Par (or similar) Retail Structures | 1.5 | % | |||||
Refer to the Glossary of Terms Used in this Report for further definition of the terms used within this page.
1 Ratings shown are the highest rating given by one of the following national rating agencies: Standard & Poor's Group, Moody's Investors Service, Inc. or Fitch, Inc. Credit ratings are subject to change. AAA, AA, A, and BBB are investment grade ratings; BB, B, CCC, CC, C and D are below-investment grade ratings. Certain bonds backed by U.S. Government or agency securities are regarded as having an implied rating equal to the rating of such securities. Holdings designated N/R are not rated by these national rating agencies.
2 Holdings are subject to change.
3 Excluding investments in derivatives.
4 Excluding repurchase agreements.
5 Since inception returns are from 6/27/06.
Nuveen Investments
14
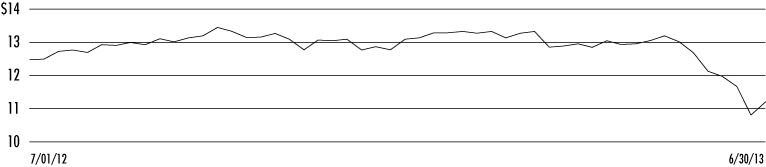
Nuveen Diversified Currency Opportunities Fund (JGT)
Performance Overview and Holding Summaries as of June 30, 2013
Average Annual Total Returns as of June 30, 2013
Cumulative | Average Annual | ||||||||||||||||||
6-Month | 1-Year | 5-Year | Since Inception5 | ||||||||||||||||
JGT at NAV | -7.97 | % | -0.91 | % | 0.75 | % | 2.85 | % | |||||||||||
JGT at Share Price | -8.81 | % | -0.97 | % | 0.84 | % | 0.81 | % | |||||||||||
JGT Blended Index (Comparative Index) | -4.38 | % | -2.31 | % | 0.86 | % | 3.50 | % | |||||||||||
Average Annual Total Returns as of June 30, 20136 (including retained gain tax credit/refund)
Cumulative | Average Annual | ||||||||||||||||||
6-Month | 1-Year | 5-Year | Since Inception5 | ||||||||||||||||
JGT at NAV | -7.97 | % | -0.91 | % | -0.75 | % | 2.96 | % | |||||||||||
JGT at Share Price | -8.81 | % | -0.97 | % | 0.84 | % | 0.93 | % | |||||||||||
Past performance is not predictive of future results. Current performance may be higher or lower than the data shown. Returns do not reflect the deduction of taxes that shareholders may have to pay on Fund distributions or upon the sale of Fund shares. Comparative index return information is provided for the Fund's shares at NAV only. Indexes are not available for direct investment.
Share Price Performance — Weekly Closing Price
Portfolio Credit Quality1,2,3,4
(as a % of total investments)
AAA/U.S. Guaranteed | 15.8 | % | |||||
AA | 10.1 | % | |||||
A | 37.8 | % | |||||
BBB | 22.0 | % | |||||
BB or Lower | 3.6 | % | |||||
N/R | 10.7 | % | |||||
Country Allocation2,3,4
(as a % of total investments)
United States | 18.1 | % | |||||
Brazil | 13.6 | % | |||||
Mexico | 13.1 | % | |||||
Canada | 10.8 | % | |||||
Turkey | 5.1 | % | |||||
Spain | 4.7 | % | |||||
South Africa | 4.6 | % | |||||
Malaysia | 4.5 | % | |||||
Italy | 4.0 | % | |||||
South Korea | 3.5 | % | |||||
Other | 18.0 | % | |||||
Portfolio Allocation2,3
(as a % of total investments)
Sovereign Debt | 72.4 | % | |||||
| U.S. Government and Agency Obligations | 13.6 | % | |||||
Corporate Bonds | 7.9 | % | |||||
| Asset-Backed and Mortgage-Backed Securities | 3.2 | % | |||||
Repurchase Agreements | 2.9 | % | |||||
Refer to the Glossary of Terms Used in this Report for further definition of the terms used within this page.
1 Ratings shown are the highest rating given by one of the following national rating agencies: Standard & Poor's Group, Moody's Investors Service, Inc. or Fitch, Inc. Credit ratings are subject to change. AAA, AA, A, and BBB are investment grade ratings; BB, B, CCC, CC, C and D are below-investment grade ratings. Certain bonds backed by U.S. Government or agency securities are regarded as having an implied rating equal to the rating of such securities. Holdings designated N/R are not rated by these national rating agencies.
2 Holdings are subject to change.
3 Excluding investments in derivatives.
4 Excluding repurchase agreements.
5 Since inception returns are from 4/25/07.
6 As previously explained in the Share Distribution and Price Information section of this report, the Fund elected to retain a portion of its realized long-term capital gains for the tax year ended December 31, 2007, and pay required federal corporate income taxes on these amounts. These standardized total returns include the economic benefit to shareholders of record of this tax credit/refund. The Fund had no retained capital gains for the tax years ended December 31, 2012 through December 31, 2008.
Nuveen Investments
15
JGG
JGT
Shareholder Meeting Report
The annual meeting of shareholders was held in the offices of Nuveen Investments on April 3, 2013; at this meeting the shareholders were asked to vote on the election of Board Members.
JGG | JGT | ||||||||||
| Common Shares | Common Shares | ||||||||||
Approval of the Board Members was reached as follows: | |||||||||||
William C. Hunter | |||||||||||
For | 8,542,536 | 43,285,588 | |||||||||
Withhold | 108,605 | 605,561 | |||||||||
Total | 8,651,141 | 43,891,149 | |||||||||
Judith M. Stockdale | |||||||||||
For | 8,559,647 | 43,265,740 | |||||||||
Withhold | 91,494 | 625,409 | |||||||||
Total | 8,651,141 | 43,891,149 | |||||||||
Carole E. Stone | |||||||||||
For | 8,537,275 | 43,248,296 | |||||||||
Withhold | 113,866 | 642,853 | |||||||||
Total | 8,651,141 | 43,891,149 | |||||||||
Virginia L. Stringer | |||||||||||
For | 8,528,565 | 43,257,774 | |||||||||
Withhold | 122,576 | 633,375 | |||||||||
Total | 8,651,141 | 43,891,149 | |||||||||
Nuveen Investments
16
JGG
Nuveen Global Income Opportunities Fund
Portfolio of Investments
June 30, 2013 (Unaudited)
| Shares | Description (1) | Coupon | Ratings (2) | Value | |||||||||||||||||||
$25 Par (or similar) Retail Structures – 2.3% (1.5% of Total Investments) | |||||||||||||||||||||||
Commercial Banks – 1.0% | |||||||||||||||||||||||
| 30,000 | PNC Financial Services | 6.125 | % | BBB | $ | 806,700 | |||||||||||||||||
| 20,000 | Regions Financial Corporation | 6.375 | % | BB | 490,000 | ||||||||||||||||||
Total Commercial Banks | 1,296,700 | ||||||||||||||||||||||
Consumer Finance – 0.4% | |||||||||||||||||||||||
| 20,000 | Discover Financial Services | 6.500 | % | BB | 502,000 | ||||||||||||||||||
Insurance – 0.6% | |||||||||||||||||||||||
| 25,000 | Hartford Financial Services Group Inc. | 7.875 | % | BB+ | 737,000 | ||||||||||||||||||
Oil, Gas & Consumable Fuels – 0.3% | |||||||||||||||||||||||
| 16,775 | Nustar Logistics Limited Partnership | 7.625 | % | Ba2 | 439,505 | ||||||||||||||||||
Total $25 Par (or similar) Retail Structures (cost $2,997,875) | 2,975,205 | ||||||||||||||||||||||
| Principal Amount (000) | Description (1) | Coupon | Maturity | Ratings (2) | Value | ||||||||||||||||||
Corporate Bonds – 66.7% (44.3% of Total Investments) | |||||||||||||||||||||||
Aerospace & Defense – 0.5% | |||||||||||||||||||||||
$ | 680 | Exelis, Inc. | 5.550 | % | 10/01/21 | BBB+ | $ | 690,801 | |||||||||||||||
Auto Components – 1.0% | |||||||||||||||||||||||
| 300 | Allison Transmission Inc., 144A | 7.125 | % | 5/15/19 | B+ | 317,250 | |||||||||||||||||
| 400 | American & Axle Manufacturing Inc. | 6.625 | % | 10/15/22 | B | 406,000 | |||||||||||||||||
| 250 | Gestamp Fund Lux SA, 144A | 5.625 | % | 5/31/20 | BB | 237,500 | |||||||||||||||||
| 300 | Pittsburgh Glass Works LLC, 144A | 8.500 | % | 4/15/16 | B+ | 297,000 | |||||||||||||||||
| 1,250 | Total Auto Components | 1,257,750 | |||||||||||||||||||||
Automobiles – 0.8% | |||||||||||||||||||||||
| 665 | Chrysler GP/CG Company | 8.000 | % | 6/15/19 | B1 | 725,681 | |||||||||||||||||
| 370 | General Motors Financial Company Inc., 144A | 4.250 | % | 5/15/23 | BB | 344,562 | |||||||||||||||||
| 1,035 | Total Automobiles | 1,070,243 | |||||||||||||||||||||
Building Products – 0.5% | |||||||||||||||||||||||
| 645 | Owens Corning Incorporated | 4.200 | % | 12/15/22 | BBB- | 624,997 | |||||||||||||||||
Capital Markets – 3.2% | |||||||||||||||||||||||
| 480 | E*Trade Financial Corporation | 6.375 | % | 11/15/19 | B2 | 487,200 | |||||||||||||||||
| 1,210 | Goldman Sachs Group, Inc. | 6.000 | % | 6/15/20 | A | 1,359,584 | |||||||||||||||||
| 1,000 | Goldman Sachs Group, Inc. | 5.250 | % | 7/27/21 | A | 1,069,899 | |||||||||||||||||
| 415 | Morgan Stanley | 6.625 | % | 4/01/18 | A | 470,384 | |||||||||||||||||
| 700 | Morgan Stanley | 4.875 | % | 11/01/22 | BBB+ | 691,531 | |||||||||||||||||
| 3,805 | Total Capital Markets | 4,078,598 | |||||||||||||||||||||
Nuveen Investments
17
JGG
Nuveen Global Income Opportunities Fund (continued)
Portfolio of Investments June 30, 2013 (Unaudited)
| Principal Amount (000) | Description (1) | Coupon | Maturity | Ratings (2) | Value | ||||||||||||||||||
Chemicals – 2.1% | |||||||||||||||||||||||
$ | 745 | Eastman Chemical Company | 3.600 | % | 8/15/22 | BBB | $ | 718,075 | |||||||||||||||
| 350 | Hexion U.S. Finance Corp. | 8.875 | % | 2/01/18 | B3 | 357,000 | |||||||||||||||||
| 450 | Ineos Finance PLC, 144A | 7.500 | % | 5/01/20 | BB- | 478,125 | |||||||||||||||||
| 250 | Momentive Performance Materials Inc. | 8.875 | % | 10/15/20 | B1 | 261,250 | |||||||||||||||||
| 365 | Omonva Solutions Inc. | 7.875 | % | 11/01/18 | B2 | 379,600 | |||||||||||||||||
| 300 | Petrologistics LP Finance, 144A | 6.250 | % | 4/01/20 | BB- | 294,000 | |||||||||||||||||
| 225 | Taminco Global Chemical Corporation, 144A | 9.750 | % | 3/31/20 | B- | 250,594 | |||||||||||||||||
| 2,685 | Total Chemicals | 2,738,644 | |||||||||||||||||||||
Commercial Banks – 1.1% | |||||||||||||||||||||||
| 285 | HSBC Holdings PLC | 6.800 | % | 6/01/38 | A+ | 327,796 | |||||||||||||||||
| 480 | Royal Bank of Scotland | 6.125 | % | 12/15/22 | BBB- | 456,754 | |||||||||||||||||
| 300 | VTB Capital SA, 144A | 6.875 | % | 5/29/18 | Baa1 | 318,000 | |||||||||||||||||
| 340 | Wells Fargo & Company | 3.450 | % | 2/13/23 | A+ | 324,712 | |||||||||||||||||
| 1,405 | Total Commercial Banks | 1,427,262 | |||||||||||||||||||||
Commercial Services & Supplies – 1.3% | |||||||||||||||||||||||
| 325 | 313 Group Incorporated, 144A | 6.375 | % | 12/01/19 | B1 | 308,750 | |||||||||||||||||
| 250 | Casella Waste Systems Inc. | 7.750 | % | 2/15/19 | Caa1 | 237,500 | |||||||||||||||||
| 400 | Ceridian Corporation, 144A | 8.875 | % | 7/15/19 | B1 | 444,500 | |||||||||||||||||
| 375 | R.R. Donnelley & Son Company | 7.625 | % | 6/15/20 | BB | 380,625 | |||||||||||||||||
| 235 | Europcar Groupe SA, 144A | 11.500 | % | 5/15/17 | B- | 339,535 | |||||||||||||||||
| 1,585 | Total Commercial Services & Supplies | 1,710,910 | |||||||||||||||||||||
Communications Equipment – 0.4% | |||||||||||||||||||||||
| 200 | Goodman Networks Inc., 144A | 13.125 | % | 7/01/18 | B | 212,000 | |||||||||||||||||
| 300 | Nokia Corporation | 5.375 | % | 5/15/19 | BB- | 291,750 | |||||||||||||||||
| 500 | Total Communications Equipment | 503,750 | |||||||||||||||||||||
Computers & Peripherals – 0.7% | |||||||||||||||||||||||
| 345 | Hewlett Packard Company | 4.650 | % | 12/09/21 | A- | 345,032 | |||||||||||||||||
| 210 | Lexmark International Group Incorporated | 5.125 | % | 3/15/20 | BBB- | 211,125 | |||||||||||||||||
| 350 | Seagate HDD Cayman | 7.000 | % | 11/01/21 | BBB- | 374,500 | |||||||||||||||||
| 905 | Total Computers & Peripherals | 930,657 | |||||||||||||||||||||
Construction Materials – 0.2% | |||||||||||||||||||||||
| 300 | Cemex SAB de CV, 144A | 9.000 | % | 1/11/18 | B+ | 315,000 | |||||||||||||||||
Consumer Finance – 0.8% | |||||||||||||||||||||||
| 915 | Ford Motor Credit Company | 6.625 | % | 8/15/17 | Baa3 | 1,035,591 | |||||||||||||||||
Containers & Packaging – 0.8% | |||||||||||||||||||||||
| 250 | Ardagh Packaging Finance/Holdings USA, 144A | 4.875 | % | 11/15/22 | Ba3 | 233,750 | |||||||||||||||||
| 415 | Ball Corporation | 4.000 | % | 11/15/23 | BB+ | 383,875 | |||||||||||||||||
| 350 | Reynolds Group | 7.125 | % | 4/15/19 | B+ | 369,687 | |||||||||||||||||
| 1,015 | Total Containers & Packaging | 987,312 | |||||||||||||||||||||
Diversified Financial Services – 6.6% | |||||||||||||||||||||||
| 2,500 | Bank of America Corporation | 5.700 | % | 1/24/22 | A | 2,775,112 | |||||||||||||||||
| 520 | Citigroup Inc. | 4.050 | % | 7/30/22 | BBB+ | 499,775 | |||||||||||||||||
| 845 | Countrywide Financial Corporation, 144A | 6.250 | % | 5/15/16 | BBB+ | 921,458 | |||||||||||||||||
| 620 | General Electric Capital Corporation | 5.300 | % | 2/11/21 | AA | 680,122 | |||||||||||||||||
| 515 | General Electric Capital Corporation | 6.875 | % | 1/10/39 | AA+ | 634,687 | |||||||||||||||||
| 1,480 | JPMorgan Chase & Company | 4.500 | % | 1/24/22 | A+ | 1,549,741 | |||||||||||||||||
| 490 | JPMorgan Chase & Company | 3.375 | % | 5/01/23 | A | 456,268 | |||||||||||||||||
| 545 | JPMorgan Chase & Company | 6.400 | % | 5/15/38 | A+ | 639,282 | |||||||||||||||||
| 350 | Nationstar Mortgage LLC Capital Corporation | 7.875 | % | 10/01/20 | B+ | 371,000 | |||||||||||||||||
| 7,865 | Total Diversified Financial Services | 8,527,445 | |||||||||||||||||||||
Nuveen Investments
18
| Principal Amount (000) | Description (1) | Coupon | Maturity | Ratings (2) | Value | ||||||||||||||||||
Diversified Telecommunication Services – 2.6% | |||||||||||||||||||||||
$ | 750 | AT&T, Inc. | 6.300 | % | 1/15/38 | A | $ | 833,824 | |||||||||||||||
| 450 | AT&T, Inc. | 5.550 | % | 8/15/41 | A | 468,542 | |||||||||||||||||
| 375 | CyrusOne LP Finance, 144A | 6.375 | % | 11/15/22 | B+ | 384,375 | |||||||||||||||||
| 400 | Frontier Communications Corporation | 8.500 | % | 4/15/20 | BB+ | 441,000 | |||||||||||||||||
| 350 | IntelSat Limited, 144A | 6.750 | % | 6/01/18 | CCC+ | 352,625 | |||||||||||||||||
| 595 | Qwest Corporation | 6.750 | % | 12/01/21 | BBB- | 662,371 | |||||||||||||||||
| 200 | Windstream Corporation | 6.375 | % | 8/01/23 | BB+ | 187,000 | |||||||||||||||||
| 3,120 | Total Diversified Telecommunication Services | 3,329,737 | |||||||||||||||||||||
Electric Utilities – 0.2% | |||||||||||||||||||||||
| 225 | InterGen NV, 144A | 7.000 | % | 6/30/23 | B+ | 219,375 | |||||||||||||||||
Energy Equipment & Services – 3.3% | |||||||||||||||||||||||
| 820 | Ensco PLC | 4.700 | % | 3/15/21 | BBB+ | 870,613 | |||||||||||||||||
| 375 | Gulfmark Offshore Inc. | 6.375 | % | 3/15/22 | BB- | 372,187 | |||||||||||||||||
| 675 | Nabors Industries Inc. | 5.000 | % | 9/15/20 | BBB | 688,101 | |||||||||||||||||
| 350 | Pacific Drilling SA, 144A | 5.375 | % | 6/01/20 | B+ | 327,250 | |||||||||||||||||
| 400 | Precision Drilling Corporation | 6.500 | % | 12/15/21 | Ba1 | 405,000 | |||||||||||||||||
| 400 | Seadrill Limited, 144A | 5.625 | % | 9/15/17 | N/R | 394,000 | |||||||||||||||||
| 765 | Transocean Inc. | 3.800 | % | 10/15/22 | BBB- | 728,702 | |||||||||||||||||
| 420 | Weatherford International Limited | 7.000 | % | 3/15/38 | Baa2 | 448,996 | |||||||||||||||||
| 4,205 | Total Energy Equipment & Services | 4,234,849 | |||||||||||||||||||||
Food & Staples Retailing – 0.2% | |||||||||||||||||||||||
| 300 | Supervalu Inc., 144A | 6.750 | % | 6/01/21 | B- | 279,000 | |||||||||||||||||
Food Products – 1.6% | |||||||||||||||||||||||
| 375 | JBS USA LLC | 7.250 | % | 6/01/21 | BB | 375,000 | |||||||||||||||||
| 250 | Marfrig Holding Europe BV, 144A | 9.875 | % | 7/24/17 | B | 251,250 | |||||||||||||||||
| 300 | Minerva Luxembourg S.A., 144A | 7.750 | % | 1/31/23 | BB- | 298,500 | |||||||||||||||||
| 200 | Mriya Agro Holding PLC, 144A | 9.450 | % | 4/19/18 | B | 178,000 | |||||||||||||||||
| 350 | Pinnacle Foods Finance LLC, 144A | 4.875 | % | 5/01/21 | B- | 334,250 | |||||||||||||||||
| 545 | Tyson Foods | 4.500 | % | 6/15/22 | BBB | 556,894 | |||||||||||||||||
| 2,020 | Total Food Products | 1,993,894 | |||||||||||||||||||||
Gas Utilities – 0.3% | |||||||||||||||||||||||
| 375 | AmeriGas Finance LLC | 7.000 | % | 5/20/22 | Ba2 | 383,437 | |||||||||||||||||
Health Care Providers & Services – 1.1% | |||||||||||||||||||||||
| 400 | HCA Holdings Inc. | 7.750 | % | 5/15/21 | B- | 432,000 | |||||||||||||||||
| 400 | Kindred Healthcare Inc. | 8.250 | % | 6/01/19 | B- | 410,000 | |||||||||||||||||
| 275 | Labco SAS, 144A | 8.500 | % | 1/15/18 | BB- | 373,167 | |||||||||||||||||
| 250 | Tenet Healthcare Corporation, 144A | 4.375 | % | 10/01/21 | BB | 229,375 | |||||||||||||||||
| 1,325 | Total Health Care Providers & Services | 1,444,542 | |||||||||||||||||||||
Hotels, Restaurants & Leisure – 0.6% | |||||||||||||||||||||||
| 300 | Graton Economic Development Authority, 144A | 9.625 | % | 9/01/19 | B | 328,500 | |||||||||||||||||
| 200 | Shearer's Foods LLC, 144A | 9.000 | % | 11/01/19 | B | 211,500 | |||||||||||||||||
| 250 | Wynn Las Vegas LLC Corporation | 5.375 | % | 3/15/22 | BBB- | 252,500 | |||||||||||||||||
| 750 | Total Hotels, Restaurants & Leisure | 792,500 | |||||||||||||||||||||
Independent Power Producers & Energy Traders – 1.0% | |||||||||||||||||||||||
| 275 | Calpine Corporation, 144A | 7.500 | % | 2/15/21 | BB+ | 293,563 | |||||||||||||||||
| 485 | Constellation Energy Group | 5.150 | % | 12/01/20 | BBB+ | 531,910 | |||||||||||||||||
| 400 | GenOn Energy | 9.500 | % | 10/15/18 | B | 444,000 | |||||||||||||||||
| 1,160 | Total Independent Power Producers & Energy Traders | 1,269,473 | |||||||||||||||||||||
Nuveen Investments
19
JGG
Nuveen Global Income Opportunities Fund (continued)
Portfolio of Investments June 30, 2013 (Unaudited)
| Principal Amount (000) | Description (1) | Coupon | Maturity | Ratings (2) | Value | ||||||||||||||||||
Industrial Conglomerates – 0.3% | |||||||||||||||||||||||
$ | 2,000 | Grieg Seafood ASA | 8.760 | % | 12/21/15 | N/R | $ | 332,546 | |||||||||||||||
Insurance – 1.7% | |||||||||||||||||||||||
| 750 | AFLAC Insurance | 6.450 | % | 8/15/40 | A- | 880,897 | |||||||||||||||||
| 385 | Liberty Mutual Group Inc., 144A | 4.950 | % | 5/01/22 | Baa2 | 395,274 | |||||||||||||||||
| 415 | Swiss Re Treasury US Corporation, 144A | 4.250 | % | 12/06/42 | AA- | 365,145 | |||||||||||||||||
| 510 | Unum Group | 5.625 | % | 9/15/20 | BBB | 562,100 | |||||||||||||||||
| 2,060 | Total Insurance | 2,203,416 | |||||||||||||||||||||
IT Services – 0.8% | |||||||||||||||||||||||
| 565 | Computer Sciences Corporation | 4.450 | % | 9/15/22 | BBB | 557,906 | |||||||||||||||||
| 400 | First Data Corporation | 6.750 | % | 11/01/20 | BB- | 407,000 | |||||||||||||||||
| 965 | Total IT Services | 964,906 | |||||||||||||||||||||
Machinery – 1.3% | |||||||||||||||||||||||
| 300 | Loxam SAS, 144A | 7.375 | % | 1/24/20 | B | 386,590 | |||||||||||||||||
| 425 | Terex Corporation | 6.000 | % | 5/15/21 | BB- | 423,937 | |||||||||||||||||
| 1,000 | Turlock Corporation | 4.150 | % | 11/02/42 | A- | 897,197 | |||||||||||||||||
| 1,725 | Total Machinery | 1,707,724 | |||||||||||||||||||||
Marine – 0.3% | |||||||||||||||||||||||
| 400 | Navios Maritime Acquisition Corporation | 8.625 | % | 11/01/17 | B | 409,000 | |||||||||||||||||
Media – 4.4% | |||||||||||||||||||||||
| 325 | Cequel Communication Holdings I, 144A | 5.125 | % | 12/15/21 | B- | 305,500 | |||||||||||||||||
| 720 | Comcast Corporation | 6.400 | % | 5/15/38 | A- | 859,375 | |||||||||||||||||
| 620 | DIRECTV Holdings LLC | 5.200 | % | 3/15/20 | BBB | 669,428 | |||||||||||||||||
| 300 | Dish DBS Corporation, 144A | 4.250 | % | 4/01/18 | BB- | 294,000 | |||||||||||||||||
| 275 | McGraw-Hill Global Education Holdings, 144A | 9.750 | % | 4/01/21 | BB | 281,188 | |||||||||||||||||
| 400 | Nara Cable Funding Limited, 144A | 8.875 | % | 12/01/18 | BB- | 416,000 | |||||||||||||||||
| 575 | NBC Universal Media LLC | 2.875 | % | 1/15/23 | A- | 546,157 | |||||||||||||||||
| 555 | News America Holdings Inc. | 6.650 | % | 11/15/37 | BBB+ | 638,664 | |||||||||||||||||
| 410 | Time Warner Cable Inc. | 5.875 | % | 11/15/40 | BBB | 375,581 | |||||||||||||||||
| 345 | Time Warner Inc. | 6.100 | % | 7/15/40 | BBB+ | 376,674 | |||||||||||||||||
| 250 | Videotron Limited, 144A | 5.625 | % | 6/15/25 | BB | 227,013 | |||||||||||||||||
| 610 | Vivendi S.A., 144A | 4.750 | % | 4/12/22 | BBB | 610,104 | |||||||||||||||||
| 5,385 | Total Media | 5,599,684 | |||||||||||||||||||||
Metals & Mining – 4.8% | |||||||||||||||||||||||
| 975 | Alcoa Inc. | 5.400 | % | 4/15/21 | BBB- | 949,078 | |||||||||||||||||
| 200 | Anglogold Holdings PLC | 6.500 | % | 4/15/40 | Baa2 | 165,415 | |||||||||||||||||
| 715 | ArcelorMittal | 6.750 | % | 2/25/22 | BB+ | 732,875 | |||||||||||||||||
| 200 | Bumi Investment PTE Limited, 144A | 10.750 | % | 10/06/17 | B- | 144,000 | |||||||||||||||||
| 720 | Cliffs Natural Resources Inc. | 4.800 | % | 10/01/20 | BBB- | 649,005 | |||||||||||||||||
| 300 | Coeur D'Alene Mines Corporation, 144A | 7.875 | % | 2/01/21 | BB- | 295,500 | |||||||||||||||||
| 350 | FMG Resources, 144A | 6.000 | % | 4/01/17 | BB+ | 340,375 | |||||||||||||||||
| 640 | Freeport McMoRan Copper & Gold, Inc. | 3.550 | % | 3/01/22 | BBB | 581,348 | |||||||||||||||||
| 300 | IAMGOLD Corproation, 144A | 6.750 | % | 10/01/20 | BB- | 253,500 | |||||||||||||||||
| 400 | Inmet Mining Corporation, 144A | 8.750 | % | 6/01/20 | B+ | 409,000 | |||||||||||||||||
| 700 | Newmont Mining Corporation | 3.500 | % | 3/15/22 | BBB+ | 599,014 | |||||||||||||||||
| 200 | Severstal OAO via Steel Capital, 144A | 4.450 | % | 3/19/18 | BB+ | 189,000 | |||||||||||||||||
| 320 | Teck Resources Limited | 6.250 | % | 7/15/41 | BBB | 303,157 | |||||||||||||||||
| 250 | TMK OAO Capital S.A., 144A | 6.750 | % | 4/03/20 | B+ | 231,875 | |||||||||||||||||
| 285 | Vale Overseas Limited | 6.875 | % | 11/10/39 | A- | 287,674 | |||||||||||||||||
| 6,555 | Total Metals & Mining | 6,130,816 | |||||||||||||||||||||
Nuveen Investments
20
| Principal Amount (000) | Description (1) | Coupon | Maturity | Ratings (2) | Value | ||||||||||||||||||
Multiline Retail – 0.7% | |||||||||||||||||||||||
$ | 865 | Macy's Retail Holdings Inc. | 3.875 | % | 1/15/22 | BBB | $ | 867,258 | |||||||||||||||
Oil, Gas & Consumable Fuels – 11.2% | |||||||||||||||||||||||
| 165 | Anadarko Petroleum Corporation | 6.200 | % | 3/15/40 | BBB- | 185,126 | |||||||||||||||||
| 875 | Apache Corporation | 4.250 | % | 1/15/44 | A- | 780,681 | |||||||||||||||||
| 400 | Athabasca Oil Corporation, 144A | 7.500 | % | 11/19/17 | B | 361,320 | |||||||||||||||||
| 400 | Atlas Pipeline LP Finance, 144A | 5.875 | % | 8/01/23 | B+ | 380,000 | |||||||||||||||||
| 375 | Bill Barrett Corporation | 7.000 | % | 10/15/22 | B+ | 375,000 | |||||||||||||||||
| 1,000 | CNPC General Capital Limited, 144A | 3.400 | % | 4/16/23 | A+ | 918,262 | |||||||||||||||||
| 200 | Concho Resources Inc. | 5.500 | % | 10/01/22 | BB+ | 198,000 | |||||||||||||||||
| 350 | Everest Acquisition LLC Finance, 144A | 7.750 | % | 9/01/22 | B | 374,500 | |||||||||||||||||
| 350 | Forest Oil Corporation | 7.250 | % | 6/15/19 | B- | 329,000 | |||||||||||||||||
| 1,000 | Gazprom OAO Via Gaz Capital S.A., 144A | 3.850 | % | 2/06/20 | Baa1 | 930,000 | |||||||||||||||||
| 300 | Halcon Resources Limited Liability Corporation, 144A | 9.750 | % | 7/15/20 | CCC+ | 299,250 | |||||||||||||||||
| 400 | Key Energy Services Inc. | 6.750 | % | 3/01/21 | BB- | 384,000 | |||||||||||||||||
| 400 | Linn Energy LLC Finance Corporation, 144A | 6.250 | % | 11/01/19 | B | 381,000 | |||||||||||||||||
| 1,000 | Lukoil International Finance BV, 144A | 3.416 | % | 4/24/18 | BBB | 972,500 | |||||||||||||||||
| 300 | Martin Mid-Stream Partners LP Finance, 144A | 7.250 | % | 2/15/21 | B- | 301,500 | |||||||||||||||||
| 400 | MEG Energy Corporation, 144A | 6.375 | % | 1/30/23 | BB | 388,000 | |||||||||||||||||
| 250 | Newfield Exploration Company | 5.625 | % | 7/01/24 | BBB- | 242,500 | |||||||||||||||||
| 400 | Niska Gas Storage US LLC | 8.875 | % | 3/15/18 | B+ | 415,000 | |||||||||||||||||
| 380 | Northern Tier Energy LLC, 144A | 7.125 | % | 11/15/20 | BB- | 383,800 | |||||||||||||||||
| 300 | Ocean Rig UDW Inc. | 9.500 | % | 4/27/16 | CCC+ | 311,250 | |||||||||||||||||
| 290 | Offshore Group Investment Limited | 7.500 | % | 11/01/19 | B- | 302,325 | |||||||||||||||||
| 350 | Paramount Resources Limited, 144A | 7.625 | % | 12/04/19 | B | 332,795 | |||||||||||||||||
| 300 | PBF Holding Company LLC, 144A | 8.250 | % | 2/15/20 | BB+ | 314,250 | |||||||||||||||||
| 400 | PetroBakken Energy Limited, 144A | 8.625 | % | 2/01/20 | CCC+ | 380,000 | |||||||||||||||||
| 210 | Petrobras International Finance Company | 5.375 | % | 1/27/21 | A3 | 210,986 | |||||||||||||||||
| 500 | Petrohawk Energy Corporation | 7.250 | % | 8/15/18 | A | 545,500 | |||||||||||||||||
| 1,000 | Rowan Companies Inc. | 4.875 | % | 6/01/22 | BBB- | 1,031,857 | |||||||||||||||||
| 250 | Sabine Pass LNG LP, 144A | 6.500 | % | 11/01/20 | BB+ | 252,500 | |||||||||||||||||
| 375 | Sabine Pass LNG LP | 7.500 | % | 11/30/16 | BB+ | 403,594 | |||||||||||||||||
| 350 | Sandridge Energy Inc. | 8.125 | % | 10/15/22 | B2 | 346,500 | |||||||||||||||||
| 2,000 | Ship Finance International Limited | 6.810 | % | 10/19/17 | N/R | 324,315 | |||||||||||||||||
| 400 | SM Energy Company | 6.625 | % | 2/15/19 | BB- | 419,000 | |||||||||||||||||
| 700 | Thai Oil PCL, 144A | 3.625 | % | 1/23/23 | Baa1 | 638,633 | |||||||||||||||||
| 16,370 | Total Oil, Gas & Consumable Fuels | 14,412,944 | |||||||||||||||||||||
Paper & Forest Products – 1.0% | |||||||||||||||||||||||
| 715 | Domtar Corporation | 4.400 | % | 4/01/22 | BBB- | 693,322 | |||||||||||||||||
| 300 | Sappi Papier Holding GMBH, 144A | 8.375 | % | 6/15/19 | BB | 316,500 | |||||||||||||||||
| 250 | Tembec Industries, Inc. | 11.250 | % | 12/15/18 | B3 | 270,000 | |||||||||||||||||
| 1,265 | Total Paper & Forest Products | 1,279,822 | |||||||||||||||||||||
Personal Products – 0.2% | |||||||||||||||||||||||
| 300 | Albea Beauty Holdings SA, 144A | 8.375 | % | 11/01/19 | B+ | 294,000 | |||||||||||||||||
Pharmaceuticals – 1.1% | |||||||||||||||||||||||
| 400 | AbbVie Incorporated, 144A | 2.900 | % | 11/06/22 | A+ | 374,056 | |||||||||||||||||
| 300 | Endo Pharmaceutical Holdings Inc. | 7.000 | % | 12/15/20 | BB- | 301,125 | |||||||||||||||||
| 375 | Sky Growth Holdings Corporation, dba Par Pharmaceuticals, 144A | 7.375 | % | 10/15/20 | B- | 384,375 | |||||||||||||||||
| 335 | Valeant Pharmaceuticals International, 144A | 6.375 | % | 10/15/20 | B1 | 331,231 | |||||||||||||||||
| 1,410 | Total Pharmaceuticals | 1,390,787 | |||||||||||||||||||||
Nuveen Investments
21
JGG
Nuveen Global Income Opportunities Fund (continued)
Portfolio of Investments June 30, 2013 (Unaudited)
| Principal Amount (000) | Description (1) | Coupon | Maturity | Ratings (2) | Value | ||||||||||||||||||
Real Estate Investment Trust – 2.8% | |||||||||||||||||||||||
$ | 1,000 | CommonWealth REIT | 5.875 | % | 9/15/20 | BBB- | $ | 1,035,272 | |||||||||||||||
| 480 | HCP Inc. | 3.750 | % | 2/01/19 | BBB+ | 492,544 | |||||||||||||||||
| 1,000 | Liberty Property Trust | 3.375 | % | 6/15/23 | Baa1 | 927,413 | |||||||||||||||||
| 1,000 | Senior Housing Properties Trust | 6.750 | % | 4/15/20 | BBB- | 1,100,153 | |||||||||||||||||
| 3,480 | Total Real Estate Investment Trust | 3,555,382 | |||||||||||||||||||||
Real Estate Management & Development – 0.8% | |||||||||||||||||||||||
| 350 | Country Garden Holding Company, 144A | 11.125 | % | 2/23/18 | BB- | 379,750 | |||||||||||||||||
| 200 | Gemdale International Investment Limited | 7.125 | % | 11/16/17 | BB- | 195,571 | |||||||||||||||||
| 200 | Kaisa Group Holdings Limited, 144A | 8.875 | % | 3/19/18 | B+ | 191,000 | |||||||||||||||||
| 300 | Mattamy Group Corporation, 144A | 6.500 | % | 11/15/20 | BB | 294,000 | |||||||||||||||||
| 1,050 | Total Real Estate Management & Development | 1,060,321 | |||||||||||||||||||||
Road & Rail – 0.2% | |||||||||||||||||||||||
| 265 | Hertz Corporation | 7.375 | % | 1/15/21 | B | 286,863 | |||||||||||||||||
Semiconductors & Equipment – 0.2% | |||||||||||||||||||||||
| 335 | Freescale Semiconductor Inc., 144A | 5.000 | % | 5/15/21 | B1 | 318,250 | |||||||||||||||||
Textiles, Apparel & Luxury Goods – 0.2% | |||||||||||||||||||||||
| 230 | Jones Group | 6.875 | % | 3/15/19 | B+ | 231,150 | |||||||||||||||||
Tobacco – 0.7% | |||||||||||||||||||||||
| 1,030 | Reynolds American Inc. | 3.250 | % | 11/01/22 | Baa2 | 957,485 | |||||||||||||||||
Trading Companies & Distributors – 0.7% | |||||||||||||||||||||||
| 605 | International Lease Finance Corporation | 4.625 | % | 4/15/21 | BBB- | 556,600 | |||||||||||||||||
| 300 | Russel Metals Inc., 144A | 6.000 | % | 4/19/22 | Ba1 | 285,252 | |||||||||||||||||
| 905 | Total Trading Companies & Distributors | 841,852 | |||||||||||||||||||||
Transportation Infrastructure – 0.8% | |||||||||||||||||||||||
| 954 | Asciano Finance Limited, 144A | 5.000 | % | 4/07/18 | Baa2 | 1,013,511 | |||||||||||||||||
Wireless Telecommunication Services – 1.6% | |||||||||||||||||||||||
| 625 | American Tower Company | 5.050 | % | 9/01/20 | BBB | 656,808 | |||||||||||||||||
| 350 | Digicel Limited, 144A | 7.000 | % | 2/15/20 | B1 | 353,500 | |||||||||||||||||
| 300 | Eileme AB, 144A | 11.625 | % | 1/31/20 | B- | 339,000 | |||||||||||||||||
| 400 | Sprint Corporation, 144A | 7.000 | % | 3/01/20 | BB | 432,000 | |||||||||||||||||
| 300 | Wind Acquisition Finance S.A., 144A | 7.250 | % | 2/15/18 | BB | 299,250 | |||||||||||||||||
| 1,975 | Total Wireless Telecommunication Services | 2,080,558 | |||||||||||||||||||||
$ | 87,594 | Total Corporate Bonds (cost $90,145,383) | 85,784,042 | ||||||||||||||||||||
| Principal Amount (000) | Description (1) | Coupon | Maturity | Ratings (2) | Value | ||||||||||||||||||
$1,000 Par (or similar) Institutional Structures – 6.4% (4.3% of Total Investments) | |||||||||||||||||||||||
Capital Markets – 0.3% | |||||||||||||||||||||||
$ | 350 | Dresdner Funding Trust, 144A | 8.151 | % | 6/30/31 | BB | $ | 351,313 | |||||||||||||||
Commercial Banks – 2.2% | |||||||||||||||||||||||
| 690 | Barclays Bank PLC | 4.750 | % | N/A (3) | BBB- | 645,276 | |||||||||||||||||
| 425 | Credit Agricole, S.A., 144A | 6.637 | % | N/A (3) | BBB- | 392,063 | |||||||||||||||||
| 355 | Rabobank Nederland, 144A | 11.000 | % | N/A (3) | A- | 455,287 | |||||||||||||||||
| 1,400 | Wachovia Capital Trust III | 5.570 | % | N/A (3) | BBB+ | 1,373,750 | |||||||||||||||||
| 2,870 | Total Commercial Banks | 2,866,376 | |||||||||||||||||||||
Nuveen Investments
22
| Principal Amount (000) | Description (1) | Coupon | Maturity | Ratings (2) | Value | ||||||||||||||||||
Diversified Financial Services – 1.6% | |||||||||||||||||||||||
$ | 500 | Citigroup Inc. | 5.950 | % | N/A (3) | BB | $ | 497,550 | |||||||||||||||
| 1,100 | General Electric Capital Corporation | 7.125 | % | N/A (3) | AA- | 1,243,000 | |||||||||||||||||
| 340 | JPMorgan Chase & Company | 5.150 | % | N/A (3) | BBB | 323,850 | |||||||||||||||||
| 1940 | Total Diversified Financial Services | 2,064,400 | |||||||||||||||||||||
Electric Utilities – 0.3% | |||||||||||||||||||||||
| 360 | Electricite de France, 144A | 5.250 | % | N/A (3) | A3 | 344,160 | |||||||||||||||||
Insurance – 1.7% | |||||||||||||||||||||||
| 570 | Catlin Insurance Company Limited | 7.249 | % | N/A (3) | BBB+ | 582,825 | |||||||||||||||||
| 250 | Genworth Financial Inc. | 6.150 | % | 11/15/66 | Ba1 | 216,875 | |||||||||||||||||
| 355 | Lincoln National Corporation | 6.050 | % | 4/20/67 | BBB | 347,786 | |||||||||||||||||
| 305 | Prudential Financial Inc. | 5.200 | % | 3/15/44 | BBB+ | 288,225 | |||||||||||||||||
| 225 | XL Capital Ltd | 7.000 | % | 6/30/23 | B+ | 219,375 | |||||||||||||||||
| 530 | ZFS Finance USA Trust V | 6.500 | % | 5/09/67 | A | 564,450 | |||||||||||||||||
| 2,235 | Total Insurance | 2,219,536 | |||||||||||||||||||||
IT Services – 0.3% | |||||||||||||||||||||||
| 400 | Zayo Escrow Corporation | 8.125 | % | 1/01/20 | B1 | 434,000 | |||||||||||||||||
$ | 8,155 | Total $1,000 Par (or similar) Institutional Structures (cost $8,409,687) | 8,279,785 | ||||||||||||||||||||
| Principal Amount (000) (4) | Description (1) | Coupon | Maturity | Ratings (2) | Value | ||||||||||||||||||
Sovereign Debt – 62.8% (41.7% of Total Investments) | |||||||||||||||||||||||
Bermuda – 0.8% | |||||||||||||||||||||||
| 900 | Bermuda Government, 144A | 5.603 | % | 7/20/20 | AA- | $ | 976,500 | ||||||||||||||||
Brazil – 0.7% | |||||||||||||||||||||||
| 1,000 | Federative Republic of Brazil | 2.625 | % | 1/05/23 | BBB | 870,000 | |||||||||||||||||
Canada – 1.4% | |||||||||||||||||||||||
| 1,700 | CAD | Province of Ontario Municipal Bond | 4.200 | % | 3/08/18 | Aa2 | 1,753,375 | ||||||||||||||||
Indonesia – 1.1% | |||||||||||||||||||||||
| 1,300 | Republic of Indonesia, 144A | 5.875 | % | 3/13/20 | Baa3 | 1,407,250 | |||||||||||||||||
Ireland – 1.7% | |||||||||||||||||||||||
| 1,500 | EUR | Irish Republic Treasury Bond | 5.900 | % | 10/18/19 | BBB+ | 2,198,220 | ||||||||||||||||
Italy – 3.6% | |||||||||||||||||||||||
| 500 | EUR | Buoni Poliennali del Tesoro, Italian Treasury Bond | 2.500 | % | 3/01/15 | BBB+ | 656,682 | ||||||||||||||||
| 1,450 | EUR | Buoni Poliennali del Tesoro, Italian Treasury Bond | 4.750 | % | 6/01/17 | BBB+ | 1,992,236 | ||||||||||||||||
| 1,385 | EUR | Buoni Poliennali del Tesoro, Italian Treasury Bond | 5.500 | % | 11/01/22 | BBB+ | 1,934,262 | ||||||||||||||||
| 3,335 | EUR | Total Italy | 4,583,180 | ||||||||||||||||||||
Malaysia – 4.0% | |||||||||||||||||||||||
| 16,500 | MYR | Republic of Malaysia | 3.172 | % | 7/15/16 | A | 5,207,174 | ||||||||||||||||
Mexico – 16.4% | |||||||||||||||||||||||
| 15,000 | MXN | Mexico Bonos de DeSarrollo | 8.000 | % | 12/17/15 | A- | 1,251,843 | ||||||||||||||||
| 49,500 | MXN | Mexico Bonos de DeSarrollo | 6.250 | % | 6/16/16 | A- | 4,005,506 | ||||||||||||||||
| 32,500 | MXN | Mexico Bonos de DeSarrollo | 5.000 | % | 6/15/17 | A- | 2,511,711 | ||||||||||||||||
| 56,300 | MXN | Mexico Bonos de DeSarrollo | 8.000 | % | 12/07/23 | A- | 5,048,106 | ||||||||||||||||
| 40,100 | MXN | Mexico Bonos de DeSarrollo | 7.750 | % | 11/13/42 | A- | 3,333,065 | ||||||||||||||||
| 60,000 | MXN | United Mexican States | 9.500 | % | 12/18/14 | A- | 4,976,016 | ||||||||||||||||
| 253,400 | MXN | Total Mexico | 21,126,247 | ||||||||||||||||||||
Nuveen Investments
23
JGG
Nuveen Global Income Opportunities Fund (continued)
Portfolio of Investments June 30, 2013 (Unaudited)
| Principal Amount (000) (4) | Description (1) | Coupon | Maturity | Ratings (2) | Value | ||||||||||||||||||
Norway – 2.9% | |||||||||||||||||||||||
20,000 | NOK | Norwegian Government Bond | 4.500 | % | 5/22/19 | AAA | $ | 3,737,355 | |||||||||||||||
Poland – 1.5% | |||||||||||||||||||||||
6,850 | PLN | Republic of Poland | 2.500 | % | 7/25/18 | A | 1,943,654 | ||||||||||||||||
Portugal – 1.4% | |||||||||||||||||||||||
1,525 | EUR | Portugal Obrigacoes do Tesouro | 5.650 | % | 2/15/24 | Ba3 | 1,846,263 | ||||||||||||||||
Russia – 1.4% | |||||||||||||||||||||||
1,800 | Russian Federation, 144A | 4.500 | % | 4/04/22 | Baa1 | 1,838,466 | |||||||||||||||||
South Africa – 6.1% | |||||||||||||||||||||||
62,000 | ZAR | Republic of South Africa | 7.250 | % | 1/15/20 | A- | 6,238,291 | ||||||||||||||||
12,800 | ZAR | Republic of South Africa | 10.500 | % | 12/21/26 | A- | 1,569,633 | ||||||||||||||||
74,800 | ZAR | Total South Africa | 7,807,924 | ||||||||||||||||||||
South Korea – 4.4% | |||||||||||||||||||||||
6,500,000 | KRW | Korea Monetary Stability Bond | 2.840 | % | 12/02/14 | Aa3 | 5,696,414 | ||||||||||||||||
Sweden – 2.1% | |||||||||||||||||||||||
16,500 | SEK | Republic of Sweden | 3.500 | % | 6/01/22 | AAA | 2,738,241 | ||||||||||||||||
Turkey – 9.0% | |||||||||||||||||||||||
12,300 | TRY | Republic of Turkey, Government Bond | 9.000 | % | 3/08/17 | BBB | 6,584,617 | ||||||||||||||||
3,575 | TRY | Republic of Turkey, Government Bond | 10.500 | % | 1/15/20 | BBB | 2,061,181 | ||||||||||||||||
3,370 | TRY | Republic of Turkey, Government Bond | 7.100 | % | 3/08/23 | BBB | 1,607,508 | ||||||||||||||||
1,000 | Republic of Turkey, Government Bond | 3.250 | % | 3/23/23 | Baa3 | 872,500 | |||||||||||||||||
500 | Republic of Turkey, Government Bond | 4.875 | % | 4/16/43 | Baa3 | 430,000 | |||||||||||||||||
Total Turkey | 11,555,806 | ||||||||||||||||||||||
Ukraine – 0.6% | |||||||||||||||||||||||
900 | Republic of Ukraine, 144A | 7.750 | % | 9/23/20 | B | 821,250 | |||||||||||||||||
United Kingdom – 3.7% | |||||||||||||||||||||||
1,500 | GBP | United Kingdom Gilt | 3.750 | % | 9/07/20 | Aa1 | 2,554,949 | ||||||||||||||||
1,300 | GBP | United Kingdom, Treasury Bill | 3.750 | % | 9/07/19 | AA+ | 2,219,268 | ||||||||||||||||
2,800 | GBP | Total United Kingdom | 4,774,217 | ||||||||||||||||||||
Total Sovereign Debt (cost $88,608,887) | 80,881,536 | ||||||||||||||||||||||
| Principal Amount (000) | Description (1) | Coupon | Maturity | Ratings (2) | Value | ||||||||||||||||||
Asset-Backed and Mortgage-Backed Securities – 7.8% (5.2% of Total Investments) | |||||||||||||||||||||||
$ | 862 | Banc of America Alternative Loan Trust, Pass Through Certificates, Series 2006-6 | 6.000 | % | 7/25/46 | Caa3 | $ | 699,437 | |||||||||||||||
964 | Bayview Opportunity Master Fund Trust, 2013-8NPL | 3.228 | % | 3/28/33 | N/R | 961,292 | |||||||||||||||||
750 | CarFinance Capital Auto Trust, Automobile Receivables-Backed Notes, Series 2013-1, 144A | 3.450 | % | 3/15/19 | Baa3 | 739,241 | |||||||||||||||||
700 | Countrywide Asset Backed Certificates, Series 2007-4 A2 | 5.530 | % | 4/25/47 | Caa1 | 652,214 | |||||||||||||||||
473 | Countrywide Home Loans Mortgage, Series 2005-27 | 5.500 | % | 12/25/35 | Caa1 | 437,581 | |||||||||||||||||
5,200 | Fannie Mae TBA Mortgage Pool, (MDR), WI/DD | 3.000 | % | TBA | N/R | 5,080,562 | |||||||||||||||||
1,000 | Nationstar Mortgage Advance Receivables Trust 2013-T1A | 3.721 | % | 6/20/44 | BB | 998,930 | |||||||||||||||||
450 | Wedgewood Real Estate Trust, Mortgage Pool 2013-1A, (5) | 5.000 | % | 7/25/43 | N/R | 449,367 | |||||||||||||||||
$ | 10,399 | Total Asset-Backed and Mortgage-Backed Securities (cost $10,231,451) | 10,018,624 | ||||||||||||||||||||
Nuveen Investments
24
| Principal Amount (000) | Description (1) | Coupon | Maturity | Value | |||||||||||||||||||
Short-Term Investments – 4.6% (3.0% of Total Investments) | |||||||||||||||||||||||
$ | 5,862 | Repurchase Agreement with State Street Bank, dated 6/28/13, repurchase price $5,862,115, collateralized by $6,080,000 U.S. Treasury Notes, 0.625%, due 5/31/17, value $5,983,158 | 0.010 | % | 7/01/13 | $ | 5,862,110 | ||||||||||||||||
Total Short-Term Investments (cost $5,862,110) | 5,862,110 | ||||||||||||||||||||||
Total Investments (cost $206,255,393) – 150.6% | 193,801,302 | ||||||||||||||||||||||
| Borrowings – (47.4)% (6), (12) | (61,000,000 | ) | |||||||||||||||||||||
Other Assets Less Liabilities – (3.2)% (7) | (4,084,547 | ) | |||||||||||||||||||||
Net Assets – 100% | $ | 128,716,755 | |||||||||||||||||||||
Investments in Derivatives as of June 30, 2013
Forward Foreign Currency Exchange Contracts outstanding:
Counterparty | Currency Contracts to Deliver | Amount (Local Currency) | In Exchange For Currency | Amount (Local Currency) | Settlement Date | Unrealized Appreciation (Depreciation) (7) | |||||||||||||||||||||
Bank of America | Brazilian Real | 21,000,000 | U.S. Dollar | 9,484,666 | 7/02/13 | $ | 73,324 | ||||||||||||||||||||
Bank of America | U.S. Dollar | 9,478,245 | Brazilian Real | 21,000,000 | 7/02/13 | (66,902 | ) | ||||||||||||||||||||
Bank of America | U.S. Dollar | 9,428,456 | Brazilian Real | 21,000,000 | 8/02/13 | (82,870 | ) | ||||||||||||||||||||
Barclays | Chilean Peso | 975,000,000 | U.S. Dollar | 2,047,459 | 7/03/13 | 128,696 | |||||||||||||||||||||
Barclays | Euro | 7,820,000 | U.S. Dollar | 10,121,661 | 7/15/13 | (57,763 | ) | ||||||||||||||||||||
Barclays | Euro | 8,000,000 | U.S. Dollar | 10,593,840 | 7/15/13 | 180,108 | |||||||||||||||||||||
Barclays | Malaysian Ringgit | 16,400,000 | U.S. Dollar | 5,291,176 | 8/06/13 | 139,178 | |||||||||||||||||||||
Barclays | Polish Zloty | 19,000,000 | U.S. Dollar | 5,936,943 | 7/12/13 | 222,308 | |||||||||||||||||||||
Barclays | Polish Zloty | 6,675,000 | U.S. Dollar | 1,994,678 | 8/30/13 | (6,915 | ) | ||||||||||||||||||||
Barclays | Swiss Franc | 9,740,000 | U.S. Dollar | 10,204,616 | 7/15/13 | (108,317 | ) | ||||||||||||||||||||
Barclays | U.S. Dollar | 833,073 | Chilean Peso | 400,000,000 | 7/03/13 | (45,888 | ) | ||||||||||||||||||||
Barclays | U.S. Dollar | 859,836 | Chilean Peso | 415,000,000 | 7/03/13 | (43,132 | ) | ||||||||||||||||||||
Barclays | U.S. Dollar | 324,182 | Chilean Peso | 160,000,000 | 7/03/13 | (9,308 | ) | ||||||||||||||||||||
Barclays | U.S. Dollar | 6,028,493 | Polish Zloty | 19,000,000 | 7/12/13 | (313,858 | ) | ||||||||||||||||||||
Barclays | U.S. Dollar | 13,894,799 | Euro | 10,684,526 | 7/15/13 | 13,426 | |||||||||||||||||||||
Barclays | U.S. Dollar | 1,294,591 | Euro | 970,000 | 7/15/13 | (31,926 | ) | ||||||||||||||||||||
Barclays | U.S. Dollar | 10,135,698 | Swiss Franc | 9,740,000 | 7/15/13 | 177,236 | |||||||||||||||||||||
Barclays | U.S. Dollar | 9,684,720 | New Zealand Dollar | 12,000,000 | 7/17/13 | (395,320 | ) | ||||||||||||||||||||
BNP Paribas | Australian Dollar | 4,800,000 | U.S. Dollar | 4,587,182 | 7/15/13 | 201,535 | |||||||||||||||||||||
BNP Paribas | Australian Dollar | 8,000,000 | U.S. Dollar | 7,577,520 | 7/15/13 | 268,108 | |||||||||||||||||||||
BNP Paribas | Euro | 10,100,000 | U.S. Dollar | 13,437,545 | 8/09/13 | 288,850 | |||||||||||||||||||||
BNP Paribas | Euro | 7,250,000 | U.S. Dollar | 9,629,813 | 8/09/13 | 191,393 | |||||||||||||||||||||
BNP Paribas | U.S. Dollar | 5,973,228 | Australian Dollar | 6,000,000 | 7/15/13 | (491,169 | ) | ||||||||||||||||||||
BNP Paribas | U.S. Dollar | 2,913,113 | Australian Dollar | 3,090,000 | 7/15/13 | (89,852 | ) | ||||||||||||||||||||
BNP Paribas | U.S. Dollar | 3,489,978 | Australian Dollar | 3,710,000 | 7/15/13 | (100,239 | ) | ||||||||||||||||||||
BNP Paribas | U.S. Dollar | 19,577,760 | Euro | 15,000,000 | 8/09/13 | (49,995 | ) | ||||||||||||||||||||
Citibank N.A. | Brazilian Real | 21,000,000 | U.S. Dollar | 9,478,245 | 7/02/13 | 66,902 | |||||||||||||||||||||
Citibank N.A. | Pound Sterling | 6,200,000 | U.S. Dollar | 9,695,250 | 8/19/13 | 268,368 | |||||||||||||||||||||
Citibank N.A. | South Korean Won | 6,600,000,000 | U.S. Dollar | 5,914,243 | 8/12/13 | 148,793 | |||||||||||||||||||||
Citibank N.A. | Swedish Krona | 19,700,000 | U.S. Dollar | 2,986,009 | 7/17/13 | 49,413 | |||||||||||||||||||||
Citibank N.A. | U.S. Dollar | 10,196,650 | Brazilian Real | 21,000,000 | 7/02/13 | (785,307 | ) | ||||||||||||||||||||
Citibank N.A. | U.S. Dollar | 9,572,428 | Pound Sterling | 6,200,000 | 8/19/13 | (145,546 | ) | ||||||||||||||||||||
Citibank N.A. | U.S. Dollar | 2,845,922 | Canadian Dollar | 3,000,000 | 8/30/13 | 2,621 | |||||||||||||||||||||
Credit Suisse | U.S. Dollar | 5,591,434 | Indian Rupee | 329,000,000 | 7/17/13 | (81,961 | ) | ||||||||||||||||||||
Credit Suisse | U.S. Dollar | 6,814,513 | Norwegian Krone | 40,100,000 | 8/05/13 | (220,638 | ) | ||||||||||||||||||||
Nuveen Investments
25
JGG
Nuveen Global Income Opportunities Fund (continued)
Portfolio of Investments June 30, 2013 (Unaudited)
Investments in Derivatives as of June 30, 2013 (continued)
Forward Foreign Currency Exchange Contracts outstanding (continued):
Counterparty | Currency Contracts to Deliver | Amount (Local Currency) | In Exchange For Currency | Amount (Local Currency) | Settlement Date | Unrealized Appreciation (Depreciation) (7) | |||||||||||||||||||||
JPMorgan | Indian Rupee | 697,000,000 | U.S. Dollar | 11,568,465 | 7/10/13 | $ | (130,124 | ) | |||||||||||||||||||
JPMorgan | Japanese Yen | 895,000,000 | U.S. Dollar | 9,506,521 | 7/16/13 | 482,056 | |||||||||||||||||||||
JPMorgan | Japanese Yen | 925,000,000 | U.S. Dollar | 9,764,017 | 7/16/13 | 437,056 | |||||||||||||||||||||
JPMorgan | Mexican Peso | 50,700,000 | U.S. Dollar | 4,167,866 | 7/08/13 | 257,147 | |||||||||||||||||||||
JPMorgan | Polish Zloty | 18,000,000 | U.S. Dollar | 5,608,656 | 7/12/13 | 194,791 | |||||||||||||||||||||
JPMorgan | South African Rand | 33,650,000 | U.S. Dollar | 3,396,485 | 7/10/13 | (3,682 | ) | ||||||||||||||||||||
JPMorgan | South African Rand | 33,650,000 | U.S. Dollar | 3,344,734 | 9/10/13 | (25,426 | ) | ||||||||||||||||||||
JPMorgan | U.S. Dollar | 2,029,462 | Mexican Peso | 26,000,000 | 7/08/13 | (23,965 | ) | ||||||||||||||||||||
JPMorgan | U.S. Dollar | 1,898,379 | Mexican Peso | 24,700,000 | 7/08/13 | 6,843 | |||||||||||||||||||||
JPMorgan | U.S. Dollar | 12,246,332 | Indian Rupee | 697,000,000 | 7/10/13 | (547,744 | ) | ||||||||||||||||||||
JPMorgan | U.S. Dollar | 3,374,019 | South African Rand | 33,650,000 | 7/10/13 | 26,148 | |||||||||||||||||||||
JPMorgan | U.S. Dollar | 5,708,306 | Polish Zloty | 18,000,000 | 7/12/13 | (294,441 | ) | ||||||||||||||||||||
JPMorgan | U.S. Dollar | 18,978,538 | Japanese Yen | 1,820,000,000 | 7/16/13 | (627,111 | ) | ||||||||||||||||||||
JPMorgan | U.S. Dollar | 11,488,380 | Indian Rupee | 697,000,000 | 8/14/13 | 98,475 | |||||||||||||||||||||
JPMorgan | U.S. Dollar | 3,911,412 | Turkish Lira | 7,400,000 | 8/16/13 | (101,558 | ) | ||||||||||||||||||||
JPMorgan | U.S. Dollar | 9,181,040 | New Zealand Dollar | 11,900,000 | 8/30/13 | 2,377 | |||||||||||||||||||||
Morgan Stanley | Pound Sterling | 9,688,000 | U.S. Dollar | 14,673,348 | 8/05/13 | (58,230 | ) | ||||||||||||||||||||
Morgan Stanley | U.S. Dollar | 9,790,016 | Pound Sterling | 6,400,000 | 8/05/13 | (58,173 | ) | ||||||||||||||||||||
Nomura International | Indian Rupee | 215,000,000 | U.S. Dollar | 3,571,429 | 7/05/13 | (43,046 | ) | ||||||||||||||||||||
Nomura International | Japanese Yen | 920,000,000 | U.S. Dollar | 9,661,755 | 7/17/13 | 385,175 | |||||||||||||||||||||
Nomura International | Singapore Dollar | 12,000,000 | U.S. Dollar | 9,685,480 | 7/15/13 | 217,774 | |||||||||||||||||||||
Nomura International | U.S. Dollar | 3,764,006 | Indian Rupee | 215,000,000 | 7/05/13 | (149,531 | ) | ||||||||||||||||||||
Nomura International | U.S. Dollar | 9,592,671 | Singapore Dollar | 12,000,000 | 7/15/13 | (124,965 | ) | ||||||||||||||||||||
Nomura International | U.S. Dollar | 9,455,759 | Japanese Yen | 920,000,000 | 7/17/13 | (179,180 | ) | ||||||||||||||||||||
Nomura International | U.S. Dollar | 3,549,026 | Indian Rupee | 215,000,000 | 8/05/13 | 30,886 | |||||||||||||||||||||
$ | (935,095 | ) | |||||||||||||||||||||||||
Credit Default Swaps outstanding:
Counterparty | Referenced Entity | Buy/Sell Protection (8) | Current Credit Spread (9) | Notional Amount | Fixed Rate (Annualized) | Termination Date | Value | Unrealized Appreciation (Depreciation) (7) | |||||||||||||||||||||||||||
JPMorgan | Markit CDX NA HY20 Index | Sell | 4.32 | % | $ | 2,000,000 | 5.000 | % | 6/20/18 | $ | 63,595 | $ | (13,405 | ) | |||||||||||||||||||||
$ | (13,405 | ) | |||||||||||||||||||||||||||||||||
Interest Rate Swaps outstanding:
Counterparty | Notional Amount | Fund Pay/Receive Floating Rate | Floating Rate Index | Fixed Rate (Annualized) | Fixed Rate Payment Frequency | Effective Date (10) | Termination Date | Unrealized Appreciation (Depreciation) (7) | |||||||||||||||||||||||||||
JPMorgan | $ | 22,469,000 | Receive | 1-Month USD-LIBOR-BBA | 1.255 | % | Monthly | 12/01/14 | 12/01/18 | $ | 713,765 | ||||||||||||||||||||||||
JPMorgan | 22,469,000 | Receive | 1-Month USD-LIBOR-BBA | 1.673 | Monthly | 12/01/14 | 12/01/20 | 1,182,278 | |||||||||||||||||||||||||||
JPMorgan | 2,000,000 | Receive | 3-Month USD-LIBOR-BBA | 2.078 | Semi-Annually | 2/19/13 | 2/19/23 | 84,121 | |||||||||||||||||||||||||||
Morgan Stanley | 11,000,000 | Receive | 3-Month USD-LIBOR-BBA | 2.095 | Semi-Annually | 3/19/13 | 3/19/23 | 474,419 | |||||||||||||||||||||||||||
Morgan Stanley | 3,000,000 | Receive | 3-Month USD-LIBOR-BBA | 2.055 | Semi-Annually | 3/22/13 | 3/22/23 | 141,123 | |||||||||||||||||||||||||||
$ | 60,938,000 | $ | 2,595,706 | ||||||||||||||||||||||||||||||||
Nuveen Investments
26
Futures Contracts outstanding:
Type | Contract Position | Number of Contracts | Contract Expiration | Notional Amount at Value (Local Currency) | Notional Amount at Value (Base Currency)* | Unrealized Appreciation (Depreciation) | |||||||||||||||||||||
German Euro Bund Futures | Long | 61 | 9/13 | 8,632,720 | EUR | $ | 11,236,775 | $ | (117,876 | ) | |||||||||||||||||
Long U.S. Treasury Bond | Short | (49 | ) | 9/13 | (6,656,344 | ) USD | (6,656,344 | ) | 212,569 | ||||||||||||||||||
UK Long GILT Bond | Long | 37 | 9/13 | 4,140,300 | GBP | 6,297,188 | (17,515 | ) | |||||||||||||||||||
Ultra Long U.S. Treasury Bond | Short | (26 | ) | 9/13 | (3,830,125 | ) USD | (3,830,125 | ) | 140,631 | ||||||||||||||||||
10-Year U.S. Treasury Note | Short | (46 | ) | 9/13 | (5,821,875 | ) USD | (5,821,875 | ) | (8,732 | ) | |||||||||||||||||
$ | 1,225,619 | $ | 209,077 | ||||||||||||||||||||||||
* Total Notional Amount at Value of Long and Short positions were $17,533,963 and $(16,308,344), respectively.
Call Options Purchased outstanding:
| Counterparty | Put Notional Amount | Call Notional Amount (11) | Expiration Date | Strike Price | Value (7) | ||||||||||||||||||
Credit Suisse | 12,000,000 | USD | 12,300,000,000 | KRW | 7/11/13 | 1,025 | KRW | $ | 12 | ||||||||||||||
Total Call Options Purchased (premiums paid $51,240) | $ | 12 | |||||||||||||||||||||
(1) All percentages shown in the Portfolio of Investments are based on net assets.
(2) Ratings: Using the highest of Standard & Poor's Group ("Standard & Poor's"), Moody's Investors Service, Inc. ("Moody's") or Fitch, Inc. ("Fitch") rating. Ratings below BBB by Standard & Poor's, Baa by Moody's or BBB by Fitch are considered to be below investment grade. Holdings designated N/R are not rated by any of these national rating agencies.
(3) Perpetual security. Maturity date is not applicable.
(4) Principal Amount (000) denominated in U.S. Dollars, unless otherwise noted.
(5) Investment valued at fair value using methods determined in good faith by, or at the discretion of, the Board of Trustees. For fair value measurement disclosure purposes, investment classified as Level 3. See Notes to Financial Statements, Footnote 2 — Investment Valuation and Fair Value Measurements for more information.
(6) Borrowings as a percentage of Total Investments is 31.5%.
(7) Other Assets Less Liabilities includes the Value or Unrealized Appreciation (Depreciation) of certain derivative instruments as listed within Investments in Derivatives as of the end of the reporting period.
(8) The Fund entered into the credit default swap to gain investment exposure to the referenced entity. Selling protection has a similar credit risk position to owning that referenced entity. Buying protection has a similar credit risk position to selling the referenced entity short.
(9) The credit spread generally serves as an indication of the current status of the payment/performance risk and therefore the likelihood of default of the credit derivative. The credit spread also reflects the cost of buying/selling protection and may include upfront payments required to be made to enter into a credit default swap contract. Higher credit spreads are indicative of a higher likelihood of performance by the seller of protection.
(10) Effective date represents the date on which both the Fund and Counterparty commence interest payment accruals on each swap contract.
(11) For disclosure purposes, Call Notional Amount is calculated by multiplying the Put Notional Amount by the Strike Price.
(12) The Fund segregates 100% of its eligible investments in the Portfolio of Investments as collateral for Borrowings.
N/A Not applicable.
TBA To be announced. Maturity date not known prior to settlement of this transaction.
MDR Denotes investment is subject to dollar roll transactions.
WI/DD Investment, or portion of investment, purchased on a when-issued or delayed delivery basis.
144A Investment is exempt from registration under Rule 144A of the Securities Act of 1933, as amended. These investments may only be resold in transactions exempt from registration, which are normally those transactions with qualified institutional buyers.
CAD Canadian Dollar
EUR Euro
GBP British Pound Sterling
KRW South Korean Won
MXN Mexican Peso
MYR Malaysian Ringgit
NOK Norwegian Krone
PLN Polish Zloty
SEK Swedish Krona
TRY Turkish Lira
USD United States Dollar
ZAR South African Rand
USD-LIBOR-BBA United States Dollar-London Inter-Bank Offered Rate.
See accompanying notes to financial statements.
Nuveen Investments
27
JGT
Nuveen Diversified Currency Opportunities Fund
Portfolio of Investments
June 30, 2013 (Unaudited)
| Principal Amount (000) | Description (1) | Coupon | Maturity | Ratings (2) | Value | ||||||||||||||||||
Corporate Bonds – 7.8% | |||||||||||||||||||||||
Commercial Banks – 0.8% | |||||||||||||||||||||||
$ | 3,000 | Export Import Bank of Korea | 1.250 | % | 11/20/15 | Aa3 | $ | 2,965,701 | |||||||||||||||
| 2,000 | VTB Capital SA, 144A | 6.875 | % | 5/29/18 | Baa1 | 2,120,000 | |||||||||||||||||
| 5,000 | Total Commercial Banks | 5,085,701 | |||||||||||||||||||||
Energy Equipment & Services – 0.3% | |||||||||||||||||||||||
| 2,000 | Transocean Inc. | 4.950 | % | 11/15/15 | BBB- | 2,145,182 | |||||||||||||||||
Metals & Mining – 0.8% | |||||||||||||||||||||||
| 2,000 | ArcelorMittal | 4.250 | % | 3/01/16 | BB+ | 2,010,000 | |||||||||||||||||
| 500 | Cliffs Natural Resources Inc. | 3.950 | % | 1/15/18 | BBB- | 477,704 | |||||||||||||||||
| 2,000 | Xstrata Finance Canada Limited, 144A | 5.800 | % | 11/15/16 | BBB | 2,181,710 | |||||||||||||||||
| 4,500 | Total Metals & Mining | 4,669,414 | |||||||||||||||||||||
Oil, Gas & Consumable Fuels – 5.2% | |||||||||||||||||||||||
| 1,000 | Athabasca Oil Corporation, 144A | 7.500 | % | 11/19/17 | B | 903,300 | |||||||||||||||||
| 3,000 | CNOOC Finance 2013 Limited | 1.125 | % | 5/09/16 | AA- | 2,951,400 | |||||||||||||||||
| 5,000 | CNPC General Capital Limited, 144A | 1.450 | % | 4/16/16 | A+ | 4,939,945 | |||||||||||||||||
| 3,000 | Gaz Capital SA, 144A | 8.125 | % | 7/31/14 | Baa1 | 3,186,900 | |||||||||||||||||
| 3,000 | Korea National Oil Corporation, 144A | 5.375 | % | 7/30/14 | A+ | 3,118,803 | |||||||||||||||||
| 3,000 | Lukoil International Finance BV, 144A | 3.416 | % | 4/24/18 | BBB | 2,917,500 | |||||||||||||||||
| 2,000 | Petrobras Global Finance BV | 2.000 | % | 5/20/16 | A3 | 1,958,472 | |||||||||||||||||
| 2,000 | Petrohawk Energy Corporation | 7.250 | % | 8/15/18 | A | 2,182,000 | |||||||||||||||||
| 5,000 | Petroleos Mexicanos | 4.875 | % | 3/15/15 | Baa1 | 5,256,250 | |||||||||||||||||
| 2,000 | Rosneft Oil Corporation, 144A | 3.149 | % | 3/06/17 | Baa1 | 1,970,000 | |||||||||||||||||
| 3,000 | Sinopec Capital 2013 Limited, 144A | 1.250 | % | 4/24/16 | Aa3 | 2,967,822 | |||||||||||||||||
| 32,000 | Total Oil, Gas & Consumable Fuels | 32,352,392 | |||||||||||||||||||||
Wireless Telecommunication Services – 0.7% | |||||||||||||||||||||||
| 4,000 | Telefonica Emisiones SAU | 3.992 | % | 2/16/16 | BBB+ | 4,125,216 | |||||||||||||||||
$ | 47,500 | Total Corporate Bonds (cost $49,193,676) | 48,377,905 | ||||||||||||||||||||
| Principal Amount (000) (3) | Description (1) | Coupon | Maturity | Ratings (2) | Value | ||||||||||||||||||
Sovereign Debt – 61.0% | |||||||||||||||||||||||
Argentina – 0.8% | |||||||||||||||||||||||
| 5,500 | Republic of Argentina | 7.000 | % | 10/03/15 | B- | $ | 4,771,250 | ||||||||||||||||
Brazil – 8.3% | |||||||||||||||||||||||
| 67,100 | BRL | Letra De Tesouro Nacional de Brazil | 0.000 | % | 7/01/14 | A- | 27,463,322 | ||||||||||||||||
| 61,250 | BRL | Letra De Tesouro Nacional de Brazil | 0.000 | % | 1/01/15 | A- | 23,775,738 | ||||||||||||||||
| 128,350 | BRL | Total Brazil | 51,239,060 | ||||||||||||||||||||
Nuveen Investments
28
| Principal Amount (000) (3) | Description (1) | Coupon | Maturity | Ratings (2) | Value | ||||||||||||||||||
Canada – 8.4% | |||||||||||||||||||||||
| 11,000 | CAD | Canadian Government Bond, (4) | 2.000 | % | 8/01/13 | N/R | $ | 10,468,147 | |||||||||||||||
| 16,000 | CAD | Province of Ontario Municipal Bond | 3.250 | % | 9/08/14 | Aa2 | 15,557,897 | ||||||||||||||||
| 10,000 | CAD | Province of Ontario Municipal Bond | 3.150 | % | 9/08/15 | Aa2 | 9,840,829 | ||||||||||||||||
| 16,000 | CAD | Quebec Province Municipal Bond | 5.500 | % | 12/01/14 | Aa2 | 16,094,323 | ||||||||||||||||
| 53,000 | CAD | Total Canada | 51,961,196 | ||||||||||||||||||||
Colombia – 1.9% | |||||||||||||||||||||||
| 5,500 | Republic of Colombia | 8.250 | % | 12/22/14 | BBB | 5,995,000 | |||||||||||||||||
| 9,948,000 | COP | Republic of Colombia | 12.000 | % | 10/22/15 | BBB | 5,945,448 | ||||||||||||||||
Total Colombia | 11,940,448 | ||||||||||||||||||||||
Hungary – 0.2% | |||||||||||||||||||||||
| 1,500 | Republic of Hungary, Government Bond | 4.125 | % | 2/19/18 | Ba1 | 1,458,750 | |||||||||||||||||
Indonesia – 1.4% | |||||||||||||||||||||||
| 8,000 | Republic of Indonesia, 144A | 7.250 | % | 4/20/15 | Baa3 | 8,640,000 | |||||||||||||||||
Ireland – 1.2% | |||||||||||||||||||||||
| 2,000 | EUR | Irish Republic Treasury Bond | 4.600 | % | 4/18/16 | BBB+ | 2,788,508 | ||||||||||||||||
| 3,400 | EUR | Irish Republic Treasury Bond | 5.500 | % | 10/18/17 | BBB+ | 4,892,510 | ||||||||||||||||
| 5,400 | EUR | Total Ireland | 7,681,018 | ||||||||||||||||||||
Italy – 3.9% | |||||||||||||||||||||||
| 8,000 | EUR | Buoni Poliennali del Tesoro, Italian Treasury Bond | 2.500 | % | 3/01/15 | BBB+ | 10,506,914 | ||||||||||||||||
| 5,000 | EUR | Buoni Poliennali del Tesoro, Italian Treasury Bond | 3.000 | % | 4/15/15 | BBB+ | 6,613,811 | ||||||||||||||||
| 5,000 | EUR | Buoni Poliennali del Tesoro, Italian Treasury Bond | 4.750 | % | 9/15/16 | BBB+ | 6,893,535 | ||||||||||||||||
| 18,000 | EUR | Total Italy | 24,014,260 | ||||||||||||||||||||
Malaysia – 4.3% | |||||||||||||||||||||||
| 85,000 | MYR | Republic of Malaysia | 3.197 | % | 10/15/15 | A | 26,840,226 | ||||||||||||||||
Mexico – 11.8% | |||||||||||||||||||||||
| 200,000 | MXN | Mexico Bonos de DeSarrollo | 7.000 | % | 6/19/14 | A- | 15,865,190 | ||||||||||||||||
| 166,000 | MXN | Mexico Bonos de DeSarrollo | 8.000 | % | 12/17/15 | A- | 13,853,735 | ||||||||||||||||
| 155,500 | MXN | Mexico Bonos de DeSarrollo | 7.250 | % | 12/15/16 | A- | 12,934,350 | ||||||||||||||||
| 175,000 | MXN | United Mexican States | 8.000 | % | 12/19/13 | A- | 13,753,831 | ||||||||||||||||
| 200,500 | MXN | United Mexican States | 9.500 | % | 12/18/14 | A- | 16,628,187 | ||||||||||||||||
| 897,000 | MXN | Total Mexico | 73,035,293 | ||||||||||||||||||||
Norway – 1.7% | |||||||||||||||||||||||
| 60,000 | NOK | Norwegian Government Bond | 5.000 | % | 5/15/15 | AAA | 10,520,632 | ||||||||||||||||
Peru – 2.2% | |||||||||||||||||||||||
| 25,000 | PEN | Republic of Peru Treasury Bond | 8.600 | % | 8/12/17 | BBB+ | 10,478,972 | ||||||||||||||||
| 1,146 | Republic of Peru | 9.875 | % | 2/06/15 | BBB | 1,294,980 | |||||||||||||||||
| 1,500 | Republic of Peru | 8.375 | % | 5/03/16 | BBB | 1,744,500 | |||||||||||||||||
Total Peru | 13,518,452 | ||||||||||||||||||||||
Poland – 0.9% | |||||||||||||||||||||||
| 5,500 | Republic of Poland | 3.875 | % | 7/16/15 | A2 | 5,750,965 | |||||||||||||||||
Portugal – 0.3% | |||||||||||||||||||||||
| 1,300 | EUR | Portugal Obrigacoes do Tesouro | 5.650 | % | 2/15/24 | Ba3 | 1,573,863 | ||||||||||||||||
Russian – 1.3% | |||||||||||||||||||||||
| 8,000 | Russian Federation, 144A | 3.625 | % | 4/29/15 | Baa1 | 8,280,000 | |||||||||||||||||
Nuveen Investments
29
JGT
Nuveen Diversified Currency Opportunities Fund (continued)
Portfolio of Investments June 30, 2013 (Unaudited)
| Principal Amount (000) (3) | Description (1) | Coupon | Maturity | Ratings (2) | Value | ||||||||||||||||||
South Africa – 3.7% | |||||||||||||||||||||||
5,500 | Republic of South Africa | 6.500 | % | 6/02/14 | Baa1 | $ | 5,728,250 | ||||||||||||||||
160,000 | ZAR | Republic of South Africa | 8.000 | % | 12/21/18 | A- | 16,865,550 | ||||||||||||||||
Total South Africa | 22,593,800 | ||||||||||||||||||||||
Spain – 3.8% | |||||||||||||||||||||||
10,000 | EUR | Spain Government Bonds, Bonos y Obligado Del Esatado | 3.300 | % | 10/31/14 | BBB | 13,232,568 | ||||||||||||||||
5,000 | EUR | Spain Government Bonds, Bonos y Obligado Del Esatado | 4.250 | % | 10/31/16 | BBB | 6,731,350 | ||||||||||||||||
2,800 | EUR | Spain Government Bonds, Bonos y Obligado Del Esatado | 4.500 | % | 1/31/18 | BBB | 3,780,016 | ||||||||||||||||
17,800 | EUR | Total Spain | 23,743,934 | ||||||||||||||||||||
Turkey – 3.9% | |||||||||||||||||||||||
17,250 | TRY | Republic of Turkey, Government Bond | 0.000 | % | 4/09/14 | N/R | 8,452,205 | ||||||||||||||||
30,500 | TRY | Republic of Turkey, Government Bond | 6.500 | % | 1/07/15 | N/R | 15,544,927 | ||||||||||||||||
47,750 | TRY | Total Turkey | 23,997,132 | ||||||||||||||||||||
Ukraine – 1.0% | |||||||||||||||||||||||
6,500 | Republic of Ukraine, 144A | 6.875 | % | 9/23/15 | B | 6,370,000 | |||||||||||||||||
Total Sovereign Debt (cost $400,390,441) | 377,930,279 | ||||||||||||||||||||||
| Principal Amount (000) | Description (1) | Coupon | Maturity | Ratings (2) | Value | ||||||||||||||||||
Asset-Backed and Mortgage-Backed Securities – 3.2% | |||||||||||||||||||||||
$ | 2,700 | Bayview Opportunity Master Fund Trust, 2013-8NPL | 3.228 | % | 3/28/33 | N/R | $ | 2,691,619 | |||||||||||||||
3,855 | Countrywide Asset Backed Certificates, Series 2007-4 A2 | 5.530 | % | 4/25/47 | Caa1 | 3,591,834 | |||||||||||||||||
6,000 | Goldman Sachs Mortgage Securities Corporation II, Commercial Mortgage Pass-Through Certificates, Series 2007-GG10 | 5.799 | % | 8/10/45 | A | 6,686,148 | |||||||||||||||||
1,000 | Nationstar Mortgage Advance Receivables Trust 2013-T1A | 3.721 | % | 6/20/44 | BB | 998,930 | |||||||||||||||||
2,791 | Stanwich Mortgage Loan Trust, Series 2012-NPL5 | 2.981 | % | 10/18/42 | N/R | 2,795,576 | |||||||||||||||||
3,050 | Wedgewood Real Estate Trust, Mortgage Pool 2013-1A, (5) | 5.000 | % | 7/25/43 | N/R | 3,045,711 | |||||||||||||||||
$ | 19,396 | Total Asset-Backed and Mortgage-Backed Securities (cost $20,133,286) | 19,809,818 | ||||||||||||||||||||
| Principal Amount (000) (3) | Description (1) | Coupon | Maturity | Ratings (2) | Value | ||||||||||||||||||
Short-Term Investments – 27.1% | |||||||||||||||||||||||
Sovereign Debt – 10.8% | |||||||||||||||||||||||
Brazil – 4.5% | |||||||||||||||||||||||
65,500 | BRL | Letra De Tesouro Nacional de Brazil | 0.000 | % | 1/01/14 | A- | $ | 28,071,961 | |||||||||||||||
Canada – 1.6% | |||||||||||||||||||||||
10,000 | CAD | Quebec Province Municipal Bond | 5.250 | % | 10/01/13 | Aa2 | 9,603,499 | ||||||||||||||||
Philipines – 0.5% | |||||||||||||||||||||||
3,000 | Republic of the Philippines | 8.250 | % | 1/15/14 | BBB- | 3,090,000 | |||||||||||||||||
South Africa – 0.8% | |||||||||||||||||||||||
47,000 | ZAR | Republic of South Africa | 7.500 | % | 1/15/14 | A- | 4,807,146 | ||||||||||||||||
South Korea – 2.4% | |||||||||||||||||||||||
17,000,000 | KRW | Korea Monetary Stability Bond | 2.780 | % | 11/09/13 | N/R | 14,893,715 | ||||||||||||||||
Turkey – 1.0% | |||||||||||||||||||||||
12,500 | TRY | Republic of Turkey, Government Bond | 0.000 | % | 7/17/13 | N/R | 6,461,347 | ||||||||||||||||
Total Sovereign Debt | 66,927,668 | ||||||||||||||||||||||
Nuveen Investments
30
| Principal Amount (000) | Description (1) | Coupon | Maturity | Ratings (2) | Value | ||||||||||||||||||
U.S. Government and Agency Obligations – 13.5% | |||||||||||||||||||||||
$ | 3,494 | Fannie Mae Mortgage Pool AB9659 | 3.000 | % | 6/01/43 | Aaa | $ | 3,418,917 | |||||||||||||||
35,000 | Federal Home Loan Bank Bonds | 0.100 | % | 11/20/13 | Aaa | 34,994,610 | |||||||||||||||||
25,000 | Federal Home Loan Mortgage Corporation, Notes | 0.145 | % | 3/27/14 | Aaa | 24,988,000 | |||||||||||||||||
20,000 | Federal National Mortgage Association | 1.250 | % | 2/27/14 | Aaa | 20,150,680 | |||||||||||||||||
83,494 | Total U.S. Government and Agency Obligations | 83,552,207 | |||||||||||||||||||||
Repurchase Agreements – 2.8% | |||||||||||||||||||||||
| 17,768 | Repurchase Agreement with State Street Bank, dated 6/28/13, repurchase price $17,768,356, collateralized by $18,125,000 U.S. Treasury Notes, 0.875%, due 2/28/17, value $18,124,329 | 0.010 | % | 7/01/13 | N/A | 17,768,341 | |||||||||||||||||
Total Short-Term Investments (cost $173,645,152) | 168,248,216 | ||||||||||||||||||||||
Total Investments (cost $643,362,555) – 99.1% | 614,366,218 | ||||||||||||||||||||||
Other Assets Less Liabilities – 0.9% (6) | 5,721,820 | ||||||||||||||||||||||
Net Assets – 100% | $ | 620,088,038 | |||||||||||||||||||||
Investments in Derivatives as of June 30, 2013
Forward Foreign Currency Exchange Contracts outstanding:
Counterparty | Currency Contracts to Deliver | Amount (Local Currency) | In Exchange For Currency | Amount (Local Currency) | Settlement Date | Unrealized Appreciation (Depreciation) (6) | |||||||||||||||||||||
Bank of America | Australian Dollar | 38,800,000 | U.S. Dollar | 36,743,018 | 7/15/13 | $ | 1,292,369 | ||||||||||||||||||||
Bank of America | Brazilian Real | 69,000,000 | U.S. Dollar | 31,163,904 | 7/02/13 | 240,920 | |||||||||||||||||||||
Bank of America | U.S. Dollar | 31,142,806 | Brazilian Real | 69,000,000 | 7/02/13 | (219,822 | ) | ||||||||||||||||||||
Bank of America | U.S. Dollar | 3,953,349 | Australian Dollar | 3,800,000 | 7/15/13 | (481,378 | ) | ||||||||||||||||||||
Bank of America | U.S. Dollar | 35,425,075 | Australian Dollar | 35,000,000 | 7/15/13 | (3,446,396 | ) | ||||||||||||||||||||
Bank of America | U.S. Dollar | 30,979,213 | Brazilian Real | 69,000,000 | 8/02/13 | (272,286 | ) | ||||||||||||||||||||
Barclays | Chilean Peso | 9,500,000,000 | U.S. Dollar | 19,949,601 | 7/03/13 | 1,253,966 | |||||||||||||||||||||
Barclays | Malaysian Ringgit | 81,000,000 | U.S. Dollar | 26,133,247 | 8/06/13 | 687,405 | |||||||||||||||||||||
Barclays | Polish Zloty | 93,000,000 | U.S. Dollar | 29,059,776 | 7/12/13 | 1,088,141 | |||||||||||||||||||||
Barclays | U.S. Dollar | 4,183,973 | Chilean Peso | 2,065,000,000 | 7/03/13 | (120,133 | ) | ||||||||||||||||||||
Barclays | U.S. Dollar | 7,738,527 | Chilean Peso | 3,735,000,000 | 7/03/13 | (388,190 | ) | ||||||||||||||||||||
Barclays | U.S. Dollar | 7,705,925 | Chilean Peso | 3,700,000,000 | 7/03/13 | (424,467 | ) | ||||||||||||||||||||
Barclays | U.S. Dollar | 29,507,885 | Polish Zloty | 93,000,000 | 7/12/13 | (1,536,250 | ) | ||||||||||||||||||||
Barclays | U.S. Dollar | 37,931,820 | New Zealand Dollar | 47,000,000 | 7/17/13 | (1,548,336 | ) | ||||||||||||||||||||
BNP Paribas | Australian Dollar | 40,000,000 | U.S. Dollar | 37,887,600 | 7/15/13 | 1,340,539 | |||||||||||||||||||||
BNP Paribas | Euro | 25,000,000 | U.S. Dollar | 33,261,250 | 8/09/13 | 714,975 | |||||||||||||||||||||
BNP Paribas | Euro | 24,250,000 | U.S. Dollar | 32,210,063 | 8/09/13 | 640,176 | |||||||||||||||||||||
BNP Paribas | U.S. Dollar | 39,821,520 | Australian Dollar | 40,000,000 | 7/15/13 | (3,274,459 | ) | ||||||||||||||||||||
BNP Paribas | U.S. Dollar | 21,106,850 | New Zealand Dollar | 25,000,000 | 7/15/13 | (1,751,158 | ) | ||||||||||||||||||||
BNP Paribas | U.S. Dollar | 4,300,299 | Euro | 3,300,000 | 8/09/13 | (4,191 | ) | ||||||||||||||||||||
BNP Paribas | U.S. Dollar | 32,629,600 | Euro | 25,000,000 | 8/09/13 | (83,325 | ) | ||||||||||||||||||||
Citibank N.A. | Australian Dollar | 49,500,000 | U.S. Dollar | 47,763,639 | 7/15/13 | 2,536,651 | |||||||||||||||||||||
Citibank N.A. | Brazilian Real | 69,000,000 | U.S. Dollar | 31,142,806 | 7/02/13 | 219,822 | |||||||||||||||||||||
Citibank N.A. | Canadian Dollar | 28,000,000 | U.S. Dollar | 26,561,937 | 8/30/13 | (24,464 | ) | ||||||||||||||||||||
Citibank N.A. | Euro | 23,210,000 | U.S. Dollar | 30,406,585 | 8/30/13 | 187,729 | |||||||||||||||||||||
Citibank N.A. | Pound Sterling | 21,000,000 | U.S. Dollar | 32,838,750 | 8/19/13 | 908,988 | |||||||||||||||||||||
Citibank N.A. | U.S. Dollar | 33,503,277 | Brazilian Real | 69,000,000 | 7/02/13 | (2,580,294 | ) | ||||||||||||||||||||
Citibank N.A. | U.S. Dollar | 60,260,655 | Australian Dollar | 60,050,000 | 7/15/13 | (5,394,380 | ) | ||||||||||||||||||||
Citibank N.A. | U.S. Dollar | 32,422,740 | Pound Sterling | 21,000,000 | 8/19/13 | (492,978 | ) | ||||||||||||||||||||
Nuveen Investments
31
JGT
Nuveen Diversified Currency Opportunities Fund (continued)
Portfolio of Investments June 30, 2013 (Unaudited)
Investments in Derivatives as of June 30, 2013 (continued)
Forward Foreign Currency Exchange Contracts outstanding (continued):
Counterparty | Currency Contracts to Deliver | Amount (Local Currency) | In Exchange For Currency | Amount (Local Currency) | Settlement Date | Unrealized Appreciation (Depreciation) (6) | |||||||||||||||||||||
Credit Suisse | U.S. Dollar | 6,220,498 | Peruvian Nouveau Sol | 17,000,000 | 7/12/13 | $ | (115,591 | ) | |||||||||||||||||||
Credit Suisse | U.S. Dollar | 22,858,600 | Indian Rupee | 1,345,000,000 | 7/17/13 | (335,067 | ) | ||||||||||||||||||||
Credit Suisse | U.S. Dollar | 53,053,955 | Norwegian Krone | 312,196,000 | 8/05/13 | (1,717,763 | ) | ||||||||||||||||||||
Deutsche Bank AG | U.S. Dollar | 29,814,822 | Mexican Peso | 384,000,000 | 8/05/13 | (268,736 | ) | ||||||||||||||||||||
Goldman Sachs | Australian Dollar | 34,000,000 | U.S. Dollar | 32,454,190 | 7/15/13 | 1,389,188 | |||||||||||||||||||||
Goldman Sachs | U.S. Dollar | 34,547,740 | Australian Dollar | 34,000,000 | 7/15/13 | (3,482,738 | ) | ||||||||||||||||||||
HSBC | U.S. Dollar | 31,797,337 | Turkish Lira | 60,600,000 | 7/12/13 | (430,301 | ) | ||||||||||||||||||||
JPMorgan | Euro | 24,000,000 | U.S. Dollar | 31,278,000 | 8/02/13 | 34,573 | |||||||||||||||||||||
JPMorgan | Indian Rupee | 5,782,000,000 | U.S. Dollar | 95,966,805 | 7/10/13 | (1,079,446 | ) | ||||||||||||||||||||
JPMorgan | Mexican Peso | 248,000,000 | U.S. Dollar | 19,060,648 | 7/08/13 | (68,705 | ) | ||||||||||||||||||||
JPMorgan | Polish Zloty | 87,000,000 | U.S. Dollar | 27,108,504 | 7/12/13 | 941,491 | |||||||||||||||||||||
JPMorgan | South African Rand | 117,000,000 | U.S. Dollar | 11,731,360 | 7/10/13 | (90,914 | ) | ||||||||||||||||||||
JPMorgan | South African Rand | 128,000,000 | U.S. Dollar | 12,704,399 | 7/10/13 | (229,371 | ) | ||||||||||||||||||||
JPMorgan | South Korean Won | 17,200,000,000 | U.S. Dollar | 15,205,092 | 8/09/13 | 178,008 | |||||||||||||||||||||
JPMorgan | U.S. Dollar | 19,357,942 | Mexican Peso | 248,000,000 | 7/08/13 | (228,589 | ) | ||||||||||||||||||||
JPMorgan | U.S. Dollar | 101,590,090 | Indian Rupee | 5,782,000,000 | 7/10/13 | (4,543,839 | ) | ||||||||||||||||||||
JPMorgan | U.S. Dollar | 24,729,240 | South African Rand | 245,000,000 | 7/10/13 | 26,805 | |||||||||||||||||||||
JPMorgan | U.S. Dollar | 27,590,144 | Polish Zloty | 87,000,000 | 7/12/13 | (1,423,131 | ) | ||||||||||||||||||||
JPMorgan | U.S. Dollar | 95,302,456 | Indian Rupee | 5,782,000,000 | 8/14/13 | 816,904 | |||||||||||||||||||||
JPMorgan | U.S. Dollar | 26,957,027 | Turkish Lira | 51,000,000 | 8/16/13 | (699,928 | ) | ||||||||||||||||||||
JPMorgan | U.S. Dollar | 18,516,384 | New Zealand Dollar | 24,000,000 | 8/30/13 | 4,793 | |||||||||||||||||||||
JPMorgan | U.S. Dollar | 18,954,397 | Mexican Peso | 248,000,000 | 9/09/13 | 68,633 | |||||||||||||||||||||
JPMorgan | U.S. Dollar | 11,629,537 | South African Rand | 117,000,000 | 9/10/13 | 88,406 | |||||||||||||||||||||
Morgan Stanley | U.S. Dollar | 43,835,301 | Mexican Peso | 588,467,000 | 8/30/13 | 1,343,271 | |||||||||||||||||||||
Nomura International | Indian Rupee | 1,133,000,000 | U.S. Dollar | 18,820,598 | 7/05/13 | (226,840 | ) | ||||||||||||||||||||
Nomura International | Japanese Yen | 3,100,000,000 | U.S. Dollar | 32,555,912 | 7/17/13 | 1,297,872 | |||||||||||||||||||||
Nomura International | U.S. Dollar | 19,835,434 | Indian Rupee | 1,133,000,000 | 7/05/13 | (787,996 | ) | ||||||||||||||||||||
Nomura International | U.S. Dollar | 31,861,798 | Japanese Yen | 3,100,000,000 | 7/17/13 | (603,758 | ) | ||||||||||||||||||||
Nomura International | U.S. Dollar | 18,702,542 | Indian Rupee | 1,133,000,000 | 8/05/13 | 162,761 | |||||||||||||||||||||
RBC | U.S. Dollar | 8,978,150 | Turkish Lira | 17,054,040 | 7/12/13 | (150,845 | ) | ||||||||||||||||||||
$ | (21,061,679 | ) | |||||||||||||||||||||||||
Futures Contracts outstanding:
| Type | Contract Position | Number of Contracts | Contract Expiration | Notional Amount at Value | Unrealized Appreciation (Depreciation) | ||||||||||||||||||
2-Year U.S. Treasury Note | Short | (50 | ) | 9/13 | $ | (11,000,000 | ) | $ | 1,759 | ||||||||||||||
5-Year U.S. Treasury Note | Short | (283 | ) | 9/13 | (34,256,266 | ) | 428,154 | ||||||||||||||||
10-Year U.S. Treasury Note | Short | (51 | ) | 9/13 | (6,454,687 | ) | 131,285 | ||||||||||||||||
$ | (51,710,953 | ) | $ | 561,198 | |||||||||||||||||||
Call Options Purchased outstanding:
| Counterparty | Put Notional Amount | Call Notional Amount (7) | Expiration Date | Strike Price | Value (6) | ||||||||||||||||||
Credit Suisse | 70,000,000 | USD | 71,750,000,000 | KRW | 7/11/13 | 1,025 | KRW | $ | 70 | ||||||||||||||
Total Call Options Purchased (premiums paid $298,900) | $ | 70 | |||||||||||||||||||||
Nuveen Investments
32
(1) All percentages shown in the Portfolio of Investments are based on net assets.
(2) Ratings: Using the highest of Standard & Poor's Group ("Standard & Poor's"), Moody's Investors Service, Inc. ("Moody's") or Fitch, Inc. ("Fitch") rating. Ratings below BBB by Standard & Poor's, Baa by Moody's or BBB by Fitch are considered to be below investment grade. Holdings designated N/R are not rated by any of these national rating agencies.
(3) Principal Amount (000) denominated in U.S. Dollars, unless otherwise noted.
(4) Investment, or portion of investment, has been pledged to collateralize the net payment obligations for investments in derivatives.
(5) Investment valued at fair value using methods determined in good faith by, or at the discretion of, the Board of Trustees. For fair value measurement disclosure purposes, investment classified as Level 3. See Notes to Financial Statements, Footnote 2 — Investment Valuation and Fair Value Measurements for more information.
(6) Other Assets Less Liabilities includes the Value and/or Unrealized Appreciation (Depreciation) of derivative instruments as listed within Investments in Derivatives as of the end of the reporting period.
(7) For disclosure purposes, Call Notional Amount is calculated by multiplying the Put Notional Amount by the Strike Price.
N/A Not applicable.
144A Investment is exempt from registration under Rule 144A of the Securities Act of 1933, as amended. These investments may only be resold in transactions exempt from registration, which are normally those transactions with qualified institutional buyers.
BRL Brazilian Real
CAD Canadian Dollar
COP Colombian Peso
EUR Euro
KRW South Korean Won
MXN Mexican Peso
MYR Malaysian Ringgit
NOK Norwegian Krone
PEN Peruvian Nuevo Sol
TRY Turkish Lira
USD United States Dollar
ZAR South African Rand
See accompanying notes to financial statements.
Nuveen Investments
33
Statement of
ASSETS & LIABILITIES
June 30, 2013 (Unaudited)
| Global Income Opportunities (JGG) | Diversified Currency Opportunities (JGT) | ||||||||||
Assets | |||||||||||
Long-term investments, at value (cost $200,393,283 and $469,717,403, respectively) | $ | 187,939,192 | $ | 446,118,002 | |||||||
Short-term investments, at value (cost $5,862,110 and $173,645,152, respectively) | 5,862,110 | 168,248,216 | |||||||||
Options purchased, at value (premiums paid $51,240 and $298,900, respectively) | 12 | 70 | |||||||||
Cash denominated in foreign currencies (cost $201,021 and $6,528,075, respectively) | 196,387 | 6,402,987 | |||||||||
Deposits with brokers | 840,000 | 28,850,001 | |||||||||
Credit default swaps premiums paid | 77,000 | — | |||||||||
Unrealized appreciation on: | |||||||||||
Forward foreign currency exchange contracts | 4,558,987 | 17,464,386 | |||||||||
Interest rate swaps, net | 2,595,706 | — | |||||||||
Receivables: | |||||||||||
Dividends | 20,299 | — | |||||||||
Due from broker (net of amounts uncollectible of $135,899 and $—, respectively) | 884,014 | 150,747 | |||||||||
Interest | 2,452,956 | 4,669,624 | |||||||||
Variation margin on futures contracts | 4,990 | 3,984 | |||||||||
Reclaims | 9,656 | 3,143 | |||||||||
Other assets | 26,949 | 57,667 | |||||||||
Total assets | 205,468,258 | 671,968,827 | |||||||||
Liabilities | |||||||||||
Cash overdraft | 306,185 | — | |||||||||
Borrowings | 61,000,000 | — | |||||||||
Unrealized depreciation on: | |||||||||||
Credit default swaps | 13,405 | — | |||||||||
Forward foreign currency exchange contracts | 5,494,082 | 38,526,065 | |||||||||
Payables: | |||||||||||
Dividends | 2,357,768 | 12,186,989 | |||||||||
Investments purchased | 7,204,814 | — | |||||||||
Reorganization expenses | — | 330,000 | |||||||||
Variation margin on futures contracts | 66,862 | 8,484 | |||||||||
Accrued expenses: | |||||||||||
Interest on borrowings | 72,986 | — | |||||||||
Management fees | 138,268 | 451,660 | |||||||||
Trustees fees | 1,076 | 44,346 | |||||||||
Other | 96,057 | 333,245 | |||||||||
Total liabilities | 76,751,503 | 51,880,789 | |||||||||
Net assets | $ | 128,716,755 | $ | 620,088,038 | |||||||
Shares outstanding | 9,359,018 | 47,780,442 | |||||||||
Net asset value per share outstanding | $ | 13.75 | $ | 12.98 | |||||||
Net assets consist of: | |||||||||||
Shares, ($.01) par value per share | $ | 93,590 | $ | 477,804 | |||||||
Paid-in surplus | 144,008,330 | 705,732,330 | |||||||||
Undistributed (Over-distribution of) net investment income | (4,071,684 | ) | (19,086,699 | ) | |||||||
Accumulated net realized gain (loss) | (640,016 | ) | (17,015,997 | ) | |||||||
Net unrealized appreciation (depreciation) | (10,673,465 | ) | (50,019,400 | ) | |||||||
Net assets | $ | 128,716,755 | $ | 620,088,038 | |||||||
Authorized shares | Unlimited | Unlimited | |||||||||
See accompanying notes to financial statements.
Nuveen Investments
34
Statement of
OPERATIONS
Six Months Ended June 30, 2013 (Unaudited)
| Global Income Opportunities (JGG) | Diversified Currency Opportunities (JGT) | ||||||||||
| Investment Income (net of foreign tax withheld of $2,680 and $54,406, respectively) | $ | 4,670,407 | $ | 10,648,666 | |||||||
Expenses | |||||||||||
Management fees | 873,238 | 2,936,074 | |||||||||
Interest expense on borrowings | 379,076 | — | |||||||||
Shareholder servicing agent fees and expenses | 136 | 212 | |||||||||
Custodian fees and expenses | 82,021 | 212,206 | |||||||||
Trustees fees and expenses | 2,474 | 8,164 | |||||||||
Professional fees | 35,693 | 47,303 | |||||||||
Shareholder reporting expenses | 18,704 | 84,570 | |||||||||
Stock exchange listing fees | 4,258 | 16,449 | |||||||||
Investor relations expense | 23,154 | 44,320 | |||||||||
Other expenses | 9,320 | 3,732 | |||||||||
Total expenses | 1,428,074 | 3,353,030 | |||||||||
Net investment income (loss) | 3,242,333 | 7,295,636 | |||||||||
Realized and Unrealized Gain (Loss) | |||||||||||
Net realized gain (loss) from: | |||||||||||
Investments and foreign currency | 417,249 | (1,223,679 | ) | ||||||||
Forward foreign currency exchange contracts | (1,692,345 | ) | (7,681,292 | ) | |||||||
Futures contracts | 195,035 | 285,082 | |||||||||
Options purchased | (102,813 | ) | (651,187 | ) | |||||||
Options written | 29,625 | 612,250 | |||||||||
Swaps | 1,059,735 | — | |||||||||
Change in net unrealized appreciation (depreciation) of: | |||||||||||
Investments and foreign currency | (14,239,525 | ) | (27,685,459 | ) | |||||||
Forward foreign currency exchange contracts | (1,463,802 | ) | (26,522,774 | ) | |||||||
Futures contracts | (47,700 | ) | 561,198 | ||||||||
Options purchased | (51,228 | ) | (298,830 | ) | |||||||
Swaps | 2,291,059 | — | |||||||||
Net realized and unrealized gain (loss) | (13,604,710 | ) | (62,604,691 | ) | |||||||
Net increase (decrease) in net assets from operations | $ | (10,362,377 | ) | $ | (55,309,055 | ) | |||||
See accompanying notes to financial statements.
Nuveen Investments
35
Statement of
CHANGES in NET ASSETS (Unaudited)
| Global Income Opportunities (JGG) | Diversified Currency Opportunities (JGT) | ||||||||||||||||||
| Six Months Ended 6/30/13 | Year Ended 12/31/12 | Six Months Ended 6/30/13 | Year Ended 12/31/12 | ||||||||||||||||
Operations | |||||||||||||||||||
Net investment income (loss) | $ | 3,242,333 | $ | 2,133,034 | $ | 7,295,636 | $ | 10,512,060 | |||||||||||
Net realized gain (loss) from: | |||||||||||||||||||
Investments and foreign currency | 417,249 | 3,052,339 | (1,223,679 | ) | (2,617,593 | ) | |||||||||||||
Forward foreign currency exchange contracts | (1,692,345 | ) | 2,546,152 | (7,681,292 | ) | 51,995,401 | |||||||||||||
Futures contracts | 195,035 | 283,574 | 285,082 | — | |||||||||||||||
Options purchased | (102,813 | ) | (28,100 | ) | (651,187 | ) | (1,180,825 | ) | |||||||||||
Options written | 29,625 | 8,200 | 612,250 | 830,850 | |||||||||||||||
Swaps | 1,059,735 | 4,591,954 | — | — | |||||||||||||||
Change in net unrealized appreciation (depreciation) of: | |||||||||||||||||||
Investments and foreign currency | (14,239,525 | ) | 2,305,944 | (27,685,459 | ) | 11,052,644 | |||||||||||||
Forward foreign currency exchange contracts | (1,463,802 | ) | 465,856 | (26,522,774 | ) | 10,892,907 | |||||||||||||
Futures contracts | (47,700 | ) | 161,500 | 561,198 | — | ||||||||||||||
Options purchased | (51,228 | ) | — | (298,830 | ) | 95,650 | |||||||||||||
Options written | — | — | — | (203,850 | ) | ||||||||||||||
Swaps | 2,291,059 | (4,745,821 | ) | — | — | ||||||||||||||
Net increase (decrease) in net assets from operations | (10,362,377 | ) | 10,774,632 | (55,309,055 | ) | 81,377,244 | |||||||||||||
Distributions to Shareholders | |||||||||||||||||||
From and in excess of net investment income | (5,212,973 | ) | — | (26,921,403 | ) | — | |||||||||||||
From net investment income | — | (7,958,039 | ) | — | — | ||||||||||||||
From accumulated net realized gains | — | (3,225,987 | ) | — | (31,349,996 | ) | |||||||||||||
Return of capital | — | — | — | (22,123,393 | ) | ||||||||||||||
Decrease in net assets from distributions to shareholders | (5,212,973 | ) | (11,184,026 | ) | (26,921,403 | ) | (53,473,389 | ) | |||||||||||
Capital Share Transactions | |||||||||||||||||||
Shares issued in reorganization | — | — | — | 75,834,805 | |||||||||||||||
Shares repurchased and retired | — | — | (2,779,492 | ) | (4,603,053 | ) | |||||||||||||
Net increase (decrease) in net assets from capital share transactions | — | — | (2,779,492 | ) | 71,231,752 | ||||||||||||||
Net increase (decrease) in net assets | (15,575,350 | ) | (409,394 | ) | (85,009,950 | ) | 99,135,607 | ||||||||||||
Net assets at the beginning of period | 144,292,105 | 144,701,499 | 705,097,988 | 605,962,381 | |||||||||||||||
Net assets at the end of period | $ | 128,716,755 | $ | 144,292,105 | $ | 620,088,038 | $ | 705,097,988 | |||||||||||
Undistributed (Over-distribution of) net investment income at the end of period | $ | (4,071,684 | ) | $ | (2,101,044 | ) | $ | (19,086,699 | ) | $ | 539,068 | ||||||||
See accompanying notes to financial statements.
Nuveen Investments
36
Statement of
CASH FLOWS
Six Months Ended June 30, 2013 (Unaudited)
| Global Income Opportunities (JGG) | |||||||
Cash Flows from Operating Activities: | |||||||
Net Increase (Decrease) in Net Assets from Operations | $ | (10,362,377 | ) | ||||
| Adjustments to reconcile the net increase (decrease) in net assets from operations to net cash provided by (used in) operating activities: | |||||||
Purchases of investments | (84,099,486 | ) | |||||
Proceeds from sales and maturities of investments | 83,354,195 | ||||||
Proceeds from (Purchases of) short-term investments, net | (4,335,547 | ) | |||||
Proceeds from (Payments for) cash denominated in foreign currencies, net | (151,314 | ) | |||||
Proceeds from (Payments for) swap contracts, net | 1,059,735 | ||||||
Premiums paid for options purchased | (402,390 | ) | |||||
Premiums paid for credit default swaps | (77,000 | ) | |||||
Proceeds from terminated purchased options, net | 151,243 | ||||||
Premiums received for options written | 29,625 | ||||||
Amortization (Accretion) of premiums and discounts, net | 725,175 | ||||||
(Increase) Decrease in: | |||||||
Deposits with brokers for futures contracts | (840,000 | ) | |||||
Receivable for dividends | (7,994 | ) | |||||
Receivable for interest | 304,662 | ||||||
Receivable for reclaims | (9,656 | ) | |||||
Receivable for variation margin on futures contracts | 129,452 | ||||||
Other assets | 30,537 | ||||||
Increase (Decrease) in: | |||||||
Payable for investments purchased | 5,789,001 | ||||||
Payable for variation margin on futures contracts | 59,334 | ||||||
Accrued interest on borrowings | 3,078 | ||||||
Accrued management fees | (11,238 | ) | |||||
Accrued Trustees fees | (12 | ) | |||||
Accrued other expenses | 10,239 | ||||||
Net realized (gain) loss from: | |||||||
Investments and foreign currency | (417,249 | ) | |||||
Options purchased | 102,813 | ||||||
Options written | (29,625 | ) | |||||
Paydowns | (8,281 | ) | |||||
Swaps | (1,059,735 | ) | |||||
Change in net unrealized (appreciation) depreciation of: | |||||||
Investments and foreign currency | 14,239,525 | ||||||
Forward foreign currency exchange contracts | 1,463,802 | ||||||
Options purchased | 51,228 | ||||||
Swaps | (2,291,059 | ) | |||||
Net cash provided by (used in) operating activities | 3,400,681 | ||||||
Cash Flows from Financing Activities: | |||||||
Increase (Decrease) in cash overdraft | (545,476 | ) | |||||
Cash distributions paid to shareholders | (2,855,205 | ) | |||||
Net cash provided by (used in) financing activities | (3,400,681 | ) | |||||
Net Increase (Decrease) in Cash | — | ||||||
Cash at the beginning of period | — | ||||||
Cash at the End of Period | $ | — | |||||
Supplemental Disclosure of Cash Flow Information | |||||||
Cash paid for interest on borrowings (excluding borrowing costs) was $342,774. | |||||||
See accompanying notes to financial statements.
Nuveen Investments
37
Financial
HIGHLIGHTS (Unaudited)
Selected data for a share outstanding throughout each period:
Investment Operations | Less Distributions | ||||||||||||||||||||||||||||||||||||||||||
| Beginning Net Asset Value | Net Investment Income (Loss)(a) | Net Realized/ Unrealized Gain (Loss) | Total | From Net Investment Income | From Accumulated Net Realized Gains | Return of Capital | Total | Offering Costs | Discount from Shares Repurchased and Retired | ||||||||||||||||||||||||||||||||||
Global Income Opportunities (JGG) | |||||||||||||||||||||||||||||||||||||||||||
Year Ended 12/31: | |||||||||||||||||||||||||||||||||||||||||||
2013 | (f) | $ | 15.42 | $ | .35 | $ | (1.46 | ) | $ | (1.11 | ) | $ | (.56 | )**** | $ | — | $ | — | $ | (.56 | ) | $ | — | $ | — | ||||||||||||||||||
2012 | 15.46 | .23 | .93 | 1.16 | (.86 | ) | (.34 | ) | — | (1.20 | ) | — | — | ||||||||||||||||||||||||||||||
2011 | 16.33 | .17 | .26 | .43 | (.36 | ) | — | (.94 | ) | (1.30 | ) | — | — | ||||||||||||||||||||||||||||||
2010 | 16.76 | .14 | .99 | 1.13 | (.76 | ) | (.06 | ) | (.74 | ) | (1.56 | ) | — | — | |||||||||||||||||||||||||||||
2009 | 18.00 | .27 | .05 | .32 | (.87 | ) | (.05 | ) | (.64 | ) | (1.56 | ) | — | — | * | ||||||||||||||||||||||||||||
2008 | 18.57 | .79 | .23 | 1.02 | (.82 | ) | — | (.77 | ) | (1.59 | ) | — | — | ||||||||||||||||||||||||||||||
Diversified Currency Opportunities (JGT) | |||||||||||||||||||||||||||||||||||||||||||
Year Ended 12/31: | |||||||||||||||||||||||||||||||||||||||||||
2013 | (f) | 14.69 | .15 | (1.30 | ) | (1.15 | ) | (.56 | )**** | — | — | (.56 | ) | — | — | * | |||||||||||||||||||||||||||
2012 | 14.01 | .24 | 1.64 | 1.88 | — | (.71 | ) | (.50 | ) | (1.21 | ) | — | .01 | ||||||||||||||||||||||||||||||
2011 | 15.64 | .12 | (.46 | ) | (.34 | ) | (.65 | ) | (.24 | ) | (.41 | ) | (1.30 | ) | — | .01 | |||||||||||||||||||||||||||
2010 | 17.12 | .36 | (.42 | ) | (.06 | ) | (.13 | ) | — | (1.29 | ) | (1.42 | ) | — | — | * | |||||||||||||||||||||||||||
2009 | 16.51 | .49 | 1.62 | 2.11 | (.93 | ) | (.48 | ) | (.10 | ) | (1.51 | ) | — | * | .01 | ||||||||||||||||||||||||||||
2008 | 19.31 | 1.07 | (2.15 | ) | (1.08 | ) | (1.18 | ) | (.02 | ) | (.53 | ) | (1.73 | ) | — | * | .01 | ||||||||||||||||||||||||||
Borrowings at End of Period(e) | |||||||||||
Global Income Opportunities (JGG) | Aggregate Amount Outstanding (000) | Asset Coverage Per $1,000 | |||||||||
Year Ended 12/31: | |||||||||||
| 2013(f) | $ | 61,000 | $ | 3,110 | |||||||
2012 | 61,000 | 3,365 | |||||||||
Nuveen Investments
38
Ratios/Supplemental Data | |||||||||||||||||||||||||||||||||||
Total Returns | Ratios to Average Net Assets(c) | ||||||||||||||||||||||||||||||||||
| Ending Net Asset Value | Ending Market Value | Based on Market Value(b) | Based on Net Asset Value(b) | Ending Net Assets (000) | Expenses | Net Investment Income (Loss) | Portfolio Turnover Rate(d) | ||||||||||||||||||||||||||||
Global Income Opportunities (JGG) | |||||||||||||||||||||||||||||||||||
Year Ended 12/31: | |||||||||||||||||||||||||||||||||||
2013 | (f) | $ | 13.75 | $ | 12.36 | (8.10 | )% | (7.29 | )% | $ | 128,717 | 2.03 | %*** | 4.60 | %*** | 43 | % | ||||||||||||||||||
2012 | 15.42 | 14.02 | 7.49 | 7.70 | 144,292 | 1.16 | 1.47 | 93 | |||||||||||||||||||||||||||
2011 | 15.46 | 14.16 | (1.19 | ) | 2.82 | 144,701 | 1.06 | 1.10 | 36 | ||||||||||||||||||||||||||
2010 | 16.33 | 15.65 | (.22 | ) | 6.85 | 152,834 | 1.06 | .82 | 105 | ||||||||||||||||||||||||||
2009 | 16.76 | 17.23 | 18.57 | 1.70 | 156,253 | 1.08 | 1.54 | 177 | |||||||||||||||||||||||||||
2008 | 18.00 | 15.93 | 7.38 | 5.85 | 167,522 | 1.05 | 4.32 | 54 | |||||||||||||||||||||||||||
Diversified Currency Opportunities (JGT) | |||||||||||||||||||||||||||||||||||
Year Ended 12/31: | |||||||||||||||||||||||||||||||||||
2013 | (f) | 12.98 | 11.21 | (8.81 | ) | (7.97 | ) | 620,088 | .98 | *** | 2.14 | *** | 5 | ||||||||||||||||||||||
2012 | 14.69 | 12.87 | 16.54 | 13.73 | 705,098 | .99 | 1.65 | 117 | |||||||||||||||||||||||||||
2011 | 14.01 | 12.11 | (3.27 | ) | (2.39 | )** | 605,962 | 1.06 | .77 | 41 | |||||||||||||||||||||||||
2010 | 15.64 | 13.77 | (1.44 | ) | (.18 | ) | 683,648 | 1.13 | 2.28 | 77 | |||||||||||||||||||||||||
2009 | 17.12 | 15.41 | 22.55 | 13.35 | 748,957 | 1.07 | 2.92 | 103 | |||||||||||||||||||||||||||
2008 | 16.51 | 13.90 | (8.32 | ) | (6.01 | ) | 729,813 | 1.05 | 5.81 | 38 | |||||||||||||||||||||||||
(a) Per share Net Investment Income (Loss) is calculated using the average daily shares method.
(b) Total Return Based on Market Value is the combination of changes in the market price per share and the effect of reinvested dividend income and reinvested capital gains distributions, if any, at the average price paid per share at the time of reinvestment. The last dividend declared in the period, which is typically paid on the first business day of the following month, is assumed to be reinvested at the ending market price. The actual reinvestment for the last dividend declared in the period may take place over several days, and in some instances may not be based on the market price, so the actual reinvestment price may be different from the price used in the calculation. Total returns are not annualized.
Total Return Based on Net Asset Value is the combination of changes in net asset value, reinvested divided income at net asset value and reinvested capital gains distributions at net asset value, if any. The last dividend declared in the period, which is typically paid on the first business day of the following month, is assumed to be reinvested at the ending net asset value. The actual reinvest price for the last dividend declared in the period may often be based on the Fund's market price (and not its net asset value), and therefore may be different from the price used in the calculation. Total returns are not annualized.
(c) • Net Investment Income (Loss) ratios reflect income earned and expenses incurred on assets attributable to borrowings, where applicable.
• Each ratio includes the effect of all interest expense paid and other costs related to borrowings as follows:
Global Income Opportunities (JGG) | Ratios of Borrowings Interest Expense to Average Net Assets(e) | ||||||
Year Ended 12/31: | |||||||
| 2013(f) | .54 | %*** | |||||
2012 | .07 | ||||||
(d) Portfolio Turnover Rate is calculated based on the lesser of long-term purchases or sales (as disclosed in Footnote 5—Investment Transactions) divided by the average long-term market value during the period.
(e) The Fund did not utilize borrowings prior to the fiscal year ended December 31, 2012.
(f) For the six months ended June 30, 2013.
* Rounds to less than $.01 per share.
** During the fiscal year ended December 31, 2011, Diversified Currency Opportunities (JGT) received payments from the Adviser of $36,215 to offset losses realized on the disposal of investments purchased in violation of the Fund's investment restrictions. This reimbursement did not have an impact on the Fund's Total Return Based on Net Asset Value.
*** Annualized.
**** Represents distributions paid "From and in excess of net investment income" for the six months ended June 30, 2013.
See accompanying notes to financial statements.
Nuveen Investments
39
Notes to
FINANCIAL STATEMENTS (Unaudited)
1. General Information and Significant Accounting Policies
General Information
The funds covered in this report and their corresponding New York Stock Exchange ("NYSE") symbols are as follows (each a "Fund" and collectively, the "Funds"):
• Nuveen Global Income Opportunities Fund (JGG) ("Global Income Opportunities (JGG)")
• Nuveen Diversified Currency Opportunities Fund (JGT) ("Diversified Currency Opportunities (JGT)")
The Funds are registered under the Investment Company Act of 1940, as amended, as non-diversified closed-end registered investment companies. Global Income Opportunities (JGG) and Diversified Currency Opportunities (JGT) were organized as Massachusetts business trusts on April 13, 2006 and February 14, 2007, respectively.
The Funds' investment adviser is Nuveen Fund Advisors, LLC (the "Adviser"), a wholly-owned subsidiary of Nuveen Investments, Inc. ("Nuveen"). The Adviser is responsible for each Fund's overall investment strategy and asset allocation decisions. The Adviser has entered into sub-advisory agreements with Nuveen Asset Management, LLC, (the "Sub-Adviser"), a subsidiary of the Adviser, under which the Sub-Adviser manages the investment portfolios of the Funds.
Global Income Opportunities' (JGG) primary investment objective is to provide a high level of current income and gains. The Fund's secondary investment objective is to seek capital preservation. The Fund invests at least 80% of its managed assets (as defined in Footnote 7—Management Fees and Other Transactions with Affiliates) in global debt securities, including but not limited to global sovereign and government-related debt, domestic and foreign debt securities, U.S. government securities, residential and commercial mortgage-backed securities and asset backed securities. The Fund may invest up to 20% in other types of securities, including, but not limited to, preferred securities of domestic and foreign issuers and convertible debt. The Fund may invest in global debt from issuers in both developed and emerging market countries. The Fund will invest primarily in securities rated investment grade at the time of purchase (or unrated but deemed to be of comparable quality by the Sub-Adviser.) However, the Fund may invest up to 30% of its managed assets in securities rated below investment grade (or unrated but deemed to be of comparable quality by the Sub-Adviser). The Fund may not invest in debt rated below CCC. The Fund will use futures, forwards and other derivatives to create or reduce exposure to countries, sectors, currencies, and interest rates in seeking to enhance total returns and/or manage risk. This strategy may create the economic effect of leverage. The Sub-Adviser will monitor and adjust investments using a propriety risk reduction methodology.
Diversified Currency Opportunities' (JGT) primary investment objective is to provide an attractive level of current income and total return. The Fund invests in currencies and short-term debt of both developed market and emerging market countries and has the flexibility to short foreign currencies. The Fund will maintain a foreign currency orientation with a maximum net exposure of the dollar of 35%. The Fund invests at least 80% of its managed assets in U.S. and foreign government securities, forward currency contracts, and other currency related derivative instruments and may invest 20% in corporate, assets-backed or other types of non-government debt. The Fund seeks to maintain a weighted-average, leverage-adjusted duration of two years or less and may employ effective leverage of up to 175% through currency forward contracts. This strategy may create the economic effect of leverage. The Sub-Adviser will monitor and adjust investments using a propriety risk reduction methodology.
Significant Accounting Policies
The following is a summary of significant accounting policies followed by the Funds in the preparation of their financial statements in accordance with accounting principles generally accepted in the United States ("U.S. GAAP").
Investment Transactions
Investment transactions are recorded on a trade date basis. Realized gains and losses from transactions are determined on the specific identification method, which is the same basis used for federal income tax purposes. Investments purchased on a when-issued/delayed delivery basis may have extended settlement periods. Any investments so purchased are subject to market fluctuation during this period. The Funds have instructed the custodian to earmark securities in the Funds' portfolios with a current value at least equal to the amount of the when-issued/delayed delivery purchase commitments. As of June 30, 2013, Global Income Opportunities (JGG) had outstanding when-issued/delayed delivery purchase commitments of $5,202,363. Diversified Currency Opportunities (JGT) had no such outstanding purchase commitments.
Investment Income
Investment income, which reflects the amortization of premiums and includes accretion of discounts for financial reporting purposes, is recorded on an accrual basis. Interest income also reflects paydown gains and losses, if any.
Nuveen Investments
40
Professional Fees
Professional fees presented on the Statement of Operations consist of legal fees incurred in the normal course of operations, audit fees, tax consulting fees and, in some cases, workout expenditures. Workout expenditures are incurred in an attempt to protect or enhance an investment, or to pursue other claims or legal actions on behalf of Fund shareholders. Should a Fund receive a refund of workout expenditures paid in a prior reporting period such amounts will be recognized as "Legal fee refund" on the Statement of Operations.
Dividends and Distributions to Shareholders
Distributions to shareholders are recorded on the ex-dividend date. The amount and timing of distributions are determined in accordance with federal income tax regulations, which may differ from U.S. GAAP.
Each Fund makes quarterly cash distributions to shareholders of a stated dollar amount per share. Subject to approval and oversight by the Funds' Board of Trustees, each Fund seeks to maintain a stable distribution level designed to deliver the long-term return potential of each Fund's investment strategy through regular quarterly distributions (a "Managed Distribution Program"). Total distributions during a calendar year generally will be made from each Fund's net investment income, net realized capital gains and net unrealized capital gains in the Fund's portfolio, if any. The portion of distributions paid attributed to net unrealized gains, if any, is distributed from the Fund's assets and is treated by shareholders as a non-taxable distribution ("Return of Capital") for tax purposes. In the event that total distributions during a calendar year exceed a Fund's total return on net asset value, the difference will reduce net asset value per share. If a Fund's total return on net asset value exceeds total distributions during a calendar year, the excess will be reflected as an increase in net asset value per share. The final determination of the source and character of all distributions for the fiscal year is made after the end of the fiscal year and is reflected in the financial statements contained in the annual report as of December 31 each year.
The actual character of distributions made by the Funds during the fiscal year ended December 31, 2012, are reflected in the accompanying financial statements.
The distributions made by the Funds during the six months ended June 30, 2013, are provisionally classified as being "From and in excess of net investment income," and those distributions will be classified as being from net investment income, net realized capital gains and/or a return of capital for tax purposes after the fiscal year end. For purposes of calculating "Undistributed (Over-distribution of) net investment income" as of June 30, 2013, the distribution amounts provisionally classified as "From and in excess of net investment income" were treated as being entirely from net investment income. Consequently, the financial statements at June 30, 2013, reflect an over-distribution of net investment income.
Due from Broker
On September 15, 2008, Lehman Brothers Holding, Inc. and certain of its affiliates ("Lehman") filed for Chapter 11 bankruptcy in U.S. Federal Court. A number of Lehman subsidiaries have subsequently filed bankruptcy or similar insolvency proceedings in the U.S. and other jurisdictions. Lehman's bankruptcy caused the Funds to terminate their outstanding Lehman derivative positions and quantify such exposures. The Funds have filed claims in the relevant Lehman bankruptcy proceedings, as appropriate. The Funds' net exposure, after application of available offsets, is expected to be modest.
In conjunction with quantifying exposure to such Lehman transactions, the Funds discounted the net gains on their outstanding Lehman derivative contracts prior to their scheduled settlement dates by an amount the Adviser believed to be the Funds' expected loss rate in seeking recovery in bankruptcy. This discounted value is recognized as the "net of amounts uncollectible of" component of "Due from broker" on the Statement of Assets and Liabilities.
Global Income Opportunities (JGG) also has an outstanding trade receivable in the amount of $871,186 from Lehman, which is recognized as a component of "Due from broker" on the Statement of Assets and Liabilities. The Fund's Adviser has agreed that to the extent that this asset is not ultimately recovered by the Fund, the Adviser or another party shall reimburse the Fund for this asset. The Fund's custodian has also agreed to waive any overdraft charges resulting from this receivable. As the receivable is an offset of the overdraft noted on the Fund's accounting records and recognized as a component of "Cash overdraft" on the Statement of Assets and Liabilities, there has been no effect on the Fund's net asset value.
Indemnifications
Under the Funds' organizational documents, their officers and trustees are indemnified against certain liabilities arising out of the performance of their duties to the Funds. In addition, in the normal course of business, the Funds enter into contracts that provide general indemnifications to other parties. The Funds' maximum exposure under these arrangements is unknown as this would involve future claims that may be made against the Funds that have not yet occurred. However, the Funds have not had prior claims or losses pursuant to these contracts and expect the risk of loss to be remote.
Netting Agreements
In the ordinary course of business, the Funds have entered into transactions subject to enforceable netting agreements or other similar arrangements ("netting agreements"). Generally, the right to offset in netting agreements allows the Funds to offset any exposure to a specific counterparty with any collateral received or delivered to that counterparty based on the terms of the agreements. Generally, the Funds manage their cash collateral and securities collateral on a counterparty basis. As of June 30, 2013, the Funds do not hold any instruments, other than the swap contracts further
Nuveen Investments
41
Notes to
FINANCIAL STATEMENTS (Unaudited) (continued)
described in Footnote 3—Portfolio Securities and Investments in Derivatives, with gross exposures on the Statement of Assets and Liabilities that could be netted subject to netting agreements.
Use of Estimates
The preparation of financial statements in conformity with U.S. GAAP requires management to make estimates and assumptions that affect the reported amounts of assets and liabilities at the date of the financial statements and the reported amounts of increases and decreases in net assets from operations during the reporting period. Actual results may differ from those estimates.
2. Investment Valuation and Fair Value Measurements
Investment Valuation
Prices of fixed-income securities, short-term U.S. and international government securities, forward foreign currency exchange contracts and swaps are provided by a pricing service approved by the Funds' Board of Trustees. These securities are generally classified as Level 2 for fair value measurement purposes. The pricing service establishes a security's fair value using methods that may include consideration of the following: yields or prices of investments of comparable quality, type of issue, coupon, maturity and rating, market quotes or indications of value from security dealers, evaluations of anticipated cash flows or collateral, general market conditions and other information and analysis, including the obligor's credit characteristics considered relevant. In pricing certain securities, particularly less liquid and lower quality securities, the pricing service may consider information about a security, its issuer, or market activity, provided by the Adviser. These securities are generally classified as Level 2 or Level 3 depending on the priority of the significant inputs.
Investments initially valued in currencies other than the U.S. dollar are converted to the U.S. dollar using exchange rates obtained from pricing services. As a result, the net asset value (NAV) of the Funds' shares may be affected by changes in the value of currencies in relation to the U.S. dollar. The value of securities traded in markets outside the United States or denominated in currencies other than the U.S. dollar may be affected significantly on a day that the NYSE is closed and an investor is not able to purchase, redeem or exchange shares. If significant market events occur between the time of determination of the closing price of a foreign security on an exchange and the time that the Funds' NAV is determined, or if under the Funds' procedures, the closing price of a foreign security is not deemed to be reliable, the security would be valued at fair value as determined in accordance with procedures established in good faith by the Funds' Board of Trustees. These securities are generally classified as Level 2 or Level 3 depending on the priority of the significant inputs.
The value of exchange-traded options are based on the mean of the closing bid and ask prices. Futures contracts are valued using the closing settlement price or, in the absence of such a price, the last traded price. Exchange-traded options and futures contracts are generally classified as Level 1. Options traded in the over-the-counter market are valued using an evaluated mean price and are generally classified as Level 2.
Repurchase agreements are valued at contract amount plus accrued interest, which approximates market value. These securities are generally classified as Level 2.
Certain securities may not be able to be priced by the pre-established pricing methods as described above. Such securities may be valued by the Funds' Board of Trustees or its designee at fair value. These securities generally include, but are not limited to, restricted securities (securities which may not be publicly sold without registration under the Securities Act of 1933, as amended) for which a pricing service is unable to provide a market price; securities whose trading has been formally suspended; debt securities that have gone into default and for which there is no current market quotation; a security whose market price is not available from a pre-established pricing source; a security with respect to which an event has occurred that is likely to materially affect the value of the security after the market has closed but before the calculation of a Fund's net asset value (as may be the case in non-U.S. markets on which the security is primarily traded) or make it difficult or impossible to obtain a reliable market quotation; and a security whose price, as provided by the pricing service, is not deemed to reflect the security's fair value. As a general principle, the fair value of a security would appear to be the amount that the owner might reasonably expect to receive for it in a current sale. A variety of factors may be considered in determining the fair value of such securities, which may include consideration of the following: yields or prices of investments of comparable quality, type of issue, coupon, maturity and rating, market quotes or indications of value from security dealers, evaluations of anticipated cash flows or collateral, general market conditions and other information and analysis, including the obligor's credit characteristics considered relevant. These securities are generally classified as Level 2 or Level 3 depending on the priority of the significant inputs. Regardless of the method employed to value a particular security, all valuations are subject to review by the Funds' Board of Trustees or its designee.
Fair Value Measurements
Fair value is defined as the price that the Funds would receive upon selling an investment or transferring a liability in an orderly transaction to an independent buyer in the principal or most advantageous market for the investment. A three-tier hierarchy is used to maximize the use of observable market data and minimize the use of unobservable inputs and to establish classification of fair value measurements for disclosure purposes. Observable inputs reflect the assumptions market participants would use in pricing the asset or liability. Observable inputs are based on market data obtained from sources independent of the reporting entity. Unobservable inputs reflect the reporting entity's own assumptions about the assumptions market participants would use in pricing the
Nuveen Investments
42
asset or liability. Unobservable inputs are based on the best information available in the circumstances. The following is a summary of the three-tiered hierarchy of valuation input levels.
Level 1 — Inputs are unadjusted and prices are determined using quoted prices in active markets for identical securities.
Level 2 — Prices are determined using other significant observable inputs (including quoted prices for similar securities, interest rates, prepayment speeds, credit risk, etc.).
Level 3 — Prices are determined using significant unobservable inputs (including management's assumptions in determining the fair value of investments).
The inputs or methodologies used for valuing securities are not an indication of the risks associated with investing in those securities. The following is a summary of each Fund's fair value measurements as of the end of the reporting period:
Global Income Opportunities (JGG) | Level 1 | Level 2 | Level 3 | Total | |||||||||||||||
Long-Term Investments*: | |||||||||||||||||||
$25 Par (or similar) Retail Structures | $ | 2,975,205 | $ | — | $ | — | $ | 2,975,205 | |||||||||||
Corporate Bonds | — | 85,784,042 | — | 85,784,042 | |||||||||||||||
$1,000 Par (or similar) Institutional Structures | — | 8,279,785 | — | 8,279,785 | |||||||||||||||
Sovereign Debt | — | 80,881,536 | — | 80,881,536 | |||||||||||||||
Asset-Backed and Mortgage-Backed Securities | — | 9,569,257 | 449,367 | 10,018,624 | |||||||||||||||
Short-Term Investments: | |||||||||||||||||||
Repurchase Agreements | — | 5,862,110 | — | 5,862,110 | |||||||||||||||
Derivatives: | |||||||||||||||||||
Forward Foreign Currency Exchange Contracts ** | — | (935,095 | ) | — | (935,095 | ) | |||||||||||||
Credit Default Swaps** | — | (13,405 | ) | — | (13,405 | ) | |||||||||||||
Interest Rate Swaps** | — | 2,595,706 | — | 2,595,706 | |||||||||||||||
Futures Contracts** | 209,077 | — | — | 209,077 | |||||||||||||||
Call Options Purchased | 12 | — | — | 12 | |||||||||||||||
Total | $ | 3,184,294 | $ | 192,023,936 | $ | 449,367 | $ | 195,657,597 | |||||||||||
Diversified Currency Opportunities (JGT) | Level 1 | Level 2 | Level 3 | Total | |||||||||||||||
Long-Term Investments*: | |||||||||||||||||||
Corporate Bonds | $ | — | $ | 48,377,905 | $ | — | $ | 48,377,905 | |||||||||||
Sovereign Debt | — | 377,930,279 | — | 377,930,279 | |||||||||||||||
Asset-Backed and Mortgage-Backed Securities | — | 16,764,107 | 3,045,711 | 19,809,818 | |||||||||||||||
Short-Term Investments: | |||||||||||||||||||
Sovereign Debt | — | 66,927,668 | — | 66,927,668 | |||||||||||||||
U.S. Government & Agency Obligations | — | 83,552,207 | — | 83,552,207 | |||||||||||||||
Repurchase Agreements | — | 17,768,341 | — | 17,768,341 | |||||||||||||||
Derivatives: | |||||||||||||||||||
Forward Foreign Currency Exchange Contracts ** | — | (21,061,679 | ) | — | (21,061,679 | ) | |||||||||||||
Futures Contracts** | 561,198 | — | — | 561,198 | |||||||||||||||
Call Options Purchased | 70 | — | — | 70 | |||||||||||||||
Total | $ | 561,268 | $ | 590,258,828 | $ | 3,045,711 | $ | 593,865,807 | |||||||||||
* Refer to the Fund's Portfolio of Investments for industry classifications and a breakdown of securities classified as Level 3.
** Represents net unrealized appreciation (depreciation) as reported in the Fund's Portfolio of Investments.
The Nuveen funds' Board of Directors/Trustees is responsible for the valuation process and has delegated the oversight of the daily valuation process to the Adviser's Valuation Committee. The Valuation Committee, pursuant to the valuation policies and procedures adopted by the Board of Directors/Trustees, is responsible for making fair value determinations, evaluating the effectiveness of the funds' pricing policies, and reporting to the Board of Directors/Trustees. The Valuation Committee is aided in its efforts by the Adviser's dedicated Securities Valuation Team, which is responsible for administering the daily valuation process and applying fair value methodologies as approved by the Valuation Committee. When determining the reliability of independent pricing services for investments owned by the funds, the Valuation Committee, among other things, conducts due diligence
Nuveen Investments
43
Notes to
FINANCIAL STATEMENTS (Unaudited) (continued)
reviews of the pricing services and monitors the quality of security prices received through various testing reports conducted by the Securities Valuation Team.
The Valuation Committee will consider pricing methodologies it deems relevant and appropriate when making a fair value determination, based on the facts and circumstances specific to the portfolio instrument. Fair value determinations generally will be derived as follows, using public or private market information:
(i.) If available, fair value determinations shall be derived by extrapolating from recent transactions or quoted prices for identical or comparable securities.
(ii.) If such information is not available, an analytical valuation methodology may be used based on other available information including, but not limited to: analyst appraisals, research reports, corporate action information, issuer financial statements and shelf registration statements. Such analytical valuation methodologies may include, but are not limited to: multiple of earnings, discount from market value of a similar freely-traded security, discounted cash flow analysis, book value or a multiple thereof, risk premium/yield analysis, yield to maturity and/or fundamental investment analysis.
The purchase price of a portfolio instrument will be used to fair value the instrument only if no other valuation methodology is available or deemed appropriate, and it is determined that the purchase price fairly reflects the instrument's current value.
For each portfolio security that has been fair valued pursuant to the policies adopted by the Board of Directors/Trustees, the fair value price is compared against the last available and next available market quotations. The Valuation Committee reviews the results of such testing and fair valuation occurrences are reported to the Board of Directors/Trustees.
3. Portfolio Securities and Investments in Derivatives
Portfolio Securities
Dollar Roll Transactions
Each Fund is authorized to enter into dollar roll transactions ("dollar rolls") in which a Fund purchases or sells Mortgage-backed securities ("MBS") for delivery in the future and simultaneously contracts to sell or repurchase substantially similar (same type, coupon, and maturity) MBS on a different specified future date. Dollar rolls are identified in the Portfolios of Investments as "MDR" for the Funds, when applicable. During the roll period, the Funds forego principal and interest paid on the MBS. Each Fund is compensated by fee income or the difference between the current sales price and the lower forward price for the future purchase. Such compensation is amortized over the life of the dollar rolls and recognized as a component of "Investment Income" on the Statement of Operations. Dollar rolls are valued daily. Global Income Opportunities (JGG) entered into dollar roll transactions during the six months ended June 30, 2013.
Dollar rolls involve the risk that the market value of the MBS the Fund is obligated to repurchase under an agreement may decline below the repurchase price. These transactions also involve some risk to the Fund if the other party should default on its obligation and the Fund is delayed or prevented from completing the transaction. In the event that the buyer of securities under a dollar roll files for bankruptcy or becomes insolvent, the Fund's use of proceeds of the dollar roll may be restricted pending a determination by the other party, or its trustee or receiver, whether to enforce the Fund's obligation to repurchase the securities.
Foreign Currency Transactions
To the extent that the Funds invest in securities and/or contracts that are denominated in a currency other than U.S. dollars, the Funds will be subject to currency risk, which is the risk that an increase in the U.S. dollar relative to the foreign currency will reduce returns or portfolio value. Generally, when the U.S. dollar rises in value against a foreign currency, the Fund's investments denominated in that currency will lose value because its currency is worth fewer U.S. dollars; the opposite effect occurs if the U.S. dollar falls in relative value. Investments and other assets and liabilities denominated in foreign currencies are converted into U.S. dollars on a spot (i.e. cash) basis at the spot rate prevailing in the foreign currency exchange market at the time of valuation. Purchases and sales of investments and income denominated in foreign currencies are translated into U.S. dollars on the respective dates of such transactions.
The books and records of the Funds are maintained in U.S. dollars. Foreign currencies, assets and liabilities are translated into U.S. dollars at 4:00 p.m. Eastern time. Investment transactions, income and expenses are translated on the respective dates of such transactions. Net realized foreign currency gains and losses resulting from changes in exchange rates include foreign currency gains and losses between trade date and settlement date of the transactions, foreign currency transactions, and the difference between the amounts of interest and dividends recorded on the books of a Fund and the amounts actually received.
Nuveen Investments
44
The realized gains and losses resulting from changes in foreign currency exchange rates and changes in foreign exchange rates associated with other assets and liabilities on investments, forward foreign currency exchange contracts, futures, options purchased, options written and swap contracts, when applicable, are recognized as a component of "Net realized gain (loss) from investments and foreign currency" on the Statement of Operations, when applicable.
The unrealized gains and losses resulting from changes in foreign currency exchange rates and changes in foreign exchange rates associated with other assets and liabilities on investments are recognized as a component of "Change in net unrealized appreciation (depreciation) of investments and foreign currency" on the Statement of Operations, when applicable. The unrealized gains and losses resulting from changes in foreign exchange rates associated with forward foreign currency exchange contracts, futures, options purchased, options written and swaps are recognized as a component of "Change in net unrealized appreciation (deprecation) of forward foreign currency exchange contracts, futures, options purchased, options written and swaps," respectively on the Statement of Operations, when applicable.
Zero Coupon Securities
Each Fund is authorized to invest in zero coupon securities. A zero coupon security does not pay a regular interest coupon to its holders during the life of the security. Income to the holder of the security comes from accretion of the difference between the original purchase price of the security at issuance and the par value of the security at maturity and is effectively paid at maturity. The market prices of zero coupon securities generally are more volatile than the market prices of securities that pay interest periodically.
Repurchase Agreements
In connection with transactions in repurchase agreements, it is each Fund's policy that its custodian take possession of the underlying collateral securities, the fair value of which exceeds the principal amount of the repurchase transaction, including accrued interest, at all times. If the counterparty defaults, and the fair value of the collateral declines, realization of the collateral may be delayed or limited.
Investment in Derivatives
The Funds record derivative instruments at fair value, with changes in fair value recognized on the Statement of Operations, when applicable. Even though the Funds' investments in derivatives may represent economic hedges, they are not considered to be hedge transactions for financial reporting purposes.
Forward Foreign Currency Exchange Contracts
Each Fund is authorized to enter into forward foreign currency exchange contracts ("forward contract") under two circumstances: (i) when a Fund enters into a contract for the purchase or sale of a security denominated in a foreign currency to "lock in" the U.S. exchange rate of the transaction, with such period being a short-dated contract covering the period between transaction date and settlement date; or (ii) when the Sub-Adviser, believes that the currency of a particular foreign country may experience a substantial movement against the U.S. dollar or against another foreign currency.
A forward contract is an agreement between two parties to purchase or sell a specified quantity of a currency at or before a specified date in the future at a specified price. Forward contracts are typically traded in the over-the-counter ("OTC") markets and all details of the contract are negotiated between the counterparties to the agreement. Accordingly, the forward contracts are valued by reference to the contracts traded in the OTC markets. The contractual obligations of a buyer or seller may generally be satisfied by taking or making physical delivery of the underlying currency, establishing an opposite position in the contract and recognizing the profit or loss on both positions simultaneously on the delivery date or, in some instances, paying a cash settlement before the designated date of delivery.
Forward contracts are valued daily at the forward rate and are recognized as a component of "Unrealized appreciation and/or depreciation on forward foreign currency exchange contracts" on the Statement of Assets and Liabilities. The change in value of the forward contracts during the reporting period is recognized as a component of "Change in net unrealized appreciation (depreciation) of forward foreign currency exchange contracts" on the Statement of Operations. When the contract is closed or offset with the same counterparty, a Fund recognizes the difference between the value of the contract at the time it was entered and the value at the time it was closed or offset as a component of "Net realized gain (loss) from forward foreign currency exchange contracts" on the Statement of Operations.
Forward contracts will generally not be entered into for terms greater than three months, but may have maturities of up to six months or more. The use of forward contracts does not eliminate fluctuations in the underlying prices of a Fund's investment securities; however, it does establish a rate of exchange that can be achieved in the future. The use of forward contracts involves the risk that anticipated currency movements will not be accurately predicted. A forward contract would limit the risk of loss due to a decline in the value of a particular currency; however, it also would limit any potential gain that might result should the value of the currency increase instead of decrease. These contracts may involve market risk in excess of the unrealized appreciation or depreciation reflected on the Statement of Assets and Liabilities. Forward contracts are subject to counterparty risk if the counterparty fails to perform as specified in the contract due to financial impairment or other reason.
Nuveen Investments
45
Notes to
FINANCIAL STATEMENTS (Unaudited) (continued)
During the six months ended June 30, 2013, Global Income Opportunities (JGG) and Diversified Currency Opportunities (JGT) entered into forward foreign currency exchange contracts to reduce risk and to take active currency exposures. Currency forward contracts were used to reduce risk by hedging the foreign currency risk associated with each Fund's foreign debt investments. The Funds also actively managed the currency exposures through currency forwards in an attempt to benefit from the potential appreciation.
The average notional amount of forward foreign currency exchange contracts outstanding during the six months ended June 30, 2013, was as follows:
| Global Income Opportunities (JGG) | Diversified Currency Opportunities (JGT) | ||||||||||
Average notional amount of forward foreign currency exchange contracts outstanding* | $ | 303,760,117 | $ | 1,566,491,091 | |||||||
* The average notional amount is calculated based on the outstanding notional amount at the beginning of the fiscal year and at the end of each fiscal quarter within the current fiscal year.
The following table presents the fair value of all forward foreign currency exchange contracts held by the Funds as of June 30, 2013, the location of these instruments on the Statement of Assets and Liabilities and the primary underlying risk exposure.
Location on the Statement of Assets Liabilities | |||||||||||||||||||||||
Underlying | Derivative | Asset Derivatives | (Liability) Derivatives | ||||||||||||||||||||
Risk Exposure | Instrument | Location | Value | Location | Value | ||||||||||||||||||
Global Income Opportunities (JGG) | |||||||||||||||||||||||
| Foreign currency exchange rate | Forward contracts | Unrealized appreciation on forward foreign currency exchange contracts | $ | 4,558,987 | Unrealized depreciation on forward foreign currency exchange contracts | $ | (5,494,082 | ) | |||||||||||||||
Diversified Currency Opportunities (JGT) | |||||||||||||||||||||||
| Foreign currency exchange rate | Forward contracts | Unrealized appreciation on forward foreign currency exchange contracts | $ | 17,464,386 | Unrealized depreciation on forward foreign currency exchange contracts | $ | (38,526,065 | ) | |||||||||||||||
The following table presents the amount of net realized gain (loss) and change in net unrealized appreciation (depreciation) on forward contracts for the six months ended June 30, 2013, and the primary underlying risk exposure.
| Fund | Underlying Risk Exposure | Derivative Instrument | Net Realized Gain (Loss) | Change in Net Unrealized Appreciation (Depreciation) | |||||||||||||||
Global Income Opportunities (JGG) | Foreign currency exchange rate | Forward contracts | $ | (1,692,345 | ) | $ | (1,463,802 | ) | |||||||||||
Diversified Currency Opportunities (JGT) | Foreign currency exchange rate | Forward contracts | (7,681,292 | ) | (26,522,774 | ) | |||||||||||||
Futures Contracts
Upon execution of a futures contract, a Fund is obligated to deposit cash or eligible securities, also known as "initial margin," into an account at its clearing broker equal to a specified percentage of the contract amount. Cash held by the broker to cover initial margin requirements on open futures contracts, if any, is recognized as "Deposits with brokers for open futures contracts" on the Statement of Assets and Liabilities. Investments in futures contracts obligate a Fund and the clearing broker to settle monies on a daily basis representing changes in the prior days "mark-to-market" of the open contracts. If a Fund has unrealized appreciation the clearing broker would credit the investors account with an amount equal to appreciation and conversely if a Fund has unrealized depreciation the clearing broker would debit a Fund's account with an amount equal to depreciation. These daily cash settlements are also known as "variation margin." Variation margin is recognized as a receivable and/or payable for "Variation margin on futures contracts" on the Statement of Assets and Liabilities.
During the period the futures contract is open, changes in the value of the contract are recognized as an unrealized gain or loss by "marking-to-market" on a daily basis to reflect the changes in market value of the contract, which is recognized as a component of "Change in net unrealized appreciation (depreciation) of futures contracts" on the Statement of Operations. When the contract is closed or expired, a Fund records a realized gain or loss equal to the difference between the value of the contract on the closing date and value of the contract when originally entered into, which is recognized as a component of "Net realized gain (loss) from futures contracts" on the Statement of Operations.
Risks of investments in futures contracts include the possible adverse movement in the price of the securities or indices underlying the contracts, the possibility that there may not be a liquid secondary market for the contracts and/or that a change in the value of the contract may not correlate with a change in the value of the underlying securities or indices.
Nuveen Investments
46
During the six months ended June 30, 2013, Global Income Opportunities (JGG) and Diversified Currency Opportunities (JGT) sold U.S. Treasury futures to hedge against potential increases in U.S. interest rates and purchased selected foreign bond futures to gain exposure to those markets.
The average notional amount of futures contracts outstanding during the six months ended June 30, 2013, was as follows:
| Global Income Opportunities (JGG) | Diversified Currency Opportunities (JGT) | ||||||||||
Average notional amount of futures contracts outstanding* | $ | 61,584,395 | $ | 36,677,447 | |||||||
* The average notional amount is calculated based on the absolute aggregate notional amount of contracts outstanding at the beginning of the fiscal year and at the end of each quarter within the current fiscal year.
The following table presents the fair value of all futures contracts held by the Funds as of June 30, 2013, the location of these instruments on the Statement of Assets and Liabilities and the primary underlying risk exposure.
Location on the Statement of Assets and Liabilities | |||||||||||||||||||||||
Underlying | Derivative | Asset Derivatives | (Liability) Derivatives | ||||||||||||||||||||
Risk Exposure | Instrument | Location | Value | Location | Value | ||||||||||||||||||
| Global Income Opportunities (JGG) | |||||||||||||||||||||||
Interest rate | Futures contracts | Receivable for variation margin on futures contracts* | $ | 353,200 | Payable for variation margin on futures contracts* | $ | (144,123 | ) | |||||||||||||||
Diversified Currency Opportunities (JGT) | |||||||||||||||||||||||
Interest rate | Futures contracts | Receivable for variation margin on futures contracts* | $ | 561,198 | Payable for variation margin on futures contracts* | $ | — | ||||||||||||||||
* Value represents unrealized appreciation (depreciation) of futures contracts as reported on the Fund's Portfolio of Investments and not deposits with brokers, if any, or the receivable or payable for variation margin on futures contracts presented on the Statement of Assets and Liabilities.
The following table presents the amount of net realized gain (loss) and change in net unrealized appreciation (depreciation) recognized on futures contracts for the six months ended June 30, 2013, and the primary underlying risk exposure.
| Fund | Underlying Risk Exposure | Derivative Instrument | Net Realized Gain (Loss) | Change in Net Unrealized Appreciation (Depreciation) | |||||||||||||||
Global Income Opportunities (JGG) | Interest rate | Futures contracts | $ | 195,035 | $ | (47,700 | ) | ||||||||||||
Diversified Currency Opportunities (JGT) | Interest rate | Futures contracts | 285,082 | 561,198 | |||||||||||||||
Swap Contracts
Each Fund is authorized to enter into swap contracts consistent with its investment objectives and policies to reduce, increase or otherwise alter its risk profile or to alter its portfolio characteristics (i.e. duration, yield curve positioning and credit quality).
Interest Rate Swaps Contracts
Each Fund may use interest rate swap and forward interest rate swap contracts ("interest rate swap contracts") for purposes of risk reduction or expressing market views. An example of risk reduction would be to synthetically convert certain Fund positions in fixed-rate securities effectively into adjustable rate instruments and thereby shorten the average interest rate reset time and duration of each Fund's portfolio of investments. An example of expressing a market view would be to enter into swap contracts of different tenors that offset one another in whole or in part (in one case paying the fixed leg, in the other case receiving the fixed leg), in order to benefit if certain changes occur in the slope of the yield curve. Forward interest rate swap transactions involve the Fund's agreement with a counterparty to pay, in the future, a fixed or variable rate payment in exchange for the counterparty paying the Fund a variable or fixed rate payment, the accruals for which would begin at a specified date in the future (the "effective date"). Interest rate swap contracts involve each Fund's agreement with the counterparty to pay or receive a fixed rate payment in exchange for the counterparty receiving or paying from each Fund a variable rate payment. The amount of the payment obligation is based on the notional amount of the interest rate swap contract. Interest rate swap contracts do not involve the delivery of securities or other underlying assets or principal. Accordingly, the risk of loss with respect to the swap counterparty on such transactions is limited to the net amount of interest payments that each Fund is to receive. Interest rate swap contracts are valued daily. Upon entering into an interest rate swap (and beginning on the effective date for a forward swap), each Fund accrues the fixed rate payment expected to be paid or received and the variable rate payment expected to be received or paid on interest rate swap contracts on a daily basis, and recognizes the daily change in the fair value of the Fund's contractual rights and obligations under the contracts. Payments received or made at the beginning of the measurement period, if any, are recognized as "Interest rate swaps premiums paid and/or received" on the Statement of
Nuveen Investments
47
Notes to
FINANCIAL STATEMENTS (Unaudited) (continued)
Assets and Liabilities. Payments made or received upon entering into the swap agreement are to compensate for differences between the stated terms of the swap agreements and prevailing market conditions (credit spreads, currency exchange rates, interest rates, and other relevant factors). The net amount recorded on these transactions for each counterparty is recognized on the Statement of Assets and Liabilities as a component of "Unrealized appreciation or depreciation on interest rate swaps (, net)" with the change during the fiscal period recognized on the Statement of Operations as a component of "Change in net unrealized appreciation (depreciation) of swaps." Once periodic payments are settled in cash, the net amount is recognized as a component of "Net realized gain (loss) from swaps" on the Statement of Operations, in addition to the net realized gain or loss recorded upon the termination of interest rate swap contracts. For tax purposes, periodic payments are treated as ordinary income or expense.
During the six months ended June 30, 2013, Global Income Opportunities (JGG) invested in interest rate swaps to partially fix the interest cost of leverage.
The average notional amount of interest rate swap contracts outstanding during the six months ended June 30, 2013, was as follows:
| Global Income Opportunities (JGG) | |||||||
Average notional amount of interest rate swap contracts outstanding* | $ | 55,604,667 | |||||
* The average notional amount is calculated based on the outstanding notional amount at the beginning of the fiscal year and at the end of each fiscal quarter within the current fiscal year.
Credit Default Swaps
Each Fund may enter into a credit default swap contract to seek to maintain a total return on a particular investment or portion of its portfolio, or to take an active long or short position with respect to the likelihood of a particular issuer's default. Credit default swap contracts involve one party making a stream of payments to another party in exchange for the right to receive a specified return if/when there is a credit event by a third party. Generally, a credit event means bankruptcy, failure to pay, or restructuring. The specific credit events applicable for each credit default swap are stated in the terms of the particular swap agreement. As a purchaser of a credit default swap contract, the Fund pays to the counterparty a periodic interest fee based on the notional amount of the credit default swap. This interest fee is accrued daily and recognized with the daily change in the market value of the contract as a component of "Unrealized appreciation or depreciation on credit default swaps (,net)" on the Statement of Assets and Liabilities and is recorded as a realized loss upon payment. Upon occurrence of a specific credit event with respect to the underlying referenced entity, the Fund is obligated to deliver that security, or an equivalent amount of cash, to the counterparty in exchange for receipt of the notional amount from the counterparty. The difference between the value of the security delivered and the notional amount received is recorded as a realized gain. Payments received or made at the beginning of the measurement period are recognized as a component of "Credit default swap premiums paid and/or received" on the Statement of Assets and Liabilities, when applicable. As a seller of a credit default swap contract, the Fund generally receives from the counterparty a periodic interest fee based on the notional amount of the credit default swap. This interest fee is accrued daily as a component of unrealized appreciation or depreciation and is recorded as a realized gain upon payment. Upon occurrence of a specific credit event with respect to the underlying referenced entity, the Fund will either receive that security, or an equivalent amount of cash, from the counterparty in exchange for payment of the notional amount to the counterparty, or pay a net settlement amount of the credit default swap contract less the recovery value of the referenced obligation or underlying securities comprising the referenced index. The difference between the value of the security received and the notional amount paid is recorded as a realized loss. Changes in the value of a credit default swap during the reporting period are recognized as a component of "Change in net unrealized appreciation (depreciation) of swaps", and realized gains and losses are recognized as a component of "Net realized gain (loss) from swaps" on the Statement of Operations. The maximum potential amount of future payments the Fund could incur as a seller of protection in a credit default swap contract is limited to the notional amount of the contract. The maximum potential amount would be offset by the recovery value, if any, of the respective referenced entity.
During the six months ended June 30, 2013, Global Income Opportunities (JGG) invested in credit default swaps to take on credit risk and earn a commensurate credit spread.
The average notional amount of credit default swap contracts outstanding during the six months ended June 30, 2013, was as follows:
| Global Income Opportunities (JGG) | |||||||
Average notional amount of credit default swap contracts outstanding* | $ | 7,402,703 | |||||
* The average notional amount is calculated based on the outstanding notional amount at the beginning of the fiscal year and at the end of each fiscal quarter within the current fiscal year.
Nuveen Investments
48
The following table presents the fair value of all swap contracts held by the Funds as of June 30, 2013, the location of these instruments on the Statement of Assets and Liabilities and the primary underlying risk exposure.
Location on the Statement of Assets and Liabilities | |||||||||||||||||||||||
Underlying | Derivative | Asset Derivatives | (Liability) Derivatives | ||||||||||||||||||||
Risk Exposure | Instrument | Location | Value | Location | Value | ||||||||||||||||||
Global Income Opportunities (JGG) | |||||||||||||||||||||||
| Credit Interest rate | Swaps Swaps | — Unrealized appreciation on interest rate swaps, net** | $ | — $2,595,706 | Unrealized depreciation on credit default swaps** — | $ | (13,405 $— | ) | |||||||||||||||
** Some swap contracts require a counterparty to pay or receive a premium, which is disclosed on the Statement of Assets and Liabilities but is not reflected in the cumulative appreciation (depreciation) presented above.
The following table presents the swap contacts, which are subject to netting agreements, as well as the collateral delivered related to those swap contracts.
Counterparty | Gross Unrealized Appreciation on Credit Default Swaps | Gross Unrealized (Depreciation) on Credit Default Swaps | Amounts Netted on Statement of Assets and Liabilities | Net Unrealized Depreciation on Credit Default Swaps | Collateral Pledged to Counterparty | Net Exposure | |||||||||||||||||||||||||
Global Income Opportunities (JGG) | |||||||||||||||||||||||||||||||
Credit default swaps | JPMorgan | $ | — | $ | (13,405 | ) | $ | — | $ | (13,405 | ) | $ | 13,405 | $ | — | ||||||||||||||||
Total | $ | — | $ | (13,405 | ) | $ | — | $ | (13,405 | ) | $ | 13,405 | $ | — | |||||||||||||||||
Counterparty | Gross Unrealized Appreciation on Interest Rate Swaps | Gross Unrealized (Depreciation) on Interest Rate Swaps | Amounts Netted on Statement of Assets and Liabilities | Net Unrealized Appreciation on Interest Rate Swaps | Collateral Pledged to Counterparty | Net Exposure | |||||||||||||||||||||||||
Global Income Opportunities (JGG) | |||||||||||||||||||||||||||||||
Interest rate swaps | JPMorgan | $ | 1,980,164 | $ | — | $ | — | $ | 1,980,164 | $ | — | $ | 1,980,164 | ||||||||||||||||||
Interest rate swaps | Morgan Stanley | 615,542 | — | — | 615,542 | — | 615,542 | ||||||||||||||||||||||||
Total | $ | 2,595,706 | $ | — | $ | — | $ | 2,595,706 | $ | — | $ | 2,595,706 | |||||||||||||||||||
The following table presents the amount of net realized gain (loss) and change in net unrealized appreciation (depreciation) recognized on swap contracts for the six months ended June 30, 2013, and the primary underlying risk exposure.
| Fund | Underlying Risk Exposure | Derivative Instrument | Net Realized Gain (Loss) | Change in Net Unrealized Appreciation (Depreciation) | |||||||||||||||
| Global Income Opportunities (JGG) | |||||||||||||||||||
Credit | Credit default swaps | $ | 1,048,185 | $ | (122,413 | ) | |||||||||||||
Interest | Interest rate swaps | 11,550 | 2,413,472 | ||||||||||||||||
Total | $ | 1,059,735 | $ | 2,291,059 | |||||||||||||||
Options Transactions
The purchase of options and/or swaptions involves the risk of loss of all or a part of the cash paid for the options (the premium). The market risk associated with purchasing options and/or swaptions is limited to the premium paid. The counterparty credit risk of purchasing options and/or swaptions, however, needs also to take into account the current value of the option, as this is the performance expected from the counterparty. When a Fund purchases an option and/or swaption, an amount equal to the premium paid (the premium plus commission) is recognized as a component of "Options and/or Swaptions purchased, at value" on the Statement of Assets and Liabilities. When a Fund writes an option and/or swaption, an amount equal to the net premium received (the premium less commission) is recognized as a component of "Options and/or Swaptions written, at value" on the Statement of Assets and Liabilities and is subsequently adjusted to reflect the current value of the written option and/or swaption until the option and/or swaption is exercised or expires or the Fund enters into a closing purchase transaction. The changes in the value of options and/or swaptions purchased during the fiscal period are recognized as a component of "Change in net unrealized appreciation (depreciation) of options and/or swaptions purchased" on the Statement of Operations. The changes in the value of options and/or swaptions written during the fiscal period are recognized as a component of "Change in net unrealized appreciation (depreciation) of options
Nuveen Investments
49
Notes to
FINANCIAL STATEMENTS (Unaudited) (continued)
and/or swaptions written" on the Statement of Operations. When an option and/or swaption is exercised or expires or a Fund enters into a closing purchase transaction, the difference between the net premium received and any amount paid at expiration or on executing a closing purchase transaction, including commission, is recognized as a component of "Net realized gain (loss) from options and/or swaptions purchased and/or written" on the Statement of Operations. The Fund, as a writer of an option and/or swaption, has no control over whether the underlying instrument may be sold (called) or purchased (put) and as a result bears the risk of an unfavorable change in the market value of the instrument underlying the written option and/or swaption. There is also the risk the Fund may not be able to enter into a closing transaction because of an illiquid market.
During the six months ended June 30, 2013, each Fund wrote put options and purchased call options on select currencies during the period in an attempt to benefit from changes in the spot values of these currencies.
The average notional amount of options contracts outstanding during the six months ended June 30, 2013, were as follows:
| Global Income Opportunities (JGG) | Diversified Currency Opportunities (JGT) | ||||||||||
Average notional amount of outstanding options purchased* | $ | 820,879,000 | $ | 2,819,832,667 | |||||||
| Global Income Opportunities (JGG) | Diversified Currency Opportunities (JGT) | ||||||||||
Average notional amount of outstanding options written* | ( | $976,250 | ) | ( | $20,175,833 | ) | |||||
* The average notional amount is calculated based on the outstanding notional amount at the beginning of the fiscal year and at the end of each fiscal quarter within the current fiscal year.
The following table presents the fair value of all options contracts held by the Funds as of June 30, 2013, the location of these instruments on the Statement of Assets and Liabilities and the primary underlying risk exposure.
Location on the Statement of Assets Liabilities | |||||||||||||||||||||||
Underlying | Derivative | Asset Derivatives | (Liability) Derivatives | ||||||||||||||||||||
Risk Exposure | Instrument | Location | Value | Location | Value | ||||||||||||||||||
Global Income Opportunities (JGG) | |||||||||||||||||||||||
| Foreign currency exchange rate | Options purchased | Options purchased, at value | $ | 12 | — | $ | — | ||||||||||||||||
Diversified Currency Opportunities (JGT) | |||||||||||||||||||||||
| Foreign currency exchange rate | Options purchased | Options purchased, at value | $ | 70 | — | $ | — | ||||||||||||||||
The following table presents the amount of net realized gain (loss) and change in net unrealized appreciation (depreciation) on options contracts for the six months ended June 30, 2013, and the primary underlying risk exposure.
| Fund | Underlying Risk Exposure | Derivative Instrument | Net Realized Gain (Loss) | Change in Net Unrealized Appreciation (Depreciation) | |||||||||||||||
| Global Income Opportunities (JGG) | |||||||||||||||||||
Foreign currency exchange rate | Options purchased | $ | (102,813 | ) | $ | (51,228 | ) | ||||||||||||
Foreign currency exchange rate | Options written | 29,625 | — | ||||||||||||||||
Nuveen Investments
50
| Fund | Underlying Risk Exposure | Derivative Instrument | Net Realized Gain (Loss) | Change in Net Unrealized Appreciation (Depreciation) | |||||||||||||||
Diversified Currency Opportunities (JGT) | |||||||||||||||||||
Foreign currency exchange rate | Options purchased | $ | (651,187 | ) | $ | (298,830 | ) | ||||||||||||
Foreign currency exchange rate | Options written | 612,250 | — | ||||||||||||||||
Market and Counterparty Credit Risk
In the normal course of business each Fund may invest in financial instruments and enter into financial transactions where risk of potential loss exists due to changes in the market (market risk) or failure of the other party to the transaction to perform (counterparty credit risk). The potential loss could exceed the value of the financial assets recorded on the financial statements. Financial assets, which potentially expose each Fund to counterparty credit risk, consist principally of cash due from counterparties on forward, option and swap transactions, when applicable. The extent of each Fund's exposure to counterparty credit risk in respect to these financial assets approximates their carrying value as recorded on the Statement of Assets and Liabilities. Credit risk is generally higher when a non-exchange-traded financial instrument is involved because the counterparty for exchange-traded financial instruments is the exchange's clearinghouse.
Each Fund helps manage counterparty credit risk by entering into agreements only with counterparties the Adviser believes have the financial resources to honor their obligations and by having the Adviser monitor the financial stability of the counterparties. Additionally, counterparties may be required to pledge collateral daily (based on the daily valuation of the financial asset) on behalf of each Fund with a value approximately equal to the amount of any unrealized gain above a pre-determined threshold. Reciprocally, when each Fund has an unrealized loss, the Funds have instructed the custodian to pledge assets of the Funds as collateral with a value approximately equal to the amount of the unrealized loss above a pre-determined threshold. Collateral pledges are monitored and subsequently adjusted if and when the valuations fluctuate, either up or down, by at least the pre-determined threshold amount.
4. Fund Shares
Transactions in Fund shares were as follows:
| Global Income Opportunities (JGG) | Diversified Currency Opportunities (JGT) | ||||||||||||||||||
| Six Months Ended 6/30/13 | Year Ended 12/31/12 | Six Months Ended 6/30/13 | Year Ended 12/31/12 | ||||||||||||||||
Shares issued in reorganization | — | — | — | 5,096,842 | |||||||||||||||
Shares issued to shareholders due to reinvestment of distributions | — | — | — | — | |||||||||||||||
Shares repurchased and retired | — | — | (225,124 | ) | (357,790 | ) | |||||||||||||
Weighted average: | |||||||||||||||||||
Price per share repurchased and retired | — | — | $ | 12.33 | $ | 12.85 | |||||||||||||
Discount per share repurchased and retired | — | — | 13.00 | % | 12.07 | % | |||||||||||||
5. Investment Transactions
Purchases and sales (including maturities but excluding short-term investments and derivative transactions) for the six months ended June 30, 2013, were as follows:
| Global Income Opportunities (JGG) | Diversified Currency Opportunities (JGT) | ||||||||||
Purchases | $ | 84,099,486 | $ | 225,009,604 | |||||||
Sales and maturities | 83,354,195 | 30,319,149 | |||||||||
Nuveen Investments
51
Notes to
FINANCIAL STATEMENTS (Unaudited) (continued)
Transactions in options written for each Fund during the six months ended June 30, 2013, were as follows:
| Global Income Opportunities (JGG) | Diversified Currency Opportunities (JGT) | ||||||||||||||||||
| Number of Contracts | Premiums Received | Number of Contracts | Premiums Received | ||||||||||||||||
Outstanding, beginning of period | — | $ | — | — | $ | — | |||||||||||||
Options written | 1 | 29,625 | 1 | 612,250 | |||||||||||||||
Options expired | (1 | ) | (29,625 | ) | (1 | ) | (612,250 | ) | |||||||||||
Outstanding, end of period | — | $ | — | — | $ | — | |||||||||||||
6. Income Tax Information
Each Fund is a separate taxpayer for federal income tax purposes. Each Fund intends to distribute substantially all of its investment company taxable income to shareholders and to otherwise comply with the requirements of Subchapter M of the Internal Revenue Code applicable to regulated investment companies. In any year when the Funds realize net capital gains, each Fund may choose to distribute all or a portion of its net capital gains to shareholders, or alternatively, to retain all or a portion of its net capital gains and pay federal corporate income taxes on such retained gains.
For all open tax years and all major taxing jurisdictions, management of the Funds has concluded that there are no significant uncertain tax positions that would require recognition in the financial statements. Open tax years are those that are open for examination by taxing authorities (i.e., generally the last four tax year ends and the interim tax period since then). Furthermore, management of the Funds is also not aware of any tax positions for which it is reasonably possible that the total amounts of unrecognized tax benefits will significantly change in the next twelve months.
The following information is presented on an income tax basis. Differences between amounts for financial statement and federal income tax purposes are primarily due to the amortization of premium, recognition of unrealized gain or loss for tax (mark-to-market) for certain foreign currency contracts, and timing differences in recognizing certain gains and losses on investment transactions. To the extent that differences arise that are permanent in nature, such amounts are reclassified within the capital accounts as detailed below. Temporary differences do not require reclassification. Temporary and permanent differences do not impact the net asset values of the Funds.
As of June 30, 2013, the cost and unrealized appreciation (depreciation) of investments (excluding investments in derivatives), as determined on a federal income tax basis, were as follows:
| Global Income Opportunities (JGG) | Diversified Currency Opportunities (JGT) | ||||||||||
Cost of investments | $ | 207,255,941 | $ | 648,036,274 | |||||||
Gross unrealized: | |||||||||||
Appreciation | $ | 477,334 | $ | 454,228 | |||||||
Depreciation | (13,931,973 | ) | (34,124,284 | ) | |||||||
Net unrealized appreciation (depreciation) of investments | $ | (13,454,639 | ) | $ | (33,670,056 | ) | |||||
Permanent differences, primarily due to reorganization adjustments, net operating losses, return of capital distributions, foreign currency reclasses, and distribution reclasses, resulted in reclassifications among the Funds' components of net assets as of December 31, 2012, the Funds' last tax year end, as follows:
| Global Income Opportunities (JGG) | Diversified Currency Opportunities (JGT) | ||||||||||
Paid-in surplus | $ | — | $ | (980,419 | ) | ||||||
Undistributed (Over-distribution of) net investment income | 9,021,893 | 47,399,251 | |||||||||
Accumulated net realized gain (loss) | (9,021,893 | ) | (46,418,832 | ) | |||||||
Nuveen Investments
52
The tax components of undistributed net ordinary income and net long-term capital gains as of December 31, 2012, the Funds' last tax year end, were as follows:
| Global Income Opportunities (JGG) | Diversified Currency Opportunities (JGT) | ||||||||||
Undistributed net ordinary income | $ | — | $ | — | |||||||
Undistributed net long-term capital gains | 770,358 | — | |||||||||
The tax character of distributions paid during the Funds' last tax year ended December 31, 2012, was designated for purposes of the dividends paid deduction as follows:
| Global Income Opportunities (JGG) | Diversified Currency Opportunities (JGT) | ||||||||||
Distributions from net ordinary income * | $ | 9,836,192 | $ | 12,219,580 | |||||||
Distributions from net long-term capital gains | 1,347,834 | 19,130,416 | |||||||||
Return of capital | — | 22,123,393 | |||||||||
* Net ordinary income consists of net taxable income derived from dividends and interest, and current year earnings and profits attributable to realized gains.
During the Funds' last tax year ended December 31, 2012, the following Fund utilized capital loss carryforwards as follows:
| Global Income Opportunities (JGG) | |||||||
Utilized capital loss carryforwards | $ | 1,566,408 | |||||
Under the Regulated Investment Company Modernization Act of 2010, capital losses incurred by a Fund after December 31, 2010, will not be subject to expiration. During the Funds' last tax year ended December 31, 2012, there were no post-enactment capital losses generated.
The Funds have elected to defer losses incurred from November 1, 2012 through December 31, 2012, the Funds' last tax year end, in accordance with federal income tax rules. These losses are treated as having arisen on the first day of the current fiscal year. The following Fund has elected to defer losses as follows:
| Diversified Currency Opportunities (JGT) | |||||||
Post-October capital losses | $ | 472,821 | |||||
Late-year ordinary losses | — | ||||||
7. Management Fees and Other Transactions with Affiliates
Each Fund's management fee compensates the Adviser for overall investment advisory and administrative services and general office facilities. The Sub-Adviser is compensated for its services to the Funds from the management fees paid to the Adviser.
Each Fund's management fee consists of two components—a fund-level fee, based only on the amount of assets within each individual Fund, and a complex-level fee, based on the aggregate amount of all eligible fund assets managed by the Adviser. This pricing structure enables each Fund's shareholders to benefit from growth in the assets within their respective Fund as well as from growth in the amount of complex-wide assets managed by the Adviser.
The annual fund-level fee for each Fund, payable monthly, is calculated according to the following schedule:
Average Daily Managed Assets* | Fund-Level Fee Rate | ||||||
For the first $500 million | .7000 | % | |||||
For the next $500 million | .6750 | ||||||
For the next $500 million | .6500 | ||||||
For the next $500 million | .6250 | ||||||
For managed assets over $2 billion | .6000 | ||||||
Nuveen Investments
53
Notes to
FINANCIAL STATEMENTS (Unaudited) (continued)
The annual complex-level fee for each Fund, payable monthly, is calculated according to the following schedule:
Complex-Level Managed Asset Breakpoint Level* | Effective Rate at Breakpoint Level | ||||||
| $55 billion | .2000 | % | |||||
| $56 billion | .1996 | ||||||
| $57 billion | .1989 | ||||||
| $60 billion | .1961 | ||||||
| $63 billion | .1931 | ||||||
| $66 billion | .1900 | ||||||
| $71 billion | .1851 | ||||||
| $76 billion | .1806 | ||||||
| $80 billion | .1773 | ||||||
| $91 billion | .1691 | ||||||
| $125 billion | .1599 | ||||||
| $200 billion | .1505 | ||||||
| $250 billion | .1469 | ||||||
| $300 billion | .1445 | ||||||
* For the fund-level and complex-level fees, managed assets include closed-end fund assets managed by the Adviser that are attributable to financial leverage. For these purposes, financial leverage includes the funds' use of preferred stock and borrowings and certain investments in the residual interest certificates (also called inverse floating rate securities) in tender option bond (TOB) trusts, including the portion of assets held by a TOB trust that has been effectively financed by the trust's issuance of floating rate securities, subject to an agreement by the Adviser as to certain funds to limit the amount of such assets for determining managed assets in certain circumstances. The complex-level fee is calculated based upon the aggregate daily managed assets of all Nuveen Funds that constitute "eligible assets." Eligible assets do not include assets attributable to investments in other Nuveen Funds or assets in excess of $2 billion added to the Nuveen Fund complex in connection with the Adviser's assumption of the management of the former First American Funds effective January 1, 2011. As of June 30, 2013, the complex-level fee rate for each of these Funds was .1679%.
The Funds pay no compensation directly to those of its trustees who are affiliated with the Adviser or to its officers, all of whom receive remuneration for their services to the Funds from the Adviser or its affiliates. The Board of Trustees has adopted a deferred compensation plan for independent trustees that enables trustees to elect to defer receipt of all or a portion of the annual compensation they are entitled to receive from certain Nuveen-advised funds. Under the plan, deferred amounts are treated as though equal dollar amounts had been invested in shares of select Nuveen-advised funds.
8. Borrowing Arrangements
Global Income Opportunities (JGG) has entered into a $67 million (maximum commitment amount) senior committed secured 364-day revolving line of credit ("Borrowings"), renewable annually, with its custodian bank. As of June 30, 2013, the outstanding balance on these Borrowings was $61 million. During the six months ended June 30, 2013, the average daily balance outstanding and annual interest rate on these Borrowings were $61 million and .96%, respectively.
In order to maintain these Borrowings, the Fund must meet certain collateral, asset coverage and other requirements. Borrowings outstanding are fully secured by securities held in the Fund's portfolio of investments.
Interest is charged on these Borrowings at a rate per annum equal to the higher of (a) the overnight LIBOR (London Inter-bank Offered Rate) rate plus .80% or the Federal Funds rate plus .80%. In addition to interest expense, the Fund accrues a 0.15% per annum commitment fee and a .10% per annum facility fee based on the total maximum commitment amount of the Borrowings through the renewal date.
Borrowings outstanding are recognized as "Borrowings" on the Statement of Assets and Liabilities. Interest expense and commitment fees are recognized as a component of "Interest expense on borrowings" on the Statement of Operations.
Nuveen Investments
54
Annual Investment Management
Agreement Approval Process (Unaudited)
The Board of Trustees (each, a "Board" and each Trustee, a "Board Member") of the Funds, including the Board Members who are not parties to the Funds' advisory or sub-advisory agreements or "interested persons" of any such parties (the "Independent Board Members"), is responsible for approving the advisory agreements (each, an "Investment Management Agreement") between each Fund and Nuveen Fund Advisors, LLC (the "Advisor") and the sub-advisory agreements (each, a "Sub-Advisory Agreement") between the Advisor and Nuveen Asset Management, LLC (the "Sub-Advisor") (the Investment Management Agreements and the Sub-Advisory Agreements are referred to collectively as the "Advisory Agreements") and their periodic continuation. Pursuant to the Investment Company Act of 1940, as amended (the "1940 Act"), the Board is required to consider the continuation of the Advisory Agreements on an annual basis. Accordingly, at an in-person meeting held on May 20-22, 2013 (the "May Meeting"), the Board, including a majority of the Independent Board Members, considered and approved the continuation of the Advisory Agreements for the Funds for an additional one-year period.
In preparation for its considerations at the May Meeting, the Board requested and received extensive materials prepared in connection with the review of the Advisory Agreements. The materials provided a broad range of information regarding the Funds, the Advisor and the Sub-Advisor (the Advisor and the Sub-Advisor are collectively, the "Fund Advisers" and each, a "Fund Adviser"). As described in more detail below, the information provided included, among other things, a review of Fund performance, including Fund investment performance assessments against peer groups and appropriate benchmarks; a comparison of Fund fees and expenses relative to peers; a description and assessment of shareholder service levels for the Funds; a summary of the performance of certain service providers; a review of product initiatives and shareholder communications; and an analysis of the Advisor's profitability with comparisons to comparable peers in the managed fund business. As part of its annual review, the Board also held a separate meeting on April 17-18, 2013, to review the Funds' investment performance and consider an analysis provided by the Advisor of the Sub-Advisor which generally evaluated the Sub-Advisor's investment team, investment mandate, organizational structure and history, investment philosophy and process, performance of the applicable Fund, and significant changes to the foregoing. As a result of its review of the materials and discussions, the Board presented the Advisor with questions and the Advisor responded.
The materials and information prepared in connection with the annual review of the Advisory Agreements supplement the information and analysis provided to the Board during the year. In this regard, throughout the year, the Board, acting directly or through its committees, regularly reviews the performance and various services provided by the Advisor and the Sub-Advisor. The Board meets at least quarterly as well as at other times as the need arises. At its quarterly meetings, the Board reviews reports by the Advisor regarding, among other things, fund performance, fund expenses, premium and discount levels of closed-end funds, the performance of the investment teams, and compliance, regulatory and risk management matters. In addition to regular reports, the Advisor provides special reports to the Board or a committee thereof from time to time to enhance the Board's understanding of various topics that impact some or all the Nuveen funds (such as accounting and financial statement presentations of the various forms of leverage that may be used by a closed-end fund or an update on the valuation policies and procedures), to update the Board on regulatory developments impacting the investment company industry or to update the Board on the business plans or other matters impacting the Advisor. The Board also meets with key investment personnel managing the fund portfolios during the year. In October 2011, the Board also created two standing committees (the Open-End Fund Committee and the Closed-End Fund Committee) to assist the full Board in monitoring and gaining a deeper insight into the distinctive business practices of open-end and closed-end funds. These Committees meet prior to each quarterly Board meeting, and the Advisor provides presentations to these Committees permitting them to delve further into specific matters or initiatives impacting the respective product line.
Nuveen Investments
55
Annual Investment Management Agreement
Approval Process (Unaudited) (continued)
In addition, the Board continues its program of seeking to have the Board Members or a subset thereof visit each sub-advisor to the Nuveen funds at least once over a multiple year rotation, meeting with key investment and business personnel. In this regard, the Independent Board Members visited certain of the Sub-Advisor's investment teams in Minneapolis in September 2012, and the Sub-Advisor's municipal team in November 2012. In addition, the ad hoc Securities Lending Committee of the Board met with certain service providers and the Audit Committee of the Board made a site visit to three pricing service providers.
The Board considers the information provided and knowledge gained at these meetings and visits during the year when performing its annual review of the Advisory Agreements. The Independent Board Members also are assisted throughout the process by independent legal counsel. Counsel provided materials describing applicable law and the duties of directors or trustees in reviewing advisory contracts. During the course of the year and during their deliberations regarding the review of advisory contracts, the Independent Board Members met with independent legal counsel in executive sessions without management present. In addition, it is important to recognize that the management arrangements for the Nuveen funds are the result of many years of review and discussion between the Independent Board Members and fund management and that the Board Members' conclusions may be based, in part, on their consideration of fee arrangements and other factors developed in previous years.
The Board considered all factors it believed relevant with respect to each Fund, including among other factors: (a) the nature, extent and quality of the services provided by the Fund Advisers, (b) the investment performance of the Fund and Fund Advisers, (c) the advisory fees and costs of the services to be provided to the Fund and the profitability of the Fund Advisers, (d) the extent of any economies of scale, (e) any benefits derived by the Fund Advisers from the relationship with the Fund and (f) other factors. Each Board Member may have accorded different weight to the various factors in reaching his or her conclusions with respect to a Fund's Advisory Agreements. The Independent Board Members did not identify any single factor as all important or controlling. The Independent Board Members' considerations were instead based on a comprehensive consideration of all the information presented. The principal factors considered by the Board and its conclusions are described below.
A. Nature, Extent and Quality of Services
In considering renewal of the Advisory Agreements, the Independent Board Members considered the nature, extent and quality of the Fund Adviser's services, including advisory services and the resulting Fund performance and administrative services. The Independent Board Members further considered the overall reputation and capabilities of the Advisor and its affiliates, the commitment of the Advisor to provide high quality service to the Funds, their overall confidence in the capability and integrity of the Advisor and its staff and the Advisor's responsiveness to questions and concerns raised by them. The Independent Board Members reviewed materials outlining, among other things, the Fund Adviser's organization and business; the types of services that the Fund Adviser or its affiliates provide to the Funds; the performance record of the applicable Fund (as described in further detail below); and any applicable initiatives Nuveen had taken for the closed-end fund product line.
In considering advisory services, the Board recognized that the Advisor provides various oversight, administrative, compliance and other services for the Funds and the Sub-Advisor generally provides the portfolio investment management services to the Funds. In reviewing the portfolio management services provided to each Fund, the Board reviewed the materials provided by the Nuveen Investment Services Oversight Team analyzing, among other things, the Sub-Advisor's investment team and changes thereto, organization and history, assets under management, the investment team's philosophy and strategies in managing the Fund, developments affecting the Sub-Advisor or Fund and Fund performance. The Independent Board Members also reviewed portfolio manager compensation arrangements to evaluate each Fund Adviser's ability to attract and retain high quality investment personnel, preserve stability, and reward performance but not provide an inappropriate incentive to take undue risks. In addition, the Board considered the Advisor's execution
Nuveen Investments
56
of its oversight responsibilities over the Sub-Advisor. Given the importance of compliance, the Independent Board Members also considered Nuveen's compliance program, including the report of the chief compliance officer regarding the Funds' compliance policies and procedures; the resources dedicated to compliance; and the record of compliance with the policies and procedures. Given the Advisor's emphasis on business risk, the Board also appointed an Independent Board Member as a point person to review and keep the Board apprised of developments in this area during the year.
In addition to advisory services, the Board considered the quality and extent of administrative and other non-investment advisory services the Advisor and its affiliates provide to the Funds, including product management, investment services (such as oversight of investment policies and procedures, risk management, and pricing), fund administration, oversight of service providers, shareholder services and communications, administration of Board relations, regulatory and portfolio compliance, legal support, managing leverage and promoting an orderly secondary market for common shares. The Board further recognized Nuveen's additional investments in personnel, including in compliance and risk management.
In reviewing the services provided, the Board considered the new services and service enhancements that the Advisor has implemented since the various advisory agreements were last reviewed. In reviewing the activities of 2012, the Board recognized the Advisor's focus on product rationalization for both closed-end and open-end funds during the year, consolidating certain Nuveen funds through mergers that were designed to improve efficiencies and economies of scale for shareholders, repositioning various Nuveen funds through updates in their investment policies and guidelines with the expectation of bringing greater value to shareholders, and liquidating certain Nuveen funds. The Board recognized the Advisor's significant investment in technology initiatives to, among other things, create a central repository for fund and other Nuveen product data, develop a group within the Advisor designed to handle and analyze fund performance data, and implement a data system to support the risk oversight group. The Board also recognized the enhancements in the valuation group within the Advisor, including upgrading the team and process and automating certain basic systems, and in the compliance group with the addition of personnel, particularly within the testing group. With the advent of the Open-End Fund Committee and Closed-End Fund Committee, the Board also noted the enhanced support and comprehensive in-depth presentations provided by the Advisor to these committees.
In addition to the foregoing actions, the Board also considered other initiatives related to the Nuveen closed-end funds, including the significant level of oversight and administration necessary to manage leverage that has become increasingly varied and complex and the ongoing redesign of technology systems to manage and track the various forms of leverage; continued capital management services, including developing shelf offering programs for various funds; the implementation of projects designed to enhance data integrity for information published on the web and to increase the use of data received from third parties to gain market intelligence; and the continued communication efforts with shareholders, fund analysts and financial advisers. With respect to the latter, the Independent Board Members noted Nuveen's continued commitment to supporting the secondary market for the common shares of its closed-end funds through a comprehensive secondary market communication program and campaigns designed to raise investor and analyst awareness and understanding of closed-end funds. Nuveen's support services included, among other things: developing materials covering the Nuveen closed-end fund product line and educational materials regarding closed-end funds; designing and executing various marketing campaigns; supporting and promoting the alternative minimum tax (AMT)-free funds; sponsoring and participating in conferences; communicating with closed-end fund analysts and financial advisors throughout the year; providing marketing and product updates for the closed-end funds; and maintaining and enhancing a closed-end fund website.
Based on their review, the Independent Board Members found that, overall, the nature, extent and quality of services provided to the respective Funds under each applicable Advisory Agreement were satisfactory.
Nuveen Investments
57
Annual Investment Management Agreement
Approval Process (Unaudited) (continued)
B. The Investment Performance of the Funds and Fund Advisers
The Board, including the Independent Board Members, considered the performance history of each Fund over various time periods. The Board reviewed reports, including an analysis of the Funds' performance and the applicable investment team. In general, in considering a fund's performance, the Board recognized that a fund's performance can be reviewed through various measures including the fund's absolute return, the fund's return compared to the performance of other peer funds, and the fund's performance compared to its respective benchmark. Accordingly, the Board reviewed, among other things, each Fund's historic investment performance as well as information comparing the Fund's performance information with that of other funds (the "Performance Peer Group") and with recognized and/or customized benchmarks (i.e., benchmarks derived from multiple recognized benchmarks) for the quarter, one-, three- and five-year periods ending December 31, 2012 as well as performance information reflecting the first quarter of 2013. In addition, with respect to closed-end funds (such as the Funds), the Independent Board Members also reviewed historic premium and discount levels, including a summary of actions taken to address or discuss other developments affecting the secondary market discounts of various funds. This information supplemented the fund performance information provided to the Board at each of its quarterly meetings.
In evaluating performance, the Board recognized several factors that may impact the performance data as well as the consideration given to particular performance data. The Board recognized that the performance data reflects a snapshot of time, in this case as of the end of the most recent calendar year or quarter. The Board noted that selecting a different performance period could derive significantly different results. Further, the Board recognized that it is possible that long-term performance can be adversely affected by even one period of significant underperformance so that a single investment decision or theme has the ability to disproportionately affect long-term performance. The Independent Board Members also noted that the investment experience of a particular shareholder in the Nuveen funds will vary depending on when such shareholder invests in the applicable fund, the class held (if multiple classes are offered in a fund) and the performance of the fund (or respective class) during that shareholder's investment period.
With respect to the comparative performance information, the Board recognized that the usefulness of comparative performance data as a frame of reference to measure a fund's performance may be limited because the Performance Peer Group, among other things, does not adequately reflect the objectives and strategies of the fund, has a different investable universe, or the composition of the peer set may be limited in size or number as well as other factors. In this regard, the Board noted that the Advisor classified, in relevant part, the Performance Peer Groups of certain funds as having significant differences from the funds but to still be somewhat relevant while the Performance Peer Groups of other funds (including the Funds) were classified as having such significant differences as to be irrelevant. Accordingly, while the Board is cognizant of the relative performance of a fund's peer set and/or benchmark(s), the Board evaluated fund performance in light of the respective fund's investment objectives, investment parameters and guidelines and considered that the variations between the objectives and investment parameters or guidelines of the funds with their peers and/or benchmarks result in differences in performance results. In addition, with respect to any Nuveen funds for which the Board has identified performance concerns, the Board monitors such funds closely until performance improves, discusses with the Advisor the reasons for such results, considers those steps necessary or appropriate to address such issues, and reviews the results of any efforts undertaken.
In considering the performance data for the Funds, given that, as noted above, their Performance Peer Groups were classified as irrelevant, limiting the usefulness of the peer comparison data, the Board also considered each Fund's performance compared to its benchmark. In this regard, the Independent Board Members noted that the Nuveen Diversified Currency Opportunities Fund (the "Diversified Currency Fund") outperformed its benchmark over the one-, three- and five-year periods, while the Nuveen Global Income Opportunities Fund (the "Global Income Fund") outperformed its benchmark over the one- and three-year periods and provided generally comparable performance to its benchmark in the five-year period.
Nuveen Investments
58
Based on their review, the Independent Board Members determined that each Fund's investment performance had been satisfactory.
C. Fees, Expenses and Profitability
1. Fees and Expenses
The Board evaluated the management fees and expenses of each Fund reviewing, among other things, the Fund's gross management fee, net management fee and net expense ratio in absolute terms as well as compared to the fees and expenses of a comparable universe of funds provided by an independent fund data provider (the "Peer Universe") and any expense limitations.
The Independent Board Members further reviewed the methodology regarding the construction of the applicable Peer Universe. In reviewing the comparisons of fee and expense information, the Independent Board Members took into account that in certain instances various factors such as: the limited size and particular composition of the Peer Universe (including the inclusion of other Nuveen funds in the peer set); expense anomalies; changes in the funds comprising the Peer Universe from year to year; levels of reimbursement or fee waivers; the timing of information used; and the differences in the type and use of leverage may impact the comparative data, thereby limiting somewhat the ability to make a meaningful comparison with peers.
In reviewing the fee schedule for a Fund, the Independent Board Members also considered the fund-level and complex-wide breakpoint schedules (described in further detail below) and any fee waivers and reimbursements provided by Nuveen. In reviewing fees and expenses (excluding leverage costs and leveraged assets, as applicable), the Board considered the expenses and fees to be higher if they were over 10 basis points higher, slightly higher if they were approximately 6 to 10 basis points higher, in line if they were within approximately 5 basis points higher than the peer average and below if they were below the peer average of the Peer Universe. In reviewing the reports, the Board noted that the majority of the Nuveen funds were at, close to or below their peer set average based on the net total expense ratio.
The Independent Board Members noted that the Diversified Currency Fund had a net management fee in line with, and a net expense ratio (including fee waivers and expense reimbursements) below, its peer averages. In addition, the Independent Board Members noted that the Global Income Fund had a net management fee and net expense ratio that were slightly higher than its peer averages, and observed that for this Fund, the peer group was small, limiting the usefulness of the comparative data.
Based on their review of the fee and expense information provided, the Independent Board Members determined that each Fund's management fees were reasonable in light of the nature, extent and quality of services provided to the Fund.
2. Comparisons with the Fees of Other Clients
The Board recognized that all Nuveen funds have a sub-advisor (which, in the case of the Funds, is an affiliated sub-advisor), and therefore, the overall fund management fee can be divided into two components, the fee retained by the Advisor and the fee paid to the sub-advisor. In general terms, the fee to the Advisor reflects the administrative services it provides to support the funds, and while some administrative services may occur at the sub-advisor level, the fee generally reflects the portfolio management services provided by the sub-advisor. The Independent Board Members reviewed information regarding the nature of services provided by the Advisor including through the Sub-Advisor, and the range of fees and average fee the Sub-Advisor assessed for such services to other clients. Such other clients include separately managed accounts (both retail and institutional accounts), foreign investment funds offered by Nuveen and funds that are not offered by Nuveen but are sub-advised by one of Nuveen's investment management teams. In evaluating the comparisons of fees, the Independent Board Members noted that the fee rates
Nuveen Investments
59
Annual Investment Management Agreement
Approval Process (Unaudited) (continued)
charged to the Funds and other clients vary, among other things, because of the different services involved and the additional regulatory and compliance requirements associated with registered investment companies, such as the Funds. Accordingly, the Independent Board Members considered the differences in the product types, including, but not limited to, the services provided, the structure and operations, product distribution and costs thereof, portfolio investment policies, investor profiles, account sizes and regulatory requirements. The Independent Board Members noted, in particular, that the range of services provided to the Funds (as discussed above) is much more extensive than that provided to separately managed accounts. Many of the additional administrative services provided by the Advisor are not required for institutional clients. The Independent Board Members further noted that the management fee rates of the foreign funds advised by the Advisor may vary due to, among other things, differences in the client base, governing bodies, operational complexities and services covered by the management fee. Given the inherent differences in the various products, particularly the extensive services provided to the Funds, the Independent Board Members believe such facts justify the different levels of fees.
3. Profitability of Fund Advisers
In conjunction with their review of fees, the Independent Board Members also considered the profitability of Nuveen for its advisory activities and its financial condition. The Independent Board Members reviewed the revenues and expenses of Nuveen's advisory activities for the last two calendar years, the allocation methodology used in preparing the profitability data and an analysis of the key drivers behind the changes in revenues and expenses that impacted profitability in 2012. The Independent Board Members noted this information supplemented the profitability information requested and received during the year to help keep them apprised of developments affecting profitability (such as changes in fee waivers and expense reimbursement commitments). In this regard, the Independent Board Members noted that they have an Independent Board Member serve as a point person to review and keep them apprised of changes to the profitability analysis and/or methodologies during the year. The Independent Board Members also considered Nuveen's revenues for advisory activities, expenses, and profit margin compared to that of various unaffiliated management firms with comparable assets under management (based on asset size and asset composition).
In reviewing profitability, the Independent Board Members recognized the Advisor's continued investment in its business to enhance its services, including capital improvements to investment technology, updated compliance systems, and additional personnel. In addition, in evaluating profitability, the Independent Board Members also recognized the subjective nature of determining profitability which may be affected by numerous factors including the allocation of expenses and that various allocation methodologies may each be reasonable but yield different results. Further, the Independent Board Members recognized the difficulties in making comparisons as the profitability of other advisers generally is not publicly available and the profitability information that is available for certain advisers or management firms may not be representative of the industry and may be affected by, among other things, the adviser's particular business mix, capital costs, types of funds managed and expense allocations. Notwithstanding the foregoing, the Independent Board Members reviewed Nuveen's methodology and assumptions for allocating expenses across product lines to determine profitability. Based on their review, the Independent Board Members concluded that the Advisor's level of profitability for its advisory activities was reasonable in light of the services provided.
The Independent Board Members also reviewed the Sub-Advisor's revenues, expenses and profitability margins (pre- and post-tax) for its advisory activities and the methodology used for allocating expenses among the internal sub-advisors. Based on their review, the Independent Board Members were satisfied that the Sub-Advisor's level of profitability was reasonable in light of the services provided.
Nuveen Investments
60
In evaluating the reasonableness of the compensation, the Independent Board Members also considered other amounts paid to a Fund Adviser by the Funds as well as indirect benefits (such as soft dollar arrangements), if any, the Fund Adviser and its affiliates receive, or are expected to receive, that are directly attributable to the management of the Funds. See Section E below for additional information on indirect benefits a Fund Adviser may receive as a result of its relationship with the Funds. Based on their review of the overall fee arrangements of each Fund, the Independent Board Members determined that the advisory fees and expenses of the respective Fund were reasonable.
D. Economies of Scale and Whether Fee Levels Reflect These Economies of Scale
With respect to economies of scale, the Independent Board Members have recognized the potential benefits resulting from the costs of a fund being spread over a larger asset base, although economies of scale are difficult to measure and predict with precision, particularly on a fund-by-fund basis. One method to help ensure the shareholders share in these benefits is to include breakpoints in the advisory fee schedule. Generally, management fees for funds in the Nuveen complex are comprised of a fund-level component and a complex-level component, subject to certain exceptions. Accordingly, the Independent Board Members reviewed and considered the applicable fund-level breakpoints in the advisory fee schedules that reduce advisory fees as asset levels increase. Further, the Independent Board Members noted that although closed-end funds may from time-to-time make additional share offerings, the growth of their assets will occur primarily through the appreciation of such funds' investment portfolio.
In addition to fund-level advisory fee breakpoints, the Board also considered the Funds' complex-wide fee arrangement. Pursuant to the complex-wide fee arrangement, the fees of the funds in the Nuveen complex are generally reduced as the assets in the fund complex reach certain levels. The complex-wide fee arrangement seeks to provide the benefits of economies of scale to fund shareholders when total fund complex assets increase, even if assets of a particular fund are unchanged or have decreased. The approach reflects the notion that some of Nuveen's costs are attributable to services provided to all its funds in the complex and therefore all funds benefit if these costs are spread over a larger asset base. In addition, with the acquisition of the funds previously advised by FAF Advisors, Inc. at the end of 2010, the Board noted that a portion of such funds' assets at the time of acquisition were deemed eligible to be included in the complex-wide fee calculation in order to deliver fee savings to shareholders in the combined complex and such funds were subject to differing complex-level fee rates.
Based on their review, the Independent Board Members concluded that the breakpoint schedules and complex-wide fee arrangement were acceptable and reflect economies of scale to be shared with shareholders when assets under management increase.
E. Indirect Benefits
In evaluating fees, the Independent Board Members received and considered information regarding potential "fall out" or ancillary benefits the respective Fund Adviser or its affiliates may receive as a result of its relationship with each Fund. In this regard, the Independent Board Members considered any revenues received by affiliates of the Advisor for serving as co-manager in initial public offerings of new closed-end funds as well as revenues received in connection with secondary offerings.
In addition to the above, the Independent Board Members considered whether the Fund Advisers received any benefits from soft dollar arrangements whereby a portion of the commissions paid by a Fund for brokerage may be used to acquire research that may be useful to the Fund Adviser in managing the assets of the Funds and other clients. The Funds' portfolio transactions are determined by the Sub-Advisor. Accordingly, the Independent Board Members considered that the Sub-Advisor may benefit from its soft dollar arrangements pursuant to which it receives research from brokers that execute the Funds' portfolio transactions. With respect to fixed income securities, however, the Board recognized that such securities generally trade on a principal basis that does not generate soft dollar credits. Nevertheless, the Sub-Advisor may also
Nuveen Investments
61
Annual Investment Management Agreement
Approval Process (Unaudited) (continued)
engage in soft dollar arrangements on behalf of other clients, and the Funds as well as the Sub-Advisor may benefit from the research or other services received. Similarly, the Board recognized that the research received pursuant to soft dollar arrangements by the Sub-Advisor may also benefit a Fund and shareholders to the extent the research enhances the ability of the Sub-Advisor to manage the Fund. The Independent Board Members noted that the Sub-Advisor's profitability may be somewhat lower if it did not receive the research services pursuant to the soft dollar arrangements and had to acquire such services directly.
Based on their review, the Independent Board Members concluded that any indirect benefits received by a Fund Adviser as a result of its relationship with the Funds were reasonable and within acceptable parameters.
F. Other Considerations
The Independent Board Members did not identify any single factor discussed previously as all-important or controlling. The Board Members, including the Independent Board Members, unanimously concluded that the terms of each Advisory Agreement are fair and reasonable, that the respective Fund Adviser's fees are reasonable in light of the services provided to each Fund and that the Advisory Agreements be renewed.
Nuveen Investments
62
Reinvest Automatically,
Easily and Conveniently
Nuveen makes reinvesting easy. A phone call is all it takes to set up your reinvestment account.
Nuveen Closed-End Funds Automatic Reinvestment Plan
Your Nuveen Closed-End Fund allows you to conveniently reinvest distributions in additional Fund shares.
By choosing to reinvest, you'll be able to invest money regularly and automatically, and watch your investment grow through the power of compounding. Just like distributions in cash, there may be times when income or capital gains taxes may be payable on distributions that are reinvested.
It is important to note that an automatic reinvestment plan does not ensure a profit, nor does it protect you against loss in a declining market.
Easy and convenient
To make recordkeeping easy and convenient, each quarter you'll receive a statement showing your total distributions, the date of investment, the shares acquired and the price per share, and the total number of shares you own.
How shares are purchased
The shares you acquire by reinvesting will either be purchased on the open market or newly issued by the Fund. If the shares are trading at or above net asset value at the time of valuation, the Fund will issue new shares at the greater of the net asset value or 95% of the then-current market price. If the shares are trading at less than net asset value, shares for your account will be purchased on the open market. If the Plan Agent begins purchasing Fund shares on the open market while shares are trading below net asset value, but the Fund's shares subsequently trade at or above their net asset value before the Plan Agent is able to complete its purchases, the Plan Agent may cease open-market purchases and may invest the uninvested portion of the distribution in newly-issued Fund shares at a price equal to the greater of the shares' net asset value or 95% of the shares' market value on the last business day immediately prior to the purchase date. Distributions received to purchase shares in the open market will normally be invested shortly after the distribution payment date. No interest will be paid on distributions awaiting reinvestment. Because the market price of the shares may increase before purchases are completed, the average purchase price per share may exceed the market price at the time of valuation, resulting in the acquisition of fewer shares than if the distribution had been paid in shares issued by the Fund. A pro rata portion of any applicable brokerage commissions on open market purchases will be paid by Plan participants. These commissions usually will be lower than those charged on individual transactions.
Flexible
You may change your distribution option or withdraw from the Plan at any time, should your needs or situation change.
You can reinvest whether your shares are registered in your name, or in the name of a brokerage firm, bank, or other nominee. Ask your investment advisor if his or her firm will participate on your behalf. Participants whose shares are registered in the name of one firm may not be able to transfer the shares to another firm and continue to participate in the Plan.
The Fund reserves the right to amend or terminate the Plan at any time. Although the Fund reserves the right to amend the Plan to include a service charge payable by the participants, there is no direct service charge to participants in the Plan at this time.
Call today to start reinvesting distributions
For more information on the Nuveen Automatic Reinvestment Plan or to enroll in or withdraw from the Plan, speak with your financial advisor or call us at (800) 257-8787.
Nuveen Investments
63
Glossary of Terms
Used in this Report
• Average Annual Total Return: This is a commonly used method to express an investment's performance over a particular, usually multi-year time period. It expresses the return that would have been necessary each year to equal the investment's actual cumulative performance (including change in NAV or market price and reinvested dividends and capital gains distributions, if any) over the time period being considered.
• Barclays Global Aggregate Bond Index: An index that provides a broad-based measure of the global investment-grade fixed income markets. Index returns assume reinvestment of distributions, but do not reflect any applicable sales charges.
• Comparative Benchmark: A 50% blend of the 1) Citigroup Non-US World Government Bond 1-3 Year Index: an index of fixed rate government bonds with a maturity of one year or longer and amounts outstanding of at least U.S. $25 million and 2) JPMorgan Emerging Local Markets Index Plus: an index that tracks total returns for local-currency-denominated money market instruments. It consists of foreign exchange forward contracts laddered with maturities ranging from one to three months. Country weights are based on a trade-weighted allocation, with maximum weight of 10% for countries with convertible currencies and 2% for countries with non-convertible currencies. Index returns assume reinvestment of distributions, but do not reflect any applicable sales charges or management fees.
• Current Distribution Rate: Current distribution rate is based on the Fund's current annualized quarterly distribution divided by the Fund's current market price. The Fund's quarterly distributions to its shareholders may be comprised of ordinary income, net realized capital gains and, if at the end of the calendar year the Fund's cumulative net ordinary income and net realized gains are less than the amount of the Fund's distributions, a tax return of capital.
• Duration: Duration is a measure of the expected period over which a bond's principal and interest will be paid, and consequently is a measure of the sensitivity of a bond's or bond Fund's value to changes when market interest rates change. Generally, the longer a bond's or Fund's duration, the more the price of the bond or Fund will change as interest rates change.
• Gross Domestic Product (GDP): The total market value of all final goods and services produced in a country/region in a given year, equal to total consumer, investment and government spending, plus the value of exports, minus the value of imports.
• Leverage: Using borrowed money to invest in securities or other assets, seeking to increase the return of an investment or portfolio.
• Net Asset Value (NAV): The net market value of all securities held in a portfolio.
• Net Asset Value (NAV) Per Share: The market value of one share of a mutual fund or closed-end fund. For a Fund, the NAV is calculated daily by taking the Fund's total assets (securities, cash, and accrued earnings), subtracting the Fund's liabilities, and dividing by the number of shares outstanding.
• S&P 500® Index: An unmanaged index generally considered representative of the U.S. stock market. Index returns assume reinvestment of distributions, but do not include the effects of any applicable sales charges or management fees.
Nuveen Investments
64
Intentionally Left Blank
Nuveen Investments
65
Intentionally Left Blank
Nuveen Investments
66
Additional Fund Information
Board of Trustees
John P. Amboian
Robert P. Bremner
Jack B. Evans
William C. Hunter
David J. Kundert
William J. Schneider
Judith M. Stockdale
Carole E. Stone
Virginia L. Stringer
Terence J. Toth
Fund Manager
Nuveen Fund Advisors, LLC
333 West Wacker Drive
Chicago, IL 60606
Custodian
State Street Bank & Trust Company
Boston, MA
Transfer Agent and
Shareholder Services
State Street Bank & Trust Company
Nuveen Funds
P.O. Box 43071
Providence, RI 02940-3071
(800) 257-8787
Legal Counsel
Chapman and Cutler LLP
Chicago, IL
Independent Registered
Public Accounting Firm
PricewaterhouseCoopers LLP
Chicago, IL
Quarterly Form N-Q Portfolio of Investments Information
Each Fund is required to file its complete schedule of portfolio holdings with the Securities and Exchange Commission (SEC) for the first and third quarters of each fiscal year on Form N-Q. You may obtain this information directly from the SEC. Visit the SEC on-line at http://www.sec.gov or in person at the SEC's Public Reference Room in Washington, D.C. Call the SEC toll-free at (800) SEC -0330 for room hours and operation.
Nuveen Funds' Proxy Voting Information
You may obtain (i) information regarding how each fund voted proxies relating to portfolio securities held during the most recent twelve-month period ended June 30, without charge, upon request, by calling Nuveen Investments toll-free at (800) 257-8787 or on Nuveen's website at www.nuveen.com and (ii) a description of the policies and procedures that each fund used to determine how to vote proxies relating to portfolio securities without charge, upon request, by calling Nuveen Investments toll free at (800) 257-8787. You may also obtain this information directly from the SEC. Visit the SEC on-line at http://www.sec.gov.
CEO Certification Disclosure
Each Fund's Chief Executive Officer has submitted to the New York Stock Exchange (NYSE) the annual CEO certification as required by Section 303A.12(a) of the NYSE Listed Company Manual.
Each Fund has filed with the SEC the certification of its Chief Executive Officer and Chief Financial Officer required by Section 302 of the Sarbanes-Oxley Act.
Share Information
Each Fund intends to repurchase shares of its own common stock in the future at such times and in such amounts as is deemed advisable. During the period covered by this report, the Funds repurchased shares of their common stock as shown in the accompanying table.
Fund | Shares Repurchased | ||||||
JGG | — | ||||||
JGT | 225,124 | ||||||
Any future repurchases will be reported to shareholders in the next annual or semi-annual report.
Nuveen Investments
67
Nuveen Investments:
Serving Investors for Generations
Since 1898, financial advisors and their clients have relied on Nuveen Investments to provide dependable investment solutions through continued adherence to proven, long-term investing principles. Today, we offer a range of high quality equity and fixed-income solutions designed to be integral components of a well-diversified core portfolio.
Focused on meeting investor needs.
Nuveen Investments provides high-quality investment services designed to help secure the long-term goals of institutional and individual investors as well as the consultants and financial advisors who serve them. Nuveen Investments markets a wide range of specialized investment solutions which provide investors access to capabilities of its high-quality boutique investment affiliates—Nuveen Asset Management, Symphony Asset Management, NWQ Investment Management Company, Santa Barbara Asset Management, Tradewinds Global Investors, Winslow Capital Management and Gresham Investment Management. In total, Nuveen Investments managed approximately $216 billion as of June 30, 2013.
Find out how we can help you.
To learn more about how the products and services of Nuveen Investments may be able to help you meet your financial goals, talk to your financial advisor, or call us at (800) 257-8787. Please read the information provided carefully before you invest. Investors should consider the investment objective and policies, risk considerations, charges and expenses of any investment carefully. Where applicable, be sure to obtain a prospectus, which contains this and other relevant information. To obtain a prospectus, please contact your securities representative or Nuveen Investments, 333 W. Wacker Dr., Chicago, IL 60606. Please read the prospectus carefully before you invest or send money.
Learn more about Nuveen Funds at: www.nuveen.com/cef
Distributed by
Nuveen Securities, LLC
333 West Wacker Drive
Chicago, IL 60606
www.nuveen.com/cef
ESA-G-0613D
ITEM 2. CODE OF ETHICS.
Not applicable to this filing.
ITEM 3. AUDIT COMMITTEE FINANCIAL EXPERT.
Not applicable to this filing.
ITEM 4. PRINCIPAL ACCOUNTANT FEES AND SERVICES.
Not applicable to this filing.
ITEM 5. AUDIT COMMITTEE OF LISTED REGISTRANTS.
Not applicable to this filing.
ITEM 6. SCHEDULE OF INVESTMENTS.
(a) See Portfolio of Investments in Item 1.
(b) Not applicable.
ITEM 7. DISCLOSURE OF PROXY VOTING POLICIES AND PROCEDURES FOR CLOSED-END MANAGEMENT INVESTMENT COMPANIES.
Not applicable to this filing.
ITEM 8. PORTFOLIO MANAGERS OF CLOSED-END MANAGEMENT INVESTMENT COMPANIES.
Not applicable to this filing.
ITEM 9. PURCHASES OF EQUITY SECURITIES BY CLOSED-END MANAGEMENT INVESTMENT COMPANY AND AFFILIATED PURCHASERS.
|
|
|
| (b) |
| (c) |
| (d)* |
| |
|
| (a) |
| AVERAGE |
| TOTAL NUMBER OF SHARES |
| MAXIMUM NUMBER (OR |
| |
|
| TOTAL NUMBER OF |
| PRICE |
| (OR UNITS) PURCHASED AS |
| APPROXIMATE DOLLAR VALUE) OF |
| |
|
| SHARES (OR |
| PAID PER |
| PART OF PUBLICLY |
| SHARES (OR UNITS) THAT MAY YET |
| |
|
| UNITS) |
| SHARE (OR |
| ANNOUNCED PLANS OR |
| BE PURCHASED UNDER THE PLANS OR |
| |
Period* |
| PURCHASED |
| UNIT) |
| PROGRAMS |
| PROGRAMS |
| |
|
|
|
|
|
|
|
|
|
| |
JANUARY 1-31, 2013 |
| 76,924 |
| $ | 13.15 |
| 76,924 |
| 4,184,466 |
|
|
|
|
|
|
|
|
|
|
| |
FEBRUARY 1-28, 2013 |
| 0 |
|
|
| 0 |
| 4,184,466 |
| |
|
|
|
|
|
|
|
|
|
| |
MARCH 1-31, 2013 |
| 0 |
|
|
| 0 |
| 4,184,466 |
| |
|
|
|
|
|
|
|
|
|
| |
APRIL 1-30, 2013 |
| 11,200 |
| $ | 12.98 |
| 11,200 |
| 4,173,266 |
|
|
|
|
|
|
|
|
|
|
| |
MAY 1-31, 2013 |
| 35,600 |
| $ | 13.06 |
| 35,600 |
| 4,137,666 |
|
|
|
|
|
|
|
|
|
|
| |
JUNE 1-30, 2013 |
| 101,400 |
| $ | 11.37 |
| 101,400 |
| 4,036,266 |
|
|
|
|
|
|
|
|
|
|
| |
TOTAL |
| 225,124 |
|
|
|
|
|
|
| |
* The registrant’s repurchase program, for the repurchase of 4,295,000 shares, was authorized November 15, 2012. Any repurchases made by the registrant pursuant to the program were made through open-market transactions.
ITEM 10. SUBMISSION OF MATTERS TO A VOTE OF SECURITY HOLDERS.
There have been no material changes to the procedures by which shareholders may recommend nominees to the registrant’s Board implemented after the registrant last provided disclosure in response to this Item.
ITEM 11. CONTROLS AND PROCEDURES.
(a) The registrant’s principal executive and principal financial officers, or persons performing similar functions, have concluded that the registrant’s disclosure controls and procedures (as defined in Rule 30a-3(c) under the Investment Company Act of 1940, as amended (the “1940 Act”) (17 CFR 270.30a-3(c))) are effective, as of a date within 90 days of the filing date of this report that includes the disclosure required by this paragraph, based on their evaluation of the controls and procedures required by Rule 30a-3(b) under the 1940 Act (17 CFR 270.30a-3(b)) and Rules 13a-15(b) or 15d-15(b) under the Securities Exchange Act of 1934, as amended (the “Exchange Act”)(17 CFR 240.13a-15(b) or 240.15d-15(b)).
(b) There were no changes in the registrant’s internal control over financial reporting (as defined in Rule 30a-3(d) under the 1940 Act (17 CFR 270.30a-3(d)) that occurred during the second fiscal quarter of the period covered by this report that has materially affected, or is reasonably likely to materially affect, the registrant’s internal control over financial reporting.
ITEM 12. EXHIBITS.
File the exhibits listed below as part of this Form.
(a)(1) | Any code of ethics, or amendment thereto, that is the subject of the disclosure required by Item 2, to the extent that the registrant intends to satisfy the Item 2 requirements through filing of an exhibit: Not applicable to this filing. |
|
|
(a)(2) | A separate certification for each principal executive officer and principal financial officer of the registrant as required by Rule 30a-2(a) under the 1940 Act (17 CFR 270.30a-2(a)) in the exact form set forth below: See Ex-99.CERT attached hereto. |
|
|
(a)(3) | Any written solicitation to purchase securities under Rule 23c-1 under the 1940 Act (17 CFR 270.23c-1) sent or given during the period covered by the report by or on behalf of the registrant to 10 or more persons: Not applicable. |
|
|
(b) | If the report is filed under Section 13(a) or 15(d) of the Exchange Act, provide the certifications required by Rule 30a-2(b) under the 1940 Act (17 CFR 270.30a-2(b)); Rule 13a-14(b) or Rule 15d-14(b) under the Exchange Act (17 CFR 240.13a-14(b) or 240.15d-14(b)), and Section 1350 of Chapter 63 of Title 18 of the United States Code (18 U.S.C. 1350) as an exhibit. A certification furnished pursuant to this paragraph will not be deemed “filed” for purposes of Section 18 of the Exchange Act (15 U.S.C. 78r), or otherwise subject to the liability of that section. Such certification will not be deemed to be incorporated by reference into any filing under the Securities Act of 1933 or the Exchange Act, except to the extent that the registrant specifically incorporates it by reference: See Ex-99.906 CERT attached hereto. |
SIGNATURES
Pursuant to the requirements of the Securities Exchange Act of 1934 and the Investment Company Act of 1940, the registrant has duly caused this report to be signed on its behalf by the undersigned, thereunto duly authorized.
(Registrant) Nuveen Diversified Currency Opportunities Fund
By (Signature and Title) | /s/ Kevin J. McCarthy |
|
| Kevin J. McCarthy |
|
| (Vice President and Secretary) |
|
Date: September 5, 2013
Pursuant to the requirements of the Securities Exchange Act of 1934 and the Investment Company Act of 1940, this report has been signed below by the following persons on behalf of the registrant and in the capacities and on the dates indicated.
By (Signature and Title) | /s/ Gifford R. Zimmerman |
|
| Gifford R. Zimmerman |
|
| Chief Administrative Officer |
|
| (principal executive officer) |
|
Date: September 5, 2013
By (Signature and Title) | /s/ Stephen D. Foy |
|
| Stephen D. Foy |
|
| Vice President and Controller |
|
| (principal financial officer) |
|
Date: September 5, 2013