| |
| sales gains. Strong underlying fundamentals of the business and improved cash burn trends are bringing the company closer to being cash flow positive in 2012. |
| |
• | CapitaCommercial Trust, an SREIT and one of the largest office landlords in Singapore, represented an average portfolio weighting of 2.42% during the period. Greater than expected weakness in the Singapore market due to fears that the Euro crisis might hurt the financial service sectors and lead to negative rental reversions has hurt shares. |
| |
• | Direcional Engenharia is the only publicly traded residential developer focusing on the lowest tier of the Brazilian government’s Minha Casa, Minha Vida low income housing program and represented a 1.24% average weighting in the portfolio. The company’s strong management team and proven execution abilities as well as high relative ROE were unable to outweigh the impact of low liquidity and overall negative sentiment toward the sector in general. |
| |
• | Westfield Group represented a 1.04% average weighting in the portfolio. The Australian REIT is one of the preeminent retail property groups in the world with operations across six countries. Overall negative trends in the retail environment, the impact of the closing of Borders in the U.S., as well as near term refinancing needs and funding issues for an aggressive development pipeline have weighed on the shares. However, having recently visited Westfield’s newly-opened Stratford City (London) project, we remain comfortable with our view of Westfield’s execution and management capabilities. |
| |
• | Housing Development and Infrastructure (HDIL), an Indian real estate developer focused in Mumbai Metropolitan Region, represented an average portfolio weighting of 0.45%. Supply side constraints have sustained high inflation levels and an aggressive tightening response from India’s Central Bank created a substantial liquidity shortage for developers and buyers, resulting in a marked slowdown in the residential market. A depreciating currency and a lack of clarity on the regulatory front exacerbated the impact of a strained macro environment and tough fundamentals. HDIL was also recently dropped from the MSCI Global Index. The shares were sold before fiscal year end. |
2012 and Beyond
Given the economic uncertainty which we described in the President’s letter to shareholders, it is too early to declare an ‘All Clear’ for investors. That said, we believe many equity valuations are historically inexpensive and there remain pockets of growth on both regional and sectoral basis. Thus, the realization of these values becomes a matter of waiting for catalysts. Meanwhile, the synchronized directionality which possessed the capital markets from July through October, started to breakdown recently as individual stocks and exchanges have begun to respond to local as opposed to global factors. Alpine believes that the prospect of a stabilization of the sovereign debt crisis in Europe will lead to a
reduction in perceived risk, which should serve as a catalyst for a return of investment into the equity markets, and more specifically, emerging markets and sectors with perceived higher volatility. While so called ‘risk-on’ trades in positive cyclical stocks may be the first to recover, recapitalizations and possible mergers and acquisitions may create opportunities in slow growth economies in Europe. We expect greater clarity on the current investment climate over the next few months. Hopefully, we will be able to report on such events by our next report to shareholders.
Till then, the Fund anticipates that a sizeable portion of our total return will be derived from the high level of distributions that the Fund is currently paying to shareholders.
Sincerely,
Samuel A. Lieber
Joel E.D. Wells
Bruce Ebnother
Portfolio Managers
Past performance is not a guarantee of future results.
Please refer to the schedule of investments for fund holding information. Fund holdings and sector allocations are subject to change and should not be considered a recommendation to buy or sell any security. Current and future portfolio holdings are subject to risk.
Diversification does not assure a profit nor protect against loss in a declining market.
This letter represents the opinions of the Fund’s management and is subject to change, is not guaranteed and should not be considered investment advice.
This is provided to you for informational purposes only, and should not be considered tax advice. Please consult your tax advisor for further assistance.
Equity Securities Risk — The stock or other security of a company may not perform as well as expected, and may decrease in value, because of factors related to the company (such as poorer than expected earnings or certain management decisions) or to the industry in which the company is engaged (such as a reduction in the demand for products or services in a particular industry).
Foreign Securities Risk — Public information available concerning foreign issuers may be more limited than would be with respect to domestic issuers. Different accounting standards may be used by foreign issuers, and foreign trading markets may not be as liquid as U.S. markets. Additionally, foreign securities also involve currency fluctuation risk, possible imposition of withholding or confiscatory taxes and adverse political or economic developments. These risks may be greater in emerging markets.
Growth Stock Risk — Growth stocks typically are very sensitive to market movements because their market prices tend to reflect future expectations. When it appears those expectations will not be met, the
| |
Manager Commentary | 
|
| | |
October 31, 2011 | |
prices of growth stocks typically fall. Growth stocks as a group may be out of favor and underperform the overall equity market while the market concentrates on undervalued stocks.
Leverage Risk — Leverage creates the likelihood of greater volatility of net asset value; the possibility either that share income will fall if the interest rate on any borrowings rises, or that share income and distributions will fluctuate because the interest rate on any borrowings varies; and if the Fund leverages through borrowings, the Fund may not be permitted to declare dividends or other distributions with respect to its common shares or purchase its capital stock, unless at the time thereof the Fund meets certain asset coverage requirements. The Adviser in its best judgment nevertheless may determine to maintain the Fund’s leveraged position if it deems such action to be appropriate in the circumstances.
Management Risk — The Adviser’s judgment about the quality, relative yield or value of, or market trends affecting, a particular security or sector, or about interest rates generally, may be incorrect. The Adviser’s security selections and other investment decisions might produce losses or cause the Fund to underperform when compared to other funds with similar investment objectives and strategies.
Market Risk — The price of a security held by the Fund may fall due to changing market, economic or political conditions.
Micro Capitalization Company Risk — Investments in micro-cap companies are associated with similar risks as investments in small and medium capitalization companies, but these risks may be even greater with respect to investments in micro-cap companies.
Real Estate Investment Trusts (“REITs”) Risk — REITs’ share prices may decline because of adverse developments affecting the real estate industry including changes in interest rates. The returns from REITs may trail returns from the overall market. Additionally, there is always a risk that a given REIT will fail to qualify for favorable tax treatment.
Real Estate-Linked Securities Market Risk — Risks associated with investment in securities of companies in the real estate industry include: declines in the value of real estate; risks related to local economic conditions, overbuilding and increased competition; increases in property taxes and operating laws; casualty or condemnation losses; variations in rental income, neighborhood values or the appeal of properties to tenants; changes in interest rates and changes in general economic and market conditions.
Small and Medium Capitalization Company Risk — Securities of small or medium capitalization companies are more likely to experience sharper swings in market values, less liquid markets, in which it may be more difficult for the Adviser to sell at times and at prices that the Adviser believes appropriate and generally are more volatile than those of larger companies.
Undervalued Stock Risk — Undervalued stocks may perform differently from the market as a whole and may continue to be undervalued by the expenses; changes in zoning market for long periods of time
Initial Public Offerings Risk — The Fund may invest a portion of its assets in shares of IPOs. IPOs may have a magnified impact on the performance of a Fund with a small asset base. The impact of IPOs on a Fund’s performance likely will decrease as the Fund’s asset size increases, which could reduce the Fund’s returns. IPOs may not be consistently available to a Fund for investing. IPO shares frequently are volatile in price due to the absence of a prior public market, the small number of shares available for trading and limited information about the issuer. Therefore, a Fund may hold IPO shares for a very short period of time. This may increase the turnover of a Fund and may lead to increased expenses for a Fund, such as commissions and transaction costs. In addition, IPO shares can experience an immediate drop in value if the demand for the securities does not continue to support the offering price.
The following are definitions of some of the terms used in this report:
Price/Earnings Ratio (P/E) is a valuation ratio of a company’s current share price compared to its per-share earnings. Normalized earnings — earnings metric that shows you want earnings look like smoothed out in the long run, taking into account the cyclical changes in an economy or stock.
EBITDA (Earnings Before Interest, Taxes, Depreciation, and Amortization) is essentially Net Income with interest, taxes, depreciation, and amortization added back to it. EBITDA can be used to analyze and compare profitability between companies and industries because it eliminates the effects of financing and accounting decisions. However, this is a non-GAAP measure that allows a greater amount of discretion as to what is (and is not) included in the calculation. This also means that companies often change the items included in their EBITDA calculation from one reporting period to the next.
Enterprise Value — is a measure of a company’s value. It is calculated as market cap plus debt, minority interest and preferred shares, minus total cash and cash equivalents.
Book Value — is the accounting value of the firm. It is calculated as total assets minus intangible assets and liabilities.
Return on Equity (ROE) — is the amount of net income returned as a percentage of shareholders equity. Return on equity measures a corporation’s profitability by revealing how much profit a company generates with the money shareholders have invested.
Real Estate Investment Trust (REIT) — is a security that trades like a stock on the major exchanges and invests in real estate directly, either through properties or mortgages. REITs receive special tax considerations and typically offer investors high yields, as well as a highly liquid method of investing in real estate.
MSCI Global Index — is a free float-adjusted market capitalization weighted index that is designed to measure the equity market performance of developed and emerging markets.
An investor cannot invest directly in an index.
This is a closed-end fund and does not continuously offer shares.
| |
| Manager Commentary |
| | |
| October 31, 2011 |
| | | | | | | | | | | | | |
| | | | | | | | | | | | | |
PERFORMANCE(1) As of October 31, 2011 |
| |
| | Ending Value
as of 10/31/11 | | l Year | | Three
Years | | Since
Inception(2)(3)(4) | |
| | | | | | | | | | |
Alpine Global Premier Properties Fund | NAV | | | $6.92 | | | (8.21% | ) | 25.08% | | (10.02% | ) | |
| | | | | | | | | | | | | |
Alpine Global Premier Properties Fund | Market Price | | | $6.01 | | | (4.54% | ) | 24.06% | | (13.71% | ) | |
| | | | | | | | | | | | | |
MSCI US REIT Total Return Index | | | | | | 10.59% | | 16.79% | | (3.00% | ) | |
| | | | | | | | | | | | | |
S&P / Citigroup World Net Total Return $ US Property Index | | | | | | 0.80% | | 15.12% | | (7.17% | ) | |
| | | | | | | | | | | | | |
| |
(1) | Performance information calculated after consideration of dividend reinvestment. |
(2) | Commenced operations on April 26, 2007. |
(3) | Annualized. |
(4) | IPO price of $20 used in calculating performance information. |
To the extent that the Fund’s historical performance resulted from gains derived from participation in initial public offerings (“IPOs”), there is no guarantee that these results can be replicated in future periods or that the Fund will be able to participate to the same degree in IPO offerings in the future.
Performance data quoted represents past performance. Past performance is no guarantee of future results and investment returns and principle value of the Fund will fluctuate so that shares, when redeemed, may be worth more or less than their original cost. Current performance may be higher or lower than the performance quoted. Call 1(800)617.7616 or visit www.alpinecef.com for current month-end performance.
S&P/Citigroup World Net Total Return US$ Property Index is an unmanaged market-weighted total return index available on a monthly basis. The index consists of many companies from developed markets whose floats are larger than $100 million and derive more than half of their revenue from property-related activities.
The MSCI US REIT Index is a free float-adjusted market capitalization weighted index that is comprised of equity REITs that are included in the MSCI US Investable Market 2500 Index, with the exception of specialty equity REITs that do not generate a majority of their revenue and income from real estate rental and leasing operations. The index represents approximately 85% of the US REIT universe.
|
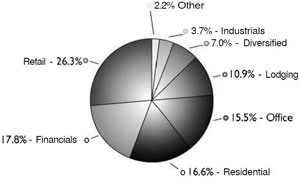
PORTFOLIO DISTRIBUTIONS* |
| |
|
|
| | | | | | | |
TOP 10 HOLDINGS* | | | | | | | |
ARA Asset Management, Ltd. | | | 3.0 | % | | Singapore | |
| | | | | | | | |
Emlak Konut Gayrimenkul Yatirim
Ortakligi | | | 2.9 | % | | Turkey | |
| | | | | | | | |
BR Malls Participacoes SA | | | 2.7 | % | | Brazil | |
| | | | | | | | |
Multiplan Empreendimentos
Imobiliarios SA | | | 2.4 | % | | Brazil | |
| | | | | | | | |
Brookfield Properties Corp. | | | 2.2 | % | | United States | |
| | | | | | | | |
American Capital Agency Corp. | | | 2.2 | % | | United States | |
| | | | | | | | |
Accor SA | | | 2.1 | % | | France | |
| | | | | | | | |
Simon Property Group, Inc. | | | 2.1 | % | | United States | |
| | | | | | | | |
CBL & Associates Properties, Inc. | | | 2.0 | % | | United States | |
| | | | | | | | |
PDG Realty SA Empreendimentos
e Participacoes | | | 2.0 | % | | Brazil | |
| | | | | | | | |
Top 10 Holdings | | | 23.6 | % | | | |
| | | | | | | | |
| | | | |
TOP 5 COUNTRIES* | | | | |
United States | | | 34.8 | % |
| | | | | |
Brazil | | | 19.6 | % |
| | | | | |
Singapore | | | 9.3 | % |
| | | | | |
United Kingdom | | | 5.6 | % |
| | | | | |
France | | | 4.4 | % |
| | | | | |
| |
* | Portfolio holdings and sector distributions are as of 10/31/11 and are subject to change. Portfolio holdings are not recommendations to buy or sell any securities. Top 10 Holdings do not include short-term investments. Portfolio Distributions percentages are based on total investments and Top 10 Holdings percentages are based on total net assets. |
| |
| | |
Annual Report | October 31, 2011 | 9 |
| |
Manager Commentary |
|
| | |
October 31, 2011 | |
|
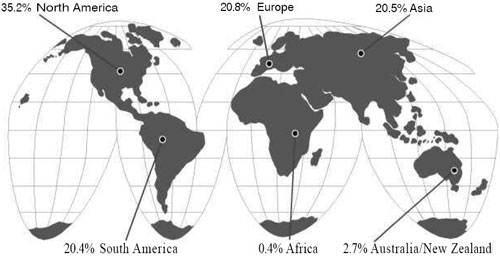
REGIONAL ALLOCATION* As of October 31, 2011 |
| |
|
|
| |
* | As a percentage of total investments, excluding any short-term investments. |
| |
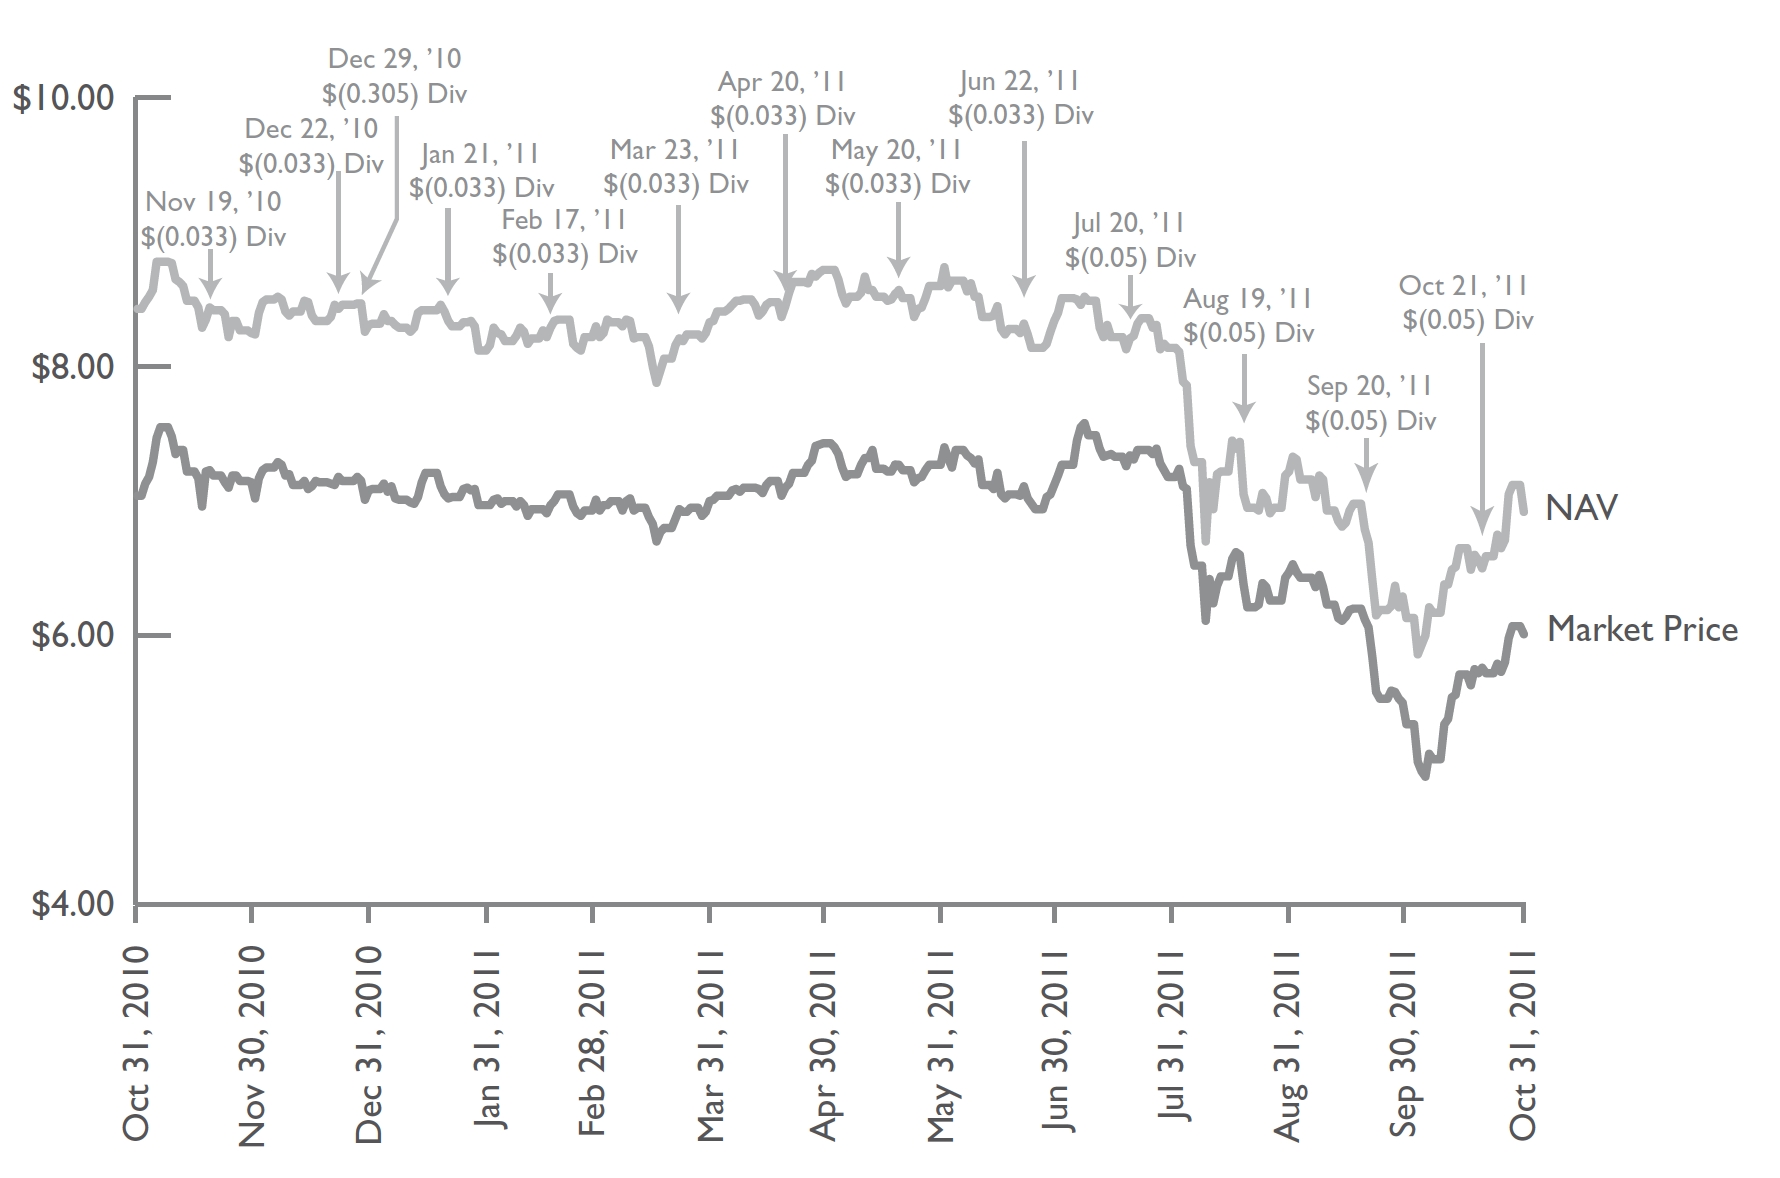
NAV AND MARKET PRICE As of October 31, 2011 |
| |
|
|
| |
| Report of Independent Registered Public Accounting Firm |
| | |
| October 31, 2011 |
To the Shareholders and Board of Trustees of
Alpine Global Premier Properties Fund:
We have audited the accompanying statement of assets and liabilities, including the schedule of portfolio investments of Alpine Global Premier Properties Fund (the “Fund”) as of October 31, 2011, and the related statement of operations for the year then ended, the statements of changes in net assets for each of the two years in the period then ended, and the financial highlights for each of the periods presented. These financial statements and financial highlights are the responsibility of the Fund’s management. Our responsibility is to express an opinion on these financial statements and financial highlights based on our audits.
We conducted our audits in accordance with the standards of the Public Company Accounting Oversight Board (United States). Those standards require that we plan and perform the audit to obtain reasonable assurance about whether the financial statements and financial highlights are free of material misstatement. The Fund is not required to have, nor were we engaged to perform, an audit of its internal control over financial reporting. Our audits included consideration of internal control over financial reporting as a basis for designing audit procedures that are appropriate in the circumstances, but not for the purpose of expressing an opinion on the effectiveness of the Fund’s internal control over financial reporting. Accordingly, we express no such opinion. An audit also includes examining, on a test basis, evidence supporting the amounts and disclosures in the financial statements, assessing the accounting principles used and significant estimates made by management, as well as evaluating the overall financial statement presentation. Our procedures included confirmation of securities owned as of October 31, 2011, by correspondence with the custodian and brokers; where replies were not received from brokers, we performed other auditing procedures. We believe that our audits provide a reasonable basis for our opinion.
In our opinion, the financial statements and financial highlights referred to above present fairly, in all material respects, the financial position of Alpine Global Premier Properties Fund as of October 31, 2011, the results of its operations for the year then ended, the changes in its net assets for each of the two years in the period then ended, and the financial highlights for each of the periods presented, in conformity with accounting principles generally accepted in the United States of America.

Milwaukee, Wisconsin
December 30, 2011
| |
| | |
Annual Report | October 31, 2011 | 11 |
| |
Schedule of Portfolio Investments |
|
| | |
October 31, 2011 | |
| | | | | | | |
Description | | Shares | | Value
(Note 1) | |
| | | | | | |
| | | | | | | |
COMMON STOCKS (98.6%) | | | | | | | |
Australia (2.7%) | | | | | | | |
FKP Property Group | | | 6,000,000 | | | $3,092,243 | |
Goodman Group | | | 4,000,000 | | | 2,599,363 | |
Stockland | | | 4,400,000 | | | 14,529,700 | |
| | | | | | | |
| | | | | | 20,221,306 | |
Brazil (19.6%) | | | | | | | |
Aliansce Shopping Centers SA | | | 1,141,210 | | | 8,608,014 | |
BHG SA-Brazil Hospitality Group* | | | 835,619 | | | 8,468,865 | |
BR Malls Participacoes SA | | | 1,880,473 | | | 20,317,893 | |
BR Properties SA | | | 1,008,449 | | | 10,161,731 | |
Brasil Brokers Participacoes SA | | | 563,300 | | | 2,277,020 | |
Cyrela Commercial Properties SA
Empreendimentos e
Participacoes | | | 1,500,842 | | | 13,724,681 | |
Direcional Engenharia SA | | | 1,595,842 | | | 8,365,657 | |
Gafisa SA | | | 2,852,400 | | | 10,583,212 | |
Iguatemi Empresa de Shopping
Centers SA | | | 665,538 | | | 12,897,137 | |
MRV Engenharia e
Participacoes SA | | | 1,510,200 | | | 10,643,574 | |
Multiplan Empreendimentos
Imobiliarios SA | | | 905,000 | | | 18,301,890 | |
PDG Realty SA
Empreendimentos e
Participacoes | | | 3,394,328 | | | 14,966,400 | |
Rossi Residencial SA | | | 1,000,609 | | | 6,323,562 | |
Sonae Sierra Brasil SA | | | 225,000 | | | 3,012,931 | |
| | | | | | | |
| | | | | | 148,652,567 | |
Chile (0.6%) | | | | | | | |
Parque Arauco SA | | | 2,378,557 | | | 4,558,557 | |
China (2.9%) | | | | | | | |
Capita Retail China Trust | | | 5,414,000 | | | 5,057,767 | |
Evergrande Real Estate Group,
Ltd. | | | 12,000,000 | | | 5,189,621 | |
Franshion Properties China, Ltd. | | | 16,185,760 | | | 3,324,406 | |
Renhe Commercial Holdings
Co., Ltd. | | | 32,652,000 | | | 4,575,496 | |
Shimao Property Holdings, Ltd. | | | 2,125,500 | | | 2,080,545 | |
Soho China, Ltd. | | | 2,778,500 | | | 1,970,408 | |
| | | | | | | |
| | | | | | 22,198,243 | |
Egypt (0.3%) | | | | | | | |
Talaat Moustafa Group* | | | 4,502,120 | | | 2,690,491 | |
| | | | | | | |
France (4.4%) | | | | | | | |
Accor SA | | | 500,526 | | | 16,359,166 | |
Eurosic, Inc. | | | 19,291 | | | 853,806 | |
Kaufman & Broad SA* | | | 76,644 | | | 1,530,305 | |
Nexity SA | | | 358,719 | | | 10,334,964 | |
Unibail-Rodamco SE | | | 20,000 | | | 3,976,187 | |
| | | | | | | |
| | | | | | 33,054,428 | |
| | | | | | | |
Description | | Shares | | Value
(Note 1) | |
| | | | | | | | |
| | | | | | | |
Germany (2.5%) | | | | | | | |
Alstria Office REIT-AG | | | 279,197 | | | $3,580,046 | |
DIC Asset AG | | | 653,242 | | | 5,958,623 | |
Prime Office REIT AG* | | | 800,000 | | | 5,291,269 | |
Sirius Real Estate, Ltd.* | | | 4,996,244 | | | 1,607,343 | |
Treveria PLC * | | | 11,057,500 | | | 2,371,541 | |
| | | | | | | |
| | | | | | 18,808,822 | |
Hong Kong (2.8%) | | | | | | | |
Hang Lung Properties, Ltd. | | | 2,000,000 | | | 7,245,558 | |
Hongkong Land Holdings, Ltd. | | | 810,000 | | | 4,256,578 | |
Mandarin Oriental International,
Ltd. | | | 1,956,000 | | | 3,163,961 | |
Sino Land Co., Ltd. | | | 2,000,000 | | | 3,161,473 | |
The Hongkong & Shanghai
Hotels, Ltd. | | | 2,378,062 | | | 3,167,678 | |
| | | | | | | |
| | | | | | 20,995,248 | |
India (0.9%) | | | | | | | |
Hirco PLC* | | | 2,434,368 | | | 2,230,465 | |
Phoenix Mills, Ltd.-Merrill Lynch
& Co., Inc. | | | 35,309 | | | 145,173 | |
Unitech Corporate Parks PLC* | | | 2,504,000 | | | 1,066,162 | |
Yatra Capital, Ltd.* | | | 666,500 | | | 3,076,189 | |
| | | | | | | |
| | | | | | 6,517,989 | |
Japan (0.8%) | | | | | | | |
Frontier Real Estate Investment
Corp. | | | 707 | | | 6,130,784 | |
| | | | | | | |
Netherlands (0.3%) | | | | | | | |
Eurocommercial Properties NV | | | 54,886 | | | 2,340,973 | |
| | | | | | | |
Norway (0.6%) | | | | | | | |
Norwegian Property ASA | | | 2,986,768 | | | 4,676,946 | |
| | | | | | | |
Philippines (1.6%) | | | | | | | |
SM Prime Holdings, Inc.(1) | | | 40,000,000 | | | 12,121,312 | |
| | | | | | | |
Poland (0.2%) | | | | | | | |
Atrium European Real Estate, Ltd. | | | 251,807 | | | 1,269,242 | |
Globe Trade Centre SA* | | | 31,674 | | | 113,373 | |
| | | | | | | |
| | | | | | 1,382,615 | |
Russia (0.5%) | | | | | | | |
Etalon Group, Ltd.-GDR*(2) | | | 475,000 | | | 2,336,050 | |
PIK Group-GDR*(2) | | | 250,502 | | | 743,991 | |
RGI International, Ltd.* | | | 837,461 | | | 1,048,545 | |
| | | | | | | |
| | | | | | 4,128,586 | |
Singapore (9.3%) | | | | | | | |
ARA Asset Management, Ltd.(2) | | | 21,782,640 | | | $22,565,239 | |
Ascott Residence Trust | | | 6,710,582 | | | 5,585,233 | |
Banyan Tree Holdings, Ltd. | | | 8,655,400 | | | 5,406,121 | |
CapitaCommercial Trust | | | 15,166,300 | | | 13,548,372 | |
CapitaMalls Asia, Ltd. | | | 5,000,000 | | | 5,387,544 | |
| |
| Schedule of Portfolio Investments |
| |
| October 31, 2011 |
| | | | | | | |
Description | | Shares | | Value
(Note 1) | |
| | | | | | | | |
| | | | | | | |
Singapore (9.3%) (continued) | | | | | | | |
Global Logistic Properties, Ltd.* | | | 6,594,924 | | | $9,182,307 | |
Parkway Life REIT | | | 3,503,000 | | | 4,998,883 | |
Starhill Global REIT | | | 8,007,071 | | | 3,820,294 | |
| | | | | | | |
| | | | | | 70,493,993 | |
Spain (1.0%) | | | | | | | |
Abertis Infraestructuras SA | | | 475,000 | | | 7,816,403 | |
| | | | | | | |
Sweden (2.2%) | | | | | | | |
JM AB | | | 639,945 | | | 11,611,425 | |
Skanska AB-B Shares | | | 303,200 | | | 4,950,920 | |
| | | | | | | |
| | | | | | 16,562,345 | |
Thailand (2.1%) | | | | | | | |
Central Pattana PCL | | | 5,155,000 | | | 5,411,657 | |
Minor International PCL | | | 23,771,800 | | | 8,050,955 | |
SC Asset Corp. PCL | | | 8,063,800 | | | 2,469,467 | |
| | | | | | | |
| | | | | | 15,932,079 | |
Turkey (2.9%) | | | | | | | |
Emlak Konut Gayrimenkul
Yatirim Ortakligi | | | 16,075,152 | | | 21,682,111 | |
| | | |
United Kingdom (5.6%) | | | | | | | |
Great Portland Estates PLC | | | 1,260,478 | | | 7,535,221 | |
Hammerson PLC | | | 1,000,000 | | | 6,533,103 | |
LXB Retail Properties PLC* | | | 3,210,000 | | | 5,217,341 | |
Metric Property Investments PLC | | | 2,416,063 | | | 3,879,681 | |
Regus PLC | | | 10,785,015 | | | 13,090,098 | |
Songbird Estates PLC* | | | 3,442,069 | | | 6,553,706 | |
| | | | | | | |
| | | | | | 42,809,150 | |
United States (34.8%) | | | | | | | |
AG Mortgage Investment Trust, Inc. | | | 210,000 | | | 3,809,400 | |
Alexander’s, Inc. | | | 28,411 | | | 12,321,851 | |
Alexandria Real Estate Equities, Inc. | | | 123,739 | | | 8,177,910 | |
American Capital Agency Corp. | | | 594,970 | | | 16,367,625 | |
American Capital Mortgage Investment Corp. | | | 303,408 | | | 5,515,957 | |
Apollo Commercial Real Estate Finance, Inc. | | | 465,922 | | | 6,527,567 | |
Apollo Residential Mortgage, Inc* | | | 100,400 | | | 1,637,524 | |
Brookdale Senior Living, Inc.* | | | 200,000 | | | 3,316,000 | |
Brookfield Properties Corp. | | | 1,026,485 | | | 16,957,532 | |
CBL & Associates Properties, Inc. | | | 1,004,353 | | | 15,446,949 | |
Chatham Lodging Trust | | | 435,098 | | | 4,894,852 | |
Chesapeake Lodging Trust | | | 167,412 | | | 2,501,135 | |
Chimera Investment Corp. | | | 3,031,660 | | | 9,125,297 | |
Colony Financial, Inc. | | | 965,507 | | | 14,163,988 | |
DiamondRock Hospitality Co. | | | 581,974 | | | 5,266,865 | |
Digital Realty Trust, Inc. | | | 95,748 | | | 5,967,973 | |
DuPont Fabros Technology, Inc. | | | 89,243 | | | 1,855,362 | |
Entertainment Properties Trust | | | 147,800 | | | 6,621,440 | |
| | | | | | | |
| | | | Value | |
Description | | Shares | | (Note 1) | |
| | | | | | | | |
| | | | | | | |
United States (34.8%) (continued) | | | | | | | |
Excel Trust, Inc. | | | 576,923 | | | $6,063,461 | |
General Growth Properties, Inc. | | | 870,929 | | | 12,802,656 | |
Host Hotels & Resorts, Inc. | | | 410,569 | | | 5,858,820 | |
Hudson Pacific Properties, Inc. | | | 34,376 | | | 459,263 | |
Invesco Mortgage Capital, Inc. | | | 880,000 | | | 13,886,400 | |
Jones Lang LaSalle, Inc. | | | 50,000 | | | 3,231,000 | |
Lennar Corp.-Class A | | | 233,750 | | | 3,866,225 | |
MFA Financial, Inc. | | | 1,882,000 | | | 12,703,500 | |
Ocwen Financial Corp.* | | | 276,059 | | | 4,002,855 | |
PennyMac Mortgage Investment Trust | | | 65,000 | | | 1,111,500 | |
ProLogis, Inc. | | | 273,572 | | | 8,141,503 | |
RLJ Lodging Trust | | | 200,000 | | | 2,964,000 | |
Simon Property Group, Inc. | | | 122,665 | | | 15,755,093 | |
Starwood Hotels & Resorts Worldwide, Inc. | | | 210,000 | | | 10,523,100 | |
Starwood Property Trust, Inc. | | | 540,000 | | | 10,146,600 | |
Two Harbors Investment Corp. | | | 1,296,931 | | | 12,126,305 | |
| | | | | | | |
| | | | | | 264,117,508 | |
| | | | | | | |
TOTAL COMMON STOCKS
(Identified Cost $722,815,990) | | | | | | 747,892,456 | |
| | | | | | | |
| | | | | | | |
PREFERRED STOCKS (0.1%) | | | | | | | |
United States (0.1%) | | | | | | | |
Beazer Homes USA, Inc., 7.500% | | | 62,000 | | | 737,800 | |
| | | | | | | |
TOTAL PREFERRED STOCKS
(Identified Cost $1,550,000) | | | | | | 737,800 | |
| | | | | | | |
| | | | | | | |
WARRANTS (0.0%)(3) | | | | | | | |
Thailand (0.0%)(3) | | | | | | | |
Minor International PCL,
expires 10/12/31 at 13.00
(Thailand Baht)* | | | 2,377,180 | | | 98,179 | |
| | | | | | | |
TOTAL WARRANTS
(Identified Cost $0) | | | | | | 98,179 | |
| | | | | | | |
| | | | | | | |
EQUITY-LINKED STRUCTURED
NOTES (0.4%) | | | | | | | |
India (0.4%) | | | | | | | |
Phoenix Mills, Ltd.-Merrill Lynch &
Co., Inc.* | | | 850,000 | | | 3,494,784 | |
| | | | | | | |
TOTAL EQUITY-LINKED
STRUCTURED NOTES
(Identified Cost $2,800,155) | | | | | | 3,494,784 | |
| | | | | | | |
| |
| |
Annual Report | October 31, 2011 | 13 |
| |
Schedule of Portfolio Investments |
|
| |
October 31, 2011 | |
| | | | | | | |
| | | | Value | |
Description | | Shares | | (Note 1) | |
| | | | | | | | |
| | | | | | | |
TOTAL INVESTMENTS
(Identified Cost $727,166,145) - (99.1%)(4) | | | | | | $752,223,219 | |
| | | | | | | |
OTHER ASSETS IN EXCESS OF LIABILITIES - (0.9%) | | | | | | 6,494,563 | |
| | | | | | | |
| | | | | | | |
NET ASSETS (100.0%) | | | | | | $758,717,782 | |
| | | | | | | |
| |
* | Non-income producing security. |
(1) | Affiliated issuer. See Note 5 in the Notes to Financial Statements. |
(2) | Security exempt from registration under Rule 144A of the Securities Act of 1933. These securities may be resold in transactions exempt from registration, normally to qualified institutional buyers. These securities have been determined to be liquid in accordance with procedures adopted by the Fund’s Board of Trustees. As of October 31, 2011, securities restricted under Rule 144A had a total value of $25,645,280 which comprised 3.4% of the Fund’s net assets. |
(3) | Less than 0.05% of Net Assets. |
(4) | Includes securities pledged as collateral for line of credit outstanding on October 31, 2011. |
|
| |
|
Common Abbreviations |
|
AB - Aktiebolag is the Swedish equivalent of the term corporation. |
AG - Aktiengesellschaft is a German term that refers to a corporation that is limited by shares, i.e., owned by shareholders. |
ASA - Allmennaksjeselskap is the Norwegian term for a public limited company. |
GDR - Global Depositary Receipt |
NV - Naamloze Vennootschap is the Dutch term for a public limited liability corporation. |
PCL - Public Company Limited |
PLC - Public Limited Company |
REIT - Real Estate Investment Trust |
SA - Generally designates corporations in various countries, mostly those employing the civil law. |
See Notes to Financial Statements.
| |
| Statement of Assets and Liabilities |
| | |
| October 31, 2011 |
| | | | |
ASSETS | | | | |
| | | | |
Investments, at value(1) | | | $740,101,907 | |
Affiliated issuers, at value(2) | | | 12,121,312 | |
Foreign currency, at value(3) | | | 506,979 | |
Unrealized appreciation on forward currency contracts | | | 118,316 | |
Receivable for investment securities sold | | | 62,779,670 | |
Dividends receivable | | | 1,202,012 | |
Prepaid and other assets | | | 433,029 | |
| | | | | |
Total Assets | | | 817,263,225 | |
| | | | | |
| | | | |
LIABILITIES | | | | |
| | | | |
Loan payable | | | 45,570,297 | |
Interest on loan payable | | | 5,340 | |
Payable for investment securities purchased | | | 11,907,351 | |
Accrued expenses and other liabilities: | | | | |
Investment advisory fees | | | 652,281 | |
Administrative fees | | | 26,931 | |
Compliance fees | | | 68,379 | |
Other | | | 314,864 | |
| | | | | |
Total Liabilities | | | 58,545,443 | |
| | | | | |
Net Assets | | | $758,717,782 | |
| | | | | |
| | | | |
NET ASSETS REPRESENTED BY | | | | |
| | | | |
Paid-in-capital | | | $1,996,509,950 | |
Distributions in excess of net investment income | | | (35,025,490 | ) |
Accumulated net realized loss on investments, swap contracts and foreign currency | | | (1,227,952,212 | ) |
Net unrealized appreciation on investments and foreign currency translations | | | 25,185,534 | |
| | | | | |
Net Assets | | | $758,717,782 | |
| | | | | |
Net asset value | | | | |
Net assets | | | $758,717,782 | |
Shares of beneficial interest issued and outstanding | | | 109,593,211 | |
Net asset value per share | | | $6.92 | |
| | | | | |
(1) Total Cost of Investments | | | $716,991,718 | |
(2) Total Cost of Affiliated Issuers | | | $10,174,427 | |
(3) Total Cost of Foreign Currency | | | $506,967 | |
See Notes to Financial Statements.
| |
| | |
Annual Report | October 31, 2011 | 15 |
| |
Statement of Operations |
|
| | |
For the Year Ended October 31, 2022 | |
| | | | |
INCOME | | | | |
| | | | |
Dividends(1) | | | $46,266,946 | |
Affiliated Dividends(2) | | | 174,535 | |
| | | | | |
Total Income | | | 46,441,481 | |
| | | | | |
| | | | |
EXPENSES: | | | | |
| | | | |
Interest on loan | | | 396,625 | |
Investment advisory fee | | | 9,039,690 | |
Administrative fee | | | 640,350 | |
Audit and tax fees | | | 83,216 | |
Custodian fees | | | 165,477 | |
Compliance fees | | | 70,254 | |
Insurance fees | | | 21,760 | |
Legal fees | | | 71,589 | |
Printing fees | | | 274,088 | |
Trustee fees | | | 73,974 | |
NYSE fees | | | 111,387 | |
Miscellaneous fees | | | 275,050 | |
| | | | | |
Total Expenses | | | 11,223,460 | |
| | | | | |
Net Investment Income | | | 35,218,021 | |
| | | | | |
| | | | |
NET REALIZED AND UNREALIZED GAIN/(LOSS) ON INVESTMENTS
AND FOREIGN CURRENCY | | | | |
| | | | |
Net realized loss on investments: | | | | |
Securities transactions | | | (16,411,481 | ) |
Foreign currency transactions | | | (1,314,320 | ) |
| | | | | |
Net realized loss on investments | | | (17,725,801 | ) |
| | | | | |
Change in unrealized appreciation/(depreciation) of: | | | | |
Investments | | | (95,031,644 | ) |
Foreign currency translations | | | 168,458 | |
| | | | | |
Net unrealized depreciation of investments | | | (94,863,186 | ) |
| | | | | |
Net realized/unrealized loss on investments and foreign currency | | | (112,588,987 | ) |
| | | | | |
Net Decrease in Net Assets Resulting from Operations | | | $(77,370,966 | ) |
| | | | | |
| | | | |
(1) Net of foreign taxes withheld | | | $1,834,405 | |
(2) Net of foreign taxes withheld | | | 74,801 | |
| | | | | |
See Notes to Financial Statements.
| |
| Statement of Changes in Net Assets |
| |
| | | | | | | | | | | |
| | For the
Year Ended
October 31, 2011 | | For the
Year Ended
October 31, 2010 | |
| | | | | | |
OPERATIONS |
| | | | | | | | | | | |
Net investment income | | | | $35,218,021 | | | | | $39,150,214 | | |
Net realized gain/(loss) on investments: | | | | | | | | | | | |
Securities transactions | | | | (16,411,481 | ) | | | | (24,079,291 | ) | |
Swap contracts | | | | — | | | | | (2,501,148 | ) | |
Foreign currency transactions | | | | (1,314,320 | ) | | | | (302,912 | ) | |
Net change in unrealized appreciation/(deprecation) of: | | | | | | | | | | | |
Investments | | | | (95,031,644 | ) | | | | 172,496,115 | | |
Foreign currency translations | | | | 168,458 | | | | | 7,330,729 | | |
| | | | | | | | | | | | |
Net increase/(decrease) in net assets resulting from operations | | | | (77,370,966 | ) | | | | 192,093,707 | | |
| | | | | | | | | | | | |
| | | | | | | | | | | |
DISTRIBUTIONS TO COMMON SHAREHOLDERS |
| | | | | | | | | | | |
From net investment income | | | | (64,127,086 | ) | | | | (68,536,746 | ) | |
From tax return of capital | | | | (18,498,905 | ) | | | | — | | |
| | | | | | | | | | | | |
Net decrease in net assets resulting from distributions to shareholders | | | | (82,625,991 | ) | | | | (68,536,746 | ) | |
| | | | | | | | | | | | |
| | | | | | | | | | | |
CAPTIAL SHARE TRANSACTIONS |
| | | | | | | | | | | |
Common stock issued to stockholders from reinvestment of dividends | | | | 28,961,437 | | | | | — | | |
| | | | | | | | | | | | |
Net increase in net assets derived from capital share transactions | | | | 28,961,437 | | | | | — | | |
| | | | | | | | | | | | |
Net Increase/(Decrease) in Net Assets | | | | (131,035,520 | ) | | | | 123,556,961 | | |
| | | | | | | | | | | | |
Net Assets | | | | | | | | | | | |
Beginning of year | | | | 889,753,302 | | | | | 766,196,341 | | |
| | | | | | | | | | | | |
End of year* | | | | $758,717,782 | | | | | $889,753,302 | | |
| | | | | | | | | | | | |
| | | | | | | | | | | |
* Including distributions in excess of net investment income of: | | | | $(35,025,490 | ) | | | | $(17,975,830 | ) | |
| | | | | | | | | | | | |
See Notes to Financial Statements.
| |
Annual Report | October 31, 2011 | 17 |
| |
Financial Highlights |
|
| |
| | | | | | | | | | | | | | | | | | | | | | | | | | |
| | For the
Year Ended
October 31,
2011 | | For the
Year Ended
October 31,
2010 | | For the
Year Ended
October 31,
2009 | | For the
Year Ended
October 31,
2008 | | For the
Period Ended
October 31,
2007(1) | |
| | | | | | | | | | | | |
PER COMMON SHARE OPERATING PERFORMANCE |
�� | | | | | | | | | | | | | | | | | | | | | | | | | | |
Net asset value per share, beginning of period | | | | $8.43 | | | | | $7.26 | | | | | $5.00 | | | | | $18.04 | | | | | $19.10 | | |
| | | | | | | | | | | | | | | | | | | | | | | | | | | |
Income from investment operations: | | | | | | | | | | | | | | | | | | | | | | | | | | |
Net investment income | | | | 0.34 | | | | | 0.37 | | | | | 0.53 | | | | | 1.41 | | | | | 0.55 | | |
Net realized and unrealized gain/(loss) on investments, swap contracts and foreign currency | | | | (1.08 | ) | | | | 1.45 | | | | | 2.28 | | | | | (12.93 | ) | | | | (0.95 | ) | |
| | | | | | | | | | | | | | | | | | | | | | | | | | | |
Total from investment operations | | | | (0.74 | ) | | | | 1.82 | | | | | 2.81 | | | | | (11.52 | ) | | | | (0.40 | ) | |
| | | | | | | | | | | | | | | | | | | | | | | | | | | |
| | | | | | | | | | | | | | | | | | | | | | | | | | |
LESS DISTRIBUTIONS TO COMMON SHAREHOLDERS |
| | | | | | | | | | | | | | | | | | | | | | | | | | |
From net investment income | | | | (0.60 | ) | | | | (0.65 | ) | | | | (0.55 | ) | | | | (1.27 | ) | | | | (0.56 | ) | |
From tax return of capital | | | | (0.17 | ) | | | | — | | | | | — | | | | | (0.25 | ) | | | | (0.07 | ) | |
| | | | | | | | | | | | | | | | | | | | | | | | | | | |
Total distributions | | | | (0.77 | ) | | | | (0.65 | ) | | | | (0.55 | ) | | | | (1.52 | ) | | | | (0.63 | ) | |
| | | | | | | | | | | | | | | | | | | | | | | | | | | |
| | | | | | | | | | | | | | | | | | | | | | | | | | |
CAPITAL SHARE TRANSACTIONS |
| | | | | | | | | | | | | | | | | | | | | | | | | | |
Common share offering costs charged to paid-in-capital | | | | — | | | | | — | | | | | — | | | | | — | | | | | (0.03 | ) | |
| | | | | | | | | | | | | | | | | | | | | | | | | | | |
Total capital share transactions | | | | — | | | | | — | | | | | — | | | | | — | | | | | (0.03 | ) | |
| | | | | | | | | | | | | | | | | | | | | | | | | | | |
Net asset value per share, end of period | | | | $6.92 | | | | | $8.43 | | | | | $7.26 | | | | | $5.00 | | | | | $18.04 | | |
| | | | | | | | | | | | | | | | | | | | | | | | | | | |
Per share market value, end of period | | | | $6.01 | | | | | $7.04 | | | | | $5.79 | | | | | $4.45 | | | | | $15.71 | | |
| | | | | | | | | | | | | | | | | | | | | | | | | | | |
| | | | | | | | | | | | | | | | | | | | | | | | | | |
Total return based on: | | | | | | | | | | | | | | | | | | | | | | | | | | |
Net Asset Value(2) | | | | (8.21 | )% | | | | 28.31 | % | | | | 66.15 | % | | | | (67.74 | )% | | | | (1.69 | )% | |
Market Value(2) | | | | (4.54 | )% | | | | 34.36 | % | | | | 48.89 | % | | | | (67.03 | )% | | | | (18.41 | )% | |
| | | | | | | | | | | | | | | | | | | | | | | | | | |
RATIOS/SUPPLEMENTAL DATA |
| | | | | | | | | | | | | | | | | | | | | | | | | | |
Net Assets attributable to common shares, at end of period (000) | | | | $758,718 | | | | | $889,753 | | | | | $766,196 | | | | | $530,868 | | | | | $1,908,062 | | |
Ratio of total expenses to average net assets | | | | 1.29 | % | | | | 1.37 | % | | | | 1.34 | % | | | | 1.44 | % | | | | 1.21 | %(3) | |
Ratio of total expenses excluding interest expense to average net assets | | | | 1.25 | % | | | | 1.32 | % | | | | 1.33 | % | | | | 1.29 | % | | | | — | | |
Ratio of net investment income to average net assets | | | | 4.06 | % | | | | 4.97 | % | | | | 9.88 | % | | | | 11.41 | % | | | | 6.31 | %(3) | |
Portfolio turnover rate(4) | | | | 67 | % | | | | 115 | % | | | | 153 | % | | | | 263 | % | | | | 89 | %(5) | |
| | | | | | | | | | | | | | | | | | | | | | | | | | | |
| | | | | | | | | | | | | | | | | | | | | | | | | | |
Borrowing at End of Period | | | | | | | | | | | | | | | | | | | | | | | | | | |
Aggregate Amount Outstanding (000) | | | | $45,570 | | | | | N/A | | | | | $18,610 | | | | | $17,974 | | | | | $28,500 | | |
Asset Coverage Per $1,000 (000) | | | | $17,650 | | | | | N/A | | | | | $42,171 | | | | | $30,535 | | | | | $67,950 | | |
| |
(1) | For the period from April 26, 2007 (inception of the fund) to October 31, 2007. |
(2) | Total investment return is calculated assuming a purchase of a common share at the opening on the first day and a sale at closing on the last day of each period reported. Total investment return on net asset value reflects at $20.00 opening IPO price and sales load of $0.90 per share for the period ended October 31, 2007. Dividends and distributions, if any, are assumed for purposes of this calculation to be reinvested at prices obtained under the Fund's dividend reinvestment plan. Total investment returns do not reflect brokerage commissions. Total investment returns for less than a full year are not annualized. Past performance is not a guarantee of future results. |
(3) | Annualized. |
(4) | Portfolio turnover rate does not reflect total return swap transactions. (See Note 2 under Notes to Financial Statements) |
(5) | Not Annualized. |
See Notes to Financial Statements.
| |
| Notes to Financial Statements |
| | |
| October 31, 2011 |
Alpine Global Premier Properties Fund (the “Fund”) is a diversified, closed-end management investment company. The Fund’s primary investment objective is capital appreciation. The Fund’s secondary investment objective is high current income.
The Fund had no operations prior to April 26, 2007 other than matters relating to its organization and the sale and issuance of 213,089.005 shares of beneficial interest in the Fund to a group consisting of Alpine Woods Capital Investors, LLC (“Alpine Woods”), certain of its officers and parties either related to or affiliated with those officers and 6,235.602 shares of beneficial interest in the Fund to the Independent Trustees at the initial subscription price of $19.10 per share. Alpine Woods serves as the Fund’s investment adviser. The Fund’s Common Shares are listed on the New York Stock Exchange (“NYSE”) under the symbol “AWP”.
|
2. SIGNIFICANT ACCOUNTING POLICIES: |
| |
The following is a summary of significant accounting policies consistently followed by the Fund in the preparation of their financial statements. The policies are in conformity with accounting principles generally accepted in the United States of America (“GAAP”), which require management to make estimates and assumptions that affect amounts reported herein. Actual results could differ from those estimates.
Valuation of Securities: The net asset value (“NAV”) of shares of the Fund is calculated by dividing the value of the Fund’s net assets by the number of outstanding shares. NAV is determined each day the NYSE is open as of the close of regular trading (normally, 4:00 p.m., Eastern time). In computing NAV, portfolio securities of the Fund are valued at their current market values determined on the basis of market quotations. In computing the Fund’s net asset value, portfolio securities that are traded on a securities exchange in the United States, except for option securities, are valued at the last reported sale price as of the time of valuation, or lacking any current reported sale at the time of valuation, at the mean between the most recent bid and asked quotations, or if market quotations are not available or determined to be unreliable, through procedures and/or guidelines established by the Board of Trustees. Each option security traded on a securities exchange in the United States is valued at the last current reported sale price as of the time of valuation if the last current reported sale price falls within the consolidated bid/ask quote for the option security. If the last current reported sale price as of the time of valuation does not fall within the consolidated bid/ask quote for the option security, the security is valued at the mid-point of the consolidated bid/ask quote for the option security. Each security traded in the over-the-counter market and quoted on the NASDAQ National Market System, is valued at the NASDAQ Official Closing Price (“NOCP”), as determined by NASDAQ, or lacking an NOCP, the last current reported sale price as of the time
of valuation by NASDAQ, or lacking any current reported sale on NASDAQ at the time of valuation, at the mean between the most recent bid and asked quotations. Each over-the-counter option that is not traded through the Options Clearing Corporation is valued by the counterparty, or if the counterparty’s price is not readily available then by using the Black Scholes method. Each other security traded over-the-counter is valued at the mean between the most recent bid and asked quotations. Short-term securities with maturities of 60 days or less are valued at amortized cost, which approximates fair value.
Securities that are principally traded in a foreign market are valued at the last current sale price at the time of valuation or lacking any current or reported sale, at the time of valuation, at the mean between the most recent bid and asked quotations as of the close of the appropriate exchange or other designated time. Trading in securities on European and Far Eastern securities exchanges and over-the-counter markets is normally completed at various times before the close of business on each day on which the NYSE is open. Trading of these securities may not take place on every NYSE business day. In addition, trading may take place in various foreign markets on Saturdays or on other days when the NYSE is not open and on which the Fund’s net asset value is not calculated. As stated below, if the market prices are not readily available or are not reflective of the fair value of the security, as of the close of the regular trading on the NYSE (normally, 4:00 pm Eastern time), the security will be priced at a fair value following procedures approved by the Board of Trustees.
When market quotations are not readily available or when the valuation methods mentioned above are not reflective of a fair value of the security, the security is valued at fair value following procedures and/or guidelines approved by the Board of Trustees. The Fund may also use fair value pricing, if the value of a security it holds is, pursuant to Board of Trustees guidelines, materially affected by events occurring before the Fund’s pricing time but after the close of the primary market or exchange on which the security is traded. These procedures may utilize valuations furnished by pricing services approved by the Board of Trustees, which may be based on market transactions for comparable securities and various relationships between securities that are generally recognized by institutional traders, a computerized matrix system, or appraisals derived from information concerning the securities or similar securities received from recognized dealers in those securities. When fair value pricing is employed, the value of the portfolio security used to calculate the Fund’s net asset value may differ from quoted or official closing prices.
Fair Value Measurement: In accordance with GAAP, the Fund uses a three-tier hierarchy to establish classification of fair value measurements for disclosure purposes. Inputs refer broadly to the assumptions that market participants would use in pricing the asset or liability, including assumptions about risk. Inputs may be
| |
| | |
Annual Report | October 31, 2011 | 19 |
| |
Notes to Financial Statements |
|
| | |
October 31, 2011 | |
observable or unobservable. Observable inputs are inputs that reflect the assumptions market participants would use in pricing the asset or liability that are developed based on market data obtained from sources independent of the reporting entity. Unobservable inputs are inputs that reflect the reporting entities own assumptions about the assumptions market participants would use in pricing the asset or liability that are developed based on the best information available.
| |
Level 1 - | Unadjusted quoted prices in active markets for identical assets or liabilities that the Fund has the ability to access. |
| |
Level 2 - | Observable inputs other than quoted prices included in level 1 that are observable for the asset or liability, either directly or indirectly. These inputs may include quoted prices for the identical instrument on an inactive market, prices for similar instruments, interest rates, prepayment speeds, credit risk, yield curves, default rates and similar data. |
| |
Level 3 - | Unobservable inputs for the asset or liability, to the extent relevant observable inputs are not available; representing the Fund’s own assumptions about the assumptions a market participant would use in valuing the asset or liability, and would be based on the best information available. |
The availability of observable inputs can vary from security to security and is affected by a wide variety of factors, including, for example, the type of security, whether the security is new and not yet established in the marketplace, the liquidity of markets, and other characteristics particular to the security. To the extent that valuation is based on models or inputs that are less observable or unobservable in the market, the determination of fair value requires more judgment. Accordingly, the degree of judgment exercised in determining fair value is greatest for instruments categorized in level 3.
The inputs used to measure fair value may fall into different levels of the fair value hierarchy. In such cases, for disclosure purposes, the level in the fair value hierarchy within which the fair value measurement falls in its entirety, is determined based on the lowest level input that is significant to the fair value measurement in its entirety.
Various inputs are used in determining the value of the Fund’s investments as of the reporting period end. The designated input levels are not necessarily an indication of the risk or liquidity associated with these investments. These inputs are categorized in the following hierarchy under applicable financial accounting standards.
The following is a summary of the inputs used to value the Fund’s net assets as of October 31, 2011:
| | | | | | | | | | | | | |
| | Valuation Inputs | | | | |
| | | | | | |
Investments in Securities at Value* | | Level 1* | | Level 2* | | Level 3** | | Total Value | |
| | | | | | | | | | |
Common Stocks | | | | | | | | | | | | | |
Australia | | $ | — | | $ | 20,221,306 | | $ | — | | $ | 20,221,306 | |
Brazil | | | 148,652,567 | | | — | | | — | | | 148,652,567 | |
Chile | | | 4,558,557 | | | — | | | — | | | 4,558,557 | |
China | | | — | | | 22,198,243 | | | — | | | 22,198,243 | |
Egypt | | | — | | | 2,690,491 | | | — | | | 2,690,491 | |
France | | | — | | | 33,054,428 | | | — | | | 33,054,428 | |
Germany | | | 9,270,153 | | | 9,538,669 | | | — | | | 18,808,822 | |
Hong Kong | | | — | | | 20,995,248 | | | — | | | 20,995,248 | |
India | | | — | | | 6,517,989 | | | — | | | 6,517,989 | |
Japan | | | — | | | 6,130,784 | | | — | | | 6,130,784 | |
Netherlands | | | — | | | 2,340,973 | | | — | | | 2,340,973 | |
Norway | | | — | | | 4,676,946 | | | — | | | 4,676,946 | |
Philippines | | | — | | | 12,121,312 | | | — | | | 12,121,312 | |
Poland | | | — | | | 1,382,615 | | | — | | | 1,382,615 | |
Russia | | | — | | | 4,128,586 | | | — | | | 4,128,586 | |
Singapore | | | — | | | 70,493,993 | | | — | | | 70,493,993 | |
Spain | | | — | | | 7,816,403 | | | — | | | 7,816,403 | |
Sweden | | | — | | | 16,562,345 | | | — | | | 16,562,345 | |
Thailand | | | — | | | 15,932,079 | | | — | | | 15,932,079 | |
Turkey | | | — | | | 21,682,111 | | | — | | | 21,682,111 | |
United Kingdom | | | — | | | 42,809,150 | | | — | | | 42,809,150 | |
United States | | | 264,117,508 | | | — | | | — | | | 264,117,508 | |
Preferred Stocks | | | | | | | | | | | | | |
United States | | | 737,800 | | | — | | | — | | | 737,800 | |
Warrants | | | | | | | | | | | | | |
Thailand | | | 98,179 | | | — | | | — | | | 98,179 | |
Equity-Linked Structured Notes | | | | | | | | | | | | | |
India | | | — | | | 3,494,784 | | | — | | | 3,494,784 | |
| | | | | | | | | | | | | | |
Total | | $ | 427,434,764 | | $ | 324,788,455 | | $ | — | | $ | 752,223,219 | |
| | | | | | | | | | | | | | |
| |
| Notes to Financial Statements |
| | |
| October 31, 2011 |
| | | | | | | | | | | | | |
| | Valuation Inputs | | | | |
| | | | | | |
Other Financial Instruments | | Level 1 | | Level 2 | | Level 3 | | Total Value | |
| | | | | | | | | | |
Assets | | | | | | | | | | | | | |
Forward Currency Contracts | | $ | — | | $ | 118,316 | | $ | — | | $ | 118,316 | |
| | | | | | | | | | | | | | |
Total | | $ | — | | $ | 118,316 | | $ | — | | $ | 118,316 | |
| | | | | | | | | | | | | | |
| | |
| * | During the fiscal year ended October 31, 2011 there were significant transfers between Level 1 and Level 2 securities. A security’s classification as Level 1 or Level 2 within the Fund can move on a daily basis throughout the year depending on whether or not the Fund has determined the value of securities principally traded in foreign markets has become stale between the close of the foreign exchanges and the time the Fund calculates its NAV. If management determines the price has become stale, a fair value adjustment will be made to the impacted securities and these fair value adjusted securities are considered to be priced using Level 2 inputs. As a result, it is not practicable to disclose transfers between Level 1 and Level 2 within the fair value hierarchy for the year ended October 31, 2011. |
| | |
| ** | During the fiscal year ended October 31, 2011, the Fund did not hold any Level 3 securities. |
Security Transactions and Investment Income: Security transactions are recorded on the date a security is purchased or sold (i.e. on the trade date). Realized gains and losses are computed on the identified cost basis. Interest income is recorded on the accrual basis and includes accretion of discounts and amortization of premiums, where applicable. Dividend income is recorded on the ex-dividend date or in the case of some foreign securities, on the date thereafter when the Fund is made aware of the dividend. Foreign income may be subject to foreign withholding taxes, which are accrued as applicable. Capital gains realized on some foreign securities are subject to foreign taxes, which are accrued as applicable. Dividends and interest from non-U.S. sources received by the Fund are generally subject to non-U.S. withholding taxes at rates ranging up to 30%. Such withholding taxes may be reduced or eliminated under the terms of applicable U.S. income tax treaties, and the Fund intends to undertake any procedural steps required to claim the benefits of such treaties.
Income Taxes: It is the Fund’s policy to comply with the requirements of Subchapter M of the Internal Revenue Code applicable to regulated investment companies and to distribute timely, all of its investment company taxable income and net realized capital gains to shareholders. Therefore, no federal income tax provision is recorded. Under applicable foreign tax laws, a withholding tax may be imposed on interest, dividends, and capital gains earned on foreign investments. Where available, the Fund will file for claims on foreign taxes withheld.
The Fund accounts for uncertainty related to income taxes in accordance with U.S. GAAP. The Fund recognizes tax benefits only if it is more likely than not that a tax position (including the Fund’s assertion that its income is exempt from tax) will be sustained upon examination.
The Fund has no material uncertain tax positions and has no unrecognized tax benefits as of October 31, 2011. Since its inception, the Fund has not recorded any amounts for interest or penalties related to uncertain tax benefits. The statute of limitations on the Fund’s Federal and New York State tax return filings remains open for the years ended October 31, 2007, and October 31, 2008 through October 31, 2011.
Distributions: On July 5, 2011, the Trust, acting in accordance with
an exemptive order received from the SEC and with approval of the Board, adopted a level distribution policy under which the Trust intends to make regular monthly cash distributions to common shareholders, stated in terms of a fixed amount per common share. With this policy the Trust can now include long-term capital gains in its distribution as frequently as twelve times a year. In practice, the Board views their approval of this policy as a potential means of further supporting the market price of the Trust through the payment of a steady and predictable level of cash distributions to shareholders.
The current monthly rate is $0.05 per share. The Trust continues to evaluate its monthly distribution policy in light of ongoing economic and market conditions and may change the amount of the monthly distributions in the future.
The level distribution rate may be modified by the Board of Trustees from time to time. If, for any monthly distribution, investment company taxable income, if any (which term includes net short-term capital gain) and net tax-exempt income, if any, is less than the amount of the distribution, the difference will generally be a tax-free return of capital distributed from the Fund’s assets. The Fund’s final distribution for each calendar year will include any remaining investment company taxable income and net tax-exempt income undistributed during the year, as well as all net capital gains, if any, realized during the year. If the total distributions made in any fiscal year exceed annual investment company taxable income, net tax-exempt income and net capital gain, such excess distributed amount would be treated as ordinary dividend income to the extent of the Fund’s current and accumulated earnings and profits. Distributions in excess of the accumulated investment company taxable income, net tax-exempt income and net capital gain would first be a tax-free return of capital to the extent of the adjusted tax basis in the shares. After such adjusted tax basis is reduced to zero, the distribution would constitute capital gain (assuming the shares are held as capital assets). Distributions to shareholders are recorded by the Fund on the ex-dividend date.
Foreign Currency Translation Transactions: The Fund may invest a portion of its assets in foreign securities. In the event that the Fund executes a foreign security transaction, the Fund will generally enter into a forward foreign currency contract to settle
| |
| | |
Annual Report | October 31, 2011 | 21 |
| |
Notes to Financial Statements |
|
| | |
October 31, 2011 | |
the foreign security transaction. The books and records of the Fund are maintained in U.S. dollars. Non-U.S. denominated amounts are translated into U.S. dollars as follows, with the resultant translation gains and losses recorded in the Statements of Operations:
| |
i) | market value of investment securities and other assets and liabilities at the exchange rate on the valuation date, |
| |
ii) | purchases and sales of investment securities, income and expenses at the exchange rate prevailing on the respective date of such transactions. |
Risk Associated With Foreign Securities and Currencies: Investments in securities of foreign issuers carry certain risks not ordinarily associated with investments in securities of domestic issuers. Such risks include future political and economic developments and the possible imposition of exchange controls or other foreign governmental laws and restrictions. In addition, with respect to certain countries, there is a possibility of expropriation of assets, confiscatory taxation, political or social instability or diplomatic developments, which could adversely affect investments in those countries. Certain countries may also impose substantial restrictions on investments in their capital markets by foreign entities, including restrictions on investments in issuers or industries deemed sensitive to relevant national interests. These factors may limit the investment opportunities available to the Fund or result in a lack of liquidity and high price volatility with respect to securities of issuers from developing countries.
Total Return Swaps: The Fund may invest in total return swap agreements to manage or gain exposure to various securities or markets in pursuit of it investment objectives.
A total return swap is an agreement between the Fund and a counter-party to exchange a market linked return for a floating rate payment, both based on a notional principal amount. Because the principal amount is not exchanged, it represents neither an asset nor a liability to either counterparty, and is referred to as notional. Total return swaps are marked to market daily based upon quotations from the market makers and the change in value, if any, is recorded as an unrealized gain or loss in the Statement of Operations. The unrealized gain (loss) related to the daily change in the valuation of the notional amount of the swap, as well as the amount due to (owed by) the Fund at termination or settlement, is combined and separately disclosed as an asset (liability). The Fund also records any periodic payments received from (paid to) the counter-party, including at termination, under such contracts as realized gain (loss).
In connection with these agreements, securities or cash may be identified as collateral in accordance with the terms of the respective swap agreements to provide assets of value and recourse in the event of default or bankruptcy/insolvency. Entering into
these agreements involves, to varying degrees, elements of credit, market and documentation risk in excess of the amounts recognized on the Statement of Assets and Liabilities. Such risks involve the possibility that there will be no liquid market for these agreements, that the counterparty to the agreements may default on its obligation to perform or disagree as to the meaning of contractual terms in the agreements and that there may be unfavorable changes in interest rates. The Fund’s maximum risk of loss from counterparty credit risk is the discounted net value of the cash flows to be received from the counterparty over the contract’s remaining life, to the extent that amount is positive. The Fund did not hold any total return swaps at October 31, 2011.
Equity-Linked Structured Notes: The Fund may invest in equity-linked structured notes. Equity-linked structured notes are derivative securities which are specially designed to combine the characteristics of one or more underlying securities and their equity derivatives in a single note form. The return and/or yield or income component may be based on the performance of the underlying equity securities, and equity index, and/or option positions. Equity-linked structured notes are typically offered in limited transactions by financial institutions in either registered or non-registered form. An investment in equity-linked structured notes creates exposure to the credit risk of the issuing financial institution, as well as to the market risk of the underlying securities. There is no guaranteed return of principal with these securities and the appreciation potential of these securities may be limited by a maximum payment or call right. In certain cases, equity linked structured notes may be more volatile and less liquid than less complex securities or other types of fixed income securities. Such securities may exhibit price behavior that does not correlate with other fixed-income securities. The Fund held 1 equity-linked structured note at October 31, 2011.
Forward Currency Contracts: The Fund is subject to foreign currency exchange rate risk in the normal course of pursuing its investment objective. The Fund may use forward currency contracts to gain exposure to or hedge against changes in the value of foreign currencies. A forward currency contract (“forward”) is an agreement between two parties to buy and sell a currency at a set price on a future date. The market value of the forward contract fluctuates with changes in forward currency exchange rates. The forward contract is marked-to-market daily and the change in market value is recorded by the Fund as unrealized appreciation or depreciation. When the forward contract is closed, the Fund records a realized gain or loss equal to the fluctuation in value during the period the forward contract was open. The Fund could be exposed to risk if a counterparty is unable to meet the terms of a forward or if the value of the currency changes unfavorably.
During the year ended October 31, 2011, the Fund entered into 42 forward currency contracts and recorded a net unrealized gain $118,316 and a net realized loss of $1,353,972 on the Statement of Operations related to investments in forward currency contracts.
| |
| Notes to Financial Statements |
| | |
| October 31, 2011 |
The Fund held the following forward currency contracts at October 31, 2011:
| | | | | | | | | | | | | |
Description | | Expiration
Date | | Contracts to
Deliver/Receive | | Settlement
Value | | | Current Value | | | Unrealized
Gain | |
| | | | | | | | | | | | | | |
Contracts Sold: | | | | | | | | | | | | | |
| | | | | | | | | | | | | | |
Euro | | 01/13/2012 | | 31,000,000 (EUR) | | 42,991,420 | | | $42,873,104 | | | $118,316 | |
| | | | | | | | | | | | | |
Derivatives: The Fund has adopted authoritative standards regarding disclosure about derivatives and hedging activities and how they affect the Fund’s Statement of Assets and Liabilities and Statement of Operations.
The effect of derivative instruments on the Statement of Assets and Liabilities as of October 31, 2011.
| | | | | | |
| | Asset Derivatives | |
| | | |
Derivatives | | Statement of Assets
and Liabilities
Location | | Fair Value | |
| | | | | | |
Foreign currency contracts | | Unrealized appreciation on forward currency contracts | | | $118,316 | |
| | | | | | | |
Total | | | | | $118,316 | |
| | | | | | | |
The effect on derivatives instruments on the Statement of Operations for the year ended October 31, 2011.
| | | | | | | | | |
Derivatives | | Statement of
Operations
Location | | Realized Loss
on Derivatives
Recognized in
Income | | Change in
Unrealized
Gain on
Derivatives
Recognized
in Income | |
| | | | | | | | |
Foreign exchange contracts | | Net realized loss on investments: Foreign currency transactions/ Change in net unrealized appreciation of: Foreign currency translations | | | $(1,353,972 | ) | | $118,316 | |
| | | | | | | | | | |
Total | | | | | $(1,353,972 | ) | | $118,316 | |
| | | | | | | | | | |
Use of Estimates: The Fund’s financial statements are prepared in accordance with accounting principles generally accepted in the United States of America. This requires management to make estimates and assumptions that affect the reported amounts of assets and liabilities and disclosure of contingent assets and liabilities at the date of the financial statements and the reported amounts of increases and decreases in net assets from operations during the reporting period. Actual results could differ from these estimates.
|
3. CAPITAL SHARE TRANSACTIONS: |
| |
The Fund has 109,593,211 common shares of beneficial interest, with no par value, authorized.
Transactions in shares of the Fund were as follows:
| | | | | | | |
| | For the
Year Ended
October 31, 2011 | | For the
Year Ended
October 31, 2010 | |
| | | | | | | | |
Common Shares Outstanding - beginning of year | | | 105,506,077 | | | 105,506,077 | |
Common shares issued as reinvestments of dividends | | | 4,087,134 | | | — | |
| | | | | | | | |
Common shares outstanding - end of year | | | 109,593,211 | | | 105,506,077 | |
| | | | | | | | |
|
4. PURCHASES AND SALES OF SECURITIES: |
| |
Purchases and sales of securities (excluding short-term securities) for the year ended October 31, 2011 are as follows:
| |
Purchases | Sales |
| | |
$617,454,337 | $593,921,105 |
| | |
The Fund did not have purchases and sales of U.S. Government obligations for the year ended October 31, 2011.
|
5. INVESTMENT ADVISORY AGREEMENT AND ADMINISTRATION AGREEMENT: |
| |
Alpine Woods Capital Investors LLC serves as the Fund’s investment adviser pursuant to an Investment Advisory Agreement with the Fund. As compensation for its services to the Fund, Alpine Woods receives an annual investment advisory fee of 1.00% based on the Fund’s average daily Managed Assets, computed daily and payable monthly.
State Street Bank and Trust Company (“SSBT”) serves as the Fund’s administrator pursuant to an Administration, Bookkeeping and Pricing Services Agreement with the Fund. As compensation for its services to the Fund, SSBT receives an annual administration fee of 0.02% of total net assets on the first $5 billion and 0.015% on total net assets exceeding $5 billion, computed daily and payable monthly.
| |
| |
Annual Report | October 31, 2011 | 23 |
| |
Notes to Financial Statements |
|
| | |
October 31, 2011 | |
The following issuers are affiliated with the Global Premier Properties Fund; that is, the Fund held 5% or more of the outstanding voting securities during the year ended October 31, 2011. As defined in Section (2)(a)(3) of the Investment Company Act of 1940, such issuers are:
| | | | | | | | | | | | | | | | |
Issuer Name | | Shares held at
October 31,
2010 | | Purchases | | Sales | | Shares held at
October 31,
2011 | | Value at
October 31,
2011 | | Realized
Gain
(Loss) | |
| | | | | | | | | | | | | | |
SM Prime Holdings, Inc. | | 20,000,000 | | 20,000,000 | | — | | | 40,000,000 | | $12,121,312 | | | — | |
|
6. INCOME TAX INFORMATION: |
| |
Classification of Distributions: Net investment income (loss) and net realized gain (loss) may differ for financial statement and tax purposes. The character of distributions made during the year from net investment income or net realized gains may differ from its ultimate characterization for federal income tax purposes.
The tax character of the distributions paid by the Fund during the year ended October 31, 2011 was as follows:
| | | | |
Distributions paid from: | | | | |
Ordinary Income | | $ | 64,127,086 | |
Return of Capital | | | 18,498,905 | |
| | | | | |
| | $ | 82,625,991 | |
| | | | | |
Tax components of distributable earnings are determined in accordance with income tax regulations which may differ from the composition of net assets reported under accounting principles generally accepted in the United States. Accordingly, for the year ended October 31, 2011, the effects of certain differences were reclassified. The Fund increased accumulated net investment income by $30,358,310 and decreased accumulated net realized gain by $11,858,575, and decreased paid in capital by $18,499,735. These differences were primarily due to the differing tax treatment of foreign currency, and certain other investments. Net assets of the portfolio were unaffected by the reclassifications and the calculation of net investment income per share in the Financial Highlights excludes these adjustments.
At October 31, 2011, the Fund had available for tax purposes unused capital loss carryovers of $78,724,245, expiring October 31, 2015, unused capital loss carryovers of $661,143,094 expiring October 31, 2016, unused capital loss carryovers of $369,610,833, expiring October 31, 2017, unused capital loss carryovers of $67,561,774, expiring October 31, 2018, and unused capital loss carryovers of $32,279,425, expiring October 31, 2019.
As of October 31, 2011, the components of distributable earnings on a tax basis were as follows:
| | | | |
Undistributed Ordinary Income | | $ | — | |
Accumulated Capital Loss | | | (1,209,319,371 | ) |
Unrealized Depreciation | | | (28,472,797 | ) |
| | | | | |
Total | | $ | (1,237,792,168 | ) |
| | | | | |
As of October 31, 2011, net unrealized appreciation/(depreciation) of investments based on federal tax costs was as follows:
| | | | |
Gross appreciation on investments
(excess of value over tax cost) | | $ | 91,029,776 | |
Gross depreciation on investments
(excess of tax cost over value) | | | (119,116,020 | ) |
Net appreciation on foreign currency | | | (386,553 | ) |
| | | | | |
Net unrealized depreciation | | | (28,472,797 | ) |
| | | | | |
Cost of investments for income tax purposes | | $ | 780,309,463 | |
| | | | | |
The differences between book and tax net unrealized appreciation and cost were primarily due to deferral of losses from wash sales and to the different tax treatment of certain other investments.
The Regulated Investment Company (“RIC”) Modernization Act of 2010 (the “Modernization Act”) modernizes several of the federal income and excise tax provisions related to RICs. The Modernization Act contains simplification provisions effective for taxable years beginning after December 22, 2010, which are aimed at preventing disqualification of a RIC for “inadvertent” failures of the asset diversification and/or qualifying income tests. Additionally, the Modernization Act allows capital losses to be carried forward indefinitely, and retain the character of the original loss, exempts RICs from the preferential dividend rule and repealed the 60-day designation requirement for certain types of pay-through income and gains.
On July 9, 2009, an Agreement among Alpine Global Dynamic Dividend Fund, Alpine Total Dynamic Dividend Fund, Alpine Global Premier Properties Fund (together, the “Funds”) and The Bank of New York (“BONY”) was executed which allows for each Fund to borrow against a secured line of credit from BONY an aggregate amount of up to $350,000,000 for all Funds. The Agreement was terminated on November 30, 2010. On December 1, 2010 the Fund entered into a lending agreement with BNP Paribas Prime Brokerage International which allows the Fund to borrow on an uncommitted and secured basis. During the year ended October 31, 2011, the average borrowing by the Fund was $36,871,388 with an average rate on borrowings of 1.06%.
| |
| Notes to Financial Statements |
| | |
| October 31, 2011 |
Compensation of Trustees: The Independent Trustees of the Fund receive $4,000 for each meeting attended.
In preparing these financial statements, the Fund has evaluated events and transactions for potential recognition or disclosure resulting from subsequent events.
Laurence B. Ashkin retired as a Trustee of the Alpine Family of Funds subsequent to the fiscal year end.
Distributions: The Fund paid a distribution of $5,479,661 or $0.05 per common share on November 30, 2011 to common shareholders of record on November 23, 2011.
The Fund also declared a distribution of $0.05 payable on December 30, 2011 to common shareholders of record on December 23, 2011.
| |
| |
Annual Report | October 31, 2011 | 25 |
| |
Additional Information |
|
| | |
October 31, 2011 (Unaudited) | |
|
DIVIDEND REINVESTMENT PLAN |
| |
Unless the registered owner of common shares elects to receive cash by contacting Boston Financial Data Services, Inc. (“Plan Administrator”), all dividends or other distributions (together, “Dividends” and each, a “Dividend”) declared on common shares will be automatically reinvested by the Plan Administrator for shareholders in the Fund’s Dividend Reinvestment Plan (the “Plan”), in additional common shares of the Fund. Shareholders that are not permitted to participate through their broker or nominee or who elect not to participate in the Plan will receive all Dividends in cash paid by check mailed directly to the shareholder of record (or, if the common shares are held in street or other nominee name, then to such nominee) by the Plan Administrator, as dividend disbursing agent. You may elect not to participate in the Plan and to receive all Dividends in cash by contacting the Plan Administrator, as dividend disbursing agent, at the address set forth below. Participation in the Plan is completely voluntary and may be terminated or resumed at any time without penalty by notice if received and processed by the Plan Administrator prior to the dividend record date; otherwise such termination or resumption will be effective with respect to any subsequently declared Dividend. If you hold your shares through a broker, and you wish for all Dividends declared on your common shares to be automatically reinvested pursuant to the Plan, please contact your broker. |
The Plan Administrator will open an account for each shareholder under the Plan in the same name in which such shareholder’s common shares are registered. Whenever the Fund declares a Dividend payable in cash, non-participants in the Plan will receive cash and participants in the Plan will receive the equivalent in common shares. The common shares will be acquired by the Plan Administrator for the participants’ accounts, depending upon the circumstances described below, either (i) through receipt of additional unissued but authorized common shares from the Fund (“Newly Issued common shares”) or (ii) by purchase of outstanding common shares on the open market (“Open-Market Purchases”) on the NYSE or elsewhere. If, on the payment date for any Dividend, the closing market price plus estimated brokerage commissions per share is equal to or greater than the NAV per share, the Plan Administrator will invest the Dividend amount in Newly Issued common shares on behalf of the participants. The number of Newly Issued common shares to be credited to each participant’s account will be determined by dividing the dollar amount of the Dividend by the NAV per share on the payment date; provided that, if the NAV is less than or equal to 95% of the closing market value on the payment date, the dollar amount of the Dividend will be divided by 95% of the closing market price per share on the payment date. If, on the payment date for any Dividend, the NAV per share is greater than the closing market value plus estimated brokerage commissions, the Plan Administrator will invest the Dividend amount in common shares acquired on behalf of the participants in Open-Market Purchases.
In the event of a market discount on the payment date for any Dividend, the Plan Administrator will have until the last business
day before the next date on which the common shares trade on an “ex-dividend” basis or 30 days after the payment date for such Dividend, whichever is sooner (the “Last Purchase Date”), to invest the Dividend amount in common shares acquired in Open-Market Purchases. If, before the Plan Administrator has completed its Open-Market Purchases, the market price per share exceeds the NAV per share, the average per share purchase price paid by the Plan Administrator may exceed the NAV of the common shares, resulting in the acquisition of fewer common shares than if the Dividend had been paid in Newly Issued common shares on the Dividend payment date. Because of the foregoing difficulty with respect to Open-Market Purchases, the Plan provides that if the Plan Administrator is unable to invest the full Dividend amount in Open-Market Purchases during the purchase period or if the market discount shifts to a market premium during the purchase period, the Plan Administrator may cease making Open-Market Purchases and may invest the uninvested portion of the Dividend amount in Newly Issued common shares at the NAV per share at the close of business on the Last Purchase Date provided that, if the NAV is less than or equal to 95% of the then current market price per share, the dollar amount of the Dividend will be divided by 95% of the market price on the payment date for purposes of determining the number of shares issuable under the Plan.
The Plan Administrator maintains all shareholders’ accounts in the Plan and furnishes written confirmation of all transactions in the accounts, including information needed by shareholders for tax records. Common shares in the account of each Plan participant will be held by the Plan Administrator on behalf of the Plan participant, and each shareholder proxy will include those shares purchased or received pursuant to the Plan. The Plan Administrator will forward all proxy solicitation materials to participants and vote proxies for shares held under the Plan in accordance with the instructions of the participants.
In the case of the Fund’s shareholders such as banks, brokers or nominees which hold shares for others who are the beneficial owners, the Plan Administrator will administer the Plan on the basis of the number of common shares certified from time to time by the record shareholder’s name and held for the account of beneficial owners who participate in the Plan.
There will be no brokerage charges with respect to common shares issued directly by the Fund. However, each participant will pay a pro rata share of brokerage commissions incurred in connection with Open-Market Purchases. The automatic reinvestment of Dividends will not relieve participants of any U.S. federal, state or local income tax that may be payable (or required to be withheld) on such Dividends. See “U.S. Federal Income Tax Matters.” Participants that request a sale of common shares through the Plan Administrator are subject to brokerage commissions.
Shareholders participating in the Plan may receive benefits not available to shareholders not participating in the Plan. If the market price plus commissions of the Fund’s shares is higher than the NAV,
| |
| Additional Information |
| | |
| October 31, 2011 (Unaudited) |
participants in the Plan will receive shares of the Fund for less than they could otherwise purchase them and will have shares with a cash value greater than the value of any cash distribution they would have received on their shares. If the market price plus commissions is below the net asset value, participants receive distributions of shares with a NAV greater than the value of any cash distribution they would have received on their shares. However, there may be insufficient shares available in the market to make distributions in shares at prices below the NAV. Also, because the Fund does not redeem its shares, the price on resale may be more or less than the NAV.
The Fund reserves the right to amend or terminate the Plan. There is no direct service charge to participants with regard to purchases in the Plan; however, the Fund reserves the right to amend the Plan to include a service charge payable by the participants.
All correspondence or questions concerning the Plan should be directed to the Plan Administrator, Boston Financial Data Services Inc. at Two Heritage Drive North Quincy, MA 02171 or by calling toll-free 1(800)617.7616.
|
FUND PROXY VOTING POLICIES & PROCEDURES |
| |
Policies and procedures used in determining how to vote proxies relating to portfolio securities and a summary of proxies voted by the Fund are available without a charge, upon request, by contacting the Fund at 1(800)617.7616 and on the Securities and Exchange Commission’s (“Commission”) web site at http://www.sec.gov. |
|
PORTFOLIO HOLDINGS |
| |
The Fund files its complete schedule of portfolio holdings with the Commission for the first and third quarters of each fiscal year on Form N-Q within 60 days after the end of the period. Copies of the Fund’s Forms N-Q are available without a charge, upon request, by contacting the Fund at 1(800)617-7616 and on the Commission’s web site at http://www.sec.gov. You may also review and copy Form N-Q at the Commission’s Public Reference Room in Washington, D.C. For more information about the operation of the Public Reference Room, please call the Commission at 1(800)SEC-0330. |
|
DESIGNATION REQUIREMENTS |
| |
Of the distributions paid by the Fund from ordinary income for year ended October 31, 2011, the following percentages met the requirements to be treated as qualifying for the corporate dividends received deduction and qualified dividend income, respectively. |
| | | | |
Dividends Received Deduction | | | 4.57 | % |
Qualified Dividend Income | | | 21.80 | % |
|
SHAREHOLDER MEETING |
| |
On May 9, 2011, the Fund held its Annual Meeting of Shareholders (the “Meeting”) for the purpose of voting on a proposal to re-elect one trustee of the Fund. The results of the proposal are as follows: |
Proposal: To elect Jeffrey E. Wacksman as Trustee to the Board of Trustees for a term of three years to expire at the 2014 Annual Meeting and until his successor has been duly elected and qualified.
| | | | |
| | Jeffrey E. Wacksman | |
For | | 97.48 | % | |
Withheld | | 2.52 | % | |
|
NOTICE |
| |
Notice is hereby given in accordance with Section 23(c) of the Investment Company Act of 1940 that the Fund may purchase at market prices from time to time its common shares in the open market. |
| |
| | |
Annual Report | October 31, 2011 | 27 |
| |
Additional Information |
|
| | |
October 31, 2011 (Unaudited) | |
| | | | | | | | |
INDEPENDENT TRUSTEES** |
| |
Name and Age | | Position(s) Held
with the Fund | | Principal Occupation During
Past Five Years | | # of Portfolios
in Alpine Fund
Complex** | | Other Directorships
Held by Trustee |
| | | | | | | | | |
H. Guy Leibler (57) | | Independent Trustee | | Private investor since 2007, Vice Chair and Chief Operating Officer of L&L Acquisitions, LLC (2004-2007); President, Skidmore, Owings & Merrill LLP (2001-2004). | | 17 | | Chairman Emeritus, White Plains Hospital Center; Trustee, Trustee, Alpine Family of Funds.* |
| | | | | | | | | |
Jeffrey E. Wacksman (51) | | Independent Trustee | | Partner, Loeb, Block & Partners LLP since 1994. | | 17 | | Director, International Succession Planning Association; Director, Bondi Icebergs Inc.; Director, MH Properties, Inc.; Trustee, Trustee, Alpine Family of Funds.* |
| | | | | | | | | |
James A. Jacobson (66) | | Independent Trustee | | Retired (11/2008-Present); Vice Chairman and Managing Director, Spear Leeds & Kellogg Specialists, LLC (01/2003-11/2008). | | 17 | | Trustee, Alpine Family of Funds.* Trustee, Allianz Global Investors Multi-Funds. |
| | | | | | | | | |
| |
* | The Independent Trustees identified above are the members of the Board of Trustees for each of the Alpine Series Trust, Alpine Equity Trust and Alpine Income Trust, Alpine Global Dynamic Dividend Fund, Alpine Total Dynamic Dividend Fund and Alpine Global Premier Properties Fund (collectively, the “Alpine Family of Funds”) |
| |
** | Alpine Woods Capital Investors, LLC manages seventeen fund portfolios within the Alpine Family of Funds. Three of the Alpine Trusts are registered as an open-end management investment company. The Trustees oversee each of the seventeen portfolios within the Alpine Family of Funds. |
| |
† | As of the date this report was printed. Laurence B. Ashkin retired as a Trustee subsequent to the fiscal year end. |
| |
| Additional Information |
| | |
| October 31, 2011 (Unaudited) |
| | | | | | | | |
INTERESTED TRUSTEE |
| |
Name and Age | | Position(s) Held
with the Fund | | Principal Occupation During
Past Five Years | | # of Portfolios
in Alpine Fund
Complex** | | Other Directorships
Held by Trustee |
| | | | | | | | | |
Samuel A. Lieber*
(55) | | Interested Trustee and President | | Chief Executive Officer of Alpine Woods Capital Investors, LLC since November 1997. President of Alpine Trusts since 1998. | | 17 | | Trustee, Alpine Family of Funds. |
| | | | | | | | | |
| |
* | Samuel A. Lieber has been a Trustee of the Fund since its inception. He is the son of Stephen A. Lieber. |
| |
** | Alpine Woods Capital Investors, LLC manages seventeen fund portfolios within the Alpine Family of Funds. Three of the Alpine Trusts are registered as open-end management investment companies. The Trustees oversee each of the seventeen portfolios within the Alpine Family of Funds. |
| |
| | |
Annual Report | October 31, 2011 | 29 |
| |
Additional Information |
|
| | |
October 31, 2011 (Unaudited) | |
In addition to Mr. Samuel A. Lieber, the table below identifies the Fund’s executive officers.
| | | | | | | | |
Name and Age | | Position(s) Held
with the Fund | | Principal Occupation During
Past Five Years | | # of Portfolios
in Alpine Fund
Complex** | | Other Directorships
Held by Trustee |
| | | | | | | | | |
Stephen A. Lieber (86)* | | Executive Vice President | | Chief Investment Officer, Alpine Woods Capital Investors, LLC since 2003; Chairman and Senior Portfolio Manager, Saxon Woods Advisors, LLC since 1999. | | N/A | | None |
| | | | | | | | | |
John M. Megyesi (51) | | Chief Compliance Officer | | Chief Compliance Officer, Alpine Woods Capital Investors, LLC since January 2009; Vice President and Manager, Trade Surveillance, Credit Suisse Asset Management, LLC (2006-2009); Manager, Trading and Surveillance, Allianz Global Investors (2004-2006). | | N/A | | None |
| | | | | | | | | |
Ronald Palmer (43) | | Chief Financial Officer | | Chief Financial Officer, Alpine Woods Capital Investors, LLC since January 2010; Independent Consultant (2008-2009); Vice President, Cash Management and Foreign Exchange, Macquarie Capital Management, LLC (2007-2008); Chief Operating Officer, Macquarie Fund Adviser, LLC (2004-2007). | | N/A | | None |
| | | | | | | | | |
Meimei Li (47) | | Treasurer | | Controller, Alpine Woods Capital Investors, LLC since February 2007; Senior Accountant, Pinnacle Group (2005-2007); Senior Auditor, Eisner & Lubin LLP (2001-2005). | | N/A | | None |
| | | | | | | | | |
Andrew Pappert (31) | | Secretary | | Director of Fund Operations, Alpine Woods Capital Investors, LLC since September 2008; Assistant Vice President, Mutual Fund Operations, Credit Suisse Asset Management, LLC (2003-2008). | | N/A | | None |
| | | | | | | | | |
| |
* | Stephen A. Lieber is the father of Samuel A. Lieber. |
| |
** | Alpine Woods Capital Investors, LLC manages seventeen fund portfolios within the Alpine Family of Funds. Three of the Alpine Trusts are registered as an open-end management investment company. The Trustees oversee each of the seventeen portfolios within the Alpine Family of Funds. |
| | | | |
| | | | |
| | | | |
| INVESTOR | | | 1 (800) 617.7616 | www.alpinecef.com |
| | | | |
| INFORMATION | | | |
| | | | |
| | | | |

|
INVESTMENT ADVISER |
Alpine Woods Capital Investors, LLC |
2500 Westchester Ave., Suite 215 |
Purchase, NY 10577 |
|
ADMINISTRATOR & |
CUSTODIAN |
State Street Bank & Trust Company |
One Lincoln Street |
Boston, MA 02111 |
|
TRANSFER AGENT |
Boston Financial Data Services, Inc. |
Two Heritage Drive |
North Quincy, MA 02l7l |
|
INDEPENDENT REGISTERED |
PUBLIC ACCOUNTING FIRM |
Deloitte & Touche LLP |
555 EastWells Street |
Milwaukee, Wl 53202 |
|
FUND COUNSEL |
Willkie Farr & Gallagher LLP |
787 7th Ave. |
NewYork, NY 10019 |

|
INVESTOR INFORMATION |
1(800) 617.7616 |
www.alpinecef.com |
| |
Item 2. | Code of Ethics. |
|
| (a) The Registrant, as of the end of the period covered by the report, has adopted a code of ethics that applies to the Registrant’s principal executive officer, principal financial officer, principal accounting officer or controller or persons performing similar functions, regardless of whether these individuals are employed by the registrant or a third party. |
| |
| (b) Not applicable. |
| |
| (c) There have been no amendments, during the period covered by this report, to a provision of the code of ethics that applies to the Registrant’s principal executive officer, principal financial officer, principal accounting officer or controller, or persons performing similar functions, regardless of whether these individuals are employed by the registrant or a third party, and that relates to any element of the code of ethics described in Item 2(a) above. |
| |
| (d) The Registrant has not granted any waivers, including an implicit waiver, from a provision of the code of ethics that applies to the registrant’s principal executive officer, principal financial officer, principal accounting officer or controller, or persons performing similar functions, regardless of whether these individuals are employed by the Registrant or a third party, that relates to any element of the code of ethics described in 2(a) above. |
| |
| (e) Not applicable. |
| |
| (f) The Registrant’s Code of Ethics is attached as Exhibit 12(A)(1) hereto. |
| |
Item 3. | Audit Committee Financial Expert. |
| |
| (a)(1) The Board of Trustees of the Registrant has determined that the Registrant has at least one audit committee financial expert serving on its audit committee. |
| |
| (a)(2) The Board of Trustees has determined that James A. Jacobson is an audit committee financial expert. Mr. Jacobson is “independent” as defined in paragraph (a)(2) of Item 3 to Form N-CSR. It has been determined that Mr. Jacobson qualifies as an audit committee financial expert based on his extensive experience in the financial services industry, including serving for more than 15 years as a senior executive at a New York Stock Exchange (“NYSE”) specialist firm and as a member of the NYSE Board of Directors (including terms as Vice Chair), his other board service, as well as his educational background. |
| |
| (a)(3) Not applicable. |
| |
Item 4. | Principal Accountant Fees and Services. |
(a) Audit Fees: The aggregate fees billed for each of the last two fiscal years for professional services rendered by the principal accountant for the audit of the registrant’s annual financial statements or services that are normally provided by the accountant in connection with statutory and regulatory filings or engagements for fiscal year 2010 was $61,750 and fiscal year 2011 was $68,334.
(b) Audit-Related Fees: The aggregate fees billed in each of the last two fiscal years for assurance and related services by the principal accountant that are reasonably related to the performance of the audit of the registrant’s financial statements and are not reported under paragraph (a) of this Item was $0 in fiscal year 2010 and $0 in fiscal year 2011.
(c) Tax Fees: The aggregate fees billed in each of the last two fiscal years for professional services rendered by the principal accountant for tax compliance, tax advice, and tax planning was $4,900 in fiscal year 2010 and $10,919 in fiscal year 2011.
(d) All Other Fees: The aggregate fees billed in each of the last two fiscal years for products and services provided by the principal accountant, other than the services reported in paragraphs (a) through (c) of this Item is $0 in fiscal year 2010 and $0 in fiscal year 2011.
(e)(1) Audit Committee Pre-Approval Policies and Procedures: All services to be performed by the Registrant’s principal auditors must be pre-approved by the Registrant’s audit committee, which may include the approval of certain services up to an amount determined by the audit committee. Any services that would exceed that amount would require additional approval of the audit committee.
(e)(2) No services described in paragraphs (b) through (d) were approved pursuant to paragraph (c)(7)(i)(C) of Rule 2-01 of Regulation S-X.
(f) Not applicable.
(g) Not applicable.
(h) Not applicable
| |
Item 5. | Audit Committee of Listed Registrants. |
| |
| The Registrant has a separately designated standing audit committee established in accordance with Section 3(a)(58)(A) of the Exchange Act and is comprised of the following members: |
| |
| H. Guy Leibler |
| Jeffrey E. Wacksman |
| James A. Jacobson |
| |
Item 6. | Schedule of Investments. |
| |
| (a) The Schedule of Investments is included as part of the Report to Stockholders filed under Item 1 of this form. |
| |
| (b) Not applicable. |
| |
Item 7. | Disclosure of Proxy Voting Policies and Procedures for Closed-End Management Investment Companies. |
| |
| The registrant’s proxy voting policies and procedures are attached hereto as Exhibit 12(a)(4). |
| |
Item 8. | Portfolio Managers of Closed-End Management Investment Companies. |
| |
(a)(1) As of January 9, 2012 |
| | | | | | |
Name | | Title | | Length of
Service | | Business Experience 5 Years |
Samuel A. Lieber | | Portfolio Manager | | Since 1998 | | Chairman, President (2006-present), Founder, Alpine Woods Capital Investor LLC (2003-present) |
Joel E.D. Wells | | Portfolio Manager | | Since 2006 | | Portfolio Manager, Alpine Emerging Markets Real Estate Fund (2008-present); Equity Real Estate markets Analyst at Wachovia Capital |
Bruce Ebnother | | Portfolio Manager | | Since September 2011 | | UBS Global Asset Management Inc., Portfolio Manager (1996-2010) |
(a)(2) Other Accounts Managed as of October 31, 2011
| | | | | | | | | | | | | | |
| | | | | | Advisory Fee Based
on Performance | | |
Type of Accounts | | Number
of
Accounts | | Total Assets
($ in
millions) | | Number
of
Accounts | | Total
Assets | | Material
Conflicts if
Any |
| | | | | | | | | | | | | | |
Samuel A. Lieber | | | | | | | | | | | | | | See below(1) |
Registered Investment Companies | | | 8 | | $ | 515.7 | | | 0 | | | 0 | | |
Other Pooled Accounts | | | 2 | | | 116.1 | | | 0 | (2) | | 0 | | |
Other Accounts | | | 1 | | | 16.2 | | | 0 | | | 0 | | |
| | | | | | | | | | | | | | |
Joel E.D. Wells | | | | | | | | | | | | | | See below(1) |
Registered Investment Companies | | | 1 | | $ | 4.3 | | | 0 | | | 0 | | |
Other Pooled Accounts | | | 0 | | | 0 | | | 0 | | | 0 | | |
Other Accounts | | | 0 | | | 0 | | | 0 | | | 0 | | |
| | | | | | | | | | | | | | |
Bruce Ebnother | | | | | | | | | | | | | | See below(1) |
Registered Investment Companies | | | 0 | | $ | 0 | | | 0 | | | 0 | | |
Other Pooled Accounts | | | 0 | | | 0 | | | 0 | | | 0 | | |
Other Accounts | | | 0 | | | 0 | | | 0 | | | 0 | | |
(1) Conflicts of interest may arise because the Fund’s Portfolio Managers have day-to-day management responsibilities with respect to both the Fund and various other accounts. These potential conflicts include:
Limited Resources. The Portfolio Managers cannot devote their full time and attention to the management of each of the accounts that they manage. Accordingly, the Portfolio Managers may be limited in their ability to identify investment opportunities for each of the accounts that are as attractive as might be the case if the Portfolio Managers were to devote substantially more attention to the management of a single account. The effects of this potential conflict may be more pronounced where the accounts have different investment strategies.
Limited Investment Opportunities. Other clients of the Alpine Woods Capital Investors LLC (the “Adviser”) may have investment objectives and policies similar to those of the Fund. The Adviser may, from time to time, make recommendations which result in the purchase or sale of a particular security by its other clients simultaneously with the Fund. If transactions on behalf of more than one client during the same period increase the demand for securities being purchased or the supply of securities being sold, there may be an adverse effect on price or quantity. It is the policy of the Adviser to allocate advisory recommendations and the placing of orders in a manner that it believes is equitable to the accounts involved, including the Fund. When two or more clients of the Adviser are purchasing or selling the same security on a given day from the same broker-dealer, such transactions may be averaged as to price.
Different Investment Strategies. The accounts managed by the Portfolio Managers have differing investment strategies. If the Portfolio Managers determine that an investment opportunity may be appropriate for only some of the accounts or decide that certain of the accounts should take different positions with respect to a particular security, the Portfolio Managers may effect transactions for one or more accounts which may affect the market price of the security or the execution of the transaction, or both, to the detriment or benefit of one or more other accounts.
Variation in Compensation. A conflict of interest may arise where the Adviser is compensated differently by the accounts that are managed by the Portfolio Managers. If certain accounts pay higher management fees or performance- based incentive fees, the Portfolio Managers might be motivated to prefer certain accounts over others. The Portfolio Managers might also be motivated to favor accounts in which they have a greater ownership interest or accounts that are more likely to enhance the Portfolio Managers’ performance record or to otherwise benefit the Portfolio Managers.
Selection of Brokers. The Portfolio Managers may select the brokers that execute securities transactions for the accounts that they supervise. In addition to executing trades, some brokers provide the Portfolio Managers with research and other services which may require the payment of higher brokerage fees than might otherwise be available. The Portfolio Managers’ decision as to the selection of brokers could yield disproportionate costs and benefits among the accounts that they manage, since the research and other services provided by brokers may be more beneficial to some accounts than to others.
Where conflicts of interest arise between the Fund and other accounts managed by the Portfolio Managers, the Portfolio Managers will use good faith efforts so that the Fund will not be treated materially less favorably than other accounts. There may be instances where similar portfolio transactions may be executed for the same security for numerous accounts managed by the Portfolio Managers. In such instances, securities will be allocated in accordance with the Adviser’s trade allocation policy.
(2) There is a fixed advisory fee for these accounts. Under certain circumstances an incentive fee can be earned by an affiliate of the Adviser based on performance.
(a)(3) Portfolio Manager Compensation as of October 31, 2011
The Portfolio Managers’ compensation will be made up of a fixed salary amount which is not based on the value of the managed assets in the Fund’s portfolio. Annually, the Adviser may calculate bonus compensation to be paid to each Portfolio Manager as a percentage of salary based in large part on the Fund’s performance and that of each of the other investment companies managed by the Portfolio Manager in comparison to other real estate funds during the same time period, which the Adviser considers to be a comparable peer group.
(a)(4) Dollar Range of Securities Owned as of October 31, 2011
| | |
Portfolio Manager | | Dollar Range of Equity Securities Held in Registrant 1 |
Samuel A. Lieber | | Over $1,000,000 |
Joel E.D. Wells | | $10,001 – 50,000 |
Bruce Ebnother | | None |
1“Beneficial Ownership” is determined in accordance with Section 16a-1(a)(2) of the Securities Exchange Act of 1934, as amended
| | |
Item 9. | Purchases of Equity Securities by Closed-End Management Investment Company and Affiliated Purchasers. |
| | |
| Not Applicable. |
| | |
Item 10. | Submission of Matters to Vote of Security Holders. |
| | |
| There have been no material changes to the procedures by which shareholders may recommend nominees to the Registrant’s Board of Trustees. |
| | |
Item 11. | Controls and Procedures. |
| | |
| (a) | The Registrant’s principal executive officer and principal financial officer have evaluated the Registrant’s disclosure controls and procedures (as defined in Rule 30a-3(c) under the Investment Company Act of 1940, as amended) within 90 days of this filing and have concluded that the registrant’s disclosure controls and procedures were effective, as of that date. |
| | |
| (b) | There was no change in the Registrant’s internal control over financial reporting (as defined in Rule 30a-3(d) under the Investment Company Act of 1940, as amended) during the second fiscal quarter of the period covered by this report that has materially affected, or is reasonably likely to materially affect, the registrant’s internal control over financial reporting. |
| | |
Item 12. | Exhibits. |
| | |
| (a)(1) The Code of Ethics that applies to the Registrant’s principal executive officer and principal financial officer is attached hereto as Exhibit 12.A.1. |
| | |
| (a)(2) The certifications required by Rule 30a-2(a) of the Investment Company Act of 1940, as amended, and Section 302 of the Sarbanes-Oxley Act of 2002 are attached hereto as Ex99.Cert. |
| | |
| (a)(3) Not applicable. |
| | |
| (a)(4) The Registrant’s Proxy Voting Policies and Procedures are attached hereto in response to Item 7. |
| | |
| (b) The certifications by the Registrant’s Principal Executive Officer and Principal Financial Officer, as required by Rule 30a-2(b) of the Investment Company Act of 1940, as amended, and Section 906 of the Sarbanes-Oxley Act of 2002 are attached hereto as Ex99.906Cert. |
| | |
| (c) Notice to shareholders regarding the Fund’s distribution. |
SIGNATURES
Pursuant to the requirements of the Securities Exchange Act of 1934 and the Investment Company Act of 1940, the registrant has duly caused this report to be signed on its behalf by the undersigned, thereunto duly authorized.
Alpine Global Premier Properties Fund
| | |
By: | /s/ Samuel A. Lieber | |
|
| |
| Samuel A. Lieber | |
| Chief Executive Officer (Principal Executive Officer) | |
| | |
Date: | January 9, 2012 | |
Pursuant to the requirements of the Securities Exchange Act of 1934 and the Investment Company Act of 1940, this report has been signed below by the following persons on behalf of the registrant and in the capacities and on the dates indicated.
| | |
By: | /s/ Samuel A. Lieber | |
|
| |
| Samuel A. Lieber | |
| Chief Executive Officer (Principal Executive Officer) | |
| | |
By: | /s/ Ronald G. Palmer, Jr. | |
|
| |
| Ronald G. Palmer, Jr. | |
| Chief Financial Officer (Principal Financial Officer) | |
| | |
Date: | January 9, 2012 | |