UNITED STATES
SECURITIES AND EXCHANGE COMMISSION
Washington, D.C. 20549
FORM N-CSR
CERTIFIED SHAREHOLDER REPORT OF REGISTERED
MANAGEMENT INVESTMENT COMPANIES
Investment Company Act file number | 811-22016 |
|
Alpine Global Premier Properties Fund |
(Exact name of registrant as specified in charter) |
|
2500 Westchester Avenue, Suite 215, Purchase, NY | | 10577 |
(Address of principal executive offices) | | (Zip code) |
|
Alpine Woods Capital Investors, LLC
2500 Westchester Avenue, Suite 215
Purchase, New York, 10577 |
(Name and address of agent for service) |
|
Registrant’s telephone number, including area code: | (914) 251-0880 | |
|
Date of fiscal year end: | October 31 | |
|
Date of reporting period: | November 1, 2007 – October 31, 2008 | |
| | | | | | | | | |
Form N-CSR is to be used by management investment companies to file reports with the Commission not later than 10 days after the transmission to stockholders of any report that is required to be transmitted to stockholders under Rule 30e-1 under the Investment Company Act of 1940 (17 CFR 270.30e-1). The Commission may use the information provided on Form N-CSR in its regulatory, disclosure review, inspection, and policymaking roles.
A registrant is required to disclose the information specified by Form N-CSR, and the Commission will make this information public. A registrant is not required to respond to the collection of information contained in Form N-CSR unless the Form displays a currently valid Office of Management and Budget (“OMB”) control number. Please direct comments concerning the accuracy of the information collection burden estimate and any suggestions for reducing the burden to Secretary, Securities and Exchange Commission, 450 Fifth Street, NW, Washington, DC 20549-0609. The OMB has reviewed this collection of information under the clearance requirements of 44 U.S.C. ss. 3507.
Item 1. Reports to Stockholders.
INVESTOR | | |
INFORMATION | | 1(800) 617.7616 | www.alpinecef.com |

| | TABLE OF CONTENTS
|
Alpine View | 1 |
| |
Manager Commentary | 5 |
| |
Report of Independent Registered Public Accounting Firm | 13 |
| |
Schedule of Portfolio Investments | 14 |
| |
Statement of Assets and Liabilities | 18 |
| |
Statement of Operations | 19 |
| |
Statements of Changes in Net Assets | 20 |
| |
Financial Highlights | 21 |
| |
Notes to Financial Statements | 22 |
| |
Additional Information | 26 |
| | ALPINE VIEW
October 31, 2008 (Unaudited) |
Dear Investor:
We are currently afflicted by a crisis of confidence which has deflated asset values, constrained capital markets, and threatened the livelihoods of millions of Americans. Wealth and prosperity have rapidly eroded. Employment and retirement prospects are diminished. Fear of a prolonged downturn has paralyzed many corporate, municipal and individual investment initiatives. Our government’s capital injections or ‘bailouts’, have been the initial response aimed at a coherent public/private sector program which can tackle immediate problems, as well as support long term solutions. If properly designed, this could be an investment in the potential, the ingenuity and the entrepreneurial spirit of America. If rapidly deployed, it could begin to restore investor confidence, rally capital markets and commence a rational reflation of long term asset values.
The credit crisis has reduced our economy’s potential capital availability. Investors’ worst fears are largely discounted in prices of stocks and bonds alike. This reflects the inability of the world’s financial institutions to fend off the contagion of crisis on their own. Into the breach have stepped the world’s Central Banks and sovereign Treasuries to save the day, if they can! The government’s use of capital injections, perceived by the market as ‘bailouts’, have called into question the proper role of government both through regulation and ownership of our entrepreneurial free market system. Some view bailouts as a necessary intrusion into our capital market system, others view them as inappropriate in the evolution of market forces even though it might avert a depression. These desperate views appear to have created an element of paralysis evidenced by our present Administration’s inability to seize the day with a comprehensive plan. Perhaps the next Administration will be inspired to do more. We need to jump-start our Nation’s capacity to reinvigorate itself when called upon by crisis. The ability to energize our collective dynamism has been a hallmark of our society and economy, in part historically positioning the U.S. for global leadership.
What Caused the Fourth Quarter Capital Markets Meltdown?
September and October of 2008 will likely be remembered by economic historians as a time when the defenses protecting our banking system succumbed to a hundred year flood of fear and uncertainty. Globalization and excessive risk tolerance has exposed weaknesses in the structure of the global credit delivery system, both precipitating and exacerbating an erosion of confidence. While underlying problems in the U.S. have been brewing for 15 months since the sub-prime mortgage valuation problem arose, the current state of rampant risk avoidance became a global pandemic following the bankruptcy of Lehman Brothers on September 15. As a result, capital has become scarce and credit for even the most creditworthy has become very expensive. Potential corporate debt maturities and covenant limitations were scrutinized from all angles, forcing major discounts of stock prices. In effect, corporate deleveraging is being forced on many public companies by eroding share prices.
While relative stability was maintained into early 2008, there were still deflationary waves of capital erosion during which liquidity was sucked out of the global capital markets. This was most prominent as the price of oil and other commodities soared to record levels by mid-year. Commodity producing countries made plans for great expansion just as the historic 77% collapse in the price of oil forced the closure of steel mills, mines and production facilities. At the same time, the maelstrom induced by the collapse of Lehman Brothers, froze certain investments in bankruptcy proceedings, which led several major money market funds to ‘break the buck’. In turn, this induced capital flight and maximum risk avoidance by both institutional and individual investors, accelerating the de-leveraging, de-risking process. Thus, foreign currencies, emerging market equities, and financial commodities were dumped as investors around the world sought safe haven in U.S. Treasury bills, actually pushing 90-day Treasury bill yields to 0.06% two days after Lehman’s bankruptcy! Now, central banks around the world are using massive injections of capital and sovereign guarantees to stabilize money markets and induce bank lending.
Even though subprime home mortgages in the U.S. were the proverbial ‘straw which broke the camel’s back’, real estate has not been the root of the problem in the sense that excess supply has not necessarily created an overhang. Rather, excess liquidity which stimulated demand beyond historical levels is the root of the problem. Home price appreciation, slack investment standards and minimal risk premiums enabled Wall Street to engineer both the origination and distribution mechanisms which created even more liquidity. Alas, these distribution systems were interlaced into critical contact with weak links in our financial system. It is safe to assume that there will be less capital available over the near term even after a successful stabilization of the markets. This should lead to reduction in the development of new capacity or excess supply of products or even raw materials. Over time, this will likely offset diminution of demand resulting from the economic impact on business staffing or expansion. Longer term, it should be an important stimulus to price levels as growth returns to the economy in ensuing years, limiting new supply to meet rising demand.
October 31, 2008 Annual Report | 1(800)617.7616 | |
www.alpinecef.com | |
1
What Might a Recovery Look Like?
In assessing investment strategy to identify potential outperformance from these beaten down equity markets, the most important questions are, first, whether the current effort to revitalize our stricken credit delivery system will be effective; second, what long-term changes will be needed to revitalize the interbank lending system and the flawed debt-securitization process; third, what will be the impact on global liquidity over the next few years; fourth, how will this crisis impact both consumer and investor confidence over time; and fifth, how can we best position the portfolio to take advantage of opportunities created by this unprecedented global crisis?
We are confident that the current effort to stabilize the global banking system is well in hand. The recapitalization process should permit banks over the next couple of years to either dispose of, or work out of, impaired loans. Unfortunately, the prospective near term continuation of global economic weakness will likely lead to further asset devaluation and income degradation, bringing additional pressures to deliver corporate balance sheets. This may create more poor performing loans. Thus, it might be a while before we see a strong, competitive lending environment. Meanwhile, we anticipate that banks will extend credit to their largest and strongest existing relationships, amplifying the ongoing consolidation within the banking system itself. We expect banks will require higher margins with more limited lending. Thus, capital for new business creation and/or expansion will probably have to come from nontraditional financial investors who require a significantly higher return on invested capital than traditional bank debt. Clearly, risk premiums required for future capital will likely be more expensive.
Banks’ future requirement of higher net interest margins should over time permit them to take on greater risk, albeit not at the level of the past decade when they faced considerable competition from the capital markets. Over the next several years, flawed asset-backed debt securitizations will come to maturity and require refinancing. In many cases the future cost of refinancing will be much higher. The requirements for interest coverage and excess collateral value will likely be greater than has historically been the norm.
Many of the debt securitizations which dominated the real estate finance environment over the past five years will be subject to recapitalizations or workouts over the next few years. These should be not only more expensive for the issuers, but they should provide lower returns for ongoing investors in these investment vehicles. It is likely that significant investment capital will be tied up for an extended period of time with relatively low return on investment. When, or if, investment bankers can devise a new and improved debt securitization process which instills a measure of confidence in wary investors, securitization could once again offer a competitive source of capital.
Consumer and investor confidence will likely be restored over time. However, the combination of elevated risk avoidance and expensive if albeit limited, liquidity suggests that the range of returns required as investors move up the risk spectrum, will likely be significantly higher. Thus, the discount rates and growth assumptions used in assessing projected investment returns suggests that venture capital will also be constrained. Funding for major capital initiatives such as real estate development, plant expansions and new infrastructure projects should also be curtailed unless confidence inducements can be supplied, such as a governmental guarantee or the strongest of corporate covenants.
Given prospects for a world in which capital has become dear and very selectively distributed, the world of investment opportunities has narrowed. The investment decision process will probably lead to an initial market focus on large and strong companies with solid cash flow and controlled capital requirements. The handful of small companies with a good business model and important niche markets or dominant positions in regions of strong growth potential will probably attract significant capital. In between these two categories, there will likely be a range of companies in the process of transforming their business model to adapt to the emerging economic environment which could provide significant investment opportunity if they are successful. We would anticipate a number of different investment opportunities over the next few years.
Economic Prospects: Potential Scenarios from most Likely, to most Optimistic, to most Pessimistic
Given the great uncertainty over future government economic stimulus packages and housing stimulus or relief, around the world, as well as the potential impact of such capital injections or inducements upon employment, incomes, investment, lending, and currencies, we have chosen to incorporate an overview of the prospective potential for what could prove to be likely scenarios for economic activity. Our most likely base case, is for the U.S. economy to stabilize towards year-end 2009 as home prices begin to improve in certain markets, unemployment stabilizes at a level under 9%, along with the prospect of a modest lift in U.S. GDP. By then, China’s economy should have also turned the corner after a period of working down expensive inventories of raw materials and refocusing its economic activity, permitting both margin expansion and lower priced products for their export market. Then, India and Brazil should also start to see greater growth as global GDP begins to grow at a rate
2
faster than the flat to negative first six months. We anticipate considerable interest rate reductions to accelerate this trend, in the emerging markets.
Our optimistic scenario has the global economy start to pick up mid-year 2009 as a result of a tremendous boost from both fiscal and monetary stimulus to the world’s major economies. Under such a scenario, home prices should begin bottoming by late in the second quarter in the U.S., and we would expect domestic unemployment to peak below 8%. We believe the significant increase in investment flowing into the equity markets in response to the positive stimulus to the economy would in itself help to stimulate renewed capital investment patterns. All of this could provide a sustained lift for the global economy. The pressure on the new Democrat controlled government to fix our economy could lead to such a powerful stimulus plan for the traditional drivers of our economy; cars and housing, that a short-term bounce can be engineered. Similar efforts may also be made abroad.
Our least likely scenario could occur if too few or ineffective stimulus programs failed to impact the economy, resulting in a prolonged and deeper downturn with potential double-digit unemployment rates in the U.S. lasting through 2010, a negative feedback loop of declining consumption, leading to higher unemployment to increased mortgage foreclosures and business failures, could further erode our country’s capital base. Such a deflationary spiral of negative consequence would weigh on global consumption patterns, limit the recovery of the banking system and perhaps destabilize governments and trade alliances, reversing many of the benefits of globalization. We believe that this risk is apparent to pragmatists in central banks and governments around the world, so every effort will likely be made to avoid such decline.
Final Thoughts: Adjusting to a New World
During preceding sections we have discussed how this “hundred year flood” of economic distress has upended the order of things related to both the capital and credit markets. Such traumatic events often lead to investment opportunities. We would like to share our thoughts regarding some of those opportunities as we structure our investment portfolios, discussing how this event has led us, as the Funds’ managers, to initiate new efforts in an attempt to position the Fund against possible future economic tsunamis.
We believe the consolidation in the banking sector will create a selective group of large capitalization companies with strong balance sheets and entrepreneurial management teams, who have enhanced returns in the past, could be rewarded with premium share prices as well as access to capital markets.
Large companies which have poor financial structure, management team or business focus will likely be forced to restructure in an attempt to transform their business to meet current economic demands. The likelihood is that only a few will succeed, and those which fail will be forced to sell assets or portfolios, to the better capitalized premier companies. Smaller companies which have good growth opportunities and solid management may find that capital is very expensive. Some should be able to expand their portfolios in spite of higher cost capital and eventually earn premium recognition from the marketplace.
Since the structured finance markets will probably take between two to four years to restructure and, or, cleanse themselves of poor performing loans, we suspect there will not be significant low cost funding for leveraged buy-outs during this period in the U.S. and Europe. Asia and Latin America present a different scenario as we believe their economic growth rates should be sustained at higher levels than growth potential of developed markets enhancing prospective values. Furthermore, they did not receive significant capital from the structured finance underwriters on Wall Street, so there should be very little overhang in those markets. Thus, as the dust settles over the next year, we believe it will become increasingly clear to investors that emerging market trends are still intact for the long term and that development of the capital markets would be required to meet economic demand. In the U.S. and Europe, we believe it will be a slower march back, with investment potential coming from relatively cheap equity valuations and companies’ abilities to transform their business models to position themselves for capital expansion.
Given the current valuation of many real estate, industrial, commodity and financial equities at historic trough levels not seen since 1990, and in some extremes even further back towards the 1970’s, we suspect that the potential for historically strong recovery of valuations off a low basis is present. If equities prove to be cyclically attractive over the next year or two, and stock markets around the world have thoroughly discounted their decline, then we look forward to positioning our portfolios not just for a rebound, but also for long term growth.
As companies transform their business models, we believe that evolution of our management process is also important and thus we are focusing on adjustments to our existing investment methodologies. In an attempt to protect our portfolios against future extreme price movement, we would hope to reduce the sort of downside risk which has impacted our portfolios this year. Unlike previous years, broad portfolio diversification failed to cushion the downside for our international portfolios in particular. In response, we are
3
gradually concentrating portfolios to a greater degree, favoring the sort of investment opportunities which we believe might outperform during this period of uncertainty and potential transformation.
While the market is certainly closer to a bottom than just a few months ago, and may have hit its nadir on November 21st, the risk of an extended downturn remains. Thus, we will err on the side of caution, while still hunting for undervalued recovery opportunities and transformational value situations. Anticipating a two to three year investment holding period, many of the downtrodden values of today may become great recoveries or even market leaders for the future.
We appreciate your support and interest. Alpine has been investing in our people, processes and systems in an effort to invest most effectively. We look forward to enhancing results for you in the New Year.
Sincerely,
Samuel A. Lieber
President, Alpine Mutual Funds
Mutual fund investing involves risk. Principal loss is possible.
The letter and those that follow represent the opinions of Alpine Funds management and are subject to change, are not guaranteed and should not be considered recommendations to buy or sell any security.
Cash Flow measures the cash generating capability of a company by adding non-cash charges (e.g., depreciation) and interest expense to pretax income.
Please refer to the schedule of portfolio investments for fund holding information. Fund holdings and sector allocations are subject to change and should not be considered a recommendation to buy or sell any security. Current and future portfolio holdings are subject to risk.
4

| MANAGER COMMENTARY
October 31, 2008 (Unaudited) |
Dear Investor:
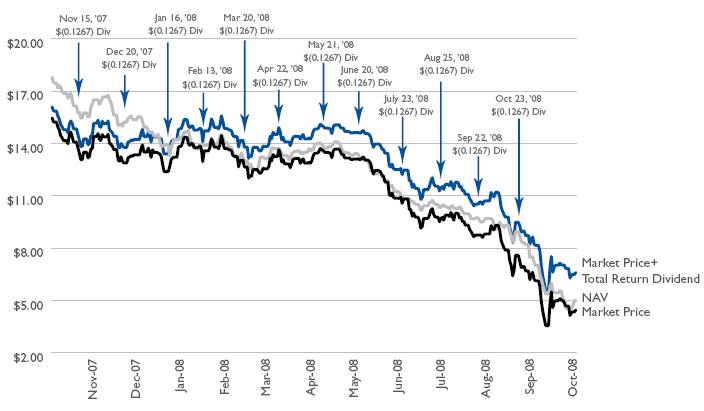
This annual report for the Alpine Global Premier Properties Fund (AWP) covers the year ended October 31, 2008. As of October 31, the net asset value per share for the Fund was $5.00. This represented a decline for the fiscal year of 67.74%. The majority of the decline occurred during the Fund’s fiscal fourth quarter, constituting the months of August, September and October, when the Fund’s net asset value per share declined by 49.20%. During the fiscal year, the Fund’s net asset value (NAV) declined from $18.04 to $5.00 per share, while the share price of AWP fell from $15.71 to $4.45, reflecting an 11.00% discount to the net asset value per share. For the year, the Fund paid a monthly dividend of 12.67¢ per share which amounted to $1.52 of distributions. This dividend represents a 13.15% yield on AWP’s average fiscal year share price of $11.56.
In this report we hope to explain what brought about the magnitude of decline in real estate shares in terms of capital markets conditions, economic conditions and the real estate cycle. We will also discuss an overview of the portfolio and key investments, a discussion of dividend prospects, as well as medium-term and long-term investment prospects. However, first we should revisit how we got here.
What Happened?
Over the past 16 months, the global credit markets have shifted from temporary paralysis toward improving liquidity, then back towards further constriction and, uncertainty as contraction from the global deleveraging process unfolded. Government intervention has tempered the downturn, yet uncertainty remains regarding the depth and duration of this financial tsunami. The crisis of confidence has limited bank lending, which is especially tough on capital intensive businesses such as real estate. The problem in the credit markets sprang from the U.S. subprime housing sector and not the broader real estate economy, per se, but the fundamental flaws of excessive leverage and structural illiquidity flows from the asset backed securitization process championed by Wall Street over the past decade.
Initially, Alpine assumed that since the asset backed securities industry had been most active in the U.S. and U.K., with less exposure in Europe and nominal presence in Asia, there would also be relatively more financial stability in countries which were less exposed. We did not appreciate how inadequate the Bush Administration’s response would be to this looming crisis and how the shockwaves would spread abroad. Last October we commented in the prior AWP annual report that we thought the Government had to respond to the mortgage problem first and foremost. They did not! When Bear Stearns all but collapsed in the spring, the stunning action of the Federal Reserve to have the company’s assets absorbed by JPMorgan signaled a pragmatic understanding of the precarious interconnectedness of the financial markets. However, the decision in September to succumb to the suasion of the moral hazard argument and permit the bankruptcy of Lehman Brothers allowed this contagion of eroding confidence to spread across sectors and continents in a matter of days. Money market funds ‘broke the buck’, banks stopped whatever lending they were still doing, capital markets froze and both consumer and investor confidence fell towards historic lows. Thus began the current phase of the cycle in which governments around the world are seeking to infuse their domestic banking systems with tremendous liquidity, fund major infrastructure and public works projects, absorb or support key industries and provide economic stimulus to stabilize, if not expand, job markets. In essence, the financial economy, which was created to enable commerce, is now undermining the productive economy.
Real Estate in a Capital Constrained World
Subsequent to the demise of Lehman Brothers, Goldman Sachs and Morgan Stanley have announced that they will become banking institutions and accede to government regulation. More significantly, this suggests that the era of investment banks operating with 30 to 40 times leverage is over. We believe both investment banks and commercial banks will return to historic levels of 8 to 12 times leverage. This will either require hundreds of billions of dollars in new equity or a reduction in loans outstanding, or a combination of the two. The relevance to real estate is that over the last decade investment banks have become a major source of debt and equity, often provided through complex capital structures, such as mortgage backed securities (CMBS) and syndications. Now, the resulting lack of credit for companies means diminished new construction or capital improvements to existing properties. Historically different types of property required annual reserves of 1% to 7% of income to provide for long-term maintenance and periodic physical improvements. In this just ended era of easy liquidity, many companies dispensed with such reserves and now must factor them into their budgeting for debt coverage and dividend analysis. As the cycle unfolds, a key factor will be the way in which debt is either refinanced or withdrawn from the market place. Existing properties may need injections of additional equity as debt levels and valuations are both adjusted. Loan to value levels may well fall from the 70% to 80% range towards 60% as both higher interest coverage from cash flow and lower cash flow multiples (capitalization rates inverted) are used. This may be very difficult in the case of CMBS financings where perhaps twenty or fifty mortgages were pooled together and then were sold to a multitude of different buyers. The ability to
5
arrive at a consensus of appropriate valuation parameters let alone coordinate a restructuring of the debt given the different needs of many lenders and borrowers may prove exceedingly difficult. We suspect that there will be a number of mortgage pools stuck in some sort of property purgatory for an extended period of time. Original investors in these pools may be forced to take substandard returns and the properties themselves may be cash starved and risk declining competitiveness.
While the debt side of the capital markets looks difficult, we suspect that this should open up opportunities for equity investors in REITs or other publicly traded real estate investors. Public companies should have greater access to capital since they utilize less debt financing than private equity investors and can use their equity as currency. It is possible that the REIT model which is now undergoing a significant stress test may emerge in a leaner and more nimble condition which will enable these companies to once again consolidate the real estate industry. For those of us who have been active investors in this sector for more than a few years, this could lead to a period similar to the 1992 through 1995 cycle in the U.S. during which ‘the modern REIT era’ evolved, providing great returns to shareholders in the wake of the S&L crisis. This scenario could unfold on a global scale as the deleveraging process continues and investors seek alternative investments for both yield and capital appreciation.
Where in the Cycle Are We?
Alpine believes that there is considerable cyclical divergence across both property types and geography. For example, the residential housing market in the U.S. began to cool in 2005; however, significant price declines on a national level only began to materialize in 2007 and accelerated into this year. We believe 2009 should see the bottom of both price and volume declines in the U.S. barring a collapse in employment levels. With home prices down between 20% to 30% for most major U.S. cities and the likelihood of mortgage rates well below 5%, prospective affordability levels and the rent versus buy cost-to-carry ratio could be stimulative. A similar pattern is unfolding in China and beginning in India, albeit, significant price adjustments are only now hitting the marketplace. The recovery in the U.K. housing market may well take a bit longer and several continental European markets, notably Spain, may take a few years before we see improvement. Brazil’s housing market may suffer from reduced supply in response to economic uncertainty during the first six months of the year; however, the potential for some modest price depreciation may not take place if the central bank starts bringing interest rates down rapidly over next year from the current level of 13.75%. Japan’s downward adjustment could bottom over the next 18 months from very low volumes. These estimates could prove conservative given the proposed stimulus packages in many countries which might accelerate recovery.
The retail sector is another area where the market is concerned regarding consumption patterns. In most countries, shopping centers have the benefit of relatively stable cash flow due to average effective lease duration of a minimum of two or three years, up to seven to ten years, with the exception of anchor tenants which are even longer. Thus, outside of bankruptcies, lease expirations are the main variable component for typically 8% to 20% of income in a given year. During a normal inflationary environment, rents should increase from expiring leases to new agreements, assuming employment levels and consumption patterns do not change materially. A major concern in the U.S. is that consumers are in the process of adjusting their household savings from a nominal level to historical patterns between 6% and 10%. It’s worth noting that even these levels are well below continental European savings rates, and even more so below the 30% to 40% range that has been the norm in Asia. Assuming a 6% to 10% savings rate will hold, we could see consumption decline by 1% to 2% per year for several years. This could have material impact on consumer spending and, hence, retail sales in the U.S. This could push ineffective retailers out of business and impact the income potential for marginal retail real estate locations. Already we have seen a rise in retail bankruptcies over the past year and would expect 2009 to be a more difficult year given the soft Christmas season. Rising unemployment will most likely compound these pressures on a global scale. We believe that investors should have a preference for community oriented; food focused shopping centers, as well as dominant regional shopping malls. A key consideration will be the sales productivity of these centers as well as the occupancy cost for tenants as a proportion of their sales revenues. Clearly the trend we have seen so far favors stores which offer a variety of merchandise at competitive prices, be they either large or small format stores offering either niche or broad market product selection. If the economy stabilizes as we move into 2010, we think this sector will respond favorably at that time.
The industrial sector has become increasingly focused on logistics, as opposed to warehousing, and should respond to the retail cycle, as well as the capital goods cycle. Again, we would expect 2009 to be the bottom for this sector unless there is a significant rise in bankruptcies amongst third-part logistics providers, which could extend the downturn of the cycle into 2010.
The office sector may face an extended period of difficulty even though office leases throughout the world typically average at least two, and often five to ten years. Thus, releasing exposure with the exception of bankruptcies is typically between 10% to 20% in most North American,
6
and 15% to 30% for Asian markets. Alpine believes that the on going contraction in the financial services sector will be most acute in cities such as New York, Frankfurt, and London; however, the credit crisis is truly global and will likely have an ongoing impact in terms of corporate staffing and expansion plans. Investors should take note that vacancy rates are historically low in many cities throughout the world as this particular up-cycle has had a rather short duration of between three to five years. This has prevented excessive new construction from over supplying many cities, which in turn should bode well for the next expansion phase of the real estate cycle. However, with regard to the cities which typically enjoy long lease duration, there could be potential supply from an explosion of sublet space as existing tenants might downsize well before lease termination. The office sector might also hold greater refinancing risk due to the relatively high proportion of commercial mortgage backed securitizations that were focused on such properties. Thus, the summation of these variables suggests that office markets around the world will not begin to see improvement in the leasing cycle before mid 2010, and with regard to some cities, this may last well into the next decade.
The other major sector of focus, the lodging sector, has come under increased pressure over the past year with the prospect for further declines into 2009 before we begin to see stabilization. The lodging sector is fundamentally dependent upon economic activity, so its observed high correlation with GDP is logical. An overlay of supply and demand characteristics shows that the rate of new room construction had been accelerating through 2007 when hotel share prices peaked in the wake of Blackstone’s purchase of Hilton. Construction financing for hotels is now virtually impossible, which will limit new supply over the next several years. Assuming economic activity picks up in 2010, so should the performance of hotel properties. The pace of improvement may be gradual; however, segmentation by category or price point could be a major differentiating factor.
The Real Estate Stock Cycle
In addition to commenting on the underlying real estate cycles, it’s important to note that the equity real estate cycle typically leads while the real estate cycle lags overall economic trends. Thus, it’s our experience that the equity markets anticipate underlying performance prospects by a range of six to eighteen months. In other words, if U.S. homebuilders stocks perform well over the first half of 2009, it does not necessarily suggest that their profitability will start to improve materially during 2009. However, it probably reflects the potential for an extended cyclical trend of rising or enhanced profitability lasting several years or more. In this context, it may be easier to understand how the shares of property securities could have fallen to such a degree over the past year or so. That is, our economy rapidly shifted from a period of economic expansion to near global recession in a matter of months! Recall that commodity prices were surging to inflationary peaks less than six months ago. With oil futures over $140 in June, some analysts were calling for prices to hit $200. Now, those same analysts are targeting $30 a barrel! Over the course of 2008, we have witnessed the psychology of the markets move from a fear of inflation, to stagflation, and now to deflation. This manic quality is part of the equity markets forward looking discounting process in assessing future corporate earnings prospects.
With this perspective, we wish to draw your attention to the following table which shows the historical performance patterns for real estate equities over this past cycle. To provide a reasonable picture of the global universe in which AWP invests, we have presented Index returns for global property stocks, global ex-U.S. (International), as well as U.K., European, Hong Kong and Japanese real estate securities indices, plus three distinct indices for the U.S., covering REITs, Homebuilders and Hotel stocks. It is worth noting that the beginning dates for most of these cycles commenced after the U.S. incursion into Iraq in 2003 and all but one peaked during 2007.
Real Estate Securities Performance
Index | | Region | | Start of Rally | | % Gain | | Last Peak | | % decline
through 11/21/08 | | 1980’s/90’s
Cycles%
+ Avg. - | |
S&P Developed Property | | Global | | 10/08/98 | | 384.2 | | 02/22/07 | | -66.9 | | 87 : -31 | |
S&P Developed ex-U.S. Prop. | | Intl. | | 03/14/03 | | 313.3 | | 05/07/07 | | -65.8 | | 93 : -37 | |
FTSE 350 Real Estate | | U.K. | | 03/14/03 | | 253.2 | | 01/02/07 | | -70.0 | | 90 : -39 | |
FTSE EPRA Euro Zone R.E. | | Euro. | | 09/21/01 | | 258.0 | | 02/21/07 | | -68.1 | | 53 : -25 | |
Hang Seng Property | | HK | | 04/14/03 | | 342.0 | | 12/05/07 | | -64.0 | | 160 : -59 | |
TOPIX Real Estate | | Tokyo | | 04/11/03 | | 537.8 | | 06/05/07 | | -75.9 | | 148 : -51 | |
MSCI U.S. REIT | | U.S. | | 02/10/99 | | 339.9 | | 02/09/07 | | -68.3 | | 84 : -28 | |
S&P Supercomposite Homebuilding | | U.S. | | 03/06/00 | | 810.2 | | 07/20/05 | | -86.8 | | 229 : -49 | |
S&P Supercomposite Hotels | | U.S. | | 03/12/03 | | 199.3 | | 07/06/07 | | -74.2 | | 403 : -48 | |
7
While it may be too early to call a bottom for the markets, it is interesting that all have bounced as of November 21st, which may have culminated the recent wave of panic selling in equity markets. It’s worth noting the relatively short period of most of these cycles, ranging from four to five years in duration on the upside, and the typical 12 to 24 month period of decline. It’s also worth noting the magnitude of decline which uniformly ranged from two-thirds to three-quarters from peak levels. This is well beyond the pattern of the overall equity market and we believe reflects the aforementioned capital intensity of real estate as an asset class. For perspective, we have included a column showing the average up and down percentage returns for cycles prior to this one, extending back at least to 1990, and even to 1980’s with available data. Note that prior cycles typically lasted half as long as this period did during the recovery phase. This leaves us with hope that the potential for capital appreciation is far greater than the potential for further falls, given the record aggregate severity of this cycle’s decline. The November 21 coincidental low also gives us some hope that the equity markets are pricing in stabilization of the real estate markets over the next year or so.
Portfolio Performance
The aforementioned 67.74% decline in the Fund’s net asset value per share reflected deteriorating conditions in almost all countries. This also reflected significant currency depreciation, most of which occurred during September and October. Historically, Alpine’s investment strategy of broad portfolio diversification in terms of the numbers of investments, the property types and geographic dispersion had an effect of smoothing out annual returns. However, after almost 20 years of investing in international real estate securities we had heretofore never experienced such a broadly sweeping market decline. There simply was no port in the storm, no where to hide, with the exception of cash. With only one market in which we had on average more than 20% of the portfolio invested (the U.S.; average 23.5%) there was really no one exposure to point a finger at as a culprit for the significant declines in the portfolio during the year. The Fund was impacted more by losses in Japanese equities which contributed 6.7% to the decline in the portfolio. The U.K. was responsible for over -5.5% of the Fund’s decline, even though we were relatively underweight in that market. Brazil was a smaller component of our portfolio, averaging a 6.7% weighting over the course of the year, yet its aggregate equity decline of 73.4% led to -5.3% of the portfolio return. France, which started the year as the fifth largest country exposure ended the year number two at 10.7% of the portfolio. However, its relatively high average weighting of 9.33% combined with an average aggregate decline of over 53% on the stock level in dollar terms led to a -4.7% reduction for the Fund’s overall returns. Similarly, Singapore with its average weighting of 7.9% of the portfolio, was down 61% at the stock level, and contributed to -5.4% losses. This totals the sources for 40% of the Fund’s 67.74%, decline in net asset value.
The smaller country exposures proved to be more troubling from management’s perspective. For example, Australian equities actually produced the lowest equity returns in the portfolio. Even though we had an average weighting of just over 4% of the Fund invested, Australia contributed almost 5% to the decline in the Fund’s NAV, due to the combination of a -28.51% decline in the Australia dollar and a collapse in the share prices of Aussie REIT’s with major international expansion efforts, whose hedged foreign currency exposure created further losses. This dramatically impacted the third quarter returns for companies such as Valad Property Group and Goodman Group. We originally started to buy Australia at the end of last year after the Centro Properties collapse had already cut share prices by more than half for most property trusts. While the market may remain fearful of ongoing international exposure for Australia stocks, the Goodman Group is still in the Fund’s portfolio because it is trading for a fraction of the value of its high quality industrial portfolio. Over the medium term Goodman could significantly benefit from its international platform of operations. While China only represented 2.4% of the of the average portfolio weighting for the year, stock declines of over 80% contributed to a - -2.7% hit to AWP’s total return. Sometimes in the case of declining markets, we start to build a position on the way down. Clearly investments made over the course of the summer were too early, and not cheap enough, as we continually caught the wrong part of the falling knife. That said, the Chinese property sector had not traded at single-digit multiples since 2003 and we believe that the stocks which we thought attractive at between eight-to-ten times earnings multiples, down from twenty-five times earnings per share, should be even more interesting at two-to-three times. We have been increasing our exposure subsequent to the Fund’s year end.
Perhaps management’s greatest disappointments were in the investments made in Austria and Norway. In Austria, we invested in Immofinance at levels considerably below stated book value and what we believed to be the company’s net asset value per share. Immofinance was the largest property company in Austria, and owned 54% of a subsidiary entity called Immoeast, which invested in both direct property and entity level equity investments in private developers throughout Eastern Europe. Given managements near 20 year experience in investing in the region, we felt comfortable with this arrangement particularly since most of Immofinance’s portfolio exposure was in high quality Austrian and German offices, apartments and logistics facilities. In October, 2007, the Fund’s position in Immofinance was at a dollar cost basis of $11.88
8
per share. That held well through April of 2008 where the shares were still trading for $11.08. Unfortunately, the price principally declined in September, and then to $1.11 at the end of October as the CEO and founder of the company suddenly left for unexplained reasons. This led to Board resignations as it became clear that the company made a $500 million Euro loan to a mysterious entity with no reportable assets or business. The monies have not been recovered and the company is currently the focus of a fraud investigation which has left a cloud over the shares and uncertainty regarding the company’s potential. This contributed to the Fund’s 2.1% portfolio decline as a result of our limited Austrian investments.
AWP’s only holding in Norway is Norwegian Properties, the owner of prime office buildings in Oslo and Stavanger, tenanted by oil companies, insurance companies and government linked entities. This stock has averaged only 1.1% of the portfolio over the past year, nonetheless contributed to 1.2% decline for the portfolio. In October of last year, the company’s shares were valued at $12.48 per share, then subsequently fell 30% to $8.72 in April, 2008 as the market grew concerned that a major acquisition had increased their debt exposure excessively (over 75%). While the company was still within its debt covenants, infighting on the board prevented the company from taking early action either through disposals or additional equity raisings which led to a mid-summer rights issue, which was poorly priced and underwritten. Alpine did not participate in the rights issue. We eventually took up the equivalent of our allotment at prices over 60% below the rights price, however, the shares ended the month of October at $1.48, a fall of 88% on the face value of our previous year’s position. Of that total, the Norwegian Krone was responsible for 29% of the fall. The Fund has subsequently invested further at similar and lower share price levels as the company has achieved several property sales at levels above the underlying net asset value. The shares themselves are trading for roughly an 80% discount to such levels.
Indeed, while many shares in the portfolio are trading at fractional valuations in the stock markets relative to what we believe could be achieved in the private real estate markets, in the current illiquid investment environment we would now expect to see significant activity to take advantage of this arbitrage either through mergers and acquisition activity or increased stock investor interest. Our estimation is that the aggregate discount in the portfolio currently stands in excess of 60% despite the overall high quality nature of the individual companies’ assets and in extreme cases, such as Norwegian Properties, could offer tremendous upside potential when liquidity returns to the capital markets.
Portfolio Strategy
We wish to highlight that only two of the Fund’s top ten holdings remain from last year. Unibail/Rodamco owns premier shopping malls throughout Europe and Accor is Europe’s major hotel owner with brands such as Sofitel and Novotel. The two actually offer reasonably defensive qualities such as the long-term leases and superior quality of the portfolio for Unibail, while half of Accor’s business is in fact linked not to the hotel industry, but rather a global corporate voucher system which many companies use to pay for employee meal expenditures. In other words, both companies have relatively stable cash flow businesses, and dominant market share, enabling them to both pay significant dividends during times of uncertainty such as we now experience. One of the new names in the top 10 holdings is Annaly Capital Management. Annaly and another portfolio holding, MFA Mortgage Investments, are REITs which invest in the mortgage securities guaranteed by Fannie Mae and Freddie Mac. Over the last few years both companies have reduced their borrowing levels from fourteen times assets to under eight, and should benefit significantly from spreads available in the current financing environment. Given the relatively high underlying yields and significant security from investments in the mortgages guaranteed by these government sponsored entities, we view both of these companies as relatively stable in this current environment and capable of producing significant cash flow in the form of dividends.
We have added to our exposure to REITs in Japan, most notably, Japan Logistics is the fund’s fifth largest holding, and the Japan Retail Fund which owns quality community shopping centers and shopping malls throughout Japan. We have taken advantage of the downturn in Brazilian shares to invest in shopping mall companies such as Multiplan and Iguatami as the market declined. AWP was also able to buy previously expensive companies focused on the development of low-income housing, subsidized by the government. These companies, MRV and PDG, both offer considerable upside even if the Brazilian economy slows significantly over the next year. By our estimation, our Brazilian investments are trading for approximately four to six times earnings, and we believe that if the Brazilian economy reaccelerates in 2010, we should benefit not only from rapidly rising earnings but significant multiple expansion.
In a nut shell, we have been able to buy both deeply discounted, high quality property portfolios on one hand, while on the other positioning ourselves in very attractively priced growth stories in the emerging markets where we believe economic growth will come back most quickly. We believe AWP’s portfolio is positioned appropriately at this stage of the real estate equity cycle, anchoring the
9
portfolio with companies producing stable cash flow and high dividends which offer attractive underlying valuations combined with the aforementioned deeply discounted growth and value situations.
Dividends
Since inception, Alpine Global Premier Properties Fund has paid monthly dividends equal to an annual rate of $1.52 per share. For 2008, these distributions reflected a dividend income collected of $1.72 less 8.4¢ withheld for foreign taxes. After deducting 17¢ for Fund operating expenses the net investment income was $1.47 per share.
At the outset of this report we discussed the impact of the credit crisis on real estate companies’ capital expenditure planning. Until recently, we have been comfortable that most companies could maintain dividend levels in dollar terms, even though share prices were declining. That is, the yields have been getting larger so AWP could still collect dividend income at a rate which sustained the Fund’s dividend payouts to shareholders. However, since the Lehman Brothers collapse, we have observed more companies reducing or altering the timing of their dividend payments. To date, roughly a quarter of REITs in the U.S. have either cut, suspended or omitted dividends. We have seen a number of listed property trusts in Australia and European companies do the same. We expect several other public companies around the world will also do so. Unfortunately, we do not as of yet have visibility on the dividend payment rates for the middle of next year. That is when we expect the majority of fiscal pressures both to conserve capital and obtain new lines of financing, to fully impact real estate company cash flows. Without visibility on that time, we cannot determine whether there will be adequate income to sustain the Fund’s current level of dividends.
Given current valuations, we believe that capital appreciation potential for many of the stocks in our universe could be greater than the potential dividend growth over the same period. We believe that the dividends will grow over time, but that the stocks will move ahead of that time in anticipation. Therefore, we are encouraged to focus on the capital appreciation potential of real estate equity total returns followed by the dividend growth potential of these stocks over time. It should be noted that by the time you receive this report a public declaration of the Fund’s prospective dividends will have been made.
Future Prospects
Given recent past performance for both real estate equities and this Fund, we realize that many investors may be upset and uncertain over the prospects for their investment. It is certainly fair to ask what happens next if there is another leg down in the economic environment. Indeed, if we were to see a depression-era climate developing, management would seek shelter in cash and remain exposed only to the most defensive situations for dividend income. However, we do not think this a likely scenario and believe that the recent decline, while more extreme than any seen in either this manager’s 23 years in the business and Alpine’s most senior manager’s 58 years of experience in the markets, still conforms to historical market cycles. We are still comforted that our traditional approach to buying value, seeking the highest quality companies with solid long-term prospects as core holdings and then attempting to position the portfolio to benefit from the economic rebound when it arrives, should be productive. This was the history of market performance during prior recoveries in 2003, 1993, 1986, 1982 and 1975. We expect the likely stock market pattern for 2009 will be volatile, but we remain optimistic with regard to the portfolio and its prospects. As such, we continue to periodically acquire shares on behalf of Alpine employees and for the Fund itself, when share price discounts relative to NAV are compelling. We remain confident of the long term prospects for the Fund!
We thank you for your interest and we look forward to building on Alpine’s long-term record as a manager of global real estate securities.
Sincerely,
Samuel A. Lieber
10
PERFORMANCE(1) as of October 31, 2008
| | Ending Value | | One | | Three | | One | | Since | |
| | as of 10/31/08 | | Month | | Month | | Year | | Inception(2)(3)(4) | |
| | | | | | | | | | | |
Alpine Global Premier Properties Fund | NAV (4) | | $ | 5.00 | | (31.81 | )% | (49.20 | )% | (67.74 | )% | (53.14 | )% |
Alpine Global Premier Properties Fund | Market Price (3) | | $ | 4.45 | | (29.68 | )% | (50.69 | )% | (67.03 | )% | (57.98 | )% |
S&P / Citigroup World Net Total Return $ US Property Index | | | | (27.45 | )% | (35.80 | )% | (51.85 | )% | (39.33 | )% |
MSCI US REIT Total Return Index | | | | (31.81 | )% | (30.32 | )% | (40.46 | )% | (37.71 | )% |
(1) | Performance information calculated after consideration of dividend reinvestment. All returns for periods of less than one year are not annualized. |
(2) | Commenced operations on April 26, 2007. |
(3) | Annualized |
(4) | IPO price of $20 used in calculating performance information. |
To the extent that the Fund’s historical performance resulted from gains derived from participation in initial public offerings (“IPOs”), there is no guarantee that these results can be replicated in future periods or that the Fund will be able to participate to the same degree in IPO allocations in the future.
Performance data quoted represents past performance. Past performance is no guarantee of future results and investment returns and principle value of the Fund will fluctuate so that shares, when redeemed, may be worth more or less than their original cost. Current performance may be higher or lower than the performance quoted. Call 1(800)617.7616 or visit www.alpinecef.com for current month end performance.
PORTFOLIO DISTRIBUTIONS v
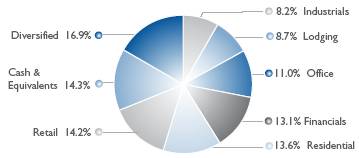
v As a percentage of net assets
TOP TEN HOLDINGS v
Annaly Capital Management, Inc. | | 6.1 | % |
Unibail-Rodamco Co. | | 5.2 | % |
Nomura Real Estate Holdings, Inc. | | 2.7 | % |
Alexander’s, Inc. | | 2.6 | % |
Japan Logistics Fund, Inc. | | 2.3 | % |
Accor SA | | 2.2 | % |
Mack-Cali Realty Corp. | | 1.8 | % |
CapitaCommercial Trust | | 1.7 | % |
Hammerson PLC | | 1.6 | % |
Midland Holdings, Ltd. | | 1.5 | % |
Top Ten Property Holdings | | 27.7 | % |
v As a percentage of net assets
11
REGIONAL ALLOCATIONv
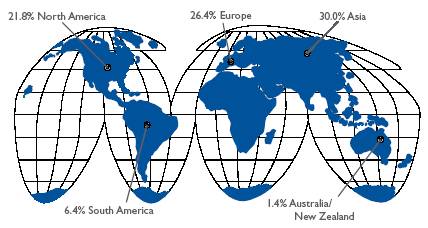
v As a percentage of net assets
Top Five Countriesv
United States | | 20.6 | % |
France | | 10.7 | % |
Singapore | | 10.7 | % |
Japan | | 8.7 | % |
United Kingdom | | 7.5 | % |
v As a percentage of net assets, excluding any short-term investments
NAV, MARKET PRICE, AND TOTAL RETURN [ Year ended 10/31/08 ]
12

| REPORT OF INDEPENDENT REGISTERED PUBLIC
ACCOUNTING FIRM |
TO THE STOCKHOLDERS AND BOARD OF TRUSTEES OF ALPINE GLOBAL PREMIER PROPERTIES FUND:
We have audited the accompanying statement of assets and liabilities, including the schedule of portfolio investments, of Alpine Global Premier Properties Fund (the “Fund”), as of October 31, 2008, and the related statement of operations for the year then ended, the statement of changes in net assets and the financial highlights for the year then ended and for the period from April 26, 2007 (inception) to October 31, 2007. These financial statements and financial highlights are the responsibility of the Fund’s management. Our responsibility is to express an opinion on these financial statements and financial highlights based on our audits.
We conducted our audits in accordance with the standards of the Public Company Accounting Oversight Board (United States). Those standards require that we plan and perform the audit to obtain reasonable assurance about whether the financial statements and financial highlights are free of material misstatement. The Fund is not required to have, nor were we engaged to perform, an audit of its internal control over financial reporting. Our audits included consideration of internal control over financial reporting as a basis for designing audit procedures that are appropriate in the circumstances, but not for the purpose of expressing an opinion on the effectiveness of the Fund’s internal control over financial reporting. Accordingly, we express no such opinion. An audit also includes examining, on a test basis, evidence supporting the amounts and disclosures in the financial statements, assessing the accounting principles used and significant estimates made by management, as well as evaluating the overall financial statement presentation. Our procedures included confirmation of securities owned as of October 31, 2008, by correspondence with the custodian and brokers; where replies were not received from brokers, we performed other auditing procedures. We believe that our audits provide a reasonable basis for our opinion.
In our opinion, the financial statements and financial highlights referred to above present fairly, in all material respects, the financial position of Alpine Global Premier Properties Fund as of October 31, 2008, the results of its operations for the year then ended, and the changes in its net assets and the financial highlights for the year ended October 31, 2008 and for the period from April 26, 2007 (inception) to October 31, 2007, in conformity with accounting principles generally accepted in the United States of America.

Milwaukee, Wisconsin
December 19, 2008
13

| SCHEDULE OF PORTFOLIO INVESTMENTS
October 31, 2008 |
| | | | Value | |
Description | | Shares | | (Note 1) | |
| | | | | |
COMMON STOCKS (84.3%) | | | | | |
Australia (1.4%) | | | | | |
Australand Property Group | | 11,228,147 | | $ | 2,201,188 | |
Goodman Group | | 8,116,752 | | 5,043,370 | |
| | | | 7,244,558 | |
| | | | | |
Austria (1.0%) | | | | | |
Conwert Immobilien Invest SE* | | 628,653 | | 3,028,727 | |
Immofinanz AG * | | 2,102,000 | | 2,330,822 | |
| | | | 5,359,549 | |
| | | | | |
Brazil (6.3%) | | | | | |
Agra Empreendimentos Imobiliarios SA* | | 1,478,100 | | 805,058 | |
Brascan Residential Properties SA | | 1,594,900 | | 2,274,748 | |
Brasil Brokers Participacoes SA* | | 2,059,200 | | 2,613,801 | |
Cyrela Brazil Realty SA | | 903,795 | | 4,305,176 | |
Cyrela Commercial Properties SA Empreendimentos e Participacoes | | 1,481,000 | | 3,602,525 | |
Gafisa SA | | 210,700 | | 1,492,843 | |
Gafisa SA - ADR | | 120,100 | | 1,752,259 | |
Iguatemi Empresa de Shopping Centers SA | | 100,400 | | 468,054 | |
Invest Tur Brasil - Desenvolvimento Imobiliario Turistico SA* | | 21,700 | | 4,056,542 | |
MRV Engenharia e Participacoes SA | | 461,900 | | 2,389,984 | |
Multiplan Empreendimentos Imobiliarios SA* | | 905,000 | | 4,549,020 | |
PDG Realty SA Empreendimentos e Participacoes | | 601,700 | | 3,068,906 | |
Tecnisa SA | | 639,500 | | 841,253 | |
Trisul SA | | 1,150,000 | | 1,146,550 | |
| | | | 33,366,719 | |
| | | | | |
Chile (0.1%) | | | | | |
Parque Arauco SA | | 1,235,504 | | 644,691 | |
| | | | | |
China (1.3%) | | | | | |
C C Land Holdings, Ltd. | | 7,118,900 | | 1,240,058 | |
CapitaRetail China Trust | | 4,514,000 | | 1,643,668 | |
Hopson Development Holdings, Ltd. | | 4,717,600 | | 1,521,797 | |
Shui On Land, Ltd. | | 998,100 | | 221,512 | |
Sino-Ocean Land Holdings, Ltd. | | 8,899,400 | | 2,296,605 | |
| | | | 6,923,640 | |
| | | | | |
France (10.7%) | | | | | |
Accor SA | | 299,000 | | 11,564,199 | |
Club Mediterranee* | | 101,895 | | 2,025,978 | |
Eurosic, Inc. | | 93,300 | | 2,221,344 | |
Kaufman & Broad SA | | 92,767 | | 1,891,780 | |
Klepierre SA | | 114,219 | | 2,608,757 | |
Nexity SA | | 263,953 | | 2,277,574 | |
Societe Immobiliere de Location pour l’Industrie et le Commerce | | 74,715 | | 6,623,113 | |
Unibail-Rodamco Co. | | 183,911 | | 27,425,263 | |
| | | | 56,638,008 | |
| | | | | |
Germany (1.3%) | | | | | |
Dawnay Day Sirius, Ltd. | | 5,011,800 | | 1,916,338 | |
Dawnay Day Treveria PLC | | 11,057,500 | | 1,182,432 | |
DIC Asset AG | | 447,709 | | 3,863,152 | |
Eurocastle Investment, Ltd. | | 103,193 | | 53,925 | |
| | | | 7,015,847 | |
| | | | | |
Guernsey (0.2%) | | | | | |
RGI International, Ltd.* | | 1,358,561 | | 740,416 | |
| | | | | |
Hong Kong (5.1%) | | | | | |
Great Eagle Holdings, Ltd. | | 5,000,000 | | 5,599,964 | |
The Hongkong & Shanghai Hotels, Ltd. | | 6,968,450 | | 6,482,865 | |
Kowloon Development Co., Ltd. | | 9,832,000 | | 3,260,397 | |
Midland Holdings, Ltd. | | 19,800,200 | | 7,945,577 | |
NWS Holdings, Ltd. | | 3,485,000 | | 3,597,396 | |
| | | | 26,886,199 | |
| | | | | | |
14
Description | | Shares | | Value
(Note 1) | |
| | | | | |
India (1.2%) | | | | | |
Hirco PLC* | | 1,299,168 | | $ | 1,923,547 | |
Indiabulls Properties Investment Trust* | | 7,100,000 | | 670,263 | |
Unitech Corporate Parks PLC* | | 3,104,000 | | 524,518 | |
Yatra Capital, Ltd.* | | 666,500 | | 3,397,954 | |
| | | | 6,516,282 | |
| | | | | |
Italy (1.5%) | | | | | |
Pirelli & C Real Estate S.p.A | | 513,795 | | 3,601,718 | |
Pirelli & C S.p.A | | 10,500,000 | | 3,680,266 | |
Risanamento S.p.A* | | 1,514,433 | | 829,996 | |
| | | | 8,111,980 | |
Japan (8.7%) | | | | | |
Frontier Real Estate Investment Corp. | | 613 | | 3,298,041 | |
Haseko Corp. | | 1,880,300 | | 1,660,604 | |
Japan Hotel and Resort, Inc. | | 1,007 | | 1,181,699 | |
Japan Logistics Fund, Inc. | | 2,002 | | 12,356,268 | |
Japan Retail Fund Investment Corp. | | 1,872 | | 6,670,105 | |
Mitsui Fudosan Co., Ltd. | | 333,400 | | 5,648,610 | |
Nomura Real Estate Holdings, Inc. | | 747,200 | | 14,237,077 | |
Secured Capital Japan Co., Ltd. | | 2,624 | | 1,361,145 | |
| | | | 46,413,549 | |
| | | | | |
Luxembourg (0.1%) | | | | | |
ProLogis European Properties | | 173,000 | | 573,293 | |
| | | | | |
Mexico (1.2%) | | | | | |
Consorcio ARA SAB de C.V. | | 709,800 | | 286,292 | |
Corp. GEO SAB de C.V.* | | 609,600 | | 845,647 | |
Desarrolladora Homex SAB de C.V.* - ADR | | 108,800 | | 2,532,864 | |
Urbi Desarrollos Urbanos SA de C.V.* | | 1,903,800 | | 2,855,515 | |
| | | | 6,520,318 | |
| | | | | |
Norway (1.1%) | | | | | |
Norwegian Property ASA | | 3,888,150 | | 5,772,794 | |
| | | | | |
Philippines (0.6%) | | | | | |
Ayala Land, Inc. | | 10,497,600 | | 1,266,064 | |
SM Prime Holdings, Inc. | | 9,605,000 | | 1,649,264 | |
| | | | 2,915,328 | |
| | | | | |
Poland (0.3%) | | | | | |
Orco Property Group | | 133,500 | | 1,738,959 | |
| | | | | |
Russia (0.9%) | | | | | |
PIK Group*(1) - GDR | | 805,000 | | 4,821,950 | |
| | | | | |
Singapore (10.7%) | | | | | |
ARA Asset Management, Ltd. | | 17,002,000 | | 3,783,318 | |
Ascendas Real Estate Investment Trust | | 6,350,000 | | 6,765,341 | |
Ascott Residence Trust | | 6,786,000 | | 2,150,654 | |
Banyan Tree Holdings, Ltd. | | 10,655,400 | | 3,592,515 | |
CapitaCommercial Trust | | 13,568,800 | | 8,966,570 | |
CapitaLand, Ltd. | | 2,925,000 | | 5,621,207 | |
CapitaMall Trust | | 3,921,000 | | 5,023,533 | |
City Developments, Ltd. | | 1,527,800 | | 6,490,317 | |
Frasers Commercial Trust | | 6,775,000 | | 1,119,268 | |
Macquarie MEAG Prime REIT | | 20,631,400 | | 7,234,207 | |
Mandarin Oriental International, Ltd. | | 1,956,000 | | 2,503,680 | |
Parkway Life Real Estate Investment Trust | | 502,000 | | 250,492 | |
Suntec Real Estate Investment Trust | | 6,677,000 | | 3,129,140 | |
| | | | 56,630,242 | |
| | | | | |
| | | | | |
Spain (0.4%) | | | | | |
Realia Business SA | | 812,384 | | 2,257,226 | |
| | | | | |
Sweden (0.9%) | | | | | |
JM AB | | 941,457 | | 4,974,193 | |
| | | | | |
Thailand (1.7%) | | | | | |
Land and Houses PLC | | 5,390,000 | | 575,138 | |
Minor International PCL | | 25,388,400 | | 5,468,828 | |
Preuksa Real Estate PCL | | 8,940,000 | | 1,173,295 | |
SC Asset Corp. PCL | | 12,431,900 | | 1,716,702 | |
| | | | 8,933,963 | |
| | | | | |
United Kingdom (7.5%) | | | | | |
Enterprise Inns PLC | | 1,195,100 | | 1,865,631 | |
Great Portland Estates PLC | | 1,155,815 | | 5,133,896 | |
Hammerson PLC | | 764,800 | | 8,738,884 | |
Helical Bar PLC | | 772,684 | | 3,696,354 | |
Mapeley, Ltd. | | 544,372 | | 2,137,644 | |
Punch Taverns PLC | | 736,764 | | 1,867,491 | |
Regus PLC | | 6,254,783 | | 4,705,910 | |
| | | | | | |
15
Description | | Shares | | Value
(Note 1) | |
| | | | | |
United Kingdom (7.5%) | | | | | |
Segro PLC | | 1,014,119 | | $ | 4,577,955 | |
Shaftesbury PLC | | 1,102,318 | | 5,911,896 | |
Songbird Estates PLC* | | 1,570,200 | | 1,238,228 | |
| | | | 39,873,889 | |
| | | | | |
United States (20.1%) | | | | | |
Alexander’s, Inc. | | 38,870 | | 13,604,500 | |
Alexandria Real Estate Equities, Inc. | | 93,739 | | 6,516,735 | |
AMB Property Corp. | | 65,000 | | 1,561,950 | |
Annaly Capital Management, Inc. | | 2,340,000 | | 32,526,000 | |
CBL & Associates Properties, Inc. | | 198,400 | | 1,831,232 | |
Centex Corp. | | 40,000 | | 490,000 | |
DiamondRock Hospitality Co. | | 583,000 | | 3,019,940 | |
Forestar Real Estate Group LLC* | | 294,650 | | 2,578,188 | |
General Growth Properties, Inc. | | 1,479,632 | | 6,125,677 | |
Jones Lang LaSalle, Inc. | | 27,900 | | 918,468 | |
Kimco Realty Corp. | | 120,000 | | 2,709,600 | |
Lennar Corp. | | 80,000 | | 619,200 | |
Mack-Cali Realty Corp. | | 410,900 | | 9,335,648 | |
M.D.C. Holdings, Inc. | | 33,100 | | 1,113,153 | |
Meritage Homes Corp.* | | 160,000 | | 2,196,800 | |
MFA Mortgage Investments, Inc. | | 650,000 | | 3,575,000 | |
MGM Mirage* | | 50,953 | | 838,686 | |
Orient-Express Hotels, Ltd. | | 458,497 | | 5,639,513 | |
ProLogis | | 165,000 | | 2,310,000 | |
Pulte Homes, Inc. | | 100,000 | | 1,114,000 | |
Regency Centers Corp. | | 85,000 | | 3,354,100 | |
Standard Pacific Corp.* | | 75,000 | | 213,750 | |
Sunrise Senior Living, Inc.* | | 405,300 | | 1,224,006 | |
Weingarten Realty Investors | | 170,000 | | 3,476,500 | |
| | | | 106,892,646 | |
| | | | | |
TOTAL COMMON STOCKS | | | | | |
(Identified Cost $1,141,377,416) | | | | 447,766,239 | |
| | | | | |
PARTICIPATION NOTES (0.8%) | | | | | |
India (0.8%) | | | | | |
Merrill Lynch - Indiabulls Real Estate, Ltd.* | | 1,298,832 | | 3,137,421 | |
Merrill Lynch - Phoenix Mills, Ltd.* | | 850,000 | | 871,486 | |
| | | | 4,008,907 | |
| | | | | |
Taiwan (0.0%)(2) | | | | | |
Macquarie Bank Limited - Chunghwa Telecom Co., Ltd.* | | 6,500 | | 106,990 | |
| | | | | |
TOTAL PARTICIPATION NOTES | | | | | |
(Identified Cost $11,804,797) | | | | 4,115,897 | |
| | | | | |
RIGHTS (0.0%)(2) | | | | | |
Australia (0.0%)(2) | | | | | |
Goodman Group, expired 11/21/08 at .90 (Australian Dollar) * | | 2,595,152 | | 8,623 | |
| | | | | |
Brazil (0.0%)(2) | | | | | |
Agra Empreendimentos Imobiliarios SA, exercisable 10/30/08 - 12/1/08 at 1.28 (Brazilian Real) * | | 716,482 | | 23,150 | |
| | | | | |
TOTAL RIGHTS | | | | | |
(Identified Cost $0) | | | | 31,773 | |
| | | | | | |
| | Maturity | | | | Value | |
Description | | Date | | Shares | | (Note 1) | |
| | | | | | | |
EQUITY - LINKED STRUCTURED NOTES (0.4%) | | | | | | | |
Finland (0.4%) | | | | | | | |
Merrill Lynch & Co., Inc. - Sponda Oyj* | | 03/24/09 | | 458,240 | | 2,044,176 | |
| | | | | | | |
TOTAL EQUITY - LINKED STRUCTURED NOTES | | | | | | | |
(Identified Cost $5,872,121) | | | | | | 2,044,176 | |
| | | | | | Value | |
Description | | 7 Day Yield | | Shares | | (Note 1) | |
| | | | | | | |
SHORT TERM INVESTMENTS (0.2%) | | | | | | | |
Federated Treasury Obligations Money Market Fund(3) | | 0.829 | % | 1,238,285 | | 1,238,285 | |
| | | | | | | |
TOTAL SHORT TERM INVESTMENTS | | | | | | | |
(Identified Cost $1,238,285) | | | | | | 1,238,285 | |
| | | | | | | |
TOTAL INVESTMENTS (85.7%) | | | | | | | |
(Identified Cost $1,160,292,619) | | | | | | 455,196,370 | |
| | | | | | | |
TOTAL OTHER ASSETS LESS LIABILITIES (14.3%) | | | | | | 75,671,245 | |
| | | | | | | |
NET ASSETS (100.0%) | | | | | | $ | 530,867,615 | |
| | | | | | | | |
16
* | Non-income producing security. |
(1) | Security exempt from registration under Rule 144A of the Securities Act of 1933. These securities may be resold in transactions exempt from registration, normally to qualified institutional buyers. These securities have been determined to be liquid in accordance with procedures adopted by the Fund’s Board of Trustees. Securities restricted under Rule 144A comprised 0.91% of the fund’s net assets. |
(2) | Less than 0.05% of net assets. |
(3) | Investments in other funds are calculated at their respective net asset values as determined by those funds, in accordance with the Investment Company Act of 1940. |
See Notes to Financial Statements.
Common Abbreviations
AB - - Aktiebolag is the Swedish equivalent of the term corporation.
ADR - - American Depositary Receipt.
AG - - Aktiengesellschaft is a German term that refers to a corporation that is limited by shares, i.e., owned by shareholders.
ASA - - Allmennaksjeselskap is the Norwegian term for a public limited company.
GDR - - Global Depositary Receipt.
Inc. - - Incorporated.
LLC - - Limited Liability Corp.
Ltd. - - Limited.
Oyj. - - Osakeyhtio is the Finnish equivalent of a limited company.
PCL - - Public Company Limited.
PLC - - Public Limited Co.
REIT - - Real Estate Investment Trust.
SA - - Generally designates corporations in various countries, mostly those employing the civil law.
SA de C.V. - A variable capital company.
SAB de C.V. - A variable capital company.
SE - SE Regulation. A European Company which can operate on a Europe-wide basis and be governed by Community law directly applicable in all Member States.
S.p.A. - - Societa` Per Azioni is an Italian shared company.
17

| STATEMENT OF ASSETS AND LIABILITIES
October 31, 2008 |
ASSETS | | | |
| | | |
Investments, at value | | $ | 455,196,370 | |
Cash | | 101,646 | |
Foreign currency, at value (Cost $1,292,770) | | 1,271,157 | |
Receivable for investment securities sold | | 94,535,597 | |
Dividends receivable | | 12,268,935 | |
Interest receivable | | 4,100 | |
Prepaid and other assets | | 27,360 | |
Total Assets | | 563,405,165 | |
| | | |
LIABILITIES | | | |
| | | |
Loan payable | | 17,974,000 | |
Interest on loan payable | | 20,739 | |
Payable for investment securities purchased | | 13,682,220 | |
Accrued expenses and other liabilities: | | | |
Investment advisory fees | | 529,016 | |
Administrative fees | | 68,771 | |
Trustee fees | | 12,000 | |
Officer fees | | 12,500 | |
Other | | 238,304 | |
Total Liabilities | | 32,537,550 | |
| | | |
Net Assets | | $ | 530,867,615 | |
| | | |
NET ASSETS REPRESENTED BY | | | |
| | | |
Paid-in-capital | | $ | 1,987,861,077 | |
Overdistributed net investment income | | (850,102 | ) |
Accumulated net realized loss on investments, swap contracts and foreign currency | | (749,590,176 | ) |
Net unrealized depreciation on investments and foreign currency translations | | (706,553,184 | ) |
Net Assets | | $ | 530,867,615 | |
Net asset value | | | |
Net assets | | $ | 530,867,615 | |
Shares of beneficial interest issued and outstanding | | 106,088,607 | |
Net asset value per share | | $ | 5.00 | |
(1) Cost of Investments | | $ | 1,160,292,619 | |
See Notes to Financial Statements.
18
| STATEMENT OF OPERATIONS
For the Year Ended October 31, 2008 |
INCOME | | | |
| | | |
Dividends | | $ | 167,449,913 | |
Interest | | 463,096 | |
Miscellaneous income | | 247,173 | |
Total Income | | 168,160,182 | |
| | | |
EXPENSES | | | |
| | | |
Interest on loan | | 1,985,245 | |
Investment advisory fee | | 13,694,747 | |
Administrative fee | | 1,780,316 | |
Audit and tax fees | | 30,149 | |
Custodian fees | | 756,307 | |
Officers fees | | 50,000 | |
Insurance fees | | 4,521 | |
Legal fees | | 78,500 | |
Printing fees | | 288,705 | |
Trustee fees | | 47,421 | |
NYSE fees | | 94,134 | |
Miscellaneous fees | | 36,999 | |
Total Expenses | | 18,847,044 | |
| | | |
Net Investment Income | | 149,313,138 | |
| | | |
REALIZED AND UNREALIZED GAIN/(LOSS) ON INVESTMENTS, SWAP CONTRACTS AND FOREIGN CURRENCY | | | |
| | | |
Net realized loss on investments: | | | |
Securities transactions | | (661,487,755 | ) |
Swap contracts | | (5,970,774 | ) |
Foreign currency transactions | | (14,310,099 | ) |
Net realized loss on investments | | (681,768,628 | ) |
Change in net unrealized appreciation/(depreciation) of investments, swap contracts and foreign currency translations: | | | |
Investments | | (564,141,565 | ) |
Swap contracts | | 22,430 | |
Foreign currency translations | | (125,467,021 | ) |
Net unrealized depreciation of investments | | (689,586,156 | ) |
Net realized/unrealized loss on investments, swap contracts and foreign currency | | (1,371,354,784 | ) |
Net Decrease in Net Assets Resulting from Operations | | $ | (1,222,041,646 | ) |
* Net of foreign taxes withheld | | $ | 8,843,831 | |
See Notes to Financial Statements.
19
| STATEMENTS OF CHANGES IN NET ASSETS
|
| | For the Year Ended
October 31, 2008 | | For the Period
April 26, 2007 (Inception)
to October 31, 2007 | |
OPERATIONS | | | | | |
| | | | | |
Net investment income | | $ | 149,313,138 | | $ | 61,343,470 | |
Net realized loss on investments: | | | | | |
Securities transactions | | (661,487,755 | ) | (82,861,878 | ) |
Swap contracts | | (5,970,774 | ) | (56,272 | ) |
Foreign currency transactions | | (14,310,099 | ) | (2,697,011 | ) |
Change in net unrealized appreciation/(depreciation) of investments, swap contracts and foreign currency translations: | | | | | |
Investments | | (564,141,565 | ) | (73,037,747 | ) |
Swap contracts | | 22,430 | | 155,565 | |
Foreign currency translations | | (125,467,021 | ) | 55,915,154 | |
Net decrease in net assets resulting from operations | | (1,222,041,646 | ) | (41,238,719 | ) |
| | | | | |
DISTRIBUTIONS TO SHAREHOLDERS | | | | | |
| | | | | |
From net investment income | | (134,678,983 | ) | (59,034,114 | ) |
From tax return of capital | | (26,406,978 | ) | (7,976,683 | ) |
Net decrease in net assets resulting from distributions to shareholders | | (161,085,961 | ) | (67,010,797 | ) |
| | | | | |
CAPITAL SHARE TRANSACTIONS | | | | | |
| | | | | |
Proceeds from sales of common shares, net of offering cost | | — | | 1,906,000,000 | |
Proceeds from underwriters’ over-allotment option common shares exercised, net of offering costs | | — | | 105,130,786 | |
Common stock issued to stockholders from reinvestment of dividends and offering costs | | 7,181,723 | | 991,463 | |
Repurchase of Shares | | (1,248,334 | ) | | |
Net increase in net assets derived from capital share transactions | | 5,933,389 | | 2,012,122,249 | |
Net Increase/(Decrease) in Net Assets | | (1,377,194,218 | ) | 1,903,872,733 | |
Net Assets | | | | | |
Beginning of period | | 1,908,061,833 | | 4,189,100 | |
End of period* | | $ | 530,867,615 | | $ | 1,908,061,833 | |
| | | | | |
|
* Including overdistributed net investment income of: | | $ | (850,102 | ) | $ | (646,697 | ) |
See Notes to Financial Statements.
20
| FINANCIAL HIGHLIGHTS
(For a share outstanding throughout the year) |
| | For the Year Ended
October 31, 2008 | | For the Period Ended
October 31, 2007 (a) | |
| | | | | |
PER COMMON SHARE OPERATING PERFORMANCE | | | | | |
| | | | | |
Net asset value per share, beginning of period | | $ | 18.04 | | $ | 19.10 | |
Income from investment operations: | | | | | |
Net investment income | | 1.41 | | 0.55 | |
Net realized and unrealized loss on investments, swap contracts and foreign currency | | (12.93 | ) | (0.95 | ) |
Total from investment operations | | (11.52 | ) | (0.40 | ) |
| | | | | |
LESS DISTRIBUTIONS TO COMMON SHAREHOLDERS | | | | | |
| | | | | |
From net investment income | | (1.27 | ) | (0.56 | ) |
From tax return on capital | | (0.25 | ) | (0.07 | ) |
Total distributions | | (1.52 | ) | (0.63 | ) |
| | | | | |
CAPITAL SHARE TRANSACTIONS | | | | | |
| | | | | |
Common share offering costs charged to paid-in-capital | | — | | (0.03 | ) |
Total capital share transactions | | — | | (0.03 | ) |
Net asset value per share, end of period | | $ | 5.00 | | $ | 18.04 | |
Per share market value, end of period | | $ | 4.45 | | $ | 15.71 | |
| | | | | |
Total return based on: | | | | | |
Net Asset Value (b) | | (67.74 | )% | (1.69 | )% |
Market Value (b) | | (67.03 | )% | (18.41 | )% |
| | | | | |
RATIOS/SUPPLEMENTAL DATA | | | | | |
| | | | | |
Net Assets attributable to common shares, at end of period (000) | | $ | 530,868 | | $ | 1,908,062 | |
Ratio of total expenses to average net assets | | 1.44 | %(c) | 1.21 | %(d) |
Ratio of net investment income to average net assets | | 11.41 | % | 6.31 | %(d) |
Portfolio turnover rate | | 263 | % | 89 | %(e) |
(a) | For the period from April 26, 2007 (inception of the fund) to October 31, 2007. |
(b) | Total investment return is calculated assuming a purchase of a common share at the opening on the first day and a sale at closing on the last day of each period reported. Total investment return on net asset value reflects a $20.00 opening IPO price and sales load of $.90 per share. Dividends and distributions, if any, are assumed for purposes of this calculation to be reinvested at prices obtained under the Fund’s dividend reinvestment plan. Total investment returns do not reflect brokerage commissions. Total investment returns for less than a full year are not annualized. Past performance is not a guarantee of future results. |
(c) | For the year ended October 31, 2008, the ratio of total expenses to average net assets excluding interest expense was 1.29%. |
(d) | Annualized. |
(e) | Not Annualized. |
See Notes to Financial Statements.
21

| NOTES TO FINANCIAL STATEMENTS
October 31, 2008 |
1. ORGANIZATION AND SIGNIFICANT ACCOUNTING POLICIES
Alpine Global Premier Properties Fund (the “Fund”) is a diversified, closed-end management investment company. The Fund’s primary investment objective is capital appreciation. The Fund’s secondary investment objective is high current income.
The Fund had no operations prior to April 26, 2007 other than matters relating to its organization and the sale and issuance of 213,089.005 shares of beneficial interest in the Fund to a group consisting of Alpine Woods Capital Investors, LLC (“Alpine Woods”), certain of its officers and parties either related to or affiliated with those officers and 6,235.602 shares of beneficial interest in the Fund to the Independent Trustees at the initial subscription price of $19.10 per share. Alpine Woods serves as the Fund’s investment adviser. The Fund’s Common Shares are listed on the New York Stock Exchange (“NYSE”) under the symbol “AWP”.
The following summarizes the significant accounting policies of the Fund.
Security Valuation: The net asset value (“NAV”) of shares of the Fund is calculated by dividing the value of the Fund’s net assets by the number of outstanding shares.NAV is determined each day the New York Stock Exchange (the “NYSE”) is open as of the close of regular trading (normally, 4:00 p.m., Eastern time). In computing NAV, portfolio securities of the Fund are valued at their current market values determined on the basis of market quotations. In computing the Fund’s net asset value, portfolio securities that are traded on a securities exchange in the United States, except for option securities, are valued at the last reported sale price as of the time of valuation, or lacking any current reported sale at the time of valuation, at the mean between the most recent bid and asked quotations. Each option security - traded on a securities exchange in the United States is valued at the last current reported sale price as of the time of valuation if the last current reported sale price falls within the consolidated bid/ask quote for the option security. If the last current reported sale price as of the time of valuation does not fall within the consolidated bid/ask quote for the option security, the security is valued at the mid-point of the consolidated bid/ask quote for the option security. Each security traded in the over-the- counter market and quoted on the NASDAQ National Market System, is valued at the NASDAQ Official Closing Price (“NOCP”), as determined by NASDAQ, or lacking an NOCP, the last current reported sale price as of the time of valuation by NASDAQ, or lacking any current reported sale on NASDAQ at the time of valuation, at the mean between the most recent bid and asked quotations. Each over-the- counter option that is not traded through the Options Clearing Corporation is valued by the counterparty, or if the counterparty’s price is not readily available then by using the Black-Scholes method. Each other security traded over-the-counter is valued at the mean between the most recent bid and asked quotations. Short-term securities with maturities of 60 days or less are valued at amortized cost, which approximates market value.
When market quotations are not readily available or when the valuation methods mentioned above are not reflective of a fair value of the security, the security is valued at a fair value following procedures and/or guidelines approved by the Board of Trustees, which may include utilizing a systematic fair valuation model provided by an independent pricing system. The Fund may also use fair value pricing, if the value of a security it holds is, pursuant to Board of Trustees guidelines, materially affected by events occurring before the Fund’s pricing time but after the close of the primary market or exchange on which the security is traded. These procedures may utilize valuations furnished by pricing services approved by the Board of Trustees, which may be based on market transactions for comparable securities and various relationships between securities that are generally recognized by institutional traders, a computerized matrix system, or appraisals derived from information concerning the securities or similar securities received from recognized dealers in those securities. When fair value pricing is employed, the value of the portfolio security used to calculate the Fund’s net asset value may differ from quoted or official closing prices.
Securities that are principally traded in a foreign market are valued at the last current sale price at the time of valuation or lacking any current or reported sale, at the time of valuation, at the mean between the most recent bid and asked quotations as of the close of the appropriate exchange or other designated time. Trading in securities on European and Far Eastern securities exchanges and over- the-counter markets is normally completed at various times before the close of business on each day on which the NYSE is open. Trading of these securities may not take place on every NYSE business day. In addition, trading may take place in various foreign markets on Saturdays or on other days when the NYSE is not open and on which the Fund’s net asset value is not calculated. As stated above, if the market prices are not readily available or are not reflective of the fair value of the security, the security will be priced at a fair value following procedures approved by the Board of Trustees. In light of the judgment involved in fair value decisions, there can be no assurance that a fair value assigned to a particular security is accurate.
22
| NOTES TO FINANCIAL STATEMENTS
October 31, 2008 |
Foreign Securities: The Fund may invest a portion of its assets in foreign securities. In the event that the Fund executes a foreign security transaction, the Fund will generally enter into a forward foreign currency contract to settle the foreign security transaction. Foreign securities may carry more risk than U.S. securities, such as political, market and currency risks.
The accounting records of the Fund are maintained in U.S. dollars. Prices of securities denominated in foreign currencies are translated into U.S. dollars at the closing rates of exchange at period end. Amounts related to the purchase and sale of foreign securities and investment income are translated at the rates of exchange prevailing on the respective dates of such transactions.
The effect of changes in foreign currency exchange rates on investments is included with the fluctuations arising from changes in market values of securities held and reported with all other foreign currency gains and losses in the Fund’s Statement of Operations.
Distributions to Shareholders: The Fund intends to make a level dividend distribution each month to its shareholders of the net investment income of the Fund after payment of Fund operating expenses. The level dividend rate may be modified by the Board of Trustees from time to time. If, for any monthly distribution, investment company taxable income, if any (which term includes net short-term capital gain) and net tax-exempt income, if any, is less than the amount of the distribution, the difference will generally be a tax-free return of capital distributed from the Fund’s assets. The Fund’s final distribution for each calendar year will include any remaining investment company taxable income and net tax-exempt income undistributed during the year, as well as all net capital gain realized during the year. If the total distributions made in any fiscal year exceed investment company taxable income, net tax-exempt income and net capital gain, such excess distributed amount would be treated as ordinary dividend income to the extent of the Fund’s current and accumulated earnings and profits. Distributions in excess of the earnings and profits would first be a tax-free return of capital to the extent of the adjusted tax basis in the shares. After such adjusted tax basis is reduced to zero, the distribution would constitute capital gain (assuming the shares are held as capital assets). Distributions to shareholders are recorded by the Fund on the ex-dividend date.
Income Taxes: The Fund’s policy is to comply with the provisions of the Internal Revenue Code applicable to regulated investment companies and to distribute all of its taxable income to its shareholders. Therefore, no federal income tax provision is required.
The Fund accounts for uncertainty related to income taxes under the provisions of Financial Accounting Standards Board (“FASB”) Interpretation No. 48, “Accounting for Uncertainty in Income Taxes — an Interpretation of FASB Statement No. 109” (“FIN 48”). The Fund recognizes tax benefits only if it is more likely than not that a tax position (including the Fund’s assertion that its income is exempt from tax) will be sustained upon examination. The Fund had no material uncertain tax positions and has not recorded a liability for material unrecognized tax benefits as of October 31, 2008. Since its inception, the Fund had not recorded any amounts for interest or penalties related to uncertain tax benefits. While the Fund maintains a fiscal year end of October 31 for financial reporting purposes, the Fund’s fiscal year end for tax return filings is December 31. As such, the statute of limitations on the Fund’s Federal and New York State tax return filings remains open for the year ended December 31, 2007. Management is currently evaluating whether to maintain the December 31 tax year or to adopt an October 31 tax year to coincide with the financial reporting year. Accordingly, the statute of limitations on the Fund’s Federal and New York State tax return filings will remain open for either the year ended October 31, 2008 or December 31, 2008, depending upon the tax year end that the Fund elects.
Securities Transactions and Investment Income: Investment security transactions are accounted for as of trade date. Dividend income is recorded on the ex-dividend date. Interest income is recorded on the accrual basis, which includes amortization of premium and accretion of discounts. Realized gains and losses from securities transactions and unrealized appreciation and depreciation of securities are determined using the highest cost basis for both financial reporting and income tax purposes.
Use of Estimates: The Fund’s financial statements are prepared in accordance with accounting principles generally accepted in the United States of America. This requires management to make estimates and assumptions that affect the reported amounts of assets and liabilities and disclosure of contingent assets and liabilities at the date of the financial statements and the reported amounts of increases and decreases in net assets from operations during the reporting period. Actual results could differ from these estimates.
New Accounting Pronouncements: In September 2006, the FASB issued FASB Statement No. 157, “Fair Valuation Measurement” (“SFAS No. 157”), which defines fair value, establishes a framework for measuring fair value, and expands disclosures about fair value measurements. SFAS No. 157 is effective for fiscal years beginning after November 15, 2007, and interim periods within those fiscal years. The Fund is currently evaluating the potential
23
| NOTES TO FINANCIAL STATEMENTS
October 31, 2008 |
impact the adoption of SFAS No. 157 will have on the Fund’s financial statements.
In March 2008 the FASB issued FASB Statement No. 161, “Disclosures about Derivative Instruments and Hedging Activities” (“SFAS No. 161”), which is intended to improve financial reporting about derivative instruments and hedging activities. It is effective for financial statements issued for fiscal years and interim periods beginning after November 15, 2008. The Fund is currently evaluating the potential impact, if any, the adoption of SFAS No. 161 will have on the Fund’s financial statements.
2. INCOME TAXES
Classification of Distributions: Net investment income (loss) and net realized gain (loss) may differ for financial statement and tax purposes. The character of distributions made during the year from net investment income or net realized gains may differ from its ultimate characterization for federal income tax purposes.
The tax character of the distributions paid by the Fund during the year ended October 31, 2008 was as follows:
Distributions paid from:
Ordinary Income | | $ | 134,678,983 | |
Return of Capital | | $ | 26,406,978 | |
Total | | $ | 161,085,961 | |
Tax components of distributable earnings are determined in accordance with income tax regulations which may differ from the composition of net assets reported under accounting principles generally accepted in the United States. Accordingly, for the period ended October 31, 2008, the effects of certain differences were reclassified. The Fund increased accumulated net investment loss by $11,569,418, increased accumulated net realized loss by $14,837,560, and decreased paid in capital by $26,406,978. These differences were primarily due to the differing tax treatment of foreign currency, and certain other investments. Net assets of the portfolio were unaffected by the reclassifications and the calculation of net investment income per share in the Financial Highlights excludes these adjustments.
At October 31, 2008, the Fund had available for tax purposes unused capital loss carryovers of $79,137,068, expiring October 31, 2015, and unused capital loss carryovers of $660,730,271, expiring October 31, 2016.
As of October 31, 2008, the components of distributable earnings on a tax basis were as follows:
Accumulated Capital Loss | | $ | (739,867,339 | ) |
Unrealized Depreciation | | (717,229,910 | ) |
Other Cumulative Effect of Temporary Differences | | 103,787 | |
Total | | $ | (1,456,993,462 | ) |
As of October 31, 2008, net unrealized appreciation/(depreciation) of investments based on federal tax costs was as follows:
Gross appreciation on investments (excess of value over tax cost) | | $ | 5,279,221 | |
Gross depreciation on investments (excess of tax cost over value) | | (721,052,196 | ) |
Net depreciation of foreign currency and derivatives | | (1,456,935 | ) |
Net unrealized depreciation | | (717,229,910 | ) |
Total cost for federal income tax purposes | | $ | 1,170,969,345 | |
The differences between book and tax net unrealized appreciation and cost were primarily due to deferral of losses from wash sales and to the different tax treatment of certain other investments
3. CAPITAL TRANSACTIONS
| | | | For the Period | |
| | For the | | April 26, 2007 | |
| | Year Ended | | (Inception) to | |
| | October 31, 2008 | | October 31, 2007 | |
Common shares outstanding - beginning of period | | 105,789,582 | | 219,325 | |
Common shares issued in connection with initial public offering | | — | | 100,000,000 | |
Common shares issued from underwriter’s over-allotment option exercised | | — | | 5,515,781 | |
Common shares issued as reinvestments of dividends | | 578,301 | | 54,476 | |
Shares repurchased* | | (279,276 | ) | | |
Common shares outstanding - end of period | | 106,088,607 | | 105,789,582 | |
* On September 18, 2008, the Fund commenced share repurchases for purposes of enhancing shareholder value and reducing the discount at which the Fund’s shares trade from their net asset value. For the period ended October 31, 2008, the Funds repurchased 279,276 of its shares at an average discount of 25.00% from net asset value per share. The Fund expects to continue to repurchase its outstanding shares at such time and in such amounts as it believes such activity will further the accomplishment of the foregoing objectives, subject to review of the Board of Trustees.
24
| NOTES TO FINANCIAL STATEMENTS
October 31, 2008 |
4. PORTFOLIO SECURITIES
Purchases and sales of investment securities, other than short-term securities, for the year ended October 31, 2008 aggregated $3,486,561,609 and $3,544,176,780, respectively. The Fund did not have purchases and sales of U.S. Government obligations for the year ended October 31, 2008.
5. INVESTMENT ADVISORY AND ADMINISTRATION AGREEMENTS
Alpine Woods serves as the Fund’s investment adviser pursuant to an Investment Advisory Agreement with the Fund. As compensation for its services to the Fund, Alpine Woods receives an annual investment advisory fee of 1.00% based on the Fund’s average daily managed assets, computed daily and payable monthly.
ALPS Fund Services, Inc. (“ALPS”) serves as the Fund’s administrator pursuant to an Administration, Bookkeeping and Pricing Services Agreement with the Fund. As compensation for its services to the Fund, ALPS receives an annual administration fee of 0.13% based on the Fund’s average daily managed assets, computed daily and payable monthly.
6. LINE OF CREDIT
On July 11, 2007, an Agreement among Alpine Global Dynamic Dividend Fund, Alpine Total Dynamic Dividend Fund, Alpine Global Premier Properties Fund (together, the “Funds”, each a “Fund”) and The Bank of New York (“BONY”) was executed which allows for each Fund to borrow against a secured line of credit from BONY an aggregate amount of up to $500,000,000 for all Funds. As of October 31, 2008 there was an unused balance of $482,026,000 available to all three Funds. During the year ended October 31, 2008, the average borrowing by Alpine Global Premier Properties Fund was $55,182,923 with an average rate on borrowings of 3.18%.
7. TOTAL RETURN SWAP CONTRACT
The Fund may enter into total return swaps. A total return swap is an agreement between the Fund and a counterparty to exchange a market linked return for a floating rate payment, both based on a notional principal amount. Because the principal amount is not exchanged, it represents neither an asset nor a liability to either counterparty, and is referred to as notional. Total return swaps are marked to market daily based upon quotations from the market makers end the change in value, if any, is recorded as an unrealized gain or loss in the Statement of Operations. The unrealized gain (loss) related to the daily change in the valuation of the notional amount of the swap, as well as the amount due to (owed by) the Fund at termination or settlement, is combined and separately disclosed as an asset (liability). The Fund also records any periodic payments received from (paid to) the counterparty, including at termination, under such contracts as realized gain (loss). Total return swaps are subject to risks (if the counterparty fails to meet its obligations).
8. EQUITY-LINKED STRUCTURED NOTES
The Fund may invest in equity-linked structured notes. Equity-linked structured notes are derivative securities which are specially designed to combine the characteristics of one or more underlying securities and their equity derivatives in a single note form. The return and/or yield or income component may be based on the performance of the underlying equity securities, an equity index, and/or option positions. Equity-linked structured notes are typically offered in limited transactions by financial institutions in either registered or non-registered form. An investment in equity-linked structured notes creates exposure to the credit risk of the issuing financial institution, as well as to the market risk of the underlying securities. There is no guaranteed return of principal with these securities and the appreciation potential of these securities may be limited by a maximum payment or call right. In certain cases, equity- linked structured notes may be more volatile and less liquid than less complex securities or other types of fixed-income securities. Such securities may exhibit price behavior that does not correlate with other fixed-income securities.
9. OTHER
Compensation of Trustees: The Independent Trustees of the Fund receive $4,000 for each meeting attended.
10. SUBSEQUENT EVENTS
Distributions: The Fund paid a distribution of $13,476,811 or $0.1267 per common share on November 28, 2008 to common shareholders of record on November 21, 2008.
25
| ADDITIONAL INFORMATION
October 31, 2007 (Unaudited) |
DIVIDEND REINVESTMENT PLAN
Unless the registered owner of common shares elects to receive cash by contacting The Bank of New York (the “Plan Administrator”), all dividends or other distributions (together, “Dividends” and each, a “Dividend”) declared on common shares will be automatically reinvested by the Plan Administrator for shareholders in the Fund’s Dividend Reinvestment Plan (the “Plan”), in additional common shares of the Fund. Shareholders that are not permitted to participate through their broker or nominee or who elect not to participate in the Plan will receive all Dividends in cash paid by check mailed directly to the shareholder of record (or, if the common shares are held in street or other nominee name, then to such nominee) by the Plan Administrator, as dividend disbursing agent. You may elect not to participate in the Plan and to receive all Dividends in cash by contacting the Plan Administrator, as dividend disbursing agent, at the address set forth below. Participation in the Plan is completely voluntary and may be terminated or resumed at any time without penalty by notice if received and processed by the Plan Administrator prior to the dividend record date; otherwise such termination or resumption will be effective with respect to any subsequently declared Dividend. If you hold your shares through a broker, and you wish for all Dividends declared on your common shares to be automatically reinvested pursuant to the Plan, please contact your broker.
The Plan Administrator will open an account for each shareholder under the Plan in the same name in which such shareholder’s common shares are registered. Whenever the Fund declares a Dividend payable in cash, non-participants in the Plan will receive cash and participants in the Plan will receive the equivalent in common shares. The common shares will be acquired by the Plan Administrator for the participants’ accounts, depending upon the circumstances described below, either (i) through receipt of additional unissued but authorized common shares from the Fund (“Newly Issued common shares”) or (ii) by purchase of outstanding common shares on the open market (“Open- Market Purchases”) on the NYSE or elsewhere. If, on the payment date for any Dividend, the closing market price plus estimated brokerage commissions per share is equal to or greater than the NAV per share, the Plan Administrator will invest the Dividend amount in Newly Issued common shares on behalf of the participants. The number of Newly Issued common shares to be credited to each participant’s account will be determined by dividing the dollar amount of the Dividend by the NAV per share on the payment date; provided that, if the NAV is less than or equal to 95% of the closing market value on the payment date, the dollar amount of the Dividend will be divided by 95% of the closing market price per share on the payment date. If, on the payment date for any Dividend, the NAV per share is greater than the closing market value plus estimated brokerage commissions, the Plan Administrator will invest the Dividend amount in common shares acquired on behalf of the participants in Open-Market Purchases.
In the event of a market discount on the payment date for any Dividend, the Plan Administrator will have until the last business day before the next date on which the common shares trade on an “ex-dividend” basis or 30 days after the payment date for such Dividend, whichever is sooner (the “Last Purchase Date”), to invest the Dividend amount in common shares acquired in Open-Market Purchases. If, before the Plan Administrator has completed its Open- Market Purchases, the market price per share exceeds the NAV per share, the average per share purchase price paid by the Plan Administrator may exceed the NAV of the common shares, resulting in the acquisition of fewer common shares than if the Dividend had been paid in Newly Issued common shares on the Dividend payment date. Because of the foregoing difficulty with respect to Open-Market Purchases, the Plan provides that if the Plan Administrator is unable to invest the full Dividend amount in Open-Market Purchases during the purchase period or if the market discount shifts to a market premium during the purchase period, the Plan Administrator may cease making Open-Market Purchases and may invest the uninvested portion of the Dividend amount in Newly Issued common shares at the NAV per share at the close of business on the Last Purchase Date provided that, if the NAV is less than or equal to 95% of the then current market price per share, the dollar amount of the Dividend will be divided by 95% of the market price on the payment date for purposes of determining the number of shares issuable under the Plan.
The Plan Administrator maintains all shareholders’ accounts in the Plan and furnishes written confirmation of all transactions in the accounts, including information needed by shareholders for tax records. Common shares in the account of each Plan participant will be held by the Plan Administrator on behalf of the Plan participant, and each shareholder proxy will include those shares purchased or received pursuant to the Plan. The Plan Administrator will forward all proxy solicitation materials to participants and vote proxies for shares held under the Plan in accordance with the instructions of the participants.
In the case of the Fund’s shareholders such as banks, brokers or nominees which hold shares for others who are the beneficial owners, the Plan Administrator will administer the Plan on the basis of the number of common shares certified from time to time by the record shareholder’s name and held for the account of beneficial owners who participate in the Plan.
26
There will be no brokerage charges with respect to common shares issued directly by the Fund. However, each participant will pay a pro rata share of brokerage commissions incurred in connection with Open-Market Purchases. The automatic reinvestment of Dividends will not relieve participants of any U.S. federal, state or local income tax that may be payable (or required to be withheld) on such Dividends. See “U.S. Federal Income Tax Matters.” Participants that request a sale of common shares through the Plan Administrator are subject to brokerage commissions.
Shareholders participating in the Plan may receive benefits not available to shareholders not participating in the Plan. If the market price plus commissions of the Fund’s shares is higher than the NAV, participants in the Plan will receive shares of the Fund for less than they could otherwise purchase them and will have shares with a cash value greater than the value of any cash distribution they would have received on their shares. If the market price plus commissions is below the net asset value, participants receive distributions of shares with a NAV greater than the value of any cash distribution they would have received on their shares. However, there may be insufficient shares available in the market to make distributions in shares at prices below the NAV. Also, because the Fund does not redeem its shares, the price on resale may be more or less than the NAV.
The Fund reserves the right to amend or terminate the Plan. There is no direct service charge to participants with regard to purchases in the Plan; however, the Fund reserves the right to amend the Plan to include a service charge payable by the participants.
All correspondence or questions concerning the Plan should be directed to the Plan Administrator, The Bank of New York, at One Wall Street, New York, New York 10286 or by calling toll-free 1(800)432.8224.
FUND PROXY VOTING POLICIES & PROCEDURES
Policies and procedures used in determining how to vote proxies relating to portfolio securities and a summary of proxies voted by the Fund are available without a charge, upon request, by contacting the Fund at 1(800)910.1434 and on the Securities and Exchange Commission’s (“Commission”) web site at http://www.sec.gov.
PORTFOLIO HOLDINGS
The Fund files its complete schedule of portfolio holdings with the Commission for the first and third quarters of each fiscal year on Form N-Q within 60 days after the end of the period. Copies of the Fund’s Forms N-Q are available without a charge, upon request, by contacting the Fund at 1(800)617.7616 and on the Commission’s web site at http://www.sec.gov. You may also review and copy Form N-Q at the Commission’s Public Reference Room in Washington, D.C. For more information about the operation of the Public Reference Room, please call the Commission at 1(800)SEC.0330.
DESIGNATION REQUIREMENTS
Of the distributions paid by the Fund from ordinary income for the year ended October 31, 2008, the following percentages met the requirements to be treated as qualifying for the corporate dividends received deduction and qualified dividend income, respectively.
Dividends Received Deduction | | 11.35 | % |
Qualified Dividend Income | | 32.76 | % |
NOTICE
Notice is hereby given in accordance with Section 23(c) of the Investment Company Act of 1940 that the Fund may purchase at market prices from time to time its common shares in the open market.
ANNUAL CERTIFICATIONS
As required, on April 15, 2008, the Fund submitted to the NYSE the annual certification of the Fund’s Chief Executive Officer certifying that, as of such date, he was not aware of any violation of the NYSE’s Corporate Governance listing standards. The Fund also has included the certifications of the Fund’s Chief Executive Officer and Chief Financial Officer required by Section 302 of the Sarbanes-Oxley Act of 2002 as exhibits to reports filed with the Commission on a quarterly basis on Form N-CSR and Form N-Q.
27
INDEPENDENT TRUSTEES
Name and Age | | Position(s) Held
with the Fund | | Principal Occupation During
Past Five Years | | # of
Portfolios
in Fund
Complex** | | Other Directorships
Held by Trustee |
| | | | | | | | |
Laurence B. Ashkin (80) | | Independent Trustee | | Real estate developer and construction consultant since 1980; Founder and President of Centrum Properties, Inc. since 1980. | | 13 | | Trustee, Alpine Family of Funds.* Director, Chicago Public Radio, Board Chair, The Perspectives Charter Schools. |
| | | | | | | | |
H. Guy Leibler (54) | | Independent Trustee | | Private investor since 2007, Vice Chair and Chief Operating Officer of L&L Aquisitions LLC (2004-2007); President, Skidmore, Owings & Merrill LLP (2001-2004). | | 13 | | Chairman Emeritus, White Plains Hospital Center; Trustee, Alpine Family of Funds. |
| | | | | | | | |
Jeffrey E. Wacksman (48) | | Independent Trustee | | Partner, Loeb, Block & Partners LLP since 1994. | | 13 | | Director, International Suc- cession Planning Association; Trustee, Larchmont Manor Park Society; Director, Bondi Icebergs Inc.; Director, MH Properties, Inc.; Trustee, Alpine Family of Funds. |
* | The Independent Trustees identified above are the members of the Board of Trustees for each of the Alpine Series Trust, Alpine Equity Trust and Alpine Income Trust, Alpine Global Dynamic Dividend Fund, and Alpine Total Dynaminc Dividend Fund (collectively, the “Alpine Family of Funds”). |
** | Alpine Woods Capital Investors, LLC manages ten other fund portfolios within the three Alpine Trusts. Each of the Alpine Trusts is registered as an open-end management investment company. The Trustees oversee each of the ten portfolios within the Alpine Trusts. |
INTERESTED TRUSTEE
Name and Age | | Position(s) Held
with the Fund | | Principal Occupation During
Past Five Years | | # of
Portfolios
in Fund
Complex** | | Other Directorships
Held by Trustee |
| | | | | | | | |
Samuel A. Lieber* (52) | | Interested Trustee and President | | Chief Executive Officer of Alpine Woods Capital Investors, LLC since November 1997. President of Alpine Trusts since 1998. | | 13 | | Trustee, Alpine Family of Funds. |
* | Samuel A. Lieber has been a Trustee of the Fund since its inception. He is the son of Stephen A. Lieber. |
** | Alpine Woods Capital Investors, LLC manages ten other fund portfolios within the three Alpine Trusts. Each of the Alpine Trusts is registered as an open-end management investment company. The Trustees oversee each of the ten portfolios within the Alpine Trusts. |
28
In addition to Mr. Samuel A. Lieber, the table below identifies the Fund’s executive officers.
Name and Age | | Position(s) Held
with the Fund | | Principal Occupation During
Past Five Years | | # of
Portfolios
in Fund
Complex** | | Other Directorships
Held by Trustee |
| | | | | | | | |
Stephen A. Lieber (83)* | | Executive Vice President | | Chief Investment Officer, Alpine Woods Capital Investors, LLC since 2003. Chairman and Senior Portfolio Manager, Saxon Woods Advisors, LLC since 1999. | | N/A | | None |
| | | | | | | | |
Sheldon R. Flamm (61) | | Vice President, Treasurer and Chief Compliance Officer | | Chief Financial Officer and Senior Managing Director, Alpine Woods Capital Investors, LLC, since 2001; Chief Financial Officer, Saxon Woods Advisors, LLC since 1999. | | N/A | | None |
| | | | | | | | |
Oliver Sun (49) | | Secretary | | Controller of Alpine Woods Capital Investors, LLC since 1998. | | N/A | | None |
* | Stephen A. Lieber is the father of Samuel A. Lieber. |
** | Alpine Woods Capital Investors, LLC manages ten other fund portfolios within the three Alpine Trusts. Each of the Alpine Trusts is registered as an open-end management investment company. The Trustees oversee each of the ten portfolios within the Alpine Trusts. |
29

| NOTES
October 31, 2008 |
30
| NOTES
October 31, 2008 |
31
INVESTOR | | |
INFORMATION | | 1(800) 617.7616 | www.alpinecef.com |
INVESTMENT ADVISER
Alpine Woods Capital Investors, LLC
2500 Westchester Ave., Suite 215
Purchase, NY 10577
ADMINISTRATOR
ALPS Fund Services, Inc.
1290 Broadway, Suite 1100
Denver, CO 80203
TRANSFER AGENT & CUSTODIAN
The Bank of New York Mellon
One Wall Street
New York, NY 10286
INDEPENDENT REGISTERED PUBLIC ACCOUNTING FIRM
Deloitte & Touche LLP
555 East Wells Street
Milwaukee, WI 53202
FUND COUNSEL
Blank Rome LLP
The Chrysler Building
405 Lexington Avenue
New York, NY 10174
INVESTOR INFORMATION
1(800)617.7616
www.alpinecef.com
Item 2. Code of Ethics.
(a) The Registrant, as of the end of the period covered by the report, has adopted a code of ethics that applies to the Registrant’s principal executive officer, principal financial officer, principal accounting officer or controller or persons performing similar functions, regardless of whether these individuals are employed by the registrant or a third party.
(b) Not applicable.
(c) There have been no amendments, during the period covered by this report, to a provision of the code of ethics that applies to the Registrant’s principal executive officer, principal financial officer, principal accounting officer or controller, or persons performing similar functions, regardless of whether these individuals are employed by the registrant or a third party, and that relates to any element of the code of ethics described in Item 2(a) above.
(d) The Registrant has not granted any waivers, including an implicit waiver, from a provision of the code of ethics that applies to the registrant’s principal executive officer, principal financial officer, principal accounting officer or controller, or persons performing similar functions, regardless of whether these individuals are employed by the Registrant or a third party, that relates to any element of the code of ethics described in 2(a) above.
(e) Not applicable.
(f) The Registrant’s Code of Ethics is attached as Exhibit 12(A)(1) hereto.
Item 3. Audit Committee Financial Expert.
The Board of Trustees of the Registrant has determined that the Registrant has at least one audit committee financial expert serving on its audit committee. The Board of Trustees has determined that Laurence B. Ashkin is an audit committee financial expert. Laurence B. Ashkin is “independent” as defined in paragraph (a)(2) of Item 3 to Form N-CSR.
2
Item 4. Principal Accountant Fees and Services.
(a) Audit Fees: The aggregate fees billed for each of the last two fiscal years for professional services rendered by the principal accountant for the audit of the registrant’s annual financial statements or services that are normally provided by the accountant in connection with statutory and regulatory filings or engagements for fiscal year 2007 was $31,500 and for fiscal year 2008 was $28,600.
(b) Audit-Related Fees: The aggregate fees billed in each of the last two fiscal years for assurance and related services by the principal accountant that are reasonably related to the performance of the audit of the registrant’s financial statements and are not reported under paragraph (a) of this Item was $0 in 2007 and $0 in 2008.
(c) Tax Fees: The aggregate fees billed in each of the last two fiscal years for professional services rendered by the principal accountant for tax compliance, tax advice, and tax planning was $4,300 in 2007 and $4,515 in 2008.
(d) All Other Fees: The aggregate fees billed in each of the last two fiscal years for products and services provided by the principal accountant, other than the services reported in paragraphs (a) through (c) of this Item is $35,500 in 2007 and $4,000 in 2008.
(e)(1) Audit Committee Pre-Approval Policies and Procedures: All services to be performed by the Registrant’s principal auditors must be pre-approved by the Registrant’s audit committee, which may include the approval of certain services up to an amount determined by the audit committee. Any services that would exceed that amount would require additional approval of the audit committee.
(e)(2) No services described in paragraphs (b) through (d) were approved pursuant to paragraph (c)(7)(i)(C) of Rule 2-01 of Regulation S-X.
(f) Not applicable.
(g) Not applicable.
(h) Not applicable
Item 5. Audit Committee of Listed Registrants.
The Registrant has a separately designated standing audit committee established in accordance with Section 3(a)(58)(A) of the Exchange Act and is comprised of the following members:
H. Guy Leibler
Jeffrey E. Wacksman
3
Laurence B. Ashkin
Item 6. Schedule of Investments.
The Schedule of Investments is included as part of the Report to Stockholders filed under Item 1 of this form.
Item 7. Disclosure of Proxy Voting Policies and Procedures for Closed-End Management Investment Companies.
Attached, as Exhibit Item 7, is a copy of the registrant’s policies and procedures.
Item 8. Portfolio Managers of Closed-End Management Investment Companies as of January 7, 2009
Name | | Title | | Length of Service | | Business
Experience 5 Years |
Samuel A. Lieber | | Portfolio Manager | | Since January 2003 | | Chairman, President (2006-present), Founder, Alpine Woods Capital Investor LLC (2003-present) |
Robert Gadsden | | Portfolio Manager | | Since January 1999 | | Portfolio Manager, Alpine Realty Income & Growth Fund (2003-present); Senior Real Estate Analyst, Alpine Woods Capital Investors LLC (2003-present) |
Peter Kovalski | | Portfolio Manager | | Since January 2002 | | Portfolio Manager, Alpine Dynamic Financial Services Fund and Alpine Woods Growth Values Financial Equities, L.P. (2003-present); |
4
Other Accounts Managed as of October 31, 2008
PM Name | | # Registered
Investment
Companies, Total
Assets | | # Other Pooled
Investments
Vehicles, Total
Assets | | # Other
Accounts, Total
Assets | | Material
Conflicts if
Any | |
Samuel A. Lieber | | 4, $701.0m | | 2, $82.2m | | 0 | | | |
Robert Gadsden | | 1, $95.3m | | 0 | | 0 | | | |
Peter Kovalski | | 1, $6.6m | | 1, $7.9m | | 0 | | | |
(a)(3) Portfolio Manager Compensation as of October 31, 2008.
The Portfolio Managers’ compensation will be made up of a fixed salary amount which is not based on the value of the assets in the Registrant’s portfolio. Annually, Alpine Woods Capital Investors LLC (the “Adviser”) may calculate bonus compensation to be paid to each portfolio manager as a percentage of salary based in large part on the Registrant’s after-tax performance in comparison to other equity income funds during the same time period, which the Adviser considers to be a comparable peer group.
(a)(4) Dollar Range of Securities Owned as of October 31, 2008.
Portfolio Manager | | Dollar Range of Equity Securities Held
in Registrant (1) | |
Samuel A. Liber | | F | |
Robert Gadsden | | B | |
Peter Kovalski | | B | |
(1) “Beneficial Ownership” is determined in accordance with Section 16a-1(a)(2) of the Securities Exchange Act of 1934, as amended
Item 9. Purchases of Equity Securities by Closed-End Management Investment Company and Affiliated Purchasers.
Period | | Total # of Shares
Purchased | | Ave. Price Paid
per Share | | Total # of Shares
Purchased as Part
of Publicly
Announced Plans
or Programs | | Maximum
Number/Approx.
$ Value of
Shares that May
Yet be Purchased
under the Plans
or Programs | |
May 1-2008, May 31, 2008 | | — | | — | | — | | — | |
June 1, 2008-June 30, 2008 | | — | | — | | — | | — | |
July 1, 2008-July 31, 2008 | | — | | — | | — | | — | |
August 1, 2008-August 31, 2008 | | — | | — | | — | | — | |
September 1, 2008-September 30, 2008 | | 22,276 | | 6.13 | | 22,276 | | — | |
October 1, 2008-October 31, 2008 | | 257,000 | | 4.26 | | 257,000 | | — | |
5
Item 10. Submission of Matters to Vote of Security Holders.
There have been no material changes to the procedures by which shareholders may recommend nominees to the Registrant’s Board of Trustees.
Item 11. Controls and Procedures.
(a) The Registrant’s principal executive officer and principal financial officer have evaluated the Registrant’s disclosure controls and procedures (as defined in Rule 30a-3(c) under the Investment Company Act of 1940, as amended) within 90 days of this filing and have concluded that the registrant’s disclosure controls and procedures were effective, as of that date.
(b) There was no change in the Registrant’s internal control over financial reporting (as defined in Rule 30a-3(d) under the Investment Company Act of 1940, as amended) during the second fiscal quarter of the period covered by this report that has materially affected, or is reasonably likely to materially affect, the registrant’s internal control over financial reporting.
Item 12. Exhibits.
(a)(1) The Code of Ethics that applies to the Registrant’s principal executive officer and principal financial officer is attached hereto as Exhibit 12.A.1.
(a)(2) The certifications required by Rule 30a-2(a) of the Investment Company Act of 1940, as amended, and Section 302 of the Sarbanes-Oxley Act of 2002 are attached hereto as Ex99.Cert.
(a)(3) Not applicable.
(b) The certifications by the Registrant’s Principal Executive Officer and Principal Financial Officer, as required by Rule 30a-2(b) of the Investment Company Act of 1940, as amended, and Section 906 of the Sarbanes-Oxley Act of 2002 are attached hereto as Ex99.906Cert.
6
SIGNATURES
Pursuant to the requirements of the Securities Exchange Act of 1934 and the Investment Company Act of 1940, the registrant has duly caused this report to be signed on its behalf by the undersigned, thereunto duly authorized.
Alpine Global Premier Properties Fund |
| | |
By: | /s/ Samuel A. Lieber | |
| Samuel A. Lieber | |
| Chief Executive Officer (Principal Executive Officer) |
| | |
Date: | January 9, 2009 | |
Pursuant to the requirements of the Securities Exchange Act of 1934 and the Investment Company Act of 1940, this report has been signed below by the following persons on behalf of the Registrant and in the capacities and on the dates indicated.
By: | /s/ Samuel A. Lieber | |
| Samuel A. Lieber | |
| Chief Executive Officer (Principal Executive Officer) |
| | |
Date: | January 9, 2009 | |
| | |
| | |
By: | /s/ Sheldon R. Flamm | |
| Sheldon R. Flamm | |
| Chief Financial Officer (Principal Financial Officer) |
| | |
Date: | January 9, 2009 | |
7