| UNITED STATES | |
| SECURITIES AND EXCHANGE COMMISSION | |
| Washington, D.C. 20549 | |
FORM N-CSR
CERTIFIED SHAREHOLDER REPORT OF REGISTERED
MANAGEMENT INVESTMENT COMPANIES
Investment Company Act file number: | 333-140770 |
|
Alpine Global Premier Properties Fund |
(Exact name of registrant as specified in charter) |
|
2500 Westchester Avenue, Suite 215, Purchase, NY | | 10577 |
(Address of principal executive offices) | | (Zip code) |
|
Alpine Woods Capital Investors, LLC
2500 Westchester Avenue, Suite 215
Purchase, New York, 10577 |
(Name and address of agent for service) |
|
Registrant’s telephone number, including area code: | (914) 251-0880 | |
|
Date of fiscal year end: | October 31 | |
|
Date of reporting period: | May 1, 2007 – October 31, 2007 | |
| | | | | | | | | |
Form N-CSR is to be used by management investment companies to file reports with the Commission not later than 10 days after the transmission to stockholders of any report that is required to be transmitted to stockholders under Rule 30e-1 under the Investment Company Act of 1940 (17 CFR 270.30e-1). The Commission may use the information provided on Form N-CSR in its regulatory, disclosure review, inspection, and policymaking roles.
A registrant is required to disclose the information specified by Form N-CSR, and the Commission will make this information public. A registrant is not required to respond to the collection of information contained in Form N-CSR unless the Form displays a currently valid Office of Management and Budget (“OMB”) control number. Please direct comments concerning the accuracy of the information collection burden estimate and any suggestions for reducing the burden to Secretary, Securities and Exchange Commission, 450 Fifth Street, NW, Washington, DC 20549-0609. The OMB has reviewed this collection of information under the clearance requirements of 44 U.S.C. ss. 3507.
Item 1. Reports to Stockholders.
INVESTOR | | |
INFORMATION | | 1(800) 617.7616 | www.alpinecef.com |
| |
| |


| | TABLE OF CONTENTS
|
Manager Commentary | 1 |
| |
Report of Independent Registered Public Accounting Firm | 8 |
| |
Schedule of Portfolio Investments | 9 |
| |
Statement of Assets and Liabilities | 13 |
| |
Statement of Operations | 14 |
| |
Statement of Changes in Net Assets | 15 |
| |
Financial Highlights | 16 |
| |
Notes to Financial Statements | 17 |
| |
Additional Information | 20 |
| | MANAGER COMMENTARY
October 31, 2007 (Unaudited) |
Alpine Comments on the Current Investment Climate
This has been a challenging year as the tone of both investor sentiment and confidence have turned from minimum to maximum risk aversion. The prospects for our economy appears less certain at this stage of the business cycle than they have for several years, even though GDP growth ranges from stable to strong abroad. The economic coupling between our domestic economy and those abroad appears looser than during recent cycles. While trade is a major part of the global glue which connects economies, we see growing importance in investment capital transfers in this era of great global financial liquidity. Alpine’s managers believe that the next year will initiate a period of transition from an uncertain world view toward events and more stable trends which could help re-price risk and enhance visibility of investment cash flows.
The subprime mortgage collapse has revealed structural weakness in parts of our financial system and unearthed poorly structured investment funds which were inappropriately sold by Wall Street. This has created a crisis of confidence in both the credit rating agencies and guarantors upon whom the market has relied for valuations. The market has lowered valuations of both issuers and holders of mortgage and asset backed securities. Banks, forced to hold these securities, are now stingy lenders. In turn, this has led to fears of a forced de-leveraging of the economy, if not a credit crunch, which might induce a recession. We are not convinced that a recession is imminent, but we recognize elevated risks.
The still vast global liquidity will continue to be focused on companies, industries, countries and regions where capital investment can generate attractive returns. The falling dollar has made American assets and products 10 to 30 percent cheaper for much of the world than they were a year ago. Thus, our exports have increased, as has tourism here. Barring a recession, the dollar may not be as weak in 2008 as in recent years, even though many countries are beginning to focus on more broadly diversifying their foreign exchange reserves away from the U.S. dollar. Nonetheless, the long-term trend of capital flowing from retirement funds and mature economies toward emerging regions with massive requirements for fixed investment in buildings, infrastructure and equipment to support and sustain business and employment growth will continue.
The major opportunity for U.S. investors participating in global investing has only been recognized over the past few years. The U.N. published a report on population trends and urbanization several months ago, forecasting that two-thirds of the world’s population will be living in large cities by 2050. This compares with roughly half today. The bulk of this growth is projected for Asia and Latin America. Countries in these regions must do all that they can to provide for the growth of the middle class lest these megalopolises become slums and breeding grounds for political and social instability. This may competitively pressure wages relative to the U.S., but such competition will help contain global inflation. Enhanced productivity is another force which lowers inflation, and this can be stimulated by innovation, which has long been a driver of our economic growth. Globally, a growing emphasis on education from grade schools through advanced degrees suggests more innovation, as well as competition. Thus, Alpine foresees an expansion of innovation and entrepreneurial opportunities world wide for equity investors. This has underpinned Alpine’s broadening the international scope of our investment programs since the start of our first international fund in 1989 and our plans for the future.
We are confident that innovation will also aid the structured finance markets. Restructuring by the strategists of Wall Street must provide more transparency of underlying cash flows, facilitating better pricing of assets and enhanced marketability. Now, the first step is to stabilize the underlying problems in the mortgage markets and permit the rating agencies to revisit their criteria for valuation. Resolution of the ideological divide between those who favor government intervention to soften and stretch out the fallout from this crisis, versus others who favor the dispassionate displacement of market adjustments, will be a key factor assessing the duration of this situation.
Our portfolios reflect a work in progress as we assess opportunities and risks in the marketplace today. Like prior periods of financial distress, a bottom will not be visible until after we pass it. So the current market psychology may overstate the risks to global capital market liquidity and misprice prospects for equity investors. This can create opportunity for investors focused on long-term trends and valuations.
Sam Lieber
President
Alpine Mutual Funds
October 31, 2007 Annual Report | 1(800)617.7616 | |
www.alpinecef.com | |
|
1
We are pleased to present the initial annual report for the Alpine Global Premier Properties Fund (AWP). The Fund’s fiscal year ended on October 31st, 2007 with a per share closing net asset value (NAV) of $18.04. After adjusting for monthly dividends of 12.67 cents per month, the portfolio produced a total return of ;-1.69% for the fiscal period. The Standard & Poor’s/Citigroup World Net Total Return $U.S. Property Index fell -2.73% for the same period. At the closing market price as of October 31st of $15.71, the annualized dividend yield on the Fund was 9.68% and the share price relative to the net asset value represented a discount of -12.9%.
Portfolio Highlights
While three of the Fund’s top ten property holdings are in Hong Kong, we wish to focus on one that just missed that cut-off, Midland Holdings which appreciated 94% for the fund in fiscal year 2007. While we are generally positive on Hong Kong and Chinese development companies, there are very few ways to invest in the existing housing market in Hong Kong. As the largest residential broker in Hong Kong, with activities in Macau and China as well, Midland provides exposure to the existing mass middle-class housing market, while most of the developers focus on the luxury-end of the market. The high-end of the housing market has recovered to levels not seen since the prior cyclical peak in 1997, although existing mid-priced housing remains roughly 36% below the peak in 1997. Growth in incomes and rising affordability, have propelled industry estimates for existing home prices to rise by 25% to 40% over the next 12 to 18 months. We believe Midland is perfectly positioned to benefit from the expected increases in both prices and volumes.
Another strong contributor in Hong Kong was Sun Hung Kai Properties, the city’s premier developer of residential, retail and now, office properties with the 118 floor, 2.5 million foot International Corporate Center and the 88 floor, International Financial Center-2. Its shares rose by over 56% during fiscal year 2007.
In China, we believe some share prices have stretched valuations, so we have been cautious regarding price multiples and balance sheets among top quality property companies. Shimao Property Holdings is a premier developer in tier 2 cities in the Yangtze River Delta, surrounding and including Shanghai, where its Riviera Gardens has been a landmark property. The Fund’s holding in Shimao has appreciated over 50% since its purchase.
Brazil offers the potential for significant economic expansion over the next decade. Alpine estimates that Brazilian residential developers offer the potential to grow earnings at a double-digit pace for the next five years, yet trade at reasonable price-to- earnings (P/E) ratios which range from 6 to 20 times next year’s earnings, averaging approximately 14 times. Since mortgages have only penetrated about 5% of the Brazilian housing market, we believe there is considerable scope for both market expansion and market share gains by the top builders. The premier residential developer is Cyrela Brazil Realty, which has historically adapted to changing market conditions and prospered. AWP’s holdings in Cyrela has benefited with more than 57% appreciation during the fiscal year.
Lodging is another area in which AWP has focused. On July 5th, shares in Hilton Hotels Corporation rose like a rocket in response to Blackstone’s takeover announcement. This is one of the three big, diversified, premier global hotel brands, and owner of several prime properties, The Fund realized a return of over 35% for its investment.
Another notable company among AWP’s lodging investments’, Orient-Express Hotels appreciated by 23% for fiscal 2007. Perhaps best know for the Venice Simplon Railroad, Orient-Express also runs luxury rail lines to Machu Pichu and in Thailand, but its collection of world class luxury boutique hotels is unsurpassed. This premier portfolio of properties has attracted large share purchases and expressions of interest in potential mergers from the Taj Group in India and Jumeirah from Dubai. This reinforces our view that unique, premier quality assets will always hold their value, even in a soft market environment.
Investment Objectives
Since this is the initial annual report to shareholders, we feel it is important to review the investment objective, and investment strategy deployed by this Fund before discussing the current investment environment and prospects, as well as its portfolio strategy and holdings.
The Alpine Global Premier Property Fund combined a global real estate equity investment program (modeled on the same strategies employed by the Alpine International Real Estate Equity Fund since 1989) with Alpine’s dynamic dividend capture strategy. This portfolio has the added flexibility of a truly global scope, incorporating potential focus on domestic equities if and when we believe they offer significant opportunity. The emphasis on premier properties also sets this portfolio apart. We believe that investments in premier real estate should provide a more durable earnings profile over the course of a business cycle.
A fundamental investment objective of the Fund is to generate a high level of monthly dividend income generated through Alpine’s dynamic dividend capture methodology. These strategies were initially employed by Alpine in 2003 in the Alpine Dynamic Dividend Fund, and have been the cornerstone of our other closed-end funds prior to this Fund.
2
Investment Opportunity
The growth in demand for both property development and investment opportunities over the past five years has intersected with the rapid expansion of emerging markets and counter cyclical trends among established economies. Continued economic expansion stimulated by demographic drivers such as population growth, urbanization and a broadening middle class, are being fueled with the growth in equity securitization throughout the world. This has produced property stock market expansion reflecting both the globalization of capital flows seeking superior returns and the realization by local property entrepreneurs that the global capital markets can provide attractive long-term funding. We believe that the initial period of this sector expansion is only two – four years old for many of the countries on which we focus. By comparison, REIT’s in the U.S. have enjoyed an impressive 15-year period incorporating sector expansion, consolidation and then revaluation by the equity markets. Thus, Alpine believes the global equitization of real estate may still be in its adolescence.
Investment Strategy
Premier properties’ are central to the investment program of this Fund. We believe that such properties hold their value over time better than do generic counterparts. The old adage, ‘location, location, location’, is appropriate but not sufficient to describe premier properties. Such properties often offer superior design, construction, amenities and management. These traits are integral with having the best location or views in town. In some cases these are perceived to be landmark properties. They often command superior rents and prices. During market downturns, when the average property goes wanting for tenants, premier properties are more likely to hold their occupancy levels, and hence their cash flow generating potential.
Alpine employs a top down – bottom up investment methodology which focuses on economic and demographic drivers of demand in relation to underlying supply conditions for property. If demand exceeds supply, prices and rents should more higher. We are mindful that mature economies tend to be slower growers, but more stable because of greater depth and breadth of economic activity. However, great potential for value creation may exist in emerging markets. The B.R.I.C. countries (Brazil, Russia, India, China) are currently of particular interest for this portfolio since growth opportunities in cities or regions in these countries face supply constraints which could lead to an extended development cycle. With greater potential for volatility in emerging markets, we seek to balance risk and opportunity for this portion of the Fund’s portfolio in terms of geographic spread and property type exposure. Even though Alpine has initiated or intensified our research effort in some of these countries over the past few years, it should be noted that Alpine’s International Real Estate Equity Fund has analyzed and adjusted its exposure and weightings in emerging economics since inception in 1989.
Continued evolution of the global property securities markets from the current state in which REIT’s are but a modest proportion of the global investable universe towards a greater potential weighting in future years, could lead to increased portfolio emphasis on REIT’s. We anticipate that the portfolio will reflect the dynamics of the global marketplace and the opportunities which management believes best enable us to achieve the goals of solid total returns and dividend income.
The portfolio construction approach employed for this Fund is designed to broadly spread risk across numerous countries and companies. We try to minimize the risks that often cannot be foreseen, be they political or financial in nature, localized or global in impact. This diversified approach translates into moderate investment position sizes, typically no larger that 2-3% of the portfolio and rarely up to 5%. Unlike many other funds, we will not concentrate the portfolio to track an index.
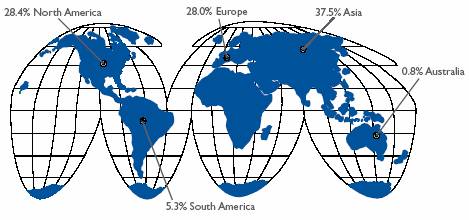
Portfolio Focus: Geographic Spread
As of October 31, the portfolio had investments in 137 companies across 22 countries. The regional allocation of the portfolio currently favors Asia at 37.5% with roughly 28% each in North America and Europe. The United States is the largest individual country with a 24.8% holding. Japan constitutes 15.5% of the portfolio and Hong Kong 11.6%. England is home for 9.5% of the portfolio, with 8.2% in France. From a broad perspective, the United States constitutes sources of growth, income and discounted valuations, while England provides primarily income and discounted valuations. France has growth opportunities, modest income as well as discounted valuations. Hong Kong is very much a growth story, as are the Chinese holdings that we have in the portfolio. AWP has a relatively modest 2.3% position in China, as we think many local stocks have become too expensive over the past 18 months. Subsequent to fiscal year-end, we have seen a significant pull back in Chinese share prices which we believe offers more attractive entry points. Japan is a market with little yield, and currently modest growth, but select companies provide fundamentally cheap valuations. Two other significant markets which offer strong growth opportunities are Singapore and Brazil. Singapore has emerged as a very efficient, transparent and open economy with a flexible, modern capital market, so it is fast becoming the clearing house for business in Southeast Asia. Brazil is emerging from decades during which it was sidetracked as a ‘mañana’ economy. Today its economy is strong, its business culture is vibrant and interest rates,
3
while still high relative to the rest of the world, have been reduced significantly from historic levels. This has created the potential for a consumer led consumption boom.
Short-Term Sub-Prime Confidence
In the Fund’s April 30th, 2007 semi-annual Report to Shareholders, we observed that the publicly traded real estate market was going through a “case of indigestion” and “market sentiment for real estate stocks was becoming a bit fragile”. We emphasized that we were “not anticipating a major market break, we do anticipate a 10% or greater correction.” Clearly, our caution was correct although we underestimated the degree to which the subprime mortgage market collapse would spread and threaten contagion throughout the financial markets. For example, the Citibank Macro Risk Index which averages the yield spreads relative to government bonds traded by market participants in the sovereign debt swap and foreign exchange markets reveals that investor confidence, as measured by the index rose from historic low levels just this past January to match historic highs on August 16th. Those peak levels were last seen at the culmination of the near collapse of Long-Term Capital Management in 1998! Thus, in seven months the market’s appetite for risk swung from minimal concern to great aversion. After a bit of moderation in early Fall, we now find ourselves in December at similar high levels of concern as measured back in August by the aforementioned MRI Index. When we were writing the AWP semi-annual the market had only a moderate risk aversion based on such measures.
The Storm In Housing Spreads
We are approaching the beginning of 2008, when many so called 2/28 and 3/27 mortgages adjust from the low teaser rates of the first two or three years to full tariff, LIBOR plus 600 basis points (approximately 11%) interest rates. The pain of 2 million homeowners being economically crippled or forced from their homes is individually tragic, yet the impact could be much greater for the U.S. economy if this swamps communities with ‘For Sale’ signs, lowering home prices, property tax revenues, and perhaps consumer spending slows.
Wall Street cleverly created pools of subprime mortgages which were repackaged into mortgage backed securities (MBS) and collateralized debt obligations (COD’s) to provide the underpinning cash flows of structured finance products which offered enhanced yields for investors. The accuracy and reliability of ratings provided by Moody’s, Standard & Poor’s and Fitch have been cast into doubt because they opined on the credit worthiness of many of the mortgage backed securities (MBS) and collateralized debt obligations (CDOs) at the time when they were issued and sold. Today, the threat of rising defaults and hence foreclosure sales at 50 to 75 cents on the dollar has created great uncertainty of future MBS and CDO cash flows. Thus, the price or yield premium which the markets now demand has increased dramatically since the beginning of the year when uncertainty was not in prices. The subprime market has become the proverbial “stick” which broke the “camel’s back” of structured finance. Investor confidence has been shaken and the cost of capital has increased as a result.
Commercial Property Prices
The impact on commercial real estate has been to eliminate aggressive borrowers who pushed prices higher. Prices for premier property will probably hold within 5% to 10% of peak levels. However, generic property could fall more. Lower quality assets may decline by 20% or more given a dearth of financial buyers. Since public property companies typically use moderate amounts of leverage, they should be increasingly competitive in such an environment. It is important to note that such projected declines in values may hold true for the U.S. and Great Britain, with less impact on the rest of Europe, and of only limited relevance for Asia.
The Current Global Property Share Valuations
The integration of the global economy has helped to retain growth despite negative effects such as record high oil prices and rising food and basic material costs. While downside risk remains with respect to home prices in both the U.S. and selected parts of Europe, much of the reduction in residential investment has already taken place. Central Bankers do not have to maintain high interest rates to cool economic activity, since credit tightening has already taken place as highly leveraged corporate and financial investors have been forced out of the market place. As a result, merger and acquisitions (M&A) have also slowed down. M&A valuation supports are not currently visable for equities. In such a context it is important to appreciate that many individual real estate stocks in the U.S., Europe and Japan have experienced declines of 20%, 30% and even greater than 40% from peak levels. Prior peak prices may have anticipated excessive growth expectations, however, current levels might already discount overly bearish scenarios. Strong economic activity in the BRIC countries (Brazil, Russia, India, China), moderate growth rates in neighboring countries, and somewhat subdued economic activity in Europe should likely sustain demand for real estate and hence, rents and prices. Outside of the U.S. and Europe, liquidity for quality real estate remains abundant and sales activity remains buoyant.
Opportunity From Uncertainty
During 2007, the capital markets have shifted from an optimistic valuation of future appreciation to a bearish concern
4
over prospective depreciation of real estate values. This has created an opportunity for value oriented investors to buy real estate in the stock market at a discount to what it trades for on ‘Main Street’. Stocks with the potential for income and value growth from strengthening property markets, can be acquired at significant discounts to underlying value. That value can be realized when sentiment improves over the next two to three years.
We wish to highlight a handful of stocks from the portfolio which reflect this situation, the Fund’s focus on premier property companies, and the opportunity for appreciation as well as attractive valuations.
The portfolio’s largest holding, Unibail-Rodamco is the product of the merger of French office and shopping mall developer with strong operational skills, and Rodamco, a Dutch semi-passive owner of top quality shopping malls throughout Europe. Early in the year before the merger, Unibail reached the price level of 240 Euros per share. Post merger, the shares occasionally dipped below 170 Euros during the summer. After AWP’s fiscal year end, shares averaged under 160 Euros, which we believe is very attractive. The combination of a 4.5% yield, secure long term leases, growth enhancement potential from upgrading properties, and a meaningful discount to its underlying property valuation of 185 Euros per share, created a compelling rational to make this company AWP’s largest portfolio position.
The Fund also acquired a significant holding in Immofinanz Immobilien, AG based in Austria. In mid-April, the shares were trading for 12.5 Euros. The price collapsed during the Fall to levels not seen since 2004, due to being traded alongside an unrelated Viennese property fund mired in alleged share price manipulation. Immofinanz AG’s portfolio is spread across Germany, Austria, and Eastern Europe. The quality portfolio of downtown office, logistics and retail properties, recently instituted a 4% plus dividend yield yet trades at an estimated 35% discount to underlying asset value. Another company in which we have been expanding the Fund’s position is called Conwert Immobilien Invest AG. The stock fell from a high of 17.5 Euros in February to its current trading range of 10 to 12 Euros first in August and again, after October. These are levels not seen since 2003. Conwert is a specialist in high quality renovations of small to medium sized downtown apartments in both Austria and Germany. We believe that institutional investors who have grown cautious on highly leveraged American investment funds in German residential real estate have overlooked this specialist entrepreneur trading roughly 35% below its net asset value.
Pirelli & C Real Estate is an Italian premier property player which has become cheap with a high (5% plus) yield, and low, single digit price to earnings multiple, this pan-European opportunity has fallen from favor since April at 60 Euros per share to 40 Euros by August and 35 by October 31. Pirelli & C has a valuable platform which provides the potential to become a premier provider of institutional property funds throughout Europe.
Long-Term Prospects
No one is comfortable with the rocky market conditions which erupted less than two months after we launched this Fund. The markets are suffering from a broad loss of investor confidence, but not a loss of jobs or a decline in demand, which normally occurs during to a recession. However, confidence is the oil which helps to lubricate the financial system and if the gears lock up, then the financial liquidity which fuels corporate investment and entrepreneurial activity becomes scarce and expensive. In an economy such as the U.S. where we are both a significant importer and exporter of capital, it is likely that we will not only share the burden of any slowdown, but also be supported by global capital flows. In other words, if the U.S. experiences a recession, we may negatively impact one or more closely linked countries, yet the potential downside will probably be softened by considerable investment flows, be they acquirers of assets and companies, or tourists taking advantage of the cheap dollar to see our great country. We also believe that in an election year, even a dysfunctional government made more so by disparate ideologies can be induced to make pragmatic decisions on behalf of its constituencies.
With many positive drivers still propelling the global economy, we suspect that the markets have placed too much emphasis on a worst case scenario. The prices of many property shares have been reduced to levels which provide an excellent entry point for opportunistic investors who believe that the potential for global growth should be sustainable over the next three to five years. We remain confortable with the current strategy of buying shares which appear oversold after the momentum investors have moved-on, investing in Premier property companies which are creating value, and positioning the portfolio in countries which could generate the greatest growth in value. We look forward to sharing in the potential returns from a globally diversified property securities investment strategy which balances growth, income and value without resorting to financial leverage or extensive derivatives based techniques. We thank you for your support and look forward to providing investors with an update on the portfolio in the New Year.
Sincerely,
Samuel Lieber
President, Portfolio Manager
5
PERFORMANCE(1) as of October 31, 2007
| | Ending Value
as of 10/31/07 | | One
Month | | Three
Month | | Since
Inception (2) | |
Alpine Global Premier Properties Fund | NAV (3) | | $ | 18.04 | | 2.75 | % | 5.17 | % | (1.69 | )% |
Alpine Global Premier Properties Fund | Market Price (3) | | $ | 15.71 | | 2.12 | % | (8.25 | )% | (18.41 | )% |
S&P / Citigroup World Net Total Return $ US Property Index | | | | 2.52 | % | 10.52 | % | (2.73 | )% |
MSCI US REIT Total Return Index | | | | 1.21 | % | 12.58 | % | (7.95 | )% |
(1) Performance information calculated after consideration of dividend reinvestment. All returns for periods of less than one year are not annualized.
(2) Commenced operations on April 26, 2007.
(3) IPO price of $20 used in calculating performance information.
Performance data quoted represents past performance. Past performance is no guarantee of future results and investment returns and principle value of the Fund will fluctuate so that shares, when redeemed, may be worth more or less than their original cost. Current performance may be higher or lower than the performance quoted. Call 1(800)617.7616 or visit www.alpinecef.com for current month end performance.
TOP TEN PROPERTY HOLDINGS v
Unibail-Rodamco Co. | | 2.80% | | France | |
Accor SA | | 2.50% | | France | |
Sumitomo Realty & Development Co. Ltd. | | 2.30% | | Japan | |
Boston Properties, Inc. | | 2.30% | | United States | |
Marriott International, Inc. - Class A | | 2.00% | | United States | |
New World Development Ltd. | | 1.90% | | Hong Kong | |
Sino Land Co. Ltd. | | 1.60% | | Hong Kong | |
Intercontinental Hotels Group PLC | | 1.60% | | United Kingdom | |
Orient-Express Hotels Ltd. | | 1.60% | | United States | |
Kowloon Development Co. Ltd. | | 1.50% | | Hong Kong | |
Top Ten Property Holdings | | 20.10% | | | |
TOP FIVE DIVIDEND HOLDINGS v
iStar Financial, Inc. | | 2.20% | | United States | |
Segro PLC | | 2.10% | | United Kingdom | |
Temple-Inland Inc. | | 1.10% | | United States | |
Hospitality Properties Trust | | 1.10% | | United States | |
Mapeley Ltd. | | 1.10% | | United Kingdom | |
Top Five Dividend Holdings | | 7.60% | | | |
PORTFOLIO DISTRIBUTIONS v

v As a percentage of net assets
6
REGIONAL ALLOCATION v
v As a percentage of net assets, excluding any short-term investments.
Top Five Countries
United States | | 24.80 | % |
Japan | | 15.50 | % |
Hong Kong | | 11.60 | % |
United Kingdom | | 9.50 | % |
France | | 8.20 | % |
NAV, MARKET PRICE, AND TOTAL RETURN [ Since Inception ]

7

| REPORT OF INDEPENDENT REGISTERED PUBLIC
ACCOUNTING FIRM
|
TO THE STOCKHOLDERS AND BOARD OF TRUSTEES OF ALPINE GLOBAL PREMIER PROPERTIES FUND:
We have audited the accompanying statement of assets and liabilities, including the schedule of portfolio investments of Alpine Global Premier Properties Fund (the “Fund”), as of October 31, 2007 and the related statements of operations, changes in net assets and the financial highlights for the period from April 26, 2007 (inception) to October 31, 2007. These financial statements and financial highlights are the responsibility of the Fund’s management. Our responsibility is to express an opinion on these financial statements and financial highlights based on our audits.
We conducted our audit in accordance with the standards of the Public Company Accounting Oversight Board (United States). Those standards require that we plan and perform the audit to obtain reasonable assurance about whether the financial statements are free of material misstatement. The Fund is not required to have, nor were we engaged to perform, an audit of its internal control over financial reporting. Our audit included consideration of internal control over financial reporting as a basis for designing audit procedures that are appropriate in the circumstances, but not for the purpose of expressing an opinion on the effectiveness of the Fund’s internal control over financial reporting. Accordingly, we express no such opinion. An audit also includes examining, on a test basis, evidence supporting the amounts and disclosures in the financial statements, assessing the accounting principles used and significant estimates made by management, as well as evaluating the overall financial statement presentation. Our procedures included confirmation of securities owned as of October 31, 2007, by correspondence with the custodian and brokers; where replies where not received from brokers, we performed other auditing procedures. We believe that our audit provides a reasonable basis for our opinion.
In our opinion, the financial statements and financial highlights referred to above present fairly, in all material respects, the financial position of Alpine Global Premier Properties as of October 31, 2007, and the results of its operations, the changes in its net assets, and the financial highlights for the period from April 26, 2007 (inception) to October 31, 2007, in conformity with accounting principles generally accepted in the United States of America.

Milwaukee, WI
December 21, 2007
8

| SCHEDULE OF PORTFOLIO INVESTMENTS October 31, 2007
|
| | | | Value | |
Description | | Shares | | (Note 1) | |
| | | | | |
COMMON STOCKS (97.9%) | | | | | |
Australia (0.8%) | | | | | |
Valad Property Group Pty Ltd. | | 8,195,000 | | $ | 14,426,070 | |
| | | | | |
Austria (1.5%) | | | | | |
Conwert Immobilien Invest AG * | | 140,899 | | 2,665,519 | |
Immofinanz AG | | 2,102,000 | | 24,967,625 | |
| | | | 27,633,144 | |
| | | | | |
Brazil (5.3%) | | | | | |
Agra Empreendimentos Imobiliarios SA * | | 1,258,700 | | 10,764,025 | |
Brascan Residential Properties SA | | 1,228,400 | | 9,795,117 | |
Brasil Brokers Participacoes SA * | | 16,300 | | 10,360,269 | |
Companhia Brasileira de Desenvolvimento Imobiliario Turistico * | | 21,000 | | 11,163,436 | |
Cyrela Brazil Realty SA | | 819,545 | | 14,050,155 | |
Cyrela Commercial Properties SA Empreendimentos e Participacoes * | | 60,000 | | 466,299 | |
Ez Tec Empreendimentos e Participacoes SA * | | 769,200 | | 4,044,561 | |
Gafisa SA * (1) | | 151,000 | | 5,384,660 | |
Gafisa SA | | 582,300 | | 10,464,005 | |
Iguatemi Empresa de Shopping Centers SA | | 42,300 | | 700,988 | |
Klabin Segall SA | | 199,100 | | 2,056,977 | |
Multiplan Empreendimentos Imobiliarios SA * | | 905,000 | | 13,214,313 | |
Sao Carlos Empreendimentos e Participacoes SA * | | 20,000 | | 239,794 | |
Tecnisa SA | | 236,000 | | 1,534,106 | |
Trisul SA * | | 1,150,000 | | 7,442,290 | |
| | | | 101,680,995 | |
| | | | | |
China (2.3%) | | | | | |
Greentown China Holdings Ltd. | | 5,336,500 | | 11,333,672 | |
Hopson Development Holdings Ltd. | | 5,229,900 | | 20,109,160 | |
Shimao Property Holdings Ltd. | | 3,301,000 | | 11,648,960 | |
| | | | 43,091,792 | |
| | | | | |
France (8.2%) | | | | | |
Accor SA | | 500,000 | | 47,707,685 | |
Club Mediterranee * | | 78,095 | | 5,243,287 | |
Eurosic, Inc. | | 89,000 | | 5,094,923 | |
Fonciere des Regions | | 89,703 | | $ | 13,087,399 | |
Kaufman & Broad SA | | 95,610 | | 5,442,852 | |
Nexity Initiale SAS | | 229,798 | | 15,275,484 | |
Societe Immobiliere de Location pour l’Industrie | | 74,715 | | 11,541,403 | |
Unibail-Rodamco Co. | | 212,392 | | 52,800,340 | |
| | | | 156,193,373 | |
| | | | | |
Germany (2.0%) | | | | | |
Colonia Real Estate AG * | | 363,800 | | 11,108,719 | |
Dawnay Day Sirius Ltd. * | | 3,955,000 | | 4,869,631 | |
Dawnay Day Treveria PLC | | 10,457,500 | | 13,216,729 | |
Eurocastle Investment Ltd. | | 292,082 | | 9,269,960 | |
| | | | 38,465,039 | |
| | | | | |
Hong Kong (11.6%) | | | | | |
The Hongkong & Shanghai Hotels Ltd. | | 6,714,000 | | 12,370,687 | |
Hongkong Land Holdings Ltd. | | 3,023,000 | | 15,054,540 | |
Kowloon Development Co. Ltd. | | 9,200,000 | | 28,489,404 | |
Midland Holdings Ltd. | | 19,496,000 | | 23,847,241 | |
New World Development Ltd. | | 10,000,000 | | 35,676,269 | |
NWS Holdings Ltd. | | 3,088,000 | | 11,594,568 | |
Shangri-La Asia Ltd. | | 3,882,000 | | 12,321,822 | |
Sino Land Co. Ltd. | | 9,910,000 | | 30,751,976 | |
Sun Hung Kai Properties Ltd. | | 1,100,000 | | 20,835,457 | |
Swire Pacific Ltd. | | 300,000 | | 4,254,056 | |
Wharf Holdings Ltd. | | 4,343,700 | | 25,949,267 | |
| | | | 221,145,287 | |
| | | | | |
India (1.3%) | | | | | |
Hirco PLC * | | 1,065,632 | | 8,353,467 | |
Unitech Corporate Parks PLC * | | 3,104,000 | | 6,889,818 | |
Yatra Capital Ltd. * | | 650,000 | | 10,262,910 | |
| | | | 25,506,195 | |
| | | | | |
Italy (1.4%) | | | | | |
Pirelli & C Real Estate S.p.A. | | 479,695 | | 23,715,493 | |
Risanamento S.p.A. * | | 300,000 | | 2,216,267 | |
| | | | 25,931,760 | |
| | | | | |
Japan (15.5%) | | | | | |
Advance Residence Investment Corp. | | 295 | | 1,178,824 | |
Aeon Mall Co. Ltd. | | 350,000 | | 9,040,870 | |
Creed Corp. | | 4,656 | | 13,843,089 | |
| | | | | | | |
9
| | | | Value | |
Description | | Shares | | (Note 1) | |
| | | | | |
Japan (continued) | | | | | |
DA Office Investment Corp. | | 348 | | $ | 2,286,517 | |
Daito Trust Construction Co. Ltd. | | 87,000 | | 3,996,879 | |
Frontier Real Estate Investment Corp. | | 413 | | 3,211,208 | |
Haseko Corp. * | | 4,150,000 | | 9,892,515 | |
The Japan General Estate Co. Ltd. | | 720,300 | | 13,642,400 | |
Japan Hotel and Resort, Inc. | | 781 | | 2,653,768 | |
Japan Logistics Fund, Inc. | | 1,203 | | 8,571,629 | |
Kenedix, Inc. | | 4,190 | | 9,079,877 | |
Mitsubishi Estate Co. Ltd. | | 998,000 | | 29,585,750 | |
Mitsui Fudosan Co. Ltd. | | 903,000 | | 24,734,365 | |
Mori Hills REIT Investment Corp. | | 2,941 | | 22,459,333 | |
Nomura Real Estate Holdings, Inc. | | 747,200 | | 21,438,322 | |
Pacific Management Corp. | | 11,175 | | 16,370,433 | |
Secured Capital Japan Co. Ltd. | | 2,624 | | 5,094,925 | |
Sumitomo Real Estate Sales Co. Ltd. | | 215,230 | | 15,484,844 | |
Sumitomo Realty & Development Co. Ltd. | | 1,270,200 | | 44,371,395 | |
Tokyo Tatemono Co. Ltd. | | 1,482,600 | | 18,878,684 | |
United Urban Investment Corp. | | 505 | | 3,672,648 | |
Urban Corp. | | 929,200 | | 16,028,328 | |
| | | | 295,516,603 | |
| | | | | |
Malaysia (0.4%) | | | | | |
KLCC Property Holdings Bhd | | 4,094,000 | | 4,345,655 | |
Resorts World Bhd | | 2,900,000 | | 3,339,130 | |
| | | | 7,684,785 | |
| | | | | |
Mexico (1.5%) | | | | | |
Corp. GEO SAB de C.V. * | | 1,522,000 | | 5,609,810 | |
Desarrolladora Homex SAB de C.V. * (1) | | 250,100 | | 14,133,151 | |
Desarrolladora Homex * | | 500,000 | | 4,723,564 | |
Urbi Desarrollos Urbanos SA de C.V. * | | 1,113,000 | | 4,299,598 | |
| | | | 28,766,123 | |
| | | | | |
Norway (1.4%) | | | | | |
Norwegian Property ASA | | 2,126,600 | | 26,548,819 | |
| | | | | |
Philippines (0.2%) | | | | | |
Ayala Land, Inc. | | 1,050,000 | | 360,577 | |
SM Prime Holdings, Inc. | | 9,605,000 | | 2,638,736 | |
| | | | 2,999,313 | |
| | | | | |
Poland (0.6%) | | | | | |
Orco Property Group | | 78,088 | | $ | 12,322,600 | |
| | | | | |
Russia (1.1%) | | | | | |
PIK Group * (2)(3) | | 763,000 | | 20,791,750 | |
| | | | | |
Singapore (5.5%) | | | | | |
ARA Asset Management Ltd. * | | 3,750,000 | | 2,980,716 | |
Ascendas REIT | | 5,000,000 | | 8,950,788 | |
Banyan Tree Holdings Ltd. | | 7,395,000 | | 10,733,688 | |
CapitaCommercial Trust | | 12,498,200 | | 23,237,599 | |
CapitaLand Ltd. | | 1,925,000 | | 10,710,706 | |
CapitaMall Trust | | 3,850,000 | | 9,739,425 | |
City Developments Ltd. | | 1,375,000 | | 15,015,897 | |
Macquarie MEAG Prime REIT | | 17,451,400 | | 14,474,482 | |
Mandarin Oriental International Ltd. | | 1,849,000 | | 4,604,010 | |
Singapore Land Ltd. | | 799,000 | | 5,356,856 | |
| | | | 105,804,167 | |
Spain (0.7%) | | | | | |
Fomento de Construccionesy Contratas SA | | 55,400 | | 4,822,974 | |
Realia Business SA | | 1,000,000 | | 9,415,514 | |
| | | | 14,238,488 | |
Sweden (1.6%) | | | | | |
JM AB | | 1,133,500 | | 25,116,321 | |
Skanska AB | | 250,000 | | 4,939,350 | |
| | | | 30,055,671 | |
Thailand (0.7%) | | | | | |
Land and Houses PLC | | 5,000,000 | | 1,228,483 | |
Minor International | | 21,644,000 | | 11,336,272 | |
| | | | 12,564,755 | |
| | | | | |
United Kingdom (9.5%) | | | | | |
Alliance & Leicester PLC | | 425,000 | | 6,985,684 | |
British Land Co. PLC | | 400,000 | | 9,015,865 | |
Great Portland Estates PLC | | 827,000 | | 9,827,428 | |
Hammerson PLC | | 875,000 | | 20,231,635 | |
Helical Bar PLC | | 685,384 | | 6,291,914 | |
Intercontinental Hotels Group PLC | | 1,304,300 | | 30,374,815 | |
Land Securities Group PLC | | 500,000 | | 17,091,885 | |
Mapeley Ltd. | | 511,572 | | 20,316,938 | |
Segro PLC | | 4,043,057 | | 39,259,510 | |
| | | | | | | |
10
| | | | Value | |
Description | | Shares | | (Note 1) | |
| | | | | |
United Kingdom (continued) | | | | | |
Shaftesbury PLC | | 1,102,318 | | $ | 12,892,809 | |
Songbird Estates PLC | | 2,050,000 | | 7,864,450 | |
Taylor Wimpey PLC | | 336,000 | | 1,729,150 | |
| | | | 181,882,083 | |
| | | | | |
United States (24.8%) | | | | | |
Alexander’s, Inc. * | | 37,870 | | 15,221,847 | |
Alexandria Real Estate Equities, Inc. | | 199,000 | | 20,524,860 | |
American Financial Realty Trust | | 1,286,046 | | 8,667,950 | |
Ashford Hospitality Trust, Inc. | | 583,900 | | 5,745,576 | |
Boston Properties, Inc. | | 400,000 | | 43,336,000 | |
Brandywine Realty Trust | | 246,500 | | 6,376,955 | |
DiamondRock Hospitality Co. | | 678,000 | | 12,990,480 | |
Hospitality Properties Trust | | 527,523 | | 20,889,911 | |
Host Hotels & Resorts, Inc. | | 400,000 | | 8,864,000 | |
HRPT Properties Trust | | 2,100,000 | | 19,719,000 | |
iStar Financial, Inc. | | 1,400,965 | | 42,743,442 | |
Kilroy Realty Corp. | | 175,000 | | 11,382,000 | |
Lennar Corp. - Class A | | 200,000 | | 4,570,000 | |
Mack-Cali Realty Corp. | | 426,500 | | 16,885,135 | |
Maguire Properties, Inc. | | 526,600 | | 14,349,850 | |
Marriott International, Inc. - Class A | | 914,200 | | 37,582,762 | |
National Retail Properties, Inc. | | 183,100 | | 4,641,585 | |
NVR, Inc. * | | 4,000 | | 1,903,000 | |
Orient-Express Hotels Ltd. | | 458,497 | | 29,710,606 | |
Simon Property Group, Inc. | | 290,000 | | 30,191,900 | |
SL Green Realty Corp. | | 70,000 | | 8,446,200 | |
Standard-Pacific Corp. | | 200,000 | | 960,000 | |
Starwood Hotels & Resorts Worldwide, Inc. | | 500,000 | | 28,430,000 | |
Sunrise Senior Living, Inc. * | | 374,300 | | 13,849,100 | |
Taubman Centers, Inc. | | 100,000 | | 5,887,000 | |
Temple-Inland, Inc. | | 400,000 | | 21,468,000 | |
Ventas, Inc. | | 250,000 | | 10,722,500 | |
Vornado Realty Trust | | 250,000 | | 27,930,000 | |
| | | | 473,989,659 | |
| | | | | |
TOTAL COMMON STOCKS
(Identified Cost $1,884,332,937) | | | | 1,867,238,471 | |
| | | | | | |
| | Interest | | | | Value | |
Description | | Rate | | Shares | | (Note 1) | |
SHORT TERM INVESTMENTS (0.0%) (4) | | | | | | | |
Blackrock Liquidity Fds Tempfund (5) | | 5.125 | % | 276,083 | | $ | 276,083 | |
Morgan Stanley Money Market Fund (5) | | 5.037 | % | 672,049 | | 672,049 | |
| | | | | | | |
TOTAL SHORT TERM INVESTMENTS
(Identified Cost $948,132) | | | | | | 948,132 | |
| | | | | | | |
TOTAL INVESTMENTS (97.9%)
(Identified Cost $1,885,281,069) | | | | | | 1,868,186,603 | |
| | | | | | | |
TOTAL OTHER ASSETS
LESS LIABILITIES (2.1%) | | | | | | 39,875,230 | |
| | | | | | | |
NET ASSETS (100.0%) | | | | | | $ | 1,908,061,833 | |
| | | | | | | | | |
* | Non-income producing security. |
(1) | ADR - American Depositary Receipt. |
(2) | GDR - Global Depositary Receipt. |
(3) | Security exempt from registration under Rule 144A of the Securities Act of 1933. These securities may be resold in transactions exempt from registration, normally to qualified institutional buyers. These securities have been determined to be liquid in accordance with procedures adopted by the Fund’s Board of Trustees. |
(4) | Less than 0.05% of Total Net Assets. |
(5) | Investments in other funds are calculated at their respective net asset value as determined by those funds, in accordance with the Investment Company Act of 1940. The interest rate shown represents the rate at October 31, 2007. |
See Notes to Financial Statements.
11
OUTSTANDING FORWARD CURRENCY CONTRACTS
| | Expiration | | Units Per | | Currency Value | | Unrealized | |
Contract Description | | Date | | Contract | | in $USD | | Gain/(Loss) | |
| | | | | | | | | |
Contracts Purchased: | | | | | | | | | |
Great Britain Pound | | 11/01/07 | | 367,130 (GBP | ) | $ | 763,375 | | $ | 3,710 | |
Japanese Yen | | 11/01/07 | | 437,793,539 (JPY | ) | 3,794,856 | | (26,999 | ) |
| | | | | | $ | 4,558,231 | | $ | (23,289 | ) |
| | | | | | | | | |
Contracts Sold: | | | | | | | | | |
Australian Dollar | | 11/02/07 | | 662,843 (AUD | ) | $ | 617,373 | | $ | (134 | ) |
European Euro | | 11/01/07 | | 1,090,212 (EUR | ) | 1,579,217 | | (7,131 | ) |
European Euro | | 11/02/07 | | 29,760 (EUR | ) | 43,108 | | 16 | |
| | | | | | $ | 2,239,698 | | $ | (7,249 | ) |
12

| | STATEMENT OF ASSETS AND LIABILITIES
October 31, 2007 |
ASSETS | | | |
| | | |
Investments, at value (1) | | $ | 1,868,186,603 | |
Cash | | 2,226,221 | |
Foreign currency, at value (Cost $19,006,058) | | 19,082,855 | |
Receivable for investment securities sold | | 90,456,935 | |
Dividends receivable | | 4,814,617 | |
Interest receivable | | 148,207 | |
Deposit with broker on total return swap contracts | | 8,405,415 | |
Unrealized appreciation on total return swap contracts | | 142,651 | |
Unrealized appreciation on forward currency contracts | | 3,726 | |
Total Assets | | 1,993,467,230 | |
| | | |
LIABILITIES | | | |
| | | |
Loan payable | | 28,500,000 | |
Interest on loan payable | | 10,133 | |
Payable for investment securities purchased | | 52,319,731 | |
Unrealized depreciation on forward currency contracts Accrued expenses and other liabilities: | | 34,264 | |
Investment advisory fees | | 1,602,614 | |
Administrative fees | | 208,340 | |
Offering cost | | 2,440,235 | |
Trustee fees | | 12,579 | |
Officer fees | | 12,500 | |
Other | | 265,001 | |
Total Liabilities | | 85,405,397 | |
| | | |
Net Assets | | $ | 1,908,061,833 | |
| | | |
NET ASSETS REPRESENTED BY | | | |
| | | |
Paid-in-capital | | $ | 2,008,334,666 | |
Overdistributed net investment income | | (646,697 | ) |
Accumulated net realized loss on investments, swap contracts and foreign currency transactions | | (82,659,108 | ) |
Net unrealized depreciation on investments, swap contracts and foreign currency translations | | (16,967,028 | ) |
Net Assets | | $ | 1,908,061,833 | |
Net asset value | | | |
Net assets | | $ | 1,908,061,833 | |
Shares of beneficial interest issued and outstanding | | 105,789,582 | |
Net asset value per share | | $ | 18.04 | |
(1) Cost of Investments | | $ | 1,885,281,069 | |
See Notes to Financial Statements.
13
| STATEMENT OF OPERATIONS
For the Period April 26, 2007 (Inception) to October 31, 2007 |
INCOME | | | |
| | | |
Dividends * | | $ | 62,453,069 | |
Interest | | 10,661,935 | |
Total Income | | 73,115,004 | |
| | | |
EXPENSES | | | |
| | | |
Interest on loan | | 10,133 | |
Investment advisory fee | | 9,734,660 | |
Administrative fee | | 1,265,506 | |
Audit and tax fees | | 31,561 | |
Custodian fees | | 369,489 | |
Officers fees | | 25,000 | |
Legal fees | | 41,872 | |
Printing fees | | 190,597 | |
Trustee fees | | 24,579 | |
Miscellaneous fees | | 78,137 | |
Total Expenses | | 11,771,534 | |
| | | |
Net Investment Income | | 61,343,470 | |
| | | |
REALIZED AND UNREALIZED GAIN/(LOSS) ON INVESTMENTS, SWAP CONTRACTS AND FOREIGN CURRENCY | | | |
| | | |
Net realized loss on investments: | | | |
Securities transactions | | (82,861,878 | ) |
Swap contracts | | (56,272 | ) |
Foreign currency transactions | | (2,697,011 | ) |
Net realized loss on investments | | (85,615,161 | ) |
Change in net unrealized appreciation/(depreciation) of investments, swap contracts and foreign currency translations: | | | |
Investments | | (73,037,747 | ) |
Swap contracts | | 155,565 | |
Foreign currency translations | | 55,915,154 | |
Net unrealized depreciation of investments | | (16,967,028 | ) |
Net realized/unrealized loss on investments, swap contracts and foreign currency | | (102,582,189 | ) |
Net Decrease in Net Assets Resulting from Operations | | $ | (41,238,719 | ) |
* Net of foreign taxes withheld | | $ | 5,742,482 | |
See Notes to Financial Statements.
14
| STATEMENT OF CHANGES IN NET ASSETS
|
| | For the Period | |
| | April 26, 2007 (Inception) | |
| | to October 31, 2007 | |
| | | |
OPERATIONS | | | |
| | | |
Net investment income | | $ | 61,343,470 | |
Net realized loss on investments: | | | |
Securities transactions | | (82,861,878 | ) |
Swap contracts | | (56,272 | ) |
Foreign currency transactions | | (2,697,011 | ) |
Change in net unrealized appreciation/(depreciation) of investments, swap contracts and foreign currency translations: | | | |
Investments | | (73,037,747 | ) |
Swap contracts | | 155,565 | |
Foreign currency translations | | 55,915,154 | |
Net unrealized depreciation of investments | | (16,967,028 | ) |
Net decrease in net assets resulting from operations | | (41,238,719 | ) |
| | | |
DISTRIBUTIONS TO SHAREHOLDERS | | | |
| | | |
From net investment income | | (59,034,114 | ) |
From tax return of capital | | (7,976,683 | ) |
Net decrease in net assets resulting from distributions to shareholders | | (67,010,797 | ) |
| | | |
CAPITAL SHARE TRANSACTIONS | | | |
| | | |
Proceeds from sales of common shares, net of offering costs | | 1,906,000,000 | |
Proceeds from underwriters’ over-allotment option of common shares exercised, net of offering costs | | 105,130,786 | |
Net asset value of common stock issued to stockholders from reinvestment of dividends | | 991,463 | |
Net increase in net assets derived from capital share transactions | | 2,012,122,249 | |
Net Increase in Net Assets | | 1,903,872,733 | |
Net Assets | | | |
Beginning of period | | 4,189,100 | |
End of period * | | $ | 1,908,061,833 | |
* Including overdistributed net investment income of: | | $ | (646,697 | ) |
See Notes to Financial Statements.
15
| FINANCIAL HIGHLIGHTS
(For a share outstanding throughout the year) |
| | Period Ended
October 31, 2007(a) | |
| | | |
PER COMMON SHARE OPERATING PERFORMANCE | | | |
| | | |
Net asset value per share, beginning of period | | $ | 19.10 | |
Income from investment operations: | | | |
Net investment income | | 0.55 | |
Net realized and unrealized loss on investments, swap contracts and foreign currency | | (0.95 | ) |
Total from investment operations | | (0.40 | ) |
| | | |
LESS DISTRIBUTIONS TO COMMON SHAREHOLDERS | | | |
| | | |
From net investment income | | (0.56 | ) |
From tax return of capital | | (0.07 | ) |
Total distributions | | (0.63 | ) |
| | | |
CAPITAL SHARE TRANSACTIONS | | | |
| | | |
Common share offering costs charged to paid-in-capital | | (0.03 | ) |
Total capital share transactions | | (0.03 | ) |
Net asset value per share, end of period | | $ | 18.04 | |
Per share market value, end of period | | $ | 15.71 | |
| | | |
Total return based on: | | | |
Net Asset Value | | (1.69 | )%(b) |
Market Value | | (18.41 | )%(b) |
| | | |
RATIOS/SUPPLEMENTAL DATA | | | |
| | | |
Net Assets attributable to common shares, at end of period (000) | | $ | 1,908,062 | |
Ratio of net expenses to average net assets | | 1.21 | %(c) |
Ratio of net investment income to average net assets | | 6.31 | %(c) |
Portfolio turnover rate | | 89 | %(d) |
(a) | For the period from April 26, 2007 (inception of the fund) to October 31, 2007. |
(b) | Total investment return is calculated assuming a purchase of a common share at the opening on the first day and a sale at closing on the last day of each period reported. Total investment return on net asset value reflects a sales load of $.90 per share. Dividends and distributions, if any, are assumed for purposes of this calculation to be reinvested at prices obtained under the Fund’s dividend reinvestment plan. Total investment returns do not reflect brokerage commissions. Total investment returns for less than a full year are not annualized. Past performances is not a guarantee of future results. |
(c) | Annualized. |
(d) | Not Annualized. |
See Notes to Financial Statements.
16

| Notes to financial statements
October 31, 2007 |
1. ORGANIZATION AND SIGNIFICANT ACCOUNTING POLICIES
Alpine Global Premier Properties Fund (the “Fund”) is a diversified, closed-end management investment company. The Fund’s primary investment objective is capital appreciation. The Fund’s secondary investment objective is high current income.
The Fund had no operations prior to April 26, 2007 other than matters relating to its organization and the sale and issuance of 213,089.005 shares of beneficial interest in the Fund to a group consisting of Alpine Woods Capital Investors, LLC (“Alpine Woods”), certain of its officers and parties either related to or affiliated with those officers and 6,235.602 shares of beneficial interest in the Fund to the Independent Trustees at the initial subscription price of $19.10 per share. Alpine Woods serves as the Fund’s investment adviser. The Fund’s Common Shares are listed on the New York Stock Exchange (“NYSE”) under the symbol “AWP”.
The following summarizes the significant accounting policies of the Fund.
Security Valuation: The net asset value (“NAV”) of shares of the Fund is calculated by dividing the value of the Fund’s net assets by the number of outstanding shares.NAV is determined each day the New York Stock Exchange (the “NYSE”) is open as of the close of regular trading (normally, 4:00 p.m., Eastern time). In computing NAV, portfolio securities of the Fund are valued at their current market values determined on the basis of market quotations. In computing the Fund’s net asset value, portfolio securities that are traded on a securities exchange in the United States, except for option securities, are valued at the last reported sale price as of the time of valuation, or lacking any current reported sale at the time of valuation, at the mean between the most recent bid and asked quotations. Each option security - - traded on a securities exchange in the United States is valued at the last current reported sale price as of the time of valuation if the last current reported sale price falls within the consolidated bid/ask quote for the option security. If the last current reported sale price as of the time of valuation does not fall within the consolidated bid/ask quote for the option security, the security is valued at the mid-point of the consolidated bid/ask quote for the option security. Each security traded in the over-thecounter market and quoted on the NASDAQ National Market System, is valued at the NASDAQ Official Closing Price (“NOCP”), as determined by NASDAQ, or lacking an NOCP, the last current reported sale price as of the time of valuation by NASDAQ, or lacking any current reported sale on NASDAQ at the time of valuation, at the mean between the most recent bid and asked quotations. Each over-the counter option that is not traded through the Options Clearing Corporation is valued by the counterparty, or if the counterparty’s price is not readily available then by using the Black-Scholes method. Each other security traded over-the-counter is valued at the mean between the most recent bid and asked quotations. Short-term securities with maturities of 60 days or less are valued at amortized cost, which approximates market value.
When market quotations are not readily available or when the valuation methods mentioned above are not reflective of a fair value of the security, the security is valued at a fair value following procedures and/or guidelines approved by the Board of Trustees, which may include utilizing a systematic fair valuation model provided by an independent pricing system. The Fund may also use fair value pricing, if the value of a security it holds is, pursuant to Board of Trustees guidelines, materially affected by events occurring before the Fund’s pricing time but after the close of the primary market or exchange on which the security is traded. These procedures may utilize valuations furnished by pricing services approved by the Board of Trustees, which may be based on market transactions for comparable securities and various relationships between securities that are generally recognized by institutional traders, a computerized matrix system, or appraisals derived from information concerning the securities or similar securities received from recognized dealers in those securities. When fair value pricing is employed, the value of the portfolio security used to calculate the Fund’s net asset value may differ from quoted or official closing prices.
Securities that are principally traded in a foreign market are valued at the last current sale price at the time of valuation or lacking any current or reported sale, at the time of valuation, at the mean between the most recent bid and asked quotations as of the close of the appropriate exchange or other designated time. Trading in securities on European and Far Eastern securities exchanges and over the- counter markets is normally completed at various times before the close of business on each day on which the NYSE is open. Trading of these securities may not take place on every NYSE business day. In addition, trading may take place in various foreign markets on Saturdays or on other days when the NYSE is not open and on which the Fund’s net asset value is not calculated. As stated above, if the market prices are not readily available or are not reflective of the fair value of the security, the security will be priced at a fair value following procedures approved by the Board of Trustees. In light of the judgment involved in fair value decisions, there can be no assurance that a fair value assigned to a particular security is accurate.
Foreign Securities: The Fund may invest a portion of its assets in foreign securities. In the event that the Fund executes a foreign security transaction, the Fund will generally enter into a forward foreign currency contract to settle the foreign security transaction. Foreign securities may carry more risk than U.S. securities, such as political, market and currency risks.
The accounting records of the Fund are maintained in U.S. dollars. Prices of securities denominated in foreign currencies are translated into U.S. dollars at the closing rates of exchange at period end. Amounts related to the purchase and sale of foreign securities and investment income are translated at the rates of exchange prevailing on the respective dates of such transactions.
The effect of changes in foreign currency exchange rates on investments is included with the fluctuations arising from changes in market values of securities held and
17
reported with all other foreign currency gains and losses in the Fund’s Statement of Operations.
Distributions to Shareholders: The Fund intends to make a level dividend distribution each month to its shareholders of the net investment income of the Fund after payment of Fund operating expenses. The level dividend rate may be modified by the Board of Trustees from time to time. If, for any monthly distribution, investment company taxable income, if any (which term includes net short-term capital gain) and net tax-exempt income, if any, is less than the amount of the distribution, the difference will generally be a tax-free return of capital distributed from the Fund’s assets. The Fund’s final distribution for each calendar year will include any remaining investment company taxable income and net tax-exempt income undistributed during the year, as well as all net capital gain realized during the year. If the total distributions made in any fiscal year exceed investment company taxable income, net tax-exempt income and net capital gain, such excess distributed amount would be treated as ordinary dividend income to the extent of the Fund’s current and accumulated earnings and profits. Distributions in excess of the earnings and profits would first be a tax-free return of capital to the extent of the adjusted tax basis in the shares. After such adjusted tax basis is reduced to zero, the distribution would constitute capital gain (assuming the shares are held as capital assets). Distributions to shareholders are recorded by the Fund on the ex-dividend date.
Income Taxes: The Fund’s policy is to comply with the provisions of the Internal Revenue Code applicable to regulated investment companies and to distribute all of its taxable income to its shareholders. Therefore, no federal income tax provision is required.
The Fund accounts for uncertainty related to income taxes under the provisions of Financial Accounting Standards Board (“FASB”) Interpretation No. 48, “Accounting for Uncertainty in Income Taxes — an Interpretation of FASB Statement No. 109” (“FIN 48”). The Fund recognizes tax benefits only if it is more likely than not that a tax position (including the Fund’s assertion that its income is exempt from tax) will be sustained upon examination. The Fund had no material uncertain tax positions and has not recorded a liability for material unrecognized tax benefits as of October 31, 2007. Since its inception, the Fund had not recorded any amounts for interest or penalties related to uncertain tax benefits.
Securities Transactions and Investment Income: Investment security transactions are accounted for as of trade date. Dividend income is recorded on the ex-dividend date. Interest income is recorded on the accrual basis, which includes amortization of premium and accretion of discounts. Realized gains and losses from securities transactions and unrealized appreciation and depreciation of securities are determined using the highest cost basis for both financial reporting and income tax purposes.
Use of Estimates: The Fund’s financial statements are prepared in accordance with accounting principles generally accepted in the United States of America. This requires management to make estimates and assumptions that affect the reported amounts of assets and liabilities and disclosure of contingent assets and liabilities at the date of the financial statements and the reported amounts of increases and decreases in net assets from operations during the reporting period. Actual results could differ from these estimates.
New Accounting Pronouncements: In September 2006, the FASB issued FASB Statement No. 157, “Fair Valuation Measurement” (“SFAS No. 157”), which defines fair value, establishes a framework for measuring fair value, and expands disclosures about fair value measurements. SFAS No. 157 is effective for fiscal years beginning after November 15, 2007, and interim periods within those fiscal years. The Fund is currently evaluating the potential impact the adoption of SFAS No. 157 will have on the Fund’s financial statements.
2. INCOME TAXES
Classification of Distributions: Net investment income (loss) and net realized gain (loss) may differ for financial statement and tax purposes. The character of distributions made during the year from net investment income or net realized gains may differ from its ultimate characterization for federal income tax purposes.
The tax character of the distributions paid by the Fund during the period April 26, 2007 (inception) to October 31, 2007 was as follows:
Distributions paid from:
Ordinary Income | | $ | 59,034,114 | |
Return of Capital | | $ | 7,976,683 | |
Total | | $ | 67,010,797 | |
Tax components of distributable earnings are determined in accordance with income tax regulations which may differ from composition of net assets reported under accounting principles generally accepted in the United States. Accordingly, for the period ended October 31, 2007, the effects of certain differences were reclassified. The Fund decreased accumulated net investment loss by $5,020,630, decreased accumulated net realized loss by $2,956,053 and decreased paid in capital by 7,976,683. These differences were primarily due to the differing tax treatment of foreign currency, and certain other investments. Net assets of the portfolio were unaffected by the reclassifications and the calculation of net investment income per share in the Financial Highlights excludes these adjustments.
18
At October 31, 2007, the Fund had available for tax purposes unused capital loss carryovers of $79,137,068, expiring October 31, 2015.
As of October 31, 2007, the components of distributable earnings on a tax basis were as follows:
Accumulated Capital Gain/(Loss) | | (79,137,068 | ) |
Unrealized Appreciation/(Depreciation) | | (21,135,765 | ) |
Total | | $ | (100,272,833 | ) |
| | | | |
As of October 31, 2007, net unrealized appreciation/ (depreciation) of investments based on federal tax costs was as follows:
Gross appreciation on investments (excess of value over tax cost) | | $ | 132,210,423 | |
Gross depreciation on investments (excess of tax cost over value) | | (153,504,164 | ) |
Net appreciation of foreign currency | | 157,976 | |
Net unrealized depreciation | | (21,135,765 | ) |
Total cost for federal income tax purposes | | $ | 1,889,480,344 | |
The differences between book and tax net unrealized appreciation and cost were primarily due to the differing tax treatment of foreign currency and certain other investments.
3. CAPITAL TRANSACTIONS
| | For the Period April 26, 2007 | |
| | (Inception) to October 31, 2007 | |
Common shares outstanding -beginning of period | | 219,325 | |
Common shares issued in connection with initial public offering | | 100,000,000 | |
Common shares issued from underwriter’s over-allotment option exercised | | 5,515,781 | |
Common shares issued as reinvestment of dividends | | 54,476 | |
Common shares outstanding - end of period | | 105,789,582 | |
4. PORTFOLIO SECURITIES
Purchases and sales of investment securities, other than short-term securities, for the period ended October 31, 2007 aggregated $3,224,624,561 and $1,255,392,551, respectively. The Fund did not have purchases and sales of U.S. Government obligations for the period ended October 31, 2007.
5. INVESTMENT ADVISORY AND ADMINISTRATION AGREEMENTS
Alpine Woods serves as the Fund’s investment adviser pursuant to an Investment Advisory Agreement with the Fund. As compensation for its services to the Fund, Alpine Woods receives an annual investment advisory fee of 1.00% based on the Fund’s average daily managed assets, computed daily and payable monthly.
ALPS Fund Services, Inc. (“ALPS”) serves as the Fund’s administrator pursuant to an Administration, Bookkeeping and Pricing Services Agreement with the Fund. As compensation for its services to the Fund, ALPS receives an annual administration fee of 0.13% based on the Fund’s average daily managed assets, computed daily and payable monthly.
6. LINE OF CREDIT
On July 11, 2007, an Agreement between the Fund and The Bank of New York (“BONY”) was executed which allows the Fund to borrow against a secured line of credit from BONY an aggregate amount of up to $500,000,000. During the period ended October 31, 2007, the average borrowing was $370,899 with an average rate on borrowings of 4.83%. As of October 31, 2007, there was an unused balance of $471,500,000 available to the Fund.
7. TOTAL RETURN SWAP CONTRACT
The Fund may enter into total return swaps. A total return swap is an agreement between the Fund and a counterparty to exchange a market linked return for a floating rate payment, both based on a notional principal amount. Because the principal amount is not exchanged, it represents neither an asset nor a liability to either counterparty, and is referred to as notional. Total return swaps are marked to market daily based upon quotations from the market makers end the change in value, if any, is recorded as an unrealized gain or loss in the Statement of Operations. The unrealized gain (loss) related to the daily change in the valuation of the notional amount of the swap, as well as the amount due to (owed by) the Fund at termination or settlement, is combined and separately disclosed as an asset (liability). The Fund also records any periodic payments received from (paid to) the counterparty, including at termination, under such contracts as realized gain (loss). Total return swaps are subject to risks (if the counterparty fails to meet its obligations).
At October 31, 2007 the Fund had the following total return swaps outstanding:
Counterparty
Morgan Stanley
Underlying Security | | Shares | | Notional Amount | |
Phoenix Mills Ltd. | | 170,000 | | 8,452,672 | |
Floating Rate
Paid by the Fund | | Termination
Date | | Unrealized
Appreciation | | Collateral | |
US One Month | | 08/02/10 | | $ | 142,651 | | $ | 8,152,672 | |
LIBOR+45bps | | | | | | | |
| | | | | | | | | |
8. OTHER
Compensation of Trustees: The Independent Trustees of the Fund receive $4,000 for each meeting attended.
9. SUBSEQUENT EVENTS
Distributions: The Fund paid a distribution of $13,403,540 or $0.1267 per common share on November 23, 2007 to common shareholders of record on November 19, 2007.
The Fund paid a distribution of $13,403,540 or $0.1267 per common share on December 28, 2007 to common shareholders of record on December 24, 2007.
19

| addiTional informaTion
October 31, 2007 (Unaudited) |
DIVIDEND REINVESTMENT PLAN
Unless the registered owner of common shares elects to receive cash by contacting The Bank of New York (the “Plan Administrator”), all dividends or other distributions (together, “Dividends” and each, a “Dividend”) declared on common shares will be automatically reinvested by the Plan Administrator for shareholders in the Fund’s Dividend Reinvestment Plan (the “Plan”), in additional common shares of the Fund. Shareholders that are not permitted to participate through their broker or nominee or who elect not to participate in the Plan will receive all Dividends in cash paid by check mailed directly to the shareholder of record (or, if the common shares are held in street or other nominee name, then to such nominee) by the Plan Administrator, as dividend disbursing agent. You may elect not to participate in the Plan and to receive all Dividends in cash by contacting the Plan Administrator, as dividend disbursing agent, at the address set forth below. Participation in the Plan is completely voluntary and may be terminated or resumed at any time without penalty by notice if received and processed by the Plan Administrator prior to the dividend record date; otherwise such termination or resumption will be effective with respect to any subsequently declared Dividend. If you hold your shares through a broker, and you wish for all Dividends declared on your common shares to be automatically reinvested pursuant to the Plan, please contact your broker.
The Plan Administrator will open an account for each shareholder under the Plan in the same name in which such shareholder’s common shares are registered. Whenever the Fund declares a Dividend payable in cash, non-participants in the Plan will receive cash and participants in the Plan will receive the equivalent in common shares. The common shares will be acquired by the Plan Administrator for the participants’ accounts, depending upon the circumstances described below, either (i) through receipt of additional unissued but authorized common shares from the Fund (“Newly Issued common shares”) or (ii) by purchase of outstanding common shares on the open market (“Open- Market Purchases”) on the NYSE or elsewhere. If, on the payment date for any Dividend, the closing market price plus estimated brokerage commissions per share is equal to or greater than the NAV per share, the Plan Administrator will invest the Dividend amount in Newly Issued common shares on behalf of the participants. The number of Newly Issued common shares to be credited to each participant’s account will be determined by dividing the dollar amount of the Dividend by the NAV per share on the payment date; provided that, if the NAV is less than or equal to 95% of the closing market value on the payment date, the dollar amount of the Dividend will be divided by 95% of the closing market price per share on the payment date. If, on the payment date for any Dividend, the NAV per share is greater than the closing market value plus estimated brokerage commissions, the Plan Administrator will invest the Dividend amount in common shares acquired on behalf of the participants in Open-Market Purchases.
In the event of a market discount on the payment date for any Dividend, the Plan Administrator will have until the last business day before the next date on which the common shares trade on an “ex-dividend” basis or 30 days after the payment date for such Dividend, whichever is sooner (the “Last Purchase Date”), to invest the Dividend amount in common shares acquired in Open-Market Purchases. If, before the Plan Administrator has completed its Open- Market Purchases, the market price per share exceeds the NAV per share, the average per share purchase price paid by the Plan Administrator may exceed the NAV of the common shares, resulting in the acquisition of fewer common shares than if the Dividend had been paid in Newly Issued common shares on the Dividend payment date. Because of the foregoing difficulty with respect to Open-Market Purchases, the Plan provides that if the Plan Administrator is unable to invest the full Dividend amount in Open-Market Purchases during the purchase period or if the market discount shifts to a market premium during the purchase period, the Plan Administrator may cease making Open-Market Purchases and may invest the uninvested portion of the Dividend amount in Newly Issued common shares at the NAV per share at the close of business on the Last Purchase Date provided that, if the NAV is less than or equal to 95% of the then current market price per share, the dollar amount of the Dividend will be divided by 95% of the market price on the payment date for purposes of determining the number of shares issuable under the Plan.
The Plan Administrator maintains all shareholders’ accounts in the Plan and furnishes written confirmation of all transactions in the accounts, including information needed by shareholders for tax records. Common shares in the account of each Plan participant will be held by the Plan Administrator on behalf of the Plan participant, and each shareholder proxy will include those shares purchased or received pursuant to the Plan. The Plan Administrator will forward all proxy solicitation materials to participants and vote proxies for shares held under the Plan in accordance with the instructions of the participants.
In the case of the Fund’s shareholders such as banks, brokers or nominees which hold shares for others who are the beneficial owners, the Plan Administrator will administer the Plan on the basis of the number of common shares certified from time to time by the record shareholder’s name and held for the account of beneficial owners who participate in the Plan.
There will be no brokerage charges with respect to common shares issued directly by the Fund. However, each participant will pay a pro rata share of brokerage commissions incurred in connection with Open-Market Purchases. The automatic reinvestment of Dividends will not relieve participants of any U.S. federal, state or local income tax that may be payable (or required to be withheld) on such Dividends. See “U.S. Federal Income Tax Matters.” Participants that request a sale of common shares through the Plan Administrator are subject to brokerage commissions.
20
Shareholders participating in the Plan may receive benefits not available to shareholders not participating in the Plan. If the market price plus commissions of the Fund’s shares is higher than the NAV, participants in the Plan will receive shares of the Fund for less than they could otherwise purchase them and will have shares with a cash value greater than the value of any cash distribution they would have received on their shares. If the market price plus commissions is below the net asset value, participants receive distributions of shares with a NAV greater than the value of any cash distribution they would have received on their shares. However, there may be insufficient shares available in the market to make distributions in shares at prices below the NAV. Also, because the Fund does not redeem its shares, the price on resale may be more or less than the NAV.
The Fund reserves the right to amend or terminate the Plan. There is no direct service charge to participants with regard to purchases in the Plan; however, the Fund reserves the right to amend the Plan to include a service charge payable by the participants.
All correspondence or questions concerning the Plan should be directed to the Plan Administrator, The Bank of New York, at One Wall Street, New York, New York 10286 or by calling toll-free 1(800)432.8224.
FUND PROXY VOTING POLICIES & PROCEDURES
Policies and procedures used in determining how to vote proxies relating to portfolio securities and a summary of proxies voted by the Fund are available without a charge, upon request, by contacting the Fund at 1(800)910.1434 and on the Commission’s web site at http://www.sec.gov.
PORTFOLIO HOLDINGS
The Fund files its complete schedule of portfolio holdings with the Commission for the first and third quarters of each fiscal year on Form N-Q within 60 days after the end of the period. Copies of the Fund’s Forms N-Q are available without a charge, upon request, by contacting the Fund at 1(800)617.7616 and on the Security and Exchange Commission’s (“Commission”) web site at http://www. sec.gov. You may also review and copy Form N-Q at the Commission’s Public Reference Room in Washington, D.C. For more information about the operation of the Public Reference Room, please call the Commission at 1(800)SEC.0330.
DESIGNATION REQUIREMENTS (Unaudited)
Of the distributions paid by the Fund from ordinary income for the year ended October 31, 2007, the following percentages met the requirements to be treated as qualifying for the corporate dividends received deduction and qualified dividend income, respectively.
Dividends Received Deduction | | 1.77 | % |
Qualified Dividend Income | | 42.09 | % |
NOTICE
Notice is hereby given in accordance with Section 23(c) of the Investment Company Act of 1940 that the Fund may purchase at market prices from time to time its common shares in the open market.
21
INDEPENDENT TRUSTEES
Name and Age | | Position(s) Held
with the Fund | | Principal Occupation During
Past Five Years | | # of
Portfolios
in Fund
Complex** | | Other Directorships
Held by Trustee |
| | | | | | | | |
Laurence B.Ashkin (79) | | Independent Trustee | | Real estate developer and construc-tion consultant since 1980; Founder and President of Centrum Properties, Inc. since 1980. | | 12 | | Trustee, Alpine Family of Funds.** |
| | | | | | | | |
H. Guy Leibler (53) | | Independent Trustee | | Vice Chair and Chief Operating Officer of L&L Holding Company, LLC since 2004; President, Skidmore, Owings & Merrill LLP (2001-2003); | | 12 | | Chairman, White Plains Hospital Center; Dressage for Kids;Trustee, Alpine Family of Funds. |
| | | | | | | | |
Jeffrey E.Wacksman (47) | | Independent Trustee | | Partner, Loeb, Block & Partners LLP since 1994. | | 12 | | Dynasty Holdings, Inc.; Bondi Icebergs Inc.; MH Properties, Inc.;Trustee, Alpine Family of Funds. |
* | The Independent Trustees identified above are the members of the Board of Trustees for each of the Alpine Series Trust, Alpine Equity Trust and Alpine Income Trust (collectively, the “Alpine Family of Funds”). |
** | Alpine Woods Capital Investors, LLC manages nine other fund portfolios within the three Alpine Trusts. Each of the Alpine Trusts is registered as an open-end management investment company. The Trustees oversee each of the nine portfolios within the Alpine Trusts. |
INTERESTED TRUSTEE
| | | | | | # of | | |
| | | | | | Portfolios | | |
| | Position(s) Held | | Principal Occupation During | | in Fund | | Other Directorships |
Name and Age | | with the Fund | | Past Five Years | | Complex** | | Held by Trustee |
| | | | | | | | |
Samuel A. Lieber* (50) | | Interested Trustee and President | | CEO of Alpine Woods Capital Investors, LLC since 1997. President of Alpine Trusts since 1998. | | 12 | | Trustee, Alpine Family of Funds. |
* | Samuel A. Lieber has been a Trustee of the Fund since its inception. He is the son of Stephen A. Lieber. |
** | Alpine Woods Capital Investors, LLC manages nine other fund portfolios within the three Alpine Trusts. Each of the Alpine Trusts is registered as an open-end management investment company. The Trustees oversee each of the nine portfolios within the Alpine Trusts. |
22
In addition to Mr. Samuel A. Lieber, the table below identifies the Fund’s executive officers.
Name and Age | | Position(s) Held
with the Fund | | Principal Occupation During
Past Five Years | | # of
Portfolios
in Fund
Complex** | | Other Directorships
Held by Trustee |
| | | | | | | | |
Stephen A. Lieber (81)* | | Executive Vice President | | Chief Investment Officer, Alpine Woods Capital Investors, LLC since 2003. Chairman and Senior Portfolio Manager, Saxon Woods Advisors, LLC since 1999. | | N/A | | None |
| | | | | | | | |
Sheldon R. Flamm (59) | | Treasurer/Chief Compliance Officer | | Chief Financial Officer and Senior Managing Director, Alpine Woods Capital Investors, LLC, since 2001; Chief Financial Officer, Saxon Woods Advisors, LLC since 1999. | | N/A | | None |
| | | | | | | | |
Oliver Sun (42) | | Secretary | | Controller of Alpine Woods Capital Investors, LLC since 1998. | | N/A | | None |
* | Stephen A. Lieber is the father of Samuel A. Lieber. |
** | Alpine Woods Capital Investors, LLC manages nine other fund portfolios within the three Alpine Trusts. Each of the Alpine Trusts is registered as an open-end management investment company. The Trustees oversee each of the nine portfolios within the Alpine Trusts. |
23
| |
INVESTOR | | |
INFORMATION | | 1(800) 617.7616 | www.alpinecef.com |
| |
| |

INVESTMENT | | Alpine Woods Capital Investors, LLC |
AdvIser | | 2500 Westchester Ave., Suite 215 |
| | Purchase, NY 10577 |
| | |
AdmInIstrAtor | | ALPS Fund Services, Inc. |
| | 1290 Broadway, Suite 1100 |
| | Denver, CO 80203 |
| | |
trAnsfer Agent & | | The Bank of New York |
CustodIAn | | One Wall Street |
| | New York, NY 10286 |
| | |
Independent regIstered | | Deloitte & Touche LLP |
publIC ACCountIng fIrm | | 555 East Wells Street |
| | Milwaukee, WI 53202 |
| | |
fund Counsel | | Blank Rome LLP |
| | The Chrysler Building |
| | 405 Lexington Avenue |
| | New York, NY 10174 |
| | |
Investor Information:
1(800) 617.7616 | www.alpinecef.com
Item 2. Code of Ethics.
(a) The Registrant, as of the end of the period covered by the report, has adopted a code of ethics that applies to the Registrant’s principal executive officer, principal financial officer, principal accounting officer or controller or persons performing similar functions, regardless of whether these individuals are employed by the registrant or a third party.
(b) Not applicable.
(c) There have been no amendments, during the period covered by this report, to a provision of the code of ethics that applies to the Registrant’s principal executive officer, principal financial officer, principal accounting officer or controller, or persons performing similar functions, regardless of whether these individuals are employed by the registrant or a third party, and that relates to any element of the code of ethics described in Item 2(a) above.
(d) The Registrant has not granted any waivers, including an implicit waiver, from a provision of the code of ethics that applies to the registrant’s principal executive officer, principal financial officer, principal accounting officer or controller, or persons performing similar functions, regardless of whether these individuals are employed by the Registrant or a third party, that relates to any element of the code of ethics described in 2(a) above.
(e) Not applicable.
(f) The Registrant’s Code of Ethics is attached as Exhibit 12(A)(1) hereto.
Item 3. Audit Committee Financial Expert.
The Board of Directors of the Registrant has determined that the Registrant has at least one audit committee financial expert serving on its audit committee. The Board of Directors has determined that Laurence B. Ashkin is an audit committee financial expert. Laurence B. Ashkin is “independent” as defined in paragraph (a)(2) of Item 3 to Form N-CSR.
2
Item 4. Principal Accountant Fees and Services.
(a) Audit Fees: The aggregate fees billed for each of the last two fiscal years for professional services rendered by the principal accountant for the audit of the registrant’s annual financial statements or services that are normally provided by the accountant in connection with statutory and regulatory filings or engagements for fiscal year 2007 was $32,200.
(b) Audit-Related Fees: The aggregate fees billed in each of the last two fiscal years for assurance and related services by the principal accountant that are reasonably related to the performance of the audit of the registrant’s financial statements and are not reported under paragraph (a) of this Item was $0 in 2007.
(c) Tax Fees: The aggregate fees billed in each of the last two fiscal years for professional services rendered by the principal accountant for tax compliance, tax advice, and tax planning was $4,300 in 2007.
(d) All Other Fees: The aggregate fees billed in each of the last two fiscal years for products and services provided by the principal accountant, other than the services reported in paragraphs (a) through (c) of this Item is $35,500 in 2007.
(e)(1) Audit Committee Pre-Approval Policies and Procedures: All services to be performed by the Registrant’s principal auditors must be pre-approved by the Registrant’s audit committee, which may include the approval of certain services up to an amount determined by the audit committee. Any services that would exceed that amount would require additional approval of the audit committee.
(e)(2) No services described in paragraphs (b) through (d) were approved pursuant to paragraph (c)(7)(i)(C) of Rule 2-01 of Regulation S-X.
(f) Not applicable.
(g) Not applicable.
(h) Not applicable
Item 5. Audit Committee of Listed Registrants.
The registrant has a separately designated standing audit committee established in accordance with Section 3(a)(58)(A) of the Exchange Act and is comprised of the following members:
H. Guy Leibler
Jeffrey E. Wacksman
Laurence B. Ashkin
3
Item 6. | | Schedule of Investments. |
| | |
| | The Schedule of Investments is included as part of the Report to Stockholders filed under Item 1 of this form. |
| | |
Item 7. | | Disclosure of Proxy Voting Policies and Procedures for Closed-End Management Investment Companies. |
| | |
| | Attached, as Exhibit Item 7, is a copy of the registrant’s policies and procedures. |
| | |
Item 8. | | Portfolio Managers of Closed-End Management Investment Companies as of January 7, 2008 |
Name | | Title | | Length of Service | | Business Experience 5 Years | |
Samuel A. Lieber | | Portfolio Manager | | Since January 2003 | | Chairman, President (2006-present), Founder, Alpine Woods Capital Investor LLC (2003-present) | |
Robert Gadsden | | Portfolio Manager | | Since January 1999 | | Portfolio Manager, Alpine Realty Income & Growth Fund (2003-present); Senior Real Estate Analyst, Alpine Woods Capital Investors LLC (2003-present) | |
Peter Kovalski | | Portfolio Manager | | Since January 2002 | | Portfolio Manager, Alpine Dynamic Financial Services Fund and Alpine Woods Growth Values Financial Equities, L.P. (2003-present); | |
Other Accounts Managed as of October 31, 2007
PM Name | | # Registered
Investment
Companies, Total
Assets | | # Other Pooled
Investments
Vehicles, Total
Assets | | # Other
Accounts, Total
Assets | | Material
Conflicts if
Any | |
Samuel A. Lieber | | 2, $140.5 million | | 3, $200.8 million | | 324, $503.0 million | | None | |
Robert Gadsden | | 2, $2.44 billion | | 0, $0 | | 1, $24.5 million | | None | |
Peter Kovalski | | 2, $1.92 billion | | 1, $26.9 million | | 0, $0 | | None | |
4
(a)(3) Portfolio Manager Compensation as of October 31, 2007.
The Portfolio Managers’ compensation will be made up of a fixed salary amount which is not based on the value of the assets in the Fund’s portfolio. Annually, the Adviser may calculate bonus compensation to be paid to each portfolio manager as a percentage of salary based in large part on the Fund’s after-tax performance in comparison to other equity income funds during the same time period, which the Adviser considers to be a comparable peer group.
(a)(4) Dollar Range of Securities Owned as of October 31, 2007.
Portfolio Manager | | Dollar Range of Equity Securities Held
in Registrant (1) | |
Samuel A. Liber | | None | |
Robert Gadsden | | None | |
Peter Kovalski | | None | |
(1)“Beneficial Ownership” is determined in accordance with Section 16a-1(a)(2) of the Securities Exchange Act of 1934, as amended
Item 9. | | Purchases of Equity Securities by Closed-End Management Investment Company and Affiliated Purchasers. |
| | |
| | Not applicable. |
| | |
Item 10. | | Submission of Matters to Vote of Security Holders. |
| | |
| | There have been no material changes to the procedures by which shareholders may recommend nominees to the registrant’s board of trustees. |
| | |
Item 11. | | Controls and Procedures. |
| | |
(a) | | The registrant’s principal executive officer and principal financial officer have evaluated the registrant’s disclosure controls and procedures (as defined in Rule 30a-3(c) under the Investment Company Act of 1940, as amended) within 90 days of this filing and have concluded that the registrant’s disclosure controls and procedures were effective, as of that date. |
| | |
(b) | | There was no change in the registrant’s internal control over financial reporting (as defined in Rule 30a-3(d) under the Investment Company Act of 1940, as amended) during the second fiscal quarter of the period covered by this report that has materially affected, or is reasonably likely to materially affect, the registrant’s internal control over financial reporting. |
5
Item 12. Exhibits.
(a)(1) The Code of Ethics that applies to the registrant’s principal executive officer and principal financial officer is attached hereto as Exhibit 12.A.1.
(a)(2) The certifications required by Rule 30a-2(a) of the Investment Company Act of 1940, as amended, and Section 302 of the Sarbanes-Oxley Act of 2002 are attached hereto as Ex99.Cert.
(a)(3) Not applicable.
(b) The certifications by the registrant’s Principal Executive Officer and Principal Financial Officer, as required by Rule 30a-2(b) of the Investment Company Act of 1940, as amended, and Section 906 of the Sarbanes-Oxley Act of 2002 are attached hereto as Ex99.906Cert.
6
SIGNATURES
Pursuant to the requirements of the Securities Exchange Act of 1934 and the Investment Company Act of 1940, the registrant has duly caused this report to be signed on its behalf by the undersigned, thereunto duly authorized.
Alpine Global Premier Properties Fund
By: | | /s/ Samuel A. Lieber | |
| | Samuel A. Lieber |
| | Chief Executive Officer (Principal Executive Officer) |
| | |
| | |
Date: | | January 7, 2008 |
Pursuant to the requirements of the Securities Exchange Act of 1934 and the Investment Company Act of 1940, this report has been signed below by the following persons on behalf of the registrant and in the capacities and on the dates indicated.
By: | /s/ Samuel A. Lieber | | |
| Samuel A. Lieber | |
| Chief Executive Officer (Principal Executive Officer) | |
| | |
Date: | January 7, 2008 | |
| | |
| | |
By: | /s/ Sheldon R. Flamm | | |
| Sheldon R. Flamm | |
| Chief Financial Officer (Principal Financial Officer) | |
| | |
Date: | January 7, 2008 | |
| | | | |
7