UNITED STATES
SECURITIES AND EXCHANGE COMMISSION
Washington, D.C. 20549
FORM N-CSR
CERTIFIED SHAREHOLDER REPORT OF REGISTERED MANAGEMENT
INVESTMENT COMPANIES
Investment Company Act file number 811-22023
Nuveen Managed Accounts Portfolios Trust
(Exact name of registrant as specified in charter)
Nuveen Investments
333 West Wacker Drive, Chicago, IL 60606
(Address of principal executive offices) (Zip code)
Mark J. Czarniecki
Vice President and Secretary
333 West Wacker Drive,
Chicago, IL 60606
(Name and address of agent for service)
Registrant’s telephone number, including area code: (312) 917-7700
Date of fiscal year end: October 31
Date of reporting period: October 31, 2020
Form N-CSR is to be used by management investment companies to file reports with the Commission not later than 10 days after the transmission to stockholders of any report that is required to be transmitted to stockholders under Rule 30e-1 under the Investment Company Act of 1940 (17 CFR 270.30e-1). The Commission may use the information provided on Form N-CSR in its regulatory, disclosure review, inspection, and policy making roles.
A registrant is required to disclose the information specified by Form N-CSR, and the Commission will make this information public. A registrant is not required to respond to the collection of information contained in Form N-CSR unless the Form displays a currently valid Office of Management and Budget (“OMB”) control number. Please direct comments concerning the accuracy of the information collection burden estimate and any suggestions for reducing the burden to Secretary, Securities and Exchange Commission, 450 Fifth Street, NW, Washington, DC 20549-0609. The OMB has reviewed this collection of information under the clearance requirements of 44 U.S.C. ss.3507.
| ITEM 1. | REPORTS TO STOCKHOLDERS. |

Nuveen Managed Accounts Portfolios Trust
| | |
| Fund Name | | |
| Nuveen Core Impact Bond Managed Accounts Portfolio | | NCIRX |
Beginning on January 1, 2021, as permitted by regulations adopted by the Securities and Exchange Commission, paper copies of the Fund’s annual and semi-annual shareholder reports will no longer be sent by mail, unless you specifically request paper copies of the reports. Instead, the reports will be made available on the Fund’s website (www.nuveen.com), and you will be notified by mail each time a report is posted and provided with a website link to access the report.
If you have already elected to receive shareholder reports electronically, you will not be affected by this change and you need not take any action. You may elect to receive shareholder reports and other communications from the Fund electronically anytime by contacting the financial intermediary (such as a broker-dealer or bank) through which you hold your Fund shares or, if you are a direct investor, by enrolling at www.nuveen.com/e-reports.
You may elect to receive all future shareholder reports in paper free of charge at any time by contacting your financial intermediary or, if you are a direct investor, by calling 800-257-8787 and selecting option #1. Your election to receive reports in paper will apply to all funds held in your account with your financial intermediary or, if you are a direct investor, to all your directly held Nuveen Funds and any other directly held funds within the same group of related investment companies.
Annual Report
Life is Complex.
Nuveen makes things e-simple.
It only takes a minute to sign up for e-Reports. Once enrolled, you’ll receive an e-mail as soon as your Nuveen Fund information is ready. No more waiting for delivery by regular mail. Just click on the link within the e-mail to see the report and save it on your computer if you wish.
Free e-Reports right to your e-mail!
www.investordelivery.com
If you receive your Nuveen Fund distributions and statements from your financial professional or brokerage account.
or
www.nuveen.com/client-access
If you receive your Nuveen Fund distributions and statements directly from Nuveen.
Must be preceded by or accompanied by a prospectus.
NOT FDIC INSURED MAY LOSE VALUE NO BANK GUARANTEE
Table
of Contents
3
Chair’s Letter to Shareholders

Dear Shareholders,
As 2020 draws to a close, the concerns that dominated much of the year are beginning to show signs of easing. COVID-19 vaccines are being administered around the world, with several of the vaccine candidates announcing high efficacy rates during their phase 3 trials. Markets took a generally positive view of Joe Biden winning the Electoral College, with Congress’s final confirmation of the Electoral College vote anticipated on January 6, 2021. The U.S. economy has made a significant, although incomplete, turnaround from the depths of a historic recession. In December, Congress passed another $900 billion in aid to individuals and businesses, extending some of the programs enacted earlier in the crisis. The bill’s next step is the President’s review and his approval or disapproval. Ongoing fiscal and monetary stimulus along with widening vaccine distribution have bolstered confidence that a semblance of normalcy can return in 2021.
While the markets’ longer-term outlook has brightened, we expect intermittent bouts of volatility to continue into the new year. COVID-19 cases are still alarmingly high in some regions, and the renewed restrictions on social and business activity taken by local and, in some cases, national authorities will undoubtedly hinder the economy’s momentum. The pandemic’s course can still be unpredictable. The timeline of vaccine rollouts depends on many variables, public confidence can shift and real-world efficacy remains to be seen. Additionally, the outcome of the Senate majority – which determines whether the government will be under split control or a Democrat majority – rests with Georgia’s two run-off elections on January 5, 2021. Nevertheless, short-term market fluctuations can provide opportunities to invest in new ideas as well as upgrade existing positioning, within our goal of providing long-term value for our shareholders.
The new year can be an opportune time to assess your portfolio’s resilience and readiness for what may come next. We encourage you to review your time horizon, risk tolerance and investment goals with your financial professional. On behalf of the other members of the Nuveen Fund Board, we look forward to continuing to earn your trust in the months and years ahead.

Terence J. Toth
Chair of the Board
December 22, 2020
4
Portfolio Managers’ Comments
Nuveen Core Impact Bond Managed Accounts Portfolio
The Fund was developed exclusively for use within Nuveen-sponsored separately managed accounts, and is a specialized bond portfolio to be used in combination with selected individual securities to effectively model institutional-level investment strategies. The Fund enables certain Nuveen separately managed account investors to achieve greater diversification and return potential than smaller managed accounts might otherwise achieve by investing in additional fixed-income classes, including those that have a lower credit quality and potentially higher yielding securities in order to gain access to special investment opportunities normally available only to institutional investors.
The Fund is managed by Nuveen Asset Management LLC, an affiliate of Nuveen Fund Advisor, LLC, the Fund’s investment adviser. Stephen Liberatore, CFA, and Jessica M. Zarzycki, CFA, have served as portfolio managers for the Fund since its inception in July 2020. Here they discuss U.S. economic and fixed income markets, the Fund’s investment strategy and its performance during the abbreviated reporting period since the Fund’s inception.
What factors affected the U.S. economy and bond markets during the twelve-month annual reporting period ended October 31, 2020, which may have had an impact on the abbreviated reporting period?
The U.S. economy rebounded more quickly than expected from the deep downturn caused by the COVID-19 crisis and containment measures. As business and social activities were drastically restricted in March and April 2020 to slow the spread of COVID-19, U.S. gross domestic product (GDP) shrank 31.4% on an annualized basis in the second quarter of 2020 (following a 5% decline in the first quarter), according to the Bureau of Economic Analysis (BEA) “third” estimate. GDP measures the value of goods and services produced by the nation’s economy less the value of the goods and services used up in production, adjusted for price changes. Government relief programs provided significant aid to individuals and businesses as the economy began reopening in May 2020, which helped the economy bounce back strongly over the summer months. GDP rose 33.1% in the third quarter of 2020, according to the BEA’s “second” estimate. While the third quarter gain was historic, the economy remained below pre-pandemic growth levels. GDP growth was 2.4% in the fourth quarter of 2019 and 2.2% for 2019 overall.
Consumer spending, the largest driver of the economy, was well supported earlier in this reporting period by low unemployment, wage gains and tax cuts. However, the COVID-19 crisis containment measures drove a significant drop in consumer spending and a sharp rise in unemployment starting in March 2020. The Bureau of Labor Statistics said the unemployment rate rose to 6.9% in October 2020 from 3.6% in October 2019. As of October 2020, slightly more than half of the 22 million jobs lost in March and April 2020 have been recovered. The average hourly earnings rate appeared to soar, growing at an annualized rate of 4.5% in October 2020, despite the spike in unemployment. Earnings data was skewed by the concentration of job losses in lower wage work, which effectively eliminated most of the low wage data, resulting in an average of mostly higher numbers. The overall trend of inflation
This material is not intended to be a recommendation or investment advice, does not constitute a solicitation to buy, sell or hold a security or aninvestment strategy, and is not provided in a fiduciary capacity. The information provided does not take into account the specific objectives orcircumstances of any particular investor, or suggest any specific course of action. Investment decisions should be made based on an investor’s objectives and circumstances and in consultation with his or her advisors.
Certain statements in this report are forward-looking statements. Discussions of specific investments are for illustration only and are not intended as recommendations of individual investments. The forward-looking statements and other views expressed herein are those of the portfolio managers as of the date of this report. Actual future results or occurrences may differ significantly from those anticipated in any forward-looking statements and the views expressed herein are subject to change at any time, due to numerous market and other factors. The Fund disclaims any obligation to update publicly or revise any forward-looking statements or views expressed herein.
For financial reporting purposes, the ratings disclosed are the highest rating given by one of the following national rating agencies: Standard & Poor’s (S&P), Moody’s Investors Service, Inc. (Moody’s) or Fitch, Inc (Fitch). This treatment of split-rated securities may differ from that used for other purposes, such as for Fund investment policies. Credit ratings are subject to change. AAA, AA, A, and BBB are investment grade ratings; BB, B, CCC, CC, C and D are below-investment grade ratings. Holdings designated N/R are not rated by these national ratings agencies.
Bond insurance guarantees only the payment of principal and interest on the bond when due, and not the value of the bonds themselves, which will fluctuate with the bond market and the financial success of the issuer and the insurer. Insurance relates specifically to the bonds in the portfolio and not to the share prices of a Fund. No representation is made as to the insurers’ ability to meet their commitments.
Refer to the Glossary of Terms Used in this Report for further definition of the terms used within this section.
5
Portfolio Managers’ Comments (continued)
remained muted, as decreases in gasoline, apparel and transportation prices offset an increase in food prices. The Bureau of Labor Statistics said the Consumer Price Index (CPI) increased 1.2% over the twelve-month reporting period ended October 31, 2020 before seasonal adjustment.
Prior to the COVID-19 crisis recession, the U.S. Federal Reserve (the Fed) had reduced its benchmark interest rate to support the economy’s slowing growth. The Fed also stopped shrinking its bond portfolio sooner than scheduled and began buying short-term Treasury bills to help money markets operate smoothly and maintain short-term borrowing rates at low levels.
As the health and economic crisis deepened, the Fed enacted an array of emergency measures in March 2020 to stabilize the financial system and support the markets, including cutting its main interest rate to near zero, offering lending programs to aid small and large companies and allowing unlimited bond purchases, known as quantitative easing. There were no policy changes at the Fed’s April, June and July 2020 meetings, where Chairman Powell reiterated a commitment to keep rates near zero until the economy recovers and maintained a cautious outlook for the U.S. economy. Also at the July 2020 meeting, the Fed extended some of its pandemic funding facilities by another three months to December 2020. At the annual Jackson Hole Economic Symposium, held virtually in August 2020, the Fed announced a change in inflation policy to average inflation targeting. Under this regime, the Fed will tolerate the inflation rate temporarily overshooting the target rate to offset periods of below-target inflation, so that inflation averages a 2% rate over time. The Fed provided further clarification of the new inflation policy and left the benchmark interest rate unchanged at its September 2020 meeting. (As expected, there were no policy changes at the Fed’s November 2020 meeting after the close of this reporting period.)
In March and April 2020, the U.S. government approved three aid packages. These included $2 trillion allocated across direct payments to Americans, an expansion of unemployment insurance, loans to large and small businesses, funding to hospitals and health agencies and support to state and local governments, as well as more than $100 billion in funding to health agencies and employers offering paid leave. As some of these programs began to expire, additional relief measures were under discussion in Congress, but a final deal had not been reached as of the end of this reporting period. The election outcome, subsequent to the close of the reporting period, did not change expectations for a stimulus bill, but the timing and size remained uncertain.
The COVID-19 crisis rapidly dwarfed all other market concerns starting in late February 2020. Equity and commodity markets sold-off and safe-haven assets rallied in March 2020 as China, other countries and then the United States initiated quarantines, restricted travel and shuttered factories and businesses. The potential economic shock was particularly difficult to assess, which amplified market volatility. An ill-timed oil price war between the Organization of the Petroleum Exporting Countries (OPEC) and non-OPEC member Russia, which caused oil prices to plunge in March 2020, exacerbated the market sell-off.
Geopolitical uncertainty remained elevated with the U.S. presidential election, the Brexit transition period winding down and U.S. – China relations deteriorating. While markets remained concerned about the potential for a disputed outcome, the next round of fiscal stimulus was expected to follow the presidential election. In Europe, the EU and U.K. continued to negotiate, but had not yet reached, a final Brexit agreement after the U.K. formally exited at the end of January 2020 and triggered the one-year transition period (which ends on December 31, 2020). Although China and the U.S. signed a “phase one” trade deal in January 2020, tensions continued to flare over other trade and technology/security issues, Hong Kong’s sovereignty and the management of the COVID-19 crisis.
During the abbreviated reporting period, macroeconomic data showed the economy rebounding sharply, albeit partially, from the historic downturn in the first half of 2020. The labor market continued to improve, additional fiscal stimulus was expected materialize after the November election and Fed policymakers telegraphed their intent to leave the federal funds rate at its current level through 2023. In addition, progress toward a COVID-19 vaccine continued to look promising. These events pushed longer-term Treasury yields higher, while short-term rates remained constrained by the Fed’s near zero target. With yield rising (and prices falling), the U.S. fixed income market posted negative performance in the abbreviated reporting period, as represented by the Bloomberg Barclays U.S. Aggregate Bond Index. Buoyed by the effects of Fed liquidity, economic upside surprises and hope for coronavirus treatments, spread sectors outperformed Treasury bonds.
6
How did the Fund perform during the abbreviated reporting period ended October 31, 2020?
The table in the Fund’s Performance Overview and Holding Summaries section of this report provides the Fund’s total return at net asset value (NAV) for the period ended October 31, 2020. The Fund’s total return at NAV is compared with the performance of a corresponding market index.
For the abbreviated reporting period ended October 31, 2020, the total return at NAV for the Fund underperformed the Bloomberg Barclays U.S. Aggregate Bond Index.
What strategies were used to manage the Fund during the abbreviated reporting period ended October 31, 2020 and how did these strategies influence performance?
The investment objective of the Portfolio is to seek total return, primarily through current income, while giving special consideration to certain environmental, social and governance (“ESG”) criteria. Under normal circumstances, the Portfolio invests at least 80% of the sum of its net assets and the amount of any borrowings for investment purposes in bonds. For these purposes bonds include fixed-income securities of all types, including but not limited to, corporate bonds, residential and commercial mortgage-backed and other asset-backed securities, U.S. government securities (securities issued or guaranteed by the U.S. government or its agencies or instrumentalities), senior loans and loan participations and assignments, and taxable and tax-exempt municipal bonds. The Portfolio may invest up to 10% of its assets in securities rated lower than investment grade or unrated securities of comparable quality as determined by the Portfolio’s sub-adviser (securities commonly referred to as “high-yield” securities or “junk” bonds). The Portfolio may invest in fixed-income securities of any maturity or duration.
The Fund began operations in July 2020 and since then we have worked to invest the portfolio in a broadly diversified portfolio with overweights to spread sectors tempered by a defensive, up-in-quality bias that should continue to benefit from liquidity programs implemented by the Fed. As spreads tightened, we continued to favor securities that allowed us to get closer to high quality assets and cash flows because of the uncertainty associated with the evolution and economic impact of the pandemic. We kept duration long versus the benchmark with the portfolio positioned to benefit from a flatter yield curve. Holdings continued to be selected based on our impact framework or on ESG leadership criteria.
During the abbreviated reporting period, the Fund’s relative performance benefited from yield curve and duration positioning and asset allocation decisions, especially the overweight to corporate debt and underweights to mortgage-backed securities and Treasury bonds. However, security selection in corporate bonds detracted from relative performance.
7
Risk Considerations and Dividend Information
Risk Considerations
Mutual fund investing involves risk; principal loss is possible. There is no guarantee the Fund’s investment objectives will be achieved. The Fund will include only holdings deemed consistent with the applicable Environmental Social Governance (ESG) guidelines. As a result, the universe of investments available to the Fund will be more limited than other funds that do not apply such guidelines. ESG criteria risk is the risk that because the Fund’s ESG criteria exclude securities of certain issuers for nonfinancial reasons, the Fund may forgo some market opportunities available to funds that don’t use these criteria. Credit risk arises from an issuer’s ability to make interest and principal payments when due, as well as the prices of bonds declining when an issuer’s credit quality is expected to deteriorate. Interest rate risk occurs when interest rates rise causing bond prices to fall. The issuer of a debt security may be able to repay principal prior to the security’s maturity, known as prepayment (call) risk, because of an improvement in its credit quality or falling interest rates. In this event, this principal may have to be reinvested in securities with lower interest rates than the original securities, reducing the potential for income. Non-U.S. investments involve risks such as currency fluctuation, political and economic instability, lack of liquidity and differing legal and accounting standards. Investments in below investment grade or high yield securities are subject to liquidity risk and heightened credit risk. These and other risk considerations, such as active management, extension, issuer, illiquid investments, income volatility, and derivatives risk, are described in detail in the Fund’s prospectus.
Dividend Information
The Fund seeks to pay regular monthly dividends out of its net investment income at a rate that reflects its past and projected net income performance. To permit the Fund to maintain a more stable monthly dividend, the Fund may pay dividends at a rate that may be more or less than the amount of net income actually earned by the Fund during the period. Distributions to shareholders are determined on a tax basis, which may differ from amounts recorded in the accounting records. In instances where the monthly dividend exceeds the earned net investment income, the Fund would report a negative undistributed net ordinary income. Refer to Note 6 – Income Tax Information for additional information regarding the amounts of undistributed net ordinary income and undistributed net long-term capital gains and the character of the actual distributions paid by the Fund during the period.
All monthly dividends paid by the Fund during the current reporting period, were paid from net investment income. If a portion of the Fund’s monthly distributions was sourced from or comprised of elements other than net investment income, including capital gains and/or a return of capital, shareholders will be notified of those sources. For financial reporting purposes, the per share amounts of the Fund’s distributions for the reporting period are presented in this report’s Financial Highlights. For income tax purposes, distribution information for the Fund as of its most recent tax year end is presented in Note 6 – Income Tax Information within the Notes to Financial Statements of this report.
8
Fund Performance
and Expense Ratios
This is a specialized bond Fund developed exclusively for use within Nuveen-sponsored seperately managed accounts.
Fund Performance
Returns quoted represent past performance, which is no guarantee of future results. Investment returns and principal value will fluctuate so that when shares are redeemed, they may be worth more or less than their original cost. Current performance may be higher or lower than the performance shown.
Total returns for a period less than one year are not annualized (i.e. cumulative returns). Since inception returns are shown for share classes that have less than 10-years of performance. Fund shares have no sales charge. Returns assume reinvestment of dividends and capital gains. For performance, current to the most recent month-end visit nuveen.com or call (800) 257-8787.
Returns do not reflect the deduction of taxes that a shareholder would pay on Fund distributions or the redemption of Fund shares.
Returns may reflect fee waivers and/or expense reimbursements by the investment adviser during the periods presented. If any such waivers and/or reimbursements had not been in place, returns would have been reduced. See Notes to Financial Statements, Note 7—Management Fees and Other Transactions with Affiliates for more information.
Expense Ratios
The expense ratios shown are as of the Fund’s most recent prospectus. The expense rations shown reflect total operating expenses (before fee waivers and/or expense reimbursements).
9
Fund Performance and Expense Ratios (continued)
Nuveen Core Impact Bond Managed Accounts Portfolio
Refer to the first page of this Fund Performance and Expense Ratios section for further explanation of the information included within this section. Refer to the Glossary of Terms Used in this Report for definitions of terms used within this section.
Fund Performance and Expense Ratios
| | | | | | | | | | | | | | | | |
| | | | | | Total Returns as of
October 31, 2020 | | | | | | | |
| | | Inception
Date | | | Cumulative | | | Expense Ratios* | |
| | | Since
Inception | | | Gross | | | Net | |
Shares at NAV | | | 7/9/20 | | | | (0.77)% | | | | —% | | | | —% | |
Bloomberg Barclays U.S. Aggregate Bond Index | | | — | | | | (0.49)% | | | | — | | | | — | |
| * | The Fund’s investment adviser has contractually agreed irrevocably during the existence of the Fund to waive all fees and pay or reimburse all expenses of the Fund, except for interest expense, taxes, fees incurred in acquiring and disposing of portfolio securities and extraordinary expenses. |
Growth of an Assumed $10,000 Investment as of October 31, 2020
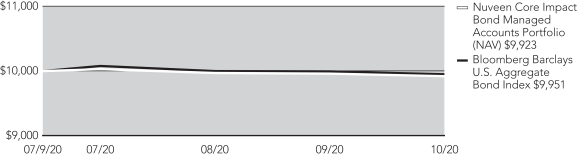
The graphs do not reflect the deduction of taxes that a shareholder may pay on Fund distributions or the redemption of Fund shares.
10
Yields as of October 31, 2020
Dividend Yield is the most recent dividend per share (annualized) divided by the offering price per share.
The SEC 30-Day Yield is a standardized measure of a Fund’s yield that accounts for the future amortization of premiums or discounts of bonds held in the fund’s portfolio. The SEC 30-Day Yield is computed under an SEC standardized formula and is based on the maximum offer price per share. Subsidized yields reflect fee waivers and/or expense reimbursements from the investment adviser during the period. If any such waivers and/or reimbursements had not been in place, yields would have been reduced. Unsubsidized yields do not reflect waivers and/or reimbursements from the investment adviser during the period. If the fund did not receive a fee waiver/expense reimbursement during the period under its most recent agreement, subsidized and unsubsidized yields will be equal. Refer to the Notes to Financial Statements, Note 7 – Management Fees and Other Transactions with Affiliates for further details on the investment adviser’s most recent agreement with the Fund to waive fees and/or reimburse expenses, where applicable. Dividend Yield may differ from the SEC 30-Day Yield because the fund may be paying out more or less than it is earning and it may not include the effect of amortization of bond premium.
| | | | |
Dividend Yield | | | 1.39% | |
SEC 30-Day Yield – Subsidized | | | 1.69% | |
SEC 30-Day Yield – Unsubsidized | | | (0.49)% | |
11
Holding
Summaries October 31, 2020
This data relates to the securities held in the Fund’s portfolio of investments as of the end of this reporting period. It
should not be construed as a measure of performance for the Fund itself. Holdings are subject to change.
For financial reporting purposes, the ratings disclosed are the highest rating given by one of the following national rating agencies: Standard & Poor’s, Moody’s Investors Service, Inc. or Fitch, Inc. This treatment of split-rated securities may differ from that used for other purposes, such as for Fund investment policies. Credit ratings are subject to change. AAA, AA, A and BBB are investment grade ratings; BB, B, CCC, CC, C and D are below investment grade ratings. Holdings designated N/R are not rated by these national rating agencies.
Nuveen Core Impact Bond Managed Accounts Portfolio
Fund Allocation
(% of net assets)
| | | | |
| | |
Corporate Bonds | | | 56.5% | |
| |
Asset-Backed and Mortgage-Backed Securities | | | 23.6% | |
| |
Municipal Bonds | | | 8.0% | |
| |
Soverign Debt | | | 7.7% | |
| |
Long-Term U.S. Government and Agency Obligations | | | 2.9% | |
| |
Short-Term U.S. Government and Agency Obligations | | | 4.2% | |
| |
Other Assets Less Liabilities | | | (2.9)% | |
| |
Net Assets | | | 100% | |
Portfolio Composition
(% of net assets)
| | | | |
| | |
Asset-Backed and Mortgage-Backed Securities | | | 23.6% | |
| |
Electric Utilities | | | 19.4% | |
| |
Banks | | | 13.4% | |
| |
Equity Real Estate Investment Trust | | | 6.8% | |
| |
Water and Sewar | | | 4.4% | |
| |
Education and Civic Organizations | | | 3.5% | |
| |
Semiconductors & Semiconductor Equipment | | | 2.7% | |
| |
Chemicals | | | 2.7% | |
| |
Other1 | | | 19.3% | |
| |
U.S. Government and Agency Obligations | | | 7.1% | |
| |
Other Assets Less Liabilities | | | (2.9)% | |
| |
Net Assets | | | 100% | |
Bond Credit Quality
(% of total investment exposure)
| | | | |
| | |
AAA | | | 11.7% | |
| |
AA | | | 10.8% | |
| |
A | | | 25.0% | |
| |
BBB | | | 21.3% | |
| |
BB or Lower | | | 5.5% | |
| |
N/R | | | 25.7% | |
| |
Total | | | 100% | |
| 1 | See Portfolio of Investments for details on “other” Portfolio Composition. |
12
Expense
Examples
As a shareholder of the Fund, you incur two types of costs: (1) transaction costs, including up-front and back-end sales charges (loads) or redemption fees, where applicable; and (2) ongoing costs, including management fees; distribution and service (12b-1) fees, where applicable; and other Fund expenses. The Examples below are intended to help you understand your ongoing costs (in dollars) of investing in the Fund and to compare these costs with the ongoing costs of investing in other mutual funds. Since the Fund’s expense example below reflects only the first 115 days of the Fund’s operations, it may not provide a meaningful understanding of the Fund’s ongoing expenses.
The Examples below are based on an investment of $1,000 invested at the beginning of the period and held through the period ended October 31, 2020.
The beginning of the period is July 9, 2020 (commencement of operations).
The information under “Actual Performance,” together with the amount you invested, allows you to estimate actual expenses incurred over the reporting period. Simply divide your account value by $1,000 (for example, an $8,600 account value divided by $1,000 = 8.60) and multiply the result by the cost shown for your share class, in the row entitled “Expenses Incurred During Period” to estimate the expenses incurred on your account during this period.
The information under “Hypothetical Performance,” provides information about hypothetical account values and hypothetical expenses based on the Fund’s actual expense ratios and an assumed rate of return of 5% per year before expenses, which is not the Fund’s actual return. The hypothetical account values and expenses may not be used to estimate the actual ending account balance or expense you incurred for the period. You may use this information to compare the ongoing costs of investing in the Fund and other funds. To do so, compare this 5% hypothetical example with the 5% hypothetical examples that appear in the shareholder reports of the other funds.
Please note that the expenses shown in the following tables are meant to highlight your ongoing costs only and do not reflect any transaction costs. Therefore, the hypothetical information is useful in comparing ongoing costs only, and will not help you determine the relative total costs of owning different funds or share classes. In addition, if these transaction costs were included, your costs would have been higher.
| | | | |
Actual Performance | | | | |
Beginning Account Value | | $ | 1,000.00 | |
Ending Account Value | | $ | 992.30 | |
Expenses Incurred During the Period | | $ | — | |
Hypothetical Performance (5% annualized return before expenses) | | | | |
Beginning Account Value | | $ | 1,000.00 | |
Ending Account Value | | $ | 1,025.07 | |
Expenses Incurred During the Period | | $ | — | |
Expenses are equal to Fund’s annualized net expense ratio of 0.00% multiplied by the average account value over the period, multiplied by 115/366 (to reflect the 115 days in the period since commencement of operations).
13
Report of Independent Registered
Public Accounting Firm
To the Board of Trustees of Nuveen Managed Accounts Portfolios Trust and Shareholders of
Nuveen Core Impact Bond Managed Accounts Portfolio
Opinion on the Financial Statements
We have audited the accompanying statement of assets and liabilities, including the schedule of investments, of Nuveen Core Impact Bond Managed Accounts Portfolio (the “Fund”) as of October 31, 2020, and the related statements of operations and changes in net assets, including the related notes, and the financial highlights for the period July 9, 2020 (commencement of operations) through October 31, 2020 (collectively referred to as the “financial statements”). In our opinion, the financial statements present fairly, in all material respects, the financial position of the Fund as of October 31, 2020, and the results of its operations, changes in its net assets, and the financial highlights for the period July 9, 2020 (commencement of operations) through October 31, 2020 in conformity with accounting principles generally accepted in the United States of America.
Basis for Opinion
These financial statements are the responsibility of the Fund’s management. Our responsibility is to express an opinion on the Fund’s financial statements based on our audit. We are a public accounting firm registered with the Public Company Accounting Oversight Board (United States) (PCAOB) and are required to be independent with respect to the Fund in accordance with the U.S. federal securities laws and the applicable rules and regulations of the Securities and Exchange Commission and the PCAOB.
We conducted our audit of these financial statements in accordance with the standards of the PCAOB. Those standards require that we plan and perform the audit to obtain reasonable assurance about whether the financial statements are free of material misstatement, whether due to error or fraud.
Our audit included performing procedures to assess the risks of material misstatement of the financial statements, whether due to error or fraud, and performing procedures that respond to those risks. Such procedures included examining, on a test basis, evidence regarding the amounts and disclosures in the financial statements. Our audit also included evaluating the accounting principles used and significant estimates made by management, as well as evaluating the overall presentation of the financial statements. Our procedures included confirmation of securities owned as of October 31 ,2020 by correspondence with the custodian and brokers; when replies were not received from brokers, we performed other auditing procedures. We believe that our audit provides a reasonable basis for our opinion.
PricewaterhouseCoopers LLP
Chicago, Illinois
December 28, 2020
We have served as the auditor of one or more investment companies in Nuveen Funds since 2002.
14
Nuveen Core Impact Bond Managed Accounts Portfolio
Portfolio of Investments October 31, 2020
| | | | | | | | | | | | | | | | | | | | |
Principal
Amount (000) | | | Description (1) | | Coupon | | | Maturity | | | Ratings (2) | | | Value | |
| | | | | |
| | | | LONG-TERM INVESTMENTS – 98.7% | | | | | | | | | | | | | | | | |
| | | | | |
| | | | CORPORATE BONDS – 56.5% | | | | | | | | | | | | | | | | |
| | | | | |
| | | | Banks – 10.7% | | | | | | | | | | | | |
| | | | | |
| $ | 200 | | | Bank of America Corp | | | 0.981% | | | | 9/25/25 | | | | A+ | | | $ | 199,788 | |
| | | | | |
| | 250 | | | Bank of America Corp | | | 2.456% | | | | 10/22/25 | | | | A+ | | | | 263,875 | |
| | | | | |
| | 250 | | | Citigroup Inc | | | 0.776% | | | | 10/30/24 | | | | A | | | | 249,908 | |
| | | | | |
| | 150 | | | International Bank for Reconstruction & Development | | | 3.125% | | | | 11/20/25 | | | | AAA | | | | 169,070 | |
| | | | | |
| | 200 | | | Kookmin Bank, 144A | | | 2.500% | | | | 11/04/30 | | | | BBB+ | | | | 199,502 | |
| | 1,050 | | | Total Banks | | | | | | | | | | | | | | | 1,082,143 | |
| | | | | |
| | | | Beverages – 2.6% | | | | | | | | | | | | |
| | | | | |
| | 250 | | | PepsiCo Inc | | | 2.875% | | | | 10/15/49 | | | | A+ | | | | 266,047 | |
| | | | | |
| | | | Building Products – 2.5% | | | | | | | | | | | | |
| | | | | |
| | 250 | | | Johnson Controls International plc / Tyco Fire & Security Finance SCA | | | 1.750% | | | | 9/15/30 | | | | BBB+ | | | | 248,547 | |
| | | | | |
| | | | Chemicals – 2.7% | | | | | | | | | | | | |
| | | | | |
| | 250 | | | LG Chem Ltd, 144A | | | 3.625% | | | | 4/15/29 | | | | BBB+ | | | | 274,859 | |
| | | | | |
| | | | Commercial Services & Supplies – 2.5% | | | | | | | | | | | | |
| | | | | |
| | 250 | | | Rockefeller Foundation | | | 2.492% | | | | 10/01/50 | | | | AAA | | | | 248,995 | |
| | | | | |
| | | | Electric Utilities – 17.0% | | | | | | | | | | | | |
| | | | | |
| | 200 | | | Avangrid Inc | | | 3.800% | | | | 6/01/29 | | | | Baa1 | | | | 228,763 | |
| | | | | |
| | 250 | | | Electricite de France SA, 144A | | | 3.625% | | | | 10/13/25 | | | | A3 | | | | 279,192 | |
| | | | | |
| | 250 | | | Interstate Power and Light Co | | | 4.100% | | | | 9/26/28 | | | | A- | | | | 295,031 | |
| | | | | |
| | 250 | | | MidAmerican Energy Co | | | 3.150% | | | | 4/15/50 | | | | Aa2 | | | | 273,754 | |
| | | | | |
| | 250 | | | Niagara Mohawk Power Corp, 144A | | | 1.960% | | | | 6/27/30 | | | | A- | | | | 254,739 | |
| | | | | |
| | 100 | | | Pattern Energy Operations LP / Pattern Energy Operations Inc, 144A | | | 4.500% | | | | 8/15/28 | | | | BB- | | | | 104,263 | |
| | | | | |
| | 250 | | | Southwestern Public Service Co | | | 3.750% | | | | 6/15/49 | | | | A | | | | 286,162 | |
| | 1,550 | | | Total Electric Utilities | | | | | | | | | | | | | | | 1,721,904 | |
| | | | | |
| | | | Equity Real Estate Investment Trust – 6.8% | | | | | | | | | | | | |
| | | | | |
| | 325 | | | HAT Holdings I LLC / HAT Holdings II LLC, 144A | | | 3.750% | | | | 9/15/30 | | | | BB+ | | | | 324,594 | |
| | | | | |
| | 225 | | | Regency Centers LP | | | 3.750% | | | | 6/15/24 | | | | BBB+ | | | | 238,159 | |
| | | | | |
| | 125 | | | Starwood Property Trust Inc, 144A, (WI/DD) | | | 5.500% | | | | 11/01/23 | | | | Ba3 | | | | 123,880 | |
| | 675 | | | Total Equity Real Estate Investment Trust | | | | | | | | | | | | | | | 686,633 | |
| | | | | |
| | | | Food & Staples Retailing – 2.5% | | | | | | | | | | | | |
| | 250 | | | Sysco Corp | | | 2.400% | | | | 2/15/30 | | | | Baa1 | | | | 253,786 | |
| | | | | |
| | | | Interactive Media & Services – 1.7% | | | | | | | | | | | | |
| | | | | |
| | 175 | | | Alphabet Inc | | | 1.100% | | | | 8/15/30 | | | | AA+ | | | | 170,587 | |
15
Nuveen Core Impact Bond Managed Accounts Portfolio (continued)
Portfolio of Investments October 31, 2020
| | | | | | | | | | | | | | | | | | | | |
Principal
Amount (000) | | | Description (1) | | Coupon | | | Maturity | | | Ratings (2) | | | Value | |
| | | | | |
| | | | Machinery – 2.5% | | | | | | | | | | | | |
| | | | | |
| $ | 250 | | | Xylem Inc/NY | | | 1.950% | | | | 1/30/28 | | | | BBB | | | $ | 258,074 | |
| | | | | |
| | | | Oil, Gas & Consumable Fuels – 2.3% | | | | | | | | | | | | |
| | | | | |
| | 225 | | | Chevron Corp | | | 2.236% | | | | 5/11/30 | | | | AA | | | | 235,476 | |
| | | | | |
| | | | Semiconductors & Semiconductor Equipment – 2.7% | | | | | | | | | | | | |
| | | | | |
| | 250 | | | NXP BV / NXP Funding LLC / NXP USA Inc, 144A | | | 3.400% | | | | 5/01/30 | | | | BBB | | | | 274,972 | |
| $ | 5,425 | | | Total Corporate Bonds (cost $5,799,777) | | | | | | | | | | | | | | | 5,722,023 | |
| | | | | |
Principal
Amount (000) | | | Description (1) | | Coupon | | | Maturity | | | Ratings (2) | | | Value | |
| | | | | |
| | | | ASSET-BACKED AND MORTGAGE-BACKED SECURITIES – 23.6% | | | | | | | | | | | | | | | | |
| | | | | |
| $ | 250 | | | BFLD Trust 2020-EYP, 144A, (1-Month LIBOR reference rate + 2.100% spread), (3) | | | 2.248% | | | | 10/15/35 | | | | A- | | | $ | 250,000 | |
| | | | | |
| | 250 | | | CPT Mortgage Trust, 144A | | | 2.997% | | | | 11/13/39 | | | | N/R | | | | 230,779 | |
| | | | | |
| | 237 | | | Fannie Mae Mortgage Pool FN MA4121 | | | 3.000% | | | | 9/01/50 | | | | N/R | | | | 248,570 | |
| | | | | |
| | 110 | | | Fannie Mae Mortgage Pool FN MA4159 | | | 2.500% | | | | 10/01/50 | | | | N/R | | | | 114,302 | |
| | | | | |
| | 45 | | | Fannie Mae Mortgage Pool FN MA4182 | | | 2.000% | | | | 11/01/50 | | | | N/R | | | | 46,408 | |
| | | | | |
| | 10 | | | Freddie Mac Structured Agency Credit Risk Debt Notes, REMIC Trust 2020-DNA2, 144A, (1-Month LIBOR reference rate + 1.850% spread), (3) | | | 1.999% | | | | 2/25/50 | | | | BB | | | | 9,783 | |
| | | | | |
| | 5 | | | Freddie Mac Structured Agency Credit Risk Debt Notes, Series STACR 2018-SPI3 M2, 144A | | | 4.140% | | | | 8/25/48 | | | | BB | | | | 5,206 | |
| | | | | |
| | 104 | | | Ginnie Mae II Pool G2 MA6820 | | | 3.000% | | | | 8/20/50 | | | | N/R | | | | 109,932 | |
| | | | | |
| | 10 | | | Ginnie Mae II Pool G2 BX3679 | | | 3.000% | | | | 8/20/50 | | | | N/R | | | | 10,955 | |
| | | | | |
| | 15 | | | Ginnie Mae II Pool G2 BX3680 | | | 3.000% | | | | 8/20/50 | | | | N/R | | | | 16,366 | |
| | | | | |
| | 5 | | | Ginnie Mae II Pool G2 BX3681 | | | 3.000% | | | | 8/20/50 | | | | N/R | | | | 5,406 | |
| | | | | |
| | 5 | | | Ginnie Mae II Pool G2 BY0338 | | | 3.500% | | | | 8/20/50 | | | | N/R | | | | 5,552 | |
| | | | | |
| | 5 | | | Ginnie Mae II Pool G2 BY0339 | | | 3.500% | | | | 8/20/50 | | | | N/R | | | | 5,543 | |
| | | | | |
| | 5 | | | Ginnie Mae II Pool G2 BY0340 | | | 3.500% | | | | 8/20/50 | | | | N/R | | | | 5,493 | |
| | | | | |
| | 30 | | | Ginnie Mae II Pool G2 MA6864 | | | 2.000% | | | | 9/20/50 | | | | N/R | | | | 31,072 | |
| | | | | |
| | 34 | | | Ginnie Mae II Pool G2 BY0325 | | | 2.500% | | | | 10/20/50 | | | | N/R | | | | 35,306 | |
| | | | | |
| | 235 | | | Hudson Yards 2019-30HY Mortgage Trust, 144A | | | 3.228% | | | | 7/10/39 | | | | AAA | | | | 259,943 | |
| | | | | |
| | 250 | | | Mosaic Solar Loan Trust 2020-2, 144A | | | 1.440% | | | | 8/20/46 | | | | N/R | | | | 247,555 | |
| | | | | |
| | 250 | | | Natixis Commercial Mortgage Securities Trust 2019-MILE, 144A, (1-Month LIBOR reference rate + 1.500% spread), (3) | | | 1.648% | | | | 7/15/36 | | | | N/R | | | | 247,558 | |
| | | | | |
| | 250 | | | Tesla Auto Lease Trust 2020-A, 144A | | | 0.780% | | | | 12/20/23 | | | | Aaa | | | | 251,306 | |
| | | | | |
| | 250 | | | Vivint Solar Financing VII LLC, 144A | | | 2.210% | | | | 7/31/51 | | | | N/R | | | | 250,370 | |
| $ | 2,355 | | | Total Asset-Backed and Mortgage-Backed Securities (cost $2,395,964) | | | | | | | | | | | | | | | 2,387,405 | |
| | | | | |
Principal
Amount (000) | | | Description (1) | | | | | Optional Call
Provisions (4) | | | Ratings (2) | | | Value | |
| | | | | |
| | | | MUNICIPAL BONDS – 8.0% | | | | | | | | | | | | | | | | |
| | | | | |
| | | | California – 1.9% | | | | | | | | | | | | |
| | | | | |
| $ | 190 | | | San Francisco City and County Public Utilities Commission, California, Power Revenue Bonds, Taxable Refunding Series 2020E, 2.825%, 11/01/41 | | | | | | | 11/30 at 100.00 | | | | Aa2 | | | $ | 190,944 | |
16
| | | | | | | | | | | | | | | | | | | | |
Principal
Amount (000) | | | Description (1) | | | | | Optional Call
Provisions (4) | | | Ratings (2) | | | Value | |
| | | | | |
| | | | Michigan – 2.6% | | | | | | | | | | | | |
| | | | | |
| $ | 250 | | | Great Lakes Water Authority, Michigan, Sewer Disposal System Revenue Bonds, Taxable Refunding Senior Lien Series 2020A, 3.056%, 7/01/39 | | | | | | | No Opt. Call | | | | AA- | | | $ | 258,370 | |
| | | | | |
| | | | New York – 3.5% | | | | | | | | | | | | |
| | | | | |
| | 355 | | | New York State Energy Research and Development Authority, Residential Solar & Energ Efficiency Financing, Taxable Green Series 2020A, 1.624%, 10/01/22 | | | | | | | 4/21 at 100.00 | | | | N/R | | | | 354,865 | |
| $ | 795 | | | Total Municipal Bonds (cost $819,322) | | | | | | | | | | | | | | | 804,179 | |
| | | | | |
Principal
Amount (000) | | | Description (1) | | Coupon | | | Maturity | | | Ratings (2) | | | Value | |
| | | | | |
| | | | SOVEREIGN DEBT – 7.7% | | | | | | | | | | | | | | | | |
| | | | | |
| | | | Chile – 2.6% | | | | | | | | | | | | |
| | | | | |
| $ | 250 | | | Chile Government International Bond | | | 2.550% | | | | 1/27/32 | | | | A+ | | | $ | 260,000 | |
| | | | | |
| | | | Indonesia – 2.4% | | | | | | | | | | | | |
| | | | | |
| | 225 | | | Perusahaan Penerbit SBSN Indonesia III, 144A | | | 3.900% | | | | 8/20/24 | | | | BBB | | | | 246,548 | |
| | | | | |
| | | | Netherlands – 2.7% | | | | | | | | | | | | |
| | | | | |
| | 250 | | | Nederlandse Waterschapsbank NV, 144A | | | 2.375% | | | | 3/24/26 | | | | AAA | | | | 272,249 | |
| $ | 725 | | | Total Sovereign Debt (cost $784,389) | | | | | | | | | | | | | | | 778,797 | |
| | | | | |
Principal
Amount (000) | | | Description (1) | | Coupon | | | Maturity | | | Ratings (2) | | | Value | |
| | | | | |
| | | | U.S. GOVERNMENT AND AGENCY OBLIGATIONS – 2.9% | | | | | | | | | | | | | | | | |
| | | | | |
| $ | 250 | | | United States Department of Housing and Urban Development | | | 2.738% | | | | 8/01/25 | | | | N/R | | | $ | 275,977 | |
| | | | | |
| | 20 | | | United States Treasury Note/Bond | | | 1.250% | | | | 5/15/50 | | | | Aaa | | | | 18,056 | |
| | | | | |
| $ | 270 | | | Total U.S. Government and Agency Obligations (cost $294,795) | | | | | | | | | | | | | | | 294,033 | |
| | | | Total Long-Term Investments (cost $10,094,247) | | | | | | | | | | | | | | | 9,986,437 | |
| | | | | |
Principal
Amount (000) | | | Description (1) | | Coupon | | | Maturity | | | Ratings (2) | | | Value | |
| | | | | |
| | | | SHORT-TERM INVESTMENTS – 4.2% | | | | | | | | | | | | | | | | |
| | | | | |
| | | | U.S. GOVERNMENT AND AGENCY OBLIGATIONS – 4.2% | | | | | | | | | | | | | | | | |
| | | | | |
| $ | 430 | | | Federal Agricultural Mortgage Corporation Discount Notes | | | 0.000% | | | | 11/02/20 | | | | N/R | | | $ | 430,000 | |
| $ | 430 | | | Total Short-Term Investments (cost $430,000) | | | | | | | | | | | | | | | 430,000 | |
| | | | Total Investments (cost $10,524,247) – 102.9% | | | | | | | | | | | | | | | 10,416,437 | |
| | | | Other Assets Less Liabilities – (2.9)% | | | | | | | | | | | | | | | (294,039 | ) |
| | | | Net Assets – 100% | | | | | | | | | | | | | | $ | 10,122,398 | |
17
Nuveen Core Impact Bond Managed Accounts Portfolio (continued)
Portfolio of Investments October 31, 2020
For Fund portfolio compliance purposes, the Fund’s industry classifications refer to any one or more of the industry sub-classifications used by one or more widely recognized market indexes or ratings group indexes, and/or as defined by Fund management. This definition may not apply for purposes of this report, which may combine industry sub-classifications into sectors for reporting ease.
| (1) | All percentages shown in the Portfolio of Investments are based on net assets. |
| (2) | For financial reporting purposes, the ratings disclosed are the highest of Standard & Poor’s Group (“Standard & Poor’s”), Moody’s Investors Service, Inc. (“Moody’s”) or Fitch, Inc. (“Fitch”) rating. This treatment of split-rated securities may differ from that used for other purposes, such as for Fund investment policies. Ratings below BBB by Standard & Poor’s, Baa by Moody’s or BBB by Fitch are considered to be below investment grade. Holdings designated N/R are not rated by any of these national rating agencies. Ratings are not covered by the report of independent registered public accounting firm. |
| (3) | Variable rate security. The rate shown is the coupon as of the end of the reporting period. |
| (4) | Optional Call Provisions: Dates (month and year) and prices of the earliest optional call or redemption. There may be other call provisions at varying prices at later dates. Certain mortgage-backed securities may be subject to periodic principal paydowns. Optional Call Provisions are not covered by the report of independent registered public accounting firm. |
| 144A | Investment is exempt from registration under Rule 144A of the Securities Act of 1933, as amended. These investments may only be resold in transactions exempt from registration, which are normally those transactions with qualified institutional buyers. |
| WI/DD | Purchased on a when issued or delayed delivery basis. |
See accompanying notes to financial statements.
18
Statement of Assets and Liabilities
October 31, 2020
| | | | |
| | |
Assets | | | | |
| |
Long-term investments, at value (cost $10,094,247) | | $ | 9,986,437 | |
| |
Short-term investments, at value (cost approximates value) | | | 430,000 | |
| |
Receivable for: | | | | |
| |
Interest | | | 43,967 | |
| |
Investments sold | | | 151,219 | |
| |
Reimbursement from Adviser | | | 19,210 | |
| |
Total assets | | | 10,630,833 | |
| |
Liabilities | | | | |
| |
Cash overdraft | | | 107,703 | |
| |
Payable for: | | | | |
| |
Investments purchased – regular settlement | | | 199,684 | |
| |
Investments purchased – when-issued/delayed-delivery settlement | | | 125,000 | |
| |
Accrued expenses: | | | | |
| |
Trustees fees | | | 20 | |
| |
Professional fees | | | 66,564 | |
| |
Other | | | 9,464 | |
| |
Total liabilities | | | 508,435 | |
| |
Net assets | | $ | 10,122,398 | |
| |
Shares outstanding | | | 1,022,265 | |
| |
Net assets value (“NAV”) per share | | $ | 9.90 | |
| |
Fund level net assets consist of: | | | | |
| |
Capital paid-in | | $ | 10,222,471 | |
| |
Total distributable earnings | | | (100,073 | ) |
| |
Fund level net assets | | $ | 10,122,398 | |
| |
Authorized shares | | | Unlimited | |
| |
Par value per share | | $ | 0.01 | |
See accompanying notes to financial statements.
19
Statement of Operations
For the period July 9, 2020 (commencement of operations) through October 31, 2020
| | | | |
| | |
Investment income | | $ | 36,275 | |
| |
Expenses | | | | |
| |
Shareholder servicing agent fees | | | 220 | |
| |
Custodian fees | | | 5,211 | |
| |
Trustees fees | | | 79 | |
| |
Professional fees | | | 67,945 | |
| |
Shareholder reporting expenses | | | 2,605 | |
| |
Federal and state registration fees | | | 1,800 | |
| |
Other | | | 418 | |
| |
Total expenses before fee waiver/expense reimbursement | | | 78,278 | |
| |
Fee waiver/expense reimbursement | | | (78,278 | ) |
| |
Net expenses | | | — | |
| |
Net investment income (loss) | | | 36,275 | |
| |
Realized and Unrealized Gain (Loss) | | | | |
| |
Net realized gain (loss) from investments | | | (5,067 | ) |
| |
Change in net unrealized appreciation (depreciation) of investments | | | (107,810 | ) |
| |
Net realized and unrealized gain (loss) | | | (112,877 | ) |
| |
Net increase (decrease) in net assets from operations | | $ | (76,602 | ) |
See accompanying notes to financial statements.
20
Statement of Changes in Net Assets
| | | | |
| | | For the period July 9, 2020 (commencement of operations)
through October 31, 2020 | |
| | |
Operations | | | | |
| |
Net investment income (loss) | | $ | 36,275 | |
| |
Net realized gain (loss) from investments | | | (5,067 | ) |
| |
Change in net unrealized appreciation (depreciation) of investments | | | (107,810 | ) |
| |
Net increase (decrease) in net assets from operations | | | (76,602 | ) |
| |
Distributions to Shareholders | | | | |
| |
Dividends | | | (23,471 | ) |
| |
Decrease in net assets from distributions to shareholders | | | (23,471 | ) |
| |
Fund Share Transactions | | | | |
| |
Proceeds from sale of shares | | | 10,199,000 | |
| |
Proceeds from shares issued to shareholders due to reinvestment of distributions | | | 23,471 | |
| |
Net increase (decrease) in net assets from Fund share transactions | | | 10,222,471 | |
| |
Net increase (decrease) in net assets | | | 10,122,398 | |
| |
Net assets at the beginning of period | | | — | |
| |
Net assets at the end of period | | $ | 10,122,398 | |
See accompanying notes to financial statements.
21
Financial Highlights
Selected data for a share outstanding throughout the period:
| | | | | | | | | | | | | | | | | | | | | | | | | | | | | | | | | | | | |
| | | | | |
| | | | | | Investment Operations | | | | | | Less Distributions | | | | |
| | | | | | | | | |
| Year ended October 31, | | Beginning
NAV | | | Net
Investment
Income
(Loss)(a) | | | Net
Realized/
Unrealized
Gain (Loss) | | | Total | | | | | | From
Net
Investment
Income | | | From
Accumulated
Net Realized
Gains | | | Total | | | Ending
NAV | |
| | | | | | | | | |
2020(e) | | $ | 10.00 | | | $ | 0.04 | | | $ | (0.12 | ) | | $ | (0.08 | ) | | | | | | $ | (0.02 | ) | | $ | — | | | $ | (0.02 | ) | | $ | 9.90 | |
22
| | | | | | | | | | | | | | | | | | | | | | | | | | | | | | | | | | |
| | | | Ratios/Supplemental Data | |
| | | | | | | | | | Ratios to Average
Net Assets Before
Waiver/Reimbursement | | | | | | Ratios to Average
Net Assets After
Waiver/Reimbursement(c) | | | | |
| | | | | | | | |
Total
Return(b) | | | Ending
Net
Assets
(000) | | | | | | Expenses | | | Net
Investment
Income
(Loss) | | | | | | Expenses | | | Net
Investment
Income
(Loss) | | | Portfolio
Turnover
Rate(d) | |
| | | | | | | | |
| | (0.77)% | | | $ | 10,122 | | | | | | | | 0.99 | %* | | | (1.31 | )%* | | | | | | | — | %* | | | 1.13 | %* | | | 113 | % |
| (a) | Per share Net Investment Income (Loss) is calculated using the average daily shares method. | |
| (b) | Total return is the combination of changes in NAV without any sales charge, reinvested dividend income at NAV and reinvested capital gains distributions at NAV, if any. Total returns are not annualized. | |
| (c) | After fee waiver and/or expense reimbursement from the Adviser, where applicable. See Note 7 – Management Fees for more information. | |
| (d) | Portfolio Turnover Rate is calculated based on the lesser of long-term purchases or sales (as disclosed in Note 4 – Portfolio Securities and Investments in Derivatives) divided by the average long-term market value during the period. | |
| (e) | For the period July 9, 2020 (commencement of operations) through October 31, 2020. | |
See accompanying notes to financial statements.
23
Notes to Financial Statements
1. General Information
Trust and Fund Information
The Nuveen Managed Accounts Portfolios Trust (the “Trust”) is an open-end management investment company registered under the Investment Company Act of 1940 (the “1940 Act”), as amended. The Trust is comprised of Nuveen Core Impact Bond Managed Accounts Portfolio (the “Fund”), as a diversified fund, among others. The Trust was organized as a Massachusetts business trust on November 14, 2006.
The Fund is developed exclusively for use within separately managed accounts by Nuveen LLC (“Nuveen”). The Fund is a specialized bond portfolio to be used in combination with selected individual securities to effectively model institutional-level investment strategies. The Fund enables certain Nuveen separately managed account investors to achieve greater diversification and return potential than smaller managed accounts might otherwise achieve by investing in additional fixed-income classes, including those that have a lower credit quality and potentially higher yielding securities in order to gain access to special investment opportunities normally available only to institutional investors.
The end of the reporting period for the Fund is October 31, 2020, and the period covered by these Notes to Financial Statements is for the fiscal period July 9, 2020 (commencement of operations) through October 31, 2020 (the “current fiscal period”).
Investment Adviser and Sub-Adviser
The Fund’s investment adviser is Nuveen Fund Advisors, LLC (the “Adviser”), a subsidiary of Nuveen. Nuveen is the investment management arm of Teachers Insurance and Annuity Association of America (TIAA). The Adviser has overall responsibility for management of the Fund, oversees the management of the Fund’s portfolio, manages the Fund’s business affairs and provides certain clerical, bookkeeping and other administrative services, and, if necessary, asset allocation decisions. The Adviser has entered into a sub-advisory agreement with Nuveen Asset Management, LLC (the “Sub-Adviser”), a subsidiary of the Adviser, under which the Sub-Adviser manages the investment portfolio of the Fund.
Other Matters
The outbreak of the novel coronavirus (“COVID-19”) and subsequent global pandemic began significantly impacting the U.S. and global financial markets and economies during the calendar quarter ended March 31, 2020. The worldwide spread of COVID-19 has created significant uncertainty in the global economy. The duration and extent of COVID-19 over the long-term cannot be reasonably estimated at this time. The ultimate impact of COVID-19 and the extent to which COVID-19 impacts the Fund’s normal course of business, results of operations, investments, and cash flows will depend on future developments, which are highly uncertain and difficult to predict. Management continues to monitor and evaluate this situation.
2. Significant Accounting Policies
The accompanying financial statements were prepared in accordance with accounting principles generally accepted in the United States of America (“U.S. GAAP”), which may require the use of estimates made by management and the evaluation of subsequent events. Actual results may differ from those estimates. The Fund is an investment company and follows accounting guidance in the Financial Accounting Standards Board (“FASB”) Accounting Standards Codification 946, Financial Services – Investment Companies. The net asset value (“NAV”) for financial reporting purposes may differ from the NAV for processing security and shareholder transactions. The NAV for financial reporting purposes includes security and shareholder transactions through the date of the report. Total return is computed based on the NAV used for processing security and shareholder transactions. The following is a summary of the significant accounting policies consistently followed by the Fund.
Compensation
The Trust pays no compensation directly to those of its trustees who are affiliated with the Adviser or to its officers, all of whom receive remuneration for their services to the Trust from the Adviser or its affiliates. The Fund’s Board of Trustees (the “Board”) has adopted a deferred compensation plan for independent trustees that enables trustees to elect to defer receipt of all or a portion of the annual compensation they are entitled to receive from certain Nuveen-advised funds. Under the plan, deferred amounts are treated as though equal dollar amounts had been invested in shares of select Nuveen-advised funds.
Distributions to Shareholders
Distributions to shareholders are recorded on the ex-dividend date. The amount, character and timing of distributions are determined in accordance with federal income tax regulations, which may differ from U.S. GAAP.
Indemnifications
Under the Trust’s organizational documents, its officers and trustees are indemnified against certain liabilities arising out of the performance of their duties to the Trust. In addition, in the normal course of business, the Trust enters into contracts that provide general indemnifications to other parties.
24
The Trust’s maximum exposure under these arrangements is unknown as this would involve future claims that may be made against the Trust that have not yet occurred. However, the Trust has not had prior claims or losses pursuant to these contracts and expects the risk of loss to be remote.
Investments and Investment Income
Securities transactions are accounted for as of the trade date for financial reporting purposes. Realized gains and losses on securities transactions are based upon the specific identification method. Investment income is comprised of interest income, which is recorded on an accrual basis and included the accretion of discounts and the amortization of premiums for financial reporting purposes. Investment income also reflects payment-in-kind (“PIK”) interest and paydown gains and losses, if any. PIK interest represents income received in the form of securities in lieu of cash.
Netting Agreements
In the ordinary course of business, the Fund may enter into transactions subject to enforceable International Swaps and Derivatives Association, Inc. (ISDA) master agreements or other similar arrangements (“netting agreements”). Generally, the right to offset in netting agreements allows each Fund to offset certain securities and derivatives with a specific counterparty, when applicable, as well as any collateral received or delivered to that counter-party based on the terms of the agreements. Generally, the Fund manages its cash collateral and securities collateral on a counterparty basis.
The Fund’s investments subject to netting agreements as of the end of the reporting period, if any, are further described in Note 4 – Portfolio Securities and Investments in Derivatives.
New Accounting Pronouncements and Rule Issuances
Reference Rate Reform
In March 2020, FASB issued Accounting Standards Update (“ASU”) 2020-04, Reference Rate Reform: Facilitation of the Effects of Reference Rate Reform on Financial Reporting. The main objective of the new guidance is to provide relief to companies that will be impacted by the expected change in benchmark interest rates at the end of 2021, when participating banks will no longer be required to submit London Interbank Offered Rate (LIBOR) quotes by the UK Financial Conduct Authority (FCA). The new guidance allows companies to, provided the only changes to existing contracts are a change to an approved benchmark interest rate, account for modifications as a continuance of the existing contract without additional analysis. For new and existing contracts, the Fund may elect to apply the optional expedients as of March 12, 2020 through December 31, 2022. Management has not yet elected to apply the optional expedients, but is currently assessing the impact of the ASU’s adoption to the Fund’s financial statements and various filings.
3. Investment Valuation and Fair Value Measurements
The Funds’ investments in securities are recorded at their estimated fair value utilizing valuation methods approved by the Board. Fair value is defined as the price that would be received upon selling an investment or transferring a liability in an orderly transaction to an independent buyer in the principal or most advantageous market for the investment. U.S. GAAP establishes the three-tier hierarchy which is used to maximize the use of observable market data and minimize the use of unobservable inputs and to establish classification of fair value measurements for disclosure purposes. Observable inputs reflect the assumptions market participants would use in pricing the asset or liability. Observable inputs are based on market data obtained from sources independent of the reporting entity. Unobservable inputs reflect management’s assumptions about the assumptions market participants would use in pricing the asset or liability. Unobservable inputs are based on the best information available in the circumstances. The following is a summary of the three-tiered hierarchy of valuation input levels.
| | |
| Level 1 – | | Inputs are unadjusted and prices are determined using quoted prices in active markets for identical securities. |
| Level 2 – | | Prices are determined using other significant observable inputs (including quoted prices for similar securities, interest rates, credit spreads, etc.). |
| Level 3 – | | Prices are determined using significant unobservable inputs (including management’s assumptions in determining the fair value of investments). |
A description of the valuation techniques applied to the Funds’ major classifications of assets and liabilities measured at fair value follows:
Prices of fixed-income securities are generally provided by an independent pricing service (“pricing service”) approved by the Board. The pricing service establishes a security’s fair value using methods that may include consideration of the following: yields or prices of investments of comparable quality, type of issue, coupon, maturity and rating, market quotes or indications of value from security dealers, evaluations of anticipated cash flows or collateral, general market conditions and other information and analysis, including the obligor’s credit characteristics considered relevant. In pricing certain securities, particularly less liquid and lower quality securities, the pricing service may consider information about a security, its issuer or market activity, provided by the Adviser. These securities are generally classified as Level 2.
Any portfolio security or derivative for which market quotations are not readily available or for which the above valuation procedures are deemed not to reflect fair value are valued at fair value, as determined in good faith using procedures approved by the Board. As a general principle, the fair value of a security would appear to be the amount that the owner might reasonably expect to receive for it in a current sale. A variety of factors may be considered in determining the fair value of such securities, which may include consideration of the following: yields or prices of investments of comparable quality, type of issue, coupon, maturity and rating, market quotes or indications of value from security dealers, evaluations of anticipated
25
Notes to Financial Statements (continued)
cash flows or collateral, general market conditions and other information and analysis, including the obligor’s credit characteristics considered relevant. To the extent the inputs are observable and timely, the values would be classified as Level 2 of the fair value hierarchy; otherwise they would be classified as Level 3.
The following table summarizes the market value of the Fund’s investments as of the end of the reporting period, based on the inputs used to value them:
| | | | | | | | | | | | | | | | |
| | | Level 1 | | | Level 2 | | | Level 3 | | | Total | |
| Long-Term Investments*: | | | | | | | | | | | | | | | | |
Corporate Bonds | | $ | — | | | $ | 5,722,023 | | | $ | — | | | $ | 5,722,023 | |
Asset-Backed and Mortgage-Backed Securities | | | — | | | | 2,387,405 | | | | — | | | | 2,387,405 | |
Municipal Bonds | | | — | | | | 804,179 | | | | — | | | | 804,179 | |
Sovereign Debt | | | — | | | | 778,797 | | | | — | | | | 778,797 | |
U.S. Government and Agency Obligations | | | — | | | | 294,033 | | | | — | | | | 294,033 | |
| Short-Term Investments: | | | | | | | | | | | | | | | | |
U.S. Government and Agency Obligations | | | — | | | | 430,000 | | | | — | | | | 430,000 | |
| Total | | $ | — | | | $ | 10,416,437 | | | $ | — | | | $ | 10,416,437 | |
| * | Refer to the Fund’s Portfolio of Investments for industry and country classifications, where applicable. |
4. Portfolio Securities and Investments in Derivatives
Portfolio Securities
Zero Coupon Securities
A zero coupon security does not pay a regular interest coupon to its holders during the life of the security. Income to the holder of the security comes from accretion of the difference between the original purchase price of the security at issuance and the par value of the security at maturity and is effectively paid at maturity. The market prices of zero coupon securities generally are more volatile than the market prices of securities that pay interest periodically.
Investment Transactions
Long-term purchases and sales (including maturities) during the current fiscal period aggregated $20,738,683 and $10,609,579, respectively.
The Fund may purchase securities on a when-issued or delayed-delivery basis. Securities purchased on a when-issued or delayed-delivery basis may have extended settlement periods; interest income is not accrued until settlement date. Any securities so purchased are subject to market fluctuation during this period. The Fund has earmarked securities in its portfolio with a current value at least equal to the amount of the when-issued/delayed delivery purchase commitments. If the Fund has outstanding when-issued/delayed-delivery purchases commitments as of the end of the reporting period, such amounts are recognized on the Statement of Assets and Liabilities.
Investments in Derivatives
The Fund is authorized to invest in certain derivative instruments, such as futures, options and swap contracts. The Fund records derivative instruments at fair value, with changes in fair value recognized on the Statement of Operations, when applicable. Even though the Fund’s investments in derivatives may represent economic hedges, they are not considered to be hedge transactions for financial reporting purposes.
Although the Fund is authorized to invest in derivative instruments, and may do so in the future, it did not make any such investments during the current fiscal period.
Market and Counterparty Credit Risk
In the normal course of business the Fund may invest in financial instruments and enter into financial transactions where risk of potential loss exists due to changes in the market (market risk) or failure of the other party to the transaction to perform (counterparty credit risk). The potential loss could exceed the value of the financial assets recorded on the financial statements. Financial assets, which potentially expose the Fund to counterparty credit risk, consist principally of cash due from counterparties on forward, option and swap transactions, when applicable. The extent of the Fund’s exposure to counterparty credit risk in respect to these financial assets approximates their carrying value as recorded on the Statement of Assets and Liabilities.
The Fund helps manage counterparty credit risk by entering into agreements only with counterparties the Adviser believes have the financial resources to honor their obligations and by having the Adviser monitor the financial stability of the counterparties. Additionally, counterparties may be required to pledge collateral daily (based on the daily valuation of the financial asset) on behalf of the Fund with a value approximately equal to the amount of any unrealized gain above a pre-determined threshold. Reciprocally, when the Fund has an unrealized loss, the Fund has instructed the custodian to pledge assets of the Fund as collateral with a value approximately equal to the amount of the unrealized loss above a pre-determined threshold. Collateral pledges are monitored and subsequently adjusted if and when the valuations fluctuate, either up or down, by at least the pre-determined threshold amount.
26
5. Fund Shares
Transactions in Fund shares during the current fiscal period were as follows:
| | | | | | | | |
| | | For the Period 7/09/20
(commencement of operations)
through 10/31/20 | |
| | | Shares | | | Amount | |
| Shares sold | | | 1,019,900 | | | $ | 10,199,000 | |
| Shares issued to shareholders due to reinvestment of distributions | | | 2,365 | | | | 23,471 | |
| Net increase (decrease) | | | 1,022,265 | | | $ | 10,222,471 | |
6. Income Tax Information
The Fund intends to distribute substantially all of its net investment income and net capital gains to shareholders and to otherwise comply with the requirements of Subchapter M of the Internal Revenue Code applicable to regulated investment companies. In any year when the Fund realizes net capital gains, the Fund may choose to distribute all or a portion of its net capital gains to shareholders, or alternatively, to retain all or a portion of its net capital gains and pay federal corporate income taxes on such retained gains.
For all open tax years and all major taxing jurisdictions, management of the Fund has concluded that there are no significant uncertain tax positions that would require recognition in the financial statements. Open tax years are those that are open for examination by taxing authorities (i.e., generally the last four tax year ends and the interim tax period since then). Furthermore, management of the Fund is also not aware of any tax positions for which it is reasonably possible that the total amounts of unrecognized tax benefits will significantly change in the next twelve months.
The following information is presented on an income tax basis. Differences between amounts for financial statement and federal income tax purposes are primarily due to timing differences in recognizing certain gains and losses on investment transactions. To the extent that differences arise that are permanent in nature, such amounts are reclassified within the capital accounts as detailed below. Temporary differences do not require reclassification. Temporary and permanent differences do not impact the NAV of the Fund.
The table below presents the cost and unrealized appreciation (depreciation) of the Fund’s investment portfolio, as determined on a federal income tax basis, as of October 31, 2020.
| | | | |
| Tax cost of investments | | $ | 10,526,487 | |
| Gross unrealized: | | | | |
Appreciation | | $ | 20,286 | |
Depreciation | | | (130,336 | ) |
| Net unrealized appreciation (depreciation) of investments | | $ | (110,050 | ) |
Permanent differences, primarily due to bond premium amortization adjustments, and paydowns resulted in reclassifications among the Fund’s components of net assets as of October 31, 2020, the Fund’s tax year end.
The tax components of undistributed net ordinary income as of October 31, 2020, the Fund’s tax year end, were as follows:
| | | | |
| Undistributed net ordinary income1 | | $ | 25,899 | |
| 1 | Net ordinary income consists of taxable market discount income and net short-term capital gains, if any. |
The tax character of distributions paid during the Fund’s tax year ended October 31, 2020 was designated for purposes of the dividends paid deduction as follows:
| | | | |
| Distributions from net ordinary income1 | | $ | 23,471 | |
| 1 | Net ordinary income consists of taxable market discount income and net short-term capital gains, if any. |
As of October 31, 2020, the Fund’s tax year end, the Fund had unused capital losses carrying forward available for federal income tax purposes to be applied against future capital gains, if any. The capital losses are not subject to expiration.
| | | | |
| Not subject to expiration: | | | | |
Short-term | | $ | 4,180 | |
Long-term | | | — | |
| Total | | $ | 4,180 | |
27
Notes to Financial Statements (continued)
7. Management Fees
The Adviser does not charge any management fees or other expenses directly to the Fund. The Adviser has agreed irrevocably during the existence of the Fund to waive all fees and pay or reimburse all expenses of the Fund (excluding interest expense, taxes, fees incurred in acquiring and disposing of portfolio securities and extraordinary expenses). The Adviser and the Sub-Adviser are compensated for their services to the Fund from the fee charged at the separately managed account level.
Other Transactions with Affiliates
As of the end of the reporting period, the percentage of Fund shares owned by TIAA are as follows:
28
Additional Fund Information (Unaudited)
| | | | | | | | | | |
| | | | | |
| | Investment Adviser Nuveen Fund Advisors, LLC 333 West Wacker Drive Chicago, IL 60606 Sub-Adviser Nuveen Asset Management, LLC 333 West Wacker Drive Chicago, IL 60606 | | Independent Registered
Public Accounting Firm PricewaterhouseCoopers LLP One North Wacker Drive Chicago, IL 60606 Custodian State Street Bank & Trust Company One Lincoln Street Boston, MA 02111 | | Legal Counsel Chapman and Cutler LLP Chicago, IL 60603 | | Transfer Agent and
Shareholder Services DST Asset Manager
Solutions, Inc. (DST) P.O. Box 219140 Kansas City, MO 64121-9140 (800) 257-8787 | | |
| | | | | | | | | | | | | | |
| | | | | |
| | | | | | | | | | |
| | |
| | Portfolio of Investments Information: The Fund is required to file its complete schedule of portfolio holdings with the Securities and Exchange Commission (SEC) for the first and third quarters of each fiscal year as an exhibit to its report on Form N-PORT. You may obtain this information on the SEC’s website at http://www.sec.gov. | | |
| | | |
| | | | | | |
| | |
| | Nuveen Funds’ Proxy Voting Information: You may obtain (i) information regarding how each fund voted proxies relating to portfolio securities held during the most recent twelve-month period ended June 30, without charge, upon request, by calling Nuveen toll-free at (800) 257-8787 or on Nuveen’s website at www.nuveen.com and (ii) a description of the policies and procedures that each fund used to determine how to vote proxies relating to portfolio securities without charge, upon request, by calling Nuveen toll-free at (800) 257-8787. You may also obtain this information directly from the SEC. Visit the SEC on-line at http://www.sec.gov. | | |
| | | | | |
| | | | | | | | | | |
| | |
| | FINRA BrokerCheck: The Financial Industry Regulatory Authority (FINRA) provides information regarding the disciplinary history of FINRA member firms and associated investment professionals. This information as well as an investor brochure describing FINRA BrokerCheck is available to the public by calling the FINRA BrokerCheck Hotline number at (800) 289-9999 or by visiting www.FINRA.org. | | |
29
Glossary of Terms Used in this Report
(Unaudited)
Average Annual Total Return: This is a commonly used method to express an investment’s performance over a particular, usually multi-year time period. It expresses the return that would have been necessary each year to equal the investment’s actual cumulative performance (including change in NAV or offer price and reinvested dividends and capital gains distributions, if any) over the time period being considered.
Bloomberg Barclays U.S. Aggregate Bond Index: An unmanaged index that includes all investment-grade, publicly issued, fixed-rate, dollar denominated, nonconvertible debt issues and commercial mortgage-backed securities with maturities of at least one year and out-standing par values of $150 million or more. Index returns assume reinvestment of distributions, but do not reflect any applicable sales charges or management fees.
Duration: Duration is a measure of the expected period over which a bond’s principal and interest will be paid, and consequently is a measure of the sensitivity of a bond’s or bond fund’s value to changes when market interest rates change. Generally, the longer a bond’s or fund’s duration, the more the price of the bond or fund will change as interest rates change.
Gross Domestic Product (GDP): The total market value of all final goods and services produced in a country/region in a given year, equal to total consumer, investment and government spending, plus the value of exports, minus the value of imports.
Net Asset Value (NAV) Per Share: A fund’s Net Assets is equal to its total assets (securities, cash and accrued earnings) less its total liabilities. For funds with multiple classes, Net Assets are determined separately for each share class. NAV per share is equal to the fund’s (or share class’) Net Assets divided by its number of shares outstanding.
Total Investment Exposure: Total investment exposure is the fund’s assets managed by the Adviser that are attributable to leverage. For these purposes, leverage includes the fund’s use of preferred stock and borrowings and investments in the residual interest certificates (also called inverse floating rate securities) in tender option bond (TOB) trusts, including the portion of assets held by a TOB trust that has been effectively financed by the trust’s issuance of floating rate securities.
Zero Coupon Bond: A zero coupon bond does not pay a regular interest coupon to its holders during the life of the bond. Income to the holder of the bond comes from accretion of the difference between the original purchase price of the bond at issuance and the par value of the bond at maturity and is effectively paid at maturity. The market prices of zero coupon bonds generally are more volatile than the market prices of bonds that pay interest periodically.
30
Annual Investment Management Agreement Approval Process
(Unaudited)
The Board of Trustees of the Fund (the “Board,” and each Trustee, a “Board Member”), which is comprised entirely of Board Members who are not “interested persons” (as defined under the Investment Company Act of 1940 (the “1940 Act”)) (the “Independent Board Members”), is responsible for determining whether to approve the Fund’s advisory arrangements. At a meeting held on May 19-21, 2020 (the “Meeting”), the Board Members were asked to approve the advisory arrangements for the Fund. At the Meeting, the Board Members considered and approved the investment management agreement (the “Investment Management Agreement”) pursuant to which Nuveen Fund Advisors, LLC (the “Adviser”) serves as investment adviser to the Fund and the investment sub-advisory agreement (the “Sub-Advisory Agreement”) pursuant to which Nuveen Asset Management, LLC (the “Sub-Adviser”) serves as investment sub-adviser to the Fund. The Adviser and the Sub-Adviser are each hereafter a “Fund Adviser.” The Investment Management Agreement and the Sub-Advisory Agreement are each hereafter an “Advisory Agreement” and collectively, the “Advisory Agreements.” Although the 1940 Act requires that the Advisory Agreements be approved by the in-person vote of a majority of the Independent Board Members, the Meeting was held virtually through the internet in view of the health risks associated with holding an in-person meeting during the COVID-19 pandemic and governmental restrictions on gatherings. The Meeting was held in reliance on an order issued by the Securities and Exchange Commission on March 13, 2020, as extended on March 25, 2020, which provided registered investment companies temporary relief from the in-person voting requirements of the 1940 Act with respect to the approval of a fund’s advisory agreement in response to the challenges arising in connection with the COVID-19 pandemic.
To assist the Board in its evaluation of an Advisory Agreement with a Fund Adviser at the Meeting, the Independent Board Members had received, in adequate time in advance of the Meeting or at other meetings, materials which outlined, among other things:
| | • | | the nature, extent and quality of the services expected to be provided by the Fund Adviser; |
| | • | | the organization of the Fund Adviser, including the responsibilities of various departments and key personnel; |
| | • | | the expertise and background of the Fund Adviser with respect to the Fund’s investment strategy; |
| | • | | certain performance-related information (as described below); |
| | • | | the profitability of Nuveen and its affiliates for their advisory activities; |
| | • | | the proposed fee and expense arrangement for the Fund; and |
| | • | | the soft dollar practices of the Fund Adviser, if any. |
At the Meeting and/or at other meetings, the Adviser made presentations to and responded to questions from the Board. During the Meeting and/or at other meetings, the Independent Board Members also met privately with their legal counsel to, among other things, review the Board’s duties under the 1940 Act, the general principles of state law in reviewing and approving advisory contracts, the standards used by courts in determining whether investment company boards of directors have fulfilled their duties, factors to be considered in voting on advisory contracts and an adviser’s fiduciary duty with respect to advisory agreements and compensation. It is with this background that the Independent Board Members considered the Advisory Agreements. As outlined in more detail below, the Independent Board Members considered various factors they believed relevant with respect to the Fund. Each Board Member may have accorded different weight to the various factors and information discussed below in reaching his or her conclusions with respect to the Fund’s Advisory Agreements. The Board Members also drew on information they had received in their capacity as trustees and directors, as applicable, of other registered investment companies advised by the Fund Advisers.
A. Nature, Extent and Quality of Services
The Independent Board Members considered the nature, extent and quality of the respective Fund Adviser’s services, including portfolio management services and administrative services. Given that the Adviser and the Sub-Adviser already serve as adviser and sub-adviser, respectively, to other Nuveen funds overseen by the Board Members, the Board has a good understanding of each such Fund Adviser’s organization, operations, personnel and services. As the Independent Board Members meet regularly throughout the year to oversee the Nuveen funds, including funds currently advised by the Fund Advisers, the Independent Board Members have relied upon their knowledge from their meetings and any other interactions throughout the year with the respective Fund Adviser in evaluating the Advisory Agreements.
At the Meeting and/or at other meetings, the Independent Board Members reviewed materials outlining, among other things, the respective Fund Adviser’s organization and business; the types of services that such Fund Adviser or its affiliates provide to the Nuveen funds (as applicable) and are expected to provide to the Fund; and the experience of the respective Fund Adviser with applicable investment strategies. Further, at the Meeting and/or at other meetings, the Independent Board Members have evaluated the background and experience of the relevant investment personnel.
31
Annual Investment Management Agreement Approval Process (Unaudited) (continued)
In considering the services that were expected to be provided by the Fund Advisers, at the Meeting and/or at other meetings, the Board has recognized that the Adviser provides a vast array of services to the Nuveen funds, the scope of which has expanded over the years in light of regulatory, market and other developments, such as the development of a liquidity management program and expanded compliance programs for the Nuveen funds. The Board has also noted the extensive resources, tools and capabilities the Adviser and its affiliates devote to the various operations of the Nuveen funds. In this regard, services provided to the Nuveen funds include, but are not limited to: investment oversight, risk management and securities valuation services; product management; fund administration; oversight of shareholder services and transfer agency functions; Board relations services; compliance and regulatory oversight services; and legal support and oversight of outside law firms. With respect to the Fund, however, the Board recognized that the Fund may not require the same level of shareholder services as other Nuveen funds given that it would be sold through separate managed accounts. In addition to the services provided by the Adviser, the Board also considered the risks borne by the Adviser and its affiliates in managing the Nuveen funds, including entrepreneurial, operational, reputational, regulatory and litigation risks.
The Board further considered the division of responsibilities between the Adviser and the Sub-Adviser and recognized that the Sub-Adviser and its investment personnel would generally be responsible for the management of the Fund’s portfolio under the oversight of the Adviser and the Board. In this regard, the Board recognized the relevant experience and expertise of the Sub-Adviser and the applicable investment personnel.
Based on its review, the Board found that, overall, the nature, extent and quality of services expected to be provided to the Fund under each Advisory Agreement were satisfactory.
B. Investment Performance
The Fund was new and, therefore, did not have its own performance history. Further, the Independent Board Members noted that although no existing fund or account managed by the Sub-Adviser is managed with identical investment parameters to those anticipated for the Fund, the Fund was expected to have similarities to certain existing funds managed by an affiliate of the Fund Advisers. Further, the Board was provided with performance-related information pertaining to various non-Nuveen open-end funds associated with vehicles similar to that with which the Fund is associated.
C. Fees, Expenses and Profitability
1. Fees and Expenses
The Board noted that the Fund’s fee structure would differ from that of most other Nuveen open-end funds. In this regard, the Board recognized that the Fund would be sold via separate managed accounts that would pay the Adviser a managed account management fee. As the Adviser will be compensated from the managed accounts, the Fund will not pay the Adviser a management fee. The managed account management fee will be an asset-based fee based on the entire separate managed account portfolio, including the portion invested in the Fund. The managed account management fee paid to the Adviser therefore will represent an implied management fee for managing the Fund and an implied management fee for managing individual securities. To evaluate the fee arrangement, the Independent Board Members reviewed the target range of management fees to be paid by the separate managed accounts, the implied management fee for the Fund and the range of implied management fees for managing individual securities (as well as the methodology utilized to develop these implied management fees). Further, the Board considered the Fund’s estimated annual operating expenses, but recognized that the Adviser had agreed to pay or reimburse the Fund’s expenses (except for interest expense, taxes, fees incurred in acquiring and disposing of portfolio securities and extraordinary expenses).
Based on its review of the information provided, the Board recognized the Fund’s proposed fee and expense structure, in which the Fund would not have a management fee and the Adviser would pay nearly all the Fund’s expenses, and determined the proposed arrangement was reasonable.
2. Comparisons with the Fees of Other Clients
At the Meeting and/or at other meetings, the Board has reviewed information regarding the fee rates that the Fund Advisers charge for certain other types of clients and the type of services provided to these other clients. With respect to the Adviser and/or the Sub-Adviser, such other clients may include retail and institutional managed accounts advised by the Sub-Adviser; investment companies offered outside the Nuveen family and sub-advised by the Sub-Adviser; foreign investment companies offered by Nuveen and sub-advised by the Sub-Adviser; and collective investment trusts sub-advised by the Sub-Adviser. Further, the Board has noted that the Adviser also advises certain ETFs sponsored by Nuveen.
In considering the fee data of other clients, the Board has considered, among other things, the differences in the amount, type and level of services provided to the Nuveen funds relative to other clients as well as the differences in portfolio investment policies, investor profiles, account sizes and regulatory requirements, all of which contribute to the variations in the fee schedules. The Board has recognized the complexity and myriad of services the Adviser provides to the Nuveen funds compared to the other types of clients as the Adviser is principally responsible for all aspects of operating the funds, including complying with the increased regulatory requirements required when managing the funds as well as the increased entrepreneurial, legal and regulatory risks that the Adviser incurs in sponsoring and managing the funds. Further, with respect to ETFs, the Board has considered that Nuveen ETFs are passively managed compared to the active management of the other Nuveen funds which has contributed to the differences in fee levels between the Nuveen ETFs and other Nuveen funds. In general, higher fee levels reflect higher levels of service provided by the Adviser, increased investment management complexity, greater product management requirements, and higher levels of business risk or some combination of these factors. Given that the Fund would be sold through separate managed accounts, the Board recognized that the Fund may not require the same level of shareholder services as other Nuveen funds.
32
3. Profitability of Fund Advisers
In conjunction with their review of fees, at the Meeting and/or at other meetings, the Independent Board Members have considered information regarding Nuveen’s level of profitability for its advisory services to the Nuveen funds for the calendar years 2019 and 2018. The Board has reviewed, among other things, Nuveen’s net margins (pre-tax) (both including and excluding distribution expenses); gross and net revenue margins (pre- and post-tax); revenues, expenses, and net income (pre-tax and after-tax and before distribution) of Nuveen for fund advisory services; and comparative profitability data comparing the margins of Nuveen compared to the adjusted margins of certain peers with publicly available data and with the most comparable assets under management (based on asset size and asset composition) for each of the last two calendar years. The Board has also reviewed the revenues and expenses the Adviser derived from its ETF product line for the 2018 and 2019 calendar years.
In reviewing the profitability data, the Independent Board Members have recognized the subjective nature of calculating profitability as the information is not audited and is dependent on cost allocation methodologies to allocate expenses of Nuveen and its affiliates between the fund and non-fund businesses. The expenses to be allocated include direct expenses in servicing the Nuveen funds as well as indirect and/or shared costs (such as overhead, legal and compliance) some of which are attributed to the Nuveen funds pursuant to the cost allocation methodologies. The Independent Board Members have reviewed a description of the cost allocation methodologies employed to develop the financial information and a summary of the history of changes to the methodology over the eleven-year period from 2008 to 2019. The Board has also appointed three Independent Board Members, along with the assistance of independent counsel, to serve as the Board’s liaisons to review the development of the profitability data and any proposed changes to the cost allocation methodology prior to incorporating any such changes and to report to the full Board. The Board has recognized that other reasonable and valid allocation methodologies could be employed and could lead to significantly different results. Based on the data, the Independent Board Members have noted that Nuveen’s net margins were higher in 2019 than the previous year and considered the key drivers behind the revenue and expense changes that impacted Nuveen’s net margins between the years. The Board has also noted the reinvestments of some of the profits into the business through, among other things, the investment of seed capital in certain funds and continued investments in enhancements to information technology, internal infrastructure and data management improvements and global investment and innovation projects.
As noted above, the Independent Board Members have also considered Nuveen’s margins from its relationship to the Nuveen funds compared to the adjusted margins of certain peers with publicly available data and with the most comparable assets under management (based on asset size and asset composition) to Nuveen for the calendar years 2019 and 2018. The Independent Board Members have noted that Nuveen’s margins from its relationships with the Nuveen funds were on the low range compared to the adjusted margins of the peers. The Independent Board Members, however, have recognized that it is difficult to make comparisons of profitability with other investment adviser peers given that comparative data is not generally public and the calculation of profitability is subjective and affected by numerous factors (such as types of funds a peer manages, its business mix, its cost of capital, the numerous assumptions underlying the methodology used to allocate expenses and other factors) which can have a significant impact on the results.
Aside from Nuveen’s profitability, the Board has recognized that the Adviser is a subsidiary of Nuveen, LLC, the investment management arm of Teachers Insurance and Annuity Association of America (“TIAA”). As such, the Board has also reviewed a balance sheet for TIAA reflecting its assets, liabilities and capital and contingency reserves for the 2019 and 2018 calendar years to consider the financial strength of TIAA. The Board has recognized the benefit of having an investment adviser and its parent with significant resources, particularly during periods of market stress.
In addition to Nuveen, the Independent Board Members have also considered the profitability of the Sub-Adviser from its relationships with the Nuveen funds. In this regard, the Independent Board Members have reviewed, among other things, the Sub-Adviser’s revenues, expenses and net revenue margins (pre- and post-tax) for its advisory activities for the calendar year ended December 31, 2019 as well as its pre-tax and after-tax net revenue margins for 2019 compared to such margins for 2018. The Independent Board Members have also reviewed a profitability analysis reflecting the revenues, expenses and revenue margin (pre- and post-tax) by asset type for the Sub-Adviser for the calendar year ended December 31, 2019 and the pre- and post-tax revenue margins from 2019 and 2018.
In evaluating the reasonableness of the compensation, the Independent Board Members have also considered any other ancillary benefits derived by the respective Fund Adviser from its relationship with the Nuveen funds as discussed in further detail below.
Based on a consideration of all the information provided, the Board has noted that Nuveen’s and the Sub-Adviser’s level of profitability was acceptable and not unreasonable in light of the services provided.
D. Economies of Scale and Whether Fee Levels Reflect These Economies of Scale
The Board considered whether the Fund could be expected to benefit from any economies of scale. The Board has recognized that although economies of scale are difficult to measure, there are several methods to help share the benefits of economies of scale, including breakpoints in the management fee schedule, fee waivers and/or expense limitations, the pricing of Nuveen funds at scale at inception and investments in Nuveen’s business which can enhance the services provided to the funds for the fees paid. The boards governing the Nuveen funds have noted that Nuveen generally has employed these various methods with respect to the Nuveen funds. In this regard, the boards governing the Nuveen funds have noted that the management fee of the Adviser is generally comprised of a fund-level component and a complex-level component each with its own
33
Annual Investment Management Agreement Approval Process (Unaudited) (continued)
breakpoint schedule, subject to certain exceptions. The Board, however, noted that the Fund would not have breakpoint schedules. In this regard, the Board noted that because the Fund would not pay a management fee, there would be no applicable fund-level or complex-wide level breakpoint schedule, although its assets would be counted toward the complex-wide total. In addition, as noted above, the Board noted that the Fund was expected to be reimbursed nearly all of its expenses by the Adviser.
The Independent Board Members have also recognized the Adviser’s continued reinvestment in its business through, among other things, investments in its business infrastructure and information technology, portfolio accounting system and other systems and platforms that will, among other things, support growth, simplify and enhance information sharing, and enhance the investment process to the benefit of all of the Nuveen funds.
Based on its review, the Board concluded that the absence of a fund-level and/or complex-level breakpoint schedule or arrangement (as applicable) was acceptable.
E. Indirect Benefits
The Independent Board Members received and considered information at the Meeting and/or at other meetings regarding other benefits the respective Fund Adviser or its affiliates may receive as a result of their relationship with the Nuveen funds. The Independent Board Members have noted that various sub-advisers (including the Sub-Adviser) may engage in soft dollar transactions pursuant to which they may receive the benefit of research products and other services provided by broker-dealers executing portfolio transactions on behalf of the applicable Nuveen funds, although the Board has recognized that certain sub-advisers may be phasing out the use of soft dollars over time.
The Board, however, has noted that the benefits for the Sub-Adviser when transacting in fixed-income securities may be more limited as such securities generally trade on a principal basis and therefore do not generate brokerage commissions. Further, the Board has considered that although the Sub-Adviser may benefit from the receipt of research and other services that it may otherwise have to pay for out of its own resources, the research may also benefit the Nuveen funds to the extent it enhances the ability of the Sub-Adviser to manage such funds or is acquired through the commissions paid on portfolio transactions of other clients.
Based on its review, the Board concluded that any indirect benefits expected to be received by a Fund Adviser as a result of its relationship with the Fund were reasonable and within acceptable parameters.
F. Approval
The Independent Board Members did not identify any single factor discussed previously as all-important or controlling. The Board Members, including a majority of the Independent Board Members, concluded that the terms of the Investment Management Agreement and the Sub-Advisory Agreement were fair and reasonable, that the Fund’s fee arrangement was reasonable and that the Investment Management Agreement and Sub-Advisory Agreement should be and were approved on behalf of the Fund.
34
Trustees and Officers
(Unaudited)
The management of the Funds, including general supervision of the duties performed for the Funds by the Adviser, is the responsibility of the Board of Trustees of the Funds. None of the Trustees who are not “interested” persons of the Funds (referred to herein as “Independent Trustees”) has ever been a Trustee or employee of, or consultant to, Nuveen or its affiliates. The names and business addresses of the Trustees and officers of the Funds, their principal occupations and other affiliations during the past five years, the number of portfolios each Trustee oversees and other directorships they hold are set forth below.
The Funds’ Statement of Additional Information (“SAI”) includes more information about the Trustees. To request a free copy, call Nuveen Investments at (800) 257-8787 or visit the Funds’ website at www.nuveen.com.
| | | | | | | | |
Name, Year of Birth & Address | | Position(s) Held with the Funds | | Year First
Elected or
Appointed (1) | | Principal Occupation(s) Including other Directorships During Past 5 Years | | Number of
Portfolios in
Fund Complex
Overseen by
Trustee |
| | | |
| Independent Trustees: | | | | |
Terence J. Toth 1959 333 W. Wacker Drive Chicago, IL 60606 | | Chairman and Trustee | | 2008 | | Formerly, a Co-Founding Partner, Promus Capital (2008-2017); Director, Quality Control Corporation (manufacturing) (since 2012); member: Catalyst Schools of Chicago Board (since 2008) and Mather Foundation Board (philanthropy) (since 2012), and chair of its investment committee; formerly, Director, Fulcrum IT Services LLC (information technology services firm to government entities) (2010-2019); formerly, Director, Legal & General Investment Management America, Inc. (asset management) (2008-2013); formerly, CEO and President, Northern Trust Global Investments (financial services) (2004-2007); Executive Vice President, Quantitative Management & Securities Lending (2000-2004); prior thereto, various positions with Northern Trust Company (financial services) (since 1994); formerly, Member, Northern Trust Mutual Funds Board (2005-2007), Northern Trust Global Investments Board (2004-2007), Northern Trust Japan Board (2004-2007), Northern Trust Securities Inc. Board (2003- 2007) and Northern Trust Hong Kong Board (1997-2004). | | 150 |
Jack B. Evans 1948 333 W. Wacker Drive Chicago, IL 60606 | | Trustee | | 1999 | | Chairman (since 2019), formerly, President (1996-2019), The Hall-Perrine Foundation, (private philanthropic corporation); Director and Chairman, United Fire Group, a publicly held company; Director, Public member, American Board of Orthopaedic Surgery (since 2015); Life Trustee of Coe College and the Iowa College Foundation; formerly, President Pro-Tem of the Board of Regents for the State of Iowa University System; formerly, Director, Alliant Energy and The Gazette Company (media and publishing); formerly, Director, Federal Reserve Bank of Chicago; formerly, President and Chief Operating Officer, SCI Financial Group, Inc., (regional financial services firm). | | 150 |
William C. Hunter 1948 333 W. Wacker Drive Chicago, IL 60606 | | Trustee | | 2003 | | Dean Emeritus, formerly, Dean, Tippie College of Business, University of Iowa (2006-2012); Director of Wellmark, Inc. (since 2009); past Director (2005-2015), and past President (2010- 2014) Beta Gamma Sigma, Inc., The International Business Honor Society; formerly, Director (2004-2018) of Xerox Corporation; Dean and Distinguished Professor of Finance, School of Business at the University of Connecticut (2003-2006); previously, Senior Vice President and Director of Research at the Federal Reserve Bank of Chicago (1995-2003); formerly, Director (1997-2007), Credit Research Center at Georgetown University. | | 150 |
35
Trustees and Officers (Unaudited) (continued)
| | | | | | | | |
Name, Year of Birth & Address | | Position(s) Held with the Funds | | Year First
Elected or
Appointed (1) | | Principal Occupation(s) Including other Directorships During Past 5 Years | | Number of
Portfolios in
Fund Complex
Overseen by
Trustee |
Albin F. Moschner 1952 333 W. Wacker Drive Chicago, IL 60606 | | Trustee | | 2016 | | Founder and Chief Executive Officer, Northcroft Partners, LLC, (management consulting) (since 2012); formerly, Chairman (2019), and Director (2012-2019), USA Technologies, Inc., (provider of solutions and services to facilitate electronic payment transactions); formerly, Director, Wintrust Financial Corporation (1996-2016); previously, held positions at Leap Wireless International, Inc. (telecommunication services), including Consultant (2011-2012), Chief Operating Officer (2008-2011), and Chief Marketing Officer (2004-2008); formerly, President, Verizon Card Services division of Verizon Communications, Inc. (2000-2003); formerly, President, One Point Services at One Point Communications (telecommunication services) (1999-2000); formerly, Vice Chairman of the Board, Diba, Incorporated (internet technology provider) (1996-1997); formerly, various executive positions (1991-1996) and Chief Executive Officer (1995-1996) of Zenith Electronics Corporation (consumer electronics). | | 150 |
John K. Nelson 1962 333 W. Wacker Drive Chicago, IL 60606 | | Trustee | | 2013 | | Member of Board of Directors of Core12 LLC. (private firm which develops branding, marketing and communications strategies for clients) (since 2008); served The President’s Council of Fordham University (2010-2019) and previously a Director of the Curran Center for Catholic American Studies (2009-2018); formerly, senior external advisor to the Financial Services practice of Deloitte Consulting LLP. (2012-2014); former Chair of the Board of Trustees of Marian University (2010-2014 as trustee, 2011-2014 as Chair); formerly Chief Executive Officer of ABN AMRO Bank N.V., North America, and Global Head of the Financial Markets Division (2007-2008), with various executive leadership roles in ABN AMRO Bank N.V. between 1996 and 2007. | | 150 |
Judith M. Stockdale 1947 333 W. Wacker Drive Chicago, IL 60606 | | Trustee | | 1997 | | Board Member, Land Trust Alliance (national public charity addressing natural land and water conservation in the U.S.) (since 2013); formerly, Board Member, U.S. Endowment for Forestry and Communities (national endowment addressing forest health, sustainable forest production and markets, and economic health of forest-reliant communities in the U.S.) (2013-2019); formerly, Executive Director (1994-2012), Gaylord and Dorothy Donnelley Foundation (private foundation endowed to support both natural land conservation and artistic vitality); prior thereto, Executive Director, Great Lakes Protection Fund (1990-1994). | | 150 |
Carole E. Stone 1947 333 W. Wacker Drive Chicago, IL 60606 | | Trustee | | 2007 | | Former Director, Chicago Board Options Exchange (2006-2017), and C2 Options Exchange, Incorporated (2009-2017); former Director, Cboe Global Markets, Inc., formerly, CBOE Holdings, Inc. (2010-May 2020); formerly, Commissioner, New York State Commission on Public Authority Reform (2005-2010). | | 150 |
Matthew Thornton III 1958 333 W. Wacker Drive Chicago, IL 60606 | | Trustee | | 2020 | | Formerly, Executive Vice President and Chief Operating Officer (2018-2019), FedEx Freight Corporation, a subsidiary of FedEx Corporation (“FedEx”) (provider of transportation, e-commerce and business services through its portfolio of companies); formerly, Senior Vice President, U.S. Operations (2006-2018), Federal Express Corporation, a subsidiary of FedEx; formerly Member of the Board of Directors (2012-2018), Safe Kids Worldwide® (a non-profit organization dedicated to preventing childhood injuries). Member of the Board of Directors (since 2014), The Sherwin-Williams Company (develops, manufactures, distributes and sells paints, coatings and related products); Director (since November 2020), Crown Castle International Corp. (owns, operates and leases cell towers and fiber routes supporting small cells and fiber solutions). | | 150 |
36
| | | | | | | | |
Name, Year of Birth & Address | | Position(s) Held with the Funds | | Year First
Elected or
Appointed (1) | | Principal Occupation(s) Including other Directorships During Past 5 Years | | Number of
Portfolios in
Fund Complex
Overseen by
Trustee |
Margaret L. Wolff 1955 333 W. Wacker Drive Chicago, IL 60606 | | Trustee | | 2016 | | Formerly, member of the Board of Directors (2013-2017) of Travelers Insurance Company of Canada and The Dominion of Canada General Insurance Company (each, a part of Travelers Canada, the Canadian operation of The Travelers Companies, Inc.); formerly, Of Counsel, Skadden, Arps, Slate, Meagher & Flom LLP (legal services, Mergers & Acquisitions Group) (2005-2014); Member of the Board of Trustees of New York-Presbyterian Hospital (since 2005); Member (since 2004) and Chair (since 2015) of the Board of Trustees of The John A. Hartford Foundation (a philanthropy dedicated to improving the care of older adults); formerly, Member (2005-2015) and Vice Chair (2011-2015) of the Board of Trustees of Mt. Holyoke College. | | 150 |
Robert L. Young 1963 333 W. Wacker Drive Chicago, IL 60606 | | Trustee | | 2017 | | Formerly, Chief Operating Officer and Director, J.P. Morgan Investment Management Inc. (financial services) (2010-2016); formerly, President and Principal Executive Officer (2013-2016), and Senior Vice President and Chief Operating Officer (2005-2010), of J.P. Morgan Funds; formerly, Director and various officer positions for J.P. Morgan Investment Management Inc. (formerly, JPMorgan Funds Management, Inc. and formerly, One Group Administrative Services) and JPMorgan Distribution Services, Inc. (financial services) (formerly, One Group Dealer Services, Inc.) (1999-2017). | | 150 |
| | | | | | |
Name, Year of Birth & Address | | Position(s) Held with the Funds | | Year First
Elected or
Appointed (2) | | Principal Occupation(s) During Past 5 Years |
| | |
| Officers of the Funds: | | |
Christopher E. Stickrod 1976 333 W. Wacker Drive Chicago, IL 60606 | | Chief Administrative Officer | | 2020 | | Senior Managing Director (since 2017) and Head of Advisory Product (since 2020), formerly, Managing Director (2016-2017) and Senior Vice President (2013-2016) of Nuveen, LLC; Senior Managing Director of Nuveen Securities, LLC (since 2018) and of Nuveen Fund Advisors, LLC (since 2019). |
Mark J. Czarniecki 1979 901 Marquette Avenue Minneapolis, MN 55402 | | Vice President and Secretary | | 2013 | | Vice President and Assistant Secretary of Nuveen Securities, LLC (since 2016) and Nuveen Fund Advisors (since 2017); Vice President and Associate General Counsel of Nuveen (since 2013) and Vice President, Assistant Secretary and Associate General Counsel of Nuveen Asset Management (since 2018). |
Diana R. Gonzalez 1978 333 W. Wacker Drive Chicago, IL 60606 | | Vice President and Assistant Secretary | | 2017 | | Vice President and Assistant Secretary of Nuveen Fund Advisors, LLC (since 2017); Vice President and Associate General Counsel of Nuveen (since 2017); Associate General Counsel of Jackson National Asset Management (2012-2017). |
Nathaniel T.Jones 1979 333 W. Wacker Drive Chicago, IL 60606 | | Vice President and Treasurer | | 2016 | | Managing Director (since 2017), formerly, Senior Vice President (2016-2017), formerly, Vice President (2011- 2016) of Nuveen; Managing Director (since 2015) of Nuveen Fund Advisors, LLC; Chartered Financial Analyst. |
Tina M. Lazar 1961 333 W. Wacker Drive Chicago, IL 60606 | | Vice President | | 2002 | | Managing Director (since 2017), formerly, Senior Vice President (2014-2017) of Nuveen Securities, LLC. |
Brian J. Lockhart 1974 333 W. Wacker Drive Chicago, IL 60606 | | Vice President | | 2019 | | Managing Director (since 2019) of Nuveen Fund Advisors, LLC; Managing Director (since 2017), formerly, Vice President (2010-2017) of Nuveen; Head of Investment Oversight (since 2017), formerly, Team Leader of Manager Oversight (2015-2017); Chartered Financial Analyst and Certified Financial Risk Manager. |
37
Trustees and Officers (Unaudited) (continued)
| | | | | | |
Name, Year of Birth & Address | | Position(s) Held with the Funds | | Year First
Elected or
Appointed (2) | | Principal Occupation(s) During Past 5 Years |
Jacques M. Longerstaey 1963 8500 Andrew Carnegie Blvd. Charlotte, NC 28262 | | Vice President | | 2019 | | Senior Managing Director, Chief Risk Officer, Nuveen, LLC (since May 2019); Senior Managing Director (since May 2019) of Nuveen Fund Advisors, LLC; formerly, Chief Investment and Model Risk Officer, Wealth & Investment Management Division, Wells Fargo Bank (NA) (from 2013-2019). |
Kevin J. McCarthy 1966 333 W. Wacker Drive Chicago, IL 60606 | | Vice President and Assistant Secretary | | 2007 | | Senior Managing Director (since 2017) and Secretary and General Counsel (since 2016) of Nuveen Investments, Inc., formerly, Executive Vice President (2016-2017) and Managing Director and Assistant Secretary (2008-2016); Senior Managing Director (since 2017) and Assistant Secretary (since 2008) of Nuveen Securities, LLC, formerly Executive Vice President (2016-2017) and Managing Director (2008-2016); Senior Managing Director (since 2017) and Secretary (since 2016) of Nuveen Fund Advisors, LLC, formerly, Co-General Counsel (2011-2020), Executive Vice President (2016-2017), Managing Director (2008-2016) and Assistant Secretary (2007-2016); Senior Managing Director (since 2017), Secretary (since 2016) of Nuveen Asset Management, LLC, formerly, Associate General Counsel (2011-2020), Executive Vice President (2016-2017) and Managing Director and Assistant Secretary (2011-2016); Senior Managing Director (since 2017) and Secretary (since 2016) of Nuveen Investments Advisers, LLC, formerly Executive Vice President (2016-2017); Vice President (since 2007) and Secretary (since 2016), formerly, Assistant Secretary, of NWQ Investment Management Company, LLC, Symphony Asset Management, LLC, Santa Barbara Asset Management, LLC and Winslow Capital Management, LLC (since 2010). Senior Managing Director (since 2017) and Secretary (since 2016) of Nuveen Alternative Investments, LLC. |
Jon Scott Meissner 1973 8500 Andrew Carnegie Blvd. Charlotte, NC 28262 | | Vice President | | 2019 | | Managing Director of Mutual Fund Tax and Financial Reporting groups at Nuveen (since 2017); Managing Director of Nuveen Fund Advisors, LLC (since 2019); Senior Director of Teachers Advisors, LLC and TIAA-CREF Investment Management, LLC (since 2016); Senior Director (since 2015) Mutual Fund Taxation to the TIAA-CREF Funds, the TIAA-CREF Life Funds, the TIAA Separate Account VA-1 and the CREF Accounts; has held various positions with TIAA since 2004. |
Deann D. Morgan 1969 730 Third Avenue New York, NY 10017 | | Vice President | | 2020 | | President, Nuveen Fund Advisors, LLC (since November 2020); Executive Vice President, Global Head of Product at Nuveen (since 2019); Co-Chief Executive Officer of Nuveen Securities, LLC (since March 2020); Managing Member MDR Collaboratory LLC (since 2018); Managing Director, Head of Wealth Management Product Structuring & COO Multi Asset Investing. The Blackstone Group (2013-2017). |
Christopher M. Rohrbacher 1971 333 W. Wacker Drive Chicago, IL 60606 | | Vice President and Assistant Secretary | | 2008 | | Managing Director (since 2017) and Assistant Secretary of Nuveen Securities, LLC; Managing Director (since 2017), formerly, Senior Vice President (2016-2017), General Counsel (since 2020), formerly, Co-General Counsel (2019-2020) and Assistant Secretary (since 2016) of Nuveen Fund Advisors, LLC; Managing Director, Associate General Counsel and Assistant Secretary of Nuveen Asset Management, LLC (since 2020); Managing Director (since 2017), formerly, Senior Vice President (2012-2017) and Associate General Counsel (sdince 2016), formerly, Assistant General Counsel (2008-2016) of Nuveen. |
William A. Siffermann 1975 333 W. Wacker Drive Chicago, IL 60606 | | Vice President | | 2017 | | Managing Director (since 2017), formerly Senior Vice President (2016-2017) and Vice President (2011-2016) of Nuveen. |
E. Scott Wickerham 1973 8500 Andrew Carnegie Blvd. Charlotte, NC 28262 | | Vice President and Controller | | 2019 | | Senior Managing Director, Head of Fund Administration at Nuveen, LLC (since 2019), formerly, Managing Director; Senior Managing Director (since 2019), Nuveen Fund Advisors, LLC; Principal Financial Officer, Principal Accounting Officer and Treasurer (since 2017) to the TIAA-CREF Funds, the TIAA-CREF Life Funds, the TIAA Separate Account VA-1 and the Treasurer (since 2017) to the CREF Accounts; Senior Director, TIAA-CREF Fund Administration (2014-2015); has held various positions with TIAA since 2006. |
Mark L. Winget 1968 333 W. Wacker Drive Chicago, IL 60606 | | Vice President and Secretary | | 2008 | | Vice President and Assistant Secretary of Nuveen Securities, LLC (since 2008), and Nuveen Fund Advisors, LLC (since 2009); Vice President, Associate General Counsel and Assistant Secretary of Nuveen Asset Management, LLC (since 2020); Vice President (since 2010) and Associate General Counsel (since 2016), formerly, Assistant General Counsel (2008-2016) of Nuveen. |
38
| | | | | | |
Name, Year of Birth & Address | | Position(s) Held with the Funds | | Year First
Elected or
Appointed (2) | | Principal Occupation(s) During Past 5 Years |
Gifford R. Zimmerman 1956 333 W. Wacker Drive Chicago, IL 60606 | | Vice President and Chief Compliance Officer | | 1988 | | Formerly: Managing Director (2002-2020) and Assistant Secretary of Nuveen Securities, LLC; Managing Director (2002-2020), Assistant Secretary (1997-2020) and Co-General Counsel (2011-2020) of Nuveen Fund Advisors, LLC; Managing Director (2004-2020) and Assistant Secretary (1994-2020) of Nuveen Investments, Inc.; Managing Director, Assistant Secretary and Associate General Counsel of Nuveen Asset Management, LLC (2011-2020); Vice President (2017-2020) Managing Director (2003-2017) and Assistant Secretary (2003-2020) of Symphony Asset Management LLC; Vice President and Assistant Secretary of NWQ Investment Management Company, LLC, Santa Barbara Asset Management, LLC (2006-2020) and of Winslow Capital Management, LLC (2010-2020); Chartered Financial Analyst. |
| (1) | Trustees serve an indefinite term until his/her successor is elected or appointed. The year first elected or appointed represents the year in which the trustee was first elected or appointed to any fund in the Nuveen fund complex. |
| (2) | Officers serve one year terms through August of each year. The year first elected or appointed represents the year in which the officer was first elected or appointed to any fund in the Nuveen fund complex. |
39
Nuveen:
Serving Investors for Generations
Since 1898, financial professionals and their clients have relied on Nuveen to provide dependable investment solutions through continued adherence to proven, long-term investing principles. Today, we offer a range of high quality solutions designed to be integral components of a well-diversified core portfolio.
Focused on meeting investor needs.
Nuveen is the investment manager of TIAA. We have grown into one of the world’s premier global asset managers, with specialist knowledge across all major asset classes and particular strength in solutions that provide income for investors and that draw on our expertise in alternatives and responsible investing. Nuveen is driven not only by the independent investment processes across the firm, but also the insights, risk management, analytics and other tools and resources that a truly world-class platform provides. As a global asset manager, our mission is to work in partnership with our clients to create solutions which help them secure their financial future.
Find out how we can help you.
To learn more about how the products and services of Nuveen may be able to help you meet your financial goals, talk to your financial professional, or call us at (800) 257-8787. Please read the information provided carefully before you invest. Investors should consider the investment objective and policies, risk considerations, charges and expenses of any investment carefully. Where applicable, be sure to obtain a prospectus, which contains this and other relevant information. To obtain a prospectus, please contact your securities representative or Nuveen, 333 W. Wacker Dr., Chicago, IL 60606. Please read the prospectus carefully before you invest or send money.
Learn more about Nuveen Funds at: www.nuveen.com/mutual-funds
| | |
Nuveen Securities, LLC, member FINRA and SIPC |
333 West Wacker Drive Chicago, IL 60606 | www.nuveen.com | | MAN-CIMAP-1020P
1434986-INV-Y-12/21 |
As of the end of the period covered by this report, the registrant has adopted a code of ethics that applies to the registrant’s principal executive officer, principal financial officer, principal accounting officer or controller, or persons performing similar functions. There were no amendments to or waivers from the code during the period covered by this report. The registrant has posted the code of ethics on its website at www.nuveen.com/fund-governance. (To view the code, click on Code of Conduct.)
| ITEM 3. | AUDIT COMMITTEE FINANCIAL EXPERT. |
As of the end of the period covered by this report, the registrant’s Board of Directors or Trustees (“Board”) determined that the registrant has at least one “audit committee financial expert” (as defined in Item 3 of Form N-CSR) serving on its Audit Committee. The registrant’s audit committee financial experts are Carole E. Stone, Jack B. Evans and William C. Hunter, who are “independent” for purposes of Item 3 of Form N-CSR.
Ms. Stone served for five years as Director of the New York State Division of the Budget. As part of her role as Director, Ms. Stone was actively involved in overseeing the development of the State’s operating, local assistance and capital budgets, its financial plan and related documents; overseeing the development of the State’s bond-related disclosure documents and certifying that they fairly presented the State’s financial position; reviewing audits of various State and local agencies and programs; and coordinating the State’s system of internal audit and control. Prior to serving as Director, Ms. Stone worked as a budget analyst/examiner with increasing levels of responsibility over a 30 year period, including approximately five years as Deputy Budget Director. Ms. Stone has also served as Chair of the New York State Racing Association Oversight Board, as Chair of the Public Authorities Control Board, as a Commissioner on the New York State Commission on Public Authority Reform and as a member of the Boards of Directors of several New York State public authorities. These positions have involved overseeing operations and finances of certain entities and assessing the adequacy of project/entity financing and financial reporting. Currently, Ms. Stone is on the Board of Directors of CBOE Holdings, Inc., of the Chicago Board Options Exchange, and of C2 Options Exchange. Ms. Stone’s position on the boards of these entities and as a member of both CBOE Holdings’ Audit Committee and its Finance Committee has involved, among other things, the oversight of audits, audit plans and preparation of financial statements.
Mr. Evans was formerly President and Chief Operating Officer of SCI Financial Group, Inc., a full service registered broker-dealer and registered investment adviser (“SCI”). As part of his role as President and Chief Operating Officer, Mr. Evans actively supervised the Chief Financial Officer (the “CFO”) and actively supervised the CFO’s preparation of financial statements and other filings with various regulatory authorities. In such capacity, Mr. Evans was actively involved in the preparation of SCI’s financial statements and the resolution of issues raised in connection therewith. Mr. Evans has also served on the audit committee of various reporting companies. At such companies, Mr. Evans was involved in the oversight of audits, audit plans, and the preparation of financial statements. Mr. Evans also formerly chaired the audit committee of the Federal Reserve Bank of Chicago.
Mr. Hunter was formerly a Senior Vice President at the Federal Reserve Bank of Chicago. As part of his role as Senior Vice President, Mr. Hunter was the senior officer responsible for all operations of each of the Economic Research, Statistics, and Community and Consumer Affairs units at the Federal Reserve Bank of Chicago. In such capacity, Mr. Hunter oversaw the subunits of the Statistics and Community and Consumer Affairs divisions responsible for the analysis and evaluation of bank and bank holding company financial statements and financial filings. Prior to serving as Senior Vice President at the Federal Reserve Bank of Chicago, Mr. Hunter was the Vice President of the Financial Markets unit at the Federal Reserve Bank of Atlanta where he supervised financial staff and bank holding company analysts who analyzed and evaluated bank and bank holding company financial statements. Mr. Hunter also currently serves on the Boards of Directors of Xerox Corporation and Wellmark, Inc. as well as on the Audit Committees of such Boards. As an Audit Committee member, Mr. Hunter’s responsibilities include, among other things, reviewing financial statements, internal audits and internal controls over financial reporting. Mr. Hunter also formerly was a Professor of Finance at the University of Connecticut School of Business and has authored numerous scholarly articles on the topics of finance, accounting and economics.
| ITEM 4. | PRINCIPAL ACCOUNTANT FEES AND SERVICES. |
The following tables show the amount of fees that PriceWaterHouseCoopers LLP, the Funds’ auditor, billed to the Funds’ during the Funds’ last two full fiscal years. The Audit Committee approved in advance all audit services and non-audit services that PriceWaterHouseCoopers LLP, provided to the Funds, except for those non-audit services that were subject to the pre-approval exception under Rule 2-01 of Regulation S-X (the “pre-approval exception”). The preapproval exception for services provided directly to the Funds waives the pre-approval requirement for services other than audit, review or attest services if: (A) the aggregate amount of all such services provided constitutes no more than 5% of the total amount of revenues paid by the Funds during the fiscal year in which the services are provided; (B) the Funds did not recognize the services as non-audit services at the time of the engagement; and (C) the services are promptly brought to the Audit Committee’s attention, and the Committee (or its delegate) approves the services before the audit is completed.
The Audit Committee has delegated certain pre-approval responsibilities to its Chair (or, in her absence, any other member of the Audit Committee).
| | | | | | | | | | | | | | | | |
Fiscal Year Ended October 31, 2020 | | Audit Fees Billed
to Funds 1 | | | Audit-Related Fees
Billed to Funds 2 | | | Tax Fees Billed
to Funds 3 | | | All Other Fees
Billed to Funds 4 | |
Fund Name | | | | | | | | | | | | | | | | |
Nuveen Core Impact Bond Managed Accounts Portfolio 5 | | | 51,700 | | | | 0 | | | | 0 | | | | 0 | |
| | | | | | | | | | | | | | | | |
Total | | $ | 51,700 | | | $ | 0 | | | $ | 0 | | | $ | 0 | |
| 1 | | “Audit Fees” are the aggregate fees billed for professional services for the audit of the Fund’s annual financial statements and services provided in connection with statutory and regulatory filings or engagements. |
| 2 | | “Audit-Related Fees” are the aggregate fees billed for assurance and related services reasonably related to the performance of the audit or review of financial statements that are not reported under “Audit Fees”. These fees include offerings related to the Fund’s common shares and leverage. |
| 3 | | “Tax Fees” are the aggregate fees billed for professional services for tax advice, tax compliance, and tax planning. These fees include: all global withholding tax services; excise and state tax reviews; capital gain, tax equalization and taxable basis calculations performed by the principal accountant. |
| 4 | | “All Other Fees” are the aggregate fees billed for products and services other than “Audit Fees”, “Audit-Related Fees” and “Tax Fees”. These fees represent all “Agreed-Upon Procedures” engagements pertaining to the Fund’s use of leverage. |
| 5 | | Fund commenced operations on 07/09/2020 |
| | | | | | | | | | | | | | | | |
| | | Percentage Approved Pursuant to Pre-approval Exception | |
| | | Audit Fees Billed
to Funds | | | Audit-Related Fees
Billed to Funds | | | Tax Fees
Billed to Funds | | | All Other Fees
Billed to Funds | |
| Fund Name | | | | | | | | | | | | | | | | |
Nuveen Core Impact Bond Managed Accounts Portfolio | | | 0 | % | | | 0 | % | | | 0 | % | | | 0 | % |
| | | | |
Fiscal Year Ended October 31, 2019 | | Audit Fees Billed
to Funds 1 | | | Audit-Related Fees
Billed to Funds 2 | | | Tax Fees
Billed to Funds 3 | | | All Other Fees
Billed to Funds 4 | |
| Fund Name | | | | | | | | | | | | | | | | |
Nuveen Core Impact Bond Managed Accounts Portfolio | | | 0 | | | | 0 | | | | 0 | | | | 0 | |
| | | | | | | | | | | | | | | | |
Total | | $ | 0 | | | $ | 0 | | | $ | 0 | | | $ | 0 | |
| 1 | | “Audit Fees” are the aggregate fees billed for professional services for the audit of the Fund’s annual financial statements and services provided in connection with statutory and regulatory filings or engagements. |
| 2 | | “Audit-Related Fees” are the aggregate fees billed for assurance and related services reasonably related to the performance of the audit or review of financial statements that are not reported under “Audit Fees”. These fees include offerings related to the Fund’s common shares and leverage. |
| 3 | | “Tax Fees” are the aggregate fees billed for professional services for tax advice, tax compliance, and tax planning. These fees include: all global withholding tax services; excise and state tax reviews; capital gain, tax equalization and taxable basis calculations performed by the principal accountant. |
| 4 | | “All Other Fees” are the aggregate fees billed for products and services other than “Audit Fees”, “Audit-Related Fees” and “Tax Fees”. These fees represent all “Agreed-Upon Procedures” engagements pertaining to the Fund’s use of leverage. |
| | | | | | | | | | | | | | | | |
| | | Percentage Approved Pursuant to Pre-approval Exception | |
| | | Audit Fees Billed
to Funds | | | Audit-Related Fees
Billed to Funds | | | Tax Fees
Billed to Funds | | | All Other Fees
Billed to Funds | |
| Fund Name | | | | | | | | | | | | | | | | |
Nuveen Core Impact Bond Managed Accounts Portfolio | | | 0 | % | | | 0 | % | | | 0 | % | | | 0 | % |
| | | | | | | | | | | | |
Fiscal Year Ended October 31, 2020 | | Audit-Related Fees
Billed to Adviser and
Affiliated Fund
Service Providers | | | Tax Fees Billed to
Adviser and
Affiliated Fund
Service Providers | | | All Other Fees
Billed to Adviser
and Affiliated Fund
Service Providers | |
Nuveen Managed Accounts Portfolios Trust | | $ | 0 | | | $ | 0 | | | $ | 0 | |
| |
| | | Percentage Approved Pursuant to Pre-approval Exception | |
| | | Audit-Related Fees
Billed to Adviser and
Affiliated Fund
Service Providers | | | Tax Fees Billed to
Adviser and
Affiliated Fund
Service Providers | | | All Other Fees
Billed to Adviser
and Affiliated Fund
Service Providers | |
| | | 0 | % | | | 0 | % | | | 0 | % |
| | | |
Fiscal Year Ended October 31, 2019 | | Audit-Related Fees
Billed to Adviser and
Affiliated Fund
Service Providers | | | Tax Fees Billed to
Adviser and
Affiliated Fund
Service Providers | | | All Other Fees
Billed to Adviser
and Affiliated Fund
Service Providers | |
Nuveen Managed Accounts Portfolios Trust | | $ | 0 | | | $ | 0 | | | $ | 0 | |
| |
| | | Percentage Approved Pursuant to Pre-approval Exception | |
| | | Audit-Related Fees
Billed to Adviser and
Affiliated Fund
Service Providers | | | Tax Fees Billed to
Adviser and
Affiliated Fund
Service Providers | | | All Other Fees
Billed to Adviser
and Affiliated Fund
Service Providers | |
| | | 0 | % | | | 0 | % | | | 0 | % |
| | | | | | | | | | | | |
Fiscal Year Ended October 31, 2020 | | Total Non-Audit Fees
Billed to Trust | | | Total Non-Audit Fees
billed to Adviser and
Affiliated Fund Service
Providers (engagements
related directly to the
operations and financial
reporting of the Trust) | | | Total Non-Audit Fees
billed to Adviser and
Affiliated Fund Service
Providers (all other
engagements) | |
| Fund Name | | | | | | | | | | | | |
Nuveen Core Impact Bond Managed Accounts Portfolio | | | 0 | | | | 0 | | | | 0 | |
| | | | | | | | | | | | |
Total | | $ | 0 | | | $ | 0 | | | $ | 0 | |
“Non-Audit Fees billed to Fund” for both fiscal year ends represent “Tax Fees” and “All Other Fees” billed to Fund in their respective amounts from the previous table.
Less than 50 percent of the hours expended on the principal accountant’s engagement to audit the registrant’s financial statements for the most recent fiscal year were attributed to work performed by persons other than the principal accountant’s full-time, permanent employees.
| | | | | | | | | | | | |
Fiscal Year Ended October 31, 2019 | | Total Non-Audit Fees
Billed to Trust | | | Total Non-Audit Fees
billed to Adviser and
Affiliated Fund Service
Providers (engagements
related directly to the
operations and financial
reporting of the Trust) | | | Total Non-Audit Fees
billed to Adviser and
Affiliated Fund Service
Providers (all other
engagements) | |
| Fund Name | | | | | | | | | | | | |
Nuveen Core Impact Bond Managed Accounts Portfolio | | | 0 | | | | 0 | | | | 0 | |
| | | | | | | | | | | | |
Total | | $ | 0 | | | $ | 0 | | | $ | 0 | |
“Non-Audit Fees billed to Fund” for both fiscal year ends represent “Tax Fees” and “All Other Fees” billed to Fund in their respective amounts from the previous table.
Audit Committee Pre-Approval Policies and Procedures. Generally, the Audit Committee must approve (i) all non-audit services to be performed for the Funds by the Funds’ independent accountant and (ii) all audit and non-audit services to be performed by the Funds’ independent accountant for the Affiliated Fund Service Providers with respect to the operations and financial reporting of the Funds. Regarding tax and research projects conducted by the independent accountant for the Funds and Affiliated Fund Service Providers (with respect to operations and financial reports of the Trust), such engagements will be (i) pre-approved by the Audit Committee if they are expected to be for amounts greater than $10,000; (ii) reported to the Audit Committee Chair for her verbal approval prior to engagement if they are expected to be for amounts under $10,000 but greater than $5,000; and (iii) reported to the Audit Committee at the next Audit Committee meeting if they are expected to be for an amount under $5,000.
| ITEM 5. | AUDIT COMMITTEE OF LISTED REGISTRANTS. |
Not applicable to this registrant.
| ITEM 6. | SCHEDULE OF INVESTMENTS. |
| a) | | See Portfolio of Investments in Item 1. |
| ITEM 7. | DISCLOSURE OF PROXY VOTING POLICIES AND PROCEDURES FOR CLOSED-END MANAGEMENT INVESTMENT COMPANIES. |
Not applicable to this registrant.
| ITEM 8. | PORTFOLIO MANAGERS OF CLOSED-END MANAGEMENT INVESTMENT COMPANIES. |
Not applicable to this registrant.
| ITEM 9. | PURCHASES OF EQUITY SECURITIES BY CLOSED-END MANAGEMENT INVESTMENT COMPANY AND AFFILIATED PURCHASERS. |
Not applicable to this registrant.
| ITEM 10. | SUBMISSION OF MATTERS TO A VOTE OF SECURITY HOLDERS. |
There have been no material changes to the procedures by which shareholders may recommend nominees to the registrant’s Board of Trustees implemented after the registrant last provided disclosure in response to this Item.
| ITEM 11. | CONTROLS AND PROCEDURES. |
| | (a) | | The registrant’s principal executive and principal financial officers, or persons performing similar functions, have concluded that the registrant’s disclosure controls and procedures (as defined in Rule 30a-3(c) under the Investment Company Act of 1940, as amended (the “1940 Act”) (17 CFR 270.30a-3(c))) are effective, as of a date within 90 days of the filing date of this report that includes the disclosure required by this paragraph, based on their evaluation of the controls and procedures required by Rule 30a-3(b) under the 1940 Act (17 CFR 270.30a-3(b)) and Rules 13a-15(b) or 15d-15(b) under the Securities Exchange Act of 1934, as amended (the “Exchange Act”) (17 CFR 240.13a-15(b) or 240.15d-15(b)). |
| | (b) | | There were no changes in the registrant’s internal control over financial reporting (as defined in Rule 30a-3(d) under the 1940 Act (17 CFR 270.30a-3(d)) that occurred during the period covered by this report that has materially affected, or is reasonably likely to materially affect, the registrant’s internal control over financial reporting. |
| ITEM 12. | DISCLOSURE OF SECURITIES LENDING ACTIVITIES FOR CLOSED-END MANAGEMENT INVESTMENT COMPANIES. |
Not applicable.
File the exhibits listed below as part of this Form.
SIGNATURES
Pursuant to the requirements of the Securities Exchange Act of 1934 and the Investment Company Act of 1940, the registrant has duly caused this report to be signed on its behalf by the undersigned, thereunto duly authorized.
(Registrant) Nuveen Managed Accounts Portfolios Trust
| | |
| By (Signature and Title) | | /s/ Mark J. Czarniecki |
| | Mark J. Czarniecki |
| | Vice President and Secretary |
Date: January 7, 2021
Pursuant to the requirements of the Securities Exchange Act of 1934 and the Investment Company Act of 1940, this report has been signed below by the following persons on behalf of the registrant and in the capacities and on the dates indicated.
| | |
| By (Signature and Title) | | /s/ Christopher E. Stickrod |
| | Christopher E. Stickrod |
| | Chief Administrative Officer |
| | (principal executive officer) |
Date: January 7, 2021
| | |
| By (Signature and Title) | | /s/ E. Scott Wickerham |
| | E. Scott Wickerham |
| | Vice President and Controller |
| | (principal financial officer) |
Date: January 7, 2021