Table of Contents
UNITED STATES
SECURITIES AND EXCHANGE COMMISSION
Washington, D.C. 20549
FORM N-CSR
CERTIFIED SHAREHOLDER REPORT OF
REGISTERED MANAGEMENT INVESTMENT COMPANIES
Investment Company Act file number 811-22033
MFS SERIES TRUST XIV
(Exact name of registrant as specified in charter)
111 Huntington Avenue, Boston, Massachusetts 02199
(Address of principal executive offices) (Zip code)
Susan S. Newton
Massachusetts Financial Services Company
111 Huntington Avenue
Boston, Massachusetts 02199
(Name and address of agents for service)
Registrant’s telephone number, including area code: (617) 954-5000
Date of fiscal year end: August 31
Date of reporting period: February 28, 2015
Table of Contents
| ITEM 1. | REPORTS TO STOCKHOLDERS. |
Table of Contents
SEMIANNUAL REPORT
February 28, 2015

MFS® INSTITUTIONAL MONEY MARKET PORTFOLIO

IMM-SEM
Table of Contents
MFS® INSTITUTIONAL MONEY MARKET PORTFOLIO
The report is prepared for the general information of shareholders.
It is authorized for distribution to prospective investors only when preceded or accompanied by a current prospectus.
NOT FDIC INSURED Ÿ MAY LOSE VALUE Ÿ NO BANK GUARANTEE
Table of Contents

Dear Shareholders:
Lower oil prices continue to influence markets in different ways. Among those economies hurt, oil-exporters such as Russia and Venezuela have been hit particularly hard, along with U.S. regions that have close oil industry ties.
The U.S. economic recovery remains solid. The labor market is strong, interest rates are historically low and reduced energy prices have helped to stimulate consumer spending.
Economic reports early in 2015 indicate that the eurozone is on a more solid footing, with confidence boosted by the launch of European Central Bank quantitative easing.
In Asia, the Chinese economy continues to raise concerns, with the People’s Bank of China implementing stimulus programs to counter a steady decline in growth rates.
As always, active risk management is integral to how we at MFS® manage your investments. We use a collaborative process, sharing insights across asset classes, regions and economic sectors. Our global investment team uses a diversified, multidisciplined, long-term approach.
Applying proven principles, such as asset allocation and diversification, can best serve investors over the long term. We are confident that this approach can help you as you work with your financial advisors to reach your goals in the years ahead.
Respectfully,

Robert J. Manning
Chairman
MFS Investment Management
April 14, 2015
The opinions expressed in this letter are subject to change and may not be relied upon for investment advice. No forecasts can be guaranteed.
1
Table of Contents
Portfolio structure (u)
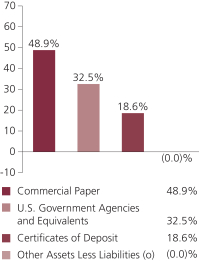
| Composition including fixed income credit quality (a)(u) | ||||
| A-1+ | 27.9% | |||
| A-1 | 72.1% | |||
| Not Rated | 0.0% | |||
| Other Assets Less Liabilities (o) | (0.0)% | |||
| Maturity breakdown (u) | ||||
| 0 - 7 days | 14.7% | |||
| 8 - 29 days | 25.1% | |||
| 30 - 59 days | 36.0% | |||
| 60 - 89 days | 13.2% | |||
| 90 - 365 days | 11.0% | |||
| Other Assets Less Liabilities (o) | (0.0)% | |||
| (a) | Ratings are assigned to portfolio securities utilizing ratings from Moody’s, Fitch, and Standard & Poor’s rating agencies and applying the following hierarchy: If all three agencies provide a rating, the middle rating (after dropping the highest and lowest ratings) is assigned; if two of the three agencies rate a security, the lower of the two is assigned. Ratings are shown in the S&P scale. All ratings are subject to change. The fund is not rated by these agencies. |
| (o) | Less than 0.1%. |
| (u) | For purposes of this presentation, accrued interest, where applicable, is included. |
From time to time Other Assets Less Liabilities may be negative due to timing of cash receipts.
Percentages are based on net assets as of 2/28/15.
The portfolio is actively managed and current holdings may be different.
2
Table of Contents
Fund expenses borne by the shareholders during the period, September 1, 2014 through February 28, 2015
As a shareholder of the fund, you incur ongoing costs, including fund expenses. This example is intended to help you understand your ongoing costs (in dollars) of investing in the fund and to compare these costs with the ongoing costs of investing in other mutual funds.
The example is based on an investment of $1,000 invested at the beginning of the period and held for the entire period September 1, 2014 through February 28, 2015.
Actual Expenses
The first line of the following table provides information about actual account values and actual expenses. You may use the information in this line, together with the amount you invested, to estimate the expenses that you paid over the period. Simply divide your account value by $1,000 (for example, an $8,600 account value divided by $1,000 = 8.6), then multiply the result by the number in the first line under the heading entitled “Expenses Paid During Period” to estimate the expenses you paid on your account during this period.
Hypothetical Example for Comparison Purposes
The second line of the following table provides information about hypothetical account values and hypothetical expenses based on the fund’s actual expense ratio and an assumed rate of return of 5% per year before expenses, which is not the fund’s actual return. The hypothetical account values and expenses may not be used to estimate the actual ending account balance or expenses you paid for the period. You may use this information to compare the ongoing costs of investing in the fund and other funds. To do so, compare this 5% hypothetical example with the 5% hypothetical examples that appear in the shareholder reports of the other funds.
Please note that the expenses shown in the table are meant to highlight your ongoing costs only and do not reflect any transactional costs, such as sales charges (loads). Therefore, the second line of the table is useful in comparing ongoing costs only, and will not help you determine the relative total costs of owning different funds. In addition, if these transactional costs were included, your costs would have been higher.
| Annualized Expense Ratio | Beginning Account Value 9/01/14 | Ending Account Value 2/28/15 | Expenses Paid During Period (p) 9/01/14-2/28/15 | |||||
| Actual | 0.01% | $1,000.00 | $1,000.45 | $0.05 | ||||
| Hypothetical (h) | 0.01% | $1,000.00 | $1,024.74 | $0.05 |
| (h) | 5% fund return per year before expenses. |
| (p) | “Expenses Paid During Period” are equal to the fund’s annualized expense ratio, as shown above, multiplied by the average account value over the period, multiplied by 181/365 (to reflect the one-half year period). |
3
Table of Contents
2/28/15 (unaudited)
The Portfolio of Investments is a complete list of all securities owned by your fund. It is categorized by broad-based asset classes.
| Certificates of Deposit - 18.6% | ||||||||
| Issuer | Shares/Par | Value ($) | ||||||
| Major Banks - 15.6% | ||||||||
| Bank of Montreal/Chicago Branch, 0.1%, due 4/01/15 | $ | 47,740,000 | $ | 47,740,000 | ||||
| Bank of Nova Scotia/Houston Branch, 0.06%, due 4/27/15 | 13,750,000 | 13,750,000 | ||||||
| Canadian Imperial Bank of Commerce/New York Branch, 0.13%, due 4/14/15 | 84,769,000 | 84,769,000 | ||||||
| Canadian Imperial Bank of Commerce/New York Branch, 0.13%, due 4/23/15 | 154,756,000 | 154,756,000 | ||||||
| Chase Bank USA N.A., 0.27%, due 7/27/15 | 173,000,000 | 173,000,000 | ||||||
| Chase Bank USA N.A., 0.25%, due 7/30/15 | 55,220,000 | 55,220,000 | ||||||
| Royal Bank of Canada/New York Branch, 0.16%, due 3/16/15 | 55,500,000 | 55,500,000 | ||||||
| Toronto Dominion Holdings (USA), Inc., 0.095%, due 4/01/15 | 26,000,000 | 26,000,000 | ||||||
| Toronto Dominion Holdings (USA), Inc., 0.165%, due 4/20/15 | 137,359,000 | 137,359,000 | ||||||
| Wells Fargo & Co., 0.19%, due 4/01/15 | 64,000,000 | 64,000,000 | ||||||
| Wells Fargo & Co., 0.23%, due 6/03/15 | 101,500,000 | 101,500,000 | ||||||
| Wells Fargo & Co., 0.24%, due 6/05/15 | 25,000,000 | 25,000,000 | ||||||
|
| |||||||
| $ | 938,594,000 | |||||||
| Other Banks & Diversified Financials - 3.0% | ||||||||
| Mizuho Corporate Bank (USA)/New York Branch, 0.24%, due 4/21/15 | $ | 132,868,000 | $ | 132,868,000 | ||||
| Mizuho Corporate Bank (USA)/New York Branch, 0.24%, due 5/15/15 | 49,150,000 | 49,150,000 | ||||||
|
| |||||||
| $ | 182,018,000 | |||||||
| Total Certificates of Deposit, at Cost and Value | $ | 1,120,612,000 | ||||||
| Commercial Paper (y) - 48.9% | ||||||||
| Automotive - 7.3% | ||||||||
| American Honda Finance Corp., 0.1%, due 3/05/15 | $ | 37,565,000 | $ | 37,564,583 | ||||
| American Honda Finance Corp., 0.1%, due 3/11/15 | 21,499,000 | 21,498,403 | ||||||
| American Honda Finance Corp., 0.08%, due 3/25/15 | 15,000,000 | 14,999,200 | ||||||
| American Honda Finance Corp., 0.12%, due 4/06/15 | 20,000,000 | 19,997,600 | ||||||
| American Honda Finance Corp., 0.11%, due 4/23/15 | 40,000,000 | 39,993,522 | ||||||
| American Honda Finance Corp., 0.12%, due 5/06/15 | 70,000,000 | 69,984,600 | ||||||
| American Honda Finance Corp., 0.14%, due 5/22/15 | 30,000,000 | 29,990,433 | ||||||
| Toyota Motor Credit Corp., 0.17%, due 4/24/15 | 76,280,000 | 76,260,549 | ||||||
| Toyota Motor Credit Corp., 0.17%, due 4/28/15 | 133,455,000 | 133,418,448 | ||||||
|
| |||||||
| $ | 443,707,338 | |||||||
| Computer Software - 1.9% | ||||||||
| Microsoft Corp., 0.1%, due 4/08/15 (t) | $ | 113,700,000 | $ | 113,687,998 | ||||
4
Table of Contents
Portfolio of Investments (unaudited) – continued
| Issuer | Shares/Par | Value ($) | ||||||
| Commercial Paper (y) - continued | ||||||||
| Conglomerates - 4.5% | ||||||||
| Siemens Capital Corp., 0.08%, due 3/24/15 (t) | $ | 49,222,000 | $ | 49,219,484 | ||||
| Siemens Capital Corp., 0.1%, due 3/24/15 (t) | 94,275,000 | 94,268,977 | ||||||
| United Technologies Corp., 0.09%, due 3/18/15 (t) | 91,136,000 | 91,132,127 | ||||||
| United Technologies Corp., 0.08%, due 3/20/15 (t) | 35,750,000 | 35,748,491 | ||||||
|
| |||||||
| $ | 270,369,079 | |||||||
| Consumer Products - 4.5% | ||||||||
| Colgate-Palmolive Co., 0.08%, due 3/05/15 (t) | $ | 750,000 | $ | 749,993 | ||||
| Colgate-Palmolive Co., 0.09%, due 3/12/15 (t) | 33,792,000 | 33,791,071 | ||||||
| Colgate-Palmolive Co., 0.09%, due 3/18/15 (t) | 67,000,000 | 66,997,152 | ||||||
| Procter & Gamble Co., 0.11%, due 5/18/15 (t) | 171,685,000 | 171,644,082 | ||||||
|
| |||||||
| $ | 273,182,298 | |||||||
| Electrical Equipment - 1.2% | ||||||||
| General Electric Co., 0.07%, due 3/27/15 | $ | 73,278,000 | $ | 73,274,295 | ||||
| Electronics - 3.2% | ||||||||
| Emerson Electric Co., 0.18%, due 4/06/15 (t) | $ | 52,000,000 | $ | 51,990,640 | ||||
| Emerson Electric Co., 0.13%, due 4/22/15 (t) | 46,556,000 | 46,547,258 | ||||||
| Emerson Electric Co., 0.13%, due 5/11/15 (t) | 49,000,000 | 48,987,437 | ||||||
| Emerson Electric Co., 0.13%, due 5/14/15 (t) | 22,300,000 | 22,294,041 | ||||||
| Emerson Electric Co., 0.13%, due 5/15/15 (t) | 25,000,000 | 24,993,229 | ||||||
|
| |||||||
| $ | 194,812,605 | |||||||
| Financial Institutions - 1.5% | ||||||||
| General Electric Capital Corp., 0.15%, due 3/20/15 | $ | 91,219,000 | $ | 91,211,778 | ||||
| Food & Beverages - 7.7% | ||||||||
| Anheuser-Busch InBev Worldwide, Inc., 0.1%, due 3/13/15 (t) | $ | 8,000,000 | $ | 7,999,733 | ||||
| Anheuser-Busch InBev Worldwide, Inc., 0.13%, due 4/01/15 (t) | 23,449,000 | 23,446,375 | ||||||
| Anheuser-Busch InBev Worldwide, Inc., 0.11%, due 4/07/15 (t) | 1,653,000 | 1,652,813 | ||||||
| Anheuser-Busch InBev Worldwide, Inc., 0.14%, due 4/13/15 (t) | 1,382,000 | 1,381,769 | ||||||
| Anheuser-Busch InBev Worldwide, Inc., 0.12%, due 4/22/15 (t) | 22,000,000 | 21,996,187 | ||||||
| Anheuser-Busch InBev Worldwide, Inc., 0.12%, due 4/27/15 (t) | 6,032,000 | 6,030,854 | ||||||
| Anheuser-Busch InBev Worldwide, Inc., 0.12%, due 4/29/15 (t) | 60,651,000 | 60,639,072 | ||||||
| Anheuser-Busch InBev Worldwide, Inc., 0.13%, due 5/11/15 (t) | 10,169,000 | 10,166,393 | �� | |||||
| Coca-Cola Co., 0.18%, due 3/24/15 (t) | 32,610,000 | 32,606,250 | ||||||
| Coca-Cola Co., 0.12%, due 4/21/15 (t) | 25,000,000 | 24,995,750 | ||||||
| Coca-Cola Co., 0.13%, due 4/29/15 (t) | 25,000,000 | 24,994,674 | ||||||
| Coca-Cola Co., 0.11%, due 5/12/15 (t) | 25,000,000 | 24,994,500 | ||||||
| Coca-Cola Co., 0.14%, due 5/20/15 (t) | 25,000,000 | 24,992,222 | ||||||
| Coca-Cola Co., 0.13%, due 6/05/15 (t) | 50,000,000 | 49,982,667 | ||||||
| Pepsico, Inc., 0.1%, due 3/12/15 (t) | 28,200,000 | 28,199,138 | ||||||
| Pepsico, Inc., 0.1%, due 3/18/15 (t) | 39,805,000 | 39,803,120 | ||||||
5
Table of Contents
Portfolio of Investments (unaudited) – continued
| Issuer | Shares/Par | Value ($) | ||||||
| Commercial Paper (y) - continued | ||||||||
| Food & Beverages - continued | ||||||||
| Pepsico, Inc., 0.1%, due 4/06/15 (t) | $ | 15,000,000 | $ | 14,998,500 | ||||
| Pepsico, Inc., 0.09%, due 4/07/15 (t) | 68,604,000 | 68,597,654 | ||||||
|
| |||||||
| $ | 467,477,671 | |||||||
| Major Banks - 4.8% | ||||||||
| ANZ National (International) Ltd., 0.16%, due 3/02/15 (t) | $ | 90,000,000 | $ | 89,999,600 | ||||
| ANZ National (International) Ltd., 0.18%, due 4/23/15 (t) | 12,400,000 | 12,396,714 | ||||||
| Royal Bank of Canada, 0.04%, due 3/09/15 | 52,576,000 | 52,575,533 | ||||||
| Royal Bank of Canada, 0.08%, due 3/20/15 | 132,533,000 | 132,527,404 | ||||||
|
| |||||||
| $ | 287,499,251 | |||||||
| Oils - 4.0% | ||||||||
| Exxon Mobil Corp, 0.06%, due 3/03/15 | $ | 151,580,000 | $ | 151,579,495 | ||||
| Exxon Mobil Corp, 0.06%, due 3/16/15 | 38,163,000 | 38,162,046 | ||||||
| Exxon Mobil Corp., 0.05%, due 3/03/15 | 49,535,000 | 49,534,862 | ||||||
|
| |||||||
| $ | 239,276,403 | |||||||
| Pharmaceuticals - 6.6% | ||||||||
| Merck & Co., Inc., 0.08%, due 3/27/15 (t) | $ | 135,000,000 | $ | 134,992,200 | ||||
| Merck & Co., Inc., 0.08%, due 3/30/15 (t) | 106,357,000 | 106,350,146 | ||||||
| Novartis Finance Corp., 0.11%, due 3/06/15 (t) | 102,205,000 | 102,203,439 | ||||||
| Novartis Finance Corp., 0.1%, due 3/17/15 (t) | 53,750,000 | 53,747,611 | ||||||
|
| |||||||
| $ | 397,293,396 | |||||||
| Retailers - 1.7% | ||||||||
| Wal-Mart Stores, Inc., 0.08%, due 3/02/15 (t) | $ | 102,800,000 | $ | 102,799,772 | ||||
| Total Commercial Paper, at Amortized Cost and Value | $ | 2,954,591,884 | ||||||
| U.S. Government Agencies and Equivalents (y) - 32.5% | ||||||||
| Federal Home Loan Bank, 0.05%, due 3/02/15 | $ | 192,623,000 | $ | 192,622,732 | ||||
| Federal Home Loan Bank, 0.04%, due 3/03/15 | 22,000,000 | 21,999,951 | ||||||
| Federal Home Loan Bank, 0.035%, due 3/04/15 | 108,000,000 | 107,999,685 | ||||||
| Federal Home Loan Bank, 0.04%, due 3/04/15 | 4,768,000 | 4,767,984 | ||||||
| Federal Home Loan Bank, 0.06%, due 3/04/15 | 23,510,000 | 23,509,882 | ||||||
| Federal Home Loan Bank, 0.036%, due 3/11/15 | 142,414,000 | 142,412,576 | ||||||
| Federal Home Loan Bank, 0.04%, due 3/16/15 | 50,000,000 | 49,999,167 | ||||||
| Federal Home Loan Bank, 0.065%, due 3/18/15 | 9,280,000 | 9,279,715 | ||||||
| Federal Home Loan Bank, 0.065%, due 3/19/15 | 13,400,000 | 13,399,565 | ||||||
| Federal Home Loan Bank, 0.055%, due 4/01/15 | 7,415,000 | 7,414,649 | ||||||
| Federal Home Loan Bank, 0.075%, due 4/01/15 | 192,165,000 | 192,152,589 | ||||||
| Federal Home Loan Bank, 0.05%, due 4/06/15 | 11,000,000 | 10,999,450 | ||||||
| Federal Home Loan Bank, 0.06%, due 4/15/15 | 21,000,000 | 20,998,425 | ||||||
| Federal Home Loan Bank, 0.065%, due 4/22/15 | 24,201,000 | 24,198,728 | ||||||
| Federal Home Loan Bank, 0.06%, due 4/24/15 | 42,580,000 | 42,576,168 | ||||||
6
Table of Contents
Portfolio of Investments (unaudited) – continued
| Issuer | Shares/Par | Value ($) | ||||||
| U.S. Government Agencies and Equivalents (y) - continued | ||||||||
| U.S. Treasury Bill, 0.011%, due 3/19/15 | $ | 150,000,000 | $ | 149,999,175 | ||||
| U.S. Treasury Bill, 0.008%, due 4/02/15 | 50,000,000 | 49,999,667 | ||||||
| U.S. Treasury Bill, 0.045%, due 4/02/15 | 65,000,000 | 64,997,400 | ||||||
| U.S. Treasury Bill, 0.025%, due 4/16/15 | 150,000,000 | 149,995,208 | ||||||
| U.S. Treasury Bill, 0.005%, due 4/23/15 | 100,000,000 | 99,999,264 | ||||||
| U.S. Treasury Bill, 0.01%, due 4/23/15 | 8,549,600 | 85,495,056 | ||||||
| U.S. Treasury Bill, 0.03%, due 5/07/15 | 129,416,000 | 129,408,774 | ||||||
| U.S. Treasury Bill, 0.053%, due 5/07/15 | 106,204,000 | 106,193,623 | ||||||
| U.S. Treasury Bill, 0.09%, due 7/09/15 | 71,705,000 | 71,681,696 | ||||||
| U.S. Treasury Bill, 0.108%, due 7/23/15 | 35,500,000 | 35,484,664 | ||||||
| U.S. Treasury Bill, 0.276%, due 1/07/16 | 155,005,000 | 154,635,571 | ||||||
| Total U.S. Government Agencies and Equivalents, at Amortized Cost and Value | $ | 1,962,221,364 | ||||||
| Total Investments, at Amortized Cost and Value | $ | 6,037,425,248 | ||||||
| Other Assets, Less Liabilities - 0.0% | 181,969 | |||||||
| Net Assets - 100.0% | $ | 6,037,607,217 | ||||||
| (t) | Security exempt from registration with the U.S. Securities and Exchange Commission under Section 4(2) of the Securities Act of 1933. |
| (y) | The rate shown represents an annualized yield at time of purchase. |
See notes to financial statements
7
Table of Contents
Financial Statements
STATEMENT OF ASSETS AND LIABILITIES
At 2/28/15 (unaudited)
This statement represents your fund’s balance sheet, which details the assets and liabilities comprising the total value of the fund.
| Assets | ||||
Investments, at amortized cost and value | $6,037,425,248 | |||
Cash | 272 | |||
Interest receivable | 285,067 | |||
Other assets | 24,520 | |||
Total assets | $6,037,735,107 | |||
| Liabilities | ||||
Payable to affiliates | ||||
Investment adviser | $144 | |||
Shareholder servicing costs | 333 | |||
Accrued expenses and other liabilities | 127,413 | |||
Total liabilities | $127,890 | |||
Net assets | $6,037,607,217 | |||
| Net assets consist of | ||||
Paid-in capital | $6,037,774,305 | |||
Accumulated net realized gain (loss) on investments | (167,088 | ) | ||
Net assets | $6,037,607,217 | |||
Shares of beneficial interest outstanding | 6,037,774,418 | |||
Net asset value per share (net assets of $6,037,607,217 / 6,037,774,418 shares of beneficial interest outstanding) | $1.00 |
See notes to financial statements
8
Table of Contents
Financial Statements
Six months ended 2/28/15 (unaudited)
This statement describes how much your fund earned in investment income and accrued in expenses. It also describes any gains and/or losses generated by fund operations.
| Net investment income | ||||
Interest income | $2,777,260 | |||
Expenses | ||||
Shareholder servicing costs | $445 | |||
Administrative services fee | 2,829 | |||
Insurance fee | 19,400 | |||
Custodian fee | 133,137 | |||
Shareholder communications | 2,426 | |||
Audit and tax fees | 15,448 | |||
Legal fees | 24,404 | |||
Miscellaneous | 25,970 | |||
Total expenses | $224,059 | |||
Fees paid indirectly | (4 | ) | ||
Reduction of expenses by investment adviser | (1,831 | ) | ||
Net expenses | $222,224 | |||
Net investment income | $2,555,036 | |||
Net realized gain (loss) on investments | $(3,533 | ) | ||
Change in net assets from operations | $2,551,503 |
See notes to financial statements
9
Table of Contents
Financial Statements
STATEMENTS OF CHANGES IN NET ASSETS
These statements describe the increases and/or decreases in net assets resulting from operations, any distributions, and any shareholder transactions.
| Six months ended 2/28/15 | Year ended 8/31/14 | |||||||
| Change in net assets | (unaudited) | |||||||
| From operations | ||||||||
Net investment income | $2,555,036 | $4,764,578 | ||||||
Net realized gain (loss) on investments | (3,533 | ) | 6,531 | |||||
Change in net assets from operations | $2,551,503 | $4,771,109 | ||||||
| Distributions declared to shareholders | ||||||||
From net investment income | $(2,555,036 | ) | $(4,764,578 | ) | ||||
| Fund share (principal) transactions at net asset value of $1 per share | ||||||||
Net proceeds from sale of shares | 19,548,430,546 | 38,183,241,595 | ||||||
Net asset value of shares issued to shareholders in reinvestment of distributions | 2,555,036 | 4,764,559 | ||||||
Cost of shares reacquired | (18,798,355,501 | ) | (37,532,671,538 | ) | ||||
Change in net assets from fund share transactions | $752,630,081 | $655,334,616 | ||||||
Total change in net assets | $752,626,548 | $655,341,147 | ||||||
| Net assets | ||||||||
At beginning of period | 5,284,980,669 | 4,629,639,522 | ||||||
At end of period | $6,037,607,217 | $5,284,980,669 | ||||||
See notes to financial statements
10
Table of Contents
Financial Statements
The financial highlights table is intended to help you understand the fund’s financial performance for the semiannual period and the past 5 fiscal years. Certain information reflects financial results for a single fund share. The total returns in the table represent the rate by which an investor would have earned (or lost) on an investment in the fund share class (assuming reinvestment of all distributions) held for the entire period.
Six months 2/28/15 (unaudited) | Years ended 8/31 | |||||||||||||||||||||||
| 2014 | 2013 | 2012 | 2011 | 2010 | ||||||||||||||||||||
Net asset value, beginning of | $1.00 | $1.00 | $1.00 | $1.00 | $1.00 | $1.00 | ||||||||||||||||||
| Income (loss) from investment operations | ||||||||||||||||||||||||
Net investment income (d) | $0.00 | (w) | $0.00 | (w) | $0.00 | (w) | $0.00 | (w) | $0.00 | (w) | $0.00 | (w) | ||||||||||||
Net realized and | (0.00 | )(w) | 0.00 | (w) | 0.00 | (w) | — | 0.00 | (w) | — | ||||||||||||||
Total from investment | $(0.00 | )(w) | $0.00 | (w) | $0.00 | (w) | $0.00 | (w) | $0.00 | (w) | $0.00 | (w) | ||||||||||||
| Less distributions declared to shareholders | ||||||||||||||||||||||||
From net investment | $(0.00 | )(w) | $(0.00 | )(w) | $(0.00 | )(w) | $(0.00 | )(w) | $(0.00 | )(w) | $(0.00 | )(w) | ||||||||||||
Net asset value, end of | $1.00 | $1.00 | $1.00 | $1.00 | $1.00 | $1.00 | ||||||||||||||||||
Total return (%) (r) | 0.05 | (n) | 0.09 | 0.14 | 0.11 | 0.17 | 0.19 | |||||||||||||||||
| Ratios (%) (to average net assets) and Supplemental data: | ||||||||||||||||||||||||
Expenses before expense | 0.01 | (a) | 0.01 | 0.01 | 0.01 | 0.01 | 0.02 | |||||||||||||||||
Expenses after expense | 0.01 | (a) | 0.01 | 0.01 | 0.01 | 0.01 | 0.01 | |||||||||||||||||
Net investment income | 0.09 | (a) | 0.09 | 0.13 | 0.11 | 0.17 | 0.19 | |||||||||||||||||
Net assets at end of period | $6,037,607 | $5,284,981 | $4,629,640 | $3,188,972 | $2,217,966 | $2,186,310 | ||||||||||||||||||
| (a) | Annualized. |
| (d) | Per share data is based on average shares outstanding. |
| (f) | Ratios do not reflect reductions from fees paid indirectly, if applicable. |
| (n) | Not annualized. |
| (r) | Certain expenses have been reduced without which performance would have been lower. |
| (w) | Per share amount was less than $0.01. |
See notes to financial statements
11
Table of Contents
(unaudited)
(1) Business and Organization
MFS Institutional Money Market Portfolio (the fund) is a diversified series of MFS Series Trust XIV (the trust). The trust is organized as a Massachusetts business trust and is registered under the Investment Company Act of 1940, as amended, as an open-end management investment company. This fund is available only to certain U.S. registered investment companies managed by MFS. MFS does not receive a management fee from this fund.
The fund is an investment company and accordingly follows the investment company accounting and reporting guidance of the Financial Accounting Standards Board (FASB) Accounting Standards Codification Topic 946 Financial Services – Investment Companies.
On July 23, 2014, the U.S. Securities and Exchange Commission adopted amendments to its money market fund regulations. At this time, management is evaluating the potential implications of the changes.
(2) Significant Accounting Policies
General – The preparation of financial statements in conformity with U.S. generally accepted accounting principles requires management to make estimates and assumptions that affect the reported amounts of assets and liabilities, and disclosure of contingent assets and liabilities at the date of the financial statements and the reported amounts of increases and decreases in net assets from operations during the reporting period. Actual results could differ from those estimates. In the preparation of these financial statements, management has evaluated subsequent events occurring after the date of the fund’s Statement of Assets and Liabilities through the date that the financial statements were issued.
In June 2014, FASB issued Accounting Standards Update 2014-11, Transfers and Servicing (Topic 860) – Repurchase-to-Maturity Transactions, Repurchase Financings, and Disclosures (“ASU 2014-11”). ASU 2014-11 changes the accounting for repurchase-to-maturity transactions (i.e., repurchase agreements that settle at the same time as the maturity of the transferred financial asset) and enhances the required disclosures for repurchase agreements and other similar transactions. Although still evaluating the potential impacts of ASU 2014-11 to the fund, management expects that the impact of the fund’s adoption will be limited to additional financial statement disclosures which would first be effective for interim reporting periods beginning after March 15, 2015.
Balance Sheet Offsetting – The fund’s accounting policy with respect to balance sheet offsetting is that, absent an event of default by the counterparty or a termination of the agreement, the International Swaps and Derivatives Association (ISDA) Master Agreement does not result in an offset of reported amounts of financial assets and financial liabilities in the Statement of Assets and Liabilities across transactions between the fund and the applicable counterparty. The fund’s right to setoff may be restricted or prohibited by the bankruptcy or insolvency laws of the particular jurisdiction to which a specific master netting agreement counterparty is subject. Balance sheet offsetting disclosures, to the extent applicable to the fund, have been included in the
12
Table of Contents
Notes to Financial Statements (unaudited) – continued
fund’s Significant Accounting Policies note under the captions for each of the fund’s in-scope financial instruments and transactions.
Investment Valuations – Pursuant to procedures approved by the Board of Trustees, investments held by the fund are generally valued at amortized cost, which approximates market value. Amortized cost involves valuing an instrument at its cost as adjusted for amortization of premium or accretion of discount rather than its current market value. The amortized cost value of an instrument can be different from the market value of an instrument.
Various inputs are used in determining the value of the fund’s assets or liabilities. These inputs are categorized into three broad levels. In certain cases, the inputs used to measure fair value may fall into different levels of the fair value hierarchy. In such cases, an investment’s level within the fair value hierarchy is based on the lowest level of input that is significant to the fair value measurement. The fund’s assessment of the significance of a particular input to the fair value measurement in its entirety requires judgment, and considers factors specific to the investment. Level 1 includes unadjusted quoted prices in active markets for identical assets or liabilities. Level 2 includes other significant observable market-based inputs (including quoted prices for similar securities, interest rates, prepayment speed, and credit risk). Level 3 includes unobservable inputs, which may include the adviser’s own assumptions in determining the fair value of investments. The following is a summary of the levels used as of February 28, 2015 in valuing the fund’s assets or liabilities:
| Investments at Value | Level 1 | Level 2 | Level 3 | Total | ||||||||||||
| Short Term Securities | $— | $6,037,425,248 | $— | $6,037,425,248 | ||||||||||||
For further information regarding security characteristics, see the Portfolio of Investments.
Repurchase Agreements – The fund enters into repurchase agreements under the terms of Master Repurchase Agreements with approved counterparties. Each repurchase agreement is recorded at cost. The fund requires that the securities collateral in a repurchase transaction be transferred to a custodian. The fund monitors, on a daily basis, the value of the collateral to ensure that its value, including accrued interest, is greater than amounts owed to the fund under each such repurchase agreement. Upon an event of default under a Master Repurchase Agreement, the non-defaulting party may close out all transactions traded under such agreement and net amounts owed under each transaction to one net amount payable by one party to the other. Absent an event of default, the Master Repurchase Agreement does not result in an offset of reported amounts of assets and liabilities in the Statement of Assets and Liabilities across transactions between the fund and the applicable counterparty. At period end, the fund had no investments in repurchase agreements.
Indemnifications – Under the fund’s organizational documents, its officers and Trustees may be indemnified against certain liabilities and expenses arising out of the performance of their duties to the fund. Additionally, in the normal course of business, the fund enters into agreements with service providers that may contain indemnification clauses. The fund’s maximum exposure under these agreements is unknown as this would involve future claims that may be made against the fund that have not yet occurred.
13
Table of Contents
Notes to Financial Statements (unaudited) – continued
Investment Transactions and Income – Investment transactions are recorded on the trade date. Interest income is recorded on the accrual basis. All premium and discount is amortized or accreted for financial statement purposes in accordance with U.S. generally accepted accounting principles.
Fees Paid Indirectly – The fund’s custody fee may be reduced according to an arrangement that measures the value of cash deposited with the custodian by the fund. This amount, for the six months ended February 28, 2015, is shown as a reduction of total expenses in the Statement of Operations.
Tax Matters and Distributions – The fund intends to qualify as a regulated investment company, as defined under Subchapter M of the Internal Revenue Code, and to distribute all of its taxable income, including realized capital gains. As a result, no provision for federal income tax is required. The fund’s federal tax returns, when filed, will remain subject to examination by the Internal Revenue Service for a three year period. Management has analyzed the fund’s tax positions taken on federal and state tax returns for all open tax years and does not believe that there are any uncertain tax positions that require recognition of a tax liability.
Distributions to shareholders are recorded on the ex-dividend date. Income and capital gain distributions are determined in accordance with income tax regulations, which may differ from U.S. generally accepted accounting principles. Certain capital accounts in the financial statements are periodically adjusted for permanent differences in order to reflect their tax character. These adjustments have no impact on net assets or net asset value per share. Temporary differences which arise from recognizing certain items of income, expense, gain or loss in different periods for financial statement and tax purposes will reverse at some time in the future. Distributions in excess of net investment income or net realized gains are temporary overdistributions for financial statement purposes resulting from differences in the recognition or classification of income, expenses, or distributions for financial statement and tax purposes.
During the year ended August 31, 2014, there were no significant adjustments due to differences between book and tax accounting.
The tax character of distributions made during the current period will be determined at fiscal year end. The tax character of distributions declared to shareholders for the last fiscal year is as follows:
| 8/31/14 | ||||
| Ordinary income (including any short-term capital gains) | $4,764,578 | |||
The federal tax cost and the tax basis components of distributable earnings were as follows:
| As of 2/28/14 | ||||
| Cost of investments | $6,037,425,248 | |||
| As of 8/31/14 | ||||
| Capital loss carryforwards | (163,555 | ) | ||
The aggregate cost above includes prior fiscal year end tax adjustments, if applicable.
14
Table of Contents
Notes to Financial Statements (unaudited) – continued
Under the Regulated Investment Company Modernization Act of 2010 (the “Act”), net capital losses recognized for fund fiscal years beginning after August 31, 2011 may be carried forward indefinitely, and their character is retained as short-term and/or long-term losses (“post-enactment losses”). Previously, net capital losses were carried forward for eight years and treated as short-term losses (“pre-enactment losses”). As a transition rule, the Act requires that all post-enactment net capital losses be used before pre-enactment net capital losses.
As of August 31, 2014, the fund had capital loss carryforwards available to offset future realized gains. Such pre-enactment losses expire as follows:
| 8/31/17 | $(163,555 | ) |
(3) Transactions with Affiliates
Investment Adviser – The fund has an investment advisory agreement with MFS to provide overall investment management and related administrative services and facilities to the fund. MFS receives no compensation under this agreement.
Shareholder Servicing Agent – MFS Service Center, Inc. (MFSC), a wholly-owned subsidiary of MFS, provides transfer agent and recordkeeping functions in connection with the issuance, transfer, and redemption of shares of the fund under a Shareholder Servicing Agent Agreement. MFSC is not paid a fee for providing these services. MFSC receives payment from the fund for out-of-pocket expenses paid by MFSC on behalf of the fund. For the six months ended February 28, 2015, these costs amounted to $445. The fund may also pay shareholder servicing related costs to non-related parties.
Administrator – MFS provides certain financial, legal, shareholder communications, compliance, and other administrative services to the fund. Prior to January 1, 2015, MFS was not paid a fee for providing these services. Effective January 1, 2015, under an administrative services agreement, the fund reimburses MFS the costs incurred to provide these services. The fund is charged an annual fixed amount of $17,500. The administrative services fee incurred for the period January 1, 2015 through February 28, 2015, was equivalent to an annual effective rate of 0.0001% of the fund’s average daily net assets.
Trustees’ and Officers’ Compensation – The fund may pay compensation to independent Trustees in the form of a retainer, attendance fees, and additional compensation to Board and Committee chairpersons. The fund does not pay compensation directly to Trustees or officers of the fund who are also officers of the investment adviser, all of whom receive remuneration for their services to the fund from MFS. Certain officers and Trustees of the fund are officers or directors of MFS, MFS Fund Distributors, Inc. (MFD), and MFSC. The independent Trustees do not currently receive compensation from the fund.
Other – Effective November 1, 2014, this fund and certain other funds managed by MFS (the funds) have entered into a service agreement (the ISO Agreement) which provides for payment of fees solely by the funds to Tarantino LLC in return for the provision of services of an Independent Senior Officer (ISO) for the funds. Frank L. Tarantino serves as the ISO and is an officer of the funds and the sole member of Tarantino LLC. The funds can terminate the ISO Agreement with Tarantino LLC at any time under the terms of the ISO Agreement. Prior to November 1, 2014, the funds had
15
Table of Contents
Notes to Financial Statements (unaudited) – continued
entered into a service agreement (the Compliance Officer Agreement) which provided for payment of fees by the funds to Tarantino LLC in return for the provision of services of an Independent Chief Compliance Officer (ICCO) for the funds. Prior to November 1, 2014, Frank L. Tarantino served as the ICCO. Effective October 31, 2014, Mr. Tarantino resigned as ICCO and the Compliance Officer Agreement between the funds and Tarantino LLC was terminated. For the six months ended February 28, 2015, the aggregate fees paid by the fund under these agreements were $10,327 and are included in “Miscellaneous” expense in the Statement of Operations. MFS had agreed to reimburse the fund for a portion of the payments made by the fund for the services under the Compliance Officer Agreement in the amount of $1,831, which is included in the reduction of total expenses in the Statement of Operations. Additionally, MFS has agreed to bear all expenses associated with office space, other administrative support, and supplies provided to the ICCO and ISO.
(4) Shares of Beneficial Interest
The fund’s Declaration of Trust permits the Trustees to issue an unlimited number of full and fractional shares of beneficial interest.
The fund is solely invested in by other MFS funds for the purpose of investing excess cash balances on a short-term basis. The MFS funds do not invest in this fund for the purpose of exercising management or control. At the end of the period, the MFS International Value Fund, the MFS Emerging Markets Debt Fund, the MFS Value Fund, and the MFS Total Return Fund were the owners of record of approximately 21%, 8%, 8%, and 5%, respectively, of the value of outstanding voting shares of the fund. No other MFS fund owned more than 5% of the value of outstanding voting shares of the fund.
(5) Line of Credit
The fund and certain other funds managed by MFS participate in a $1.1 billion unsecured committed line of credit, subject to a $1 billion sublimit, provided by a syndication of banks under a credit agreement. Borrowings may be made for temporary financing needs. Interest is charged to each fund, based on its borrowings, generally at a rate equal to the higher of the Federal Reserve funds rate or one month LIBOR plus an agreed upon spread. A commitment fee, based on the average daily, unused portion of the committed line of credit, is allocated among the participating funds at the end of each calendar quarter. In addition, the fund and other funds managed by MFS have established unsecured uncommitted borrowing arrangements with certain banks for temporary financing needs. Interest is charged to each fund, based on its borrowings, at a rate equal to the Federal Reserve funds rate plus an agreed upon spread. For the six months ended February 28, 2015, the fund’s commitment fee and interest expense were $10,435 and $0, respectively, and are included in “Miscellaneous” expense in the Statement of Operations.
16
Table of Contents
PROXY VOTING POLICIES AND INFORMATION
MFS votes proxies on behalf of the fund pursuant to proxy voting policies and procedures that are available without charge, upon request, by calling 1-800-225-2606, by visiting the Proxy Voting section of mfs.com or by visiting the SEC’s Web site at http://www.sec.gov.
Information regarding how the fund voted proxies relating to portfolio securities during the most recent twelve-month period ended June 30 is available without charge by visiting the Proxy Voting section of mfs.com or by visiting the SEC’s Web site at http://www.sec.gov.
QUARTERLY PORTFOLIO DISCLOSURE
The fund will file a complete schedule of portfolio holdings with the Securities and Exchange Commission (the Commission) for the first and third quarters of each fiscal year on Form N-Q. The fund’s Form N-Q is also available on the EDGAR database on the Commission’s Internet Web site at http://www.sec.gov, and may be reviewed and copied at the:
Public Reference Room
Securities and Exchange Commission
100 F Street, NE, Room 1580
Washington, D.C. 20549
Information on the operation of the Public Reference Room may be obtained by calling the Commission at 1-800-SEC-0330. Copies of the fund’s Form N-Q also may be obtained, upon payment of a duplicating fee, by electronic request at the following e-mail address: publicinfo@sec.gov or by writing the Public Reference Section at the above address.
From time to time, MFS may post important information about the fund or the MFS funds on the MFS web site (mfs.com). This information is available by visiting the “Market Commentary” and “Announcements” sub sections in the “Market Outlooks” section of mfs.com.
PROVISION OF FINANCIAL REPORTS AND SUMMARY PROSPECTUSES
The fund produces financial reports every six months and updates its summary prospectus and prospectus annually. To avoid sending duplicate copies of materials to households, only one copy of the fund’s annual and semiannual report and summary prospectus may be mailed to shareholders having the same last name and residential address on the fund’s records. However, any shareholder may contact MFSC (please see back cover for address and telephone number) to request that copies of these reports and summary prospectuses be sent personally to that shareholder.
17
Table of Contents
Save paper with eDelivery.
| MFS® will send you prospectuses, |

reports, and proxies directly via e-mail so you will get information faster with less mailbox clutter.
To sign up:
1. Go to mfs.com.
2. Log in via MFS® Access.
3. Select eDelivery.
If you own your MFS fund shares through a financial institution or a retirement plan, MFS® TALK, MFS® Access, or eDelivery may not be available to you.
WEB SITE
mfs.com
MFS TALK
1-800-637-8255
24 hours a day
ACCOUNT SERVICE AND LITERATURE
Shareholders
1-800-225-2606
Financial advisors
1-800-343-2829
Retirement plan services
1-800-637-1255
MAILING ADDRESS
MFS Service Center, Inc.
P.O. Box 55824
Boston, MA 02205-5824
OVERNIGHT MAIL
MFS Service Center, Inc.
c/o Boston Financial Data Services
30 Dan Road
Canton, MA 02021-2809
Table of Contents
| ITEM 2. | CODE OF ETHICS. |
During the period covered by this report, the Registrant has not amended any provision in its Code of Ethics (the “Code”) that relates to an element of the Code’s definitions enumerated in paragraph (b) of Item 2 of this Form N-CSR. During the period covered by this report, the Registrant did not grant a waiver, including an implicit waiver, from any provision of the Code.
| ITEM 3. | AUDIT COMMITTEE FINANCIAL EXPERT. |
Not applicable for semi-annual reports.
| ITEM 4. | PRINCIPAL ACCOUNTANT FEES AND SERVICES. |
Not applicable for semi-annual reports.
| ITEM 5. | AUDIT COMMITTEE OF LISTED REGISTRANTS. |
Not applicable to the Registrant.
| ITEM 6. | INVESTMENTS |
A schedule of investments for each series of the Registrant is included as part of the report to shareholders of such series under Item 1 of this Form N-CSR.
| ITEM 7. | DISCLOSURE OF PROXY VOTING POLICIES AND PROCEDURES FOR CLOSED-END MANAGEMENT INVESTMENT COMPANIES. |
Not applicable to the Registrant.
| ITEM 8. | PORTFOLIO MANAGERS OF CLOSED-END MANAGEMENT INVESTMENT COMPANIES. |
Not applicable to the Registrant.
| ITEM 9. | PURCHASES OF EQUITY SECURITIES BY CLOSED-END MANAGEMENT INVESTMENT COMPANY AND AFFILIATED PURCHASERS. |
Not applicable to the Registrant.
Table of Contents
| ITEM 10. | SUBMISSION OF MATTERS TO A VOTE OF SECURITY HOLDERS. |
There were no material changes to the procedures by which shareholders may send recommendations to the Board for nominees to the Registrant’s Board since the Registrant last provided disclosure as to such procedures in response to the requirements of Item 407 (c)(2)(iv) of Regulation S-K or this Item.
| ITEM 11. | CONTROLS AND PROCEDURES. |
| (a) | Based upon their evaluation of the effectiveness of the registrant’s disclosure controls and procedures (as defined in Rule 30a-3(c) under the Investment Company Act of 1940 (the “Act”)) as conducted within 90 days of the filing date of this report on Form N-CSR, the registrant’s principal financial officer and principal executive officer have concluded that those disclosure controls and procedures provide reasonable assurance that the material information required to be disclosed by the registrant on this report is recorded, processed, summarized and reported within the time periods specified in the Securities and Exchange Commission’s rules and forms. |
| (b) | There were no changes in the registrant’s internal controls over financial reporting (as defined in Rule 30a-3(d) under the Act) that occurred during the second fiscal quarter of the period covered by the report that have materially affected, or are reasonably likely to materially affect, the registrant’s internal control over financial reporting. |
| ITEM 12. | EXHIBITS. |
| (a) | File the exhibits listed below as part of this form. Letter or number the exhibits in the sequence indicated. |
| (1) | Any code of ethics, or amendment thereto, that is the subject of the disclosure required by Item 2, to the extent that the registrant intends to satisfy the Item 2 requirements through filing of an exhibit. |
| (2) | A separate certification for each principal executive officer and principal financial officer of the registrant as required by Rule 30a-2(a) under the Act (17 CFR 270.30a-2): Attached hereto. |
| (b) | If the report is filed under Section 13(a) or 15(d) of the Exchange Act, provide the certifications required by Rule 30a-2(b) under the Act (17 CFR 270.30a-2(b)), Rule 13a-14(b) or Rule 15d-14(b) under the Exchange Act (17 CFR 240.13a-14(b) or 240.15d-14(b)) and Section 1350 of Chapter 63 of Title 18 of the United States Code (18 U.S.C. 1350) as an exhibit. A certification furnished pursuant to this paragraph will not be deemed “filed” for the purposes of Section 18 of the Exchange Act (15 U.S.C. 78r), or otherwise subject to the liability of that section. Such certification will not be deemed to be incorporated by reference into any filing under the Securities Act of 1933 or the Exchange Act, except to the extent that the registrant specifically incorporates it by reference: Attached hereto. |
Table of Contents
Notice
A copy of the Declaration of Trust, as amended, of the Registrant is on file with the Secretary of State of The Commonwealth of Massachusetts and notice is hereby given that this instrument is executed on behalf of the Registrant by an officer of the Registrant as an officer and not individually and the obligations of or arising out of this instrument are not binding upon any of the Trustees or shareholders individually, but are binding only upon the assets and property of the respective constituent series of the Registrant.
Table of Contents
SIGNATURES
Pursuant to the requirements of the Securities Exchange Act of 1934 and the Investment Company Act of 1940, the registrant has duly caused this report to be signed on its behalf by the undersigned, thereunto duly authorized.
(Registrant) MFS SERIES TRUST XIV
| By (Signature and Title)* | ROBIN A. STELMACH | |
| Robin A. Stelmach, President |
Date: April 14, 2015
Pursuant to the requirements of the Securities Exchange Act of 1934 and the Investment Company Act of 1940, this report has been signed below by the following persons on behalf of the registrant and in the capacities and on the dates indicated.
| By (Signature and Title)* | ROBIN A. STELMACH | |
| Robin A. Stelmach, President (Principal Executive Officer) |
Date: April 14, 2015
| By (Signature and Title)* | DAVID L. DILORENZO | |
| David L. DiLorenzo, Treasurer (Principal Financial Officer and Accounting Officer) |
Date: April 14, 2015
| * | Print name and title of each signing officer under his or her signature. |