UNITED STATES
SECURITIES AND EXCHANGE COMMISSION
Washington, D.C. 20549
FORM N-CSR
CERTIFIED SHAREHOLDER REPORT OF REGISTERED MANAGEMENT INVESTMENT COMPANIES
Investment Company Act file number 811-22039
First Trust Specialty Finance and Financial Opportunities Fund
(Exact name of registrant as specified in charter)
120 East Liberty Drive, Suite 400
Wheaton, IL 60187
(Address of principal executive offices) (Zip code)
W. Scott Jardine, Esq.
First Trust Portfolios L.P.
120 East Liberty Drive, Suite 400
Wheaton, IL 60187
(Name and address of agent for service)
registrant’s telephone number, including area code: 630-765-8000
Date of fiscal year end:November 30
Date of reporting period:May 31, 2019
Form N-CSR is to be used by management investment companies to file reports with the Commission not later than 10 days after the transmission to stockholders of any report that is required to be transmitted to stockholders under Rule 30e-1 under the Investment Company Act of 1940 (17 CFR 270.30e-1). The Commission may use the information provided on Form N-CSR in its regulatory, disclosure review, inspection, and policymaking roles.
A registrant is required to disclose the information specified by Form N-CSR, and the Commission will make this information public. A registrant is not required to respond to the collection of information contained in Form N-CSR unless the Form displays a currently valid Office of Management and Budget (“OMB”) control number. Please direct comments concerning the accuracy of the information collection burden estimate and any suggestions for reducing the burden to Secretary, Securities and Exchange Commission, 100 F Street, NE, Washington, DC 20549. The OMB has reviewed this collection of information under the clearance requirements of 44 U.S.C. § 3507.
Item 1. Reports to Stockholders.
The Report to Shareholders is attached herewith.

First Trust
Specialty Finance and Financial
Opportunities Fund (FGB)
Semi-Annual Report
For the Six Months Ended
May 31, 2019
First Trust Specialty Finance and Financial Opportunities Fund (FGB)
Semi-Annual Report
May 31, 2019
Caution Regarding Forward-Looking Statements
This report contains certain forward-looking statements within the meaning of the Securities Act of 1933, as amended, and the Securities Exchange Act of 1934, as amended. Forward-looking statements include statements regarding the goals, beliefs, plans or current expectations of First Trust Advisors L.P. (“First Trust” or the “Advisor”) and/or Confluence Investment Management LLC (“Confluence” or the “Sub-Advisor”) and their respective representatives, taking into account the information currently available to them. Forward-looking statements include all statements that do not relate solely to current or historical fact. For example, forward-looking statements include the use of words such as “anticipate,” “estimate,” “intend,” “expect,” “believe,” “plan,” “may,” “should,” “would” or other words that convey uncertainty of future events or outcomes.
Forward-looking statements involve known and unknown risks, uncertainties and other factors that may cause the actual results, performance or achievements of First Trust Specialty Finance and Financial Opportunities Fund (the “Fund”) to be materially different from any future results, performance or achievements expressed or implied by the forward-looking statements. When evaluating the information included in this report, you are cautioned not to place undue reliance on these forward-looking statements, which reflect the judgment of the Advisor and/or Sub-Advisor and their respective representatives only as of the date hereof. We undertake no obligation to publicly revise or update these forward-looking statements to reflect events and circumstances that arise after the date hereof.
Performance and Risk Disclosure
There is no assurance that the Fund will achieve its investment objectives. The Fund is subject to market risk, which is the possibility that the market values of securities owned by the Fund will decline and that the value of the Fund shares may therefore be less than what you paid for them. Accordingly, you can lose money by investing in the Fund. See “Risk Considerations” in the Additional Information section of this report for a discussion of certain other risks of investing in the Fund.
Performance data quoted represents past performance, which is no guarantee of future results, and current performance may be lower or higher than the figures shown. For the most recent month-end performance figures, please visitwww.ftportfolios.com or speak with your financial advisor. Investment returns, net asset value and common share price will fluctuate and Fund shares, when sold, may be worth more or less than their original cost.
The Advisor may also periodically provide additional information on Fund performance on the Fund’s web page atwww.ftportfolios.com.
How to Read This Report
This report contains information that may help you evaluate your investment in the Fund. It includes details about the Fund and presents data and analysis that provide insight into the Fund’s performance and investment approach.
By reading the portfolio commentary by the portfolio management team of the Fund, you may obtain an understanding of how the market environment affected the Fund’s performance. The statistical information that follows may help you understand the Fund’s performance compared to that of relevant market benchmarks.
It is important to keep in mind that the opinions expressed by personnel of First Trust and Confluence are just that: informed opinions. They should not be considered to be promises or advice. The opinions, like the statistics, cover the period through the date on the cover of this report. The material risks of investing in the Fund are spelled out in the prospectus, the statement of additional information, this report and other Fund regulatory filings.
First Trust Specialty Finance and Financial Opportunities Fund (FGB)
Semi-Annual Letter from the Chairman and CEO
May 31, 2019
Dear Shareholders,
One thing we can all agree on and expect: headline news coming out of Washington, D.C. continues to influence the financial markets. As December 2018 came to a close, the partial government shutdown and potential bank liquidity crisis, unnerved many investors. While tariff trade talks between the United States and China loomed well beyond the March 1, 2019 deadline these skirmishes were compounded by a late May announcement from President Trump that he would enact new tariffs on Mexican imports if the flow of illegal immigration was not curtailed.
As of May 31, 2019, U.S. equity markets, as indicated by the S&P 500® Index, returned -6.35% for the month of May, and 10.74% for the calendar year-to-date. Bond markets, measured by the Bloomberg Barclays U.S. Aggregate Bond Index, returned 1.78% and 4.80%, respectively, for the same periods. The 10-Year Treasury Note yields declined from 2.99% on November 30, 2018 to 2.13% as of May 31, 2019, and depending on how you read the tea leaves, may indicate another rate cut is on the way.
Despite the ongoing bluster of the news cycle, the economy keeps humming along and productivity growth due to deregulation and lower taxes on corporate profits has improved over the last two years.
| • | Ninety-eight percent of companies in the S&P 500® Index reported earnings for the first quarter of 2019, and 76% of these companies beat their estimates. |
| • | The Consumer Confidence Index, as reported on May 28, 2019 hit a six-month high at 134.1. |
| • | The U.S. inflation rate hovers near 2% on average, as it has for the last decade. |
| • | The U.S. unemployment rate of 3.6% for May remains at the lowest level since December of 1969. |
No one can predict the inevitable and expected market fluctuations, so speak periodically with your investment professional who can provide insight when it comes to investing and discovering opportunities when they arise. That’s a drum worth beating and it’s how most of us build wealth over time.
Thank you for giving First Trust the opportunity to be a part of your financial plan. We value our relationship with you.
Sincerely,
James A. Bowen
Chairman of the Board of Trustees
Chief Executive Officer of First Trust Advisors L.P.
First Trust Specialty Finance and Financial Opportunities Fund (FGB)
“AT A GLANCE”
As of May 31, 2019 (Unaudited)
| Fund Statistics | |
| Symbol on New York Stock Exchange | FGB |
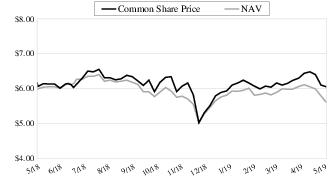
| Common Share Price | $6.05 |
| Common Share Net Asset Value (“NAV”) | $5.60 |
| Premium (Discount) to NAV | 8.04% |
| Net Assets Applicable to Common Shares | $80,465,575 |
| Current Quarterly Distribution per Common Share(1) | $0.1750 |
| Current Annualized Distribution per Common Share | $0.7000 |
| Current Distribution Rate on Common Share Price(2) | 11.57% |
| Current Distribution Rate on NAV(2) | 12.50% |
Common Share Price & NAV (weekly closing price)
| Performance | | | | | |
| | | | Average Annual Total Returns |
| | 6 Months Ended
5/31/19 | 1 Year Ended
5/31/19 | 5 Years Ended
5/31/19 | 10 Years Ended
5/31/19 | Inception
(5/25/07)
to 5/31/19 |
| Fund Performance(3) | | | | | |
| NAV | 2.82% | 5.16% | 3.55% | 12.74% | 0.48% |
| Market Value | 5.77% | 10.12% | 6.03% | 14.50% | 0.74% |
| Index Performance | | | | | |
| Blended Benchmark(4) | 2.18% | 3.27% | 5.26% | 13.83% | 4.29% |
| MSCI U.S. Investable Market Financials Index | -3.46% | -5.66% | 7.28% | 9.98% | -0.43% |
| Asset Classification | % of Total
Investments |
| Common Stocks - Business Development Companies | 88.4% |
| Real Estate Investment Trusts (REITs) | 11.6 |
| Total | 100.0% |
| Industry Classification | % of Total
Investments |
| Capital Markets | 88.4% |
| Mortgage Real Estate Investment Trusts | 11.6 |
| Total | 100.0% |
| Top Ten Holdings | % of Total
Investments |
| Ares Capital Corp. | 12.0% |
| New Mountain Finance Corp. | 7.7 |
| BlackRock TCP Capital Corp. | 7.5 |
| Golub Capital BDC, Inc. | 7.2 |
| Hercules Capital, Inc. | 7.1 |
| TriplePoint Venture Growth BDC Corp. | 6.2 |
| Barings BDC, Inc. | 6.0 |
| Solar Capital Ltd. | 5.8 |
| Annaly Capital Management, Inc. | 5.7 |
| Two Harbors Investment Corp. | 5.0 |
| Total | 70.2% |
| (1) | Most recent distribution paid or declared through 5/31/2019. Subject to change in the future. |
| (2) | Distribution rates are calculated by annualizing the most recent distribution paid or declared through the report date and then dividing by Common Share Price or NAV, as applicable, as of 5/31/2019. Subject to change in the future. |
| (3) | Total return is based on the combination of reinvested dividend, capital gain, and return of capital distributions, if any, at prices obtained by the Dividend Reinvestment Plan and changes in NAV per share for NAV returns and changes in Common Share Price for market value returns. Total returns do not reflect sales load and are not annualized for periods of less than one year. Past performance is not indicative of future results. |
| (4) | Blended Benchmark consists of the following:
Wells Fargo BDC Index (70%), FTSE NAREIT Mortgage REIT Index (20%) and S&P SmallCap Financials Index (10%). |
Portfolio Commentary
First Trust Specialty Finance and Financial Opportunities Fund (FGB)
Semi-Annual Report
May 31, 2019 (Unaudited)
Advisor
First Trust Advisors L.P. (“First Trust” or the “Advisor”) serves as the investment advisor to the First Trust Specialty Finance and Financial Opportunities Fund (the “Fund”). First Trust is responsible for the ongoing monitoring of the Fund’s investment portfolio, managing the Fund’s business affairs and providing certain administrative services necessary for the management of the Fund.
Sub-Advisor
Confluence Investment Management LLC, a registered investment advisor (“Confluence” or the “Sub-Advisor”), located in St. Louis, Missouri, serves as the sub-advisor to the Fund. The investment professionals at Confluence have over 80 years of aggregate portfolio management experience. Confluence professionals have invested in a wide range of specialty finance and other financial company securities during various market cycles, working to provide attractive risk-adjusted returns to clients.
Confluence Portfolio Management Team
Mark Keller, CFA
Chief Executive Officer and Chief Investment Officer
David Miyazaki, CFA
Senior Vice President and Portfolio Manager
Daniel Winter, CFA
Senior Vice President and Chief Investment Officer - Value Equity
First Trust Specialty Finance and Financial Opportunities Fund (FGB)
The primary investment objective of the Fund is to seek a high level of current income. As a secondary objective, the Fund seeks an attractive total return. The Fund pursues its investment objectives by investing, under normal market conditions, at least 80% of its Managed Assets in a portfolio of securities of specialty finance and other financial companies that the Fund’s Sub-Advisor believes offer attractive opportunities for income and capital appreciation. Under normal market conditions, the Fund concentrates its investments in securities of companies within industries in the financial sector. “Managed Assets” means the total asset value of the Fund minus the sum of its liabilities, other than the principal amount of borrowings. There can be no assurance that the Fund will achieve its investment objectives. The Fund may not be appropriate for all investors.
Market Recap
The Fund is a financial sector fund with a particular focus on a niche called business development companies (“BDCs”). BDCs lend to and invest in private companies, oftentimes working with those not large enough to efficiently access the public markets. Each BDC has a unique profile, determined by its respective management team. Some specialize in particular industries, while others apply a more generalized approach and maintain a diversified portfolio. Both approaches can work effectively and offer shareholders a unique and differentiated return opportunity derived from the private markets. As of May 31, 2019, the Fund had approximately 88% of its assets invested in 22 BDCs. The Fund also maintained an allocation of almost 12% to mortgage-backed securities real estate investment trusts (“MBS REITs”).
Performance Analysis
| | 6 Months
Total Return
Ended 5/31/19 | |
| FGB Market Value Total Return | 5.77% | |
| FGB NAV Total Return | 2.82% | |
| Blended Benchmark* | 2.18% | |
*Components and weights of the Blended Benchmark: Wells Fargo BDC Index (70%); FTSE NAREIT Mortgage REIT Index (20%); S&P SmallCap Financials Index (10%).Source: Bloomberg.
The Fund uses leverage because we believe that, over time, leverage provides opportunities for additional income and total return for common shareholders. However, the use of leverage can also expose common shareholders to additional volatility. For example, as the prices of securities held by the Fund decline, the negative impact of valuation changes on Common Share net asset value (“NAV”) and common shareholder total return is magnified by the use of leverage. Conversely, leverage may enhance Common Share returns during periods when the prices of securities held by the Fund generally are rising. For the performance referenced above, the use of leverage had a negative impact on returns. The Blended Benchmark does not use leverage.
Portfolio Commentary (Continued)
First Trust Specialty Finance and Financial Opportunities Fund (FGB)
Semi-Annual Report
May 31, 2019 (Unaudited)
The Fund’s market value total return and the Fund’s NAV total return for the six-month period ended May 31, 2019 were both higher than that of the Blended Benchmark. During this time frame, BDCs continued to deliver steady operating performance against the backdrop of changing and volatile financial markets. This trend was apparent at the end of 2018, when financial markets declined sharply in response to concerns regarding tight Fed policy, trade disputes and slowing global economic growth. Throughout this time frame, industry fundamentals for BDCs remained intact, even as their loan portfolio values were marked down. The steady performance of loans positioned BDCs to not only recover nicely in the early part of 2019, but also helped BDCs chart a course that was less volatile than many other areas of the equity markets.
The industry also continued to adjust to a regulatory change enacted by Congress in March of 2018. The change involved an increase in the amount of debt BDCs can utilize in their business. Previously, regulations generally limited BDCs to having no more debt than equity in their capital structure, a ceiling known as “1:1.” The regulatory change doubled the amount of permissible debt, raising the ceiling to “2:1.”
Although the 2:1 ceiling creates more flexibility for BDCs and can open the door to potentially higher returns, higher leverage can also cut the wrong way and exacerbate the effect of losses on shareholders. For this reason, we’ve had a cautious view toward the higher ceiling. And we’re not alone. Banks who lend to BDCs, industry analysts, debt rating agencies and other investors also expressed a measure of caution.
We believe the response from management teams has generally been prudent. Increases in debt usage were announced in transparent fashion and implemented gradually. The slow approach allowed the interested parties to respond, adjust and better understand how higher levels of debt might change the return and risks of the industry. We are still early in the process and remain cautious; however, we believe the industry’s first steps toward the use of higher leverage have generally been taken with appropriate care.
The BDC industry also continues to evolve and grow. In recent quarters, certain underperforming managers were replaced with new ones. The initial work by the new managers to turn around troubled loan portfolios has been constructive. In other situations, consolidation has also helped rationalize and combine weaker BDCs, even as new BDCs continue to enter the public arena. And finally, efforts to address industry regulations regarding Acquired Fund Fees and Expenses (“AFFE”) continue to move forward. We believe these trends have not just increased the size of the industry, but also its overall quality.
The Fund’s MBS REITs continue to face a challenging interest rate environment. The flat, and sometimes inverted, yield curve has put downward pressure on MBS REIT profits. At the same time, fluctuations in mortgage refinancing volume and changes in Fed policy have also weighed on MBS prices. These conditions combined to lower MBS REIT income and dividends for some MBS REITs, including some held by the Fund.
Market and Fund Outlook
One of the central concepts at the formation of the Fund back in 2007 was to provide a means of investing in BDCs. The industry back then was still early in its formation and the Fund was positioned to create a way to participate in its growth, while delivering a level of income that was both substantial as well as unique. Twelve years later, we have most certainly witnessed significant growth in the BDC industry. Assets have grown as the number and size of publicly traded BDCs have both increased. At the same time, capital structures have strengthened with more diversity on the debt side of balance sheets, while managerial fee structures have become more shareholder-friendly. Regulations have also evolved with the 2018 increase in the BDC debt ceiling, along with current work regarding AFFE. We believe these changes have collectively helped advance the industry, improving quality, diversity and liquidity for investors.
On the income front, the high level of income earned from BDC investments in the middle market has followed a differentiated path relative to traditional debt markets. BDCs have made loans and collected interest at relatively high rates when compared to the general level of interest rates. In turn, the Fund has been able to deliver this income to shareholders through its own distributions.
As we look forward, we believe the income earned by BDCs from middle market loan portfolios should remain differentiated, and most likely, higher than most other fixed income markets. That said, we believe the protracted time frame of low to very low interest rates has encouraged large amounts of capital to flow into the middle markets, a trend that has pushed yields on BDC loan portfolios lower. In turn, this has put downward pressure on the income and dividend-generating capacity for many BDCs. And for certain BDCs, the challenges have been compounded by idiosyncratic credit problems, which in some cases have also caused dividend reductions.
On the MBS REIT front, companies continue to work through the challenges of unpredictable mortgage refinancing patterns, a flat and sometimes inverted yield curve, and changing Fed policy regarding interest rates and the size of its balance sheet. The challenges and uncertainty have put downward pressure on profits and reduced distributions. As we look forward, we believe MBS REITs are
Portfolio Commentary (Continued)
First Trust Specialty Finance and Financial Opportunities Fund (FGB)
Semi-Annual Report
May 31, 2019 (Unaudited)
likely to continue to face headwinds on a variety of fronts. Yet talented management teams have in the past been able to find attractive opportunities during such times and we believe that should be the case for MBS REITs held by the Fund.
Fluctuations in income and distributions from investments held by the Fund directly affect the Fund’s own income. But even as the nature of BDC and MBS REIT income is often variable, we nevertheless believe the income can continue to be attractive and highly differentiated relative to the broader bond market. In this regard, we believe the Fund can continue to play a constructive role in investor portfolios where income is an objective.
On the regulatory front, progress continues forward regarding AFFE. This issue was a big driver in the decision by major equity index sponsors to remove BDCs from their indices, which had the effect of significantly lowering institutional ownership of BDCs. We have no knowledge regarding if, or when, AFFE regulatory change might take place. However, we do believe that amending AFFE would probably encourage more institutions to own BDCs, a trend that could improve liquidity, governance and perhaps even valuations in the industry.
The Fund is unique in its focus on BDCs and we believe the Fund is well-positioned to participate in the ongoing growth of the industry.
First Trust Specialty Finance and Financial Opportunities Fund (FGB)
Portfolio of Investments
May 31, 2019 (Unaudited)
| Shares | | Description | | Value |
COMMON STOCKS – BUSINESS DEVELOPMENT
COMPANIES – 115.8% |
| | | Capital Markets – 115.8% | | |
| 172,787 | | Alcentra Capital Corp. (a) | | $1,428,948 |
| 333,700 | | Apollo Investment Corp. (a) | | 5,182,361 |
| 722,412 | | Ares Capital Corp. (a) | | 12,685,555 |
| 637,594 | | Barings BDC, Inc. (a) | | 6,312,181 |
| 900 | | BlackRock Capital Investment Corp. | | 5,454 |
| 556,863 | | BlackRock TCP Capital Corp. (a) | | 7,946,435 |
| 20,238 | | Capital Southwest Corp. (a) | | 436,534 |
| 130,340 | | CM Finance, Inc. (a) | | 939,751 |
| 108,063 | | Goldman Sachs BDC, Inc. (a) | | 2,021,859 |
| 429,730 | | Golub Capital BDC, Inc. (a) | | 7,533,167 |
| 585,598 | | Hercules Capital, Inc. (a) | | 7,472,230 |
| 49,107 | | Main Street Capital Corp. (a) | | 1,946,601 |
| 466,714 | | Medley Capital Corp. | | 1,297,465 |
| 577,564 | | New Mountain Finance Corp. (a) | | 8,062,793 |
| 272,084 | | OFS Capital Corp. (a) | | 3,267,729 |
| 20,000 | | PennantPark Floating Rate Capital Ltd. | | 233,800 |
| 755,081 | | PennantPark Investment Corp. (a) | | 4,900,476 |
| 340,472 | | Portman Ridge Finance Corp. | | 919,274 |
| 295,709 | | Solar Capital Ltd. (a) | | 6,062,034 |
| 286,126 | | Stellus Capital Investment Corp. (a) | | 3,982,874 |
| 206,751 | | TPG Specialty Lending, Inc. (a) | | 4,035,780 |
| 483,845 | | TriplePoint Venture Growth BDC Corp. (a) | | 6,478,685 |
| | | Total Common Stocks - Business Development Companies | | 93,151,986 |
| | | (Cost $102,910,543) | | |
| REAL ESTATE INVESTMENT TRUSTS – 15.1% |
| | | Mortgage Real Estate
Investment Trusts – 15.1% | | |
| 681,782 | | Annaly Capital Management, Inc. (a) | | 6,006,499 |
| 108,500 | | Capstead Mortgage Corp. (a) | | 858,235 |
| 434,949 | | Two Harbors Investment Corp. (a) | | 5,315,077 |
| | | Total Real Estate Investment Trusts | | 12,179,811 |
| | | (Cost $15,299,747) | | |
| | | Total Investments – 130.9% | | 105,331,797 |
| | | (Cost $118,210,290) (b) | | |
| | | Outstanding Loan – (31.1)% | | (25,000,000) |
| | | Net Other Assets and Liabilities – 0.2% | | 133,778 |
| | | Net Assets – 100.0% | | $80,465,575 |
|
| (a) | All or a portion of this security serves as collateral on the outstanding loan. |
| (b) | Aggregate cost for financial reporting purposes approximates the aggregate cost for federal income tax purposes. As of May 31, 2019, the aggregate gross unrealized appreciation for all investments in which there was an excess of value over tax cost was $8,107,182 and the aggregate gross unrealized depreciation for all investments in which there was an excess of tax cost over value was $20,985,675. The net unrealized depreciation was $12,878,493. |
Valuation Inputs
A summary of the inputs used to value the Fund’s investments as of May 31, 2019 is as follows (see Note 2A - Portfolio Valuation in the Notes to Financial Statements):
| | Total
Value at
5/31/2019 | Level 1
Quoted
Prices | Level 2
Significant
Observable
Inputs | Level 3
Significant
Unobservable
Inputs |
| Common Stocks - Business Development Companies* | $ 93,151,986 | $ 93,151,986 | $ — | $ — |
| Real Estate Investment Trusts* | 12,179,811 | 12,179,811 | — | — |
| Total Investments | $ 105,331,797 | $ 105,331,797 | $— | $— |
| * | See Portfolio of Investments for industry breakout. |
Page 6
See Notes to Financial Statements
First Trust Specialty Finance and Financial Opportunities Fund (FGB)
Statement of Assets and Liabilities
May 31, 2019 (Unaudited)
| ASSETS: | |
Investments, at value
(Cost $118,210,290)
| $ 105,331,797 |
Cash
| 113,833 |
Foreign currency (Cost $26)
| 19 |
| Receivables: | |
Dividends
| 220,391 |
Common Shares issued under the Dividend Reinvestment Plan
| 14,778 |
Prepaid expenses
| 9,908 |
Total Assets
| 105,690,726 |
| LIABILITIES: | |
Outstanding loan
| 25,000,000 |
| Payables: | |
Investment advisory fees
| 93,872 |
Interest and fees on loan
| 73,053 |
Audit and tax fees
| 28,172 |
Shareholder reporting fees
| 8,998 |
Transfer agent fees
| 5,360 |
Administrative fees
| 4,716 |
Custodian fees
| 4,357 |
Legal fees
| 3,262 |
Trustees’ fees and expenses
| 2,590 |
Financial reporting fees
| 771 |
Total Liabilities
| 25,225,151 |
NET ASSETS
| $80,465,575 |
| NET ASSETS consist of: | |
Paid-in capital
| $ 123,966,125 |
Par value
| 143,594 |
Accumulated distributable earnings (loss)
| (43,644,144) |
NET ASSETS
| $80,465,575 |
NET ASSET VALUE,per Common Share (par value $0.01 per Common Share)
| $5.60 |
Number of Common Shares outstanding (unlimited number of Common Shares has been authorized)
| 14,359,360 |
See Notes to Financial Statements
Page 7
First Trust Specialty Finance and Financial Opportunities Fund (FGB)
Statement of Operations
For the Six Months Ended May 31, 2019 (Unaudited)
| INVESTMENT INCOME: | |
Dividends
| $ 5,581,595 |
Interest
| 5,522 |
Total investment income
| 5,587,117 |
| EXPENSES: | |
Investment advisory fees
| 540,146 |
Interest and fees on loan
| 434,011 |
Shareholder reporting fees
| 27,319 |
Audit and tax fees
| 23,722 |
Administrative fees
| 23,221 |
Listing expense
| 16,202 |
Transfer agent fees
| 15,886 |
Custodian fees
| 8,793 |
Trustees’ fees and expenses
| 7,958 |
Financial reporting fees
| 4,625 |
Legal fees
| 3,680 |
Other
| 5,110 |
Total expenses
| 1,110,673 |
NET INVESTMENT INCOME (LOSS)
| 4,476,444 |
| NET REALIZED AND UNREALIZED GAIN (LOSS): | |
Net realized gain (loss) on investments
| (3,779,222) |
Net change in unrealized appreciation (depreciation) on investments
| 1,790,270 |
NET REALIZED AND UNREALIZED GAIN (LOSS)
| (1,988,952) |
NET INCREASE (DECREASE) IN NET ASSETS RESULTING FROM OPERATIONS
| $ 2,487,492 |
Page 8
See Notes to Financial Statements
First Trust Specialty Finance and Financial Opportunities Fund (FGB)
Statements of Changes in Net Assets
| | Six Months
Ended
5/31/2019
(Unaudited) | | Year
Ended
11/30/2018 |
| OPERATIONS: | | | |
Net investment income (loss)
| $ 4,476,444 | | $ 9,406,881 |
Net realized gain (loss)
| (3,779,222) | | (4,928,937) |
Net change in unrealized appreciation (depreciation)
| 1,790,270 | | (3,682,446) |
Net increase (decrease) in net assets resulting from operations
| 2,487,492 | | 795,498 |
| DISTRIBUTIONS TO SHAREHOLDERS FROM: | | | |
Investment operations
| (5,024,432) | | (9,031,700) |
Return of capital
| — | | (1,012,217) |
Total distributions to shareholders
| (5,024,432) | | (10,043,917) |
| CAPITAL TRANSACTIONS: | | | |
Proceeds from Common Shares reinvested
| 42,864 | | 43,261 |
Net increase (decrease) in net assets resulting from capital transactions
| 42,864 | | 43,261 |
Total increase (decrease) in net assets
| (2,494,076) | | (9,205,158) |
| NET ASSETS: | | | |
Beginning of period
| 82,959,651 | | 92,164,809 |
End of period
| $ 80,465,575 | | $ 82,959,651 |
| CAPITAL TRANSACTIONS were as follows: | | | |
Common Shares at beginning of period
| 14,352,033 | | 14,344,765 |
Common Shares issued as reinvestment under the Dividend Reinvestment Plan
| 7,327 | | 7,268 |
Common Shares at end of period
| 14,359,360 | | 14,352,033 |
See Notes to Financial Statements
Page 9
First Trust Specialty Finance and Financial Opportunities Fund (FGB)
Statement of Cash Flows
For the Six Months Ended May 31, 2019 (Unaudited)
| Cash flows from operating activities: | | |
Net increase (decrease) in net assets resulting from operations
| $2,487,492 | |
| Adjustments to reconcile net increase (decrease) in net assets resulting from operations to net cash provided by operating activities: | | |
Purchases of investments
| (7,258,199) | |
Sales, maturities and paydown of investments
| 7,650,365 | |
Net realized gain/loss on investments
| 3,779,222 | |
Net change in unrealized appreciation/depreciation on investments
| (1,790,270) | |
| Changes in assets and liabilities: | | |
Decrease in dividends receivable
| 8,643 | |
Increase in prepaid expenses
| (8,100) | |
Increase in interest and fees payable on loan
| 13,881 | |
Increase in investment advisory fees payable
| 3,782 | |
Decrease in audit and tax fees payable
| (18,278) | |
Increase in legal fees payable
| 2,109 | |
Decrease in shareholder reporting fees payable
| (8,051) | |
Decrease in administrative fees payable
| (27) | |
Increase in custodian fees payable
| 12 | |
Increase in transfer agent fees payable
| 2,455 | |
Decrease in Trustees’ fees and expenses payable
| (95) | |
Decrease in other liabilities payable
| (626) | |
Cash provided by operating activities
| | $4,864,315 |
| Cash flows from financing activities: | | |
Proceeds from Common Shares reinvested
| 28,086 | |
Distributions to Common Shareholders from investment operations
| (7,536,038) | |
Cash used in financing activities
| | (7,507,952) |
Decrease in cash and foreign currency
| | (2,643,637) |
Cash and foreign currency at beginning of period
| | 2,757,489 |
Cash and foreign currency at end of period
| | $113,852 |
| Supplemental disclosure of cash flow information: | | |
Cash paid during the period for interest and fees
| | $420,130 |
Page 10
See Notes to Financial Statements
First Trust Specialty Finance and Financial Opportunities Fund (FGB)
Financial Highlights
For a Common Share outstanding throughout each period
| | Six Months
Ended
5/31/2019
(Unaudited) | | Year Ended November 30, |
| 2018 | | 2017 | | 2016 | | 2015 | | 2014 |
Net asset value, beginning of period
| $ 5.78 | | $ 6.42 | | $ 6.82 | | $ 6.54 | | $ 7.72 | | $ 8.61 |
| Income from investment operations: | | | | | | | | | | | |
Net investment income (loss)
| 0.31 | | 0.66 | | 0.54 | | 0.66 | | 0.64 | | 0.65 |
Net realized and unrealized gain (loss)
| (0.14) | | (0.60) | | (0.24) | | 0.32 | | (1.12) (a) | | (0.85) |
Total from investment operations
| 0.17 | | 0.06 | | 0.30 | | 0.98 | | (0.48) | | (0.20) |
| Distributions paid to shareholders from: | | | | | | | | | | | |
Net investment income
| (0.35) | | (0.63) | | (0.60) | | (0.66) | | (0.67) | | (0.66) |
Return of capital
| — | | (0.07) | | (0.10) | | (0.04) | | (0.03) | | (0.03) |
Total distributions paid to Common Shareholders
| (0.35) | | (0.70) | | (0.70) | | (0.70) | | (0.70) | | (0.69) |
Premiums from shares sold in at the market offering
| — | | — | | — | | — | | 0.00 (b) | | — |
Net asset value, end of period
| $5.60 | | $5.78 | | $6.42 | | $6.82 | | $6.54 (a) | | $7.72 |
Market value, end of period
| $6.05 | | $6.07 | | $6.38 | | $7.00 | | $6.17 | | $8.58 |
Total return based on net asset value (c)
| 2.82% | | 1.09% | | 4.23% | | 16.39% | | (6.25)% (a) | | (2.44)% |
Total return based on market value (c)
| 5.77% | | 6.83% | | 0.91% | | 26.63% | | (20.42)% | | 14.00% |
| Ratios to average net assets/supplemental data: | | | | | | | | | | | |
Net assets, end of period (in 000’s)
| $ 80,466 | | $ 82,960 | | $ 92,165 | | $ 97,753 | | $ 93,659 | | $ 110,395 |
Ratio of total expenses to average net assets
| 2.67% (d) | | 2.38% | | 2.02% | | 1.87% | | 1.85% | | 1.71% |
Ratio of total expenses to average net assets excluding interest expense
| 1.63% (d) | | 1.58% | | 1.52% | | 1.54% | | 1.63% | | 1.52% |
Ratio of net investment income (loss) to average net assets
| 10.77% (d) | | 10.79% | | 7.66% | | 10.42% | | 9.14% | | 8.00% |
Portfolio turnover rate
| 7% | | 12% | | 5% | | 13% | | 10% | | 14% |
| Indebtedness: | | | | | | | | | | | |
Total loan outstanding (in 000’s)
| $ 25,000 | | $ 25,000 | | $ 25,000 | | $ 25,000 | | $ 25,000 | | $ 25,000 |
Asset coverage per $1,000 of indebtedness (e)
| $ 4,219 | | $ 4,318 | | $ 4,687 | | $ 4,910 | | $ 4,746 | | $ 5,416 |
| (a) | The Fund received a reimbursement from the sub-advisor in the amount of $15 in connection with a trade error, which represents less than $0.01 per share. Since the sub-advisor reimbursed the Fund, there was no effect on the total return. |
| (b) | Amount represents less than $0.01 per share. |
| (c) | Total return is based on the combination of reinvested dividend, capital gain and return of capital distributions, if any, at prices obtained by the Dividend Reinvestment Plan, and changes in net asset value per share for net asset value returns and changes in Common Share Price for market value returns. Total returns do not reflect sales load and are not annualized for periods of less than one year. Past performance is not indicative of future results. |
| (d) | Annualized. |
| (e) | Calculated by subtracting the Fund’s total liabilities (not including the loan outstanding) from the Fund’s total assets, and dividing by the outstanding loan balance in 000’s. |
See Notes to Financial Statements
Page 11
Notes to Financial Statements
First Trust Specialty Finance and Financial Opportunities Fund (FGB)
May 31, 2019 (Unaudited)
1. Organization
First Trust Specialty Finance and Financial Opportunities Fund (the “Fund”) is a non-diversified, closed-end management investment company organized as a Massachusetts business trust on March 20, 2007, and is registered with the Securities and Exchange Commission (“SEC”) under the Investment Company Act of 1940, as amended (the “1940 Act”). The Fund trades under the ticker symbol “FGB” on the New York Stock Exchange (“NYSE”).
The primary investment objective of the Fund is to seek a high level of current income. As a secondary objective, the Fund seeks an attractive total return. The Fund pursues its investment objectives by investing, under normal market conditions, at least 80% of its Managed Assets in a portfolio of securities of specialty finance and other financial companies that Confluence Investment Management LLC (“Confluence” or the “Sub-Advisor”) believes offer attractive opportunities for income and capital appreciation. Under normal market conditions, the Fund concentrates its investments in securities of companies within industries in the financial sector. “Managed Assets” means the total asset value of the Fund minus the sum of its liabilities, other than the principal amount of borrowings. There can be no assurance that the Fund will achieve its investment objectives. The Fund may not be appropriate for all investors.
2. Significant Accounting Policies
The Fund is considered an investment company and follows accounting and reporting guidance under Financial Accounting Standards Board (“FASB”) Accounting Standards Codification (“ASC”) Topic 946, “Financial Services-Investment Companies.” The following is a summary of significant accounting policies consistently followed by the Fund in the preparation of the financial statements. The preparation of the financial statements in accordance with accounting principles generally accepted in the United States of America (“U.S. GAAP”) requires management to make estimates and assumptions that affect the reported amounts and disclosures in the financial statements. Actual results could differ from those estimates.
A. Portfolio Valuation
The net asset value (“NAV”) of the Common Shares of the Fund is determined daily as of the close of regular trading on the NYSE, normally 4:00 p.m. Eastern time, on each day the NYSE is open for trading. If the NYSE closes early on a valuation day, the NAV is determined as of that time. Foreign securities are priced using data reflecting the earlier closing of the principal markets for those securities. The Fund’s NAV per Common Share is calculated by dividing the value of all assets of the Fund (including accrued interest and dividends), less all liabilities (including accrued expenses, dividends declared but unpaid and any borrowings of the Fund), by the total number of Common Shares outstanding.
The Fund’s investments are valued daily at market value or, in the absence of market value with respect to any portfolio securities, at fair value. Market value prices represent last sale or official closing prices from a national or foreign exchange (i.e., a regulated market) and are primarily obtained from third-party pricing services. Fair value prices represent any prices not considered market value prices and are either obtained from a third-party pricing service or are determined by the Pricing Committee of the Fund’s investment advisor, First Trust Advisors L.P. (“First Trust” or the “Advisor”), in accordance with valuation procedures adopted by the Fund’s Board of Trustees, and in accordance with provisions of the 1940 Act. Investments valued by the Advisor’s Pricing Committee, if any, are footnoted as such in the footnotes to the Portfolio of Investments. The Fund’s investments are valued as follows:
Common stocks, real estate investment trusts (“REITs”), and other equity securities listed on any national or foreign exchange (excluding The Nasdaq Stock Market LLC (“Nasdaq”) and the London Stock Exchange Alternative Investment Market (“AIM”)) are valued at the last sale price on the exchange on which they are principally traded or, for Nasdaq and AIM securities, the official closing price. Securities traded on more than one securities exchange are valued at the last sale price or official closing price, as applicable, at the close of the securities exchange representing the principal market for such securities.
Securities traded in an over-the-counter market are fair valued at the mean of their most recent bid and asked price, if available, and otherwise at their closing bid price.
Certain securities may not be able to be priced by pre-established pricing methods. Such securities may be valued by the Fund’s Board of Trustees or its delegate, the Advisor’s Pricing Committee, at fair value. These securities generally include, but are not limited to, restricted securities (securities which may not be publicly sold without registration under the Securities Act of 1933, as amended) for which a third-party pricing service is unable to provide a market price; securities whose trading has been formally suspended; a security whose market or fair value price is not available from a pre-established pricing source; a security with respect to which an event has occurred that is likely to materially affect the value of the security after the market has closed but before the calculation of the Fund’s NAV or make it difficult or impossible to obtain a reliable market quotation; and a security whose price, as provided by the third-party pricing service, does not reflect the security’s fair value. As a general principle, the current fair value of a security would appear to be the amount which the owner might reasonably expect to receive for the security upon its current sale. When fair value
Notes to Financial Statements (Continued)
First Trust Specialty Finance and Financial Opportunities Fund (FGB)
May 31, 2019 (Unaudited)
prices are used, generally they will differ from market quotations or official closing prices on the applicable exchanges. A variety of factors may be considered in determining the fair value of such securities, including, but not limited to, the following:
| 1) | the type of security; |
| 2) | the size of the holding; |
| 3) | the initial cost of the security; |
| 4) | transactions in comparable securities; |
| 5) | price quotes from dealers and/or third-party pricing services; |
| 6) | relationships among various securities; |
| 7) | information obtained by contacting the issuer, analysts, or the appropriate stock exchange; |
| 8) | an analysis of the issuer’s financial statements; and |
| 9) | the existence of merger proposals or tender offers that might affect the value of the security. |
If the securities in question are foreign securities, the following additional information may be considered:
| 1) | the value of similar foreign securities traded on other foreign markets; |
| 2) | ADR trading of similar securities; |
| 3) | closed-end fund or exchange-traded fund trading of similar securities; |
| 4) | foreign currency exchange activity; |
| 5) | the trading prices of financial products that are tied to baskets of foreign securities; |
| 6) | factors relating to the event that precipitated the pricing problem; |
| 7) | whether the event is likely to recur; and |
| 8) | whether the effects of the event are isolated or whether they affect entire markets, countries or regions. |
The Fund is subject to fair value accounting standards that define fair value, establish the framework for measuring fair value and provide a three-level hierarchy for fair valuation based upon the inputs to the valuation as of the measurement date. The three levels of the fair value hierarchy are as follows:
| • | Level 1 – Level 1 inputs are quoted prices in active markets for identical investments. An active market is a market in which transactions for the investment occur with sufficient frequency and volume to provide pricing information on an ongoing basis. |
| • | Level 2 – Level 2 inputs are observable inputs, either directly or indirectly, and include the following: |
| o | Quoted prices for similar investments in active markets. |
| o | Quoted prices for identical or similar investments in markets that are non-active. A non-active market is a market where there are few transactions for the investment, the prices are not current, or price quotations vary substantially either over time or among market makers, or in which little information is released publicly. |
| o | Inputs other than quoted prices that are observable for the investment (for example, interest rates and yield curves observable at commonly quoted intervals, volatilities, prepayment speeds, loss severities, credit risks, and default rates). |
| o | Inputs that are derived principally from or corroborated by observable market data by correlation or other means. |
| • | Level 3 – Level 3 inputs are unobservable inputs. Unobservable inputs may reflect the reporting entity’s own assumptions about the assumptions that market participants would use in pricing the investment. |
The inputs or methodologies used for valuing investments are not necessarily an indication of the risk associated with investing in those investments. A summary of the inputs used to value the Fund’s investments as of May 31, 2019, is included with the Fund’s Portfolio of Investments.
B. Securities Transactions and Investment Income
Securities transactions are recorded as of the trade date. Realized gains and losses from securities transactions are recorded on the identified cost basis. Dividend income is recorded on the ex-dividend date. Interest income is recorded daily on the accrual basis.
The Fund holds shares of business development companies (“BDCs”) and may hold shares of exchange-traded funds (“ETFs”). The Fund records the character of distributions received from the BDCs during the year based on estimates available. The tax character of distributions received from these securities may vary when reported by the issuer after their tax reporting periods conclude.
Notes to Financial Statements (Continued)
First Trust Specialty Finance and Financial Opportunities Fund (FGB)
May 31, 2019 (Unaudited)
Distributions received from the Fund’s investments in REITs may be comprised of return of capital, capital gains, and income. The actual character of the amounts received during the year are not known until after the REITs’ fiscal year end. The Fund records the character of distributions received from the REITs during the year based on estimates available. The characterization of distributions received by the Fund may be subsequently revised based on information received from the REITs after their tax reporting periods conclude.
C. Dividends and Distributions to Shareholders
Dividends from net investment income of the Fund are declared and paid quarterly or as the Board of Trustees may determine from time to time. Distributions of any net realized capital gains earned by the Fund are distributed at least annually. Distributions will automatically be reinvested into additional Common Shares pursuant to the Fund’s Dividend Reinvestment Plan unless cash distributions are elected by the shareholder.
Distributions from income and realized capital gains are determined in accordance with federal income tax regulations, which may differ from U.S. GAAP. Certain capital accounts in the financial statements are periodically adjusted for permanent differences in order to reflect their tax character. These permanent differences are primarily due to the varying treatment of income and gain/loss on portfolio securities held by the Fund and have no impact on net assets or NAV per share. Temporary differences, which arise from recognizing certain items of income, expense and gain/loss in different periods for financial statement and tax purposes, will reverse at some point in the future.
The tax character of distributions paid by the Fund during the fiscal year ended November 30, 2018, was as follows:
| Distributions paid from: | |
Ordinary income
| $9,030,428 |
Capital gains
| — |
Return of capital
| 1,012,217 |
As of November 30, 2018, the components of distributable earnings and net assets on a tax basis were as follows:
Undistributed ordinary income
| $— |
Undistributed capital gains
| — |
Total undistributed earnings
| — |
Accumulated capital and other losses
| (21,495,993) |
Net unrealized appreciation (depreciation)
| (17,099,605) |
Total accumulated earnings (losses)
| (38,595,598) |
Other
| (2,511,606) |
Paid-in capital
| 124,066,855 |
Total net assets
| $82,959,651 |
D. Income Taxes
The Fund intends to continue to qualify as a regulated investment company by complying with the requirements under Subchapter M of the Internal Revenue Code of 1986, as amended, which includes distributing substantially all of its net investment income and net realized gains to shareholders. Accordingly, no provision has been made for federal and state income taxes. However, due to the timing and amount of distributions, the Fund may be subject to an excise tax of 4% of the amount by which approximately 98% of the Fund’s taxable income exceeds the distributions from such taxable income for the calendar year.
Under the Regulated Investment Company Modernization Act of 2010 (the “Act”), net capital losses arising in taxable years beginning after December 22, 2010, may be carried forward indefinitely, and their character is retained as short-term and/or long-term losses. Previously, net capital losses were carried forward for up to eight years and treated as short-term losses. As a transition rule, the Act requires that post-enactment net capital losses be used before pre-enactment net capital losses. At November 30, 2018, for federal income tax purposes, the Fund had capital loss carryforwards available that are shown in the following table, to the extent provided by
Notes to Financial Statements (Continued)
First Trust Specialty Finance and Financial Opportunities Fund (FGB)
May 31, 2019 (Unaudited)
regulations, to offset future capital gains through the years indicated. To the extent that these loss carryforwards are used to offset future capital gains, it is probable that the capital gains offset will not be distributed to Fund shareholders.
| | Capital Loss
Available
Through 2019 | | Post-Effective
(No Expiration) | | Total Capital
Loss Available |
| | $ 5,452,015 | | $ 16,043,978 | | $ 21,495,993 |
At the taxable year ended November 30, 2018, $14,556,882 of the Fund’s capital loss carryforward expired.
Certain losses realized during the current fiscal year may be deferred and treated as occurring on the first day of the following fiscal year for federal income tax purposes. For the fiscal year ended November 30, 2018, the Fund did not incur any net ordinary losses.
The Fund is subject to certain limitations under the U.S. tax rules on the use of capital loss carryforwards and net unrealized built-in losses. These limitations apply when there has been a 50% change in ownership.
The Fund is subject to accounting standards that establish a minimum threshold for recognizing, and a system for measuring, the benefits of a tax position taken or expected to be taken in a tax return. Taxable years ended 2015, 2016, 2017, and 2018 remain open to federal and state audit. As of May 31, 2019, management has evaluated the application of these standards to the Fund, and has determined that no provision for income tax is required in the Fund’s financial statements for uncertain tax positions.
E. Expenses
The Fund will pay all expenses directly related to its operations.
F. New Accounting Pronouncement
On August 28, 2018, the FASB issued Accounting Standards Update (“ASU”) 2018-13, “Disclosure Framework – Changes to the Disclosure Requirements for Fair Value Measurement,” which amends the fair value measurement disclosure requirements of ASC 820. The amendments of ASU 2018-13 include new, eliminated, and modified disclosure requirements of ASC 820. In addition, the amendments clarify that materiality is an appropriate consideration of entities when evaluating disclosure requirements. The ASU is effective for fiscal years beginning after December 15, 2019, including interim periods therein. Early adoption is permitted for any eliminated or modified disclosures upon issuance of this ASU. The Fund has early adopted ASU 2018-13 for these financial statements, which did not result in a material impact.
3. Investment Advisory Fee, Affiliated Transactions and Other Fee Arrangements
First Trust, the investment advisor to the Fund, is a limited partnership with one limited partner, Grace Partners of DuPage L.P., and one general partner, The Charger Corporation. The Charger Corporation is an Illinois corporation controlled by James A. Bowen, Chief Executive Officer of First Trust. First Trust is responsible for the ongoing monitoring of the Fund’s investment portfolio, managing the Fund’s business affairs and providing certain administrative services necessary for the management of the Fund. For these investment management services, First Trust is entitled to a monthly fee calculated at an annual rate of 1.00% of the Fund’s Managed Assets. First Trust also provides fund reporting services to the Fund for a flat annual fee in the amount of $9,250.
Confluence serves as the Fund’s sub-advisor and manages the Fund’s portfolio subject to First Trust’s supervision. The Sub-Advisor receives a portfolio management fee at an annual rate of 0.50% of the Fund’s Managed Assets that is paid by First Trust from its investment advisory fee.
BNY Mellon Investment Servicing (US) Inc. (“BNYM IS”) serves as the Fund’s transfer agent in accordance with certain fee arrangements. As transfer agent, BNYM IS is responsible for maintaining shareholder records for the Fund. The Bank of New York Mellon (“BNYM”) serves as the Fund’s administrator, fund accountant, and custodian in accordance with certain fee arrangements. As administrator and fund accountant, BNYM is responsible for providing certain administrative and accounting services to the Fund, including maintaining the Fund’s books of account, records of the Fund’s securities transactions, and certain other books and records. As custodian, BNYM is responsible for custody of the Fund’s assets. BNYM IS and BNYM are subsidiaries of The Bank of New York Mellon Corporation, a financial holding company.
Each Trustee who is not an officer or employee of First Trust, any sub-advisor or any of their affiliates (“Independent Trustees”) is paid a fixed annual retainer that is allocated equally among each fund in the First Trust Fund Complex. Each Independent Trustee is also paid an annual per fund fee that varies based on whether the fund is a closed-end or other actively managed fund, or is an index fund.
Notes to Financial Statements (Continued)
First Trust Specialty Finance and Financial Opportunities Fund (FGB)
May 31, 2019 (Unaudited)
Additionally, the Lead Independent Trustee and the Chairmen of the Audit Committee, Nominating and Governance Committee and Valuation Committee are paid annual fees to serve in such capacities, with such compensation allocated pro rata among each fund in the First Trust Fund Complex based on net assets. Independent Trustees are reimbursed for travel and out-of-pocket expenses in connection with all meetings. The Lead Independent Trustee and Committee Chairmen rotate every three years. The officers and “Interested” Trustee receive no compensation from the Fund for acting in such capacities.
4. Purchases and Sales of Securities
The cost of purchases and proceeds from sales of securities, excluding short-term investments, for the six months ended May 31, 2019, were $7,258,199 and $7,650,365, respectively.
5. Borrowings
The Fund has a committed facility agreement (the “BNP Facility”) with BNP Paribas Prime Brokerage International, Ltd. (“PBL”), which currently has a maximum commitment amount of $25,000,000. Absent certain events of default or failure to maintain certain collateral requirements, PBL may not terminate the BNP Facility except upon 179 calendar days’ prior notice. The interest rate under the BNP Facility is equal to the 1-month LIBOR plus 85 basis points. In addition, under the BNP Facility, the Fund pays a commitment fee of 0.55% on the undrawn amount. Prior to May 22, 2019, the commitment fee was equal to 0.85%.
The average amount outstanding for the six months ended May 31, 2019 was $25,000,000, with a weighted average interest rate of 3.33%. As of May 31, 2019, the Fund had outstanding borrowings of $25,000,000 under the BNP Facility. The high and low annual interest rates for the six months ended May 31, 2019 were 3.37% and 3.20%, respectively, and the interest rate at May 31, 2019 was 3.28%.
6. Indemnification
The Fund has a variety of indemnification obligations under contracts with its service providers. The Fund’s maximum exposure under these arrangements is unknown. However, the Fund has not had prior claims or losses pursuant to these contracts and expects the risk of loss to be remote.
7. Financial Sector Concentration Risk
Under normal market conditions, the Fund invests at least 80% of its Managed Assets in securities of companies within industries in the financial sector. A fund concentrated in a single industry or sector is likely to present more risks than a fund that is broadly diversified over several industries or groups of industries. Compared to the broad market, an individual sector may be more strongly affected by changes in the economic climate, broad market shifts, moves in a particular dominant stock, or regulatory changes. Specialty finance and other financial companies in general are subject to extensive government regulation, which may change frequently. The profitability of specialty finance and other financial companies is largely dependent upon the availability and cost of capital funds, and may fluctuate significantly in response to changes in interest rates, as well as changes in general economic conditions. From time to time, severe competition may also affect the profitability of specialty finance and other financial companies. Financial companies can be highly dependent upon access to capital markets and any impediments to such access, such as general economic conditions or a negative perception in the capital markets of a company’s financial condition or prospects, could adversely affect its business. Leasing companies can be negatively impacted by changes in tax laws which affect the types of transactions in which such companies engage.
8. Subsequent Events
Management has evaluated the impact of all subsequent events to the Fund through the date the financial statements were issued, and has determined that there were no subsequent events requiring recognition or disclosure in the financial statements that have not already been disclosed.
Additional Information
First Trust Specialty Finance and Financial Opportunities Fund (FGB)
May 31, 2019 (Unaudited)
Dividend Reinvestment Plan
If your Common Shares are registered directly with the Fund or if you hold your Common Shares with a brokerage firm that participates in the Fund’s Dividend Reinvestment Plan (the “Plan”), unless you elect, by written notice to the Fund, to receive cash distributions, all dividends, including any capital gain distributions, on your Common Shares will be automatically reinvested by BNY Mellon Investment Servicing (US) Inc. (the “Plan Agent”), in additional Common Shares under the Plan. If you elect to receive cash distributions, you will receive all distributions in cash paid by check mailed directly to you by the Plan Agent, as the dividend paying agent.
If you decide to participate in the Plan, the number of Common Shares you will receive will be determined as follows:
| (1) | If Common Shares are trading at or above net asset value (“NAV”) at the time of valuation, the Fund will issue new shares at a price equal to the greater of (i) NAV per Common Share on that date or (ii) 95% of the market price on that date. |
| (2) | If Common Shares are trading below NAV at the time of valuation, the Plan Agent will receive the dividend or distribution in cash and will purchase Common Shares in the open market, on the NYSE or elsewhere, for the participants’ accounts. It is possible that the market price for the Common Shares may increase before the Plan Agent has completed its purchases. Therefore, the average purchase price per share paid by the Plan Agent may exceed the market price at the time of valuation, resulting in the purchase of fewer shares than if the dividend or distribution had been paid in Common Shares issued by the Fund. The Plan Agent will use all dividends and distributions received in cash to purchase Common Shares in the open market within 30 days of the valuation date except where temporary curtailment or suspension of purchases is necessary to comply with federal securities laws. Interest will not be paid on any uninvested cash payments. |
You may elect to opt-out of or withdraw from the Plan at any time by giving written notice to the Plan Agent, or by telephone at (866) 340-1104, in accordance with such reasonable requirements as the Plan Agent and the Fund may agree upon. If you withdraw or the Plan is terminated, you will receive a certificate for each whole share in your account under the Plan, and you will receive a cash payment for any fraction of a share in your account. If you wish, the Plan Agent will sell your shares and send you the proceeds, minus brokerage commissions.
The Plan Agent maintains all Common Shareholders’ accounts in the Plan and gives written confirmation of all transactions in the accounts, including information you may need for tax records. Common Shares in your account will be held by the Plan Agent in non-certificated form. The Plan Agent will forward to each participant any proxy solicitation material and will vote any shares so held only in accordance with proxies returned to the Fund. Any proxy you receive will include all Common Shares you have received under the Plan.
There is no brokerage charge for reinvestment of your dividends or distributions in Common Shares. However, all participants will pay a pro rata share of brokerage commissions incurred by the Plan Agent when it makes open market purchases.
Automatically reinvesting dividends and distributions does not mean that you do not have to pay income taxes due upon receiving dividends and distributions. Capital gains and income are realized although cash is not received by you. Consult your financial advisor for more information.
If you hold your Common Shares with a brokerage firm that does not participate in the Plan, you will not be able to participate in the Plan and any dividend reinvestment may be effected on different terms than those described above.
The Fund reserves the right to amend or terminate the Plan if in the judgment of the Board of Trustees the change is warranted. There is no direct service charge to participants in the Plan; however, the Fund reserves the right to amend the Plan to include a service charge payable by the participants. Additional information about the Plan may be obtained by writing BNY Mellon Investment Servicing (US) Inc., 301 Bellevue Parkway, Wilmington, Delaware 19809.
Proxy Voting Policies and Procedures
A description of the policies and procedures that the Fund uses to determine how to vote proxies and information on how the Fund voted proxies relating to portfolio investments during the most recent 12-month period ended June 30 is available (1) without charge, upon request, by calling (800) 988-5891; (2) on the Fund’s website atwww.ftportfolios.com; and (3) on the Securities and Exchange Commission’s (“SEC”) website atwww.sec.gov.
Portfolio Holdings
The Fund files portfolio holdings information for each month in a fiscal quarter within 60 days after the end of the relevant fiscal quarter on Form N-PORT. Portfolio holdings information for the third month of each fiscal quarter will be publicly available on the
Additional Information (Continued)
First Trust Specialty Finance and Financial Opportunities Fund (FGB)
May 31, 2019 (Unaudited)
SEC’s website atwww.sec.gov. The Fund’s complete schedule of portfolio holdings for the second and fourth quarters of each fiscal year is included in the semi-annual and annual reports to shareholders, respectively, and is filed with the SEC on Form N-CSR. The semi-annual and annual report for the Fund is available to investors within 60 days after the period to which it relates. The Fund’s Forms N-PORT and Forms N-CSR are available on the SEC’s website listed above.
Submission of Matters to a Vote of Shareholders
The Fund held its Annual Meeting of Shareholders (the “Annual Meeting”) on April 8, 2019. At the Annual Meeting, James A. Bowen and Niel B. Nielson were elected by the Common Shareholders of the First Trust Specialty Finance and Financial Opportunities Fund as Class III Trustees for a three-year term expiring at the Fund’s annual meeting of shareholders in 2022. The number of votes cast in favor of Mr. Bowen was 13,018,285, the number of votes against was 385,005 and the number of broker non-votes was 950,962. The number of votes cast in favor of Mr. Nielson was 13,012,047, the number of votes against was 391,243 and the number of broker non-votes was 950,962. Richard E. Erickson, Thomas R. Kadlec and Robert F. Keith are the other current and continuing Trustees.
Risk Considerations
The following discussion summarizes certain (but not all) of the principal risks associated with investing in the Fund. The Fund is subject to the informational requirements of the Securities Exchange Act of 1934 and the Investment Company Act of 1940 and, in accordance therewith, files reports, proxy statements and other information that is available for review.
Business Development Company (“BDC”) Risk. Investments in closed-end funds that elect to be treated as BDCs may be subject to a high degree of risk. BDCs typically invest in small and medium-sized private and certain public companies that may not have access to public equity markets or capital raising, and investments in these companies present a greater risk of loss due ot the companies’ youth and limited track record.. As a result, a BDC’s portfolio could include a substantial amount of securities purchased in private placements, and its portfolio may carry risks similar to those of a private equity or venture capital fund. Securities that are not publicly registered may be difficult to value and may be difficult to sell at a price representative of their intrinsic value. Investments in BDCs are subject to various risks, including management’s ability to meet the BDC’s investment objective, and to manage the BDC’s portfolio when the underlying securities are redeemed or sold, during periods of market turmoil and as investors’ perceptions regarding a BDC or its underlying investments change. Certain BDCs in which the Fund invests employ the use of leverage in their portfolios through borrowings or in the issuance of preferred stock. While leverage often serves to increase the yield of a BDC, the leverage also subjects the BDC to increased risks, including the likelihood of increased volatility and the possibility that the BDC’s common share income will fall if the dividend rate on any preferred shares or the interest rate on any borrowings rises. In addition, the market price for BDCs, together with other dividend paying stocks, may be negatively affected by a rise in interest rates. BDC shares are not redeemable at the option of the BDC shareholder and, as with shares of other closed-end funds, they may trade in the secondary market at a discount to their NAV.
Cyber Security Risk. The Fund is susceptible to potential operational risks through breaches in cyber security. A breach in cyber security refers to both intentional and unintentional events that may cause the Fund to lose proprietary information, suffer data corruption or lose operational capacity. Such events could cause the Fund to incur regulatory penalties, reputational damage, additional compliance costs associated with corrective measures and/or financial loss. Cyber security breaches may involve unauthorized access to the Fund’s digital information systems through “hacking” or malicious software coding, but may also result from outside attacks such as denial-of-service attacks through efforts to make network services unavailable to intended users. In addition, cyber security breaches of the Fund’s third-party service providers, such as its administrator, transfer agent, custodian, or sub-advisor, as applicable, or issuers in which the Fund invests, can also subject the Fund to many of the same risks associated with direct cyber security breaches. The Fund has established risk management systems designed to reduce the risks associated with cyber security. However, there is no guarantee that such efforts will succeed, especially because the Fund does not directly control the cyber security systems of issuers or third party service providers.
Financial Sector Concentration Risk. Under normal market conditions, the Fund invests at least 80% of its managed assets in securities of companies within industries in the financial sector. A fund concentrated in a single industry or sector is likely to present more risks than a fund that is broadly diversified over several industries or groups of industries. Compared to the broad market, an individual sector may be more strongly affected by changes in the economic climate, broad market shifts, moves in a particular dominant stock, or regulatory changes. Specialty finance and other financial companies in general are subject to extensive government regulation, which may change frequently. The profitability of specialty finance and other financial companies is largely dependent upon the availability and cost of capital funds, and may fluctuate significantly in response to changes in interest rates, as well as changes in general economic conditions. From time to time, severe competition may also affect the profitability of specialty finance and other financial companies. Financial companies can be highly dependent upon access to capital markets and any impediments to such access, such as general economic conditions or a negative perception in the capital markets of a company’s financial condition or
Additional Information (Continued)
First Trust Specialty Finance and Financial Opportunities Fund (FGB)
May 31, 2019 (Unaudited)
prospects, could adversely affect its business. Leasing companies may be negatively impacted by changes in tax laws which affect the types of transactions in which such companies engage.
Illiquid Securities Risk. Illiquid securities may be difficult to dispose of at a fair price at the times when the Fund believes it is desirable to do so. The market price of illiquid securities generally is more volatile than that of more liquid securities, which may adversely affect the price that the Fund pays for or recovers upon the sale of such securities. Illiquid securities are also more difficult to value, especially in challenging markets.
Income Risk. The income common shareholders receive from the Fund is based primarily on the dividends and interest it earns from its investments, which can vary widely over the short and long-term. If prevailing market interest rates drop, distribution rates of the Fund’s portfolio holdings may decline which then may adversely affect the Fund’s distributions on its common shares as well. The Fund’s income also would likely be adversely affected when prevailing short-term interest rates increase and the Fund is utilizing leverage.
Leverage Risk. The use of leverage by the Fund can magnify the effect of any losses. If the income and gains from the securities and investments purchased with leverage proceeds do not cover the cost of leverage, the return to the common shares will be less than if leverage had not been used. Leverage involves risks and special considerations for common shareholders including: the likelihood of greater volatility of net asset value and market price of the common shares than a comparable portfolio without leverage; the risk that fluctuations in interest rates on borrowings will reduce the return to the common shareholders or will result in fluctuations in the dividends paid on the common shares; in a declining market, the use of leverage is likely to cause a greater decline in the net asset value of the common shares than if the Fund were not leveraged, which may result in a greater decline in the market price of the common shares; and when the Fund uses certain types of leverage, the investment advisory fee payable to the Advisor and by the Advisor to the Sub-Advisor will be higher than if the Fund did not use leverage.
Management Risk and Reliance on Key Personnel. The implementation of the Fund’s investment strategy depends upon the continued contributions of certain key employees of the Advisor and Sub-Advisor, some of whom have unique talents and experience and would be difficult to replace. The loss or interruption of the services of a key member of the portfolio management team could have a negative impact on the Fund.
Market Discount from Net Asset Value. Shares of closed-end investment companies such as the Fund frequently trade at a discount from their net asset value. The Fund cannot predict whether its common shares will trade at, below or above net asset value.
Non-Diversification. The Fund is a non-diversified investment company under the 1940 Act and will not be treated as a regulated investment company under the Internal Revenue Code of 1986. Accordingly, the diversification-specific regulatory requirements under the 1940 Act and the Internal Revenue Code of 1986 regarding the minimum number or size of portfolio securities do not apply to the Fund.
Potential Conflicts of Interest Risk. First Trust, Confluence and the portfolio managers have interests which may conflict with the interests of the Fund. In particular, First Trust and Confluence currently manage and may in the future manage and/or advise other investment funds or accounts with the same or substantially similar investment objective and strategies as the Fund. In addition, while the Fund is using leverage, the amount of the fees paid to First Trust (and by First Trust to Confluence) for investment advisory and management services are higher than if the Fund did not use leverage because the fees paid are calculated based on managed assets. Therefore, First Trust and Confluence have a financial incentive to leverage the Fund.
REIT, Mortgage-Related and Asset-Backed Securities Risk. Investing in REITs involves certain unique risks in addition to investing in the real estate industry in general. REITs are subject to interest rate risk (especially mortgage REITs) and the risk of default by lessees or borrowers. An equity REIT may be affected by changes in the value of the underlying properties owned by the REIT. A mortgage REIT may be affected by the ability of the issuers of its portfolio of mortgages to repay their obligations. REITs whose underlying assets are concentrated in properties used by a particular industry are also subject to risks associated with such industry. REITs may have limited financial resources, their securities may trade less frequently and in a limited volume, and their securities may be subject to more abrupt or erratic price movements than larger company securities. In addition to REITs, the Fund may invest in a variety of other mortgage-related securities, including commercial mortgage securities and other mortgage-backed instruments. Mortgage-related securities are susceptible to adverse economic, political or regulatory events that affect the value of real estate. Mortgage-related securities are also significantly affected by other factors such as borrower defaults, delinquencies, realized or liquidation losses and other shortfalls. Rising interest rates tend to extend the duration of mortgage-related securities, making them more sensitive to changes in interest rates, and may reduce the market value of the securities.
In addition, mortgage-related securities are subject to prepayment risk, the risk that borrowers may pay off their mortgages sooner than expected, particularly when interest rates decline. This can reduce the Fund’s returns because the Fund may have to reinvest that money at lower prevailing interest rates.
Additional Information (Continued)
First Trust Specialty Finance and Financial Opportunities Fund (FGB)
May 31, 2019 (Unaudited)
The Fund’s investments in other asset-backed securities are subject to risks similar to those associated with mortgage-backed securities, as well as additional risks associated with the nature of the assets and the servicing of those assets. In general, mortgage-related securities and asset-backed securities are subject to credit risk, extension risk, interest rate risk, liquidity risk and valuation risk.
Specialty Finance and Other Financial Companies Risks. The profitability of specialty finance and other financial companies in which the Fund may invest is largely dependent upon the availability and cost of capital, and may fluctuate significantly in response to changes in interest rates, as well as changes in general economic conditions. Any impediments to a specialty finance or other financial company’s access to capital markets, such as those caused by general economic conditions or a negative perception in the capital markets or the company’s financial condition or prospects, could adversely affect such company’s business. From time to time, severe competition may also affect the profitability of specialty finance and other financial companies. Specialty finance and other financial companies are subject to rapid business changes, significant competition, value fluctuations due to the concentration of loans in particular industries significantly affected by economic conditions (such as real estate or energy) and volatile performance based upon the availability and cost of capital and prevailing interest rates. In addition, credit and other losses resulting from the financial difficulties of borrowers or other third parties potentially may have an adverse effect on companies in these industries.
Valuation Risk. The valuation of the Fund’s investments may carry more risk than that of traditional common stock. Uncertainties in the conditions of the financial market, unreliable reference data, lack of transparency and inconsistency of valuation models and processes may lead to inaccurate asset pricing.
INVESTMENT ADVISOR
First Trust Advisors L.P.
120 East Liberty Drive, Suite 400
Wheaton, IL 60187
INVESTMENT SUB-ADVISOR
Confluence Investment Management LLC
20 Allen Avenue, Suite 300
Saint Louis, MO 63119
TRANSFER AGENT
BNY Mellon Investment Servicing (US) Inc.
301 Bellevue Parkway
Wilmington, DE 19809
ADMINISTRATOR,
FUND ACCOUNTANT, AND
CUSTODIAN
The Bank of New York Mellon
240 Greenwich Street
New York, NY 10286
INDEPENDENT REGISTERED
PUBLIC ACCOUNTING FIRM
Deloitte & Touche LLP
111 S. Wacker Drive
Chicago, IL 60606
LEGAL COUNSEL
Chapman and Cutler LLP
111 W. Monroe Street
Chicago, IL 60603
Item 2. Code of Ethics.
Not applicable.
Item 3. Audit Committee Financial Expert.
Not applicable.
Item 4. Principal Accountant Fees and Services.
Not applicable.
Item 5. Audit Committee of Listed registrants.
Not applicable.
Item 6. Investments.
| (a) | | Schedule of Investments in securities of unaffiliated issuers as of the close of the reporting period is included as part of the report to shareholders filed under Item 1 of this form. |
Item 7. Disclosure of Proxy Voting Policies and Procedures for Closed-End Management Investment Companies.
Not applicable.
Item 8. Portfolio Managers of Closed-End Management Investment Companies.
| (b) | | There has been no change, as of the date of this filing, in any of the portfolio managers identified in response to paragraph (a)(1) of this Item in the registrant’s most recently filed annual report on Form N-CSR. |
Item 9. Purchases of Equity Securities by Closed-End Management Investment Company and Affiliated Purchasers.
Not applicable.
Item 10. Submission of Matters to a Vote of Security Holders.
There have been no material changes to the procedures by which the shareholders may recommend nominees to the registrant’s board of trustees, where those changes were implemented after the registrant last provided disclosure in response to the requirements of Item 407(c)(2)(iv) of Regulation S-K (17 CFR 229.407) (as required by Item 22(b)(15) of Schedule 14A (17 CFR 240.14a-101)), or this Item.
Item 11. Controls and Procedures.
| (a) | | The registrant’s principal executive and principal financial officers, or persons performing similar functions, have concluded that the registrant’s disclosure controls and procedures (as defined in Rule 30a-3(c) under the Investment Company Act of 1940, as amended (the “1940 Act”) (17 CFR 270.30a-3(c))) are effective, as of a date within 90 days of the filing date of the report that includes the disclosure required by this paragraph, based on their evaluation of these controls and procedures required by Rule 30a-3(b) under the 1940 Act (17 CFR 270.30a-3(b)) and Rules 13a-15(b) or 15d-15(b) under the Securities Exchange Act of 1934, as amended (17 CFR 240.13a-15(b) or 240.15d-15(b)). |
| (b) | | There were no changes in the registrant’s internal control over financial reporting (as defined in Rule 30a-3(d) under the 1940 Act (17 CFR 270.30a-3(d)) that occurred during the period covered by this report that has materially affected, or is reasonably likely to materially affect, the registrant’s internal control over financial reporting. |
Item 12. Disclosure of Securities Lending Activities for Closed-End Management Investment Companies.
Item 13. Exhibits.
| (a)(2) | | Certifications pursuant to Rule 30a-2(a) under the 1940 Act and Section 302 of the Sarbanes-Oxley Act of 2002 are attached hereto. |
| (b) | | Certifications pursuant to Rule 30a-2(b) under the 1940 Act and Section 906 of the Sarbanes- Oxley Act of 2002 are attached hereto. |
SIGNATURES
Pursuant to the requirements of the Securities Exchange Act of 1934 and the Investment Company Act of 1940, the registrant has duly caused this report to be signed on its behalf by the undersigned, thereunto duly authorized.
| (registrant) | | First Trust Specialty Finance and Financial Opportunities Fund | | |
| By (Signature and Title)* | | /s/ James M. Dykas | | |
| | | James M. Dykas, President and Chief Executive Officer
(principal executive officer) | | |
Pursuant to the requirements of the Securities Exchange Act of 1934 and the Investment Company Act of 1940, this report has been signed below by the following persons on behalf of the registrant and in the capacities and on the dates indicated.
| By (Signature and Title)* | | /s/ James M. Dykas | | |
| | | James M. Dykas, President and Chief Executive Officer
(principal executive officer) | | |
| By (Signature and Title)* | | /s/ Donald P. Swade | | |
| | | Donald P. Swade, Treasurer, Chief Financial Officer
and Chief Accounting Officer
(principal financial officer) | | |
* Print the name and title of each signing officer under his or her signature.