UNITED STATES
SECURITIES AND EXCHANGE COMMISSION
Washington, D.C. 20549
FORM N-CSR
CERTIFIED SHAREHOLDER REPORT OF REGISTERED MANAGEMENT INVESTMENT COMPANIES
Investment Company Act file number 811-22039
First Trust Specialty Finance & Financial Opportunities Fund
(Exact name of registrant as specified in charter)
120 East Liberty Drive, Suite 400
Wheaton, IL 60187
(Address of principal executive offices) (Zip code)
W. Scott Jardine, Esq.
First Trust Portfolios L.P.
120 East Liberty Drive, Suite 400
Wheaton, IL 60187
(Name and address of agent for service)
Registrant’s telephone number, including area code: 630-765-8000
Date of fiscal year end: November 30
Date of reporting period: November 30, 2023
Form N-CSR is to be used by management investment companies to file reports with the Commission not later than 10 days after the transmission to stockholders of any report that is required to be transmitted to stockholders under Rule 30e-1 under the Investment Company Act of 1940 (17 CFR 270.30e-1). The Commission may use the information provided on Form N-CSR in its regulatory, disclosure review, inspection, and policymaking roles.
A registrant is required to disclose the information specified by Form N-CSR, and the Commission will make this information public. A registrant is not required to respond to the collection of information contained in Form N-CSR unless the Form displays a currently valid Office of Management and Budget (“OMB”) control number. Please direct comments concerning the accuracy of the information collection burden estimate and any suggestions for reducing the burden to Secretary, Securities and Exchange Commission, 100 F Street, NE, Washington, DC 20549-0609. The OMB has reviewed this collection of information under the clearance requirements of 44 U.S.C. § 3507.
Item 1. Reports to Stockholders.
(a) The Report to Shareholders is attached herewith.

Opportunities Fund (FGB)


| 1 | |
| 2 | |
| 3 | |
| 6 | |
| 7 | |
| 8 | |
| 9 | |
| 10 | |
| 11 | |
| 12 | |
| 17 | |
| 18 | |
| 22 | |
| 28 | |
| 30 |

| Fund Statistics | |
| Symbol on New York Stock Exchange | FGB |
| Common Share Price | $3.35 |
| Common Share Net Asset Value (“NAV”) | $3.94 |
| Premium (Discount) to NAV | ()% |
| Net Assets Applicable to Common Shares | $56,553,039 |
| Current Quarterly Distribution per Common Share(1) | $0.0825 |
| Current Annualized Distribution per Common Share | $0.3300 |
| Current Distribution Rate on Common Share Price(2) | 9.85% |
| Current Distribution Rate on NAV(2) | 8.38% |

| Performance | ||||
| Average Annual Total Returns | ||||
| 1 Year Ended 11/30/23 | 5 Years Ended 11/30/23 | 10 Years Ended 11/30/23 | Inception (5/25/07) to 11/30/23 | |
| Fund Performance(3) | ||||
| NAV | 16.69% | 2.39% | 2.36% | 0.90% |
| Market Value | 6.04% | -1.84% | 1.22% | -0.37% |
| Index Performance | ||||
| Blended Benchmark(4) | 9.15% | 7.03% | 6.14% | N/A |
| MSCI U.S. Investable Market Financials Index(5) | -1.65% | 5.21% | 6.95% | N/A |
| Asset Classification | % of Total Investments |
| Common Stocks - Business Development Companies | 88.0% |
| Common Stocks | 12.0 |
| Total | 100.0% |
| Industry Classification | % of Total Investments |
| Capital Markets | 90.0% |
| Mortgage Real Estate Investment Trusts | 6.1 |
| Financial Services | 2.6 |
| Banks | 1.0 |
| Insurance | 0.3 |
| Total | 100.0% |
| Top Ten Holdings | % of Total Investments |
| Hercules Capital, Inc. | 8.4% |
| Main Street Capital Corp. | 7.3 |
| Blackstone Secured Lending Fund | 7.3 |
| New Mountain Finance Corp. | 6.7 |
| Golub Capital BDC, Inc. | 6.7 |
| BlackRock TCP Capital Corp. | 6.3 |
| PennantPark Investment Corp. | 6.2 |
| Sixth Street Specialty Lending, Inc. | 5.9 |
| Barings BDC, Inc. | 5.6 |
| Ares Capital Corp. | 4.8 |
| Total | 65.2% |
| (1) | Most recent distribution paid through November 30, 2023. Subject to change in the future. |
| (2) | Distribution rates are calculated by annualizing the most recent distribution paid through the report date and then dividing by Common Share Price or NAV, as applicable, as of November 30, 2023. Subject to change in the future. |
| (3) | Total return is based on the combination of reinvested dividend, capital gain, and return of capital distributions, if any, at prices obtained by the Dividend Reinvestment Plan and changes in NAV per share for NAV returns and changes in Common Share Price for market value returns. Total returns do not reflect sales load and are not annualized for periods of less than one year. Past performance is not indicative of future results. |
| (4) | The Blended Benchmark consists of a 70/20/10 blend of the MVIS U.S. Business Development Companies Index, the FTSE NARIET Mortgage REIT Index and the S&P SmallCap Financials Index. The Blended Benchmark return is calculated by using the monthly return of the three indices during each period shown above. At the beginning of each month, the three indices are rebalanced, to account for divergence from that ratio that occurred during the course of each month to the ratios noted above. The monthly returns are then compounded for each period shown above, giving the performance for the Blended Benchmark for each period shown above. Since the MVIS U.S. Business Development Companies Index had an inception date of August 4, 2011, the performance of the Blended Benchmark is not available for all of the periods disclosed. |
| (5) | Because the index has an inception date of June 5, 2007, performance data is not available for all the periods shown. |
| Performance Analysis | ||||
| Average Annual Total Returns | ||||
| 1 Year Ended 11/30/23 | 5 Years Ended 11/30/23 | 10 Years Ended 11/30/23 | Inception (5/25/07) to 11/30/23 | |
| Fund Performance(1) | ||||
| NAV | 16.69% | 2.39% | 2.36% | 0.90% |
| Market Value | 6.04% | -1.84% | 1.22% | -0.37% |
| Index Performance | ||||
| Blended Benchmark(2) | 9.15% | 7.03% | 6.14% | N/A |
| MSCI U.S. Investable Market Financials Index(3) | -1.65% | 5.21% | 6.95% | N/A |
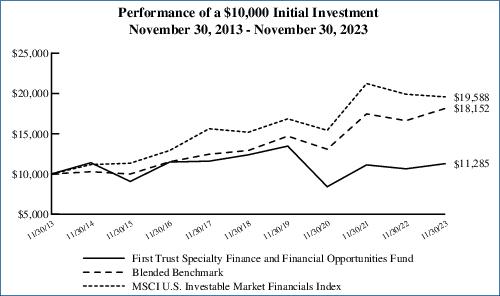
Performance figures assume reinvestment of all distributions and do not reflect the deduction of taxes that a shareholder would pay on Fund distributions or the redemption or sale of Fund shares. An index is a statistical composite that tracks a specified financial market or sector. Unlike the Fund, the indices do not actually hold a portfolio of securities and therefore do not incur the expenses incurred by the Fund. These expenses negatively impact the performance of the Fund. The Fund’s past performance does not predict future performance.
| (1) | Total return is based on the combination of reinvested dividend, capital gain and return of capital distribution, if any, at prices obtained by the Dividend Reinvestment Plan and changes in NAV per share for NAV returns and changes in Common Share Price for market value returns. Total returns do not reflect sales load and are not annualized for period of less than one year. Past performance is not indicative of future results. |
| (2) | The Blended Benchmark consists of a 70/20/10 blend of the MVIS U.S. Business Development Companies Index, the FTSE NARIET Mortgage REIT Index and the S&P SmallCap Financials Index. The Blended Benchmark returns are calculated by using the monthly return of the three indices during each period shown above. At the beginning of each month, the three indices are rebalanced, to account for divergence from that ratio that occurred during the course of each month to the ratios noted above. The monthly returns are then compounded for each period shown above, giving the performance for the Blended Benchmark for each period shown above. Since the MVIS U.S. Business Development Companies Index had an inception date of August 4, 2011, the performance of the Blended Benchmark is not available for all of the periods disclosed. |
| (3) | Because the index has an inception date of June 5, 2007, performance data is not available for all the periods shown in the table. |
| Shares | Description | Value | ||
| COMMON STOCKS – BUSINESS DEVELOPMENT COMPANIES – 97.3% | ||||
| Capital Markets – 97.3% | ||||
| 150,000 | Ares Capital Corp. (a) | $2,973,000 | ||
| 50,000 | Bain Capital Specialty Finance, Inc. | 757,000 | ||
| 390,000 | Barings BDC, Inc. (a) | 3,517,800 | ||
| 332,000 | BlackRock TCP Capital Corp. (a) | 3,950,800 | ||
| 160,000 | Blackstone Secured Lending Fund (a) | 4,539,200 | ||
| 150,000 | Blue Owl Capital Corp. (a) | 2,199,000 | ||
| 71,000 | Capital Southwest Corp. (a) | 1,598,920 | ||
| 42,565 | Crescent Capital BDC, Inc. (a) | 709,984 | ||
| 38,500 | FS KKR Capital Corp. (a) | 760,760 | ||
| 135,000 | Goldman Sachs BDC, Inc. (a) | 1,988,550 | ||
| 280,000 | Golub Capital BDC, Inc. (a) | 4,166,400 | ||
| 340,000 | Hercules Capital, Inc. (a) | 5,253,000 | ||
| 111,000 | Main Street Capital Corp. (a) | 4,587,630 | ||
| 328,000 | New Mountain Finance Corp. (a) | 4,204,960 | ||
| 10,000 | Oaktree Specialty Lending Corp. | 200,000 | ||
| 98,000 | OFS Capital Corp. (a) | 1,047,620 | ||
| 600,000 | PennantPark Investment Corp. (a) | 3,876,000 | ||
| 44,000 | Portman Ridge Finance Corp. | 739,200 | ||
| 177,000 | Sixth Street Specialty Lending, Inc. (a) | 3,709,920 | ||
| 161,000 | SLR Investment Corp. (a) | 2,437,540 | ||
| 48,000 | Trinity Capital, Inc. | 708,480 | ||
| 105,000 | TriplePoint Venture Growth BDC Corp. (a) | 1,111,950 | ||
| Total Common Stocks - Business Development Companies | 55,037,714 | |||
| (Cost $58,621,457) | ||||
| COMMON STOCKS – 13.3% | ||||
| Banks – 1.1% | ||||
| 20,000 | Bank of America Corp. | 609,800 | ||
| Capital Markets – 2.2% | ||||
| 11,000 | Blackstone, Inc. | 1,236,070 | ||
| Financial Services – 2.8% | ||||
| 4,500 | Berkshire Hathaway, Inc., Class B (a) (b) | 1,620,000 | ||
| Insurance – 0.4% | ||||
| 150 | Markel Group, Inc. (b) | 215,864 | ||
| Mortgage Real Estate Investment Trusts – 6.8% | ||||
| 210,000 | AGNC Investment Corp. (a) | 1,852,200 | ||
| Shares | Description | Value | ||
| Mortgage Real Estate Investment Trusts (Continued) | ||||
| 110,000 | Annaly Capital Management, Inc. (a) | $1,987,700 | ||
| 3,839,900 | ||||
| Total Common Stocks | 7,521,634 | |||
| (Cost $7,962,447) | ||||
| Total Investments – 110.6% | 62,559,348 | |||
| (Cost $66,583,904) | ||||
| Outstanding Loan – (15.2)% | (8,600,000) | |||
| Net Other Assets and Liabilities – 4.6% | 2,593,691 | |||
| Net Assets – 100.0% | $56,553,039 | |||
| (a) | All or a portion of this security serves as collateral for the outstanding loan. At November 30, 2023, the segregated value of these securities amounts to $40,545,139. |
| (b) | Non-income producing security. |
| Total Value at 11/30/2023 | Level 1 Quoted Prices | Level 2 Significant Observable Inputs | Level 3 Significant Unobservable Inputs | |
| Common Stocks - Business Development Companies* | $ 55,037,714 | $ 55,037,714 | $ — | $ — |
| Common Stocks* | 7,521,634 | 7,521,634 | — | — |
| Total Investments | $ 62,559,348 | $ 62,559,348 | $— | $— |
| * | See Portfolio of Investments for industry breakout. |
| ASSETS: | |
Investments, at value | $ 62,559,348 |
Cash | 3,857,773 |
Foreign currency | 20 |
Dividends receivable | 119,821 |
Prepaid expenses | 3,019 |
Total Assets | 66,539,981 |
| LIABILITIES: | |
Outstanding loan | 8,600,000 |
| Payables: | |
Distributions | 1,185,326 |
Audit and tax fees | 59,141 |
Investment advisory fees | 53,476 |
Interest and fees on loan | 52,380 |
Shareholder reporting fees | 16,219 |
Legal fees | 5,846 |
Trustees’ fees and expenses | 3,622 |
Transfer agent fees | 3,090 |
Administrative fees | 2,637 |
Custodian fees | 2,308 |
Financial reporting fees | 771 |
Other liabilities | 2,126 |
Total Liabilities | 9,986,942 |
NET ASSETS | $56,553,039 |
| NET ASSETS consist of: | |
Paid-in capital | $ 112,902,839 |
Par value | 143,676 |
Accumulated distributable earnings (loss) | (56,493,476) |
NET ASSETS | $56,553,039 |
NET ASSET VALUE, per Common Share (par value $0.01 per Common Share) | $3.94 |
Number of Common Shares outstanding (unlimited number of Common Shares has been authorized) | |
Investments, at cost | $66,583,904 |
Foreign currency, at cost (proceeds) | $26 |
| INVESTMENT INCOME: | ||
Dividends | $ 6,474,311 | |
Interest | 43,927 | |
Total investment income | 6,518,238 | |
| EXPENSES: | ||
Investment advisory fees | 624,092 | |
Interest and fees on loan | 606,183 | |
Audit and tax fees | 58,558 | |
Shareholder reporting fees | 51,395 | |
Listing expense | 23,750 | |
Administrative fees | 21,562 | |
Trustees’ fees and expenses | 19,868 | |
Transfer agent fees | 18,480 | |
Legal fees | 14,601 | |
Financial reporting fees | 9,250 | |
Custodian fees | 3,733 | |
Other | 8,109 | |
Total expenses | 1,459,581 | |
NET INVESTMENT INCOME (LOSS) | 5,058,657 | |
| NET REALIZED AND UNREALIZED GAIN (LOSS): | ||
Net realized gain (loss) on investments | (1,472,282) | |
Net change in unrealized appreciation (depreciation) on investments | 4,104,165 | |
NET REALIZED AND UNREALIZED GAIN (LOSS) | 2,631,883 | |
NET INCREASE (DECREASE) IN NET ASSETS RESULTING FROM OPERATIONS | $ 7,690,540 | |
| Year Ended 11/30/2023 | Year Ended 11/30/2022 | ||
| OPERATIONS: | |||
Net investment income (loss) | $ 5,058,657 | $ 3,758,321 | |
Net realized gain (loss) | (1,472,282) | (2,032,454) | |
Net change in unrealized appreciation (depreciation) | 4,104,165 | (5,577,903) | |
Net increase (decrease) in net assets resulting from operations | 7,690,540 | (3,852,036) | |
| DISTRIBUTIONS TO SHAREHOLDERS FROM: | |||
Investment operations | (4,741,305) | (4,009,322) | |
Return of capital | — | (731,983) | |
Total distributions to shareholders | (4,741,305) | (4,741,305) | |
Total increase (decrease) in net assets | 2,949,235 | (8,593,341) | |
| NET ASSETS: | |||
Beginning of period | 53,603,804 | 62,197,145 | |
End of period | $ 56,553,039 | $ 53,603,804 | |
| COMMON SHARES: | |||
Common Shares at end of period | 14,367,591 | 14,367,591 |
| Cash flows from operating activities: | ||
Net increase (decrease) in net assets resulting from operations | $7,690,540 | |
| Adjustments to reconcile net increase (decrease) in net assets resulting from operations to net cash provided by operating activities: | ||
Purchases of investments | (10,031,330) | |
Sales, maturities and paydown of investments | 12,060,188 | |
Return of capital and realized gain distributions received from investments | 249,532 | |
Net realized gain/loss on investments | 1,472,282 | |
Net change in unrealized appreciation/depreciation on investments | (4,104,165) | |
| Changes in assets and liabilities: | ||
Increase in dividends receivable | (13,751) | |
Increase in prepaid expenses | (55) | |
Increase in interest and fees payable on loan | 16,497 | |
Increase in investment advisory fees payable | 2,474 | |
Decrease in audit and tax fees payable | (112) | |
Increase in legal fees payable | 5,162 | |
Increase in shareholder reporting fees payable | 3,808 | |
Increase in administrative fees payable | 201 | |
Increase in custodian fees payable | 1,489 | |
Increase in transfer agent fees payable | 1,559 | |
Increase in trustees’ fees and expenses payable | 563 | |
Increase in other liabilities payable | 1,999 | |
Cash provided by operating activities | $7,356,881 | |
| Cash flows from financing activities: | ||
Distributions to Common Shareholders from investment operations | (4,741,305) | |
Cash used in financing activities | (4,741,305) | |
Increase in cash and foreign currency | 2,615,576 | |
Cash and foreign currency at beginning of period | 1,242,217 | |
Cash and foreign currency at end of period | $3,857,793 | |
| Supplemental disclosure of cash flow information: | ||
Cash paid during the period for interest and fees | $589,686 |
| Year Ended November 30, | |||||||||
| 2023 | 2022 | 2021 | 2020 | 2019 | |||||
Net asset value, beginning of period | $ 3.73 | $ 4.33 | $ 3.44 | $ 5.92 | $ 5.78 | ||||
| Income from investment operations: | |||||||||
Net investment income (loss) | 0.35 (a) | 0.26 | 0.26 | 0.33 | 0.58 | ||||
Net realized and unrealized gain (loss) | 0.19 | (0.53) | 0.96 | (2.37) | 0.22 | ||||
Total from investment operations | 0.54 | (0.27) | 1.22 | (2.04) | 0.80 | ||||
| Distributions paid to shareholders from: | |||||||||
Net investment income | (0.33) | (0.28) | (0.30) | (0.44) | (0.40) | ||||
Return of capital | — | (0.05) | (0.03) | — | (0.26) | ||||
Total distributions paid to Common Shareholders | (0.33) | (0.33) | (0.33) | (0.44) | (0.66) | ||||
Net asset value, end of period | $ | $3.73 | $4.33 | $3.44 | $5.92 | ||||
Market value, end of period | $ | $3.49 | $4.00 | $3.28 | $5.90 | ||||
Total return based on net asset value (b) | 16.69% | (5.60)% | 36.49% | (34.67)% | 14.58% | ||||
Total return based on market value (b) | 6.04% | (4.39)% | 32.23% | (37.49)% | 8.74% | ||||
| Ratios to average net assets/supplemental data: | |||||||||
Net assets, end of period (in 000’s) | $ 56,553 | $ 53,604 | $ 62,197 | $ 49,437 | $ 85,054 | ||||
Ratio of total expenses to average net assets | 2.71% | 2.02% | 1.78% | 2.35% | 2.56% | ||||
Ratio of total expenses to average net assets excluding interest expense | 1.59% | 1.53% | 1.49% | 1.78% | 1.60% | ||||
Ratio of net investment income (loss) to average net assets | 9.40% | 6.44% | 6.35% | 8.87% | 9.95% | ||||
Portfolio turnover rate | 16% | 5% | 8% | 20% | 7% | ||||
| Indebtedness: | |||||||||
Total loan outstanding (in 000’s) | $ 8,600 | $ 8,600 | $ 8,600 | $ 6,500 | $ 25,000 | ||||
Asset coverage per $1,000 of indebtedness (c) | $ 7,576 | $ 7,233 | $ 8,232 | $ 8,606 | $ 4,402 | ||||
| (a) | Based on average shares outstanding. |
| (b) | Total return is based on the combination of reinvested dividend, capital gain and return of capital distributions, if any, at prices obtained by the Dividend Reinvestment Plan, and changes in net asset value per share for net asset value returns and changes in Common Share Price for market value returns. Total returns do not reflect sales load and are not annualized for periods of less than one year. Past performance is not indicative of future results. |
| (c) | Calculated by subtracting the Fund’s total liabilities (not including the loan outstanding) from the Fund’s total assets, and dividing by the outstanding loan balance in 000’s. |
| 1) | the last sale price on the exchange on which they are principally traded or, for Nasdaq and AIM securities, the official closing price; |
| 2) | the type of security; |
| 3) | the size of the holding; |
| 4) | the initial cost of the security; |
| 5) | transactions in comparable securities; |
| 6) | price quotes from dealers and/or third-party pricing services; |
| 7) | relationships among various securities; |
| 8) | information obtained by contacting the issuer, analysts, or the appropriate stock exchange; |
| 9) | an analysis of the issuer’s financial statements; |
| 10) | the existence of merger proposals or tender offers that might affect the value of the security; and |
| 11) | other relevant factors. |
| 1) | the last sale price on the exchange on which they are principally traded; |
| 2) | the value of similar foreign securities traded on other foreign markets; |
| 3) | ADR trading of similar securities; |
| 4) | closed-end fund or exchange-traded fund trading of similar securities; |
| 5) | foreign currency exchange activity; |
| 6) | the trading prices of financial products that are tied to baskets of foreign securities; |
| 7) | factors relating to the event that precipitated the pricing problem; |
| 8) | whether the event is likely to recur; |
| 9) | whether the effects of the event are isolated or whether they affect entire markets, countries or regions; and |
| 10) | other relevant factors. |
| • | Level 1 – Level 1 inputs are quoted prices in active markets for identical investments. An active market is a market in which transactions for the investment occur with sufficient frequency and volume to provide pricing information on an ongoing basis. |
| • | Level 2 – Level 2 inputs are observable inputs, either directly or indirectly, and include the following: |
| o | Quoted prices for similar investments in active markets. |
| o | Quoted prices for identical or similar investments in markets that are non-active. A non-active market is a market where there are few transactions for the investment, the prices are not current, or price quotations vary substantially either over time or among market makers, or in which little information is released publicly. |
| o | Inputs other than quoted prices that are observable for the investment (for example, interest rates and yield curves observable at commonly quoted intervals, volatilities, prepayment speeds, loss severities, credit risks, and default rates). |
| o | Inputs that are derived principally from or corroborated by observable market data by correlation or other means. |
| • | Level 3 – Level 3 inputs are unobservable inputs. Unobservable inputs may reflect the reporting entity’s own assumptions about the assumptions that market participants would use in pricing the investment. |
| Distributions paid from: | 2023 | 2022 |
Ordinary income | $4,741,305 | $4,009,322 |
Capital gains | — | — |
Return of capital | — | 731,983 |
Undistributed ordinary income | $— |
Undistributed capital gains | — |
Total undistributed earnings | — |
Accumulated capital and other losses | (50,972,396) |
Net unrealized appreciation (depreciation) | (4,335,754) |
Total accumulated earnings (losses) | (55,308,150) |
Other | (1,185,326) |
Paid-in capital | 113,046,515 |
Total net assets | $56,553,039 |
| Tax Cost | Gross Unrealized Appreciation | Gross Unrealized (Depreciation) | Net Unrealized Appreciation (Depreciation) | |||
| $66,895,095 | $6,374,151 | $(10,709,898) | $(4,335,747) |
| (1) | If Common Shares are trading at or above net asset value (“NAV”) at the time of valuation, the Fund will issue new shares at a price equal to the greater of (i) NAV per Common Share on that date or (ii) 95% of the market price on that date. |
| (2) | If Common Shares are trading below NAV at the time of valuation, the Plan Agent will receive the dividend or distribution in cash and will purchase Common Shares in the open market, on the NYSE or elsewhere, for the participants’ accounts. It is possible that the market price for the Common Shares may increase before the Plan Agent has completed its purchases. Therefore, the average purchase price per share paid by the Plan Agent may exceed the market price at the time of valuation, resulting in the purchase of fewer shares than if the dividend or distribution had been paid in Common Shares issued by the Fund. The Plan Agent will use all dividends and distributions received in cash to purchase Common Shares in the open market within 30 days of the valuation date except where temporary curtailment or suspension of purchases is necessary to comply with federal securities laws. Interest will not be paid on any uninvested cash payments. |
| • | The Fund will concentrate its investments in securities of companies within industries in the financial sector, which is comprised of specialty finance companies, banks, savings institutions, brokerage firms, investment management companies, insurance companies, holding companies of the foregoing and companies that provide related services to such companies. |
| • | The Fund will not invest more than 20% of its Managed Assets in master limited partnerships. |
| NOT FDIC INSURED | NOT BANK GUARANTEED | MAY LOSE VALUE |
Assumed Portfolio Total Return (Net of Expenses) | -10% | -5% | 0% | 5% | 10% |
Common Share Total Return | -12.63% | -6.87% | -1.11% | 4.65% | 10.41% |
| Name, Year of Birth and Position with the Fund | Term of Office and Year First Elected or Appointed(1) | Principal Occupations During Past 5 Years | Number of Portfolios in the First Trust Fund Complex Overseen by Trustee | Other Trusteeships or Directorships Held by Trustee During Past 5 Years |
| INDEPENDENT TRUSTEES | ||||
| Richard E. Erickson, Trustee (1951) | • Three Year Term• Since Fund Inception | Retired; Physician, Edward-Elmhurst Medical Group (2021 to September 2023); Physician and Officer, Wheaton Orthopedics (1990 to 2021) | 256 | None |
| Thomas R. Kadlec, Trustee (1957) | • Three Year Term• Since Fund Inception | Retired; President, ADM Investor Services, Inc. (Futures Commission Merchant) (2010 to July 2022) | 256 | Director, National Futures Association and ADMIS Singapore Ltd.; Formerly, Director of ADM Investor Services, Inc., ADM Investor Services International, ADMIS Hong Kong Ltd., and Futures Industry Association |
| Denise M. Keefe, Trustee (1964) | • Three Year Term• Since 2021 | Executive Vice President, Advocate Aurora Health and President, Advocate Aurora Continuing Health Division (Integrated Healthcare System) | 256 | Director and Board Chair of Advocate Home Health Services, Advocate Home Care Products and Advocate Hospice; Director and Board Chair of Aurora At Home (since 2018); Director of Advocate Physician Partners Accountable Care Organization; Director of RML Long Term Acute Care Hospitals; Director of Senior Helpers (since 2021); and Director of MobileHelp (since 2022) |
| Robert F. Keith, Trustee (1956) | • Three Year Term• Since Fund Inception | President, Hibs Enterprises (Financial and Management Consulting) | 256 | Formerly, Director of Trust Company of Illinois |
| Niel B. Nielson, Trustee (1954) | • Three Year Term• Since Fund Inception | Senior Advisor (2018 to Present), Managing Director and Chief Operating Officer (2015 to 2018), Pelita Harapan Educational Foundation (Educational Products and Services) | 256 | None |
| (1) | Currently, Denise M. Keefe and Robert F. Keith, as Class I Trustees, are serving as trustees until the Fund’s 2026 annual meeting of shareholders. Richard E. Erickson, Thomas R. Kadlec and Bronwyn Wright, as Class II Trustees, are serving as trustees until the Fund’s 2024 annual meeting of shareholders. James A. Bowen and Niel B. Nielson, as Class III Trustees, are serving as trustees until the Fund’s 2025 annual meeting of shareholders. |
| Name, Year of Birth and Position with the Fund | Term of Office and Year First Elected or Appointed(1) | Principal Occupations During Past 5 Years | Number of Portfolios in the First Trust Fund Complex Overseen by Trustee | Other Trusteeships or Directorships Held by Trustee During Past 5 Years |
| INDEPENDENT TRUSTEES | ||||
| Bronwyn Wright, Trustee (1971) | • Three Year Term• Since 2023 | Independent Director to a number of Irish collective investment funds (2009 to Present); Various roles at international affiliates of Citibank (1994 to 2009), including Managing Director, Citibank Europe plc and Head of Securities and Fund Services, Citi Ireland (2007 to 2009) | 232 | None |
| INTERESTED TRUSTEE | ||||
| James A. Bowen(2), Trustee and Chairman of the Board (1955) | • Three Year Term• Since Fund Inception | Chief Executive Officer, First Trust Advisors L.P. and First Trust Portfolios L.P.; Chairman of the Board of Directors, BondWave LLC (Software Development Company) and Stonebridge Advisors LLC (Investment Advisor) | 256 | None |
| Name and Year of Birth | Position and Offices with Fund | Term of Office and Length of Service | Principal Occupations During Past 5 Years |
| OFFICERS(3) | |||
| James M. Dykas (1966) | President and Chief Executive Officer | • Indefinite Term • Since 2016 | Managing Director and Chief Financial Officer, First Trust Advisors L.P. and First Trust Portfolios L.P.; Chief Financial Officer, BondWave LLC (Software Development Company) and Stonebridge Advisors LLC (Investment Advisor) |
| Derek D. Maltbie (1972) | Treasurer, Chief Financial Officer and Chief Accounting Officer | • Indefinite Term • Since 2023 | Senior Vice President, First Trust Advisors L.P. and First Trust Portfolios L.P., July 2021 to Present. Previously, Vice President, First Trust Advisors L.P. and First Trust Portfolios L.P., 2014 to 2021. |
| W. Scott Jardine (1960) | Secretary and Chief Legal Officer | • Indefinite Term • Since Fund Inception | General Counsel, First Trust Advisors L.P. and First Trust Portfolios L.P.; Secretary and General Counsel, BondWave LLC; Secretary, Stonebridge Advisors LLC |
| Daniel J. Lindquist (1970) | Vice President | • Indefinite Term • Since Fund Inception | Managing Director, First Trust Advisors L.P. and First Trust Portfolios L.P. |
| Kristi A. Maher (1966) | Chief Compliance Officer and Assistant Secretary | • Indefinite Term • Chief Compliance Officer Since January 2011• Assistant Secretary Since Fund Inception | Deputy General Counsel, First Trust Advisors L.P. and First Trust Portfolios L.P. |
| (2) | Mr. Bowen is deemed an “interested person” of the Fund due to his position as CEO of First Trust Advisors L.P., investment advisor of the Fund. |
| (3) | The term “officer” means the president, vice president, secretary, treasurer, controller or any other officer who performs a policy making function. |
| • | Information we receive from you and your broker-dealer, investment professional or financial representative through interviews, applications, agreements or other forms; |
| • | Information about your transactions with us, our affiliates or others; |
| • | Information we receive from your inquiries by mail, e-mail or telephone; and |
| • | Information we collect on our website through the use of “cookies.” For example, we may identify the pages on our website that your browser requests or visits. |
| • | In order to provide you with products and services and to effect transactions that you request or authorize, we may disclose your personal information as described above to unaffiliated financial service providers and other companies that perform administrative or other services on our behalf, such as transfer agents, custodians and trustees, or that assist us in the distribution of investor materials such as trustees, banks, financial representatives, proxy services, solicitors and printers. |
| • | We may release information we have about you if you direct us to do so, if we are compelled by law to do so, or in other legally limited circumstances (for example to protect your account from fraud). |
FUND ACCOUNTANT, AND
CUSTODIAN
PUBLIC ACCOUNTING FIRM
(b) Not applicable.
Item 2. Code of Ethics.
| (a) | The registrant, as of the end of the period covered by this report, has adopted a code of ethics that applies to the registrant’s principal executive officer, principal financial officer, principal accounting officer or controller, or persons performing similar functions, regardless of whether these individuals are employed by the registrant or a third party. |
| (c) | There have been no amendments, during the period covered by this report, to a provision of the code of ethics that applies to the registrant’s principal executive officer, principal financial officer, principal accounting officer or controller, or persons performing similar functions, regardless of whether these individuals are employed by the registrant or a third party, and that relates to any element of the code of ethics description. |
| (d) | The registrant has not granted any waivers, including an implicit waiver, from a provision of the code of ethics that applies to the registrant’s principal executive officer, principal financial officer, principal accounting officer or controller, or persons performing similar functions, regardless of whether these individuals are employed by the registrant or a third party, that relates to one or more of the items set forth in paragraph (b) of this item’s instructions. |
| (e) | Not applicable. |
| (f) | A copy of the code of ethics that applies to the registrant’s principal executive officer, principal financial officer, principal accounting officer or controller is filed as an exhibit pursuant to Item 13(a)(1). |
Item 3. Audit Committee Financial Expert.
As of the end of the period covered by the report, the registrant’s board of trustees has determined that Thomas R. Kadlec, Robert F. Keith and Bronwyn Wright are qualified to serve as audit committee financial experts serving on its audit committee and that each of them is “independent,” as defined by Item 3 of Form N-CSR.
Item 4. Principal Accountant Fees and Services.
(a) Audit Fees (Registrant) -- The aggregate fees billed for each of the last two fiscal years for professional services rendered by the principal accountant for the audit of the registrant’s annual financial statements or services that are normally provided by the accountant in connection with statutory and regulatory filings or engagements for those fiscal years were $44,000 for the fiscal year ended November 30, 2022 and $44,000 for the fiscal year ended November 30, 2023.
(b) Audit-Related Fees (Registrant) -- The aggregate fees billed in each of the last two fiscal years for assurance and related services by the principal accountant that are reasonably related to the performance of the audit of the registrant’s financial statements and are not reported under paragraph (a) of this Item were $0 for the fiscal year ended November 30, 2022 and $0 for the fiscal year ended November 30, 2023.
Audit-Related Fees (Investment Advisor) -- The aggregate fees billed in each of the last two fiscal years for assurance and related services by the principal accountant that are reasonably related to the performance of the audit of the registrant’s financial statements and are not reported under paragraph (a) of this Item were $0 for the fiscal year ended November 30, 2022 and $0 for the fiscal year ended November 30, 2023.
(c) Tax Fees (Registrant) -- The aggregate fees billed in each of the last two fiscal years for professional services rendered by the principal accountant for tax compliance, tax advice, and tax planning to the registrant were $16,250 for the fiscal year ended November 30, 2022 and $21,000 for the fiscal year ended November 30, 2023. These fees were for tax consultation and/or tax return preparation.
Tax Fees (Investment Advisor) -- The aggregate fees billed in each of the last two fiscal years for professional services rendered by the principal accountant for tax compliance, tax advice, and tax planning to the registrant’s advisor were $0 for the fiscal year ended November 30, 2022 and $0 for the fiscal year ended November 30, 2023.
(d) All Other Fees (Registrant) -- The aggregate fees billed in each of the last two fiscal years for products and services provided by the principal accountant to the registrant, other than the services reported in paragraphs (a) through (c) of this Item were $0 for the fiscal year ended November 30, 2022 and $0 for the fiscal year ended November 30, 2023.
All Other Fees (Investment Advisor) -- The aggregate fees billed in each of the last two fiscal years for products and services provided by the principal accountant to the registrant’s investment advisor, other than the services reported in paragraphs (a) through (c) of this Item were $0 for the fiscal year ended November 30, 2022 and $0 for the fiscal year ended November 30, 2023.
(e)(1) Disclose the audit committee’s pre-approval policies and procedures described in paragraph (c) (7) of Rule 2-01 of Regulation S-X.
Pursuant to its charter and its Audit and Non-Audit Services Pre-Approval Policy, the Audit Committee (the “Committee”) is responsible for the pre-approval of all audit services and permitted non-audit services (including the fees and terms thereof) to be performed for the registrant by its independent auditors. The Chairman of the Committee is authorized to give such pre-approvals on behalf of the Committee up to $25,000 and report any such pre-approval to the full Committee.
The Committee is also responsible for the pre-approval of the independent auditor’s engagements for non-audit services with the registrant’s advisor (not including a sub-advisor whose role is primarily portfolio management and is sub-contracted or overseen by another investment advisor) and any entity controlling, controlled by or under common control with the investment advisor that provides ongoing services to the registrant, if the engagement relates directly to the operations and financial reporting of the registrant, subject to the de minimis exceptions for non-audit services described in Rule 2-01 of Regulation S-X. If the independent auditor has provided non-audit services to the registrant’s advisor (other than any sub-advisor whose role is primarily portfolio management and is sub-contracted with or overseen by another investment advisor) and any entity controlling, controlled by or under common control with the investment advisor that provides ongoing services to the registrant that were not pre-approved pursuant to its policies, the Committee will consider whether the provision of such non-audit services is compatible with the auditor’s independence.
(e)(2) The percentage of services described in each of paragraphs (b) through (d) for the registrant and the registrant’s investment advisor of this Item that were approved by the audit committee pursuant to the pre-approval exceptions included in paragraph (c)(7)(i)(c) or paragraph (c)(7)(ii) of Rule 2-01 of Regulation S-X are as follows:
(b) 0%
(c) 0%
(d) 0%
(f) The percentage of hours expended on the principal accountant’s engagement to audit the registrant’s financial statements for the most recent fiscal year that were attributed to work performed by persons other than the principal accountant’s full-time, permanent employees was less than fifty
percent.
(g) The aggregate non-audit fees billed by the registrant’s accountant for services rendered to the registrant, and rendered to the registrant’s investment advisor (not including any sub-advisor whose role is primarily portfolio management and is subcontracted with or overseen by another investment advisor), and any entity controlling, controlled by, or under common control with the advisor that provides ongoing services to the registrant for the fiscal year ended November 30, 2022, were $16,250 for the registrant and $0 for the registrant’s investment advisor; and for the fiscal year ended November 30, 2023, were $21,000 for the registrant and $44,000 for the registrant’s investment advisor.
(h) The registrant’s audit committee of its Board of Trustees has considered whether the provision of non-audit services that were rendered to the registrant’s investment advisor (not including any sub-advisor whose role is primarily portfolio management and is subcontracted with or overseen by another investment advisor), and any entity controlling, controlled by, or under common control with the investment advisor that provides ongoing services to the registrant that were not pre-approved pursuant to paragraph (c)(7)(ii) of Rule 2-01 of Regulation S-X is compatible with maintaining the principal accountant’s independence.
(i) Not applicable.
(j) Not applicable.
Item 5. Audit Committee of Listed Registrants.
(a) The registrant has a separately designated standing audit committee established in accordance with Section 3(a)(58)(A) of the Securities Exchange Act of 1934 consisting of all the independent directors of the registrant. The audit committee of the registrant is comprised of: Richard E. Erickson, Thomas R. Kadlec, Denise M. Keefe, Robert F. Keith, Niel B. Nielson and Bronwyn Wright.
Item 6. Investments.
(a) Schedule of Investments in securities of unaffiliated issuers as of the close of the reporting period is included as part of the report to shareholders filed under Item 1 of this form.
(b) Not applicable.
Item 7. Disclosure of Proxy Voting Policies and Procedures for Closed-End Management Investment Companies.
A description of the policies and procedures used to vote proxies on behalf of the Fund is attached as an exhibit.
Item 8. Portfolio Managers of Closed-End Management Investment Companies.
(a)(1) Identification of Portfolio Manager(s) or Management Team Members and Description of Role of Portfolio Manager(s) or Management Team Members
Investment decisions for the registrant are made by the Portfolio Management Team of Confluence Investment Management LLC (“Confluence”). The members of the Confluence Portfolio Management Team are responsible for portfolio management including security research and selection, leverage management, guidance compliance and position review, communication with and reporting to Advisor to the Fund.
Information provided as of December 6, 2023
Mark A. Keller, CFA – Chief Executive Officer and Chief Investment Officer
Mr. Keller has over 30 years of investment experience with a focus on value-oriented equity analysis and management. From 1994 to May 2008, he was the Chief Investment Officer of Gallatin Asset Management, Inc., and its predecessor organization, A.G. Edwards Asset Management, the investment management arm of A.G. Edwards, Inc. From 1999 to 2008, Mr. Keller was Chairman of A.G. Edwards’ Investment Strategy Committee, which set investment policy and established asset allocation models for the entire organization. Mr. Keller was a founding member of the A.G. Edwards Investment Strategy Committee, on which he served for over 20 years, the last ten of which as Chairman of the Committee. Mr. Keller began his career with A.G. Edwards in 1978, serving as an equity analyst for the firm’s Securities Research Department from 1979 to 1994. During his last five years in Securities Research, Mr. Keller was Equity Strategist and manager of the firm’s Focus List. Mr. Keller was a Senior Vice President of A.G. Edwards & Sons, Inc. and of Gallatin Asset Management, Inc., and was a member of the Board of Directors of both companies. Mr. Keller received a Bachelor of Arts from Wheaton College (Illinois) and is a CFA charterholder.
David B. Miyazaki, CFA – Senior Vice President and Portfolio Manager
Prior to joining Confluence in May 2008, Mr. Miyazaki served as a Portfolio Manager and Analyst with Gallatin Asset Management, Inc., the investment management arm of A.G. Edwards, Inc. Mr. Miyazaki was responsible for equity investments in value-oriented separately managed accounts. He also co-managed the A.G. Edwards’ ETF-based asset allocation program. In addition to portfolio management, Mr. Miyazaki served as a member of the A.G. Edwards’ Investment Strategy Committee. As a strategist, he was responsible for the firm’s quantitative asset allocation models, including its Cyclical Asset Allocation program. Prior to joining A.G. Edwards in 1999, Mr. Miyazaki was a Portfolio Manager at Koch Industries in Wichita, Kansas. His previous experience includes working as an Investment Analyst at Prudential Capital Group in Dallas, Texas, and as a Bond Trader at Barre & Company, also in Dallas. Mr. Miyazaki received a Bachelor of Business Administration from Texas Christian University and is a CFA charterholder.
Daniel T. Winter, CFA – Senior Vice President and Chief Investment Officer – Value Equity
Prior to joining Confluence in May 2008, Mr. Winter served as a Portfolio Manager and Analyst with Gallatin Asset Management, Inc., the investment arm of A.G. Edwards, Inc. While at Gallatin, Mr. Winter chaired the portfolio management team responsible for the firm’s six value-oriented equity strategies. His responsibilities also included directing the strategy implementation and trading execution for the equity portfolios. Mr. Winter also served as a portfolio manager for the Cyclical Growth ETF Portfolio and the Cyclical Growth and Income ETF Portfolio which were offered through variable annuities. He was also a member of the firm’s Allocation Advisor Committee which oversaw the A.G. Edwards exchange-traded fund focused strategies. Prior to joining the firm’s Asset Management division in 1996, Mr. Winter served as a portfolio manager for A.G. Edwards Trust Company. Mr. Winter earned a Bachelor of Arts in business management from Eckerd College and a Master of Business Administration from Saint Louis University. Mr. Winter is a CFA charterholder.
| Name | Title | Length of Service | Business Experience Past 5 Years |
| Mark Keller | CEO and CIO | 16 | Chief Executive Officer and Chief Investment Officer of Confluence Investment Management LLC |
| Daniel Winter | Senior V.P. and CIO of Value Equity | 16 | Portfolio Manager and Analyst with Confluence Investment Management LLC |
| David Miyazaki | Senior V.P. and Portfolio Manager | 16 | Portfolio Manager and Analyst with Confluence Investment Management LLC |
| (a)(2) | Other Accounts Managed by Portfolio Manager(s) or Management Team Member and Potential Conflicts of Interest |
Information provided as of December 6, 2023
Other Accounts Managed by Portfolio Manager(s) or Management Team Member
Name of Portfolio Manager or
| Type of Accounts
| Total No. of Accounts
| Total Assets
| No. of
| Total Assets in Accounts where Advisory Fee is Based on
|
| 1. Mark Keller | Registered Investment Companies: | 1 | 21,502,709 | 0 | $0 |
| Other Accounts: | 17,253 | 6,825,256,518 | 0 | $0 | |
| Other Pooled Investment Vehicles: | 0 | $0 | 0 | $0 | |
2. Daniel Winter
| Registered Investment Companies: | 1 | 21,502,709 | 0 | $0 |
| Other Accounts: | 15,783 | 6,325,659,332 | 0 | $0 | |
| Other Pooled Investment Vehicles: | 0 | $0 | 0 | $0 | |
| 3. David Miyazaki | Registered Investment Companies: | 0 | $0 | 0 | $0 |
| Other Accounts: | 1,267 | 348,153,362 | 0 | $0 | |
| Other Pooled Investment Vehicles: | 0 | $0 | 0 | $0 |
Potential Conflicts of Interests
As disclosed in the Confluence Form ADV Part 2A, from time to time, Confluence is presented, in connection with its discretionary portfolio management and investment advisory services, with an opportunity to participate in public offerings of securities. Certain of our clients, including those in certain Wrap Account Programs, may be prohibited from participating in such offerings by their respective Financial Institution. Certain of our other clients may be unable to participate in such offerings if their respective Financial Institution did not participate in the initial distribution of securities in such offering, depending on their particular Financial Institution or Custodian. Accordingly, Confluence’s policy is to not purchase shares in such public offerings for its clients. In contrast, the First Trust Specialty Finance and Financial Opportunities Fund and the First Trust Confluence Small Cap Value Fund, the open-end mutual fund and the closed-end fund for which we act as sub-advisor, and our institutional clients are not similarly restricted, and are therefore allowed to participate in public offerings.
(a)(3) Compensation Structure of Portfolio Manager(s) or Management Team Members
Information provided as of December 6, 2023
The fund’s portfolio managers are compensated with an annual base salary and a discretionary bonus based on Confluence’s overall firm profits. The firm provides a 401k contribution and may make a discretionary additional contribution. In addition, the Firm’s portfolio managers are equity owners in the Firm, aligning their long-term interests with the Fund holder to strive to achieve superior investment performance over an appropriate time period. This ensures that the portfolio managers are incented to implement a consistent investment strategy for the Fund without incurring undue risk.
Confluence allows partners to defer profit sharing allocations from the firm. Profit sharing is based on the overall firm profits rather than individual investment product strategies.
(a)(4) Disclosure of Securities Ownership
Information provided as of December 6, 2023
| Name | Dollar Range of Registrant Shares Beneficially Owned |
| Mark Keller | $10,001 - $50,000 |
| Daniel Winter | None |
| David Miyazaki | $10,001 - $50,000 |
| Brian Hansen | $10,001 - $50,000 |
| Joe Hanzlik | $1 - $10,000 |
Item 9. Purchases of Equity Securities by Closed-End Management Investment Company and Affiliated Purchasers.
Not applicable.
Item 10. Submission of Matters to a Vote of Security Holders.
There have been no material changes to the procedures by which the shareholders may recommend nominees to the registrant’s board of directors, where those changes were implemented after the registrant last provided disclosure in response to the requirements of Item 407(c)(2)(iv) of Regulation S-K (17 CFR 229.407) (as required by Item 22(b)(15) of Schedule 14A (17 CFR 240.14a-101)), or this Item.
Item 11. Controls and Procedures.
| (a) | The registrant’s principal executive and principal financial officers, or persons performing similar functions, have concluded that the registrant’s disclosure controls and procedures (as defined in Rule 30a-3(c) under the Investment Company Act of 1940, as amended (the “1940 Act”) (17 CFR 270.30a-3(c))) are effective, as of a date within 90 days of the filing date of the report that includes the disclosure required by this paragraph, based on their evaluation of these controls and procedures required by Rule 30a-3(b) under the 1940 Act (17 CFR 270.30a-3(b)) and Rules 13a-15(b) or 15d-15(b) under the Securities Exchange Act of 1934, as amended (17 CFR 240.13a-15(b) or 240.15d-15(b)). |
| (b) | There were no changes in the registrant’s internal control over financial reporting (as defined in Rule 30a-3(d) under the 1940 Act (17 CFR 270.30a-3(d)) that occurred during the period covered by this report that has materially affected, or is reasonably likely to materially affect, the registrant’s internal control over financial reporting. |
Item 12. Disclosure of Securities Lending Activities for Closed-End Management Investment Companies.
| (a) | Not applicable. |
| (b) | Not applicable. |
Item 13. Exhibits.
| (a)(1) | Code of ethics, or any amendment thereto, that is the subject of disclosure required by Item 2 is attached hereto. |
| (a)(2) | Certifications pursuant to Rule 30a-2(a) under the 1940 Act and Section 302 of the Sarbanes-Oxley Act of 2002 are attached hereto. |
| (a)(3) | Not applicable. |
| (a)(4) | Not applicable. |
| (b) | Certifications pursuant to Rule 30a-2(b) under the 1940 Act and Section 906 of the Sarbanes-Oxley Act of 2002 are attached hereto. |
| (c) | Disclosure of Proxy Voting Policies and Procedures for Closed-End Management Investment Companies required by Item 7 is attached hereto. |
SIGNATURES
Pursuant to the requirements of the Securities Exchange Act of 1934 and the Investment Company Act of 1940, the registrant has duly caused this report to be signed on its behalf by the undersigned, thereunto duly authorized.
| (registrant) | First Trust Specialty Finance and Financial Opportunities Fund |
| By (Signature and Title)* | /s/ James M. Dykas | |
| James M. Dykas, President and Chief Executive Officer (principal executive officer) |
| Date: | February 8, 2024 |
Pursuant to the requirements of the Securities Exchange Act of 1934 and the Investment Company Act of 1940, this report has been signed below by the following persons on behalf of the registrant and in the capacities and on the dates indicated.
| By (Signature and Title)* | /s/ James M. Dykas | |
| James M. Dykas, President and Chief Executive Officer (principal executive officer) |
| Date: | February 8, 2024 |
| By (Signature and Title)* | /s/ Derek D. Maltbie | |
| Derek D. Maltbie, Treasurer, Chief Financial Officer and Chief Accounting Officer (principal financial officer) |
| Date: | February 8, 2024 |
* Print the name and title of each signing officer under his or her signature.