Empresa Distribuidora y Comercializadora Norte Sociedad Anónima (EDN)
Filed: 12 Aug 19, 12:00am
UNITED STATES
SECURITIES AND EXCHANGE COMMISSION
Washington, D.C. 20549
FORM 6-K
REPORT OF FOREIGN PRIVATE ISSUER
PURSUANT TO RULE 13a-16 OR 15d-16 UNDER
THE SECURITIES EXCHANGE ACT OF 1934
For the month of August, 2019
EMPRESA DISTRIBUIDORA Y COMERCIALIZADORA NORTE S.A. (EDENOR)
(DISTRIBUTION AND MARKETING COMPANY OF THE NORTH )
(Translation of Registrant's Name Into English)
Argentina
(Jurisdiction of incorporation or organization)
Av. del Libertador 6363,
12th Floor,
City of Buenos Aires (A1428ARG),
Tel: 54-11-4346-5000
(Address of principal executive offices)
(Indicate by check mark whether the registrant files or will file annual reports under cover of Form 20-F or Form 40-F.)
Form 20-F X Form 40-F
(Indicate by check mark whether the registrant by furnishing the information contained in this form is also thereby furnishing the information to the Commission pursuant to Rule 12g3-2(b) under the Securities Exchange Act of 1934.)
Yes No X
(If "Yes" is marked, indicate below the file number assigned to the registrant in connection with Rule 12g3-2(b): 82- .)
![]()
| Results for the second quarter 2019
| |
Ticker:EDN Ratio: 20 Class B shares = 1 ADR
Share Cap. net of repurchases: 874 million shares | 43.7 million ADRs
Market Cap. net of repurchases1: ARS 34.7 bn | USD 758 million |
Investor Relations Contacts:
Leandro Montero Chief Financial Officer
Federico Mendez Planning and Investor Relations Manager | |
ir.edenor.com |investor@edenor.com Tel: +54 (11) 4346 -5510 | ||
Buenos Aires, Argentina, Friday, August 9, 2019. Empresa Distribuidora y Comercializadora Norte S.A. (NYSE/BYMA: EDN) (“edenor” or “the Company”), Argentina’s largest electricity distributor both in terms of number of customers and energy sales, announces its results for 2Q19. All figures are stated in Argentine pesos of constant purchasing power and have been prepared in accordance with International Financing Reporting Standards (“IFRS”), except for what is expressly indicated in the Statements of Comprehensive Income (Loss) expressed at historical values.
Conference Call Information
There will be a conference call to discuss Edenor’s 2Q19 results on Monday, August 12, 2019, at 11:00 a.m. Buenos Aires time / 10:00 a.m. New York time.
The presentation will be given by Leandro Montero,edenor’s Chief Financial Officer. For those interested in participating, please dial:
+ 1(844) 204-8586 in the United States;
+1(412) 317-6346 if outside the United States;
+54 (11) 3984-5677 in Argentina.
Participants should use conference ID “Edenor” and dial in five minutes before the call is set to begin. There will also be a live audio webcast of the conference at ir.edenor.com.

1Listing as of 8/8/2019, ARS 39.7 per share and USD 17.32 per ADR
Edenor S.A – 2Q ‘19 Earnings Release | 2 |
![]()
SUMMARY OF RESULTS FOR THE SECOND QUARTER 2019
In millon of Pesos | 6 Months | 2Q | ||||
in constant purchising power | 2019 | 2018 | Δ% | 2019 | 2018 | Δ% |
Revenue from sales | 35,739 | 34,325 | 4.1% | 18,245 | 15,079 | 21.0% |
EBITDA | 3,519 | 6,641 | -47.0% | 2,619 | 1,890 | 38.6% |
Adjusted EBITDA | 4,252 | 7,360 | -42.2% | 2,936 | 2,355 | 24.7% |
Net income | 10,828 | 3,267 | 231.4% | 10,684 | 149 | na |
Capital expenditures | 4,469 | 3,285 | 36.0% | 2,206 | 1,897 | 16.3% |
Revenue from sales increased by 21.0 %, to ARS 18.2 billion, in 2Q19, mainly due to higher billings as a result of the increase in the electricity seasonal price and the application of the adjustment on Own Distribution Costs (“CPD”). Furthermore, revenues payable by the Federal Government on account of consumptions by low-income neighborhoods under the Framework Agreement and the recovery resulting from the application of caps for certain user categories benefiting from the social tariff were recognized. These effects were partially offset by the impact of lower physical electricity sales volumes.
EBITDAincreased by 38.6%, reaching over ARS 2.6 billion in 2Q19, reflecting the increase in revenue from sales, which was partially offset by an increase in energy purchases as a result of the entry into effect of the new reference seasonal prices, and partially offset by a decrease in physical units. Additionally, an increase in operating expenses was evidenced, mainly due to an increase in fees and remuneration for services, supplies consumptions and penalties.
Adjusted EBITDAincreased by 24.7%, reaching ARS 2.9 billion in 2Q19, in line with the EBITDA and including adjustments for meter reading frequency and extraordinary service disruptions from previous periods, as well as commercial interest.
Net results amounted to ARS 10.7 billion in 2Q19, experiencing a ARS 10.5 billion increase, mainly due to the implementation of the Liabilities Regularization Agreement which put an end to the reciprocal claims originating from several breaches incurred by the Federal Government andedenor during the so-called Tariff Transition Period (2006-2016).
Investments in 2Q19 reached ARS 2.2 billion as a result of the ambitious plan devised byedenor for the 2017–2021 period, with a special focus on investments optimizing service quality levels.
Edenor S.A – 2Q ‘19 Earnings Release | 3 |
![]()
RELEVANT EVENTS
Termination of the Share Buyback Program
On June 12, 2019,edenor’s board of directors resolved to early terminate the share buyback program adopted in its meeting held on April 8, 2019.
Under this program, 1.9 million own Series B shares were acquired for a total amount of ARS 74 million at an average price of USD 17.33 per ADR. Thus, the Company holds 31.4 million own portfolio shares representing 3.5% of the capital stock.
Moody’s Change in Outlook
On July 16, 2019, Moody’s Latin America issued a report affirmingedenor’s corporate rating at “B1” and its domestic rating at “Aa3.ar”. However, it changed its outlook from stable to negative. This variation mainly reflects the same change in Moody’s outlook on the sovereign debt rating, since the company is subject to the domestic operating environment and regulations.
Implementation of the Transfer of Jurisdiction and Liabilities Regularization Agreement
On May 10, 2019, we executed an Agreement for the Implementation of the transfer of jurisdiction of the electricity distribution utility service from the Federal Government to the Province of Buenos Aires and the Autonomous City of Buenos, as well as a Liabilities Regularization Agreement with the Secretary of Energy, acting on behalf of the National Government, thus terminating the pending reciprocal claims originated in the 2006-2016 transition period. Thus, we voluntarily dismiss the complaint for the breach of the obligations under the Contractual Renegotiation Memorandum of Understanding, agree to settle debts for works and loans originating in the transition period, and commit ourselves to pay users certain penalties and compensations corresponding to such period. Lastly, we undertake to execute investments additional to those committed under the RTI to help improve the reliability and security of the distribution utility service. This agreement involves disbursements for an approximate total amount of ARS 7,600 million, including the payment of the generated income tax. In consideration, the Federal Government partially recognizes our claim by fully offsetting outstanding liabilities within the Wholesale Electricity Market (“WEM”) for electricity purchases made during the transition period, as well as the partial settlement of investment loans granted by CAMMESA and the cancellation of penalties collectable by the National Treasury, all of this for an approximate amount of ARS 6,900 million. The effects of this agreement are disclosed in the financial statements as of June 30, 2019.
It is worth highlighting that this agreement marks the completion of the distribution segment’s normalization under the Federal Government, and entails a new beginning to focus on the problems and opportunities of the business.
Edenor S.A – 2Q ‘19 Earnings Release | 4 |
![]()
MAIN RESULTS FOR THE SECOND QUARTER 2019
In millon of Pesos | 6 Months | 2Q | ||||
in constant purchising power | 2019 | 2018 | ?% | 2019 | 2018 | Δ% |
Revenue from sales | 35,739 | 34,325 | 4.1% | 18,245 | 15,079 | 21.0% |
Energy purchases | (21,709) | (18,252) | 18.9% | (10,225) | (8,601) | 18.9% |
Gross margin | 14,030 | 16,072 | (12.7%) | 8,020 | 6,478 | 23.8% |
Operating expenses | (11,576) | (10,234) | 13.1% | (5,856) | (4,981) | 17.6% |
Other operating expenses | (809) | (675) | 20.0% | (508) | (312) | 63.0% |
Net operating income | 1,644 | 5,164 | (68.2%) | 1,656 | 1,185 | 39.8% |
Labilities regularization agreement | 13,066 | - | na | 13,066 | - | na |
Financial Results, net | (3,187) | (3,914) | (18.6%) | (898) | (2,688) | (66.6%) |
RECPAM | 5,827 | 3,889 | 49.8% | 2,207 | 2,037 | 8.3% |
Income Tax | (6,522) | (1,871) | 248.5% | (5,347) | (385) | na |
Net income | 10,828 | 3,267 | 231.4% | 10,684 | 149 | na |
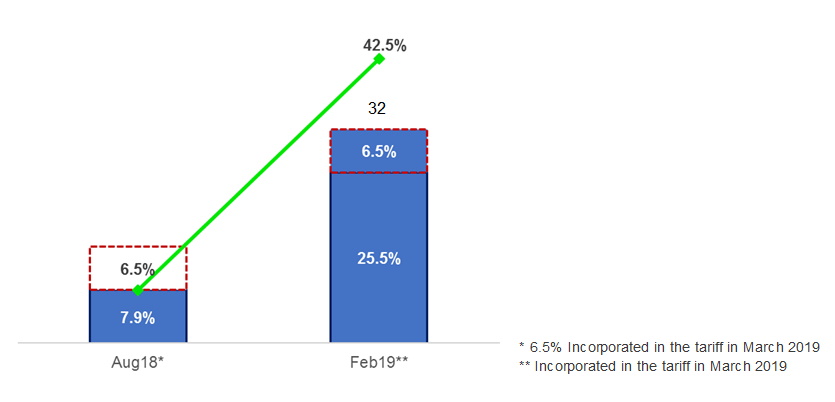
Revenue from sales increased by 21.0%, to ARS 18,245 million, in 2Q19, against ARS 15,079 million in the 2Q18. This ARS 3,166 million increase is mainly due to higher billings as a result of the ARS 1,512 million increase in the electricity seasonal price, and the application of the CPD adjustment in the amount of ARS 1,038 million. Furthermore, during the quarter revenues from the Federal Government were recognized for consumptions by low-income neighborhoods under the Framework Agreement and the recovery from the application of caps on certain user categories benefiting from the social tariff, which receivables were recognized under the Liabilities Regularization Agreement for a total amount of ARS 1,394 million. Furthermore, in 2Q19 revenues from the installments under the tariff deferral for the August 2018 - February 2019 period were recognized in the amount of ARS 825 million. These effects were partially offset by the impact of the lower physical electricity sales volumes in the amount of ARS 1,581 million, as analyzed below, and lower collections on account of the 48-installment deferral of the income accrued during the February 2017 - January 2018 period for ARS 215 million, as the update applied by the regulatory agency did not fully reflect the CPD increase (an appeal was filed with the ENRE) and the impact of the drop in the demand, the latter will recover in the next tariff update. Finally, between the comparison periods CPD adjustments were applied for a total 42.5%, corresponding to the first and second semester of 2018, the tariff being fully updated as from March 2019.
Furthermore, a gap is identified between the CPD measurement and its granting which, in an inflationary scenario, has a negative impact on the Distribution Value Added (“VAD”), added to the fact that the composition of the CPD formula (which replicatesedenor’s cost structure) has a greater weight on the salary index, and was below the IPC and IPIM evolution. VAD adjustments on the recognition of increases in own distribution costs are summarized below:
Edenor S.A – 2Q ‘19 Earnings Release | 5 |
![]()
| 6 Months 2019 | 6 Months 2018 | Variation | |||||
| GWh | Part. % | Customers | GWh | Part. % | Customers | % GWh | % Customers |
Residential * | 4,096 | 41.5% | 2,726,807 | 4,622 | 42.4% | 2,613,899 | (11.4%) | 4.3% |
Small commercial | 844 | 8.6% | 321,931 | 943 | 8.7% | 325,727 | (10.5%) | (1.2%) |
Medium commercial | 778 | 7.9% | 31,566 | 869 | 8.0% | 32,759 | (10.5%) | (3.6%) |
Industrial | 1,739 | 17.6% | 6,859 | 1,868 | 17.1% | 6,859 | (6.9%) | 0.0% |
Wheeling System | 1,787 | 18.1% | 691 | 1,982 | 18.2% | 707 | (9.8%) | (2.3%) |
Others |
|
|
|
|
|
|
|
|
Public lighting | 360 | 3.7% | 21 | 366 | 3.4% | 21 | (1.4%) | 0.0% |
Shantytowns and others | 262 | 2.7% | 466 | 244 | 2.2% | 440 | 7.2% | 5.9% |
Total | 9,866 | 100% | 3,088,341 | 10,894 | 100% | 2,980,412 | (9.4%) | 3.6% |
|
|
|
|
|
|
|
|
|
| 2Q | 2Q | Variation | |||||
| GWh | Part. % | Customers | GWh | Part. % | Customers | % GWh | % Customers |
Residential * | 2,015 | 41.6% | 2,726,807 | 2,281 | 47.0% | 2,613,899 | (11.7%) | 4.3% |
Small commercial | 407 | 8.4% | 321,931 | 452 | 9.3% | 325,727 | (10.0%) | (1.2%) |
Medium commercial | 368 | 7.6% | 31,566 | 409 | 8.4% | 32,759 | (10.0%) | (3.6%) |
Industrial | 845 | 17.4% | 6,859 | 902 | 18.6% | 6,859 | (6.3%) | 0.0% |
Wheeling System | 867 | 17.9% | 691 | 964 | 19.9% | 707 | (10.0%) | (2.3%) |
Others |
|
|
|
|
|
|
|
|
Public lighting | 200 | 4.1% | 21 | 205 | 4.2% | 21 | (2.4%) | 0.0% |
Shantytowns and others | 148 | 3.0% | 466 | 132 | 2.7% | 440 | 12.2% | 5.9% |
Total | 4,849 | 100% | 3,088,341 | 5,344 | 110% | 2,980,412 | (9.3%) | 3.6% |
|
|
|
|
|
|
|
|
|
* 593,733 customers benefit from Social Tariff | ||||||||
Thevolume of energy sales decreased by 9.3%, reaching 4,849 GWh, in 2Q19, against 5,344 GWh for the same period of 2018. This decline is mainly explained by decreases amounting to 11.7% for residential customers, 10.0% for medium and small commercial customers, and 8.2% for large users (industrial users and the wheeling system). The residential demand decreased mainly as a result of a higher average temperature —especially in the month of June, where average temperatures were 3.7 °C higher than in the same month of 2018—, as well as the impact of the economic recession and the tariff increases. Small and medium commercial customers were adversely affected by the lower commercial activity levels resulting from the economic situation, whereas large users were affected by the lower industrial activity, which is reflected in the fall in the industrial production index (IPI). Furthermore,edenor’s customer base rose by 3.6%, mainly on account of the increase in residential customers, which have risen to levels above their historical growth as a result of the implemented market discipline actions and the installation during the last year of more than 100,000 integrated energy meters that were mostly destined to regularize clandestine connections. By contrast, the number of small and medium commercial customers experienced a decrease due to the lower activity levels in the last year.
Energy purchases increased by 18.9%, to ARS 10,225 million, in 2Q19, against ARS 8,601 million for the same period in 2018. This ARS 1,623 million increase is mainly due to the 29.7% real-term increase in the average purchase price, which generated an impact of ARS 2,466 million, as a result of the entry into effect of the new reference seasonal prices for electricity applicable as from August 2018 and February 2019 pursuant to Provision No. 75/2018 and Resolution No. 366/2018 of the Secretariat of Renewable Resources and Electricity Market. This increase was partially offset by an 8.4% decrease in energy volumes due to the drop in demand, which was valued at approximately ARS 953 million. Despite this increase, the electricity reference seasonal price for residential customers is still subsidized by the National Government, especially in the case of residential customers, where the subsidy reached 40% of the system’s actual generation cost in 2Q19. Additionally, the energy loss rate increased from 18.6% in 2Q18 to 19.2% in 2Q19, and was mainly generated by an increase in the incentive to fraud as a result of the economic recession and the impact of tariff increases. In turn, costs associated with these losses increased by 11.0% in real terms (or 72.5% in nominal terms), mainly on account of the application of the new seasonal price for its determination.
Edenor S.A – 2Q ‘19 Earnings Release | 6 |
![]()
Operating expenses increased by 17.6%, reaching ARS 5,856 million in 2Q19, against ARS 4,981 million in 2Q18. This is mainly accounted for by an increase in depreciation in the amount of ARS 258 million; a ARS 192 million increase in fees and remuneration for services; higher supplies consumptions for ARS 183 million, as well as an increase in penalties in the amount of ARS 178 million. This last increase is mainly explained by new penalties for commercial service quality issues for ARS 302 million, and was partially offset by lower penalties for technical service quality issues in the amount of ARS 77 million as a result of the impact of investments on service quality improvement and a lower user demand.
In million of pesos | 6 Months | 2Q | ||||
in constant purchising power | 2019 | 2018 | Δ% | 2019 | 2018 | Δ% |
Salaries, social security taxes | (3,409) | (3,602) | (5.4%) | (1,723) | (1,791) | (3.8%) |
Pensions Plans | (145) | (121) | 19.3% | (133) | (56) | 138.9% |
Communications expenses | (199) | (212) | (6.2%) | (111) | (105) | 5.5% |
Allowance for the imp. of trade and other receivables | (406) | (543) | (25.2%) | (214) | (229) | (6.4%) |
Supplies consumption | (731) | (351) | 108.5% | (342) | (160) | 114.3% |
Leases and insurance | (86) | (109) | (21.1%) | (38) | (50) | (24.9%) |
Security service | (179) | (154) | 16.9% | (80) | (75) | 6.8% |
Fees and remuneration for services | (2,176) | (1,952) | 11.5% | (1,121) | (928) | 20.7% |
Amortization of assets by right of use | (46) | 0 | na | (46) | 0 | na |
Public relations and marketing | (25) | (8) | 215.5% | (17) | (4) | 296.3% |
Advertising and sponsorship | (13) | (4) | 215.5% | (9) | (2) | 296.2% |
Reimbursements to personnel | (0) | (0) | na | (0) | (0) | na |
Depreciation of property, plant and equipment | (1,875) | (1,477) | 26.9% | (963) | (705) | 36.5% |
Directors and Sup. Committee members’ fees | (5) | (14) | (62.5%) | 0 | (6) | na |
ENRE penalties | (1,926) | (1,334) | 44.4% | (855) | (678) | 26.2% |
Taxes and charges | (350) | (348) | 0.6% | (203) | (190) | 6.7% |
Other | (3) | (4) | (33.7%) | (2) | (1) | 13.4% |
Total | (11,576) | (10,234) | 13.1% | (5,856) | (4,981) | 17.6% |
Edenor S.A – 2Q ‘19 Earnings Release | 7 |
![]()
Financial results experienced a 66.6% improvement, with ARS 898 million losses in the 2Q19, against ARS 2,688 million losses in 2Q18. The main impact corresponds to the variation in the exchange rate, which improved exchange difference results in the amount of ARS 2,041 million, considering that in 2Q18 there was a 43.2% devaluation of the peso against the U.S. Dollar, whereas in 2Q19 a slight appreciation of the peso was recorded. This profit was partially offset by higher commercial interest on the debt held with CAMMESA due to higher rates in the amount of ARS 161 million, an increase in interest paid for ARS 114 million, and lower changes in the fair value of financial assets for ARS 59 million. It should be noted that the previously-mentioned liabilities regularization agreement will discontinue interest charges generated from debts with CAMMESA in the upcoming quarters.
Net income increased by ARS 10,535 million, recording profits for ARS 10,684 million, in 2Q19, against profits for ARS 149 million for the same period in 2018. This increase is mainly due to the implementation of the liabilities regularization agreement that implied, for one time only, the partial recognition of the claim made byedenor for an amount of ARS 6,906 million in compensation for the breaches of the National State during 10 years of the Tariff Transition Period, as likewise, the adjustment of the liabilities recorded at the time of the agreement, replicating the conditions applied to all distributors in the sector, generating a profit of ARS 6,160 million, totaling an amount of ARS 13,066 million. Additionally, the increase is also due to a higher gross margin resulting from the offsetting of revenues from social tariff caps and the Framework Agreement under the above-mentioned liabilities settlement, the collection of installments corresponding to the August 2018 and February 2019 tariff deferrals, and a higher average sales price, which was partially offset by a decrease in sales volumes and a higher average purchase price. Furthermore, losses from financial results experienced a considerable decrease as a result of a ARS 2,041 million improvement on account of exchange differences against the same period of the previous year. Finally, it should be noted that the income tax for the period includes the impact of the liabilities regularization agreement and a provision for the possible application of the inflationary tax adjustment.
Adjusted EBITDA
Adjusted EBITDA showed ARS 2,936 million profits in 2Q19, ARS 581 million higher than in the same period of 2018. Adjustments correspond to penalties for meter reading frequency and extraordinary service disruptions from previous periods, as well as commercial interest.
In millon of Pesos | 6 Months | 2Q | ||||
in constant purchising power | 2019 | 2018 | Δ% | 2019 | 2018 | Δ% |
Net operating income | 1,644 | 5,164 | -68.2% | 1,656 | 1,185 | 39.8% |
Depreciation of property, plant and equipment | 1,875 | 1,477 | 26.9% | 963 | 705 | 36.5% |
EBITDA | 3,519 | 6,641 | -47.0% | 2,619 | 1,890 | 38.6% |
Penalties - Res. No 118/2018 | - | 282 | na | - | 210 | na |
Penalties - frecuency of meter reading | - | (231) | na | - | (111) | na |
Penalties - Actualization (*) | 554 | 504 | 10.0% | 208 | 291 | -28.5% |
Commercial Interests | 179 | 164 | 8.9% | 109 | 75 | 45.8% |
Adjusted EBITDA | 4,252 | 7,360 | -42.2% | 2,936 | 2,355 | 24.7% |
(*) The liabilities regularization agreement will discontinue the update of the obligations corresponding to the transition period (2006-2016) in future quarters.
Edenor S.A – 2Q ‘19 Earnings Release | 8 |
![]()
Capital Expenditures
edenor’ s capital expenditures during 2Q19 totaled ARS 2,206 million, compared to ARS 1,897 million in 2Q18. Our investments mainly consisted of the following:
· ARS 321 million in new connections;
· ARS 1,101 million in grid enhancements;
· ARS 570 million in maintenance;
· ARS 14 million in legal requirements;
· ARS 103 million in communications and telecontrol;
· ARS 97 million in other investment projects.
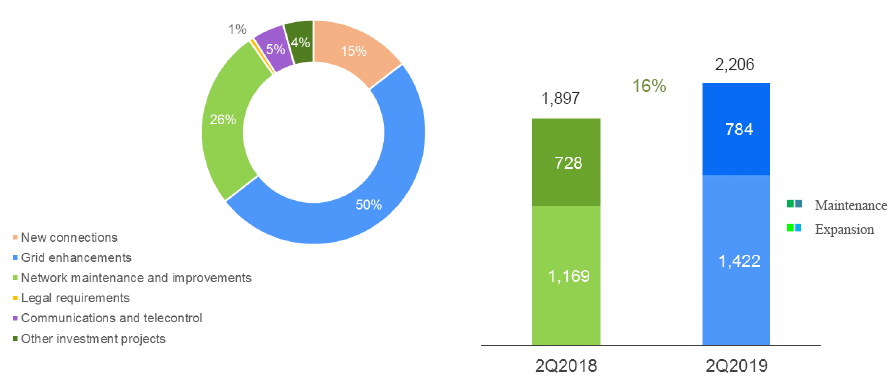
The increase in investments results from the ambitious plan devised byedenor for the 2017-2021 period, which focuses on investments optimizing service quality levels in accordance with the quality curves required in the RTI by the regulatory agency.
Total investments in 2018 amounted to ARS 10,841 million at values restated as of June 2019, this period showing one of the Company’s highest investment levels since its creation.
Edenor S.A – 2Q ‘19 Earnings Release | 9 |
![]()
Service Quality Standards
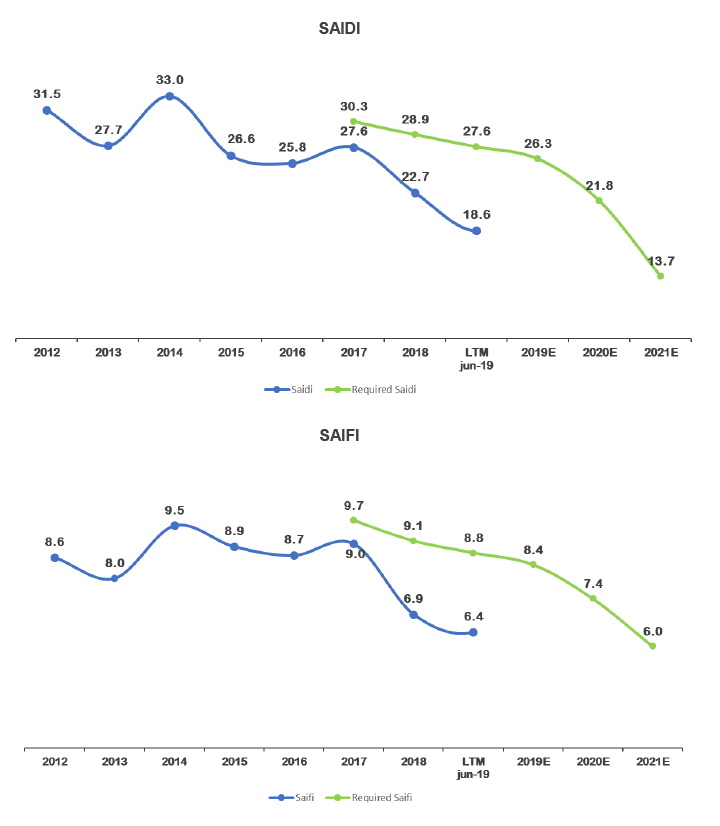
Quality standards are measured based on the duration and frequency of service outages using the SAIDI and SAIFI indicators. SAIDI refers to the duration of outages, and is measured by the number of outage hours per year. SAIFI refers to the frequency of outages, and measures the number of times a user experiences an outage during a year.
In 2Q19, SAIDI and SAIFI indicators were 18.6 hours and 6.4 outages per year during the last twelve months, evidencing a 29.8% and 20.7% decrease, respectively, compared to the same period of the previous year. This improvement in service levels is mainly due to the fulfillment of the ambitious plan devised by the company since the RTI. Its success is also evidenced by the fact that these indicators exceed the service quality improvement path defined by the regulatory entity.
Edenor S.A – 2Q ‘19 Earnings Release | 10 |
![]()
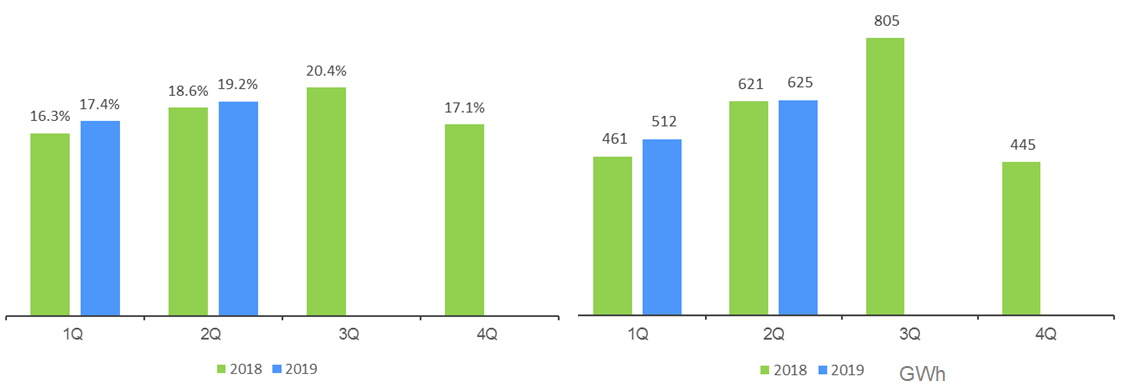
Energy Losses
In 2Q19, energy losses experienced a 19.2% increase, against 18.6% for the same period in 2018. The drop in the demand by large users (which have substantially lower loss levels) adversely affects this indicator in percentage terms; however, the level of losses in physical units remained constant. Likewise, the rise in the average energy purchase price also increases the value in pesos of these losses.
Furthermore, the Company has implemented the creation of multidisciplinary teams to work on new solutions to energy losses and leverage learnings from successful experiences from other distributors. In turn, the Company further increased its activities to reduce energy losses on two fronts: on the one hand, Market Discipline actions (DIME) were intensified aiming to detect and normalize irregular connections and electricity theft and frauds and, on the other hand, there was an increase in the installation of Inclusion Meters (Energy Integrated Meter, MIDE) to foster consumption self-management and the integration of users not having a regular income, at the same time encouraging consumption reduction and the prevention of irregular connections having an impact on the safety of customers. The company expects to intensify these actions until reaching expected levels with the purpose of meeting the outlined loss reduction goals.
Indebtedness
As of June 30, 2019, the outstanding principal of our dollar-denominated financial debt amounts to USD 201 million, whereas the net debt amounts to USD 127 million. The financial debt consists of USD 164 million corresponding to Corporate Bonds maturing in 2022, net of repurchases, and USD 38 million to the bank loan taken out with the Industrial and Commercial Bank of China (ICBC) Dubai Branch. Currently both liabilities bear interest at a fixed rate.
Edenor S.A – 2Q ‘19 Earnings Release | 11 |
![]()
About edenor
Empresa Distribuidora y Comercializadora Norte S.A. (edenor) is the largest electricity distribution company in Argentina in terms of number of customers and electricity sold (in GWh). Through a concession,edenor distributes electricity exclusively to the northwestern zone of the greater Buenos Aires metropolitan area and the northern part of the City of Buenos Aires, which has a population of approximately 9 million people and an area of 4,637 sq. km. In 2018,edenor sold 21,172 GWh of energy and purchased 25,906 GWh (including wheeling system demands), with revenue from sales in the amount of ARS 68.5 billion adjusted by inflation. In turn, the Company had positive net results in the amount of ARS 5,260 million adjusted by inflation.
This press release may contain forward-looking statements. These statements are not historical facts, and are based on the management’s current view and estimates of future economic circumstances, industry conditions, and the Company’s performance and financial results. The words “anticipates”, “believes”, “estimates”, “expects”, “plans” and similar expressions, as they relate to the Company, are intended to identify forward-looking statements. Such statements reflect the current views of management and are subject to a number of risks and uncertainties, including those identified in the documents filed by the Company with the U.S. Securities and Exchange Commission. There is no guarantee that the expected events, trends or results will actually occur. The statements are based on many assumptions and factors, including general economic and market conditions, industry conditions, and operating factors. Any changes in such assumptions or factors could cause actual results to differ materially from current expectations.
Edenor S.A.
Avenida del Libertador 6363, Piso 4º
(C1428ARG) Buenos Aires, Argentina
Tel: 5411.4346.5510
investor@edenor.com
www.edenor.com
Edenor S.A – 2Q ‘19 Earnings Release | 12 |
![]()
Condensed Interim Statements of Financial Position
as of June 30, 2019 and December 31, 2018
Values expressed in constant purchasing power
In million of Argentine Pesos | 06.30.2019 |
| 12.31.2018 |
|
| 06.30.2019 |
| 12.31.2018 |
AR$ | AR$ |
| AR$ | AR$ | ||||
|
|
|
|
|
|
|
|
|
ASSETS |
|
|
|
| EQUITY |
|
|
|
|
|
|
|
|
|
|
|
|
Non-current assets |
|
|
|
| Share capital | 875 |
| 883 |
Property, plant and equipment | 79,048 |
| 76,488 |
| Adjustment to share capital | 20,914 |
| 21,092 |
Interest in joint ventures | 10 |
| 11 |
| Additional paid-in capital | 295 |
| 295 |
Deferred tax asset | 289 |
| - |
| Treasury stock | 31 |
| 23 |
Other receivables | 797 |
| 980 |
| Adjustment to treasury stock | 459 |
| 281 |
Total non-current assets | 80,144 |
| 77,479 |
| Adquisition cost of own shares | (1,786) |
| (1,309) |
|
|
|
|
| Legal reserve | 1,026 |
| 187 |
Current assets |
|
|
|
| Opcional reserve | 15,792 |
| 449 |
Inventories | 1,687 |
| 1,542 |
| Other comprehensive loss | (168) |
| (168) |
Other receivables | 591 |
| 296 |
| Accumulated losses | 10,828 |
| 16,181 |
Trade receivables | 11,433 |
| 9,290 |
| TOTAL EQUITY | 48,266 |
| 37,915 |
Financial assets at fair value through profit or loss | 2,154 |
| 4,140 |
|
|
|
|
|
Financial assets at amortized cost | - |
| 1,480 |
|
|
|
|
|
Cash and cash equivalents | 1,139 |
| 34 |
| LIABILITIES |
|
|
|
Total current assets | 17,004 |
| 16,782 |
| Non-current liabilities |
|
|
|
|
|
|
|
|
|
|
|
|
|
|
|
|
| Trade payables | 300 |
| 350 |
TOTAL ASSETS | 97,148 |
| 94,262 |
| Other payables | 3,294 |
| 9,334 |
|
|
|
|
| Borrowings | 7,473 |
| 8,806 |
|
|
|
|
| Deferred revenue | 273 |
| 337 |
|
|
|
|
| Salaries and social security payable | 198 |
| 199 |
|
|
|
|
| Benefit plans | 486 |
| 471 |
|
|
|
|
| Deferred tax liability | 13,151 |
| 9,854 |
|
|
|
|
| Tax liabilities | - |
| - |
|
|
|
|
| Provisions | 1,615 |
| 1,310 |
|
|
|
|
| Total non-current liabilities | 26,790 |
| 30,662 |
|
|
|
|
|
|
|
|
|
|
|
|
|
| Current liabilities |
|
|
|
|
|
|
|
| Trade payables | 13,121 |
| 17,886 |
|
|
|
|
| Other payables | 2,520 |
| 2,353 |
|
|
|
|
| Borrowings | 1,205 |
| 1,319 |
|
|
|
|
| Derivative financial instruments | 1 |
| 1 |
|
|
|
|
| Deferred revenue | 5 |
| 7 |
|
|
|
|
| Salaries and social security payable | 1,374 |
| 2,133 |
|
|
|
|
| Benefit plans | 32 |
| 40 |
|
|
|
|
| Tax payable | 2,824 |
| 756 |
|
|
|
|
| Tax liabilities | 785 |
| 960 |
|
|
|
|
| Provisions | 223 |
| 229 |
|
|
|
|
| Total current liabilities | 22,092 |
| 25,684 |
|
|
|
|
| TOTAL LIABILITIES | 48,882 |
| 56,346 |
|
|
|
|
|
|
|
|
|
|
|
|
|
| TOTAL LIABILITIES AND EQUITY | 97,148 |
| 94,262 |
Edenor S.A – 2Q ‘19 Earnings Release | 13 |
![]()
Condensed Interim Statements of Comprehensive Income (Loss)
for the three-month periods ended June 30, 2019 and 2018
Values expressed in constant purchasing power
In millon of Argentine Pesos | 06.30.2019 |
| 06.30.2018 |
AR$ | AR$ | ||
|
|
|
|
Continuing operations |
|
|
|
Revenue | 35,739 |
| 34,325 |
Electric power purchases | (21,709) |
| (18,252) |
Subtotal | 14,030 |
| 16,072 |
Transmission and distribution expenses | (6,900) |
| (6,204) |
Gross loss | 7,130 |
| 9,868 |
Selling expenses | (3,178) |
| (2,493) |
Administrative expenses | (1,498) |
| (1,537) |
Other operating expense, net | (810) |
| (675) |
Operating Profit (Loss) | 1,644 |
| 5,164 |
Labilities regularization agreement | 13,066 |
| - |
Financial income | 412 |
| 338 |
Financial expenses | (3,157) |
| (2,241) |
Other financial expense | (442) |
| (2,010) |
Net financial expense | (3,187) |
| (3,914) |
RECPAM | 5,827 |
| 3,889 |
Profit (Loss) before taxes | 17,350 |
| 5,139 |
|
|
|
|
Income tax | (6,522) |
| (1,871) |
Profit (Loss) for the period | 10,828 |
| 3,267 |
|
|
|
|
Basic and diluted earnings Profit (Loss) per share: |
|
|
|
Basic and diluted earnings profit (loss) per share | 12.33 |
| 3.64 |
Edenor S.A – 2Q ‘19 Earnings Release | 14 |
![]()
Condensed Interim Statements of Comprehensive Income (Loss)
for the three-month periods ended June 30, 2019 and 2018
Expressed at historical values
In millon of Argentine Pesos | 06.30.2019 |
| 06.30.2018 |
AR$ | AR$ | ||
|
|
|
|
Continuing operations |
|
|
|
Revenue | 33,181 |
| 21,266 |
Electric power purchases | (20,051) |
| (11,312) |
Subtotal | 13,130 |
| 9,954 |
Transmission and distribution expenses | (5,076) |
| (3,326) |
Gross loss | 8,054 |
| 6,628 |
Selling expenses | (2,801) |
| (1,466) |
Administrative expenses | (1,212) |
| (888) |
Other operating expense, net | (755) |
| (416) |
Operating Profit (Loss) | 3,287 |
| 3,858 |
Labilities regularization agreement | 12,824 |
| - |
Financial income | 381 |
| 209 |
Financial expenses | (2,947) |
| (1,048) |
Other financial expense | (333) |
| (1,202) |
Net financial expense | (2,899) |
| (2,041) |
|
|
|
|
Profit (Loss) before taxes | 13,211 |
| 1,816 |
|
|
|
|
Income tax | (2,484) |
| (563) |
Profit (Loss) for the period | 10,727 |
| 1,253 |
|
|
|
|
Basic and diluted earnings Profit (Loss) per share: |
|
|
|
Basic and diluted earnings Profit (Loss) per share | 4.83 |
| 4.83 |
Edenor S.A – 2Q ‘19 Earnings Release | 15 |
![]()
Condensed Interim Statements of Cash Flows
for the three-month periods ended June 30, 2019 and 2018
Values expressed in constant purchasing power
In millon of Argentine Pesos |
| 06.30.2019 |
| 06.30.2018 |
AR$ | AR$ | |||
|
|
|
|
|
Cash flows from operating activities |
|
|
|
|
Loss (Profit) for the period |
| 10,828 |
| 3,267 |
Adjustments to reconcile net (loss) profit to net cash flows provided by operating activities: |
| 6,960 |
| 4,405 |
|
|
|
|
|
Changes in operating assets and liabilities: |
|
|
|
|
Increase in trade receivables |
| (2,484) |
| (3,450) |
Increase in trade payables |
| (2,691) |
| 4,163 |
Income tax payment |
| (1,555) |
| (553) |
Others |
| (5,409) |
| 42 |
|
|
|
|
|
Net cash flows provided by operating activities |
| 5,649 |
| 7,873 |
|
|
|
|
|
Net cash flows used in investing activities |
| (2,859) |
| (5,427) |
|
|
|
|
|
Net cash flows used in financing activities |
| (1,723) |
| (1,519) |
|
|
|
|
|
Net (decrease) increase in cash and cash equivalents |
| 1,068 |
| 927 |
|
|
|
|
|
Cash and cash equivalents at beginning of year |
| 34 |
| 129 |
Exchange differences in cash and cash equivalents |
| 40 |
| 32 |
Result for exposure to inflation in cash and cash equivalents |
| (3) |
| 72 |
Net decrease in cash and cash equivalents |
| 1,068 |
| 927 |
Cash and cash equivalents at the end of period |
| 1,139 |
| 1,160 |
|
|
|
|
|
Supplemental cash flows information |
|
|
|
|
Non-cash operating, investing and financing activities |
|
|
|
|
Labilities regularization agreement |
| 13,066 |
| - |
Acquisitions of property, plant and equipment through increased trade payables |
| (650) |
| (374) |
|
Investor Relations Contacts:
Leandro Montero Chief Financial Officer
Federico Mendez Planning and Investor Relations Manager |
investor@edenor.com |Tel: +54 (11) 4346-5510 |
Edenor S.A – 2Q ‘19 Earnings Release | 16 |

SIGNATURES
Pursuant to the requirements of the Securities Exchange Act of 1934, the registrant has duly caused this report to be signed on its behalf by the undersigned, thereunto duly authorized.
| Empresa Distribuidora y Comercializadora Norte S.A. | |
|
|
|
|
|
|
| By: | /s/ Leandro Montero |
| Leandro Montero | |
| Chief Financial Officer | |
Date:August9, 2019