Empresa Distribuidora y Comercializadora Norte Sociedad Anónima (EDN)
Filed: 8 Nov 19, 4:48pm
UNITED STATES
SECURITIES AND EXCHANGE COMMISSION
Washington, D.C. 20549
FORM 6-K
REPORT OF FOREIGN PRIVATE ISSUER
PURSUANT TO RULE 13a-16 OR 15d-16 UNDER
THE SECURITIES EXCHANGE ACT OF 1934
For the month of November, 2019
EMPRESA DISTRIBUIDORA Y COMERCIALIZADORA NORTE S.A. (EDENOR)
(DISTRIBUTION AND MARKETING COMPANY OF THE NORTH )
(Translation of Registrant's Name Into English)
Argentina
(Jurisdiction of incorporation or organization)
Av. del Libertador 6363,
12th Floor,
City of Buenos Aires (A1428ARG),
Tel: 54-11-4346-5000
(Address of principal executive offices)
(Indicate by check mark whether the registrant files or will file annual reports under cover of Form 20-F or Form 40-F.)
Form 20-F X Form 40-F
(Indicate by check mark whether the registrant by furnishing the information contained in this form is also thereby furnishing the information to the Commission pursuant to Rule 12g3-2(b) under the Securities Exchange Act of 1934.)
Yes No X
(If "Yes" is marked, indicate below the file number assigned to the registrant in connection with Rule 12g3-2(b): 82- .)

![]()
| Results for the third quarter 2019
| |
Ticker:EDN Ratio: 20 Class B = 1 ADR
Share Cap. Net of repurchases: 875 million shares | 43.8 million ADRs
Market Cap. net of repurchases1: ARS 18.2 bn | USD 228 million |
Investor Relations Contacts:
Leandro Montero Chief Financial Officer
Federico Mendez Planning and Investor Relations Manager | |
ir.edenor.com |investor@edenor.com Tel: +54 (11) 4346 -5510 | ||
Buenos Aires, Argentina, November 8, 2019. Empresa Distribuidora y Comercializadora Norte S.A. (NYSE/ BYMA: EDN) (“edenor” or “the Company”), Argentina’s largest electricity distributor both in terms of number of customers and electricity sales, announces its results for the third quarter of 2019. All figures are stated in Argentine Pesos at constant currency, and the information has been prepared in accordance with International Financing Reporting Standards (“IFRS”), except for what is expressly indicated in the Statements of Comprehensive Income (Loss), which are expressed at historical values.
Conference Call Information
There will be a conference call to discuss Edenor’s 3Q19 results on Monday, November 11, 2019, at 12:00 p.m. Buenos Aires time / 10:00 a.m. New York time.
The presentation will be given by Leandro Montero,edenor’s Chief Financial Officer. For those interested in participating, please dial:
+ 1 (844) 204-8586 in the United States;
+1 (412) 317-6346 if outside the United States;
+54 (11) 3984-5677 in Argentina.
Participants should use conference ID “Edenor” and dial in five minutes before the call is set to begin. There will also be a live audio webcast of the conference atir.edenor.com.

1 Listing as of 11/08/2019, ARS 20.85 per share and USD 5.22 per ADR
Edenor S.A. – 3Q19 Earnings Release 2
![]()
SUMMARY OF RESULTS FOR THE THIRD QUARTER 2019
In millon of Pesos | 9 Months | 3Q | ||||
in constant purchising power | 2019 | 2018 | Δ% | 2019 | 2018 | Δ% |
Revenue from sales | 64,308 | 62,311 | 3.2% | 24,148 | 23,741 | 1.7% |
EBITDA | 7,377 | 10,698 | (31.0%) | 3,371 | 3,235 | 4.2% |
Adjusted EBITDA | 8,386 | 12,131 | (30.9%) | 3,509 | 3,860 | (9.1%) |
Net income | 12,425 | 7,094 | 75.2% | 258 | 3,422 | na |
Capital expenditures | 7,190 | 7,127 | 0.9% | 2,168 | 3,435 | (36.9%) |
Revenue from sales increased by 1.7 %, to ARS 24.1 billion, in 3Q19, mainly due to higher billings as a result of the increase in the seasonal price of electricity and the application of the adjustment on Own Distribution Costs (“CPD”) since March 2019. Furthermore, revenues corresponding to tariff deferral installments for the August 2018 - February 2019 period and higher collections on account of social tariff cap recoveries, not registered last year, were recognized in the third quarter this year. These effects were partially offset by the impact of lower physical electricity sales volumes and the lower CPD increases in comparison to inflation.
EBITDAincreased by 4.2%, reaching ARS 3.4 billion in 3Q19, reflecting a lower gross margin as a result of the slight increase in revenue from sales, outweighed by a higher increase in electric power purchases. This lower margin was offset by lower operating expenses, mainly due to decreases in salaries and social security taxes payable measured in constant currency, as well as in penalties, which resulted in an increase in operating profits.
Adjusted EBITDA decreased by 9.1%, reaching ARS 3.5 billion in 3Q19, in line with the EBITDA and including adjustments for commercial interests.
Net results amounted to ARS 258 million in 3Q19, experiencing a ARS 3.2 billion decrease compared to the same period of 2018, mainly due to the better financial results posted on a one-off basis in 3Q18 as a result of the revaluation of the real estate receivable.
Investmentsin 3Q19 reached ARS 2.2 billion as a result of the completion of the Capex plan devised byedenor for the year, with a special focus on investments optimizing service quality levels, as was defined for the 2017-2021 period.
Edenor S.A. – 3Q19 Earnings Release 3
![]()
RELEVANT EVENTS
Tariff Maintenance Agreement
On September 19, 2019, a tariff scheme’s maintenance agreement was executed with the Federal Government, which provides as follows:
- Keeping in effect tariff schemes effective as of August 1, 2019 for all tariff categories;
- Postponing the application of Own Distribution Costs (CPD) which should have applied since August 1, 2019, corresponding to the January-June 2019 period and for 19.05%, to January 1, 2020;
- Updating tariff schemes for seasonal prices of energy as from January 1, 2020;
- That the difference in the CPD and seasonal prices generated between those applied as from August 1, 2019 and those applicable as from January 1, 2020, will be recoverable, adjusted based on the applicable CPD, in seven monthly and consecutive installments payable as from January 1, 2020;
- The commitment to keep service quality levels and meet the quality parameters stipulated in the Concession Agreement.
- Postponing the payment of penalties until March 1, 2020 at their original values plus the applicable updates at the time of payment.
Determination of the Seasonal Price of Energy
On October 22, 2019, Resolution No. 38/2019 was issued by the Secretariat of Renewable Resources and Electricity Market, which provided for the continued application of Power Capacity Reference Prices (POTREF) and the Stabilized Price for Energy (PEE) in the MEM established in Resolution No. 14/2019 dated April 29, 2019 for the November 1, 2019 - April 30, 2020 period.
Framework Agreement
An Agreement for the Extension of the Framework Agreement was executed with the Federal Government, which provides as follows:
- An extension, effective as from January 1, 2019 and until May 31, 2019, of the New Framework Agreement entered into on October 6, 2003;
- The commitment by the Federal Government to pay the amounts corresponding to the economic contribution for the supply of electricity to low-income neighborhoods, after discounting the electricity associated with the Social Tariff;
- The onerous assignment by the Company to Edesur of the receivables acknowledged in its favor under this extension, in order to allow its collection.
As of September 30, 2019, we accounted for a total amount of ARS 735 million in revenues from the sale of electricity under the Framework Agreement corresponding to the Federal Government’s participation until May 31, 2019.
Edenor S.A. – 3Q19 Earnings Release 4
![]()
Contractual Termination of Real Estate Asset
As regards the real estate project acquired in November 2015, the later contractual termination due to breach by Ribera Desarrollos S.A. (“RDSA”) in August 2018, and the legal proceedings respectively brought against the seller and the insurance company, on September 30, 2019,edenor executed an agreement whereby it will receive from the insurance company as total, final and conclusive compensation, the amount of USD 15 million and the assignment in favor of edenor of the insurance company’s right to subrogate to the rights of the insured party for the amount paid against the policy holder, RDSA.
As of the date hereof,edenor has received the amount of USD 14 million. The remaining amount will be paid in six quarterly consecutive installments, payable as from April 2020.
Furthermore, the arbitration complaint against RDSA brought before the Buenos Aires Stock Exchange’s Arbitration Court seeking the refund of the price paid for the undelivered real estate was suspended to be able to prove claims at RDSA’s bankruptcy proceeding.
Changes in Ratings
On September 3, 2019, Moody’s Latin America issued a report downgradingedenor‘s local corporate ratings from Aa3.ar to Baa3.ar, as well as global ratings from B1 to Caa1, placing its credit rating under review for a possible downgrade. This action results from a downgrade in the Argentine Government’s senior unsecured ratings from B2 to Caa2 and its placing under review for a possible downgrade, and reflects the strong credit links and the company’s exposure to Argentine regulations and operating environment. In turn, Moody’s downgraded shares ratings to Category 2. However, the downgrade in Argentine regulated companies’ ratings to Caa1, a step above the sovereign debt rating, shows relatively strong credit indicators, under sufficient liquidity and leverage, combined with comfortable debt profiles.
On September 19, 2019, S&P Global Ratings downgradededenor’s local ratings from ‘raA’ to ‘raBBB’ and withdrew it from Special Review with negative implications, where it had been placed on August 21, 2019. The outlook is negative. This downgrade reflects a more challenging macroeconomic, financial and business context for the corporate sector after the downgrade in Argentina’s global ratings to ‘CCC-’ on August 30, 2019.
Edenor S.A. – 3Q19 Earnings Release 5
![]()
MAIN RESULTS FOR THE THIRD QUARTER 2019
In millon of Pesos | 9 Months | 3Q | ||||
in constant purchising power | 2019 | 2018 | Δ% | 2019 | 2018 | Δ% |
Revenue from sales | 64,308 | 62,311 | 3.2% | 24,148 | 23,741 | 1.7% |
Energy purchases | (40,433) | (34,496) | 17.2% | (16,039) | (13,985) | 14.7% |
Gross margin | 23,874 | 27,816 | (14.2%) | 8,109 | 9,755 | (16.9%) |
Operating expenses | (18,252) | (18,532) | (1.5%) | (5,244) | (7,032) | (25.4%) |
Other operating expenses | (1,474) | (1,202) | 22.6% | (564) | (444) | 27.1% |
Net operating income | 4,148 | 8,082 | (48.7%) | 2,301 | 2,280 | 0.9% |
Labilities regularization agreement | 15,296 | - | na | 613 | - | na |
Financial Results, net | (6,531) | (5,380) | 21.4% | (2,950) | (982) | 200.4% |
RECPAM | 8,518 | 8,452 | 0.8% | 1,970 | 4,082 | (51.7%) |
Income Tax | (9,005) | (4,060) | 121.8% | (1,676) | (1,957) | (14.4%) |
Net income | 12,425 | 7,094 | 75.2% | 258 | 3,422 | (92.5%) |
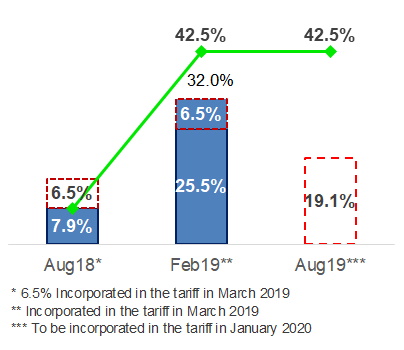
Revenues from sales increased by 1.7%, reaching ARS 24,148 million in 3Q19, against ARS 23,741 million in 3Q18. This ARS 407 million increase is mainly accounted for by higher billings for electric power purchases measured in pesos in the amount of ARS 1,792 million. In turn, during the quarter revenues from tariff deferral installments for the August 2018 - February 2019 period in the amount of ARS 899 million and higher collections from social tariff cap recoveries for ARS 448 million were recognized, unlike the same period last year. This was partly offset by lower collections under the deferred income recoverable in 48 installments and accrued during the February 2017 - January 2018 period for ARS 346 million, as well as the impact of lower physical electric power sales volumes for ARS 1,117 million and the application of the below-inflation adjustment on the CPD for ARS 268 million. Finally, between the comparison periods, CPD adjustments were applied for a total 42.5%, corresponding to the first and second semester of 2018, the adjustment for the first semester of 2019 of 19.1% being deferred to January 2020.
Furthermore, a mismatch has been identified between the CPD measurement and its granting, which in an inflationary scenario has a negative impact on the Distribution Value Added (“VAD”), combined with the fact that the composition of the CPD formula (which replicatesedenor’s cost structure) has a greater weight on the salary index, and was below the evolution of the IPC and the IPIM. VAD adjustments on the recognition of increases in own distribution costs are summarized below:
Edenor S.A. – 3Q19 Earnings Release 6
![]()
| 9 Months 2019 | 9 Months 2018 | Variation | |||||
| GWh | Part. % | Customers | GWh | Part. % | Customers | % GWh | % Customers |
Residential * | 6,504 | 42.7% | 2,733,618 | 7,148 | 43.3% | 2,644,011 | (9.0%) | 3.4% |
Small commercial | 1,273 | 8.4% | 321,583 | 1,401 | 8.5% | 323,322 | (9.2%) | (0.5%) |
Medium commercial | 1,165 | 7.7% | 31,228 | 1,282 | 7.8% | 32,427 | (9.1%) | (3.7%) |
Industrial | 2,620 | 17.2% | 6,827 | 2,781 | 16.8% | 6,871 | (5.8%) | (0.6%) |
Wheeling System | 2,656 | 17.4% | 692 | 2,904 | 17.6% | 705 | (8.5%) | (1.8%) |
Others |
|
|
|
|
|
|
|
|
Public lighting | 559 | 3.7% | 21 | 565 | 3.4% | 21 | (1.1%) | 0.0% |
Shantytowns and others | 451 | 3.0% | 465 | 438 | 2.7% | 450 | 2.8% | 3.3% |
Total | 15,228 | 100% | 3,094,434 | 16,520 | 100% | 3,007,807 | (7.8%) | 2.9% |
|
|
|
|
|
|
|
|
|
| 3Q 2019 | 3Q 2018 | Variation | |||||
| GWh | Part. % | Customers | GWh | Part. % | Customers | % GWh | % Customers |
Residential * | 2,408 | 44.9% | 2,733,618 | 2,526 | 44.9% | 2,644,011 | (4.7%) | 3.4% |
Small commercial | 429 | 8.0% | 321,583 | 458 | 8.1% | 323,322 | (6.3%) | (0.5%) |
Medium commercial | 388 | 7.2% | 31,228 | 414 | 7.4% | 32,427 | (6.3%) | (3.7%) |
Industrial | 882 | 16.4% | 6,827 | 913 | 16.2% | 6,871 | (3.4%) | (0.6%) |
Wheeling System | 869 | 16.2% | 692 | 922 | 16.4% | 705 | (5.7%) | (1.8%) |
Others |
|
|
|
|
|
|
|
|
Public lighting | 198 | 3.7% | 21 | 200 | 3.5% | 21 | (0.7%) | 0.0% |
Shantytowns and others | 189 | 3.5% | 465 | 194 | 3.4% | 450 | (2.7%) | 3.3% |
Total | 5,362 | 100% | 3,094,434 | 5,626 | 100% | 3,007,807 | (4.7%) | 2.9% |
|
|
|
|
|
|
|
|
|
* 563,244 customers benefit from Social Tariff | ||||||||
Thevolume of energy sales decreased by 4.7%, reaching 5,362 GWh, in 3Q19, against 5,626 GWh for the same period of 2018. This decrease was mainly explained by 4.7% decreases for residential customers, 6.3% decreases for medium and small commercial customers, and 4.6% decreases for large users (industrial users and the wheeling system). The residential demand decreased mainly as a result of higher average temperatures compared with the previous year in the colder months, as well as the impact of the economic recession and the tariff increases. Recorded temperatures were on average 1°C higher in July and 0.4°C higher in August. Small and medium commercial customers were adversely affected by the lower commercial activity resulting from the economic situation, and large users, by the lower industrial activity, which is reflected in the fall in the industrial production index (IPI). Furthermore,edenor’s customer base rose by 2.9%, mainly on account of the increase in residential customers, which have risen to levels above their historical growth as a result of the implemented market discipline actions and the installation during the last year of more than 100,000 integrated energy meters that were mostly destined to regularize clandestine connections. By contrast, the number of commercial customers experienced a decrease due to the lower activity levels in the last year.
Electric power purchases increased by 14.7%, reaching ARS 16,039 million in 3Q19, against ARS 13,985 million in 3Q18. This ARS 2,054 million increase is mainly due to the 18.1% real-term increase in the average purchase price, which generated an impact of ARS 2,460 million, as a result of the entry into effect of the new reference seasonal prices for electricity applicable as from August 2018, February and May 2019 pursuant to Provision No. 75/2018, Resolution No. 366/2018 and Resolution No. 14/2019 of the Secretariat of Renewable Resources and Electricity Market. This increase was partially offset by a 4.5% decrease in energy volumes net of losses due to the drop in demand, which was valued at approximately ARS 668 million. Despite this increase, the reference seasonal price for residential customers is still subsidized by the Federal Government, especially in the case of residential customers, where in 3Q19 the subsidy reached 50% of the system’s actual generation cost. Additionally, the energy loss rate increased from 20.4% in 3Q18 to 23.1% in 3Q19, and was mainly generated by an increase in the incentive to fraud as a result of the economic recession and the impact of tariff increases. In turn, costs associated with these losses increased by 16.2% in real terms (or 79.6% in nominal terms), mainly on account of the application of the new seasonal price for its determination.
Edenor S.A. – 3Q19 Earnings Release 7
![]()
Operating expenses decreased by 25.4%, reaching ARS 5,244 million in 3Q19, against ARS 7,032 million in 3Q18. This is mainly explained by two reasons: Firstly, as a result of the decrease in penalties in the amount of ARS 1,016 million as a result of extraordinary penalties for deviating from the investment plan and the updating of penalties, which were later included in the liabilities regularization agreement, recorded in 3Q18 for ARS 177 million and ARS460 million, respectively. In turn, a decrease in penalties was posted in 3Q19 compared to the same period of the previous year as a result of the impact of investments on the improvement of service quality levels and a lower user demand. Secondly, due to a ARS 359 million decrease in constant currency in salaries and social security taxes payable, as salary adjustments were below inflation levels.
In million of pesos | 9 Months | 3Q | ||||
in constant purchising power | 2019 | 2018 | Δ% | 2019 | 2018 | Δ% |
Salaries, social security taxes | (5,637) | (6,213) | (9.3%) | (1,806) | (2,165) | (16.6%) |
Pensions Plans | (235) | (201) | 16.5% | (72) | (65) | 10.6% |
Communications expenses | (324) | (371) | (12.6%) | (101) | (133) | (24.2%) |
Allowance for the imp. of trade and other receivables | (845) | (1,155) | (26.9%) | (388) | (545) | (28.7%) |
Supplies consumption | (1,078) | (666) | 61.9% | (256) | (271) | (5.7%) |
Leases and insurance | (156) | (190) | (17.8%) | (59) | (67) | (11.6%) |
Security service | (269) | (263) | 2.4% | (67) | (90) | (25.3%) |
Fees and remuneration for services | (3,687) | (3,453) | 6.8% | (1,242) | (1,259) | (1.4%) |
Amortization of assets by right of use | (94) | 0 | na | (42) | 0 | na |
Public relations and marketing | (35) | (18) | 90.4% | (6) | (9) | (31.5%) |
Advertising and sponsorship | (18) | (9) | 90.4% | (3) | (5) | (31.5%) |
Reimbursements to personnel | (1) | (1) | na | (0) | (0) | na |
Depreciation of property, plant and equipment | (3,135) | (2,616) | 19.8% | (1,028) | (956) | 7.6% |
Directors and Sup. Committee members’ fees | (16) | (23) | (28.8%) | (11) | (8) | 41.0% |
ENRE penalties | (2,147) | (2,498) | (14.1%) | 17 | (999) | (101.7%) |
Taxes and charges | (568) | (848) | (33.0%) | (175) | (457) | (61.7%) |
Other | (8) | (7) | 8.4% | (5) | (2) | 88.2% |
Total | (18,252) | (18,532) | (1.5%) | (5,244) | (7,032) | (25.4%) |
Financial results experienced a 20.4% increase in losses, with ARS 2,950 million losses in 3Q19, against ARS 982 million losses for 3Q18. This difference is mainly due to the variation in other financial results in the amount of ARS 3,184 million resulting from the one-time revaluation of the real estate asset in the third quarter of 2018 and the impact of a lower increase in the reasonable value of financial assets for ARS 506 million in 3Q19. These higher negative results were partially offset by a ARS 1,383 million decrease in the payment of commercial interest on the debt with CAMMESA as a result of the regularization of liabilities, lower foreign exchange losses for ARS 329 million as a result of a lower devaluation of the peso against the U.S. dollar over the quarter, and lower interest payments for ARS 257 million.
Edenor S.A. – 3Q19 Earnings Release 8
![]()
Net income decreased by ARS 3,164 million, recording profits for ARS 258 million, in 3Q19, against profits for ARS 3,422 million for the same period in 2018. Operating results remained constant since the lower gross margin resulting from the increase in electric power purchases in pesos and the increase in losses was offset by lower operating expenses. In this context, the decrease in net results is mainly due to the better financial results posted on a one-off basis in 3Q18 as a result of the revaluation of the real estate receivable.
Adjusted EBITDA
Adjusted EBITDA showed ARS 3,509 million profits in 3Q19, ARS 351 million lower than in the same period of 2018. Adjustments correspond to penalties from other periods for deviating from the investment plan, reading periodicity, extraordinary service disruptions, the updating of penalties and commercial interest.
In millon of Pesos | 9 Months | 3Q | ||||
in constant purchising power | 2019 | 2018 | Δ% | 2019 | 2018 | Δ% |
Net operating income | 4,148 | 8,082 | (48.7%) | 2,301 | 2,280 | 0.9% |
Depreciation of property, plant and equipment | 3,228 | 2,616 | 23.4% | 1,070 | 956 | 12.0% |
EBITDA | 7,377 | 10,698 | (31.0%) | 3,371 | 3,235 | 4.2% |
Penalties - SAPIA | - | 177 | na | - | 177 | na |
Penalties - Res. No 118/2018 | - | 317 | na | - | - | na |
Penalties - frecuency of meter reading | - | (371) | na | - | (112) | na |
Penalties - Actualization (*) | 670 | 1,027 | (34.7%) | - | 460 | na |
Commercial Interests | 338 | 283 | 19.5% | 138 | 99 | 39.1% |
Adjusted EBITDA | 8,386 | 12,131 | (30.9%) | 3,509 | 3,860 | (9.1%) |
(*)The liabilities regularization agreement will discontinue the updating of penalties corresponding to the transition period (2006-2016) in future quarters.
Edenor S.A. – 3Q19 Earnings Release 9
![]()
Capital Expenditures
edenor’ s capital expenditures during 3Q19 totaled ARS 2,168 million, compared to ARS 3,435 million in 3Q18. Our investments mainly consisted of the following:
· ARS 404 million in new connections;
· ARS 964 million in grid enhancements;
· ARS 493 million in maintenance;
· ARS 20 million in legal requirements;
· ARS 167 million in communications and telecontrol;
· ARS 120 million in other investment projects.
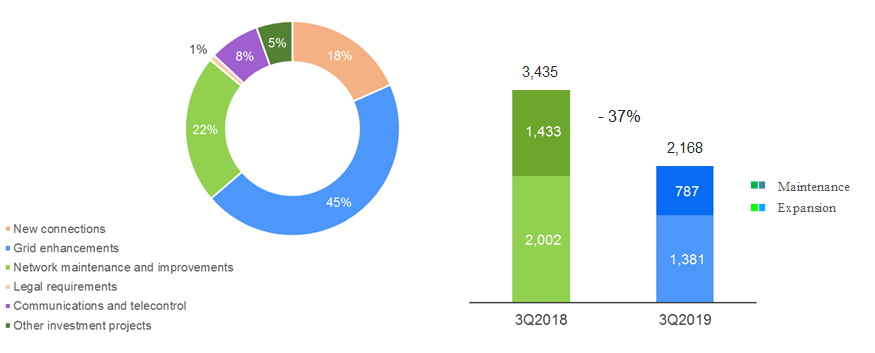
The company is seeking to reach a total investment amount for 2019 similar to the previous year. The reduction in investments of the 3Q18 compared to the same period last year is mainly due to a different timing in the execution of the plan in comparison to 2018, and to a lesser extent in the deceleration of the Capex plan set byedenor at the beginning of the year as a result of lower revenues due to the fall in sales volumes. The plan maintains focus on the investments that improve the quality of service, what can be seen in the fulfillment of the quality curves required by the regulator in the integral tariff review.
Edenor S.A. – 3Q19 Earnings Release 10
![]()
Service Quality Standards
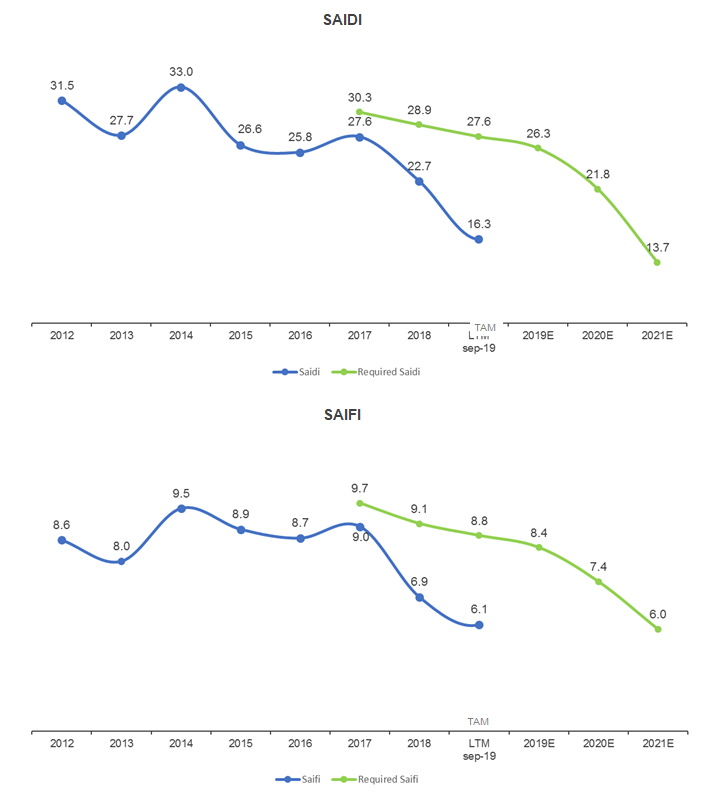
Quality standards are measured based on the duration and frequency of service outages using the SAIDI and SAIFI indicators. SAIDI refers to the duration of outages, and measures the number of outage hours per year. SAIFI refers to the frequency of outages, and measures the number of times a user experiences an outage during a year.
In 3Q19, SAIDI and SAIFI indicators were 16.3 hours and 6.1 outages per year during the last twelve months, evidencing a 39.0% and 20.6% improvement, respectively, compared to the same period of the previous year. This recovery in service levels is mainly due to the fulfillment of the ambitious plan devised by the company since the RTI. Its success is also evidenced by the fact that these indicators exceed the service quality improvement path defined by the regulatory entity.
Edenor S.A. – 3Q19 Earnings Release 11
![]()
Energy Losses
In 3Q19, energy losses experienced a 23.1% increase, against 20.4% for the same period in 2018. The drop in the demand by large users (which have substantially lower loss levels) adversely affects this indicator in percentage terms. Likewise, the rise in the average electric power purchase price also increases the value in pesos of these losses.
During 2019, multidisciplinary teams were created to work on new solutions to energy losses, furthermore the level of activities aimed at reducing losses continued to increase. Market Discipline actions (DIME) were intensified with the objective of detecting and normalizing irregular connections, fraud and energy theft and the installation of Inclusion Meters (Integrated Energy Meter - MIDE) were increased. Despite this, losses continued to grow as a result of a greater number of clandestine connections due to the impact of the economic recession and tariff increases.

Indebtedness
As of September 30, 2019, the outstanding principal of our dollar-denominated financial debt amounts to USD 201.3 million, whereas the net debt amounts to USD 154.3 million. The financial debt consists of USD 163.8 million corresponding to Corporate Bonds maturing in 2022, net of repurchases, and USD 37.5 million to the bank loan taken out with the Industrial and Commercial Bank of China (ICBC) Dubai Branch. Currently both liabilities bear interest at a fixed rate. After the financial statements’ closing date, the second principal installment of the loan with the ICBC in the amount of USD 12.5 million, together with the applicable interest for the period, was repaid upon maturity on October 15. In turn, to the date of this report Corporate Bonds maturing in 2022 for a total face value of USD 2.0 million were repurchased.
Edenor S.A. – 3Q19 Earnings Release 12
![]()
About Edenor
Empresa Distribuidora y Comercializadora Norte S.A. (edenor) is the largest electricity distribution company in Argentina in terms of number of customers and electricity sold (in GWh). Through a concession,edenor distributes electricity exclusively to the northwestern zone of the greater Buenos Aires metropolitan area and the northern part of the City of Buenos Aires, which has a population of approximately 9 million people and an area of 4,637 sq. km. In 2018,edenor sold 21,172 GWh of energy and purchased 25,906 GWh (including wheeling system demands), with revenue from sales in the amount of ARS 77 billion adjusted by inflation as of September 2019. In turn, the company had positive net results in the amount of ARS 5,913 million adjusted by inflation as of September 2019.
This press release may contain forward-looking statements. These statements are not historical facts, and are based on management’s current view and estimates of future economic circumstances, industry conditions, Company performance and financial results. The words “anticipates”, “believes”, “estimates”, “expects”, “plans” and similar expressions, as they relate to the Company, are intended to identify forward-looking statements. Such statements reflect the current views of management and are subject to a number of risks and uncertainties, including those identified in the documents filed by the Company with the U.S. Securities and Exchange Commission. There is no guarantee that the expected events, trends or results will actually occur. The statements are based on many assumptions and factors, including general economic and market conditions, industry conditions, and operating factors. Any changes in such assumptions or factors could cause actual results to differ materially from current expectations.
Edenor S.A.
Avenida del Libertador 6363, Piso 4º
(C1428ARG) Buenos Aires, Argentina
Tel: 5411.4346.5510
investor@edenor.com
www.edenor.com
Edenor S.A. – 3Q19 Earnings Release 13
![]()
Condensed Interim Statements of Financial Position
as of September 30, 2019 and December 31, 2018
Values expressed in constant purchasing power
In million of Argentine Pesos | 09.30.2019 |
| 12.31.2018 |
|
| 09.30.2019 |
| 12.31.2018 |
AR$ | AR$ |
| AR$ | AR$ | ||||
|
|
|
|
|
|
|
|
|
ASSETS |
|
|
|
| EQUITY |
|
|
|
|
|
|
|
|
|
|
|
|
Non-current assets |
|
|
|
| Share capital | 875 |
| 883 |
Property, plant and equipment | 89,961 |
| 85,953 |
| Adjustment to share capital | 23,610 |
| 23,811 |
Interest in joint ventures | 10 |
| 12 |
| Additional paid-in capital | 331 |
| 331 |
Deferred tax asset | 287 |
| - |
| Treasury stock | 31 |
| 23 |
Other receivables | 29 |
| 1,102 |
| Adjustment to treasury stock | 520 |
| 319 |
Total non-current assets | 90,287 |
| 87,067 |
| Adquisition cost of own shares | (2,007) |
| (1,470) |
|
|
|
|
| Legal reserve | 1,153 |
| 210 |
Current assets |
|
|
|
| Opcional reserve | 17,745 |
| 505 |
Inventories | 1,808 |
| 1,733 |
| Other comprehensive loss | (188) |
| (188) |
Other receivables | 1,264 |
| 333 |
| Accumulated losses | 12,425 |
| 18,183 |
Trade receivables | 13,844 |
| 10,439 |
| TOTAL EQUITY | 54,496 |
| 42,607 |
Financial assets at fair value through profit or loss | 2,941 |
| 4,652 |
|
|
|
|
|
Financial assets at amortized cost | - |
| 1,663 |
|
|
|
|
|
Cash and cash equivalents | 215 |
| 38 |
| LIABILITIES |
|
|
|
Total current assets | 20,072 |
| 18,859 |
| Non-current liabilities |
|
|
|
|
|
|
|
|
|
|
|
|
|
|
|
|
| Trade payables | 327 |
| 394 |
TOTAL ASSETS | 110,360 |
| 105,926 |
| Other payables | 3,229 |
| 10,489 |
|
|
|
|
| Borrowings | 10,142 |
| 9,895 |
|
|
|
|
| Deferred revenue | 271 |
| 379 |
|
|
|
|
| Salaries and social security payable | 232 |
| 224 |
|
|
|
|
| Benefit plans | 535 |
| 530 |
|
|
|
|
| Deferred tax liability | 16,516 |
| 11,073 |
|
|
|
|
| Tax liabilities | - |
| - |
|
|
|
|
| Provisions | 1,870 |
| 1,472 |
|
|
|
|
| Total non-current liabilities | 33,121 |
| 34,456 |
|
|
|
|
|
|
|
|
|
|
|
|
|
| Current liabilities |
|
|
|
|
|
|
|
| Trade payables | 12,569 |
| 20,099 |
|
|
|
|
| Other payables | 2,469 |
| 2,644 |
|
|
|
|
| Borrowings | 1,898 |
| 1,482 |
|
|
|
|
| Derivative financial instruments | 3 |
| 1 |
|
|
|
|
| Deferred revenue | 5 |
| 7 |
|
|
|
|
| Salaries and social security payable | 1,690 |
| 2,398 |
|
|
|
|
| Benefit plans | 32 |
| 45 |
|
|
|
|
| Tax payable | 2,847 |
| 849 |
|
|
|
|
| Tax liabilities | 957 |
| 1,079 |
|
|
|
|
| Provisions | 271 |
| 258 |
|
|
|
|
| Total current liabilities | 22,742 |
| 28,862 |
|
|
|
|
| TOTAL LIABILITIES | 55,863 |
| 63,319 |
|
|
|
|
|
|
|
|
|
|
|
|
|
| TOTAL LIABILITIES AND EQUITY | 110,360 |
| 105,926 |
Edenor S.A. – 3Q19 Earnings Release 14
![]()
Condensed Interim Statements of Comprehensive Income (Loss)
for the three-month period ended on September 30, 2019 and 2018
Values expressed in constant purchasing power
In millon of Argentine Pesos | 09.30.2019 |
| 09.30.2018 |
AR$ | AR$ | ||
|
|
|
|
Continuing operations |
|
|
|
Revenue | 64,308 |
| 62,311 |
Electric power purchases | (40,433) |
| (34,496) |
Subtotal | 23,874 |
| 27,816 |
Transmission and distribution expenses | (10,734) |
| (10,974) |
Gross loss | 13,140 |
| 16,842 |
Selling expenses | (5,006) |
| (4,888) |
Administrative expenses | (2,512) |
| (2,671) |
Other operating expense, net | (1,474) |
| (1,202) |
Operating Profit (Loss) | 4,148 |
| 8,082 |
Labilities regularization agreement | 15,296 |
| - |
Financial income | 749 |
| 638 |
Financial expenses | (4,165) |
| (4,519) |
Other financial expense | (3,116) |
| (1,499) |
Net financial expense | (6,531) |
| (5,380) |
RECPAM | 8,518 |
| 8,452 |
Profit (Loss) before taxes | 21,430 |
| 11,154 |
|
|
|
|
Income tax | (9,005) |
| (4,060) |
Profit (Loss) for the period | 12,425 |
| 7,094 |
|
|
|
|
Basic and diluted earnings Profit (Loss) per share: |
|
|
|
Basic and diluted earnings profit (loss) per share | 12.33 |
| 3.64 |
Edenor S.A. – 3Q19 Earnings Release 15
![]()
Condensed Interim Statements of Comprehensive Income (Loss)
for the three-month period ended on September 30, 2019 and 2018
Expressed at historical values
In millon of Argentine Pesos | 09.30.2019 |
| 09.30.2018 |
AR$ | AR$ | ||
|
|
|
|
Continuing operations |
|
|
|
Revenue | 56,222 |
| 34,727 |
Electric power purchases | (35,371) |
| (19,308) |
Subtotal | 20,851 |
| 15,419 |
Transmission and distribution expenses | (7,306) |
| (5,315) |
Gross loss | 13,545 |
| 10,104 |
Selling expenses | (4,047) |
| (2,608) |
Administrative expenses | (1,905) |
| (1,403) |
Other operating expense, net | (1,285) |
| (669) |
Operating Profit (Loss) | 6,307 |
| 5,423 |
Labilities regularization agreement | 13,403 |
| - |
Financial income | 654 |
| 358 |
Financial expenses | (3,562) |
| (1,948) |
Other financial expense | (2,755) |
| (767) |
Net financial expense | (5,663) |
| (2,356) |
|
|
|
|
Profit (Loss) before taxes | 14,048 |
| 3,067 |
|
|
|
|
Income tax | (2,494) |
| (966) |
Profit (Loss) for the period | 11,554 |
| 2,101 |
|
|
|
|
Basic and diluted earnings Profit (Loss) per share: |
|
|
|
Basic and diluted earnings Profit (Loss) per share | 4.83 |
| 4.83 |
Edenor S.A. – 3Q19 Earnings Release 16
![]()
Condensed Interim Statements of Cash Flows
for the three-month period ended September 30, 2019 and 2018
Values expressed in constant purchasing power
In millon of Argentine Pesos |
| 09.30.2019 |
| 09.30.2018 |
AR$ | AR$ | |||
|
|
|
|
|
Cash flows from operating activities |
|
|
|
|
Loss (Profit) for the period |
| 12,425 |
| 7,094 |
Adjustments to reconcile net (loss) profit to net cash flows provided by operating activities: |
| (2,961) |
| 6,192 |
|
|
|
|
|
Changes in operating assets and liabilities: |
|
|
|
|
Increase in trade receivables |
| (4,819) |
| (6,953) |
Increase in trade payables |
| 4,263 |
| 7,936 |
Income tax payment |
| (2,130) |
| (1,108) |
Others |
| 279 |
| 636 |
|
|
|
|
|
Net cash flows provided by operating activities |
| 7,058 |
| 13,797 |
|
|
|
|
|
Net cash flows used in investing activities |
| (5,103) |
| (7,332) |
|
|
|
|
|
Net cash flows used in financing activities |
| (1,855) |
| (1,707) |
|
|
|
|
|
Net (decrease) increase in cash and cash equivalents |
| 100 |
| 4,758 |
|
|
|
|
|
Cash and cash equivalents at beginning of year |
| 38 |
| 127 |
Exchange differences in cash and cash equivalents |
| 79 |
| 384 |
Result for exposure to inflation in cash and cash equivalents |
| (2) |
| (828) |
Net decrease in cash and cash equivalents |
| 100 |
| 4,758 |
Cash and cash equivalents at the end of period |
| 215 |
| 4,441 |
|
|
|
|
|
Supplemental cash flows information |
|
|
|
|
Non-cash operating, investing and financing activities |
|
|
|
|
Liabilities regularization agreement |
| (15,296) |
| - |
Acquisitions of property, plant and equipment through increased trade payables |
| (311) |
| (684) |
|
Investor Relations Contacts:
Leandro Montero Chief Financial Officer
Federico Mendez Planning and Investor Relations Manager |
investor@edenor.com |Tel: +54 (11) 4346-5510 |
Edenor S.A. – 3Q19 Earnings Release 17

SIGNATURES
Pursuant to the requirements of the Securities Exchange Act of 1934, the registrant has duly caused this report to be signed on its behalf by the undersigned, thereunto duly authorized.
| Empresa Distribuidora y Comercializadora Norte S.A. | |
|
|
|
|
|
|
| By: | /s/ Leandro Montero |
| Leandro Montero | |
| Chief Financial Officer | |
Date:November 8, 2019